
Article (refereed) - postprint - CORE
55
Article (refereed) - postprint Miller, James David; Hess, Tim. 2017. Urbanisation impacts on storm runoff along a rural-urban gradient. Journal of Hydrology, 552. 474-489. 10.1016/j.jhydrol.2017.06.025 © 2017 Elsevier B.V. This manuscript version is made available under the CC-BY-NC-ND 4.0 license http://creativecommons.org/licenses/by-nc-nd/4.0/ This version available http://nora.nerc.ac.uk/517476/ NERC has developed NORA to enable users to access research outputs wholly or partially funded by NERC. Copyright and other rights for material on this site are retained by the rights owners. Users should read the terms and conditions of use of this material at http://nora.nerc.ac.uk/policies.html#access NOTICE: this is the author’s version of a work that was accepted for publication in Journal of Hydrology. Changes resulting from the publishing process, such as peer review, editing, corrections, structural formatting, and other quality control mechanisms may not be reflected in this document. Changes may have been made to this work since it was submitted for publication. A definitive version was subsequently published in Journal of Hydrology, 552. 474-489. 10.1016/j.jhydrol.2017.06.025 www.elsevier.com/ Contact CEH NORA team at [email protected] The NERC and CEH trademarks and logos (‘the Trademarks’) are registered trademarks of NERC in the UK and other countries, and may not be used without the prior written consent of the Trademark owner. brought to you by CORE View metadata, citation and similar papers at core.ac.uk provided by NERC Open Research Archive
-
Upload
khangminh22 -
Category
Documents
-
view
1 -
download
0
Transcript of Article (refereed) - postprint - CORE

Article (refereed) - postprint
Miller, James David; Hess, Tim. 2017. Urbanisation impacts on storm runoff along a rural-urban gradient. Journal of Hydrology, 552. 474-489. 10.1016/j.jhydrol.2017.06.025
© 2017 Elsevier B.V.
This manuscript version is made available under the CC-BY-NC-ND 4.0 license http://creativecommons.org/licenses/by-nc-nd/4.0/
This version available http://nora.nerc.ac.uk/517476/
NERC has developed NORA to enable users to access research outputs wholly or partially funded by NERC. Copyright and other rights for material on this site are retained by the rights owners. Users should read the terms and conditions of use of this material at http://nora.nerc.ac.uk/policies.html#access
NOTICE: this is the author’s version of a work that was accepted for publication in Journal of Hydrology. Changes resulting from the publishing process, such as peer review, editing, corrections, structural formatting, and other quality control mechanisms may not be reflected in this document. Changes may have been made to this work since it was submitted for publication. A definitive version was subsequently published in Journal of Hydrology, 552. 474-489. 10.1016/j.jhydrol.2017.06.025 www.elsevier.com/
Contact CEH NORA team at
The NERC and CEH trademarks and logos (‘the Trademarks’) are registered trademarks of NERC in the UK and other countries, and may not be used without the prior written consent of the Trademark owner.
brought to you by COREView metadata, citation and similar papers at core.ac.uk
provided by NERC Open Research Archive

1
Urbanisation impacts on storm runoff along a rural‐urban gradient 1
James David Millera, b (corresponding author) [email protected] 2
Tim Hessb 3
aCentre for Ecology and Hydrology, Maclean Building, Benson Lane, Crowmarsh Gifford, Oxfordshire, 4
OX10 8BB, UK 5
bCranfield University, Cranfield, Bedfordshire, MK43 0AL, UK 6

2
1 Introduction 7
Urban development brings an increase in impervious surfaces that reduces rainfall infiltration to 8
underlying soils and surface storage capacity (Booth, 1991) with a concomitant rise in the degree of 9
artificial drainage that acts to convey runoff through more efficient pathways (Boyd et al., 1994). The 10
combined effects include an increase in storm runoff (Burn and Boorman, 1993) and volume (Kjeldsen et 11
al., 2013), reduction in baseflows (Simmons and Reynolds, 2013) and shortening of catchment response 12
times (Smith et al., 2005; Anderson, 1970) resulting in a more flashy response (Baker et al., 2004). 13
Urbanisation thus presents a particular challenge to planners as the development of previously rural or 14
low urban density catchments will potentially alter the rainfall‐runoff response and require careful 15
planning to manage the changes in the timing and quantity of water moving through the catchment. 16
Coupled with projected increased frequency of extreme rainfall events as a result of climate change, this 17
poses a significant environmental risk in the form of pluvial and fluvial flooding (Bell et al., 2012; Eigenbrod 18
et al., 2011; Poelmans et al., 2011). 19
Many studies on the hydrological impacts of urbanisation have been based on field observations (e.g. 20
Hood et al., 2007; Kauffman et al., 2009; Sheeder et al., 2003) and increasingly utilise models calibrated 21
to observations (Bach et al., 2014). In both cases, suitable hydrological metrics are required to quantify 22
hydrological response and subsequently attribute response to differences in land use. Arbitrary flow 23
statistics are not always suitable for quantifying the hydrological impacts of land‐use change (LUC) 24
(Mcintyre et al., 2013) and for urban storm events, Braud et al. (2013) show the storm hydrograph 25
provides the most suitable means for comparing hydrological response. In addition, relevant information 26
describing how the catchment differs from a control or baseline condition is required. LUC in urban areas 27
is highly complex and as such the diversity of the urban fabric is generally represented by either: urban 28
land‐use type (e.g. urban/suburban: Morton et al., 2011), density of urban development (e.g. dwelling 29
3
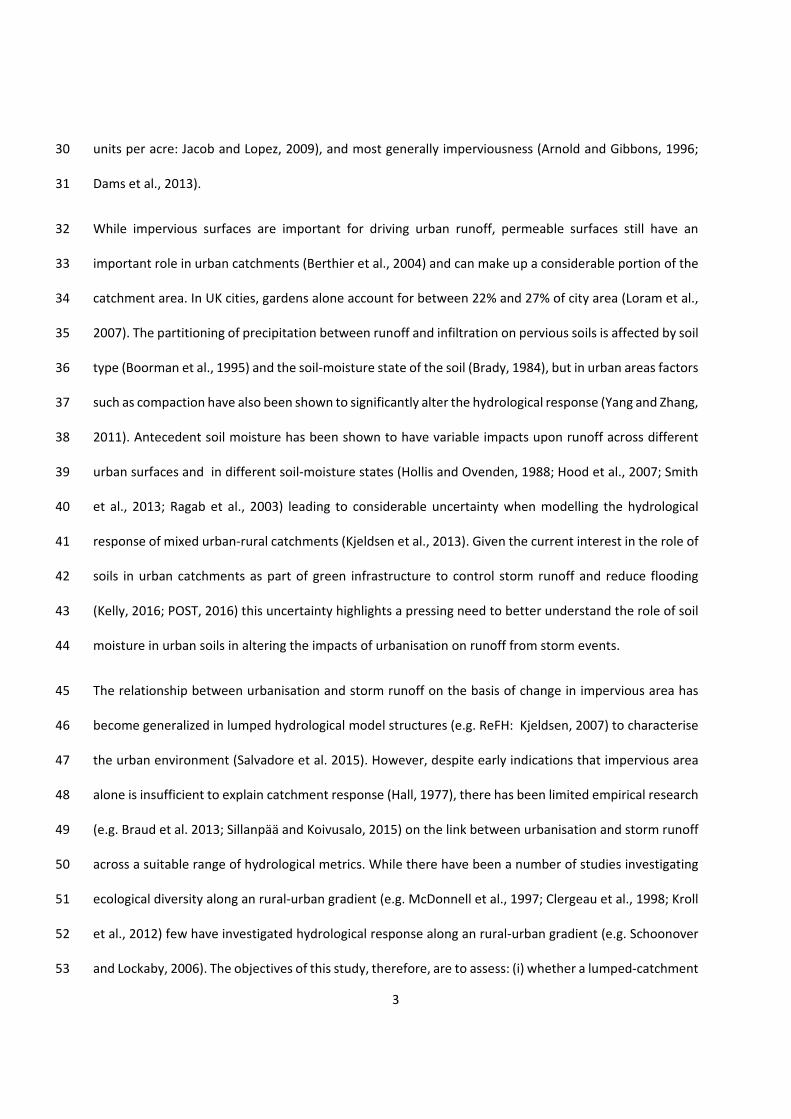
units per acre: Jacob and Lopez, 2009), and most generally imperviousness (Arnold and Gibbons, 1996; 30
Dams et al., 2013). 31
While impervious surfaces are important for driving urban runoff, permeable surfaces still have an 32
important role in urban catchments (Berthier et al., 2004) and can make up a considerable portion of the 33
catchment area. In UK cities, gardens alone account for between 22% and 27% of city area (Loram et al., 34
2007). The partitioning of precipitation between runoff and infiltration on pervious soils is affected by soil 35
type (Boorman et al., 1995) and the soil‐moisture state of the soil (Brady, 1984), but in urban areas factors 36
such as compaction have also been shown to significantly alter the hydrological response (Yang and Zhang, 37
2011). Antecedent soil moisture has been shown to have variable impacts upon runoff across different 38
urban surfaces and in different soil‐moisture states (Hollis and Ovenden, 1988; Hood et al., 2007; Smith 39
et al., 2013; Ragab et al., 2003) leading to considerable uncertainty when modelling the hydrological 40
response of mixed urban‐rural catchments (Kjeldsen et al., 2013). Given the current interest in the role of 41
soils in urban catchments as part of green infrastructure to control storm runoff and reduce flooding 42
(Kelly, 2016; POST, 2016) this uncertainty highlights a pressing need to better understand the role of soil 43
moisture in urban soils in altering the impacts of urbanisation on runoff from storm events. 44
The relationship between urbanisation and storm runoff on the basis of change in impervious area has 45
become generalized in lumped hydrological model structures (e.g. ReFH: Kjeldsen, 2007) to characterise 46
the urban environment (Salvadore et al. 2015). However, despite early indications that impervious area 47
alone is insufficient to explain catchment response (Hall, 1977), there has been limited empirical research 48
(e.g. Braud et al. 2013; Sillanpää and Koivusalo, 2015) on the link between urbanisation and storm runoff 49
across a suitable range of hydrological metrics. While there have been a number of studies investigating 50
ecological diversity along an rural‐urban gradient (e.g. McDonnell et al., 1997; Clergeau et al., 1998; Kroll 51
et al., 2012) few have investigated hydrological response along an rural‐urban gradient (e.g. Schoonover 52
and Lockaby, 2006). The objectives of this study, therefore, are to assess: (i) whether a lumped‐catchment 53

4
spatial measure of urbanisation can explain the observed variability in catchment response to storm 54
events along a rural‐urban gradient; and (ii) the extent to which antecedent soil moisture conditions 55
modify that relationship. These objectives provide the structural sub‐headings used the following 56
Methods, Results and Discussions sections. 57
2 Study Sites 58
The Thames basin in southern England (Fig. 1) is the largest drainage basin in the UK (Crooks and Kay, 59
2015) and has a temperate mid‐latitude climate. The basin contains the rapidly urbanising towns of 60
Swindon (Population 210,000) and Bracknell (Population 77,000). Both are located in low‐lying river 61
catchments gauged by the Environment Agency (EA) at Water Eaton (station number 39087) and Binfield 62
(station number 39052) respectively. High spatial and temporal resolution monitoring of flow and 63
precipitation was undertaken over a four year period from May 2011 to October 2015 across eight 64
independent sub‐catchments within these two river catchments (Fig. 1; Table 1). 65
66
FIGURE 1: EA catchments at Swindon and Bracknell, showing study catchments, monitoring locations 67
and land cover. Inset shows EA catchment locations within Thames basin and the United Kingdom. 68
69
3 Methods 70
3.1 Hydro‐meteorological urban monitoring networks 71
Precipitation was monitored at 8 locations (shown as Raingauge in Fig. 1) at a 15 min resolution with 72
tipping bucket raingauges (Casella TBRG), with network design following BSI (2012a). Data were quality 73
controlled for errors relating to low/high intensity, missing data, and synchronization between sensors, 74
following national (BSI, 2012b) and international guidelines (WMO, 1994; WMO, 2008). Additional 15 min 75
5
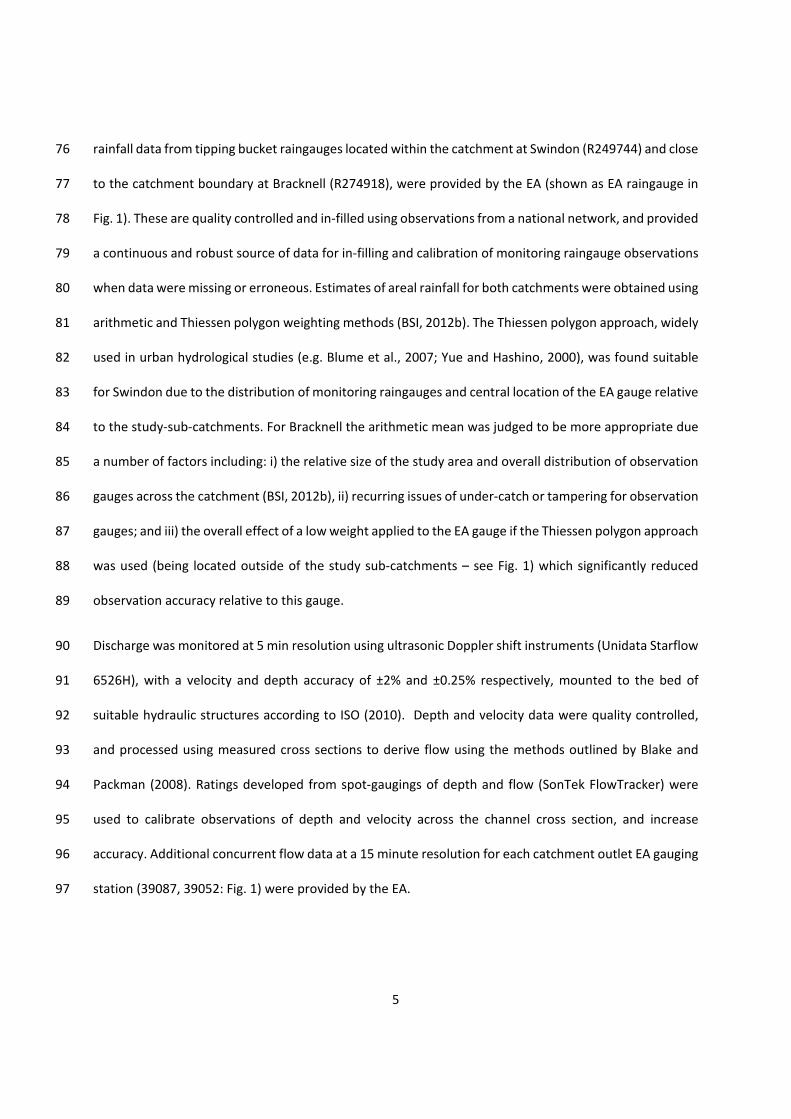
rainfall data from tipping bucket raingauges located within the catchment at Swindon (R249744) and close 76
to the catchment boundary at Bracknell (R274918), were provided by the EA (shown as EA raingauge in 77
Fig. 1). These are quality controlled and in‐filled using observations from a national network, and provided 78
a continuous and robust source of data for in‐filling and calibration of monitoring raingauge observations 79
when data were missing or erroneous. Estimates of areal rainfall for both catchments were obtained using 80
arithmetic and Thiessen polygon weighting methods (BSI, 2012b). The Thiessen polygon approach, widely 81
used in urban hydrological studies (e.g. Blume et al., 2007; Yue and Hashino, 2000), was found suitable 82
for Swindon due to the distribution of monitoring raingauges and central location of the EA gauge relative 83
to the study‐sub‐catchments. For Bracknell the arithmetic mean was judged to be more appropriate due 84
a number of factors including: i) the relative size of the study area and overall distribution of observation 85
gauges across the catchment (BSI, 2012b), ii) recurring issues of under‐catch or tampering for observation 86
gauges; and iii) the overall effect of a low weight applied to the EA gauge if the Thiessen polygon approach 87
was used (being located outside of the study sub‐catchments – see Fig. 1) which significantly reduced 88
observation accuracy relative to this gauge. 89
Discharge was monitored at 5 min resolution using ultrasonic Doppler shift instruments (Unidata Starflow 90
6526H), with a velocity and depth accuracy of ±2% and ±0.25% respectively, mounted to the bed of 91
suitable hydraulic structures according to ISO (2010). Depth and velocity data were quality controlled, 92
and processed using measured cross sections to derive flow using the methods outlined by Blake and 93
Packman (2008). Ratings developed from spot‐gaugings of depth and flow (SonTek FlowTracker) were 94
used to calibrate observations of depth and velocity across the channel cross section, and increase 95
accuracy. Additional concurrent flow data at a 15 minute resolution for each catchment outlet EA gauging 96
station (39087, 39052: Fig. 1) were provided by the EA. 97
6
3.2 Objective 1: Hydrological response along a rural‐urban gradient 98
3.2.1 Catchment characterization 99
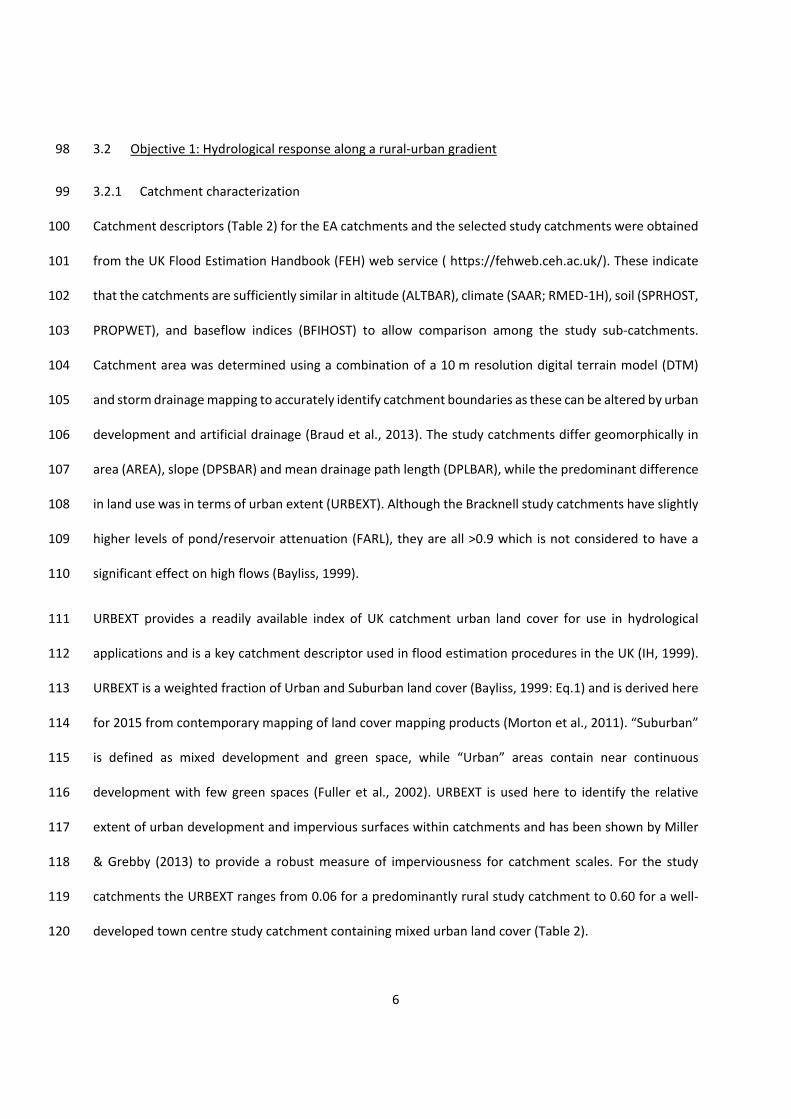
Catchment descriptors (Table 2) for the EA catchments and the selected study catchments were obtained 100
from the UK Flood Estimation Handbook (FEH) web service ( https://fehweb.ceh.ac.uk/). These indicate 101
that the catchments are sufficiently similar in altitude (ALTBAR), climate (SAAR; RMED‐1H), soil (SPRHOST, 102
PROPWET), and baseflow indices (BFIHOST) to allow comparison among the study sub‐catchments. 103
Catchment area was determined using a combination of a 10 m resolution digital terrain model (DTM) 104
and storm drainage mapping to accurately identify catchment boundaries as these can be altered by urban 105
development and artificial drainage (Braud et al., 2013). The study catchments differ geomorphically in 106
area (AREA), slope (DPSBAR) and mean drainage path length (DPLBAR), while the predominant difference 107
in land use was in terms of urban extent (URBEXT). Although the Bracknell study catchments have slightly 108
higher levels of pond/reservoir attenuation (FARL), they are all >0.9 which is not considered to have a 109
significant effect on high flows (Bayliss, 1999). 110
URBEXT provides a readily available index of UK catchment urban land cover for use in hydrological 111
applications and is a key catchment descriptor used in flood estimation procedures in the UK (IH, 1999). 112
URBEXT is a weighted fraction of Urban and Suburban land cover (Bayliss, 1999: Eq.1) and is derived here 113
for 2015 from contemporary mapping of land cover mapping products (Morton et al., 2011). “Suburban” 114
is defined as mixed development and green space, while “Urban” areas contain near continuous 115
development with few green spaces (Fuller et al., 2002). URBEXT is used here to identify the relative 116
extent of urban development and impervious surfaces within catchments and has been shown by Miller 117
& Grebby (2013) to provide a robust measure of imperviousness for catchment scales. For the study 118
catchments the URBEXT ranges from 0.06 for a predominantly rural study catchment to 0.60 for a well‐119
developed town centre study catchment containing mixed urban land cover (Table 2). 120

7
0.5 1)
121
3.2.2 Event identification 122
A wide range of methods exist to select storm events based on either identifying a rainfall event (Hollis & 123
Ovenden, 1988), isolating peak runoff values in a series (Smith et al. 2013), or a combination of the two 124
(Burns et al. 2005). Events were selected across the eight catchments (Table 2) using a set of pre‐defined 125
criteria applied in sequence (Table 3). Hydrograph separation, event window definitions and time‐based 126
metric definitions are shown in Figure 2. The first stage involved identifying isolated rainfall events based 127
upon exceedance of a pre‐defined value. The second stage utilised an automated baseflow separation 128
technique that drew upon a combination of methods reviewed in study of published event‐based 129
hydrograph separation methods by Blume et al. (2007). This identified the starting point in the hydrograph 130
rising limb and applied a linear interpolation to the point at which the hydrograph recession meets 131
baseflow – defined as the minimum value within a baseflow‐end ‘window’. Finally visual analysis of 132
rainfall‐runoff plots was used to filter out erroneous or multiple events. 133
134
FIG 2: Hydrograph separation with event instants used to select independent events and time instants 135
used to derive time‐based metrics of storm events 136
137
3.2.3 Metrics of hydrological response 138
A number of hydrological response metrics were identified to be important in quantifying storm runoff in 139
urban catchments. Following correlation analysis seven, independent, volume‐ and time‐based 140
hydrograph metrics were selected (Table 4: Fig. 2). Volume‐based metrics facilitate comparison in the 141

8
quantity of storm runoff between the study catchments. Time‐based metrics aid comparison of shape and 142
duration based elements of hydrological response to rainfall events. 143
Peak flow (QMAX) and direct runoff (DR) provide a measure of runoff response during an event, while the 144
percentage runoff (PR) expresses the conversion of rainfall to runoff. Time‐to‐peak (TP), also known as 145
time‐of‐rise, indicates catchment responsiveness on the rising limb of the hydrograph (Mcdonnell et al., 146
1990). Flood duration (Ɵ) provides an indication of overall hydrograph shape relative to direct runoff 147
duration and indicates the ‘flashiness’ or kurtosis of catchment response to runoff (Braud et al., 2013). 148
Lag‐time provides a measure of the duration between rainfall and runoff and was calculated using two 149
methods reported by Dingman (1994) (Fig. 2). As study catchments varied by both area and to a lesser 150
degree slope (Table 1), hydrograph metrics must therefore be scaled to account for geomorphic 151
differences. While volume‐based metrics can be converted to specific discharge using study catchment 152
area (runoff per unit area), it can be more difficult to compare time‐based metrics. Lag‐time, for example, 153
has been shown to be a function of both area and slope (Watt and Chow, 1985). 154
Flood duration has been shown by Robson & Reed (1999) to be a function of TP: 155
Ɵ 2.99 . 2)
156
while TP itself has been shown by Kjeldsen (2007) to be a function of a number of FEH catchment 157
descriptors (r2 = 0.74): 158
= . . 1 . . 3)
159
9
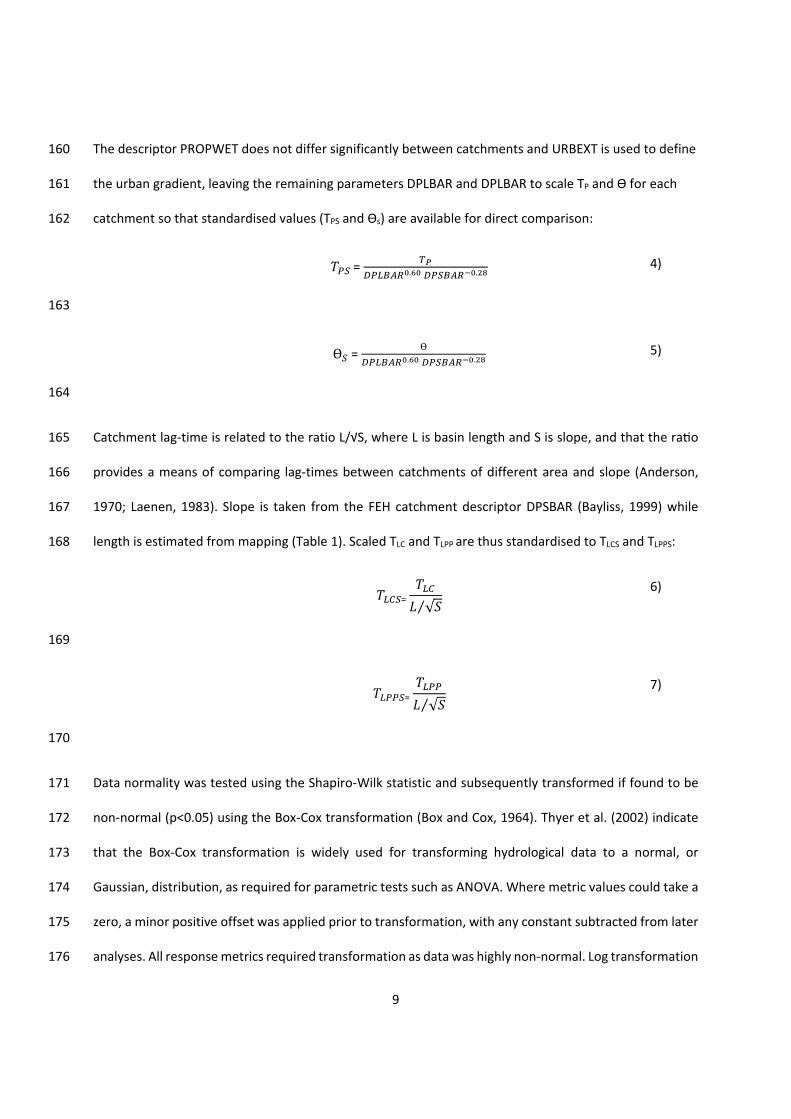
The descriptor PROPWET does not differ significantly between catchments and URBEXT is used to define 160
the urban gradient, leaving the remaining parameters DPLBAR and DPLBAR to scale TP and Ɵ for each 161
catchment so that standardised values (TPS and Ɵs) are available for direct comparison: 162
= . . 4)
163
Ɵ = Ɵ
. . 5)
164
Catchment lag‐time is related to the ratio L/√S, where L is basin length and S is slope, and that the ra o 165
provides a means of comparing lag‐times between catchments of different area and slope (Anderson, 166
1970; Laenen, 1983). Slope is taken from the FEH catchment descriptor DPSBAR (Bayliss, 1999) while 167
length is estimated from mapping (Table 1). Scaled TLC and TLPP are thus standardised to TLCS and TLPPS: 168
=
√⁄
6)
169
=
√⁄
7)
170
Data normality was tested using the Shapiro‐Wilk statistic and subsequently transformed if found to be 171
non‐normal (p<0.05) using the Box‐Cox transformation (Box and Cox, 1964). Thyer et al. (2002) indicate 172
that the Box‐Cox transformation is widely used for transforming hydrological data to a normal, or 173
Gaussian, distribution, as required for parametric tests such as ANOVA. Where metric values could take a 174
zero, a minor positive offset was applied prior to transformation, with any constant subtracted from later 175
analyses. All response metrics required transformation as data was highly non‐normal. Log transformation 176
10
of each metric provided some improvement but subsequent step‐wise Box‐Cox transformation (2 decimal 177
places) with power parameter values (λ) to reduce the Shapiro‐Wilk p statistic was undertaken using an 178
optimization routine for each metric and proved more effective. Independent testing of the 179
transformation on each sites data distribution was undertaken to ascertain that the result was a normal 180
distribution for each study catchment, and not simply the dataset as a whole. Shapiro‐Wilk p statistics 181
values for independent sites were found to be significantly higher than the un‐transformed site values 182
and dataset as a whole, and histograms became more normal in appearance. This validated the use of the 183
applied Box‐Cox transformation λ values. It was not possible to transform URBEXT as it’s bounded, while 184
the distribution of SMD is heavily skewed towards zero for long periods limiting any transformation to a 185
normal distribution. Statistical analysis for difference in geometric means between study catchments and 186
along the urban gradient utilised analysis of variance (ANOVA). Tukey’s ‘Honest Significance Difference’ 187
(HSD) function was utilised to confidence intervals on the means of each site and was found suitable as it 188
incorporates an adjustment for sample size to counter the potential bias towards sites with more data. 189
The resulting values were recorded for each site to identify significant differences between study 190
catchments and between soil moisture conditions. 191
3.3 Objective 2: Role of antecedent soil moisture 192
Antecedent soil moisture conditions have been shown to affect the responsiveness of a catchment to 193
rainfall (Penna et al., 2011) and are considered important initial conditions in a range of hydrological 194
models that seek to model storm runoff generation (e.g. TOPMODEL: Quinn and Beven, 1993; ReFH: 195
Kjeldsen, 2007). Soil moisture deficit (SMD) defines the amount of amount of water required for a soil to 196
reach field capacity and provides an indication of antecedent soil moisture, shown to affect high flow 197
generation (Michele and Salvadori, 2002). SMD was obtained for the EA catchments from the relevant 198
40 km x 40 km grid squares of the UK Meteorological Office rainfall and evaporation system (MORECS) 199
(Hough and Jones, 1997). 200
11
To classify the antecedent condition Meyles et al. (2003) have shown that a classification of preferred 201
states in soil moisture applied in Australia by Grayson et al. (1997) holds true for the UK, whereby ‘wet’ 202
soils with a value at or around field capacity (SMD = 0) will generate more runoff while ‘dry’ soils with 203
higher SMD generate less runoff. We defined a wet catchment as one near to field capacity and used 204
observed data to identify the value at which conditions could be classed as wet and more conducive to 205
runoff generation. To determine a suitable break in SMD with which to classify soils as either wet or dry 206
we used MORECS SMD data and peak flow data to identify a value indicative of a seasonal change that 207
has observable impacts on runoff generation from the two least urban catchments (S2, B1: Table 2). The 208
variable response of catchments under wet and dry conditions was tested statistically to ascertain if the 209
antecedent soil moisture of catchments play a contributory role in determining the response of 210
catchments along the urban gradient. 211
4 Results 212
4.1 Objective 1: Hydrological response along a rural‐urban gradient 213
4.1.1 Hydrological summary 214
Rainfall data over this period highlight two important periods (Fig. 3). First the relatively low rainfalls 215
experienced during the winter of 2011/12 in contrast to the following wet spring and winter of 2012/13, 216
(Parry et al., 2013). Second, the winter storms of 2013/14 during which the UK endured its wettest winter 217
on record and suffered considerable widespread flooding (Muchan et al., 2015). Event rarity was assessed 218
using the updated FEH 2013 DDF model (Stewart et al. 2015) available from the FEH Web Service 219
(fehweb.ceh.ac.uk). Storms were generally found to not be extreme, with a summer storm on 29/07/2015 220
(29 mm in 6 hours: return period, T = 4.5 years) being the only event exceeding a return period of 2 years, 221
and the largest storm occurring on 23/12/2013 (32 mm in 23 hours: T = 1.6 years). Flows show a similar 222
monthly pattern but were higher at all times in Swindon than at Bracknell, primarily a result of the large 223
12
baseflow contribution from the sewage treatment works within the catchment. In the Swindon catchment 224
there were some gaps in the flow data (Fig. 3) during summer 2014 due to a recording malfunction. 225
226
FIGURE 3: Monthly rainfall and flow for Environment Agency rainfall and gauging stations at Swindon 227
(39087) and Bracknell (39052). The blue upper envelope marks the long‐term maximum monthly rainfall 228
for Swindon. 229
230
4.1.2 Selected events 231
Figure 4 shows a breakdown of the selected 336 useable events by catchment and season – with summer 232
defined as April to September. The mean number of useable events per season at all sites was 21, and 233
variability in the number of events at each sites primarily reflects the length of monitoring data available 234
but also the quality of data at sites and periods of equipment malfunction. The data indicates that study 235
catchments with lower levels of urbanisation URBEXT ≤ 0.26) exhibit more winter than summer events 236
compared to the study catchments with higher urbanisation levels where summer events are dominant. 237
238
FIGURE 4: Histogram of storm events by site and season (summer defined as April to September) for 239
each sub‐catchment with mean frequency of all study catchments indicated by dashed red line. 240
241
4.1.3 Standardizing time‐based metrics 242
Across the eight sub‐catchments, Pearson’s product moment of coefficient of correlation (ρ) revealed 243
AREA to be highly correlated with mean and maximum drainage path length (DPLBAR: ρ =0.99; LDP: ρ = 244
0.96) but not with slope (DPSBAR: ρ = ‐0.11). URBEXT was not correlated with other catchment descriptors 245
13
(ρ < 0.3). To assess the effectiveness of the scaling on removing the effects of area (AREA) and slope 246
(DPSBAR) the relationships between both descriptors and time‐based metrics ‐ before and with the 247
resulting scaling applied ‐ are assessed and illustrated in in Figure 5. 248
249
FIGURE 5: Time‐based hydrograph metrics against AREA and DPSBAR before (a, b) and after (aS, bS) 250
scaling (eqs. 4 – 7). Data are fitted with a linear model fitted with significance (p) of fitted model slope (* 251
denotes p < 0.05) and model equation reported. Grey shading shows the 95% confidence interval. 252
253
Prior to scaling, the clear relationship between AREA and time–based metrics is evident (Fig. 5a), with the 254
relationship being both positive and significant (p < 0.05). Following scaling (Fig 5aS) the effect of AREA 255
has been removed, with a near zero and non‐significant slope (p > 0.05). Scaling has the effect of 256
increasing metric values in the smaller study catchments (below 5km2), and having little impact on the 257
larger study catchments – with some minor variability due to slope. DPSBAR is also shown to have a 258
significant effect upon all four metrics (p < 0.05) (Fig. 5b) however the relationship is negative. Scaling (Fig 259
5bS) results in a near zero regression slope for all time–based metrics, primarily through increases to 260
values in the steeper catchments, and significantly reduces the relationship except TLCS. In summary, the 261
scaling methods have proved effective at removing the effects of catchment size and slope. 262
4.1.4 Analysis of storm hydrographs along rural‐urban gradient 263
The variability in response among study catchments along the rural‐urban gradient is illustrated in Figure 264
6, showing the area weighted event hydrographs for each study catchment. Some general patterns can 265
be observed as URBEXT increases tenfold from S2 (0.06) to S3 (0.60). 266
14
Baseflow is clearly a higher proportion of flow in the less urban study catchments, and while it 267
generally drops with increasing urbanisation, there is clear inter‐catchment variability. 268
Variability in hydrograph shape across the selected events (grey) compared to the mean (red) 269
generally decreases with urbanisation. 270
The mean hydrograph peak is significantly lower than the largest event, particularly in the more 271
rural catchments (URBEXT ≤ 0.14). 272
For study catchments with URBEXT ≥ 0.26 the hydrograph becomes flashier but there is clear 273
inter‐catchment variability that does not follow the urban gradient. 274
275
FIGURE 6: Comparison of area weighted event hydrographs (grey) and mean hydrograph (red) among 276
study catchments (Table 1, Fig. 1) with catchment UREBEXT in brackets (ordered top left to bottom right 277
by URBEXT) 278
279
The hydrographs in Figure 6 demonstrate some of the generalised observations that are applied to urban 280
catchments reported in the literature, but also indicate that there are inter‐catchment differences that 281
do not fit such generalizations. Table 5 and Figures 7 and 8 outline statistical analyses of how the metrics 282
vary along the urban gradient of catchments studied. 283
284
FIGURE 7: Boxplots of normalised peak flow (Qmax), storm runoff (DR), and percentage runoff (PR) across 285
the study catchments – URBEXT in brackets. Box‐plots sharing the same letter have means that are not 286
significantly different. 287
288
15
An analysis of the volume‐based metrics (Fig. 7) reveals significant increases in peak flows (Qmax) between 289
the less urban (URBEXT ≤ 0.14) and more urban (URBEXT ≥ 0.26) catchments. The pattern is less clear for 290
PR, and DR does not become significantly higher until URBEXT reaches 0.42 (S4). There is an apparent 291
increase in the means along the urban gradient (Table 5), however there is no consistent trend and few 292
significant differences between the more urban study catchments despite very different levels of 293
urbanisation (0.26 – 0.6). The only signficant difference observed is a higher Qmax at S5. 294
295
FIGURE 8: Box‐plots of scaled and normalised time‐to‐peak (TPS), flood duration (ƟS), time lag‐to‐peak 296
(TLPPS), and time lag‐to‐centroid (TLCS) across study catchments – URBEXT in brackets. Box‐plots sharing the 297
same letter have means that are not significantly different. 298
299
The time‐based metrics (Fig. 8) show an overall reduction in all metrics along the urban gradient but with 300
significant inter‐catchment variability. There are differences between the less urban study catchments 301
(URBEXT ≤ 0.14) and most metrics suggest longer response times for these compared to shorter times in 302
more urban study catchments (URBEXT ≥ 0.26). The pattern in the more urban study catchments varies 303
between metrics, with ƟS showing the greatest variability between study catchments and highlighting a 304
significantly shorter flood duration (1.6 h) at S5 (Table 5) than all other study catchments. The differences 305
between B2 and S1, both of similar URBEXT, and the lack of difference between S1 and S4, despite a large 306
difference in URBEXT, both suggest controls being in place that alter the response time. Taken together 307
the time‐based metrics demonstrate that while there is a drop in response times between the less urban 308
and more urban study catchments, there is no clear urban gradient among the more heavily urbanised 309
study catchments and that URBEXT is a poor indicator of catchment response time in such heavily 310
modified catchments. 311
16
4.2 Objective 2: Role of antecedent soil moisture 312
A value of 7.6 mm was identified as being the value separating a seasonal change from typically wet soils 313
during winter (October – March) to dry soils during summer (April – September). To validate this we also 314
assessed flow data and observed that the value was also indicative of a change in runoff response as 315
evinced in peak flows from the two least urban catchments (S2, B1: Fig. 9). The value is close to the 6 mm 316
value used in the UK flood estimation methods to distinguish between a wet and dry catchment (Bayliss, 317
1999). 318
Plots of antecedent soil moisture deficit versus each of the metrics (Fig. 9) provide an indication of the 319
relationship between antecedent soil moisture and runoff response. For all volume‐based metrics, 320
broadly similar relationships between SMD and storm response are observed within catchments of similar 321
URBEXT. The least urban study catchments (S2 and B1) show similarly rapid decrease in PR, DR and QMAX 322
with increasing SMD. For the study catchments with an URBEXT of 0.26 only S1 shows a consistently 323
negative relationship with SMD. For the more heavily urban study catchments (URBEXT≥0.42) little or no 324
change in metric values with increasing SMD is demonstrated, except a positive relationship with Qmax at 325
site S5. 326
327
FIGURE 9: Change in metrics (Table 4) with SMD by catchment with linear fit and 95% confidence intervals 328
shown in grey. (Y axis is log scale) 329
330
The time‐based metrics reveal less significant and less consistent changes along the urban gradient, 331
compared to the volume‐based metrics (Fig. 9) reflecting the increased variability observed in Figure 8. 332
The relationship between SMD and response time for the less urban study catchments is not significant, 333
17
while for those at URBEXT 0.26 the relationship is consistently negative, in particular showing that at S1, 334
increasingly dry conditions result in a rapid drop in TPS and Ɵs. The heavily urban study catchments 335
(URBEXT≥0.44) are not significantly affected by SMD, although there is a weak positive relationship 336
between TLPPS and SMD in S5. 337
The interaction between site and soil moisture has been shown to be significant (p < 0.05) across all 338
selected metrics and Table 6 reports the differences between study catchments under dry and wet 339
antecedent conditions. Antecedent soil moisture was found to significantly reduce all volume‐based 340
metrics in dry conditions for study catchments with an URBEXT of 0.06 and 0.14, but not the majority of 341
more urban study catchments (URBEXT≥0.26). This was particularly evident at S2 where QMAX (74.3 ls‐1km‐342
2 ), DR (2.4 mm) and PR (17.2%) under wet conditions were between 750% and 1200% higher than in a dry 343
state (9.8 ls‐1km‐2, 0.2 mm, and 2% respectively), reflecting the large range of values recorded as shown in 344
Figure 8. The exception was found comparing DR and PR at S1 where values in dry (0.9 mm and 7.2%) 345
were significantly less than wet conditions (8.6 mm and 53.9%), explaining the large ranges shown in 346
Figure 8. Except S1 the results suggest antecedent soil moisture does not significantly affect the volume 347
of runoff generated during storm events or the variability along the urban gradient between the more 348
urban study catchments. 349
Despite a large range of TPS and ƟS values (Fig. 8) and clear effects upon volume‐based metrics (Table 5) 350
no significant difference has been shown in the response time of the least urban S2 and B1 under drier 351
conditions for any metric (Table 6). While response time values decrease under drier conditions the lack 352
of a significant reduction in response times is reflected in all study catchments except S1 (URBEXT=0.26) 353
and to a lesser degree catchment B3 where only TPS is reduced when dry. No substantial change is 354
observed in the pattern of TLPPS along the urban gradient. In summary, there is no consistent pattern of 355
antecedent soil moisture affecting the timing of runoff along the urban gradient, with only site S1 356
exhibiting consistent impacts across the applied metrics. 357
18
5 Discussion 358
5.1 Objective 1: Hydrological response along a rural‐urban gradient 359
This study builds upon early and contemporary empirical studies into the impacts of urbanisation on 360
runoff (e.g. Hall, 1977; Boyd, 1995; Roy and Shuster, 2009; Zhang and Shuster, 2014) to determine if a 361
lumped‐catchment spatial measure of urbanisation explains variability in catchment response to observed 362
storm events along a rural‐urban gradient. 363
The volume‐based metrics (Fig. 7) show an increase in urbanisation between an URBEXT of 0.14 and 0.26 364
acts to increase peak flow generation, while the increase in storm runoff and percentage runoff is more 365
gradual. While no specific threshold value is provided with which to identify at what level the effects of 366
urbanisation on storm runoff become apparent, the ranges identified adds to the evidence of there being 367
a gradual change in behaviour along an urban gradient between more rural and more urban catchments 368
(Shuster et al., 2005; USGS, 2003; Sillanpää and Koivusalo, 2015; Mejía et al., 2015) and fit within the 369
range of reported threshold values of between 5% (Kjeldsen, 2010), to around 20‐25% (Brun and Band, 370
2000). An increase in the volume of runoff with increasing urbanisation is a common finding from urban 371
hydrological studies (Leopold, 1968; Jacobson, 2011; McGrane, 2015), particularly for less extreme storms 372
(Hollis, 1975). Our observation of no systematic increases in runoff volume metrics across the more urban 373
catchments (URBEXT ≥ 0.26) is however, not well reflected in the wider literature. The results could 374
indicate that either: i) the volume of runoff is not affected by changes in urban extent within this range, 375
or ii) there exist differences between the catchments that act to render them similar in volume of 376
response. The former theory is substantiated by observations from Hammer (1972) and Miller et al. (2014) 377
who found the impacts of progressive urban expansion would be more extreme at lower levels of 378
development in smaller catchments, but there is little similar evidence to support the lack of variability in 379
more heavily modified catchments. The data is perhaps also suggestive of a threshold being crossed and 380
the catchments passing into such an altered state in which pervious areas are so fragmented and altered 381
19
as to effect no significant change in the volume of runoff with increasing urbanisation, agreeing with the 382
‘stressed’ ecosystem classification proposed by Schueler (2000) for catchments with 26‐100% impervious 383
cover. Explanations for the latter could include variability in the actual imperviousness of urban surfaces, 384
as no surface is truly 100% impervious (Hollis, 1988) and imperviousness varies over time, with season, 385
and by surface type (Redfern et al., 2016). There is also the role that distribution and connectivity of 386
pervious and impervious surfaces relative to a catchment outlet and storm drainage will play in making 387
such truly effective impervious area (Shuster et al., 2005; Graf, 1977). Other contributory factors include 388
observations that impacts of urban land cover vary with rainfall magnitude (Gallo et al., 2013b) and that 389
rural contributions become increasingly important with greater storm magnitude (Sheeder et al., 2003). 390
Reduction in catchment response time with urbanisation is another common finding from urban studies 391
(Fletcher et al., 2013; McGrane, 2015) and while there were more significant reductions in time‐based 392
metrics along the rural‐urban gradient compared to volume metrics, the pattern between the more urban 393
catchments (URBEXT≥0.26) was highly variable and requires consideration of drivers other than urban 394
extent. That significant differences were observed between the less urban study catchments 395
(URBEXT≤0.14) compared to more urban study catchments fits well with observations from reported 396
literature that urbanisation generally will reduce time‐to‐peak (Williams, 1976; Sillanpää and Koivusalo, 397
2014), flood duration (Braud et al., 2013) and lag‐time (Anderson, 1970). What is clear however from the 398
more urban study catchments (URBEXT≥0.26) is that once catchments become more heavily modified 399
other processes not represented by URBEXT start to significantly affect the conveyance time of runoff. 400
The observations reported here are of international interest as empirical observations in small urban 401
catchments are limited and imperviousness is widely used in catchment scale studies. The limitations of 402
spatial measures of urbanisation such as imperviousness for attribution and modelling are increasingly 403
being identified in international studies, particularly where stormwater infrastructure is present 404
(Meierdiercks et al. 2010) and when considering high flows (Ogden et al. 2011; Braud et al. 2013). Runoff 405
20
timing in particular has been shown to be more a function of stormwater infrastructure than land use 406
(Smith et al. 2013). Accordingly there is growing interest in the application of alternative measures of 407
urbanisation such as methods to characterize urban form using landscape metrics (Jiao, 2015). 408
5.2 Objective 2: Role of antecedent soil moisture 409
We found antecedent soil moisture to affect the quantity of runoff generated in storm events for some of 410
the study catchments but to have little effect on the more urbanised study catchments (URBEXT≥0.42). 411
The clear relationship between soil moisture and runoff volume in catchments with large rural areas is 412
demonstrative of significant correlations between runoff and antecedent soil moisture reported in the 413
literature (Meyles et al., 2003; Penna et al., 2011; Zhang et al., 2011). The diminished role of soil moisture 414
in more urban catchments is less clear, some evidence suggesting wetter soils cause higher runoff (Ragab 415
et al., 2003) and other studies finding antecedent soil moisture does not significantly impact storm 416
hydrological response (Smith et al., 2013). The latter view, as found here, supports the view of Shuster et 417
al. (2005) who surmised a reduction in soil water storage potential with increased impervious area, as 418
shown by Booth et al. (2002), correspondingly decreases the importance of antecedent soil moisture in 419
runoff. 420
The lack of an observed relationship between SMD and time‐based metrics suggests that soil moisture 421
does not generally control how quickly catchments respond to storm events, the flashiness of the 422
response, or the lag‐time between the rainfall and runoff. That no differences were observed in the least 423
urban catchments was surprising as studies under more natural catchments show that antecedent 424
conditions can affect catchment response times (Penna et al., 2011; Haga et al., 2005). Similarly there is 425
evidence from more urban studies that under drier conditions lag‐times are increased in locations with 426
more green space (Hood et al., 2007), but again this was not replicated in this study. 427
21
The combined results from both volume‐ and time‐based metrics suggest some evidence for SMD 428
affecting runoff volume in less urban catchments but not the timing of storm runoff. This suggests that in 429
rural catchments a reduced runoff volume in drier conditions is not accompanied by a significant decrease 430
in catchment response time. The lack of any consistent impact of SMD on either volume of timing of runoff 431
in the more urban catchments (URBEXT ≥ 0.26), except S1, suggests it does not play a role in runoff 432
generation when developed areas begin to dominate the catchment land cover. The significant reductions 433
in both volume‐ and time‐based metrics at S1 under drier conditions is further evidence of this, whereby 434
despite a high URBEXT the dominant land cover is Rural (64.5%: Table 1). Under such conditions it is likely 435
to be effectively reducing the contributing area of storm runoff as the majority of rainfall infiltrates into 436
the previous soil storage space. 437
The role of soil moisture in runoff generating processes remains uncertain in urban environments with 438
mixed pervious and impervious surfaces (McGrane, 2015) and requires further study considering the 439
current international research interest into the role that urban green spaces and SuDS are in controlling 440
flooding (Palla and Gnecco, 2015) and their value in terms of ecosystem services (Duku et al. 2015). 441
5.3 Contributing urban factors not covered by URBEXT or imperviousness 442
The limitations of using a lumped spatial measure of urbanisation such as URBEXT or imperviousness are 443
particularly evident in observations from: i) catchments with similar levels of URBEXT but accompanied 444
by highly divergent responses to storm events; and ii) catchments with similar responses but different 445
levels of URBEXT. The response of the study catchments could be explained by a number of potential 446
factors explored within the wider international literature, 447
Urban drainage ‐ Evidence from other studies suggests a combination of increased peak flows and 448
reduced response times may be a result of storm drainage systems that act to speed up the 449
conveyance of runoff and increase peak flow (Roy and Shuster, 2009) especially when the 450
22
connectivity of these systems is high (Shuster et al., 2005). Events from S5 (0.46) would seem to 451
be indicative of such a catchment, and the catchment drainage is dominated by artificial drainage. 452
It has been shown that for larger catchments impervious area and road density are good 453
explanatory variables for lag‐times (McEnroe and Zhao, 2001) but at smaller scales it becomes 454
necessary to consider the effective impervious area (EIA) (Booth and Jackson, 1997). This is the 455
hydraulically connected impervious area where runoff travels over impervious surfaces directly 456
to storm drainage (Han and Burian, 2009). This has been shown to vary considerably between 457
development types (Roy and Shuster, 2009) and be potentially much less than total impervious 458
area (TIA) (Ebrahimian et al., 2016). A number of studies have sought to relate TIA to EIA, however 459
low fits of linear relationships between the two measures are reported, with variations according 460
to age of developments, local topography, ownership, and regulations. (Alley and Veenhuis, 1983; 461
Wenger et al., 2008; Roy and Shuster, 2009). A paired catchment study by Hood et al. (2007) 462
provides a particularly relevant example of how variable the response of a similarly urban 463
catchment can be due to the drainage layout and connectivity. Clearly URBEXT or imperviousness 464
alone cannot provide this level of information, highlighting the need for ancillary information on 465
urban drainage and its connectivity, particularly in smaller urban catchments. 466
Soils ‐ S1 (0.26) had reductions in both volume‐ and time‐based metrics with drier conditions, 467
while other study catchments with large rural fractions (S2, B1) only had decreases in runoff 468
volume, and the similarly urban B2 (0.26) was unaffected by SMD. This is indicative of a seasonal 469
or soil‐moisture related control mechanism independent of URBEXT that is controlled by the high 470
relative non‐urban fraction, as previously discussed. It suggests that while catchments S1 and B2 471
have a similar URBEXT and level of pervious surfaces, the fragmented pervious ‘urban’ soils in the 472
mainly Suburban B2 do not respond in the same way as the continuous ‘rural’ soils. This highlights 473
23
the need to consider the relative extent of undeveloped areas surfaces, not just pervious and 474
impervious surfaces, as urban soils may not behave like more natural rural soils. 475
Urban distribution ‐ Distribution of urban area towards the outlet can lead to a flashier response 476
(Zhang and Shuster, 2014) possibly explaining the particularly fast response at B2 whereby 477
urbanisation appears concentrated towards the monitoring point. A measure of location of 478
impervious surfaces relative to the catchment outlet would provide some clear measure of such 479
a factor. Such a measure is already available as a catchment descriptor in the UK (URBLOC: Bayliss, 480
2000) but has not to date been used in flood estimation, primarily as the focus has been upon 481
larger less urban catchments. 482
Artificial attenuation – Despite being significantly more urban, the adjacent B3 (URBEXT = 0.44; 483
Urban = 16%: Table 1) and B2 (URBEXT = 0.26; Urban = 3.5%) have surprisingly similar responses 484
as measured by both volume and time‐based metrics. Both are highly modified with large scale 485
drainage systems, but the wider literature suggests that in B3 the presence of retention ponds 486
have which have been noted are likely to have some form of artificial control that act to slow 487
down the movement of water and reduce flood peaks, and (Table 1). Such impacts are supported 488
from wide variety of observations comparing catchments with and without stormwater controls 489
(Hood et al., 2007) or the impacts of implementing SuDS (Palla and Gnecco, 2015) and form a key 490
element of sustainable flood management in urban areas (Defra, 2014). A catchment measure of 491
artificial attenuation from SuDS features would complement catchment descriptors for urban 492
drainage in cases where the former is designed to cancel out the latter, and be additional to 493
natural attenuation. 494
Natural attenuation – S4 (0.42) has response times similar to a catchment that is less urbanised 495
(S1: 0.26) but no indication of seasonal SMD control, and longer times than catchments of similar 496
24
URBEXT (B3: 0.44, S5:0.46). This is perhaps indicative of features that act to attenuate the runoff 497
response such as sustainable urban drainage systems (SuDS) (Jarden et al., 2015) which have been 498
noted as only isolated instances within the catchment (Table 1). More likely, given its size and 499
location, is that flows are attenuated by a large area of natural green space (Fig. 1) that has been 500
observed to frequently flood, a solution often outlined in literature on urban flood management 501
to attenuate peak flows (Wilby, 2007, Hamel et al., 2013; CIWEM, 2010). These surfaces are not 502
currently included in the natural attenuation index used here (FARL) that covers only rivers and 503
lakes but are considered in a more recent descriptor for flood plan extent (FPEXT) (Kjeldsen et al., 504
2008). The FEH FPEXT values for S4 are however low (0.077) but another FEH index of location 505
(FPLOC) (0.74) indicates this area is located such that is has a large contributing area and could 506
play a greater role in attenuating upstream flows. Such indexes when combined with more 507
information on the spatial distribution of impervious surfaces and storm drainage could be of 508
particular use in attributing the for the reduced response times of urban catchments with such 509
large continuous features of green space downstream of urban areas. 510
Urban soils and soil moisture ‐ While the observations of the role of SMD in urban storm runoff 511
are valuable given the paucity of studies on urban soil hydrology (Ossola et al., 2015) a degree of 512
caution must be attached in that SMD here is derived from MORECS and is not from measured 513
data within the urban catchments. Given urban soils can be highly modified and compacted, with 514
resulting reduced water holding capacity (Chen et al., 2014) in‐situ SMD could be highly divergent 515
from MORECS values and infiltration potential reduced, resulting in runoff more typical of 516
impervious surfaces (Redfern et al., 2016). Shuster et al. (2005) note that the hysteric behaviour 517
of soils could also be changed and alter the lag‐times of runoff. More detailed information on local 518
soils, their state, and local soil moisture could provide a better picture on the overall level of 519
perviousness and the role of soils in small urban catchments. This could involve some resampling 520
25
of local soils and tests to ascertain compaction, with results used to alter catchment soil indexes 521
such as HOST used here. 522
Further investigation would be required to define more hydrologically relevant measures of land use 523
and antecedent conditions and to determine whether they improve attribution of storm runoff in small 524
urban catchments. Additionally, the practical implications for implementation in methods such as the 525
FEH require additional assessment, as there are limited gauged sites in small urban catchments 526
(Faulkner et al. 2012) and benefits might only occur at certain scales. 527
5.4 Study limitations 528
This study has been based upon using high‐resolution monitoring equipment to study detailed rainfall‐529
runoff processes at the resolutions and locations necessary to better understand the impacts of 530
urbanisation on both the volume and timing of runoff, but has a number of limitations that could be 531
improved in further research: 532
‐ While data availability over the monitoring period is variable between study catchments this 533
reflects the real‐world constraints of urban hydrological monitoring and difficulties of working 534
with high‐resolution data (Hutchins et al., 2016). 535
‐ Errors and uncertainty occur in data, but by following standard guidance on data collection and 536
quality control, and using modern monitoring technology, these have been minimised. 537
‐ Event lag‐times of were calculated from areal rainfall, and this could affect the reported lag‐times 538
accuracy, particularly in small catchments. This was minimised by having a good coverage of 539
observation gauges (Fig. 1). Further research could focus on spatial variability of rainfall and storm 540
type relationships with observed response. 541
26
‐ For the more urban study catchments (URBEXT≥ 0.42) there was a bias towards more summer 542
events (Fig. 2), however this could simply reflect the lack of significant runoff being generated 543
during summer in more rural catchments. 544
‐ SMD was derived for a large area which, given the scale and variability of land use within the 545
catchments studied may be unrepresentative. In addition, Hess et al. (2016) have shown that the 546
spatial variability of evapotranspiration is low in this region. 547
‐ Study locations are in a temperate climate and results may not be transferrable to semi‐arid 548
(Hawley and Bledsoe, 2011) or cold climates (Sillanpää and Koivusalo, 2015). 549
6 Conclusion 550
This study used high‐resolution rainfall‐runoff data from 8 small catchments at varying levels of 551
urbanisation, in order to determine if a spatial measure of urbanisation can explain variability in 552
catchment response to storm events along a rural‐urban gradient and whether antecedent soil moisture 553
modifies the relationship between urbanisation and storm runoff. The results suggest that generalised 554
relationships between urbanisation and storm runoff, whereby increased urbanisation leads to higher 555
peak flows and increased runoff, along with reduced catchment response times, are not well represented 556
in real‐world data. The observations showed that runoff volume per unit area has little variation once 557
catchments become significantly urbanised (URBEXT ≥ 0.42), and that the both volume and timing of 558
runoff in particular are likely to be affected by other factors in addition to urban extent or impervious 559
cover. Analysis of antecedent soil moisture and hydrological metrics suggest that SMD only affects runoff 560
volume in catchments dominated by “Rural” (non‐urban) land cover, and runoff timing does not follow 561
any clear rural‐urban gradient. Taken together the results suggest only minor improvements could be 562
gained in attribution of storm runoff through refined estimates of impervious surfaces at such scales, and 563
that further work is required to determine what contributing factors are causing the observed variability 564
in timing of runoff along the rural‐urban gradient. 565

27
Acknowledgements 566
The study catchments form part of a wider network that is currently being used by the POLLCURB project 567
(http://www.pollcurb.ceh.ac.uk/) to better understand the impacts of urbanisation on hydrology and 568
water quality at various scales (Hutchins et al., 2016) funded by the Natural Environment Research Council 569
(NERC UK) as part of the Changing Water Cycle program (NE/K002317/1). We would like to thank Gianni 570
Vesuviano for his work on code to extract storm events and Mike Hutchins, Nathan Rickard, and Scott 571
McGrane for their contributions in data collection as part of the POLLCURB project. The paper has 572
benefitted from internal review by Lisa Stewart, Gianni Vesuviano and Mike Hutchins. We also 573
acknowledge the efforts of three anonymous reviewers. 574
References 575
Alley, WM, Veenhuis J (1983) Effective impervious area in Urban runoff modelling. Journal of Hydraulic 576
Engineering 109(17669): 313–319. 577
Anderson DG (1970) Effects of Urban Development on Floods in Northern Virginia. United States 578
Geological Survey: C4–C6. Available from: http://pubs.usgs.gov/wsp/2001c/report.pdf. 579
Arnold, C, L; Gibbons J (1996) Impervious surface coverage : The emergence of a key environmental 580
indicator. Journal of the American Planning Association 62: 243–258. 581
Bach PM, Rauch W, Mikkelsen PS, et al. (2014) A critical review of integrated urban water modelling – 582
Urban drainage and beyond. Environmental Modelling & Software, Elsevier Ltd 54: 88–107. 583
Available from: http://linkinghub.elsevier.com/retrieve/pii/S1364815213003216 (accessed 24 584
January 2014). 585
Baker DB, Richards RP, Loftus TT, et al. (2004) A new flahiness index: characteristics and applications to 586
MidWestern rivers and streams. Journal of the American Water Resources Association 44883: 503–587
522. 588
28
Bayliss, A. Black, KB, Fava‐Verde, A. Kjeldsen T (2000) URBEXT 2000 ‐ A new FEH catchment descriptor 589
Calculation , dissemination and application. 590
Bell VA, Kay AL, Cole SJ, et al. (2012) How might climate change affect river flows across the Thames 591
Basin? An area‐wide analysis using the UKCP09 Regional Climate Model ensemble. Journal of 592
Hydrology 442–443: 89–104. Available from: 593
http://www.sciencedirect.com/science/article/pii/S0022169412002648 (accessed 11 July 2014). 594
Berthier E, Andrieu H and Creutin JD (2004) The role of soil in the generation of urban runoff: 595
development and evaluation of a 2D model. Journal of Hydrology 299(3–4): 252–266. Available 596
from: http://linkinghub.elsevier.com/retrieve/pii/S0022169404003695 (accessed 15 October 597
2013). 598
Blake JR and Packman JC (2008) Identification and correction of water velocity measurement errors 599
associated with ultrasonic Doppler flow monitoring. Water and Environment Journal 22(3): 155–600
167. Available from: http://doi.wiley.com/10.1111/j.1747‐6593.2007.00089.x (accessed 15 601
October 2013). 602
Blume T, Zehe E and Bronstert A (2007a) Rainfall—runoff response, event‐based runoff coefficients and 603
hydrograph separation. Hydrological Sciences Journal 52(5): 843–862. 604
Blume T, Zehe E and Bronstert A (2007b) Rainfall – runoff response, event‐based runoff coefficients and 605
hydrograph separation. Hydrological Sciences Journal 52(5): 843–862. 606
Boorman DB, Hollis JM and Lilly A (1995) Hydrology of soil types: a hydrologically‐based classification of 607
the soils of United Kingdom. Institute of Hydrology Report Report No.(126): 146. Available from: 608
http://nora.nerc.ac.uk/7369/. 609
Booth DB (1991) Urbanization and the Natural Drainage System ‐ Impacts, Solutions, and Processes. The 610
Northwest enviromental Journal 7(1): 93–118. Available from: 611
https://digital.lib.washington.edu/researchworks/bitstream/handle/1773/17032/Urbanization and 612
29
the Natural Drainage System.pdf?sequence=1. 613
Booth DB and Jackson CR (1997) Urbanization of aquatic systems: Degradation thresholds, stormwater 614
detection, and the limits of mitigation. JAWRA Journal of the American Water Resources 615
Association 33(5): 1077–1090. Available from: http://dx.doi.org/10.1111/j.1752‐616
1688.1997.tb04126.x. 617
Booth DB, Hartley D and Jackson R (2002) Forest Cover, Impervious‐Surface Area, and the Mitigation of 618
Stormwater Impacts. Journal of the American Water Resources Association 38(3): 835–845. 619
Box, GEP; Cox D (1964) An analysis of Transformations. Journal of the Royal Statsitical Society 26(2): 620
211–252. 621
Boyd MJ, Bufill MC and Knee RM (1994) Predicting pervious and impervious storm runoff from urban 622
drainage basins. Hydrological Sciences (August 1994). 623
Braud I, Breil P, Thollet F, et al. (2013) Evidence of the impact of urbanization on the hydrological regime 624
of a medium‐sized periurban catchment in France. Journal of Hydrology, Elsevier B.V. 485: 5–23. 625
Available from: http://linkinghub.elsevier.com/retrieve/pii/S0022169412003496 (accessed 15 626
October 2013). 627
Brun SE and Band LE (2000) Simulating runoff behavior in an urbanizing watershed. Computers, 628
Environment and Urban Systems 24(1): 5–22. 629
Burn DH and Boorman DB (1993) Estimation of hydrological parameters at ungauged catchments. 630
Journal of Hydrology 143(3–4): 429–454. 631
Burns D, Vitvar T, McDonnell J, et al. (2005) Effects of suburban development on runoff generation in 632
the Croton River basin, New York, USA. Journal of Hydrology 311(1–4): 266–281. Available from: 633
http://linkinghub.elsevier.com/retrieve/pii/S0022169405000703 (accessed 29 September 2013). 634
Chen Y, Day SD, Wick AF, et al. (2014) Influence of urban land development and subsequent soil 635
rehabilitation on soil aggregates, carbon, and hydraulic conductivity. Science of the Total 636
30
Environment, Elsevier B.V. 494: 329–336. Available from: 637
http://dx.doi.org/10.1016/j.scitotenv.2014.06.099. 638
Ciria (2014) Demonstrating the multiple benefits of SuDS ‐ a business case. 639
CIWEM (2010) Multi‐Functional Urban Green Infrastructure. 640
Clergeau P, Savard JPL, Mennechez G, et al. (1998) Bird Abundance and Diversity Along An Urban‐Rural 641
Gradient: A Comparative Study Between Two Cities on Different Continents. The Condor 100(3): 642
413–425. 643
Crooks SM and Kay AL (2015) Simulation of river flow in the Thames over 120 years : evidence of change 644
in rainfall‐runoff response ? Journal of Hydrology: Regional Studies 4: 1–36. 645
Dams J, Dujardin J, Reggers R, et al. (2013) Mapping impervious surface change from remote sensing for 646
hydrological modeling. Journal of Hydrology 485: 84–95. Available from: 647
http://www.sciencedirect.com/science/article/pii/S0022169412008621 (accessed 11 July 2014). 648
Defra (2014) Delivering Sustainable Drainage Systems. (September). 649
Duku C, Rathjens H, Zwart SJ, et al. (2015) Towards ecosystem accounting: a comprehensive approach to 650
modelling multiple hydrological ecosystem services. Hydrology and Earth System Sciences 651
Discussions 12(3): 3477–3526. Available from: http://www.hydrol‐earth‐syst‐sci‐652
discuss.net/12/3477/2015/hessd‐12‐3477‐2015.html. 653
Ebrahimian A, Wilson BN and Gulliver JS (2016) Improved methods to estimate the effective impervious 654
area in urban catchments using rainfall‐runoff data. Journal of Hydrology, Elsevier B.V. 536: 109–655
118. Available from: http://dx.doi.org/10.1016/j.jhydrol.2016.02.023. 656
Eigenbrod F, Bell V a., Davies HN, et al. (2011) The impact of projected increases in urbanization on 657
ecosystem services. (March). Available from: 658
http://rspb.royalsocietypublishing.org/content/278/1722/3201. 659
31
Faulkner D, Kjeldsen T, Packman J, et al. (2012) Estimating flood peaks and hydrographs for small 660
catchments: phase 1. Available from: http://evidence.environment‐661
agency.gov.uk/FCERM/Libraries/FCERM_Project_Documents/SC090031_report.sflb.ashx. 662
Feaster T, Gotvald A and Weaver J (2014) Methods for Estimating the Magnitude and Frequency of 663
Floods for Urban and Small, Rural Streams in Georgia, South Carolina, and North Carolina, 2011. 664
Pubs.Usgs.Gov (March). Available from: http://pubs.usgs.gov/sir/2014/5030/. 665
Fletcher TD, Andrieu H and Hamel P (2013) Understanding, management and modelling of urban 666
hydrology and its consequences for receiving waters: A state of the art. Advances in Water 667
Resources, Elsevier Ltd 51: 261–279. Available from: 668
http://linkinghub.elsevier.com/retrieve/pii/S0309170812002412 (accessed 19 September 2013). 669
Fuller RM, Smith GM, Sanderson JM, et al. (2002) The UK Land Cover Map 2000: construction of a 670
parcel‐based vector map from satellite images. 39(1): 15–25. Available from: 671
http://www.ingentaconnect.com/content/maney/caj/2002/00000039/00000001/art00003. 672
Gallo EL, Brooks PD, Lohse KA, et al. (2013) Land cover controls on summer discharge and runoff 673
solution chemistry of semi‐arid urban catchments. Journal of Hydrology 485: 37–53. Available 674
from: http://www.scopus.com/inward/record.url?eid=2‐s2.0‐84875488385&partnerID=tZOtx3y1 675
(accessed 12 November 2014). 676
Graf WL (1977) Network characteristics in suburbanizing streams. Water Resources Research 13(2): 459–677
463. Available from: http://doi.wiley.com/10.1029/WR013i002p00459. 678
Grayson RB, Western AW, Chiew FHS, et al. (1997) Preferred states in spatial soil moisture patterns: 679
Local and nonlocal controls. Water Resources Research 33(12): 2897. 680
Haga H, Matsumoto Y, Matsutani J, et al. (2005) Flow paths, rainfall properties, and antecedent soil 681
moisture controlling lags to peak discharge in a granitic unchanneled catchment. Water Resources 682
Research 41(12): 1–14. 683
32
Hall MJ (1977) The effect of urbanization on storm runoff from two catchment areas in North London. 684
AHS‐AI SH Publication No 123: 144–152. 685
Hamel P, Daly E and Fletcher TD (2013) Source‐control stormwater management for mitigating the 686
impacts of urbanisation on baseflow: A review. Journal of Hydrology 485: 201–211. Available from: 687
http://www.sciencedirect.com/science/article/pii/S0022169413000292 (accessed 11 July 2014). 688
Hammer TR (1972) Stream channel enlargement due to urbanization. Water Resources Research 8(6): 689
1530–1540. 690
Han WS and Burian SJ (2009) Determining Effective Impervious Area for Urban Hydrologic Modeling. 691
(February): 111–120. 692
Hawley RJ and Bledsoe BP (2011) How do flow peaks and durations change in suburbanizing semi‐arid 693
watersheds? A southern California case study. Journal of Hydrology 405(1–2): 69–82. Available 694
from: http://www.sciencedirect.com/science/article/pii/S0022169411003210. 695
Hess TM, Daccache A, Daneshkhah A and Knox JW (2016) Scale impacts on spatial variability in reference 696
evapotranspiration. Hydrological Sciences Journal, 61: 601‐609. 697
Hollis GE (1975) The effect of urbanization on floods of different recurrence interval. Water Resources 698
Research 11(3): 431–435. Available from: http://doi.wiley.com/10.1029/WR011i003p00431. 699
Hollis GE (1988) One year irrigation experiment to assess loses and runoff volume relationships for a 700
residential road in Hampshire, England. Water Resources Research 11(3): 61–74. 701
Hollis GE and Ovenden JC (1988) The Quantity of Stormwater Runoff From Ten Stretches of Road , a Car 702
Park and Eight Roofs in Hertfordshire , England During 1983. Hydrological Processes 2: 227–243. 703
Hood MJ, Clausen JC and Warner GS (2007) Comparison of stormwater lag times for low impact and 704
traditional residential development. Journal of the American Water Resources Association 43(4): 705
1036–1046. 706
Hough MN and Jones RJA (1997) The United Kingdom Meteorological Office rainfall and evaporation 707
33
calculation system: MORECS version 2.0‐an overview.pdf. Hydrology and Earth System Sciences 708
1(2): 227–239. 709
Hutchins MG, McGrane SJ, Miller JD, et al. (2016) Integrated modeling in urban hydrology: reviewing the 710
role of monitoring technology in overcoming the issue of ‘big data’ requirements. Wiley 711
Interdisciplinary Reviews: Water. Available from: http://doi.wiley.com/10.1002/wat2.1177. 712
Jacob JS and Lopez R (2009) Is denser greener? an evaluation of higher density development as an urban 713
stormwater‐quality best management practice. Journal of the American Water Resources 714
Association 45(3): 687–701. 715
Jacobson CR (2011) Identification and quantification of the hydrological impacts of imperviousness in 716
urban catchments: a review. Journal of environmental management 92(6): 1438–48. Available 717
from: http://www.ncbi.nlm.nih.gov/pubmed/21334133 (accessed 19 September 2013). 718
Jarden KM, Jefferson AJ and Grieser JM (2015) Assessing the effects of catchment‐scale urban green 719
infrastructure retrofits on hydrograph characteristics. Hydrological Processes. 720
Kauffman GJ, Belden AC, Vonck KJ, et al. (2009) Link between Impervious Cover and Base Flow in the 721
White Clay Creek Wild and Scenic Watershed in Delaware. Journal of Hydrologic Engineering 4: 722
324–334. 723
Kelly DA (2016) Impact of paved front gardens on current and future urban flooding. Journal of Flood 724
Risk Management. Available from: http://doi.wiley.com/10.1111/jfr3.12231. 725
Kjeldsen, TR, Jones, DA, Bayliss A (2008) Improving the FEH statistical procedures for flood frequency 726
estimation. 727
Kjeldsen TR (2007) The revitalised FSR/FEH rainfall‐runoff method. Available from: 728
http://www.ceh.ac.uk/sections/hrr/RevitalisationofFSRFEHrainfall‐runoffmodel.html. 729
Kjeldsen TR (2010) Modelling the impact of urbanization on flood frequency relationships in the UK. 730
Hydrology Research 41(5): 391. Available from: 731
34
http://www.iwaponline.com/nh/041/nh0410391.htm (accessed 15 October 2013). 732
Kjeldsen TR, Miller JD and Packman JC (2013) Modelling design flood hydrographs in catchments with 733
mixed urban and rural land cover T. Hydrology research 44(6): 1040–1057. 734
Kroll F, Muller F, Haase D, et al. (2012) Rural‐urban gradient analysis of ecosystem services supply and 735
demand dynamics. Land Use Policy, Elsevier Ltd 29(3): 521–535. Available from: 736
http://dx.doi.org/10.1016/j.landusepol.2011.07.008. 737
Leopold LB (1968) Hydrology for‐ Urban Land Planning ‐ Effects of Urban Land Use. 738
Loram A, Tratalos J, Warren PH, et al. (2007) Urban domestic gardens (X): The extent & structure of the 739
resource in five major cities. Landscape Ecology 22(4): 601–615. 740
McDonnell, MarkPickett S, Pickett S, Groffman P, et al. (1997) Ecosystem processes along an urban to 741
rural gradient. Urban Ecosystems 1: 21–36. 742
Mcdonnell JJ, Bonell M, Stewart MK, et al. (1990) Implications for Stream Hydrograph Separation L1. 743
Water Resour. Res. 26(3): 455–458. 744
McEnroe BM and Zhao H (2001) Lag times of Urban and Developing watersheds in Johnson County, 745
Kansas. 746
McGrane SJ (2015) Impacts of urbanisation on hydrological and water quality dynamics, and urban 747
water management: a review. Hydrological Sciences Journal, Taylor & Francis 31(13)(December): 748
2295–2311. Available from: http://dx.doi.org/10.1080/02626667.2015.1128084. 749
Meierdiercks KL, Smith J a., Baeck ML, et al. (2010) Analyses of Urban Drainage Network Structure and 750
its Impact on Hydrologic Response1. JAWRA Journal of the American Water Resources Association 751
46(5): 932–943. Available from: http://doi.wiley.com/10.1111/j.1752‐1688.2010.00465.x. 752
Mejía A, Rossel F, Gironás J, et al. (2015) Anthropogenic controls from urban growth on flow regimes. 753
Advances in Water Resources 84: 125–135. Available from: 754
http://linkinghub.elsevier.com/retrieve/pii/S0309170815001967. 755
35
Meyles E, Williams A, Ternan L, et al. (2003) Runoff generation in relation to soil moisture patterns in a 756
small Dartmoor catchment, Southwest England. Hydrological Processes 17(2): 251–264. 757
Michele C De and Salvadori G (2002) On the derived flood frequency distribution: Analytical 758
formulatioon and the influence of antecedent soil moisture condition. Journal of Hydrology 262(1–759
4): 245–258. 760
Miller JD, Kim H, Kjeldsen TR, et al. (2014) Assessing the impact of urbanization on storm runoff in a peri‐761
urban catchment using historical change in impervious cover. Journal of Hydrology 515: 59–70. 762
Morton D, Rowland C, Wood C, et al. (2011) Final Report for LCM2007 ‐ the new UK land cover map. 763
Countryside Survey Technical Report No 11/07. Available from: 764
http://www.countrysidesurvey.org.uk/outputs/land‐cover‐map‐2007‐final‐report. 765
Muchan K, Hannaford J and Parry S (2015) The winter storms of 2013 / 2014 in the UK : hydrological 766
responses and impacts. Weather 70(2): 1–7. 767
Ogden FL, Raj Pradhan N, Downer CW, et al. (2011) Relative importance of impervious area, drainage 768
density, width function, and subsurface storm drainage on flood runoff from an urbanized 769
catchment. Water Resources Research 47(12): n/a‐n/a. Available from: 770
http://doi.wiley.com/10.1029/2011WR010550 (accessed 4 October 2013). 771
Ossola A, Hahs AK and Livesley SJ (2015) Habitat complexity influences fine scale hydrological processes 772
and the incidence of stormwater runoff in managed urban ecosystems. Journal of Environmental 773
Management 159: 1–10. Available from: http://dx.doi.org/10.1016/j.jenvman.2015.05.002. 774
Palla A and Gnecco I (2015) Hydrologic modeling of Low Impact Development systems at the urban 775
catchment scale. Journal of Hydrology, Elsevier B.V. 528: 361–368. Available from: 776
http://linkinghub.elsevier.com/retrieve/pii/S0022169415004631. 777
Parry S, Marsh T and Kendon M (2013) 2012: From drought to floods in England and Wales. Weather 778
68(10): 268–274. 779
36
Penna D, Tromp‐Van Meerveld HJ, Gobbi A, et al. (2011) The influence of soil moisture on threshold 780
runoff generation processes in an alpine headwater catchment. Hydrology and Earth System 781
Sciences 15(3): 689–702. 782
Poelmans L, Rompaey A Van, Ntegeka V, et al. (2011) The relative impact of climate change and urban 783
expansion on peak flows: a case study in central Belgium. Hydrological Processes 25(18): 2846–784
2858. Available from: http://doi.wiley.com/10.1002/hyp.8047 (accessed 11 October 2013). 785
POST (2016) Adapting Urban Areas to Flooding. 786
Quinn PF and Beven KJ (1993) Spatial and Temporal Predictions of Soil‐Moisture Dynamics, Runoff, 787
Variable Source Areas and Evapotranspiration for Plynlimon, Mid‐Wales. Hydrological Processes 788
7(4): 425–448. 789
Ragab R, Rosier P, Dixon A, et al. (2003) Experimental study of water fluxes in a residential area: 2. Road 790
infiltration, runoff and evaporation. Hydrological Processes 17(12): 2423–2437. Available from: 791
http://doi.wiley.com/10.1002/hyp.1251 (accessed 18 November 2013). 792
Redfern TW, Macdonald N, Kjeldsen TR, et al. (2016) Current understanding of hydrological processes on 793
common urban surfaces. Progress in Physical Geography: 1–15. Available from: 794
http://ppg.sagepub.com/cgi/doi/10.1177/0309133316652819. 795
Roy AH and Shuster WD (2009) Assessing Impervious Surface Connectivity and Applications for 796
Watershed Management. JAWRA Journal of the American Water Resources Association 45(1): 198–797
209. Available from: http://doi.wiley.com/10.1111/j.1752‐1688.2008.00271.x. 798
Salvadore E, Bronders J and Batelaan O (2015) Hydrological modelling of urbanized catchments: A 799
review and future directions. Journal of Hydrology, Elsevier B.V. 529: 62–81. Available from: 800
http://linkinghub.elsevier.com/retrieve/pii/S0022169415004412. 801
Schoonover JE and Lockaby BG (2006) Land cover impacts on stream nutrients and fecal coliform in the 802
lower Piedmont of West Georgia. Journal of Hydrology 331(3–4): 371–382. 803
37
Schueler TR (2000) The importance of imperviousness. Feature article from Watershed Protection 804
Techniques 1(3): 100–111. 805
Sheeder SA, Ross JD and Carlson TN (2003) Dual urban and rural hydrograph signals in three small 806
watersheds. Journal of the American water Resources Association 38(4): 1027–1040. 807
Shuster WD, Bonta J, Thurston H, et al. (2005) Impacts of impervious surface on watershed hydrology: A 808
review. Urban Water Journal 2(4): 263–275. Available from: 809
http://www.tandfonline.com/doi/abs/10.1080/15730620500386529 (accessed 7 November 2013). 810
Sillanpää N and Koivusalo H (2015) Measurements and data analysis of suburban development impacts 811
on runoff event characteristics and unit hydrographs. Journal of Hydrology 521: 9718. 812
Simmons DL and Reynolds J (2013) Effect of urbanisation on the water balance of a catchment with 813
shallow groundwater. Journal of Hydrology, Elsevier B.V. 485: 162–176. Available from: 814
http://linkinghub.elsevier.com/retrieve/pii/S0022169412003022 (accessed 19 September 2013). 815
Smith BK, Smith JA, Baeck ML, et al. (2013) Spectrum of storm event hydrologic response in urban 816
watersheds. Water Resources Research 49(5): 2649–2663. Available from: 817
http://doi.wiley.com/10.1002/wrcr.20223 (accessed 6 October 2013). 818
Smith JA, Baeck ML, Meierdiercks KL, et al. (2005) Field studies of the storm event hydrologic response 819
in an urbanizing watershed. Water Resources Research 41(10): 1–15. Available from: 820
http://doi.wiley.com/10.1029/2004WR003712 (accessed 15 October 2013). 821
Stewart L, et al. (2015) Risks and Extremes. In: Rodda JC and Robinson M (eds) Progress in Modern 822
Hydrology: Past, Present and Future. Oxford: Wiley pp.60‐99. 823
Thyer M, Kuczera G and Wang QJ (2002) Quantifying parameter uncertainty in stochastic models using 824
the Box – Cox transformation. Journal of Hydrology 265(1–4): 246–257. Available from: 825
http://linkinghub.elsevier.com/retrieve/pii/S0022169402001130. 826
USGS (2003) Effects of Urban Development on Floods. 827
38
Watt EW and Chow AKC (1985) A general expression for basin lag time. Canadian Journal of Civil 828
Engineering 12(2): 294–300. 829
Wenger SJ, Peterson JT, Freeman MC, et al. (2008) Stream fish occurrence in response to impervious 830
cover, historic land use, and hydrogeomorphic factors. Canadian Journal of Fisheries and Aquatic 831
Sciences 65(7): 1250–1264. Available from: 832
http://www.nrcresearchpress.com/doi/full/10.1139/F08‐046. 833
Williams PW (1976) Impact of urbanization on the hydrology of Wairau Creek, North Shore, Auckland. 834
Journal of Hydrology (NZ). 835
Yang JL and Zhang GL (2011) Water infiltration in urban soils and its effects on the quantity and quality 836
of runoff. Journal of Soils and Sediments 11(5): 751–761. 837
Yue S and Hashino M (2000) Unit hydrographs to model quick and slow runoff components of 838
streamflow. Journal of Hydrology 227(1–4): 195–206. 839
Zhang Y and Shuster W (2014) Impacts of Spatial Distribution of Impervious Areas on Runoff Response of 840
Hillslope Catchments: Simulation Study. Journal of Hydrologic Engineering 19(6): 1089–1100. 841
Available from: http://ascelibrary.org/doi/abs/10.1061/%28ASCE%29HE.1943‐5584.0000905. 842
Zhang Y, Wei H and Nearing MA (2011) Effects of antecedent soil moisture on runoff modeling in small 843
semiarid watersheds of southeastern Arizona. Hydrology and Earth System Sciences 15(10): 3171–844
3179. 845
846
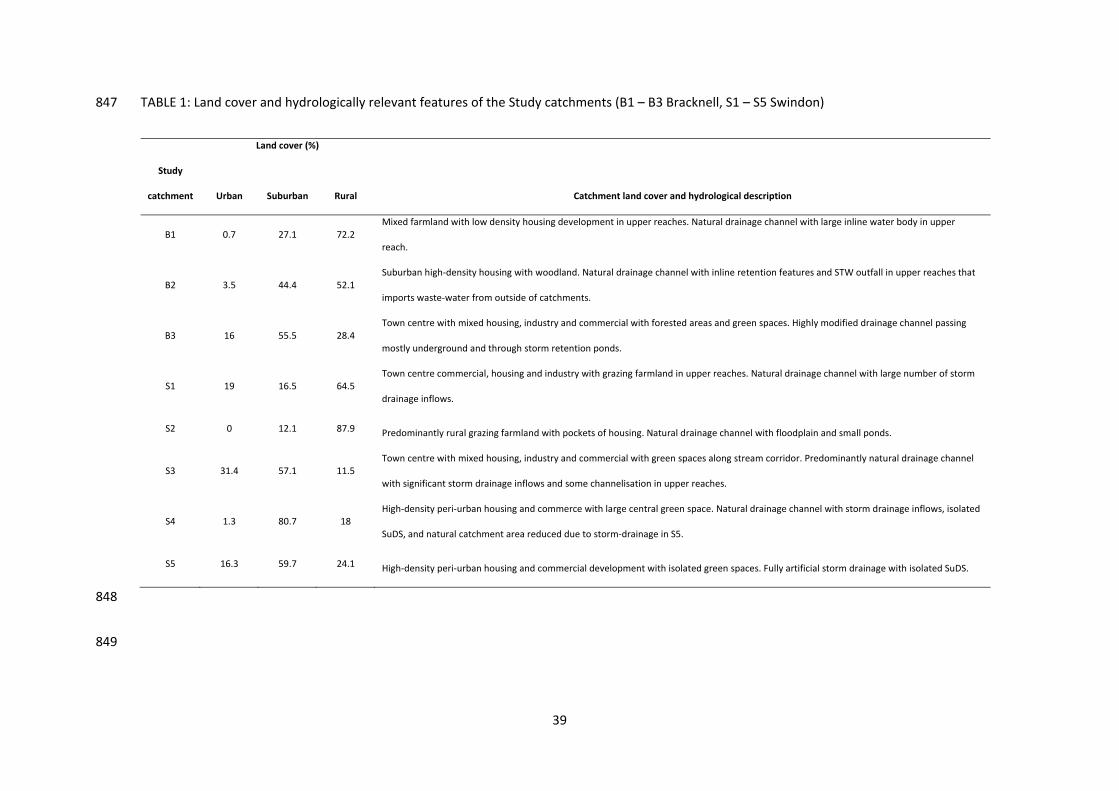
39
TABLE 1: Land cover and hydrologically relevant features of the Study catchments (B1 – B3 Bracknell, S1 – S5 Swindon) 847
Land cover (%)
Study
catchment Urban Suburban Rural Catchment land cover and hydrological description
B1 0.7 27.1 72.2 Mixed farmland with low density housing development in upper reaches. Natural drainage channel with large inline water body in upper
reach.
B2 3.5 44.4 52.1 Suburban high‐density housing with woodland. Natural drainage channel with inline retention features and STW outfall in upper reaches that
imports waste‐water from outside of catchments.
B3 16 55.5 28.4 Town centre with mixed housing, industry and commercial with forested areas and green spaces. Highly modified drainage channel passing
mostly underground and through storm retention ponds.
S1 19 16.5 64.5 Town centre commercial, housing and industry with grazing farmland in upper reaches. Natural drainage channel with large number of storm
drainage inflows.
S2 0 12.1 87.9 Predominantly rural grazing farmland with pockets of housing. Natural drainage channel with floodplain and small ponds.
S3 31.4 57.1 11.5 Town centre with mixed housing, industry and commercial with green spaces along stream corridor. Predominantly natural drainage channel
with significant storm drainage inflows and some channelisation in upper reaches.
S4 1.3 80.7 18 High‐density peri‐urban housing and commerce with large central green space. Natural drainage channel with storm drainage inflows, isolated
SuDS, and natural catchment area reduced due to storm‐drainage in S5.
S5 16.3 59.7 24.1 High‐density peri‐urban housing and commercial development with isolated green spaces. Fully artificial storm drainage with isolated SuDS.
848
849
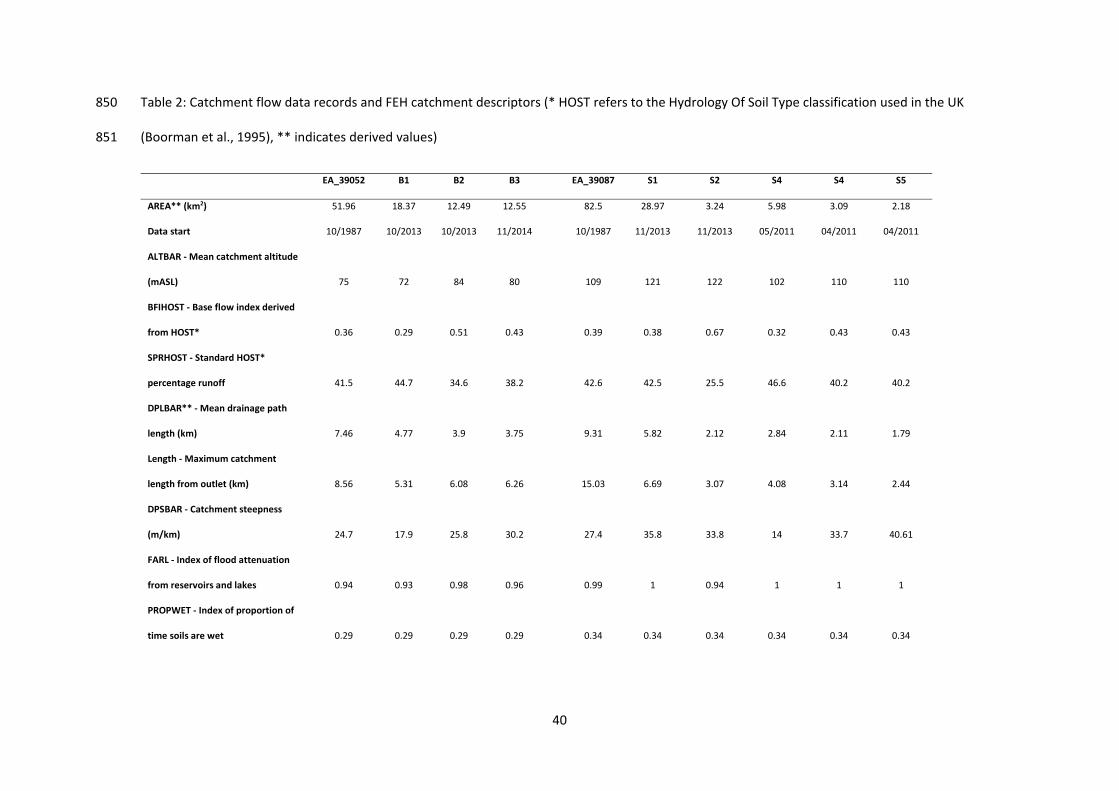
40
Table 2: Catchment flow data records and FEH catchment descriptors (* HOST refers to the Hydrology Of Soil Type classification used in the UK 850
(Boorman et al., 1995), ** indicates derived values) 851
EA_39052 B1 B2 B3 EA_39087 S1 S2 S4 S4 S5
AREA** (km2) 51.96 18.37 12.49 12.55 82.5 28.97 3.24 5.98 3.09 2.18
Data start 10/1987 10/2013 10/2013 11/2014 10/1987 11/2013 11/2013 05/2011 04/2011 04/2011
ALTBAR ‐ Mean catchment altitude
(mASL) 75 72 84 80 109 121 122 102 110 110
BFIHOST ‐ Base flow index derived
from HOST* 0.36 0.29 0.51 0.43 0.39 0.38 0.67 0.32 0.43 0.43
SPRHOST ‐ Standard HOST*
percentage runoff 41.5 44.7 34.6 38.2 42.6 42.5 25.5 46.6 40.2 40.2
DPLBAR** ‐Mean drainage path
length (km) 7.46 4.77 3.9 3.75 9.31 5.82 2.12 2.84 2.11 1.79
Length ‐Maximum catchment
length from outlet (km) 8.56 5.31 6.08 6.26 15.03 6.69 3.07 4.08 3.14 2.44
DPSBAR ‐ Catchment steepness
(m/km) 24.7 17.9 25.8 30.2 27.4 35.8 33.8 14 33.7 40.61
FARL ‐ Index of flood attenuation
from reservoirs and lakes 0.94 0.93 0.98 0.96 0.99 1 0.94 1 1 1
PROPWET ‐ Index of proportion of
time soils are wet 0.29 0.29 0.29 0.29 0.34 0.34 0.34 0.34 0.34 0.34
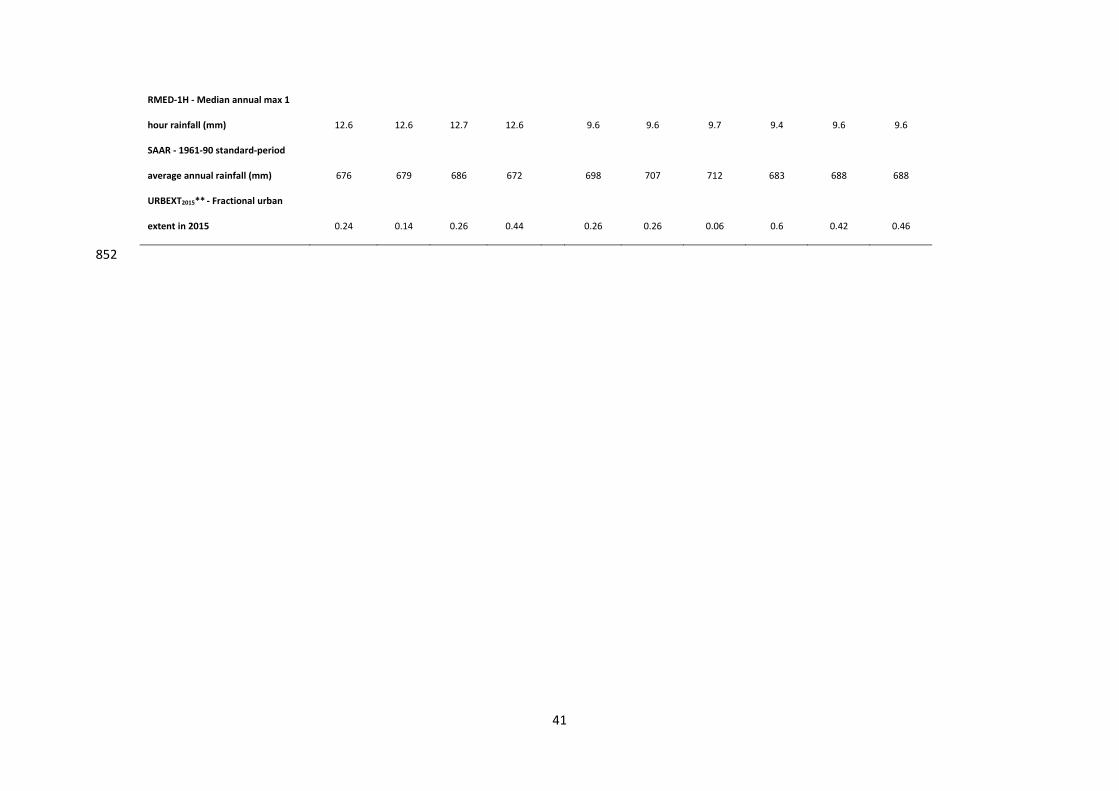
41
RMED‐1H ‐ Median annual max 1
hour rainfall (mm) 12.6 12.6 12.7 12.6 9.6 9.6 9.7 9.4 9.6 9.6
SAAR ‐ 1961‐90 standard‐period
average annual rainfall (mm) 676 679 686 672 698 707 712 683 688 688
URBEXT2015** ‐ Fractional urban
extent in 2015 0.24 0.14 0.26 0.44 0.26 0.26 0.06 0.6 0.42 0.46
852

42
TABLE 3: Event selection criteria (illustrated in Figure 2). 853
Stage 1 ‐ Rainfall ‐ Minimum 2mm rainfall in 4 hours to define rainfall event (0.5mm/hr)
‐ Events separated by period defined by baseflow window (Bf.window)
‐ No rain exceeding 0.5 mm occurs during pre‐event period (Ev.pre ‐ Ev.start)
and zero rainfall 2 hours prior to event start
‐ No rain exceeding 0.2 mm following event end (Ev.end)
‐ No gaps between rainfall ‘spikes’ during event window (Ev.start – Ev.end)
exceeding 3 hours
Stage 2 – Storm
runoff and
baseflow
‐ Only single event hydrographs
‐ Baseflow calculated for event runoff
Stage 3 ‐
Rainfall‐runoff
‐ User selection of timing for periods defining post event window (Ev.post) and
baseflow window (Bf.window) based on catchment size and hydrograph
‐ No significant increase in flow before rainfall event start (Ev.start)
‐ No rainfall driving runoff post event recession (Ev.post)
‐ No mistiming in response – e.g. significant delay between rainfall and runoff
854
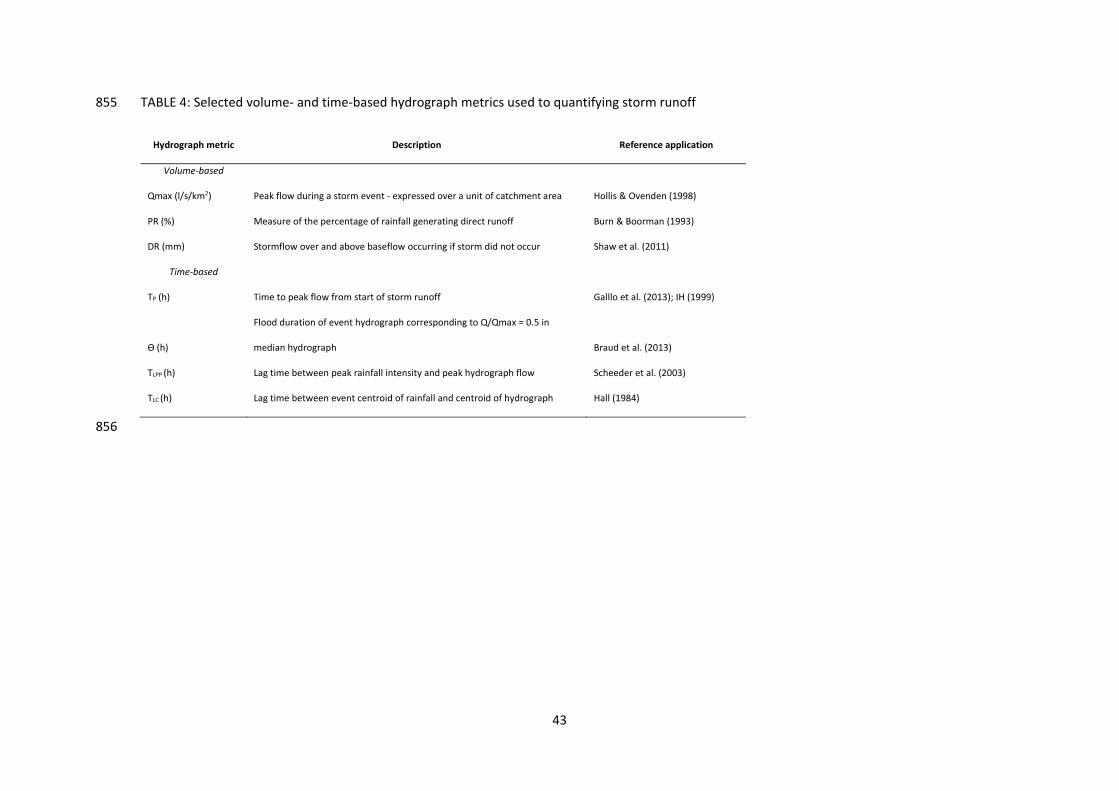
43
TABLE 4: Selected volume‐ and time‐based hydrograph metrics used to quantifying storm runoff 855
Hydrograph metric Description Reference application
Volume‐based
Qmax (l/s/km2) Peak flow during a storm event ‐ expressed over a unit of catchment area Hollis & Ovenden (1998)
PR (%) Measure of the percentage of rainfall generating direct runoff Burn & Boorman (1993)
DR (mm) Stormflow over and above baseflow occurring if storm did not occur Shaw et al. (2011)
Time‐based
TP (h) Time to peak flow from start of storm runoff Galllo et al. (2013); IH (1999)
Ɵ (h)
Flood duration of event hydrograph corresponding to Q/Qmax = 0.5 in
median hydrograph Braud et al. (2013)
TLPP (h) Lag time between peak rainfall intensity and peak hydrograph flow Scheeder et al. (2003)
TLC (h) Lag time between event centroid of rainfall and centroid of hydrograph Hall (1984)
856
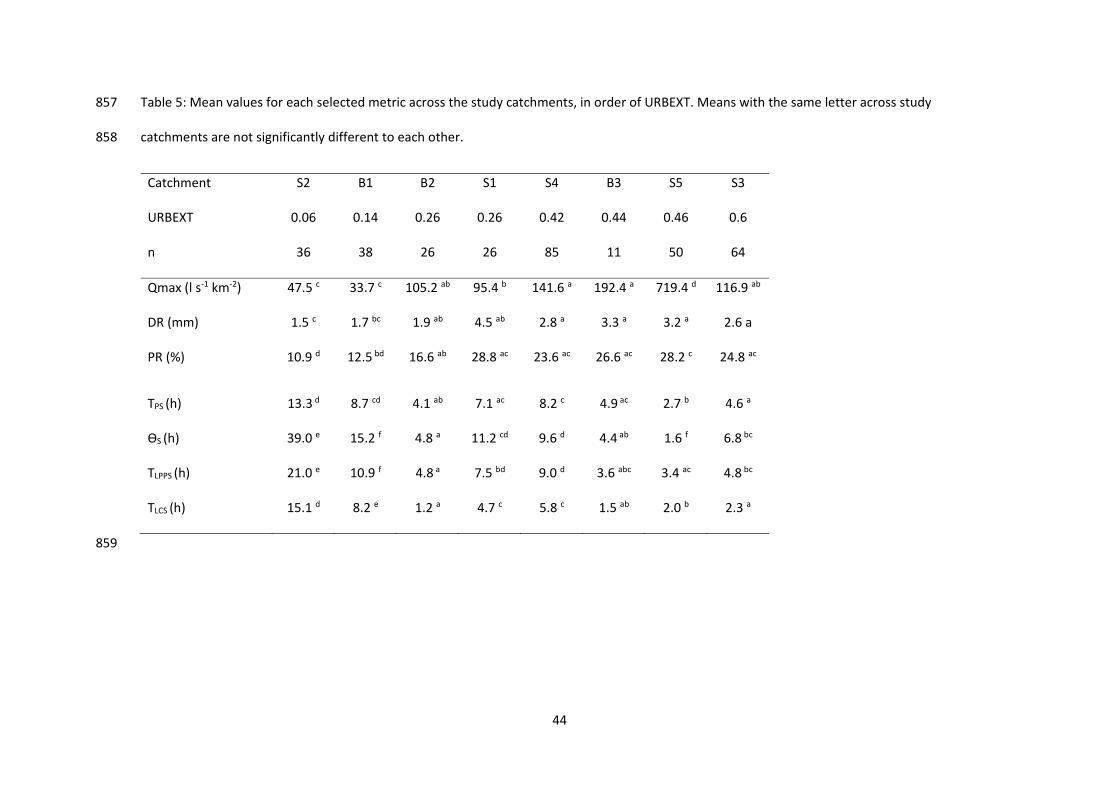
44
Table 5: Mean values for each selected metric across the study catchments, in order of URBEXT. Means with the same letter across study 857
catchments are not significantly different to each other. 858
Catchment S2 B1 B2 S1 S4 B3 S5 S3
URBEXT 0.06 0.14 0.26 0.26 0.42 0.44 0.46 0.6
n 36 38 26 26 85 11 50 64
Qmax (l s‐1 km‐2) 47.5 c 33.7 c 105.2 ab 95.4 b 141.6 a 192.4 a 719.4 d 116.9 ab
DR (mm) 1.5 c 1.7 bc 1.9 ab 4.5 ab 2.8 a 3.3 a 3.2 a 2.6 a
PR (%) 10.9 d 12.5 bd 16.6 ab 28.8 ac 23.6 ac 26.6 ac 28.2 c 24.8 ac
TPS (h) 13.3 d 8.7 cd 4.1 ab 7.1 ac 8.2 c 4.9 ac 2.7 b 4.6 a
ƟS (h) 39.0 e 15.2 f 4.8 a 11.2 cd 9.6 d 4.4 ab 1.6 f 6.8 bc
TLPPS (h) 21.0 e 10.9 f 4.8 a 7.5 bd 9.0 d 3.6 abc 3.4 ac 4.8 bc
TLCS (h) 15.1 d 8.2 e 1.2 a 4.7 c 5.8 c 1.5 ab 2.0 b 2.3 a
859
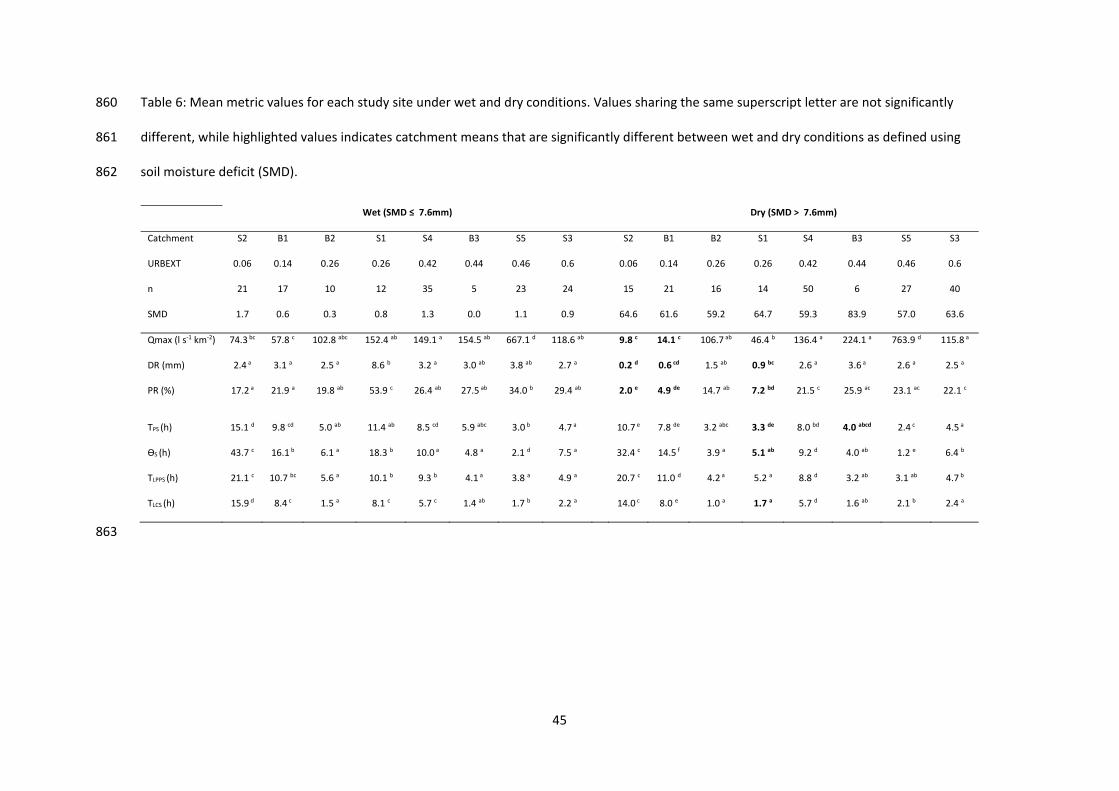
45
Table 6: Mean metric values for each study site under wet and dry conditions. Values sharing the same superscript letter are not significantly 860
different, while highlighted values indicates catchment means that are significantly different between wet and dry conditions as defined using 861
soil moisture deficit (SMD). 862
Wet (SMD ≤ 7.6mm) Dry (SMD > 7.6mm)
Catchment S2 B1 B2 S1 S4 B3 S5 S3 S2 B1 B2 S1 S4 B3 S5 S3
URBEXT 0.06 0.14 0.26 0.26 0.42 0.44 0.46 0.6 0.06 0.14 0.26 0.26 0.42 0.44 0.46 0.6
n 21 17 10 12 35 5 23 24 15 21 16 14 50 6 27 40
SMD 1.7 0.6 0.3 0.8 1.3 0.0 1.1 0.9 64.6 61.6 59.2 64.7 59.3 83.9 57.0 63.6
Qmax (l s‐1 km‐2) 74.3 bc 57.8 c 102.8 abc 152.4 ab 149.1 a 154.5 ab 667.1 d 118.6 ab 9.8 c 14.1 c 106.7 ab 46.4 b 136.4 a 224.1 a 763.9 d 115.8 a
DR (mm) 2.4 a 3.1 a 2.5 a 8.6 b 3.2 a 3.0 ab 3.8 ab 2.7 a 0.2 d 0.6 cd 1.5 ab 0.9 bc 2.6 a 3.6 a 2.6 a 2.5 a
PR (%) 17.2 a 21.9 a 19.8 ab 53.9 c 26.4 ab 27.5 ab 34.0 b 29.4 ab 2.0 e 4.9 de 14.7 ab 7.2 bd 21.5 c 25.9 ac 23.1 ac 22.1 c
TPS (h) 15.1 d 9.8 cd 5.0 ab 11.4 ab 8.5 cd 5.9 abc 3.0 b 4.7 a 10.7 e 7.8 de 3.2 abc 3.3 de 8.0 bd 4.0 abcd 2.4 c 4.5 a
ƟS (h) 43.7 c 16.1 b 6.1 a 18.3 b 10.0 a 4.8 a 2.1 d 7.5 a 32.4 c 14.5 f 3.9 a 5.1 ab 9.2 d 4.0 ab 1.2 e 6.4 b
TLPPS (h) 21.1 c 10.7 bc 5.6 a 10.1 b 9.3 b 4.1 a 3.8 a 4.9 a 20.7 c 11.0 d 4.2 a 5.2 a 8.8 d 3.2 ab 3.1 ab 4.7 b
TLCS (h) 15.9 d 8.4 c 1.5 a 8.1 c 5.7 c 1.4 ab 1.7 b 2.2 a 14.0 c 8.0 e 1.0 a 1.7 a 5.7 d 1.6 ab 2.1 b 2.4 a
863
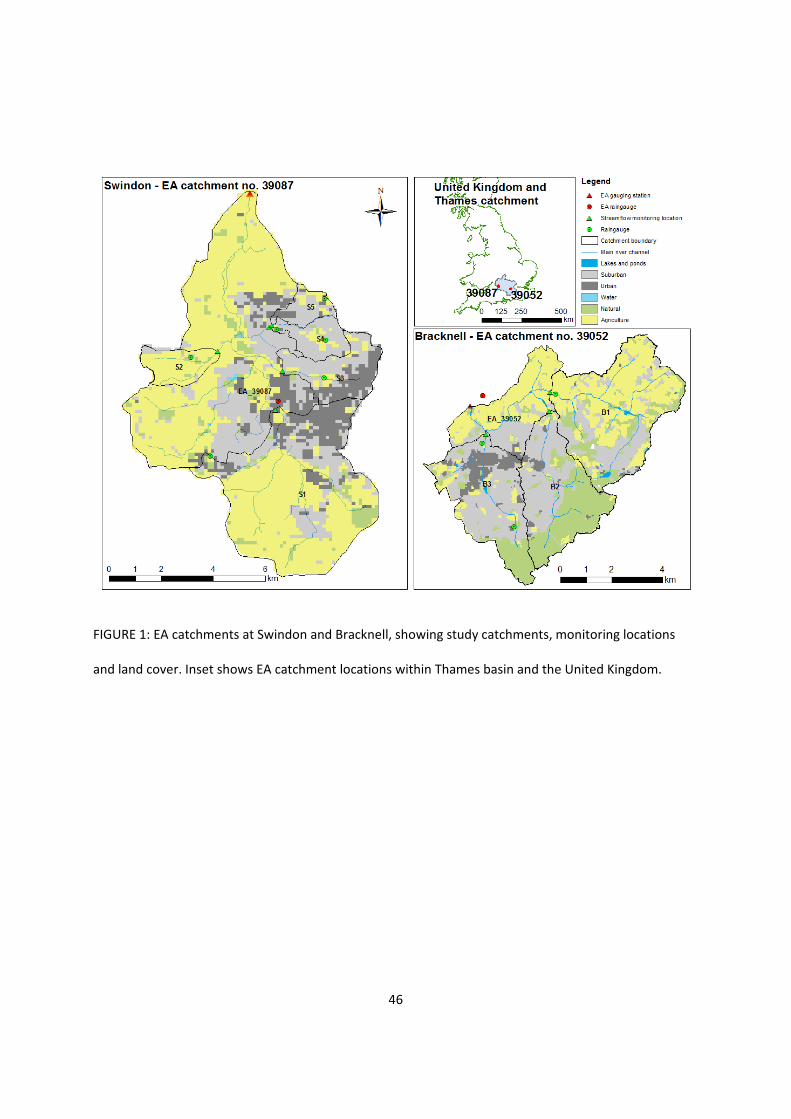
46
FIGURE 1: EA catchments at Swindon and Bracknell, showing study catchments, monitoring locations
and land cover. Inset shows EA catchment locations within Thames basin and the United Kingdom.
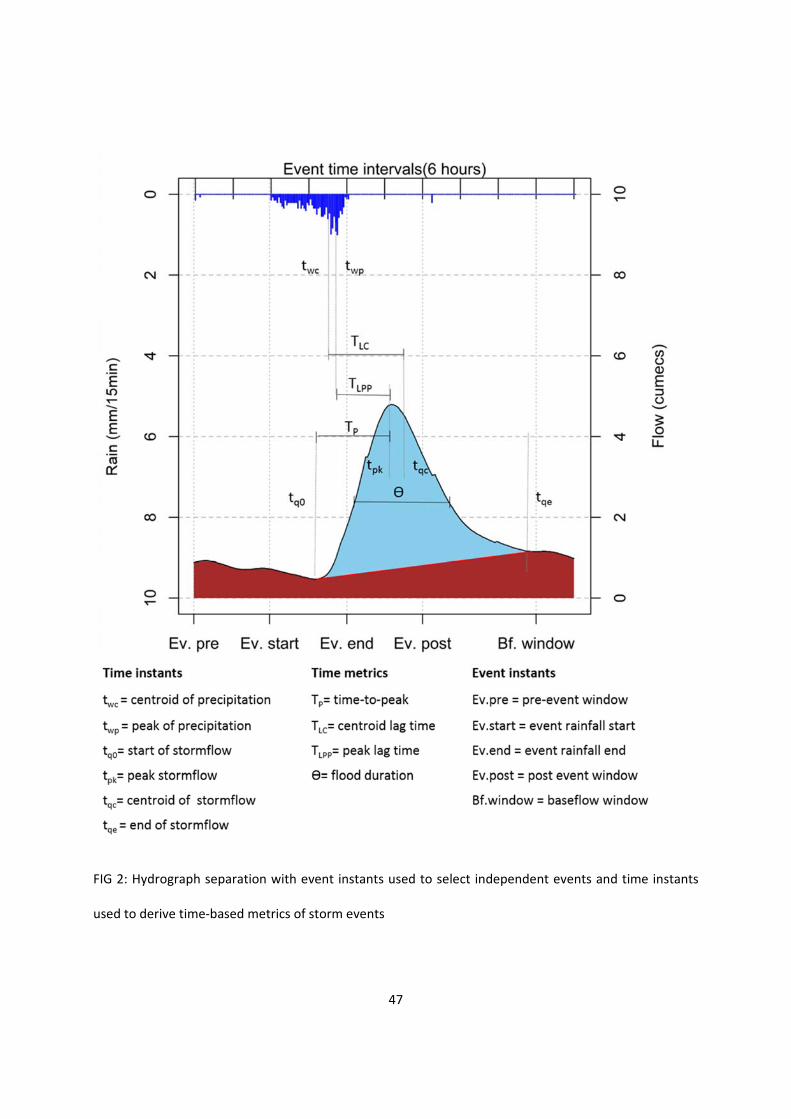
47
FIG 2: Hydrograph separation with event instants used to select independent events and time instants
used to derive time‐based metrics of storm events
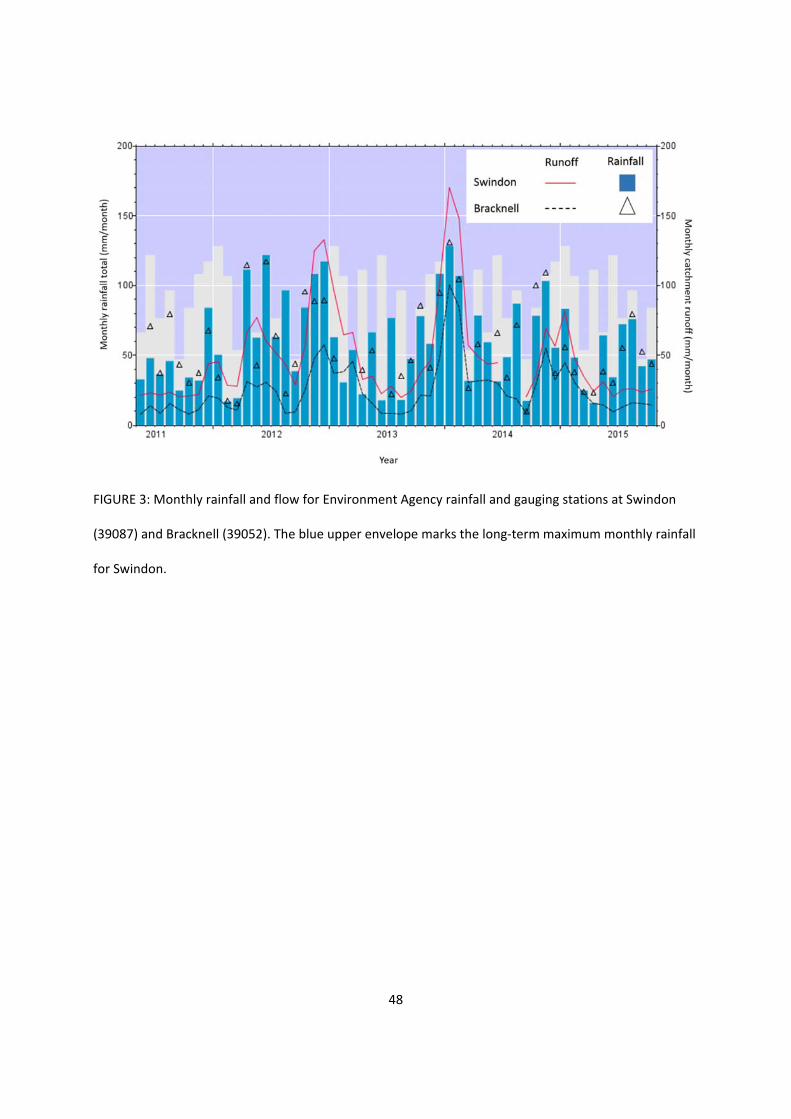
48
FIGURE 3: Monthly rainfall and flow for Environment Agency rainfall and gauging stations at Swindon
(39087) and Bracknell (39052). The blue upper envelope marks the long‐term maximum monthly rainfall
for Swindon.
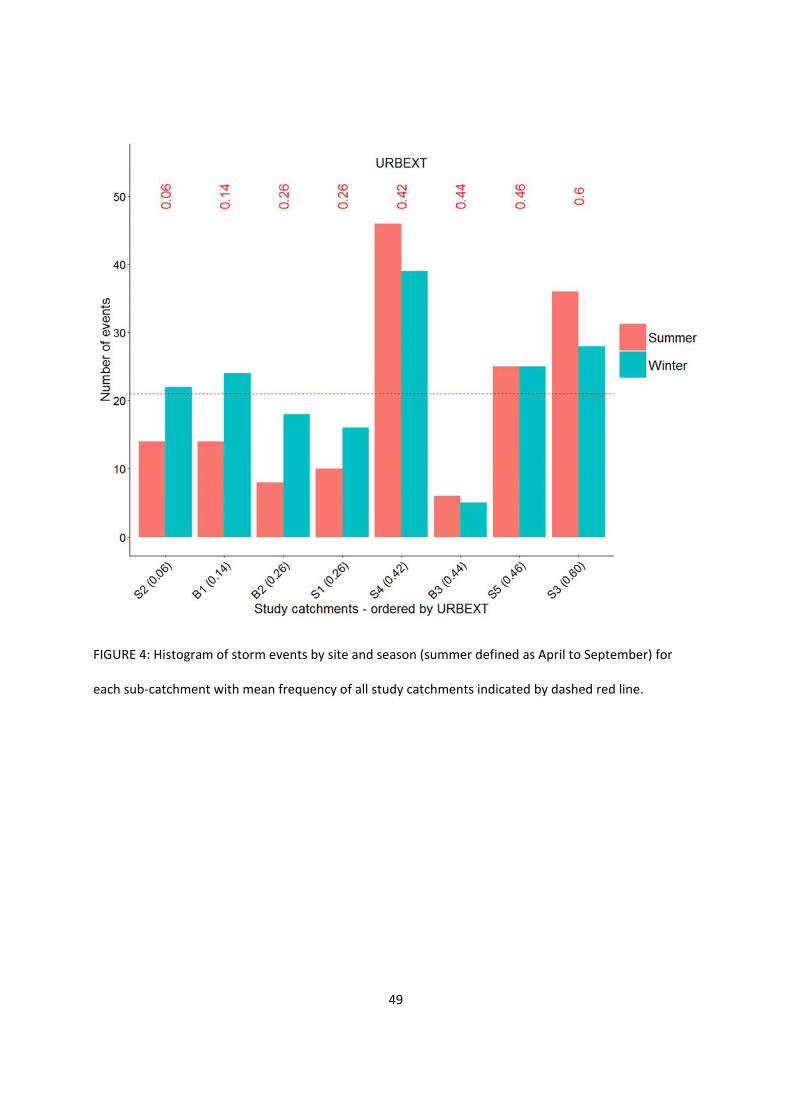
49
FIGURE 4: Histogram of storm events by site and season (summer defined as April to September) for
each sub‐catchment with mean frequency of all study catchments indicated by dashed red line.
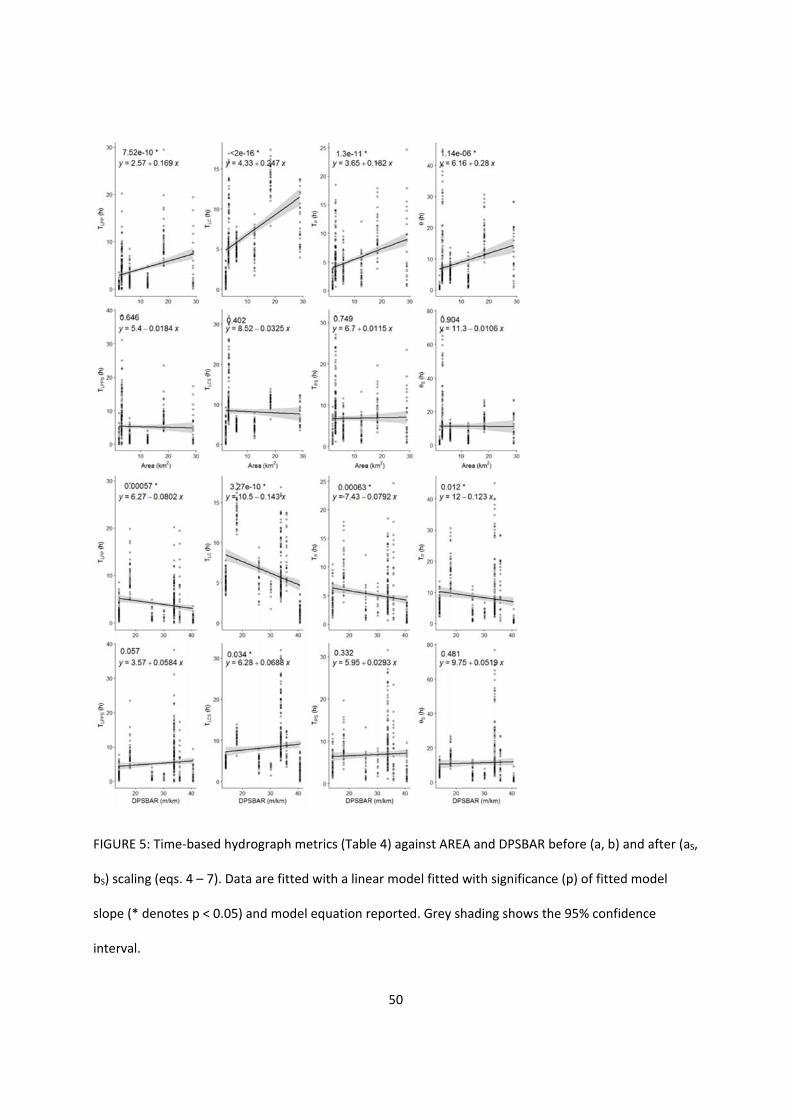
50
FIGURE 5: Time‐based hydrograph metrics (Table 4) against AREA and DPSBAR before (a, b) and after (aS,
bS) scaling (eqs. 4 – 7). Data are fitted with a linear model fitted with significance (p) of fitted model
slope (* denotes p < 0.05) and model equation reported. Grey shading shows the 95% confidence
interval.
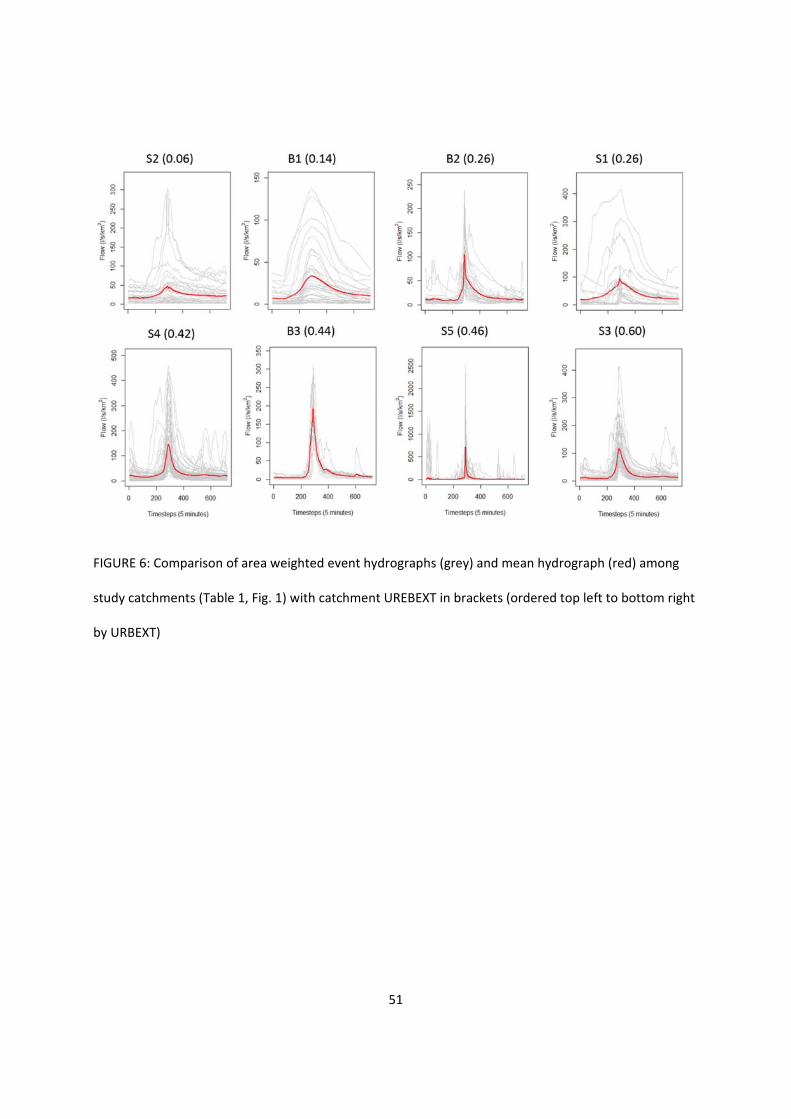
51
FIGURE 6: Comparison of area weighted event hydrographs (grey) and mean hydrograph (red) among
study catchments (Table 1, Fig. 1) with catchment UREBEXT in brackets (ordered top left to bottom right
by URBEXT)
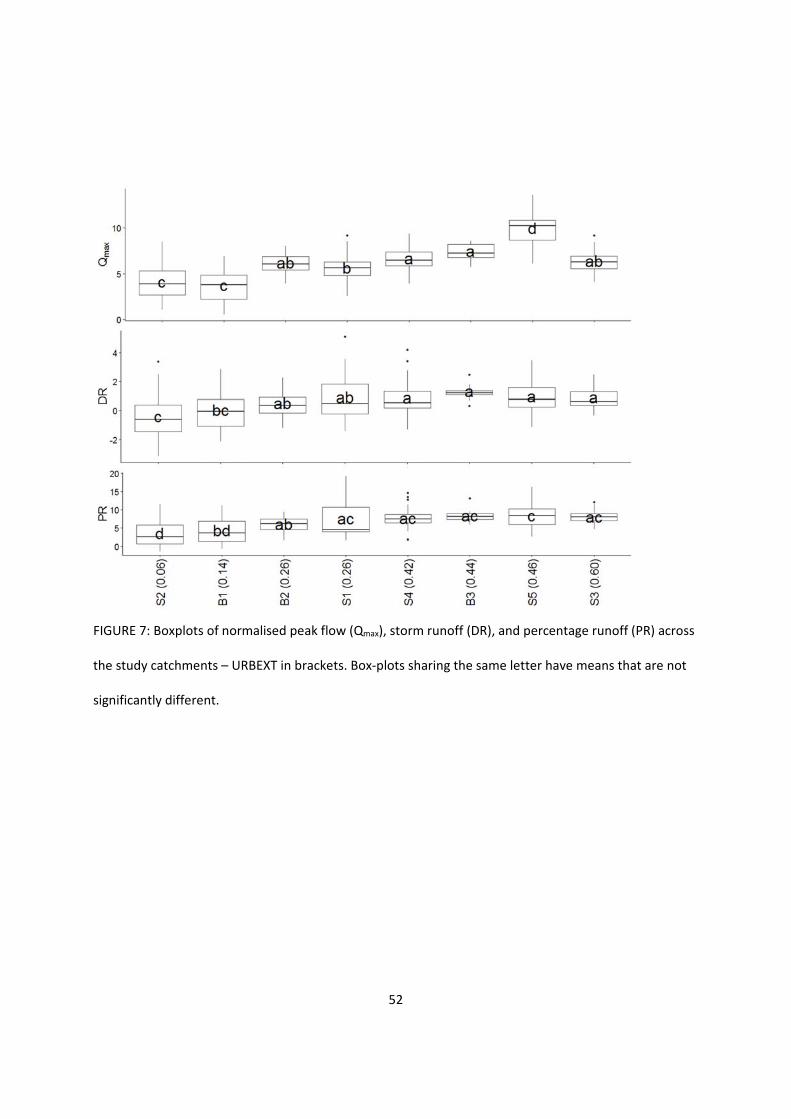
52
FIGURE 7: Boxplots of normalised peak flow (Qmax), storm runoff (DR), and percentage runoff (PR) across
the study catchments – URBEXT in brackets. Box‐plots sharing the same letter have means that are not
significantly different.
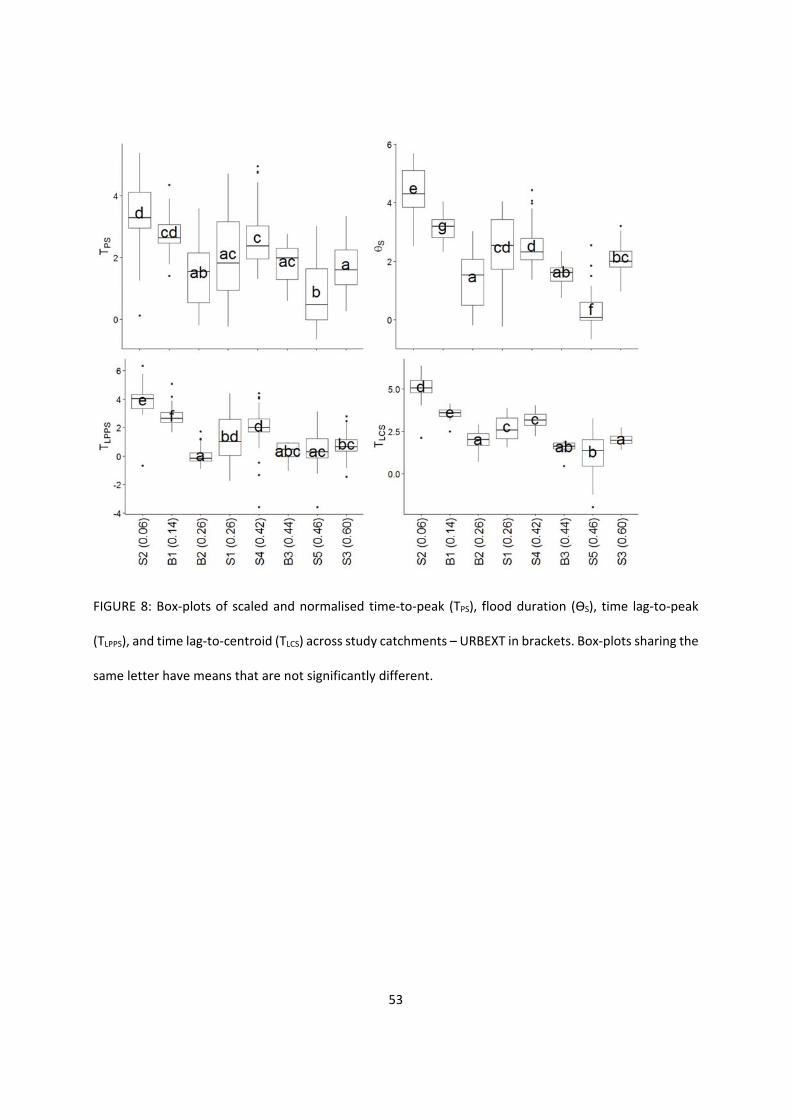
53
FIGURE 8: Box‐plots of scaled and normalised time‐to‐peak (TPS), flood duration (ƟS), time lag‐to‐peak
(TLPPS), and time lag‐to‐centroid (TLCS) across study catchments – URBEXT in brackets. Box‐plots sharing the
same letter have means that are not significantly different.
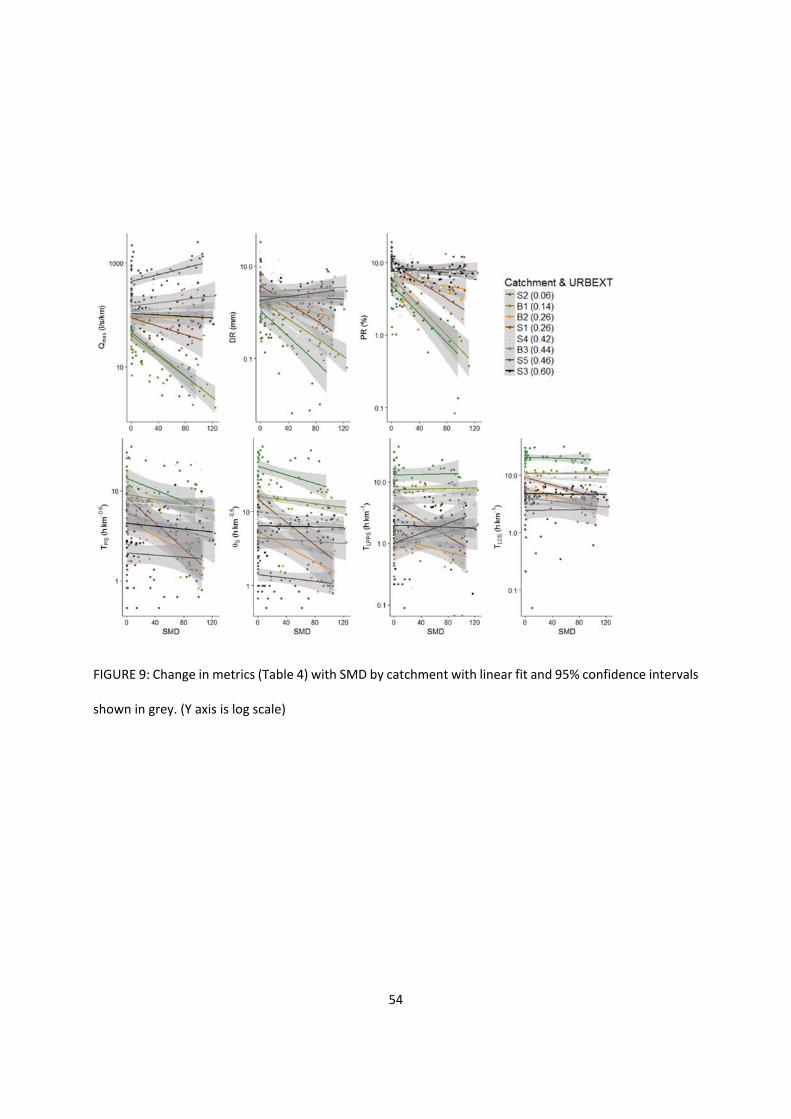
54
FIGURE 9: Change in metrics (Table 4) with SMD by catchment with linear fit and 95% confidence intervals
shown in grey. (Y axis is log scale)