Article (refereed) - postprint - CORE
39
Article (refereed) - postprint DeLuca, Thomas H.; Glanville, Helen C.; Harris, Matthew; Emmett, Bridget A.; Pingree, Melissa R.A.; de Sosa, Laura L.; Cerdá-Moreno, Cristina; Jones, Davey L.. 2015. A novel biologically-based approach to evaluating soil phosphorus availability across complex landscapes. Soil Biology and Biochemistry, 88. 110-119. https://doi.org/10.1016/j.soilbio.2015.05.016 © 2015 Elsevier Ltd This manuscript version is made available under the CC-BY-NC-ND 4.0 license http://creativecommons.org/licenses/by-nc-nd/4.0/ This version available http://nora.nerc.ac.uk/id/eprint/512998/ NERC has developed NORA to enable users to access research outputs wholly or partially funded by NERC. Copyright and other rights for material on this site are retained by the rights owners. Users should read the terms and conditions of use of this material at http://nora.nerc.ac.uk/policies.html#access NOTICE: this is the author’s version of a work that was accepted for publication in Soil Biology and Biochemistry. Changes resulting from the publishing process, such as peer review, editing, corrections, structural formatting, and other quality control mechanisms may not be reflected in this document. Changes may have been made to this work since it was submitted for publication. A definitive version was subsequently published in Soil Biology and Biochemistry, 88. 110-119. https://doi.org/10.1016/j.soilbio.2015.05.016 . www.elsevier.com/ Contact CEH NORA team at [email protected] The NERC and CEH trademarks and logos (‘the Trademarks’) are registered trademarks of NERC in the UK and other countries, and may not be used without the prior written consent of the Trademark owner. brought to you by CORE View metadata, citation and similar papers at core.ac.uk provided by NERC Open Research Archive
-
Upload
khangminh22 -
Category
Documents
-
view
1 -
download
0
Transcript of Article (refereed) - postprint - CORE
Article (refereed) - postprint
DeLuca, Thomas H.; Glanville, Helen C.; Harris, Matthew; Emmett, Bridget A.; Pingree, Melissa R.A.; de Sosa, Laura L.; Cerdá-Moreno, Cristina; Jones, Davey L.. 2015. A novel biologically-based approach to evaluating soil phosphorus availability across complex landscapes. Soil Biology and Biochemistry, 88. 110-119. https://doi.org/10.1016/j.soilbio.2015.05.016
© 2015 Elsevier Ltd
This manuscript version is made available under the CC-BY-NC-ND 4.0 license http://creativecommons.org/licenses/by-nc-nd/4.0/
This version available http://nora.nerc.ac.uk/id/eprint/512998/
NERC has developed NORA to enable users to access research outputs wholly or partially funded by NERC. Copyright and other rights for material on this site are retained by the rights owners. Users should read the terms and conditions of use of this material at http://nora.nerc.ac.uk/policies.html#access
NOTICE: this is the author’s version of a work that was accepted for publication in Soil Biology and Biochemistry. Changes resulting from the publishing process, such as peer review, editing, corrections, structural formatting, and other quality control mechanisms may not be reflected in this document. Changes may have been made to this work since it was submitted for publication. A definitive version was subsequently published in Soil Biology and Biochemistry, 88. 110-119. https://doi.org/10.1016/j.soilbio.2015.05.016 .
www.elsevier.com/
Contact CEH NORA team at [email protected]
The NERC and CEH trademarks and logos (‘the Trademarks’) are registered trademarks of NERC in the UK and other countries, and may not be used without the prior written consent of the Trademark owner.
brought to you by COREView metadata, citation and similar papers at core.ac.uk
provided by NERC Open Research Archive

A novel rhizosphere trait-based approach to evaluating soil phosphorus availability across
complex landscapes
Thomas H. DeLuca
Highlights
Existing methods for assessing phosphorus (P) availability do not adequately reflect plant
P acquisition strategies
We evaluated a novel P extraction procedure to explore the concept of biologically based
P protocol
Soil P was extracted in parallel with CaCl2, citric acid, phytase and phosphatase solution
and 1 M HCl
We tested this method on 204 soil samples collected in the United Kingdom and
compared it with the standard Olsen P method
This method helped explain an observed downward trend in Olsen P from 1998 to 2007
as a shift from inorganic to organic P.
This method can be used as a means of assessing P availability across complex
landscapes
*Highlights (for review)

1
A novel rhizosphere trait-based approach to evaluating soil phosphorus availability 1
across complex landscapes 2
3
Thomas H. DeLucaa,b*
, Helen C. Glanville
b, Matthew Harris
b, Bridget A. Emmett
c, Melissa 4
R.A. Pingreea, Laura L. de Sosa
b, Cristina Morenà, Davey L. Jones
b 5
6
aSchool of Environmental and Forest Sciences, University of Washington, 102 Anderson Hall, 7
Box 352100, Seattle, WA, 98195-2100, USA 8
bSchool of Environment, Natural Resources & Geography, Bangor University, Deiniol Road, 9
Bangor, LL57 2UW, UK 10
cCentre for Ecology and Hydrology, Environment Centre Wales, Deiniol Road, Bangor, 11
Gwynedd, LL57 2UW, UK 12
13
*Corresponding author. Tel.: (206) 685-1928 14
E-mail address: [email protected] (T.H.DeLuca) 15
16
*ManuscriptClick here to view linked References

2
ABSTRACT 17
Plants employ a range of strategies to increase phosphorus (P) availability in soil. Current soil 18
P extraction methods (e.g. Olsen P), however, often fail to capture the potential importance of 19
rhizosphere processes in supplying P to the plant. This has led to criticism of these standard 20
approaches, especially in non-agricultural soils of low P status and when comparing soil 21
types across diverse landscapes. Similarly, more complex soil P extraction protocols (e.g. 22
Hedley sequential fractionation) lack functional significance from a plant ecology 23
perspective. In response to this, we developed a novel procedure using a suite of established 24
extraction protocols to explore the concept of a P protocol based on biologically significant P 25
pools, fluxes and transformations. Soil P was extracted in parallel by using 10 mM CaCl2 26
(soluble P), 10 mM citric acid (chelate-labile P), phytase and phosphatase solution (enzyme 27
labile organic P) and 1 M HCl (mineral occluded P). To test the integrated protocol, we 28
conducted the analyses on 204 soil samples collected as part of a UK national ecosystem 29
survey (Countryside Survey) in 1998 and repeated again in 2007. Overall, Olsen P showed a 30
net decline in national soil P levels during this 10 year period. In accordance with these 31
results, soluble P, chelate-labile P and occluded P were all found to decrease over the 10 year 32
study period. In contrast, enzyme labile organic P increased over the same period likely due 33
to the accumulation of P in litter and O horizon organic matter. This new method is simple 34
and inexpensive and therefore has the potential to greatly improve our ability to characterise 35
and understand changes in soil P status across complex landscapes. 36
37
Keywords: Bioavailability, Ecosystem assessment, Nutrient index, Phosphate, Soil quality 38
indicator 39

3
1. Introduction 40
Increasing food security concerns and decreasing mineable phosphorus (P) supplies 41
necessitate efficient use of soil P resources; however, current methods used to assess plant 42
available P are often ineffective when used on landscapes with a great degree of plant and soil 43
heterogeneity. Soil P exists in a variety of forms including soluble inorganic, insoluble 44
inorganic (Pi), organic, and surface adsorbed with the amounts present in each fraction 45
varying greatly between soil types (Bieleski, 1973). 46
The ability to effectively assess soil P status and phytoavailability is extremely 47
important in terms of environmental protection and agricultural productivity; however, 48
phytoavailable P is not a distinct value for any given soil (Withers et al., 2014). Importantly, 49
plants express unique mechanisms for releasing P from different pools of differing 50
recalcitrance, each contributing to varying extents depending upon several plant and soil 51
parameters (Neumann and Römheld, 1999; Lambers et al., 2006). Current efforts to monitor 52
soil P status are based on methods specifically developed for agricultural purposes with the 53
specific objective of estimating the phytoavailability of soil P and enabling fertiliser rate 54
recommendations (e.g. Mehlich, 1978; Menon et al., 1989; Saggar et al., 1992; Sims et al., 55
2000). Commonly, these are single solution extractions (e.g. NaHCO3 or acid NH4F) which 56
correlate with plant Pi uptake in a controlled environment (e.g. Bray and Kurtz, 1945; Olsen 57
et al., 1954; Mehlich, 1984). These extractions have proved very useful for agriculture as they 58
offer a straightforward index of P fertility. Across complex landscapes; however, single 59
extraction methods do not adequately characterise the bioavailability of P which is directly 60
influenced by plant community and shifts in soil biophysical conditions. Phosphorus 61
fractionation schemes were developed in an attempt to better characterize the P status of soils 62
(e.g. Hedley et al. 1982). Such fractionation approaches expose a single soil sample to a 63
sequence of extractants to quantify pools of progressively occluded P. These approaches 64

4
offer a more detailed picture of soil P status, are more suited to use over complex landscapes, 65
offer some sense of how P might become available over time and they can provide an 66
indication of the mechanisms controlling P solubility in a given soil (Cross and Schlesinger, 67
1995; Levy and Schlesinger, 1999; Negassa and Leinwieber, 2009). Examples of 68
fractionation methods include the widely adopted Hedley procedure (Hedley et al., 1982) or 69
the Chang and Jackson method (Chang and Jackson, 1957). Unfortunately, fractionation 70
methods are time consuming and require careful preparation making them inappropriate for 71
routine use, especially in agriculture. Furthermore, these fractionations do not adequately 72
reflect rhizosphere processes (Johnson et al., 2003; Yang and Post, 2011). Phosphorus 73
solubilised by rhizosphere processes (in particular organic acid, proton and ectoenzyme 74
excretion) are not individually characterised in these schemes. Instead, chemical analogues 75
are used which, while they may correlate well with plant availability or P accumulation with 76
soil development, they do not offer insight into the potential P uptake mechanisms or 77
rhizosphere P transformations that drive ecosystem P dynamics. 78
In this paper we introduce an alternative functional plant trait-based approach to 79
evaluate soil P status. Here we combine together four established approaches to assessing 80
different pools of bioavailable P thereby simultaneously assessing soil P as influenced by 81
plant rhizosphere mediated processes across a diverse array of soils. The extractants were 82
chosen to emulate four common and significant plant rhizosphere mediated P acquisition 83
mechanisms: (1) root interception, (2) organic acid complexation, (3) enzyme hydrolysis and 84
(4) proton excretion induced acidification. Rather than sequentially extracting these P pools 85
as in the Hedley fractionation, we run the extractions in parallel to measure the total amount 86
of P mobilised by each individual test. The purpose of this effort was to create a simple P 87
assessment regime that reflects rhizosphere mediated P availability, is sensitive to landscape 88
variation in soil P status, and facilitates evaluation of short, medium and long term fluxes 89

5
between P pools. The combined analyses are collectively referred to as the Rhizosphere 90
Based P (RBP) extraction regime. The RBP method is compared with the standard Olsen P 91
method across a variety of soils and is compared on field moist and air dried soils. 92
93
2. Materials and methods 94
2.1. Soils 95
For the main study, soil samples were collected throughout the UK as part of the 96
Centre for Ecology and Hydrology Countryside Survey (CS) in 1998 (CS98) and 2007 97
(CS07) with sites representing all the dominant landscape types and soil groups in the UK 98
(Emmett et al., 2010; Reynolds et al., 2013). To encompass all the major soil and land use 99
types, a total of 2614 soil samples were collected throughout the UK, based on a stratified 100
random sample of 1 km squares at gridpoints on a 15 km grid using the Institute of Terrestrial 101
Ecology (ITE) Land Classification as the basis of the stratification (Wood et al., 2012). At 102
each grid intersection, a 1 km2 sample area was selected. Within the 1 km
2 sample area, 3 103
plots (5 × 5 m2) were randomly located and a single 15 cm long × 4 cm diameter soil sample 104
was collected from each of the plots. Additional information about vegetation and soils were 105
also collected from the same plots. To facilitate comparison of P pool concentrations during 106
the two sample dates, we used the vegetation and soil categories provided in the CS (Emmett 107
et al., 2010). For plant communities we used the „Aggregate Vegetation‟ grouping which 108
includes eight categories: 1) lowland wooded; 2) upland wooded; 3) crops and weeds; 4) tall 109
grass and herbs; 5) fertile grassland; 6) infertile grassland; 7) moorland; 8) heath and bog. For 110
soil types, we use the loss-on-ignition categories of: 1) mineral; 2) humus-mineral; 3) organo-111
mineral; 4) organic. The 1 km2 areas were stratified within the 45 major Land Classes of the 112
UK. All the sites were characterised by a temperate climate with a North-South mean annual 113
6
temperature range of 7.5 to 10.6°C and East-West mean annual rainfall range from 650 to 114
1700 mm. 115
Samples were stored at 4°C prior to analysis for key characteristics including pH, 116
total C and N, mineralisable C and N, Olsen-P (0.5 M NaHCO3, pH 8.5), bulk density and 117
soil biota as described in Emmett et al. (2008), Emmett et al. (2010), Simfukwe et al. (2011) 118
and Reynolds et al. (2013). All remaining sample was then air-dried and sieved prior to long 119
term storage and use in this study. 120
To assess the changes in soil P seen between the 1998 and 2007 Countryside Survey, a 121
subset of 102 spatially paired soils (204 in total) from the CS98 and CS07 archived soils was 122
selected randomly. In order to represent the archive‟s spatial diversity, the samples were 123
stratified according to their “Environmental Zone” – nine classifications derived from 124
Institute of Terrestrial Ecology Land Classes which reflect an array of geographically distinct 125
regions of Britain (Bunce et al., 1996). Across all land use and vegetation classes the 126
dominant soil types (% of total) were brown soils (33%), surface water gley soils (19%), 127
podzolic soils (14%), peat soils (12%), groundwater gley soils (11%), lithomorphic soils (8%) 128
and pelosol soils (3%) (Avery, 1990; Simfukwe et al., 2011). These soils were assessed using 129
the novel Rhizosphere Based P (RBP) extraction regime described below and for total C 130
based on loss-on-ignition (Nelson and Sommers, 1982; Reynolds et al., 2012). 131
132
2.2. Principles behind the proposed RBP method 133
We employed four existing soil P analysis methods to provide a clear picture of soil P 134
status as influenced by plant rhizosphere mediated processes. Phosphorus in soil can be 135
grouped into three primary pools: (1) readily available, dissolved orthophosphate, (2) more 136
recalcitrant “active P” forms which, over time, are solubilised to replenish this readily 137
available pool, and (3) fixed P which may remain unchanged in soil for many years. The 138

7
method below herein uses a combination of established extraction procedures to represent the 139
P solubilised by the four primary plant P acquisition mechanisms: (1) root interception, (2) 140
organic acid complexation/dissolution, (3) enzyme hydrolysis and (4) proton excretion 141
induced acidification. The procedures were adapted in order to correspond to the maximum 142
level of each extractant reported in the literature. 143
Each fraction was measured in parallel by shaking 0.5 g of soil with each extractant 144
(10 ml; described below) in separate 15 ml centrifuge tubes for 3 h on a reciprocal shaker at 145
200 rev min-1
. Preliminary work showed 3 h to be the point at which equilibrium was reached 146
between soil- and solution-P. Extracts were then centrifuged (3,220 g, 30 min) to negate the 147
need to filter the supernatant (Poile et al., 1990). An aliquot of the supernatant was then 148
decanted and stored for no more than 3 d at 4°C prior to analysis. 149
Soluble P was assessed using a 10 mM calcium chloride (CaCl2) solution which 150
corresponds to labile P that is easily available to plants (Bieleski, 1973; van Raij, 1998). 151
Typically, this is a relatively small pool of P which root hairs and arbuscular mycorrhizas 152
might remove directly from the soil solution. 153
Organic acid extractable P was assessed using a 10 mM solution of citric acid to 154
quantify the chelate-extractable, active pool of P sorbed to clay particles or as compounds of 155
Ca, Fe or Al which have been shown to be accessible to plants following the release of 156
organic acids into soil (Jones and Darrah, 1994; Hinsinger, 2001; Johnson and Loeppert, 157
2006; Li et al., 2007). Citrate extractable P was chosen over acetic acid or oxalic acid, 158
because it does not interfere with the P analysis reagents described below and is frequently 159
implicated in root and microbial P mobilization in soil. 160
Phosphatase (acid phosphatase from wheat germ; Sigma P3627; Enzyme Commission 161
Number 232-630-9) and phytase (from wheat, Sigma P1259; Enzyme Commission Number 162
3.1.3.26) enzymes were used to evaluate the quantity of available organic P. The final 163

8
concentration of the enzymes in the extraction solution was 0.02 enzyme units ml-1
. This 164
concentration was sufficient to ensure that they would be present in excess. The solution is 165
prepared by the addition of phosphatase and phytase to a sodium acetate buffer (50 mM, pH 166
6.5) with MgCl2 (0.08 mM) added as a pre-enzyme activator (Ahlers, 1974). We should note 167
here that in more recent enzyme assays we have found commercially available phytase 168
(purchased from Sigma) to be contaminated with P so we have since switched to only using 169
phosphatase. 170
The more recalcitrant P was extracted using 1.0 M HCl. This recalcitrant P fraction is 171
thought to be solubilised by proton excretion in the rhizosphere and by microbial processes 172
(Petersen and Böttger, 1991; Gahoonia et al., 1992). 173
All extracts were diluted appropriately and analysed colorimetrically (630 nm) using 174
the malachite-green method as described in Ohno and Zibilske (1991) using a PowerWave-175
XS microplate spectrophotometer (BioTek Instruments Inc., Winooski, VT). Malachite-green 176
was chosen over the standard molybdate blue method (Murphy and Riley, 1962), as it is 177
highly sensitive and not susceptible to interference from organic acids. The method was 178
slightly modified to incorporate a ten-fold in-plate dilution where necessary. 179
The standard method used for assessing P availability in the CS is the Olsen-P method 180
(Allen, 1989). Briefly, 5 g of air-dried soil was mixed with 100 ml of 0.5 M sodium 181
bicarbonate at pH 8.5. Phosphate in the extract was then determined colorimetrically by 182
molybdate blue at 880 nm using a Skalar continuous flow analyser with the addition of a 183
dialysis step to overcome the effect of the Olsen‟s reagent. 184
185
2.3. Comparison of Olsen P and the RBP method in field-moist soils 186
The soils evaluated in Section 2.2 were all air-dried prior to extraction (following the 187
UK national soil inventory protocol). To compare the proposed RBP method with the 188
9
standard Olsen P method in field-moist and air dried samples, we collected 27 independent 189
soil samples (0-10 cm) from different farms within the Hiraethlyn catchment in North Wales 190
(53°10°N, 3°45‟W; area = 27 km2). The samples were characterised as described above with 191
exception of ammonium (NH4+) and nitrate (NO3
-) which were measured in 0.5 M K2SO4 192
extracts as described in Jones and Willett (2006). The samples ranged in soil organic matter 193
content from 4.61 to 18.19 % (mean ± SEM, 10.54 ± 0.62%), pH from 4.76 to 6.36 (mean ± 194
SEM, 5.57 ± 0.08), moisture content from 7.8 to 80.8% (mean ± SEM, 49.5 ± 4.0), available 195
NO3- from 2.4 to 49.1 mg kg
-1 (mean ± SEM, 15.4 ± 1.9 mg kg
-1), available NH4
+ from 0.8 to 196
42.9 mg kg-1
(mean ± SEM, 5.6 ± 1.7) and available K from 61 to 364 mg kg-1
(mean ± SEM, 197
157 ± 15). The soils were sieved to pass 5 mm and stored at 5°C until weighed out for 198
extraction as either fresh (field moist, corrected to dry weight based on moisture content) and 199
air dried (dried for 48 hours at room temperature) were extraction using the RBP procedure as 200
described above. 201
202
2.4. Statistical analysis 203
A one-way ANOVA was used to detect changes in P concentration between the two 204
survey years for the different fractions. Data were then split according to one of three 205
grouping variables, namely (1) vegetation community type, (2) broad ecosystem type, and (3) 206
soil organic matter content (measured via loss-on-ignition) and ANOVA undertaken to 207
identify differences in P concentration. Pearson correlations were used to assess the 208
relationship between our individual extraction techniques and that of the standard Olsen P 209
method employed on the Countryside Survey. Principle components analysis (PCA) was used 210
to explore variability, patterns, and relationships between P concentrations (mg kg-1
) of the 211
four P pools and Olsen P. Significant (p < 0.05) environmental and soil characteristic vectors 212
were fit onto the PCA ordination. In a PCA, maximum variances are accounted for but a 213
10
normal distribution of the population is not a requirement (Reimann et al., 2011). Incomplete 214
observations were excluded from PCA except for AgClass where two blank values for 1998 215
data were substituted with 2007 values. Outliers were included in the analysis. Data was 216
scaled to ensure homogeneity of variances. Correlations and ANOVA were analysed using 217
SPSS 16 for windows (SPSS Inc., Chicago, IL) and PCA was run using the vegan package 218
(Oksanen et al., 2013) in the R Statistical Environment (R Version 3.0.3, http://www.r-219
project.org/). For comparison of P fractions in the field-moist soils, linear regression and t-220
tests were undertaken using Minitab v16 (Minitab Inc, State College, PA). 221
222
3. Results 223
3.1. Relationship between the soil P extractants 224
Three of the methods used in our rhizosphere-based P fractionation protocol were 225
highly correlated with the Olsen P method with the exception of the enzyme extraction 226
method which was weakly correlated with Olsen P (P < 0.05; Table 1). Citrate-extractable P 227
was most highly correlated (r2 = 0.563, P < 0.001) with the enzyme extraction closely 228
followed by the 1.0 M HCl extraction (r2 = 0.432, P < 0.001). All three of these methods are 229
effective at accessing moderately soluble mineral adsorbed and precipitated mineral forms of 230
P. The HCl extractable P was also highly correlated (r2 = 0.732, P < 0.001) with citrate 231
extractable P. 232
The relationship between the four P extraction methods of RBP and that of Olsen P 233
are further demonstrated in Figure 1. Using principal components (PC) analyses, we found 234
that PC1 explains 48.66% of the total variation in the P concentration across methods and 235
PC2 accounts for 20.71% of the total variation. Figure 1 provides a visualization of PCA 236
scores, calculated by observations and displayed by grey dots, in relation to the loadings, or P 237
methods (in blue). The lengths of the arrows are proportional to the variability explained by 238

11
PC1 and PC2 and angles between loadings represent the correlation between the variables. 239
The arrows labeled with environmental or soils characteristics (in red) point to the direction 240
of the most rapid change across that variable and lengths indicate the correlation of that 241
variable and the P method ordination. Factor loadings for this PCA reveal close associations 242
between citrate and HCl-extractable P. Enzyme-extractable P explains the least variability in 243
the data is markedly distinct from all other methods. 244
245
3.2. Country scale changes in soil P status 246
Assessing the change in P pools in the UK Countryside Survey soils over the 10 year 247
period, we observed a significant decrease in P in the inorganic P fractions (HCl, CaCl2 and 248
citrate extractable). The largest percentage change was observed in the CaCl2, or soluble, 249
fraction with a 41% decrease (P < 0.05) from 1998 to 2007 (Table 1). Citrate extractable P 250
decreased significantly (P < 0.01) from 284 mg P kg-1
to 188 mg P kg-1
between 1998 and 251
2007. The less labile inorganic (Pi), as extracted by HCl, decreased from 573 to 399 mg kg-1
252
(P < 0.05) during this same period. Interestingly, enzyme extractable P increased (P < 0.001) 253
by more than a factor of two from 130 mg kg-1
in 1998 to 291 mg kg-1
in 2007. The increase 254
in organic extractable P may partially explain the decrease in inorganic P fractions as there 255
was no significant difference between the sum of the averages of the four extractants for the 256
two sampling dates. 257
Taking the UK as a whole, the pattern of decreasing available inorganic P (based on 258
an Olsen-P bicarbonate extraction) described in 2007 CS is corroborated by the shift in 259
inorganic P pools as demonstrated by the RBP. 260
12
261
3.3. Changes in soil P with vegetation community and soil organic matter types 262
The general trend of decreasing inorganic P and increasing organic P is apparent when 263
soils are grouped by plant community. Ecosystem type or aggregate vegetation class (AVC) 264
describes the predominant habitat of the parcel of land on which the sampling plot is located. 265
The HCl-extractable P consistently made up the largest P fraction as it likely accounts for 266
most of the P in the more labile inorganic P pools. Enzyme extractable organic P (Po) 267
increased (Fig. 2) from 1998 to 2007 and inorganic P as extracted by citrate and HCl 268
decreased during this same period (Fig. 2). However, no significant changes were observed 269
for the labile CaCl2 fraction (Fig. 2). No significant changes were seen for either of the AVC 270
woodland classifications (Upland woodland and Lowland woodland) or under the crop and 271
weed category. The HCl extractable P decreased by 569 mg P kg-1
(P < 0.05) under tall grass 272
and herb. Enzyme-extractable organic P increased (P < 0.05) in fertile and infertile 273
grasslands, heath and bog, and moorland, while citrate-extractable inorganic P increased; 274
however, the changes in both fractions in heath and bogs are much larger than in the 275
grasslands. 276
Within the four soil organic matter (SOM) status groupings, larger changes in P were 277
observed in the soils with the highest C contents. In particular, we observed a decrease in the 278
inorganic P fractions extracted with CaCl2, citrate and HCl. Enzyme-extractable organic P did 279
not follow a specific pattern with soil SOM status (Fig. 3). However, in all but the organo-280
mineral classifications there was a significant (P < 0.05) increase in enzyme-extractable 281
organic P and significant (P < 0.05) decreases in HCl-extractable P in the highest and lowest 282
SOM categories as well as large significant decreases in citrate-extractable inorganic P (Fig. 283
4). 284
13
285
3.4. Comparison of Olsen P and the RBP method in field-moist and dried soils 286
Using the Olsen extraction method, the field-moist samples from the Hiraethlyn 287
agricultural catchment in North Wales showed a wide range of P levels ranging from 6 to 63 288
mg P kg-1
(mean ± SEM, 27 ± 3). Overall, P concentrations in the Olsen extracts were 289
significantly correlated with P recovered in all four proposed RBP extraction regime (Fig. 4). 290
Of these, the best correlation was seen with the citrate extraction (r2 = 0.87), while the 291
weakest correlation was found between the enzyme-based and Olsen bicarbonate extraction 292
(r2 = 0.16). Soil P pools in moist versus dry soils were found to be closely aligned for all P 293
pools (Fig 5); however, air drying nearly doubled P extraction by citrate (P < 0.01) and 294
enzymes (P < 0.001) and slightly increased CaCl2 soluble P (P < 0.05). Air drying of soils 295
slightly decreased P extraction by using 1 M HCl (P < 0.05). 296
297
4. Discussion 298
4.1. Basing an assessment of available P on known rhizosphere processes 299
Bicarbonate extraction of soil, or Olsen P, is one of the most widely adopted test used 300
for assessing soil P availability. Further, it is often used in broad regional or national scale 301
assessments of soil P status (e.g. Sparling and Schipper, 2004; Emmett et al., 2010; Zhang et 302
al., 2012). While highly suited to near-neutral or alkaline pH agricultural soils, Olsen P has 303
been shown to be of less use in predicting plant available P in semi-natural acidic and peat 304
soils (Kuo, 1996; Emmett et al., 2008). For example, across a diverse range of agricultural 305
soils (n = 164), Speirs et al. (2013) demonstrated that Olsen-P only provides an approximate 306
guide to plant P availability (correlation between Olsen P and wheat yield, r2 = 0.064). 307
Further, Jordan-Meille et al. (2012) have openly criticised current soil P availability testing 308
procedures calling for “a more mechanistic approach in which the processes involved in plant 309

14
P nutrition are truly reproduced by a single standard method”. This has led to the emergence 310
of alternative approaches such as diffusive gradient thin films (DGT) which have proven to 311
provide better predictors of plant P availability than Olsen P (Six et al., 2014). The DGT 312
technique is highly suited to soils receiving high levels of fertiliser where plant capture is 313
largely related to sorption-desorption reactions and where rhizosphere P acquisition 314
mechanisms are down-regulated. However, we do not feel that a single chemical extraction or 315
technique like DGT adequately represents P availability in more P limited non-agricultural 316
environments where plants may be expressing a diverse array of mechanisms to exploit soil P 317
reserves. In our view this complexity needs to be captured by parallel extractions. 318
In both the national and regional scale examples used here, we clearly demonstrate 319
that the three inorganic P accessing extractants of the RBP method (CaCl2, citrate and HCl) 320
all correlate to some extent with Olsen P, but each provides insight into the source of the P; 321
soluble (directly available to roots and arbuscular mycorrhizas; Bolan, 1991), chelate labile 322
(available by the release of organic acids from roots and ectomycorrhizas; Jones and Darrah, 323
1994), or proton labile (release of H+ by root tips and ectomycorrhizas; Römheld et al., 324
1984). Enzyme extractable P, however, represents labile organic P (Tabatabai, 1994), a 325
component of soil P not effectively accessed by bicarbonate (Kuo, 1996) thereby explaining 326
the relatively weak factor loadings for enzyme extractable P compared to inorganic P 327
methods. The orthogonal correlation between soluble P by CaCl2 extraction and HCl-328
extractable P, and the proximity of other methods, supports the conclusion that CaCl2 and 329
HCl access labile and recalcitrant forms of P, respectively. Inclusion of the environmental and 330
soil characteristics reveals that vegetation class is most strongly correlated with the PCA 331
ordination and it has a negative directional gradient. 332
333
4.2. National scale changes in soil P status 334

15
The final report from CS07 (Emmett et al., 2010) described a surprisingly large 335
decrease in mean Olsen-P concentration in all broad habitat types across the UK from 43 mg 336
P kg-1
in 1998 to 32 mg P kg-1
in 2007 (Table 2). The greatest change was seen in soil beneath 337
dwarf shrub heath, whilst the highest Olsen-P concentration and smallest significant change 338
was seen in arable soils. The RBP procedure described here effectively confirmed the 339
declining trend in inorganic available P described in the UK national survey, CS07 (Emmett 340
et al., 2010) and provided the clear pattern of increasing labile organic P. Therefore, the 341
observed decrease in inorganic P over a 10 year period does not specifically reflect a net loss 342
of P from the system; but rather demonstrates a noted change between pools of P from 343
inorganic to organic with the significant increase in enzyme extractable organic P. This is 344
seen across soils in all SOM categories and under all vegetation types to varying extents. As 345
there is overlap in the P pools quantified by each extractant this cannot be taken as the 346
average total available P value (in mg P kg-1
) across the UK. However, it does indicate there 347
is no net loss of P from UK soils. Further, our results suggest that the inorganic P is not 348
simply precipitating out into increasingly insoluble forms otherwise we would have observed 349
a smaller net decrease in the more stringent HCl extraction method where in reality, the 350
largest decrease in extractable inorganic came with the HCl extraction (e.g. Fig. 2). 351
The declining chelate and proton labile P could reflect consumption of residual P 352
without replenishment in the form of fertilisation (Withers et al., 2014). Chelate labile P 353
reflects P that is available to P-efficient plants whereas HCl labile is a gross proxy for proton 354
release at plant root tips (Jones, 1998; Hinsinger, 2001; Dakora and Phillips, 2002). Given 355
that the largest decreases are associated with grasslands (which have progressively been 356
receiving less P fertilization; 29.5 kg P ha-1
in 1983 to <10 kg P ha-1
in 2013; Defra, 2014) 357
suggests that plants harvested for fodder may be mining soil P reserves. The increasing 358
organic P across many categories of vegetation suggests that P is being taken out of the 359

16
mineral soil by plants and soil biota and is accumulating P in an organic form in litter and O 360
horizon organic matter. The organic P fraction can make up between 20 and 80% of total P 361
(Pt) in some soils (Dalal, 1977). A proportion of this will be easily hydrolysed (George et al., 362
2002; Tang et al., 2006; Tarafdar and Jungk, 1987) and made available for plant uptake, but 363
the remainder is relatively stable and will remain occluded (Stewart and Tiessen, 1987). The 364
C density in the four SOM categories corroborates this theory; the patterns of increasing 365
organic P (Fig. 3c) and C density (Emmett et al., 2008) are very similar. 366
Increases in organic P in soil O horizon and litter may be attributed to increased 367
primary productivity due to several confounding environmental changes happening across the 368
UK over the study period. Increasing atmospheric nitrogen (N) deposition in the UK as 369
reported in a number of studies (e.g. Galloway et al., 2004; Stevens et al., 2006) has been 370
shown to increase primary productivity (Cannell et al., 1998) and consequently induce P 371
limitation through depletion of phytoavailable P. The increased uptake of inorganic P would 372
then be returned to the soil as organic P. Longer term increases in atmospheric CO2 373
concentrations (IPCC, 2007) and temperature (Jones and Hulme, 1997) along with increasing 374
yields due to increasing N fertilization and use of improved hybrids (Jones et al., 2013) may 375
exacerbate the removal of labile and semi-labile inorganic P. Further, a decrease in external P 376
inputs may also be partly responsible for this shift in P status of UK soils. P fertiliser use on 377
grass and crops over the study period decreased by 40% and 35% respectively primarily due 378
to the increasing cost of P fertilizer (Defra, 2011). 379
The observed increase in soil pH reported in CS07 from 1998 to 2007 may also 380
contribute to the observed decrease in P associated with labile fractions. This soil pH 381
increased was particularly strong in soils with lower organic matter contents and soils with 382
neutral to alkaline pH (Emmett et al., 2010). With increasing pH in acidic soils one would 383
expect an increase in P solubility; however, an increase in the pH of alkaline/calcareous 384

17
would likely enhance precipitation of P as insoluble Ca-P (Samadi and Gilkes, 1999) 385
rendering the P unavailable to plants. However, the small degree of the change in pH makes it 386
unlikely that this represents the main driver of the change in P status with the exception of 387
microsite effects. 388
The lack of significant changes in any P pools in woodland habitats suggests that 389
more complex and successionally advanced habitats were less susceptible to changes in soil P 390
status. Woodlands often express limited presence of soluble or labile P as nutrient 391
mineralization and solubilisation is balanced by nutrient uptake and immobilization 392
associated with litter fall and decomposition (Glenn-Lewin et al., 1992). It could also be that 393
the slower life histories associated with tree dominated habitats yield slower to responses to 394
shifts in nutrient inputs. For example, Cannell et al. (1998) modelled the response of conifer 395
forests to increasing N deposition, atmospheric CO2 and temperature and predicts changes in 396
soil and plant response over decadal or century timescales. However, Shaw et al. (2002) and 397
Stevens et al. (2006) saw responses to similar parameters in grassland habitats in a matter of 398
months and years in both laboratory and field studies. 399
Given that British soils are relatively immature (ca. 10,000 years old; Avery, 1990), it 400
is likely that they are still undergoing the changes in form and amounts of P described by 401
Walker and Syers (1976). They describe soils reaching a terminal steady state at 402
approximately 22,000 years, before which occluded P and organic P increase at the expense 403
of more labile fractions. This can be seen to some extent in these results with the increase in 404
organic P fractions and decrease in labile fractions. However, the changes seen over the short 405
period studied here likely cannot be attributed wholly to pedogenic processes. Similar to the 406
CS results for Olsen P, there were no clear relationships between change in any P fraction and 407
2007 values for soil pH, SOM, moisture content, or with change in soil pH and SOM between 408
1998 and 2007. 409

18
Drying of soils prior to extraction has been shown to increase P solubility (Turner and 410
Haygarth, 2001; Styles and Coxson, 2006). The evaluation of moist and dry soil samples 411
from Hiraethlyn catchment in North Wales further demonstrates differences between the 412
Olsen method and the RBP method (Fig. 4) and indicates that use of fresh soils would be a 413
preferable approach for the RBP method. This is consistent with the findings of Styles and 414
Coxson (2006) which demonstrated an increase in extractable P with drying as a result of 415
destabilization of soil organic matter. Turner and Haygarth (2001) suggested that rewetting of 416
dried soils released P from the lysing of microbial cells and questioned the use of soil P 417
analyses that did not take soil moisture into account. In this study, we used air dried soils that 418
had been previously collected and archived as part of the CS; however, in future efforts, we 419
would recommend using this method with field moist soils and correcting to dry weight based 420
on soil moisture content. 421
Finally, it is important to note that we observed a great deal of variation in the P 422
content of batches of phytase enzyme reagent and found the some batches to be highly 423
contaminated with P. This required extensive dilution which compromised the overall assay 424
or pre-analysis treatment of the enzymes with dialysis membranes, a time consuming step. 425
We recommend only using acid phosphatase for the enzyme component of the assay. 426
427
4.3. Conclusions 428
Soil P transformations occur over both a dynamic, rapid biological cycle and a much 429
more gradual pedogenic cycle. Further, plant community directly influences P availability 430
making a single extraction approach inappropriate for natural or seminatural settings with 431
diverse plant assemblages. Given the limited solubility of P and its propensity to adsorb to 432
organic and mineral surfaces, almost all plants have evolved to develop specialized 433
mechanisms for enhancing P acquisition from soil. Therefore, measurement of P across 434

19
landscapes using a single extraction technique is likely to generate artefacts and will not 435
adequate reflect P bioavailability. The exhaustive, repeated sampling of CS offers an 436
invaluable opportunity to assess shifts in soil conditions at the national scale. The use of the 437
single solution bicarbonate method (Olsen P) for assessing soil P status does not adequately 438
evaluate the P status of soils in the UK. The RBP method has great promise for this type of 439
survey by providing a simultaneous assessment of biologically available P through the use of 440
four accepted P methods: 1) Soluble or solution P; 2) Enzyme extractable organic P; 3) 441
Chelate extractable P; 4) Proton extractable inorganic P. This suite of P extraction methods 442
offers a great deal of insight into changes occurring across diverse landscapes. The RBP 443
method proposed here has the potential to greatly improve our ability to characterise the soil 444
P status across complex landscapes. The RBP method is relatively quick (full assessment of 445
four P pools on ~56 soils in a day), inexpensive, and requires no specialist equipment making 446
P fractionation more accessible and feasible for large scale studies. It has proved accurate and 447
reliable on soils with a range of characteristics. 448
Future national surveys such as the UK Countryside Survey will help shed light on 449
whether this is a temporary change in P status in UK soils or a continuing trend. Whichever is 450
found to be the case, it is not necessarily a worrying phenomenon. Soils in the UK are 451
typically enriched in P which can cause eutrophication of water bodies (Withers et al., 2000). 452
If this is removed from the soluble and labile inorganic phase and stabilised in the organic 453
fraction it might have positive implications for water quality without greatly altering long-454
term P fertility. Simultaneously, agricultural P fertilizer costs are climbing with increasing 455
limitation of minable P resources which makes plant P acquisition strategies that much more 456
important when assessing P availability. The long-term change in P pools observed herein 457
may also have implications for vegetation community structure and ecosystem dynamics 458
20
especially in a changing climate where community composition is likely to change in semi-459
natural ecosystems. 460
461
Acknowledgements 462
This work was funded by the UK Natural Environmental Research Council (NERC) under 463
the Macronutrients Programme and the European Social Fund (ESF) through the Welsh 464
European Funding Office‟s Knowledge Economy Skills Scholarships (KESS) programme. 465
The Countryside Survey of 2007 was funded by a partnership of nine government funded 466
bodies led by NERC and the Department for Environment, Food and Rural Affairs (Defra). 467
Data and reports are available from the Countryside Survey website 468
(http://www.countrysidesurvey.org.uk/). Field plot establishment and soil collection at 469
Hiraethlyn was made possible by Natural Resource Wales (NRW). 470
471
21
References 472
Ahlers, J., 1974. Kinetics of alkaline phosphatase from pig kidney. Biochemical Journal 141, 473
257-263. 474
Allen, S.E., 1989. Chemical Analysis of Ecological Materials, 2nd Edition, Blackwell 475
Scientific Publications, London. 476
Avery, B.W., 1990. Soils of the British Isles. CAB International, Wallingford, UK. 477
Bieleski, R., 1973. Phosphate pools, phosphate transport, and phosphate availability. Annual 478
Review of Plant Physiology 24, 225-252. 479
Bolan, N.S., 1991. A critical-review on the role of mycorrhizal fungi in the uptake of 480
phosphorus by plants. Plant and Soil 134, 189-207. 481
Bray, R.H., Kurtz, L.T., 1945. Determination of total, organic, and available forms of 482
phosphorus in soils. Soil science 59, 39-45. 483
Bunce, R.G.H., Barr, C.J., Clarke, R.T., Howard, D.C., Lane, A.M.J., 1996. ITE Merlewood 484
land classification of Great Britain. Journal of Biogeography 23, 625-634. 485
Cannell, M.G.R., Thornley, J.H.M., Mobbs, D.C., Friend, A.D., 1998. UK conifer forests may 486
be growing faster in response to increased N deposition, atmospheric CO2 and 487
temperature. Forestry 71, 277-296. 488
Chang, S.C., Jackson, M.L., 1957. Fractionation of soil phosphorus. Soil Science 84, 133-489
144. 490
Cross, A.F., Schlesinger, W.H., 1995. A literature review and evaluation of the Hedley 491
fractionation: Applications to the biogeochemical cycle of soil phosphorus in natural 492
ecosystems. Geoderma 64, 197-214. 493
Dakora, F.D., Phillips, D.A., 2002. Root exudates as mediators of mineral acquisition in low-494
nutrient environments. Plant and Soil 245, 35-47. 495
Dalal, R.C., 1977. Soil organic phosphorus. Advances in Agronomy 29, 83-117. 496
22
Defra, 2011. Department for Environment, Food and Rural Affairs C4 Fertiliser Use. 497
http://archive.defra.gov.uk/evidence/statistics/foodfarm/enviro/observatory/indicators/c/498
c4_data.htm (last accessed 6/30/2014) 499
Defra, 2014. The British survey of fertiliser practice: fertiliser use on farm crops for crop year 500
2013. Crop Statistics, Department for Environment, Food and Rural Affairs, York, UK. 501
Emmett, B.A., Frogbrook, Z., Chamberlain, P.M., Griffiths, R, Pickup, R, Poskitt, J., 502
Reynolds, B., Rowe, E., Rowland, E, Spurgeon, D., Wilson, J., Wood, C., 2008. 503
Countryside Survey Soils Manual. Countryside Survey Technical Report No.04/07, 504
191. Centre for Ecology and Hydrology, Wallingford, UK. 505
Emmett, B.A., Reynolds, B., Chamberlain, P.M., Rowe, E., Spurgeon, D., Brittain, S.A., 506
Frogbrook, Z., Hughes, S., Lawlor, A.J., Poskitt, J., Potter, E, Robinson, D.A., Scott, A, 507
Wood, C, Woods, C., 2010. Countryside Survey: Soils Report from 2007. Technical 508
Report No. 9/07, CEH Project Number: C03259), Centre for Ecology and Hydrology, 509
Wallingford, UK. 510
Gahoonia, T.S., Claassen, N., Jungk, A., 1992. Mobilization of phosphate in different soils by 511
ryegrass supplied with ammonium or nitrate. Plant and Soil 140, 241-248. 512
Galloway, J.N., Dentener, F.J., Capone, D.G., Boyer, E.W., Howarth, R.W., Seitzinger, S.P., 513
Asner, G.P., Cleveland, C.C., Green, P.A., Holland, E.A., Karl, D.M., Michaels, A.F., 514
Porter, J.H., Townsend, A.R., Vosmarty, C.J., 2004. Nitrogen cycles: Past, present, and 515
future. Biogeochemistry 70, 153-226. 516
George, T., Gregory, P., Wood, M., Read, D., Buresh, R., 2002. Phosphatase activity and 517
organic acids in the rhizosphere of potential agroforestry species and maize. Soil 518
Biology & Biochemistry 34, 1487-1494. 519
Glenn-Lewin, D.C., Peet, R.K., Veblen, T.T., 1992. Plant succession: theory and prediction. 520
Springer, New York. 521
23
Hedley, M.J., Chauhan, B.S., Stewart, J.W.B., 1982. Changes in inorganic and organic soil 522
phosphorus fractions induced by cultivation practices and by laboratory incubations. 523
Soil Science Society of America Journal 46, 970-976. 524
Hinsinger, P., 2001. Bioavailability of soil inorganic P in the rhizosphere as affected by root-525
induced chemical changes: a review. Plant and Soil 237, 173-195. 526
IPCC, 2007. Climate Change 2007 Synthesis Report. Intergovernmental Panel on Climate 527
Change, Geneva, Switzerland. 528
Johnson, S.E., Loeppert, R.H., 2006. Role of organic acids in phosphate mobilization from 529
iron oxide. Soil Science Society of America Journal 70, 222-234. 530
Johnson, A.H., Frizano, J., Vann, D.R., 2003 Biogeochemical implications of labile 531
phosphorus in forest soils determined by the Hedley fractionation procedure. Oecologia 532
135, 487-499. 533
Jones, D.L., 1998. Organic acids in the rhizosphere - a critical review. Plant and Soil 205, 25-534
44. 535
Jones, D.L., Darrah, P.R., 1994. Role of root derived organic-acids in the mobilization of 536
nutrients from the rhizosphere. Plant and Soil 166, 247-257. 537
Jones, D.L., Willett, V.B., 2006. Experimental evaluation of methods to quantify dissolved 538
organic nitrogen (DON) and dissolved organic carbon (DOC) in soil. Soil Biology & 539
Biochemistry 38, 991-999. 540
Jones, D.L., Cross, P., Withers, P.J.A., DeLuca, T.H., Robinson, D.A., Quilliam, R.S., Harris, 541
I.M., Chadwick, D.R., Edwards-Jones, G., 2013. Nutrient stripping: the global disparity 542
between food security and soil nutrient stocks. Journal of Applied Ecology 50, 851-862. 543
Jones, P.D., Hulme, M., 1997. The Changing Temperature of Central England. Climate of the 544
British Isles, Past, Present and Future. Routledge, London, UK. 545

24
Jordan-Meille, L., Rubaek, G.H., Ehlert, P.A.I., Genot, V., Hofman, G., Goulding, K., 546
Recknagel, J., Provolo, G., Barraclough, P., 2012. An overview of fertilizer-P 547
recommendations in Europe: soil testing, calibration and fertilizer recommendations. 548
Soil Use and Management 28, 419-435. 549
Kuo, S. 1996. Phosphorus. p. 869-919. In D. L. Sparks. (ed.) Methods of Soil Analysis: Part 550
3- Chemical Methods. Soil Science Society of America, Madison, WI. 551
Lambers, H., Shane, M.W., Cramer, M.D., Pearse, S.J., Veneklaas, E.J., 2006. Root structure 552
and functioning for efficient acquisition of phosphorus: matching morphological and 553
physiological traits. Annals of Botany 98, 693-713. 554
Levy, E.T., Schlesinger, W.H., 1999. A comparison of fractionation methods for forms of 555
phosphorus in soils. Biogeochemistry 47, 25-38. 556
Li, L., Li, S.-M., Sun, J.-H., Zhou, L.-L., Bao, X.-G., Zhang, H.-G., Zhang, F.-S., 2007. 557
Diversity enhances agricultural productivity via rhizosphere phosphorus facilitation on 558
phosphorus-deficient soils. Proceedings of the National Academy of Sciences 104, 559
11192-11196. 560
Mehlich, A., 1978. New extractant for soil test evaluation of phosphorus, potassium, 561
magnesium, calcium, sodium, manganese and zinc. Communications in Soil Science 562
and Plant Analysis 9, 477-492. 563
Mehlich, A., 1984. Mehlich 3 soil test extractant: A modification of Mehlich 2 extractant. 564
Communications in Soil Science and Plant Analysis 15, 1409-1416. 565
Menon, R., Hammond, L., Sissingh, H., 1989. Determination of plant-available phosphorus 566
by the iron hydroxide-impregnated filter paper, Pi soil test. Soil Science Society of 567
America Journal 53, 110-115. 568
Murphy, J., Riley, J.P., 1962. A modified single solution method for the determination of 569
phosphate in natural waters. Analytica Chimica Acta 27, 31-36. 570
25
Negassa, W., Leinweber, P., 2009. How does the Hedley sequential phosphorus fractionation 571
reflect impacts of land use and management on soil phosphorus: A review. Journal of 572
Plant Nutrition and Soil Science 172, 305-325. 573
Nelson D.W., Sommers, L.E., 1982. Total carbon organic carbon and organic matter. In 574
Methods of Soil Analysis, Part 2. Chemical and Microbiological Properties, 2nd
Edition. 575
pp 539-580. American Society of Agronomy, Inc. Soil Science Society of America, 576
Inc., Madison, WI. 577
Neumann, G., Römheld, V., 1999. Root excretion of carboxylic acids and protons in 578
phosphorus-deficient plants. Plant and Soil 211, 121-130. 579
Ohno, T., Zibilske, L.M., 1991. Determination of low concentrations of phosphorus in soil 580
extracts using malachite green. Soil Science Society of America Journal 55, 892-895. 581
Oksanen, J.F., Blanchet, G., Kindt, R., Legendre, P., Minchin, P.R., O'Hara, R. B., Simpson, 582
G.L., Solymos, P., Stevens, M.H., and Wagner, H. 2013. vegan: Community Ecology 583
Package. R package version 2.0-10. http://CRAN.R-project.org/package=vegan. 584
Olsen, S.R., Cole, C.V., Watanabe, F.S., Dean, L.A., 1954. Estimation of available 585
phosphorus in soils by extraction with sodium bicarbonate. US Department of 586
Agriculture Circular 939. US Department of Agriculture, Washington DC. 587
Petersen, W., Böttger, M., 1991. Contribution of organic acids to the acidification of the 588
rhizosphere of maize seedlings. Plant and Soil 132, 159-163. 589
Poile, G.J., Ring, S.M., Conyers, M.K., Slattery, W.J., 1990. The influence of centrifuging on 590
phosphorus (Olsen P) soil test values. Australian Journal of Soil Research 28, 559-562. 591
R Development Core Team, 2014. R: A Language and Environment for Statistical 255 592
Computing, R Foundation for Statistical Computing, Vienna, Austria. 593
Reimann, C., Filzmoser, P., Garrett, R., & Dutter, R. 2011. Statistical data analysis explained: 594
applied environmental statistics with R. John Wiley & Sons, Chichester, England. 595

26
Reynolds, B., Chamberlain, P.M., Poskitt, J., Woods, C., Scott, W.A., Rowe, E.C., Robinson, 596
D.A., Frogbrook, Z.L., Keith, A.M., Henrys, P.A., Black, H.I.J., Emmett, B.A., 2013. 597
Countryside Survey: National "soil change" 1978-2007 for topsoils in Great Britain-598
acidity, carbon, and total nitrogen status. Vadose Zone Journal 12, vzj2012.0114. 599
Römheld, V., Muller, C., Marschner, H., 1984. Localization and capacity of proton pumps in 600
roots of intact sunflower plants. Plant Physiology 76, 603-606. 601
Saggar, S., Hedley, M., White, R., 1992. Development and evaluation of an improved soil test 602
for phosphorus. 1. The influence of phosphorus fertilizer solubility and soil properties 603
on the extractability of soil P. Nutrient Cycling in Agroecosystems 33, 81-91. 604
Samadi, A. and R.L. Gilkes., 1999. Phosphurs transformations and their relationships with 605
calcareous soil properties of southern Australia. Soil Science Society of America 606
Journal 63, 809-815. 607
Shaw, M.R., Zavaleta, E.S., Chiariello, N.R., Cleland, E.E., Mooney, H.A., Field, C.B., 2002. 608
Grassland responses to global environmental changes suppressed by elevated CO2. 609
Science 298, 1987-1990. 610
Simfukwe, P., Hill, P.W., Emmett, B.A., Jones, D.L., 2011. Soil classification provides a poor 611
indicator of carbon turnover rates in soil. Soil Biology & Biochemistry 43, 688-696. 612
Sims, J., Edwards, A., Schoumans, O., Simard, R., 2000. Integrating soil phosphorus testing 613
into environmentally based agricultural management practices. Journal of 614
Environmental Quality 29, 60-71. 615
Six, L., Smolders, E., Merckx, R., 2014. Testing phosphorus availability for maize with DGT 616
in weathered soils amended with organic materials. Plant and Soil 376, 177-192. 617
Sparling, G., Schipper, L., 2004. Soil quality monitoring in New Zealand: trends and issues 618
arising from a broad-scale survey. Agriculture Ecosystems & Environment 104, 545-619
552. 620
27
Speirs, S.D., Scott, B. J., Moody, P.W., Mason S.D., 2013. Soil phosphorus tests II: A 621
comparison of soil test-crop response relationships for different soil tests and wheat. 622
Crop & Pasture Science 64, 469-479. 623
Stevens, C.J., Dise, N.B., Gowing, D.J.G., Mountford, J.O., 2006. Loss of forb diversity in 624
relation to nitrogen deposition in the UK: regional trends and potential controls. Global 625
Change Biology 12, 1823-1833. 626
Stewart, J.W.B., Tiessen, H., 1987. Dynamics of soil organic phosphorus. Biogeochemistry 4, 627
41-60. 628
Styles, D., C. Coxon. 2006. Laboratory drying of organic-matter rich soils: Phosphorus 629
solubility effects, influence of soil characteristics, and consequences for environmental 630
interpretation. Geoderma 136, 120-135 631
Tabatabai, M.A., 1994 Soil enzymes. In: Weaver RW, Angle S, Bottomley P, Bezdicek D, 632
Smith S, Tabatabai A, Wollum A (eds) Methods of soil analysis. Part 2. 633
Microbiological and Biochemical Properties. Soil Science Society of America, 634
Madison, pp 775–833, Madison, WI. 635
Tang, J., Leung, A., Leung, C., Lim, B.L., 2006. Hydrolysis of precipitated phytate by three 636
distinct families of phytases. Soil Biology & Biochemistry 38, 1316-1324. 637
Tarafdar, J., Jungk, A., 1987. Phosphatase activity in the rhizosphere and its relation to the 638
depletion of soil organic phosphorus. Biology and Fertility of Soils 3, 199-204. 639
Turner, B.L., Haygarth, P.M., 2001. Phosphorus solubilization in rewetted soils. Nature 411, 640
258. 641
van Raij, B., 1998. Bioavailable tests: Alternatives to standard soil extractions. 642
Communications in Soil Science and Plant Analysis 22, 1553-1570. 643
Walker, T.W., Syers, J.K., 1976. The fate of phosphorus during pedogenesis. Geoderma 15, 1-644
19. 645

28
Withers, P.J.A., Davidson, I.A., Foy, R.H., 2000. Prospects for controlling nonpoint 646
phosphorus loss to water: A UK perspective. Journal of Environmental Quality 29, 167-647
175. 648
Withers, P.J.A., Sylvester-Bradley, R., Jones, D.L., Healey, J.R., Talboys, P.J., 2014. Feed the 649
crop not the soil: rethinking phosphorus management in the food chain. Environmental 650
Science and Technology 48, 6523-6530. 651
Wood, C.M. Howard, D.C. Henrys, P.A. Bunce, R.G.H. Smart, S.M. 2012. Countryside 652
Survey: Measuring Habitat Change over 30 years. 1978 Data Rescue - Final Report. 653
CEH Project no.: NEC03689. 18 pp. 654
Yang, X., Post, W.M., 2011. Phosphorus transformations as a function of pedogenesis: A 655
synthesis of soil phosphorus data using Hedley fractionation method. Biogeosciences 656
8, 2907-2916. 657
Zhang, X., Li, Z.W., Zeng, G.M., Xia, X.L., Yang, L., Wu, J.J., 2012. Erosion effects on soil 658
properties of the unique red soil hilly region of the economic development zone in 659
southern China. Environmental Earth Sciences 67, 1725-1734. 660

29
Figure legends
Fig. 1. Principle component analyses (PCA) of the four P analysis methods of the rhizosphere 661
based P (RBP) extraction regime and the conventional Olsen P method as determined for 102 662
soil samples collected in 1998 in the UK Countryside Survey (Emmett et al., 2010). 663
Observations are displayed by grey dots, in relation to the loadings, P methods are displayed 664
as blue arrows and environmental or soils characteristics by red arrows. 665
666
Fig. 2. Mean change between 1998 and 2007 in P content (mg kg-1
) in (a) CaCl2, (b) citrate, 667
(c) enzyme, and (d) HCl extract fractions of soils collected from different ecosystem types 668
within the UK. Values indicate means ± SEM. Asterisks indicate significant differences 669
between years (* P < 0.05, ** P < 0.01). 670
671
Fig. 3. Mean change between 1998 and 2007 in P content (mg kg-1
) in (a) CaCl2, (b) citrate, 672
(c) enzyme, and (d) HCl extract fractions within soils of differing soil organic matter status 673
within the UK. Values indicate means ± SEM. Asterisks indicate significant differences 674
between years (* P < 0.05, ** P < 0.01, *** P < 0.001). 675
676
Fig. 4. Relationship between Olsen P content and the four fractions of the proposed 677
rhizosphere trait-based method for field-moist soils collected from within the Hiraethlyn 678
catchment in North Wales. (a) Olsen P vs. CaCl2; (b) Olsen P vs. citrate; (c) Olsen P vs. 679
enzyme; (d) Olsen P vs. HCl extract. Lines and associated r2 values are linear regression fits 680
to the experimental data. 681
682
Fig. 5. Relationship between field-moist and air dried soils for the four soil extractions, (a) 683
CaCl2; (b) citrate; (c) enzyme; (d) HCl of the proposed rhizosphere trait-based method for 684

30
collected within the Hiraethlyn catchment in North Wales extract. Lines and associated r2 685
values are linear regression fits to the experimental data. 686
687

Table 1
Mean concentration of P (mg kg-1
) solubilised by 10 mM CaCl2, 10 mM citric acid, 0.02
enzyme units of phosphatase and phytase enzymes, and 1.0 M HCl across 102 soil samples
collected both in 1998 and 2007 in the UK Countryside Survey.
Extract 1990 2009 Progression
CaCl2 33 ± 6a 19 ± 3
b Decrease
Citrate 285 ± 26a 188 ± 26
b Decrease
Enzyme 130 ± 28b 291 ± 31
a Increase
HCl 572 ± 40a 399 ± 34
b Decrease
Total, sum of averages 903 ± 16 897 ± 15 No change
Data represent means ± SEM, n = 102. Different letters following numeric means indicates
significant (P < 0.05) change in P between 1990 and 2009.
Table

Table 2
Pearson correlation matrix for P solubilized using the Olsen bicarbonate method and the 4
extractants used in the rhizosphere-based P fractionation procedure (10 mM CaCl2, 10 mM
citric acid solution, 0.02 enzyme units of phosphatase and phytase enzymes, and 1.0 M HCl).
Significance indicated by asterisks, * P < 0.01, ** P < 0.001 (n = 204).
Olsen CaCl2 Citrate Enzyme HCl
Olsen 1.000
CaCl2 0.372** 1.000
Citrate 0.563** 0.153 1.000
Enzyme 0.145 0.143 0.169 1.000
HCl 0.432** 0.013 0.732** 0.18* 1.000
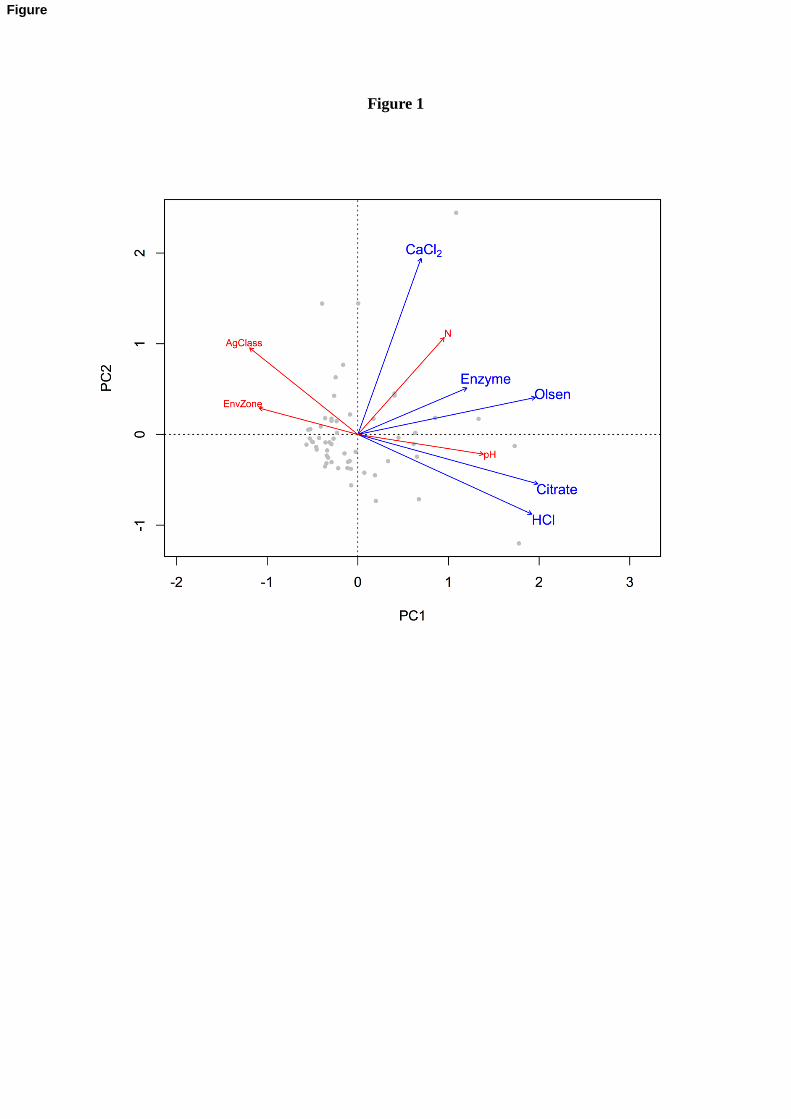
Figure 1
Figure

Figure 2
-400
0
400
800
-400
0
400
800
-400
0
400
800
Lowland
Woo
ded
Uplan
d W
oode
d
Cro
ps a
nd W
eeds
Tall G
rass
and
Her
b
Fertile
Gra
ssland
Infe
rtile G
rass
land
Moo
rland
Gra
ss M
osaics
Hea
th a
nd B
og
Change in s
oil
P fra
ction b
etw
een 1
998 a
nd 2
007 (
mg P
kg
-1)
-800
-400
0
400
800
A. CaCl2 extractable P
B. Citrate extractable P
C. Enzyme extractable P
D. HCl extractable P
**
** **
*
**
****
**
*
**

Figure 3
-400
0
400
800
-400
0
400
800
Soil organic matter category
Mineral Humus-mineral Organo-mineral Organic
Change in s
oil
P fra
ction b
etw
een 1
998 a
nd 2
007 (
mg P
kg
-1)
-800
-400
0
400
800
C. Enzyme extractable P
D. HCl extractable P
**
**
*****
***
B. Citrate extractable P
** ***
-400
0
400
800
A. CaCl2 extractable P
*

Figure 4
A. CaCl2
Olsen P (mg kg-1
)
0 10 20 30 40 50 60 70
Ca
Cl 2
ext
racta
ble
P (
mg
P k
g-1
)
0
10
20
30
B. Citrate
Olsen P (mg kg-1
)
0 10 20 30 40 50 60 70
Citra
te e
xtra
cta
ble
P (
mg
P k
g-1
)
0
100
200
300
400
500
600
700
C. Enzymes
Olsen P (mg kg-1
)
0 10 20 30 40 50 60 70
Enzy
me
ext
racta
ble
P (
mg
P k
g-1
)
0
500
1000
1500
2000
D. HCl
Olsen P (mg kg-1
)
0 10 20 30 40 50 60 70
HC
l ext
racta
ble
P (
mg
P k
g-1
)
0
400
800
1200
1600
2000
r2 = 0.66
P < 0.001
r2 = 0.87
P < 0.001r2 = 0.53
P < 0.001
r2 = 0.16
P = 0.043

Figure 5
PO4-P (mg kg
-1 air dried soil)
0.0 0.5 1.0 1.5 2.0
PO
4-P
(m
g k
g-1
DW
so
il)
0
1
2
3
4
PO4-P (mg kg
-1 air dried soil)
0 20 40 60 80 100
PO
4 -P (m
g k
g-1 D
W so
il)
0
50
100
150
200
250
PO4-P (mg kg
-1 air dried soil)
0 200 400 600 800
PO
4-P
(m
g k
g-1
DW
so
il)
0
200
400
600
800
PO4-P (mg kg
-1 air dried soil)
0 1 2 3 4
PO
4 -P (m
g k
g-1 D
W so
il)
0
2
4
6
8
a) CaCl2 extraction - Root interception, r
2 = 0.74 b) Citrate extraction - Organic acid complexation, r
2 = 0.94
c) HCl extraction - Proton excretion, r2 = 0.52 d) Phosphatase extraction - Enzyme hydrolysis, r
2 = 0.87