Spectrophotometric Determination of Chromium (III) and - CORE
This article appeared in a journal published by Elsevier. The attachedcopy is furnished to the author for internal non-commercial researchand education use, including for instruction at the authors institution
and sharing with colleagues.
Other uses, including reproduction and distribution, or selling orlicensing copies, or posting to personal, institutional or third party
websites are prohibited.
In most cases authors are permitted to post their version of thearticle (e.g. in Word or Tex form) to their personal website orinstitutional repository. Authors requiring further information
regarding Elsevier’s archiving and manuscript policies areencouraged to visit:
http://www.elsevier.com/copyright
Author's personal copy
Arsenic, cobalt and chromium food web biodilution in a Patagoniamountain lake
J.E. Revenga a,n, L.M. Campbell b, M.A. Arribere c,d, S. Ribeiro Guevara c
a Centro Regional Universitario Bariloche (CRUB), Universidad Nacional del Comahue, Quintral 1250, 8400 Bariloche, Argentinab School of Environmental Studies, Saint Mary’s University, 923 Robie Street, Halifax, Nova Scotia, Canada B3H-3C3c Laboratorio de Analisis por Activacion Neutronica, UAIN, Centro Atomico Bariloche, Comision Nacional de Energıa Atomica (CNEA), Bustillo 9500, 8400 Bariloche, Argentinad Instituto Balseiro, Universidad Nacional de Cuyo y CNEA, Bustillo 9500, 8400 Bariloche, Argentina
a r t i c l e i n f o
Article history:
Received 27 December 2011
Received in revised form
22 March 2012
Accepted 26 March 2012Available online 1 May 2012
Keywords:
Stable nitrogen carbon isotopes
Metals trophodynamics
Biodilution
Patagonia
Argentina
a b s t r a c t
Mussels, Diplon chilensis, from Lake Moreno, a double-basined mountain lake in southern Argentina, is
known to have elevated concentrations of chromium (Cr, 425 mg g�1 dry weight DW) and arsenic (As,
35 mg g�1 DW), attributed to untreated sewage. To further understand the trophodynamics of Cr, As
and cobalt (Co), we investigated concentrations and transfer throughout the food web in each basin of
Lake Moreno. Each basin differs in morphology in that the gently-sloping Lake Moreno West has more
littoral habitat than deeper Lake Moreno East with its higher proportion of pelagic habitat. Despite the
morphological differences, both basins share similar water quality parameters and species assemblages.
As a result, Lake Moreno provides an exceptional opportunity to compare trophodynamics of elements
that enable us to hypothesize pelagic–littoral habitat coupling in response to lake morphology as the
underlying factor influencing both Cr pathway and Co and As trophodynamic modeling. Using stable
isotopes of nitrogen (d15N) and carbon (d13C) to characterize metals trophodynamics in each basin,
biodilution of As, Cr and Co were indicated by negative regressions. This is confirmed by elevated As, Co
and Cr concentrations in phytoplankton (11.375.7, 7.474.9, 44.5740.7 mg g�1 DW respectively),
while zooplankton and biofilm had the next elevated concentrations. Those elevated concentrations are
in contrast with lower concentrations in sport fish such as rainbow trout (0.570.5, 0.270.3,
1.871.2 mg g�1 DW). Higher concentrations of Cr in fish were associated with higher proportion of
benthic/littoral prey items in western basin, and were confirmed by significant correlation with d13C
values. Arsenic, Co and Cr concentrations in fish, while elevated, do not post health risks to human or
wildlife consumers.
& 2012 Elsevier Inc. All rights reserved.
1. Introduction
Chromium (Cr), cobalt (Co) and arsenic (As) are essentialelements (Luoma and Rainbow, 2008). At sufficiently elevatedconcentrations, Cr, Co and As can be toxic to animals due to theirhigh affinity for sulfur (S) and nitrogen (N) ligands, and conse-quently, their protein binding ability to interfere with metabolicprocesses (Luoma and Rainbow, 2008). Diplodon chilensis musselsfrom Lake Moreno, a double-basined mountain lake in NahuelHuapi National Park, southern Argentina, had very elevatedconcentrations of Cr and As (�30 mg g�1; �40 mg g�1, dryweight, respectively) (Ribeiro Guevara et al., 2004). The elevatedconcentrations in mussels are thought to be associated with the
untreated sewage from the town of San Carlos de Bariloche(Ribeiro Guevara et al., 2004).
The role of food chains in carrying contaminants to toppredator fish, a possible source for human dietary exposure, hasreceived attention for several decades. The trophic transfer(trophodynamics) of elements along a food chain can result inan increase (biomagnification), a decrease (biodilution) or even nochange in elemental concentrations ([elements]) (Luoma andRainbow, 2008). For example, trophodynamics of elements suchas mercury (Hg) is well studied with consistent biomagnificationtrends (Campbell et al., 2005a, 2005b) while other elements suchas iron have been reported as never biomagnifying in food webs(Wang, 2002). For other elements, there is a growing number ofstudies demonstrating biomagnification, depending on site andspecies specific factors such as rubidium, selenium, cadmium,copper, zinc and more recently silver (Campbell et al., 2005a;Ikemoto et al., 2008; Revenga et al., 2011). Nevertheless, whereasthe role of food chains in biomagnifying contaminants leading to
Contents lists available at SciVerse ScienceDirect
journal homepage: www.elsevier.com/locate/ecoenv
Ecotoxicology and Environmental Safety
0147-6513/$ - see front matter & 2012 Elsevier Inc. All rights reserved.
http://dx.doi.org/10.1016/j.ecoenv.2012.03.014
n Corresponding author. Fax: þ54 2944 422111.
E-mail addresses: [email protected] (J.E. Revenga),
[email protected] (L.M. Campbell), [email protected] (M.A. Arribere),
[email protected] (S. Ribeiro Guevara).
Ecotoxicology and Environmental Safety 81 (2012) 1–10
Author's personal copy
high concentrations in top predators is well known for organicpollutants and some elements, little is known about trophic transferpatterns for many other elements (Luoma and Rainbow, 2008).
In regards to As, Cr and Co trophodynamics in freshwaterecosystems, a review of the literature indicates contrastingresults. Driver (1994) reported biodilution trends, e.g., higherAs, Cr and Co concentrations ([As], [Cr], [Co]) in lower trophiclevel organisms compared to higher trophic organisms in lakesnear the Hanford Site, U.S.A. Similarly, biodilution trends for As infood webs including plankton and several species of fish from 20lakes in USA (Chen et al., 2000). More recently, [As] and [Cr] werefound to regress negatively with trophic level for a food chainincluding gastropods, crustacea, insects and fish in an iron ore-polluted lagoon in Brazil (Pereira et al., 2010). In contrast, noconsistent relationship between [As], [Cr] and [Co] and trophiclevel was found by Ikemoto et al. (2008) in a trophic chaincomposed by phytoplankton, gastropods, crustacea and fish inMekong Delta, South Vietnam. Similarly, [As] and [Cr] did notregress significantly with trophic level in molluscs, crustacea, andfish from Yellow River Delta in China (Cui et al., 2011).
Carbon (C) and nitrogen (N) stable isotope analyses has becomean important tool in the study of elements trophodynamics over thepast decade (Campbell et al., 2005a, 2005b; Dehn et al., 2006;Watanabe et al., 2008). Stable nitrogen isotope ratios (d15N) tend toincrease 2–5% with each trophic level (Vanderklift and Ponsard,2003) allowing the numerical characterization of trophic level.Regressing [elements], against d15N values allows for the quantifica-tion and modeling of trophic transfer along food webs. By contrast,carbon isotope ratios (d13C) often shows lower trophic fractionation(0.8–1%), and as such, are useful for evaluating sources of primaryproduction within a freshwater food web. Based on the availabilityof 12C and 13C components in atmospheric CO2, there is often acontinuum of higher d13C values for benthic/littoral organisms tolower d13C values associated with pelagic organisms (Peterson andFry, 1987). Furthermore, the relationship between d13C and d15Nvalues of all species within a food web defines a two-dimensionalspace where the trophic position of a population (or community)can be determined (Jardine et al., 2006), and the food web structureof an ecosystem can be characterized (Vander Zanden andRasmussen, 1999).
In a recent study comparing the two basins of Lake Moreno inNahuel Huapi National Park, Arcagni et al. (unpublished results,cited by Revenga et al., 2011) found increased d13C in fish fromLake Moreno West (MW) and increased d15N in the whole biota inLake Moreno East (ME) respectively. Even so, in terms of relativedifferences in trophic position, as indicated by d15N, betweenspecies, the general food web structure was similar in both basins.The best possible explanation is that there is a higher proportionof littoral prey items available for fish in MW and the higherproportion of N2 fixation by cyanobacteria in ME, i.e. differencesin morphology could allow for different pelagic and littoralpartitioning and habitat coupling (Dolson et al., 2009) betweenbasins. Given that the two interconnected basins of Lake Morenoshare identical species assemblages and similar water qualityparameters, being lake morphology the unique detectable differ-ence, the lake offer unusually good experimental conditions toexamine trophic transfer of contaminants as influenced by habitatand dietary carbon sources. We hypothesized that the change introphic position (mean d13C and/or mean d15N) of some organ-isms in MW relative to ME modifies the pathway and/or thepattern of trophic transfer of elements. Our objectives are to:(1) compare the trophodynamics patterns of Cr, Co and Asbetween the two basins of Lake Moreno; (2) determine if higher[elements] in top predator fish species are associated withconsumption of higher proportions of benthic/littoral or pelagicprey items using d13C analyses and, if it is so, (3) identify whichdietary species that more likely are associated with increaseduptake of As, Cr and Co.
2. Materials and methods
2.1. Study site
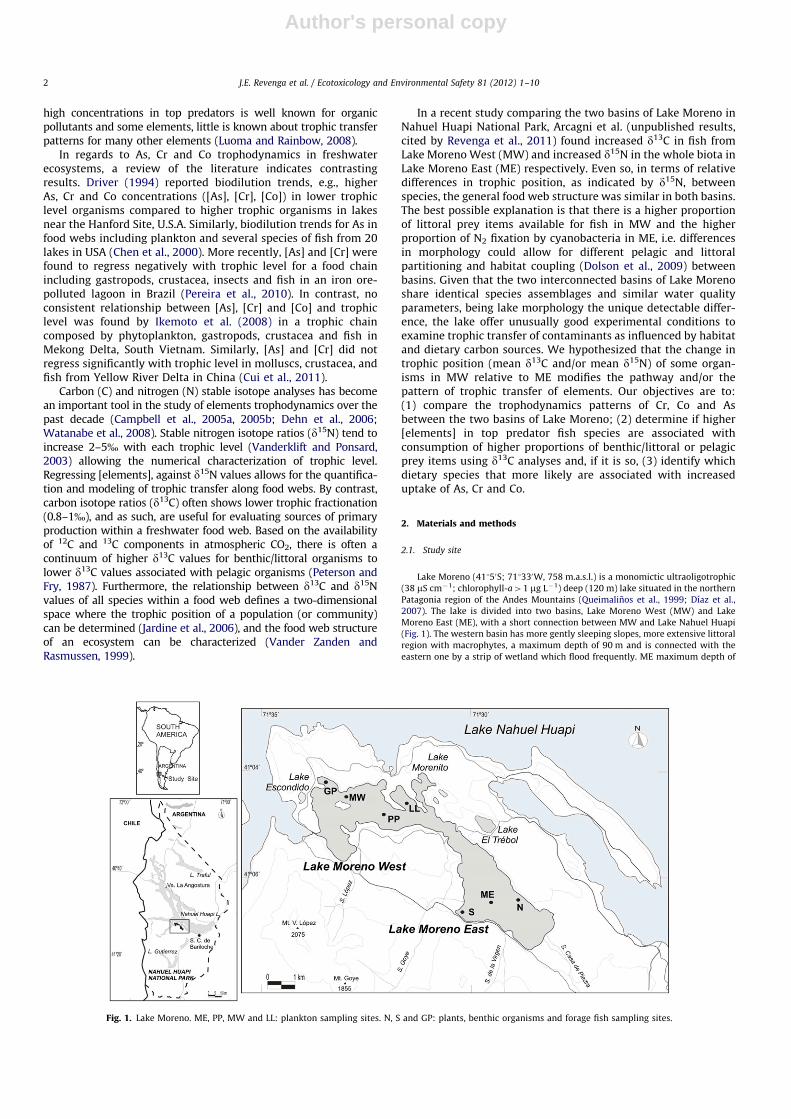
Lake Moreno (41150S; 711330W, 758 m.a.s.l.) is a monomictic ultraoligotrophic
(38 mS cm�1; chlorophyll-a41 mg L�1) deep (120 m) lake situated in the northern
Patagonia region of the Andes Mountains (Queimalinos et al., 1999; Dıaz et al.,
2007). The lake is divided into two basins, Lake Moreno West (MW) and Lake
Moreno East (ME), with a short connection between MW and Lake Nahuel Huapi
(Fig. 1). The western basin has more gently sleeping slopes, more extensive littoral
region with macrophytes, a maximum depth of 90 m and is connected with the
eastern one by a strip of wetland which flood frequently. ME maximum depth of
Fig. 1. Lake Moreno. ME, PP, MW and LL: plankton sampling sites. N, S and GP: plants, benthic organisms and forage fish sampling sites.
J.E. Revenga et al. / Ecotoxicology and Environmental Safety 81 (2012) 1–102

Author's personal copy
120 m has very steep slopes, and predominant rocky shores. In contrast to the
long maximum depths, the total surface area of both basins comprise 10.6 km2
(Dıaz et al., 2007). The lake is thermally stratified in the summer season from late
November through April, while during the mixing period, the temperature is about
7 1C throughout the water column. Dissolved oxygen concentration remains at
saturation levels throughout the water column year-around.
Plankton, benthic organisms, forage fish and plants were sampled from
seven sampling stations across Lake Moreno (Fig. 1), over six consecutive seasons
(2004–2009). Prior to sampling trace metal protocols were followed, e.g., all
netting, plastic and glass sample containers, filtering devices and bottles were
washed for 15 days in 50 percent HNO3 and thoroughly rinsed in ASTM grade-1
water before use. Plankton samples were collected by vertical hauls to the lake
surface with 250 cm3 conical nets and sieved into three size fractions: o50 mm
(‘‘phytoplankton’’), 50–200 mm (‘‘mixed plankton’’) and 4200 mm (‘‘zooplankton’’)
(Balseiro et al., 1997; Modenutti et al., 1998, 2000). Submerged macrophytes and
biofilm were collected by hand. Macroinvertebrates were hand-picked from macro-
phytes and submerged objects or collected from baited fish traps. Freshwater mussels
D. chilensis, were collected via SCUBA diving. The shells and digestive tracts for the
snail Chilina sp., D. chilensis, the crab Aegla sp., and the crayfish Samastacus sp., were
removed. In 2004, brown trout Salmo trutta, rainbow trout Oncorhynchus mykiss,
brook trout Salvelinus fontinalis, creole perch Percichthys trucha, and velvet catfish
Diplomystes viedmensis, were caught with gill nets (Ribeiro Guevara et al., 2005). The
small fish ‘‘puyen’’ Galaxias maculatus were collected by using baited fish traps and
sorted into five size classes: 30–40 mm, 40–50 mm, 50–60 mm, 60–70 mm and
470 mm.
2.2. Elemental analysis
Chromium, cobalt and arsenic concentrations were measured in lake samples
using Instrumental Neutron Activation Analysis (INAA) using the protocols
described in Revenga et al. (2011) and Ribeiro Guevara et al. (2004). In brief,
Samples were freeze-dried and homogenized until constant weight. Aliquots of
homogenized plankton, benthic organisms, plants and forage fish of about 100 mg
were sealed in SUPRASIL ANs quartz ampoules (Ribeiro Guevara et al., 2004,
2005) and irradiated for 24 h at the RA-6 nuclear research reactor at Centro
Atomico Bariloche. Gamma-ray spectra were collected using an intrinsic High
Purity Germanium (HPGe) n-type detector, 12.3 percent relative efficiency and a
4096-channel analyzer. The concentrations reported are referred to dry weight
(DW) basis. Certified Reference Materials (CRM) from the National Research
Council of Canada (NRCC) and sample replicates were analyzed for analytical
quality control. The measured CRM elements concentrations showed good agree-
ment with NRCC’s certified values (Table 1) whereas the replicates variability were
within the range of the analytical uncertainties (15–20 percent; Ribeiro Guevara
et al., 2004).
2.3. Stable isotope analysis
Stable nitrogen and carbon isotopes for whole-body invertebrates and fish
dorsal muscle and liver were analyzed using the DELTAPLUS-XP stable isotope
ratio mass spectrometer in the Queen’s Facility for Isotope Research (QFIR) at
Queen’s University, Canada. Briefly, each sample was finely ground, weighed out
into tin capsules, and combusted in an elemental analyzer to 1800 1C. The
resulting gases CO2 and N2 were analyzed with DELTAPLUS-XP (see Revenga
et al., 2011 for details). Standards were measured at the beginning of each round
and then after every sample duplicate. Standard deviations, for the C standard
NBS21 (graphite) was 70.2%, for the international N standard ammonium sulfate
(Certified Reference Material [CRM] 8548, IAEA) was 70.2%, for the Carbon Rod
standard it was 70.1% and for the sulfanilamide standard it was 70.4% for N
and 70.2% for C. In-house standards were also used to assess variability and are
used in all biological runs in the lab thereby allowing us to monitor within- and
between- run variability. Those include, lipid-extracted Atlantic salmon
(SD d15N¼0.1%, SD d13C¼0.4%); Red tilapia (SD d15N¼0.1%, SD d13C¼0.1%)
and chicken blood (SD d15N¼0.2%, SD d13C¼0.1%). All stable isotope values are
reported in the d notation, as the deviation from standards in parts per thousand
(%) according to the equation: dX¼1/4(Rsample/Rstandard – 1)�1000, where X is 13C
or 15N and R is 13C:12C or 15N:14N using PeeDee Belemnite and atmospheric
nitrogen.
2.4. Statistics and data modeling
To test the possible effect of a diet shift, on Cr, Co and As trophodynamics in
each basin of Lake Moreno, mean and standard deviations (SD) for elements
concentrations in fish were calculated for both individuals and homogenates.
Normality of data was tested by the Shapiro–Wilk’s test rendering significantly
non-normal distributions (p40.05) for all elements and normal distributions for
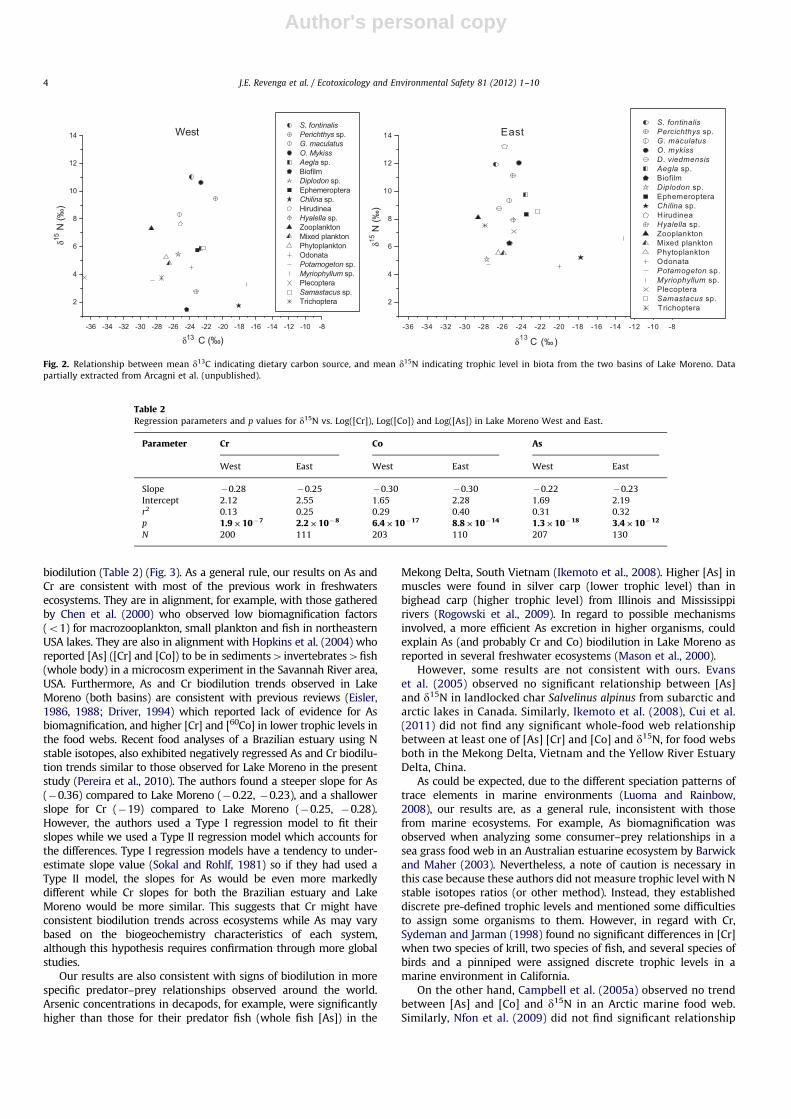
isotopes. To visualize differences in the trophic position of some organisms, d13C
values were plotted against d15N for each basin (Fig. 2). Trends for elements
concentrations, as indicated by this notation [elements], with trophic level
(as measured by d15N) in fish, were assessed using regression analysis model II
(Sokal and Rohlf, 1981) with [elements] log10 transformed, to ensure normality.
This model is appropriate when the independent variable (d15N in this case) is not
fixed under laboratory conditions, i.e., it cannot be manipulated by the experi-
menter, and thus, both the independent (d15N) and dependent ([elements])
variables can be measured with error estimated for both (Sokal and Rohlf,
1981). The Between-basins differences in regression models were tested using
Analysis of Co-Variance (ANCOVA). Significance level was set at 0.05 unless
otherwise noted.
To assess the importance of littoral and pelagic prey contributions to rainbow
trout diets in each basin, we used isotope mixing model analysis. This enables us
to estimate the proportions of possible food sources (e.g., average isotope values of
each potential prey item) to the diet of the targeted consumer (Phillips, 2001;
Phillips and Gregg, 2001). We chose rainbow trout as a model because it is the
only Lake Moreno species for which published stomach content data and
quantitative diet information is available (Vigliano et al., 2009), thereby allowing
us to confirm the output of the mixing model as being feasible. The dietary items
which we included in the rainbow stable isotope mixing model, were based on
published data, and are known to consist �70 percent of total annual ingestion for
rainbow trout of ages 2þ to 6þ in Lake Moreno (Vigliano, et al., 2009) However,
the number of known food items important to Lake Moreno rainbow trout is over
10 (Vigliano et al., 2009), which exceeds the maximum of 3 sources that can be
feasibly estimated when two isotope signatures are measured (Phillips, 2001;
Phillips and Gregg, 2001). In such cases, a possible solution is to reduce the
number of food sources by combining them (e.g., Phillips et al., 2005). Accordingly,
we reduced the number of food sources to two (instead to three) for two reasons:
(a) our approach differs from Phillips et al. (2005), in that we were primarily
interested in comparing the relative contribution of pelagic-feeding small fish
(main prey, intermediate d13C values) and benthic/littoral organisms (higher d13C
values) to the rainbow trout diet in each basin, rather than estimating the dietary
contributions of all potential prey; (b) the species-specific N fractionation between
trophic levels is unknown for Patagonia lakes, so combining multiple species into
two sources increases the feasibility of the model output in terms of comparing
littoral vs. pelagic contributions to rainbow trout diets.
The mixing model in this study used this formula: d13CM¼ fAd13CAþ fBd13CB;
1¼ fAþ fB, where d13CM, d13CA and d13CB represent the mean C isotopic signatures for
the mix (consumer) and the food sources A and B, and fA and fB are the proportions of
A and B in M (Phillips, 2001). We compared the between-basin variation of the
following food sources: the pelagic small puyen fish [G.maculatus, GM] and the
benthic/littoral prey item snails [Chilina sp. CH] and the decapods [Aegla sp.þSamas-
tacus sp., AeS]. Different contrasts were made between basins by keeping the main
prey (small fish G. maculatus with intermediate d13C values, ‘‘A’’ in the formula) and
varying benthic/littoral prey items (higher d13C values, ‘‘B’’ in the formula) as follows,
GMþCh and GMþAeS. Insect larvae were excluded because Trichoptera and
Plecoptera had significantly lower d13C values strongly associated with pelagic
carbon (Fig. 2) whereas the total sample numbers of the more benthic/littoral
Odonata and Ephemeroptera was far too small for robust analyses.
3. Results and discussion
3.1. Elements trophodynamics
3.1.1. Food web biodilution
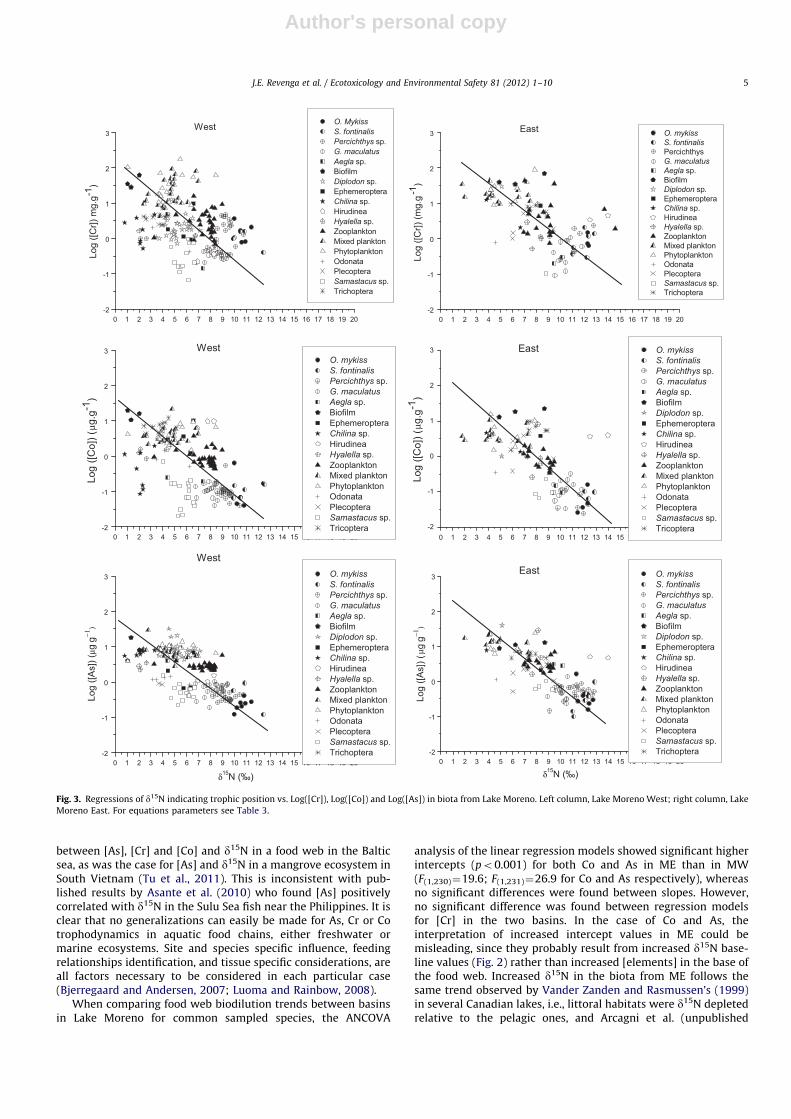
All Log([elements]) were negatively and significantly regressedwith d15N in both Lake Moreno basins, suggesting food web
Table 1Quality control for Cr, Co and As concentrations measured in the biota of Lake Moreno. Certified reference material from National Research
Council of Canada (NRCC DORM-2 dog fish muscle; NRCC TORT lobster hepatopancreas).
Sample Cr Co As
Certified Measured Certified Measured Certified Measured
NRCC DORM-2 34.775.6 31.673.6 0.18270.031 0.22170.022 18.071.1 16.871.5
NRCC TORT 0.7770.15 0.6270.19 0.51070.092 0.55470.050 21.671.8 21.271.9
J.E. Revenga et al. / Ecotoxicology and Environmental Safety 81 (2012) 1–10 3
Author's personal copy
biodilution (Table 2) (Fig. 3). As a general rule, our results on As andCr are consistent with most of the previous work in freshwatersecosystems. They are in alignment, for example, with those gatheredby Chen et al. (2000) who observed low biomagnification factors(o1) for macrozooplankton, small plankton and fish in northeasternUSA lakes. They are also in alignment with Hopkins et al. (2004) whoreported [As] ([Cr] and [Co]) to be in sediments4invertebrates4fish(whole body) in a microcosm experiment in the Savannah River area,USA. Furthermore, As and Cr biodilution trends observed in LakeMoreno (both basins) are consistent with previous reviews (Eisler,1986, 1988; Driver, 1994) which reported lack of evidence for Asbiomagnification, and higher [Cr] and [60Co] in lower trophic levels inthe food webs. Recent food analyses of a Brazilian estuary using Nstable isotopes, also exhibited negatively regressed As and Cr biodilu-tion trends similar to those observed for Lake Moreno in the presentstudy (Pereira et al., 2010). The authors found a steeper slope for As(�0.36) compared to Lake Moreno (�0.22, �0.23), and a shallowerslope for Cr (�19) compared to Lake Moreno (�0.25, �0.28).However, the authors used a Type I regression model to fit theirslopes while we used a Type II regression model which accounts forthe differences. Type I regression models have a tendency to under-estimate slope value (Sokal and Rohlf, 1981) so if they had used aType II model, the slopes for As would be even more markedlydifferent while Cr slopes for both the Brazilian estuary and LakeMoreno would be more similar. This suggests that Cr might haveconsistent biodilution trends across ecosystems while As may varybased on the biogeochemistry characteristics of each system,although this hypothesis requires confirmation through more globalstudies.
Our results are also consistent with signs of biodilution in morespecific predator–prey relationships observed around the world.Arsenic concentrations in decapods, for example, were significantlyhigher than those for their predator fish (whole fish [As]) in the
Mekong Delta, South Vietnam (Ikemoto et al., 2008). Higher [As] inmuscles were found in silver carp (lower trophic level) than inbighead carp (higher trophic level) from Illinois and Mississippirivers (Rogowski et al., 2009). In regard to possible mechanismsinvolved, a more efficient As excretion in higher organisms, couldexplain As (and probably Cr and Co) biodilution in Lake Moreno asreported in several freshwater ecosystems (Mason et al., 2000).
However, some results are not consistent with ours. Evanset al. (2005) observed no significant relationship between [As]and d15N in landlocked char Salvelinus alpinus from subarctic andarctic lakes in Canada. Similarly, Ikemoto et al. (2008), Cui et al.(2011) did not find any significant whole-food web relationshipbetween at least one of [As] [Cr] and [Co] and d15N, for food websboth in the Mekong Delta, Vietnam and the Yellow River EstuaryDelta, China.
As could be expected, due to the different speciation patterns oftrace elements in marine environments (Luoma and Rainbow,2008), our results are, as a general rule, inconsistent with thosefrom marine ecosystems. For example, As biomagnification wasobserved when analyzing some consumer–prey relationships in asea grass food web in an Australian estuarine ecosystem by Barwickand Maher (2003). Nevertheless, a note of caution is necessary inthis case because these authors did not measure trophic level with Nstable isotopes ratios (or other method). Instead, they establisheddiscrete pre-defined trophic levels and mentioned some difficultiesto assign some organisms to them. However, in regard with Cr,Sydeman and Jarman (1998) found no significant differences in [Cr]when two species of krill, two species of fish, and several species ofbirds and a pinniped were assigned discrete trophic levels in amarine environment in California.
On the other hand, Campbell et al. (2005a) observed no trendbetween [As] and [Co] and d15N in an Arctic marine food web.Similarly, Nfon et al. (2009) did not find significant relationship
-36 -34 -32 -30 -28 -26 -24 -22 -20 -18 -16 -14 -12 -10 -8
2
4
6
8
10
12
14S. fontinalisPerichthys sp.G. maculatusO. MykissAegla sp. BiofilmDiplodon sp. EphemeropteraChilina sp. HirudineaHyalella sp. Zooplankton Mixed plankton Phytoplankton OdonataPotamogeton sp.Myriophyllum sp. PlecopteraSamastacus sp. Trichoptera
δ15N
(‰)
δ13 C (‰)
West
-36 -34 -32 -30 -28 -26 -24 -22 -20 -18 -16 -14 -12 -10 -8
2
4
6
8
10
12
14
S. fontinalisPercichthys sp.G. maculatusO. mykissD. viedmensisAegla sp.
BiofilmDiplodon sp.
EphemeropteraChilina sp. HirudineaHyalella sp.
Zooplankton Mixed plankton Phytoplankton OdonataPotamogeton sp.Myriophyllum sp.
Plecoptera Samastacus sp.Trichoptera
δ15N
( ‰)
δ13 C (‰ )
East
Fig. 2. Relationship between mean d13C indicating dietary carbon source, and mean d15N indicating trophic level in biota from the two basins of Lake Moreno. Data
partially extracted from Arcagni et al. (unpublished).
Table 2
Regression parameters and p values for d15N vs. Log([Cr]), Log([Co]) and Log([As]) in Lake Moreno West and East.
Parameter Cr Co As
West East West East West East
Slope �0.28 �0.25 �0.30 �0.30 �0.22 �0.23
Intercept 2.12 2.55 1.65 2.28 1.69 2.19
r2 0.13 0.25 0.29 0.40 0.31 0.32
p 1.9�10�7 2.2�10�8 6.4�10�17 8.8�10�14 1.3�10�18 3.4�10�12
N 200 111 203 110 207 130
J.E. Revenga et al. / Ecotoxicology and Environmental Safety 81 (2012) 1–104
Author's personal copy
between [As], [Cr] and [Co] and d15N in a food web in the Balticsea, as was the case for [As] and d15N in a mangrove ecosystem inSouth Vietnam (Tu et al., 2011). This is inconsistent with pub-lished results by Asante et al. (2010) who found [As] positivelycorrelated with d15N in the Sulu Sea fish near the Philippines. It isclear that no generalizations can easily be made for As, Cr or Cotrophodynamics in aquatic food chains, either freshwater ormarine ecosystems. Site and species specific influence, feedingrelationships identification, and tissue specific considerations, areall factors necessary to be considered in each particular case(Bjerregaard and Andersen, 2007; Luoma and Rainbow, 2008).
When comparing food web biodilution trends between basinsin Lake Moreno for common sampled species, the ANCOVA
analysis of the linear regression models showed significant higherintercepts (po0.001) for both Co and As in ME than in MW(F(1,230)¼19.6; F(1,231)¼26.9 for Co and As respectively), whereasno significant differences were found between slopes. However,no significant difference was found between regression modelsfor [Cr] in the two basins. In the case of Co and As, theinterpretation of increased intercept values in ME could bemisleading, since they probably result from increased d15N base-line values (Fig. 2) rather than increased [elements] in the base ofthe food web. Increased d15N in the biota from ME follows thesame trend observed by Vander Zanden and Rasmussen’s (1999)in several Canadian lakes, i.e., littoral habitats were d15N depletedrelative to the pelagic ones, and Arcagni et al. (unpublished
0 1 2 3 4 5 6 7 8 9 10 11 12 13 14 15 16 17 18 19 20-2
-1
0
1
2
3O. mykissS. fontinalisPercichthys sp.G. maculatusAegla sp. Biofilm Ephemeroptera Chilina sp. Hirudinea Hyalella sp. Zooplankton Mixed plankton Phytoplankton Odonata Plecoptera Samastacus sp. Tricoptera
Log
([Co]
) (μg
.g-1
)
West
0 1 2 3 4 5 6 7 8 9 10 11 12 13 14 15 16 17 18 19 20-2
-1
0
1
2
3 O. mykissS. fontinalisPercichthys sp.G. maculatus Aegla sp. BiofilmDiplodon sp. EphemeropteraChilina sp. HirudineaHyalella sp. Zooplankton Mixed plankton Phytoplankton Odonata PlecopteraSamastacus sp. Trichoptera
Log
([As]
) (μ g
g−1)
δ15N (‰)
West
0 1 2 3 4 5 6 7 8 9 10 11 12 13 14 15 16 17 18 19 20-2
-1
0
1
2
3 O. mykiss S. fontinalis Percichthys G. maculatusAegla sp. BiofilmDiplodon sp. EphemeropteraChilina sp. HirudineaHyalella sp. Zooplankton Mixed plankton Phytoplankton Odonata PlecopteraSamastacus sp. Trichoptera
Log
([Cr])
(mg.
g-1
)
East
0 1 2 3 4 5 6 7 8 9 10 11 12 13 14 15 16 17 18 19 20-2
-1
0
1
2
3 O. mykissS. fontinalisPercichthys sp.G. maculatusAegla sp. BiofilmDiplodon sp. Ephemeroptera Chilina sp. HirudineaHyalella sp. Zooplankton Mixed plankton Phytoplankton Odonata PlecopteraSamastacus sp. Tricoptera
Log
([Co]
) (μg
.g-1
)
East
0 1 2 3 4 5 6 7 8 9 10 11 12 13 14 15 16 17 18 19 20-2
-1
0
1
2
3 O. mykissS. fontinalisPercichthys sp.G. maculatus
Aegla sp. BiofilmDiplodon sp.
EphemeropteraChilina sp.
HirudineaHyalella sp.
Zooplankton Mixed plankton Phytoplankton Odonata PlecopteraSamastacus sp.
Trichoptera
Log
([As]
) (μg
g−1)
δ15N (‰)
East
0 1 2 3 4 5 6 7 8 9 10 11 12 13 14 15 16 17 18 19 20-2
-1
0
1
2
3
O. MykissS. fontinalisPercichthys sp.G. maculatusAegla sp. BiofilmDiplodon sp. Ephemeroptera Chilina sp. HirudineaHyalella sp. Zooplankton Mixed plankton Phytoplankton Odonata PlecopteraSamastacus sp. Trichoptera
Log
([Cr])
mg.
g-1)
West
Fig. 3. Regressions of d15N indicating trophic position vs. Log([Cr]), Log([Co]) and Log([As]) in biota from Lake Moreno. Left column, Lake Moreno West; right column, Lake
Moreno East. For equations parameters see Table 3.
J.E. Revenga et al. / Ecotoxicology and Environmental Safety 81 (2012) 1–10 5
Author's personal copy
results, cited in Revenga et al., 2011) have come to similarconclusions for Lake Moreno. A possible mechanism for theincreased d15N in ME could be a lower proportion of N2 fixationby benthic/littoral cyanobacteria in that basin. The higher d15Nvalues observed in ME is probably better explained by lowerbenthic/littoral metabolism in this basin. In alignment with thatconclusion, our results suggest that a lower influence of littoralprocesses in ME could influences elemental trophodynamic mod-eling by increasing baseline d15N and emphasizes the advantageof using trophic levels of organisms corrected for baseline varia-tion in d15N, instead of d15N only, whenever experimentalinformation on variability of d15N fractionation between trophiclevels is available (Jardine et al., 2006).
3.1.2. Trophic transfer pathways
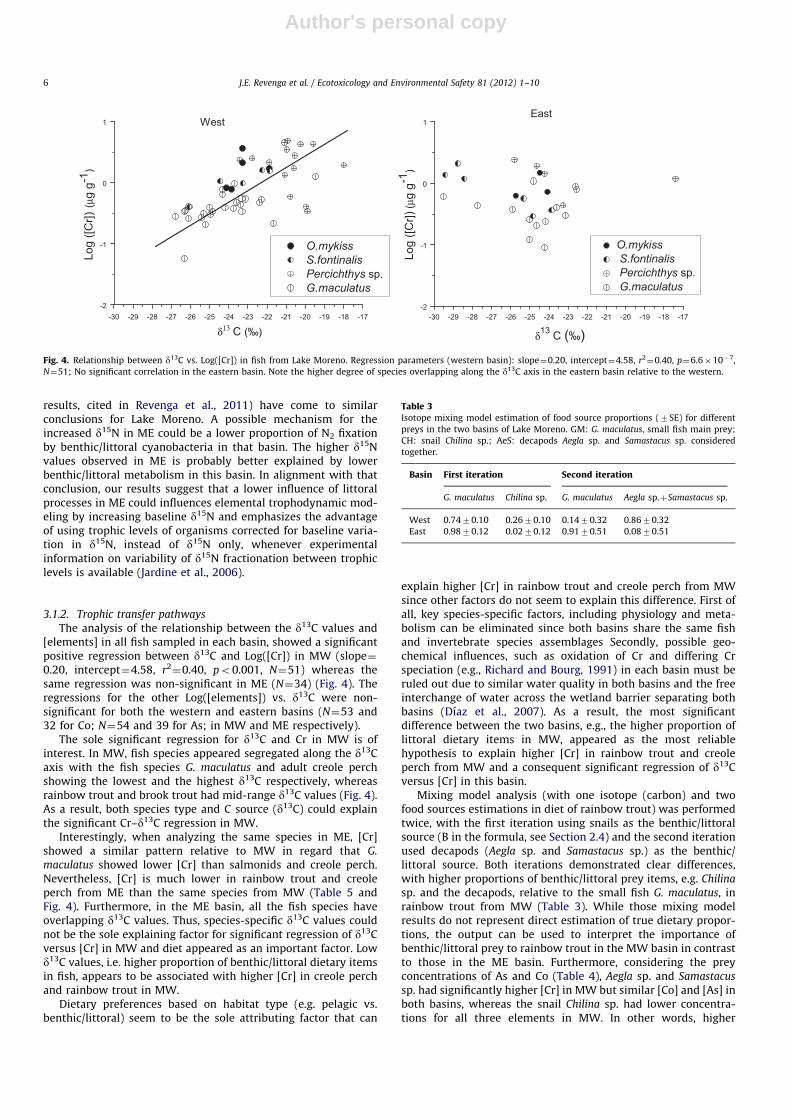
The analysis of the relationship between the d13C values and[elements] in all fish sampled in each basin, showed a significantpositive regression between d13C and Log([Cr]) in MW (slope¼0.20, intercept¼4.58, r2
¼0.40, po0.001, N¼51) whereas thesame regression was non-significant in ME (N¼34) (Fig. 4). Theregressions for the other Log([elements]) vs. d13C were non-significant for both the western and eastern basins (N¼53 and32 for Co; N¼54 and 39 for As; in MW and ME respectively).
The sole significant regression for d13C and Cr in MW is ofinterest. In MW, fish species appeared segregated along the d13Caxis with the fish species G. maculatus and adult creole perchshowing the lowest and the highest d13C respectively, whereasrainbow trout and brook trout had mid-range d13C values (Fig. 4).As a result, both species type and C source (d13C) could explainthe significant Cr–d13C regression in MW.
Interestingly, when analyzing the same species in ME, [Cr]showed a similar pattern relative to MW in regard that G.
maculatus showed lower [Cr] than salmonids and creole perch.Nevertheless, [Cr] is much lower in rainbow trout and creoleperch from ME than the same species from MW (Table 5 andFig. 4). Furthermore, in the ME basin, all the fish species haveoverlapping d13C values. Thus, species-specific d13C values couldnot be the sole explaining factor for significant regression of d13Cversus [Cr] in MW and diet appeared as an important factor. Lowd13C values, i.e. higher proportion of benthic/littoral dietary itemsin fish, appears to be associated with higher [Cr] in creole perchand rainbow trout in MW.
Dietary preferences based on habitat type (e.g. pelagic vs.benthic/littoral) seem to be the sole attributing factor that can
explain higher [Cr] in rainbow trout and creole perch from MWsince other factors do not seem to explain this difference. First ofall, key species-specific factors, including physiology and meta-bolism can be eliminated since both basins share the same fishand invertebrate species assemblages Secondly, possible geo-chemical influences, such as oxidation of Cr and differing Crspeciation (e.g., Richard and Bourg, 1991) in each basin must beruled out due to similar water quality in both basins and the freeinterchange of water across the wetland barrier separating bothbasins (Dıaz et al., 2007). As a result, the most significantdifference between the two basins, e.g., the higher proportion oflittoral dietary items in MW, appeared as the most reliablehypothesis to explain higher [Cr] in rainbow trout and creoleperch from MW and a consequent significant regression of d13Cversus [Cr] in this basin.
Mixing model analysis (with one isotope (carbon) and twofood sources estimations in diet of rainbow trout) was performedtwice, with the first iteration using snails as the benthic/littoralsource (B in the formula, see Section 2.4) and the second iterationused decapods (Aegla sp. and Samastacus sp.) as the benthic/littoral source. Both iterations demonstrated clear differences,with higher proportions of benthic/littoral prey items, e.g. Chilina
sp. and the decapods, relative to the small fish G. maculatus, inrainbow trout from MW (Table 3). While those mixing modelresults do not represent direct estimation of true dietary propor-tions, the output can be used to interpret the importance ofbenthic/littoral prey to rainbow trout in the MW basin in contrastto those in the ME basin. Furthermore, considering the preyconcentrations of As and Co (Table 4), Aegla sp. and Samastacus
sp. had significantly higher [Cr] in MW but similar [Co] and [As] inboth basins, whereas the snail Chilina sp. had lower concentra-tions for all three elements in MW. In other words, higher
-30 -29 -28 -27 -26 -25 -24 -23 -22 -21 -20 -19 -18 -17-2
-1
0
1
O.mykiss S.fontinalis Percichthys sp.G.maculatus
Log
([Cr])
(μg
g-1)
δ13 C (‰)
West
-30 -29 -28 -27 -26 -25 -24 -23 -22 -21 -20 -19 -18 -17-2
-1
0
1
O.mykiss S.fontinalisPercichthys sp.G.maculatus
Log
([Cr])
(μg
g-1)
δ13 C (‰)
East
Fig. 4. Relationship between d13C vs. Log([Cr]) in fish from Lake Moreno. Regression parameters (western basin): slope¼0.20, intercept¼4.58, r2¼0.40, p¼6.6�10�7,
N¼51; No significant correlation in the eastern basin. Note the higher degree of species overlapping along the d13C axis in the eastern basin relative to the western.
Table 3Isotope mixing model estimation of food source proportions (7SE) for different
preys in the two basins of Lake Moreno. GM: G. maculatus, small fish main prey;
CH: snail Chilina sp.; AeS: decapods Aegla sp. and Samastacus sp. considered
together.
Basin First iteration Second iteration
G. maculatus Chilina sp. G. maculatus Aegla sp.þSamastacus sp.
West 0.7470.10 0.2670.10 0.1470.32 0.8670.32
East 0.9870.12 0.0270.12 0.9170.51 0.0870.51
J.E. Revenga et al. / Ecotoxicology and Environmental Safety 81 (2012) 1–106

Author's personal copy
Ta
ble
4C
r,C
oa
nd
As
con
ten
tsin
pro
du
cers
an
din
ve
rte
bra
tes
fro
mLa
ke
Mo
ren
oa.
N:
sam
ple
size
,if
the
sam
ple
sa
reh
om
og
en
ate
s,th
en
um
be
ro
fin
div
idu
als
pe
rsa
mp
leis
ne
xt
toN
;S
D:
sta
nd
ard
de
via
tio
n;
N/A
:n
ot
an
aly
zed
.
Org
an
ism
Cr
Co
As
We
stE
ast
We
stE
ast
We
stE
ast
NM
ea
n7
SD
(ra
nk
)N
Me
an7
SD
(ra
nk
)N
Me
an7
SD
(ra
nk
)N
Me
an7
SD
(ra
nk
)N
Me
an7
SD
(ra
nk
)N
Me
an7
SD
(ra
nk
)
Ph
yto
pla
nk
ton
20
44
.497
40
.72
(8.8
4–
17
5.5
0)
10
35
.307
26
.33
(7.7
4–
90
.00
)
20
5.0
97
2.4
3
(1.4
9–
9.4
8)
10
7.4
37
4.9
4
(1.5
2–
15
.70
)
20
8.4
07
2.5
7
(3.8
4–
13
.93
)
10
11
.327
5.7
4
(6.1
1–
22
.99
)
Mix
ed
pla
nk
ton
30
28
.937
25
.31
(4.2
0–
94
.32
)
19
22
.617
12
.25
(9.4
5–
40
.41
)
30
4.7
47
3.7
7
(2.1
0–
21
.67
)
19
5.5
47
3.9
2
(1.8
9–
8.6
7)
30
8.4
57
4.8
3
(4.9
2–
16
.04
)
19
14
.557
7.0
3
(5.5
9–
28
.17
)
Zo
op
lan
kto
n3
34
.337
3.9
2
(0.6
9–
16
.02
)
24
6.2
87
10
.56
(1.2
4–
43
.74
)
33
1.1
17
0.7
3
(0.3
6–
3.7
5)
24
1.0
17
0.5
5
(0.4
7–
2.4
7)
33
2.9
07
0.7
2
(2.0
9–
4.1
5)
24
3.6
17
1.3
7
(1.7
3–
5.7
0)
Po
tam
og
eto
nsp
.4
0.9
77
0.6
0
(0.3
0–
1.5
6)
51
.217
1.2
1
(0.3
0–
2.9
6)
42
.797
1.0
2
(1.9
8–
4.1
4)
51
.107
0.4
5
(0.5
6–
1.6
3)
40
.567
0.4
2
(0.2
7–
1.1
8)
50
.737
0.5
6
(0.1
6–
1.6
6)
My
rio
ph
yll
usp
.2
3.7
97
3.4
7
(0.2
7–
6.2
5)
34
.777
1.4
0
(3.7
9–
6.3
7)
22
.397
0.5
5
(1.2
4–
2.8
2)
32
.967
1.3
9
(1.4
7–
4.2
2)
20
.707
0.2
2
(0.1
2–
1.2
8)
32
.197
0.3
4
(1.9
4–
2.5
8)
Bio
film
34
2.0
67
18
.15
(28
.35
–6
2-6
4)
45
1.2
17
16
.95
(19
.26
–9
.93
)
31
5.4
17
4.6
0
(10
.56
–1
9.7
1)
41
8.4
47
3.9
5
(6.7
2–
22
.61
)
39
.997
7.2
2
(3.9
8–
18
.00
)
41
0.8
87
2.0
5
(8.2
2–
11
.43
)
Ep
he
me
rop
tera
43
.387
4.1
8
(0.9
2–
9.6
3)
18
.48
44
.487
3.8
5
(1.2
7–
10
.07
)
13
.81
42
.557
2.8
7
(0.6
7–
6.7
4)
12
.06
Od
on
ata
51
.847
1.4
7
(0.4
3–
4.2
7)
10
.78
51
.107
0.5
3
(0.5
1–
1.8
4)
10
.35
51
.217
0.2
2
(0.8
7–
1.4
5)
11
.15
Ple
cop
tera
34
.397
3.3
7
(2.3
7–
8.2
8)
52
.117
1.7
8
(0.9
5–
5.2
1)
35
.077
0.2
6
(4.7
8–
5.2
9)
51
.757
1.5
0
(0.3
9–
3.8
8)
32
.967
3.6
0
(0.8
5–
7.1
2)
51
.187
0.7
7
(0.4
4–
2.2
1)
Tri
cho
pte
ra9
5.0
27
2.3
8
(2.5
3–
10
.44
)
76
.897
2.0
6
(3.6
5–
9.7
3)
97
.617
2.1
5
(4.4
1–
12
.05
)
76
.337
2.8
2
(1.5
1–
9.6
4)
92
.827
0.9
8
(0.9
0–
4.1
0)
74
.627
1.5
5
(2.1
8–
6.6
1)
Hir
ud
ine
a2
0.2
97
0.0
9
(0.2
3–
0.3
6)
33
.637
0.8
1
(3.0
0–
4.5
3)
38
.527
1.9
4
(6.2
9–
9.6
4)
33
.137
1.2
6
(1.6
9–
4.0
1)
31
.207
0.2
6
(1.0
2–
1.5
0)
33
.897
1.5
1
(2.1
6–
4.9
1)
Dip
lod
on
sp.
27
(1–
15
)2
.977
3.8
3
(0.7
4–
18
.41
)
1(1
5)
29
.63
27
(1–
15
)0
.277
0.2
1
(0.1
5–
1.1
4)
1(1
5)
1.0
32
7(1
–1
5)
8.7
47
5.9
7
(4.5
2–
20
.71
)
1(1
5)
39
.06
Ch
ilin
asp
.7
(1–
5)
2.1
77
1.6
5
(0.8
6–
4.7
4)
44
.217
5.6
2
(0.7
5–
12
.6)
7(1
–1
5)
0.7
37
0.7
2
(1.2
3–
1.9
5)
42
.057
1.7
4
(1.3
5–
4.6
3)
7(1
–1
5)
6.8
67
1.0
9
(5.4
7–
8.2
1)
48
.527
3.2
0
(6.3
9–
3.2
4)
Hy
ale
lla
sp.
52
.997
3.6
8
(0.9
8–
3.5
0)
52
.997
3.6
8
(0.5
1–
9.3
6)
41
.297
0.3
3
(0.8
4–
1.5
6)
52
.197
3.3
7
(0.2
6–
8.2
0)
43
.387
1.2
1
(2.2
2–
5.0
1)
58
.227
11
.18
(1.6
0–
28
.30
)
Sam
ast
acu
ssp
.b1
3(1
–8
)1
.177
0.1
8
(0.0
7–
0.9
5)
10
.10
15
(1–
6)
0.1
47
0.1
7
(0.0
4–
0.2
0)
40
.127
0.0
7
(0.0
7–
0.2
3)
15
(1–
6)
0.5
77
0.3
1
(0.3
5–
0.8
7)
40
.737
0.1
9
(0.6
1–
2.1
5)
Aeg
lasp
.b2
(2–
6)
2.5
47
3.3
93
0.2
57
0.0
5
(0.2
0–
0.3
0)
2(2
–6
)0
.227
0.0
43
0.1
17
0.0
3
(0.0
9–
0.1
5)
2(2
–6
)3
.317
0.9
53
3.2
77
0.6
3
(2.7
5–
3.9
7)
aC
on
cen
tra
tio
ns
are
for
wh
ole
bo
dy
.b
Co
nce
ntr
ati
on
sa
refo
rw
ho
leb
od
yw
ith
ou
tsh
ell
an
dd
ige
stiv
eg
lan
d.
J.E. Revenga et al. / Ecotoxicology and Environmental Safety 81 (2012) 1–10 7

Author's personal copy
proportion of these decapods in rainbow trout diet could representhigher exposition to Cr but not to Co and As.
As a result, it is possible to interpret the higher availability oflittoral prey items from the more extensive littoral region in MW,relative to ME, could result in significant differences in how Cr istransferred through the food web. For example, Logan (2002)reported a close relationship between Cr and organic matter inlakes enriched with soil-released humic compounds. Organicmatter including terrestrial material is visibly more abundantalong the shorelines of MW (personal observation). Likewise, thisuptake pathway from sediments for Cr also has been demonstratedas important for littoral river crabs Zilchiopsis collastinensis consum-ing organic detritus along the Middle Parana River, northernArgentina (Marchese et al., 2008). The higher [Cr] in Lake Morenodecapods could not be explained by a higher absorption of thiselement from sediment pore water but from a diet based on organicdetritus enriched in Cr in MW.
3.1.3. Tissue distribution in fish
Elements concentrations in animal tissues are not homoge-neous (Luoma and Rainbow, 2008). However, due to logistics andstandard practices, a quick review of literature will indicate thatmeasurements are most frequently made for whole-body inver-tebrates and on muscle-only tissue from large fish. The preferencefor muscle tissue in fish studies is often explained by the difficultyof homogenizing a whole large fish, the low N turnover rate inthat tissue reflecting feeding habits during a longer period, thehigh proportion of muscle to other tissue types in most fish and,in some cases, human consumption concerns.
Nevertheless, information from other organs like livers whichaccumulate differently than muscle through its detoxifying functioncan be a useful monitoring tissue for understanding trophody-namics. This was demonstrated for silver fish, which accumulatespreferably in liver tissue as opposed to muscle tissue, and served asa useful indicator of Ag food web biomagnification and monitoringfish in Patagonian lakes (Revenga et al., 2011; Ribeiro Guevara et al.,
2005). In the present study, [Cr] was higher in muscle than in liverfor all fish (both basins), whereas [Co] presented the inverserelationship. Arsenic concentration showed a more variable picture,in which creole perch had higher values (up to three times) in liverthan in muscle (both basins), but other fish species had the reverserelationship (Table 5). Similar results for elevated As in liver asopposed to muscle tissue was reported by Evans et al. (1998) inNorth American fish species burbot Lota lota, suggesting that aspecies-specific factor could be implied in As tissue distribution.
Our [Cr] results differ from those reported by Kosanovic et al.(2007) who found similar [Cr] in both muscle and liver of marinefish from the Arabian Gulf. Turkish lake research by Turkmen andCiminli (2007) and Uysal et al. (2009) indicated that liver tendedto have higher [Cr] than for muscle tissue for African catfishClarias gariepinus. Crucian carp Carassius carassius and the com-mon nase, Chondrostoma nasus. Similar to As, there appears to bespecies-specific mechanisms for accumulating Cr in varioustissues. Relative to Co, available information is more consistent.Kosanovic et al. (2007) and Turkmen and Ciminli (2007) alsoreported higher [Co] in fish liver than in muscle. In short, livertissue for all fish species tended to show lower [Cr] than musclebut the trends were reversed for [Co].
Velvet catfish D. viedmensis from the eastern basin had thehighest mean [Cr] (Table 5). Assuming that fish muscle is 70percent water for dry-weight tissue concentrations, the averagedry-weight [Cr] in velvet catfish muscle tissue was similar to themaximum measured in 12 species of freshwater fish from fieldstudies in USA (0.01–3.7 mg g�1 DW) (Jenkins, 1980). Whereas themean [Cr] for creole perch was within the reported US freshwaterfish range, the maximum [Cr] found in muscle of those fish fromMW and from velvet catfish from ME exceeded the threshold of4.0 mg g�1 total Cr DW, considered as a presumptive evidence ofCr contamination of lakes (Eisler, 1986). Chromium concentra-tions from the present study could not be compared with minimalrisk levels for humans set by the Agency for Toxic Substances andDisease Registry (USA), since this Agency discriminates among Crspecies [Cr(VI) more toxic than Cr(III) and Cr(IV)], and it is not
Table 5Cr, Co and As mean contents in tissues from different fish in Lake Moreno. N: sample size with range of fish per sample in parenthesis; SD: standard deviation;
N/A: not analyzed.
Species Cr Co As
West East West East West East
N Mean7SD
(rank)
N Mean7SD
(rank)
N Mean7SD
(rank)
N Mean7SD
(rank)
N Mean7SD
(rank)
N Mean7SD
(rank)
O. mykiss
Muscle 5 (1–6) 1.8171.18
(0.40–3.66)
3 (5–10) 0.9570.47
(0.29–1.48)
4 (1–4) 0.2070.27
(0.04–0.64)
4 (7–12) 0.0770.06
(0.02–0.16)
7 (1–6) 0.2470.09
(0.12–2.46)
7 (1–12) 0.4870.51
(0.16–1.62)
Liver 6 (1–6) 0.8770.61
(0.09–1.22)
3 (5–10) 0.4670.27
(0.30–0.82)
6 (1–4) 0.3370.18
(0.19–0.68)
6 (1–12) 0.2270.06
(0.16–0.30)
10 (1–12) 0.6870.36
(0.09–1.13)
4 (1–9) 0.6970.11
(0.59–0.82)
S. fontinalis
Muscle 5 (1–2) 1.1270.49
(0.40–1.61)
6 (1–4) 0.9870.70
(0.10–2.09)
6 (1–2) 0.1270.05
(0.06–0.17)
3 (1–4) 0.0970.02
(0.06–0.10)
3 (1–2) 0.5470.39
(0.12–0.93)
6 (1–4) 0.3870.31
(0.10–0.95)
Liver 6 (1–2) 0.8670.65
(0.37–1.97)
5 (1–4) 0.8770.22
(0.20–1.08)
6 (1–2) 0.3270.09
(0.27–0.50)
7 (1–4) 0.3370.19
(0.15–0.70)
6 (1–2) 0.3470.19
(0.19–0.69)
7 (1–4) 0.7470.43
(0.34–1.59)
P. trucha
Muscle 15 (1–11) 2.5071.52
(0.40–4.85)
5 (1–11) 1.4770.75
(0.40–2.41)
13 (1–10) 0.1270.13
(0.04–0.55)
5 (1–10) 0.0470.02
(0.02–0.08)
17 (1–11) 0.3870.09
(0.27–0.56)
17 (1–11) 0.2370.27
(0.10–1.36)
Liver 7 (4–11) 0.7470.73
(0.10–2.04)
18 (1–11) 0.3470.34
(0.07–1.44)
6 (8–11) 0.7370.36
(0.33–1.40)
17 (1–11) 0.5370.26
(0.11–1.16)
7 (4–11) 1.2870.343
(0.79–0.47)
17 (1–11) 2.1470.86
(0.66–3.60)
G. maculatus
(whole body)
28 (1–30) 0.4670.24
(0.06–0.95)
13 (1–18) 0.4870.34
(0.24–1.09)
28 (1–30) 0.1270.04
(0.02–0.20)
13 (1) 0.1470.08
(0.08–0.32)
25 (1–30) 0.6570.25
(0.10–1.00)
14 (1) 0.5670.27
(0.22–0.84)
D. viedmensis
Muscle N/A N/A 8 3.6071.39
(1.31–5.38)
N/A N/A 8 (1) 0.1170.05
(0.05–0.24)
N/A N/A 8 (1–7) 0.3270.09
(0.16–0.46)
J.E. Revenga et al. / Ecotoxicology and Environmental Safety 81 (2012) 1–108
Author's personal copy
possible to measure Cr speciation using our current INAA meth-ods (http://www.atsdr.cdc.gov). Given the elevated [Cr] values,speciation analyses of Cr in fish from Lake Moreno are needed tofurther assess human and wildlife health risk from consumingthose fish species.
Cobalt concentrations of fish from Lake Moreno were clearlylower than previously reported for freshwater fish in Egypt andAtlantic cod from the Baffin Bay in the Arctic (Ali and Fishar,2005; Muir et al., 2005). Since maximum risk levels are set at0.01 mg Co/kg/day for intermediate duration (365 days) oralexposition (http://www.atsdr.cdc.gov), fish consumption in LakeMoreno is safe relative to Co. Overall, [As] in fish from LakeMoreno are lower than those reviewed for fish muscle tissuecollected from lakes in USA and Canada (Jenkins, 1980). Further-more, most cases of arsenic-induced toxicity in humans are due toexposure to inorganic arsenic. Although there are fewer studieson As speciation in freshwater organisms relative to marineorganisms, several studies coincide that arsenobetaine, an innoc-uous organic compound, is the major arsenical in both freshwaterand marine fish (Miyashita et al., 2009; Peshut et al., 2008; Shiomiet al., 1995; Slejkovec et al., 2004). This information and the lackof reports on human As intoxication in the region, suggest thatthere is no reason for concern on fish consumption relative to Asin Lake Moreno.
4. Conclusions
Biodilution of As, Cr and Co in the two basins of Lake Morenowere indicated by significant negative regressions. Althoughtrophic structures (as shown by C and N stable isotopes relation-ships) in both basins of Lake Moreno are similar, changes in therelative contribution of littoral/pelagic components of food chainscould explain different pathways and accumulation patterns of Crin fish. Furthermore, higher baseline values of d15N in LakeMoreno East could obscure the interpretation of Co and As foodweb transfer. The particular characteristics of Lake Morenoincluding two interconnected basins with different morphologybut similar water quality parameters and identical species com-position, enabled us to hypothesize that underlying phenomenonexplaining differences in both Cr pathway and Co and As tropho-dynamic modeling, is the lake morphology, promoting higherproportion of benthic species in the diet of fish in MW and higherbaseline d15N values in ME.
Acknowledgments
We thank the assistance of Lic. Marina Arcagni and Mr. RicardoSanchez in all the field work, Dr. M. Dieguez and Dr. C. Queimalinosfor their help with the plankton samplers; Dr. R. Daga for the sitecharacterization, Dr. Kurt Kyser and Ms. Kerry Klassen from QFIR atQueen’s University, for isotopes measurements, the RA-6 reactorstaff for the irradiation of the samples and Mr. J. Perez duringplankton sampling. We also thank three anonymous reviewers forvaluable criticism on a previous version of this paper. This work waspartially funded by projects PICT2005 33838 and PICT2003 1051 ofthe ANPCyT (Agencia Nacional de Promocion Cientıfica y Tecnolo-gica) of Argentina and The Canadian Government Department ofForeign Affairs and Trade Emerging Leaders in the Americas ELAPprogram.
References
Agency for Toxic Substances and Disease Registry. Minimal Risk Levels (MRLs) forHazardous Substances. /http://www.atsdr.cdc.gov/S (available June 2011).
Ali, M.H.H., Fishar, M.R.A., 2005. Accumulation of trace metals in some benthicinvertebrate and fish species relevant to their concentration in water andsediment of lake Qarun, Egypt. Egypt. J. Aquat. Res. 31. 1110-0354.
Asante, K.A., Agusa, T., Kubota, R., Mochizuki, H., Ramu, K., Nishida, S., Ohta, S., Yeh,H., Subramanian, A., Tanabe, S., 2010. Trace elements and stable isotope ratios(d13C and d15N) in fish from deep-waters of the Sulu Sea and the Celebes Sea.Mar. Pollut. Bull. 60, 1560–1570.
Balseiro, E.G., Modenutti, B.E., Queimalinos, C.P., 1997. Nutrient recycling andshifts in NP ratio by different zooplankton structures in a South Andes lake. J.Plankton Res. 19, 805–817.
Barwick, M., Maher, W., 2003. Biotransference and biomagnification of seleniumcopper, cadmium, zinc, arsenic and lead in a temperate seagrass ecosystemfrom Lake Macquarie Estuary, NSW, Australia. Mar. Environ. Res. 56, 471–502.
Bjerregaard, P., Andersen, O., 2007. Ecotoxicology of metals—sources, transport,and effects in the ecosystem. In: Nordberg, G.F., Fowler, B.A., Nordberg, M.,Friberg, L.T. (Eds.), Handbook on the Toxicology of Metals. Elsevier, Amsterdam,pp. 251–277.
Campbell, L.M., Norstrom, R.J., Hobson, K.A., Muir, D.C.G., Backus, S., Fisk, A.T.,2005a. Mercury and other trace elements in a pelagic Artic marine foodweb (Northwater Polynya, Baffin Bay). Sci. Total Environ. 351–352, 247–263.
Campbell, L.M., Fisk, A.T., Wang, W., Kock, G., Muir, D.C.G., 2005b. Evidence forbiomagnification of rubidium in freshwater and marine food webs. Can. J. Fish.Aquat. Sci. 62, 1161–1167.
Chen, C.Y., Stemberger, R.S., Klaue, B., Blum, J.D., Pickhardt, P.C., Folt, C.L., 2000.Accumulation of heavy metals in food web components across a gradient oflakes. Limnol. Oceanogr. 45, 1525–1536.
Cui, B., Zhang, Q., Zhang, K., Liu, X., Zhang, H., 2011. Analyzing trophic transfer ofheavy metals for food webs in the newly-formed wetlands of the Yellow RiverDelta, China. Environ. Pollut. 159, 1297–1306.
Dehn, L.A., Follmann, E.H., Rosa, C., Duffy, L.K., Thomas, D.L., Bratton, G.R., Taylor,R.J., O’Hara, T.M., 2006. Stable isotope and trace element status of subsistence-hunted bowhead and beluga whales in Alaska and gray whales in Chukotka.Mar. Pollut. Bull. 52, 301–319.
Dıaz, M., Pedrozo, F.L., Reynolds, C., Temporetti, P.F., 2007. Chemical compositio-nand the nitrogen-regulated trophic state of Patagonian lakes. Limnologica 37,17–27.
Dolson, R., McCann, K., Rooney, N., Ridgway, M., 2009. Lake morphometrypredicts the degree of habitat coupling by a mobile predator. Oikos 118,1230–1238.
Driver, C.J., 1994. Ecotoxicity Literature Review of Selected Hanford Site Con-taminants. Report prepared for U.S. Department of Energy Pacific NorthwestLaboratory Richland, Washington 99352 under Contract DE-ACO6-76RLO1830.
Eisler, R., 1986. Chromium hazards to fish, wildlife, and invertebrates: a synopticreview. U.S. Fish and Wildlife Service Biological Report 85 (1.6), 60 pp.
Eisler, R., 1988. Arsenic Hazards to Fish, Wildlife, and Invertebrates: A SynopticReview. U.S. Fish and Wildlife Service Biological Report 85(1.12).
Evans, M.S., Lockhart, L., Klaverkamp, J., 1998. Metal Studies of Water, Sediments,and Fish from the Resolution Bay Area of Great Slave Lake: Studies Related tothe Decommissioned Pine Point Mine. National Water Research InstituteSeries. Saskatoon7 National Water Research Institute.
Evans, M.S., Muir, D., Lockhart, W.L., Stern, G., Ryan, M., Roach, P., 2005. Persistentorganic pollutants and metals in the freshwater biota of the CanadianSubarctic and Arctic: an overview. Sci. Total Environ. 351–352, 94–147.
Hopkins, W.A., Staub, B.P., Snodgrass, J.W., Taylor, B.E., DeBiase, A.E., Roe, J.H.,Jackson, B.P., Congdon, J.D., 2004. Responses of benthic fish exposed tocontaminants in outdoor microcosms examining the ecological relevance ofprevious laboratory toxicity tests. Aquat. Toxicol. 68, 1–12.
Ikemoto, T., Tu, N.P.C., Okuda, N., Iwata, A., Omori, K., Tanabe, S., Tuyen, B.C.,Takeuchi, I., 2008. Biomagnification of trace elements in the aquatic food webin the Mekong Delta, South Vietnam using stable carbon and nitrogen isotopeanalysis. Arch. Environ. Contam. Toxicol. 54, 504–515.
Jardine, T.D., Kidd, C.A., Fisk, A.T., 2006. Applications, considerations, and sourcesof uncertainty when using stable isotope analysis in ecotoxicology. Environ.Sci. Technol. 40, 7501–7511.
Jenkins, D.W., 1980. Biological Monitoring of Toxic Trace Metals, vol. 2. Toxic TraceMetals in Plants and Animals of the World. Part I. 2. U.S. EnvironmentalProtection Agency Report 600/3-80-090, pp. 364–443.
Kosanovic, M., Yousif Hasan, M., Subramanian, D., Al Ahbabi, A.F., Kathiri, O.A.,Abdulla, M.A., Aleassa, M.A., 2007. Influence of urbanization of the westerncoast of the United Arab Emirates on trace metal content in muscle and liver ofwild Red-spot emperor (Lethrinus lentjan). Food Chem. Toxicol. 45, 2261–2266.
Logan, T.J., 2002. Metals in Scandinavian surface waters: effects of acidification,liming, and potential reacidification. Crit. Rev. Environ. Sci. Technol. 32 (2,3),73–295.
Luoma, S.N., Rainbow, P.S., 2008. Metal Contamination in Aquatic Environments:Science and Lateral Management. Cambridge University Press, Cambridge,New York, USA.
Marchese, M., Gagneten, A.M., Parma, M.J., Pave, P.J., 2008. Accumulation andelimination of chromium by freshwater species exposed to spiked sediments.Arch. Environ. Contam. Toxicol. 55, 603–609.
Mason, R.P., Laporte, J.M., Andres, S., 2000. Factors controlling the bioaccumulationof mercury, methylmercury, arsenic, selenium, and cadmium by freshwaterinvertebrates and fish. Arch. Environ. Contam. Toxicol. 38, 283–297.
Miyashita, S., Shimoya, M., Kamidate, Y., Kuroiwa, T., Shikino, O., Fujiwara, S.,Francesconi, K.A., Kaise, T., 2009. Rapid determination of arsenic species in
J.E. Revenga et al. / Ecotoxicology and Environmental Safety 81 (2012) 1–10 9
Author's personal copy
freshwater organisms from the arsenic-rich Hayakawa River in Japan usingHPLC-ICP-MS. Chemosphere 75, 1065–1073.
Modenutti, B.E., Balseiro, E.G., Queimalinos, C.P., Anon Suarez, D., Dieguez, M.C.,Albarino, R.J., 1998. Structure and dynamics of food webs in Andean lakes.Lake Reserv. Manage. 3, 179–186.
Modenutti, B.E., Balseiro, E.G., Queimalinos, C.P., 2000. Ciliate community struc-ture in two South Andean lakes: the effect of lake water on Ophrydium
naumanni distribution. Aquat. Microb. Ecol. 21, 299–307.Muir, D., Wang, X., Bright, D., Lockhart, L., Kock, G., 2005. Spatial and temporal
trends of mercury and other metals in landlocked char from lakes in theCanadian Arctic archipelago. Sci. Total Environ. 351–352, 464–478.
Nfon, E., Cousins, I.T., Jarvinen, O., Mukherjee, A.B., Verta, M., Broman, D., 2009.Trophodynamics of mercury and other trace elements in a pelagic food chainfrom the Baltic Sea. Sci. Total Environ. 407, 6267–6274.
Pereira, A.A., van Hattum, P.M., de Boer, J., van Bodegom, P.M., Rezende, C.E.,Slomons, W., 2010. Trace elements and carbon and nitrogen stable isotopes inorganisms from a tropical coastal lagoon. Arch. Environ. Contam. Toxicol. 59,464–477.
Peshut, P.J., Morrison, R.J., Brooks, B.A., 2008. Arsenic speciation in marine fish andshellfish from American Samoa. Chemosphere 71, 484–492.
Peterson, B.J., Fry, B., 1987. Stable isotopes in ecosystems studies. Annu. Rev. Ecol.Syst. 18, 293–320.
Phillips, D.L., 2001. Mixing models in analyses of diet using multiple stableisotopes: a critique. Oecologia 127, 166–170.
Phillips, D.L., Gregg, J.W., 2001. Uncertainty in source partitioning using stableisotopes. Oecologia 127, 171–179.
Phillips, D.L., Newsome, S.D., Gregg, J.W., 2005. Combining sources in stableisotope mixing models: alternative methods. Oecologia 144, 520–527.
Queimalinos, C.P., Modenutti, B.E., Balseiro, E.G., 1999. Symbiotic association of theciliate Ophryidium naumanni with Chlorella causing a deep chlorophyll amaximum in an oligotrophic South Andes lake. J. Plankton Res. 21, 167–178.
Revenga, J.E., Campbell, L.M., Kyser, K., Klassen, K., Arribere, M.A., Ribeiro Guevara,S., 2011. Trophodynamics and distribution of silver in a Patagonia Mountainlake. Chemosphere 83, 265–270.
Ribeiro Guevara, S., Bubach, D.F., Vigliano, P.H., Lippolt, G., Arribere, M.A., 2004.Heavy metal and other trace elements in native mussel Diplodon chilensis fromNorthern Patagonia Lakes, Argentina. Biol. Trace Elem. Res. 102, 245–263.
Ribeiro Guevara, S., Arribere, M.A., Bubach, D.F., Vigliano, P.H., Rizzo, A.P., Alonso, M.,Sanchez, R., 2005. Silver contamination on abiotic and biotic compartments of
Nahuel Huapi National Park lakes, Patagonia, Argentina. Sci. Total Environ. 336,119–134.
Richard, F.C., Bourg, A.C.M., 1991. Aqueous geochemistry of chromium: a review.Water Res. 25, 807–816.
Rogowski, D.L., Soucek, D.J., Levengood, J.M., Johnson, S.R., Chick, J.H., Dettmers,J.M., Pegg, M.A., Epifanio, J.M., 2009. Contaminant concentrations in Asiancarps, invasive species in the Mississippi and Illinois Rivers. Environ. Monit.Assess. 157, 211–222.
Shiomi, K., Sugiyama, Y., Shimakura, K., Nagashima, Y., 1995. Arsenobetaine as themajor arsenic compound in the muscle of two species of freshwater fish. Appl.Organomet. Chem. 9, 105–109.
Slejkovec, Z., Bajc, Z., Doganoc, D.Z., 2004. Arsenic speciation patterns in fresh-water fish. Talanta 62, 931–936.
Sydeman, W.J., Jarman, W.M., 1998. Trace metals in seabirds, steller sea lion andforage fish and zooplankton from central California. Mar. Pollut. Bull. 36,828–832.
Sokal, R.R., Rohlf, F.J., 1981. Biometry. W.H. Freeman Publishers, San Francisco.Tu, N.P.C., Agusa, T., Ha, N.N., Tuyen, B.C., Tanabe, S., Takeuchi, I., 2011. Stable
isotope-guided analysis of biomagnification profiles of arsenic species in atropical mangrove ecosystem. Mar. Pollut. Bull. 63, 124–134.
Turkmen, M., Ciminli, C., 2007. Similar determination of metals in fish and musselspecies by inductively coupled plasma–atomic emission spectrometry. FoodChem. 103, 670–675.
Uysal, K., Kose, E., Bulbul, M., Donmez, M., Erdogan, Y., Koyun, M., Omeroglu, C., Ozmal,F., 2009. The comparison of heavy metal accumulation ratios of some fish speciesin Enne Dame Lake (Kutahya/Turkey). Environ. Monit. Assess. 157, 355–362.
Vander Zanden, M.J., Rasmussen, J.B., 1999. Primary consumer d13C and d15N andthe trophic position of aquatic consumers. Ecology 80, 1395–1404.
Vanderklift, M.A., Ponsard, S., 2003. Sources of variation in consumer diet d15Nenrichment: a meta analysis. Oecologia 136, 169–182.
Vigliano, P.H., Beauchamp, B.A., Milano, D., Macchi, P.J., Alonso, M., Garcia Asorey,M., Denegri, M.A., Ciancio, J.E., Lippolt, G., Rechencq, M., Barriga, J.P., 2009.Quantifying predation on Galaxiids and other native organisms by introducedrainbow trout in an ultraoligotrophic lake in Northern Patagonia, Argentina: abioenergetics modeling approach. Trans. Am. Fish. Soc. 138, 1405–1419.
Wang, W.-X., 2002. Interactions of trace metals and different marine food chains.Mar. Ecol. Prog. Ser. 243, 295–309.
Watanabe, K., Monaghan, M.T., Takemon, Y., Omura, T., 2008. Biodilution of heavymetals in a stream macroinvertebrate food web: evidence from stable isotopeanalysis. Sci. Total Environ. 394, 57–67.
J.E. Revenga et al. / Ecotoxicology and Environmental Safety 81 (2012) 1–1010
Copyright © 2022 FDOKUMEN