Taylor-PEA.pdf - Patagonia Area Resource Alliance
239
AMC Mining Consultants (Canada) Ltd. BC0767129 — 200 Granville Street, Suite 202 Vancouver BC V6C 1S4 CANADA — T +1 604 669 0044 F +1 604 669 1120 E [email protected] W amcconsultants.com Adviser of choice to the world’s minerals industry Technical Report Hermosa Property, Taylor Zn-Pb-Ag Deposit PEA Arizona Minerals Inc. Santa Cruz County, Arizona, USA In accordance with the requirements of National Instrument 43-101 “Standards of Disclosure for Mineral Projects” of the Canadian Securities Administrators Qualified Persons: G. Methven P.Eng. G. Z Mosher P.Geo. Q. Jin P.E. W. Hughes P.Eng. C. Kottmeier P.Eng. R. M. Smith P.E. D. Bartlett, CPG AIPG, RG AZ E. Christenson P.E. AMC Project: 716027 Effective date: 29 March 2017 Submitted date: 11 April 2017
-
Upload
khangminh22 -
Category
Documents
-
view
1 -
download
0
Transcript of Taylor-PEA.pdf - Patagonia Area Resource Alliance

AMC Mining Consultants (Canada) Ltd. BC0767129
— 200 Granville Street, Suite 202 Vancouver BC V6C 1S4 CANADA
— T +1 604 669 0044 F +1 604 669 1120 E [email protected] W amcconsultants.com
Adviser of choice to the world’s minerals industry
Technical Report Hermosa Property, Taylor Zn-Pb-Ag Deposit PEA Arizona Minerals Inc.
Santa Cruz County, Arizona, USA
In accordance with the requirements of National Instrument 43-101 “Standards of Disclosure for Mineral Projects” of the Canadian Securities Administrators
Qualified Persons:
G. Methven P.Eng. G. Z Mosher P.Geo. Q. Jin P.E. W. Hughes P.Eng. C. Kottmeier P.Eng. R. M. Smith P.E. D. Bartlett, CPG AIPG, RG AZ E. Christenson P.E.
AMC Project: 716027 Effective date: 29 March 2017 Submitted date: 11 April 2017

Hermosa Property, Taylor Zn-Pb-Ag Deposit PEA Arizona Minerals Inc. 716027
amcconsultants.com 1
1 Summary
Introduction
AMC Mining Consultants (Canada) Ltd. (AMC) was commissioned by Arizona Mining Inc. (AZ) to prepare an updated Mineral Resource estimate and Preliminary Economic Assessment (PEA) and report according to National Instrument 43-101 Technical Report (NI 43-101 Technical Report or Report) for the Taylor Zn-Pb-Ag deposit located on the Hermosa Property, (Property). The Property is located in Santa Cruz County near the town of Patagonia, southern Arizona, USA.
The Property hosts two known mineral deposits, the Taylor Deposit and the Central Deposit. The latest Technical Report for the Property was completed by AMC, dated 29 November 2016 and reported additional Mineral Resources for the Taylor Deposit, (November 2016 Technical Report). Prior to that the Taylor Deposit was also the subject of an NI 43-101 report dated 17 March 2016 by Metal Mining Consultants Inc. (March 2016 Technical Report). The Property is 100% owned by Arizona Minerals Inc. (AMI) a wholly owned subsidiary of AZ. This Technical Report provides an update of the Mineral Resource estimate for both the Taylor and Central deposits and reports the results of the PEA.
AMC are responsible for managing and preparing the Technical Report with inputs from Mr G Mosher of Global Mineral Resource Services, an associate of AMC, Mr G. Methven AMC, Mr W. Hughes AMC, Mr C. Kottmeier AMC, Mr Q. Jin, SGS North America Inc., Mr R. M. Smith, Newfields, Mr E. Christenson of WestLand Resources Inc., Mr D. Bartlett of Clear Creek Associates.
All currency amounts and commodity prices are in United States (US) dollars unless stated otherwise. Quantities are stated in both Imperial and SI units. Commodity weights of measure are in ounces per short ton (oz/ton) or percent (%) unless stated otherwise.
Location, ownership and history
The Property is located approximately 50 miles (81 km) southeast of Tucson, Arizona; 15 miles (24 km) northeast of Nogales in Santa Cruz County, Arizona, and eight miles (13 km) north of the international border with Mexico. The area has a semi-arid climate. Available water well information and preliminary hydrological analysis suggests adequate water supplies are available for project requirements. Experienced, skilled workers are readily available within a reasonable commuting distance. All major services and supplies are available in Tucson.
Arizona Mining Inc. (AZ) holds 100% ownership interest in the Property through its wholly owned subsidiary Arizona Minerals Inc. (AMI), a Nevada corporation, which was registered on 4 October 2005 with the Arizona Corporation Commission to do business within the State of Arizona.
The Property was explored by ASARCO intermittently from 1940 through 1991. Pan American Silver held the Property between 1994 and 2002 but confined their activity to internal economic evaluations. AZ has been active on the Property since 2006.
Geology and mineralization
Southeastern Arizona lies within a belt of 1600 to 1700 Ma-age Proterozoic rocks. Late Precambrian-Early Paleozoic rifting split the Proterozoic basement into a number of separate continental blocks with passive continental margins. Phanerozoic shelf-type sediments overlie the Precambrian basement.
The oldest rocks in the Patagonia Mountains are Proterozoic-age granodiorite that are overlain by Cambrian-age sedimentary rocks. Most of Arizona was above sea level during the Ordovician and Silurian. Widespread sedimentary deposition resumed in the upper Devonian. Pennsylvanian-Permian-age sandstones, shales and carbonates were deposited during a time of shifting and cyclical environments. The Pennsylvanian Naco Group of southeastern Arizona is comprised of Pennsylvanian Horquilla Limestone, the Pennsylvanian-Permian Earp Formation and the Permian Colina Limestone, Epitaph Dolomite, Scherrer Formation and Concha Limestone. The Epitaph Formation, Scherrer Formation and the Concha Limestone underlie the Hermosa project and are disconformably overlain by Jurassic rhyolites.

Hermosa Property, Taylor Zn-Pb-Ag Deposit PEA Arizona Minerals Inc. 716027
amcconsultants.com 2
Mesozoic-age volcanic, sedimentary and intrusive rocks lie disconformably above the Paleozoic stratigraphic sequence. Cretaceous-age intermediate and felsic volcanic and intrusive rocks cover much of the Property and surrounding areas. In the northwestern Patagonia Mountains, Jurassic granite intrudes Triassic to Jurassic volcanic and sedimentary rocks. Most of the central and southern parts of the range consist of Laramide-age (64 to 58 Ma), medium to coarse-grained hornblende granodiorite batholithic rocks. The batholith is bounded by northwest-striking faults and its emplacement is thought to have been structurally controlled.
Seven stratigraphic units have been recognized within the Property: three carbonate units of Paleozoic age (in ascending order, Epitaph, Scherrer and Concha) that are overlain by two volcanic units; the Hardshell (Jurassic age) and Meadow Valley (Cretaceous age). An undivided carbonate unit (Lower Paleozoic Carbonate) and an older volcanic unit (Older Volcanics Triassic / Jurassic age) comprise the sixth and seventh domains. All units dip gently to the northwest but stratigraphic relationships are complicated by the presence of a listric thrust that dips to the southwest, predates the two youngest Mesozoic volcanic units, and places the Epitaph, Scherrer and Concha over the undivided Lower Paleozoic Carbonate unit. A near-vertical, northeast striking fault, that may comprise a portion of the thrust, also predates the two youngest Tertiary volcanic units and separates the carbonate sequence to the southeast from a volcanic sequence to the northwest that includes the Older Volcanic unit.
The Property hosts two stratigraphically controlled mineral deposits. The two deposits, Taylor Deposit and the Central Deposit. The Taylor Deposit is predominantly a carbonate replacement deposit (CRD) which permeates downward, to significant depth (3,600 feet (ft) or 1,100 meters (m)), into three recognized sedimentary formations on the Property and is comprised of Zn-Pb-Ag-Cu sulphides. The Central Deposit is a Manto style deposit which is confined to the contact between Permian carbonates and the overlying Jurassic rhyolites and does not permeate below the Concha limestone 100 ft to 500 ft (30 m – 150 m). The Central Deposit is comprised of Mn oxides with accessory silver minerals. The host rocks (Jurassic Rhyolites and Concha Limestone) strike approximately southwest-northeast and dip ± 25° to the northwest. They do not appear to be significantly disrupted by post-mineralization faulting at deposit scale.
Exploration and data management
AZ has been active on the Property since 2006 the work carried out has been almost exclusively drilling.
Drill programs conducted by AZ on the Property between 2007 and 2016 are summarized in Table 1.1
Table 1.1 AZ drill programs
Year Type Number Length (ft) Length (m) Target
2007 Core 4 4,450 1,356 Central Deposit
2007 & 2008 Core 3 7,928 2,416 Central Deposit
2009 Core 6 12,005 3,659 Central Deposit
2010 -2012 Core 57 81,846 24,947 Central Deposit
2012 RC 6 2,480 756 Central Deposit
2010 -2012 RC 159 101,813 31,033 Central Deposit
2007 - 2012 Core 16 32,846 10,011 Taylor Deposit
2014 - 2015 Core 8 29,337 8,942 Taylor Deposit
2016 Core 35 144,010 43,894 Taylor Deposit
2016 - 2017 Core 37 151,483 46,172 Taylor Deposit
Total 331 568,198 173,187
Mineral Resource estimates
The current Mineral Resource estimate is an update of the estimate presented in the November 2016 Technical Report. The current estimate is based on 20,369 assays from 440 surface drillholes. AZ provided wireframes of major lithological units, and gradeshells of the main mineralized domains, in dxf format, together with drillhole

Hermosa Property, Taylor Zn-Pb-Ag Deposit PEA Arizona Minerals Inc. 716027
amcconsultants.com 3
locations, downhole surveys, assays and geology as csv data files. There is one difference to 2016 in that the sulphide and oxide domains are estimated in a single block model and discussed as one below.
The dataset upon which the current Mineral Resource is based has an effective date of 16 February 2017 and includes data from 37 holes (151,483 aggregate feet or 46,172 m), that were drilled since the 2016 resource estimate. Brining the total number of drill holes used for the sulphide resource to 96 (358,250 aggregate feet or 109,189 m). Mr. Greg Mosher, P.Geo. an associate of AMC completed the Mineral Resource estimate using GenesisTM software from SGS Geostat.
The estimation has been carried out within eight grade domains: Veins within Mesozoic volcanics termed the Trench Vein System, together with three carbonate units of Paleozoic age, in ascending order, Epitaph, Scherrer and Concha, the underlying thrust contact between the Epitaph and overthrust younger volcanics, termed the Taylor Deeps and several related lenses of mineralization termed the Sub-Taylor Deeps, comprise the sulphide portion of the deposit collectively termed the Taylor Deposit. The Central Deposit, which lies up-dip of the Taylor Deposit and contains oxide mineralization, is comprised of the Upper Silver zone (LAG), and the Manto Oxide zone (MOX).
Log probability plots of copper, lead, zinc and silver assays were examined for evidence of statistical outliers. Only silver assays demonstrated the presence of a weak break in the trend line and it was decided that capping was not warranted because the effect of capping is negligible with respect to the resultant estimated grade.
The majority of samples are five (5) feet (1.5 m) in length but because the anticipated stope height is on the order of 60 ft or 100 ft (18 m or 30 m), resolution of data at a scale of five feet in the vertical direction was considered unnecessarily fine. For that reason, samples from the LAG, MOX, Concha, Scherrer Epitaph and Taylor Deeps domains were composited to 10 ft (3 m) in length. In comparison to the other domains, the Trench Vein System and Sub-Taylor Deeps domains are relatively narrow for this reason samples from these domains were composited to a nominal five feet. The length of these composites was adjusted to completely fill the sample length so that the exact five-foot length was obtained only in cases in which the samples spanned a distance evenly divisible by five feet. Compositing honoured lithological domain boundaries. Partial composites were discarded if less than one foot in length. The 20,369 samples within the volume of the gradeshells were reduced to 10,865 composites.
A formula to estimate bulk density during the resource tabulation process was devised on the basis of abundance of galena, sphalerite and chalcopyrite. Table 1.3 sets out the parameters used for the bulk density estimation and hence the tonnage factor used. This formula produces bulk density values within approximately 10% of the measurements carried out on the drill core. Because the estimation was carried out in Imperial units, it was necessary to convert bulk density to tonnage factor (cubic feet/short ton). That conversion is also included in Table 1.2. The formula, in its reduced form is:
TF= (((Pb%*0.0862)+(Zn%*0.0597)+(Cu%*0.12))+((100-Pb%-Zn%-Cu%)*0.027)*0.031).

Hermosa Property, Taylor Zn-Pb-Ag Deposit PEA Arizona Minerals Inc. 716027
amcconsultants.com 4
Table 1.2 Tonnage factor calculation
Element % of mineral Mineral SG of mineral
Pb 87 Galena 7.5
Zn 67 Sphalerite 4.0
Cu 35 Chalcopyrite 4.2
Hostrock 2.7
SG units g/cm³
Bulk density to ft³/ton = 62.43 lbs/ft³/2000 lbs
Example of calculation of formula terms:
SG of Galena = (Pb%/0.87)*(7.5/100) = Pb%*0.0862
TF = (((Pb%*0.0862)+(Zn%*0.0597)+(Cu%*0.12)+((100-Pb%-Zn%-Cu%)*0.027))*0.031)
Spatial continuity of mineralization (assays of silver, copper, lead, zinc and manganese) was assessed using DataMine variographic software.
Lead, zinc and silver grades were estimated for four of the sulphide domains, Concha, Scherrer, Epitaph, and Taylor Deeps using Ordinary Kriging. Lead, zinc and silver grades were estimated for the Trench Vein System and Sub-Taylor Deeps domains using Inverse Distance Squared (ID²). Silver, zinc and manganese were estimated for the LAG and MOX domains using Ordinary Kriging. Grades were interpolated in three passes of increasing search ellipse dimensions. In order for a grade to be interpolated into a block in passes 1 and 2, it was necessary that a minimum of four (4) and a maximum of 10 composites were located within the volume of the search ellipse. In pass 3, the minimum ranged from 1 to 4 composites; the maximum remained at 10 composites. In all three passes, each block was informed by a minimum of two holes.
Because of their variable orientation, grades were interpolated for the LAG and Trench Vein System domains using the dynamic anisotropy module in Datamine.
Each domain was estimated separately and boundaries between domains were treated as hard, i.e. the estimation of grades within one domain could not be influenced by grades of composites in adjacent domains.
Grades of silver, lead and zinc for the Taylor Deposit have been estimated for the sulphide domains and the resource has been tabulated on the basis of Zinc Equivalency (ZnEq). Copper was not used as a component of the ZnEq formula because of its relatively low abundance and uncertainty pertaining to mineral processing and recovery and therefore to its value.
The ZnEq formula to equate lead and silver to zinc is:
ZnEq = [((Pb%/100)*2000*$0.95*95%) + ((Zn%/100)*2000*$1.00*92%) + (Ag ounces/short ton*$20.00*90%)] /((2000*$1.00*92%)/100)
The price and recovery inputs to the equation are given in Table 1.3.
Table 1.3 Zinc equivalent parameters
Metal Price (US$) Recovery (%)
Lead 0.95/lb 95
Zinc 1.00/lb 92
Silver 20.00/lb 90
Silver, zinc and manganese grades have been estimated for the LAG and MOX Domains. Although manganese is generally the most valuable metal of the three, it was decided to tabulate the resource on the basis of the combined monetary value of the three metals rather than as a manganese equivalency because a manganese equivalency is considered an unconventional concept. The dollar value is based on metal grade times metal price times metal recovery. The combed metal value is termed Oxval (oxide value) and the formula is:

Hermosa Property, Taylor Zn-Pb-Ag Deposit PEA Arizona Minerals Inc. 716027
amcconsultants.com 5
Oxval = ((Mn grade (%)* $1.22*86%)+(Zn grade (%)*$1.00*55%)+(Ag ounces/short ton*$20.00*72%)) where the recovery rate for manganese is 86%, for zinc 55% and for silver 72%.
Mineral Resources were classified as Measured, Indicated and Inferred. For a block to be classified as Measured, it was necessary that a minimum of 16 (16) composites were located within 250 feet of the block centroid; for a block to be classified as Indicated, it was necessary that a minimum of eight (8) composites were located within 500 ft (152 m) of the block centroid and for a block to be classified as Inferred, it was necessary that a minimum of four (4) composites be located within 750 ft (229 m) of the block centroid with the exception of the Trench Vein System and Sub-Taylor Deeps domains for which a block could be classed as Inferred if three composites from two drillholes were located within 1,500 ft (457 m) of the block centroid.
The block model was validated in three ways: visual comparison between block grades and underlying assay grades, statistical comparison between block and composite values, and by swath plots in east-west, north-south and vertical slices. The swath plots are for the entire deposit and are based on an amalgamation of ZnEq values for all seven geological domains. In all cases there is reasonable correlation and agreement although grades are inevitably smoothed by the kriging process.
The following tables summarizes the Measured, Indicated and Inferred Mineral Resources for the Taylor and Central Deposits, as of 29 March 2017. Mineral Resources that are not Mineral Reserves do not have demonstrated economic viability.
Table 1.4 is a summary of the Mineral Resources for the Taylor Deposit stated at 29 March 2017 at a cut-off grade of 4% ZnEq
Table 1.4 Taylor Deposit Mineral Resources
Classification Million tons Zn% Pb% Ag oz/ton ZnEq%
Measured 8,613 4.2 4.0 1.6 9.7
Indicated 63,840 4.5 4.4 1.9 10.6
Measured and Indicated 72,453 4.4 4.4 1.8 10.5
Inferred 38,627 4.4 4.2 3.1 11.6
Mineral Resources are reported as of 29 March 2017 Stated at a cut-off grade of 4% ZnEq based on prices, recovery and costs as follows: Prices of $1.00/lb for zinc, $0.95/lb for lead and $20.00/oz for silver Average processing recovery factors of 90% for zinc, 95% for lead, and 85% for silver Total operating costs are estimated to be of the order of $60/ton. ZnEq calculation is discussed above Numbers are rounded and may not match later detailed tables.
Table 1.5 is a summary of the Mineral Resources for the Central Deposit stated at 29 March 2017 at a cut-off grade of US$100/ton (OxVal). The cut-off grades for Central Deposit have been predicated on the assumption that these resources will be extracted by underground methods.
Table 1.5 Central Deposit Mineral Resources
Classification Million tons Zn (%) Ag (opt) Mn (%) Oxval ($/Ton)
Measured 20.702 1.8 4.1 9.2 270
Indicated 49.913 2.3 1.9 9.6 250
Measured & Indicated 70.616 2.2 2.5 9.5 260
Inferred 0.350 3.2 2.7 7.2 226
Mineral Resources are reported as of 29 March 2017 Stated at a cut-off grade of $100/ton Oxval based on prices, recovery and costs as follows: Prices of $1.00/lb for zinc, $0.95/lb ,$20.00/oz for silver and $1.22/lb for manganese Average processing recovery factors of 55% for zinc, 86% for manganese, and 72% for silver Total operating costs (mining and processing) are estimated to be on the order of $100/ton. Oxval calculation is discussed above Numbers are rounded and may not match later detailed tables.
Hermosa Property, Taylor Zn-Pb-Ag Deposit PEA Arizona Minerals Inc. 716027
amcconsultants.com 6
Mineral Resources are not Mineral Reserves and do not have demonstrated economic viability. There is no certainty that all or any part of Mineral Resources will be converted to Mineral Reserves. Inferred Mineral Resources are based on limited drilling which suggests the greatest uncertainty for a Mineral Resoouce estimate and that geological continuity is only implied. Additional drilling will be required to verify geological and mineralization continuity and there is no certainty that all of the Inferred Mineral Resources will be converted to Measured and Indicated Mineral Resources. Quantity and grades are rounded to reflect the fact that the estimate is an approximation.
Metallurgy
The Hermosa Taylor deposit is a lead-zinc-silver deposit with relatively simple mineralogy. Upon review of the metallurgical testing data, it is clear that Hermosa Taylor mineralization responded well to a conventional sequential lead / silver – zinc flotation.
Most of the composites tested for Bond ball mill work index were in the medium to moderately hard range. The Bond abrasion indices indicate mild to medium abrasiveness.
The projected final lead concentrate graded 69.7% Pb and 1,072 g/t Ag at a lead recovery of 95.4% and a silver recovery of 69.3%. The final zinc concentrate graded 56.1% Zn at a zinc recovery of 92.7%. The overall silver recovery was 92.4%.
Mercury and fluorine levels of cycle F concentrates from all locked cycle tests were below levels deemed problematic to smelters. The manganese content of the final zinc concentrate was 1.32% Mn. Zinc smelters in particular could start with penalty rates as low as 0.5% Mn.
Processing
The project processing facility is designed to treat 10,000 tpd of lead, zinc and silver material at an operational availability of 92%. The processing flow sheet for the project is a standard flow sheet that is commonly used in the mining industry, including conventional flotation recovery methods typical for lead-zinc material. Figure 1.1 below is a process plant overall flowsheet. SGS completed the process design based on the results of 2017 SGS Lakefield metallurgical testing programs.
Run-of-mine (ROM) material will be crushed in a primary jaw crusher that is located adjacent to the underground mine portal. From there it will be conveyed to the processing facilities where it will be ground to 80 percent finer than 105 microns in a semi-autogenous grinding (SAG) and ball milling circuit.
The mineralized material is further processed in a flotation circuit consisting of lead flotation followed by zinc flotation. The majority of the silver will be recovered in the lead flotation circuit and some silver will also be collected in the zinc flotation circuit.
Lead sulfide will be recovered in a rougher flotation bank, producing a concentrate that will be upgraded to smelter specifications in three stages of cleaning. Tails from the lead flotation section will then be conditioned for zinc sulfide flotation. The process scheme for zinc flotation also includes a rougher bank and two stages of cleaning to produce smelter-grade zinc concentrates. For both lead and zinc sections, the rougher flotation concentrates will be reground to 80 percent finer than 38 microns prior to cleaner flotation to liberate the sulfides for further upgrading.
Tailings from the flotation circuit will be thickened, filtered and conveyed to a splitter at the plant. From there, normally 55% of the filtered tailings will be conveyed to tailing storage facility and the remainder will be disposed of as backfill into the underground mine.
Water will be reclaimed from the tailing thickener overflow and from the tailing filtrate. Process make-up water will be pumped from the water wells.
Lead and zinc concentrates will be thickened, filtered, and discharged to a covered stockpile. They will then be reclaimed by front-end loader onto highway haulage trucks for ocean shipment to smelters.

Hermosa Property, Taylor Zn-Pb-Ag Deposit PEA Arizona Minerals Inc. 716027
amcconsultants.com 7
Figure 1.1 Flowsheet for lead and zinc concentrate production
Surface infrastructure
Infrastructure near the project site is either available or readily upgradable as described in this report. There is reasonably modern infrastructure surrounding the Hermosa project and it is in close proximity to a qualified work force for construction and also operating the mine site. The infrastructure includes a paved road between Patagonia and the project mine site. The existing power line to the site is adequate for temporary facilities only and will need to be upgraded to supply power for the project. The water source for the project is under investigation on the mine private property, potential water resources are currently being evaluated for existing wells located at the project site. Additional water sources located approximately 8 miles (13 km) from the mine property are also being consider as an alternative. A reasonable amount of infrastructure has been included for development of this project.
Tailings storage facility
The Hermosa project will include an underground mining operation where minerals will be extracted through a milling process. After mineral extraction, approximately 50% of the tailings will be sent back underground as backfill and the remaining tailings will be filtered and placed in a dry stack tailings storage facility (TSF) on the surface. In addition to tailings, mine development rock will be generated during the mining process. It is anticipated that approximately half of the mine development rock will contain sulphide minerals and will be classified as potentially acid generating (PAG) rock and the other half classified as non-PAG. All PAG rock will be stored within the dry stack TSF on the surface. The PAG rock will be co-mingled with the tailings, thereby encapsulating the PAG rock within the dry stack tailings. The non-PAG rock will be utilized as construction material for the dry stack TSF and related infrastructure.
Two dry stack TSF locations, Trench Camp and Hermosa, will be designed to contain the dry stack tailings and PAG development rock produced from the mining operation. Additionally, the Trench Camp TSF will store historic tailings which currently reside within the proposed TSF footprint. The TSFs will utilize the majority of the non-PAG development rock as armoring on the exposed face of the tailings to prevent water and wind erosion. The design

Hermosa Property, Taylor Zn-Pb-Ag Deposit PEA Arizona Minerals Inc. 716027
amcconsultants.com 8
of each TSF consists of a perimeter road which fully encloses a composite lined TSF basin, consisting of a low permeability soil layer (prepared subgrade) and geomembrane liner. Located directly on the geomembrane liner, a protective layer augmented by drainage pipes sited in the topographic lows will be used to provide cover over the geomembrane liner. The protective layer (granular material) will also limit hydraulic head and hydraulic gradient on the liner system by promoting drainage. Each TSF is designed as a “zero discharge” (non-discharge) facility where water liberated from the tailings will be re-used in the process circuit along with any meteoric water collected from precipitation events, falling directly on the TSF footprint.
Underground mining and infrastructure
The climate in the project area varies from high desert in the Sonoita Valley to the steppe-like climate of the higher elevation grasslands and scrub area. Average rainfall is 17 in (432 mm) per year, with the majority of precipitation occurring between June and October. The Project area is located within the Middle Sonoita Creek and Harshaw Creek watersheds.
Groundwater flows in bedrock fractures at the site. There is little to no alluvium present. Groundwater is recharged from precipitation at higher elevations and in the washes and drainages which carry surface flows from rain events north and northwest out of the basins.
Porosity of fractured bedrock aquifers is generally low, on the order of 1% to 2%. However, mineralization can result in higher porosities. Based on initial aquifer testing results at selected locations, it is estimated that groundwater inflows to the underground mine will be low, possibly less than 5 l/s, depending on the geometry of the underground workings.
Call & Nicholas, Inc. (CNI) undertook the preliminary geotechnical study for the underground works on the Project. The recommended mining method is sub-level open stoping (SLOS). Mining will take place initially from the primary stopes followed by secondary stopes. The recommended maximum stope dimensions for mining parallel to strike in the Concha are 148 ft H by 69 ft L by 50 ft W (45 m H by 21 m L by 15 m W) and in the Epitaph are 100 ft H by 45 ft L and 50 ft W (30 m H by 14 m L by 15 m W). While CNI recognize a third rock type, the Scherrer, is rich in mineralization and is planned for mining, it was not separated as a distinct geotechnical domain. Any mining that occurs within the Scherrer should follow the criteria of the Epitaph rock type.
Stope dimensions were optimized for height, rather than length. In both domains, because of the geologic joint fabric, mining perpendicular to the strike of the deposit allows for greater achievable dimensions. Analyses were limited to a depth of 4000 feet (1,219 m).
The Concha rock type was identified as the superior mining host rock. The rock quality designation (RQD = 93%), joint conditions, and intact rock strength qualify this rock to be of good quality per Barton’s Q’ classification system. The Epitaph rock type was identified as the lesser quality mining host rock. While the Epitaph has an identical rock quality designation (RQD = 93%), the joint conditions were of significantly less quality than those from within the Concha rock type.
In order to achieve nearly full mineral recovery at the project, paste backfill will be used to fill open stopes following their excavation. By filling these stopes with paste backfill, pillars will be established that will subsequently become the walls of later stage (secondary) stopes. In order to stand at heights up to 147 ft (45.0 m) when mining in the Concha, a paste fill strength of 967 kPa is required (Mitchell, et al.). When mining in the Epitaph, in which stope heights are less 100 ft (30.0 m), a paste fill strength of 645 kPa is required.
Development drifts include all decline drifting and level access drifts, with assumed dimensions of 18 ft by 18 ft (5.5 m by 5.5 m). Due to the good quality of the rock, no support beyond spot bolting should be required in the development drifts. However, AZ should anticipate the presence of infrequent faults that may require some support. Surficial support in the form of fibre-reinforced shotcrete (fibrecrete), or shotcrete in conjunction with pattern bolting may be needed when mining through these faults.
Production drifts include all stope accesses; bottom cuts, middle cuts, and top cuts, with dimensions of 14.8 ft by 14.8 ft (4.5 m by 4.5 m). Stope bottom cuts will not generally require any support beyond infrequent spot bolting.

Hermosa Property, Taylor Zn-Pb-Ag Deposit PEA Arizona Minerals Inc. 716027
amcconsultants.com 9
However, to account for faulting and areas of lesser quality ground, CNI recommend using fibrecrete or shotcrete with systematic bolting 6 ft lengths, 5.2 ft spacing(1.8 m lengths; 1.6 m spacing) in approximately 20% of all production drifting.
The proposed shaft dimensions are 21 ft diameter (6.5 m). The total shaft length is 3,625 ft (1,105 m). The temporary support requirements consist of 7.8 ft (2.4 m) friction bolts and welded-wire mesh. Permanent support includes concrete lining with a design compressive strength of 418,000 lbs/ft2 to 585,000 lbs/ft2 (20-28 MPa), minimum lining thickness of 17.7 in (450 mm).
Several options exist to access the Taylor deposit. AMC undertook a trade-off study to evaluate the various options and generate a net present value for each case. Options considered included:
• Option 1 (Base Case) – the deposit is accessed via a decline from surface and a vertical shaft.
• Option 2 – the deposit is accessed by a vertical shaft only. Sub-levels on 100 ft (30 m) intervals are accessed directly from the shaft.
• Option 3 – the deposit is accessed via a shaft on 200 ft (60 m) sub-level intervals. An internal ramp system located near the deposit allows access to the intermediate 100 ft (30 m) sub-level intervals.
• Option 4 – the deposit is accessed via twin declines. An alternate location for the underground portals for a twin decline system is considered. There are areas outside the existing lease that could be purchased if the trade-off study supported the decision.
Based on the financial results of the study, Option 1 – The shaft and decline from the surface of the lease area had the highest discounted cash flow with approximately US$114M above the next best option. AMC recommended the use of the shaft and decline access as it has the greatest flexibility, shortest duration to access the mineralization and the ability to generate cash the earliest.
Following selection of Option 1 the shaft and decline from surface as the optimal means of accessing the mine, AMC carried out a detailed mine design and development and production schedule for the updated 2017 Mineral Resource. A number of mining methods were considered including SLOS, room and pillar and longhole benching. The method that best supports low operating cost, high productivity with good recovery and low dilution is SLOS.
AMC used a function of the Datamine software, Mine Stope Optimizer (MSO) to evaluate preliminary stope wireframes for the SLOS mining method. Varying stope heights between 60 ft and 100 ft (18 m and 30 m) were generated. The stope height of 100 ft (30 m) was selected as the optimum when considering planned dilution. The amount of dilution in a stope is a trade-off with the additional development required to access stopes with less height. The selected stope height of 100 ft (30 m) is within the maximum stope size recommendations from the geotechnical stope design criteria.
In order to optimize the mine economics, a high grade core of mineralization was identified above a cut-off grade of 15% ZnEq, that is located between 3140 ft L and 3260 ft L. The high grade material is accessible from each level independently and could be mined simultaneously, using more selective Longhole type mining methods over stope heights of 60 ft (18 m) floor to floor. A mine plan and mine design was developed to allow early access of the high grade core between Year 4 and Year 6 (inclusive) of the Life of Mine (LOM) plan. The use of pastefill ensures that lower grade material is not sterilized but is extracted as a second pass.
Stope wireframes were generated above a cut-off grade of 6% ZnEq in order to determine the potential mining inventory. The potential mining inventory is the Mineral Resource above the cut-off grade that includes the application of mining factors such as recovery and dilution. AMC has applied a dilution factor of 5% at zero grade to the Mineral Resource and a mining recovery factor of 95% has been applied to the stopes.
Once stope wireframes were generated, a check was made to remove any outlying stopes that would not be economic when the cost of access development was included. The cost of access development was determined for each level and each level was evaluated to determine if the value was sufficient to pay for its access. The potential mining inventory associated with the potentially economic stopes are summarized in Table 1.6.

Hermosa Property, Taylor Zn-Pb-Ag Deposit PEA Arizona Minerals Inc. 716027
amcconsultants.com 10
Table 1.6 Potential mining inventory
Tons (M) ZnEq (%) Ag (oz/t) Pb (%) Zn (%)
60.8 10.3 1.7 4.3 4.4
In order to maximize the Net Present Value (NPV) of the project, the high grade material is targeted as the optimal starting position. The lower grade material will be extracted as a second pass.
Mining panels consist of five 60 ft (18 m) levels that will be mined in a bottom up mining sequence. Once the high grade material is extracted, the mine will extract mineralized material using primary and secondary stopes that are back filled with cemented pastefill. The primary stopes will be mined and backfilled prior to mining secondary stopes on a level sequence. As the level advances towards the south of the deposit, the level above can commence primary stoping.
In order to determine an appropriate production rate which can be supported by the deposit, AMC has used a combination of Taylor`s rule of thumb and vertical tons per metre to determine expected production ranges. Production rate based on Taylors rule of thumb, is estimated at approximately 3.8 Mtpa (3.5 Mtonnes pa).
Most successful mines do not exceed 40 vertical metres / annum (vmpa). The deposit has approximately 80 kt/vm of mineralization and this would support a production rate of approximately 3.5 Mtpa (3.2 Mtonnes pa).
AMC has completed a high level schedule of the mineralized material production aimed at meeting the target production rate of 10,000 tons per day. Based on this production schedule, the targeted throughput of 3.6 Mtpa (3.3 Mtonnes pa) is achievable. AMC considers that this production rate is high for the deposit, however, given the potential to mine from multiple fronts on each level as well as over multiple levels at a time, it is achievable. For this study AMC has scheduled production at a rate of 3.6 Mtpa (3.3 Mtonnes pa).
Underground layouts were prepared for the shaft and decline design layout and the development quantities determined by type for cost estimation and scheduling. Vertical development is generally associated with vertical ventilation raises or passes. All waste access development was assumed to be 18 ft by 18 ft (5.5 m by 5.5 m) and all development in mineralization to be 14.8 ft by 14.8 ft (4.5 m by 4.5 m). The total development required over the LOM is summarized in Table 1.7.
Table 1.7 Development quantities by type
Description Units Value Units Value
Decline (ft) 26,860 (m) 8,187
Lateral waste development (ft) 191,696 (m) 58,429
Vertical raise development (ft) 16,448 (m) 5,013
Vertical shaft development (ft) 3,625 (m) 1,105
Total lateral development (ft) 218,556 (m) 66,616
Total vertical development (ft) 20,073 (m) 6,118
The function of the ventilation system is to dilute / remove airborne dust, diesel emissions, explosive gases, and to maintain temperatures at levels necessary to ensure safe production throughout the life of the mine. AMC has undertaken a preliminary estimate of the ventilation requirements based on the underground equipment rating and anticipated utilization. This estimate has been checked against benchmark data for ventilation quantities. The total ventilation required for the mine is is 2,012,936 cfm (950 m3/s).
The mine will be ventilated by a “Pull” or exhausting type ventilation system. That is, the primary mine ventilation fans will be located at the primary exhaust airways of the mine. Fresh air will enter each mine via the main intake raises or shaft with exhaust to the surface via dedicated return airways. Most production activities will require auxiliary fans and ducting with level airflows managed through regulators located at raise accesses.
Hermosa Property, Taylor Zn-Pb-Ag Deposit PEA Arizona Minerals Inc. 716027
amcconsultants.com 11
Intake air will be provided via the 21 ft (6.5 m) diameter shaft, the decline and one fresh air raise 18 ft (5.5 m) in diameter. Air will be exhausted via three return air raises that are 14.8 ft (4.5 m) in diameter.
The stopes will be mined in a primary then secondary sequence. All stopes will be backfilled with cemented paste fill. Paste fill will be reticulated underground via boreholes and pipelines placed adjacent to the return air raise to the active mining level and then extended as mining progresses. Paste fill will flow under gravity to the active level and to the respective stope for filling. Fill delivery to all sublevels below each main level will be made via a series of inter-linked boreholes that connect to the perimeter drive on each sublevel.
AMC has conducted a high level evaluation of the paste fill strength required and estimates a cement dosage of approximately 4.5% will generate a paste fill strength of 645 kPa which is in line with geotechnical design specifications. Based on the production rate of 10,000 t/d (9.1 ktonnes pd) and the selected stope sizes, approximately 1,177,155 yards3pa (900,000 m3pa) of paste fill will be required.
AMC has undertaken high level capital cost estimates for the paste fill plant as well as the distribution system of US$12M and an operating cost of US$4.35 per ton of mineralized material (US$4.80 / tonne).
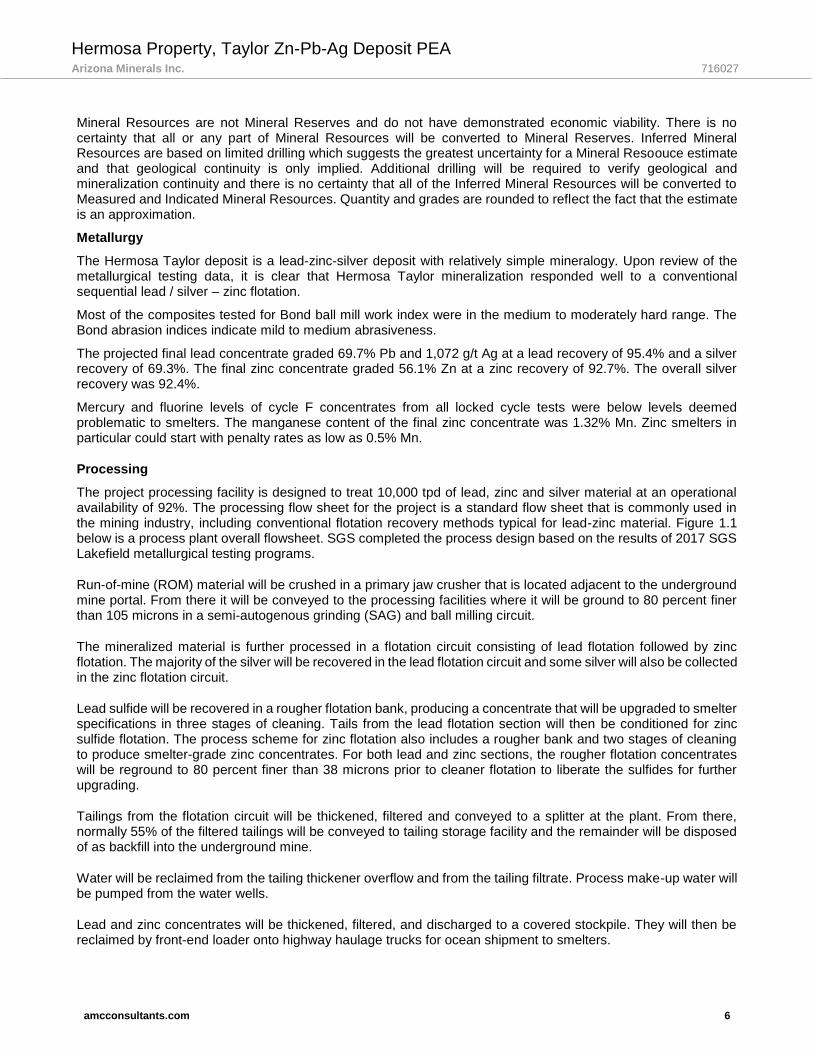
AMC has completed an estimate of the quantity of major equipment required to meet the production rate. The equipment numbers are based on average haul distances for trucks, number of active crews for development and the number of active stopes required to meet production. AMC has not selected specific equipment models however recommended equipment includes Atlas Copco Jumbos and Simba production rigs with 50 t underground trucks and 12.5 t loaders. Equipment numbers are summarized in Figure 1.2.
Figure 1.2 Primary underground equipment
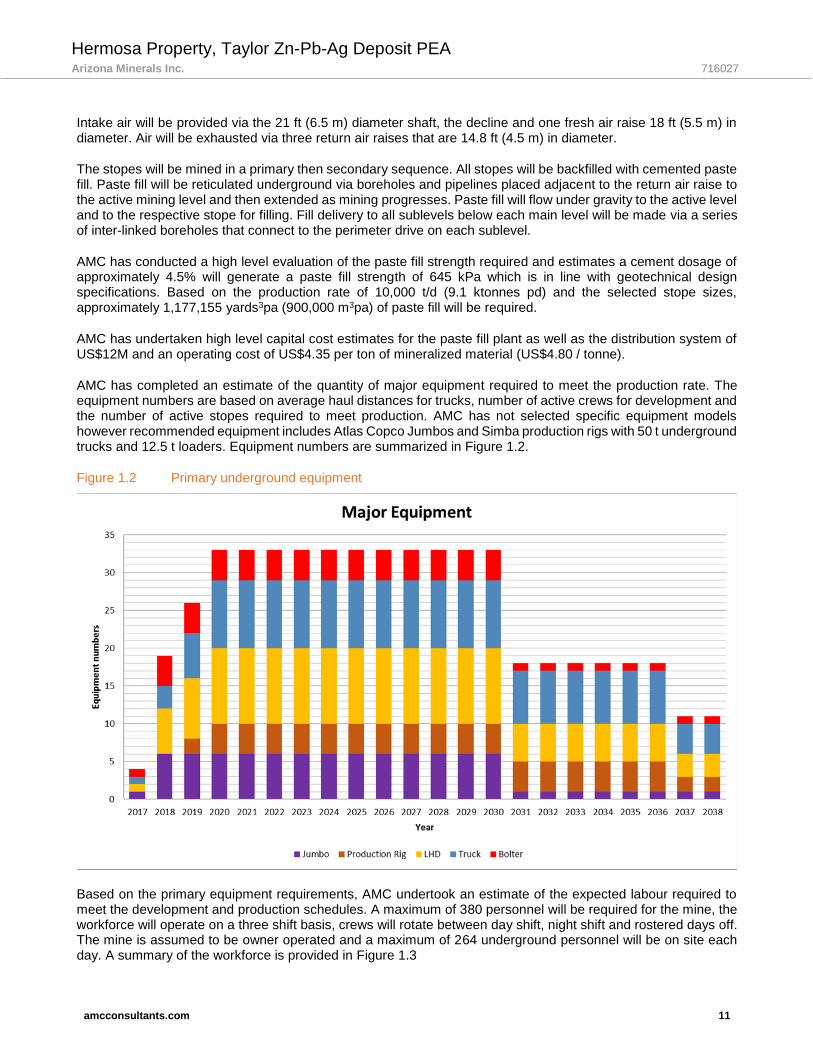
Based on the primary equipment requirements, AMC undertook an estimate of the expected labour required to meet the development and production schedules. A maximum of 380 personnel will be required for the mine, the workforce will operate on a three shift basis, crews will rotate between day shift, night shift and rostered days off. The mine is assumed to be owner operated and a maximum of 264 underground personnel will be on site each day. A summary of the workforce is provided in Figure 1.3
Hermosa Property, Taylor Zn-Pb-Ag Deposit PEA Arizona Minerals Inc. 716027
amcconsultants.com 12
Figure 1.3 Underground work force
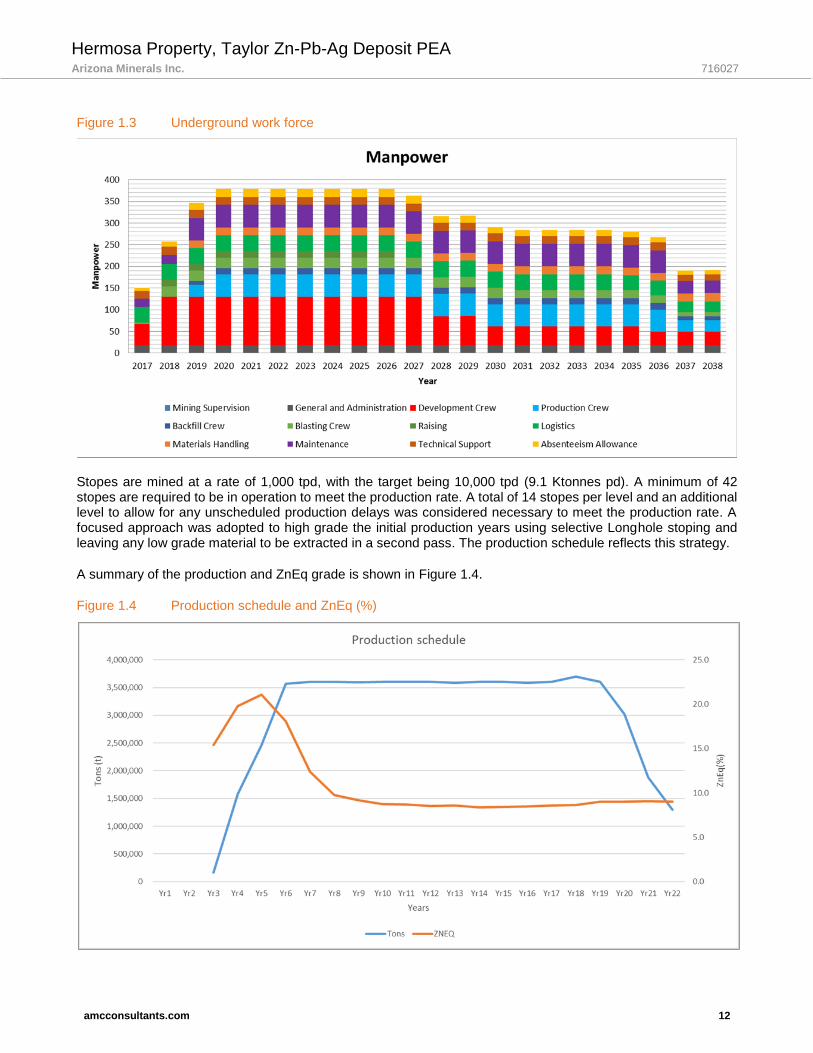
Stopes are mined at a rate of 1,000 tpd, with the target being 10,000 tpd (9.1 Ktonnes pd). A minimum of 42 stopes are required to be in operation to meet the production rate. A total of 14 stopes per level and an additional level to allow for any unscheduled production delays was considered necessary to meet the production rate. A focused approach was adopted to high grade the initial production years using selective Longhole stoping and leaving any low grade material to be extracted in a second pass. The production schedule reflects this strategy.
A summary of the production and ZnEq grade is shown in Figure 1.4.
Figure 1.4 Production schedule and ZnEq (%)
Hermosa Property, Taylor Zn-Pb-Ag Deposit PEA Arizona Minerals Inc. 716027
amcconsultants.com 13
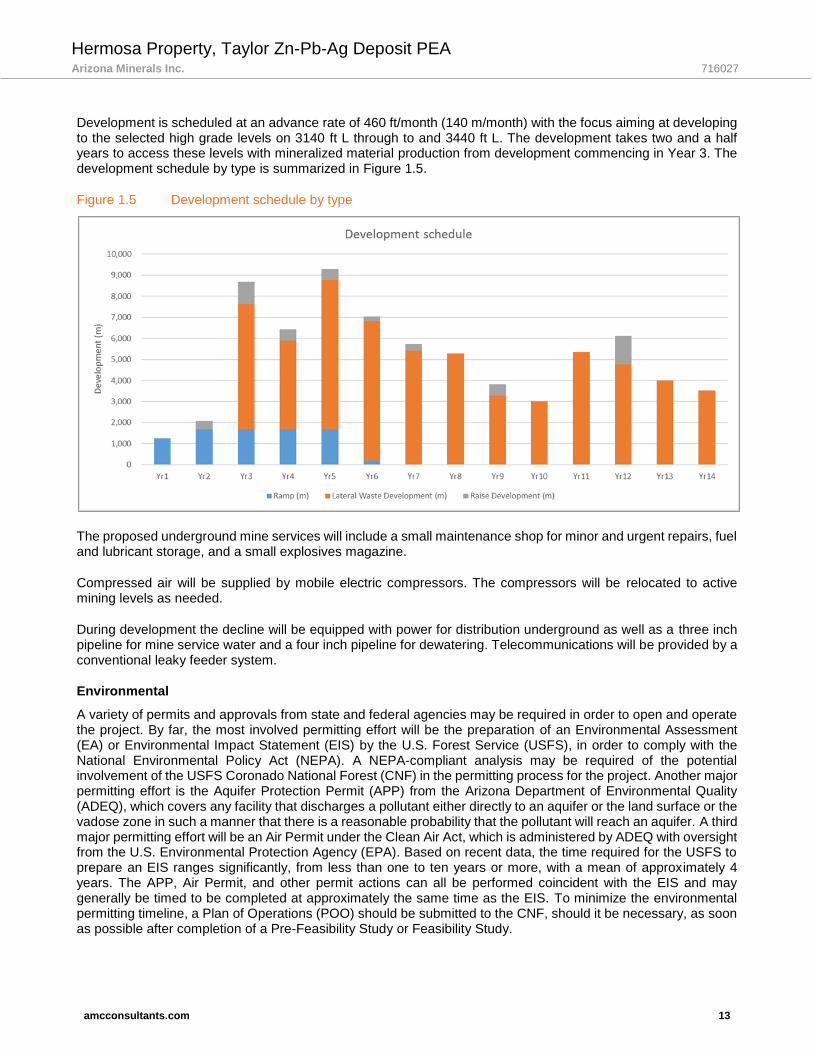
Development is scheduled at an advance rate of 460 ft/month (140 m/month) with the focus aiming at developing to the selected high grade levels on 3140 ft L through to and 3440 ft L. The development takes two and a half years to access these levels with mineralized material production from development commencing in Year 3. The development schedule by type is summarized in Figure 1.5.
Figure 1.5 Development schedule by type
The proposed underground mine services will include a small maintenance shop for minor and urgent repairs, fuel and lubricant storage, and a small explosives magazine.
Compressed air will be supplied by mobile electric compressors. The compressors will be relocated to active mining levels as needed.
During development the decline will be equipped with power for distribution underground as well as a three inch pipeline for mine service water and a four inch pipeline for dewatering. Telecommunications will be provided by a conventional leaky feeder system.
Environmental
A variety of permits and approvals from state and federal agencies may be required in order to open and operate the project. By far, the most involved permitting effort will be the preparation of an Environmental Assessment (EA) or Environmental Impact Statement (EIS) by the U.S. Forest Service (USFS), in order to comply with the National Environmental Policy Act (NEPA). A NEPA-compliant analysis may be required of the potential involvement of the USFS Coronado National Forest (CNF) in the permitting process for the project. Another major permitting effort is the Aquifer Protection Permit (APP) from the Arizona Department of Environmental Quality (ADEQ), which covers any facility that discharges a pollutant either directly to an aquifer or the land surface or the vadose zone in such a manner that there is a reasonable probability that the pollutant will reach an aquifer. A third major permitting effort will be an Air Permit under the Clean Air Act, which is administered by ADEQ with oversight from the U.S. Environmental Protection Agency (EPA). Based on recent data, the time required for the USFS to prepare an EIS ranges significantly, from less than one to ten years or more, with a mean of approximately 4 years. The APP, Air Permit, and other permit actions can all be performed coincident with the EIS and may generally be timed to be completed at approximately the same time as the EIS. To minimize the environmental permitting timeline, a Plan of Operations (POO) should be submitted to the CNF, should it be necessary, as soon as possible after completion of a Pre-Feasibility Study or Feasibility Study.

Hermosa Property, Taylor Zn-Pb-Ag Deposit PEA Arizona Minerals Inc. 716027
amcconsultants.com 14
Baseline studies to obtain background environmental data have been initiated and should be continued in the coming months. Results from exploration, geotechnical and hydrogeologic investigations will be used to develop a POO to submit to the CNF as well as provide data to support the NEPA, APP, and other permitting processes.
Capital cost
Capital costs for the project were estimated by AMC for mining, SGS for the processing and associated plant infrastructure and Newfields for the tailings facility and ponds. Preproduction capital includes capital costs for Years 1 to 3, all capital from Year 4 to the end of mine life is termed sustaining capital.
The initial and sustaining capital costs are summarized in Table 1.8 and include direct and indirect costs and a variable contingency that depends on the individual accuracy of the various components of the estimate. Contingency averages 20% of pre-production capital. Owners costs, Engineering, Procurement and Construction Management (EPCM) and contingency are spread equally over the three year pre-production period.

Hermosa Property, Taylor Zn-Pb-Ag Deposit PEA Arizona Minerals Inc. 716027
amcconsultants.com 15
Table 1.8 Total pre-production and sustaining capital costs
Item Total (US$) Pre-production capital (US$)
Year 1 2 3
Underground development 324,838,491 5,670,194 9,569,852 39,609,083
Mine equipment (incl. sust. capital) 110,700,000 4,600,000 17,100,000 10,700,000
Shaft (incl. sust. capital) 173,620,000 42,105,000 42,105,000
Backfill plant 10,000,000 10,000,000
Water to site 3,000,000 3,000,000
Power 41,000,000 41,000,000
Roads 7,000,000 7,000,000
TSF - trench and Hermosa 38,970,000 8,340,000 8,340,000
Processing 110,832,313 32,877,048 65,754,097
UG infrastructure (incl. sust. capital) 25,675,331 3,945,889 3,945,889 3,945,889
EPCM 35,098,765 433,333 10,931,872 22,433,560
Owners cost 1,000,000 191,667 191,667 116,667
Contingency 75,631,000 19,570,735 17,672,337 26,019,928
Total 957,365,900 135,856,818 142,733,664 178,579,224
Pre-production capital 457,169,706
Sustaining capital 500,196,195
Operating cost
The total operating cost is estimated to be US$48.08/t for the mine. The total operating cost includes mining (US$35.35/t of mineralized material), processing cost (US$10.73/t of mineralized material) and General and Administration cost (US$2/t of mineralized material). Operating costs are based on a combination of bench mark costs for similar operations with equivalent production throughput and validated by first principle estimates for labour, power, reagents and consumables.
Economic assessment
All currency is in US dollars (US$) unless otherwise stated. The cost estimate was prepared with a base date of Year 1 and does not include any escalation beyond this date. For net present value (NPV) estimation, all costs and revenues are discounted at 8% from the base date. Metal prices were selected after discussion with AZ and referencing current markets and forecasts in the public domain. A regular corporate tax rate of 35% for federal tax and 4.9% for Arizona State tax is applied as the mining income will be earned in Arizona, USA. It is assumed that 3% of the NSR value would be the royalties to be paid.
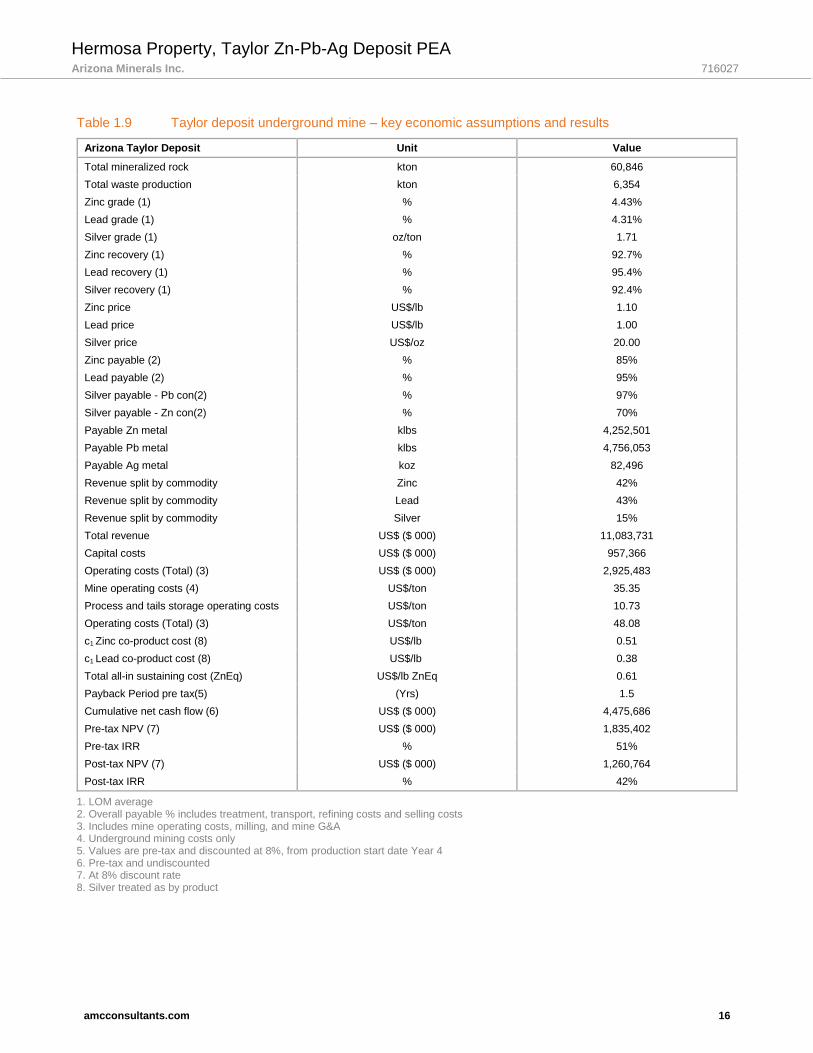
AMC conducted a high level economic assessment of the conceptual underground operation of the Taylor deposit. The underground mine is projected to generate approximately US$1,835M pre-tax NPV and US$1,261M post-tax NPV at 8% discount rate, pre-tax IRR of 51.4% and post-tax IRR of 41.7%. Project capital is estimated at US$957M with a payback period of 1.5 years (discounted pre-tax cash flow from start of production). Key assumptions and results of the underground mine economics are provided in the Table 1.8.
The PEA is preliminary in nature. It includes Inferred Mineral Resources that are considered too speculative geologically to have the economic considerations applied to them that would enable them to be categorized as Mineral Reserves. There is no certainty that the PEA will be realized.
Hermosa Property, Taylor Zn-Pb-Ag Deposit PEA Arizona Minerals Inc. 716027
amcconsultants.com 16
Table 1.9 Taylor deposit underground mine – key economic assumptions and results
Arizona Taylor Deposit Unit Value
Total mineralized rock kton 60,846
Total waste production kton 6,354
Zinc grade (1) % 4.43%
Lead grade (1) % 4.31%
Silver grade (1) oz/ton 1.71
Zinc recovery (1) % 92.7%
Lead recovery (1) % 95.4%
Silver recovery (1) % 92.4%
Zinc price US$/lb 1.10
Lead price US$/lb 1.00
Silver price US$/oz 20.00
Zinc payable (2) % 85%
Lead payable (2) % 95%
Silver payable - Pb con(2) % 97%
Silver payable - Zn con(2) % 70%
Payable Zn metal klbs 4,252,501
Payable Pb metal klbs 4,756,053
Payable Ag metal koz 82,496
Revenue split by commodity Zinc 42%
Revenue split by commodity Lead 43%
Revenue split by commodity Silver 15%
Total revenue US$ ($ 000) 11,083,731
Capital costs US$ ($ 000) 957,366
Operating costs (Total) (3) US$ ($ 000) 2,925,483
Mine operating costs (4) US$/ton 35.35
Process and tails storage operating costs US$/ton 10.73
Operating costs (Total) (3) US$/ton 48.08
c1 Zinc co-product cost (8) US$/lb 0.51
c1 Lead co-product cost (8) US$/lb 0.38
Total all-in sustaining cost (ZnEq) US$/lb ZnEq 0.61
Payback Period pre tax(5) (Yrs) 1.5
Cumulative net cash flow (6) US$ ($ 000) 4,475,686
Pre-tax NPV (7) US$ ($ 000) 1,835,402
Pre-tax IRR % 51%
Post-tax NPV (7) US$ ($ 000) 1,260,764
Post-tax IRR % 42%
1. LOM average 2. Overall payable % includes treatment, transport, refining costs and selling costs 3. Includes mine operating costs, milling, and mine G&A 4. Underground mining costs only 5. Values are pre-tax and discounted at 8%, from production start date Year 4 6. Pre-tax and undiscounted 7. At 8% discount rate 8. Silver treated as by product
Hermosa Property, Taylor Zn-Pb-Ag Deposit PEA Arizona Minerals Inc. 716027
amcconsultants.cm 17
Conclusions and or recommendations
Geology
Approximately 65% of the Taylor Deposit Mineral Resource has been classified as Measured and Indicated, a substantial increase from 27% of the Mineral Resource that was classified as Indicated in the 2016 estimate. The Inferred portion of the Taylor Deposit is largely located on the periphery of the deposit and therefore the author sees little benefit in AZ conducting additional surface drilling to upgrade the remaining 35% of the deposit as currently defined.
The calculation used to estimate bulk density and tonnage factors for the Taylor Deposit may be refined by the inclusion of pyrite content and possibly by inclusion of a term to account for porosity as well as other elements. Some of this data is currently available and it is recommended that AZ investigates the possibility of obtaining a calculated bulk density that is in closer agreement with measured values than has been achieved to date.
The Mineral Resource for the Central Deposit was estimated using fixed bulk density values; it is probable that these single values can be improved upon by using an approach similar to that advocated for the Taylor Deposit.
Geological and mineral resource risks associated with the Property are those attributable to any mineral exploration property at a comparable stage of exploration, namely the uncertainty attached to the continuity, grade, and tonnage of the mineral resource that has been estimated. Additional drilling to enhance the level of confidence that can be placed on the estimate, and the refinement of the bulk density equation will both help to mitigate this risk.
No further drilling is required for the Central Deposit at this time. However, desktop studies should be undertaken to determine the full resource, non-pit constrained, should it be decided the most appropriate way to mine the Central Deposit is through common underground infrastructure developed for the Taylor Deposit.
Exploration
AZ should continue to aggressively explore the Hermosa project for additional zinc / lead / silver / copper resources. This is especially true for the near vertical vein sets extending across the Trench claim block and for the Taylor Deeps zone. The Trench Vein domain has the potential to impact the early production of the mine with higher than average grade zinc / lead / silver material. Additionally, the Taylor Deeps zone should be drilled to it’s extents as it could significantly increase the overall size of the deposit.
Mining
Additional work on the structural geology of the deposit is recommended. This will assist with better definition of the expected groundwater inflows and a more accurate estimate of the implications of faulting on ground conditions and ground support requirements. In the next level of study AMC recommends obtaining geotechnical information regarding the shaft and decline locations and portal.
The underground mine is relatively deep and has a large mining footprint. There is potential to explore the economics of a smaller, decline only, operation that concentrates on high grade early production from a shallower mine with minimum pre-production capital and less throughput. Once the mine is in production, the cost of expansion could be funded directly from operations.
The primary issues remain around permitting of the mine, including permitting of access roads and power supply upgrades. The underground deposit shows good potential for an economic mine with a relatively simple mining method and accessibility. Further work is required to best assess the opportunity for a more selective method of extracting high grade mineralization. The production schedules completed for the PEA are level based schedules, AMC recommends undertaking a more detailed schedule on a stope basis for the next level of study. The more detailed schedule should take into account further opportunities to defer capital development expenditure.
Operating cost estimates for mining have largely been based on benchmark costs for similar type of mining method and throughput. Operating costs have been validated based on labour schedules and labour numbers and then
Hermosa Property, Taylor Zn-Pb-Ag Deposit PEA Arizona Minerals Inc. 716027
amcconsultants.cm 18
split into cost categories for North American costs for a mining operation. The validated costs are within 5% of the benchmark data, it was decided to use the more conservative mining cost of US$35.35. The backfill costs were determined seperately and are based on costs for labour, cement and consumables from local vendors.
Metallurgical
Additional lock cycle testing is recommended for each deposit, this will allow for validation of the final estimated recoveries and the selected concentrate grades.
It should be verified that potential smelters have the capacity and ability to accept the proposed quantity and quality of produced lead and zinc concentrates. Transportation, treatment charges, and refinery charges should be confirmed.
Surface infrastructure
Further studies to improve the economics include the following:
• Further review the topography and geo-technical conditions to minimize earthwork, foundation and conveying costs.
• Utilize on-site mining equipment to supplement the contractor equipment for rough grading required for the access roads to the site.
• Coordinate with the local power company to optimize the power line routing and connection to the electrical power grid.
• Complete a thorough investigation on the water source prior to completing the FS.
• Perform further characterizing of the groundwater supply by installing and testing an additional production well and a deep hydrogeologic test well. Analyze aquifer test data from both wells and incorporate the results into a numerical groundwater flow model to simulate the long-term adequacy of the supply.
Environmental permitting
AZ should continue baseline studies that will support the permitting processes expected to be required to develop the project. These include:
• Biological Resources
• Cultural Resources
• Hydrogeological Studies
• Geochemical Studies
• Air and weather monitoring
• Storm water quality
• Geotechnical (soil and rock) investigations
The estimated cost for additional baseline studies is $2.5 million.
Project economics
The results show that the pre-tax NPV is robust and remains positive for the range of sensitivities evaluated. The post-tax NPV performs similarly, and also remains positive for the range of sensitivities evaluated. The sensitivity analysis examined the impact on pre-tax and post-tax NPV (at 8% discount rate) of a 15% positive or negative change in metal prices, operating costs, capital costs, and corporate tax rate. The project is most sensitive to changes in zinc and lead prices, followed next by changes in operating costs.

Hermosa Property, Taylor Zn-Pb-Ag Deposit PEA Arizona Minerals Inc. 716027
amcconsultants.cm 19
Contents
1 Summary .................................................................................................................................................. 1
2 Introduction ............................................................................................................................................ 33
3 Reliance on other experts ...................................................................................................................... 35
4 Property description and location ........................................................................................................... 36 Location ....................................................................................................................................... 36 Property description ..................................................................................................................... 37 Property ownership ...................................................................................................................... 38 Mineral tenure .............................................................................................................................. 38 Options agreements..................................................................................................................... 44 Agreements and royalties ............................................................................................................ 44 Environmental liabilities ............................................................................................................... 46 Permits and others ....................................................................................................................... 46
5 Accessibility, climate, local resources, infrastructure and physiography ............................................... 47 Accessibility ................................................................................................................................. 47 Climate ......................................................................................................................................... 47 Infrastructure ................................................................................................................................ 47
5.3.1 Water ....................................................................................................................... 47 5.3.2 Workforce ................................................................................................................ 47 5.3.3 Commercial resources and services ....................................................................... 47 5.3.4 Social services and security .................................................................................... 47 5.3.5 Power ...................................................................................................................... 48 5.3.6 Transportation ......................................................................................................... 48
Physiography ............................................................................................................................... 48
6 History .................................................................................................................................................... 49 Prior ownership of the Property ................................................................................................... 49 Previous exploration and development work ............................................................................... 49 Historical Mineral Resource and Mineral Reserve estimates ...................................................... 49 Prior production from the Property ............................................................................................... 50
7 Geological setting and mineralization .................................................................................................... 52 Regional geology ......................................................................................................................... 52 Stratigraphy .................................................................................................................................. 54 Regional structural geology ......................................................................................................... 54
7.3.1 Laramide ................................................................................................................. 55 7.3.2 Middle Tertiary ......................................................................................................... 55
Project geology ............................................................................................................................ 55 7.4.1 Lithology and stratigraphy ....................................................................................... 56 7.4.2 Structural geology ................................................................................................... 62
7.4.2.1 High angle structures ............................................................................... 63 7.4.3 Alteration ................................................................................................................. 63 7.4.4 Mineralization .......................................................................................................... 64
8 Deposit types ......................................................................................................................................... 67 Taylor Deposit .............................................................................................................................. 67 Central Deposit (Oxide) ............................................................................................................... 68
9 Exploration ............................................................................................................................................. 69 Exploration ................................................................................................................................... 69
10 Drilling .................................................................................................................................................... 70 Introduction .................................................................................................................................. 70 Drilling summary .......................................................................................................................... 70 Taylor Deposit .............................................................................................................................. 70
Hermosa Property, Taylor Zn-Pb-Ag Deposit PEA Arizona Minerals Inc. 716027
amcconsultants.cm 20
10.3.1 Procedures .............................................................................................................. 70 10.3.2 Relevant sample results .......................................................................................... 72
Central deposit ............................................................................................................................. 84 10.4.1 Procedures .............................................................................................................. 84 10.4.2 Relevant sample results .......................................................................................... 84
11 Sample preparation, analyses and security ........................................................................................... 85 Background .................................................................................................................................. 85 Taylor Deposit .............................................................................................................................. 85
11.2.1 Sample preparation ................................................................................................. 85 11.2.2 Analysis ................................................................................................................... 85 11.2.3 Security ................................................................................................................... 86 11.2.4 Quality control ......................................................................................................... 87
11.2.4.1 Blanks ...................................................................................................... 87 11.2.4.2 Reference materials ................................................................................. 88 11.2.4.3 Reproducibility of laboratory preparation and pulp duplicates ................. 90 11.2.4.4 Core duplicates ........................................................................................ 91
Central Deposit ............................................................................................................................ 92 11.3.1 Quality assurance quality control analytical program .............................................. 92 11.3.2 Analytical program ................................................................................................... 92
11.3.2.1 Sample preparation and analysis ............................................................ 92 11.3.3 QA / QC protocol efficacy study .............................................................................. 92
11.3.3.1 Performance of reference standards ....................................................... 92 11.3.4 Quality control program ........................................................................................... 93
11.3.4.1 Performance of blanks, standards and duplicates ................................... 94 11.3.5 Inspectorate 4-acid, AAS Ag re-assay program ...................................................... 95 11.3.6 Manto re-assay program ......................................................................................... 97 11.3.7 Database updates ................................................................................................... 98
12 Data verification ..................................................................................................................................... 99 Taylor Deposit .............................................................................................................................. 99
12.1.1 Drill core examination .............................................................................................. 99 12.1.2 Drillhole collar location ............................................................................................ 99 12.1.3 Assay data verification ............................................................................................ 99
Central Deposit ............................................................................................................................ 99 12.2.1 AZ comparative drilling ............................................................................................ 99 12.2.2 Additional data validation ...................................................................................... 100
13 Mineral processing and metallurgical testing ....................................................................................... 101 Summary of historical testwork .................................................................................................. 101 Samples provided to SGS ......................................................................................................... 101 Mineralogy ................................................................................................................................. 102 Comminution .............................................................................................................................. 102 Locked cycle flotation tests ........................................................................................................ 103 Simplified flowsheet for the Taylor deposit ................................................................................ 106 Concentrate analysis ................................................................................................................. 108
14 Mineral Resource estimates ................................................................................................................ 110 Introduction ................................................................................................................................ 110 Exploratory data analysis ........................................................................................................... 111
14.2.1 Assays ................................................................................................................... 111 14.2.2 Capping ................................................................................................................. 114 14.2.3 Composites ........................................................................................................... 114
Bulk density ................................................................................................................................ 114 Geological interpretation ............................................................................................................ 115 Spatial analysis .......................................................................................................................... 116 Block model ............................................................................................................................... 118
14.6.1 Parameters ............................................................................................................ 118
Hermosa Property, Taylor Zn-Pb-Ag Deposit PEA Arizona Minerals Inc. 716027
amcconsultants.cm 21
14.6.2 Interpolation plan ................................................................................................... 118 14.6.3 Metal equivalency formula .................................................................................... 119
Mineral Resource classification ................................................................................................. 119 Mineral Resource tabulation ...................................................................................................... 119 Block model validation ............................................................................................................... 126
Comparisons .............................................................................................................................. 129 14.10.1 Taylor Deposit estimates ....................................................................................... 129 14.10.2 Central Deposit estimates ..................................................................................... 130
Conclusions and recommendations........................................................................................... 130
15 Mineral Reserve estimates .................................................................................................................. 131
16 Mining methods .................................................................................................................................... 132 Hydrological parameters ............................................................................................................ 132 Geotechnical parameters ........................................................................................................... 132
16.2.1 Excavation dimensions.......................................................................................... 132 16.2.2 Mining in the Concha............................................................................................. 133 16.2.3 Mining in the Epitaph / Scherrer ............................................................................ 133 16.2.4 Paste backfill strength ........................................................................................... 133 16.2.5 Ground support recommendations ........................................................................ 133
16.2.5.1 Development drifts ................................................................................. 133 16.2.5.2 Production drifts ..................................................................................... 133 16.2.5.3 Stope top and middle cuts in the Concha .............................................. 134 16.2.5.1 Stope top and middle cuts in the Epitaph .............................................. 134 16.2.5.2 Shaft ground support recommendations ............................................... 134 16.2.5.3 Placement of critical mine infrastructure ................................................ 134
Underground access .................................................................................................................. 134 16.3.1 Option 1 ventilation ................................................................................................ 138 16.3.2 Option 2 and 3 ventilation ..................................................................................... 138 16.3.3 Option 4 ventilation ................................................................................................ 138 16.3.4 Production and development scheduling .............................................................. 138
Mining method selection ............................................................................................................ 139 Dilution and mining recovery factors.......................................................................................... 141 Stope design and selection ........................................................................................................ 141 Production rate ........................................................................................................................... 142 Underground development ........................................................................................................ 143 Ventilation .................................................................................................................................. 144
16.9.1 Fan Selection ........................................................................................................ 145 Backfill ........................................................................................................................................ 146 Underground mining equipment ................................................................................................ 147 Underground mining personnel ................................................................................................. 148 Underground production and development schedule ................................................................ 149
17 Recovery methods ............................................................................................................................... 153 Introduction ................................................................................................................................ 153 Primary crushing ........................................................................................................................ 154 Crushed material conveying, transport and storage .................................................................. 154 Grinding and flash flotation ........................................................................................................ 155 Lead flotation and regrind .......................................................................................................... 155 Zinc flotation and regrind ........................................................................................................... 156 Lead concentrate dewatering .................................................................................................... 156 Zinc concentrate dewatering ...................................................................................................... 156 Tailing dewatering ...................................................................................................................... 157
Tailing deposition ....................................................................................................................... 157 Reagents .................................................................................................................................... 157 Water system ............................................................................................................................. 157
17.12.1 Fresh water ........................................................................................................... 157

Hermosa Property, Taylor Zn-Pb-Ag Deposit PEA Arizona Minerals Inc. 716027
amcconsultants.cm 22
17.12.2 Process water ........................................................................................................ 158 17.12.2.1 Process water – lead circuit ................................................................... 158 17.12.2.2 Process water – zinc circuit ................................................................... 158
18 Project infrastructure ............................................................................................................................ 159 Surface infrastructure ................................................................................................................ 159
18.1.1 Power .................................................................................................................... 162 18.1.1.1 Power supply ......................................................................................... 162 18.1.1.2 Power distribution .................................................................................. 162
18.1.2 Water ..................................................................................................................... 163 18.1.2.1 Fresh water ............................................................................................ 163 18.1.2.2 Process water and distribution ............................................................... 163 18.1.2.3 Potable water ......................................................................................... 163
18.1.3 Access roads ......................................................................................................... 163 18.1.4 Process and associated buildings and structures ................................................. 164 18.1.5 Process plant site development ............................................................................ 164 18.1.6 Administration buildings and mine dry .................................................................. 165 18.1.7 Surface workshop .................................................................................................. 165 18.1.8 Surface magazine ................................................................................................. 165 18.1.9 Surface mobile equipment .................................................................................... 165 18.1.10 Accommodations ................................................................................................... 166
Fuel storage ............................................................................................................................... 166 Tailings storage facilities (TSFs) ................................................................................................ 166
18.3.1 Tailings and development rock storage requirements .......................................... 167 18.3.2 Trench Camp existing tailings piles ....................................................................... 168 18.3.3 TSF storage capacity ............................................................................................ 170 18.3.4 TSF design ............................................................................................................ 173 18.3.5 Rock armoring and tailings placement .................................................................. 174 18.3.6 Stormwater control ................................................................................................ 175
Underground infrastructure ........................................................................................................ 175 18.4.1 Power demand and distribution ............................................................................. 175
Dewatering ................................................................................................................................. 178 18.5.1 Service water ......................................................................................................... 178 18.5.2 Waste water .......................................................................................................... 178
Compressed air .......................................................................................................................... 178 Communications ........................................................................................................................ 178 Main production hoist ................................................................................................................. 178
18.8.1 Fire detection and suppression systems ............................................................... 179 18.8.2 Underground facilities............................................................................................ 180 18.8.3 Mine escape and rescue ....................................................................................... 180
19 Market studies and contracts ............................................................................................................... 182 Overview .................................................................................................................................... 182 Concentrate terms ..................................................................................................................... 182
19.2.1 Zinc concentrates .................................................................................................. 182 19.2.1.1 Commercial terms .................................................................................. 182
19.2.2 Lead concentrates ................................................................................................. 182 19.2.2.1 Commercial terms .................................................................................. 183
Concentrate transportation logistics .......................................................................................... 183
20 Environmental studies, permitting and social or community impact .................................................... 184 Social and community ................................................................................................................ 185 Biological and cultural resource work completed to date .......................................................... 185
20.2.1 Forest Service approval of a POO ........................................................................ 188 20.2.2 Clean water act section 404 permit ....................................................................... 189 20.2.3 Endangered species act ........................................................................................ 190 20.2.4 National historic preservation act .......................................................................... 191

Hermosa Property, Taylor Zn-Pb-Ag Deposit PEA Arizona Minerals Inc. 716027
amcconsultants.cm 23
20.2.5 Natural Gas Act Section 7 ..................................................................................... 191 State environmental permitting .................................................................................................. 191
20.3.1 Arizona state cultural resource regulations ........................................................... 191 20.3.2 Air quality permit .................................................................................................... 192 20.3.3 Aquifer protection permit ....................................................................................... 192 20.3.4 Arizona pollutant discharge elimination system .................................................... 193 20.3.5 Arizona 401 water quality certification................................................................... 194 20.3.6 Arizona state mine inspector ................................................................................. 194 20.3.7 Arizona corporation commission ........................................................................... 194
21 Capital and operating costs ................................................................................................................. 197 Underground mine capital cost estimate ................................................................................... 197
21.1.1 Underground development .................................................................................... 197 21.1.2 Underground mobile equipment ............................................................................ 197 21.1.3 Main production shaft ............................................................................................ 198
Processing capital cost estimate ............................................................................................... 199 21.2.10 Process plant contingency and accuracy .............................................................. 202 21.2.11 Exclusions from process plant cost estimate ........................................................ 202
Processing operating cost estimate ........................................................................................... 203 Tailings storage facility capital cost ........................................................................................... 205
21.4.1 Trench Camp dry stack TSF ................................................................................. 207 21.4.2 Hermosa dry stack TSF......................................................................................... 207 21.4.3 Cost estimate basis for major construction items ................................................. 207
Total capital cost estimate for the mine ..................................................................................... 210 Underground mine operating cost ............................................................................................. 210 General and administration operating cost estimate ................................................................. 211 Total mine operating cost .......................................................................................................... 211
22 Economic analysis ............................................................................................................................... 212 Assumptions .............................................................................................................................. 212 Economic analysis ..................................................................................................................... 212 Sensitivity analysis ..................................................................................................................... 215 Taxation assumptions ................................................................................................................ 216
23 Adjacent properties .............................................................................................................................. 218
24 Other relevant data and information .................................................................................................... 219
25 Interpretation and conclusions ............................................................................................................. 220 Geology and Mineral Resources ............................................................................................... 220 Mining ........................................................................................................................................ 220 Metallurgical testing and Mineral processing ............................................................................. 221 Tailings storage facility .............................................................................................................. 221 Surface infrastructure ................................................................................................................ 222 Environmental permitting ........................................................................................................... 222 Project economics...................................................................................................................... 222
26 Recommendations ............................................................................................................................... 223 Geology and Mineral Resources ............................................................................................... 223 Exploration ................................................................................................................................. 223 Mining ........................................................................................................................................ 223 Metallurgical and Mineral processing ........................................................................................ 223 Geotechnical investigation and evaluation ................................................................................ 224 Surface infrastructure ................................................................................................................ 225 Environmental permitting ........................................................................................................... 225 Project economics...................................................................................................................... 225
27 References ........................................................................................................................................... 226
28 Qualified Person’s Certificates ............................................................................................................. 229
Hermosa Property, Taylor Zn-Pb-Ag Deposit PEA Arizona Minerals Inc. 716027
amcconsultants.cm 24
Tables
Table 1.1 AZ drill programs ...................................................................................................................... 2
Table 1.2 Tonnage factor calculation ....................................................................................................... 4
Table 1.3 Zinc equivalent parameters ...................................................................................................... 4
Table 1.4 Taylor Deposit Mineral Resources ........................................................................................... 5
Table 1.5 Central Deposit Mineral Resources .......................................................................................... 5
Table 1.6 Potential mining inventory ...................................................................................................... 10
Table 1.7 Development quantities by type ............................................................................................. 10
Table 1.8 Total pre-production and sustaining capital costs .................................................................. 15
Table 1.9 Taylor deposit underground mine – key economic assumptions and results......................... 16
Table 2.1 Persons who prepared or contributed to this technical report ................................................ 33
Table 4.1 Unpatented Mining Claims Held by AMI ................................................................................. 39
Table 4.2 Patented claims owned by Arizona Mining Inc. ...................................................................... 40
Table 6.1 Historic production from Hardshell area mine ........................................................................ 51
Table 10.1 AZ drill programs .................................................................................................................... 70
Table 10.2 Taylor deposit 2016-2017 CRD drilling results summary ....................................................... 73
Table 10.3 Taylor deposit 2016-2017 drilling details ................................................................................ 83
Table 11.1 Summary of preparation and assay methods ......................................................................... 86
Table 11.2 Upper and lower limits for 4 acid ICP method ........................................................................ 86
Table 11.3 Performance of silver reference materials .............................................................................. 88
Table 11.4 Performance of lead reference materials ............................................................................... 89
Table 11.5 Performance of zinc reference materials ................................................................................ 89
Table 11.6 Performance of copper reference materials ........................................................................... 89
Table 11.7 Performance of arsenic reference material ............................................................................ 89
Table 11.8 Summary of pulp duplicate results ......................................................................................... 90
Table 11.9 Summary of preparation duplicate results .............................................................................. 91
Table 11.10 Summary of quarter core duplicate results ............................................................................. 91
Table 11.11 Reference standard expected values ..................................................................................... 93
Table 11.12 Results for silver standards .................................................................................................... 93
Table 11.13 Reference standard re-assay results ...................................................................................... 96
Table 11.14 Summary statistics for inspectorate re-assay program .......................................................... 96
Table 12.1 Comparison drillhole pairs ...................................................................................................... 99
Table 12.2 Twinned drillhole comparisons ............................................................................................. 100
Table 13.1 Composite head assays ....................................................................................................... 101
Table 13.2 Comminution test results ...................................................................................................... 103
Table 13.3 Locked cycle metallurgical results ........................................................................................ 104
Table 13.4 Projected lead metallurgical results ...................................................................................... 105
Table 13.5 Projected zinc metallurgical results ...................................................................................... 106
Table 13.6 Projected silver metallurgical results .................................................................................... 106
Table 13.7 Composite head assays ....................................................................................................... 107
Table 13.8 Optimized locked cycle results ............................................................................................. 108
Table 13.9 Potential Penalty Element Analysis for LCT15 Concentrates .............................................. 109
Table 14.1 Taylor Deposit Mineral Resources ....................................................................................... 111
Table 14.2 Central Deposit Mineral Resources ...................................................................................... 111
Hermosa Property, Taylor Zn-Pb-Ag Deposit PEA Arizona Minerals Inc. 716027
amcconsultants.cm 25
Table 14.3 Drillhole dataset descriptive statistics ................................................................................... 112
Table 14.4 Tonnage factor calculation ................................................................................................... 115
Table 14.5 Variography by gradeshell domain ....................................................................................... 117
Table 14.6 Block model parameters ....................................................................................................... 118
Table 14.7 Search ellipses and interpolation plan .................................................................................. 118
Table 14.8 Zinc equivalent parameters .................................................................................................. 119
Table 14.9 Taylor Deposit Mineral Resource summary ......................................................................... 120
Table 14.10 Central Deposit Mineral Resource summary ........................................................................ 120
Table 14.11 Taylor Deposit Concha Domain Mineral Resources ............................................................ 121
Table 14.12 Taylor Deposit Scherrer Domain Mineral Resources ........................................................... 122
Table 14.13 Taylor Deposit Epitaph Domain Mineral Resources ............................................................. 123
Table 14.14 Taylor Deposit Taylor Deeps Domain Mineral Resources ................................................... 124
Table 14.15 Central Deposit LAG Domain Mineral Resources ................................................................ 125
Table 14.16 Central Deposit MOX Domain Mineral Resources ............................................................... 126
Table 14.17 Comparison between composite and block statistics ........................................................... 127
Table 14.18 Comparison of 2016 and 2017 Taylor Deposit estimates .................................................... 129
Table 14.19 Comparison of 2016 and 2017 Central Deposit estimates ................................................... 130
Table 16.1 Key assumptions for the production and development schedules ....................................... 132
Table 16.2 Key assumptions for the production and development schedules ....................................... 138
Table 16.3 Total LOM capital cost estimate ........................................................................................... 139
Table 16.4 Underground mining methods .............................................................................................. 139
Table 16.5 MSO parameters .................................................................................................................. 141
Table 16.6 Potential mining inventory .................................................................................................... 141
Table 16.7 Development quantities by type ........................................................................................... 144
Table 16.8 Primary fan selection ............................................................................................................ 146
Table 16.9 Key assumptions for paste fill ............................................................................................... 146
Table 16.10 Production and development schedule ................................................................................ 151
Table 18.1 Electrical power requirements for each area of the project .................................................. 162
Table 18.2 LOM tailings and development rock distribution ................................................................... 168
Table 18.3 Trench Camp existing tailings piles volume estimates ......................................................... 168
Table 18.4 TSF storage capacities ......................................................................................................... 170
Table 18.5 Summary of underground power demand ............................................................................ 176
Table 20.1 Duration of USFS, BLM, and Corps EIS process for EIS’ completed during 2015 .............. 189
Table 20.2 Environmental permits and approvals .................................................................................. 195
Table 21.1 Underground capital cost estimate ....................................................................................... 197
Table 21.2 Underground development cost estimate ............................................................................. 197
Table 21.3 Underground mobile equipment cost estimate ..................................................................... 198
Table 21.4 Main production shaft cost estimate ..................................................................................... 198
Table 21.5 Underground infrastructure cost estimate ............................................................................ 198
Table 21.6 Summary process plant - initial capital cost for 10,000 TPD process plant ......................... 199
Table 21.7 Summary of plant operating cost by cost item ..................................................................... 203
Table 21.8 Plant power consumption summary ..................................................................................... 203
Table 21.9 Plant power cost ................................................................................................................... 203
Table 21.10 Labor cost ............................................................................................................................. 204

Hermosa Property, Taylor Zn-Pb-Ag Deposit PEA Arizona Minerals Inc. 716027
amcconsultants.cm 26
Table 21.11 Reagent cost ......................................................................................................................... 205
Table 21.12 Wear material operating cost estimates ............................................................................... 205
Table 21.13 Grinding media operating cost estimates ............................................................................. 205
Table 21.14 Repair materials and operating supplies .............................................................................. 205
Table 21.15 Dry stack TSF operational unit cost summary ...................................................................... 206
Table 21.16 Dry stack TSF operational total cost summary ..................................................................... 206
Table 21.17 Trench Camp dry stack TSF capital cost estimate summary ............................................... 207
Table 21.18 Hermosa dry stack TSF capital cost estimate summary ...................................................... 207
Table 21.19 Total mine capital cost estimate ........................................................................................... 210
Table 21.20 Mine operating cost by area ................................................................................................. 211
Table 22.1 Taylor deposit underground mine – key economic assumptions and results....................... 213
Table 22.2 Taylor deposit production and cash flow forecast ................................................................ 214
Table 22.3 Taylor deposit economic sensitivity analysis (post-tax) ........................................................ 215
Table 22.4 Assumptions for taxation purposes in 2017 PEA Financial Model ....................................... 216
Figures
Figure 1.1 Flowsheet for lead and zinc concentrate production ................................................................ 7
Figure 1.2 Primary underground equipment ............................................................................................ 11
Figure 1.3 Underground work force ......................................................................................................... 12
Figure 1.4 Production schedule and ZnEq (%) ........................................................................................ 12
Figure 1.5 Development schedule by type .............................................................................................. 13
Figure 4.1 Arizona map showing Property ............................................................................................... 36
Figure 4.2 Property location map ............................................................................................................. 37
Figure 4.3 Property claim status map ...................................................................................................... 43
Figure 4.4 Agreements and royalties map ............................................................................................... 45
Figure 7.1 Regional geology map ............................................................................................................ 52
Figure 7.2 Taylor Property geology ......................................................................................................... 56
Figure 7.3 Plan of outlines for Taylor and Central Deposit ...................................................................... 59
Figure 7.4 Generalized long section (looking northeast) of the Taylor and Central Deposits ................. 60
Figure 7.5 Generalized cross section (looking northwest) of the Taylor and Central Deposits ............... 61
Figure 7.6 Stratigraphic column for the Property ..................................................................................... 62
Figure 7.7 Structural trends with quartz sulphide vein mineralization ..................................................... 66
Figure 10.1 Drill collar for drillhole HDS-335 ............................................................................................. 71
Figure 10.2 Locations of drillholes intersecting sulphide mineralization .................................................... 72
Figure 11.1 Core storage container ........................................................................................................... 87
Figure 11.2 Silver check assays Skyline and Inspectorate Laboratories ................................................... 94
Figure 11.3 Re-assay drillholes ................................................................................................................. 97
Figure 13.1 Locked cycle flowsheet ......................................................................................................... 104
Figure 13.2 Final simplified flowsheet and conditions ............................................................................. 108
Figure 14.1 Plan view of Taylor and Central Deposit drillholes ............................................................... 110
Figure 14.2 Plan view of drillholes and boundary of block model ............................................................ 114
Figure 14.3 Plan view of gradeshell domains .......................................................................................... 116
Figure 14.4 Gradeshell domains in long section ...................................................................................... 116
Figure 14.5 Long section through a portion of the Taylor block model ................................................... 127
Hermosa Property, Taylor Zn-Pb-Ag Deposit PEA Arizona Minerals Inc. 716027
amcconsultants.cm 27
Figure 14.6 Swath Plot for Concha Domain – East-West ........................................................................ 128
Figure 14.7 Swath Plot for Concha Domain North-South ........................................................................ 128
Figure 14.8 Swath Plot Concha Domain by Elevation ............................................................................. 129
Figure 16.1 Option 1 general layout ........................................................................................................ 136
Figure 16.2 Option 2 general layout ........................................................................................................ 136
Figure 16.3 Option 3 general layout ........................................................................................................ 137
Figure 16.4 Option 4 general layout ........................................................................................................ 137
Figure 16.5 Block model above cut-off grade of 4% ZnEq ...................................................................... 140
Figure 16.6 Tons and grade by level ....................................................................................................... 142
Figure 16.7 Design layout for the 3140 L (Plan view) .............................................................................. 143
Figure 16.8 Underground mine design .................................................................................................... 144
Figure 16.9 Benchmark data for ventilation airflow requirements ........................................................... 145
Figure 16.10 Paste fill distribution system ................................................................................................. 147
Figure 16.11 Primary underground equipment .......................................................................................... 148
Figure 16.12 Underground work force ....................................................................................................... 149
Figure 16.13 Production schedule and ZnEq (%) ...................................................................................... 150
Figure 16.14 Development schedule by type ............................................................................................ 150
Figure 17.1 Process plant overall flowsheet ............................................................................................ 154
Figure 18.1 General arrangement drawing of the site infrastructure ....................................................... 160
Figure 18.2 Detailed surface drawing of key infrastructure ..................................................................... 161
Figure 18.3 Tailings storage facilities ...................................................................................................... 167
Figure 18.4 Plan view of existing tailings piles 1 through 4 ..................................................................... 169
Figure 18.5 Sections of existing tailings piles 1 through 4 ....................................................................... 169
Figure 18.6 Trench Camp starter TSF plan view ..................................................................................... 171
Figure 18.7 Trench Camp ultimate TSF plan view .................................................................................. 172
Figure 18.8 Hermosa ultimate TSF plan view .......................................................................................... 173
Figure 18.9 TSF typical section ............................................................................................................... 174
Figure 18.10 Typical rock armoring and dry stack tailings section 3 ......................................................... 174
Figure 18.11 Single line diagram showing underground power distribution .............................................. 177
Figure 18.12 Estimated hoist performance curve ...................................................................................... 179
Figure 18.13 40-person refuge station ....................................................................................................... 181
Figure 21.1 Benchmark data for mining costs ......................................................................................... 211
Figure 22.1 Sensitivity analysis – post-tax NPV at 8% discount rate ...................................................... 215
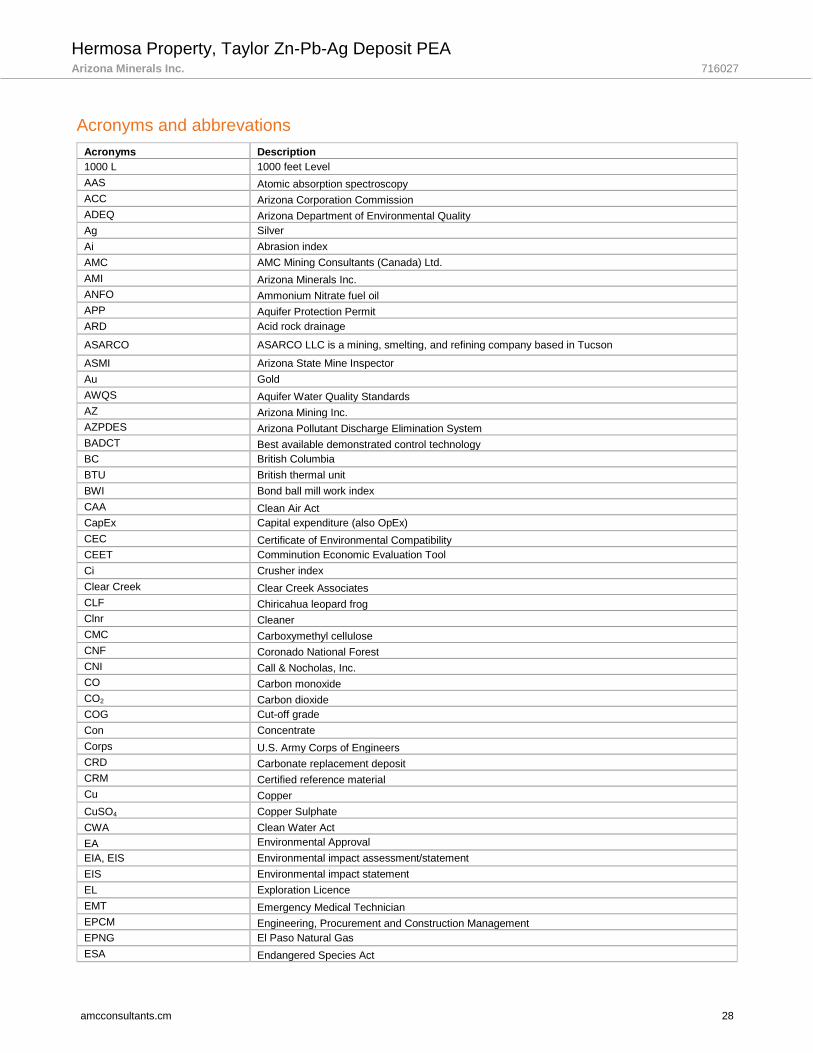
Hermosa Property, Taylor Zn-Pb-Ag Deposit PEA Arizona Minerals Inc. 716027
amcconsultants.cm 28
Acronyms and abbrevations
Acronyms Description
1000 L 1000 feet Level
AAS Atomic absorption spectroscopy
ACC Arizona Corporation Commission
ADEQ Arizona Department of Environmental Quality
Ag Silver
Ai Abrasion index
AMC AMC Mining Consultants (Canada) Ltd.
AMI Arizona Minerals Inc.
ANFO Ammonium Nitrate fuel oil
APP Aquifer Protection Permit
ARD Acid rock drainage
ASARCO ASARCO LLC is a mining, smelting, and refining company based in Tucson
ASMI Arizona State Mine Inspector
Au Gold
AWQS Aquifer Water Quality Standards
AZ Arizona Mining Inc.
AZPDES Arizona Pollutant Discharge Elimination System
BADCT Best available demonstrated control technology
BC British Columbia
BTU British thermal unit
BWI Bond ball mill work index
CAA Clean Air Act
CapEx Capital expenditure (also OpEx)
CEC Certificate of Environmental Compatibility
CEET Comminution Economic Evaluation Tool
Ci Crusher index
Clear Creek Clear Creek Associates
CLF Chiricahua leopard frog
Clnr Cleaner
CMC Carboxymethyl cellulose
CNF Coronado National Forest
CNI Call & Nocholas, Inc.
CO Carbon monoxide
CO2 Carbon dioxide
COG Cut-off grade
Con Concentrate
Corps U.S. Army Corps of Engineers
CRD Carbonate replacement deposit
CRM Certified reference material
Cu Copper
CuSO4 Copper Sulphate
CWA Clean Water Act
EA Environmental Approval
EIA, EIS Environmental impact assessment/statement
EIS Environmental impact statement
EL Exploration Licence
EMT Emergency Medical Technician
EPCM Engineering, Procurement and Construction Management
EPNG El Paso Natural Gas
ESA Endangered Species Act
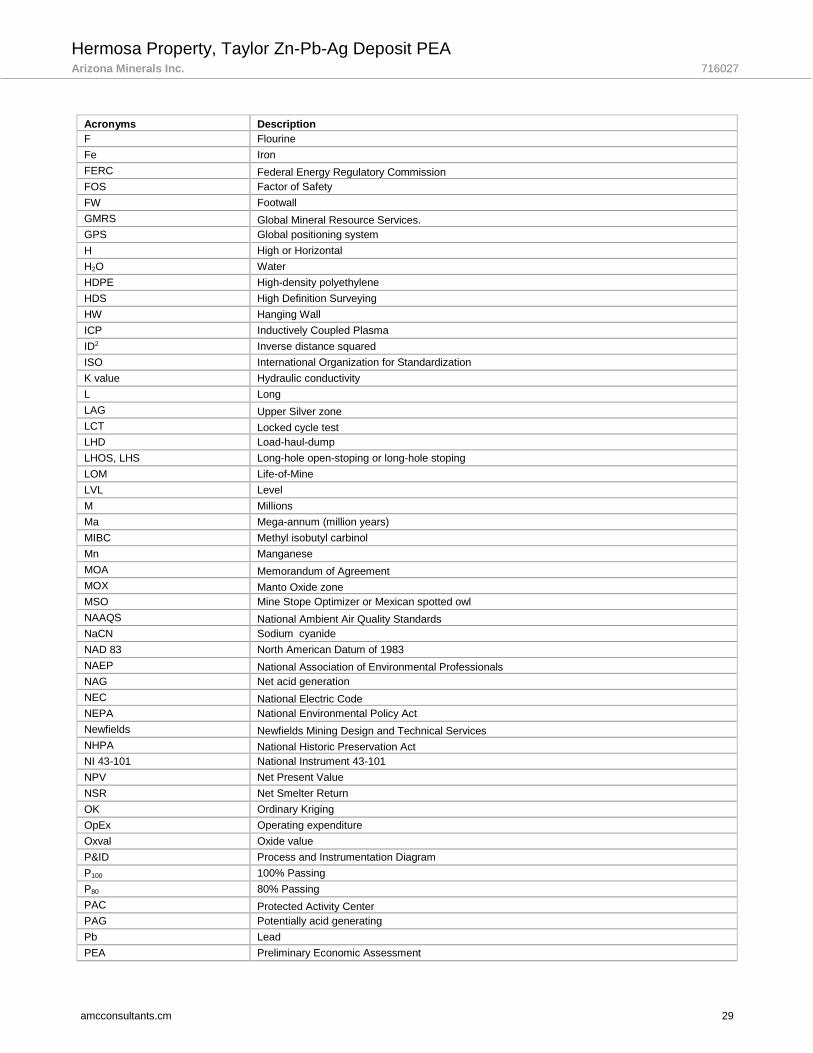
Hermosa Property, Taylor Zn-Pb-Ag Deposit PEA Arizona Minerals Inc. 716027
amcconsultants.cm 29
Acronyms Description
F Flourine
Fe Iron
FERC Federal Energy Regulatory Commission
FOS Factor of Safety
FW Footwall
GMRS Global Mineral Resource Services.
GPS Global positioning system
H High or Horizontal
H2O Water
HDPE High-density polyethylene
HDS High Definition Surveying
HW Hanging Wall
ICP Inductively Coupled Plasma
ID2 Inverse distance squared
ISO International Organization for Standardization
K value Hydraulic conductivity
L Long
LAG Upper Silver zone
LCT Locked cycle test
LHD Load-haul-dump
LHOS, LHS Long-hole open-stoping or long-hole stoping
LOM Life-of-Mine
LVL Level
M Millions
Ma Mega-annum (million years)
MIBC Methyl isobutyl carbinol
Mn Manganese
MOA Memorandum of Agreement
MOX Manto Oxide zone
MSO Mine Stope Optimizer or Mexican spotted owl
NAAQS National Ambient Air Quality Standards
NaCN Sodium cyanide
NAD 83 North American Datum of 1983
NAEP National Association of Environmental Professionals
NAG Net acid generation
NEC National Electric Code
NEPA National Environmental Policy Act
Newfields Newfields Mining Design and Technical Services
NHPA National Historic Preservation Act
NI 43-101 National Instrument 43-101
NPV Net Present Value
NSR Net Smelter Return
OK Ordinary Kriging
OpEx Operating expenditure
Oxval Oxide value
P&ID Process and Instrumentation Diagram
P100 100% Passing
P80 80% Passing
PAC Protected Activity Center
PAG Potentially acid generating
Pb Lead
PEA Preliminary Economic Assessment
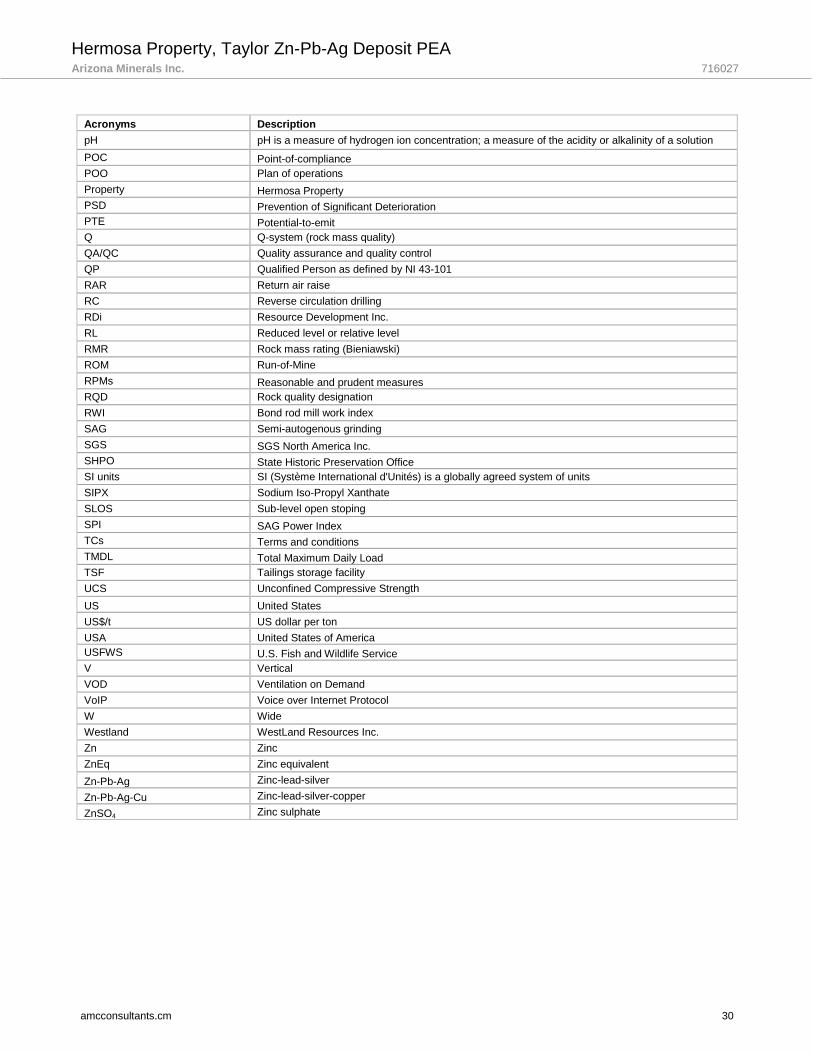
Hermosa Property, Taylor Zn-Pb-Ag Deposit PEA Arizona Minerals Inc. 716027
amcconsultants.cm 30
Acronyms Description
pH pH is a measure of hydrogen ion concentration; a measure of the acidity or alkalinity of a solution
POC Point-of-compliance
POO Plan of operations
Property Hermosa Property
PSD Prevention of Significant Deterioration
PTE Potential-to-emit
Q Q-system (rock mass quality)
QA/QC Quality assurance and quality control
QP Qualified Person as defined by NI 43-101
RAR Return air raise
RC Reverse circulation drilling
RDi Resource Development Inc.
RL Reduced level or relative level
RMR Rock mass rating (Bieniawski)
ROM Run-of-Mine
RPMs Reasonable and prudent measures
RQD Rock quality designation
RWI Bond rod mill work index
SAG Semi-autogenous grinding
SGS SGS North America Inc.
SHPO State Historic Preservation Office
SI units SI (Système International d'Unités) is a globally agreed system of units
SIPX Sodium Iso-Propyl Xanthate
SLOS Sub-level open stoping
SPI SAG Power Index
TCs Terms and conditions
TMDL Total Maximum Daily Load
TSF Tailings storage facility
UCS Unconfined Compressive Strength
US United States
US$/t US dollar per ton
USA United States of America
USFWS U.S. Fish and Wildlife Service
V Vertical
VOD Ventilation on Demand
VoIP Voice over Internet Protocol
W Wide
Westland WestLand Resources Inc.
Zn Zinc
ZnEq Zinc equivalent
Zn-Pb-Ag Zinc-lead-silver
Zn-Pb-Ag-Cu Zinc-lead-silver-copper
ZnSO4 Zinc sulphate

Hermosa Property, Taylor Zn-Pb-Ag Deposit PEA Arizona Minerals Inc. 716027
amcconsultants.cm 31
Unit abbreviations Description
% Percentage
° Degree (angle of dip)
°C Degrees celsius
µm Micrometre
A Amps
BTU British Thermal Units
cfm Cubic feet per minute
cm Centimetre
d Days
dmt Dry metric tonne
dst Dry short ton
dt Dry ton
ft Feet
ft/month Feet per month
ft3/ton Cubic feet per short ton
g Gallon
g/hr Gallons per hour
g/min Gallons per minute
g/t Grams per ton
g/tonne Grams per tonne
ha Hectare
hp Horsepower
hr Hours
in Inch
kg Kilogram
km Kilometre
koz Thousand ounces
kPa Kilopascal
kt Thousand (short) tons
ktonne Kilotonne
kV Kilo volts
kVA Kilovolt-Ampere
kW Kilowatts
kWh Kilowatt-hour
kWh/t Kilowatt-hour per ton
L Litre
L/s Litres/second
lb/ton Pound per ton
lbs Pounds
lbs/ft3 Pounds per cubic foot
m Metre
M tonnes pa Million tonnes per annum
m/d Metre per day
m3 Cubic metre (cu. m)
m3/s Cubic metre per second
mg Milligram
mi Mile
mil A thousandth of an inch
ML Mining Lease
mm Millimetre
Mm3pa Million cubic metre per annum
Moz Million ounces
MPa Megapascal
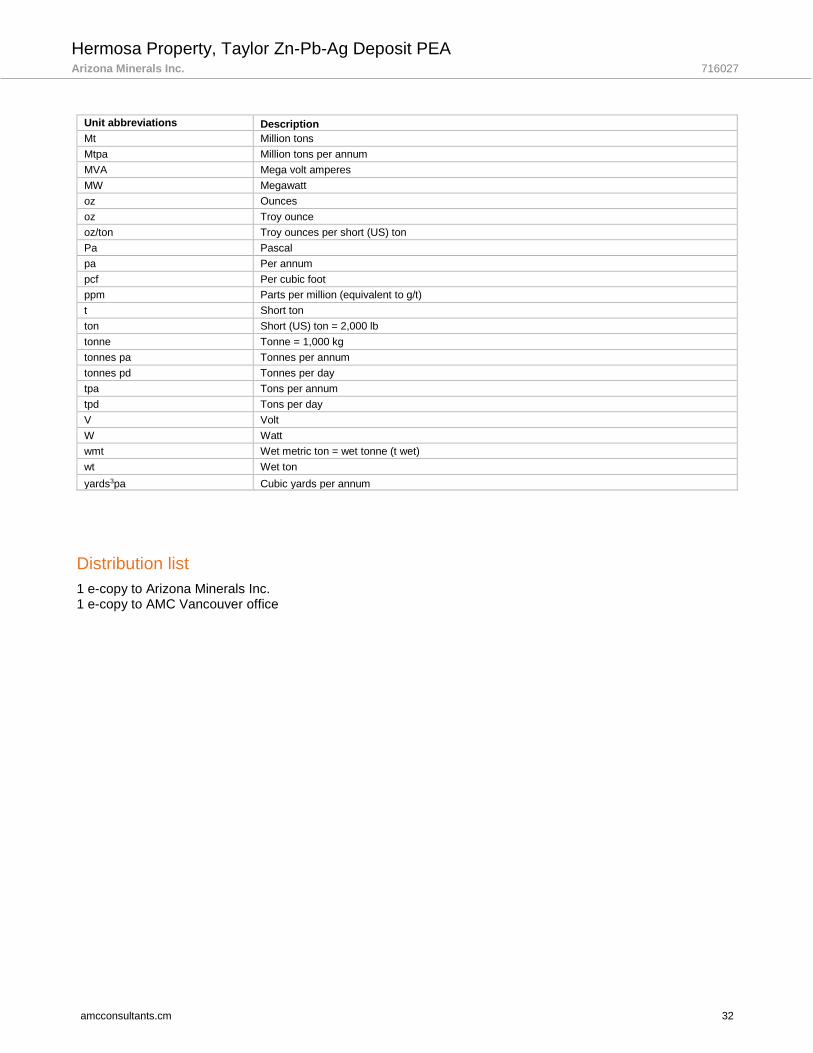
Hermosa Property, Taylor Zn-Pb-Ag Deposit PEA Arizona Minerals Inc. 716027
amcconsultants.cm 32
Unit abbreviations Description
Mt Million tons
Mtpa Million tons per annum
MVA Mega volt amperes
MW Megawatt
oz Ounces
oz Troy ounce
oz/ton Troy ounces per short (US) ton
Pa Pascal
pa Per annum
pcf Per cubic foot
ppm Parts per million (equivalent to g/t)
t Short ton
ton Short (US) ton = 2,000 lb
tonne Tonne = 1,000 kg
tonnes pa Tonnes per annum
tonnes pd Tonnes per day
tpa Tons per annum
tpd Tons per day
V Volt
W Watt
wmt Wet metric ton = wet tonne (t wet)
wt Wet ton
yards3pa Cubic yards per annum
Distribution list
1 e-copy to Arizona Minerals Inc. 1 e-copy to AMC Vancouver office

Hermosa Property, Taylor Zn-Pb-Ag Deposit PEA Arizona Minerals Inc. 716027
amcconsultants.cm 33
2 Introduction
AMC Mining Consultants (Canada) Ltd. (AMC) was commissioned by Arizona Mining Inc. (AZ) to prepare an updated Mineral Resource estimate and Preliminary Economic Assessment (PEA) and report according to National Instrument 43-101 Technical Report (NI 43-101 Technical Report or Report) for the Taylor Zn-Pb-Ag deposit located on the Hermosa Property, (Property). The Property is located in Santa Cruz County near the town of Patagonia, southern Arizona, USA.
The Property hosts two known mineral deposits, the Taylor Deposit and the Central Deposit. The latest Technical Report for the Property was completed by AMC, dated 29 November 2016 and reported additional Mineral Resources for the Taylor Deposit, (November 2016 Technical Report). Prior to that the Taylor Deposit was also the subject of an NI 43-101 report dated 17 March 2016 by Metal Mining Consultants Inc. (March 2016 Technical Report). The Property is 100% owned by Arizona Minerals Inc. (AMI) a wholly owned subsidiary of AZ. This Technical Report provides an update of the Mineral Resource estimate for both the Central and Taylor deposits and reports the results of the PEA.
AMC are responsible for managing and preparing the Technical Report with inputs from Mr G. Mosher of Global Mineral Resource Services, an associate of AMC, Mr G. Methven AMC, Mr W. Hughes AMC, Mr C. Kottmeier AMC, Mr Q. Jin, SGS North America Inc., Mr R. M. Smith, Newfields, Mr E. Christenson of WestLand Resources Inc., Mr D. Bartlett of Clear Creek Associates. Persons who contributed to the report and assume responsibility for Sections are listed in Table 2.1.
Table 2.1 Persons who prepared or contributed to this technical report
Qualified Persons Responsible for the Preparation of this Technical Report
Qualified Person
Position Employer Independent
of AZ? Date of Last Site
Visit Professional Designation
Sections of Report
Mr G. Methven Principal Mining Engineer
AMC Mining Consultants (Canada) Ltd.
Yes 13 July 2016 P.Eng. (BC)
1 (part), 2, 3, 15, 16, 21 (part), 24, 25 (part), 26 (part), 27 (part)
Mr G. Z. Mosher
Principal Geologist Global Mineral Resource Services.
Yes 10 Feb 2017 P.Geo. (BC)
1 (part) 4-10 (exc. 5.3.1), 11,12, 14, 23, 25 (part), 26 (part), 27 (part)
Mr Q. Jin Senior Process Engineer
SGS North America Inc. Yes 4 October 2016 P.E.
1 (part), 13, 17, 18 (part), 19, 21 (part), 25 (part), 26 (part), 27 (part).
Mr W. Hughes
Principal Mechanical / Infrastructure Engineer
AMC Mining Consultants (Canada) Ltd.
Yes No visit P.Eng. (BC) 1 (part), 18 (part), 25 (part), 26 (part), 27 (part)
Mr R. M. Smith Principal Engineer Newfields Mining Design and Technical Services
Yes 19 January 2017 P.E. 1 (part), 18 (part), 21 (part), 25 (part), 26 (part), 27 (part)
Mr C. Kottmeier
Principal Mining Engineer
AMC Mining Consultants (Canada) Ltd.
Yes No visit P.Eng. (BC) 1 (part), 21 (part), 22, 25 (part), 26 (part), 27 (part)
Mr D. Bartlett Principal and President
Clear Creek Associates Yes 4 October 2016 CPG AIPG,
RG AZ 5.3.1, 20.3.3
Mr E. Christenson
Senior Engineer WestLand Resources Inc.
Yes 2 March 2017 P.E. AZ 1 (part), 20 (exc. 20.3.3), 25 (part), 26 (part), 27 (part)

Hermosa Property, Taylor Zn-Pb-Ag Deposit PEA Arizona Minerals Inc. 716027
amcconsultants.cm 34
Other Experts who assisted the Qualified Persons
Expert Position Employer Independent
of AZ? Visited Site Sections of Report
Mr D Taylor Chief Operating Officer
Arizona Minerals Inc. No Yes 1 - 12
Mr S Burkett Senior Geologist Arizona Minerals Inc. No Yes 1 - 12
Mr. Johnny Pappas
Director Environmental and Permitting
Arizona Minerals Inc. No Yes 20
The key information used in this report is listed in Section 27, References.
All currency amounts and commodity prices are in United States (US) dollars unless stated otherwise. Quantities are stated in both Imperial and SI units. Commodity weights of measure are in ounces per short ton (oz/ton) or percent (%) unless stated otherwise.
This Report includes the tabulation of numerical data which involves a degree of rounding for the purpose of Mineral Resource estimation. AMC does not consider any rounding of the numerical data to be material to the Property.
This Report has been produced in accordance with the Standards of Disclosure for Mineral Projects as contained in NI 43-101 and accompanying policies and documents. NI 43-101 utilizes the definitions and categories of Mineral Resources and Mineral Reserves as set out in the Canadian Institute of Mining, Metallurgy and Petroleum (CIM) Definition Standards on Mineral Resources and Mineral Reserves (CIM Definition Standards).
A draft of the NI 43-101 Technical Report was provided to AZ to check for factual accuracy. The report has an effective date of 29 March 2017.

Hermosa Property, Taylor Zn-Pb-Ag Deposit PEA Arizona Minerals Inc. 716027
amcconsultants.cm 35
3 Reliance on other experts
The Qualified Persons have relied, in respect of legal aspects, upon the work of the Expert listed below. To the extent permitted under NI 43-101, the Qualified Persons disclaim responsibility for the relevant section of the Technical Report.
The following disclosure is made in respect of this Expert:
• Marian C. LaLonde, attorney-at-law of the firm Quarles & Brady LLP.
Report, opinion or statement relied upon:
• Title Report, dated 22 March 2017 which provides a legal description of all patented and unpatented mining claims associated with Arizona Minerals, Inc.’s Hermosa Project located in Santa Cruz County, Arizona.
• Marian C. LaLonde stated that her office confirmed on 20 March 2017 during a phone call with the Treasurer of Santa Cruz County, that all taxes due on the patented mining claims have been timely paid.
• In addition, on 20 March 2017, her office researched the validity of the unpatented claims on the Bureau of Land Management’s Legacy Rehost System (LR2000) and confirmed that all unpatented claims for the Hermosa Project are of record and in good standing.
Extent of reliance:
• Full reliance following a review by the Qualified Person(s).
Portion of Technical Report to which disclaimer applies:
• Section 4.
The following disclosure is made in respect of this Expert:
• Paul J Ireland, Chief Financial Officer, Arizona Mining Inc. (with input from external chartered professional accountants).
Report, opinion or statement relied upon:
• Information on the application of corporate taxation for Arizona, USA and applicable royalties.
Extent of reliance:
• Full reliance following a review by the Qualified Person(s).
Portion of Technical Report to which disclaimer applies:
• Section 22.

Hermosa Property, Taylor Zn-Pb-Ag Deposit PEA Arizona Minerals Inc. 716027
amcconsultants.cm 36
4 Property description and location
Location
The Taylor and Central Deposits are located on the Property that is part of the Harshaw and Patagonia Mining Districts located in the Patagonia Mountains of Santa Cruz County, Arizona (Figure 4.1 and Figure 4.2). The Property is located 8 miles (13 km) southeast of the town of Patagonia, which has a population of approximately 1,000 people.
Figure 4.1 Arizona map showing Property
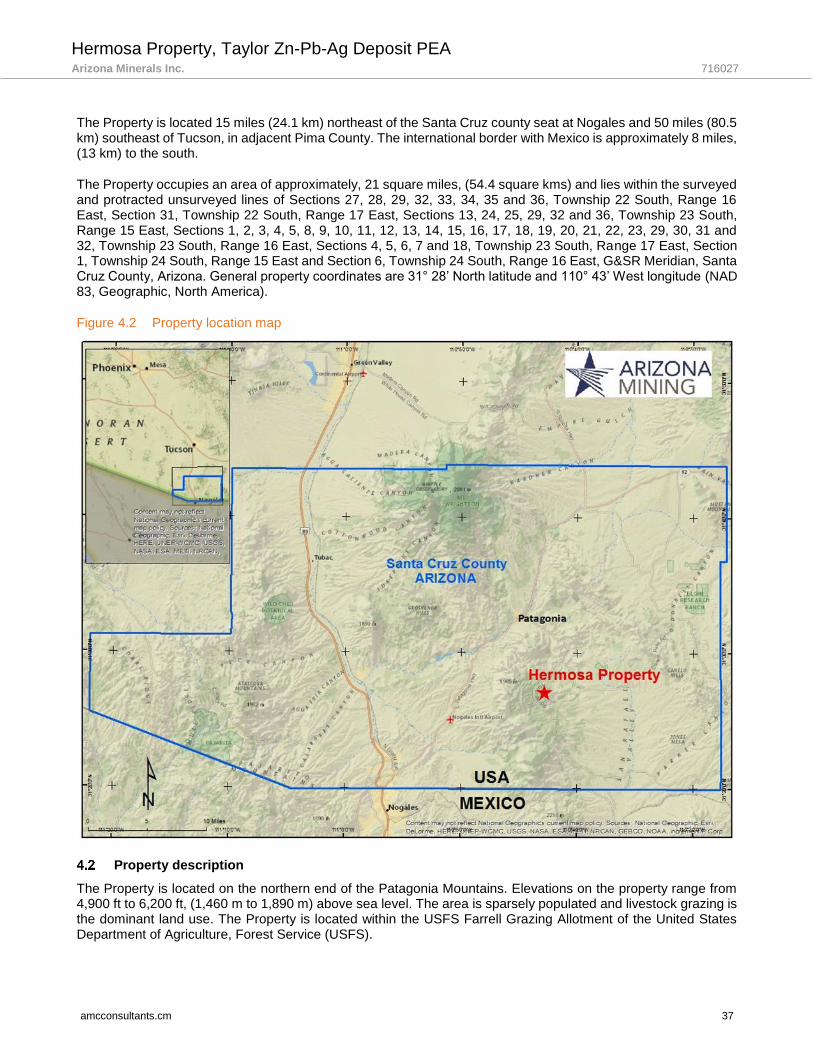
Hermosa Property, Taylor Zn-Pb-Ag Deposit PEA Arizona Minerals Inc. 716027
amcconsultants.cm 37
The Property is located 15 miles (24.1 km) northeast of the Santa Cruz county seat at Nogales and 50 miles (80.5 km) southeast of Tucson, in adjacent Pima County. The international border with Mexico is approximately 8 miles, (13 km) to the south.
The Property occupies an area of approximately, 21 square miles, (54.4 square kms) and lies within the surveyed and protracted unsurveyed lines of Sections 27, 28, 29, 32, 33, 34, 35 and 36, Township 22 South, Range 16 East, Section 31, Township 22 South, Range 17 East, Sections 13, 24, 25, 29, 32 and 36, Township 23 South, Range 15 East, Sections 1, 2, 3, 4, 5, 8, 9, 10, 11, 12, 13, 14, 15, 16, 17, 18, 19, 20, 21, 22, 23, 29, 30, 31 and 32, Township 23 South, Range 16 East, Sections 4, 5, 6, 7 and 18, Township 23 South, Range 17 East, Section 1, Township 24 South, Range 15 East and Section 6, Township 24 South, Range 16 East, G&SR Meridian, Santa Cruz County, Arizona. General property coordinates are 31° 28’ North latitude and 110° 43’ West longitude (NAD 83, Geographic, North America).
Figure 4.2 Property location map
Property description
The Property is located on the northern end of the Patagonia Mountains. Elevations on the property range from 4,900 ft to 6,200 ft, (1,460 m to 1,890 m) above sea level. The area is sparsely populated and livestock grazing is the dominant land use. The Property is located within the USFS Farrell Grazing Allotment of the United States Department of Agriculture, Forest Service (USFS).
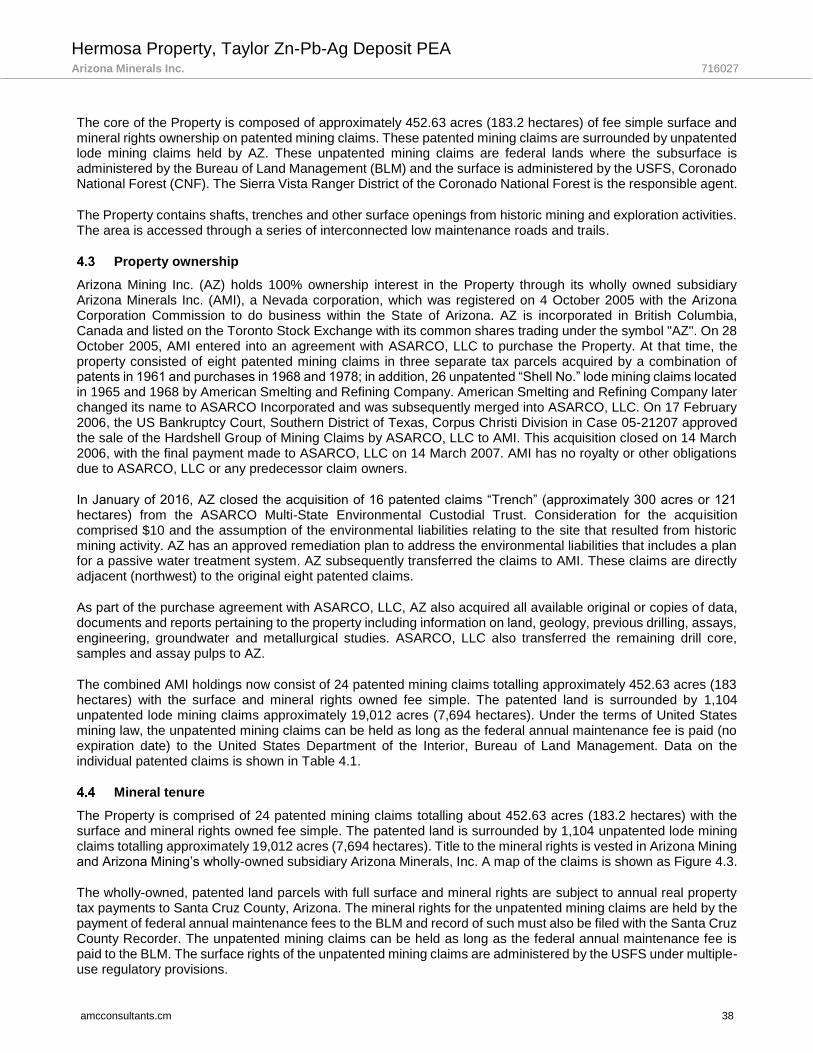
Hermosa Property, Taylor Zn-Pb-Ag Deposit PEA Arizona Minerals Inc. 716027
amcconsultants.cm 38
The core of the Property is composed of approximately 452.63 acres (183.2 hectares) of fee simple surface and mineral rights ownership on patented mining claims. These patented mining claims are surrounded by unpatented lode mining claims held by AZ. These unpatented mining claims are federal lands where the subsurface is administered by the Bureau of Land Management (BLM) and the surface is administered by the USFS, Coronado National Forest (CNF). The Sierra Vista Ranger District of the Coronado National Forest is the responsible agent.
The Property contains shafts, trenches and other surface openings from historic mining and exploration activities. The area is accessed through a series of interconnected low maintenance roads and trails.
Property ownership
Arizona Mining Inc. (AZ) holds 100% ownership interest in the Property through its wholly owned subsidiary Arizona Minerals Inc. (AMI), a Nevada corporation, which was registered on 4 October 2005 with the Arizona Corporation Commission to do business within the State of Arizona. AZ is incorporated in British Columbia, Canada and listed on the Toronto Stock Exchange with its common shares trading under the symbol "AZ". On 28 October 2005, AMI entered into an agreement with ASARCO, LLC to purchase the Property. At that time, the property consisted of eight patented mining claims in three separate tax parcels acquired by a combination of patents in 1961 and purchases in 1968 and 1978; in addition, 26 unpatented “Shell No.” lode mining claims located in 1965 and 1968 by American Smelting and Refining Company. American Smelting and Refining Company later changed its name to ASARCO Incorporated and was subsequently merged into ASARCO, LLC. On 17 February 2006, the US Bankruptcy Court, Southern District of Texas, Corpus Christi Division in Case 05-21207 approved the sale of the Hardshell Group of Mining Claims by ASARCO, LLC to AMI. This acquisition closed on 14 March 2006, with the final payment made to ASARCO, LLC on 14 March 2007. AMI has no royalty or other obligations due to ASARCO, LLC or any predecessor claim owners.
In January of 2016, AZ closed the acquisition of 16 patented claims “Trench” (approximately 300 acres or 121 hectares) from the ASARCO Multi-State Environmental Custodial Trust. Consideration for the acquisition comprised $10 and the assumption of the environmental liabilities relating to the site that resulted from historic mining activity. AZ has an approved remediation plan to address the environmental liabilities that includes a plan for a passive water treatment system. AZ subsequently transferred the claims to AMI. These claims are directly adjacent (northwest) to the original eight patented claims.
As part of the purchase agreement with ASARCO, LLC, AZ also acquired all available original or copies of data, documents and reports pertaining to the property including information on land, geology, previous drilling, assays, engineering, groundwater and metallurgical studies. ASARCO, LLC also transferred the remaining drill core, samples and assay pulps to AZ.
The combined AMI holdings now consist of 24 patented mining claims totalling approximately 452.63 acres (183 hectares) with the surface and mineral rights owned fee simple. The patented land is surrounded by 1,104 unpatented lode mining claims approximately 19,012 acres (7,694 hectares). Under the terms of United States mining law, the unpatented mining claims can be held as long as the federal annual maintenance fee is paid (no expiration date) to the United States Department of the Interior, Bureau of Land Management. Data on the individual patented claims is shown in Table 4.1.
Mineral tenure
The Property is comprised of 24 patented mining claims totalling about 452.63 acres (183.2 hectares) with the surface and mineral rights owned fee simple. The patented land is surrounded by 1,104 unpatented lode mining claims totalling approximately 19,012 acres (7,694 hectares). Title to the mineral rights is vested in Arizona Mining and Arizona Mining’s wholly-owned subsidiary Arizona Minerals, Inc. A map of the claims is shown as Figure 4.3.
The wholly-owned, patented land parcels with full surface and mineral rights are subject to annual real property tax payments to Santa Cruz County, Arizona. The mineral rights for the unpatented mining claims are held by the payment of federal annual maintenance fees to the BLM and record of such must also be filed with the Santa Cruz County Recorder. The unpatented mining claims can be held as long as the federal annual maintenance fee is paid to the BLM. The surface rights of the unpatented mining claims are administered by the USFS under multiple-use regulatory provisions.
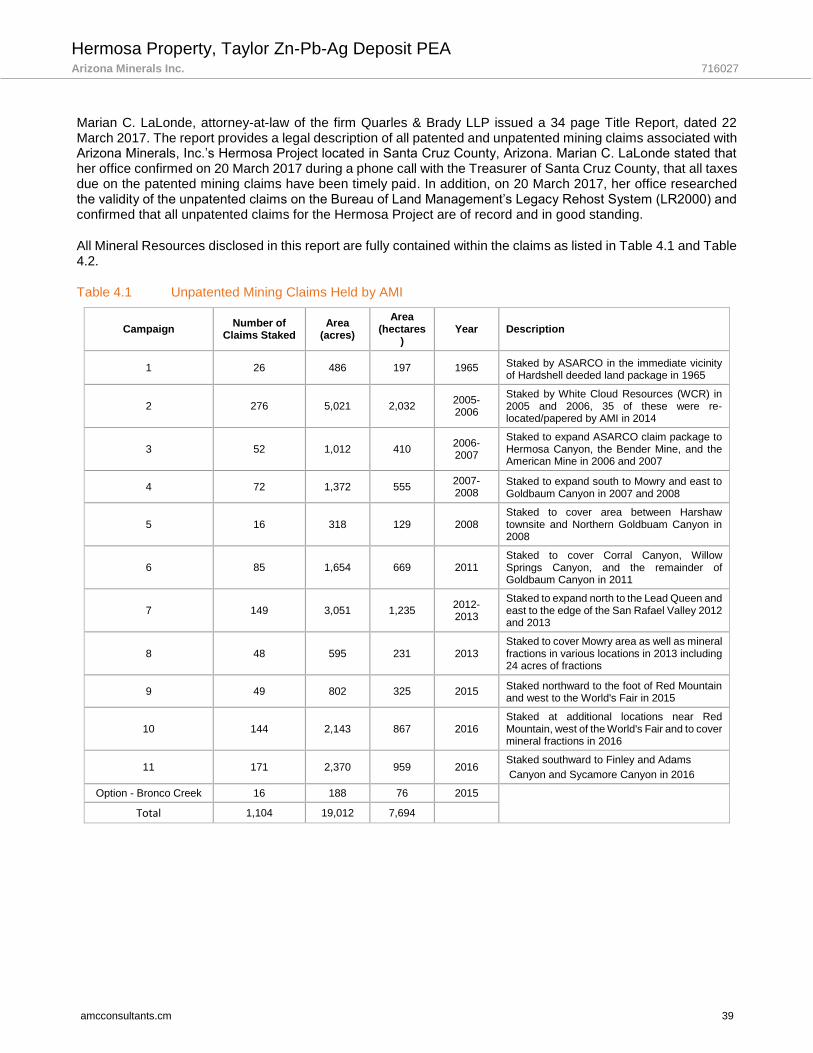
Hermosa Property, Taylor Zn-Pb-Ag Deposit PEA Arizona Minerals Inc. 716027
amcconsultants.cm 39
Marian C. LaLonde, attorney-at-law of the firm Quarles & Brady LLP issued a 34 page Title Report, dated 22 March 2017. The report provides a legal description of all patented and unpatented mining claims associated with Arizona Minerals, Inc.’s Hermosa Project located in Santa Cruz County, Arizona. Marian C. LaLonde stated that her office confirmed on 20 March 2017 during a phone call with the Treasurer of Santa Cruz County, that all taxes due on the patented mining claims have been timely paid. In addition, on 20 March 2017, her office researched the validity of the unpatented claims on the Bureau of Land Management’s Legacy Rehost System (LR2000) and confirmed that all unpatented claims for the Hermosa Project are of record and in good standing.
All Mineral Resources disclosed in this report are fully contained within the claims as listed in Table 4.1 and Table 4.2.
Table 4.1 Unpatented Mining Claims Held by AMI
Campaign Number of
Claims Staked Area
(acres)
Area (hectares
) Year Description
1 26 486 197 1965 Staked by ASARCO in the immediate vicinity of Hardshell deeded land package in 1965
2 276 5,021 2,032 2005-2006
Staked by White Cloud Resources (WCR) in 2005 and 2006, 35 of these were re-located/papered by AMI in 2014
3 52 1,012 410 2006-2007
Staked to expand ASARCO claim package to Hermosa Canyon, the Bender Mine, and the American Mine in 2006 and 2007
4 72 1,372 555 2007-2008
Staked to expand south to Mowry and east to Goldbaum Canyon in 2007 and 2008
5 16 318 129 2008 Staked to cover area between Harshaw townsite and Northern Goldbuam Canyon in 2008
6 85 1,654 669 2011 Staked to cover Corral Canyon, Willow Springs Canyon, and the remainder of Goldbaum Canyon in 2011
7 149 3,051 1,235 2012-2013
Staked to expand north to the Lead Queen and east to the edge of the San Rafael Valley 2012 and 2013
8 48 595 231 2013 Staked to cover Mowry area as well as mineral fractions in various locations in 2013 including 24 acres of fractions
9 49 802 325 2015 Staked northward to the foot of Red Mountain and west to the World's Fair in 2015
10 144 2,143 867 2016 Staked at additional locations near Red Mountain, west of the World's Fair and to cover mineral fractions in 2016
11 171 2,370 959 2016 Staked southward to Finley and Adams
Canyon and Sycamore Canyon in 2016
Option - Bronco Creek 16 188 76 2015
Total 1,104 19,012 7,694
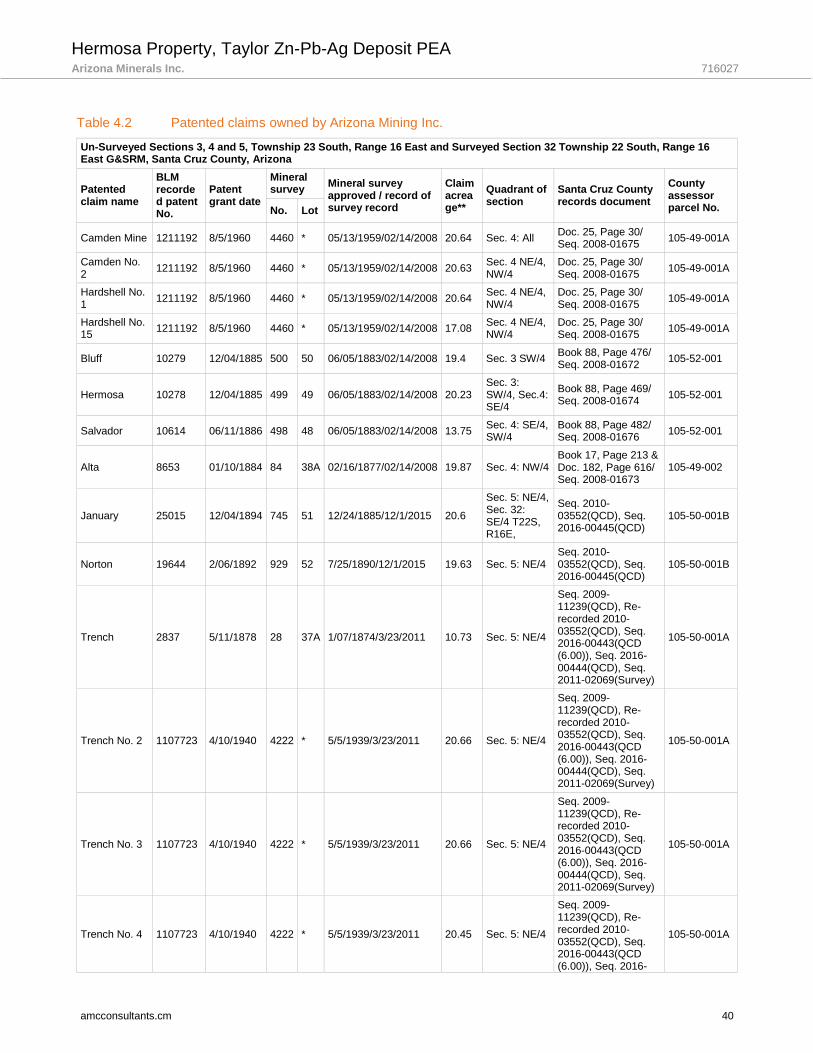
Hermosa Property, Taylor Zn-Pb-Ag Deposit PEA Arizona Minerals Inc. 716027
amcconsultants.cm 40
Table 4.2 Patented claims owned by Arizona Mining Inc.
Un-Surveyed Sections 3, 4 and 5, Township 23 South, Range 16 East and Surveyed Section 32 Township 22 South, Range 16 East G&SRM, Santa Cruz County, Arizona
Patented claim name
BLM recorded patent No.
Patent grant date
Mineral survey
Mineral survey approved / record of survey record
Claim acreage**
Quadrant of section
Santa Cruz County records document
County assessor parcel No. No. Lot
Camden Mine 1211192 8/5/1960 4460 * 05/13/1959/02/14/2008 20.64 Sec. 4: All Doc. 25, Page 30/ Seq. 2008-01675
105-49-001A
Camden No. 2
1211192 8/5/1960 4460 * 05/13/1959/02/14/2008 20.63 Sec. 4 NE/4, NW/4
Doc. 25, Page 30/ Seq. 2008-01675
105-49-001A
Hardshell No. 1
1211192 8/5/1960 4460 * 05/13/1959/02/14/2008 20.64 Sec. 4 NE/4, NW/4
Doc. 25, Page 30/ Seq. 2008-01675
105-49-001A
Hardshell No. 15
1211192 8/5/1960 4460 * 05/13/1959/02/14/2008 17.08 Sec. 4 NE/4, NW/4
Doc. 25, Page 30/ Seq. 2008-01675
105-49-001A
Bluff 10279 12/04/1885 500 50 06/05/1883/02/14/2008 19.4 Sec. 3 SW/4 Book 88, Page 476/ Seq. 2008-01672
105-52-001
Hermosa 10278 12/04/1885 499 49 06/05/1883/02/14/2008 20.23 Sec. 3: SW/4, Sec.4: SE/4
Book 88, Page 469/ Seq. 2008-01674
105-52-001
Salvador 10614 06/11/1886 498 48 06/05/1883/02/14/2008 13.75 Sec. 4: SE/4, SW/4
Book 88, Page 482/ Seq. 2008-01676
105-52-001
Alta 8653 01/10/1884 84 38A 02/16/1877/02/14/2008 19.87 Sec. 4: NW/4 Book 17, Page 213 & Doc. 182, Page 616/ Seq. 2008-01673
105-49-002
January 25015 12/04/1894 745 51 12/24/1885/12/1/2015 20.6
Sec. 5: NE/4, Sec. 32: SE/4 T22S, R16E,
Seq. 2010-03552(QCD), Seq. 2016-00445(QCD)
105-50-001B
Norton 19644 2/06/1892 929 52 7/25/1890/12/1/2015 19.63 Sec. 5: NE/4 Seq. 2010-03552(QCD), Seq. 2016-00445(QCD)
105-50-001B
Trench 2837 5/11/1878 28 37A 1/07/1874/3/23/2011 10.73 Sec. 5: NE/4
Seq. 2009-11239(QCD), Re-recorded 2010-03552(QCD), Seq. 2016-00443(QCD (6.00)), Seq. 2016-00444(QCD), Seq. 2011-02069(Survey)
105-50-001A
Trench No. 2 1107723 4/10/1940 4222 * 5/5/1939/3/23/2011 20.66 Sec. 5: NE/4
Seq. 2009-11239(QCD), Re-recorded 2010-03552(QCD), Seq. 2016-00443(QCD (6.00)), Seq. 2016-00444(QCD), Seq. 2011-02069(Survey)
105-50-001A
Trench No. 3 1107723 4/10/1940 4222 * 5/5/1939/3/23/2011 20.66 Sec. 5: NE/4
Seq. 2009-11239(QCD), Re-recorded 2010-03552(QCD), Seq. 2016-00443(QCD (6.00)), Seq. 2016-00444(QCD), Seq. 2011-02069(Survey)
105-50-001A
Trench No. 4 1107723 4/10/1940 4222 * 5/5/1939/3/23/2011 20.45 Sec. 5: NE/4
Seq. 2009-11239(QCD), Re-recorded 2010-03552(QCD), Seq. 2016-00443(QCD (6.00)), Seq. 2016-
105-50-001A

Hermosa Property, Taylor Zn-Pb-Ag Deposit PEA Arizona Minerals Inc. 716027
amcconsultants.cm 41
Un-Surveyed Sections 3, 4 and 5, Township 23 South, Range 16 East and Surveyed Section 32 Township 22 South, Range 16 East G&SRM, Santa Cruz County, Arizona
Patented claim name
BLM recorded patent No.
Patent grant date
Mineral survey
Mineral survey approved / record of survey record
Claim acreage**
Quadrant of section
Santa Cruz County records document
County assessor parcel No. No. Lot
00444(QCD), Seq. 2011-02069(Survey)
Trench No. 5 1107723 4/10/1940 4222 * 5/5/1939/3/23/2011 20.45 Sec. 5: SE/4, NE/4
Seq. 2009-11239(QCD), Re-recorded 2010-03552(QCD), Seq. 2016-00443(QCD (6.00)), Seq. 2016-00444(QCD), Seq. 2011-02069(Survey)
105-50-001A
Trench No. 6 1107723 4/10/1940 4222 * 5/5/1939/3/23/2011 20.66 Sec. 5: SE/4, NE/4
Seq. 2009-11239(QCD), Re-recorded 2010-03552(QCD), Seq. 2016-00443(QCD (6.00)), Seq. 2016-00444(QCD), Seq. 2011-02069(Survey)
105-50-001A
Trench No. 7 1107723 4/10/1940 4222 * 5/5/1939/3/23/2011 20.4 Sec. 5: NE/4
Seq. 2009-11239(QCD), Re-recorded 2010-03552(QCD), Seq. 2016-00443(QCD (6.00)), Seq. 2016-00444(QCD), Seq. 2011-02069(Survey)
105-50-001A
Trench No. 8 1107723 4/10/1940 4222 * 5/5/1939/3/23/2011 18.7 Sec. 5: NE/4
Seq. 2009-11239(QCD), Re-recorded 2010-03552(QCD), Seq. 2016-00443(QCD (6.00)), Seq. 2016-00444(QCD), Seq. 2011-02069(Survey)
105-50-001A
Trench Ext. No. 1
1107723 4/10/1940 4222 * 5/5/1939/3/23/2011 14.2 Sec.4: NW/4
Doc. 119/393, Seq. 2009- 11239(QCD), Seq. 2010-03552(QCD), Seq. 2016-00443(QCD), Seq. 2011-02069(Survey)
105-49-003
Trench Ext. No. 2
1107723 4/10/1940 4222 * 5/5/1939/3/23/2011 20.32 Sec. 5: NE/4
Seq. 2009-11239(QCD), Re-recorded 2010-03552(QCD), Seq. 2016-00443(QCD (6.00)), Seq. 2016-00444(QCD), Seq. 2011-02069(Survey)
105-50-001A
Trench Ext. No. 3
1107723 4/10/1940 4222 * 5/5/1939/3/23/2011 19.4 Sec. 5: NE/4
Seq. 2009-11239(QCD), Re-recorded 2010-03552(QCD), Seq. 2016-00443(QCD (6.00)), Seq. 2016-00444(QCD), Seq. 2011-02069(Survey)
105-50-001A
Trench Ext. No. 4
1107723 4/10/1940 4222 * 5/5/1939/3/23/2011 18.71 Sec.4: NW/4 Doc. 119/393, Seq. 2009- 11239(QCD),
105-49-003

Hermosa Property, Taylor Zn-Pb-Ag Deposit PEA Arizona Minerals Inc. 716027
amcconsultants.cm 42
Un-Surveyed Sections 3, 4 and 5, Township 23 South, Range 16 East and Surveyed Section 32 Township 22 South, Range 16 East G&SRM, Santa Cruz County, Arizona
Patented claim name
BLM recorded patent No.
Patent grant date
Mineral survey
Mineral survey approved / record of survey record
Claim acreage**
Quadrant of section
Santa Cruz County records document
County assessor parcel No. No. Lot
Seq. 2010-03552(QCD), Seq. 2016-00443(QCD), Seq. 2011-02069(Survey)
Hardshell No. 7
1107723 4/10/1940 4222 * 5/5/1939/3/23/2011 15.97 Sec.4: NW/4
Doc. 119/393, Seq. 2009- 11239(QCD), Seq. 2010-03552(QCD), Seq. 2016-00443(QCD), Seq. 2011-02069(Survey)
105-49-003
Josephine 1107723 4/10/1940 4222 * 5/5/1939/3/23/2011 20.65 Sec. 5: NE/4
Seq. 2009-11239(QCD), Re-recorded 2010-03552(QCD), Seq. 2016-00443(QCD (6.00)), Seq. 2016-00444(QCD), Seq. 2011-02069(Survey)
105-50-001A
Note: Filed with the Official Records of Santa Cruz County, Nogales, Arizona and U.S. Bureau of Land Management, Phoenix, Arizona. The Bluff, Hermosa, Salvador and Alta claims, when surveyed and patented, were part of Pima County, Arizona Territory. Early records with Pima County, Tucson. These sections in T23S, R16E are non-standard, un-surveyed and protracted. * No lot number assigned. (QCD) Quit claim deed. **Record of Survey Total Acreage 452.63

Hermosa Property, Taylor Zn-Pb-Ag Deposit PEA Arizona Minerals Inc. 716027
amcconsultants.cm 43
Figure 4.3 Property claim status map
Hermosa Property, Taylor Zn-Pb-Ag Deposit PEA Arizona Minerals Inc. 716027
amcconsultants.cm 44
Options agreements
Effective 7 October 2015 AMI entered into an agreement with Bronco Creek Exploration, Inc. granting it permission to explore on 16 unpatented mining claims with an option to acquire the claims on fulfilment of the terms of the agreement. The agreement calls for the payment on execution of $25,000 followed by three annual payments of $20,000 for a total of $85,000. If AMI fulfils the terms of the agreement and exercises the option to acquire the claims, then it will also convey an NSR Royalty interest of 2% of production returns from those claims to the seller. Figure 4.3 displays the optioned claims and are indicated in yellow.
Agreements and royalties
There is a 2% NSR Royalty payable by AMI to a private Canadian company controlled by AZ’s Executive Chairman, from any future production extracted from the original eight patented mining claims and 26 unpatented mining claims acquired in 2005. There are no underlying royalties, fees or other obligations due to ASARCO, LLC or previous claim holders.
As discussed under 4.5, above, in the event AMI exercises its option to acquire the Bronco Creek claims there will be a 2% NSR Royalty payable from any production from those claims.
On 25 April 2016 the Company closed the sale of a 1% net smelter return royalty to Osisko Gold Royalties Ltd. ("Osisko") on all sulphide mineralization of lead and zinc (and any copper, silver or gold recovered from the concentrate from such mineralization) mined from the Taylor Sulphide and Taylor Deeps Sulphide domains.
See Figure 4.4 for the location of these royalties and other landholdings.
AMI has granted a grazing lease to the Hale Family Revocable Trust doing business as the Hale Ranch on the patented 61.61 hectares (152.24 acres) in cooperation with the USFS, Sierra Vista Ranger District. This arrangement is a continuation of a similar lease that had existed between the Hale Ranch and ASARCO LLC since 1966. The Hermosa project is located under the American Peak Pasturage of the Farrell Grazing Allotment from the USFS to the Hale Ranch. Range Management on the unpatented ground is supervised by the USFS. Some arrangements will be required with the Hale Ranch/USFS Farrell Grazing Allotment for loss of grazing areas on the American Peak pasturage should the project progress to mine production.
Santa Cruz County has a 66 ft (20 m) wide road easement centred on the mid-line of the Harshaw Road (USFS CNF Road No. 49). About 400 ft (122 m) of the Harshaw Road crosses the northwest end of the Alta patented claim, where an access road to the property is located. The local power company, UniSource Energy Services, also has a high voltage power line with easements along the Harshaw Road, through the Alta patented claim. A branch of this power line also extends through the Harshaw townsite owned by the Hale Ranch and continues into the San Rafael Valley.
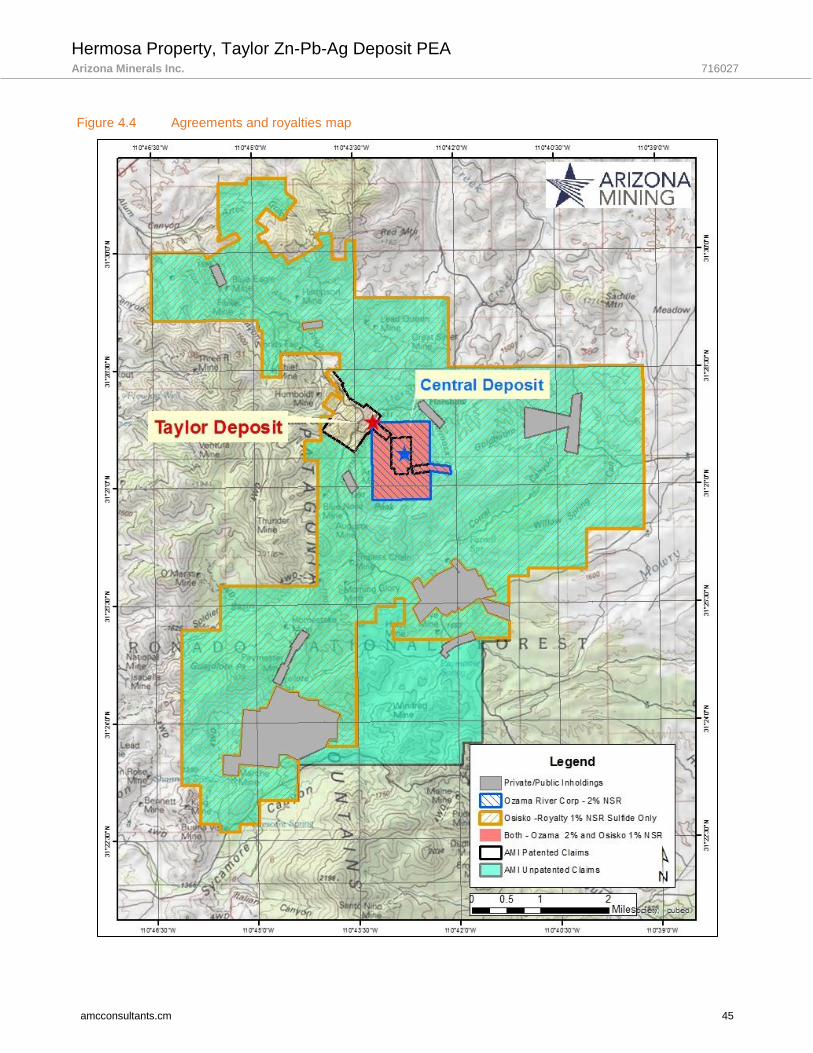
Hermosa Property, Taylor Zn-Pb-Ag Deposit PEA Arizona Minerals Inc. 716027
amcconsultants.cm 45
Figure 4.4 Agreements and royalties map
Hermosa Property, Taylor Zn-Pb-Ag Deposit PEA Arizona Minerals Inc. 716027
amcconsultants.cm 46
Environmental liabilities
In January 2016, AZ acquired the patented "Trench" claims from the ASARCO Multi-State Environmental Custodial Trust. Consideration for the acquisition included the assumption of the environmental liabilities relating to the trust site that resulted from historic mining activity. AZ is working with ADEQ's Voluntary Remediation Program on the active treatment system, which will effectively manage and treat discharge from ASARCO's January Mine Adit and seepage from the Tailings Storage Facilities (TSF).
Permits and others
The issue of permits is addressed in Section 20.
Hermosa Property, Taylor Zn-Pb-Ag Deposit PEA Arizona Minerals Inc. 716027
amcconsultants.cm 47
5 Accessibility, climate, local resources, infrastructure and physiography
Accessibility
The Property is accessed via Harshaw Road, a Santa Cruz county road, leading 8 miles (13 km) southeastward from Patagonia, Arizona to the Harshaw townsite. An interconnecting system of United States Forest Service (USFS) numbered roads, originally constructed largely for exploration, mining and ranching, exist around Harshaw and the district. The Property extends southward for approximately 3 miles (5 km) from Harshaw townsite and approximately 1 mile (1.6 km) southeast and southwest from Harshaw townsite. Access around the Property is by unimproved two-track roads. See Figure 4.2 for location and access information.
Climate
The Harshaw-Patagonia area is mountainous and has a semi-arid climate characteristic of the Arizona Uplands. Daytime temperatures seldom remain above 90°F (32°C) in the summer with warm to moderately cool nights. Winter days are usually mild with periodic frosts at night. Light snowfall is not uncommon but seldom remains for more than a few days. Cooler temperatures and higher winds occur at higher elevations in the area.
Precipitation, characteristic of this upland desert region, is variable and cyclic. Annual precipitation averages 17 in (43 cm) and ranges from 8 in to 36 in (20 cm to 91 cm) per year with higher amounts of precipitation occurring at higher elevations in the range. More than 50% of the rainfall occurs during the period from late June to early October in cyclonic, often torrential “monsoonal” thunderstorms, which are often accompanied by strong, destructive winds.
Infrastructure
5.3.1 Water
The local base level of the water table is approximately 4,950 ft (1,509 m) elevation at Harshaw town site. The project area and the local Harshaw Creek drainage are not part of an Arizona Department of Water Resources Active Management Area. Available water well information and preliminary hydrogeological analysis suggests adequate groundwater supplies are available for project requirements.
5.3.2 Workforce
Southern Arizona hosts several major mining districts and the local area has several large active mines. Experienced, skilled workers are readily available within a reasonable commuting distance.
5.3.3 Commercial resources and services
Resources in the town of Patagonia are limited. The town has a high school, a motel, several restaurants, a small grocery store and a gas station. Nogales, 15 miles (24 km) southwest of Patagonia, has a population of approximately 25,000 people and is large enough to serve as a supply and service centre for most needs. Nogales has rail freight service, and a small commercial airport.
Tucson, just over 50 miles (80 km) to the north, is the commercial and service/supply centre for one of the world’s largest mining districts. Tucson has a full-service commercial airport and is a large rail centre.
5.3.4 Social services and security
Patagonia has K-12 schools and a well-stocked town library. In addition, the community has a small family medical facility. Emergency Medical Technician (EMT) services are associated with the Volunteer Fire Department. Medical helicopter landing facilities are available. Patagonia has a small police force which is supplemented by the Santa Cruz County Sherriff and the Arizona Highway Patrol. The U.S. Border Patrol has a strong presence in the area. Nogales has a small regional hospital. Tucson’s large hospitals are easily accessible by ambulance or helicopter.

Hermosa Property, Taylor Zn-Pb-Ag Deposit PEA Arizona Minerals Inc. 716027
amcconsultants.cm 48
5.3.5 Power
A 13.2 kV power line follows Harshaw Creek from west of Patagonia to the old town site of Harshaw and continues on to the San Rafael Valley. Higher capacity power lines traverse the Sonoita Creek Valley from Huachuca City to Sonoita-Elgin and Patagonia from the east. A major regional natural gas pipeline, owned and operated by El Paso Natural Gas extends from Nogales to the northeast through the Sonoita Valley and to localities to the east. A trunk phone line follows the Harshaw Creek Road with phone service available in Harshaw. Cellular telephone service is good in the Patagonia-Harshaw area.
5.3.6 Transportation
The Property is accessed via state and county hard surfaced roads and USFS secondary and tertiary roads, constructed largely for exploration, mining and ranching needs around Harshaw townsite and the district. A major rail hub is located approximately 15 miles (24 km) south near the city of Nogales.
Physiography
The Property lies on the eastern pediment flank of the Patagonia Mountains, a portion of the northwestern edge of the Mexican Highlands section of the Basin and Range Physiographic Province of the southwestern United States. Elevations in the mountains range up to 7,200 ft (2,195 m) above sea level, while elevations on the Property range from 4,800 ft to 6,200 ft (1,460 m to 1,890 m) above sea level. The Property is dominated by the western San Rafael Valley pediment plateau at about 5,400 ft (1,646 m), which on-laps the higher foothills of the Patagonia range to the west. The plateau is deeply incised by tributaries of Harshaw Creek which drain to the north.
The Property is located in an area of moderate to rugged topography, with numerous arroyos and canyons incised through volcanic and sedimentary stratigraphy. The arroyos and canyons contain streams which flow intermittently in response to rainfall events. Vegetation is typical of the Pinyon-Oak-Juniper woodland and is characterized by short evergreen trees and scrub oaks mixed with a variety of desert and upland shrubs. Lower slope faces are covered by open grasslands.
Hermosa Property, Taylor Zn-Pb-Ag Deposit PEA Arizona Minerals Inc. 716027
amcconsultants.cm 49
6 History
Prior ownership of the Property
Ownership of the Property prior to its acquisition by Asarco is not known. Asarco began operating the nearby Trench Mine in 1939 and continued ownership of the Property until it was acquired by AMI which was subsequently acquired by AZ.
Previous exploration and development work
ASARCO explored the Property with intermittent drill programs from 1940 through 1991. The early program diamond drilling, spurred by WWII metal prices, failed to find significant extensions of Hardshell Incline lead-silver minerials. Nonetheless, several thousand tons of moderate grade lead-silver oxide minelization was shipped from the lower levels of the Hardshell Incline Mine from 1943 to 1948 and from 1963 and 1964. Second pass diamond drilling programs, undertaken from 1946 to 1953, located thick Ag-Pb-Zn bearing, manganese oxides of the Main Manto to the southeast of the Hardshell Incline.
Rising silver prices in the mid-1960s led to renewed interest in the Hermosa mineralization. Re-evaluation of the geological data led to staking of additional claims in the district and the three patented claims of the Hermosa Group were acquired between 1965 and 1968. ASARCO used the newly developed, air-hammer rotary drilling equipment to drill the silica jasperoid cap and the vuggy Main Manto zone. Diamond drilling was used successfully in some outlying stratigraphic holes but attempts to deepen air-hammer drillholes in vuggy, silicified limestone often failed when drill fluid circulation was lost.
Recovery by weight or footage, water levels and volumes, lithology, alteration, mineralization and miscellaneous comments were logged in the field for most ASARCO drillholes and posted to graphic logs and cross-sections. Most air-hammer holes were drilled dry or with minimal water injection for dust control. They were usually lost after the water table or significant fracture zones or voids were encountered. Most of this drilling did not penetrate the static water table. Down-hole deviation was not measured for any of the ASARCO drillholes at the Property.
Geophysical surveying, detailed geological and metallurgical studies on the manganese oxide mineralization began in the late 1960s and continued through 1991. Close-spaced, rotary hammer drilling partially defined heap leach amenable, low-grade manganese, low-grade silver resource located near the historic Hermosa mine workings. Three shallow rotary air-hammer drillholes were completed in 1989 for metallurgical samples and a 1,500 ft (457 m) deep diamond drillhole in 1990-91 explored for deeper mineralization. ASARCO drilled 114 air-hammer and core holes, with an aggregate of approximately 46,000 ft (14,021 m) on the Property and surrounding area.
ASARCO conducted beneficiation tests to determine silver recovery processes. Bench scale, high-tension magnetic separation, electrostatic separation, reduction and segregation kilning, SO2 and thio-sulphate leaching and various cyanidation processes, in both company and commercial laboratories were tested. Little consideration was given to recovering other metals, including Mn, Zn, Cu, Au and potential co-products silica or clays. Minor test consideration was given to heap-leaching non-manganese low-grade silver mineralization.
Pan American Silver had a minimal lease/option/first right of refusal on most of ASARCO’s Hardshell Property from 1994 to 2002, Pan American Silver did not undertake any significant exploration work, confining their activity to internal economic evaluations.
Historical Mineral Resource and Mineral Reserve estimates
ASARCO made a number of historical resource and reserve estimates for the Property. A 1968, open pit resource of 6.5 million tons at 5 oz/ton silver; 1% to 2% lead + zinc and 15 % MnO2 was calculated and used in a number of older publications. An updated, open pit resource was calculated by ASARCO in 1975 to contain 20 million tons at an average grade of 3.33 oz/ton silver with 8% manganese, with a waste:to mineralization stripping ratio of 2:1. A 1979 ASARCO estimate reported a range of resources, and the median was 6,586,500 tons at an average grade of 7.92 oz/ton silver, at a cut-off grade of 5 oz/ton silver. A mineral inventory estimate calculated by ASARCO
Hermosa Property, Taylor Zn-Pb-Ag Deposit PEA Arizona Minerals Inc. 716027
amcconsultants.cm 50
in 1984 estimated a resource of 9,596,000 short tons with an average grade of 6.9 oz/ton silver, at a cut-off grade of 1.5 oz/ton silver.
These estimates pre-date the inception of National Instrument 43-101 (NI 43-101) and are included here only for the purpose of completeness of the historical record. These estimates do not conform to the categories set out in Sections 1.2 and 1.3 of the Instrument and a qualified person has not done sufficient work to classify these historical estimates as current Mineral Resources and Reserves and AMI is not treating these historical estimates as current Mineral Resources or Mineral Reserves.
Prior production from the Property
Mining in the Harshaw District dates from mid-18th century Spanish Colonial times, but is poorly documented before the 1870’s. Initially, oxide lead-silver vein was mined from the Trench Property, located approximately 1 mile (1.6 km) northwest of Hermosa and from the Mowry Property located approximately two miles to the south. This work continued intermittently until the late 19th century. Historical information from the late 1800’s and early 1900’s has been well documented (Schrader, 1915: USGS Bulletin 582 and Keith, 1975: AZ Geol. Survey Bulletin 191). The district’s historic production is poorly reported but is believed to be around 250,000 tons, yielding approximately two million ounces of silver with by-product lead, zinc, copper and manganese.
Early, unnamed, small-scale miners in the Hermosa area developed small tonnages of milling and direct-shipping oxidized mineralization in a number of small individual mines.
Production from the district was dominated by the Trench-area mines, small mines on the Alta claim, the Hardshell Incline and the Hermosa mine. The Trench area mines and sulphide flotation custom mill, located a mile northwest of the Property, produced primarily silver with minor by-product lead, but important production of direct-shipping manganese was recorded during World Wars I and II and the Korean War. The bulk of the production was from small underground operations in the area. Approximately half of the production was direct-shipping oxide mineralization and the balance was milling mineralization. The Trench mill produced both lead and zinc concentrates with copper, silver and minor gold by-product production.
The Alta Claim, staked in 1877, produced several thousand tons of oxidized high-grade lead-silver material from a northeastward-dipping vein. The Hardshell Incline Mine, discovered in 1879, produced approximately 35,000 tons with an average grade of about 8 oz/ton silver and 6% to 8% lead between 1896 and 1964.
The Hermosa Mine located one-half mile to the southeast of the Hardshell Incline Mine and discovered about the same time, produced high-grade silver halide mineralization from a 30° north-dipping stratiform vein, averaging approximately 20 oz/ton silver. Approximately 70,000 tons (63,490 tonnes) of material was processed in a 100 t/day mill over an 18 to 24 month period, producing 1.4 million ounces of silver, as confirmed by Wells Fargo shipping records. Scavenging secondary production from 1902 to 1943 yielded an additional 600,000 ounces of silver with by-product lead and copper.
ASARCO operated the nearby Trench Mine, located approximately 1 mile northwest of Hermosa, between 1939 and 1949 and produced lead, zinc, silver, and copper from a fissure vein sulphide deposit. The 150 t/day Trench lead-zinc flotation mill also treated district mineralization between 1939 and 1964 on a custom basis.
A summary of the historic production of the Hermosa area mines is presented in Table 6.1, derived from the Arizona Bureau of Mine Data (Bulletin 191, 1975) and ASARCO company files (Fleetwood Koutz, personal communication, 2006).
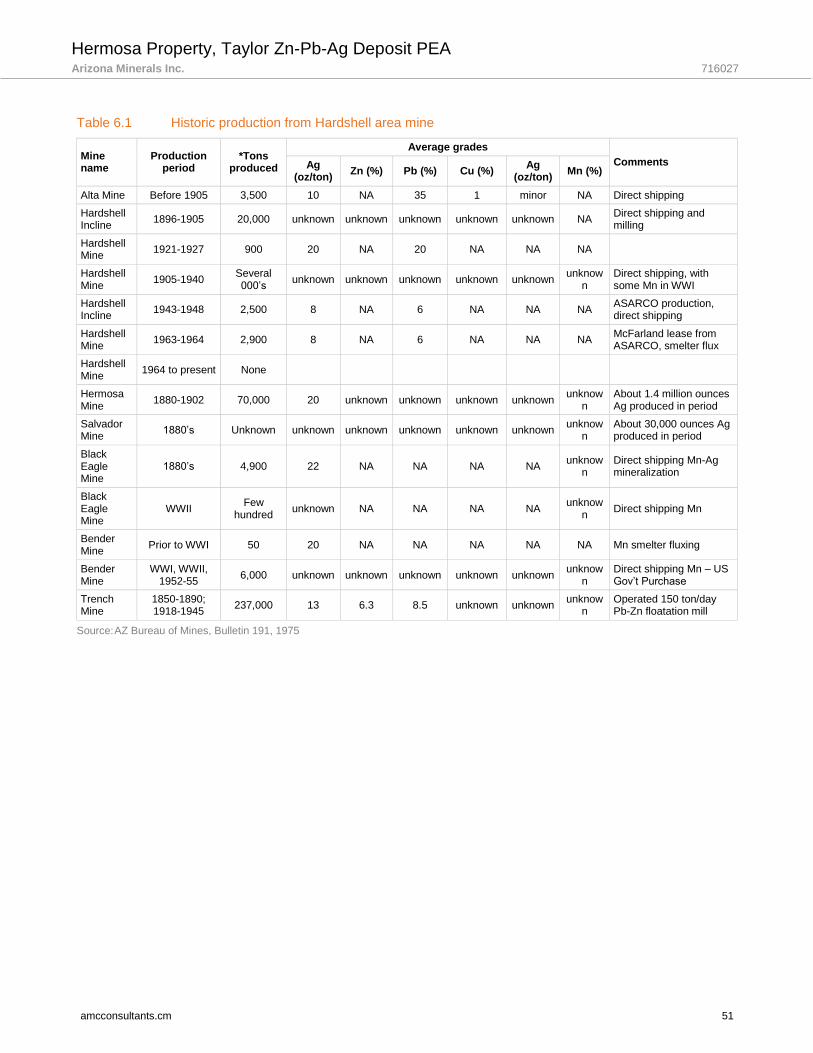
Hermosa Property, Taylor Zn-Pb-Ag Deposit PEA Arizona Minerals Inc. 716027
amcconsultants.cm 51
Table 6.1 Historic production from Hardshell area mine
Mine name
Production period
*Tons produced
Average grades
Comments Ag (oz/ton)
Zn (%) Pb (%) Cu (%) Ag
(oz/ton) Mn (%)
Alta Mine Before 1905 3,500 10 NA 35 1 minor NA Direct shipping
Hardshell Incline
1896-1905 20,000 unknown unknown unknown unknown unknown NA Direct shipping and milling
Hardshell Mine
1921-1927 900 20 NA 20 NA NA NA
Hardshell Mine
1905-1940 Several 000’s
unknown unknown unknown unknown unknown unknow
n Direct shipping, with some Mn in WWI
Hardshell Incline
1943-1948 2,500 8 NA 6 NA NA NA ASARCO production, direct shipping
Hardshell Mine
1963-1964 2,900 8 NA 6 NA NA NA McFarland lease from ASARCO, smelter flux
Hardshell Mine
1964 to present None
Hermosa Mine
1880-1902 70,000 20 unknown unknown unknown unknown unknow
n About 1.4 million ounces Ag produced in period
Salvador Mine
1880’s Unknown unknown unknown unknown unknown unknown unknow
n About 30,000 ounces Ag produced in period
Black Eagle Mine
1880’s 4,900 22 NA NA NA NA unknow
n Direct shipping Mn-Ag mineralization
Black Eagle Mine
WWII Few
hundred unknown NA NA NA NA
unknown
Direct shipping Mn
Bender Mine
Prior to WWI 50 20 NA NA NA NA NA Mn smelter fluxing
Bender Mine
WWI, WWII, 1952-55
6,000 unknown unknown unknown unknown unknown unknow
n Direct shipping Mn – US Gov’t Purchase
Trench Mine
1850-1890; 1918-1945
237,000 13 6.3 8.5 unknown unknown unknow
n Operated 150 ton/day Pb-Zn floatation mill
Source: AZ Bureau of Mines, Bulletin 191, 1975

Hermosa Property, Taylor Zn-Pb-Ag Deposit PEA Arizona Minerals Inc. 716027
amcconsultants.cm 52
7 Geological setting and mineralization
Regional geology
The regional geology of the area is shown in Figure 7.1 obtained from the Geological Map of the Patagonia Mountains, Santa Cruz County, Arizona published by the USGS in 2015. The location of the Hermosa Taylor Deposit and Central deposit are indicated by a red and blue stars, respectfully. Note the legend is shown on the following page.
Figure 7.1 Regional geology map

Hermosa Property, Taylor Zn-Pb-Ag Deposit PEA Arizona Minerals Inc. 716027
amcconsultants.com 53
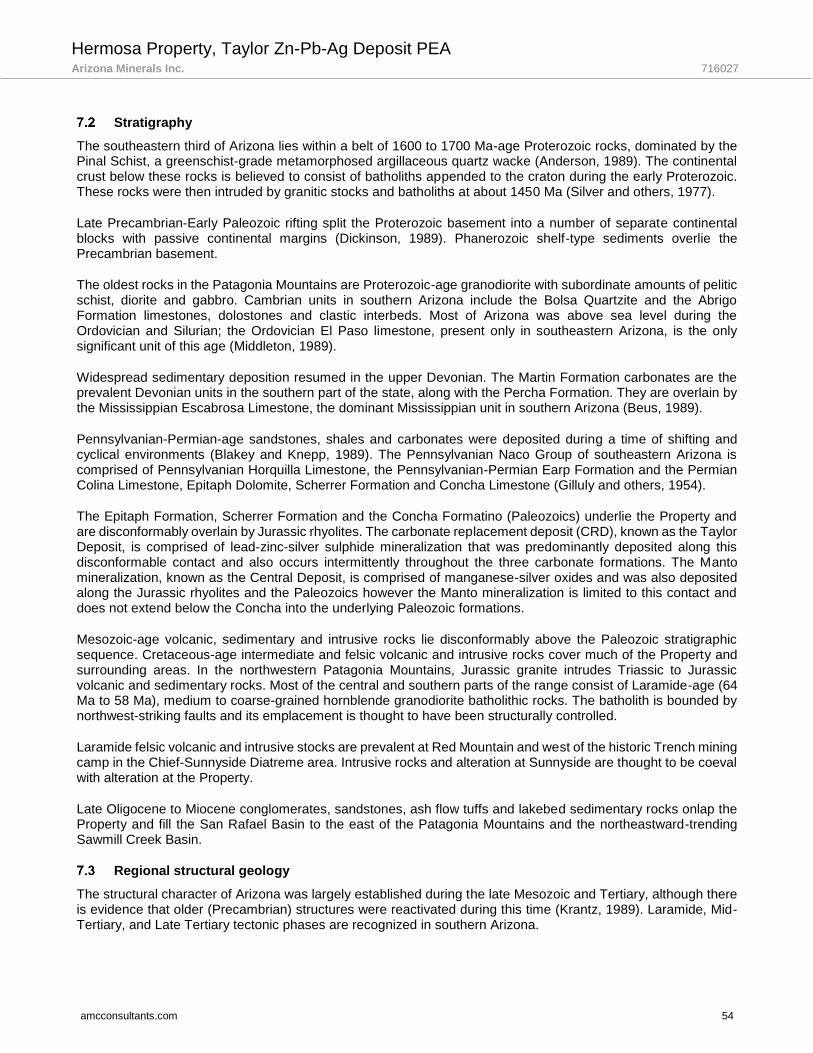
Hermosa Property, Taylor Zn-Pb-Ag Deposit PEA Arizona Minerals Inc. 716027
amcconsultants.com 54
Stratigraphy
The southeastern third of Arizona lies within a belt of 1600 to 1700 Ma-age Proterozoic rocks, dominated by the Pinal Schist, a greenschist-grade metamorphosed argillaceous quartz wacke (Anderson, 1989). The continental crust below these rocks is believed to consist of batholiths appended to the craton during the early Proterozoic. These rocks were then intruded by granitic stocks and batholiths at about 1450 Ma (Silver and others, 1977).
Late Precambrian-Early Paleozoic rifting split the Proterozoic basement into a number of separate continental blocks with passive continental margins (Dickinson, 1989). Phanerozoic shelf-type sediments overlie the Precambrian basement.
The oldest rocks in the Patagonia Mountains are Proterozoic-age granodiorite with subordinate amounts of pelitic schist, diorite and gabbro. Cambrian units in southern Arizona include the Bolsa Quartzite and the Abrigo Formation limestones, dolostones and clastic interbeds. Most of Arizona was above sea level during the Ordovician and Silurian; the Ordovician El Paso limestone, present only in southeastern Arizona, is the only significant unit of this age (Middleton, 1989).
Widespread sedimentary deposition resumed in the upper Devonian. The Martin Formation carbonates are the prevalent Devonian units in the southern part of the state, along with the Percha Formation. They are overlain by the Mississippian Escabrosa Limestone, the dominant Mississippian unit in southern Arizona (Beus, 1989).
Pennsylvanian-Permian-age sandstones, shales and carbonates were deposited during a time of shifting and cyclical environments (Blakey and Knepp, 1989). The Pennsylvanian Naco Group of southeastern Arizona is comprised of Pennsylvanian Horquilla Limestone, the Pennsylvanian-Permian Earp Formation and the Permian Colina Limestone, Epitaph Dolomite, Scherrer Formation and Concha Limestone (Gilluly and others, 1954).
The Epitaph Formation, Scherrer Formation and the Concha Formatino (Paleozoics) underlie the Property and are disconformably overlain by Jurassic rhyolites. The carbonate replacement deposit (CRD), known as the Taylor Deposit, is comprised of lead-zinc-silver sulphide mineralization that was predominantly deposited along this disconformable contact and also occurs intermittently throughout the three carbonate formations. The Manto mineralization, known as the Central Deposit, is comprised of manganese-silver oxides and was also deposited along the Jurassic rhyolites and the Paleozoics however the Manto mineralization is limited to this contact and does not extend below the Concha into the underlying Paleozoic formations.
Mesozoic-age volcanic, sedimentary and intrusive rocks lie disconformably above the Paleozoic stratigraphic sequence. Cretaceous-age intermediate and felsic volcanic and intrusive rocks cover much of the Property and surrounding areas. In the northwestern Patagonia Mountains, Jurassic granite intrudes Triassic to Jurassic volcanic and sedimentary rocks. Most of the central and southern parts of the range consist of Laramide-age (64 Ma to 58 Ma), medium to coarse-grained hornblende granodiorite batholithic rocks. The batholith is bounded by northwest-striking faults and its emplacement is thought to have been structurally controlled.
Laramide felsic volcanic and intrusive stocks are prevalent at Red Mountain and west of the historic Trench mining camp in the Chief-Sunnyside Diatreme area. Intrusive rocks and alteration at Sunnyside are thought to be coeval with alteration at the Property.
Late Oligocene to Miocene conglomerates, sandstones, ash flow tuffs and lakebed sedimentary rocks onlap the Property and fill the San Rafael Basin to the east of the Patagonia Mountains and the northeastward-trending Sawmill Creek Basin.
Regional structural geology
The structural character of Arizona was largely established during the late Mesozoic and Tertiary, although there is evidence that older (Precambrian) structures were reactivated during this time (Krantz, 1989). Laramide, Mid-Tertiary, and Late Tertiary tectonic phases are recognized in southern Arizona.
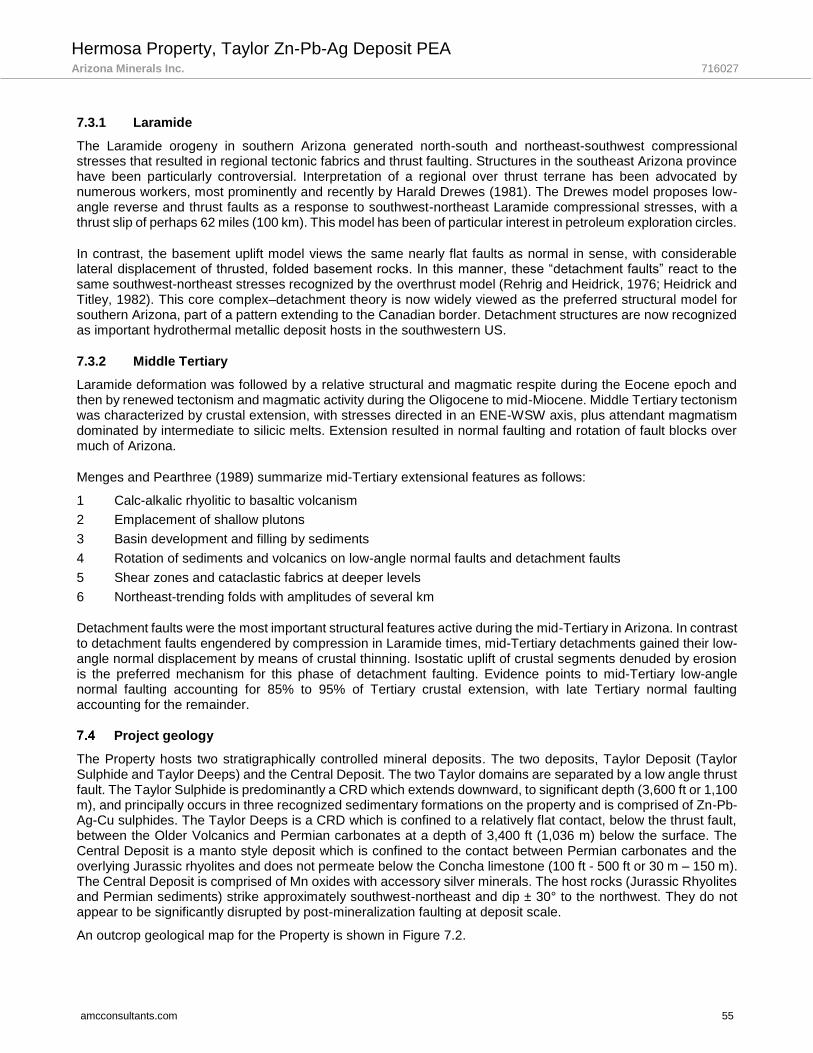
Hermosa Property, Taylor Zn-Pb-Ag Deposit PEA Arizona Minerals Inc. 716027
amcconsultants.com 55
7.3.1 Laramide
The Laramide orogeny in southern Arizona generated north-south and northeast-southwest compressional stresses that resulted in regional tectonic fabrics and thrust faulting. Structures in the southeast Arizona province have been particularly controversial. Interpretation of a regional over thrust terrane has been advocated by numerous workers, most prominently and recently by Harald Drewes (1981). The Drewes model proposes low-angle reverse and thrust faults as a response to southwest-northeast Laramide compressional stresses, with a thrust slip of perhaps 62 miles (100 km). This model has been of particular interest in petroleum exploration circles.
In contrast, the basement uplift model views the same nearly flat faults as normal in sense, with considerable lateral displacement of thrusted, folded basement rocks. In this manner, these “detachment faults” react to the same southwest-northeast stresses recognized by the overthrust model (Rehrig and Heidrick, 1976; Heidrick and Titley, 1982). This core complex–detachment theory is now widely viewed as the preferred structural model for southern Arizona, part of a pattern extending to the Canadian border. Detachment structures are now recognized as important hydrothermal metallic deposit hosts in the southwestern US.
7.3.2 Middle Tertiary
Laramide deformation was followed by a relative structural and magmatic respite during the Eocene epoch and then by renewed tectonism and magmatic activity during the Oligocene to mid-Miocene. Middle Tertiary tectonism was characterized by crustal extension, with stresses directed in an ENE-WSW axis, plus attendant magmatism dominated by intermediate to silicic melts. Extension resulted in normal faulting and rotation of fault blocks over much of Arizona.
Menges and Pearthree (1989) summarize mid-Tertiary extensional features as follows:
1 Calc-alkalic rhyolitic to basaltic volcanism
2 Emplacement of shallow plutons
3 Basin development and filling by sediments
4 Rotation of sediments and volcanics on low-angle normal faults and detachment faults
5 Shear zones and cataclastic fabrics at deeper levels
6 Northeast-trending folds with amplitudes of several km
Detachment faults were the most important structural features active during the mid-Tertiary in Arizona. In contrast to detachment faults engendered by compression in Laramide times, mid-Tertiary detachments gained their low-angle normal displacement by means of crustal thinning. Isostatic uplift of crustal segments denuded by erosion is the preferred mechanism for this phase of detachment faulting. Evidence points to mid-Tertiary low-angle normal faulting accounting for 85% to 95% of Tertiary crustal extension, with late Tertiary normal faulting accounting for the remainder.
Project geology
The Property hosts two stratigraphically controlled mineral deposits. The two deposits, Taylor Deposit (Taylor Sulphide and Taylor Deeps) and the Central Deposit. The two Taylor domains are separated by a low angle thrust fault. The Taylor Sulphide is predominantly a CRD which extends downward, to significant depth (3,600 ft or 1,100 m), and principally occurs in three recognized sedimentary formations on the property and is comprised of Zn-Pb-Ag-Cu sulphides. The Taylor Deeps is a CRD which is confined to a relatively flat contact, below the thrust fault, between the Older Volcanics and Permian carbonates at a depth of 3,400 ft (1,036 m) below the surface. The Central Deposit is a manto style deposit which is confined to the contact between Permian carbonates and the overlying Jurassic rhyolites and does not permeate below the Concha limestone (100 ft - 500 ft or 30 m – 150 m). The Central Deposit is comprised of Mn oxides with accessory silver minerals. The host rocks (Jurassic Rhyolites and Permian sediments) strike approximately southwest-northeast and dip ± 30° to the northwest. They do not appear to be significantly disrupted by post-mineralization faulting at deposit scale.
An outcrop geological map for the Property is shown in Figure 7.2.
Hermosa Property, Taylor Zn-Pb-Ag Deposit PEA Arizona Minerals Inc. 716027
amcconsultants.com 56
Figure 7.2 Taylor Property geology
7.4.1 Lithology and stratigraphy
The Cretaceous and Jurassic volcanic rocks and the underlying Permian sedimentary rocks of the Property are divided into the following units (Figure 7.7), recognized across the property and in the drillholes. They are listed and described from youngest to oldest, with features shown in millimeters, (mm).
Intrusive Volcanics (Tk – Tertiary – Cretaceous): Two types of intrusives have been identified in the drilling. The first intrusive has been classified as a quartz-feldspar-porphyry (QFP). The intrusive has primarily been intercepted in the Taylor Sulphide domain as narrow dikes following high angle structures through the Paleozoic sequence and along the contact between the Concha and Scherrer formations as narrow sills. The second intrusive identified in drilling is a diorite. The diorite intrusives are most common below the thrust fault and Taylor Deeps Sulphide domain at depths greater than 3,400 ft (1,036 m). It’s possible that these are feeders for the Meadow Valley Andesite (Kmv). The intrusives have not been age dated.
Trachyandesite of Meadow Valley (Kmv-Cretaceous): It is an approximately conformable, complex flow unit that overlies the Hardshell Volcanic Sequence on the western and northern margins of the Property. Drilling shows local dikes of similar composition. The trachyandesite is variably described as dark gray to brown, fine to medium-grained with 1 mm to 3 mm euhedral-subhedral plagioclase phenocrysts and sparse 2 mm to 5 mm square K-feldspar phenocrysts in a fine-grained plagioclase-pyroxene-amphibole groundmass. It may contain interstitial magnetite and is generally fresh to weakly propylitized, especially on fractures.
Hermosa Property, Taylor Zn-Pb-Ag Deposit PEA Arizona Minerals Inc. 716027
amcconsultants.com 57
Hardshell Volcanic Sequence (Jh-Jurassic): Five distinct rhyolitic volcanic units have been identified as making up the Hardshell sequence in addition to a basal Tuffaceous Sandstone, and have been correlated between surface mapping and drillholes.
Rhyolite crystal tuff (Jhct): Appears to be the uppermost unit in the Hardshell volcanic sequence and is conformable with underlying rhyolite breccia unit (Khb). Described as white to gray to buff to locally pale pink, fine- to medium-grained, and crystal-rich. Rare, thin, relict bedding planes. Abundant 1 mm to 3 mm plagioclase crystals and rare 0.5 mm, broken quartz eyes. Rare patches and zones of 5 mm to 15 mm, angular to subrounded lithic clasts.
Rhyolite Breccia (Jhb): Prominent outcrop former in the Hardshell Ridge zone. Clast-supported or nearly clast-supported fragmental unit with abundant 1 mm to 5 m (15 ft), angular, unsorted, rhyolite clasts in very-fine-grained rhyolitic groundmass. Contains abundant clasts with diameters greater than core diameter.
Rhyolite Lithic Tuff (Jhlt): Gray to gray-green, locally crystal-rich tuff with common 5 mm to 25 mm rhyolitic lithic fragments. Abundant 1 mm to 25 mm, partially-collapsed and flatted pumice fragments in very-fine-grained, partially welded groundmass give the rock a distinctive, eutaxitic texture.
Rhyolite Polymict Breccia (JhHZ): This is the unit that comprises the Hardshell Zone, and is interpreted to be the primary host to the deposits exploited by the old Hardshell Incline workings. Rhyolite volcanoclastic and fragmental unit with abundant 1 mm to 25 mm, angular, rhyolite lithic clasts in a welded, eutaxitic matrix. Distinguished from the Jhlt unit by the presence of sparse to very abundant sedimentary clasts derived from underlying Paleozoic rocks. Contains limestone clasts, up to 10 ft (3 m) or more in diameter. Commonly mineralized with Mn-oxide as 1 mm to 10 mm blebs and larger pods up to complete replacements, as well as in veins/veinlets and fracture coatings. Limestone clasts are replaced by Zn-Pb-Ag sulphides, at depth, in the northwest area of the property. Local zones of gray, vuggy, pervasive silicification.
Rhyolite Tuff (Jht): Basal unit in the Hardshell Volcanic Sequence. Light gray, massive, rhyolite tuff with rare, fine-grained plagioclase phenocrysts and rare, < 10 mm lithic clasts in very-fine-grained, tuffaceous groundmass. Local irregular, faint relict bedding and weak, hematite-limonite liesegang banding. Lies directly on Paleozoic sedimentary rock in the western part of the property, and on the spherulite unit (JoSP) of the Older Volcanic Sequence to the east.
Tuffaceous Sandstone (Jhtss): Tan to reddish-brown, granular, fine-grained, massive to thin bedded, reworked, partially silicified tuffaceous-sandstone. Composed of fine-grained quartz and felspar with sparse lithic fragments. Unconformably overlies the Paleozoics.
Older Volcanic Sequence (Jo-Triassic/Jurassic): The Older Volcanic Sequence is a predominantly rhyolitic volcanic package that underlies the Hardshell Sequence in the southeastern part of the property and contains lithologies that occur as clasts in the Hardshell Volcanic Sequence, especially in the Khb and Khlt units. The Older Volcanic Sequence has not been mapped in detail, and relatively few core holes penetrate the unit. The following units have been recognized and placed in a tentative stratigraphic sequence.
Rhyolite Spherulite Zone (JoSP): Abundant, crowded, 1 mm to 100 mm, semi-spherical, zoned, partially devitrified spherulites in very-fine-grained partially welded groundmass.
Rhyolite Welded Tuff (JoT): Light reddish-gray to purple, densely welded crystal tuff with strong to subtle laminar eutaxitic texture. Abundant, 0.1 mm to 3 mm, subhedral to euhedral, plagioclase phenocrysts in shard-bearing, eutaxitic, very-fine-grained groundmass. Laminated to thin-bedded, locally contorted due to flowage. This rock type is the most common clast lithology in the Khb of the Hardshell Volcanic Sequence.
Latite Porphyry (JoLA): Distinctly porphyritic intrusive and/or flow unit with prominent, abundant, 1 mm to 5 mm, subhedral to euhedral, white, prismatic plagioclase phenocrysts and less common 1 mm to 5 mm, euhedral, white, approximately equant K-feldspar phenocrysts. Rare, relict, 0.1 mm to 1 mm, rotten, biotite books in fine to medium-grained, red-brown groundmass.
Lithic Tuff (JoLT): Greenish-gray, fragmental. Rare, 1 mm to 3 mm, subhedral plagioclase phenocrysts, Common 1 mm to 25 mm, angular, lithic clasts in fine-grained, partially silicified, tuffaceous groundmass.
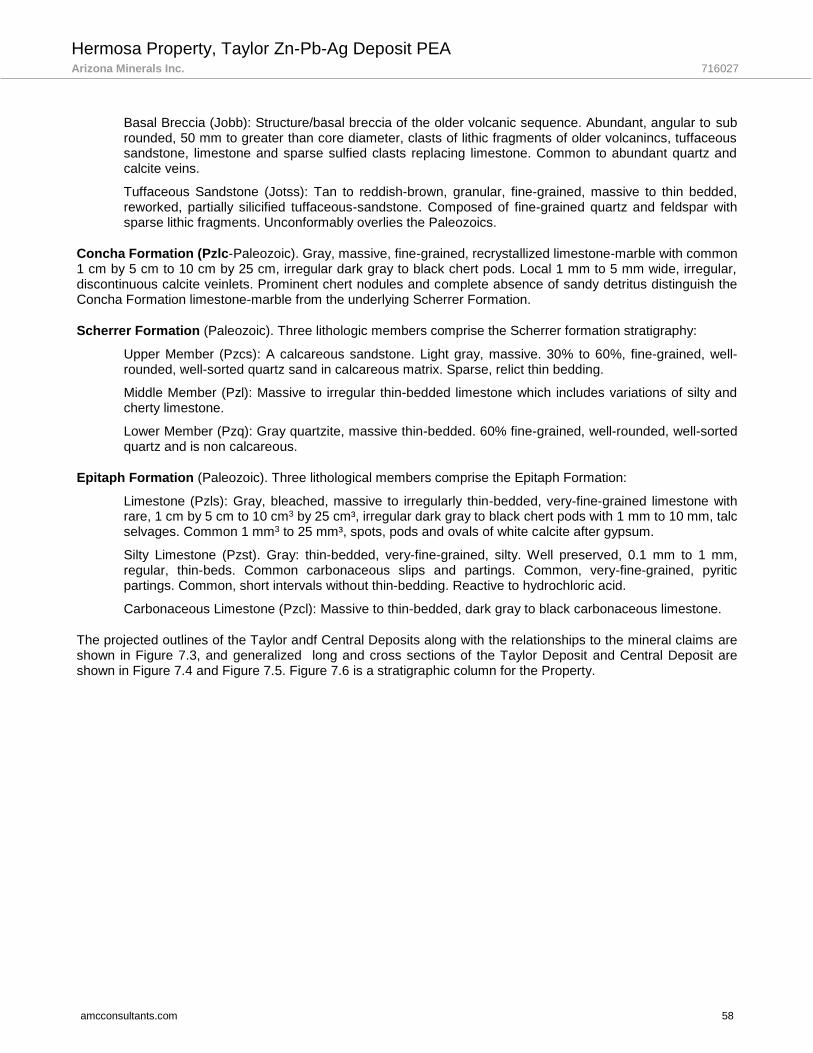
Hermosa Property, Taylor Zn-Pb-Ag Deposit PEA Arizona Minerals Inc. 716027
amcconsultants.com 58
Basal Breccia (Jobb): Structure/basal breccia of the older volcanic sequence. Abundant, angular to sub rounded, 50 mm to greater than core diameter, clasts of lithic fragments of older volcanincs, tuffaceous sandstone, limestone and sparse sulfied clasts replacing limestone. Common to abundant quartz and calcite veins.
Tuffaceous Sandstone (Jotss): Tan to reddish-brown, granular, fine-grained, massive to thin bedded, reworked, partially silicified tuffaceous-sandstone. Composed of fine-grained quartz and feldspar with sparse lithic fragments. Unconformably overlies the Paleozoics.
Concha Formation (Pzlc-Paleozoic). Gray, massive, fine-grained, recrystallized limestone-marble with common 1 cm by 5 cm to 10 cm by 25 cm, irregular dark gray to black chert pods. Local 1 mm to 5 mm wide, irregular, discontinuous calcite veinlets. Prominent chert nodules and complete absence of sandy detritus distinguish the Concha Formation limestone-marble from the underlying Scherrer Formation.
Scherrer Formation (Paleozoic). Three lithologic members comprise the Scherrer formation stratigraphy:
Upper Member (Pzcs): A calcareous sandstone. Light gray, massive. 30% to 60%, fine-grained, well-rounded, well-sorted quartz sand in calcareous matrix. Sparse, relict thin bedding.
Middle Member (Pzl): Massive to irregular thin-bedded limestone which includes variations of silty and cherty limestone.
Lower Member (Pzq): Gray quartzite, massive thin-bedded. 60% fine-grained, well-rounded, well-sorted quartz and is non calcareous.
Epitaph Formation (Paleozoic). Three lithological members comprise the Epitaph Formation:
Limestone (Pzls): Gray, bleached, massive to irregularly thin-bedded, very-fine-grained limestone with rare, 1 cm by 5 cm to 10 cm3 by 25 cm³, irregular dark gray to black chert pods with 1 mm to 10 mm, talc selvages. Common 1 mm3 to 25 mm³, spots, pods and ovals of white calcite after gypsum.
Silty Limestone (Pzst). Gray: thin-bedded, very-fine-grained, silty. Well preserved, 0.1 mm to 1 mm, regular, thin-beds. Common carbonaceous slips and partings. Common, very-fine-grained, pyritic partings. Common, short intervals without thin-bedding. Reactive to hydrochloric acid.
Carbonaceous Limestone (Pzcl): Massive to thin-bedded, dark gray to black carbonaceous limestone.
The projected outlines of the Taylor andf Central Deposits along with the relationships to the mineral claims are shown in Figure 7.3, and generalized long and cross sections of the Taylor Deposit and Central Deposit are shown in Figure 7.4 and Figure 7.5. Figure 7.6 is a stratigraphic column for the Property.

Hermosa Property, Taylor Zn-Pb-Ag Deposit PEA Arizona Minerals Inc. 716027
amcconsultants.com 59
Figure 7.3 Plan of outlines for Taylor and Central Deposit
Note the section lines for sections illustrated in Figures 7.4 and 7.5.

Hermosa Property, Taylor Zn-Pb-Ag Deposit PEA Arizona Minerals Inc. 716027
amcconsultants.com 60
Figure 7.4 Generalized long section (looking northeast) of the Taylor and Central Deposits
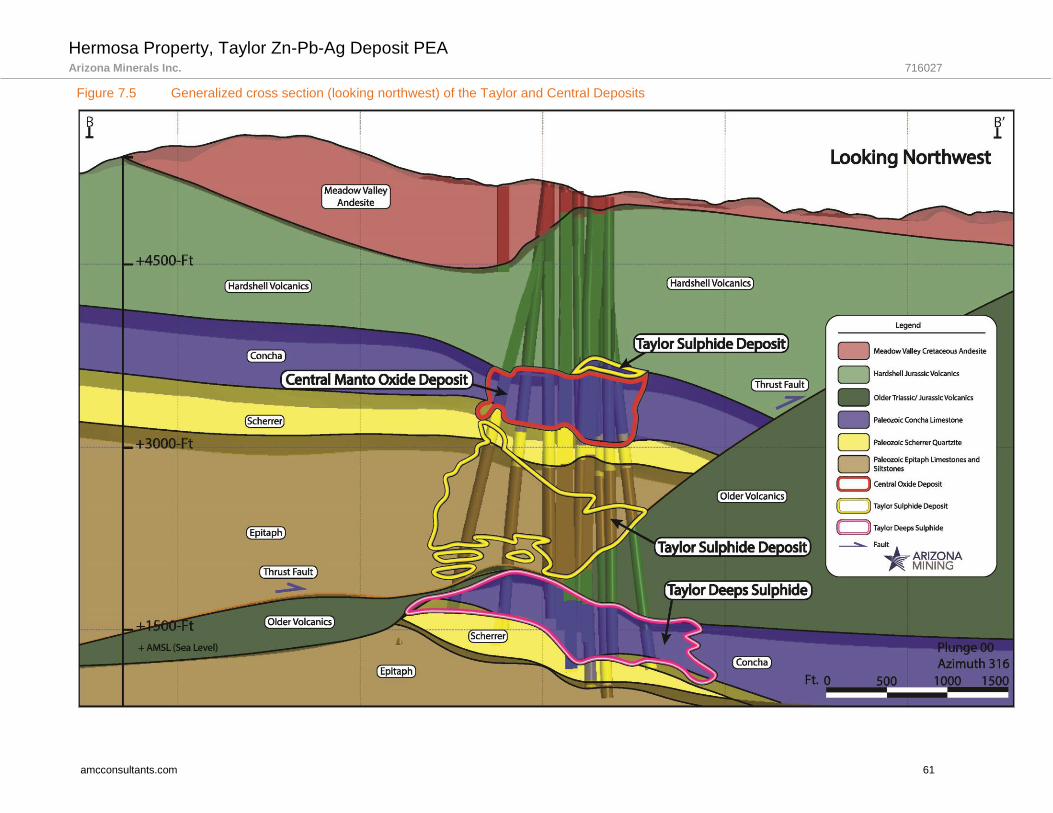
Hermosa Property, Taylor Zn-Pb-Ag Deposit PEA Arizona Minerals Inc. 716027
amcconsultants.com 61
Figure 7.5 Generalized cross section (looking northwest) of the Taylor and Central Deposits
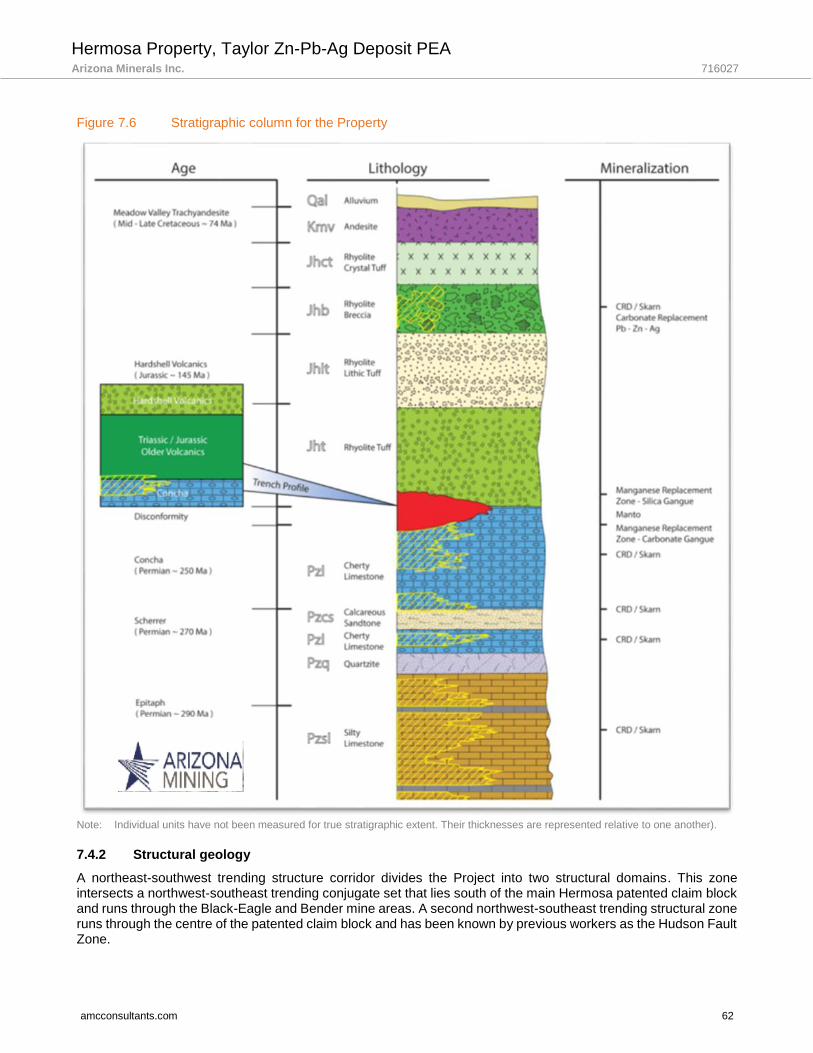
Hermosa Property, Taylor Zn-Pb-Ag Deposit PEA Arizona Minerals Inc. 716027
amcconsultants.com 62
Figure 7.6 Stratigraphic column for the Property
Note: Individual units have not been measured for true stratigraphic extent. Their thicknesses are represented relative to one another).
7.4.2 Structural geology
A northeast-southwest trending structure corridor divides the Project into two structural domains. This zone intersects a northwest-southeast trending conjugate set that lies south of the main Hermosa patented claim block and runs through the Black-Eagle and Bender mine areas. A second northwest-southeast trending structural zone runs through the centre of the patented claim block and has been known by previous workers as the Hudson Fault Zone.
Hermosa Property, Taylor Zn-Pb-Ag Deposit PEA Arizona Minerals Inc. 716027
amcconsultants.com 63
Outcrops, old workings and road cuts are commonly disrupted by irregular, discontinuous, complex structural zones. These zones are characterized by rubbly, broken, brecciated and sheared features that do not typically displace either lithologic contacts or alteration or mineralization zones at map or cross-section scale (typically 1:2400).
7.4.2.1 High angle structures
There are two main fault orientations observed on the property, a northeast-southwest trending structural zone and a northwest-southeast.
One of the main fault orientations on the Property is a northeast-southwest trending structural zone that runs through the southeastern corner of the main patented claim block. This zone intersects a northwest-southeast trending conjugate set that lies south of the main Hermosa patented claim block and runs through the Black-Eagle and Bender mine areas. A second northwest-southeast trending structural zone runs through the center of the patented Alta and Trench claim blocks and has been known by previous workers as the Hudson Fault Zone (Alta claim block), Trench-Josephine Fault Zone and January-Norton Fault Zone (Trench claim block). This structural zone is interpreted as controls for mineralization in the Volcanics (Cretaceous through Triassic) and Paleozoic Sediments.
Outcrops, old workings and road cuts are commonly disrupted by irregular, discontinuous, complex structural zones. These zones are characterized by rubbly, broken, brecciated and sheared features that do not typically displace either lithologic contacts or alteration or mineralization zones at map or cross-section scale (typically 1:2400).
7.4.2.2 Low angle structure
A low angle thrust fault has been identified on the property through drilling. The fault is assumed to be Mesozoic in age and has emplaced three members of the Paleozoic sequence (Concha, Scherrer and Epitaph) over the Triassic - Jurassic Older Volcanics creating a wedge of “Older” Volcanics below the Palaeozoic sequence. The primary direction of movement along the thrust is from the south to north. Due to the lack of surface expression in the Cretaceous Meadow Valley Andesite, there is no evidence that the thrust fault propagates through the entire Jurassic - Hardshell Volcanic Sequence. It’s likely that the thrusting occurred during the deposition of Hardshell Volcanics.
7.4.3 Alteration
Rhyolitic rocks, particularly Jhb, across the Property are uniformly light gray to tan, with primary volcanic and clastic textures generally well preserved. The same rocks are generally shades of purple to maroon where they crop out at a distance from known mineralization. Locally, in otherwise unaltered rhyolite outcrops, small patches of fine-grained secondary K-feldspar have been noted. These observations suggest that the tan coloration proximal to mineralization may be pervasive and moderately-strong potassic alteration. This alteration appears to form a broad background upon which later alteration more directly associated with the Property mineralization has been imposed. The clasts within Hardshell volcanic sequence lithic tuff and breccia are commonly selectively overprinted by white kaolinite-sericite veinlets and patches. The fine-grained, tuffaceous, matrix to the lithic tuff, polymict breccia and lower rhyolite tuff are pervasively overprinted by very-fine, disseminated kaolinite-sericite. In both cases, primary textures are generally very well preserved and the rock remains competent and hard.
Where mineralization occurs at the contact between Jurassic and Permian rocks, it exhibits an asymmetric envelope of pervasive and strong silicification, referred to in the past as “jasperoid”. The greatest volume and the most massive expression of this silicification is within the rhyolite tuff in the hanging wall of the mineralization where it commonly penetrates more than 30 ft (10 m) above mineralization. In the footwall carbonates, silicification is less complete and penetrates only a few meters below the volcanic-carbonate contact into the Concha limestone. Primary minerals and textures in these rocks are completely replaced by grey, fine-grained quartz. Rare, small patches or pods of ghostly relict volcanic texture have been noted. Where quartz sulphide veins are present in the Jurrasic volcanics, pervasive silicification of the host rock is associated with the vein-forming event.
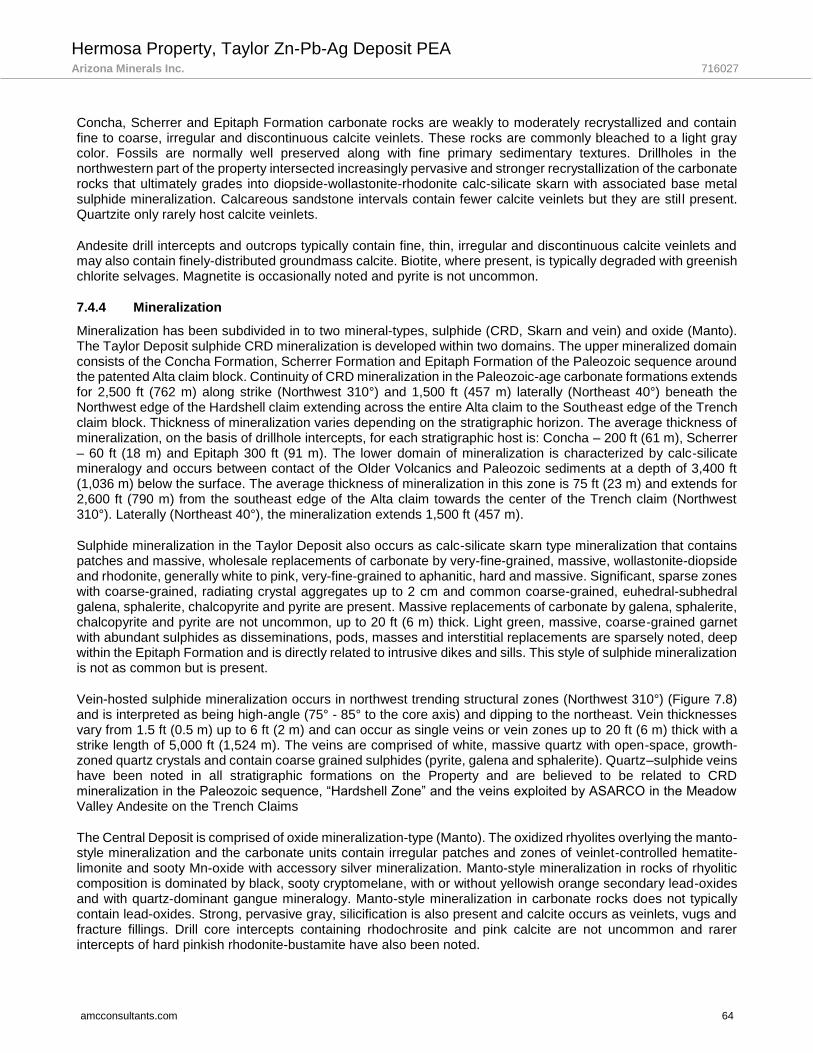
Hermosa Property, Taylor Zn-Pb-Ag Deposit PEA Arizona Minerals Inc. 716027
amcconsultants.com 64
Concha, Scherrer and Epitaph Formation carbonate rocks are weakly to moderately recrystallized and contain fine to coarse, irregular and discontinuous calcite veinlets. These rocks are commonly bleached to a light gray color. Fossils are normally well preserved along with fine primary sedimentary textures. Drillholes in the northwestern part of the property intersected increasingly pervasive and stronger recrystallization of the carbonate rocks that ultimately grades into diopside-wollastonite-rhodonite calc-silicate skarn with associated base metal sulphide mineralization. Calcareous sandstone intervals contain fewer calcite veinlets but they are stil l present. Quartzite only rarely host calcite veinlets.
Andesite drill intercepts and outcrops typically contain fine, thin, irregular and discontinuous calcite veinlets and may also contain finely-distributed groundmass calcite. Biotite, where present, is typically degraded with greenish chlorite selvages. Magnetite is occasionally noted and pyrite is not uncommon.
7.4.4 Mineralization
Mineralization has been subdivided in to two mineral-types, sulphide (CRD, Skarn and vein) and oxide (Manto). The Taylor Deposit sulphide CRD mineralization is developed within two domains. The upper mineralized domain consists of the Concha Formation, Scherrer Formation and Epitaph Formation of the Paleozoic sequence around the patented Alta claim block. Continuity of CRD mineralization in the Paleozoic-age carbonate formations extends for 2,500 ft (762 m) along strike (Northwest 310°) and 1,500 ft (457 m) laterally (Northeast 40°) beneath the Northwest edge of the Hardshell claim extending across the entire Alta claim to the Southeast edge of the Trench claim block. Thickness of mineralization varies depending on the stratigraphic horizon. The average thickness of mineralization, on the basis of drillhole intercepts, for each stratigraphic host is: Concha – 200 ft (61 m), Scherrer – 60 ft (18 m) and Epitaph 300 ft (91 m). The lower domain of mineralization is characterized by calc-silicate mineralogy and occurs between contact of the Older Volcanics and Paleozoic sediments at a depth of 3,400 ft (1,036 m) below the surface. The average thickness of mineralization in this zone is 75 ft (23 m) and extends for 2,600 ft (790 m) from the southeast edge of the Alta claim towards the center of the Trench claim (Northwest 310°). Laterally (Northeast 40°), the mineralization extends 1,500 ft (457 m).
Sulphide mineralization in the Taylor Deposit also occurs as calc-silicate skarn type mineralization that contains patches and massive, wholesale replacements of carbonate by very-fine-grained, massive, wollastonite-diopside and rhodonite, generally white to pink, very-fine-grained to aphanitic, hard and massive. Significant, sparse zones with coarse-grained, radiating crystal aggregates up to 2 cm and common coarse-grained, euhedral-subhedral galena, sphalerite, chalcopyrite and pyrite are present. Massive replacements of carbonate by galena, sphalerite, chalcopyrite and pyrite are not uncommon, up to 20 ft (6 m) thick. Light green, massive, coarse-grained garnet with abundant sulphides as disseminations, pods, masses and interstitial replacements are sparsely noted, deep within the Epitaph Formation and is directly related to intrusive dikes and sills. This style of sulphide mineralization is not as common but is present.
Vein-hosted sulphide mineralization occurs in northwest trending structural zones (Northwest 310°) (Figure 7.8) and is interpreted as being high-angle (75° - 85° to the core axis) and dipping to the northeast. Vein thicknesses vary from 1.5 ft (0.5 m) up to 6 ft (2 m) and can occur as single veins or vein zones up to 20 ft (6 m) thick with a strike length of 5,000 ft (1,524 m). The veins are comprised of white, massive quartz with open-space, growth-zoned quartz crystals and contain coarse grained sulphides (pyrite, galena and sphalerite). Quartz–sulphide veins have been noted in all stratigraphic formations on the Property and are believed to be related to CRD mineralization in the Paleozoic sequence, “Hardshell Zone” and the veins exploited by ASARCO in the Meadow Valley Andesite on the Trench Claims
The Central Deposit is comprised of oxide mineralization-type (Manto). The oxidized rhyolites overlying the manto-style mineralization and the carbonate units contain irregular patches and zones of veinlet-controlled hematite-limonite and sooty Mn-oxide with accessory silver mineralization. Manto-style mineralization in rocks of rhyolitic composition is dominated by black, sooty cryptomelane, with or without yellowish orange secondary lead-oxides and with quartz-dominant gangue mineralogy. Manto-style mineralization in carbonate rocks does not typically contain lead-oxides. Strong, pervasive gray, silicification is also present and calcite occurs as veinlets, vugs and fracture fillings. Drill core intercepts containing rhodochrosite and pink calcite are not uncommon and rarer intercepts of hard pinkish rhodonite-bustamite have also been noted.

Hermosa Property, Taylor Zn-Pb-Ag Deposit PEA Arizona Minerals Inc. 716027
amcconsultants.com 65
A separate, noteworthy horizon in the Jurassic rhyolitic volcanics has been designated the “Hardshell Zone” contains both sulphide and oxide mineralization. This zone supported historic mining at the Hardshell Incline mine and is composed of a 10 ft to greater than 100 ft (3 m to 30 m) thick polymict rhyolite breccia with a minor portion of clasts of carbonate sedimentary provenance. This horizon is the locus of partial to massive Mn-oxide replacement mineralization in the southeastern drillholes and partial to massive Pb-Zn sulphide replacement mineralization in the northwestern drillholes.
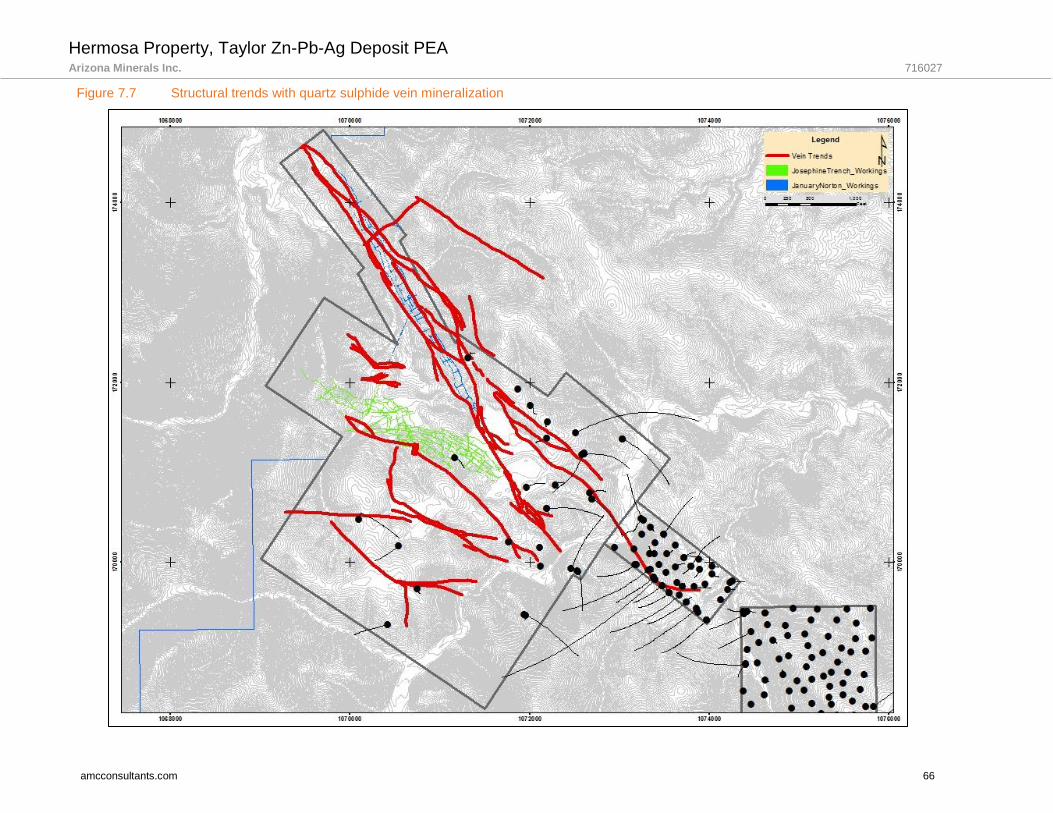
Hermosa Property, Taylor Zn-Pb-Ag Deposit PEA Arizona Minerals Inc. 716027
amcconsultants.com 66
Figure 7.7 Structural trends with quartz sulphide vein mineralization
Hermosa Property, Taylor Zn-Pb-Ag Deposit PEA Arizona Minerals Inc. 716027
amcconsultants.com 67
8 Deposit types
The Property hosts two stratigraphically-controlled mineral deposits which are described below.
Taylor Deposit
The Taylor Deposit closely conforms to the genetic class of polymetallic carbonate replacement deposit, (CRD). The salient characteristics of this class of deposit are described below. This description is taken, with modification, from Nelson, 1996.
Geological characteristics
Irregularly shaped, conformable to crosscutting bodies, such as massive lenses, pipes and veins, of sphalerite, galena, pyrite and other sulphides and sulphosalts in carbonate hosts; distal to skarns and to small, high-level felsic intrusions.
Tectonic setting: Intrusions emplaced into miogeoclinal to platformal, continental settings.
Depositional environment / geological setting: In northern Mexico, most are hosted by Cretaceous limestones. In Colorado, the principal host is the Devonian- Mississippian Leadville limestone; in Utah, the Permian Torweap Formation hosts the Deer Trail deposit. The most favourable hosts in the Canadian Cordillera are massive Lower Cambian and Middle Devonian limestones, rather than impure carbonates and dolostone-quartzite units.
Age of mineralization: In the southern Cordillera deposits of this class are typically Tertiary in age.
Host/associated rock types: Hosted by limestone and dolostone. The carbonates are typically within a thick sediment package with siliciclastic rocks that is cut by granite, quartz monzonite and other intermediate to felsic hypabyssal, porphyritic lithologies. There may be volcanic rocks in the sequence, or more commonly above, which are related to the intrusive rocks.
Deposit form: Irregular: mantos (cloak shaped), lenses, pipes, chimneys, veins; in some deposits the chimneys and/or mantos are stacked.
Texture / structure: Massive to highly vuggy, porous mineralization. In some cases, fragments of wallrock are incorporated into the mineralization. Some deposits have breccias: fragments of wallrock and also of sulphide mineralization within a sulphide matrix.
Mineralogy (principal and subordinate): Sphalerite, galena, pyrite, chalcopyrite, marcasite; arsenopyrite, pyrargyrite / proustite, enargite, tetrahedrite, geocronite, electrum, digenite, jamesonite, jordanite, bournonite, stephanite, polybasite, rhodochrosite, sylvanite, calaverite. Chimneys may be more Zn-rich, Pb-poor than mantos.
Gangue mineralogy (principal and subordinate): Quartz, barite, gypsum; minor calc- silicate minerals.
Alteration mineralogy: Limestone wallrocks are commonly dolomitized and/or silicified, whereas shale and igneous rocks are argillized and chloritized. Jasperoid occurs in some U.S. examples.
Weathering: In some cases, a deep oxidation zone is developed. Mexican deposits have well developed oxide zones with cassiterite, hematite, Cu and Fe carbonates, cerussite and smithsonite.
Mineralization controls: The irregular shapes of these deposits and their occurrence in carbonate hosts emphasize the importance of ground preparation in controlling fluid channels and depositional sites. Controlling factors include faults, fault intersections, fractures, anticlinal culminations, bedding channelways (lithologic contrasts), karst features and pre-existing permeable zones. In several districts karst development associated with unconformities is believed to have led to development of open spaces subsequently filled by mineralization. Some deposits are spatially associated with dikes.

Hermosa Property, Taylor Zn-Pb-Ag Deposit PEA Arizona Minerals Inc. 716027
amcconsultants.com 68
Genetic model: Manto deposits are high-temperature replacements as shown by fluid inclusion temperatures in excess of 572°F (300°C), high contents of Ag, presence of Sn, W and complex sulphosalts, and association with skarns and small felsic intrusions. They are the product of pluton-driven hydrothermal solutions that followed a variety of permeable pathways, such as bedding, karst features and fracture zones.
Associated deposit types: There is probably an overall outward gradation from granite- hosted Mo-Cu porphyries, endoskarns and possibly W- and Sn mineralization, through exoskarns and into Ag-Pb-Zn veins, mantos and possibly Carlin-type sediment-hosted Au-Ag deposits. Only some, or possibly one, of these types may be manifest in a given district. Ag-Pb-Zn vein, manto and skarn deposits belong to a continuum which includes many individual occurrences with mixed characteristics.
Central Deposit (Oxide)
The Central Deposit is also a CRD manto style deposit comprised predominantly of cryptomelane-type manganese oxide minerals. Silver and base metals occur predominately in the lattice-structure of cryptomelane. Accessory silver-bearing sulphides and sulphosalts as well as lead oxides and sulphate minerals are present as well.
Hermosa Property, Taylor Zn-Pb-Ag Deposit PEA Arizona Minerals Inc. 716027
amcconsultants.com 69
9 Exploration
Exploration
AZ has been active on the Property since 2006. A re-assay program of all remaining ASARCO assay pulps verified the silver and manganese assay data and added high-quality Pb, Zn, Cu, and Au values to the database. Rock types, alteration, and mineral codes from paper drill logs and cross sections were added to the electronic assay database. All available ASARCO drill assays and supplemental 16 element X-ray fluorescence analyses were captured electronically as well. Preliminary SO2 leach tests were run on two composite samples of assay pulps at Hazen Laboratories. A Mineral Resource estimate and preliminary economic evaluation was included in a 7 February 2007 Preliminary Economic Assessment report written by Pincock, Allen and Holt.
A mapping program at a 1:50 (metric) scale was in progress in the first quarter of 2017. The primary focus of the program is to generate outcrop and structure maps, on the newly acquired Trench claims and the surrounding unpatented lode mining claims, in close proximity to the Taylor Sulphide Deposit. An emphasis is being placed on mapping structures and trying to identify any post-mineral faults or mineralizing controls that can be used to generate blind drill targets.

Hermosa Property, Taylor Zn-Pb-Ag Deposit PEA Arizona Minerals Inc. 716027
amcconsultants.com 70
10 Drilling
Introduction
The following discussion is an overview of the drill programs conducted on the Property by AZ. Drilling carried out by ASARCO is discussed in Section 6.2. The drilling completed by AZ was initially focused on the manto (oxide) of the Central Deposit (2006-2014) and subsequently on the Taylor Deposit (2010-present) to determine the extents of the CRD mineralization.
Drilling summary
Drill programs conducted by AZ on the Property between 2007 and 2017 are summarized in Table 10.1.
Table 10.1 AZ drill programs
Year Type Number Length (ft) Length (m) Target
2007 Core 4 4,450 1,356 Central Deposit
2007 & 2008 Core 3 7,928 2,416 Central Deposit
2009 Core 6 12,005 3,659 Central Deposit
2010 -2012 Core 57 81,846 24,947 Central Deposit
2012 RC 6 2,480 756 Central Deposit
2010 -2012 RC 159 101,813 31,033 Central Deposit
2007 - 2012 Core 16 32,846 10,011 Taylor Deposit
2014 - 2015 Core 8 29,337 8,942 Taylor Deposit
2016 Core 35 144,010 43,894 Taylor Deposit
2016-2017 Core 37 151,483 46,172 Taylor Deposit
Total 331 568,198 173,187
The objective of the drill programs has evolved over time. The programs carried out between 2007 and 2012 were designed to assess and define the near-surface, silver-manganese oxide mineralization that was historically referred to as the Hardshell deposit. Drilling since 2014 has focused on the sulphide mineralization that is located stratigraphically below and down-dip of the oxide mineralization and that forms the basis of the current and previous resource estimates.
The sulphide mineralization (Taylor Deposit) is a carbonate replacement type deposit of lead, zinc and silver with subordinate copper content. Manganese is generally present as a carbonate or silicate in similar content to the oxide deposit. The sulphide mineralization occurs both as stratiform (manto) bodies that dip at generally less than 30°, and as steep-dipping, crosscutting bodies (chimneys). The manto-type mineralization is generally constrained within the host carbonate units; the chimney-type mineralization cuts across formational boundaries. The near-surface manganese-silver oxide mineralization (Central Deposit) has been interpreted to be a stratiform (manto) type replacement-style deposit that may be the oxidized upper portion of the deeper sulphide deposit.
In addition to the carbonate-hosted mineralization, lead-zinc-silver-copper sulphide mineralization occurs at the tectonized contact between underlying carbonates and overlying volcanic rocks. Another minor type of mineralization that has been identified occurs within agglomerate horizons in the Hardshell Volcanics.
Taylor Deposit
10.3.1 Procedures
Only the procedures for the drill core collected in 2016-17 are discussed here as only diamond drilling has been carried out in that period. Procedures for earlier programs including RC programs are discussed in the March 2016 Technical Report.
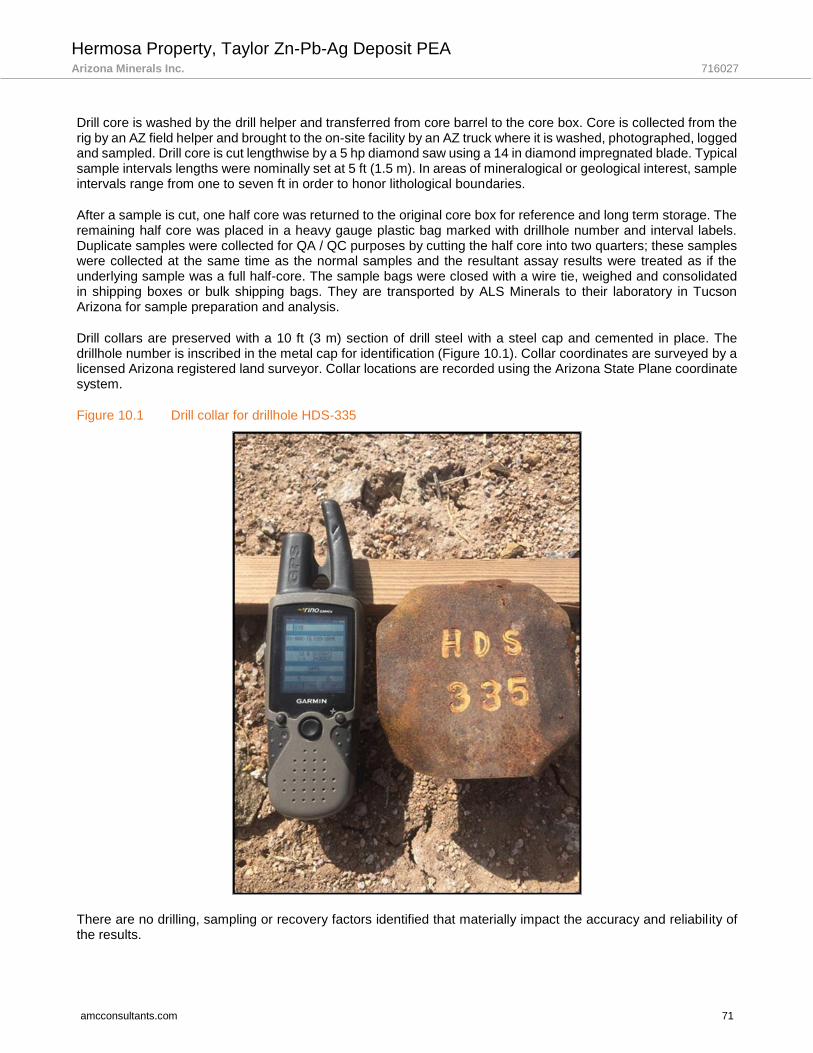
Hermosa Property, Taylor Zn-Pb-Ag Deposit PEA Arizona Minerals Inc. 716027
amcconsultants.com 71
Drill core is washed by the drill helper and transferred from core barrel to the core box. Core is collected from the rig by an AZ field helper and brought to the on-site facility by an AZ truck where it is washed, photographed, logged and sampled. Drill core is cut lengthwise by a 5 hp diamond saw using a 14 in diamond impregnated blade. Typical sample intervals lengths were nominally set at 5 ft (1.5 m). In areas of mineralogical or geological interest, sample intervals range from one to seven ft in order to honor lithological boundaries.
After a sample is cut, one half core was returned to the original core box for reference and long term storage. The remaining half core was placed in a heavy gauge plastic bag marked with drillhole number and interval labels. Duplicate samples were collected for QA / QC purposes by cutting the half core into two quarters; these samples were collected at the same time as the normal samples and the resultant assay results were treated as if the underlying sample was a full half-core. The sample bags were closed with a wire tie, weighed and consolidated in shipping boxes or bulk shipping bags. They are transported by ALS Minerals to their laboratory in Tucson Arizona for sample preparation and analysis.
Drill collars are preserved with a 10 ft (3 m) section of drill steel with a steel cap and cemented in place. The drillhole number is inscribed in the metal cap for identification (Figure 10.1). Collar coordinates are surveyed by a licensed Arizona registered land surveyor. Collar locations are recorded using the Arizona State Plane coordinate system.
Figure 10.1 Drill collar for drillhole HDS-335
There are no drilling, sampling or recovery factors identified that materially impact the accuracy and reliability of the results.
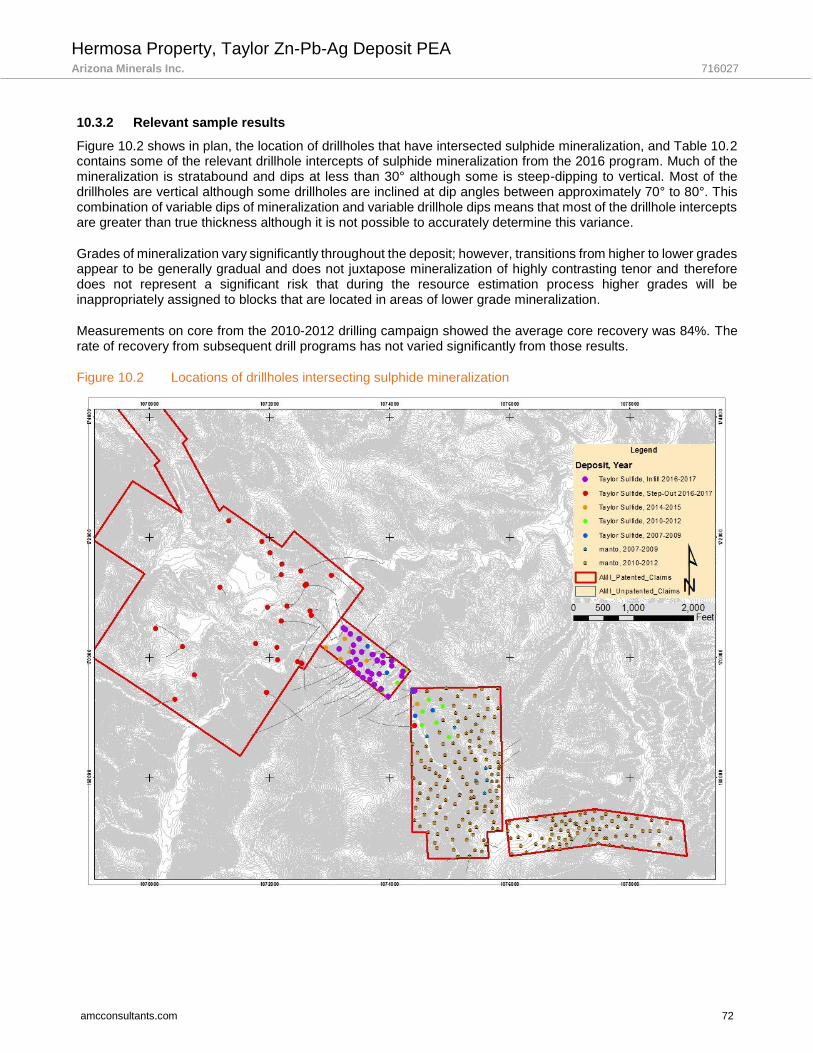
Hermosa Property, Taylor Zn-Pb-Ag Deposit PEA Arizona Minerals Inc. 716027
amcconsultants.com 72
10.3.2 Relevant sample results
Figure 10.2 shows in plan, the location of drillholes that have intersected sulphide mineralization, and Table 10.2 contains some of the relevant drillhole intercepts of sulphide mineralization from the 2016 program. Much of the mineralization is stratabound and dips at less than 30° although some is steep-dipping to vertical. Most of the drillholes are vertical although some drillholes are inclined at dip angles between approximately 70° to 80°. This combination of variable dips of mineralization and variable drillhole dips means that most of the drillhole intercepts are greater than true thickness although it is not possible to accurately determine this variance.
Grades of mineralization vary significantly throughout the deposit; however, transitions from higher to lower grades appear to be generally gradual and does not juxtapose mineralization of highly contrasting tenor and therefore does not represent a significant risk that during the resource estimation process higher grades will be inappropriately assigned to blocks that are located in areas of lower grade mineralization.
Measurements on core from the 2010-2012 drilling campaign showed the average core recovery was 84%. The rate of recovery from subsequent drill programs has not varied significantly from those results.
Figure 10.2 Locations of drillholes intersecting sulphide mineralization

Hermosa Property, Taylor Zn-Pb-Ag Deposit PEA Arizona Minerals Inc. 716027
amcconsultants.com 73
Table 10.2 Taylor deposit 2016-2017 CRD drilling results summary
Drillhole From (feet)
To (feet)
Interval (feet)
From (meters)
To (meters
)
Interval (meters
) Zn% Pb% Ag opt Cu% Zone
HDS-347 765 775 10 233.2 236.2 3 0.45 4.78 4.65 0.02 Vein
HDS-347 3809 3820.5 11.5 1160.9 1164.4 3.5 1.65 2.09 0.96 0.03 TDS
HDS-353 3170 3202 32 966.2 975.9 9.8 12.21 8.19 2.25 0.69 TS
Including 3170 3187 17 966.2 971.4 5.2 22.04 14.75 3.79 1.21 TS
HDS-353 3551 3555 4 1082.3 1083.5 1.2 5.04 7.04 4.99 0.35 TS
HDS-353 3951 3956 5 1204.2 1205.7 1.5 7.74 6.83 1.1 1.38 Vein
HDS-353 5220.
5 5235 14.5 1591.1 1595.6 4.4 2.58 0.37 1.22 1.86 Vein
HDS-359 1025 1033 8 312.4 314.8 2.4 3.38 2.6 1.33 0.19 Vein
HDS-359 1078.
5 1081 2.5 328.7 329.5 0.8 4.64 7.21 13.1 0.65 Vein
HDS-359 1140 1145 5 347.5 349 1.5 1.52 4.07 5.1 0.28 Vein
HDS-359 1313.
5 1346.5 33 400.3 410.4 10.1 22.78 20.17 12.19 0.13 Vein
HDS-359 3137.
5 3148.5 11 956.3 959.6 3.4 1.27 5.38 9.78 0.62 Vein
HDS-372 990 1080 90 301.7 329.2 27.4 1.28 0.59 1.06 0.03 Vein
HDS-372 1503 1521 18 458.1 463.6 5.5 4.77 2.05 2.63 0.04 Vein
HDS-372 1974 1996 22 601.6 608.4 6.7 0.71 1.57 3.01 0.04 Vein
HDS-378 1215 1218 3 370.3 371.2 0.9 5.2 2.79 7.55 0.4 Vein
HDS-378 1795.
5 1800.5 5 547.2 548.8 1.5 1.54 3.37 3.82 0.09 Vein
HDS-379 502 507 5 153 154.5 1.5 6.88 2.32 3.7 0.09 Vein
HDS-379 967 972 5 294.7 296.3 1.5 3.85 3.12 3.62 0.16 Vein
HDS-379 1750 1762 12 533.4 537 3.7 2.48 1.42 6.82 0.34 Vein
HDS-379 1797 1823 26 547.7 555.6 7.9 1.71 5.19 4.44 0.19 Vein
HDS-379 2397 2402 5 730.6 732.1 1.5 0.96 1.12 4.29 0.19 Vein
HDS-379 3235.
5 3238 2.5 986.1 986.9 0.8 0.39 7.46 3.41 1.29 Vein
HDS-379 3549.
5 3577 27.5 1081.8 1090.2 8.4 0.9 8.85 2.97 0.07 TDS
HDS-379 4562 4582 20 1390.4 1396.5 6.1 3.6 3.91 1.23 0.08 TDS
HDS-380 2881 2888.5 7.5 878.1 880.4 2.3 2.62 1.78 10.56 0.33 TS
HDS-380 2948.
5 2973.5 25 898.7 906.3 7.6 1.47 1.95 4.15 0.24 TS
HDS-380 3467 3470.5 3.5 1056.7 1057.8 1.1 9.72 8.15 12.22 0.86 Vein
HDS-381 872 878 6 265.8 267.6 1.8 4.97 2.38 1.95 0.11 Vein
HDS-381 1580 1600 20 481.6 487.7 6.1 1.98 1.4 0.8 0.12 Vein
HDS-381 3530 3551 21 1075.9 1082.3 6.4 0.3 1.74 2.97 0.09 Vein
HDS-381 3690 3753 63 1124.7 1143.9 19.2 1.29 2.52 2.16 0.1 TDS

Hermosa Property, Taylor Zn-Pb-Ag Deposit PEA Arizona Minerals Inc. 716027
amcconsultants.com 74
Drillhole From (feet)
To (feet)
Interval (feet)
From (meters)
To (meters
)
Interval (meters
) Zn% Pb% Ag opt Cu% Zone
HDS-381 3921 3941 20 1195.1 1201.2 6.1 2.48 2.1 0.8 0.5 TDS
HDS-382 1567 1654 87 477.6 504.1 26.5 9.62 10.46 4.66 1.04 TS
HDS-382 2437 2448.5 11.5 742.8 746.3 3.5 5.26 4.44 1.65 0.07 TS
HDS-382 2585 2590 5 787.9 789.4 1.5 4.56 3.54 1.22 0.03 TS
HDS-382 2747 2776 29 837.2 846.1 8.8 1.41 3.03 0.93 0.01 TS
Including 2766 2776 10 843 846.1 3 3.3 7.35 2.26 0.02 TS
HDS-382 2797 2812 15 852.5 857.1 4.6 2.39 4.21 1.49 0.02 TS
HDS-382 2927 3017 90 892.1 919.5 27.4 1.06 2.07 0.94 0.01 TDS
Including 2957 2984 27 901.2 909.5 8.2 1.41 4.12 2.02 0.02 TDS
HDS-382 3048.
5 3059 10.5 929.1 932.3 3.2 1.9 3.96 1.93 0.06 TDS
HDS-382 3177 3180 3 968.3 969.2 0.9 8.57 5.06 3.59 0.78 TDS
HDS-383 No significant mineralization
HDS-384 988 1014.5 26.5 301.1 309.2 8.1 2.79 2.86 10.4 0.34 Vein
HDS-384 1209.
5 1227 17.5 368.6 374 5.3 3.45 3.02 2.65 0.05 TS
HDS-384 1377 1387 10 419.7 422.7 3 4.61 8.45 8.51 0.24 Vein
HDS-384 1417 1435 18 431.9 437.4 5.5 5.12 4.49 2.68 0.06 Vein
HDS-384 3435 3440 5 1046.9 1048.5 1.5 3.35 1.54 5.08 0.17 Vein
HDS-384 4309 4312 3 1313.3 1314.2 0.9 10.6 13.3 69.42 2.65 Vein
HDS-384 4334 4348.5 14.5 1320.9 1325.4 4.4 0.33 1.7 7.41 0.18 TS
HDS-384 4472 4482 10 1363 1366 3 0.46 0.6 3.6 0.08 Vein
HDS-385 3835.
5 3837.5 2 1169 1169.6 0.6 3.89 9.04 25.93 1.31 Vein
HDS-385 3947 4015 68 1203 1223.7 20.7 1.29 2.28 2.11 0.03 TDS
HDS-386 1400 1405 5 426.7 428.2 1.5 5.64 2.37 2.58 0.03 Vein
HDS-386 1654.
5 1657 2.5 504.3 505 0.8 4.84 26.76 26.54 0.63 Vein
HDS-386 3351 3354 3 1021.3 1022.2 0.9 2.98 0.68 10.09 0.66 Vein
HDS-386 3676 3680 4 1120.4 1121.6 1.2 2.48 6.19 4.9 0.12 Vein
HDS-386 3890 3917 27 1185.6 1193.8 8.2 1.72 1.23 1.08 0.15 TDS
HDS-386 3947 3998 51 1203 1218.5 15.5 0.6 3 3.88 0 TDS
HDS-387 902 913 11 274.9 278.3 3.4 12.4 9.24 13.26 0.76 TS
HDS-387 1470 1498 28 448 456.6 8.5 2.7 1.12 2.21 0.17 TS
HDS-387 2740 2751 11 835.1 838.5 3.4 2.06 1.85 0.62 0.03 TS
HDS-387 2772 2828 56 844.9 861.9 17.1 8.92 8.24 2.73 0.04 TS
HDS-387 2858 2890 32 871.1 880.8 9.8 1.61 2.44 0.86 0.01 TS

Hermosa Property, Taylor Zn-Pb-Ag Deposit PEA Arizona Minerals Inc. 716027
amcconsultants.com 75
Drillhole From (feet)
To (feet)
Interval (feet)
From (meters)
To (meters
)
Interval (meters
) Zn% Pb% Ag opt Cu% Zone
HDS-387 3145 3149 4 958.5 959.8 1.2 2.7 11 8.87 0.23 Vein
HDS-387 3359.
5 3472 112.5 1023.9 1058.2 34.3 5.41 9.56 3.22 0.39 TDS
Including 3359.
5 3401 41.5 1023.9 1036.6 12.6 11.12 21.84 7.51 0.94 TDS
HDS-387 3497 3523 26 1065.8 1073.8 7.9 3.29 4.02 1.42 0.31 TDS
HDS-388 527 562 35 160.6 171.3 10.7 1.34 0.6 1.67 0.05 TS
HDS-388 640 654 14 195.1 199.3 4.3 5.07 3.56 2.15 0.01 TS
HDS-388 1367 1390 23 416.6 423.7 7 2.54 1.82 1.31 0.06 TS
HDS-388 2058.
5 2082 23.5 627.4 634.6 7.2 4.67 7.73 2.76 0.03 TS
HDS-388 2637 2652 15 803.7 808.3 4.6 1.76 1.18 0.43 0.04 TS
HDS-388 2747 2767 20 837.2 843.3 6.1 2.67 2.41 0.88 0.04 TS
HDS-388 3227 3293.5 66.5 983.5 1003.8 20.3 1.36 1.87 1.98 0.05 TDS
HDS-388 3403.
5 3415 11.5 1037.3 1040.8 3.5 4.22 3.69 1.32 0.28 TDS
HDS-389 491.5 498 6.5 149.8 151.8 2 16.2 7.87 5.08 0.02 TS
HDS-389 1125.
5 1128.5 3 343 344 0.9 0.09 0.46 5.92 0.38 Vein
HDS-389 1888.
5 1891 2.5 575.6 576.3 0.8 18.45 15.3 12.48 3.89 TS
HDS-389 2149 2155 6 655 656.8 1.8 3.77 2.3 0.82 0.18 TS
HDS-389 2445 2453.5 8.5 745.2 747.8 2.6 13.05 8.22 3.41 0.78 TS
HDS-389 2555.
5 2588 32.5 778.9 788.8 9.9 6.49 4.95 1.96 0.38 TS
HDS-389 2747.
5 2767.5 20 837.4 843.5 6.1 1.3 1.55 0.64 0.01 TS
HDS-389 3372 3390 18 1027.7 1033.2 5.5 1.69 3.16 6.45 0.28 TDS
HDS-390 805.5 812.5 7 245.5 247.6 2.1 2.22 0.8 6.77 0.03 Vein
HDS-390 1426 1429.5 3.5 434.6 435.7 1.1 25.8 15.6 18.03 0.19 Vein
HDS-390 1883.
5 1887 3.5 574.1 575.1 1.1 6.08 2.65 6.33 0.28 Vein
HDS-390 3552.
5 3556.5 4 1082.7 1084 1.2 0.11 5.24 14.99 0.02 Vein
HDS-390 4101 4122 21 1249.9 1256.3 6.4 2.91 1.87 1.84 0.12 TDS
HDS-391 830 840 10 253 256 3 1.96 3.85 4.46 0.18 TS
HDS-391 1445 1455 10 440.4 443.5 3 3.05 1.69 3.57 0.22 Vein
HDS-391 1575 1590 15 480 484.6 4.6 0.63 4.08 5.54 0.09 Vein
HDS-391 2098.
5 2101.5 3 639.6 640.5 0.9 16.6 12.9 9.86 0.14 Vein
HDS-391 3676 3679 3 1120.4 1121.3 0.9 4.73 6.26 3.09 0.09 Vein
HDS-391 3732 3765 33 1137.5 1147.5 10.1 1.95 1.31 3.2 0.39 Vein
HDS-391 4080 4090 10 1243.5 1246.6 3 0.54 3.02 2.75 0.04 TS
HDS-391 4110 4130 20 1252.7 1258.8 6.1 1.34 1.55 1.38 0.23 TDS
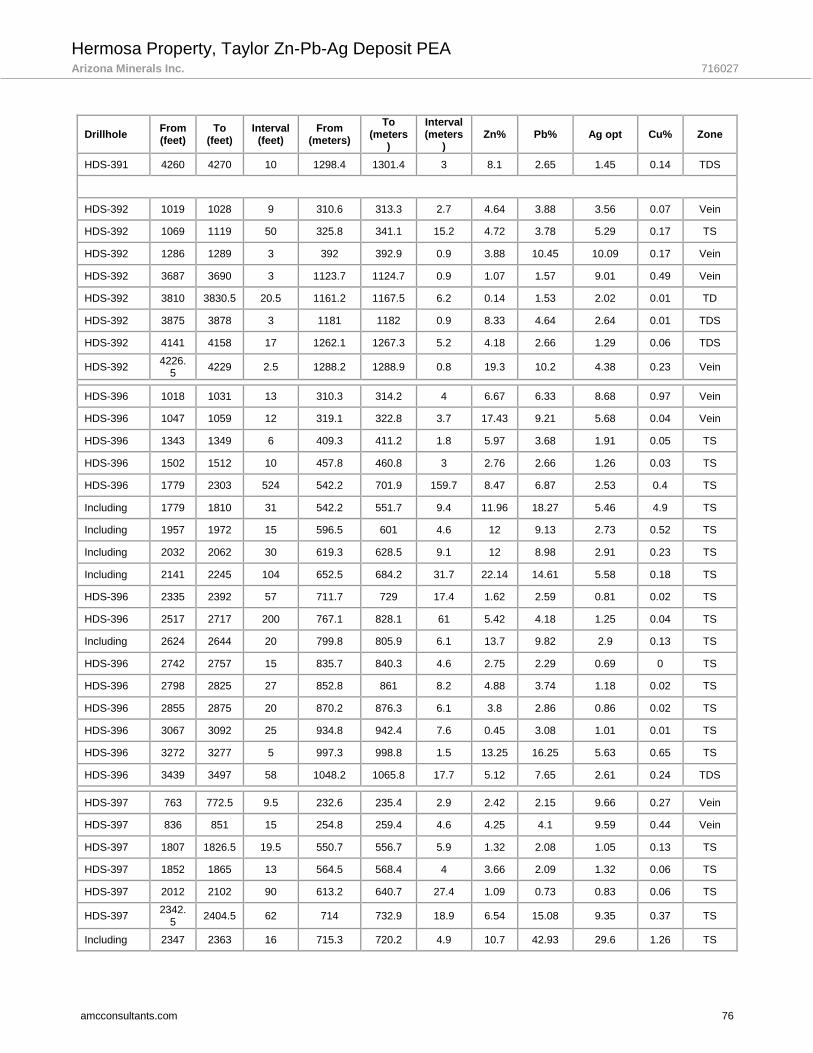
Hermosa Property, Taylor Zn-Pb-Ag Deposit PEA Arizona Minerals Inc. 716027
amcconsultants.com 76
Drillhole From (feet)
To (feet)
Interval (feet)
From (meters)
To (meters
)
Interval (meters
) Zn% Pb% Ag opt Cu% Zone
HDS-391 4260 4270 10 1298.4 1301.4 3 8.1 2.65 1.45 0.14 TDS
HDS-392 1019 1028 9 310.6 313.3 2.7 4.64 3.88 3.56 0.07 Vein
HDS-392 1069 1119 50 325.8 341.1 15.2 4.72 3.78 5.29 0.17 TS
HDS-392 1286 1289 3 392 392.9 0.9 3.88 10.45 10.09 0.17 Vein
HDS-392 3687 3690 3 1123.7 1124.7 0.9 1.07 1.57 9.01 0.49 Vein
HDS-392 3810 3830.5 20.5 1161.2 1167.5 6.2 0.14 1.53 2.02 0.01 TD
HDS-392 3875 3878 3 1181 1182 0.9 8.33 4.64 2.64 0.01 TDS
HDS-392 4141 4158 17 1262.1 1267.3 5.2 4.18 2.66 1.29 0.06 TDS
HDS-392 4226.
5 4229 2.5 1288.2 1288.9 0.8 19.3 10.2 4.38 0.23 Vein
HDS-396 1018 1031 13 310.3 314.2 4 6.67 6.33 8.68 0.97 Vein
HDS-396 1047 1059 12 319.1 322.8 3.7 17.43 9.21 5.68 0.04 Vein
HDS-396 1343 1349 6 409.3 411.2 1.8 5.97 3.68 1.91 0.05 TS
HDS-396 1502 1512 10 457.8 460.8 3 2.76 2.66 1.26 0.03 TS
HDS-396 1779 2303 524 542.2 701.9 159.7 8.47 6.87 2.53 0.4 TS
Including 1779 1810 31 542.2 551.7 9.4 11.96 18.27 5.46 4.9 TS
Including 1957 1972 15 596.5 601 4.6 12 9.13 2.73 0.52 TS
Including 2032 2062 30 619.3 628.5 9.1 12 8.98 2.91 0.23 TS
Including 2141 2245 104 652.5 684.2 31.7 22.14 14.61 5.58 0.18 TS
HDS-396 2335 2392 57 711.7 729 17.4 1.62 2.59 0.81 0.02 TS
HDS-396 2517 2717 200 767.1 828.1 61 5.42 4.18 1.25 0.04 TS
Including 2624 2644 20 799.8 805.9 6.1 13.7 9.82 2.9 0.13 TS
HDS-396 2742 2757 15 835.7 840.3 4.6 2.75 2.29 0.69 0 TS
HDS-396 2798 2825 27 852.8 861 8.2 4.88 3.74 1.18 0.02 TS
HDS-396 2855 2875 20 870.2 876.3 6.1 3.8 2.86 0.86 0.02 TS
HDS-396 3067 3092 25 934.8 942.4 7.6 0.45 3.08 1.01 0.01 TS
HDS-396 3272 3277 5 997.3 998.8 1.5 13.25 16.25 5.63 0.65 TS
HDS-396 3439 3497 58 1048.2 1065.8 17.7 5.12 7.65 2.61 0.24 TDS
HDS-397 763 772.5 9.5 232.6 235.4 2.9 2.42 2.15 9.66 0.27 Vein
HDS-397 836 851 15 254.8 259.4 4.6 4.25 4.1 9.59 0.44 Vein
HDS-397 1807 1826.5 19.5 550.7 556.7 5.9 1.32 2.08 1.05 0.13 TS
HDS-397 1852 1865 13 564.5 568.4 4 3.66 2.09 1.32 0.06 TS
HDS-397 2012 2102 90 613.2 640.7 27.4 1.09 0.73 0.83 0.06 TS
HDS-397 2342.
5 2404.5 62 714 732.9 18.9 6.54 15.08 9.35 0.37 TS
Including 2347 2363 16 715.3 720.2 4.9 10.7 42.93 29.6 1.26 TS
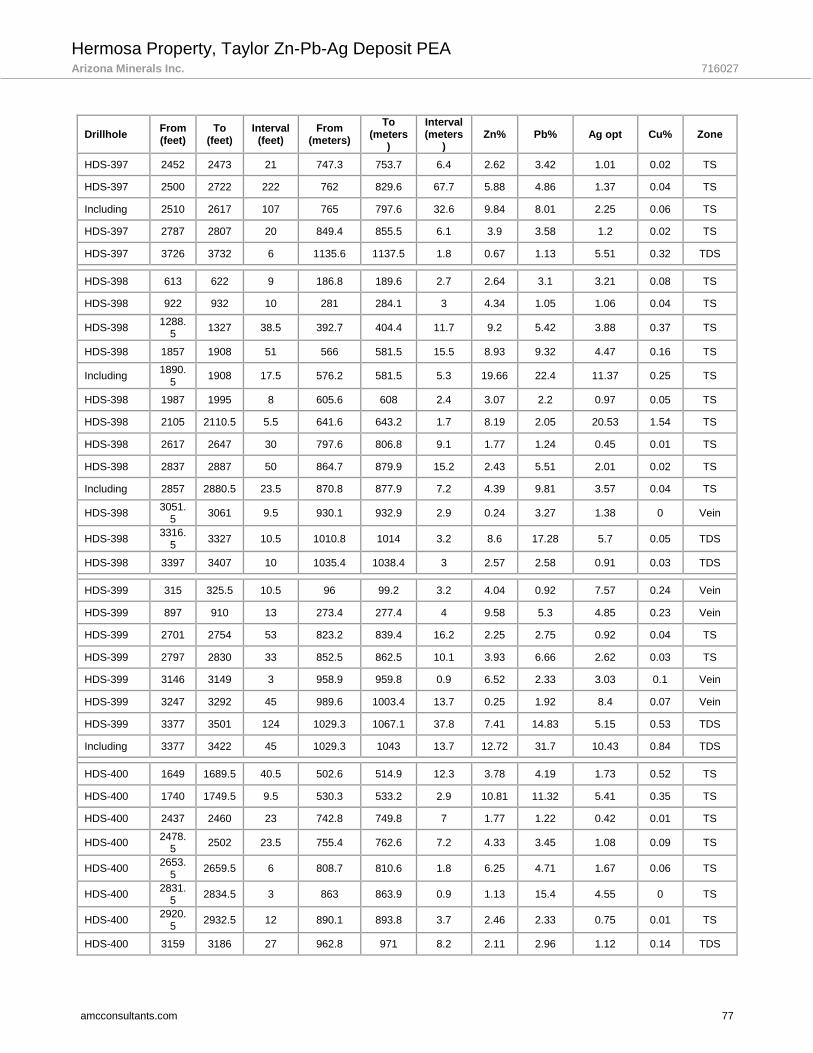
Hermosa Property, Taylor Zn-Pb-Ag Deposit PEA Arizona Minerals Inc. 716027
amcconsultants.com 77
Drillhole From (feet)
To (feet)
Interval (feet)
From (meters)
To (meters
)
Interval (meters
) Zn% Pb% Ag opt Cu% Zone
HDS-397 2452 2473 21 747.3 753.7 6.4 2.62 3.42 1.01 0.02 TS
HDS-397 2500 2722 222 762 829.6 67.7 5.88 4.86 1.37 0.04 TS
Including 2510 2617 107 765 797.6 32.6 9.84 8.01 2.25 0.06 TS
HDS-397 2787 2807 20 849.4 855.5 6.1 3.9 3.58 1.2 0.02 TS
HDS-397 3726 3732 6 1135.6 1137.5 1.8 0.67 1.13 5.51 0.32 TDS
HDS-398 613 622 9 186.8 189.6 2.7 2.64 3.1 3.21 0.08 TS
HDS-398 922 932 10 281 284.1 3 4.34 1.05 1.06 0.04 TS
HDS-398 1288.
5 1327 38.5 392.7 404.4 11.7 9.2 5.42 3.88 0.37 TS
HDS-398 1857 1908 51 566 581.5 15.5 8.93 9.32 4.47 0.16 TS
Including 1890.
5 1908 17.5 576.2 581.5 5.3 19.66 22.4 11.37 0.25 TS
HDS-398 1987 1995 8 605.6 608 2.4 3.07 2.2 0.97 0.05 TS
HDS-398 2105 2110.5 5.5 641.6 643.2 1.7 8.19 2.05 20.53 1.54 TS
HDS-398 2617 2647 30 797.6 806.8 9.1 1.77 1.24 0.45 0.01 TS
HDS-398 2837 2887 50 864.7 879.9 15.2 2.43 5.51 2.01 0.02 TS
Including 2857 2880.5 23.5 870.8 877.9 7.2 4.39 9.81 3.57 0.04 TS
HDS-398 3051.
5 3061 9.5 930.1 932.9 2.9 0.24 3.27 1.38 0 Vein
HDS-398 3316.
5 3327 10.5 1010.8 1014 3.2 8.6 17.28 5.7 0.05 TDS
HDS-398 3397 3407 10 1035.4 1038.4 3 2.57 2.58 0.91 0.03 TDS
HDS-399 315 325.5 10.5 96 99.2 3.2 4.04 0.92 7.57 0.24 Vein
HDS-399 897 910 13 273.4 277.4 4 9.58 5.3 4.85 0.23 Vein
HDS-399 2701 2754 53 823.2 839.4 16.2 2.25 2.75 0.92 0.04 TS
HDS-399 2797 2830 33 852.5 862.5 10.1 3.93 6.66 2.62 0.03 TS
HDS-399 3146 3149 3 958.9 959.8 0.9 6.52 2.33 3.03 0.1 Vein
HDS-399 3247 3292 45 989.6 1003.4 13.7 0.25 1.92 8.4 0.07 Vein
HDS-399 3377 3501 124 1029.3 1067.1 37.8 7.41 14.83 5.15 0.53 TDS
Including 3377 3422 45 1029.3 1043 13.7 12.72 31.7 10.43 0.84 TDS
HDS-400 1649 1689.5 40.5 502.6 514.9 12.3 3.78 4.19 1.73 0.52 TS
HDS-400 1740 1749.5 9.5 530.3 533.2 2.9 10.81 11.32 5.41 0.35 TS
HDS-400 2437 2460 23 742.8 749.8 7 1.77 1.22 0.42 0.01 TS
HDS-400 2478.
5 2502 23.5 755.4 762.6 7.2 4.33 3.45 1.08 0.09 TS
HDS-400 2653.
5 2659.5 6 808.7 810.6 1.8 6.25 4.71 1.67 0.06 TS
HDS-400 2831.
5 2834.5 3 863 863.9 0.9 1.13 15.4 4.55 0 TS
HDS-400 2920.
5 2932.5 12 890.1 893.8 3.7 2.46 2.33 0.75 0.01 TS
HDS-400 3159 3186 27 962.8 971 8.2 2.11 2.96 1.12 0.14 TDS

Hermosa Property, Taylor Zn-Pb-Ag Deposit PEA Arizona Minerals Inc. 716027
amcconsultants.com 78
Drillhole From (feet)
To (feet)
Interval (feet)
From (meters)
To (meters
)
Interval (meters
) Zn% Pb% Ag opt Cu% Zone
HDS-401 776.5 793 16.5 236.7 241.7 5 14.4 7.61 13.23 0.49 Vein
HDS-401 1891 1904 13 576.3 580.3 4 6.32 4.34 2.08 0.07 Vein
HDS-401 1934 1999 65 589.5 609.3 19.8 3.6 2.26 1.56 0.08 TS
HDS-401 2061 2091 30 628.2 637.3 9.1 5.33 3.82 1.55 0.08 TS
HDS-401 2161 2265 104 658.6 690.3 31.7 2.62 3.39 1.21 0.06 TS
HDS-401 2288 2338 50 697.3 712.6 15.2 5.76 4.6 1.42 0.06 TS
HDS-401 2413 2420 7 735.4 737.6 2.1 5.19 3.82 1.15 0.05 Vein
HDS-401 2472 2513 41 753.4 765.9 12.5 2.37 2.98 0.97 0.03 TS
HDS-401 2537.
5 2593 55.5 773.4 790.3 16.9 3.83 4.31 1.42 0.07 TS
HDS-401 3318 3329 11 1011.3 1014.6 3.4 0.33 0.84 22.66 0.19 Vein
HDS-401 3404 3419 15 1037.5 1042.1 4.6 1.86 2 0.76 0.11 TDS
HDS-401 3619 3660 41 1103 1115.5 12.5 2.63 2.39 0.83 0.33 TDS
HDS-401 3760 3775 15 1146 1150.6 4.6 1.77 2.21 1.3 0.25 TDS
HDS-402 345 355 10 105.2 108.2 3 2.7 1.39 9.53 0.42 Vein
HDS-402 385 389 4 117.3 118.6 1.2 4.13 3.73 19.8 0.81 Vein
HDS-402 435 445 10 132.6 135.6 3 3.47 1.11 3.43 0.07 Vein
HDS-402 930 940 10 283.5 286.5 3 3.28 3.44 4.27 0.1 Vein
HDS-402 1424 1454.5 30.5 434 443.3 9.3 7.38 2.66 4.47 0.43 TS
HDS-402 1815 1845 30 553.2 562.3 9.1 1.26 0.87 1.03 0.04 TS
HDS-402 1915 1935 20 583.7 589.8 6.1 4.02 2.34 1.12 0.22 TS
HDS-402 2701 2711.5 10.5 823.2 826.4 3.2 2.25 2.59 0.91 0.04 TS
HDS-402 2761 2847 86 841.5 867.7 26.2 5.54 4.26 1.5 0.06 TS
Including 2761 2785 24 841.5 848.8 7.3 10.23 7.35 2.55 0.14 TS
HDS-402 3242 3262 20 988.1 994.2 6.1 0.2 0.89 10.36 0.13 Vein
HDS-402 3352 3480 128 1021.6 1060.7 39 6.13 6.07 2.14 0.32 TS
Including 3352 3370 18 1021.6 1027.1 5.5 15.66 23.6 7.11 0.71 TDS
Including 3430 3445 15 1045.4 1050 4.6 19.75 11.03 4.21 1 TDS
HDS-403 1272 1277 5 387.7 389.2 1.5 5.68 1.94 0.9 0.02 Vein
HDS-403 1557 1592 35 474.6 485.2 10.7 1.72 1.21 1.38 0.04 Vein
HDS-403 2015 2132 117 614.1 649.8 35.7 3.95 3.09 1.05 0.03 TS
Including 2054 2082 28 626 634.6 8.5 12.93 9.12 3.06 0.06 TS
HDS-403 2527 2782 255 770.2 847.9 77.7 2.01 1.68 0.58 0.02 TS
Including 2751.
5 2782 30.5 838.6 847.9 9.3 9.27 7.7 2.18 0.07 TS
HDS-403 3283 3317 34 1000.6 1011 10.4 6.72 18.9 6.4 0.32 TDS

Hermosa Property, Taylor Zn-Pb-Ag Deposit PEA Arizona Minerals Inc. 716027
amcconsultants.com 79
Drillhole From (feet)
To (feet)
Interval (feet)
From (meters)
To (meters
)
Interval (meters
) Zn% Pb% Ag opt Cu% Zone
HDS-404 806 810 4 245.7 246.9 1.2 4.12 2.33 5.4 0.2 Vein
HDS-404 1735 1748 13 528.8 532.8 4 4.09 4.48 3.5 0.26 Vein
HDS-404 2075.
5 2173 97.5 632.6 662.3 29.7 5.29 4.62 1.47 0.08 CRD
Including 2082 2092 10 634.6 637.6 3 9.28 8.81 2.63 0.1 TS
Including 2140.
5 2157 16.5 652.4 657.4 5 10.29 10.29 3.34 0.22 TS
HDS-404 2284 2332 48 696.1 710.8 14.6 1.35 1.28 0.43 0.02 TS
HDS-404 2521 2792 271 768.4 851 82.6 2.22 2.46 0.81 0.02 TS
Including 2527 2573 46 770.2 784.2 14 5.37 5.36 1.6 0.03 TS
HDS-404 3231 3312 81 984.8 1009.4 24.7 0.5 1.39 7.65 0.14 Vein
Including 3237 3247 10 986.6 989.6 3 2.65 2.67 44.2 0.75 Vein
HDS-404 3404.
5 3467 62.5 1037.6 1056.7 19 4.68 7.83 2.69 0.16 TDS
Including 3405.
5 3427 21.5 1037.9 1044.5 6.6 7.93 16.54 5.59 0.22 TDS
HDS-405 668 675 7 203.6 205.7 2.1 10.45 1.91 2.42 0.03 Vein
HDS-405 1025.
5 1047 21.5 312.6 319.1 6.6 7.54 3.64 2.93 0.06 TS
HDS-405 1676 1722 46 510.8 524.8 14 4.43 3.53 1.61 0.1 TS
Including 1694 1702 8 516.3 518.7 2.4 15.94 12.33 4.09 0.11 TS
HDS-405 1767 1782 15 538.6 543.1 4.6 2.09 1.27 0.84 0.05 TS
HDS-405 1832 1912 80 558.4 582.7 24.4 1.85 1.02 0.85 0.17 TS
Including 1902 1909 7 579.7 581.8 2.1 11.15 5.29 1.8 0.14 TS
HDS-405 2079 2122 43 633.6 646.8 13.1 1.3 0.89 0.65 0.05 TS
HDS-405 2248 2290 42 685.2 698 12.8 3.51 4.95 1.77 0.04 TS
Including 2248 2262 14 685.2 689.4 4.3 9.2 9.83 3.38 0.08 TS
HDS-405 2327 2383 56 709.2 726.3 17.1 4.35 3.89 1.36 0.04 TS
Including 2327 2332 5 709.2 710.8 1.5 13.4 9.18 3.38 0.13 TS
Including 2377 2383 6 724.5 726.3 1.8 12.5 11.75 3.97 0.13 TS
HDS-405 2442 2460 18 744.3 749.8 5.5 2.1 1.3 0.54 0.04 TS
HDS-405 2593.
5 2677 83.5 790.5 815.9 25.4 2.57 1.99 0.61 0.02 TS
HDS-405 2712 2742 30 826.6 835.7 9.1 2.12 1.9 0.54 0.01 TS
HDS-405 3110 3132 22 947.9 954.6 6.7 1.08 4.1 1.44 0.02 TS
HDS-406 1379.
5 1382 2.5 420.5 421.2 0.8 0.7 0.39 7.5 0.45 Vein
HDS-406 1488 1500 12 453.5 457.2 3.7 7.53 3.68 1.64 0.06 TS
HDS-406 1723 1728 5 525.1 526.7 1.5 5.03 2.8 2.87 0.28 Vein
HDS-406 1901 1905 4 579.4 580.6 1.2 1.4 0.49 6.07 0.17 Vein
HDS-406 1970 2011 41 600.4 612.9 12.5 3.52 1.45 0.81 0.06 TS

Hermosa Property, Taylor Zn-Pb-Ag Deposit PEA Arizona Minerals Inc. 716027
amcconsultants.com 80
Drillhole From (feet)
To (feet)
Interval (feet)
From (meters)
To (meters
)
Interval (meters
) Zn% Pb% Ag opt Cu% Zone
HDS-406 2398 2410.5 12.5 730.9 734.7 3.8 3.11 4.39 1.46 0.03 TS
HDS-406 2508 2579 71 764.4 786 21.6 12.02 9.42 2.98 0.11 TS
HDS-406 3371 3408 37 1027.4 1038.7 11.3 3.11 2.92 1.03 0.25 TDS
HDS-406 3532 3535.5 3.5 1076.5 1077.6 1.1 1.47 2.72 20.24 1.13 TDS
HDS-407 572 587 15 174.3 178.9 4.6 4.94 1.5 1.65 0.02 TS
HDS-407 912 972 60 278 296.3 18.3 2.24 1.22 1.03 0.01 Vein
Including 947 957 10 288.6 291.7 3 10.47 4.09 2.67 0.04 Vein
HDS-407 1047 1062 15 319.1 323.7 4.6 1.75 1.19 1 0.03 Vein
HDS-407 2037 2092 55 620.8 637.6 16.8 1.83 1.31 0.51 0.04 TS
HDS-407 2242 2286.5 44.5 683.3 696.9 13.6 1.49 1.14 0.69 0.2 TS
HDS-407 2652 2687 35 808.3 819 10.7 2.73 2.48 0.85 0.03 TS
HDS-407 2814.
5 2822 7.5 857.8 860.1 2.3 3.05 3.14 0.98 0.01 TS
HDS-407 2987 3012 25 910.4 918 7.6 1 1.23 0.41 0.01 TS
HDS-407 3139.
5 3152 12.5 956.9 960.7 3.8 1.84 2.76 3.74 0.13 TS
HDS-407 3181.
5 3197.5 16 969.7 974.6 4.9 1.27 3.71 2.22 0.13 TS
HDS-407 3277 3332 55 998.8 1015.5 16.8 10.14 9.52 5.98 0.27 TDS
HDS-408 1140 1165 25 347.5 355.1 7.6 1.35 1.43 0.69 0.01 Vein
HDS-408 1344 1392 48 409.6 424.3 14.6 13.06 8.51 3.77 0.26 TS
HDS-408 1937 2019.5 82.5 590.4 615.5 25.1 18.16 13.83 5.07 0.11 TS
Including 1942 1996 54 591.9 608.4 16.5 24.55 18.52 6.71 0.14 TS
HDS-408 2624.
5 2712.5 88 799.9 826.7 26.8 2.05 1.97 0.69 0.02 TS
HDS-408 2827 2872 45 861.6 875.3 13.7 1.28 0.71 0.22 0 TS
HDS-408 3017 3079 62 919.5 938.4 18.9 1.42 2.09 0.73 0.02 TS
HDS-408 3119 3134.5 15.5 950.6 955.3 4.7 1.48 2.82 1.8 0.03 Vein
HDS-408 3340.
5 3347 6.5 1018.1 1020.1 2 1.03 5.36 2.45 0.1 Vein
HDS-408 3375 3477 102 1028.6 1059.7 31.1 1.28 1.57 0.72 0.11 TDS
HDS-408 3507 3515 8 1068.9 1071.3 2.4 3.93 3.16 1.88 0.77 TDS
HDS-409 1370.
5 1437 66.5 417.7 438 20.3 3 2.13 2.19 0.08 TS
HDS-409 1980.
5 2100 119.5 603.6 640 36.4 3.58 2.34 1.45 0.11 TS
Including 2037 2051 14 620.8 625.1 4.3 10.73 6.99 3.05 0.17 TS
HDS-409 2212 2225 13 674.2 678.1 4 2.66 1.95 0.79 0.05 TS
HDS-409 2276.
5 2402 125.5 693.8 732.1 38.3 2.1 6.84 3.63 0.08 TS
Including 2322.
5 2348 25.5 707.9 715.6 7.8 3.14 20.22 11.86 0.28 TS
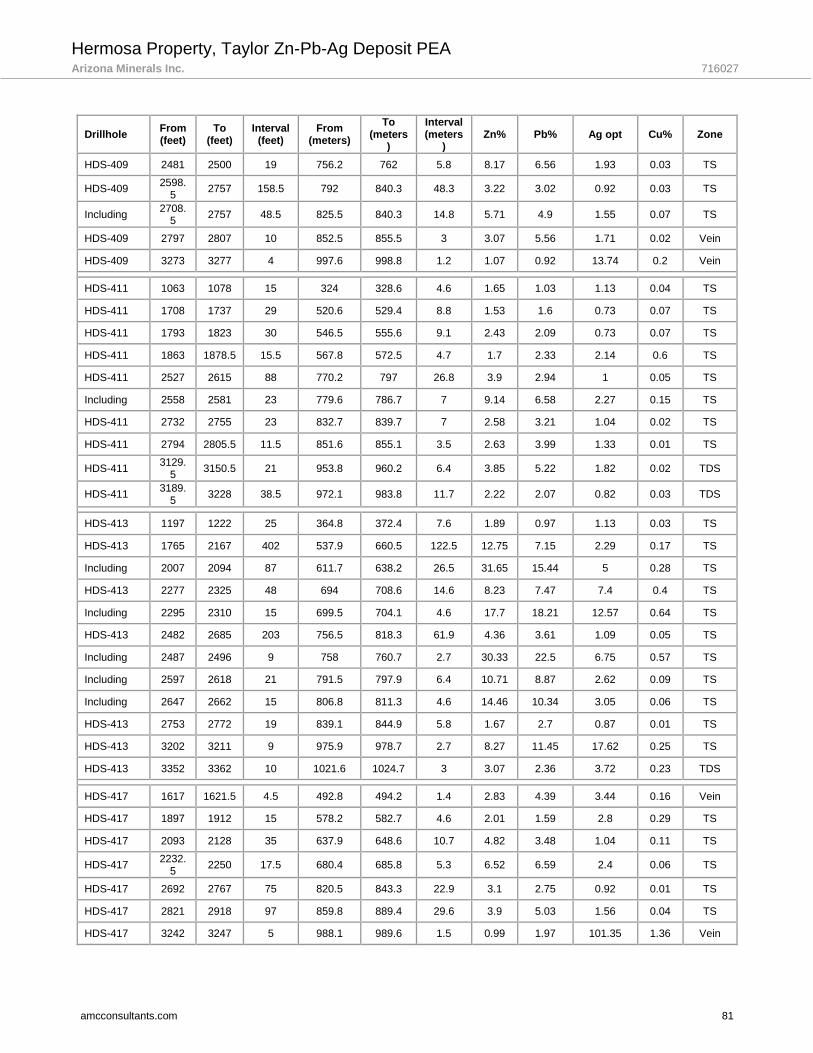
Hermosa Property, Taylor Zn-Pb-Ag Deposit PEA Arizona Minerals Inc. 716027
amcconsultants.com 81
Drillhole From (feet)
To (feet)
Interval (feet)
From (meters)
To (meters
)
Interval (meters
) Zn% Pb% Ag opt Cu% Zone
HDS-409 2481 2500 19 756.2 762 5.8 8.17 6.56 1.93 0.03 TS
HDS-409 2598.
5 2757 158.5 792 840.3 48.3 3.22 3.02 0.92 0.03 TS
Including 2708.
5 2757 48.5 825.5 840.3 14.8 5.71 4.9 1.55 0.07 TS
HDS-409 2797 2807 10 852.5 855.5 3 3.07 5.56 1.71 0.02 Vein
HDS-409 3273 3277 4 997.6 998.8 1.2 1.07 0.92 13.74 0.2 Vein
HDS-411 1063 1078 15 324 328.6 4.6 1.65 1.03 1.13 0.04 TS
HDS-411 1708 1737 29 520.6 529.4 8.8 1.53 1.6 0.73 0.07 TS
HDS-411 1793 1823 30 546.5 555.6 9.1 2.43 2.09 0.73 0.07 TS
HDS-411 1863 1878.5 15.5 567.8 572.5 4.7 1.7 2.33 2.14 0.6 TS
HDS-411 2527 2615 88 770.2 797 26.8 3.9 2.94 1 0.05 TS
Including 2558 2581 23 779.6 786.7 7 9.14 6.58 2.27 0.15 TS
HDS-411 2732 2755 23 832.7 839.7 7 2.58 3.21 1.04 0.02 TS
HDS-411 2794 2805.5 11.5 851.6 855.1 3.5 2.63 3.99 1.33 0.01 TS
HDS-411 3129.
5 3150.5 21 953.8 960.2 6.4 3.85 5.22 1.82 0.02 TDS
HDS-411 3189.
5 3228 38.5 972.1 983.8 11.7 2.22 2.07 0.82 0.03 TDS
HDS-413 1197 1222 25 364.8 372.4 7.6 1.89 0.97 1.13 0.03 TS
HDS-413 1765 2167 402 537.9 660.5 122.5 12.75 7.15 2.29 0.17 TS
Including 2007 2094 87 611.7 638.2 26.5 31.65 15.44 5 0.28 TS
HDS-413 2277 2325 48 694 708.6 14.6 8.23 7.47 7.4 0.4 TS
Including 2295 2310 15 699.5 704.1 4.6 17.7 18.21 12.57 0.64 TS
HDS-413 2482 2685 203 756.5 818.3 61.9 4.36 3.61 1.09 0.05 TS
Including 2487 2496 9 758 760.7 2.7 30.33 22.5 6.75 0.57 TS
Including 2597 2618 21 791.5 797.9 6.4 10.71 8.87 2.62 0.09 TS
Including 2647 2662 15 806.8 811.3 4.6 14.46 10.34 3.05 0.06 TS
HDS-413 2753 2772 19 839.1 844.9 5.8 1.67 2.7 0.87 0.01 TS
HDS-413 3202 3211 9 975.9 978.7 2.7 8.27 11.45 17.62 0.25 TS
HDS-413 3352 3362 10 1021.6 1024.7 3 3.07 2.36 3.72 0.23 TDS
HDS-417 1617 1621.5 4.5 492.8 494.2 1.4 2.83 4.39 3.44 0.16 Vein
HDS-417 1897 1912 15 578.2 582.7 4.6 2.01 1.59 2.8 0.29 TS
HDS-417 2093 2128 35 637.9 648.6 10.7 4.82 3.48 1.04 0.11 TS
HDS-417 2232.
5 2250 17.5 680.4 685.8 5.3 6.52 6.59 2.4 0.06 TS
HDS-417 2692 2767 75 820.5 843.3 22.9 3.1 2.75 0.92 0.01 TS
HDS-417 2821 2918 97 859.8 889.4 29.6 3.9 5.03 1.56 0.04 TS
HDS-417 3242 3247 5 988.1 989.6 1.5 0.99 1.97 101.35 1.36 Vein
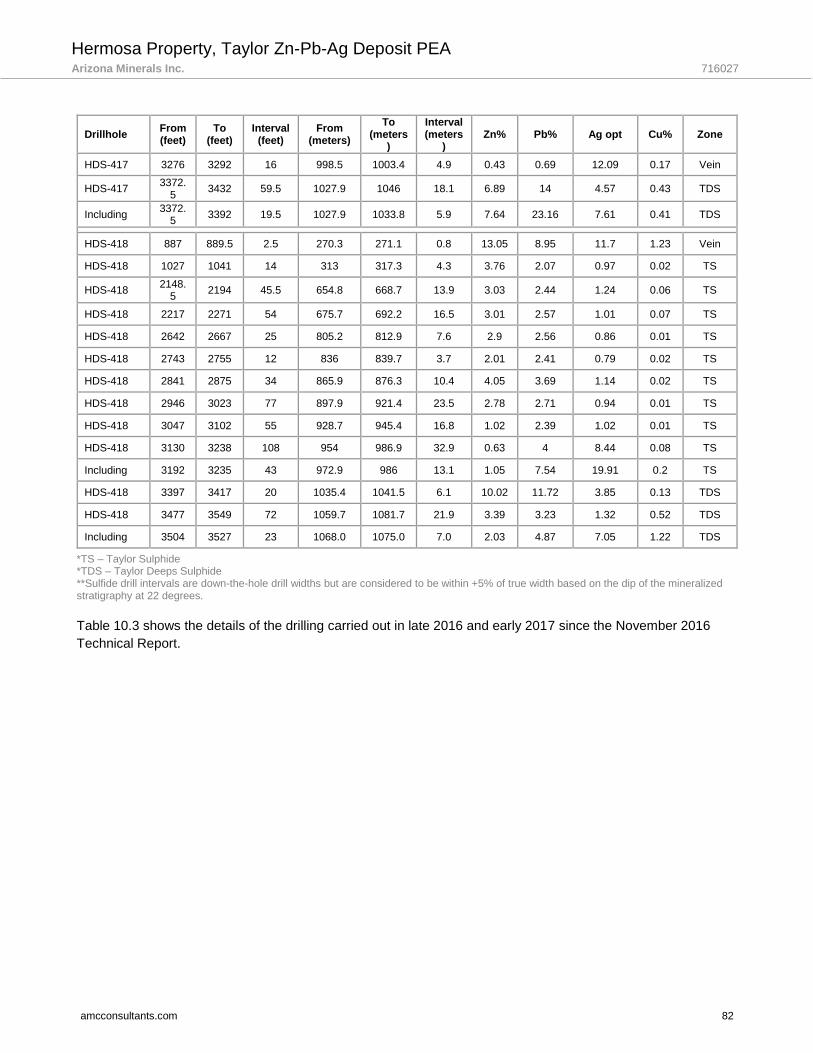
Hermosa Property, Taylor Zn-Pb-Ag Deposit PEA Arizona Minerals Inc. 716027
amcconsultants.com 82
Drillhole From (feet)
To (feet)
Interval (feet)
From (meters)
To (meters
)
Interval (meters
) Zn% Pb% Ag opt Cu% Zone
HDS-417 3276 3292 16 998.5 1003.4 4.9 0.43 0.69 12.09 0.17 Vein
HDS-417 3372.
5 3432 59.5 1027.9 1046 18.1 6.89 14 4.57 0.43 TDS
Including 3372.
5 3392 19.5 1027.9 1033.8 5.9 7.64 23.16 7.61 0.41 TDS
HDS-418 887 889.5 2.5 270.3 271.1 0.8 13.05 8.95 11.7 1.23 Vein
HDS-418 1027 1041 14 313 317.3 4.3 3.76 2.07 0.97 0.02 TS
HDS-418 2148.
5 2194 45.5 654.8 668.7 13.9 3.03 2.44 1.24 0.06 TS
HDS-418 2217 2271 54 675.7 692.2 16.5 3.01 2.57 1.01 0.07 TS
HDS-418 2642 2667 25 805.2 812.9 7.6 2.9 2.56 0.86 0.01 TS
HDS-418 2743 2755 12 836 839.7 3.7 2.01 2.41 0.79 0.02 TS
HDS-418 2841 2875 34 865.9 876.3 10.4 4.05 3.69 1.14 0.02 TS
HDS-418 2946 3023 77 897.9 921.4 23.5 2.78 2.71 0.94 0.01 TS
HDS-418 3047 3102 55 928.7 945.4 16.8 1.02 2.39 1.02 0.01 TS
HDS-418 3130 3238 108 954 986.9 32.9 0.63 4 8.44 0.08 TS
Including 3192 3235 43 972.9 986 13.1 1.05 7.54 19.91 0.2 TS
HDS-418 3397 3417 20 1035.4 1041.5 6.1 10.02 11.72 3.85 0.13 TDS
HDS-418 3477 3549 72 1059.7 1081.7 21.9 3.39 3.23 1.32 0.52 TDS
Including 3504 3527 23 1068.0 1075.0 7.0 2.03 4.87 7.05 1.22 TDS
*TS – Taylor Sulphide *TDS – Taylor Deeps Sulphide **Sulfide drill intervals are down-the-hole drill widths but are considered to be within +5% of true width based on the dip of the mineralized stratigraphy at 22 degrees.
Table 10.3 shows the details of the drilling carried out in late 2016 and early 2017 since the November 2016
Technical Report.
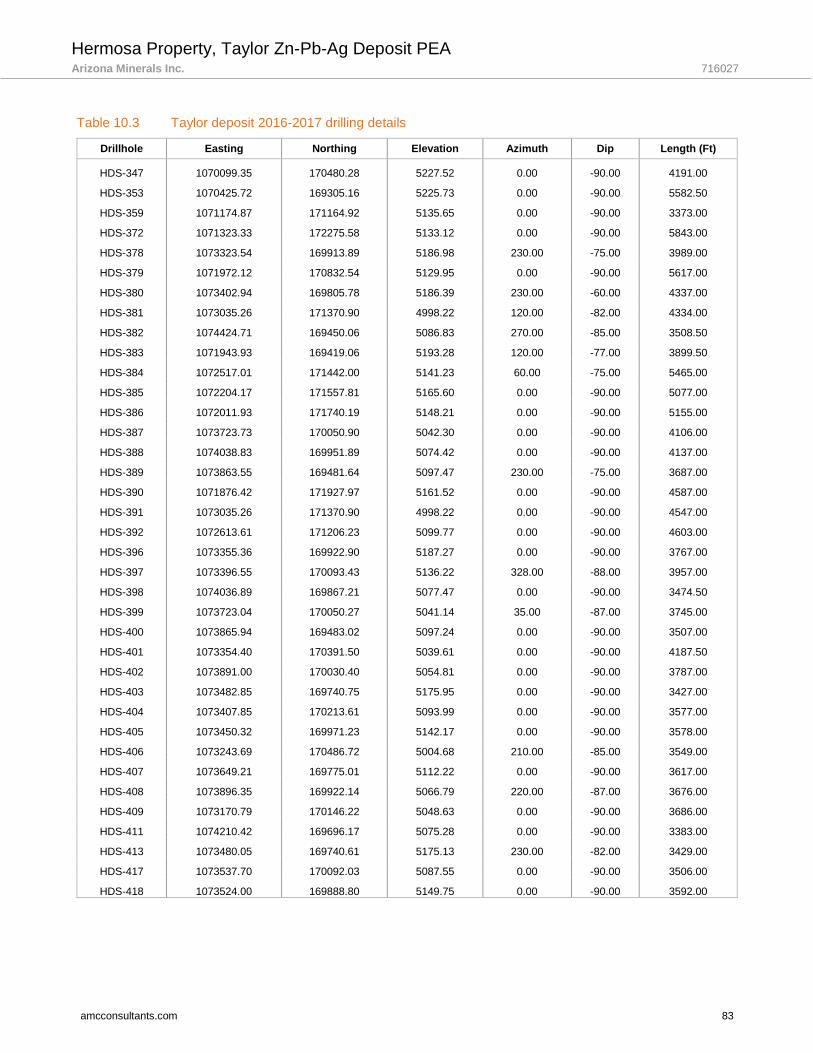
Hermosa Property, Taylor Zn-Pb-Ag Deposit PEA Arizona Minerals Inc. 716027
amcconsultants.com 83
Table 10.3 Taylor deposit 2016-2017 drilling details
Drillhole Easting Northing Elevation Azimuth Dip Length (Ft)
HDS-347 1070099.35 170480.28 5227.52 0.00 -90.00 4191.00
HDS-353 1070425.72 169305.16 5225.73 0.00 -90.00 5582.50
HDS-359 1071174.87 171164.92 5135.65 0.00 -90.00 3373.00
HDS-372 1071323.33 172275.58 5133.12 0.00 -90.00 5843.00
HDS-378 1073323.54 169913.89 5186.98 230.00 -75.00 3989.00
HDS-379 1071972.12 170832.54 5129.95 0.00 -90.00 5617.00
HDS-380 1073402.94 169805.78 5186.39 230.00 -60.00 4337.00
HDS-381 1073035.26 171370.90 4998.22 120.00 -82.00 4334.00
HDS-382 1074424.71 169450.06 5086.83 270.00 -85.00 3508.50
HDS-383 1071943.93 169419.06 5193.28 120.00 -77.00 3899.50
HDS-384 1072517.01 171442.00 5141.23 60.00 -75.00 5465.00
HDS-385 1072204.17 171557.81 5165.60 0.00 -90.00 5077.00
HDS-386 1072011.93 171740.19 5148.21 0.00 -90.00 5155.00
HDS-387 1073723.73 170050.90 5042.30 0.00 -90.00 4106.00
HDS-388 1074038.83 169951.89 5074.42 0.00 -90.00 4137.00
HDS-389 1073863.55 169481.64 5097.47 230.00 -75.00 3687.00
HDS-390 1071876.42 171927.97 5161.52 0.00 -90.00 4587.00
HDS-391 1073035.26 171370.90 4998.22 0.00 -90.00 4547.00
HDS-392 1072613.61 171206.23 5099.77 0.00 -90.00 4603.00
HDS-396 1073355.36 169922.90 5187.27 0.00 -90.00 3767.00
HDS-397 1073396.55 170093.43 5136.22 328.00 -88.00 3957.00
HDS-398 1074036.89 169867.21 5077.47 0.00 -90.00 3474.50
HDS-399 1073723.04 170050.27 5041.14 35.00 -87.00 3745.00
HDS-400 1073865.94 169483.02 5097.24 0.00 -90.00 3507.00
HDS-401 1073354.40 170391.50 5039.61 0.00 -90.00 4187.50
HDS-402 1073891.00 170030.40 5054.81 0.00 -90.00 3787.00
HDS-403 1073482.85 169740.75 5175.95 0.00 -90.00 3427.00
HDS-404 1073407.85 170213.61 5093.99 0.00 -90.00 3577.00
HDS-405 1073450.32 169971.23 5142.17 0.00 -90.00 3578.00
HDS-406 1073243.69 170486.72 5004.68 210.00 -85.00 3549.00
HDS-407 1073649.21 169775.01 5112.22 0.00 -90.00 3617.00
HDS-408 1073896.35 169922.14 5066.79 220.00 -87.00 3676.00
HDS-409 1073170.79 170146.22 5048.63 0.00 -90.00 3686.00
HDS-411 1074210.42 169696.17 5075.28 0.00 -90.00 3383.00
HDS-413 1073480.05 169740.61 5175.13 230.00 -82.00 3429.00
HDS-417 1073537.70 170092.03 5087.55 0.00 -90.00 3506.00
HDS-418 1073524.00 169888.80 5149.75 0.00 -90.00 3592.00

Hermosa Property, Taylor Zn-Pb-Ag Deposit PEA Arizona Minerals Inc. 716027
amcconsultants.com 84
Central deposit
10.4.1 Procedures
Competent, intact core samples were divided with a hydraulic splitter. Spatulas and trowels were used for splitting the sample in clayey or rubbly intervals. Splitter and sample trays were carefully cleaned between samples. Typical, standard sample interval length was nominally set at 5 ft. In areas of mineralogical or geological interest, sample intervals ranged from 1.5 ft to 7 ft.
One split was returned to the original core box for reference and long term storage. The other split was placed in a heavy gauge plastic bag marked with drillhole number and interval labels. These bags were closed with a wire tie, weighed and consolidated in shipping boxes or bulk shipping bags.
Reverse circulation holes were drilled wet. The holes were cleaned and blown by the driller between each nominal 5 ft sample interval. A cyclone and wet rotary splitter were set up to obtain two identical splits, weighing approximately 10 lb to 15 lb. The original and duplicate samples were placed in Tyvek sample bags, collected on pallets, shrink wrapped and transported to the project sample processing facility.
The samples were then inventoried and weighed. Standards, blanks and duplicates were inserted in the sample stream. Shipment of samples to Skyline Laboratory of Tucson, Arizona for sample preparation and analyses occurred at regular intervals throughout the drilling campaign.
Figure 10.2 shows in plan, the location of drillholes that have intersected Manto mineralization. Much of the mineralization is stratabound and dips at less than 30°. All of the drillholes are vertical so this combination of variable dips of mineralization and vertical drillholes dips means that most of the drillhole intercepts are slightly greater than true thickness although it is not possible to accurately determine this variance. This is also shown in Figure 7.4 and Figure 7.5.
10.4.2 Relevant sample results
In addition to the true thickness, the results from drilling results and calculated intercepts are shown in long and cross sections as shown in Figure 7.4 and Figure 7.5.

Hermosa Property, Taylor Zn-Pb-Ag Deposit PEA Arizona Minerals Inc. 716027
amcconsultants.com 85
11 Sample preparation, analyses and security
Background
ASARCO drill programs generated chip samples derived from air rotary hammer drilling and core samples from diamond drillholes. It is assumed that sampling conformed to standard industry practices of the time. AMI inventoried the ASARCO samples in 2006 and re-analyzed 4,272 ASARCO pulp samples. Sample preparation and copper, lead, zinc, and manganese analyses were conducted by Skyline Laboratories in Tucson, Arizona using inductively-coupled plasma and atomic absorption methods. A split of each pulp was then sent to Assayers Canada in Vancouver, British Columbia for silver and gold fire assays.
Taylor Deposit
For the 2010 to 2012 drilling campaign, Skyline Laboratory prepared 250 gram pulps which were analyzed at Inspectorate Laboratories of Sparks, Nevada. AZ implemented a QC program using commercial standards which identified a low bias for silver reported by fire assay with a gravimetric finish. A total of 8,078 samples from 188 holes were re-analyzed by 4-acid digest and atomic absorption spectroscopy (AAS) finish. These assays, mostly from the Upper Silver, Hardshell and Manto Oxide areas, replaced the original fire assay silver results.
Samples for the 2014-2015 drilling campaign were submitted to ALS Minerals, Tucson for the same methods as described in Table 11.1. The quality control (QC) results and discussion for these programs can be found in the March 2016 Technical Report. All data for the 2014-2015 drilling campaign were acceptable for use in resource estimation.
A few of the 154 quarter-core duplicates were outside an anticipated range of one another. Core boxes for these 3 intervals were pulled to evaluate the discrepancies. Within CRD mineralization zones, it was noted that galena, sphalerite, pyrite and chalcopyrite mineralization can be irregular. A duplicate sample from a quarter split could simply have abundant CRD mineralization in duplicate-A and moderate mineralization in the duplicate-B sample. Similarly, an interval within a “Hardshell” mineralization zone may include a mineralized limestone clast, which occurs intermittently. Quarter-core analyses did not agree well if a well mineralized clast was present in the duplicate-A sample but not in the duplicate-B sample.
Samples for the 2016 drill program, specifically holes HDS-330 to HDS-369, were submitted to ALS Minerals, Tucson for the same methods as described in Table 11.1. The quality control (QC) results and discussion for these programs can be found in the October 2016 Technical Report. All data for the first phase of the 2016 drilling campaign were acceptable for use in resource estimation.
The following information refers to the analytical program for 2016-2017 analyses, covering holes HDS-347, 353, 359, 372, HDS-378 to 409, 411, 413, and HDS-417 to HDS-418. The QP for this section is Lynda Bloom of Analytical Solutions Ltd. except for the observation in Section 11.4 which is made by the QP for Section 10.
11.2.1 Sample preparation
All samples were prepared and analyzed at ALS Minerals, an ISO 17025 accredited laboratory. Drill core samples are prepared using the following protocol (Method Code Prep-31):
1. Drying: Air dry if possible; dry at a maximum temperature of 120° C if oven drying is necessary;
2. Crush entire sample to more than 70% passing 2 mm;
3. Riffle split to achieve a 250 grams subsample; and
4. Pulverize the 250 grams subsample to greater than 85% passing 75 micron.
11.2.2 Analysis
Drill core samples used for Mineral Resource estimation have been analyzed for 33-elements using a 4-acid digestion followed by Inductively Coupled Plasma (ICP) determination.

Hermosa Property, Taylor Zn-Pb-Ag Deposit PEA Arizona Minerals Inc. 716027
amcconsultants.com 86
The analytical methods are summarized in Table 11.1.
Table 11.1 Summary of preparation and assay methods
Element Method code Detection limit Digest Instrumentation
33 elements, see below ME-ICP61 Varies; see below 0.25 grams four-acid: HNO3 + HClO4
+HF + HCl digest plus HCl leach ICP-AES
Au Au-ICP21 0.001 ppm 30 grams Fire Assay ICP-AES
Reanalysis when initial analysis is greater than 1% for lead and zinc and 100 g/ton for Silver
Ag Ag-OG62 1 ppm 0.25 grams four-acid: HNO3 + HClO4
+HF + HCl ICP-AES
Pb Pb-OG62 0.001% 0.25 grams four-acid: HNO3 + HClO4
+HF + HCl ICP-AES
Zn Zn-OG62 0.001% 0.25 grams four-acid: HNO3 + HClO4
+HF + HCl ICP-AES
The lower and upper limits for the 4-acid digest method (ME-ICP61) are shown Table 11.2.
Table 11.2 Upper and lower limits for 4 acid ICP method
High grade samples, for Ag greater than 100 g/ton and base metals over 1%, are analyzed a second time using ICP methods optimized for high grade samples. The same sample weight and acids are used for the repeat analysis.
11.2.3 Security
Core and samples are stored in secure shipping containers, owned by AZ, at the project and at the office located in Patagonia, Arizona. The on-site storage location also has facilities for core logging, core cutting and core sampling. Core is stored in wax cardboard boxes and organized in shipping containers by drillhole number which is shown in Figure 11.1. This has been validated by the QP for Section 10.
Element Lower limit Upper limit Element Lower limit Upper limit Analyte Lower limit Upper limit
Ag 0.5 ppm 100 ppm Fe 0.01% 50% S 0.01% 10%
Al 0.01% 50% Ga 10 ppm 10,000 ppm Sb 5 ppm 10,000 ppm
As 5 ppm 10,000 ppm K 0.01% 10% Sc 1 ppm 10,000 ppm
Ba 10 ppm 10,000 ppm La 10 ppm 10,000 ppm Sr 1 ppm 10,000 ppm
Be 0.5 ppm 1,000 ppm Mg 0.01% 50% Th 20 ppm 10,000 ppm
Bi 2 ppm 10,000 ppm Mn 5 ppm 100,000 ppm Ti 0.01% 10%
Ca 0.01% 50% Mo 1 ppm 10,000 ppm Tl 10 ppm 10,000 ppm
Cd 0.5 ppm 500 ppm Na 0.01% 10% U 10 ppm 10,000 ppm
Co 1 ppm 10,000 ppm Ni 1 ppm 10,000 ppm V 1 ppm 10,000 ppm
Cr 1 ppm 10,000 ppm P 10 ppm 10,000 ppm W 10 ppm 10,000 ppm
Cu 1 ppm 10,000 ppm Pb 2 ppm 10,000 ppm Zn 2 ppm 10,000 ppm
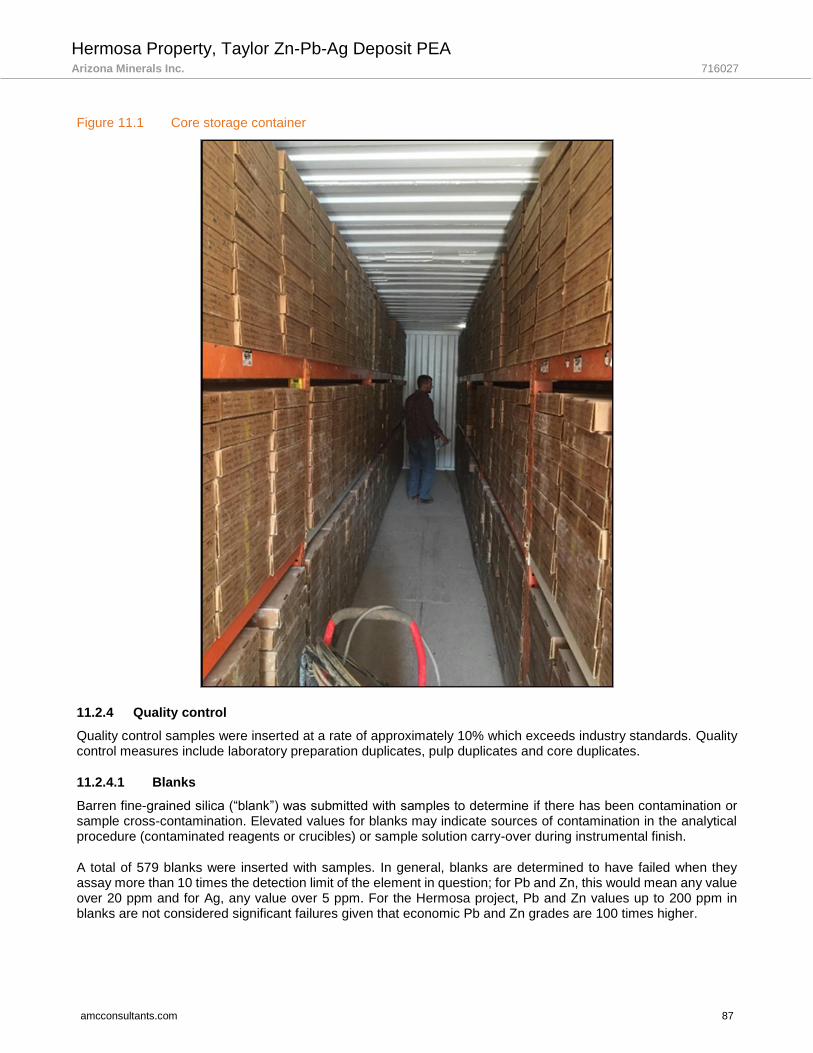
Hermosa Property, Taylor Zn-Pb-Ag Deposit PEA Arizona Minerals Inc. 716027
amcconsultants.com 87
Figure 11.1 Core storage container
11.2.4 Quality control
Quality control samples were inserted at a rate of approximately 10% which exceeds industry standards. Quality control measures include laboratory preparation duplicates, pulp duplicates and core duplicates.
11.2.4.1 Blanks
Barren fine-grained silica (“blank”) was submitted with samples to determine if there has been contamination or sample cross-contamination. Elevated values for blanks may indicate sources of contamination in the analytical procedure (contaminated reagents or crucibles) or sample solution carry-over during instrumental finish.
A total of 579 blanks were inserted with samples. In general, blanks are determined to have failed when they assay more than 10 times the detection limit of the element in question; for Pb and Zn, this would mean any value over 20 ppm and for Ag, any value over 5 ppm. For the Hermosa project, Pb and Zn values up to 200 ppm in blanks are not considered significant failures given that economic Pb and Zn grades are 100 times higher.

Hermosa Property, Taylor Zn-Pb-Ag Deposit PEA Arizona Minerals Inc. 716027
amcconsultants.com 88
Using the above criteria, there were no actionable QC failures for Ag, Pb or Zn in blanks. All the blanks were fine silica and therefore the contamination events are most likely related to solution carry-over in the ICP after high grade samples. Elevated Pb and Zn values are reported for 5% of the blanks, using the criteria of 10 times the detection limit, but are not considered quality control failures for the Hermosa project.
It is recommended that a coarse blank be inserted instead of the fine-silica blank. A coarse blank will monitor possible sample cross-contamination in sample preparation as well as analysis.
11.2.4.2 Reference materials
The certified reference materials (CRMs) inserted for the QC program are purchased from a third-party supplier, OREAS. The CRMs were analyzed at 15 laboratories to determine expected values and tolerances. The materials are matrix-matched for the Hermosa deposit style with the source rock from SEDEX deposits within carbonaceous dolomitic sediments. Expected values for the CRMs are based on 4-acid digest Induced Coupling Plasma (ICP) analyses.
There were 1,364 insertions of CRMs with drill core samples. A low proportion of quality control failures were identified for Pb, Zn, Cu and Ag; these are cases where the results were outside the tolerance of 3 standard deviations or there were consecutive RMs outside +2 or -2 standard deviations. There were nine QC failures identified for Ag, five for Pb, three for Zn and one for Cu. This represents a 0.5% failure rate for the CRM’s.
All acceptable data were plotted on control charts and are summarized in Tables 11.3 to 11.7. The observed average values for Ag, Pb, Zn and Cu fall within ± 2% of expected values. There is no consistent bias for the reference materials with respect to Ag, Pb, Zn and Cu.
The observed As values are generally lower than the expected values by approximately 4%. It is not uncommon for there to be differences between laboratories for analytical methods that require acid digestion and this may explain the low bias for As at ALS.
Laboratory performance, based on blanks and standards, was excellent and analytical data are considered acceptable for use in resource estimation.
Table 11.3 Performance of silver reference materials
CRM N Outliers
excluded Failures excluded
Expected Ag (ppm) Observed Ag (ppm) Percent of Accepted Accepted Std. Dev. Average Std. Dev.
133b 394 2 3 104 2.0 103.1 1.88 99.2%
133a 2 - - 100 2.4 104.0 0.00 104.1%
132b 2 - - 61 2.2 58.6 0.14 96.5%
132a 452 1 - 57 3.0 58.1 1.78 101.9%
131b 487 - 7 33 1.2 34.3 1.01 103.0%
131a 12 - - 31 1.3 31.4 0.94 101.6%
Total 1349 Weighted average 101.5%

Hermosa Property, Taylor Zn-Pb-Ag Deposit PEA Arizona Minerals Inc. 716027
amcconsultants.com 89
Table 11.4 Performance of lead reference materials
CRM N Outliers
excluded Failures excluded
Expected Pb (ppm) Observed Pb (ppm) Percent of accepted Accepted Std. Dev. Average Std. Dev.
133b 396 1 2 50,600 980 50,910 785 100.6%
133a 2 - - 49,000 1,620 51,650 212 105.4%
132b 0 - 2 38,600 660 - - -
132a 452 1 - 36,400 1,350 36,115 555 99.2%
131b 493 - 1 18,800 860 18,533 309 98.6%
131a 12 - - 17,200 490 16,900 525 98.3%
Total 1355 Weighted average 99.4%
Table 11.5 Performance of zinc reference materials
CRM N Outliers excluded
Failures excluded
Expected Zn (ppm) Observed Zn (ppm) Percent of accepted Accepted Std. Dev. Average Std. Dev.
133b 398 1 - 113,500 3,470 113,480 1,873 100.0%
133a 2 - - 108,700 3,540 115750 1,061 106.5%
132b 2 - - 52,500 1,950 49850 354 95.0%
132a 452 1 - 49,800 1,070 49,634 816 99.7%
131b 492 - 2 30,400 1,190 30,920 558 101.7%
131a 11 - 1 28,300 800 28,018 458 99.0%
Total 1357 Weighted average 100.5%
Table 11.6 Performance of copper reference materials
CRM N Outliers excluded
Failures excluded
Expected Cu (ppm) Observed Cu (ppm) Percent of accepted Accepted Std. Dev. Average Std. Dev.
133b 397 1 1 320 14 327 10 102.1%
133a 2 - - 323 15 328 11 101.5%
132b 2 - - 477 24 469 2 98.2%
132a 452 1 - 461 23 465 14 100.9%
131b 493 - 1 216 11 225 7 104.3%
131a 11 1 - 322 17 329 10 102.2%
Total 1357 Weighted average 102.5%
Table 11.7 Performance of arsenic reference material
CRM N Outliers excluded
Failures excluded
Expected As (ppm) Observed As (ppm) Percent of accepted accepted Std. Dev. Average Std. Dev.
133b 398 1 - 144 13 136 5.4 94.7%
133a 2 - - 139 15 137 9.9 98.6%
132b 2 - - 149 15 144 2.8 96.6%
132a 452 1 - 146 16 140 6.0 95.6%
131b 494 - - 82 7.1 80 4.0 97.6%
131a 12 - - 82 6.9 78 3.0 95.3%
Total 1360 Weighted Average 96.1%
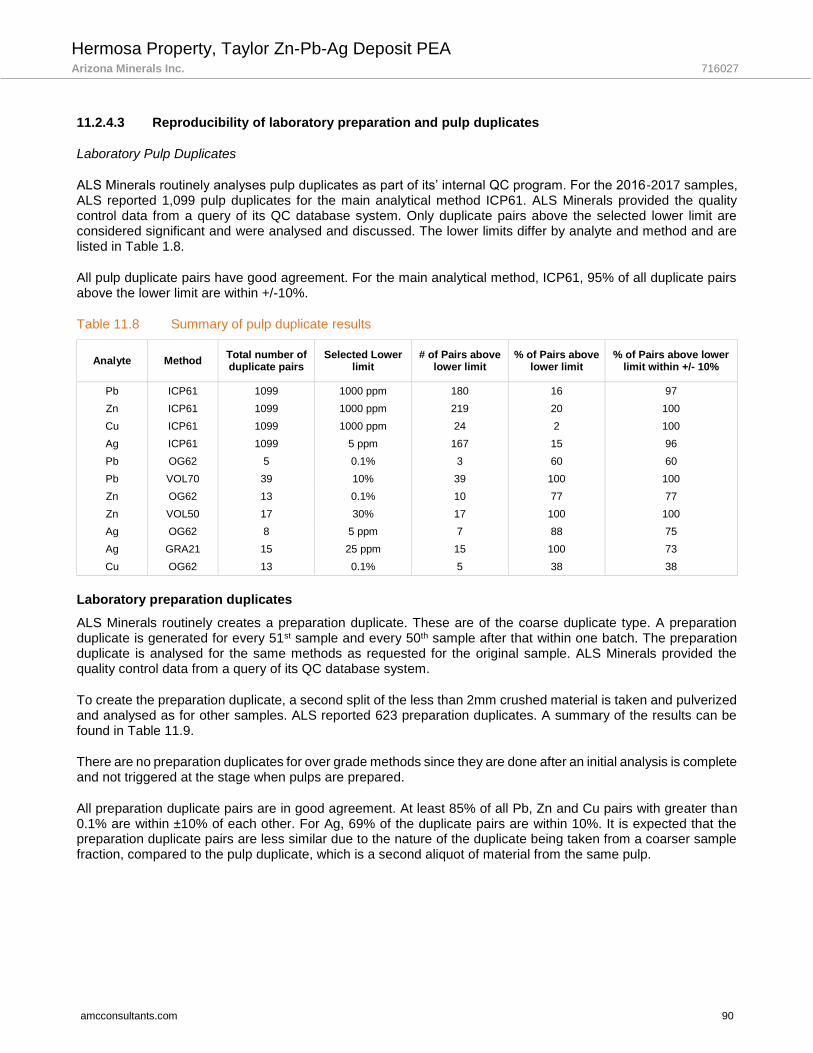
Hermosa Property, Taylor Zn-Pb-Ag Deposit PEA Arizona Minerals Inc. 716027
amcconsultants.com 90
11.2.4.3 Reproducibility of laboratory preparation and pulp duplicates
Laboratory Pulp Duplicates
ALS Minerals routinely analyses pulp duplicates as part of its’ internal QC program. For the 2016-2017 samples, ALS reported 1,099 pulp duplicates for the main analytical method ICP61. ALS Minerals provided the quality control data from a query of its QC database system. Only duplicate pairs above the selected lower limit are considered significant and were analysed and discussed. The lower limits differ by analyte and method and are listed in Table 1.8.
All pulp duplicate pairs have good agreement. For the main analytical method, ICP61, 95% of all duplicate pairs above the lower limit are within +/-10%.
Table 11.8 Summary of pulp duplicate results
Analyte Method Total number of duplicate pairs
Selected Lower limit
# of Pairs above lower limit
% of Pairs above lower limit
% of Pairs above lower limit within +/- 10%
Pb ICP61 1099 1000 ppm 180 16 97
Zn ICP61 1099 1000 ppm 219 20 100
Cu ICP61 1099 1000 ppm 24 2 100
Ag ICP61 1099 5 ppm 167 15 96
Pb OG62 5 0.1% 3 60 60
Pb VOL70 39 10% 39 100 100
Zn OG62 13 0.1% 10 77 77
Zn VOL50 17 30% 17 100 100
Ag OG62 8 5 ppm 7 88 75
Ag GRA21 15 25 ppm 15 100 73
Cu OG62 13 0.1% 5 38 38
Laboratory preparation duplicates
ALS Minerals routinely creates a preparation duplicate. These are of the coarse duplicate type. A preparation duplicate is generated for every 51st sample and every 50th sample after that within one batch. The preparation duplicate is analysed for the same methods as requested for the original sample. ALS Minerals provided the quality control data from a query of its QC database system.
To create the preparation duplicate, a second split of the less than 2mm crushed material is taken and pulverized and analysed as for other samples. ALS reported 623 preparation duplicates. A summary of the results can be found in Table 11.9.
There are no preparation duplicates for over grade methods since they are done after an initial analysis is complete and not triggered at the stage when pulps are prepared.
All preparation duplicate pairs are in good agreement. At least 85% of all Pb, Zn and Cu pairs with greater than 0.1% are within ±10% of each other. For Ag, 69% of the duplicate pairs are within 10%. It is expected that the preparation duplicate pairs are less similar due to the nature of the duplicate being taken from a coarser sample fraction, compared to the pulp duplicate, which is a second aliquot of material from the same pulp.
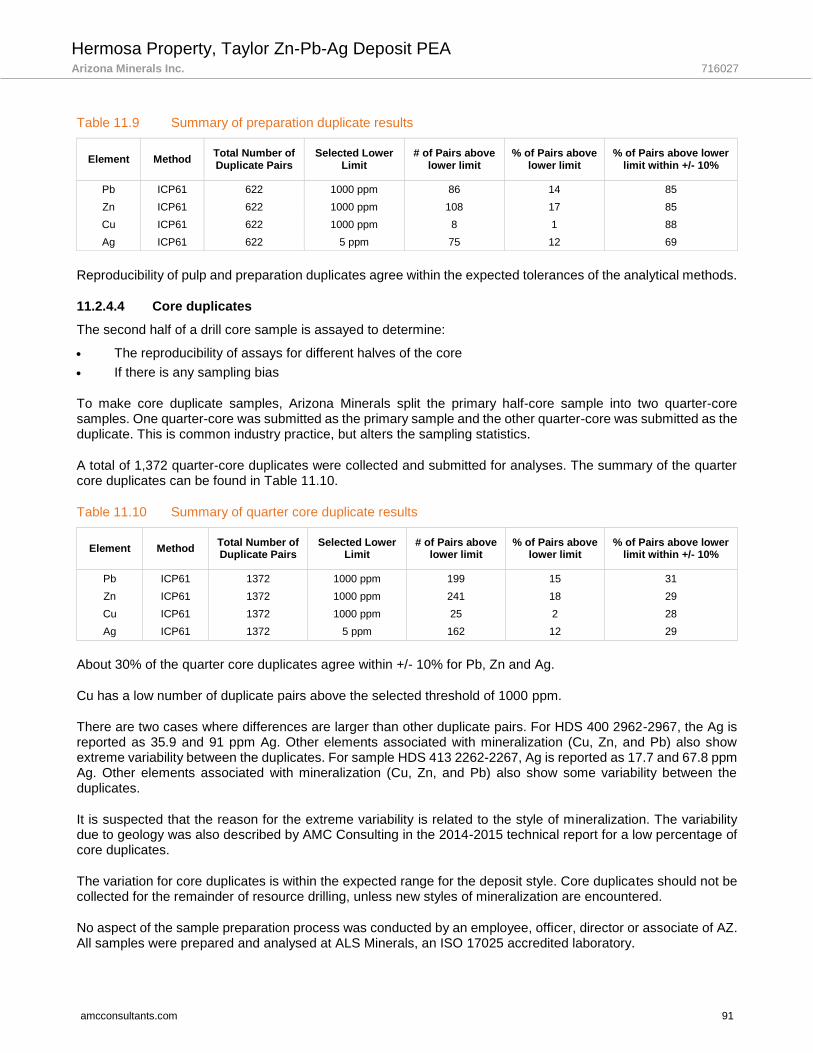
Hermosa Property, Taylor Zn-Pb-Ag Deposit PEA Arizona Minerals Inc. 716027
amcconsultants.com 91
Table 11.9 Summary of preparation duplicate results
Element Method Total Number of Duplicate Pairs
Selected Lower Limit
# of Pairs above lower limit
% of Pairs above lower limit
% of Pairs above lower limit within +/- 10%
Pb ICP61 622 1000 ppm 86 14 85
Zn ICP61 622 1000 ppm 108 17 85
Cu ICP61 622 1000 ppm 8 1 88
Ag ICP61 622 5 ppm 75 12 69
Reproducibility of pulp and preparation duplicates agree within the expected tolerances of the analytical methods.
11.2.4.4 Core duplicates
The second half of a drill core sample is assayed to determine:
• The reproducibility of assays for different halves of the core
• If there is any sampling bias
To make core duplicate samples, Arizona Minerals split the primary half-core sample into two quarter-core samples. One quarter-core was submitted as the primary sample and the other quarter-core was submitted as the duplicate. This is common industry practice, but alters the sampling statistics.
A total of 1,372 quarter-core duplicates were collected and submitted for analyses. The summary of the quarter core duplicates can be found in Table 11.10.
Table 11.10 Summary of quarter core duplicate results
Element Method Total Number of Duplicate Pairs
Selected Lower Limit
# of Pairs above lower limit
% of Pairs above lower limit
% of Pairs above lower limit within +/- 10%
Pb ICP61 1372 1000 ppm 199 15 31
Zn ICP61 1372 1000 ppm 241 18 29
Cu ICP61 1372 1000 ppm 25 2 28
Ag ICP61 1372 5 ppm 162 12 29
About 30% of the quarter core duplicates agree within +/- 10% for Pb, Zn and Ag.
Cu has a low number of duplicate pairs above the selected threshold of 1000 ppm.
There are two cases where differences are larger than other duplicate pairs. For HDS 400 2962-2967, the Ag is reported as 35.9 and 91 ppm Ag. Other elements associated with mineralization (Cu, Zn, and Pb) also show extreme variability between the duplicates. For sample HDS 413 2262-2267, Ag is reported as 17.7 and 67.8 ppm Ag. Other elements associated with mineralization (Cu, Zn, and Pb) also show some variability between the duplicates.
It is suspected that the reason for the extreme variability is related to the style of mineralization. The variability due to geology was also described by AMC Consulting in the 2014-2015 technical report for a low percentage of core duplicates.
The variation for core duplicates is within the expected range for the deposit style. Core duplicates should not be collected for the remainder of resource drilling, unless new styles of mineralization are encountered.
No aspect of the sample preparation process was conducted by an employee, officer, director or associate of AZ. All samples were prepared and analysed at ALS Minerals, an ISO 17025 accredited laboratory.

Hermosa Property, Taylor Zn-Pb-Ag Deposit PEA Arizona Minerals Inc. 716027
amcconsultants.com 92
AZ maintains a QC program that meets or exceeds industry standards. Sample preparation, security, and analytical procedures are all industry-standard and produce analytical results for silver and base metals with accuracy and precision that is suitable for Mineral Resource estimation.
Central Deposit
11.3.1 Quality assurance quality control analytical program
Standards were inserted every 20th sample as a check of assay accuracy and precision. Five standards were prepared for the Hermosa project and certified by Mineral Exploration Group of Reno, Nevada using a systematic, six laboratories, round-robin analytical program.
Field duplicates from core and chips were taken at intervals of approximately 50 ft (15 m). Core duplicates were quarter-splits, chip duplicates were nominally full sample weight.
Blank samples were used to check the integrity of sample preparation procedures and were inserted at the beginning and end of every sample batch run. Blank samples were prepared and certified by Mineral Exploration Group of Reno, Nevada from limestone, silica sand and volcanic rocks.
11.3.2 Analytical program
11.3.2.1 Sample preparation and analysis
Skyline Laboratory prepared two identical 250 gram pulps from each sample. One pulp was retained by Skyline Laboratory and the second pulp was sent to Inspectorate Laboratories of Sparks, Nevada for the 2010 to 2012 drilling campaign. The duplicate pulps from the 2006 and 2009 drilling campaigns were sent to Assayers Canada.
Pulps were analyzed by ICP at Skyline for percent copper, lead, zinc, and manganese after a multi-acid digestion. Inspectorate Laboratory determined silver values by gravimetric fire assay with gold values determined by AA finish on the same dissolved doré bead. Remaining portions of the core and all assay pulps are stored in locked, steel shipping containers on property owned or controlled by AZ.
A partial re-assay program of sample pulps was undertaken in October and November 2013 to address an under-reporting bias detected by the in-place quality assurance-quality control program. Inspectorate Laboratory determined silver values by 4-acid digestion followed by atomic absorption spectroscopy (AAS).
11.3.3 QA / QC protocol efficacy study
AZ retained the services of Analytical Solutions Ltd to assess the effectiveness of the quality assurance, quality control program used by the company for the 2010-2012 drilling campaign. Lynda Bloom’s report to AZ was included in the 31 October 2012 Preliminary Economic Assessment document. Analytical Solutions Ltd concluded that the QA / QC program was adequate to ensure a reliable resource level estimate. They also identified the following shortcomings in the reference standard portion of the program, addressed in the following section.
11.3.3.1 Performance of reference standards
Twenty of the 29 listed silver quality control/quality assurance failures were incorrectly designated as standards. These 20 cases have been corrected and do not require additional follow up.
Silver values of the reference standard S-1 is biased low by 29%, S-2 is biased low by 7.8% and S-3 is biased low by 10.1% compared to expected values of the reference standards (Table 3.2.1-a from the ASL report, reproduced here as Table 11.8). These standards contain less than 6.21 oz/ton Ag, within the average grade range for the Taylor Deposit. Analytical Solutions, Ltd submitted two batches of the S-1, S-2 and S-3 standards to TSL, Saskatoon for additional analysis and the 2008 reference standard assays were found consistently low by 5% to 10%.

Hermosa Property, Taylor Zn-Pb-Ag Deposit PEA Arizona Minerals Inc. 716027
amcconsultants.com 93
Table 11.11 Reference standard expected values
RM N Expected Ag (oz/ton) Observed Ag (oz/ton) Percent of
expected QC failures
Average Std. Dev. Average Std. Dev.
S-1 95 0.47 0.16 0.334 0.049 1 3
S-1 77 4.14 0.69 3.82 0.18 92.2 3
S-3 183 6.21 0.72 5.58 0.27 89.9 7
S-4 172 12.16 1.62 11.9 0.43 98.6 5
S-5 61 32.99 1.62 33.37 0.86 101.2 4
S-900 series 208 N/A 6.68 0.22 N/A 7
796 29
The systematic low Ag bias results from analytical methodology specific to Ag assaying, from poorly constrained reference standards or from combinations thereof. A new commercial reference was purchased and approximately 10% of the assays within the average grade range for the Central Deposit were re-submitted to the analytical laboratory for re-assay.
Gold, zinc and copper values for the standards are consistent. Manganese values for the standards range from 0.2% to 10.1% and are biased 5% to 20% low. Lead values for the standards range from 0.1% to 6.4% and do not indicate a systematic analytical bias.
11.3.4 Quality control program
Analytical Solutions Ltd. reviewed the analytical quality control, quality assurance program for AZ. Analytical Solutions Ltd. concluded that the protocols and procedures used by AZ are robust and effective.
Systematic contamination during sample preparation was not detected in the analyses of blanks.
The Ag results for standards are summarized in Table 11.9. Silver values are biased 29% low for analyses that lie within the average grade range for the Taylor Deposit. 20 of the 29 listed silver quality control/quality assurance failures were incorrectly designated as standards. These 20 cases have been corrected and do not require additional follow up.
Gold, zinc and copper values for the standards are consistent. Manganese values for the standards range from 0.2% to 10.1% and are biased 5% to 20% low. Lead values for the standards range from 0.1% to 6.4%. Results do not indicate a systematic analytical bias.
Table 11.12 Results for silver standards
CRM N Expected Ag (oz/ton) Observed Ag (oz/ton) Percent of
expected QC failures
Average Std. Dev. Average Std. Dev.
S-1 95 0.47 0.16 0.334 0.049 71.0 3
S-2 77 4.14 0.69 3.82 0.18 92.2 3
S-3 183 6.21 0.72 5.58 0.27 89.9 7
S-4 172 12.16 1.62 11.98 0.43 98.6 5
S-5 61 32.99 1.62 33.37 0.86 101.2 4
S-900 series 208 N/A N/A 6.68 0.22 N/A 7
796 * - Weighted average 90.8* 29
Certificates are not available for the Mining Exploration Geochemistry standards and it is possible that the materials have degraded over time. Additional testwork on the standards to verify consensus values is in progress. It has been recommended that commercially available reference materials are used in future programs.

Hermosa Property, Taylor Zn-Pb-Ag Deposit PEA Arizona Minerals Inc. 716027
amcconsultants.com 94
Cross-check exchange analyses between Skyline and Inspectorate laboratories were done for silver from 242 pulps (Figure 11.5). There is broad, general correspondence between the two sets of silver results. Specific differences may be related to acid digestion procedures used at Skyline and Inspectorate Laboratories.
298 core duplicate pairs were submitted for silver and gold assays and 322 pairs were submitted for manganese, lead, zinc and copper analyses. Assays for duplicate pairs agree within acceptable limits. Approximately 70% of the duplicate pairs agree within 25% for all elements except gold.
183 reverse circulation sample duplicates were submitted for silver and gold assays and 180 pairs for manganese, lead, zinc and copper. Assays for duplicate pairs agree within acceptable limits. Approximately 70% of the duplicate pairs agree within 20% for all elements except gold.
Figure 11.2 Silver check assays Skyline and Inspectorate Laboratories
11.3.4.1 Performance of blanks, standards and duplicates
Blanks
Systematic contamination was not detected.
Hermosa Property, Taylor Zn-Pb-Ag Deposit PEA Arizona Minerals Inc. 716027
amcconsultants.com 95
Duplicates
Reproducibility of laboratory and field duplicates within acceptable parameters. No changes to drill core sampling recommended at this time.
Reference standards
The assay laboratories reported relatively precise and consistent results for all assays. However, assay accuracy for the grade range 2 oz/ton to 6 oz/ton Ag from Inspectorate Laboratories were systematically reported at least 10% low as compared to the included lower grade reference standards and at least 20% low for the low grade standards S-1 and S-2. The lab performance for higher grade reference standards was of acceptable accuracy and precision.
11.3.5 Inspectorate 4-acid, AAS Ag re-assay program
The requested analytical method used for the Central Deposit assays by Inspectorate Laboratories was 30 grams weight fire assay with gravimetric Ag. This technique adds a Ag inquart to all samples to ensure the presence of a doré bead. In addition, a number of blanks with the Ag inquart but not with any sample are included with each sample batch to determine the correction factor for Ag loss in the fire assay cupellation step. The correction factor was then applied to the weighed bead to yield the Ag assay value.
For samples containing <10 mg Ag, a standard, 6% correction factor was routinely applied to yield the reported Ag assay value. Subsequent to the detection of the under-reporting bias, Inspectorate Laboratories undertook additional Ag loss validation studies and further divided the <10 mg categories to <3, <5, <7 and <10 mg with correction factors of 0.0%, 9.0%, 8.0% and 6.0% respectively.
This modification to the analytical protocol did not completely account for the under-reporting bias and it was suggested that the inherent accuracy and precision of the 30 gram, fire assay, gravimetric Ag assay method was inadequate for the lower grade ranges of the Taylor Deposit. Inspectorate recommended an alternative approach using an acid digestion followed by AAS with higher grade, over-limit samples processed by 30 grams, fire assay, gravimetric Ag.
A subset of 298 samples with assays within the 0.4 oz/ton to 6 oz/ton Ag were pulled from the pulp archives, randomized and re-submitted to Inspectorate Laboratories for re-analysis to test this suggested alternative analytical protocol. Each sample was subjected to Aqua Regia and 4 Acid digestions followed by AAS trace element analysis and a duplicate 1 assay ton, gravimetric Ag finish. The results and comparisons are detailed in Table 11.10.
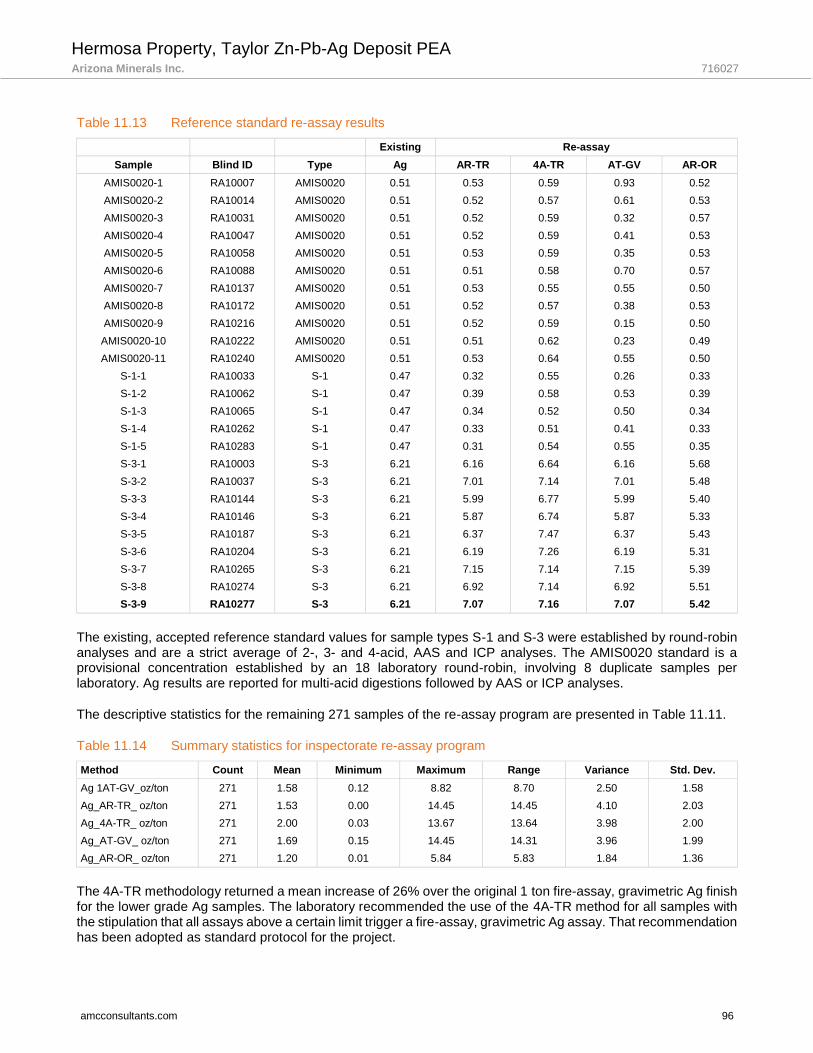
Hermosa Property, Taylor Zn-Pb-Ag Deposit PEA Arizona Minerals Inc. 716027
amcconsultants.com 96
Table 11.13 Reference standard re-assay results
Existing Re-assay
Sample Blind ID Type Ag AR-TR 4A-TR AT-GV AR-OR
AMIS0020-1 RA10007 AMIS0020 0.51 0.53 0.59 0.93 0.52
AMIS0020-2 RA10014 AMIS0020 0.51 0.52 0.57 0.61 0.53
AMIS0020-3 RA10031 AMIS0020 0.51 0.52 0.59 0.32 0.57
AMIS0020-4 RA10047 AMIS0020 0.51 0.52 0.59 0.41 0.53
AMIS0020-5 RA10058 AMIS0020 0.51 0.53 0.59 0.35 0.53
AMIS0020-6 RA10088 AMIS0020 0.51 0.51 0.58 0.70 0.57
AMIS0020-7 RA10137 AMIS0020 0.51 0.53 0.55 0.55 0.50
AMIS0020-8 RA10172 AMIS0020 0.51 0.52 0.57 0.38 0.53
AMIS0020-9 RA10216 AMIS0020 0.51 0.52 0.59 0.15 0.50
AMIS0020-10 RA10222 AMIS0020 0.51 0.51 0.62 0.23 0.49
AMIS0020-11 RA10240 AMIS0020 0.51 0.53 0.64 0.55 0.50
S-1-1 RA10033 S-1 0.47 0.32 0.55 0.26 0.33
S-1-2 RA10062 S-1 0.47 0.39 0.58 0.53 0.39
S-1-3 RA10065 S-1 0.47 0.34 0.52 0.50 0.34
S-1-4 RA10262 S-1 0.47 0.33 0.51 0.41 0.33
S-1-5 RA10283 S-1 0.47 0.31 0.54 0.55 0.35
S-3-1 RA10003 S-3 6.21 6.16 6.64 6.16 5.68
S-3-2 RA10037 S-3 6.21 7.01 7.14 7.01 5.48
S-3-3 RA10144 S-3 6.21 5.99 6.77 5.99 5.40
S-3-4 RA10146 S-3 6.21 5.87 6.74 5.87 5.33
S-3-5 RA10187 S-3 6.21 6.37 7.47 6.37 5.43
S-3-6 RA10204 S-3 6.21 6.19 7.26 6.19 5.31
S-3-7 RA10265 S-3 6.21 7.15 7.14 7.15 5.39
S-3-8 RA10274 S-3 6.21 6.92 7.14 6.92 5.51
S-3-9 RA10277 S-3 6.21 7.07 7.16 7.07 5.42
The existing, accepted reference standard values for sample types S-1 and S-3 were established by round-robin analyses and are a strict average of 2-, 3- and 4-acid, AAS and ICP analyses. The AMIS0020 standard is a provisional concentration established by an 18 laboratory round-robin, involving 8 duplicate samples per laboratory. Ag results are reported for multi-acid digestions followed by AAS or ICP analyses.
The descriptive statistics for the remaining 271 samples of the re-assay program are presented in Table 11.11.
Table 11.14 Summary statistics for inspectorate re-assay program
Method Count Mean Minimum Maximum Range Variance Std. Dev.
Ag 1AT-GV_oz/ton 271 1.58 0.12 8.82 8.70 2.50 1.58
Ag_AR-TR_ oz/ton 271 1.53 0.00 14.45 14.45 4.10 2.03
Ag_4A-TR_ oz/ton 271 2.00 0.03 13.67 13.64 3.98 2.00
Ag_AT-GV_ oz/ton 271 1.69 0.15 14.45 14.31 3.96 1.99
Ag_AR-OR_ oz/ton 271 1.20 0.01 5.84 5.83 1.84 1.36
The 4A-TR methodology returned a mean increase of 26% over the original 1 ton fire-assay, gravimetric Ag finish for the lower grade Ag samples. The laboratory recommended the use of the 4A-TR method for all samples with the stipulation that all assays above a certain limit trigger a fire-assay, gravimetric Ag assay. That recommendation has been adopted as standard protocol for the project.
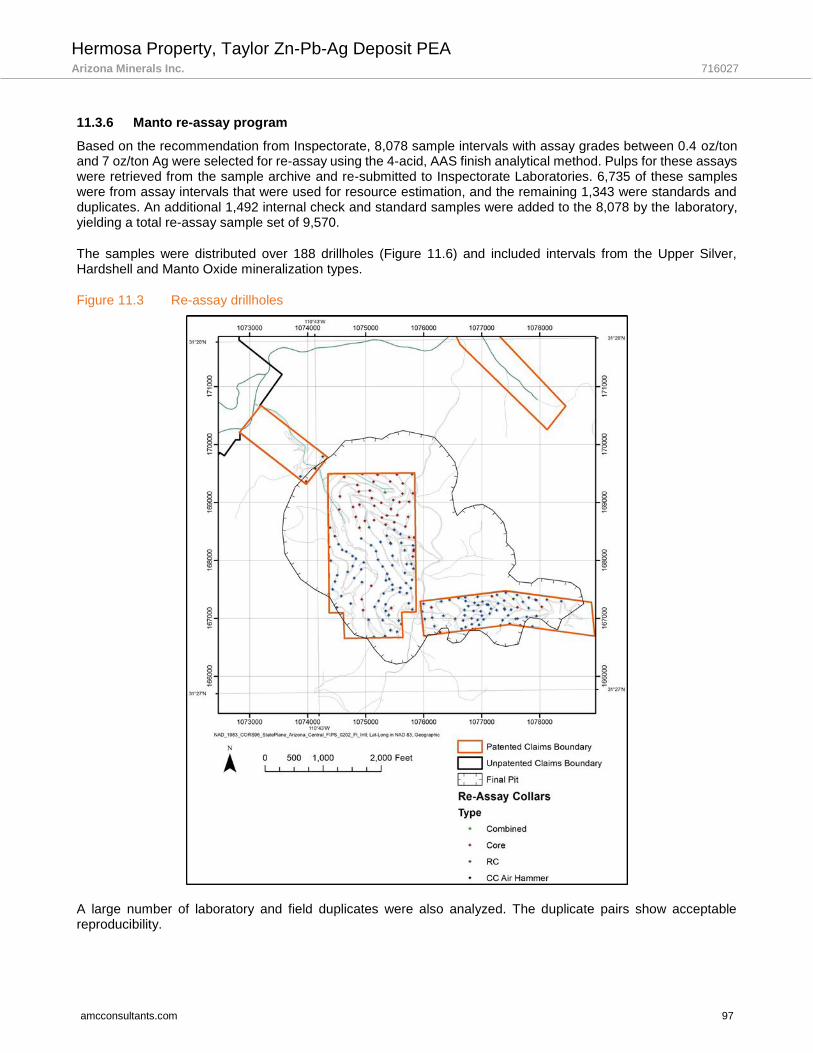
Hermosa Property, Taylor Zn-Pb-Ag Deposit PEA Arizona Minerals Inc. 716027
amcconsultants.com 97
11.3.6 Manto re-assay program
Based on the recommendation from Inspectorate, 8,078 sample intervals with assay grades between 0.4 oz/ton and 7 oz/ton Ag were selected for re-assay using the 4-acid, AAS finish analytical method. Pulps for these assays were retrieved from the sample archive and re-submitted to Inspectorate Laboratories. 6,735 of these samples were from assay intervals that were used for resource estimation, and the remaining 1,343 were standards and duplicates. An additional 1,492 internal check and standard samples were added to the 8,078 by the laboratory, yielding a total re-assay sample set of 9,570.
The samples were distributed over 188 drillholes (Figure 11.6) and included intervals from the Upper Silver, Hardshell and Manto Oxide mineralization types.
Figure 11.3 Re-assay drillholes
A large number of laboratory and field duplicates were also analyzed. The duplicate pairs show acceptable reproducibility.
Hermosa Property, Taylor Zn-Pb-Ag Deposit PEA Arizona Minerals Inc. 716027
amcconsultants.com 98
11.3.7 Database updates
The re-assay results for Ag using the 4-acid, AAS finish were inserted into the assay database, replacing all assays between 0.02 oz/ton and 5.0 oz/ton Ag. Samples with assay grades greater than 5.0 oz/ton Ag retained the 1 ton, fire-assay, gravimetric Ag finish, judged to be a more accurate and precise for higher grade materials.
In the QP’s opinion, the sample preparation, security, and analytical procedures are adequate for Mineral Resource estimation purposes.
Hermosa Property, Taylor Zn-Pb-Ag Deposit PEA Arizona Minerals Inc. 716027
amcconsultants.com 99
12 Data verification
Taylor Deposit
During several visits the QP conducted tests to assure that the data used for the Mineral Resource estimate described in Section 14 of this report was adequate for the purpose of that estimate. The latest such visit took place on February 10, 2017 for a period of one day.
12.1.1 Drill core examination
Drill core was examined on three occasions for the identification of the major lithotypes described in the drill logs generated by AZ, and for the presence of lead-zinc mineralization as reported in the drill logs and in assays. The major rock types, carbonate and volcanic, that were observed in the core, were consistent with the descriptions employed in the drill logs. Lead and zinc mineralization, as galena and sphalerite, were abundant in the core from a number of drillholes that were being logged at the time of the site visits. No samples were collected as the presence of this mineralization was obvious. Further, samples of split core can be expected to display variations in metal content because of the coarse and commonly disseminated nature of the mineralization.
12.1.2 Drillhole collar location
The locations of several drilholes (HDS-342 and HDS-354) were verified using a hand-held GPS. The datum employed by the GPS was WGS 84; the datum used by the Taylor project is NAD 83, Arizona Central State Plane 0202. AZ provided coordinates for the two holes converted to WGS 84. The converted coordinates were within one ft of those recorded by the GPS. During the most recent site visit the locations of the majority of the infill holes were examined and their locations noted with respect to previously-drilled holes.
12.1.3 Assay data verification
A comparison of assay certificates, as received by AZ from ALS Minerals in Tucson, Arizona, with the corresponding assay values included in the drillhole dataset received by AMC from AZ was carried out. Approximately 1,500 samples (6,000 assays) were checked for lead, zinc, copper and silver values from six drillholes. No discrepancies were found. It should be noted that silver grades in the dataset are reported in ounces per short ton whereas in the assay certificates silver grades are reported in grams per metric tonne. A conversion of 34.2857 grams per metric tonne = one ounce per short ton was used to compare the two data sets for silver. Lead, zinc and copper grades were recorded in the AZ dataset in percent whereas the assay certificates report grades in parts per million (ppm). A conversion of 10,000 ppm = 1% was used to compare the two data sets.
The QP is of the opinion that the data collected is adequate for the purpose of the preparing a Mineral Resource estimate for the Taylor Deposit as described in Section 14.
Central Deposit
The following text has been copied or abridged from the January 2014 PFS report, which describes the work pertaining to the Central Deposit, that is not covered in Section 12.1.
12.2.1 AZ comparative drilling
Table 12.1 Comparison drillhole pairs
New core hole number Core hole TD (ft) Previous air- hammer number Air-hammer hole TD (ft) Separation distance (ft)
HDS-99 1,257.00 HDS-83 480 6.6
HDS-98 1,016.00 HDS-40 570 10.5
HDS-100 1,127.00 HDS-62 385 27.8
HDS-101 1,058.50 HDS-81 500 13.4
Note: All drillholes are vertical.
Hermosa Property, Taylor Zn-Pb-Ag Deposit PEA Arizona Minerals Inc. 716027
amcconsultants.com 100
The results of the twin drilling are summarized in Table 12.2. Twinned holes intercepted similar material at equivalent depths down hole with similar interval lengths.
Table 12.2 Twinned drillhole comparisons
Hole Interval (ft) Thickness (ft)
Silver (oz/ton)
Manganese (%) Zinc (%) Copper (%)
HDS-98 vs. HDS-40
390-567
177
5.09
17.75
1.83
0.2 HDS-98 (Core)
HDS-81 (Air-hammer) 380-565 185 6.4 18.65 1.93 0.21
HDS-99 vs. HDS-83
350-470
120
6.34
17.6
1.44
0.13 HDS-99 (Core)
HDS-81 (Air-hammer) 350-470 120 7.08 14.52 1.55 0.17
HDS-100 vs. HDS-62
222-373
151
7.09
12.35
2.43
0.21 HDS-100 (Core)
HDS-81 (Air-hammer) 220-370 150 6.52 8.57 2.09 0.34
HDS-101 vs. HDS-81
272-508
236
5.64
5.07
1.86
0.11 HDS-101 (Core)
HDS-81 (Air-hammer) 265-500 235 9.36 5.87 2.4 0.1
The analytical results for all metals show grade values behave similarly. Pincock, Allen & Holt (2008) concluded that the analytical variability reflects natural short range grade differences in the deposit rather than drilling method bias.
12.2.2 Additional data validation
Logging procedures and protocols, re-logs of chips and core and field checks have also been used to validate data sources. Drillhole collar locations have been resurveyed by a licensed Arizona registered land surveyor.
In the QP’s opinion, the data is suitable for the purposes used in the Technical Report.
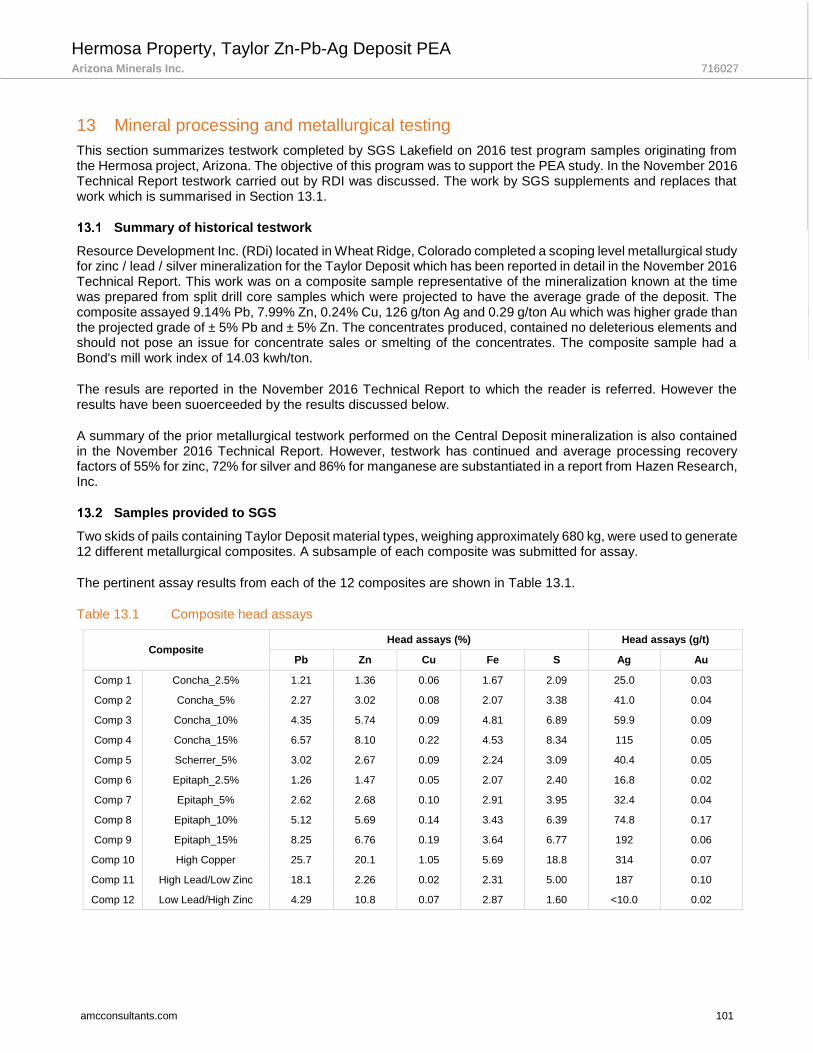
Hermosa Property, Taylor Zn-Pb-Ag Deposit PEA Arizona Minerals Inc. 716027
amcconsultants.com 101
13 Mineral processing and metallurgical testing
This section summarizes testwork completed by SGS Lakefield on 2016 test program samples originating from the Hermosa project, Arizona. The objective of this program was to support the PEA study. In the November 2016 Technical Report testwork carried out by RDI was discussed. The work by SGS supplements and replaces that work which is summarised in Section 13.1.
Summary of historical testwork
Resource Development Inc. (RDi) located in Wheat Ridge, Colorado completed a scoping level metallurgical study for zinc / lead / silver mineralization for the Taylor Deposit which has been reported in detail in the November 2016 Technical Report. This work was on a composite sample representative of the mineralization known at the time was prepared from split drill core samples which were projected to have the average grade of the deposit. The composite assayed 9.14% Pb, 7.99% Zn, 0.24% Cu, 126 g/ton Ag and 0.29 g/ton Au which was higher grade than the projected grade of ± 5% Pb and ± 5% Zn. The concentrates produced, contained no deleterious elements and should not pose an issue for concentrate sales or smelting of the concentrates. The composite sample had a Bond's mill work index of 14.03 kwh/ton.
The resuls are reported in the November 2016 Technical Report to which the reader is referred. However the results have been suoerceeded by the results discussed below.
A summary of the prior metallurgical testwork performed on the Central Deposit mineralization is also contained in the November 2016 Technical Report. However, testwork has continued and average processing recovery factors of 55% for zinc, 72% for silver and 86% for manganese are substantiated in a report from Hazen Research, Inc.
Samples provided to SGS
Two skids of pails containing Taylor Deposit material types, weighing approximately 680 kg, were used to generate 12 different metallurgical composites. A subsample of each composite was submitted for assay.
The pertinent assay results from each of the 12 composites are shown in Table 13.1.
Table 13.1 Composite head assays
Composite Head assays (%) Head assays (g/t)
Pb Zn Cu Fe S Ag Au
Comp 1 Concha_2.5% 1.21 1.36 0.06 1.67 2.09 25.0 0.03
Comp 2 Concha_5% 2.27 3.02 0.08 2.07 3.38 41.0 0.04
Comp 3 Concha_10% 4.35 5.74 0.09 4.81 6.89 59.9 0.09
Comp 4 Concha_15% 6.57 8.10 0.22 4.53 8.34 115 0.05
Comp 5 Scherrer_5% 3.02 2.67 0.09 2.24 3.09 40.4 0.05
Comp 6 Epitaph_2.5% 1.26 1.47 0.05 2.07 2.40 16.8 0.02
Comp 7 Epitaph_5% 2.62 2.68 0.10 2.91 3.95 32.4 0.04
Comp 8 Epitaph_10% 5.12 5.69 0.14 3.43 6.39 74.8 0.17
Comp 9 Epitaph_15% 8.25 6.76 0.19 3.64 6.77 192 0.06
Comp 10 High Copper 25.7 20.1 1.05 5.69 18.8 314 0.07
Comp 11 High Lead/Low Zinc 18.1 2.26 0.02 2.31 5.00 187 0.10
Comp 12 Low Lead/High Zinc 4.29 10.8 0.07 2.87 1.60 <10.0 0.02
Hermosa Property, Taylor Zn-Pb-Ag Deposit PEA Arizona Minerals Inc. 716027
amcconsultants.com 102
Mineralogy
The samples include various silicates and sulphides; sphalerite ranged from 2.2% to 32.6% and averaged 8.5%, galena from 1.2% to 31.1% and averaged 8.5%. Cu-sulphides included mainly chalcopyrite from traces to 1.8% and averages 0.23%, tetrahedrite averaged 0.12%, and there were traces of chalcocite, bornite, and other Cu-sulphides. The main gangue sulphide was pyrite that ranged from 0.1% to 9.6% and averaged 4.6%. A number of other minerals included quartz (24.4%), rhodonite (10.7%), rhodochrosite (10.6%), and calcite (8.3%). A number of Zn-bearing silicates were also present.
Mineralogy data indicated that the average zinc concentration was similar at 62% to 63% by weight in Composites 2, 4, 8, and 10 and 65% by weight in Composite 12. Sphalerite from Composite 12 had the lowest concentrations of iron (0.14% by weight), manganese (0.19% by weight), and cadmium (0.01% by weight). It is apparent that sphalerite in Composite 12 was different than that in the other samples.
Sphalerite hosted most of the zinc at 72% to 99% in all samples. Composite 12 was the exception in which sphalerite accounted for 29% of the total zinc in the sample and Zn-bearing silicates for the remainder.
Liberated sphalerite at a 80% Passing (P80) grind size of approximately 212 µm accounts for between 78% to 93% in Composites 1 to 11, and 28% in Composite 12. Liberated galena ranged from 29% to 89% and averages 70%. Liberated Cu-sulphides (which comprise chalcopyrite, chalcocite, bornite, tetrahedrite, and other Cu-sulphides as one mineral group) ranged from 9% to 74% and averaged 49%. Liberated pyrite accounted for between 7% and 94% and averages 82%.
Comminution
Composites 1-10 were submitted for SAG Power Index (SPI) and Bond ball mill work index testing (BWI). Composites 1, 2, 4, 7, and 8 were also tested for Bond rod mill work index (RWI) and Bond abrasion index. The results achieved are shown in Table 13.2. There is a good relationship between hardness and head grade. As the head grade of zinc and lead increase, the hardness of the mineralization decreases.
Composites 6 and 7 were deemed hard to very hard with respect to SPI rating. Composite 10 was deemed soft, while the rest of the composites obtained a medium hardness SPI rating.
Composites 1 and 7 were hard to very hard in testing for RWI at 18.3 kWh/t and 17.7 kWh/t, respectively. The three other composites were deemed moderately hard.
Most of the composites tested for BWI were in the medium to moderately hard range. Composites 1 and 2, at 17.9 kWh/t and 17.8 kWh/t respectively, were deemed hard to very hard. Composite 10, at 8.9 kWh/t, was soft in nature.
The Bond abrasion indices ranged from 0.211 g to 0.340 g, indicating mild to medium abrasiveness.

Hermosa Property, Taylor Zn-Pb-Ag Deposit PEA Arizona Minerals Inc. 716027
amcconsultants.com 103
Table 13.2 Comminution test results
Composite CEET SPI® Work Indices (kWh/t) AI
Ci (Min) RWI BWI (g)
Comp 1 Concha_2.5% 9.8 102.6 18.3 17.9 0.340
Comp 2 Concha_5% 8.0 97.9 15.9 17.8 0.221
Comp 3 Concha_10% 15.3 64.4 - 15.9 -
Comp 4 Concha_15% 9.8 95.1 15.6 14.3 0.277
Comp 5 Scherrer_5% 5.6 87.5 - 14.9 -
Comp 6 Epitaph_2.5% 9.5 126.3 - 16.6 -
Comp 7 Epitaph_5% 5.6 121.5 17.7 15.8 0.310
Comp 8 Epitaph_10% 7.5 74.2 14.8 15.4 0.299
Comp 9 Epitaph_15% 4.5 60.5 - 14.1 -
Comp 10 High Copper 7.9 14.7 - 8.9 -
CEET = Comminution Economic Evaluation Tool Ci = Crusher index g = gram
Locked cycle flotation tests
One locked cycle flotation test was completed for composites Epitaph_10%, Concha_10%, and Scherrer_5%. Test conditions were based on those of comparable batch rougher and cleaner flotation tests. The flowsheet followed for each test is shown in Figure 13.1 and the metallurgical projections are summarized in Table 13.3.
Each 2 kg sample for the locked cycle tests were ground to a target P80 of 500 µm, in the presence of ZnSO4 and NaCN, and subjected to flash flotation. The ground material was treated with 3418A collector, lime to reach a pH of 9.0 and then floated for 1 minute. The flash rougher concentrate was then reground to a target P80 of 75 µm and cleaned twice with the addition of more ZnSO4 and NaCN, to help reject contained zinc. The 2nd flash cleaner concentrate was a final product. The tailings from each stage were reverted back to the head of the previous circuit in the next cycle. The flash tailing was ground to a target P80 of 106 µm and floated for 6 minutes in the presence of ZnSO4, NaCN and 3418A. The lead rougher concentrate was then reground to a target P80 of 38 µm and cleaned three times. The third lead cleaner concentrate was a final product. The tailings from each stage were reverted back to the head of the previous circuit in the next cycle.
The lead rougher tailings were treated with CuSO4 and SIPX and floated for 6 minutes at a pH of 11. The zinc rougher concentrate was then reground to a target P80 of 38 µm, treated with additional CuSO4 and SIPX and then cleaned twice to generate the final zinc concentrate. The first zinc cleaner tailing and the zinc rougher tailing were final products at each stage.
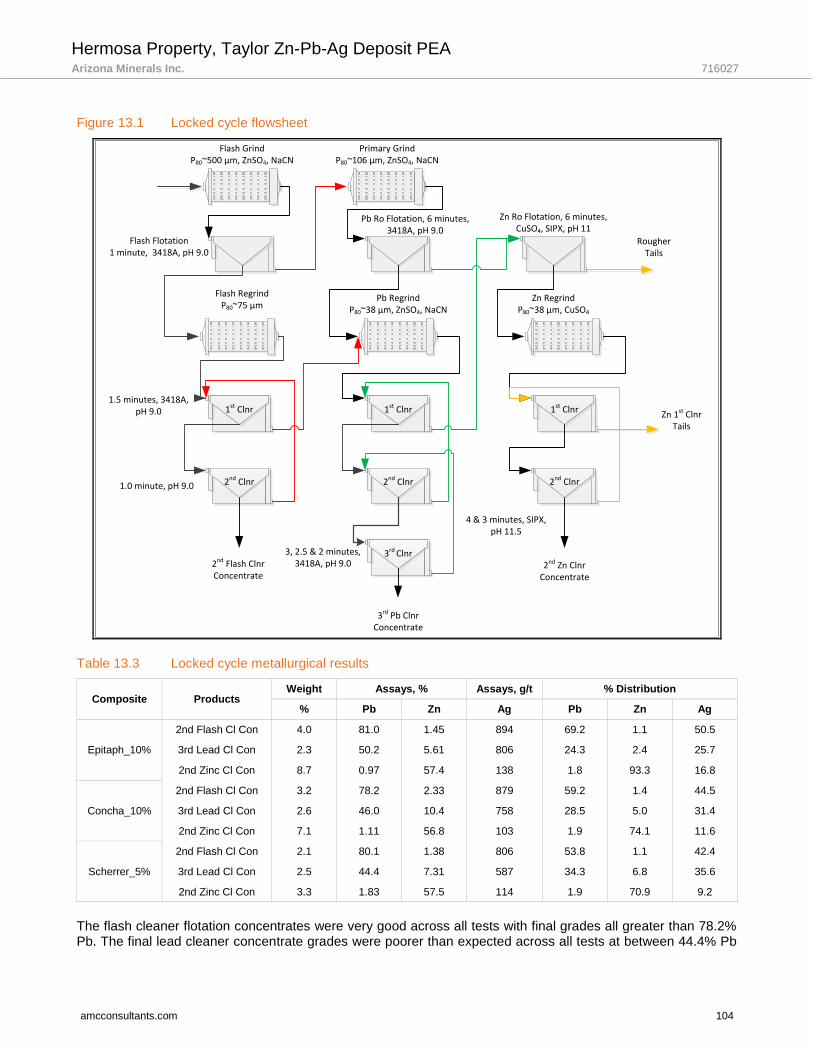
Hermosa Property, Taylor Zn-Pb-Ag Deposit PEA Arizona Minerals Inc. 716027
amcconsultants.com 104
Figure 13.1 Locked cycle flowsheet
Table 13.3 Locked cycle metallurgical results
Composite Products Weight Assays, % Assays, g/t % Distribution
% Pb Zn Ag Pb Zn Ag
Epitaph_10%
2nd Flash Cl Con 4.0 81.0 1.45 894 69.2 1.1 50.5
3rd Lead Cl Con 2.3 50.2 5.61 806 24.3 2.4 25.7
2nd Zinc Cl Con 8.7 0.97 57.4 138 1.8 93.3 16.8
Concha_10%
2nd Flash Cl Con 3.2 78.2 2.33 879 59.2 1.4 44.5
3rd Lead Cl Con 2.6 46.0 10.4 758 28.5 5.0 31.4
2nd Zinc Cl Con 7.1 1.11 56.8 103 1.9 74.1 11.6
Scherrer_5%
2nd Flash Cl Con 2.1 80.1 1.38 806 53.8 1.1 42.4
3rd Lead Cl Con 2.5 44.4 7.31 587 34.3 6.8 35.6
2nd Zinc Cl Con 3.3 1.83 57.5 114 1.9 70.9 9.2
The flash cleaner flotation concentrates were very good across all tests with final grades all greater than 78.2% Pb. The final lead cleaner concentrate grades were poorer than expected across all tests at between 44.4% Pb
Flash GrindP80~500 µm, ZnSO4, NaCN
Flash Flotation1 minute, 3418A, pH 9.0
1st Clnr
RougherTails
2nd Clnr
3rd Clnr
4th Clnr2nd Clnr
3rd Pb Clnr Concentrate
Pb Ro Flotation, 6 minutes, 3418A, pH 9.0
Zn Ro Flotation, 6 minutes, CuSO4, SIPX, pH 11
Flash RegrindP80~75 µm
Pb RegrindP80~38 µm, ZnSO4, NaCN
Zn RegrindP80~38 µm, CuSO4
Primary GrindP80~106 µm, ZnSO4, NaCN
3rd Clnr2nd Flash Clnr Concentrate
1st Clnr 1st Clnr 1st Clnr
2nd Clnr
Zn 1st ClnrTails
2nd Zn Clnr Concentrate
1.5 minutes, 3418A, pH 9.0
1.0 minute, pH 9.0
3, 2.5 & 2 minutes, 3418A, pH 9.0
4 & 3 minutes, SIPX, pH 11.5

Hermosa Property, Taylor Zn-Pb-Ag Deposit PEA Arizona Minerals Inc. 716027
amcconsultants.com 105
and 50.2% Pb. This can be improved by rejecting more gangue material reporting to the concentrate by the use of a silicate dispersant or depressant, such as CMC or dextrin, and by generating a coarser regrind product. The final zinc concentrate from each locked cycle test was of very high quality with final grades ranging from 56.8% Zn to 57.5% Zn. Zinc recovery was high for the Epitaph_10% test at 93.3%. Zinc recovery was lower for the Concha_10% and Scherrer_5% composites, at 74.1% and 70.9% respectively, due to the presence of Zn-bearing silicates and oxides in the composites. Silver grades averaged between 550-900 g/t for the flash and lead concentrates and 100-150 g/t Ag for the zinc concentrate. The overall silver recovery ranged from 87.2% to 93%.
A series of batch cleaner tests were undertaken on composites 3, 4, 5, and 8 to prove the concentrate grade of the lead cleaner flotation circuit can be upgraded by coarsening the regrind size and adding the silicate depressant CMC. Two tests were also undertaken on composites 9 and 11 without regrind size optimization and depressant addition. The results are shown in Table 13.4.
Table 13.5 and Table 13.6. The projected results are calculated by comparing the locked cycle test results to the best cleaner batch test results and applying those trends back to the individual composites of that mineral type. Full locked cycle tests under optimized conditions would be required to confirm results. Results from composites 1, 2, 6 and 7 are based on batch cleaner tests without lead cleaner optimization and the results are projected based on the above locked cycle results.
The flash concentrate returned Pb grades of over 79% in the optimized tests, with the highest grade at 81.2% Pb for Concha_15%. Coarsening the regrind and adding CMC to the last lead cleaner improved Pb grades to greater than 69% Pb. This helped to improve average Pb grade in the combined flash and lead concentrates to over 76% in each composite. Tests on Epitaph_10% and Composite 11 achieved combined concentrates of well over 79% Pb. Lead recovery was highest for Composite 11 at 97.6%, with the Epitaph composites ranging from 93.4% to 96.6% lead recovery. The high grade Concha composite recovered 91.2% of the available lead while the average grade Concha and Scherrer composites recovered 87.7% and 88.1%, respectively.
The tests requiring further lead cleaner optimization graded between 75.7% and 82.2% Pb in the flash concentrate, while recovering 39% to 58% of the contained lead. The lead cleaner concentrates were all lower than expected ranging from 45.1% Pb to 56.2% Pb. The combined lead concentrates graded between 60.4% Pb and 71.6% Pb. Overall lead recoveries for the batch cleaner tests were low for the lower grade Concha composites, but over 91% for the low grade Epitaph composites.
Table 13.4 Projected lead metallurgical results
Composite
Head grade Flash con Lead con Combined Pb cons
Pb (%) Grade Recovery Grade Recovery Mass Grade Recovery
Pb (%) Pb (%) Pb (%) Pb (%) (%) Pb (%) Pb (%)
Composite 1 Concha_2.5% 1.21 79.1 39.2 55.4 43.4 1.7 67.3 82.6
Composite 2 Concha_5% 2.27 75.7 50.8 45.1 35.5 3.1 60.4 86.3
Composite 3 Concha_10% 4.35 81.0 59.2 69.4 28.5 4.8 76.8 87.7
Composite 4 Concha_15% 6.57 81.2 49.9 73.0 41.3 6.6 77.8 91.2
Composite 5 Scherrer_5% 3.02 80.1 53.7 70.8 34.3 3.7 76.2 88.1
Composite 6 Epitaph_2.5% 1.26 79.0 45.7 56.2 45.4 1.6 67.6 91.1
Composite 7 Epitaph_5% 2.62 82.2 58.0 55.2 36.8 3.4 71.6 94.8
Composite 8 Epitaph_10% 5.12 81.0 69.6 73.9 23.8 5.5 79.1 93.4
Composite 9 Epitaph_15% 8.25 79.0 90.7 48.2 5.9 8.9 77.7 96.6
Composite 11 High Pb - Low Zn 18.4 83.7 88.3 51.6 9.3 21.9 80.0 97.6
Zinc results were very good for all of the average grade and high grade composites. The Epitaph zinc concentrate grades ranged from 57.4% Zn to 59.8% Zn, with recoveries of 94.5% and 94.8%. The Concha and Scherrer
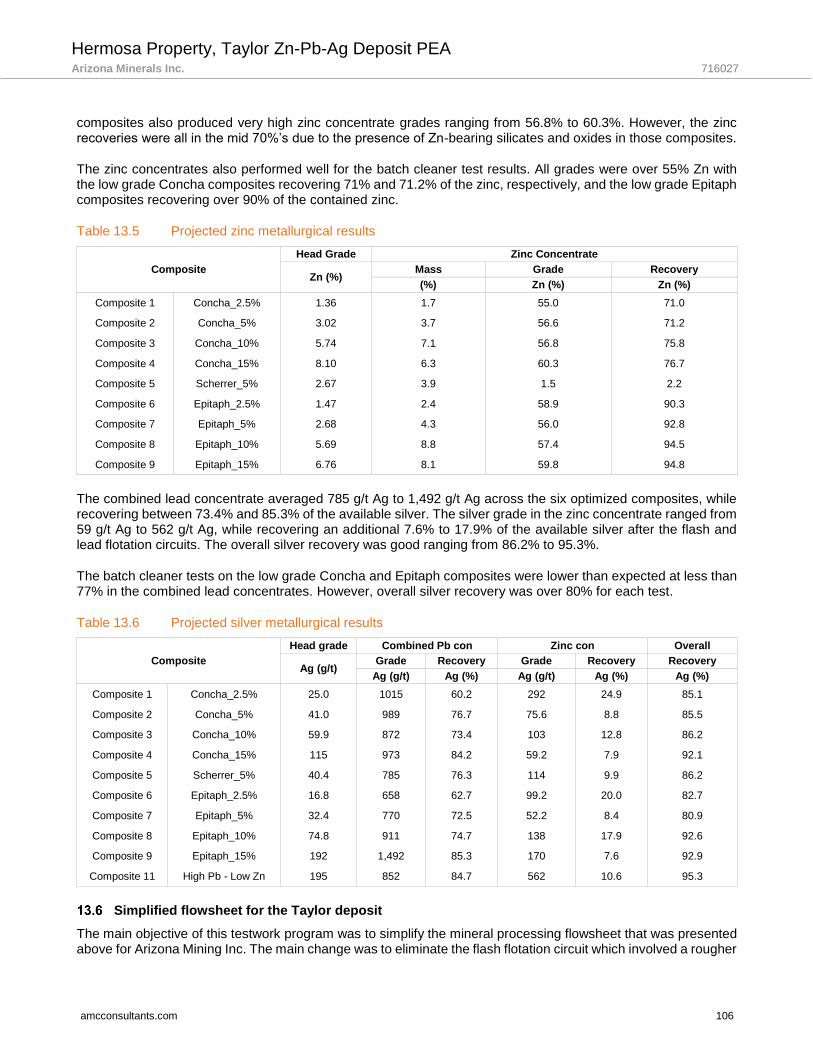
Hermosa Property, Taylor Zn-Pb-Ag Deposit PEA Arizona Minerals Inc. 716027
amcconsultants.com 106
composites also produced very high zinc concentrate grades ranging from 56.8% to 60.3%. However, the zinc recoveries were all in the mid 70%’s due to the presence of Zn-bearing silicates and oxides in those composites.
The zinc concentrates also performed well for the batch cleaner test results. All grades were over 55% Zn with the low grade Concha composites recovering 71% and 71.2% of the zinc, respectively, and the low grade Epitaph composites recovering over 90% of the contained zinc.
Table 13.5 Projected zinc metallurgical results
Composite
Head Grade Zinc Concentrate
Zn (%) Mass Grade Recovery
(%) Zn (%) Zn (%)
Composite 1 Concha_2.5% 1.36 1.7 55.0 71.0
Composite 2 Concha_5% 3.02 3.7 56.6 71.2
Composite 3 Concha_10% 5.74 7.1 56.8 75.8
Composite 4 Concha_15% 8.10 6.3 60.3 76.7
Composite 5 Scherrer_5% 2.67 3.9 1.5 2.2
Composite 6 Epitaph_2.5% 1.47 2.4 58.9 90.3
Composite 7 Epitaph_5% 2.68 4.3 56.0 92.8
Composite 8 Epitaph_10% 5.69 8.8 57.4 94.5
Composite 9 Epitaph_15% 6.76 8.1 59.8 94.8
The combined lead concentrate averaged 785 g/t Ag to 1,492 g/t Ag across the six optimized composites, while recovering between 73.4% and 85.3% of the available silver. The silver grade in the zinc concentrate ranged from 59 g/t Ag to 562 g/t Ag, while recovering an additional 7.6% to 17.9% of the available silver after the flash and lead flotation circuits. The overall silver recovery was good ranging from 86.2% to 95.3%.
The batch cleaner tests on the low grade Concha and Epitaph composites were lower than expected at less than 77% in the combined lead concentrates. However, overall silver recovery was over 80% for each test.
Table 13.6 Projected silver metallurgical results
Composite
Head grade Combined Pb con Zinc con Overall
Ag (g/t) Grade Recovery Grade Recovery Recovery
Ag (g/t) Ag (%) Ag (g/t) Ag (%) Ag (%)
Composite 1 Concha_2.5% 25.0 1015 60.2 292 24.9 85.1
Composite 2 Concha_5% 41.0 989 76.7 75.6 8.8 85.5
Composite 3 Concha_10% 59.9 872 73.4 103 12.8 86.2
Composite 4 Concha_15% 115 973 84.2 59.2 7.9 92.1
Composite 5 Scherrer_5% 40.4 785 76.3 114 9.9 86.2
Composite 6 Epitaph_2.5% 16.8 658 62.7 99.2 20.0 82.7
Composite 7 Epitaph_5% 32.4 770 72.5 52.2 8.4 80.9
Composite 8 Epitaph_10% 74.8 911 74.7 138 17.9 92.6
Composite 9 Epitaph_15% 192 1,492 85.3 170 7.6 92.9
Composite 11 High Pb - Low Zn 195 852 84.7 562 10.6 95.3
Simplified flowsheet for the Taylor deposit
The main objective of this testwork program was to simplify the mineral processing flowsheet that was presented above for Arizona Mining Inc. The main change was to eliminate the flash flotation circuit which involved a rougher
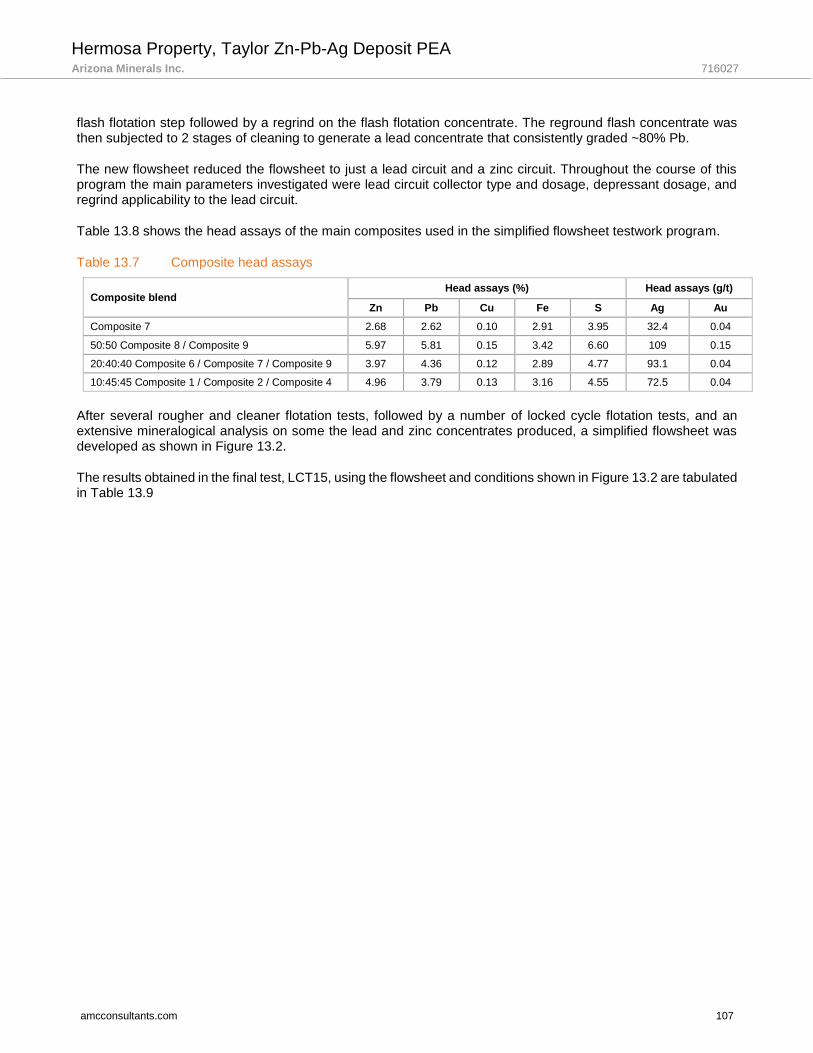
Hermosa Property, Taylor Zn-Pb-Ag Deposit PEA Arizona Minerals Inc. 716027
amcconsultants.com 107
flash flotation step followed by a regrind on the flash flotation concentrate. The reground flash concentrate was then subjected to 2 stages of cleaning to generate a lead concentrate that consistently graded ~80% Pb.
The new flowsheet reduced the flowsheet to just a lead circuit and a zinc circuit. Throughout the course of this program the main parameters investigated were lead circuit collector type and dosage, depressant dosage, and regrind applicability to the lead circuit.
Table 13.8 shows the head assays of the main composites used in the simplified flowsheet testwork program.
Table 13.7 Composite head assays
Composite blend Head assays (%) Head assays (g/t)
Zn Pb Cu Fe S Ag Au
Composite 7 2.68 2.62 0.10 2.91 3.95 32.4 0.04
50:50 Composite 8 / Composite 9 5.97 5.81 0.15 3.42 6.60 109 0.15
20:40:40 Composite 6 / Composite 7 / Composite 9 3.97 4.36 0.12 2.89 4.77 93.1 0.04
10:45:45 Composite 1 / Composite 2 / Composite 4 4.96 3.79 0.13 3.16 4.55 72.5 0.04
After several rougher and cleaner flotation tests, followed by a number of locked cycle flotation tests, and an extensive mineralogical analysis on some the lead and zinc concentrates produced, a simplified flowsheet was developed as shown in Figure 13.2.
The results obtained in the final test, LCT15, using the flowsheet and conditions shown in Figure 13.2 are tabulated in Table 13.9

Hermosa Property, Taylor Zn-Pb-Ag Deposit PEA Arizona Minerals Inc. 716027
amcconsultants.com 108
Figure 13.2 Final simplified flowsheet and conditions
Table 13.8 Optimized locked cycle results
Products Weight Assays, %, g/t % Distribution
% Zn Pb Ag Pb Zn Ag
3rd Lead Cl Con 6.1 3.40 69.7 1072 95.4 5.2 69.3
2nd Zinc Cl Con 6.7 56.1 1.03 331 1.5 92.7 23.2
Zinc Ro Tail 87.2 0.10 0.16 8.27 3.1 2.1 7.6
Head (Calc.) 100.0 4.03 4.49 95.0 100.0 100.0 100.0
Head (Direct) 3.97 4.36 93.1
The projected final lead concentrate graded 69.7% Pb and 1,072 g/t Ag at a lead recovery of 95.4% and a silver recovery of 69.3%. The final zinc concentrate graded 56.1% Zn at a zinc recovery of 92.7%. The overall silver recovery was 92.4%. The manganese content of the final zinc concentrate was 1.35% Mn.
Concentrate analysis
The potential penalty elements associated with the lead and zinc concentrates produced in cycle F of LCT15 are shown in Table 13.9. The manganese content of 1.35% Mn in the zinc concentrate is of potential concern.

Hermosa Property, Taylor Zn-Pb-Ag Deposit PEA Arizona Minerals Inc. 716027
amcconsultants.com 109
Table 13.9 Potential Penalty Element Analysis for LCT15 Concentrates
Element Unit 3rd Pb Cl Con F 2nd Zn Cl Con F
Hg g/t 3.3 6.0
Fe g/t 17,100 31,900
Mn g/t 4,530 13,500
Cd g/t - 1,540
Si g/t 4.42 2.92

Hermosa Property, Taylor Zn-Pb-Ag Deposit PEA Arizona Minerals Inc. 716027
amcconsultants.com 110
14 Mineral Resource estimates
Introduction
The current Mineral Resource estimate is an update of the estimate presented in the Technical Report of 16 November 2016, titled “Technical Report, Taylor Zn-Pb-Ag Deposit Mineral Resource Update. The current estimate is based on 20,369 assays from 440 surface drillholes. AZ provided wireframes of major lithological units, and gradeshells of the main mineralized domains, in dxf format, together with drillhole locations, downhole surveys, assays and geology as csv data files. Mr. Greg Mosher, P.Geo. an associate of AMC completed the Mineral Resource estimate using GenesisTM software from SGS Geostat.
The dataset upon which the current Mineral Resource is based includes data from 37 holes (151,483 aggregate feet), that were drilled since the 2016 Mineral Resource estimate. Figure 14.1 is a plan view of all drillhole locations and highlighting those holes drilled subsequent to the 2016 estimate.
Figure 14.1 Plan view of Taylor and Central Deposit drillholes
The Mineral Resource is comprised of sulphide and oxide domains; the sulphide domains comprise the Taylor Deposit and include the Concha, Scherrer, Epitaph and Taylor Deeps Zones, and Sub-Taylor Deeps. The oxide domains comprise the Central Deposit which consists of the Upper Silver zone (LAG), and the Manto Oxide zone (MOX).

Hermosa Property, Taylor Zn-Pb-Ag Deposit PEA Arizona Minerals Inc. 716027
amcconsultants.com 111
Table 14.1 is a summary of the Mineral Resources for the Taylor Deposit stated at 29 March 2017. Detailed tables follow in Section 14.10. Table 14.2 is a summary of the Mineral Resources for the Central Deposit stated at 29 March 2017. Detailed tables follow in Section 14.8.
Table 14.1 Taylor Deposit Mineral Resources
Classification Million tons Zn% Pb% Ag oz/ton ZnEq%
Measured 8,613 4.2 4.0 1.6 9.7
Indicated 63,840 4.5 4.4 1.9 10.6
Measured and Indicated 72,453 4.4 4.4 1.8 10.5
Inferred 38,627 4.4 4.2 3.1 11.6
Mineral Resources are reported as of 29 March 2017 • Stated at a cut-off grade of 4% ZnEq based on prices, recovery and costs as follows: • Prices of $1.00/lb for zinc, $0.95/lb for lead and $20.00/oz for silver • Average processing recovery factors of 90% for zinc, 95% for lead, and 85% for silver • Total operating costs are estimated to be of the order of $60/ton. • ZnEq calculation is discussed in Section 14.1.8. • Numbers are rounded and may not match later detailed tables.
Table 14.2 Central Deposit Mineral Resources
Classification Million tons Zn% Ag oz/ton Mn % Oxval $/ton
Measured 20,702 1.8 4.1 9.2 270.0
Indicated 49,913 2.3 1.9 9.6 250.0
Measured and Indicated 70,616 2.2 2.5 9.5 260.0
Inferred 0.350 3.2 2.7 7.2 226.0
Mineral Resources are reported as of 29 March 2017 Stated at a cut-off grade of $100/ton Oxval based on prices, recovery and costs as follows: • Prices of $1.00/lb for zinc,$20.00/oz for silver and $1.22/lb for manganese • Average processing recovery factors of 55% for zinc, 72% for silver and 86% for manganese, • Total operating costs are estimated to be on the order of $100/ton. . • Oxval calculation is discussed in Section 14.1.8. • Numbers are rounded and may not match later detailed tables.
Neither deposit is materially affected by any known environmental, permitting, legal, title, taxation, socio-economic, political or other relevant issues. The estimates of Mineral Resources may be affected if mining, metallurgical, of infrastructure factors change from those currently anticipated at the Property.
Exploratory data analysis
14.2.1 Assays
AMC received a dataset in csv format from AZ with an effective date of 16 February 2017, that included data for drillhole collars, downhole surveys, assays for copper, lead, zinc, silver and manganese, and lithology. The dataset as received contained assay data for a total of 114,504 samples from 440 drillholes. However, only 398 of those drillholes with 20,639 samples are contained in the gradeshells within which the Mineral Resource has been estimated. The outline of the block model, surface expression of the gradeshell domains and location of the drillholes are shown in plan view in Figure 14.2. Descriptive statistics of the assays employed in the Mineral Resource estimate are presented in Table 14.3.
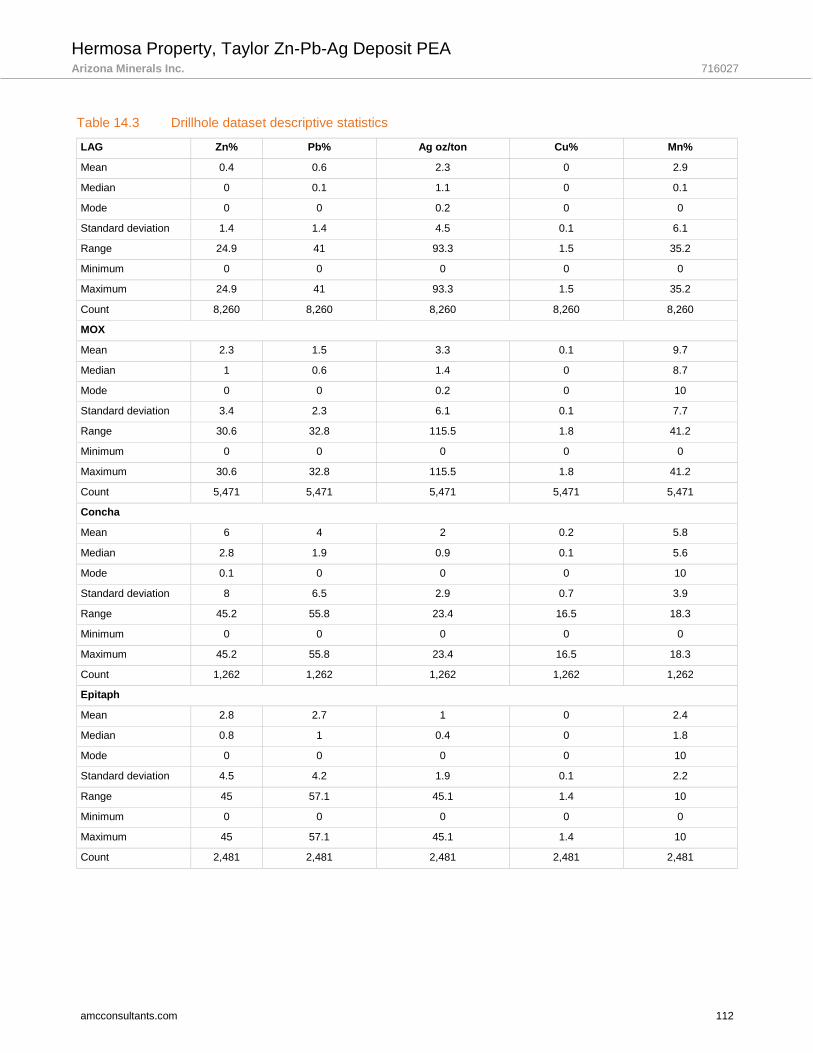
Hermosa Property, Taylor Zn-Pb-Ag Deposit PEA Arizona Minerals Inc. 716027
amcconsultants.com 112
Table 14.3 Drillhole dataset descriptive statistics
LAG Zn% Pb% Ag oz/ton Cu% Mn%
Mean 0.4 0.6 2.3 0 2.9
Median 0 0.1 1.1 0 0.1
Mode 0 0 0.2 0 0
Standard deviation 1.4 1.4 4.5 0.1 6.1
Range 24.9 41 93.3 1.5 35.2
Minimum 0 0 0 0 0
Maximum 24.9 41 93.3 1.5 35.2
Count 8,260 8,260 8,260 8,260 8,260
MOX
Mean 2.3 1.5 3.3 0.1 9.7
Median 1 0.6 1.4 0 8.7
Mode 0 0 0.2 0 10
Standard deviation 3.4 2.3 6.1 0.1 7.7
Range 30.6 32.8 115.5 1.8 41.2
Minimum 0 0 0 0 0
Maximum 30.6 32.8 115.5 1.8 41.2
Count 5,471 5,471 5,471 5,471 5,471
Concha
Mean 6 4 2 0.2 5.8
Median 2.8 1.9 0.9 0.1 5.6
Mode 0.1 0 0 0 10
Standard deviation 8 6.5 2.9 0.7 3.9
Range 45.2 55.8 23.4 16.5 18.3
Minimum 0 0 0 0 0
Maximum 45.2 55.8 23.4 16.5 18.3
Count 1,262 1,262 1,262 1,262 1,262
Epitaph
Mean 2.8 2.7 1 0 2.4
Median 0.8 1 0.4 0 1.8
Mode 0 0 0 0 10
Standard deviation 4.5 4.2 1.9 0.1 2.2
Range 45 57.1 45.1 1.4 10
Minimum 0 0 0 0 0
Maximum 45 57.1 45.1 1.4 10
Count 2,481 2,481 2,481 2,481 2,481

Hermosa Property, Taylor Zn-Pb-Ag Deposit PEA Arizona Minerals Inc. 716027
amcconsultants.com 113
Scherrer Zn% Pb% Ag oz/ton Cu% Mn%
Mean 2.9 2.8 1.4 0.1 3.9
Median 1 0.7 0.3 0 2.7
Mode 0 0 0 0 10
Standard deviation 5.1 5.8 4.1 0.3 3.5
Range 45 82.8 55.7 5 22.3
Minimum 0 0 0 0 0
Maximum 45 82.8 55.7 5 22.3
Count 906 906 906 906 906
Taylor Deeps
Mean 2.3 3.79 2.2 0.2 2.7
Median 0.6 1 0.6 0 1.8
Mode 0 0 0 0 10
Standard deviation 4 6.95 6 0.4 2.6
Range 29 57 148.2 6.6 10
Minimum 0 0 0 0 0
Maximum 29 57 148.2 6.6 10
Count 1,282 1,282 1,282 1,282 1,282
Sub-Taylor Deeps
Mean 1.6 1.4 1.6 0.2 1.9
Median 0.6 0.7 0.3 0 1.1
Mode 0 0 0 0 0
Standard Deviation 3.2 2.4 6.2 0.5 2.1
Range 20.4 15.2 69.4 3.4 9.8
Minimum 0 0 0 0 0
Maximum 20.4 15.2 69.4 3.4 9.9
Count 165 165 165 165 165
Trench Vein System
Mean 1.2 1 1.1 0 1.2
Median 0.1 0 0.1 0 0.3
Mode 0 0 0 0 0.2
Standard Deviation 3.8 3.1 2.8 0.1 2
Range 32.8 33.1 19.2 0.7 10
Minimum 0 0 0 0 0
Maximum 32.8 33.1 19.2 0.7 10
Count 542 542 542 542 542

Hermosa Property, Taylor Zn-Pb-Ag Deposit PEA Arizona Minerals Inc. 716027
amcconsultants.com 114
Figure 14.2 Plan view of drillholes and boundary of block model
14.2.2 Capping
Log probability plots of copper, lead, zinc and silver assays were examined for evidence of statistical outliers. Only silver assays demonstrated the presence of a weak break in the trend line and it was decided that capping was not warranted because the effect of capping is negligible with respect to the resultant estimated grade.
14.2.3 Composites
The majority of samples are five (5) feet in length but because the anticipated stope height is on the order of 60 or 100 feet, resolution of data at a scale of five feet in the vertical direction was considered unnecessarily fine. For that reason, samples from the LAG, MOX, Concha, Scherrer Epitaph and Taylor Deeps domains were composited to 10 feet in length. In comparison to the other domains, the Trench Vein System and Sub-Taylor Deeps domains are relatively narrow for which reason samples from these domains were composited to a nominal five-foot length. In practice, the length of these composites was adjusted to completely fill the sample length so that the exact five-foot length was obtained only in cases in which the samples spanned a distance evenly divisible by five feet. Compositing honoured lithological domain boundaries. Partial composites were discarded if less than one foot in length. The 20,369 samples within the volume of the gradeshells were reduced to 10,865 composites.
Bulk density
AMI has collected a total of 1,266 bulk density measurements from both mineralized and un-mineralized intervals collected from 195 drillholes throughout the deposit. These measurements were made on pieces of whole drill core and provide an indication of expected values and potential range of values for un-mineralized rock and a range of concentrations of mineralization. However, because the bulk density of mineralized rock varies significantly in proportion to the abundance of galena and sphalerite, it is not possible to apply fixed values when computing tonnage. For that reason, a formula to estimate bulk density during the resource tabulation process was devised on the basis of abundance of galena, sphalerite and chalcopyrite. Table 14.4 sets out the parameters used for the bulk density estimation. This formula produces bulk density values within approximately 10% of the measurements carried out on the drill core. Because the estimation was carried out in Imperial units, it was necessary to convert bulk density to tonnage factor (cubic feet/short ton). That conversion is also included in Table 14.4. The formula, in its reduced form is:

Hermosa Property, Taylor Zn-Pb-Ag Deposit PEA Arizona Minerals Inc. 716027
amcconsultants.com 115
TF= (((Pb%*0.0862)+(Zn%*0.0597)+(Cu%*0.12))+((100-Pb%-Zn%-Cu%)*0.027)*0.031)
Table 14.4 Tonnage factor calculation
Element % of mineral Mineral SG of mineral
Pb 87 Galena 7.5
Zn 67 Sphalerite 4.0
Cu 35 Chalcopyrite 4.2
Hostrock 2.7
SG units g/cm³
Bulk density to Ft³/Short ton = 62.43 lbs/ft³/2000 lbs
Example of calculation of formula terms:
SG of Galena = (Pb%/0.87)*(7.5/100) = Pb%*0.0862
TF = (((Pb%*0.0862)+(Zn%*0.0597)+(Cu%*0.12)+((100-Pb%-Zn%-Cu%)*0.027))*0.031)
Geological interpretation
The estimation has been carried out within eight grade domains: Sulphide veins within Mesozoic volcanics termed the Trench Vein System, together with three carbonate units of Paleozoic age, in ascending order, Epitaph, Scherrer and Concha, the underlying thrust contact between the Epitaph and overthrust younger volcanics, termed the Taylor Deeps and several related lenses of mineralization termed the Sub-Taylor Deeps, comprise the sulphide portion of the deposit collectively termed the Taylor Deposit. The Central Depost, which lies up-dip of the Taylor Deposit and contains oxide mineralization, is comprised of the LAG and MOX domains.
The Mineral Resource estimate has been constrained by gradeshells for the six domains listed in the preceding paragraph. The gradeshells were constructed using Leapfrog software and were constrained as follows (from uppermost to lowermost):
LAG: Oxide, within the Meadow Valley Andesite, 0.5 ounces per ton silver, and clipped against the MOX domain.
MOX: Oxide, 3% manganese equivalent, within both Concha and overlying Hardshell volcanics. Manganese equivalent = ((Mn%/100)*1.22*0.95)+(Zn%/100)*1*0.95)+(Ag oz/st*20*0.95))/(1.22*0.95);
Concha, Scherrer and Epitaph: Sulphide, lithological domain, 1% zinc equivalent;
Taylor Deeps: Sulphide, 1% zinc equivalent, plus +/- 150 feet of the thrust contact between Epitaph and lower volcanic package.
Gradeshells are shown in plan and long section in Figures 14.2 and 14.3.
The Trench Vein System and Sub-Taylor Deeps domains were modelled visually using conventional wireframes. It should be noted that both the Sub-Taylor Deeps Mineral Resources have been incorporated with those of the Taylor Deeps domain in Table 14.16

Hermosa Property, Taylor Zn-Pb-Ag Deposit PEA Arizona Minerals Inc. 716027
amcconsultants.com 116
Figure 14.3 Plan view of gradeshell domains
Figure 14.4 Gradeshell domains in long section
Spatial analysis
Spatial continuity of mineralization (assays of silver, copper, lead, zinc and manganese) was assessed using DataMine variographic software, with results shown in Table 14.5. The models are all spherical and have two structures.

Hermosa Property, Taylor Zn-Pb-Ag Deposit PEA Arizona Minerals Inc. 716027
amcconsultants.com 117
Table 14.5 Variography by gradeshell domain
Domain Metal Rotation Z Rotation X Rotation Y NUGGET Range X1 Range Y1 Range Z1 C1 Range X2 Range Y2 Range Z2 C2
LAG
AG -40 15 -5 1.48 68.10 54.90 8.80 11.80 211.00 198.00 24.20 12.60
CU -40 15 -5 0.00 84.50 117.30 5.30 0.01 428.20 471.80 14.90 0.00
MN -40 15 -5 3.51 21.10 52.70 4.20 4.76 569.70 490.50 14.90 26.79
PB -40 15 -5 0.18 66.20 48.10 2.20 0.34 196.10 183.10 10.80 1.24
ZN -40 15 -5 0.17 48.10 48.10 3.40 0.09 172.70 206.50 10.50 1.40
MOX
AG -40 35 0 3.45 47.50 24.20 2.20 18.79 247.90 263.70 9.90 12.28
CU -40 35 0 0.00 58.10 50.40 5.00 0.01 265.20 246.40 11.10 0.01
MN -40 35 0 5.60 15.60 18.70 5.00 14.20 184.00 231.60 15.60 36.17
PB -40 35 0 0.48 61.50 83.10 3.50 0.08 243.10 292.30 12.30 4.22
ZN -40 35 0 1.09 70.80 98.50 5.90 3.43 172.30 206.20 12.50 6.41
Concha
AG -55 30 -10 0.71 87.90 116.00 6.60 1.29 193.40 235.60 16.70 5.06
CU -55 30 -10 0.04 63.50 63.50 7.60 0.14 224.60 224.60 27.40 0.26
MN -55 30 -10 1.41 46.20 52.70 5.90 0.16 175.80 202.20 19.60 12.51
PB -55 30 -10 3.72 67.70 67.70 5.30 6.48 252.30 236.90 21.50 27.03
ZN -55 30 -10 5.72 33.80 43.10 4.30 1.63 196.00 199.60 23.10 49.85
Scherrer
AG -55 30 -5 0.25 52.70 57.10 4.40 0.10 120.90 127.50 11.00 2.17
CU -55 30 -5 0.00 68.40 49.30 4.60 0.00 288.00 329.30 13.80 0.00
MN -55 30 -5 0.45 31.40 44.40 3.60 0.54 344.60 258.50 14.80 3.52
PB -55 30 -5 1.38 57.10 39.60 3.10 0.21 237.40 191.20 10.80 12.22
ZN -55 30 -5 1.69 59.30 70.30 7.30 3.97 178.00 202.20 17.10 11.27
Epitaph
AG -40 32 -5 0.99 65.90 46.20 3.30 0.04 237.40 217.60 13.40 8.87
CU -40 32 -5 0.01 77.40 70.60 2.40 0.01 214.10 198.40 8.90 0.05
MN -40 32 -5 1.15 37.40 41.80 3.30 0.06 257.10 244.00 21.80 10.32
PB -40 32 -5 2.30 87.90 83.50 4.40 0.18 250.50 261.50 13.20 20.50
ZN -40 32 -5 1.74 44.00 30.80 3.30 0.60 285.70 200.00 15.60 15.09
Taylor Deeps
AG -55 10 -25 3.30 62.40 44.50 3.80 12.84 187.10 193.80 12.20 16.82
CU -55 10 -25 0.01 52.00 43.10 4.30 0.06 147.10 142.70 9.60 0.05
MN -55 10 -25 0.58 43.90 50.90 3.80 1.12 328.80 271.20 14.00 4.11
PB -55 10 -25 3.85 34.30 40.50 4.80 10.83 224.50 215.10 17.40 23.80
ZN -55 10 -25 1.25 19.80 28.60 4.80 2.91 169.20 193.40 13.20 8.35
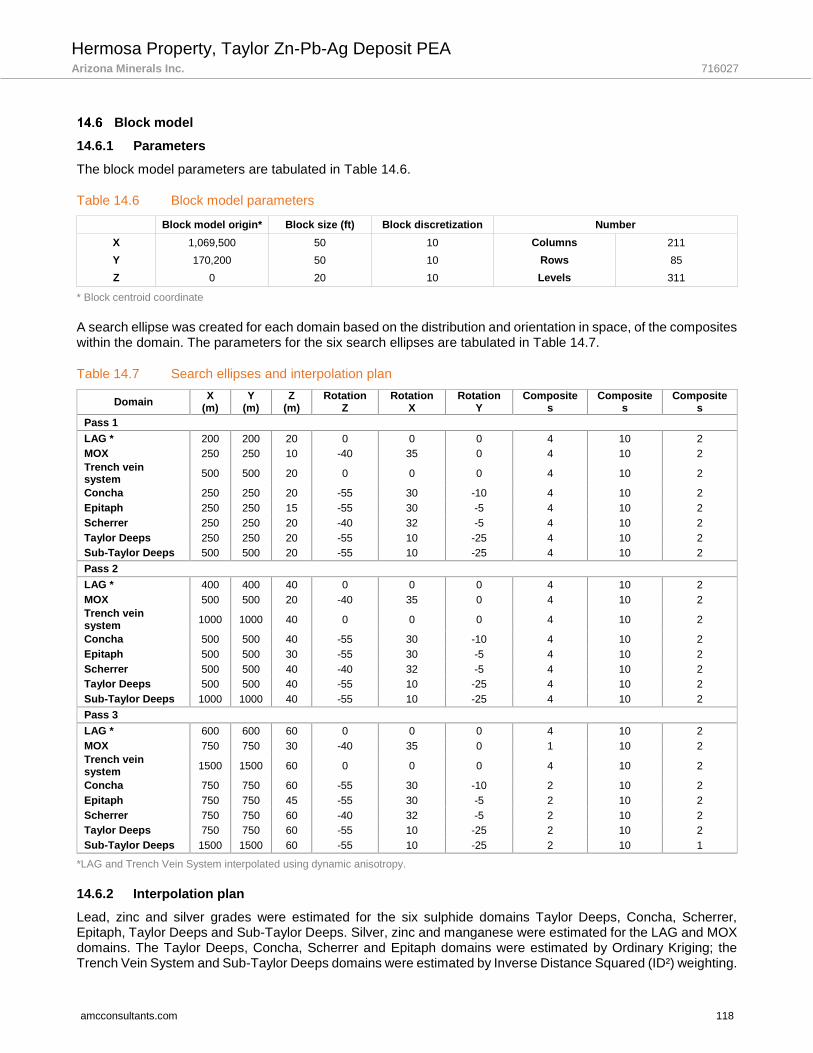
Hermosa Property, Taylor Zn-Pb-Ag Deposit PEA Arizona Minerals Inc. 716027
amcconsultants.com 118
Block model
14.6.1 Parameters
The block model parameters are tabulated in Table 14.6.
Table 14.6 Block model parameters
Block model origin* Block size (ft) Block discretization Number
X 1,069,500 50 10 Columns 211
Y 170,200 50 10 Rows 85
Z 0 20 10 Levels 311
* Block centroid coordinate
A search ellipse was created for each domain based on the distribution and orientation in space, of the composites within the domain. The parameters for the six search ellipses are tabulated in Table 14.7.
Table 14.7 Search ellipses and interpolation plan
Domain X
(m) Y
(m) Z
(m) Rotation
Z Rotation
X Rotation
Y Composite
s Composite
s Composite
s
Pass 1
LAG * 200 200 20 0 0 0 4 10 2
MOX 250 250 10 -40 35 0 4 10 2
Trench vein system
500 500 20 0 0 0 4 10 2
Concha 250 250 20 -55 30 -10 4 10 2
Epitaph 250 250 15 -55 30 -5 4 10 2
Scherrer 250 250 20 -40 32 -5 4 10 2
Taylor Deeps 250 250 20 -55 10 -25 4 10 2
Sub-Taylor Deeps 500 500 20 -55 10 -25 4 10 2
Pass 2
LAG * 400 400 40 0 0 0 4 10 2
MOX 500 500 20 -40 35 0 4 10 2
Trench vein system
1000 1000 40 0 0 0 4 10 2
Concha 500 500 40 -55 30 -10 4 10 2
Epitaph 500 500 30 -55 30 -5 4 10 2
Scherrer 500 500 40 -40 32 -5 4 10 2
Taylor Deeps 500 500 40 -55 10 -25 4 10 2
Sub-Taylor Deeps 1000 1000 40 -55 10 -25 4 10 2
Pass 3
LAG * 600 600 60 0 0 0 4 10 2
MOX 750 750 30 -40 35 0 1 10 2
Trench vein system
1500 1500 60 0 0 0 4 10 2
Concha 750 750 60 -55 30 -10 2 10 2
Epitaph 750 750 45 -55 30 -5 2 10 2
Scherrer 750 750 60 -40 32 -5 2 10 2
Taylor Deeps 750 750 60 -55 10 -25 2 10 2
Sub-Taylor Deeps 1500 1500 60 -55 10 -25 2 10 1
*LAG and Trench Vein System interpolated using dynamic anisotropy.
14.6.2 Interpolation plan
Lead, zinc and silver grades were estimated for the six sulphide domains Taylor Deeps, Concha, Scherrer, Epitaph, Taylor Deeps and Sub-Taylor Deeps. Silver, zinc and manganese were estimated for the LAG and MOX domains. The Taylor Deeps, Concha, Scherrer and Epitaph domains were estimated by Ordinary Kriging; the Trench Vein System and Sub-Taylor Deeps domains were estimated by Inverse Distance Squared (ID²) weighting.
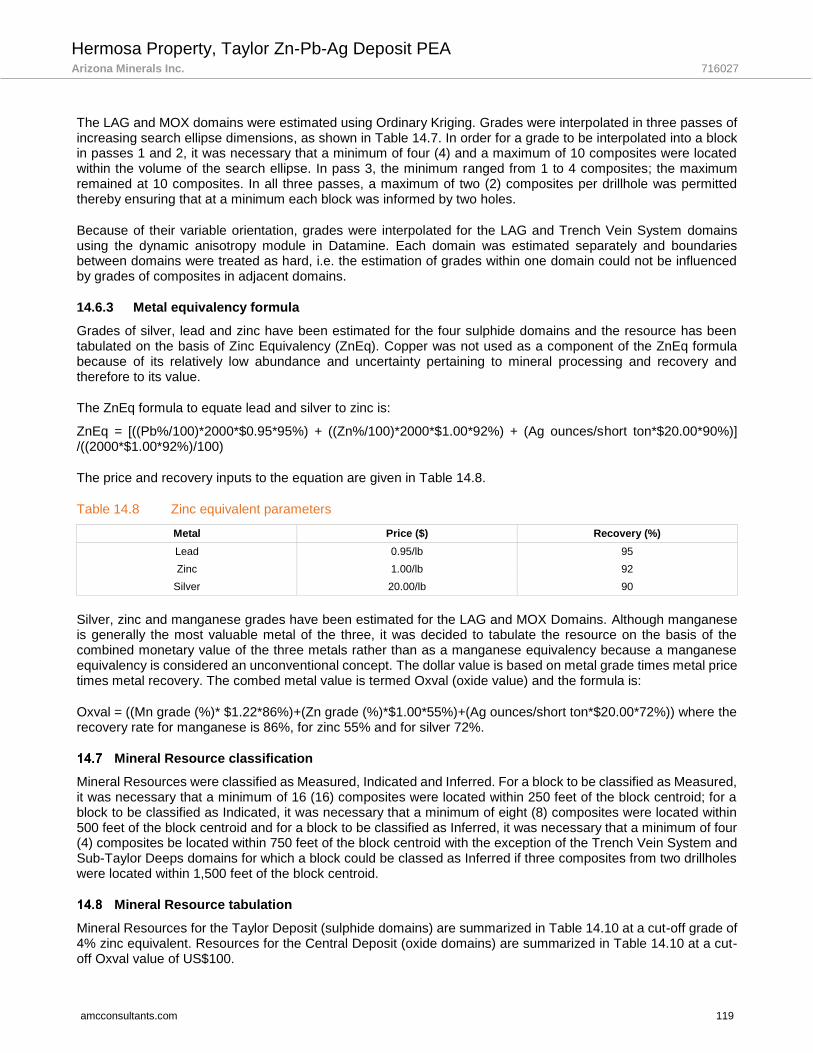
Hermosa Property, Taylor Zn-Pb-Ag Deposit PEA Arizona Minerals Inc. 716027
amcconsultants.com 119
The LAG and MOX domains were estimated using Ordinary Kriging. Grades were interpolated in three passes of increasing search ellipse dimensions, as shown in Table 14.7. In order for a grade to be interpolated into a block in passes 1 and 2, it was necessary that a minimum of four (4) and a maximum of 10 composites were located within the volume of the search ellipse. In pass 3, the minimum ranged from 1 to 4 composites; the maximum remained at 10 composites. In all three passes, a maximum of two (2) composites per drillhole was permitted thereby ensuring that at a minimum each block was informed by two holes.
Because of their variable orientation, grades were interpolated for the LAG and Trench Vein System domains using the dynamic anisotropy module in Datamine. Each domain was estimated separately and boundaries between domains were treated as hard, i.e. the estimation of grades within one domain could not be influenced by grades of composites in adjacent domains.
14.6.3 Metal equivalency formula
Grades of silver, lead and zinc have been estimated for the four sulphide domains and the resource has been tabulated on the basis of Zinc Equivalency (ZnEq). Copper was not used as a component of the ZnEq formula because of its relatively low abundance and uncertainty pertaining to mineral processing and recovery and therefore to its value.
The ZnEq formula to equate lead and silver to zinc is:
ZnEq = [((Pb%/100)*2000*$0.95*95%) + ((Zn%/100)*2000*$1.00*92%) + (Ag ounces/short ton*$20.00*90%)] /((2000*$1.00*92%)/100)
The price and recovery inputs to the equation are given in Table 14.8.
Table 14.8 Zinc equivalent parameters
Metal Price ($) Recovery (%)
Lead 0.95/lb 95
Zinc 1.00/lb 92
Silver 20.00/lb 90
Silver, zinc and manganese grades have been estimated for the LAG and MOX Domains. Although manganese is generally the most valuable metal of the three, it was decided to tabulate the resource on the basis of the combined monetary value of the three metals rather than as a manganese equivalency because a manganese equivalency is considered an unconventional concept. The dollar value is based on metal grade times metal price times metal recovery. The combed metal value is termed Oxval (oxide value) and the formula is:
Oxval = ((Mn grade (%)* $1.22*86%)+(Zn grade (%)*$1.00*55%)+(Ag ounces/short ton*$20.00*72%)) where the recovery rate for manganese is 86%, for zinc 55% and for silver 72%.
Mineral Resource classification
Mineral Resources were classified as Measured, Indicated and Inferred. For a block to be classified as Measured, it was necessary that a minimum of 16 (16) composites were located within 250 feet of the block centroid; for a block to be classified as Indicated, it was necessary that a minimum of eight (8) composites were located within 500 feet of the block centroid and for a block to be classified as Inferred, it was necessary that a minimum of four (4) composites be located within 750 feet of the block centroid with the exception of the Trench Vein System and Sub-Taylor Deeps domains for which a block could be classed as Inferred if three composites from two drillholes were located within 1,500 feet of the block centroid.
Mineral Resource tabulation
Mineral Resources for the Taylor Deposit (sulphide domains) are summarized in Table 14.10 at a cut-off grade of 4% zinc equivalent. Resources for the Central Deposit (oxide domains) are summarized in Table 14.10 at a cut-off Oxval value of US$100.

Hermosa Property, Taylor Zn-Pb-Ag Deposit PEA Arizona Minerals Inc. 716027
amcconsultants.com 120
Table 14.9 Taylor Deposit Mineral Resource summary
Classification Million tons Zn% Pb% Ag oz/ton ZnEq%
Measured 8,613 4.2 4.0 1.6 9.7
Indicated 63,840 4.5 4.4 1.9 10.6
Measured and Indicated 72,453 4.4 4.4 1.8 10.5
Inferred 38,627 4.4 4.2 3.1 11.6
Mineral Resources are reported as of 29 March 2017 Stated at a cut-off grade of 4% ZnEq based on prices, recovery and costs as follows: • Prices of $1.00/lb for zinc, $0.95/lb for lead and $20.00/oz for silver • Average processing recovery factors of 90% for zinc, 95% for lead, and 85% for silver • Total operating costs are estimated to be of the order of $60/ton ZnEq calculation is discussed in Section 14.1.8. Numbers are rounded and may not match later detailed tables.
Table 14.10 Central Deposit Mineral Resource summary
Classification Million tons Zn% Ag oz/ton Mn % Oxval ($/ton)
Measured 20.702 1.8 4.1 9.2 270.0
Indicated 49.913 2.3 1.9 9.6 250.0
Measured & Indicated 70.616 2.2 2.5 9.5 260.0
Inferred 0.350 3.2 2.7 7.2 226.0
Mineral Resources are reported as of 29 March 2017 Stated at a cut-off grade of $100/ton Oxval based on prices, recovery and costs as follows: • Prices of $1.00/lb for zinc, $0.95/lb ,$20.00/oz for silver and $1.22/lb for manganese • Average processing recovery factors of 55% for zinc, 86% for manganese, and 72% for silver • Total operating costs (mining and processing) are estimated to be on the order of $100/ton. Oxval calculation is discussed in Section 14.1.8. Numbers are rounded and may not match later detailed tables.
In Tables 14.11 through 14.14, the Taylor Deposit Mineral Resources are tabulated for each domain at a range of zinc equivalent cut-off grades. Note that resources estimated for the Sub-Taylor Deeps domain are all classed as Inferred and the figures have been incorporated into the Inferred portion of the Taylor Deeps Resource. In Tables 14.15 and 14.16, the Mineral Resources for the Central Deposit are stated at a range of Oxval cut-off values. Tons which are stated in millions of tons, have been rounded to the nearest ten thousand; metal (lead, zinc, copper and manganese) grades have been rounded to the nearest 0.1% and silver grades to the nearest 0.1 ounce.

Hermosa Property, Taylor Zn-Pb-Ag Deposit PEA Arizona Minerals Inc. 716027
amcconsultants.com 121
Table 14.11 Taylor Deposit Concha Domain Mineral Resources
Measured
Cut-off ZnEq (%) Tons Zn% Pb % Ag oz/ton ZnEq %
25 260,000 17.4 12 4.4 33.5
20 459,000 14.8 10.4 3.7 28.6
15 686,000 12.8 9.1 3.3 25
10 1,139,000 10.1 7.3 2.6 19.9
5 1,965,000 7.3 5.4 2 14.5
4 2,264,000 6.6 4.9 1.9 13.2
3 2,577,000 6 4.4 1.7 12
2 2,866,000 5.5 4.1 1.6 11.1
1 2,976,000 5.3 3.9 1.6 10.7
Indicated
25 2,136,000 17 12.7 4.8 34.1
20 3,889,000 14.1 10.8 4.1 28.7
15 6,468,000 11.9 9 3.5 24.2
10 9,518,000 10.1 7.6 3 20.4
5 13,204,000 8.3 6.2 2.5 16.8
4 13,857,000 8 5.9 2.4 16.2
3 14,724,000 7.6 5.6 2.4 15.5
2 15,319,000 7.4 5.5 2.3 15
1 15,545,000 7.3 5.4 2.3 14.8
Measured & Indicated
25 2,396,000 17 12.6 4.7 34
20 4,348,000 14.2 10.7 4.1 28.7
15 7,154,000 12 9.1 3.5 24.3
10 10,657,000 10.1 7.6 3 20.4
5 15,169,000 8.2 6.1 2.5 16.5
4 16,121,000 7.8 5.8 2.4 15.8
3 17,300,000 7.4 5.5 2.3 15
2 18,185,000 7.1 5.2 2.2 14.4
1 18,521,000 7 5.1 2.1 14.1
Inferred
25 444,000 14 12.2 5.4 31.2
20 1,049,000 11 10.8 4.6 26.1
15 1,719,000 9.6 9.3 4 22.6
10 2,337,000 8.7 8.1 3.5 20
5 2,768,000 7.9 7.2 3.1 18
4 2,846,000 7.7 7.1 3.1 17.6
3 3,003,000 7.4 6.7 3 16.9
2 3,095,000 7.2 6.6 2.9 16.5
1 3,411,000 6.6 6 2.7 15.1

Hermosa Property, Taylor Zn-Pb-Ag Deposit PEA Arizona Minerals Inc. 716027
amcconsultants.com 122
Table 14.12 Taylor Deposit Scherrer Domain Mineral Resources
Measured
Cut-off ZnEq (%) Tons Zn% Pb % Ag oz/ton ZnEq %
25 29,000 6.2 16.5 10.3 32.4
20 56,000 5.9 13.7 8.7 27.9
15 105,000 5.4 11 6.6 22.6
10 237,000 4.6 8.2 4.4 16.9
5 691,000 3.4 4.8 2.2 10.3
4 897,000 3 4.1 1.9 8.9
3 1,067,000 2.8 3.7 1.7 8.1
2 1,217,000 2.6 3.4 1.5 7.4
1 1,252,000 2.5 3.3 1.5 7.2
Indicated
25 107,000 11.7 14.9 8.4 34.6
20 223,000 8.5 12.5 7.2 27.8
15 557,000 7.2 9.1 5.2 21.2
10 1,993,000 5.4 6 3.2 14.4
5 6,473,000 3.8 3.8 1.9 9.3
4 7,849,000 3.5 3.4 1.7 8.5
3 9,349,000 3.2 3.1 1.5 7.7
2 10,574,000 2.9 2.8 1.4 7.1
1 11,343,000 2.8 2.7 1.3 6.7
Measured & Indicated
25 136,000 10.5 15.2 8.8 34.1
20 279,000 8 12.8 7.5 27.8
15 661,000 6.9 9.4 5.4 21.4
10 2,230,000 5.3 6.2 3.4 14.7
5 7,164,000 3.7 3.9 1.9 9.4
4 8,747,000 3.4 3.5 1.7 8.5
3 10,416,000 3.1 3.1 1.5 7.7
2 11,791,000 2.9 2.9 1.4 7.1
1 12,595,000 2.8 2.7 1.3 6.8
Inferred
20 1,000 9.6 7.1 4.2 20.7
15 17,000 7.9 6 2.9 16.6
10 153,000 5.4 4.4 2.1 11.7
5 491,000 3.7 3.5 1.7 8.7
4 530,000 3.5 3.4 1.6 8.4
3 613,000 3.2 3.1 1.5 7.8
2 701,000 2.9 2.9 1.4 7.1
1 732,000 2.8 2.8 1.3 6.9
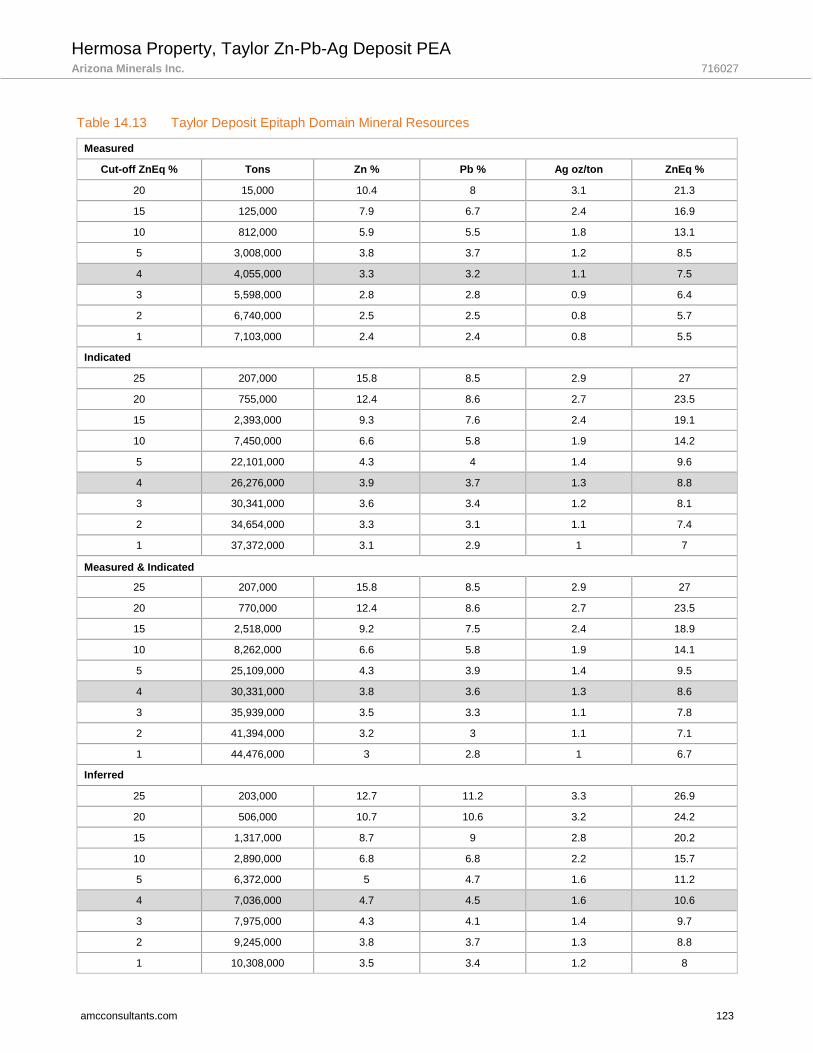
Hermosa Property, Taylor Zn-Pb-Ag Deposit PEA Arizona Minerals Inc. 716027
amcconsultants.com 123
Table 14.13 Taylor Deposit Epitaph Domain Mineral Resources
Measured
Cut-off ZnEq % Tons Zn % Pb % Ag oz/ton ZnEq %
20 15,000 10.4 8 3.1 21.3
15 125,000 7.9 6.7 2.4 16.9
10 812,000 5.9 5.5 1.8 13.1
5 3,008,000 3.8 3.7 1.2 8.5
4 4,055,000 3.3 3.2 1.1 7.5
3 5,598,000 2.8 2.8 0.9 6.4
2 6,740,000 2.5 2.5 0.8 5.7
1 7,103,000 2.4 2.4 0.8 5.5
Indicated
25 207,000 15.8 8.5 2.9 27
20 755,000 12.4 8.6 2.7 23.5
15 2,393,000 9.3 7.6 2.4 19.1
10 7,450,000 6.6 5.8 1.9 14.2
5 22,101,000 4.3 4 1.4 9.6
4 26,276,000 3.9 3.7 1.3 8.8
3 30,341,000 3.6 3.4 1.2 8.1
2 34,654,000 3.3 3.1 1.1 7.4
1 37,372,000 3.1 2.9 1 7
Measured & Indicated
25 207,000 15.8 8.5 2.9 27
20 770,000 12.4 8.6 2.7 23.5
15 2,518,000 9.2 7.5 2.4 18.9
10 8,262,000 6.6 5.8 1.9 14.1
5 25,109,000 4.3 3.9 1.4 9.5
4 30,331,000 3.8 3.6 1.3 8.6
3 35,939,000 3.5 3.3 1.1 7.8
2 41,394,000 3.2 3 1.1 7.1
1 44,476,000 3 2.8 1 6.7
Inferred
25 203,000 12.7 11.2 3.3 26.9
20 506,000 10.7 10.6 3.2 24.2
15 1,317,000 8.7 9 2.8 20.2
10 2,890,000 6.8 6.8 2.2 15.7
5 6,372,000 5 4.7 1.6 11.2
4 7,036,000 4.7 4.5 1.6 10.6
3 7,975,000 4.3 4.1 1.4 9.7
2 9,245,000 3.8 3.7 1.3 8.8
1 10,308,000 3.5 3.4 1.2 8

Hermosa Property, Taylor Zn-Pb-Ag Deposit PEA Arizona Minerals Inc. 716027
amcconsultants.com 124
Table 14.14 Taylor Deposit Taylor Deeps Domain Mineral Resources
Measured
Cut-off ZnEq (%) Tons Zn % Pb % Ag oz/ton ZnEq %
25 83,000 6.5 14 9.2 29.3
20 174,000 6.7 12.6 6.7 25.7
15 344,000 6.2 10.3 5.2 21.5
10 605,000 5.4 8.2 4.2 17.6
5 1,169,000 4.1 5.7 2.9 12.5
4 1,397,000 3.7 5.1 2.6 11.2
3 1,719,000 3.3 4.4 2.2 9.8
2 1,969,000 3 4 2 8.8
1 2,036,000 2.9 3.9 2 8.6
Indicated
25 107,000 7.4 17.1 6.4 30.4
20 488,000 6.4 14 5.8 25.8
15 1,129,000 5.3 11 5 21
10 2,543,000 4.3 8.3 4 16.3
5 5,303,000 2.9 5.3 2.6 10.7
4 13,620,000 2.7 4.8 2.4 9.8
3 15,857,000 2.5 4.4 2.2 9
2 18,223,000 2.3 4.1 2.1 8.4
1 20,231,000 2.2 3.9 2 8
Measured & Indicated
25 571,000 7.2 16.7 6.8 30.3
20 1,302,000 6.4 13.8 5.9 25.7
15 2,887,000 5.4 10.9 5 21.1
10 5,908,000 4.4 8.3 4 16.4
5 14,789,000 3 5.3 2.7 10.8
4 17,254,000 2.8 4.8 2.5 9.9
3 19,942,000 2.6 4.4 2.2 9.1
2 22,200,000 2.4 4.1 2.1 8.4
1 23,341,000 2.3 3.9 2 8.1
Inferred
25 54,000 7.3 13 8.1 28
20 309,000 3.7 6.5 13.2 23
15 1,006,000 3.4 6.1 9.6 18.8
10 3,104,000 3.1 5.6 5.6 14.1
5 1,066,700 2.3 3.9 3 9.1
4 13,300,000 2.1 3.5 2.7 8.2
3 16,250,000 1.9 3.1 2.4 7.3
2 19,121,000 1.7 2.8 2.2 6.6
1 22,014,000 1.6 2.5 1.9 5.9
* Includes Sub-Taylor Deeps Resources
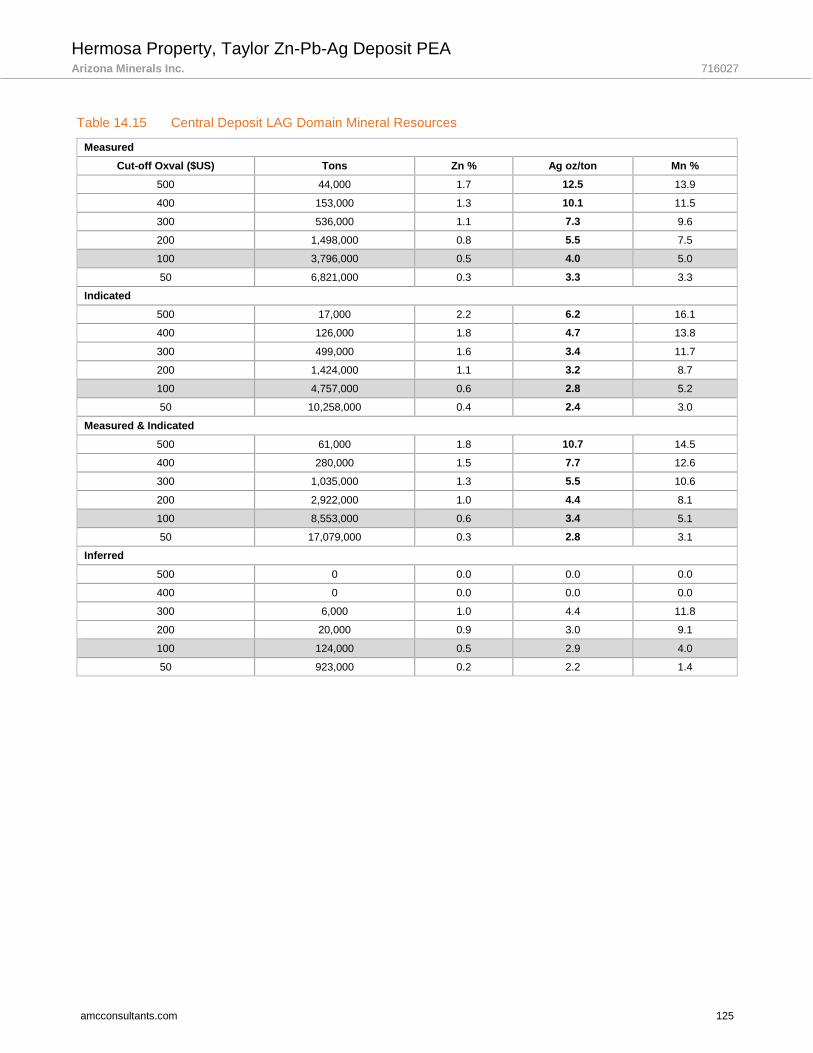
Hermosa Property, Taylor Zn-Pb-Ag Deposit PEA Arizona Minerals Inc. 716027
amcconsultants.com 125
Table 14.15 Central Deposit LAG Domain Mineral Resources
Measured
Cut-off Oxval ($US) Tons Zn % Ag oz/ton Mn %
500 44,000 1.7 12.5 13.9
400 153,000 1.3 10.1 11.5
300 536,000 1.1 7.3 9.6
200 1,498,000 0.8 5.5 7.5
100 3,796,000 0.5 4.0 5.0
50 6,821,000 0.3 3.3 3.3
Indicated
500 17,000 2.2 6.2 16.1
400 126,000 1.8 4.7 13.8
300 499,000 1.6 3.4 11.7
200 1,424,000 1.1 3.2 8.7
100 4,757,000 0.6 2.8 5.2
50 10,258,000 0.4 2.4 3.0
Measured & Indicated
500 61,000 1.8 10.7 14.5
400 280,000 1.5 7.7 12.6
300 1,035,000 1.3 5.5 10.6
200 2,922,000 1.0 4.4 8.1
100 8,553,000 0.6 3.4 5.1
50 17,079,000 0.3 2.8 3.1
Inferred
500 0 0.0 0.0 0.0
400 0 0.0 0.0 0.0
300 6,000 1.0 4.4 11.8
200 20,000 0.9 3.0 9.1
100 124,000 0.5 2.9 4.0
50 923,000 0.2 2.2 1.4

Hermosa Property, Taylor Zn-Pb-Ag Deposit PEA Arizona Minerals Inc. 716027
amcconsultants.com 126
Table 14.16 Central Deposit MOX Domain Mineral Resources
Measured
Cut-off Oxval ($US) Tons Zn % Ag oz/ton Mn %
500 2,340,000 2.9 7.0 16.3
400 5,874,000 2.6 5.9 14.3
300 10,787,000 2.5 5.1 12.2
200 16,016,000 2.2 4.4 10.5
100 18,462,000 2.0 4.1 9.8
50 18,509,000 2.0 4.1 9.8
Indicated
500 1,672,000 4.9 2.9 17.3
400 9,447,000 3.7 2.4 14.7
300 25,505,000 3.1 2.2 12.4
200 42,834,000 2.7 1.9 10.6
100 49,524,000 2.5 1.8 9.8
50 49,895,000 2.5 1.8 9.8
Measured & Indicated
500 4,012,000 3.7 5.3 16.7
400 15,321,000 3.3 3.8 14.6
300 36,292,000 2.9 3.0 12.4
200 58,851,000 2.6 2.6 10.6
100 67,986,000 2.4 2.4 9.8
50 68,405,000 2.3 2.4 9.8
Inferred
500 12,000 6.4 13.7 9.2
400 56,000 7.4 5.5 9.7
300 133,000 5.6 3.9 9.4
200 267,000 4.3 3.0 8.1
100 296,000 4.0 2.8 7.8
50 296,000 4.0 2.8 7.8
Block model validation
The block model was validated in three ways: 1) by visual comparison of composite and block grades to check for similarity of magnitude and to identify any anomalous relationships, 2) by comparison of assay, composite and block model grades, and 3) by swath plots.
Figure 14.5 is a long section view through the block model showing the correspondence of composite and block grades to demonstrate the general correspondence between the two.
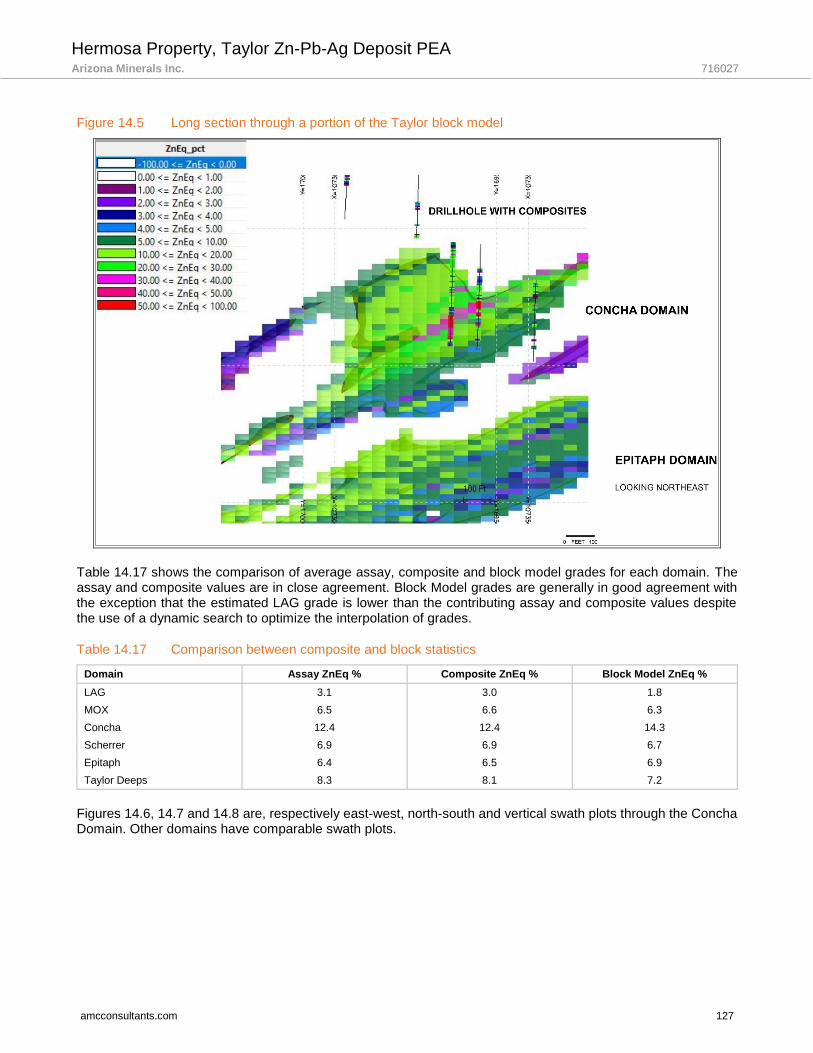
Hermosa Property, Taylor Zn-Pb-Ag Deposit PEA Arizona Minerals Inc. 716027
amcconsultants.com 127
Figure 14.5 Long section through a portion of the Taylor block model
Table 14.17 shows the comparison of average assay, composite and block model grades for each domain. The assay and composite values are in close agreement. Block Model grades are generally in good agreement with the exception that the estimated LAG grade is lower than the contributing assay and composite values despite the use of a dynamic search to optimize the interpolation of grades.
Table 14.17 Comparison between composite and block statistics
Domain Assay ZnEq % Composite ZnEq % Block Model ZnEq %
LAG 3.1 3.0 1.8
MOX 6.5 6.6 6.3
Concha 12.4 12.4 14.3
Scherrer 6.9 6.9 6.7
Epitaph 6.4 6.5 6.9
Taylor Deeps 8.3 8.1 7.2
Figures 14.6, 14.7 and 14.8 are, respectively east-west, north-south and vertical swath plots through the Concha Domain. Other domains have comparable swath plots.

Hermosa Property, Taylor Zn-Pb-Ag Deposit PEA Arizona Minerals Inc. 716027
amcconsultants.com 128
Figure 14.6 Swath Plot for Concha Domain – East-West
Figure 14.7 Swath Plot for Concha Domain North-South
0
500000
1000000
1500000
2000000
2500000
0
0.1
0.2
0.3
0.4
0.5
0.6
0.7107204
6
107216
6
107228
6
107240
6
107252
6
107264
6
107276
6
107288
6
107300
6
107312
6
107324
6
107336
6
107348
6
107360
6
107372
6
107384
6
107396
6
107408
6
107420
6
107432
6
107444
6
107456
6
107468
6
107480
6
No
. C
om
po
sit
es &
Weig
hti
ng
To
tal
Weig
hte
d V
alu
e
Easting
CONCHA Eastings Composite Cu_pct & Model CU_OK
Number of Composites Model Tonnes Declustered Grade Model Grade
0
200000
400000
600000
800000
1000000
1200000
1400000
1600000
1800000
0
0.5
1
1.5
2
2.5
168888
168938
168988
169038
169088
169138
169188
169238
169288
169338
169388
169438
169488
169538
169588
169638
169688
169738
169788
169838
169888
169938
169988
170038
170088
170138
170188
170238
170288
170338
170388
170438
170488
No
. C
om
po
sit
es &
Weig
hti
ng
To
tal
Weig
hte
d V
alu
e
Northing
CONCHA Northings Composite Cu_pct & Model CU_OK
Number of Composites Model Tonnes Declustered Grade Model Grade

Hermosa Property, Taylor Zn-Pb-Ag Deposit PEA Arizona Minerals Inc. 716027
amcconsultants.com 129
Figure 14.8 Swath Plot Concha Domain by Elevation
Comparisons
14.10.1 Taylor Deposit estimates
The 2016 and 2017 Mineral Resource estimates for the Taylor Deposit are shown in Table 14.18. No Measured Mineral Resources were estimated in 2016 but were estimated in 2017 to reflect the higher level of confidence that can now be placed on the portion of the Taylor Deposit that was the subject of the infill drilling that was carried out during the period between the two estimates.
Table 14.18 Comparison of 2016 and 2017 Taylor Deposit estimates
2017 2016
Classification M tons Pb (%) Zn (%) Ag oz/ton ZnEq (%) M tons Pb (%) Zn (%) Ag oz/ton ZnEq (%)
Measured 8.613 4.0 4.2 1.6 9.7
Indicated 63.840 4.4 4.5 1.9 10.6 31.140 4.7 4.4 1.8 10.9
M + I 72.453 4.4 4.3 1.7 10.5 31.140 4.7 4.4 1.8 10.9
Inferred 38.627 4.2 4.4 3.1 11.6 82.750 4.2 4.7 2.2 11.1
A considerable amount of additional drilling was carried out on the deposit, primarily to upgrade to Measured and Indicated categories, resources that were previously classified as Indicated and Inferred. This infill drilling had the effect of enhancing data support, which changed the variography and hence the search strategy. This additional drilling has reduced the potential for over-extrapolation or “smearing” of high grades that can occur in areas without good sample support. An example of this is drillhole HDS 375 which in 2016 was located in an area with relatively few neighbouring drillholes.
Based on more drilling and hence more confidence there is now some Measured Mineral Resource, which has a lower average grade than the Indicated Mineral Resource. There is also the recognition of a vertical component to the mineralization in the area of the Measured in addition to the manto style which is prevalent in the deposit.
0
500000
1000000
1500000
2000000
2500000
0
0.1
0.2
0.3
0.4
0.5
0.6
0.7
0.82512
2562
2612
2662
2712
2762
2812
2862
2912
2962
3012
3062
3112
3162
3212
3262
3312
3362
3412
3462
3512
3562
3612
3662
3712
3762
3812
3862
3912
3962
4012
4062
No
. C
om
po
sit
es &
Weig
hti
ng
To
tal
Weig
hte
d V
alu
e
Elevation
CONCHA Elevations Composite Cu_pct & Model CU_OK
Number of Composites Model Tonnes Declustered Grade Model Grade
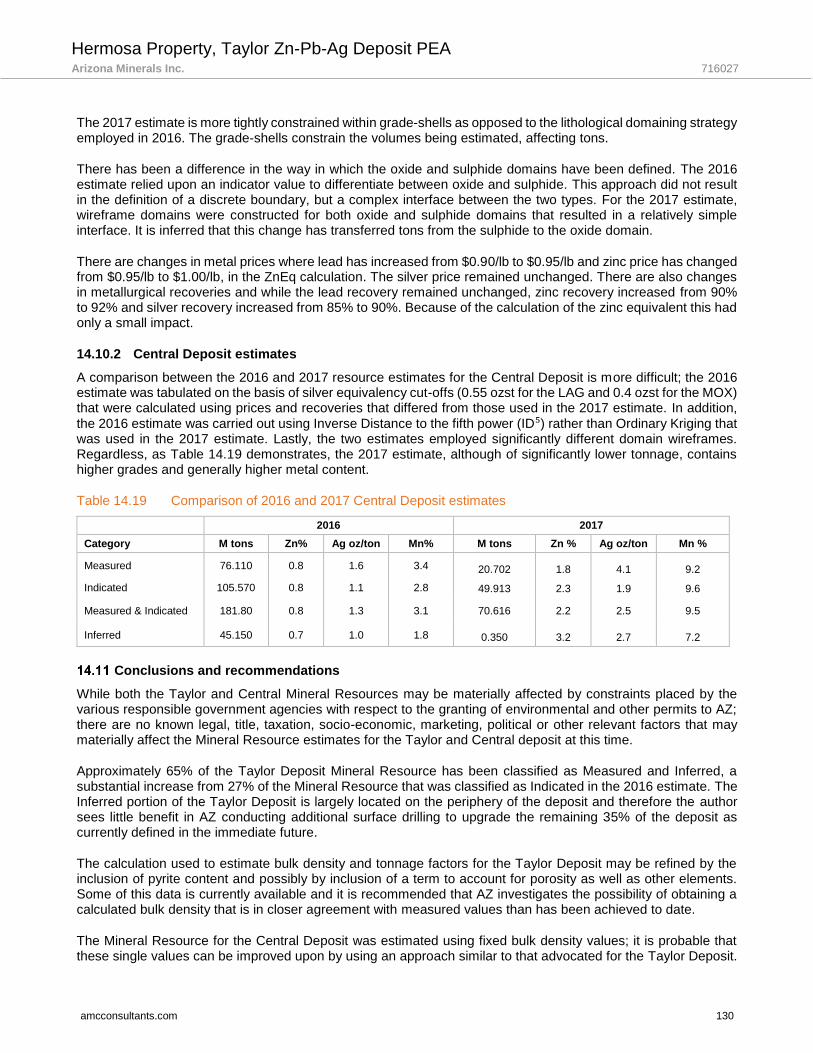
Hermosa Property, Taylor Zn-Pb-Ag Deposit PEA Arizona Minerals Inc. 716027
amcconsultants.com 130
The 2017 estimate is more tightly constrained within grade-shells as opposed to the lithological domaining strategy employed in 2016. The grade-shells constrain the volumes being estimated, affecting tons.
There has been a difference in the way in which the oxide and sulphide domains have been defined. The 2016 estimate relied upon an indicator value to differentiate between oxide and sulphide. This approach did not result in the definition of a discrete boundary, but a complex interface between the two types. For the 2017 estimate, wireframe domains were constructed for both oxide and sulphide domains that resulted in a relatively simple interface. It is inferred that this change has transferred tons from the sulphide to the oxide domain.
There are changes in metal prices where lead has increased from $0.90/lb to $0.95/lb and zinc price has changed from $0.95/lb to $1.00/lb, in the ZnEq calculation. The silver price remained unchanged. There are also changes in metallurgical recoveries and while the lead recovery remained unchanged, zinc recovery increased from 90% to 92% and silver recovery increased from 85% to 90%. Because of the calculation of the zinc equivalent this had only a small impact.
14.10.2 Central Deposit estimates
A comparison between the 2016 and 2017 resource estimates for the Central Deposit is more difficult; the 2016 estimate was tabulated on the basis of silver equivalency cut-offs (0.55 ozst for the LAG and 0.4 ozst for the MOX) that were calculated using prices and recoveries that differed from those used in the 2017 estimate. In addition,
the 2016 estimate was carried out using Inverse Distance to the fifth power (ID⁵) rather than Ordinary Kriging that was used in the 2017 estimate. Lastly, the two estimates employed significantly different domain wireframes. Regardless, as Table 14.19 demonstrates, the 2017 estimate, although of significantly lower tonnage, contains higher grades and generally higher metal content.
Table 14.19 Comparison of 2016 and 2017 Central Deposit estimates
2016 2017
Category M tons Zn% Ag oz/ton Mn% M tons Zn % Ag oz/ton Mn %
Measured 76.110 0.8 1.6 3.4 20.702 1.8 4.1 9.2
Indicated 105.570 0.8 1.1 2.8 49.913 2.3 1.9 9.6
Measured & Indicated 181.80 0.8 1.3 3.1 70.616 2.2 2.5 9.5
Inferred 45.150 0.7 1.0 1.8 0.350 3.2 2.7 7.2
Conclusions and recommendations
While both the Taylor and Central Mineral Resources may be materially affected by constraints placed by the various responsible government agencies with respect to the granting of environmental and other permits to AZ; there are no known legal, title, taxation, socio-economic, marketing, political or other relevant factors that may materially affect the Mineral Resource estimates for the Taylor and Central deposit at this time.
Approximately 65% of the Taylor Deposit Mineral Resource has been classified as Measured and Inferred, a substantial increase from 27% of the Mineral Resource that was classified as Indicated in the 2016 estimate. The Inferred portion of the Taylor Deposit is largely located on the periphery of the deposit and therefore the author sees little benefit in AZ conducting additional surface drilling to upgrade the remaining 35% of the deposit as currently defined in the immediate future.
The calculation used to estimate bulk density and tonnage factors for the Taylor Deposit may be refined by the inclusion of pyrite content and possibly by inclusion of a term to account for porosity as well as other elements. Some of this data is currently available and it is recommended that AZ investigates the possibility of obtaining a calculated bulk density that is in closer agreement with measured values than has been achieved to date.
The Mineral Resource for the Central Deposit was estimated using fixed bulk density values; it is probable that these single values can be improved upon by using an approach similar to that advocated for the Taylor Deposit.
Hermosa Property, Taylor Zn-Pb-Ag Deposit PEA Arizona Minerals Inc. 716027
amcconsultants.com 131
15 Mineral Reserve estimates
There are no Mineral Reserve estimates to report for the Property.
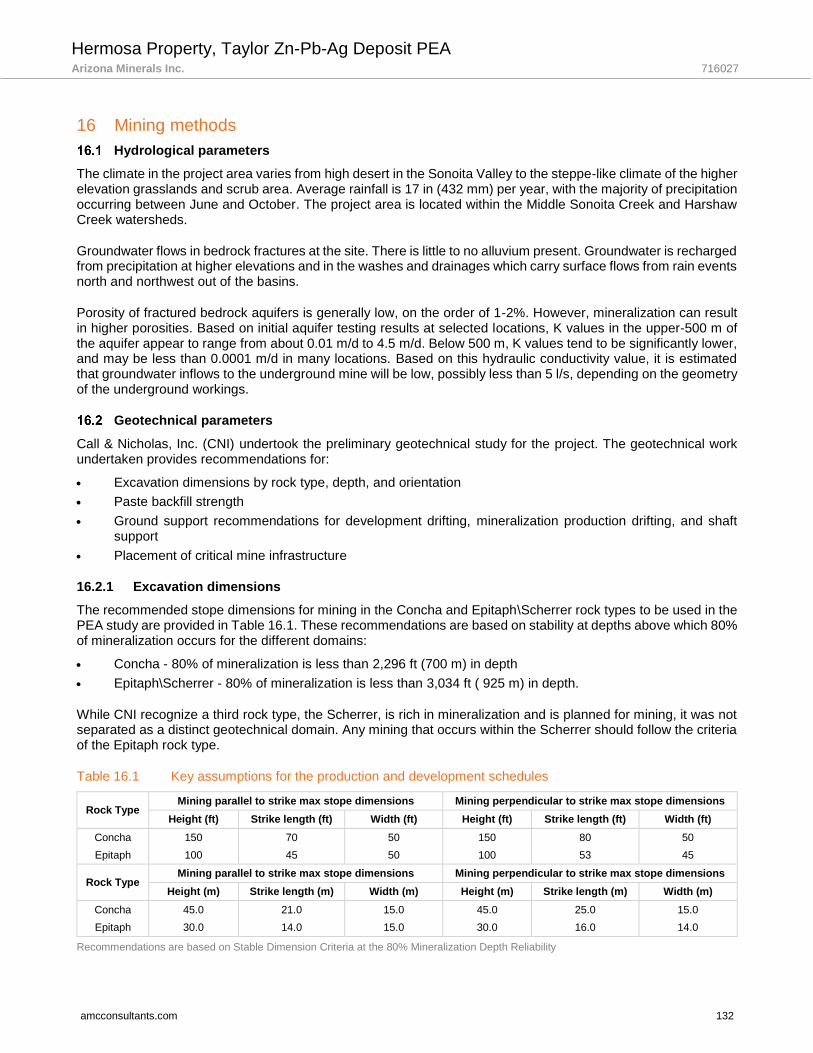
Hermosa Property, Taylor Zn-Pb-Ag Deposit PEA Arizona Minerals Inc. 716027
amcconsultants.com 132
16 Mining methods
Hydrological parameters
The climate in the project area varies from high desert in the Sonoita Valley to the steppe-like climate of the higher elevation grasslands and scrub area. Average rainfall is 17 in (432 mm) per year, with the majority of precipitation occurring between June and October. The project area is located within the Middle Sonoita Creek and Harshaw Creek watersheds.
Groundwater flows in bedrock fractures at the site. There is little to no alluvium present. Groundwater is recharged from precipitation at higher elevations and in the washes and drainages which carry surface flows from rain events north and northwest out of the basins.
Porosity of fractured bedrock aquifers is generally low, on the order of 1-2%. However, mineralization can result in higher porosities. Based on initial aquifer testing results at selected locations, K values in the upper-500 m of the aquifer appear to range from about 0.01 m/d to 4.5 m/d. Below 500 m, K values tend to be significantly lower, and may be less than 0.0001 m/d in many locations. Based on this hydraulic conductivity value, it is estimated that groundwater inflows to the underground mine will be low, possibly less than 5 l/s, depending on the geometry of the underground workings.
Geotechnical parameters
Call & Nicholas, Inc. (CNI) undertook the preliminary geotechnical study for the project. The geotechnical work undertaken provides recommendations for:
• Excavation dimensions by rock type, depth, and orientation
• Paste backfill strength
• Ground support recommendations for development drifting, mineralization production drifting, and shaft support
• Placement of critical mine infrastructure
16.2.1 Excavation dimensions
The recommended stope dimensions for mining in the Concha and Epitaph\Scherrer rock types to be used in the PEA study are provided in Table 16.1. These recommendations are based on stability at depths above which 80% of mineralization occurs for the different domains:
• Concha - 80% of mineralization is less than 2,296 ft (700 m) in depth
• Epitaph\Scherrer - 80% of mineralization is less than 3,034 ft ( 925 m) in depth.
While CNI recognize a third rock type, the Scherrer, is rich in mineralization and is planned for mining, it was not separated as a distinct geotechnical domain. Any mining that occurs within the Scherrer should follow the criteria of the Epitaph rock type.
Table 16.1 Key assumptions for the production and development schedules
Rock Type Mining parallel to strike max stope dimensions Mining perpendicular to strike max stope dimensions
Height (ft) Strike length (ft) Width (ft) Height (ft) Strike length (ft) Width (ft)
Concha 150 70 50 150 80 50
Epitaph 100 45 50 100 53 45
Rock Type Mining parallel to strike max stope dimensions Mining perpendicular to strike max stope dimensions
Height (m) Strike length (m) Width (m) Height (m) Strike length (m) Width (m)
Concha 45.0 21.0 15.0 45.0 25.0 15.0
Epitaph 30.0 14.0 15.0 30.0 16.0 14.0
Recommendations are based on Stable Dimension Criteria at the 80% Mineralization Depth Reliability

Hermosa Property, Taylor Zn-Pb-Ag Deposit PEA Arizona Minerals Inc. 716027
amcconsultants.com 133
Stope dimensions were optimized for height, rather than length. In both domains, because of the geologic joint fabric, mining perpendicular to the strike of the deposit allows for greater achievable dimensions. Analyses were limited to a depth of 4000 ft (1,219 m).
16.2.2 Mining in the Concha
The Concha rock type was identified as the superior mining host rock. The rock quality designation (RQD = 93%), joint conditions, and intact rock strength qualify this rock to be of good quality per Barton’s Q’ classification system.
16.2.3 Mining in the Epitaph / Scherrer
The Epitaph rock type was identified as the lesser quality mining host rock. While the Epitaph has an identical rock quality designation (RQD = 93%), the joint conditions were of significantly less quality than those from within the Concha rock type. Observations from the drilling indicate that there are continuous zones of 30 m to 60 m of predominately slicken-sided joints with carbonaceous infill material. The joint conditions used for analysis reflect this. Due to these joint conditions, the Epitaph falls within the fair quality classification per Barton’s Q’ classification system.
Further to being of a lesser rock quality than the Concha, the Epitaph is found at greater depths where stresses more significantly influence stability. Mining at an orientation perpendicular to strike allows for greater lengths to be achieved at the optimal height.
16.2.4 Paste backfill strength
In order to achieve nearly full mineralization recovery at the project, paste backfill will be used to fill open stopes following their excavation. By filling these stopes with paste backfill, pillars will be established that will subsequently become the walls of later stage (secondary) stopes.
The stability of the paste backfill wall is directly related to the amount of cement binder used in the paste mixture. The strength of the paste backfill mixture must be great enough to hold a vertical face of a backfilled primary stope at the full stope height during mining of secondary stopes. In order to stand at heights up to 45.0 m when mining in the Concha, a backfill strength of 967 kPa is required (Mitchell, et al.). When mining in the Epitaph, in which stope heights are less (30.0 m), a backfill strength of 645 kPa is required. These values include a 1.15 safety factor to compensate for the natural variability in the paste backfill quality and potential for binder separation due to long pumping distances.
16.2.5 Ground support recommendations
16.2.5.1 Development drifts
Development drifts include all decline drifting and level access drifts. CNI have assumed dimensions of 18 ft (5.5 m) height and 18 ft (5.5 m) width for all development drifts. Due to the good quality of the rock at the project, no support beyond spot bolting should be required in the development drifts.
Despite not needing patterned ground control in development drifting, AZ should anticipate the presence of infrequent faults that may require some support. Surficial support in the form of fibre-reinforced shotcrete (fibrecrete), or shotcrete in conjunction with pattern bolting may be needed when mining through these faults. Because of the scarcity of drilling data and the absence of a rock quality model, the frequency of these faults is difficult to predict. CNI recommend that AZ anticipate using fibrecrete or shotcrete with systematic bolting 6 ft in length with a spacing of 5.3 ft (1.8 m lengths; 1.6 m spacing) in approximately 20% of all drifting.
16.2.5.2 Production drifts
Production drifts include all stope accesses; bottom cuts, middle cuts, and top cuts. CNI have assumed dimensions of 14.8 ft (4.5 m) height and 14.8 ft (4.5 m) width for all production drifts.
Stope bottom cuts will not generally require any support beyond infrequent spot bolting. However, to account for faulting and areas of lesser quality ground, CNI recommend that AZ anticipate using fibrecrete or shotcrete with

Hermosa Property, Taylor Zn-Pb-Ag Deposit PEA Arizona Minerals Inc. 716027
amcconsultants.com 134
systematic bolting 6 ft in length with a spacing of 5.3 ft (1.8 m lengths; 1.6 m spacing) in approximately 20% of all production drifting.
16.2.5.3 Stope top and middle cuts in the Concha
Ground support requirements when stoping in the Concha are on the boundary of unsupported stability and requiring systematic bolting. Consequently, two forms of support, a minimum and maximum support, should be anticipated when mining in the Concha to be applied at an assumed 50% occurrence for each:
• At the minimum 50%, no top cut or middle cut support is required.
• At the maximum 50%, pattern bolting will be required in backs and ribs and will include the installation of 8 ft (2.4 m) friction bolts on 6.6 ft (2.0 m) nominal spacing in conjunction with a welded wire mesh.
16.2.5.1 Stope top and middle cuts in the Epitaph
Support of the top cuts and middle cuts when stoping in the Epitaph rock type will require systematic bolting and regular (50% occurrence) shotcrete application as specified below:
• Pattern bolting of the backs and sills will include the installation of 8 ft (2.4 m) friction bolts on 5.3 ft (1.6 m) nominal spacing in conjunction with a welded wire mesh.
• In approximately 50% of headings, regular (unreinforced) shotcrete should be applied to a thickness of 1.6 in to 3.9 in (40 mm to 100 mm).
16.2.5.2 Shaft ground support recommendations
The proposed shaft dimensions are: 21 ft inner diameter (6.5 m). The total shaft depth is 3,625 ft (1,105 m). The support requirements are as follows:
• Temporary support consists of 8 ft (2.4 m) friction bolts and welded-wire mesh.
• Final support consists of steel reinforced concrete that meets the following criteria:
— Concrete Design compressive strength of 20-28 MPa.
— Minimum lining thickness of 18 in (450 mm).
16.2.5.3 Placement of critical mine infrastructure
Recommendations for the placement of critical mine infrastructure is based on the knowledge of the regional fault geology and spatial drill hole data. Often, these types of large scale regional faults can inhibit the transfer of mining-induced stresses and as a result, these stresses will concentrate on the edges of the faults. To mitigate complications of placing infrastructure into such a high-stress environment, any infrastructure should be planned to the south of all mine workings.
Underground access
Several options exist to access the Taylor deposit. AMC undertook a trade-off study to evaluate the various options and generate a net present value for each case. Based on the financial results of the study, the best options were selected based on economics and operability.
AMC conducted a trade-off study to determine the optimum economic means to access the deposit. AMC generated a mining inventory, stopes were selected at a cut-off grade of 4% zinc equivalent (ZnEq). The economic stope wireframes generated using Datamine’s Mine Stope Optimizer software (MSO), commence from a depth of 1,430 ft (436 m) below surface and extend to a depth of 3,850 ft (1,174 m) below surface. The mineralization is at a depth that is on the limit for a decline access to operate efficiently and economically, and a vertical hoisting shaft was considered as an alternative means of access. Vertical shafts are generally used to access an underground mine which operates below a depth of 1,000 m, particularly when considering a high production rate and extended mine life. AMC evaluated the following options:
• Option 1 (Base Case) – the deposit is accessed via a decline from surface and a vertical shaft. Development of the access decline commences at the same time as sinking of the vertical shaft. Once the sub-levels are
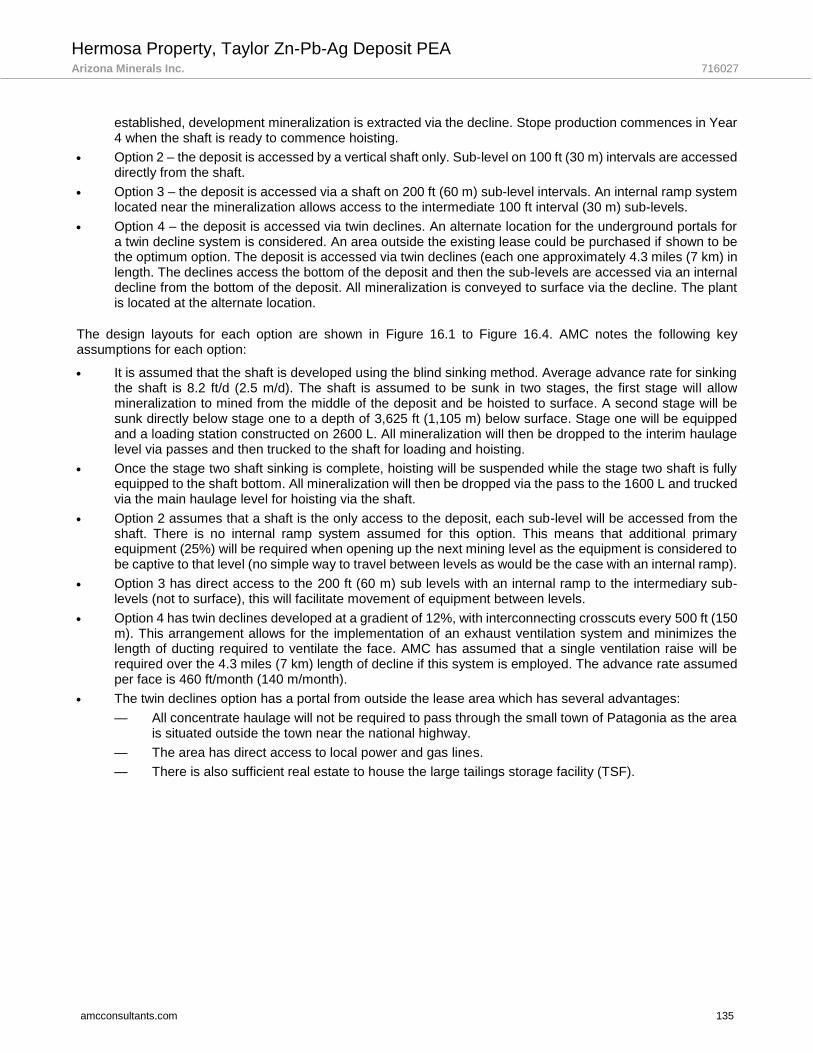
Hermosa Property, Taylor Zn-Pb-Ag Deposit PEA Arizona Minerals Inc. 716027
amcconsultants.com 135
established, development mineralization is extracted via the decline. Stope production commences in Year 4 when the shaft is ready to commence hoisting.
• Option 2 – the deposit is accessed by a vertical shaft only. Sub-level on 100 ft (30 m) intervals are accessed directly from the shaft.
• Option 3 – the deposit is accessed via a shaft on 200 ft (60 m) sub-level intervals. An internal ramp system located near the mineralization allows access to the intermediate 100 ft interval (30 m) sub-levels.
• Option 4 – the deposit is accessed via twin declines. An alternate location for the underground portals for a twin decline system is considered. An area outside the existing lease could be purchased if shown to be the optimum option. The deposit is accessed via twin declines (each one approximately 4.3 miles (7 km) in length. The declines access the bottom of the deposit and then the sub-levels are accessed via an internal decline from the bottom of the deposit. All mineralization is conveyed to surface via the decline. The plant is located at the alternate location.
The design layouts for each option are shown in Figure 16.1 to Figure 16.4. AMC notes the following key assumptions for each option:
• It is assumed that the shaft is developed using the blind sinking method. Average advance rate for sinking the shaft is 8.2 ft/d (2.5 m/d). The shaft is assumed to be sunk in two stages, the first stage will allow mineralization to mined from the middle of the deposit and be hoisted to surface. A second stage will be sunk directly below stage one to a depth of 3,625 ft (1,105 m) below surface. Stage one will be equipped and a loading station constructed on 2600 L. All mineralization will then be dropped to the interim haulage level via passes and then trucked to the shaft for loading and hoisting.
• Once the stage two shaft sinking is complete, hoisting will be suspended while the stage two shaft is fully equipped to the shaft bottom. All mineralization will then be dropped via the pass to the 1600 L and trucked via the main haulage level for hoisting via the shaft.
• Option 2 assumes that a shaft is the only access to the deposit, each sub-level will be accessed from the shaft. There is no internal ramp system assumed for this option. This means that additional primary equipment (25%) will be required when opening up the next mining level as the equipment is considered to be captive to that level (no simple way to travel between levels as would be the case with an internal ramp).
• Option 3 has direct access to the 200 ft (60 m) sub levels with an internal ramp to the intermediary sub-levels (not to surface), this will facilitate movement of equipment between levels.
• Option 4 has twin declines developed at a gradient of 12%, with interconnecting crosscuts every 500 ft (150 m). This arrangement allows for the implementation of an exhaust ventilation system and minimizes the length of ducting required to ventilate the face. AMC has assumed that a single ventilation raise will be required over the 4.3 miles (7 km) length of decline if this system is employed. The advance rate assumed per face is 460 ft/month (140 m/month).
• The twin declines option has a portal from outside the lease area which has several advantages:
— All concentrate haulage will not be required to pass through the small town of Patagonia as the area is situated outside the town near the national highway.
— The area has direct access to local power and gas lines.
— There is also sufficient real estate to house the large tailings storage facility (TSF).
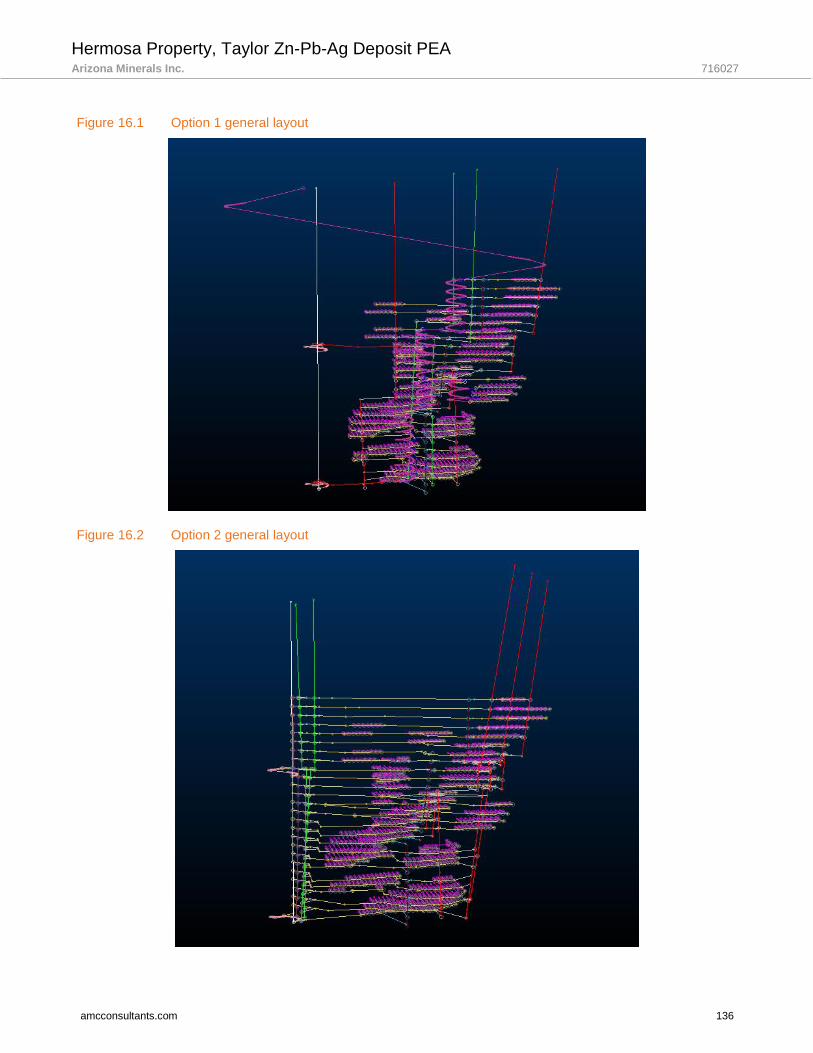
Hermosa Property, Taylor Zn-Pb-Ag Deposit PEA Arizona Minerals Inc. 716027
amcconsultants.com 136
Figure 16.1 Option 1 general layout
Figure 16.2 Option 2 general layout

Hermosa Property, Taylor Zn-Pb-Ag Deposit PEA Arizona Minerals Inc. 716027
amcconsultants.com 137
Figure 16.3 Option 3 general layout
Figure 16.4 Option 4 general layout
A ventilation system was developed for each option considered. It was assumed that the mine will be ventilated by a “Pull” or exhausting type ventilation system. That is, the primary mine ventilation fans will be located at the primary exhaust airways of the mine. Fresh air will enter via the main intake raises or shaft with exhaust to the surface via dedicated return airways. Most production activities will require auxiliary fans and ducting with level airflows managed through regulators located at raise accesses.
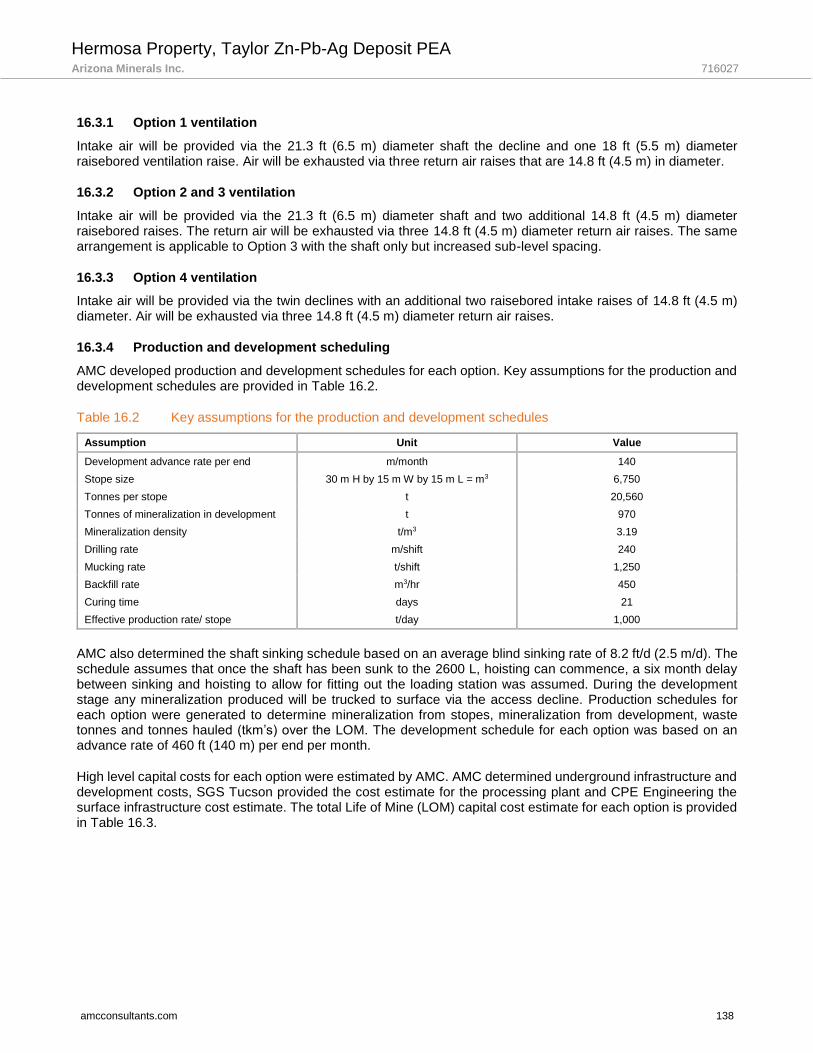
Hermosa Property, Taylor Zn-Pb-Ag Deposit PEA Arizona Minerals Inc. 716027
amcconsultants.com 138
16.3.1 Option 1 ventilation
Intake air will be provided via the 21.3 ft (6.5 m) diameter shaft the decline and one 18 ft (5.5 m) diameter raisebored ventilation raise. Air will be exhausted via three return air raises that are 14.8 ft (4.5 m) in diameter.
16.3.2 Option 2 and 3 ventilation
Intake air will be provided via the 21.3 ft (6.5 m) diameter shaft and two additional 14.8 ft (4.5 m) diameter raisebored raises. The return air will be exhausted via three 14.8 ft (4.5 m) diameter return air raises. The same arrangement is applicable to Option 3 with the shaft only but increased sub-level spacing.
16.3.3 Option 4 ventilation
Intake air will be provided via the twin declines with an additional two raisebored intake raises of 14.8 ft (4.5 m) diameter. Air will be exhausted via three 14.8 ft (4.5 m) diameter return air raises.
16.3.4 Production and development scheduling
AMC developed production and development schedules for each option. Key assumptions for the production and development schedules are provided in Table 16.2.
Table 16.2 Key assumptions for the production and development schedules
Assumption Unit Value
Development advance rate per end m/month 140
Stope size 30 m H by 15 m W by 15 m L = m3 6,750
Tonnes per stope t 20,560
Tonnes of mineralization in development t 970
Mineralization density t/m3 3.19
Drilling rate m/shift 240
Mucking rate t/shift 1,250
Backfill rate m3/hr 450
Curing time days 21
Effective production rate/ stope t/day 1,000
AMC also determined the shaft sinking schedule based on an average blind sinking rate of 8.2 ft/d (2.5 m/d). The schedule assumes that once the shaft has been sunk to the 2600 L, hoisting can commence, a six month delay between sinking and hoisting to allow for fitting out the loading station was assumed. During the development stage any mineralization produced will be trucked to surface via the access decline. Production schedules for each option were generated to determine mineralization from stopes, mineralization from development, waste tonnes and tonnes hauled (tkm’s) over the LOM. The development schedule for each option was based on an advance rate of 460 ft (140 m) per end per month.
High level capital costs for each option were estimated by AMC. AMC determined underground infrastructure and development costs, SGS Tucson provided the cost estimate for the processing plant and CPE Engineering the surface infrastructure cost estimate. The total Life of Mine (LOM) capital cost estimate for each option is provided in Table 16.3.
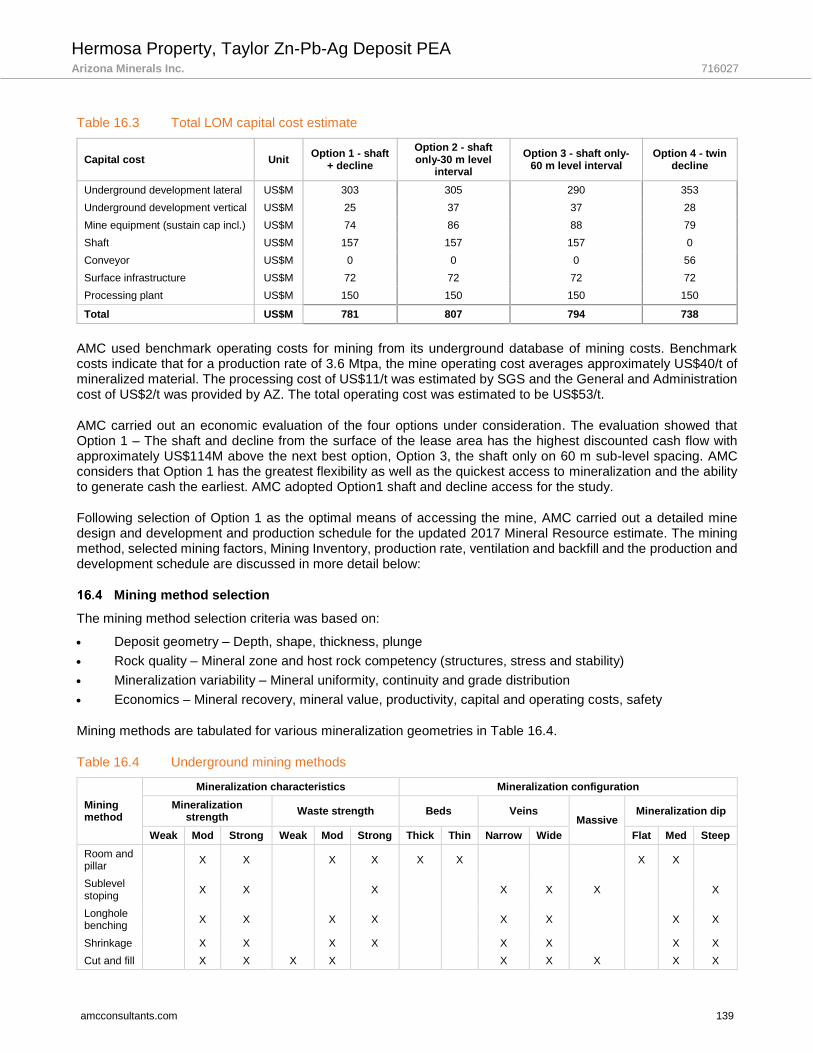
Hermosa Property, Taylor Zn-Pb-Ag Deposit PEA Arizona Minerals Inc. 716027
amcconsultants.com 139
Table 16.3 Total LOM capital cost estimate
Capital cost Unit Option 1 - shaft
+ decline
Option 2 - shaft only-30 m level
interval
Option 3 - shaft only-60 m level interval
Option 4 - twin decline
Underground development lateral US$M 303 305 290 353
Underground development vertical US$M 25 37 37 28
Mine equipment (sustain cap incl.) US$M 74 86 88 79
Shaft US$M 157 157 157 0
Conveyor US$M 0 0 0 56
Surface infrastructure US$M 72 72 72 72
Processing plant US$M 150 150 150 150
Total US$M 781 807 794 738
AMC used benchmark operating costs for mining from its underground database of mining costs. Benchmark costs indicate that for a production rate of 3.6 Mtpa, the mine operating cost averages approximately US$40/t of mineralized material. The processing cost of US$11/t was estimated by SGS and the General and Administration cost of US$2/t was provided by AZ. The total operating cost was estimated to be US$53/t.
AMC carried out an economic evaluation of the four options under consideration. The evaluation showed that Option 1 – The shaft and decline from the surface of the lease area has the highest discounted cash flow with approximately US$114M above the next best option, Option 3, the shaft only on 60 m sub-level spacing. AMC considers that Option 1 has the greatest flexibility as well as the quickest access to mineralization and the ability to generate cash the earliest. AMC adopted Option1 shaft and decline access for the study.
Following selection of Option 1 as the optimal means of accessing the mine, AMC carried out a detailed mine design and development and production schedule for the updated 2017 Mineral Resource estimate. The mining method, selected mining factors, Mining Inventory, production rate, ventilation and backfill and the production and development schedule are discussed in more detail below:
Mining method selection
The mining method selection criteria was based on:
• Deposit geometry – Depth, shape, thickness, plunge
• Rock quality – Mineral zone and host rock competency (structures, stress and stability)
• Mineralization variability – Mineral uniformity, continuity and grade distribution
• Economics – Mineral recovery, mineral value, productivity, capital and operating costs, safety
Mining methods are tabulated for various mineralization geometries in Table 16.4.
Table 16.4 Underground mining methods
Mining method
Mineralization characteristics Mineralization configuration
Mineralization strength
Waste strength Beds Veins Massive
Mineralization dip
Weak Mod Strong Weak Mod Strong Thick Thin Narrow Wide Flat Med Steep
Room and pillar
X X X X X X X X
Sublevel stoping
X X X X X X X
Longhole benching
X X X X X X X X
Shrinkage X X X X X X X X
Cut and fill X X X X X X X X X

Hermosa Property, Taylor Zn-Pb-Ag Deposit PEA Arizona Minerals Inc. 716027
amcconsultants.com 140
The mineralization extends over a vertical height of 2,620 ft (800 m), is 2,890 ft (880 m) along strike and 2,160 ft (670 m) in width, dipping north west at approximately 30°. A visual examination of the block model above a cut-off grade of 4% Zinc Equivalent (ZnEq) and consideration of the mineralization characteristics (strength and configuration) suggested that the deposit was best suited to either:
• Room and Pillar – Flat to shallow dipping, competent ground.
• Longhole benching or Sublevel Stoping – Medium to steep dip, competent to fair ground.
The mineralization above a cut-off grade of 4% Zn Eq is shown in Figure 16.5.
Figure 16.5 Block model above cut-off grade of 4% ZnEq
The mining factors of dilution and recovery generally applied to these mining methods are:
• Room and Pillar – Dilution 5% to 15%, Recovery 80% to 85%%
• Longhole benching – Dilution 5% to 25%, Recovery 85% to 90%
• Sublevel stoping (SLOS) – Dilution 10% to 15%, Recovery 85% to 90%.
The method that best supports low operating cost, high productivity with good recovery and low dilution is SLOS. AMC recommends using this mining method for the study. Further optimization using various decision making tools should be considered in the next level of study. Mining activities will be fully mechanized and large modern trackless mobile equipment will be employed throughout. Ground conditions are generally expected to be fair to good, with a relatively small proportion of poor ground anticipated.
In order to optimize the mine economics, a high grade core of mineralization was identified above a cut-off grade of 15% ZnEq, that is located between 3140 L and 3260 L. The high grade material is accessible from each level independently and could be mined simultaneously, using more selective Longhole type mining methods over stope heights of 60 ft (18 m) floor to floor. A mine plan and mine design was developed to allow early access of the high grade core between Year 4 and Year 6 (inclusive) of the LOM plan. The use of pastefill ensures that lower grade material is not sterilized but is extracted as a second pass.
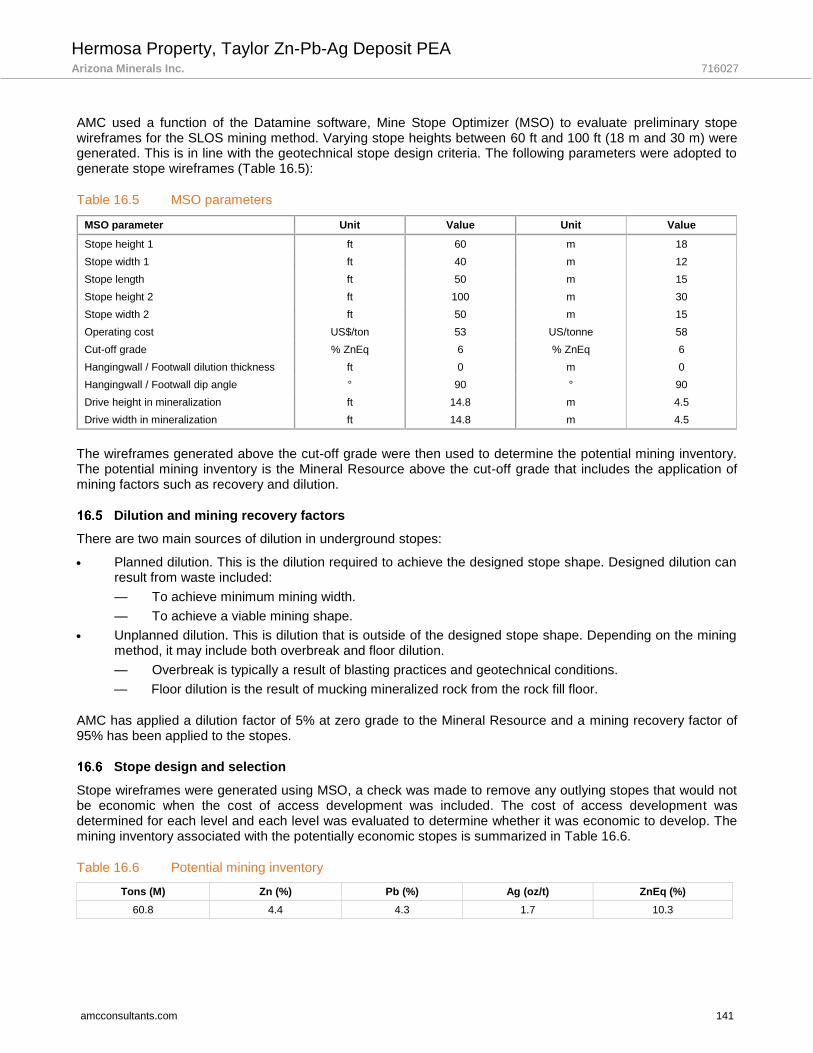
Hermosa Property, Taylor Zn-Pb-Ag Deposit PEA Arizona Minerals Inc. 716027
amcconsultants.com 141
AMC used a function of the Datamine software, Mine Stope Optimizer (MSO) to evaluate preliminary stope wireframes for the SLOS mining method. Varying stope heights between 60 ft and 100 ft (18 m and 30 m) were generated. This is in line with the geotechnical stope design criteria. The following parameters were adopted to generate stope wireframes (Table 16.5):
Table 16.5 MSO parameters
MSO parameter Unit Value Unit Value
Stope height 1 ft 60 m 18
Stope width 1 ft 40 m 12
Stope length ft 50 m 15
Stope height 2 ft 100 m 30
Stope width 2 ft 50 m 15
Operating cost US$/ton 53 US/tonne 58
Cut-off grade % ZnEq 6 % ZnEq 6
Hangingwall / Footwall dilution thickness ft 0 m 0
Hangingwall / Footwall dip angle ° 90 ° 90
Drive height in mineralization ft 14.8 m 4.5
Drive width in mineralization ft 14.8 m 4.5
The wireframes generated above the cut-off grade were then used to determine the potential mining inventory. The potential mining inventory is the Mineral Resource above the cut-off grade that includes the application of mining factors such as recovery and dilution.
Dilution and mining recovery factors
There are two main sources of dilution in underground stopes:
• Planned dilution. This is the dilution required to achieve the designed stope shape. Designed dilution can result from waste included:
— To achieve minimum mining width.
— To achieve a viable mining shape.
• Unplanned dilution. This is dilution that is outside of the designed stope shape. Depending on the mining method, it may include both overbreak and floor dilution.
— Overbreak is typically a result of blasting practices and geotechnical conditions.
— Floor dilution is the result of mucking mineralized rock from the rock fill floor.
AMC has applied a dilution factor of 5% at zero grade to the Mineral Resource and a mining recovery factor of 95% has been applied to the stopes.
Stope design and selection
Stope wireframes were generated using MSO, a check was made to remove any outlying stopes that would not be economic when the cost of access development was included. The cost of access development was determined for each level and each level was evaluated to determine whether it was economic to develop. The mining inventory associated with the potentially economic stopes is summarized in Table 16.6.
Table 16.6 Potential mining inventory
Tons (M) Zn (%) Pb (%) Ag (oz/t) ZnEq (%)
60.8 4.4 4.3 1.7 10.3
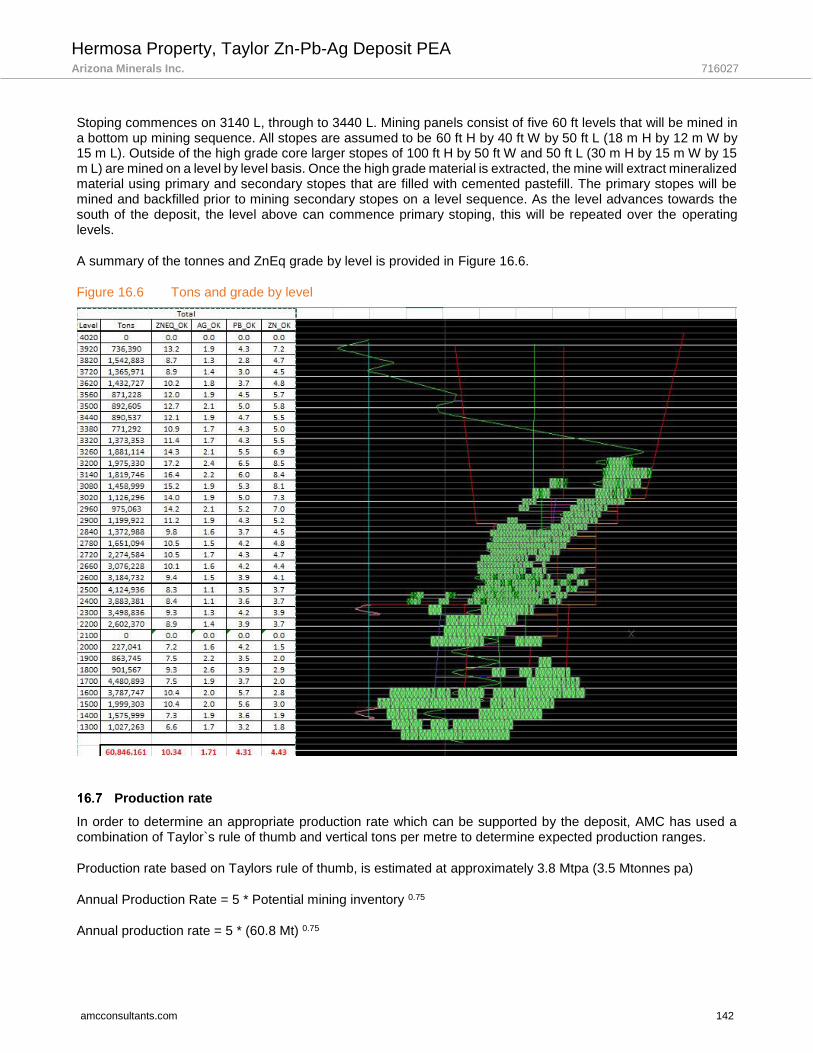
Hermosa Property, Taylor Zn-Pb-Ag Deposit PEA Arizona Minerals Inc. 716027
amcconsultants.com 142
Stoping commences on 3140 L, through to 3440 L. Mining panels consist of five 60 ft levels that will be mined in a bottom up mining sequence. All stopes are assumed to be 60 ft H by 40 ft W by 50 ft L (18 m H by 12 m W by 15 m L). Outside of the high grade core larger stopes of 100 ft H by 50 ft W and 50 ft L (30 m H by 15 m W by 15 m L) are mined on a level by level basis. Once the high grade material is extracted, the mine will extract mineralized material using primary and secondary stopes that are filled with cemented pastefill. The primary stopes will be mined and backfilled prior to mining secondary stopes on a level sequence. As the level advances towards the south of the deposit, the level above can commence primary stoping, this will be repeated over the operating levels.
A summary of the tonnes and ZnEq grade by level is provided in Figure 16.6.
Figure 16.6 Tons and grade by level
Production rate
In order to determine an appropriate production rate which can be supported by the deposit, AMC has used a combination of Taylor`s rule of thumb and vertical tons per metre to determine expected production ranges.
Production rate based on Taylors rule of thumb, is estimated at approximately 3.8 Mtpa (3.5 Mtonnes pa)
Annual Production Rate = 5 * Potential mining inventory 0.75
Annual production rate = 5 * (60.8 Mt) 0.75

Hermosa Property, Taylor Zn-Pb-Ag Deposit PEA Arizona Minerals Inc. 716027
amcconsultants.com 143
Most successful mines do not exceed 40 vertical metres/annum (vmpa). The deposit has approximately 80 kt/vm of mineralization this would support a production rate of approximately 3.5 Mtpa (3.2 Mtonnes pa).
AMC has completed a high level schedule of the mineralization production aimed at meeting the target production rate of 10,000 tons per day. Based on this production schedule, the targeted throughput of 3.6 Mtpa is achievable. AMC considers that this production rate is high for the deposit, however, given the potential to mine from multiple fronts on each level as well as over multiple levels at a time. For this study AMC has scheduled production at a rate of 3.6 Mtpa.
Underground development
Underground layouts were prepared for the shaft and decline design layout and the development quantities determined by type for cost estimation and scheduling. A typical level design is shown in Figure 16.7 for the 3140 L and Figure 16.8 for the complete mine design.
Figure 16.7 Design layout for the 3140 L (Plan view)
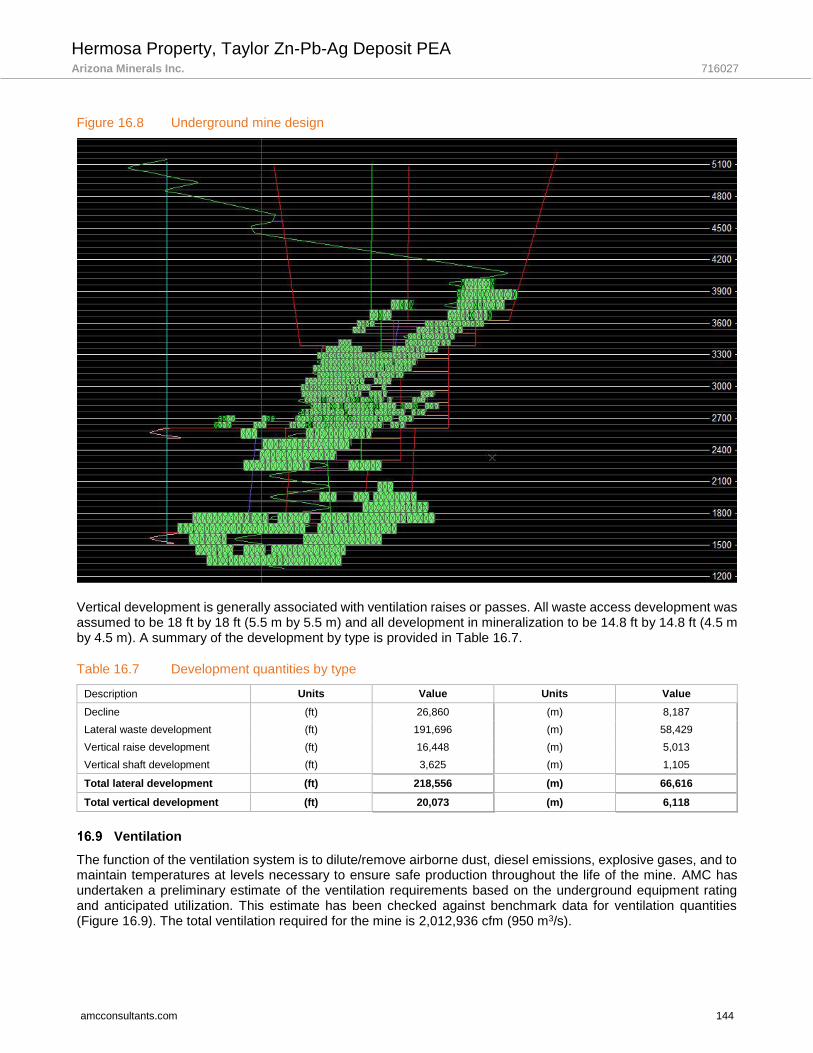
Hermosa Property, Taylor Zn-Pb-Ag Deposit PEA Arizona Minerals Inc. 716027
amcconsultants.com 144
Figure 16.8 Underground mine design
Vertical development is generally associated with ventilation raises or passes. All waste access development was assumed to be 18 ft by 18 ft (5.5 m by 5.5 m) and all development in mineralization to be 14.8 ft by 14.8 ft (4.5 m by 4.5 m). A summary of the development by type is provided in Table 16.7.
Table 16.7 Development quantities by type
Description Units Value Units Value
Decline (ft) 26,860 (m) 8,187
Lateral waste development (ft) 191,696 (m) 58,429
Vertical raise development (ft) 16,448 (m) 5,013
Vertical shaft development (ft) 3,625 (m) 1,105
Total lateral development (ft) 218,556 (m) 66,616
Total vertical development (ft) 20,073 (m) 6,118
Ventilation
The function of the ventilation system is to dilute/remove airborne dust, diesel emissions, explosive gases, and to maintain temperatures at levels necessary to ensure safe production throughout the life of the mine. AMC has undertaken a preliminary estimate of the ventilation requirements based on the underground equipment rating and anticipated utilization. This estimate has been checked against benchmark data for ventilation quantities (Figure 16.9). The total ventilation required for the mine is 2,012,936 cfm (950 m3/s).

Hermosa Property, Taylor Zn-Pb-Ag Deposit PEA Arizona Minerals Inc. 716027
amcconsultants.com 145
Figure 16.9 Benchmark data for ventilation airflow requirements
The mine will be ventilated by a “Pull” or exhausting type ventilation system. That is, the primary mine ventilation fans will be located at the primary exhaust airways of the mine. Fresh air will enter each mine via the main intake airways with exhaust to the surface via dedicated return airways. Most production activities will require auxiliary fans and ducting with level airflows managed through regulators located at raise accesses.
Intake air will be provided via the 21 ft (6.5 m) diameter shaft, the decline and one fresh air raise 18 ft (5.5 m) in diameter. Air will be exhausted via three return air raises that are 14.8 ft (4.5 m) in diameter.
16.9.1 Fan Selection
Fan sizing estimate was based on:
• Raise diameter and length
• Maximum raise airflow
• Estimated frictional resistance assuming raisebore development
• Estimated fan efficiencies
Table 16.7 shows the primary fan requirements.
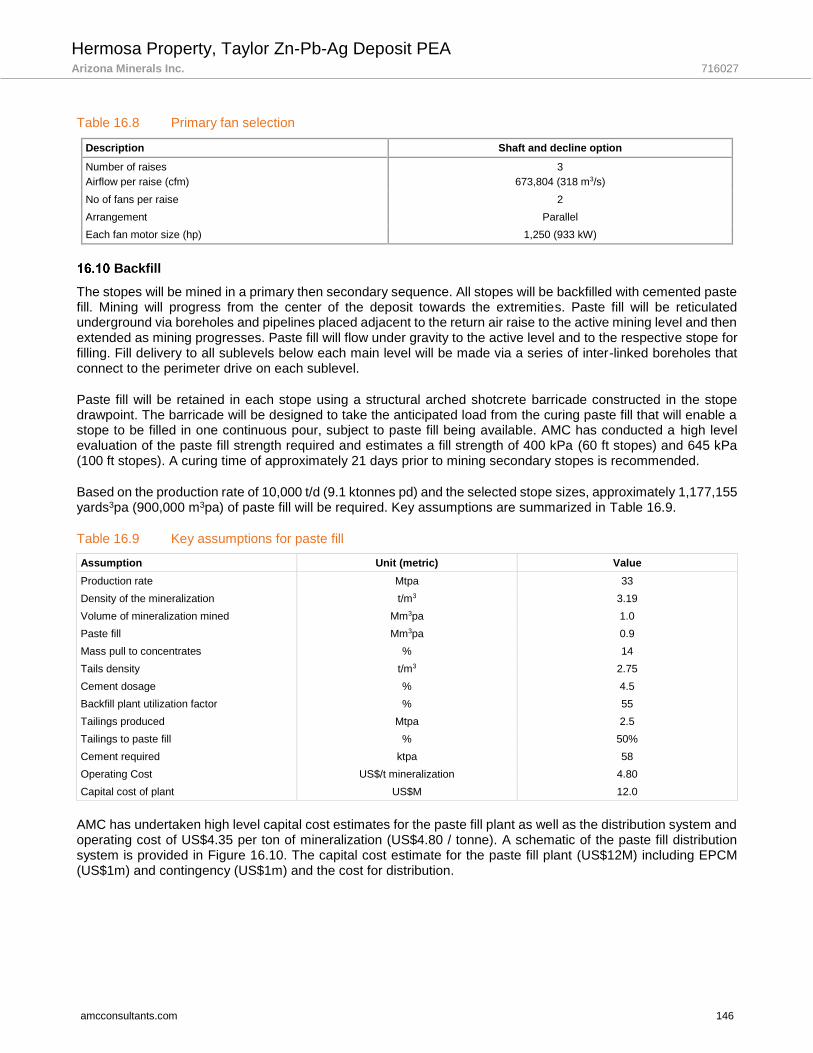
Hermosa Property, Taylor Zn-Pb-Ag Deposit PEA Arizona Minerals Inc. 716027
amcconsultants.com 146
Table 16.8 Primary fan selection
Description Shaft and decline option
Number of raises
Airflow per raise (cfm)
3
673,804 (318 m3/s)
No of fans per raise 2
Arrangement Parallel
Each fan motor size (hp) 1,250 (933 kW)
Backfill
The stopes will be mined in a primary then secondary sequence. All stopes will be backfilled with cemented paste fill. Mining will progress from the center of the deposit towards the extremities. Paste fill will be reticulated underground via boreholes and pipelines placed adjacent to the return air raise to the active mining level and then extended as mining progresses. Paste fill will flow under gravity to the active level and to the respective stope for filling. Fill delivery to all sublevels below each main level will be made via a series of inter-linked boreholes that connect to the perimeter drive on each sublevel.
Paste fill will be retained in each stope using a structural arched shotcrete barricade constructed in the stope drawpoint. The barricade will be designed to take the anticipated load from the curing paste fill that will enable a stope to be filled in one continuous pour, subject to paste fill being available. AMC has conducted a high level evaluation of the paste fill strength required and estimates a fill strength of 400 kPa (60 ft stopes) and 645 kPa (100 ft stopes). A curing time of approximately 21 days prior to mining secondary stopes is recommended.
Based on the production rate of 10,000 t/d (9.1 ktonnes pd) and the selected stope sizes, approximately 1,177,155 yards3pa (900,000 m3pa) of paste fill will be required. Key assumptions are summarized in Table 16.9.
Table 16.9 Key assumptions for paste fill
Assumption Unit (metric) Value
Production rate Mtpa 33
Density of the mineralization t/m3 3.19
Volume of mineralization mined Mm3pa 1.0
Paste fill Mm3pa 0.9
Mass pull to concentrates % 14
Tails density t/m3 2.75
Cement dosage % 4.5
Backfill plant utilization factor % 55
Tailings produced Mtpa 2.5
Tailings to paste fill % 50%
Cement required ktpa 58
Operating Cost US$/t mineralization 4.80
Capital cost of plant US$M 12.0
AMC has undertaken high level capital cost estimates for the paste fill plant as well as the distribution system and operating cost of US$4.35 per ton of mineralization (US$4.80 / tonne). A schematic of the paste fill distribution system is provided in Figure 16.10. The capital cost estimate for the paste fill plant (US$12M) including EPCM (US$1m) and contingency (US$1m) and the cost for distribution.
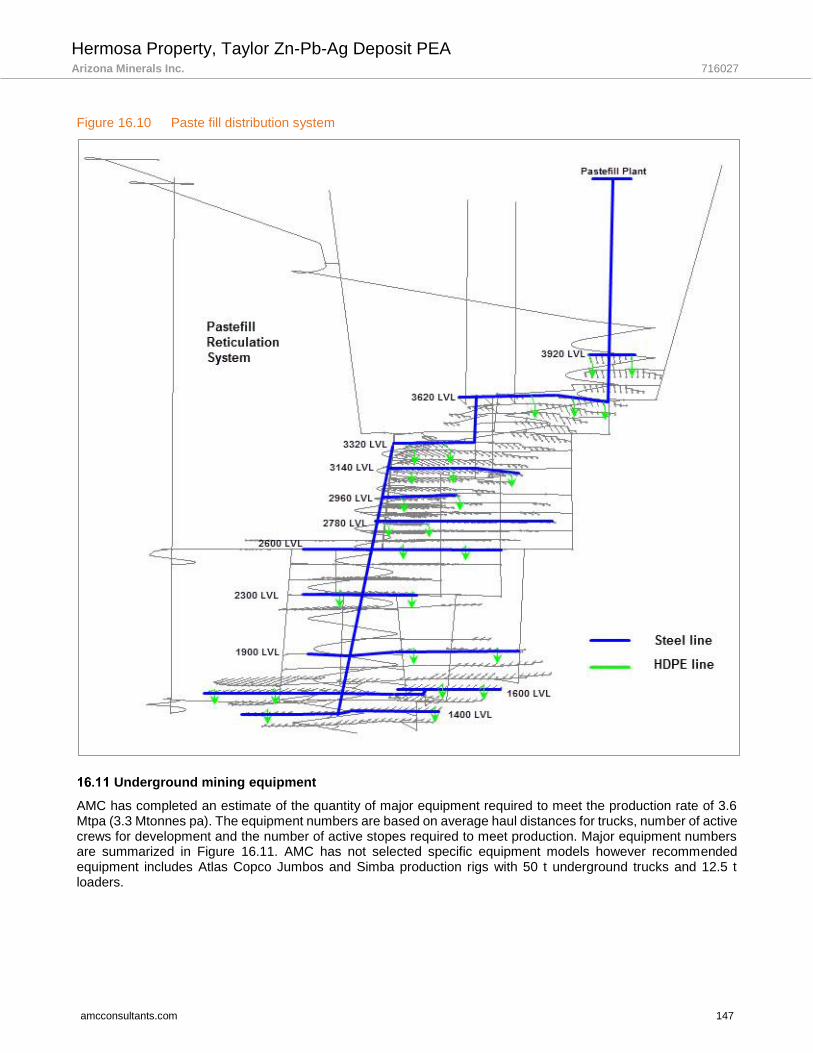
Hermosa Property, Taylor Zn-Pb-Ag Deposit PEA Arizona Minerals Inc. 716027
amcconsultants.com 147
Figure 16.10 Paste fill distribution system
Underground mining equipment
AMC has completed an estimate of the quantity of major equipment required to meet the production rate of 3.6 Mtpa (3.3 Mtonnes pa). The equipment numbers are based on average haul distances for trucks, number of active crews for development and the number of active stopes required to meet production. Major equipment numbers are summarized in Figure 16.11. AMC has not selected specific equipment models however recommended equipment includes Atlas Copco Jumbos and Simba production rigs with 50 t underground trucks and 12.5 t loaders.
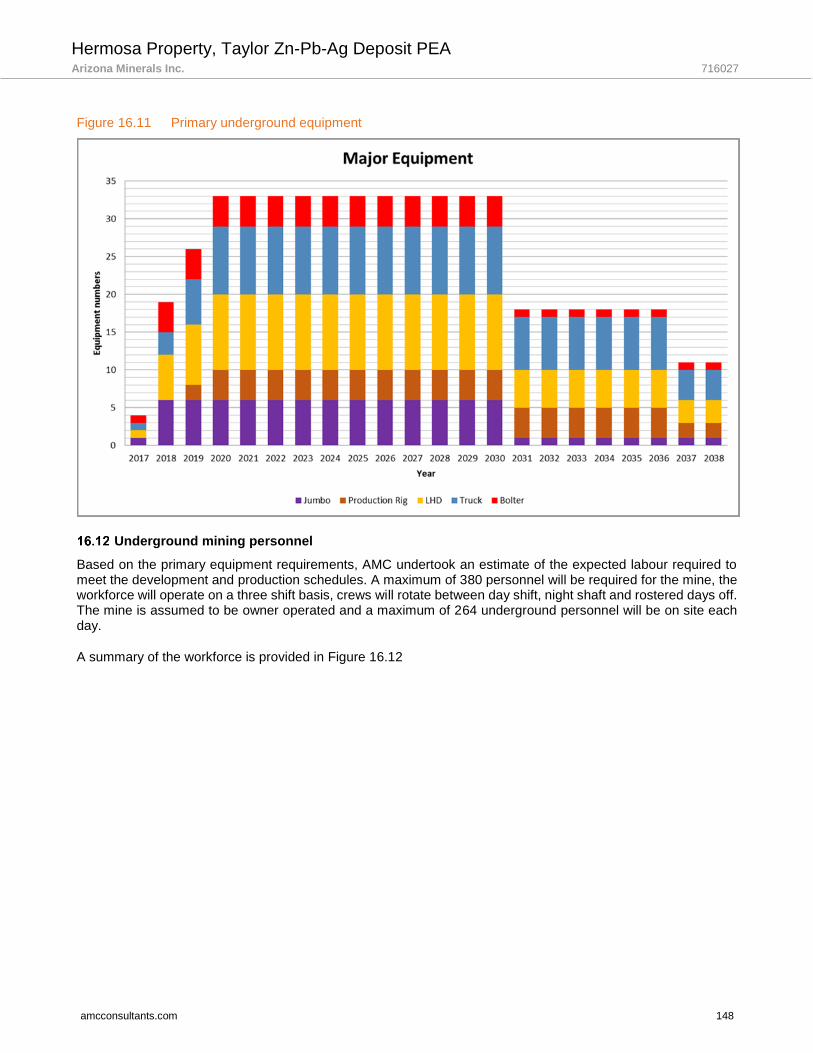
Hermosa Property, Taylor Zn-Pb-Ag Deposit PEA Arizona Minerals Inc. 716027
amcconsultants.com 148
Figure 16.11 Primary underground equipment
Underground mining personnel
Based on the primary equipment requirements, AMC undertook an estimate of the expected labour required to meet the development and production schedules. A maximum of 380 personnel will be required for the mine, the workforce will operate on a three shift basis, crews will rotate between day shift, night shaft and rostered days off. The mine is assumed to be owner operated and a maximum of 264 underground personnel will be on site each day.
A summary of the workforce is provided in Figure 16.12
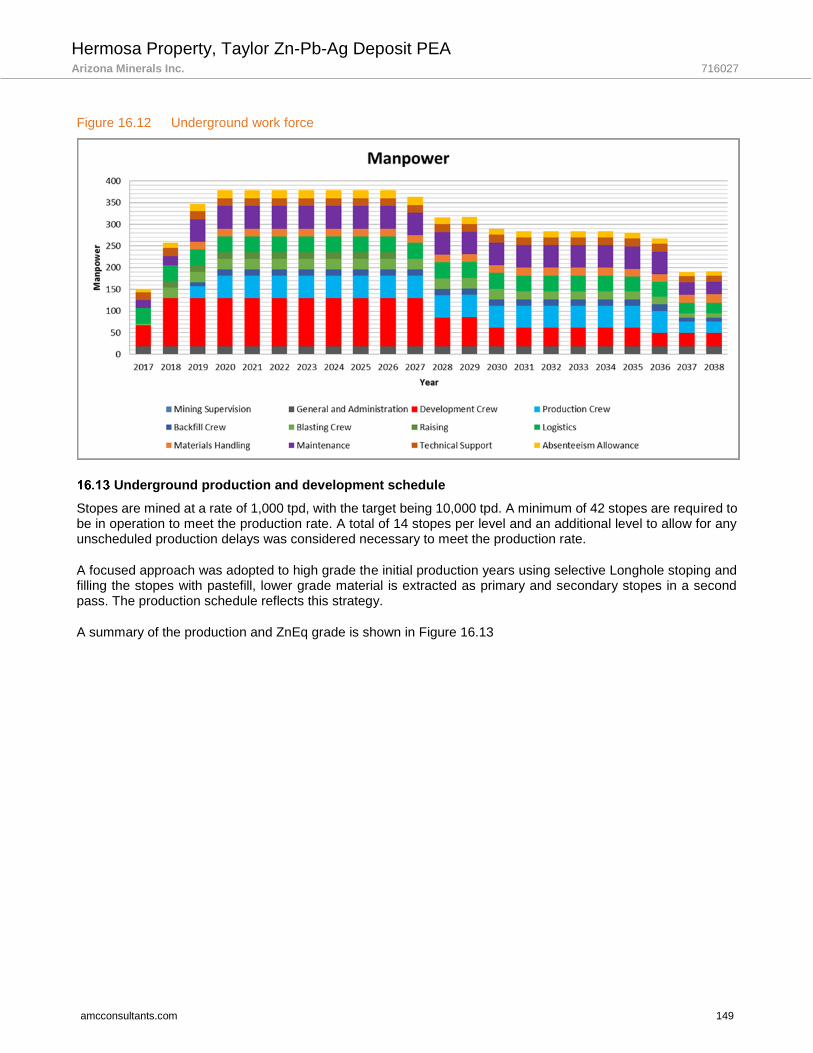
Hermosa Property, Taylor Zn-Pb-Ag Deposit PEA Arizona Minerals Inc. 716027
amcconsultants.com 149
Figure 16.12 Underground work force
Underground production and development schedule
Stopes are mined at a rate of 1,000 tpd, with the target being 10,000 tpd. A minimum of 42 stopes are required to be in operation to meet the production rate. A total of 14 stopes per level and an additional level to allow for any unscheduled production delays was considered necessary to meet the production rate.
A focused approach was adopted to high grade the initial production years using selective Longhole stoping and filling the stopes with pastefill, lower grade material is extracted as primary and secondary stopes in a second pass. The production schedule reflects this strategy.
A summary of the production and ZnEq grade is shown in Figure 16.13
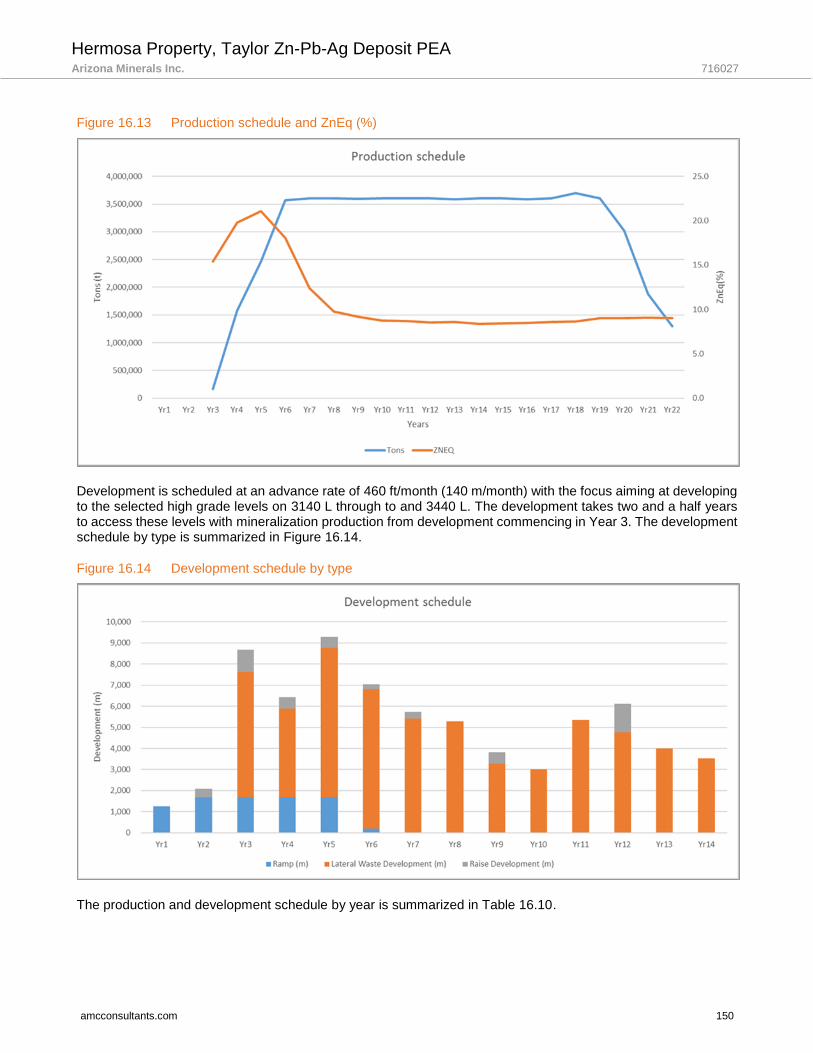
Hermosa Property, Taylor Zn-Pb-Ag Deposit PEA Arizona Minerals Inc. 716027
amcconsultants.com 150
Figure 16.13 Production schedule and ZnEq (%)
Development is scheduled at an advance rate of 460 ft/month (140 m/month) with the focus aiming at developing to the selected high grade levels on 3140 L through to and 3440 L. The development takes two and a half years to access these levels with mineralization production from development commencing in Year 3. The development schedule by type is summarized in Figure 16.14.
Figure 16.14 Development schedule by type
The production and development schedule by year is summarized in Table 16.10.

Hermosa Property, Taylor Zn-Pb-Ag Deposit PEA Arizona Minerals Inc. 716027
amcconsultants.com 151
Table 16.10 Production and development schedule
Yr1 Yr2 Yr3 Yr4 Yr5 Yr6 Yr7 Yr8 Yr9 Yr10 Yr11 Yr12
Tons 0 0 162,258 1,575,443 2,464,614 3,567,052 3,600,669 3,600,184 3,596,207 3,600,214 3,600,271 3,606,800
ZnEq 0.00 0.00 15.41 19.78 21.09 18.06 12.39 9.79 9.20 8.73 8.67 8.52
Ag 0.00 0.00 2.42 2.75 2.89 2.68 1.93 1.52 1.43 1.38 1.38 1.47
Pb 0.00 0.00 6.02 7.39 7.88 6.93 4.85 3.67 3.56 3.48 3.58 3.70
Zn 0.00 0.00 7.13 9.89 10.61 8.71 5.79 4.75 4.35 4.00 3.85 3.49
Ramp (m) 1,260 1,680 1,678 1,691 1,680 197 0 0 0 0 0 0
Level (m) 0 0 5,933 4,190 7,078 6,610 5,418 5,287 3,277 3,014 5,345 4,756
Raise (m) 0 402 1,071 552 531 240 312 0 549 0 0 1,356
Shaft (m) 274 274 274 282 0 0 0 0 0 0 0 0
Waste (tons) 143,094 199,933 765,632 586,136 813,655 624,207 502,562 475,973 321,021 271,369 481,215 492,359
Pastefill (tons) 0 0 73,746 716,039 1,120,167 1,621,225 1,636,504 1,636,284 1,634,476 1,636,297 1,636,323 1,639,291
Yr13 Yr14 Yr15 Yr16 Yr17 Yr18 Yr19 Yr20 Yr21 Yr22 Yr23 Totals
Tons 3,589,042 3,600,457 3,606,405 3,585,426 3,600,191 3,694,689 3,600,618 3,018,929 1,879,970 1,296,723 60,846,161
ZnEq 8.60 8.36 8.41 8.48 8.59 8.67 8.99 9.00 9.06 9.03 10.34
Ag 1.55 1.52 1.50 1.65 1.59 1.63 1.63 1.63 1.62 1.54 1.71
Pb 3.84 3.73 3.74 3.93 4.07 3.96 4.04 4.07 3.96 3.92 4.31
Zn 3.36 3.26 3.31 3.06 3.09 3.07 3.26 3.26 3.30 3.51 4.43
Ramp (m) 0 0 0 0 0 0 0 0 0 0 8,187
Level (m) 3,997 3,523 0 0 0 0 0 0 0 0 58,429
Raise (m) 0 0 0 0 0 0 0 0 0 0 5,013
Shaft (m) 0 0 0 0 0 0 0 0 0 0 1,105
Waste (tons) 359,841 317,224 0 0 0 0 0 0 0 0 6,354,221
Pastefill (tons) 1,631,220 1,636,408 1,639,111 1,629,576 1,636,287 1,679,236 1,636,481 1,372,103 854,446 589,361 27,654,580
Hermosa Property, Taylor Zn-Pb-Ag Deposit PEA Arizona Minerals Inc. 716027
amcconsultants.com 152
16.13.1 Proposed underground infrastructure
The proposed underground mine services will include a small maintenance shop for minor and urgent repairs, fuel and lubricant storage, and a small explosives magazine.
Compressed air will be supplied by mobile electric compressors. The compressors will be relocated to active mining levels as needed.
During development the decline will be equipped with power for distribution underground as well as a three inch pipeline for mine service water and a four inch pipeline for dewatering. Telecommunications will be provided by a conventional leaky feeder system.
Hermosa Property, Taylor Zn-Pb-Ag Deposit PEA Arizona Minerals Inc. 716027
amcconsultants.com 153
17 Recovery methods
Introduction
This section defines the process design criteria to be applied to the crushing, grinding, flotation, and dewatering facilities for a 10,000 stpd (9,072 tonnes per day) lead, zinc and silver mineral processing facility for the Taylor Deposit, to be located 50 miles (80 km) southeast of Tucson, Arizona, and 8 miles (13 km) north of the USA border with Mexico.
The crushing plant will process the run-of-mine (ROM) material by using a primary jaw crusher to reduce the material from a nominal 20 inch to a 100% Passing (P100) of 243 mm (P80 of 117 mm).
The grinding circuit will be a semi-autogenous (SAG) mill - ball mill grinding circuit with subsequent processing in a flotation circuit. The SAG mill will operate in closed circuit with a vibrating screen. The ball mill will operate in closed circuit with hydrocyclones.
Cyclone overflow, the grinding circuit product, is fed to the flotation plant. The flotation plant will consist of lead and zinc flotation circuits. The lead flotation circuit will consist of rougher flotation and three-stage cleaner flotation. The zinc flotation circuit will consist of rougher flotation and two-stage cleaner flotation.
Both lead and zinc concentrates are thickened, filtered, and stored in concentrate storage facilities prior to loading onto trucks for shipment.
Zinc rougher flotation tailing will be the final tailing. Tailing thickener underflow will be pumped to a tailing filtration facility. After filtration, fifty percent (50%) of final tailing will be transferred to the backfill plant and the remainder will be transferred to a tailings storage facility (TSF).
Plant water stream types include: lead process water, zinc process water, fresh water, and potable water.
The overall flowsheet is shown in Figure 17.1.
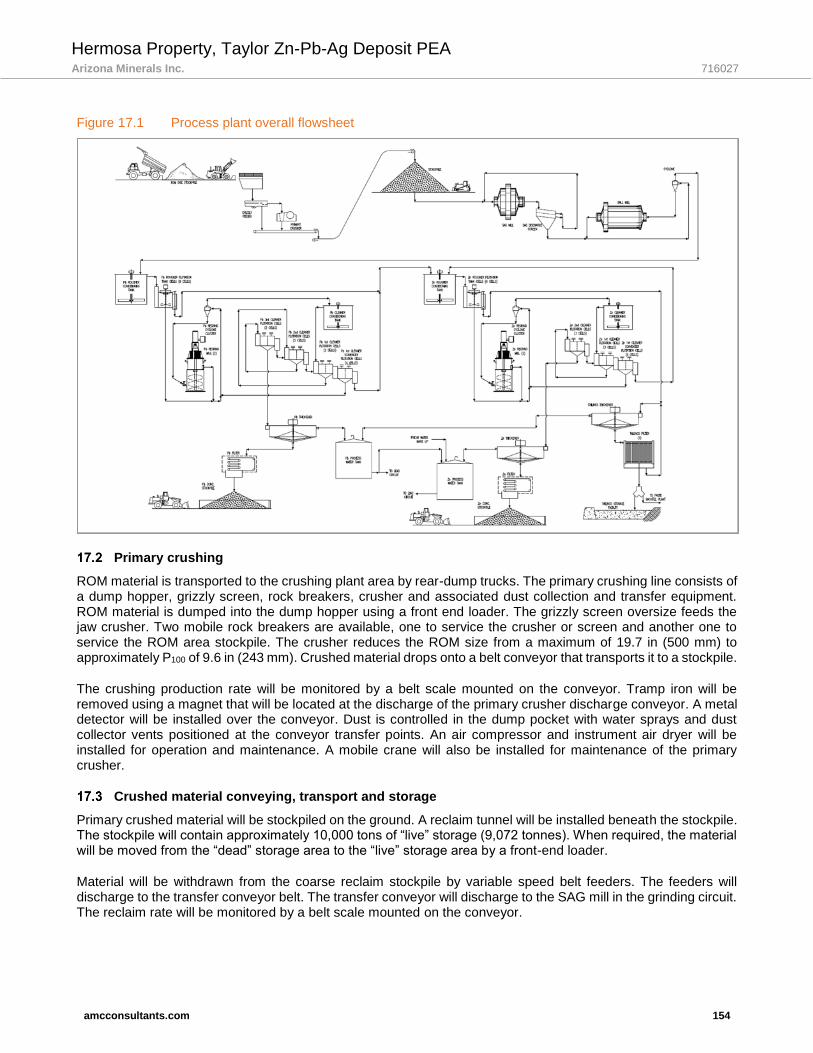
Hermosa Property, Taylor Zn-Pb-Ag Deposit PEA Arizona Minerals Inc. 716027
amcconsultants.com 154
Figure 17.1 Process plant overall flowsheet
Primary crushing
ROM material is transported to the crushing plant area by rear-dump trucks. The primary crushing line consists of a dump hopper, grizzly screen, rock breakers, crusher and associated dust collection and transfer equipment. ROM material is dumped into the dump hopper using a front end loader. The grizzly screen oversize feeds the jaw crusher. Two mobile rock breakers are available, one to service the crusher or screen and another one to service the ROM area stockpile. The crusher reduces the ROM size from a maximum of 19.7 in (500 mm) to approximately P100 of 9.6 in (243 mm). Crushed material drops onto a belt conveyor that transports it to a stockpile.
The crushing production rate will be monitored by a belt scale mounted on the conveyor. Tramp iron will be removed using a magnet that will be located at the discharge of the primary crusher discharge conveyor. A metal detector will be installed over the conveyor. Dust is controlled in the dump pocket with water sprays and dust collector vents positioned at the conveyor transfer points. An air compressor and instrument air dryer will be installed for operation and maintenance. A mobile crane will also be installed for maintenance of the primary crusher.
Crushed material conveying, transport and storage
Primary crushed material will be stockpiled on the ground. A reclaim tunnel will be installed beneath the stockpile. The stockpile will contain approximately 10,000 tons of “live” storage (9,072 tonnes). When required, the material will be moved from the “dead” storage area to the “live” storage area by a front-end loader.
Material will be withdrawn from the coarse reclaim stockpile by variable speed belt feeders. The feeders will discharge to the transfer conveyor belt. The transfer conveyor will discharge to the SAG mill in the grinding circuit. The reclaim rate will be monitored by a belt scale mounted on the conveyor.

Hermosa Property, Taylor Zn-Pb-Ag Deposit PEA Arizona Minerals Inc. 716027
amcconsultants.com 155
Dust control in the stockpile area will be achieved using a wet type dust collector system. One of the two dust collector systems will be installed to control dust at the discharge of the stockpile feed conveyor and another one will be installed to control dust in the reclaim tunnel.
Grinding and flash flotation
The mineralized material will be ground in a SAG mill primary grinding circuit and a ball mill secondary grinding circuit.
The SAG mill will operate in closed circuit with a vibrating screen. Water is added to the SAG mill to produce a slurry and the material feed size is reduced as it traverses the SAG mill. The SAG mill discharges onto a double deck screen with 8.0 mm sized bottom openings. Screen oversize is recirculated to the SAG mill feed chute by a series of conveyors. Screen undersize will flow by gravity to the cyclone feed pump box. A belt scale mounted on the recycle conveyor will monitor the SAG mill recycle rate. The target SAG grind is P80 of 2,178 microns.
Secondary grinding will be performed in a ball mill. The ball mill will operate in closed circuit with hydrocyclones. Ball mill discharge will be combined with vibrating screen undersize in the cyclone feed pump box and will be pumped to hydrocyclone clusters. Combined slurry will be pumped using variable speed horizontal centrifugal slurry pumps (one operating and one standby) to the cyclone clusters.
Hydrocyclone overflow (final grinding circuit product at 80% minus 105 microns) will flow by gravity to the tramp oversize screen positioned prior to the flotation circuit.
Cyclone overflow will be sampled by primary samplers and analysed by the lead and zinc on-stream analyser for metallurgical control prior to flotation. Cyclone overflow from the cyclone cluster will also be monitored for particle size distribution by a particle size monitor.
Zinc sulfate (ZnSO4) and sodium cyanide (NaCN) will be added into the ball mill.
Grinding balls will be added to the SAG mill and ball mill by ball loading systems. Air compressors and an instrument air dryer will provide service and instrument air for operations and maintenance. An overhead crane will be installed for maintenance of the grinding mills.
Lead flotation and regrind
Hydrocyclone overflow will flow by gravity to the lead flotation circuit. The lead flotation circuit will consist of one row of rougher cells and one row of cleaner cells. The rougher row will consist of eight (8) 1,766 ft3 (50 m3) tank type rougher flotation cells with a drop between each cell. The lead rougher concentrate will be sampled by a rougher concentrate primary sampler and pumped (one operating pump and one spare) to the lead regrind mill circuit. Reground lead rougher concentrate will flow by gravity from the lead cleaner conditioning tank to the lead first cleaner flotation cells. The lead cleaner row consists of eleven (11) flotation cells; two (2) 11 yard3 (8.5 m3) forced air first cleaner cell, four (4) 300 ft3 (8.5 m3) forced air first cleaner scavenger cells, three (3) 100 ft3 (2.8 m3) forced air second cleaner cells, and two (2) 100 ft3 (2.8 m3) forced air third cleaner cells. The lead first cleaner concentrate is pumped (one operating pump and one spare) into the second cleaner flotation cells. Lead rougher tailing and lead first cleaner scavenger tailing will flow by gravity into the zinc rougher conditioning tank. The lead second cleaner concentrate will be pumped to the lead third cleaner flotation cells. The lead third cleaner concentrate will flow by gravity to the lead concentrate thickener.
The concentrate samples cut by the samplers will be analysed for process control by the lead and zinc on-stream analyser. Tailing from rougher flotation cells and first cleaner scavenger cells will be combined together and sampled with primary samplers and analysed by the lead and zinc on-stream analyser.
Lead rougher concentrate will be pumped to the lead regrind cyclone feed pump box and combined with the regrind mill discharge. The combined slurry will be pumped using horizontal centrifugal slurry pumps (one operating and one spare) to a hydrocyclone cluster. Overflow from the regrind cyclone cluster (final regrind circuit product) will be sampled for particle size distribution analysis by the lead regrind cyclone particle size monitor. It

Hermosa Property, Taylor Zn-Pb-Ag Deposit PEA Arizona Minerals Inc. 716027
amcconsultants.com 156
will then be analysed by the lead and zinc on-stream analyser and flow by gravity to the lead cleaner conditioning tank. The cyclone underflow will flow by gravity to the lead regrind mill. Product from the regrind mill will report to the lead regrind cyclone feed pump box.
Air compressors, air receivers, and instrument air dryer will be installed for general plant operation and maintenance.
A bridge crane will be installed for maintenance of the flotation and regrind equipment.
Zinc flotation and regrind
Lead rougher tailing and lead first cleaner scavenger tailing will flow by gravity to a zinc rougher conditioning tank. The zinc flotation circuit will consist of one row of rougher cells and one row of cleaner cells. The rougher row will consist of eight (8) 1,766 ft3 tank type rougher flotation cells. The zinc rougher concentrate will be sampled by the zinc rougher concentrate primary sampler and pumped (one operating pump and one spare) to the zinc regrind mill circuit. The zinc cleaner row consists of fifteen (15) flotation cells; one bank of four (4) 300 ft3 (8.5 m3) forced air first cleaner flotation cells, eight (8) 300 ft3 (8.5 m3) forced air first cleaner scavenger flotation cells, and three (3) 100 ft3 (2.8 m3) forced air second cleaner flotation cells. Tailing from zinc rougher cells will flow by gravity to the tailing sample box, then to the tailing thickener.
Reground zinc rougher concentrate will flow by gravity from the zinc cleaner conditioning tank to the zinc first cleaner flotation cells. The zinc first cleaner concentrate will be pumped (one operating pump and one spare) into the zinc second cleaner flotation cell. The zinc secondary cleaner flotation concentrate will be pumped to the zinc concentrate thickener.
The concentrate samples cut by the samplers will be analysed for process control by the lead and zinc on-stream analyser. Tailing from rougher flotation cells and first cleaner scavenger cells will be sampled with primary samplers and analysed by the lead and zinc on-stream analyser.
Zinc rougher concentrate will be pumped to a zinc regrind hydrocyclone feed pump box and combined with the zinc regrind mill discharge. The combined slurry will be pumped using horizontal centrifugal slurry pumps (one operating and one spare) to the zinc regrind hydrocyclone cluster. Overflow from the zinc regrind cyclone cluster will be sampled by sampler for particle size distribution analysis by the zinc regrind cyclone particle size monitor. It will then be analysed by the lead and zinc on-stream analyser and flow by gravity to the zinc cleaner conditioning tank. The underflow will flow by gravity to the zinc regrind mill. Product from the regrind mill will report to the zinc regrind cyclone feed pump box.
Lead concentrate dewatering
Concentrate from the lead third cleaner flotation cells will be pumped to a lead concentrate thickener. The concentrate thickener overflow will be pumped back to the thickener feed for dilution and the thickener spray bar; to control froth, or to the lead process water tank. The concentrate thickener underflow will be pumped (one operating pump and one spare) to an agitated storage tank and then to a pressure filter. Filter cake will discharge to a covered stockpile.
Concentrates, both lead and zinc, will be reclaimed by front-end loader onto highway haulage trucks. A truck scale will be located near the concentrate load out area.
Zinc concentrate dewatering
Concentrate from the zinc secondary cleaner flotation cell will be pumped to a zinc concentrate thickener. The concentrate thickener overflow will be pumped back to the thickener feed for dilution and the thickener spray bar; to control froth, or to the zinc process water tank. The concentrate thickener underflow will be pumped to an agitated storage tank and then to a pressure filter. Filter cake will discharge to a covered stockpile.

Hermosa Property, Taylor Zn-Pb-Ag Deposit PEA Arizona Minerals Inc. 716027
amcconsultants.com 157
Tailing dewatering
Tailings from the zinc rougher flotation will flow by gravity and be distributed to a high rate tailings thickener. Thickener overflow will flow by gravity from the tailings thickener overflow tank to the process water tank. Thickener underflow will be pumped by variable speed horizontal centrifugal slurry pumps (one operating and one stand-by) to the tailing filter feed tank.
Tailings slurry will be pumped from the tailing filter feed tank by horizontal centrifugal pumps to feed slurry to five (5) tailing filters (four filters will normally be in operation with one (1) filter on stand-by.) Tailing filter cake from the filters will discharge to a series of conveyor belts. After filtration, fifty percent (50%) of final tailing will be transferred to backfill plant and the remainder will be discharged to a mobile/stacking conveyor system to build dry stack tailings.
Filtrate will flow by gravity to a filtrate surge tank. The filtrate transfer pumps (one operating and one stand-by) will return filtrate from the filtrate surge tank to the tailing thickener distribution box.
Tailing deposition
Damp tailings from the tailings filters will be transported to a tailings disposal area. Dry tailings will be delivered by conveyors and placed behind a dry tailings buttress with a radial stacker similar to that used for some heap leach operations. A dozer will be used to spread the dry tailings and provide sufficient compaction for trafficability of the conveyors and stacker. The active stacking area will be limited to minimize dust and erosion.
Advantages of the dry tailings disposal over conventional tailings disposal is that it eliminates the need for an engineered embankment and seepage containment system, maximizes water conservation and minimizes water makeup requirements. Dry tailings disposal also results in a very compact site and limited ground disturbance.
Reagents
Reagents requiring receiving, handling, mixing, and distribution systems include:
• Sodium cyanide (NaCN)
• Zinc sulfate (ZnSO4·7H2O)
• Aerofloat 242 (promoter)
• Carboxymethyl cellulose (CMC)
• Copper sulfate (CuSO4·5H2O)
• Sodium isopropyl xanthate (SIPX)
• Methyl isobutyl carbinol (MIBC, frother)
• Flocculant
• Lime
Water system
17.12.1 Fresh water
Fresh water will be supplied from wells located on the property. Fresh water from the wells will be pumped to a fresh water tank (also used for fire suppression). The fresh water distribution system provides fresh water for process requirements such as process water makeup, reagent mixing and gland water. Controls will be installed to ensure flow to the process water system when the raw water system is operating. From the fresh water tank, low pressure process water will flow to the systems that do not require high pressure. Booster pumps will be installed to provide high pressure water to the systems that require it; including pump gland water. Gland water is provided for sealing each pump without return. Pumps and control systems will be installed at the fresh water tank to provide pressure to the fire suppression system.

Hermosa Property, Taylor Zn-Pb-Ag Deposit PEA Arizona Minerals Inc. 716027
amcconsultants.com 158
17.12.2 Process water
17.12.2.1 Process water – lead circuit
The lead process water tank will receive overflow from the lead concentrate thickener, tailing thickener and water reclaimed from the tailing dam. The lead process water will be used as makeup water in the primary cyclone feed sump. Fresh water can be added to the lead process water tank if necessary. This lead process water is not suitable for general distribution throughout the process plant. Water is reclaimed from the tailing dam using reclaim water pumps mounted on floating barges.
17.12.2.2 Process water – zinc circuit
Overflow from the zinc concentrate thickener and lead process water excess overflow will be recycled to the zinc process water tank, and will be used as makeup water in the zinc flotation circuit. Fresh water can be added to the zinc process water tank.

Hermosa Property, Taylor Zn-Pb-Ag Deposit PEA Arizona Minerals Inc. 716027
amcconsultants.com 159
18 Project infrastructure
Surface infrastructure
The project is located approximately 8 miles (13 km) from Patagonia Arizona. The first 6 miles (10 km) of this road is paved and the last 2 miles (3 km) to the mine property is a dirt road. This road will require upgrading. A major rail hub is located approximately 15 miles (24 km) south, near the city of Nogales.There are also water wells on the property and an overhead electrical power line to the property. However, these will also need to be upgraded for the Hermosa project.
The following paragraphs discuss the proposed upgrades required for the proposed mining and processing equipment and associated infrastructure.
A general arrangement drawing of surface infrastructure is provided in Figure 18.1 and a detailed surface layout of the key infrastructure in Figure 18.2.
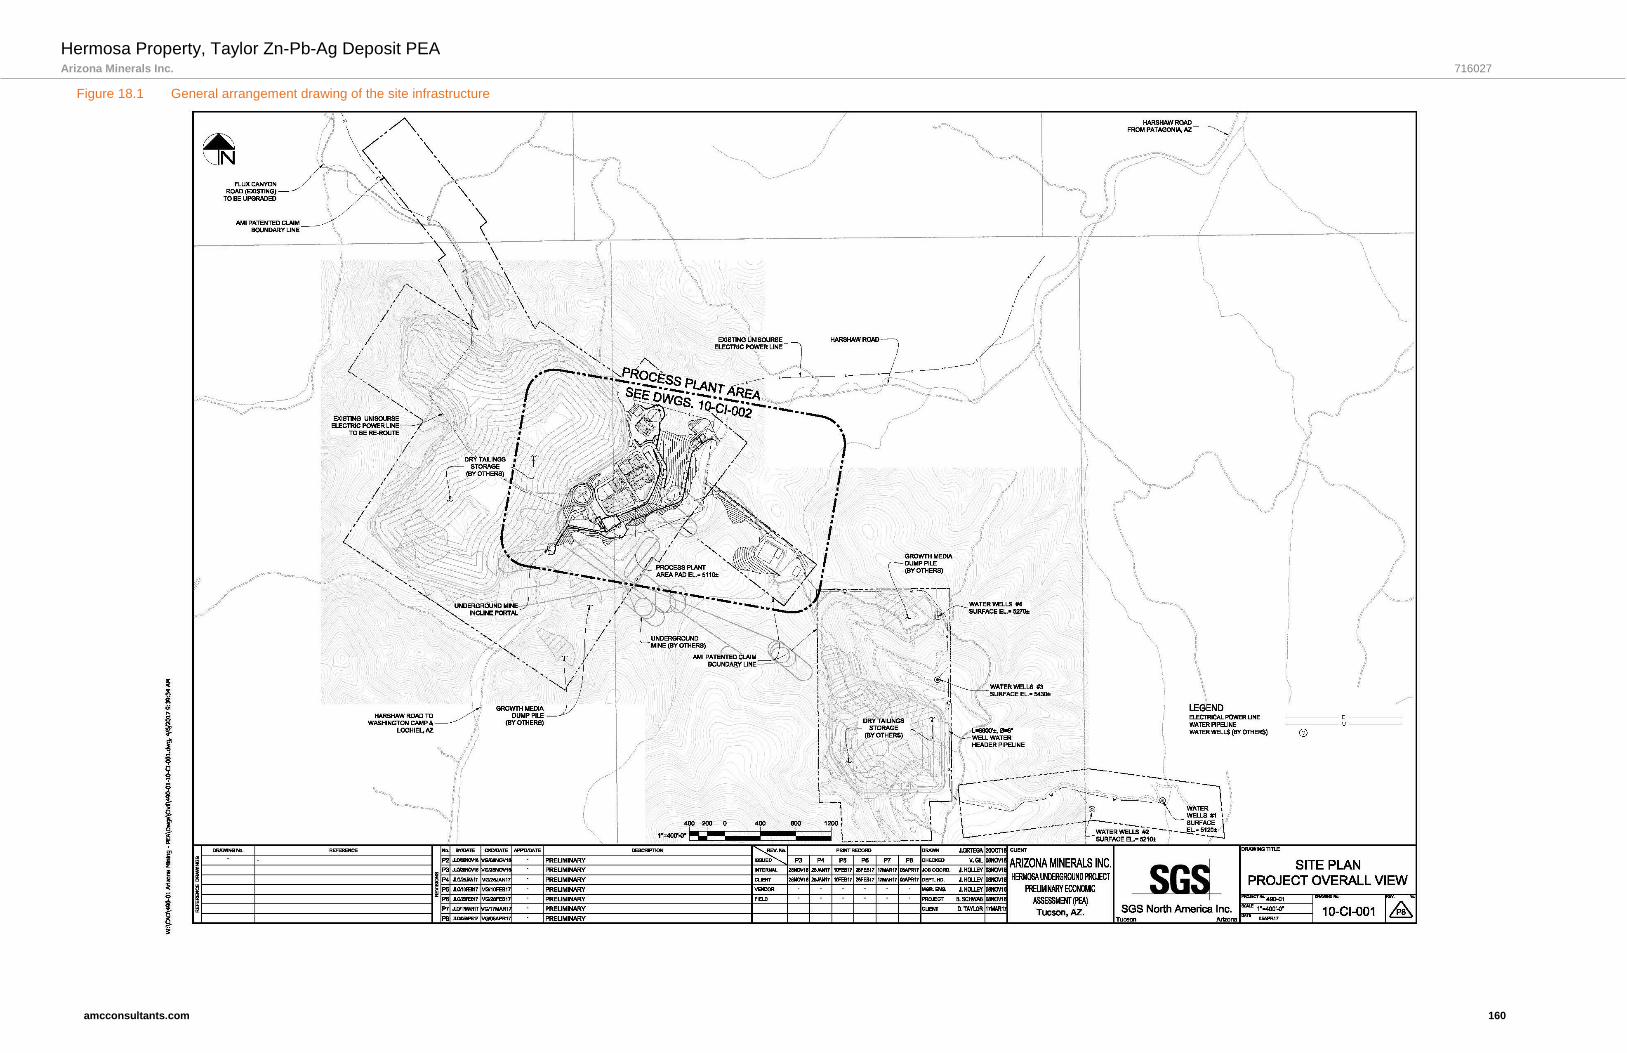
Hermosa Property, Taylor Zn-Pb-Ag Deposit PEA Arizona Minerals Inc. 716027
amcconsultants.com 160
Figure 18.1 General arrangement drawing of the site infrastructure

Hermosa Property, Taylor Zn-Pb-Ag Deposit PEA Arizona Minerals Inc. 716027
amcconsultants.com 161
Figure 18.2 Detailed surface drawing of key infrastructure
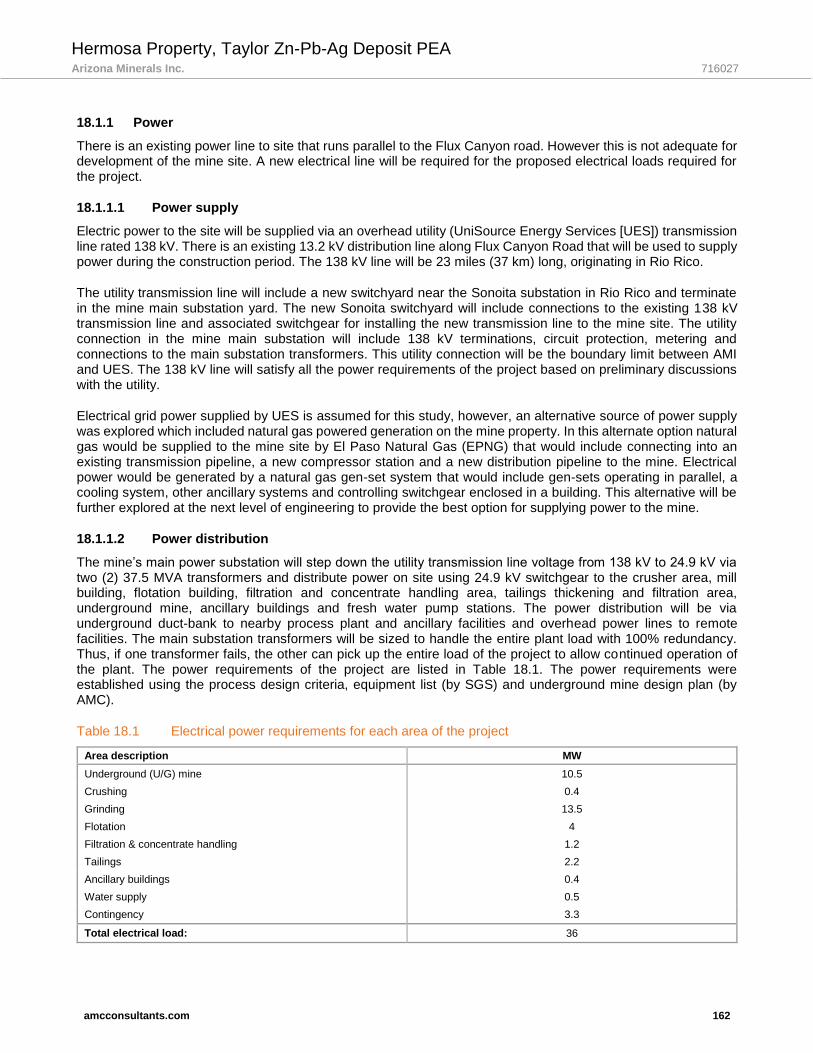
Hermosa Property, Taylor Zn-Pb-Ag Deposit PEA Arizona Minerals Inc. 716027
amcconsultants.com 162
18.1.1 Power
There is an existing power line to site that runs parallel to the Flux Canyon road. However this is not adequate for development of the mine site. A new electrical line will be required for the proposed electrical loads required for the project.
18.1.1.1 Power supply
Electric power to the site will be supplied via an overhead utility (UniSource Energy Services [UES]) transmission line rated 138 kV. There is an existing 13.2 kV distribution line along Flux Canyon Road that will be used to supply power during the construction period. The 138 kV line will be 23 miles (37 km) long, originating in Rio Rico.
The utility transmission line will include a new switchyard near the Sonoita substation in Rio Rico and terminate in the mine main substation yard. The new Sonoita switchyard will include connections to the existing 138 kV transmission line and associated switchgear for installing the new transmission line to the mine site. The utility connection in the mine main substation will include 138 kV terminations, circuit protection, metering and connections to the main substation transformers. This utility connection will be the boundary limit between AMI and UES. The 138 kV line will satisfy all the power requirements of the project based on preliminary discussions with the utility.
Electrical grid power supplied by UES is assumed for this study, however, an alternative source of power supply was explored which included natural gas powered generation on the mine property. In this alternate option natural gas would be supplied to the mine site by El Paso Natural Gas (EPNG) that would include connecting into an existing transmission pipeline, a new compressor station and a new distribution pipeline to the mine. Electrical power would be generated by a natural gas gen-set system that would include gen-sets operating in parallel, a cooling system, other ancillary systems and controlling switchgear enclosed in a building. This alternative will be further explored at the next level of engineering to provide the best option for supplying power to the mine.
18.1.1.2 Power distribution
The mine’s main power substation will step down the utility transmission line voltage from 138 kV to 24.9 kV via two (2) 37.5 MVA transformers and distribute power on site using 24.9 kV switchgear to the crusher area, mill building, flotation building, filtration and concentrate handling area, tailings thickening and filtration area, underground mine, ancillary buildings and fresh water pump stations. The power distribution will be via underground duct-bank to nearby process plant and ancillary facilities and overhead power lines to remote facilities. The main substation transformers will be sized to handle the entire plant load with 100% redundancy. Thus, if one transformer fails, the other can pick up the entire load of the project to allow continued operation of the plant. The power requirements of the project are listed in Table 18.1. The power requirements were established using the process design criteria, equipment list (by SGS) and underground mine design plan (by AMC).
Table 18.1 Electrical power requirements for each area of the project
Area description MW
Underground (U/G) mine 10.5
Crushing 0.4
Grinding 13.5
Flotation 4
Filtration & concentrate handling 1.2
Tailings 2.2
Ancillary buildings 0.4
Water supply 0.5
Contingency 3.3
Total electrical load: 36
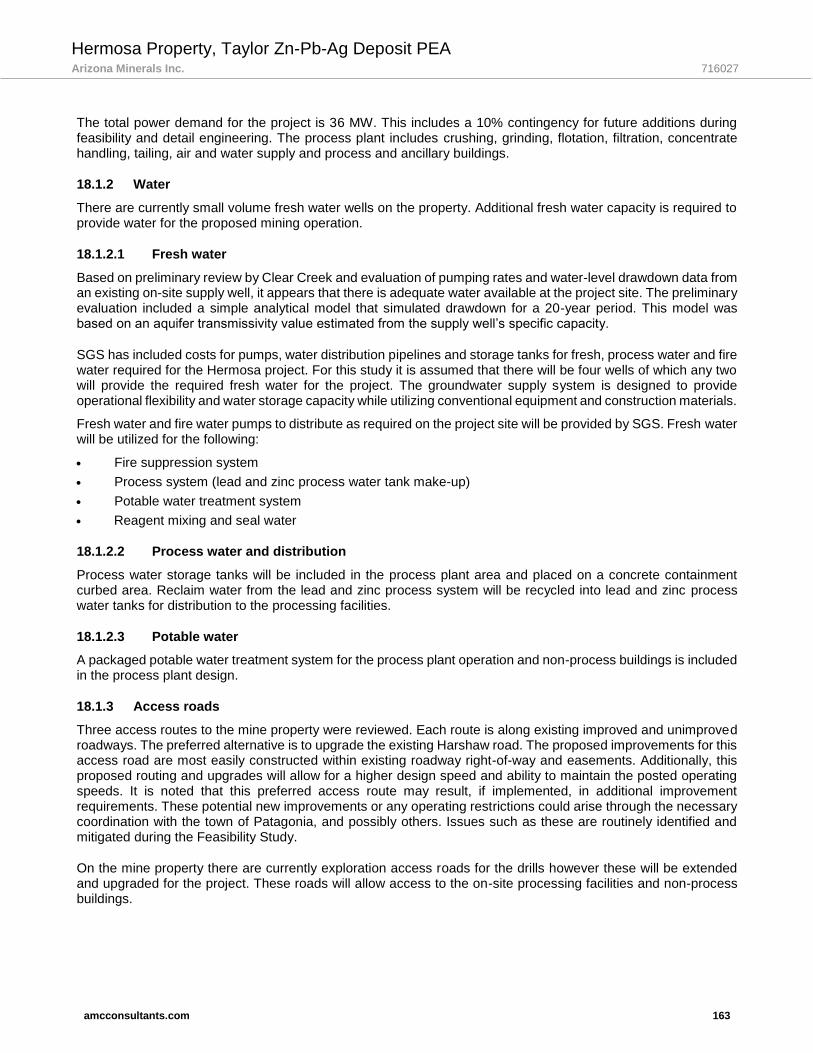
Hermosa Property, Taylor Zn-Pb-Ag Deposit PEA Arizona Minerals Inc. 716027
amcconsultants.com 163
The total power demand for the project is 36 MW. This includes a 10% contingency for future additions during feasibility and detail engineering. The process plant includes crushing, grinding, flotation, filtration, concentrate handling, tailing, air and water supply and process and ancillary buildings.
18.1.2 Water
There are currently small volume fresh water wells on the property. Additional fresh water capacity is required to provide water for the proposed mining operation.
18.1.2.1 Fresh water
Based on preliminary review by Clear Creek and evaluation of pumping rates and water-level drawdown data from an existing on-site supply well, it appears that there is adequate water available at the project site. The preliminary evaluation included a simple analytical model that simulated drawdown for a 20-year period. This model was based on an aquifer transmissivity value estimated from the supply well’s specific capacity.
SGS has included costs for pumps, water distribution pipelines and storage tanks for fresh, process water and fire water required for the Hermosa project. For this study it is assumed that there will be four wells of which any two will provide the required fresh water for the project. The groundwater supply system is designed to provide operational flexibility and water storage capacity while utilizing conventional equipment and construction materials.
Fresh water and fire water pumps to distribute as required on the project site will be provided by SGS. Fresh water will be utilized for the following:
• Fire suppression system
• Process system (lead and zinc process water tank make-up)
• Potable water treatment system
• Reagent mixing and seal water
18.1.2.2 Process water and distribution
Process water storage tanks will be included in the process plant area and placed on a concrete containment curbed area. Reclaim water from the lead and zinc process system will be recycled into lead and zinc process water tanks for distribution to the processing facilities.
18.1.2.3 Potable water
A packaged potable water treatment system for the process plant operation and non-process buildings is included in the process plant design.
18.1.3 Access roads
Three access routes to the mine property were reviewed. Each route is along existing improved and unimproved roadways. The preferred alternative is to upgrade the existing Harshaw road. The proposed improvements for this access road are most easily constructed within existing roadway right-of-way and easements. Additionally, this proposed routing and upgrades will allow for a higher design speed and ability to maintain the posted operating speeds. It is noted that this preferred access route may result, if implemented, in additional improvement requirements. These potential new improvements or any operating restrictions could arise through the necessary coordination with the town of Patagonia, and possibly others. Issues such as these are routinely identified and mitigated during the Feasibility Study.
On the mine property there are currently exploration access roads for the drills however these will be extended and upgraded for the project. These roads will allow access to the on-site processing facilities and non-process buildings.

Hermosa Property, Taylor Zn-Pb-Ag Deposit PEA Arizona Minerals Inc. 716027
amcconsultants.com 164
18.1.4 Process and associated buildings and structures
The following non-process buildings are included in the project:
• Core shed
• Mill change room
• Process area lunch rooms
• Warehouse
• Truck shop
• Truck wash area
• Maintenance shops
• Plant engineering building
• Assay laboratory
• Concrete batch plant
• Multi-purpose room / training room
• Infirmary / ambulance area
• Emergency generators
• Reagent storage
• Truck scale and guard gate
• Electrical substations
The following process buildings are included in the project:
• Grinding
• Flotation
• Concentrate filtering
• Tailings filter
• Lead and zinc concentrate storage / load out building
18.1.5 Process plant site development
During the study, various process plant site locations were considered and, as a result, the current process plant site adjacent to tailings impoundment was selected as the preferred location. The advantages of this plant site location are:
• The primary crusher was located adjacent to the mine shaft to minimize haulage.
• The crushed mineralization stockpile was located in a location to reduce the overland conveyor length.
• The primary crusher elevation was set to balance cuts versus fill, and to place the jaw crusher on cut. In addition the location was selected to minimize conveyor lengths to the coarse mineralization stockpile.
• The process facility was oriented to optimize the natural area sloping direction and cut and fill requirements.
• The fresh and firewater storage tank was located at an elevation to utilize gravity flow to the processing plant areas.
Preliminary geotechnical information was available for the recommended process plant site earthwork and depth to bedrock. Additional geotechnical investigations will need to be carried out for all major equipment locations prior to finalizing the process plant layout and location.

Hermosa Property, Taylor Zn-Pb-Ag Deposit PEA Arizona Minerals Inc. 716027
amcconsultants.com 165
18.1.6 Administration buildings and mine dry
The main buildings and offices are constructed and sited near the processing plant. Offices will be provided for all technical service and management personnel. A double storey structure with an equivalent 2,500 ft2 footprint is estimated for the mine buildings, offices, meeting rooms and change rooms. A 260 cap lamp station will be required for mine personnel. A mine dry with a maximum of 380 lockers will be required for the mine and 117 for the plant. It is assumed that the mill employees will have their own change facility.
18.1.7 Surface workshop
The underground mines will be supported by a centrally located maintenance facility near the offices, a workshop fitted with a storage warehouse. The maintenance workshop will consist of a pre-engineered steel structure placed on a slab cast on grade. The building will have three maintenance bays and one wash bay. The shop will be sufficient to handle major maintenance and repairs that will be needed by the underground mining operation. Smaller repairs and routine maintenance will be handled underground.
The maintenance shop will provide administration space and will be attached to the warehouse. Both structures will be fitted with sprinklers and fire alarms. The fire water pumps will be installed in the wash bay mechanical room.
The maintenance shop will be equipped with carbon monoxide detection equipment and for tools, and the maintenance asset management system, will also be provided. A waste oil storage facility will be placed near the shop.
The warehouse will provide enough inventory space for daily operations as well as for critical maintenance spares. Stock levels for routine and minor maintenance will be set at a one-week supply which will provide enough buffer given the direct access to the mine site and the proximity of local suppliers. Other major stock items for planned maintenance will be brought in via the main highway from Tucson, AZ.
18.1.8 Surface magazine
The mine is expected to be relatively dry and the primary explosive being used for development and stoping will be Ammonium Nitrate Fuel Oil (ANFO). The production blasting powder factor, not including slot raising, is 0.88 lb / ton (0.44 kg/tonne). The lateral development has a powder factor of 2.20 lb / ton (1.10 kg / tonne). At 10,000 tons / day, the average explosive consumption was determined to be 1,710 tons of ANFO in a year for all stoping and lateral development. This would require approximately 143 tons / month of explosives requiring 7 transport deliveries per month. Peak consumption is in Year 6 and the maximum quantity of explosives required is 2,460 tons per year, or 205 tons per month, requiring 10 transport deliveries per month.
The surface magazines should be placed in a remote location near the access road but away from main buildings and mine infrastructure. A fenced and gated facility will be required with suitable storage to meet requirements and separate storage facilities will be required for high explosives and detonators.
18.1.9 Surface mobile equipment
The mine will designate an emergency vehicle (ambulance) for evacuation to medical care via the access road. A fire truck will also be located near the ambulance. A vacuum truck, flat deck, and mechanics vehicles will also be required.
A telehandler and small forklift for moving equipment and supplies around the processing plant and warehouse will be required.
A small 38.6 ton (35 tonne) crane for maintenance tasks in the processing plant, surface handling, and other tasks can be procured with an operator on rent as needed for shutdown maintenance tasks. The low usage of such equipment would not necessitate having a permanent qualified operator on site.

Hermosa Property, Taylor Zn-Pb-Ag Deposit PEA Arizona Minerals Inc. 716027
amcconsultants.com 166
An 18.7 ton (17 tonne) LHD will be required to move mineralization from the shaft to the feeder apron of the primary crusher.
18.1.10 Accommodations
The work force will be encouraged to live near the mine and a daily bus service will be provided to drive them from Nogales, Sierra Vista and Tucson. There is no allowance for a mine camp on site. Kitchen facilities will be available for dispensing tea and coffee in the mine offices. AMC has estimated an underground workforce of a maximum of 380 personnel in addition there will be approximately 120 processing employees for a total of 500. The workforce will operate on a three-shift basis, one week night shift, one week day shift and one week rostered days off. It was assumed that the mine will be owner operated.
Fuel storage
Fuel storage will consist of two tanks that will have the capacity to support two months’ consumption at peak production. The tank system will be enclosed by a lined berm of sufficient capacity to contain 110% of the contents of a full tank in the event of a major leak or spillage. Fuel will be trucked to site on a year-round basis.
Tailings storage facilities (TSFs)
Two “dry stack” tailings storage facilities (TSF) have been designed and located on private land that is wholly owned by Arizona Minerals Inc. at the sites known as Trench Camp and Hermosa. The Trench Camp TSF was sized to contain historic tailings currently located on the Trench Camp site, tailings produced from the mineral recovery process and potentially acid generating (PAG) development rock. It was designed to be near the processing facilities for easy access and will be the first TSF to be constructed. The Hermosa TSF was developed to contain additional tailings and PAG development rock after the Trench Camp TSF is full. Both TSF’s have been designed with the capacity to hold approximately 15% more tailings tonnage than the currently design capacity identified herein to allow for additional storage should more mineralization be identified in later stages of the project development. A plan view of the Trench Camp and Hermosa overall site layout can be referenced on Figure 18.3. It should be noted that this figure depicts geometry of the TSF’s in that expanded case identified above.

Hermosa Property, Taylor Zn-Pb-Ag Deposit PEA Arizona Minerals Inc. 716027
amcconsultants.com 167
Figure 18.3 Tailings storage facilities
18.3.1 Tailings and development rock storage requirements
It is anticipated that the LOM mineralized material of 60.846 million tons (55.20 million tonnes) will produce 52.79 million tons (47.89 million tonnes) of tailings given 13.23% of the total tonnage processed will be removed as part of the mineral recovery process. After mineral recovery, it is estimated that 50% of the tailings will be utilized as paste backfill in the underground mine workings and the remaining 50% will be stored on the surface in the form of dry stack tailings. In addition to tailings, the mining process will create 6.35 million tons (5.76 million tonnes) of development rock.
Based on geologic data, approximately half of the development rock, 3.18 million tons (2.88 million tonnes), contains sulphide mineralization and as a result is currently classified as PAG rock. The remaining 3.18 million tons (2.88 million tonnes) is currently considered non-PAG rock and suitable as construction material. Geochemical analysis of the waste rock material will be carried out in more advanced stages of this project to better define waste characterization. The current plan is to co-mingle the PAG development rock with the dry stack tailings, thereby encapsulating the PAG material within the tailings. By encapsulation of the PAG development rock material in the fine grained dry stack tailings, oxygen and moisture ingress will be effectively cut off, which in turn will Minimize the potential for acid rock drainage.
Table 18.2 shows the amount of LOM mineralized material removed during mineral recovery, paste tailings used as mine backfill, filtered dry stack tailings placed within the two TSFs and development rock distribution.

Hermosa Property, Taylor Zn-Pb-Ag Deposit PEA Arizona Minerals Inc. 716027
amcconsultants.com 168
Table 18.2 LOM tailings and development rock distribution
Description Material quantity
(tons / tonnes)
Percentage
(%)
Tailings / development rock
(tons/tonnes)
Tailings produced during mineral recovery from mineralized material
60,846,000 tons LOM mineralized material
(55,200,000 tonnes) 86.77%
52,790,000 tons
(47,890,000 tonnes)
Paste tailings used as mine backfill 52,790,000 tons LOM tailings
(47,890,000 tonnes) 50.0%
26,400,000 tons
(23,950,000 tonnes)
Filtered tailings to be placed in dry stack TSFs
52,790,000 tons LOM tailings
(47,890,000 tonnes) 50.0%
26,400,000 tons
(23,950,000 tonnes)
Development rock (PAG) – Directed to TSFs
6,350,000 tons LOM development rock
(5,760,000 tonnes) 50.0%
3,180,000 tons
(2,880,000 tonnes)
Development rock (non-PAG) – Construction use
6,350,000 tons LOM development rock
(5,760,000 tonnes) 50.0%
3,180,000 tons
(2,880,000 tonnes)
18.3.2 Trench Camp existing tailings piles
Four historic tailings deposits containing tailings and waste rock (existing tailings piles 1 through 4) exist within the proposed Trench Camp TSF footprint (Figure 18.44). A geotechnical investigation was completed in January 2017 that consisted of borings, test pits and geophysical surveys which focused on the Trench Camp existing tailings piles 1 through 4, to define the tailings and waste rock volumes within each facility as well as determine tailings and waste rock material properties (sections are shown in Figure 18.55). Boreholes were placed along the geophysics lines in order to correlate known depths of the logged materials to seismic velocities. Using the depth of tailings and waste rock identified in the boreholes in combination with the velocities generated during the geophysical survey, a velocity band was identified that correlated with the bottom of the tailings and waste rock material within the existing tailings piles. The tailings depth data was used to estimate the volume of tailings and/or PAG waste rock within each pile. The estimated tailings and PAG waste rock volumes to be relocated onto the lined TSF are based on an in-situ density of 100 pcf (1.6 tonnes per cubic meter) and are presented in the Table 18.3.
Table 18.3 Trench Camp existing tailings piles volume estimates
Existing tailings piles Estimated volume (tons/tonnes)
1 312,000 tons (283,000 tonnes)
2 / 4 677,000 tons (614,000 tonnes)
3 223,000 tons (202,000 tonnes)
Total 1,212,000 tons (1,100,000 tonnes)
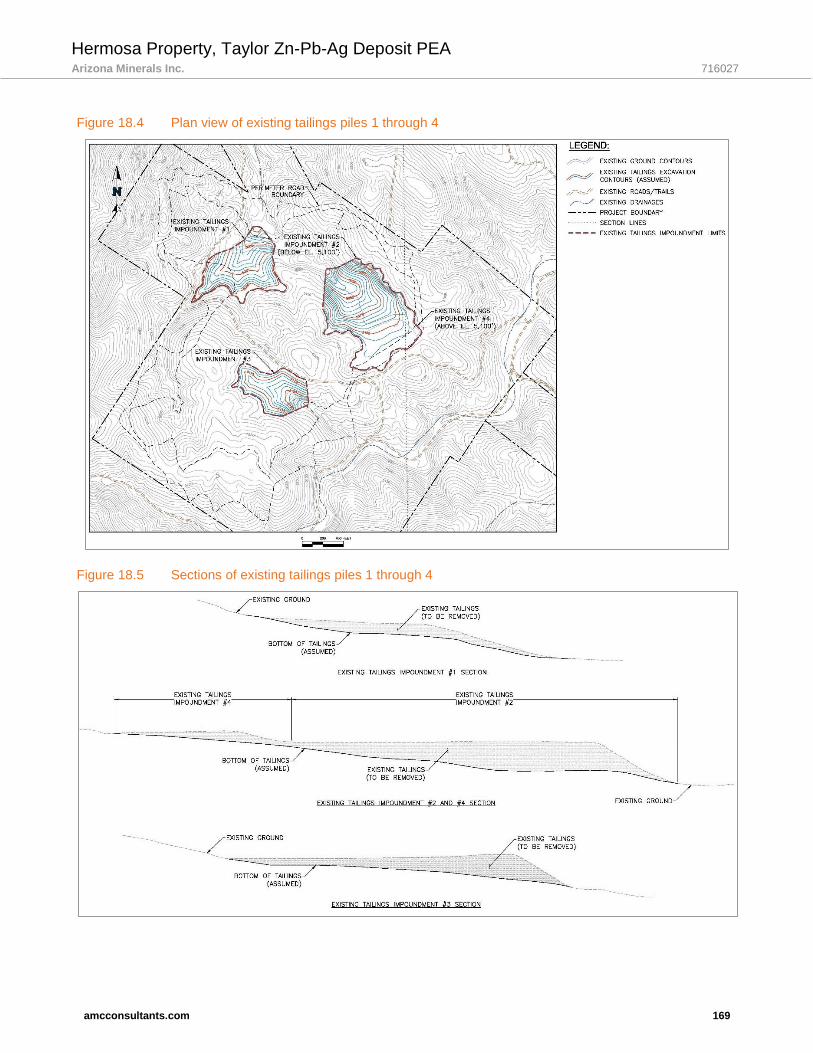
Hermosa Property, Taylor Zn-Pb-Ag Deposit PEA Arizona Minerals Inc. 716027
amcconsultants.com 169
Figure 18.4 Plan view of existing tailings piles 1 through 4
Figure 18.5 Sections of existing tailings piles 1 through 4
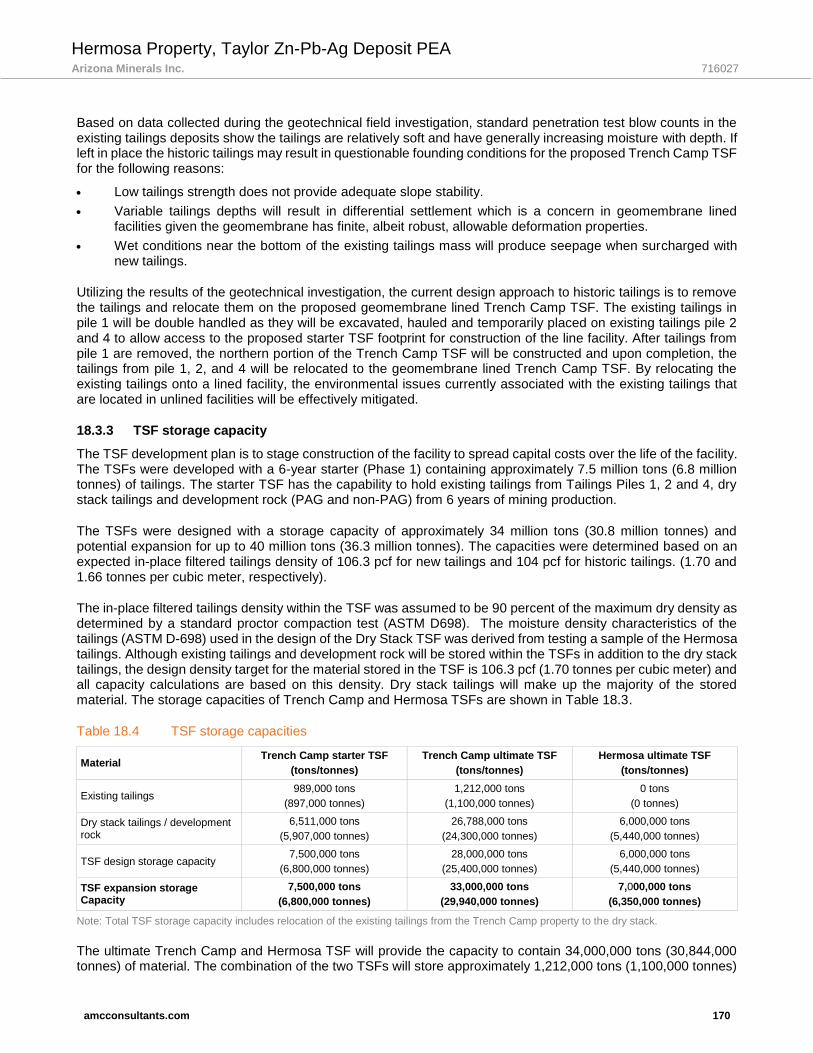
Hermosa Property, Taylor Zn-Pb-Ag Deposit PEA Arizona Minerals Inc. 716027
amcconsultants.com 170
Based on data collected during the geotechnical field investigation, standard penetration test blow counts in the existing tailings deposits show the tailings are relatively soft and have generally increasing moisture with depth. If left in place the historic tailings may result in questionable founding conditions for the proposed Trench Camp TSF for the following reasons:
• Low tailings strength does not provide adequate slope stability.
• Variable tailings depths will result in differential settlement which is a concern in geomembrane lined facilities given the geomembrane has finite, albeit robust, allowable deformation properties.
• Wet conditions near the bottom of the existing tailings mass will produce seepage when surcharged with new tailings.
Utilizing the results of the geotechnical investigation, the current design approach to historic tailings is to remove the tailings and relocate them on the proposed geomembrane lined Trench Camp TSF. The existing tailings in pile 1 will be double handled as they will be excavated, hauled and temporarily placed on existing tailings pile 2 and 4 to allow access to the proposed starter TSF footprint for construction of the line facility. After tailings from pile 1 are removed, the northern portion of the Trench Camp TSF will be constructed and upon completion, the tailings from pile 1, 2, and 4 will be relocated to the geomembrane lined Trench Camp TSF. By relocating the existing tailings onto a lined facility, the environmental issues currently associated with the existing tailings that are located in unlined facilities will be effectively mitigated.
18.3.3 TSF storage capacity
The TSF development plan is to stage construction of the facility to spread capital costs over the life of the facility. The TSFs were developed with a 6-year starter (Phase 1) containing approximately 7.5 million tons (6.8 million tonnes) of tailings. The starter TSF has the capability to hold existing tailings from Tailings Piles 1, 2 and 4, dry stack tailings and development rock (PAG and non-PAG) from 6 years of mining production.
The TSFs were designed with a storage capacity of approximately 34 million tons (30.8 million tonnes) and potential expansion for up to 40 million tons (36.3 million tonnes). The capacities were determined based on an expected in-place filtered tailings density of 106.3 pcf for new tailings and 104 pcf for historic tailings. (1.70 and 1.66 tonnes per cubic meter, respectively).
The in-place filtered tailings density within the TSF was assumed to be 90 percent of the maximum dry density as determined by a standard proctor compaction test (ASTM D698). The moisture density characteristics of the tailings (ASTM D-698) used in the design of the Dry Stack TSF was derived from testing a sample of the Hermosa tailings. Although existing tailings and development rock will be stored within the TSFs in addition to the dry stack tailings, the design density target for the material stored in the TSF is 106.3 pcf (1.70 tonnes per cubic meter) and all capacity calculations are based on this density. Dry stack tailings will make up the majority of the stored material. The storage capacities of Trench Camp and Hermosa TSFs are shown in Table 18.3.
Table 18.4 TSF storage capacities
Material Trench Camp starter TSF
(tons/tonnes)
Trench Camp ultimate TSF
(tons/tonnes)
Hermosa ultimate TSF
(tons/tonnes)
Existing tailings 989,000 tons
(897,000 tonnes)
1,212,000 tons
(1,100,000 tonnes)
0 tons
(0 tonnes)
Dry stack tailings / development rock
6,511,000 tons
(5,907,000 tonnes)
26,788,000 tons
(24,300,000 tonnes)
6,000,000 tons
(5,440,000 tonnes)
TSF design storage capacity 7,500,000 tons
(6,800,000 tonnes)
28,000,000 tons
(25,400,000 tonnes)
6,000,000 tons
(5,440,000 tonnes)
TSF expansion storage Capacity
7,500,000 tons
(6,800,000 tonnes)
33,000,000 tons
(29,940,000 tonnes)
7,000,000 tons
(6,350,000 tonnes)
Note: Total TSF storage capacity includes relocation of the existing tailings from the Trench Camp property to the dry stack.
The ultimate Trench Camp and Hermosa TSF will provide the capacity to contain 34,000,000 tons (30,844,000 tonnes) of material. The combination of the two TSFs will store approximately 1,212,000 tons (1,100,000 tonnes)
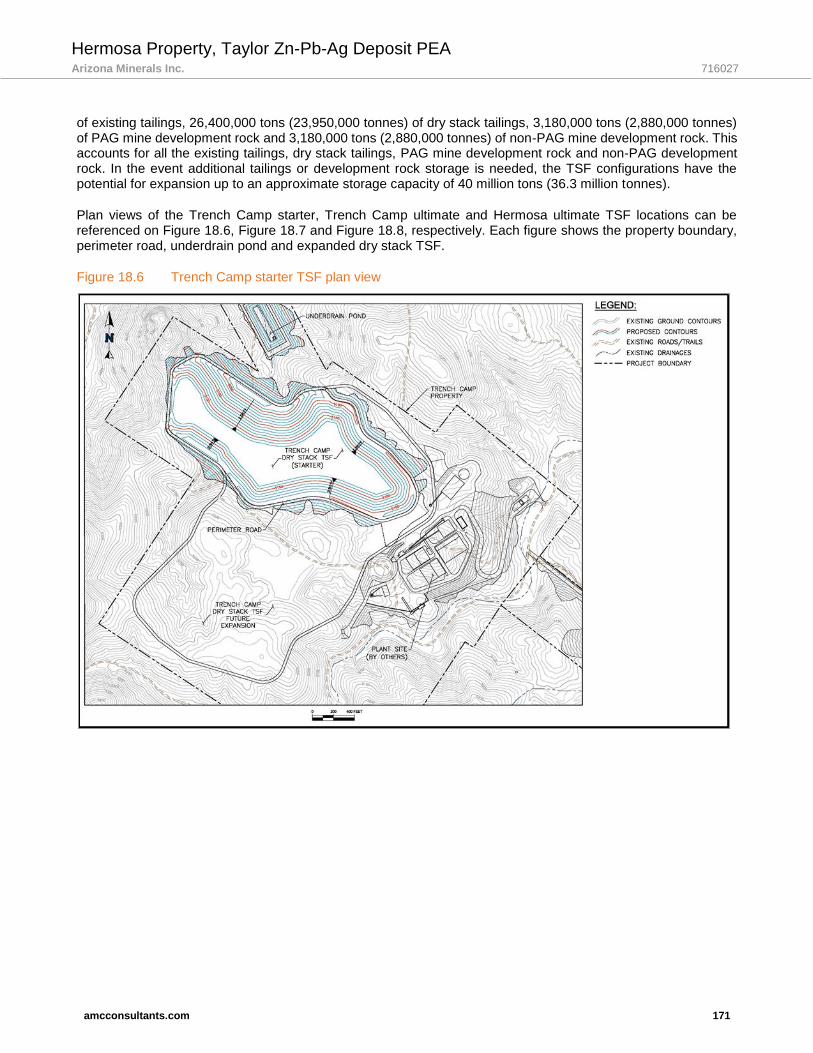
Hermosa Property, Taylor Zn-Pb-Ag Deposit PEA Arizona Minerals Inc. 716027
amcconsultants.com 171
of existing tailings, 26,400,000 tons (23,950,000 tonnes) of dry stack tailings, 3,180,000 tons (2,880,000 tonnes) of PAG mine development rock and 3,180,000 tons (2,880,000 tonnes) of non-PAG mine development rock. This accounts for all the existing tailings, dry stack tailings, PAG mine development rock and non-PAG development rock. In the event additional tailings or development rock storage is needed, the TSF configurations have the potential for expansion up to an approximate storage capacity of 40 million tons (36.3 million tonnes).
Plan views of the Trench Camp starter, Trench Camp ultimate and Hermosa ultimate TSF locations can be referenced on Figure 18.6, Figure 18.7 and Figure 18.8, respectively. Each figure shows the property boundary, perimeter road, underdrain pond and expanded dry stack TSF.
Figure 18.6 Trench Camp starter TSF plan view
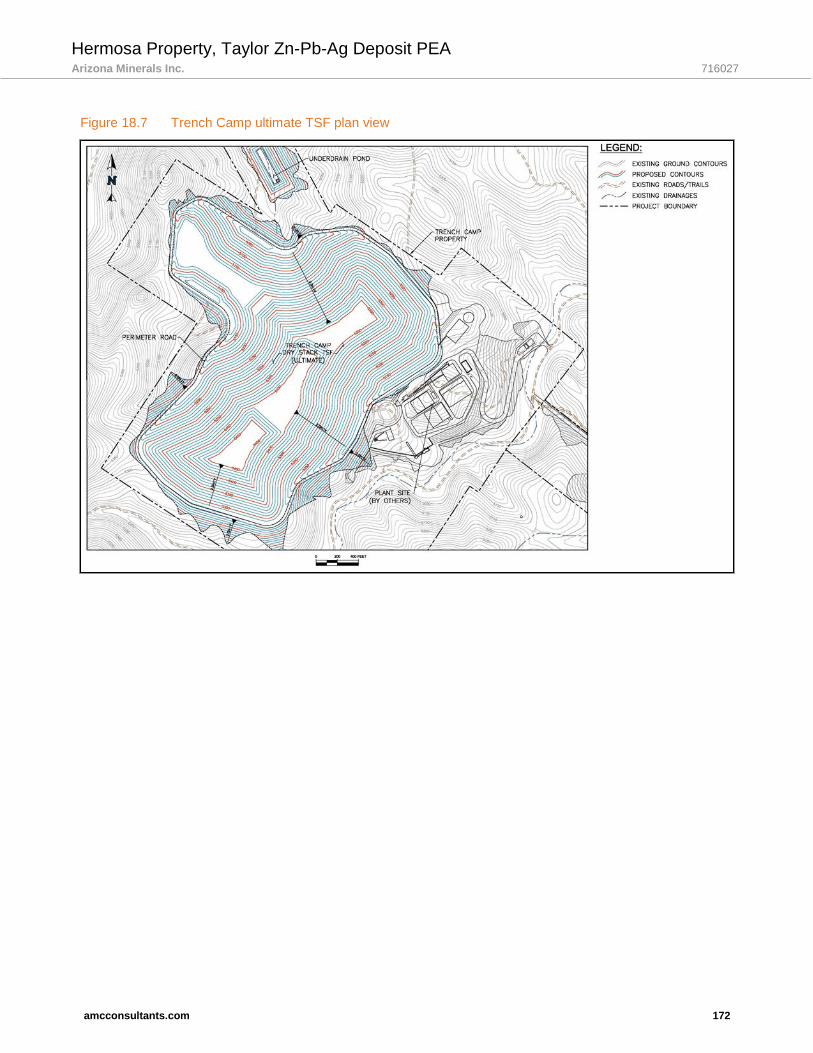
Hermosa Property, Taylor Zn-Pb-Ag Deposit PEA Arizona Minerals Inc. 716027
amcconsultants.com 172
Figure 18.7 Trench Camp ultimate TSF plan view

Hermosa Property, Taylor Zn-Pb-Ag Deposit PEA Arizona Minerals Inc. 716027
amcconsultants.com 173
Figure 18.8 Hermosa ultimate TSF plan view
18.3.4 TSF design
In general, the TSF design concepts for Trench Camp and Hermosa are similar. Each TSF consists of a perimeter road which fully encompasses a basin area. The perimeter road is designed with upstream slopes of 2.5 H (horizontal):1 V (vertical), downstream side slopes of 2.0 H:1 V and a crest width of 25 feet (7.62 m). In areas where the downstream slope is in cut, the daylight slope is increased to 1.5 H:1 V since the cut is assumed to be in rock. The perimeter road will provide light vehicle access, containment of surface water runoff from the dry stack surface and passive resistance at the toe of the dry stack TSF slope. The passive resistance component generally requires that the perimeter road be elevated above existing ground or constructed in conjunction with existing ground in a manner which provides an internal slope toward the facility. The perimeter roads will be constructed using standard cut/fill operations within the TSF basin and plant site area as well as non-PAG material produced from mining operations. A typical perimeter road section and detail can be referenced on Figure 18.9.
The dry stack TSF basins and upstream slopes of the perimeter roads are designed with a composite liner system consisting of 12 in (305 mm) of low permeability soil with a coefficient of permeability (k) ≤ 1x10⁻⁶ cm / sec overlain by a 60 mil (1.5 mm) high-density polyethylene (HDPE) double sided textured geomembrane. To protect the geomembrane, reduce head and facilitate long-term drainage of the tailings, an 18 inch (457 mm) protective layer consisting of crushed gravel will be placed over the geomembrane liner. In addition, perforated corrugated polyethylene piping will be placed in the topographic lows within the TSF basin to augment collection and conveyance of underdrainage flow from the tailings. Underdrain flows will be directed via gravity to underdrain collection ponds which are located downstream of the TSFs. The underdrain collection outlets are routed through the perimeter roads via a reinforced concrete encased outlet pipe. The underdrain collection ponds have been sited near the north side end of the Trench Camp and Hermosa Dry Stack tailings storage facilities. The TSFs are considered zero discharge facilities, given the underdrain flow collected in the pond will be pumped back to the plant site and ultimately reused in the processing circuit. Typical TSF basin and underdrain system details can be referenced on Figure 18.9.
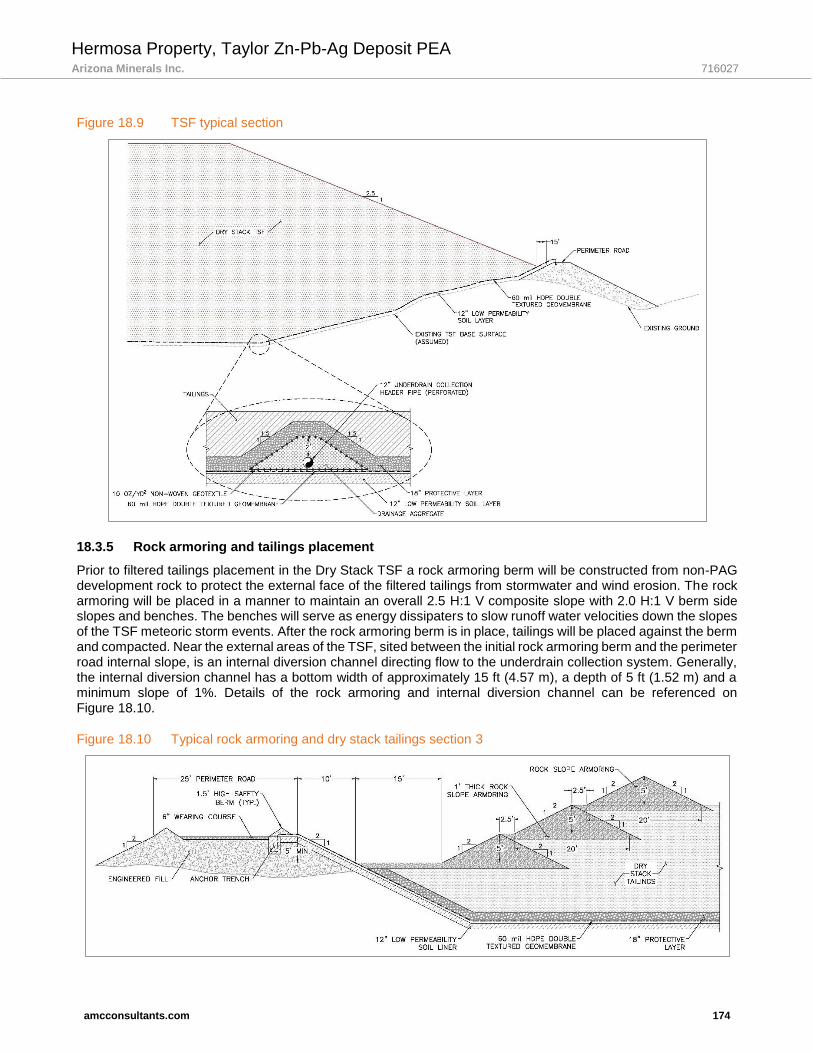
Hermosa Property, Taylor Zn-Pb-Ag Deposit PEA Arizona Minerals Inc. 716027
amcconsultants.com 174
Figure 18.9 TSF typical section
18.3.5 Rock armoring and tailings placement
Prior to filtered tailings placement in the Dry Stack TSF a rock armoring berm will be constructed from non-PAG development rock to protect the external face of the filtered tailings from stormwater and wind erosion. The rock armoring will be placed in a manner to maintain an overall 2.5 H:1 V composite slope with 2.0 H:1 V berm side slopes and benches. The benches will serve as energy dissipaters to slow runoff water velocities down the slopes of the TSF meteoric storm events. After the rock armoring berm is in place, tailings will be placed against the berm and compacted. Near the external areas of the TSF, sited between the initial rock armoring berm and the perimeter road internal slope, is an internal diversion channel directing flow to the underdrain collection system. Generally, the internal diversion channel has a bottom width of approximately 15 ft (4.57 m), a depth of 5 ft (1.52 m) and a minimum slope of 1%. Details of the rock armoring and internal diversion channel can be referenced on Figure 18.10.
Figure 18.10 Typical rock armoring and dry stack tailings section 3
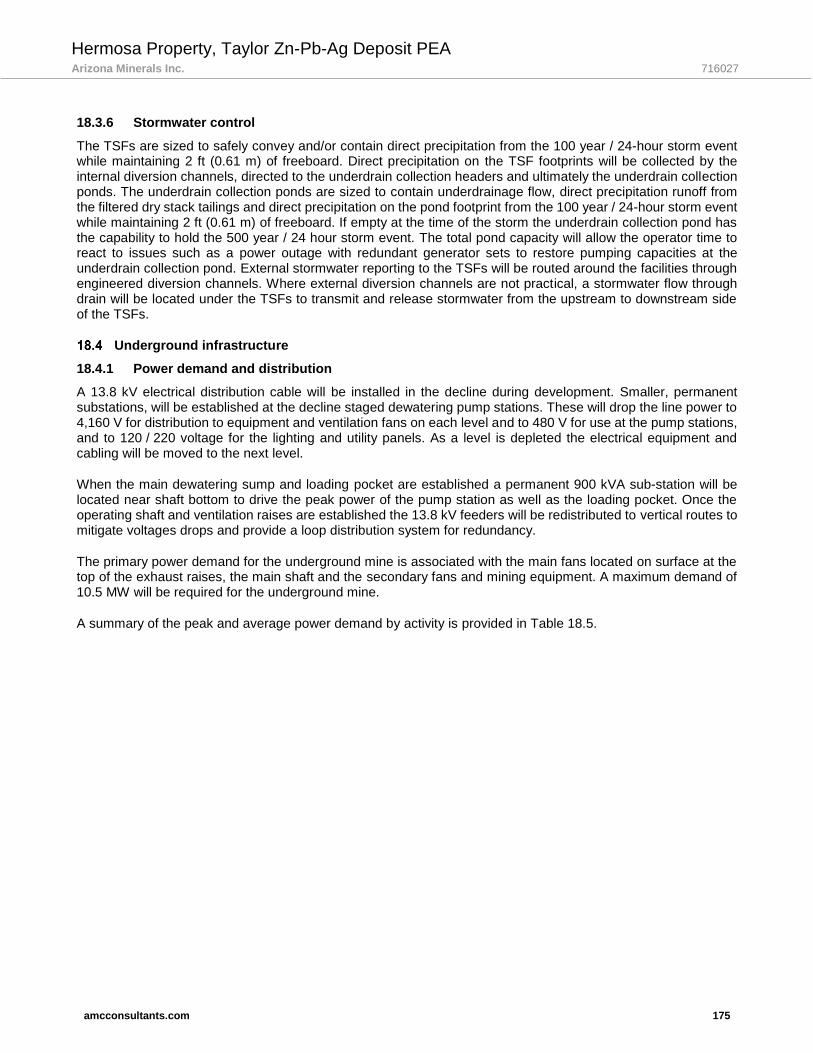
Hermosa Property, Taylor Zn-Pb-Ag Deposit PEA Arizona Minerals Inc. 716027
amcconsultants.com 175
18.3.6 Stormwater control
The TSFs are sized to safely convey and/or contain direct precipitation from the 100 year / 24-hour storm event while maintaining 2 ft (0.61 m) of freeboard. Direct precipitation on the TSF footprints will be collected by the internal diversion channels, directed to the underdrain collection headers and ultimately the underdrain collection ponds. The underdrain collection ponds are sized to contain underdrainage flow, direct precipitation runoff from the filtered dry stack tailings and direct precipitation on the pond footprint from the 100 year / 24-hour storm event while maintaining 2 ft (0.61 m) of freeboard. If empty at the time of the storm the underdrain collection pond has the capability to hold the 500 year / 24 hour storm event. The total pond capacity will allow the operator time to react to issues such as a power outage with redundant generator sets to restore pumping capacities at the underdrain collection pond. External stormwater reporting to the TSFs will be routed around the facilities through engineered diversion channels. Where external diversion channels are not practical, a stormwater flow through drain will be located under the TSFs to transmit and release stormwater from the upstream to downstream side of the TSFs.
Underground infrastructure
18.4.1 Power demand and distribution
A 13.8 kV electrical distribution cable will be installed in the decline during development. Smaller, permanent substations, will be established at the decline staged dewatering pump stations. These will drop the line power to 4,160 V for distribution to equipment and ventilation fans on each level and to 480 V for use at the pump stations, and to 120 / 220 voltage for the lighting and utility panels. As a level is depleted the electrical equipment and cabling will be moved to the next level.
When the main dewatering sump and loading pocket are established a permanent 900 kVA sub-station will be located near shaft bottom to drive the peak power of the pump station as well as the loading pocket. Once the operating shaft and ventilation raises are established the 13.8 kV feeders will be redistributed to vertical routes to mitigate voltages drops and provide a loop distribution system for redundancy.
The primary power demand for the underground mine is associated with the main fans located on surface at the top of the exhaust raises, the main shaft and the secondary fans and mining equipment. A maximum demand of 10.5 MW will be required for the underground mine.
A summary of the peak and average power demand by activity is provided in Table 18.5.

Hermosa Property, Taylor Zn-Pb-Ag Deposit PEA Arizona Minerals Inc. 716027
amcconsultants.com 176
Table 18.5 Summary of underground power demand
Description Peak power (kW) Average power draw (kW)
Hoist 3,210 1,041
Main dewatering pumps 1,305 421
Main fans 5,320 4,530
Level distribution fans 304 246
Other (compressors, lights, etc.) 365 249
Totals 10,504 6,488
Figure 18.11 shows the conceptual plan for UG power distribution on site via the 24.9 kV, 3 phase, 60 Hz feeders and transformers stepping down 13.8 kV to 4,160 V or 480 V as needed for mining equipment, underground fans, pumps, etc. Lighting and control voltage will be rated at 120 V. Emergency diesel generators will be installed at the process plant and underground mine for backup power in case the utility power fails.

Hermosa Property, Taylor Zn-Pb-Ag Deposit PEA Arizona Minerals Inc. 716027
amcconsultants.com 177
Figure 18.11 Single line diagram showing underground power distribution

Hermosa Property, Taylor Zn-Pb-Ag Deposit PEA Arizona Minerals Inc. 716027
amcconsultants.com 178
Dewatering
During decline development, fifteen staged submersible high head low flow pump stations will be established. Each pump will transfer up the decline through a 4” steel grooved pipe line to the next sump. The pumps are sized so that the nominal 80 US gpm (5 l/s) ground water and the 80 US gpm (5 l/s) drilling and utility water can be handled by one pump, two pumps are installed in each sump in case of failure. Smaller pumps on the level can be used to transfer water from the face to the decline sumps.
When the decline is established near the shaft bottom, the main dewatering sump will be developed. This will consist of three horizontal multi-stage 400 hp pumps each capable of 160 gpm (10 l/s). The 4” steel decline dewatering line will be connected together bypassing the staged pumps altogether. The decline sumps will be connected with drain holes leading to the dirty water side of the main sumps. Water overflowing the intermediate weir will then be stored in the clean water sump for use by the main dewatering pumps.
Two dewatering pumps will normally operate to provide enough capacity to drain the clean water sump, which will be sized to provide a duty cycle of no more than 25% to prevent frequent starting of the pumps. The third pump provides an online spare, and in an emergency upset condition can provide additional capacity to the system.
As the decline progresses below the shaft bottom, and after the main sump is in service, existing pumps can be relocated to extend the staged dewatering system into deeper levels in the mine.
18.5.1 Service water
A three-inch HDPE line will be installed in stages down the decline to provide fresh water for use in the mine. Every 100 vertical feet, a head tank and pressure reducing valve will be installed to control the pressure in the line. A combination of hoses and HDPE piping will extend out onto the levels to provide utility water. Service water will be required for drilling and watering down access routes. A total service water requirement of 70 US gpm is required for the underground mine.
18.5.2 Waste water
Underground mine water from operations and grey water from the office and mine dry will be routed via HDPE piping systems, partially or completely buried, to the plant for processing as part of the tailings system.
Compressed air
Four portable air compressors (one for each level) will be moved together with the primary mining equipment. The compressors will be sized so that they will be able to supply four operating drills.
Communications
A leaky feeder system will provide means for communication underground. All vehicles will be fitted with radios. A call bell and emergency system will be used when signalling the main production shaft.
Main production hoist
The shaft will have a 21-foot (6.5 m) finished diameter and the production hoist will be a conventional double drum hoist with two skips discharging into the bins on surface in the headframe. Loading pockets will be on the 2600 and 1600 levels. The cycle times were estimated using 10 m/s velocity for the conveyance and allowing for creep in / creep out and decking time. The hoist is designed to accommodate the mine’s full production target of 10,000 tons per day (achieved in Year 6), and the capacity of each skip is 27.6 tons (25 tonnes) and the total weight of each skip is 47.4 tons (43 tonnes) when fully loaded.
The cycle time was used to estimate the peak and average power requirements (including acceleration loads for the sheaves and drums), this is illustrated in Figure 18.12.

Hermosa Property, Taylor Zn-Pb-Ag Deposit PEA Arizona Minerals Inc. 716027
amcconsultants.com 179
Figure 18.12 Estimated hoist performance curve
The peak power demand is during the acceleration phase just as the conveyance reaches peak velocity. Average annual power draw includes time allowances for regular and unplanned maintenance downtime.
Skips will be provided with decks for inspection purposes and the conveyance will have bails and cage-heads for lowering heavy slung loads if required. The skips themselves will be bottom dump and activated by scrolls in the headframe.
The loading pocket will consist of a conveyor feeding a diversion chute that alternately charges two weigh flasks. Each flask is loaded during a skipping cycle so that it is ready when a skip returns to the loading pocket. Allowance has been made in the skip production schedule for 10% additional capacity for waste to be hoisted to surface.
18.8.1 Fire detection and suppression systems
The mine ventilation systems will be provided with an ethyl mercaptan (stench gas) system (activated manually or remotely) to warn underground personnel in the event of an emergency. Radio contact via the leaky feeder system provides an alternative method of communication. The main ventilation fans can be shut down or adjusted to assist with fire control systems in the mine.

Hermosa Property, Taylor Zn-Pb-Ag Deposit PEA Arizona Minerals Inc. 716027
amcconsultants.com 180
If the automatic stench system fails to release, two back-up measures will be in place. Back-up measures include manual firing of the system at the unit allowing the stench gas to be distributed as above and release of a gas cylinder by hand into the fresh air intake.
Once stench is released, underground mine personnel would report immediately to the nearest mine refuge station or surface, whichever is closer.
18.8.2 Underground facilities
Underground mine services will include lunchrooms, a small maintenance shop for minor and urgent repairs, fuel and lubricant storage, and small magazines for high explosives and detonators.
The lunchrooms will provide a clean space with potable water, tables, and chairs. They will also be used as mine refuge areas. The mine rescue team will be able to use the space for training and to store equipment and supplies. A lunchroom will be provided on each of the main operating areas.
A single bay maintenance shop with a jib crane will be provided. The intent of this bay is to enable routine tasks such as lubrication and changing of filters, and minor repairs to keep the equipment in a serviceable condition and return it quickly into service. Any significant maintenance will be conducted on surface in the main workshop.
A fuel and lubrication area will be provided underground. Fuelling will be conducted via tankers from surface. Storage will also be provided for lubricants and waste oil. A small location equipped with fire doors, fire detection, and air operated pumps will dispense the products near the maintenance bay.
The explosives magazines will be a few rounds deep and equipped with lockable doors and wooden benches. The magazines will be ventilated and kept cool. The intent is to provide a small stockpile of detonators, cord, and high velocity explosive for daily blasting activities. Explosives handling and delivery from surface will be accomplished using mobile loading equipment drawing from the surface magazines.
18.8.3 Mine escape and rescue
Portable refuge stations will be located appropriately relative to operating levels. Lunchrooms near the maintenance area will also serve as refuge stations. Self-rescue storage will be provided in the lunchrooms as well as first aid kits at the refuge stations.
Four portable refuge stations will provide refuge for up to 40 persons each during an emergency. MineARC was approached to provide a refuge station design and specifications. MineARC has estimated the finished refuge area to be 25 ft x 60 ft x 10 ft high (7.6 m x 18.3 m x 3 m). This size chamber will provide:
• Approximately 38 ft2 (3.5 m²) unobstructed floor space per occupant (less when figuring in tables, furnishings, etc.).
• Useable floor space area per occupant with nominal furnishings and equipment installed, should remain above the minimum recommended of 15 ft2 (1.4 m²) per occupant.
• Refuge chamber volume of approximately 15,000 ft³ (423 m3).
• Refuge volume of 375 ft³ per occupant (10.6 m3 per occupant) – well above the minimum recommendation of 60 ft³ (1.7 m3) per occupant.
For a 15,000 ft³ refuge chamber, a 495 cfm scrubbing unit will provide two complete air exchanges per hour (above the minimum 1.5 x system recommendation), ensuring efficient air flow across both the CO2 and CO scrubber chemicals and effective removal of CO2 and CO within the chamber, under full occupancy (40 persons).
It is recommended to install a battery backup / air conditioning system sized correctly for 40 persons that will provide backup electrical supply for all emergency equipment for a minimum 36 hours of duration, under full occupancy. A 22,000 British Thermal Unit (BTU) air conditioning system will manage heat and humidity build-up from 40 occupants and additional heat sources within the chamber (i.e.: lighting, electrical equipment, host rock
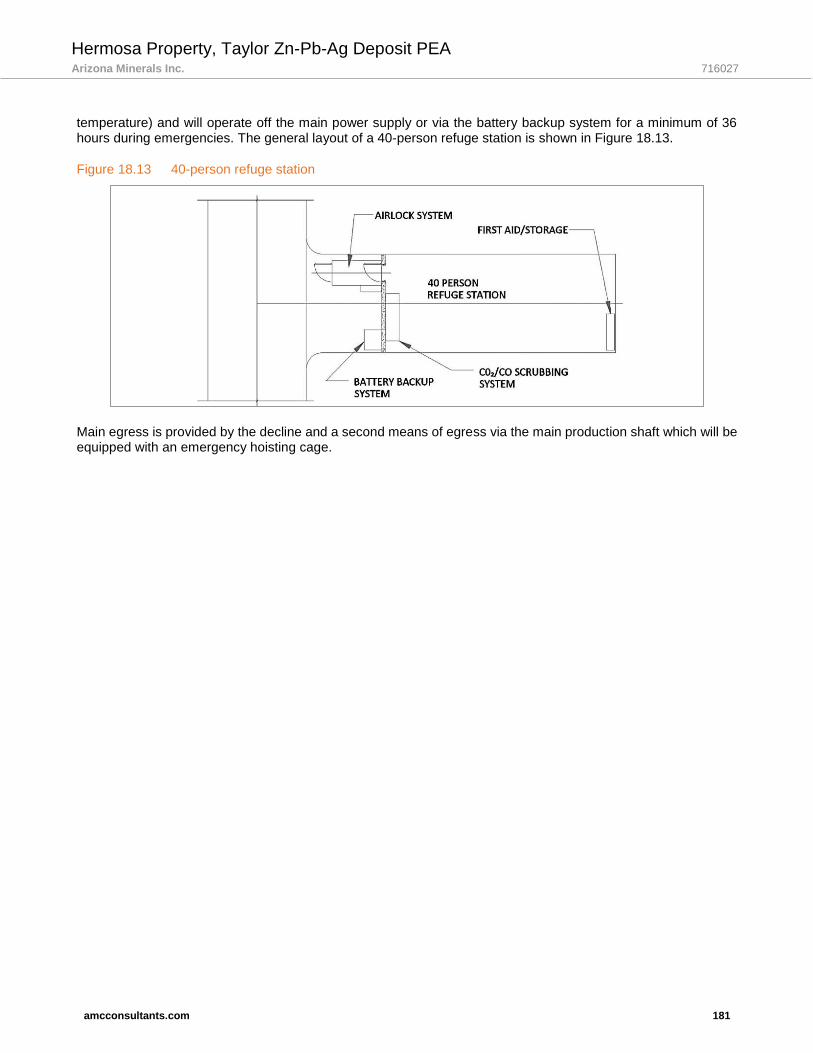
Hermosa Property, Taylor Zn-Pb-Ag Deposit PEA Arizona Minerals Inc. 716027
amcconsultants.com 181
temperature) and will operate off the main power supply or via the battery backup system for a minimum of 36 hours during emergencies. The general layout of a 40-person refuge station is shown in Figure 18.13.
Figure 18.13 40-person refuge station
Main egress is provided by the decline and a second means of egress via the main production shaft which will be equipped with an emergency hoisting cage.

Hermosa Property, Taylor Zn-Pb-Ag Deposit PEA Arizona Minerals Inc. 716027
amcconsultants.com 182
19 Market studies and contracts
An independent marketing and logistics study for the concentrate products to be produced from the Hermosa deposit was undertaken by Exen Consulting Services (Exen).
Overview
The Hermosa Taylor project will produce relatively large quantities of both zinc and lead concentrates.The longer term outlook for demand for each of the concentrate products is favourable, with growing demand for the payable metals matched by only limited mine supply growth. Based on transportation logistics, the concentrates will likely be loaded in bulk into ocean-going vessels at the port of Guaymas, Mexico for shipment to buyers in Asia, Europe and elsewhere. There are currently no sales contracts for this project.
Long term forecast metal prices used in cash flow model were as follows (all in US dollar):
Zn $1.10/lb
Pb $1.00/lb
Ag $20.00/oz
Copper mineralization is present in low concentrations. It was assumed that there would be no value for the copper and it is not included in the project economics. These penalties have been estimated and accounted for in the financial model.
Concentrate terms
19.2.1 Zinc concentrates
The project is expected to produce approximately 235,000 dmt zinc concentrates on average annually. Based on indicated grades, the zinc concentrates should be suitable for most zinc smelters; however, elevated levels of manganese may result in the imposition of minor penalties for AMI.
19.2.1.1 Commercial terms
For the purposes of project evaluation, the following terms were used in derivation of the zinc concentrate NSRs (all figures in US dollars).
Payable metals:
Zinc: 85% of the Zn content, subject to a minimum deduction of 8 units
Silver: Deduct 3.0 ozs/dmt and pay for 70% of the balance of Ag content
Treatment charge: US$210.00/dmt ($190.51/dst)
Penalties: All inclusive, US$12.60/dmt (Mn - 0.50% free; US$1.50 per dmt for every 0.10% above 0.50%)
19.2.2 Lead concentrates
The project is expected to produce approximately 189,000 dmt lead concentrates on average annually. Based on the expected analysis, the concentrates can be considered ‘clean’, high grade with valuable levels of payable silver and no deleterious elements which might affect their marketability.
Hermosa Property, Taylor Zn-Pb-Ag Deposit PEA Arizona Minerals Inc. 716027
amcconsultants.com 183
19.2.2.1 Commercial terms
For the purposes of project evaluation, the following terms were used in derivation of the lead concentrate NSRs (all figures in US dollars):
Payable metals:
Lead: 95% of the Pb content, subject to a minimum deduction of 3 units
Silver: 95% of the Ag content, subject to a minimum deduction of 50 grams/dmt (1.46 ozs/dst)
Treatment charge: US$190.00/dmt (US$172.37/dst)
Silver refining charge: US$1.25/payable oz
Penalties: None based on the indicated analysis
Concentrate transportation logistics
The project is well located with nearby infrastructure available for both bulk rail and truck shipments to the loadport alternatives evaluated by Exen. Although other port options may be considered, Guaymas, Mexico, located approximately 440 kms from the mine, is in regular use by other concentrate producers in the U.S. and Mexico and likely offers the best loadport alternative to AMI. Although railing concentrates to the port appears competitive, trucking will likely prove to be the most flexible and cost competitive option available to AMI.
Exen recommends that an all-inclusive transportation cost average for the two products of US$97.20/dmt (US$88.18/dst) be used for evaluation purposes.
Hermosa Property, Taylor Zn-Pb-Ag Deposit PEA Arizona Minerals Inc. 716027
amcconsultants.com 184
20 Environmental studies, permitting and social or community impact
The purpose of this section is to identify and discuss those environmental permits and approvals that are most likely to drive the permitting schedule for the project. The following sections explain the various permitting programs and the estimated time required to secure permits and approvals. Erik Christenson of WestLand is the qualified person for Section 20 with the exception of Section 20.3.2. Doug Bartlett of CCA is the qualified person for Section 20.3.2. Details on tailings and waste rock disposal, site monitoring, and water management are not discussed in this section.
The format of this section is as follows:
• A brief overview of the social and community setting within which the project will be developed.
• The USA federal permitting processes that may drive the permitting schedule for project development.
• Overview of the key permits administered by the State of Arizona that are likely to be required to develop the project. These state permits are separate from the federal permitting processes, but analyses, modelling, and baseline data collected for state permits can be used to provide baseline information for federal evaluation under the National Environmental Policy Act (NEPA) and other federal permitting processes.
Several federal agencies may have a role in the review and approval of the project. If required, the U.S. Forest Service (USFS) must approve a mine plan of operations (POO) that will be prepared and submitted to the Coronado National Forest (CNF) by AZ to develop the project. If the U.S. Army Corps of Engineers (Corps) determines that the project will impact surface water features that are considered waters of the US, a permit issued by the Corps in accordance with the requirements of Section 404 of the Clean Water Act (CWA) and its implementing regulations will be required. Off-site utility infrastructure improvements needed to develop the project (power and possibly water supply, as well as access to the property) may, upon final design, cross public lands administered by the CNF or impact water features defined by the Corps to be waters of the US. Approval of the proposed project by these agencies will require compliance with NEPA.
NEPA is the centerpiece of USA federal environmental policy. NEPA provides a process that federal agencies must follow to ensure that environmental effects of federal actions (e.g., the approval of a POO or CWA Section 404 Permit) are disclosed to the public, offer the public opportunity to provide input during the review process, and ensure that environmental resources are considered in the decision-making process. Considering the federal agencies likely to be involved in the review and approval of the project, it is anticipated that the CNF will take the lead for federal agencies for implementation of the NEPA review process, and that the other federal agencies (e.g., the Corps) will act as cooperating agencies for the purpose of NEPA compliance. Even if the CNF is not involved in the permitting process, the Corps may require a NEPA review for any impacts to waters of the US on private land. It is anticipated that the development of the project may require, at a minimum, an Environmental Assessment (EA) and possibly an Environmental Impact Statement (EIS).
Other key federal permits required to develop the project may include the Endangered Species Act (ESA) and the National Historic Preservation Act (NHPA). Elements of the ESA are applicable even on private lands absent of any other federal nexus. NHPA would only apply if there is a discretionary federal nexus. As with the NEPA process, if USFS land and authorization of the action is required, it is anticipated that the CNF will be the lead agency for ESA and NHPA compliance for the project.
Primary state environmental permits that are likely to be required to develop the project are an Air Quality Permit pursuant to the Clean Air Act (CAA), an Aquifer Protection Permit (APP), 401 Water Quality Certification, a permit to discharge treated wastewater under the Arizona Pollutant Discharge Elimination System (AZPDES), a permit to discharge stormwater under AZPDES, and a Mined Land Reclamation Plan, which includes financial assurance.
The Environmental Protection Agency (EPA) has granted Arizona Department of Environmental Quality (ADEQ) authority over the CAA and Section 401 and 402 of the CWA in relation to water quality standards and treated wastewater and stormwater discharge permits, respectively. These permitting processes are expected to proceed concomitantly with any NEPA process, and any data analysis, collection, and modelling performed to support these permits will be used to disclose and analyze effects during the NEPA process, if required. In the balance of
Hermosa Property, Taylor Zn-Pb-Ag Deposit PEA Arizona Minerals Inc. 716027
amcconsultants.com 185
this section, a more detailed description of Social and Community functions that have the potential to affect permitting process (Section 20.1), key USA federal permits and approvals (Section 20.2), and key Arizona state permits and approvals (Section 20.3) are provided.
Social and community
The project is located in a relatively remote area, approximately eight miles north of the international border with Mexico in Santa Cruz County, Arizona. Nogales, the Santa Cruz county seat, is located approximately 20 miles by road to the southwest, with a 2015 estimated population of approximately 20,250.1 The second largest community in the county is Rio Rico, also approximately 20 miles away from the project, with a 2010 population of approximately 19,000.2 Both of these communities are located along Interstate 19, the principal interstate highway connecting Nogales to Interstate 10 in Tucson, Arizona. Santa Cruz County also includes several small towns and communities, of which Patagonia, with approximately 900 residents, is the closest to the Project.3 Patagonia straddles State Route (SR) 82 and is located about 8 miles (13 km) northwest of the Project. In addition to Nogales, other major population and economic centers in the region include Sierra Vista, with a 2015 estimated population of approximately 43,350, located approximately 45 miles to the east, and Tucson, with a 2015 estimated population of approximately 531,650, located approximately 65 miles to the north.4 Pima County, where Tucson is located, had a 2015 estimated population of approximately 1,010,000.5
Patagonia has limited social and economic infrastructure. The Town has a public elementary and middle school and a high school serving grades 9 through 12. There are several commercial lodging locations, several restaurants, a small grocery store and a gas station. Patagonia has a Police Department with a small, fully-staffed force. The Santa Cruz County Sheriff and the Arizona Department of Public Safety Highway Patrol Division, patrol the area around Patagonia and the project. Medical facilities in Patagonia include a small family medical clinic and the Patagonia Fire Department’s Emergency Medical Technician (EMT) service. The Fire Department also has helicopter landing facilities for transporting serious medical cases to larger hospitals in Nogales or Tucson. Nogales has a regional hospital. The Tucson metropolitan area of eastern Pima County has historically been the commercial and service / supply center for the mining industry in southern Arizona. Tucson has a commercial airport and large rail center.
Although the Patagonia area has historically been a mining, ranching, and railroad community that would generally be favorable to development of a major mining operation with the attendant economic benefits and increase in employment opportunities, the project, as well as past and current drilling activities by AZ, have already attracted the attention of local and national environmental organizations, and the community appears to be divided in its support of the project. In recent years, the Patagonia and nearby Sonoita areas have attracted artists and upscale, well-educated, professional/technical individuals who have either retired to the area or commute to work elsewhere. Sonoita is also home to a nascent wine industry. Many local businesses cater to the tourist and outdoor sporting industry. The Patagonia Mountains, in which the project is located, have been noted internationally as a bird-watching destination to observe numerous species of rare and exotic birds. The area is also popular for other outdoor recreational activities, including hiking, biking, horseback riding, and off-road four-wheel driving within the CNF lands. As a result, it is expected that the project may attract similar levels of opposition as has other recent mine permitting efforts in the region.
Biological and cultural resource work completed to date
Since 2012, AZ has conducted biological and cultural studies and surveys in the vicinity of the project. These efforts have included multiple years of survey for species listed under the ESA, Forest Service sensitive species, and full pedestrian surveys for cultural resources adjacent to and in portions of the project. This section
1 United States Census Bureau American Fact Finder. 2015 Population Estimates (as of 1 July 2015). 2 United States Census Bureau American Fact Finder. 2010 Population Estimates (as of 1 July 2015). 3 Town of Patagonia. General Plan 2009. Available online at: https://issuu.com/seagoedd/docs/patagonia_general_plan?layout=
http://skin.issuu.com/v/light/layout.xml&showFlipBtn=true&e=3005223/4148168 4 United States Census Bureau American Fact Finder. 2015 Population Estimates (as of 1 July 2015). 5 Ibid

Hermosa Property, Taylor Zn-Pb-Ag Deposit PEA Arizona Minerals Inc. 716027
amcconsultants.com 186
summarizes the results of environmental surveys completed to date. Sections 20.2.3 and 20.2.4, describe the permitting implications of survey results and findings.
In 2012 and 2013, AZ commissioned surveys for Sonoran tiger salamander, a species listed as endangered without critical habitat under the ESA. The surveys determined that the closest known observation of the Sonoran tiger salamander is over 2 miles (3.2 km) away and across several topographic ridges from the project.6,7
Lesser long-nosed bats, a species listed under the ESA without critical habitat, are known to forage in the area surrounding AZ’s private land,8 but an extensive search of the known abandoned mine features and monitoring of select features detected no evidence that this species was using these features as day-roosting habitat in 2012 and 2013.9,10 The closest known lesser long-nosed day-roost to the project is approximately 5 miles (8 km) away.
Surveys were conducted for yellow-billed cuckoo in 2012, 2013, and 2016. Yellow-billed cuckoos, a species listed as threatened under the ESA with proposed critical habitat, have been detected along Harshaw Creek and other drainages in the vicinity of the project.11,12,13,9 There are no areas of proposed critical habitat within or adjacent to the project.
Mexican spotted owl (MSO) is listed as threatened with critical habitat under the ESA. One pair of MSO and their associated Protected Activity Center (PAC) is located in Alum Gulch, within approximately 0.5 miles (0.6 km) of the project. The MSO pair has historically been reported from this PAC and breeding was confirmed by surveys in 2016.14 Widespread surveys for MSO in the areas within and adjacent to the project in 2012, 2013, and 2016 have detected no other MSO.15,16 The Property is located in designated critical habitat for the species
The jaguar and ocelot, both listed as endangered under the ESA, are known from the mountainous regions of southeastern Arizona, they have historically been detected in the Patagonia Mountains in the past, but are not known to currently occupy them. The Property is located in designated critical habitat for the jaguar; critical habitat has not been designated for ocelot. Over three years ago, a male ocelot originally detected in the Huachuca Mountains in 2011 was detected once in the Patagonia Mountains, but has since returned to the Huachuca Mountains over 15 miles (24 km) east of AZ’s private land and has not been detected since in the Patagonia
6 WestLand Resources, Inc. 2013. 2012 Surveys for the Sonora tiger salamander (Ambystoma movortium stebbinsi) in the Patagonia Mountains, near Harshaw, Arizona. Prepared for Arizona Minerals, Inc. April.
7 WestLand Resources, Inc. 2013. 2013 Surveys for the Sonora tiger salamander (Ambystoma mavortium stebbinsi) in the Patagonia Mountains, near Harshaw, Arizona. Prepared for Arizona Minerals, Inc. December.
8 WestLand Resources, Inc. 2013. Summary of 2013 Survey for lesser long-nosed bat (Leptonycteris yerbabuenae) in the Patagonia Mountains near Harshaw, Arizona. Prepared for Arizona Minerals, Inc. December.
9 WestLand Resources, Inc. 2013. Summary of 2013 Survey for lesser long-nosed bat (Leptonycteris yerbabuenae) in the Patagonia Mountains near Harshaw, Arizona. Prepared for Arizona Minerals, Inc. December.
10 WestLand Resources, Inc. 2013. 2012 Surveys for lesser long-nosed bat (Leptonycteris curasoae yerbabuenae) in the Patagonia Mountains, near Harshaw, Arizona. Prepared for Arizona Minerals, Inc. April.
11 WestLand Resources, Inc. 2013. Revised 2012 Survey for yellow-billed cuckoo (Coccyzus americanus) in the Patagonia Mountains, near Harshaw, Arizona. Prepared for Arizona Minerals, Inc. April.
12 WestLand Resources, Inc. 2013. 2013 Survey for yellow-billed cuckoo (Coccyzus americanus) in the Patagonia Mountains, near Harshaw, Arizona. Prepared for Arizona Minerals, Inc. December.
13 WestLand Resources, Inc. 2016. 2016 yellow-billed cuckoo (Coccyzus americanus) in support of the Hermosa Taylor Drilling Plan of Operations. November..
14 WestLand Resources, Inc. 2016. 2016 Surveys for Mexican spotted owl (Strix occidentalis lucida) in Support of the Hermosa Taylor Drilling Plan of Operations. November.
15 WestLand Resources, Inc. 2013. 2012 Survey for Mexican spotted owl (Strix occidentalis lucida) in the Patagonia Mountains, near Harshaw, Arizona. Prepared for Arizona Minerals, Inc. April.
16 WestLand Resources, Inc. 2013. Summary of 2013 Survey for Mexican spotted owl (Strix occidentalis lucida) in the Patagonia Mountains, near Harshaw, Arizona. Prepared for Arizona Minerals, Inc. December.
Hermosa Property, Taylor Zn-Pb-Ag Deposit PEA Arizona Minerals Inc. 716027
amcconsultants.com 187
Mountains.17 There has been extensive survey for jaguar and ocelot by the University of Arizona and, no other ocelots currently known to occur in Arizona have been detected in the Patagonia Mountains. There are only two jaguars known to occur at present in the USA; one has been observed in the Huachuca Mountains and one in the Dos Cabezas Mountains. No jaguar have been detected in the Patagonia Mountains in the past 50 years.18,19
In 2012 and 2013, AZ commissioned surveys for Chiricahua leopard frog (CLF; Lithobates [Rana] chiricahuensisi), a species listed as threatened under the ESA with designated critical habitat, in the vicinity of the project. No CLF were detected and the areas within and adjacent to the Property, and there is no designated critical habitat in the area. During these surveys, no other special-status species that might inhabit aquatic systems in the vicinity of the Propertd were observed. These species include Arizona treefrog (Hyla wrightorum), northern Mexican garter snake (Thamnophis eques megalops), springsnails (Pyrgulopsis spp.), and Huachuca water umbel (Lilaeopsis schaffneriana ssp. recurva).
Gila topminnow (Poeciliopsis occidentalis occidentalis) is listed as an endangered species without critical habitat under the ESA. Surveys for this species were conducted in 2013 in a 0.5 miles (0.8 km) perennial reach of Harshaw Creek, approximately 4.5 miles (7.2 km) downstream from the project. Gila topminnow were not detected during these surveys.20
In addition to analysis of species listed as threatened or endangered under the ESA, the CNF also evaluates the effects to CNF designated sensitive and rare species as part of the NEPA process, (see Section 20.2.3). Surveys for USFS sensitive plant and animal species were conducted between 2012 and 2016 within and proximate to the project. AZ has commissioned surveys for sensitive plant species in the area surrounding the project. These sensitive species include beardless chinchweed (Pectis imberbis), Bartram stonecrop (Graptopetalum bartramii), Sonoran noseburn (Tragia laciniata), and Hexalectris orchid species. Neither beardless chinchweed nor Bartram stonecrop were detected in the area surrounding the project in 2013 and 2016.21 Hexalectris species have been detected in the vicinity of the project.22,23 Surveys conducted in 2016 have also detected Sonoran noseburn (Tragia laciniata) in areas adjacent to AMI’s private land. 24
In 2012 and 2013, surveys for two grassland avian species listed as sensitive by Region 3 of the USFS: Arizona grasshopper sparrow (Ammodramus savannarum ammolegus) and Baird’s sparrow (Ammodramus bairdii) were conducted in the vicinity of the Property. Neither the Arizona grasshopper sparrow nor Baird’s sparrow were detected.25
Surveys for CNF sensitive small mammals in the vicinity of the Property were conducted in 2012. No current CNF sensitive small mammals were detected.
In 2013 and 2016, AZ commissioned surveys for northern goshawk (Accipiter gentilis), a species that is considered sensitive by Region 3 of the USFS in the CNF within and adjacent to AMI’s private land. No goshawks were
17 USFWS. 2016. Recovery Plan for the Ocelot (Leopardus pardalis), First Revision. U.S. Fish and Wildlife Service, Southwest Region, Albuquerque, New Mexico.
18 Culver, M., Malusa, S., Childs, J.L., Emerson, K., Fagan, T., Harveson, P.M., Haynes, L.E., Sanderson, J.G., Sheehy, J.H., Skinner, T., Smith, N., Thompson, K., and Thompson, R.W., 2016, Jaguar surveying and monitoring in the United States: U.S. Geological Survey Open-File Report 2016–1095, 228 p., http://dx.doi.org/10.3133/ofr20161095.
19 USFWS. 2016. Amended Final Reinitiated Biological and Conference Opinion for the Rosemont Copper Mine, Pima County, Arizona 20 WestLand Resources, Inc. 2013. 2013 Survey for Gila Topminnow (Poeciliopsis occidentalis occidentalis), in the Patagonia Mountains,
Near Harshaw, Arizona. 21 WestLand Resources, Inc. 2013. 2012 Survey for Bartram’s Stonecrop (Graptopetalum bartramii) and Beardless Chinchweed (Pectis
imberbis), in the Patagonia Mountains, Near Harshaw, Arizona. 22 WestLand Resources, Inc. 2012. Survey for Hexalectris colemanii and Hexalectris arizonica across southeastern Arizona – 2012. [publically
available at http://www.rosemonteis.us/technical-reports/all] 23 WestLand Resources, Inc. 2013 [revised]. 2012 Survey for Hexalectris Colemanii and H. Arizonica in the Patagonia Mountains, Near
Harshaw, Arizona. 24 WestLand Resources, Inc. 2016. Northern Goshawk (Accipiter gentilis) Survey is Support of the Hermosa Taylor Drilling Plan of Operations.
December. 25 WestLand Resources, Inc. 2013. 2012-2013 Surveys for Grassland Bird Species in the Patagonia Mountains, Near Harshaw, Arizona.
Hermosa Property, Taylor Zn-Pb-Ag Deposit PEA Arizona Minerals Inc. 716027
amcconsultants.com 188
observed during the survey. In general, habitat selection by nesting northern goshawks in southern Arizona is poorly understood, but potential habitat for goshawks, particularly in patches of dense riparian woodland, exists in the vicinity the projectd.26
Based on the results of these biological surveys the development of the project is not expected to result in a trend towards federal listing under the ESA for any CNF designated sensitive species and their presence in the vicinity of the project is not expected to preclude development of the project.
Between 2012 and 2017, a large portion of the area surrounding AMI’s private land was surveyed for cultural resources, and a number of historic and pre-historic cultural resources were identified.27,28 Surveys have not been conducted on the majority of private lands owned by AMI that will be used for development of the project. On the portions of AMI’s private land surveyed for cultural resources, historic resources have been identified.
20.2.1 Forest Service approval of a POO
Even if facilities and operations for the project are located on private land, there may be off-site improvements for access and utilities (power and water) that cross land administered by the CNF. Pursuant to USA mining laws, AZ is entitled to conduct operations that are reasonably incident to the exploration and development of mineral deposits on its unpatented mining claims, i.e., those claims for which the surface right is still held by federal government. Pursuant to regulations of the U.S. Secretary of Agriculture, AZ must conduct mining operations on public lands administered by the USFS in accordance with the requirements found at 36 Code of Federal Regulations (CFR) Part 228A and in accordance with a POO that has been approved by the USFS. Pursuant to USFS regulations AZ has assumed that the planned activities on CNF lands will require approval of a POO. If required AZ will prepare a proposed POO and submit that to the CNF. Once the POO is submitted and determined sufficient to initiate environmental review, the CNF will conduct an environmental review of the plan in accordance with the requirements of the NEPA and USFS implementing regulations and policy.
NEPA requires the federal government to involve the public in its planning/decision making activities, consider the effects of its decisions on the environment, and to disclose the effects of its activities to the public. There are three levels of NEPA review:
1 Categorical Exclusion, for groups or categories of actions that are relatively minor and have been determined by the action agency not to have significant impacts to the human environment.
2 Environmental Assessment for actions that are not categorically excluded from NEPA analysis and are not expected to have significant affects to the human environment
3 Environmental Impact Statement for actions that result in significant effects to the human environment.
When multiple federal agencies are involved in a project, one of the agencies normally will act as the lead agency, and the other federal action agencies as cooperating agencies for the purpose of NEPA compliance can rely on the lead agencies NEPA analysis provided it fully covers the actions of the cooperating agencies. If NEPA compliance is required for the project, it is anticipated that the CNF will act as the Lead Agency for NEPA and that the Corps of Engineers, if a CWA Section 404 permit is required, would be a cooperating agency. The USFWS does not have a NEPA obligation associated with any ESA Section 7 consultation that may be required.
26 WestLand Resources, Inc. 2013. Summary of 2013 Survey for Northern Goshawk (Accipiter gentilis) in the Patagonia Mountains, Near Harshaw, Arizona.
27 WestLand Resources, Inc. 2013. A Cultural Resources Inventory of 2,634 Acres of Private and Federal Lands in Support of the Hermosa Drilling Project Plan of Operations Within the Coronado National Forest, Arizona.
28 WestLand Resources, Inc. 2016. A Cultural Resources Inventory 160 Acres of Coronado National Forest Land for Possible Mineral Exploration Activities in Santa Cruz County, Arizona.
28 WestLand Resources, Inc. unpublished data, 2017. A Cultural Resources Inventory of Approximately 19.4 Acres of Coronado National Forest Land near Harshaw, in Santa Cruz County, Arizona.
28 WestLand Resources, Inc. unpublished data, 2017. A Cultural Resources Inventory of Approximately 9.8 Acres of Coronado National Forest Land near Harshaw, in Santa Cruz County, Arizona.

Hermosa Property, Taylor Zn-Pb-Ag Deposit PEA Arizona Minerals Inc. 716027
amcconsultants.com 189
Under 36 CFR Part 228.5, the CNF must determine whether to approve the POO as submitted by AZ, as proposed, or to require changes or additions deemed necessary to meet the requirements of the regulations for environmental protection. The purpose of the CNF’s evaluation of the proposed action and the evaluation of alternatives to the proposed action during NEPA is to determine if changes or additions to the POO are necessary to meet the requirements of the regulations for environmental protection set forth in 36 CFR Part 228.8. The CNF cannot select the no action alternative that would be analyzed as part of the NEPA review. A CNF NEPA review of the POO is also expected to provide the NEPA review required for the Corps (if a 404 permit is required).
As a general practice, completion of the NEPA process, if required will ultimately determine the permitting timeline for the project. All other required federal and state environmental permits are expected to be completed within the time frame anticipated for NEPA compliance. The time to complete required permitting efforts can vary substantially depending on the level of NEPA review and other factors outside of AZ’s control. A recent study published by the National Association of Environmental Professionals (NAEP) evaluated EIS preparation and review times in 2015 (Table 20.1). The median time to complete an EIS was approximately 3.9 years, ranging from 0.75 to 11.1 years. Over the past number of years this average time has been increasing approximately 1 month per year.29 The completion of an EA is typically much shorter, but national statistics to inform an expected range of preparation times are not available. Previous experience on permitting of mining projects suggests that 1.5 to 3 years is a reasonable time range, but can vary significantly depending upon public interest, the availability of agency resources, and nature of the resources likely to be affected. While every project has its own unique circumstances that can affect compliance schedules for the NEPA, it is currently anticipated that completion of NEPA review for development of the project will take between 2 and 6 years. Once the environmental review of the project is complete, revisions to the submitted POO will likely be necessary to incorporate changes during the NEPA process and additions required by the USFS. Note that the USFS will also require that closure and reclamation plans meet performance standards and have financial assurance.
Table 20.1 Duration of USFS, BLM, and Corps EIS process for EIS’ completed during 2015
Agency Number of EIS completed in 2015 Preparation time
Units Mean Median Min Max
USFS 40 Calendar days 1,505 1,276 247 4,027
Approximate months 50 43 8 134
BLM 22 Calendar days 1,876 1,445 614 3,766
Approximate months 63 48 21 126
Corps 12 Calendar days 2,527 2,038 939 5,110
Approximate months 84 68 31 170
all agencies (including those above)
183 Calendar days 1,841 1,428 247 8,464
Approximate months 61 48 8 282
Source: National Association of Environmental Professions. 2016. Annual NEPA Report 2015 of the National Environmental Policy (NEPA) Practice.
20.2.2 Clean water act section 404 permit
At this time, it is not certain that surface water features within the likely footprint of the project are subject to jurisdiction under Section 404 of the CWA. The presence or absence of drainage features subject to Corps jurisdiction under the CWA is determined by a jurisdictional waters delineation (a Delineation) by the Corps. A Delineation has not been completed for all of AMI’s private land or adjacent USFS lands. A portion of AMI's private land has been evaluated by the Corps and the small drainage features within that area have been determined not to be waters of the US. If the Corps determines that any remaining surface water features within the project area are subject to their jurisdiction under the CWA, a CWA Section 404 permit will be required for the project activities that propose discharges of fill to these features. Based upon preliminary review of the project, some drainages in the project area are likely to be considered waters of the U.S. under the current Corps regulations.
29 National Association of Environmental Professions. 2016. Annual NEPA Report 2015 of the National Environmental Policy (NEPA) Practice.
Hermosa Property, Taylor Zn-Pb-Ag Deposit PEA Arizona Minerals Inc. 716027
amcconsultants.com 190
If the project requires a CWA Section 404 permit, it is not likely to qualify for the simpler general permit program administered by the Corps, but rather will likely require an Individual CWA Section 404 permit. Securing this permit will require completion of an alternatives analysis to identify the least environmentally damaging practicable alternative, and development of mitigation measures in accordance with applicable Corps regulations to offset unavoidable impacts to waters of the US. A State Water Quality Certification from ADEQ will also be required, and the Corps must meet its NEPA obligations. Consistent with past practices, the Corps is likely to seek cooperating agency status with the CNF rather than prepare their own NEPA review document. Unlike the CNF, however, the Corps can select the no action alternative when they prepare their separate decision document permit for the project.
20.2.3 Endangered species act
Section 7 of the ESA requires that, for any federal agency action, the permitting authority must evaluate the potential impact of a project to federally-listed species and their critical habitat. If a federal agency with authority over the project determines that the project may affect a listed species or designated critical habitat, consultation with the U.S. Fish and Wildlife Service (USFWS) will be required. Based on experience with other mining projects in southern Arizona, it is anticipated that formal Section 7 consultation may be required. During this consultation the USFWS is required to determine if any listed species will be harmed or harassed (collectively referred to as ‘take’) by the project and determine if adverse impact to critical habitat will occur. USFWS will also determine, during this consultation, if the proposed action is likely to jeopardize the continued existence of any listed species30 or adversely modify critical habitat.31 Should the USFWS make a jeopardy or adverse modification determination, they are required to identify reasonable and prudent alternatives to the proposed action that meet the purpose and need of the proposed activity. If an incidental take permit is required, the USFWS is likely to identify binding reasonable and prudent measures (RPMs) and terms and conditions (TCs) of ‘take’ to offset the impacts. Importantly, the ESA does not necessarily preclude development of projects with potential impacts to federally listed species.
Regardless of whether the project will require a federal agency action, Section 9 of the ESA will be applicable and the ‘take’ of listed species is prohibited without a permit. Should the project have no federal nexus and require a permit for ‘take’ of listed species, AZ must obtain a Section 10 permit under the ESA. The Section 10 permitting process is an applicant-driven process, is often complex, requires mitigation to offset ‘take’ of listed species, and can take several years to develop in coordination with the USFWS. 32
The project is within designated critical habitat for jaguar and Mexican spotted owl. In addition, Sonora tiger salamander and lesser long-nosed bat, both listed as endangered under the ESA, and yellow-billed cuckoo, of which the populations in western North America are listed as threatened, are known to occur in the vicinity of the project (see Section 20.2). It is anticipated that the project may trigger Section 7 consultation if a federal permitting process is required. While ultimately to be determined by the USFWS, the project is unlikely to jeopardize any listed species or to adversely modify designated critical habitat, and as such, the ESA is not anticipated to preclude development of the project. The USFWS is likely to authorize ‘take’ listed species by the project. As part of this authorization, it is anticipated that USFWS will issue RPMs and T&Cs of ‘take’. Often these conditions are determined during consultation and are part of negotiated conservation measures proposed by the project proponent. These conservation measures will ultimately be incorporated into the final POO.
30 Jeopardizing the continued existence is defined as directly or indirectly affecting a species’ numbers, reproduction, or distribution in such a way as to considerably reduce the species’ ability to survive and recover in the wild. (50 CFR Part 402)
31 Adversely modifying critical habitat is defined as “Destruction or adverse modification means a direct or indirect alteration that appreciably diminishes the value of critical habitat for the conservation of a listed species. Such alterations may include, but are not limited to, those that alter the physical or biological features essential to the conservation of a species or that preclude or significantly delay development of such features.” (50 CFR Part 402)
32 Because Section 10 permits are discretionary decisions by the USFWS or National Marine Fishers Service, these permits generally require NEPA review and independent ESA compliance by these agencies.

Hermosa Property, Taylor Zn-Pb-Ag Deposit PEA Arizona Minerals Inc. 716027
amcconsultants.com 191
20.2.4 National historic preservation act
As stated in Section 20.2, a large portion of the area surrounding AZ’s private land has been surveyed for cultural resources and a number of historic and pre-historic cultural resources have been identified. If the project will have a federal nexus, any adverse effects to cultural properties will require consultation and mitigation in the form of data recovery and research. Should impacts to cultural resources eligible for registration on the National Register of Historic Places33 (Historic Properties) be unavoidable, authorization to mitigate the impacts to these resources is obtained through implementation of Section 106 consultation under the NHPA.
The consultation is typically conducted between the federal action agencies and the State Historic Preservation Office (SHPO). The Advisory Council on Historic Preservation will also be asked if they would like to participate in the consultation but typically they decline. The National Historic Preservation Act also requires that federal action agencies consult with tribes having cultural affinity to the project area, development of an historic properties treatment plan, and development and execution of a Memorandum of Agreement (MOA). Signatories to the MOA could be the SHPO, CNF, Corps (if a 404 permit is required), concurring parties to the agreement can include interested Native American groups and AZ. Concurring parties are not obligated to sign the MOA but will be given opportunity to review and comment. It is not anticipated that effects to cultural resources will preclude development of the project.
20.2.5 Natural Gas Act Section 7
The Project may include connecting into an existing transmission pipeline, a new compressor station and a new distribution pipeline to the mine. Under Section 7 of the Natural Gas Act, Federal Energy Regulatory Commission (FERC) is charged with evaluating whether interstate natural gas pipeline projects proposed by private companies should be approved and, if determined appropriate for approval, issues certificates of public converience and necessity of natural gas facilities engaged in interstate natural gas transportation by pipleline. The FERC decision to approve a project may require NEPA compliance. It is uncertain whether or not FERC involvement will be required (depending on whether or not the pipeline work will constitute an interstate project) however, should a NEPA process be reuired through FERC, the process is not expected to preclude development of the project.
State environmental permitting
A variety of state permits and approvals may be necessary to develop the project. A summary of the expected state permits / approvals, the lead agency for each permit/approval, and comments relevant to each are provided in Table 20.2, at the end of this section. This list has been prepared based on the current understanding of the project approach and the regulations currently in effect. The list may be subject to change as project development continues forward. The timeframes described are based on recent projects in Arizona, but are subject to change depending on the complexity of the project, public opinion, agency capabilities and priorities and other factors outside of AZ’s control.
Discussion of the most significant state environmental permits and approval actions is provided in the following subsections. These processes are anticipated to be completed concurrent with the NEPA analysis for the project and none of these permitting processes are expected to preclude development of the project.
20.3.1 Arizona state cultural resource regulations
The Arizona Antiquities Act (ARS §41-841 through §41-847) was enacted in 1927 and subsequently has been amended. The law provides for the protection and regulation of archaeological and paleontological sites on lands owned or controlled by the State of Arizona, or an agency of the State. The Arizona State Historic Preservation Act (ARS §41-861 through §41-866) was passed in 1982. The Act places the responsibility for historic properties on the head of state agencies, requires state agencies to identify properties meeting the criteria of the Arizona Register of Historic Places (Administrative Code R12-8-302). It also establishes a responsibility for agencies to actively manage historic properties, provides for the State Historic Preservation Officer to review agency plans involving an Arizona Register of Historic Places property, and establishes an acquisition and preservation fund. Importantly, the law criminalizes the intentional disturbance of human remains or funerary objects on private land
33 The official list of the Nation's historic places considered worthy of preservation.
Hermosa Property, Taylor Zn-Pb-Ag Deposit PEA Arizona Minerals Inc. 716027
amcconsultants.com 192
within the state. For unintentional disturbance on private land, the statute defines a process for reporting, treatment, and disposition of human remains. No Arizona state regulations that require systematic survey or treatment of cultural resources within the project area are known.
20.3.2 Air quality permit
Air quality is regulated at the federal level by the EPA under the CAA, although authority for air quality permitting has been delegated by the EPA (Region IX) to the Arizona Department of Environmental Quality (ADEQ), with the EPA retaining oversight. Prevention of Significant Deterioration (PSD) is a program established under the CAA to maintain ground-level concentrations of regulated air pollutants within National Ambient Air Quality Standards (NAAQS), which have been established for a variety of pollutants, including ozone, carbon monoxide, nitrogen dioxide, sulphur dioxide, particulate matter, and lead. Areas of the USA in compliance with NAAQS are designated as “attainment areas”. A PSD permit allows a facility to be constructed and operated within an attainment area.
The project is presently located in an attainment area for all regulated pollutants. A relatively small non-attainment area for particulate matter is located in the vicinity of Nogales, Arizona, such that any facilities proposed beyond the current project area should be reviewed for potential effects to this non-attainment area. PSD review is triggered for proposed emissions of a regulated pollutant greater than 250 tpa or for proposed emissions greater than 100 tpa, if the proposed facility includes a “categorical source”.
The PSD program also provides special protection for designated Class I areas, which are areas of special national or regional natural, scenic, recreational, or historic value. Generally, these additional analyses come into play for proposed facilities planned to be constructed within 6.2 miles (10 km) of a Class I area. Currently, there are no Class I areas within 6.2 miles (10 km) of the project.34
ADEQ has a Unitary Permit Program wherein construction permits and operating permits are combined into one application and subsequently one air quality control operating permit is issued. ADEQ has two air quality permit classifications: Class I (major source) and Class II (minor source). A Class I air quality operating permit is required for emissions of regulated pollutant exceeding 100 tpa (not to be confused with the PSD threshold). An assessment of the potential-to-emit (PTE) of regulated air pollutants allows the determination of the source classification for an air quality control permit application as a Class I or a Class II.
Development and issuance of a Class I permit may take 18 months to over 2 years, based on complexity and level and nature of public comment, whereas a Class II permit generally takes about 9 to 12 months. In either case, it is anticipated that ADEQ will require atmospheric dispersion modelling to demonstrate compliance with NAAQS for the proposed project. Obtaining a Clean Air Act permit is likely to occur within the timeframe of any NEPA process and information collected to support the permit will be used to support air permitting and the NEPA process. It is not anticipated that obtaining an air permit will preclude development of the project.
20.3.3 Aquifer protection permit
ADEQ is responsible for issuing an Aquifer Protection Permit (APP) to facilities that discharge pollutants which may have the potential to adversely impact groundwater quality. The following types of facilities fall under APP regulations: surface impoundments (process water ponds, holding ponds, settling pits or ponds, etc.), tailings storage facilities, waste rock stockpiles subjected to leaching, mine leaching facilities, wastewater treatment facilities, septic tanks (sewage treatment facilities, including on-site wastewater treatment facilities), injection wells, and point-source discharges to “navigable waters”.
In order to obtain an APP, applicants must make five “demonstrations” to the satisfaction of the ADEQ:
1. That the facilities are designed and will be constructed and operated according to “best available demonstrated control technology (BADCT).”
34 EPA Region 9 – Air. 2011. Class I Areas in EPA Region 9. Available online at: https://www3.epa.gov/region9/air/maps/pdfs/air1100018-9.pdf

Hermosa Property, Taylor Zn-Pb-Ag Deposit PEA Arizona Minerals Inc. 716027
amcconsultants.com 193
2. That the facility will not “cause or contribute to” an exceedance of Aquifer Water Quality Standards (AWQS) at designated point(s) of compliance, or if AWQS for a pollutant has already been exceeded in an aquifer (pre-existing condition), that no additional degradation will occur.
3. That the applicant is technically capable of carrying out the conditions of the permit.
4. That the applicant is financially capable of constructing, operating, closing and assuring post-closure care of the facility.
5. That the facility complies with applicable municipal or county zoning ordinances and regulations (however, mines are exempted from local zoning ordinances).
In the BADCT demonstration, two general approaches are available:
1. The use of “prescriptive” BADCT criteria
2. The use of “individual” BADCT criteria
Prescriptive BADCT include pre-approved control technologies for tailings impoundments and certain types of ponds and generally represent conservative approaches that are relatively independent of site conditions. As such, the site characterization requirements are generally less rigorous.
In order to characterize pre-existing conditions and demonstrate that the facility will comply with AWQS, an extensive hydrogeological characterization of the site, including the characterization of subsurface water levels, groundwater flow direction(s), groundwater quality, and other parameters, is required. Baseline data are required to establish normal seasonal fluctuations in subsurface conditions and background water quality. Several existing wells are currently being monitored by AMI, and additional hydrogeological investigations are underway. One or more point-of-compliance (POC) wells will be identified during the APP permitting process. To the extent possible, one or more of the wells identified in the POO will be used as POC wells.
In addition to the hydrogeological characterization, characterization of representative samples of materials representing waste rock and tailings is a permit requirement. These samples assist in identifying the BADCT approaches for waste rock and tailings accumulations on site.
The permitting process for an APP on a project of this size typically requires 12 to 18 months. ADEQ has an expedited program for accelerating the APP process in which an additional fee is paid to use an ADEQ-approved consultant.
20.3.4 Arizona pollutant discharge elimination system
The ADEQ’s AZPDES program was developed out of Section 402 of the CWA, of which the EPA has ceded administration to ADEQ. AZ currently maintains stormwater compliance coverage under the AZPDES Multi-Sector General Permit (MSGP-2010) industrial stormwater program. Mine facilities, which can include associated pre-mining exploration and construction, are required to obtain coverage for discharges of stormwater from their operations. This program requires a project proponent to prepare a Stormwater Pollution Prevention Plan (SWPPP), submit a Notice of Intent (NOI) to discharge stormwater, install appropriate Best Management Practices (BMPs), and conduct regular inspections of the site and analytical monitoring during exploration, construction and operations, in accordance with the approved SWPPP.
Stormwater discharges to Harshaw Creek and Alum Gulch, drainages in the immediate vicinity of the project that are classified by ADEQ as impaired waters, will require a demonstration that the discharges are not expected to cause or contribute to an exceedance of a water quality standard. Harshaw Creek and Alum Gulch have an approved Total Maximum Daily Load (TMDL), a calculation of the amount of a pollutant that a waterbody can receive and still safely meet water quality standards. Because discharges will be to impaired water, ADEQ will require additional limits, controls, or monitoring necessary to be consistent with the assumptions of any available waste load allocation in the TMDL.
It is anticipated that the project will require coverage under an individual AZPDES permit to discharge treated waste water. This will include effluent limitations, usually consisting of both numeric and narrative standards. The
Hermosa Property, Taylor Zn-Pb-Ag Deposit PEA Arizona Minerals Inc. 716027
amcconsultants.com 194
numeric limitations typically restrict quantities, rates, and concentrations of pollutants that may be present in the discharge, and can be either technology or water quality-based. Technology-based standards require usage of available pollution control technology, while water quality-based standards protect ambient water quality by requiring the discharger to achieve the applicable numeric standard (as mentioned above). If both technology and water quality-based standards exist for a particular constituent, the more restrictive standard applies. It is not anticipated that obtaining an AZPDES individual permit will preclude development of the project.
20.3.5 Arizona 401 water quality certification
The ADEQ’s Section 401 certification is issued to ensure that federally permitted or licensed activities do not cause a violation of state water quality standards when an activity may result in a discharge to water of the state. In Arizona, this certification is almost exclusively required only when a 404 permit is also required. Each review is specific to the proposed project and the project’s site. A State Water Quality Certification is necessary before a permit may be issued by a federal agency. The certification process runs concurrently with the NEPA process. It is not anticipated that obtaining a 401 Water Quality Certification will preclude development of the project.
20.3.6 Arizona state mine inspector
The Arizona State Mine Inspector (ASMI) has jurisdiction over reclamation plans, associated costs, and financial assurance mechanisms. The amount of financial assurance is based on the actual estimated costs of reclamation. These costs and financial assurance mechanisms will be developed concurrent with all other permitting and will not preclude development of the project.
20.3.7 Arizona corporation commission
Construction of a 138 kV transmission line would require a Certificate of Environmental Compatibility (CEC) issued by the Arizona Corporation Commission (ACC). The CEC would be issued after approval from the Arizona Power Plant and Transmission Line Siting Committee (the Committee). The Committee provides a single, independent forum to evaluate applications to build power plants (of 100 megawatts or more) or transmission projects (of 115,000 volts or more) in the state. The utility provider for the transmission line would be required to apply for a CEC according to A.R.S. (refence: 40-3 60).
The application for the CEC would include project (transmission line) location information, a description of the proposed project, cost data, and a description of any environmental studies conducted. During public hearings, the Committee would consider the application, the evidence and exhibits presented, and the legal requirements to determine whether or not to the approve the application for construction of the transmission line. As part of the CEC application process, alternatives for power supply would be analyzed. The exhibits to be presented to the Committee would likely include the following:
• A narrative of the project including location, jurisdiction, surface management, existing land uses, and future land use mapping.
• An environmental report.
• Descriptions of any areas that provide habitat for special status species within the project area and any biological field surveys and/or agency correspondence related to the project.
• Visual resource analysis.
• Cultural resource survey findings.
• Existing and future recreational facilities within the project area.
• Development and plans of the state, local government, and private entities for other developments within the project area.
• Description of noise emission levels and any interference with communication signals.
• Summary of public scoping meetings and responses to public comments.
If approved, the CEC would be granted under specific conditions issued by the Committee. Obtaining a CEC permit is not expected to preclude the development of the project.
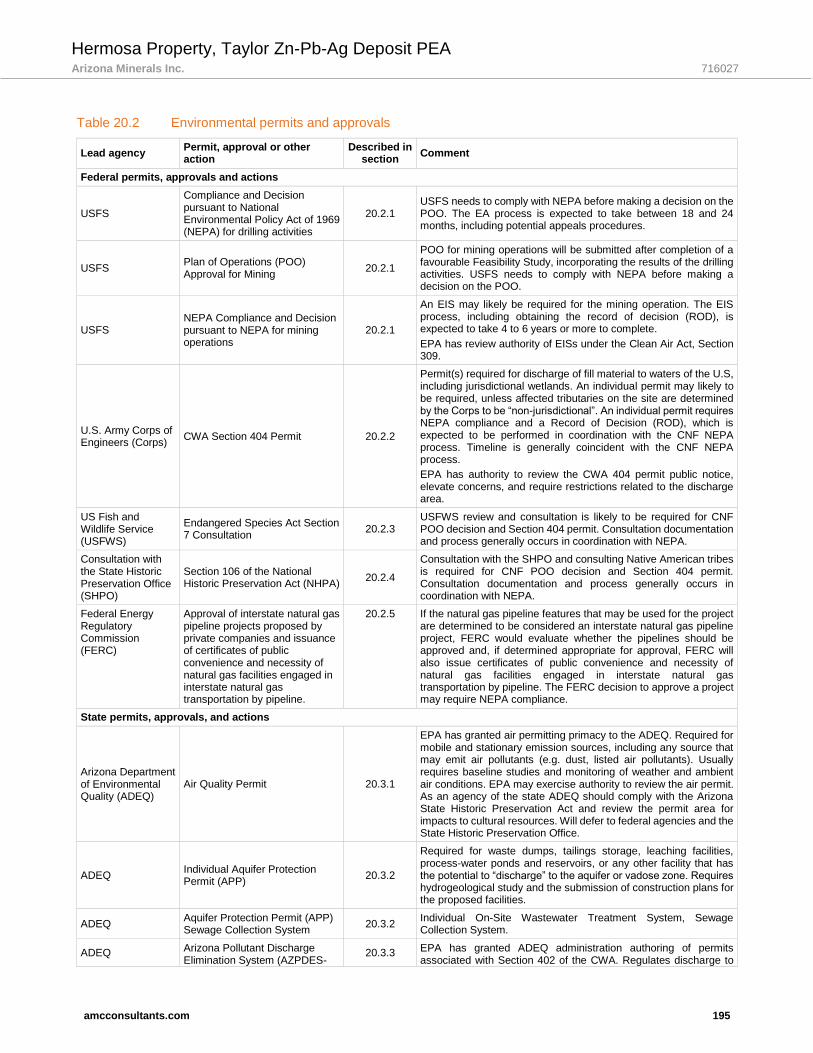
Hermosa Property, Taylor Zn-Pb-Ag Deposit PEA Arizona Minerals Inc. 716027
amcconsultants.com 195
Table 20.2 Environmental permits and approvals
Lead agency Permit, approval or other action
Described in section
Comment
Federal permits, approvals and actions
USFS
Compliance and Decision pursuant to National Environmental Policy Act of 1969 (NEPA) for drilling activities
20.2.1 USFS needs to comply with NEPA before making a decision on the POO. The EA process is expected to take between 18 and 24 months, including potential appeals procedures.
USFS Plan of Operations (POO) Approval for Mining
20.2.1
POO for mining operations will be submitted after completion of a favourable Feasibility Study, incorporating the results of the drilling activities. USFS needs to comply with NEPA before making a decision on the POO.
USFS NEPA Compliance and Decision pursuant to NEPA for mining operations
20.2.1
An EIS may likely be required for the mining operation. The EIS process, including obtaining the record of decision (ROD), is expected to take 4 to 6 years or more to complete.
EPA has review authority of EISs under the Clean Air Act, Section 309.
U.S. Army Corps of Engineers (Corps)
CWA Section 404 Permit 20.2.2
Permit(s) required for discharge of fill material to waters of the U.S, including jurisdictional wetlands. An individual permit may likely to be required, unless affected tributaries on the site are determined by the Corps to be “non-jurisdictional”. An individual permit requires NEPA compliance and a Record of Decision (ROD), which is expected to be performed in coordination with the CNF NEPA process. Timeline is generally coincident with the CNF NEPA process.
EPA has authority to review the CWA 404 permit public notice, elevate concerns, and require restrictions related to the discharge area.
US Fish and Wildlife Service (USFWS)
Endangered Species Act Section 7 Consultation
20.2.3 USFWS review and consultation is likely to be required for CNF POO decision and Section 404 permit. Consultation documentation and process generally occurs in coordination with NEPA.
Consultation with the State Historic Preservation Office (SHPO)
Section 106 of the National Historic Preservation Act (NHPA)
20.2.4
Consultation with the SHPO and consulting Native American tribes is required for CNF POO decision and Section 404 permit. Consultation documentation and process generally occurs in coordination with NEPA.
Federal Energy Regulatory Commission (FERC)
Approval of interstate natural gas pipeline projects proposed by private companies and issuance of certificates of public convenience and necessity of natural gas facilities engaged in interstate natural gas transportation by pipeline.
20.2.5 If the natural gas pipeline features that may be used for the project are determined to be considered an interstate natural gas pipeline project, FERC would evaluate whether the pipelines should be approved and, if determined appropriate for approval, FERC will also issue certificates of public convenience and necessity of natural gas facilities engaged in interstate natural gas transportation by pipeline. The FERC decision to approve a project may require NEPA compliance.
State permits, approvals, and actions
Arizona Department of Environmental Quality (ADEQ)
Air Quality Permit 20.3.1
EPA has granted air permitting primacy to the ADEQ. Required for mobile and stationary emission sources, including any source that may emit air pollutants (e.g. dust, listed air pollutants). Usually requires baseline studies and monitoring of weather and ambient air conditions. EPA may exercise authority to review the air permit. As an agency of the state ADEQ should comply with the Arizona State Historic Preservation Act and review the permit area for impacts to cultural resources. Will defer to federal agencies and the State Historic Preservation Office.
ADEQ Individual Aquifer Protection Permit (APP)
20.3.2
Required for waste dumps, tailings storage, leaching facilities, process-water ponds and reservoirs, or any other facility that has the potential to “discharge” to the aquifer or vadose zone. Requires hydrogeological study and the submission of construction plans for the proposed facilities.
ADEQ Aquifer Protection Permit (APP) Sewage Collection System
20.3.2 Individual On-Site Wastewater Treatment System, Sewage Collection System.
ADEQ Arizona Pollutant Discharge Elimination System (AZPDES-
20.3.3 EPA has granted ADEQ administration authoring of permits associated with Section 402 of the CWA. Regulates discharge to
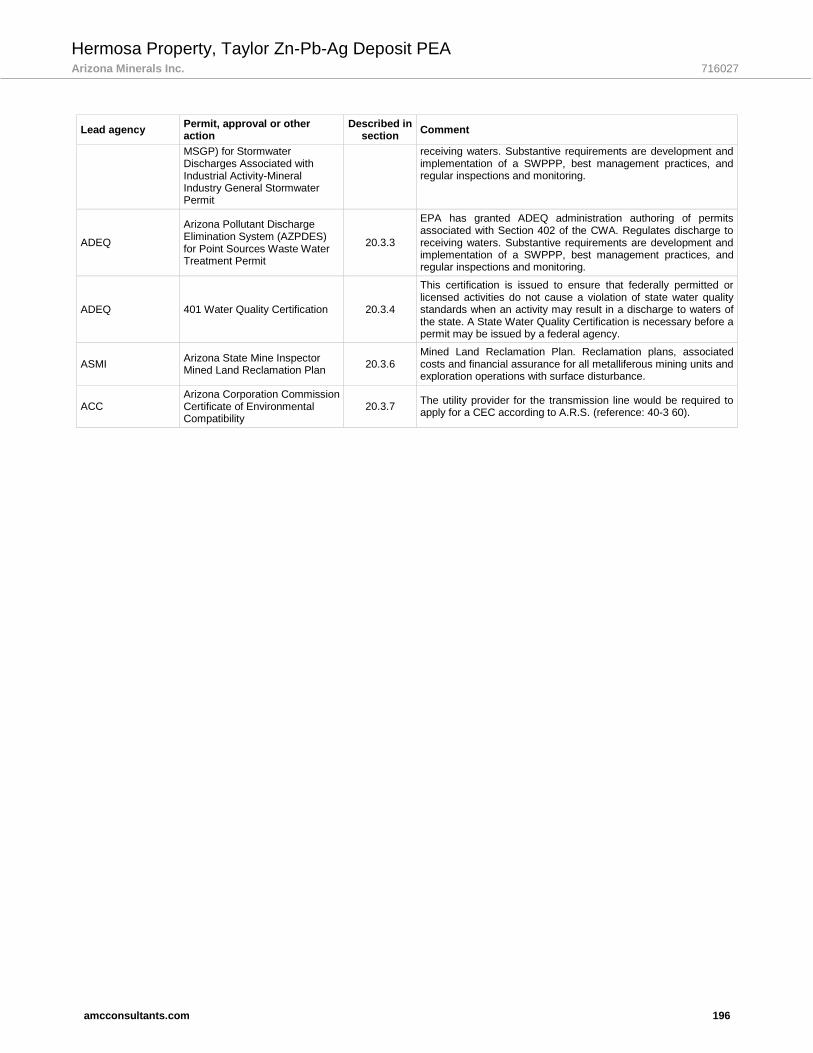
Hermosa Property, Taylor Zn-Pb-Ag Deposit PEA Arizona Minerals Inc. 716027
amcconsultants.com 196
Lead agency Permit, approval or other action
Described in section
Comment
MSGP) for Stormwater Discharges Associated with Industrial Activity-Mineral Industry General Stormwater Permit
receiving waters. Substantive requirements are development and implementation of a SWPPP, best management practices, and regular inspections and monitoring.
ADEQ
Arizona Pollutant Discharge Elimination System (AZPDES) for Point Sources Waste Water Treatment Permit
20.3.3
EPA has granted ADEQ administration authoring of permits associated with Section 402 of the CWA. Regulates discharge to receiving waters. Substantive requirements are development and implementation of a SWPPP, best management practices, and regular inspections and monitoring.
ADEQ 401 Water Quality Certification 20.3.4
This certification is issued to ensure that federally permitted or licensed activities do not cause a violation of state water quality standards when an activity may result in a discharge to waters of the state. A State Water Quality Certification is necessary before a permit may be issued by a federal agency.
ASMI Arizona State Mine Inspector Mined Land Reclamation Plan
20.3.6 Mined Land Reclamation Plan. Reclamation plans, associated costs and financial assurance for all metalliferous mining units and exploration operations with surface disturbance.
ACC Arizona Corporation Commission Certificate of Environmental Compatibility
20.3.7 The utility provider for the transmission line would be required to apply for a CEC according to A.R.S. (reference: 40-3 60).
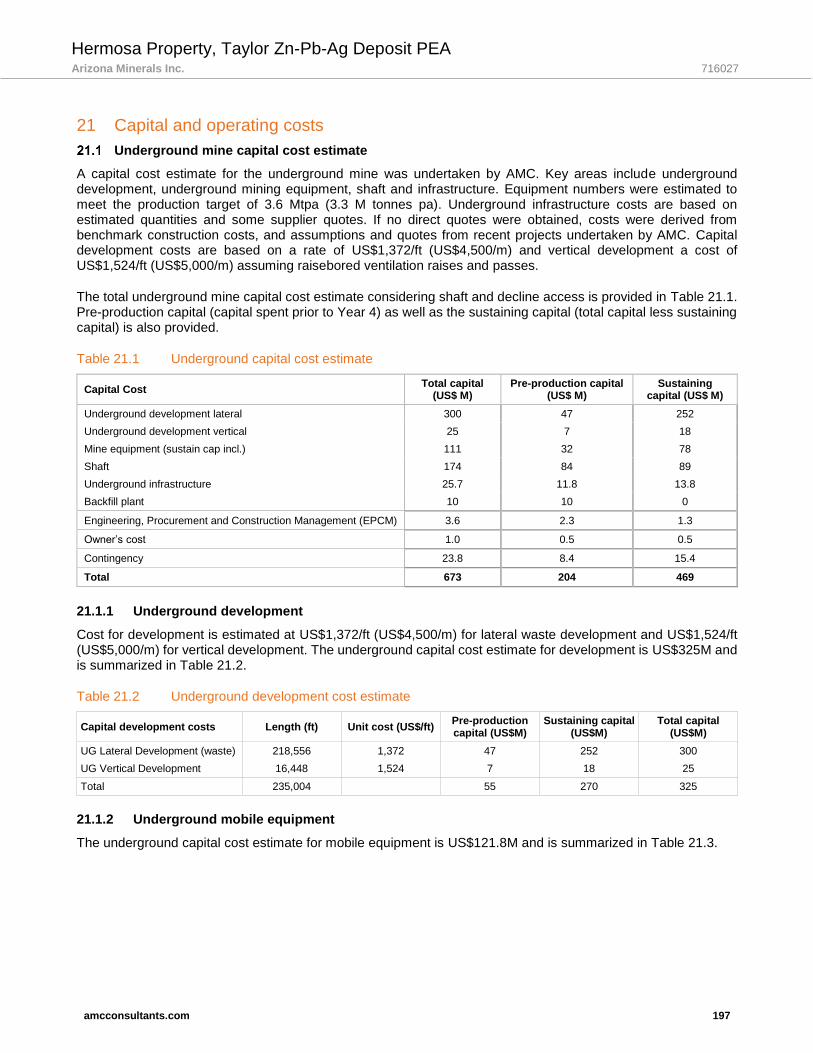
Hermosa Property, Taylor Zn-Pb-Ag Deposit PEA Arizona Minerals Inc. 716027
amcconsultants.com 197
21 Capital and operating costs
Underground mine capital cost estimate
A capital cost estimate for the underground mine was undertaken by AMC. Key areas include underground development, underground mining equipment, shaft and infrastructure. Equipment numbers were estimated to meet the production target of 3.6 Mtpa (3.3 M tonnes pa). Underground infrastructure costs are based on estimated quantities and some supplier quotes. If no direct quotes were obtained, costs were derived from benchmark construction costs, and assumptions and quotes from recent projects undertaken by AMC. Capital development costs are based on a rate of US$1,372/ft (US$4,500/m) and vertical development a cost of US$1,524/ft (US$5,000/m) assuming raisebored ventilation raises and passes.
The total underground mine capital cost estimate considering shaft and decline access is provided in Table 21.1. Pre-production capital (capital spent prior to Year 4) as well as the sustaining capital (total capital less sustaining capital) is also provided.
Table 21.1 Underground capital cost estimate
Capital Cost Total capital
(US$ M) Pre-production capital
(US$ M) Sustaining
capital (US$ M)
Underground development lateral 300 47 252
Underground development vertical 25 7 18
Mine equipment (sustain cap incl.) 111 32 78
Shaft 174 84 89
Underground infrastructure 25.7 11.8 13.8
Backfill plant 10 10 0
Engineering, Procurement and Construction Management (EPCM) 3.6 2.3 1.3
Owner’s cost 1.0 0.5 0.5
Contingency 23.8 8.4 15.4
Total 673 204 469
21.1.1 Underground development
Cost for development is estimated at US$1,372/ft (US$4,500/m) for lateral waste development and US$1,524/ft (US$5,000/m) for vertical development. The underground capital cost estimate for development is US$325M and is summarized in Table 21.2.
Table 21.2 Underground development cost estimate
Capital development costs Length (ft) Unit cost (US$/ft) Pre-production capital (US$M)
Sustaining capital (US$M)
Total capital (US$M)
UG Lateral Development (waste) 218,556 1,372 47 252 300
UG Vertical Development 16,448 1,524 7 18 25
Total 235,004 55 270 325
21.1.2 Underground mobile equipment
The underground capital cost estimate for mobile equipment is US$121.8M and is summarized in Table 21.3.

Hermosa Property, Taylor Zn-Pb-Ag Deposit PEA Arizona Minerals Inc. 716027
amcconsultants.com 198
Table 21.3 Underground mobile equipment cost estimate
Description Capital cost (US$M)
Pre-production capital* 32.4
Sustaining capital* 78.3
Contingency 11.1
Total 121.8
Years 1 to 3 inclusive
The estimate for mobile equipment icludes the following:
• Longhole production drill (4)
• 2-boom development jumbo (6)
• Scoops (4 production, 6 development)
• 50-tonne trucks (6 production, 3 waste)
• Bolter (4)
• Ancillary equipment
21.1.3 Main production shaft
The main production shaft capital cost estimate is US$182.3M and is summarized in Table 21.4. The cost estimate is based on a 2017 contractor quote for this project.
Table 21.4 Main production shaft cost estimate
Description Capital cost (US$M)
Shaft sinking 83.6
Shaft furnishings 84.8
EPCM, owners costs and contingency 8.7
Allowances for delays and bad ground included in contingency
Additional cost for sinking in two phases included in sinking
Sustaining Capital 5.2
Total 182.3
21.1.3.1 Underground infrastructure
The underground infrastructure capital cost estimate is US$32.3M and is summarized in Table 21.5. The costs are based upon supplier quotations, pricing in the public domain, and unit rates from previous experience. The underground infrastructure costs largely consist of electrical distribution, ventilation, and dewatering system costs.
Table 21.5 Underground infrastructure cost estimate
Description Total cost (US$M)
Mine dewatering 4.7
Service water 1.4
Electrical distribution 2.2
Workshop, magazine and refuge stations 1.6
Communications 0.9
Primary fans and facilities 13.0
Indirect costs and contingency 6.6
Sustaining Capital 2.0
Total 32.3
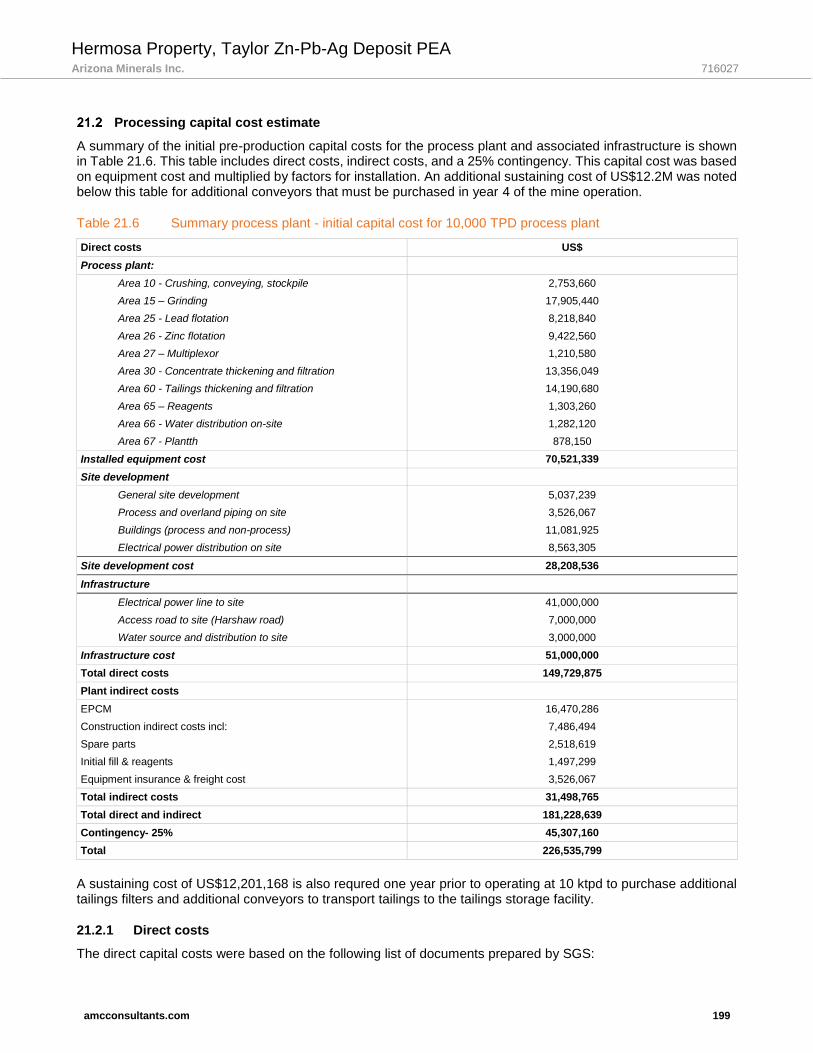
Hermosa Property, Taylor Zn-Pb-Ag Deposit PEA Arizona Minerals Inc. 716027
amcconsultants.com 199
Processing capital cost estimate
A summary of the initial pre-production capital costs for the process plant and associated infrastructure is shown in Table 21.6. This table includes direct costs, indirect costs, and a 25% contingency. This capital cost was based on equipment cost and multiplied by factors for installation. An additional sustaining cost of US$12.2M was noted below this table for additional conveyors that must be purchased in year 4 of the mine operation.
Table 21.6 Summary process plant - initial capital cost for 10,000 TPD process plant
Direct costs US$
Process plant:
Area 10 - Crushing, conveying, stockpile 2,753,660
Area 15 – Grinding 17,905,440
Area 25 - Lead flotation 8,218,840
Area 26 - Zinc flotation 9,422,560
Area 27 – Multiplexor 1,210,580
Area 30 - Concentrate thickening and filtration 13,356,049
Area 60 - Tailings thickening and filtration 14,190,680
Area 65 – Reagents 1,303,260
Area 66 - Water distribution on-site 1,282,120
Area 67 - Plantth 878,150
Installed equipment cost 70,521,339
Site development
General site development 5,037,239
Process and overland piping on site 3,526,067
Buildings (process and non-process) 11,081,925
Electrical power distribution on site 8,563,305
Site development cost 28,208,536
Infrastructure
Electrical power line to site 41,000,000
Access road to site (Harshaw road) 7,000,000
Water source and distribution to site 3,000,000
Infrastructure cost 51,000,000
Total direct costs 149,729,875
Plant indirect costs
EPCM 16,470,286
Construction indirect costs incl: 7,486,494
Spare parts 2,518,619
Initial fill & reagents 1,497,299
Equipment insurance & freight cost 3,526,067
Total indirect costs 31,498,765
Total direct and indirect 181,228,639
Contingency- 25% 45,307,160
Total 226,535,799
A sustaining cost of US$12,201,168 is also requred one year prior to operating at 10 ktpd to purchase additional tailings filters and additional conveyors to transport tailings to the tailings storage facility.
21.2.1 Direct costs
The direct capital costs were based on the following list of documents prepared by SGS:
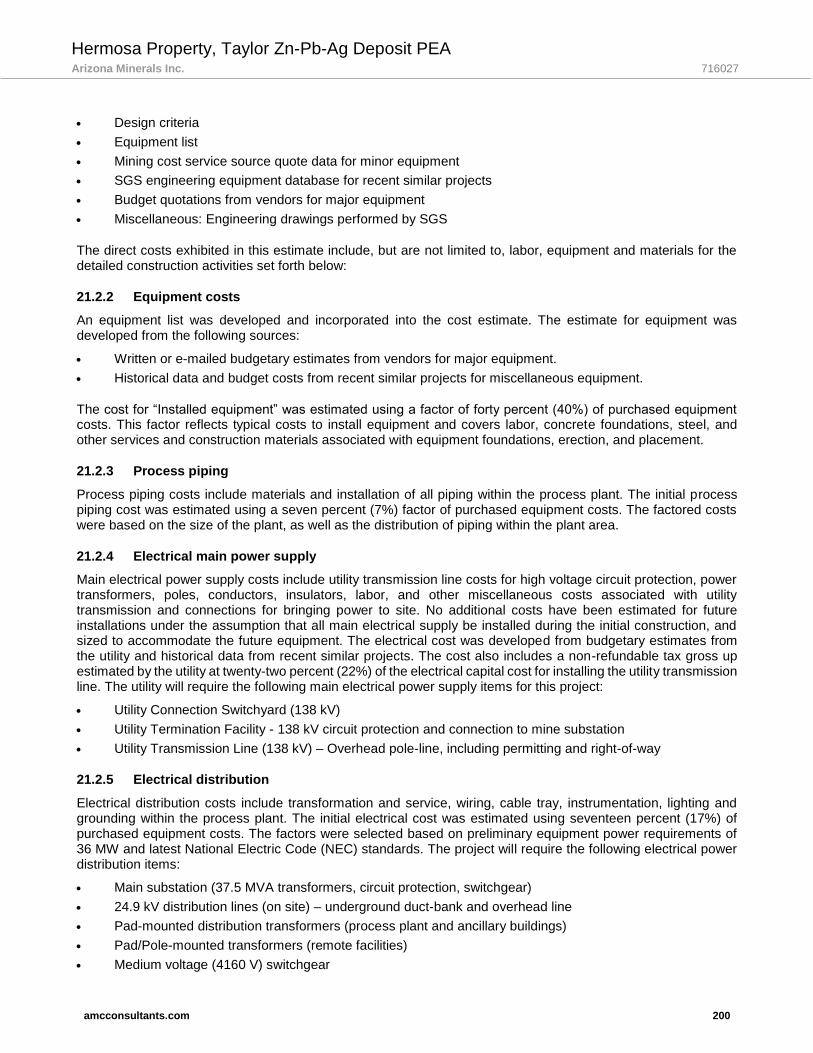
Hermosa Property, Taylor Zn-Pb-Ag Deposit PEA Arizona Minerals Inc. 716027
amcconsultants.com 200
• Design criteria
• Equipment list
• Mining cost service source quote data for minor equipment
• SGS engineering equipment database for recent similar projects
• Budget quotations from vendors for major equipment
• Miscellaneous: Engineering drawings performed by SGS
The direct costs exhibited in this estimate include, but are not limited to, labor, equipment and materials for the detailed construction activities set forth below:
21.2.2 Equipment costs
An equipment list was developed and incorporated into the cost estimate. The estimate for equipment was developed from the following sources:
• Written or e-mailed budgetary estimates from vendors for major equipment.
• Historical data and budget costs from recent similar projects for miscellaneous equipment.
The cost for “Installed equipment” was estimated using a factor of forty percent (40%) of purchased equipment costs. This factor reflects typical costs to install equipment and covers labor, concrete foundations, steel, and other services and construction materials associated with equipment foundations, erection, and placement.
21.2.3 Process piping
Process piping costs include materials and installation of all piping within the process plant. The initial process piping cost was estimated using a seven percent (7%) factor of purchased equipment costs. The factored costs were based on the size of the plant, as well as the distribution of piping within the plant area.
21.2.4 Electrical main power supply
Main electrical power supply costs include utility transmission line costs for high voltage circuit protection, power transformers, poles, conductors, insulators, labor, and other miscellaneous costs associated with utility transmission and connections for bringing power to site. No additional costs have been estimated for future installations under the assumption that all main electrical supply be installed during the initial construction, and sized to accommodate the future equipment. The electrical cost was developed from budgetary estimates from the utility and historical data from recent similar projects. The cost also includes a non-refundable tax gross up estimated by the utility at twenty-two percent (22%) of the electrical capital cost for installing the utility transmission line. The utility will require the following main electrical power supply items for this project:
• Utility Connection Switchyard (138 kV)
• Utility Termination Facility - 138 kV circuit protection and connection to mine substation
• Utility Transmission Line (138 kV) – Overhead pole-line, including permitting and right-of-way
21.2.5 Electrical distribution
Electrical distribution costs include transformation and service, wiring, cable tray, instrumentation, lighting and grounding within the process plant. The initial electrical cost was estimated using seventeen percent (17%) of purchased equipment costs. The factors were selected based on preliminary equipment power requirements of 36 MW and latest National Electric Code (NEC) standards. The project will require the following electrical power distribution items:
• Main substation (37.5 MVA transformers, circuit protection, switchgear)
• 24.9 kV distribution lines (on site) – underground duct-bank and overhead line
• Pad-mounted distribution transformers (process plant and ancillary buildings)
• Pad/Pole-mounted transformers (remote facilities)
• Medium voltage (4160 V) switchgear
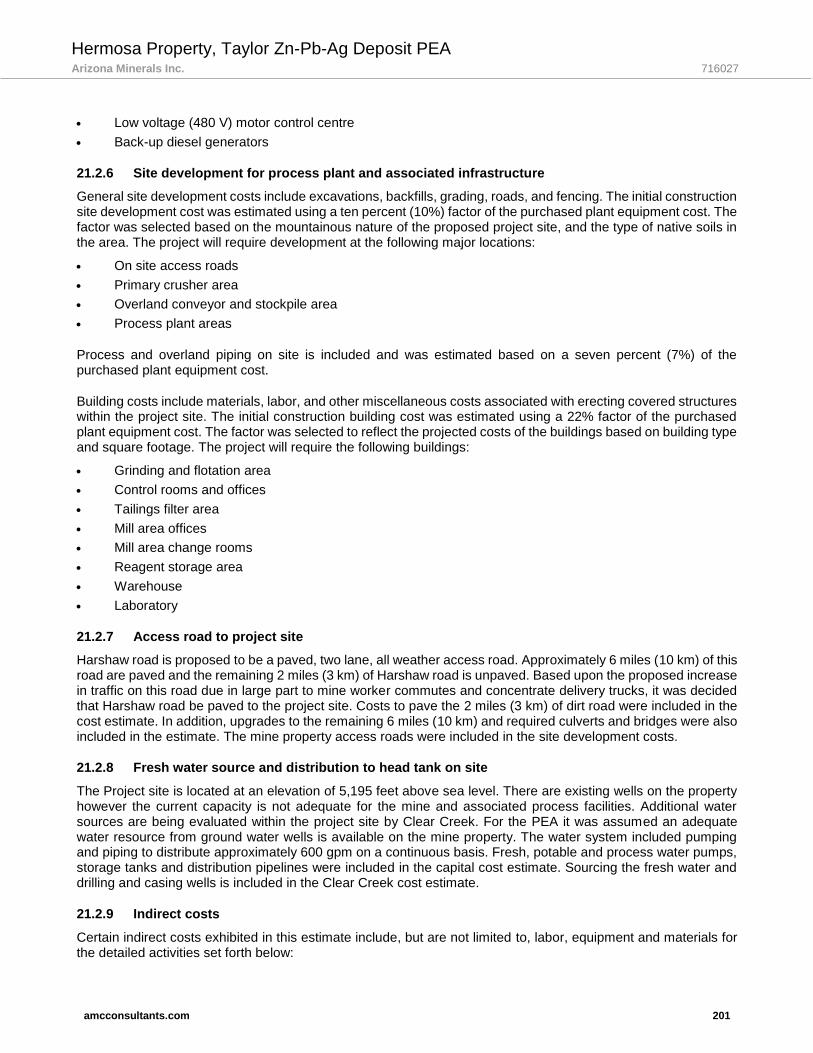
Hermosa Property, Taylor Zn-Pb-Ag Deposit PEA Arizona Minerals Inc. 716027
amcconsultants.com 201
• Low voltage (480 V) motor control centre
• Back-up diesel generators
21.2.6 Site development for process plant and associated infrastructure
General site development costs include excavations, backfills, grading, roads, and fencing. The initial construction site development cost was estimated using a ten percent (10%) factor of the purchased plant equipment cost. The factor was selected based on the mountainous nature of the proposed project site, and the type of native soils in the area. The project will require development at the following major locations:
• On site access roads
• Primary crusher area
• Overland conveyor and stockpile area
• Process plant areas
Process and overland piping on site is included and was estimated based on a seven percent (7%) of the purchased plant equipment cost.
Building costs include materials, labor, and other miscellaneous costs associated with erecting covered structures within the project site. The initial construction building cost was estimated using a 22% factor of the purchased plant equipment cost. The factor was selected to reflect the projected costs of the buildings based on building type and square footage. The project will require the following buildings:
• Grinding and flotation area
• Control rooms and offices
• Tailings filter area
• Mill area offices
• Mill area change rooms
• Reagent storage area
• Warehouse
• Laboratory
21.2.7 Access road to project site
Harshaw road is proposed to be a paved, two lane, all weather access road. Approximately 6 miles (10 km) of this road are paved and the remaining 2 miles (3 km) of Harshaw road is unpaved. Based upon the proposed increase in traffic on this road due in large part to mine worker commutes and concentrate delivery trucks, it was decided that Harshaw road be paved to the project site. Costs to pave the 2 miles (3 km) of dirt road were included in the cost estimate. In addition, upgrades to the remaining 6 miles (10 km) and required culverts and bridges were also included in the estimate. The mine property access roads were included in the site development costs.
21.2.8 Fresh water source and distribution to head tank on site
The Project site is located at an elevation of 5,195 feet above sea level. There are existing wells on the property however the current capacity is not adequate for the mine and associated process facilities. Additional water sources are being evaluated within the project site by Clear Creek. For the PEA it was assumed an adequate water resource from ground water wells is available on the mine property. The water system included pumping and piping to distribute approximately 600 gpm on a continuous basis. Fresh, potable and process water pumps, storage tanks and distribution pipelines were included in the capital cost estimate. Sourcing the fresh water and drilling and casing wells is included in the Clear Creek cost estimate.
21.2.9 Indirect costs
Certain indirect costs exhibited in this estimate include, but are not limited to, labor, equipment and materials for the detailed activities set forth below:
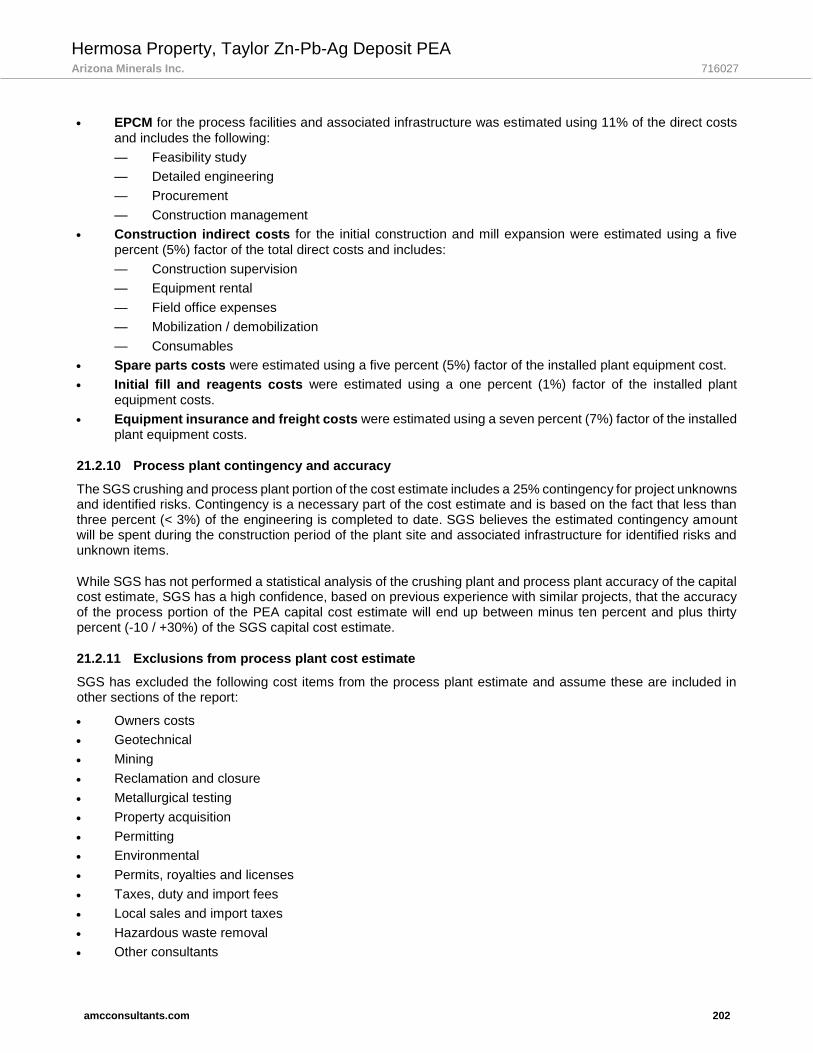
Hermosa Property, Taylor Zn-Pb-Ag Deposit PEA Arizona Minerals Inc. 716027
amcconsultants.com 202
• EPCM for the process facilities and associated infrastructure was estimated using 11% of the direct costs
and includes the following:
— Feasibility study
— Detailed engineering
— Procurement
— Construction management
• Construction indirect costs for the initial construction and mill expansion were estimated using a five
percent (5%) factor of the total direct costs and includes:
— Construction supervision
— Equipment rental
— Field office expenses
— Mobilization / demobilization
— Consumables
• Spare parts costs were estimated using a five percent (5%) factor of the installed plant equipment cost.
• Initial fill and reagents costs were estimated using a one percent (1%) factor of the installed plant
equipment costs.
• Equipment insurance and freight costs were estimated using a seven percent (7%) factor of the installed
plant equipment costs.
21.2.10 Process plant contingency and accuracy
The SGS crushing and process plant portion of the cost estimate includes a 25% contingency for project unknowns and identified risks. Contingency is a necessary part of the cost estimate and is based on the fact that less than three percent (< 3%) of the engineering is completed to date. SGS believes the estimated contingency amount will be spent during the construction period of the plant site and associated infrastructure for identified risks and unknown items.
While SGS has not performed a statistical analysis of the crushing plant and process plant accuracy of the capital cost estimate, SGS has a high confidence, based on previous experience with similar projects, that the accuracy of the process portion of the PEA capital cost estimate will end up between minus ten percent and plus thirty percent (-10 / +30%) of the SGS capital cost estimate.
21.2.11 Exclusions from process plant cost estimate
SGS has excluded the following cost items from the process plant estimate and assume these are included in other sections of the report:
• Owners costs
• Geotechnical
• Mining
• Reclamation and closure
• Metallurgical testing
• Property acquisition
• Permitting
• Environmental
• Permits, royalties and licenses
• Taxes, duty and import fees
• Local sales and import taxes
• Hazardous waste removal
• Other consultants
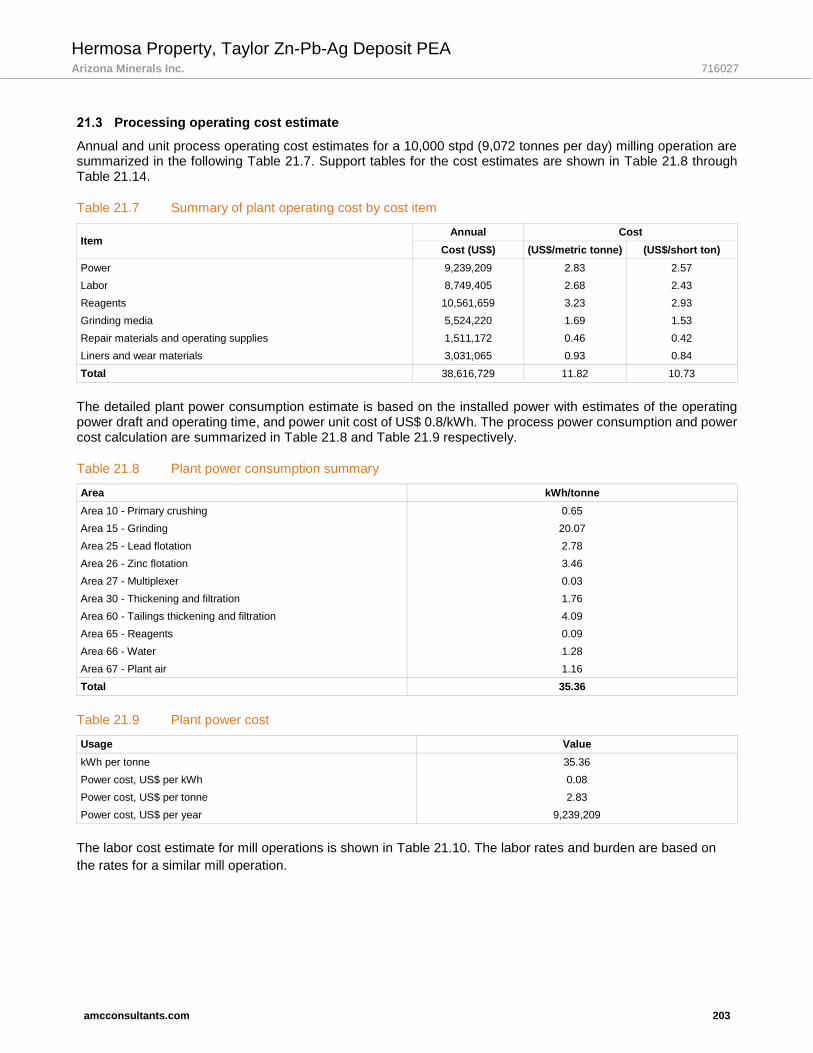
Hermosa Property, Taylor Zn-Pb-Ag Deposit PEA Arizona Minerals Inc. 716027
amcconsultants.com 203
Processing operating cost estimate
Annual and unit process operating cost estimates for a 10,000 stpd (9,072 tonnes per day) milling operation are summarized in the following Table 21.7. Support tables for the cost estimates are shown in Table 21.8 through Table 21.14.
Table 21.7 Summary of plant operating cost by cost item
Item Annual Cost
Cost (US$) (US$/metric tonne) (US$/short ton)
Power 9,239,209 2.83 2.57
Labor 8,749,405 2.68 2.43
Reagents 10,561,659 3.23 2.93
Grinding media 5,524,220 1.69 1.53
Repair materials and operating supplies 1,511,172 0.46 0.42
Liners and wear materials 3,031,065 0.93 0.84
Total 38,616,729 11.82 10.73
The detailed plant power consumption estimate is based on the installed power with estimates of the operating power draft and operating time, and power unit cost of US$ 0.8/kWh. The process power consumption and power cost calculation are summarized in Table 21.8 and Table 21.9 respectively.
Table 21.8 Plant power consumption summary
Area kWh/tonne
Area 10 - Primary crushing 0.65
Area 15 - Grinding 20.07
Area 25 - Lead flotation 2.78
Area 26 - Zinc flotation 3.46
Area 27 - Multiplexer 0.03
Area 30 - Thickening and filtration 1.76
Area 60 - Tailings thickening and filtration 4.09
Area 65 - Reagents 0.09
Area 66 - Water 1.28
Area 67 - Plant air 1.16
Total 35.36
Table 21.9 Plant power cost
Usage Value
kWh per tonne 35.36
Power cost, US$ per kWh 0.08
Power cost, US$ per tonne 2.83
Power cost, US$ per year 9,239,209
The labor cost estimate for mill operations is shown in Table 21.10. The labor rates and burden are based on
the rates for a similar mill operation.

Hermosa Property, Taylor Zn-Pb-Ag Deposit PEA Arizona Minerals Inc. 716027
amcconsultants.com 204
Table 21.10 Labor cost
Function Per crew Total Total hrs/Yr Rate (US$) Total (US$)
Operations shift crews (4 crews req'd)
Control room operator 1 4 8,760 42.00 367,920
Crusher operator 1 4 8,760 39.20 343,392
Grinding operator 1 4 8,760 36.40 318,864
Zinc flotation operator 1 4 8,760 35.00 306,600
Lead flotation operator 1 4 8,760 35.00 306,600
Filter operator (concentrate) 1 4 8,760 35.00 306,600
Tailings / water operator 1 4 8,760 35.00 306,600
Training / vacation relief 1 4 8,760 28.70 251,412
Labor 3 12 8,760 28.70 251,412
Zinc conc handling (loading trucks) 1 4 8,760 28.70 251,412
Lead conc handling (loading trucks) 1 4 8,760 28.70 251,412
Sub total 52 2,759,400
Operations day crew
Reagent mixing (10 and 4) 2 2 4,160 28.70 119,392
Tailings storage operation 4 4 8,320 28.70 238,784
General cleanup; ball charging 3 3 6,240 28.70 179,088
Sub total 9 537,264
Maintenance
Mechanics 10 10 20,800 41.30 859,040
Shift electrician 1 4 8,760 42.42 371,599
Day electrician / inst. Tech 6 6 12,480 42.42 529,402
Laborers 2 2 4,160 28.70 119,392
Sub total 22 1,879,433
Technical
Shift sample prep / sampler 1 4 8,760 $28.00 $245,280
Day sample prep 2 2 4,160 $28.00 $116,480
Assayers (day only) 4 4 8,320 $36.40 $302,848
Sub total 10 $664,608
Salaried personnel
Mill superintendent 1 142,000 142,000
General foreman 1 130,600 130,600
Maintenance foreman 3 133,500 400,500
Plant foreman 3 125,000 375,000
Senior metallurgist 1 139,200 139,200
Metallurgist 3 127,800 383,400
Process technician 3 96,600 289,800
Instrument technician 3 99,400 298,200
Process foreman 6 125,000 750,000
Sub total 24 2,908,700
Grand total 117 8,749,405
Reagent cost estimates are shown in Table 21.11. The reagent consumption rates are based on SGS Lakefield metallurgical test work data in 2017.
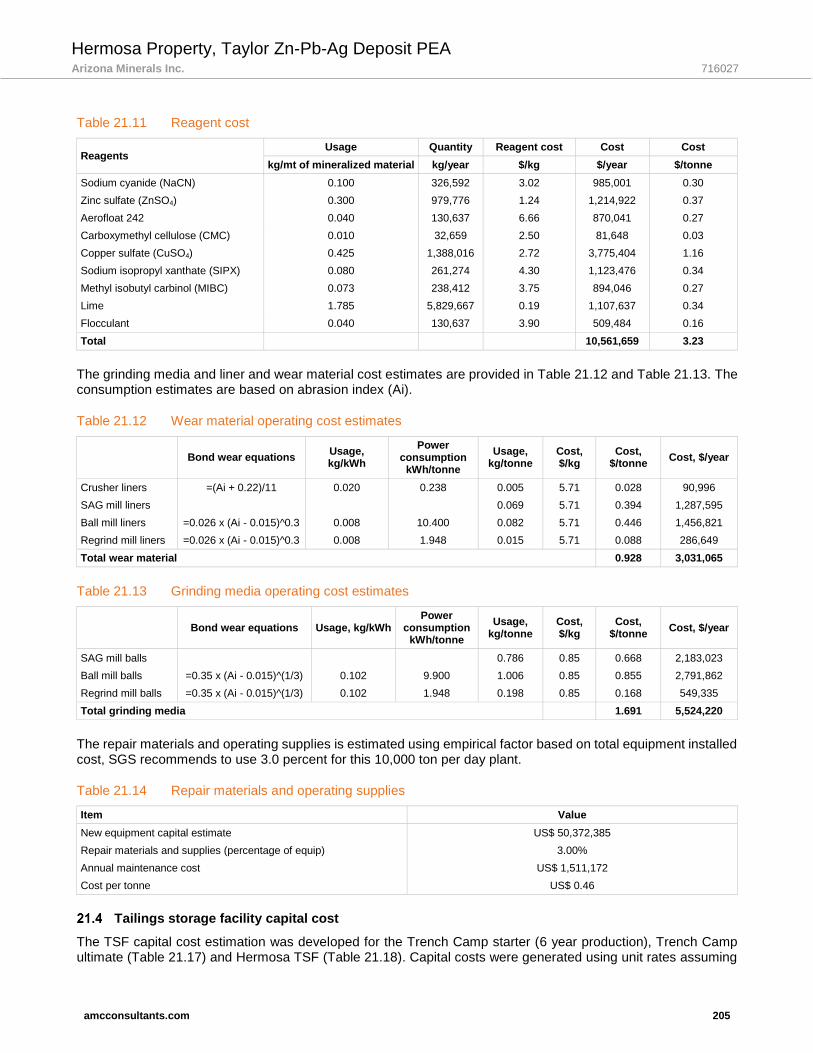
Hermosa Property, Taylor Zn-Pb-Ag Deposit PEA Arizona Minerals Inc. 716027
amcconsultants.com 205
Table 21.11 Reagent cost
Reagents Usage Quantity Reagent cost Cost Cost
kg/mt of mineralized material kg/year $/kg $/year $/tonne
Sodium cyanide (NaCN) 0.100 326,592 3.02 985,001 0.30
Zinc sulfate (ZnSO4) 0.300 979,776 1.24 1,214,922 0.37
Aerofloat 242 0.040 130,637 6.66 870,041 0.27
Carboxymethyl cellulose (CMC) 0.010 32,659 2.50 81,648 0.03
Copper sulfate (CuSO4) 0.425 1,388,016 2.72 3,775,404 1.16
Sodium isopropyl xanthate (SIPX) 0.080 261,274 4.30 1,123,476 0.34
Methyl isobutyl carbinol (MIBC) 0.073 238,412 3.75 894,046 0.27
Lime 1.785 5,829,667 0.19 1,107,637 0.34
Flocculant 0.040 130,637 3.90 509,484 0.16
Total
10,561,659 3.23
The grinding media and liner and wear material cost estimates are provided in Table 21.12 and Table 21.13. The consumption estimates are based on abrasion index (Ai).
Table 21.12 Wear material operating cost estimates
Bond wear equations Usage, kg/kWh
Power consumption
kWh/tonne
Usage, kg/tonne
Cost, $/kg
Cost, $/tonne
Cost, $/year
Crusher liners =(Ai + 0.22)/11 0.020 0.238 0.005 5.71 0.028 90,996
SAG mill liners 0.069 5.71 0.394 1,287,595
Ball mill liners =0.026 x (Ai - 0.015)^0.3 0.008 10.400 0.082 5.71 0.446 1,456,821
Regrind mill liners =0.026 x (Ai - 0.015)^0.3 0.008 1.948 0.015 5.71 0.088 286,649
Total wear material 0.928 3,031,065
Table 21.13 Grinding media operating cost estimates
Bond wear equations Usage, kg/kWh Power
consumption kWh/tonne
Usage, kg/tonne
Cost, $/kg
Cost, $/tonne
Cost, $/year
SAG mill balls
0.786 0.85 0.668 2,183,023
Ball mill balls =0.35 x (Ai - 0.015)^(1/3) 0.102 9.900 1.006 0.85 0.855 2,791,862
Regrind mill balls =0.35 x (Ai - 0.015)^(1/3) 0.102 1.948 0.198 0.85 0.168 549,335
Total grinding media
1.691 5,524,220
The repair materials and operating supplies is estimated using empirical factor based on total equipment installed cost, SGS recommends to use 3.0 percent for this 10,000 ton per day plant.
Table 21.14 Repair materials and operating supplies
Item Value
New equipment capital estimate US$ 50,372,385
Repair materials and supplies (percentage of equip) 3.00%
Annual maintenance cost US$ 1,511,172
Cost per tonne US$ 0.46
Tailings storage facility capital cost
The TSF capital cost estimation was developed for the Trench Camp starter (6 year production), Trench Camp ultimate (Table 21.17) and Hermosa TSF (Table 21.18). Capital costs were generated using unit rates assuming
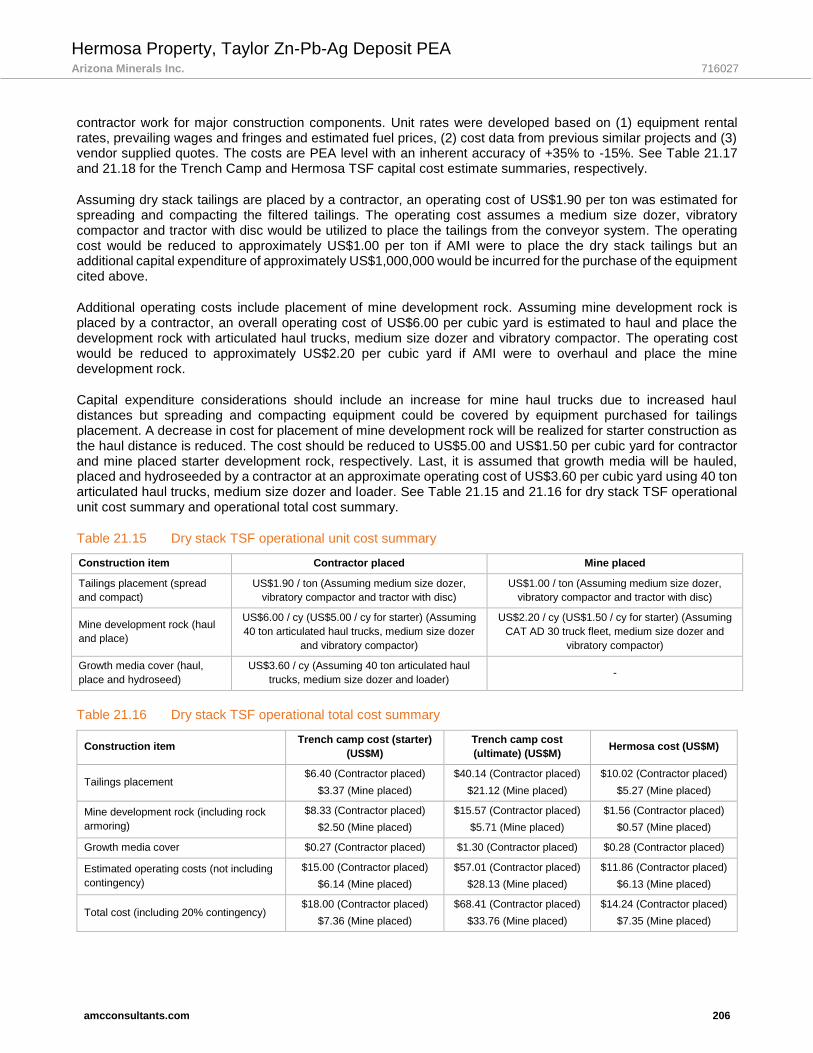
Hermosa Property, Taylor Zn-Pb-Ag Deposit PEA Arizona Minerals Inc. 716027
amcconsultants.com 206
contractor work for major construction components. Unit rates were developed based on (1) equipment rental rates, prevailing wages and fringes and estimated fuel prices, (2) cost data from previous similar projects and (3) vendor supplied quotes. The costs are PEA level with an inherent accuracy of +35% to -15%. See Table 21.17 and 21.18 for the Trench Camp and Hermosa TSF capital cost estimate summaries, respectively.
Assuming dry stack tailings are placed by a contractor, an operating cost of US$1.90 per ton was estimated for spreading and compacting the filtered tailings. The operating cost assumes a medium size dozer, vibratory compactor and tractor with disc would be utilized to place the tailings from the conveyor system. The operating cost would be reduced to approximately US$1.00 per ton if AMI were to place the dry stack tailings but an additional capital expenditure of approximately US$1,000,000 would be incurred for the purchase of the equipment cited above.
Additional operating costs include placement of mine development rock. Assuming mine development rock is placed by a contractor, an overall operating cost of US$6.00 per cubic yard is estimated to haul and place the development rock with articulated haul trucks, medium size dozer and vibratory compactor. The operating cost would be reduced to approximately US$2.20 per cubic yard if AMI were to overhaul and place the mine development rock.
Capital expenditure considerations should include an increase for mine haul trucks due to increased haul distances but spreading and compacting equipment could be covered by equipment purchased for tailings placement. A decrease in cost for placement of mine development rock will be realized for starter construction as the haul distance is reduced. The cost should be reduced to US$5.00 and US$1.50 per cubic yard for contractor and mine placed starter development rock, respectively. Last, it is assumed that growth media will be hauled, placed and hydroseeded by a contractor at an approximate operating cost of US$3.60 per cubic yard using 40 ton articulated haul trucks, medium size dozer and loader. See Table 21.15 and 21.16 for dry stack TSF operational unit cost summary and operational total cost summary.
Table 21.15 Dry stack TSF operational unit cost summary
Construction item Contractor placed Mine placed
Tailings placement (spread
and compact)
US$1.90 / ton (Assuming medium size dozer,
vibratory compactor and tractor with disc)
US$1.00 / ton (Assuming medium size dozer,
vibratory compactor and tractor with disc)
Mine development rock (haul
and place)
US$6.00 / cy (US$5.00 / cy for starter) (Assuming
40 ton articulated haul trucks, medium size dozer
and vibratory compactor)
US$2.20 / cy (US$1.50 / cy for starter) (Assuming
CAT AD 30 truck fleet, medium size dozer and
vibratory compactor)
Growth media cover (haul,
place and hydroseed)
US$3.60 / cy (Assuming 40 ton articulated haul
trucks, medium size dozer and loader) -
Table 21.16 Dry stack TSF operational total cost summary
Construction item Trench camp cost (starter)
(US$M)
Trench camp cost
(ultimate) (US$M) Hermosa cost (US$M)
Tailings placement $6.40 (Contractor placed)
$3.37 (Mine placed)
$40.14 (Contractor placed)
$21.12 (Mine placed)
$10.02 (Contractor placed)
$5.27 (Mine placed)
Mine development rock (including rock
armoring)
$8.33 (Contractor placed)
$2.50 (Mine placed)
$15.57 (Contractor placed)
$5.71 (Mine placed)
$1.56 (Contractor placed)
$0.57 (Mine placed)
Growth media cover $0.27 (Contractor placed) $1.30 (Contractor placed) $0.28 (Contractor placed)
Estimated operating costs (not including
contingency)
$15.00 (Contractor placed)
$6.14 (Mine placed)
$57.01 (Contractor placed)
$28.13 (Mine placed)
$11.86 (Contractor placed)
$6.13 (Mine placed)
Total cost (including 20% contingency) $18.00 (Contractor placed)
$7.36 (Mine placed)
$68.41 (Contractor placed)
$33.76 (Mine placed)
$14.24 (Contractor placed)
$7.35 (Mine placed)

Hermosa Property, Taylor Zn-Pb-Ag Deposit PEA Arizona Minerals Inc. 716027
amcconsultants.com 207
21.4.1 Trench Camp dry stack TSF
Table 21.17 Trench Camp dry stack TSF capital cost estimate summary
Construction item Cost (starter) ($USM) Cost (ultimate) ($USM)
Mobilization / demobilization $0.79 $1.35
Site preparation / remove existing tailings piles $3.86 $5.53
Rock excavation $0.35 $0.80
Perimeter road construction $2.02 $4.47
Low permeability soil layer $0.59 $1.49
Geomembrane liner $0.98 $2.44
Protective layer $1.55 $3.90
TSF underdrain collection system $2.60 $2.80
Underdrain collection pond (including reclaim system) $0.68 $0.68
External stormwater management – flow through drain $0.60 $0.60
Contingency (30%) $2.80 $4.77
Estimated direct costs (including contingency) $16.82 $28.65
Estimated indirect costs $2.66 $4.54
Total cost $19.49 $33.18
21.4.2 Hermosa dry stack TSF
Table 21.18 Hermosa dry stack TSF capital cost estimate summary
Construction item Cost (ultimate) ($USM)
Mobilization / demobilization $0.50
Site preparation $0.23
Rock excavation $0.09
Perimeter road construction $3.31
Low permeability soil layer $0.39
Geomembrane liner $0.65
Protective layer $1.03
TSF underdrain collection system $0.87
Underdrain collection pond (including reclaim system) $0.75
External stormwater management – flow through drain $1.05
Contingency (30%) $1.77
Estimated direct costs (including contingency) $10.64
Estimated indirect costs $1.68
Total cost $12.33
21.4.3 Cost estimate basis for major construction items
• Mobilization / demobilization
— Unit rate
− Earthworks contractor is assumed to be 5% of total direct cost
− Geosynthetics contractor is assumed to be 1% of total direct cost
• Site preparation / relocating existing tailings piles
— Measurement

Hermosa Property, Taylor Zn-Pb-Ag Deposit PEA Arizona Minerals Inc. 716027
amcconsultants.com 208
− Assumed to be approximately 18 - 24 in (457 mm – 610 mm) thick over the disturbance footprint of the TSF
− Volume based on assumed base topography of existing tailings
— Unit rate
− Clearing and stripping based on scraper and dozer fleet with material located to stockpile within 1 mile (1,609 m)
− Existing tailings relocation based on haul, place and compaction of tailings using trucks, a loader, dozers, a compactor and a tractor with a disc considering an average haul of approximately 0.75 mile (1,208 m) round trip
• Rock excavation
— Measurement
− Rock excavation assumed to be approximately 25% of cut to fill excavation value
— Unit rate
− Drill and blast based on work completed by mine
• Perimeter road construction
— Measurement
− Engineered fill volume based on a crest width of 25 ft (7.6 m) with 2.5 H:1 V upstream and 2.0 H:1 V downstream side slopes
− Wearing course volume is based on 6 in thick across the width of the perimeter road
— Unit rate
− Engineered fill material sourced as a cut to fill from the basin and plant site areas in combination with non-PAG mine development rock
− Wearing course material is produced by a crushing and screening operation and placed using trucks and dozers
• Low permeability soil liner
— Measurement
− Low permeability soil to be 12 in (305 mm) thick (prescriptive BADCT requirement) over the basin and upstream slope of the perimeter road
— Unit rate
− Assumes borrow source located on site with material placed using dozers, scrapers and compactor
− Assumes low permeability surface is prepared for geosynthetics placement
• Geomembrane liner
— Measurement
− Area of basin and upstream slope of the perimeter road
— Unit rate
− Supply and install for 60 mil class (1.5 mm) HDPE geomembrane (prescriptive BADCT requirement)
− 10 percent increase for supply to account for wastage and overlap
• Protective layer
— Measurement
− Protective layer to be 18 in (457 mm) thick (prescriptive BADCT requirement) over the basin area and upstream slope of the perimeter road
— Unit rate
− Assumes material is produced from non-PAG mine development rock using a crushing and screen operation and placed using trucks and dozers
• TSF underdrain collection system

Hermosa Property, Taylor Zn-Pb-Ag Deposit PEA Arizona Minerals Inc. 716027
amcconsultants.com 209
— Measurement
− Underdrain collection pipe - linear foot measurement
− Concrete encasement - linear foot measurement
— Unit rate
− Supply and install
− Pipe fittings were estimated at 10% of pipe supply and install cost
− Supply and install of non-woven geotextile
− Cross sectional area of select gravel (crushing and screening operation)
− Cross sectional area of reinforced concrete
• Underdrain collection pond
— Measurement
− Volume based on a crest width of 25 ft (7.6 m) with 2.5 H:1 V upstream and 2.0 H:1 V downstream side slopes
− Area of geomembrane
− Reclaim pipe linear foot measurement
− Pump, support and instrumentation
— Unit rate
− Material sourced as a cut to fill from the basin area in combination with non-PAG mine development rock
− Supply and install for 80 mil (2.0 mm) HDPE geomembrane and geonet
− 10 percent increase for supply of geomembrane and geonet to account for wastage and overlap
− Supply and install of pump system and pipe
• External stormwater management
— Measurement
− Flow through drain linear foot measurement
— Unit rate
− Based on supply and install of flow through drain pipe as well as cross sectional area of pipe bedding and pipe backfill
• Direct costs
— Summation of costs listed above
• Indirect costs
— Engineering cost is assumed to be 5% of direct costs
— Construction management is assumed to be 6% of direct costs
— Quality assurance/quality control (QA/QC) is assumed to be 7% of direct costs
— Surveying is assumed to be 1% of direct costs
• Filtered dry stack tailings (operating cost)
— Measurement
− Volume based on tailings capacity of dry stack TSF
— Unit rate
− Based on cost to spread and compact tailings after placed by conveyor using a dozer, compactor and tractor with disc (conveyor cost captured by others)
• Mine development rock (includes rock armoring) (operating cost)
— Measurement
− Volume based on mine development rock capacity of dry stack TSF including the 5.3 ft (1.6 m) thick rock armour exterior

Hermosa Property, Taylor Zn-Pb-Ag Deposit PEA Arizona Minerals Inc. 716027
amcconsultants.com 210
— Unit Rate
− Based on cost to haul and place of mine development rock using trucks and dozers
• Growth media cover (reclaim) (operating cost)
— Measurement
− Volume based on 2 ft (600 mm) depth of growth media over dry stack surface
— Unit rate
− Based on contractor cost to haul, place and re-vegetate growth media from a stockpile using trucks and dozers
Total capital cost estimate for the mine
The total LOM capital cost estimate for the mine is provided in Table 21.19. Pre-production capital (capital spent prior to Year 4) as well as the project capital (total capital less pre-production capital) is also provided.
Table 21.19 Total mine capital cost estimate
Item Total (US$) Pre-production capital (US$)
Year
Underground Development
324,838,491
1
5,670,194
2
9,569,852
3
39,609,083
Mine Equipment (incl. sust. capital) 110,700,000 4,600,000 17,100,000 10,700,000
Shaft (incl. sust. capital) 173,620,000 42,105,000 42,105,000
Backfill plant 10,000,000 10,000,000
Water to site 3,000,000 3,000,000
Power 41,000,000 41,000,000
Roads 7,000,000 7,000,000
TSF - Trench and Hermosa 38,970,000 8,340,000 8,340,000
Processing 110,832,313 32,877,048 65,754,097
UG Infrastructure (incl. sust. capital) 25,675,331 3,945,889 3,945,889 3,945,889
EPCM 35,098,765 433,333 10,931,872 22,433,560
Owners Cost 1,000,000 191,667 191,667 116,667
Contingency 75,631,000 19,570,735 17,672,337 26,019,928
Total 957,365,900 135,856,818 142,733,664 178,579,224
Pre-production capital 457,169,706
Sustaining capital 500,196,195
Underground mine operating cost
AMC has used benchmark operating costs for mining from its underground database of mining costs. Benchmark costs indicate that for a production rate of 3.6 Mtpa (3.3 Mtonnes pa), the mine operating cost averages approximately US$31/t of mineralization. The benchmark data includes all mining methods, however approximately a third of the data represents SLOS or Longhole stope data. The database has costs for backfill included in some of the operations but not all.
AMC considers a cost of US$31/t of mineralization to be a reasonable estimate for the production rate with an additional cost for paste fill of US$4.35. The total mining cost assumed for this study is US$35.35. The benchmark data for mining costs is provided in Figure 21.1.

Hermosa Property, Taylor Zn-Pb-Ag Deposit PEA Arizona Minerals Inc. 716027
amcconsultants.com 211
Figure 21.1 Benchmark data for mining costs
AMC validated the operating costs based on labour schedules and labour numbers and then split into cost categories for North American costs for a mining operation. The split by cost area is summarised in Table 21.20. The validated costs are within 5% of the benchmark data, it was decided to use the more conservative mining cost of US$35.35. The backfill costs were determined seperately and are based on costs for labour, cement and consumables from local vendors.
Table 21.20 Mine operating cost by area
Item Percentage of total Total (US$) / ton of mineralized materal
Labour 33% 10.93
Power 17% 5.63
Consumables 25% 8.28
Services 7% 2.32
Other 5% 1.84
Backfill 13% 4.35
Total 100% 33.35
General and administration operating cost estimate
Cost estimates for General and administration (G&A) were provided by AZ at a unit cost of US$2.00/ton. G&A costs are those that support the overall management and operation of the business and include rent, utilities, insurance and managerial, procurement, environment, safety and administrative salaries.
Total mine operating cost
The total operating cost is estimated to be US$48.08/t mineralized material for the mine. The total operating cost includes mining (US$35.35/t of mineralized material), processing cost (US$10.73/t of mineralized material) and General and Administration cost (US$2/t mineralized material).

Hermosa Property, Taylor Zn-Pb-Ag Deposit PEA Arizona Minerals Inc. 716027
amcconsultants.com 212
22 Economic analysis
Assumptions
All currency is in US dollars (US$) unless otherwise stated. The cost estimate was prepared with a base date of Year 1 and does not include any escalation beyond this date. For net present value (NPV) estimation, all costs and revenues are discounted at 8% from the base date. Metal prices were selected after discussion with AZ and referencing current markets and forecasts in the public domain. A regular corporate tax rate of 35% % for federal tax and 4.9% for Arizona State tax is applied as the mining income will be earned in Arizona, USA. It is assumed that 3% of the NSR value would be the royalties to be paid.
Economic analysis
AMC conducted a high level economic assessment of the conceptual underground operation of the Taylor deposit. The underground mine is projected to generate approximately US$1,835M pre-tax NPV and US$1,261M post-tax NPV at 8% discount rate, pre-tax IRR of 51.4% and post-tax IRR of 41.7%. Project capital is estimated at US$957M with a payback period of 1.5 years (discounted pre-tax cash flow from start of production in Year 4). Key assumptions and results of the underground mine economics are provided in the Table 22.1. The LOM production schedule, average metal grades, recovered metal, and cash flow forecast is shown in Table 22.2.
The PEA is preliminary in nature. It includes Inferred Mineral Resources that are considered too speculative geologically to have the economic considerations applied to them that would enable them to be categorized as Mineral Reserves. There is no certainty that the PEA will be realized.

Hermosa Property, Taylor Zn-Pb-Ag Deposit PEA Arizona Minerals Inc. 716027
amcconsultants.com 213
Table 22.1 Taylor deposit underground mine – key economic assumptions and results
Arizona Taylor Deposit Unit Value
Total mineralized rock kton 60,846
Total waste production kton 6,354
Zinc grade (1) % 4.43%
Lead grade (1) % 4.31%
Silver grade (1) oz/ton 1.71
Zinc recovery (1) % 92.7%
Lead recovery (1) % 95.4%
Silver recovery (1) % 92.4%
Zinc price US$/lb 1.10
Lead price US$/lb 1.00
Silver price US$/oz 20.00
Zinc payable (2) % 85%
Lead payable (2) % 95%
Silver payable - Pb con(2) % 97%
Silver payable - Zn con(2) % 70%
Payable Zn metal klbs 4,252,501
Payable Pb metal klbs 4,756,053
Payable Ag metal koz 82,496
Revenue split by commodity Zinc 42%
Revenue split by commodity Lead 43%
Revenue split by commodity Silver 15%
Total revenue US$ ($ 000) 11,083,731
Capital costs US$ ($ 000) 957,366
Operating costs (Total) (3) US$ ($ 000) 2,925,483
Mine operating costs (4) US$/ton 35.35
Process and tails storage operating costs US$/ton 10.73
Operating costs (Total) (3) US$/ton 48.08
c1 Zinc co-product cost (8) US$/lb 0.51
c1 Lead co-product cost (8) US$/lb 0.38
Total all-in sustaining cost (ZnEq) US$/lb ZnEq 0.61
Payback Period pre tax(5) (Yrs) 1.5
Cumulative net cash flow (6) US$ ($ 000) 4,475,686
Pre-tax NPV (7) US$ ($ 000) 1,835,402
Pre-tax IRR % 51%
Post-tax NPV (7) US$ ($ 000) 1,260,764
Post-tax IRR % 42%
1. LOM average 2. Overall payable % includes treatment, transport, refining costs and selling costs 3. Includes mine operating costs, milling, and mine G&A 4. Underground mining costs only 5. Values are pre-tax and discounted at 8%, from production start date Year 4 6. Pre-tax and undiscounted 7. At 8% discount rate 8. Silver treated as by product
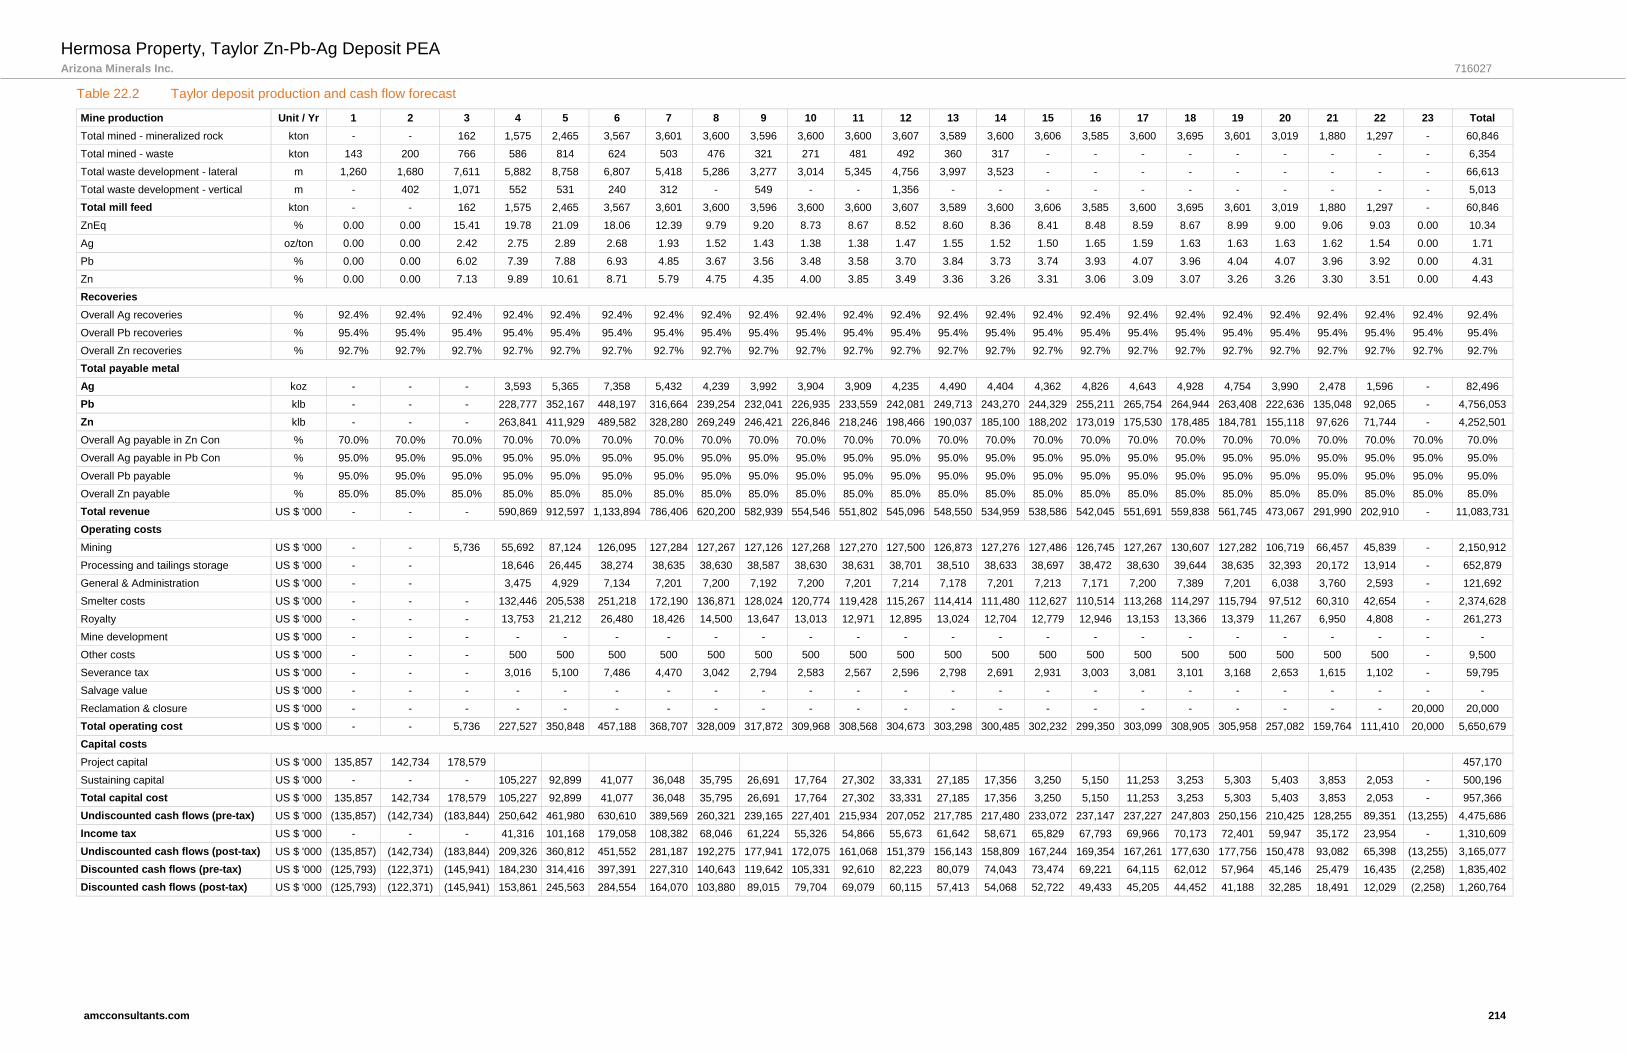
Hermosa Property, Taylor Zn-Pb-Ag Deposit PEA Arizona Minerals Inc. 716027
amcconsultants.com 214
Table 22.2 Taylor deposit production and cash flow forecast
Mine production Unit / Yr 1 2 3 4 5 6 7 8 9 10 11 12 13 14 15 16 17 18 19 20 21 22 23 Total
Total mined - mineralized rock kton - - 162 1,575 2,465 3,567 3,601 3,600 3,596 3,600 3,600 3,607 3,589 3,600 3,606 3,585 3,600 3,695 3,601 3,019 1,880 1,297 - 60,846
Total mined - waste kton 143 200 766 586 814 624 503 476 321 271 481 492 360 317 - - - - - - - - - 6,354
Total waste development - lateral m 1,260 1,680 7,611 5,882 8,758 6,807 5,418 5,286 3,277 3,014 5,345 4,756 3,997 3,523 - - - - - - - - - 66,613
Total waste development - vertical m - 402 1,071 552 531 240 312 - 549 - - 1,356 - - - - - - - - - - - 5,013
Total mill feed kton - - 162 1,575 2,465 3,567 3,601 3,600 3,596 3,600 3,600 3,607 3,589 3,600 3,606 3,585 3,600 3,695 3,601 3,019 1,880 1,297 - 60,846
ZnEq % 0.00 0.00 15.41 19.78 21.09 18.06 12.39 9.79 9.20 8.73 8.67 8.52 8.60 8.36 8.41 8.48 8.59 8.67 8.99 9.00 9.06 9.03 0.00 10.34
Ag oz/ton 0.00 0.00 2.42 2.75 2.89 2.68 1.93 1.52 1.43 1.38 1.38 1.47 1.55 1.52 1.50 1.65 1.59 1.63 1.63 1.63 1.62 1.54 0.00 1.71
Pb % 0.00 0.00 6.02 7.39 7.88 6.93 4.85 3.67 3.56 3.48 3.58 3.70 3.84 3.73 3.74 3.93 4.07 3.96 4.04 4.07 3.96 3.92 0.00 4.31
Zn % 0.00 0.00 7.13 9.89 10.61 8.71 5.79 4.75 4.35 4.00 3.85 3.49 3.36 3.26 3.31 3.06 3.09 3.07 3.26 3.26 3.30 3.51 0.00 4.43
Recoveries
Overall Ag recoveries % 92.4% 92.4% 92.4% 92.4% 92.4% 92.4% 92.4% 92.4% 92.4% 92.4% 92.4% 92.4% 92.4% 92.4% 92.4% 92.4% 92.4% 92.4% 92.4% 92.4% 92.4% 92.4% 92.4% 92.4%
Overall Pb recoveries % 95.4% 95.4% 95.4% 95.4% 95.4% 95.4% 95.4% 95.4% 95.4% 95.4% 95.4% 95.4% 95.4% 95.4% 95.4% 95.4% 95.4% 95.4% 95.4% 95.4% 95.4% 95.4% 95.4% 95.4%
Overall Zn recoveries % 92.7% 92.7% 92.7% 92.7% 92.7% 92.7% 92.7% 92.7% 92.7% 92.7% 92.7% 92.7% 92.7% 92.7% 92.7% 92.7% 92.7% 92.7% 92.7% 92.7% 92.7% 92.7% 92.7% 92.7%
Total payable metal
Ag koz - - - 3,593 5,365 7,358 5,432 4,239 3,992 3,904 3,909 4,235 4,490 4,404 4,362 4,826 4,643 4,928 4,754 3,990 2,478 1,596 - 82,496
Pb klb - - - 228,777 352,167 448,197 316,664 239,254 232,041 226,935 233,559 242,081 249,713 243,270 244,329 255,211 265,754 264,944 263,408 222,636 135,048 92,065 - 4,756,053
Zn klb - - - 263,841 411,929 489,582 328,280 269,249 246,421 226,846 218,246 198,466 190,037 185,100 188,202 173,019 175,530 178,485 184,781 155,118 97,626 71,744 - 4,252,501
Overall Ag payable in Zn Con % 70.0% 70.0% 70.0% 70.0% 70.0% 70.0% 70.0% 70.0% 70.0% 70.0% 70.0% 70.0% 70.0% 70.0% 70.0% 70.0% 70.0% 70.0% 70.0% 70.0% 70.0% 70.0% 70.0% 70.0%
Overall Ag payable in Pb Con % 95.0% 95.0% 95.0% 95.0% 95.0% 95.0% 95.0% 95.0% 95.0% 95.0% 95.0% 95.0% 95.0% 95.0% 95.0% 95.0% 95.0% 95.0% 95.0% 95.0% 95.0% 95.0% 95.0% 95.0%
Overall Pb payable % 95.0% 95.0% 95.0% 95.0% 95.0% 95.0% 95.0% 95.0% 95.0% 95.0% 95.0% 95.0% 95.0% 95.0% 95.0% 95.0% 95.0% 95.0% 95.0% 95.0% 95.0% 95.0% 95.0% 95.0%
Overall Zn payable % 85.0% 85.0% 85.0% 85.0% 85.0% 85.0% 85.0% 85.0% 85.0% 85.0% 85.0% 85.0% 85.0% 85.0% 85.0% 85.0% 85.0% 85.0% 85.0% 85.0% 85.0% 85.0% 85.0% 85.0%
Total revenue US $ '000 - - - 590,869 912,597 1,133,894 786,406 620,200 582,939 554,546 551,802 545,096 548,550 534,959 538,586 542,045 551,691 559,838 561,745 473,067 291,990 202,910 - 11,083,731
Operating costs
Mining US $ '000 - - 5,736 55,692 87,124 126,095 127,284 127,267 127,126 127,268 127,270 127,500 126,873 127,276 127,486 126,745 127,267 130,607 127,282 106,719 66,457 45,839 - 2,150,912
Processing and tailings storage US $ '000 - -
18,646 26,445 38,274 38,635 38,630 38,587 38,630 38,631 38,701 38,510 38,633 38,697 38,472 38,630 39,644 38,635 32,393 20,172 13,914 - 652,879
General & Administration US $ '000 - -
3,475 4,929 7,134 7,201 7,200 7,192 7,200 7,201 7,214 7,178 7,201 7,213 7,171 7,200 7,389 7,201 6,038 3,760 2,593 - 121,692
Smelter costs US $ '000 - - - 132,446 205,538 251,218 172,190 136,871 128,024 120,774 119,428 115,267 114,414 111,480 112,627 110,514 113,268 114,297 115,794 97,512 60,310 42,654 - 2,374,628
Royalty US $ '000 - - - 13,753 21,212 26,480 18,426 14,500 13,647 13,013 12,971 12,895 13,024 12,704 12,779 12,946 13,153 13,366 13,379 11,267 6,950 4,808 - 261,273
Mine development US $ '000 - - - - - - - - - - - - - - - - - - - - - - - -
Other costs US $ '000 - - - 500 500 500 500 500 500 500 500 500 500 500 500 500 500 500 500 500 500 500 - 9,500
Severance tax US $ '000 - - - 3,016 5,100 7,486 4,470 3,042 2,794 2,583 2,567 2,596 2,798 2,691 2,931 3,003 3,081 3,101 3,168 2,653 1,615 1,102 - 59,795
Salvage value US $ '000 - - - - - - - - - - - - - - - - - - - - - - - -
Reclamation & closure US $ '000 - - - - - - - - - - - - - - - - - - - - - - 20,000 20,000
Total operating cost US $ '000 - - 5,736 227,527 350,848 457,188 368,707 328,009 317,872 309,968 308,568 304,673 303,298 300,485 302,232 299,350 303,099 308,905 305,958 257,082 159,764 111,410 20,000 5,650,679
Capital costs
Project capital US $ '000 135,857 142,734 178,579
457,170
Sustaining capital US $ '000 - - - 105,227 92,899 41,077 36,048 35,795 26,691 17,764 27,302 33,331 27,185 17,356 3,250 5,150 11,253 3,253 5,303 5,403 3,853 2,053 - 500,196
Total capital cost US $ '000 135,857 142,734 178,579 105,227 92,899 41,077 36,048 35,795 26,691 17,764 27,302 33,331 27,185 17,356 3,250 5,150 11,253 3,253 5,303 5,403 3,853 2,053 - 957,366
Undiscounted cash flows (pre-tax) US $ '000 (135,857) (142,734) (183,844) 250,642 461,980 630,610 389,569 260,321 239,165 227,401 215,934 207,052 217,785 217,480 233,072 237,147 237,227 247,803 250,156 210,425 128,255 89,351 (13,255) 4,475,686
Income tax US $ '000 - - - 41,316 101,168 179,058 108,382 68,046 61,224 55,326 54,866 55,673 61,642 58,671 65,829 67,793 69,966 70,173 72,401 59,947 35,172 23,954 - 1,310,609
Undiscounted cash flows (post-tax) US $ '000 (135,857) (142,734) (183,844) 209,326 360,812 451,552 281,187 192,275 177,941 172,075 161,068 151,379 156,143 158,809 167,244 169,354 167,261 177,630 177,756 150,478 93,082 65,398 (13,255) 3,165,077
Discounted cash flows (pre-tax) US $ '000 (125,793) (122,371) (145,941) 184,230 314,416 397,391 227,310 140,643 119,642 105,331 92,610 82,223 80,079 74,043 73,474 69,221 64,115 62,012 57,964 45,146 25,479 16,435 (2,258) 1,835,402
Discounted cash flows (post-tax) US $ '000 (125,793) (122,371) (145,941) 153,861 245,563 284,554 164,070 103,880 89,015 79,704 69,079 60,115 57,413 54,068 52,722 49,433 45,205 44,452 41,188 32,285 18,491 12,029 (2,258) 1,260,764
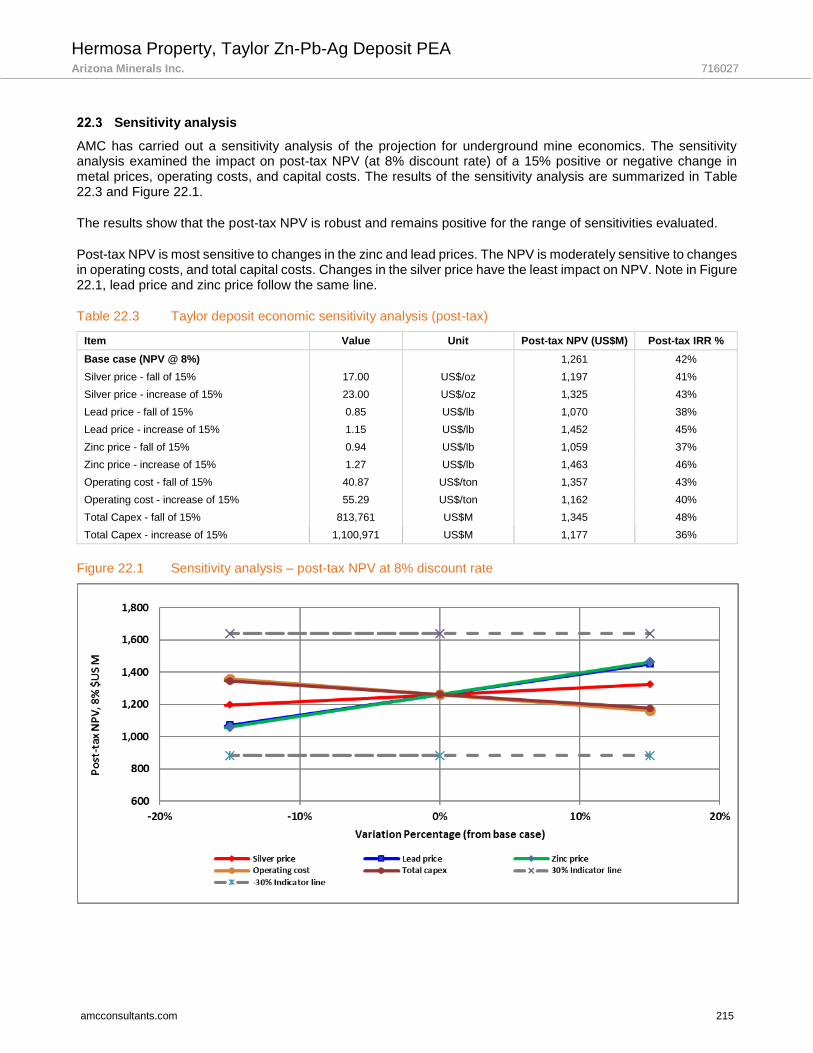
Hermosa Property, Taylor Zn-Pb-Ag Deposit PEA Arizona Minerals Inc. 716027
amcconsultants.com 215
Sensitivity analysis
AMC has carried out a sensitivity analysis of the projection for underground mine economics. The sensitivity analysis examined the impact on post-tax NPV (at 8% discount rate) of a 15% positive or negative change in metal prices, operating costs, and capital costs. The results of the sensitivity analysis are summarized in Table 22.3 and Figure 22.1.
The results show that the post-tax NPV is robust and remains positive for the range of sensitivities evaluated.
Post-tax NPV is most sensitive to changes in the zinc and lead prices. The NPV is moderately sensitive to changes in operating costs, and total capital costs. Changes in the silver price have the least impact on NPV. Note in Figure 22.1, lead price and zinc price follow the same line.
Table 22.3 Taylor deposit economic sensitivity analysis (post-tax)
Item Value Unit Post-tax NPV (US$M) Post-tax IRR %
Base case (NPV @ 8%) 1,261 42%
Silver price - fall of 15% 17.00 US$/oz 1,197 41%
Silver price - increase of 15% 23.00 US$/oz 1,325 43%
Lead price - fall of 15% 0.85 US$/lb 1,070 38%
Lead price - increase of 15% 1.15 US$/lb 1,452 45%
Zinc price - fall of 15% 0.94 US$/lb 1,059 37%
Zinc price - increase of 15% 1.27 US$/lb 1,463 46%
Operating cost - fall of 15% 40.87 US$/ton 1,357 43%
Operating cost - increase of 15% 55.29 US$/ton 1,162 40%
Total Capex - fall of 15% 813,761 US$M 1,345 48%
Total Capex - increase of 15% 1,100,971 US$M 1,177 36%
Figure 22.1 Sensitivity analysis – post-tax NPV at 8% discount rate
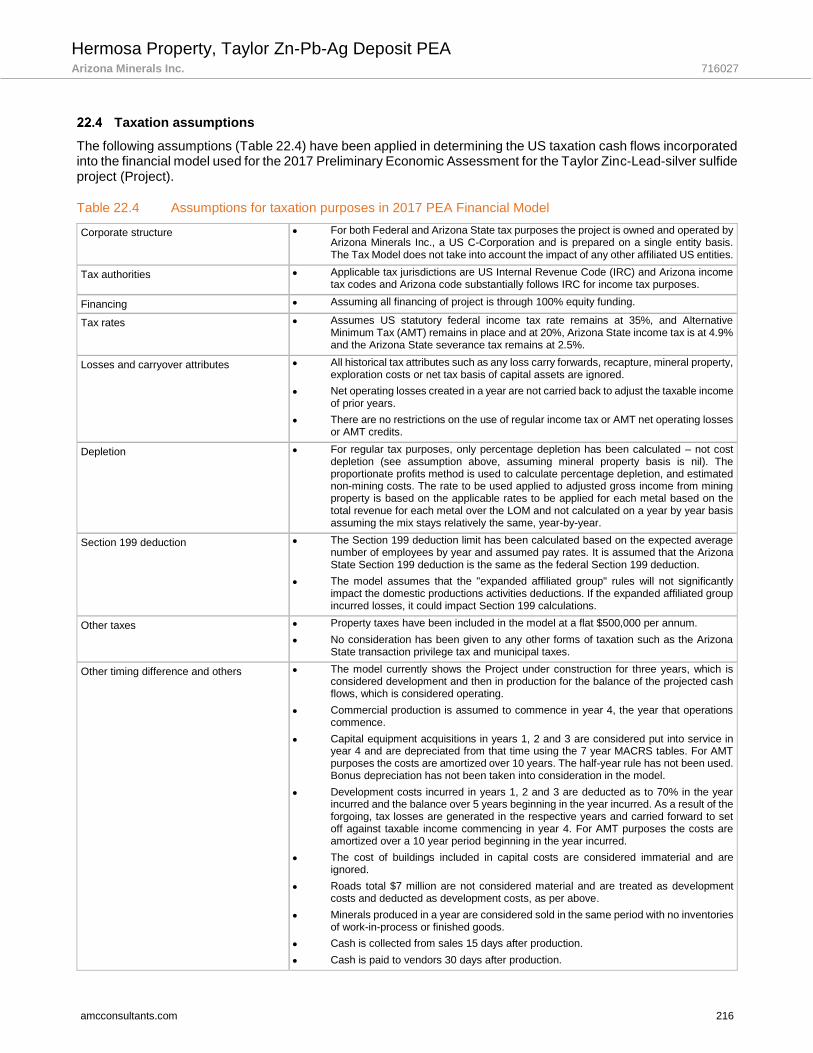
Hermosa Property, Taylor Zn-Pb-Ag Deposit PEA Arizona Minerals Inc. 716027
amcconsultants.com 216
Taxation assumptions
The following assumptions (Table 22.4) have been applied in determining the US taxation cash flows incorporated into the financial model used for the 2017 Preliminary Economic Assessment for the Taylor Zinc-Lead-silver sulfide project (Project).
Table 22.4 Assumptions for taxation purposes in 2017 PEA Financial Model
Corporate structure • For both Federal and Arizona State tax purposes the project is owned and operated by Arizona Minerals Inc., a US C-Corporation and is prepared on a single entity basis. The Tax Model does not take into account the impact of any other affiliated US entities.
Tax authorities • Applicable tax jurisdictions are US Internal Revenue Code (IRC) and Arizona income tax codes and Arizona code substantially follows IRC for income tax purposes.
Financing • Assuming all financing of project is through 100% equity funding.
Tax rates • Assumes US statutory federal income tax rate remains at 35%, and Alternative Minimum Tax (AMT) remains in place and at 20%, Arizona State income tax is at 4.9% and the Arizona State severance tax remains at 2.5%.
Losses and carryover attributes • All historical tax attributes such as any loss carry forwards, recapture, mineral property, exploration costs or net tax basis of capital assets are ignored.
• Net operating losses created in a year are not carried back to adjust the taxable income of prior years.
• There are no restrictions on the use of regular income tax or AMT net operating losses or AMT credits.
Depletion • For regular tax purposes, only percentage depletion has been calculated – not cost depletion (see assumption above, assuming mineral property basis is nil). The proportionate profits method is used to calculate percentage depletion, and estimated non-mining costs. The rate to be used applied to adjusted gross income from mining property is based on the applicable rates to be applied for each metal based on the total revenue for each metal over the LOM and not calculated on a year by year basis assuming the mix stays relatively the same, year-by-year.
Section 199 deduction • The Section 199 deduction limit has been calculated based on the expected average number of employees by year and assumed pay rates. It is assumed that the Arizona State Section 199 deduction is the same as the federal Section 199 deduction.
• The model assumes that the "expanded affiliated group" rules will not significantly impact the domestic productions activities deductions. If the expanded affiliated group incurred losses, it could impact Section 199 calculations.
Other taxes • Property taxes have been included in the model at a flat $500,000 per annum.
• No consideration has been given to any other forms of taxation such as the Arizona State transaction privilege tax and municipal taxes.
Other timing difference and others • The model currently shows the Project under construction for three years, which is considered development and then in production for the balance of the projected cash flows, which is considered operating.
• Commercial production is assumed to commence in year 4, the year that operations commence.
• Capital equipment acquisitions in years 1, 2 and 3 are considered put into service in year 4 and are depreciated from that time using the 7 year MACRS tables. For AMT purposes the costs are amortized over 10 years. The half-year rule has not been used. Bonus depreciation has not been taken into consideration in the model.
• Development costs incurred in years 1, 2 and 3 are deducted as to 70% in the year incurred and the balance over 5 years beginning in the year incurred. As a result of the forgoing, tax losses are generated in the respective years and carried forward to set off against taxable income commencing in year 4. For AMT purposes the costs are amortized over a 10 year period beginning in the year incurred.
• The cost of buildings included in capital costs are considered immaterial and are ignored.
• Roads total $7 million are not considered material and are treated as development costs and deducted as development costs, as per above.
• Minerals produced in a year are considered sold in the same period with no inventories of work-in-process or finished goods.
• Cash is collected from sales 15 days after production.
• Cash is paid to vendors 30 days after production.

Hermosa Property, Taylor Zn-Pb-Ag Deposit PEA Arizona Minerals Inc. 716027
amcconsultants.com 217
• Underground development costs incurred after the commencement of production are assumed to relate to mining in the year the costs are incurred and are expensed in the same year.
• Reclamation costs are assumed to be incurred at the end of the mine life. For tax calculation, the cash method is used.
• As stated in the royalty agreements, the royalty payments are not grossed up for any withholding taxes that may be deductible.
• Assume all taxes are paid in the year incurred.
• Withholding taxes on repatriation to Canadian Parent are not considered as all after tax profits are assumed to remain in the US subsidiary.
• Uniform capitalization rules 263A will be disregarded as the adjustment gives rise to 1 year timing differences.

Hermosa Property, Taylor Zn-Pb-Ag Deposit PEA Arizona Minerals Inc. 716027
amcconsultants.com 218
23 Adjacent properties
Currently there are no significant operating mines in the Harshaw or nearby mining districts. Properties adjacent to the Hermosa Property have had limited or no recent exploration. The mineralization on adjacent properties is hosted in various types of deposits that are not directly related to AZ’s Hermosa Taylor Deposit sulphide CRD mineralization nor a projection of the mineralization types found on the Hermosa Property, and this information is not intended to indicate that such mineralization might be present on the Hermosa Property.
Hermosa Property, Taylor Zn-Pb-Ag Deposit PEA Arizona Minerals Inc. 716027
amcconsultants.com 219
24 Other relevant data and information
There is no additional information or explanation to add at this time to make the technical report understandable and not misleading.
Hermosa Property, Taylor Zn-Pb-Ag Deposit PEA Arizona Minerals Inc. 716027
amcconsultants.com 220
25 Interpretation and conclusions
Geology and Mineral Resources
The Property hosts two known mineral deposits, the Central Deposit and the Taylor Deposit. The Central Deposit is a siliceous, oxide, silver-manganese manto that was the subject of extensive exploration by AZ. The Taylor Deposit, the subject of this report, contains zinc-lead-silver sulphide mineralization with subordinate copper, and is comprised of both manto-type and chimney-type zones of mineralization. This deposit is the down-dip extension of the Central deposit and has been encountered to date only by drillholes. The spacing of holes drilled to date on the Taylor deposit are relatively widely spaced but a good understanding of the nature of the mineralization and its morphology have been obtained.
Seven stratigraphic domains have been recognized within the Property: three carbonate units of Paleozoic age (in ascending order, Epitaph, Scherrer and Concha) that are overlain by two volcanic units; the Hardshell (Jurassic age) and Meadow Valley (Cretaceous age). An undivided carbonate unit (Lower Paleozoic Carbonate) and an older volcanic unit (Older Volcanics Triassic/Jurassic age) comprise the sixth and seventh domains. All units dip gently to the northwest but stratigraphic relationships are complicated by the presence of a listric thrust that dips to the southwest, predates the two youngest Mesozoic volcanic units, and places the Epitaph, Scherrer and Concha over the undivided Lower Paleozoic Carbonate unit. A near-vertical, northeast striking fault, that may comprise a portion of the thrust, also predates the two youngest Tertiary volcanic units and separates the carbonate sequence to the southeast from a volcanic sequence to the northwest that includes the Older Volcanic unit.
Gradeshells have been used to constrain the current Resource Estimate. The sulphide domains within the Taylor Deposit have been constrained on the basis of the lithological domain and minimum zinc equivalent grade. The oxide domains in the Central Deposit have been constrained by lithological domain and either minimum silver or manganese grades.
Approximately 70% of the Taylor Deposit Mineral Resource has been classified as Measured and Inferred, a substantial increase from 28% of the Mineral Resource that was classified as Indicated in the 2016 estimate. The Inferred portion of the Taylor Deposit is largely located on the periphery of the deposit and therefore the author sees little benefit in AMI conducting additional surface drilling to upgrade the remaining 30% of the deposit as currently defined.
The calculation used to estimate bulk density and tonnage factors for the Taylor Deposit may be refined by the inclusion of pyrite content and possibly by inclusion of a term to account for porosity as well as other elements. Some of this data is currently available and it is recommended that AZ investigates the possibility of obtaining a calculated bulk density that is in closer agreement with measured values than has been achieved to date.
The Mineral Resource for the Central Deposit was estimated using fixed bulk density values; it is probable that these single values can be improved upon by using an approach similar to that advocated for the Taylor Deposit.
Geological and mineral resource risks associated with the Property are those attributable to any mineral exploration property at a comparable stage of exploration, namely the uncertainty attached to the continuity, grade, and tonnage of the mineral resource that has been estimated. Additional drilling to enhance the level of confidence that can be placed on the estimate, and the refinement of the bulk density equation will both help to mitigate this risk.
Mining
Additional work on the structural geology of the Taylor Deposit is required. This will assist with better definition of the expected groundwater inflows and a more accurate estimate of the implications of faulting on ground conditions and ground support requirements. Additional geotechnical sampling and testwork is required particularly in areas of critical infrastructure including the main shaft, decline and portal locations.
The underground mine is relatively deep and has a large mining footprint. There is potential to explore the economics of a smaller, decline only, operation that concentrates on high grade early production from a shallower
Hermosa Property, Taylor Zn-Pb-Ag Deposit PEA Arizona Minerals Inc. 716027
amcconsultants.com 221
mine with minimum pre-production capital and less throughput. Once the mine is in production, the cost of expansion could be funded directly from operations.
The primary issues remain around permitting of the mine, including permitting of access roads and power supply upgrades. The underground deposit shows good potential for an economic mine with a relatively simple mining method and accessibility. Further work is required to best assess the opportunity for a more selective method of extracting high grade mineralization. The production schedules completed for the PEA are level based schedules, a more detailed schedule on a stope basis is required for the next level of study. The more detailed schedule should take into account opportunities to further defer capital development expenditure.
Operating cost estimates for mining have largely been based on benchmark costs for similar type of mining method and throughput. These costs were validated based on first principles costs for labour and benchmark distribution of costs for North America. Mine capital costs are largely based on recent estimates for similar projects for other studies, vendor quotes for equipment and unit rates from previous experience. A first principles estimate and vendor or contractor quotes should be obtained for the next level of study.
Metallurgical testing and Mineral processing
The conclusions from the testwork carried out on the Taylor Deposit included that most of the composite samples tested for BWI were in the medium to moderately hard range, and a conventional process flowsheet for Pb / Zn minerals and standard suite of reagents produced marketable-grade concentrates of lead and zinc. From the work carried out the metal recoveries are projected to be 95.4% of lead and 69.2% of silver in lead concentrate and 92.7% of zinc and 23.2% of silver in zinc concentrates.
Processing of the material will be by conventional flotation recovery methods. The material will be crushed close to the underground mine portal and the material conveyed to the processing plant. The material will be ground to 80% passing 105 microns in a SAG/Ball mill circuit. The material will then be floated with the rougher concentrates being reground to 80% passing 38 microns prior to cleaning to produce high-value separate lead-silver and zinc concentrates. Concentrates will be trucked to the port for ocean shipment to smelters.
Tailings storage facility
The conclusions relate to the TSF:
• Cost for removing existing tailings piles are based on quantities developed from geotechnical investigation involving test brings and geophysics in the existing tailings piles.. Existing ground base grades beneath the tailings piles are reasonably well defined. An increase in the amount of tailings or unsuitable material under the tailings assessed during this effort will result in an increase in cost. However, the risk of significant volumetric increases are relatively low given drilling and geophysics were performed to develop the volumetrics presented herein. No further work is required to de-risk the tailings and waste rock materials that exist in tailings piles 1, 2, 3 and 4.
• Costing for lining the TSF is based on conforming to the prescriptive BADCT criteria which states “Tailings Impoundments will be designed with a composite liner consisting of single geomembrane of at least 30 mil thickness (60 mil if HDPE) over, a minimum, 12 in (placed in two 6 in lifts) of 3/8 inch minus native or natural materials compacted to achieve a saturated hydraulic conductivity (k) no greater than 10-6 cm/sec.”
— Unit costing could be impacted depending on identification and location of a suitable borrow source for the soil component of the liner system. Costing presented herein assumes a clay source that is proximate to the TSF area, cost could increase if the borrow area is remote to the TSF locations.
— Dependent upon groundwater depth (if shallow in the area of the TSF), may alter the prescriptive BADCT approach.
• Cost for the protective layer is based on production of a material that conforms to the prescriptive BADCT criteria which states “The geomembrane will be covered by a protective / drainage layer consisting of 3/4 inch minus, well draining material with a minimum thickness of 18 inches.”
— Costing for the protective layer assumes mine development rock is crushed and screened to prescriptive BADCT standards and placed on the TSF liner system using trucks and low contact pressure dozers. If a portion of the protective layer is to be sourced from a surface borrow, costing
Hermosa Property, Taylor Zn-Pb-Ag Deposit PEA Arizona Minerals Inc. 716027
amcconsultants.com 222
could be impacted depending on identification and location of a suitable borrow source as well as the processing requirements to develop the material within specifications. A decrease in cost may be realized with a borrow source proximate to the TSF area but conversely may increase if the borrow area is remote to the TSF locations.
• Costing for the TSF underdrain system assumes an individual BADCT approach where underdrain pipes are constructed in topographic drainages instead of 3 inch (76 mm) diameter corrugated perforated HDPE pipe at 20 foot (6.1 m) spacing for hydraulic relief over the liner. Additional cost would be required if a full underdrain piping system is required within the TSF basin.
• Costing for the rock excavation has been based on a volume estimated as 25 percent of the basin cut to fill. Should more areas require drilling and blasting costs for this item may increase.
• Cost for construction of the rock slope armoring assumes the entirety of the rock slope armoring is constructed from non-PAG development rock. If there is a decrease the availability of non-PAG development rock, additional cost may be required for construction of the perimeter road and rock slope armoring.
Surface infrastructure
Additional work has been devoted to infrastructure components including power acquisition, road upgrading and fresh water development. Electrical Power is available from the Tucson Electric Power (TEP) grid within southern Arizona. Initial discussions with the power company indicate that reliable power is available and a preliminary design and associated cost can be provided after the project electrical power consumption has been further developed. It is suggested to perform a formal trade off study during the Feasibility Study to review utilizing a natural gas powered generation for electrical power.
There is currently a paved road from Patagonia to within a few miles of the mine property. This road will be upgraded for the project. The cost for this effort was reviewed with local engineering and construction companies and an allowance included in the cost estimate.
Fresh water is available on site however depending on the volume available additional water may be required from the valley near the mine site. A water distribution system delivers fire and raw water on site to the processing facilities.
Environmental permitting
Numerous permits and approvals from state and federal agencies may be required in order to develop the project. The most involved permitting efforts could include the preparation of an EA or EIS for the USFS to comply with NEPA, an APP from the ADEQ, and an Air Permit, also from the ADEQ. The preparation of an EIS, should it be required, will certainly be the most complex, costly, and time-consuming permitting effort. The time to prepare an EA or EIS is expected to take 2 to 6 years or more after submission of a POO to the USFS. Should a NEPA process be required, a POO should be submitted as soon as possible after completion of a Pre-Feasibility Study or Feasibility Study. Baseline studies to obtain background data on environmental and cultural resources have been initiated and should be continued in the coming months.
Project economics
The results show that the pre-tax NPV is robust and remains positive for the range of sensitivities evaluated. The post-tax NPV performs similarly, and also remains positive for the range of sensitivities evaluated. The sensitivity analysis examined the impact on pre-tax and post-tax NPV (at 8% discount rate) of a 15% positive or negative change in metal prices, operating costs, capital costs, and corporate tax rate. The project is most sensitive to changes in zinc and lead prices, followed next by changes in operating costs.
Hermosa Property, Taylor Zn-Pb-Ag Deposit PEA Arizona Minerals Inc. 716027
amcconsultants.com 223
26 Recommendations
Geology and Mineral Resources
Although the understanding and definition of the Taylor deposit could be achieved by additional drilling, most of the surface locations from which holes can be drilled in a practical and efficient fashion have already been exploited during the initial and infill drill programs. Therefore, no further drilling is recommended until underground access becomes available at which time drill stations can be located to effectively test those portions of the deposit that are material to near-term mining plans.
The ability to model bulk density remains unresolved despite the collection of measurements of a broad range of types of mineralization and hostrocks. It is recommended that further investigation is carried out with the goal of obtaining an accurate formula with which bulk density can be estimated on the basis of metal content.
The Mineral Resource for the Central Deposit was estimated using fixed bulk density values; it is probable that these single values can be improved upon by using an approach similar to that advocated for the Taylor Deposit.
Exploration
AZ should continue to aggressively explore the Hermosa project for additional zinc / lead / silver / copper resources. This is especially true for the near vertical vein sets extending across the Trench claim block and for the Taylor Deeps zone. The Trench Vein domain has the potential to impact the early production of the mine with higher than average grade zinc / lead / silver material. Additionally, the Taylor Deeps zone should be drilled to it’s extents as it could significantly increase the overall size of the deposit.
Mining
AMC recommends further work be done to define the structural geology with the aim of better defining ground water ingress and ground conditions. This will allow a more precise interpretation of the ground control requirements and related costs.
AMC recommends obtaining additional geotechnical sampling and testwork particularly in areas of critical infrastructure including the main shaft, decline and portal locations.
AMC recommends evaluating an alternative low cost, medium production operation aimed at targeting high grade material in the early stages on mine life with access via decline only, the operation could consider reduced capital and throughput. Once the mine is in production, the cost of expansion could be funded directly from operations.
Further work is required to best assess the opportunity for a more selective method of extracting high grade mineralization. The production schedules completed for the PEA are level based schedules, a more detailed schedule on a stope basis is recommended for the next level of study.
Opportunity to defer capital development expenditure to an as needed basis should be evaluated in the next level of study.
A first principles estimate of operating and capital costs based on actual vendor or contractor quotes should be obtained for the next level of study.
The cost of this work is estimated to be US$1.0 million.
Metallurgical and Mineral processing
Further studies to improve the economics include the following:
• It should be verified that potential smelters have the capacity and ability to accept the proposed quantity and quality of produced lead and zinc concentrates. As part of the program, additional concentrate analysis should be completed to further define the concentrate qualities. Transportation, treatment charges, and refinery charges should be confirmed.
Hermosa Property, Taylor Zn-Pb-Ag Deposit PEA Arizona Minerals Inc. 716027
amcconsultants.com 224
• Additional lock cycle testing is recommended for each deposit, this will allow for validation of the final estimated recoveries and the selected concentrate grades.
• Once additional testing has been performed, and samples representing optimized test conditions are available, the statistical model should be applied to ensure estimated recoveries represent optimal conditions.
• Perform a Feasibility Study to provide additional project definition. This will provide basic engineering in adequate detail to obtain a +/- 15% capital and operating cost estimate for the process plant and infrastructure.
Geotechnical investigation and evaluation
Additional geotechnical investigation and engineering evaluation should be performed on the TSF design elements presented in this PEA to develop a basis for design of all engineered structures. The investigation will focus on defining geotechnical and construction related design parameters for use in engineering analyses to be performed in future phases of the project. A brief summary of investigation and evaluation required is presented below.
• Basin preparation assessment (US$100,000)
— Conduct a geotechnical investigation including borings, test pits, geotechnical and laboratory testing on samples collected from borings/test pits as well as geologic mapping of the proposed TSF areas. These investigations will be completed to assess subsurface conditions for the purpose of quantifying rock excavation required, identifying construction borrow sources and estimating surface preparation requirements to form a uniform and smooth basin for placement of geomembrane and construction of appurtenant civil structures. The geotechnical laboratory testing will include but not necessarily be limited to engineering characterization, strength testing of soils and rock, one dimensional consolidation test work and permeability testing of soils and rock encountered in the geotechnical investigation. The geotechnical investigation can be split evenly into two phases for Prefeasibility and Feasibility level assessments. The Prefeasibility level assessment would focus on de-risking the project by addressing any areas of geotechnical concern such as differential settlement, foundation strength and/or construction borrow source identification. If the results of the Prefeasibility work are satisfactory, a Feasibility level geotechnical investigation would then be undertaken to focus on augmentation of the Prefeasibility work to add confidence to the previous findings and to shore up quantification and qualification issues that might remain.
• Perimeter road assessment (US$25,000)
— Conduct geotechnical drilling within the proposed perimeter road foundation where fills are greatest to define overburden depth and assess strength parameters (in particular identifying low strength areas), define bedrock conditions such as identifying karst conditions that may affect foundation treatment requirements. This activity would also be split evenly between the Prefeasibility and Feasibility phases of the project with continued Feasibility level work if Prefeasibility results are positive.
• Borrow area assessment (US$35,000)
— Undertake a borrow investigation and laboratory test work to confirm assumptions in the cost estimate with respect to the material suitability and haul distance for construction. This would typically be completed as part of the Feasibility level effort.
• Topographic survey (US$30,000)
— Complete a ground / aerial survey of the area for accurate contour generation and determine areas of localized steep topography and overhangs. The survey should be completed to develop a topographic base map accurate to a one foot contour interval and would be completed as part of the Prefeasibility level work.
• Tailings testwork (US$10,000)
— Complete additional testing on samples of the proposed tailings to obtain information regarding the strength and drainage characteristics of the material. This work should be completed as part of the Prefeasibility Level effort.
Hermosa Property, Taylor Zn-Pb-Ag Deposit PEA Arizona Minerals Inc. 716027
amcconsultants.com 225
Surface infrastructure
Further studies to improve the economics include the following:
• Further review the topography and geo-technical conditions to minimize earthwork, foundation and conveying costs.
• Utilize on-site mining equipment to supplement the contractor equipment for rough grading required for the access roads to the site. This same philosophy could be evaluated for the bulk of the cut and fill required at the leach pad and ponds.
• Coordinate with the local power company to optimize the power line routing and connection to the electrical power grid.
• Complete a thorough investigation on the water source prior to completing the FS.
• Perform further characterizing of the groundwater supply by installing and testing an additional production well and a deep hydrogeologic test well. Analyze aquifer test data from both wells and incorporate the results into a numerical groundwater flow model to simulate the long-term adequacy of the supply.
Clear Creek recommends further characterizing of the groundwater supply by installing and testing an additional production well and a deep hydrogeologic test well. Analyze aquifer test data from both wells and incorporate the results into a numerical groundwater flow model to simulate the long-term adequacy of the supply.
Environmental permitting
AMI should continue baseline studies that will support the permitting processes expected to be required to develop the project. These include:
• Biological Resources
• Cultural Resources
• Hydrogeologic Studies
• Geochemical Studies
• Air and weather monitoring
• Stormwater quality
• Geotechnical (soil and rock) investigations
The estimated cost for additional baseline studies is US$2.5 million.
Project economics
Given the robust economics of the project, AMC recommends taking the project to the next study level of accuracy. The PEA is preliminary in nature. It includes Inferred Mineral Resources that are considered too speculative geologically to have the economic considerations applied to them that would enable them to be categorized as Mineral Reserves. The next level of study should consider only Measured and Indicated Resources.

Hermosa Property, Taylor Zn-Pb-Ag Deposit PEA Arizona Minerals Inc. 716027
amcconsultants.com 226
27 References
Geological
Arizona Department of State, Administrative Code, Chapter 15. Department of Water Resources.
Arizona Mining Guidance Manual (BADCT), Aquifer Protection Program, Arizona Department of Environmental Quality.
Beus, S.S., 1989, Devonian and Mississippian geology of Arizona, in Jenney, J.P., and Reynolds, S.J., eds., Geologic evolution of Arizona: Arizona Geological Society Digest 17, p. 287-311.
Bloom, L., 2012. Review of Wildcat Silver Corporation’s Assay Quality Control Program. Unpublished report, Analytical Solutions Ltd. 152 pages.
Dickinson, W.R., 1989, Tectonic setting of Arizona through geologic time, in Jenney, J.P., and Reynolds, S.J., eds., Geologic evolution of Arizona: Arizona Geological Society Digest 17, p. 1-16.
Drewes, H.D., 1981, Tectonics of southeastern Arizona: U.S. Geological Survey Professional Paper 1144, 96p., 10 plates.
Drielick, Thomas L., Easton, George, Timothy J., Christopher L., McNulty, Terance P., Osterberg, Mark W., Smith, Michael R., Snider, Joshua W., Taylor, Mark F., 2014 Hermosa Project, Form 43-101F1 Technical Report, Pre-Feasibility Study, Santa Cruz County, Arizona, M3, January 17, 2014.
Gilluly, James, Cooper, J.R., and Williams, J.S., 1954, Late Paleozoic stratigraphy of central Cochise County, Arizona: U.S. Geological Survey Professional Paper 266, 49 p., 1 sheet, scale 1:62,500.
Heidrick, T.L., and Titley, S.R., 1982, Fracture and dike patterns in Laramide plutons and their structural and tectonic implications, American southwest, in Titley, S.R., ed., Advances in geology of the porphyry copper deposits, southwestern North America: Tucson, University of Arizona Press, p. 73-91.
Krantz, R.W., 1989, Laramide structures of Arizona, in Jenney, J.P., and Reynolds, S.J., eds., Geologic evolution of Arizona: Arizona Geological Society Digest 17, p. 463-483.
Malhotra, 2015. Scoping Metallurgical Testing of Hermosa NW Polymetallic Project, Unpublished report, Resource Development Inc. 43 pages.
Middleton, L.T., 1989, Cambrian and Ordovician depositional systems in Arizona, in Jenney, J.P., and Reynolds, S.J., eds., Geologic evolution of Arizona: Arizona Geological Society Digest 17, p. 273- 286.
Nelson, J.L. (1996): Polymetallic Mantos Ag-Pb-Zn, in Selected British Columbia Mineral Deposit Profiles, Volume 2 - Metallic Deposits, Lefebure, D.V. and Hõy, T., Editors, British Columbia Ministry of Employment and Investment, Open File 1996-13, pages 101-104.
Rehrig, W.A., and Heidrick, T.L., 1976, Regional tectonic stress during the Laramide and late Tertiary intrusive periods, Basin and Range province, Arizona, in Wilt, J.C., and Jenney, J.P., eds., Tectonic digest: Arizona Geological Society Digest, v. 10, p. 205-228.
Silver, L. T., Bickford, M. E., Van Schmus, W. R., Anderson, J. L., Anderson, T. H., and Medaris, L. G. Jr., 1977. The 1.4-1.5 b.y. transcontinental anorogenic plutonic perforation of North America: Geological Society of America Abstracts with Programs, v. 9, no. 7, p. 1176-1177.
Smith, CDM, “Slope Stability Evaluation (Updated), Jan Adit Tailings Impoundment, Patagonia, Arizona” dated 16 February 2009.
Hermosa Property, Taylor Zn-Pb-Ag Deposit PEA Arizona Minerals Inc. 716027
amcconsultants.com 227
Wilson, S.E. (2016) NI 43-101 Technical Report Mineral Resource Estimate for Arizona Mining Inc. Hermosa Taylor Deposit, Santa Cruz County, Arizona. Prepared by Metal Mining Consultants Inc. 17 March 2016.
Environmental
Arizona Department of State, Administrative Code, Chapter 15. Department of Water Resources
Arizona Mining Guidance Manual (BADCT), Aquifer Protection Program, Arizona Department of Environmental Quality.
CDM Smith, “Slope Stability Evaluation (Updated), Jan Adit Tailings Impoundment, Patagonia, Arizona” dated 16 February 2009.
Culver, M., Malusa, S., Childs, J.L., Emerson, K., Fagan, T., Harveson, P.M., Haynes, L.E., Sanderson, J.G., Sheehy, J.H., Skinner, T., Smith, N., Thompson, K., and Thompson, R.W., 2016, Jaguar surveying and monitoring in the United States: U.S. Geological Survey Open-File Report 2016–1095, 228 p., http://dx.doi.org/10.3133/ofr20161095.
EPA Region 9 – Air. 2011. Class I Areas in EPA Region 9. Available online at: https://www3.epa.gov/region9/air/maps/pdfs/air1100018-9.pdf
National Association of Environmental Professions. 2016. Annual NEPA Report 2015 of the National Environmental Policy (NEPA) Practice.
Town of Patagonia. General Plan 2009. Available online at: https://issuu.com/seagoedd/docs/patagonia_general_plan?layout= http://skin.issuu.com/v/light/layout.xml&showFlipBtn=true&e=3005223/4148168
United States Census Bureau American Fact Finder. 2015 Population Estimates (as of 1 July 2015).
United States Census Bureau American Fact Finder. 2010 Population Estimates (as of 1 July 2015).
USFWS. 2016. Amended Final Reinitiated Biological and Conference Opinion for the Rosemont Copper Mine, Pima County, Arizona
USFWS. 2016. Recovery Plan for the Ocelot (Leopardus pardalis), First Revision. U.S. Fish and Wildlife Service, Southwest Region, Albuquerque, New Mexico
WestLand Resources, Inc. 2012. Survey for Hexalectris colemanii and Hexalectris arizonica across southeastern Arizona – 2012. [publically available at http://www.rosemonteis.us/technical-reports/all]
WestLand Resources, Inc. 2013. 2012 Survey for Bartram’s Stonecrop (Graptopetalum bartramii) and Beardless Chinchweed (Pectis imberbis), in the Patagonia Mountains, Near Harshaw, Arizona.
WestLand Resources, Inc. 2013 [revised]. 2012 Survey for Hexalectris colemanii and H. arizonica in the Patagonia Mountains, Near Harshaw, Arizona.
WestLand Resources, Inc. 2013. 2012 Surveys for lesser long-nosed bat (Leptonycteris curasoae yerbabuenae) in the Patagonia Mountains, near Harshaw, Arizona. Prepared for Arizona Minerals, Inc. April.
WestLand Resources, Inc. 2013. 2012 Surveys for the Sonora tiger salamander (Ambystoma movortium stebbinsi) in the Patagonia Mountains, near Harshaw, Arizona. Prepared for Arizona Minerals, Inc. April.
WestLand Resources, Inc. 2013. 2012-2013 Surveys for Grassland Bird Species in the Patagonia Mountains, Near Harshaw, Arizona.
Hermosa Property, Taylor Zn-Pb-Ag Deposit PEA Arizona Minerals Inc. 716027
amcconsultants.com 228
WestLand Resources, Inc. 2013. 2013 Survey for Gila Topminnow (Poeciliopsis occidentalis occidentalis), in the Patagonia Mountains, Near Harshaw, Arizona.
WestLand Resources, Inc. 2013. 2012 Survey for Mexican spotted owl (Strix occidentalis lucida) in the Patagonia Mountains, near Harshaw, Arizona. Prepared for Arizona Minerals, Inc. April.
WestLand Resources, Inc. 2013. 2013 Surveys for the Sonora tiger salamander (Ambystoma mavortium stebbinsi) in the Patagonia Mountains, near Harshaw, Arizona. Prepared for Arizona Minerals, Inc. December.
WestLand Resources, Inc. 2013. 2013 Survey for yellow-billed cuckoo (Coccyzus americanus) in the Patagonia Mountains, near Harshaw, Arizona. Prepared for Arizona Minerals, Inc. December.
WestLand Resources, Inc. 2013. A Cultural Resources Inventory of 2,634 Acres of Private and Federal Lands in Support of the Hermosa Drilling Project Plan of Operations Within the Coronado National Forest, Arizona.
WestLand Resources, Inc. 2013. Revised 2012 Survey for yellow-billed cuckoo (Coccyzus americanus) in the Patagonia Mountains, near Harshaw, Arizona. Prepared for Arizona Minerals, Inc. April.
WestLand Resources, Inc. 2013. Summary of 2013 Survey for lesser long-nosed bat (Leptonycteris yerbabuenae) in the Patagonia Mountains near Harshaw, Arizona. Prepared for Arizona Minerals, Inc. December.
WestLand Resources, Inc. 2013. Summary of 2013 Survey for Mexican spotted owl (Strix occidentalis lucida) in the Patagonia Mountains, near Harshaw, Arizona. Prepared for Arizona Minerals, Inc. December.
WestLand Resources, Inc. 2013. Summary of 2013 Survey for Northern Goshawk (Accipiter gentilis) in the Patagonia Mountains, Near Harshaw, Arizona.
WestLand Resources, Inc.2016. 2016 yellow-billed cuckoo (Coccyzus americanus) in support of the Hermosa Taylor Drilling Plan of Operations. November.
WestLand Resources, Inc. 2016. A Cultural Resources Inventory 160 Acres of Coronado National Forest Land for Possible Mineral Exploration Activities in Santa Cruz County, Arizona.
WestLand Resources, Inc. WestLand Resources, Inc. 2016. Northern Goshawk (Accipiter gentilis) Survey in Support of the Hermosa Taylor Drilling Plan of Operations.
WestLand Resources, Inc. 2016. 2016 Surveys for Mexican spotted owl (Strix occidentalis lucida) in Support of the Hermosa Taylor Drilling Plan of Operations. November.
WestLand Resources, Inc. unpublished data, 2017. A Cultural Resources Inventory of Approximately 19.4 Acres of Coronado National Forest Land near Harshaw, in Santa Cruz County, Arizona.
WestLand Resources, Inc. unpublished data, 2017. A Cultural Resources Inventory of Approximately 9.8 Acres of Coronado National Forest Land near Harshaw, in Santa Cruz County, Arizona.
Tailings Storage Facility
Arizona Department of State, Administrative Code, Chapter 15. Department of Water Resources
Arizona Mining Guidance Manual (BADCT), Aquifer Protection Program, Arizona Department of Environmental Quality.
CDM Smith, “Slope Stability Evaluation (Updated), Jan Adit Tailings Impoundment, Patagonia, Arizona” dated February 16, 2009.

Hermosa Property, Taylor Zn-Pb-Ag Deposit PEA Arizona Minerals Inc. 716027
amcconsultants.com 229
28 Qualified Person’s Certificates
CERTIFICATE OF GARY METHVEN, P.Eng. I, Gary Methven, P.Eng., of Vancouver, Britsh Columbia, do hereby certify that:
1. I am currently employed as a Principal Mining Engineer with AMC Mining Consultants (Canada) Ltd. with an office located at Suite 202, 200 Granville Street, Vancouver, British Columbia, V6C 1S4;
2. This certificate applies to the technical report titled “Hermosa Property, Taylor Zn-Pb-Ag Deposit Preliminary Economic Assessment” for Arizona Mining Inc., with an effective date of 29 March 2017, (the “Technical Report”) prepared for Arizona Mining Inc.(“the Issuer”);
3. I graduated from the University of Witwatersrand in Johannesburg, South Africa with a Bachelor of Science degree in Mining Engineering in 1993. I am a member in good standing of the Association of Professional Engineers and Geoscientists of British Columbia (License #180019), a member of Registered Professional Engineers of Queensland (License #06839), and a member of the Australian Institute of Mining and Metallurgy (CP). I have experience in narrow-vein gold deposits, flat and steeply dipping, bulk and selective mining methods for base metals, mine infrastructure, design and planning, mine production and financial evaluation, reserve estimation, technical reviews, feasibitly and pre-feasibility studies, project and construction management, contracts management and cost estimation;
I have read the definition of "qualified person" set out in National Instrument 43-101 (NI 43-101) and certify that by reason of my education, affiliation with a professional association (as defined in NI 43-101) and past relevant work experience, I fulfill the requirements to be a "qualified person" for the purposes of NI 43-101;
4. I have visited the Property on 13 July 2016, for 1 day;
5. I am responsible for 1 (part), 2, 3, 15, 16, 21 (part), 24, 25 (part), 26 (part), and 27 (part) of the Technical Report;
6. I am independent of the Issuer and related companies applying all of the tests in Section 1.5 of the NI 43-101;
7. I have not had prior involvement with the property that is the subject of the Technical Report.
8. I have read NI 43-101, and the Technical Report has been prepared in compliance with NI 43-101 and Form 43-101F1.
9. As of the effective date of the Technical Report and the date of this certificate, to the best of my knowledge, information and belief, this Technical Report contains all scientific and technical information that is required to be disclosed to make the Technical Report not misleading;
Effective Date: 29 March 2017 Signing Date: 11 April 2017
“Original signed and sealed by”
Gary Methven, P.Eng. Principal Mining Engineer AMC Mining Consultants (Canada) Ltd.
Hermosa Property, Taylor Zn-Pb-Ag Deposit PEA Arizona Minerals Inc. 716027
amcconsultants.com 230
CERTIFICATE OF GREGORY Z. MOSHER, P.GEO. I, Gregory Z. Mosher, P.Geo., of Vancouver, British Columbia, do hereby certify that:
1. I am currently employed as a Principal Geologist with Global Mineral Resource Services, with an office at 603 – 131 East Third Street, North Vancouver, British Columbia V7L 1E5;
2. This certificate applies to the technical report titled “Hermosa Property, Taylor Zn-Pb-Ag Deposit Preliminary Economic Assessment” for Arizona Mining Inc., with an effective date of 29 March 2017,(the “Technical Report”) prepared for Arizona Mining Inc.(“the Issuer”);
3. I am a graduate of Dalhousie University (B.Sc. Hons., 1970) and McGill University (M.Sc. Applied, 1973). I am a registered member in good standing of the Association of Professional Engineers and Geoscientists of British Columbia, Licence #19267. My relevant experience with respect to lead-zinc Mineral deposits extends over 40 years and includes exploration, mine geology and Mineral Resource estimations.
I have read the definition of "qualified person" set out in National Instrument 43-101 (NI 43-101) and certify that by reason of my education, affiliation with a professional association (as defined in NI 43-101) and past relevant work experience, I fulfill the requirements to be a "qualified person" for the purposes of NI 43-101.
4. I visited the Property on 10 February 2017 for 1 day;
5. I am responsible for Sections 1 (part), 4-10 (exc.5.3.1), 11, 12, 14, 23, 25 (part), 26 (part), and 27 (part) of the Technical Report;
6. I am independent of the Issuer and related companies applying all of the tests in Section 1.5 of the NI 43-101;
7. I am an author of a Technical Report on the Property dated 15 November, 2016 (?) but otherwise have not had prior involvement with the property that is the subject of the Technical Report.
8. I have read NI 43-101, and the Technical Report has been prepared in compliance with NI 43-101 and Form 43-101F1.
9. As of the effective date of the Technical Report and the date of this certificate, to the best of my knowledge, information and belief, this Technical Report contains all scientific and technical information that is required to be disclosed to make the Technical Report not misleading;
Effective Date: 29 March 2017 Signing Date: 11 April 2017
“Original signed and sealed by”
Gregory Z. Mosher, P.Geo. Principal Geologist Global Mineral Resource Services
Hermosa Property, Taylor Zn-Pb-Ag Deposit PEA Arizona Minerals Inc. 716027
amcconsultants.com 231
CERTIFICATE OF QINGHUA JIN, P.E. I, Qinghua Jin, P.E., of Tucson, Arizona, do hereby certify that:
1. I am currently employed as a Senior Process Engineer with SGS North America Inc. with an office at 3845 N. Business Center Drive, Suite 111, Tucson, AZ. 85705, USA;
2. This certificate applies to the technical report titled “Hermosa Property, Taylor Zn-Pb-Ag Deposit Preliminary Economic Assessment” for Arizona Mining Inc., with an effective date of 29 March 2017, (the “Technical Report”) prepared for Arizona Mining Inc.(“the Issuer”);
3. I am a graduate of Northeastern University in Shenyang, China with a Bachelor of Engineering degree in Mineral Processing Engineering in 1990. I obtained two Master of Science degrees in Mining Engineering and Statistics both from West Virginia University, USA, in 2002 and 2006, respectively. I am a member in good standing of the Association of Arizona State Board of Technical Registration (License #53463), and a registered member of the Society for Mining, Metallurgy & Exploration (04138753RM). I have practiced mineral processing for 26 years. I have worked on scoping, prefeasibility and feasibility studies for mining projects in the North America, South America, Europe, and Asia, as well as worked on the design phases of some of these projects.
I have read the definition of "qualified person" set out in National Instrument 43-101 (NI 43-101) and certify that by reason of my education, affiliation with a professional association (as defined in NI 43-101) and past relevant work experience, I fulfill the requirements to be a "qualified person" for the purposes of NI 43-101.
4. I have visited the Property on 4 October 2016 for 1 day;
5. I am responsible for 1 (part), 13, 17, 18 (part), 19, 21 (part), 25 (part), 26 (part), and 27 (part) of the Technical Report;
6. I am independent of the Issuer and related companies applying all of the tests in Section 1.5 of the NI 43-101;
7. I have not had prior involvement with the property that is the subject of the Technical Report.
8. I have read NI 43-101, and the Technical Report has been prepared in compliance with NI 43-101 and Form 43-101F1.
9. As of the effective date of the Technical Report and the date of this certificate, to the best of my knowledge, information and belief, this Technical Report contains all scientific and technical information that is required to be disclosed to make the Technical Report not misleading;
Effective Date: 29 March 2017 Signing Date: 11 April 2017
“Original signed and sealed by”
Qinghua Jin, P.E., Sr. Process Engineer SGS North America Inc.
Hermosa Property, Taylor Zn-Pb-Ag Deposit PEA Arizona Minerals Inc. 716027
amcconsultants.com 232
CERTIFICATE OF WILLIAM HUGHES, P.Eng. I, William Hughes, P.Eng., of Vancouver, Britsh Columber, do hereby certify that:
1. I am currently employed as a Principal Mechanical / Infrastructure Engineer with AMC Mining Consultants (Canada) Ltd. with an office located at Suite 202, 200 Granville Street, Vancouver, British Columbia, V6C 1S4;
2. This certificate applies to the technical report titled “Hermosa Property, Taylor Zn-Pb-Ag Deposit Preliminary Economic Assessment” for Arizona Mining Inc., with an effective date of 29 March 2017, (the “Technical Report”) prepared for Arizona Mining Inc.(“the Issuer”);
3. I graduated from the University of Saskatchewan in Saskatoon, Canada with a Bachelors of Science – Mechanical Engineering in 1989. I am a member in good standing of the Association of Professional Engineers and Geoscientists of British Columbia (License #110586), and Saskatchewan (Reg#09130). I have experience in the mining industry consisting of practical problem solving for maintenance and capital projects. I have designed and constructed mine clarification and dewatering systems, ventilation systems, materials handling, hoisting, and surface infrastructure. I have extensive experience in maintenance programs and the analysis of operating costs versus capital costs in order to optimize preventative maintenance and asset management;
I have read National Instrument 43-101 – Standards of Disclosure for Mineral Projects (“NI 43-101”) and certify that by reason of my education, affiliation with a professional association (as defined in NI 43-101) and past relevant work experience, I fulfill the requirements to be a "qualified person" for the purposes of NI 43-101;
4. I have not visited the PROPERTY;
5. I am responsible for 1 (part), 18 (part), 25 (part), 26 (part), and 27 (part) of the Technical Report;
6. I am independent of the Issuer and related companies applying all of the tests in Section 1.5 of the NI 43-101;
7. I have not had prior involvement with the property that is the subject of the Technical Report.
8. I have read NI 43-101, and the Technical Report has been prepared in compliance with NI 43-101 and Form 43-101F1.
9. As of the effective date of the Technical Report and the date of this certificate, to the best of my knowledge, information and belief, this Technical Report contains all scientific and technical information that is required to be disclosed to make the Technical Report not misleading;
Effective Date: 29 March 2017 Signing Date: 11 April 2017
“Original signed and sealed by”
William Hughes, P.Eng. Principal Mechanical / Infrastructure Engineer AMC Mining Consultants (Canada) Ltd.

Hermosa Property, Taylor Zn-Pb-Ag Deposit PEA Arizona Minerals Inc. 716027
amcconsultants.com 233
CERTIFICATE OF R. MICHAEL SMITH, Professional Engineer (P.E.)
I, R. Michael Smith, Registered Professional Engineer In Colorado, Alaska and Nevada, do hereby certify that:
1. I am currently employed as a Principal Engineer with Newfields Mining Design and Technical Services with an office at 9400 Station Street, Suite 300, Lone Tree, CO 80124;
2. This certificate applies to the technical report titled “Hermosa Property, Taylor Zn-Pb-Ag Deposit Preliminary Economic Assessment” for Arizona Mining Inc., with an effective date of 29 March 2017, (the “Technical Report”) prepared for Arizona Mining Inc.(“the Issuer”);
3. I am a graduate of The University of Colorado in Denver, Colorado, USA, with a Bachelors Degree in Civil Engineering, 1983. I am a member in good standing of the Society of Mining Engineers (SME), the American Society of Civil Engineers (ASCE), Colorado Board of Registration for Profession Engineers (License Number 28114), Alaska Board of Registration for Professional Engineers (License Number CE8785) and Nevada Board of Registration of Professional Engineers (License Number 16194). I have over 34 years of progressive engineering experience, in over 40 countries and 5 continents, the last 29 years of which have been spent exclusively on Mining projects. My primary areas of expertise as it relates to mining are design, construction and capital/operation cost estimation of Tailings Storage Facilities and Heap Leach Pad Facilities. My experience constitutes design and construction of over 65 Tailings Storage Facilities with an aggregate storage capacity of over 8.2 billion tons (7.4 billion tonnes) and over 80 Heap Leach Pad Facilities with an aggregate lined area of over 505 M ft2 (47.8 Mm2). I have been in leadership roles for over 20 years and am intimately familiar with the requirements of completing studies of this sort, the level of accuracy that is attendant to PEA level design and what it takes to produce practical designs that are both financially accurate are acheiveable for a construction standpoint. I have read the definition of "qualified person" set out in National Instrument 43-101 (NI 43-101) and certify that by reason of my education, affiliation with a professional association (as defined in NI 43-101) and past relevant work experience, I fulfill the requirements to be a "qualified person" for the purposes of NI 43-101.
4. I have visited the Project site on 5 occasions, twice in 2012/13, once in 2015, once in 2016 and most recently from January 16 – 19 of 2017. Between the five trips I have an aggregate time on site of 10 days. The most recent trip was to observe and review geotechnical drilling results of the Trench Camp Property;
5. I am responsible for Sections 1 (part), 18 (part), 21 (part), 25 (part), 26 (part), and 27 (part) of the Technical Report;
6. I am independent of the Issuer and related companies applying all of the tests in Section 1.5 of the NI 43-101;
7. I have had prior involvement with the property that is the subject of the Technical Report; in 2014 I lead a study to develop a tailing storage option on the Trench Camp site and in 2012/13 I lead an effort to complete a PFS on the Hermosa Project which was an open pit Silver project, prior to discovery of deeper mineralization.
8. I have read NI 43-101, and the Technical Report has been prepared in compliance with NI 43-101 and Form 43-101F1.
9. As of the effective date of the Technical Report and the date of this certificate, to the best of my knowledge, information and belief, this Technical Report contains all scientific and technical information that is required to be disclosed to make the Technical Report not misleading;
Hermosa Property, Taylor Zn-Pb-Ag Deposit PEA Arizona Minerals Inc. 716027
amcconsultants.com 234
Effective Date: 29 March 2017 Signing Date: 11 April 2017
“Original signed and sealed by”
R. Michael Smith, P.E. Principal Engineer Newfields Mining Design and Technical Services
Hermosa Property, Taylor Zn-Pb-Ag Deposit PEA Arizona Minerals Inc. 716027
amcconsultants.com 235
CERTIFICATE OF CARL KOTTMEIER, P.ENG. I, Carl Kottmeier, P.Eng. of North Vancouver, British Columbia, do hereby certify that:
1. I am currently employed as a Principal Mining Engineer with AMC Mining Consultants (Canada) Ltd. with an office at 202, 200 Granville Street, Vancouver, British Columbia V6C 1S4;
2. This certificate applies to the technical report titled “Hermosa Property, Taylor Zn-Pb-Ag Deposit Preliminary Economic Assessment” for Arizona Mining Inc., with an effective date of 29 March 2017, (the “Technical Report”) prepared for Arizona Mining Inc.(“the Issuer”);
3. I am a graduate of the University of British Columbia in Vancouver, British Columbia, Canada (Applied Science – Mining and Mineral Process Engineering, 1989). I am a member in good standing of the Association of Professional Engineers and Geoscientists of British Columbia (License #18702), and a member of the Canadian Institute of Mining, Metallurgy and Petroleum. I have practiced my profession continuously since 1989, and have been involved in mine engineering for a total of 28 years since my graduation from university. This has involved working primarily in Canada and in the United States. My experience is principally in coal, base metals, gold and silver.
I have read the definition of "qualified person" set out in National Instrument 43-101 (NI 43-101) and certify that by reason of my education, affiliation with a professional association (as defined in NI 43-101) and past relevant work experience, I fulfill the requirements to be a "qualified person" for the purposes of NI 43-101.
4. I have not visited the Property.
5. I am responsible for 1 (part), 21 (part), 22, 25 (part), 26 (part), and 27 (part) of the Technical Report;
6. I am independent of the Issuer and related companies applying all of the tests in Section 1.5 of the NI 43-101;
7. I have not had prior involvement with the property that is the subject of the Technical Report.
8. I have read NI 43-101, and the Technical Report has been prepared in compliance with NI 43-101 and Form 43-101F1.
9. As of the effective date of the Technical Report and the date of this certificate, to the best of my knowledge, information and belief, this Technical Report contains all scientific and technical information that is required to be disclosed to make the Technical Report not misleading;
Effective Date: 29 March 2017 Signing Date: 11 April 2017
“Original signed and sealed by”
Carl Kottmeier, P.Eng. Principal Mining Engineer AMC Mining Consultants (Canada) Ltd.

Hermosa Property, Taylor Zn-Pb-Ag Deposit PEA Arizona Minerals Inc. 716027
amcconsultants.com 236
CERTIFICATE OF DOUG BARTLETT, CPG AIPG, RG AZ I, Doug Bartlett, CPG AIPG, RG AZ, of Scottsdale, Arizona, do hereby certify that:
1. I am currently employed as a Principal and President with Clear Creek Associates with an office at 6155 E. Indian School Rd., Suite 200, Scottsdale, AZ 85251;
2. This certificate applies to the technical report titled “Hermosa Property, Taylor Zn-Pb-Ag Deposit Preliminary Economic Assessment” for Arizona Mining Inc., with an effective date of 29 March 2017, (the “Technical Report”) prepared for Arizona Mining Inc.(“the Issuer”);
3. I am a graduate of Colorado State Univeristy in Fort Collins, Colorado, USA (Bachelors/Masters of Geology in 1977/1984). I am a member in good standing of the American Institute of Professional Geologists (CPG #8433), and a registered geologist in the states of Arizona (RG#25059), California (PG#8809; CHG#965), Oregon (RG#2305), Washington (PG#2879), and Pennsylvania (PG#4995). I have experience in mining hydrogeology, groundwater production, and hydrogeologic permitting. I have read the definition of "qualified person" set out in National Instrument 43-101 (NI 43-101) and certify that by reason of my education, affiliation with a professional association (as defined in NI 43-101) and past relevant work experience, I fulfill the requirements to be a "qualified person" for the purposes of NI 43-101.
4. I have visited the Property on 4 October 2016, for 1 day;
5. I am responsible for Section 5.3.1, and 20.3.3 of the Technical Report;
6. I am independent of the Issuer and related companies applying all of the tests in Section 1.5 of the NI 43-101;
7. I have not had prior involvement with the property that is the subject of the Technical Report.
8. I have read NI 43-101, and the Technical Report has been prepared in compliance with NI 43-101 and Form 43-101F1.
9. As of the effective date of the Technical Report and the date of this certificate, to the best of my knowledge, information and belief, this Technical Report contains all scientific and technical information that is required to be disclosed to make the Technical Report not misleading;
Effective Date: 29 March 2017 Signing Date: 11 April 2017
“Original signed and sealed by”
Doug Bartlett, CPG AIPG, RG AZ Principal & President Clear Creek Associates
Hermosa Property, Taylor Zn-Pb-Ag Deposit PEA Arizona Minerals Inc. 716027
amcconsultants.com 237
CERTIFICATE OF Erik Christenson, P.E. AZ I, Erik Christenson, P.E. AZ, of Tucson, Arizona, do hereby certify that:
1. I am currently employed as a Senior Engineer with WestLand Resources Inc. with an office at 4001 E Paradise Falls Drive, Tucson, AZ 85712, USA;
2. This certificate applies to the technical report titled “Hermosa Property, Taylor Zn-Pb-Ag Deposit Preliminary Economic Assessment” for Arizona Mining Inc., with an effective date of 29 March 2017, (the “Technical Report”) prepared for Arizona Mining Inc.(“the Issuer”);
3. I am a graduate of the University of Arizona in Tucson, Arizona (Bachelors/Masters of Civil Engineering in 2012). I am a registrant in good standing of the Arizona Board of Technical Registration (Civil Engineering License #57421), and a member of the AZ Water Association. I have experience in mining process design, leaching system design and operation, milling design and operation, Plan of Operation development, water balance studies, surface hydrology, and dewatering operations.
I have read the definition of "qualified person" set out in National Instrument 43-101 (NI 43-101) and certify that by reason of my education, affiliation with a professional association (as defined in NI 43-101) and past relevant work experience, I fulfill the requirements to be a "qualified person" for the purposes of NI 43-101
4. I have visited the Property on 2 March 2017 for 1 day;
5. I am responsible for Sections 1 (part), 20 (exc. 20.3.3), 25 (part), 26 (part), and 27 (part) of the Technical Report;
6. I am independent of the Issuer and related companies applying all of the tests in Section 1.5 of the NI 43-101;
7. I have not had prior involvement with the property that is the subject of the Technical Report;
8. I have read NI 43-101, and the Technical Report has been prepared in compliance with NI 43-101 and Form 43-101F1.
9. As of the effective date of the Technical Report and the date of this certificate, to the best of my knowledge, information and belief, this Technical Report contains all scientific and technical information that is required to be disclosed to make the Technical Report not misleading;
Effective Date: 29 March 2017 Signing Date: 11 April 2017
“Original signed and sealed by”
Erik Christenson, P.E. AZ Senior Engineer WestLand Resources, Inc.
Hermosa Property, Taylor Zn-Pb-Ag Deposit PEA Arizona Minerals Inc. 716027
amcconsultants.com
Our offices
Australia
Adelaide
Level 1, 4 Greenhill Road Wayville SA 5034 Australia T +61 8 8201 1800 E [email protected]
Brisbane
Level 21, 179 Turbot Street Brisbane Qld 4000 Australia T +61 7 3230 9000 E [email protected]
Melbourne
Level 19, 114 William Street Melbourne Vic 3000 Australia T +61 3 8601 3300 E [email protected]
Perth
9 Havelock Street West Perth WA 6005 Australia T +61 8 6330 1100 E [email protected]
Canada
Toronto
Suite 300, 90 Adelaide Street West Toronto, Ontario M5H 3V9 Canada T +1 416 640 1212 E [email protected]
Vancouver
Suite 202, 200 Granville Street Vancouver BC V6C 1S4 Canada T +1 604 669 0044 E [email protected]
Singapore United Kingdom
Singapore
Registered Office 16 Raffles Quay, #33-03 Hong Leong Building Singapore 048581 T +65 8620 9268 E [email protected]
Maidenhead
Registered in England and Wales Company No. 3688365
Level 7, Nicholsons House Nicholsons Walk, Maidenhead Berkshire SL6 1LD United Kingdom T +44 1628 778 256 E [email protected]
Registered Office: Monument House, 1st Floor, 215 Marsh Road, Pinner, Greater London, HA5 5NE, United Kingdom