Are some people suffering as a result of increasing mass ...
68
Are some people suffering as a result of increasing mass exposure of the public to ultrasound in air? T. G. Leighton FREng FRS Institute of Sound and Vibration Research, Faculty of Engineering and the Environment, University of Southampton, Highfield, Southampton SO17 1BJ, UK. [email protected] ABSTRACT New measurements indicate that the public are being exposed, without their knowledge, to airborne ultrasound. Existing guidelines are insufficient for such exposures, the vast majority referring to occupational exposure only (where workers are aware of the exposure, can be monitored and can wear protection). Existing guidelines are based on an insufficient evidence base, most of which was collected over 40 years ago by researchers who themselves considered it insufficient to finalize guidelines, but which produced preliminary guidelines. This warning of inadequacy was lost as nations and organisations issued ‘new’ guidelines based on these early guidelines, and through such repetition generated a false impression of consensus. The evidence base is so slim that few reports have progressed far along the sequence from anecdote to case study, to formal scientific controlled trials and epidemiological studies. Early studies reported hearing threshold shifts, nausea, headache, fatigue, migraine and tinnitus, but there is insufficient research on human subjects, and insufficient measurement of fields, to assess what health risk current occupational and public exposures might produce. Furthermore, the assumptions underpinning audiology and physical measurements at high frequencies must be questioned: simple extrapolation of approaches used at lower frequencies does not address current unknowns. Recommendations are provided. EXECUTIVE SUMMARY The history For over 40 years there have been reports of hearing threshold shift [1] and a range of subjective effects (nausea, dizziness, migraine, fatigue, tinnitus, and ‘pressure in the ears’ [1- 8]) from ultrasound in air to which workers have been routinely exposed (plus other symptoms that have not occurred in more than one study; section 2.2). The degree of response, from significant to none, varied between workers. The evidence base has not studied sufficient numbers of subjects, and has not been sufficiently sensitive to the presence of sensitive individuals, or sensitive sub-groups, within the population, to support the guidelines required today. Studies focused on occupational exposure to ultrasound, which tends also to occur alongside high levels of audible sound, and the effect of this audio frequency noise on the observed effects must be isolated because there is increasing public exposure to ultrasound without such audible cues. Measurement methods and audiological procedures in the past have tended to follow extrapolations of methods used in the audio frequency range which, alongside the calibrations and allowed tolerances of the equipment used, must be critically examined (section 2.1). It is therefore no simple matter to measure the Very High Frequency/Ultrasonic (VHF/US) fields to which people are exposed, either in situ or during audiological testing, and relate those to the levels quoted in past studies. Consequently the evidence to date has been wholly inadequate to inform the development of guidelines for the increasing exposure of the public to ultrasound in air, and is suspect for occupational exposure. The need for evidence Policymakers need guidelines from which to work. Guidelines must be based on good evidence. Evidence must be collected with reliable measurement methods and calibrations, and this is unlikely to be possible by simply extending to the ultrasonic regime the established procedures used in 1
-
Upload
khangminh22 -
Category
Documents
-
view
0 -
download
0
Transcript of Are some people suffering as a result of increasing mass ...

Are some people suffering as a result of increasing mass exposure of the public to ultrasound in air?
T. G. Leighton FREng FRS
Institute of Sound and Vibration Research, Faculty of Engineering and the Environment, University of Southampton, Highfield, Southampton SO17 1BJ, UK. [email protected]
ABSTRACT
New measurements indicate that the public are being exposed, without their knowledge, to airborne ultrasound. Existing guidelines are insufficient for such exposures, the vast majority referring to occupational exposure only (where workers are aware of the exposure, can be monitored and can wear protection). Existing guidelines are based on an insufficient evidence base, most of which was collected over 40 years ago by researchers who themselves considered it insufficient to finalize guidelines, but which produced preliminary guidelines. This warning of inadequacy was lost as nations and organisations issued ‘new’ guidelines based on these early guidelines, and through such repetition generated a false impression of consensus. The evidence base is so slim that few reports have progressed far along the sequence from anecdote to case study, to formal scientific controlled trials and epidemiological studies. Early studies reported hearing threshold shifts, nausea, headache, fatigue, migraine and tinnitus, but there is insufficient research on human subjects, and insufficient measurement of fields, to assess what health risk current occupational and public exposures might produce. Furthermore, the assumptions underpinning audiology and physical measurements at high frequencies must be questioned: simple extrapolation of approaches used at lower frequencies does not address current unknowns. Recommendations are provided.
EXECUTIVE SUMMARY
The history
For over 40 years there have been reports of hearing threshold shift [1] and a range of subjective effects (nausea, dizziness, migraine, fatigue, tinnitus, and ‘pressure in the ears’ [1- 8]) from ultrasound in air to which workers have been routinely exposed (plus other symptoms that have not occurred in more than one study; section 2.2). The degree of response, from significant to none, varied between workers. The evidence base has not studied sufficient numbers of subjects, and has not been sufficiently sensitive to the presence of sensitive individuals, or sensitive sub-groups, within the population, to support the guidelines required today. Studies focused on occupational exposure to ultrasound, which tends also to occur alongside high levels of audible sound, and the effect of this audio frequency noise on the observed effects must be isolated because there is increasing public exposure to ultrasound without such audible cues. Measurement methods and audiological procedures in the past have tended to follow extrapolations of methods used in the audio frequency range which, alongside the calibrations and allowed tolerances of the equipment used, must be critically examined (section 2.1). It is therefore no simple matter to measure the Very High Frequency/Ultrasonic (VHF/US) fields to which people are exposed, either in situ or during audiological testing, and relate those to the levels quoted in past studies. Consequently the evidence to date has been wholly inadequate to inform the development of guidelines for the increasing exposure of the public to ultrasound in air, and is suspect for occupational exposure.
The need for evidence
Policymakers need guidelines from which to work. Guidelines must be based on good evidence. Evidence must be collected with reliable measurement methods and calibrations, and this is unlikely to be possible by simply extending to the ultrasonic regime the established procedures used in
1
audiology, acoustical engineering, and metrology at audio frequencies. There must be a sufficient volume of evidence to be statistically significant, and it must not ignore possible variations in sensitivity seen in the population, and between and within subsets of the population.
UK clinicians are unlikely to consider ultrasound in their differential diagnosis when encountering the symptoms listed earlier, as it is not well recognised and not included in any of the relevant NICE (UK National Institute for Health and Care Excellence) publications, which are all evidence based.
For both policymakers and clinicians, the evidence base is inadequate to predict the health risk and discomfort likely to be seen in the general population as a result of public exposure to ultrasound in air. Even for occupational exposure the evidence base is too small (if it were adequate we would not see a factor of over 3 million in intensity between the lowest and highest guidelines at 20 kHz). When the research has not been done, assurances such as ‘there are no studies that show any issues of long term exposure to airborne ultrasound... despite many years of human exposure to existing ultrasound sources’ [9] take on a different meaning compared to similar statements made about research-rich fields. Lack of evidence and reliable physical measurements is not currently a stimulus for evidence gathering, but rather is providing a situation of uncertainty and confusion that enables manufacturers and those responsible for public places to deploy devices that insonify the public. The current lack of evidence makes it unlikely that clinicians will consider it a possible cause when confronted with patients experiencing these symptoms.
The evidence base has not progressed far up the hierarchy from manufacturer claims and individual anecdotes, to case and cohort studies and laboratory testing, all the way up to randomized controlled trials. In such a dearth of scientific and medical data, those least reliable items that form the base of this hierarchy cannot be ignored, and therefore web pages are perforce cited at times in this study. Given that we must be sceptical even of articles in peer reviewed journals of high quality, we must be increasingly sceptical of citations further down the publication hierarchy, from non-peer reviewed articles (Professional Journals, most conferences) down to web pages.
This paper presents new measurements that demonstrate human exposure to airborne ultrasound in public places, including railway stations, museums, libraries, schools, and sports stadia. It argues that the guidelines for protecting humans from airborne ultrasound vary and are uniformly inadequate: for energy above 22.4 kHz, they are based on avoiding ultrasonically-induced hearing damage at the lower frequencies used to understand speech, taking no account of reports of the ability of airborne ultrasound in occupational settings to cause nausea, dizziness, tinnitus, fatigue, migraine and headaches. The scepticism to reports of symptoms by the public is supported by the scarcity of attempts to measure such fields, and lack of a proposed mechanism by which such effects are produced, both of which this paper has taken the initial steps to address. Furthermore the guidelines are based on the average response of small groups, often of adult males, whereas recent data suggest 1 in 20 people aged 40-49 years have hearing thresholds that at least 20 dB more sensitive at 20 kHz than the average 30-39 year old [10]. Moreover, 5% of the 5-19 year age group are reported to have a 20 kHz threshold that is 60 dB more sensitive than the median for the 30-39 year age group [10]. There will therefore be significant numbers of the public (with a greater proportion seen amongst children) who have significantly better VHF/US hearing acuity than the ‘average’ on which current guidelines are based. Whilst this does not allow us to extrapolate what adverse effects this might cause, it suggests that the underpinning scientific research on which guidelines have been set are inadequate for current exposures.
Objectives
The objectives of this paper are:
• to show that the public is being exposed to Very high Frequency (VHF) sound and ultrasound (US) on a mass basis;
2

• to show that the current state of knowledge is inadequate to make an assessment of the safety of such exposures, current guidelines being based on inadequate data;
• to draw attention to the need to understand what mechanisms might be capable of generating the symptoms listed above following exposure to VHF sound and ultrasound.
Recommendations
For exposure to airborne VHF sound and ultrasound, this paper recommends that:
• No new guidelines must be based primarily on selection of levels quoted in older guidelines, as this gives the incorrect impression of consensus, independence, and the consideration of new science.
• Guidelines for occupational exposure must not be applied to public or residential exposure, and recognition must be given to exposure of long-term ‘guests’ (in schools, hospitals, prisons, public transport etc.).
• All new guidelines must indicate from what research base they are drawn, and where they have been unable to draw on any such research base (e.g. when making recommendations on durations of exposure, sensitive subgroups etc.).
• Studies and new guidelines must take account of the deviation from the average of individuals within a population, and within particular demographic subsets within the population.
• New guidelines must consider the implications of the duration of exposure in a rigorous manner with an appropriate scientific basis.
• Research must be undertaken in recognition that the fundamental science upon which all existing guidelines have been based is not sufficiently substantial.
• Research is required to ensure that guidelines properly account for which adverse effects should be minimized or prevented.
• Research must be undertaken to consider whether specifying only third octave levels in guidelines is appropriate for narrowband and tonal exposures.
• Research must be undertaken to support guidelines in specific recognition that current public exposures to narrowband or tonal ultrasonics may not be accompanied by the high levels of audio frequency sound that was typical of most of the occupational ultrasound studies on which the current guidelines are based.
• All data must be examined for its statistical significance before conclusions are drawn, in particular with regards to sample size, number of studies, and the degree to which the sample represents the relevant population.
• Attention must be paid to the fact that international standards for the specification of noise measurement instrumentation do not adequately address the requirements for measuring airborne VHF sound and ultrasound. For example, at 20 kHz a sound level meter can over-read by 40% or under-read without limit (tolerances from +3 dB to -∞ dB), and still meet even the most stringent requirements of the standard. For higher frequencies there are virtually no performance specifications. Standards specifying a new type of instrumentation for airborne VHF sound and ultrasound are therefore required.
• Research must be undertaken to assess whether current audiological practices, equipment and standards are suitable for the VHF and ultrasonic regimes, and identify measures to rectify any shortcomings.
• A current survey of modern devices and their source levels (using international standard procedures and calibrations traceable back to primary standards) should be undertaken.
• A statement from manufacturers of the source level and spectral content (using international standard procedures and calibrations traceable back to primary standards) of the output of VHF/US if above a yet-to-be-determined spectral level; a statement of the purpose of the sound; an assessment of the levels when deployed in the field.
3

Subsidiary recommendations can be listed in section 4.
1. OVERVIEW
1.1 Mass public exposure of today versus occupational exposure of the past
(a) Public exposure and the decibel
Take a smart phone or tablet computer, equip it with an App capable of producing a spectrogram of the microphone reading, and see whether you can detect airborne ultrasound in a public place (Appendix A). Because some such devices (such as the iPhone 5 and iPad Air 2) have microphones capable of monitoring above 20 kHz (Appendix A), you may detect a tone [as in figure 1(a)] or alternatively pulses, at frequencies close to 20 kHz. The data in figure 1 were recorded in two large hallways, in public buildings, at a time when they were occupied and traversed by hundreds of people. In both there were loudspeakers placed every few metres. Figure 1(a) was recorded in the main lobby of a major public library, open on several levels, that contained walkways, workstations for staff and visitors, and seating areas where many people (including infants) sat directly under the ceiling-mounted loudspeakers. The only occupancy data the author could find for this library sums both actual and virtual visitors, totalling over 3 million each year. In the absence of plans the author estimates this lobby to measure around 50 m by 50 m by 15 m high.
The smartphone or tablet is a convenient and inexpensive method of immediately testing for the presence of ultrasound, although it comes with many limitations (e.g. uncertainty regarding the reported levels) and drawbacks (the possibility of increased awareness causing anxiety in some individuals). To make calibrated measurements for this paper, either 3 [figure 1(b,c)] or 2 [figure 2] independent microphone and data acquisition systems were deployed, all with with calibrations traceable back to a primary standard (see Appendix A for details).
Figure 1(b,c) records a Sound Pressure Level (SPL) of around 94 dB re 20 µPa (in the third-octave frequency band centred at 20 kHz). This was recorded at a table where the public eat in the food concourse of the main hall of a major railway station (which hosts nearly 30 million visitors each year). Here the loudspeakers are wall-mounted. This hall measures around 100 m by 30 m by 20 m high and contains food outlets and shops.
In both situations the microphones were at head height and pointed towards the loudspeakers and approximately 1 m from the nearest speaker, locations typical of public occupancy. Considerable audio frequency energy is evident in figure 1(b), corresponding mainly to voice announcements of train departures via the Public Address system. In the absence of specific information, the author considered the aforementioned loudspeakers of the PAVA (Public Address Voice Alarm) system to be the most likely to be producing the ultrasound in both the library and the railway station, and in the recording locations of figure 2.
Figure 2(a,b) reports data taken in the toilets of a major swimming pool (the building as a whole receives over 600,000 visitors per year). Figure 2(c,d) shows the data recorded at a world-renowned museum that receives in excess of 3 million visitors per year (data taken in an open hall measuring roughly 30 m by 40 m by 15 m high). These two sites produced SPLs of 77 and 63 dB re 20 µPa respectively in the third-octave frequency band centred at 20 kHz. One school and one major sports stadium were also tested, and both contained signals close to 20 kHz. All measurements were made at locations that members of the public of all ages, and local workers, occupy on a daily basis. These locations had been identified for testing from anecdotal reports of by members of the public claiming to have headaches, migraine, nausea, fatigue, dizziness and an uncomfortable feeling of ‘pressure in the ears’ that they attribute to ultrasound. Should we be concerned?
4

Although the symptoms correlate with those reported from occupational exposure in the literature [1-8], participants in the historical studies were usually also exposed to high levels of audio frequency sound. This is because unlike the devices measured in figures 1 and 2, ultrasonic devices tested in the past (such as ultrasonic cleaning baths) generated audio frequency sound. A further complication is that it is no simple matter to compare the dB levels measured in this paper with those reported historically (see below). This will be discussed extensively in section 2, but an introductory example is found in figures 1 and 2. To see this, note that the dB levels labelled against the peaks in figures 1(c), 2(b,d) do not match the levels on the graphs’ vertical axes (and a third level is shown by the horizontal dotted line, and a fourth – the energy in the peak itself – both to be discussed later). That it is possible to report four different dB levels from the same data, even after an extensive careful calibration, is a very important point that should be borne in mind when assessing historical reports of dB levels: it is vital that there is sufficient metadata to understand what is being reported. When plotting a spectrum from the voltage time history output of a sensor (used here as a more general proxy for acoustic pressure as monitored by microphone), there are a number of conventions. With the frequency usually plotted on the abscissa, the four most common options for the vertical axis are: V Hz-1; V2 Hz-1; V; V2. Clearly the representations that use V2 in preference to V are plotting a parameter which reflects a function related to the power of the signal, as opposed to the amplitude. The advantage of using Hz-1 comes from the common interpretation of a spectrum as a histogram, since the frequency bins will be finite: changing the width of these bins should affect the amplitude of the spectral level plotted [11]. This is certainly appropriate for broadband signals, and it is these which have usually been considered when setting third-octave limits shown in figure 3, almost all of which are guidelines for occupational exposures to ‘VHF/US’ (using this label throughout this article to mean ‘Very High Frequency Sound [12-20 kHz], or Ultrasound [>20 kHz]’, noting that some authorities place the lower frequency limit for ultrasound at 10 kHz [2], 15 kHz [30], 16 kHz [5,31] or 18 kHz [12] rather than 20 kHz [32]). It seems likely that setting guidelines based on the energy in a third-octave band for VHF/US followed standard practice for exposure to audio frequency occupational noise, which tends to be broadband, and the design of commercial sound level meters (Appendix A). However, stating maximum permissible levels in terms of the energy allowed in a third octave band is problematic if the signal is narrowband, as are the examples in figures 1 and 2. These examples are nearly tonal, and for purely tonal signals, the energy in the bin that contains the signal is independent of the bin width, since all the energy is at a single frequency, i.e. it has zero bandwidth. Only one of the bins will contain non-zero energy. Division of the energy of that bin by the bandwidth of the bin simply causes the spectral peak corresponding to the sine wave to reduce in amplitude as the bin width increases. As a result, the parameters V and V2 are sometimes used in preference to V Hz-1 and V2 Hz-1, if the signal is perceived to more closely resemble a sinewave than a broadband signal.
In figures 1(c) and 2(b,d), the vertical axis is plotted as the power spectral density [dB re (20 µPa)2 /Hz]. The horizontal dotted line (red in the online version of the paper) shows that level which would give the identical third-octave level if the energy were equally distributed across frequencies in the band centred on 20 kHz (the upper and lower frequencies of which are shown by the vertical dotted line). However, the actual measured signal is narrowband so that, given the preceding paragraph, it makes sense also to express this in terms of the Sound Pressure Level (SPL) over the frequency bin that contains most energy: since the frequency resolution of the Power Spectral Density (PSD) is 23.4 Hz, this ‘peak SPL’ level is 10log10(23.4)=13.7 dB higher than the maximum PSD level for this peak (shown on the vertical axis). Its peak SPL is 10log10(22400-17800)=36.6 dB higher than the horizontal dotted line that would score exactly the same when compared to the third octave levels of the guidelines (figure 3). When integrated across just the frequency range of the peak itself (as opposed to the whole third octave band), loss of the energy contained in the background signal outside the narrow band covered by the peak gives SPLs of 92 [figure 1(c)], 75 [figure 2(b)] and 61 [figure 2(d)] dB re 20 µPa.
5

The range of available guidelines [3, 7, 12, 13 - 14 - 15 - 16 - 17
- 18 - 19 - 20- 21 - 22 - 23 - 24 - 25 - 26 - 27 - 28 - 29 - 30 - 31 - 32 - 33 - 34] is plotted in figure 3. Almost all refer to the maximum permissible level allowable for occupational exposures for 8 hours a day, 5 days a week, in each third octave band. Comparison of these for near-tonal signals of figures 1 and 2 is therefore problematic, particularly if those exposures are not occupational.
The problems increase when we consider the limitations of the underpinning research on which the guidelines are based, the misinterpretations of these, and would worsen if we were to introduce the subjective or annoyance effects that different signals elicit. These issues will be discussed in section 1.2.
As a postscript on the use of dB levels in this paper, ISO [35] allows use of a reference intensity of 10-12 W m−2 or a reference rms pressure of 20 µPa when stating dB levels for sound in air. The human ear is a pressure sensor (intensity of course being a vector) and reference rms pressure of 20 µPa will be used in this paper unless otherwise stated (the microphones in figures 1(b,c) and 2 were calibrated in terms of pressure). Conversion between intensity and pressure assumes knowledge of the geometry of the wavefront and knowledge of the pressure and density at the reference and measurement points, oversight of which can lead to errors and ambiguities [36], though these are unlikely for the type of measurements reported in this paper. In general, even when using calibrated microphones, because of both the equipment and the processing issues it is probably prudent to include a ~3 dB expanded uncertainty when assessing calculations made from field microphone measurements [37, 38], and any guidelines (current or historical) following from them. Radosz [27, 39] discusses the difficulties associated with calibration on field measurements at these frequencies.
(b) The crux of the matter
In assessing the issue of human exposure to ultrasound in air, the heart of the matter is this: advances in the ability to market inexpensive commercial ultrasonic sources have led to their increased use, exposing large numbers of people. Industrial ultrasonic devices, for cleaning, drilling, homogenising etc. have been around for decades, and form the core of historical interest in developing guidelines and in the underpinning research base. However many devices now deliver exposures that cannot be classed as occupational. Some sources are deliberately incorporated into devices (e.g. pest scarers, some door opening sensors), while some are present as an adjunct to the main operation of a device (e.g. in many Public Address Voice Alarm systems). It is also possible that some modern devices are inadvertently producing ultrasound (e.g. possibly from data projection and lighting systems, but this needs confirmation). Output powers vary significantly between types of device, although surveying is sparse and levels stated by manufacturers are open to question because procedures for taking measurements traceable back to primary standards have only just been developed (with papers [40-42] preceding a full formal recommendation). Exposures that, were they to be done in a laboratory would require significant consideration by, and permission from, an ethics committee, are occurring in public spaces. Individuals are unlikely to be aware of such exposures. Some members of the public are complaining, for themselves and their children. No studies have been conducted to assess which, if any, of these complaints can be traced to exposure to VHF/US. Such public exposures are not common knowledge and, on the assumption (indeed the definition) that humans cannot hear ultrasound, their safety is rarely questioned. Guidelines for the exposure of humans to VHF/US in air vary, but are not adequate for current exposures because:
• Firstly, the original studies are scarce and not sufficient for guidelines (which outnumber the source studies by around 3:1).
• Secondly, none of the guidelines that pertain to exposure above the third octave band centred on 20 kHz are based on avoiding effects that have been labelled as ‘subjective’ (including nausea, dizziness, tinnitus, fatigue, migraine and persistent headaches [1-8,
6

20, 43]): at these frequencies, the guidelines are designed to avoid hearing damage at the lower frequencies used for speech (see section 1.2). It is likely that the public exposures today are at levels whereby the issue that needs consideration is whether they generate subjective effects, and if so, what is the impact of these on quality of life, and on concentration and productivity in work and schools, given mass exposure.
• Thirdly, these guidelines take little account of the very significant variability in sensitivity to VHF/US of individuals, or specific demographics within the population compared to the ‘average’ on which the guidelines are based (often an adult male from industrial or Services employment). Recent data suggest 1 in 20 of people aged 40-49 years old have hearing thresholds that are at least 20 dB more sensitive at 20 kHz than the average 30-39 year old [10]. One demographic that should be investigated for departure from the ‘population norm’ is children. The same study [10] reports that 5% of the 5-19 year age group are reported to have a 20 kHz threshold that is 60 dB more sensitive than the median for the 30-39 year age group [10]. Our current level of knowledge does not allow us to say whether or not enhanced hearing acuity in the VHF/US range will affect their chances of suffering adverse (including subjective) effects (section 1.2(b)), but the departures from the ‘averages’ used to produce current guidelines clearly need investigating, as does the change in VHF/US sensitivity during infancy and childhood. Other recent data challenges the assumption underlying early guidelines, and repeated since, that the steep fall-off in sensitivity seen in the average of the human adult data between 16-20 kHz may be extrapolated to higher frequencies (section 1.2(b)) [44].
• Fourthly, international standards for measuring ultrasonic fields are only just developing, so that even where outputs of devices are stated, or field measurements taken, their accuracy cannot be guaranteed unless they can be traced back to primary standards and measurement procedures.
For these reasons, this paper asserts that the scientific basis for setting guidelines for exposure to VHF sound and ultrasound in air is not sufficient to cope with the current mass exposure of the public and workers, and that there is as yet an insufficient scientific basis to confirm that any of the current guidelines are safe for large numbers of people. Lack of research means that it is not possible to prove or disprove public health risk or discomfort. Publication of this report comes at the cost of possibly raising anxiety and potentially promoting symptoms in individuals who had none. However, it is important that existing sufferers are able to identify the true cause of their symptoms, whether ultrasonic or not, and lack of research means that it is impossible to make such an identification for the source of the symptoms currently reported by members of the public. This paper highlights the knowledge gap in which ultrasonic sources are being placed in public places.
1.2 Are the current guidelines appropriate for mass public exposure to tones?
Scepticism is always required when anecdotal reports of subjective symptoms are produced by members of the public, particularly when the public attribute the cause to something imposed upon them (a windfarm, power cable etc.) and other individuals feel no adverse effects. However, we must also be sceptical about scepticism: it is possible for some individuals to be particularly susceptible to certain agents (allergens being an example), and our classification of symptoms as ‘subjective’ glosses over what we really mean by the word: all symptoms are subjective until we develop the technology to detect and objectively measure a quantifiable and repeatable observable (the introduction of fMRI has, for example, begun to convert some previously subjective symptoms into observables that are quantifiable by proxy, as has recently been investigated for infrasound [26]). Following convention, ultrasonically-induced temporary or permanent changes in the quietest sounds an individual can hear at a given frequency (called the Temporary Threshold Shift [TTS] and
7

Permanent Threshold Shifts [PTS] respectively) are called ‘objective’ measures in this paper in contrast to the ‘subjective’ effects (nausea, fatigue etc.). However, the audiological measurement of a hearing threshold is often a subjective assessment of hearing performance, requiring individual judgement on whether the sound is detectable or not, the extent to which that can be truthfully reported, and whether lack of repeatability in re-testing can have an identified causal link (such as recent noise exposure that is not reported by the subject to the tester). Such tests have an objective ‘right/wrong’ answer, whereas annoyance, fatigue etc. are often assessed on a rating scale with no ‘right/wrong’ answer. This, and the tendency for better test-retest reliability with performance measures, has led to TTS and PTS being classed as ‘objective’ measures, but the distinction is not so straightforward.
No mechanism been proposed that might produce the above subjective symptoms claimed for very high frequency (VHF: 12-20 kHz) and ultrasonic (>20 kHz) acoustic irradiation. Audiology has, for at least four decades, established methods of objectively quantifying the adverse effects of exposure to audio frequency sound that is too loud, or persists for too long. This is primarily through measurement of the TTS of patients who come to them for testing, and from epidemiological studies relating any PTS to estimates of past occupational noise exposure. Indeed, as section 1.2 will explain, this has played a large part in setting the guidelines for the advisable levels of exposure to VHF/US (figure 3) to the extent that the inducement of subjective effects above the 20 kHz third octave band has not played a role in setting guidelines. Those guidelines show a large spread in values (a factor of over 3 million in intensity, and a factor of more than 1000 in pressure, at 20 kHz), even though they are based in large part on monitoring the averages of selected cohorts, rather than reflecting the spread in response that characterises the hearing and balance functions in the general population. The calibrated recording in figure 1(c) would contravene around half of the maximum permissible levels in figure 3, and would do so continuously without interruption. The concern arises because in section 1.2 it is proposed that even the guidelines in figure 3 are based on inadequate evidence, and were for the most part drawn up for the scenario of occupational exposure of adults for limited and monitored periods of time.
(a) What question is being asked?
Figure 3 is visually unpalatable but necessarily so. Lawton [45, 46], on whose excellent compilations of guidelines much of figure 3 is based, followed the generally accepted route of tabulating the centre frequency of the third octave band against the maximum permitted dB level (which is sometimes the instantaneous level, the time-averaged (e.g. 8 hour) level, or unspecified). However, figure 3 illustrates that, in doing so, that Maximum Permissible Level stretches from the lower to the upper frequency limit of each band (as shown in blue on the upper axis of figure 3).
Figure 3 also makes clear the step change in allowed levels that occurs across the 20 kHz band. This follows from the criteria that levels at and below the 20 kHz band (i.e. below 22.4 kHz; see figure 3) are set to avoid subjective effects (nausea, fatigue etc.) whilst above 22.4 kHz they are set to avoid the ultrasound generating hearing loss at frequencies generally used to understand speech (normal audiometric testing for hearing loss does not extend to frequencies higher than 8 kHz, so damage at frequencies higher than 8 kHz would not normally be detected [47]).
Finally, the agreement between authors in Figure 3 is illusory (authors that tend to agree are grouped in boxes in the legend). There are only six basic studies (Grigor’eva [13]; Acton [15-17]; Parrack [14] with a 1969 revision from Parrack via personal communication [3, 19]). As a result, the reviews and guidelines in figure 3 outnumber the underpinning studies by around 3:1, such that (in the words of Lawton [46]) ‘these first interim limits were taken up by national and international bodies, and repeated with enough regularity over several decades to gain a degree of authority and permanence, perhaps not deserved… It seems that Soviet, UK and American investigators of the 1960s took a reasoned approach, recommending DRCs [Damage Risk Criteria] and MPLs [Maximum
8
Permissible Levels] supported by limited experimental and survey data. These tentative first recommendations were then taken up by national and international bodies, to gain authority by repetition: the idea of ‘proposed’ or ‘tentative’ has been lost in the repetitions’. Henceforth any new guidelines must address the fact that:
• there is a paucity of original studies, and re-issuing new guidelines based on old ones gives the unintended impression of confirmation, validation and independent agreement where none was intended; furthermore, transcription errors occur and through repetition become embedded (though care was taken in Appendix B, the original sources are now over 40 years old, and some of their recommended levels are known only through citation by others);
• these original studies dealt with occupational exposures rather than modern public exposures (see figures 1 and 2);
• the original studies had small subject numbers, and neglected potentially sensitive individuals and demographics, such as children (we should consider variations in individual sensitivity of both auditory and subjective effects – numerous research teams of adults dating from the 1940s [48] to the present day, as observed by this author, noted that some team members reported effects such as dizziness when close to the ultrasonic source, whilst others were unaffected, although controlled human experimentation in ignorance of the exposure conditions would be required to prove that such reports are ultrasonically-induced);
• past studies addressed the duration of exposure in an uneven manner (such that many national guidelines opt for an 8 hour daily exposure, 5 days a week) and the convention of trading off the intensity of exposure against its duration is not well suited to the public exposures to VHF/US seen in figures 1 and 2;
• modern wide-ranging guidelines need to take into account who is to be protected and monitored, and which adverse effects are to be minimised or even prevented.
Figure 3 groups ‘families’ of similar guidelines into boxes. The dominant sources are the 1975 work of Acton [16] (which produced three similar families, bracketed together in figure 3), Parrack (1969) and, to a lesser extent, Grigor’eva [13]. Parrack’s 1966 recommendations [14] have been surprisingly long-lived and influential, given that he retracted them in 1969 (as cited in the 1982 WHO guidelines [19]). These were all based on work carried out in the 1960s and 1970s on exposure to occupational noise in the VHF/US regimes. It has been difficult to identify the source of the basic research on which the 1976 USAF, and the 2004 ACGIH 8 hour average, guidelines are based.
The scenario in mind for the basic studies behind figure 3 would typically be work at an ultrasonic cleaning bath, and the goal for signals above 22.4 kHz would be the avoidance of hearing loss below 8 kHz. The context of such known exposures would be worker protection against occupational exposure enshrined in law, subject to monitoring, with known and recorded durations for the exposure and ‘quiet’ times for recovery. Furthermore, the worker would be made aware of the exposure and might (within reason) be required to wear protective equipment. The occupational source envisaged by most of those setting guidelines would be inadvertently leaking ultrasound into the air (for example, an ultrasonic cleaning bath), and so shielding it could be an option. In contrast, people receiving VHF/US exposures in public areas, for exposures resembling figures 1 and 2 (that are not accompanied by a familiar audio frequency alert that most people can hear, such as the hiss of an ultrasonic cleaning bath), are currently ignorant of their exposures; they cannot reasonably be expected to wear hearing protection; they receive no monitoring of their exposure; they might also be exposed at home (by pest scarers) or during the commute (by public transport PAVA), and at work. Whether they respond significantly or not at all is a function of the unknown variation in response in the population, and the as-yet unknown exposures. Moreover, how we view a symptom depends on our knowledge of cause and effect (section 3) and the extent to which the evidence base leads to guidance of which clinicians can be aware. To take one example, dizziness from ultrasound is classed as a subjective symptom. Dizziness from taking a medication for which it is a known side
9

effect would not be classed as subjective, and in that respect would not only be a consideration in how well the medication can be tolerated and how it affects productivity and quality of life, but would also be included in statutory assessments of risk and health (for example when operating machinery).
Against this uncertainty in the hazard comes uncertainty in the response: there are no records of large numbers of complaints from the public, and this might be because only a small number are affected, or it might be because there has been no awareness of exposure and no route by which to complain. If significant numbers do complain, statistically there will be a proportion that attributes adverse effects to ultrasound when ultrasound is not in fact the cause. Large numbers will be unaffected: whilst their existence at all is surprising, the exposures shown in figures 1 and 2 are orders of magnitude less intense than those exploited in ultrasonic weaponry [section 2.2(c)(iv)].
This section will ask whether, considering today’s mass exposure of the public to tonal VHF/US signals, the six original studies on which figure 3 is based were considering relevant cohorts, relevant exposures and relevant adverse effects, and whether we need to reconsider the guidelines for occupational and public exposures.
When drawing up guidelines, we are mapping the available evidence base on to a dB level, a process that retrospectively translates the evidence base into a single question: what is the appropriate dB level? It is vital, in doing so, that we ask ourselves how well the original research maps onto that specific question, and avoid a mismatch because the context is not considered.
The work of Knight [49] is commonly cited, drawing upon his conclusion that ‘there is no evidence of hazardous influence of airborne ultrasonic radiation on the acoustic or vestibular systems’[49]. What question was Knight [49] really asking? This author’s interpretation of it would be “If a group of only 18 men with an average age of 30, who work in the ultrasonic cleaning baths industry but for whom there is no quantification of exposure either to audio frequency or ultrasonic signals, is compared to a group of 20 men of similar average age who do not work in the ultrasonic cleaning bath industry, do the average (across the whole group) Hearing Threshold Levels from 250 to 8000 Hz differ between the two groups?” The average of the ultrasonic workers was worse by 2-7 dB over the entire frequency range. However Knight’s data also shows the most pronounced reduction as being a dip at 4 kHz, which usually follows from exposure to high levels of audio frequency sound. Indeed Knight [49] records that half of the 18-man cohort had experienced gunfire, of which one also working with pneumatic road drills, one with riveting noise, and one (who had also received an ototoxic drug) had worked in an aero-engine test bed. Of the remaining 9 men who had not experienced gunfire, 2 tested 100 W guitar amplifiers between their ultrasonic exposures. This would negate comparisons. In common with many studies that looked for changes to hearing, Knight [49] adds as a postscript that ‘The reported prevalence of subjective effects and stress disorders was extremely small’.
Knight [49] compared the average hearing sensitivity of a group who worked with ultrasonic cleaning machines, with the average hearing sensitivity of a group that did not. There is no measurement of the exposure the first group had, no attempt to test the variability within that group, and no reported recognition of any self-selection that subjective effects may cause in occupational studies (a subject who routinely feels fatigue and nausea when operating a particular machine is less likely to continue doing so, and so be available for Knight to select). When the excellent review by Howard et al. [34] cites Knight, it states: ‘There are no reports of hearing loss due to ultrasound exposure [1, 49], although there is a report of temporary threshold shift in subjects exposed to frequencies of 18kHz at 150dB for about 5 minutes [1]. Research has shown that airborne ultrasound has the potential to cause nausea, fatigue, and headaches [3, 7, 8, 20, 43, 50]’ [34]. The context (which as section 2.2 will demonstrate is sometimes crucially omitted) includes the fact that that Knight’s study [49] was not designed to address the question of whether a minority (that would
10

be hard to detect in population averages such as Knight [49] conducted) will suffer the above subjective effects. It is not sufficient to say that such deficiencies would be evident to epidemiologists and statisticians, because in 40 years no organization setting guidelines has attempted to rectify the problems in the original data, which is used to support assurances from manufacturers that ‘there are no studies that show any issues of long term exposure to airborne ultrasound... despite many years of human exposure to existing ultrasound sources’ [9]. Do we care if only a minority is affected? The spirit of German workplace law effectively states that protection must be given to all workers from all possible hazards [51, 52]. In contrast, in the UK the Health and Safety at Work etc Act 1974 qualifies the duty of employers to protect their employees and the public, and employees to protect themselves and each other, by the principle of ‘so far as is reasonably practicable’, explained as follows by the UK Health and Safety Executive (HSE) [53]: ‘In other words, an employer does not have to take measures to avoid or reduce the risk if they are technically impossible or if the time, trouble or cost of the measures would be grossly disproportionate to the risk’. This suggests a balance between risk and remedy. If a minority of a given workforce were suffering adverse effects from airborne ultrasound, although the above attitudes taken by German and British lawmakers seem different, in both cases the workers would be protected, once workers and management were aware of the exposure. Measures might include building protective casings around the sounds, donning ear protection, limiting exposures, and/or redeploying sensitive individuals to other tasks. This section has up to now considered occupational exposures in terms of the underlying scientific studies and the resulting guidelines. What, however, about public exposure such as was recorded in figures 1 and 2? The public and management may well be unaware of it, the ‘dosages’ of ultrasound would be uncontrolled and unmonitored, and the option of protective measures impractical. There are unknown numbers of sites generating ultrasound; an inadequate evidence base from which to predict the effects; the vagaries of reporting subjective symptoms amongst the footfall of millions at each site; the complexities of assessing the cost of a minority of those who commute, attend education or seek recreation feeling subjective adverse effects. These may seem obvious questions when seen from a public health perspective, but they are not relevant to the guidelines of figure 3, except for one. Only the 1984 INIRC-IRPA [20] guidelines (building on a 1981 report [54]) considered public exposure, giving a very reasoned account of the differences that must be taken into account for public, as opposed to occupational, exposure (section 1.2(c)) but noting that these were interim because of the lack of definitive data. The author has been unable to identify any additional data, other than the occupational exposure studies that are criticized in this paper, on which the INIRC-IRPA [20] based the ‘existing data’ of their opening remark: ‘Existing data suggest that exposure of the general public to airborne ultrasound (one-third octave band mid frequencies above 20 kHz) at levels up to 110 dB is not known to cause untoward health effects. However, noting that the general population can potentially be exposed 24 hours per day and for the other considerations noted above, an added safety factor should be incorporated, at least as an interim measure until more definite data on adverse health effects of exposure to airborne ultrasound become available. Thus an SPL of 100 dB is recommended. For similar reasons, an added safety factor should be incorporated into the exposure limit for frequencies in the range of the one-third octave band centred on 20 kHz. An SPL of 70 dB is recommended’. This interim 70 dB limit is the only suggestion we have to cover the mass public exposures of figures 1 and 2, and it is based on a small number of occupational exposure studies primarily of the average response of small cohorts of adult males. (b) The use of averages
11

It is commonly accepted that arithmetic averaging of data is a sensible route to reliable conclusions, but this section contests this for the mass exposure of the public to ultrasound in air. As emphasized in the previous subsection, Knight [49] (in common with all the studies on which the guidelines of figure 3 are based) worked with averages, primarily for occupational exposures, and was therefore insensitive to the variation that occurs within the population. Therefore they did not detect population variation, in particular whether specific demographics (such as children) vary significantly from the average. As long ago as 1972, Johnsson and Hawkins [55] suggested that the high frequency sensitivity of children arises because the concentration of hair cells in the basilar portion of the cochlea is high in newborns, and subsequently reduces. This sensitivity had been observed for some time [56-58] but there were no standard methods of testing [44, 59]. Figure 4(a) shows the evidence behind the earlier statement that 5% of the people tested by Rodríguez Valiente et al. [10] who were between the ages of 40 and 49 years old, had hearing at 20 kHz that was at least 20 dB more sensitive than the median for the 30-39 year olds tested (a typical age for subjects on which a considerable portion of figure 3 is based). At 20 kHz, 5% of the 5-19 year age group had a threshold 60 dB more sensitive than the median for the 30-39 year age group. Because the dB scale is logarithmic, these 20 and 60 dB differences correspond to factors of 100 and 1,000,000 in intensity (equivalent to factors of 10 and 1000 in pressure for plane and spherical progressive waves). Filipo et al. [60] compared the average hearing threshold of a group of 25 children aged 7-10, with the average of a group of 20 people aged 17-20, using pure tone audiometry via headphones at 8, 10, 12.5, 16 and 20 kHz. They found the average threshold at 20 kHz of the younger group was 20 dB more sensitive than that of the older group. Burén et al. [61] conducted pure tone audiometry on three groups, having median ages 11, 14 and 19 (to the nearest 6 months, the respective cohort size being 172, 94 and 69). At 20 kHz the average threshold of the youngest group was 10 dB more sensitive than that of the oldest group. Although the raw data are not available, it would appear that the most sensitive individuals in the youngest group have thresholds at 20 kHz that were 55 dB better than the average threshold for the older group. As a word of caution, Herbertz [62] does show the raw scatter in the data, and although he does make conclusions on trends, the scatter is significant: in audiometric ultrasonic studies, it might be useful to show scatter and provide raw data as a matter of course. In audiology, standard pure tone audiometry measures hearing thresholds from 0.125 to 8 kHz, and does not as a matter of routine measure frequencies about 8 kHz (which are known as ‘extended high frequencies’, EHFs). The international standard [63] for the EHF range covers only from 8 to 16 kHz, and furthermore only includes data from subjects aged 18-25. If, during childhood, the hearing acuity to VHF/US decreases rapidly with age, care must be taken when applying averaging and developing standards for the VHF/US regime. Commercial high frequency audiometers, and problems with their use, are discussed in Appendix A. Having therefore questioned what demographic is sampled using a cohort of what size, and having obtained access to the raw data with its scatter, what is to be done with it? Certainly its statistical significance should be tested. There is no escaping the attraction of presenting the average, but which average? Even if one decides on using the mean, which mean should be used? At a practical level, how appropriate for predicting the threshold for subjective effects, is a system that averages decibels of hearing thresholds of Temporary or Permanent Threshold Shifts? Because the decibel is a logarithmic representation, then consider three individuals with hearing thresholds of 60, 70, and 80 dB re 20 µPa. These decibel levels correspond to hearing thresholds in pressure of 20, 63.2 and 200 mPa, giving a mean rms acoustic pressure of 94.4 mPa (73.5 dB re 20 µPa), not 70 dB – and error bars that are not symmetrical about the mean when plotted on a dB scale. Simply taking the mean of the raw dB numbers tends to increase the permissible levels over and above the arithmetic mean of the acoustic pressures because it takes a geometric mean. Note that the mean of the intensities
12

represented by 60, 70, and 80 dB re 10-12 W m-2 (1, 10 and 100 µW m-2) is 37 µW m-2 , i.e. 75 dB re 10-12 W m-2. Without an established record of human responses to ultrasound in air (taking into account deviations from the average) and without a mechanism for producing these effects, the only basis for this approach for either hearing loss or subjective effects from ultrasound in air is an extrapolation from the practice that has served at audio frequencies [64], of averaging dBs because it is more closely aligned to audio frequency hearing than a linear representation would be. Extrapolation of this approach to predict the subjective effects produced by ultrasound in air has yet to be validated. (c) The range seen in the guidelines One immediate question to address is why, if the guidelines are based on the same small number of basic studies, there is such a spread in allowable limits (7 orders of magnitude in intensity, and a factor of more than 3000 in pressure, at 20 kHz). The most generous guidelines in figure 3 can, in the opinion of this author, be immediately criticized. Ultrasonic manufacturing (of pest deterrents, cleaning baths etc.) grew significantly in the 1980s: for example, between 1980 and 1983, production of ultrasonic pest control devices in the US increased roughly 80-fold [65]. The manufacturers sought high intensities, to generate an effective deterrent. On addressing safety concerns in the postscript to their protocol for deploying ultrasonic pest deterrents, in 1989 proponents of the devices stated ‘OSHA standards require ear protection or exposure limitation for continuous sound pressures above 120 dB. Commercial ultrasonic units fall below this threshold; most units do not operate continuously, and sound pressures (except very close to the transducers) are less than 120 dB. Some workers, especially younger females, may be annoyed by the ultrasound field’ [66] (noting that these stated dB levels are re 20 µPa rms). Recent measurements in a Tokyo restaurant detected 120 dB re 20 µPa SPL directly under a pest deterrent source, and 90 dB re 20 µPa SPL some 15 m from it, and noted strong adverse reactions from some [section 2.2(c)(i)]. Having in this way been used to justify high exposures in the past, in 2004 US Occupational Health and Safety Administration [OSHA] voted to adopt the recommendations from The American Conference of Governmental Industrial Hygienists (ACGIH) [23] to increase the allowable limits by 30 dB ‘when there is no possibility that the ultrasound can couple with the body by touching water or some other medium’. This rationale permitted manufacturers and users to deploy devices that exposed humans to 1000 times the intensity levels that other guidelines considered to be the maximum permissible. Furthermore the ACGIH [23] confined itself to avoiding only one specific adverse effect: ‘These recommended limits (set at the middle frequencies of the one-third octave bands from 10 kHz to 50 kHz) are designed to prevent possible hearing loss caused by the subharmonics of the set frequencies rather than the ultrasonic sound itself.’ That is to say, the only hazard that was to be avoided was one where the energy in subharmonics caused hearing loss: no other criteria were deemed relevant. Any potential for the primary ultrasonic frequency (e.g. the peak at 20.8 kHz in figure 1(c)) to cause hearing impairment other than through audio frequency subharmonics is ignored. Despite extensive criticisms from the international community [34] the latest version of the OSHA manual [50] still supports all these stances except that the 30 dB statement is not explicit, though given previous editions users could readily implicitly apply it given that it still states ‘ACGIH set the ceiling values assuming that the worker has no direct contact with the ultrasound source, but that the worker does have contact with water or other media that can transfer the sound waves’. The 2012 ACGIH document [67] repeats the above permission to allow for a 30 dB increase if the transmission path is airborne, and also states that all [measurement] instrumentation should meet the specifications of an standard that allows for sound level meters in general usage to underestimate the measured 20 kHz to an unlimited degree and still meet the standard (see section 2.1).
13

Consider the railway station of figure 1(b,c). The 30,000,000 who pass through it each year are not covered by the above OSHA guidelines, as it explicitly protects only workers. If 5% of the workers on 8 hour shifts are impaired by headaches, migraine, nausea, fatigue, tinnitus or dizziness, would that effect on their work and lives not be considered at all if we were to adopt the OSHA guidelines? The answer is that it would be in part, if the exposure is at 10-20 kHz, because of the following phrase from OSHA and ACGIH, repeated from the start to their latest editions [50]: ‘Subjective annoyance and discomfort may occur in some individuals at levels between 75 and 105 dB for the frequencies from 10 kHz to 20 kHz, especially if they are tonal in nature. Hearing protection or engineering controls may be needed to prevent subjective effects’ (noting that these stated dB levels are re 20 µPa rms). On reviewing this, Lenhardt [68] recommends his earplug design [69] and notes that goggles may be required if theories that the eye is a route by which ultrasound activates the auditory system are proven [70]. The exposures of figures 1 and 2 are indeed tonal. Engineering controls (shielding) will be practicable for some workers, but not if the objective of the device is to emit sound into the public space (section 2.2), as appears to the case for the sources of figures 1 and 2. For these hearing protection might be worn (if proven to be adequate for VHF/US), but if the assessment of need comes from guidelines that follow from the current evidence base with its data predominantly the averages of adult males, then it is not aligned with German occupational law that states “Risks are to be controlled at source; …individual protection measures are subordinate to other measures… special dangers for vulnerable groups of workers are to be taken into account” (translated from Bundesministerium der Justiz und für Verbraucherschutz, 1982) [51]. Having looked in detail at the guidelines which are most permissive above the 20 kHz third octave bands, consider now the third octave band centred at 20 kHz, where the exposures of figures 1 and 2 occur. In this band in figure 3, the OSHA guidelines [50] are not the most permissive. In 1966 Parrack [14] suggested a 140 dB re 20 µPa maximum permissible limit in octave and third-octave bands, though Parrack retracted this in 1969 [19, 3], reducing overall (and making the 20 kHz limit 105 dB re 20 µPa). Nevertheless Parrack’s original 140 dB re 20 µPa limit has persisted with many reviewers and authorities, from Crabtree and Forshaw [4] in 1977 to Altmann [71] in 2010, who stated that ‘High audio frequencies (above 10 kHz) produce less threshold shift [than do lower frequencies], and at ultrasound the ear is essentially untouched if levels are below 140 dB. In these frequency ranges heating of air cavities, of textiles or hair may become important above about 160 dB’ (dB levels re 20 µPa). The extreme heating of hairs at around 160 dB re 20 µPa follows from original experiments with mice [72-74]. Acton [16] in turn revised his 1968 limit of 110 dB re 20 µPa, reducing it to 75 dB re 20 µPa for the third octave band centred around 20 kHz, as its frequency range extended from 22.5 kHz down to 17.6 kHz, i.e. to within the audio frequency range (and certainly audible to many young females [75]). In addition, criteria for narrowband emissions were introduced [16, 76]. For the most part, the subsequent guidelines do not address questions that should be key, such as the lack of dose-response relationships. Lawton (2001) summarizes the issue of the duration of the exposure as follows: ‘None of the recommended limits have a fully-developed Exposure Level, combining noise level and duration on a daily basis. Where duration is considered at all, there is an equal-energy trading relationship: halving of noise duration allows a 3 dB increase in level. However, the recommended limits have two stated aims: to avoid subjective effects and to avoid hearing damage. In sensitive individuals, adverse subjective effects might be expected to appear shortly after the start of a very high frequency noise exposure. An increase of permitted band level, in line with any duration correction, would hasten the onset of subjective effects in sensitive individuals, and probably involve a larger proportion of the exposed population. Both of these outcomes are
14

undesirable: a relaxation of maximum acceptable level, to account for reduced daily duration, works to thwart one stated aim of any recommended limit.’ Four years later, Howard et al. [34] noted that the 1984 INIRC-IRPA [20] guidelines ‘allow for an increase in the exposure limits if the exposure duration is less than 4 hours per day; however, Health Canada [22] does not support this recommendation and it should be noted that the IRPA recommended limits for continuous exposure for airborne ultrasound to the public are lower than [the INIRC-IRPA [20] 1984 limits for occupational exposure]’. The 1984 INIRC-IRPA [20] guidelines built on earlier ones from 1981 [54] and make cogent points on the extra considerations public exposure requires over and above occupational exposure, including the often neglected issue of the duration of the exposure and opportunity for people to undertake ‘recovery times’ without exposure. They state that: ‘Exposure may occur for up to 24 hours per day; There is no medical surveillance as is possible for a controlled occupational group; It would be undesirable to require hearing protectors or other protective devices to keep levels at the ears within the limits; Noise-related effects such as annoyance, stress, etc. must be considered in addition to other possible auditory effects; The general public is a population containing a broad range of sensitivities to insult from physical agents’. This range of guidelines is critically assessed by several authors [28, 45, 46, 77, 78]. The standard method for estimating noise induced hearing loss [79] does take into account the duration of exposure, but it is only relevant to noise at frequencies less than 10 kHz and for SPLs exceeding 140 dB re 20 µPa it is an extrapolation. Given that workers in public places (as in figures 1 and 2) might feel adverse effects without identifying the source, the examination of the effects of long-duration exposure should be addressed [5]. Perhaps of greatest concern is that the above discussion of the range seen in the guidelines, and how they relate to the exposed people, can currently only be made of occupational exposure, as there is only one interim recommendation for public exposure. (d) Are current guidelines adequate? This paper argues that Figure 3, and the current understanding of the adverse effects of ultrasound in air, are grounded on, and provide for, an insufficient scientific basis to control human exposure to VHF sound and ultrasound. Furthermore, new guidelines should not merely select Maximum Permitted Levels in each frequency band from previous reviews, without stating the precise criteria for that selection – the author believes this cannot adequately be done, because:
• Most of the papers cited in figure 3 are reviews of the original work, and that work was not
suitable for mass public exposure. New guidelines must not simply select levels from past guidelines. They require directed research specific for today’s guidelines, considering appropriate adverse effects, exposure duration, and cohorts (both in size and demographic, tuned to quantify the more sensitive outliers, with research to investigate the possible implications of the presence of children, workers exposed in ignorance, and the additional exposure outside of the workplace).
• Subjective effects (including migraine, nausea, fatigue, headache and dizziness), and the public health / economic / social question of how these affect safety and performance particularly when exposure is continuous (in the home, workplace, school or hospital etc.), must not be ignored in setting guidelines. Recalling the opening paragraph of section 1.2, measurement of hearing thresholds and TTS and PTS appear to be ‘objective’ and therefore attractive and more readily quantifiable than ‘subjective’ effects. However the amplitudes demonstrated in figures 1 and 2 are less likely to produce TTS than they are to produce subjective effects.
15
• Past guidelines were based on studies that attempted to identify differences in average values (e.g. in the hearing thresholds) between groups (e.g. those who worked with equipment thought to produce ultrasound in air - usually without quantifying exposures - and those who do not). The guidelines were overwhelmingly influenced by studies on adult men. The response of the ear (which serves hearing and balance, and provides input into other procedures such as swallowing) varies very greatly between individuals, such that the concept of an ‘average’ becomes difficult. This is particularly so when considering frequency issues, because we generally lose sensitivity to high frequencies with increasing age, so that the application of guidelines based on data from 30-year old males to schoolchildren or infants is questionable. If, as a Gedankenexperiment, each agency had taken into account the 5% most sensitive 5-19 year olds in figure 4(a) by adjusting the Maxmum Permissible SPLs in accordance with the hearing sensitivity of the demographic, then they would reduce the levels in the 20 kHz band down by 60 dB. If this were valid, even the quietest signal in figures 1 and 2 (the museum) would exceed all modern guidelines by a significant margin.
• The above 60 dB adjustment is interesting but open to challenge. Without a validated mechanism for the production of subjective effects, it is not possible to assess the questionable validity of the assumption that the potential for adverse effects has been linked to hearing acuity or sensitivity. The received wisdom that ‘if you cannot hear a sound it cannot cause an adverse effect’ continues to be supported by agencies, the current OSHA (2015) guidelines stating that: ‘Research indicates that ultrasonic noise has little effect on general health unless there is direct body contact with a radiating ultrasonic source. Reported cases of headache and nausea associated with airborne ultrasonic exposures appear to have been caused by high levels of audible noise from source subharmonics. The American Conference of Governmental Industrial Hygienists (ACGIH [22]) has established permissible ultrasound exposure levels. These recommended limits (set at the middle frequencies of the one-third octave bands from 10 kHz to 100 kHz) are designed to prevent possible hearing loss caused by the subharmonics of the set frequencies, rather than the ultrasound itself. These exposure levels represent conditions under which it is believed that nearly all workers may be repeatedly exposed without adverse effects on their ability to hear and understand normal speech’ [50]. Transposition of hearing thresholds, TTS and other measurements to cover all adverse effects is not justified on current research.
• The current mass exposure of human populations is to tones such as those shown in figures 1 and 2, whereas the guidelines are almost all stated in terms of the Sound Pressure Level (SPL) averaged over bands of 1/3 of an octave, or even greater. This perhaps reflects the fact that those considering the exposure followed procedures developed for exposure to broadband noise at audio frequencies, not exposure to the intense tones. Section 1.1(a) noted that if guidelines are expressed as a single number for each third octave band, they cannot distinguish between the data and the horizontal dotted lines in figures 1(c) and 2(b,d). The measured signal, if audible, would be akin to a piercing whistle, whilst the dotted horizontal line, if audible, would sound akin to a ‘shhh’ (36.6 dB less in terms of the peak SPL in the narrowband range of the measured signal). We have no empirical evidence and no mechanism for the generation of adverse effects that allows us to state that the two will generate the same adverse effects. The standard for estimating noise induced hearing loss at audio frequencies simply uses the A-weighted acoustic energy [Pa2.s] averaged over the number of years of exposure regardless of whether this is a pure-tone, narrowband noise, or broadband noise [80] even though, at audio frequencies, as stimulus levels for a pure tone increase, there are nonlinear effects in the cochlea which mean that the area of the basilar membrane receiving the acoustic energy broadens. Across the spectrum of effects (objective, subjective and psychological) that have been claimed to result from ultrasonic exposure (these include proven, disproven and uncertain), it would be difficult to extrapolate from guidelines designed from one sort of exposure (e.g. broadband
16

occupational exposure to a specific ultrasonic tool for limited duration) to the long term tonal exposure of figures 1 and 2, even were the mechanism for the development of adverse effects established (which it is not).
Failure to recognize these flaws (in the scientific basis for applying past research to current exposures) has led to widespread dismissal amongst the scientific and medical communities of the claims by the public of adverse effects by VHF sound and ultrasound in air. The temptation has been to extrapolate to the whole current population the almost certainty that the original widespread claims of “ultrasonic sickness” were false (section 2.2(a)), and reports suggesting mis-attribution in some members of the public for infrasonic exposure [81]. This paper does not set out to prove adverse effects, but rather to achieve the objectives outlined in the Executive Summary.
2. EXPOSURES
2.1 The current scenario: Difficult measurements are not keeping pace with burgeoning deployments
There has been a massive increase in deployment of devices that operate by placing ultrasonic fields in air (in residential, recreational and occupational places). Those exposed (and in the case of workers, their employers) are often in ignorance of the exposure, and there is no monitoring of levels, and of off-times and the duration of respite periods in and out of work. The advent of emitters such as those measured in figures 1 and 2 open up the prospect of the citizen scientist undertaking personal monitoring and exploration (Appendix A).
These exposures contrast to those considered in developing most guidelines, where occupational sources (like cleaning baths) place ultrasound in air only through unintended leakage, and against which screens or hearing protection can be considered as viable mitigation given the limited periods to which cognizant humans are exposed to them (which cannot be considered reasonable if exposure is not occupational).
The number and type of sources is increasing year on year, but the information detailing their types and locations is not publicly advertised, and there is no statutory requirement to do so. Whilst ultrasonic pest deterrents have been in use, even domestically, for well over 20 years, in recent years inexpensive technology has allowed a proliferation of devices that project VHF/US into air. In part this is because the manufacture of ultrasonic sources involves hazardous materials. This has in the past contributed to high shelf prices where health and safety practices challenge the manufacturer, but now manufacturers from regions without such regulations are able to market devices at one tenth the price. This has resulted in the increased deployment of ultrasonic deterrents for pests. Some residents, on behalf of themselves and their children, have claimed that ultrasonic projectors (placed by themselves, landlords and neighbours etc.) cause them distress in their homes, gardens, workplaces and transport routes [section 2.2(c)(i)]. Of course, such claims might be spurious, but it is not ethical to persist with possible detrimental exposures on the basis that no claims could be proven because no measurements have been made. Some devices that project ultrasound in air are useful, and in the long term industry would benefit by knowing what usage is safe. Some manufacturers of ultrasonic pest deterrents are in the invidious position of believing they are compliant with guidelines but include in their instruction manuals warnings of subjective adverse reactions [82] and even damage to the ears [83]. Others offer advice on resolving complaints from neighbours [84] (which is not applicable if a neighbouring infant or pet, or their carer, is unable to identify the ultrasonic source as the problem). For other devices (e.g. automatic door opening systems) there are alternatives (e.g. infrared sensors) for which the safety guidelines are not so questionable.
17

The measurement of device outputs and VHF/US fields in situ is currently inadequate to provide, and compare against, guidelines that are relevant to today’s exposures. Although dB scales are provided by the manufacturers or distributers of the phone/software, recordings such as that shown in figure 1(a) do not currently have a traceable calibration, so that signal level cannot be known. Sound level meters are not so simple that they can produce dB levels that are guaranteed fit for purpose for whatever use the operator wishes to make of them, when measuring a VHF/US signal of any type (tonal, broadband, etc.). Many studies (e.g. [85]) specify the use of sound level meters in measuring VHF/US fields, and yet the performance of these meters and their microphones in this regime is often poorly specified. The relevant standard [86] states that a Class 1 sound level meter should record frequencies up to and including the 16 kHz third octave band, but that 12.5 kHz is the minimum frequency to which the frequency characteristics should be specified. Whilst the performance acceptance limits in this standard [86] at 1 kHz are ±1 dB, at 20 kHz they are from +3 dB to -∞ dB for a Class 1 device, meaning that it could be capable of severely underestimating signal amplitudes at 20 kHz signals and still meet acceptance by the standard. This standard [86] cross references to an older standard [87] which states: “The noise which is usually of interest with ultrasonic equipment arises from audible sounds produced by the ultrasonic process, for example, the cavitation noise which is audible in ultrasonic cleaners. To achieve reproducible measurements of the audible sound with existing sound level meters which comply with IEC 651, the practice is to use the A-weighting response in conjunction with a low-pass filter which has a very sharp cut-off above 20 000 Hz. The purpose of this standard is to specify the characteristics of such a low-pass filter. When the filter characteristic is used with the sound level meter A-weighting specified in IEC 651, the resulting nominal values of the overall frequency response fall within the scope of Type 1 tolerances. Where the measurement of the ultrasonic component frequencies is required, the practice is to measure the unweighted sound pressure level using a microphone system which is known to have a frequency response extending sufficiently, for example, to at least the operating frequency of the ultrasonic equipment. A narrow band or one-third octave band filter is usually included in the measuring chain. However, this standard is not concerned with the measurement of such components, nor with any possible hazard from them”. The use of A-weighting, a filter based on average human hearing that is a common option with sound level meters, is of course wholly inappropriate for assessing health risk due to airborne ultrasonic frequencies, especially so with sensitive individuals or demographics.
The tolerance of -∞ dB at 20 kHz is common across several standards (which have tolerances for overestimation of +3 dB and +5 dB for Class 1 and Class 2 devices) [86, 88], although the older 1997 version [88] specified tighter tolerances for the Class 0 devices at 20 kHz, from +2 dB to -3 dB. Class 0 was generally considered to be a laboratory standard and beyond the requirements for general measurement instruments. Since then the old four-class system(classes 0 to 3) has been replaced by a 2-class system (classes 1 and 2), and this older standard [88] is now considered obsolete and replaced by the newer one in Europe and the USA [86] which allows the -∞ dB tolerance at 20 kHz.
Although microphones with ultrasonic sensitivity are now commercially available, the smaller wavelengths associated with these higher frequencies are much more strongly scattered than the 250-8000 Hz signals typically used in hearing tests. At ultrasonic frequencies, the shape of the ear, head and microphone mounting can strongly influence the field they are detecting. A free field audiometric or sound field measurement at 2000 Hz is robust to exact positioning of the microphone or head, because the wavelength in dry air at 20 oC at 2000 Hz is around 17 cm, ten times the wavelength at 20 kHz. However, a given microphone tends to become more directional as the frequency increases (figure 5), so that the measured SPL can change significantly if the microphone is angled slightly differently to the sound source.
The greater directionality that is observed as the ratio of the sensor size to wavelength increases, has been usefully exploited for decades, e.g. with microphones lined up in arrays (effectively making
18
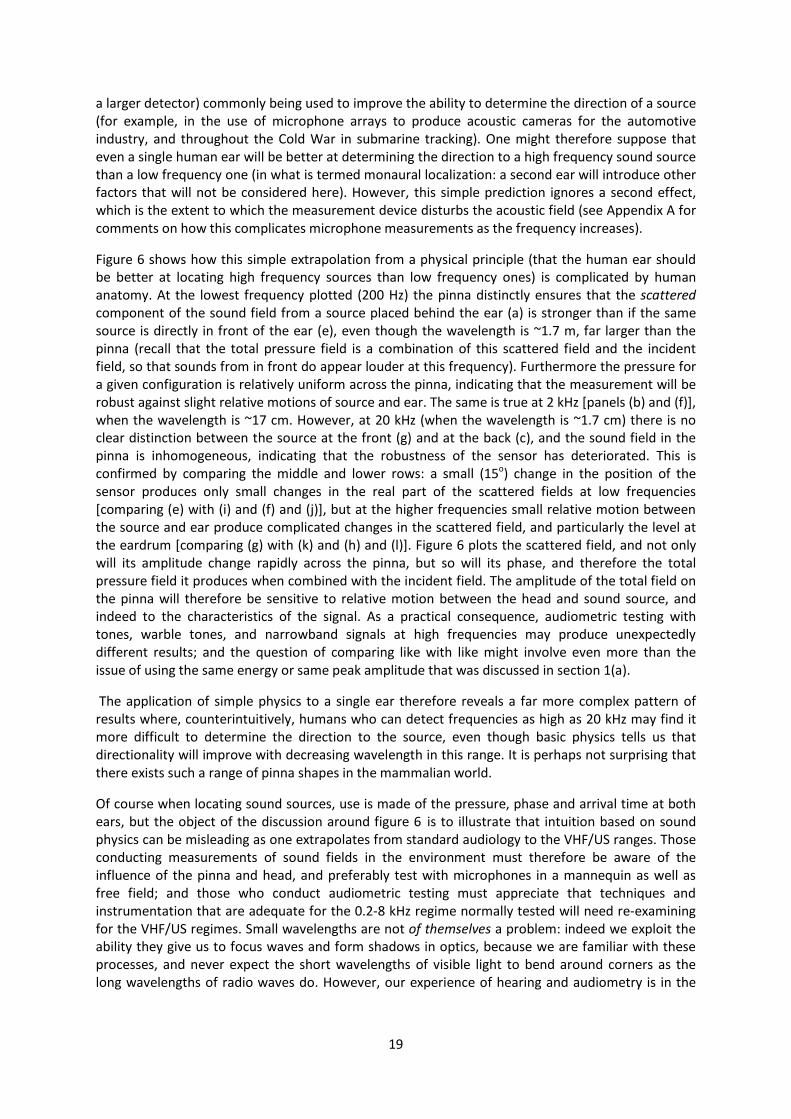
a larger detector) commonly being used to improve the ability to determine the direction of a source (for example, in the use of microphone arrays to produce acoustic cameras for the automotive industry, and throughout the Cold War in submarine tracking). One might therefore suppose that even a single human ear will be better at determining the direction to a high frequency sound source than a low frequency one (in what is termed monaural localization: a second ear will introduce other factors that will not be considered here). However, this simple prediction ignores a second effect, which is the extent to which the measurement device disturbs the acoustic field (see Appendix A for comments on how this complicates microphone measurements as the frequency increases).
Figure 6 shows how this simple extrapolation from a physical principle (that the human ear should be better at locating high frequency sources than low frequency ones) is complicated by human anatomy. At the lowest frequency plotted (200 Hz) the pinna distinctly ensures that the scattered component of the sound field from a source placed behind the ear (a) is stronger than if the same source is directly in front of the ear (e), even though the wavelength is ~1.7 m, far larger than the pinna (recall that the total pressure field is a combination of this scattered field and the incident field, so that sounds from in front do appear louder at this frequency). Furthermore the pressure for a given configuration is relatively uniform across the pinna, indicating that the measurement will be robust against slight relative motions of source and ear. The same is true at 2 kHz [panels (b) and (f)], when the wavelength is ~17 cm. However, at 20 kHz (when the wavelength is ~1.7 cm) there is no clear distinction between the source at the front (g) and at the back (c), and the sound field in the pinna is inhomogeneous, indicating that the robustness of the sensor has deteriorated. This is confirmed by comparing the middle and lower rows: a small (15o) change in the position of the sensor produces only small changes in the real part of the scattered fields at low frequencies [comparing (e) with (i) and (f) and (j)], but at the higher frequencies small relative motion between the source and ear produce complicated changes in the scattered field, and particularly the level at the eardrum [comparing (g) with (k) and (h) and (l)]. Figure 6 plots the scattered field, and not only will its amplitude change rapidly across the pinna, but so will its phase, and therefore the total pressure field it produces when combined with the incident field. The amplitude of the total field on the pinna will therefore be sensitive to relative motion between the head and sound source, and indeed to the characteristics of the signal. As a practical consequence, audiometric testing with tones, warble tones, and narrowband signals at high frequencies may produce unexpectedly different results; and the question of comparing like with like might involve even more than the issue of using the same energy or same peak amplitude that was discussed in section 1(a).
The application of simple physics to a single ear therefore reveals a far more complex pattern of results where, counterintuitively, humans who can detect frequencies as high as 20 kHz may find it more difficult to determine the direction to the source, even though basic physics tells us that directionality will improve with decreasing wavelength in this range. It is perhaps not surprising that there exists such a range of pinna shapes in the mammalian world.
Of course when locating sound sources, use is made of the pressure, phase and arrival time at both ears, but the object of the discussion around figure 6 is to illustrate that intuition based on sound physics can be misleading as one extrapolates from standard audiology to the VHF/US ranges. Those conducting measurements of sound fields in the environment must therefore be aware of the influence of the pinna and head, and preferably test with microphones in a mannequin as well as free field; and those who conduct audiometric testing must appreciate that techniques and instrumentation that are adequate for the 0.2-8 kHz regime normally tested will need re-examining for the VHF/US regimes. Small wavelengths are not of themselves a problem: indeed we exploit the ability they give us to focus waves and form shadows in optics, because we are familiar with these processes, and never expect the short wavelengths of visible light to bend around corners as the long wavelengths of radio waves do. However, our experience of hearing and audiometry is in the
19

relatively long-wavelength regime for sound, and our procedures and intuition are ill suited to the short-wavelengths of ultrasound in air, such that the casual user can make incorrect assumptions.
The complications illustrated above for receivers have their counterparts with VHF/US sources. Although ultrasonic projectors are widespread with advertised output levels, it is highly unlikely that these can be reliably traced to international standards since traceable standards are only just emerging. At higher frequencies sources tend to be more directional, and scatter by the room and objects in it can produce small scale spatial variation of the sound field. As a result, small discrepancies in positioning microphones, and details of the stands that mount them, can lead to significant changes in the measurement.
2.2 Categories of exposure
Leighton [91] defined three categories of exposure of humans to ultrasound in air. Category One is labelled ‘Ultrasonic noise exposure’. This occurs when some process or device (e.g. a jet engine) generates ultrasound as a by-product of its operation. Category Two is labelled ‘Unintended ultrasonic exposure’. This occurs when some process (such as an ultrasonic cleaning bath) requires the generation of a specific ultrasonic signal as key to completing its task, but in addition to insonifying its inanimate target, it also unintentionally exposes a human or animal to ultrasound. Category Three is labelled ‘Deliberate ultrasonic exposure’. This occurs when devices (such as pest deterrents) are designed to expose humans and/or animals to ultrasound in air in order to elicit some subjective response (whether or not the target is the intended species or demographic).
(a) ‘Ultrasonic noise exposure’
‘Ultrasonic noise exposure’ first became an issue in the 1940s, when ‘‘ultrasonic sickness’’ was thought by many (probably erroneously [45]) to be caused by the advent of the jet engine [14, 92-94]. ‘Ultrasonic sickness’ was claimed to be responsible for earache, headache, irritability, excessive fatigue and feelings of fear [95-97]. In 1948 the Ultrasonics Panel (formed only one year previously) of the US Aeronautical Board reported on the first legal case for injury by ultrasound [92, 98]. In a study considering ultrasound from jet engines, dental drills and cleaning baths, Parrack [94] concluded that ‘Ultrasonic sickness, as described around 1948-1952, appears to be largely of psychosomatic origin and engendered by the apprehension and/or fear growing out of speculative publicity about the effects of air-borne ultrasound’. This is one of several quotes by Parrack that was used in a 1967 article by a member of American Sterilizer Company [99], which concluded that there was no evidence to support a call in the same journal (Canadian Hospital) for protective measures when using ultrasonic equipment in hospitals. In the same year, Acton and Carson [1] stated that subjective adverse reactions did not occur unless the subject was sensitive to sound up to at least 17 kHz, and the sound pressure level in the 17 kHz band exceeded 78 dB re 20 µPa, women and younger individuals being more prone to suffer adverse effects (in the absence of a mechanism, the hypothesis being that this is due to greater high frequency acuity). Given the preceding sentence, it is at this point germane to comment that the lack of clear mechanism for adverse reaction in the time of Acton and Carson [1] and which is still the case today, means that we should avoid an automatic association between hearing sensitivity and the potential for adverse effects, unless this is proven. This is discussed further in section 3. It has been (and still is) often the response to the accelerated development of a new technology, that the popular press and the public between them to ratchet up concerns. In the 1950’s this led to stories of an ‘ultrasonic death ray’ [100]. The existence of bizarre extrapolations from an excitable press and anxious public is in itself potentially harmful, as it can cause more moderate judges to dismiss all such claims, and produce anxiety-based symptoms in some. There were enough scientific
20

reports to allow the popular press to extrapolate. Allen et al. [101] had observed some lethal effects from intense ultrasonic exposures in air of mice and cockroaches (recall that the frequency sensitivity varies between species as well as individuals), and transitory dizziness and feelings of heating in humans. Fatigue, headaches and nausea were reported by several sources [98]. In a 1966 review, Gorskhkov et al. [102] claimed to observe the death of 28 out of 80 volunteers who were exposed to intense sustained jet noise in Spain, the remainder being permanently debilitated. Of course the generation of ultrasound through use of a jet engine undeniably generated levels of audio frequency sound that few had ever experienced before, so intense that unprotected exposure close-up quickly led to permanent hearing loss. Indeed, the nature of other sources of ‘Ultrasonic noise exposure’ were that the exposure was almost always accompanied by audio frequency noise which has two consequences. First, it might fortuitously have led to the use of hearing protection: in general, the effectiveness of such protection increases with frequency, and even if deployed against audio frequency noise, it might defend well against ultrasound in air. The US Navy conducted specific ‘experiments at its Aero Medical Equipment Laboratory at Philadelphia which left Navy men being tested unharmed. The men were protected against noise by a helmet or springband headphones, double kapok-filled "ear doughnuts" and cotton ear plugs. Some of the men lost weight and seven said they were more tired than ordinarily, but the Navy concluded that ''although high-frequency sound does damage some animal tissues, ill effects upon human tissues appear unlikely unless the frequency is extremely high''’ ([103]; the author cannot find the evidence for these conclusions beyond what is stated in this quote). Second, adverse effects from ultrasound would need to be separated out from adverse effects of intense audio frequency sound. This turned out to be important, because in 1953 a research study attributed the symptoms of ‘ultrasonic sickness’ to high levels of audio frequency sound [104]. Health Canada [22] and the Health Protection Agency [105] lists numerous sources of ultrasonic noise in the industrial workplace, based in part on the work of Michael [100] and Shoh [106], and more recent studies add to the body of knowledge on device outputs [107]. The EU EARS project recently reported ‘Traceable measurement of airborne ultrasound output of devices is now possible for the first time, using a newly developed measurement set-up and measurement methods for the characterisation of typical sources. Sound pressure levels with peak values up to 147 dB were detected from commercially available devices’ [26] (dB levels are re 20 µPa). (b) ‘Unintended ultrasonic exposure’
Probably the earliest widespread example of ‘Unintended ultrasonic exposure’ came from the ultrasonic cleaning bath, which deliberately generates ultrasound to clean but does not intend or require that ultrasound to impinge upon humans or animals for it to operate. Its operation is usually accompanied by a hissing audio-frequency sound associated with cavitation [11, 108], the effects of which would have to be separated out from those of the ultrasound, and any subharmonics of the ultrasound.
In 1977 Crabtree and Forshaw [4] reported that the noise from ultrasonic cleaners caused nausea, headaches, tinnitus and fatigue in Services personnel at CFB North Bay and CFB Trenton. One third octave sound pressure levels around 20 kHz were 105 dB re 20 µPa at the position of the operator, ‘well under 140 dB (the level below which damage to the human ear is thought not to occur)’ to quote the authors, noting that their 140 dB criterion (re 20 µPa) was based on the 1966 guideline of Parrack [14] which he replaced 8 years prior to the above quote by Crabtree and Forshaw (section 1.2(c)). Crabtree and Forshaw [4] recommended enclosing the units or, failing that, the use of hearing protection. They also noted that ‘One of the authors (RBC) himself experienced extraordinary fatigue and an 'unnatural sensation' in his ears after a two-hour exposure (without hearing protection) in the ultrasonic room at CFB Trenton’. Crawford [109] noted loss of equilibrium,
21

unusual fatigue, nausea and headaches that persisted after insonification ceased. Acton and Carson [1] noted that cleaning baths producing 95 dB re 20 µPa at 20 kHz and 115 dB re 20 µPa at 40 kHz, resulted in worker complaints of fatigue, buzzing noises and painful whistles, nausea and headache, persisting for some hours after the end of exposure. The effects disappeared when the tanks were in an enclosure. In the presence of ultrasonic drills operating at 20 kHz, Acton and Carson [1] both noted that ‘No complaints were volunteered by the operators of the drills, who were all men, but the authors themselves experienced a persistent ringing in the head and an unpleasant sensation of 'fullness' of the ears from the noise which was clearly audible yet not very loud, but they were not exposed for sufficiently long periods for the other symptoms to become manifest’. In 1983 Acton [3] confirmed sensations of fullness and pressure in the ears and added tinnitus to the list for workers exposed to ultrasound. Herman and Powell [5] provide interesting anecdotes from their survey of VHF/US devices, adding to the preceding list the irritation of a researcher by audible emissions from a device mounted above an escalator, and unconfirmed irregular heart beat when in the vicinity of another device (both devices being intrusion alarms, which are discussed in section 2.2(c)(i)). Skillern [2] investigated noise levels in the vicinity of ultrasonic devices for cleaning, welding and drilling. He gave one of the earliest descriptions of pain in the ear, commenting on the narrowband nature of the source, though contamination of this by energy at other frequencies could clearly be an issue: ‘Certainly the drill gave the author the most interesting subjective response, and it was the only instrument that was operated for a long period of time, viz., longer than one hour with the operator remaining close. The same subjective pain was experienced by the operator with the operation of the drill. This pain was similar to a burning sensation in the auditory canal. The sound emitted from the drill was evidently a very narrow band as pain was experienced more rapidly than while measuring other devices with sound pressure levels of greater intensity.’ It is no easy thing to distinguish between the effects of the ultrasound, and that of the associated audio frequency sound that accompanies the operation of the equipment [1], and a number of agencies [23, 33, 50] attribute all the adverse effects to this audio frequency energy, and others appear strongly influenced by this consideration [20]. Given that the public exposure of figures 1 and 2 lack unusual audio frequency energy, it is important to explore this assumption. Maccà et al. [110] compared 24 industrial ultrasound-exposed subjects (a comparatively small sample), 113 industrial noise-exposed subjects and 148 non-exposed subjects, using both conventional-frequency (0.125-8 kHz) and high-frequency (9-18 kHz) audiometry. They describe the ‘Unintended ultrasonic exposure’ as follows: ‘The [ultrasound-exposed] group comprised 14 subjects recruited in a spectacle frames factory where there were four welding machines (three Branson welders, operating frequency 30 kHz, and one Schoeller, operating frequency 25 kHz); subjects worked continuously at a distance of 30–40 cm from the machines and non-continuously in front of the cleaning tanks. The other 10 subjects were employed in a textile factory; subjects worked at a distance of 30–40 cm from all the machines. They all had ear protectors, but used them minimally; the shift was 6 h and 30 min in a day. The intensity levels measured near the ears of subjects exceeded the TLV-C (threshold limit value-ceiling) proposed by ACGIH in all sample cutters and label-trimmers at nominal frequencies of 20, 31.5 and 40 kHz, and in two of the cleaning tanks at frequencies of 20 and 25 kHz. All ultrasound emissions were accompanied by subharmonics produced in the audible high-frequency range as by-products of industrial ultrasonic processes’. Maccà et al. [110] found correlations that indicated adverse effects on hearing from those who had worked with ultrasonic devices, in agreement with earlier studies [111-113], but hoped to separate out the effect of the audio frequency noise that accompanies most occupational exposures to industrial ultrasound of the type described above. Their findings are plotted in figure 7. Recalculation of the 𝜒𝜒2 test results for their data in Appendix C agrees with the conclusions of Maccà et al. that the cohort exposed to audio frequency noise showed statically significant increases in problems with tinnitus and hypoacusia (partial loss of hearing). In addition to these differences between cohorts,
22

Maccà et al. conclude from the raw data on individuals (not presented in their paper) that ‘Significant correlations were also shown between the group of workers [who were] exposed [to audio frequency noise] to tinnitus, sensation of fullness in the ears and hearing loss >25 dB at 4 kHz’. However there is slight disagreement between the 𝜒𝜒2 test result of Appendix C for the ultrasound-exposed group, both agreeing that it exhibit statistically significant increases in asthenia (loss or lack of bodily strength) and vertigo, but only Appendix C finding (from the data tabulated by Maccà et al.) a statistically significant increase in ‘tingling in the limbs’ for the ultrasound-exposed group. Maccà et al. state that ‘Asthenia mainly occurred once a week and vertigo about once a month, both at the end of the workshift or during it. Histories also showed that the symptoms persisted for a few days after exposure had ceased and no longer occurred in the absence of exposure’. Since the current article went to press, the authors of reference [110] have confirmed that the numbers, analysis and conclusions in Appendix C and Table 2 of this paper are correct, and that ‘tingling in the limbs’ should have been identified as being significant from their numbers. Grezsik and Pluta [114] measured 106 operators of ultrasonic devices and concluded that noise levels in the third octave bands centred on 10, 12.5 and 16 kHz that were well below several of the guidelines in figure 3 (80 dB re 20 µPa) produced hearing loss in the 10-16 kHz range (which would not be detected by normal audiometric testing that goes up to 8 kHz) measurable in people who had experienced long exposures (8 hours a day for up to 15 years). These conclusions were drawn by looking at averages of the cohort [114], whereas in a companion paper [115] Grezsik and Pluta returned to the factory they examined in 1983 [111] and tested again the 26 workers out of the original 55 who were still employed by the factory, using the same methods they employed in 1983. This enabled them to compare the effect of three years of additional industrial exposure on individuals, and they detected an additional hearing loss (over and above ageing) of 1 dB per year in the range 14–17 kHz for workers with prolonged exposure. They found that the number of ears that responded to the highest frequencies fell by 10% per kHz per year in the range 13-19 kHz and concluded that the higher the frequency to which an ear was sensitive, the greater its susceptibility to high frequency noise. This re-testing of individuals is significant because the authors paid particular attention to the quality of the delivery of sound above 8 kHz when testing, there being no standard method of doing this, making it difficult to extrapolate from measurements and compare between studies. In dental ultrasonics, a single source may be exposing a range of people and the relevant guidelines would vary between workers, patients, pupils, visitors, inmates etc. To take the case of a dental ultrasonic tool, the patient can receive ultrasound through both airborne and bone conduction routes, whilst the dental practitioners (for whom occupational guidelines should apply) receive longer and repeated exposures through the airborne route only. By 1976 Moller et al. [116] had observed tinnitus and/or TTS in half of the 20 patients they subjected to 5 minutes of dental scaling, other studies finding no such effects [117]. Coles and Hoare [118] had found tinnitus and numbness of the ears (though not at significant levels compared to the normal population [118]), and Rahko et al. [119] found no significant difference in hearing ability between dental personnel and controls. Even guidelines with dedicated sections on dental ultrasonics [19] had a very thin research base on which to comment, with too few studies, and too few subjects, to assess reproducibility. The subject continues to produce anecdotal stories from patients and operators [120, 121]. Trenter and Walmsley produced a good review of this in 2003 [122]. Whilst older technologies produced considerable audio frequency energy alongside the ultrasound, making identification of the source of adverse reactions difficult, newer technologies may well produce ultrasound without audio frequency emissions. One example is the use of ultrasound to charge electronic devices wirelessly. Whilst the author has no specific knowledge of the safety or
23

otherwise of this technology because the manufacturers are not currently revealing the frequencies or intensities used, it does the manufacturer no favours not to report the output characteristic of the device, but instead to inform us that ‘the power levels beamed are more than 50 times lower than the lowest ultrasound imaging exposure limits set by the FDA for medical imaging, making the system inherently safe and within all existing regulatory constraints’ [9]. The FDA limits for medical imaging are set to avoid heating and cavitation in utero for ultrasonic transmission via tissue, not via an air path, and relate to the ultrasonic signals of 1 MHz or higher (section 3.2). The health risk under consideration in this paper is via different mechanisms and a different propagation path. The manufacturer refers to a published paper [123] that uses 1 MHz and includes no air in the transmission path, allowing charging at a few tens of mm. Whilst the frequencies and intensities used in that study [123] would have negligible health risk through an airborne transmission path to the human, to achieve the manufacturer’s goal (‘a world where you could simply lift your phone in the air to charge it without needing to plug it in, no less be next to a power outlet’ [9]) one would need to overcome the problems of reflection losses at the air/device interface, and absorption losses which restrict the range of the ultrasound in air. A practical device might need to increase the power (though the manufacturers state they will decrease power [9]) and decrease the frequency (to allow the airborne ultrasound to propagate to greater ranges): indications of this intention occurs in the manufacturer’s statement that ‘uBeam's frequency is too high for dogs and most mammals’ [9], suggesting that it might fall into the remit of this paper, because no mammal can hear 1 MHz through air (note again application of the common yet unproven assumption that if airborne ultrasound cannot be heard, then it can do no harm). There are therefore too few specifics published currently to assess the safety of this technology.
[When this article was in final proof stage, the manufacturer enhanced their defence on the safety of the technology through an industry blog [124] (although their website [9] still compares its outputs to those for fetal scanning). As deduced above, they need to use lower frequencies than the 1 MHz that was used in the journal article they cite [123], and now state that they transmit ‘at a single frequency within the range of 45 kHz to 75 kHz with an output of 145 dB to 155 dB (or 316 W m-2 – 3 kW m-2)’ [124]. They do not state the location at which these levels are measured. The only guidelines for public exposure is the INRC IRPA [20] one allowing 100 dB in the third-octave bands centred on 40 and 50 kHz, and these did not take into account the requirement to avoid subjective adverse effects.]
Although a current survey of modern devices is needed to update and/or correct this list, and quantify the likely exposures, a 1981 FDA report [5] listed ultrasonic sources including TV remote controls, humidifiers/vapourizers, and devices to assist the visually impaired. It also listed intrusion alarms and automatic door openers, examples where infra-red technology now provides adequate alternatives (the measurements of which figures 1 and 2 are a subset have confirmed ultrasound from such devices in public places, at lower levels than found in figures 1 and 2). The modern world has numerous sources of ultrasound not common in 1981 (e.g. vehicle parking and collision avoidance sensors), and in some circumstances it is difficult to identify the source. For example, the full set of data of which figures 1 and 2 are a subset, includes measurements detecting low level ultrasound in some libraries and schools, but it has been difficult to determine whether lighting, data projectors, smart screen multimedia projectors, or some other system is producing it, and without controlled testing where the subject is in ignorance of the exposure conditions, it is not possible to confirm the discomfort they attribute to such low levels of ultrasound. Some will by their nature be intermittent, such as the ultrasonic signals used to monitor which adverts or websites are viewed (Appendix D). We need to know what the sources are in the modern world, the levels of exposure, and compare these to appropriate guidelines.
24

In the author’s opinion, the most common source of high intensity airborne ultrasound in public places, even more so than pest deterrents, is one which has not been identified previously, specifically the public address systems that are found in sports facilities, cinemas, workplaces, public transport etc. Many PAVA (Public Address Voice Alarm) systems in shopping centres, airports, public buildings, department stores and most UK stadia are monitored using 20 kHz tones. These tones report to an ‘end of line’ device on each loudspeaker circuit which 'acknowledge' receipt of the signal, which is then returned to the amplifier and repeated continuously across the hundreds of circuits throughout the stadium/building/space. Manufacturers require some method of monitoring because EU legislation [125] makes supervision of evacuation systems mandatory, which is laudable. From the various alternative monitoring techniques available, one of the selection criteria should be compliance with safety guidelines, and our current knowledge does not make the guidelines of figure 3 applicable for assessing long duration exposure by VHF/US tones in PAVA systems, particularly as one device might exposure workers, visitors with differing ages and medical histories (even possibly confined people such as patients and prisoners), for very different durations and intensities during a day. Moreover, PAVA exposures resemble tones (continuous or pulsed), and as the dotted lines in figures 1 and 2 show, a broadband level 36.6 dB lower than a tonal peak scores an identical SPL as does that peak if the limit is based only on third octave band levels. The author considers PAVA systems to be the most likely source of all the signals in figures 1 and 2. (c) ‘Deliberate ultrasonic exposure’ Category Three systems range from automated door openers (the author and his team have measured ultrasonic signals from such devices) to ultrasonic weapons, as marketed to joggers against dogs.
(i) Pest repellents
Ultrasonic pest repellers can be mounted inside or on roofspaces, on building exteriors, in gardens and public spaces. They are designed as deterrents for a range of species including dog, cat, fox, bird (esp. pigeon), rodent (esp. squirrel, mouse, rat). Whether they deter animals by generating an unattractive environment, or by other adverse effects, is not known [126]. This raises the question of their use near protected species (e.g. bats), pets, working animals and the wider ecosystem (e.g. fauna that are currently thought not to response to ultrasound directly – such as pollinating bees [127] – could be indirectly affected by ultrasonically mediated effects upon their predators or food source). Although some researchers have induced extreme adverse effects, from seizure-like responses in rodents [128] and cats [129] (with anecdotal reports for birds [130]) to mutilation [48, 74] and death [72], they appear to have used levels far in excess of those used in commercial ultrasonic deterrents.
Although walls would afford a measure of protection to residents from ultrasonic pest repellents outside of the home, some repellents are marketed for use in the home. Furthermore, Herman and Powell [5] observed significant person-to-person variations in reactions to a dog repeller that vary from ‘no perception or no symptoms at all, to expressions of severe discomfort 40 feet from the source, in another room’ [5].
Marketing these devices is a major business, and there are numerous claims of both efficacy and inefficacy, and have been from the outset [85, 131-134]. In possibly the first scientific study of the effectiveness of ultrasound as a pest repellent, Frings [48] noted that there were numerous claims without any evidence, even following an open challenge he had issued to a national pest control convention in the 1940s to provide such data. In 1982 Shumake et al. [135] noted a range of effectiveness depending on frequency, intensity, and the environment and history of the rat population tested (e.g. prior exposure etc.). In 1990 Smith [136] called for Trading Standards policing following trials showing no effect on deterring birds when ultrasonic devices were placed within a
25

building; and in 2001 a warning was issued by the Federal Trade Commission’s Division of Enforcement on the effectiveness of ultrasonic rodent and insect repellents [137]. Their continued use, however, suggests certainly a perceived benefit.
The possibility of humans and pets being affected has been recognized for decades, again with numerous claims and counterclaims [138, 139]. As noted in section 2.1, some manufacturers publicly note the problem. In 2001, Cope [140] surveyed the nuisance caused by several commercial units but, because his microphones were calibrated for the audio frequency range only, he restricted his study only to the inadvertent generation of VHF acoustic signals from devices that purport to generate ultrasonic signals. He found that none of the devices matched the manufacturer’s specifications on dynamic range or operating frequency. He measured VHF sound signals between 18 and 19 kHz (i.e. within the third octave band centred at 20 kHz – figure 3), with SPLs up to 109 dB re 20 µPa at a range of 1 m from the source, increasing as one approached the source. This indicated little improvement in quality control since 1984, when Gold et al. [141] warned that pest control devices did not match manufacturer claims for frequency, output or effectiveness.
News outlets and web forums have featured reports of adverse reactions by individuals to pest deterrents and warnings re their proximity to children and pets [142 - 143-144 - 145 -146 ] although these have not been subjected to rigorous scientific testing, which would involve human experimentation. Recently, however, Ueda et al. [147, 148] rigorously measured the ultrasonic fields in a Tokyo restaurant from pest scarers around 20 kHz (with strong harmonics) reaching 120 dB re 20 µPa directly under the source, and 90 dB re 20 µPa some 15 m from it. Young workers could hear the output better than older ones. A survey was made of 35 volunteers (including 29 college students, 12 of whom were female). The survey responses indicated that the sound could be heard by 31 of the 35 volunteers (of which 4 could hear it clearly). Discomfort, restlessness, and ‘pain in the ear’ were common, whilst nausea and dizziness were less common. Some responded so strongly as to add that ‘my head may split’ and ‘I will never come here again because of the pain in the ear.’ Relocating the sources provided mitigation for adults although there were no data for children. Recently the Federal Public Service in Belgium for Health, Food Chain Safety and Environment issued advice regarding the potential nuisance caused to humans by ultrasonic pest repellers [149], having commissioned a two-part study, firstly measuring the outputs of several devices [150] (building on an earlier study [151]), and secondly to monitor the reactions of human subjects [152]. The first study [150] showed that simple calculations to estimate the levels 6.5 m from the source, having measured the levels 1 m from the source, tended to significantly underestimate the actual field measured at 6.5 m. The second study [152] tested exposed two groups with normal hearing (25 adults with ages from 18 to 25 years, and 25 adults with ages from 46 to 58 years) to SPLs of 44.6 - 71 dB (depending on the nominal frequency setting: 12.5, 25 or 35 kHz) at a range of 6.5 m from the devices. After 20 minutes exposures, there was no detectable effect on hearing thresholds, and one of the subjects reported nausea, headache, dizziness, pressure in the ears, pain in the eyes, tinnitus, tiredness, or feelings of tenseness, warmth, unease, or fright. However those subjects that could perceive them found them to be disturbing. The authors state that ‘Some settings of the ultrasonic repellent were not investigated in this study. One of the reasons was that [in a pilot test] their respective emissions were considered so loud and annoying that it was agreed that prolonged continuous exposure would not be possible.’
Given their wide usage, increasingly in domestic gardens frequented by children and pets, an up-to-date assessment of current requirements, device effectiveness, and the alternative methods available [136] would be useful.
(ii) Entertainment and communication
26

There are many possible reasons why VHF/US signals might be included in entertainment and communication systems as technology develops, in order to affect the acoustic field or its perception. However, it has not been possible to ascertain actual current usage or amplitudes. Subcarrier frequencies in radio and telephone communications offer data opportunities, but it is not known whether they use VHF/US.
There is debate in the hifi entertainment industry as to the value of including the capacity to generate sounds above 20 kHz into the more expensive sound reproduction systems. Whilst many markets for high value products have a history of being able to charge a premium for high-tech but ultimately borderline enhancements, many argue that discerning users appreciate inclusion of an ultrasonic capacity results in hifi [153]. Certainly the compact disc format provides no such capacity. The ability to hear an ultrasonic tone is of course very different from an ability to appreciate the difference made by that perception of broader range of frequencies present when such a pulse starts.
The use of ultrasound to provide the sensation of touch through acoustic streaming and radiation forces (section 3.2) may become commercialized in the near future.
(iii) Acoustic spotlights
‘Audiosonic spotlights’ [154, 155] use intense ultrasound to generate zones into which audio frequency sound is contained, so that exhibition booths, museums etc. can have audio commentary contained in front of the exhibit without leaking to neighbouring ones. To do this with audio frequency sources would require large loudspeakers or arrays, much larger than a wavelength (just as it does the receiver in figure 5). However, a transducer of modest size can generate a tight beam of ultrasound because of its smaller wavelength. If two beams are generated, and they are intense enough to generate nonlinearities, then an audio frequency signal can be generated. Because the generation of the difference frequency is a second-order process (as represented by the ‘𝑠𝑠2’ term in the following simple power series expansion), the power of the primary ultrasonic frequencies needs to be very great in order to generate a loud signal at audio frequencies:
𝑅𝑅 = 𝑠𝑠0 + 𝑠𝑠1𝑃𝑃 + 𝑠𝑠2𝑃𝑃2 + 𝑠𝑠3𝑃𝑃3 + ⋯ . (1) If the driving sound field 𝑃𝑃 = cos 2𝜋𝜋𝑓𝑓𝑎𝑎𝑡𝑡 + cos 2𝜋𝜋𝑓𝑓𝑏𝑏𝑡𝑡 consists of two ultrasonic frequencies, 𝑓𝑓𝑎𝑎 and 𝑓𝑓𝑏𝑏, then when the second order nonlinearity is significant it generates a propagating wave with energies at other frequencies including the difference frequency, (𝑓𝑓𝑎𝑎 − 𝑓𝑓𝑏𝑏):
𝑃𝑃2 = (cos 2𝜋𝜋𝑓𝑓𝑎𝑎𝑡𝑡 + cos 2𝜋𝜋𝑓𝑓𝑏𝑏𝑡𝑡)2
= (cos 2𝜋𝜋𝑓𝑓𝑎𝑎𝑡𝑡)2 + (cos 2𝜋𝜋𝑓𝑓𝑏𝑏𝑡𝑡)2 + 2 cos 2𝜋𝜋𝑓𝑓𝑎𝑎𝑡𝑡 cos 2𝜋𝜋𝑓𝑓𝑏𝑏𝑡𝑡
= (cos 2𝜋𝜋𝑓𝑓𝑎𝑎𝑡𝑡)2 + (cos 2𝜋𝜋𝑓𝑓𝑏𝑏𝑡𝑡)2 + cos 2𝜋𝜋(𝑓𝑓𝑎𝑎 + 𝑓𝑓𝑏𝑏)𝑡𝑡 + cos 2𝜋𝜋(𝑓𝑓𝑎𝑎 − 𝑓𝑓𝑏𝑏)𝑡𝑡,
(2)
the final term indicating that energy will propagate at the difference frequency. It should be stressed that this is different to the phenomenon of beats, which requires no nonlinearity but which is simply a linear phenomenon resulting from superposition of signals at a receiver, and generates no energy at the difference frequency. If the two frequencies, 𝑓𝑓𝑎𝑎 and 𝑓𝑓𝑏𝑏, are 30 and 31 kHz, the second order nonlinearity will generate a signal at 1 kHz (plus a sum signal at 61 kHz, and second harmonics of the double the frequencies of the original signals at 60 and 62 kHz).
The advantage of generating low frequencies in this way is that, for a given size of acoustic source, it is easier to produce a beam of sound the higher the frequency used. Therefore the two 𝑓𝑓𝑎𝑎 and 𝑓𝑓𝑏𝑏 signals can be generated over a zone that is far more confined than the (𝑓𝑓𝑎𝑎 − 𝑓𝑓𝑏𝑏) could ever be if it were generated by a source of the same size, but in the overlap zone between the two high
27

frequency beams, a narrow zone containing the low frequency (𝑓𝑓𝑎𝑎 − 𝑓𝑓𝑏𝑏) is generated: an ‘acoustic spotlight’. If the frequency of 𝑓𝑓𝑏𝑏 varies over time, then (𝑓𝑓𝑎𝑎 − 𝑓𝑓𝑏𝑏) follows it to produce a time-varying audio waveform.
The phenomenon originated many decades ago for submarine sonar, but only in recent decades has the technology become sufficiently affordable for the mass market. The point here is that the second order nonlinearity is weak, because 𝑠𝑠2 is small: to produce significant sound levels at the difference frequency, the amplitude of the ‘primary’ ultrasonic signals, 𝑓𝑓𝑎𝑎 and 𝑓𝑓𝑏𝑏, within the acoustic spotlight must be very high.
(iv) Ultrasonic weapons
Just because acoustic weaponry is intended to produce adverse effects in its victims, it cannot be free of regulation: Even if one accepts the argument for its deployment in certain circumstances, the effects it produces must be proportionate, with due consideration taken of the potential for exposure of the target, unintended targets, and the user, and for its mis-use. As a result, it falls within the remit of this paper.
In the use of acoustic weaponry, a method is required to ensure that the attacker is not disturbed, but the victim is. This occasionally occurs through providing hearing protection for the attacker, or a safe stand-off distance through the use of a remotely- or automatically- activated ultrasonic source [156]. However, if the attacker is operating (and hence closer to) the weapon, then usually the acoustic field is at a high frequency to which the victim (but not the attacker) is sensitive; or the field is confined to a location occupied by the victim but not the attacker; or both methods are used.
At audio frequencies, confinement has received most attention, with recent success despite a poor initial record [157]. There has been considerable publicity given to non-lethal sonic weapons for crowd control, marine vessel protection etc. such as the commercial LRAD (Long Range Acoustic Devices) systems. Reputedly designed to deliver warning messages at 1 km range, they are advertised as being capable of producing audio frequency signals of 120 dB re 20 µPa at 60 m and 130 dB re 20 µPa at 4 m [158, 159]. At such levels, in addition to psychological reactions, hearing damage is a risk (depending on the level and duration of exposure), and there have also been reports of migraine, vomiting and loss of equilibrium [160]. Handheld prototypes have been reported generating pulses of sound of 1 s duration at 125-150 dB re 20 µPa, with ‘the capacity to knock people off their feet’ [159], but any proven effectiveness might well rely on auditory effects rather than radiation forces, which would be too weak (section 3.2).
The sensitivity of the ear makes auditory routes to adverse effects more accessible than other routes. Given that combatants, pirates and hostage takers will learn to use hearing protection, the market would appear to be primarily for less prepared targets, such as occur in crowd control, at least with the current cumbersome vehicle-mounted devices.
Although some have confused the ability of LRAD devices to project ‘beams’ of intense sound with the ability of parametric sonar to generate such beams, the LRAD does not use the technology of the preceding subsection. LRAD has the expected directionality of a large sound source operating at, typically, 2.5 kHz, as discussed in section 2.2. Although there are repeated calls to use the parametric sonar technology described in the preceding section to produce beams of audible sound for non-lethal weaponry [71, 161-164], such calls do not take into account the fact that, although the intensities at the primary frequencies 𝑓𝑓𝑎𝑎 and 𝑓𝑓𝑏𝑏 are necessarily large to produce nonlinear effects, the audio frequency signal at (𝑓𝑓𝑎𝑎 − 𝑓𝑓𝑏𝑏) is weak because it is produced by a second order nonlinearity, and extremely strong primary beams would be needed to produce anything other than a comparatively weak audio frequency signal.
28

Although an LRAD source was aimed at protestors in New York at the 2004 Republican National Convention, the uncertainty at the effect on people at very short ranges meant it was not activated [165]. LRADs were probably not used on the public until 2009, in Pittsburgh at the G20 Summit. LRAD devices operate at frequencies of a few kHz, and so are outside the main topic of this article. Ultrasonic weapons are distinctly different: utilizing higher frequencies, a tight beam can be produced from a smaller (e.g. handheld) device, although scattering and attenuation are usually more of an issue at these higher frequencies. Barring subharmonics or the ability of the victim to hear above the upper limit expected by the manufacturer (figure 4), the ultrasonic weapon would not be expected to give to humans the audible cues and discomfort of an LRAD, although if the intended target is some non-human pest, it may claim to operate in such a way. In either scenario, the ultrasonic weapon is perceived to offer the advance of presenting a deterrent without risk of hearing loss to humans. This assumption must be critically assessed against research (or its lack) on: the potential for ultrasound to cause audio frequency hearing loss; the occurrence of non-auditory adverse reactions; and the ability to generate immediate adverse reactions in the general population as opposed to sensitive individuals.
There are numerous adverts available for ultrasonic weapons, though the author has found no convincing evidence of efficacy. In the marketplace, ultrasonic weapons claiming to induce non-auditory effects face the challenge of competing with devices like LRAD, which do exploit the extreme sensitivity of the human ear to acoustics, and appear to compete on price. Of many such products, the ‘Phasor Pain Field Pistol 135 dB’ is advertised as producing 10-25 kHz at 130-135 dB re 20 µPa (‘130 dB at 18 inches’ [166]), and is ‘intended for animal control, routing out rodents, predators from bird feeders, control of unruly dogs, cats, even people!... May be set to an inaudible but intolerable feeling of pain or discomfort’ [166] because ‘Exposure to people will cause severe discomfort, pain nausea, paranoia and disorientation’ [166]. The larger ‘Phasor Pain Field Generator with remote control 140 dB’ operates in the same frequency range and claims to produce 140 dB re 20 µPa at arrange of 30 cm. This device is advertised for ‘for potential crowd control applications… Excellent for keeping out two and four legged pests from gardens, unauthorized areas…Also excellent deterrent to intruders when used in the home’ [156]. The statement by the manufacturer on the safety of the device is recommended reading, contained in Appendix D.
It is clearly possible to generate sound fields intense enough to cause both auditory and non-auditory adverse effects, in both the 10-20 kHz and the less-researched 20-25 kHz ranges that these two devices, and many similar ones, claim to cover, though as to the specific amplitudes claimed for these devices, this study has not had access in order to verify the accuracy of these claims in a manner traceable back to primary standards. Let us assume as a working hypothesis that there exists, in the classified literature, similar dearth of evidence found in the open literature [and which has led to the uncertainties outlined in this article as to effects and mechanisms; sections 1.2(a,d), 2.2 and 3]. If so, despite the persistence of advertisements for ultrasonic weapons, the most reliable option to make a VHF/US weapon work is by deterring victims using acoustic fields that are audible to them, but not to the user of the device. This is of course the protocol for the familiar pest deterrents, and the less common devices resembling the ‘blast wave pistol’ mentioned above for deterring non-humans with VHF/US auditory sensitivity. It would be extremely disturbing if this protocol were to be used to target specific demographics of the human population, such as women or children or other groups who do not experience high frequency hearing loss (either through genetic or environmental reasons [167]) to the same extent as other demographic groups. As a species we have already commercialized such devices, as will now be discussed.
(v) Mosquito
There now exist devices that exploit the fact that the sensitivity of the ear to high frequencies is personal, and often age-related. The purpose of these devices is to target specific demographic
29

groups, for example by using high frequencies below 20 kHz to prevent teenagers loitering around shops. In 2006 The Telegraph reported that ‘Police have given their backing to a gadget that sends out an ultra high-pitched noise that can be heard only by those under 20 and is so distressing it forces them to clutch their ears in discomfort’ [168]. The device operates on the principle that people more than, say, 25 years old will have lost sensitivity to these irritating VHF acoustic signals. Variations on this, for example producing low frequency sensations using two ultrasonic fields of slightly different frequency, have also been proposed [169].
Routine hearing threshold measurement is normally restricted to frequencies below 8 kHz. Although the loss of high frequency sensitivity with advancing age is well established, the trends with age and gender in the 15-20 kHz range used by Mosquito devices are less frequently researched [170].
The installation and use of such ‘Mosquito’ devices continues to be unregulated. Individual householders and owners of business premises can install the devices. These devices do not emit ultrasound but emit intense sounds at around 15-18 kHz (the later versions tending to 17-18 kHz). This is done with the specific intention of creating a distress response in young people and thereby discourage them from ‘loitering’ in the vicinity of the device, neglecting:
o The effect on very young children and animals brought close the device by parents or grandparents who are not aware of the signal;
o The effect on children with pre-existing conditions that make them especially sensitive (autistic spectrum disorder, hyperacusis, Williams syndrome etc.);
o The health effects on children who cannot avoid long term exposure (e.g. because of their residence, the daily route to school);
o The lack of research to understand the potential effects of VHF/US signals on individuals who cannot hear them;
o The lack of research on the auditory and possible non-auditory effects of such exposures.
In 2008 the Association of Chief Police Officers declined to award its ‘Secured by Design’ accreditation to Mosquito, their press release stating ‘Secured by Design is the only official form of national Police approval and we must be satisfied that products are safe and meet performance standards before offering them Police endorsement. We have refused to accredit Mosquito primarily due to lack of evidence that it is safe. Following credible, external scrutiny of the product it could not be confirmed that noise it emits is only audible to young people and the potential effects of the product on people suffering disabilities was inadequately researched and uncertain. In addition, there were issues surrounding the appropriateness of utilising this kind of device given that it’s discriminatory against a particular group… ACPO Crime Prevention Initiatives has taken the stance that the product is not yet and may never be ready to receive official Police endorsement however the decision as to whether or not to use Mosquito is a matter for individual for individual Forces’ [171]. Sections of the media reported dissatisfaction with the decision from manufacturers and shopkeepers [172]. In Congleton in 2015, the local government unanimously voted to refuse permission to install Mosquito devices following instances including a parent reporting that a Mosquito device caused a child to fall from a bicycle as he removed his hands from the handlebars to cover his ears [173]. They supported enhanced educational routes to improving teenager behaviour. Whilst it touches beyond the remit of this article, such a social response to an acoustical technology that was designed to reduce a social problem, does introduce symmetry in addressing the fact that the Mosquito should not be a substitute for investment to provide appropriate safe places (e.g. youth clubs) for children to meet, since the device can potentially displace children to more hazardous areas.
30
The Mosquito produces a discriminatory adverse effect. Its use should not be conflated with the use of a ultrasonic ring tone, intended to be covert with respect to the older generation [174], presumably using a signal and an amplitude that does not distress youths using it.
Section 2.2 has shown examples of VHF/US devices that are marketed to cause distress (section 2.2(c)(iv, v)), whilst other airborne VHF/US technologies are marketed as safe (section 2.2(b); Appendix D). Statements from manufacturers include insufficient detail and contain assurances of safety that are not supported by relevant evidence. Coming atop this paper’s evidence of public exposure by commercial devices that are not explicitly advertised as producing ultrasound, and the difficulties in measuring device outputs and fields, it is important that there are appropriate guidelines backed by rigorous research, and calibrated measurements backed by appropriate equipment and standardized procedures, so that safety can be properly assessed for the populations and demographics that will be exposed.
3 IS THERE A FEASIBLE MECHANISM FOR THE REPORTED ADVERSE SUBJECTIVE EFFECTS OF ULTRASOUND? The range of subjective symptoms reported by the public (migraine, nausea, tinnitus, headaches, fatigue, dizziness, feelings of ‘pressure’) are so common and so non-specific that most clinicians are unlikely to attribute them to a physical cause. As regards viewing the proposal that airborne ultrasound is the cause, difficulties include the fact that: the lack of evidence means that adverse effects from airborne ultrasound are not included in any of the relevant NICE publications that support differential diagnoses; the sources of ultrasound are difficult to identify and locate or even confirm as existing at all; the VHF/US fields have been difficult to measure in a manner traceable to international standards; reports are primarily anecdotal and vary from describing instantaneous responses to a 30 minute delay before the onset of adverse effects and include reports of persistence of headaches etc. for hours after exposure has ceased; especially in the case of occupational exposure, some VHF/US studies would have included significant audio frequency energy [1]. Although reports of subjective effects from airborne VHF/US date back over 40 years, they are complicated by inadequate progression along the evidence hierarchy, the disproving of the original ultrasonic sickness claims, and the frequent presence of high levels of audio frequency sound accompanying the ultrasonic exposures, as reported in this paper. This has left holes in the evidence base. One further question is whether subjective effects might occur only in those who can hear the sound, or whether they can also occur in others. The case for asking whether there is a conceivable mechanism by which subjective effects can occur in those who cannot hear the sound is based on:
• the need to assess the anecdotal stories from those who purport to have suffered in this way;
• the need properly to frame the assumption that adverse effects only occur when airborne VHF/US is heard, which has, and will in future, direct assessments of who is susceptible, and what safety guidelines are required.
If an unpleasant intense signal is heard, whether it be VHF/US or some audio frequency noise that accompanies the ultrasound (such as the hiss of cavitation in a cleaning bath, the noise of an ultrasonic drill etc.) then a combination of anxiety, stress and our knowledge of the human response to audio frequency noise can offer a plausible explanation for the symptoms (which nevertheless needs testing). If however nothing is heard, is there a mechanism for generating adverse subjective effects?
31

The lack of a mechanism for generating these subjective effects has underpinned many assumptions. Howard et al. [34] worked on the assumption that subjective effects from exposure to ultrasound were caused by the accompanying levels of audio-frequency sound that the sources of ultrasound generated, such generation being either accidental (e.g. through the unwanted placement of energy at subharmonic frequencies) or deliberate (as when nonlinear effects are used to produce zones of audio frequency signal, the advent of such devices being the specific prompt for the review of guidelines by Howard et al. [34]). In 1984 the INIRC-IRPA [20] stated that ‘Effects on the general public of airborne acoustic energy appear to be mediated by nervous reaction. Many people are unable to enter commercial establishments having an intrusion alarm (where the alarm is turned off, but the airborne ultrasound is still radiating) because they immediately suffer headaches or feel nauseated.’ In the above quote the phrase ‘mediated by nervous reaction’, ICRNIPA are probably using phraseology similar to that of Health Canada who stated ‘the so-called “subjective” effects on the central nervous system’ such that, for example, a sufferer feels compelled to remove themselves from the vicinity of the source of pain or disturbance. This paper will proceed on the assumption that at least some of the complaints from the public are indeed caused by ultrasound in air. 3.1 Is the potential for adverse effects linked to hearing acuity? We are taught, as part of formal education, definitions such as ‘Ultrasound is the name given to sound waves that have frequencies greater than 20000Hz. It's too high pitched for human hearing, but many animals, such as dogs, cats and bats can hear ultrasound’ [175]. However, even a small sample size can show VHF/US detectability to the levels shown in figure 1(c) [26]. Given that we know that there is great variation between individuals in hearing acuity and frequency range, with a tendency for greater high frequency acuity in the younger population, a single cut-off frequency for all is clearly too simplistic. It is timely to re-examine the source of the current received wisdom, and to interpret it in the light of the difficulties that having such small wavelengths introduces in making measurements that can usefully be transferred from one piece of equipment to another. There is a wealth of material on hearing acuity and how it varies with frequency. However, it is important to appreciate that this legacy of knowledge was almost wholly taken with low amplitude tests. Furthermore, the accepted trends come from averages over large numbers. As we enter an era where it is possible that large numbers of the population are exposed to high amplitude ultrasound without any corresponding audio-frequency cues, then the diversity in the population, and the unnatural nature of the stimulation, mean that reliance on received wisdom from current audiology must be scientifically tested. As seen above [22, 34, 50] the common belief is that if there is to be an adverse effect, the subject must be able to hear it, an assumption which has been used to justify the focus by the ACGIH [23] on the levels of the subharmonics only, which forms the basis of current US regulations for exposures above the 20 kHz third octave band. There is a wealth of material on mechanisms for acuity [176 -182] although a great deal is based on bone conduction rather than the airborne pathway. The issue to be addressed in section 3.2 is whether there is a mechanism for adverse effects without hearing acuity. 3.2 Is there an alternative mechanism? Adverse effects without hearing acuity The remarkable aspect of looking for a mechanism for adverse effects without hearing acuity, is that the intensities associated with acoustic field are almost always low compared to the intensities we see in comparable radiations. The 140 dB re 20 µPa acoustic field cited by Crabtree and Forshaw ([4]
32

– see section 1.2(c) and below) corresponds to an acoustic pressure that, in a plane acoustic wave at ground level in Earth’s atmosphere, would have an intensity of around 100 W m-2, roughly one tenth of the intensity of ground-level daylight on a clear day. Whilst a dark adjusted person might shy from such dim daylight for a short period, this is a response due to the sensitivity of the relevant sense organ (the eye). If our sense organ is not part of the equation, adverse effects are unlikely, as we would feel only mild heating from the absorption of such weak daylight. However therefore can airborne ultrasound cause adverse effects if we cannot feel it? It would be unwise to consider adverse effects only in terms of the physics of the wave. Frings and Senkovits [74], on confirming their earlier work [72, 73] that damage in mice from airborne ultrasound comes from heating of the fur, stated that this finding was ‘supporting the statement of Davis [92] that reflection from the skin can afford satisfactory protection from heating by high intensity air-borne sounds in man’ (the context being that all these authors were considering heating only, and Davis specifically excludes ‘sense organs’ and ‘general “sensations” or mental states’ from the musing to which Frings and Senkovits were referring). However, intense acoustic fields can generate nonlinearities, such that an oscillating acoustic pressure can give rise to a steady ‘radiation pressure’, net motions in the gas or liquid through which the wave travels (streaming, microstreaming [91]) and the generation of harmonics (at frequencies of nf), ultraharmonics (at frequencies of nf/m) and subharmonics (at frequencies of f/m which can be in the audio frequency range if the frequency f of the fundamental wave is ultrasonic, and m and n are integers greater than unity). A radiation pressure of 𝑝𝑝rad = 𝐼𝐼/𝑐𝑐 is generated by a plane wave of intensity 𝐼𝐼 that is wholly absorbed after travelling through a medium of sound speed 𝑐𝑐 [91, 108]. For the 140 dB re 20 µPa field mentioned above, this equates to a radiation pressure of 0.3 Pa, a tiny steady pressure given that the human ear can withstand immersion, where every metre further underwater adds an additional 10,000 Pa. It would certainly be too weak to ‘knock people off their feet’ ([159]; section 2.2(b)(iv)). Health Canada [22] stated that “most plausible mechanisms for non-auditory effects of airborne ultrasound on a human are heating and cavitation”, though neither is relevant to humans below the levels associated with extremely intense ultrasonic field, and certainly not for the potential human exposures of figure 1. The two mechanisms (heating and cavitation) immediately suggest themselves, because they are of such importance during diagnostic foetal scanning that the US FDA mandated that scanners show on-screen real-time indicators reflecting the likely hazard to the foetus associated with these mechanisms [78], but they are not relevant for current airborne exposures (section 2.2(b)). Although experiments with ultrasound in air generated death in insects and mice in 10-180 seconds as a result of 20 kHz in air at 169 dB re 20 µPa [101], and dizziness and mild-to-very-unpleasant heating at crevices (fingers, skin clefts, nasal passages) in excess of 140 dB re 20 µPa in humans [3, 22, 101] these levels are almost certainly very significantly greater than those to which the public are being exposed. As Davis et al. [30] commented in 1949, ‘Although we can cook a small animal with the energy of a sound field, it is probably impossible to cook a man…. There is no evidence that air-borne ultrasonics can produce any specific direct effect on the brain or other parts of the nervous system [92]. In spite of many suggestions of such mysterious possibilities, the only reliably established effects are either through the stimulation of the ear or some other sense organ’. From the point of view of heating and cavitation, this is a sensible proposal, but in the absence of a mechanism for subjective effects, it needs careful testing against evidence, which includes an assessment of whether the current evidence base is sufficiently large.
33

However, the ear has extraordinary properties, an analogue sensor with a dynamic range exceeding 120 dB (6 orders of magnitude in pressure) and it is no simple matter to predict the sensations it might generate when driven by intense ultrasound in air. Recognizing that the data in figure 8 is drawn from only 5 males of 25-35 years age, having normal hearing, and granted that at high frequencies relative positioning on the tympanum will be challenging, its trends suggest that the response of the tympanic membrane decreases with frequency, but offers the preliminary suggestion that the limited data suggest a drop of only around a factor of 10 in displacement (roughly 20 dB) in going from 1 to 10 kHz [183]. It is difficult to extrapolate what would be the effect of the outer ear, especially given the small-wavelength effects seen in figure 4, but resonances would not be unexpected. Given the 120 dB operational dynamic range of human hearing, in the absence of measurements it is not unrealistic to hypothesize tympanic membrane vibration when high amplitude (e.g. 140 dB re 20 µPa) signals at 20-30 kHz are incident on the tympanum (the upper frequency limit of normal human hearing is not set by the tympanum, but rather by the frequency characteristics of the middle ear [184] with loss of hair cell activity in the basal region of the cochlea contributing to high frequency loss from childhood onwards [111]). That tympanic ultrasonic vibration speculatively might occur in some individuals, is stimulated by extrapolating to high frequencies the variation between individuals: figure 8 indicates that, at 80 dB re 20 µPa exposures, the individuals showing the greatest displacement at 10 kHz exhibit displacements (~ 0.01 µm for the 1 STD upper limit at 10 kHz) that are comparable with the displacements observed in the individuals at the 1 STD lower limit experience at 1 kHz. It is not possible to extrapolate from the ≤10 kHz data on just 5 adult males shown in figure 8 to discuss VHF/US exposure in the general population, but figure 8 does give perspective on the use of averages. The tympanic membrane contains mechanical proprioceptors that are sensitive to pressure, tension and stretch (Nagai [185] identifying Pacinian corpuscules). The middle ear tympano-ossicular chain contains two muscles, the tensor tympani and the stapedius muscles, which contract to reduce the amount of motion in the presence of intense acoustic fields [186]. When applying small air pressure changes sufficient to cause small movements of the tympanum, Job et al. [186] used fMRI to show that proprioreceptors in the tympanic membrane responded by generating brain activity in a limited region of Brodmann area 43 at the caudal edge of the somatosensory cortex. This is the area involved in activities accompanying oral intake such as gustation and swallowing. The tympanic membrane is tensed by the tensor tympani muscle, and both it and the veli palatini muscles (which are involved in swallowing) are Eustachian tube muscles that, it was recently proposed [187] are in histochemical continuity with a long tendon [186], possibly forming a functional unit. Taking a step back, it is perhaps not unsurprising that sensors in the tympanic membrane that detect pressure changes might have a neural connection to Eustachian tube muscles because the response of opening the Eustachian tube by swallowing mitigates pain from, for example, reduced air pressure in aircraft: indeed, Nagai [185] disrupted the function of the Eustachian tube by anaesthetizing the tympanic membrane. Consider therefore the following untested hypothesis. In the presence of intense ultrasound, the tympanic membrane still undergoes displacement (extrapolating from figure 8). Given the diversity in the responses of the hearing and balance systems between individuals, in some individuals the neural connections in the brain between these tympanic receptors and the associated Eustachian tube muscles are activated. However, the brain does not receive complementary signals from the auditory nerve that it usually receives when hearing sound, because the inner ear is not responding to the ultrasonic stimulation: the filtering by the middle ear and cochlea means that the brain does not associate the ultrasonic vibration of the tympanic receptors with hearing as it would at lower frequencies. The hypothesis is that the conflicting signals from the cochlea, and those from the receptors in the tympanum and Eustachian system, could lead to headache, dizziness, nausea, fatigue etc. A similar disconnect in the brain between the signals from proprioceptors and those
34

from the inner ear (the balance organs) is the most widely cited cause of motion sickness (vision also being important here, but not critical, because people with severely impaired vision can still experience motion sickness; [188-190]; note that there are competing hypotheses for the cause of motion sickness [191-193]). This speculation ends by noting the overlap between the wide range of symptoms reported for motion sickness and those reported for ultrasonic exposure. The terminology ‘ultrasonic seasickness’ should not imply that a given motion sickness medication would work in relieving adverse subjective effects from ultrasound as it depends on the mechanism and the specific effect on the proprioceptors. Some issues remain unresolved by this hypothesis. For example, the marketing of the Mosquito device suggests that, at least for the lower intensities and frequencies used in that application, subjective effects have not been reported by those who cannot hear the device, which challenges the above mechanism. The conclusion must be that there is a knowledge gap regarding the mechanism for the reported subjective effects of ultrasound in air, and without a validated mechanism, measures to protect the public and workforce become more difficult to design and to assess. Indeed it opens up the need critically to assess the assumptions underpinning the transposition of established practices in the audio frequency range to the ultrasonic range, including the use of equivalent noise pressure levels for an 8 hour day, and maximum third octave limits [107]. 4. CONCLUSIONS Any author raising the issue of a possible health hazard from ultrasound in air should understand that this comes at reputational risk: writing in 1966, Parrack [94] wrote ‘what are the "effects of airborne ultrasound on humans?" The question is generated by conflicting points of view presented in some recent public utterance on this subject. Some of these statements ascribe to air-borne ultrasound, a capacity to induce remarkably dramatic effects in humans. Apparently, twenty years have wrought little change in our understanding of the effects on man of air-borne ultrasound!’, eventually concluding that the reported symptoms were probably psychosomatic (see section 2.2(a) for the quote). The same year he published his now infamous 140 dB re 20 µPa guidelines [14], which he retracted 3 years later. Parrack could little imagine that the 20 years of uncertainty to which he referred would extend to 70 years by 2015. Why therefore does this article choose to address the same topic? In part it is because the industry still refers to the ‘latest’ guidelines without recognizing that these are re-issues or slight adaptations of older guidelines without addressing the fact that those guidelines were based on an inadequate research base, as some of those older guidelines explicitly state [20]. It is also because of evidence that commercial devices project ultrasound into air in public places at not insignificant intensities. These intensities are almost certainly significantly less than those to which occupational workers tested in the past were exposed, and there has been no research to test independently whether adverse effects reported by the public are in fact caused by ultrasound. However, signals such as those shown in figures 1 and 2 represent an opportunity, because they warrant testing the effect of tonal ultrasonic signals alone: very many of the original studies on which the guidelines are based relate to exposures where the ultrasonic component is contaminated by audio frequency energy through subharmonics, or through a physical phenomenon (jet noise, cavitation etc.) that was produced when the ultrasonic energy was generated. In such circumstances there remains to this day uncertainty (and for most authors, significant doubts) whether the ultrasound, rather than the accompanying audio frequency energy, caused the adverse effect [43, 107, 194]. This is less likely to be an issue with the spectra of figures 1 and 2.
35

Despite the fact that potential adverse effects were raised over 70 years ago, we still know very little about human responses (both auditory and non-auditory) to ultrasound in air. Standard hearing tests do not consider acuity above 8 kHz, and although loss in this frequency range due to exposure at other frequencies has been established, the number of studies and cohort sizes remain small. Furthermore, the questions asked in directed studies have not to date been designed to address the mass public exposures of figures 1 and 2. The same is true in assessing the extent to which individuals suffer the effects labelled as ‘subjective’ (nausea, headaches, tinnitus etc.), and to what extent public exposures might stimulate these, and to what extent ultrasound might be blamed by the public when it is not the source of adverse effects. There is a lack of confirmed mechanism, and although a speculative one is aired in this paper, it has no supporting evidence. The evidence suggests that VHF/US provides greater adverse effects in some individuals than others, possibly even without the need to hear it, although this is insufficiently researched. If this is the case, employers, parents, spouses, teachers and carers may well be unaware that the location they find to be benign, and into which they direct those for whom they are responsible, may induce adverse effects in more susceptible individuals. The increased susceptibility of some minorities has been exploited to produce deterrents aimed at them on the basis of this susceptibility, rather than on the basis of their actions. As a form of discrimination, ultrasound in air has the peculiar characteristic that susceptible individuals may not even know that the adverse effects are caused by ultrasound as opposed to some other source (e.g. ‘sick building syndrome’). The overwhelming conclusion must be that the research base is too small to support the current guidelines because:
• The issuing of new guidelines based on a review of existing guidelines has inadvertently given rise to the misconception that there exists a consensus, the new guidelines validating the old and vice versa, when what is missing is the fundamental research to validate a genuinely new set of guidelines. That research must ask the correct directed questions and test sufficient numbers of subjects in representative cohorts in order to allow manufacturers to know that their products are safe, and to allow those who believe they are suffering as a result of ultrasound exposure to have the true source of their symptoms identified, whether it is ultrasonic or not;
• The application of these guidelines for occupational exposure, to circumstances of public exposure, is inappropriate, particularly given the nature of the few research studies on which current guidelines are based (typically small numbers of adult males having occupational exposure);
• The use of averaging is problematic, there is a failure to consider the spread of the population about the mean, and a failure to consider sensitive subsets of the population (including specific demographics);
• Most, if not all, advertised levels on commercial devices cannot have been rigorously measured traceable to primary standards.
Because there is now mass public exposure to ultrasound in air, we require:
• Appropriate guidelines for both public and occupational exposure, with appropriate consideration of women and children and exposure in residential areas, accompanied by an end to the practice of issuing new guidelines based on old guidelines (particularly the erroneous interpretation of the most populous guideline in figure 3 as indicating consensus, so enhancing this particular problem), and an end to using occupational guidelines for non-occupational circumstances;
• Survey of the occurrence and properties of devices that expose the public and workers;
36

• Standardization of procedures for reporting levels, reporting both third octave and peak SPL levels where the signals are tonal, with information on the frequency content (centre frequency for tonal signals, and existence of harmonics and subharmonics);
• Measurements following international protocols that take account of the particular features of using ultrasonic equipment (directionality, scattering etc.), and manufacturers should label using only measurements taken in this way, expressed with suitable metadata and clarity as to the spectral distribution of the energy;
• Survey of adverse reaction (both impairment of normal sensations, and inability to achieve optimal performance, e.g. in schools), taking into account the false positives, with appropriate care for sufferers regardless of whether ultrasound is the actual source of discomfort;
• If genuine adverse reactions are found in workplace, residential or public settings, an assessment of whether normal measures offer sufficient protection (e.g. the fall-off of intensity with range from source, attenuation of ultrasound by common materials and enclosures [141]);
• Standardization of procedures and equipment for hearing tests above 8 kHz; • Double blind testing of individuals who suggest they are sensitive; • A critical assessment of the unchallenged use of hearing thresholds as a proxy for all adverse
effects, and as a reliable indicator as to the likelihood of the occurrence of adverse effects; • A requirement that researchers who report the results of testing the acuity and reaction of
humans to ultrasound in air should publish the raw data and report on the scatter in the data, not just the trends that come from linear regressions (for example by using electronic supplements to journal papers);
• Assessment of workplace, public and residential exposures (and their overlap e.g. in hospitals, schools, nurseries);
• Research towards the possibility of dose-response relationships for auditory and non-auditory effects, taking into account sensitive individuals;
• Appreciation of the implication of averaging and assessment of departures from the average;
• Assessment of what public exposure is necessary, what can be stopped with little inconvenience to the user, and for what devices alternatives must be found, if adverse reactions are proven with existing exposures;
• Political will to address these issues. There exists a knowledge partial vacuum on the adverse effects of ultrasound in air, and legislators must make a choice on whether this vacuum is considered to be a lack of evidence for or against the current exposure of the public to ultrasound. After this immediate response, the evidence to allow those who wish to use ultrasound in air, to do so safely, must be gathered.
Acknowledgements Apart from a contribution to equipment costs, this work was unfunded, and therefore a large number of volunteers were vital to completing this multidisciplinary study, and credit to them that it was completed in a few months. To be sure of the levels recorded in figures 1 and 2, several independent measurements were made of the ultrasonic field from students Fabio Casagrande Hirono and Mengyang Zhu and from the National Physical Laboratory’s Ben Piper, each operating their own independent equipment and measurement systems. Ben Piper and Richard Barham of NPL assisted with calibration, as did ISVR Consultancy Services (ICS), who loaned us equipment. The author is very grateful to Ben Lineton and Sian Lloyd Jones for audiological advice, Sian also providing an independent audiological detective to assist in tracing though often obscure and difficult-to-find records of the tests on which some current guidelines are based. All of the above, plus Ben Lawton, Carl Verschuur, and Claire Chapman commenting on the draft. The author is
37

grateful to Erika Quaranta for undertaking all the modelling requested by the author of the interaction of sound and ultrasound with the pinna (figure 6); and to Richard Jackett (NPL) for supplying figure 5 at the author’s request. The author is grateful to: Paul White for advising on signal processing and the statistics of Appendix C; Andrea Wolff for interpretations and guidance on German law; Su Blandy for helpful advice on how a clinician interacts with NICE guidelines. The author is grateful to work experience school students Laura Overton-Hore and Tim Scrase for their assistance during field tests, taking notes on sites locations and metadata, and assistance in checking transcriptions of notes and data. Data accessibility statement. The original data in this paper (figures 1 and 2) were collected from sites that only gave permission for recording on condition of anonymity. The original data files contain information (e.g. audio frequency public address announcements) that would reveal the location and break the contract, and so cannot currently be made publicly available. Each site been supplied with a report of the findings for their site and comparison to guidelines. Ethics statement. This work did not involve any active collection of human or animal data. Funding statement. The author is grateful to the Colt Foundation for supplying funds used for the purchase of equipment. Authors’ contributions. This is a sole author paper. The author was supported by volunteers as described in the acknowledgements. Competing interests. The author has no competing interests. APPENDIX A: Instrumentation and the citizen scientist
Figure 1(a) shows the type of spectrogram (also known as a time-frequency plot) that can be taken with a smart phone equipped with an appropriate app. Spectrograms show how the spread of energy (the colour scale) across the various frequencies (the vertical axis) varies as a function of time (the horizontal axis), and they can also show PSDs like figures 1(c) and 2(b,d). However, if members of the public wish to try to detect VHF/US signals in such a way, they must appreciate that:
• the reported dB levels are unlikely to be reliable; • like ears, even high frequency microphones have an upper frequency limit above which they
are insensitive, and their device can obtain no information on the existence or not of signals above this [see the notes in section 1.1(a)];
• some signal processing routines produce artefacts, e.g. through aliasing.
Some smartphones and tablet computers do have high frequency sensitivity sufficient to produce images such as figure 1(a), and sound level meter apps are available. Not only must your microphone and preamplifier system be sensitive to high frequencies, but the settings on the app must ensure that the data are acquired at sufficiently high frequency (to detect 20 kHz signals, the sample rate must be over 40,000 Hz, preferably over 48,000 Hz). The number of samples in the Fast Fourier Transform (FFT) should be a maximum, and if there are other settings, these too should be set to maximum. Activating the automatic gain functions can help generate good pictures but means the reported levels must be treated with scepticism. Always take a note of those settings, the make, model and (if possible) operating system, and details of the spectrum analyser app, and your location (with time and GPS if possible). Interrupt your recording by placing your finger over the microphone, after the manner shown in figure 1(a), to ensure the signal is not electrical pickup
38

(check on the web which microphone you need to cover – many phones have two different microphones, one for voice and one for functions like video recording, and that is the one you need to cover).
For pulsed signals, note that if the time window over which the signal is measured encompasses just a single pulse, as in figure 2(c,d), then the intensity will be scaled by the duty cycle in the expected manner compared to measurements over a longer period [91].
It may be that a future app could record spectra, settings, metadata and GPS data in order to map locations or shows the change of fields over time.
In figure 1(a) the app is SpectrumViewPlus. Microphone sensitivity for VHF sound and ultrasound varies significantly between iPhone models, the iPhone 5 appearing to be most sensitive in limited testing, but even today’s microphone and app combinations would probably not be sensitive to signals as high as 30 kHz. Similar recordings could be made with a modern iPad, but the reliability of calibrations on sound level meter apps, especially in the VHF/US frequency range, should be treated with scepticism. It is not possible to reply on an iPhone and the available apps to make the calibrated measurements of figures 1(b,c) and 2. Instead three [for figure 1(b,c)] or two [for figure 2] calibrated microphone and data acquisition systems were deployed to allow each to cross-validate the other. This paper presents the data from one system only in each figure to save space. The data in figure 1(b) were recorded using a B&K Type 4939 Microphone plus Type 2669 preamplifier, B&K NEXUS Type 2692-C Charge Amplifier, RME Fireface UCX Sound Card into a Windows laptop running Adobe Audition 3.0. The data for figure 2 were recorded on a Fostex handheld recorder with a PCB 377B02 microphone and a PCB 426E01 preamplifier and a PCB 480E09 ICP® sensor signal conditioner. The signal processing strategy adopted for figures 1(b,c) and 2 gives a frequency resolution of ~ 23 Hz. The calibration of each system was traceable back to primary standards for VHF/US at the National Physical Laboratory (NPL) in the UK, and Danish Fundamental Metrology A/S (DFM) in Denmark. The calibration of the microphones were checked by NPL against a reference microphone (IEC type WS3) which had been calibrated up to 200 kHz at DFM using a primary free-field calibration method. Both of the microphones used to record the signals in figures 1(b,c) and 2 are ‘free-field’ (as opposed to ‘pressure’; [195]) microphones, designed to measure the pressure that would have existed in the environment before the microphone itself was introduced and disturbed that acoustic field (as the microphone body scatters and diffracts the field). In principle free field microphones should always be pointed at the source of interest. The compensation factors that are used to infer this pre-existing field become more difficult to calculate as the frequency increases, which again makes extension of standard measurement methods and equipment into the VHF/US regime less simple than an uncritical belief in a microphone’s output might assume. Even when all such compensations are made in the calibration conditions of an anechoic chamber, in the field (when sometimes the location of the ultrasonic source is difficult to identify) the uncertainties become much greater. In closing this appendix, it is worth commenting on another correction factor that is not appropriate for the ultrasonic regime. Commercial sound level meters usually are equipped with third octave band filters and the widespread use of these in assessing environmental noise might have influenced their use in the guidelines of figure 3. However, they are probably unsuitable for assessing the tonal exposures of figure 1 and 2, because the broadband signals shown by the dotted horizontal line in figures 1(c), 2(b,d) score identically to the tonal data when assessed against third octave levels. Such sound level meters also come equipped with a range of filters (A, B, C weighting etc. which filter the
39
incoming sound to reflect the response of a normal human ear to low, medium and high intensities) but these are unsuitable to use when measuring airborne ultrasound [5]. Recalling from section 2.1 that, for sound level meters, the most stringent international standard [86] allowed variations from the stated design at 20 kHz from +3 dB to -∞ dB for a Class 1 device, it would seem appropriate to question the underlying science behind other instrumentation. Although commercial high frequency audiometers exist, the underlying science behind those measurements must be questioned. High frequency audiometers are designed to provide a subject’s dB HL (Hearing Level), which is the dB difference between the dB SPL of the quietest signal that a given subject can hear, compared to RETSPL (Reference Equivalent Threshold Sound Pressure Level), for example at 18 and 20 kHz. However, the RETSPL is an average, and if the average is insufficiently representative, then provision of dB HL is less appropriate than simply recording the dB SPL of the quietest sound the subject can hear at a given frequency. One manufacturer, when questioned, confirmed that the RETSPL values for 18 and 20kHz were obtained from Table 1 of the 1990 paper by Frank [196], which gives median threshold values from 200 ears of 100 young adults (aged 18-28 years old) who had normal hearing at 0.25-8 kHz. Given the discussion of section 1.2(b), the statistical significance of this sample can be questioned even when used to provide RETSPL for subjects aged 18-28, and its use is open to challenge outside of this age range. Indeed, Frank [196] did not recommend using his data to derive RETSPL values for 18 and 20 kHz because of the large variations seen in threshold between subjects even in this restricted 18-28 year old cohort. The author did suggest that ‘test-minus-retest’ thresholds on the same ear, using the same equipment, might be used clinically. This is because, in his data, the intra-subject test/retest variance (when the same ear was re-tested) appeared to be sufficiently low (+/-10 dB for at least 95% at 18 and 20 kHz). As a further point regarding equipment, Frank [196] took his measurements with a specific type of earphone (a Sennheiser HD250), and because of the significant high frequency differences (in terms of output, distortion etc.) seen between different types of earphones, use of a RETSPL derived from his data for high frequency audiometers that use a different type of earphone, would be questionable were it to occur. APPENDIX B: Compendium of guidelines levels for the third octave band centred on 20 kHz Table 1 is a compendium of the Maximum Permissible Sound Pressure Levels that are shown graphically in figure 3 for the third octave bands (unless otherwise stated) centred from 8 to 50 kHz (no data outside these limits are shown although some guidelines have been suggested), arranged in original author publication year (1966-2015). Figure 3 makes clear the 70 dB spread at 20 kHz that relates to a factor of 10,000,000 range in intensity (and over 3000 in pressure; see the note on dB references in section 1.1(a)).
These data are based on the compilations listed by Lawton [45, 46], with additions. Most of the authors specify levels to the nearest 5 dB, and the vertical axis is therefore quantified in this way (the popular 110 dB re 20 µPa band being expanded to accommodate all the occupants). The exceptions are the EARS Project 20 and 25 kHz values (77 and 102 dB re 20 µPa respectively) [26], and the ‘American Conference of Governmental Industrial Hygienists (2004)’ [23] for 8 hour average (building on their earlier 1989 guidelines [33]). The ACGIH (2004) [23] 8 hour average specifies 88, 89, 92 and 94 dB re 20 µPa for the third octave bands having centre frequencies of 10, 12.5, 16, and 20 kHz, perhaps an unrealistically fine distinction given that much of the acoustics industry works to a measurement tolerance of around 3 dB.
Polish researchers [24,28] report that Poland (2002) separated out the maximum allowable SPL (𝐿𝐿max) from the 8 hour third octave limit (𝐿𝐿eq8h) and furthermore reduced the allowable limits on 𝐿𝐿eq8h by 3 dB for pregnant women and 5 dB for young people (though Poland’s allowable 𝐿𝐿max is
40

the same for all types of person). French researchers [29] have also discussed reduced levels for pregnant women, although France has no national guidelines (see below). Note that one of the reviews [27] has erroneous values attributed to USA-Air Force (1977) in an otherwise very useful paper. This error occurred because of an error in [27] when citing [19], and thereby attributing the USSR (1975) values to the USAF (1976). The same paper also contains values for Bulgaria (1979) that resemble the levels for USSR (1975) but the author could not identify the original source and so the Bulgaria (1979) levels are not included in figure 3. Another otherwise excellent paper [28] also has incorrect levels for the guidelines issued by Australia (1981). That paper [28] also reports levels for France (1985) that are similar to the levels for Australia (1981) (as cited in Damongeot and André [7]). However, France has never, as a country, had recommended levels for either infrasound or ultrasound, but rather reports from research institutions [7,29], some of which may have been incorrectly interpreted as national maximum levels by the authors of reference [28]. Both papers [27, 28] report levels for Sweden (1992) that are identical to the levels reported into the above table for Sweden (1978) as cited in WHO [19], except that they report a level of 115 dB re 20 µPa for the third octave band centred on 25 kHz [the author has not been able to track down the source of Sweden (1992)]. Both papers [27, 28] contain values for USSR (1989) that resemble the USSR (1983) guidelines cited by Tanttari [21].
APPENDIX C: Statistics for figure 7
Tables 4 and 7 of Maccà et al. [110], from which the data of figure 7 are obtained, contain typographical errors in the number of subjects in the study. Estimations of the true values were obtained by assuming that the number of subjects (n) takes a positive integer value, then multiplying the percentages given in the relevant table by n/100 to give a value m, the number of people exhibiting symptom if this value of n were correct. Given that m should be an integer, the ‘error’ (e) is defined as the difference between m and the rounded value of m. The sum of the squared errors across all of the data provides a value s, and n was identified as the lowest positive integer for which s is suitably small. This identified the number of ultrasound-exposed subjects in Table 4 of Maccà et al. [110] to be 24, and the number of noise-exposed subjects to be 56. These values were confirmed by the authors of the original paper just before publication (the 24 as described for the whole cohort in section 2.2(b), the 56 comprising a subset of the 113 industrial noise-exposed subjects described in the same section, comprising 20 women and 36 men). The p-values, as re-calculated using a 𝜒𝜒2 test from their data for these corrected cohort sizes, are shown in Table 2. The p-values scoring less than 0.05 are indicated in bold, but bracketed if the number of occurrences of each observation (shown in curly brackets after each one) is less than 5 (thereby failing the test of robustness). Using the data tabulated by Maccà et al., the results of Table 2 agree with the 𝜒𝜒2 findings on statistical significance presented by Maccà et al., except in that here ‘tingling in the limbs’ for the ultrasound group is also shown to be significant. Since the current article went to press, the authors of reference [109] have confirmed that the numbers, analysis and conclusions in Appendix C and Table 2 of this paper are correct, and that ‘tingling in the limbs’ should have been identified as being significant from their numbers. APPENDIX D: Example of manufacturer statement
There is now a market for products which embed software on television, computer and mobile devices to track which adverts and websites the device owner views. For example, adverts on a PC or TV will emit a coded ultrasonic signal which is detected by mobiles phones, which then transmit the information back to the company. In simple terms, it might indicate whether the user is watching an advert or fast-forwarding through it; or enable the company to infer user habits and preferences
41

from the various sites visited and adverts watched. One manufacturer states: ‘Millions of mobile devices with SilverPush powered SDK [software development kit] are constantly listening to SilverPush patented audio beacons (ultrasonic) which are watermarked in Televison ad commercial. A pair is made once a SDK comes in proximity of audio beacon. The individual ID is mapped back to its audience genome and a brand-consumer journey has been started’ [197]. Whilst the author cannot find information on physical measurements of the intermittent emission of ultrasonic signals or any adverse health effects, the practice of embedding such signals has raised privacy concerns [198].
The designers of the above technology should in principle have taken into account the requirement not to generate adverse effects in humans, although the only guidelines for public exposure is the INRC IRPA [20] one allowing 100 dB in the third-octave bands centred on 40 and 50 kHz, and these did not take into account the requirement to avoid subjective adverse effects.
In contrast, other devices however are designed to generate such adverse effects. A statement by the manufacturer on the on safety of the Phasor Pain Field Generator states: ‘We have selected a sound pressure level and a strength that we feel is safe to use and liability-free. This means you can use it feeling comfortable it will have a deterring effect on the intrusion and yet at the same time will not cause injury to the intruder where you could be liable. You might want to check your local laws, as some states unfortunately favor the rights of the perpetrator far more than the homeowner or law-abiding citizen. Even though these products will not cause injury, they could create a situation in a highly politically correct atmosphere, so it is always good to know your local environment. We can only warn you of this, and it has not yet happened (knock on wood)’ [156].
42

REFERENCES
1 Acton WI, Carson MB. 1967 Auditory and subjective effects of airborne noise from industrial ultrasonic sources. Br J Ind Med 24, 297-304. (doi: 10.1136/oem.24.4.297)
2 Skillern CP. 1965 Human response to measured sound pressure levels from ultrasonic devices. Industrial Hygiene Journal, March-April 1965, pages 132-136.
3 Acton WI. 1974 The effects of industrial airborne ultrasound on humans. Ultrasonics 12, 124-128.
4 Crabtree RB, Forshaw SE. 1977 Exposure to ultrasonic cleaner noise in the Canadian Forces. DCIEM Technical Report No. 77X45 (July 1977). Accession Number : ADA048115 http://oai.dtic.mil/oai/oai?verb=getRecord&metadataPrefix=html&identifier=ADA048115
5 Herman BA, Powell D. 1981 Airborne ultrasound: Measurement and possible adverse effects. U.S. Department of Health and Human Resources, Public Health Service Publication (Food and Drug Administration) 81-8163 (12 pages).
6 Acton WI. 1983 Exposure to industrial ultrasound: hazards, appraisal and control. J Soc Occup Med 33, 107-113.
7 Damongeot A, André G. 1988 Noise from ultrasonic welding machines: risks and prevention. Applied Acoustics 25(1), 49–66.
8 Von Gierke HE, Nixon CW. 1992 Noise and Vibration Control Engineering: Principles and Applications, chapter 16: Damage Risk Criteria for Hearing and Human Body Vibration, 598–600. John Wiley and Sons New York, New York, USA.
9 http://ubeam.com/ (viewed 22 October 2010).
10 Rodríguez Valiente A, Trinidad A, García Berrocal JR, Górriz C, Ramírez Camacho R. 2014 Extended high-frequency (9-20 kHz) audiometry reference thresholds in 645 healthy subjects. International Journal of Audiology 53, 531-545. DOI:10.3109/14992027.2014.893375
11 Leighton TG, Birkin PR, Hodnett M, Zeqiri B, Power JF, Price GJ, Mason T, Plattes M, Dezhkunov N, Coleman, AJ. 2005 Characterisation of measures of reference acoustic cavitation (COMORAC): An experimental feasibility trial. In A.A. Doinikov, ed. Bubble and Particle Dynamics in Acoustic Fields: Modern Trends and Applications, Research Signpost, Kerala, Research Signpost, 37-94 (see footnote 5) http://resource.isvr.soton.ac.uk/staff/pubs/PubPDFs/Pub8039.pdf
12 Swedish regulations 2005. Buller - Arbetsmiljöverkets föreskrifter om buller samt allmänna råd om tillämpningen av föreskrifterna. Swedish manual AFS 2005:16 (http://www.av.se/ dokument/afs/afs2005_16.pdf see especially ultrasound limits on page 22-23). (in Swedish with title translation: ‘Noise - Work Environment Authority regulations on noise and general advice on the application of Regulations’).
13 Grigor’eva VM. 1966 Effect of ultrasonic vibrations on personnel working with ultrasonic equipment. Soviet Physics – Acoustics 11: 426-427.
43

14 Parrack HO. 1966 Effect of air-borne ultrasound on humans. Int. J. Audiology 5(3), 294-308.
15 Acton WI. 1968 A criterion for the prediction of auditory and subjective effects due to air-borne noise from ultrasonic sources. Ann Occup Hyg 11, 227-234.
16 Acton WI. 1975 Exposure criteria for industrial ultrasound. Ann Occup Hyg 18, 267-268.
17 Acton WI. 1976 Exposure criteria for industrial ultrasound. Ultrasonics 14, 42.
18 Lee HK (1980). Health hazards of occupational exposure to airborne ultrasound. Occupational Health Technical Memorandum No. 6; 1980. Health and Welfare Canada, Medical Services Branch.
19 World Health Organization (WHO) 1982 WHO United Nations Environment Programme, International Radiation Protection Association (1982). Ultrasound: Environmental Health Criteria 22. World Health Organization, Geneva. ISBN 92 4 154082 6
20 International Non-Ionizing Radiation Committee of the International Radiation Protection Association. (INIRC-IRPA) 1984 Interim guidelines on the limits of human exposure to airborne ultrasound. Health Physics, 46(4), 969–974, April 1984. URL http://www.icnirp.de/documents/ultrasound.pdf
21 Tanttari J. 1986. Low-frequency ultrasound in the working environment. Proceedings INTER-NOISE 86; Cambridge MA; 2: 805-810. Noise Control Foundation, NY. ISBN 0-931784-14-X
22 Health Canada 1991. Guidelines for the safe Use of Ultrasound: Part II - Industrial and Commercial Applications Safety Code 24. Document EHD-TR-158; Health Protection Branch, Environmental Health Directorate, National Health and Welfare, Canada.
23 American Conference of Governmental Industrial Hygienists (ACGIH). 2004. 2004 TLVs and BEIs based on the documentation of the Threshold Limit Values for chemical substances and physical agents, Biological Exposure Indices. ACGIH, Cincinnati, Ohio.
24 Pawlaczyk-Łuszczyńska M, Dudarewicz A, Śliwińska-Kowalska M. 2007 Theoretical predictions and actual hearing threshold levels in workers exposed to ultrasonic noise of impulsive character - a pilot study. Int J Occup Safety Ergon; 13(4), 409-418. http://www.tandfonline.com/doi/abs/10.1080/10803548.2007.11105098#.VdcelU3JCUk
25 US Department of Defence 2010. Department of Defence Instruction Number 6055.12, Hearing Conservation Program.
26 EARS Project (2015) Assessment and safety of non-audible sound, EARS Project Communiqué, June 2015 3 pages, http://www.ears-project.eu/emrp/ears-downloads.html
27 Radosz J. 2012 Methodology issues of ultrasonic noise exposure assessment. Noise Control Engr. J. 60(6), 645-654.
28 Smagowska B, Pawlaczyk-Łuszczyńska M. 2013 Effects of ultrasonic noise on the human body—a bibliographic review. Int J Occup Safety Ergon; 19(2), 195-202.
29 Chatillon J. 2006 Limites d’exposition aux infrasons et aux ultrasons - Étude bibliographiqu. INRS Hygiène et sécurité du travail - Cahiers de notes documentaires - 2e trimestre 2006 - 203 (translation: Limits of exposure to infrasound and ultrasound. A bibliographical study.
44

INRS - Health and Safety - Cahiers documentary notes - 2nd Quarter 2006 - 203/67 (http://www.inrs.fr/media.html?refINRS=ND%202250) (in French).
30 Davis H, Parrack HO, Eldredge DH. 1949 Hazards of intense sound and ultrasound. The Annals of Otology, Rhinology, and Laryngology, 58(3), 732-738.
31 Schmidt RF (editor) Fundamentals of sensory physiology (third edition). (Springer-Verlag, Berlin). ISBN 13:978-3-540-15870-7 doi: 10.1007/978-3-642-82598-9. Page 208.
32 American National Standards Institute 2013. American National Standard Acoustical Terminology. ANSI S1.1-2013. ANSI, New York.
33 American Conference of Governmental Industrial Hygienists (ACGIH). 1989. Threshold limit values and biological exposure indices for 1988-1989. Technical report, American Conference of Governmental Industrial Hygienists, available from American Conference of Governmental Industrial Hygienists, 6500 Glenway Ave, Building D-7, Cincinnati, Ohio, USA 45211-4438.
34 Howard CQ, Hansen CH, Zander AC. 2005 A review of current ultrasound exposure limits. J. Occup. Health Safety Austr. New Zealand 21 (3), 253–257.
35 International Standards Organization 2013 Acoustics -- Preferred reference values for acoustical and vibratory levels (2013). ISO/DIS 1683:2013. (International Standards Organization, Geneva).
36 Ainslie MA and Leighton TG. 2015 Sonar equations for planets and moons. Proceedings of the 22nd International Congress on Sound and Vibration. Major challenges in Acoustics, Noise and Vibration Research, 2015 (Edited by: Crocker MJ, Pawelczyk M, Pedrielli F, Carletti E, Luzzi S . ISSN 2329-3675, ISBN 978-88-88942-48-3). (Florence, Italy, 12016 July 2015) Paper number 1304 (8 pages). http://iiav.org/archives_icsv_last/2015_icsv22/content/papers/papers/full_paper_1304_20150330094349943.pdf
37 Craven NJ, Kerry G. 2007 A Good Practice Guide on the Sources and Magnitude of Uncertainty Arising in the Practical Measurement of Environmental Noise. DTI Project: 2.2.1 - National Measurement System Programme for Acoustical Metrology. University of Salford publishing, Version 1a, May 2007 ISBN: 0-9541649-0-3.
38 Manvell D, Aflalo E. 2005 Uncertainties in Environmental Noise Assessments – ISO 1996, Effects of Instrument Class and Residual Sound. Proceedings of Forum Acusticum 2005 Budapest (29 Aug - 2 Sep, 2005) (edited by Augusztinovicz F, Nagy AB, Hunyadi Z) Publisher: Budapest : OPAKFI, ©2005 paper number 217-0.
39 Radosz J. 2014 Uncertainty due to instrumentation for sound pressure level measurement in high frequency range. Noise Control Engr. J. 62(4), 186-195.
40 Barrera-Figueroa S, Rasmussen K, Torras-Rosell A, Jacobsen F. 2013 Free-field calibration of measurement microphones at high frequencies. Proceedings of INTERNOISE 2011 (4-7 September 2011; Osaka, Japan) 1692-1696.
45

41 Barrera-Figueroa S, Torras-Rosell A, Jacobsen F. 2013 Extending the frequency range of free-field reciprocity calibration of measurement microphones to frequencies up to 150 kHz. Proceedings of INTERNOISE 2013 (15-18 September 2013; Innsbruck, Austria) 3898-3906.
42 EARS Project 2013. EARS Project Newsletter No 2 (January 2013) 6 pages http://www.ears-project.eu/emrp/ears-downloads.html
43 National Occupational Health and Safety Commission (NOHSC) 2002 Noise - annual situation report 2002. Technical report, Commonwealth of Australia, July 2002. URL http: //www.nohsc.gov.au/PDF/Standards/ASR/Noise2002ASR.pdf
44 Ashihara K. 2007. Hearing thresholds for pure tones above 16 kHz. J. Acoust. Soc. Am. 122(3), EL52-EL57 (doi: 10.1121/1.2761883)
45 Lawton BW. 2001 Damage to human hearing by airborne sound of very high frequency or ultrasonic frequency. Health and Safety Executive Contract Research Report 343/2001. HSE Books, Sudbury. ISBN 0 7176 2019 0.
46 Lawton BW. 2013 Exposure limits for airborne sound of very high frequency and ultrasonic frequency. ISVR Technical Report No 334, University of Southampton, April 2013 (16 pages).
47 Kurakata K, Ashihara K, Matsushita K, Tamai H, Ihara Y. 2003 Threshold of hearing in free field for high-frequency tones from 1 to 20 kHz. Acoust. Sci. & Tech. 24(6), 398-399.
48 Frings H. 1948 Pest control with sound waves; ultrasonics as a possibility in the future of rodent and insect control. Pests and their control, 16(4), 9-11 and 44-46
49 Knight JJ. 1968 Effects of airborne ultrasound on man, Ultrasonics 6(1), 39–41. doi:10.1016/0041-624X(68)90016-4
50 Occupational Health and Safety Administration (OSHA) 2015 Technical Manual, Section III: Chapter 5 - Noise Measurement. U.S. Department of Labor, Occupational Safety and Health Administration. https://www.osha.gov/dts/osta/otm/new_noise/index.html#appendixc and https://www.osha.gov/dts/osta/otm/new_noise/appendixc.pdf (last downloaded 18 July 2015).
51 Bundesministerium der Justiz und für Verbraucherschutz 1982. Dieses Gesetz dient dazu, Sicherheit und Gesundheitsschutz der Beschäftigten bei der Arbeit durch Maßnahmen des Arbeitsschutzes zu sichern und zu verbessern. Es gilt in allen Tätigkeitsbereichen und findet im Rahmen der Vorgaben des Seerechtsübereinkommens der Vereinten Nationen vom 10. Dezember 1982 (BGBl. 1994 II S. 1799) auch in der ausschließlichen Wirtschaftszone Anwendung. (http://www.gesetze-im-internet.de/arbschg/ and http://www.gesetze-im-internet.de/arbschg/__4.html ) (in German).
52 Bundesministerium der Justiz und für Verbraucherschutz 2007. Verordnung zum Schutz der Beschäftigten vor Gefährdungen durch Lärm und Vibrationen (Lärm- und Vibrations Arbeitsschutzverordnung - LärmVibrationsArbSchV) (http://www.gesetze-im-internet.de/bundesrecht/l_rmvibrationsarbschv/gesamt.pdf ) (in German).
53 Health and Safety Executive 2003. Health and safety regulation... a short guide HSC13 (rev1) (http://www.hse.gov.uk/pubns/hsc13.pdf )
46

54 INIRC-IRPA (1981) International Non-Ionizing Radiation Committee of the International Radiation Protection Association. Guidelines on limits of human exposure to airborne acoustic energy having one-third octave bands with mid frequencies from 8 to 50 kHz. International Radiation Protection Association, International Non-Ionizing Radiation Committee (IRPA/INIRC)
55 Johnsson LG, Hawkins JE. 1972 Sensory and neural degeneration with aging, as seen in microdissections of the human inner ear. Ann. Otol. 81, 179-193.
56 Green DM, Kidd, Jr. G, Stevens KN. 1987 High-frequency audiometric assessment of a young adult population J. Acoust. Soc. Am. 81(2), 485-494.
57 Henry KR, Fast GA. 1984 Ultrahigh-frequency auditory thresholds in young adults: Reliable responses up to 24 kHz with a quasi-free-field technique. Audiology 23, 477-489
58 Stelmachowicz PG, Beauchaine KA, Kalberer A,Jesteadt W. 1989. Normative thresholds in the 8- to 20-kHz range as a function of age. J. Acoust. Soc. Am., 86(4), 1384-1391.
59 Ashihara K, Kurakata K, Mizunami T, Matsushita K. 2006. Hearing threshold for pure tones above 20 kHz. Acoust. Sci. Tech. 27, 12-19.
60 Filipo R, de Seta E, Bertoli GA. 1988 High-frequency audiometry in children. Scand. Audiol. 17, 213-216.
61 Burén M, Solem BS, Laukli E. 1992 Threshold of hearing (0.125-20 kHz) in children and youngsters. Br. J. of Audiology 26, 23-31.
62 Herbertz J.1983 Loudness of airborne ultrasonic noise. Proceedings Ultrasonics International 83, Halifax, Nova Scotia, July 1983; 226-231.
63 International Standards Organization 2006 Acoustics – Reference zero for the calibration of audiometric equipment. Part 5: Reference equivalent threshold sound pressure levels for pure tones in the frequency range 8 kHz to 16 kHz. ISO 385-9:2006. Geneva: ISO.
64 International Standards Organization 2000 Acoustics – Statistical distribution of hearing thresholds as a function of age. (Document published on 2000-05-04) 9 pages (http://www.iso.org/iso/catalogue_detail.htm?csnumber=26314) ISO 7029:2000. Geneva: ISO.
65 Mix J. 1984 Researchers debunk controlling insects with ultrasonic devices. Pest Control (February 1984), 25-28.
66 Jackson WB, McCartney WC, Ashton AD. 1989 Protocol for field tests of ultrasonic devices for rodent management. In Vertebrate pest control and management materials, 6th Volume, ASTM STP 1055 (Fagerstone KA, Curnow, RD, Eds.) American Society for Testing and Materials, Philadelphia, 1989, pp. 7-12.
67 American Conference of Governmental Industrial Hygienists (ACGIH). 2012. 2012 TLVs and BEIs based on the documentation of the Threshold Limit Values for chemical substances and physical agents, Biological Exposure Indices. ACGIH, Cincinnati, Ohio. ISBN 978-1-607260-48-6.
47

68 Lenhardt ML 2008 Airborne ultrasonic standards for hearing protection, 2008. Proceedings of the 9th International Congress on Noise as a Public Health Problem (ICBEN) 2008, Foxwoods, CT.
69 Lenhardt ML 2007 Novel vacuum personal hearing protection device. In: Proceedings of the National Hearing Conservation Association, Savannah, GA, February 18-20.
70 Lenhardt ML. 2007. Eyes as fenestrations to the ears; a novel mechanism for high frequency hearing. Int. Tinnitus J. 13, 3-10.
71 Altmann J 2010 Acoustic weapons - A prospective assessment. Science & Global Security, 9, 165-234.
72 Allen CH, Frings H, Rudnick I. 1948 Some Biological Effects of Intense High Frequency Airborne Sound. J. Acoust. Soc. Am. 20, 62-65.
73 Frings H, Allen CH, Rudnick I. 1948 The physical effects of high intensity air-borne ultrasonic waves on animals. J. Cellular Physiology, 31(3), 339-358.
74 Frings and Senkovits , 1951 Destruction of the pinnae of white mice by high intensity air-borne sound. Journal of Cellular and Comparative Physiology 37(2) 267-281.
75 Pearson JD, Morrell CH, Gordon-Salant S, Brant LJ, Metter EJ, Klein LL, Fozard JL. 1995 Gender differences in a longitudinal study of age-associated hearing loss. J Acoust Soc Am. 1995 97(2), 1196-1205.
76 Acton WI, Hill CR. 1977 Hazards of industrial ultrasound. Protection 12, 15-16.
77 Duck FA 2007 Medical and non-medical protection standards for ultrasound and infrasound. Progress in Biophysics and Molecular Biology 93 176–191.
78 Duck FA 2008 Hazards, risks and safety of diagnostic ultrasound. Medical Engineering & Physics 30 1338–1348.
79 International Standards Organization 2013. Acoustics -- Estimation of noise-induced hearing loss. ISO 1999:2013. (Document published on 2013-10-01) 23 pages (International Organization for Standardization, Geneva) http://www.iso.org/iso/catalogue_detail.htm?csnumber=45103
80 International Standards Organization 2013. Acoustics -- Preferred reference values for acoustical and vibratory levels. ISO 2013. ISO/DIS 1683:2013 (International Organization for Standardization, Geneva)
81 Rubin GJ, Burns M, Wessely S. 2014 Possible psychological mechanisms for "wind turbine syndrome". On the windmills of your mind. Noise and Health 16(69), 116-122.
82 Pigeonpatrol 2015 Tubesonic Impact Instruction Manual http://pigeonpatrol.ca/wp-content/uploads/2014/11/tubesonic_pdf.pdf
83 Pigeonpatrol 2015 Ultrasonic Impact Instruction Manual http://pigeonpatrol.ca/wp-content/uploads/2013/12/ultrasonic_balcony_impact_pdf.pdf
84 Bird-X 2015 Ultrasound and good neighbour information. http://www.bird-x.com/ultrasound-safety-pages-249.php
48

85 Jackson WB. 1980 Ultrasonics protect egg farm. Pest Control Aug 1980, 28-38.
86 British Standards publications 2013 Electroacoustics — Sound level meters — Part 1: Specifications BS EN 61672-1:2013, following IEC 61672-1:2002, British Standards 2013.
87 British Standards publications 1998 Filters for the measurement of audible sound in the presence of ultrasound BS EN 61012-1998, following IEC 61012-1990 British Standards 1998
88 American National Standards Institute 1997. Specification for sound level meters. ANSI S1.4-1983 (R1997). ANSI, New York.
89 Grace SM, Quaranta E, Shinn-Cunningham BG, Voigt F. 2008 Simulation of the Binaural Environmental Transfer Function for Gerbils Using a Boundary Element Method. Acta Acustica united with Acustica 94, 310-320. (DOI 10.3813/AAA.918034)
90 Kahana Y, Nelson PA. 2007 Boundary element simulations of the transfer function of human heads and baffled pinnae using accurate geometric models. Journal of Sound and Vibration 300, (3-5) 552–579. (doi:10.1016/j.jsv.2006.06.079)
91 Leighton TG. 2007 What is ultrasound? Progress in Biophysics and Molecular Biology 93(1-3), 3-83. (doi:10.1016/j.pbiomolbio.2006.07.026)
92 Davis H. 1948 Biological and psychological effects of ultrasonics. J. Acoust. Soc. Am. 20, 605-607.
93 MacPherson PA, Thrasher DB. 1959 A ‘near field’ study of jet engine noise. DRML Technical Memorandum No. 27-11 (Toronto).
94 Parrack HO.1966 “Effects of Air-Borne Ultrasound on Humans". The 8th International Congress of Audiology, Mexico City, Mexico, Nov. I966.
95 Pharris C. 1948 Ultrasonic sickness. American Industrial Hygiene Quarterly, 9(3) 57-62
96 Nixon CW. 1988 A glimpse into history: The origin of hearing conservation was in the Military? Fort Belvoir, VA:Defense Technical Information Center; 1998. Accession no. ADA355531
97 McIlwain DS, Gates K, Ciliax D. 2008 Heritage of Army audiology and the road ahead: The Army hearing programme. Am. J. Public Health 98(12), 2167-2172. (doi: 10.2105/AJPH.2007.128504).
98 Graff KF. 1981 A History of Ultrasonics. In: Physical Acoustics Volume XV: Principles and Methods Mason WP, Thurston RN (eds). New York, Academic Press. Chapter 1, pp 2 -97. (ISBN 0-12-477915-8 (v. 15)
99 Brown GG. 1967 Airborne ultrasonics and their effects on humans. Canadian Hospital, January 1967, pp. 55-56.
100 Michael PL, Kerlin RL, Bienvenue GR, Prout JH. 1974 An evaluation of industrial acoustic radiation above 10 kHz. Final Report on Contract No. HSM-99-72-125. US Department of Health, Education and Welfare.
101 Allen CH, Frings H, Rudnick I. 1948 Some Biological Effects of Intense High Frequency Airborne Sound. J. Acoust. Soc. Am. 20, 62-65.
49

102 Gorskhkov SI, Gorbunov ON, Antropov GA. 1966 Biological effect of ultrasound (translated from Russian). US Department of Commerce, JPRS 36, 924.
103 Ziff W (editor). 1948 Flying Magazine 43(3) 10. Chicago, Ziff-Davis Publishing Company.
104 Ades HW, Davis H, Eldredge DH, Miles WR, Neff WD. 1953 BENOX Report: An Exploratory Study of the Biological Effects of Noise. Fort Belvoir, VA: Defense Technical Information Center. Accession no. AD0024685
105 Health Protection Agency. 2010 Health effects of exposure to ultrasound and infrasound. Report of the independent Advisory Group on Non-ionizing Radiation. 196 pages. ISBN 978-0-85951-622-4
106 Shoh A. 1975 Industrial Applications of Ultrasound - A Review I. High-Power Ultrasound. IEEE Transactions on Sonics and Ultrasonics, SU-22 (2) 60-71.
107 Śliwiński A. 2013 Assessment of Ultrasonic Noise Hazard in Workplaces Environment. Archives of Acoustics 38(2), 243–252 DOI: 10.2478/aoa-2013-0029.
108 Leighton TG. 1994 The Acoustic Bubble, Academic Press, 640pages (ISBN 0124419208).
109 Crawford AE. 1955 Ultrasonic Engineering. Butterworth, London.
110 Maccà I, Scapellato ML, Carrieri M, Maso S, Trevisan A, Bartolucci GB. 2015 High-frequency hearing thresholds: effects of age, occupational ultrasound and noise exposure. Int Arch Occup Environ Health 88(2), 197-211. (doi: 10.1007/s00420-014-0951-8)
111 Grezsik J, Pluta E. 1983 High-frequency hearing risk of operators of industrial ultrasonic devices. Int Arch Occup Environ Health 57,137–142.
112 Sulkowski WI, Pawlaczyk Luszczynska M. 1994 Evaluation of occupational exposure to noise from the hearing conservation point of view. Int J Occup Med Environ Health 7, 167–175.
113 Silvestri F, Arena G, Predonzani A, Cardini G, Palma G. 2001 Effects of ultrasonic hearing. G Ital Med Lav Erg 23–3, 332.
114 Grezsik J, Pluta E. 1986 High-frequency-noise-induced hearing loss: a field study on the role of intensity level and accumulated noise dose. Int Arch Occup Environ Health 57, 127–136.
115 Grezsik J, Pluta E. 1986 Dynamics of high-frequency hearing loss of operators of industrial ultrasonic devices. Int Arch Occup Environ Health 53, 77-88.
116 Moller P, Grevstad AO, Kristofferson T. 1976 Ultrasonic scaling of maxillary teeth causing tinnitus and temporary hearing shifts. J. Clin. Periodontol. 3, 123–127.
117 Walmsley AD, Hickson FS, Laird WRE, Williams AR. 1987. Investigation into patients’ hearing following ultrasonic scaling. British Dental Journal 162, 221–224
118 Coles RAA, Hoare NW. 1985 Noise induced hearing loss and the dentist. British Dental Journal 159, 209–218
119 Rahko AA, Karma PH, Rahko KT, Kataja MJ. 1988. High-frequency hearing of dental personnel. Community Dentistry and Oral Epidemiology 16, 268–270
50

120 Morrissey E 2015 Don’t lend me this ear. Registered Dental Hygienist magazine, 35(2) (February 13, 2015) http://www.rdhmag.com/articles/print/volume-35/issue-02/columns/anecdotal-hygienist/don-t-lend-me-this-ear.html
121 Bauman N. 2013 Ultrasonic Tooth Cleaning and Tinnitus. Center for Hearing Loss Help, http://hearinglosshelp.com/blog/ultrasonic-tooth-cleaning-and-tinnitus/
122 Trenter SC, Walmsley AD. 2003 Ultrasonic dental scaler: associated hazards. J Clin Periodontol 30, 95–101
123 Radziemski L, Makin IRS. 2016 In vivo demonstration of ultrasound power delivery to charge implanted medical devices via acute and survival porcine studies. Ultrasonics 64 (2016) 1–9.
124 http://techcrunch.com/2015/11/07/wireless-power-charger/#.v1vbjhj:w69e
125 European Union 2008 Fire detection and fire alarm systems - Part 16: Voice alarm control and indicating equipment. EN 54-16:2008
126 Burwell AK, Baldwin AL. 2006 Do audible and ultrasonic sounds of intensities common in animal facilities affect the autonomic nervous system of rodents? J. Applied Animal Welfare Science, 9(3), 179–200.
127 Kirchner WH, Dreller C, Towne WF. 1991 Hearing in honeybees: operant conditioning and spontaneous reactions to airborne sound. J Comp Physiol A, 168, 85-89.
128 Lehmann A, Busnel RG. 1963 A study of audiogenic seizure. Chapter 10 in ‘Acoustic behaviour of animals’, Elvesier, Amsterdam, Editor R.G Busnel, pages 244-274.
129 Lowrie M, Bessant C, Harvey RJ, Sparkes A, Garosi L. 2015. Audiogenic reflex seizures in cats. Journal of Feline Medicine and Surgery (Published online before print April 27, 2015, doi: 10.1177/1098612X15582080) http://jfm.sagepub.com/content/early/2015/05/22/1098612X15582080.abstract
130 Whitford P. 2015 Scientific studies show that birds are affected by ultrasound. BIRD-X commercial material. http://www.bird-x.com/filebin/pdf/research/Ultrasound_Whitford-Study_observations.pdf
131 Scalingi AV. 1980 Use of ultrasonics in IPM program for rodent control. Pest Control Dec 1980 pp 26-28.
132 Ballard JB, Gold RE. 1982 Ultrasonics: no effect on cockroach behaviour. Pest Control Jun 1982, 24-26.
133 Laidlaw G. 1984 Canada has developed guidelines to restrict ultrasonics. Pest Control, Mar 1984, 32 (1 page).
134 Bomford M, O’Brien PH. 1990 Sonic deterrents in animal damage control: a review of device tests and effectiveness. Wildl. Soc. Bull. 18, 411-422.
135 Shumake SA, Kolz AL, Crane KA, Johnson RE. 1982 Variables affecting ultrasound repellency in Philippine rats. J. Wildl. Manage. 46(1), 148-155
51
136 Smith CP. 1990 Repelling pest birds by visual, chemical, acoustic and physical stimuli: A review. Proceedings of the 9th British Pest Control Conference (British Pest Control Association, 5-8 April 1990), 10 pages.
137 Federal Trade Commission’s Division of Enforcement , 2001 FTC warns manufacturers and retailers ultrasonic pest control (published 3 May 2001) http://www.ftc.gov/opa/2001/05/fyi0128.htm
138 Culver EH. 1980 Practical utilization of ultrasonic devices in rodent control Part I. Pest Control Sep 1980, 14-16.
139 Culver EH. 1980 Electromagnetics vs Ultrasonics: a clarification. Pest Control Aug 1980, 30-32.
140 Cope A. 2001 Noise nuisance caused by domestic garden ‘ultrasonic’ pest control devices. Acoustics Bulletin Nov/Dec, 13-21.
141 Gold RE, Decker TN, Vance AD. 1984 Acoustical Characterization and Efficacy Evaluation of Ultrasonic Pest Control Devices Marketed for Control of German Cockoraches (Orthoptera: Blattellidae). J Econ Entomol 77, 1507-1512.
142 Wisnewski G. 2010 Ultraschall: der horror aus nachbars garten (Title translated from German: Ultrasound: The Horror from the neighbour's garden?). Kopp Online (published 20.09.2010) (http://info.kopp-verlag.de/hintergruende/deutschland/gerhard-wisnewski/ultraschall-der-horror-aus-nachbars-garten-.html) (in German)
143 Frida van Til, Stichting KonijnenBelangen 2005 Waarschuwing voor kattenverjagers: marteling voor mens en dier (17 juli 2015) http://igo.nl/nieuws/algemeen/artikel/14842/Waarschuwing-voor-kattenverjagers-marteling-voor-mens-en-di
144 BIRD-X Manufacturer’s instructional material 2015 Ultrasonic pigeon and bird control. http://www.pigeoncontrolresourcecentre.org/html/reviews/ultrasonic-pigeon-and-bird-control.html
145 Schlossmatte 2015 Tiervertreibergeraete http://schlossmatte.ch/siedlung/tiervertreibergeraete.htm
146 http://www.pieptonen.nl/ (last accessed 23 August 2015).
147 Ueda M, Ota A, Takahashi H. 2014 Investigation on high-frequency noise in public space. -We tried noise abatement measures for displeasure people.- Proceedings of the 7th Forum Acusticum (7-12 September 2014, Krakow, Poland) paper PJ06_7 (5 pages).
148 Ueda M, Ota A, Takahashi H. 2014 Investigation on high-frequency noise in public space. Internoise 2014, Melbourne Australia, 16-19 November 2014. 7 pages.
149 Federal Public Service in Belgium for Health, Food Chain Safety and Environment (2015) Ultrasonic animal repellers: disturbing or not? (published 28 September 2015) http://www.health.belgium.be/eportal/Environment/19104803_EN?backNode=83&fodnlang=en#.VjXwWrfhDIV
52

150 Glorieux C. 2014 Undesirable effects as a result of short-term exposure to an ultrasonic repellent device. Part I - Acoustic measurements. Assignment no. DGS/PB_PP/IVC/13026 from the Federal Public Service in Belgium for Health, Food Chain Safety and Environment (28 July 2014).
151 AIB-Vinçotte 2011 Karakterisatie van (ultra) geluidsemissies van ultrasone dierenverdrijvers. Meetverslag, in opdracht van FOD volksgezondheid, voedselketen en leefmilieu, DG5/RB/ML/11031
152 van Wieringen A. 2014 Undesirable effects as a result of short-term exposure to an ultrasonic repellent device. Part I - Exposure of volunteers. Assignment no. DGS/PB_PP/IVC/13026 from the Federal Public Service in Belgium for Health, Food Chain Safety and Environment (28 July 2014).
153 Ashihara K, Shogo Kiryu S. 2003 Audibility of components above 22 kHz in a harmonic complex tone. Acta Acustica united with Acustica, 89, 540–546.
154 Bennett MB, Blackstock DT, 1975 Parametric array in air. J. Acoust. Soc. Am., 57, 562-568
155 Pompei FJ. 1999 The use of airborne ultrasonics for generating audible sound beams. J. Audio Engineering Soc., 47, 726–730
156 Information Unlimited Amherst Product information and advertising material 2015 Phasor Pain Field Generator http://www.amazing1.com/products/phasor-pain-field-generator-with-remote-control-140db.html and http://www.amazing1.com/content/download/PCC30_Instructions.pdf
157 Jauchem JR. 2007 High-intensity acoustics for military nonlethal applications: A lack of useful systems. Military Medicine 172(2), 182-189.
158 General Dynamics, 2002, Long Range Acoustic Device (LRAD), Product Information Sheet.
159 Lewer N, Davison N. 2005 Non-lethal technologies - an overview. Disarmament Forum (Issue 1), pp. 36-51. Geneva: UNIDIR.
160 Sella M. 2003 “The Sound of Things to Come”. New York Times, 23 March 2003.
161 Rodwell R. 1973 Army tests new riot weapon. New Scientist (Technology Review) (20 September 1973) vol. 59 page 684.
162 Rodwell R. 1973 ‘Squawk box’ technology. New Scientist (Comment) (20 September 1973) vol. 59 page 667.
163 Rodwell R. 1973 How dangerous is the Army’s squawk box? New Scientist (Comment) (27 September 1973) vol. 60 page 730.
164 National Research Council. 2003 An Assessment of Non-Lethal Weapons Science and Technology, Committee for an Assessment of Non-Lethal Weapons Science and Technology, National Research Council, 198 pages ISBN: 978-0-309-08288-4 (see pages 31, 39). http://www.nap.edu/openbook.php?record_id=10538
165 Casey-Maslen S. 2010 Non-kinetic-energy weapons termed ‘non-lethal’ - A Preliminary Assessment under International Humanitarian Law and International Human Rights Law.
53

Geneva Academy of International Humanitarian Law and Human Rights. October 2010. 86 pages.
166 Information Unlimited Amherst Product information and advertising material 2015 Phasor Pain Field Pistol 135 dB http://www.amazing1.com/products/phasor-pain-field-pistol-135db.html and http://www.amazing1.com/content/download/PSP60INS.pdf
167 Wilcox SA, Saunders K, Osborn AH, Arnold A, Wunderlich J, Kelly T, Collins V, Wilcox LJ, McKinlay Gardner RJ, Kamarinos M, Cone-Wesson B, Williamson R, Dahl HH. 2000 High frequency hearing loss correlated with mutations in the GJB2 gene. Hum Genet 106, 399–405. (DOI 10.1007/s004390000273)
168 Alleyne R. 2006 Plagued by teenagers? You’ll like the sound of this. Daily Telegraph online, http://www.telegraph.co.uk/news/main.jhtml?xml=/news/2006/02/16/noise16.xml.
169 Stapleton H. 2005 Sound emitting device. UK Patent application GB 2421655B (published 17 January 2007).
170 Wiley TL, Cruickshanks KJ, Nondahl DM, Tweed TS, Klein R, Klein BEK. 1998 Aging and high-frequency hearing sensitivity. Journal of Speech, Language and Hearing Research 41, 1061-1072.
171 Child R. 2008 Mosquito is denied official Police approval. Association of Chief Police Officers, Media release (February 2008).
172 The Mirror. 2008 Exclusive: Fury as tops cops refuse to back 'discriminatory' anti-yob Mosquito gadget (19 February 2008) http://www.mirror.co.uk/news/uk-news/exclusive-fury-as-tops-cops-refuse-294088
173 Byrne J. 2015 ‘Vile piece of equipment’ that targets loitering youths will not be used. The Chronicle (Thursday 15 January 2015), www.chronicleseries.co.uk
174 Vitello P. 2006 “A ring tone meant to fall on deaf ears”. The New York Times, June 12, 2006.
175 BBC Bitesize, 2015 http://www.bbc.co.uk/schools/gcsebitesize/science/add_gateway_pre_2011/radiation/ultrasoundrev2.shtml (last accessed by the author 28 June 2015)
176 Pumphrey RJ. 1950 Upper limit of frequency for human hearing. Nature, 4222, 571.
177 Bryan ME, Tempest W. 1970 Hearing above 20 kHz. British Journal of Audiology, 4(3) 67-71.
178 Abramovich, SJ. 1978 Auditory perception of ultrasound in patients with sensorineural and conductive hearing loss. Journal of Laryngology & Otology 92(10), 861-867.
179 Fujimoto K, Nakagawa S, Tonoike M. 2005 Nonlinear explanation for bone-conducted ultrasonic hearing Hearing Research 204, 210–215.
180 Fujisaka Y-I, Nakagawa S, Tonoike M. 2006 Relationship between detecting pitch via bone-conducted ultrasound and eigenfrequencies of human head. Journal of Computational Acoustics, 14(3) 369–378.
54

181 Ito K, Nakagawa S. 2013 Perception mechanisms of bone-conducted ultrasound assessed by acoustic characteristics in the external auditory meatus. Japanese Journal of Applied Physics 49 paper 07HF31 (7 pages).
182 Ito K, Nakagawa S. 2010 Bone-conducted ultrasonic hearing assessed by tympanic membrane vibration in living human beings. Acoust. Sci. & Tech. 34, 413-423.
183 Ahn T-S, Baek M-J, Lee D. 2013 Experimental measurement of tympanic membrane response for finite element model validation of a human middle ear. SpringerPlus, 2:527 (doi:10.1186/2193-1801-2-527)
184 Hemilä S, Nummela S,Reuter T. 1995 What middle ear parameters tell about impedance matching and high frequency hearing. Hearing Research 85(1–2), 31–44.
185 Nagai T. 1995 Innervation of the tympanic membrane. Acta Otorhinolaryngol Belg 49, 117–120.
186 Job A, Paucod J-C, O’Beirne GA, Delon-Martin C. 2011 Cortical representation of tympanic membrane movements due to pressure variation: An fMRI Study. Human Brain Mapping 32(5):744-749. (DOI : 10.1002/hbm.21063)
187 Kierner AC, Mayer R, v Kirschhofer K. 2002 Do the tensor tympani and tensor veli palatini muscles of man form a functional unit? A histochemical investigation of their putative connections. Hear. Res. 165, 48–52.
188 Money KE. 1970 Motion sickness. Physiological Reviews 50(1), 1-39.
189 Graybiel A. 1970 Susceptibility to acute motion sickness in blind persons. Aerospace Medicine 41 650–653.
190 Sharma K, Aparna. 1997 Prevalence and correlates of susceptibility to motion sickness. Acta geneticae medicae et gemellologiae: twin research 46 (2), 105-121.
191 Reason JT, Brand JJ. 1975 Motion Sickness, London, Academic Press, pp 83–101.
192 Riccio GE, Stoffregen TA. 1991 An ecological theory of motion sickness and postural instability. Ecological Psychology 3(3), 195–240.
193 Bos JE. 2011 Nuancing the relationship between motion sickness and postural stability. Displays 32, 189–193. (doi:10.1016/j.displa.2010.09.005).
194 Smith PE. 1967. Temporary threshold shift produced by exposure to high-frequency noise. Am Ind Hyg Assoc J. 28(5) 447-51.
195 G.R.A.S. Selection Guide for Microphones and Preamplifiers. (Publish Date: Oct 10, 2012) 8 pages http://www.ni.com/white-paper/14044/en/
196 Frank T. 1990 High-Frequency Hearing Thresholds in Young Adults Using a Commercially
Available Audiometer. Ear and Hearing, 11(6), 450-454.
197 http://www.silverpush.co/#!/audio 198 Center for Democracy & Technology (2015, Letter to the Federal Trade Commission USA,
https://cdt.org/files/2015/10/10.16.15-CDT-Cross-Device-Comments.pdf
55

56
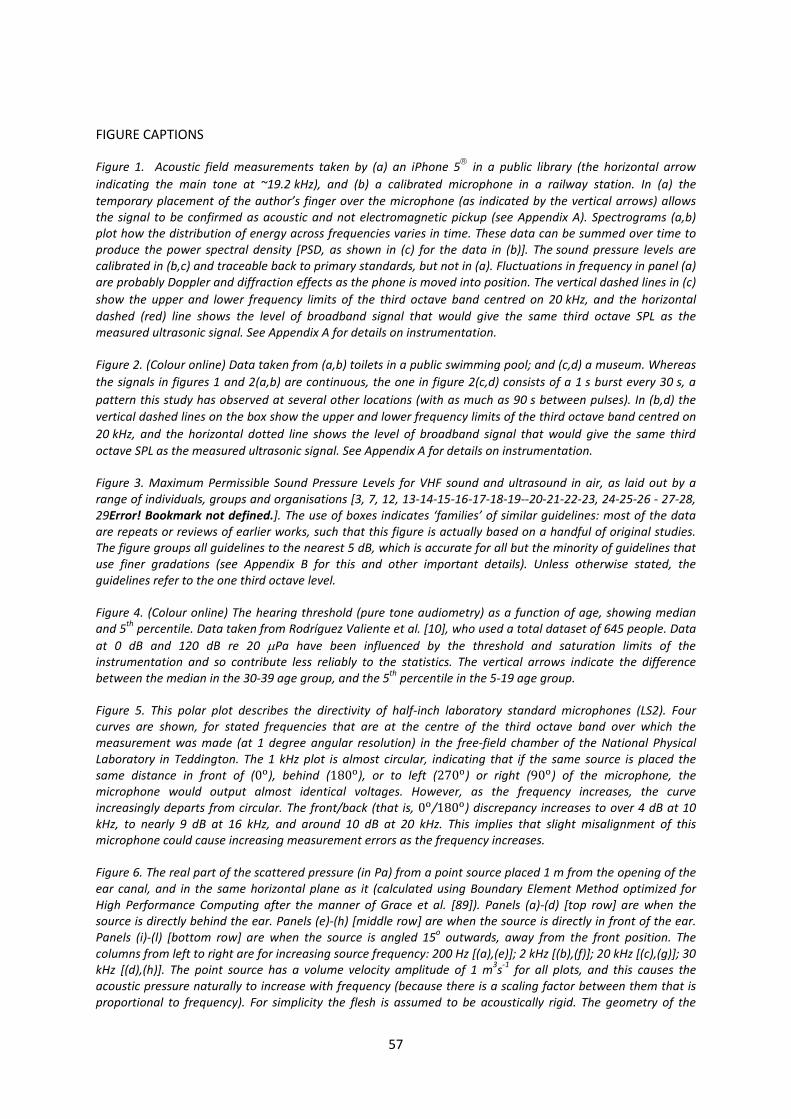
FIGURE CAPTIONS
Figure 1. Acoustic field measurements taken by (a) an iPhone 5 in a public library (the horizontal arrow indicating the main tone at ~19.2 kHz), and (b) a calibrated microphone in a railway station. In (a) the temporary placement of the author’s finger over the microphone (as indicated by the vertical arrows) allows the signal to be confirmed as acoustic and not electromagnetic pickup (see Appendix A). Spectrograms (a,b) plot how the distribution of energy across frequencies varies in time. These data can be summed over time to produce the power spectral density [PSD, as shown in (c) for the data in (b)]. The sound pressure levels are calibrated in (b,c) and traceable back to primary standards, but not in (a). Fluctuations in frequency in panel (a) are probably Doppler and diffraction effects as the phone is moved into position. The vertical dashed lines in (c) show the upper and lower frequency limits of the third octave band centred on 20 kHz, and the horizontal dashed (red) line shows the level of broadband signal that would give the same third octave SPL as the measured ultrasonic signal. See Appendix A for details on instrumentation.
Figure 2. (Colour online) Data taken from (a,b) toilets in a public swimming pool; and (c,d) a museum. Whereas the signals in figures 1 and 2(a,b) are continuous, the one in figure 2(c,d) consists of a 1 s burst every 30 s, a pattern this study has observed at several other locations (with as much as 90 s between pulses). In (b,d) the vertical dashed lines on the box show the upper and lower frequency limits of the third octave band centred on 20 kHz, and the horizontal dotted line shows the level of broadband signal that would give the same third octave SPL as the measured ultrasonic signal. See Appendix A for details on instrumentation.
Figure 3. Maximum Permissible Sound Pressure Levels for VHF sound and ultrasound in air, as laid out by a range of individuals, groups and organisations [3, 7, 12, 13-14-15-16-17-18-19--20-21-22-23, 24-25-26 - 27-28, 29Error! Bookmark not defined.]. The use of boxes indicates ‘families’ of similar guidelines: most of the data are repeats or reviews of earlier works, such that this figure is actually based on a handful of original studies. The figure groups all guidelines to the nearest 5 dB, which is accurate for all but the minority of guidelines that use finer gradations (see Appendix B for this and other important details). Unless otherwise stated, the guidelines refer to the one third octave level.
Figure 4. (Colour online) The hearing threshold (pure tone audiometry) as a function of age, showing median and 5th percentile. Data taken from Rodríguez Valiente et al. [10], who used a total dataset of 645 people. Data at 0 dB and 120 dB re 20 µPa have been influenced by the threshold and saturation limits of the instrumentation and so contribute less reliably to the statistics. The vertical arrows indicate the difference between the median in the 30-39 age group, and the 5th percentile in the 5-19 age group.
Figure 5. This polar plot describes the directivity of half-inch laboratory standard microphones (LS2). Four curves are shown, for stated frequencies that are at the centre of the third octave band over which the measurement was made (at 1 degree angular resolution) in the free-field chamber of the National Physical Laboratory in Teddington. The 1 kHz plot is almost circular, indicating that if the same source is placed the same distance in front of (0o), behind (180o), or to left (270o) or right (90o) of the microphone, the microphone would output almost identical voltages. However, as the frequency increases, the curve increasingly departs from circular. The front/back (that is, 0o/180o) discrepancy increases to over 4 dB at 10 kHz, to nearly 9 dB at 16 kHz, and around 10 dB at 20 kHz. This implies that slight misalignment of this microphone could cause increasing measurement errors as the frequency increases.
Figure 6. The real part of the scattered pressure (in Pa) from a point source placed 1 m from the opening of the ear canal, and in the same horizontal plane as it (calculated using Boundary Element Method optimized for High Performance Computing after the manner of Grace et al. [89]). Panels (a)-(d) [top row] are when the source is directly behind the ear. Panels (e)-(h) [middle row] are when the source is directly in front of the ear. Panels (i)-(l) [bottom row] are when the source is angled 15o outwards, away from the front position. The columns from left to right are for increasing source frequency: 200 Hz [(a),(e)]; 2 kHz [(b),(f)]; 20 kHz [(c),(g)]; 30 kHz [(d),(h)]. The point source has a volume velocity amplitude of 1 m3s-1 for all plots, and this causes the acoustic pressure naturally to increase with frequency (because there is a scaling factor between them that is proportional to frequency). For simplicity the flesh is assumed to be acoustically rigid. The geometry of the
57

pinna was adapted from Kahana and Nelson [90] with an added ear canal depth of 2.5 cm. The ear canal in this model is straight so that the eardrum is visible in every image at the base of the ear canal. Human ear canals contain a bend, although in some individuals this is less pronounced than in others.
Figure 7. (Colour online) Plots of the occurrence of a range of subjective symptoms from the 2015 data of Maccà et al. [110]. There are no data for the inducement of ‘Tingling in limbs’ by industrial audio frequency noise. Note that there are typographical errors in the original tables as explained in Appendix C.
Figure 8. (Colour online) The displacement of the tympanic membrane measured in vivo on five healthy males aged between 25 and 35, for two different sound pressure levels in the ear cavity, the signals having centre frequencies in third octave bands from 200 to 10,000 Hz. Taken from Ahn et al. [183].
Table 1. Compendium of levels shown graphically in figure 3 for the third octave bands (unless otherwise stated) centred from 8 to 50 kHz (no data outside these limits are shown although some guidelines have been suggested), arranged in original author publication year (1966-2015). All are for occupational exposure except one, the one labelled ‘INRC IRPA (1984) for General public’. The listing of these figures in this table should not be misinterpreted as an endorsement of them as guidelines by the author.
Table 2. The p-values calculated to 3 significant figures from the data of Maccà et al. [110] using cohort sizes of 24 and 56 for the numbers of ultrasound-exposed and industrial noise-exposed subjects. Entries with p-values below 0.05 are shown in bold to show they satisfy the first criterion for significance, but they are bracketed if they fail to satisfy the second criterion of having at least five instances of each occurrence in the observations. The number of occurrences in shown in after each occurrence for which the p-value is less than 5%.
58

f(kHz) 8 10 12.5 16 20 25 31.5 40 50 Parrack (1966) - - - - 140 140 140 140 140 Grigor’eva (1966) 80 85 90 90 120 for wideband exceeding
20 kHz Acton (1968) 75 75 75 75 110 110 110 - - Parrack (1969) cited in WHO (1982) and Acton (1983)
- 80 80 80 105 110 115 115 115
Japan (1971) cited in WHO (1982)
90 90 90 90 110 110 110 110 110
USSR (1975) cited in WHO (1982)
- - 75 85 110 110 110 110 110
Acton (1975, 1976) 75 75 75 75 75 110 110 110 - US Air Force (1976) cited in WHO (1982)
- - 85 85 85 85 85 85 -
Internat. Lab. Off. (1977) cited in Lee (1980)
- - 75 85 110 110 110 110 110
Sweden (1978) cited in WHO (1982)
- - - - 105 110 115 115 115
Norway (1978) cited in Damongeot & Andre (1985)
120 (octave band limit)
ACGIH (1979) as cited in Lee (1980)
- 80 80 80 105 110 115 115 115
Canada (1980) cited in WHO (1982)
80 80 80 80 80 110 110 110 110
Australia (1981) cited in Damongeot & Andre (1985)
- 75 75 75 75 110 110 110 110
USSR (1983) cited in Tanttari (1986)
- - 80 90 100 105 110 110 110
INRC IRPA (1984) for Occupational exposure
- - - -
75 110 110 110 110
INRC IRPA (1984) for General public
- - - - 70 100 100 100 100
Health Canada (1991) - - - 75 75 110 110 110 110 Poland (2002) Leq8h - 80 80 80 90 105 110 110 - Poland(2002) Lmax - 100 100 100 110 125 130 130 - ACGIH (2004) 8 hour average cited in Howard et al (2005)
- 88 89 92 94 - - - -
ACGIH (2004) ceiling values cited in Howard et al (2005)
105 105 105 105 140 145 145 145
US Dept of Defence (2010) - 80 80 80 105 110 115 115 115 EARS Project (2015) - 75 75 75 77 102 110 110 110 Table 1. Compendium of the Maximum Permissible Sound Pressure Levels that are shown graphically in figure 3 for the third octave bands (unless otherwise stated) centred from 8 to 50 kHz (no data outside these limits are shown although some guidelines have been suggested), arranged in original author publication year (1966-2015). All are for occupational exposure except one, the one labelled ‘INRC IRPA (1984) for General public’. The listing of these figures in this table should not be misinterpreted as an endorsement of them as guidelines by the author.
59

Symptom: Subjects exposed to: Ultrasound Industrial noise Headache 0.0628 0.232 Asthenia 0.000131 8 0.518 Vertigo 0.000175 6 0.652 Tingling in limbs 0.000807 7 - Sleep disorders 0.0625 0.115 Tinnitus 0.318 0.00366 18 Nausea 0.592 0.476 Stomach pain 0.984 0.0876 Vomiting (0.0394) 1 0.178 Sensation of fullness 0.667 0.153 Hypoacusia (0.0496) 3 0.000021 14 Uncertain gait 0.529 0.544
Table 2. The p-values calculated to 3 significant figures from the data of Maccà et al. [110] using cohort sizes of 24 and 56 for the numbers of ultrasound-exposed and industrial noise-exposed subjects. Entries with p-values below 0.05 are shown in bold to show they satisfy the first criterion for significance, but they are bracketed if they fail to satisfy the second criterion of having at least five instances of each occurrence in the observations. The number of occurrences in shown in after each occurrence for which the p-value is less than 5%.
60

(b)
(a) (c)
Figure 1.
61
(a) (c)
(b) (d)
Figure 2.
62

Figure 3.
63

Figure 4.
64

Figure 5.
65

Figure 6.
66

Figure 7.
67

Figure 8.
68