Electromagnetic controlled cortical impact device for precise ...
Upload
khangminh22Category
view
1download
0
─── Economics and Management ───
───Ukrainian Food Journal. 2016. Volume 5. Issue 3 ─── 568
Are public perceptions precise towards the status of quality and safety of commercial brands of noodles?
Jakia Sultana Jothi1,3, M. Burhan Uddin2
1 – Department of Food Processing and Engineering, Chittagong Veterinary and Animal Sciences University (CVASU), Bangladesh 2 – Department of Food Technology and Rural Industries, Bangladesh Agricultural University (BAU), Bangladesh 3 – Department of Biofunctional Science and Technology, Graduate School of Biosphere Science, Hiroshima University, Japan
Abstract Keywords: Consumer Attitude Noodles Chemical Microbial Preference
Article history: Received 19.06.2016 Received in revised form 09.08.2016 Accepted 01.09.2016
Corresponding author: Jakia Sultana Jothi E-mail: juthi.engg.bau@ gmail.com
Introduction. Consumers are more conscious about the food safety and food quality which are the most important challenges throughout the world. In the aspect of food quality and safety, the study was conducted to assess quality in some commercial brands of Bangladeshi noodles.
Materials and methods. The study was carried out in two phases. In phase I, a comprehensive baseline survey was completed to know consumer attitude towards noodles covering the peoples of different areas in Bangladesh. Consumers alleged that all commercial branded noodles are adulterated by the use of low grade flour and harmful food colors that are hazardous for health. In phase II, four commercial branded noodles samples were collected from local market for assessing chemical composition, cooking characteristics, microbial profile and sensory evaluation (descriptive and preference test).
Results and discussion. Noodles samples were found in the range as moisture 7.07–10.70%, ash 1.01–2.70%, fat 0.40–0.73%, crude protein 11.00–11.17%, crude fibre 0.05–0.30%, total carbohydrate 74.19–80.34%, starch content 61.09–66.35% and pH 8.15–8.88. The degree of gelatinization, acid value and energy content was found as 96.55–99.85%, 0.79–0.85 mg/g and 344.52 kcal/100g – 370.53 kcal/100 g respectively. Microbial profile indicates, noodles industries maintained good hygienic conditions during noodles production according to GMP and there was no fecal contamination and any microbial hazards. The cooking characteristics of all noodles samples were varied but all had acceptable quality. There was significant difference (p<0.05) in the smoothness, yellowness, whiteness and shininess except brightness and textural attributes examined among the cooked noodles samples. Although descriptive score were varied, but were obtained satisfactory score. There was significant difference (p<0.05) in all the sensory attributes (color, flavor, taste, texture and overall acceptability) among the noodles but were achieved satisfactory score for all noodles samples.
Conclusions. Commercial brands noodles samples fulfilled the requirement of Bangladesh Standards and Testing Institution (BSTI) standards. So the concept of peoples about commercial brands noodles is not precise.
─── Economics and Management ───
───Ukrainian Food Journal. 2016. Volume 5. Issue 3 ─── 569
Introduction In Asia, noodles are consumed extensively as a traditional food. In the ancient period,
they were prepared and consumed within the home. Now-a-days the new technology developed to improve it’s quality with different variety, continue a staple of Asian intakes. Noodles become very available and can be obtained with different forms including fresh, cooked or processed for longer shelf life. Now noodles are reflected as a convenient fast food because of easy to prepare [1].
According to World Instant Noodles Association (2013), noodles are consumed in more than 80 countries and have become worldwide renowned foods. The world intake of noodles was 101.42 billion packets in 2013 and most of the intake took place in Asia. This included 44.03 billion in China, 14.10 billion in Indonesia, 5.41 billion in Japan, 4.36 billion in India and 0.16 billion in Bangladesh. However, North America also consumed 4.34 billion packets of noodles [2].
Factors to assess Asian noodle quality are appearance, color, eating quality and texture. Cooking characteristics and shelf life belongs to additional quality factors. Appearance can be assessed by three parameters such as brightness, yellowness and discoloration, although additionally glossiness, luster and geometry also consider as quality. Sensory evaluation and instrumental testing are the ways to assess eating quality and textural attributes. Trained panels frequently accomplish for sensory evaluation of Asian noodle texture and terminologies used are often subjective [3].
However, in the developing country like Bangladesh, it is very essential to assess the quality of commercial brands of noodles because it has very insignificant information in it and consumer are very worried about the quality and safety of foods. Hence, this experiment is crucial to meet a void in the scientific field as well as to meet up consumer demand.
The current study was carried out in two phases. In the first phase, the main goal was to complete a comprehensive baseline survey to know consumer attitude towards noodles covering the people of different sections of society. In the second phase, some commercial brands of Bangladeshi noodles quality were evaluated.
Materials and methods
Phase-I: Method of Base Line Survey. A comprehensive Baseline Survey was
completed covering the people of different sections of society. 1920 questionnaires were distributed among the respondents from where 951 complete questionnaires were received. Quantitative and qualitative data were transformed into scoring.
Phase-II: Laboratory experiment. The study was conducted in the laboratory of the department of Food technology and Rural Industries under the faculty of Agricultural Engineering and Technology and the laboratory of the department of Microbiology and Food Hygiene, Bangladesh Agricultural University and the laboratory of Bangladesh Standards and Testing Institution (BSTI).
Sampling. In order to carry out experiment, noodles samples of different commercial brands (coded with A, B, C and D to overcome the sampling biasness) were purchased from local market, Bangladesh, whose manufacture date were same. Control sample (coded with E) was made by using wheat flour (100g), salt (2g), gelatin (0.5g) and water (40g) with standard procedure.

─── Economics and Management ───
───Ukrainian Food Journal. 2016. Volume 5. Issue 3 ─── 570
Chemical analysis of noodles. All noodle samples were analyzed for its moisture content, ash content, fat content, crude protein content, crude fibre content, total carbohydrate content, starch content, pH of cooked noodles, acid value and degree of gelatinization, to determine important chemical parameters to assess the quality according to AOAC method [4]. All tests were executed in triplicate and the results averaged.
Microbial profile. The standard plate count and yeast and mold count were done according to the method described in “Recommended Method for Microbiological Examination of Food” [5]. Coliform count of selected brands noodles was done [6]. All tests were executed in triplicate and the results averaged.
Cooking Quality Attributes of Noodles. Cooking time, cooking yield, cooking loss and water absorption of all noodle samples were examined using standard method [7]. All tests were executed in triplicate and the results averaged.
Sensory Assessment. Samples were presented to a panel of 30 panelists selected from department. The descriptive test using a 5-point attribute scale and preference test using a nine-point hedonic scale were conducted consecutively. All the panelists were briefed before evaluation. Panelists evaluated the appearance of uncooked and cooked noodles under daylight illumination. The samples were coded with letters and served to the panelists at random to guard against any bias. Each sample was simulated triplicate by the full panel over three consecutive days during the course of evaluation.
Statistical analysis. The data obtained from the experiments were statistically analyzed for analysis of variance (ANOVA) and consequently Duncan's Multiple Range Test (DMRT) was used to determine significant difference among the various samples in triplicate. Data were analyzed using the software, Statistical Package for Social Sciences (SPSS) version SPSS 16.0.2 at the 0.05 level [8].
Results and discussion Phase-I: Baseline Survey Results Status of Adulteration. This survey was performed to know the opinions of general
people of our society. 1920 questionnaires were distributed among the respondents and 951 complete questionnaires were received from them and most of the respondent’s opinion is shown in table 1.
Table 1
Status of Adulteration in Noodles Available in Local Market
Responses Total respondent (n)
Adulterated Not-Adulterated 951 85.40% 14.60%
From Table 1, it is clear that 85.40% people of our society think that noodles available
in local market are adulterated. Adulterants Used in Noodles. According to the survey results, about six out seven of
respondents opined that the processed noodles are being adulterated with different types of

─── Economics and Management ───
───Ukrainian Food Journal. 2016. Volume 5. Issue 3 ─── 571
adulterant like high moisture, excessive amounts of permitted preservatives, harmful food colors, low grade flour and harmful preservatives. The consumer response about the type and the level of individual adulterants in noodles has been shown in Figure 1.
According to the public opinion, 41.66% among adulterated noodles are adulterated by the use of low grade flours.
vi) Others; 1,42v) Harmful preservatives;
11,87
iv) Low grade flour; 41,66
iii) Harmful food colors; 23,2
ii) Excessive permitted
preservatives; 10,04
i) High moisture; 11,8
Figure 1. Consumer Response about the Individual Adulterants Present in Noodles
(Percent Respondent)
Status of Quality and Safety of Noodles. Different respondent interpreted from different points on quality and safety issue of noodles avail in the market. The present respondent on quality and safety issue of noodles has been shown in Figure 2.
i) Are healthful for the customers?;
3,53iv) Customer
should not eat it.; 29,56
iii) Customers should eat it.; 6,95
ii) Are harmful for the consumers?;
59,96
Figure 2. Consumer Response about the Status of Quality and Safety of Noodles
(Percent Respondent)

─── Economics and Management ───
───Ukrainian Food Journal. 2016. Volume 5. Issue 3 ─── 572
From Figure 2, about six tenth people of our society believed noodles avail in market are harmful for consumers where three out of ten respondents stated that customer should not eat it. According to the survey results, it was concluded that public thought noodles available in market are unsafe for consumers to eat.
Preventive Measures to Control Adulteration in Noodles. The preventive measure
need to be undertaken to control adulteration in commercial brands noodles are shown in Figure 3.
vi) Others; 2v) Strengthening
supervision by legal authority; 17
iv) Social motivation of food
consumers; 20
iii) Adopting BSTI standards; 23
ii) Social motivation of food
processor; 16
i) Enforcing law and imposing
punishment; 22
Figure 3. Consumer Response about the Status of Preventive Measures to Control Adulteration
(Percent Respondent)
According to the respondents, preventive measure should be “Adopting BSTI standard” (23%), “Enforcing law and imposing punishment” (22%) and “Social motivation of food consumers” (20%). On the other hand 17% people believed that preventive measure should be “Strengthening supervision by legal authority”. “Social motivation of food processor” (16%) is also a preventive measure need to be undertaken to control adulteration in commercial brands noodles.
Phase-II: Chemical Analysis of Noodles The results of chemical analysis of noodles samples are tabulated in Table 2. The
higher moisture content was obtained in sample A (10.70%) followed by B (8.35%), C (7.71%), E (7.31%) and D (7.07%). According to Bangladesh Standard and Testing Institution [9], the maximum moisture content of noodles should be 10%. The analysis showed that sample A had little bit higher moisture content than standard limits. The moisture content of all noodles samples varied. This variation might be due to the different drying time, drying condition and temperature.
─── Economics and Management ───
───Ukrainian Food Journal. 2016. Volume 5. Issue 3 ─── 573
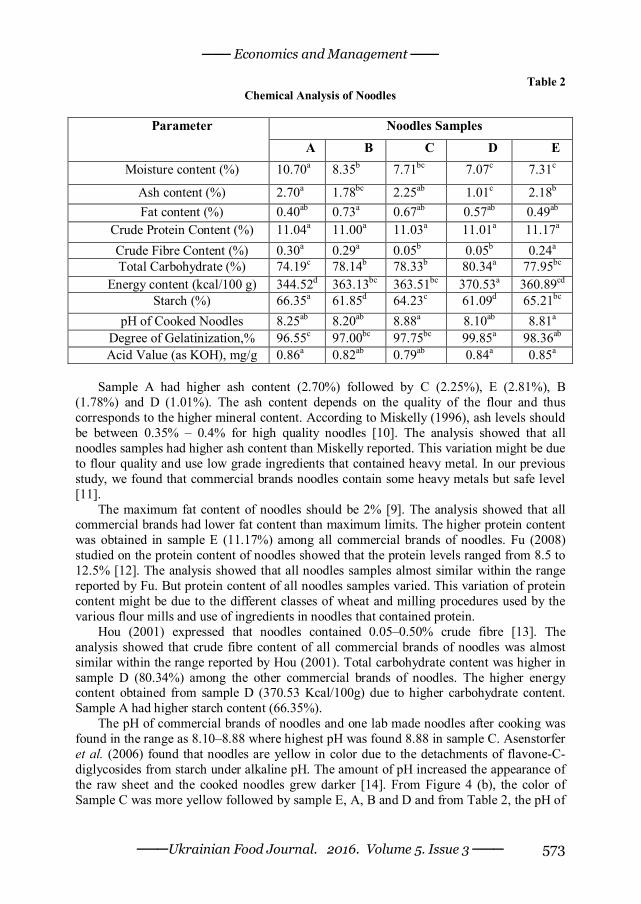
Table 2 Chemical Analysis of Noodles
Noodles Samples Parameter
A B C D E Moisture content (%) 10.70a 8.35b 7.71bc 7.07c 7.31c
Ash content (%) 2.70a 1.78bc 2.25ab 1.01c 2.18b Fat content (%) 0.40ab 0.73a 0.67ab 0.57ab 0.49ab
Crude Protein Content (%) 11.04a 11.00a 11.03a 11.01a 11.17a Crude Fibre Content (%) 0.30a 0.29a 0.05b 0.05b 0.24a Total Carbohydrate (%) 74.19c 78.14b 78.33b 80.34a 77.95bc
Energy content (kcal/100 g) 344.52d 363.13bc 363.51bc 370.53a 360.89cd Starch (%) 66.35a 61.85d 64.23c 61.09d 65.21bc
pH of Cooked Noodles 8.25ab 8.20ab 8.88a 8.10ab 8.81a Degree of Gelatinization,% 96.55c 97.00bc 97.75bc 99.85a 98.36ab Acid Value (as KOH), mg/g 0.86a 0.82ab 0.79ab 0.84a 0.85a
Sample A had higher ash content (2.70%) followed by C (2.25%), E (2.81%), B
(1.78%) and D (1.01%). The ash content depends on the quality of the flour and thus corresponds to the higher mineral content. According to Miskelly (1996), ash levels should be between 0.35% – 0.4% for high quality noodles [10]. The analysis showed that all noodles samples had higher ash content than Miskelly reported. This variation might be due to flour quality and use low grade ingredients that contained heavy metal. In our previous study, we found that commercial brands noodles contain some heavy metals but safe level [11].
The maximum fat content of noodles should be 2% [9]. The analysis showed that all commercial brands had lower fat content than maximum limits. The higher protein content was obtained in sample E (11.17%) among all commercial brands of noodles. Fu (2008) studied on the protein content of noodles showed that the protein levels ranged from 8.5 to 12.5% [12]. The analysis showed that all noodles samples almost similar within the range reported by Fu. But protein content of all noodles samples varied. This variation of protein content might be due to the different classes of wheat and milling procedures used by the various flour mills and use of ingredients in noodles that contained protein.
Hou (2001) expressed that noodles contained 0.05–0.50% crude fibre [13]. The analysis showed that crude fibre content of all commercial brands of noodles was almost similar within the range reported by Hou (2001). Total carbohydrate content was higher in sample D (80.34%) among the other commercial brands of noodles. The higher energy content obtained from sample D (370.53 Kcal/100g) due to higher carbohydrate content. Sample A had higher starch content (66.35%).
The pH of commercial brands of noodles and one lab made noodles after cooking was found in the range as 8.10–8.88 where highest pH was found 8.88 in sample C. Asenstorfer et al. (2006) found that noodles are yellow in color due to the detachments of flavone-C-diglycosides from starch under alkaline pH. The amount of pH increased the appearance of the raw sheet and the cooked noodles grew darker [14]. From Figure 4 (b), the color of Sample C was more yellow followed by sample E, A, B and D and from Table 2, the pH of

─── Economics and Management ───
───Ukrainian Food Journal. 2016. Volume 5. Issue 3 ─── 574
Sample C was highest followed by sample E, A, B and D. So the relationship between pH and color of noodles found similar that reported by Asenstorfer et al. (2006).
The degree of gelatinization of all commercial brands of noodles were obtained in the range as 96.55–99.85%. According to BSTI (2001), the minimum requirements of degree of gelatinization for noodles should be 80% [9]. The analysis showed that all commercial brands of noodles had higher degree of gelatinization than minimum limits.
Acid value was found in the range as 0.79–0.86 mg/g where the reference values are maximum 2mg/g prescribed in relevant BSTI standards [9]. The analysis showed that all noodles samples had lower acid value than maximum limits.
Table 3
Microbial Profile of Noodles
Noodles Samples Parameters (cfu/g) A B C D E
Total Plate Count <10 <10 <10 <10 <10 Total Fungi Count ND ND ND ND ND
Coliform Count ND ND ND ND ND Bacillus cereus ND ND ND ND ND Staphylococcal ND ND ND ND ND
Results are expressed as mean values of three replicates; ND – Not Detected Microbial profile of noodles. The microbiological profile of the all commercial
brands of noodles along with control noodles are presented on Table 3. Total plate count of the all commercial brands of noodles and control noodles was
observed to be below 10 cfu/g. Total fungi count, coliform count, Bacillus cereus and staphylococcal were not detected in all commercial brands of noodles samples and control noodles.
It indicates, noodles industries maintained good hygienic conditions during noodles production according to GMP and there was no fecal contamination. But continuous inspection should be needed for maintaining proper hygienic condition in noodles production floor.
Cooking Characteristics of Noodles. Table 4 shows the mean values of the cooking
characteristics of commercial brands of noodles samples along with control noodles. The optimum cooking time of all commercial brands of noodles samples were found in
this study ranged from 6 – 9 minutes. Sample A had higher cooking yield 484.62% because of high amount of starch content among all commercial brand noodles samples (shown in Table 2). The cooking yield varied for all noodles samples. This variation of cooking yield might be due to flour quality, starch content, water holding capacity, water absorption rate and use of ingredients for example gum that increase water holding capacity.
Cooking loss is undesirable and according to Wu et al. (1987), it should not exceed 10% [15]. From Table 4, sample C had higher cooking loss. The significantly lowest value of the cooking loss occurred with all noodles samples than Wu et al. (1987) reported. The differences observed in cooking loss might be due to fineness of granulation of flour and starch damage used in noodles making and free lipids content in noodles.

─── Economics and Management ───
───Ukrainian Food Journal. 2016. Volume 5. Issue 3 ─── 575
Table 4 Cooking Characteristics of Noodles
Noodles Sample
Cooking Time (Min.)
Cooking Yield (%)
Cooking Loss (%)
Water Absorption
(%)
Moisture content after cooking (%)
A 6a 484.62a 6.11b 384.62a 84.36a B 7ab 388.64bc 7.90bc 288.64bc 77.24bc C 9c 426.75ab 9.35cd 326.75ab 79.67ab D 7ab 380.64bc 5.30ab 280.64bc 77.09bc E 6a 481.02ab 4.01a 381.02ab 80.83ab
The water absorption for all noodles ranged from 280.64 – 384.62% where moisture
content varied from 77.09–84.36% and varied might be due to flour quality, starch content, water holding capacity and use of ingredients for example gum that increase water holding capacity.
The better cooking quality was observed in sample A, C and E noodles samples. But the quality of sample B and D was also acceptable.
Sensory Assessment of Noodles Descriptive Test. Figure 4 represents the Spider web plot of the sensory attributes of
brightness, smoothness, yellowness, whiteness and shininess of the all uncooked (a) and cooked noodles (b).
The one way analysis of varience indicated that there was no significant difference (p>0.05) in the brightness, smoothness and shininess except yellowness and whiteness of the uncooked noodles (values are not shown but mean score was varied. In terms of brightness, smoothness and shininess, the range of mean score was 2.86–3.86, 2.57–3.43 and 2.71–3.86 respectively. But sample C (3.86) was declared to be very yellow among the noodle samples while Sample D had higher score (3.86) for whiteness.
For cooked noodles samples, there was significant difference (p<0.05) in the smoothness, yellowness, whiteness and shininess except brightness examined (Figure 4(b)). The range of mean scores for brightness was (3.00–3.71), smoothness (2.71–3.86), yellowness (1.14–3.14), whiteness (1.57–3.86) and shininess (2.71–3.86).
Figure 4(c) represents the Spider web plot of the textural attributes according to smoothness, softness, chewness and ease of swallowing of the all cooked noodles. The one way analysis of varience indicated that there was no significant difference (p>0.05) in the textural attributes according to smoothness, softness, chewness and ease of swallowing of the all cooked noodles. The range of mean scores for smoothness was (3.14–3.86), softness (2.86–3.71), chewiness (2.29–2.86) and ease of swallowing (2.71–3.71).
Preference Test. The means sensory liking scores for color, flavor, texture, taste and overall acceptability of cooked noodle samples are shown in Table 5.

─── Economics and Management ───
───Ukrainian Food Journal. 2016. Volume 5. Issue 3 ─── 576
0
1
2
3
4Brightness
Smothness
YellownessWhiteness
ShininessSample ASample BSample CSample DSample E
(a) Uncooked Noodles Appearance
0
1
2
3
4Brightness
Smothness
YellownessWhiteness
ShininessSample A
Sample B
Sample C
Sample D
Sample E
(b) Cooked Noodles Appearance
0
1
2
3
4Smoothness
Softness
Chewiness
Ease of swallowing
Sample A
Sample B
Sample C
Sample D
Sample E
(c) Cooked Noodles Texture
Figure 4. Spider Web Plot on Sensory Descriptive Profiling of Noodles Samples

─── Economics and Management ───
───Ukrainian Food Journal. 2016. Volume 5. Issue 3 ─── 577
Table 5 Mean Sensory Score of Noodle Samples
*Mean Scores on sensory attributes Sample
Color Flavor Texture Taste Overall Acceptability
A 7.57 ± 0.68a 7.60 ± 0.67a 7.67 ± 0.99a
7.63 ± 0.99a 7.67 ± 0.66a
B 6.53 ± 0.94b 6.77 ± 1.01b 6.80 ± 1.19b
6.97 ± 0.96b 6.80 ± 0.96b
C 7.27 ± 1.01a 7.40 ± 0.86a 7.60 ± 0.97a
7.67 ± 1.24a 7.63 ± 0.81a
D 6.50 ± 1.22b 6.57 ± 1.06b 6.93 ± 1.05b
6.60 ± 0.93b 6.63 ± 0.85b
E 7.63 ± 0.81a 7.80 ± 0.55a 7.97 ± 0.85a
8.07 ± 0.74a 7.90 ± 0.85a
LSD (p<0.05)
0.4853 0.4277 0.5180 0.5043 0.4281
*Mean value ± standard deviation (n = 30). Means with different superscripts within a column are significantly different and the same superscripts do not significantly different (NSD) at p<0.05
The one-way analysis of variance indicated that there was significant difference
(p<0.05) in all the sensory attributes examined among all noodles samples. The range of mean scores for color was (6.5–7.63). In term of flavor, sample E had the highest mean score (7.8) followed by samples A (7.6) and C (7.4), while samples D (6.57) and B (6.77) had acceptable but slightly lower score. There was no significant difference in texture acceptability among samples A (7.67), C (7.60) and E (7.97). The range of mean score for taste was (6.60–8.07). Based on the scores for overall acceptability, there was no significant difference in overall acceptability among samples A (7.67) and C (7.63) over control samples (7.90). Also sample B and D also got satisfactory overall acceptability score. All the noodles samples obtained satisfactory score so they may be recommended as preferred for consumption.
Conclusions The assurance and protection of food quality has always been important to consumers.
Governments over many centuries have endeavored to provide for the safety and wholesomeness of food by legal provisions. Though commercial brands of noodles samples were varied in their quality characteristics but all noodles samples fulfilled the requirement of Bangladesh Standards and Testing Institution (BSTI) standards. However, this study was useful in differentiating the quality characteristics among the Commercial brands noodles. So public perceptions to judge the quality and safety of commercial brands of noodles is erroneous might be due to lack of familiarity to evaluate quality.

─── Economics and Management ───
───Ukrainian Food Journal. 2016. Volume 5. Issue 3 ─── 578
References
1. Choy A.L. (2011), Enhancing the quality of instant noodles: The impact of low protein wheat flour, ingredients and processing conditions. PhD Thesis, School of Applied Sciences Science, Engineering and Health Portfolio, RMIT University, pp. 9–14.
2. World Instant Noodles Association (WINA) (2013), International Ramen Manufacturers Association (IRMA), Following adoption of CODEX International Standards for Instant Noodles.
3. Ong Y.L. (2007) Glutenin Macropolymer in Salted and Alkaline Noodles and its Relation with Dough Rroperties and Cooked Noodle Texture. MS Thesis, Dept. of Crop Science, Oregon State University, pp. 1–27.
4. AOAC (2005), Official Methods of Analysis, Eighteenth Edition, Association of Official Analytical Chemists, Washington, D. C.
5. American Public Health Association (1966), Recommended Methods for the Microbiological Examination of Foods, Second edition, Publication Office, American Public Health Association (APHA), Cornell University.
6. Jacobs M.B., Gerstein M.J. (1960), Handbook of Microbiology, University of Wisconsin–Madison,Van NostrandCo. Inc., Alexander St., Princeton.
7. AACC (2000), Laboratory Methods. 10th ed., American Association of Cereal Chemists,The Association, Saint Paul, MN, USA.
8. SPSS (2008), Statistical Package for Social Sciences (SPSS). Version SPSS 16.0. SPSS Inc., Chicago, IL, USA.
9. BSTI (2001), Bangladesh Standard Specification for Noodles (BDS 1106:2001), First Revision, Bangladesh Standard Testing Institute (BSTI), 116/A Tejgaon Industrial area, Dhaka. pp. 1–7.
10. Miskelly D.M. (1996), The use of alkali for noodle processing. In: JE Kruger, RB Matsuo and JW Dick (Editors), Pasta and Noodle Technology. American Association of Cereal Chemists, St Paul, Minnesota, pp. 227–273.
11. Jothi J.S., Uddin M. B., (2014), Detection of Heavy Metals in Some Commercial Brands of Noodles, European Academic Research, II(8), pp. 10667- 10679.
12. Fu B.X. (2008), Asian noodles: History, classification, raw materials, and processing, Food Research International, 41(9), pp. 888–902.
13. Hou G.Q. (2001), Oriental noodles, Advances in Food and Nutrition Research, 43, pp. 140–193.
14. Asenstorfer R.E., Wang Y., Mares D.J. (2006), Chemical structure of flavonoid compounds in wheat (Triticumaestivum L.) flour that contribute to the yellow color of Asian alkaline noodles, Journal of Cereal Science, 43(1), pp. 108–119.
15. Wu Y.V., Youngs V.L., Warner K., Bookwalter G.N. (1987), Evaluation of spaghetti supplemented with distillers’ dried grains, Cereal Chemistry, 64, pp. 434–436.
Copyright © 2022 FDOKUMEN