Are Ceramic Water Filters a Sustainable Intervention for Low ...
35
Household Water Treatment: Are Ceramic Water Filters a Sustainable Intervention for Low-income Countries? : A literature review Supervisor: Dr. Jeroen Ensink Candidate number: 1402062 Word count: 9,769 Project length: Extended Submitted in part fulfilment of the requirements for the degree of MSc in Control of Infectious Diseases September 2015 MSc Project Report 2014-2015
-
Upload
khangminh22 -
Category
Documents
-
view
4 -
download
0
Transcript of Are Ceramic Water Filters a Sustainable Intervention for Low ...

Household Water Treatment: Are
Ceramic Water Filters a Sustainable
Intervention for Low-income
Countries? : A literature review
Supervisor: Dr. Jeroen Ensink
Candidate number: 1402062
Word count: 9,769
Project length: Extended
Submitted in part fulfilment of the requirements for the degree of MSc in
Control of Infectious Diseases
September 2015
MSc Project Report
2014-2015
1
Contents
Abstract 2
Acknowledgements 3
1.0 Introduction 4
2.0 Background 5
2.1 Diarrhoea in low-income countries 5
2.2 Aetiology of diarrhoea 6
2.3 Transmission route of pathogens 7
2.4 Brief overview of WASH interventions 8
2.5 Recommendations for quality of water 9
2.6 Household water treatment 10
2.7 Introduction to ceramic water filter and sustainability 11
3.0 Aims and objectives 12
3.1 Aim 12
3.2 Objectives 12
4.0 Methodology 13
5.0 Results 14
5.1 Table of results 16
5.2 User compliance 17
5.3 Filter longevity 20
5.4 Willingness-to-pay 21
5.5 Accessibility to replacements/spare parts 22
5.6 Health impact 22
6.0 Discussion 23
7.0 Conclusion/Recommendations 30
Reference List 31

2
Abstract
Diarrhoeal disease remains to be the second biggest killer of children under 5 worldwide yet
can be easily prevented through water, sanitation and hygiene interventions. Since 2002,
World Health Organisation has promoted the use of household water treatment that increases
water quality in the household helping to reach the millennium development targets. Ceramic
water filters is one such household water treatment technology that reduces turbidity and is
highly efficacious at removing pathogens. With the arrival of the sustainability development
goals, this literature review aimed to investigate and analyse the sustainability of ceramic
water filter interventions by focusing on five key aspects that affect sustainability; compliance,
filter longevity, willingness to pay, accessibility and health outcomes. Search found a total of
945 papers of which 10 were deemed suitable for review. The quality of the studies were
relatively low with none assessing all of the five desired outcomes. Study design consisted of
randomised control trials and cross-sectional surveys. The longest time since distribution was
4 years with most studies having a relatively short time frame therefore limiting our
understanding of long-term ceramic water filter sustainability. Notable gaps in the literature
were identified namely that there was no research on the long-term benefits of CWFs.
Evidence for effectiveness of CWFs was inconclusive due to inherent biases of the RCT
design. The review concludes that further research on the effectiveness of ceramic water
filters on reducing diarrhoea be conducted as well as more studies that identify major barriers
that prevent a sustainable ceramic water filter intervention.

3
Acknowledgements
I would like to, first and foremost, express my sincere gratitude for all the help and support
from my tutor and supervisor Dr Jeroen Ensink. Thank-you for introducing and teaching me
about the subject and for your guidance throughout the project.
A big thank-you to my fellow students for being such great company during the long library
hours. And finally to my parents for helping me to stay focused and calm.

4
1.0 Introduction
Diarrhoeal disease is both treatable and, more importantly, preventable yet 760,000 children
under five die from it every year(1) although this figure is sometimes estimated to be as high
as 1.3 million per year(2).
In 2000, The United Nations (UN) established the Millennium Development Goals (MDG) to
which all 193 UN member states committed to achieve. MDG7 focused on ensuring
environmental sustainability namely to halve by 2015 the proportion of the population without
sustainable access to safe drinking water and basic sanitation. The global target of safe
drinking water was supposedly met in 2010 five years ahead of schedule, with current
estimates standing at 91% of the global population using an improved drinking water
source(3). Although this declaration is arguably over estimating figures since the methodology
used for monitoring progress has not incorporated the core components – “sustainable”,
“access” and “safe” – of the MDG7 water target(4).
Improvements in urban areas, through piped water systems, are more straightforward than
the less accessible rural areas. Currently eight out of ten people without access to improved
water source live in rural areas(3). It is in these remote and expansive areas where more
durable options for the provision of safe drinking water must be focused in order to increase
communities’ access and decrease early childhood mortality. In 2002, World Health
Organisation literature review recognised household water treatment (HWT) as an achievable
and low-cost approach for increasing water quality and reducing early childhood diarrhoea
(ECD)(5).
With the end of the Millennium Development Goals and the beginning of Sustainable
Development Goals, more emphasis is being placed on development which is maintainable
thereby securing future generations livelihoods(6). Target 6.1 of the SDGs aims to achieve
universal and equitable access to safe and affordable drinking water for all by 2030.
Sustainability is defined as the maintenance of processes at a certain level, a concept that is
vital for a successful WASH intervention with prolonged optimal health outcomes. Whilst the
explanation of sustainability for development remains broad and ambiguous, it is usually
broken down into three non-distinct dimensions: social, economic and environmental. In order
to achieve these three aspects of sustainability, WASH interventions and the technology used
must therefore in itself be maintainable. This review focuses on sustainability of the ceramic
water filter (CWF) and main themes surrounding user compliance in order to evaluate its future
prospects in development.
5
2.0 Background
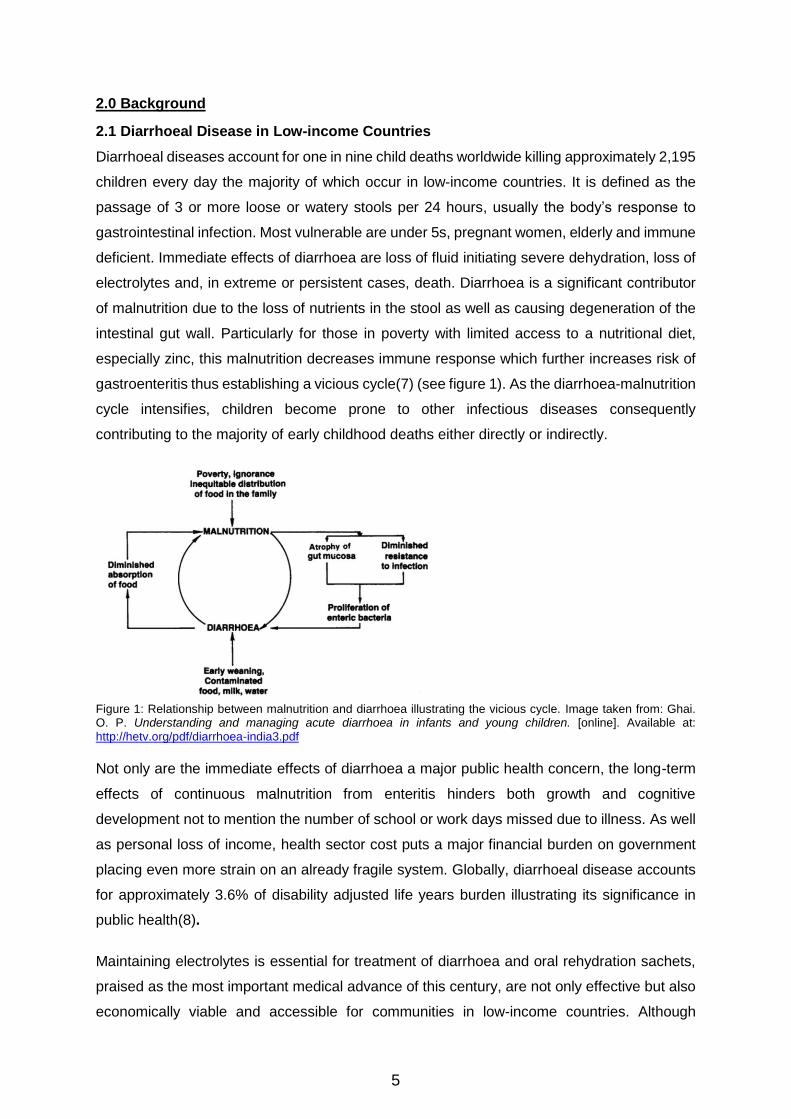
2.1 Diarrhoeal Disease in Low-income Countries
Diarrhoeal diseases account for one in nine child deaths worldwide killing approximately 2,195
children every day the majority of which occur in low-income countries. It is defined as the
passage of 3 or more loose or watery stools per 24 hours, usually the body’s response to
gastrointestinal infection. Most vulnerable are under 5s, pregnant women, elderly and immune
deficient. Immediate effects of diarrhoea are loss of fluid initiating severe dehydration, loss of
electrolytes and, in extreme or persistent cases, death. Diarrhoea is a significant contributor
of malnutrition due to the loss of nutrients in the stool as well as causing degeneration of the
intestinal gut wall. Particularly for those in poverty with limited access to a nutritional diet,
especially zinc, this malnutrition decreases immune response which further increases risk of
gastroenteritis thus establishing a vicious cycle(7) (see figure 1). As the diarrhoea-malnutrition
cycle intensifies, children become prone to other infectious diseases consequently
contributing to the majority of early childhood deaths either directly or indirectly.
Figure 1: Relationship between malnutrition and diarrhoea illustrating the vicious cycle. Image taken from: Ghai. O. P. Understanding and managing acute diarrhoea in infants and young children. [online]. Available at: http://hetv.org/pdf/diarrhoea-india3.pdf
Not only are the immediate effects of diarrhoea a major public health concern, the long-term
effects of continuous malnutrition from enteritis hinders both growth and cognitive
development not to mention the number of school or work days missed due to illness. As well
as personal loss of income, health sector cost puts a major financial burden on government
placing even more strain on an already fragile system. Globally, diarrhoeal disease accounts
for approximately 3.6% of disability adjusted life years burden illustrating its significance in
public health(8).
Maintaining electrolytes is essential for treatment of diarrhoea and oral rehydration sachets,
praised as the most important medical advance of this century, are not only effective but also
economically viable and accessible for communities in low-income countries. Although
6
treatment reduces the mortality of diarrhoeal disease, more focus needs to be placed on
reducing morbidity by preventing the acquisition of waterborne pathogens through water,
sanitation and hygiene (WASH) interventions. In this way, reducing the number of diarrhoeal
disease episodes will increase nutritional status of children increasing quality of life and
reducing long-term damages associated with diarrhoea.
2.2. Aetiology of Diarrhoea
Pathogens that can be transmitted through contaminated water vary according to
characteristics, pathogenicity and behaviour. The three classes of pathogens of common
public health concern are protozoa, bacteria and viruses. All are unique in size, structure,
biochemical make up and virulence.
Oocysts of Cryptosporidium alongside the cysts of Giardia are the main protozoa causing
diarrhoea in low-income countries. These structures are incredibly persistent in water due to
their resilient structure which only breaks down after consumption in stomach acid of the host
to cause infection.
Bacterial pathogens of significant importance include Escherichia coli, Campylobacter jejuni,
Vibrio cholera and Shigella dysentriae. Variation in infectivity, pathogenicity and dose
response is diverse amongst the bacteria class. For example, Campylobacter is relatively
common with a low mortality rate, conversely E. coli O157 is far less common and infection
can more severe reactions through haemolytic uremic syndrome and potentially death(9).
Cholera has a fairly high infective dose whereas the infective dose of Shigella is very low with
at only 10-100 organisms(10).
Critical waterborne viruses include rotavirus and norovirus. Whilst the former is more
widespread globally, the latter is typically associated with outbreaks in developed countries
within enclosed living conditions such as cruise ships.
The importance of different pathogens varies according to seasonality, geographical location
and conditions(9). For example, cholera most commonly presents as a sudden outbreak and
associated with natural disasters or overcrowded and unsanitary living conditions such as
refugee camps. On the other hand, rotavirus is present in almost all settings with the global
burden of disease amongst children hospitalized relatively evenly spread between WHO
regions, although 95% of deaths occur in low-income countries of Africa and Asia(11).

7
2.3 Transmission routes of pathogens
It is estimated that 94% of the burden of diarrhoeal disease is due to the environment and
associated with risk factors such as unsafe drinking water and hygiene(12). Enteric pathogens
transmit from host-to-host most commonly through the faecal oral route easily exacerbated in
settings where there is low sanitation and hygiene. The transmission of waterborne pathogens
from faeces to ingestion is best represented in the F-diagram (see figure 2).
Barriers to prevent these transmission routes clearly require an integrated approach.
Appropriate sanitation prevents the first stage of transmission of faecal pathogens to the
environment. Secondary barriers focus more on protecting a potential new host from ingesting
pathogens by increasing water quantity, hygiene and water quality. Although consumption of
contaminated water poses the greatest risk, it is important not to forget other water related
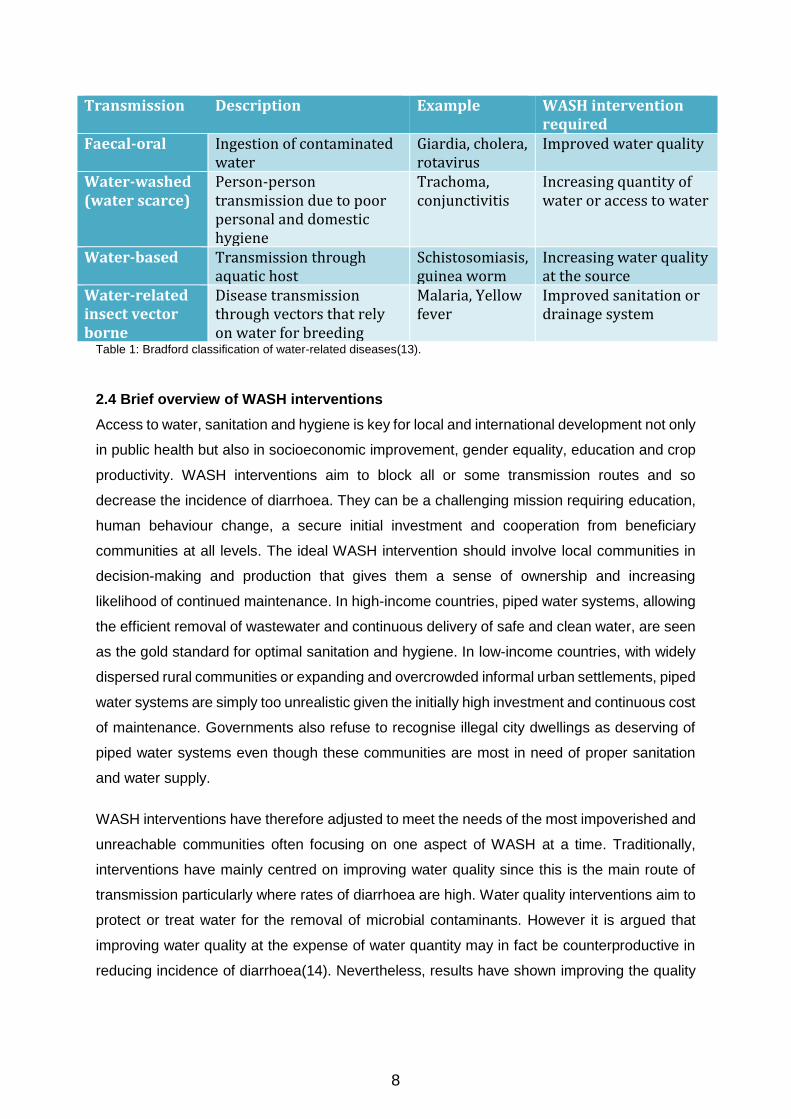
infections (see table 1). Although the transmission of these pathogens does not take the
faecal-oral route, appropriate WASH interventions have the power to significantly impact on
lowering the incidence of disease.
FAECES
Fluids
Fields
Flies
Fingers
Food New Host
Water Quality Sanitation
Water Quantity Hand-washing
Figure 2: The F-diagram illustrating various pathways of the faecal-oral route and WASH interventions barriers of transmission
8
Transmission Description Example WASH intervention required
Faecal-oral Ingestion of contaminated water
Giardia, cholera, rotavirus
Improved water quality
Water-washed (water scarce)
Person-person transmission due to poor personal and domestic hygiene
Trachoma, conjunctivitis
Increasing quantity of water or access to water
Water-based Transmission through aquatic host
Schistosomiasis, guinea worm
Increasing water quality at the source
Water-related insect vector borne
Disease transmission through vectors that rely on water for breeding
Malaria, Yellow fever
Improved sanitation or drainage system
Table 1: Bradford classification of water-related diseases(13).
2.4 Brief overview of WASH interventions
Access to water, sanitation and hygiene is key for local and international development not only
in public health but also in socioeconomic improvement, gender equality, education and crop
productivity. WASH interventions aim to block all or some transmission routes and so
decrease the incidence of diarrhoea. They can be a challenging mission requiring education,
human behaviour change, a secure initial investment and cooperation from beneficiary
communities at all levels. The ideal WASH intervention should involve local communities in
decision-making and production that gives them a sense of ownership and increasing
likelihood of continued maintenance. In high-income countries, piped water systems, allowing
the efficient removal of wastewater and continuous delivery of safe and clean water, are seen
as the gold standard for optimal sanitation and hygiene. In low-income countries, with widely
dispersed rural communities or expanding and overcrowded informal urban settlements, piped
water systems are simply too unrealistic given the initially high investment and continuous cost
of maintenance. Governments also refuse to recognise illegal city dwellings as deserving of
piped water systems even though these communities are most in need of proper sanitation
and water supply.
WASH interventions have therefore adjusted to meet the needs of the most impoverished and
unreachable communities often focusing on one aspect of WASH at a time. Traditionally,
interventions have mainly centred on improving water quality since this is the main route of
transmission particularly where rates of diarrhoea are high. Water quality interventions aim to
protect or treat water for the removal of microbial contaminants. However it is argued that
improving water quality at the expense of water quantity may in fact be counterproductive in
reducing incidence of diarrhoea(14). Nevertheless, results have shown improving the quality
9
of water, especially at the household level, is more effective at reducing diarrhoea than other
WASH interventions(15).
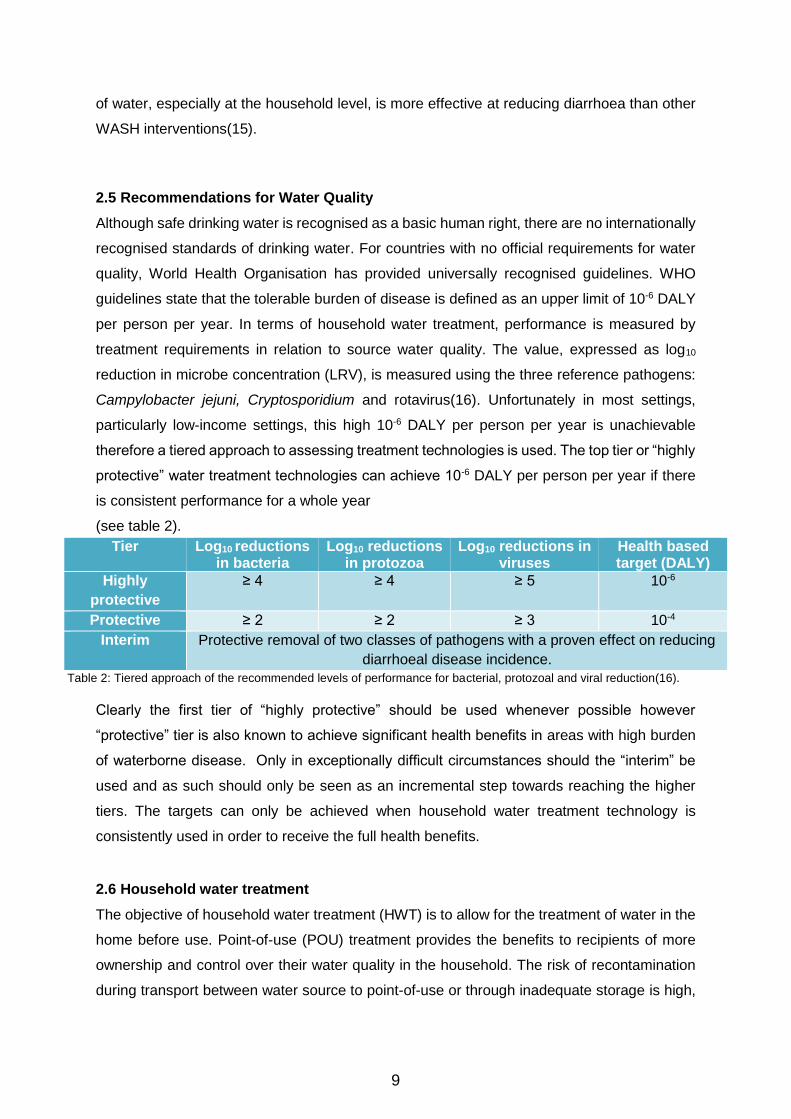
2.5 Recommendations for Water Quality
Although safe drinking water is recognised as a basic human right, there are no internationally
recognised standards of drinking water. For countries with no official requirements for water
quality, World Health Organisation has provided universally recognised guidelines. WHO
guidelines state that the tolerable burden of disease is defined as an upper limit of 10-6 DALY
per person per year. In terms of household water treatment, performance is measured by
treatment requirements in relation to source water quality. The value, expressed as log10
reduction in microbe concentration (LRV), is measured using the three reference pathogens:
Campylobacter jejuni, Cryptosporidium and rotavirus(16). Unfortunately in most settings,
particularly low-income settings, this high 10-6 DALY per person per year is unachievable
therefore a tiered approach to assessing treatment technologies is used. The top tier or “highly
protective” water treatment technologies can achieve 10-6 DALY per person per year if there
is consistent performance for a whole year
(see table 2).
Table 2: Tiered approach of the recommended levels of performance for bacterial, protozoal and viral reduction(16).
Clearly the first tier of “highly protective” should be used whenever possible however
“protective” tier is also known to achieve significant health benefits in areas with high burden
of waterborne disease. Only in exceptionally difficult circumstances should the “interim” be
used and as such should only be seen as an incremental step towards reaching the higher
tiers. The targets can only be achieved when household water treatment technology is
consistently used in order to receive the full health benefits.
2.6 Household water treatment
The objective of household water treatment (HWT) is to allow for the treatment of water in the
home before use. Point-of-use (POU) treatment provides the benefits to recipients of more
ownership and control over their water quality in the household. The risk of recontamination
during transport between water source to point-of-use or through inadequate storage is high,
Tier Log10 reductions in bacteria
Log10 reductions in protozoa
Log10 reductions in viruses
Health based target (DALY)
Highly
protective
≥ 4 ≥ 4 ≥ 5 10-6
Protective ≥ 2 ≥ 2 ≥ 3 10-4
Interim Protective removal of two classes of pathogens with a proven effect on reducing
diarrhoeal disease incidence.

10
particularly in cases where source water has low bacterial count(17). HWT can therefore
address both of these problems. Cochrane review of thirty HWT randomised control trials
show on average a 50% reduction in diarrhoea morbidity when interventions to improve water
quality were given at the household level rather than at the source(18). Furthermore, meta-
analysis reveals that point of use treatment is more effective at reducing diarrhoea by 0.79
(0.63-0.98) whereas treatment of water at the source has minimal effect at 0.95 (0.9-1.0)(19).
HWT can either physically inactivate microorganisms through boiling, solar disinfection
(SODIS) and filtration or chemically degrade microbes typically using chlorine as a germicide.
Boiling, the most traditional form of point of use treatment, requires a continuous rolling boil
for 10 minutes before it can denature the proteins of pathogens. Although very effective at
removing microbes, this method does require the constant need for fuel/firewood which may
be costly to the user. Chlorination provides a quicker alternative, commonly used in disaster
or waterborne outbreak settings, which can be easily implemented and monitored. This
method is also an efficient solution for safe storage since residual chlorine in the containers
protects from recontamination. However getting the correct dilution is challenging since too
little is ineffective and hyperchlorination, a common problem, is damaging for health. Solar
water disinfection (SODIS) method involves placing water in direct sunlight between 6-48
hours allowing the combined effect of solar heat energy and UV radiation to act as
germicide(20). Although simple to use and low-cost, the practicalities of SODIS are sometimes
not realistic in settings with unpredictable weather patterns and seasonality. In addition, water
must be consumed within 24 hours before risk of recontamination increases. The main
drawback of both chlorination and SODIS is the decline in microbicidal activity as source water
turbidity increases. Suspended matter physically shields the pathogens from chemical or UV
damage and, together with boiling; these methods have no effect on turbidity. Filtration,
although more costly, is the only method to address turbidity as it physically blocks the
movement of suspended particles into the effluent. Biosand filtration requires a container filled
with varying sizes of granules all below the recommended 0.7mm size that effectively filters
microbial contaminants(21). Maintenance of the biosand filter is minimal and is therefore a
good candidate when choosing household water treatment although the weight of the vessel
makes it difficult for mobile households as well as a large initial cost because the sand is not
normally available locally in low-income countries.
2.7 Introduction to ceramic water filter and sustainability
CWFs are typically manufactured by mixing clay and finely grounded burnout materials,
moulded into shape and kilned eventually producing a hardened container with a specific

11
range of pore sizes usually within the range of 40μm. Such a simple manufacturing process
allows for many moulds to form varying sizes and shapes, most common being a candle or
pot (see figure 3). Few raw materials are needed for CWF manufacturing and can be sourced
locally in most low-income countries, only the kiln needs a specialist and colloidal silver must
be imported.
The pores created within the ceramic material act by physically blocking the passage of
parasites and solid particles by size exclusion as well as absorbing bacteria. Significant
improvements are seen when colloidal silver or silver nitrate, toxic to bacterial cells, is painted
on the inside of the filter(22). The silver nanoparticles interact and disrupt the cell wall of
bacteria acting as an effective microbicide. CWF are ideal for low-income settings since the
filters can last between 6 months and 1 year without the need for a power source. After a
certain amount of time, usually one year although changes according to design, the ceramic
filter component will need to be replaced. Filter efficacy, under both laboratory conditions and
in the field, consistently show efficient removal of pathogenic bacteria, protozoa and
viruses(23). The wide variety in design and the ease of the manufacturing process means
CWFs can adapt according to settings and needs of the beneficiaries. The ceramic water filter
(CWF) has, in recent years, received wide universal coverage with most interventions
occurring in Cambodia. NGOs such as Potters for Peace promote its usage globally and assist
in establishing factories and workshops(24). Although the health benefits of drinking clean
water from CWFs seem obvious, there is little literature on its effectiveness and, even more
importantly, no research on whether the CWF is a feasibly sustainable intervention. An
essential part of a successful intervention is its ability to self-sustain beyond the
implementation efforts of NGOs. Human behaviour change, or compliance is needed for this
to happen particularly in CWF interventions. Whilst sustainability relies on filter endurance,
continuous compliance by user and demand for replacements is also key. Since the filter
component must be replaced, willingness-to-pay and access to these parts is essential. Finally
all of these aspects must combine to produce the ultimately ideal outcome of continuous
reduction in diarrhoeal disease in particular early childhood diarrhoea ECD.
Figure 3: most common shapes for ceramic water filters

12
Three key aspects can directly affect compliance: filter longevity, willingness to pay (WTP)
and access to spare parts. In turn health outcomes of a CWF are totally reliant on compliance
of the user (see figure 4).
Figure 4: A conceptual framework of sustainability.
3.0 Aims and objectives
3.1 Aim
The aim of this review is to assess whether ceramic water filters are a long term solution to
improving water quality by evaluating it effectiveness in reducing diarrhoeal disease whilst
focusing on five key indicators of sustainability.
3.2 Objectives
Investigate uptake and acceptance of CWFs by assessing the literature on compliance
of recipients
Investigate whether CWF is a durable technology that can maintain a high level of
performance for a prolonged period of time
Assess the demand for CWFs by examining willingness-to-pay for replacements/spare
parts
Assess to what extent access to spare parts/replacement component can affect the
sustainability of a CWF intervention
4.0 Methodology
Assessing the sustainability of ceramic water filters requires, not just looking at the beneficial
outcomes, but also evaluating the steps involved in implementation of an intervention including
factors associated with compliance (see figure 4). This conceptual framework was used for
the basis in evaluating the literature and therefore sustainability of ceramic filter interventions.
Compliance
Willingness to Pay
Accessibility to spare parts
Filter longevity
Health Outcomes

13
Search terms used: “ceramic water filter” against “household water treatment”. Databases
used were PubMed, Web of Knowledge and Google Scholar with relevant additional records
identified through citations in other papers. The key inclusion criteria were: i) implementation
of a ceramic water filter intervention ii) outcome of at least one of the 5 key concepts. Exclusion
criteria were: i) research papers published before 2000 ii) systematic reviews
After identifying records through database searching and citations from other sources with
duplicates removed, papers were initially assessed on the relevance of their title. Titles that
specified research on either effectiveness of CWF in reducing diarrhoea or one of the key
concepts of sustainability were further assessed for eligibility. Abstracts were then analysed,
excluding any studies that did not perform research in the field or did not collect primary data.

14
5.0 Results
A total of 645 citations were identified from Web of Knowledge (694), Pubmed (92) and Google
Scholar (159) with an additional 18 from recommendations of articles submitted for
publication. After removal of duplicates, 612 articles were screened for titles and abstracts
giving 36 full-text eligible articles. Study sites of all 10 papers ranged from Asia (5), Latin
America (4) and Africa (1). No research investigated all five indicators of sustainability.
Quality of study was determined by the number of outcomes measured:
High: Paper covered 4-5 outcome measures
Medium: Paper covered 3 outcome measures
Low: Paper covered less than 3 outcome measures
Records identified through database
searching (n=945)
Records after duplicates removed (n=612)
Records screened (n=612)
Records excluded (n=591)
Additional records identified through other
sources (n=18)
Full-text articles assessed for eligibility
(n=21)
Full text articles excluded (n=11)
Not measuring any of the 5
key concepts=8 Not perform research in the
field=3
Iden
tifi
cati
on
S
cre
en
ing
E
lig
ibilit
y
Inclu
ded
Studies included for qualitative synthesis
(n=10)

15
Using quality assessment, three papers were of a high quality as they investigated 4 of the
indicators with one of medium quality. The majority (60%) however were of low quality since
they had only researched 2 or less outcome measures (Table 1). User compliance (A) was
measured in 7 papers, filter longevity in 4, accessibility (D) in 5 and health outcomes (E) in 4.
Willingness to pay was investigated in 2 with an additional paper discussing willingness to pay
of study participants in an unpublished affiliated research paper. Only two study designs were
used of which 7 used randomised control trials (RCT) and 4 used a cross-sectional survey.
All research that measured health outcomes used a RCT design (5) which was also used to
measure compliance in two papers. Cross-sectional survey produced the high quality papers
since two that used this approach provided four outcome measures and another two gave
three outcome measures [Clasen 2006 only used cross-sectional survey for compliance (A),
filter longevity (B) and accessibility (D)].
16
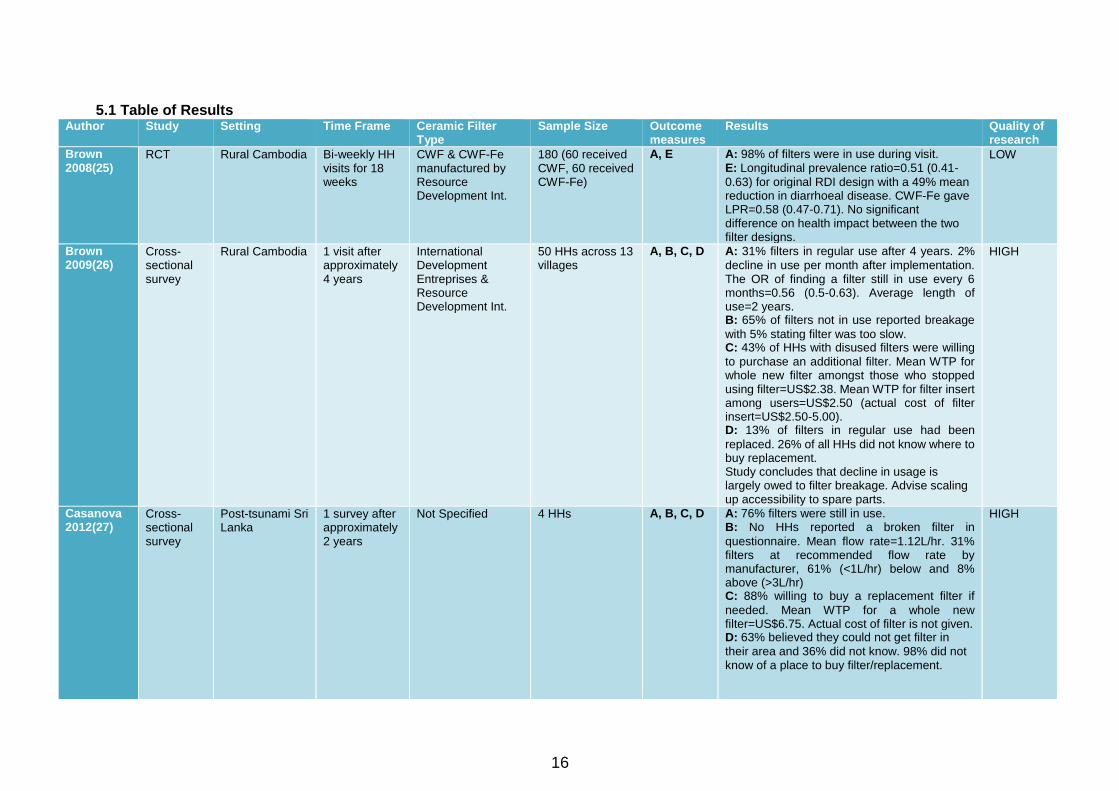
5.1 Table of Results Author Study Setting Time Frame Ceramic Filter
Type Sample Size Outcome
measures Results Quality of
research
Brown 2008(25)
RCT Rural Cambodia Bi-weekly HH visits for 18 weeks
CWF & CWF-Fe manufactured by Resource Development Int.
180 (60 received CWF, 60 received CWF-Fe)
A, E A: 98% of filters were in use during visit. E: Longitudinal prevalence ratio=0.51 (0.41-
0.63) for original RDI design with a 49% mean reduction in diarrhoeal disease. CWF-Fe gave LPR=0.58 (0.47-0.71). No significant difference on health impact between the two filter designs.
LOW
Brown 2009(26)
Cross-sectional survey
Rural Cambodia 1 visit after approximately 4 years
International Development Entreprises & Resource Development Int.
50 HHs across 13 villages
A, B, C, D A: 31% filters in regular use after 4 years. 2%
decline in use per month after implementation. The OR of finding a filter still in use every 6 months=0.56 (0.5-0.63). Average length of use=2 years. B: 65% of filters not in use reported breakage
with 5% stating filter was too slow. C: 43% of HHs with disused filters were willing
to purchase an additional filter. Mean WTP for whole new filter amongst those who stopped using filter=US$2.38. Mean WTP for filter insert among users=US$2.50 (actual cost of filter insert=US$2.50-5.00). D: 13% of filters in regular use had been
replaced. 26% of all HHs did not know where to buy replacement. Study concludes that decline in usage is largely owed to filter breakage. Advise scaling up accessibility to spare parts.
HIGH
Casanova 2012(27)
Cross-sectional survey
Post-tsunami Sri Lanka
1 survey after approximately 2 years
Not Specified 4 HHs A, B, C, D A: 76% filters were still in use. B: No HHs reported a broken filter in
questionnaire. Mean flow rate=1.12L/hr. 31% filters at recommended flow rate by manufacturer, 61% (<1L/hr) below and 8% above (>3L/hr) C: 88% willing to buy a replacement filter if
needed. Mean WTP for a whole new filter=US$6.75. Actual cost of filter is not given. D: 63% believed they could not get filter in
their area and 36% did not know. 98% did not know of a place to buy filter/replacement.
HIGH

17
Author Study Design
Setting Time Frame Ceramic Filter Type
Sample Size Outcome Results Quality of research
Clasen 2004(28)
RCT Rural Bolivia Visits at 6 week intervals for 6 months
Katadyn Ceradyn™ 50 HHs (C), D, E (C): Mean WTP for whole new filter=US$9.25.
Actual cost=US$25.00. D: Spare parts left with community leaders but
no HHs had replaced them. E: Risk of diarrhoea decreased by 70% in
CWF group with OR=0.29 (0.13-0.65). Risk of diarrhoea for <5 age=83% with OR=0.17 (0.06-0.49)
LOW
Clasen 2005(29)
RCT Rural Colombia 6 months Katadyn® candle 140 HHs E CWF reduced prevalence of diarrhoea by 60%. OR=0.40 (0.25-0.63). Although results were only statisically significant at one site.
LOW
Clasen 2006(30)
Cross-sectional survey
Post-flooding Dominican Republic
Survey 16 months after distribution
Ceramica Stefani/First Water
115 HHs A, B, C/D A: 48.7% still in use. B: 22 (19%) candle filters broken, 6 (5%)
clogged, 4 (3%) leaking of GAC into effluent. Average period of operation was 9 months. C/D: Replacements were made accessible to
all participants at $4.50. Of filters still in use, 62% had replaced the candle element.
MEDIUM
Clasen 2006(31)
RCT & Cross-sectional survey
Rural Bolivia RCT: 5 visits over 5 months Survey: 1 visit after 9 months
Katadyn® candle Stefani® candle
RCT: 60 HHs (20 received Katadyn®, 20 received Stefani®)
A, B, D, E A: 67% of filters regularly used after 9 months,
13% were occasionally used, 21% not in use. B: Of those not in regular use, 25% were
broken, 31% said filter was too slow. D: Replacement candles not available locally so
users were not cleaning as much. E: CWF reduced prevalence of diarrhoea by
45.3% giving an adjusted OR=0.49 (0.24-1.01). No statistically significant difference found for <5 age group.
HIGH
Du Preez 2008(32)
RCT Rural South Africa and Zimbabwe
Pictorial diary used over 6 months
British Berkefeld® South Africa: 56 HHs (29 received filter) Zimbabwe: 58 HHs (31 received filter)
E CWF reduced incidence of bloody and non-bloody diarrhoea by 80%. RR=0.21 (0.12-0.36).
LOW
Ensink 2015(33)
RCT Displaced communities, Pakistan
1 survey 6 months after distribution
Stefani® 3,075 (78 received filter)
A, B A: No CWF in use after 6 months B: 30% were broken after 6 months. Study
proposes that CWF do not usually last longer than 2 months
LOW
Luoto 2011(34)
RCT Urban Bangladesh
1 visit 2 months after distribution
CrystalPur Filter 800 (600 received filter for 2 months on rotation)
A, C A: Average of 29% (25-32%) self-reported
using the CWF after each 2 month trial period. The CWF was the most successful intervention compared to chemical disinfection products.
LOW

18
5.2 User compliance
Seven papers included user compliance by calculating the proportion of filters still in use after
distribution.
One four-armed randomised control trial compared three different chemical products and a
CrystalPur siphon filter in where three intervention groups received a product in randomised
order every 2 months (34). The ceramic water filter proved to be the most popular although
only with an average of 29% (25-32%) of filters still being regularly used after 2 months. One
of the paper’s main aims was to investigate barriers to usage of POU products, using an open-
ended question, which was not detailed in the results. Only the two most common reasons for
discontinuation were provided for all products one of them being that the filter took up too
much time with 27% of users choosing this option. Although whether the filtration of the water
was too slow or that the maintenance of the filter took up too much time remains to be seen.
Furthermore, no details have been provided for the number of people willing to participate
bringing into question the reliability of the study.
An additional RCT was conducted in rural Cambodia with a high compliance of 98% during
18week time frame. This high compliance can be due to the biweekly visits conducted during
the intervention trial. This may have appeared to increase user compliance through courtesy
bias since investigators visited households on a regular basis.
In Bolivia, after first assessing health outcomes of ceramic filters during the 5 month RCT trial,
a follow-up visit after 9 months was conducted resulting in 67% of HHs still regularly using the
filter, 13% in occasional use and 21% not using filter at time of visit(31). The methodology
used for categorising the filter compliance status has not been made clear particularly the
definition of occasional use making it difficult to clearly interpret compliance. Reasons for
discontinuing using the filter were mainly caused by filter being too slow (31%) or the filter
broke (25%). The design of the study involved a three-armed RCT with two different candle
designs and a control. No distinction has been made between the two different types of
candles that were initially distributed which would have been useful for assessing compliance
individually however would have reduced the power of the study given that the sample size
would have decreased.
A cross-sectional survey approximately 4 years after distribution of CWF in Cambodia with a
relatively large sample size of 405 households was able to give a more accurate picture of
long-term sustainability(26). Compliance was measured as percentage of filters remaining in
household use as a function of time resulting in a calculation of 2% decline in usage per month
(see figure 5). Using logistic regression, declining odds of 44% every 6 months of finding a

19
filter still in use was calculated with an odds ratio of 0.56 (0.5-0.63). The data was collected
from several interventions therefore has not considered the heterogeneity of implementation
methods used such as differences in education or prices charged for water filter. The paper
concludes that the most important predictor of compliance was time since implementation.
When controlled for time since implementation, the most important factors to increase filter
usage were initial investment in technology (OR=2.1 95%CI 1.2-3.7) and access to household
latrine (OR=2.4 95%CI1.5-4.0).
Figure 5: Graph showing the decline of percentage of filters remaining in household use in 6 month increments. Image taken from: Brown. J. et al. 2009. Sustained use of household-scale water filtration device in rural Cambodia.
In contrast, research in Pakistan has shown a much more rapid decline in filter usage (33).
CWFs were used as the control for this RCT therefore limited information on factors affecting
user compliance is limited. Although initially slightly resembling Brown et al’s 2% decline with
10% not using in the first 3 months, there is a rapid drop in usage after 3 months with 65%
reported to have stopped using the filter between 3-5 months after distribution until eventually
no households were using the filter after 6 months. This information is prone to bias since only
one visit could be carried out after 6 months and it solely relied on recall when filter stopped
being used.
A cross-sectional survey investigating CWF after post-tsunami Sri Lanka found that a much
higher 76% of beneficiaries were still using the filter, although the research paper has not
stated specifically how long after distribution the survey took place, it is estimated
approximately 2 years post implementation(27). The definition for a filter user included if they
had reported using within the last month possibly to account for seasonality (5% of
respondents). Although this is a low proportion and may not have affected the results, a more
accurate figure may have been to exclude this 5% since they may not be regular users. No
20
questions were asked to those who had stopped using the filter as to why, which would be
useful in identifying reasons for discontinuation however amongst the users, the most common
complaint was that the flow rate was too slow (14%).
A cross-sectional survey after 16 months conducted in Dominican Republic severe flooding
found a relatively low compliance with only 48.7% CWFs still in use(30).
5.3 Filter Longevity
No papers specifically looked at filter durability in the field however four papers have recorded
breakage with one measuring flow rate.
During a 9 month follow-up visit as part of an RCT in Pakistan, 30% of filters were found to be
broken with the research estimating the average lifespan of the Stefani® as not much longer
than 2 months(33). Filters in the households were examined by investigator and found that
breakage was associated with tightening of the saturated filter that prevents leakage from the
top to the bottom.
During the cross-sectional survey in Cambodia, of the households using the filter, 214 reported
breakage(26). This figure calculates that 42% of the households included in the study had
breakage. In addition, filter breakage appears to be the primary reason for discontinuation
since 65% of non-users reported the filter as broken.
On the other hand, data collected for cross-sectional survey in Sri Lanka found that no
households selected the ‘filter broke’ option(27). A surprising result given that this research
was carried out approximately 2 years post implementation. Filter flow rates were also
measured from 343 households giving a mean flow rate of 1.12L/hr (range 0-5.9). Only 31%
of filters fell within manufacturers guidelines for flow rate of 1-3 L/hr and 61% of filters’ flow
rate was <1L/hr. Unexpectedly, 8% of filters had a flow rate greater than 3L/hr although this is
believed to have been due to cracking in the ceramic vessel reported by households. This,
once again, brings into question the classification of ‘broken’. The fact that the paper reports
some ceramic vessels have cracked yet also concludes that no filters are broken is unclear.
An improvement may have been close inspection of CWF allowing the investigator to classify
the filter as either broken or not rather than relying on recall of household.
The cross-sectional survey conducted in post-flooding Dominican Republic found 22 (19%)
filters were no longer in use due to breakage again making this the main reason for
discontinuation since 65% of filter not in use were because of breakage. 6 filters were found
to have clogging whilst 4 leaked granular activated carbon from the filter core into the effluent

21
water. Of the filters that were broken, a common reason was that the filter had been knocked,
or that it occurred during cleaning/replacement.
5.4 Willingness to Pay
Three papers investigated willingness to pay with one discussing unpublished data of an
analogous paper.
Although Clasen et al. did not conduct the research on WTP in Bolivia, the results of a
corresponding paper using the same intervention are discussed briefly(28). When asked to
estimate cost of filter, households were fairly accurate ($24.18) however when asked on their
WTP, mean response was considerably lower than the cost of the total filter system ($9.25).
Results do not show the cost of the ceramic candle replacement component nor is any data
given on willingness to pay for the spare part, which is the most important aspect given that
only the ceramic parts need replacing regularly.
Alternatively, Brown et al’s follow-up study in Cambodia does include WTP specifically for the
replacement component(26). WTP results were measured separately for those who had
discontinued usage and those regularly using the filter. By asking an open-ended question on
an appropriate price for the whole CWF to those who stopped using the filter, mean response
was US$2.38 (US$1.48-2.95). Only 21 households reported that they had replaced their filter
after breakage. For households in regular use of a filter, method of assessing WTP for just
ceramic insert involved choosing an option rather than an open-ended question. 72% were
willing to pay for the lowest price (US$2.50) however only 26% were willing to purchase the
highest price (US$5.00). The actual price of ceramic insert is between $2.50-5.00. For those
that had discontinued use of filter, odds of willing to purchase an additional filter increased by
3.1 (1.6-6.0) when filter had been initially purchased rather than given to them for free.
In the Sri-Lankan cross-sectional study, Casanova et al. found a relatively high 88% willing to
buy replacements or spare parts if needed although this was only asked to the households
who were already regularly using their filter(27). A better understanding of demand and WTP
would be to incorporate those who had discontinued use of filter and understand if there was
still a demand even though filter was no longer in use. Only one household claimed to have
successfully replaced a filter with 7% reporting they had bought spare parts. This
demonstrates that there may be not such a high demand or willingness to pay amongst those
that discontinued filter use. Using an open ended question, the mean WTP response for a
whole new filter amongst filter users was USD$6.75. No information is given on the average
price of a CWF therefore no inference can be made on how realistic this response.

22
In the Dominican Republic survey, the paper states that ceramic candle components were
made accessible to all recipients at the price of US$4.50. Of those that still had a filter in use,
62% had successfully replaced it demonstrating a relatively high demand from users.
5.5 Accessibility to Replacement/Spare Parts
Four studies had incorporated accessibility into their research. The RCT conducted in rural
Bolivia made clear in the methodology that “spare candles, buckets and taps were left with
community leaders”(28). However a third of intervention households had filters that were
broken during the 6-month trial period. More information is needed as it remains to question
whether the spare parts were not actually accessible to the users or whether the users had
been trained in replacing components.
The cohort survey conducted in Cambodia found that, although distribution points for
replacement filter and parts were present in all study provinces, only 26% actually knew where
to purchase them from(26). However whether these distribution points were feasibly
accessible to the users remains unknown.
Similarly, Sri Lankan survey found that only 5/345 (1%) households knew that they could get
a new filter in their area whilst 63% believed they could not and 36% did not know(27).
In studies where no accessibility to spare parts was a common concern of the users and, as
a consequence, user were avoiding regular cleaning for fear of breaking it(31).
5.6 Health Impact
Five papers researched the health outcomes of using ceramic water filter, all of them looking
at diarrhoea incidence.
Research in Bolivia assessed the effect of ceramic filter on diarrhoea incidence used relied on
5 visits over 5 months where female head of household was asked to recall episodes of
diarrhoea among all household members in the past 7 days allowing diarrhoea to be calculated
as period prevalence. An odds ratio of 0.49 (0.24-1.01) shows a slightly protective effect
although the confidence interval overlaps 1.00 so is considered to have no significant
effect(31). Additionally no significant difference was found for children under 5 years of age.
CWF also reduced prevalence of diarrhoea by 45.3% in the intervention arm. While the
intervention group was divided to receive two different types of ceramic filter, no analysis on
the individual effectiveness of the filters was completed, possibly due to the subsequent
reduction in sub-group sample size and thus power of study.

23
Another RCT in rural Bolivia, using a similar methodology of recall and monthly visits but with
Katadyn CeradynTM filter, produced an adjusted OR of 0.29 (0.13-0.65) and a 70% reduced
risk of diarrhoea in the intervention group(28). As expected, a more protective effect was seen
in under 5 age group with a 88% reduction in prevalence of ECD associated with and OR of
0.17 (0.06-0.49).
By contrast, an RCT in Colombia using the same filter yielded a lower adjusted OR of 0.40
(0.25-0.63)(29). Although producing statistical difference overall, out of the three study sites
only one showed a significant odds ratio individually.
All three of the aforementioned RCT trials relied on recall of diarrhoeal disease episodes in
the past week since time of visit. Increasing the accuracy and possibly reducing courtesy bias
would be to use a pictorial diary whereby participants mark the days one person in the
household has diarrhoea. An RCT for CWFs used just that methodology producing a relative
rate of 0.21 (0.12-0.36)(32).
Discussion
The aim of this study was to assess to what extent CWFs are a sustainable intervention for
low-income countries by assessing literature on its effectiveness in reducing diarrhoea and
evaluating five key aspects of sustainability, providing recommendations to policymakers and
future implementers.
The review identified ten studies that were deemed suitable for analysis and review. The large
majority of the papers were of low quality with no study identified that presented findings on
all five aspects of sustainability.
The most notable gap in the literature was the lack of studies on the long-term effects of a
CWF intervention. Only two studies left a considerable time after filter distribution in order to
assess it sustainability (26, 27). However no papers investigated whether use of CWFs will
provide continuous beneficial outcomes for a prolonged period of time. This therefore limits
the extent to which recommendations can be made on the use of CWFs as a long-term
solution to improving water quality. The consequence of having such few research papers on
sustainability together with the clear heterogeneity in results leaves no room for inference of
possible trends or identification of factors that affect sustainability. This study has therefore
found a lack of evidence that would help implementers and policy-makers identify key areas
to improve sustainability of CWF interventions.

24
Due to the lack of research of CWFs, search terms and inclusion criteria were kept relatively
broad so as to incorporate more papers. However this has led to more biases and
inconsistencies in results as well as limiting our understanding of factors affecting
sustainability. There may be more information from NGO reports which would have been more
useful in terms of understanding the pitfalls and successes of a sustainable intervention.
However, some reports were unavailable to public domain and the lack of standardised
methodology could have opened the door to more biased results, particularly given that NGOs
are more likely to overestimate the effectiveness of their intervention.
Reasons for such a lack of research is likely due to the challenges faced when assessing
effectiveness and sustainability. All of the research that looked at health outcomes of CWF
used an RCT design whilst cross-sectional surveys were the most accurate for assessing
factors associated with long-term use. Whilst RCTs are seen as the gold standard for
determining intervention effectiveness, designing an RCT to assess sustainability may be too
unrealistic given that few outcomes, such as filter longevity or accessibility, in the control group
cannot be measured. This leads onto the second problem of deciding when the ideal time
point for assessing sustainability would be. Results of this review shows that the longest time
since distribution of filters was 4 years before a cross-sectional survey producing a high quality
paper(26). The other cross-sectional surveys were conducted 9 months-2 years post
implementation. There appears to be a clear lack of research over a prolonged period of time
which is a core requirement for assessing whether an intervention is maintainable.
In order to first assess whether CWFs are a sustainable intervention, it is important to
investigate whether the filters can consistently provide safe water. WHO guidelines on water
quality state that there should be no detectable level of harmful pathogen in drinking water(35)
and, in order to achieve this, CWFs must therefore be 100% effective at removing microbes.
Research in labs have shown that CWFs can perform to a high level(36) although whether the
same efficacy is translated in the field has been debated. For example, studies have found
46/79 filters had a negative log10 reduction value of E. coli demonstrating a higher
concentration of bacteria in the treated water than untreated water(37). A similar study, where
17% of effluent water samples had higher concentration of E. coli than influent water, drew
attention to a possible regrowth of bacteria on the tap of the receptacle(23). These findings
clearly point out how easily recontamination of water can occur in the home. Given that some
filter designs such as the siphon filter will deposit treated water into an open bucket, exposing
the treated water to flies or contaminated fingers when collecting water, this highlights how
filters with a 99% microbial removal in the lab does not necessarily mean clean and safe water
is being consumed by the user.
25
Although delivery of safe water is important, the real question remains as to whether CWFs
are effective at reducing diarrhoeal disease. Results provided were diverse with no definitive
answer. Such a heterogeneity of results in effectiveness can be accounted for by a number of
factors such as the importance of different waterborne pathogens in each setting, compliance
of participants or implementation approach. Many of the RCT go into detail about methodology
of assessing filter effectiveness although few have detailed the approach used when
distributing the filters. None have specified what information recipients received or specifically
stated that an inspection was made to ensure all participants in the intervention arm actually
received the filter. Disregarding this aspect can lead to a type 3 error; a phenomenon of a
phantom intervention where an estimate of effect may not actually be measuring any
intervention. In order to counteract this problem, recognising fidelity and compliance would
strengthen the reliability of the study. Fidelity is defined as how well an intervention is
implemented in comparison to the original procedure design. All of the papers either failed to
complete this or failed to reference this is in their methodology. Only one out of the four studies
that measured diarrhoeal disease incidence measured compliance(25) although the other
three tested water quality during visits therefore inadvertently ensured filters were in use(29,
31, 32). Future research should explicitly state the method of assuring fidelity and compliance
in order to strengthen the statistical power of outcome measurements.
Randomised controlled trials, seen as the gold standard for evaluating the effectiveness of an
intervention, was used for all four papers. One of the major concerns when conducting RCTs
of household water treatment is the lack of blinding leading to observer and participant bias.
Producing a placebo filter is simply unfeasible given that the design of the placebo would need
to replicate filtering of turbid water to clear water without compromising the microbial content
of the effluent water. In addition, there are significant ethical concerns since households may
cease their current water treatment to use the control placebo filter putting people at high risk
of drinking contaminated water leading to more incidence of diarrhoea. Communities in the
control group may also lose trust in interventions and NGOs. As such, no blinded RCTs have
been conducted on the effectiveness of CWFs. Implications of an unblinded intervention trial
may lead to control groups over-exaggerating diarrhoeal episodes to secure a filter for the
household and intervention arm under-reporting incidence of diarrhoea to please the
investigators(38). This unblinded approach can cause type I error; detecting an effect that is
not present. A ratio of odds ratio was calculated for lack of blindness in intervention trials giving
a value of 0.75 (0.61-0.81) demonstrating that all non-blinded RCT effect sizes would need to
be multiplied by 0.75 in order to correct for blinding(39). Indeed, when adjusting for blindness
26
in meta-regression of HWT interventions, the relative risk increased from 0.56 (0.51-0.63) to
0.85 (0.76-0.96) making the size of effect much smaller and the upper limit of the confidence
interval close to the value of no effect of 1(40). With such low conclusive evidence, it is
believed that the effects of HWT intervention may be entirely explained by bias either from
lack of blinding or through publication bias(41).
For all of the studies reviewed, health was a subjective outcome measured through incidence
of diarrhoeal episodes. In three of the studies, data was collected during visits that relied on
memory of episodes in the past week increasing the chances of recall bias. It is considered
this method is inaccurate beyond 48 hours, particularly given that the respondent would need
to account for other family members such as those under 5(42). Only in du Preez’s paper is a
different and possibly more accurate method used with a pictorial diary whereby recall of
diarrhoea disease was only required for the past 24 hours(32). However respondents may not
truthfully report diarrhoeal disease episodes for a number of reasons; embarrassment, fear of
the investigator or misunderstanding of the definition of diarrhoea are just three examples.
Since blinding is not possible, this unreliability of recall is likely to occur non-randomly between
the control and intervention arm and can overestimate the intervention’s effectiveness(43).
It is important for RCTs to specific whether intention-to-treat (ITT) or per protocol was used
for analysing the difference between control and intervention arm. Using ITT, whereby the
groups are analysed according to their original allocation, reduces the chance of bias since
the process of randomisation should, in theory, produce groups that have similar
characteristics apart from the intervention(44). On the other hand, per-protocol is analysing
the differences according to which individuals are in fact using the filter, that is to say are
complying, and resulting bias as the differences between intervention and control are due to
human behaviour traits. Only one RCT measured compliance throughout the trial however
none of the papers specifically stated which of ITT or per-protocol was used.
Although research on effectiveness of CWF has produced heterogeneous results, there is a
promising, albeit rather weak, association between reduction in diarrhoea and use of CWFs.
However, the potential impact of CWFs is limited given the fact that improving drinking water
quality only prevents one transmission route of the faecal-oral pathway (see figure 2) and only
addresses the waterborne agents of water-related diseases (see table 1). However it is
believed that the transmission of pathogens from fluids to new host is a major pathway in low-
resource settings with high endemicity of diarrhoea and so treating water at the household
level is more effective at reducing diarrhoea than other WASH interventions, particularly in
comparison to water quality interventions at the source since risk of recontamination during
transport and storage is high(15, 17). As well as CWFs directly preventing ECD, it can hinder

27
the vicious malnutrition diarrhoea cycle and as such could potentially indirectly prevent early
childhood mortality.
Of course, none of these possible health outcomes are possible without compliance by the
user. To highlight its importance, modelling of CWF sustainability found compliance to be a
main driving factor affecting outcomes such as ECD(45). Indeed research has found that the
benefits of increasing log10 reduction values of the filter are strongly dependent on
compliance(46). If compliance is low, there are diminishing returns from increasing LRVs
reducing the efficacy of the filter and reducing chances of beneficial health outcomes. This
review found no clear trends in compliance across the literature with a wide range of results
from 98% compliance over 18 weeks(25) to no compliance after 6 months(33). Since
measurement of compliance relied on self-reports of usage, this opened the door to courtesy
bias leading to an overestimation of usage as participants are more likely to over-report it’s
usage to please the investigator. Five papers had investigated bacteria count of effluent water
at the same time and, in this way, reduced the chances of users overstating its use since the
filter would have to be working at time of visit in order to take samples. Similarly, Brown et al.
and Casanova et al. specifically showed that checks were done in order to confirm the filter
was being regularly used(26);(27).
Such heterogeneous results in compliance can be accounted for by a number of different
factors. One of the most important distinctions that should be discussed is the difference in
settings. Three papers had carried out investigations in a post-disaster situation (Ensink 2015
was considered post-disaster) whilst the other four were part of standard development
interventions. It is believed that post-disaster circumstances would increase the uptake and
usage of filters due to increase in waterborne diseases, the loss of their usual trusted water
source or willingness to accept anything that should improve their current situation(47-49).
Contrastingly, user compliance in a development setting requires more challenging behaviour
and attitude change because households may already feel they have a trusted and safe water
source and there is not is such a high incentive to incorporate filtering into their daily lives. By
this logic, interventions post-disaster should have a higher compliance than development
interventions however the results have not followed this trend.
Understanding reasons for compliance and acceptance of CWFs by communities is extremely
complex and beyond the scope of this literature review. More studies, through surveys and
interviews, would begin to help identify what incentivises uptake and compliance of CWFs and
could help mould future implementation strategies since acceptance by community is central
to a successful WASH intervention with optimal health outcomes. However, given the fact that
28
results in prolonged filter use has not been consistent in this review, it does not make a strong
case for a sustainable intervention.
One of the main factors that can affect user compliance is the durability of the technology
itself. CWFs are usually made locally and, since there are no universal standards for filter
manufacturing, it is therefore difficult to ensure quality of each filter is to a high standard. This
review found that the most common reason for discontinuation of a filter was due to breakage
however there were no clear trends found most probably due to the variation in design,
porosity and manufacturing process of the filter. Differences in response to breakages were
diverse. For example, in Pakistan, tightening of the filter caused damage to the point where
filter could no longer be used(33) whereas, in Sri Lanka, households had reported cracking of
the ceramic vessel although worryingly continued to use it even though its efficacy in filtering
microbes would have decreased(27). The danger with this problem is that users are given a
false sense of security about the quality of water they are drinking and continue to use the
filter even though there may be no health benefits.
Ceramic water filters are expected to have a flow rate of 1-3L/hr which would provide adequate
supply of drinking water to a household. However, slow flow rate appeared to be a common
complaint across the literature with one study finding over half the filters’ flow rate below 1L/hr.
Even under laboratory conditions, the ceramic filter does not provide convincing evidence it is
a technology that can consistently perform. Research on filters from three different production
lines found all filters decreased flow rate to below 0.5L/hr after 12 weeks(50). Similarly, using
a continuous flow dosing system, filters did not reach their expected lifespan before physically
failing(51). Understandably, these results are not representative of filter performance in situ
and may even be underestimating filter durability since source water, particularly in low-
income settings may have a higher turbidity and therefore more likely to cause clogging thus
slowing the flow rate. Restoring flow rate can be achieved by scrubbing the filter although this
can weaken the integrity of the ceramic material consequently shortening the lifespan of the
filter(52). There appears to therefore be a compromise between slow filter rate and breakage
of the filter which does not make a strong case for an intervention with prolonged compliance
and consistent efficacy.
It appears that the filter technology, in addition to requiring regular replacement is relatively
prone to breakage therefore, in order to sustain the intervention, participants must be willing
to pay for a replacement or new filter. Methodology reviewed in the literature relied on open-
ended questions for a hypothetical price respondents would be willing without any justification
or consequence. This method is essentially biased since there is no incentive, such as actually
purchasing the filter with their answer, to be honest. Indeed, meta-analysis found an average

29
ratio of hypothetical to actual value of 2.6(53). Research in Northern Ghana on WTP for
ceramic filters found that the take-it-or-leave-it (TIOI) offer, whereby investigators ask if
participants are willing to buy at a set amount and have until the end of the day to pay for a
filter, found this method to be the most accurate compared to a similar open-ended question
methodology(54). Unfortunately mean WTP figures provided across the papers are non-
comparable given the fact there is economic variability between all study sites. In order to pool
results, a more accurate method may have been to present WTP as a proportion of their
weekly/monthly income or as a proportion of the market price. Mean WTP figures were
relatively low with some less than the market price. This is reflective of a systematic review
which found that, across WTP for household water treatment research, average WTP price
was consistently lower than market price suggesting a universal lack of demand for increased
water quality and not just for CWFs (55). Whether this trend is due to indifference towards the
filter or simply deficiency of personal funds has not been clarified in any of the studies
nevertheless it does not present a strong case for a sustainable intervention. Research
investigating WTP for water has also found that people are less willing to pay for water quality
and more on the time spent collecting the water(13). Since HWT does not reduce the time
spent collecting water, but in fact increases time spent on water duties, this may explain why
WTP for CWF or replacement parts is relatively low.
WTP is just one aspect of the process of replacing the filter component and heavily relies on
gaining access to replacements/spare parts, especially important since the majority of CWF
interventions occur in a rural setting. Although no research specifically looked at the role of
accessibility as a barrier for sustaining the intervention, the fact that up to 98% of study
participants did not know where to buy a filter from(27) in some studies and only 13% of regular
users had replaced the candle component(26) clearly demonstrates the high occurrence of
missed opportunities to buy a replacement. Even in interventions that made parts accessible
to the participants, a third of the filters were broken with no replacement demonstrating a
possible apathy continuing to use the filter(28). The studies, nevertheless highlight that it is
not necessarily lack of access to replacements that is a limiting factor but rather the lack of
awareness about location of supplier or knowledge of when to change the filter. More research
is needed that could successfully identify why replacement of filters is so low, recognising
major barriers and rectifying these problems for future interventions.

30
7.0 Conclusion/Recommendations
This literature review found a clear lack of evidence for ceramic water filter effectiveness and
sustainability. Even in studies that assessed the health impact of CWFs, bias due to lack of
blinding was an inherent trait and does not provide convincing evidence that would allow future
recommendations to be made. There certainly has been no research on the long-term health
impact of a CWF intervention. There is no doubt that improving water quality within the home
is beneficial, however the danger arises when water quality interventions are favoured over
water quantity or adequate sanitation. Implementing a CWF should only be seen as an
incremental step towards achieving prevention of all faecal-oral transmission routes and there
is concern that much needed resources may be diverted once a CWF intervention has been
put in place. In order to truly achieve significant health impact, an integrated approach of
improving water quantity, water quality and sanitation is required although in most low-income
settings this is simply too costly.
Examining the five main indicators of sustainability, a general theme across the studies was
the overall indifference towards to filter. Low compliance, low willingness-to-pay for a
replacement and a low proportion of successfully replaced filters indicates a possible apathy
towards the filter. More research on customer satisfaction would help understand whether
there is an actual demand for CWFs in the first place however, so far, the evidence does not
give a strong case for a sustainable intervention. Nevertheless in low-resource settings, HWT
interventions are the only solution and, in comparison to the other methods of treating water,
CWF does appear to be the most appropriate.

31
Reference List
1. Organisation WH. Diarrhoeal Disease: Fact Sheet: World Health Organisation; 2013 [Available from: http://www.who.int/mediacentre/factsheets/fs330/en/.
2. UNICEF. Diarrhoea: Acute diarrhoea still a major cause of child death 2012 [Available from: http://www.unicef.org/health/index_43834.html.
3. Nations U. The millennium development goals report 2015. New York: United Nations, 2015.
4. Clasen TF. Millennium Development Goals water target claim exaggerates achievement. Tropical Medicine & International Health. 2012;17(10):1178-80.
5. Sobsey MD. Managing water in the home: accelerated health gains from improved water supply. World Health Organisation. 2002.
6. UNEP. Integrating the three dimensions of sustainable development. UNEP, 2015.
7. Guerrant RL, Oria RB, Moore SR, Oria MOB, Lima AAM. Malnutrition as an enteric infectious disease with long-term effects on child development. Nutrition Reviews. 2008;66(9):487-505.
8. Organisation WH. Burden of disease and cost-effectiveness estimates: World Health Organisation; 2012 [
9. Kotloff KL, Nataro JP, Blackwelder WC, Nasrin D, Farag TH, Panchalingam S, et al. Burden and aetiology of diarrhoeal disease in infants and young children in developing countries (the Global Enteric Multicenter Study, GEMS): a prospective, case-control study. Lancet. 2013;382(9888):209-22.
10. Percival SL, Yates MV, Williams DD, Chalmers R, Gray N. Microbiology of waterborne diseases. 2 ed. Oxford: Academic Press; 2014.
11. Path. Rotavirus disease overview: Path; [Available from: http://sites.path.org/rotavirusvaccine/rotavirus-disease/.
12. Prüss-Üstün A, Corvalán C. Preventing disease through health environments: toward and estimate of the environmental burden of disease. World Health Organisation. 2006.
13. Cairncross S, Valdmanis V. Water supply, sanitation, and hygiene promotion. In: Jamison DT, Breman JG, Measham AR, editors. Disease control priorities in developing countries. 2 ed. Washington (DC): World Bank; 2006.
14. Cairncross S. Measuring the health impact of water and sanitation 2008 [Available from: http://www.lboro.ac.uk/well/resources/fact-sheets/fact-sheets-htm/mthiws.htm.
15. Fewtrell L, Kaufmann RB, Kay D, Enanoria W, Haller L, Colford JM. Water, sanitation, and hygiene interventions to reduce diarrhoea in less developed countries: a systematic review and meta-analysis. Lancet Infectious Diseases. 2005;5(1):42-52.
16. Organisation WH. Evaluating household water treatment options: health based targets and microbiological performance specifications. 2011.
32
17. Wright J, Gundry S, Conroy R. Household drinking water in developing countries: a systematic review of microbiological contamination between source and point-of-use. Tropical Medicine & International Health. 2004;9(1):106-17.
18. Clasen TF, Roberts IG, Rabie T, Schmidt W-P, Cairncross S. Interventions to improve water quality for preventing diarrhoea. Cochrane Database of Systematic Reviews. 2006(3).
19. Waddington H, Snilstveit B. Effectiveness and sustainability of water, sanitation, and hygiene interventions in combating diarrhoea. Journal of Development Effectiveness. 2009;1(3):295-335.
20. McGuigan KG, Conroy RM, Mosler HJ, du Preez M, Ubomba-Jaswa E, Fernandez-Ibanez P. Solar water disinfection (SODIS): A review from bench-top to roof-top. Journal of Hazardous Materials. 2012;235:29-46.
21. CAWST. Biosand filter construction manual Calgary: Center for Affordable Water and Sanitation Technology; 2010 [Available from: resources.cawst.org/package/biosand-filter-constructionmanual_en.
22. Kallman EN, Oyanedel-Craver VA, Smith JA. Ceramic Filters Impregnated with Silver Nanoparticles for Point-of-Use Water Treatment in Rural Guatemala. Journal of Environmental Engineering-Asce. 2011;137(6):407-15.
23. Brown J, Sobsey M, Sampson M, Proum S. Low-tech ceramic water filters for drinking water treatment: Laboratory and field effectiveness against waterborne indicators of human fecal contamination. Abstracts of the General Meeting of the American Society for Microbiology. 2007;107:600.
24. Peace Pf. Ceramic water filter project 2015 [Available from: http://pottersforpeace.com/about-us/.
25. Brown J, Sobsey MD, Loomis D. Local drinking water filters reduce diarrheal disease in Cambodia: A randomized, controlled trial of the ceramic water purifier. American Journal of Tropical Medicine and Hygiene. 2008;79(3):394-400.
26. Brown J, Proum S, Sobsey MD. Sustained use of a household-scale water filtration device in rural Cambodia. Journal of Water and Health. 2009;7(3):404-12.
27. Casanova LM, Walters A, Naghawatte A, Sobsey MD. A post-implementation evaluation of ceramic water filters distributed to tsunami-affected communities in Sri Lanka. Journal of Water and Health. 2012;10(2):209-20.
28. Clasen TF, Brown J, Collin S, Suntura O, Cairncross S. Reducing diarrhea through the use of household-based ceramic water filters: A randomized, controlled trial in rural Bolivia. American Journal of Tropical Medicine and Hygiene. 2004;70(6):651-7.
29. Clasen T, Parra GG, Boisson S, Collin S. Household-based ceramic water filters for the prevention of diarrhea: A randomized, controlled trial of a pilot program in Colombia. American Journal of Tropical Medicine and Hygiene. 2005;73(4):790-5.
30. Clasen TFB, S. Household-based ceramic water filters for the treatment of drinking water in disaster response: an assessment of a pilot programme in the Dominican Republic2006; 1(2).

33
31. Clasen TF, Brown J, Collin SM. Preventing diarrhoea with household ceramic water filters: Assessment of a pilot project in Bolivia. International Journal of Environmental Health Research. 2006;16(3):231-9.
32. du Preez M, Conroy RM, Wright JA, Moyo S, Potgieter N, Gundry SW. Short Report: Use of Ceramic Water Filtration in the Prevention of Diarrheal Disease: A Randomized Controlled Trial in Rural South Africa and Zimbabwe. American Journal of Tropical Medicine and Hygiene. 2008;79(5):696-701.
33. Ensink JHJ, Bastable A, Cairncross S. Assessment of a membrane drinking water filter in an emergency setting. Journal of Water and Health. 2015;13(2):362-70.
34. Luoto J, Najnin N, Mahmud M, Albert J, Islam MS, Luby S, et al. What Point-of-Use Water Treatment Products Do Consumers Use? Evidence from a Randomized Controlled Trial among the Urban Poor in Bangladesh. Plos One. 2011;6(10):8.
35. Organisation WH. Guidelines for drinking water quality. Geneva, Switzerland: 2011.
36. Simonis JJ, Basson AK, Selepe T. Removal of microbes to World Health Organization requirements using a locally developed, low cost, micro-porous, ceramic water filter. Journal of Water Sanitation and Hygiene for Development. 2014;4(4):620-4.
37. UNICEF. Use of ceramic water filters in Cambodia. Water and Sanitation Program, 2007.
38. Schmidt W-P, Arnold BF, Boisson S, Genser B, Luby SP, Barreto ML, et al. Epidemiological methods in diarrhoea studies-an update. International Journal of Epidemiology. 2011;40(6):1678-92.
39. Wood L, Egger M, Gluud LL, Schulz KF, Juni P, Altman DG, et al. Empirical evidence of bias in treatment effect estimates in controlled trials with different interventions and outcomes: meta-epidemiological study. British Medical Journal. 2008;336(7644):601-5.
40. Hunter PR. Household Water Treatment in Developing Countries: Comparing Different Intervention Types Using Meta-Regression. Environmental Science & Technology. 2009;43(23):8991-7.
41. Schmidt WP, Cairncross S. Household Water Treatment in Poor Populations: Is There Enough Evidence for Scaling up Now? Environmental Science & Technology. 2009;43(4):986-92.
42. Boerma JT, Black RE, Sommerfelt AE, Rutstein SO, Bicego GT. ACCURACY AND COMPLETENESS OF MOTHERS RECALL OF DIARRHEA OCCURRENCE IN PRESCHOOL-CHILDREN IN DEMOGRAPHIC AND HEALTH SURVEYS. International Journal of Epidemiology. 1991;20(4):1073-80.
43. Blum D, Feachem RG. MEASURING THE IMPACT OF WATER-SUPPLY AND SANITATION INVESTMENTS ON DIARRHEAL DISEASES - PROBLEMS OF METHODOLOGY. International Journal of Epidemiology. 1983;12(3):357-65.
44. Shah PB. Intention-to-treat and per-protocol analysis. Canadian Medical Association Journal. 2011;183(6):696.
45. Mellor J, Abebe L, Ehdaie B, Dillingham R, Smith J. Modeling the sustainability of a ceramic water filter intervention. Water Research. 2014;49:286-99.
34
46. Enger KS, Nelson KL, Rose JB, Eisenberg JNS. The joint effects of efficacy and compliance: A study of household water treatment effectiveness against childhood diarrhea. Water Research. 2013;47(3):1181-90.
47. Clasen T, Smith L, Albert J, Bastable A, Fesselet JF. The drinking water response to the indian ocean tsunami, including the role of household water treatment. Disaster prevention management. 2006(15):190-201.
48. Noji EK. The public health consequences of disasters. Prehospital and disaster medicine. 2000;15(4):147-57.
49. Lantagne D, Clasen T. Point of use water treatment in emergency response. London: London School of Hygiene and Tropical Medicine, 2009.
50. van Halem D, Heijman SGJ, Soppe AIA, van Dijk JC, Amy GL. ceramic silver-impregnated pot filters for household drinking water in developing countries: material characterisation and performance studies. Water Science and Technology. 2007;7(5):9.
51. Kaufman AR, Casanova LM, Sobsey MD. Efficacy of a ceramic siphon household water filter for removal of pathogenic microorganisms: lifespan volume test. Journal of Water Sanitation and Hygiene for Development. 2011;1(2):102-11.
52. van Halem D, van der Laan H, Heijman SGJ, van Dijk JC, Amy GL. Assessing the sustainability of the silver-impregnated ceramic pot filter for low-cost household drinking water treatment. Physics and Chemistry of the Earth. 2009;34(1-2):36-42.
53. Blum AG, Null C, Hoffmann V. Marketing Household Water Treatment: Willingness to Pay Results from an Experiment in Rural Kenya. Water. 2014;6(7):1873-86.
54. Berry J, Fischer G, Guiteras R. Eliciting and utilising willingness to pay: evidence from field trials in Northern Ghana. Poverty Action Lab; 2011.
55. Null C, Kremer M, Miguel E, Hombrados JG, Meeks R, Zwane AP. Willingness to pay for cleaner water in less developed countries: a systematic review of experimental evidence. International Initiative for Impact Evaluation. 2012.