Are Aid Flows Excessive or Insufficient? Estimating the Growth Impact of Aid in Threshold...
22
ESTIMATING THE GROWTH IMPACT OF AID IN THRESHOLD REGRESSIONS: ARE AID FLOWS EXCESSIVE OR INSUFFICIENT? Sarantis Kalyvitis a , Thanasis Stengos b , and Irene Vlachaki c January 2010 Abstract: Existing empirical studies and policy reports claim that foreign aid flows have not succeeded in boosting economic growth in the recipient countries. The present note examines whether there exists an aid threshold that determines the growth impact of foreign aid. We use a threshold regression methodology to estimate growth specifications and the associated aid thresholds in a sample of 42 aid recipients covering the period 1970-2000. Our findings indicate that there is a threshold level of aid above which its growth impact becomes positive. Keywords: growth, aid, threshold regression, endogeneity. JEL classification: F35, O4, C2. Acknowledgements: We thank Zeb Aurangzeb for excellent research assistance. a Corresponding author: Department of International and European Economic Studies, Athens University of Economics and Business, Patission Str. 76, Athens 10434, Greece. Tel: (+30210) – 8203174. Fax: (+30210) – 8203137. e-mail: [email protected] b Department of Economics, University of Guelph, Guelph, Ontario N1G 2W1, Canada. e-mail: [email protected] c Department of International and European Economic Studies, Athens University of Economics and Business, Patission Str. 76, Athens 10434, Greece. e-mail: [email protected]
-
Upload
independent -
Category
Documents
-
view
2 -
download
0
Transcript of Are Aid Flows Excessive or Insufficient? Estimating the Growth Impact of Aid in Threshold...
ESTIMATING THE GROWTH IMPACT OF AID IN THRESHOLD REGRESSIONS:
ARE AID FLOWS EXCESSIVE OR INSUFFICIENT?
Sarantis Kalyvitisa, Thanasis Stengosb, and Irene Vlachakic
January 2010 Abstract: Existing empirical studies and policy reports claim that foreign aid flows have not succeeded in boosting economic growth in the recipient countries. The present note examines whether there exists an aid threshold that determines the growth impact of foreign aid. We use a threshold regression methodology to estimate growth specifications and the associated aid thresholds in a sample of 42 aid recipients covering the period 1970-2000. Our findings indicate that there is a threshold level of aid above which its growth impact becomes positive. Keywords: growth, aid, threshold regression, endogeneity. JEL classification: F35, O4, C2. Acknowledgements: We thank Zeb Aurangzeb for excellent research assistance.
a Corresponding author: Department of International and European Economic Studies, Athens University of Economics and Business, Patission Str. 76, Athens 10434, Greece. Tel: (+30210) – 8203174. Fax: (+30210) – 8203137. e-mail: [email protected] b Department of Economics, University of Guelph, Guelph, Ontario N1G 2W1, Canada. e-mail: [email protected] c Department of International and European Economic Studies, Athens University of Economics and Business, Patission Str. 76, Athens 10434, Greece. e-mail: [email protected]
1. Introduction
A persistent issue in development economics involves the failure of foreign aid in terms of boosting
economic growth in the recipients.1 Yet, some empirical studies are more favorable to a positive impact of
aid on growth under the assumption of diminishing returns. In particular, Hadjimichael et al. (1995),
Lensink and White (2001), Dalgaard and Hansen (2001), and Clemens et al. (2004) have found positive
but decreasing marginal returns to aid flows by introducing an aid-squared term. Hansen and Tarp (2000,
2001) have controlled for both decreasing marginal returns and a potential synergy effect between aid and
policy, in the spirit of Burnside and Dollar (2000) who had claimed that aid contributes positively to
growth only in good policy environments. They show that the inclusion of decreasing returns in aid flows
is important and renders the interaction effect of aid with policy insignificant. Alvi et al. (2008) adopt a
non-parametric approach to allow for a flexible functional form of aid-nonlinearities and also provide
results in favor of diminishing returns. On the flip side, and viewing the growth-aid nexus from a policy
perspective, several reports have highlighted the role of insufficient, rather than excessive, aid flows in
explaining the poor growth results of recipients. Perhaps the most prominent manifestation of this claim
involves the attainment of the Millennium Development Goals (MDGs), which require substantial
additional funding in terms of foreign aid flows to the developing world.2 For instance, Zedillo et al.
(2001) estimate that roughly $50 billion a year in additional aid will be required to achieve the MDGs in
all developing countries. Devarajan et al. (2002) have estimated a figure in the range of 40 to 70 billion
USD in required increased assistance per year, which roughly represent a doubling of official aid flows
over 2000 levels. The Commission for Africa (2005) calls for an additional 25 billion USD per year in aid
to African countries by 2010, with a further 25 billion USD a year to be implemented by 2015.
The present note attempts to re-examine the growth impact of aid by asking the following question.
1 For detailed reviews and evidence see Kanbur (2006), Doucougliagos and Paldam (2008), and the papers cited therein. 2 In July 2005, the G-8 agreed to double foreign aid to Africa, from $25 billion a year to $50 billion to finance the “big push”, required for African countries to get out of the poverty trap though a large aid-financed increase in investment. Similarly, the European Commission (2005) issued an EU Strategy for Africa in which increased aid was required to achieve a large increase in growth. See also United Nations (2006) for a detailed review on related estimates for Africa.
1

Are aid flows to developing or underdeveloped countries excessive or insufficient? In other words, we aim
at answering whether there exists a threshold in foreign aid flows, above which the growth impact of aid
changes critically. To this end, we use the threshold regression model developed by Hansen (2000) and
Caner and Hansen (2004) to estimate variants of standard growth specifications with aid thresholds in a
cross section of 42 aid recipients covering the period 1970-2000. Our central finding is that there is a
threshold level of aid above which the growth impact of aid becomes unambiguously positive. In
particular, we find that low values of aid flows as percentage of the recipients’ GDP exert a negative or
insignificant effect on growth. However, the growth impact of aid becomes positive for countries in which
aid flows exceed a critical threshold. This result is robust to a number of specifications, the data
frequency, and to the endogeneity of institutions in aid recipients, a point that has been forcefully raised
by Acemoglu et al. (2001) and has since then been a benchmark in assessing the growth effect of aid in
developing countries.
Our results obviously coincide with recent calls for a major scaling up of aid to help poor countries
achieve the Millennium Development Goals. In particular, Sachs et al. (2004) and Sachs (2005) have put
forward an idea that goes back to Rostow (1960), according to which poor countries are stuck in low-
savings poverty traps and that a major intervention (‘big push’) is required to eliminate poverty. One
simplifying idea behind these calls is that investment is inadequate due to low savings (triggered for
instance by the needs for subsistence consumption) and productivity in developing countries. Hence these
countries will converge to a low-growth equilibrium, a situation that is aggravated under credit market
imperfections. Alternatively, potential non-convexities in the production process, like increasing returns
on infrastructural capital or threshold effects in human capital, suggest that a large aid-induced rise in
domestic investment would have a strong long-run growth impact. In this vein, aid recipients could benefit
from a massive inflow of aid oriented towards sufficient savings and capital accumulation to break free
from the poverty trap.
It is noteworthy that the actual experiences and associated empirical evidence have not provided
overwhelming support for these mechanisms up to now. Although Azariadis and Stachurski (2005) have
2
noted that generally poverty-trap models seem to be lacking testable quantitative implications, some
studies have attempted to investigate their predictions in the context of aid flows. Easterly (2006) claims
that the stylized facts are not consistent with a low-income poverty trap due to insufficient aid, as growth
is lower in aid-intensive countries than in similar developing countries that get little aid, whereas aid has
risen over time as a percent of income in Africa, but Africa’s growth rate has fallen over time. Kraay and
Raddatz (2007) have recently tested whether the savings and increasing returns patterns predicted by
poverty-trap models are supported by the data. They show that there is no supporting evidence either in
the behavior of saving and per capita income, or technological nonconvexities, in favor of a poverty trap.
The authors also fail to find evidence for the existence of a high-growth high-equilibrium that countries
might be able to attain with appropriately large aid inflows.
Against such a background, the results presented in the current paper seem to offer, for the first time,
some compelling evidence that large-scale aid flows can have a growth impact over the long run. This
empirical regularity is supported by the recent findings of Herzer and Morrissey (2009) who have
established that there is substantial heterogeneity in the output effects of aid among 59 recipients: although
the estimated long-run effect of aid is negative, it is found that the effect is positive in about one third of
the countries examined. Indeed, the United Nations (2006) report has mentioned several stories of aid
successes, which resulted in boosting domestic investment and growth over the last decades. For instance,
the East Asian miracle economies, notably the Republic of Korea and Taiwan Province of China, received
enormous amounts of aid during the initial and early stages of their development.3 In Africa, both
Botswana and Mauritius received very large amounts of aid at key strategic moments in their development
as, earlier, did Tunisia.4 These examples indicate that, despite the often-cited failure of aid in boosting
development in recipients, large amounts of well-targeted aid can, in conjunction with other factors,
3 The nearly 6 billion USD in US economic aid to South Korea between 1946 and 1978 was only marginally lower than its total aid to all of Africa in the same period (6.9 billion USD). A similar pattern was found in Taiwan Province of China, where although its big push began on the back of a greater degree of domestic resource mobilization, aid still accounted for nearly 40 per cent of gross domestic capital formation in the 1950s and was over 4 billion USD between 1949 and 1967 with per capita aid being higher than that to Korea. 4 Botswana had initially a very high aid to GDP ratio, which dropped sharply thanks to a sustained period of rapid growth, whereas a similar picture can be found in Mauritius.
3
produce remarkable success stories in terms of growth.
The rest of the paper is structured as follows. Section 2 briefly outlines the empirical methodology and
describes the specification utilized and the dataset. Section 3 presents the empirical results and section 4
concludes the paper.
2. Empirical methodology and data
The threshold regression model treats the sample split value (threshold parameter) as unknown by
internally sorting the data on the basis of some threshold determinants into groups of observations, each of
which obeys the same model. The threshold regression approach is parsimonious, but also allows for
increased flexibility in functional form and it is not as susceptible to the curse of dimensionality problems
as nonparametric methods. Chan (1993) showed that the asymptotic distribution of the threshold estimate
is a function of a compound Poisson process. This distribution is too complicated for inference as it
depends on nuisance parameters. Using a concentrated least squares (TR-CLS) approach, Hansen (2000)
developed a more useful asymptotic distribution theory for estimating both the threshold parameter
estimate and the regression slope coefficients in a cross-section of observations. This sample-splitting
methodology has the advantage of endogenously determining the threshold, as opposed to simple
parametric approaches that set the threshold exogenously.5
In particular, assume that 1{ , , , }ni i i iy x q u = is strictly stationary, ergodic and ρ-mixing, and that
Eui |F i−1 0, where yi is the dependent variable (growth), xi is a p×1 vector of covariates (including
aid), and qi is a threshold variable (aid). Consider then the following threshold regression with threshold
for aid:
1 1i iy x uβ′= + i , qi ≤ γ (1)
5 Masanjala and Papageorgiou (2004) point out that the exogeneity assumption in determining the threshold effect is, in fact, constrained to the estimation of dynamic linear panel data models, which is not the case in the context of the present analysis.
4

2 2i iy x uβ′= + i , qi ≤ γ (2) Equations (1) and (2) describe the relationship between the variables of interest in each of the two regimes
with γ being the sample split (aid threshold). Note that qi is observed but the sample split is unknown. Τhe
variance covariance matrix of the errors 1 2( , )i iu u ′ has the following properties: Eu1i,u2i 0,
Eu1i2 1
2 0, Eu2i2 2
2 0. In general, if the model involves exogenous slope variables then
estimation is based on Concentrated Least Squares (Hansen, 2000). In turn, the heteroskedasticity-
consistent Lagrange Multiplier (LM) test introduced by Hansen (1996) is used to verify whether there is
indeed evidence of a sample split; the null hypothesis of the test is that there is no threshold effect and the
corresponding p-values are computed by a bootstrap analog. Using a similar set of assumptions, Caner and
Hansen (2004) study the case of endogeneity in the slope variables and propose a concentrated two stage
least squares estimator (IVTR-C2SLS) for the threshold parameter and a GMM estimator for the slope
parameters.
To estimate equations (1) and (2) we use data from 42 aid-recipient countries over the period 1970-
2000.6 Since our emphasis is on the long-run growth impact of aggregate aid without the inclusion of
country fixed effects that traditionally help capture the impact of worldwide business cycles, we estimate
long-run horizon cross-country regressions using alternatively whole-period and ten-year averages, rather
than four-year averages as is common in a strand of the relevant literature. Hence, growth volatility, which
is far higher in poorer countries (Pritchett, 2000), and cyclical factors are unlikely to affect our estimates.
In turn, we follow the empirical specification adopted by Dalgaard et al. (2004, Table 3), which allows for
a parsimonious representation of the long-run growth equation with aid as one of the determinants.
However, we also experiment with additional potential control variables to assess the robustness of our
results. Data come from the World Bank database unless otherwise specified. The dependent variable of
6 The countries included are: Burkina Faso, Bolivia, Brazil, Botswana, Chile, Côte d'Ivoire, Cameroon, Congo Rep., Colombia, Costa Rica, Dominican Republic, Ecuador, Egypt Arab Rep., Ethiopia, Ghana, Gambia, Guinea-Bissau, Guatemala, Honduras, Indonesia, Jamaica, Kenya, South Africa, Sri Lanka, Madagascar, Mexico, Mali, Malawi, Malaysia, Niger, Nicaragua, Peru, Philippines, Paraguay, Singapore, Sierra Leone, El Salvador, Thailand, Trinidad and Tobago, Uganda, Venezuela, and Yemen.
5
the estimated regressions is the average growth rate of real per capita GDP. To capture convergence
effects the logarithm of initial GDP per capita in constant 1985 dollars (source: Heston et al., 2006) is
included as a control variable. Dalgaard et al. (2004) have established that the growth impact of aid is far
smaller in the tropical region. In line with these authors, the importance of (non-political) structural
characteristics on aid effectiveness is assessed using the fraction of a country’s area that is in the tropics
(source: Gallup and Sachs, 1999). A measure of institutional quality that captures security of property
rights and efficiency of the government bureaucracy also enters growth regressions; data are drawn from
Knack and Keefer (1995).7 Turning to macroeconomic policy variables, and in line with Burnside and
Dollar (2000), Dalgaard et al. (2004) use the budget surplus as a percentage of GDP to capture fiscal
policy, inflation, and the revised trade openness dummy variable introduced by Sachs and Warner (1995)
and updated by Easterly et al. (2004) and Wacziarg and Welch (2008).8
Regarding data on aid flows, we employ in some benchmark regressions ordinary data for aid flows
measured by Effective Development Assistance (EDA) as a percentage of real GDP (constant 1985
dollars) drawn from Roodman (2007).9 However, a prevalent criticism of aid-growth regressions involves
the likely endogeneity of aid as is often argued that donors might reward countries that have used aid well
in the past or, conversely, help countries that have experienced natural disasters, thus inducing a spurious
correlation between aid and growth. To avoid endogeneity-induced problems and account solely for the
exogenous component of aid, we use the recently developed approach by Rajan and Subramanian (2008)
to instrument aid. This approach focuses merely on bilateral aid flows and donor-specific, rather than
recipient-specific, characteristics by starting from the bilateral donor-recipient relationship and
aggregating up to construct endogeneity-free data. In particular, the instrumentation strategy by Rajan and
Subramanian (2008) picks instruments directly at the level of the donor, rather than the recipient, country
7 The dummies for East Asia and Sub-Saharan Africa, which are routinely included in empirical growth specifications, cannot be identified in a threshold regression framework. 8 Sachs and Warner (1995) define closed economies as those that have average tariffs on machinery and materials above 40%, or a black market premium above 20%, or pervasive government control of key tradables. 9 Another standard measure of aid is Official Development Assistance (ODA) provided by the OECD and the World Bank. However, as also pointed out by Dalgaard and Hansen (2001), EDA and ODA are highly correlated, so switching from one definition to the other is not expected to affect our results significantly.
6
and hence precludes any direct association of excluded instruments with growth rates. The authors model
the supply of aid based on the bilateral (donor-recipient) relationship and then aggregate up the predicted
values of aid received from each donor over all donors in order to get a precise measure of aid flows as a
percentage of the recipient’s GDP. The choice of aid instruments relies on two assumptions: the first
assumption is that the greater the extent of historic relationships between a donor and a recipient the more
likely that a donor will want to give aid. This idea introduces colonial links and common language in the
aid supply regression. The second assumption is that donors are more likely to want to give aid the more
they expect to have influence over the recipient. Thus, the relative size of donor and recipient, and also the
interaction terms between relative size and colonial links are included in the set of instruments to construct
the exogenous part of aid flows.10
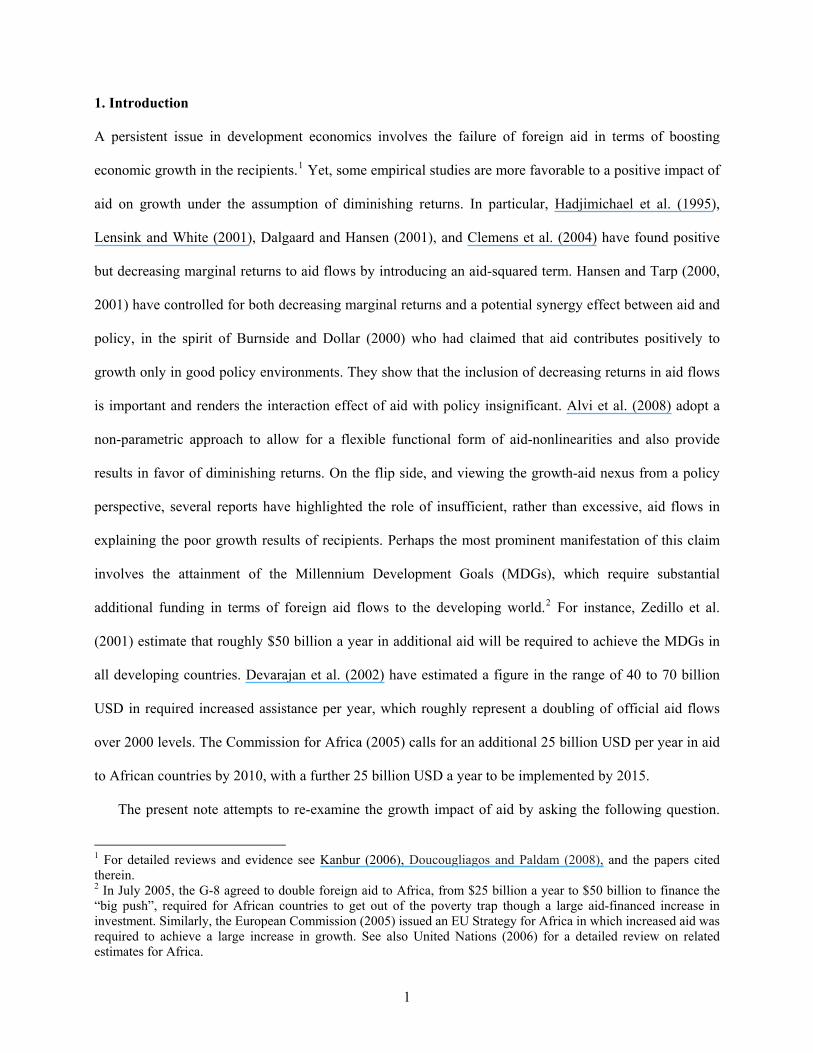
To assess the relationship between actual and fitted aid for the period 1970–2000 we regress actual aid
on fitted aid and the full set of growth covariates. We find that the relationship between actual and fitted
aid is strong, with a t-statistic that exceeds 6. Figure 1, which depicts the residuals from regressions of
actual and fitted aid on the growth covariates, indicates that the correlation coefficient is high and
statistically significant, reaching almost 0.65. Thus, we can safely infer that, as in Rajan and Subramanian
(2008), fitted aid contains a great amount of information about actual aid flows, which cannot be
attributed to growth factors that affect both variables simultaneously.
An important issue in the present context involves the endogeneity of institutional quality in a growth
regression since more developed countries can simply afford better institutions, or both growth and
institutions might be affected by the same factors. In this vein, Acemoglu et al. (2001) have used
European settler mortality as a source of exogenous variation in institutions. During colonization in the
previous three centuries, Europeans pursued different policies depending on the mortality rate faced by the
settlers. Specifically, Europeans were more likely to set up extractive institutions when faced with high
mortality, and it is possible that the differences in institutions have persisted to create differences in
institutional qualities across countries in the late twentieth century. Following this rationale, we adopt the
10 See Rajan and Subramanian (2008) for more details on the instrumentation strategy.
7
same approach to address the likely endogeneity of institutions and we use data on settler mortality
obtained from Acemoglu et al. (2001). These data correspond to estimates of mortality rates (expressed in
logarithms) faced by European soldiers, bishops and sailors in the colonies in the 17th, 18th and 19th
centuries.11 However, the settler mortality instrument is available for a subset of countries that were
colonized, and this reduces our sample to 36 countries.
Table 1 summarizes the descriptive statistics of the variables at hand. Actual aid flows for the 42 aid
recipients analyzed here have on average been 1.5% of their GDP ranging between nearly zero and almost
7%. In contrast, the estimated exogenous component of aid amounts to almost 5% of the recipients’ GDP
and varies widely ranging between -4.4% and 30%. The annual growth rate of the recipients’ real per
capita GDP hardly reaches 1.4%, but in some extreme cases it may exceed 7%. Institutional quality is at
medium levels and inflation is on average 1% with a maximum value of almost 7%. Average budget
surplus is close to zero and almost half of the recipient counties have closed economies, according to the
definition of Sachs and Werner (1995). Ninety per cent of the recipients’ land is located in the tropics.
Descriptive statistics for settler mortality implies that in ex-colonies almost one-quarter of the living
settlers would die per annum due to unfavourable disease environment.12
3. Empirical findings
In this section we present the empirical results based on the methodology developed in the previous
section. For comparison purposes, we also report results from OLS and 2SLS regressions. The first four
columns of Table 2 report the results when ordinary aid data are used to assess the growth impact of aid.
Although this dataset for aid is not purged from endogeneity, we nevertheless report our findings to allow
for comparisons of our estimates with the rest of the literature. Column (1) presents the estimates of a 11 Estimates of mortality rates correspond to potential settler mortality, measured in terms of deaths per annum per 1,000 “mean strength” (raw mortality numbers are adjusted to what they would be if a force of 1,000 living people were kept in place for a whole year, e.g., it is possible for this number to exceed 1,000 in episodes of extreme mortality as those who die are replaced with new arrivals). For more details on the construction of the mortality rate index, see Acemoglu et al. (2001). 12 The extreme value of this variable corresponds to Mali, for which estimated mortality rates exceed 1,000, i.e. all living settlers and also new-born settlers are expected to die in one-year period. Another case with estimated mortality rates above 1,000 is Gambia for which the index reaches 1470.
8
pooled OLS regression that confirm some standard results from the literature. The control variables have
the expected signs although the majority of them are statistically insignificant. In particular, institutional
quality, budget surplus and trade openness are positively signed, as expected, but only the latter variable is
statistically significant at 1% level. Initial income appears with a negative and statistically significant sign,
thus confirming the standard convergence hypothesis. In accordance with Dalgaard et al. (2004), inflation
and the percent of a country’s land located in the tropics enter with negative signs, but are found to be
insignificant. Interestingly for our purposes, the coefficient on aid is negative and statistically
insignificant, thus confirming the broad picture from the empirical literature on the aid-growth nexus.
To detect any non-linearities in the aid-growth relationship we follow the standard empirical strategy
and we augment the linear growth regression of column (1) by adding an aid-squared term. The inclusion
of this additional variable improves OLS estimation whereas the effects of the control variables remain
intact (see column 2 of Table 2). Aid now exerts a statistically significant negative effect on growth rates,
but this adverse effect is progressively weakened as aid increases, as indicated by the statistically
significant positive coefficient of the squared term. Thus, in face of ordinary aid data one finds significant
evidence that the marginal growth effect of aid is not uniform across recipients, but it is differentiated
according to the amount received.
Given the aforementioned evidence in favour of aid non-linearities, in columns (3) and (4) we move
on to estimate threshold regressions using the same dataset with ordinary aid data. The control variables
have the expected signs and are now mostly significant. In particular, the threshold estimates show that in
major aid recipients (i.e. countries above the threshold) the fraction of land in tropics exerts a largely
negative climate effect on growth and the budget surplus affects growth positively. For both subgroups of
countries trade openness retains its positive significance and the standard convergence hypothesis is
empirically validated. Regarding aid, the threshold regressions indicate the coefficient on aid is
insignificant or significantly negative below this threshold, whereas it becomes positive, but is always
insignificant, for values above the threshold. However, the threshold is found to be insignificant. The
heteroskedasticity-consistent Lagrange-multiplier (LM) test obtained in Hansen (1996), as reported in the
9
lower part of Table 2, indicates that no aid threshold exists when ordinary aid data are employed.
The right panel of Table 2 highlights the main point of the paper. In particular, in columns (5)-(10) we
report estimates with endogeneity-free aid data. First, column (5) reports the results from OLS regression.
Again, the control variables appear with the expected signs and trade openness, budget surplus and initial
income exert a statistically significant growth effect. The OLS coefficient on aid is statistically
insignificant, although now it is positively signed. As in the case of ordinary aid data, we let a quadratic
term of endogeneity-free aid enter an alternative growth regression in order to detect non-constant
marginal effects of aid (column 6). The results remain virtually the same, but the coefficient of aid
becomes now negative (although it is still insignificant), whereas the statistically significant positive
coefficient of the squared term bears evidence that the reverse growth effect of aid is moderated at higher
aid levels. Thus, we move on to threshold regressions with endogeneity-free aid. The picture here changes
starkly: there is an aid threshold below which the sign of the estimated aid impact is negative and
statistically insignificant, but above which the corresponding coefficient becomes positive and statistically
significant. This result provides prima facie evidence that the adverse growth impact of aid typically
reported in the literature is driven by low aid flows, whereas it is reversed in countries with large aid
inflows. In columns (9) and (10) of Table 2 we perform a similar exercise with ten-year averages, which
may give an indication of the robustness of the aforementioned results in the medium-run horizon. Our
unbalanced sample of 42 countries now consists of 114 observations with endogeneity-free aid data
obtained in a similar manner as before.13 The main picture survives and, in fact, is now more striking. The
estimated aid coefficient above this threshold remains positive and statistically significant, whereas the
corresponding ones below the threshold is found to be negative and statistically significant. In accordance
with these findings, the values of the LM test indicate that one can safely reject the null hypothesis of no
threshold at 1% significance level. Thus, we get significant evidence in favour of the existence of an aid
threshold effect when both cross-sectional and panel data are employed and when endogeneity of aid is
controlled for. Regarding the rest of the controls, we find that, as in column (1), the fraction of land in the
13 We do not report results from the corresponding OLS regression, since they are similar to those of column (5).
10
tropics turns out a growth deterrent in major aid recipients, whereas budget surplus exerts an adverse
effect for countries below the aid threshold and a positive effect for those above the threshold.
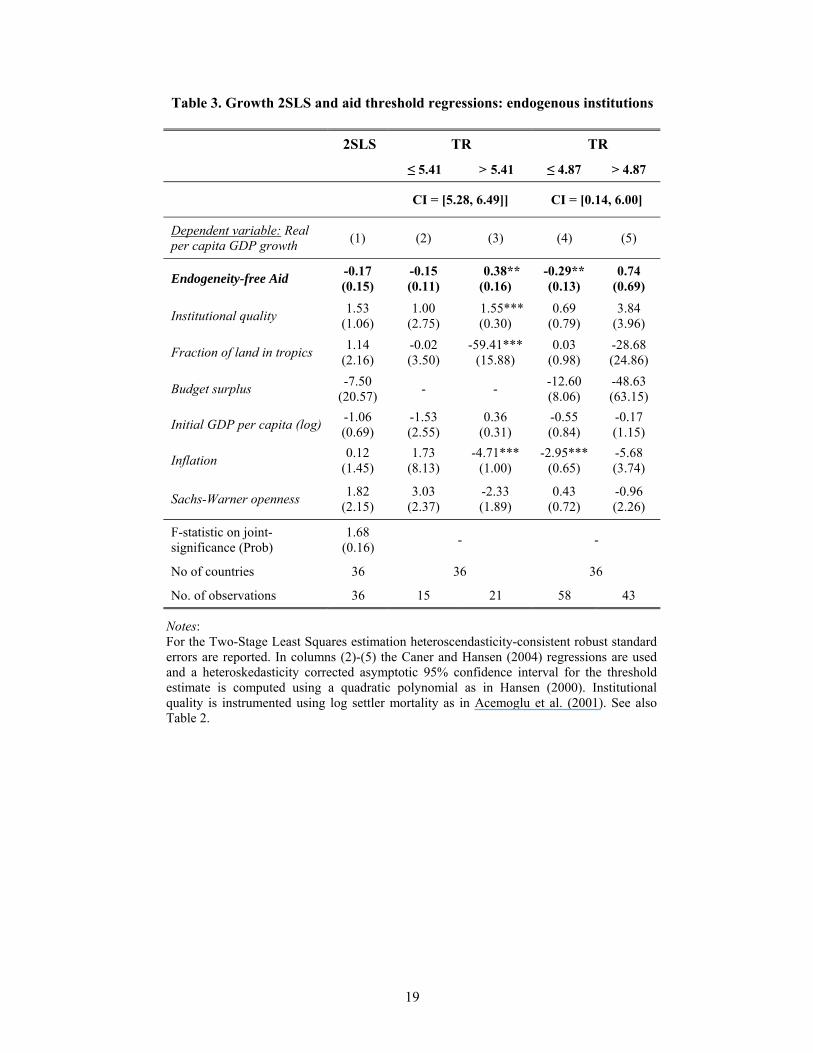
We next address the potential endogeneity of institutions discussed in the previous section by using
settler mortality data as instruments. Due to data availability our sample is now reduced to 36
observations.14 Column (1) in Table 3 reports results from the Two-Stage Least Squares regression and it
is evident that the instrumentation of institutions does not affect the growth impact of aid. The coefficient
of aid turns out negative and insignificant validating the findings of the literature. However, when we
account for the presence of a threshold in the effect of aid the picture is again different; as can be readily
seen in columns (2) and (3) of Table 3, there is a threshold for aid above which the growth impact of aid is
positive and statistically significant, whereas it is insignificant below the threshold.15 Thus, we confirm
that the presence of an aid threshold for its positive growth impact is not affected by the endogeneity of
institutions. We also address the endogeneity of institutions using 10-year averages in a similar way as the
one outlined for the whole-period averages; consequently, our sample now consists of 101 observations.
The results are reported in columns (4) and (5) of Table 3. Although the threshold regressions indicate that
the coefficient of aid above the threshold is now insignificant, its sign changes again from significantly
negative to positive above the threshold.
As a final step, to eliminate the possibility of omitted-variable bias and test the robustness of our main
result to the inclusion of additional explanatory variables we follow the recent study by Alvi et al. (2008)
and we augment the model by first adding ethnic fractionalization to our benchmark regression. Ethnic
fractionalization denotes the probability that two individuals will belong to different ethnic groups and the
data correspond to 1960 values provided by Easterly and Levine (1997). Columns (1)-(2) and (5)-(6) of
Table 4 report the results for both exogenous and endogenous institutions. Ethnic fractionalization has a
negative effect on growth in high aid-recipient countries. Our main result persists across the estimated
14 Botswana, Guinea-Bissau, Malawi, Philippines, Thailand, and Yemen are excluded due to missing observations. 15 We note that the budget deficit is not included in specifications (2)-(3) because it is highly correlated with institutional quality in high aid recipients, which caused numerical problems in the cross section regression with endogenous institutions.
11
specifications. The coefficient on aid is found to be negative below the threshold and significantly positive
above the threshold. Following Alvi et al. (2008), we also replicate estimation using money supply as a
share of GDP as a control variable (source: World Bank). Again the regressions corroborate our evidence
on the positive growth impact of aid for high aid recipients.16
4. Concluding remarks
One of the major issues in international development is the failure of aid to boost growth in recipient
countries. The negative or, at best, insignificant growth effect of aid supported by almost all studies lies in
the central assumption that the relationship between aid and growth is uniform across countries. Using a
data-driven threshold regression approach, this paper aimed at investigating whether the growth impact of
aid changes beyond a critical threshold. We showed that in standard OLS and Two-Stage Least Squares
regressions aid is found to be ineffective in enhancing growth in recipient countries. However, when a
threshold regression approach is used we found that high aid flows affect growth positively.
The paper thus belongs to the newer generation of empirical studies that have attempted to investigate
heterogeneous policy effects on growth. For instance, Kourtellos et al. (2007) have recently shown that
countries that belong to a growth regime characterized by levels of ethnolinguistic fractionalization above
a threshold value experience a negative partial relationship between aid and growth, while those belonging
to the regime with fractionalization below the threshold do not experience any growth effects from aid.
The authors also find that countries in the regime with higher levels of ethnolinguistic fractionalization
experience, on average, lower growth rates than countries in the lower fractionalization regime.
Investigating threshold effects of aid in conjunction with other variables, like ethnolinguistic
fractionalization, seems therefore to offer a promising route for future research.
16 We also experimented with the following additional variables. We introduced assassinations and an interaction term with ethnic fractionalization, but both variables turned out insignificant, whereas the coefficient of aid was not substantially affected. Also, following Clemens et al. (2004) we augmented the model by adding the logarithm of life expectancy at birth in 1970. However, the estimation of this specification generated numerical problems because, although initial log life expectancy is not very strongly correlated with initial log GDP (the correlation coefficient is around 0.7), for high aid levels the correlation between these variables reaches 0.95.
12

We close this note with a word of caution. Given that most recipients are below the estimated
threshold, our evidence provides some indications why aid flows have been insufficient in terms of
exerting a large effect on the growth of recipients. Hence, the evidence seems to favor the view that a
substantial increase of aid flows is required in order for aid to be effective in terms of growth.
Nevertheless, the present approach cannot identify the generating mechanisms and channels through
which this effect takes place, but only aims at highlighting a robust empirical fact that warrants further
exploration. Recently, Minoiu and Reddy (2010) find that developmental aid has a positive and large
effect on growth, while non-developmental aid is mostly growth-neutral. Ouattara and Strobl (2008) have
shown that the negative growth effect of aid comes mainly from financial program aid, whereas project
aid affects growth positively but with diminishing returns. In this spirit, investigating the role of various
aid forms on growth through a more refined analysis warrants further investigation.
13
References
Acemoglu D., S. Johnson and J. A. Robinson (2001), “The colonial origins of comparative development: an empirical investigation”, American Economic Review 91(5): 1369-1401.
Alvi E., D. Mukherjee and E.K. Shukralla (2008), “Aid, policies, and growth in developing countries: a new look at the empirics”, Southern Economic Journal, 74(3): 693-706
Azariadis C. and J. Stachurski (2005), “Poverty traps”, in P. Aghion and S. Durlauf (eds.), Handbook of Economic Growth, North Holland: Amsterdam.
Burnside C. and Dollar (2000), “Aid, policies and growth”, American Economic Review 90(4): 847-868.
Caner M. and B. Hansen (2004), “Instrumental variable estimation of a threshold model”, Econometric Theory 20(5): 813-843.
Chan K.S. (1993), “Consistency and limiting distribution of the least squares estimator of a threshold autoregressive model”, The Annals of Statistics 21(1): 520-533.
Clemens M.A., R. Bhavnani and S. Radelet (2004) “Counting chickens when they hatch: The short-term effect of aid on growth”, Center for Global Development Working Paper 44: Washington.
Commission for Africa (2005), Our Common Interest: Report Of The Commission For Africa, http://www.commissionforafrica.org.
Dalgaard C. and H. Hansen (2001), “On aid, growth and good policies”, Journal of Development Studies 37(6): 17–41.
Dalgaard C., H. Hansen and F. Tarp (2004), “On the empirics of foreign aid and growth”, Economic Journal 114(496): F191–216.
Devarajan S., M. Miller and Eric V. Swanson (2002), “Goals for development: history, prospects and costs”, World Bank Policy Research Working Paper No. 2819.
Doucougliagos H. and M. Paldam (2008), “Aid effectiveness on growth: a meta study”, European Journal of Political Economy 24(1), 1–24.
Easterly W. and R. Levine (1997), “Africa’s growth tragedy: policies and ethnic divisions”, Quarterly Journal of Economics 112(4): 1203–50.
Easterly W. (2006), “Reliving the 1950s: the big push, poverty traps, and takeoffs in economic development”, Journal of Economic Growth, 11: 289–318
Easterly W., R. Levine and D. Roodman (2004), “Aid, policies and growth: a comment”, American Economic Review 94(3): 774-780.
European Commission (2005), EU Strategy for Africa: Towards a Euro-African pact to accelerate Africa’s development, European Parliament and the European Economic and Social Committee: Brussels.
Gallup J.L. and J.D. Sachs (1999), “Geography and economic development”, in: B. Pleskovic and Stiglitz J.E. (eds.), Annual World Bank Conference on Development Economics, World Bank: Washington DC.
Hadjimichael M.T., D. Ghura, M. Mühleisen, R. Nord, and E. M. Uçer (1995), “Sub-Saharan Africa: growth, savings, and investment, 1986-93”, Occasional Paper 118, International Monetary Fund.
Hansen B.E. (1996), “Inference when a nuisance parameter is not identified under the null hypothesis”, Econometrica 64(2), 413-430.
Hansen, B.E. (2000), “Sample splitting and threshold estimation”, Econometrica 68(3): 575–604.
Hansen H. and F. Tarp (2000), “Aid effectiveness disputed”, Journal of International Development 12(3): 375–98.
Hansen H. and F. Tarp (2001), “Aid and growth regressions”, Journal of Development Economics 64(2): 547–70.
Herzer D. and O. Morrissey (2009), “The long-run effect of aid on domestic output”, CREDIT Research Paper 09/01, University of Nottingham.
Heston A, R. Summers and B. Aten (2006), Penn World Tables Version 6.2, Center for International Comparisons of Production, Income and Prices, University of Pennsylvania.
Kanbur R. (2006), “The economics of international aid”, in S. Kolm and J.M. Ythier (eds.), Handbook of the Economics of Giving, Altruism and Reciprocity, Elsevier: Amsterdam.
Knack S. and P. Keefer (1995), “Institutions and economic performance: cross-country tests using alternative institutional measures”, Economics and Politics 7(3): 207-227.
Kraay A. and C. Raddatz (2007), “Poverty traps, aid, and growth”, Journal of Development Economics, 82: 315–347.
Kourtellos A, C.M. Tan, X. Zhang (2007), “Is the relationship between aid and economic growth nonlinear?”, Journal of Macroeconomics 29(3): 515–540.
Lensink R. and H. White (2001), “Are there negative returns to aid?”, Journal of Development Studies
15
37(6): 42–65.
Masanjala W.H. and C. Papageorgiou (2004), “The Solow model with CES technology: nonlinearities and parameter heterogeneity”, Journal of Applied Econometrics 19(2): 171-201.
Minoiu C. and S.G. Reddy (2010), “Development aid and economic growth: A positive long-run relation”, Quarterly Review of Economics and Finance, 50(1): 27-39.
Ouattara B. and E. Strobl (2008), “Aid, policy and growth: does aid modality matter?”, Review of World Economics, 144(2): 347-365.
Pritchett L. (2000), “Understanding patterns of economic growth: searching for Hills among Plateaus, Mountains and Plains”, World Bank Economic Review 14(2): 221-250.
Rajan R.G. and A. Subramanian (2008), “Aid and growth: what does the cross-country evidence really show?”, Review of Economics and Statistics 90(4): 643-665.
Roodman D. (2007), “The anarchy of numbers: aid, development, and cross-country empirics”, World Bank Economic Review 21(2): 255-277.
Rostow W. (1960), The Stages of Economic Growth: A Noncommunist Manifesto, Cambridge University Press: Cambridge.
Sachs J. (2005), Investing in Development: A Practical Plan to Achieve the Millenium Development Goals, UN Millenium Project: New York.
Sachs J. and A. Warner (1995), “Economic reform and the process of global integration”, Brookings Papers on Economic Activity 1: 1-118.
Sachs J., J.W. McArthur, G. Schmidt-Traub, M. Kruk, C. Bahadur, M. Faye, G. McCord (2004), “Ending Africa's poverty trap”, Brookings Papers on Economic Activity 1:117-240.
United Nations (2006), Doubling Aid: Making the ‘Big Push’ Work, New York.
Wacziarg R. and K.H. Welch (2008), “Trade liberalization and growth: new evidence”, The World Bank Economic Review, 22(2): 187-231.
Zedillo E., A.Y Al-Hamad, D. Bryer D, M. Chinery-Hesse, J. Delors, R. Grynspan, A.Y. Livshit, A.M. Osman, R. Rubin, M. Singh and M. Son (2001), Recommendations of the Highlevel Panel on Financing for Development, UN General Assembly, New York: United Nations.
16
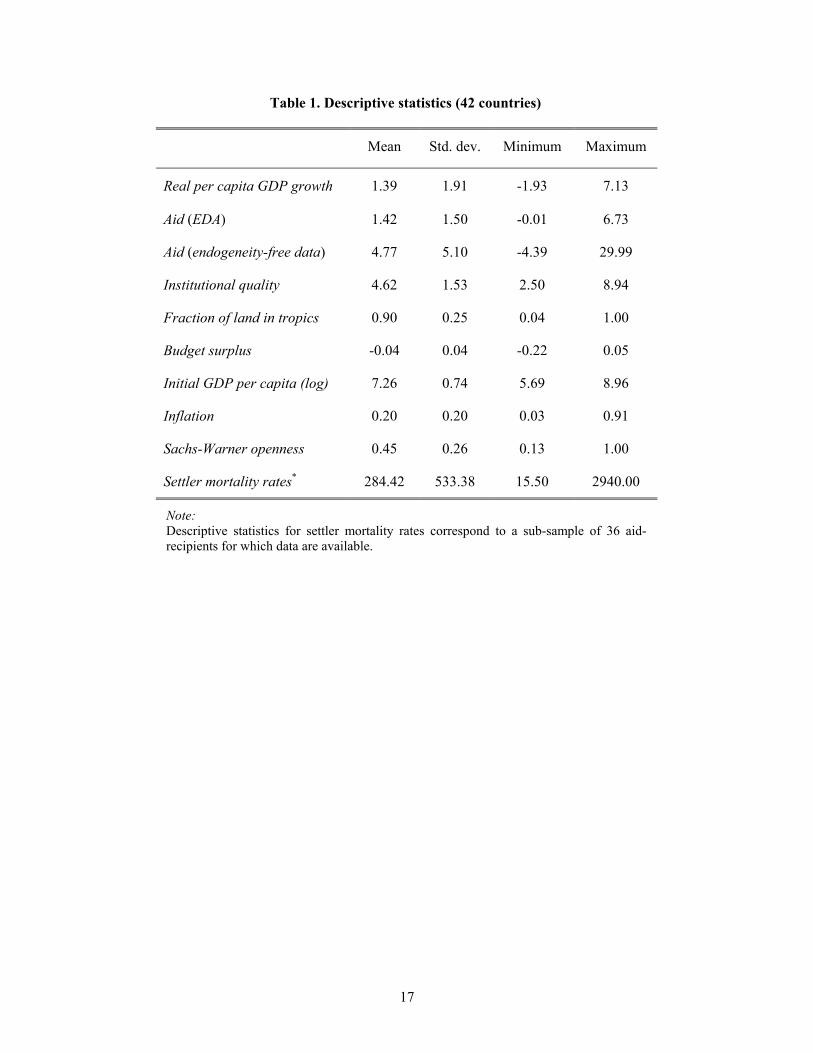
Table 1. Descriptive statistics (42 countries)
Mean Std. dev. Minimum Maximum
Real per capita GDP growth 1.39 1.91 -1.93 7.13
Aid (EDA) 1.42 1.50 -0.01 6.73
Aid (endogeneity-free data) 4.77 5.10 -4.39 29.99
Institutional quality 4.62 1.53 2.50 8.94
Fraction of land in tropics 0.90 0.25 0.04 1.00
Budget surplus -0.04 0.04 -0.22 0.05
Initial GDP per capita (log) 7.26 0.74 5.69 8.96
Inflation 0.20 0.20 0.03 0.91
Sachs-Warner openness 0.45 0.26 0.13 1.00
Settler mortality rates* 284.42 533.38 15.50 2940.00
Note: Descriptive statistics for settler mortality rates correspond to a sub-sample of 36 aid-recipients for which data are available.
17

18
Table 2. Growth OLS and aid threshold regressions
ordinary aid endogeneity-free aid
OLS TR OLS TR TR ≤ 1.37 >1.37 ≤3.32 >3.32 ≤ 6.18 < 6.18 CI = [1.29, 1.87] CI = [2.81, 6.48] CI = [5.32, 8.10]
Dependent variable: per capita growth (1) (2) (3) (4) (5) (6) (7) (8) (9) (10)
Aid -0.33 (0.32)
-1.20** (0.50)
-1.21**(0.53)
0.15 (0.29)
0.05 (0.05)
-0.05 (0.07)
-0.06 (0.06)
0.25*** (0.06)
-0.26*** (0.09)
0.08** (0.04)
Institutional quality 0.20 (0.14)
0.18 (0.14)
0.35***(0.11)
-0.02 (0.32)
0.11 (0.16)
0.15 (0.16)
-0.18* (0.11)
0.02 (0.21)
0.10 (0.16)
1.06*** (0.29)
Fraction of land in tropics -1.12 (1.19)
-1.13 (1.35)
1.06* (0.60)
-7.26*** (1.58)
-1.51 (1.22)
-1.37 (1.28)
-0.71 (0.44)
-1.50 (2.06)
-0.83 (0.85)
-19.51***(5.53)
Budget surplus 7.86 (10.50)
13.01 (10.68)
3.86 (6.21)
18.30* (10.16)
17.26** (8.64)
22.22** (10.65)
-29.38***(4.50)
41.17***(10.71)
-0.08 (0.36)
0.99** (0.42)
Initial GDP per capita (log) -0.93** (0.40)
-1.31***(0.35)
-1.28***(0.41)
-2.54*** (0.91)
-0.56* (0.30)
-0.59* (0.31)
-0.15 (0.10)
-0.79** (0.37)
-2.61 (7.19)
-11.24 (9.40)
Inflation -0.45 (1.26)
-0.19 (1.14)
-0.62 (0.87)
3.78 (2.50)
-0.41 (1.53)
-0.16 (1.60)
-0.55 (0.41)
2.12 (1.61)
-2.73*** (0.63)
-3.84***(0.85)
Sachs-Warner openness 3.68***(1.03)
3.19*** (0.93)
2.44***(0.86)
4.28*** (1.33)
4.08*** (0.96)
3.61*** (0.94)
5.75*** (0.49)
3.16*** (0.82)
0.71 (0.48)
-0.84 (0.73)
Aid Squared 0.16** (0.07) 0.01*
(0.00)
R-squared 0.54 0.58 - - 0.53 0.55 - -
F-statistic on joint-significance (Prob) 7.69 (0.00)
12.72 (0.00) - - 5.81
(0.00) 5.94
(0.00) - -
LM test for no threshold: Bootstrap P-value - - 0.25 - - 0.00 0.01
No of countries 42 42 42 42 42 42 42
No. of observations 42 42 24 18 42 16 26 78 36
Notes: All regressions include a constant. Robust standard errors are in parentheses. *** denotes significance at 1%, ** at 5%, and * at 10%. TR and CI denote Hansen (2000) Threshold Regression and the 95% Confidence Interval. Variables in columns (1)-(8) are averaged over 1970-2000 and in columns (9)-(10) are 10-year averages. For the heteroscedasticity-consistent Lagrange-multiplier (LM) test for no threshold the null hypothesis is that there is no threshold effect (Hansen, 1996).
19
Table 3. Growth 2SLS and aid threshold regressions: endogenous institutions
2SLS TR TR ≤ 5.41 > 5.41 ≤ 4.87 > 4.87
CI = [5.28, 6.49]] CI = [0.14, 6.00]
Dependent variable: Real per capita GDP growth (1) (2) (3) (4) (5)
Endogeneity-free Aid -0.17 (0.15)
-0.15 (0.11)
0.38** (0.16)
-0.29** (0.13)
0.74 (0.69)
Institutional quality 1.53 (1.06)
1.00 (2.75)
1.55*** (0.30)
0.69 (0.79)
3.84 (3.96)
Fraction of land in tropics 1.14 (2.16)
-0.02 (3.50)
-59.41*** (15.88)
0.03 (0.98)
-28.68 (24.86)
Budget surplus -7.50 (20.57) - - -12.60
(8.06) -48.63 (63.15)
Initial GDP per capita (log) -1.06 (0.69)
-1.53 (2.55)
0.36 (0.31)
-0.55 (0.84)
-0.17 (1.15)
Inflation 0.12 (1.45)
1.73 (8.13)
-4.71*** (1.00)
-2.95*** (0.65)
-5.68 (3.74)
Sachs-Warner openness 1.82 (2.15)
3.03 (2.37)
-2.33 (1.89)
0.43 (0.72)
-0.96 (2.26)
F-statistic on joint-significance (Prob)
1.68 (0.16) - -
No of countries 36 36 36
No. of observations 36 15 21 58 43
Notes: For the Two-Stage Least Squares estimation heteroscendasticity-consistent robust standard errors are reported. In columns (2)-(5) the Caner and Hansen (2004) regressions are used and a heteroskedasticity corrected asymptotic 95% confidence interval for the threshold estimate is computed using a quadratic polynomial as in Hansen (2000). Institutional quality is instrumented using log settler mortality as in Acemoglu et al. (2001). See also Table 2.
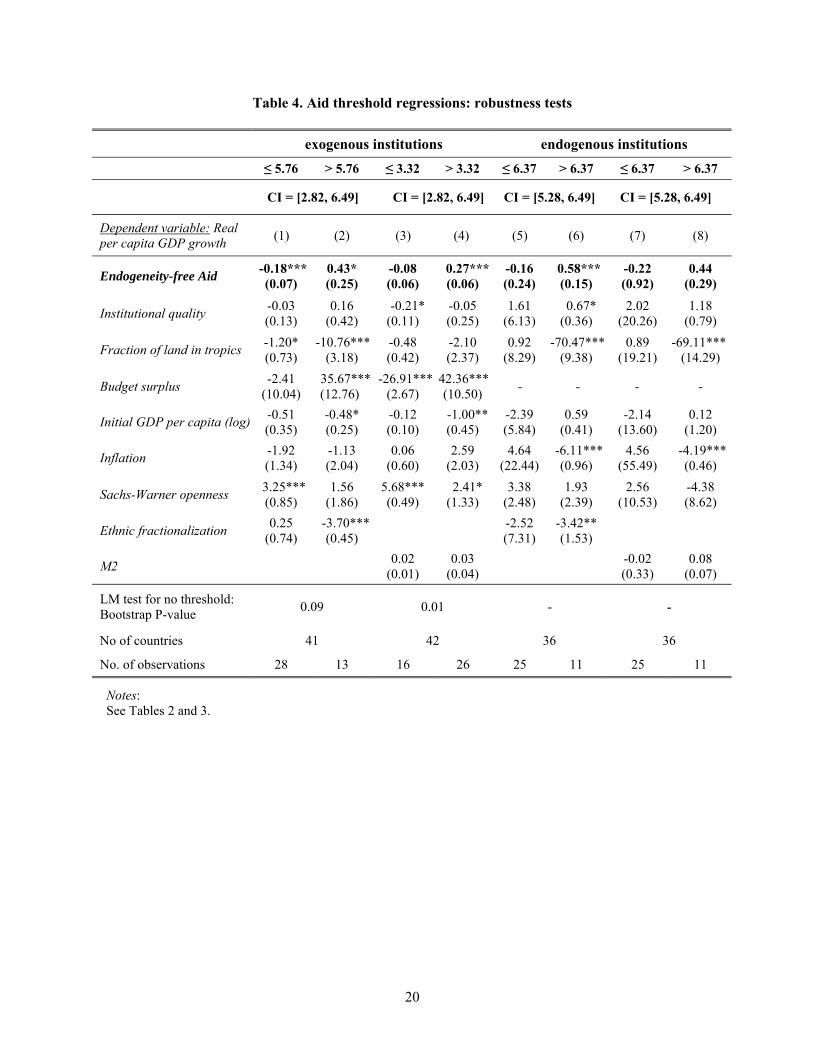
Table 4. Aid threshold regressions: robustness tests exogenous institutions endogenous institutions ≤ 5.76 > 5.76 ≤ 3.32 > 3.32 ≤ 6.37 > 6.37 ≤ 6.37 > 6.37
CI = [2.82, 6.49] CI = [2.82, 6.49] CI = [5.28, 6.49] CI = [5.28, 6.49]
Dependent variable: Real per capita GDP growth (1) (2) (3) (4) (5) (6) (7) (8)
Endogeneity-free Aid -0.18*** (0.07)
0.43* (0.25)
-0.08 (0.06)
0.27***(0.06)
-0.16 (0.24)
0.58*** (0.15)
-0.22 (0.92)
0.44 (0.29)
Institutional quality -0.03 (0.13)
0.16 (0.42)
-0.21* (0.11)
-0.05 (0.25)
1.61 (6.13)
0.67* (0.36)
2.02 (20.26)
1.18 (0.79)
Fraction of land in tropics -1.20* (0.73)
-10.76***(3.18)
-0.48 (0.42)
-2.10 (2.37)
0.92 (8.29)
-70.47*** (9.38)
0.89 (19.21)
-69.11***(14.29)
Budget surplus -2.41 (10.04)
35.67***(12.76)
-26.91***(2.67)
42.36***(10.50) - - - -
Initial GDP per capita (log) -0.51 (0.35)
-0.48* (0.25)
-0.12 (0.10)
-1.00**(0.45)
-2.39 (5.84)
0.59 (0.41)
-2.14 (13.60)
0.12 (1.20)
Inflation -1.92 (1.34)
-1.13 (2.04)
0.06 (0.60)
2.59 (2.03)
4.64 (22.44)
-6.11*** (0.96)
4.56 (55.49)
-4.19***(0.46)
Sachs-Warner openness 3.25*** (0.85)
1.56 (1.86)
5.68*** (0.49)
2.41* (1.33)
3.38 (2.48)
1.93 (2.39)
2.56 (10.53)
-4.38 (8.62)
Ethnic fractionalization 0.25 (0.74)
-3.70***(0.45) -2.52
(7.31) -3.42** (1.53)
M2 0.02 (0.01)
0.03 (0.04) -0.02
(0.33) 0.08
(0.07)
LM test for no threshold: Bootstrap P-value 0.09 0.01 - -
No of countries 41 42 36 36
No. of observations 28 13 16 26 25 11 25 11
Notes: See Tables 2 and 3.
20
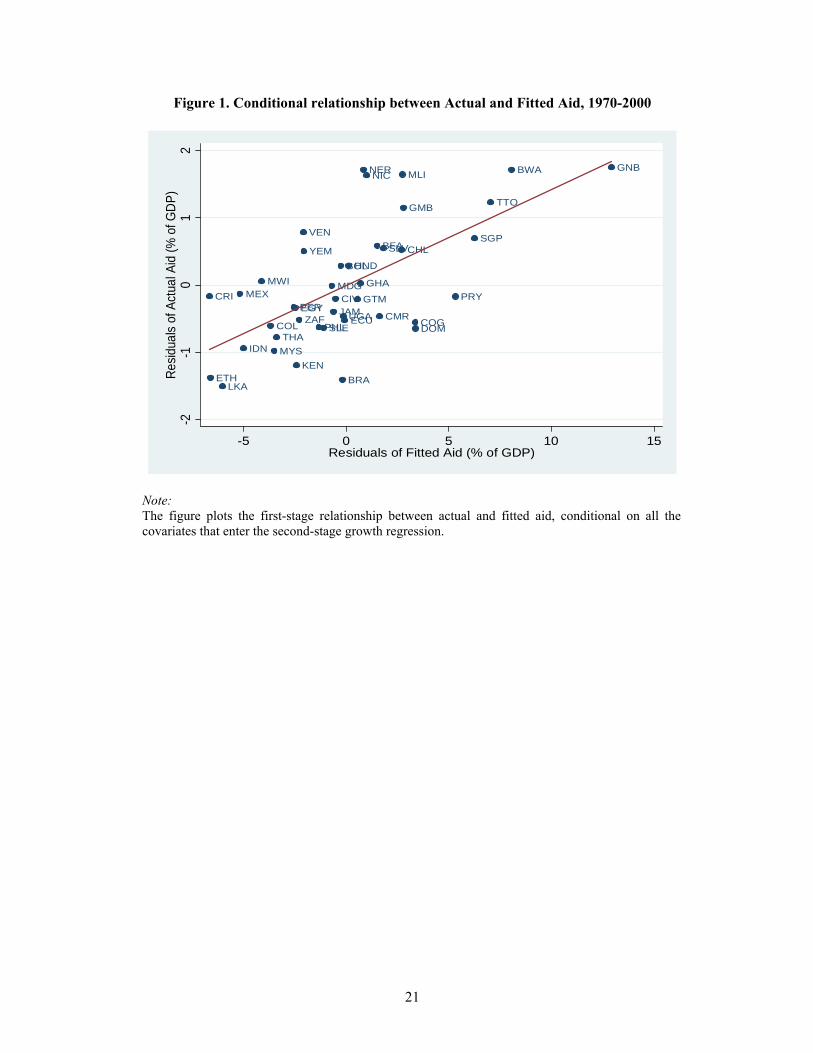
Figure 1. Conditional relationship between Actual and Fitted Aid, 1970-2000
BFA
BOL
BRA
BWA
CHL
CIV
CMR COGCOL
CRI
DOMECU
EGY
ETH
GHA
GMB
GNB
GTM
HND
IDN
JAM
KEN
LKA
MDGMEX
MLI
MWI
MYS
NERNIC
PER
PHL
PRY
SGP
SLE
SLV
THA
TTO
UGA
VEN
YEM
ZAF
-2-1
01
2Re
sidua
ls of
Act
ual A
id (%
of G
DP)
-5 0 5 10 15Residuals of Fitted Aid (% of GDP)
Note: The figure plots the first-stage relationship between actual and fitted aid, conditional on all the covariates that enter the second-stage growth regression.
21