Nanobarcoding: detecting nanoparticles in biological samples ...
Upload
independentCategory
view
4download
0
Aqueous Polymer Two-Phase Systems for the Proteomic Analysis of
Plasma Membranes from Minute Brain Samples
Jens Schindler,*,†,§ Urs Lewandrowski,‡ Albert Sickmann,‡ and Eckhard Friauf†
Animal Physiology Group, Department of Biology, University of Kaiserslautern,D- 67653 Kaiserslautern, Germany, and Rudolf-Virchow-Center, DFG Research Center for Experimental
Biomedicine, University of Würzburg, D-97078 Würzburg, Germany
Received July 27, 2007
Comprehensive knowledge about the plasma membrane protein profile of a given brain region, atdefined developmental stages, will greatly foster the understanding of brain function and dysfunction.Protocols are required which selectively enrich plasma membranes from small brain regions, therebyresulting in high yields. Here, we present a suitable protocol that is based on aqueous polymer two-phase systems. It is material saving, easy to perform, fast, and low-priced. Evidence for its effectivenesswas obtained by marker enzyme assays, immunoblot analyses, and mass spectrometry. Plasmamembranes from all parts of the cells (somata, dendrites, and axons) were enriched, whereas therewas a reduction of mitochondria and endoplasmic reticulum. The total of 15.0% of the initial activity ofthe plasma membrane marker was recovered, while the activity of the mitochondrial marker and themarker for the endoplasmic reticulum was 0.2% of the initial activity. Mass spectrometric analyses ofproteins purified from approximately one-fourth of rat cerebellum (i.e., 80 mg of tissue) resulted in theidentification of 525 different proteins, with 27.3% (gene ontology) or 38.2% (gene cards) being allocatedto the plasma membrane. When accepting 4.7% of the initial mitochondrial marker activity and 2.9%of the initial activity of the marker for the endoplasmic reticulum as contaminations, the yield of theplasma membrane marker increased to 28.8%. Under these conditions, 586 different proteins wereidentified by mass spectrometry, 26.1–36.5% of which were plasma membrane proteins. Taken together,our protocol represents a powerful tool for the analysis of the plasma membrane subproteome of distinctbrain regions.
Keywords: plasma membrane • brain proteomics • two-phase system • countercurrent distribution
Introduction
The human brain comprises roughly 1011 neurons, 1014-1015
synapses, and 1013 glia cells. It is composed of a plethora ofanatomically defined regions, such as nuclei, areas, and layers.Each region is equipped with a distinct, albeit almost unknown,repertoire of proteins which form the molecular basis for thephysiological and morphological specializations. Neural pro-cessing involves a full panoply of many different plasmamembrane proteins. Therefore, a comprehensive knowledgeabout these proteins is required to understand physiologicalprocesses. Because of the complexity of the brain, neuroanato-mists and neurophysiologists commonly do not investigate thebrain in toto, but focus on particular brain regions, such asthe hippocampus, the primary visual cortex, or the cerebellum,and its distinguishing characteristics. Such a reductionistic
approach is also advisable in proteomic studies when charac-teristic protein profiles are of interest. Analyzing the brain inits entirety would dilute proteins that are restricted to a givenregion, and specific profiles would thus elude detection. Incontrast, focusing on specific brain regions provides theadvantage of a reduced sample complexity and, thus, greatlyfacilitates the detection of region specific characteristics. Animminent disadvantage of this approach is the relatively smallamount of tissue obtainable. This disadvantage is even ag-gravated when subproteomes, such as those from plasmamembranes, are to be analyzed. As the latter are of particularinterest for neuroscientists, efficient protocols of high yield arerequired for the analysis of plasma membranes obtained fromsmall and distinct brain regions.
Traditionally, purification protocols for plasma membranescombine differential centrifugation and density gradient cen-trifugation.1 As an alternative to density gradients, microsomesobtained through differential centrifugation are further purifiedby affinity partitioning in aqueous polymer two-phase systems.2,3
Aqueous polymer two-phase systems exploit differences insurface properties, rather than density, to separate the varioussubcellular compartments.4 They enable the separation ofsubstructures of plasma membranes in high purity.5,6 On the
* Corresponding author: Jens Schindler, University of Freiburg, Instituteof Physiology, Hermann-Herder-Strasse 7, D-79104 Freiburg, Germany.Phone: +49 761 203 5148. Fax: +49 761 203 5191. E-mail: [email protected].
† University of Kaiserslautern.§ Present address: Institute of Physiology, University of Freiburg, D-79104
Freiburg, Germany.‡ University of Würzburg.
432 Journal of Proteome Research 2008, 7, 432–442 10.1021/pr0704736 CCC: $40.75 2008 American Chemical SocietyPublished on Web 11/13/2007

basis of aqueous polymer two-phase systems, we recentlyestablished a protocol for small amounts (300 mg) of braintissue.7 In the present paper, we aimed to establish a protocolwhich avoids both the material-consuming preparation ofmicrosomes and the expensive synthesis of affinity ligand-coupled polymers. Our aim was to develop a simple, fast, andlow-priced protocol which results in high yield and high purityof plasma membranes from small brain samples. For thispurpose, we used the rat cerebellum and adapted variousparameters that influence membrane partitioning (for reviews,see refs 8 and 9). The novel protocol fulfils these demands: itis applicable to small brain samples (40–80 mg) and yieldsnearly 30% of the initial plasma membrane marker activity.Furthermore, mass spectrometry identified up to 38.2% plasmamembrane proteins, demonstrating a high level of purity.Moreover, the purification procedure can be performed within2 h, and costs are negligible.
Experimental Procedures
Chemicals. Dextran T500 was purchased from Roth (Karlsruhe,Germany). The solvents used for liquid chromatography wereobtained from Merck (Darmstadt, Germany), all other chemi-cals from Sigma-Aldrich (Munich, Germany).
Antibodies. Antibodies directed against the Na+/K+/Cl–
cotransporter 1, neurofilament, and the synaptic vesicle gly-coprotein 2 were from the Developmental Studies HybridomaBank (University of Iowa, Iowa City, IA). The antibody againstcalnexin was from BD Biosciences (Heidelberg, Germany), theantibody against cytochrome c oxidase subunit IV was fromMoBiTech (Göttingen, Germany), and the antibody against themicrotubule associated protein 2 was from Chemicon (Hamp-shire, Great Britain). The antibody targeting the K+/Cl- cotrans-porter 2 was produced by Dr. Isabelle Guillemin (Kaiserslautern,Germany),10 and the antibody against the glycine transporter1 was provided by Dr. Francisco Zafra (Madrid, Spain).11
Secondary antibodies were ECL antimouse IgG and ECLantirabbit IgG obtained from GE Healthcare (Munich,Germany).
Tissue Preparation. Two-month-old Sprague–Dawley rats ofboth genders were deeply anesthetized by an intraperitonealinjection of chloral hydrate (700 mg/kg) and killed by decapita-tion. After removing the brain from the cranium, the cerebellumwas dissected by cutting the cerebellar pedunculi in a solutioncontaining 25 mM NaHCO3, 2.5 mM KCl, 1.25 mM NaH2PO4,1 mM MgCl2, 2 mM CaCl2, 260 mM D-glucose, 2 mM sodiumpyruvate, 3 mM myo-inositol, and 1 mM kynurenic acid, pH7.4, at 4 °C. The tissue was stored at -80 °C until further usage.All experiments conformed to the German Animal ProtectionLaw and were approved by the Landesuntersuchungsamt(Koblenz, Germany).
Purification of Brain Plasma Membranes. The whole pro-cedure for the purification of brain plasma membranes wasperformed at 4 °C and is illustrated in Figure 1. Two-phasesystems were prepared one day prior to usage from stocksolutions of 200 mM Tris, adjusted to pH 7.8 with sulfuric acid(Tris/SO4
2-), 40% (w/w) polyethylene glycol (PEG) 3350, and20% (w/w) dextran prepared from freeze-dried dextran T500.The two-phase system used for homogenization of 0.1 g oftissue (labeled ‘A’ in Figure 1) was prepared by mixing 1.035 gof dextran, 0.518 g of PEG, 0.75 g of Tris/SO4
2-, and 0.598 g ofwater and was incubated at 4 °C overnight. Six additional two-phase systems were prepared (labeled ‘B’–‘G’ in Figure 1), eachone containing 1.035 g of dextran, 0.518 g of PEG, 0.75 g of
Tris/SO42-, and 0.698 g of water. All two-phase systems were
thoroughly mixed by vortexing and stored at 4 °C overnight.The next day, the 6 top phases of the two-phase systems
‘B’–‘G’, each amounting to ∼1.9 g, were collected and stored.In total, 0.1 g of tissue from rat cerebellum was added to thetwo-phase system ‘A’ and homogenized by 10 strokes withrotation (250 rpm) in a glass Teflon homogenizer followed bysonication for 45 s. Phase separation was accelerated bycentrifugation for 10 min at 350g. The resulting top phase wasthen transferred onto the fresh bottom phase ‘B’. The remain-ing bottom phase of two-phase system ‘A’ was mixed with anamount of fresh top phase equal to the amount removedbefore. The two resulting two-phase systems were mixed byinverting 20 times, vortexing, and inverting another 20 times.Phase separation was accelerated by centrifugation. In each ofthe following steps, all top phases were transferred onto thenext bottom phase (top phase ‘B’ onto bottom phase ‘C’, topphase ‘A’ onto bottom phase ‘B’), and bottom phase ‘A’ wasagain re-extracted with a fresh top phase. After each transfer,phases were mixed and centrifuged. The procedure wasfinished when two-phase systems ‘A’–‘G’ were separated bycentrifugation, resulting in a total of 7 top and 7 bottom phases.
Prior to mass spectrometric analysis, the top phase ‘G’ wasdiluted with 1 M KCl and 15 mM Tris (pH 7.4) and sedimentedat 233 000g for 1 h at 4 °C. The pellet was washed another two
Figure 1. Schematic of the protocol to enrich brain plasmamembranes. In the 1st step, brain tissue is homogenized in atwo-phase system. After phase separation, the top phase istransferred onto the fresh bottom phase ‘B’, and the bottomphase of the primary two-phase system ‘A’ is covered with afresh top phase. In the subsequent steps, the top phases aretransferred one bottom phase along, always transferring thelatest top phase onto a fresh bottom phase and re-extractingbottom phase ‘A’ with a fresh top phase (for example, in the 3rdstep, top phase ‘B’ is transferred onto the fresh bottom phase‘C’, top phase ‘A’ is then transferred onto bottom phase ‘B’, andbottom phase ‘A’ is finally covered with a fresh top phase). Bydoing so, 7 two-phase systems (‘A’–‘G’) are obtained after thefinal 8th step, each containing a top and a bottom phase. SeeExperimental Procedures for further details.
Two-Phase Systems for Plasma Membrane Proteomics research articles
Journal of Proteome Research • Vol. 7, No. 01, 2008 433

times with the same buffer, followed by three washes with 0.2M Na2CO3 at 4 °C. In another series of experiments, top phases‘F+G’ were combined and then treated as described above.
Protein Assays. Protein amount was determined using theBradford method,12 with bovine serum albumin as standard.The marker for plasma membranes was alkaline phosphatase(E.C. 3.1.3.1),13 whereas the marker for mitochondria wassuccinate dehydrogenase (E.C. 1.3.5.1).13 NADH ferricyanidereductase (E.C 1.6.2.2) activity was used as a marker for theendoplasmic reticulum.14
Immunoblotting. Proteins were resolved on a 4–12% Bis-Tris gel with a MOPS buffer system (NuPAGE Novex, Invitrogen,Karlsruhe, Germany) and transferred to a PVDF membrane at30 V for 1.5 h using the NuPAGE system. Antibodies werediluted in TTBS (20 mM Tris, 150 mM NaCl, and 0.1% Tween-20, pH 7.5) with 5% nonfat dry milk and incubated at roomtemperature for 2 h with continuous agitation. The membraneswere washed four times within 10 min with TTBS and incu-bated with a peroxidase-labeled secondary antibody in TTBS/nonfat dry milk at room temperature. After 1 h, the blots werewashed with TTBS as described before. Bound antibodies weredetected using Western Lightning Reagent Plus (Perkin-Elmer,Boston, MA) and the VersaDoc 3000 documentation system(Bio-Rad, Munich, Germany).
1D-PAGE of Purified Plasma Membrane Proteins PriorTo Mass Spectrometry. In total, 40 µg of high-salt and high-pH-treated proteins were resuspended via ultrasonication in25 µL LDS-sample buffer (Invitrogen). After incubation at 75°C for 15 min, the sample was applied to a 4–12% Bis-Tris gelwith a MOPS buffer system (NuPAGE-Novex, Invitrogen).Protein separation occurred for 15 min at 50 V and additional60 min at 200 V and 4 °C. Visualization of protein bands wasperformed by a modified colloidal Coomassie staining.15 Briefly,the gel was immersed for 16 h in a solution containing 34%(v/v) methanol, 2% (v/v) phosphoric acid (89%), 17% (w/v)ammonium sulfate, and 0.066% (w/v) Coomassie G250. Back-ground gel staining was reduced by gentle washing in water.Subsequently, the gel lanes were cut into 1-mm-thick slices andfrozen at -80 °C until further usage.
Sample Processing for Mass Spectrometry. Prior to trypticdigestion, proteins were in-gel-reduced and carbamidomethyl-ated. Each gel slice was alternately washed three times with50 mM ammonium hydrogen carbonate and 25 mM am-monium hydrogen carbonate, 50% acetonitrile, followed byincubation at 57 °C for 30 min with 10 mM dithiothreitol. Uponcooling to room temperature, the proteins were carbamido-methylated with 10 mM iodoacetamide for 30 min, followedby two alternate washing steps as stated before. The gel pieceswere dried, and proteins were subjected to trypsin proteolysisby adding 7 µL of a 25 µg/mL trypsin solution (sequencinggrade, Promega, Madison, WI) in 50 mM ammonium hydrogencarbonate and incubating at 37 °C for 16 h. Peptides wereextracted by incubation in 15 µL of 0.1% trifluoroacetic acidfor 30 min at room temperature.
Mass Spectrometry. Separation of tryptic peptide mixtureswas achieved by nanoscale reversed-phase liquid chromatog-raphy in combination with online ESI-MS. For the HPLCseparation, a nano-LC system (Famos, Switchos, Ultimate,Dionex, Idstein, Germany) was used, employing a lineargradient with a slope of 0.5% B/min (solvent A, 0.1% formicacid in water; solvent B, 0.1% formic acid and 84% acetonitrile)to a final concentration of 50% B. Following a 5 min washingperiod with 95% B, the columns were equilibrated in 5% B prior
to application of the next sample. The column system consistedof a self-made precolumn (100 µm inner diameter × 2 cmlength, Ace C18, 5 µm particle size, 100 Å pore size, HiChromLtd., Berkshire, U.K.) and a self-made separation column (75µm inner diameter × 15 cm length, Ace C18, 3 µm particle size,100 Å pore size, HiChrom Ltd.). Mass spectrometric analysiswas performed on a Qtrap4000 linear ion trap system (AppliedBiosystems, Darmstadt, Germany). For online coupling, a microion spray source (Applied Biosystems) was used, equipped witha New Objective ESI needle (10 µm tip diameter, MS Wil, Wil,Switzerland). Needle voltage was set to 2.3 kV in positive ionmode. The declustering potential was set to 60 V, while thecollision gas was set to high. A scan cycle consisted of anenhanced multiple charge survey scan (mass range 380–1500amu; 4000 amu/s scan rate) followed by an enhanced resolu-tion scan (250 amu/s scan rate) of the three most intensesignals in the spectrum. Exclusion list for ion signals was setto 22 s after a single occurrence of the respective ion. Enhancedproduct ion spectra were recorded within the linear ion trapfor doubly and triply charged precursor ions (mass range115–1500 amu; 4000 amu/s scan rate), enabling the identifica-tion of major immonium ions as well as sufficient ion seriesinformation for successful processing via database searchalgorithms. Data acquisition was accomplished using theAnalyst 1.4 software (Applied Biosystems).
Mass Spectrometric Data Interpretation. The derived massspectrometric data sets were converted to Mascot GenericFormat and searched against the Swiss-Prot database (release50.2 of 27-Jun-2006, 5231 sequence entries) with the speciessubset Rattus using the Mascot search algorithm Version 2.1(Matrix Science, London, U.K.). Generation of peak lists wasaccomplished using a Mascot script (mascot.dll, version 1.6b15,Matrix Science) as plug-in to the Analyst 1.4 software. All peaksbelow 0.1% of overall intensity were removed; spectra werecentroided, and doubly and triply charged precursors withmore than 10 peaks were searched against the Swiss-Protdatabase. As for the search parameters, the number of allowedmiscleavages was set to one, and carbamidomethylation waschosen as fixed as well as oxidation of methionine as variablemodification. Ion tolerance for peptide and fragment ions wasset to 0.4 amu, while the search was confined to doubly andtriply charged precursors. All scores below 28 for individualpeptide hits were discarded. A protein hit was based on at leasttwo identified peptides with subsequent manual validation.
Bioinformatic Analyses. EASE (http://david.niaid.nih.gov/david/ease.htm) was used for Gene Ontology searches.16
Further searches for the subcellular localization were performedusing gene cards (http://www.gene cards.org/index.shtml). Forthe prediction of transmembrane helices, we used the DAS-TMfilter server (http://mendel.imp.ac.at/sat/DAS/DAS.html).17
Results
Establishment of the Protocol. In a first step, we set out tofind conditions under which brain plasma membranes becomemaximally purified by the two-phase system. To obtain anoptimal reduction of contaminations, we determined thepolymer and buffer concentration that resulted in the bestremoval of mitochondria and the endoplasmic reticulum fromthe top phase, to which plasma membranes have the highestaffinity of all cellular membranes.5,18 Best results were obtainedat a polymer concentration of 6.9% (w/w) PEG and 6.9% (w/w) dextran in the presence of 50 mM Tris/SO4
2- (data notshown). Unfortunately, the amount of ions introduced into the
research articles Schindler et al.
434 Journal of Proteome Research • Vol. 7, No. 01, 2008
two-phase system during homogenization of the brain tissueis uncontrollable. This is fretful, because even low amounts ofsalts can have a dramatic influence on the partitioning ofmembranes.5 To overcome the effects of the ions released fromthe tissue, we increased the buffer concentration in the two-phase system from 157 to 50 mM (this study). By doing so, theinfluence of the released ions on membrane partitioning wasreduced. In addition, we tested different ways of tissue ho-mogenizing. The best reproducibility was obtained by com-bining homogenization via a glass Teflon homogenizer withsubsequent sonication. Although partitioning of membranesin a single two-phase system already results in a slightenrichment of plasma membranes in the top phase, a consid-erable amount of contaminating material is still recovered. Asa consequence, plasma membranes have to be extracted in amultistep procedure such as countercurrent distribution.19
Therefore, we exploited the principle of countercurrent distri-bution for our protocol.
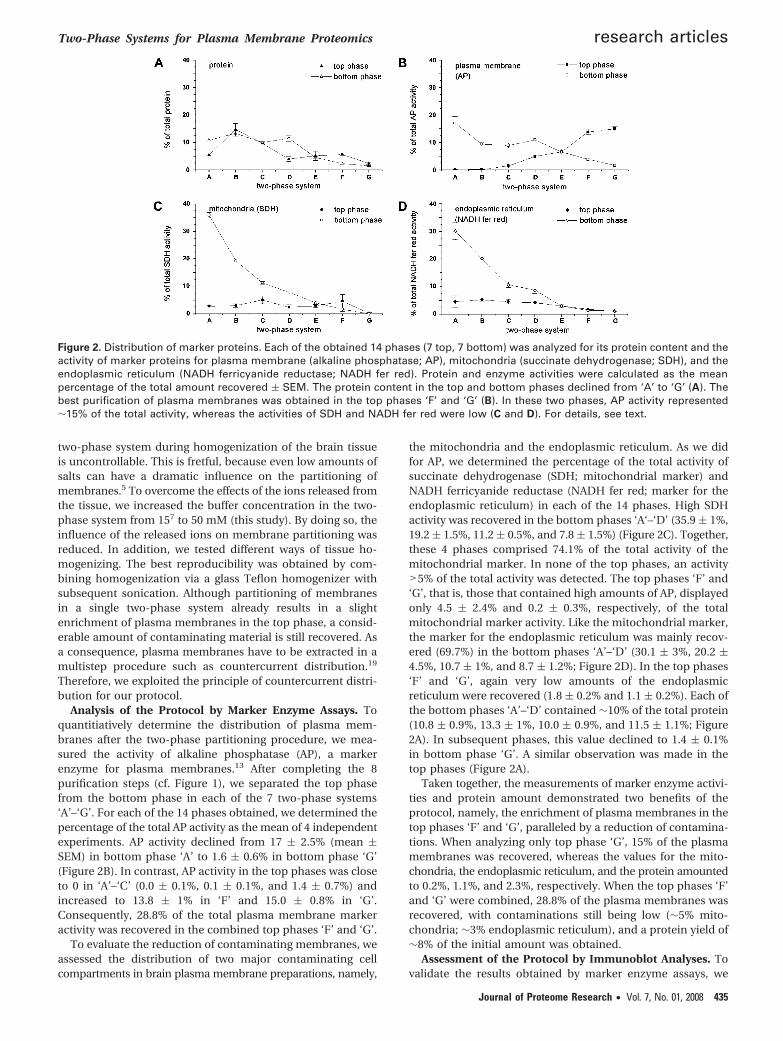
Analysis of the Protocol by Marker Enzyme Assays. Toquantitiatively determine the distribution of plasma mem-branes after the two-phase partitioning procedure, we mea-sured the activity of alkaline phosphatase (AP), a markerenzyme for plasma membranes.13 After completing the 8purification steps (cf. Figure 1), we separated the top phasefrom the bottom phase in each of the 7 two-phase systems‘A’–‘G’. For each of the 14 phases obtained, we determined thepercentage of the total AP activity as the mean of 4 independentexperiments. AP activity declined from 17 ( 2.5% (mean (SEM) in bottom phase ‘A’ to 1.6 ( 0.6% in bottom phase ‘G’(Figure 2B). In contrast, AP activity in the top phases was closeto 0 in ‘A’–‘C’ (0.0 ( 0.1%, 0.1 ( 0.1%, and 1.4 ( 0.7%) andincreased to 13.8 ( 1% in ‘F’ and 15.0 ( 0.8% in ‘G’.Consequently, 28.8% of the total plasma membrane markeractivity was recovered in the combined top phases ‘F’ and ‘G’.
To evaluate the reduction of contaminating membranes, weassessed the distribution of two major contaminating cellcompartments in brain plasma membrane preparations, namely,
the mitochondria and the endoplasmic reticulum. As we didfor AP, we determined the percentage of the total activity ofsuccinate dehydrogenase (SDH; mitochondrial marker) andNADH ferricyanide reductase (NADH fer red; marker for theendoplasmic reticulum) in each of the 14 phases. High SDHactivity was recovered in the bottom phases ‘A‘–‘D’ (35.9 ( 1%,19.2 ( 1.5%, 11.2 ( 0.5%, and 7.8 ( 1.5%) (Figure 2C). Together,these 4 phases comprised 74.1% of the total activity of themitochondrial marker. In none of the top phases, an activity>5% of the total activity was detected. The top phases ‘F’ and‘G’, that is, those that contained high amounts of AP, displayedonly 4.5 ( 2.4% and 0.2 ( 0.3%, respectively, of the totalmitochondrial marker activity. Like the mitochondrial marker,the marker for the endoplasmic reticulum was mainly recov-ered (69.7%) in the bottom phases ‘A’–‘D’ (30.1 ( 3%, 20.2 (4.5%, 10.7 ( 1%, and 8.7 ( 1.2%; Figure 2D). In the top phases‘F’ and ‘G’, again very low amounts of the endoplasmicreticulum were recovered (1.8 ( 0.2% and 1.1 ( 0.2%). Each ofthe bottom phases ‘A’–‘D’ contained ∼10% of the total protein(10.8 ( 0.9%, 13.3 ( 1%, 10.0 ( 0.9%, and 11.5 ( 1.1%; Figure2A). In subsequent phases, this value declined to 1.4 ( 0.1%in bottom phase ‘G’. A similar observation was made in thetop phases (Figure 2A).
Taken together, the measurements of marker enzyme activi-ties and protein amount demonstrated two benefits of theprotocol, namely, the enrichment of plasma membranes in thetop phases ‘F’ and ‘G’, paralleled by a reduction of contamina-tions. When analyzing only top phase ‘G’, 15% of the plasmamembranes was recovered, whereas the values for the mito-chondria, the endoplasmic reticulum, and the protein amountedto 0.2%, 1.1%, and 2.3%, respectively. When the top phases ‘F’and ‘G’ were combined, 28.8% of the plasma membranes wasrecovered, with contaminations still being low (∼5% mito-chondria; ∼3% endoplasmic reticulum), and a protein yield of∼8% of the initial amount was obtained.
Assessment of the Protocol by Immunoblot Analyses. Tovalidate the results obtained by marker enzyme assays, we
Figure 2. Distribution of marker proteins. Each of the obtained 14 phases (7 top, 7 bottom) was analyzed for its protein content and theactivity of marker proteins for plasma membrane (alkaline phosphatase; AP), mitochondria (succinate dehydrogenase; SDH), and theendoplasmic reticulum (NADH ferricyanide reductase; NADH fer red). Protein and enzyme activities were calculated as the meanpercentage of the total amount recovered ( SEM. The protein content in the top and bottom phases declined from ‘A’ to ‘G’ (A). Thebest purification of plasma membranes was obtained in the top phases ‘F’ and ‘G’ (B). In these two phases, AP activity represented∼15% of the total activity, whereas the activities of SDH and NADH fer red were low (C and D). For details, see text.
Two-Phase Systems for Plasma Membrane Proteomics research articles
Journal of Proteome Research • Vol. 7, No. 01, 2008 435
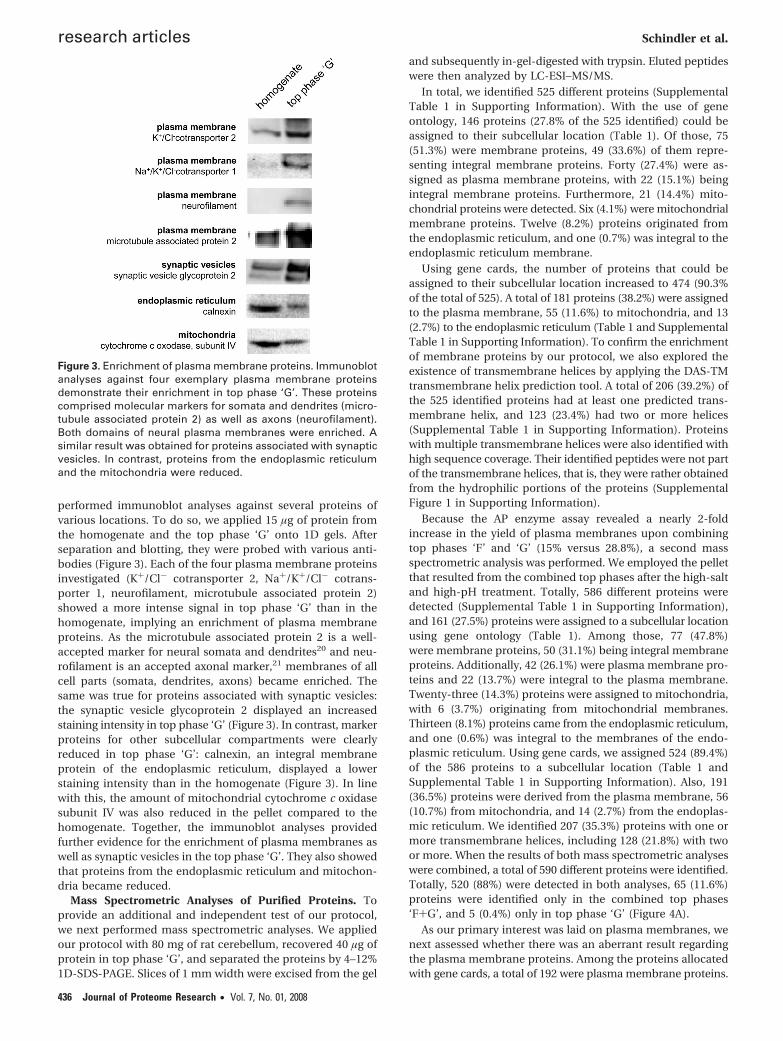
performed immunoblot analyses against several proteins ofvarious locations. To do so, we applied 15 µg of protein fromthe homogenate and the top phase ‘G’ onto 1D gels. Afterseparation and blotting, they were probed with various anti-bodies (Figure 3). Each of the four plasma membrane proteinsinvestigated (K+/Cl- cotransporter 2, Na+/K+/Cl- cotrans-porter 1, neurofilament, microtubule associated protein 2)showed a more intense signal in top phase ‘G’ than in thehomogenate, implying an enrichment of plasma membraneproteins. As the microtubule associated protein 2 is a well-accepted marker for neural somata and dendrites20 and neu-rofilament is an accepted axonal marker,21 membranes of allcell parts (somata, dendrites, axons) became enriched. Thesame was true for proteins associated with synaptic vesicles:the synaptic vesicle glycoprotein 2 displayed an increasedstaining intensity in top phase ‘G’ (Figure 3). In contrast, markerproteins for other subcellular compartments were clearlyreduced in top phase ‘G’: calnexin, an integral membraneprotein of the endoplasmic reticulum, displayed a lowerstaining intensity than in the homogenate (Figure 3). In linewith this, the amount of mitochondrial cytochrome c oxidasesubunit IV was also reduced in the pellet compared to thehomogenate. Together, the immunoblot analyses providedfurther evidence for the enrichment of plasma membranes aswell as synaptic vesicles in the top phase ‘G’. They also showedthat proteins from the endoplasmic reticulum and mitochon-dria became reduced.
Mass Spectrometric Analyses of Purified Proteins. Toprovide an additional and independent test of our protocol,we next performed mass spectrometric analyses. We appliedour protocol with 80 mg of rat cerebellum, recovered 40 µg ofprotein in top phase ‘G’, and separated the proteins by 4–12%1D-SDS-PAGE. Slices of 1 mm width were excised from the gel
and subsequently in-gel-digested with trypsin. Eluted peptideswere then analyzed by LC-ESI–MS/MS.
In total, we identified 525 different proteins (SupplementalTable 1 in Supporting Information). With the use of geneontology, 146 proteins (27.8% of the 525 identified) could beassigned to their subcellular location (Table 1). Of those, 75(51.3%) were membrane proteins, 49 (33.6%) of them repre-senting integral membrane proteins. Forty (27.4%) were as-signed as plasma membrane proteins, with 22 (15.1%) beingintegral membrane proteins. Furthermore, 21 (14.4%) mito-chondrial proteins were detected. Six (4.1%) were mitochondrialmembrane proteins. Twelve (8.2%) proteins originated fromthe endoplasmic reticulum, and one (0.7%) was integral to theendoplasmic reticulum membrane.
Using gene cards, the number of proteins that could beassigned to their subcellular location increased to 474 (90.3%of the total of 525). A total of 181 proteins (38.2%) were assignedto the plasma membrane, 55 (11.6%) to mitochondria, and 13(2.7%) to the endoplasmic reticulum (Table 1 and SupplementalTable 1 in Supporting Information). To confirm the enrichmentof membrane proteins by our protocol, we also explored theexistence of transmembrane helices by applying the DAS-TMtransmembrane helix prediction tool. A total of 206 (39.2%) ofthe 525 identified proteins had at least one predicted trans-membrane helix, and 123 (23.4%) had two or more helices(Supplemental Table 1 in Supporting Information). Proteinswith multiple transmembrane helices were also identified withhigh sequence coverage. Their identified peptides were not partof the transmembrane helices, that is, they were rather obtainedfrom the hydrophilic portions of the proteins (SupplementalFigure 1 in Supporting Information).
Because the AP enzyme assay revealed a nearly 2-foldincrease in the yield of plasma membranes upon combiningtop phases ‘F’ and ‘G’ (15% versus 28.8%), a second massspectrometric analysis was performed. We employed the pelletthat resulted from the combined top phases after the high-saltand high-pH treatment. Totally, 586 different proteins weredetected (Supplemental Table 1 in Supporting Information),and 161 (27.5%) proteins were assigned to a subcellular locationusing gene ontology (Table 1). Among those, 77 (47.8%)were membrane proteins, 50 (31.1%) being integral membraneproteins. Additionally, 42 (26.1%) were plasma membrane pro-teins and 22 (13.7%) were integral to the plasma membrane.Twenty-three (14.3%) proteins were assigned to mitochondria,with 6 (3.7%) originating from mitochondrial membranes.Thirteen (8.1%) proteins came from the endoplasmic reticulum,and one (0.6%) was integral to the membranes of the endo-plasmic reticulum. Using gene cards, we assigned 524 (89.4%)of the 586 proteins to a subcellular location (Table 1 andSupplemental Table 1 in Supporting Information). Also, 191(36.5%) proteins were derived from the plasma membrane, 56(10.7%) from mitochondria, and 14 (2.7%) from the endoplas-mic reticulum. We identified 207 (35.3%) proteins with one ormore transmembrane helices, including 128 (21.8%) with twoor more. When the results of both mass spectrometric analyseswere combined, a total of 590 different proteins were identified.Totally, 520 (88%) were detected in both analyses, 65 (11.6%)proteins were identified only in the combined top phases‘F+G’, and 5 (0.4%) only in top phase ‘G’ (Figure 4A).
As our primary interest was laid on plasma membranes, wenext assessed whether there was an aberrant result regardingthe plasma membrane proteins. Among the proteins allocatedwith gene cards, a total of 192 were plasma membrane proteins.
Figure 3. Enrichment of plasma membrane proteins. Immunoblotanalyses against four exemplary plasma membrane proteinsdemonstrate their enrichment in top phase ‘G’. These proteinscomprised molecular markers for somata and dendrites (micro-tubule associated protein 2) as well as axons (neurofilament).Both domains of neural plasma membranes were enriched. Asimilar result was obtained for proteins associated with synapticvesicles. In contrast, proteins from the endoplasmic reticulumand the mitochondria were reduced.
research articles Schindler et al.
436 Journal of Proteome Research • Vol. 7, No. 01, 2008

Altogether, 180 (93.8%) were found in both analyses, 11 (5.7%)were detected in the combined top phases ‘F+G’, and one(0.5%) was exclusive to the top phase ‘G’ (Figure 4B). Together,the similar percentages demonstrate that combining top phases‘F+G’ does not lead to an aberrant result of the identifiedproteins, especially plasma membrane proteins. In summary,the results of the mass spectrometric analyses were in ac-cordance with those obtained by marker enzyme assays andimmunoblotting. Both the top phase ‘G’ and the combined topphases ‘F+G’ were enriched in plasma membrane proteins.
Assessment of the Potential/Quality of the NovelProtocol. To assess the quality of our novel protocol, wesurveyed several features and compared them with those ofour previously published protocol (Table 2). The novel protocolis superior in two aspects: [1] it can be performed in half-thetime and [2] it yields a 3–6-fold higher amount of plasmamembrane (15.0–28.8% vs 5.0%), thus, requiring much less
starting material (40–80 mg of brain tissue vs 300 mg of braintissue). On the other hand, it is inferior in one aspect, as thepurity of plasma membrane proteins was lower (36.5–38.2%vs 41.7%). In all other aspects, the two protocols were coequal.
Proteins with Relevance To Neural Processing. As neuralprocessing involves a full panoply of many different plasmamembrane proteins, comprehensive knowledge about them isa prerequisite for understanding complex physiological pro-cesses. In a final step, we therefore evaluated whether ourprotocol fosters the analysis of plasma membrane proteins thatare relevant to neural processing. Five aspects of neuralprocessing were taken into consideration (Table 3).
First, neurons release neurotransmitters. We detected severalproteins involved in neurotransmitter release, such as varioussyntaxines, syntaxin binding proteins, and the synaptosomalassociated proteins 23 and 25. Second, the neurotransmittersbind to the postsynaptic membrane and interact with receptors.We identified ionotropic and metabotropic glutamate receptors,and γ-aminobutyric acid receptors. Third, the effects of theneurotransmitters at the postsynaptic membrane are usuallyterminated by their reuptake involving specific neurotransmit-ter transporters. We identified the orphan sodium- and chloride-dependent neurotransmitter transporter NTT4, the excitatoryamino acid transporters 1, 2, and 4, and transporters for theinhibitory neurotransmitters γ-aminobutyric acid and glycine.Fourth, aside from neurotransmitter transporters, several othertransporters are required to maintain cell function. We foundtransporters that enable the uptake of amino acids, such as thesystem N amino acid transporter 1. We also found transporterswhich support nutrition, such as the solute carrier 2 facilitatedglucose transporter member 1 or the monocarboxylate trans-porter 1. Furthermore, we identified transporters involved inpH regulation, like the sodium bicarbonate transporter 3, theelectrogenic sodium bicarbonate cotransporter 1, or the sodium/hydrogen exchanger 1. Additional transporters participating inion homeostasis were the solute carrier cotransporter 12member 5, the band 3 anion transport protein, the sodiumpotassium calcium exchanger 2, or sodium calcium exchangers1 and 2. Finally, ion channels are required for neural process-ing. Within this category, we identified calcium channels suchas the voltage dependent P/Q-type calcium channel subunit
Table 1. Subcellular Distribution of Identified Proteinsa
top phase ‘G’ combined top phases ‘F+G’
Number of identified proteins 525 586with subcellular location
(gene ontology)146 161
membrane 75 (51.3%) 77 (47.8%)integral to membrane 49 (33.6%) 50 (31.1%)plasma membrane 40 (27.3%) 42 (26.1%)integral to plasma membrane 22 (15.1%) 22 (13.7%)mitochondria 21 (14.4%) 23 (14.3%)mitochondrial membrane 6 (4.1%) 6 (3.7%)endoplasmic reticulum 12 (8.2%) 13 (8.1%)integral to endoplasmic
reticulum membrane1 (0.7%) 1 (0.6%)
with subcellular location(gene cards)
474 524
plasma membrane 181 (38.2%) 191 (36.5%)mitochondria 55 (11.6%) 56 (10.7%)endoplasmic reticulum 13 (2.7%) 13 (2.7%)
a Identified proteins from top phase ‘G’ and the combined top phases ‘F+G’ were analyzed for their subcellular location using gene ontology and genecards.
Figure 4. Comparison between the proteins identified in topphase ‘G’ and in the combined top phases ‘F+G’. Proteinsidentified in both mass spectrometric analyses were compared.Regarding all proteins (A) and plasma membrane proteins (B),∼90% were detected in both analyses (88% and 93.8%, respec-tively). Less than 1% (0.4% and 0.5%) were exclusive to the topphase ‘G’ and ∼10% (11.6% and 5.7%) in the combined topphases ‘F+G’.
Two-Phase Systems for Plasma Membrane Proteomics research articles
Journal of Proteome Research • Vol. 7, No. 01, 2008 437

R-1A and the dihydropyrimidine-sensitive L-type calciumchannel alpha2/delta subunit. Furthermore, we detected sev-eral potassium channels, namely, the potassium voltage-gatedchannel subfamily A member 1, and the potassium voltage-gated channels subfamily C members 1 and 3. Additionally,several sodium channels were identified, for example, thesodium channel protein type 1 and 2. In addition, several otherplasma membrane proteins, such as members of the AP-2complex or neuroligins, were identified which have deepimpact on cellular function but did not fit into the mentionedcategories.
Together, these findings demonstrate that our protocolindeed fosters the enrichment of plasma membrane proteinswhich are relevant to neural processing. It is thus suited forthe enrichment of brain plasma membranes from minute brainsamples prior to mass spectrometric analysis.
Proteins Not Derived from Plasma Membranes. Aside fromthe proteins localized to plasma membranes, we also detectedproteins from other locations (Supplemental Table 1 in Sup-porting Information). One group represented mitochondrialproteins, like the ADP/ATP translocase 1 and 2 or the ATPsynthase R, �, γ, and D chain. Proteins from the endoplasmicreticulum and the Golgi complex comprised a second group,encompassing calnexin and the Golgi apparatus protein 1.Cytoskeletal proteins, like alpha internexin, gephyrin, or tubu-lin, comprised the third group of proteins not derived fromplasma membranes. A fourth group represented proteins of thetranslation machinery, including various 60S and 40S ribosomalproteins. Proteins from synaptic vesicles comprised the fifthgroup of proteins that are not derived from plasma membranes.Among the identified proteins were various Ras proteins,synaptotagmins 1 and 2, synaptophysin, and the vesicularinhibitory amino acid transporter. A last group of detectedproteins were those reported to be ‘cytoplasmic’ in thedatabases. They included the leucine-rich glioma-inactivatedprotein 1, the B-type creatine kinase, or chaperones, forexample, the heat shock 70 kDa protein.
Despite all nonplasma membrane proteins listed here, it isworthwhile to recall that more than one-third of all identifiedproteins (top phase ‘G’, N ) 181/474; top phases ‘F+G’, N )191/586) were from plasma membranes. Consequently, thelatter represented the largest group.
Discussion
This study presents a novel, fast, and low-priced protocolthat allows the enrichment of plasma membrane proteins fromsmall brain regions. It is based on aqueous polymer two-phasesystems and results in a purity of 27% (gene ontology) and 38%
(gene cards) of these proteins, which are of particular impor-tance as they mediate interneural communication. In com-parison with our protocol published recently,7 the novelprotocol is easier to perform. It omits careful fractionation andcasting of density gradients, because the two phases thatcontain membranes of different subcellular origin form on theirown. Going through the whole procedure, that is, ending upwith plasma membranes enriched in top phases ‘F+G’, takesonly ∼2 h, and the costs for the chemicals required forpurification are negligible. Nearly 30% of the initial plasmamembranes are recovered.
Aqueous Polymer Two-Phase Systems. Conventional pro-tocols for isolating plasma membranes from tissue combinedifferential centrifugation and density gradient centrifugation.1
Both approaches employ density differences to separate or-ganelles and plasma membranes. On sucrose density gradients,plasma membrane vesicles have a density of 1.14–1.17 g ·cm-3.Membrane vesicles of the Golgi complex (1.12–1.15 g · cm-3),of the endoplasmic reticulum (1.15–1.17 g · cm-3), and ofmitochondria (1.18–1.20 g ·cm-3) have very similar densities.22
Therefore, centrifugation results in an overlap and unsatisfyingseparation of those membranes. As density is obviously noappropriate criterion for separation, partitioning of membranesin aqueous polymer two-phase systems represents an attractivealternative. In these systems, membranes are separated ac-cording to surface properties rather than density. The outerleaflet of plasma membranes contains large amounts of sphin-gomyelin and phosphatidylcholine, whereas the outer leafletof intracellular membranes (e.g., endoplasmic reticulum andmitochondria) contains lower amounts of those phospholipids.Instead, it contains higher amounts of phosphatidylserine andphosphatidylethanolamine23 This difference results in a dif-ferential partitioning behavior in two-phase systems. As aconsequence, it improves the separation of plasma membranesfrom those of mitochondria and the endoplasmic reticulum.24
Our data demonstrate the efficiency of separation: ∼70% of thetwo intracellular membrane markers employed (SDH, NADHfer red) were recovered in bottom phases ‘A’–‘D’, whereasplasma membranes became enriched in top phases ‘F+G’. Inaddition, aqueous polymer two-phase systems, as the ones weused, preserve protein structure and function.25 Plasma mem-branes with native protein complexes can easily be recoveredfrom the phase-forming polymers by ultracentrifugation incontrast to current depletion protocols,26–28 or immunopuri-fication of the desired protein complexes.29
Comparison of the Novel Protocol with Other Protocols.In comparison with our previous protocol,7 the present pro-tocol has the major advantage that it is material-saving,
Table 2. Comparison between Previous and Present Protocol
present study
previous study7 top phase ‘G’ top phases ‘F+G’
time required to perform the protocol ∼4 h ∼2 h ∼2 hstarting material 300 mg of tissue 80 mg of tissue 40 mg of tissueaffinity ligand needs to be coupled with dextran not required not requiredyield of initial plasma membranes 5.3 ( 0.7% 15.0 ( 0.8% 28.8 ( 1.8%yield of initial mitochondria 0.2 ( 0.1% 0.2 ( 0.3% 4.7 ( 2.7%yield of initial endoplasmic reticulum 0.4 ( 0.1% 1.1 ( 0.2% 2.9 ( 0.4%number of identified proteins with subcellular location 472 474 524allocated to plasma membrane 41.7% 38.2% 36.5%allocated to mitochondria 7.8% 11.6% 10.7%allocated to endoplasmic reticulum 5.1% 2.7% 2.7%
research articles Schindler et al.
438 Journal of Proteome Research • Vol. 7, No. 01, 2008

requiring 3–6 times less tissue (40–80 vs 300 mg). This isparticularly attractive if brain regions of individuals and/orsmall brain regions need to be analyzed. In this regard, theadvantage outweighs the disadvantage of the lower purity ofplasma membrane proteins obtained with the novel protocol(36.5–38.2% vs 41.7%). If higher purity of plasma membranes
is desired, the countercurrent protocol can be extended byfurther steps. Alternatively, the membranes from top phases‘F+G’ can be purified further by a plasma-membrane-specificaffinity ligand coupled with dextran. This will pull plasmamembranes into the bottom phase while contaminating mem-branes will remain in the top phase. Both approaches would,
Table 3. Selected Plasma Membrane Proteins with Neurobiological Relevancea
no. of identified peptides
accession protein name no. of TMH in ‘G’ in ‘F+G’
Neurotransmitter ReleaseP35280 Ras-related protein Rab-8A 0 6 5P61765 Syntaxin-binding protein 1 0 25 30Q9WU70 Syntaxin-binding protein 5 1 1 1P32851 Syntaxin-1A 1 12 6P61265 Syntaxin-1B2 1 20 21Q08850 Syntaxin-4 1 4 4O70377 Synaptosomal-associated protein 23 0 1 4P60881 Synaptosomal-associated protein 25 0 17 19
Neurotransmitter ReceptorsP19490 Glutamate receptor 1 5 3 3P19491 Glutamate receptor 2 4 0 2Q63226 Glutamate receptor delta-2 subunit 3 6 6P23385 Metabotropic glutamate receptor 1 8 8 6Q9Z0U4 Gamma-aminobutyric acid type B receptor, subunit 1 8 3 3O88871 Gamma-aminobutyric acid type B receptor, subunit 2 8 1 2P62813 Gamma-aminobutyric-acid receptor alpha-1 subunit 5 6 5P30191 Gamma-aminobutyric-acid receptor alpha-6 subunit 4 2 0P63138 Gamma-aminobutyric-acid receptor subunit beta-2 5 4 5P18506 Gamma-aminobutyric-acid receptor delta subunit 5 1 2P18508 Gamma-aminobutyric-acid receptor gamma-2 subunit 5 2 3
Neurotransmitter ReuptakeP31662 Orphan sodium- and chloride-dependent neurotransmitter
transporter NTT411 8 12
P23978 Sodium- and chloride-dependent GABA transporter 1 12 2 5P31647 Sodium- and chloride-dependent GABA transporter 3 11 6 8P28572 Sodium- and chloride-dependent glycine transporter 1 12 3 4P24942 Excitatory amino acid transporter 1 10 14 14P31596 Excitatory amino acid transporter 2 11 10 12O35921 Excitatory amino acid transporter 4 8 7 7
Ion ChannelsQ9Z2L0 Voltage-dependent anion-selective channel protein 1 0 6 9P54282 Voltage-dependent P/Q-type calcium channel subunit alpha-1A 29 1 1P54290 Dihydropyridine-sensitive L-type, calcium channel alpha-2/delta
subunits4 3 6
P10499 Potassium voltage-gated channel subfamily A member 1 6 3 4P25122 Potassium voltage-gated channel subfamily C member 1 7 3 4Q01956 Potassium voltage-gated channel subfamily C member 3 8 3 3P04774 Sodium channel protein type 1 subunit alpha 24 2 1P04775 Sodium channel protein type 2 subunit alpha 24 8 8Q00954 Sodium channel beta-1 subunit 2 3 1P54900 Sodium channel beta-2 subunit 2 5 5
TransportersQ9JHZ9 System N amino acid transporter 1 10 2 2P11167 Solute carrier family 2, facilitated glucose transporter member 1 11 4 3Q8VII6 Choline transporter-like protein 1 10 5 1Q63016 Large neutral amino acids transporter small subunit 1 14 2 3Q9R1N3 Sodium bicarbonate cotransporter 3 17 2 2Q9JI66 Electrogenic sodium bicarbonate cotransporter 1 13 14 16Q63632 Solute carrier family 12 member 4 12 0 2Q63633 Solute carrier family 12 member 5 12 14 12P23562 Band 3 anion transport protein 14 7 9P11505 Plasma membrane calcium-transporting ATPase 1 9 23 23P11506 Plasma membrane calcium-transporting ATPase 2 9 42 36Q64568 Plasma membrane calcium-transporting ATPase 3 11 28 26Q64542 Plasma membrane calcium-transporting ATPase 4 11 13 13P06685 Sodium/potassium-transporting ATPase alpha-1 chain 8 48 42P06686 Sodium/potassium-transporting ATPase alpha-2 chain 8 47 48P06687 Sodium/potassium-transporting ATPase alpha-3 chain 8 54 50P07340 Sodium/potassium-transporting ATPase subunit beta-1 1 12 14P13638 Sodium/potassium-transporting ATPase subunit beta-2 1 8 10Q63377 Sodium/potassium-transporting ATPase subunit beta-3 1 4 5P53987 Monocarboxylate transporter 1 12 2 2Q01728 Sodium/calcium exchanger 1 11 3 3P48768 Sodium/calcium exchanger 2 11 15 11O54701 Sodium/potassium/calcium exchanger 2 12 2 1
a Eighty-six selected proteins were categorized that had been identified by mass spectrometry. The Swiss-Prot primary accession number, the numberof transmembrane helices (TMH), and the number of identified peptides in top phase ‘G’ and in the combined top phases ‘F+G’ are listed for eachprotein.
Two-Phase Systems for Plasma Membrane Proteomics research articles
Journal of Proteome Research • Vol. 7, No. 01, 2008 439
however, diminish the yield. In comparison with analogousprotocols, the purity values of 36.5–38.2% obtained with ourprotocol are high. For example, the percentage of proteins thatNielsen et al.26 and Olsen et al.30 allocated to the plasmamembrane was 12–15% and ∼20%, respectively. The amountof sample material that both studies used was similar to thatapplied in our previous protocol.
We successfully identified proteins containing multipletransmembrane helices and thereby obtained a high sequencecoverage. This demonstrates the suitability of our combinedapproach (enrichment of plasma membranes by two-phasepartitioning, depletion of high-salt- and high-pH-soluble pro-teins, separation of the resistant proteins by SDS-PAGE, slicingthe gel, and protein analysis in each single slice by LC–MS–MS)to display the proteome of brain plasma membranes.
Small Tissue Samples. One major attempt of the presentstudy was to establish a protocol that can be used on smallbrain tissue samples. We were motivated by the fact that it isoften mandatory to focus on anatomically and physiologicallydefined brain regions rather than to investigate the brain as awhole.
First, region-specific proteins are often not detected by thein toto approach, as they become diluted below detectionthreshold. Region-specific proteins are quite common anddetermine the typical molecular makeup of a given region. Forexample, several genes encoding for special types of K+
channels are heavily expressed in the central auditory system,yet hardly somewhere else.31–33 Another example is providedby the hippocampus, which consists of anatomically andphysiologically distinct subregions (CA1, CA3, dentate gyrus).Sets of genes are expressed specifically in these subregions.34
Therefore, it is logical that recent proteome mapping studieshave restricted themselves to individual brain regions, such asthe hippocampus.26,35–37 The results by Zhao et al.34 displayedplain differential regulation even between hippocampal sub-regions which may warrant further focus.
Second, disorders associated with perturbation of specificbrain function, such as deafness or blindness, will predomi-nantly affect the proteome of the centers in the auditory orthe visual system, rather than the whole brain. Moreover, asthe effects may vary along the sensory system studied, it is evenadvisable to focus on individual centers.
Subcellular Proteomes. Many proteins have a definitesubcellular location at a certain physiological state, yet localizeelsewhere when the conditions change.38,39 In line with this, itwas recently suggested that the analysis of subproteomes willgive more specific insight into brain function and reveal evenminute differences.40 Taken together, analysis of subproteomesmay be the key to handle brain complexity.41 In this respect,our protocol has the power to greatly enrich plasma membraneproteins. In homogenates, plasma membrane proteins repre-sent only 0.4–2.5% of all proteins.42 In contrast, 27.3–38.2% ofthe proteins identified by mass spectrometry in top phase ‘G’were plasma membrane proteins, and 26.1–36.5% were plasmamembrane proteins when top phases ‘F+G’ were combined.Finally, the high yield of our protocol adds a material- andanimal-saving aspect. This is in line with a previous report onrat fat cells which demonstrated that purification of plasmamembranes by density gradient centrifugation required ∼20
animals, yet only 1–2 animals when aqueous polymer two-phase systems were used.43
Plasma Membrane Proteins Relevant to Neural Pro-cessing. Employing mass spectrometry, we identified proteinsinvolved in neural processing and grouped them into severalcategories (Table 2). Proteins such as syntaxins or the synap-tosomal associated protein 25 are required for transmitterrelease.44 Among the neurotransmitter receptors, we identifiedthe gamma-aminobutyric acid receptor alpha-6 subunit whichis restricted to cerebellar granule cells45 and the glutamatereceptor delta-2 subunit which selectively localizes to cerebellarPurkinje neurons.46,47 Identification of these proteins demon-strates the potential of our protocol to display tissue-specificcharacteristics that determine its physiology.
Proteins Not Allocated to the Plasma Membrane. Asidefrom the plasma membrane proteins, we identified proteinsthat were not allocated to the plasma membrane. These mayreflect contaminations, but they may also have been copurifiedwith plasma membrane proteins because they closely interactwith the latter. Several other studies in which plasma mem-branes were purified also reported a relatively high contamina-tion level by nonplasma membrane proteins. Analyzing variousbrain areas, Olsen et al.48 reported 18% of the proteins beingof mitochondrial origin, and 7.6% from the endoplasmicreticulum and the Golgi complex. To address the problem ofdistinguishing bona fide organellar proteins from those that arecontaminating, protein correlation profiling was recently per-formed and multiple locations were demonstrated for 39%among a total of 1404 proteins.49 For several proteins that weidentified, multiple locations, that is, locations that differ fromthose reported in gene cards, have been reported in theliterature. For example, the ATP synthase subunits R and �,allocated to the mitochondria in gene cards, were also detectedat the plasma membrane.50,51 A large group of ‘contaminating’proteins comprised cytoskeletal proteins (top phase ‘G’, N )33/525; top phase ‘F+G’, N ) 37/586). Among those proteinswas gephyrin which anchors the inhibitory, strychnine-sensitiveglycine receptor to the cytoskeleton and clusters it in thepostsynaptic membrane.52,53 The high-affine interaction of bothproteins is essential for the formation of inhibitory synapses54
and may explain the occurrence of gephyrin in our plasmamembrane fraction. Another identified cytoskeletal protein(gene cards) is alpha internexin which localizes to the postsyn-aptic density.55,56 B-type creatine kinase, a cytosolic protein(gene cards), was also identified in our analysis. This kinaseinteracts with and activates KCC2,57,58 a K+/Cl- cotransporterin the plasma membrane. The leucine-rich glioma-inactivatedprotein 1 interacts with Kv1 channels and thereby modulatestheir activity.29 Both proteins were identified in our analysis.
A further group of proteins enriched by our protocol com-prised proteins from synaptic vesicles (top phase ‘G’, 21/525; topphase ‘F+G’, 21/586). The surface properties of plasma mem-branes and synaptic vesicle membranes may be alike, thus,resulting in their copartitioning in the two-phase system. Inaddition, some synaptic vesicles are always primed with theplasma membrane as a readily releasable pool,44 and therefore,they can be purified with the plasma membrane. Proteins ofthe translation machinery represented another group of con-taminations. These proteins may be part of the translationmachinery described in the large dendritic arbors of cerebellarPurkinje cells59–61 and may be trapped in the vesicles formedduring the homogenization procedure. Further, the buffer inour two-phase system did not contain Mg2+, and the amount
research articles Schindler et al.
440 Journal of Proteome Research • Vol. 7, No. 01, 2008
introduced by the tissue was diluted 20-fold. Therefore, ribo-somal proteins, which are ‘sticky’ in the absence of Mg2+, maynot have been stabilized and thus appeared together withplasma membranes. Taken together, there are several reasonswhy we detected proteins that are not allocated to the plasmamembrane.
Conclusions
Our novel protocol yields high amounts of plasma mem-branes with a purity superior to that achieved in mostprotocols. Therefore, it represents an attractive and easy-to-perform tool to study the plasma membrane subproteome ofsmall, anatomically (and physiologically) defined brain regions.
Abbreviations: PEG, polyethylene glycol; MOPS, 4-morpho-linepropanesulfonic acid; AP, alkaline phosphatase; SDH, suc-cinate dehydrogenase; NADH fer red, NADH ferricyanidereductase.
Acknowledgment. We thank T. Kehrwald for technicalassistance and Drs. M. Becker and H.G. Nothwang forinsightful discussions and critical reading of the manuscript.The monoclonal antibodies from Drs. C. Lytle, K. M.Buckley, and T. M. Jessell/J. Dodd against the Na+/K+Cl-
cotransporter 1, the synaptic vesicle glycoprotein 2, andneurofilament, respectively, were obtained through theDevelopmental Studies Hybridoma Bank, developed underthe auspice of the National Institute of Child Health andHuman Development and maintained by the University ofIowa, Department of Biological Sciences, Iowa City, IA. Forthe supply of chromatographic C18 material, we thankNicola Vosloo at Hichrom Ltd., U.K.
Supporting Information Available: Proteins identifiedby mass spectrometry and their subcellular location (Supple-mental Table 1). Annotation of identified peptides (Supple-mentary Figure 1 ). Amino acid sequences of 4 selected plasmamembrane proteins which were identified with high sequencecoverage. Identified peptides are in red, regions which cor-respond to predicted transmembrane helices are highlightedin yellow. Peptides that were identified by mass spectrometrywere rather obtained from the hydrophilic portions of theproteins. This material is available free of charge via the Internetat http://pubs.acs.org.
References(1) DePierre, J. W.; Karnovsky, M. L. Plasma membranes of mam-
malian cells: A review of methods for their characterization andisolation. J. Cell Biol. 1973, 56, 275–303.
(2) Persson, A.; Johansson, B.; Olsson, H.; Jergil, B. Purification of rat-liver plasma-membranes by wheat-germ-agglutinin affinity par-titioning. Biochem. J. 1991, 273, 173–177.
(3) Morre, D. M.; Morre, D. J. Aqueous two-phase partition appliedto the isolation of plasma membranes and Golgi apparatus fromcultured mammalian cells. J. Chromatogr., B: Anal. Technol.Biomed. Life Sci. 2000, 743, 377–387.
(4) Albertsson, P. A. Partition of Cell Particles and Macromolecules;Wiley: New York, 1986; Vol. 3.
(5) Gierow, P.; Sommarin, M.; Larsson, C.; Jergil, B. Fractionation ofrat-liver plasma-membrane regions by 2-phase partitioning. Bio-chem. J. 1986, 235, 685–691.
(6) Abedinpour, P.; Jergil, B. Isolation of a caveolae-enriched fractionfrom rat lung by affinity partitioning and sucrose gradientcentrifugation. Anal. Biochem. 2003, 313, 1–8.
(7) Schindler, J.; Lewandrowski, U.; Sickmann, A.; Friauf, E.; Nothwang,H. G. Proteomic analysis of brain plasma membranes isolated byaffinity two-phase partitioning. Mol. Cell. Proteomics 2006, 5, 390–400.
(8) Persson, A.; Jergil, B. The purification of membranes by affinitypartitioning. FASEB J. 1995, 9, 1304–1310.
(9) Schindler, J.; Nothwang, H. G. Aqueous polymer two-phasesystems: Effective tools for plasma membrane proteomics. Pro-teomics 2006, 6, 5409–5417.
(10) Wojcik, S. M.; Katsurabayashi, S.; Guillemin, I.; Friauf, E.; Rosenmund,C.; Brose, N.; Rhee, J. S. A shared vesicular carrier allows synapticcorelease of GABA and glycine. Neuron 2006, 50, 575–587.
(11) Olivares, L.; Aragon, C.; Gimenez, C.; Zafra, F. Carboxyl terminusof the glycine transporter GLYT1 is necessary for correct processingof the protein. J. Biol. Chem. 1994, 269, 28400–28404.
(12) Bradford, M. M. Rapid and sensitive method for quantitation ofmicrogram quantities of protein utilizing principle of protein-dyebinding. Anal. Biochem. 1976, 72, 248–254.
(13) Graham, F. M. In Biomembrane Protocols: Methods in MolecularBiology; Graham, F. M., Higgins, J. A., Eds.; Humana Press: Totowa,NJ, 1993.
(14) Hrycay, E. G.; Obrien, P. J. Microsomal Electron-Transport. 2.Reduced nicotinamide adenine dinucleotide-cytochrome-b5 re-ductase and cytochrome-P-450 as electron carriers in microsomalNADH-peroxidase activity. Arch. Biochem. Biophys. 1974, 160, 230–245.
(15) Neuhoff, V.; Stamm, R.; Pardowitz, I.; Arold, N.; Ehrhardt, W.;Taube, D. Essential problems in quantification of proteins follow-ing colloidal staining with coomassie brilliant blue dyes in poly-acrylamide gels, and their solution. Electrophoresis 1990, 11, 101–117.
(16) Hosack, D. A.; Dennis, G., Jr.; Sherman, B. T.; Lane, H. C.; Lempicki,R. A. Identifying biological themes within lists of genes with EASE.GenomeBiology 2003, 4, R70R70.7.
(17) Cserzo, M.; Eisenhaber, F.; Eisenhaber, B.; Simon, I. On filteringfalse positive transmembrane protein predictions. Protein Eng.2002, 15, 745–752.
(18) Larsson, C. In Isolation of Membranes and Organelles from PlantCells; Hall, J. L., Morre, A. L., Eds.; Academic Press: London, 1983.
(19) Craig, L. C. Countercurrent distribution methods. Med. Res. 1952,5, 3–24.
(20) Caceres, A.; Binder, L. I.; Payne, M. R.; Bender, P.; Rebhun, L.;Steward, O. Differential subcellular localization of tubulin and themicrotubule-associated protein MAP2 in brain tissue as revealedby immunocytochemistry with monoclonal hybridoma antibodies.J. Neurosci. 1984, 4, 394–410.
(21) Dodd, J.; Morton, S. B.; Karagogeos, D.; Yamamoto, M.; Jessell,T. M. Spatial regulation of axonal glycoprotein expression onsubsets of embryonic spinal neurons. Neuron 1988, 1, 105–116.
(22) Evans, W. H.; Findley, J.; Biological Membranes: A PracticalApproach; IRL Press: Washington, DC, 1987.
(23) Zachowski, A. Phospholipids in animal eukaryotic membranes:Transverse asymmetry and movement. Biochem. J. 1993, 294, 1–14.
(24) Cao, R.; Li, X.; Liu, Z.; Peng, X.; Hu, W.; Wang, X.; Chen, P.; Xie, J.;Liang, S. Integration of a two-phase partition method into pro-teomics research on rat liver plasma membrane proteins. J.Proteome Res. 2006, 5, 634–642.
(25) Johansson, G.; Walter, H. Partitioning and concentrating bioma-terials in aqueous phase systems. Int. Rev. Cytol. 2000, 192, 33–60.
(26) Nielsen, P. A.; Olsen, J. V.; Podtelejnikov, A. V.; Andersen, J. R.;Mann, M.; Wisniewski, J. R. Proteomic mapping of brain plasmamembrane proteins. Mol. Cell. Proteomics 2005, 4, 402–408.
(27) Molloy, M. P.; Herbert, B. R.; Walsh, B. J.; Tyler, M. I.; Traini, M.;Sanchez, J. C.; Hochstrasser, D. F.; Williams, K. L.; Gooley, A. A.Extraction of membrane proteins by differential solubilization forseparation using two-dimensional gel electrophoresis. Electro-phoresis 1998, 19, 837–844.
(28) Camacho-Carvajal, M. M.; Wollscheid, B.; Aebersold, R.; Steimle,V.; Schamel, W. W. A. Two-dimensional blue native/SDS gelelectrophoresis of multi-protein complexes from whole cellularlysates–A proteomics approach. Mol. Cell. Proteomics 2004, 3, 176–182.
(29) Schulte, U.; Thumfart, J. O.; Klocker, N.; Sailer, C. A.; Bildl, W.;Biniossek, M.; Dehn, D.; Deller, T.; Eble, S.; Abbass, K. Theepilepsy-linked Lgi1 protein assembles into presynaptic Kv1channels and inhibits inactivation by Kvbeta1. Neuron 2006, 49,697–706.
(30) Olsen, J. V.; Andersen, J. R.; Nielsen, P. A.; Nielsen, M. L.; Figeys,D.; Mann, M.; Wisniewski, J. R. HysTag–A novel proteomicquantification tool applied to differential display analysis ofmembrane proteins from distinct areas of mouse brain. Mol. Cell.Proteomics 2004, 3, 82–92.
Two-Phase Systems for Plasma Membrane Proteomics research articles
Journal of Proteome Research • Vol. 7, No. 01, 2008 441
(31) Karschin, C.; Wischmeyer, E.; Preisig-Muller, R.; Rajan, S.; Derst,C.; Grzeschik, K. H.; Daut, J.; Karschin, A. Expression pattern inbrain of TASK-1, TASK-3, and a tandem pore domain K(+) channelsubunit, TASK-5, associated with the central auditory nervoussystem. Mol. Cell. Neurosci. 2001, 18, 632–648.
(32) Kharkovets, T.; Hardelin, J. P.; Safieddine, S.; Schweizer, M.;El-Amraoui, A.; Petit, C.; Jentsch, T. J. KCNQ4, a K+ channelmutated in a form of dominant deafness, is expressed in the innerear and the central auditory pathway. Proc. Natl. Acad. Sci. U.S.A.2000, 97, 4333–4338.
(33) Trussell, L. O. Cellular mechanisms for preservation of timing incentral auditory pathways. Curr. Opin. Neurobiol. 1997, 7, 487–492.
(34) Zhao, X.; Lein, E. S.; He, A.; Smith, S. C.; Aston, C.; Gage, F. H.Transcriptional profiling reveals strict boundaries between hip-pocampal subregions. J. Comp. Neurol. 2001, 441, 187–196.
(35) Bierczynska-Krzysik, A.; Pradeep John, J. P.; Silberring, J.; Kotlinska,J.; Dylag, T.; Cabatic, M.; Lubec, G. Proteomic analysis of ratcerebral cortex, hippocampus and striatum after exposure tomorphine. Int. J. Mol. Med. 2006, 18, 775–784.
(36) Pollak, D. D.; John, J.; Hoeger, H.; Lubec, G. An integrated map ofthe murine hippocampal proteome based upon five mouse strains.Electrophoresis 2006, 27, 2787–2798.
(37) Chen, P.; Li, X.; Sun, Y.; Liu, Z.; Cao, R.; He, Q.; Wang, M.; Xiong,J.; Xie, J.; Wang, X. Proteomic analysis of rat hippocampal plasmamembrane: characterization of potential neuronal-specific plasmamembrane proteins. J. Neurochem. 2006, 98, 1126–1140.
(38) Malinow, R.; Malenka, R. C. AMPA receptor trafficking and synapticplasticity. Annu. Rev. Neurosci. 2002, 25, 103–126.
(39) Bryant, N. J.; Govers, R.; James, D. E. Regulated transport of theglucose transporter GLUT4. Nat. Rev. Mol. Cell Biol. 2002, 3, 267–277.
(40) Tribl, F.; Marcus, K.; Bringmann, G.; Meyer, H. E.; Gerlach, M.;Riederer, P. Proteomics of the human brain: sub-proteomes mighthold the key to handle brain complexity. J. Neural Transm. 2006,113, 1041–1054.
(41) Fountoulakis, M. Application of proteomics technologies in theinvestigation of the brain. Mass Spectrom. Rev. 2004, 23, 231–258.
(42) Evans, H. W. In Preparative Centrifugation; Rickwood, D., Ed.; IRLPress: Oxford, NY, 1991.
(43) Morre, D. M.; Sammons, D. W.; Yim, J.; Bruno, M.; Snyder, T.;Reust, T.; Maianu, L.; Garvey, W. T.; Morre, D. J. Isolation bypreparative free-flow electrophoresis and aqueous two-phasepartition from rat adipocytes of an insulin-responsive small vesiclefraction with glucose transport, activity. J. Chromatogr., B: Biomed.Appl. 1996, 680, 201–212.
(44) Becherer, U.; Rettig, J. Vesicle pools, docking, priming, and release.Cell Tissue Res. 2006, 326, 393–407.
(45) Luddens, H.; Pritchett, D. B.; Kohler, M.; Killisch, I.; Keinanen, K.;Monyer, H.; Sprengel, R.; Seeburg, P. H. Cerebellar GABA-Areceptor selective for a behavioral alcohol antagonist. Nature 1990,346, 648–651.
(46) Araki, K.; Meguro, H.; Kushiya, E.; Takayama, C.; Inoue, Y.; Mishina,M. Selective expression of the glutamate receptor channel delta 2subunit in cerebellar Purkinje cells. Biochem. Biophys. Res. Com-mun. 1993, 197, 1267–1276.
(47) Pirker, S.; Schwarzer, C.; Wieselthaler, A.; Sieghart, W.; Sperk, G.GABA(A) receptors: Immunocytochemical distribution of 13 sub-units in the adult rat brain. Neuroscience 2000, 101, 815–850.
(48) Olsen, J. V.; Nielsen, P. A.; Andersen, J. R.; Mann, M.; Wisniewski,J. R. Quantitative proteomic profiling of membrane proteins fromthe mouse brain cortex, hippocampus, and cerebellum using theHysTag reagent: Mapping of neurotransmitter receptors and ionchannels. Brain Res. 2007, 1134, 95–106.
(49) Foster, L. J.; de Hoog, C. L.; Zhang, Y.; Zhang, Y.; Xie, X.; Mootha,V. K.; Mann, M. A mammalian organelle map by protein correla-tion profiling. Cell 2006, 125, 187–199.
(50) Moser, T. L.; Stack, M. S.; Asplin, I.; Enghild, J. J.; Hojrup, P.; Everitt,L.; Hubchak, S.; Schnaper, H. W.; Pizzo, S. V. Angiostatin bindsATP synthase on the surface of human endothelial cells. Proc. Natl.Acad. Sci. U.S.A. 1999, 96, 2811–2816.
(51) Bae, T. J.; Kim, M. S.; Kim, J. W.; Kim, B. W.; Choo, H. J.; Lee, J. W.;Kim, K. B.; Lee, C. S.; Kim, J. H.; Chang, S. Y. Lipid raft proteomereveals ATP synthase complex in the cell surface. Proteomics 2004,4, 3536–3548.
(52) Kirsch, J.; Langosch, D.; Prior, P.; Littauer, U. Z.; Schmitt, B.; Betz,H. The 93-kDa glycine receptor-associated protein binds totubulin. J. Biol. Chem. 1991, 266, 22242–22245.
(53) Kirsch, J.; Wolters, I.; Triller, A.; Betz, H. Gephyrin antisenseoligonucleotides prevent glycine receptor clustering in spinalneurons. Nature 1993, 366, 745–748.
(54) Schrader, N.; Kim, E. Y.; Winking, J.; Paulukat, J.; Schindelin, H.;Schwarz, G. Biochemical characterization of the high affinitybinding between the glycine receptor and gephyrin. J. Biol. Chem.2004, 279, 18733–18741.
(55) Suzuki, T.; Mitake, S.; Okumura-Noji, K.; Shimizu, H.; Tada, T.;Fujii, T. Excitable membranes and synaptic transmission: postsyn-aptic mechanisms. Localization of alpha-internexin in the postsyn-aptic density of the rat brain. Brain Res. 1997, 765, 74–80.
(56) Liu, S. H.; Cheng, H. H.; Huang, S. Y.; Yiu, P. C.; Chang, Y. C.Studying the protein organization of the postsynaptic density bya novel solid phase- and chemical cross-linking-based technology.Mol. Cell. Proteomics 2006, 5, 1019–1032.
(57) Inoue, K.; Ueno, S.; Fukuda, A. Interaction of neuron-specificK+-Cl- cotransporter, KCC2, with brain-type creatine kinase.FEBS Lett. 2004, 564, 131–135.
(58) Inoue, K.; Yamada, J.; Ueno, S.; Fukuda, A. Brain-type creatinekinase activates neuron-specific K+-Cl- co-transporter KCC2.J. Neurochem. 2006, 96, 598–608.
(59) Bian, F.; Chu, T.; Schilling, K.; Oberdick, J. Differential mRNAtransport and the regulation of protein synthesis: Selective sen-sitivity of Purkinje cell dendritic mRNAs to translational inhibition.Mol. Cell. Neurosci. 1996, 7, 116–133.
(60) Berry, F. B.; Brown, I. R. CaM I mRNA is localized to apicaldendrites during postnatal development of neurons in the ratbrain. J. Neurosci. Res. 1996, 43, 565–575.
(61) Furuichi, T.; Simonchazottes, D.; Fujino, I.; Yamada, N.; Hasegawa,M.; Miyawaki, A.; Yoshikawa, S.; Guenet, J. L.; Mikoshiba, K.Widespread expression of inositol 1,4,5-trisphosphate receptortype-1 gene (Insp3R1) in the mouse central-nervous-system.Recept. Channels 1993, 1, 11–24.
PR0704736
research articles Schindler et al.
442 Journal of Proteome Research • Vol. 7, No. 01, 2008
Copyright © 2022 FDOKUMEN