Aquatic Ecological and Human Health Risk Assessment of Chemicals in Wet Weather Discharges in the...
11
Aquatic Ecological and Human Health Risk Assessment of Chemicals in Wet Weather Discharges in the Sydney Region, New South Wales, Australia GARY BICKFORD *, JOHN TOLLà, JUDI HANSEN , ELAINE BAKER§ and ROBERT KEESSEN Sydney Water Corporation P.O. Box A53, Sydney South, 2000 NSW, Australia àParametrix Inc., 5808 Lake Washington Blvd NE Suite 200 Kirkland, Washington 98033, USA §University of Sydney, Department of Geology, Sydney NSW, Australia Sydney Water has completed a risk assessment to assess the risks to human health and aquatic organisms in creeks, rivers, estuaries and ocean waters aected by wet weather sewage overflows, stormwater and sewage treatment plant discharges. The risk assessment methodology consists of a comparison of measured and predicted concentrations of chemicals with toxicity reference values. Estimates of receiving water chemical concentrations were derived using data from a 10-year period so that the variable rainfall pattern was represented. Computer models were used to simulate and predict wet weather discharges dur- ing this ten year period. Risks were validated by bioassays and bioassessments. Risks to aquatic life from wet weather discharges were attributed to 14 chemicals at one or more of the sites and stormwater was the predominate source of the chemicals. There were no risks to people engaged in water based activities. Noncarcinogenic risks from fish ingestion are predicted at three sites. Predicted cancer risks for most individual chemicals were relatively small. Carcinogenic risks were typically associated with organochlorine compounds, polycyclic aromatic hydro- carbons, dichlorobenzene, and arsenic. The predicted cancer risks also appear to be largely the result of stormwater rather than sewage overflow inputs and largely due to historical contamination by organochlorine pesticides. It is expected the concentrations of these chemicals will decrease over time. Ó 1999 Published by Elsevier Science Ltd. All rights reserved. Keywords: sewer overflows; stormwater; sewage treat- ment; risk assessment; carcinogens; non-carcinogens. Introduction Sydney Water Corporation provides waste water ser- vices to more than 3.8 million residential customers and 73,000 businesses in the Sydney, Blue Mountains and Illawarra regions. Sydney Water has completed a risk assessment to assess the risks to human health and aquatic organisms of chemicals in creeks, rivers, estuaries and ocean waters aected by stormwater and sewage discharges during wet weather (Fig. 1). All wet weather discharges in- cluding stormwater, sewage overflows and sewage treatment plant (STP) discharges were considered (Sydney Water, 1998). The aim of the study is to de- termine the risks presented by chemicals to the envi- ronment and the source of the risks. The study was conducted as part of a number of environmental inves- tigations to determine the benefit of reducing sewer overflows. Data from stormwater, sewage overflows and STP discharges were used to evaluate the water quality at 37 receiving water sites. These sites were chosen to provide an overall picture of the wet weather characteristics of the receiving waters. The sites included locations downstream of the major sewage overflow sites. Wet weather sewage overflows are caused by rain- water that enters the sewerage system through holes, cracks, faulty joints, yard gullies, inspection hole covers, cross connections from stormwater systems and other illegal connections into the sewerage system. Most of the sewerage systems in this region are laid in impermeable rock or clay trenches that often serve as channels where stormwater can follow the sewer pipes and enter through any crack or fault. Overflows are a necessary component of sewerage systems and are designed to protect public health by stopping sewage backing up into homes and businesses. In the regions under con- sideration there are around 3000 designed sewage PII: S0025-326X(99)00057-0 Marine Pollution Bulletin Vol. 39, Nos. 1–12, pp. 335–345, 1999 Ó 1999 Published by Elsevier Science Ltd. All rights reserved Printed in Great Britain 0025-326X/99 $ - see front matter *Corresponding author. 335
-
Upload
independent -
Category
Documents
-
view
0 -
download
0
Transcript of Aquatic Ecological and Human Health Risk Assessment of Chemicals in Wet Weather Discharges in the...
Aquatic Ecological and Human HealthRisk Assessment of Chemicals in WetWeather Discharges in the SydneyRegion, New South Wales, AustraliaGARY BICKFORD *, JOHN TOLLà, JUDI HANSEN , ELAINE BAKER§ and ROBERT KEESSEN Sydney Water Corporation P.O. Box A53, Sydney South, 2000 NSW, AustraliaàParametrix Inc., 5808 Lake Washington Blvd NE Suite 200 Kirkland, Washington 98033, USA§University of Sydney, Department of Geology, Sydney NSW, Australia
Sydney Water has completed a risk assessment to assessthe risks to human health and aquatic organisms in creeks,rivers, estuaries and ocean waters a�ected by wet weathersewage over¯ows, stormwater and sewage treatment plantdischarges. The risk assessment methodology consists of acomparison of measured and predicted concentrations ofchemicals with toxicity reference values. Estimates ofreceiving water chemical concentrations were derivedusing data from a 10-year period so that the variablerainfall pattern was represented. Computer models wereused to simulate and predict wet weather discharges dur-ing this ten year period. Risks were validated by bioassaysand bioassessments. Risks to aquatic life from wetweather discharges were attributed to 14 chemicals at oneor more of the sites and stormwater was the predominatesource of the chemicals. There were no risks to peopleengaged in water based activities. Noncarcinogenic risksfrom ®sh ingestion are predicted at three sites. Predictedcancer risks for most individual chemicals were relativelysmall. Carcinogenic risks were typically associated withorganochlorine compounds, polycyclic aromatic hydro-carbons, dichlorobenzene, and arsenic. The predictedcancer risks also appear to be largely the result ofstormwater rather than sewage over¯ow inputs andlargely due to historical contamination by organochlorinepesticides. It is expected the concentrations of thesechemicals will decrease over time. Ó 1999 Published byElsevier Science Ltd. All rights reserved.
Keywords: sewer over¯ows; stormwater; sewage treat-ment; risk assessment; carcinogens; non-carcinogens.
Introduction
Sydney Water Corporation provides waste water ser-vices to more than 3.8 million residential customers and73,000 businesses in the Sydney, Blue Mountains andIllawarra regions.
Sydney Water has completed a risk assessment toassess the risks to human health and aquatic organismsof chemicals in creeks, rivers, estuaries and ocean watersa�ected by stormwater and sewage discharges duringwet weather (Fig. 1). All wet weather discharges in-cluding stormwater, sewage over¯ows and sewagetreatment plant (STP) discharges were considered(Sydney Water, 1998). The aim of the study is to de-termine the risks presented by chemicals to the envi-ronment and the source of the risks. The study wasconducted as part of a number of environmental inves-tigations to determine the bene®t of reducing sewerover¯ows.
Data from stormwater, sewage over¯ows and STPdischarges were used to evaluate the water quality at 37receiving water sites. These sites were chosen to providean overall picture of the wet weather characteristics ofthe receiving waters. The sites included locationsdownstream of the major sewage over¯ow sites.
Wet weather sewage over¯ows are caused by rain-water that enters the sewerage system through holes,cracks, faulty joints, yard gullies, inspection hole covers,cross connections from stormwater systems and otherillegal connections into the sewerage system. Most of thesewerage systems in this region are laid in impermeablerock or clay trenches that often serve as channels wherestormwater can follow the sewer pipes and enterthrough any crack or fault. Over¯ows are a necessarycomponent of sewerage systems and are designed toprotect public health by stopping sewage backing upinto homes and businesses. In the regions under con-sideration there are around 3000 designed sewage
PII: S0025-326X(99)00057-0
Marine Pollution Bulletin Vol. 39, Nos. 1±12, pp. 335±345, 1999
Ó 1999 Published by Elsevier Science Ltd. All rights reserved
Printed in Great Britain
0025-326X/99 $ - see front matter
*Corresponding author.
335
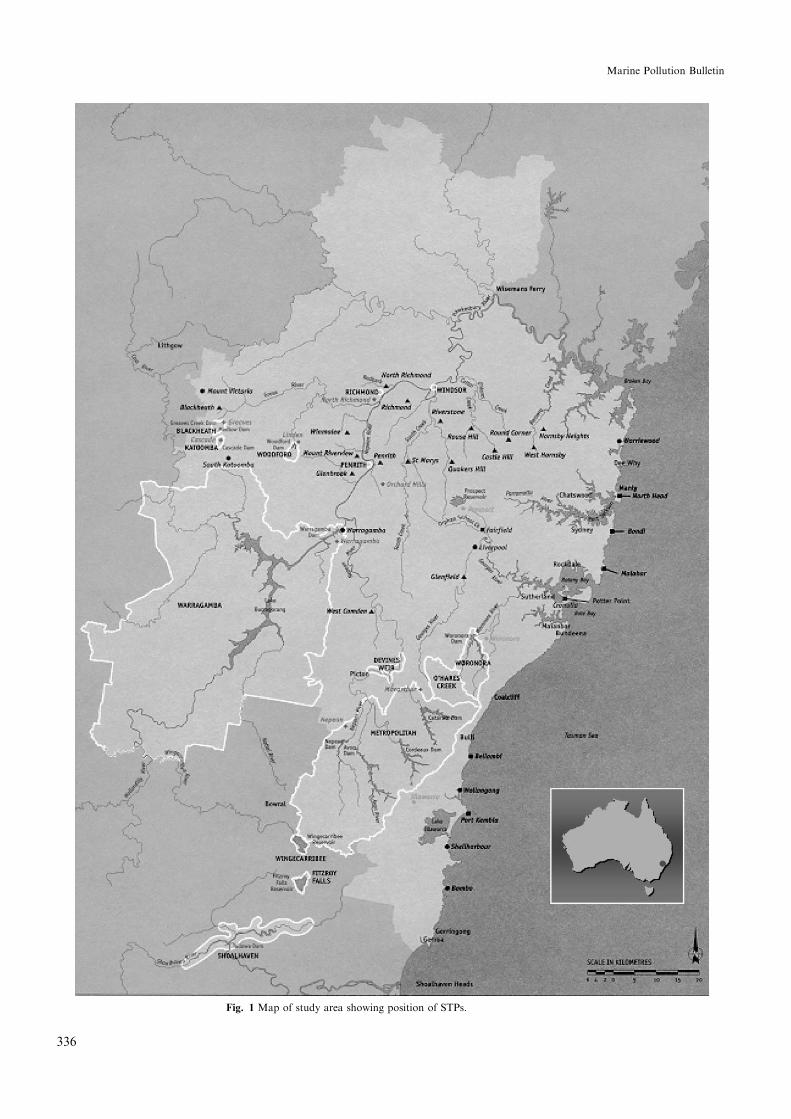
Fig. 1 Map of study area showing position of STPs.
336
Marine Pollution Bulletin
over¯ow structures. Most operate only during largestorm events, however about 200 operate in smallerrainfall events.
During wet weather, stormwater from urban areas is amajor source of contaminants to the receiving waters.Stormwater contains contaminants from a range ofsources including chemicals contained in industrial dis-charge, septic systems, household pest control, garden-ing products, termite control chemicals, domestic petwaste and vehicle exhaust particulate matter. Storm-water is not treated prior to discharge into local water-ways in the Sydney region.
Description of Study Area
The risk assessment study area includes seven geo-graphic areas in the Sydney, Blue Mountains, and Ill-awarra Region. Within these geographic areas, 37speci®c receiving water sites were chosen for evaluation(see Table 1). These sites cover a wide range of re-ceiving water conditions from small creeks high withincatchments, to freshwater and estuarine rivers, lagoonsand lakes, ocean beaches, and marine bays. The vari-ous catchments range from highly urbanised (e.g.,around Sydney) to sparsely developed (e.g., BlueMountains).
Blue MountainsThe Blue Mountains geographic area includes the
Grose River and its tributaries to the con¯uence withthe Nepean River, and the Coxs and Kedumba riv-ers and tributaries to the inlet of Lake Burragorang. Thearea is characterised by a ridgeline, which separatesthe catchments of the Grose and Coxs rivers. Mostof the catchment is undeveloped forest or heathlandwith some developed areas. The sewerage systems withinthis area discharge highly treated e�uent into creekswhich ¯ow to the Hawkesbury-Nepean River.
Upper NepeanThe Upper Nepean geographic area lies within the
Hawkesbury-Nepean River basin and extends from theupper reaches of the Nepean River and the WarragambaRiver downstream of the Warragamba Dam, to up-stream of the con¯uence of the Nepean River withGlenbrook Creek. The area includes the upper NepeanRiver and the Warragamba River. A substantial portionof the area is forested and farming is widespread in-cluding intensive agricultural industries such as poultry,pig, and dairy farms. Warragamba Dam regulates ¯owsin the river. The topography within the region, exceptaround the upper reaches of the Warragamba River, isgently undulating with elevation ranges between 100 and200 m. In areas underlain by sandstone, the river ischaracterised by narrow ¯oodplains, minor bank ero-sion, and steep cli�s above the watercourse. Where un-derlain by shale, it has a broader ¯oodplain that isusually used for agricultural. Treated e�uent from the
STPs discharge to the Warragamba and Nepean rivers.Sewage over¯ows from urban areas discharge intoMatahill Creek, the Nepean River, and other tributariessuch as Narellan Creek. The presence of a weir on theNepean River downstream of the system causes manywet weather discharges to pond in the river.
Middle Hawkesbury-NepeanThe Middle Hawkesbury-Nepean geographic area
comprises the middle section of the Hawkesbury-Nepean River and extends from the con¯uence of theNepean River with Glenbrook Creek, including Cattaiand South Creeks, downstream to the con¯uence of theHawkesbury River with the MacDonald River atWisemans Ferry. Most of this area is gently undulatingplains and low hills on Winamatta Group shales andsandstones. Many of the tributary catchments to thenorth and west are relatively undeveloped. The ¯atterterrain to the east of the main river channel is primarilyagricultural but is becoming increasingly urbanised asmany of SydneyÕs new urban areas are within this area.The river is entirely freshwater in the Nepean section,while the Hawkesbury section is tidally in¯uenced. Theriver has an extensive ¯oodplain throughout this region.Flows from the 10 STPs represent a signi®cant propor-tion of the ¯ows going into the Hawkesbury-NepeanRiver in dry weather.
Lower HawkesburyThe Lower Hawkesbury geographic area includes all
catchments draining into the saline water zone betweenthe con¯uence of the Hawkesbury River with the Mac-Donald River at Wisemans Ferry and the mouth of theHawkesbury River at Broken Bay. The main portion ofthe lower Hawkesbury River is tidal and estuarine. Theupper reaches of these catchments tend to be relativelyurbanised. The lower reaches are largely natural bush-land. The creeks are in deeply cut valleys throughoutalmost their entire course. The sewerage systems servingthis area are West Hornsby and Hornsby Heights sew-erage systems.
Port Jackson, Pittwater, Northern beaches, and Northernlagoons
This coastal geographic area includes the upperParramatta River and tributaries, Port Jackson, LaneCove River and Middle Harbour. Most of this area ishighly urbanised and used for residential, commercial,or industrial purposes. Outside of the tributary valleysand steep shorelines, the majority of these catchmentshave gently sloping topography. Below the tributarycreeks most of the receiving waters within this regionare slow moving tidal water bodies with substantialwater depths (5±30 m). The sewage within this region istreated at STPs that discharge to the ocean. A largenumber (14±200 per 10 yr) of sewer over¯ows occur inthis area.
337
Volume 39/Numbers 1±12/January±December 1999
Georges River, Southern beaches, Port Hacking, CooksRiver, and Botany Bay
The river is freshwater and non-tidal above LiverpoolWeir and estuarine below the weir to Botany Bay.Botany Bay is almost exclusively marine water althoughfreshwater intrusions can occur around the entrance tothe Georges and Cooks rivers. Port Hacking has thegeomorphic characteristics of a drowned river valley.The land uses in this region vary greatly from mostlyrural in the upper Georges River to highly urbanisedaround the lower Georges River and northern shore ofBotany Bay. The southern shore of Port Hacking is
essentially pristine. Three STPs (Glen®eld, Liverpooland Fair®eld) discharge treated e�uent directly to theGeorges River under some wet weather conditions.
IllawarraThe Illawarra geographic area comprises the relatively
narrow coastal strip (up to 10 km wide) between theIllawarra escarpment and the Paci®c Ocean. Lake Ill-awarra is used for recreation, supports commercial®sheries and has conservation signi®cance. The seweragesystems drain to coastal treatment plants, which dis-charge to the ocean. Sewer over¯ows from the
TABLE 1
Geographic area and sites evaluated in the risk assessment.
Geographic area Site name of the 37 sites assessed
Blue Mountains Entrance to the Grose RiverUnnamed Creek downstream of Winmalee STPHat Hill Creek downstream of Blackheath STP
Upper NepeanUpper Nepean River Nepean River downstream of the West Camden STPWarragamba/Nepean River Warragamba River downstream of the Warragamba STP
Middle Hawkesbury-NepeanLower Nepean River Nepean River downstream of the Penrith Weir
Nepean River downstream of the Winmalee STPHawkesbury River Nepean River downstream of the con¯uence with Redbank Creek
Nepean River downstream of the con¯uence with South CreekSouth Creek South Creek downstream of St. Marys STP
Breakfast Creek downstream of Quakers Hat STPCattai Creek Cattai Creek downstream of Castle Hill STP
Lower HawkesburyBerowra Creek Berowra Creek Freshwater ReachCowan Creek Cowan Creek Downstream of Kuringai Creek
Port Jackson, Pittwater, Northern Beaches, and Northern LagoonsParramatta River Toongabbie Creek at Toongabbie Creek over¯owLane Cove River Lane Cove River at Gloucester Avenue over¯owSydney Harbour Paramatta River near Silverwater Bridge
Lane Cove River at Lane Cove Siphon Over¯owLong Bay/Middle Harbour-Quakers Hat Bay
Rose BayPittwater Pittwater around Bayview ParkNorthern Lagoons Narrabeen Lagoon
Upper Manly Lagoon (Brookvale over¯ow)Northern/Eastern Beaches Shelly Beach, Manly
Georges River, Southern Beaches, Port Hacking, Cooks River,and Botany BayUpper Georges Georges River downstream of Glen®eld STP Over¯owCentral Georges Georges River downstream of Fair®eld STP Over¯ow
Georges River at Chipping Norton Over¯owGeorges River downstream of the Salt Pan Creek Con¯uence
Lower Georges/Botany Bay Georges River downstream of Captain Cook BridgeBotany Bay at Brighton Le Sands
Cooks River Entrance to the Cooks RiverPort Hacking Gunnamatta BaySouthern Beaches Malabar Beach
IllawarraLake Illawarra Lake Illawarra Over¯owPort Kembla Port Kembla HarbourMinamurra River Minnamurra RiverIllawarra Beaches North Wollongong Beach at the entrance to Fairy and Cabbage Tree
Creeks
338
Marine Pollution Bulletin
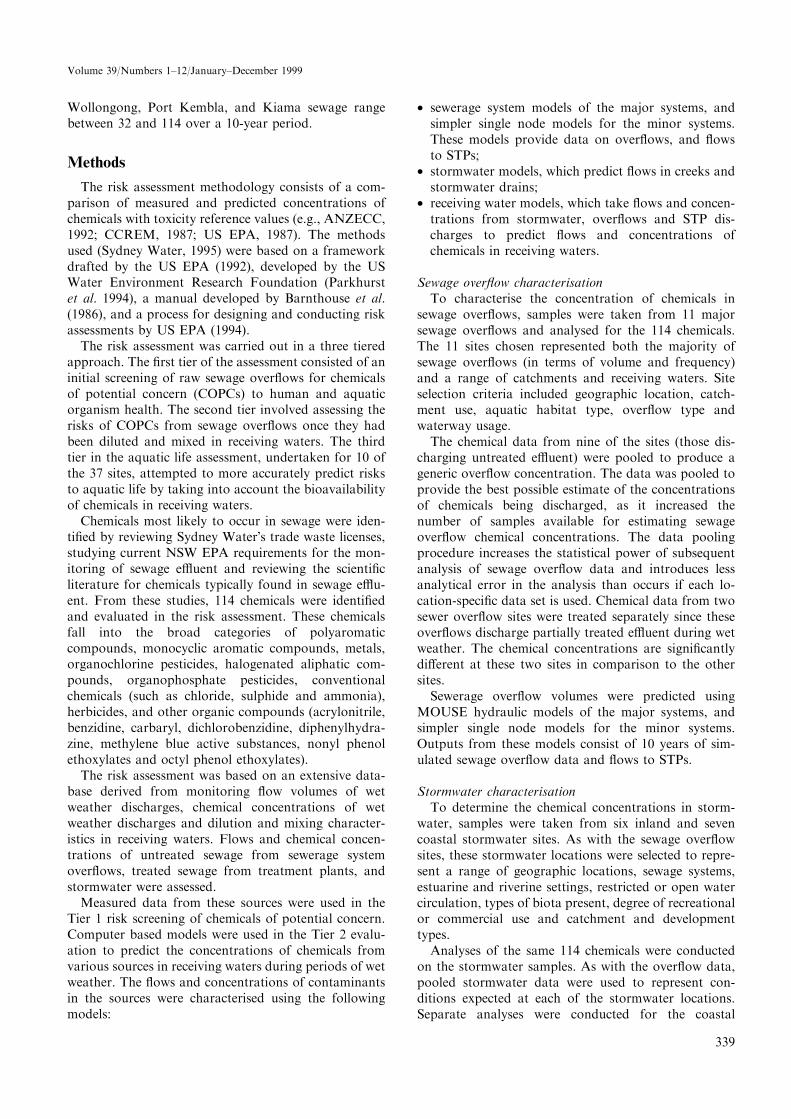
Wollongong, Port Kembla, and Kiama sewage rangebetween 32 and 114 over a 10-year period.
Methods
The risk assessment methodology consists of a com-parison of measured and predicted concentrations ofchemicals with toxicity reference values (e.g., ANZECC,1992; CCREM, 1987; US EPA, 1987). The methodsused (Sydney Water, 1995) were based on a frameworkdrafted by the US EPA (1992), developed by the USWater Environment Research Foundation (Parkhurstet al. 1994), a manual developed by Barnthouse et al.(1986), and a process for designing and conducting riskassessments by US EPA (1994).
The risk assessment was carried out in a three tieredapproach. The ®rst tier of the assessment consisted of aninitial screening of raw sewage over¯ows for chemicalsof potential concern (COPCs) to human and aquaticorganism health. The second tier involved assessing therisks of COPCs from sewage over¯ows once they hadbeen diluted and mixed in receiving waters. The thirdtier in the aquatic life assessment, undertaken for 10 ofthe 37 sites, attempted to more accurately predict risksto aquatic life by taking into account the bioavailabilityof chemicals in receiving waters.
Chemicals most likely to occur in sewage were iden-ti®ed by reviewing Sydney WaterÕs trade waste licenses,studying current NSW EPA requirements for the mon-itoring of sewage e�uent and reviewing the scienti®cliterature for chemicals typically found in sewage e�u-ent. From these studies, 114 chemicals were identi®edand evaluated in the risk assessment. These chemicalsfall into the broad categories of polyaromaticcompounds, monocyclic aromatic compounds, metals,organochlorine pesticides, halogenated aliphatic com-pounds, organophosphate pesticides, conventionalchemicals (such as chloride, sulphide and ammonia),herbicides, and other organic compounds (acrylonitrile,benzidine, carbaryl, dichlorobenzidine, diphenylhydra-zine, methylene blue active substances, nonyl phenolethoxylates and octyl phenol ethoxylates).
The risk assessment was based on an extensive data-base derived from monitoring ¯ow volumes of wetweather discharges, chemical concentrations of wetweather discharges and dilution and mixing character-istics in receiving waters. Flows and chemical concen-trations of untreated sewage from sewerage systemover¯ows, treated sewage from treatment plants, andstormwater were assessed.
Measured data from these sources were used in theTier 1 risk screening of chemicals of potential concern.Computer based models were used in the Tier 2 evalu-ation to predict the concentrations of chemicals fromvarious sources in receiving waters during periods of wetweather. The ¯ows and concentrations of contaminantsin the sources were characterised using the followingmodels:
· sewerage system models of the major systems, andsimpler single node models for the minor systems.These models provide data on over¯ows, and ¯owsto STPs;
· stormwater models, which predict ¯ows in creeks andstormwater drains;
· receiving water models, which take ¯ows and concen-trations from stormwater, over¯ows and STP dis-charges to predict ¯ows and concentrations ofchemicals in receiving waters.
Sewage over¯ow characterisationTo characterise the concentration of chemicals in
sewage over¯ows, samples were taken from 11 majorsewage over¯ows and analysed for the 114 chemicals.The 11 sites chosen represented both the majority ofsewage over¯ows (in terms of volume and frequency)and a range of catchments and receiving waters. Siteselection criteria included geographic location, catch-ment use, aquatic habitat type, over¯ow type andwaterway usage.
The chemical data from nine of the sites (those dis-charging untreated e�uent) were pooled to produce ageneric over¯ow concentration. The data was pooled toprovide the best possible estimate of the concentrationsof chemicals being discharged, as it increased thenumber of samples available for estimating sewageover¯ow chemical concentrations. The data poolingprocedure increases the statistical power of subsequentanalysis of sewage over¯ow data and introduces lessanalytical error in the analysis than occurs if each lo-cation-speci®c data set is used. Chemical data from twosewer over¯ow sites were treated separately since theseover¯ows discharge partially treated e�uent during wetweather. The chemical concentrations are signi®cantlydi�erent at these two sites in comparison to the othersites.
Sewerage over¯ow volumes were predicted usingMOUSE hydraulic models of the major systems, andsimpler single node models for the minor systems.Outputs from these models consist of 10 years of sim-ulated sewage over¯ow data and ¯ows to STPs.
Stormwater characterisationTo determine the chemical concentrations in storm-
water, samples were taken from six inland and sevencoastal stormwater sites. As with the sewage over¯owsites, these stormwater locations were selected to repre-sent a range of geographic locations, sewage systems,estuarine and riverine settings, restricted or open watercirculation, types of biota present, degree of recreationalor commercial use and catchment and developmenttypes.
Analyses of the same 114 chemicals were conductedon the stormwater samples. As with the over¯ow data,pooled stormwater data were used to represent con-ditions expected at each of the stormwater locations.Separate analyses were conducted for the coastal
339
Volume 39/Numbers 1±12/January±December 1999
catchments, Blue Mountain and Hawkesbury-Nepeaninland areas, as each of these catchments have sig-ni®cantly di�erent land use characteristics. Coastalcatchments are typically a mix of urban and lightindustrial land use, the Hawkesbury-Nepean is typi-cally a mix of rural and urban, and the Blue moun-tains is a mix of natural with a small proportion ofurban.
Stormwater ¯ows and chemical characteristics for theinland and coastal areas were determined using di�erentmodelling software. Stormwater ¯ows in coastal regionswere predicted using models based on AQUALM soft-ware. These models produced stormwater ¯ow volumesthroughout the catchment, which were subsequentlyused as input for the receiving water models. Inlandstormwater ¯ows to the Hawkesbury-Nepean werepredicted using models built on HSPF software. In ad-dition to determining ¯ows, the HSPF inland modelscarried out some dilution modelling along the longcreeks to provide information on the concentration ofcontaminants entering receiving waters. The creeks inthe Hawkesbury Nepean are relatively long comparedwith those in the coastal catchments, and the HSPFsoftware simulated in-stream ¯ows and dilutions withinthese waterways. Therefore, over¯ows and STP dis-charges located within these catchments were includedas sources within this model. Outputs from these modelsconsisted of ¯ow volumes and concentrations at mod-elled points, and ¯ows and concentrations of dischargesinto receiving waters.
STP dischargesChemical concentrations in the STP discharges to the
Hawkesbury-Nepean River and its tributaries were de-termined from discharge samples taken from 17 STPs.Chemical concentrations in STP discharges were as-sumed to be constant throughout wet and dry weatherand the chemical concentrations used in the receivingwater model were generic concentrations pooled fromthe STP data.
Flow volumes at the STPs were derived from ten yearsof measured sewerage system ¯ows.
Summary of discharge characterisation resultsThe modelling produced a series of ¯ow rates at key
locations at the following time intervals over the tenyear simulation period:
· modelled over¯ows and partially treated STP ¯ows at15 min intervals,
· stormwater at daily intervals in coastal catchments,and hourly in Hawkesbury-Nepean catchments, and
· fully treated STPs ¯ows at hourly intervals.
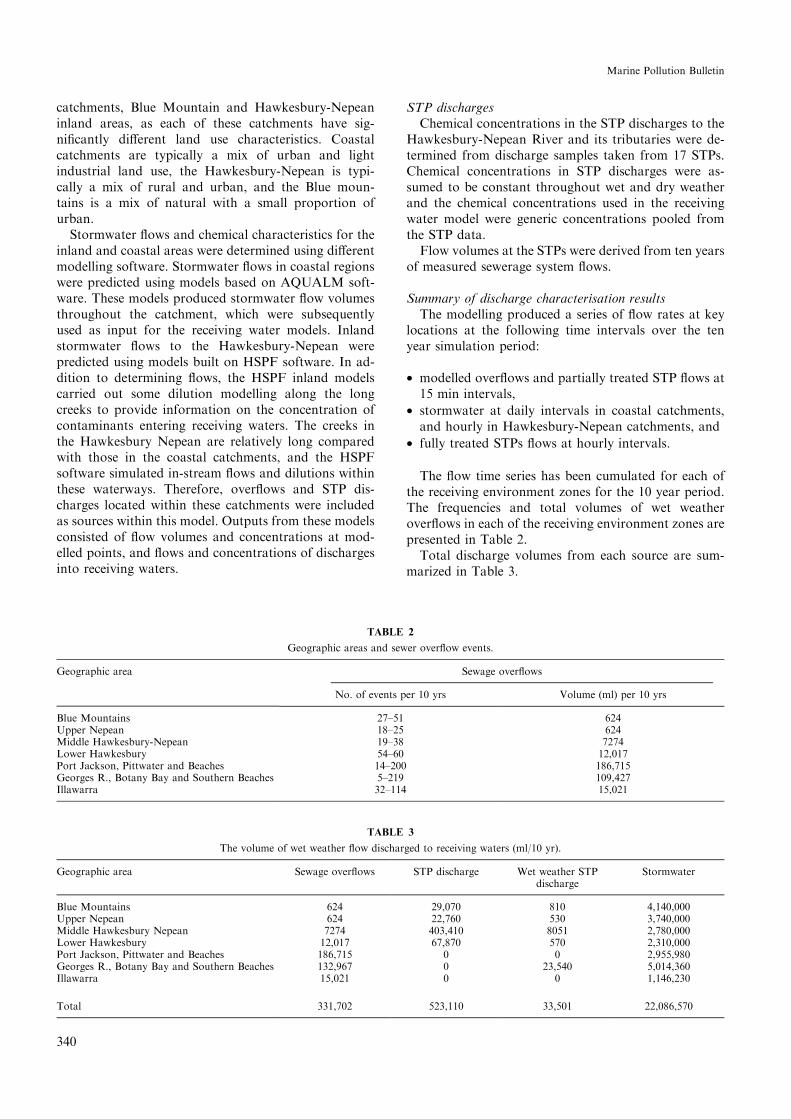
The ¯ow time series has been cumulated for each ofthe receiving environment zones for the 10 year period.The frequencies and total volumes of wet weatherover¯ows in each of the receiving environment zones arepresented in Table 2.
Total discharge volumes from each source are sum-marized in Table 3.
TABLE 2
Geographic areas and sewer over¯ow events.
Geographic area Sewage over¯ows
No. of events per 10 yrs Volume (ml) per 10 yrs
Blue Mountains 27±51 624Upper Nepean 18±25 624Middle Hawkesbury-Nepean 19±38 7274Lower Hawkesbury 54±60 12,017Port Jackson, Pittwater and Beaches 14±200 186,715Georges R., Botany Bay and Southern Beaches 5±219 109,427Illawarra 32±114 15,021
TABLE 3
The volume of wet weather ¯ow discharged to receiving waters (ml/10 yr).
Geographic area Sewage over¯ows STP discharge Wet weather STPdischarge
Stormwater
Blue Mountains 624 29,070 810 4,140,000Upper Nepean 624 22,760 530 3,740,000Middle Hawkesbury Nepean 7274 403,410 8051 2,780,000Lower Hawkesbury 12,017 67,870 570 2,310,000Port Jackson, Pittwater and Beaches 186,715 0 0 2,955,980Georges R., Botany Bay and Southern Beaches 132,967 0 23,540 5,014,360Illawarra 15,021 0 0 1,146,230
Total 331,702 523,110 33,501 22,086,570
340
Marine Pollution Bulletin
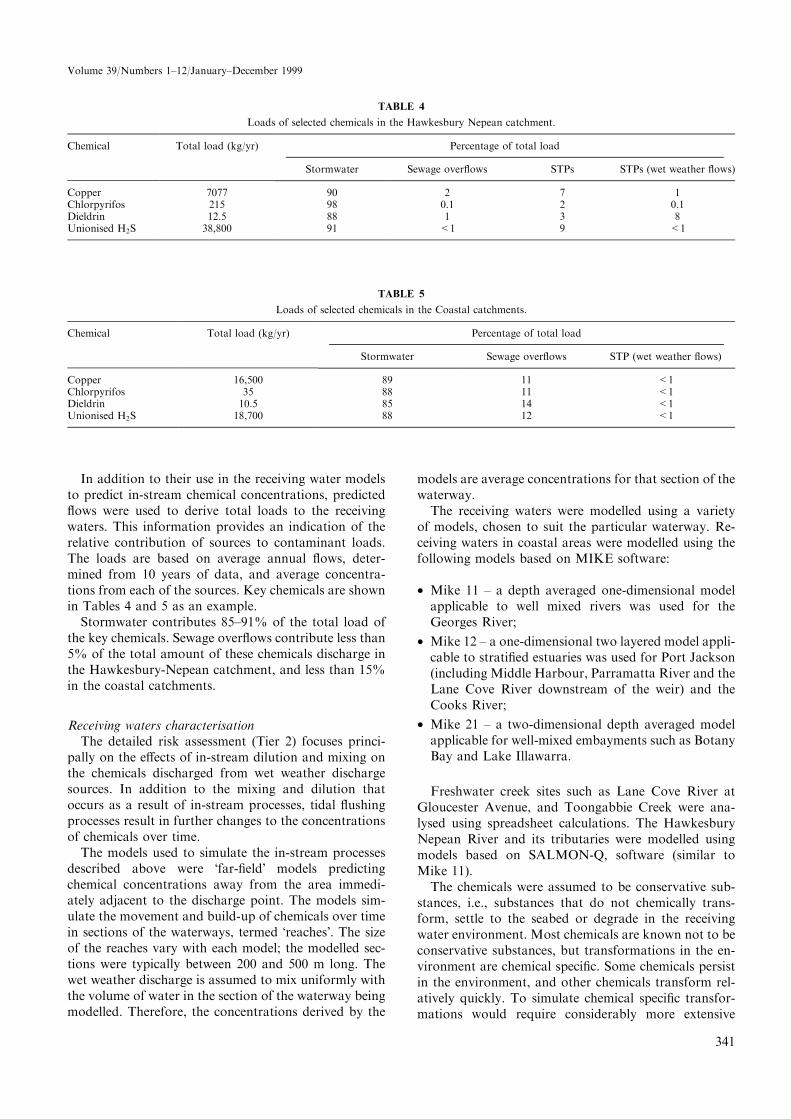
In addition to their use in the receiving water modelsto predict in-stream chemical concentrations, predicted¯ows were used to derive total loads to the receivingwaters. This information provides an indication of therelative contribution of sources to contaminant loads.The loads are based on average annual ¯ows, deter-mined from 10 years of data, and average concentra-tions from each of the sources. Key chemicals are shownin Tables 4 and 5 as an example.
Stormwater contributes 85±91% of the total load ofthe key chemicals. Sewage over¯ows contribute less than5% of the total amount of these chemicals discharge inthe Hawkesbury-Nepean catchment, and less than 15%in the coastal catchments.
Receiving waters characterisationThe detailed risk assessment (Tier 2) focuses princi-
pally on the e�ects of in-stream dilution and mixing onthe chemicals discharged from wet weather dischargesources. In addition to the mixing and dilution thatoccurs as a result of in-stream processes, tidal ¯ushingprocesses result in further changes to the concentrationsof chemicals over time.
The models used to simulate the in-stream processesdescribed above were Ôfar-®eldÕ models predictingchemical concentrations away from the area immedi-ately adjacent to the discharge point. The models sim-ulate the movement and build-up of chemicals over timein sections of the waterways, termed ÔreachesÕ. The sizeof the reaches vary with each model; the modelled sec-tions were typically between 200 and 500 m long. Thewet weather discharge is assumed to mix uniformly withthe volume of water in the section of the waterway beingmodelled. Therefore, the concentrations derived by the
models are average concentrations for that section of thewaterway.
The receiving waters were modelled using a varietyof models, chosen to suit the particular waterway. Re-ceiving waters in coastal areas were modelled using thefollowing models based on MIKE software:
· Mike 11 ± a depth averaged one-dimensional modelapplicable to well mixed rivers was used for theGeorges River;
· Mike 12 ± a one-dimensional two layered model appli-cable to strati®ed estuaries was used for Port Jackson(including Middle Harbour, Parramatta River and theLane Cove River downstream of the weir) and theCooks River;
· Mike 21 ± a two-dimensional depth averaged modelapplicable for well-mixed embayments such as BotanyBay and Lake Illawarra.
Freshwater creek sites such as Lane Cove River atGloucester Avenue, and Toongabbie Creek were ana-lysed using spreadsheet calculations. The HawkesburyNepean River and its tributaries were modelled usingmodels based on SALMON-Q, software (similar toMike 11).
The chemicals were assumed to be conservative sub-stances, i.e., substances that do not chemically trans-form, settle to the seabed or degrade in the receivingwater environment. Most chemicals are known not to beconservative substances, but transformations in the en-vironment are chemical speci®c. Some chemicals persistin the environment, and other chemicals transform rel-atively quickly. To simulate chemical speci®c transfor-mations would require considerably more extensive
TABLE 4
Loads of selected chemicals in the Hawkesbury Nepean catchment.
Chemical Total load (kg/yr) Percentage of total load
Stormwater Sewage over¯ows STPs STPs (wet weather ¯ows)
Copper 7077 90 2 7 1Chlorpyrifos 215 98 0.1 2 0.1Dieldrin 12.5 88 1 3 8Unionised H2S 38,800 91 <1 9 <1
TABLE 5
Loads of selected chemicals in the Coastal catchments.
Chemical Total load (kg/yr) Percentage of total load
Stormwater Sewage over¯ows STP (wet weather ¯ows)
Copper 16,500 89 11 <1Chlorpyrifos 35 88 11 <1Dieldrin 10.5 85 14 <1Unionised H2S 18,700 88 12 <1
341
Volume 39/Numbers 1±12/January±December 1999

investigation and modelling. Therefore the simplifyingassumption was made in the models that chemicals donot transform or degrade, on the basis that this wouldprovide a conservative (over-estimate) of chemical con-centrations in the water column.
The prediction of stormwater and over¯ow loads wasundertaken using 10 years of rainfall data from 1985 to1994, measured at the various rainfall monitoring sta-tions located throughout the catchments. The use of 10years of rainfall data records was important to simulatethe e�ects of catchment saturation on runo� and in®l-tration into the sewerage system. Catchment land-usesand sewerage system conditions were assumed to beconstant throughout the simulation period. The receiv-ing water models are essentially wet weather models.Although the models have been set up to run continu-ously through wet and dry weather conditions, theyhave been calibrated for wet weather ¯ow conditionsonly. Periods a�ected by wet weather were de®ned as thedays during and the day immediately following rainfallin the catchment. Based on this assumption, the perioda�ected by wet weather amounted to 30% of the 10 yearperiod.
The results were summarized by processing 10 yearsof data for each chemical to provide:
· number of days concentrations exceed acute toxicityreference values (TRVs) concentrations;
· number of occasions the four-day moving averageconcentration exceeded chronic TRVs; and
· maximum hazard quotient at each site for the 10 yearsimulation.
Validation of the risk assessment predictions wascarried out by conducting bioassays and bioassessmentsto compare with the predicted risks to aquatic life.
Bioassays are laboratory experiments to determine thetoxicity of chemicals on sensitive aquatic species. Bio-assay tests were used to assess the toxicity of wetweather STP discharges, stormwaters and undilutedsewer over¯ow discharge, receiving waters and sedi-ments. This information provides an independent site-speci®c measure of toxicity for comparison to the riskestimates. Organisms that are adapted to salinities of thewater and sediments being tested were selected for the
bioassays. For water column tests, the salt intolerantwater ¯ea (C. dubia) and salt tolerant sea urchin(H. tuberculata) were tested, depending on receivingwater salinity. Sediment tests employed amphipod spe-cies adapted to freshwater (H. azteca), variable salinities<17 ppt (Corophium sp.), variable salinities 4±25 ppt(E. estuarius), and high salinities >25 ppt (R. abronius).For sediment bioassays, the presence of coarse (sand) or®ne (silts and clays) materials in the sediments was alsoconsidered when selecting appropriate species. TheC. dubia is regarded as one of the most sensitive stan-dard freshwater species (Doherty, 1983), and sea urchingametes (H. tuberculata) as one of the most sensitivemarine organisms (Nacci et al., 1986). Amphipods, usedin some of the water column and all the sediment tests,are regarded as less sensitive than C. dubia and H. tuber-culata, but among the most sensitive organisms availablefor sediment testing (Swartz et al., 1985). There is no onespecies or group or organisms that can be de®ned as themost sensitive to all chemicals (Thurston et al., 1985).
At most sites, the receiving water samples were takenupstream (or away from) the sewage over¯ow dischargepoint to evaluate the impacts of stormwater only in thereceiving environment. These results were compared tosewage over¯ow bioassay results to determine whetherany toxicity measured in over¯ows would be in excess ofthat expected from the receiving waters themselves.
Field surveys of macroinvertebrates living in sedi-ments were carried out to examine whether impacts ofsewer over¯ows were evident in the receiving water en-vironments.
The likely e�ects of acute and chronic exposure tochemicals discharged from sewage over¯ows, stormwa-ter and STP discharges were evaluated in the humanhealth risk assessment. Acute exposure may occur due tothe incidental ingestion of water while wading orswimming during or soon after rainfall. Chronic riskswere determined by assessing risks from the ingestion of®sh, shell®sh and water.
Results and Discussion
Aquatic life risk assessmentThe evaluation of risks to aquatic life from wet
weather discharges identi®ed a number of COPCs at the
TABLE 6
Chemicals of concern determined in the aquatic risk assessment.a
Metals Organics Other chemical stressors Physical stressors
Copper (A, C) 2,4 dichlorophenol (C, F) Ammonia (A, C) TSS (C )Silver (A, C) alpha BHC (C) Nitrite (A, C) DO (A, C)Zinc (A, C) beta BHC (C, F) Hydrogen sulphide (C)
Chlordanes (C)Chlorpyrifos (A, C)
Dieldrin (C)Diazinon (A, C)
Hexachlorobenzene (C, F)
aC ± Chronic chemical of concern, A ± Acute chemical of concern, F ± Chemical of concern at freshwater sites only.
342
Marine Pollution Bulletin

37 receiving water sites evaluated. In estuarine waters,14 chemicals were identi®ed as COCs at one or more ofthe sites (Table 6). While sewage over¯ows contribute tothe risks to aquatic life for most of these chemicals,stormwater is the main risk driver. Stormwater con-tributes greater than 85% of the load of the chemicals ofconcern (Fig. 2), except ammonia and nitrite which areassociated with both stormwater and over¯ows.
Over¯ow abatement was found to reduce the riskposed by ammonia and nitrite in most waterways. Therisk for COCs associated with stormwater (e.g., copperand chlorpyrifos) were generally found at levels ofconcern during all wet weather events.
Suspended solids can smother and interfere with ®lterfeeding and breathing (ventilating) of benthic inverte-brates and young ®sh. The modelled data showed thatfollowing a wet weather over¯ow event, there is oftenthe potential for chronic risks to aquatic life from sus-pended solids at 17 of the 37 sites evaluated.
While depressions in DO were evaluated qualitativelyat all receiving water sites, they were estimated bymodelling at six sites. From these evaluations, depres-sions in DO from wet weather discharges were predictedto be of concern at 14 of the 37 sites.
Potential loss of habitat for benthic organisms due toscouring were identi®ed at ®ve sites, but only on a smallarea adjacent to where the over¯ow enters the water-way.
The e�ects of sedimentation include reduced plantproduction from covering with silt, and interferencewith respiration and feeding of ®sh and invertebrates.This potential impact was identi®ed at 10 of the 37 sites,however, the contribution of sewage over¯ows to thisimpact was considered to be small.
For all estuarine sites, either an upper freshwaterlayer develops or the entire waterway becomes freshduring storm events. However, these conditions occurnaturally in estuaries and potential additional risks fromsewage over¯ow discharges would not be expected.
The bioassessment study (®eld survey of benthic or-ganisms) was inconclusive regarding the impact ofover¯ows. The survey found communities were gener-ally depauperate, but there was no observable e�ectdownstream of the larger over¯ows surveyed. Even ifover¯ows were abated it is very likely these sites wouldremain impacted from stormwater as upstream andreference sites were similarly impacted.
While the results of the sewage over¯ow bioassays(laboratory toxicity tests) show that undiluted sewagefrom over¯ows are toxic, no conclusions could be drawnon the impact of over¯ows on the toxicity of thedownstream receiving waters. However, it was evidentthat receiving waters upstream of the over¯ows testedwere toxic in wet weather, and in some cases in dryweather, which would suggest that much of the mea-sured toxicity may be attributable to stormwater. Sedi-ment bioassays, from a short-term exposure perspective,indicate toxicity is generally not expected for organismswhose sensitivities are similar to amphipods.
Human health risk assessmentTo assess the number of people using the waterways
(®shing, swimming, etc.), and the duration and fre-quency of their water based activities, a recreational useand ®shing survey was conducted. The survey con®rmedthat there are a small number of people who, regardlessof the weather conditions, use the waterways for recre-ation. The survey also indicated that people catch and
Fig. 2 Loads of chemicals to the Hawkesbury-Nepean catchmentfrom all sources.
343
Volume 39/Numbers 1±12/January±December 1999
consume ®sh from selected waterways which receive wetweather discharges.
Incidental water ingestion risks from short-term ex-posures to chemicals during or following a wet weatherover¯ow event were evaluated at all 37 receiving watersites. The risk assessment did not predict risks from thechemicals examined to people engaged in water basedactivities at any of these sites.
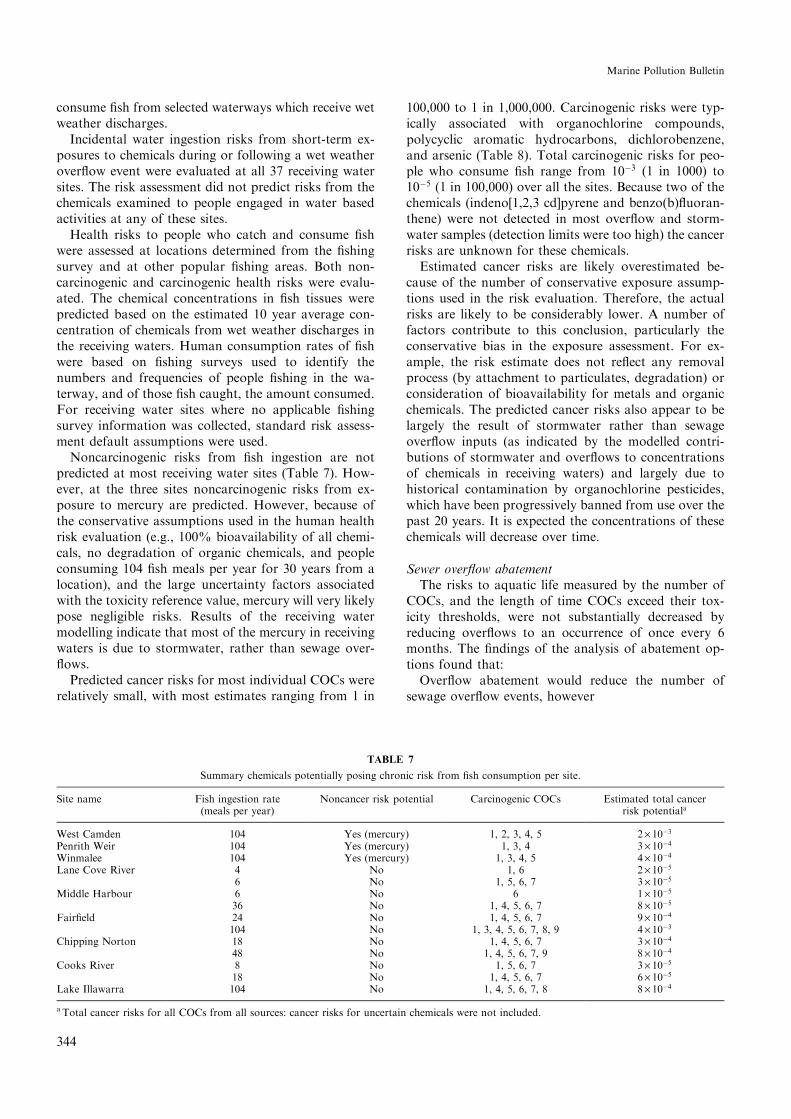
Health risks to people who catch and consume ®shwere assessed at locations determined from the ®shingsurvey and at other popular ®shing areas. Both non-carcinogenic and carcinogenic health risks were evalu-ated. The chemical concentrations in ®sh tissues werepredicted based on the estimated 10 year average con-centration of chemicals from wet weather discharges inthe receiving waters. Human consumption rates of ®shwere based on ®shing surveys used to identify thenumbers and frequencies of people ®shing in the wa-terway, and of those ®sh caught, the amount consumed.For receiving water sites where no applicable ®shingsurvey information was collected, standard risk assess-ment default assumptions were used.
Noncarcinogenic risks from ®sh ingestion are notpredicted at most receiving water sites (Table 7). How-ever, at the three sites noncarcinogenic risks from ex-posure to mercury are predicted. However, because ofthe conservative assumptions used in the human healthrisk evaluation (e.g., 100% bioavailability of all chemi-cals, no degradation of organic chemicals, and peopleconsuming 104 ®sh meals per year for 30 years from alocation), and the large uncertainty factors associatedwith the toxicity reference value, mercury will very likelypose negligible risks. Results of the receiving watermodelling indicate that most of the mercury in receivingwaters is due to stormwater, rather than sewage over-¯ows.
Predicted cancer risks for most individual COCs wererelatively small, with most estimates ranging from 1 in
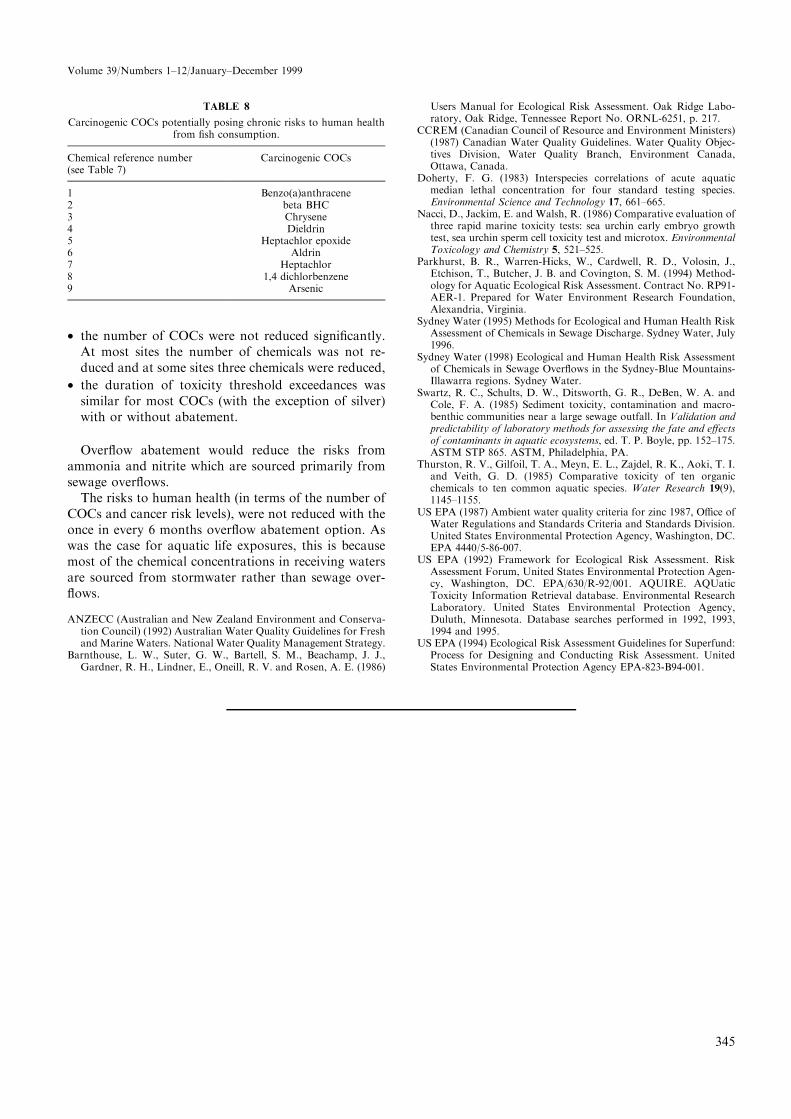
100,000 to 1 in 1,000,000. Carcinogenic risks were typ-ically associated with organochlorine compounds,polycyclic aromatic hydrocarbons, dichlorobenzene,and arsenic (Table 8). Total carcinogenic risks for peo-ple who consume ®sh range from 10ÿ3 (1 in 1000) to10ÿ5 (1 in 100,000) over all the sites. Because two of thechemicals (indeno[1,2,3 cd]pyrene and benzo(b)¯uoran-thene) were not detected in most over¯ow and storm-water samples (detection limits were too high) the cancerrisks are unknown for these chemicals.
Estimated cancer risks are likely overestimated be-cause of the number of conservative exposure assump-tions used in the risk evaluation. Therefore, the actualrisks are likely to be considerably lower. A number offactors contribute to this conclusion, particularly theconservative bias in the exposure assessment. For ex-ample, the risk estimate does not re¯ect any removalprocess (by attachment to particulates, degradation) orconsideration of bioavailability for metals and organicchemicals. The predicted cancer risks also appear to belargely the result of stormwater rather than sewageover¯ow inputs (as indicated by the modelled contri-butions of stormwater and over¯ows to concentrationsof chemicals in receiving waters) and largely due tohistorical contamination by organochlorine pesticides,which have been progressively banned from use over thepast 20 years. It is expected the concentrations of thesechemicals will decrease over time.
Sewer over¯ow abatementThe risks to aquatic life measured by the number of
COCs, and the length of time COCs exceed their tox-icity thresholds, were not substantially decreased byreducing over¯ows to an occurrence of once every 6months. The ®ndings of the analysis of abatement op-tions found that:
Over¯ow abatement would reduce the number ofsewage over¯ow events, however
TABLE 7
Summary chemicals potentially posing chronic risk from ®sh consumption per site.
Site name Fish ingestion rate(meals per year)
Noncancer risk potential Carcinogenic COCs Estimated total cancerrisk potentiala
West Camden 104 Yes (mercury) 1, 2, 3, 4, 5 2´ 10ÿ3
Penrith Weir 104 Yes (mercury) 1, 3, 4 3´ 10ÿ4
Winmalee 104 Yes (mercury) 1, 3, 4, 5 4´ 10ÿ4
Lane Cove River 4 No 1, 6 2´ 10ÿ5
6 No 1, 5, 6, 7 3´ 10ÿ5
Middle Harbour 6 No 6 1´ 10ÿ5
36 No 1, 4, 5, 6, 7 8´ 10ÿ5
Fair®eld 24 No 1, 4, 5, 6, 7 9´ 10ÿ4
104 No 1, 3, 4, 5, 6, 7, 8, 9 4´ 10ÿ3
Chipping Norton 18 No 1, 4, 5, 6, 7 3´ 10ÿ4
48 No 1, 4, 5, 6, 7, 9 8´ 10ÿ4
Cooks River 8 No 1, 5, 6, 7 3´ 10ÿ5
18 No 1, 4, 5, 6, 7 6´ 10ÿ5
Lake Illawarra 104 No 1, 4, 5, 6, 7, 8 8´ 10ÿ4
a Total cancer risks for all COCs from all sources: cancer risks for uncertain chemicals were not included.
344
Marine Pollution Bulletin
· the number of COCs were not reduced signi®cantly.At most sites the number of chemicals was not re-duced and at some sites three chemicals were reduced,
· the duration of toxicity threshold exceedances wassimilar for most COCs (with the exception of silver)with or without abatement.
Over¯ow abatement would reduce the risks fromammonia and nitrite which are sourced primarily fromsewage over¯ows.
The risks to human health (in terms of the number ofCOCs and cancer risk levels), were not reduced with theonce in every 6 months over¯ow abatement option. Aswas the case for aquatic life exposures, this is becausemost of the chemical concentrations in receiving watersare sourced from stormwater rather than sewage over-¯ows.
ANZECC (Australian and New Zealand Environment and Conserva-tion Council) (1992) Australian Water Quality Guidelines for Freshand Marine Waters. National Water Quality Management Strategy.
Barnthouse, L. W., Suter, G. W., Bartell, S. M., Beachamp, J. J.,Gardner, R. H., Lindner, E., Oneill, R. V. and Rosen, A. E. (1986)
Users Manual for Ecological Risk Assessment. Oak Ridge Labo-ratory, Oak Ridge, Tennessee Report No. ORNL-6251, p. 217.
CCREM (Canadian Council of Resource and Environment Ministers)(1987) Canadian Water Quality Guidelines. Water Quality Objec-tives Division, Water Quality Branch, Environment Canada,Ottawa, Canada.
Doherty, F. G. (1983) Interspecies correlations of acute aquaticmedian lethal concentration for four standard testing species.Environmental Science and Technology 17, 661±665.
Nacci, D., Jackim, E. and Walsh, R. (1986) Comparative evaluation ofthree rapid marine toxicity tests: sea urchin early embryo growthtest, sea urchin sperm cell toxicity test and microtox. EnvironmentalToxicology and Chemistry 5, 521±525.
Parkhurst, B. R., Warren-Hicks, W., Cardwell, R. D., Volosin, J.,Etchison, T., Butcher, J. B. and Covington, S. M. (1994) Method-ology for Aquatic Ecological Risk Assessment. Contract No. RP91-AER-1. Prepared for Water Environment Research Foundation,Alexandria, Virginia.
Sydney Water (1995) Methods for Ecological and Human Health RiskAssessment of Chemicals in Sewage Discharge. Sydney Water, July1996.
Sydney Water (1998) Ecological and Human Health Risk Assessmentof Chemicals in Sewage Over¯ows in the Sydney-Blue Mountains-Illawarra regions. Sydney Water.
Swartz, R. C., Schults, D. W., Ditsworth, G. R., DeBen, W. A. andCole, F. A. (1985) Sediment toxicity, contamination and macro-benthic communities near a large sewage outfall. In Validation andpredictability of laboratory methods for assessing the fate and e�ectsof contaminants in aquatic ecosystems, ed. T. P. Boyle, pp. 152±175.ASTM STP 865. ASTM, Philadelphia, PA.
Thurston, R. V., Gilfoil, T. A., Meyn, E. L., Zajdel, R. K., Aoki, T. I.and Veith, G. D. (1985) Comparative toxicity of ten organicchemicals to ten common aquatic species. Water Research 19(9),1145±1155.
US EPA (1987) Ambient water quality criteria for zinc 1987, O�ce ofWater Regulations and Standards Criteria and Standards Division.United States Environmental Protection Agency, Washington, DC.EPA 4440/5-86-007.
US EPA (1992) Framework for Ecological Risk Assessment. RiskAssessment Forum, United States Environmental Protection Agen-cy, Washington, DC. EPA/630/R-92/001. AQUIRE. AQUaticToxicity Information Retrieval database. Environmental ResearchLaboratory. United States Environmental Protection Agency,Duluth, Minnesota. Database searches performed in 1992, 1993,1994 and 1995.
US EPA (1994) Ecological Risk Assessment Guidelines for Superfund:Process for Designing and Conducting Risk Assessment. UnitedStates Environmental Protection Agency EPA-823-B94-001.
TABLE 8
Carcinogenic COCs potentially posing chronic risks to human healthfrom ®sh consumption.
Chemical reference number(see Table 7)
Carcinogenic COCs
1 Benzo(a)anthracene2 beta BHC3 Chrysene4 Dieldrin5 Heptachlor epoxide6 Aldrin7 Heptachlor8 1,4 dichlorbenzene9 Arsenic
345
Volume 39/Numbers 1±12/January±December 1999