Applying DPPI: A Defect Causal Analysis Approach Using Bayesian Networks
15
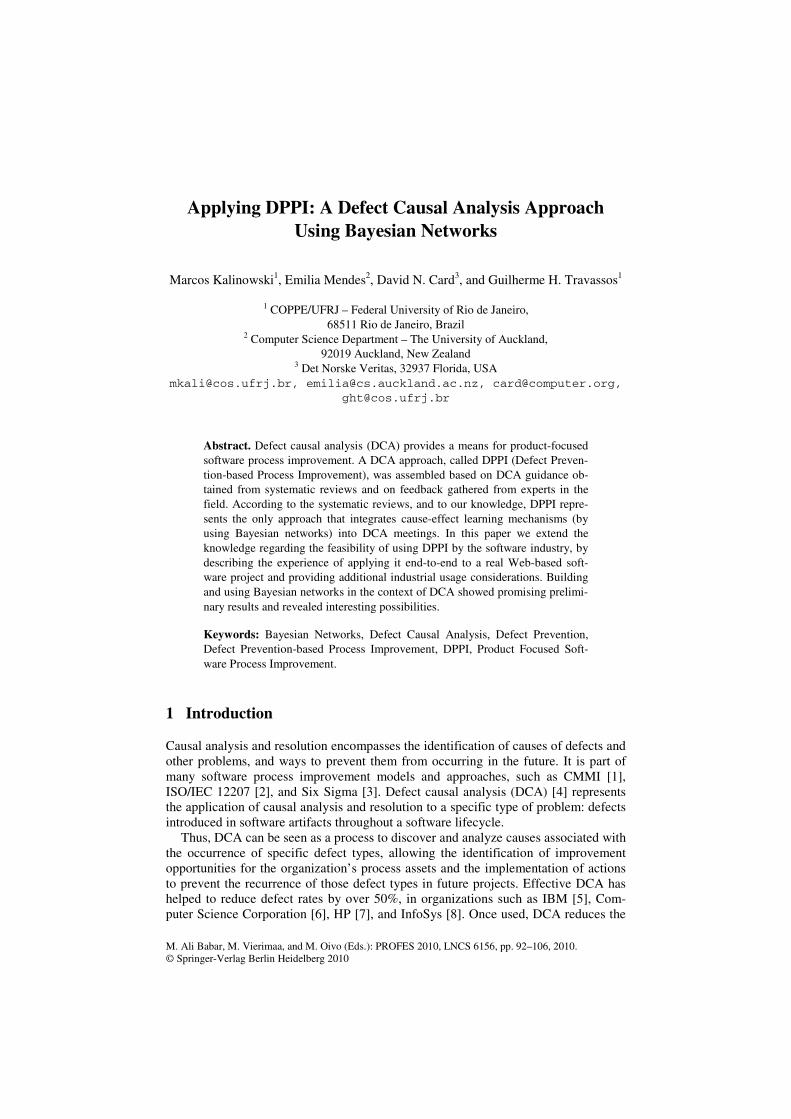
M. Ali Babar, M. Vierimaa, and M. Oivo (Eds.): PROFES 2010, LNCS 6156, pp. 92–106, 2010. © Springer-Verlag Berlin Heidelberg 2010 Applying DPPI: A Defect Causal Analysis Approach Using Bayesian Networks Marcos Kalinowski 1 , Emilia Mendes 2 , David N. Card 3 , and Guilherme H. Travassos 1 1 COPPE/UFRJ – Federal University of Rio de Janeiro, 68511 Rio de Janeiro, Brazil 2 Computer Science Department – The University of Auckland, 92019 Auckland, New Zealand 3 Det Norske Veritas, 32937 Florida, USA [email protected], [email protected], [email protected], [email protected] Abstract. Defect causal analysis (DCA) provides a means for product-focused software process improvement. A DCA approach, called DPPI (Defect Preven- tion-based Process Improvement), was assembled based on DCA guidance ob- tained from systematic reviews and on feedback gathered from experts in the field. According to the systematic reviews, and to our knowledge, DPPI repre- sents the only approach that integrates cause-effect learning mechanisms (by using Bayesian networks) into DCA meetings. In this paper we extend the knowledge regarding the feasibility of using DPPI by the software industry, by describing the experience of applying it end-to-end to a real Web-based soft- ware project and providing additional industrial usage considerations. Building and using Bayesian networks in the context of DCA showed promising prelimi- nary results and revealed interesting possibilities. Keywords: Bayesian Networks, Defect Causal Analysis, Defect Prevention, Defect Prevention-based Process Improvement, DPPI, Product Focused Soft- ware Process Improvement. 1 Introduction Causal analysis and resolution encompasses the identification of causes of defects and other problems, and ways to prevent them from occurring in the future. It is part of many software process improvement models and approaches, such as CMMI [1], ISO/IEC 12207 [2], and Six Sigma [3]. Defect causal analysis (DCA) [4] represents the application of causal analysis and resolution to a specific type of problem: defects introduced in software artifacts throughout a software lifecycle. Thus, DCA can be seen as a process to discover and analyze causes associated with the occurrence of specific defect types, allowing the identification of improvement opportunities for the organization’s process assets and the implementation of actions to prevent the recurrence of those defect types in future projects. Effective DCA has helped to reduce defect rates by over 50%, in organizations such as IBM [5], Com- puter Science Corporation [6], HP [7], and InfoSys [8]. Once used, DCA reduces the
-
Upload
independent -
Category
Documents
-
view
1 -
download
0
Transcript of Applying DPPI: A Defect Causal Analysis Approach Using Bayesian Networks
M. Ali Babar, M. Vierimaa, and M. Oivo (Eds.): PROFES 2010, LNCS 6156, pp. 92–106, 2010. © Springer-Verlag Berlin Heidelberg 2010
Applying DPPI: A Defect Causal Analysis Approach Using Bayesian Networks
Marcos Kalinowski1, Emilia Mendes2, David N. Card3, and Guilherme H. Travassos1
1 COPPE/UFRJ – Federal University of Rio de Janeiro, 68511 Rio de Janeiro, Brazil
2 Computer Science Department – The University of Auckland, 92019 Auckland, New Zealand
3 Det Norske Veritas, 32937 Florida, USA [email protected], [email protected], [email protected],
Abstract. Defect causal analysis (DCA) provides a means for product-focused software process improvement. A DCA approach, called DPPI (Defect Preven-tion-based Process Improvement), was assembled based on DCA guidance ob-tained from systematic reviews and on feedback gathered from experts in the field. According to the systematic reviews, and to our knowledge, DPPI repre-sents the only approach that integrates cause-effect learning mechanisms (by using Bayesian networks) into DCA meetings. In this paper we extend the knowledge regarding the feasibility of using DPPI by the software industry, by describing the experience of applying it end-to-end to a real Web-based soft-ware project and providing additional industrial usage considerations. Building and using Bayesian networks in the context of DCA showed promising prelimi-nary results and revealed interesting possibilities.
Keywords: Bayesian Networks, Defect Causal Analysis, Defect Prevention, Defect Prevention-based Process Improvement, DPPI, Product Focused Soft-ware Process Improvement.
1 Introduction
Causal analysis and resolution encompasses the identification of causes of defects and other problems, and ways to prevent them from occurring in the future. It is part of many software process improvement models and approaches, such as CMMI [1], ISO/IEC 12207 [2], and Six Sigma [3]. Defect causal analysis (DCA) [4] represents the application of causal analysis and resolution to a specific type of problem: defects introduced in software artifacts throughout a software lifecycle.
Thus, DCA can be seen as a process to discover and analyze causes associated with the occurrence of specific defect types, allowing the identification of improvement opportunities for the organization’s process assets and the implementation of actions to prevent the recurrence of those defect types in future projects. Effective DCA has helped to reduce defect rates by over 50%, in organizations such as IBM [5], Com-puter Science Corporation [6], HP [7], and InfoSys [8]. Once used, DCA reduces the
Applying DPPI: A Defect Causal Analysis Approach Using Bayesian Networks 93
rework effort [8] and increases the probability of achieving other process-based qual-ity and performance goals [1].
However, despite its benefits and broad industry adoption, there are still numerous unanswered questions concerning DCA implementation in software organizations and a small number of related publications [9]. Therefore, in order to provide guidance on how to efficiently implement DCA in software organizations, a systematic review was conducted in 2006 and replicated in 2007 [10]. The results of both systematic review trials, besides allowing producing DCA guidance, revealed opportunities for further investigation [11]. For instance, “the DCA state of the art did not seem to include any approach integrating learning mechanisms regarding cause-effect relations into DCA meetings”. This means that, in all of the approaches found, the knowledge about cause-effect relationships gathered during each DCA session was only used to initiate actions to improve the development process, and afterwards discarded.
To our knowledge, the first effort to bridge this gap is reported in the initial con-cept of a DCA approach described in [12]. In this initial concept the integration of knowledge gathered in successive causal analysis events as means to assemble a deeper understanding of the defects` cause-effect relations is suggested by using Bayesian networks. Such integration aims to facilitate the creation and maintenance of common causal models to be used to support the identification of causes of defects, allowing efficient process improvement in each DCA event. For instance, such causal models can help to answer the following questions during DCA meetings: “Given the past projects within my organizational context, which causes led to which types of defects?”, or “Given the past projects within my organizational context, with which probability did a certain cause lead to a specific defect type?”. Further this initial concept was evolved and tailored into the DPPI (defect prevention based process improvement) approach, based on an additional systematic review trial (conducted in 2009) and feedback gathered from experts in the field. DPPI, besides using and feed-ing Bayesian networks to support DCA, addresses all the specific practices of the CMMI CAR (Causal Analysis and Resolution) process area.
In this paper we extend the knowledge regarding the feasibility of using DPPI by the software industry, by (i) describing the experience of applying DPPI to a large scale Web-based software project detailing how its activities and tasks could be per-formed in the context of a real software project, and (ii) providing industrial consid-erations for DPPI with additional insights from a practitioner’s point of view into its underlying usage assumptions, the need for tools, and other usage possibilities.
The remainder of this paper is organized as follows. In Section 2 a theoretical background on DCA is described. In Section 3, an overview of DPPI and its activities is provided. Section 4 describes the experience of applying DPPI to a Web-based software project. Section 5 contains the industrial considerations. Finally, conclusions and comments on future work are given in Section 6.
2 Defect Causal Analysis
To have a clear understanding of what defect causal analysis represents in the scope of this paper it is important to first understand what the term defect means. The IEEE standard terminology for software engineering [13] states that when a defect is found
94 M. Kalinowski et al.
through peer reviews it is related to a fault in the artifact being reviewed. When a defect is found through testing activities, on the other hand, it is related to a failure in the software product being tested. In this paper the term defect is used to represent faults revealed by software inspections.
Card [9] summarizes the DCA process in six steps: (i) to select a sample of the de-fects; (ii) to classify selected defects; (iii) to identify systematic errors; (iv) to deter-mine the main cause; (v) to develop action proposals; and (vi) to document meeting results. In this context, a systematic error is an error that results in the same or similar defects being repeated in different occasions. Finding systematic errors indicates the existence of significant improvement opportunities for the project or organizational process assets. Besides listing these six steps, the importance of managing the imple-mentation of the action proposals until their conclusion and communicating the im-plemented changes to the development team is highlighted [9].
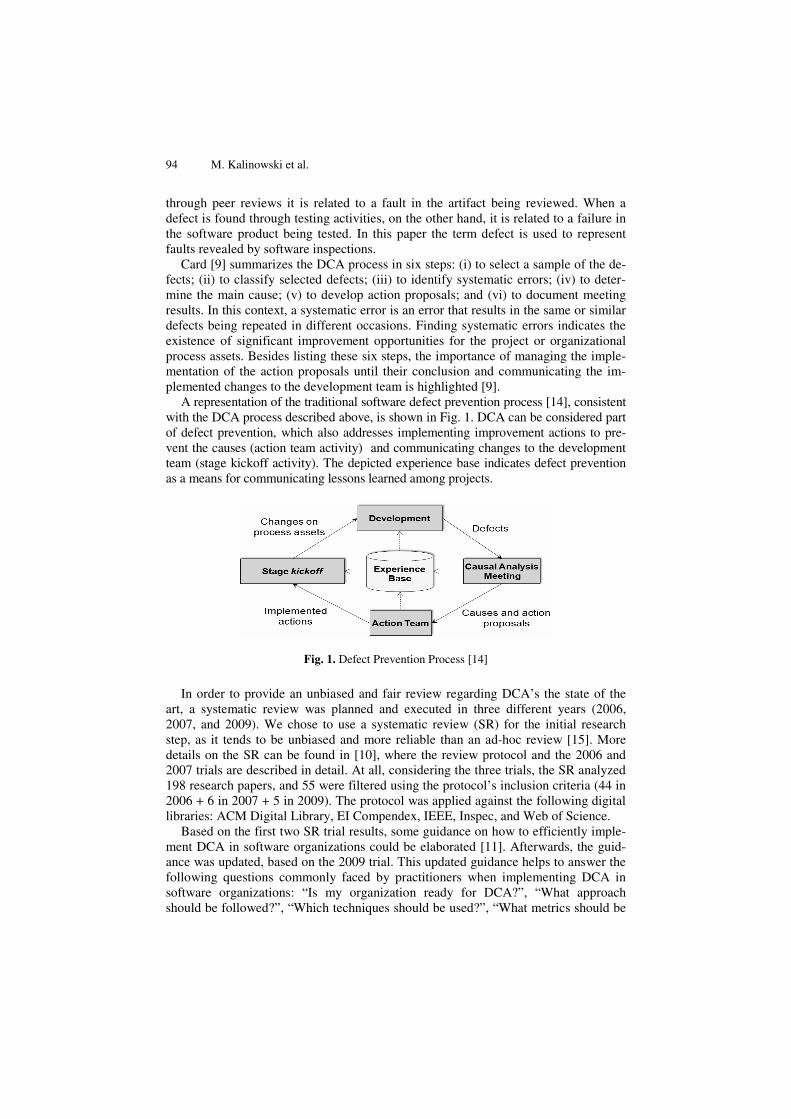
A representation of the traditional software defect prevention process [14], consistent with the DCA process described above, is shown in Fig. 1. DCA can be considered part of defect prevention, which also addresses implementing improvement actions to pre-vent the causes (action team activity) and communicating changes to the development team (stage kickoff activity). The depicted experience base indicates defect prevention as a means for communicating lessons learned among projects.
Fig. 1. Defect Prevention Process [14]
In order to provide an unbiased and fair review regarding DCA’s the state of the art, a systematic review was planned and executed in three different years (2006, 2007, and 2009). We chose to use a systematic review (SR) for the initial research step, as it tends to be unbiased and more reliable than an ad-hoc review [15]. More details on the SR can be found in [10], where the review protocol and the 2006 and 2007 trials are described in detail. At all, considering the three trials, the SR analyzed 198 research papers, and 55 were filtered using the protocol’s inclusion criteria (44 in 2006 + 6 in 2007 + 5 in 2009). The protocol was applied against the following digital libraries: ACM Digital Library, EI Compendex, IEEE, Inspec, and Web of Science.
Based on the first two SR trial results, some guidance on how to efficiently imple-ment DCA in software organizations could be elaborated [11]. Afterwards, the guid-ance was updated, based on the 2009 trial. This updated guidance helps to answer the following questions commonly faced by practitioners when implementing DCA in software organizations: “Is my organization ready for DCA?”, “What approach should be followed?”, “Which techniques should be used?”, “What metrics should be
Applying DPPI: A Defect Causal Analysis Approach Using Bayesian Networks 95
collected?”, “How should DCA be integrated with Statistical Process Control?”, “How should defects be categorized?”, “How should causes be categorized?”, and “What are the expected costs and results of implementing DCA?”. More details on this guidance can be found in [11].
Using the initial guidance, a proposal towards a defect prevention based software process improvement approach could be outlined [12], addressing an identified oppor-tunity for further investigation by suggesting the use of Bayesian networks to inte-grate cause-effect learning mechanisms into DCA meetings. Afterwards this approach was evolved and tailored into DPPI based on the updated guidance, feedback gathered from experts in the field, and the experience of instantiating some of its concepts based on real project data. DPPI, besides using and feeding Bayesian networks to support DCA, addresses all the specific practices of the CMMI CAR process area. The next section provides a brief DPPI overview.
3 DPPI Overview
DPPI represents a practical approach for defect prevention that follows the framework of the traditional defect prevention process, described by Jones [14]. Thus, although slightly rearranged, the DCA meeting, action team, and stage kickoff activities, shown in Fig. 1, are also considered.
When comparing DPPI to the traditional defect prevention process, the main inno-vation is the integration of knowledge gathered in successive causal analysis events in order to provide a deeper understanding of the organization’s defect cause-effect relations; this addresses an opportunity for further investigation identified in our SRs and highlighted in [11]. To our knowledge this opportunity was first addressed in the initial concept that led to DPPI, described in [12], and so far no other approach con-siders this integration. Such integration allows establishing and maintaining common causal models to support the identification of causes for efficient process improve-ment in each causal analysis event. Those causal models could support diagnostic reasoning, helping to understand, for instance, given similar projects of the organiza-tion, which causes usually lead to which defect types.
Additionally, DPPI follows the guidance for implementing DCA efficiently in software organizations [11] in order to tailor the defect prevention activities into more specific tasks, providing further details on the techniques to be used to accomplish these tasks efficiently. Moreover, it integrates defect prevention into the measurement and control strategy of the development activity for which defect prevention is being applied, allowing one to observe whether the implemented improvements to the de-velopment activity brought real benefits. The tailored approach addresses all CMMI CAR specific practices. Thus, following the DPPI approach results in CMMI com-patibility regarding the analysis of causes of software defects.
Given that DPPI aims at continuous improvement by enhancing the development activity’s sub-process performance and capability, as suggested by the guidance, it was designed to take place right after the inspection of the artifacts of each main software lifecycle development activity.
DPPI includes four activities: (i) Development Activity Result Analysis; (ii) DCA Preparation; (iii) DCA Meeting; and (iv) Development Activity Improvement.
96 M. Kalinowski et al.
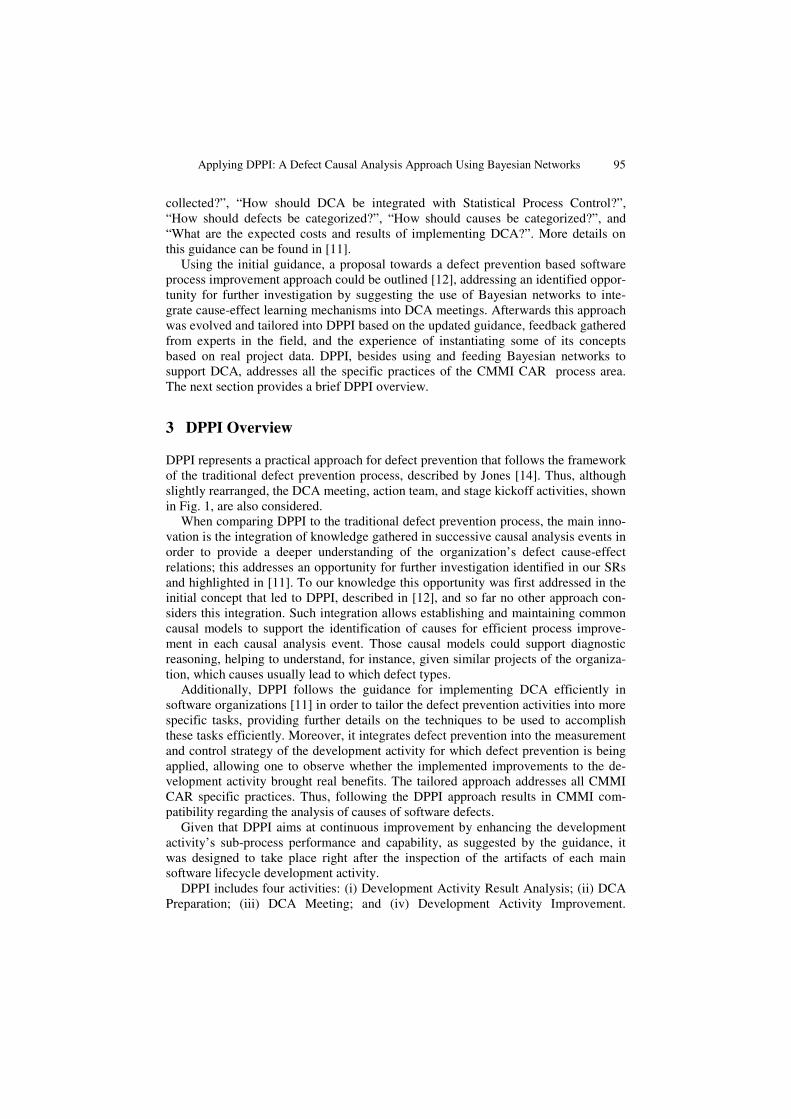
Fig. 2. DPPI Approach Overview
The main tasks for each of these activities, as well as the roles involved in their exe-cution, are depicted in Fig. 2. Note that the software development activity itself and its inspection are out of DPPI’s scope.
This figure also highlights the proposal to maintain information regarding the or-ganization’s defect cause-effect relations (causal model) for each development activ-ity. DPPI considers those causal models to be dynamically established and maintained by feeding and using Bayesian networks. Pearl [16] suggests that probabilistic causal models can be built using Bayesian networks, if concrete examples of cause-effect relations can be gathered in order to feed the network. In the case of DPPI the exam-ples to feed the Bayesian network can be taken from each DCA meeting results. A brief description of the four DPPI activities and their tasks is provided in the follow-ing subsections.
3.1 Development Activity Result Analysis
This activity, which is not mandatory (unless CMMI compatibility is desired), aims at the quantitative measurement and control of the development activity, but is sug-gested by the guidance as essential to understand the DCA’s efficiency, as highlighted in [17]. It comprises two tasks to be performed by the DPPI moderator (could be the same moderator of the inspection in which the defects where revealed). Further details on these tasks follow.
Analyze Development Activity Results. In this task the development activity’s de-fect related results should be analyzed, comparing it against the same development activity historical defect related results. For DPPI this analysis focuses on changes in
Applying DPPI: A Defect Causal Analysis Approach Using Bayesian Networks 97
defect rates, and changes in the activities’ input and output quality. Thus, as suggested by the guidance, the following metrics should be analyzed against historical data by using a statistical process control chart: (i) number of defects per unit of size, (ii) number of defects found per inspection hour, (iii) Phase Input Quality (PIQ, which indicates the percentage of defects found in the analyzed development activity that were actually introduced in prior activities), and (iv) Phase Output Quality (POQ, which indicates the percentage of defects of the analyzed development activity that leaked into other development activities). The PIQ and POQ metrics allow to com-prehend an activity’s input and output quality, and are described in further details in [18], however, sometimes data to calculate them might not be available.
Moreover, as suggested by [19] and indicated by the guidance, the type of the sta-tistical process control chart for the first two of those metrics should be a U-chart, given that defects follow a Poisson distribution. For the PIQ and POQ metrics (which represent a relative percentage) a standard individuals (xMR) chart can be plotted. Those charts can easily indicate if the defect metrics of the development activity sub-process are under control by applying some basic statistical tests (more details on those tests can be obtained in [20]).
Establish Quantitative Improvement Goals. This task concerns establishing im-provement goals for the development activity sub-process. A typical example of quantitative improvement goal is: “reducing the defect rate by X percent”. If the sub-process related to the development activity is out of control the focus of the causal analysis meeting becomes revealing assignable causes and the improvement goal should be related to stabilizing the sub-process. If it is under control the focus is on finding the common causes and the improvement goal should be improving the proc-ess performance and capability.
3.2 DCA Preparation
This activity comprises the preparation for defect causal analysis by selecting the samples of defects to be analyzed and identifying the systematic errors that have been committed leading to several of those defects.
Apply Pareto Chart and Select Samples. This task refers to finding the clusters (samples) of defects where systematic errors are more likely present. Since systematic errors lead to defects of the same type, as indicated by the guidance [11], the Pareto chart can be used to find those clusters, by using the defect categories as the discriminating parameter.
Find Systematic Errors. This task comprises analyzing the defect sample (reading the description of the sampled defects) in order to find its systematic errors. Examples of systematic errors can be found in [21]. Only the defects related to those systematic errors should be considered in the DCA meeting. At this point the moderator could receive support from representatives of the document authors and the inspectors involved in finding the defects.
98 M. Kalinowski et al.
3.3 DCA Meeting
In this activity the moderator should be supported by representatives of the authors (which know the project context) and the software process engineering group (SEPG). A description of the two tasks involved in this activity follows.
Identify Main Causes. This task comprises analyzing the descriptions of the defects related to the systematic errors in order to find the main causes for each systematic error. It receives great support from having a causal model represented as a Bayesian network and can be stated as the core of our approach. Given the causal model elabo-rated based on prior DCA meetings for the same development activity, the probabili-ties for causes to lead to the defect type related to the systematic error being analyzed can be calculated by using the Bayesian network inference. Afterwards those prob-abilities can be used to support the DCA meeting team in identifying the main causes. Therefore it can be represented as a probabilistic cause-effect diagram [12] for the type of defect related to the systematic error being analyzed.
This diagram was designed based on the cause-effect diagram [24], suggested by the guidance for identifying causes. The probabilistic cause-effect diagram extends the cause-effect diagram by (i) showing the probabilities for each possible cause to lead to the analyzed defect type and (ii) representing the causes using grey tones, where the darker tones are used for the causes with higher probability. This represen-tation can be easily interpreted and highlights the causes with greater probabilities of causing the analyzed defect type. A concrete example of how such diagram can be built based on the Bayesian network is shown in Section 4.
At the end of the meeting the Bayesian network should be fed with the resulting causes for the defect type, so that the probabilities of the causes can be updated for the next DCA event.
Propose Actions to Prevent Causes. In this task, actions should be brainstormed to improve the process assets in order to prevent the identified causes. The overall meet-ing results (current defect rates, improvement goals, main defect categories, system-atic errors, causes, and action proposals) should be documented.
3.4 Development Activity Improvement
Finally, in this activity, the action proposals should be implemented by a dedicated team and managed until their conclusion. After implementation, the changes to the process should be communicated to the development team.
Given this brief overview of DPPI, the next section describes the proof of concept experience of applying DPPI to a real large scale Web-based software project.
4 DPPI Proof of Concept
As a proof of concept, DPPI was applied retroactively to perform defect causal analy-sis on the functional specification activity of a real Web-based software project. The scope of this project, called SIGIC, was to develop a new information system to man-age the activities of the COPPETEC Foundation. Thus the project involved several
Applying DPPI: A Defect Causal Analysis Approach Using Bayesian Networks 99
departments from the Foundation, such as: human resources, financial, protocol, among others. The system to be implemented was modularized and developed in an iterative and incremental lifecycle. Based on this lifecycle, a development process was defined, in which software inspections were performed on each of the modules’ functional specifications, using the ISPIS framework [22].
In total, more than 10 iterations were performed and more than 200 use cases were specified, implemented and delivered to the client over a three years development period. By the end of the project, all inspection data was available, including details on over 1000 defects found and removed from the functional specifications before the actual implementation. In this context, DPPI was applied retroactively to the func-tional specification activity of the fourth developed module regarding protocol of bound solicitations, called MPTV. The details of how each DPPI activity (except the improvement activity, which could not be performed since the application was retro-active) could be performed are described hereafter.
4.1 Applying Development Activity Result Analysis
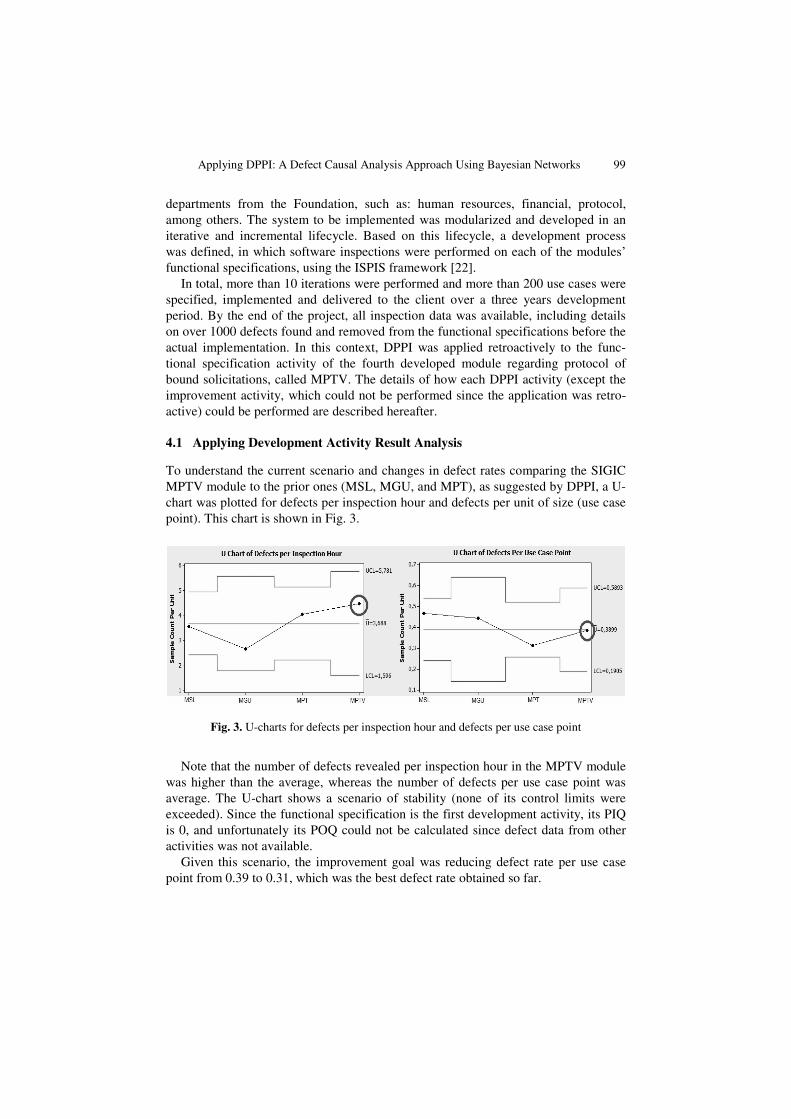
To understand the current scenario and changes in defect rates comparing the SIGIC MPTV module to the prior ones (MSL, MGU, and MPT), as suggested by DPPI, a U-chart was plotted for defects per inspection hour and defects per unit of size (use case point). This chart is shown in Fig. 3.
Fig. 3. U-charts for defects per inspection hour and defects per use case point
Note that the number of defects revealed per inspection hour in the MPTV module was higher than the average, whereas the number of defects per use case point was average. The U-chart shows a scenario of stability (none of its control limits were exceeded). Since the functional specification is the first development activity, its PIQ is 0, and unfortunately its POQ could not be calculated since defect data from other activities was not available.
Given this scenario, the improvement goal was reducing defect rate per use case point from 0.39 to 0.31, which was the best defect rate obtained so far.
100 M. Kalinowski et al.
4.2 Applying DCA Preparation
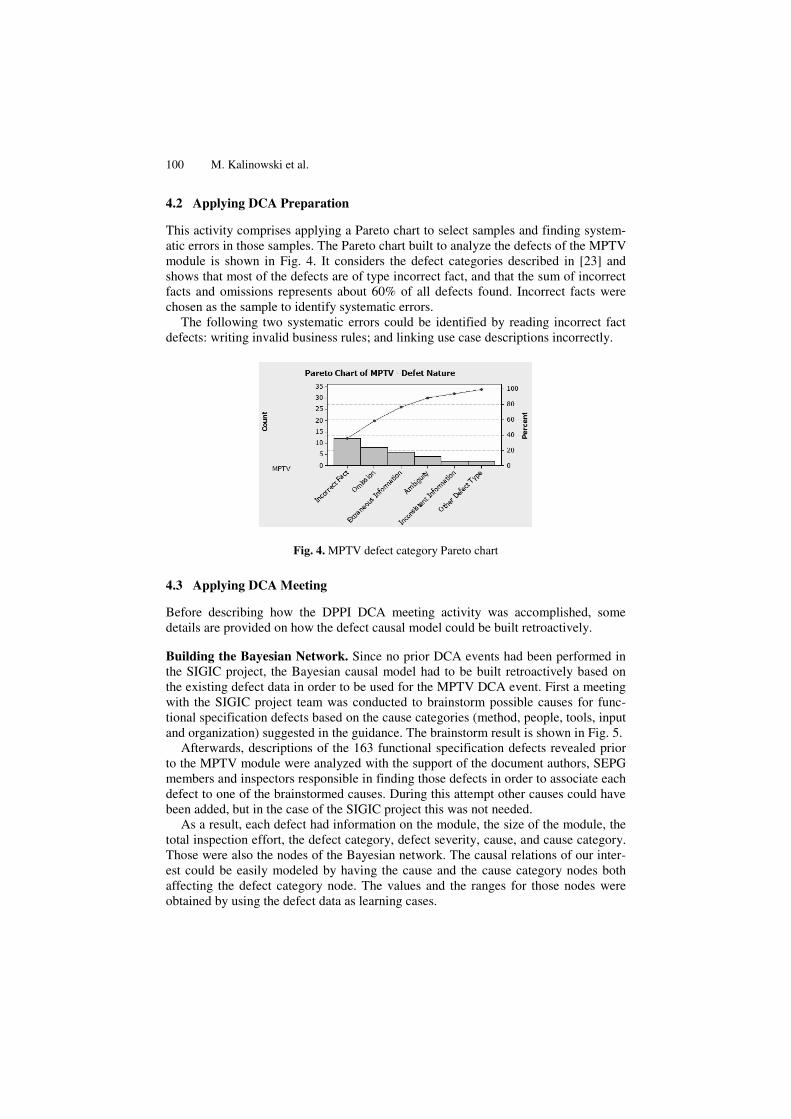
This activity comprises applying a Pareto chart to select samples and finding system-atic errors in those samples. The Pareto chart built to analyze the defects of the MPTV module is shown in Fig. 4. It considers the defect categories described in [23] and shows that most of the defects are of type incorrect fact, and that the sum of incorrect facts and omissions represents about 60% of all defects found. Incorrect facts were chosen as the sample to identify systematic errors.
The following two systematic errors could be identified by reading incorrect fact defects: writing invalid business rules; and linking use case descriptions incorrectly.
Fig. 4. MPTV defect category Pareto chart
4.3 Applying DCA Meeting
Before describing how the DPPI DCA meeting activity was accomplished, some details are provided on how the defect causal model could be built retroactively.
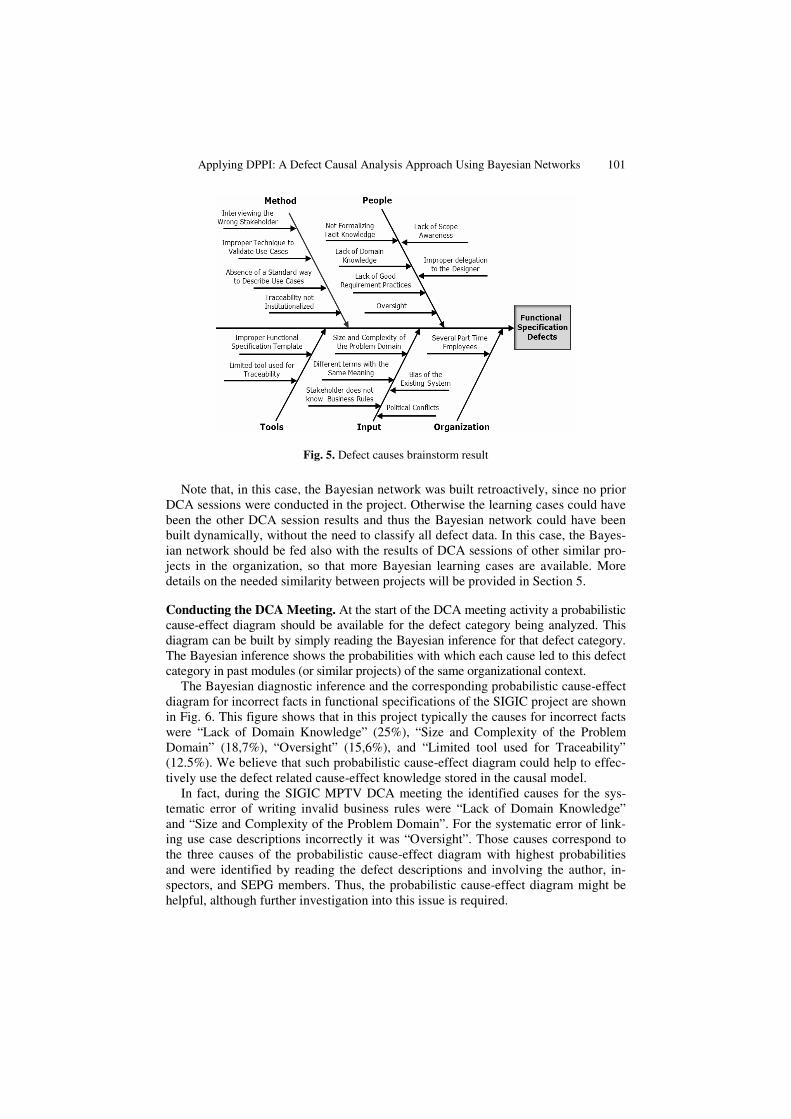
Building the Bayesian Network. Since no prior DCA events had been performed in the SIGIC project, the Bayesian causal model had to be built retroactively based on the existing defect data in order to be used for the MPTV DCA event. First a meeting with the SIGIC project team was conducted to brainstorm possible causes for func-tional specification defects based on the cause categories (method, people, tools, input and organization) suggested in the guidance. The brainstorm result is shown in Fig. 5.
Afterwards, descriptions of the 163 functional specification defects revealed prior to the MPTV module were analyzed with the support of the document authors, SEPG members and inspectors responsible in finding those defects in order to associate each defect to one of the brainstormed causes. During this attempt other causes could have been added, but in the case of the SIGIC project this was not needed.
As a result, each defect had information on the module, the size of the module, the total inspection effort, the defect category, defect severity, cause, and cause category. Those were also the nodes of the Bayesian network. The causal relations of our inter-est could be easily modeled by having the cause and the cause category nodes both affecting the defect category node. The values and the ranges for those nodes were obtained by using the defect data as learning cases.
Applying DPPI: A Defect Causal Analysis Approach Using Bayesian Networks 101
Fig. 5. Defect causes brainstorm result
Note that, in this case, the Bayesian network was built retroactively, since no prior DCA sessions were conducted in the project. Otherwise the learning cases could have been the other DCA session results and thus the Bayesian network could have been built dynamically, without the need to classify all defect data. In this case, the Bayes-ian network should be fed also with the results of DCA sessions of other similar pro-jects in the organization, so that more Bayesian learning cases are available. More details on the needed similarity between projects will be provided in Section 5.
Conducting the DCA Meeting. At the start of the DCA meeting activity a probabilistic cause-effect diagram should be available for the defect category being analyzed. This diagram can be built by simply reading the Bayesian inference for that defect category. The Bayesian inference shows the probabilities with which each cause led to this defect category in past modules (or similar projects) of the same organizational context.
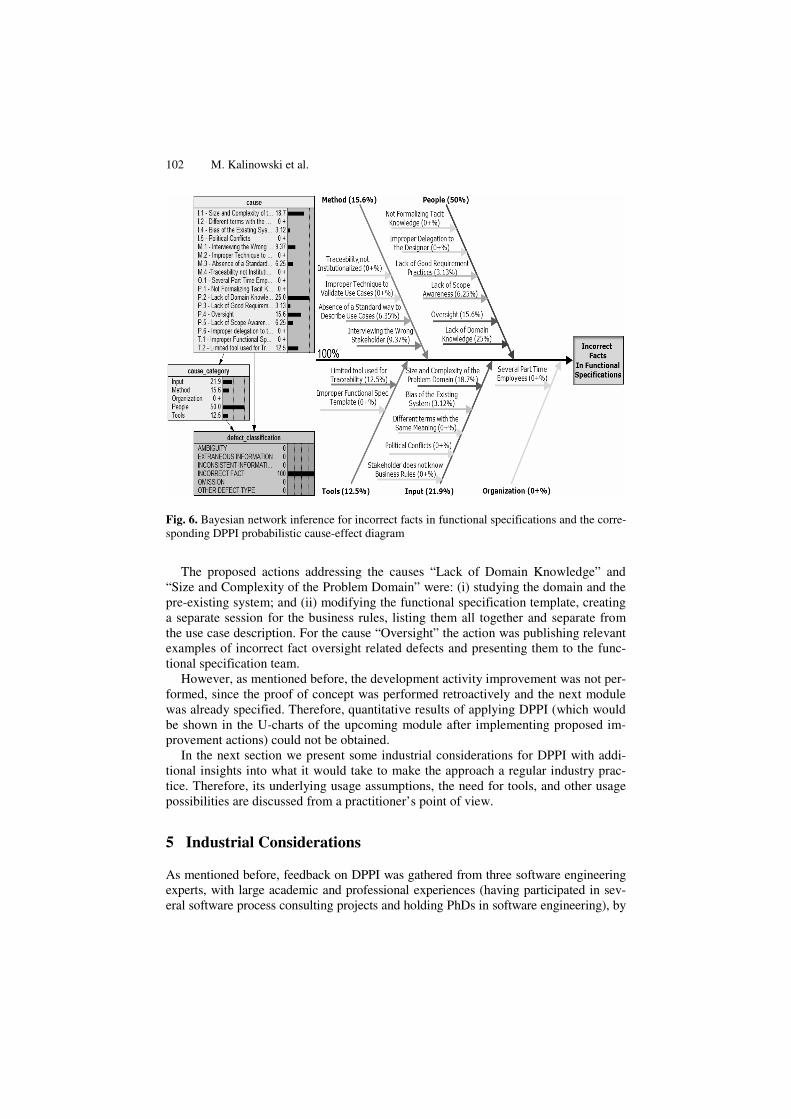
The Bayesian diagnostic inference and the corresponding probabilistic cause-effect diagram for incorrect facts in functional specifications of the SIGIC project are shown in Fig. 6. This figure shows that in this project typically the causes for incorrect facts were “Lack of Domain Knowledge” (25%), “Size and Complexity of the Problem Domain” (18,7%), “Oversight” (15,6%), and “Limited tool used for Traceability” (12.5%). We believe that such probabilistic cause-effect diagram could help to effec-tively use the defect related cause-effect knowledge stored in the causal model.
In fact, during the SIGIC MPTV DCA meeting the identified causes for the sys-tematic error of writing invalid business rules were “Lack of Domain Knowledge” and “Size and Complexity of the Problem Domain”. For the systematic error of link-ing use case descriptions incorrectly it was “Oversight”. Those causes correspond to the three causes of the probabilistic cause-effect diagram with highest probabilities and were identified by reading the defect descriptions and involving the author, in-spectors, and SEPG members. Thus, the probabilistic cause-effect diagram might be helpful, although further investigation into this issue is required.
102 M. Kalinowski et al.
Fig. 6. Bayesian network inference for incorrect facts in functional specifications and the corre-sponding DPPI probabilistic cause-effect diagram
The proposed actions addressing the causes “Lack of Domain Knowledge” and “Size and Complexity of the Problem Domain” were: (i) studying the domain and the pre-existing system; and (ii) modifying the functional specification template, creating a separate session for the business rules, listing them all together and separate from the use case description. For the cause “Oversight” the action was publishing relevant examples of incorrect fact oversight related defects and presenting them to the func-tional specification team.
However, as mentioned before, the development activity improvement was not per-formed, since the proof of concept was performed retroactively and the next module was already specified. Therefore, quantitative results of applying DPPI (which would be shown in the U-charts of the upcoming module after implementing proposed im-provement actions) could not be obtained.
In the next section we present some industrial considerations for DPPI with addi-tional insights into what it would take to make the approach a regular industry prac-tice. Therefore, its underlying usage assumptions, the need for tools, and other usage possibilities are discussed from a practitioner’s point of view.
5 Industrial Considerations
As mentioned before, feedback on DPPI was gathered from three software engineering experts, with large academic and professional experiences (having participated in sev-eral software process consulting projects and holding PhDs in software engineering), by
Applying DPPI: A Defect Causal Analysis Approach Using Bayesian Networks 103
presenting them the approach. During this feedback session one of the main discussions was concerning DPPI’s underlying usage assumptions, which are presented hereafter.
5.1 Underlying Usage Assumptions
The underlying assumptions for using DPPI include the existence of a defined process for the project, as suggested by [9], and the execution of software inspections during which information regarding the detected defects is stored. The information regarding defects should include the activity in which the defect was introduced, the activity in which the defect was found and the defect type. More details on defect categorization can be found in the guidance described in [11].
Moreover, DPPI has to be used to improve the same activity for different modules of the same or similar projects. In case of using it between different projects, they should share the same defect categorization scheme, follow similar processes, be related to domains of similar complexity, use teams of similar experience, and use the same type of technology. Basically, in this case, the assumptions are the same as for grouping different projects for statistical process control, described in [20]. Otherwise the U-charts and even the causal model would not be meaningful. Regarding the U-charts, in particular, in order for them to be useful to control the sub-process of the development activity being analyzed, inspections need to be performed following a defined and stable inspection process (so that defect data can be related to the per-formance of the development activity sub-process).
Regarding the causal model, causes identified in prior DCA events for the same development activity concerning similar projects/modules need to registered with their category (considerations on this categorization can be found in [11]) and the related defect type, so that the Bayesian network for the development activity can be built dynamically using that data as learning cases. Otherwise the causal model would have to be built retroactively (as done in Section 4 of this paper), which requires much more effort, resulting in a difficulty to scale in order to consider defect cause-effect knowledge reflecting several projects of the organization during the DCA ses-sions. Other considerations regarding effort, more specifically related to tool support follow in the next subsection.
5.2 Considerations on Tool Support
Some tool support can be used in order to facilitate the application of DPPI. For in-stance, plotting the U-charts and the Pareto diagram manually would require much effort. Several statistical tools can be used for this purpose, during the experience described in this paper, the U-charts and the Pareto diagram were plotted using the MiniTab software.
Another aspect for which tool support is required is building the Bayesian network from the learning cases and performing the Bayesian inference. Again several tools can be used for this purpose; during the experience described in this paper the Bayes-ian network was built using Netica software, which was also used for the Bayesian inference.
Besides these tools, the application described in this paper used ISPIS [22], which facilitated conducting a well defined and stable inspection process and registering
104 M. Kalinowski et al.
defect data. However, inspections are out of the DPPI scope and could have been performed manually as well.
5.3 Other Usage Possibilities
Practitioners might want to use DPPI to support CMMI implementation. Table 1 con-tains a mapping of the specific practices of the CMMI CAR process area to the DPPI activities.
Table 1. Mapping of CMMI CAR process area specific practices to DPPI activities
CMMI CAR Specific Goal/Practice Related DPPI Activities SG 1 Determine Causes of Defects DCA Preparation and DCA Meeting SP 1.1 Select Defect Data for Analysis DCA Preparation SP 1.2 Analyze Causes DCA Meeting SG 2 Address Causes of Defects Development Activity Result Analysis and
Development Activity Improvement SP 2.1 Implement the Action Proposals Development Activity Improvement SP 2.2 Evaluate the Effect of Changes Development Activity Result Analysis SP 2.3 Record Data Throughout DPPI, by using its templates
Another usage possibility is for defect prediction. Since the causal model with de-fect related knowledge obtained by applying DPPI is stored as a Bayesian Network it can be used for two reasons, diagnosis and prediction [16]. In this paper we only ex-plored the diagnosis perspective. However, the Bayesian network can be traversed in the opposite direction, in order to support the definition of risk mitigation strategies by performing “what-if” scenario simulation on the causes. For instance, “What hap-pens to the defect profile if the wrong stakeholder was interviewed?”.
6 Conclusions
The DPPI approach was assembled based on DCA guidance obtained from SRs and on feedback gathered from experts in the field. DPPI provides a framework for con-ducting, measuring and controlling DCA in order to use it efficiently for process im-provement. It represents the only approach that integrates cause-effect learning mechanisms into DCA meetings. Those learning mechanisms consider a concrete characteristic of the product, the defects introduced in its artifacts, to enable the con-struction of a causal model for the organization, represented through a Bayesian net-work. In order to allow using such Bayesian network to support DCA meetings a graphical representation, called probabilistic cause-effect diagram, was designed.
In this paper we extended the knowledge regarding the feasibility of using DPPI by the software industry, by: (i) describing the experience of applying DPPI to a large scale Web-based software project detailing how its activities and tasks could be per-formed in that context, and (ii) providing industrial considerations for DPPI with additional insights from a practitioner’s point of view into its underlying usage as-sumptions, the need for tools, and other usage possibilities.
Applying DPPI: A Defect Causal Analysis Approach Using Bayesian Networks 105
In general, the experience of applying DPPI end-to-end to a real software project provides preliminary feasibility indication of using it as a means for product-focused process improvement. In particular, its main innovation, the causal model represented through a Bayesian network which represents knowledge regarding a concrete charac-teristic of the product (its defects), could be built successfully. Moreover, in the context of the project in which the network was applied, the Bayesian diagnostic inference, represented in the probabilistic cause-effect diagram, predicted the main causes efficiently. However, the benefits of using the network to support DCA meet-ings have not been evaluated objectively so far.
Regarding the industrial considerations, the application of DPPI allowed providing additional insights into its underlying usage assumptions and the needs for tool support. Additionally, the possibility of using DPPI as a step by step for analyzing software defect causes in compliance with the CMMI CAR process area was dis-cussed. Moreover, the possibility of using the resulting Bayesian network for defect prediction in order to support the definition of risk mitigation strategies by performing “what-if” scenario simulation was mentioned.
In our point of view, building and using Bayesian networks in the context of DCA showed promising preliminary results and interesting possibilities. Hence, we invite academy and industry for further investigation on this topic.
Acknowledgments. We would like to thank the SIGIC project team, without their support the experience described in this paper would not have been possible. Thanks also to the experts which provided us feedback on DPPI.
References
1. SEI: CMMI for Development (CMMI-DEV), Version 1.2. CMU/SEI-2006-TR008. Soft-ware Engineering Institute, Carnegie Mellon University, Pittsburgh, PA (2006)
2. ISO/IEC: ISO/IEC 12207:2008 Systems and software engineering – Software life cycle processes (2008)
3. Eckes, G.: The Six Sigma Revolution: How General Electric and Others Turned Process Into Profits. John Wiley and Sons, Chichester (2000)
4. Card, D.: Defect Causal Analysis Drives Down Error Rates. IEEE Software 10(4), 98–99 (July 1993)
5. Mays, R.G., Jones, C.L., Holloway, G.J., Studinski, D.P.: Experiences with Defect Preven-tion. IBM Systems Journal 29(1), 4–32 (1990)
6. Dangerfield, O., Ambardekar, P., Paluzzi, P., Card, D., Giblin, D.: Defect Causal Analysis: A Report from the Field. In: Proceedings of International Conference of Software Quality, American Society for Quality Control (1992)
7. Grady, R.B.: Software Failure Analysis for High-Return Process Improvement Decisions. Hewlett-Packard Journal 47(4), 15–24 (1996)
8. Jalote, P., Agrawal, N.: Using Defect Analysis Feedback for Improving Quality and Pro-ductivity in Iterative Software Development. In: 3rd ICICT, Cairo, pp. 701–713 (2005)
9. Card, D.: Defect Analysis: Basic Techniques for Management and Learning. Advances in Computers ch. 7, 65, 259–295 (2005)
10. Kalinowski, M., Travassos, G.H.: A Systematic Review Regarding Software Defect Causal Analysis. Technical report (in portuguese), 158 p, COPPE/UFRJ (2008)
106 M. Kalinowski et al.
11. Kalinowski, M., Travassos, G.H., Card, D.N.: Guidance for Efficiently Implementing De-fect Causal Analysis. In: VII Br. Sym. Soft. Qual (SBQS), Florianópolis, Brazil (2008)
12. Kalinowski, M., Travassos, G.H., Card, D.N.: Towards a Defect Prevention Based Process Improvement Approach. In: 34th Euromicro SEAA, Parma, Italy, pp. 199–206 (2008)
13. IEEE: IEEE Standard Glossary of Software Engineering Terminology. Standard 610. IEEE Press, Los Alamitos (1990)
14. Jones, C.L.: A process-integrated approach to defect prevention. IBM Systems Jour-nal 24(2), 150–167 (1985)
15. Brereton, P., Kitchenham, B.A., Budgen, D., Turner, M., Khalil, M.: Lessons from apply-ing the systematic literature review process within the software engineering domain. Jour-nal of Systems and Software 80(4), 571–583 (2007)
16. Pearl, J.: Causality Reasoning, Models and Inference. Cambridge University Press, Cam-bridge (2000)
17. Jantti, M., Toroi, T., Eerola, A.: Difficulties in establishing a defect management process: A case study. In: Münch, J., Vierimaa, M. (eds.) PROFES 2006. LNCS, vol. 4034, pp. 142–150. Springer, Heidelberg (2006)
18. Damm, L., Lundberg, L.: Company-wide Implementation of Metrics for Early Software Fault Detection. In: International Conference on Soft. Eng. (ICSE 2007), Minneapolis (2007)
19. Hong, G., Xie, M., Shanmugan, P.: A Statistical Method for Controlling Software Defect Detection Process. Computers and Industrial Engineering 37(1-2), 137–140 (1999)
20. Florac, A.W., Carleton, A.D.: Measuring the Software Process: Statistical Process Control for Software Process Improvement. Pearson Education, London (1999)
21. Leszak, M., Perry, D.E., Stoll, D.: Classification and evaluation of defects in a project ret-rospective. Journal of Systems and Software 61(3), 173–187 (2002)
22. Kalinowski, M., Travassos, G.H.: A Computational Framework for Supporting Software Inspections. In: Int. Conf. on Automated Soft. Eng. (ASE 2004), Linz, Austria, pp. 46–55 (2004)
23. Shull, F.: Developing Techniques for Using Software Documents: A Series of Empirical Studies. Ph.D. thesis, University of Maryland, College Park (1998)
24. Ishikawa, K.: Guide to Quality Control. Asian Productivity Organization, Tokyo (1976)