Applying cross-channel user experience design theory to ...
157
Applying cross-channel user experience design theory to practice A case study of a public transportation company in Sweden Master’s thesis within Informatics, 30 credits Author: Ida Lång, Anne Schlegel Tutor: Andrea Resmini, Bertil Lindenfalk Jönköping May 2015
-
Upload
khangminh22 -
Category
Documents
-
view
0 -
download
0
Transcript of Applying cross-channel user experience design theory to ...

Applying cross-channel user experience design theory to
practice A case study of a public transportation company in Sweden
Master’s thesis within Informatics, 30 credits
Author: Ida Lång, Anne Schlegel
Tutor: Andrea Resmini, Bertil Lindenfalk
Jönköping May 2015
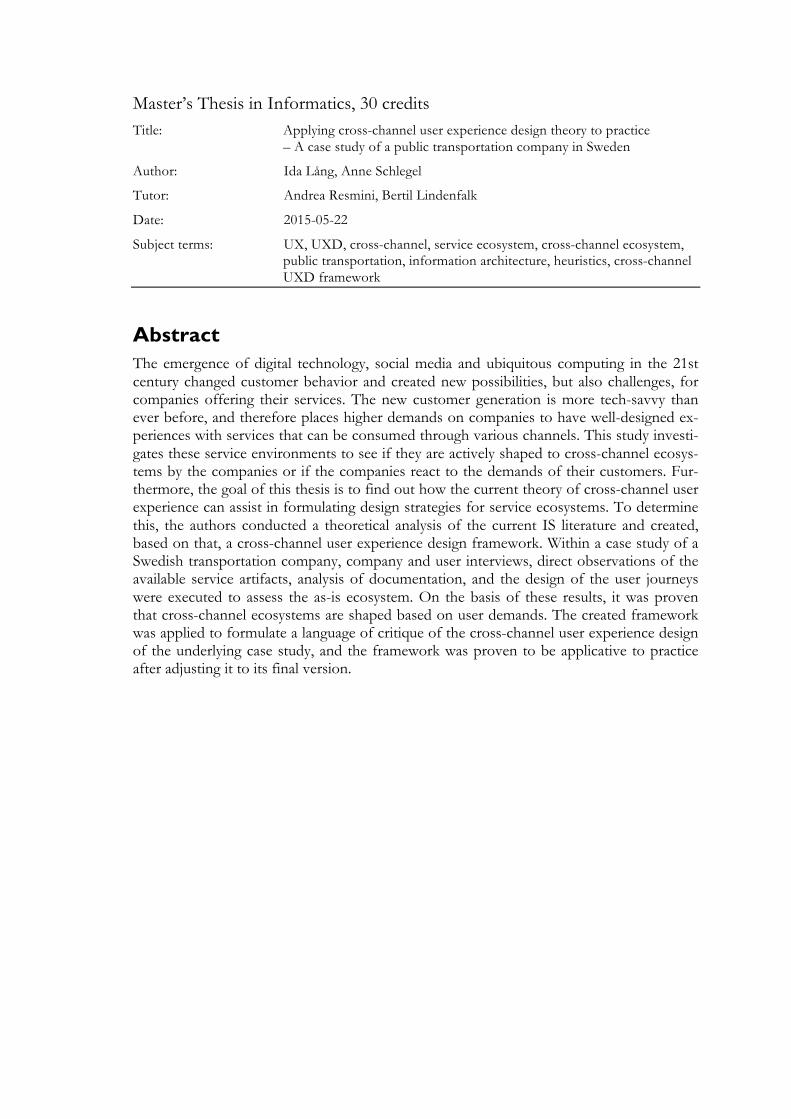
Master’s Thesis in Informatics, 30 credits Title: Applying cross-channel user experience design theory to practice
– A case study of a public transportation company in Sweden
Author: Ida Lång, Anne Schlegel
Tutor: Andrea Resmini, Bertil Lindenfalk
Date: 2015-05-22
Subject terms: UX, UXD, cross-channel, service ecosystem, cross-channel ecosystem, public transportation, information architecture, heuristics, cross-channel UXD framework
Abstract The emergence of digital technology, social media and ubiquitous computing in the 21st century changed customer behavior and created new possibilities, but also challenges, for companies offering their services. The new customer generation is more tech-savvy than ever before, and therefore places higher demands on companies to have well-designed ex-periences with services that can be consumed through various channels. This study investi-gates these service environments to see if they are actively shaped to cross-channel ecosys-tems by the companies or if the companies react to the demands of their customers. Fur-thermore, the goal of this thesis is to find out how the current theory of cross-channel user experience can assist in formulating design strategies for service ecosystems. To determine this, the authors conducted a theoretical analysis of the current IS literature and created, based on that, a cross-channel user experience design framework. Within a case study of a Swedish transportation company, company and user interviews, direct observations of the available service artifacts, analysis of documentation, and the design of the user journeys were executed to assess the as-is ecosystem. On the basis of these results, it was proven that cross-channel ecosystems are shaped based on user demands. The created framework was applied to formulate a language of critique of the cross-channel user experience design of the underlying case study, and the framework was proven to be applicative to practice after adjusting it to its final version.

Acknowledgments We would like to thank our tutors, Andrea Resmini and Bertil Lindenfalk, for guiding us and
providing invaluable input throughout the process of writing this master thesis. It would have looked very different without you. We also thank Karlstadsbuss, particularly Robert Sahlberg and Mathias
Lindgren, for their hospitality and investing the time to share their knowledge with us. Lastly, we thank all our fellow students, who have given us feedback and taken the time to read our work dur-
ing the writing process.

1
Table of Contents 1 Introduction ............................................................................ 4
1.1 Problem ............................................................................................ 4 1.2 Purpose ............................................................................................ 4 1.3 Research questions .......................................................................... 5 1.4 Delimitations ..................................................................................... 5
2 Theoretical framework ........................................................... 6 2.1 Cross-channels in business ecosystems ......................................... 6
2.1.1 Channels, touchpoints, tools and devices ........................... 6 2.1.2 Multiple channel environments ............................................ 7 2.1.3 Channel ecosystems ......................................................... 10 2.1.4 Cross-channel ecosystem research .................................. 11
2.2 User experience and user experience design in business ecosystems ............................................................................................. 13
2.2.1 The user ............................................................................. 14 2.2.2 User experience ................................................................. 14 2.2.3 User experience design ..................................................... 15
2.3 User experience in cross-channel ecosystems .............................. 16 2.3.1 Impact of user experience in cross-channel designs ......... 16 2.3.2 User experience design applied on business cross-channel ecosystems ..................................................................... 19
2.4 The public transportation industry .................................................. 22 2.4.1 The industry in general ...................................................... 22 2.4.2 The industry in the relevant context ................................... 23
2.5 Framework creation ........................................................................ 25
3 Methodology ......................................................................... 28 3.1 Research design ............................................................................ 28 3.2 Case study ..................................................................................... 29
3.2.1 Industry selection ............................................................... 31 3.2.2 Company selection ............................................................ 31
3.3 Data collection ................................................................................ 32 3.3.1 Primary data ...................................................................... 32 3.3.2 Secondary data .................................................................. 35
3.4 Analysis .......................................................................................... 37 3.5 Generalizability and validity ............................................................ 39
4 Findings and analysis .......................................................... 40 4.1 Company findings ........................................................................... 40
4.1.1 Company presentation ....................................................... 40 4.1.2 IT systems ......................................................................... 43 4.1.3 Company service artifacts ................................................. 43
4.2 User findings .................................................................................. 65 4.2.1 User activities .................................................................... 65 4.2.2 User activity sequences ..................................................... 70 4.2.3 User artifacts ...................................................................... 71
4.3 Combining findings ......................................................................... 72 4.3.1 Defining channels, touchpoints and devices ...................... 72
2
4.3.2 Defining user journeys ....................................................... 75 4.4 Analysis .......................................................................................... 78
4.4.1 Composition ....................................................................... 79 4.4.2 Continuity ........................................................................... 81 4.4.3 Place-making ..................................................................... 84 4.4.4 Consistency ....................................................................... 90 4.4.5 Resilience .......................................................................... 95 4.4.6 Reduction ........................................................................... 98 4.4.7 Correlation ....................................................................... 102 4.4.8 The before and after phase ............................................. 104
5 Discussion .......................................................................... 108 5.1 Result discussion ......................................................................... 108
5.1.1 Finalized framework ......................................................... 108 5.1.2 Design Strategy Discussion ............................................. 108
5.2 Method discussion ........................................................................ 111 5.3 Implications for research .............................................................. 113 5.4 Implications for practice ................................................................ 114 5.5 Future research ............................................................................ 114
6 Conclusion .......................................................................... 115 List of references .................................................................... 116
3
Figures Figure 2.1 - Initial cross-channel user experience framework ....................... 27 Figure 3.1 - Emergence of digital technology and social media .................... 35 Figure 4.1 - Brand mark of the Karlstad municipality .................................... 41 Figure 4.2 - Bus card scanner before scanning ............................................ 44 Figure 4.3 - Bus card scanner after successful scanning .............................. 45 Figure 4.4 - Bus stops signs mounted at a bus stop in Karlstad ................... 47 Figure 4.5 - Bus line map of the Karlstadsbuss basic bus lines .................... 48 Figure 4.6 - Bus line map of the Karlstadsbuss center bus lines .................. 49 Figure 4.7 - Bus line map of the Karlstadsbuss hockey bus lines ................. 49 Figure 4.8 - Bus line map of the Karlstadsbuss special bus lines ................. 50 Figure 4.9- Big Live! display at a bus stop in the city center of Karlstad ....... 51 Figure 4.10- small Live! display at a bus stop in the suburbs of Karlstad ..... 52 Figure 4.11- Big ticket machine - touch screen display ................................. 54 Figure 4.12- Big ticket machine - cash slit and card reader .......................... 55 Figure 4.13 - Big ticket machine - change and ticket compartment .............. 55 Figure 4.14 - Small ticket machine ................................................................ 56 Figure 4.15 - Karlstadsbuss app in the App Store ......................................... 58 Figure 4.16 - Karlstadsbuss app - menu ....................................................... 59 Figure 4.17 - Karlstadsbuss bus card ............................................................ 61 Figure 4.18 - Turkronor - showing icons of “Sola i Karlstad” and a bus of
Karlstadsbuss ................................................................................... 62 Figure 4.19 - Turkronor - showing icons of brand mark and “Östra Bron” ..... 62 Figure 4.20 - Turkronor - available in different colors for the different values63 Figure 4.21 - Active mobile ticket .................................................................. 64 Figure 4.22 - Cross-channel matrix visualization of the Karlstadsbuss
ecosystem ........................................................................................ 75 Figure 4.23 - Standard user journey 1 ........................................................... 76 Figure 4.24 - Standard user journey 2 ........................................................... 77 Figure 4.25 - Standard user journey 13 ......................................................... 77 Figure 4.26 - Cross-channel user experience framework ............................. 79 Figure 5.1- Final cross-channel user experience framework ...................... 108
Tables Chart 4.1 - Composition analysis .................................................................. 80 Chart 4.2 - Continuity analysis ...................................................................... 82 Chart 4.3 - Correlation analysis ................................................................... 104
Appendix Appendix 1 – Transcript company interview Karlstadsbuss ........................ 122 Appendix 2 – Documentation of user interviews ......................................... 150

4
1 Introduction Within this chapter, the problem, purpose, research questions and delimination of this study are presented.
1.1 Problem Since the beginning of the 21st century, people can search, purchase and consume services via multiple channels, tools and devices in physical and digital environments. In this world of ubiquitous computing, the term cross-channel has recently surfaced. A cross-channel “distributes parts of a single good or service among different devices, media or environments, and requires the user to move across two or more complementary, non-alternative domains” (Resmini & Rosati, 2009).
But since these opportunities are novel technology, businesses can find it difficult to see the advantages of investing time and resources in developing good experiences for their customers in cross-channel environments. This is not only based on the design difficulty, but also on the trouble they have seeing the added value, which proper cross-channel im-plementations can provide. Simultaneously, the majority of customers are up-to-date with technology and expect systems which are user friendly, easy to navigate, and allow for per-sonalization. A gap is formed between expectations and offers on the market, due to the fact that companies miss seeing the benefit of designing their services holistically in a cross-channel environment that meets the expectations of the users.
It has been observed that companies in the Swedish transportation industry are engaging in the cross-channel implementations in ways that appears to be without sufficient analysis and preparation. This has damaged customer satisfaction and overall experience, which has led to lost customer loyalty and profits (Apanasevic, Markendahl & Arvidsson, 2013; Trafi-kanalys, 2013; Dziekan, 2008).
1.2 Purpose The purpose of this master thesis is to verify whether companies are actively structuring their services as cross-channel ecosystems, or if they are reacting to user demands. It also desires to investigate how current theory of cross-channel user experience (UX) can assist in formulating a design strategy for a service ecosystem.
To achieve this task, a case study is conducted, in which the as-is situation is assessed through the lens of the existing literature. Based on the theoretical framework and existing information system (IS) literature, a framework is created, which is used to guide the analy-sis of the ecosystem of the given case study. While the framework is implemented in this specific case study, the hope of the authors is that the developed model can be useful for other companies with similar contextual settings. The goal of this work is to create a lan-guage of critique of the user experience design (UXD) within the cross-channel ecosystem of the case study firm, and to gain a better understanding of how cross-channel ecosystems function in practice.

5
1.3 Research questions 1. Are companies in the transportation industry actively structuring their cross-
channel service ecosystem, or are they reacting to user demands? 2. How does current theory of cross-channel user experience assist in formulating a
design strategy for a service ecosystem?
1.4 Delimitations The goal of this work is to create a language of critique of the UXD of the cross-channel ecosystem for the company strategy. This study does not provide recommendations on how to design or develop the proposed changes in detail. The acceptance of the recom-mendation and practical implementations are the decision and the responsibility of Karls-tadsbuss itself.
Though the subject of cross-channel environments has evolved through technical achieve-ments in the area of connectivity, devices and software, this is considered as given and is not investigated further with recommendations concerning the technical design, such as in-terface design, app design or web design.
Within this thesis, the focus is placed upon cross-channels and UXD. This means that the study briefly mentions, but does not cover, topics such as multi-channels, omni-channels, transmedia, crossmedia and similar.
In terms of geographical restrictions, this study is limited to Sweden, due to the fact that the cultural barriers are the lowest for the authors and thus extensive research into such variables can be excluded.
This study is limited to the transportation industry. The transportation industry was select-ed for this research, since the offering of services via different channels is the nature of the industry.
As products contain and are framed by service elements, this study does not distinguish be-tween the terms product and service and uses service as a synonym for both.
The literature review of this study is limited to the time range of 2007 until 2015, as the au-thors found that articles older than 2007, in general, reference different or outdated tech-nologies and theories.

6
2 Theoretical framework Cross-channel ecosystems, UXD, and the usage of UXD to improve the UX in cross-channel environments are emerging topics within the academic literature of the last years. In the following section, the authors of this study create a theoretical framework of the existing IS literature in the research fields cross-channel eco-systems, UX and UXD. The following chapter is divided into five parts. First, the field of cross-channels in business ecosystems is approached. This section covers the topics channels, touchpoints, tools and devices, multiple channel environments and channel ecosystems in the cross-channel ecosystem literature. Secondly, the terms user, UX and UXD are introduced. In the third chapter, the two previous defined subjects are com-bined. Within this section, the IS research literature is collected from the theoretical and then from the prac-tical point of view. The fourth chapter deals with the public transportation industry, both in general and in detail for the underlying case study setting. Finally, the last chapter of the theoretical framework concerns the framework creation based on the previous chapters.
2.1 Cross-channels in business ecosystems Within this chapter, the research field of cross-channels is approached through four sec-tions. First, existing literature, which deals with channels, touchpoints, tools and devices is presented. Following, multiple channel environments are introduced with the terms ubiqui-tous computing, multi-channel, cross-channel, and omni-channel. Furthermore, the existing literature revolving around the term channel ecosystem is discussed. Lastly, existing themes from the literature are examined, namely dealing with how companies manage their service offerings in the connection with channels and channel ecosystems
2.1.1 Channels, touchpoints, tools and devices
Before the authors can analyze the cross-channel literature in detail, related terms have to be introduced and further defined for this study. The terms relevant to understanding cross-channel ecosystems are channels, touchpoints, tools and devices.
The term ‘channel’ is used in many different contexts, dependent upon in which area the term is used. The following section presents channel definitions from the areas of business, technology and information architecture, since these fields are relevant to this study.
The definition of ‘channel’ in business and technology revolves around the context in which the channel is used. Within the technology context, communication channels are used for transmitting information from senders to receivers (Herriott, 2010). In the retail-ing context channels are described as intermediaries, who bring the service to the consumer (MBA & Company, 2014).
In the area of media studies, Jenkins (2008) defined a channel as not only the specific me-dium but also all the environmental conditions surrounding the medium. Resmini and Lac-erda (2015) took this definition further into ecosystems of services and described channel as “a pervasive layer for the transmission of information”.
The study’s definition is that channels are purposefully designed mediums, which transfer information concerning a specific context in a specific setting or manner.
When talking about channels, touchpoints have to be considered as well, since “individual el-ements of a channel configure touchpoints” (Resmini & Lacerda, 2015). The authors further under-stand that touchpoints are created through the interplay of tools and, if needed, devices.
7
A tool is an artifact with the goal of supporting the user. In that sense, an offered artifact has potential to be useful and a tool. However, without the user willing and able to use the artifact, the artifact is not considered as a tool and is meaningless to the user, e.g. a bike for someone who cannot ride bikes. The tool becomes a touchpoint as soon as the user utilizes the tool or makes sense of it to achieve a personal goal.
A device is an intermediator, which physically enables the user to use a tool, e.g. for using an app, the device ‘smartphone’ is needed. A tool can be usable without a device, but a de-vice cannot be a tool, e.g. a smartphone without an operating system is meaningless.
The authors understand touchpoints therefore as the intersection of the service and the customer interaction. These interactions take play in digital, physical or biological spaces where the business and the customer meet during the offering of their service (Kalbach & Kahn, 2011; Maiden, 2010). Furthermore, the notion of Risdon (2013) is considered, who argued that a touchpoint is more than just the interaction between user and elements of business. He defined touchpoints as “a point of interaction involving a specific human need in a spe-cific time and place” (Risdon, 2013).
This study will therefore consider touchpoints as part of channels and channels in turn as enablers of touchpoints. Channels logically group touchpoints and yet in themselves are part of a bigger system of channels, which creates an ecosystem. Within an ecosystem sev-eral different channels can exist next to one another (Resmini & Lacerda, 2015).
2.1.2 Multiple channel environments
The observed case study ecosystem of this thesis is defined through an environment of multiple channels and touchpoints, in different forms, to consume the offered services. To approach this environment, the different terms, which are formed by multiple channels and devices, are explained.
Cao (2014) argued that multiple channel environments are not a new phenomenon, but have been used in retailing for over 100 years. The increased business importance of eco-systems with multiple channels and touchpoints of today lies in the new opportunities brought by the internet and ubiquitous computing.
In this section, the terms crossmedia and transmedia are intentionally neither mentioned nor discussed, since these terms originated in and deal almost exclusively with the media and entertainment industry (Resmini & Lacerda, 2015). In addition, the authors are not fur-ther observing literature dealing with bridging experiences because the term does not add further value to the theoretical framework.
Ubiquitous computing
The term ubiquitous computing was first coined in 1991 by Mark Weiser who stated that "the most profound technologies are those that disappear. They weave themselves into the fabric of everyday life until they are indistinguishable from it. […] Most of the computers that participate in an embodied vir-tuality will be invisible in fact as well as in metaphor.” This definition has proven to remain rele-vant and is still widely cited by human-computer interaction researchers (Kinsley, 2010).
Ubiquitous computing refers to embedding computing power into the environment through objects, appliances, displays, and systems, in mostly invisible ways (Resmini & Rosati, 2011). Ubiquitous computing’s highest ideal is “to make a computer so imbedded, so fit-ting, so natural, that we use it without even thinking about it” (Weiser, 1991). The term ubiquitous computing and its pervasiveness in society, is interrelated with - and is the basis for - the

8
definition of multi-channel, cross-channel, and omni-channel. Following, the authors pre-sent existing definitions of these terms from the existing literature.
Multi-channel
The term multi-channel refers to an ecosystem, where more than one channel is used to deliver a service to the consumer. The channels can offer simultaneous and alternative in-formation, as well as providing similar content through different means (Resmini & Rosati, 2011).
Wäljas, Segerståhl, Väänänen-Vainio-Mattila and Oinas-Kukkonen (2010) defined multi-channel as the answer to the consumers’ demand of ‘anytime and anywhere’ access to in-formation and functionality. Though, they stated that the single channels in the multi-channel ecosystem are often redundant or complementary devices from the core service channel.
Furthermore, Resmini and Lacerda (2015) argued that the actual use of a service can only be completed in the selected channel in this sort of environment. The company gives the customer the choice of selecting one among a variable number of different physical, digital and biological channels to use. As soon as the choice is made, a change to another channel is not possible anymore.
Employing a multi-channel ecosystem challenges an organization to choose an information sharing strategy for the existing channels. Chatterjee (2010) described two strategic options companies can use:
• The silo approach, in which the different channels are deployed independently from each other, or
• The integration approach, where the two, more, or all existing channels are inte-grated with each other.
The choice of the strategy effects the services a company is able to provide to its custom-ers.
Cao (2014) stated that the silo approach can be strategically used for customer targeting, but creates a ‘silo effect’ with lack of communication or coordination between channels. This effect can lead to poor customer satisfaction, loss of sales, and duplication of efforts, just to name a few examples
Resmini and Lacerda (2015) are in agreement with Cao’s notion. They saw “simple duplication and adaptation of one or multiple activities within parallel but non-communicating processes” take place in multi-channel ecosystems. They criticized the multi-channel strategy for its inability to describe how or if a system should synchronize channels. In addition, they argued that the design and management of multi-channel ecosystems “is still largely production- or organization-driven”, which is of relevance when distinguishing between multi-channels and cross-channels.
The integrated multi-channel strategy proposed by Cao (2014) is also defined by research-ers as cross-channel or omni-channel, rather than being multi-channel. Following, these terms are further introduced.
9
Cross-channel
When using the definition of multi-channel as the basis for defining cross-channel, the first obvious main difference between both terms is that the consumption of services is not lim-ited to one selected channel. Resmini and Rosati (2011, pp. 10) explained the concept of cross-channel as “a single service is spread across multiple channels in such a way that it can be experi-enced as a whole (if ever) only by polling a number of different environments and media.”
Furthermore, Resmini and Rosati (2009, pp. 197) stated that a cross-channel ecosystem “distributes parts of a single good or service among different devices, media or environments, and requires the user to move across two or more complementary, non-alternative domains”.
In his book “Intersection” (2012, p. 370), Guenther explained that the term cross-channel applies to a variety of design work by stating that “it refers to the practice of considering individual items as part of a larger experience, and designing them as a system that reaches across traditionally sepa-rate delivery channels. Every individual part is seen in terms of its role in an overall composite design. This includes physical, virtual, and blended channels. Nevertheless, the characterization depends on the way a de-vice or medium is used.”.
Wäljas et al. (2010) spoke of ‘crossmedial’ services, but are mostly in consensus with the cross-channel definition by Guenther. They referred to the main motivation of deploying cross-channel as the optimization of “communication channels [...] for the different contextual set-tings that occur throughout the activities they support”. They specifically referred to the deployment of complementary, but sometimes also exclusive channels, to offer more than redundant information. The different channels in a cross-channel environment “only become fully func-tional when their components are used in combinations” to enable the larger experience (Wäljas et al., 2010).
Moreover, Resmini and Lacerda (2015) especially emphasized the ownership in cross-channel ecosystems. They claimed that the actors in the ecosystem determine the ecosys-tem, which contrasts with the definition of multi-channel, where the ownership of the eco-system lies with the company who manages and designs the environment. This indicates a clear shift in ownership and with that, a power shift from the company to the user in the cross-channel environment. Novak and Schwabe (2009) also took that stand and claim that ubiquitous computing has fundamentally “transformed the role of end-users from passive consumers to active co-creators of content, products and services in commercial value networks”. This implies that companies do not design the cross-channel ecosystems, but find themselves within them, due to the design of the actors of the ecosystem. Therefore, it can be concluded that com-panies have to react to the users’ demands concerning the ecosystem to stay competitive.
Omni-channel
In the existing literature, the term ‘omni-channel’ is defined by “the capability to meet and ser-vice customers at every possible touchpoint” (Klosek, 2012). Omni-channel strategies are a current trend in the marketing field, in which businesses try “tying together traditional, online and mobile initiatives” (O’Heir, 2013). The goal of omni-channel efforts is “the accurate attribution of all marketing efforts—both digital and non-digital—to their impact on consumer buying across all channels” (Fulgoni, 2014).
Analyzing these definitions objectively, the omni-channel and cross-channel definitions in-clude the same elements. The elements targeted in an omni-channel strategy are multiple channels (digital and non-digital), which tie together initiatives (here it can be assumed that the UX is designed to be accessed equally and consistently through all existing channels).
10
However, the definition of omni-channel differs from cross-channel in regards to the re-sponsible party, which manages the strategy. Omni-channel strategies are executed by mar-keting departments, and cross-channel strategies by information architects from a holistic strategy perspective. That being said, omni-channel strategies can overlap with the business strategy level.
To put it simply, cross-channels and omni-channels cover relatively the same topic, but from different business viewpoints. Based on that, omni-channel and cross-channel are both covered in this work under the term cross-channel.
2.1.3 Channel ecosystems
This study has acknowledged that channels can be physical, digital and biological, and that they build ecosystems around services. Therefore, this section discusses how channels are shaped in digital and in channel ecosystems, which include all three aspects of channel forms. The choice to neglect biological and physical ecosystems was taken because of the difficulties in distinguishing between them, from a channel ecosystem perspective (i.e. peo-ple and physical items within channel ecosystems) and a factual biological ecosystem (i.e. ecologies). Also, very few articles describe either of these two as stand-alone topics, but far more often in combination with digital ecosystems and channel ecosystems overall.
In general, the construct of the ecosystem attempts to understand and explain the behav-iors and connections among the actors within a cooperation or competition setting (Adner & Kapoor, 2010). In detail, an ecosystem is a space in which several systems interlace and integrate with each other. Within the ecosystem, new or altered content is constantly pro-duced by participants through various interactions, i.e. they are self-organizing, which keeps the system organic and ‘alive’ (Resmini & Lacerda, 2015; Boley & chang, 2007; Briscoe, Sadedin & De Wilde, 2011; Fisher, Norris & Buie, 2012). In this ‘space’ a user finds various systems and their respective channels, where different media and services interact to deliver an experience. Furthermore, they enable the user to reach her goals, all while she still is contributing to the ecosystem and its dynamics (Resmini & Lacerda, 2015; Fisher, Norris & Buie, 2012; Boley & Chang, 2007). By focusing on how a UX functions within an ecosys-tem, the design moves from the individual artifact and the context to the system as a whole. Today, systems have to adapt to users, and not the traditional method which caters to the opposite (Corrigan & Miller, 2011). Also, users rarely stay inactive in these ecosys-tems, but switch back and forth among the available channels (Fisher, Norris & Buie, 2012; Resmini & Rosati, 2011). Due to the many components, these systems are often very com-plex.
This implies that no service can function in isolation anymore, but is a part of a larger eco-system and should be designed to function accordingly (Resmini & Rosati, 2009; Buxton, 2007; Karakas, 2009; Fisher, Norris & Buie, 2012; Bharadwaj, El Sawy, Pavlou & Venka-traman, 2013). Therefore, the design of a single artifact is becoming less important, and in-stead the system experience across channels and the ecosystem as a whole should be con-sidered (Garrett, 2010; Resmini & Lacerda, 2015; Maiden, 2010; Resmini & Rosati, 2011; Corrigan & Miller 2011; Guenther, 2012). Here, the key to success is to design a channel ecosystem that supports the user and enhances her channel system experience on an over-arching level (Fisher, Norris & Buie, 2012).
Contrary to expectations, the experience of a user is no longer affected by technical factors. The device itself is not hindered by connectivity barriers or location, which simplifies get-ting connected today, thanks to ubiquitous computing. The users and services have there-

11
fore become enriched and overall improved (Karakas, 2009; Fjord, 2011; Bharadwaj et al., 2013; Fisher, Norris & Buie, 2011). However, the new barrier lies within the digital divide between computer systems and their compatibilities, i.e. the services ability to partake in convergence (Briscoe, Sadedin & De Wilde, 2011; Karakas, 2009; Resmini & Rosati, 2009; Bharadwaj et al., 2013).
When speaking of digital barriers, digital ecosystems have to be outlined. Digital ecosys-tems can refer to many things and are used to describe a variety of concepts. This variety ranges from digital counterparts of biological ecosystems, nature inspired computing, net-work infrastructure, and e-businesses (Briscoe, Sadedin & De Wilde, 2011). When com-pared to social ecosystems, this typically centers on subjects such as family, hobbies or pro-fession. Digital ecosystems overlap across these topics in a way that removes geographical restrictions (Boley & Chang, 2007). A (digital) ecosystem is not centralized or provided by a single content creator, but is a result of multiple contributors (Boley & Chang, 2007; Kara-kas, 2009; Resmini & Lacerda, 2015; Bharadwaj et al., 2013; Corrigan & Miller, 2011).
The major contributing actors in digital ecosystems are the users. They function as the cen-terpiece or mediator of an integrated collection of various channels (Resmini & Lacerda, 2015; Corrigan & Miller, 2011). By understanding the relationships the various channels have with one another and what functions they offer, the user can orchestrate the transi-tions from one channel to the next in a convenient, orderly fashion (Fisher, Norris & Buie, 2012; Resmini & Rosati, 2011). Companies must in turn realize how the user selects and uses channels, and clearly visualize the path across them. After all, one poor channel can damage the entire experience for a user (Fisher, Norris & Buie, 2012). Fisher, Norris and Buie (2012) brought up the notion that not all users register that these are channels with which they are dealing with in ecosystems. Users think of them as ‘brand’ or ‘brand offer-ings’. In these cases, the ecosystem is not novel to the user, since they are so accustomed to being a part of the ecosystem, and they do not have to think or figure the system out be-fore they act.
2.1.4 Cross-channel ecosystem research
As described above, ecosystems deploy complex connections and behaviors between the user and the offered channels. The existing multi-channel and cross-channel literature tries to make sense of this. During the literature analysis, two main themes were identified in the research focus: the channel perspective and the user centric perspective. These themes can occur in-dependently from each other or be connected in the research. Following, the literature themes are presented and analyzed in detail.
Channel centric view in cross-channel ecosystems
The cross-channel literature, which adopts the channel centric view, focuses on the optimi-zation of the channels to position the business service within the channel ecosystem. The goal of channel optimization is to attain higher numbers of customers, increased customer loyalty, improved satisfaction and higher sales. This study adopts the clustering of Cao and Li (2015) and their two main approaches of the narrow channel perspective and broad channel per-spective.
Within the narrow channel perspective, the cross-channel ecosystem is viewed holistically with consistent offerings throughout all channels, managed from a single entity in the company (Cao, 2014; Cao & Li, 2015; Chatterjee 2010; Corrigan & Miller, 2011; Dinner et al., 2014; Fisher et al., 2012; Klie, 2012; Minkara, 2013; Minkara & Pinder, 2013; Resmini & Rosati,

12
2009; Resmini & Rosati, 2010; Resmini & Rosati, 2011; Resmini & Lacerda, 2015; Schramm-Klein et al., 2011; van Baal, 2014; Wa ̈ljas et al., 2010).
The broad channel perspective implies a management of channels through silo management, where information between the channels is synchronized or complementary and has to be coordinated between each other. The channel coordination is responsible for managing the integration between the channels, which can start from completely independent channels without any connection and end with a full cross-channel integration (Avery et al., 2012; Avery et al., 2008; Bock et al., 2012; Chatterjee 2010; Chiu. et al., 2010; Dinner et al., 2014; Falk et al., 2007; Fulgoni, 2014; Klosek, 2012; Kuniavsky, 2008; Kuniavsky, 2010; Le Voi et al., 2011; Maiden, 2010; Napolitano, 2013; Novak & Schwabe, 2009; O'Heir, 2013; Oha et al., 2012; Phaseware, 2011; Piercy, 2010; Segerståhl, 2008; van Baal, 2014; Vanguard, 2010; Verhagen & Van Dolen, 2009; Zhou et al., 2010).
Independently from the channel perspective exists a major research area of the cross-channel literature, which applies the channel view. This is the Channel behavior (Avery et al., 2012; Avery et al., 2008; Chatterjee, 2010; Chiu et al., 2010; Dinner et al., 2014; Falk et al., 2007; Piercy, 2010; Schramm-Klein et al., 2011; van Baal, 2014). Chiu et al. (2010) which researched the issue of cross-channel free-riding behavior across channels of different companies. Avery et al. (2008), Avery et al. (2012), Piercy (2010), and Schramm-Klein et al. (2011) investigated the short-term and long-term effects on channel synergies and cannibal-ization in cross-channel environments. Chatterjee (2010) compared the shopping behavior of shoppers in multi- and cross-channel retailers. Falk et al. (2007) explored the effects of perceived trust and risk of one channel on the use of another channel. Dinner at al. (2014) and Van Baal (2014) studied the effects of marketing in cross-channel environments.
User centric view in cross-channel ecosystems
In the existing literature, which applies the user centric view, the nature and focus of humans is widely spread across interactivity, importance, definitions and typology. Some authors refer to the social, or the human side of the cross-channels, as users (Resmini & Rosati, 2009; Voi, Charlier & Soltis, 2011; Resmini 2012; Fisher, Norris & Buie, 2012; Corrigan & Miller, 2011; Resmini & Rosati, 2010; Wäljas, Segerståhl, Väänänen-Vainio-Mattila & Oinas-Kukkonen, 2010; Segerståhl, 2008; Gegner, Runonen & Keinonen, 2011; Resmini & Lac-erda, 2015), others as customers, consumers and buyers (Vanguard Communications Cor-poration, 2010; Phaseware, 2009), or a mix of several. This mix usually refers to articles, where consumers, customers and buyers can be used interchangeably (a noteworthy excep-tion are Novak and Schwabe, (2009), where the content equally applies to users and con-sumers). The key difference in the usage of either term is the main focus of the articles. If the authors refer to the human aspect as users, the content generally has a more direct fo-cus on channels and their interaction with users to utilize the cross-functions. In several cases, the term indicates instead that the article is technical, and focused on user design, UXD or HCI. If customers, consumers, or buyers are used, the focus is commonly on as-pects such as customer buying behavior, enterprise architecture, strategy or how to manage more than one channel within a company, and the actual human-technology integration is put to the side.
Typologies aside, the interesting element is how users or customers are described in the context of cross-channels and what their functions are. Generally, four different perspec-tives on customer-orientation are being covered: humans as end-users, users as intermediates, hu-mans as design-focus, and actors as owners of the ecosystem. Authors are not limited or bound to one of these perspectives, but these are most common.

13
The theme Humans as end-users is commonly found among articles, which refer to people as customers, buyers, or consumers. Here, it is stated that businesses must adapt to the changes in consumer demand and start using several channels. They do not say, however, that customers should be included in the design process, or be part of the overall develop-ment process. Only that by focusing on the customer activity, rather than the medium (channels), can challenges be easier to overcome (Novak & Schwabe, 2009). Though, it is generally acknowledged that users today are better informed and more tech-savvy than ever before, and they are not unused to going through several channels to reach their final goal (Resmini & Rosati, 2010; Fisher et al., 2012). Wäljas et al. (2010) even added that customers are able to work rather well with inconsistency across channels. Most articles with the mindset of humans as end-users have been found outside the time range of 2007-2015, and therefore, the authors deem this way of approaching humans and channels as outdated.
The theme Users as intermediates sees the user as the connection between the different chan-nels, and deeply involved as a centered core: the narrator or navigator of the experience in the digital ecology (Resmini & Rosati, 2009; Resmini, 2012; Corrigan & Miller, 2011; Segerståhl, 2008). Since technology, location or devices are not constraints anymore, nor indicators for context, the user must become the key connector and main focus (Voi et al., 2011; Resmini 2012; Resmini & Rosati, 2010). By being active producers, or developers of content, the users are contributing to the enhancement of the cross-channel experience, and making the traditional consumer-producer relationship outdated (Resmini & Rosati, 2009; Voi et al., 2011; Novak & Schwabe, 2009; Briscoe, Sadedin & De Wilde, 2011; Kara-kas, 2009).
The theme Humans as design-focus suggests that processes, people, channels and technology should be designed to support the customer, and be developed with the customer as the core focus. Authors in the field state that each channel must be tailored to provide the modern customer with smooth, personalized solutions and experiences (Voi et al., 2011; Vanguard, 2010; Novak & Schwabe, 2009; Phaseware, 2009; Corrigan & Miller, 2011). Continuous effort should be put into understanding customer needs and finding out what their cross-channel experience is lacking (Vanguard, 2010).
The theme Actors as owners of the ecosystem is the most recent theme within the cross-channel literature and is a progression of the theme users as intermediates. Within their work, Resmini and Lacerda (2015) stated that within cross-channel ecosystems the role of ownership was transferred from corporate to the actor within the ecosystem. This notion perpetuates the theme of humans as a design-focus further, stating that the user himself is the designer of the ecosystem. This also implies an already mentioned (see chapter 2.1.2 Multiple channel envi-ronments) power shift to users.
2.2 User experience and user experience design in business eco-systems This section discusses definitions and theories regarding users and the emotional aspects of engaging with a service and the service ecosystem. It also covers UX and UXD and their impact on users, channels and companies. These topics are important for understanding why companies should involve users in their development processes, and defines what the user’s role, control and powers in the ecosystem are.
14
2.2.1 The user
In this document, the term user is defined as a result of the literature analysis and the over-all theoretical framework. The user is the actor within the existing ecosystem, who selects which services to use from the company, via the various channels that are available. At any point of time and at any touchpoint, the user has the unconstrained choice to use services, as well as to stop using them. This is why the user is the ultimate recipient of the service and is the decision body for whether or not a company’s service is successful. The behavior of users in cross-channel ecosystems reflects a personal agenda, and is not determined by any company. Hassenzahl (2008) and Corrigan and Miller (2011) stated that this personal agenda takes form in attaining new or better insights, pleasurable simulation, or social ex-change.
2.2.2 User experience
The literature reports that UX is becoming more and more important (Hassenzahl, 2008). Today, ubiquitous computing and the most recent technology are rarely the key drivers for a business’s success, but how well the service serves the user (Zhou, Xu & Jiao, 2010). UX is the experience created by services in the real world and its ecosystems (Garrett, 2010). According to Hassenzahl (2008), UX is not about problem solving solutions, but instead genuinely about creating positive feelings within the users as they interact with a service. This thesis uses the ISO definition of UX. UX hereby focuses on the user’s behaviors, atti-tudes, and emotions about the use of a product, system or service (ISO 9241-210:2009). In practical settings UX is commonly used as a synonym with usability, UXD or user-centered design (Hassenzahl, 2008; Law, Roto, Hassenzahl, Vermeeren & Kort, 2009; Kuniavsky, 2010; Karapanos, 2013; Corrigan & Miller, 2011; Zhou, Xu & Jiao, 2010; Garrett, 2010). While UX indeed has similar components, academic literature makes a point of distinguish-ing these concepts, as UX has a far wider range (Karapanos, 2013; Hassenzahl, 2008; Kuni-avsky, 2010). Most prominent is the notion that UX adds the aspect of emotions to the use of the technology or service. Since emotions are constantly changing, so is the UX, which makes the process dynamic. Due to its dynamic nature, UX is commonly claimed to be working in a present-state, although things such as user expectations impact the upcoming (pre-experience) or previous (post-experience) UX within a service or touchpoint (Law et al., 2009; Hassenzahl, 2008; Corrigan & Miller, 2011; Karapanos, 2013). Kuniavsky (2010, p 13) also suggested the notion that UX is not simply usability, by stating that ‘’bad usability can break a good product, good usability is insufficient to create a good experience’’.
Some authors argued that UX can be a social or group experience. However, most authors agreed that UX is what each individual in a group feels and experiences and is therefore not collective (Law et al., 2009). Instead, the group is a part of the context to the individual us-er. Fjord (2011) stated that context is defined through interrelated conditions that are used to improve the UX and usability. They argued that increased amounts of context lead to better UX, up to a certain point, when at that time it becomes intrusive.
In some definitions of UX, the literature claims that UX is not applicable to all services, only to those who have some sort of interface, whether it be a tool, entertainment system, or IS (Law et al, 2009; Karapanos, 2013). This would exclude face-to-face interaction (Law et al, 2009), but as Resmini and Lacerda (2015), and Unger and Chandler (2009) stated, a service or channel can be biological and still be part of a customer journey. While a human cannot be designed, the personal meeting can without a doubt impact the UX and is there-fore judged as a part of the total UX.

15
When observing the underlying ecosystem of this case study, it has been consciously decid-ed to exclude factors such as aesthetics, symbolism, stimuli, identification and similar as-pects. These subjects are highly related to either interface design, user acceptance of inno-vation or user evaluation of products (Karapanos, 2013). While these are important topics for researching UX, they only have an indirect impact, or require studies of user adaptation and adoption to a system, which is not the purpose of this research and are therefore omit-ted.
2.2.3 User experience design
By understanding the user and how a user comprehends a system, a company has a higher likelihood of designing a meaningful and good experience (Fisher, Norris & Buie, 2012). As UXD is a particularly ‘young’ field, there is no generally accepted definition established yet (Kuniavsky, 2010; Zhou, Xu & Jiao, 2010; Unger & Chandler, 2009). It was at the begin-ning of 1990, that the industry came together around this particular approach of design, heading towards a shift to include physical, sensual, cognitive, emotional, and aesthetic in-fluence on how a person uses and interacts with a system (Garrett, 2010; Zhou, Xu & Jiao, 2010; Kuniavsky, 2010; Dziekan, 2008). Many authors agree with the initial view of Don Norman, who coined the term, which stated UXD as “all aspects of the person’s experience with the system like industrial design, graphics, the interface, the physical interaction, and the manual”.
With the prevalence of ubiquitous computing, the focus has shifted from designing single digital artifacts to designing experiences across processes and concepts, such as experience design, service design or total experience design emerged (Garrett, 2010; Maiden, 2010; Resmini & Rosati, 2011; Corrigan & Miller 2011; Guenther, 2012). The rapidly evolving technology and changing social use of ubiquitous computing further increases the complex-ity of UXD (Kuniavsky, 2010; Bharadwaj et al., 2013). The more complex a service or eco-system is, the more complex the process of designing a good UX is (Garrett, 2010). As the-se types of services often consist of a mixture of channels (physical, digital, biological - Un-ger and Chandler (2009) even included scent and hearing as part of UXD), it becomes in-creasingly difficult to create a good UXD, since the actors and their expectations become less obvious (Kuniavsky, 2010; Garrett, 2010; Unger & Chandler, 2009; Corrigan & Miller, 2011; Zhou et al., 2011; Fisher, Norris & Buie, 2012). On the same note, Buxton (2007) said that the increased pervasiveness in digital ecosystems makes the requirements of eco-system adaptation essential and that no service exists today without a social and physical context that gives it meaning.
The concept of UX serves as a basis for UXD. Hassenzahl (2008) stated that the true meaning of UXD is to take hedonic, underlying needs and design technologies that match these needs. He argued that interactive services have two aspects that impact the UX: pragmatic quality and hedonic quality. The first refers to a service’s ability to support the actual functions (e.g. buy a bus ticket), while the latter concerns the personal agenda and sense of self (e.g. appearing and feeling competent as the user arrived on time). By under-standing the underlying hedonic motivations, it is easier to understand what the pragmatic functions should be. However, understanding the hedonic motivations is harder than the pragmatic (Hassenzahl, 2008; Karapanos, 2013). Some authors claimed that collecting user feedback without thinking about motivations (i.e. the hedonic qualities) is a very common mistake, since this removes vital information that can help a company understand its users (Corrigan & Miller, 2011; Fisher, Norris & Buie, 2012).
When moving further towards the company application, the literature speaks of brand ex-perience as an extension of UX. As a user interacts with services provided by a brand, the

16
combined knowledge the user has about the brand before the interaction creates the brand experience. During interactions with touchpoints, brand experience impacts the UX (Law et al, 2009; Maiden, 2010; Corrigan & Miller, 2011; Unger & Chandler, 2009; Fisher, Norris & Buie, 2012). In particular, Corrigan and Miller (2011) pointed out the importance well designed touchpoints have on the quality of UX within ubiquitous computing.
Garrett (2010) stated that businesses today are realizing the importance of a good UX, which encourages companies to focus on developing good UXD to gain competitive ad-vantage. In the end, it is the UX that determines if the user will return, or seek out compet-itors and their offers (Garrett, 2010; Fisher, Norris & Buie, 2012). Literature explains that in most cases, proper time spent on UXD is rewarded by higher efficiency, fewer mistakes, higher employee motivation and better user satisfaction (Garrett, 2010; Maiden, 2010; Cor-rigan & Miller, 2011; Unger & chandler, 2009; Fisher, Norris & Buie, 2012).
2.3 User experience in cross-channel ecosystems As already stated in the previous chapter, effort, which is spent on a good UX, rewards companies (Garrett, 2010; Maiden, 2010; Corrigan & Miller, 2011; Unger & Chandler, 2009; Fisher, Norris & Buie, 2012). To approach methods of purposefully designing the UX within cross-channel environments for companies, the authors first present the existing research literature, which deals with cross-channel UX and its design in general, before put-ting this topic in an applied business context.
2.3.1 Impact of user experience in cross-channel designs
Since information technology has invaded all aspects of human life, designers have started to explore the ways in which they can design experiences better for service and digital eco-systems.
In the IS context, digital ecosystems rely on the nature of the touchpoints that the user in-teracts with in the ecosystem (Corrigan & Miller, 2011; Zhou et al., 2011). Maiden (2010) referred to a need to orchestrate touchpoints in a company's brand strategy. He further pointed out the need of achieving harmony between touchpoints to convey the brand sto-ry. Furthermore, Unger and Chandler (2009) spoke of the importance of integrating the various channels and services into a single, rich experience.
Zhou et al. (2011) argued that the interaction between the user and the ecosystem has to be considered for a good UX. This interaction is not restricted to “the user and a single product, but rather the user, multiple products and services as well as the ambience where the interaction is perform-ing”. Under ambience, Zhou et al. (2011) understood the ecosystem in which the user is acting. This embodies relationships with her surroundings, which are other users and ser-vices, but also environmental, social, and cultural factors. Kourouthanassis et al. (2007) fol-lowed a similar notion. They consider that user interactions take place with heterogeneous devices in a physical environment. These interactions change and affect the behavioral, emotional, or sensorial UX and happen on a conscious or subconscious level.
The literature suggests that designers should be able to understand how an experience in an ecosystem develops, articulates and unfolds in order to recreate the right setting for UX. In light of digital experiences, this approach should consider the critical incidents that may oc-cur, emotional responses and the memories that the interactions bring to the user, and who experiences services in an ecosystem (Corrigan & Miller, 2011; Hohl, 2009; Maiden, 2010; Novak & Schwabe, 2009; Zhou et al., 2011).

17
When talking about designing cross-channel experiences, Resmini and Rosati (2011) argued that their comprehension of a good UX in cross-channel environments is rather holistic in nature. To create a good global experience, they are willing to sacrifice the detailed UX. Resmini and Rosati (2011) believed that the total experience is bigger than the sum of its experience parts. It can be understood that perfectly designed devices with bad intercon-nections within the ecosystem make it hard and sometimes impossible for users to move between the channels, which creates a bad UX in the cross-channel context. This notion is also supported by Fisher et al. (2012), who proposed a ‘meaning first’ approach, when de-signing UX in cross-channel ecosystems. They stated that by understanding what is mean-ingful to a user, designers can create a consistent UX across touchpoints and channels. They acknowledged that the design of each individual channel is also necessary, but that the UX suffers if a user cannot see the relationships between channels and touchpoints.
In conclusion, the consistent overarching design of the channels and touchpoints is neces-sary to create a positive UX. To further determine the detailed requirements, several au-thors tried to define design principles to guide the creation of good holistic cross-channel UX.
Wäljas et al. (2010) proposed common themes for system characteristics of cross-platform services to enable good UX: composition, continuity, and consistency.
Composition describes how the channels and touchpoints are designed in the ecosystem. The factor of composition mainly relates to the choice of deploying a multi-channel ecosys-tem with a silo-approach or a cross-channel ecosystem with an integration approach.
The theme of continuity refers to the interoperability of the channels. It determines if a us-er can start a process in one channel and continue it into another. Continuity is established through seamless synchronization of data and content, and by explicitly designing the eco-system to support users in migrating their tasks between channels and touchpoints.
Finally, consistency is a usability principle, where constancy between channels and touch-points can be created through perceptual (look and feeling), semantic (symbols and termi-nology), and syntactic (interaction logic) consistency.
Resmini and Rosati (2010), and Resmini and Rosati (2011) approached a better UXD of cross-channel ecosystems from the viewpoint of information architecture. Resmini and Rosati (2010 & 2011) saw information architecture as the glue that holds all the pieces (channels and touchpoints) within an ecosystem together. They defined their first version of the cross-channel heuristics in 2010: resilience, place, choice, and correlation. The pro-gression of these terms was presented by Resmini and Rosati in 2011: place-making, con-sistency, resilience, reduction, and correlation. Following, the heuristics from 2011 are pre-sented and compared to the heuristics from 2010.
The term place-making refers to the ability to help users reduce disorientation by creating a sense of place. Place-making is a development from the heuristic of 2010 Place. Place is de-fined through personal, social, and existential context, to support the user in coordination and movement within and across digital and physical channels, and cross-channel ecosys-tems.
Consistency contains internal and external uniformity. On one hand, it ensures that each of the channels and touchpoints are designed for their own single purposes, contexts, and the people (internal consistency). On the other hand, consistency in cross-channel ecosystems has the goal of maintaining the same logic within a cross-channel ecosystem across multiple

18
channels and touchpoints at all possible times of usage (external consistency). The term consistency was newly introduced in 2011 to complement the existing picture of design heuristics on the basis of Resimi and Rosati's’ (2011) experiences.
Resilience is the capability of a cross-channel ecosystem to “recognize, shape, and adapt itself to specific users, needs, and seeking strategies” (Resmini & Rosati, 2011, p. 55) in terms of processes and functionalities. This heuristic was not changed from 2010 to 2011.
Reduction is defined as the capability of cross-channel ecosystems “to manage large infor-mation sets and minimize the stress and frustration for [the user] associated with choosing from an ever-growing set of information sources, services, and goods” (Resmini & Rosati, 2011, p. 55). Reduction is further advanced from the former heuristic choice and seems to be used as a smoother name adoption.
Correlation describes the capability of a cross-channel ecosystem to visualize relevant con-nections to the user through suggestions. With correlation, connections among pieces of information, services, and goods are created to help users achieve explicit goals or stimulate latent needs. This heuristic was not changed from 2010 to 2011.
Furthermore, Resmini and Rosati (2011) divided their heuristics between grounding and re-fining elements. Place-making, consistency, and resilience are considered to be the ground-ing elements on which the cross-channel ecosystem is built. They create anchoring points for the design. Following, the heuristics “reduction and correlation bring both purposefulness and complexity to the process; they refine, restrict, and expand where and when necessary” (Resmini & Rosati, 2011, p. 55).
When comparing the common themes of Wäljas et al. (2010) and Resmini and Rosati (2011), one can recognize that Wäljas et al. (2010) still configured their common themes for multi- or cross-channel environments (see themes composition and continuity). Instead, Resmini and Rosati (2011) specifically targeted cross-channel ecosystems, since they take this environment as a given as-is situation in this era of ubiquitous computing. However, the term consistency is used by both authors. Both agreed that a cross-channel ecosystem has to support the user with a consistent structure and artifacts to enable their navigation through the environment. Furthermore, Resmini and Rosati (2011) defined an internal, channel specific, and an external, overarching environmental consistency.
Another model which supports the creation of good UX is developed by Morville (2011a) and is called the cross-channel crystal. The model follows already mentioned factors from the above introduced common themes and heuristics and then adds factors to it. The fac-tors covered by the model are: composition, consistency, connection, continuity, context, and conflict. This framework was introduced by Morville in 2011. However, he did not provide any further substantial descriptions or research to this model other than the initial given keywords in one of his presentations. Hence, the detailed meaning of the different facets can only be interpreted. Due to that, this study makes sense of this framework with the support of the already presented framework and literature.
As the authors interpret, the model makes use of the common themes discussed by Wäljas et al. (2010): composition and continuity. In addition, elements of the heuristics of Resmini and Rosati (2011) are considered: consistency, correlation within the term connection, and place-making and resilience within the term context. The term conflict is added inde-pendently but picks up existing themes of the cross-channel literature, e.g. cross-channel free-riding.
19
In the following, the different cross-channel facets of the cross-channel crystal by Morville (2011b) are introduced based on the author’s interpretation, which is guided by the previ-ously analyzed literature.
Composition describes the mixture of channels and devices and the features of each (Mor-ville, 2011b). Following the notion of Wäljas et al. (2010), it also determines if the ecosys-tem is designed in a multi-channel or cross-channel approach.
Consistency describes the optimization of the channels and touchpoints within the ecosys-tems in respect to the symmetry of brand, features, organization, and interaction. Here, the goal is to achieve a good balance within the ecosystem (Morville, 2011b). If consistency, which is also used by Wäljas et al. (2010), also distinguishes between internal and external (Resmini & Rosati, 2011), it cannot be determined on the basis of the available literature.
Connection covers the bridging of the channels through links, tags, addresses, barcodes, signs, maps, etc. To make effective use of connections, the bridging tools must be visible to the user at the point of need (Morville, 2011b). Based on that interpretation, the facet con-nection employs the concept of heuristic correlation (Resmini & Rosati, 2011).
Continuity fulfills the need to maintain the state within the ecosystem to enable users to flow between channels and touchpoints (Morville, 2011b). Based on that interpretation, facet continuity makes use of the concept of the eponymous common theme of Wäljas et al. (2010).
The facet context considers the impact of time, location, device constraints, personal and social influences, and how their context impacts the ecosystem for the user, the user psy-chology and the user behavior (Morville, 2011b). Since context not only considers itself, but also location (place), the authors understand that the heuristic place-making and resili-ence of Resmini and Rosati (2011) are further used here.
Within the facet conflict, the occurring research themes of the cross-channel literature are addressed, e.g. free riding behavior of the users (Chiu et al., 2010; Avery et al., 2008; Avery et al., 2012; Piercy, 2010; Schramm-Klein et al., 2011). It gives the opportunity to realign incentives, metrics, the business model, and the org chart. (Morville, 2011b) This facet is added by Morville (2011b) independently from Wäljas et al. (2010), and Resmini and Rosati (2011).
In the following section, the link between cross-channels, UX and UXD is examined in the context of business application. Here, the purpose is to understand how these subjects im-pact companies and their decision-making in practice.
2.3.2 User experience design applied on business cross-channel ecosystems
Within the previous chapters, the existing IS literature was analyzed in regard to cross-channel ecosystems, UX, UXD, and the impact of UX and UXD on the design of cross-channel ecosystems. In the following section, the authors analyze the impact of UX and UXD on the cross-channel ecosystem design in the applied business context. First, best practices when applying UX and UXD to cross-channel ecosystems are presented. If appli-cable, the authors connected the best practices with the frameworks of Wäljas et al. (2010), Resmini & Rosati (2011), and Morville (2011b) from the previous chapter with the goal to prove their practice relevance.
For companies, the development of services has become increasingly focused on under-standing the ecosystem, wherein the service exists. In part, this change occurred due to bet-

20
ter informed and empowered users, who can place tougher demands on tailored solutions to their personal contexts and needs (Fjord, 2011; Oracle 2013; Corrigan & Miller, 2011). Now, there is a general agreement amongst practitioners that businesses must accept the existence of a ‘digital’, tech-savvy customer, who expects to be able to interact through a multitude of channels in a way more complex than traditionally (Resmini & Rosati, 2009; Phaseware 2011; Oracle 2013; Karakas, 2009; Maiden, 2010). The expected services should be highly relevant to the customer, which makes the one-to-many development model out-dated. Instead, the systems should be sensitive and self-learning in order to enrich the users to move beyond the current design disciplines (Oracle, 2013; Resmini & Rosati, 2009; Bris-coe, Sadedin & De Wilde, 2011; Karakas, 2009; Buxton, 2007). In association with that, Banerjee (2013) stated that in a market, where companies provide similar services, a superi-or UX is important for staying competitive.
Within the era of ubiquitous computing, designing a good UX presents a challenge for companies in existing ecosystems, which are constantly evolving. Researchers therefore share their practical experiences concerning best practices with colleagues, who might be facing similar circumstances. In the following text, recommended best practices are stated.
The major purpose of best practice and prerequisite for designing UX in cross-channel ecosystems is to allow customers to consume information and services across multiple channels and touchpoints. It is crucial to enable the customer's decision-making process, which is nonlinear and moves across multiple channels (Banerjee, 2013). The cross-channel crystal facet composition describes the same condition (Morville, 2011b) as Wäljas et al. (2010).
Kuniavsky (2008) further recommended defining services before devices are designed. A basic principle of UXD for cross-channel ecosystem is that the whole experience within the ecosystem is considered more important than the UX for the single devices, channels, and touchpoints (Resmini & Rosati, 2011; Fisher et al., 2012). This requires that the relationship between various pieces be taken into consideration before designing the single pieces in the customer journey during the usage of the service.
In addition, Kuniavsky (2008) speaks about the “society of devices”. He stated that very few devices in ubiquitous ecosystems exist independently anymore. The simultaneous usage of a large number of devices is a usual occurrence nowadays. The UXD for the interaction of these devices with one another and within the ecosystem is needed. This can be connected with the cross-channel crystal facet continuity of Moreville (2011b) and Wäljas et al. (2010).
Additional best practices that Banerjee (2013) provided are the real-time collection of cus-tomer data, their modelling and analysis. The real-time collection of event data contains the collection of data of all touchpoints, where a user contacts the company's ecosystem, to gain as much insight as possible. After this collection, it is necessary to model and analyze the data to find correlations and patterns “to recognize and understand [...] customers and anticipate their needs, provide personalized offerings and information, guide their buying and even their care process, reduce effort duplication by providing degree of recognition and help in rewarding them” (Banerjee, 2013).
Further best practices, which are stated by Banerjee (2013), follow the notions of the pre-sented design principles for good UX in cross-channel ecosystems. Banerjee (2013) called this a “cross-channel customer experience strategy” and suggests:
• Channel unification,
• Unified data management,

21
• Proactive notification,
• Contextual insight,
• Preventive care, and
• Active knowledge base.
Channel unification provides consistent service information, and the brand image through all available channels (Banerjee, 2013). This correlates with the design principles of con-sistency of Moreville (2011b), Wäljas et al. (2010), and Resmini and Rosati (2011).
Unified Data Management refers to the technical data management between the channels to enable a usage of data equally across all channels at all times (Banerjee, 2013). This cor-relates with the design principles of connection of Moreville (2011b) or the heuristic corre-lation of Resmini and Rosati (2011).
Contextual insight makes use of the data, which has been collected regarding the individual customer behavior and patterns to individually customize the services for the customer (Banerjee, 2013). Since these best practices consider the personal context of how a user consumes the service, this particular practice correlates with Morville's (2011b) context fac-et or the resilience heuristic of Resmini and Rosati (2011).
Proactive Information covers a constant stream of proactive information of product order status, service tickets, or sales information. Dependent on the point of view, this best prac-tice refers to the heuristic reduction of Resmini and Rosati (2011), to reduce the stress of the user to find the information herself and manage the information flow for the user.
Preventive Care describes the method of declining the effort of personal customer care through available support documents, automated assistance tools, etc., which should be added to the existing cross-channel ecosystem of a company. Active knowledge base char-acterizes the need not only for real-time data collection and analysis of those, but also the constant update and enrichment of the existing database to ensure an optimal serving of the customers. These two best practices were not part of the specific cross-channel litera-ture and are, therefore, deemed as generic and cross-channel UXD irrelevant best practices, since they cover elements, which are good management. The cross-channel crystal facet, which has not been discussed in the best practice literature, was conflict.
Beside the existing best practices from the IS literature, researchers and consultancies tried to support companies with the improvement of their UX and the adjustment to successful cross-channel ecosystems with frameworks. These frameworks are provided by the IS re-search (Resmini & Rosati, 2010; Resmini & Rosati, 2011; Wäljas et al., 2010; Moreville, 2011b; Corrigan & Miller, 2011; Gegner et al., 2011; Novak & Schwabe, 2009; Cao, 2014) and white papers from the industry (Banerjee, 2013; Le Voi et al., 2011; Phaseware, 2011; Vanguard, 2010). In the following text, these frameworks are presented in detail.
In the previous chapter, the authors already analyzed and discussed the frameworks of Wäljas et al. (2010), Resmini and Rosati (2010), Resmini and Rosati (2011), and Moreville (2011b). Furthermore, Corrigan and Miller (2011) provided the total experience design (TxD) framework which “goes beyond a specific medium, delivery channel, or interaction”. TxD aims to design a UX that lasts throughout the entire end-user interaction and also considers the pre- and post-service time perspective. Gegner et al. (2011) created a framework for UX independent of cross-channel ecosystems, but considered the internalization of the UX

22
thinking in the company strategy and service development. Novak and Schwabe (2009) in-troduced a framework enabling travel agencies to cope with the challenges brought by ubiquitous computing and multiple channel ecosystems. Cao (2014) on the other hand, presented a maturity framework for companies to detect where they are situated in the movement from multi-channel to cross-channel ecosystems in their organization. Le Voi et al. (2011) examined the context sensitivity of customers with ubiquitous ecologies to pro-vide services with an optimum of context. They developed a UX context sensitivity model. Phaseware (2011) and Vanguard (2010) orchestrated a framework for an optimal creation of a customer support ecosystem with cross-channel attributes. Banerjee (2013) followed a similar path, as Corrigan and Miller (2011), with his model of the ‘customer experience lifecycle’. Banerjee’s model is represented by the infinity sign. The model aims to serve the customer before and after the service creation to enable a long-term relationship. He brought his framework into a value chain perspective and designed a model, which covers the overall customer experience from buying stage to owning stage and the related services.
In conclusion, within the IS research, several researchers and consultancies created frame-works and shared best practices with the aim of supporting companies in their efforts to align their resources and to adjust to the cross-channel ecosystem, in which they find them-selves in, to create a good UX to stay competitive.
2.4 The public transportation industry In this section, the public transportation industry in Sweden is described and the industry is linked to the topics of multiple channel ecosystems and cross-channel UXD. This is essen-tial, as it provides insight, which is necessary for understanding the context of this case study, as well as the problem statement. The delimitation of Sweden as a geographical re-striction has already been discussed (see chapter 1.4), therefore, the industry is limited to Sweden. When discussing the industry and the theoretical framework, this is kept in mind, although several references provide generalizable information and are used, although their original setting was placed elsewhere.
2.4.1The industry in general
In Sweden, on average only 467 out of 1000 persons are car owners, which means that more than half of the Swedish population utilizes different means of transportation (re-gionfakta.com, 2014). It is noticeable that the highest deviation from this average comes from regions where public traffic is sparse. This is most likely due to low population and extensive distances in such areas, which make public transportation less profitable. Because of this, the locals have a higher need for motor driven vehicles, due to the rural location of the communities. During the last 13 years the turnover for the transportation industry has grown faster than Sweden’s GDP, until 2013, when the profits decreased and the number of employees hired in Sweden went down. At the same time, the number of employees for international transportation companies in Sweden increased, as well as international part-nerships for the Swedish companies (Trafikanalys, 2013).
Dziekan (2008) defined public transportation as “a collective form of passenger transport that is ac-cessible to all. The conditions such as timetable, routes and prices are set and people do not travel in their own vehicles”. This thesis has decided to adopt this definition, but looks only into the bus in-dustry, and, therefore, other means of public transportation such as trams, trains, boats and air traffic are excluded. Public transportation can be divided into local, regional and interre-gional. Due to time restraints, an interregional investigation is not possible to execute, and therefore, the focus is on local and regional transportation.

23
When observing the preference of users towards or against public transportation, Dziekan (2008) questioned if potential users reject public transportation due to lack of knowledge. However, if they do know about a bus option, this study wants to understand why the op-tion remains unattractive to them. In urban life, public transportation helps to maintain sustainability, improves mobility and simplifies life for many of the inhabitants, both those with and without cars, motorbikes or similar vehicles. Successful public transportation ben-efits the urban area as a whole (Dziekan, 2008). The commonly considered motivations for using or not using public transportation are time, money, reliability and flexibility, but also attitudes, social norms, perceived behavioral control, ecological norms, accuracy of infor-mation, complexity of ticket systems and habits (Dziekan, 2008; Trafikanalys, 2013; Apa-nasevic, Markendahl & Arvidsson, 2013). Generally, public transportation is perceived as something positive and is overall thought of as reliable, if not the fastest transportation ve-hicle (Apanasevic, Markendahl & Arvidsson, 2014). Interestingly, more women than men utilized public transportation (Trafikanalys, 2013).
Overall in Sweden, public transportation is increasing at a steady pace. Since 2000, the trav-eler percentage has increased by over 30%, where buses are the most prominent contribu-tor to the growth at over 50% of all public transportation. Most of the travelers belong to the metropolitan areas of Stockholm, Göteborg and Malmö (84%). During 2013, the year from which the authors could access statistics, only seven out of 21 regions dropped in numbers of travels, with Värmland having the most negative numbers, at a negative 7% (Trafikanalys, 2013). However, little is known on whether the increase in travelers reflects an increased number of new passengers or an increased frequency of existing passengers. In Sweden, there exists, as mentioned, 21 regions with different public transportation. All these areas are governed by the respective municipality, which means wide differences in management, user friendliness, payment systems and online presence. Therefore, the suc-cess of public transportation companies can vary greatly, depending on the region.
However, between 2000 and 2014, the number of travels within Karlstad had been increas-ing by 67% (Karlstadsbuss, 2015). So it can be assumed that the decrease concerns Värm-land as a region, and not the local company “Karlstadsbuss”. This company is further pre-sented later in the thesis.
While travels are increasing, the financial aspect of the industry is not performing at par. In 2000, the public transportation could finance 58% of their operations themselves (the re-maining amount is provided by the government), by 2013, the number was down to 51%. Although the price and profit relationship has a negative slope, between the years 2000-2013 the ticket prices increased by 41%, but the profit margins only increased by 25% (Trafikanalys, 2013). This means that the travel costs for companies have risen.
2.4.2The industry in the relevant context
After the description of the underlying industry, the nature of the ecosystem in which transportation companies exist in is analyzed. Furthermore, research about the user’s be-havior in transportation ecosystems is presented to determine if cross-channel UXD is ap-plicable and could provide benefits for this industry.
Transportation systems have to manage highly dynamic and changing scenarios, where any-thing from a traffic jam, a slow boarding, or an accident can quickly ruin the entire route and time schedule. Public transportation companies must therefore design ecosystems that can inform passengers of what is occurring in real-time to keep them satisfied, both in terms of pragmatic and hedonic qualities (Vieira, Caldas & Salgado, 2011; Hassenzahl,

24
2008; Dziekan, 2008). Simply providing static timetables and information is not enough an-ymore. Context allows the understanding of this dynamic and how it impacts whether peo-ple decide to use the available transportation. This context can take the form of clarity, easy orientation, estimated arrival times, route recommendations, description of the nearest bus stop, current location of the bus, estimated rush hours, meteorological impacts and so on. Information must be provided throughout the entire journey. It is said that the easier it is to access information concerning public transportation in an urban area, the more attrac-tive the service becomes to potential users (Vieira, Caldas & Salgado, 2011; Dziekan, 2008). Ease of access is increased by offering a variety of channels, such as information centers, buses, bus station displays, web pages, smartphones, interactive TV, call centers and so on, in an integrated, clarifying way. Information, which is available via multiple channels, and redundancy are very important in ensuring this door-to-door availability of information, i.e. pre-trip and post-trip as well as during the actual trip. Companies need to understand that the ecosystem in which the users exist in has to be able to assist and serve their users (Vieira, Caldas & Salgado, 2011; Dziekan, 2008; Corrigan & Miller, 2011; Apanasevic, Markendahl & Arvidsson, 2013).
At the same time, humans are selective in terms of what pieces of information they decide to pick up. As an information process is not instant but commonly sequential, an overa-bundance of information at one time should be avoided (Dziekan, 2008). Therefore, the UXD must be adjusted to provide enough information to keep the users satisfied, without overwhelming them. Dziekan (2008) suggested four design principles for companies to keep in mind:
1. How well and through which channel the information draws attention i.e. visual, readable, sounds, recognizability, color pallet, graphical design, properly separated from advertisement of other white noise and so on. In this thesis, this is covered in the elements consistency, continuity, composition and correlation.
2. How easy the signs can be read, i.e. color combinations, fonts, thickness of letters, spacing, etc. This is a mix of consistency and correlation.
3. How easily users can understand the provided information, regardless of familiarity with the system or nationality. This is covered in the elements place-making, conti-nuity, correlation and reduction.
4. How well users understand that the information is authentic and reliable, which is covered by the elements place-making, reduction and consistency.
Dziekan (2008) explained that the user’s mental representation of the ecosystem, which they exist in, serves as a basis for the selection of travel mode, route and destination choic-es, as well as impacts pathfinding and orientation within the system. With continuous inter-action within the ecosystem, the mental representation is constantly evolving; the user keeps matching new information, which the system provides to the mental map they creat-ed, in a tacit way. Constant interaction also improves the quality of the mental representa-tion. However, even non-users tend to have a mental representation and knowledge about the key traits of public transportation in their rural area. Therefore, potential users cannot always be considered as ignorant or ‘new’ to the ecosystem. Dziekan (2008) said that po-tential users only need the impression that there is, or have vague knowledge about, an ex-isting public transportation option to consider it for travel. Naturally, if so, they cannot know details such as bus number or location of bus stops, but based on her research this is not necessary to know, when the potential users consider their options. It was also found

25
that the route, timetable or similar information was not the most confusing aspect to new users, but rather that payment systems and the different forms they take in different loca-tions was (Dziekan, 2008; Trafikanalys, 2013).
In summary, it can be concluded that the industry of public transportation is a complex, always evolving cross-channel ecosystem. This ecosystem empowers users with growing in-fluence in terms of co-creation of the existing system and existing perceptions about the company's offerings. It can be concluded, that cross-channel UXD can be applied and could bring benefits for companies in this industry.
2.5 Framework creation In the above presented literature, several business UX cross-channel frameworks from the IS literature are proposed to support a company’s movement to a good UX within cross-channel ecosystems. One of the research questions of the current study seek to address how the current theory of cross-channel user experience assists in formulating a design strategy for a service ecosystem. The theoretical framework and the analysis of the industry have led to the selection of elements of the following frameworks to create a framework for this study to address this question:
• Wäljas et al. (2010) - common themes of cross-platform services
• Resmini & Rosati (2011) - Heuristics for a pervasive information architecture
• Corrigan & Miller (2011) - Total experience design
The chapter 2.3.1 presented the three frameworks of Wäljas et al (2010), Resmini and Rosati (2011), and Morville (2011b). Furthermore, the practice relevance of these frame-works could be proven in chapter 2.3.2. The only element for which the authors could find no explicit practice relevance was the facet conflict of Morville (2011b). In addition, Mor-ville (2011b) does not consider the heuristics resilience and reduction of Resmini and Rosati (2011), even though these elements have practice relevance. Because of the irrele-vant facet conflict, the missing elements resilience and reduction, and the missing academic validation and detailed explanations of the cross-channel crystal, the authors create a new framework in this thesis to answer one of the research questions. To do this, the frame-work of Corrigan and Miller (2011) was again selected, since it addresses an aspect that is specific to the industry in which this case study takes place. Dziekan (2008) stated the fact that users, even if they are not using and are not informed about services of the local public transportation, have a predefined perception of the company’s services. Due to that, the authors want to examine the time perspective, which considers the decision making process of the user before she actually decides to use the offered service. This is, from the author’s point of view, best covered by the TxD framework by Corrigan and Miller (2011).
The following, in chapter 2.3.2, presented frameworks which are not considered for this thesis, since:
• Gegner et al. (2011) did not consider the complex effects of cross-channel ecosys-tems on the UX for companies.
• Novak and Schwabe (2009) examined another industry.

26
• Cao (2014) presented a maturity framework to classify the stage of movement from multi- to cross-channel company environment. This study cannot use this framework because the existence of a cross-channel ecosystem is taken as a given.
• Le Voi at el. (2011) concentrated too specifically on context, which does not pro-vide any further insights to this case study.
• Phaseware (2011) and Vanguard (2010) dealt with user support systems, which are not applicable since this case study analyses the holistic ecosystem of the company and not just the support area of it.
• Banerjee (2013) provided a framework, which puts emphasis on the infinitive cus-tomer-service-company life-cycle. This framework considers the recommendation of a customer within the lifecycle, but it does not take existing opinions about the company into consideration. The framework further describes the expectation that recommendations transform into new needs, which enable the infinity in the infinity loop and start the selection process from the beginning, which is not ap-plicable to the underlying case study.
Based on the selected frameworks, the authors created a new UXD cross-channel frame-work. In this framework the elements of the common themes for cross-platform services (Wäljas et al., 2010) and the heuristics for a pervasive information architecture (Resmini & Rosati, 2011) are combined with the time perspective of the TxD framework (Corrigan & Miller, 2011). The elements of the three frameworks are arranged in the form of a three-stage circle with the timeline element of the before and after phase. The authors chose this form, since the center of a good UX in cross-channel ecosystems is the creation of a cross-channel ecosystem with the element composition. Continuity further enables the cross-channel ecosystem with synchronized and migrated data across all channels that allows the interoperability of the channels. On the basis of that, the heuristics reduction, correlation, consistency, place-making, and resilience of Resmini and Rosati (2010) can be applied. Fol-lowing the notion of Resmini and Rosati (2011), the framework considers grounding heu-ristics in the lower part and established heuristics for purposefulness and complexity in the upper part of the outer circle. To put emphasis on the existing opinion about the compa-ny's services and the existing ecosystem, the authors included the timeline of Corrigan and Miller (2011). Contrary to the notion of Corrigan and Miller (2011), the before and after phases in this framework do not only consider the user’s experience with single touch-points but the holistic UX with the ecosystem. On the left side, the prevalent opinion, an-ticipation, and motivation of using the ecosystem are considered. Following the timeline, in the middle, one can find the elements of actual experience with the ecosystem, which is af-fected by the cross-channel UXD elements. On the right side, one can find the user’s re-flection about the experience and the sharing of it.
This study endeavors to answer the above stated research question with the support of this framework.

27
Figure 2.1 - Initial cross-channel user experience framework

28
3 Methodology In this section, the methodology for this study is described. It explains what was done to achieve the final re-sults, how the study was performed and motivates the decisions, which were taken.
Initially, a description of the research design is provided, which discusses how the purpose of the thesis, the research gap, was found. Then, the approach to fill the research gap is discussed, the reasons for selecting the case study as the research method, as well as the reasoning for the industry and company selection. After this, a detailed description of the empirical data collection, both primary and secondary, followed by a de-scription of how the data analysis was executed is provided. Finally, the generalizability and validity of this study are discussed.
3.1 Research design As described in chapter 1.1, the novelty of cross-channels, multi-channels, digital ecosys-tems, the pressures from tech-savvy users, and their expectations put many companies in a tight spot (Garrett, 2010; Resmini & Rosati, 2011; Guenther, 2012; Fjord, 2011; Vieira, Caldas & Salgado, 2011). If they do not meet the user’s expectations of services, they lose customers, and if they provide them, but in an unsatisfactory way, they can lose not only customers, but also brand loyalty and reputation. This contemporary phenomena makes it hard for certain companies to see the relationship between user expectations and ecosys-tem design, but for most the problem lies within managing user expectations and designing a satisfactory service (Hassenzahl, 2008; Zhou, Xu & Jiao, 2010; Vieira, Caldas & Salgado, 2011). This aspect of the problem is covered in the existing IS literature, but is still not clearly understood, or proved. Theories that can be built upon do exist, although very few explicitly cover how these theories can be applied to the practice. Therefore, the need to investigate and clarify this problem became the purpose of this thesis.
Any problem should have a strategy for approaching its solution, or in the underlying case, the explanation for this is referred to as a research design. It is the general plan which is put in place to relate the concepts and theories to the empirical findings (Ghauri & Grønhaug, 2010; Yin, 2009; Trusty, 2011). As this study needs to understand a great detail about the decision making process, the ecosystem and processes of a very specific topic, the oppor-tunity to find new or omitted variables is critical. Based on this, it is necessary to use a re-search design that can find non-explicit information and allows a degree of openness, which is needed to properly investigate, analyze and respond properly to the purpose of this study (Patton, 2002; Ghauri & Grønhaug, 2010).
This research design can therefore be categorized as exploratory; an approach that requires a poorly understood problem in need of flexibility and has the ability to be shaped, as new information is uncovered. As this design is adopted, it is logical to start by explaining what is currently known about the topic (theoretical framework), and finalized by clarify what was learned, when contrasted and compared with what could be observed from the prima-ry data (empirical findings) (Patton, 2002; Ghauri & Grønhaug, 2010; Yin, 2009). While there are indeed theories taken into account when conducting this research, the study does not attempt to test a single theory, confirm a hypothesis, or create a highly generalizable re-sult, but develops a greater understanding of the subject at hand and develops its own framework.

29
This means that what is performed is an exploratory research, with an overall inductive ap-proach. An inductive approach uses theory to make sense of a primary data collection, and examines the interactions between the two, although the main findings are departed from primary data (Ghauri & Grønhaug, 2010; Patton, 2002). Inductive research is commonly used in qualitative research, which is also true for this thesis (Ghauri & Grønhaug, 2010; Patton, 2002; Creswell, 2007).
Qualitative research generates data, such as detailed document reviews, in-depth inquiries, quotations and observation descriptions. These forms of primary data allow descriptions and in-depth insights about the phenomena (Yin, 2009). Trusty (2011) explained that im-plementation of a qualitative research is difficult, since the questions of the study are com-monly not perfectly structured at the outset, and broad answers are therefore needed from the participant. The qualitative research approach, however, gives results that are a combi-nation of rational and explorative findings, which highlights the skills and experiences of the researcher when analyzing the data (Ghauri & Grønhaug, 2010; Yin, 2009). Qualitative research provides a deeper understanding of the research instead of just scratching on the surface. Through qualitative research, unexpected events or omitted variables can appear, which is desired for this study (Patton, 2002). To conclude, due to the importance of reach-ing a deep understanding of a phenomena, it is necessary to analyze cross-channel ecosys-tems, UXD theories and frameworks in a practical setting, and, therefore, the selection of this research design is rationalized.
3.2 Case study Within the qualitative research, many different approaches exist to gather empirical data collections. In this thesis, a case study is conducted as the method of choice.
Patton (2002) defined case studies as a purposeful sampling technique, as they are infor-mation rich and provide useful insights from the relevant phenomena. The empirical sam-pling is conducted to find understanding, rather than making something universally accept-ed and generalized. This is accurate for what the authors are searching to answer in the re-search questions.
According to Yin (2009), a case study is an empirical inquiry that investigates a relevant phenomenon within a specific context, where the boundaries between the two are not ob-vious. It attempts to understand why certain actions were taken, how they were implement-ed, and what outcomes were generated. Compared to many other research methods, case studies enable the authors to find in-depth knowledge within a topic and further find ex-tensive answers with multiple variables, as well as help researchers to retain a holistic ap-proach, as they deal with complex phenomenon (Yin, 2009; Ghauri & Grønhaug, 2010). The ability of case studies to handle these multiple variables as well as a wide range of evi-dence (such as documents, artifacts and interviews), is in high demand, as discussed in the sections purpose and research questions.
Yin (2009) explained that research purposes have three conditions to be met if a case study is to be applied. First, research questions should ask ‘how’ or ‘why’. These question forms force the authors to move from straightforward towards more complicated answers, providing in-depth understanding about why and how specific phenomenon takes form. The questions also indicate that the authors must look at how the phenomenon functions in its context, rather than looking at one-time events of short fluctuations (Yin, 2009; Ghauri & Grønhaug, 2010). The second condition concerns whether or not the research requires a great control of behavioral events. If the answer is no, a case study is suitable.

30
Since this study investigates current events and is interviewing people involved in activities, the authors have no way of controlling it and can only understand and analyze it, which, definitely satisfies this condition (Yin, 2009; Patton, 2002). Third, the research must focus on a contemporary event, which is something that has been stressed multiple times already.
The case study at hand is classified as a single, embedded case study. This means that one company is investigated, but several units of analysis are taken into consideration. Ghauri and Grønhaug (2010) argued that a one-shot case study is a poor construct, as it does not allow for comparisons or generalization. This is not the plan of this thesis, as several units of analysis are investigated and compared to one another. The decision to focus on one case study, instead of multiple case studies, is based on the belief that the evaluation of one relevant company is, firstly, challenging enough in itself secondly, based on the wish to ana-lyze the ecosystem of the topic in depth and detail, and thirdly, to provide sufficient infor-mation to achieve the desired results.
To ensure that the case study is as unbiased as possible, techniques of triangulation are em-ployed. Triangulation helps strengthen a study by combining multiple perspectives and, if applicable, methods onto a case. In this research, the authors employ triangulation in terms of data and theory, i.e. utilizing several methods and theories to interpret the empirical findings, and author triangulation, since the authors are two researchers with varying knowledge and backgrounds (Patton, 2002; Ghauri & Grønhaug, 2010).
As the case is investigated through triangulation, several different realities are discovered, and these differentiating viewpoints must be compared and contrasted to properly portray the situation and case context the study is facing (Yin, 2009; Patton, 2002; Ghauri & Grønhaug, 2010). Within this case study, the company IT manager, company business de-veloper and the users of the ecosystem are examined. This creates a frame of data that pro-vides diverse viewpoints on the existing situation in a triangular fashion. In addition, direct observations are employed, i.e. the researchers partake in the actual situation and perform the relevant actions, as a further tool to understand the everyday realities of the system’s users. Patton (2002) argued that without putting ourselves into the affected position, it is impossible to understand human behavior.
The authors do acknowledge that case studies have several drawbacks. First, informal ma-nipulation or bias is more likely to occur than if a more systematic procedure would be ap-plied. Therefore, the flexible structure of case studies puts very high demands on the re-searchers to be rigorous, despite the non-systematic methodology, since there is no way of proving the abilities of the researchers. Secondly, generalizations from case studies are claimed to be poor. Indeed, while case studies are in most cases not applicable to popula-tions, they provide a greater understanding of complex phenomenon, and are thereby gen-eralizable to theoretical propositions. Third, case studies leave little opportunity to prove causal relationships. However, as the purpose of this study is not to prove or test a theory, but to provide insight into how companies are thinking about and managing subjects, and why they are working in their particularly manners, an in-depth approach is necessary (Ghauri & Grønhaug, 2010; Yin, 2009).

31
3.2.1 Industry selection
When selecting an industry, a number of criteria were used as determination factors, which the industry must fulfill.
Criteria 1: The industry must have an established, complex channel ecosystem that can be investigated.
Criteria 2: The cross-channel experience must have been in place long enough for users to interact and reflect, and, therefore, have formed opinions about the system.
Criteria 3: The industry must utilize channels of all categories, i.e. physical, biological and digital.
Criteria 4: The ecosystem should not be too technologically advanced. This is relevant, since it would create restrictions on the user base and most likely force the research to fo-cus on less relevant items, e.g. interaction design, internet presence.
Criteria 5: The user base should be large and contain as many different demographics as possible.
Criteria 6: The users of the industry should have personal agendas, when entering the sys-tem, rather than being at the mercy of the company.
By combining literature and personal experience, the public transportation industry was se-lected. The industry was at par with the system demands and was well-established and complex, utilized all channel types and had a very large user base. Through personal experi-ence, the authors had discovered several problematic areas within the available cross-channel experience, which created a desire for them to improve the system.
Within the industry of public transportation, the niches of bus, ferry, train, tram and flights are employed. Through the use of secondary sources, e.g. websites, an evaluation of public transportation companies was performed. The results found that the public transportation ecosystem of buses was the best suited, based on the usage of various channels, complexity of the ecosystem and the amount of users.
3.2.2 Company selection
Once the industry was selected, it needed to be narrowed down to the specific company that would be the subject of the case study. The next step was to analyze which of the ex-isting bus companies had the most interesting or most unique systems. Similar to the indus-try selection, the use of secondary sources, e.g. websites, was used to narrow down the number of companies. This resulted in a list of 20 bus companies, arranged in a hierarchical order, based on the above mentioned factors. The top ten companies were contacted through e-mail, and a brief description about the purpose of the thesis was provided.
The criteria for the final selection were:
Criteria 1: The company should do business in an industry, which fulfils the above men-tioned industry criteria.
Criteria 2: The company should be willing to allocate the time which is required to con-duct the desired research methods.

32
The company, which was chosen in the end was Karlstadsbuss, which was the one that had the highest ranking. What placed this company high in the ranking was primarily the uniqueness of their channel ecosystem, which offered channels not available at any of the other companies.
3.3 Data collection Qualitative data collection is necessary to get insight, understand and analyze data. No study can be conducted without using some sort of data, weather primary, secondary or a mixture of both (Patton, 2002; Ghauri & Grønhaug, 2010). In this thesis a primary data collection was conducted through company interviews, user inquiries, direct observations, and secondary data for theory building purposes. Secondary data has also been used in combination with interviews to help grasp how the case study company provides its ser-vices to users.
3.3.1 Primary data
Primary, or raw, data is advantageous, as it is collected for a specific purpose and directly related to the particular study (Patton, 2002). It provides great insight into people’s atti-tudes and opinions, which are important in general, but in particular when the study ap-proaches the topic of UX. In this thesis, the primary data collection is executed through di-rect observation, interviews with the IT manager and business developer of the selected company, and data gathering from the users.
Direct observations
To evaluate the service artifacts that exist in the ecosystem properly, the authors made the decision to get first-hand experiences and make closer observations. By doing so, the au-thors had the possibility of gaining more qualified insight into the various touchpoints, channels and their interlinks.
Yin (2009) and Patton (2015) referred to this source of evidence as ‘direct observations’, and state that directly observing a phenomenon is a way of discovering relevant behavioral and environmental conditions. By visiting the field of the study, the researchers were able to provide additional information about the subject at hand, and found potential weakness-es that otherwise might have been overlooked. Incorporating direct observations also lead to contextual sensitivity for the researcher, richer descriptions of findings and allow for moving beyond simple prejudices and perceptions formed outside of the field.
As the case study is limited to the area in which the selected company operates, it was deemed possible to perform a study of this sort, even though direct observations are a highly time-consuming method. Despite the time constraints of the thesis, they were possi-ble to perform, as this methodology was used to further enhance triangulation, rather than being the primary source of the data collection.
The direct observations were executed through the actual usage of the service artifacts of the case study ecosystem. During that usage, the authors noted and listed the elements of the service, and took photos of the physical service artifacts.
33
Interviews
To use interviews in qualitative research is very common, as they allow direct quotations and first-hand knowledge. The drawback of interviews is that they are humanitarian, which can lead to issues, such as investigator misinterpretations, untrustworthy statements from the interviewees, or non-transparency in the enclosed information. Nonetheless, strong or highly impacting biases are normally detected quickly as an interview progresses. In addi-tion, many questionable statements can be confirmed or rejected with the compliments of either secondary data, or triangulation techniques. A deeper understanding of the topic is possible through observing and listening to the interviewee, and using interviews (Patton, 2002; Ghauri & Grønhaug, 2010).
Interviews are traditionally conducted to gain knowledge. The authors cannot directly ob-serve the actions taken, but through data gathering, understand a perspective that is mean-ingful and allows them to make tacit knowledge explicit. This does put pressure on the au-thors to have an understanding of how to interpret and obtain such information, as most, if not all, primary data gathering does (Patton, 2002; Yin, 2009). As mentioned, nothing can substitute raw data: the actual words said by the actual people.
When the interview design is discussed, three key approaches are normally brought up: un-structured interviews, semi-structured interviews and structured interviews. Unstructured interviews are very informal in their nature, and allow the researcher to ask questions as they come up, without much or any agenda at all. Semi-structured interviews outline a set of topics to be covered through the allotted time, and the questions serve as a check-list throughout the interview. Structured interviews are carefully worded and arranged in a cer-tain order, and then repeated for all respondents regardless of their differences in knowledge or experiences (Patton, 2002).
Company approach
The authors decided to approach the organizational correspondents with a semi-structured interview. A benefit of semi-structured interviews is that they delimit how far one can stray from the topic, and thus make the interviews more systematic and focused (Patton, 2002). Normally, a drawback with semi-structured interviews is that differences in wording can re-sult in different responses, but as the interviews were conducted with two correspondents simultaneously, such issues can be disregarded. A few days before the interview took place, a file with the agenda and questions was provided to the company, to allow them to pre-pare and to make sure the limited interview time would be efficiently used. The questions sent to the company did not include every question, but rather overarching questions that included all relevant topics that needed to be discussed. The interviewers brought another set of questions, which was far more detailed and extensive. The detailed set of questions was not provided because it would have been overwhelming for the interviewees to receive such an extensive list, and the questions were formulated in an academic language that would have made little sense, or might have even confused the interviewees. During the in-terview, the overarching questions were asked, and the more detailed list was simultaneous-ly checked to add useful follow-up questions. It should be noted that the detailed list in no way covered all questions or details that were brought up during the interview.
The actual interview was conducted with two representatives from Karlstadsbuss, Robert Sahlberg and Mathias Lindgren, and both of the thesis authors. Sahlberg is the appointed business developer of Karlstadsbuss and Lindgren is head of IT. The interview took place the 11th of March at the Karlstadsbuss office in Karlstad and lasted one and a half hours.
34
The interview was conducted in English, which was the language all parties felt comforta-ble using, although none of them were native English speakers. Occasional Swedish terms were mentioned, but this did not create any mentionable language barrier. This was taken into consideration during the analysis. During the interview, a great deal of organizational information was provided via a powerpoint presentation written in Swedish.
The interview started with a recap of what the study is about and how the information of the interview is used. Failure to capture the data recording is fatal (Patton, 2002), as it is what the analysis is based upon. Hence, the authors decided to utilize a mobile phone as a tape recorder, to be able to go back and get the correct quotes and phrasings. Permission to do this was asked, reasons explained, and permission was given by the organization corre-spondents. The option of anonymity was offered, but was deemed unnecessary by the in-terviewees.
When closing the interview, the ways in which the interview material is going to be used was once more explained, and permission to contact for follow-up details was asked for and accepted.
After the conduction of the interview, the interview was transcribed and can be viewed in the appendix 1.
User approach
Data from users is essential for grasping the content of an ecosystem, understanding the cross-channel UX and finding areas of improvement for the case study company. The ini-tial plan was to narrow the user demographic down to a specific group, but as this would create tight limitations on the ecosystem, this idea was expanded to a more extensive user group. Also, a narrow group would clash with the criteria for selecting the industry. Focus groups and user shadowing was considered, but these methods were assessed to be too time consuming to conduct in a systematic way. Surveys or questionnaires were also con-sidered, but the structure of these methods would only scratch the surface, rather than providing the in-depth responses needed. Therefore, qualitative interviews were selected. The purpose was to collect responses from a diverse group of users to better map an accu-rate ecosystem. The users were asked about how they prefer travelling, the motivation be-hind their choices, and to explain their opinions of Karlstadsbuss and the services they of-fer. This was done in a semi-structured way. Later on, the interview responses were clus-tered, to find patterns, determine the user ecosystem, and visualize the most common jour-neys of the users.
First, an attempt to get user interviews was conducted via phone, where companies located in central Karlstad were asked to allocate a few of their employees for questioning about their travel habits. It was made clear that the interviews would be very short and anony-mous. This resulted in a very low number of interviews, therefore a new approach to col-lect data was needed. Second, attempts to reach relevant users via social media was consid-ered, but was concluded to be a too biased approach. Last, the authors decided to travel to Karlstad and conduct the interview first-hand by asking potential users in a public setting. The option of approaching the users within the city of Karlstad was decided upon, due to the difficulty of contacting users via their work place, and since the authors had no location where they could invite interviewees and hold the sessions.
An interview had an average time of 4 and a half minutes, and was semi-structured. The in-terviewer had a paper with the questions and asked the interviewees questions in a prede-termined order. Via this process, the critical topics were covered, but left space for the us-

35
ers to add or include aspects or information without the probing of the interviewer. About half of the asked persons agreed to do interviews. However, not all of the people asked were Karlstadsbuss users, or familiar with Karlstadsbuss, and therefore, some of the user responses were not useful. In the end, 19 of 24 conducted interviews provided insights into the ecosystem and user patterns.
The information gathered from the users was first written down with all details included, an then the various touchpoints and channel interactions were extracted and organized in a sequential order that included primary choice of transportation, pre-trip activities, primary activities and post-trip activities. The summaries of the user interviews can be viewed in the appendix 2.
3.3.2 Secondary data
Secondary data consists of knowledge and information that has been collected by other scholars, and has therefore a different initial purpose, when compared to primary data (Ghauri & Grønhaug, 2010). The purpose of secondary data is to gain more in-depth knowledge about the field of study, as well as to get better insight into the research prob-lem. Without a theoretical foundation, critical questions cannot be derived for the empirical data gathering (Ghauri & Grønhaug, 2010). It has been argued that interviews in combina-tion with secondary data are a good complementation (Czarniawska, 1998; Patton, 2002). The secondary data in this thesis consists mainly of articles, since these provide more unbi-ased information compared to other alternatives (Ghauri & Grønhaug, 2010). Secondary data has also been gathered through various websites, to allow the authors to collect infor-mation about the company ecosystem in advance of the interviews, as well as for searching for information that might have been forgotten or omitted during the interviews, and to analyze the digital service artifacts of Karlstadsbuss.
The cited references in the literature review are limited to an 8-year range (2007 to 2015). To define a reasonable limitation within the literature review, the authors analyzed the de-velopment of the digital technology and social media. It is assumed that the emergence of smartphones, apps, and social media stimulated the development of cross-channel envi-ronments, as smartphones and apps enable users to engage in services with portable devic-es independent from location. Social media made it possible to share huge amounts of in-formation and pushed the development of faster networks. The time range of the literature was dated to 2007, when Apple released the iPhone, the hype around smartphones started to hit the mass markets and the phones started to move away from the physical numeric keypad towards digital keypads. Facebook was already established at this point in time, and one year later the App Store of Apple was opened, which quickened the change to the digi-tal ecosystem of today (Rose, 2001; Webdesignerdepot.com, 2009; Apple.com, 2008).
Figure 3.1 - Emergence of digital technology and social media

36
Literature and theoretical background
Yin (2009) and Trusty (2011) stated that one conducts literature reviews and knowledge searches to develop sharper and more insightful questions, rather than creating answers.
The main source for identifying, locating and extracting resources for the theoretical framework of this study was the Jönköping University Library online system “Primo”, which has access to several online databases. In addition, the online databases “Scopus” and “Google Scholar” were used for academic articles, which were referred to in articles the authors had selected from “Primo”. The sources, which were found during the litera-ture search, are composed of articles, journals, conference proceedings, and books to con-duct a thorough theoretical framework on the topic UXD in cross-channel environments.
When looking for relevant articles, the following selected descriptive keywords were used: “ubiquitous computing”, “multi-channel”, “cross-media”, “multi device”, “cross-channel”, “user experience + channel”, “user experience + device”, “UX + channel”, “UX + de-vice”, “user experience design + channel”, “user experience design + device”, “UXD + channel”, “UXD + device”, “experience design + channel”, “experience design + device”, “design for user experience + channel”, and “design for user experience + device”.
The credibility and relevance of the academic resources were considered in the selection of the literature review. An advanced search in “Primo” included specific parameters for the search. For instance, the search was limited to the “subject” or “title” category items that “contains” or “is (exact)” to the descriptive keywords. Furthermore, the search of available academic resources was limited to filter categories within English language articles, peer-reviewed journals, conference proceedings and books. Peer-reviewed journals, articles and conference proceedings were preferred sources and the most encountered academic re-sources in the university library. Additionally, the literature material includes white papers and books. This is due to the fact that the research fields of cross-channel environments and UXD are young and emerging, and academic articles provided too little basis for the theoretical framework.
The online search provided a large collection of academic resources. Therefore, a review of each resource was performed to determine its relevance within the topic. The criteria selec-tion was based on the proximity of the relation of the abstract content with the selected topic. Also, the number of quotations played a relevant role in the selection process. Once a resource was labeled as useful, the resource reference list was reviewed to verify that addi-tional academic resources could be selected for the literature review. If relevant references were found, an online search through “Primo”, “Scopus”, and “Google Scholar” was per-formed again to obtain the material.
Documentation
For a better understanding of the channel ecosystems, the current offers provided by the company were investigated at a distance, when they were not able to investigate via direct observations. By examining the case study company webpage and app, and the social media pages of the case study company, it was possible to find descriptions of the available ser-vices and channels. Simultaneously, this provided an opportunity to get first-hand experi-ence through interaction with the ecosystem. Therefore, a substantial amount of time was spent on gauging the webpage, as well as the mobile app and the social media pages of Karlstadsbuss. If deemed relevant, screenshots of these elements were taken. These are considered as secondary sources of information, and are combined with the primary data in the analysis. This was also very useful for developing insightful questions that were asked

37
during the interviews with the company representatives. As the website and app can be ac-cessed repeatedly, and does not cover events in real-time, they are defined as documenta-tion rather than direct observations (Yin, 2009).
3.4 Analysis The analysis starts with the combination of the findings from the direct observations, doc-umentation, and the company interview to present the case study company, in order to ex-plain the various services artifacts offered by the observed company. However, to achieve insight into the ecosystem of the company, rather than just examining the service artifacts, the findings were combined with the interaction points found in the user interviews. By do-ing so, the analysis was applied to a cross-channel ecosystem, instead of just individual ser-vices offered by the company.
Once the findings had been put together, the tools and artifacts proved to be too many to handle individually. Therefore, they were initially clustered into categories based on the ac-tivity they assisted to perform. By utilizing this method of categorization (Ghauri & Grønhaug, 2010), researchers can place units of data into logical groups. By labeling the clusters and sorting the data in this manner, the researchers can get a good understanding of which sets of data are related and interconnected (Ghauri & Grønhaug, 2010). As the users utilized different terminologies to describe a specific activity, or had different tactics for performing the same activity in the user interviews, categorization helped to make sense of which data related to which. In the end, after several iterations, nine categories could be determined, which were labelled as ‘user activities’. These were then grouped together in an abstract manner, allowing them to link with the framework created in chapter 2.5. This is relevant for the latter parts of the analysis. Therefore, the nine categories were placed in the before phase, during phase and after phase described in the framework. This approach is referred to as abstraction (Ghauri & Grønhaug, 2010). Once categorized, the labeled user activities were sorted in a chronological order, based on their placement in both the ab-straction categories and, on a less holistic level, what order users performed them in (Pat-ton, 2015).
Next, the artifacts within the categories were measured, based on their popularity among users. This was measured by calculating how many users mentioned a specific artifact when interacting with the cross-channel ecosystem. Ghauri and Grønhaug (2010) referred to this analysis activity as dimensionalization, while Patton (2015) and Yin (2009) used the term pattern matching. According to Yin (2009), this is one of the most desirable techniques when performing case study analysis.
After this, the service artifacts, already categorized based on the user activities they were involved in, were clustered into specific channels. As defined, a channel consists of touch-points, and thus the artifacts needed to be translated into touchpoints. The categorization led to a total of six channel groups. When cross-matching the channels and user activities, an ecosystem matrix could be determined. This matrix could be visualized after several de-sign iterations.
The developed matrix was then used to map the 19 user journeys that were found in the in-terviews. User journeys are a way of displaying data, and describe the start to end user ac-tivities until the goal of the user’s service enquiry is fulfilled. This is an analytical approach from the area of service design (Stickdorn & Schneider, 2011). This assists in further un-derstanding how the user connects touchpoints to each other in the ecosystem, and strengthens the internal accuracy of the pattern matching and the user activity clustering.
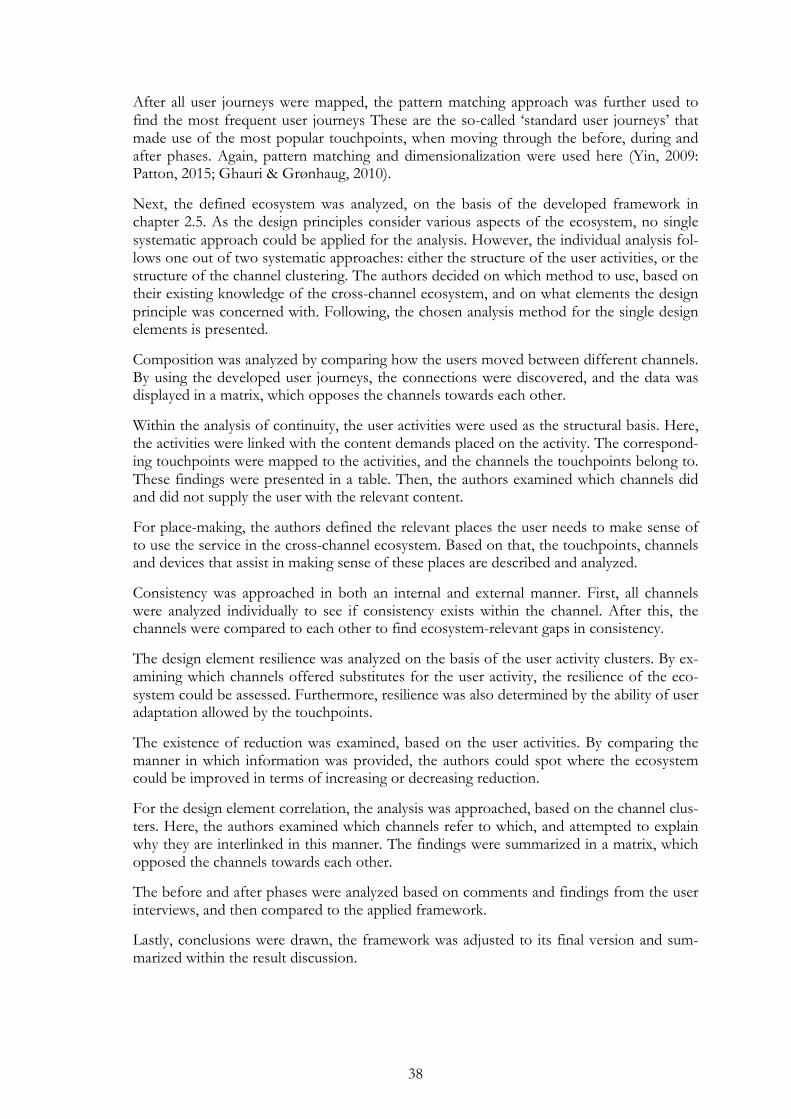
38
After all user journeys were mapped, the pattern matching approach was further used to find the most frequent user journeys These are the so-called ‘standard user journeys’ that made use of the most popular touchpoints, when moving through the before, during and after phases. Again, pattern matching and dimensionalization were used here (Yin, 2009: Patton, 2015; Ghauri & Grønhaug, 2010).
Next, the defined ecosystem was analyzed, on the basis of the developed framework in chapter 2.5. As the design principles consider various aspects of the ecosystem, no single systematic approach could be applied for the analysis. However, the individual analysis fol-lows one out of two systematic approaches: either the structure of the user activities, or the structure of the channel clustering. The authors decided on which method to use, based on their existing knowledge of the cross-channel ecosystem, and on what elements the design principle was concerned with. Following, the chosen analysis method for the single design elements is presented.
Composition was analyzed by comparing how the users moved between different channels. By using the developed user journeys, the connections were discovered, and the data was displayed in a matrix, which opposes the channels towards each other.
Within the analysis of continuity, the user activities were used as the structural basis. Here, the activities were linked with the content demands placed on the activity. The correspond-ing touchpoints were mapped to the activities, and the channels the touchpoints belong to. These findings were presented in a table. Then, the authors examined which channels did and did not supply the user with the relevant content.
For place-making, the authors defined the relevant places the user needs to make sense of to use the service in the cross-channel ecosystem. Based on that, the touchpoints, channels and devices that assist in making sense of these places are described and analyzed.
Consistency was approached in both an internal and external manner. First, all channels were analyzed individually to see if consistency exists within the channel. After this, the channels were compared to each other to find ecosystem-relevant gaps in consistency.
The design element resilience was analyzed on the basis of the user activity clusters. By ex-amining which channels offered substitutes for the user activity, the resilience of the eco-system could be assessed. Furthermore, resilience was also determined by the ability of user adaptation allowed by the touchpoints.
The existence of reduction was examined, based on the user activities. By comparing the manner in which information was provided, the authors could spot where the ecosystem could be improved in terms of increasing or decreasing reduction.
For the design element correlation, the analysis was approached, based on the channel clus-ters. Here, the authors examined which channels refer to which, and attempted to explain why they are interlinked in this manner. The findings were summarized in a matrix, which opposed the channels towards each other.
The before and after phases were analyzed based on comments and findings from the user interviews, and then compared to the applied framework.
Lastly, conclusions were drawn, the framework was adjusted to its final version and sum-marized within the result discussion.

39
3.5 Generalizability and validity To ensure a high research quality in this thesis, the subjects of generalization and validity are considered.
Generalizations drawn from case studies are very rare and unreliable, as the study at hand is commonly context dependent (Yin, 2009; Ghauri & Grønhaug, 2010). Especially, as this thesis concerns a single case study, it is acknowledged that the results of this study are re-stricted in terms of generalizability. Yin (2009) suggested that case studies attempt to gen-eralize a set of results of a broader theory, which can be agreed on to suit this paper. The purpose of this thesis is to gain a better understanding of a contemporary, complex phe-nomenon, and therefore the authors believe that the knowledge that can be drawn from this case study is more important than creating something that can be applied to a broader context. The results are held true for this particular case study, although further research must be conducted for the findings to be generalizable. Nonetheless, the implications of the findings do help strengthen existing research theories, and provide a suggestion of how researchers can approach and conduct a similar study.
The methodology section of the paper has explained pedagogically and thoroughly how the study was conducted, and the motivations for the choices that were made. By demonstrat-ing transparency throughout the research paper, it is possible to replicate the case study (Yin, 2009; Ghauri & Grønhaug, 2010).
When discussing validity, two subject areas are considered: validity of the evidence within the study and the validity of the outcome of the study (Yin, 2009; Ghauri & Grønhaug, 2010). Concerning evidence, there are two questions to keep in mind: are there multiple sources of evidence, and was the evidence used valid for the study. Based on the previous discussion on triangulation, it has been confirmed that evidence in the form of primary da-ta from multiple sources, as well as an extensive amount of literature, has been used. Through using the literature, the authors have defined the context of the phenomena and the aspects of what is studied. In section 3.1 it is explained how the study was approached in practice. Concerning the second question, the point to be proven is, whether or not the right sources of evidence were used. For the data collection, the authors observed the de-sign of the cross-channel ecosystem, by interviewing the company, and questioning the us-ers of the ecosystem. In addition, direct observations were applied and documentations ex-amined to confirm the function of these artifacts. The evidence of the ecosystem is there-fore constructed by all key actors, and thus no source of evidence was omitted. As for the theory used in the paper, the authors explained their decisions in chapter 3.3.2.1. By using a high citation ranking of the articles and utilizing the method of snowballing among article references, an extensive array of literature was found. The finalized reference list of this paper is far shorter than the bibliography, as more than double the amount of articles were read and deemed either outdated or being a poor fit concerning the research objectives. By reading such an extensive amount of articles, it is believed that no critical literature was omitted.
Next, the outcome of this study is examined. In the analysis, discussion and conclusion the authors avoided making claims the study cannot validate. The analysis of the primary and secondary data helps strengthen the validity of the results of this paper in varying degrees. The research gap that has been stated was found and reinforced through theory and thus, proven to exist.

40
4 Findings and analysis In this section, the findings from the interview with the business developer and the IT Manager of the case study company, the user interviews, and direct observations of the Karlstadsbuss transportation system arti-facts and the examination of the company documentation in form of the website and app are presented.
First, the company findings are reported, which consist of information from the company interview, an anal-ysis of the Karlstadsbuss website and app, and direct observations. To share the findings, the company is in-troduced, followed by an explanation of the IT systems and the service artifacts that Karlstadsbuss offers. Next, the findings from the user interviews are summarized and clustered. This includes the explanation of the user activities in the ecosystem and the users opinions, motivations and feelings towards the company’s services. After this, both findings are combined to determine the user relevant Karlstadsbuss ecosystem. This ecosystem is represented textually and visually with the support of user journeys. Lastly, a language of cri-tique is compiled to test the UXD of the above defined ecosystem on the basis of the in chapter 2.5 devel-oped framework.
4.1 Company findings In order to approach the Karlstadsbuss ecosystem, the authors executed a company inter-view with the business developer and the IT manager of Karlstadsbuss. Furthermore, they analyzed the Karlstadsbuss website and app. On the basis of these results, the service arti-facts of Karlstadsbuss have been observed directly. The results of these investigations are presented below. First, the company Karlstadsbuss, its goals, mission, strategies and com-munication plan are described. Further on, the value of IT systems for Karlstadsbuss is de-termined. Finally, the different artifacts of the Karlstadsbuss service are presented in detail.
4.1.1 Company presentation
Karlstadsbuss is a department of the Karlstad municipality within Karlstad in Sweden (Karlstadsbuss, 2015a; R. Sahlberg & M. Lindgren, personal communication, 2015-03-11). Karlstadsbuss provides the local public bus transport in Karlstad. The department has 12 employees. In the summer, Karlstadsbuss additionally provides a boat bus service on the local canals of the city (Karlstadsbuss, 2015a). The remaining public transport services in the Värmland region are managed by Värmlandstrafiken. The coordination of Värmland-strafiken and Karlstadsbuss within the Värmland region is executed by the local authority within the transport committee of Värmland. Since 2013, Förenade Buss AB operates the actual bus service, by providing buses and bus drivers (R. Sahlberg & M. Lindgren, person-al communication, 2015-03-11; Karlstadsbuss, 2015a; Region Värmland, 2015).
Since Karlstadsbuss is a department of the Karlstad municipality, it has to follow the Karls-tad municipality graphic profile for its channels and touchpoints. The graphic profile of the Karlstad municipality includes red, yellow and orange coloring, and contains the brand mark of the Karlstad municipality: the smiling sun.

41
Figure 4.1 - Brand mark of the Karlstad municipality
“The challenge there is to make those services so they feel like it is the same service. […] That is a long-term goal, to make it feel like it’s one service that we are providing. But of course they all have a history and we are trying to go from there.” (R. Sahlberg, personal communication, 2015-03-11).
In 2014, six out of ten residents in Karlstad chose to take the bus. In terms of customer satisfaction, Karlstadsbuss placed second best of all public transport companies in Sweden (2014) (Karlstadsbuss, 2014).
The vision of Karlstadsbuss is that “in Karlstad it is easy to live without a car” R. Sahlberg, per-sonal communication, 2015-03-11).
“We don’t mention public transport in that vision because we feel like we are a part of sustainable travel. [...] It is not a human right to have a car and you shouldn’t need to own one to live a good life in our city.” (R. Sahlberg, personal communication, 2015-03-11).
Since 2005, Karlstadsbuss has had the two goals of doubling their number of travellers and having the most satisfied customers of all the public transport companies in Sweden. To achieve this, Karlstadsbuss follows five strategies when doing business:
• Let the customer help to prioritize, • Ensure the base quality, • Communicate, • Work with a long-term view, and • Be on the forefront (R. Sahlberg & M. Lindgren, personal communication, 2015-03-11; Karlstadsbuss, 2014).
In the following paragraph the five strategies are presented in detail.
Through market research, customer satisfaction surveys, social media, and personal contact with the customers, Karlstadsbuss creates data to distinguish what is important to its cus-tomers. This is used as the guideline to prioritize its efforts. Ensuring the basic quality in-cludes keeping the core service of Karlstadsbuss in mind, which is satisfying public transport with buses. For Karlstadsbuss, that encompasses clean buses, reasonable prices, friendly bus drivers and having buses that arrive on time. The strategy of ‘communication’ means that Karlstadsbuss shares information about what it is currently doing to improve its offerings. This includes telling the customers about the projects, activities and engagements of Karlstadsbuss over all media channels in a transparent manner. The fourth strategy en-compasses that Karlstadsbuss works with a long-term approach. This means that Karls-tadsbuss engages in local politics, and with the city planning and development department of Karlstad to ensure a good position of public transport for Karlstad in the future. Being on the forefront includes being a part of research projects to know what kind of market developments can be expected in ten to twenty years. Here, the collaboration of Karlstads-buss and the Service and Market Oriented Transport Research Group (SOMAT) of the

42
Karlstad University were especially mentioned (R. Sahlberg & M. Lindgren, personal com-munication, 2015-03-11).
Karlstadsbuss is working with one communication plan for all of its customers. Though, it is targeting activities for specific user groups, e.g. information days, or fares. Furthermore, Karlstadsbuss is actively involved within youth councils and student and senior organiza-tions of the city to enable an open dialog. If a specific knowledge need arises, Karlstads-buss further invites specific user groups for focus groups to clarify questions or customers needs. “It always comes back to have this open communication. […] If you get the customers in one place, let them know what else is out there.” (R. Sahlberg, personal communication, 2015-03-11).
To consider customer priorities in its work is one of the main strategies of Karlstadsbuss. To find out about those, Karlstadsbuss had to generate customer data from different sources. The sources, which were highlighted in the interview, are:
• A yearly-published customer satisfaction survey, organized by the national public transportation organization. This organization conducts 100 interviews per month per region or city, in total 1200 interviews per year, to calculate the national rating in customer satisfaction of all public transportation companies in Sweden.
• A survey, which randomly appears at the Karlstadsbuss website, asking about the satisfaction concerning the website.
• Social media, in form of Facebook or Twitter.
“We have a Facebook page. People write a lot about what they are thinking about different things. When we released our application [we took the users in consideration]. It’s one feature that at least 9 of 10 were writing about. So we know that this is the feature they want.” (M. Lindgren, personal communica-tion, 2015-03-11).
• Research activities from the Karlstad University and its research group SOMAT. As specific example, a few years ago SOMAT executed a customer involved service in-novation.
“We recruited 40 people for a few days. They were instructed [...] to take notes about things […] they saw, how they reacted to things when they were using our public transportation. And then they got interviewed […] and then those researchers could extract […] different areas […] for new improvement. […] That gave us a lot of insight as well on how the customers think.” (R. Sahlberg, personal communication, 2015-03-11).
• Focus groups, which are conducted for specific knowledge needs for specific cus-tomer groups.
In general, Karlstadsbuss believes that listening to the young generation of ‘Digital Natives’ can predict the future business development areas. “If we can satisfy the needs of the younger peo-ple […] without making it worse for the elderly, it is a good way of development.” (R. Sahlberg, person-al communication, 2015-03-11).

43
4.1.2 IT systems
Concerning the hierarchy of decisions for the Karlstadsbuss IT systems, Robert Sahlberg is developing the services and the content for the IT systems. Mathias Lindgren is responsible for operational decisions concerning the IT systems of Karlstadsbuss. When more strategic decisions have to be made, Robert Sahlberg and Mathias Lindgren consult their department head or, if necessary, take the decision to the local politicians. Furthermore, Karlstadsbuss abides by national laws, regulations and is involved with EU regulations via the ticket sys-tem BIMS.
Karlstadsbuss employs several systems, which are relevant for their transport service:
• The central ticketing system BIMS, which is used by public transportation compa-nies in the regions of Värmland, Dalarna, Gävleborg, Örebro, Västmanland and Uppland and passengers using Tåg i Bergslagen (train operator in Bergslagen) and funded by the EU, • The real-time bus arrival system Live!, • The travel planner, • The website, • The app for buses, • The app for boats, • The new system to inform about disruptions, • The small ticket machines, • The big ticket machines, • The Pressbyrån vending machines, and • The bus TV.
“Almost all of our customers get in touch with one or more systems in every travel they do, so it (IT systems) is really important.” (M. Lindgren, personal communication, 2015-03-11).
4.1.3 Company service artifacts
On the basis of the primary and analyzed secondary data, the authors established a list of the available artifacts within the Karlstadsbuss ecosystem (R. Sahlberg & M. Lindgren, per-sonal communication, 2015-03-11; Karlstadsbuss, 2015a; Karlstadsbuss, 2015b; Karlstads-buss, 2015c; Karlstadsbuss, 2015d; Karlstadsbuss, 2014). Within this observation, the study does not further consider the Karlstadsbuss service of the bus boats, since this service was not available during the time of the research. Furthermore, the transportation services for disabled and handicapped are also excluded, as these function vary greatly from the regular bus system.
When discussing service artifacts, it was said that “We don’t demand that people have to use just one channel, it should be broad and you could use whatever you want.” (R. Sahlberg, personal com-munication, 2015-03-11).
In the following section, the study presents the Karlstadsbuss service artifacts, which are designed by Karlstadsbuss as parts of its service offering: bus, bus card scanner, next stop display, bus TV, bus driver, bus stop, bus stop signs, bus line maps, bus timetables, QR code, real-time display Live!, customer center, booklet, disruption phone number, kiosks (Pressbyrån & others), ticket machines, website, interactive ticket purchase place map, in-teractive bus line map, app, social media, bus card, paper ticket, turkronor, mobile ticket.

44
Bus
The buses in Karlstadsbuss are run by Förenade Buss AB. The contract for this service de-livery was defined in a public tender, which Förenade Buss AB won in 2013. The services of Förenade Buss AB include the offering of buses, bus drivers and keeping the buses run-ning. The bus branding is defined by the tender conditions and complies with the graphic profile of the Karlstad municipality. The basic elements of the service delivery include clean buses, friendly bus drivers, and buses which are on time according to the time tables.
The buses of the basic bus lines of Karlstadsbuss are bendy buses. Furthermore, buses in the standard size are deployed, which hold about 80 people. On occasion, buses for the special lines can be smaller than the standard size buses and hold about 50 people. Within the bus, a customer can find beside seats and areas for wheelchairs, walking aids, or strollers, the following elements:
• A bus card scanner, • The bus line map, • 1-3 (depending on the bus size) next stop displays, and • 2-3 (depending on the bus size) Bus TV’s.
Bus card scanner
The bus card scanner in the Karlstadsbuss buses is situated circa half a meter behind the bus driver on the right side, when entering the bus. The bus card scanner consists of a small display, twelve buttons located on both sides of the display, and a scanner field below the display. The scanning field originally displays a sticker, which shows a hand holding the Karlstadsbuss bus card and the icon for the radio or Wi-Fi function. The design uses the Karlstad municipality graphic profile. However, since the field is handled so much, the au-thors could observe that most of the stickers were scratched and whitened by the sun, so much that it was not possible to recognize the icon of the sticker anymore.
Before scanning, the start screen of the bus card scanner shows the Karlstad’s brand mark, the company name, welcomes the user on board, and invites the traveller to hold the bus card over the scanning area with an arrow pointing towards the scanner field. In addition, the lowest button on the left side can be used to retrieve the balance or validity of the trav-eller’s bus card.
Figure 4.2 - Bus card scanner before scanning
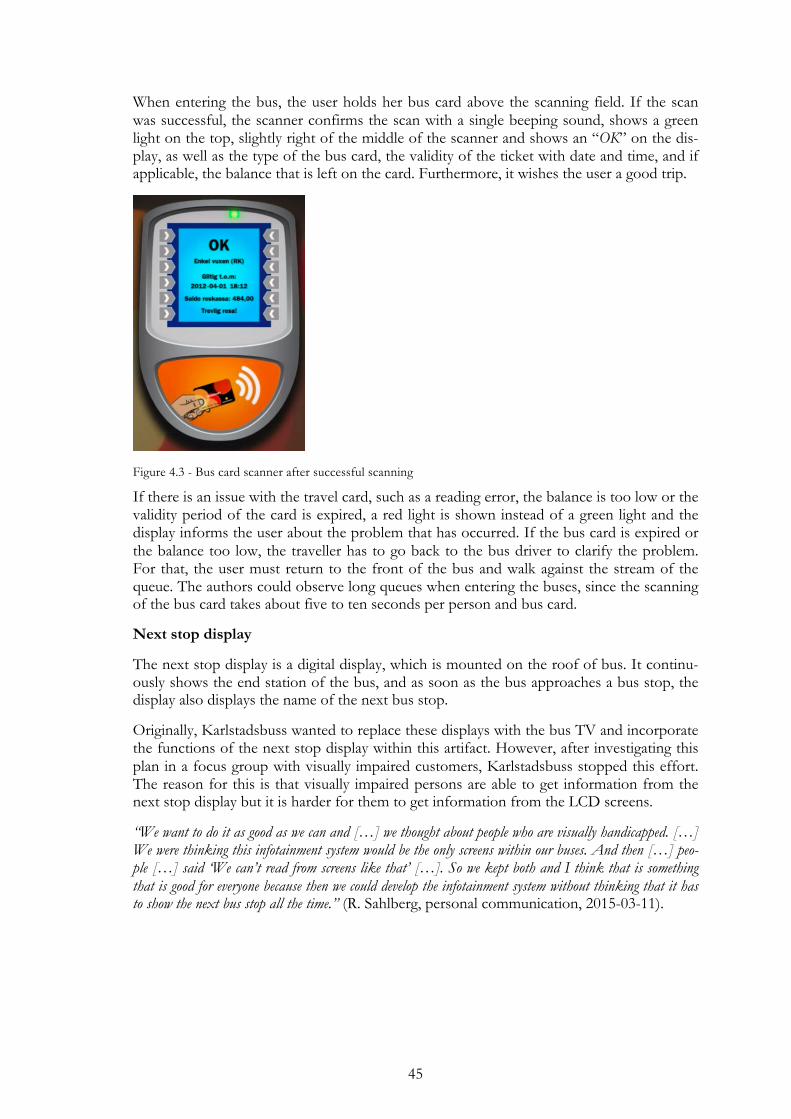
45
When entering the bus, the user holds her bus card above the scanning field. If the scan was successful, the scanner confirms the scan with a single beeping sound, shows a green light on the top, slightly right of the middle of the scanner and shows an “OK” on the dis-play, as well as the type of the bus card, the validity of the ticket with date and time, and if applicable, the balance that is left on the card. Furthermore, it wishes the user a good trip.
Figure 4.3 - Bus card scanner after successful scanning
If there is an issue with the travel card, such as a reading error, the balance is too low or the validity period of the card is expired, a red light is shown instead of a green light and the display informs the user about the problem that has occurred. If the bus card is expired or the balance too low, the traveller has to go back to the bus driver to clarify the problem. For that, the user must return to the front of the bus and walk against the stream of the queue. The authors could observe long queues when entering the buses, since the scanning of the bus card takes about five to ten seconds per person and bus card.
Next stop display
The next stop display is a digital display, which is mounted on the roof of bus. It continu-ously shows the end station of the bus, and as soon as the bus approaches a bus stop, the display also displays the name of the next bus stop.
Originally, Karlstadsbuss wanted to replace these displays with the bus TV and incorporate the functions of the next stop display within this artifact. However, after investigating this plan in a focus group with visually impaired customers, Karlstadsbuss stopped this effort. The reason for this is that visually impaired persons are able to get information from the next stop display but it is harder for them to get information from the LCD screens.
“We want to do it as good as we can and […] we thought about people who are visually handicapped. […] We were thinking this infotainment system would be the only screens within our buses. And then […] peo-ple […] said ‘We can’t read from screens like that’ […]. So we kept both and I think that is something that is good for everyone because then we could develop the infotainment system without thinking that it has to show the next bus stop all the time.” (R. Sahlberg, personal communication, 2015-03-11).

46
Bus TV
The bus TV is the infotainment system of Karlstadsbuss. The bus TV is transmitted via ca. 20 inch LCD displays. The displays are mounted at the left side of the buses in eye height, about 1,5 meters off the floor. The Karlstadsbuss Bus TV allows Karlstad and Karlstads-buss opportunities of communicating local news and informing about current projects, provides how-to-guides to use the services of Karlstadsbuss, and involving their customers.
The content of the Bus TV covers
• International and local news, • Local advertising, • How-to- and information videos of the YouTube Channel of Karlstadsbuss, • Voluntary contributions of customers, and • Information via real-time display Live! about the arrival of buses for the next bus
stop.
These elements are displayed in a constant loop. In the case of the voluntary contributions of customers, customers are encouraged to send in pictures and videos of their experiences in Karlstad and with Karlstadsbuss. Karlstadsbuss provides an email address to its custom-ers via Bus TV and on its website for that purpose.
Bus driver
The tasks of the bus drivers, who work in the Karlstadsbuss buses, are:
• To drive the bus, • To stop at all bus stops in the event that someone wants to leave the bus and press-
es the stop button, or someone is standing at the next bus station and wants to take the bus,
• To lower the bus height if customers with strollers, wheelchairs or walking aids want to enter or exit the bus,
• To communicate announcements in case of the need for information, • To validate paper and mobile tickets and confirm those tickets in the bus system, • To accept turkronor, • To sell bus tickets for cash, and • To refill monthly bus cards for cash or turkronor. • Furthermore, the bus driver answers questions from customers concerning the bus
route or further bus traffic related questions.
Bus stop
The bus stop of Karlstadsbuss is a glass shelter, or a bus stand. Seats are mounted within the glass shelter type bus stops. It is possible that seats can be positioned next to the bus stop stands, but this is not always the case. The Karlstadsbuss bus stops consist of several elements and touchpoints. At every bus stop one can find the following parts:
• Signs, which indicate which bus lines stop and leave from the bus stop, • Bus line maps, which indicate where the buses go and stop, • Bus time tables, which show the arrival times of the buses that stop at the bus stop, • The Live! display is available in different sizes at most of the bus stops,

47
• The QR code, which informs travellers about disruptions after scanning, and • Different marketing posters.
To provide their customers with the best possible service within the Värmland region, Karlstadsbuss partnered up with Värmlandstrafiken. Due to this partnership, buses of Värmlandstrafiken can stop at the bus stops of Karlstadsbuss.
Bus stop signs
The bus stop signs are mounted to the glass shelter of the bus stop, or to the top of the bus stop stands, and indicate the bus stop name and which bus lines stop and leave at the bus stop. The signs’ background has a dark orange color, following the Karlstad municipal-ity graphic profile. The bus lines are visualized with colored circles or round-edged squares with the respective bus line number on them. The coloring of the circles is done according to the coloring of the bus lines in the bus line maps and timetables.
If Värmlandstrafiken buses stop at the bus station, it is indicated with an added space on the upper part of the sign in the light orange brand color of Värmlandstrafiken and the logo of Värmlandstrafiken (see Figure 4.4). Värmlandstrafiken bus numbers are not specifi-cally displayed on the signs.
Figure 4.4 - Bus stops signs mounted at a bus stop in Karlstad
Bus line maps
Bus line maps can be found at the bus stops, on the website, the app, and within the bus. Furthermore, the bus line maps are connected with the interactive bus line map on the website and the app. Karlstadsbuss deploys four different bus line maps:
• Basic bus line • Center bus line • Hockey bus line • Special bus line
The basic bus lines are indicated by the one-digit bus line number in a circle of a defined color for the specific bus line. The center, hockey, and special bus lines are indicated by the two-digit bus line number in a round-edged square of purple for the center lines or black

48
for the hockey, or special bus lines. This enables the traveller to distinguish between the bus lines at the first glance.
The basic bus lines cover the main travel routes in Karlstad and connect the center with the suburbs of Karlstad. There are eight buses from the basic bus line numbered from 1 to 8. Each bus number has its own color:
• 1 - Campus - Universitetet - Centrum - Bergvik Köpcenter - Ikea (yellow) • 2 - Mjölnartorpet/Välsviken - Kronoparken - Centrum - Skåre (green) • 3 - Stockfallet/Universitetet-Lorensberg-Centrum-Sjukhuset-
Sommarro/Jakobsberg (red) • 4 - Norra Kroppkärr - Centrum - Gruvlyckan - Bergvik Köpcenter (mint blue) • 5 - Centrum - Hultsberg - Henstad (orange) • 6 - Färjestad - Centrum - Våxnäs - Gruvlyckan (dark blue) • 7 - Orrholmen - Centrum - Zakrisdal (pink) • 8 - Sjöstad - Herrhagen - Centrum - Skåre - Grava (light blue)
Figure 4.5 - Bus line map of the Karlstadsbuss basic bus lines
Each line of the center bus lines have a purple color and are numbered from 11 to 13. The center buses mainly cover the areas within and close to the Karlstad city center. All the buses leave or end at the bus station ‘Stora Torget’ in the city center. They run mainly be-tween 7:00 and 17:00, once per hour.

49
Figure 4.6 - Bus line map of the Karlstadsbuss center bus lines
All the hockey bus lines have a black color and are numbered from 61 to 64. The unique-ness of these bus lines is that they only run during hockey games in the city, to transport all the hockey fans to the hockey arena at the bus station ‘Löfbergs Lila Arena’. The bus lines do not run for practice matches. The buses leave 60 minutes before the match starts and leave 15 minutes after the match has ended.
Figure 4.7 - Bus line map of the Karlstadsbuss hockey bus lines
All the special bus lines are a black color and are numbered from 51 to 59. Each of the buses leave from or end at the bus station ‘Stora Torget’ in the city center. These bus lines only run in the morning, late afternoon, or evening to cover the peak hours of travelling to and from the city center.

50
Figure 4.8 - Bus line map of the Karlstadsbuss special bus lines
Karlstadsbuss put a lot of effort into the simplification of the bus line system and the bus line maps in 2005. To do that, Karlstadsbuss divided the bus lines into basic and special-ized lines. The underlying design principle for the new bus map system was the concept of subway maps. Furthermore, Karlstadsbuss worked together with a local marketing compa-ny to create signs and use colors, which are easy to remember. One of the main goals of Karlstadsbuss is to reach an easy understanding of their system.
“We know from a lot of research that maybe the most important factor for increase in travel in public transportation is to increase the knowledge about the possibilities. […] That’s more important than priz-ing. […] Having something that’s easy to communicate and easy to understand, that’s very key to make it accessible, because people hate to be stupid.” (R. Sahlberg, personal communication, 2010-03-11).
“People don’t want to read the map or to use manual for the public transportation to make it self-explaining.“ (R. Sahlberg, personal communication, 2010-03-11).
Karlstadsbuss is aware of an area that requires improvement within the prioritization of buses in the city. A big factor in the decision of whether a customer takes the bus is the time duration, i.e. how long it takes to take the bus in comparison to the car. The overarch-ing goals are to create faster routes or more optimal connections.
Bus timetable
The bus timetable is a list of the regularly planned routes, without any adjustments for dis-ruptions, construction detours or similar non-standard information. The bus timetables are provided in four different ways: printed and placed at the bus stop, digitally on the website and through the app, and in the booklet.
The bus timetables follow the design of the bus lines by maintaing the coloring and using the circle or round-edged quarter with the one-digit or two-digit numbers.
On the app and the website, the timetable is provided as a downloadable pdf document, one for each bus line. In the pdf is also a map of how the bus line drives in Karlstad. At the bus stop, the timetable is provided as a physical touchpoint, where a printed version of all bus lines that pass through that particular bus stop has been placed. In the booklet all bus lines timetables are provided.
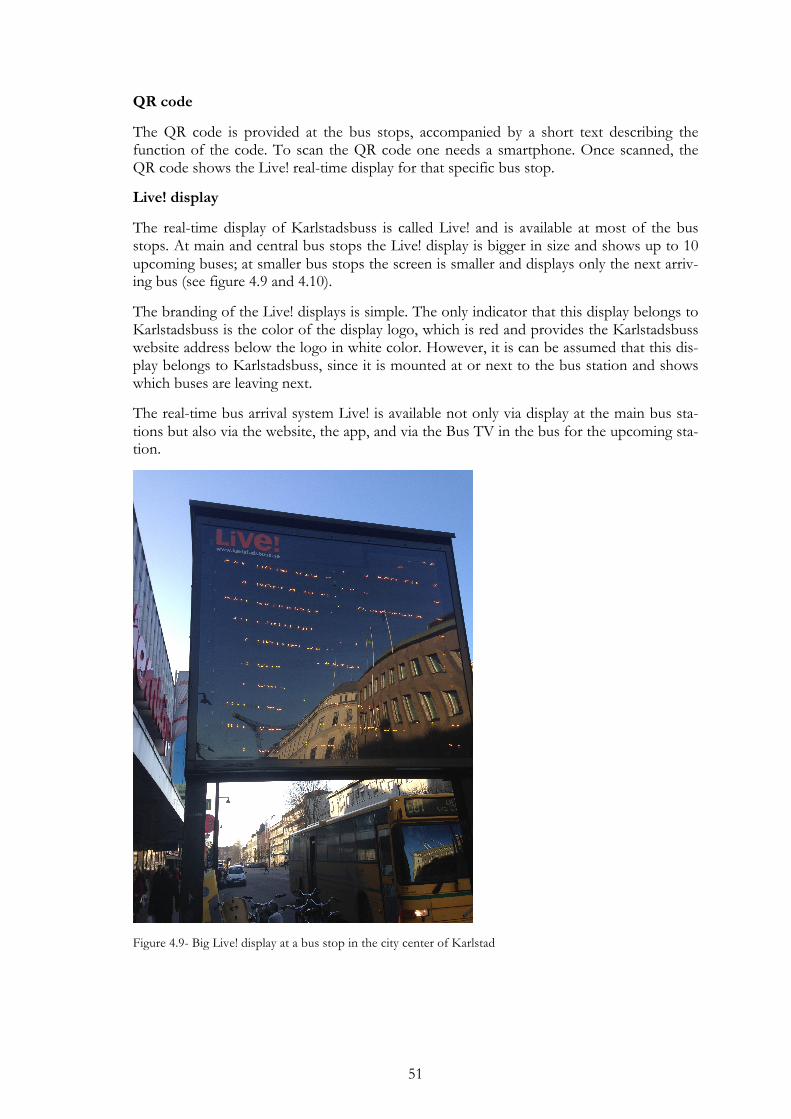
51
QR code
The QR code is provided at the bus stops, accompanied by a short text describing the function of the code. To scan the QR code one needs a smartphone. Once scanned, the QR code shows the Live! real-time display for that specific bus stop.
Live! display
The real-time display of Karlstadsbuss is called Live! and is available at most of the bus stops. At main and central bus stops the Live! display is bigger in size and shows up to 10 upcoming buses; at smaller bus stops the screen is smaller and displays only the next arriv-ing bus (see figure 4.9 and 4.10).
The branding of the Live! displays is simple. The only indicator that this display belongs to Karlstadsbuss is the color of the display logo, which is red and provides the Karlstadsbuss website address below the logo in white color. However, it is can be assumed that this dis-play belongs to Karlstadsbuss, since it is mounted at or next to the bus station and shows which buses are leaving next.
The real-time bus arrival system Live! is available not only via display at the main bus sta-tions but also via the website, the app, and via the Bus TV in the bus for the upcoming sta-tion.
Figure 4.9- Big Live! display at a bus stop in the city center of Karlstad
52
Figure 4.10- small Live! display at a bus stop in the suburbs of Karlstad
The information given at the Live! display is:
• The bus number, • The bus name and end station, and • The minutes left to the arrival of the bus. • When the bus is arriving the display shows “Nu” (now) instead of the minutes left.
In the case that a bus is late, the minutes at the display do not continue counting down un-til the bus is moving towards the bus stop again. This means that a traveller can look at the display, which shows two minutes, and wait for another five minutes if the bus is five minutes late.
Due to the partnership of Karlstadsbuss and Värmlandstrafiken, the arrival of Värmland-strafiken buses is also displayed on the Live! display at a Karlstadsbuss bus stop. However, the travel planning system and the underlying system of Live! is not shared between Värm-landstrafiken and Karlstadsbuss. That is why the arrival time of the buses of Värmland-strafiken is not measured in real-time. The companies only exchange the travel times be-tween each other. Via this method, Karlstadsbuss ensures that the buses of Värmlandstraf-iken displayed in their real-time arrival display live, even though these times are not real-time.
Customer center
The customer center of Karlstadsbuss is located in central Karlstad, in the same building as the city library, the municipality and the Karlstadsbuss office. The building is marked with the Karlstad’s logo of a smiling sun, and the name is written on an orange sign (same color as the buses). At the customer center the user can ask about bus connections, ticket alter-natives, information about prices, get a timetable booklet, refill bus cards, buy tickets and buy turkronor. It is also possible to call the customer center for information.
Booklet
The booklet is a printed, physical artifact, where the user can find timetables for all bus lines. It also provides the four bus line maps. The timetables are presented in the form of a list with the regularly planned routes, without any adjustments for disruptions, construction detours or similar non-standard information. The booklets can be collected at kiosk, which sell tickets or turkronor, and the Karlstadsbuss customer center.
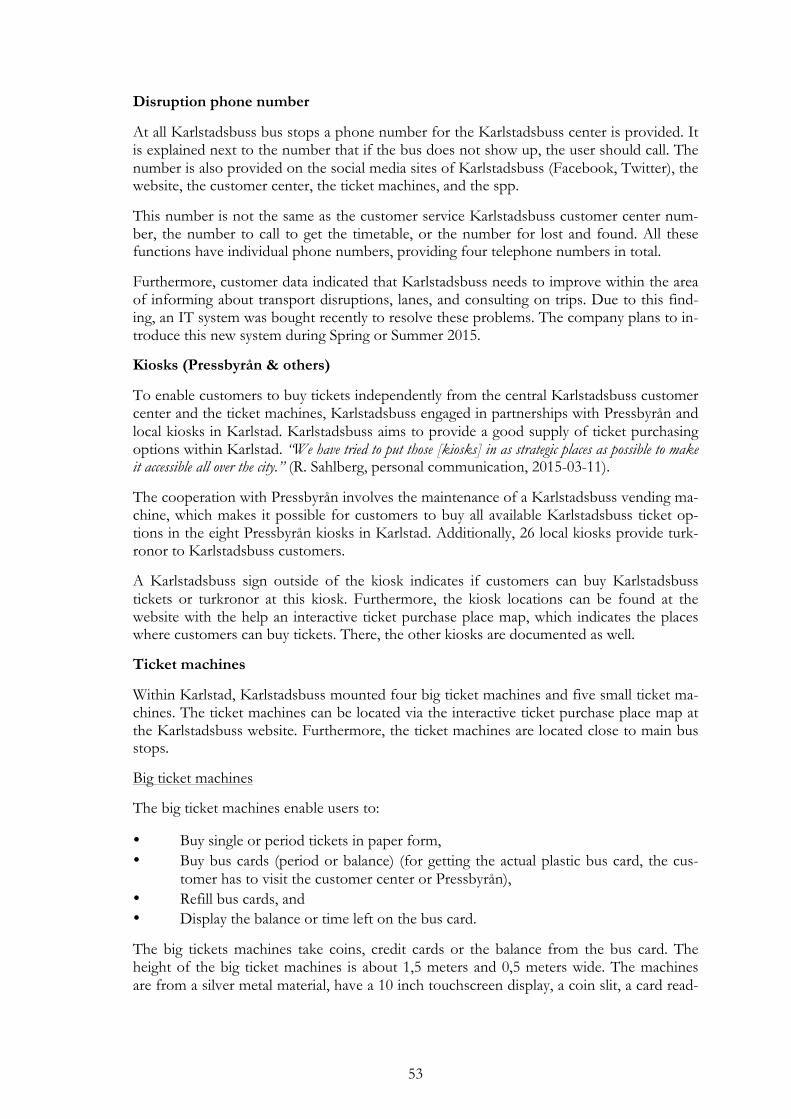
53
Disruption phone number
At all Karlstadsbuss bus stops a phone number for the Karlstadsbuss center is provided. It is explained next to the number that if the bus does not show up, the user should call. The number is also provided on the social media sites of Karlstadsbuss (Facebook, Twitter), the website, the customer center, the ticket machines, and the spp.
This number is not the same as the customer service Karlstadsbuss customer center num-ber, the number to call to get the timetable, or the number for lost and found. All these functions have individual phone numbers, providing four telephone numbers in total.
Furthermore, customer data indicated that Karlstadsbuss needs to improve within the area of informing about transport disruptions, lanes, and consulting on trips. Due to this find-ing, an IT system was bought recently to resolve these problems. The company plans to in-troduce this new system during Spring or Summer 2015.
Kiosks (Pressbyrån & others)
To enable customers to buy tickets independently from the central Karlstadsbuss customer center and the ticket machines, Karlstadsbuss engaged in partnerships with Pressbyrån and local kiosks in Karlstad. Karlstadsbuss aims to provide a good supply of ticket purchasing options within Karlstad. “We have tried to put those [kiosks] in as strategic places as possible to make it accessible all over the city.” (R. Sahlberg, personal communication, 2015-03-11).
The cooperation with Pressbyrån involves the maintenance of a Karlstadsbuss vending ma-chine, which makes it possible for customers to buy all available Karlstadsbuss ticket op-tions in the eight Pressbyrån kiosks in Karlstad. Additionally, 26 local kiosks provide turk-ronor to Karlstadsbuss customers.
A Karlstadsbuss sign outside of the kiosk indicates if customers can buy Karlstadsbuss tickets or turkronor at this kiosk. Furthermore, the kiosk locations can be found at the website with the help an interactive ticket purchase place map, which indicates the places where customers can buy tickets. There, the other kiosks are documented as well.
Ticket machines
Within Karlstad, Karlstadsbuss mounted four big ticket machines and five small ticket ma-chines. The ticket machines can be located via the interactive ticket purchase place map at the Karlstadsbuss website. Furthermore, the ticket machines are located close to main bus stops.
Big ticket machines
The big ticket machines enable users to:
• Buy single or period tickets in paper form, • Buy bus cards (period or balance) (for getting the actual plastic bus card, the cus-
tomer has to visit the customer center or Pressbyrån), • Refill bus cards, and • Display the balance or time left on the bus card.
The big tickets machines take coins, credit cards or the balance from the bus card. The height of the big ticket machines is about 1,5 meters and 0,5 meters wide. The machines are from a silver metal material, have a 10 inch touchscreen display, a coin slit, a card read-

54
er and PIN field with a small display. Furthermore, there is a compartment with a sheer plastic flap to retrieve the change, receipts and printed tickets. Additionally, the machine al-so has a round scanner field for the bus cards. The scanner field has the same icon as the scanner field of the bus card scanners within the buses, but also the same problem - the sun and usage have whitened the sticker. The compartment, the cash slit, and the card reader have short description stickers mounted above or next to them to explain their func-tions, or which coin types the machine takes. Above the touchscreen, the customer can see the black Karlstadsbuss logo and a sticker of the Karlstad municipality logo. The sticker on the machines that the authors looked at was whitened through due to the sun and was only identifiable by the familiar shape (figure 4.11). In addition, when selecting ticket options, where the scanning of the bus card is needed, the screen shows where to hold the bus card to the scanner. In the case of questions about disruptions or bus times, the machine refers to telephone numbers and the customer center with the address, telephone numbers, the e-mail-, website-, and Facebook address. The user interface of the touchscreen makes use of the Karlstad graphic profile.
The authors had particular problems when the sun was shining on the ticket machine, as it was hard to see the content of the display. Further, the screen was dusty and had an un-clean appearance.
Figure 4.11- Big ticket machine - touch screen display

55
Figure 4.12- Big ticket machine - cash slit and card reader
Figure 4.13 - Big ticket machine - change and ticket compartment
Small ticket machines
The features enabled by the small ticket machines are to buy tickets for single rides and add a balance to bus cards, 14 or 30 day period cards.
The small tickets machines take coins or credit card. The height of the big ticket machines is about 1,5 meters and 0,2 meters wide. The machines are of a silver metal and blue plastic material, have a 10 inch touchscreen display, a coin slit, a card reader and PIN field with a small display. The small ticket machines look like parking meters and function similarly. Description stickers are mounted close to the coin slit and the card reader to explain the usage of the ticket machine. On the right lower corner of the machine the ticket can be taken from a small compartment. The Karlstad municipality branding cannot be found.

56
Figure 4.14 - Small ticket machine
Historical background on the two different ticket machine types
At the time when these machines were put up, the small ticket machines were the only op-tion on the market for Karlstadsbuss. When the new ticket machine system was intro-duced, the big machines with the more extensive ticket options were added in addition to the small ticket machines. The small ticket machines were never dismounted, and therefore exist in parallel to the other.
Website
The website ‘www.karlstadsbuss.se’ represents the formal online presence of Karlstadsbuss (i.e. not including social media presence). The website is managed by the Karlstadsbuss IT department, and therefore the company is responsible for updates as well as ensuring the shared platforms and systems are functioning correctly (e.g. that the Live!-function shows the same timetable as the app). The website is linked to the official website of the Karlstad municipality. The website also refers to the Karlstadsbuss social media accounts on Face-book, Twitter and YouTube, and to the Värmlandstrafiken website. The website uses the Karlstad municipality graphic profile and makes use of the Karlstad logo.
The Karlstadsbuss website offers information about:
• Ticket types • Ticket purchasing places (in form of a written list) • How to buy and use tickets • How to use the App • How to use the travel planner • Contact details of the company (address of the customer center, phone numbers,
email addresses) • The company's history and current management • Boat buses • Special travel services for users with disabilities • Information about traffic disruptions • News concerning Karlstadsbuss • Projects Karlstadsbuss is currently partaking in.

57
The website also offer a number of functions:
• The Live! real-time display for all Karlstadsbuss bus stops (selectable from a list) • Bus timetables in pdf format • An interactive map, where ticket machines, kiosks and the customer center is
placed • An interactive map that shows the bus stop locations • Refilling of bus cards online via the webshop • The travel planner • Comment functions for user feedback • A user survey about the website quality.
Interactive ticket purchase place map
The interactive ticket purchase map is available via the website of Karlstadsbuss. The map itself is provided by Google, and on that map Karlstadsbuss has placed the ticket purchas-ing locations. There are five color-coded symbols placed on the interactive map; red for the customer center, orange for Pressbyrån, grey for local kiosks where one can only buy turk-ronor, dark blue for big ticket machines and light blue for small ticket machines.
The user can either zoom in on the map to see the site, or click on a symbol to get the loca-tion details and a reminder of which type of ticket purchasing point it is. It is also possible to obtain directions to the purchasing place, as long as the user can type in her current lo-cation (this service is provided by Google Maps).
Interactive bus stop map
The interactive bus stop map is available via the website of Karlstadsbuss. The map itself is provided by Google, and on that map Karlstadsbuss has placed the locations of the bus stops. The user can either zoom in on the map to see the site, or click on a symbol to get the location details. When the user click on a bus stop symbol, the map provides the bus stop name, which bus lines provide service to the bus stop and the next 3 departure times. If the user would like to see more departures, she is linked to the Live! real-time display on the website. The user can also use the travel planner functions on the map by choosing a destination and start location directly via the bus stop symbols.
Travel Planner
The travel planner function is provided on the website and in the app. The user can enter either the address they are at or the bus stop they wish to travel from, and enter the desired destination (either address or bus stop). The user can then choose if she prefers to filter the timetable depending on the departure time from the bus stop, or the arrival time to the destination. The travel app provides estimated travel time, the number of necessary trans-fers and what a ticket would cost.
App
The Karlstadsbuss app is available in the App Store for the iPhone, iPad, or iPod Touch with iOS 7.0 Software or newer, and for Android smartphones. Furthermore, it adjusts the language setting of the app to Swedish or English depending on the underlying language settings of the device.

58
The app offers the following functions:
• The real-time display Live! for the selected bus stops, • The travel planner function, where the user can search for a bus stop, use localiza-
tion, choose bus stops on the interactive bus line map, or enter an address, • The localization of the current position to find a bus stop close by, • The saving of recent searches and proposition of them during next searches, • To create travel favorites, • To buy mobile tickets via credit card, • Gives information on ticket types and ticket options, • To manage already purchased tickets (available via ’My tickets’), • To view time tables and bus line maps, • To change app settings, • To give feedback, and • Get contact information.
Figure 4.15 - Karlstadsbuss app in the App Store

59
Figure 4.16 - Karlstadsbuss app - menu
Facebook is the most active social media channel for Karlstadsbuss. The main activities in-clude posting information about disruptions in traffic, technical issues, or competitions for users. The Facebook page allows users to post questions and comments, which Karlstads-buss responds to in a formal manner. This is useful to both, as it provides transparency, and allows for questions that many users might have to be answered publicly. On Face-book, links to Karlstadsbuss’ YouTube videos are provided, as well as links that are shared on both the Facebook page and their Twitter account.
“We have a Facebook page. People write a lot about what they are thinking about different things. When we released our application [we took the users in consideration]. It’s one feature that at least 9 of 10 were writing about. So we know that this is the feature they want.” (R. Sahlberg, personal communica-tion, 2015-03-11).
Karlstadsbuss states on its Twitter that this is not a very active media source for them, and suggests their own website or their Facebook account for better service. The main usage of the Twitter account is to inform about disruptions, such as construction or technical issues, announce competitions, promote themselves and certain events (e.g. that buses to a sport event are running).
YouTube
YouTube is used mainly as a learning tool for Karlstadsbuss users. The majority of the con-tent is ‘how-to’ videos, which describe how the user can use the services of Karlstadsbuss (e.g. how to buy a ticket via the app, how to use the travel card), but also here, as with Twitter and Facebook, self-promoting videos exists. There are as of now (2015-05-05) 23 videos in uploaded on the YouTube channel.
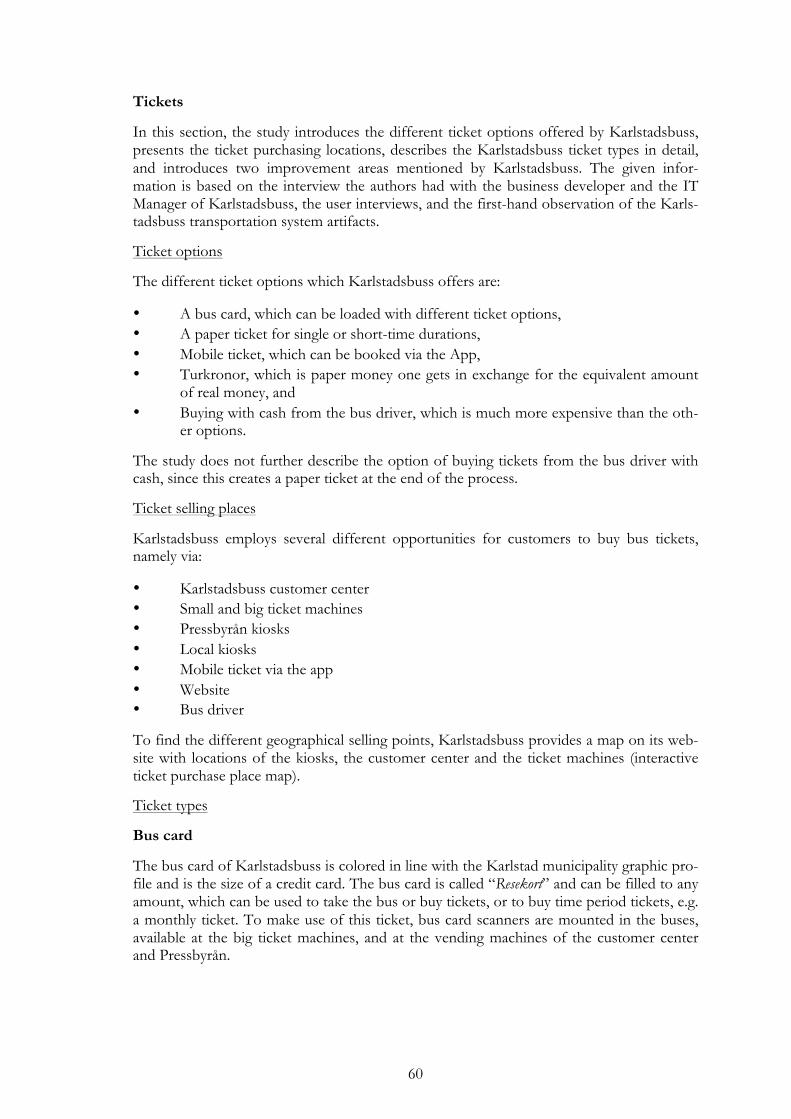
60
Tickets
In this section, the study introduces the different ticket options offered by Karlstadsbuss, presents the ticket purchasing locations, describes the Karlstadsbuss ticket types in detail, and introduces two improvement areas mentioned by Karlstadsbuss. The given infor-mation is based on the interview the authors had with the business developer and the IT Manager of Karlstadsbuss, the user interviews, and the first-hand observation of the Karls-tadsbuss transportation system artifacts.
Ticket options
The different ticket options which Karlstadsbuss offers are:
• A bus card, which can be loaded with different ticket options, • A paper ticket for single or short-time durations, • Mobile ticket, which can be booked via the App, • Turkronor, which is paper money one gets in exchange for the equivalent amount
of real money, and • Buying with cash from the bus driver, which is much more expensive than the oth-
er options.
The study does not further describe the option of buying tickets from the bus driver with cash, since this creates a paper ticket at the end of the process.
Ticket selling places
Karlstadsbuss employs several different opportunities for customers to buy bus tickets, namely via:
• Karlstadsbuss customer center • Small and big ticket machines • Pressbyrån kiosks • Local kiosks • Mobile ticket via the app • Website • Bus driver
To find the different geographical selling points, Karlstadsbuss provides a map on its web-site with locations of the kiosks, the customer center and the ticket machines (interactive ticket purchase place map).
Ticket types
Bus card
The bus card of Karlstadsbuss is colored in line with the Karlstad municipality graphic pro-file and is the size of a credit card. The bus card is called “Resekort” and can be filled to any amount, which can be used to take the bus or buy tickets, or to buy time period tickets, e.g. a monthly ticket. To make use of this ticket, bus card scanners are mounted in the buses, available at the big ticket machines, and at the vending machines of the customer center and Pressbyrån.

61
Figure 4.17 - Karlstadsbuss bus card
The bus cards can be bought at the customer center and Pressbyrån. The refill can be done via:
• The customer center (cash and credit card), • Pressbyrån (cash and credit card), • Big ticket machines (cash and credit card), • The website (credit card) and • The bus driver (cash and turkronor).
Karlstadsbuss further offers an automatic fill up option for bus cards as soon as the bal-ance falls under a defined, pre-set amount.
Paper ticket
Paper tickets function as a certificate of value. If the user buys a single ticket, or a 24 or 72 hour ticket, the user recieves a paper ticket instead of a bus card or turkronor. The paper ticket is shown to the bus driver when entering the bus, who in turn registers the users in the bus system. The purchase can be done at:
• The customer center (cash and credit card), • Pressbyrån (cash and credit card), • Big and small ticket machines (cash and credit card), and • The bus driver (cash and turkronor).
Turkronor
Turkronor resembles real money bills, but is designed by Karlstadsbuss with the Karlstad municipality graphic profile and elements, which are typical to the city. The Karlstad brand logo, the sun, Karlstadsbuss buses, the town’s landmark, the statue “Sola i Karlstad” and the bridge “Östra Bron”.
There are several different types of turkronor available:
• 15 turkronor bill for 15 SEK single ticket youth

62
• 23 turkronor bill for 23 SEK single ticket adults • 100 turkronor bill for 100 SEK refill for balance bus card • 215 turkronor bill for 14 day time period for bus card for children • 239 turkronor bill for 14 day time period for bus card for youth and students • 316 turkronor bill for 14 day time period for bus card for adults • 379 turkronor bill for 30 day time period for bus card for children • 409 turkronor bill for 30 day time period for bus card for youth and students • 549 turkronor bill for 30 day time period for bus card for adults
Figure 4.18 - Turkronor - showing icons of “Sola i Karlstad” and a bus of Karlstadsbuss
Figure 4.19 - Turkronor - showing icons of brand mark and “Östra Bron”

63
Figure 4.20 - Turkronor - available in different colors for the different values
The number on the turkronor bill stands for the amount of Swedish crowns the turkronor is worth. The exchange rate is 1 to 1. Turkronor can be bought at the customer center, Pressbyrån and kiosks and are handed to the bus driver when buying tickets or refilling bus cards. The purchases can be done at:
• The customer center (cash and credit card), • Pressbyrån (cash and credit card), and • Local kiosks (cash and credit card).
History of turkronor
In 2011, two armed bus robberies happened in Luleå. Due to this, Sweden’s transport in-dustry started a movement to abandon cash payments on buses to prevent future rob-beries. Turkronor was the solution of Karlstadsbuss. Though, up to now, cash payments are still available for a higher price at the Karlstadsbuss buses, to discourage cash payments on the bus.
Mobile ticket
The mobile ticket of Karlstadsbuss is available via the Karlstadsbuss app, under the section ’My tickets.’ To be able to buy tickets via the app, it is necessary to register the user’s phone number. The app sends a confirmation code via SMS, and after entering the confirmation code from the SMS, the phone is connected with the app and the user is registered.
To buy a ticket, the user can search for a trip and select ‘buy ticket’ after selecting the de-sired connection. Tickets can also be purchased independently from the selection of a trip. It is only possible to buy single tickets via the app. The user has to select the type of ticket (for adults, youth, student, senior, school child, group or family) and can then proceed to the payment. The payment is executed by Nets Sweden. The user has to enter her credit card details, which can be remembered by the app by giving the card a name, but this is op-tional. Afterwards, the receipt of the purchase can be sent to an e-mail address.
After the purchase, the ticket can be found in ‘My tickets’ under the section ‘Unused’. To use the ticket, the ticket has to be activated. After selecting ‘Activate ticket’ the user is in-formed about the validity of the ticket after activation. After the activation the ticket can be found under ‘My tickets’ under the section ‘Active’.
When opening the ticket, it is shown full-screen. On the ticket a timer is shown, which shows the remaining time and a count-down until the ticket’s expiration. Furthermore, the ticket type is shown in the upper left corner. In the upper right corner, the price of the ticket can be seen as well as the number of tickets available. Below these fields, the tickets

64
states ‘Karlstadsbuss’. Below that, the time is counting down. Situated under the time is the validity of the ticket in date and time. In the lower part of the screen is a field, with the cur-rent time and moving arrows, which move from the upper right to the lower left of this field. Below this field is the Karlstadsbuss phone number on the left and the Karlstadsbuss logo with the Karlstad municipality logo on the right.
As soon as the ticket is no longer valid, it moves to the section ‘My tickets’ under the sec-tion ‘Used’.
Figure 4.21 - Active mobile ticket
Customers find it complicated to buy tickets
A challenge for Karlstadsbuss at the moment is that its customers are unsatisfied with the purchase of tickets. “It shouldn’t be something spectacular. It should be very natural. And the problem today is that people see it as a problem, because it differs from the way that you pay at other stores. […] We have to get the foundation right.” (R. Sahlberg, personal communication, 2015-03-11).
Customers want to pay by credit card
Karlstadsbuss currently faces a high customer demand to offer payment via credit card on the buses. However, with how payment systems technology is today, payment with credit card would take too much time, create longer queues, and thereby delay the bus traffic. Karlstadsbuss wants to avoid long queues when entering the bus. This is why Karlstads-buss is waiting for further technology developments in this area. Here, Karlstadsbuss takes London’s public transport development as an example, where the bus card is now available on a credit card with contactless payments.
“People are fed up with having a separate card for that and a separate card for that. I mean I hate it my-self.” (R. Sahlberg, personal communication, 2015-03-11).

65
4.2User findings
4.2.1User activities
Through the user interviews, plenty of information was gathered. The information was mixed in quality and needed to be sorted and clustered in order to make sense. What was discovered, regarding the actual usage of the Karlstadsbuss services, was that users do not utilize all the offered service artifacts. However, other elements are relevant to them, which have not been mentioned by Karlstadsbuss.
Among the used services, it was possible to find patterns. These patterns made it possible to describe the various activities the user must undertake when travelling with Karlstads-buss in order to fulfill her goal. Three use phases the users goes through when consuming the Karlstadsbuss services could be distinguished: before, during, and after. The discovered activities are listed below and described in detail afterwards.
Before:
• Decide to travel with Karlstadsbuss
During:
• Find ticket purchase place • Buy and refill ticket • Hold ticket • Research trip • Find bus stop • Check arrival/departure time • Validate ticket • Information during trip
After:
• Share experience
Before phase
Decision to travel with Karlstadsbuss
Within the user interviews, the authors could determine that the decision to travel with Karlstadsbuss is influenced by different factors. The study found four main factors in the user interviews that were relevant to the user’s decisions of taking the Karlstadsbuss bus. These elements were:
• The motivation for travelling, • The general attitude towards bus transportation, • The opinion of Karlstadsbuss, and • The anticipation concerning the upcoming travel.
Motivation for travelling
The authors asked the 19 interviewed users why they travel within Karlstad. There are mul-tiple motivations mentioned by the interviewees. The generic motivations for travelling

66
with any transportation medium, and specific motivations to take the bus, could be deter-mined. These motivations are listed below.
Generic motivations to travel:
• To get to work (12) • To get to university (4) • To visit friends or family (4) • To do shopping in the city center (3) • To get to the city center (2) • To get to school (1) • To get to gym (1) • To drop and pick up children at school (1)
Specific motivations to travel with the bus:
• Seasonal reasons (Winter) (4) • In case of bad weather (4) • Because of car parking issues (3) • Because it is environmentally more sustainable (2) • When drinking alcohol (1) • Because no car is available and the distance is too long to bike (1) • When the family car is occupied (1) • Because taking the bus is cheaper in comparison to taking the car (1)
Attitudes towards bus transportation
After the motivation for travelling is determined, a user has to decide on a transportation medium. This decision is influenced by the general attitude towards travelling on the bus. Every interviewed user had a preferred transportation method. Walking, taking the bike, taking the bus or taking the car are the preferred transportation mediums of the 19 inter-viewed people.
Three people prefer the car to other transportation options, on the basis that Karlstadsbuss is not operating in the immediate living area, missing more direct commute routes, time is-sues due to infrequent buses when dropping off the children and the need to get to work quickly.
Seven persons must travel a short distance to work or university and therefore, prefer to walk or bike instead of taking the bus. Their behavior only changes in the case of bad weather or during winter.
As soon as a longer distance has to be travelled, the bus is the preferred transportation method for ten people. A ‘longer distance’ starts around 6 kilometers for the majority of the users.
Opinion of Karlstadsbuss
Even if the motivation to travel occurs, and the user prefers buses as her main choice of travelling, a bad opinion about Karlstadsbuss could influence the user to use another trans-portation medium in Karlstad. That is why the authors asked the interviewees what they think about Karlstadsbuss in general.

67
In general, the attitude towards Karlstadsbuss was positive. 15 of 19 people expressed a positive opinion and only two persons a negative. Two persons did not offer their opinion. 15 of the 19 interviewed people commented on the services of Karlstadsbuss in detail.
11 people stated that they think the Karlstadsbuss bus system is easy to understand and navigate. User 3 appreciates the changes made by Karlstadsbuss from the last years: “They are on the right path”. Furthermore, user 23 states that Karlstadsbuss is “up to speed” with technology compared to other regions. She also thinks that Karlstadsbuss has an overall better quality compared to other regions and feels that Karlstadsbuss seems to care about its passengers.
When investigating the users’ opinions of Karlstadsbuss, the study found that different el-ements impact the user’s opinions of the company. Some can be influenced by Karlstads-buss, such as the friendliness of the bus drivers. This is positively mentioned by user 16, who says that the Karlstadsbuss drivers are friendly. Others cannot be controlled by Karls-tadsbuss, but rather the behavior of the fellow travellers. For example user 24 reports that he is annoyed by the fellow travellers since they do not have respect for others. Though, he does not blame Karlstadsbuss for that. But factors like this can have a negative impact on the opinion of a company.
Anticipation concerning the upcoming travel
When examining the elements, which influence the decision of a user to take the bus of Karlstadsbuss, the study also had to consider the user’s anticipation of the actual bus trans-portation service. On one hand, even if the user has a positive opinion of Karlstadsbuss, but expects negative experiences within the upcoming travel, the user will probably decide to use another transportation medium. On the other hand, a user who would normally use another medium of transportation might choose the Karlstadsbuss bus because she has an-ticipation towards upcoming transportation, e.g. user does not want to arrive sweaty to a job interview and takes the bus instead of the bike.
The interviewed persons had no specific anticipations, but provided general feedback. It could be examined that people expect their transportation medium to deliver them quickly and comfortably to their final destination. Costs and sustainability were additional consid-erations for three users. The ten most frequent users believe that these expectations are met with the bus transportation service. Four people become frequent users when their preferred method of transportation (walking or biking) is not comfortable anymore, due to bad weather or the cold winter season.
User 17 explicitly mentions that she does not trust the bus to be on time, especially during the winter, and because of this expectation she attempts to avoid this transportation medi-um.
In summary, several factors exist that have an influence on the user’s decision for or against using the bus of Karlstadsbuss. Unfortunately, Karlstadsbuss has only a small pos-sibility of changing these elements, by delivering good service and trying to satisfy its users.
During Phase
After the user to use the Karlstadsbuss service, she has to execute a number of activities until the arrival at the final destination. During the user interviews the authors could speci-fy activities which all users had in common. Following, the study describes the actions of the interviewees in detail.
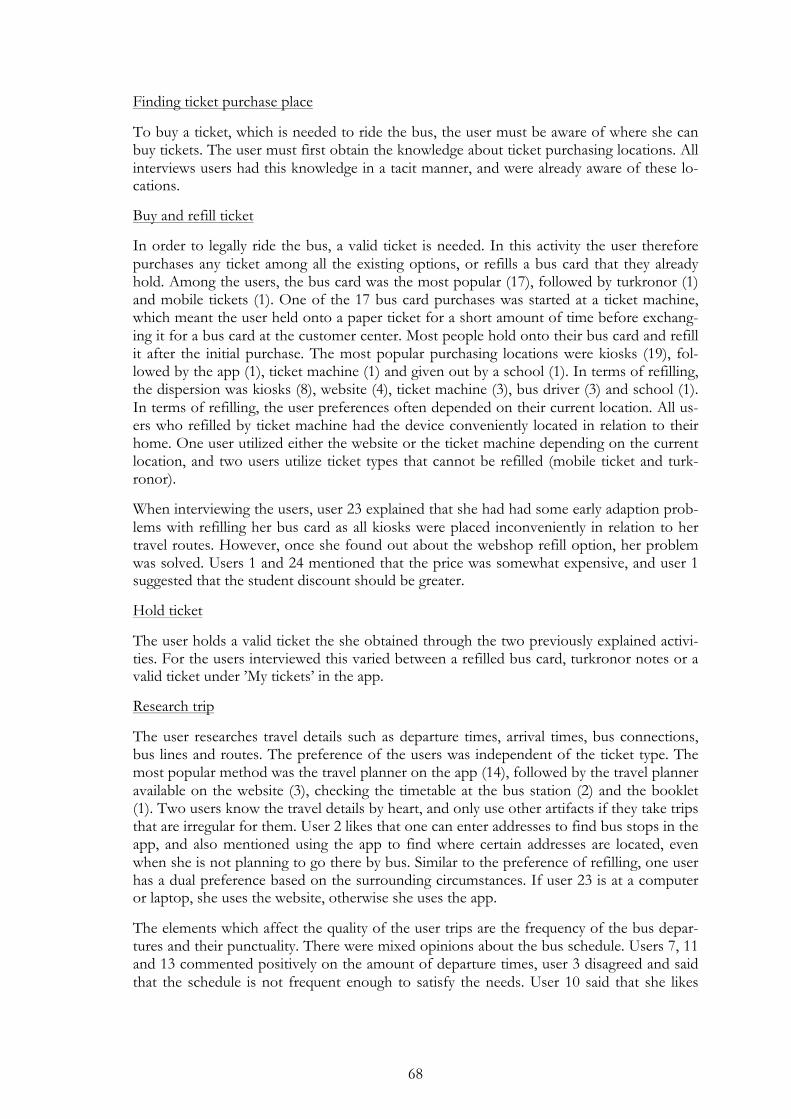
68
Finding ticket purchase place
To buy a ticket, which is needed to ride the bus, the user must be aware of where she can buy tickets. The user must first obtain the knowledge about ticket purchasing locations. All interviews users had this knowledge in a tacit manner, and were already aware of these lo-cations.
Buy and refill ticket
In order to legally ride the bus, a valid ticket is needed. In this activity the user therefore purchases any ticket among all the existing options, or refills a bus card that they already hold. Among the users, the bus card was the most popular (17), followed by turkronor (1) and mobile tickets (1). One of the 17 bus card purchases was started at a ticket machine, which meant the user held onto a paper ticket for a short amount of time before exchang-ing it for a bus card at the customer center. Most people hold onto their bus card and refill it after the initial purchase. The most popular purchasing locations were kiosks (19), fol-lowed by the app (1), ticket machine (1) and given out by a school (1). In terms of refilling, the dispersion was kiosks (8), website (4), ticket machine (3), bus driver (3) and school (1). In terms of refilling, the user preferences often depended on their current location. All us-ers who refilled by ticket machine had the device conveniently located in relation to their home. One user utilized either the website or the ticket machine depending on the current location, and two users utilize ticket types that cannot be refilled (mobile ticket and turk-ronor).
When interviewing the users, user 23 explained that she had had some early adaption prob-lems with refilling her bus card as all kiosks were placed inconveniently in relation to her travel routes. However, once she found out about the webshop refill option, her problem was solved. Users 1 and 24 mentioned that the price was somewhat expensive, and user 1 suggested that the student discount should be greater.
Hold ticket
The user holds a valid ticket the she obtained through the two previously explained activi-ties. For the users interviewed this varied between a refilled bus card, turkronor notes or a valid ticket under ’My tickets’ in the app.
Research trip
The user researches travel details such as departure times, arrival times, bus connections, bus lines and routes. The preference of the users was independent of the ticket type. The most popular method was the travel planner on the app (14), followed by the travel planner available on the website (3), checking the timetable at the bus station (2) and the booklet (1). Two users know the travel details by heart, and only use other artifacts if they take trips that are irregular for them. User 2 likes that one can enter addresses to find bus stops in the app, and also mentioned using the app to find where certain addresses are located, even when she is not planning to go there by bus. Similar to the preference of refilling, one user has a dual preference based on the surrounding circumstances. If user 23 is at a computer or laptop, she uses the website, otherwise she uses the app.
The elements which affect the quality of the user trips are the frequency of the bus depar-tures and their punctuality. There were mixed opinions about the bus schedule. Users 7, 11 and 13 commented positively on the amount of departure times, user 3 disagreed and said that the schedule is not frequent enough to satisfy the needs. User 10 said that she likes
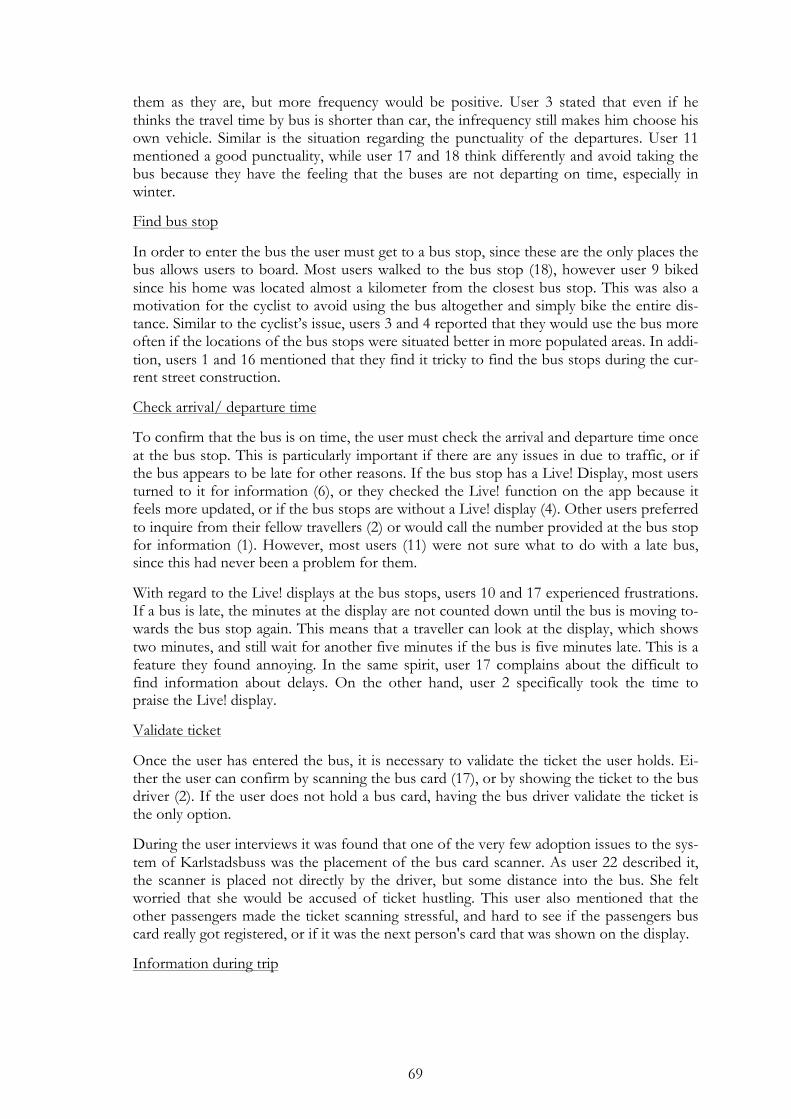
69
them as they are, but more frequency would be positive. User 3 stated that even if he thinks the travel time by bus is shorter than car, the infrequency still makes him choose his own vehicle. Similar is the situation regarding the punctuality of the departures. User 11 mentioned a good punctuality, while user 17 and 18 think differently and avoid taking the bus because they have the feeling that the buses are not departing on time, especially in winter.
Find bus stop
In order to enter the bus the user must get to a bus stop, since these are the only places the bus allows users to board. Most users walked to the bus stop (18), however user 9 biked since his home was located almost a kilometer from the closest bus stop. This was also a motivation for the cyclist to avoid using the bus altogether and simply bike the entire dis-tance. Similar to the cyclist’s issue, users 3 and 4 reported that they would use the bus more often if the locations of the bus stops were situated better in more populated areas. In addi-tion, users 1 and 16 mentioned that they find it tricky to find the bus stops during the cur-rent street construction.
Check arrival/ departure time
To confirm that the bus is on time, the user must check the arrival and departure time once at the bus stop. This is particularly important if there are any issues in due to traffic, or if the bus appears to be late for other reasons. If the bus stop has a Live! Display, most users turned to it for information (6), or they checked the Live! function on the app because it feels more updated, or if the bus stops are without a Live! display (4). Other users preferred to inquire from their fellow travellers (2) or would call the number provided at the bus stop for information (1). However, most users (11) were not sure what to do with a late bus, since this had never been a problem for them.
With regard to the Live! displays at the bus stops, users 10 and 17 experienced frustrations. If a bus is late, the minutes at the display are not counted down until the bus is moving to-wards the bus stop again. This means that a traveller can look at the display, which shows two minutes, and still wait for another five minutes if the bus is five minutes late. This is a feature they found annoying. In the same spirit, user 17 complains about the difficult to find information about delays. On the other hand, user 2 specifically took the time to praise the Live! display.
Validate ticket
Once the user has entered the bus, it is necessary to validate the ticket the user holds. Ei-ther the user can confirm by scanning the bus card (17), or by showing the ticket to the bus driver (2). If the user does not hold a bus card, having the bus driver validate the ticket is the only option.
During the user interviews it was found that one of the very few adoption issues to the sys-tem of Karlstadsbuss was the placement of the bus card scanner. As user 22 described it, the scanner is placed not directly by the driver, but some distance into the bus. She felt worried that she would be accused of ticket hustling. This user also mentioned that the other passengers made the ticket scanning stressful, and hard to see if the passengers bus card really got registered, or if it was the next person's card that was shown on the display.
Information during trip

70
If there are any problems or issues once the user has entered the bus and has begun the trip, information can be needed. User 5 tended to acquire information of this sort by talk-ing to the bus driver, and the remaining users had little or no input or information about this activity.
However, user 23 notes the large array of information available on the Bus TV, which makes the system highly informative in her opinion, although she does not explicitly say how or if she is using it herself. This person also remembers the change of regional accent to standard Swedish to improve understanding for non-regional customers.
After Phase
Share experience
After arriving at the final destination, users have the possibility to share their experiences, e.g. through conversation or via social media. From the 19 interviewed people only three shared their travel experiences. Two persons shared noteworthy experiences with family and friends, and one person shared negative experiences with the bus driver.
4.2.2 User activity sequences
During the analysis of the user interviews, it showed that all users had unique journeys and experiences with the ecosystem. However, even if their ecosystem interactions differ, the sequence of their activities appeared similar. It was found that three key activity sequences existed:
The ‘Buy ticket’ start
Here, the user started with the need to buy a ticket, or refill an existing bus card, in order to start utilizing the Karlstadsbuss services. First, the user either started by locating where to buy tickets and how to get there, or they were already aware of where to buy tickets and performed this action. Second, the user researched the trip details, such as route, timetable, if there are any connections and so on. Lastly, the user went to the bus stop. At the bus stop the user found information about disruptions, otherwise, the user entered the bus, val-idated the ticket and ended her journey at the final destination.
The ‘Research trip’ start
Here, the user started with a need to go somewhere, and began by researching the trip. Once they had the information needed, they either started the process of buying a ticket, or they already held a valid ticket from before. Lastly, the user went to the bus stop. At the bus stop the user could be informed about disruptions, otherwise the user entered the bus, validated the ticket and ended her journey at the final destination.
The ‘Expert’ trip
These users took the same or similar bus trips regularly, i.e. had a standard bus trip. Within the standard bus trip they knew the relevant information by heart. Since these users had all of the important trip knowledge, the only information they needed to seek was about dis-ruptions. They bought or refilled a ticket if needed, otherwise they simply went to the bus stop, entered the bus, validated their ticket and ended their journey at the final destination.
It appears obvious that the activity sequence changes the most at the start of the journey, and is much less varied at later stages. It was also found that regardless of which of the three activity sequences the user performed, the touchpoints the user interacted with re-

71
mained very similar. Therefore, the study drew the conclusion that the order in which the user activities are performed is not related to which touchpoints they use. The authors also concluded that a number of touchpoints are important for all users, regardless of how well adopted they are to the ecosystem.
4.2.3 User artifacts
Chapter 4.1 described the different artifacts, which are available for users when consuming the Karlstadsbuss services. Through the user interviews, the authors found that not all arti-facts are actively used in the user activities. On the contrary, the interviewees mentioned el-ements which were not made available through Karlstadsbuss, but were still relevant to the users. The following elements are made available by Karlstadsbuss and are relevant to the user within their user journey:
• Bus • Bus card scanner • Bus driver • Bus stop • Bus timetables • Real-time display Live! • Customer center • Booklet • Disruption phone number • Kiosks (Pressbyran & others) • Ticket machines • Website • App • Bus card • Paper ticket • Turkronor • Mobile ticket
This list contains the elements, which are offered by Karlstadsbuss but not relevant to the user within their user journey:
• Next stop display • Bus TV • Bus stop signs • Bus line maps • QR code • Interactive ticket place map • Interactive bus line map • Facebook • Twitter
These elements were relevant to the user, but are not offered by Karlstadsbuss:
• Feet & bike • Fellow travellers

72
• Friends and family
4.3 Combining findings After stating the information of the company and user findings, the study determined the user-relevant ecosystem for the analysis. In the previous chapter, the authors already distin-guished which activities are executed by and which artifacts were relevant to the user. To define this ecosystem in detail, the authors made use of user journeys. The user journeys visualize the user’s movements between the different touchpoints to consume the services of Karlstadsbuss. These touchpoints were clustered into channels and devices that assist the user during her journey. That is why this study first establishes the channels, touch-points and devices of the Karlstadsbuss services. Second, the three most standard user journeys, which are based on the user interviews, are visualized and explained. Based on the combination of the user journeys and the Karlstadsbuss touchpoints, the study finally pro-vides the user-relevant ecosystem.
4.3.1 Defining channels, touchpoints and devices
The definitions of channels, touchpoints and devices were formed on the basis of the ex-amined Karlstadsbuss artifacts, the company and the user interviews. Firstly, the authors combined the list of artifacts and the user activities into a big picture. Secondly, these ele-ments were clustered into devices, touchpoints and channels based on the definitions from chapter 2.1.1. Here, tools are not expressly defined, since the study understands that tools become touchpoints as soon as the user uses the tool or makes sense of it to achieve a per-sonal goal. It was assumed that this was the case for all the tools offered by Karlstadsbuss, to simplify the clustering. Lastly, this chapter visualized the single user journeys to test the clusters and made the final adjustments to the groups. The channels, touchpoints, and de-vices are described in the following text.
The study defined the Karlstadsbuss channels as:
App. The channel App clusters all touchpoints that are offered via the Karlstadsbuss app, and the Karlstadsbuss Facebook and Twitter page available via the Facebook and Twitter app. The touchpoints of the channel App need a device in the form of a smartphone or tablet and can then offer a variety of touchpoints to the user.
Website. The channel Website groups all touchpoints that are offered via the Karlstadsbuss website, and the Karlstadsbuss Facebook and Twitter pages available via internet browsers. The touchpoints of the channel Website need a device in the form of a computer, laptop, smartphone, or tablet to be used.
Printed media. The channel Printed media considers all elements of the Karlstadsbuss eco-system, which are available on paper. When printed, the artifacts need a physical location to be posted in to be useful. The QR code needs a smartphone to be useful, and the paper ticket needs the device ticket machine to be created.
Service counter. The channel Service counter includes the touchpoints kiosk, customer cen-ter and school. The authors distinguish service counters from the People channel, since they form fixed places for users to buy tickets. In the case of the customer center, additional functions are offered, such as information services. On the basis of this definition, the bus driver belongs to the biological channel, since the bus driver’s position moves.

73
People. The channel People is concerned with all human touchpoints, which can be used by customers. People can hold knowledge and information that can help you, although the usefulness varies and is unpredictable. In this channel two touchpoints are slightly differ-ent. First, purchasing a ticket or refilling a bus card through the bus driver is a biological touchpoint, although the bus driver uses the technology provided inside of the bus to per-form the task. The second, validating the ticket through the bus driver, does not require any technology, just the bus driver.
Bus system. The channel Bus system clusters all the elements available through the bus transport service offerings of Karlstadsbuss. It refers to touchpoints available at the bus stops, the bus stops themselves, purchasing tickets and refilling via ticket machines, valida-tion through bus card scanners, bus cards and bus signs.
The study determines the following touchpoints available and relevant to the user within the appropriate channel:
Bus system
• Ticket Machine • Bus stop • Signs • Bus card • Bus card scanner • Next stop display • Bus TV • Real-time display Live! • Bus line maps
People
• Bus driver • Feet/ bike • Friends and family • Fellow travellers • Phone number to inform about disruptions
Service counter
• Customer center • Kiosks (Pressbyrån & others) • School
Printed media
• Paper ticket • Turkronor • Booklet • QR code • Bus timetables • Bus line maps

74
Website
• Interactive bus stop map • Interactive ticket purchase map • Travel Planner • Real-time display Live! • Bus timetables • Bus line maps • Facebook and Twitter
App
• Mobile ticket • Interactive bus line map • Real-time display Live! • Bus timetables • Bus line maps • Facebook and Twitter
It can be observed that some touchpoints appear in more than one channel in different forms, e.g. the bus line map, which is available via the channel App, Website, Printed Media at the bus stop, and within the Bus system itself.
The following elements are considered as devices:
• Bus • Bus TV (within the function of a TV when showing local news and YouTube vide-
os) • Smartphone (for using the app or the mobile website) • Telephone (for calling telephone numbers) • Tablet (for using the app or the mobile website) • PC (also synonym for laptop, for using the website) • Bus stop (as the medium to display touchpoints from the channel Printed media) • Ticket machine (to print paper tickets) • Bike (to get to the bus station) • Bus card scanner
However, the devices smartphone, telephone, tablet, PC, and bike are not further de-scribed, since it can be assumed that these are everyday life devices, which functions are known to public.
The defined channels, touchpoints and devices can also be recovered within the structure of user journeys. Before the user journeys are presented, the construction of the upcoming visualizations is described on the basis of the following picture.

75
Figure 4.22 - Cross-channel matrix visualization of the Karlstadsbuss ecosystem
On the far left, highlighted in blue, one can find the various devices used in the appropriate channel. Next to this column, marked in grey, the channels build the vertical axis for the displayed matrix. The horizontal axis of the matrix is composed of the different user activi-ties defined in chapter 4.2.1. Within the intersection of the channels and the activities, the different touchpoints can be found. The touchpoints are grouped under specific activities e.g. Hold ticket to indicate for which user goal the touchpoints are used. The positioning in the channel indicates where the touchpoints can be touched, e.g. if a user holds a ticket in the App channel, she uses a mobile ticket. This visualization is used throughout chapter 4.3 to display the user journeys and the user-relevant ecosystem.
4.3.2 Defining user journeys
In the following section the goal was to find out which elements of the Karlstadsbuss eco-system were relevant to the user. To determine this, the user behavior needed to be visual-ized in the ecosystem. The study aimed to achieve a comparison between the user experi-ences and the ecosystem to derive use patterns, as well as touchpoint frequencies. The au-thors decided to use the alignment diagram user journey, since it enabled the authors to visualize the behavior of a user in a service surrounding. From now on, the summary of all user activities is called user journeys. User journeys describe the start to end user activities, until the goal of the service enquiry of the user is fulfilled (Stickdorn & Schneider, 2011).
Within the user interviews, the interviewees shared their personal versions of their usage of the Karlstadsbuss services. Although the authors interviewed 19 people, it was found that not a single user had the same user journey. However, most of them used the same touch-points, though not in the same sequence. To determine which channels, touchpoints and devices were relevant, an extensive work on comparison and analysis was required. This work consisted of writing and designing individual user journeys, which helped compare the findings in a perspicuous manner. Once these were designed, the frequency of the touchpoint usage was calculated, as well as how often the various touchpoints were linked to one another, e.g. how often the user moved from the touchpoint bus card to webshop to refill the bus card, compared to moving from bus card to ticket machine to refill the bus card. This created patterns in usage, and also showed which touchpoints the users consid-ered to be most important. Based on the knowledge from this analysis, three standard

76
journeys were derived. It was decided that the rarer user journeys and less frequently used touchpoints are adequate to describe instead of visualize (all touchpoint usages are de-scribed in detail in chapter 4.2.1).
In the user journeys to follow, the touchpoints used are highlighted in green, where light green marked with thick black outlines marks the start of the journey, regular boxes filled with green for the duration of the journey, and dark green with a thick black outline marks the end of the journey. The flow of the journey is presented via black arrows. If there is more than one option given within the touchpoints, the selected option used is highlighted in thick black letters. The diamond shape indicates a decision, which has to be taken by the user during the journey. The decision has the same color shading as the used touchpoints and states the question, which has to be answered in order to complete the journey. De-pending on the answer to the question in the decision, the direction of the journey is indi-cated with arrows containing “yes” or “no” in them. In total, four questions could be distin-guished that can appear in the user journey that impact user decisions:
• Do I know the timetable by heart? (Impact if they use research functions) • Do I have time to plan the trip? (Impact how they use research functions) • Am I at a computer? (Impact selection of research device and tool) • Do I need to refill my bus card? (Impact user activity sequence).
The white touchpoints are provided by Karlstadsbuss, but are not used in the standardized user journey. A legend is presented in the lower left corner for further clarification. On the basis of this template, three standard user journeys are presented now.
Figure 4.23 - Standard user journey 1
The first and most standard user journey contains six touchpoints and one decision that impacts the activity sequence.
78% of the users touched five or more of these six touch points, and all users touched at least three of them. 16% of the users exactly and exclusively touched these touchpoints, in varying order. Within the user journey, the user starts by purchasing a bus card (the ‘buy ticket’ start activity sequence) at a kiosk, school, or the Karlstadsbuss customer center. This was true for 84% of the users. Once holding a bus card and getting ready to travel, the user

77
asks if they need to refill their bus card. If they do, they go to the kiosk, school, or Karls-tadsbuss customer center to refill. This is true for 47%. After the refill, the user researches the trip details via the App travel planner. This is also what is done immediately if no refill is needed. The App travel planner is used by 73% of the users. Next, they get to the bus stop by foot (95%). All users need to go to the bus stop to start the trip. Once the bus ar-rives at the bus stop, the user enters the bus. Lastly, the user validates the ticket by holding it to the bus card scanner (89%).
Figure 4.24 - Standard user journey 2
The second most common journey is very similar to the first one, but the bus card is re-filled via the website instead of at a service counter (21%).
Figure 4.25 - Standard user journey 13
The third standard journey varies more in the touchpoint usage. Still, the initial ticket pur-chase takes place at a kiosk, school, or the Karlstadsbuss customer center and the user
78
holds a bus card from this point on. Within this user journey, the diverge occurs when the user refills her bus card via the bus driver (16%).
If the card does not need to be refilled, the user has either memorized the timetable and immediately goes to the bus stop (10%), or the user has not memorized the timetable and researches travel details via the App travel planner (74%). After researching the trip, the us-er goes to the bus stop (95%). If there are disruptions in traffic, the user either looks at the Live! display at the bus stop (10%), or the Live! function on the app (21%). After getting to the bus stop, and if needed, getting informed about disruptions, the user would enter the bus and validate the ticket at the bus card scanner (89%).
If, on the contrary, the user needs to refill her bus card, the refill activity is postponed until the user enters the bus. Therefore, the user follows the same route she would follow with-out the need of refilling, with the same decisions on the way until she enters the bus. After entering the bus, she performs the refill through the bus driver and then validates the ticket at the bus card scanner (16%).
As the study combined the two perspectives of the main actors in the Karlstadsbuss eco-system, the application of the developed framework from chapter 2.5 can be executed.
4.4 Analysis To evaluate the ecosystem of Karlstadsbuss, the developed framework, which was created in chapter 2.5, was used for establishing a language of critique. The framework consists of seven design principles that should create, when applied, a good UX within a cross-channel ecosystem. In this section, the authors examined the ecosystem and the touchpoints on the basis of each of the seven principles:
• Composition • Continuity • Place-making • Consistency • Resilience • Reduction • Correlation
Moreover, the authors checked to which extent the ‘before’ and ‘after’ phases were relevant for the UX on the basis of the user findings. Finally, the results of the analysis indicated if the framework is useful to develop a language of critique.

79
Figure 4.26 - Cross-channel user experience framework
4.4.1 Composition
The framework element composition describes whether an ecosystem is designed as multi-channel, in a silo approach, or cross-channel, in an integrational approach. To determine which approach has been applied to the Karlstadsbuss ecosystem, the individual user jour-neys were analyzed in respect to the movement between touchpoints in different channels.
To visualize the crossing of channels, the matrix below was created. As soon as a user in her user journey crosses between channels, the linking of the two channels is marked with an “X”. If the user can continue within a specific channel, it is marked with an “X” as well. Based on the analysis it was found that all channels allow the crossing of channels, howev-er, not all channels allow the crossing of every channel. The channels which have not been crossed by the interviewed users are:
• from Website to Printed media (and vice versa) • from Service counter to People (and vice versa)
Another interesting finding of the analysis was that the channel Service counter did not allow the user to continue the journey within the channel itself. Then again, since there is only one touchpoint within this channel, the reasons for this is obvious. The study also exam-ined the possibility of undertaking the whole user journey without changing between chan-nels at all. The authors found that this is not possible, since the ecosystem is not composed in such a way. The closest the user can get in terms of not changing across channels is ei-ther in the channel App, where the user must still use the channels Bus system (bus stop) and People (validate by bus driver, getting to the bus stop), or the channel Bus system, where the user must still touch People (getting to the bus stop, validate by bus driver) and Printed media (when getting a paper ticket).

80
App Website Printed media
Service counter
People Bus system
App X X X X x X
Website X X X X X
Printed media
X X X X X
Service counter
X X X X
People X X X X X
Bus system
X X X X X X
Chart 4.1 - Composition analysis
In conclusion, the Karlstadsbuss ecosystem is composed as a cross-channel ecosystem. The service of bus transport must be consumed via different channels. The start of the process in one channel does not imply that the customer has to, nor can, stay in this specific chan-nel, but enables the user to switch between the available channels until the service is con-sumed e.g. buying tickets at the Pressbyrån, researching the trip on the website, and talk to fellow travellers at the bus station. On the contrary, some selected channels require the user to change the channel, e.g. buying mobile ticket via the app requires the user to show the mobile ticket to the bus driver in the bus, i.e. moving from a digital touchpoint to a biolog-ical.
The question, which now had to be answered, is if Karlstadsbuss consciously designs the ecosystem as a cross-channel environment. Within the company interview, the Karlstads-buss’ business developer pointed out that their goal is to leave the channel choice and channel switch to Karlstadsbuss users: “We don’t demand that people have to use just one channel, it should be broad and you could use whatever you want.” (R. Sahlberg, personal communication, 2015-03-11). The company findings determined that the company provides its users with choices to consume its services. Here, Karlstadsbuss is following its strategy of prioritizing its efforts on the basis of the user demands. By designing the offered services in this man-ner, the user is able to pick the channels she feels most comfortable using. Karlstadsbuss leaves the choice to the user, and with that, the power of shaping her own user ecosystem.
When comparing the definitions given in the theoretical framework with the encountered Karlstadsbuss ecosystem, it can be argued that a cross-channel environment exists. Resmini and Rosati (2011, pp. 10) defined cross-channels as “a single service is spread across multiple channels in such a way that it can be experienced as a whole (if ever) only by polling a number of different environments and media.”. This is true in the investigated ecosystem. Furthermore, Wäljas et al. (2010) argued that cross-channels “only become fully functional when their components are used in combination” to enable the larger experience, which is also true for the examined environ-ment. Finally, Resmini and Lacerda (2015) specifically pointed out the ownership and pow-er shift in cross-channel ecosystems to the user, which could be observed as well. There-fore, it can be established that this study indeed encounters a cross-channel ecosystem in the usage of the Karlstadsbuss services.

81
4.4.2 Continuity
The design principle continuity refers to the interoperability of the channels. This frame-work element has two factors: that the user can start a process in one channel and continue it in another, and the synchronization of data and content to enable this (Wäljas et al, 2010). Since it was already proved that movement between channels is possible in section 4.4.1, the study examines the synchronization of content and data, which is the basis for enabling the user’s channel migration. From now on, the term content is used for summa-rizing content and data.
The authors started to test if continuity exists with the cross-channel matrix (figure 4.22), created in the previous chapter 4.3. As all user activities are clustered here, it is easy to get an overview of the various choices the user has across the different channels. As all indi-vidual user activities have a specific information need, the touchpoints have to provide the respective content. However, an explanation of what kind of content is needed for the spe-cific activities is missing in this matrix. To determine this, the content, which is asked for within the user activities, was analyzed. After specifying the content from the user activities, a table was created. This table merges the content group (the general topic of the content need) and the content details (the specific content need) with the touchpoints, which pro-vide the demanded content and the channels they belong to. Following, the authors count-ed the number of touchpoints and the different channels for each content need (see table 4.2). If channels are not providing the demanded content, they are listed in the last column.

82
Chart 4.2 - Continuity analysis

83
The analysis of the content table led to the following results: six generic content groups ex-ist with 12 detailed content demands. No content was available via all six channels. Five channels provided content regarding the ticket options, price, duration, and the bus route. The five content details are as follows: validity/ balance of bus card, departure/arrival times of the bus, bus stop name and location, disruption information, and experiences, and are spread across four channels. The validity/ balance of mobile tickets, paper tickets, and turkronor can be validated in two channels. The addresses of the ticket purchase locations can be checked within its own channel or via signs of Karlstadsbuss at the different kiosks.
On the basis of the analyzed information, the authors conclude the need to synchronize content to all channels and the possible inclusion of the missing channels.
A printed artifact that provides content concerning ticket options with ticket prices and du-rations could not be found. This has the potential to provide an option ensuring this in-formation is spread and made available within all channels and to reach all customer groups.
The addresses of all ticket purchase sites are only available via the website. The position of the ticket purchase sites can also be determined through the Karlstadsbuss signage at the kiosks, which indicate that tickets can be purchased there. Providing this information via the Printed media and the App channel would enable users with more possibilities to find out where to buy tickets. Service counter and the Bus system could serve as mediums to spread printed information. Since the knowledge of people cannot be actively designed and their memory likely will not hold all ticket purchase locations, they could make use of the Printed media, App, or Website channel as well.
Since the paper ticket and turkronor are only designed to serve a one time purpose, the au-thors do not see the need to spread the validity and balance content between more chan-nels than just the ones concerned. However, since the nature of the mobile ticket is digital, it could technically allow sharing content to the channel Website to manage the user’s tick-ets. Though, via the website, just the refilling of the bus card is possible, while only the us-age and management of mobile single tickets is possible via the mobile ticket . On the one hand, sharing the validity of a single ticket may not require spreading to other channels and makes little sense. On the other hand, if there were more share ticket options available, the limitation between the two channels would not make sense. This further relates to the missing channel App within the content, dealing with the validity/ balance of bus cards. That is why the reduction of available functions within the App and the Website channel is questioned.
Furthermore, the channel Printed media does not seem to be considered when checking the validity/ balance of the bus card. Some people might like to have a printed receipt of their remaining validity/ balance of their bus card. This could be provided by the ticket machine, the bus driver or the service counters.
It was determined that the channel Service counter is does not provide detailed content when researching bus routes. From the point of view of the authors, this makes sense since ser-vice counters mainly support the user activity Buy and refill ticket. Though, they could serve as a provider of printed information from the Printed media channel and thus act as an indi-rect information medium.
The channels People and Service Counter do not make content available concerning bus depar-ture and arrival, or bus stop names and locations. This state makes sense to the authors, due to the restricted function of service counters and the memory of people. Based on this,

84
it is understood that these channels would only provide incomplete and possibly biased in-formation. However, when they have access to the Printed media channel they could pro-vide this content sufficiently.
Lastly, the channels Printed media and Service Counter do not provide possibilities for distrib-uting disruption information and sharing experiences. The content disruption information is highly time dependent, and printed media cannot be distributed fast enough to satisfy the user’s information needs. The service counters can only inform about long-term disrup-tions if they themselves are informed, which the authors have no specific information about. The sharing of experiences is rather unofficial and spontaneous in nature. There-fore, there is no observed need for customers to share experiences via printed form, if this is not part of the marketing campaign. The authors do not have any information about ex-periences shared via service counters, but imagine that this is a possibility for users, though it has not been mentioned by the interviewees.
In conclusion, based on the analysis, the need for further continuity could be distinguished in terms of content. For five content details it does not make sense to spread the infor-mation to further channels:
• Validity/ balance of ticket: turkronor & paper ticket • Bus schedule: bus route, departure/ arrival & bus stop name and location
For two elements a content spread to extra channels only makes sense in specific circum-stances:
• Disruption info: channel Service counter in case of long-term disruptions • Experiences: channel Printed media in case of marketing campaigns
For five content needs the possibility of spreading information to further channels exists:
• Ticket options, prices & duration: channel Printed media • Find ticket purchase place: channel Printed media and App • Validity/ balance of mobile ticket: channel Website • Validity/ balance of bus card: channel Printed media and App
However, overall continuity is present for the content needs and supports the user in se-lecting and migrating between channels by herself and depending on her preferences. Therefore, both aspects of continuity are fulfilled in the ecosystem.
These results are in line with the Karlstadsbuss attitude towards the channel choice of its customers. “We don’t demand that people have to use just one channel, it should be broad and you could use whatever you want.” (R. Sahlberg, personal communication, 2015-03-11).
4.4.3 Place-making
The heuristic place-making by Resmini and Rosati (2011) refers to the capability of helping users reduce disorientation by creating a sense of place. Furthermore, place is defined through personal, social, and existential context, to support the user in coordination and movement within and across digital, physical, and cross-channel ecosystems.
Specifically in the context of the transportation industry, Dziekan (2008) explained that the user’s mental representation of the ecosystem she exists in serves as a basis for the selec-tion of travel mode, route and destination choices, as well as impacting path finding and
85
orientation within the system. During the interaction with the ecosystem, the mental repre-sentation is constantly evolving, and parts are internalized in a tacit manner. That is why it is understandable that place-making enables the mental representation of the ecosystem.
Within the touchpoint bus line maps, Karlstadsbuss already invested efforts to improve the user’s place-making. Robert Sahlberg reported: “We know from a lot of research that maybe the most important factor for increase in travel in public transportation is to increase the knowledge (mental representation of the ecosystem) about the possibilities. […] That’s more important than prizing. […] Having something that’s easy to communicate and easy to understand, that’s very key to make it accessible, because people hate to be stupid.” (personal communication, 2015-03-11). Furthermore he added that “people don’t want to read the map or to use manual for the public transportation to make it self-explaining.“ (personal communication, 2015-03-11). Place-making assists the user in finding her way through the ecosystem and should therefore be actively designed.
Before analyzing whether place-making is considered within the Karlstadsbuss ecosystem, this study had to define the places that are relevant when using the Karlstadsbuss services. To determine this, the authors considered the factors that are obvious, but necessary, for creating a sense of place. The factors were approached in a hierarchical manner, starting with broad and ending with specific sense making needs.
When the user decides to take the bus, she has to know in which city she is situated, since Karlstadsbuss only offers its services in Karlstad. Next, the user has to find the places in the city where the bus stops. In addition, a user needs to know if she has to carry a ticket to take the bus. If the user has to have a ticket, she has to determine how and where she can buy tickets. Specifically, the user needs to know what actors of the ecosystem can provide ticket services. Moreover, the user has to deduce which route she has to take to arrive at her desired destination. When she arrives at a bus stop, she needs to distinguish whether this is the right bus stop for her selected route. When a bus is arriving at the bus stop the user is standing at, the user must be able to determine if this is the bus she wants to take or not. If it is the correct bus for her route, the user wants to know if her ticket is accepted and validated for the trip. In the bus, the user checks if the bus is taking the route that has been reported, to deliver her at her final destination. Finally, the user wants to know when the bus is approaching the bus stop she wants to depart the bus at. These needs that assist in making sense of the ecosystem can appear in different orders, and be repeated as long as the user is confronted with an unknown situation. The more the user is acquainted with the ecosystem, the less her need for sense through place-making, since the ecosystem has de-veloped meaning to the user.
This preceding user story creates the need for place-making of the following places, to make sense of the Karlstadsbuss ecosystem:
• City • Bus stop • Ticket requirement • Ticket purchase place • Bus • Destination
In the following sections, the available touchpoints are analyzed based on their ability to provide a sense of place within the Karlstadsbuss ecosystem.

86
Place city
The user’s position determines if she is able to use the services of Karlstadsbuss. Signage, buildings, architecture, and tacit knowledge play an important role in making sense in which city the user is currently in. In addition, the location functions of digital tools can as-sist.
Karlstadsbuss provides different factors for assisting the user in making sense of where she is situated. The company name on different elements such as the buses, the bus stop, the ticket machine, printed media at bus stops and other touchpoints of the Bus system, and signage e.g. at the kiosks, informs the user about her position. Furthermore, Karlstadsbuss uses the same graphic profile as the Karlstad municipality. This includes the municipality logo, the smiling sun. Moreover, the user can ask people on the street about her position. Finally, the user’s location can be determined digitally via the function in the app, when the user is situated in Karlstad. However, the app determines the user’s location via the travel planner and the Live! display, even if she is not situated in Karlstad. It does not inform the user that she is positioned outside of the service reach of Karlstadsbuss. As a consequence, users can buy and activate mobile tickets via the Karlstadsbuss app, even though users can-not actually make use of them because they are not in Karlstad.
When using the buses offered by Karlstadsbuss, the bus TV in the bus provides a sense of place, since it shows local news and advertising, and photo contributions from fellow trav-ellers interacting with Karlstad and Karlstadsbuss.
To conclude, place-making in terms of city is provided by:
• App: travel planner, Live! Display • Printed media: bus line map, timetable when mounted at a bus stop • Service counter: when signs from the Bus system are mounted at them • People • Bus system: ticket machine, signs mounted at bus stops, bus stop, bus line map, Live!
display, bus, bus TV
Place-making is not provided in terms of position by:
• Website: no location functions within the interactive bus line map or the travel plan-ner.
Even though the App travel planner and the Live! display can localize the user’s position, the app does not actively inform the user that she is not positioned in Karlstad, and there-fore does not prevent the user from activating mobile tickets, even though active tickets are not useful outside of Karlstad.
Place bus stop
To consume the services of Karlstadsbuss, not only does the user's position ‘in the city’ have to be correct, but also her position in regard to the bus stops. A user cannot take the bus if she is not standing at a bus stop, since this is the only place buses in Sweden allow the users to enter.
Karlstadsbuss provides different elements to ensure the user realizes that she is located at a Karlstadsbuss bus stop. The bus stop of Karlstadsbuss is a glass shelter, or a bus stand. This design is a standard layout for Swedish bus stops. Furthermore, the Karlstadsbuss bus
87
stops consist of different elements, which can be found at every bus stop and enable the user recognize the place:
• Signs • Bus line maps • Timetables • Live! Display • QR codes
These elements are designed to either follow the Karlstad municipality graphic profile (QR code, signs) or include the name Karlstadsbuss (bus line map, timetables, Live! display).
If buses from Värmlandstrafiken halt at the bus stop, this is explicitly signposted. Bus stops, at which no Karlstadsbuss buses stop, miss elements (Live! display, bus line maps, QR codes) or the elements follow a different design and content (signs, timetables).
Furthermore, the app provides a location function via the travel planner and the Live! dis-play, which shows the user the closest bus stop to her position. Moreover, the website pro-vides the different bus stops via the interactive bus stop map and the bus line maps placed on a map of Karlstad, available in pdf format. In addition, a user could ask people to de-termine the position of the bus stop, or check a printed booklet. Finally, a user could see where Karlstadsbuss buses are stopping to find the Karlstadsbuss bus stop. Hence, the bus is place-making itself, which is further explained later in this section.
However, two users (user 1 and 16) mentioned problems locating moved and temporary bus stops due to street constructions, which indicates a place-making that can be improved.
In conclusion, place-making in terms of a bus stop is provided by:
• App: travel planner, Live! Display • Website: bus line maps, interactive bus stop map • Printed media: booklet • People • Bus system: bus stop, signs, bus line maps, Live! display
The channel Service counter does not provide any sense making for the place bus stop, due to restricted functionality of this channel.
Place ticket requirement
To explore whether tickets are required in the ecosystem of Karlstadsbuss, a user can make use of different elements. Normally a user has a tacit knowledge of her familiar transporta-tion system, e.g. the knowledge that in Sweden bus ticket are required to take the bus. If this is not the case, the user has other methods of determining the requirement, which is carrying a valid ticket to use the bus transportation service of Karlstadsbuss. First, the bus driver will presumably point out the need as soon as the user enters the bus. Secondly, there is always the possibility to ask people about it. In addition, a user can find this infor-mation as she researches her trip via the travel planner at the website, which has a ticket section, or the app, which explicitly advertises the sale of tickets. However, consuming the information via the website could be problematic if the user cannot understand Swedish. Even then, the app provides the information about tickets in English. Finally, a user will
88
probably notice the behavior of their fellow travellers, since they hold tickets in their hand and queue at the bus card scanner.
In conclusion, place-making in terms of ticket requirement is provided by:
• App: travel planner, mobile tickets • Website: travel planner, ticket section element • Printed media: paper ticket, turkronor • People: friends, family, fellow travellers, bus driver • Bus system: bus card
The channel Service counter does not provide any sense making for the place ticket require-ment, when the user does not know that she has to buy tickets.
Place ticket purchase places
To be able to buy or refill tickets, a user must know where she can do this. Karlstadsbuss offers information about this topic via their website, with the help of an interactive ticket purchase map. Within this map, the user can find the physical location to buy or refill tick-ets. However, before entering the interactive ticket purchase map, information is given concerning the mobile ticket and the bus card. When selecting the bus card, which can be purchased and refilled at physical locations, the option of refilling the bus card online is de-scribed. The page webshop is further provided to refill the bus card. Though, the name webshop is misleading, since it could be understood as an option for purchasing merchan-dise of Karlstadsbuss instead.
One option for buying and refilling tickets is the Karlstadsbuss customer center. The ad-dress of the Karlstadsbuss customer center is given via the ticket machine, the app, the website, the booklet and social media in the contact section.
Since Karlstadsbuss recently introduced the mobile ticket, it executes extensive marketing for it. The mobile ticket is promoted via social media, the website, the bus TV and Printed media at the bus stop.
The placement of the kiosks can be distinguished through signs positioned directly at the purchase site. Karlstadsbuss additionally partnered with kiosks, which were situated at rele-vant places close to the major bus stops. Robert Sahlberg reported that “We have tried to put those (kiosks) in as strategic places as possible to make it accessible all over the city.” (personal commu-nication, 2015-03-11). Furthermore, the big ticket machines can be recognized by the Karlstadsbuss logo and their close position to major bus stations in the city. The small tick-et machines are harder to spot, since they have no Karlstadsbuss branding on them and look like parking meters. However, they are positioned close to bus stops, where parking meters would not make sense to use.
Finally, a user could ask people to determine the position of the ticket purchase sites, or di-rectly ask the bus driver and buy tickets from him.
Karlstadsbuss does not provide any information stating that bus cards for pupils are also available via the schools in Karlstad. Most likely this is because a non-pupil traveller has no way of acquiring this type of ticket.
In conclusion, place-making in terms of ticket purchase place is provided by:
89
• App: ’My Tickets’, app contacts (just address of the customer center), social media (just address of the customer center and mobile ticket marketing)
• Website: interactive ticket place map, webshop, social media (just the address of the customer center)
• Printed media: booklet (just the address of the customer center) • People: friends, family, fellow travellers, bus driver • Service counter: kiosk, customer center • Bus system: ticket machines, signs at ticket purchasing places (kiosk)
Place bus
The basis of the Karlstadsbuss service is the bus transport. That is why the place bus is an important element of the Karlstadsbuss ecosystem. Within the bus, a user can find seats and areas for wheelchairs, walking aid, or strollers, and the following elements:
• Bus driver • Bus card scanner • Bus line map • Next stop display • Bus TV
To create the opportunity to take the bus, the bus driver can serve as a means to buy, refill or validate tickets and the bus card scanner can validate bus cards. The next stop display shows the upcoming bus stops and therefore determines that the bus is following its pre-scribed route displayed on the bus line map. The bus TV provides the Live! display for the upcoming bus stop. Furthermore, the bus TV provides local news, how-to-guides to use functions in the app, and shares contributions of fellow travellers. Moreover, the user takes the bus with other people, with whom she can decide to interact with.
However, the odd placement of the bus card scanner was mentioned by user 22. The bus card scanner is positioned 0,5 meters behind the bus driver. This placing creates the feeling of entering the bus without validating the ticket with the bus driver. If someone is entering without a ticket, the bus driver does not realize this until the traveller is already in the mid-dle of the bus. Furthermore, it is difficult for the bus driver to see if the traveller actually validates the bus card at the bus card scanner. Even if the bus card scanner confirms the scanning with an acoustic signal, this signal is hard to distinguish, when a large queue of people are standing in line in the bus. In addition, as soon as something goes wrong with the scanning of the bus card, for any reason, the traveller has to move against the direction of the queue back to the bus driver.
In conclusion, place-making in terms of the bus is provided by:
• App: mobile ticket • Printed media: paper ticket, turkronor • People: fellow travellers, bus driver • Bus system: bus card, bus line maps, Live! display via the bus TV, bus TV, next stop
display
The channels Website and Service Counter are not particularly relevant for sense making of the place bus. Furthermore, the placement of the bus card scanner in the bus should be ques-tioned in terms of sense.
90
Place destination
The place destination is the actual reason for the user to take this specific bus ride and use the Karlstadsbuss ecosystem. This is why it is important for the user to make sense of the place destination. This place is influenced by all the already established places in the Karls-tadsbuss ecosystem. Furthermore, the place destination is personal to the user. It can be as-sumed that the final destination of the user is located within Karlstad. To arrive at her final destination, the user has to be in the city, know that she has to buy a ticket, find a place to purchase the ticket, find the relevant bus stop, take the bus, and exit the bus at her final destination. To be able to leave the bus stop at the right place, the next stop display is needed. Following, the user must verify at the bus stop that she has really arrived at the planned destination. Finally, the user must make sense of her surroundings, the place city, to find her way to the place/ address she wanted to travel.
To conclude the analysis, place-making is a design principle that is observed within the Karlstadsbuss ecosystem. However, small adjustments in the areas of digital location and finding ticket purchase sites could further enhance the experience for new users, specifical-ly in making sense of the bus transportation in Karlstadsbuss. Furthermore, the placement of the bus card scanner within the bus should be reconsidered. In addition, place-making has to be especially considered when making changes in an existing environment, where users have already established a mental representation of the system, e.g. in the case of moving bus stops due to constructions.
4.4.4 Consistency
Consistency concerns the perceptual, semantic and syntactic aspects of an ecosystem and its channels. Consistency is relevant, as it helps the user to navigate through the ecosystem and the channels, makes the adoption easier for a new users and helps show the connec-tions and correlations between the different touchpoints offered by the various channels.
Within the company interview, the Karlstadsbuss business developer expressed that Karls-tadsbuss aims to provide an overall consistency to its customers. “The challenge there is to make those services so they feel like it is the same service. […] That is a long-term goal, to make it feel like it’s one service that we are providing.” (R. Sahlberg, personal communication, 2015-03-11).
When examining channels, internal consistency exists when the three aspects are applied to each individual channel. The external consistency of a cross-channel ecosystem concerns the extent in which the aspects are applied across channels. First, internal channel con-sistency is discussed, and then external.
Internal Consistency
Channel App
The channel App covers the Karlstadsbuss app and the apps of Facebook and Twitter. As Karlstadsbuss is not able to impact the interaction structure of these social media elements, only the perceptual and semantic factors are considered. However, when discussing the Karlstadsbuss app, syntactic consistency is included. The Karlstadsbuss app consist of ’my tickets’, the buy ticket function, the travel planner, timetables, the bus line maps, the inter-active bus stop map and the Live! display. All perspectives of consistency are examined across these functions.
When looking at perceptual factors, the color scheme, the overall feeling and fonts are con-sidered. The color scheme, placement of information and overall feeling is consistent

91
throughout the app. The font and text colors vary depending on the informational content, but this is not consistent across the app, e.g. in some places grey letters mean the option is unavailable, while in others it means that the users have a search history that they can ac-cess, or it is even used to imply suggestions. Also, the Live! menu’s font is different than the other menu alternatives. To summarize, there are some inconsistencies existing in terms of perceptual factors, but overall there is consistency.
In the area of semantics, the terminology and use of symbols are considered. The termi-nology within the app is consistent. The symbol of Karlstadsbuss, the smiling sun, and the name “Karlstadsbuss” appears on the app logo and on the purchased mobile ticket, but no place else. Once the user opens the app, Karlstadsbuss is not mentioned. Other symbols, such as the symbol used for ’my tickets,’ reappear once the user has selected to enter the ’my tickets’ menu, which is helpful in making navigation easy. Hence, the use of symbols is inconsistent.
For syntactic, the placement of drop-down menus and buttons are the same for all func-tions, which makes it easy to navigate, provides a consistent feel and syntactic within the app.
When comparing the Karlstadsbuss app and its social media accounts, one can immediately find drawbacks in consistency. Perceptually, the company is unable to change the colors, fonts or menu layouts, which creates unavoidable inconsistency. Although the feel of the app and Facebook account can still be compared, the Facebook page feels more personal and fun than the app, as if the company attempts to reach out to the user rather than just providing a service. This makes sense, since the purpose of the Karlstadsbuss app is to be informative and easy to navigate, while Facebook is used to achieve goals that revolve around customer communication.
The semantics are also somewhat limited, as Facebook and Twitter use their own symbols, which cannot be changed by the company. However, the profile picture is the same as the app logo, which makes the user understand that it is the same company managing both medias. The terminology is, as far as the social medias allows, the same as on the app, but the personal attitude makes the context in which communication takes place less serious.
Channel Website
The analysis of Website consistency concerns the website of Karlstadsbuss and the Karls-tadsbuss social media accounts. Again, the syntactic of the social media accounts is not de-signed by Karlstadsbuss and is therefore excluded. The Karlstadsbuss website contains the following touchpoints: interactive ticket purchase map, webshop, travel planner, bus line map, timetable, interactive bus stop map and the Live! display.
In terms of the perceptual aspects, both consistency and inconsistency can be found. The placing of headings, menus and the overall feeling is consistent, but the various pages differ in terms of color and design. The most prominent difference in the perceptual aspect is found amongst the research functions, which look different in the travel planner, interac-tive bus stop map, Live! display and interactive ticket purchase place map.
Within semantic aspects, the Karlstadsbuss website has more consistency than perceptual. The same symbols are used repeatedly and consistently and appear in the same place for all pages. The only place the symbols show inconsistency is in the design of the pinpoints of the interactive ticket purchase map and the interactive bus stop map, where the shape, col-or and marking differ. However, the terminology is consistent across the website.

92
The syntactic consistency of the website is good, as the buttons, menus and interlinks look and work in the same way, and have the same placement. The only inconsistent page is the webshop, which presents an entirely different design. As this function requires more securi-ty and offers differing functions from the rest of Karlstadsbuss website, it is understanda-ble that it appears somewhat different. However, the differences are so great, the user needs to learn a new interaction system, which creates inconsistency and poor UX. The syntactic aspect suffers from the inconsistency of the search functions mentioned in the perceptual section, where the Live! display differs from the travel planner, and both of them are different from the interactive bus stop map and interactive ticket purchase place.
As for social media, many perceptual and important semantic features (such as menu names for terminology and logos) cannot be impacted by Karlstadsbuss. The website al-lows for consistency when posting pictures, where the same promotional pictures and con-tent as on the Karlstadsbuss website are found. The Facebook account feels more personal than the website, which makes sense since it provides customer contact and information in a different manner than the website.
Channel Printed media
The channel Printed media consists of paper tickets, turkronor, the booklet, bus line map, timetable and QR code. As these touchpoints function very differently from one another, they were clustered into two categories before comparing their consistency: ticket-related (paper tickets and turkronor) and information search (booklet, timetable, bus line map and QR code) printed media. In terms of syntactic aspects, the only difference in interaction is that the user looks directly at the Printed media touchpoints, while with the booklet, the user instead flips through the pages to find the relevant information. Therefore further analysis of this would not contribute to this paper.
For the ticket-related printed media, the perceptual perspective points to inconsistency, as the two artifacts look and feel completely different in terms of color, material and personal-ity. In semantic terms, there are two consistencies: the term ‘Karlstadsbuss’ and the sun symbol is appearing on both elements. Otherwise, there are no further similarities. Alt-hough there is inconsistency, these are ticket types with very different usage, and therefore the authors do not see a need to create a better consistency within this area of the ecosys-tem.
The perceptual aspects of information research are consistent, in relation to the content they provide. The bus line map is the same in the booklet as in the printed version on the bus stop, and the timetable in the booklet is the same as the printed version at the bus stop. The QR code adopts a different sort of technology, and therefore it is logical that it looks different.
The semantic aspects of the information research printed media have the same structure as the perceptual ones: the touchpoints, which provide the same content, show great con-sistency. Unfortunately, the authors’ knowledge of the QR code was insufficient to provide a proper analysis of these elements, as they had no opportunity to examine this artifact.
Channel Service counter
During the analysis of channel Service counter, it was found that all elements that create con-sistency are related to the syntactic aspect, and thus the perceptual and semantic aspect are excluded from this channel. With respect to syntactic consistency, the interactions which take place are verbal exchanges with a person who is more informed about the ticket sys-
93
tem than the user. This interaction takes place across a desk, physical service counter or a similar construction.
Channel People
The authors understand that a person cannot have syntactic logic, or consistency in their looks or terminology. The only aspect it would be applicable to is the touchpoint of the bus driver, as this is the only element within the channel People that can hold ecosystem con-sistency. As the bus driver cannot be compared in a stand-alone manner, the discussion concerns how the bus driver matches the graphical profile of Karlstadsbuss in the external discussion.
Channel Bus system
The Bus system is built upon the elements ticket machine, bus card, signs, bus line map, bus stops, Live! display, bus card scanner, next stop display and Bus TV. For this channel, the touchpoints are designed with such different purposes, a narrow in-depth analysis would create less relevant results compared to examining the touchpoints in an overarching way. Also, across these touchpoints the users do not seek consistency in detail. What is consid-ered is the consistency in the touchpoints that offer the same content and services. When analyzing which opportunities for consistency exist, six consistency demands appeared.
The perceptual aspect places a consistency demand for the graphic profile of the bus line colors and bus line numbers to be consistent. This demand concerns the bus line map, the signs, the bus TV and the Live! display, as these are the touchpoints that provide this con-tent. This study found proof that this demand is met, and that there is consistency.
A perceptual misalignment was found within the Live! displays. The large Live! display and the smaller Live! display are not designed in the same way, and have different color schemes for both text and background, as well as differences in font. The authors found this to be an inconsistency.
A demand that mixes perceptual and semantic is the graphical profile of Karlstadsbuss, which should be observable throughout the bus system. Here, the channel Bus system shows consistency in most touchpoints, apart from the small ticket machine, which provides none of the graphical elements of Karlstadsbuss, the Live! display and next stop display. The two latter touchpoints are designed in such a way that the colors and fonts cannot be aligned. The Live! display does not provide the logo of the sun. The next stop display does not have any of the semantic elements, but is located inside the bus where plenty of semantic ele-ments can be found, therefore enabling the user to connect the display with Karlstadsbuss.
The next semantic consistency demand requires that the next stop display, Live! display and bus TV should show the same departure and arrival times, which they do. Another seman-tic demand is that the name of the bus stops should be consistent within all touchpoints to reduce confusion. The findings proved that this consistency exists.
Lastly, a syntactic demand is placed on the bus card scanner and ticket machine, to have similar interaction interfaces and to be navigated in a similar manner. According to the au-thors’ knowledge, this is an inconsistency in the Bus system channel, as the interfaces of the bus card scanner and ticket machines, especially the small ticket machines, have different, unrelated designs.

94
External consistency
When evaluating the external consistency of the Karlstadsbuss ecosystem, the approach needed to be adjusted to suit such a large analysis. Therefore, the important consistency as-pects are considered, i.e. those that ease ecosystem navigation, that are relevant for the var-ious user activities and those that assist in making the system feel like a coherent service. Therefore, the perceptual aspect analysis considers the use of the graphic profile in terms of colors and overall feeling. The semantic regards the terminology and how well the logo of Karlstadsbuss is used. To examine the syntactic consistency, the services providing the same content are compared, and appraised for consistent logic.
Perceptual
When looking at the factor of color usage, the interviewees from Karlstadsbuss stated dur-ing the company interview that they sometimes stretch the graphical profile of Karlstad’s municipality. This could be recognized in the Karlstadsbuss app, which has a different, alt-hough more aesthetically pleasing, color scheme. Additionally, the company name does not appear in the app, so this channel can be deemed as rather inconsistent in regards to the rest of the channels. Three other elements did not follow the color coding. First, the paper tickets, which are simply black and white. Second, the channel Service counter, which only fol-lows the graphical profile through signs and otherwise has its own profile branding. Third, the bus drivers, who do not hold any perceptually recognizable elements, e.g. no uniforms or work clothes that match the color scheme. Concerning the overall feeling of the ser-vices, it could be determined that the social media accounts and the bus TV have more friendly designs than the other channels and touchpoints. As the social media accounts and bus TV are more recently developed and more non-traditional than most parts of the eco-system, this can be seen as a trend Karlstadsbuss is employing.
Semantic
Regarding the semantic aspect of using the logo, it was observed that the small ticket ma-chine, the bus drivers, next stop display and the service counters (signs excluded) are in-consistent in their usage of the logos of Karlstadsbuss. For service counters (kiosk and school) this is logical, as these touchpoints serve many functions outside the Karlstadsbuss ecosystem, but for the remaining artifacts it creates inconsistency for the users. For all oth-er touchpoints consistency can be found. Consistency is high for the semantic terminology as well, where social media and bus TV somewhat fall out of line, as they often display top-ics and content that are not available elsewhere. The app is also inconsistent as it is availa-ble in English, although the authors see this as a positive step for the overall development of Karlstadsbuss, and is therefore a good change rather than a negative inconsistency as-pect.
Syntactic
To approach the syntactic perspective, the study utilized clusters based on the content the channels hold and services they perform. The clusters which have been created to perform the analysis are: bus line, timetables, interfaces of ticket scanner, ticket machine and web-shop, company interaction points, bus driver and digital touchpoints.
Within the cluster bus line, the various channels (App, Website, Printed media, Bus system) pro-vide replicas of the same map. Therefore, the user can easily recognize them in the physical space she occupies, as long as she can find a bus stop. This is very consistent in its design and usage, across the different channels.
95
The syntactic consistency of the timetables is also very good, as they hold the same infor-mation across all channels they are available in (App, Website, Printed media, Bus system).
The ticket scanner, the ticket machine and the webshop, on the other hand, show incon-sistency. These touchpoints were grouped together not for their services, but for their in-terfaces. The user’s interactions with these three different touchpoints is not aligned, and the navigation is not consistent across the services. This can cause issues for the user, espe-cially if she wants to change between ticket machine and website to refill the bus card, or vice versa.
The bus drivers maintain some syntactic logic in terms of what tasks and behaviors they are asked to perform. They are instructed to deny a user passage on the bus without a valid ticket, to receive and manage turkronor and paper tickets, as well as to confirm the validity of mobile tickets. They shall drive the bus along a designated route, that matches the bus line maps, and arrive at the destinations according to the timetables. The bus drivers shall stop at all relevant bus stops and open the doors to allow passengers to enter and exit the bus. Based on the findings, this syntactic logic is applied and is therefore consistent.
Digital touchpoints are available on both the App and the Website. These touchpoints are, to some extent, the same as the travel planner, bus line map, timetable, social media and in-teractive bus stop map and are designed and offered in a consistent way to the user. How-ever, the ticket services have very little in common, in terms of what services they provide, their interaction design and their layout.
To conclude, the ecosystem of Karlstadsbuss has aspects that show inconsistency, however this inconsistency appears in a limited amount of touchpoints:
• The app (perceptual, semantic, syntactic), • Live! display (perceptual), • The small ticket machine (semantic, syntactic), and • The webshop (perceptual, syntactic).
“The challenge there is to make those services so they feel like it is the same service. […] That is like a long-term goal to make it feel like it’s one service that we are providing. But of course they all have a history and we are trying to go from there.” (R. Sahlberg, personal communication, 2015-03-11). In con-clusion, it was discovered that there exists a good overall consistency across the channels in the perceptual and semantic perspectives . It was observed that, when applicable, the Karls-tadsbuss ecosystem has less syntactic consistency than the preceding two perspectives.
4.4.5 Resilience
Resilience is found when an ecosystem recognizes, shapes and adapts itself to the users and her goals. To some extent, one can observe elements that resemble resilience within com-position and continuity, where touchpoints in various channels allow the user to substitute a service for another. It is within that aspect the ecosystem is shaped to the user, although resilience expresses this substitution more explicitly. Buxton (2007) expresses the im-portance of resilience further when explaining that due to increased pervasiveness in busi-nesses today, the requirements of ecosystem adaptation have become essential.
When broken down into the forms that channels can take, Kourouthanassis et al. (2007) stated that user interactions within an ecosystem take place through heterogeneous devices in a physical environment. In addition, Zhou et al. (2011) said that digital ecosystems rely on the touchpoints the user interacts with. This interaction is not restricted to “the user and a

96
single product, but rather the user, multiple products and services as well as the ambience where the interac-tion is performing”. As the authors also know from the theoretical framework, users are a nat-ural connector across channels in the ecosystem, as they are the navigator of the cross-channel experience (Resmini & Rosati, 2009; Resmini, 2012; Corrigan & Miller, 2011; Segerståhl, 2008; Novak & Schwabe, 2009).
Thus, having the user shape the ecosystem does not eliminate the notion of resilience, but the system creates resilience by offering a variety of selections to the user. Vanguard (2010) and Fisher et al. (2012) stated that it is the task of the company to understand customer needs and determine what is missing in their cross-channel experience. Karlstadsbuss stat-ed that “in one way we are making a lot of decisions without asking people for permission but of course making use of that customer data that we have, that’s an important part ..[...]. I would say that since we are so local we have a really good understanding on what the questions are important.” (R. Sahlberg, per-sonal communication, 2015-03-11).
It can be argued that the physical touchpoints in the ecosystem are designed to be static and are therefore incapable of adapting. It is similar for People, where the only place adapta-tion can occur is in the behavior of the bus driver and service counter employees, when talking to a user. It can be concluded that the system does not adapt to the user as much as the user shapes the system.
In practice, resilience means that one can find the ability of the ecosystem to substitute for itself via various channels, (e.g. if the phone is out of battery, when the user wishes to use Live! she can instead turn to the Live! display at the bus stop), and how the digital touch-points allow for adaptation to the user.
Resilience in touchpoint substitutes
Resilience via substitutes has been observed in:
• Bus line maps • Interactive bus stop maps • Departure and arrival times • Disruption information • Ticket purchase • Bus card refill
Bus line map
The bus line maps offer resilience, as the user can easily exchange the map available in one channel with another, since both have an identical design. The bus line map can be ac-cessed via booklet, at the bus stop as Printed media, on the app, website and inside the bus. Thus, the user can choose the preferred touchpoint for the situation, and needs no time to understand a new map design. At the same time, the travel planner (App and Website) also functions as a substitute, however not as a direct one, since it provides the information in a different layout and also requires a different interaction for finding information.
Interactive bus stop map
The interactive bus stop map can be found both in the App and on the Website, and thus, the system has resilience. Although, since both maps are only available through digital channels, it creates constraints on the usefulness and resilience.

97
Departure and arrival time
The timetables provide consistent information in the form of Printed media, App and Website. The user is able to choose from different channel types (physical and digital) to get infor-mation. The user can also use the Live! display, Live! function on the App or Website and the bus TV to find out when the bus leaves and if it is on time. Therefore, the timetable function contains resilience.
Disruption information
Information about disruptions is provided on the website, the Facebook and Twitter ac-count, and via the bus TV. Users also mentioned turning to fellow travellers and the bus driver to gain information about disruptions and to obtain general information during their trips. This means that channels of all types (biological, digital and physical) provide substi-tutes for this activity.
Ticket purchase
The purchasing of a ticket is available at kiosks, the Karlstadsbuss customer center, handed out at school, by the bus driver, the ticket machine or via the app. This activity therefore has high resilience, as there are not only many different options, but the options are also available in all different channel types (biological, physical, digital).
Bus card refill
The bus card can be refilled in a variety of places: on the webshop, at a kiosk, at the Karls-tadsbuss customer center, or at the ticket machine. This allows the user to choose a pre-ferred method. For example, user 24 mentioned they did not like to wait in line at Press-byrån, nor the social interaction, and therefore selected the ticket machine instead, or the alternative, which is most convenient for them, e.g. user 23 refills at the webshop, as no physical ticket refill site is located near her.
The authors see that several parts of the ecosystem are unable to hold resilience. The buses, bus card scanner, bus driver and the bus stops can only be substituted with another bus, bus card scanner, bus driver or bus stop. An area where resilience would make sense, but does interestingly not exist, is in the ticket holding. While users can hold several tickets of different types simultaneously, the tickets are not backed up by the system. Because of this, a purchased and lost bus card cannot be replaced by a mobile version of the ticket, or by a purchasing receipt. The user can register her card online and disable its usage if lost, but this does not enable her to keep using her bus card. This principle applies to mobile tickets, paper tickets and turkronor as well. If the user loses her physical ticket, or her smartphone does not work, the purchased ticket is void.
Digital touchpoint adaptation
When analyzing resilience in digital touchpoints, there were four digital touchpoints to con-sider: the bus card scanner, ticket machine, app and website. The remaining touchpoints, which hold digital information, are not directly in contact with the user, and the social me-dia accounts do not allow for impacts that affect resilience.
The bus card scanner does not hold much resilience, as it does not adapt to the users. It can confirm the validity of a bus card, but it does not know to whom the bus cards belongs to, how long they will travel, or where they will get on and off the bus. The ticket machine behaves similarly to the bus card scanner, as it recognizes the validity and balance of the
98
bus card, but no other user-related information. Therefore, little user adaptation and resili-ence is found within these digital touchpoints.
The App allows for a larger array of user adaptation. The user can choose favorite bus routes and bus stops, the app remembers the history of the journeys the user has searched for, and allows the user to view old mobile tickets she purchased.
The Website does not hold much resilience. It does not remember previous user interactions and does not allow the user to select favorites or record standard journeys. The webshop does, however, provide the user with her purchasing history (only via the webshop, not from other ticket refill places). The webshop suggests the username when the user attempts to log in and gives the user detailed information about her bus card. The webshop also re-members the last time the user logged in on her account. It also allows the user to link sev-eral bus cards to one another.
To conclude, the ecosystem of Karlstadsbuss shows good resilience when looking at user options and substituting touchpoints. The user often has several alternatives, and the con-tent sharing and consistency within these alternatives supports a smooth touchpoint transi-tion. Within the area of user adaptation, the ecosystem is not very resilient, as the app and the webshop are the only touchpoints that actively reshape to enhance the UX. However, the authors can see areas where resilience can be used to improve the UX even though this is a topic that did not surface during the company interview, nor did any of the users refer to these areas as problematic.
4.4.6 Reduction
The heuristic reduction by Resmini and Rosati (2011, p.55) refers to the capability of a cross-channel ecosystem to “to manage large information sets and minimize the stress and frustration for [the user] associated with choosing from an ever-growing set of information sources, services, and goods”.
Since ecosystems like that of Karlstadsbuss are not centralized or provided by a single con-tent creator, but are a result of multiple contributors (Boley & Chang, 2007; Karakas, 2009; Resmini & Lacerda, 2015; Bharadwaj et al., 2013; Corrigan & Miller, 2011), these ecosys-tems become very complex. In the case of Karlstadsbuss, contributors to the ecosystem are, for example, Karlstadsbuss as a company, Karlstad municipality, the customers via so-cial media, and fellow travellers on the street and in the bus. In this context, Karlstadsbuss strives to satisfy different needs within one ecosystem, e.g. the need for including up-to-date technology for tech-savvy customers, and simplicity and easy understanding for less technology affine customers. Robert Sahlberg stated “If we can satisfy the needs of the younger people […] without making it worse for the elderly, it is a good way of development.” (personal com-munication, 2015-03-11). The conflict of these contradicting forces can be solved by reduc-tion.
In the following section, the Karlstadsbuss ecosystem is analyzed in regards to the applica-tion of reduction within the different touchpoints and channels, to simplify the user activi-ties during their journey. Since the touchpoints in the channel People, except for the bus driver, cannot be designed in terms of reduction, the study does not further consider this channel during this analysis.
Find ticket purchase place
Within the user activity Find ticket purchase place, a large set of possibilities is offered to the user. To support the user with the management of this large set of data, two touchpoints

99
are provided for finding the addresses or locations of ticket purchase sites. A further need for reduction does not exists from the study’s point of view.
Buy and refill tickets
Karlstadsbuss is aware that users are not fully satisfied with the ticket buying process at Karlstadsbuss, and are currently working on simplifying the process. Robert Sahlberg ar-gues that buying tickets “shouldn’t be something spectacular. It should be very natural. And the prob-lem today is that people see it as a problem, because it differs from the way that you pay at other stores. […] We have to get the foundation right.” (personal communication, 2015-03-11). The design principle of reduction can assist in simplifying processes, when a user is confronted with a large set of information and possibilities to choose from.
In the user activity Buy and refill ticket several elements have to be considered. First, the user must select her preferred ticket type, which restricts her selection for ticket types and pur-chase locations. Second, the user must decide how she will buy or refill the selected option (if refilling is available).
The user has four possibilities in terms of ticket type: bus card, paper ticket, turkronor, or mobile ticket. As soon as she decides on a ticket type, she is restricted in her ticket options.
Paper tickets offer single tickets, or short-term duration tickets (24 or 72 hours), which makes sense since the paper will probably deteriorate in condition after several uses. Turk-ronor offer the possibility of buying single tickets and 14 day, 30 day, or 100 SEK refills for the bus card, which are one-time usages. The mobile ticket only offers single tickets, even though the characteristics of the medium would enable a longer use.
The bus cards offers either time related ticket options, or a balance option, which can be used for single trips. Bus cards can be purchased at Pressbyrån, the customer center, the school and the ticket machine. The ticket machine only provides the user with a paper tick-et which shall be brought to the customer center, where the user receives the physical bus card. The bus card is the only ticket option that can be used over a longer period of time and can be refilled at Pressbyrån, via turkronor or cash at the bus driver, via the website or the ticket machine.
To summarize, the bus card offers all ticket options at the time of purchase, besides the short-term duration tickets via the channel Service counter and the touchpoint ticket machine, which is not usable on its own. The validation of the bus card is executed in the channel Bus system. Furthermore, as soon as it must be refilled, three more channels becomes rele-vant to this ticket type: Website, People (bus driver), and Printed media (turkronor). The turk-ronor offers the purchase of single tickets, but only refills the bus card, with three relevant channels: Service counter, Printed media, and People. The paper ticket only offers single tickets, or short-term duration tickets and can be purchased via Service counter, Printed media, and Peo-ple. The mobile ticket offers single tickets, which is relevant in two channels: App and Peo-ple.
In conclusion, the touchpoints in this user activity have several disadvantages in terms of reduction.
• The buying activity should be reduced to just one touchpoint- buying bus cards at the ticket machine.
• The reduction of the website to only refilling the bus card, and the mobile ticket to only single ticket sales is illogical.

100
• The removal of the reductions in terms of ticket options and functions for the bus card, mobile ticket, and website would improve consistency, and sense-making for the user. With all ticket types and functions available for almost all channels, it would actually reduce the complexity for the user.
Hold ticket
Since there are four different types of tickets within the Karlstadsbuss ecosystem, there are four different ways for the user to retain a ticket. The possession possibilities when using paper tickets, turkronor and the bus card are limited due to their physical nature. Although, the retaining of the extra media ’ticket’ can be considered as redundant. That is why Karls-tadsbuss plans to eliminate the medium bus card and introduce ticket services via the credit card in the next years. This service is already being tested in London. Robert Sahlberg un-derstands that “people are fed up with having a separate card for that and a separate card for that. I mean I hate it myself.” (personal communication, 2015-03-11). In conclusion, the reduction of bus cards with the merge to credit cards could simplify the process of retaining tickets.
Research trip
Within the user activity Research trip, the user is confronted with a large amount of infor-mation, possibilities and options. The key for finding the optimal route is to reduce the in-formation, which has to be consumed to a reasonable minimum. Karlstadsbuss invested ef-forts and resources into achieving this in 2006, and simplified its bus lines and bus line maps. Karlstadsbuss divided the bus map and bus lines into basic lines and specialized lines.
Moreover, the touchpoints to research a bus trip are reduced to five elements. Three touchpoints are made available in diverse channels. In addition, the touchpoints are built upon each other and make use of the same information.
• Travel planner (App and Website) • Bus line map (App, Website, Printed media and Bus system) • Timetable (App, Website and Printed media) • Booklet (Printed media) • Signs (Bus system)
The basic bus lines of Karlstadsbuss leave every day of the week in regular intervals, about every five to ten minutes. This would create a very long timetable for the basic bus lines. However, Karlstadsbuss managed to visualize the time tables in such a manner that the regularity of the departures, but not every departure, is displayed.
Furthermore, the location function of the travel planner in the Karlstadsbuss app reduces the numbers of bus stops a user can choose from, providing a more easily processed num-ber, with the suggestions of bus stops close to the user. However, even if the travel planner is also available at the Karlstadsbuss website, there is no location function included and therefore the choice of the user is not simplified through reduction.
In conclusion, Karlstadsbuss made optimal use of reduction in all the available touch-points, especially for the bus line maps, timetables and travel planner in the App channel. However, the choices and information in the website’s travel planner could be further re-duced by a location function.
101
Check arrival/ departure time
To check the real-time arrival/ departure time of the buses, Karlstadsbuss provides the Live! displays via the bus stop, the website, the app and later in the user journey, on the bus TV. Another option for checking actual arrival/ departure time is given at the bus station via the Printed media touchpoint QR code. This means that there are only two touchpoints made available to the user.
Furthermore, the real-time display only shows the next one or ten arriving buses. This ena-bles the user to consume the needed information during a short glance at the display. However, the Live! display does not provide any further information in case of disruptions or delays. The only behavior in the Live! Display that can be observed by the user is the ar-rival/ departure time when it does not change until the bus moves in the direction of the bus stop again. This behavior has been mentioned negatively by two users (17 and 18) in the user interviews.
Since the authors had no opportunity to scan the QR code, a detailed reduction analysis for the QR code cannot be provided by the authors.
In conclusion, Karlstadsbuss made good use of reduction in the user activity Check arrival/ departure time. Even though the information given via the Live! display is reduced to the ar-rival time. This reduction prevents the user from extracting the needed information for her further travels. Karlstadsbuss has already indicated this to be a major problem and is cur-rently working on providing better disruption information via an extra IT system (R. Sahl-berg & M. Lindgren, personal communication, 2015-03-11). In addition, if the user has a smartphone, she could make better use of the Karlstadsbuss app, instead of scanning the QR code at the bus stop. That is why it is suggested that Karlstadsbuss consider removing the QR code and just provide the Live! display instead.
Validate ticket
In the user activity Validate ticket, only two options are available that are based on the user’s choice of ticket type: validating with the bus driver and validating at the bus card scanner.
The ticket validation with the bus driver proved to be very simple in the analysis of the ecosystem. The traveller presents the ticket, and in case that it is valid, the bus driver con-firms the ticket on his system. The study sees no further need of reduction in this touch-point.
The ticket validation with the bus card is performed at the bus card scanner. Karlstadsbuss reduced the number of available bus card scanners to one per bus. As a result, long queues are formed at larger bus stops when many travellers are entering and attempting to validate their bus card. The actual options at the bus card scanner are reduced to a minimum, which include scanning the bus card and checking the validity or balance of the bus card. Howev-er, the time required by the bus card scanner to scan a bus card is too long when a large number of travellers enter the bus. This causes the travellers to feel rushed. User 22 report-ed in the interview that due to the time pressure she and the people around her feel, she does not really know if her bus card is scanned. At other times, the bus card scanner has not completed processing the scan, and therefore shows the scan of the person before her.
In conclusion, Karlstadsbuss applies the principle of reduction to its ticket validation. However, the time the bus card scanner needs to complete a scan should be reduced, or

102
the process of scanning the bus card should be redesigned to improve the user movement and UX.
Information during the trip
Within the user activity information during the trip, the user has three touchpoints, which can be actively influenced by Karlstadsbuss, the bus driver, the Live! display via the bus TV and the next stop display. During the analysis, a further need for reduction in this activity could not be determined.
Share experience
Within the user activity share experience the user can make use of three elements within the Karlstadsbuss ecosystem: Facebook, Twitter and the bus driver. During the analysis, a fur-ther need for reduction in this activity could not be determined.
To summarize the finding from this section, the study observes that Karlstadsbuss makes good use of reduction in its ecosystem. However, in some user activities, room for im-provement can be distinguished.
Buy and refill tickets:
• Reduce the number of needed touchpoints when the user buys ticket, to just one (buying bus card at ticket machine).
• Remove the reductions for ticket options and functions for the bus card, mobile ticket, and website. With all ticket types and functions available for almost all channels, it would reduce the complexity and improve consistency, and sense-making for the user. That only the bus card refill is available at the website and just single tickets for the mobile ticket is especially illogical.
Research trip:
• Add the function of user location to the website travel planner and interactive bus line map.
Check arrival/ departure time:
• Consider the removal of the touchpoint QR code.
Validate ticket:
• Reduction of bus card scanning at the bus card scanner should be considered, or a redesign of the whole bus card scanning process within the bus (including the po-sition of the bus card scanner in the bus and user flow).
4.4.7 Correlation
Correlation is concerned with how well a cross-channel ecosystem visualizes relevant chan-nel connections to the user. The ecosystem should help a user to achieve her goals, and correlation assists with this by making useful suggestions.
This subject was brought up during the company interview, where it was said that “It always comes back to have this open communication. […] If you get the customers in one place, let them know what else is out there.” (R. Sahlberg, personal communication, 2015-03-11). Just as in the defi-
103
nition of correlation, both interviewees spoke of the importance of guiding the users once they have entered the ecosystem.
The literature agreed with this notion, as Fisher et al. (2012) stated that ecosystem designers must create meaningful interlinks for the users, as the UX suffers if the users cannot see the relationships between channels and touchpoints. Similarly, Resmini and Rosati (2011) explained that no matter how perfect an individual channel is, it is still part of a bad UX if the user cannot understand how to move between channels.
To analyze this, the authors looked into the six defined channels, and observed how they refer to other channels and touchpoints at various points during the user journey.
Channel App
The App explains to the user how to locate the bus stop and how the bus stops are con-nected via routes, by offering the interactive bus stop map, travel planner and bus line maps. While users can buy mobile tickets, the app does not explain how or where users can use them. It does not refer to the Karlstadsbuss website or printed media. The Karlstads-buss app itself does not refer to the channel Service counter, however when using the Face-book app and visiting the account of Karlstadsbuss, the location and opening hours of the Karlstadsbuss customer center is provided. It does, however, provide a link to the Karls-tadsbuss Facebook page. It is understandable that the app does not speak of bus drivers or fellow travellers, as this is not information a user searches for via this medium. But it does provide the phone number to the Karlstadsbuss service center.
Channel Website
The Website of Karlstadsbuss gives directions to bus stops and explains how the bus stops are connected via routes, by offering the interactive bus stop map, travel planner and bus line maps. It provides a vast amount of information about ticket types and their various us-es, as well as information on where to find ticket purchase locations. It explains how to ride the Karlstadsbuss buses, and what rules are enforced when travelling. It also provides in-formation about the bus TV, the full range of phone numbers that are available to the user, and links to the social media accounts on Facebook, Twitter and YouTube. On YouTube it is possible to find videos that explain how to use the app of Karlstadsbuss. On the Face-book page it is also possible to find the opening hours and address of the Karlstadsbuss customer center.
Channel Printed media
The channel Printed media provides phone numbers to the Karlstadsbuss customer center through their placement on the bus stops. Via the bus line maps and booklet, the Printed media channel refers to the system of bus stops and to which routes they belong to.
Channel Service counter
The service counters are connected to ticket types and general ticket information as they provide suggestions to the user. At the Karlstadsbuss customer center, the user can be connected to most of the other channels and touchpoints as the employees hold infor-mation not only about tickets but about the system as a whole.
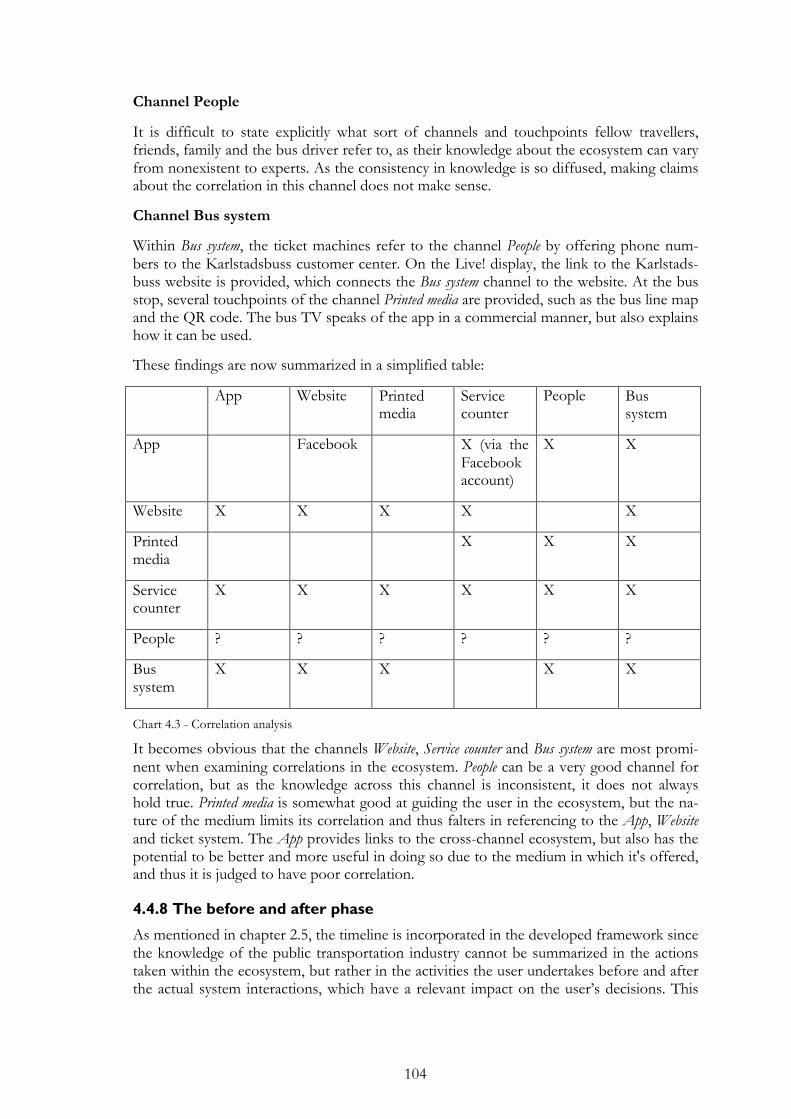
104
Channel People
It is difficult to state explicitly what sort of channels and touchpoints fellow travellers, friends, family and the bus driver refer to, as their knowledge about the ecosystem can vary from nonexistent to experts. As the consistency in knowledge is so diffused, making claims about the correlation in this channel does not make sense.
Channel Bus system
Within Bus system, the ticket machines refer to the channel People by offering phone num-bers to the Karlstadsbuss customer center. On the Live! display, the link to the Karlstads-buss website is provided, which connects the Bus system channel to the website. At the bus stop, several touchpoints of the channel Printed media are provided, such as the bus line map and the QR code. The bus TV speaks of the app in a commercial manner, but also explains how it can be used.
These findings are now summarized in a simplified table:
App Website Printed media
Service counter
People Bus system
App Facebook X (via the Facebook account)
X X
Website X X X X X
Printed media
X X X
Service counter
X X X X X X
People ? ? ? ? ? ?
Bus system
X X X X X
Chart 4.3 - Correlation analysis
It becomes obvious that the channels Website, Service counter and Bus system are most promi-nent when examining correlations in the ecosystem. People can be a very good channel for correlation, but as the knowledge across this channel is inconsistent, it does not always hold true. Printed media is somewhat good at guiding the user in the ecosystem, but the na-ture of the medium limits its correlation and thus falters in referencing to the App, Website and ticket system. The App provides links to the cross-channel ecosystem, but also has the potential to be better and more useful in doing so due to the medium in which it's offered, and thus it is judged to have poor correlation.
4.4.8 The before and after phase
As mentioned in chapter 2.5, the timeline is incorporated in the developed framework since the knowledge of the public transportation industry cannot be summarized in the actions taken within the ecosystem, but rather in the activities the user undertakes before and after the actual system interactions, which have a relevant impact on the user’s decisions. This
105
idea was supported in the theoretical framework, where it was said that user expectations impact pre-experiences and post-experience with a service, which in turn is needed to cre-ate a good UX (Law et al., 2009; Hassenzahl, 2008; Corrigan & Miller, 2011; Karapanos, 2013; Vieira, Caldas & Salgado, 2011; Dziekan, 2008; Apanasevic, Markendahl & Arvidsson, 2013).
Before phase
The before phase refers to the user’s anticipations and opinions about a service ecosystem, as well as the user’s motivation for engaging with the system. The combination of pre-existing knowledge and the actual interaction with the services of an ecosystem is part of what creates the UX (Law et al, 2009; Maiden, 2010; Corrigan & Miller, 2011; Unger & Chandler, 2009; Fisher, Norris & Buie, 2012). When the literature turned to the industry specific impacts of user expectations, Dziekan (2008) explained that the user's mental rep-resentation of the transportation system greatly impacts which choices she makes once in-side the ecosystem.
It was also stated in literature that even non-users have predefined perceptions of a com-pany’s service, which proves that users create an opinion and attitude before they interact with a system (Dziekan, 2008). The findings from the user interviews agreed with this, as the non-users the authors interviewed also had a mental representation of Karlstadsbuss’ services. These opinions had been shaped by interactions with actual travelers, who had shared their experiences with them, and from what they have been able to observe from the system without using its services.
Mostly due to the information available to the new tech-savvy, empowered users, the way a company provides their range of services becomes more and more important. It is said that the easier it is to access information concerning public transportation in an urban area, the more attractive the service becomes to potential users. Simultaneously, users rarely process all information provided at once, but tend to pick up details that are relevant one at a time. Since the process of gathering information is sequential, an overabundance of information should not be provided at one time (Dziekan, 2008; Vieira, Caldas & Salgado, 2011).
Also, it has been found in literature that new users struggle the most with determining how the payment systems work, compared to other user activities (Vieira, Caldas & Salgado, 2011; Dziekan, 2008). The findings on user adoption of Karlstadsbuss are in line with these statements, as the only struggle users mentioned with getting acquainted with the system, was how to refill their tickets and how to validate them. Even so, the majority of the users commented that the system of Karlstadsbuss was easy to learn and to navigate within.
By continuous interaction with the ecosystem, the user keeps evolving and changing the mental representation she holds. The more recent the interaction, the better the quality of the mental representation (Dziekan, 2008). This means that since the opinion is constantly evolving, the company has an opportunity to impact the anticipations and opinions of al-ready existing users. This is where a very important distinction becomes apparent: it has an opportunity to impact, not design. By creating and improving services and touchpoint ex-periences, Karlstadsbuss can change the mindset of users in terms of opinion and anticipa-tion. Even so, Karlstadsbuss cannot forge or force their desired mental representation onto the user, which is why opinion and anticipation cannot be designed. Similar to this, Karls-tadsbuss cannot design or impact elements that are external to them, e.g. the behavior of fellow travellers.
106
In the findings, the opinion of Karlstadsbuss was generally good among users, and as men-tioned, non-users also had a positive perception of the company. The elements that explic-itly impacted the user’s opinions positively were improvements of technology and quality, that Karlstadsbuss seemed to care about their passengers, and the behavior of the bus driv-ers. Within the area of anticipation, the study did not find a lot of specific information, only the following expectations: arriving to the end destination, feeling comfortable during the trip, and that the monetary and environmental costs of taking the car would exceed those of taking the bus. Due to some negative experiences in the past, one user expected the bus to not fulfill its promise of delivering her to her destination on time, which made her reluc-tant to use the service. This is a very good example of how a continuous interaction could help changing a user’s anticipation, provided that the company has solved the issue.
The third factor of the before phase, motivation, is different from opinion and anticipation, as Karlstadsbuss cannot design or impact this factor since it is created externally from the company. All the company can do is to ensure its services are available in the user’s ecosys-tem, and thereby exist as a mental option in the user's mind when selecting a medium of transportation. Concerning motivation, the conclusion is therefore that Karlstadsbuss has the possibility of influencing the user’s motivation by making her aware of the service’s ex-istence.
An interesting finding of this case study is that although these three factors were evaluated, they were found insufficient to fully explain the before phase. Here, the additional factor attitude came into play, to make sense of the decision whether or not to use the Karlstads-buss services. Attitude differs from opinion, since it does not concern the opinion of a company or brand, but of the bus as a transportation medium. Attitude does however have an influence over opinion, as it can be interpreted as creating a higher level impact of deci-sions. The authors found that all users had preferences in their choice of transportation, and that circumstances could influence a change in preference. Similar to motivation, the attitude towards the public bus transportation is formed externally from Karlstadsbuss, and therefore there is very little the company can do other than remain available.
However, Karlstadsbuss does try to influence the Karlstad inhabitants’ in terms of attitude towards the car, since its vision is that “in Karlstad it is easy to live without a car”. Robert Sahl-berg reported that Karlstadsbuss does not “mention public transport in that vision because we feel like we are a part of sustainable travel. [...] It is not a human right to have a car and you shouldn’t need to own one to live a good life in our city.” (R. Sahlberg & M. Lindgren, personal communication, 2015-03-11).
After phase
The after phase includes the user’s processing of the received service. The framework con-siders the elements Reflection and Sharing within the phase after consuming the service. The importance of this phase is that it ultimately shapes the future interactions of the user and the company, since it shapes the elements of the Before phase through iterations. A bad ex-perience creates negative associations, and therefore poor anticipation, attitude and opin-ion.
When sharing experiences, there are two aspects to consider: informal sharing and formal sharing in the form of feedback.
During the user interviews, the authors could decipher that sharing experiences with friends, family or fellow travellers is informal. Sharing impacts other users’ anticipations, opinions and attitudes, but these experiences are not necessarily gathered by Karlstadsbuss.
107
It is up to the users to decide whether or not they are willing to share their experiences, and according to the user interviews this ratio is very low.
Formal sharing can be thought of as providing feedback to a company, which is a more explicitly stated opinion of a user. It is necessary for companies to obtain the experiences of their customers, to be able to shape the factors which might have affected the user’s ex-perience negatively. By understanding the hedonic qualities of a user (the motivational as-pects) a company can improve the services’ different functions to better support them. Simply collecting static user feedback, or gathering user feedback without considering the context in which it is gathered, are very common mistakes (Corrigan & Miller, 2011; Fisher, Norris & Buie, 2012; Hassenzahl, 2008; Karapanos, 2013).
Since the user priorities and satisfaction is grounded in the strategy of Karlstadsbuss, the company is aware of this fact and created a variety of platforms where the users can leave feedback and share their experiences. For example, through their social media accounts (Facebook and Twitter), the user survey on their website, personal interaction and focus groups. By promotion and informing the users that these feedback options exist, the likeli-hood of receiving relevant user feedback increases. Robert Sahlberg talked, for example, about the information Karlstadsbuss could extract from its Facebook page: “People write a lot about what they are thinking about different things. When we released our application (we took the users in consideration). It’s one feature that at least 9 of 10 were writing about. So we know that this is the feature they want.” (personal communication, 2015-03-11).
The user reflections about the Karlstadsbuss services proved to be hard to gather. Even when probed, this knowledge appeared to be highly tacit in its nature and not easily com-municated. Therefore, the authors did not find any reflective behavior among the users, and deem this factor to be immeasurable. Hence, it cannot be included in the final frame-work version.

108
5 Discussion Within this chapter, the results of the analysis and the method of this study are discussed. Furthermore, the implications for research, implications for practice and the position for future research are provided.
5.1 Result discussion This section contains the adjustments that led to the final cross-channel UXD framework, and the formulated design strategy discussion in form of the summarized language of cri-tique of the cross-channel UXD of the Karlstadsbuss ecosystem.
5.1.1 Finalized framework
Based on the results from the analysis in chapter 4.4, some of the elements within the initial cross-channel UXD framework needed adjustments in the before and after phase. The el-ement attitude is added to the before phase and the element reflection is removed from the af-ter phase. The remaining original elements were proven to be relevant by the authors. The changes create the final cross-channel UXD framework of this study.
Figure 5.1- Final cross-channel user experience framework
5.1.2 Design Strategy Discussion
Within this chapter, a summary of the examined results from the analysis in chapter 4.4 is provided in form of a language of critique.
It could be determined that the Karlstadsbuss ecosystem is indeed composed as a cross-channel ecosystem. Following, the areas of improvement in the different channels are stat-ed, based on the design elements of the final framework. Where no areas of improvement are mentioned, the cross-channel UXD was found to be adequate.

109
Channel App
Within the analysis of the Karlstadsbuss ecosystem concerning continuity, the authors found that the channel App does not provide content for the user activities Find ticket pur-chase place and Hold ticket (check validity/ balance of bus card). Here, the authors see an area of improvement.
When examining place-making within the Karlstadsbuss ecosystem, the authors recognized that the channel App does not actively inform the user about when she is not located in Karlstad. The result of this missing function is that the user can activate mobile tickets, even though activated mobile tickets are not usable outside of Karlstad.
For consistency, several improvement suggestions were provided. From the point of view of the authors, the internal consistency can be enhanced through more consistent use of the semantic elements in the channel App. The symbol and company name of Karlstads-buss appear on the app logo and mobile ticket, but nowhere else. Adding this information can provide a better UX. Moreover, the external consistency of the channel App can be further developed in perceptual, semantic and syntactic aspects. Through the stretch of the municipality graphic profile in terms of colors, and the lack of internal semantic consisten-cy of the logo and company name, inconsistency towards the other channels is created. The channel App is the only channel that provides information in English, which creates seman-tic inconsistency in the ecosystem. Since the authors understand this as a positive develop-ment, they propose to apply and expand this to the remaining channels. The authors see big potential for creating syntactic consistency in the ecosystem through an expansion of the available ticket options and functions to the App channel. This idea is also supported by the framework element reduction. Based on the analysis, the reduction of the available mo-bile ticket types to just single tickets restricts the UX. This is why the study proposes a re-moval of the reduction to single tickets and a broadening to all ticket types that are availa-ble in the Karlstadsbuss ecosystem.
In the area of resilience, the offering of substitutes for all the ticket types is suggested, mo-bile ticket included, in order to provide the users with a backup solution e.g. if their smartphone has no battery or they lose their bus card. Finally, the channel App can be fur-ther improved in the area of correlation by displaying more connections to other channels of the Karlstadsbuss ecosystem.
Channel Website
During the analysis, the authors determined elements in the channel Website, which can, if adjusted, further enhance the UX. The analysis of the external syntactic consistency of the App also applies to the Website. The reduction of the website functions to only refill the bus card restricts the UX. That is why the study suggests a removal of this reduction in func-tion and instead proposes a broadening to all ticket types and functions in all channels in the Karlstadsbuss ecosystem, the website included. This change would also optimize the syn-tactical consistency between the digital channels App and Website, as the interaction design of both systems would be made more similar.
Furthermore, the continuity in the Karlstadsbuss ecosystem would be improved if the Web-site provided information about validity/ balance of the mobile ticket.
The user’s place-making can be improved with a location function in the interactive bus line map and the travel planner. This was also a result from the analysis of the element re-duction.

110
An area of further improvement concerns the internal perceptual consistency of the trip re-search functions, which appears with different designs in the website. The touchpoint Live! display differs from the travel planner also in syntactic logic, and both of these touchpoints are designed differently from the interactive bus stop map and interactive ticket purchase place. Thus, the ecosystem would benefit from a more aligned design. In the internal syn-tactic aspect, the only inconsistent page is the webshop, which differs in its overall design when compared to the Karlstadsbuss website. When analyzing the external consistency of the Karlstadsbuss ecosystem, the authors found a syntactic inconsistency between the tick-et scanner, ticket machine and webshop, even though the ticket machine and the webshop actually share the same function of refilling the bus card. The study sees a possibility of UX improvement, by redesigning the ticket machine and the webshop to an analogous interac-tion logic.
Also when analyzing the touchpoint webshop, no substitute for the retention of tickets to improve resilience was found. That is why the authors suggest the offering of substitutes for the tickets, to provide the users with a backup solution in case the ticket is lost or not at hand. In addition, the study sees opportunities for including elements of user adaption to the channel Website, e.g. remembering previous user interactions, selection of favorites or standard journeys, to further improve the UX.
Channel Printed media
The analysis of the Karlstadsbuss channel Printed media uncovered areas for development of cross-channel UX within the elements of continuity, resilience and reduction. Continuity can be further improved if the channel Printed media would also provide content about tick-et options, prices & duration, validity/ balance bus card and experiences in case of market-ing campaigns.
An area where more resilience would provide a better UX, is the substitution of ticket holding. This was already mentioned in the channel App and Website and is from the au-thor’s point of view also applicable to the touchpoints turkronor and paper ticket.
Finally, the study sees a possibility to simplify the user activity Check arrival/ departure time with reduction and removal of the touchpoint QR code.
Channel Service counter
The only critique the authors could establish in the channel Service counter appears in the area of continuity, as this channel could provide information about long-term disruptions, based on the analysis.
Channel People
The analysis of the channel People proved to be rather difficult to improve, since its design possibilities are limited. The only improvement the authors can suggest in this section is to improve the external perceptual consistency with an introduction of uniforms, expanding the graphical profile to the bus drivers.
Channel Bus system
When analyzing the cross-channel UXD of the Karlstadsbuss ecosystem, the study could find improvement fields in the factors place-making, reduction, consistency and resilience for the channel Bus system.

111
Similar to the channel App, Website and Printed Media the authors suggest a substitution of tickets to create resilience in the ecosystem. As already mentioned in the channel App and Website, the authors also propose the removal of the ticket type and function restriction for the bus card and ticket machine, to unify the available ticket logic throughout the Karls-tadsbuss ecosystem. Moreover, the authors propose reduction of the process of buying a bus card via a ticket machine to one touchpoint instead of two, to simplify the process and improve the UX.
Furthermore, the study proposes a reflection on the positioning of the bus card scanner in the Karlstadsbuss buses in terms of customer flow. This is also a finding of the design ele-ment reduction, in which the authors propose a reduction of scanning time, or a redesign of the scanning process to reduce the time of the ticket validation.
Lastly, the study determined internal and external inconsistencies in the channel Bus system. These inconsistencies form areas of improvement. The internal perceptual consistency of the Live! displays can be further enhanced by aligning the color scheme for both text and background, and font for the big and small display types. The small ticket machine proved to have perceptual inconsistency in the analysis, since none of the graphical elements of Karlstadsbuss are attached to them. The small ticket machine is also affected by an internal syntactic inconsistency in comparison to the bus card scanner and big ticket machines due to its long duration time in the ecosystem of Karlstadsbuss. Finally, as already mentioned in the section of the Website channel, the external syntactic consistency can be improved be-tween the touchpoints ticket machine and webshop.
Before and after phase
An overall improvement of the UXD in the cross-channel ecosystem could influence the UX positively. The sharing of positive experiences in the after phase could have a further positive effect on the upcoming before phase of the next UX of this user and the people which received the shared information. This can ultimately improve the overall user satis-faction and increase the amount of travellers. In conclusion, the improvement of the cross-channel UXD can support Karlstadsbuss in reaching its company goals.
5.2 Method discussion Within the discussion about the methods used in this thesis, five critical topics are re-viewed. First, a discussion about translation and language barriers is conducted. Second, the usage of sampling methods is brought up. Third, the authors elaborate upon the primary data collection method. Fourth, the action of sending the interviews to the company before conducting the interview is critically observed. Lastly, the approach of analyzing the service artifacts is debated.
Language
To avoid communication barriers, conversations were conducted in the native language of the interviewer and interviewee whenever possible. This removed language barriers in the e-mail communication with Karlstadsbuss, as well as for the majority of the user interviews (18 out of 19).
The authors believe that the one interview conducted in English (user 14) suffered due to a language barrier, and that the interview would have provided more details if it had been conducted in the native language of the interviewee. As this was realized quickly, the au-thors found it fruitless to attempt further interviews in other languages than the mother

112
tongue of the interviewees. Nonetheless, the interview with user 14 was believed to be good enough to be used in the analysis.
The company interview was however, as explained in chapter 3.3.1.3, conducted in English, due to language barriers from the side of the authors. This was unavoidable, as both au-thors needed to understand what was said during the interview in great detail. As the com-pany interview was successful and the desired data was extracted, the authors argue that language barriers did not impact the end result of this thesis aspect.
Sampling method
Here, the authors discuss the sampling method that was used for gathering user data, ex-cluding the methods which were used to collect data from the company and secondary da-ta.
The used method was a mixture of random sampling and self-selected sampling. The au-thors approached citizens of Karlstad at random and questioned those willing to respond, after the purpose of the thesis had been introduced. If the originally planned, narrow, user group would have been possible to interview, this thesis would have looked very different, as it would have tried to map and make the ecosystem appear more attractive for this single user group. This would not only made the thesis findings less useful, but would have also clashed with the industry selection criteria. Now, the thesis has a broader perspective of the ecosystem, and therefore has a more complex, but also more relevant, view to evaluate. Be-cause of this, the authors agree that the change of sampling method turned out for the bet-ter.
Primary data collection
The method the authors discuss in this section is the usage of interviews for gathering pri-mary data from the users. In the case of the company interview, the authors feel confident that it was the right method choice for this thesis, as other methods would not have pro-vided results that are deep enough, e.g. survey, questionnaire, or that would have been too time consuming and therefore not possible to realize with the time constraints placed upon the authors, e.g. shadowing.
For the user interviews, however, the authors argue that while semi-structured interviews did provide some in-depth knowledge, other methods could have provided even more de-tailed information about the users’ experiences, behaviors and emotions. To collect deeper insights, other methods would have been needed. The two methods the authors discussed are those of user shadowing and focus groups. These methods would have provided great-er knowledge about hidden agendas, and tacit knowledge might have become explicit. Be-cause of the difficulty of gathering user responses from interviews, arranging focus groups would have been even more complex and problematic. While the authors would have liked to engage in such an activity, it turned out to be an unavailable option. The method of user shadowing had the same issue as company shadowing holds: the time it would require to perform this sort of sampling would have been too great with respect to the allotted time. Therefore, this method was ruled out early in the method selection process.
Another method that was considered were surveys. These would have been used to in-crease the number of respondents, which could have resulted in more obvious user pat-terns and standard journeys. The drawback of this approach is that a survey would not have been as in-depth as interviews, and no omitted variables would have surfaced, e.g. such as fellow travellers did via the user interviews.
113
Providing Questions
Providing the company interviewees with questions before conducting the interview might have had both positive and negative results. On one hand, the company had time to pre-pare answers that sound good, and discuss subjects that should not be brought up during the interview. Therefore, the findings could be reduced in terms of information validity. On the other hand, it gave the company time to find out details about the various topics and questions posed, which might have lead to a more qualitative and efficient use of inter-view time. The authors argue that since detailed and complex questions were asked, such as those concerning the IT systems and system design, it was better to allow the company time to prepare in advance, even if the authors can see the possible drawbacks. If this was the right decision or not, is impossible to say, but in the end the information gathered from the interview proved very useful for understanding the ecosystem.
Examining service artifacts
In this section, the examination of the service artifacts provided by Karlstadsbuss is dis-cussed. The authors tried to integrate and collect direct observations of the various service artifacts available in the ecosystem, but due to time and budget restraints it was not possi-ble to interact and get direct evaluations of all of them. Although the authors did try their best to get secondary information about these artifacts.
The bus card and the bus card scanner were not examined directly by the authors. The costs of acquiring a bus card would have been too expensive for the authors. Although, they had the opportunity to observe up close how these two artifacts interacted, after ask-ing a friendly user, who allowed close-up observation of the process.
The customer center of Karlstadsbuss was not visited, and, therefore, the authors did not get a chance to evaluate its knowledge. By not visiting the customer center, the authors were unable to get a copy of the booklet, but an acquaintance, who was located in Karlstad, assisted by providing photos of the booklet.
The authors could not interact with the QR code, as their smartphones were not equipped with QR code scanning software.
The behavioral rules and codes of conduct for bus drivers could not be observed. Alt-hough the authors did interact with some of the bus drivers of Karlstadsbuss, the time pe-riod spent observing them was too short to draw any valid conclusions.
Lastly, the authors did not manage to examine the small ticket machines in Karlstad, as the time spent in the city had the primary focus of interviewing users and examining the touchpoints that the users and Karlstadsbuss found most important. The remaining service artifacts were observed directly.
5.3 Implications for research By approaching the research questions of this thesis, it was possible to gain insight into the contemporary phenomena of UX in cross-channel ecosystems and its design. This can be useful for research in several ways.
First, by clarifying the phenomena of how cross-channel ecosystems take form and are ap-proached in practice, the study suggests how cross-channel ecosystems are designed by companies. This is relevant for research, as little academic literature exists, which applies cross-channel UX literature to practical settings.
114
Second, the findings imply a practical application of established theories, presented in form of a framework. The study’s results further strengthen the theoretical claims about the practical relevance of cross-channel UXD principles. By extracting design principles from the current literature and combining these into a cross-channel UXD framework, a tool was derived that can be used and developed in future research.
5.4 Implications for practice Through the language of critique, the authors were able to propose several suggestions for improving the UXD of the Karlstadsbuss ecosystem. As this is a single case study, it is acknowledged that the outcome of the analysis is restricted in its nature and, therefore, not generalizable to any great extents. The purpose of this thesis was not to create a highly gen-eralizable result, but to gain further insight into the contemporary phenomena of cross-channel ecosystems and how it functions in practice.
That being said, the authors see opportunities for other businesses within the same sector to draw conclusions and inspiration for their ecosystem design, based on the findings. It is believed that even though the findings are specific, the approach of the research and analy-sis are transferrable. Therefore, it could help other practitioners to evaluate their ecosys-tems for improvements in terms of cross-channel UXD.
5.5 Future research As this is an exploratory study, future research is needed to validate the findings further, as well as testing the proposed language of critique and the developed framework. Based on the limitations in generalizability of the end result, there are several aspects that would be interesting to see comparisons of and elaborations on.
First, this is a single case study, even though the authors examined several aspects, only one ecosystem is considered. Therefore, widening the application of the developed framework to create a language of critique for other public transportation companies would be inter-esting. This would also be the most correct comparison to conduct, as the elements of the public transportation companies only vary by a limited extent.
It would also be very interesting to examine how much the findings differ depending on geographical location, i.e. how well the language of critique would fit with public transpor-tation companies located in other countries.
Next, the transfer of the developed framework out of the limited area of public transporta-tion could be very exciting. Here, it would be interesting to test the framework for the pri-vate bus industry, but also in other transportation sectors, such as trains and ferries.
115
6 Conclusion Within this section, the research questions, which are the basis of this study, are answered.
The aim of this master thesis was to verify if companies actively structure their services as cross-channel ecosystems, or if they react to user demands. To answer this question, a thorough theoretical analysis of the existing cross-channel UXD literature was conducted (chapter 2.1). Furthermore, an interview of the case study company was executed to gain insights into its strategies (chapter 4.1). According to the theory, the movement from multi- to cross-channel ecosystems introduced a power shift from the company to the users. This means that users co-create their ecosystem and place demands on the companies, which ex-ist in the ecosystem. In order to stay competitive, companies must react to the user de-mands (Resmini & Lacerda, 2015). The thesis findings further confirmed this, since one of the five strategies of Karlstadsbuss is to let the user prioritize its company efforts (Karls-tadsbuss, 2014). In conclusion, the study was able to prove that the examined case study company designs its cross-channel ecosystem based on the demands of its users.
The thesis further desired to examine how current theory of cross-channel UX assists in formulating a design strategy for a service ecosystem. On the basis of the previously men-tioned extensive theoretical analysis, the authors created an initial theoretical framework (chapters 2.2, 2.3, 2.4, 2.5). Afterwards, a visualization of the user-relevant ecosystem of the case study was developed, based on one company interview, 19 user interviews, and the ex-amination of the ecosystem service artifacts (chapters 4.1, 4.2, 4.3). On one hand, the prac-tical relevance of the initial framework was reviewed in the practical setting of this case study, and on the other hand, the framework was used to create a language of critique for the cross-channel UXD of the ecosystem of the case study (4.4, 5.1). Based on the results of the analysis, the current theory of cross-channel UX can indeed assist in formulating a design strategy for a service ecosystem.

List of references
116
List of references Adner, R. & Kapoor, R. (2010). Value Creating in Innovation Ecosystems: How the Structure of Technological Interdependence Affects Firm Performance in New Technology Generations. Strategic Management Journal, 31, pp. 306-33.
Apanasevic, T., Markendahl, J. & Arvidsson, N. (2013). An Exploratory Study of Consumer Attitudes Towards Mobile Ticketing in Sweden. Presented at: the 24th Eu-ropean Regional Conference of the International Telecommunication Society, Florence, 20–23 Octo-ber 2013.
Apple.com (2008). Apple Introduces the New iPhone 3G - Twice as Fast at Half the Price. Retrieved March 17, 2015 from: http://www.apple.com/pr/library/2008/06/09Apple-Introduces-the-New-iPhone-3G.html
Avery, J., Steenburgh, T.J., Deighton, J. & Caravella, M. (2008). Adding Bricks to Clicks: The Effects of Store Openings on Sales Through Direct Channels. Retrieved February 17, 2015 from: http://hbswk.hbs.edu/item/5621.html
Avery, J., Steenburgh, T.J., Deighton, J. & Caravella, M. (2012). Adding Bricks to Clicks: Predicting the Patterns of Cross-Channel Elasticities Over Time. Journal of Marketing, 76, pp. 96-111.
Banerjee, P. (2013). Crafting a Unified Cross-Channel Customer Experience [White Paper from Oracle]. (Available from http://www.oracle.com/us/corporate/analystreports/heavy-reading-customer-experience-1906553.pdf).
Bharadwaj, A., El Sawy, O.A., Pavlou, P.A., & Venkatraman, N. (2013). Digital Busi-ness Strategy: Toward A Next Generation of Insights. MIS Quarterly, Vol. 37, No. 2, 471-482.
Bock, G., Lee, J., Kuan, H. & Kim, J. (2012). The progression of online trust in the multi-channel retailer context and the role of product uncertainty. Decision Support Sys-tems, 53, pp. 97–107.
Boley, H. & Chang, E. (2007). Digital Ecosystems: Principles and Semantics. Pub-lished at: 2007 Inaugural IEEE International Conference on Digital Ecosystems and Technolo-gies. Cairns, Australia.
Briscoe, G., Sadedin, S. & De Wilde, P. (2011). Digital Ecosystems: Ecosystem-Oriented Architectures. Nat Comput, 10, pp. 1143-1194.
Buxton, B. (2007). Sketching user experiences: Getting the design right and the right design. Boston: Elsevier/Morgan Kaufmann.
Cao, L. (2014). Business Model Transformation in Moving to a Cross-Channel Retail Strategy: A Case Study. International Journal of Electronic Commerce, 18/4, pp. 69-95.
Cao, L. & Li, L. (2015). The Impact of Cross-Channel Integration on Retailers’ Sales Growth. Journal of Retailing (2015), http://dx.doi.org/10.1016/j.jretai.2014.12.005.

List of references
117
Chiu, H., Hsieh, Y., Roan, J., Tseng, K. & Hsieh, J. (2011). The challenge for multi-channel services: Cross-channel free-riding behaviour. Electronic Commerce Research and Applications, Volume 10, 268–277.
Corrigan, M., & Miller, G. (2011). Toward a User-Centric Digital Ecosystem. IT Pro, 12-15.
Creswell, J.W. (2007). Qualitative inquiry & research design – Choosing among five approaches, 2nd ed. Sage Publications, Inc.; Thousand Oaks.
Czarniawska, B. (1998). A narrative approach to organization studies. Thousand Oaks, U.S: SAGE Publications, Inc.
Dinner, I.M., Van Heerde, H.J. & Nedlin, S.A. (2014). Driving Online and Offline Sales: The Cross-Channel Effects of Traditional, Online Display, and Paid Search Advertising. Journal of Marketing Research, 51, pp. 527-545.
Falk, T., Scheper, J., Hammerschmidt, M. & Bauer H.H. (2007). Identifying Cross-Channel Dissynergies for Multichannel Service Providers. Journal of Service Research, 10/2, pp. 143-160.
Fisher, J., Norris, S., & Buie, E. (2012). Sense-making in Cross-channel Design. Jour-nal of Information Architecture, Issue 1-2(4).
Fulgoni, G.M. (2014). “Omni-Channel” - Retail Insights and The Consumer’s Path-to-Purchase: How Digital Has Transformed the Way People Make Purchasing Deci-sions. Journal of Advertising Research, December 2014, pp. 377-380.
Garrett, J. J. (2010). The elements of user experience: user-centered design for the web and beyond. Berkeley, CA: New Riders.
Gegner, L., Runonen, M., & Keinonen, T. (2011). Oscillating Between Extremes: A Framework for Mapping Differing Views on User eXperience. Paper presented at: DPPI '11 Proceedings of the 2011 Conference on Designing Pleasurable Products and Interfaces, Art. No. 57.
Ghauri, P. & Grønhaug, K. (2010). Research Methods in Business Studies, 4th ed. Dorset, GB: Henry Ling ltd.
Guenther, M. (2012). Intersection: how enterprise design bridges the gap between business, tech-nology, and people. S.l.: Morgan Kaufmann.
Hassenzahl, M. (2008). User Experience (UX): Towards an experiential perspective on product quality. Paper presented at: IHM ‘08 Proceedings of the 20th International Con-ference of the Association Francophone d’Interaction Homme-Machine, Pages 11-15.
Hassenzahl, M., & Tractinsky, N. (2006). User experience – a research agenda. Behav-iour & Information Technology, Volume 25, 91-97.
Herriot, S.R. (2010). Communication channels in markets: a definition and conceptu-alization. Journal of Marketing Communications, 3/3, 139-149.
International Organization for Standardization (ISO). (2009). ISO FDIS 9241-210: 2009 Ergonomics of human system interaction - Part 210: Human-centered design for interactive systems. London: International Organization for Standardization.

List of references
118
Jenkins, H. (2011). Transmedia 202: Further Reflections. http://henryjenkins.org/2011/08/defining_transmedia_further_re.html
Kalbach, J. & Kahn, P. (2011). Locating Value with Alignment Diagrams. Parsons Journal for Information Mapping, Vol. III, Issue 2.
Karlstadsbuss (2015a). Karlstadsbuss. Retrieved March 9, 2015 from: http://karlstad.se/karlstadsbuss/
Karlstadsbuss (2015b). Karlstadsbuss Webbtv. Retrieved March 9, 2015 from: https://www.youtube.com/channel/UCFfO7kDh-ihRhwZDRbSsCeg
Karlstadsbuss (2015c). Karlstadsbuss Buslinie. Retrieved March 9, 2015 from: https://www.facebook.com/karlstadsbuss
Karlstadsbuss (2015d). Karlstadsbuss @Karlstadsbuss. Retrieved March 9, 2015 from: https://twitter.com/Karlstadsbuss
Karlstadsbuss (2014). Vällkommen till Karlstadsbuss. [Company Presentation] Karls-tadsbuss.
Karlstads Kommun (2015). Hur många bor det i Karlstad?. Retrieved April 12, 2015 from: http://karlstad.se/kommun-och-politik/kommunfakta/befolkningssiffror/
Karakas, F. (2009). Welcome to world 2.0: the new digital ecosystem. Journal of Busi-ness Strategy, Vol. 30, Issue 4, 23-30.
Karapanos, E. (2013). Modeling Users’ Experiences with Interactive Systems. Heidelberg: Springer.
Kinsley, S. (2010). Ubiquitous Computing: Mark Weiser’s Vision and Legacy. Re-trieved March 17, 2015 from: http://www.samkinsley.com/2010/03/12/ubiquitous-computing-mark-weisers-vision-and-legacy/
Klie, L. (2012). Cross-Channel Design Can Be Transformational - Companies today must deliver cohesive experiences across multiple touchpoints. Customer Relationship Management, November 2012, p. 12.
Klosek, N. (2012). Creating the Omni Channel - How Independent Dealers Are Scal-ing Best Buy’s Marketing Tactics to Fit Their Needs. Dealerscope 54/11, 28–30.
Kuniavsky, M. (2008). User experience design for ubiquitous computing. Interactions, November, December 2008, Volume 15(6), 20-22.
Kuniavsky, M. (2010). Smart Things: Ubiquitous Computing User Experience Design. Am-sterdam; Boston: Morgan Kaufmann Publisher.
Law, E.L-C., Roto, V., Hassenzahl, M., Vermeeren, A.P.O.S., Kort, J. 2009. Under-standing, Scoping and Defining User eXperience: A Survey Approach. Proceedings of Human Factors in Computing Systems, pp. 719-728.
Le Voi, H., Charlier, M., & Soltis, D. (2011). Designing For Digital Context: Understand-ing How User Context is Evolving [White Paper by Fjord], (Available from http://cdx.dexigner.com/article/21960/Design_for_Context.pdf).

List of references
119
Maiden, N. (2010). Service Design: It's All in the Brand. IEEE Software, Volume. 27, No. 5, 18-19.
MBA & Company (2014). What are marketing channels?. Retrieved March 23, 2015 from: http://blog.mbaco.com/what-are-marketing-channels/
Minkara, O. (2013). Omni-Channel Customer Care - Empowered Customers De-mand a Seamless experience. [White Paper by Aberdeen Group], (Available from: http://www.cdmn.ca/wp-content/uploads/2013/10/8675-RA-omni-channel-experience.pdf).
Minkara, O. & Pinder, A. (2013). Next Generation Customer Experience Management. [White Paper by Aberdeen Group], (Available from: http://resources.idgenterprise.com/original/AST-0085440_Next_Gen.PDF).
Moreville, P. (2011a). Ubiquitous IA Cross-Channel Strategy - Slide 26 & 27. [Key-note Presentation at the User Focus 2011], (Available from: http://de.slideshare.net/morville/crosschannel-strategy).
Moreville, P. (2011b). Cross-Channel Strategy. Retrieved March 31, 2015 from: http://findability.org/archives/000652.php.
Napolitano, M. (2013). Omni-channel distribution: Moving at the speed of “now”. Modern Materials Handling, June 2013, pp. 48-54.
Norman, D. A. (1990). The design of everyday things. New York: Doubleday.
Novak, J., & Schwabe, G. (2009). Designing for reintermediation in the brick-and-mortar world: Towards the travel agency of the future. Electronic Markets: The Interna-tional Journal on Networked Business, Volume 19, 25-29.
Oha, L., Teo, H. & Sambamurthy, V. (2012). The effects of retail channel integration through the use of information technologies on firm performance. Journal of Opera-tions Management, 30, pp. 368-381.
O’Heir, J. (2013). H.H. Gregg Completes Omni-Channel Strategy - Drives Black Fri-day with New Mobile E-Commerce Platform. Dealerscope 55/14, 76.
Patton, M.Q. (2002). Qualitative research & evaluation methods. London, GB: SAGE.
Patton, M.Q. (2015). Qualitative research & evaluation methods, 4th ed. Thousand Oaks, US: SAGE.
Piercy, N. (2010). Positive and negative cross-channel shopping behaviour. Marketing Intelligence & Planning, 30/1, pp. 83-104.
Regionfakta.com, retrieved April 7, 2015 from: http://www.regionfakta.com/
Region Värmland (2015). Kollektivtrafiknämnden. Retrieved April 27, 2015, from: http://www.regionvarmland.se/politik-beslut/kollektivtrafiknamnden
Resmini, A., & Rosati, L. (2009). Information Architecture for Ubiquitous Ecologies. Medes 2009, Proceedings of the International Conference on Management of Emergent Digital EcoSystems, Article No. 29.

List of references
120
Resmini, A., & Rosati, L. (2010). The Semantic Environment: Heuristics for a Cross-Context Human–Information Interaction Model. In E. Dubois et al. (eds.), The Engi-neering of Mixed Reality Systems, Human-Computer Interaction Series (p. 79-99). London: Springer.
Resmini, A. & Rosati, L. (2011). Pervasive information architecture: Designing cross-channel user experience. Burlington, MA: Morgan Kaufmann.
Resmini, A. (2012). Information Architecture in the Age of Complexity. Bulletin, No-vember/October 2012.
Resmini, A. & Lacerda, F. (2015). Crossmedia to Cross-channel Product and service ecosystems in blended spaces. Draft Copy, yet to be published.
Risdon, C. (2013). Un-Sucking the Touchpoint. Retrieved April 29, 2015 from: http://www.adaptivepath.com/ideas/un-sucking-the-touchpoint/
Rose, F. (2001). Pocket Monster: How DoCoMo's wireless Internet service went from fad to phenom - and turned Japan into the first post-PC nation. Wired 9.05.
Schramm-Klein, H., Wagner, G., Steinmann, S. & Morschett, D. (2011). Cross-channel integration – is it valued by customers?. The International Review of Retail, Dis-tribution and Consumer Research, 21/5, pp. 501-511.
Segerståhl, K. (2008). Utilization of Pervasive IT Compromised? Understanding the Adoption and Use of a Cross Media System. Presented at: MUM ‘08 Proceedings of the 7th International Conference on Mobile and Ubiquitous Multimedia, 168-175.
Stickdorn, M. & Schneider J. (2011). This is Service Design Thinking. Hoboken, NJ: John Wiley & Sons.
Trafikanalys. (2014). Local and regional public transportation 2013. Government is-sued statistic, retrieved November 27, 2014 from: http://www.trafa.se/PageDocuments/Lokal_och_regional_kollektivtrafik_2013.pdf
Trafikanalys. (2013). Transportbranschen - Hur står det till?. Governmen issued sta-tistics, retrieved April 4, 2015 from: http://trafa.se/sv/Statistik/Ovrig-statistik/Transportbranschen/
Trafikanalys. (2013). Lokal och Regional Kollektivtrafik 2013. Government issued statistics, retrieved April 4, 2015 from: http://trafa.se/sv/Statistik/Kollektivtrafik-och-samhallsbetalda-resor/Lokal-och-regional-kollektivtrafik/
Trusty, J. (2011). Quantitative articles: Developing studies for publication in counsel-ing journals. Journal of Counseling and Development: JCD, 89(3), 261-267.
Unger, R. & Chandler, C. (2009). A project guide to UX design: for user experience designers in the field or in the making. Berkeley, California: New Riders.
Van Baal, S. (2014). Should retailers harmonize marketing variables across their dis-tribution channels? An investigation of cross-channel effects in multi-channel retail-ing. Journal of Retailing and Consumer Services, 21, pp. 1038-1046.
Vanguard Communications Corporation. (2010). Building a Great Cross-Channel Cus-tomer Experience: How to Foster Intimacy and Create Value Using Self Service [White Paper].
List of references
121
(Available from http://crmxchange.com/uploadedFiles/Featured_White_Papers/PDF/Building%20aGenesys.%20Great%20Cross-Channel%20Customer%20Experience.pdf ).
Vieira, V., Caldas, L.R., & Salgado, A.C. (2011). Towards an Ubiquitous and Context Sensitive Public Transportation System. IEEE, published at The 4th International Confer-ence of Ubi-Media Computing.
Verhagen, T. & Van Dolen, W. (2009). Online purchase intentions: A multi-channel store image perspective. Information & Management, 46, pp. 77–82.
Webdesignerdepot.com (2009). The evolution of cell phone design between 1983-2009. Retrieved March 17, 2015 from: http://www.webdesignerdepot.com/2009/05/the-evolution-of-cell-phone-design-between-1983-2009/
Weiser, M. (1991). The Computer for the 21st Century. Scientific American Special Issue on Communications, Computers, and Networks, 09-91.
Wäljas M., Segerståhl K., Va ̈a ̈na ̈nen-Vainio-Mattila K. & Va ̈a ̈na ̈nen-Vainio-Mattila H. (2010). Cross-Platform Service User Experience: A Field Study and an Initial Frame-work. Presented at: MobileHCI'10, September 7-10, 2010, Lisboa: Portugal.
Yin, R.K. (2009). Case study research: Design and methods. London: SAGE.
Zhou, F., Xu, Q., & Jianxin, R. (2011). Fundamentals of product ecosystem design for user experience. Research Engineering Design, Volume 22, 43-61.

Appendix
122
Appendix 1 – Transcript company interview Karlstadsbuss Anne: We are in the program “IT, Management and Innovation” in the Jönköping Interna-tional Business School and within this program we are educated to be the translator be-tween the developer and the management. We like our course very much and one of our professors is a researcher in the area of cross-channel environments and the Information Architecture in them. And cross-channel environments are for example you Karlstadsbuss, where you have several different devices and methods to get the service and you can select whatever you want and you can change between it.
Ida: Yes, combine them in different ways.
Anne: Exactly, but a lot of people say we have to have an App and we have to have a Web-site and we have to have kiosks, but the user is still frustrated because of in example the get information in the app but they get different information on the website and this is a bad user experience. And our goal is it to find an ecosystem, an environment, see what is al-ready there, what already has been there and apply frameworks from the research to find methods to improve it even more. And that is what we would like to do for a public trans-portation company and since you have been interested we would like to do it with you guys if you are happy with that proposal. Exactly, did I forgot something Ida?
Ida: No, I think you covered it.
Robert: How did you find us?
Anne: Ho did we found you?
Ida: It was a mixture of internal knowledge and also reputation because Karlstadsbuss has a quite good reputation, the system here. It is supposed to be very good and this makes us more challenged, since it is very hard to find improvements.
Anne: You made an assignment on your exchange university.
Ida: Yes, during previous semesters I did a mapping of bus payment systems in Sweden and with that mywallet business that was going on and the difficulties and Karlstad was among the more creative ones with Turkronor and similar. You have a very interesting way of managing and we were just curios to why it is so different here in compared to other re-gions.
Anne: Exactly, and we sat down a few days ago and we analyzed the existing system on what you already offer your customers and we were really impressed. SO in comparison to Jönköping, huh… So, we will have problems to find improvements.
Ida: Yeah.
Mathias: It is good to have challenges.
Anne: Yeah, exactly.
Robert: There are rooms for improvements. I assure you.
Anne: Okay. Yeah, that is it from us.

Appendix
123
Ida: Is there anything on particular that you already know, that you want to get out of this proposal? Or should we just move along and see what we come up with?
Robert: I think we could move along and see what we come up with. I think we find those things in our discussions.
Ida: Yes, I think so, too.
Anne: Okay.
Ida: Do you have a video?
Robert: Yes, I think, let us see here if we can just… It seems to work. Maybe we could, while I am doing it, your first question is about the roles. Maybe you could start. So you know what are our roles are.
Mathias: My main role is to manage our IT systems. And the two biggest and most im-portant system we have is the real time system towards our customers, we call it Karlstads-buss Live! and then there is the ticketing system. That is my two biggest focuses.
Anne: Okay.
Robert: Yes, and my name is Robert Sahlberg I am business development manager. I work a lot with different kind of development projects not just business development but that is a par of it. So, you can say that I am involved with all of our development projects really. So, that is my focus, to develop the user experience in our business and so on.
Ida: A broad portfolio.
Robert: Yes, it is really broad. But I enjoy to you know work with different kind of projects so I like that.
Ida: Have you been working for a long time for the company?
Robert: I have been here for about six years now I think and you?
Mathias: Ten years.
Ida: Time flies.
Robert: Yeah, it is a long time ago I lived in Jönköping now. I also worked with, I got into public transportation in Jönköping, not for the local traffic but we had the head office for Swebus there for the busses going to Stockholm. So I was advertising manager for them.
Starting a presentation of Karlstadsbuss
So this is how it looks here. A lot of people and busses. Just a quick overview of – you have to excuse that this pictures are in Swedish but I will try to just explain them, cause I saw in your presentation that you would like to talk, to see about our organization. In our region – Värmland – there is a regional authority, public transport authority and under that authority we have the orange one, the municipality, which we are a part of. We are a de-partment in the municipality in Karlstad. And then you have Värmlandstrafik, who is the regional busses and trains and so on. So, we are delegates under this regional authority and this regional authority is just two persons. But they work with the regional transport pro-gram and so on, but they don’t have any busses and so on. They have two delegates and it
Appendix
124
is us, Karlstadsbuss, we do the public transportation within Karlstad the urban area of Karlstad and Värmlandstrafik has the rest of the region.
Anne: And the regional authority, this is just responsible for Värmland itself. Is there a re-gional authority for Sweden and it goes down to the Komuns or is it just Värmland?
Robert: No, you don’t have, of course there are like national organizations but they don’t really have anything to, beside, of course we have, you have the law, the framework, we have to work with but we don’t have any on a national that says “you have to do it like that” except the law.
Anne: Okay.
Mathias: But there is one authority per region, for each and every region in Sweden.
Robert: And the most common thing is that there is only one, like for instance in Jönkö-ping, you have Jönköpings Landstrafiken and they are both of us at the same time. On of the reasons for Karlstad to have that on there is own is because Karlstad is like a region center and it differs a lot from the urban area of Karlstad and the rest of the region. If you would count among sub travels in this region it is almost half of the travels are made within Karlstad if you take the amount, of course if you count kilometers there is a lot more in the region but still.
Ida: There are more car placements in the rural area, I guess?
Robert: Yes, so.
Anne: Who decided that there to, it must be something historical right?
Robert: It’s the politicians. They invest a lot in public transportation and they want to have some control over it. We don’t know the future but this is how it is right now.
Anne: Okay.
Mathias: But historically this was normal when doing things in al over Sweden but over time the local company has disappeared and only have one regional.
Ida: You have to have the common ticket system so you work for both?
Mathias: No. But we have the same system and we share the technology.
Ida: Okay, is it a ticket combination as well, like can you buy a ticket for Karlstadsbuss and use the same in Värmlandstrafiken?
Robert: Yes, we cooperate.
Anne: All systems you use? Also your live!?
Mathias: No, just the ticketing system and the travel planner and the mumble mumble (11:55).
Robert: One thing to that is also good to know is that private bus companies who want to you know traffic different lines and have different aspirations they need to apply to rum-bler (12:25) trafik and then they can do that to the regional authority. They don’t go to ei-ther of us or Värmlandstrafik and I think one of the good things is that this was not the case before 2012, because that was when the law about regional authorities came, is that
Appendix
125
when a private company don’t have to go for instance Värmlandstrafik, who is like a com-petitor, you know with busses and they have a brand and stuff like that, this regional au-thority don’t have a brand that is competing with the private company so who want to op-erate.
Anne: Did something change since 2012? Do you have private busses now?
Robert: Not very much but I think the way of organizing feels a little more clean than they would go to Värmlandstrafik, who also operates busses on the same routes.
Anne: So do you have or do you don’t have? You don’t have in Karlstad?
Mathias: No. I think there is only in Stockholm, maybe some…
Robert: Of course, there are private companies but that is like Swebus and Bus4You that kind far distance…
Anne: Long-distance…
Robert: Long-distance busses that goes through this region. But they don’t have to ask Värmlandstrafiken for permission to stop at their bus stops. So that’s a good thing for be-ing neutral. I can just say, we have a vision for our work. We say in Karlstad it is easy to live without a car. We don’t mention public transport in that vision because we feel like we are a part of sustainable travel, so that’s our mission to make it easy to live without your own car in this city. It is not a human right to have a car and shouldn’t need to own one to live a good life in our city. That’s how we see it. And we also have two main goals: To double public transport and to have the most satisfied customers compared to others in Sweden. And we count from 2005 when we started to raise our ambitions with public transport. And then we had 3,9 million travels within this city and last year we had 6,5 mil-lion travels, so it increased about 67 percent so we are on our way to double this. It is not easy to do the final part but we have some plans on ho we are going to achieve that. So you see an increase in each year and we are very very happy about that. And this is not, let’s see… and we know hat 6 out of 10 people in Karlstad us our public transportation at least one time very month. That’s how we define if someone is a customer or not. Still of course 55 percent of travels are done with the car and this is actually a few years now that we counted that in 4 years the amount of travels has increased with 33 percent and the amount of travellers with 22 percent and I mean in the urban areas of Karlstad we have 65.000 people but in these 4 years we have seen that over 7.000 new customers discovered the public transport as an alternative, so that’s a… We think that’s a really great result. And if we look back before 2005, we can see that increase in public transportation doesn’t happen, doesn’t just happen like that. So it was some percent up, some percent down. And when we see at customer satisfaction. We are number two in Sweden.
Ida: Is this a government owned firm or who did the…?
Robert: This is our national organization, who organizes this interviews. They are done each month. In Karlstad we have 100 telephone interviews each month. So it’s 1200 inter-views per year. This (graph in the presentation) is the whole year last year. So you see Jön-köping is quite high in that ranking as well. Mumble (18:17)
Anne: This is surprising.
Ida: I can’t agree with that.
Appendix
126
Robert: And we have a market share, and this is really hard to define, market share. The way that we define it is how people mainly are doing their first travel in the morning. And we only compare public transportation with other motorized travels. So we exclude walking and bicycle in this. Because we don’t want to see this travels as competition. So this is the part where we want to increase travels.
Anne: Because your vision is “You don’t need a car”, so you have to take it out?
Robert: Yes, and this how the most in our business are doing it national wide as well. So.. we have to see… yeah I can just also take this one (slide), we use five strategies while we are working: the first one is to let the customer help us prioritize and that means that we use market research, different data that can help us know what is important for the cus-tomers and that should be our guide to what areas we should work with. So that is a quite simple strategy. But it keeps us focused. The second one is to make sure that the quality of our product is good, I mean that the busses are clean, the prices are okay, that the bus driv-ers behave nice, and stuff like that.
Mathias: And the bus arrives in time.
Robert: Very important one. The third one is communication. We think it is really im-portant to communicate what we are doing. I mean we think like that we don’t have any-thing to hide. I think this is something that a lot of companies in our business should be doing a lot more because we really have something good to tell people. And we shouldn’t be ashamed of that. That’s something we actively are doing. We always try to tell the peo-ple in Karlstad what we are doing. When trying to raise quality with our drivers, we tell people what we are working at.
Ida: I saw that you have projects at your webpage as well. You talk a bit about your devel-opment plans and similar.
Robert: Yeah. So, we always try to communicate and be active in media and so on. So, that’s a really important part of how we have achieved this results. We think communica-tion is maybe the, in one way it’s maybe the most important one, maybe it’s the one that differs most from other companies. Swedish… (20:18)
Ida: Long-term.
Robert: Yeah, long-term. Yeah, we work in the long-term and what that means for us is that we always try to be part of the development in the city, city development. Make sure that it’s possible to have good public transportation in the future. How they build roads and plan new areas and stuff like that and of course also make the conditions better, if we can.
Anne: Does that also include that you are not in for the short-term profit and that you ra-ther go in for continuous results over a long term?
Robert: Yeah, I would say that, I mean you need to have both but I mean to have this long-term way of seeing things I think it is really important. I mean we don’t have sharehold-ers…
Anne: Okay.
Robert: Since we are part of the municipality.
Anne: Isn’t than the municipality the shareholder?
Appendix
127
Ida: Stakeholder.
Robert: No, we are not a company, we are a department. So, but we are politically orga-nized unit, so. But one of the tings that we have made a few years ago, is that we are a part of the city planning department.
Anne: Okay.
Robert: So it’s the same politicians that make the decisions on how we are building the city that also makes the decisions of public transports. And that is something that is quite unique for us. And that’s really the essence of this one. That we should be part of the de-velopment of the city. And the last strategy is to be on the forefront. We are part of a lot of research projects and we actually have a research group at Karlstad University, who works with, it is called Somat (24:51), Service Oriented Marketing Transport Something. And you know to know what is next in ten years or twenty years is also a key to taking the right de-cisions. So to be part of what’s happening. Different kind a national products and stuff like that. That’s really important to make the right decisions.
Anne: Is that also included in the sign I saw, that you are working with the EU?
Mathias: That’s the ticketing system.
Anne: Ah, the ticketing system.
Mathias: We got funding from the EU for the ticketing system.
Ida: Is this the ne with the different Swedish (25:53) ?
Mathias: MINZ
Ida: BINZ?
Robert: And I would say that very central for us is, this is our offers for the customers in Karlstad. We are trying to make it very easy to get an overview. (slide with map with bus lines) We actually have more, specialized bus routes as well, but this is like probably our base lines. That covers most people’s needs.
Mathias: Before 2005, there were actually three or four different types of maps depending on which time of day it was. It was one type of busses between six in the morning and six in the evening and it was evening busses and night busses.
Anne: So you redesigned after 2005?
Mathias: Yes.
Anne: Did you, How did you redesign? Do you still know? With which maxims with which goals did you redesign that? Did you know? Is it simplify because?
Robert: Yes.
Anne: What I really like is that it is really easy to understand. And you have this really pleas-ing to the eye colors and the numbers in this dots and you know. And I like that you can see it all over the place, you can see that in the signs, you can see that in the display in the busses.
Robert: Yeah.

Appendix
128
Anne: And so on. And is this a concept you developed with the redesign or is this mumble (28:00).
Mathias: Yeah, when we developed this map, actually the map we did ourselves, but the de-sign of the signs at the bus stops and so on we hired a marketing firm here in Karlstad. Who helped us with this, the signs and stuff. But of course it was focused to be …
Anne: Easy.
Mathias: Yeah, to be easy to use these signs all over. This was just possible that the cus-tomers recognize it. Mumble (28:47)
Robert: I would say that one of the key reasons that this is so important is we know from a lot of research that maybe the most important factor for, you know, increase in travel in public transportation is to increase the knowledge about the possibilities. Increase the knowledge and how the busses, the possibilities where you can go and when the busses go and that it is easy to get that information. That’s more important than prizing and so on. Having something that’s easy to communicate and easy to understand, that’s very key to make it accessible and. Because people hate to be stupid. They want to understand for themselves and I mean it is noting more frustrating than to you know be at the bus stop and don’t understand what you are, what’s happening, what’s the bus I am going to take and if you have all those questions you won’t be standing there you take your car or some-thing else so.
Anne: Yes.
Robert: So we are really need to be focused on making it easy to understand for yourself. People don’t want to read the map or to use manual for the public transportation to make it self-explaining.
Mathias: When we designed this we looked at the subway and almost everyone knows how to use the subway when they read it for the first time. So, focus to simplify it as much as possible.
Anne: Okay.
Robert: So I would say that is probably still one of our main goals to make it easy to under-stand. On of our challenges at the moment is to make people understand that how they can buy tickets. Because it is actually a challenge, it shouldn’t be, it shouldn’t be something that is very easy but the circumstances with public transport is a little special since all of the units are moving and so on. You can’t really build it like in a store. That’s a big challenge for us but technology is catching up so I see a bright future.
Anne: Can we maybe use the slides you showed us?
Robert: Yeah, of course.
Anne: That would be great.
Robert: I think, you know, I have a lot of other examples but maybe it’s better if you, if we run through the questions so you get what you want and maybe sometime we can go to a picture and illustration.
Anne: Okay.

Appendix
129
Robert: I hope you get a little overview among how we see things.
Ida: Yeah, no it’s really helpful.
Anne: Yeah, I think we already have some questions answered.
Ida: Yeah.
Anne: When we go to the questions company values we have I think, right?
Ida: Yeah. It’s similar to your mission, right? That you value the long-term and similar?
Anne: Sustainable and so on. So when we would summarize the values. It’s customer prior-ities first,
Robert: Yeah.
Anne: Sustainable,
Robert: Yeah.
Anne: Long-term oriented,
Robert: Yes.
Anne: Improving the city.
Robert: Yeah. I think that summarizes quite well. To communicate is of course very cen-tral.
Ida: In all what you do.
Robert: Yeah.
Anne: Yeah. Okay, organization of Karlstadsbuss is structured. So we had this how it is in-volved in the public transportation system but you said you are a department in the Komuns. Right?
Robert: Hmm.
Anne: So you have the Karlstad Komun,
Robert: Yeah.
Anne: And then you are a department of it.
Robert: Yeah.
Anne: Okay.
Mathias: And we are part of this Stads….swedish (33.25).
Ida: Aha.
Mathias: If you can translate it.
Robert: City planning development. City planning department.
Anne: Yeah. Okay, okay.

Appendix
130
Ida: So, when people are hired to Karlstadsbuss are they hired through like the municipality or are they hired for you, or?
Robert: I always say that.
Ida: Or do you have employees within Karlstadsbuss or do you only have employees with the municipality, or?
Robert: All of us are employed within the municipality.
Ida: Oh, okay.
Robert: We buy service from the operator, where all the bus drivers and so on, they are employed at that company. So they are not actually employed by us, we are buying that ser-vice. But I think that is exactly the same in Jönköping as well.
Mathias: It is the same almost all over Sweden.
Anne: So there is a bus driver company?
Robert: Yeah.
Mathias: Yeah.
Robert: Who actually performs the service, that owns the busses and everything.
Anne: Oh! They also own the busses but, okay. How they are called? I think you had the name.
Ida: Is it Swedishbuss (34:38)?
Robert: Yes.
Ida: Yeah.
Anne: And how do you make sure that the busses have your design and how do you make sure that the quality of the bus cleanness and the…
Robert: We have a close cooperation, I mean that is defined when we, I mean we use pub-lic tender. And we have, so we have different conditions under which they work and you know the branding is a part of that. That is something that we decide. Cause we are re-sponsible for all the marketing.
Anne: Okay. And you also measure that.
Mathias: Yeah, and we also of course have a deal between us and Föreraldebuss that says that you have to follow this and this rule and so on.
Anne: Okay. And you measure that, like you check it?
Robert: Yeah, we have actually some measures that are connected to a bonus system so in this, where you saw the customer satisfaction, I mean that’s like a summary but there are a lot of different questions in that. And we have two questions that are connected to a bo-nus. And that is that the drivers are, behave nice, and that the busses are clean. That’s the ones, two that we, there we are connected to a bonus system. That’s to ensure the quality. And the company also gets a, two Swedish Kronor for each passenger.
Appendix
131
Ida: Ah!
Robert: So, they have incentives on both quality and amount of travel. Yeah.
Ida: And I also saw that you work with Nobina in some way or are they like the bus…
Robert: They, that is the company that we used to work with before Färänäldebuss.
Anne: Ah! Okay.
Robert: We had a public tender that Färänäldebuss won. That started traffic in 2013.
Ida: Ah, okay.
Robert: So, before that we have Nobina.
Ida: Ah, okay.
Anne: I just check that the recorder still work. Okay, good. Organogram should we? Do we still need that?
Ida: No, I don’t think so.
Anne: Okay.
Ida: When we talk about your customers and how you communicate with them. Are you working in different ways with different user groups? Like for example elderly, are you communicating with them in one way, or is it one communication plan for all different us-ers, or?
Robert: It’s mainly one plan but we do different activities for different target groups. So, for instance they have these… What do you call them?
Ida: In Swedish?
Robert: Tema dagar Swedish (38:05)
Ida. Ah! Okay.
Anne: Thementage.
Ida: Information days, yeah.
Robert: Then we are part of that. We are at the universities where people can ask us ques-tions and some stuff like that. And the same thing is when they are doing activities for sen-iors then we…
Mathias: We actually, were at the senior fare,
Ida: Ah.
Mathias: yesterday and the day before yesterday over here. We were there, selling tickets and giving information and so on.
Ida: Ah, okay.
Robert: And we also have like dialog with those target groups, I mean we are part of you know the student organization, they do meetings with the different parts of the city and
Appendix
132
different organizations in the city. They have these meetings and we are part of that. Same thing with seniors and, so we try to figure out what they want. Of course, they all want, they always want more than what the can get, but…
Mathias: More cheap…
Ida: Yeah.
Robert: Or everyone wants to go for free.
Ide: Yeah, that’s true.
Mathias: Swedish (39:19)
Robert: Like a youth council for the youth and sometimes we, I mean, when we have a specific need, than we can out together a focus group or something. That could be younger people or older people, disabled people, or something like that, when we have like different questions we need to work out how we should work.
Ida: Do you work with advertising, the company itself or do you just use your bus stations to promote, or do you use like billboards or TV commercials, radio?
Robert: It differs, mainly we use our own channels…
Ida: Yeah.
Robert: I would say the busses are a really big part of it. Both outside, cause that’s the best billboards in the city and also inside the busses we have an infotainments system, what we can use.
Anne: That’s really good.
Robert: That’s…
Anne: Buss TV.
Robert: Yeah. But we also use traditional media.
Mathias: Yeah.
Robert: But that’s mainly for larger campaigns. So I think we have done all of them.TV commercials and …
Anne: Local TV?
Robert: Yeah.
Mathias: And the outside of the busses is only us. No other company can use that, so when we use it it’s more effective also because of that.
Robert: I think in Jönköping you have…
Ida: It’s a lot of commercials.
Robert: Yeah, it’s a lot of other commercials for everything.
Anne: Okay, do we have that?

Appendix
133
Ida: I think more or less.
Anne: Okay, good. How do you market your business?
Ida: We talked in general.
Anne: DO you have some kind of… So, your branding is really consistent, as I said with the numbers and the colors and son on. How do you make sure that this is like every-where? Because in the meantime you have a lot of channels or device where you offer the services. How do you make sure that you are consistent through all of them?
Robert: Of course we, we are actually a part of the municipalities graphic profile. We use that as our mumble (42:12)
Ida: the sun.
Robert: Yeah, with the sun. Instead of Karlstad Komun is says Karlstadsbuss and we have the same type faces, the fonts, and you know the ground colors, but then of course we have all of these colors and we have some specific things that we use in our communica-tion. We try to stand out a little from you know everything else that the municipality does.
Anne: So, do you have some kind of checklist like color is in, website color is in, or how, ya, like practically how do you do that?
Robert: I would say the checklist is the municipality graphic profile, that’s the foundation. Sometimes we make a twist of it, but we always know what we are making a twist of. We can always go back, you know, to the basics. So, and when we use different colors then we often go to this one (shows in presentation) where we can find different themes and so on. But, it’s important to not stray away to far from the foundation. So, but I mean when we work with advertising agency, we work with relationships there, they know how far they can go.
Anne: Okay.
Ida: When we talk about Färäraldebuss (43:57) and Landstrafiken in general, do you have other partnerships that you work with? You talked about university as well.
Robert: I think we have quite a large network of, you know, experts in different areas re-garding this business and that’s actually one of the benefits of having this being the fore-front and that combined with good results. That we attract competence, I think that’s really good. I think when we have a question, we can always reach out to and quite easy find, you know, some national experts in that area. So, it’s good to have that network with compe-tence, cause we, I mean, we are like 12 people here, we can’t know everything.
Mathias: And then of course we have this BIMS what we talked about early on. Since we have the same central system, we communicate and help out each other.
Ida: When speaking of partnerships in that term, things like app development and the tick-et system, are you externalizing that or are you developing it in-house, or?
Mathias: It’s external.
Ida: All of it to one vendor, or do you have different vendors for different?
Mathias: Well regarding the App it’s one vendor.

Appendix
134
Ida: And the webpage is another?
Mathias: Yeah.
Ida: How do you make sure there is consistency when you get the product from differ-ent…?
Anne: Tenders again, or?
Mathias: Yeah, often it’s tenders. But it’s the same almost like we already said regarding this handle from the municipality, that’s…
Ida: …provided to the…
Mathias: Yeah, exactly.
Anne: And the payment system? For example Jönköping has an external payment provider, who is dealing with the payments, the actual payments of the customers. Do you have this internal or external?
Mathias: I am not sure.
Ida: Like they have one vendor for the payment system and one vendor for the technology for example, do…
Anne: For example that they, you have like put in your payment details and we send the money to you over our payment system. Right?
Mathias: Yeah, of course there is both for the ticketing system and the App where you could also buy tickets via the App. There is this in Swedish Inrösade (46:56).
Ida: Ah, okay.
Mathias: I don’t now what you call it in…
Ida: Cash, Cashing in person.
Mathias: Called Nets and they take care of the payments.
Ida: Ah, okay.
Anne: Okay, what else did we have in our group?
Ida: I think we are moving on to this part.
Anne: Okay, ticket, payment service, okay. But ticket is in-house, we said and things like partnerships with Pressbyran and the other kiosks, is this like, you are partnering up with all Pressbyrans in Karlstad and I also saw that there was a kiosk that was nit Pressbyran partnering up with you. How do you manage that?
Mathias: I think we are partnering up with all Pressbyrans?
Robert: Yes, yes.
Mathias: And like you said we have this Turkronor and those are sold at, I don’t it’s 40/50 places.
Robert: Yeah.

Appendix
135
Mathias: And there is of course a deal with each and everyone of them.
Ida: So they are negotiated from place to place?
Robert: Yes.
Mathias: Yeah, but I think…
Anne: Hui, that’s a lot of work.
Robert: But it’s a standard…
Anne: Okay.
Robert: Especially with the Turkronor, because it doesn’t demand that much. They only have these like… Have you seen them?
Ida: No.
Robert: It’s like…
Mathias: Paper Money.
Robert: Yeah, like paper money, you can, so they are really easy to distribute.
Anne & Ida: Okay.
Robert: But the difference with the Pressbyrans, they also have like a vending machine, so they have like more, but I mean for the ones who are just selling these paper ticket, the dis-tribution is quite easy. So, we can use something standardized.
Anne: Okay, and we have tried to put those as in strategic places as possible to make it ac-cessible. All over the city.
Anne: Okay. I don’t know if this is, I don’t know if this helps anyhow but do you have a map of those?
Robert: We actually have that on our webpage. You can see locations.
Ida: You have the ticket buying… There are 34 of those out of which 8 sell travel card.
Robert: (Searches the webpage on the computer, keyboard tapping)
Ida: I think it’s just on the home…
Anne: Ahh!
Ida: Yeah, this was the one, that I was…
Robert: So here you have…
Anne: The grey ones are Turkronor.
Ida: Yeah.
Robert: Now, this is our (shows on the screen) customer center, this is actually in this building at the entrance floor. The orange ones, they are like the Pressbyrans and that’s the places where you can load
Appendix
136
Ida: recharge…
Robert: Recharge…
Ida: Refill the card.
Robert: where you can refill your cards and stuff like that. The grey ones there are the plac-es where you can get these Turkronor.
Anne: (Mathias went to take us some Turkronor, and shows them to us) Wow!
Robert: And they also have like vending machines and the blue ones that’s like full service. And the green ones they are a little limited. It’s like a parking ticket machines.
Anne: Ah.
Robert: Where you can buy the…
Ida: Yeah, we were… Is there… What’s the history behind the big machines and the small machines? Is it a cost thing or is it just convenience, or?
Robert: You know the history behind.
Mathias: For a few years ago it was about a thing you can have this. (51:28)
Ida: oh. Okay. Otherwise it is just a documentation.
Mathias: It was about the time when we introduced this Turkronor and we had some de-mands from the Swedish (51:50)
Ida: The public.
Swedish (51:57)
Robert: To get rid of cash on the busses.
Mathias: Because there was the…
Ida: The robberies.
Mathias: robberies.
Anne: This was her assignment about.
Ida: Partly.
Mathias: Yeah, and this was before we had this new ticketing system. And we had the old one and the old one that the… There were no vending machines for that old system, so we had to buy it from a different company.
Anne: Yeah.
Mathias: And this was something that was used in some other cities, so we, that’s why this is like parking machines sort of ticketing machines. And then when we got the new ticket-ing system we also bought this big ones.
Ida: How old is this Turkronor idea? Was that with the old system or is that a new thing as well?
Appendix
137
Mathias: I don’t know, like 2009.
Ida: Okay, and there was a demand to pay with cash then or how come, because I assume you have different ticketing systems already in place at that time?
Mathias: Yeah. Because since you could pay with cash or we still have the possibility to buy tickets with cash but it’s more expensive, so the cash usage on the busses have decreased with like, I don’t know, 98 percent or something. And …
Anne: You can still buy with cash…
Mathias: Yeah.
Anne: Okay.
Mathias: More expensive than ticket. Yeah, and because the whole ticket system was really old so we didn’t have the possibility to distribute a lot of ticket machines around the city so was a convenient way of have a large, or a lot of selling points.
Anne: Okay.
Robert: But the reason we did it like cash, that was just like a marketing gimmick really.
Ida: ah, okay.
Robert: To make it, I mean, to make it feel like you still paid with money. So, it was a little more fun to do it that way then just have like coupons or something like that.
Anne: Okay.
Robert: Yeah.
Anne: Okay. I think it’s really cool.
Mathias: It’s a lot of work with these Turkronor and it’s quite expensive, so in long-term we probably get rid of this Turkronor.
Anne: How many percentage of the customers use this actually?
Robert: It decreases.
Mathias: Yeah. I am not quite sure but, I don’t know, around 15/20 percent or something.
Anne: Okay.
Ida: Yeah. Which of your systems, like systems in general are in direct contact with your users, with your travelers? What would you say? Like you probably have a lot of systems going on and how many of these require the customer to interact with you?
Robert: Yeah, we have to, of course we have the website, we have our mobile app. So, wait, where do you draw the line where people are interacting, for instance at our infotainment system it’s possible for people to you know send in their pictures and sometimes they are shown.
Anne: Machine. The machine is the Bims.
Robert: Of course.

Appendix
138
Mathias: Yeah the ticketing machines.
Ida: So basically all your systems are interacting with the…
Robert: Yeah I would say…
Ida: …in one way or another.
Robert: Yeah.
Ida: I guess the real-time displays is something that you look at rather than interact with but.. .So the majority still requires direct customer interaction.
Anne: Are you all in… Like who is in ch… Are there specific… So you said you are for Bims and Live! And who is in charge of for example the website and the app and the ma-chines and all those like devices. Are there responsible persons, where you say like this is marketing, this is IT, something like that. Who is responsible for the Buss TV?
Robert: I would say when it comes to the more technical parts then it’s Mathias and so. It really depends on what you mean with responsible.
Mathias: Who makes decisions concerning that? For example we made an analysis and we just saw, looked up and we, she checked out, she checked the Karlstadsbuss website for bus times and then she checked Värmland bus website. And the busses, which were not run by Värmland had a small time difference in the timetables.
Ida: By one minute.
Anne: By one minute. Like from Karlstadsbuss. And who is, you know, if somebody gets aware of that, who can, who would be able to, would be responsible for maybe like adjust-ing that or making a change in that? In the App or in the Website?
Robert: I would say that you are….
Mathias: Okay.
Robert: You are… I would say that I work mostly with, you know, maybe developing the services or the content, which we…
Mathias: And then he leaves it to me.
Robert: Yeah.
Anne: Okay.
Mathias: I have to do all the working. (joke)
Anne: Okay.
Robert: One way there and I am the one with another project.
Anne: Okay.
Robert: But it’s also, of course, it something we work quite close together, so of course, I mean, we are a part of it both of us in different ways, so.

Appendix
139
Mathias: Yeah. When it’s small decisions we deal with it ourselves when it’s bigger ques-tions we have our boss of course. Maybe we consult him and when there is even bigger de-cisions it’s our politicians. But it really depends on the type of question raised.
Robert: Since we don’t have… I mean like Mathias don’t have his department with a lot of staff
Mathias: Unfortunately.
Robert: I don’t have one for myself, I mean we have to cover for each other sometimes so, I mean, we keep a basic understanding on what we are doing, so.
Ida: Yeah, when your developing and similar how much do the customers, the travellers come into play in the decision making? Like how big part are they of your decisions?
Anne: When you say customer priorities…
Ida: …is the number one strategy. So how much is that incorporated into the actual deci-sion making?
Robert: I would say it depends on how you do it, if, I mean, in one way we are making a lot of decisions without asking people for permission but of course making use of that cus-tomer data that we have, that’s an important part. We are constantly getting customer feedback through different systems. People are writing in the media. So, I would say that since we are so local we have a really good understanding on what the questions are im-portant. And we also see that it reflects in the answers for example in this market research that we show here where we have different questions. For instance we know that the over-all customer satisfaction is high, people are, they are satisfied with the information that we are giving but we are getting lower ratings for, you know, people think that it is not that easy to buy a ticket for instance. We can see that, okay this is an area where people aren’t that satisfied, we want them to be more satisfied, so we can identify that as an area where we have to work. And of course sometimes you don’t have to make it so complicated to have that, I mean we have a Facebook page, people write a lot about what they are thinking about different things. When we released our application. It’s one feature that like 9 out of 10 at least 9 of the 10 were writing about. So we know that, okay, this is the feature they want. Okay, so it is very easy to draw the conclusion that okay, this is our focus for the next release.
Anne & Ida: Okay.
Mathias: Yeah and regarding our website and the old App that we had. We had this meas-uring that we asked the customers that entered the page “What do you think about this this and that?” and do you want to improve and so on. So that’s also one way of getting the customer’s…
Anne: I got the questions.
Mathias: Okay. And another thing that I thought it was when we introduced the big vend-ing machines we had a focus group that studied the MMI and so on.
Ida: Ah, okay.
Robert: We also made, that’s a very interesting thing we did a few years ago called customer involved service innovation, something like that. Where we had, like, I think we recruited 40 people that for a few days they were instructed – this is build on research, developed

Appendix
140
partly by the scientist here at the university – so they took notes about things, you know, they were, you they reacted to things when they were using our public transportation. And then they got interviewed under, with a certain structure and then those researchers could extract different areas that were important. Different areas where there were room for new improvement and so on, so that gave us a lot of insight as well. How the customers think. Yeah.
Anne: So then, this is…
Ida: Basically all the way down to here. Here somewhere. I think we can move on to this here.
Anne: I just want to ask here.
Ida: yeah. Go ahead.
Anne: When you have your average customer and you say you cluster you, you know, you are more or less serving the whole city and you know. So you have the old ones these pen-sioners, you have the school people, you have the university people. So can you really say you have one customer group you un…, like who is not that fond of riding the bus? Or something like that where you say this is a customer group where we really have to focus on or something like that?
Robert: The hardest group is of course, by tradition, the middle aged man.
Anne Yeah.
Robert: Who love their car, it’s like their status symbol in live. That’s the hardest group to attract but still, we see at lot of middle-aged man actually taking the bus now and then. So, but I think when we are developing we are trying to develop areas, which benefits a lot of people. Sometimes we have to develop, for instance accessibility and the best part of course is when we can make it accessible that is a benefit for all of our customers. But that’s some, that kind of development is often regulated by law and so on. But We want to do it as good as we can and for instance there is one area where we actually got some in-formation from a focus group when we thought about people who you know, they are not blind but almost, cause we were thinking like this infotainment system would be the only screens within our busses. And then we got from some people that had this problem they said like “We can’t read from screens like that” but they could read from these you know more traditional internal signs where you see the next bus stop. So we actually kept both and I actually think that is something that is good for everyone cause then we could devel-op the infotainment system without thinking that it has to show next bus stop all the time. So we can work more full-screen. We don’ have to develop, to have certain areas which have always show the next bus stop and so on. So I think to you know solve specific prob-lems but still have a, you know, a broader picture. It’s a good way of…
Ida: developing…
Robert: Yeah. But of course I think when it comes to new development I think we gain more from you know listening to the young people than listening to the elder people. I don’t think you should write maybe that. But I think that’s the truth cause that’s where de-velopment is going. So if we can satisfy the needs of the younger people coming to Karls-tadsbuss without making it worse for the elder I think…
Anne: yeah.

Appendix
141
Robert: … it’s a good way of development as well.
Anne: That’s true.
Ida: What would you say is like IT, moving away from the users speaking about IT itself. What role does it play in your systems at Karlstadsbuss?
Mathias: I would say it is a very central part.
Ida: Is it like…
Mathias: Almost all of our customers get in touch with one or more systems in every travel they do so it is really important.
Ida: When they get in touch with, wit you say your designing it for users to work with one channel for example if you have the travel card, you can only use that or do work with more a possibility for customers to switch between the different payment method and be-tween different way of reading the time tables, or do you thinking about this should be us-ing it like a silo version of things? Or are thinking of as a system where the user should be able to use really among different way, like different developed services, service per service, or service for the system?
Robert: I think the challenge there is to, to make those services so they feel like it’s the same service. That’s I think, that’s like a long-term goal to make it feel like it’s one service that we are providing. But of course they all have a history and we are trying to go from there to you know making it…
Ida: funnel it down… (1:10.38)
Robert: yeah.
Anne: Ah, okay.
Robert: But it’s always like for instance when we developed our new appli… App. Of course that’s, it takes it in a little new direction and that’s the kinds of things that always happens when we are introducing a new system. And then we se like okay this is the way we want to go and then we have to make some adjustments with other systems. So…
Anne So, the Live! functionality you have at the bus station and the Live! Functionality you have in the App is this the same system?
Mathias: Yes.
Anne: Okay. In want way they differ maybe between… the Bus TV, the and the App as well, so were are just searching for maybe, yeah, so how many, I don’t know how to say that. Do you have one specific system, which is not integrated with the others where you say, like, this is something maybe which can be improved our something like this? Where you say the Website times and the App times are fed by different systems or is this all the same?
Mathias: No, it’s one source that the different systems connect to and get the time.
Anne: Okay, and you said Värmland has the same system?
Mathias: They have the same system for travel planner.

Appendix
142
Anne: Okay. Okay, okay, so.
Mathias: And we these signs here in Karlstad like at the bus station and bigger bus stops that we have in common and there we show both our departures and also their departures at the same sign, so.
Anne: So you have to kind of integrate two systems in one.
Mathias: Yeah.
Anne: What I really like was that when we looked at the methods, how you get in contact with the users are I think really active and really linked between each other. So Facebook refers to YouTube, Facebook refers to the App, YouTube refers to twitter, Twitter refers to Facebook again and so on. Was this some kind of strategy you, is this something which happened naturally? Or is this some kind of strategy you followed there like that you kind of cover all the channels which can be used, or?
Robert: I thinks it’s, I mean, I think it always comes back to, you know have these open communication. I think that’s like the strategy really and to, you know, if you get the cus-tomers in one place, you know, let them know what else there is out there, where you can provide some service and something like that, so. I think it’s pretty natural in the way we think. That it should be that way.
Mathias: And I think one strategy is that we don’t demand that people have to use just one channel, it should be broad and you could use whatever you want.
Ida: Do you find like, how to say, channel cannibalization in this like some of your ways to buy tickets pushed the other ones away like this Turkronor is decreasing for example? Are you experiencing that there is a lot of, like some channels are highly preferred and pushing other systems away, or?
Robert: I think it’s a very natural thing for that to happen, I mean, and I think that is one thing to be open to the users cause, cause I mean if we provide different kind of, you know, …
Ida: service…
Robert: …services, yeah, and we se which one the users prefer, I mean, that should be our focus. So, I think that’s always changing over time, so I think it’s dangerous to make deci-sion, we should only use one and that’s our focus. Cause I think you always have to be open for what’s happening, cause it changes very quickly sometimes.
Mathias: And there is quite a large demand to be able to buy with credit cards on the busses and we are looking at that. The problem is that it takes to much time and we don’t want the bus to be standing still, we want the customers to go on board as quick as possible that the bus can go. But there are new technologies coming along that makes this payment much quicker. So, we plan to introduce this also. And this could cannibal on the other payment system as well.
Robert: Yeah, for instance in London they don’t have their bus card anymore cause they have this contactless Visa Master Card prepared payments.
Anne: Those Wi-Fi cards.
Robert: So finally people are paying in the same way as they are doing in all other stores.
Appendix
143
Anne: True, true.
Robert: Cause I think people fed p with having a separate card for that and a separate card for that. I mean I hate it myself.
Anne: That’s true.
Ida: Yeah, one pick for everything.
Anne: How many cards do have? Like we got for example a three day pass and we have like this paper thing and then a lot of people have this chip card. And than you have the App and the Turkronor so you have four different ways of…
Mathias: Yeah and you could pay with cash.
Anne: And with cash. Okay, so, but then you get again the paper ticket, right from the bus driver? But this is another one?
Mathias: Yeah.
Anne: Okay.
Ida: Can you buy the tickets online? Like apart from the App. You can buy it on the webpage?
Mathias: Yeah.
Ida: You can do that too?
Mathias: Yeah.
Anne: Like for printout?
Mathias: No, you buy tickets or you load your purse for this smart card.
Ida: Ah, okay.
Anne: Okay.
Ida: We move on to these parts actually. We are more or less covered the basis.
Anne: Okay. There is so many information out there and your users already said it’s hard to buy tickets. Do you have any plan to have or do you have already any, some maybe meth-ods to simplify searches, propose customized user paths or something. I mean for example you say, what I could think of in the area public transport is like, okay you bought, you have a user account and you buy over your user account with you ticket maybe three single tickets and then the App or the Website or your user account proposes you: “hey, you bought three tickets. Do you know that in the same time you could buy a three pass ticket and that would give you a saving of this and this amount”, or something like that. Is this something, which is there, or, which is, like “hey, you user card expires, like your monthly bus card expires in two days, her you can have the link to order, here is the link to the App and you can prolong it”. Is there something you…?
Robert: It’s an area of interest. We don’t have that today. But we are, I think, especially when it comes to the mobile phone and the way we can sell tickets there, there we have some great possibilities to work in that way. When it comes to the bus cards, we have, we don’t have that function yet, but like auto, when your balance gets to a certain level it au-
Appendix
144
tomatically refills. That kind of service is something we are looking at. But I think it’s an area where we could definitely develop more.
Anne: Okay. I think we are…
Ida: We are done…
Anne: Done, more or less and you said you sure have things you can optimize and maybe we didn’t covered it here. So, what do you, where you see improvement needs?
Robert: Yeah, the ticketing…
Mathias: yeah.
Robert: That is definitely one area where we will focus this year and I think for a few years. I mean, there is a lot of things happening, for instance, I know that both Visa and Master Card have the strategy that in 2020 all of Europe should be contactless. So it’s something that’s happening in the quite near future. Where we get new possibilities maybe to go in the same direction as London, where you can skip the…
Ida: Swipe…
Robert: …traditional bus card and just use your…, But of course there are a lot of issues we have to solve for that to work. But of course that’s an area where we can develop cause from the point where I think that the way you buy tickets, it shouldn’t be something spec-tacular. It should be very natural. And the problem today is that it’s like people see it as a problem, cause it differs from the way that you pay at other stores. And I think that getting to the play where you can actually buy a ticket just as easy as anything else that you buy during your day. I think that’s like the main thing when it comes to ticket. But of course within the App we develop you know loyalty and so on. And that’s also part of the buying experience. But that’s like the other side of it, we have to get the foundation right as well for people who don’t want to, you know, the VIP customer at once. But I mean other areas where see at lot of improvement I think is how the busses are prioritized in the city. There is strong connection between how long it takes you from A to B compared with taking the car and how many people are travelling. So, if we can, have like better routes, which are faster, where you only have to stop at the bus stops, for instance we can attract more peo-ple. Cause eventually we get where it’s fast to go with the public transportation as with the car and that is also a great area of development for us.
Mathias: Another area where we know that our customers don’t give us high grades are in-formation regarding disruptions, lanes, and consult on trips and so on. So we just recently bought a system for this, so, we plan to introduce this during the Spring or Summer.
Ida: Can I just ask one question regarding your amount of travels are highly increased over the past years. Is it similar with the profitization, or the like does it correspond to how well the company, your department is doing in terms of profits.
Robert: You can’t really draw a line of the increase in passengers and the increase in reve-nues cause the increase in revenues aren’t that steep cause a part of these increase in travel is that some of the same people are travelling more. I mean they get a period ticket and they travel more on it. And for that we don’t get any more money.
Ida: Yeah.
Robert: So…

Appendix
145
Ida: So the company is doing fairly similar?
Robert: Yeah. But I mean it’s not like we are doing bad but it’s not as steep as the increase in travelers.
Ida: Okay, yeah. So, sorry if this was a rude question.
Robert: No, no, no.
Mathias: No.
Robert: Not at all, I mean, I thinks it’s a really interesting question and I think, cause that is something that you have to take in account when you are doing, you know, development, that even if you are getting more travels, I mean, the revenues it’s not linear.
Ida: Yeah.
Robert: So, but I mean we have more revenues now than we had before so it’s not like that they have decreased but the…
Ida: I read a similar article from Trafikverket, where they say that there are in general the amount of bus travels was having greatly increased but the expense of providing the travels has increased in on a similar rate, so it was a standby but I don’t know if that’s…
Robert: I think that one of the reasons, I mean, from Trafikverket, were that they can show this is because a lot of the public transportation authorities, they have made some, they have bought a lot of trains, and that’s really really expensive. So, I wouldn’t say that the costs have increased that much, cause we don’t have that, we don’t have any trains within Karlstad. So, yeah.
Anne: Another questions, which is more funny I think is, the boat busses, are they, will there be an App as well in the Summer?
Robert: We have an App for that.
Ida: Oh, yeah?
Robert: We had that for a few years.
Anne: There is a bus boat App?
Robert: Yes.
Mathias: That’s cool.
Robert: But it’s like a guiding App. Of course you can get information about the routes but it’s not real time. But you can use your head phones and you can listen…
Ida: Ah, like a tourist…
Robert: Yeah, so it’s like…
Anne: how is the App called? Because…
Robert: Boat busses.
Ida: Okay, We tried out all Apps you had, jus, not regularly.
Appendix
146
Robert: But it’s also an area of development, too. To get the real-time information for the boats. But we don’t have that yet.
Anne: Okay, and another one, which is my personal more less questions: You haven’t, you almost have nothing in English, right? So, how much percentage of your customers are not Swedish speaking?
Mathias: Good question. I don’t have the answer.
Robert: We don’t know that. We don’t have any research about that. But I can say for in-stance our new application, that is both in Swedish and English. So if you don’t have a Swedish operating system then it automatically is in English.
Ida: Oh, okay.
Robert: And we are also for our webpage, maybe you have some information about that, will be interesting to hear, cause I think Jönköping, they use Google Translate. So you can see their webpage in almost any language.
Anne: Yeah, if you use Google translate it’s automatically included as a function.
Robert: Yeah, I mean, they have included that in…
Anne: In their website…
Robert: Yeah.
Anne: Ah, okay.
Robert: I think they have that in Jönköping. I think that was one of the examples I heard about where, cause that’s also an area of interest, cause I know that for webpages where you constantly update news and stuff like that. To keep up with different translations that’s a lot of work.
Ida: Yeah.
Robert: But if you can have it automated system and if it’s good enough, I think that Google translate is a really interesting development if you can integrate that. So you can choose your own language and get an acceptable correctness.
Anne: I never used the website of Landstrafiken in Jönköping.
Ida: I used them in Swedish, so…
Anne: Yeah.
Ida: But it would make sense for them to have it though, based on international basis they have.
Anne: I know the App I have is in English, that’s true.
Robert: (Opens the browser to check the Website) Let’s see here.
Ida: Jlt.se
Anne: Yeah, the App is in Swedish, English.
Robert: Yeah, you have this translate function there.

Appendix
147
Ida: Oh, yeah.
Anne: ah.
Robert: So you can pick your language. They have a lot of translators. Jönköping Landstraf-ik. You can get it in Yiddish, For instance something that we, where are you from?
Anne: German.
Robert: You are from… we can take it in German.
Anne: It’s Deutsch.
Robert: This is something that’s actually…
Anne: No, that’s not German in there.
Ida: With T I think.
Robert: Yeah, T.
Mathias: should be in…
Ida: In English, yeah.
Mathias: yeah, or…
Anne: … the local language…
Mathias: yeah.
Robert: but alternative are…
Anne: But it’s nice they are suche, search for flight, and next departure of flight.
Robert: It’s not perfect.
Anne: Yeah, that’s true.
Robert: But it’s..
Anne: Search for flight…
Robert: Let’s see if you can just go into some page here.
Ida: Now that’s in Swedish. Ah, no.
Robert: No. Tickets und Preise. Let’s see here . Why didn’t that gets translated? Did they forget that I wanted it in German?
Anne: There is no translation.
Ida: Ah, that’s a thing they need to work out. Yeah, you can get it in German on this homepage.
Robert: Yes, it just applies to some pages. Cause here it’s not.
Mathias: Swedish (1:32:27)
Robert: I don’t know.
Appendix
148
Ida: Ah, it could be.
Robert: It lost…
Ida: ..it’s translation function.
Robert: Lost in translation.
Ida: Lost in transmission.
Robert: yeah. It’s not perfect. But it’s…
Ida: …it’s a start.
Robert: Yeah, but I mean when you see functions like this it’s like, you feel like, oh it’s made it’s not good enough. But you still feel like this is the future.
Anne: Yeah, that’s true.
Mathias: It’s definitely better than nothing.
Robert: yeah.
Anne: yeah., it’s true.
Ida: So what will happen now is that we will go and retrospect with us and start analyzing and also we will compose some sort of user interviews or get in contact with the users and see if they thing similarly and corresponds and.
Anne: And we also can look into the ticket, how people wants to use tickets or something.
Ida: And we going to ask if we may, if we have additional questions, would it be okay to e-mail them?
Robert: Yes, of course.
Ida: The follow ups?
Anne: How you want the document to be written? Do you want to stay anonymous and we should call, talk about company X and person a and B, or?
Robert: For me it’s okay if you mention my name.
Mathias: and for me, too.
Ida: Okay.
Anne: Good. So the deliverable of our work is on the 22nd of May. And I think this would be the also the time where we could deliver that to you. Of course there is a lot of academ-ic blab la before that.
Mathias: Yeah, we know.
Anne: You know. Do you want to have maybe like a management abstract or like presenta-tion, or should we come back and present it to you or should we keep in dialog concerning that? How would you prefer it? Or would you prefer first read it and then say it’s some-thing interesting or maybe it’s not. And you just say if you want to have more information about it?

Appendix
149
Robert: But I think you can send both for the report and the abstract and, so I think that’s a good start.
Mathias: yeah.
Robert: I mean, if you make some great discoveries then it’s maybe something we need to talk about.
Anne: Of course.
Ida: Okay, then thank you so much for taking the time and meeting us and…
Anne: And thank you for the Kronor.
Robert & Mathias: Yes.
Ida: And we will be in touch.

Appendix
150
Appendix 2 – Documentation of user interviews Interview number: Demographic: Location: User pattern:
Interview 1 Male, 25 City Center Frequent user
Lives in city center, studies at the university. Normally walks but to university he takes the bus, roughly 3 times/ week in the morning & afternoon (15 kilometers for back & forth). He uses ‘Månadskort’, which is cheaper than the one-time ticket, which he used earlier. Bought the card via a ticket machine, and then activated it at the Karlstadsbuss office. Overall he finds the system easy, some constructions in the city make the bus stop a bit tricky to find. To get information he looks at the timetable at the bus stop or otherwise the App. He knows the route by heart, and does not share his travel experiences. If he misses information during the trip, he looks at the live-display at the bus stop, or the App. Adop-tion of the system was very easy and had no issues with it. Would like a better student dis-count, otherwise he has no problems or is missing anything.
Interview 2 Female, 25 City Center Frequent user
Lives and works in the city center. A few times a week she travels to customers, and for shopping. She travels mostly in the mornings and evenings. The estimated distance is 10-20 kilometers per day. She used to travel daily by bus, now she mainly walks and uses the bus once every second week due to a move to the city center. She used ‘Periodkort’ that she buys at Pressbyrån. Tried Pay-per-travel card before, due to long sessions of time spent outside Karlstad. Occasionally, she shares her travel experiences. Experiences very few problems and has a positive impression of Karlstadsbuss. She uses the App to find infor-mation about timetables and routes. She highlights the usefulness of the live updates and the ability to write an address and get the closest bus stop. The adoption time was short and smooth.
Interview 3 Male, 35-45 City Center Frequent user
He is living fairly central in Karlstad since a short while ago. Normally walks to get around with daily business, such as getting to work, shopping, and so on. The second most used transportation is car, which he uses to drive to Hammarö to leave and pick up his children at school. The distance to school is roughly 10 kilometers long. Before the move he lived on Hammarö, but the move into the city changed his bus behavior. When he travelled, he used a ‘Resekort’, which he charged and bought on the bus by the bus driver. Today he us-es the bus infrequently. He thinks very positively of Karlstadsbuss, and appreciates the changes he has seen in the past few years in terms of which routes the buses takes and how often. He thinks they are ‘on the right path’. He does however miss good connections to and from Hammarö, and state that if good connections to the children’s school existed he would most likely use them instead of driving. He thinks that the bus commonly is a faster option than car, but due to the time it takes to leave the children and then get to work im-mediately afterwards makes it hard to match with the bus schedule. He thinks better rides to school for his children could make the option of taking the bus more appealing, since he then wouldn’t have the issue of time management.
Interview 4 Male, 55+ Outside city center Non-frequent user
Works in the city center, but lives in Hammarö. Commonly travels in the morning and af-ternoon to and from his workplace, roughly 8 km. He does however use Värmlandstrafiken much more than Karlstadsbuss, due to the fact that Karlstadsbuss doesn’t operate in his

Appendix
151
immediate area of living. Normally he travels by car, but if it’s occupied by other family members he uses the bus, about 1 time/month. To find out about which bus lines to take and timetables, he uses the mobile App. He uses the ‘värdekort’ ticket, and refills it on the bus by the bus driver, but considers to start refilling via the App instead.
Interview 5 Male, 55+ City Center Non-frequent user
Works and lives in the city center. He does not travel much inside the city, since everything he needs in located within walking or biking distance. He rarely uses the bus, but when he does it is mainly to visit friends, who live outside the city center. When he travels by bus he uses the ‘Resekort’, which he refills at Pressbyrån. He doesn’t find the system complicated. Normally he uses the Karlstadsbuss webpage to find information about timetables, routes and bus stations. If he lacks information during the journey he asks the bus driver.
Interview 6 Female, 25-30 City Center Non-frequent user
She works and lives in the city center. Most often she travels to and from work, and via the work to visit company clients. To do this she uses a car provided by her firm, and the range is Karlstad with rural area, about 30 kilometers/daily. She uses the bus about 1 time/month, usually due to alcohol intake (e.g. social gathering, visiting a bar). When she travels she uses ‘Turkronor’ that she buys at Pressbyrån. She does not share her travel ex-periences with others. She does find the system easy to use, and enjoys that there are rarely are problems when she chooses to go by bus. She uses the app to find out about timetables and bus stations, as well as which routes the buses take. She had no issues getting used to the system, and the adoption rate was quick. She thinks the only thing that would impact her transportation choice, would be a direct commute route.
Interview 7 Female, 55+ City center Non-user
Lives and works in the city center, 6 days a week. She normally walks when she needs to get somewhere, since everything is conveniently located. She thinks well of Karlstadsbuss, many of her clients speaks well about the travel service to her (such as, oh this is perfect, then I can catch that bus, or now I can travel without the time running out of my ticket!).
Interview 8 Female, 40 City Center Frequent user
Lives centrally, works in Rud. She normally uses the bus or bicycle, and her main reason for travelling is to and from her workplace, which takes 10 minutes by bus. When she trav-els by bus she uses a ‘Månadskort’, which she refills as Pressbyrån. She knows the route and relevant timetables by heart, but if not she uses the App. She cannot think of any prob-lems with the Karlstadsbuss service, and find the information sufficient. She does not share her travel experiences. The adoption to the system was very smooth, and she is overall very pleased with taking the bus.
Interview 9 Male, 60+ Hammarö Seasonal user
He lives outside the city center, but his workplace is located there. He travels daily to work, and otherwise he travels to Munkfors to visit friends. Normally, he uses a bicycle for trav-els, but during winter he chooses the bus. He prefers the bus to car since the costs were equal to driving (fuel), and car was in the long run more expensive according to his calcula-tions. When he uses the bus he utilizes a ‘Värdekort’, which he charges on the bus (he thinks, not certain). He finds information about routes and timetables on the webpage, and occasionally at the bus stop timetable. Feels rather satisfied with the amount of infor-

Appendix
152
mation he’s provided. Would like to have bus stops in the populated areas, he thinks the placement of bus stops in Hammarö is strange. He has roughly 700 meters to the bus stop, which he feels encourages him to bike all the way instead of just biking to the bus stop.
Interview 10 Female, 20-25 City Center Frequent us-er
Lives and works in the city center, but also studies at the university, and therefore she uses the bus daily, in the morning and afternoon. She finds the bus to be her best alternative, as she doesn’t have a car and find the distance too long to bike (15 minutes by bus). She uses a ‘Månadskort’, which she refills online on the webpage. She uses the App to get timetable and route information, sometimes she checks times and connections at the bus station. She does not share her travel experiences. The adoption of the system was very rapid, and she thinks it is easy to access information. She thinks an area of improvement is the real-time update (at the bus stop) if the bus is late; it just keeps saying ‘2 minutes’ even if it’s late. She would also like more departure times, but is not very dissatisfied with the current timetable.
Interview 11 Female, 40 City Center Frequent / seasonal user
Lives and works in the city center, and therefore prefers to walk. If not walking, she uses the bus, normally if the weather is bad or during the winter. She uses ‘Värdekort’ that she refills online, or at ticket machines if she travels by night. She either uses the App to find timetables, or simply walks to the bus stop, since the bus arrives so frequently in her opin-ion. She is not missing anything in particular from the system, and had a short adoption time. She is very positive about Karlstadsbuss (“suveränt”). She prefers the bus over car due to parking issues.
Interview 12 Male, 45 City Center Frequent/ seasonal user
Lives and works in the city center, and therefore prefers to bike. If not walking, he uses the bus, normally if the weather is bad or during the winter. He uses ‘Värdekort’ that he refills at Pressbyrån. He uses the App to find timetables. He is not missing anything in particular from the system, and had a short adoption time. He is very positive about Karlstadsbuss (“suveränt”). He prefers bus over car due to parking issues and environmental aspects. He misses the SMS tickets.
Interview 13 Male, 45 City Center Frequent user
Lives and works in the city center, and prefers walking to work and for shopping, arrends, etc.. Uses bus to visit his children, a distance of 6 kilometers, on weekends and afternoons. He estimates the usage to 10 times/ month, and uses ‘Månadskort’ that he refills at Press-byrån. He uses the App to get information about routes and timetables, and is happy with the App now (less satisfied before the update). Normally he plans ahead for which bus to take though the App, but if he doesn’t have an agenda he just looks at the bus stop’s time-table. He does not share his travel experiences. He is happy with the information provided to him, and has a fast adoption to the system.
Interview 14 Female, 16 City Center Frequent user
Lives in the city center and goes to the local grammar school. She takes the bus every day. Don’t know the distance or time. She takes the bus card offered by the school. She uses the time table at the bus stop to get information. She doesn’t think the system is complicated.

Appendix
153
Interview 15 Female, 40 Doesn’t live in Karlstad Tourist
Her husband has a business trip in Karlstad. They sleep in a hotel in the city center. She wants to see the city, doesn’t know the transportation system. That’s why she is walking.
Interview 16 Female, 65+ City center Frequent user
Retired, but lives in the city center. Normally walks or take the bus. The main reason for travelling is to visit friends or shopping. She prefers bus over car to avoid parking, she thinks the bus is cheaper and likes the environmental aspects of choosing the bus. The dis-tance is roughly 15 kilometers back and forth. She uses a timetable booklet to find the de-parture times, and finds this sufficient in terms of information. She uses a ‘Resekort’ that she refills at Pressbyrån. She does not share her travel experiences, and is generally satisfied with the services. She thinks all the reconstruction in the city makes the bus stops a little tricky to find. She thinks the bus drivers are very friendly and thinks the bus schedules are very decent.
Interview 17 Female, 25 City center Infrequent user
Lives and work in the city center. Normally walk, bike or take the bus (4 times/month). When she travels by bus she uses the App to find timetables and for buying tickets. She does not share her travel experiences, apart from expressing frustrations to the bus driver. She is reluctant to use the bus more since she does not trust the bus to take her to the end destination on time. She is not pleased with information about late busses. If she misses in-formation during the journey she speaks with her fellow travelers.
Interview 18 Female, 25 City center Infrequent user
Lives and work in the city center. Normally walks, or take the bus (4 times/month). When she travels she uses a ‘Värdekort’ that she refills on a machine. She prefers to refill on the machine due to its convenient location. She uses the App to find routes and timetables. She thinks be buses tend to be late, especially during the winter months. She is especially an-noyed when the bus leaves ahead of schedule from the bus stop. She shares her travel ex-periences if they have been negative (i.e. shares her complaint to friends and family).
Interview 19, 20, 21 Male 45, Male 65+, Male Non-users
Haven’t used the bus in the past 10 years, or have no experience at all with the system as they are tourist from other cities in the region.
Interview 22 Female 24 In Karlstad Frequent user
Works and studies at University. She prefers bus or bike when she travels, depending on the distance (10 km is the normal “switching distance”, which occurs about 4 times/week). Normal reasons for travelling is work, university, the city or the gym. She prefers bus when going to the city or to work. She uses Värdekort that she refills online. She uses the App to find timetable and routes. If information is missing she first checks the live display, and if the bus doesn’t show up she speaks with fellow travellers or call the number provided in the bus stop (this has never happened yet though). She thinks the flow of information is sufficient. Her general impression of Karlstadsbuss is very good: often in time, informative, a large array of platforms where you can find information, such as the Buss TV. The adop-tion was a little tricky when register her bus card, as the machine was located very different-ly from the systems she had used before, and she sees that other people are struggling with

Appendix
154
travel card registration. She does not normally share travel experience, unless something eventful happened during the trip. If so, she shares it within the friend group.
Interview 23 Female 24 In Karlstad Frequent us-er
Studies at university and work, lives in Karlstad but not in the city center. She prefers walk-ing or taking the bus, depending on the distance (6 km is switching point). Her main rea-sons for travelling is to go to work, university or to the city. She selects bus for going into the city. She uses the bus about 5-10 times per month. She uses Resekassa (travel card) that she refills online, because of the flexibility. Before she found this feature she refilled at Pressbyrån, which was a hassle since none was located conveniently based on where she was living at the time. She uses the app or the online travelplaner (website). If there is in-formation missing during the trip she look at the Live display, or the app (has never been necessary). She generally have a positive opinion about Karlstadsbuss, she thinks they’re “up to speed” with technology compared to other regions, and has an overall better quality, that they seem to care about their passengers, she mentions Buss-TV and the switch from a regional accent to standard swedish to simplify for the travellers. She does not share her travelling experiences, and does not miss anything in particular. The adoption was quick, apart from the earlier mentioned refill issue.
Interview 24 Male 28 In Karlstad Frequent/ seasonal user
Works in city center, lives in Karlstad (6-7 km from city center). Normally bikes, but if the weather is bad or during winter he prefers bus. He travels by bus on average 1.3 times per week, normally to the city center where he works, or to the city to change to another bus. Overall he likes Karlstadsbuss, finds it somewhat expensive. He rarely shares his travel ex-periences. When he travels he uses a Värdekort that he refills at the ticket machines. He prefers the machines due to their location, and to avoid the lines and “social involvement” at Pressbyrån. He knows some routes and timetables by heart, otherwise he checks the app. If he misses information he uses the app. His standard journey is look at app (unless he knows the departure time by heart) to confirm time, go to bus stop, travel. His adoption to the system was pretty smooth, and he doesn’t miss anything. He thinks his fellow travellers can be bad, and without respect for their passengers, but don’t blame the bus firm for it.