Comparative Review of Three Approaches to Biofuel ... - CORE

CLIMATE RESEARCHClim Res
Vol. 40: 249–260, 2009doi: 10.3354/cr00833
Published December 10
1. INTRODUCTION
Socio-economic development strategies have histori-cally focussed narrowly on local development concernsand have not emphasized cross-sector interactions anddependencies, especially over large spatial and tempo-ral scales (Gunderson & Holling 2002, Starzomski et al.2004, Levin 2006). The consideration of long-term andremote effects of ecological exploitation for human de-velopment purposes has not historically been a majorconsideration (Lubchenco 1998). The implications for
social–ecological systems are that optimising humandevelopment activities at a local scale for short-term,microeconomic gain does not necessarily translate intobenefits at the whole-system scale. In particular theeffects of local development optimisation efforts haveoften had significant remote effects in other sectors ofthe social–ecological system or in components of theecosystem. These sectors are traditionally viewed asdistinct parts of a system and only local dependenciesand interactions with other sectors are considered instrategic planning and implementation.
© Inter-Research 2009 · www.int-res.com*Email: [email protected]
Applying Bayesian modelling to assess climatechange effects on biofuel production
Camaren Peter1,*, Willem de Lange2, Josephine K. Musango2, Kurt April3, Anet Potgieter1
1Ndibano: Intelligence in Systems, 245 Private Bag X18, Rondebosch 7701, Cape Town, South Africa 2CSIR Natural Resources and the Environment, PO Box 320, Stellenbosch 7599, South Africa
3Graduate School of Business, University of Cape Town, Private Bag X3, Rondebosch 7701, Cape Town, South Africa
ABSTRACT: Socioeconomic and ecological systems exhibit complex, interdependent behaviourwhich is often difficult to model and understand. This is due to the complex reorganisation of keysub-system processes involving nonlinear, cross-scale and cross-sector interactions in real time.Hence, predictive models of complex social–ecological systems are often subject to large uncertain-ties. We propose an approach for evaluating land-use adaptations for biofuel production, usingBayesian networks and integrating research on the food, water and energy sectors. The approach isintended to facilitate interdisciplinary consideration of cross-scale and intersector dependencies. Weapplied this approach to 2 examples of land-use strategies and show how the resilience of a strategythat meets the new South African national biofuel production target can be assessed in relation to cli-mate change. Cross-disciplinary consideration of variables may be enhanced through the sensitivityanalysis enabled by Bayesian networks, which is used to conceptualise the conditional causal depen-dencies between subsystem variables. We formulate and run a national scale South African modelwhich links the impacts of projected climate change effects in southern Africa to irrigated agriculture,water storage planning and biofuel production. We demonstrate how the approach can be used toevaluate land-use changes in different projected climate change scenarios and land-use combina-tions, and how conflicting demands between water, food and biofuel energy sources may be prelim-inarily identified and assessed in an integrated probabilistic framework. Evaluating this problem inthe context of climate change and water-related limits to growth enables research to support inte-grated analysis and planning for biofuel production and development.
KEY WORDS: Bayesian networks · Climate change · Biofuels · Land-use change · Resilience · Cross-sector analysis
Resale or republication not permitted without written consent of the publisher
Contribution to CR Special 20 ‘Integrating analysis of regional climate change and response options’ OPENPEN ACCESSCCESS
Clim Res 40: 249–260, 2009
Biofuel is currently being considered as a supplemen-tary source of low emission, renewable energy as a liq-uid fuel supplement in agriculture-based economiessuch as South Africa (DME 2006), and in transitional andindustrially developed countries (e.g. Brazil, USA). Withthe increased global awareness of climate change ef-fects, the pressure to lower emissions has grown. How-ever, the impact of the agricultural sector entering an en-ergy market with rising demands and the threat of lowerfossil fuel reserves in the future poses complex inter-sectoral development challenges. This is perceived to bedue to the interdependency that is being created be-tween the energy and food production sectors by theintroduction and use of biofuel as a source of alternativeenergy (MIT 2007, Sugrue & Douthwaite 2007).
Both climate change effects and regional human de-velopment activities (especially significant land-usechanges) may threaten water supply and agriculturalfood production in southern Africa (Mendelsohn et al.2000, Mukheibir & Sparks 2003, Midgeley et al. 2005,Kates & Dasgupta 2007). In the southern African region,climate-change models (Mendelsohn et al. 2000) pre-dict an increase in water scarcity due to temperature in-creases. For agricultural production this suggests anincrease in plant evapotranspiration rates, surfacerunoff and dam evaporation rates. At the national scalethis implies that sector-driven competition between fueland food producers will increase. Avoiding unintendedeffects of diverting existing agriculture for food andanimal feed to biofuel production requires prescribingan appropriate balance between the agricultural activi-ties of food and biofuel production.
The South African total national biofuel target (Lem-mer 2006) for 2013 was originally drafted at 4.5% ofliquid road transport fuels (DME 2007); that is, approx-imately 8% of ethanol in national petroleum production(NPP = 10.985 × 10⁹ l) and 2% biodesel in diesel, whichis approximately 4.5% of national petrol and diesel vol-umes (DME 2007). Achieving this target across a rangeof scenarios requires blending in up to 5 and 10% bio-fuel components for biodiesel and fuel ethanol, respec-tively (DME 2006). This target was later slashed to 2%(i.e. around 400 million l yr–1; DME 2007) citing con-cerns over food security in 2007, and the cultivation ofmaize for ethanol production has been suspended inthe initial phase of the strategy. Biofuel production fromsoya beans, sunflowers and sugarcane on this scalefrom irrigated agriculture alone may require a largeamount of new arable land, and the conversion (to fuel-producing agriculture) of significant areas of land onwhich food-producing agriculture (especially subsis-tence agriculture) is currently being practised.
Between academic disciplines, economic sectors, civilsociety and governance bodies, there is a debate on thenational biofuel development strategy. Climate-change
adaptation strategies involving land-use changes that aimto develop the biofuel sector holistically and sustainablyrequire that the effects of climate change on productionlimits and intersectoral dependencies are taken intoaccount. This study outlines an approach to assesswhat scenarios may create the conditions for conflictingsectoral interests to play out in response to the biofuelstrategy being proposed.
The aim of this study is to show how interdisciplinarymulti-participant cooperation around intersectoraleffects can be enhanced by using a Bayesian model toassess land-use adaptation strategies against multiplefuture scenarios—i.e. to establish an understanding ofa multi-sector, social–ecological system in an ana-lytical framework which could help support a multi-participatory approach. The focus of our analysis is ontesting the land-use combinations that can help attainbiofuel production targets; and in particular, exploringthe sensitivity of surpluses that would be required tomeet targets under climate change effects. To thisend, we apply the approach to 2 examples of hypothet-ical land-use combinations, and test these strategiesagainst projected climate change effects for the regionregarding rainfall and temperature variation. Thisstudy is therefore an illustrative and descriptive study,and is not an exhaustive study of the multitude offuture options, nor is it definitive in terms of prediction.
The approach proposed in this study provides aframework in which subtle changes—resulting fromthe exposure of different land-use combinations to pro-jected climate change scenarios—may be evaluatedagainst each other. We argue (and show) that thisBayesian framework constitutes an adaptive, flexibleframework that can test a wide range of system con-figurations against envisaged future system scenarios;especially where land-use changes (or adaptations)are concerned. In particular, the food, water andenergy sectors are considered in an integrated frame-work in which biofuel development strategies beingconsidered in South Africa may be evaluated againstits cross-sector impacts on other critical sectors, in par-ticular; regarding food security. The framework is for-mulated using graphical causal maps and Bayesiannetworks in interdisciplinary workshops where inter-disciplinary and multi-sector concerns of the systemmay be formulated and tested.
2. METHODOLOGY
2.1. Background
Studies of the suitability of Bayesian nets for model-ling the challenges facing social–ecological systemshave recently emerged. Bayesian nets have been used
250
Peter et al.: Bayesian analyses of climate change and biofuel production
to model environmental decision support (Baran &Jantunen 2004), biophysical systems (e.g. integratingestuarine eutrophication models; Borsuk et al. 2004)and integrated water resource planning (Bromley et al.2005). In the approach used in this study, large- andsmall-scale spatio-temporal system interdependenciesmay be considered within an integrated framework.This framework can be used to consider (1) biofuelproduction options in relation to land-use strategies,and (2) crop production sensitivities to climate changeeffects. The approach helped us to formulate aBayesian model which provides a probabilistic frame-work of driver–response mechanisms acting acrossscales and sectors.
We used a case study formulated in previous re-search (Musango & Peter 2007) to assess the feasibilityof the current, revised biofuel production targets (DME2007). We adapted the model in Musango & Peter(2007) to assess the impact of climate change on irri-gated agriculture in South Africa using Bayesian net-works. We formulated and ran a national-scale SouthAfrican model which links the impacts of predicted cli-mate-change effects (e.g. changes in temperature andrainfall) to irrigated agricultural activities, water-stor-age planning and biofuel production. Using the modelwe explored ways of assessing the resilience of 2 pos-sible biofuel-related land-use strategies (or land-useadaptations) to various climate-change scenarios.
We evaluated adaptation responses in a Bayesianmodelling framework and assessed the relative trade-offs of increased biofuel production in terms of foodcrop production and impacts on water supply. Throughthe sensitivity analysis provided by Bayesian nets, thestudy provided an enhanced understanding of cross-scale and cross-sector (e.g. food and energy) activities,with particular respect to the critical limits and thresh-olds to the growth of crops as biofuel feedstock in rela-tion to climate change. This could form the basisfor facilitation of interdisciplinary cooperation. The ap-proach provided a probabilistic framework for sen-sitivity analysis of cross-scale and cross-sector inter-dependencies in a variety of scenarios and land-usecombinations. The Bayesian framework can mergequantitative data sources and qualitatively (or subjec-tively) assessed variables with varying levels of confi-dence (Demirez et al. 2006) in the conditional causalbelief structure of the Bayesian Network. Systeminterdependencies and sensitivities may be manuallychanged within this framework to reflect unfoldingcontextual changes and improved understanding ofsystem features. Expert opinion and information ob-tained from the literature and other data was used toconstrain the probabilities in the Bayesian model.
The scenarios were formulated with an understand-ing of regional climate change projections for the
African continent and southern Africa in particular(Mendelsohn et al. 2000, Midgeley et al. 2005), andfrom the results of global climate change modelling(Bates et al. 2008). These regional climate changemodels project a general increase in temperatures overthe southern African region. More detailed projectionsindicate that rainfall may decrease in the west (Midge-ley et al. 2005) and increase in the eastern part of thecountry. The model that was formulated and tested inthis study does not provide a spatial account of activi-ties in South Africa. Instead, activities are aggregatedat the national scale, i.e. each activity is assessedindependently of its local spatial context. The system isevaluated at a cumulative scale, and the modellingchallenge lies in assessing the scale and level of de-scription required for modelling critical interdepen-dencies that govern the behaviour of the system. Theflexibility provided by the Bayesian modelling frame-work enables different scenarios and adaptationresponses to be appropriately formulated and tested atthis scale.
We show how key sensitivities between subsystemcomponents and with the external system environmentmay be elucidated and assessed (and verified) andhow sensitivities change depending on the scenariounder which the social–ecological system is beingassessed. The approach integrates top-down and bot-tom-up learning in a traceable process (Peter 2008),and may be used to enable interdisciplinary considera-tion and scrutiny of land-use strategies under a varietyof proposed scenarios. This may also be used to stimu-late dialogue and debate between various decisionmakers and help create a shared understanding ofcross-sector and cross-scale dependencies which havea significant impact at the system scale (Peter 2008).
The critical difference between Bayesian models anddynamic simulation models such as STELLA andVENSIM is that Bayesian models are probability-theory based models i.e. probability distributions areused to model interactions between processes, vari-ables, events, stocks, flows, etc. Moreover, variablesare related through conditional causality, i.e. a reasonmust exist for the causal relationship between anyparent and child variable (node). Maximum-likelihoodbased (versus probability-based) statistical approachesrely on correlations as evidence for relationships, with-out necessarily explaining causality. This leads tothe often lamented ignominy of ‘spurious correlations’,which often brings statistical evidence into question.Scientific hypotheses are based on articulating theconditional dependences upon which causal relation-ships are assumed to exist, and to make predictionsfrom that understanding. Bayesian networks andgraphical causal models force researchers to articulatethe assumptions that underlie the conditional causal
251

Clim Res 40: 249–260, 2009
relationships that they believe exist between variablesin a Bayesian network. They therefore provide a rig-orous interrogation framework for investigation ofscientific research hypotheses.
A hierarchy of land-use model human decision-mak-ing complexity was proposed by Agarwal et al. (2000,their Table 2.2). In this hierarchy, probability-basedmodels—such as the one used in our study—rank atthe 4th level of complexity, below single-agent land-use models (Level 5) and multi-agent land-use models(Level 6). The larger volume of variables included inthe model provides the flexibility to test a variety of sce-narios and adaptations. Decision-makers are constantlyfaced with ‘whitewaters’ (Malhotra 1999), where emer-gent or unforeseeable changes occur, which change thecontext or nature of the problem to such a degree thatflexible, modular modelling frameworks are required toeasily reconfigure subsystem modules. With Bayesiannetworks this is a ‘cut-and-paste’ task, as editing themodel is enabled with Bayesian software. Bayesiannetworks were chosen for this task because of the widerange of scenarios, and a wide range of adaptationoptions could be catered for within the framework,which provides adaptability and modularity. Moreover,Bayesian networks make evident the difference be-tween observational and interventional variables (Mederet al. 2009), allowing researchers and decision-makersto have a clear understanding of where to measure andmonitor within a system, and where to make interven-tions (respectively).
2.2. Conceptualising and formulating the model
Interdisciplinary cooperation was employed formodel formulation and verification. A graphical causalmodel of the various sub-models formulated in an inte-grated Bayesian framework is shown in Fig. 1. Themodel is formulated to evaluate the economic valueadded (VAD) of water to agricultural production andwater use in relation to water storage and climate dri-ven changes in annual temperature and rainfall, and,comparing this with results obtained from scenariosthat are run without considering climate drivenchanges and water losses from water storage in dams.The model has 4 basic modules which are outlined inFig. 1 and shown in detail in Fig. 2. The economicsmodules calculate the economic VAD to water (andwater use) through food-based agriculture with andwithout climate change effects (Fig. 2a,b). The biofuelproduction module (Fig. 2c) enables the user to in-crease the area of a crop under production, and dedi-cate a percentage of the yield to biofuel productionand calculates the resulting biodiesel and bioethanolproduction. The water storage, temperature and rain-
fall module (Fig. 2d) enables the user to assess theimpact of climatic changes in rainfall and precipitationon the total amount of water available. The 4th module(Fig. 2a) calculates what the envisaged water use wouldbe for planners who did not consider climate changeeffects.
The conceptual framework of total economic value(TEV) (Blignaut & de Wit 2004) goes beyond the utility-based approach of neoclassical economics by con-sidering a wide range of ecological services providedby ecosystems, ranging from ecosystems as sources orsinks to ecosystems as providers of human develop-ment services (e.g. recreation, spiritual and culturalvalue). We use the conceptual framework of TEV todefine and formulate the linkages between the varioussectoral socio-economic and biophysical domains ofconcern in this study. However, we kept the systemsdevelopment process as open as possible, and drew onother concepts and frameworks. For example, in arecent study of agricultural services in the CrocodileBasin of the Incomati catchment, Hassan (2003) useddirect and total VAD to assess the value of sugar cane,subtropical fruit and forestry activities. We use the eco-nomic multipliers derived in this study to evaluate bothdirect and total VAD derived from water use in humanactivities as proxies to help compare the micro- andmacroeconomic impacts of adaptation strategies, withinthe broader TEV framework.
Emission reductions due to the inclusion of biofuel inpetroleum may be deduced using estimated conver-sion rates for emission reductions from the percentageof biofuel added to the national petroleum supply. Forexample, the carbon dioxide extracted from wheatamounts to roughly one-third of the wheat ground(Lemmer 2006). Other indicators of interest which arenot explicitly calculated in the model may be inferredfrom the model outputs. There are estimates availablefor the VAD contributed through agricultural produc-tion of biofuel feedstock. For example, 1 t of groundwheat is estimated to yield a VAD of 243 South Africanrand (Lemmer 2006).
252
Biofuel productionmodule
Economics & wateruse module:
including climatechange effects
Water storage,temperature &rainfall module
Economics & wateruse module:
without consideringclimate change
b c
d a
Fig. 1. Sub-models of Bayesian agro–water–biofuels model for South Africa

Peter et al.: Bayesian analyses of climate change and biofuel production 253
Gra
inirr
igat
ion
(km
3 yr
–1)
Whe
atirr
igat
ion
(km
3 yr
–1)
Sug
arca
neirr
igat
ion
(km
3 yr
–1)
Frui
t &
nuts
irrig
atio
n(k
m3
yr–1
)
Sun
flow
erw
ater
use
(km
3 yr
–1)
Soy
bea
nw
ater
use
(km
3 yr
–1)
Hum
an &
indu
stria
l wat
er
use
(km
3 y
r–1
)
Sug
ar b
eet
wat
er u
se(k
m3
yr–1
)
Tota
l wat
er u
sep
er a
nnum
(km
3 yr
–1)
Tota
l val
uead
d: i
rrig
ated
crop
s (R
yr–1
)
Can
ola
wat
er u
se(k
m3
yr–1
)
Sug
arca
ned
irect
val
uead
d (R
yr–1
)
Frui
t &
nut
sd
irect
val
uead
d (R
yr–1
)
Gra
in t
otal
valu
e ad
d(R
yr–1
)
Whe
at t
otal
valu
e ad
d(R
yr–1
)
Sug
arca
neto
tal v
alue
add
(R y
r–1)
Frui
t &
Nut
s to
tal
valu
e ad
d(R
yr–1
)
Tota
l wat
er u
sep
er a
nnum
(km
3 yr
–1)
Dire
ct v
alue
add
: irr
igat
edcr
ops
(R y
r–1)
Tota
l val
uead
d: i
rrig
ated
cro
ps
(R y
r–1)
Fore
stry
wat
er u
se(h
a yr
–1)
Gra
ind
irect
val
ue a
dd
(R y
r–1)
Whe
at d
irect
valu
e ad
d(R
yr–1
)
Sug
arca
ned
irect
val
ue a
dd
(R y
r–1)
Frui
t &
nut
sd
irect
val
uead
d (R
yr–1
)
Sug
ar b
eet
wat
er u
se(k
m3
yr–1
)
Soy
bea
nw
ater
use
(km
3 yr
–1)
Sun
flow
erw
ater
use
(km
3 yr
–1)
Can
ola
wat
er u
se(k
m3
yr–1
)
Gra
in t
otal
valu
e ad
d (R
yr–1
)
Whe
atto
tal v
alue
ad
d(R
yr–1
)
Sug
arca
neto
tal v
alue
ad
d(R
yr–1
)
Frui
t &
nuts
tot
al v
alue
add
(R y
r–1)
Mod
ule
a: e
cono
mic
s &
wat
er u
se w
ithou
t cl
imat
e ch
ange
con
sid
erat
ions
Mod
ule
b: e
cono
mic
s &
wat
er u
se w
ithcl
imat
e ch
ange
con
sid
erat
ions
Ave
rage
ann
ual
tem
per
atur
e(°
C y
r–1)
Mea
n an
nual
runo
ff ev
apor
atio
n ra
te(m
m y
r–1)
Inte
r-b
asin
tra
nsfe
r(k
m3
yr–1
)
Dam
evap
orat
ion
loss
es(k
m3
yr–1
)
Dam
evap
orat
ion
rate
(mm
yr–1
)
Rai
nfal
l(m
m y
r–1)
Dam
s w
ater
stor
ed la
st y
ear
(km
3 yr
–1)
Mea
n an
nual
runo
ff(k
m3
yr–1
)
Eva
por
atio
n lo
sses
from
mea
n an
nual
run
off
(km
3 yr
–1)
Dam
s p
lann
edw
ater
sto
rage
thi
s ye
ar (k
m3
yr–1
)P
lann
ed s
tora
geab
stra
ctio
n th
is y
ear
(km
3 yr
–1)
Exp
ecte
d n
etm
ean
annu
al r
unof
f th
is y
ear
(km
3 yr
–1)
Sto
red
wat
er in
dam
s(k
m3
yr–1
)
Dam
wat
er lo
sses
(km
3 yr
–1)
Wat
er a
vail-
able
thi
s ye
ar(k
m3
yr–1
)
Pla
nned
w
ater
use
with
out
clim
ate
chan
ge
effe
cts
(km
3 yr
–1)
Pla
nned
wat
erav
aila
ble
thi
s ye
ar(k
m3
yr–1
)
Rat
io: a
vaila
ble
wat
er/p
lann
edw
ater
use
Wat
er r
atio
gene
rato
r cu
rve
Fore
stp
lant
atio
ns: a
rea
(ha
yr–1
)
Bio
etha
nol
pro
duc
tion
– gr
ain
Bio
etha
nol
pro
duc
tion
– w
heat
Bio
etha
nol
pro
duc
tion
– su
garc
ane
Bio
etha
nol
pro
duc
tion
– su
gar
bee
t
Bio
etha
nol
pro
duc
tion
– ca
nola
Bio
etha
nol
pro
duc
tion
– su
nflo
wer
Bio
etha
nol
pro
duc
tion
– so
ybea
n
Per
cent
age
area
bio
die
sel
– so
ybea
n
Per
cent
age
area
bio
die
sel
– su
nflo
wer
Per
cent
age
area
bio
die
sel
– ca
nola
Per
cent
age
area
bio
etha
nol
– su
gar
bee
t
Per
cent
age
area
bio
etha
nol
– su
garc
ane
Per
cent
age
area
bio
etha
nol
– w
heat
Per
cent
age
area
bio
etha
nol
– gr
ain
Tota
l bio
etha
nol
pro
duc
tion
(l yr
–1)
Tota
l bio
fuel
pro
duc
tion
(l yr
–1)
Tota
l bio
die
sel
pro
duc
tion
(l yr
–1)
Frui
t &
nuts
irrig
atio
n(k
m3
yr–1
)
Sug
arca
neirr
igat
ion
(km
3 yr
–1)
Whe
atirr
igat
ion
(km
3 yr
–1)
Gra
inirr
igat
ion
(km
3 yr
–1)
Hum
an &
ind
ustr
ial w
ater
use
(km
3 yr
–1)
Mod
ule
c: b
iofu
el p
rod
uctio
nM
odul
e d
: wat
er s
tora
ge, r
ainf
all &
tem
per
atur
e
Dire
ct v
alue
ad
d: i
rrig
ated
crop
s (R
yr–1
)
Gra
in d
irect
valu
e ad
d(R
yr–1
)
Whe
at d
irect
valu
e ad
d(R
yr–1
)
Gra
in r
eal
area
pla
nted
(ha
yr–1
)
Whe
at r
eal
area
pla
nted
(ha
yr–1
)
Sug
arca
nere
al a
rea
pla
nted
(ha
yr–1
)
Sug
ar b
eet
real
are
ap
lant
ed(h
a yr
–1)
Can
ola
real
are
ap
lant
ed(h
a yr
–1)
Sun
flow
erre
al a
rea
pla
nted
(ha
yr–1
)
Soy
bea
nre
al a
rea
pla
nted
(ha
yr–1
)
Soy
bea
nar
ea(h
a yr
–1)
Sun
flow
erar
ea(h
a yr
–1)
Can
ola
area
use
(ha
yr–1
)
Sug
ar b
eet
area
(ha
yr–1
)
Sug
arca
near
ea(h
a yr
–1)
Whe
atar
ea(h
a yr
–1)
Gra
inar
ea(h
a yr
–1)
Frui
t &
nuts
are
a(h
a yr
–1)
Wat
erra
tio
a
b
cd
Fig
. 2. D
iag
ram
of
the
Bay
esia
n m
odel
con
-si
stin
g o
f 4
mod
ule
s,
a to
d
Clim Res 40: 249–260, 2009
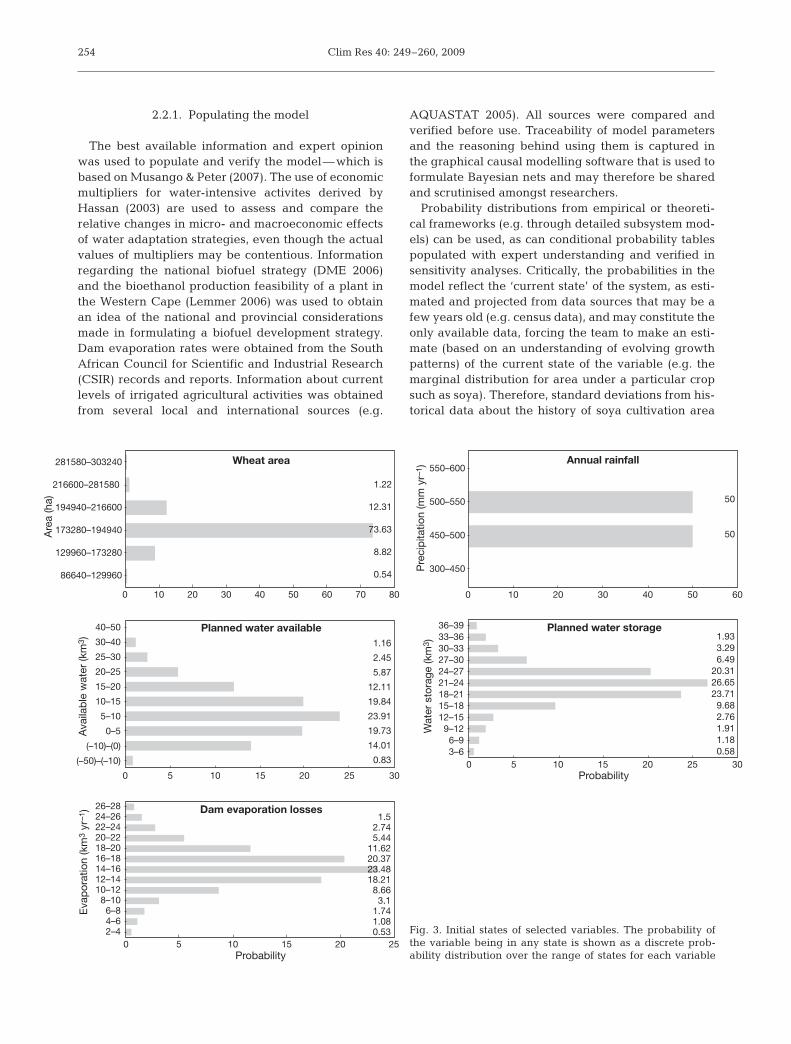
2.2.1. Populating the model
The best available information and expert opinionwas used to populate and verify the model—which isbased on Musango & Peter (2007). The use of economicmultipliers for water-intensive activites derived byHassan (2003) are used to assess and compare therelative changes in micro- and macroeconomic effectsof water adaptation strategies, even though the actualvalues of multipliers may be contentious. Informationregarding the national biofuel strategy (DME 2006)and the bioethanol production feasibility of a plant inthe Western Cape (Lemmer 2006) was used to obtainan idea of the national and provincial considerationsmade in formulating a biofuel development strategy.Dam evaporation rates were obtained from the SouthAfrican Council for Scientific and Industrial Research(CSIR) records and reports. Information about currentlevels of irrigated agricultural activities was obtainedfrom several local and international sources (e.g.
AQUASTAT 2005). All sources were compared andverified before use. Traceability of model parametersand the reasoning behind using them is captured inthe graphical causal modelling software that is used toformulate Bayesian nets and may therefore be sharedand scrutinised amongst researchers.
Probability distributions from empirical or theoreti-cal frameworks (e.g. through detailed subsystem mod-els) can be used, as can conditional probability tablespopulated with expert understanding and verified insensitivity analyses. Critically, the probabilities in themodel reflect the ‘current state’ of the system, as esti-mated and projected from data sources that may be afew years old (e.g. census data), and may constitute theonly available data, forcing the team to make an esti-mate (based on an understanding of evolving growthpatterns) of the current state of the variable (e.g. themarginal distribution for area under a particular cropsuch as soya). Therefore, standard deviations from his-torical data about the history of soya cultivation area
254
50
50
281580–303240
216600–281580
194940–216600
173280–194940
129960–173280
��86640–129960
550–600
500–550
450–500
300–450
Wheat area Annual rainfall
1.16
2.45
5.87
12.11
19.84
23.91
19.73
14.01
0.83
40–50
30–40
25–30
20–25
15–20
10–15
5–10
0–5
(–10)–(0)
(–50)–(–10)
36–3933–3630–3327–3024–2721–2418–2115–1812–159–126–93–6
26–2824–2622–2420–2218–2016–1814–1612–1410–128–106–84–62–4
Planned water available1.933.296.49
20.3126.6523.71
9.682.761.911.180.58
Planned water storage
Dam evaporation losses
Probability
Probability
0 10 20 30 40 50 60 70 80
0 5 10 15 20 25 30
0 10 20 30 40 50 60
0 5 10 15 20 25 30
0 5 10 15 20 25
1.52.745.44
11.6220.3723.4818.218.663.1
1.741.080.53
1.22
12.31
73.63
8.82
0.54
Are
a (h
a)
Pre
cip
itatio
n (m
m y
r–1 )
Ava
ilab
le w
ater
(km
3 )
Wat
er s
tora
ge (k
m3 )
Eva
por
atio
n (k
m3
yr–1
)
Fig. 3. Initial states of selected variables. The probability ofthe variable being in any state is shown as a discrete prob-ability distribution over the range of states for each variable

Peter et al.: Bayesian analyses of climate change and biofuel production
are not used to characterise the probability. Rather, theextent of uncertainty in the estimated ‘current state’ ofarea under soya production is reflected, i.e. the uncer-tainty around the shared knowledge of the interdisci-plinary group. In other Bayesian modelling applica-tions—such as to asset management by Demirez et al.(2006) where up-to-date real-time information is avail-able, and the historical patterns of change have somerelevance—historical standard deviations can be used.By characterising the variables to reflect the ‘currentstate’ (subjectively estimated), the Bayesian model inits default state reverts to a baseline state representingthe shared understanding of the expert group of whatthe ‘current state’ of the system is, to which all sce-narios can be compared.
In general, most of the model makes use of equationswith reliable constraints to relate probability distri-butions between variables. The constraints governingthese equations are generally well understood, andwhile the Bayesian modules deal more explicitly withcumulative effects rather than considering spatial andtemporal differences during the period of a year, theiroutputs are verifiable. There are 2 ways of characteris-ing the probabilities: with (1) discrete and (2) continu-ous probability distributions. Both ways make use ofthe Bayesian conditional probability principle to relatevariables in causal relationships. In this study, discreteprobability distributions were used, as they allow theuser to add new evidence to the Bayesian model andupdate the model to reflect new understanding (Demirezet al. 2006).
Very few variables were subjectively characterisedin this Bayesian model (using expert opinion to formu-late conditional probability tables, CPTs), and the fewvariables that were subjective, were verified againstexpert opinion and understanding of the limits andthresholds of the system under different scenarios (e.g.see the curve in Fig. 4, generated from a conditionalprobability table). To emphasise, these outputs can beverified against empirical, and modelled evidence, andoutput, driver and constraint values of the Bayesian
network are verified in each scenario. If the marginaland a priori probability distributions are incorrectlydetermined then the outputs will also be nonsensical.Therefore, input–output relationships are carefullyscrutinised and verified by experts for each scenario.
2.2.2. Sensitivity analysis and running the model
When running the Bayesian model using a Bayesiansoftware interface, the probability distribution of eachselected variable may be viewed. The parameters ofstates (or intervals) chosen for agricultural land-usedriver variables are shown in Table 1, and the initialstates for a selection of critical variables are shown inFig. 3. The probability of the variable being in anystate is shown as a discrete probability distributionover the range of states for each variable. Before themodel is run, variables are automatically initialised todefaults representing current value settings (e.g. thewheat area variable in Fig. 3 has a 73.64% chance ofbeing in the interval, or state: 173 280 to 194 940 ha).Sensitivity analysis is conducted by varying the valuesof driver variable states (i.e. 100% in a single state) andobserving response variable distributions.
For each scenario, the response variables are veri-fied for the full range of driver variables. Biodiesel,bioethanol and biofuel production at the aggregateand individual levels are verified. This curve in partic-ular shows that a standard relationship has been usedto represent the non-linear response of crops to water,i.e. at first they will grow in response to availablewater, but growth ceases when heavy rainfall or flood-ing conditions are approached. This limit is set when 8times the annual rainfall is obtained. Some responsevariable values are verified using calculations, whileothers are verified using information available online,such as census data. These, and expert judgement,were used to formulate equations between variablesthat are conditionally dependent (or causally related)in the Bayesian network. For the curves shown in Fig. 4
255
Table 1. Specifications of land-use change Strategies 1 and 2 (S1, S2): increased crop area and percentage of crops used for biofuel production
Crop Area (ha) Area increase Crop used in (ha) production (%)
Current S1 S2 S1 S2 S1 S2
Soy 0 to 5200 57200 to 62400 78000 to 83200 57200 78000 85 85Sunflower 10000 to 20000 70000 to 80000 80000 to 90000 60000 60000 85 85Canola 0 to 15000 105000 to 120000 150000 to 165000 105000 1500000 85 85Sugar beet 0 to 10000 40000 to 50000 70000 to 80000 40000 70000 75 75Sugar cane 72000 to 81000 90000 to 99000 72000 to 81000 18000 18000 65 65Wheat 173280 to 194940 0 to 43320 173280 to 194940 –162450 0 5 5Maize 103040 to 115920 0 to 25760 103040 to 115920 –115920 0 5 5
Total 400190 402020 776190 1830 376000
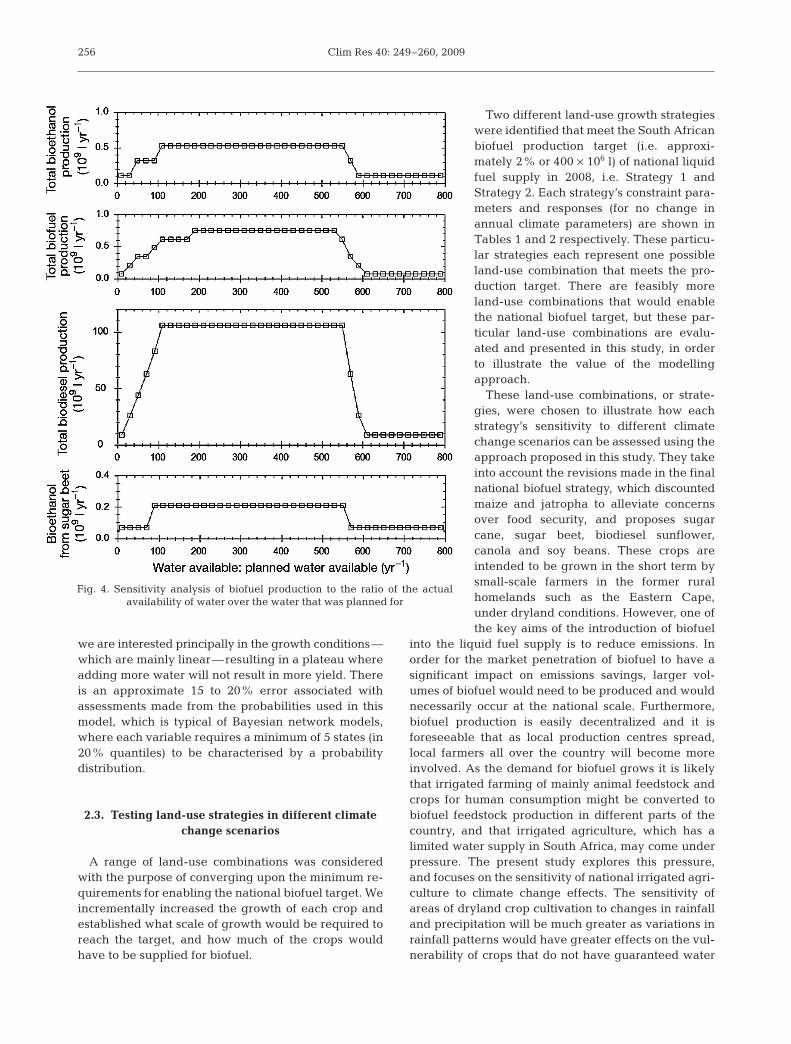
Clim Res 40: 249–260, 2009
we are interested principally in the growth conditions—which are mainly linear—resulting in a plateau whereadding more water will not result in more yield. Thereis an approximate 15 to 20% error associated withassessments made from the probabilities used in thismodel, which is typical of Bayesian network models,where each variable requires a minimum of 5 states (in20% quantiles) to be characterised by a probabilitydistribution.
2.3. Testing land-use strategies in different climatechange scenarios
A range of land-use combinations was consideredwith the purpose of converging upon the minimum re-quirements for enabling the national biofuel target. Weincrementally increased the growth of each crop andestablished what scale of growth would be required toreach the target, and how much of the crops wouldhave to be supplied for biofuel.
Two different land-use growth strategieswere identified that meet the South Africanbiofuel production target (i.e. approxi-mately 2% or 400 × 106 l) of national liquidfuel supply in 2008, i.e. Strategy 1 andStrategy 2. Each strategy’s constraint para-meters and responses (for no change inannual climate parameters) are shown inTables 1 and 2 respectively. These particu-lar strategies each represent one possibleland-use combination that meets the pro-duction target. There are feasibly moreland-use combinations that would enablethe national biofuel target, but these par-ticular land-use combinations are evalu-ated and presented in this study, in orderto illustrate the value of the modellingapproach.
These land-use combinations, or strate-gies, were chosen to illustrate how eachstrategy’s sensitivity to different climatechange scenarios can be assessed using theapproach proposed in this study. They takeinto account the revisions made in the finalnational biofuel strategy, which discountedmaize and jatropha to alleviate concernsover food security, and proposes sugarcane, sugar beet, biodiesel sunflower,canola and soy beans. These crops areintended to be grown in the short term bysmall-scale farmers in the former ruralhomelands such as the Eastern Cape,under dryland conditions. However, one ofthe key aims of the introduction of biofuel
into the liquid fuel supply is to reduce emissions. Inorder for the market penetration of biofuel to have asignificant impact on emissions savings, larger vol-umes of biofuel would need to be produced and wouldnecessarily occur at the national scale. Furthermore,biofuel production is easily decentralized and it isforeseeable that as local production centres spread,local farmers all over the country will become moreinvolved. As the demand for biofuel grows it is likelythat irrigated farming of mainly animal feedstock andcrops for human consumption might be converted tobiofuel feedstock production in different parts of thecountry, and that irrigated agriculture, which has alimited water supply in South Africa, may come underpressure. The present study explores this pressure,and focuses on the sensitivity of national irrigated agri-culture to climate change effects. The sensitivity ofareas of dryland crop cultivation to changes in rainfalland precipitation will be much greater as variations inrainfall patterns would have greater effects on the vul-nerability of crops that do not have guaranteed water
256
Fig. 4. Sensitivity analysis of biofuel production to the ratio of the actual availability of water over the water that was planned for

Peter et al.: Bayesian analyses of climate change and biofuel production
supply. Therefore, to some extent this study focuses ona best-case scenario for biofuel feedstock production.The details for implementing the national biofuel strat-egy in the Eastern Cape are still ongoing, and themodel built for this study may be further developed infuture work to assess the specific dimensions of theEastern Cape, linking and detailing the different spa-tial and temporal scales. However, that is beyond thescope of this study, which focuses on showing how thesensitivity of critical limits—thresholds obtained usingBayesian networks—helps researchers and decision-makers better understand the limitations of the pro-duction of biofuel feedstock. Land-use Strategy 1excludes maize and wheat and Strategy 2 includesmaize and wheat, to compare 2 strategies which in-clude and exclude the commercial sector in biofuelproduction, respectively.
Groups of scenarios were chosen to illustrate thesensitivity to climate change effects. Group 1 and 2scenarios are applied to Strategies 1 and 2, and testsboth strategies under the same climate change con-ditions for comparison. In Group 1 scenarios (see Sec-tion 3.1) it is shown how the national biofuel produc-tion target can be achieved more confidently at higherannual rainfall levels (i.e. >400 × 106 l yr–1: see Fig. 5)if higher average annual rainfall is obtained (i.e.>400 mm yr–1). In Group 2 scenarios the temperature isincreased incrementally and the strategies evaluated
over the rainfall range to identify how thislimits crop production. A temperature rangeis used, so that the scenarios cater for arange of possible annual temperature varia-tions, as the predictions from global climatechange models for 2099 (Bates et al. 2008)cannot simply be linearly regressed in orderto determine possible temperature changesin the short and medium terms (Bates et al.2008). Temperature variations due to cli-mate change are likely to vary significantlyfrom the values obtained through linearregression over a period of 100 yr.
The agricultural expansion Strategies 1and 2 are specified in Tables 1 & 2. Thesepercentages were iteratively determined,after testing various growth strategies
against whether they could provide the surplusesrequired to meet production targets. The relationshipsbetween hectareage and tonnage per crop are wellunderstood and reliably determined and verifiedagainst South African census data on agricultural pro-duction. These strategic options are tested under dif-ferent scenarios (i.e. Group 1 and 2 scenarios) to illus-trate how Bayesian nets may be used to estimate therobustness of the proposed strategy to possible climatechange effects (Mendelsohn et al. 2000).
The land-use strategies may be understood by com-paring the driver and response variables with theircurrent values, also shown in Tables 1 & 2. In Strategy1, the driver variables reflect a situation where com-mercial irrigated crops such as maize and wheat areexcluded from biofuel feedstock production, and Strat-egy 2 reflects a situation where they are included, butvery low percentages (i.e. 5%) of maize and wheatcrop yields are used as biofuel feedstock. The areasunder cultivation of maize and wheat were signifi-cantly reduced in Strategy 1, so that sufficient irriga-tion is available to grow the required crops. The yieldsobtained from cultivating these areas are sensitive towater availability, and are calculated from crop yieldsthat are biased relative to water availability to thewhole system. The relationships which characteriseyield variations with water availability are taken to besimilar for all crop-types and are denoted by a simpli-
257
Fig. 5. Comparing (a) Strategy 1 and (b) Strategy 2: increased annual rainfall improves chances of achieving national biofuel production target
Table 2. Comparing responses to South African land-use growth strategies (Strategies 1 and 2 — see Section 2.3): biofuel production, water availability and planned water use
Planned water Total planned Bioethanol Biodiesel Biofuel available water use production production production(km3 yr–1) (km3 yr–1) (106 l yr–1) (106 l yr–1) (106 l yr–1)
Initial 5 to 10 11.59 to 12.98 0 + Residual 0 + Residual 0 + ResidualStrategy 1 5 to 10 10.39 to 11.59 211 to 422 72 to 94 408 to 545Strategy 2 5 to 10 11.69 to 12.98 211 to 422 72 to 94 ~408

Clim Res 40: 249–260, 2009
fied s-shaped growth curve with a non-linear drop-off,i.e. too little or too much water per area farmed resultsin crop yield losses (see Fig. 4). Lastly, percentages ofthe total annual projected yield (as modelled) of eachcrop are used for bioethanol and biodiesel productionas shown in Table 1, i.e. the percentage contribution ofannual crop production is used as biofuel feedstock.For each hectare of maize, grain, wheat, sugar cane,soybeans and sunflower seeds cultivated, biofuel pro-duction of 542, 2016, 1014, 86 and 536 l, respectively,is assumed feasible and is consistent with that in on-line and published literature and discussions on thesubject (Lemmer 2006). In these strategies it is feas-ible that approximately 400 to 500 × 106 l of the afore-mentioned target of around 2% of national petroleumproduction (see Table 2) can be obtained, but re-quiring, under Strategy 1, a significant expansion(280 200 ha) of the crop types chosen in the nationalstrategy, i.e. sugar cane, sugar beet, biodiesel sun-flower, canola and soy beans, and a significant reduc-tion in irrigated commercial maize and wheat, leavingan overall moderate expansion of 1830 ha. In Strategy2, an expansion of 376 000 ha in total, including maizeand wheat, is required to meet the target.
3. RESULTS
In Group 1 scenarios the availability of water in thenational system for irrigation was considered. Biofuelproduction sensitivities to rainfall are illustrated. InGroup 2 scenarios, the robustness of the strategyagainst annual temperature increases was evaluated.
3.1. Group 1 scenarios: sensitivity to rainfall
The annual average rainfall was increased (in theBayesian model) across the range 0 to 1200 mm yr–1
for both Strategies 1 and 2. The strategies being eval-uated were shown to be more feasible in high rain-fall years (Fig. 5); exceeding ~600 mm yr–1 in Strat-egy 1 and exceeding 400 mm yr–1 in Strategy 2. InFig. 5 the resilience (Gunderson 2000) of the 2 strate-gies to annual rainfall changes can be compared. Inthe next scenario, we tested the resilience of thisstrategy to scenarios where annual temperatures mayincrease.
3.2. Group 2 scenarios: sensitivity to temperature
The sensitivity of Strategies 1 and 2 to rises in tem-perature is assessed in Fig. 6. The average annual tem-perature is raised in 1°C increments, from the average
22°C (no increase in annual temperature) to 27°C ineach consecutive row of panels in Fig. 6, where totalbiofuel production in response to rainfall at each tem-perature is shown. In the model, total biofuel produc-tion in summed from total biodiesel and bioethanolproduction. Meeting a total biofuel production ofapproximately 400 million l yr–1 would require a con-stant increase in annual rainfall, and the point at whichrainfall meets the requirements of the AgriculturalLand-use Strategy changes from the top to the bottomrow of panels (see Fig. 6). This shows how climate-related limits to growth can be assessed and verified,using Bayesian networks. These limits are not preciseand predictive measurements of the system, but are in-tended to guide overall understanding of the system’scritical limits and thresholds in a variety of scenarios.Other land-use strategies can also be assessed in dif-ferent climate change scenarios in the manner outlinedin this study.
4. DISCUSSION
Both the long- and short-term implications ofhuman-development trajectories into the future arecritical to understand if sustainable development tra-jectories are to be realised (Kates & Clarke 1996). TheBayesian modelling framework is flexible and adapt-able, and can support analyses of a wide range offuture climate change and human development sce-narios. The approach helps envisage cross-sector inter-dependencies, and to compare between system leveltrade-offs in an integrated analytical framework. It isalso a flexible approach that allows for new evidenceto be added and can serve as an input to learning(Demirez et al. 2006). Bayesian belief networks are ascertain as the information used to characterise them,and reflect real-world uncertainties over cross-systemand multi-scale interdependencies.
We showed how the national biofuel strategy ofSouth Africa (and other countries) may be tested at thenational scale before the identification and more in-depth investigation of key subsystem dependencies.The model allows the assessment of various strategiesagainst one another, which may be used to facilitatemore focussed discussion around system interdepen-dencies and cross-sector linkages at policy making andimplementation level. The model is interdisciplinaryand allows for a broad variety of variables to be linked,irrespective of scale or whether the variables are for-mulated using empirical data or subjective judgement.The sensitivities and uncertainties associated with allvariables may be visualised and used to enhance deci-sion-making processes through a broader considera-tion of system linkages.
258

Peter et al.: Bayesian analyses of climate change and biofuel production
In particular, this study shows how the energy–emis-sions threat to food security (the threat of rising energyneeds and the need for lower emissions to food securitythrough rising demand for biofuel crop production) canbe considered using a Bayesian approach. If risingdemands for energy and low emissions cause foodprices to rise (as agricultural farming for biofuels be-comes more lucrative and farmers dedicate largertracts of land to crop strains suited for fuel production),then this approach can be used to identify the strengthsand limitations of a particular land-use strategy.
5. CONCLUSIONS
This study showed how the national biofuels targetmay be analysed for robustness to climate change
effects, using 2 particular biofuels production strate-gies as examples to illustrate how a variety of land-useagro-production combinations may be tested against apossible set of future scenarios and compared. Themodel presented in this study is multi-scale and con-sists of various embedded sub-system modules whichare related through cross-sector interactions. The Bay-esian software interface enables the model to be easilyadapted with changes in understanding of sub-systeminter-dependencies and sensitivities and may be usedto facilitate and enable interdisciplinary considerationand scrutiny of adaptation responses under a variety ofproposed scenarios. In this way, the approach taken inthis study integrates top-down and bottom-up learningin a traceable process. Key parameters, thresholdsand functional relationships defining the system areencoded into a Bayesian network using a software
259
Fig. 6. Scenario 2a: increasing average annual temperature by 5°C, in 1°C increments by row of panels, to assess sensitivity to climate change conditions for land-use Strategies 1 and 2
enabled knowledge engineering language to managemodel development. Best available information fromcurrent literature and available data is used to con-strain the probabilities in the Bayesian model, whichis then verified through sensitivity analysis. Theapproach elucidates key sensitivities in the system,which depends on the scenario under which the sys-tem is being assessed. Sensitivity to scale and the exactnature of the causal interdependencies in the systemmay be iteratively probed and compared with observa-tion and empirical data. Using this approach, under-standing may be shared and iteratively improved inthe consideration of policy-making for biofuels devel-opment programmes which have consequences inother related sectors.
LITERATURE CITED
Agarwal C, Green GL, Grove M, Evans T, Schweik C (2000) Areview and assessment of land-use change models:dynamics of space, time and human choice. Centre for theStudy of Institutions, Population and EnvironmentalChange, Indiana University, Bloomington, IN
AQUASTAT (2005) FAO information system on water andagriculture. www.fao.org/ag/agl/aglw/aquastat/countries/south_africa/print1.stm (accessed 10 July 2009)
Baran E, Jantunen T (2004) Stakeholder consultation forBayesian decision support systems in environmental man-agement. Proc Regional Conference on Ecological andEnvironmental Modeling, Universiti Sains Malaysia, 15–16September, 2004
Bates BC, Kundzewics ZW, Wu S, Palutikof JP (eds) (2008)Climate change and water. Technical Paper of the Inter-governmental Panel on Climate Change. IPCC Secre-tariat, Geneva
Blignaut J, de Wit MP (2004) Sustainable options: devel-opment lessons from applied environmental economics.University of Cape Town Press, Cape Town
Borsuk ME, Stow CA, Reckhow KH (2004) A Bayesian net-work of eutrophication models for synthesis, predictionand uncertainty analysis. Ecol Model 173:219–239
Bromley J, Jackson NA, Clymer OJ, Giacomello AM, JensenFV (2005) The use of Hugin to develop Bayesian networksas an aid to integrated water resource planning. EnvironModel Softw 20:231–242
Demirez R, Mau RR, Shenoy C (2006) Bayesian networks: adecision tool to improve portfolio risk analysis. JAF 106-119
DME (Department of Minerals and Energy) (2006) Draft bio-fuels industrial strategy of the Republic of South Africa.Department of Minerals and Energy. www.compete-bioafrica.net/policy/Biofuels_Strategy_SA.pdf
DME (2007) Biofuels industrial strategy of the Republic ofSouth Africa.
Gunderson LH (2000) Ecological resilience—in theory andapplication. Annu Rev Ecol Syst 31:425-39
Gunderson LH, Holling CS (2002) (eds) Panarchy: under-
standing transformations in human and natural systems.Island Press, Washington, DC
Hassan RM (2003) Economy-wide benefits from water inten-sive industries in South Africa: quasi-input-output ana-lysis of the contribution of irrigation agriculture and culti-vated plantations in the Crocodile River catchment.Development Southern Africa 20:171–195
Kates RW, Clarke WC (1996) Expecting the unexpected. Envi-ronment 38:6–11
Kates RW, Dasgupta P (2007) African poverty: a grand chal-lenge for sustainability science. Proc Natl Acad Sci USA104:16747–16750
Lemmer W (2006) Bio-ethanol production in the WesternCape: value adding to winter cereal through ethanol,DDGS, and CO2 production. Department of Agriculture,Cape Town
Levin SA (2006) Learning to live in a global commons: socio-economic challenges for a sustainable environment. EcolRes 21:328-333
Lubchenco J (1998) Entering the century of the environment:a new social contract for science. Science 279:491–497
Malhotra Y (1999) Toward a knowledge ecology for organisa-tional white-waters. Knowledge Manag 2:18–21
Meder B, Hagmayer Y, Waldmann MR (2009) The role oflearning data in causal reasoning about observations andinterventions. Mem Cognit 37:249–264
Mendelsohn R, Dinar A, Dalfelt A (2000) Climate changeimpacts on African agriculture. Centre for EnvironmentalEconomics and Policy in Africa, University of Pretoria
Midgeley GF, Chapman RA, Hewitson B, Johnston P andothers (2005) A status quo, vulnerability and adaptationassessment of the physical and socio-economic effects ofclimate change in the Western Cape. Report to the West-ern Cape Government. Council for Scientific and Indus-trial Research Report No. ENV-S-C 2005-073, Stellenbosch
MIT Technology Review (2007) Ethanol demand threatensfood prices. www.technologyreview.com/Energy/18173/(accessed Feb 13, 2009)
Mukheibir P, Sparks D (2003) Water resource managementand climate change in South Africa: visions, driving fac-tors and sustainable development indicators. Report forPhase I of the Sustainable Development and ClimateChange project. Energy and Development Research Cen-tre (EDRC), University of Cape Town
Musango JM, Peter C (2007) A Bayesian approach towardsfacilitating climate change adaptation research on theSouth African agricultural sector. AGREKON 46:245–259
Peter C (2008) Complexity based modelling for sustainabilityand resilience of social-ecological systems. In: BurnsM, Weaver A (eds) Exploring sustainability science — asouthern African perspective. Stellenbosch University Press,Stellenbosch, p 471–505
Sugrue A, Douthwaite R (2007) Biofuel production and thethreat to South Africa’s food security. Wahenga Brief 11:1–8, www.sarpn.org.za/documents/d0002509/Biofuel_SA_Wahenga_Apr2007.pdf (accessed 15 July 2008)
Starzomski BM, Cardinale BJ, Dunne JA, Hillery MJ andothers (2004) Contemporary visions of progress in eco-logy and thoughts for the future. Ecol Soc 9(1):14, www.ecologyandsociety.org/vol9/iss1/art14 (accessed 15 No-vember 2007)
Submitted: July 16, 2008; Accepted: September 16, 2009 Proofs received from author(s): November 12, 2009
Clim Res 40: 249–260, 2009260
Copyright © 2022 FDOKUMEN