Applications (VSC-A) Final Report: Appendix Volume 3 Security
682
DOT HS 811 492D September 2011 Vehicle Safety Communications – Applications (VSC-A) Final Report: Appendix Volume 3 Security
-
Upload
khangminh22 -
Category
Documents
-
view
1 -
download
0
Transcript of Applications (VSC-A) Final Report: Appendix Volume 3 Security

DOT HS 811 492D September 2011
Vehicle Safety Communications –Applications (VSC-A)
Final Report: Appendix Volume 3 Security


Technical Report Documentation Page 1. Report No.
DOT HS 811 492D 2. Government Accession No. 3. Recipient's Catalog No.
4. Title and Subtitle Vehicle Safety Communications – Applications (VSC-A) Final Report: Appendix Volume 3 Security
5. Report Date
September 2011
6. Performing Organization Code
7. Authors Ahmed-Zaid, F., Bai, F., Bai, S., Basnayake, C., Bellur, B., Brovold, S., Brown, G., Caminiti, L., Cunningham, D., Elzein, H., Hong, K., Ivan, J., Jiang, D., Kenney, J., Krishnan, H., Lovell, J., Maile, M., Masselink, D., McGlohon, E., Mudalige, P., Popovic, Z., Rai, V., Stinnett, J., Tellis, L., Tirey, K., VanSickle, S.
8. Performing Organization Report No.
9. Performing Organization Name and Address
Crash Avoidance Metrics Partnership on behalf of the Vehicle Safety Communications 2 Consortium 27220 Haggerty Road, Suite D-1 Farmington Hills, MI 48331
10. Work Unit No. (TRAIS)
11. Contract or Grant No. DTNH22-05-H-01277
12. Sponsoring Agency Name and Address NHTSA Headquarters
1200 New Jersey Avenue, SE West Building
Washington, DC 20590
Research and Innovative Technology Administration U.S. Department of Transportation
1200 New Jersey Avenue, SE East Building
Washington, DC 20590
13. Type of Report and Period Covered
Final Report Dec. 8, 2006, through Dec. 7, 2009
14. Sponsoring Agency Code
15. Supplementary Notes
16. Abstract
The Vehicle Safety Communications – Applications (VSC-A) Project was a three-year project (December 2006 - December 2009) to develop and test communications-based vehicle-to-vehicle (V2V) safety systems to determine if Dedicated Short Range Communications (DSRC) at 5.9 GHz, in combination with vehicle positioning, can improve upon autonomous vehicle-based safety systems and/or enable new communications-based safety applications. The VSC-A Project was conducted by the Vehicle Safety Communications 2 Consortium (VSC2). Members of VSC2 are Ford Motor Company, General Motors Corporation, Honda R & D Americas, Inc., Mercedes-Benz Research and Development North America, Inc., and Toyota Motor Engineering & Manufacturing North America, Inc. This document presents the third volume set of appendices for the Final Report of the VSC-A Project which contains technical content for the Security Protocols and Implementation Results, Security Network Simulations, and Analysis of Infrastructure and Communications Requirements for V2V PKI Security Management. 17. Key Word 18. Distribution Statement
Document is available to the public from the National Technical Information Service www.ntis.gov
19. Security Classif. (of this report)
Unclassified 20. Security Classif. (of this page)
Unclassified 21. No. of Pages
682 22. Price
Form DOT F 1700.7 (8-72) Reproduction of completed page authorize
i

Table of Contents
Appendix F Security Protocols and Implementation Results
Appendix G-1 Security Network Simulations Prepared by: Ahren Studer and Adrian Perrig
Appendix G-2 Security Network Simulations Prepared by: Yih-Chun Hu and Jason J. Haas
Appendix G-3 Security Network Simulations Prepared by: Mercedes-Benz RDNA
Appendix H-1 Analysis of Infrastructure and Communications Requirements for V2V PKI Security Management Prepared by: Adrian Perrig and Ahren Studer
Appendix H-2 Analysis of Infrastructure and Communications Requirements for V2V PKI Security Management Prepared by: India Science Laboratory, General Motors Research & Development
Appendix H-3 Analysis of Infrastructure and Communications Requirements for V2V PKI Security Management Prepared by: Yih-Chun Hu and Jerry T. Chiang
Appendix H-4 Analysis of Infrastructure and Communications Requirements for V2V PKI Security Management Prepared by: Security Innovations
Appendix H-5 Analysis of Infrastructure and Communications Requirements for V2V PKI Security Management Prepared by: Telcordia Technologies, Inc.
Appendix Volume 3 ii

VSC-A Final Report: Appendix F
Security Protocols and Implementation Results
Appendix Volume 3 F-i

List of Acronyms
BSW Blind Spot Warning
BSM Basic Safety Message
CA Certificate Authority
CAMP Crash Avoidance Metrics Partnership
DoS Denial-of-Service
DSRC Dedicated Short Range Communications
DVI Driver-Vehicle Interface
ECC Elliptic Curve Cryptography
ECDSA Elliptic Curve Digital Signature Algorithm
EEBL Emergency Electronic Brake Lights
GPS Global Positioning System
GSM Group System for Mobile
HMAC Hash Message Authentication Code
MAC Medium Access Control
MAC Message Authentication Code
OBE On-Board Equipment
OEM Original Equipment Manufacturers
OTP Objective Test Procedure
PHY Physical layer
PKI Public Key Infrastructure
PM Privacy Module
PRNG Pseudo Random Number Generator
RF Radio Frequency
RSE Road Side Equipment
SDH Sensor Data Handler
SHA Secure Hash Algorithm
SM Security Module
TA Threat Arbitration
TADS TESLA and Digital Signature
TESLA Timed Efficient Stream Loss-tolerant Authentication
Appendix Volume 3 F-ii

USDOT United States Department of Transportation
UTC Universal Time Clock
VoD Verify-on-Demand
VSC2 Vehicle Safety Communications 2
VSC-A Vehicle Safety Communications – Applications
V-V or V2V Vehicle-to-Vehicle
WMH Wireless Message Handler
Appendix Volume 3 F-iii

Table of Contents List of Acronyms............................................................................................. F-ii
1 Background.............................................................................................. F-1
2 Assumptions and Requirements............................................................ F-2 2.1 Application Scenario .......................................................................................F-2
2.2 Architecture .....................................................................................................F-2
2.3 Network Model ................................................................................................F-3
2.4 Cryptographic Assumptions ............................................................................F-4
2.5 GPS Assumptions ............................................................................................F-4
2.6 Hardware (HW) Platform ................................................................................F-4
2.7 Further Assumptions .......................................................................................F-4
3 Revised Threat Model .............................................................................. F-5 3.1 Attacks.............................................................................................................F-5
3.2 Adversaries ......................................................................................................F-5
3.2.1 Standard Engineer ..............................................................................F-6
3.2.2 Advanced Engineer ............................................................................F-6
3.2.3 Sophisticated Engineer .......................................................................F-7
3.2.4 Unauthorized Insider ..........................................................................F-7
3.2.5 Authorized Insider ..............................................................................F-7
3.3 Analysis ...........................................................................................................F-7
3.4 Security Requirements and Goals ...................................................................F-8
3.4.1 Cryptography .....................................................................................F-8
3.4.2 System Performance...........................................................................F-8
3.5 Privacy.............................................................................................................F-9
3.5.1 Attacks .............................................................................................F-10
3.5.2 Adversaries on Privacy ....................................................................F-11
3.5.3 Analysis............................................................................................F-11
3.5.4 Security Requirements and Goals for Privacy .................................F-12
3.6 Summary of Security Design Requirements and Goals ................................F-12
4 Potential Protocols for Broadcast Message Authentication .............. F-14 4.1 Cryptographic Mechanisms...........................................................................F-14
4.1.1 Hash Algorithms ..............................................................................F-14
4.1.2 Message Authentication Code (MAC).............................................F-14
Appendix Volume 3 F-iv

4.1.3 Digital Signatures .............................................................................F-15
4.1.4 Certificates .......................................................................................F-16
4.1.5 Time Stamp and Location ................................................................F-16
4.2 Certificate Exchange Between Vehicles .......................................................F-16
4.2.1 Certificate with Each Message.........................................................F-17
4.2.2 Periodic Certificate Broadcast..........................................................F-17
4.2.3 Certificate Exchange on Demand.....................................................F-18
4.2.4 Comprehensive Model for Certificate Exchange .............................F-19
4.2.5 Conclusions ......................................................................................F-21
4.3 Message Broadcast Authentication Schemes ................................................F-22
4.3.1 Message Broadcast Authentication with Digital Signatures ............F-22
4.3.2 TESLA .............................................................................................F-23
4.3.3 TESLA Authentication and Digital Signatures (TADS)..................F-32
4.4 Verify-on-Demand (VoD) .............................................................................F-35
4.4.1 Background and Assumptions .........................................................F-35
4.4.2 Verify-on-Demand ...........................................................................F-36
4.4.3 Summary ..........................................................................................F-37
4.5 Conclusions ...................................................................................................F-38
5 Potential Protocols for Privacy Protection.......................................... F-40 5.1 Change of Identifiable Properties ..................................................................F-40
5.1.1 Multiple Certificates ........................................................................F-40
5.1.2 Multiple Certificates for Broadcast Authentication Protocols .........F-41
5.2 Pseudonym Identifiers ...................................................................................F-42
5.2.1 Anonymity Against the CA ..............................................................F-42
5.3 Conclusions and Recommendations ..............................................................F-42
6 Protocol Evaluation ............................................................................... F-43 6.1 Protocol Properties ........................................................................................F-43
6.2 Security Properties ........................................................................................F-44
6.2.1 Digital Signatures .............................................................................F-44
6.2.2 TADS ...............................................................................................F-44
6.2.3 TESLA .............................................................................................F-44
6.3 Cryptography.................................................................................................F-45
6.4 System Performance ......................................................................................F-45
Appendix Volume 3 F-v

7 Implementation of the New Security Protocols................................... F-47 7.1 General Specification ....................................................................................F-47
7.1.1 Link Messages to Certificates ..........................................................F-47
7.1.2 Over-the-Air Message Format .........................................................F-48
7.1.3 Time Format.....................................................................................F-48
7.1.4 Time-Stamp and Geographic Location ............................................F-48
7.1.5 Cryptographic Algorithms and Pseudo Random Number Generator..........................................................................................F-48
7.2 TESLA...........................................................................................................F-48
7.2.1 Modes of Operation..........................................................................F-48
7.2.2 Sequential Byte ................................................................................F-50
7.2.3 TESLA Key Chain Privacy Preserving Algorithm ..........................F-50
7.3 TADS.............................................................................................................F-51
7.3.1 Message Verification Strategies.......................................................F-51
7.4 ECDSA Verify-on-Demand ..........................................................................F-51
7.5 Privacy...........................................................................................................F-52
7.6 Performance...................................................................................................F-53
8 Conclusions ........................................................................................... F-55
9 References ............................................................................................. F-56
Appendix Volume 3 F-vi

List of Figures Figure 1: VSC-A System Architecture ............................................................................F-3 Figure 2: Comprehensive Certificate Exchange Model .................................................F-20 Figure 3: Comprehensive Certificate Exchange Flow ...................................................F-21
: TESLA Main Idea ..........................................................................................F-24 Figure 4: TESLA Protocol Run .....................................................................................F-25 Figure 5
Figure 6: Verify-and-then-Process Flow .......................................................................F-35 Figure 7: Verify-on-Demand Flow ................................................................................F-37 Figure 8: TESLA Adaption to Channel Access .............................................................F-50 Figure 9: Verify-on-Demand Processing Flow ..............................................................F-52 Figure 10: Privacy Mechanism Architecture .................................................................F-53
Appendix Volume 3 F-vii

List of Tables Table 3-1 List of Potential Attacks to a V2V System ......................................................F-5 Table 3-2: List of Potential Adversaries to a Attack a V2V System ...............................F-6 Table 3-3: Cryptography Security Requirements ............................................................F-8 Table 3-4: System Performance Requirements................................................................F-9 Table 3-5: System Performance Goals ............................................................................F-9 Table 3-6: Core Privacy Attack .....................................................................................F-10 Table 3-7: Privacy Security Requirements ....................................................................F-12 Table 3-8: Security Requirements .................................................................................F-13 Table 3-9: Security Goals ..............................................................................................F-13 Table 4-1: Secure Hash Algorithm (SHA).....................................................................F-14 Table 4-2: Message Authentication Code ......................................................................F-15 Table 4-3: Estimated Performance of RSA and ECDSA Signatures .............................F-15 Table 4-4: Estimated Security Lifespan of Signatures Computed with ECDSA-224
Vs. ECDSA-256............................................................................................F-15 Table 4-5: Certificate Size .............................................................................................F-16 Table 4-6: Certificate with Each Message Metrics........................................................F-17 Table 4-7: Periodic Certificate Broadcast ......................................................................F-18 Table 4-8: Certificate Exchange on Demand .................................................................F-19 Table 4-9: Certificate Exchange Methods – Properties .................................................F-22 Table 4-10: Security Overhead for 400 MHz ................................................................F-23 Table 4-11: TESLA Performance Metrics .....................................................................F-30 Table 4-12: TESLA Authentication Conclusions ..........................................................F-31 Table 4-13: TADS Performance Metrics .......................................................................F-33 Table 4-14: TADS Conclusions.....................................................................................F-34 Table 4-15: Pros & Cons of Verify-then-Process and VoD Approaches ......................F-38 Table 5-1: Change of Identity Logic ..............................................................................F-41 Table 6-1: Authentication Protocol Properties ..............................................................F-43 Table 6-2: Privacy Protection Method Properties ..........................................................F-44 Table 6-3: Authentication Protocol Performance ..........................................................F-46 Table 7-1: Average OTA Overhead Caused by the Various Security Protocols ...........F-47 Table 7-2: Security Protocol Performance.....................................................................F-53
Appendix Volume 3 F-viii

1
VSC-A Final Report: Appendix F Security Protocols and Implementation Results
Background
The vehicle industry and the United States Department of Transportation (USDOT) have conducted extensive research on the effectiveness of V2V wireless communication to improve vehicle safety. Data security is a crucial aspect when considering deployment of such a technology. Therefore, security issues were addressed in the previous Vehicle Safety Communications (VSC) Project [34] which was conducted by the Vehicle Safety Communications Consortium (VSCC) under a cooperative agreement with the USDOT. In this project, a protocol for authenticating safety broadcast messages was defined. This protocol is based on the Elliptic Curve Digital Signature Algorithm (ECDSA) and relies on an existing public key infrastructure (PKI). This work strongly influenced the Dedicated Short Range Communications (DSRC) security standards work and found its way in the IEEE 1609.2 [15] standards process, which is currently in trial use.
The members of the Vehicle Safety Communications 2 (VSC2) Consortium (Ford, General Motors, Honda, Mercedes-Benz, and Toyota) have expressed some concerns about the previously defined scheme when used for V2V safety applications. Those concerns focus primarily on the following issues:
Computational complexity and, therefore, cost that might hinder market penetration
Latency due to security overhead
Per-message over-the-air (OTA) security overhead
Privacy
Those concerns are the starting point for extending the previous work and implementing an enhanced security protocol for broadcast message authentication1. The protocol to be defined must fulfill the following requirements:
High efficiency in both computational complexity and OTA overhead
Low time delay overhead due to a security protocol
A mechanism to provide privacy for vehicles
The project consisted of the following main tasks: (1) definition and analysis of potential security protocols, (2) evaluation of the identified security protocols by using extensive network simulations, (3) implementation of the potential security protocols in a test bed environment, and (4) ranking the potential security protocols.
This report provides the definition of the Vehicle Safety Communications - Applications (VSC-A) authentication protocols and implementation results. This report is organized as follows. In Sections 2 and 3, the necessary background is defined and the threat model of the previous report [34] is revised. Authentication protocols for the given application scenario are suggested in Section 4, and basic privacy protection protocols are defined in
1 Note that in literature often the term multicast source authentication or data origin authentication is used.
Appendix Volume 3 F-1

2
VSC-A Final Report: Appendix F Security Protocols and Implementation Results
Section 5. These protocols are evaluated in Section 6, and the implementation is described in Section 7. Conclusions and an outlook are given in Section 8.
Assumptions and Requirements
V2V safety applications run in a highly mobile wireless communication network with unique requirements. The application scenario and system architecture as well as network model and assumptions are described below.
2.1 Application Scenario
A set of vehicles broadcasts safety-related messages (such as global positioning system (GPS) position and velocity beacons) on a wireless channel (DSRC radio channel). Vehicles in the one-hop neighborhood receive these broadcast messages and process them. If a safety threat occurs, a vehicle issues a driver notification. The communication channel is generally not reliable and packets are lost with varying probability. Vehicles act both as senders and receivers. They are expected to send out around 10 messages per second and receive up to 1,000 messages per second. However, these numbers are not fixed and can vary. For instance, a less frequent number of broadcast messages is likely in congested traffic scenarios. These safety messages are characterized as small with an estimated average size of 170 bytes (most messages are 100-200 bytes).
Security is a core issue. In particular, receivers need to be able to validate that a message originates from a properly certified sender and that the message was not manipulated during the transmission between sender and receiver. The focus of this project is the secure message broadcast used in V2V safety applications. This report only considers the On-Board Equipment (OBE) of vehicles and does not consider Road-Side Equipment (RSE) data security. Deployed vehicles are assumed to have a lifespan of 10-15 years. Therefore, the nominal lifetime of a DSRC radio is assumed to be 15 years. An overview of the application scenario and involved threats was given in [28].
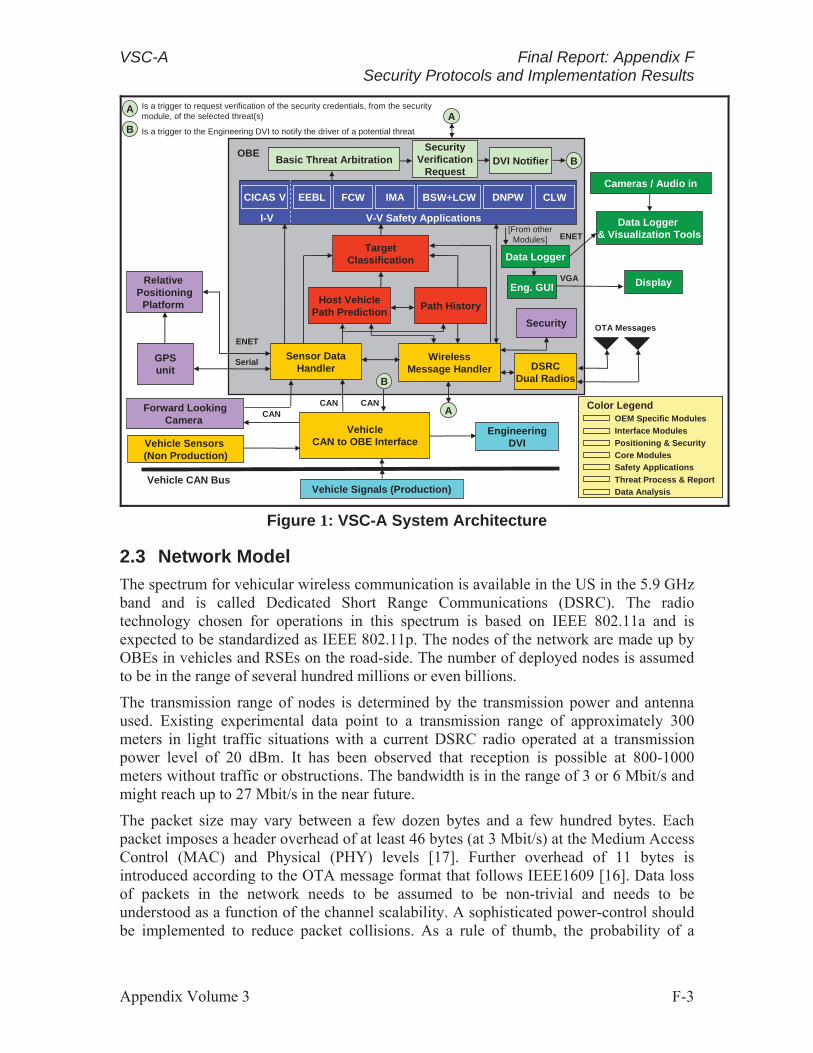
2.2 Architecture
Figure 1 describes the preliminary architecture of the VSC-A system. The Sensor Data Handler (SDH) inputs sensor data such as location and velocity that is then broadcast by the Wireless Message Handler (WMH) over the DSRC Radio after the Security Module (SM) has attached an authentication tag (e.g., a digital signature). The messages are received by another vehicle’s DSRC Radio and are then processed by the WMH. The WMH involves the SM to verify the data origin of a message. Safety Applications, as well as the Threat Arbitration (TA), are involved to evaluate the threat level for the driver. If a certain threat-level threshold is exceeded, then the TA issues a threat notification via the Driver-Vehicle Interface Notifier (DVIN).
Appendix Volume 3 F-2
VSC-A Final Report: Appendix F Security Protocols and Implementation Results
Color Legend
Vehicle Sensors (Non Production)
DVI Notifier
Engineering DVI
Vehicle CAN Bus Vehicle Signals (Production)
OBEBasic Threat Arbitration
Vehicle CAN to OBE Interface
DSRC Dual Radios
Target Classification
Sensor Data Handler
Wireless Message Handler
Host Vehicle Path Prediction
Path History
I-V V-V Safety Applications
EEBL BSW+LCW DNPW IMA FCW CLW
Security
B
B
CAN CAN
Data Logger & Visualization Tools
Cameras / Audio in
Display
Data Logger
[From other Modules]
Eng. GUI
GPSunit
Serial
ENET
VGA
ENET
Relative Positioning
Platform
CICAS V
OTA Messages
Interface Modules
Core Modules
Positioning & Security
Safety Applications
Threat Process & Report
OEM Specific Modules
Security Verification
Request
A
A
Data Analysis
Forward Looking Camera
CAN
Is a trigger to request verification of the security credentials, from the security module, of the selected threat(s)
Is a trigger to the Engineering DVI to notify the driver of a potential threat
A
B
Figure 1: VSC-A System Architecture
2.3 Network Model
The spectrum for vehicular wireless communication is available in the US in the 5.9 GHz band and is called Dedicated Short Range Communications (DSRC). The radio technology chosen for operations in this spectrum is based on IEEE 802.11a and is expected to be standardized as IEEE 802.11p. The nodes of the network are made up by OBEs in vehicles and RSEs on the road-side. The number of deployed nodes is assumed to be in the range of several hundred millions or even billions.
The transmission range of nodes is determined by the transmission power and antenna used. Existing experimental data point to a transmission range of approximately 300 meters in light traffic situations with a current DSRC radio operated at a transmission power level of 20 dBm. It has been observed that reception is possible at 800-1000 meters without traffic or obstructions. The bandwidth is in the range of 3 or 6 Mbit/s and might reach up to 27 Mbit/s in the near future.
The packet size may vary between a few dozen bytes and a few hundred bytes. Each packet imposes a header overhead of at least 46 bytes (at 3 Mbit/s) at the Medium Access Control (MAC) and Physical (PHY) levels [17]. Further overhead of 11 bytes is introduced according to the OTA message format that follows IEEE1609 [16]. Data loss of packets in the network needs to be assumed to be non-trivial and needs to be understood as a function of the channel scalability. A sophisticated power-control should be implemented to reduce packet collisions. As a rule of thumb, the probability of a
Appendix Volume 3 F-3

VSC-A Final Report: Appendix F Security Protocols and Implementation Results
packet loss for a large packet is higher than for a small one, and the probability of packet loss of two small packets is smaller than for a single large packet.
2.4 Cryptographic Assumptions
Cryptographic mechanisms can either be introduced in the application layer or in an underlying layer such as the MAC layer. Cryptographic mechanisms were introduced on the application layer in IEEE 1609.2 in order to establish end-to-end security between the original message originator (e.g., a vehicle’s DSRC radio, the Certificate Authority (CA), etc.) and the receiver. Introducing further cryptographic mechanisms in an underlying layer increases overhead at no increased security level. For the same reasons, security is only considered on the application layer here.
It is assumed that there is a PKI deployed. The details of deploying and managing a PKI were analyzed in [34]. It is assumed that the strength of standard cryptographic algorithms to resist exhaustive search attacks follows Moore’s Law, but that no superior cryptanalytic attack strategies will be found during the system’s life-time.
2.5 GPS Assumptions
Vehicles require a continuous GPS signal for safety applications to work properly. In particular, GPS safety applications will fail to work once the vehicle’s location cannot be determined. Therefore, we assume that a loss of the GPS signal of more than one minute does not allow normal operation but only degraded operation. After a loss of more than 5 minutes, operation is not useful anymore. Today’s vehicle oscillators’ accuracy as required for DSRC radio transmissions is 20 ppm (cf. [17]). The accuracy of the local clock to synchronize to the global GPS time signal is in the range of 0.3 ms. Assuming that ensuring security is only useful in normal safety application operation, the maximum clock skew to the reference GPS clock is therefore = 1.5 ms.
2.6 Hardware (HW) Platform
The computational platform of the OBE used in the VSC-A Project is a 400 MHz industry embedded platform based on a Freescale PowerPC Central Processing Unit (CPU) and running a Linux derivative. The security protocol is expected to run solely on the existing platform.
2.7 Further Assumptions
Regular maintenance of the vehicle is provided with high probability (i.e., once a year) by a workshop, but it is not required. It is conceivable that program code and further data are downloaded to the vehicle’s OBE during maintenance in a workshop. Forward compatibility of the implemented security mechanisms is included in the software design such that cryptographic algorithms can be updated as part of the secure software update scheme. In the same manner, cryptographic keying data can be updated. The handling of different security protocol versions is provided by the application layer (e.g., by implementing a version identifier and algorithms to handle different security versions).
Appendix Volume 3 F-4

3
VSC-A Final Report: Appendix F Security Protocols and Implementation Results
Further assumptions about the environmental characteristics (i.e., unit size, temperature range, etc.), the cost of goods, as well as management cost can be found in [34].
Revised Threat Model
Vehicles broadcast safety related messages. If a forged message is accepted by a vehicle, this could possibly lead to a false driver notification. In the following sections, this central threat is elaborated and extended. The results of [34] are included and revised.
3.1 Attacks
Table 3-1, below, is a list of potential attacks to a V2V system. Privacy related aspects are elaborated in a separate section. Note that only attacks that are related to a security protocol but not to physical attacks, Denial of Service (DoS) attacks, and exploitation of implementation flaws were considered. Also attacks that successfully compromise the underlying cryptographic algorithms were excluded. Finally, attacks that are based on key management aspects and organization of a Certificate Authority (CA) were excluded.
Table 3-1 List of Potential Attacks to a V2V System
Attack Scenario Description AT1 Replay Attack A message is replayed at a later time.
AT2 Tunneling Attack2
A message is relayed to or replayed at a different geographic location (e.g., by forwarding messages through a separate communication channel such as Group System for Mobile (GSM) communication).
AT3 Forged Messages The adversary injects forged messages to the network.3
3.2 Adversaries
Adversaries have, in general, the following capabilities and limitations:
1. Adversaries have full control over the network. They can eavesdrop, capture, drop, resend, delay, and alter packets.
2. The adversary has access to an out-of-band network with negligible delay (such as GSM)
3. The adversaries’ computational resources are bounded but might be very large. The adversary can perform a large number of computations at the same time, but is limited by cryptographic strength that is believed to be computationally infeasible (such as inverting a one-way function).
4. There are no almighty adversaries. For instance, there is no adversary that is able to manipulate the GPS signal transmitted by the satellite system.
2 Tunneling attacks are sometimes also called wormhole attack. 3 Forged messages (also called bogus messages) are sent by a non-trustworthy (not holding a certified key) or manipulated DSRC radio.
Appendix Volume 3 F-5

VSC-A Final Report: Appendix F Security Protocols and Implementation Results
5. Adversaries have access to the vehicle’s DSRC radios (inside attack) and/or to programmable DSRC radios (outside attack)
6. Adversaries are rational or malicious. An adversary might launch an attack for the sake of curiosity or for being malicious. However, such an adversary is limited by its financial resources. On the other side, a financially powerful adversary (such as a government agency or a large international company) will act rational in such a way that it will only mount an attack if there is a high probability of a gain in the end.
7. Adversaries’ capabilities are limited to the technological level. Attackers will not apply methods such as bribery and blackmailing.
The following list of potential adversaries in Table 3-2 reflect a real-world scenario:
Table 3-2: List of Potential Adversaries to a Attack a V2V System
Adversary Description
AD1 Standard Engineer Attackers with a programmable radio transmitter/receiver.
AD2 Advanced Engineer
Attackers with access to an un-modified DSRC radio who can control the input and sensor values.
AD3 Sophisticated Engineer
Attackers who have access to a modified DSRC radio and who are able to mount sophisticated physical attacks (such as side-channel and probing attacks).
AD4 Unauthorized Insider
Inside attackers who have access to records and equipment operated by an Original Equipment Manufacturer (OEM) or the DSRC unit manufacturer.
AD5 Authorized Insider
Inside “attackers” who have access to any record, equipment, and data related to the system (e.g., police).
Attacks are accounted to the original source adversary of an attack. For instance, there are tools available on the Internet that defeat a security mechanism and can be used by anyone. Such attacks are accounted toward the original attackers (who developed the tool) but not the user of the attack tool (who might be a novice). In the same fashion, attacks performed by attackers that are hired by a third party are accounted toward the attacker category that mounts the attack.
3.2.1 Standard Engineer
A standard engineer has access to a programmable radio transceiver. The standard engineer has average electrical engineering skills that can be learned in academia and industry. A standard engineer is potentially able to mount Replay Attacks (AT1) and Tunneling Attacks (AT2). A standard engineer might be a single person or a group of people connected by the Internet. Standard engineers act both rational and malicious.
3.2.2 Advanced Engineer
An advanced engineer has access to a programmable radio transceiver and to an unmodified DSRC radio. The advanced engineer is potentially able to mount attacks AT1, AT2, and Forged Messages (AT3). An advanced engineer might be a single person
Appendix Volume 3 F-6

VSC-A Final Report: Appendix F Security Protocols and Implementation Results
or a group of people connected by the Internet. Advanced engineers act both rational and malicious.
3.2.3 Sophisticated Engineer
Sophisticated engineers have access to a modified DSRC radio as well as a programmable radio transceiver. They are highly skilled engineers with large knowledge in the security area. They are able to mount sophisticated attacks, both physical and logical ones. Therefore, the sophisticated engineer is potentially able to mount attacks AT1, AT2, and AT3. Sophisticated engineers might work together in large groups, possibly connected by the Internet. They might make their results available or sell them. Sophisticated engineers might be financed by powerful organizations (legally or illegally). A combination would be, for instance, an illegal organization that finances highly competent academic engineers in order to make an illegal business model out of the compromised system. Sophisticated engineers act both rational and malicious.
3.2.4 Unauthorized Insider
Unauthorized insiders have access to records and equipment operated by an authority, an OEM, or the DSRC unit manufacturer. They are involved in the security processes (e.g., as a workshop mechanic, an employee of a trusted third party, or a police officer). This attacker group is very powerful in combination with sophisticated engineers. The insiders pass information to the sophisticated engineers (e.g., by Internet) who use their expertise and newly won insider knowledge to mount an attack. Such an attack is accounted to the unauthorized insider category. Unauthorized insiders act both rational and malicious. Unauthorized insiders are potentially able to mount all listed attacks. The financial investment might be enormous though, if not infeasible. Furthermore, the scope of insider information is assumed to be local and of a single source but not comprehensive.
3.2.5 Authorized Insider
Authorized insiders have legal access to all stored system and design information. Contrary to the unauthorized insider, authorized insiders have global and comprehensive access to all data, and they are able to process the data. The authorized insider is represented by the government comprising its agencies and organizations such as police. The authorized insider is potentially able to mount all attacks and is only limited by their financial resources as well as restrictions of the system. Authorized insiders act in a rational manner.
3.3 Analysis
Below is an analysis of the identified attacks. The analysis provides a better means to derive requirements for the authentication mechanism.
1. Replay Attack (AT1): A message can be replayed by retransmitting a received or intercepted message. The attack is successful if a receiver accepts the replayed message and takes action based on it. The impact is high since potentially an impact in the physical world is introduced. The likelihood that such an attack is performed is high for all malicious attackers and low for the authorized insider. This attack is counteracted by including an authenticated time-stamp in each message.
Appendix Volume 3 F-7

VSC-A Final Report: Appendix F Security Protocols and Implementation Results
2. Tunneling Attack (AT2): A tunneling attack can simply be mounted by using an additional channel such as GSM. The likelihood is the same as for AT1, and the attack can be counteracted by including an authenticated geographic location in each message.
3. Forged Messages (AT3): Forged and bogus information affect safety such that there is a high impact. Forged messages are potentially broadcast by all adversaries. While the likelihood of malicious adversaries is high, it is low for the authorized insider. The countermeasure is to implement a cryptographic authentication method.
3.4 Security Requirements and Goals
Security requirements, goals, and recommendations are now directly derived from the analysis of the attacks. A security requirement must be fulfilled by the security protocols designed in the following sections. A security goal is to be approached by the security protocols.
3.4.1 Cryptography
The cryptographic security requirements follow directly in Table 3-3 from the basic application requirements as well as the National Institute for Standards and Technology’s (NIST) security recommendations for security systems that are to last beyond the year 2030 [21]. The first column of the following tables is consecutively numbered whereas the last column describes which attacks are addressed with the given requirement.
Table 3-3: Cryptography Security Requirements
Cryptography Security Requirements
R1 Every message must be protected against forgery and masquerading (message integrity and authentication, respectively).
AT1, AT2, AT3
R2 Every message must include an authenticated time-stamp (accurate to at least a millisecond) and an authenticated geographic location of the sender’s origin.
R3 Memory attacks should be impossible. Hence, all cryptographic keys must be at least 80 bits.
R4
At the time of the attack, the probability of compromising any key within its intended lifetime must be less than or equal to the probability of compromising a 128 bit symmetric key over 15 years (assuming Moore’s Law by Brute Force attack).4
3.4.2 System Performance
The system performance requirements are given by the network and HW platform limitations. They are described in Table 3-4.
4 This requirement is equivalent to the IEEE 1609.2 cryptographic key strength. For instance, a 100-bit cryptographic key must have a life span not exceeding 15 years/228 = 1.76 s.
Appendix Volume 3 F-8

VSC-A Final Report: Appendix F Security Protocols and Implementation Results
Table 3-4: System Performance Requirements
System Performance Requirements R5 The certificate size should be no greater than 300 bytes.
R6 The protocol must support 10 authentication generations per second for outgoing messages.
R7 The protocol must support 1000 authentication verifications per second for incoming messages.
R8
The combined time required to generate an authentication of an outgoing V2V message and verify the authentication of an incoming V2V message should be less than 20 ms assuming that the receiver has access to a verified certificate of the sender and that there are no packet losses due to communication errors.5
Furthermore, the following goals are derived as listed in Table 3-5:
Table 3-5: System Performance Goals
System Performance Goals G1 Make the average OTA bandwidth overhead introduced by security mechanisms
reasonable. G2 Make the number of application errors introduced by security protocols reasonable.6
Goal G1 aims at minimizing the OTA bandwidth in the foreseen scenario of at most 100 vehicles in the neighborhood with each broadcasting 10 messages per second. Protocols are to be optimized and evaluated in this category. Goal G2 aims at minimizing the number of application errors introduced by the security protocols. Network simulations need to analyze the properties of the suggested security protocols, in particular, whether or not the protocols endanger reliability of the safety applications because of application errors.
3.5 Privacy
Privacy is a central aspect when deploying DSRC radio-equipped vehicles. V2V applications broadcast information such as time, location, and velocity of a vehicle. Due to its central role, privacy threats are now considered in more detail. A privacy solution needs to be implemented on two levels: (1) organizational issues including key management, and (2) a privacy mechanism implemented locally on each OBE. In this project we consider the latter aspect.
5 This requirement only considers the delays due to cryptographic computations. Therefore, it is suggested to verify in a simulation run whether the new security protocol also meets an acceptable latency influenced by network data traffic, in particular in a congested environment. 6 The number of application errors introduced by a security protocol needs to be obtained by network simulations in order to reflect a real-world setting.
Appendix Volume 3 F-9

VSC-A Final Report: Appendix F Security Protocols and Implementation Results
3.5.1 Attacks
The core attack is the disclosure of actions and identity of vehicles7 based on the introduction of the vehicle’s radio transmissions. In Table 3-6 below this core attack is divided into three steps: obtaining information (sniffing), linking transmissions (tracking), and recovering identity. Table 3-6 also describes the attacks that are described.
Table 3-6: Core Privacy Attack
Attack Scenario Description
ATP1 Obtain Privacy Sensitive Information
Obtain vehicle broadcast information including location, time-stamp and driving information. Then process the information.
ATP2 Link Transmissions based on Vehicle Status Transmissions
Decide with a high probability whether two transmissions origin from the same vehicle, based on the vehicle’s transmissions.
ATP3 Recover Identity Recover the identity of a vehicle using a set of vehicle transmissions.
3.5.1.1 ATP1: Obtain Privacy Sensitive Information The attacker obtains data broadcast by a vehicle. The data includes the vehicle’s location and driving information as well as a time stamp. The attacker will process the data. The following are examples of this attack:
1. Use the gained and processed information for setting up a tracking attack (ATP2)
2. Use the gained information to trigger an event. For instance, pass the information to a connected camera and take a picture of the vehicle to issue a speeding ticket.
The information can be obtained by different means, including the following8:
Receive information OTA by a manipulated or programmable DSRC radio
Manipulate or compromise a vehicle’s DSRC radio unit
In this work, only the former manner of obtaining privacy related information is considered. 3.5.1.2 ATP2: Link Transmissions Based on Vehicle Status Transmissions Transmissions are linked in order to create vehicle profiles based on the obtained information such as location, velocity, and time. When two or more transmissions are received (with arbitrary time-span in between), the attack aims to predict at high probability whether both transmissions were broadcast by the same vehicle.
The attack is based on a single or a set of radio receivers that cover some area. The road network is divided into two distinct areas: the observed zone and the unobserved zone. Vehicles are not aware of these zones and do not know if it is currently moving in an observed or unobserved zone. Also, for each attacker the observed and unobserved zones
7 Only vehicles are considered here, not the actual driver. 8 RSUs or infrastructure attacks are not considered here.
Appendix Volume 3 F-10

VSC-A Final Report: Appendix F Security Protocols and Implementation Results
differ. The attack processes the received information in the observed zones in order to link transmissions. Transmissions are linked based on message content such as location and velocity. Linking of transmissions based on physical properties such as Radio Frequency (RF) fingerprinting is not considered here.
The more capable the attacker is the larger the potential observed zone. The following are examples:
Individual: The observed zone is small and covers the transmission range of a single or very few radios (i.e., at most a square kilometer)
Group: The observed zone covers the transmission range of a few dozen radios (i.e., a few square kilometers)
Agency: The observed zone is almost continuous and covers most parts of the road network.
This information can potentially be used in unintended and unapproved ways, for example, to calculate the average speed of a vehicle (not by using a single transmission but based on time and location of several messages). However note that short-term linking of messages by receiving vehicles is required for safety messages (e.g., for path prediction) while long-term linking of messages results in the above threats. 3.5.1.3 ATP3: Recover Identity Recovering identity aims at recovering a real-world identifier (such as driver’s name, license plate, vehicle identification number) for a given set of a vehicle’s transmissions. However, it is assumed that the attack is not based on the use of cameras, a physical pursuit, some on-board tracking device, or further actions in the physical world that can already be performed today.
3.5.2 Adversaries on Privacy
For ease of consideration, two attacker categories on privacy are introduced below. 3.5.2.1 Individual Attacker The individual attacker has access to a programmable radio transceiver. He can receive vehicle’s transmissions with a small set of receivers (ATP1) and potentially mount an attack to link transmissions (ATP2) and recover identities (ATP3). The individual attacker has access to a single or a small set of radio receivers. The individual attacker might be a single person, a small set of persons, or an (illegal) organization. 3.5.2.2 Global Attacker A global attacker has access to a large set of radio receivers and is able to observe a majority of the vehicle traffic. It is assumed there is potentially only a single global attacker available, namely, someone inside the system provider or government organization.
3.5.3 Analysis
Below the ATP1, ATP2, and ATP3 attacks are analyzed.
1. Obtain Privacy Sensitive Information (ATP1): The attack can be mounted by all attacker categories. The broadcast and received information is vital for safety
Appendix Volume 3 F-11

VSC-A Final Report: Appendix F Security Protocols and Implementation Results
applications. Access to it cannot properly be controlled in the given environment. Encrypting the information using a global key is useless since the global key will be extracted soon after deployment of the first devices. Using a fine-grained key management scheme for encryption purposes contradicts the safety application requirements.
The obtained information contains public information only. Furthermore, there is no threat if the recorded data cannot be mapped to a vehicle. However, introducing an authentication mechanism might lead to non-repudiation of messages. This is mainly due to key management implemented by a CA.
2. Link Transmissions based on Vehicle Status Transmissions (ATP2): It is assumed that the attacker is able to reliably link all transmissions of a vehicle inside of an observed area by reading the transmissions’ contents and comparing location and velocity. The attack can be mounted by all adversaries.
The basic counteraction is to change any identifiable property of vehicles simultaneously. Therefore, it is required that vehicles are able to change (or randomize) all identifiers (e.g., Media Access Control (MAC) address, application ID and certificate) simultaneously.
3. Recover Identity (ATP3): All attackers can potentially mount this attack. A counteraction is that vehicles do not broadcast any data that can be mapped to a real-world identity. This needs to be implemented both on the security layer as well as the network layer.
Additional information that might be available to the attacker includes information obtained in the physical world such as a license plate number and further information such as cryptographic certificates that are required to organize the safety application network. The first category of information is out of scope since it is already available today and can be done anyway. The second category is restricted to the authorized inside personnel.
3.5.4 Security Requirements and Goals for Privacy
The privacy security requirements are identified Table 3-7.
Table 3-7: Privacy Security Requirements
Privacy Security Requirements
R10 A vehicle must be able to change (or randomize) any identifiable property simultaneously (pseudonym, MAC address as well as network, and security protocol related states).
ATP2
R11 DSRC messages must not include publicly known identifiers of vehicles. ATP3
As stated before, it is acceptable and maybe necessary that authorities are able to recover identity based on additional non-public information.
3.6 Summary of Security Design Requirements and Goals
The security requirements and goals for potential security protocols are summarized below in Table 3-8 and Table 3-9.
Appendix Volume 3 F-12

VSC-A Final Report: Appendix F Security Protocols and Implementation Results
Table 3-8: Security Requirements
Security Requirements
Cryptography
R1 Every message must be protected against forgery and masquerading (message integrity and authentication, respectively).
R2 Every message must include an authenticated time-stamp (accurate to at least a millisecond) and an authenticated geographic location of the sender’s origin.
R3 Memory attacks should be impossible. Hence, all cryptographic keys must be at least 80 bits.
R4
At the time of the attack, the probability of compromising any key within its intended lifetime must be less than or equal to the probability of compromising a 128 bit symmetric key over 15 years (assuming Moore’s Law by Brute Force attack).9
System Performance
R5 The certificate size should be no greater than 300 bytes.
R6 The protocol must support 10 authentication generations per second for outgoing messages.
R7 The protocol must support 1000 authentication verifications per second for incoming messages.
R8
The combined time required to generate an authentication of an outgoing V2V message and verify the authentication of an incoming V2V message should be less than 20 ms assuming that the receiver has access to a verified certificate of the sender and that there are no packet losses due to communication errors.10
Privacy R10
A vehicle must be able to change (or randomize) any identifiable property simultaneously (pseudonym, MAC address, as well as network and security protocol related states).
R11 DSRC messages must not include publicly known identifiers of vehicles.
Table 3-9: Security Goals
Security Goals
System Performance
G1 Make the average OTA bandwidth overhead introduced by security mechanisms reasonable.
G2 Make the number of application errors introduced by security protocols reasonable.11
9 This requirement is equivalent to the IEEE 1609.2 cryptographic key strength. For instance, a 100-bit cryptographic key must have a life span not exceeding 15 years/228 = 1.76 s. 10 This requirement only considers the delays due to cryptographic computations. Therefore, it is suggested to verify in a simulation run whether the new security protocol also meets an acceptable latency influenced by network data traffic, in particular in a congested environment. 11 The number of application errors introduced by a security protocol needs to be obtained by network simulations in order to reflect a real-world setting.
Appendix Volume 3 F-13

4
VSC-A Final Report: Appendix F Security Protocols and Implementation Results
Potential Protocols for Broadcast Message Authentication
Potential approaches for secure broadcast authentication and related areas are described below. The considered approaches are as follows:
1. Methods for certificate exchange between vehicles
2. Broadcast message authentication schemes
3. Selective verification of messages
4.1 Cryptographic Mechanisms
Cryptography is the basis for security schemes. The main cryptographic mechanisms are introduced below. All run-time performance was measured on a 400 MHz PowerPC.
4.1.1 Hash Algorithms
A hash algorithm H maps a message of arbitrary length to a fixed-size output. The most widely used hash algorithm family is the Secure Hash Algorithm (SHA) hash [30]. During the last years, attacks on SHA became known. Therefore, NIST recommends using the SHA-2 family with a hash length of at least 224 bits or 28 bytes, respectively (SHA-224) [20]. The SHA-2 family is also currently suggested in the IEEE 1609.2 trial standard [15]. On the other hand, NIST started a public competition for a new hash standard [19]. The usage of the new hash standard should be considered before deployment of a future DSRC network.
Due to the cryptographic requirement of a 128-bit long-term security level (Requirement R4), SHA-256 is recommended as a default hash algorithm. The performance values of SHA-256 are given in Table 4-1.
Table 4-1: Secure Hash Algorithm (SHA)
Secure Hash Algorithm (SHA) Algorithm Overhead (hash size) Computational Time
SHA-256 32 bytes 18 μs (entire 512-bit block) 9 μs (for every additional 512-bit block)
4.1.2 Message Authentication Code (MAC)
A MAC is a symmetric authentication scheme. The sender computes a so called MAC tag of fixed size over a given message of arbitrary length using a symmetric key shared with the receiver. The most widely used MAC scheme is the Hash Message Authentication Code (HMAC) algorithm. The HMAC is based on a hash function, usually of the SHA hash family. Due to the cryptographic security requirements (R4), using HMAC-SHA-256 by default is suggested. The overhead of HMAC-SHA-256 is depicted below in Table 4-2.
Appendix Volume 3 F-14

VSC-A Final Report: Appendix F Security Protocols and Implementation Results
Table 4-2: Message Authentication Code
Message Authentication Code
Algorithm Overhead
(MAC tag size) Computational time for single block / bulk
(per 512 bit block) HMAC-SHA-256 32 bytes 36 μs / 18 μs
4.1.3 Digital Signatures
The most widely used digital signature schemes are the ECDSA [1] and RSA Signature. ECDSA comes with a shorter signature length than RSA and is by far more computationally efficient in the signature generation. On the other side, RSA signature verification is more efficient than ECDSA verification if RSA short exponents are used. The 128-bit long-term security requirement (R4) suggests ECDSA with 256-bit keys, which corresponds to RSA with 3072-bit keys at an equal security level. Depending on the life-span of the data to protect, Elliptic Curve Cryptography (ECC) with 224-bit keys might be used. In particular, for authenticating V2V safety messages which do not have a life span of several years but possibly only a few days or weeks, ECDSA-224 appears more reasonable. This is because ECDSA-224 results in a performance gain of approximately 50 percent compared to ECDSA-256. The following table presents the estimated performance of RSA and ECDSA signatures for an industry-computing platform at 400 MHz based on [6], [9].
Table 4-3: Estimated Performance of RSA and ECDSA Signatures
Performance Metric Signature Scheme
RSA-3072 ECDSA-224 ECDSA-256 Signature Generation 240 ms 4 ms 6 ms Signature Verification 8 ms 16 ms 23 ms Key Length 3072 bit 224 bit 256 bit Signature Size 384 byte 56 byte 64 byte Implementation Code Size 5 Kbyte 10 Kbyte 10 Kbyte
As mentioned above, the life time of V2V safety messages is expected to be rather short. The following table shows the estimated lifetime of signatures computed with ECDSA-224 versus ECDSA-256. These lifetimes were estimated by various institutions and security experts. It becomes clear that the cryptographic strength of ECDSA-224 is sufficient to secure short-lived safety messages.
Table 4-4: Estimated Security Lifespan of Signatures Computed with ECDSA-224 Vs. ECDSA-256
Institution / Security Expert Calendar Year Validity
ECDSA-224 ECDSA-256 NIST 2011-2030 > 2030 ECRYPT 2009-2028 2009-2038 Lenstra/Verheul 2066 2090
Appendix Volume 3 F-15

VSC-A Final Report: Appendix F Security Protocols and Implementation Results
Based on today’s HW, the running time for an attack in calendar year 2050 at $100 million US is 1,000 years for ECDSA-224 and 100 million years for ECDSA-256.
4.1.4 Certificates
Certificates bind a public-key to the sender’s identity or pseudonym. An RSA public key consists of modulus m as well as a fixed short exponent such as 216+1. The secret key consists of two, half-sized prime numbers p and q. An ECDSA-256 public key is an elliptic curve point that can be expressed in 32 bytes + 1 bit using point compression, or 64 bytes using no compression. An ECDSA signature requires 64 bytes. The certificate size is determined by the sum of the public-key size, the signature size, as well as some overhead. A typical IEEE 1609.2 certificate containing a compressed public key has a size of 117 bytes when using 256-bit Elliptic Curve Cryptography (ECC) for both vehicles and CA. In the remaining document we will assume that the size of a certificate is 117 bytes as defined in the IEEE 1609.2 trial standard. The actual implementation developed for the VSC-A Project, however, uses 148-byte certificates which contain an uncompressed public key. The resulting certificate sizes are listed in Table 4-5.
Table 4-5: Certificate Size
Item Size (Bytes)
RSA (3072-bit keys) ECDSA (256-bit keys)
Public-key 384 bytes 33 bytes (point compression) / 64 byte (no point compression)
Secret-key 384 bytes 32 bytes
Certificate 788 bytes (= 384 + 384 + 20 byte; fixed small exponent as public key)
117 bytes (= 33 + 64 + 20 byte; point compression as defined in IEEE 1609.2)
RSA has a very large certificate and signature size as well as a computationally demanding signature generation mechanism. Since requirements R5, R6, and R8 cannot be held by any means, we define ECDSA-256 as the default digital signature algorithm for the given V2V security protocol.
4.1.5 Time Stamp and Location
As defined in security requirement R2 and in order to avoid replay attacks, each message includes an authenticated time stamp. At the same time, messages include authenticated location information. Therefore, a message (m, T, L) is authenticated where T is the time stamp and L the current location. The receiver first determines the current time T’ and location L’ then it computes T = T-T’ and L = L-L’. If T is larger than some threshold
T or if L is larger than threshold L, then the message verification fails. Otherwise, the receiver verifies the authentication information.
4.2 Certificate Exchange Between Vehicles
A PKI is assumed to be deployed and properly managed. Certificates are issued by a trustworthy CA. The CA’s public key is securely deployed in all vehicles at production time such that each vehicle is able to verify any certificate in a trustworthy manner.
Appendix Volume 3 F-16

VSC-A Final Report: Appendix F Security Protocols and Implementation Results
Further information about PKIs and certificates, such as hierarchical structures, are given in [34].
Once vehicle A approaches vehicle B and wants to send a trustworthy message, A needs to make sure that B has access to A’s certificate. The certificate exchange or distribution, respectively, can be performed by RSEs, by the sending vehicle, or by another communication channel. Several mechanisms describing how RSE infrastructure enhances the certificate exchange is detailed in [34]. In this report, we assume the case that the supporting infrastructure does not broadcast the vehicle’s certificate. A mechanism must be implemented to make sure that vehicle B has access to A’s certificate in this scenario in order to verify A’s message.
The metrics to evaluate certificate exchange methods are the OTA overhead as well as the time delay, respectively. The later metric describes the time verifier B needs to get a hold of A’s certificate after receiving A’s initial message.
4.2.1 Certificate with Each Message
The straightforward certificate exchange method is to send the certificate with each message. Receiver B then checks whether it already verified A’s certificate in the past (B holds a list of trustworthy certificates). If not, B verifies the certificate. Then B verifies the message. Note that IEEE 1609.2 suggests such an approach. The approach ensures that the verifier B has immediate access to A’s certificate in order to verify A’s message. However, this comes at the cost of a significant OTA overhead which might cause immense network congestion and packet loss. The packet loss directly affects transmission of safety messages. The latency, as well as overhead, is summarized in Table 4-6. Note that we assume 10 outgoing messages per second (Requirement R6) each adding an overhead of 117 bytes for the attached certificate. Since certificates are sent together with a message, a network layer overhead here is not assumed.
Table 4-6: Certificate with Each Message Metrics
Certificate with Each Message Certificate Size 117 bytes Time Delay 0 ms
Over-the-air Overhead 1170 bytes per second (without network layer overhead) 117 bytes per message
4.2.2 Periodic Certificate Broadcast
In order to reduce the OTA overhead, a certificate might be periodically broadcast rather than attached to each message. This comes at the cost of latency, and, thus, initial verification errors, since the certificate might not be available at the time when vehicle A’s initial message is received.
On the other hand, the broadcast range of a vehicle is larger than the impact range. For instance, a vehicle might have a physical impact to other vehicles in its close surrounding, for example 100 m, but has a broadcast range of more than 300 m. Therefore, a latency of the time-span a vehicle needs to drive 100 m would be acceptable. Driving 100 m takes at least two seconds at reasonable speed. To be on the safe side and
Appendix Volume 3 F-17

VSC-A Final Report: Appendix F Security Protocols and Implementation Results
to tolerate network packet loss, periodicity of one second is suggested. To avoid network packet collisions, two parameters are introduced for the periodicity:
Minimum periodicity pmin: wait for at least pmin ms after the previous certificate broadcast
Maximum periodicity pmax: wait for at most pmax ms after the previous certificate broadcast
pmin = 900 ms and pmax = 1100 ms were exemplarily used. The time delay and OTA overhead is listed in Table 4-7. We assume two cases. The first case is that certificates are broadcast to message packets such that a network layer overhead of 46 + 11 = 57 bytes, respectively, is introduced. The second case is that certificate packets are sent in a piggy-back fashion together with data packets.
Table 4-7: Periodic Certificate Broadcast
Periodic Certificate Broadcast (Periodicity of 1000 ms) Certificate Size 117 bytes
Time delay until certificate is received
500 ms (on average)
1100 ms (worst case; if certificate is properly received)
Over-the-air Overhead
Piggy-back with data packet
117 bytes per sec. 11.7 bytes per message (average)
4.2.3 Certificate Exchange on Demand
Whenever vehicle A detects an unknown vehicle B in its reception range, it concludes that vehicle B does not know its certificate. In such a case, A sends out its certificate (including its identification). Since B acts according to the same rules, B will also broadcast its certificate (at latest when it receives A’s certificate). Vehicles A and B can also request the other party’s certificate.
Several parameters are introduced to keep the network load low and the probability of certificate reception high. These are as follows:
Minimum delay d: wait for at least d ms after the previous certificate broadcast before sending out the certificate
Backoff b: wait for at most b+d ms after reception of a certificate request or an initial message before sending out the certificate
Number of repetitions r: send out the certificate r times with the above defined back-off time in between
Power control c: send out the certificate with transmission power c
The delay time avoids network congestion due to massive broadcasting of certificates. The actual back-off time is chosen randomly in between 0 and b ms. The number of repetitions might be any number being zero or larger. Finally, the power control might be
Appendix Volume 3 F-18

VSC-A Final Report: Appendix F Security Protocols and Implementation Results
adjusted in order to enlarge the reception range and make sure that approaching neighbors receive the certificate before receiving the initial message. Therefore, the power control c will be a function of the current power for safety message transmissions.
Assuming a delay of d = 250 ms and a back-off time of b = 250 ms as well as r = 0 (to avoid network congestion), we receive the performance values listed in Table 4-8. A sophisticated power control c might improve these values. The team distinguishes two cases:
(1) Certificates are distributed as separate messages with a network layer overhead of 57 bytes for each certificate packet
(2) Certificates are sent in a piggy-back fashion together with data packets.
Note that Table 4-8 assumes maximum traffic load (i.e., continuous certificate demands).
Table 4-8: Certificate Exchange on Demand
Certificate Exchange on Demand (d = 250 ms, b = 250 ms, r = 0) Certificate Size 117 bytes
Time Delay
375 ms (on average)
500 ms (worst case; if certificate is properly received)
Over-the-air Overhead
Additional message 464 bytes per sec. (117 + 57 = 174 bytes per 375ms) 46.4 bytes per message
Piggy-Back with data packet
312 bytes per sec. (117 bytes per 375 ms) 31.2 bytes per message
4.2.4 Comprehensive Model for Certificate Exchange
A comprehensive model is derived by combining the periodic certificate distribution and the certificate exchange on demand. The comprehensive model is described by the parameters pmin, pmax, d, b, r, and c. The comprehensive model behaves like the certificate exchange-on-demand with an additional rule to broadcast a certificate after a randomly chosen time of between pmin and pmax, if a certificate was not demanded (due to a message reception or request) since that time. The model is depicted in Figure 2 and the broadcast flow is depicted in Figure 3. Note that the certificate broadcast takes into account the power control c.
Appendix Volume 3 F-19

VSC-A Final Report: Appendix F Security Protocols and Implementation Results
request
[pmin, pmax] broadcast certificate
[0, b] broadcast certificate
Repeat r times after d + [0, b] ms
d
time
Default: On Demand
If No Request: Periodic Broadcast
previous broadcast (either on demand or periodic)
Figure 2: Comprehensive Certificate Exchange Model
Appendix Volume 3 F-20

VSC-A Final Report: Appendix F Security Protocols and Implementation Results
Wait time d+b
Time-out (no request)
Request
Wait for request; Timeout after time p
[pmin, pmax]
Periodic Broadcast: Broadcast Certificate
Set Timer to t=0 r’ := r
On Demand: Broadcast Certificate
Wait until t d+b
r’ = 0
r’ 0
r’ := r’-1
Figure 3: Comprehensive Certificate Exchange Flow
The performance of the comprehensive model is limited by the performance of the periodic broadcast algorithm (upper bound) and the performance of the exchange-on-demand algorithm (lower bound).
4.2.5 Conclusions
There are two potential certificate exchange mechanisms, namely, broadcasting a certificate with each message as well as the comprehensive model. Both of these mechanisms fulfill the security requirements. Broadcasting a certificate with each message comes with a significant higher bandwidth requirement than the comprehensive model. Implementing a combination of both certificate exchange protocols first appears to be optimal to get the best of both approaches. In normal operation, one could choose the comprehensive model, whereas for emergency warnings, the certificate is attached to all messages. However, it cannot be foreseen whether such an approach results in an exponential explosion of the network traffic load and collapse of the system.
Appendix Volume 3 F-21

VSC-A Final Report: Appendix F Security Protocols and Implementation Results
In the table below, it is assumed that certificates are sent in a piggy-back fashion in order to save bandwidth overhead. Table 4-9 summarizes the properties of sending a certificate with each message and the comprehensive model.
Table 4-9: Certificate Exchange Methods – Properties
Certificate with Each Message Comprehensive Model No time delay until the first message can be verified
Additional over-the-air bandwidth overhead
Potential time delay until the first message can be verified
Adjustable over-the-air bandwidth overhead
4.3 Message Broadcast Authentication Schemes
There is a variety of broadcast message authentication protocols known in open literature. However, most of these protocols focus on the broadcast of multimedia data streams (i.e., extensive data amounts are broadcast in a predominantly static infrastructure without strict latency demands). The requirements in the given scenario are quite different. In particular, the real-time requirement, the session-less requirement (including state-less character of the communication), and the high data throughput requirement differ. Presented below are potential broadcast authentication schemes including plain digital signatures, Timed Efficient Stream Loss-tolerate Authentication (TESLA), TESLA and Digital Signature (TADS), as well as further mechanisms.
4.3.1 Message Broadcast Authentication with Digital Signatures
The straightforward method of providing message broadcast authentication is to implement digital signatures. The sender signs the message and broadcasts the signature along with the message. Receivers can then verify the message. Before message verification, the receivers need to be able to get a hold of the sender’s certificate as described above. 4.3.1.1 Protocol Parameters and Structure
H: H(m) describes the hash of message m. |H| is the hash length of H, in case of SHA-256 it is |H| = 32 bytes.
Sig: Sig(m, ASK) describes the signature of a message m with secret key A. In ECDSA-256 the signature length of Sig is |Sig| = 64 bytes.
Ver: Ver(m, s, APK) describes the verification process of a signature s against message m and public key A. The result is either ‘success’ or ‘failure.’
TS: describes the 6-byte time-stamp to avoid replay attacks.
Appendix Volume 3 F-22

VSC-A Final Report: Appendix F Security Protocols and Implementation Results
Data packets have the following structure:
m SigA(H(m)||TS) (64 bytes)
Cert.-Dig. (8 bytes)
TS (6 bytes)
Certificates are sent in a piggy-back fashion to form data-certificate packets:
m SigA(H(m)||TS) (64 bytes) Cert. (117 bytes) TS (6 bytes)
4.3.1.2 Performance ECDSA-256 and SHA-256 are used to compute digital signatures. The computational overhead due to hashing is negligible for the considered message sizes. The time delay is computed as the sum of computation time at the sender and receiver side. The OTA overhead per message consists of the digital signature but no additional network layer overhead since signatures are sent together with the message. The security overhead for a 400 MHz computing platform is as depicted in Table 4-10.
Table 4-10: Security Overhead for 400 MHz
Message Authentication with Digital Signatures Over-the-air overhead 70 bytes per message Computations for sender A per message H(m) + Sig 6 ms Computations for all receivers B per message H(m) + Ver 23 ms Signature Generations per second 166 Signature Verifications per second 43 Time delay 29 ms
Note that additional overhead is introduced by the certificate distribution.
4.3.2 TESLA
Message authentication can be based on digital signatures or on timeliness as suggested by the TESLA protocol [25], [24], [26]. TESLA is based on so called hash chains where a secret x is iteratively hashed using a one-way hash function H:
x H(x) H(H(x)) … Hi(x)
Note that given x, it is easy to compute H(x) whereas the opposite is considered to be computationally infeasible when using an appropriate hash function H such as SHA-256. Time is divided into time slots. Each hash chain element is valid for a single time slot and can be seen as a secret key for that slot.
Figure 4 describes the main idea of TESLA. First, the sender commits to a key k by computing and broadcasting H(k). Then, the sender computes the MAC of a message m over key k and broadcasts m as well as MACk(m). After some time, the sender discloses k. The receiver is now able to verify k by computing H(k) and to compare it to the sender’s commitment. If this succeeds, the receiver computes MACk(m) and compares it to the
Appendix Volume 3 F-23

VSC-A Final Report: Appendix F Security Protocols and Implementation Results
MAC transmitted by the sender. The security of TESLA is based on the following security condition:
TESLA Security Condition--The receiver will only accept a message m as authentic if and only if:
1. The receiver can unambiguously decide, based on its internal time and the TESLA parameters, that the sender did not yet disclose the corresponding TESLA key at the time the message was received
2. The receiver can successfully authenticated, after receiving the corresponding TESLA key, the message using the MAC tag and validated the disclosed TESLA key by hashing it back to an already validated one
Note that a validated TESLA key is one that can be linked (by a hash chain) to a digital signature, which in turn can be verified using a certificate issued by a trustworthy CA.
H(K)AuthenticCommitment
m
MAC(K,m)
Kdisclosed
1: Verify K
2: VerifyMACH( m
MAC(K
K)AuthenticCommitment ,m)
Kdisclosed
1: Verify K1: Verify K
2: VerifyMAC
2: Verify MAC
3: m3: m3: m AAAuuuthththenenentttiiiccc!!!
Figure 4: TESLA Main Idea
Figure 5 describes a TESLA protocol run. Here, the sender first generates a hash chain as described above:
H(kn)=kn-1; H(kn-1)=kn-2 … H(k2)=k1
The sender authenticates a message m with ki in time slot ti as MAC(ki,m). In the example below, the sender authenticates the message in the first time slot and broadcasts m1, MAC(k1, m1). Then m2, MAC(k2,m2) and m3, MAC(k3, m3) is broadcast in the second and third time slots, respectively. Together with the third message, the sender also opens the key k1 of the first message by broadcasting the disclosed key. In the fourth time slot, the sender broadcasts m4, MAC(k4, m4), k2, and so on. Note that this setting is used for ease of presentation. It is also possible to open keys after sending a message in the immediately following time slot or a later time slot.
When receiving the fourth message, all receivers first verify whether H(k2) equals k1. If so, all receivers verify the MAC and finally accept the message as authenticated. Clearly, the first check only works if there is a secure anchor. Hence, in the third message the sender broadcasts k1 as well as a standard digital signature of k1. All receivers verify the signature and, if successful, accept k1. Once k2 is opened and verified by checking whether H(k2) equals k1, the property of a hash chain makes sure that k2 can be mapped on a digital signature and thus is authenticated. Note that it is crucial for TESLA that the
tt
Appendix Volume 3 F-24
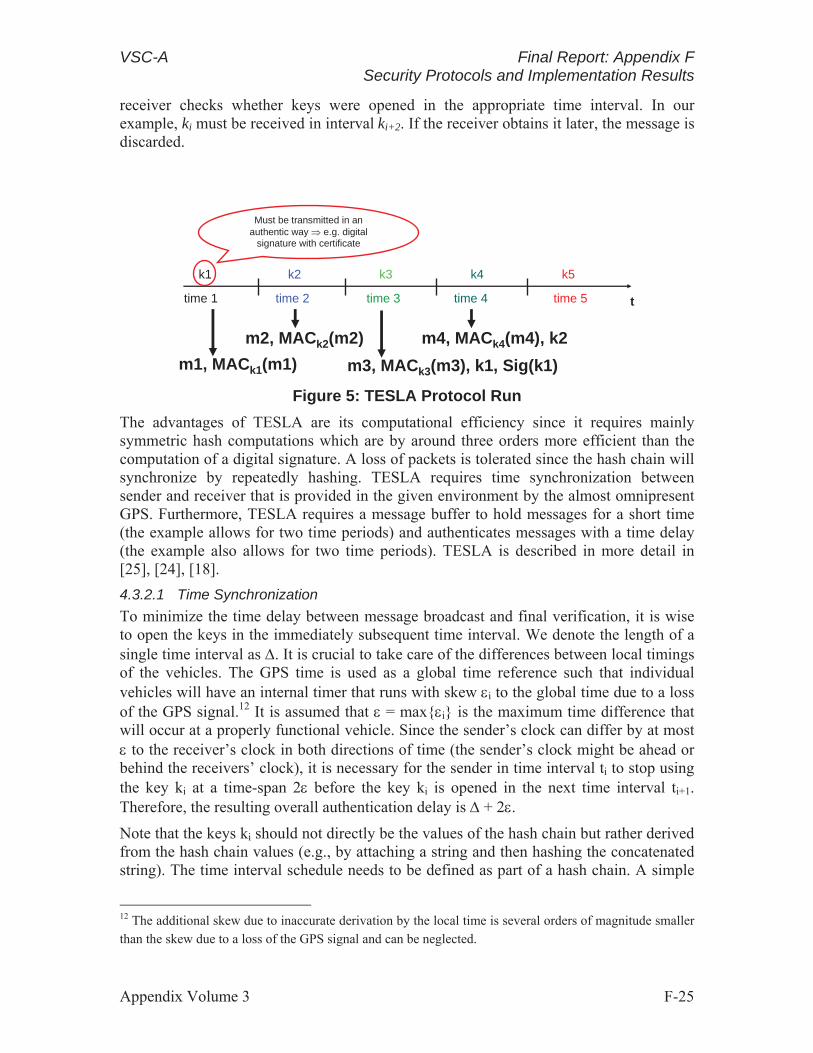
Must be transmitted in an authentic way e.g. digital
signature with certificate
k2 k3 k4 k5
time 1 time 2 time 3 time 4 time 5
k1
t
m2, MACk2(m2) m4, MACk4(m4), k2
VSC-A Final Report: Appendix F Security Protocols and Implementation Results
receiver checks whether keys were opened in the appropriate time interval. In our example, ki must be received in interval ki+2. If the receiver obtains it later, the message is discarded.
m1, MACk1(m1) m3, MACk3(m3), k1, Sig(k1)
Figure 5: TESLA Protocol Run
The advantages of TESLA are its computational efficiency since it requires mainly symmetric hash computations which are by around three orders more efficient than the computation of a digital signature. A loss of packets is tolerated since the hash chain will synchronize by repeatedly hashing. TESLA requires time synchronization between sender and receiver that is provided in the given environment by the almost omnipresent GPS. Furthermore, TESLA requires a message buffer to hold messages for a short time (the example allows for two time periods) and authenticates messages with a time delay (the example also allows for two time periods). TESLA is described in more detail in [25], [24], [18]. 4.3.2.1 Time Synchronization To minimize the time delay between message broadcast and final verification, it is wise to open the keys in the immediately subsequent time interval. We denote the length of a single time interval as . It is crucial to take care of the differences between local timings of the vehicles. The GPS time is used as a global time reference such that individual vehicles will have an internal timer that runs with skew i to the global time due to a loss of the GPS signal.12 It is assumed that = max{ i} is the maximum time difference that will occur at a properly functional vehicle. Since the sender’s clock can differ by at most to the receiver’s clock in both directions of time (the sender’s clock might be ahead or
behind the receivers’ clock), it is necessary for the sender in time interval ti to stop using the key ki at a time-span 2 before the key ki is opened in the next time interval ti+1. Therefore, the resulting overall authentication delay is + 2 .
Note that the keys ki should not directly be the values of the hash chain but rather derived from the hash chain values (e.g., by attaching a string and then hashing the concatenated string). The time interval schedule needs to be defined as part of a hash chain. A simple
12 The additional skew due to inaccurate derivation by the local time is several orders of magnitude smaller than the skew due to a loss of the GPS signal and can be neglected.
Appendix Volume 3 F-25

VSC-A Final Report: Appendix F Security Protocols and Implementation Results
method is to define the start time of the hash chain anchor. Since we need time accuracy in the millisecond range, we estimate a proper time definition field to require 6 bytes. This field is part of the signed hash chain anchor. 4.3.2.2 Protocol Refinements We use hash chains of l elements that are used for at most l time intervals each of time length . The value k1 is called the hash chain anchor, which needs to be digitally signed, and it is broadcast as (Sig(k1), k1). Furthermore, each i-th hash chain element is digitally signed such that (Sig(k1+ni), k1+ni) becomes the new anchor once the 1+ni-th interval is reached. In each time interval ti, an arbitrary amount of message packets mi,j can be authenticated and broadcast limited only by the computational and network restrictions. Messages are sent together with the MAC in data packets. Keys ki are disclosed in separate key packets by the sender at time ti+1+2 (according to the sender’s local time). The verifier discards the data packets if he received them later than ti+1+ (because of the maximum potential time skew between receiver and sender). Note that future keys can be used (i.e., in time interval ti the sender might use key kj where j i). In that case, the key kj is opened in interval j+1 but not in time interval i+1. Only keys which were used to authenticate messages are broadcast to save bandwidth. Key packets are then sent d times in d time intervals (i.e., one key per interval). It is up to the implementer to send the same key or subsequent keys of the hash chain.
The hash chains can be pre-computed at idle time. A vehicle might pre-compute hash chains and also pre-compute all signed hash chain anchors (including intermediate ones) while it is parked for some time-period such as a day or so. The hash chains can be stored with log2(l) elements, and elements can be recovered by a single hash operation [32]. Note that secure storage is required, if such a schema is used. Otherwise an attacker is able to forge authentic messages.
The signed hash chain anchor is broadcast together with a certificate as a certificate packet since the signature can only be verified if the sender’s certificate is available. The verifier stores the certificate for future messages in the best case until the certificate expires. The certificate packet includes the anchor such that immediate signature verification is possible. However, the anchor must not be used to authenticate a message since it is immediately opened; instead the next hash chain element should be used. The algorithm determining when to send the certificate and a signed anchor is implemented according to the certificate exchange mechanism.
The verifier receives message packets and buffers these. It is assumed that the receiver gets a hold of the signed hash chain anchor as well as the certificate beforehand and that it was able to verify these. When the verifier receives a key packet for time interval ti, it first verifies the key ki (by checking whether the hash or iterated hash equals in a previously trustworthy hash chain element) and then the buffered message packets. Packets that fail the MAC authentication verification are discarded. The successfully verified key ki is stored as the last trustworthy hash chain element for the next iteration. Packets stored in the buffer that cannot be verified after v time intervals can be discarded (i.e., if received in time interval ti, they are discarded in time interval ti+v+1 or later). 4.3.2.3 Protocol Parameters and Structure Below is a list of the protocol parameters for TESLA:
Appendix Volume 3 F-26

VSC-A Final Report: Appendix F Security Protocols and Implementation Results
: Maximum time difference (skew) to the GPS global time of a properly working DSRC unit. According to Section 2.5, the maximum skew is = 1.5 ms.
: The length of a time interval ti. In order to meet the low-time delay requirement R9, = 10 ms is chosen. Note that it is assumed this value is global.
: The key disclosure delay. Keys are disclosed in the immediately following time interval. The disclosed keys might be received in the immediately following time interval or later. Note that we assume this value to be global.
o: The key usage delay. Instead of using key ki in interval i, we use a future key ki+o in interval i. Keys are then regularly disclosed in interval i+o+ (i.e., in interval i+o+1). Note that this value can be individually set by every node and changed at run-time.
ti: The time interval i.
ki: Key used in time interval ti.
d: The number of key disclosures of an already disclosed key. We consider both d=1 and d=2. The first choice of d=1 keeps bandwidth overhead low whereas the second choice of d=2 decreases the probability of a safety message loss due to not being able to verify the message.
v: Defined time-span for buffering of data packets. After v time, interval packets can be discarded. v = 10 is chosen in order to keep buffer requirements low.
l: length of hash chain. It is wise to change hash chains together with pseudonyms as described later on. Note that the expected length is in the range of 30,000 to around 10,000,000 such that memory storage for at most 24 elements each of 32 bytes per hash chain is required.
T: T describes the definition for the time schedule. We estimate that the size of this field requires |T| = 6 bytes. Note that for each new hash chain, the time schedule is determined by the GPS clock rather than from the old hash chain’s schedule.
i: length of partition of a hash chain such that for each n it is (Sig(k1+ni), k1+ni) a signed hash chain intermediate anchor. To keep the hashing computation low, we assume i = 1000. Note that the corresponding time schedule T’ is derived of T by addition of the passed time (i.e., T’ := T + i * ).
H: H(m) describes the hash of message m. The hash algorithm is SHA-256. We assume that each TESLA key is valid for at most 100 ms. TESLA keys are derived from the hash chain elements by applying SHA-256. The potential attack at hand is a brute-force attack to the TESLA key as well as an attack to the hash chain. Later attack is similar in complexity as a brute-force attack to 128-bit AES. A brute-force attack on a TESLA key of life-span of 100 ms requires a key length of at least x bits according to requirement R4 where x fulfils (15 years / 2128-x) = 100 ms which holds for x 96 (cf. Section 3.6, Requirement R4). Therefore, we truncate the 256-bit output of H to |H| = 12 bytes. [Note: Truncation is only used
Appendix Volume 3 F-27

VSC-A Final Report: Appendix F Security Protocols and Implementation Results
for deriving TESLA keys of the hash chain values but not for computing the hash chain values!]
MACK(m): MAC describes the Message Authentication Code of a message m with key K. By the same arguments as above, the 256-bit output of MAC is truncated to |MAC| = 12 bytes.
Hash chains and signed hash chain elements are computed during run-time. The expected time for computing a hash chain is l * 30 μs. Using l = 1,000,000 this takes 30 seconds and should be pre-computed. For fast hash chain traversal, 20 elements need to be stored. Traversal is then, on average, computed by a single hash computation (i.e., in 30 μs). Each hash chain is split into 1,000 partitions each of i=1,000 hash chain elements). Each partition provides hash values for a duration of 1,000 * 10 ms = 10 seconds. Therefore, every 10 seconds a signature generation needs to be computed each taking 6 ms time.
The actual keys used for authentication are derived from the hash chain by computing the hash value according to SHA-256. The length of the hash values is 12 bytes. This is done as follows:
o Let ki be a hash chain element of 12 bytes. The next hash chain element ki-
1 is computed as the 12 least significant bytes of SHA-256(ki 0x00) where denotes concatenation. These values ki are the TESLA keys that are disclosed.
o The keys ki’ used with the MAC to compute an authentication tag are derived from the TESLA keys ki. They are computed as ki’ = the least 12 significant bytes of SHA-256(ki 0xFF).
HMAC-SHA-256 is used for computing the MAC authentication portion. However, the HMAC-SHA-256 output is truncated to the 12 least significant bytes.
Sig: Sig describes the signature of a message. The signature length of Sig is |Sig| = 64 bytes.
Ver: Ver describes the verification process of a signature. The result is either ‘successful’ or ‘failure.’
TESLA with separate key disclosure Data packets have the following structure:
mi,jMACki(mi,j||TS) (12 bytes) Cert.-Dig. (8 bytes) TS(6 bytes)
Appendix Volume 3 F-28

VSC-A Final Report: Appendix F Security Protocols and Implementation Results
Key packets are sent additionally and introduce a network layer overhead of 57 bytes. They have the following structure:
ki (12 bytes) Cert.-Dig. (8 bytes)
Certificates are always sent together with data packets to form Certificate-Data packets. These include the certificate as well as the signed hash chain anchor. Certificate packets are broadcast according to the certificate distribution algorithm. The anchor k1+ni must not be used to authenticate a message since it is immediately opened. However, this structure allows immediate verification of the hash chain anchor. Certificate packets might be sent together with data packets in a piggy-back fashion such that they do not introduce network layer overhead. Certificate-Data packets have the following structure:
k1+ni (12 bytes)
T (6 bytes)
SigA(k1+ni | T) (64 bytes)
Cert (117 bytes)
MACki(mi,j||TS) (12 bytes)
mi, TS (6 bytes)
TESLA Piggyback TESLA keys could also be disclosed as part of the next message packet (i.e., sent in a piggy-back fashion). The data and key packet would then be combined to a single packet and the overhead would significantly be reduced by 57 bytes. However, additional time delay is introduced, in particular if data packets are only rarely sent. This protocol version is called TESLA Piggyback, and the packet format then looks as follows for Data packets and Certificate-Date packets, respectively. TESLA keys could also be disclosed as part of the next message packet (i.e., sent in a piggy-back fashion). The data and key packet would then be combined to a single packet and the overhead would significantly be reduced by 57 bytes. However, additional time delay is introduced, in particular if data packets are only rarely sent. This protocol version is called TESLA Piggyback, and the packet format then looks as follows for Data packets and Certificate-Date packets, respectively.
Cert.-Dig. (8 bytes)
MACki(mi,j||TS) (12 bytes)
mi,j TS (6 bytes)
ki-1 (12 bytes)
k1+ni (12 bytes)
T (6 bytes)
SigA(k1+ni | T) (64 bytes)
Cert (117 bytes)
MACki(mi,j||T S) (12 bytes)
mi,j TS (6 bytes)
ki-1(12 bytes)
4.3.2.4 Performance The following table describes the performance of TESLA using the following assumptions. For ease of comparison, the broadcast of the hash chain anchor and its signature in the TESLA performance are included, but the certificate broadcast is not included. However, the certificate exchange algorithm determines the broadcast interval of the signed hash chain anchor since the latter one is always broadcast together with the certificate. Therefore, the comprehensive model for a certificate exchange is assumed (cf. Section 4.2.4) with parameters of Section 4.2.3. A signed hash chain anchor is on
Appendix Volume 3 F-29

VSC-A Final Report: Appendix F Security Protocols and Implementation Results
average broadcast every 375 ms together with a data or key packet (i.e., with on average every 3.75th message the signed hash chain anchor is broadcast). Opening of the keys adds 57 bytes of network overhead for the network layer header. Both cases of disclosing the key once (d=1) and twice (d=2) are considered. Potential network layer overhead of certificate and hash chain anchor broadcasts is considered with the certificate or data broadcast overhead, respectively. For the communication overhead of receivers B, it is assumed that the time span between entering A’s neighborhood and leaving it is 3 seconds such that a once obtained signed hash chain anchor is valid for 30 received messages (in most cases, this time span will be far longer). Note that computing a MAC over a short message, hash chain traversal, as well as simple hash chain iteration, is negligible in computational cost. The extensive hash chain iteration requires at most 1,000 hash iterations (worst case) and on average 500 (average case) to validate the first received key. The average case describes the mean value for the computational effort, whereas the worst case describes the case where the anchor needs to be verified first. Subsequently, an opened key needs to be iterated through the entire chain. If the anchor is already verified and a hash chain element stored as trusted (e.g., because of a previous validation), the computational effort is negligible. The time delay does not include the computation time for processing the certificate (and with it the signature verification of the hash chain anchor) since it is assumed that the certificate is broadcast well in advance. However, it includes the TESLA delay of at most + 2 = 13 ms.
Table 4-11: TESLA Performance Metrics
Metric Key Disclosed Once (d=1) Key Disclosed Twice (d=2)
Over-the-air overhead
Certificate-Exchange on Demand: |MAC| + (|H| + 57) + 1/3.75 * (|Sig| + |H| + |T|) = 12 + 12 + 57 + 1/3.75 * (64 + 12 + 6) 103 bytes per message
Certificate-Exchange on Demand: |MAC| + 2(|H| + 57) + 1/3.75 * (|Sig| + |H| + |T|) = 12 + 24 + 114 + 1/3.75 * (64 + 12 + 6) 172 bytes per message
Certificate with each message: |MAC| + (|H| + 57) + |Sig| + |H| + |T| = 12 + 12 + 57 + 64 + 12 + 6 = 163 bytes per message
Certificate with each message: |MAC| + 2(|H| + 57) + |Sig| + |H| + |T| = 12 + 24 + 114 + 64 + 12 + 6 = 232 bytes per message
Computations for sender A per message
Sig (pre-computed) + MAC(m) + hash chain traversal = negligible
Computations for receivers B per message
Average case: MAC(m) + 1/30 * ECDSA verification + 1/30 * (500 hash chain iterations) + hash chain iteration 23/30 + 4.5/30 0.9 ms Worst case: MAC(m) + ECDSA verification + (1000 hash chain iterations) + hash chain iteration 23 + 9 = 32 ms
Trusted hash chain element already stored: MAC(m) + hash chain iteration = negligible
Buffer overhead for receivers B
Few 100 bytes per communication partner (at most 20-30 Kbyte altogether)
Appendix Volume 3 F-30

VSC-A Final Report: Appendix F Security Protocols and Implementation Results
Metric Key Disclosed Once (d=1) Key Disclosed Twice (d=2) Authentication Generations per sec.
>> 100
Authentication Verifications per sec.
Average case: 1,000
Time delay (including TESLA key disclosure delay but without certificate exchange)
Average case: 0.9 + 13 = 13.9 ms
Worst case: 32 + 13 = 45 ms
Note that additional overhead is added due to the certificate exchange. 4.3.2.5 Certificate Exchange in TESLA The certificate exchange in TESLA conforms to the certificate exchange methods described in Section 4.2. Certificates can be broadcast with each message by combining a data packet with a certificate packet. Note that the signed hash chain anchor is also broadcast at this time. On the other side, the comprehensive certificate exchange model can be used to adjust the certificate broadcast. In that case, the certificate exchange algorithm determines broadcast of TESLA certificate packets. Note that receivers need to store the verified hash chain anchor additionally to the certificate identification.
It is suggested to combine the broadcast of the signed hash chain anchor together with the certificate and assume such a mechanism below. 4.3.2.6 Conclusions TESLA is mainly based on symmetric cryptography and is resource efficient. The latency at the sender’s side is negligible due to possible pre-computations. On the other hand, time delay is added on the verifier’s side because of time dependency.
TESLA provides broadcast authentication. It does not provide non-repudiation to a third party without additional mechanisms. Non-repudiation can only be obtained by adding a time-stamp to received data packets. For a summary of the conclusions please refer to the following table.
Table 4-12: TESLA Authentication Conclusions
TESLA Authentication Conclusions Message authentication is computationally extremely efficient.
TESLA does not provide non-repudiation (but can be introduced by a trusted time-stamp).
Receiver needs to get a hold of both the MAC authentication as well as the disclosed TESLA key (i.e., two packets must be received).
TESLA introduces time dependency.
Introduces time delay on the verifier’s side.
Appendix Volume 3 F-31

VSC-A Final Report: Appendix F Security Protocols and Implementation Results
4.3.3 TESLA Authentication and Digital Signatures (TADS)
TADS combines TESLA and digital signatures [10], [33]. The main idea is to digitally sign all messages and at the same time include TESLA information. The receiver is then able to either verify the message using the TESLA mechanism for optimal computational performance, or to verify the digital signature for immediate message validation. 4.3.3.1 Protocol Parameters and Structure TESLA is changed in such a way that the data packets include a signature over the message and the hash chain anchor. We keep the protocol parameters of TESLA and change the packet structure as described hereafter. Data packets use the following structure:
mi,j MACki(mi,j | SigA(mi,j||TS)) (12 bytes)
SigA(mi,j||TS) (64 bytes)
Cert.-Dig. (8 bytes)
TS (6 bytes)
Note that the MAC portion includes the digital signature. It is assumed that verifying the MAC is the first choice for a receiver. In order to avoid unnoticed manipulation of the digital signature portion, it is included in the MAC computation. Hence, if the MAC verification is successful, the receiver is sure that the appended digital signature was actually transmitted by the sender. On the other side, if the TESLA MAC verification step succeeds but the digital signature verification fails, then the recipient is convinced that the sender is cheating or that the message or signature were manipulated during transmission. However, since the digital signature is incorrect, there is no non-repudiation property, and the receiver cannot prove this to a third party such as the CA.
Key packets have the following structure:
ki (12 bytes)
Cert.-Dig. (8 bytes)
It is assumed that certificates are always sent together with data packets. Note that in the case that a certificate is transmitted along with a message, the most recent intermediate TESLA anchor is also automatically disclosed if it is renewed regularly as part of the TESLA schedule. Therefore, we disclose intermediate TESLA anchors (i.e., TESLA keys together with a time stamp and a digital signature over these two data elements) automatically in a piggy-back fashion. The following packet is called the combined data-certificate-key packet. The digital signature can be verified immediately based on the available information. The structure is as follows. Note that instead of using a certificate Cert, it is possible to attach the certificate digest Cert-Dig.
Appendix Volume 3 F-32

VSC-A Final Report: Appendix F Security Protocols and Implementation Results
k1+ni (12 bytes)
T (6 bytes)
Cert (117 bytes)
mi,j MACki(mi,j | SigA(mi,j | k1+ni | T||TS)) (12 bytes)
SigA(mi,j | k1+ni | T||TS) (64 bytes)
TS (6 bytes)
Also note that the TESLA schedule (key k1+ni, Time T) should be updated with the broadcast of each certificate packet in order to reduce the computational burden on the receiver’s side. Therefore, the length of a partition of a hash chain i is not fixed here but depends on the certificate distribution algorithm. There are now two choices: (1) broadcasting data packets followed by key packets to disclose TESLA keys, or (2) always broadcasting data-certificate-key packets to broadcast information, and at the same time disclose a TESLA key. In the last case, it is possible to include the full certificate only once in a while and otherwise attach the certificate digest.
A receiver obtaining a data packet now has the choice of using TESLA and waiting for the key packet to be opened, or the receiver might immediately verify the data packet by verifying the attached signature. Therefore, a protocol run looks either like the digital signature run (cf. Section 4.3.1) or the TESLA run (cf. Section 4.3.2).
TADS PIGGYBACK
TESLA keys could also be disclosed as part of the next message packet (i.e., sent in a piggy-back fashion). The data and key packet would then be combined to a single packet, and the overhead would be significantly reduced by 57 bytes. However, additional time delay is introduced, in particular if data packets are only rarely sent. We call this protocol version TADS Piggyback, and the packet format then looks as follows for Data packets and Certificate-Date packets, respectively.
Cert.-Dig. (8 bytes)
MACki(mi,j||TS) (12 bytes)
mi,j TS (6 bytes)
ki-1 (12 bytes)
signature (64 bytes)
k1+ni (12 bytes)
T (6 bytes)
Cert (117 bytes)
MACki(mi,j||TS) (12 bytes)
mi,j TS (6 bytes)
ki-1(12 bytes)
signature (64 bytes)
4.3.3.2 Performance The following table describes the performance of TADS. In order to keep the OTA overhead in an acceptable range, disclosed keys are not resent (i.e., a value d=1). Otherwise, we use the same assumptions as for TESLA (cf. Section 4.3.2).
Table 4-13: TADS Performance Metrics
TADS Performance Metrics
Over-the-air overhead |MAC| + 2 |H| + 57 + |T| + |Sig| = 12 + 2*12 + 57 + 6 + 64 = 163 bytes per message
Computations for sender A per message
Sig + MAC(m) + hash chain traversal 6 ms
Appendix Volume 3 F-33

VSC-A Final Report: Appendix F Security Protocols and Implementation Results
TADS Performance Metrics
Computations for receivers B per message
Immediate verification (ECDSA mode): Ver 23 ms Average case (TESLA mode): MAC(m) + 1/30 * ECDSA verification + 1/29 * (500 hash chain iterations) + hash chain iteration 23/29 + 4.5/29 1 ms Worst case (TESLA mode): MAC(m) + ECDSA verification + hash chain iteration 23 ms
Trusted hash chain element already stored: MAC(m) + hash chain iteration = negligible
Buffer overhead for receivers B few 100 bytes per communication partner (at most 20-30 Kbyte altogether)
Authentication Generations per second
166
Authentication Verifications per second
Immediate verification: 43 Average case: 1,000
Time delay (including TESLA key disclosure but without certificate exchange)
Immediate verification: 29 ms Average case: 1 + 13 = 14 ms Worst case: 32 + 13 = 45 ms
4.3.3.3 Conclusions TADS combines TESLA and digital signature broadcast authentication. The receiver can immediately verify messages at additional computational cost, or the TESLA information can be used after a time delay. A receiver might base the decision of which verification method to use on the message content or on the expected time delay. For instance, the receiver might verify the message using the digital signature if it did not receive the disclosed TESLA key during the next time interval. The flexibility of time delay comes at the cost of OTA overhead. Furthermore, TADS inherits the properties of digital signatures, in particular the non-repudiation property. For a summary of the conclusions please refer to the following table.
Table 4-14: TADS Conclusions
TADS Conclusions A digital signature is attached to all messages.
The non-repudiation property is attained if the digital signature is verified for a given message.
Messages can immediately be verified by performing a digital signature verification.
Messages can efficiently be verified by performing a TESLA verification.
Introduces additional bandwidth overhead due to the attached signature.
Appendix Volume 3 F-34

VSC-A Final Report: Appendix F Security Protocols and Implementation Results
4.4 Verify-on-Demand (VoD)
The VSC-A architecture as depicted in Figure 1 suggests that after reception messages are always verified for a valid signature, and only successfully verified signatures are then processed. However, most of these routine safety messages will not result in driver warnings since it is expected that the VSC-A system would be used to provide warnings only when the threat of a collision is high. Therefore, it is reasonable to define an approach where messages are first processed and then verified on demand only. In the following sections such an approach is defined and reasonable assumptions are derived.
4.4.1 Background and Assumptions
The verify-and-then-process approach first verifies the signatures of all incoming data packets for trustworthiness. If the signature verification is successful, then the message is processed. The flow is depictured in Figure 6.
Threat level threshold
Threat level > threshold
Failed; discarded
Signature Verification (Security Module)
Threat Processing & Threat Arbitration
DVI Notifier (DVIN)
DSRC Radio (Physical Layer)
Figure 6: Verify-and-then-Process Flow
If threat processing and threat arbitration determines a threat level greater than a given threshold (representing a potential threat), the DVIN is involved to finally notify the needed information to the DVI that provides the warning/notification to the vehicle driver appropriately based on the threat level. The Threat Processing and Arbitration typically works on a packet-by-packet basis when evaluating the threat level. The DVIN only passes a notification to the vehicle DVI after receiving a positive threat level. On the other hand, the DVIN might decide not to pass a notification even in the case of a positive threat level (e.g., if another notification was just displayed to the driver).
The number of messages that evaluate to a threat level greater than zero is foreseen to be in the range of 20 received messages per second. This requirement arises from the worst case assumption of the Blind Spot Warning (BSW) application which might result in the
Appendix Volume 3 F-35

VSC-A Final Report: Appendix F Security Protocols and Implementation Results
highest number of threat messages to the Threat Arbitration module for evaluation. If it is assumed that a vehicle encounters at most four new vehicles on both the left and right side per second, then it should be clear that at most eight new messages can be produced in that one second that results in a threat level that is greater than zero. However, it is possible to adjust the strategy to only verify the first message that evaluates to a threat level larger than the given threshold in order to reduce the CPU load. Further messages that might evaluate to such a threat level could be introduced by RSUs. Applications such as emergency brake warning (EEBL), etc., will be triggered very rarely in the order of days such that their effect on the total load of messages evaluating to a threat level greater than zero is negligible. Altogether, the load of messages being evaluated at a threat level larger than a given threshold is foreseen to be at most 20 per second. Therefore, it is reasonable to define and evaluate the VoD approach.
4.4.2 Verify-on-Demand
Assuming that only messages that evaluate to a threat level larger than zero have an actual impact to a vehicle’s safety level, it is reasonable to only verify these messages that result in a threat level above that threshold value [11]. As described above, this results in a signature verification load of at most 20 per second. Compared to the overall received messages of at most 1,000, this is a potential significant reduction of the verification load compared to the standard approach of always verifying signatures before Threat Processing and Arbitration. Note that this approach does not affect the signature generation. All messages are still signed before being broadcast.
Typically, packets are verified on a packet-by-packet, verify-then-process basis. It is assumed that all packets that lead to a threat level larger than the given threshold are verified. It is possible to configure it for any set of packets that finally lead to a threat level larger than the given threshold, all packets of the set are verified or only the packet of greatest threat level is verified.
Assume that an attacker has complete knowledge of the Threat Arbitration module algorithms and that the adversary has full control over the DSRC radio including the secret key data. The adversary may then be able to construct messages that would need to be verified and messages that would not be verified. The attacker is not able to use its power in order to mount an attack since the WSM that would lead to a threat level greater than zero (the ones that may result in an impact to the driver) will be verified first. Thus any message of importance to cause a warning will be verified by this approach.
Now consider the detection of malicious or defective nodes. If the message content is obviously manipulated, a “sanity check” module at the verifier’s side could detect such manipulation and trigger a signature verification. In case of a valid signature, the “sanity check” module could trigger further actions that could, for instance, result in a certificate revocation. Note that the signature verification does not need to be done immediately if the threat level of the message is zero, but it can be shifted to idle time. If a message has an invalid signature, no conclusions can be drawn about the sender in both the Always-Verify and VoD approaches. Again, based on the packet-by-packet evaluation assumption of the Threat Arbitration, detection of malicious and defective nodes does not differ in these approaches.
Appendix Volume 3 F-36

DVI Notifier
Verified Threat with Level > threshold
Signature Verification (Security Module) Processing (Application/Safety Layer)
Failed; Threat Threat level > discarded threshold
Threat Processing and Threat Arbitration
Threat level threshold
DSRC Radio (Physical Layer)
VSC-A Final Report: Appendix F Security Protocols and Implementation Results
Finally, DoS attacks are considered. In the Verify-All approach, it is easy to mount an attack using faked messages with invalid signatures. The VoD approach is vulnerable to this attack in the same way. Here, messages that are known to evaluate to a threat level larger than zero are created and broadcast. Therefore, the approaches do not differ in this attack category. 4.4.2.1 Implementation The VoD approach can be implemented by introducing a Signature Verification module in between the Threat Arbitration and DVIN module (cf. Figure 1) as depicted in Figure 7. The criteria when to perform a signature verification does not need to be globally defined, but it can be individually fixed per implementation. These criteria depend on the design and implementation of the safety applications as well as on available HW resources.
Figure 7: Verify-on-Demand Flow
Note that the security layer is put in between two application processing layers such that separation of concerns is removed and a cross-layer architecture is introduced. Therefore, the proper and secure implementation of this approach tends to be different than in the Always-Verify approach.
4.4.3 Summary
The VoD processing method should not be seen as an alternative to efficient authentication protocols but as an orthogonal and practical approach. The basic principle can be used with existing security protocols right away while the research continues into the design of efficient authentication protocols for VSC-A. The design principle of verifying messages may be summarized as follows:
Appendix Volume 3 F-37

VSC-A Final Report: Appendix F Security Protocols and Implementation Results
1. If verification of all incoming messages can be done by designing an efficient authentication protocol, then we will be able to verify all incoming messages in a timely fashion (cf. security requirements of Section 3).
2. If verification of all incoming messages cannot be done in a timely fashion or is computationally expensive, then we can use the VoD approach to verify only the messages that result in a potential safety warning to the HV and its driver.
The VoD approach results in cross-layer security design and introduces security assumptions in the application layer. However, the VoD approach allows balancing of the verification load at run-time in congested situations without any further compromise on the security properties of the VSC-A system. The approach also allows implementing V2V applications today on a computationally weak HW platform. The approach will then, over time, verify more and more messages as the computational HW platform becomes faster. Therefore, the VoD approach is inherently compatible to future versions and allows quick deployment today. The pros and cons of the Always-Verify and VoD approaches are summarized in Table 4-15.
Table 4-15: Pros & Cons of Verify-then-Process and VoD Approaches
Verify-then-Process Verify-on-Demand
Pros
No special security assumptions need to be made for the implementation
Clear separation of security and application layer
Relieves the security module from its heavy load of verification
Allows flexible balancing of verification load
Stays easily compatible with future generation implementations and allows quick deployment
Cons High processing burden
The approach introduces a cross-layer security design assumption on the application layer
Limits the design-to-threat evaluation on a per packet basis’s
4.5 Conclusions
Message broadcast authentication mechanisms consist of a certificate exchange mechanism as well as an authentication scheme. While the comprehensive model for the certificate exchange appears to outperform the certificate with each message algorithm, there are three potential protocols for the authentication scheme: TESLA, TADS, and VoD. Each of these schemes has advantageous and drawbacks such that there is no protocol clearly ahead. All three protocols have clear advantages to using plain digital signatures, though. While TESLA is extremely efficient in computational performance, TADS combines the best of both TESLA and digital signatures in a single protocol at
Appendix Volume 3 F-38

VSC-A Final Report: Appendix F Security Protocols and Implementation Results
additional overhead. On top of and orthogonal to the authentication protocols, the VoD approach might be used. It allows flexible handling of the signature verification load and is particularly appealing since it allows both compliance to IEEE 1609.2 and applying a computational standard HW platform in vehicles. The protocols will be evaluated in more detail in Chapter 6.
Further authentication schemes were analyzed but dismissed. These include the Asymmetric MAC Broadcast Authentication [8], the BiBa signature and broadcast authentication scheme [23], Efficient Multi-chained Stream Signature (EMSS) scheme [25], group signatures, and ID-based signatures [3].
Appendix Volume 3 F-39

VSC-A Final Report: Appendix F Security Protocols and Implementation Results
5 Potential Protocols for Privacy Protection
Privacy can be protected both on the vehicle’s side and on the organizational level. It is wise to consider a combination of both approaches to ensure a sufficient level of privacy. And while it might be desired and or necessary to allow access to private data to a trusted third party in a well-defined manner, such as to allow for revocation of vehicles, a proper balance needs to be achieved.
In the following sections, protocols for privacy protection including the impact on vehicle revocation are considered. The considered aspects derived from the security requirements are as follows:
1. Change of identifiable properties (Requirement R10)
2. Pseudonym identifiers (Requirement R11)
5.1 Change of Identifiable Properties
Vehicles broadcast messages together with a certificate such that receivers are able to verify the message validity. An attacker can easily predict whether two messages were authenticated using the same credentials (certificate). The same holds for other identifiable properties such as MAC address. In the following sections, mechanisms to provide so called location privacy are presented.
5.1.1 Multiple Certificates
A certificate can be identified by its public key such that DSRC radio transmissions can be linked based on the associated public key. To avoid linking of transmissions, it is wise to provide vehicles with multiple certificates and change the public key periodically. 5.1.1.1 Certificate Change Strategy Raya and Hubaux suggest a periodic change of certificates based on the vehicle’s driving and DSRC properties such as transmission range, messages per second and speed [27]. They determine in their setting on a highway an appropriate time period for a certificate change of around one minute.
Further approaches suggest changing pseudonyms once the best opportunity is identified. In [12], it is assumed that it is reasonable for a vehicle to change identities when it is hard for a DSRC radio observer to distinguish vehicles. Therefore, the level of disorder (i.e., entropy), is applied as metric. A vehicle first assesses its environment and determines the entropy based on that information. Once the level of entropy reaches a certain threshold, a pseudonym change is triggered. An algorithm is proposed and analyzed in [13]. The algorithm suggests changing pseudonyms if the number of vehicles in the close neighborhood passes a defined threshold.
If a vehicle is driven on average five hours per day, assuming a certificate has a size of 117 bytes and changes every minute without being reused, approximately 12.2 megabytes of storage space is required to hold certificates for one year. By changing pseudonyms less frequently or reusing certificates, the required storage space is reduced.
Appendix Volume 3 F-40
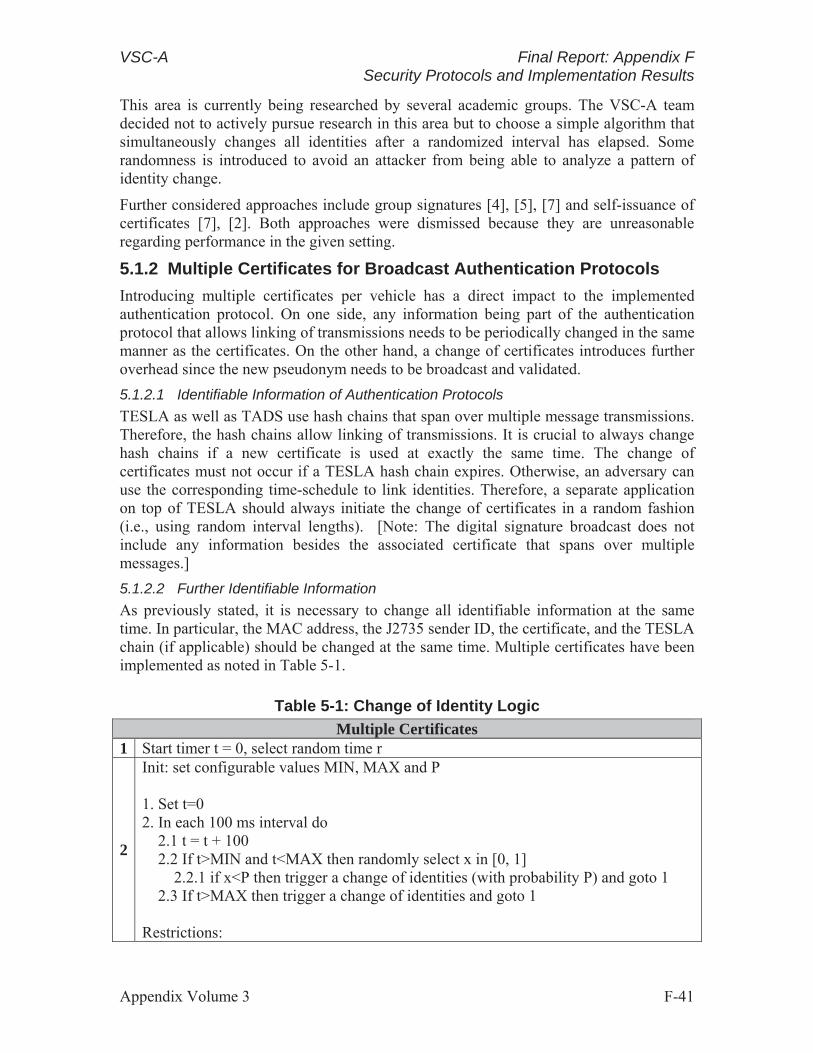
VSC-A Final Report: Appendix F Security Protocols and Implementation Results
This area is currently being researched by several academic groups. The VSC-A team decided not to actively pursue research in this area but to choose a simple algorithm that simultaneously changes all identities after a randomized interval has elapsed. Some randomness is introduced to avoid an attacker from being able to analyze a pattern of identity change.
Further considered approaches include group signatures [4], [5], [7] and self-issuance of certificates [7], [2]. Both approaches were dismissed because they are unreasonable regarding performance in the given setting.
5.1.2 Multiple Certificates for Broadcast Authentication Protocols
Introducing multiple certificates per vehicle has a direct impact to the implemented authentication protocol. On one side, any information being part of the authentication protocol that allows linking of transmissions needs to be periodically changed in the same manner as the certificates. On the other hand, a change of certificates introduces further overhead since the new pseudonym needs to be broadcast and validated. 5.1.2.1 Identifiable Information of Authentication Protocols TESLA as well as TADS use hash chains that span over multiple message transmissions. Therefore, the hash chains allow linking of transmissions. It is crucial to always change hash chains if a new certificate is used at exactly the same time. The change of certificates must not occur if a TESLA hash chain expires. Otherwise, an adversary can use the corresponding time-schedule to link identities. Therefore, a separate application on top of TESLA should always initiate the change of certificates in a random fashion (i.e., using random interval lengths). [Note: The digital signature broadcast does not include any information besides the associated certificate that spans over multiple messages.] 5.1.2.2 Further Identifiable Information As previously stated, it is necessary to change all identifiable information at the same time. In particular, the MAC address, the J2735 sender ID, the certificate, and the TESLA chain (if applicable) should be changed at the same time. Multiple certificates have been implemented as noted in Table 5-1.
Table 5-1: Change of Identity Logic
Multiple Certificates 1 Start timer t = 0, select random time r
2
Init: set configurable values MIN, MAX and P
1. Set t=0 2. In each 100 ms interval do
2.1 t = t + 100 2.2 If t>MIN and t<MAX then randomly select x in [0, 1] 2.2.1 if x<P then trigger a change of identities (with probability P) and goto 1 2.3 If t>MAX then trigger a change of identities and goto 1
Restrictions:
Appendix Volume 3 F-41

VSC-A Final Report: Appendix F Security Protocols and Implementation Results
Multiple Certificates If a change of identities is triggered but the following requirements are not fulfilled, delay the change of identities until both requirements are fulfilled. 1. Change of identifiers shall not happen for the duration when event-based applications were currently setting the event flag in the OTA message. 2. Change of identifiers shall happen only when the threat state for each threat from each application is below to a pre-defined configurable value.
5.2 Pseudonym Identifiers
Random identifiers are a straightforward way of implementing pseudonyms that cannot be mapped to a real-world identifier. The mechanism is implemented as follows:
Pseudonym Identifier Generator ID = RNG()
Here, RNG is a random number generator that generates truly random numbers. Such pseudonyms are used for identifying and managing entities in the system, and in particular, as certificate identifier. By having random certificate identifiers, it is a straightforward method to implement a scheme such that no publicly known identifiers are ever broadcast. However, the CA might hold additional non-public information that allows a mapping of an identifier to a real-world identity.
5.2.1 Anonymity Against the CA
If anonymity against the CA is desired, organizational means need to be established. Organizational management aspects are not further pursued here but point to [34].
5.3 Conclusions and Recommendations
As a basic set of privacy protection mechanisms, the team suggests using the following recommendations which fulfill the requirements:
1. Use randomized pseudonyms
2. Provide vehicles with the ability to change pseudonyms/certificates simultaneously with further identifiable properties
The implementation of further privacy protection mechanisms that were described above mainly depends on the requirements defined by authorities, vehicle manufacturers, and vehicle drivers and is out of scope for this project. These requirements require a balance to be struck between privacy and the necessary level of control over the system and network.
Appendix Volume 3 F-42

VSC-A Final Report: Appendix F Security Protocols and Implementation Results
6 Protocol Evaluation
In the following sections, the authentication protocols will be evaluated.
6.1 Protocol Properties
The authentication protocol properties are summarized in Table 6-1.
Table 6-1: Authentication Protocol Properties
Authentication Protocols Digital Signatures TESLA TADS Verify-on-Demand
Defined in IEEE 1609.2
Well researched
Robust
Computationally demanding
Very efficient
Depends on timeliness
Receiver needs to get hold of two packets (message and key) to validate the message
No non-repudiation
Introduces time delay on verifier side
Combination of TESLA and digital signatures
o Messages can be efficiently verified using TESLA
o Messages can immediately be verified using digital signature
Non-repudiation property is attained
Introduces additional bandwidth overhead
Only verifies critical messages (threat level 0)
Relieves security module from heavy load
Is compatible to future versions and IEEE 1609.2
Introduces cross-layer security design assumptions on the application layer
The privacy protection method properties are listed below in Table 6-2.
Appendix Volume 3 F-43

VSC-A Final Report: Appendix F Security Protocols and Implementation Results
Table 6-2: Privacy Protection Method Properties
Pseudonym identifiers Multiple Certificates Use random strings as public identifiers
No publicly known identifiers need to be broadcast
Use multiple certificates per vehicle
Change all identifiers simultaneously
Use supporting infrastructure (optional)
Introduces location privacy
6.2 Security Properties
All of the security schemes provide message authentication and integrity whereas no confidentiality is provided. Furthermore, there is no explicit mechanism for availability provided. The protocols differ in the non-repudiation property.
6.2.1 Digital Signatures
Digital signatures provide inherent non-repudiation. Any message that was digitally signed and that can be verified using a certified public key is non-repudiable. Therefore, any party that received and verified such a message can prove the identity of the message sender to a third party.
6.2.2 TADS
TADS is based on digital signatures as well as TESLA. Therefore, messages authenticated with TADS provide non-repudiation based on the digital signature properties. [Note: TADS computes the TESLA MAC over the ECDSA signature.] In most cases, a receiver will verify the MAC but not the digital signature due to the increased processor load. Therefore, a malicious sender could provide an invalid ECDSA signature but a valid MAC such that the non-repudiation property of ECDSA is not given anymore.
6.2.3 TESLA
The situation is different for TESLA. TESLA is not a signature mechanism and does not provide non-repudiation as anybody could forge “authentic” TESLA packets after the key is disclosed. However, in conjunction with a trusted time-stamping mechanism, TESLA could achieve properties similar to a digital signature, as explained in [26]. [Note: The time-stamp needs to enable a judge to verify whether a message arrived safely before the corresponding TESLA key was disclosed.]
The level of trust in the non-repudiation property of that given message directly depends on the level of trust in the attached time-stamp. For instance, if the message is received by a RSE that forwards the message to a certified time-stamp server, the level of trust is high. Furthermore, vehicles might store received messages in an event data recorder and attach the time of message reception. The level of trust then depends on the internal vehicle time as well as the level of tamper protection of the vehicle’s computational
Appendix Volume 3 F-44

VSC-A Final Report: Appendix F Security Protocols and Implementation Results
platform. If the computational platform is tamper evident or even tamper resistance, the level of trust might be acceptable for the CA to use the stored information; whereas, it is probably not acceptable without tamper-evident HW. [Note: Such limitations do not exist for the case of digital signatures and TADS. Here received messages can be stored in an unprotected event data recorder, and the trust is entirely based on the original digital signature over the message.]
6.3 Cryptography
ECDSA-256 and SHA-256 are used for issuance of certificates as well as for the digital signature and TADS. TESLA is designed in such a way that for the temporary keys a 96-bit key having a life span of at most 100 ms is used. Such a key provides sufficient security according to the requirements for up to 15 years/2128-96 = 110 ms. Therefore, according to current knowledge, Requirements R1, R3, and R4 are met. Requirement R2 is met by using an authenticated time stamp and location information.
The security margin of current cryptosystems was analyzed in [14] in 2006. It was estimated that compromising ECC with 128 bit keys requires around one year of time at a cost of 1,000,000 Euro. The algorithms suggested here are 264 times harder to compromise. Assuming Moore’s Law that suggests that HW capabilities double every 18 months, it is derived that the scheme can be compromised in 2102 at a runtime of one year and a cost of 1,000,000 Euro (using today’s currency value). On the other side, the scheme can be compromised today in one year at a cost of 1025 Euro. An attacker investing 10 billion Euro and 1 year run time would be able to compromise the system in 2040. It becomes clear that breaking the cryptographic mechanisms can be considered infeasible.
During the last years, attacks against the SHA-1 hash algorithm were discovered. Until now, no such attack was discovered against SHA-256. However, since these algorithms are very similar, it is just a matter of time until attack advancements are made. In general, it is wise to review the applied cryptographic algorithms.
6.4 System Performance
Table 6-3 gives an overview of the authentication protocols’ performance. The authentication protocols ECDSA, TESLA, and TADS are combined with the comprehensive certificate distribution. Furthermore, VoD is presented. The performance is derived from the performance analysis of the certificate exchange and the broadcast authentication protocol. The computation time for certificate verification is not considered.
For TESLA the communication overhead of receivers B, it is assumed that the time-span between entering A’s neighborhood and leaving it is 3 seconds such that a once obtained signed hash chain anchor is valid for 30 received messages (in most cases, this time-span will be far longer).
The computational performance is described both for authentication generation and verification independently. Vehicles need to perform both generation and verification. The available resources are then shared for doing so. Below, performance numbers are
Appendix Volume 3 F-45

VSC-A Final Report: Appendix F Security Protocols and Implementation Results
presented assuming that both authentication generation and verification methods have full leverage of the available resources.
A crucial metric is OTA overhead. It is computed by adding the performance values of the certificate exchange and authentication protocol analysis. It is assumed that certificate packets are always sent in a piggy-back fashion together with data packets. The OTA overhead is quantified in bytes per second when assuming 10 messages on average per second. Network overhead on the MAC and PHY layer as well as the IEEE 1609.2 packet layer is incorporated where security mechanisms introduce such overhead.
It becomes clear that ECDSA fails the required authentication verifications. TESLA and TADS is very efficient in terms of signature verification but comes at the cost of increased bandwidth overhead.
Table 6-3: Authentication Protocol Performance
Authentication Protocol Performance Performance Requirement
ECDSA TESLA TADS Verify-on-
Demand (ECDSA)
R5 Certificate size 117 bytes 117 bytes 117 bytes 117 bytes
R6 Authentication generations per second
166 >> 100 166 166
R7 Max. authentication verifications per second
43 1,000
1,000 / 43 (TESLA / immediate verification)
43 (requires 20 authentication verifications after filtering)
R8
Time delay (authentication generation + verification)
29 ms
14 ms (average) 51 ms (worst)
14 ms (average) 36 ms (worst) 29 ms (immediate)
29 ms
Appendix Volume 3 F-46

7
VSC-A Final Report: Appendix F Security Protocols and Implementation Results
Implementation of the New Security Protocols
In the following sections, details of the implemented security protocols are described.
7.1 General Specification
7.1.1 Link Messages to Certificates
Certificates are typically not attached to each message13 in order to save OTA bandwidth. The average OTA overhead caused by the security protocols depends on a variety of different parameters, such as the underlying cryptographic protocol (ECDSA, TESLA, TADS), key sizes (ECDSA-224/256) and certificate distribution parameters. The table below shows the expected OTA overhead under the assumption that certificates are broadcast piggy-backed style with every xth message. The given security overheads were derived from the actual implementation of the security module which uses 148-byte certificates.
If a certificate is not transmitted, the message must include a reference to the certificate in order to identify the originator of a message. This is achieved by a so-called certificate digest which is identified by the hash-value H(cert) truncated to the eight least significant bytes (cf. [15]). The probability of two vehicles using the same certificate digest is then negligible.14
Table 7-1: Average OTA Overhead Caused by the Various Security Protocols
Method OTA (bytes) X=3 X=10
ECDSA-256 (187 + 78*(x-1))/x 115 89
TESLA (ECDSA-256/no piggy back) 77+(217 + 26*(x-1) )/x 167 122
TESLA (ECDSA-256/piggy back) (229 + 38 *(x-1) )/x 102 57
TADS (ECDSA-256/no piggy back) 77+(217 + 90 * (x-1))/x 210 180
TADS (ECDSA-256/piggy back) (217 +102 * (x-1) )/x 141 114
13 It is possible to enforce the transmission of certificates with each message using the corresponding SM parameter. 14 The probability of two vehicles using the same certificate reference (i.e., the same truncated hash value) is larger than 0.5 for a set of more than 4 billion vehicles due to the birthday paradox.
Appendix Volume 3 F-47

VSC-A Final Report: Appendix F Security Protocols and Implementation Results
7.1.2 Over-the-Air Message Format
The OTA format of messages and certificates was defined according to IEEE 1609.2 [15] and using slight adoptions to account for the specific security protocols.
7.1.3 Time Format
For security purposes, time is measured in milliseconds since 00:00:00 Coordinated Universal Time (UTC) of January 1, 2004 and is represented in a 6-byte field. A precision in milliseconds is sufficient for the V2V security requirements. For ease of use, the 6-byte time value might be converted to a UINT64 for computation15.
Note that in [15] the following data types are defined: (1) Time32 describing the time in seconds since January 1, 2004, and (2) Time64 describing the microseconds since January 1, 2004. For the purpose of the VSC-A Project, the number of milliseconds suffices.
7.1.4 Time-Stamp and Geographic Location
The time-stamps and geographic locations of messages must be authenticated. The location is part of the SAE J2735 format and will be authenticated as part of the J2735 Part I payload. A 6-byte time stamp is included in the security field of the message.
7.1.5 Cryptographic Algorithms and Pseudo Random Number Generator
The cryptographic algorithms SHA-256, ECDSA [1], and HMAC [31] are implemented according to accepted standards. For ECDSA, the elliptic curve P-256 is used for message authentication and certificates [29]. It is recommended to use the elliptic curve P-224 in future implementations for message authentication to reduce CPU load.
The pseudo random number generator (PRNG) HMAC_DRBG based on SHA-256 is implemented according to [22]. A random key for the PRNG is generated and brought in at deployment time.
7.2 TESLA
7.2.1 Modes of Operation
If a DSRC radio is used that implements the IEEE 1609 Standard, then V2V communication is only possible during the control channel interval. The control channel interval has a duration of 38 ms during a periodic 100 ms interval16 (the IEEE 1609 standard defines a duration of at most 44 ms depending on the chosen guard time intervals). The following approaches are implemented:
1. Interval allocation: The TESLA time intervals are allocated such that the TESLA time interval starts together with the control channel interval. This approach is only possible if the OBE initially synchronizes with the security module. We send TESLA messages at the beginning of the first three intervals
15 A conversion to the Time64 format is simply achieved by multiplying the Time48 value with 1,000. 16 Presuming that messages are generated at a frequency of 10 Hz.
Appendix Volume 3 F-48

VSC-A Final Report: Appendix F Security Protocols and Implementation Results
only and disclose keys (if any) during the second to fourth interval. Note that on average only one message per 100 ms is sent so that exactly one message, one disclosed key as well as one re-sent disclosed key is broadcast during a 100 ms interval. Messages sent during the fourth TESLA interval will be delayed to the start of the next control channel interval start. Therefore, it is wise to allocate messages such that they are sent during the beginning of the control channel interval. This is depicted in Figure 8. There is a very high probability that data packets passed to the MAC layer are broadcast within 5 ms. The OBE provides a method such that the security module is notified at the start of a control channel interval to ease the implementation of this approach.
2. Separate TESLA key disclosure: In the standard configuration used in the VSC-A Project heartbeat safety messages were generated randomly during the control channel. Due to processing latencies caused by the security module and latencies caused in the network layer prior to broadcasting a safety message, it can happen that a message is broadcast in the subsequent control channel. In order to compensate the delay effect of channel switching instead of using key ki in interval i, a future key ki+o in interval i is used to compute the MAC to ensure that a TESLA key is always disclosed in an interval after the message has been broadcast. As defined in the TESLA protocol, a key ki+o is then normally disclosed in the following interval i+o+1. Due to channel switching, it is expected that the maximum key disclosure delay is in the range of 70 to 80 ms. Therefore, a key disclosure delay of around o = 7 TESLA time intervals, which means a delay of an additional 70 ms, is introduced.
3. Piggy-backed TESLA key disclosure: Using a piggy-backed key disclosure, instead of broadcasting a TESLA message Mi and some time later the corresponding TESLA authentication key Ki as a separate OTA packet, it is also possible to attach the authentication key to the next message by broadcasting Mi+1|Ki to save OTA bandwidth. Hence, TESLA keys are typically disclosed approximately 100 ms later.
If Channel 172 is used instead of channel switching (i.e., if a full 6 Mbit/s channel is available for safety applications and the SM at any time), then approach 1 can be used with a significantly reduced key disclosure latency value of o = 2 or 3.
Appendix Volume 3 F-49

open keys
100 ms
38 ms
control channel Channel access
TESLA intervals
send messages
VSC-A Final Report: Appendix F Security Protocols and Implementation Results
Figure 8: TESLA Adaption to Channel Access
7.2.2 Sequential Byte
Messages can be mapped to a sender by means of the certificate or the certificate digest, respectively. Therefore, if a TESLA key was disclosed, it can be mapped to the sender using the included certificate digest. However, the disclosed TESLA key cannot be mapped to the TESLA message if authenticated without additional information. Therefore, an additional byte is reserved in TESLA messages (data packets) and disclosed keys (key packet) which contain a sequential number that associates TESLA messages with the corresponding disclosed authentication keys.
While the sequential byte does not influence security and reliability, there are cases where it improves the efficiency of the implementation. However, at this time it is unclear if the increase in efficiency is worth increasing the OTA overhead. Please note that the sequential byte is not necessary when disclosing TESLA keys piggy-backed, because messages are always transmitted in the right order.
7.2.3 TESLA Key Chain Privacy Preserving Algorithm
A change of hash chains needs to be handled carefully in TESLA after a certificate change since a continuous hash chain will give an adversary additional information to compromise privacy. Therefore, randomness needs to be introduced when changing TESLA hash chains. The following approach is used.
Let Ci be the certificate used in the considered time-frame. After a vehicle switches to certificate Ci, a new TESLA hash chain is used. As described above, the hash chain is divided into partitions of length i. If a hash chain of length l is exhausted, a new hash chain is started. A vehicle V determines the TESLA schedule as follows [18]:
1. For each certificate Ci, V randomly selects a value x [0, ... ,(i-1)* ]. The
value x describes a value that is at most the life-span of a partition.
2. When V changes to a new hash chain (e.g., because of a change of certificates) at time T’, V does the following:
a. Determine T’ as the current GPS signal time
Appendix Volume 3 F-50

VSC-A Final Report: Appendix F Security Protocols and Implementation Results
b. Compute T1 := T’ - x
c. Use the TESLA hash chain according to (k1, T1), and apply the signed hash chain value (k1, T1, Sig(k1 | T1)) as an anchor
3. V then changes regularly to a new hash chain partition and signed hash chain value at time Ts+1 := Ts + i* . [Note: The new time Ts+1 is derived from Ts
without involving a recent GPS signal time. Now V uses the value (ks+1, Ts+1, Sig(ks+1 | Ts+1)) as a new anchor.]
4. Once all partitions are exhausted or once V changes to a new certificate Ci+1, a new hash chain is used (i.e., the TESLA schedule is reset, and starts at Step 1).
This approach does not give an attacker any more information than a change of certificates does. In particular, if certificates are switched outside of a zone observed by an adversary, then the attacker does not learn any more information from the TESLA time schedule. The time schedule includes a random element for this purpose.
Please note that the same key chain privacy preserving algorithm is also used in TADS.
7.3 TADS
TADS is an extension of TESLA. The disclosed keys are not sent repetitively (i.e., d = 1), however other configurations (e.g., d=2) are possible, as well.
Furthermore, the length of a partition of a hash chain i is not fixed but variable. The TESLA schedule is sent together with each certificate broadcast such that i depends on the certificate distribution algorithm.
The remaining parameters are equal to TESLA. Differences in processing to TESLA are described in the following section.
7.3.1 Message Verification Strategies
A clear advantage of TADS is its ability to balance TESLA and digital signature verifications in a flexible fashion. The verification strategy does not need to be globally defined but can be implemented by each OEM individually. Potential strategies include minimizing the total delay, maximizing CPU utilization or prioritized verification [10]. The strategy to minimize total delay by performing TESLA verifications by default and perform ECDSA signature verifications after a defined time-span when the disclosed TESLA key has not been received was implemented.
7.4 ECDSA Verify-on-Demand
In ECDSA VoD messages are first evaluated by the Threat Arbitration. If the threat level of a received message exceeds a predefined threshold, the signature of this message is verified. If the threat level does not exceed this predefined threat level, the message is either discarded or an attached certificate sent along with this message is verified. This behavior is shown in Figure 9. Alternatively, it is also possible to verify a certificate that is attached to a threat message just in time before the signature of the threat message is verified. This latter processing method was implemented to deal with the problem of
Appendix Volume 3 F-51

VSC-A Final Report: Appendix F Security Protocols and Implementation Results
Appendix Volume 3 F-52
certificate flooding. Furthermore, the TA can be configured in such a way that only the first safety message related to a threat is verified or that all safety messages related to the threat are verified. In the standard configuration only the first threat message is verified.
Figure 9: Verify-on-Demand Processing Flow
Threat
Arbitration
message
threat level >=
threshold
threat level <
threshold
Verify message with or without certificate
verification
Verify attached certificate ?
yes no
Verify attached
certificate if it is received for the first time
Discard Message
7.5 Privacy
A simple privacy preservation mechanism has been implemented on the WSU, as described in Section 5, and involves a simultaneous change of all identifiers (i.e., certificate, TESLA key chain, MAC address, J2735 sender ID, message counter, etc.). A Privacy Module (PM) runs on the WSU to trigger such a change. An algorithm function ‘f’ that determines when to trigger a change was implemented according to Section 5 with the architecture presented in Figure 10. The function ‘f’ triggers a change of identifiers such that the PM requests an identification change from the SM. The SM then switches the certificate and acknowledges the change of identities to the WSU. Thereafter, the PM triggers a change of all remaining identities, namely MAC address and sender ID, of the WSU. Note that VSC-A defined the identifiers to be changed as all cryptographic information that might be used to identify a vehicle (certificate and TESLA chain) as well as MAC address, sender ID, and message counter.

VSC-A Final Report: Appendix F Security Protocols and Implementation Results
Figure 10: Privacy Mechanism Architecture
7.6 Performance
The three potential protocols as well as the IEEE 1609.2 ECDSA security protocol were implemented on a car-PC (a standard PC running at 2.4 GHz) and on-board the WSU (a 400 MHz industry computing platform). The implementation for the WSU consists of the same source code with platform-specific assembly optimized cryptographic operations. Therefore, it is possible to use the car-PC platform with its variety of development tools to develop the SM and then to cross-compile it to the WSU platform. Several modes of operation were implemented for TESLA and TADS in order to optimize performance. As mentioned above, separate and piggy-backed TESLA key disclosure modes were implemented. These modes provide a trade-off for OTA bandwidth overhead and overall latency. Performance measurements of the SM running on the WSU clearly show that the IEEE 1609.2 ECDSA protocol is too resource-demanding to run in software. This also holds for the powerful car-PC. Furthermore, the performance measurements show that both TESLA and TADS are highly computationally efficient. It can be expected that a considerable amount of vehicles can securely communicate at a basic safety message (BSM) rate of 10 Hz since message verification requires computation time in the range of a millisecond. At the same time, TESLA and TADS only add slight overhead in delay and OTA bandwidth overhead when compared to IEEE 1609.2 ECDSA. Preliminary performance numbers for the SM running on-board of the WSU are presented in Table 7-2.
Table 7-2: Security Protocol Performance
. IEEE 1609.2 ECDSA
TESLA TADS
Authentication generation (crypto only on idle system)
4.9 ms (ECC-224) / 6.6 ms (ECC-256)
0.3 ms 5.2 ms (ECC-224) / 7.3 ms (ECC-256)
Authentication generation* 6.6 ms (ECC-256) 0.6 ms 7.6 ms (ECC-256)
Appendix Volume 3 F-53

VSC-A Final Report: Appendix F Security Protocols and Implementation Results
. IEEE 1609.2 ECDSA
TESLA TADS
Authentication verification (crypto only on idle system)
17.8ms (ECC-224) / 26.5ms (ECC-256)
0.3 ms 0.3 ms (TESLA) / 26.5 ms (ECDSA-256)
Authentication verification*
28.5 ms (ECC-256) 0.4 ms
2 ms (average)
(0.1% ECDSA, 99.9% TESLA)
CPU Load for 2 WSUs at 10 messages per second: Signing / Signing + Verifying*
8% / 34% 1% / 2%
8% / 10%
(0.1% ECDSA, 99.9% TESLA verifications)
Latency: Avg. (no channel switching,)* 36 ms
piggy-back separate piggy-
back separate
104 ms 46 ms 110 ms 48 ms
Average OTA packet size (send certificate with each 3rd message)
115 bytes 102 bytes
167 bytes
141 bytes 210 bytes
*CPU load and latency was measured on a system that runs safety applications
VoD applied to ECDSA was implemented as well. The performance numbers equal those of IEEE 1609.2 ECDSA. The implementation of the SM provided valuable insights to crucial protocol details and allowed the optimization of protocol parameters. The implementation proved that a security protocol, such as ECDSA VoD, can be efficiently implemented in software on-board of the WSU. The performance numbers per signature generation equal those of IEEE 1609.2 ECDSA. However, the CPU load of a receiving WSU is significantly lower due to the fact that only safety messages that result in a high threat level are verified. ECDSA VoD performed well with all VSC-A safety applications and was selected for the objective test procedure (OTP). ECDSA VoD with certificates attached to each message is designed to have a zero verification error rate (VER)17. TESLA and TADS with a separate key disclosure showed high verification error rates due to high packet losses resulting from increased OTA security overhead and the fact that two packets (the message to be verified and the delayed authentication key) must be received in order to successfully verify a message. When running the security software onboard the WSU, in the presence of high packet losses, the implementation of TADS
17 The verification error rate (VER) is defined as the fraction of successfully verified packets over received packets.
Appendix Volume 3 F-54

8
VSC-A Final Report: Appendix F Security Protocols and Implementation Results
piggyback did not perform well with more than eight vehicles. This was due to the high computational load caused by TADS piggyback verifying messages that cannot be verified using TESLA, due to a lost key packet, with ECDSA. If many key packets are lost, especially from vehicles which are distant, the CPU load increases until the computational resources are exhausted. Analysis of the issue suggested that a more advanced scheduling strategy to process received packets is necessary to prevent the computational breakdown, however a high verification error rate will then occur instead. TESLA piggyback performed well in all settings but showed a large minimum latency time of 100 ms compared to ECDSA. Overall the implementation proves that a security protocol can be efficiently implemented in software on board an automotive grade platform such as the WSU, if certain conditions such as advanced queuing techniques and VoD filtering are implemented.
Conclusions
The VSC-A Project focused on security for V2V safety messages with a main focus on efficient broadcast authentication of safety messages. Furthermore, a certificate distribution and privacy protection mechanism for V2V communication was developed. Message authentication was considered before and defined in the IEEE 1609.2 standard. However, the VSC-2 Consortium expressed concerns regarding the previously defined authentication scheme mainly in terms of its high computational complexity that might hinder market penetration. Therefore, alternative authentication schemes were designed identified, and evaluated in a test-bed implementation and a V2V network simulation. Three protocols were evaluated each having two modes of operation: IEEE 1609.2 ECDSA and ECDSA VoD as well as TESLA and TADS with piggyback and separate key disclosure mode. All protocols were implemented to run on board the WSU at 400 MHz. ECDSA VoD was used in the OTP test bed, and later with up to 60 vehicles, and successfully tested for all VSC-A safety applications. TADS, and TADS VoD, is an interesting approach for future work. Furthermore, a generalized certificate distribution scheme was presented, and a privacy mechanism was implemented that changes or randomizes all identifiers between two safety message transmissions.
Appendix Volume 3 F-55

9
VSC-A Final Report: Appendix F Security Protocols and Implementation Results
References
[1] ANSI, “Public Key Cryptography For The Financial Services Industry: The Elliptic Curve Digital Signature Algorithm (ECDSA),” ANSI X9.62, 1998.
[2] Frederik Armknecht, Andreas Festag, Dirk Westhoff, and Ke Zeng, “Cross-Layer Privacy Enhancement and Non-Repudiation in Vehicular Communication,“ 4th Workshop on Mobile Ad-Hoc Networks (WMAN), Bern Switzerland, March 2007.
[3] Dan Boneh and Matthew Franklin.”Identity-based encryption from the Weil Pairing.“ SIAM J. Comput., 32(3):586–615, 2003. Also appeared in CRYPTO ’01.
[4] Dan Boneh, Xavier Boyen, and Hovav Shacham. Short Group Signatures. In Proceedings of Crypto '04, 2004.
[5] Dan Boneh and Hovav Shacham, “Group Signatures with Verifier-Local Revocation,” In proceedings of the 11'th ACM conference on Computer and Communications Security (CCS), pp. 168-177, 2004.
[6] M. Brown, D. Hankerson, J. Lopez, and A. Menezes, ”Software Implementation of the NIST Elliptic Curves Over Prime Fields,“ Cryptographers' Track at the San Francisco RSA Conference 2001, Lecture Notes in Computer Science (Topics in Cryptology -- CT-RSA 2001, Springer-Verlag, 2020:250--265, 2001.
[7] Giorgio Calandriello, Panos Papadimitratos, Jean-Pierre Hubaux, and Antonio Lioy, ”Efficient and Robust Pseudonymous Authentication in VANET,“ VANET '07: Proceedings of the fourth ACM international workshop on Vehicular ad hoc networks, Montreal, Canada, 2007.
[8] Ran Canetti, Juan Garay, Gene Itkis, Daniele Micciancio, Moni Naor, and Benny Pinkas, "Multicast Security: A Taxonomy and Some Efficient Constructions," INFOCOMM '99, 1999.
[9] escrypt – Embedded Security, eslib – Embedded Security Library, 2007.
[10] Bhargav Bellur, Anitha Varghese, “TESLA Authentication and Digital Signatures for V2X Messages,” www.ip.com, IP.com number: IPCOM000175320D, IP.com Electronic Publication: October 9, 2008.
[11] Hariharan Krishnan, “"Verify-on-Demand" –A Practical and Scalable Approach for Broadcast Authentication in Vehicle Safety Communication,” www.ip.com, IP.com number: IPCOM000175512D, IP.com Electronic Publication: October 10, 2008.
[12] Matthias Gerlach, “Assessing and Improving Privacy in VANETs,” Workshop on Embedded Security in Cars (escar), November 2006.
[13] Matthias Gerlach and Felix Güttler, “Privacy in VANETs using Changing Pseudonyms – Ideal and Real,” IEEE 65th Vehicular Technology Conference, VTC 2007.
[14] Tim Güneysu, Christof Paar, and Jan Pelzl, “On the Security of Elliptic Curve Cryptosystems against Attacks with Special-Purpose Hardware,” SHARCS 2006, Cologne, Germany.
Appendix Volume 3 F-56

VSC-A Final Report: Appendix F Security Protocols and Implementation Results
[15] IEEE Trial-use Standard 1609.2TM-2006, “WAVE – Security Services for Applications and Management Messages,” 2006.
[16] IEEE P1609.3, “Trial-use Standard for Wireless Access in Vehicular Environments (WAVE) - Networking Services,” 2007.
[17] IEEE Std. 802.11a, Part 11: “Wireless LAN Medium Access Control (MAC) and Physical Layer (PHY) specifications,” 2003.
[18] Ken Labertaux and Yih-Chun Hu, “Strong VANET Security on a Budget,” escar 2006, Berlin.
[19] National Institute of Standards and Technology – Computer Security Division, “NIST’s Plan for New Cryptographic Hash Functions,” 2007.
[20] National Institute of Standards and Technology – Computer Security Division, “NIST’s Policy on Hash Functions,” March 2006.
[21] National Institute of Standards and Technology – Computer Security Division, “Recommendation for Key Management,” Special Publication 800-57 Part 1, March 2007.
[22] NIST, “Recommendation for Random Number Generation Using Deterministic Random Bit Generators,” June, 2006.
[23] Adrian Perrig, “The BiBa One-time Signature and Broadcast Authentication Protocol,” 8th ACM Conference on Computer and Communications Security, November 2001.
[24] Adrian Perrig, Ran Canetti, Dawn Song, and J. D. Tygar, ”Efficient and Secure Source Authentication for Multicast,“ Network and Distributed System Security Symposium, NDSS '01, 2001.
[25] Adrian Perrig, Ran Canetti, J.D. Tygar, and Dawn Xiaodong Song, ”Efficient Authentication and Signing of Multicast Streams over Lossy Channels,“ IEEE Symposium on Security and Privacy, 2000.
[26] Adrian Perrig, Ran Canetti, J.D. Tygar, and Dawn Xiaodong Song, “The TESLA Broadcast Authentication Protocol,” Cryptobytes, Volume 5, No. 2 (RSA Laboratories), Summer/Fall 2002.
[27] Maxim Raya and Jean-Pierre Hubaux, “The Security of Vehicular Ad Hoc Networks,“ Proceedings of the 3rd ACM workshop on Security of ad hoc and sensor networks (SASN'05), pp. 11-21, 2005.
[28] Maxim Raya, Panos Papadimitratos, and Jean-Pierre Hubaux, “Securing Vehicular Communication,” Infocom ’06, April, 2006.
[29] NIST, “Recommended Elliptic Curves for Federal Government Use,” July, 1999.
[30] NIST, “Secure Hash Standard FIPS 180-2,” August, 2002.
[31] NIST, “The Keyed-Hash Message Authentication Code (HMAC) FIPS 198,” March, 2002.
Appendix Volume 3 F-57

VSC-A Final Report: Appendix F Security Protocols and Implementation Results
[32] Yaron Sella, “On the Computation-Storage Trade-Offs of Hash Chain Traversal,” In Proceedings of Financial Cryptography 2003, 2003.
[33] Ahren Studer, Fan Bai, Bhargav Bellur, and Adrian Perrig. Flexible, “Extensible, and Efficient VANET Authentication,” 6th Embedded Security in Cars (ESCAR 08).
[34] CAMP VSC Consortium, “Vehicle Safety Communications Project – Final Report,” NHTSA Publication DOT HS 810 591, April 2006.
Appendix Volume 3 F-58

VSC-A Final Report: Appendix G-1
Security Network Simulations Prepared by
Ahren Studer and Adrian Perrig
Appendix Volume 3 G-1-i

Acronym List
CA Certificate Authority
CAMP Crash Avoidance Metrics Partnership
CCDF Complimentary Cumulative Distribution Function
CPU Central Processing Unit
ECDSA Elliptic Curve Digital Signature Algorithm
FIFO First-in-first-out
ITS Intelligent Transportation Systems
JPO Joint Program Office
LRU Least Recently Used
MAC Message Authentication Code
MAC Medium Access Control
NHTSA National Highway Traffic Safety Administration
OBU On-Board Unit
QPSK Quadrature Phase Shift Keying
RAM Random Access Memory
RITA Research and Innovative Technology Administration
SUMO Simulation of Urban Mobility
TADS TESLA And Digital Signatures
TESLA Timed Efficient Stream Loss-Tolerant Authentication
USDOT United States Department of Transportation
V2V Vehicle-to-Vehicle
VSC-A Vehicle Safety Communications-Applications
WAVE Wireless Access in Vehicular Environments
WSM WAVE Short Message
Appendix Volume 3 G-1-ii

Table of Contents Acronym List ................................................................................................ G-1-ii
1 Introduction ........................................................................................... G-1-1 1.1 Outline ......................................................................................................... G-1-1
2 Description of Simulation .................................................................... G-1-2 2.1 Radio Model ................................................................................................ G-1-2
2.2 Simulation of Channel Switching ................................................................ G-1-4
2.3 OBU Model ................................................................................................. G-1-5
2.3.1 OBU Storage Model ....................................................................... G-1-5
2.3.2 OBU Processing Model ................................................................. G-1-7
2.3.3 Simulation of Change of Certificates ............................................. G-1-8
2.4 Description of Traffic Topologies ............................................................... G-1-9
2.5 General Simulation Description ................................................................ G-1-10
3 Key Metrics .......................................................................................... G-1-10
4 Certificate Distribution Simulations .................................................. G-1-11
5 ECDSA Simulations ............................................................................ G-1-18
6 TESLA with Piggybacked Key Disclosures Simulations ................. G-1-24
7 TESLA with Separate Key Disclosures Simulations ........................ G-1-31
8 TADS Simulations ............................................................................... G-1-40 8.1 TADS with Piggybacked Keys .................................................................. G-1-40
8.2 TADS with Separate Key Disclosures ...................................................... G-1-45
9 Comparison and Ranking of the Various Schemes ......................... G-1-48
10 Impact of Changing Certificates ........................................................ G-1-56
11 Conclusion and Suggestions ............................................................ G-1-60
12 References .......................................................................................... G-1-61
Appendix Volume 3 G-1-iii

List of FiguresFigure 1: Probability of Reception versus Distance for the Two Radio Models ....... G-1-4 Figure 2: Division of Time During One Period Of Channel Switching ...................... G-1-5 Figure 3: A Map of the City Topology ..................................................................... G-1-10 Figure 4: Certificate Reception and Message Verification with 16 Vehicles/km .... G-1-14 Figure 5: Certificate Reception and Message Verification with 80 Vehicles/km .... G-1-15 Figure 6: Certificate Reception and Message Verification with 100 Vehicles/km2 . G-1-17 Figure 7: Reception and Verification Rates with Varying Density and Processors
for ECDSA ................................................................................................ G-1-19 Figure 8: Reception and Verification Rates with Varying Density and Processors
for ECDSA ................................................................................................ G-1-21 Figure 9: Number of Messages Dropped at the Security Layer Versus the Number
of Senders in Range with 250 Vehicles/km2 and Varying Transmission Power for ECDSA ..................................................................................... G-1-22
Figure 10: Delay Statistics with a 2.4 GHz Processor and 250 Vehicles/km 2 for ECDSA .................................................................................................... G-1-23 Figure 11: Verification Rate with Various Intervals and 40 Vehicles/KM for TESLA Piggyback ................................................................................................. G-1-25 Figure 12: Authentication Delay with Various Intervals and 40 Vehicles/km for TESLA Piggyback ................................................................................... G-1-26 Figure 13: Verification Rate in Congested Highway and City Settings for TESLA Piggyback ................................................................................................ G-1-28 Figure 14: Authentication Delay in Congested Highway and City Settings for TESLA Piggyback ................................................................................................ G-1-29 Figure 15: MAC Delays in Congested Highway and City Settings for TESLA Piggyback ................................................................................................. G-1-30 Figure 16: Verification Rate with Various Intervals and 40 Vehicles/km for TESLA with Separate Keys ................................................................................. G-1-32 Figure 17: Authentication Delay with Various Intervals and 40 Vehicles/km for TESLA with Separate Keys .................................................................... G-1-34 Figure 18: Verification Rate in Congested Highway and City Settings for TESLA with Separate Keys.......................................................................................... G-1-36 Figure 19: MAC Delays in Congested Highway and City Settings for TESLA with Separate Keys ........................................................................................... G-1-37 Figure 20: Fraction of Packets that Fail the Security Check for TESLA with Separate Keys ......................................................................................................... G-1-38 Figure 21: Authentication Delay in Congested Highway and City Settings for TESLA with Separate Keys .................................................................................. G-1-39 Figure 22: Verification Rate and MAC Delay for TESLA Versus TADS with Piggybacked Key Disclosures and a 400 MHz Processor ...................... G-1-41 Figure 23: Authentication Delay and TADS Verification Method for TESLA Versus TADS with Piggybacked Key Disclosures and a 400 MHz Processor .... G-1-42 Figure 24: Verification Rate and Authentication Delay for TESLA Versus TADS with | Piggybacked Key Disclosures and a 2.4 GHz Processor ........................ G-1-44 Figure 25: Verification Rate and MAC Delay for TESLA Versus TADS with Separate Key Disclosures ....................................................................... G-1-46
Appendix Volume 3 G-1-iv

Figure 26: Fraction of Packets that Fail the Security Check and Verification Method for TESLA and TADS with Separate Key Disclosures ........................... G-1-47 Figure 27: Authentication Delay for TESLA and TADS with Separate Key Disclosures ............................................................................................... G-1-48 Figure 28: Verification Rate and Authentication Delay for the Various Schemes with 80 Vehicles/km ....................................................................................... G-1-50 Figure 29: Interpacket Delay for the Various Schemes with 80 Vehicles/km .......... G-1-51 Figure 30: Verification Rate and Authentication Delay for No Security, TESLA, and TADS with 120 Vehicles/km .................................................................. G-1-53 Figure 31: MAC Delay and Percentage of Packets that Fail the Security Check and for No Security, TESLA, and TADS with 120 Vehicles/km ................... G-1-54 Figure 32: Interpacket Delay for No Security, TESLA, and TADS with 120 Vehicles/km ............................................................................................. G-1-55 Figure 33: Certificate Reception for Highway and City Scenarios for TESLA with Varying Percentages of Vehicles Changing Certificates ........................ G-1-57 Figure 34: Verification Rate for Highway and City Scenarios for TESLA with Varying Percentages of Vehicles Changing Certificates ........................ G-1-58 Figure 35: Percentage of Messages Without Certificates or Timeout for TESLA
with Varying Percentages of Vehicles Changing Certificates on the Highway ................................................................................................. G-1-59
Appendix Volume 3 G-1-v

List of Tables Table 1: Radio Model Parameters Used in the Simulations ........................................ G-1-3 Table 2: Buffer Sizes Allocated for the Different Storage Needs for the Schemes
(note: KB is 1024 bytes) .............................................................................. G-1-6 Table 3: Time Required to Complete Various Operations on the 400MHz and 3.2GHz Processors ...................................................................................................... G-1-8
Appendix Volume 3 G-1-vi

1
VSC-A Final Report: Appendix G-1 Security Network Simulations – Studer and Perrig
Introduction
The goal of this work is to simulate and analyze five suggested broadcast authentication mechanisms for use in vehicular ad hoc networks: (1) Elliptic Curve Digital Signature Algorithm (ECDSA), Timed Efficient Stream Loss-tolerant Authentication (TESLA) with (2) piggybacked key disclosures and (3) separate key disclosures, and TESLA And Digital Signatures (TADS) with (4) piggybacked key disclosures and (5) separate key disclosures. In addition to analyzing the different algorithms to determine which provides the best scalability and performance, how parameters related to certificate distribution, TESLA interval size, as well as processor selection impact the performance of the different mechanisms were also examined.
The main goal is to answer the question of which mechanism allows a receiver to verify the most packets in a timely fashion? In sparse traffic with high probability of packet reception, all of the schemes perform well. Instead, the focus was on performance in worst-case scenarios with dense, fast moving traffic and channel switching enabled (thus with less available bandwidth and more contention and interference).
1.1 Outline
Section 2 describes the simulation environment with details about the radio model; simulation of channel switching; simulation of on-board unit (OBU) storage, processing, and certificate changes; highway and city topologies and traffic models; and more general simulation details such as the amount of simulated time in each simulation run.
In Section 3, the different metrics used when analyzing and comparing the different authentication mechanisms and the certificate distribution model are described.
Section 4 discusses the simulations used to determine the certificate distribution parameters and how the rate-limited reactive certificate distribution (vehicles responding to a new sender with their own certificate) was decided.
The simulation of ECDSA with two different processors is discussed in Section 5. Even with a more powerful 2.4GHz processor, ECDSA requires an excessive computational overhead and fails to support the number of senders encountered in dense high-speed traffic.
Section 6 contains the results of the TESLA with piggybacked key disclosures simulations. It was found that a smaller TESLA interval provides more reliable delivery of packets that pass the security check. The smaller TESLA intervals do require more computation to verify keys, but the calculation of nine or fewer additional hashes adds negligible time to the authentication delay. In scenarios with congested traffic and channel switching enabled, TESLA with piggybacked key disclosures allows vehicles to verify the majority of messages received from nearby senders within 200 ms or less.
In Section 7, the impact of interval size on TESLA with separate key disclosures and how the scheme performs in scenarios with dense traffic is discussed. With a smaller key interval, separate key disclosures allow faster verification. However, with less time between when a sender broadcasts a message and when it discloses the key, unexpected
Appendix Volume 3 G-1-1

2
VSC-A Final Report: Appendix G-1 Security Network Simulations – Studer and Perrig
delays at the MAC layer can cause the sender to broadcast the message in the key disclosure interval. Thereby causing the message to fail the TESLA security check which results in an unverifiable packet. It was found that an interval of 20 ms allows faster verification than TESLA with piggyback while causing less than 2 percent of packets to fail the security check in sparse traffic situations. When simulating TESLA with separate key disclosures in congested situations, the added bandwidth of separate key packets causes channel contention, increasing the MAC delays, and increases the percentage of packets that fail the security check. The interval size could be increased further to reduce the fraction of packets that fail the security check. However, the larger interval size would cause longer delays, and even with the smaller 20 ms interval size, the average verification delay is close to that of TESLA with piggybacked key disclosures.
In Section 8, the performance of TESLA with the performance of TADS is compared. With TADS, packets include both a signature and a message authentication code (MAC). The MAC allows computationally efficient verification. The signature allows a receiver to verify a packet if the associated key disclosure is lost. The same TESLA intervals for both TESLA and TADS was analyzed to determine which performs best under congested traffic scenarios. It was found that TADS with piggybacked keys and the faster 2.4GHz processor can provide an advantage when trying to verify messages from senders at long distances. With senders so far away, the probability of receiving a subsequent key disclosure is small, and TADS can use the signature for verification. However, when using separate key disclosures, TADS adds additional bandwidth and causes even more packets to fail the security check than TESLA with separate key disclosures.
All of the schemes are compared with the performance of vehicle-to–vehicle (V2V) communication without a broadcast authentication mechanism in Section 9. TESLA with piggybacked key disclosures does perform best, however, there still is a noticeable difference between the no-security and security-enabled scenarios.
In a final set of simulations, how vehicles changing certificates impacts authentication is analyzed in Section 10. Even with every vehicle changing their certificate in a short period of time, receivers manage to receive the new certificates in a timely fashion and maintain high verification rates.
In Section 11, concluding remarks are made with suggestions to improve the performance of the various schemes.
Description of Simulation
2.1 Radio Model
During the simulation, a single modulation scheme and two different loss and fading models were used depending on the traffic scenario, that being highway or city traffic.
All Wireless Access in Vehicular Environments (WAVE) Short Message (WSM) data is transmitted using Quadrature Phase Shift Keying (QPSK) with a half-data rate. With this modulation scheme, messages are sent at 6Mb/s. The signal-to-interference/noise ratio needed for successful decoding of data is 6.3096 (or 8 dB).
Appendix Volume 3 G-1-2

VSC-A Final Report: Appendix G-1 Security Network Simulations – Studer and Perrig
The highway path loss model is based on the findings of a Daimler-Chrysler measurement study on US 101 [11]. The study assumed Rayleigh fading for all distances on the highway. For city simulations, path loss and fading values from Cheng, et al.'s, study of vehicular communication in urban Pittsburgh [1] was used. Table 1 contains the path loss and fading parameters used in the simulations.
Table 1: Radio Model Parameters Used in the Simulations
Scenario Path Loss Exponent Range
Nakagami Fading Model Shape
Parameter Range Highway 1.9 < 2000 r 1.0 <0 r
3.8 <200 r City 2.1 < 1000 r 2.5 < 300 r
4.0 <100 r 1.75 < 10030 r 0.5 <100 r
Based on the modulation scheme, the path loss and fading models, and a noise floor of 99 dBm, the probability of reception at a given distance based on the original transmission power can be calculated. Figure 1 (a) and (b) contain plots of the probability of reception for 20 dBm and 10 dBm transmission power for highway and city settings, respectively. Note that these probabilities assume there is no interference. For all of our simulations, messages are broadcast at 10 dBm or 20 dBm. When broadcasting messages at 10 dBm, messages are still broadcast that include certificates at 20 dBm to improve certificate reception rates.
(a) Highway Reception
Appendix Volume 3 G-1-3

VSC-A Final Report: Appendix G-1 Security Network Simulations – Studer and Perrig
(b) City Reception
Figure 1: Probability of Reception versus Distance for the Two Radio Models
2.2 Simulation of Channel Switching
IEEE 1609.4 [5] indicates that vehicles will use channel switching to provide multiple services on different channels. Two channel types are planned, a single control channel and multiple service channels. While the control channel is active, senders will broadcast safety packets or advertisements for services on other channels. For the remainder of the time, vehicles will use other frequencies to interact with various services. While listening to other channels in the service interval, vehicles are prevented from sending safety messages or any data related to the authentication of safety messages (e.g., key disclosures). As a result, the simulation needs to take into account how having access to the radio a fraction of the time impacts the different broadcast authentication mechanisms. This section covers how channel switching is simulated with details on how different intervals are assigned and what happens to packets that a vehicle tries to send when the service channel is active (i.e., the time when the radio is using a different channel).
To simulate channel switching, the MAC layer is told that the channel is busy during the guard intervals and the service channel and drop any messages received outside of the control channel. This simulates the vehicle switching to a different frequency during the service channel or the guard intervals. If a vehicle is in the middle of receiving or transmitting a packet when the rear guard interval starts, the transmission/reception is allowed to complete since it will take only a few microseconds. If a vehicle tries to send a packet while outside of the control channel, the MAC layer acts as though the channel is busy and queues the packet until the channel is free (i.e., the next control channel period). If transmission of a packet is delayed due to channel contention such that the rear guard
Appendix Volume 3 G-1-4

VSC-A Final Report: Appendix G-1 Security Network Simulations – Studer and Perrig
interval has already started, the MAC layer will assume the channel is busy during the service channel and only start the backoff timer once the channel is free during the next control channel.
Figure 2 depicts a plot of how the channel is managed during one 100 ms interval. Note that safety messages are only sent during the control channel between the front and rear guards.
Figure 2: Division of Time During One Period Of Channel Switching
Note: Safety messages are only transmitted during the shaded interval between the front and rear guard.
The majority of the simulations were run with channel switching enabled since the goal of these simulations is to determine what authentication mechanism provides the best performance over a wide range of scenarios. Under light traffic and with unlimited computation, all of the authentication schemes perform well. However, the focus is on the worst-case scenario with limited computation, high traffic density, and channel switching enabled, thus less bandwidth is available for the authentication schemes.
2.3 OBU Model
In reality, vehicles' OBUs are limited in storage and processing capabilities. Fixed size buffers and a queue were used to simulate these limitations. In this section, how the change of certificates is simulated and how that impacts senders and receivers is discussed.
2.3.1 OBU Storage Model
OBUs have limited storage to keep various items associated with V2V communication. In addition to private values (e.g., private ECDSA keys and TESLA hash chains), the OBU must also store certificates and messages from other OBUs. Each OBU has 200 kilobytes of short-term storage (e.g., random access memory (RAM)) available for security-related operations. Even with this limited storage, a receiver can store all of the messages it has heard within the message lifetime of 500 ms. In this section, how the simulation of storage and management of various pieces of information within the 200 KB is discussed. Table 2 summarizes how the 200 KB is allocated to store various items.
An OBU's TESLA hash chain is stored in a compressed format [2], [9] in a 10 kilobyte buffer. This provides a significant storage gain over storing the entire hash chain, while incurring limited additional computation. The OBU has to perform only one hash operation to recover the next item in the chain. Only OBUs simulating TADS or TESLA have to allocate the 10 KB to store the hash chain.
Appendix Volume 3 G-1-5

VSC-A Final Report: Appendix G-1 Security Network Simulations – Studer and Perrig
Certificates and received messages are stored in separate buffers since an OBU can use a single certificate for multiple messages. Each OBU has 45 KB to store certificates in the simulations. With 117 byte ECDSA certificates, an OBU can store 393 certificates at any given time. TESLA certificates are larger since they include a Certificate Authority (CA) signature, the OBU's signature, and the hash chain anchor. However, once the OBU's signature is verified, the receiver only has to store the 117 byte CA-provided certificate and the hash chain anchor for a total of 135 bytes. This allows an OBU to store information about 341 different senders. Storage of information about senders in TADS requires the same space as TESLA. Certificates are deleted according to two different mechanisms, expiration or eviction when certificate storage is full. If an OBU receives no messages from a given sender within one minute, the OBU will consider the certificate expired and delete it. If an OBU has encountered so many senders that the certificate storage is full, the OBU will evict the least recently used (LRU) certificate to make space for newly heard senders. In all of the simulations, 45 KB of certificate storage provides enough space such that the LRU replacement strategy does not cause thrashing (i.e., a certificate is evicted and immediately put back into the certificate storage, evicting a certificate for another sender within range).
Received messages are stored in a separate buffer along with any information needed to perform verification. This includes the 170 byte safety message payload, an 8 byte certificate digest (or a pointer to the certificate in the certificate storage), and the signature and/or MAC. For ECDSA, an OBU needs 242 bytes per message to allow a total of 655 messages within the 155 KB message buffer. TESLA and TADS have 145 KB of message storage because 10 KB is needed to store the hash chain. With TESLA, an OBU needs 190 bytes per message for a total of 781 messages. With TADS, storage of the signature and the MAC requires 254 bytes per messages. With TADS, an OBU is limited to 580 messages in the 145 KB message buffer. This sounds like limited storage, but the limited bandwidth and message lifetime allow OBUs to store every message they receive. With the radio model in this paper (see Section 2.1), an OBU can expect to hear at most 1000 messages a second. Given messages are only stored for a maximum of 500 ms before they are considered no longer useful. This puts the maximum number of currently valid messages at 500. As such, even with the larger TADS messages, an OBU can store every message it receives.
Table 2: Buffer Sizes Allocated for the Different Storage Needs for the Schemes (note: KB is 1024 bytes)
Item Type ECDSA Storage
TESLA Storage
TADS Storage
Certificates 45 KB 45 KB 45 KB Not-Yet-Verified Received
155 KB 145 KB 145 KB
Messages TESLA
Hash Chain 0 KB 10 KB 10 KB
In 2.3.2 how the simulation of processing of messages, hash chains, and certificates as a single long queue is discussed. For storage purposes, the processing queue is only a
Appendix Volume 3 G-1-6

VSC-A Final Report: Appendix G-1 Security Network Simulations – Studer and Perrig
virtual queue, thus, all of the items are always stored in their respective buffers. This means that received TESLA and TADS messages are stored in a single large buffer, even though some messages may be waiting in the processing queue while others are waiting for a key disclosure.
2.3.2 OBU Processing Model
Each OBU is equipped with a single central processing unit (CPU) that can perform one calculation within a fixed amount of time. The first-in-first-out (FIFO) queue is utilized to simulate the sequential processing of various cryptographic items. The FIFO queue is modified to become a push-out FIFO queue such that any MACs or digital signatures that are unverifiable before the maximum allowed delay (500 ms in all simulations) are discarded. The delay is calculated as the time from when a message was received and when the OBU will complete the associated MAC or signature verification. 2.3.1 contains a description of the storage of various items while the operations are in the queue. In the remainder of this section, when items (i.e., certificate verifications, hash operations, MAC verifications, or signature verifications) are added to the processing queue and the amount of time needed to complete each of the operations are discussed.
The processing queue is treated as a single long buffer that holds operations yet-to-be performed. When a sender wants to broadcast a message, the OBU pauses the current operation and prioritizes the generation of the authenticator(s) (i.e., signature and/or MAC generation). Once the authenticator is generated, the OBU resumes the halted operation. When an OBU receives a packet, it first checks if it has a copy of the sender's certificate. Once the sender's certificate is verified, the receiver can verify the sender's messages or TESLA keys.
If the receiver lacks a certificate for this sender, the receiver checks if the packet includes a certificate. If the packet lacks a certificate, the receiver drops the packet. If this packet includes a certificate, the receiver adds the certificate to the certificate storage and enqueues the certificate verification operation. Given a push-out FIFO queue is used where only messages are discarded, enqueueing the certificate verification first ensures the receiver will have verified the certificate before processing the associated messages or TESLA keys. When simulating TESLA or TADS, certificate verification takes twice as long since each certificate includes a signature from the CA to verify the sender's public key and a signature from the sender to verify the current TESLA hash chain anchor.
After the sender's certificate is verified, the receiver can start verifying messages or key disclosures. Under ECDSA, provided there is space in the message storage buffer, the message is recorded and the verification operation is enqueued. Under TESLA or TADS, if the key used to generate the MAC meets the security requirement (i.e., the key is scheduled to be disclosed at a later time) and there is space to store the message, the OBU stores the message until the key is disclosed (or with TADS the key disclosure is missed and the signature is verified). When the OBU receives a key disclosure, the OBU verifies if the received key corresponds to the hash chain anchor or the most recently verified key by enqueueing the appropriate number of hash operations. Note that hash operations are permitted even after the maximum allowed delay since verifying the most recent key can help when verifying future key disclosures. For example, a receiver can verify key K1000
based on a recently disclosed key K990 with 10 hashes rather than using 1000 hashes to
Appendix Volume 3 G-1-7

VSC-A Final Report: Appendix G-1 Security Network Simulations – Studer and Perrig
compare K1000 to the anchor, key K0 . Once the appropriate key is received and enqueued, the MAC is added to the queue. This ordering where keys are enqueued before MACs ensures the key is verified before the associated MAC. With TADS, if the key disclosure does not arrive within the expected time, the receiver enqueues the signature. Once the signature or MAC is verified or expires (exceeds the maximum allowed delay), the receiver frees the buffer space associated with the message and the signature or MAC.
Table 3: Time Required to Complete Various Operations on the 400MHz and 3.2GHz Processors
Operation Time on the 400MHz
PowerPC Time on the 3.2GHz
CPU ECC-256 ECDSA Signature
Generation 6.2 ms 1.3 ms
ECC-256 ECDSA Signature Verification 22.7 ms 4.9 ms
ECDSA Certificate Verify 22.7 ms 4.9 ms TESLA/TADS Certificate Verify 45.4 ms 9.8 ms
Hash Calculation 10.5 s 1 s 10 Hash Calculations 18.5 s 13 s
TESLA Authenticator Generation 900 s 120 s TESLA Authenticator Verification 800 s 100 s
Different operations require different amounts of time on different processors. In these simulations, it is assumed that OBUs are equipped with one of two processors: a 400 MHz PowerPC or a 3.2 GHz x 86 CPU. Table 3 contains a list of the time needed to complete various operations on the two processors. Note that verification of a TESLA or TADS certificate requires twice as much time as an ECDSA certificate since there are two digital signatures in TESLA and TADS certificates.
2.3.3 Simulation of Change of Certificates
In a subset of the simulations, how OBUs changing certificates impact the performance of the various broadcast authentication schemes are evaluated. Rather than having a unique ID for each certificate, a serial number is added to the certificate to allow receivers to differentiate certificate A and certificate B from sender S . This allows simpler management of certificates and the ability to associate the delay between receiving two messages from the same sender, even when the sender's ``identity'' changes with certificates. However, in practice receivers would be unable to associate a sender's new and old certificate for privacy purposes. In the remainder of this section, how serial numbers simplify the storage of certificates and how changing certificates impacts other parts of the broadcast authentication mechanism are discussed.
Serial numbers in certificates allows approximation of the performance when senders change certificates, but introduce a small inaccuracy when simulating certificate storage. In this simulation, a receiver knows when a sender changes from certificate A to certificate B . This allows the receiver to replace A with B since a sender will stop using A . However, in reality, a receiver will only know a sender as the identity in the
Appendix Volume 3 G-1-8

VSC-A Final Report: Appendix G-1 Security Network Simulations – Studer and Perrig
certificate. As a result, the receiver will have to store both certificates until certificate A expires (i.e., there have been zero messages from that sender for 60 seconds).18 This difference is immaterial and should only cause a discrepancy between simulation and real-life performance if certificate storage is reduced. With less certificate storage, no-longer-used certificates may consume space and cause the eviction of a certificate C which is still in use but temporarily out of radio range. While out of radio range, the OBU may evict C since it is least recently used. Once the owner of C re-enters the receiver's radio range, the OBU will have to expend processing power verifying C a second time. If space is limited and eviction of still active certificates is a worry, receivers could store short-keyed hashes of any evicted certificates. The hash would require 16 bytes or less of storage, but would save the receiver from re-verifying a certificate if it matches a stored hash.
When a new certificate is used, an OBU stops using any information associated with the old certificate. This means that for TESLA or TADS, the OBU will start to use a new TESLA hash chain anchor and cancel the disclosure of any keys associated with the old hash chain. When keys are disclosed with messages (as opposed to having a separate key disclosure packet), the first message using the new certificate will include the new hash chain anchor rather than the key to verify the messages from the old hash chain.
2.4 Description of Traffic Topologies
For simulations, two different traffic topologies are used to simulate different driving conditions, that is, a highway topology and a city topology. The traffic density and average speed for the highway topology are varied. The city topology involves stop-and-go driving on a Manhattan grid where the speed limit is fixed but vehicle density varies.
The highway topology is a large circular highway with a radius of 1 kilometer and 2 lanes of traffic in each direction. The large radius and this radio model prevents packets from passing through the center of the circle. Since all transmissions follow the road, this topology approximates an infinitely long 2-lane highway. During these simulations vehicles travel at the same speed and are evenly spaced along the roadway at a fixed density as measured in vehicles/km (to calculate vehicles/km per lane divide by 4). Given vehicles travelling in the same direction stay at a fixed distance, data is ignored that may cause anomalies in the metrics (see Section 3). Specifically, vehicles traveling in the same direction cause an inflated successful authentication rate, because receivers will have the sender's certificate the majority of the time. Vehicle density is varied from 16 to 120 vehicles/km. Vehicle speed is varied from 13 m/s (30 miles per hour) to 40 m/s (90 miles per hour). However, unless otherwise stated, simulations use the 40 m/s speed since it is a worst-case scenario for the authentication schemes (i.e., vehicles enter and exit radio range at a greater rate).
18Section 2.3.1 discusses how certificates are stored and replaced.
Appendix Volume 3 G-1-9

VSC-A Final Report: Appendix G-1 Security Network Simulations – Studer and Perrig
Figure 3: A Map of the City Topology
The city topology is a 10x10 grid of city blocks (see Figure 3). Based on census data about Manhattan, each city block is 275 meters east to west and 80 meters north to south. Simulation of Urban Mobility (SUMO19) is used to generate realistic stop-and-go traffic with traffic lights at each intersection. The speed limit within the city topology is 30 miles per hour with vehicles exceeding that speed limit by at most 10 miles per hour for short periods of time. In different simulations, vehicle density is varied from 10 vehicles/km 2 to 250 vehicles/km 2 .
2.5 General Simulation Description
Each of the different traffic scenarios and authentication schemes for a fixed amount of time are simulated. After analyzing the performance of the different schemes with one certificate per sender, shorter simulations are performed where different fractions of the population change certificates.
During evaluation of the different broadcast authentication schemes, each simulation runs for a total of 5 minutes and 30 seconds of simulated time. The first 30 seconds of the simulation are a warm-up period where vehicles collect certificates and fill queues and buffers, but no data is collected about performance. After the warm-up period, different performance metrics are collected for the remaining 5 minutes. Section 3 discusses the different metrics collected and used to analyze the different schemes. The warm-up period allows the steady state performance of the different schemes to be analyzed.
Once there is an understanding of the performance of the different authentication schemes, changing certificates is simulated. These simulations are shorter and only run for 2 minutes of simulated time. After a 30 second warm-up period, some fraction f of the OBUs change to a new certificate at a randomly assigned time within the next minute (i.e., any vehicle changing its certificate performs the change between 30 seconds and 90 seconds into the simulation).
3 Key Metrics
A number of different metrics are used to analyze the results of the various simulations and to rank the different authentication schemes. In this section different metrics and how
19Simulation of Urban MObility http://sumo.sourceforge.net/
Appendix Volume 3 G-1-10

VSC-A Final Report: Appendix G-1 Security Network Simulations – Studer and Perrig
each helps evaluate the different authentication schemes and other parameters (e.g., certificate distribution) are described.
Certificate Reception versus Distance. The complementary cumulative distribution function (CCDF) of new certificates versus distance allows one to analyze how close a sender is before the receiver has a copy of the sender's certificate. A CCDF of 100 percent at a larger distance is desirable since that implies the reception of certificates and, thus, the ability to verify messages from a longer distance.
Message Reception versus Distance. The percentage/fraction of messages successfully received versus distance provides a good indicator of how reliably packets are delivered to the application layer on a receiver. A vehicle needs to receive the message, have a certificate from the sender, and successfully verify the message within 500 ms to consider the message successfully received. For TESLA/TADS, the key used to generate the MAC must be not-yet-disclosed for the packet to be successfully received. In some plots, percentages for both ”Received” and ”Verified” are shown. In that case, ”Received” is the percentage of packets received. ”Verified” is the percentage of packets successfully passed to the application layer.
Average Authentication Delay versus Distance. Authentication delay measures the time from when a packet leaves the application layer on the sender and arrives at the application layer on the receiver. This delay includes any computation at the receiver or sender, network delay (i.e., Medium Access Control (MAC) delay and transmission time), and time waiting for the TESLA key disclosure, if applicable. Plotting authentication delay versus distance helps show how varying packet reception rates impacts TESLA/TADS. For ECDSA, the majority of the delay is associated with computation and queueing on the receiver and thus is largely distance independent.
Number of Packets versus Verification Delay. The verification delay is the time from when a packet is received to when it is passed to the application layer. The number of packets versus verification delay provides the distribution of the delay introduced by the security mechanism.
Packet Count versus MAC Delay. The MAC delay provides a good approximation of the channel contention. More packets sent at longer delays means there was more backoff as a result of the channel being busy.
Impact of Mobility. To measure the impact of changing traffic conditions in the city simulations, the number of messages dropped at the security layer versus the number of senders heard within a 2 second time window is plotted. This plot shows how varying vehicle density impacts the security mechanism. Packets are dropped at the security layer for a number of reasons in that the receiver lacks a certificate for the sender, the packet is not verifiable within 500 ms (due to long queueing delays or missed key disclosures), or the TESLA MAC was generated using an already disclosed key.
Certificate Distribution Simulations
In this section, the first series of simulations where the parameters that result in the best certificate distribution were analyzed are discussed. To analyze certificate distribution, a number of simulations on the highway and city topologies were run with varying vehicle
Appendix Volume 3 G-1-11
4

VSC-A Final Report: Appendix G-1 Security Network Simulations – Studer and Perrig
density and speeds. In these simulations, focus was on the performance of TESLA with piggybacked keys and the certificate reception versus distance and message reception versus distance metrics was examined. It was chosen to focus on TESLA because it is bandwidth limited. TESLA with separate key disclosures will have similar results but will warrant less certificate broadcasts to mitigate the additional bandwidth consumed by key disclosure packets. ECDSA and TADS are computationally limited due to digital signature verifications and thus their performance is highly dependent on what processor is being used. For all of these simulations, all messages and certificates are broadcast at 20 dBm.
The results show that responding to a new (not-yet-heard) certificate with the receiver's own certificate broadcast works well. However, vehicles need to limit how often certificates are broadcast to reduce bandwidth consumption which negatively impacts performance. In the certificate distribution schemes, a vehicle schedules to broadcast a new certificate whenever it hears a new certificate or it has been a randomly selected time since the last certificate was broadcast. How quickly a receiver responds to a new certificate was varied as the basis for the three certificate distribution approaches: (1) instant certificate response, or rate limited responses with a maximum of (2) one Hertz, and maximum of (3) two Hertz. With ”instant certificate response,” a vehicle schedules a certificate broadcast for the next message after hearing a new certificate. With 1 Hertz and 2 Hertz, the vehicle schedules the certificate 1 second or 500 ms in the future, respectively (unless a certificate broadcast is already scheduled). These delays limit the frequency with which a vehicle will broadcast a certificate. After broadcasting a certificate, the sender selects a random delay before it will broadcast the next certificate (provided it does not broadcast the certificate sooner in response to a new certificate). In the simulations, a sender samples a uniform distribution between 1 to 2 to determine when to send the next certificate if no new certificates are received. Waiting more time between certificate broadcasts when no new certificates are received may improve performance in slow moving traffic. To further reduce contention and computation, a receiver could leverage map information when deciding to verify and respond to a new certificate. For example, a receiver on the highway could ignore certificates from senders on the other side of a barrier traveling the other direction or senders on service roads. However, the analysis of these two potential improvements have been left as future work.
On the highway, higher speeds (40 m/s) stress the certificate broadcast mechanism since vehicles are rapidly approaching each other, resulting in a greater rate of new vehicles. With limited vehicle density, it is best to broadcast a certificate in the first message after hearing a new sender (i.e., ``Instant Certificate''). With 16 vehicles/km and channel switching enabled, instant certificate response requires few extra certificates and the channel can support the extra bandwidth needed to include all of these certificates. Figure 4(a) and (b) show the CCDF of certificate reception and fraction of packets that are successfully verified versus distance. Looking at these plots one can see that the instant certificate response provides better certificate reception with a small advantage with respect to message verification. However, when vehicle density increases to 80 vehicles/km and channel switching remains enabled, instant certificate consumes too much bandwidth. With 80 vehicles/km, interference decreases packet reception rates. As a result, vehicles are closer when the certificates are first received, when compared to the less dense setting (see Figure 5(a)). However, certificates at 2 Hertz provides the best
Appendix Volume 3 G-1-12

VSC-A Final Report: Appendix G-1 Security Network Simulations – Studer and Perrig
message verification performance across all of the distances (see Figure 5(b)). At close (0 m to 200 m) and long (400 m and on) range, instant certificate response performs worst due to added interference and thus packet loss. In the mid-range (200 m to 400 m), the more frequent certificate response of 2 Hz allows similar or improved performance compared to instant certificate. However, less frequent certificates cause more packet loss due to messages received from senders with no known certificate.
Appendix Volume 3 G-1-13

VSC-A Final Report: Appendix G-1 Security Network Simulations – Studer and Perrig
(a)
(b) Figure 4: Certificate Reception and Message Verification with 16
Vehicles/km
Appendix Volume 3 G-1-14

VSC-A Final Report: Appendix G-1 Security Network Simulations – Studer and Perrig
(a)
(b) Figure 5: Certificate Reception and Message Verification with 80
Vehicles/km
Within the city, slower vehicle speeds mean less vehicles enter radio range in a given period of time. With a slower arrival rate, less frequent certificate broadcasts provide similar performance to instant certificate responses. As shown in Figure 6 where density
Appendix Volume 3 G-1-15

VSC-A Final Report: Appendix G-1 Security Network Simulations – Studer and Perrig
is 100 vehicles/km2, the radio model with high loss and fading means poor network performance is the limiting factor. Certificate reception is better with more frequent certificates, but message verification is the same independent of certificate broadcast rate.
Based on these results certificates are used at 2 Hertz for the remainder of highway simulations and 1 Hertz for city simulations.
Appendix Volume 3 G-1-16

VSC-A Final Report: Appendix G-1 Security Network Simulations – Studer and Perrig
(a)
(b) Figure 6: Certificate Reception and Message Verification with 100
Vehicles/km2
Appendix Volume 3 G-1-17

5
VSC-A Final Report: Appendix G-1 Security Network Simulations – Studer and Perrig
ECDSA Simulations
ECDSA-based message authentication is computationally limited due to the processing associated with verifying incoming digital signatures. The results show that on the highway, where more vehicles are within radio range at any given time, ECDSA fails to verify the majority of signatures even with the more powerful 2.4 GHz processor. In the city, increased path loss and fading results in less vehicles in radio range and thus acceptable verification rates when using the 2.4GHz processor.
Figure 7(a) and (b) show how ECDSA is too computationally expensive under reasonable traffic densities. In addition to low verification rates, ECDSA causes high delays with almost 500 ms delays independent of distance. Even with the 2.4 GHz CPU, ECDSA fails to verify more than 50 percent of messages with 80 vehicles/km. With 10 dBm message broadcast power, less senders are within radio range and thus more messages are verified at short distances (i.e., greater chance of a received message reaching the front of the queue within 500 ms). However, past 200 meters, less messages are received and thus less messages are verified.
Appendix Volume 3 G-1-18

VSC-A Final Report: Appendix G-1 Security Network Simulations – Studer and Perrig
(a) 40 vehicles/km, 400MHz CPU
(b) 80 vehicles/km, 2.4GHz CPU Figure 7: Reception and Verification Rates with Varying Density and
Processors for ECDSA In the city, the strong signal attenuation and varying traffic density that results from stop-and-go traffic allows the 2.4 GHz processor to verify the majority of incoming signatures. However, the 400 MHz processor is unable to support the number of
Appendix Volume 3 G-1-19

VSC-A Final Report: Appendix G-1 Security Network Simulations – Studer and Perrig
incoming signatures, even with lower vehicle density. Figure 8(a) and (b) show the fraction of verified messages with varying processors and vehicle densities in the city simulation. With 10 dBm message transmission power and the 2.4 GHz processor, vehicles can verify nearly all of the received messages. Looking at the number of packets dropped at the security layer versus the number of senders in range (Figure 9(a) and (b)), one can see that more senders in range and thus more incoming signatures increases the number of dropped packets. However, when a vehicle drives away from a congested area, the vehicle has less signatures to verify and can process the signatures before the 500 ms deadline. The number of packets versus delay plot in Figure 10(a) supports the idea that sender density is correlated with verification delay. When in regions with more senders, the delay is higher (note the large number of packets with delays over 400 ms). After leaving the dense region, the vehicle can process received packets with varying delays (the lower part of the curve between 100 ms and 400 ms). When in sparse regions, the vehicle can quickly verify signatures in less than 100 ms. Figure 10(b) shows that the average delay is independent of the distance between the sender and receiver and more an artifact of the number of items in the queue at the time of reception. In delay versus distance plots, the average delay at long distances has high variance due to the limited number of packets received at that distance. This variance causes the noisy pattern past 650 meters in Figure 10(b).
Appendix Volume 3 G-1-20
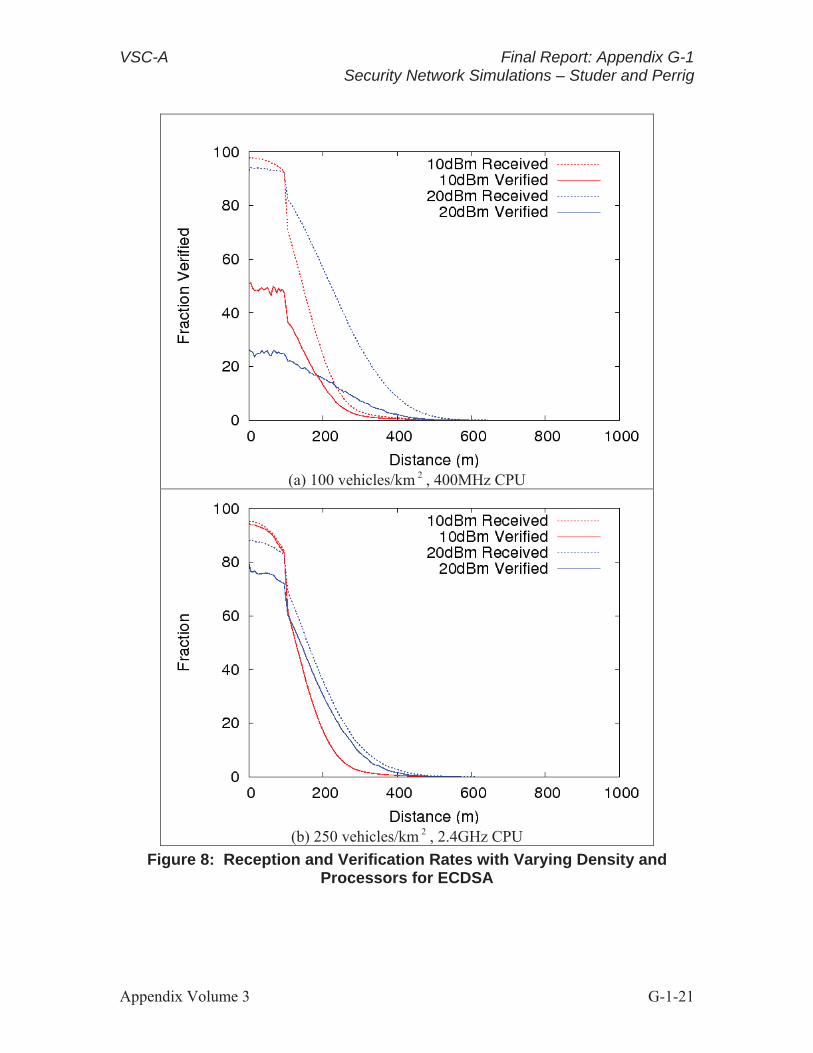
VSC-A Final Report: Appendix G-1 Security Network Simulations – Studer and Perrig
(a) 100 vehicles/km 2 , 400MHz CPU
(b) 250 vehicles/km 2 , 2.4GHz CPU Figure 8: Reception and Verification Rates with Varying Density and
Processors for ECDSA
Appendix Volume 3 G-1-21

VSC-A Final Report: Appendix G-1 Security Network Simulations – Studer and Perrig
(a) 10 dBm (20 dBm certificates)
(b) 20 dBm Figure 9: Number of Messages Dropped at the Security Layer Versus the
Number of Senders in Range with 250 Vehicles/km2 and Varying Transmission Power for ECDSA
Appendix Volume 3 G-1-22

VSC-A Final Report: Appendix G-1 Security Network Simulations – Studer and Perrig
(a) Packets versus delay
(b) Delay versus distance Figure 10: Delay Statistics with a 2.4 GHz Processor and 250 Vehicles/km 2
for ECDSA
Appendix Volume 3 G-1-23

VSC-A Final Report: Appendix G-1 Security Network Simulations – Studer and Perrig
Summary
Based on these results, ECDSA is too computationally expensive if every message must be verified. In the city where vehicle density varies and sparse regions allow vehicles to empty queues, ECDSA can function with acceptable delays. However, on the highway or other dense scenarios, ECDSA incurs significant delays and high packet loss due to delays over 500 ms.
6 TESLA with Piggybacked Key Disclosures Simulations
When simulating TESLA with piggybacked keys, what key interval works best and if it can support more vehicles than ECDSA needs to be analyzed. For all of these simulations, a 400MHz processor is assumed. With piggybacked keys, a vehicle uses the key disclosed in the next heartbeat message to generate the MAC for this packet. A longer TESLA time interval means less keys are used in a given time period. With less keys in an interval, less hashing is needed to verify the keys from two messages (i.e., keys 100 ms apart) correspond to the same chain. However, fewer keys in an interval means coarser key granularity (i.e., a disclosed key corresponds to a larger time interval). With coarser key granularity, unexpected MAC layer delays have a greater chance of causing a receiver to drop a message due to the use of a disclosed key to generate the MAC (i.e., the message and MAC are disclosed in the same interval as the key). Given the efficiency of hash computation, a finer key granularity becomes the determining factor when selecting key interval size. A 20 ms key interval was found to provide a good balance between hash computation and key granularity. When simulating dense traffic scenarios, TESLA was found to outperform ECDSA for nearby senders even with 80 vehicles/km or 250 vehicles/km 2 .
Figure 11 shows what fraction of messages are successfully authenticated when using varying interval sizes and 40 vehicles/km on the highway. For these simulations, channel switching was enabled (a) or disabled (b). With channel switching enabled, any packet delayed from one control channel to the next experiences an unexpected 50 ms delay. This 50 ms delay causes messages to fail the security check when the interval is larger. The reason is that the 50 ms delay causes the packet to be broadcast in the same interval as when the sender is expected to disclose the key. Note that for channel switching enabled, 10 ms, 20 ms, and 30 ms intervals had the same verification rates. With channel switching disabled (Figure 11(b)), only larger intervals, which are close to the period of the vehicles' safety messages, cause packets to fail the security check. With 100 ms intervals, a sender will use the next key to generate a MAC. If a sender tries to broadcast a packet right before the end of an interval, an unexpected MAC delay will cause reception to occur during the next interval, when the key is scheduled to be disclosed, and thus the packet is dropped. The difference in performance between channel switching enabled and channel switching disabled is due to less interference and thus improved packet reception when channel switching is disabled.
Appendix Volume 3 G-1-24

VSC-A Final Report: Appendix G-1 Security Network Simulations – Studer and Perrig
(a) Channel Switching Enabled
(b) Channel Switching Disabled Figure 11: Verification Rate with Various Intervals and 40 Vehicles/KM for
TESLA Piggyback Figure 12(a) and (b) show the verification delay associated with the different intervals when channel switching is enabled (with channel switching disabled the results are similar). The faster authentication is a result of less computation. However, larger
Appendix Volume 3 G-1-25

VSC-A Final Report: Appendix G-1 Security Network Simulations – Studer and Perrig
intervals only have an advantage on the order of 250 s. For the remainder of TESLA piggyback simulations, 20 ms intervals are used to balance the computational advantage of larger intervals with the increased chance of passing the security check associated with smaller intervals.
(a)
(b) Figure 12: Authentication Delay with Various Intervals and 40 Vehicles/km
for TESLA Piggyback
Appendix Volume 3 G-1-26

VSC-A Final Report: Appendix G-1 Security Network Simulations – Studer and Perrig
Figure 13(a) and (b) show how TESLA performs in congested situations where ECDSA with a 2.4 GHz processor had trouble authenticating packets (i.e., 80 vehicles/km and 250 vehicles/km 2 ). Unlike ECDSA, the distance from a sender has an impact on verification rate and delays. This relation is due to the need for a receiver to hear two packets to verify a TESLA packet. The further away a sender is, the smaller the probability is that the receiver will hear the subsequent message and the key disclosure. With a TESLA interval of 20 ms, zero messages fail the security check in these scenarios. The majority of received but not verified packets (i.e., the difference between the solid and dashed lines) are a result of the 500 ms verification deadline. Few messages are dropped because the receiver has no certificate for the sender. Figure 14 shows the delay versus distance for these configurations. When vehicles are closer, the probability that subsequent messages, and thus key disclosures needed for verification, are received is higher and thus messages are quickly verified. One would expect the authentication delay to be close to 100 ms at short distances. As shown in Figure 15, MAC delays cause a portion of the additional authentication delay. However, the majority of the delay is the result of missing messages. With less than 100 percent packet reception, some key disclosures are missed, causing receivers to wait until the next message to verify the message. This additional waiting time increases the average authentication delay.
Appendix Volume 3 G-1-27

VSC-A Final Report: Appendix G-1 Security Network Simulations – Studer and Perrig
(a) Highway: 80 vehicles/km
(b) City: 250 vehicles/km2
Figure 13: Verification Rate in Congested Highway and City Settings for TESLA Piggyback
Appendix Volume 3 G-1-28

VSC-A Final Report: Appendix G-1 Security Network Simulations – Studer and Perrig
(a) Highway: 80 vehicles/km
(b) City: 250 vehicles/km 2
Figure 14: Authentication Delay in Congested Highway and City Settings for TESLA Piggyback
Appendix Volume 3 G-1-29

VSC-A Final Report: Appendix G-1 Security Network Simulations – Studer and Perrig
(a) Highway: 80 vehicles/km
(b) City: 250 vehicles/km2
Figure 15: MAC Delays in Congested Highway and City Settings for TESLA Piggyback
Appendix Volume 3 G-1-30

7
VSC-A Final Report: Appendix G-1 Security Network Simulations – Studer and Perrig
Summary
These results indicate that TESLA with piggybacked keys can authenticate the majority of messages in realistic dense traffic scenarios, while incurring acceptable delays. However, one drawback to TESLA is that the distance from the sender has a strong correlation with the authentication delay and the probability of verifying a message within the 500 ms deadline.
TESLA with Separate Key Disclosures Simulations
When analyzing TESLA with separate key disclosures, what key interval works best and how it performs in the congested scenarios used to analyze ECDSA and TESLA with piggybacked key disclosures needs to be determined. A 400 MHz processor when simulating TESLA with separate key disclosures is assumed. It is also assumed that vehicles are synchronized within 1.5 ms of global time, so the maximum clock difference between two vehicles is 3 ms. When analyzing TESLA with separate keys, the key usage delay is 1 unless near the end of a TESLA interval or the end of the control channel. When within 3 ms of the end of a TESLA interval, a sender uses a key usage delay of 2 (i.e., the key disclosed 2 intervals from now). If in the last TESLA interval before the service channel, a sender uses the key disclosed during the first interval in the next control channel.
When TESLA keys are disclosed in their own packets, a larger TESLA interval results in larger authentication delays, but it has a smaller chance of a packet being discarded because it fails the security check. When using a separate key disclosure, vehicles use the next disclosed key to generate the MAC for this packet. If differences in clock skew could cause others to reject the MAC (i.e., 3 ms or less is left in the current interval), the vehicle uses the key disclosed 2 intervals from now. With channel switching enabled, a vehicle will use the key disclosed in the first interval in the next control channel rather than the key disclosed in the service channel.
A larger TESLA interval provides better verification rates but slower authentication since there is more time between when a packet is broadcast and a key is disclosed. As such,20 ms intervals was chosen to use for the remainder of the simulations where separate key disclosures are needed. With 20 ms intervals, messages still fail the security check. However, using a larger interval for separate key disclosures uses more bandwidth than piggybacked keys while experiencing similar authentication delays. Figure 16(a) and (b) show what fraction of messages are successfully authenticated when using varying interval sizes, 20 dBm broadcasts, and 40 vehicles/km on the highway. For these simulations, channel switching was enabled (a) or disabled (b). Here a larger interval size provides better verification rates. With a larger interval size, there is more time between when a vehicle generates a MAC and when the key is disclosed. This additional time permits delays at the MAC layer to occur without causing the message to be broadcast when the key is scheduled to be disclosed. If channel switching is disabled (Figure 16(b)), there is less channel contention, smaller MAC delays, and thus less packets dropped due to the use of already disclosed keys, when compared to channel-switching enabled with the same TESLA interval size. However, higher sender densities and the resulting channel contention and MAC delays would require larger TESLA intervals or
Appendix Volume 3 G-1-31

VSC-A Final Report: Appendix G-1 Security Network Simulations – Studer and Perrig
longer periods between message and MAC broadcast and the scheduled key disclosure even with channel switching disabled.
(a) Channel Switching Enabled
(b) Channel Switching Disabled Figure 16: Verification Rate with Various Intervals and 40 Vehicles/km for
TESLA with Separate Keys
Appendix Volume 3 G-1-32

VSC-A Final Report: Appendix G-1 Security Network Simulations – Studer and Perrig
Figure 17(a) and (b) show the verification delay associated with the different intervals when channel switching is enabled or disabled. With larger intervals, the verification delay is larger. With channel switching enabled, the verification delays are much larger because of the additional delay incurred when a packet is sent during the last interval in a control channel. When this occurs, the vehicle selects a key disclosed during the next control channel and thus delays are over 50 ms. With channel switching disabled, authentication delays are much closer to the length of an interval (the expected result). Based on these results, a 20 ms interval for the remainder of simulations was used. This interval size causes fewer packets to fail the security check compared to 10 ms intervals. At the same time, 20 ms intervals provide faster verification than larger interval size which provide similar authentication delays when compared to piggybacked keys but require additional bandwidth for the separate key disclosure packet.
Appendix Volume 3 G-1-33

VSC-A Final Report: Appendix G-1 Security Network Simulations – Studer and Perrig
(a) Channel Switching Enabled
(b) Channel Switching Disabled Figure 17: Authentication Delay with Various Intervals and 40 Vehicles/km
for TESLA with Separate Keys
In congested scenarios, TESLA provides fast verification of messages from nearby vehicles, but suffers from packet loss due to MAC delays and packet loss. Figure 18 shows what fraction of packets are verified in both highway and city settings. The added
Appendix Volume 3 G-1-34

VSC-A Final Report: Appendix G-1 Security Network Simulations – Studer and Perrig
channel contention from separate key disclosures causes larger MAC delays (see Figure 19) and thus a significant fraction of packets fail the security check in these simulations for the 20 dBm settings (see Figure 20). In the city setting, the variance in vehicle density allows vehicles to maintain relatively high verification rates. Figure 21 confirms that packet reception plays an important role in the performance of TESLA with separate key disclosures. When vehicles are nearby, authentication delays are shorter since packet reception is improved. However, when senders are further away, key disclosures are frequently missed; and it takes longer to verify a message. The MAC delay plot indicates that the addition of key disclosure packets stresses the channel. This added communication causes contention, interference, and packet loss, causing poor verification rates and delays. As such, separate key disclosures decrease scalability since bandwidth is already limited.
Appendix Volume 3 G-1-35

VSC-A Final Report: Appendix G-1 Security Network Simulations – Studer and Perrig
(a) Highway: 80 vehicles/km
(b) City: 250 vehicles/km2
Figure 18: Verification Rate in Congested Highway and City Settings for TESLA with Separate Keys
Appendix Volume 3 G-1-36

VSC-A Final Report: Appendix G-1 Security Network Simulations – Studer and Perrig
(a) Highway: 80 vehicles/km
(b) City: 250 vehicles/km 2
Figure 19: MAC Delays in Congested Highway and City Settings for TESLA with Separate Keys
Appendix Volume 3 G-1-37

VSC-A Final Report: Appendix G-1 Security Network Simulations – Studer and Perrig
(a) Highway: 80 vehicles/km
(b) City: 250 vehicles/km2
Figure 20: Fraction of Packets that Fail the Security Check for TESLA with Separate Keys
Appendix Volume 3 G-1-38

VSC-A Final Report: Appendix G-1 Security Network Simulations – Studer and Perrig
(a) Highway: 80 vehicles/km
(b) City: 250 vehicles/km2
Figure 21: Authentication Delay in Congested Highway and City Settings for TESLA with Separate Keys
Appendix Volume 3 G-1-39

VSC-A Final Report: Appendix G-1 Security Network Simulations – Studer and Perrig
Summary
TESLA with separate key disclosures allows fast verification while the number of senders in range is low. However, the added bandwidth associated with separate key disclosures prevents the scheme from scaling to more congested scenarios with higher transmission power. With more bandwidth usage, MAC delays are longer and more packets are lost due to interference. Longer delays cause more messages to fail the TESLA security check that the authenticator was generated using a not-yet-disclosed key. With key disclosures lost due to interference, vehicles have to wait longer to verify packets.
8 TADS Simulations
TADS tries to take advantage of both ECDSA and TESLA. The majority of the time TESLA is used to authenticate a message. However, if it has been 20 ms since the sender should have broadcast the key, the receiver can use the ECDSA signature to verify the packet rather than waiting for a future key disclosure. TADS's disadvantage is that including both signatures and TESLA increases the amount of data added to each packet. The question is then does the benefit of having signatures and TESLA justify the additional bandwidth?
TADS can work in two different ways with piggybacked key disclosures or with separate key disclosures. Based on the simulations of TESLA with different intervals, the same interval size with TADS (20ms) was used. Rather than analyzing how TADS performs across a wide range of scenarios, the focus is on how TADS performs when compared to TESLA under the more stressed scenario of a congested highway with 80 vehicles/km and 20 dBm broadcast power.
8.1 TADS with Piggybacked Keys
When key disclosure is piggybacked with the next message, TADS provides similar performance to TESLA and can even have benefits for senders further away. The additional bandwidth to include a signature has limited impact on the network contention for 80 vehicles/km and thus network performance is similar. When a vehicle tries to verify every message, computation becomes the limiting factor. If vehicles are equipped with the faster 2.4 GHz processor, TADS provides similar performance to TESLA for nearby senders. At longer distances, TADS can verify more messages from senders than TESLA since vehicles are not required to receive a key disclosure.
For the first set of simulations, TESLA and TADS are compared with vehicles with 400 MHz processors. With the slower processor, TADS is too busy verifying signatures from far away vehicles, delaying the verification of messages and causing a large fraction of messages to exceed the 500 ms limit. Looking at Figure 22, it can be seen that the network performance for TESLA and TADS is similar with message reception never varying more than 10 percent and similar MAC delays. However, TADS verifies over 30 percent less packets from nearby senders. Based on the authentication delay and verification method plots (see Figure 23(a) and (b)), it can be seen that vehicles spend significant resources verifying signatures from vehicles further away. The computation
Appendix Volume 3 G-1-40

VSC-A Final Report: Appendix G-1 Security Network Simulations – Studer and Perrig
associated with these signature verifications delay any other computation due to our FIFO-queueing strategy and packets are lost due to the 500 ms time limit.
(a) Verification Rate
(b) MAC Delay Figure 22: Verification Rate and MAC Delay for TESLA Versus TADS with
Piggybacked Key Disclosures and a 400 MHz Processor
Appendix Volume 3 G-1-41

VSC-A Final Report: Appendix G-1 Security Network Simulations – Studer and Perrig
(a) Authentication Delay
(b) TADS Verification Method Figure 23: Authentication Delay and TADS Verification Method for TESLA Versus TADS with Piggybacked Key Disclosures and a 400 MHz Processor
Next TADS with the faster 2.4GHz processor is simulated. The majority of the time, vehicles can use TESLA to efficiently verify messages. However, with the additional processing power, vehicles can handle signature verifications associated with far away vehicles while having a limited impact on other messages. Figure 24(a) shows that with
Appendix Volume 3 G-1-42

VSC-A Final Report: Appendix G-1 Security Network Simulations – Studer and Perrig
the faster processor, TADS provides similar verification rates when compared to TESLA from 0 to 400 m.At longer distances, TADS can use signatures to verify packets where TESLA failed to verify due to missed key disclosures. Since only the processor changed (and not the radio model), the MAC delays (see Figure 22(b)) and the authentication methods (see Figure 23(b)) are the same as with the 400 MHz processor. The authentication method remains the same since the vehicle only verifies the ECDSA signature if it has been 20 ms since the key should have been disclosed. The number of items in the processing queue has zero impact on the verification method decision. However, TADS still tries to verify so many signatures that signature verifications delay TESLA-based verifications such that TESLA provides faster authentication than TADS (see Figure 24). If receivers waited until the second or third key disclosure or only verified messages from nearby or critical senders, TADS may have better performance. These enhancements to TADS is considered as important future work.
Appendix Volume 3 G-1-43

VSC-A Final Report: Appendix G-1 Security Network Simulations – Studer and Perrig
(a) Verification Rate
(b) Authentication Delay Figure 24: Verification Rate and Authentication Delay for TESLA Versus
TADS with Piggybacked Key Disclosures and a 2.4 GHz Processor
Appendix Volume 3 G-1-44

VSC-A Final Report: Appendix G-1 Security Network Simulations – Studer and Perrig
Summary
These results show that TADS with piggybacked key disclosures provides similar performance to TESLA if vehicles are equipped with a faster processor. The addition of a signature to the packet consumes additional bandwidth but has limited impact on network performance. The main advantage with TADS is that, with a faster processor, receivers can quickly verify any message if the next key disclosure from the sender is never received.
8.2 TADS with Separate Key Disclosures
When simulating TADS with separate key disclosures, a 2.4 GHz processor is assumed since separate key disclosures degrade reception and thus require additional processing to verify signatures. The simulations show that TADS fails to support dense, high-speed traffic and is outperformed by TESLA even when receivers are equipped with the faster processor. When keys are disclosed in a separate packet, TADS requires too much bandwidth and causes significant contention and losses in the wireless channel.
Figure 25 shows the verification rate and MAC delays. These plots show that TADS requires too much bandwidth to remain competitive, and the MAC layer introduces significant delays at the MAC layer and loss of packets. These MAC layer delays cause a large fraction of packets to fail the security check (see Figure 26(a)). The added contention also causes interference and loss of key disclosures which cause vehicles to use signatures to verify the majority of messages (see Figure 26(b)). TADS does have a smaller authentication delay (see Figure 2). However, this is a result of receivers using signatures to verify messages after missing the key disclosure. With so few packets passing the security check, the 2.4 GHz processor can handle the computational load associated with verifying the signatures.
Appendix Volume 3 G-1-45
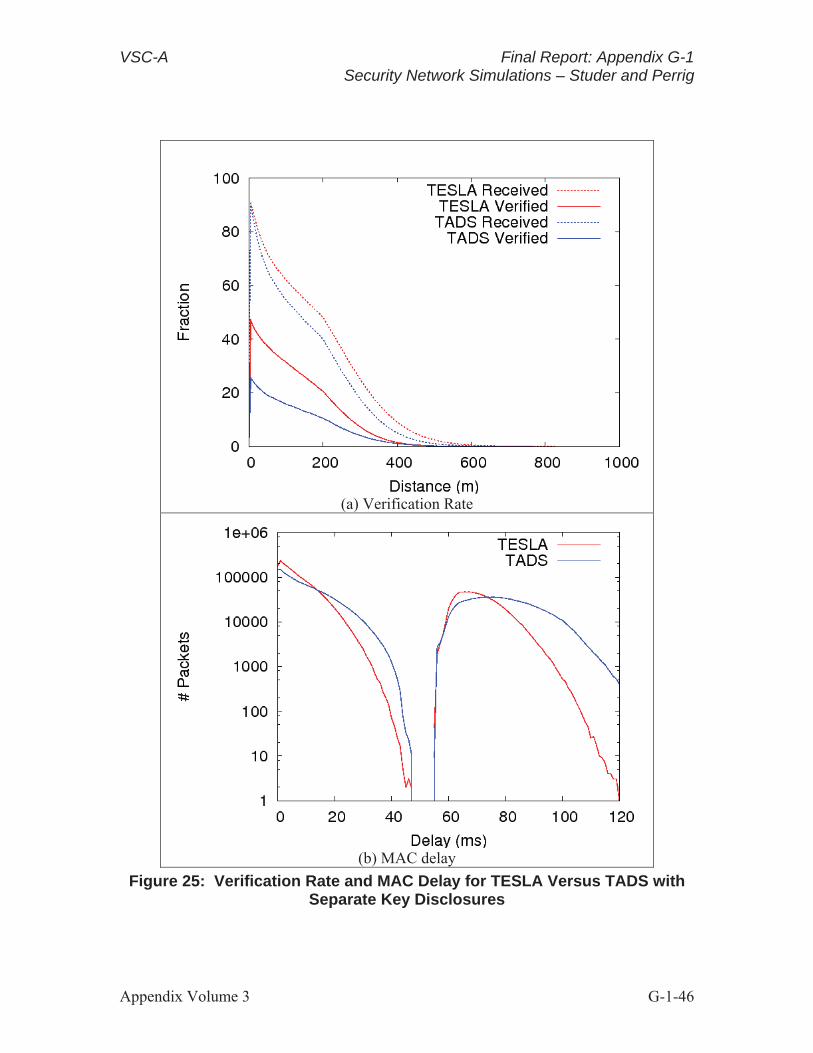
VSC-A Final Report: Appendix G-1 Security Network Simulations – Studer and Perrig
(a) Verification Rate
(b) MAC delay Figure 25: Verification Rate and MAC Delay for TESLA Versus TADS with
Separate Key Disclosures
Appendix Volume 3 G-1-46

VSC-A Final Report: Appendix G-1 Security Network Simulations – Studer and Perrig
(a) Security Check Failure Rate
(b) TADS Verification Method Figure 26: Fraction of Packets that Fail the Security Check and Verification
Method for TESLA and TADS with Separate Key Disclosures
Appendix Volume 3 G-1-47

9
VSC-A Final Report: Appendix G-1 Security Network Simulations – Studer and Perrig
Figure 27: Authentication Delay for TESLA and TADS with Separate Key Disclosures
Summary
Under dense traffic scenarios with high transmission power, TADS with separate key disclosures suffers from channel contention. With more bandwidth usage than TESLA with separate key disclosures, TADS has more packets fail the security check. However, TADS authentication delays are smaller. With so few packets passing the security check, TESLA verification is successful or the processor can complete the verification of the signature within 60 ms.
Comparison and Ranking of the Various Schemes
For a final comparison between the different authentication schemes, how the schemes perform in the 80 vehicles/km highway scenario (within the city simulation, variance in density allows the schemes to have moderate success even when portions of the road are congested) is examined. As a worst-case scenario, only the performance when 20 dBm transmission power is used is compared. The larger transmission power strains both computation and bandwidth limited schemes since it forces the receiver to verify more messages and causes greater contention for the channel, respectively. This comparison indicates that TESLA with piggybacked keys provides the best overall performance, whereas TADS with piggybacked keys and a 2.4 GHz processor is a close second. TADS also provides the signature security property, which is necessary if receivers ever need to prove to a third party that the sender was the original source of a message. ECDSA is third and could be best if receivers only tried to verify a fraction of the incoming messages rather than every single message. Finally, TESLA and TADS with separate key disclosures require too much bandwidth and, thus, are the worst choice when selecting an authentication mechanism.
Appendix Volume 3 G-1-48

VSC-A Final Report: Appendix G-1 Security Network Simulations – Studer and Perrig
Figure 27 and Figure 28 show the performance of vehicle-to-vehicle (V2V) communication without security enabled and with each of the 5 different authentication mechanisms. The security mechanisms do introduce additional packet losses and delays (see Figure 27) and provide less consistent delivery of messages (see Figure 28). Compared to no security, TESLA with piggybacked key disclosures provides good performance for senders within 200 meters. TESLA causes less than an additional 10 percent message loss for nearby senders (see Figure 27(a)). Authentication delay also remains under 200 ms within 200 meters for TESLA with piggybacked key disclosures (see Figure 27(b)). Figure 28 shows TESLA also has the same consistency at delivering packets from senders within 200 meters. TADS with piggybacked key disclosure is second best but has noticeable delays due to processing of signatures. ECDSA has longer delays and more packets are lost due to queueing. Finally, the schemes with separate key disclosures consume significant bandwidth which negatively impacts their performance. This extra bandwidth causes contention and interference. With longer MAC delays from channel contention, a larger number of messages fail the security check (see Figure 26(a)). High packet loss from interference causes receivers to miss messages and key disclosures, delaying authentication (see Figure 27(b)), and causing inconsistent message delivery to the application layer (see Figure 28).
Appendix Volume 3 G-1-49

VSC-A Final Report: Appendix G-1 Security Network Simulations – Studer and Perrig
(a) Verification Rate
(b) Authentication Delay Figure 28: Verification Rate and Authentication Delay for the Various
Schemes with 80 Vehicles/km
Appendix Volume 3 G-1-50

VSC-A Final Report: Appendix G-1 Security Network Simulations – Studer and Perrig
(a) Average
(b) Median Figure 29: Interpacket Delay for the Various Schemes with 80 Vehicles/km
Simulations with 120 vehicles/km to test the scalability of TESLA and TADS with piggybacked key disclosures were run. Figure 29, Figure 30, and Figure 31 compare the performance of TESLA and TADS with piggybacked key disclosures to no security mechanism. At such a high vehicle density, the security mechanisms' additional bandwidth is causing contention and loss from interference. With so many vehicles, a
Appendix Volume 3 G-1-51

VSC-A Final Report: Appendix G-1 Security Network Simulations – Studer and Perrig
significant fraction of messages are delayed at the MAC layer for 80 ms or more and fail the security check (see Figure 30). With less packets successfully received, TADS has faster verification times when compared to the less dense 80 vehicles/km scenario thanks to less computation associated with verifying signatures. However, within the first 300 meters, TESLA provides more reliable delivery to the application layer thanks to higher packet delivery rates (see Figure 31). When senders are further away, TADS verifies signatures to reduce the average and median interpacket arrival time.
Appendix Volume 3 G-1-52

VSC-A Final Report: Appendix G-1 Security Network Simulations – Studer and Perrig
(a) Verification Rate
(b) Authentication Delay Figure 30: Verification Rate and Authentication Delay for No Security,
TESLA, and TADS with 120 Vehicles/km
Appendix Volume 3 G-1-53

VSC-A Final Report: Appendix G-1 Security Network Simulations – Studer and Perrig
(a) MAC Delay
(b) Security Check Failure Rate Figure 31: MAC Delay and Percentage of Packets that Fail the Security
Check and for No Security, TESLA, and TADS with 120 Vehicles/km
Appendix Volume 3 G-1-54

VSC-A Final Report: Appendix G-1 Security Network Simulations – Studer and Perrig
(a) Average
(b) Median Figure 32: Interpacket Delay for No Security, TESLA, and TADS with 120
Vehicles/km Based on these results, TESLA with piggybacked keys provides the best overall performance of the five schemes. It allows consistent and timely authentication of packets even under dense channel contention. TADS with piggybacked keys provides similar performance but suffers from the added bandwidth used to include signatures and
Appendix Volume 3 G-1-55

VSC-A Final Report: Appendix G-1 Security Network Simulations – Studer and Perrig
MACs in every packet. In our simulations, TADS spends a large amount of processing power verifying signatures from far away senders, delaying authentication. TADS can prioritize verifications to reduce the average delay, but channel contention is a problem that will remain with TADS. ECDSA is too computationally expensive when all received packets are verified. However, ECDSA requires less bandwidth than TADS and with prioritized verification it could provide similar or better performance than TESLA. Our simulation results indicate that separate key disclosures consume too much bandwidth. Vehicles can reduce transmission power to reduce channel contention but that reduces transmission range. With a reduced transmission range, drivers will have less time to respond to alerts since the vehicle will only hear alerts when the dangerous situation is nearby.
10 Impact of Changing Certificates
Vehicles may change certificates to help provide a certain level of privacy to drivers. However, changing certificates can negatively impact the authentication mechanism. In addition to needing the new certificate, TESLA will be unable to authenticate the last message from the sender because the corresponding key will never be disclosed. To analyze just how much changing certificates impacts security, TESLA was simulated with some fraction of the vehicles in the simulation changing certificates within a 1-minute time window. TESLA was the focus since ECDSA and TADS will have better results, because those schemes only need the original message to complete verification. Schemes with separate key disclosures are considered impractical and, thus, are not simulated.
Figure 32 and Figure 33 show how certificate changes impact the certificate reception and message verification rate for both highway and city scenarios. As more vehicles change certificates, receivers hear new certificates at shorter distances. This is expected since a sender 50 meters away changing a certificate will result in a new certificate at a 50 meter distance. What is more important is how certificate changes impact packet verification rates. In these scenarios, vehicles are able to quickly receive the new certificate and continue verifying messages. Even with 100 percent of senders changing certificates, less than 1 percent of messages are lost. Looking at the number of messages that timeout and the number of messages that have no certificate in the highway setting (see Figure ), it can be seen that most losses are a result of not yet receiving the sender's new certificate and only a small fraction are because the receiver never receives the final key disclosure.
Appendix Volume 3 G-1-56

VSC-A Final Report: Appendix G-1 Security Network Simulations – Studer and Perrig
(a) Highway: 40 vehicles/km
(b) City: 100 vehicles/km 2
Figure 33: Certificate Reception for Highway and City Scenarios for TESLA with Varying Percentages of Vehicles Changing Certificates
Appendix Volume 3 G-1-57

VSC-A Final Report: Appendix G-1 Security Network Simulations – Studer and Perrig
(a) Highway: 40 vehicles/km
(b) City: 100 vehicles/km2
Figure 34: Verification Rate for Highway and City Scenarios for TESLA with Varying Percentages of Vehicles Changing Certificates
Appendix Volume 3 G-1-58

VSC-A Final Report: Appendix G-1 Security Network Simulations – Studer and Perrig
(a) Messages with no certificates
(b) Messages which timeout Figure 35: Percentage of Messages Without Certificates or Timeout for TESLA with Varying Percentages of Vehicles Changing Certificates on
the Highway
Appendix Volume 3 G-1-59

VSC-A Final Report: Appendix G-1 Security Network Simulations – Studer and Perrig
Summary
These results indicate that certificate changes can work in vehicular networks with less than 1 percent additional losses when the channel is not saturated. However, the majority of these losses are a result of messages received before learning the new certificate. As channel contention increases, interference can cause greater delays before the reception of a new certificate. The longer a receiver lacks a certificate, the longer it is unable to verify messages from the sender.
11 Conclusion and Suggestions
Through a number of simulations it was found that TESLA with piggybacked keys provides the best scalability of the five authentication schemes and that certificate changes have limited impact on the authentication schemes provided vehicles quickly receive the new certificate. However, certain refinements could allow the other authentication schemes to perform well across different scenarios.
With certain refinements, TADS with piggybacked keys and ECDSA could perform well with the slower 400 MHz processor. These schemes also have the advantage of providing the security property. Both ECDSA and TADS could benefit from selective verification to reduce the number of verifications performed. TADS could also reduce computation by waiting until the second or third key disclosure was missed before starting signature verification.
TESLA and TADS with separate key disclosures and carefully selected transmission power could provide the fastest verification with the least computation. As vehicle density increases, schemes with separate key disclosures require lower transmission power to reduce channel contention. Lower transmission power does result in shorter transmission range. However, higher vehicle density often results in slower vehicle speeds (e.g., traffic jams) and thus less need for long range safety messages.
This work has also shown that certificate changes have a negligible impact on authentication. However, in this work only random certificate changes were considered. Several works have examined clusters of vehicles simultaneously changing certificates to improve privacy [3], [8], [10]. Future work should also consider how coordinated certificate changes would impact authentication.
Appendix Volume 3 G-1-60

VSC-A Final Report: Appendix G-1 Security Network Simulations – Studer and Perrig
12 References
[1] Lin Cheng, Benjamin E. Henty, Daniel D. Stancil, Fan Bai, Priyantha Mudalige, Mobile Vehicle-to-Vehicle Narrow-Band Channel Measurement and Characterization of the 5.9 GHz Dedicated Short Range Communication (DSRC) Frequency Band, IEEE Journal on Selected Areas in Communications, 25(8):1501--1516, 2007.
[2] Don Coppersmith and Markus Jakobsson. Almost Optimal Hash Sequence Traversal. Proceedings of the 4 th Conference on Financial Cryptography, 2002.
[3] Matthias Gerlach. Assessing and Improving Privacy in VANETs, Proceedings of Workshop on Embedded Security in Cars (ESCAR), 2006.
[4] IEEE. 1609.4: Trial-Use Standard for Wireless Access in Vehicular Environments (WAVE) - Multi-Channel Operation,. IEEE Standards, 2006.
[5] IEEE. 1609.2: Trial-Use Standard for Wireless Access in Vehicular Environments-Security Services for Applications and Management Messages, IEEE Standards, 2006.
[6] Mark Luk, Adrian Perrig, Bram Whillock, Seven Cardinal Properties of Sensor Network Broadcast Authentication, Proceedings of ACM Workshop on Security of Ad Hoc and Sensor Networks (SASN), 2006.
[7] Adrian Perrig, Ran Canetti, J.D. Tygar, Dawn Song, The TESLA Broadcast Authentication Protocol,. RSA CryptoBytes, 5(Summer), 2002.
[8] Krishna Sampigethaya, Leping Huang, Mingyan Li, Radha Poovendran, Kanta Matsuura, Kaoru Sezaki, CARAVAN: Providing Location Privacy for VANET, Proceedings of Embedded Security in Cars (ESCAR), 2005.
[9] Yaron Sella, On the Computation-storage Trade-offs of Hash Chain Traversal. Proceedings of the 5 th Conference on Financial Cryptography, 2003.
[10] Ahren Studer, Elaine Shi, Fan Bai, Adrian Perrig, TACKing Together Efficient Authentication, Revocation, and Privacy in VANETs, Proceedings of the Annual IEEE Communications Society Conference on Sensor, Mesh, and Ad Hoc Communications and Networks (SECON), 2009.
[11] Q. Chen, F. Schmidt-Eisenlohr, and D. Jiang, Overhaul of IEEE 802.11 Modeling and Simulation in NS-2 (802.11Ext), 2008.
Appendix Volume 3 G-1-61

VSC-A Final Report: Appendix G-2
Security Network Simulations Prepared by
Yih-Chun Hu and Jason J. Haas
Appendix Volume G-2-i

Acronym List
CAMP Crash Avoidance Metrics Partnership
CCDF Complimentary Cumulative Distribution Function
CCH Control Channel
ECDSA Elliptic Curve Digital Signature Algorithm
FIFO First-in-first-out
HOV High Occupancy Vehicle
HW Hardware
ITS Intelligent Transportation Systems
JPO Joint Program Office
MAC Medium Access Control
NGSIM Next-Generation Simulation
NHTSA National Highway Traffic Safety Administration
NS2 The Network Simulator
ODC On-demand Certificates
OTA Over-the-Air
PHY Physical
PPC Power PC
RITA Research and Innovative Technology Administration
SCH Service Channel
SW Software
TESLA Timed Efficient Stream Loss-Tolerant Authentication
TIGER Topologically Integrated Geographic Encoding and Referencing system
UIUC University of Illinois at Urbana-Champaign
USDOT United States Department of Transportation
VANET Vehicle Ad-Hoc Network
V2V Vehicle-to-vehicle
VSC-A Vehicle Safety Communications-Applications
Appendix Volume 3 G-2-ii

Table of Contents Acronym List ................................................................................................ G-2-ii
1 Introduction ........................................................................................... G-2-1
2 Settings ................................................................................................. G-2-1 2.1 Verification Queue ...................................................................................... G-2-1
2.2 Simulator ..................................................................................................... G-2-2
2.3 TESLA Key Intervals .................................................................................. G-2-2
2.4 Two Signature ............................................................................................. G-2-3
2.5 Processor Computation Times..................................................................... G-2-3
2.6 IEEE 1609.4 Channel Switching ................................................................. G-2-3
2.7 Heartbeat Transmission Time Randomization ............................................ G-2-4
2.8 Legend Format ............................................................................................ G-2-4
3 Cook County Simulations .................................................................... G-2-4 3.1 IEEE 1609.4 Disabled ................................................................................. G-2-5
3.1.1 20 dBm Transmit Power ................................................................ G-2-6
3.1.2 10 dBm Transmit Power .............................................................. G-2-15
3.2 3.2 1609.4 Enabled .................................................................................... G-2-26
3.2.1 20 dBm Transmit Power .............................................................. G-2-26
3.2.2 10 dBm Transmit Power .............................................................. G-2-35
4 Interstate 80 Simulations ................................................................... G-2-45 4.1 Fading Model ............................................................................................ G-2-45
4.2 IEEE 1609.4 Disabled ............................................................................... G-2-47
4.2.1 20 dBm Transmit Power .............................................................. G-2-47
4.2.2 10 dBm Transmit Power .............................................................. G-2-57
4.3 IEEE 1609.4 Enabled ................................................................................ G-2-67
4.3.1 20 dBm Transmit Power .............................................................. G-2-67
4.3.2 10 dBm Transmit Power .............................................................. G-2-77
4.4 I-80 Final Comparisons ............................................................................. G-2-87
4.4.1 Failure Mode Analysis ................................................................. G-2-88
5 Certificate Distribution Optimization ................................................ G-2-92 5.1 Certificate Broadcast Power ...................................................................... G-2-92
5.2 Certificate Broadcast Period ...................................................................... G-2-98
Appendix Volume 3 G-2-iii

6 Conclusion ........................................................................................ G-2-106
7 References ........................................................................................ G-2-107
Appendix Volume 3 G-2-iv

List of FiguresFigure 1: Theoretic Reception Probability for Urban Simulations with 10 and 20 dBm Transmission Power ..................................................................................... G-2-5 Figure 2: Cook County, Illinois, Simulation Results: 20 dBm Transmit Power, PC Processor, No Channel Switching ............................................................... G-2-11 Figure 3: Cook County, Illinois, Simulation Results: 20 dBm Transmit Power, PPC Processor, No Channel Switching ............................................................... G-2-15 Figure 4: Cook County, Illinois, Simulation Results: 10 dBm Transmit Power, PC | Processor, No Channel Switching .............................................................. G-2-21 Figure 5: Cook County, Illinois, Simulation Results: 10 dBm Transmit Power, PPC Processor, No Channel Switching .............................................................. G-2-25 Figure 6: Cook County, Illinois, Simulation Results: 20 dBm Transmit Power, PC Processor, with Channel Switching ........................................................... G-2-31 Figure 7: Cook County, Illinois, Simulation Results: 20 dBm Transmit Power, PPC Processor, with Channel Switching ............................................................ G-2-35 Figure 8: Cook County, Illinois, Simulation Results: 10 dBm Transmit Power, PC Processor, with Channel Switching ........................................................... G-2-41 Figure 9: Cook County, Illinois, Simulation Results: 10 dBm Transmit Power, PPC Processor, with Channel Switching ............................................................ G-2-45 Figure 10: Theoretic Reception Probability for Highway Simulations with 10 and 20 dBm Transmission Power ................................................................... G-2-46 Figure 11: I-80 Simulation Results: 20 dBm Transmit Power, PC Processor, No Channel Switching .............................................................................. G-2-52 Figure 12: I-80 Simulation Results: 20 dBm Transmit Power, PPC Processor, No Channel Switching .................................................................................... G-2-56 Figure 13: I-80 Simulation Results: 10 dBm Transmit Power, PC Processor, No Channel Switching .............................................................................. G-2-62 Figure 14: I-80 Simulation Results: 10 dBm Transmit Power, PPC Processor, No Channel Switching .................................................................................... G-2-66 Figure 15: I-80 Simulation Results: 20 dBm Transmit Power, PC Processor, with Channel Switching .................................................................................... G-2-72 Figure 16: I-80 Simulation Results: 20 dBm Transmit Power, PPC Processor, with Channel Switching .................................................................................... G-2-76 Figure 17: I-80 Simulation Results: 10 dBm Transmit Power, PC Processor, with Channel Switching .................................................................................... G-2-82 Figure 18: I-80 Simulation Results: 10 dBm Transmit Power, PPC Processor, with Channel Switching .................................................................................... G-2-86 Figure 19: I-80 Simulation Results: Final Comparison of TESLA Piggyback with Settings Used in Section 4 ........................................................................ G-2-91 Figure 20: I-80 Simulation Results: Certificate Broadcast Power Variation, PC Processor, No Channel Switching, ECDSA ............................................. G-2-94 Figure 21: I-80 Simulation Results: Certificate Broadcast Power Variation, PC Processor, No Channel Switching, TESLA .............................................. G-2-96 Figure 22: I-80 Simulation Results: Certificate Broadcast Power Variation, PC Processor, No Channel Switching, Two Signature ................................... G-2-98 Figure 23: I-80 Simulation Results: Certificate Broadcast Rate Variation, ............. G-2-102
Appendix Volume 3 G-2-v

Figure 24: I-80 Simulation Results: Certificate Broadcast Rate Variation, ............. G-2-104 Figure 25: I-80 Simulation Results: Certificate Broadcast Rate Variation, PC Processor, No Channel Switching, Two Signature .................................................. G-2-106
Appendix Volume 3 G-2-vi

List of Tables Table 1: Simulated Processor Delays .......................................................................... G-2-3 Table 2: Urban Simulations Fading Model Settings .................................................... G-2-5 Table 3: Section 3.1.1 Settings .................................................................................... G-2-6 Table 4: Cook County, No Channel Switching, 20 dBm Transmission Power: Certificate Storage Requirements and Maximum Verification Queue Size .. G-2-8 Table 5: Section 3.1.2 Settings .................................................................................. G-2-16 Table 6: Cook County, Illinois, No Channel Switching, 10 dBm Transmission Power: Certificate Storage Requirements and Maximum Verification Queue Size G-2-25 Table 7: Section 3.2.1 Settings .................................................................................. G-2-26 Table 8: Cook County, Illinois, with Channel Switching, 20 dBm Transmission
Power: Certificate Storage Requirements and Max Verification Queue Size .................................................................................................. G-2-28
Table 9: Section 3.2.2 Settings .................................................................................. G-2-35 Table 10: Cook County, Illinois, with Channel Switching, 10 dBm Transmission
Power: Certificate Storage Requirements and Max Verification Queue Size ................................................................................................. G-2-37
Table 11: Highway Simulations Fading Model Settings ........................................... G-2-46 Table 12: Section 4.1.1 Settings ................................................................................ G-2-47 Table 13: I-80, No Channel Switching, 20 dBm Transmission Power: Certificate Storage Requirements and Maximum Verification Queue Size ................ G-2-48 Table 14: Section 4.1.2 Settings ................................................................................ G-2-57 Table 15: I-80, No Channel Switching, 10 dBm Transmission Power: Certificate Storage Requirements and Maximum Verification Queue Size ................ G-2-58 Table 16: Section 4.3.1 Settings ................................................................................ G-2-67 Table 17: I-80, with Channel Switching, 20 dBm Transmission Power: Certificate Storage Requirements and Maximum Verification Queue Size ................ G-2-68 Table 18: Section 4.3.2 Settings ................................................................................ G-2-77 Table 19: I-80, with Channel Switching, 10 dBm Transmission Power: Certificate Storage Requirements and Maximum Verification Queue Size ................ G-2-78 Table 20: Section 4.4 Settings ................................................................................... G-2-87 Table 21: Section 5.1Settings .................................................................................... G-2-92 Table 22: Section 5.2 Settings ................................................................................... G-2-99 Table 23: ECDSA ODC versus Static Certificate Periods: ..................................... G-2-100 Table 24: TESLA Piggyback ODC versus Static Certificate Periods: ................... G-2-100 Table 25: Two Signature Piggyback ODC versus Static Certificate Periods: Failure Mode Comparison (Packet Count)........................................................... G-2-100 Table 26: Final Results: Parameter Optimizations ................................................. G-2-106
Appendix Volume 3 G-2-vii

VSC-A Final Report: Appendix G-2 Security Network Simulations – Hu and Haas
1 Introduction
A thorough characterization of the performance of VANETs has not yet been presented in the literature, but hardware (HW) and software (SW) designers working on building and standardizing VANETs can be greatly helped by such information. The main application for VANETs currently is safety, supported by the regular broadcast of safety heartbeat messages. This application has previously been proposed in the literature [6]. Various protocols have also been proposed in the literature to secure these messages to protect VANETs from arbitrary and irreconcilable damage [4]. As one of the The Vehicle Safety Communications – Applications (VSC-A) teams chosen to investigate the performance of VANET security protocols, the results of the simulations are presented in this document.
In the simulations, results that accurately reflect real-world VANET performance have been provided. Both synthetic vehicle traffic on real road maps and recordings of vehicles on highways for the vehicle traces have been used in the simulations. Three different security protocols have been simulated: Elliptic Curve Digital Signature Algorithm (ECDSA) using ECDSA to sign heartbeats, TESLA using the TESLA protocol [5] to sign heartbeats, and two signature using both ECDSA and TESLA to sign heartbeats. For TESLA and two signature, two variations will be investigated: sending keys attached to heartbeat packets (piggyback mode or ”piggy”), and sending keys in separate packets (optimum mode or ”opt”).
Results showing that using TESLA with piggybacked keys results in the best performance in almost every scenario and for most metrics has been presented. Often, two signature with piggybacked keys results in similar performance and is the next best choice to TESLA piggyback.
The remainder of this document is organized as follows. In Section 2, details of the settings used in the simulations are presented. Simulations in an urban environment in Section 3 and in a highway environment in Section 4 are presented. The best manner in which to send certificates are investigated, the results of which are presented in Section 5. Finally, the whitepaper concludes in Section 6.
2 Settings
In this section, the simulation environment and the settings used for the simulations are discussed.
2.1 Verification Queue
Our verification queue is basically a first-in-first-out (FIFO) structure. Packets that are ready for verification (i.e., the receiver has a certificate for the sender, and in the case of TESLA signature verification, a valid TESLA key has been received from the sender) are queued as the criteria for verification are met. Packets are dequeued when they are verified. That is, as soon as the processor can compute the verification.
Appendix Volume 3 G-2-1

VSC-A Final Report: Appendix G-2 Security Network Simulations – Hu and Haas
If a heartbeat packet is stored by a receiving vehicle for longer than 500 ms and has not been verified, the packet is dropped. However, if that packet has a certificate attached to it and the certificate is a new certificate requiring verification, that packet is retained for verification beyond the 500 ms if necessary, but the heartbeat part of the packet is not verified or counted as being successfully received at the application layer.
Besides the time limit on packets in the verification queue, the size of the queue is limited to be 200 kB. For the TESLA key chain that a vehicle uses to sign messages for TESLA or two signature, a key chain that required 12 kB for storage was used, reducing the size allotted to packets in the verification queue to 188 kB.
2.2 Simulator
The University of Illinois at Urbana-Champaign (UIUC) VANET simulator was used for all of the simulations. This simulator has undergone rigorous validation, including a packet-by-packet comparison with the VANET extensions to NS2 [1]. Additionally, the simulator has been calibrated to match the Network Simulator (NS2) results of the other two teams during the intermediate results workshop.
The main advantage of using this simulator is that it is dedicated to simulating VANETs. Since it is a dedicated tool for VANET, it is much faster than NS2. In previous comparisons, the UIUC VANET simulator has been estimated at 600 times faster than NS2 for running simulations of the scale used in our highway simulations presented in Section 4. In other words, what it takes our simulator approximately 4 hours to simulate, NS2 would require 100 days.
2.3 TESLA Key Intervals
Throughout the simulations that are presented in Sections 3, 4, and 5, a key interval of =100 ms is used for the piggyback versions of TESLA and two signature, and =10
ms for the optimum versions of TESLA and two signature. Throughout all of the simulations, it was found that =100 ms resulted in better performance for the piggyback variations. For the optimum variations, it was found that =10 ms resulted in the lowest latency. Using =30 ms sometimes resulted in more packets being received, but the latency introduced by the additional key release delay always resulted in larger total delays in aggregate. In one set of highway simulations, (20 dBm transmission power, no channel switching, using the PC processor) TESLA optimum with =30 ms as a reference is presented. Varying the key interval for the optimum protocol variations did not change the relative rankings. Thus, because =10 ms results in the lowest total delay, that is the major strength of the optimum protocol variations.
For all of the simulations, a key was sent only once because the additional packet overhead of sending multiple copies of a key causes more channel congestion and physical failures, which will be shown as being the largest failure mode. A TESLA key chain of length =1,000,000 with anchors every i =1,000 hashes was used. In order to minimize the number of packets that failed the TESLA security condition, key releases were aligned with the vehicles' heartbeat times. Vehicles having a clock skew of up to 1.5 ms were simulated, thus 2 vehicles' clocks could be up to 3 ms different.
Appendix Volume 3 G-2-2

VSC-A Final Report: Appendix G-2 Security Network Simulations – Hu and Haas
2.4 Two Signature
The two signature protocol waits for a fixed amount of time after when a heartbeat's key is scheduled to be released before the vehicle that received the heartbeat uses the ECDSA signature for verification rather than the TESLA signature. For the 2 signature TESLA time-out duration, 200 ms was chosen to use rather than the 20 ms specified in the parameters document. This was chosen because early tests with the highway scenarios indicated that a large majority of packets were requiring ECDSA signature verification, thus the advantages of the lower processing overhead of TESLA were not being utilized by the two signature algorithms so as not to differentiate its performance significantly from ECDSA.
2.5 Processor Computation Times
Using either of two processors was simulated: a PC processor (standard desktop variety), and a PowerPC processor (PPC). Processing overhead is simulated for ECDSA and TESLA signature generation and verification. Additionally, TESLA requires vehicles to hash keys to verify them if they are not consecutive on the transmitting vehicle's key chain. This processing delay is labeled as the TESLA hash time. Table 1 shows the times that were used in the simulations.
Table 1: Simulated Processor Delays
PC PPC ECDSA
Verification 4.9 ms 22.7 ms
ECDSA Generation
1.3 ms 6.2 ms
TESLA Verification
0.1 ms 0.8 ms
TESLA Generation
0.12 ms 0.9 ms
TESLA hash time
1 us 10.5 us
2.6 IEEE 1609.4 Channel Switching
Enabling or disabling IEEE 1609.4 channel switching was simulated. With channel switching disabled, vehicles can send and receive heartbeats at any time. With channel switching enabled, vehicles can only begin transmitting heartbeats during the control channel (CCH) interval. If a vehicle begins receiving a heartbeat before the end of a CCH but finishes receiving after the CCH, this packet is considered to have been correctly received if the receiver finishes receiving the packet finishes before the end of the rear guard time. The duration of the CCH is 44 ms. A front guard time of 4 ms and a rear guard time of 2 ms was simulated. These guard intervals are times when vehicles are switching their radios between the service channel (SCH) interval and the CCH interval.
Appendix Volume 3 G-2-3

VSC-A Final Report: Appendix G-2 Security Network Simulations – Hu and Haas
2.7 Heartbeat Transmission Time Randomization
In order for two vehicles that randomly happen to choose the same time to broadcast their heartbeats relative to the beginning of the CCH interval (or to some absolute time where 1609.4 channel switching is disabled), the heartbeat broadcast time was randomized around the fixed relative time. This interval allowed vehicles to send up to 2.5 ms before or after the fixed relative time.
2.8 Legend Format
In the graphs presented in this report, the legend entries for the graphs generally follow this format: protocol used, processor used (if applicable), key interval (if applicable), and channel switching use. For reference, each scenario was simulated in Section 3 and Section 4 without any security protocol or overhead in addition to each of the security protocols and their variations. These simulations are labeled as ”None.”' The processor will be either a PC or a PPC, which will determine the time verifications and signatures required. Key intervals are given in seconds. Finally, 1609.4 channel switching was either enabled or disabled. Enabled is labeled as ”CCH’' and disabled as ”No CCH,”' where CCH stands for Control Channel.
3 Cook County Simulations
In this section, the results of the urban simulations are presented. The urban simulation trace was generated using VanetMobiSim [3]. The trace area had 300 vehicles contained in a 2 km by 2 km area of Cook County, Illinois20, which contains downtown Chicago. The road data was obtained from the U.S. Census Bureau's Topologically Integrated Geographic Encoding and Referencing (TIGER) system database from the year 2000.
mThe vehicle speed ranged from 10-30 , and driver behavior was modeled using thes
built-in intelligent driver model with the ability to change lanes. The area contained 20 stop lights, and road speed limits were provided in the TIGER data.
Fading Model
In all of the simulations, the channel fading model was used as presented by Cheng, et al. [2]. The governing equations presented by these authors are presented again here as Equations (1) and (2).
d P(d ) 10 1 log10 X if d0 d dc0 d0 1
d d P(d ) = P(d0 ) 10 1 log10 c 10 2 log10 X if d > dc (1)
d d 20 c
20 Centered at approximately Latitude: 41.888988, Longitude: -87.622833
Appendix Volume 3 G-2-4

VSC-A Final Report: Appendix G-2 Security Network Simulations – Hu and Haas
22 1 x2 x f (x; , ) = e (2)( )
Two different settings were utilized for this fading model; one for the urban environment, and one for the highway environment. For the urban environment presented in this section, Table 2 shows the settings of the fading model used. Figure 1 shows the theoretic reception probability of 10 and 20 dBm transmission power with the urban fading settings. These settings were obtained based on the work done by Cheng, et al. [2].
Table 2: Urban Simulations Fading Model Settings
d0 16 m
cd 100 m
1 2
2 4
1 ( d 5 m) 3
2 ( 70<5 d m m) 2
3 ( dm <70 ) 1
Figure 1: Theoretic Reception Probability for Urban Simulations with 10 and 20 dBm Transmission Power
3.1 IEEE 1609.4 Disabled
In this section, the simulated performance with IEEE 1609.4 Channel Switching disabled is shown, first for 20 dBm transmit power and then for 10 dBm transmit power.
Appendix Volume 3 G-2-5

VSC-A Final Report: Appendix G-2 Security Network Simulations – Hu and Haas
3.1.1 20 dBm Transmit Power
Figure 2 and Figure 3 how the performance of the security protocols for our urban environment with the settings summarized in Table 3 using the PC processor and the PPC processor, respectively. Figure 2(a) and Figure 3(a) show the over-the-air (OTA) performance. With either processor, TESLA piggyback provides the best performance of the security protocols. These figures show that performance is determined first by the number of packets sent (more for TESLA and two signature optimum) and then by packet size (smallest for TESLA piggyback).
Table 3: Section 3.1.1 Settings
Transmit power 20 dBm 1609.4 disabled
TESLA Piggyback key interval
100 ms
TESLA optimum key interval
10 ms
Two signature piggyback key
interval
100 ms
Two signature optimum key interval
10 ms
Figure 2(b) and Figure 3(b) show application layer performance. With either processor, ECDSA performs the poorest because neither processor is able to handle the computational load imposed by ECDSA signatures. With the PPC processor, the load is so severe that at no range does ECDSA allow for greater than 20 percent of messages to arrive at the application layer. These figures show TESLA piggyback resulting in the best performance of the security protocols. Two signature piggyback performs next best with the PC processor and better than TESLA piggyback at longer ranges (beyond approximately 350 m).
Figure 2(c) and Figure 3(c) show the average total packet delay. That is, the time from when a packet is released to the transmitter's Medium Access Control (MAC) layer until it is successfully received at the receiver's application layer. Total delay incorporates MAC layer delay, transmission delay, and verification delay (i.e., waiting for keys and waiting in the processing queue). With the PC processor, the extra processing required by the two signature scheme for verifying ECDSA signatures is very slight, resulting in each two signature protocol variation performing similarly to the corresponding TESLA protocol variation. TESLA optimum (with the PPC) and either TESLA optimum or two signature optimum (with the PC) result in the lowest average total delay. The optimum variations have lower total delay than the piggyback variations, because the keys for verification are released sooner. ECDSA again performs the poorest for either processor.
Figure 2(d) and Figure 3(d) show histograms of the number of packets verified versus their verification time. The number of packets verified is shown on a logarithmic scale. For ECDSA and either processor, a significant proportion of packets are verified at the maximum verification delay of 500 ms. Additionally, for the PPC, almost all ECDSA verifications take nearly the full 500 ms, which means that the processor is essentially
Appendix Volume 3 G-2-6

VSC-A Final Report: Appendix G-2 Security Network Simulations – Hu and Haas
always the performance bottleneck. Both processors show a periodic behavior resulting from the periodic release of TESLA keys for the TESLA and two signature protocols. For the PPC, both the TESLA and (more noticeably) the two signature protocols show a more smooth graph (the peaks are less distinguished from the valleys), which is the result of using a slower processor compared to the PC and the longer time taken for certificate verifications and in the two signature case also for ECDSA signature verifications. For either processor, the optimum variations can result in lower verification latency because of not needing to wait for the key attached to the following heartbeat packet. The two signature variations, when using the PC processor, do not show verifications extending as long as the TESLA variations. This is because following the timeout period in the two signature variations the ECDSA signature is verified, and the vehicle does not wait for another TESLA key.
Figure 2(e) and Figure 3(e) show the median and average time between when a vehicle receives heartbeat packets at the application layer (after verification) for a transmitting vehicle versus distance to that vehicle. For both processors, TESLA piggyback has the smallest inter-packet arrival time, followed by two signature piggyback. With the PPC, ECDSA clearly has longer inter-packet arrival times, and the two signature schemes are smoother. That is, they do not show as pronounced of a stair-step behavior in their medians compared to the TESLA protocols. Both of these effects arise from the reduced processing speed of the PPC causing verification delay due to processing being a more major mode of delay.
Figure 2(f) and Figure 3(f) show the complimentary cumulative distribution function (CCDF) of the distance when the first certificate from a vehicle is received. The choice of processor has no effect on this graph because the network layer performance, which determines when these packets are received, is not affected by processor. As is shown in the OTA performance figures, there are two factors that determine how protocols perform relative to each other. First, more packets (optimal variations of TESLA and two signature) result in poorer performance. Second, smaller packets result in better performance. This leads to TESLA piggyback resulting in the first certificates from vehicles being received at longer distances. The difference in performance among TESLA piggyback, ECDSA, and two signature piggyback are relatively small compared to the optimum variations and the performance without any security overhead. These same observations and reasons for determining relative rankings explain the performance shown in Figure 2(g) and Figure 3(g), which show the MAC layer delay histograms. The count of packets is displayed using a logarithmic scale.
Table 4 shows the storage requirements for the PC and PPC in terms of maximum number of certificates stored by a vehicle and the maximum size in bytes of a vehicle's verification queue. The optimum variations result in fewer stored certificates because certificate storage depends only on what is received at the physical layer (PHY) since all new certificates are verified in our queuing model. None of the simulations resulted in a full verification queue.
Appendix Volume 3 G-2-7

VSC-A Final Report: Appendix G-2 Security Network Simulations – Hu and Haas
Table 4: Cook County, No Channel Switching, 20 dBm Transmission Power: Certificate Storage Requirements and Maximum Verification Queue Size
Max Stored Certificates
(PC)
Max Queue Size (PC)
Max Stored Certificates
(PPC)
Max Queue Size
(PPC) ECDSA 161 67,881 158 67,360 TESLA
piggyback 166 34,025 161 157,371
TESLA optimum 148 157,276 148 26,014
Two signature
piggyback 157 39,257 157 81,343
Two signature optimum
143 23,918 141 55,123
Figure 2 (a) Network Layer Reception Performance
Appendix Volume 3 G-2-8

VSC-A Final Report: Appendix G-2 Security Network Simulations – Hu and Haas
Figure 2 (b) Application Layer Reception Performance
Figure 2 (c) Average Packet Total Delay versus Distance
Appendix Volume 3 G-2-9

VSC-A Final Report: Appendix G-2 Security Network Simulations – Hu and Haas
Figure 2 (d) Number of Packets versus Verification Latency
Figure 2 (e) Inter-packet Arrival Time
Appendix Volume 3 G-2-10

VSC-A Final Report: Appendix G-2 Security Network Simulations – Hu and Haas
Figure 2 (f) First Certificate Arrival Distance
Figure 2 (g) Number of Packets versus MAC Layer Delay
Figure 2: Cook County, Illinois, Simulation Results: 20 dBm Transmit Power, PC Processor, No Channel Switching
Appendix Volume 3 G-2-11

VSC-A Final Report: Appendix G-2 Security Network Simulations – Hu and Haas
Figure 3 (a) Network Layer Reception Performance
Figure 3 (b) Application Layer Reception Performance
Appendix Volume 3 G-2-12

VSC-A Final Report: Appendix G-2 Security Network Simulations – Hu and Haas
Figure 3 (c) Average Packet Total Delay versus Distance
Figure 3 (d) Number of Packets versus Verification Latency
Appendix Volume 3 G-2-13

VSC-A Final Report: Appendix G-2 Security Network Simulations – Hu and Haas
Figure 3 (e) Inter-packet Arrival Time
Figure 3 (f) First Certificate Arrival Distance
Appendix Volume 3 G-2-14

VSC-A Final Report: Appendix G-2 Security Network Simulations – Hu and Haas
Figure 3 (g) Number of Packets versus MAC Layer Delay
Figure 3: Cook County, Illinois, Simulation Results: 20 dBm Transmit Power, PPC Processor, No Channel Switching
3.1.2 10 dBm Transmit Power
Figure 4 and Figure 5 show the performance of the security protocols for our urban environment with the settings summarized in Table 5 using the PC processor and the PPC processor, respectively. Figure 4(a) and Figure 5(a) show the OTA performance. The relative rankings are the same as in the previous section, with TESLA piggyback performing best, but the performance of the protocols are more similar with 10 dBm transmission power because fewer packets are receivable. Thereby, reducing the effects of the discriminating factors of number of packets and packet size.
Appendix Volume 3 G-2-15

VSC-A Final Report: Appendix G-2 Security Network Simulations – Hu and Haas
Table 5: Section 3.1.2 Settings
Transmit Power 10 dBm 1609.4 disabled TESLA
piggyback key 100 ms interval
TESLA optimum key interval 10 ms
Two signature piggyback key
interval 100 ms
Two signature optimum key 10 ms
interval
Figure 4(b) and Figure 5(b) show the percent of packets received at the application layer versus distance for the PC and the PPC processors, respectively. ECDSA performs noticeably better for both processors with 10 dBm transmission power at shorter distances compared to ECDSA's performance with 20 dBm transmission power because there are fewer packets received. Therefore, fewer packets to verify result in the graphs showing more packets being verified at closer range and fewer being verified at longer range. The relative rankings again are the same as in the previous section with TESLA piggyback performing best, but the difference in the non-ECDSA protocols' performances are less pronounced.
Figure 4(c) and Figure 5(c) show the average total packet delay versus distance for the PC and the PPC, respectively. The PC graph shows very similar performance for the non-ECDSA protocols compared to the performance using 20 dBm transmission power. The PPC graph now shows two signature optimum resulting in lower average total delay than TESLA piggyback, which differs from the relative positions of the protocols for 20 dBm transmission power. Two signature performs better because there are fewer packets received and correspondingly fewer to verify, resulting in lower verification delay and thus lower total delay. ECDSA's performance is much improved over 20 dBm for the same reason meaning that fewer packets are received and, thus, fewer verifications are performed.
Figure 4(d) and Figure 5(d) show histograms of the number of packets verified versus their verification latency. These graphs show the same relative performance as was shown in the previous section.
Figure 4(e) and Figure 5(e) show the time between arrivals at the application layer versus distance. The performance shown in these graphs are very similar to the performance shown in the previous section. The main difference with 10 dBm transmission power compared to 20 dBm is ECDSA's median arrival time for the PPC is not as distinguished from the other protocols' medians.
Appendix Volume 3 G-2-16

VSC-A Final Report: Appendix G-2 Security Network Simulations – Hu and Haas
Figure 4(f) and Figure 5(f) show the CCDF of the distance when a vehicle's certificate is first received. For 10 dBm transmission power, the vast majority are received beyond 200 m. For 20 dBm, the vast majority are received beyond 400 m.
Figure 4(g) and Figure 5(g) show packet count versus the MAC layer delay. These graphs differ slightly from the MAC layer delay shown in the previous section. For 10 dBm transmission power, there are fewer packets received or sensed, thus packets are delayed less often at the MAC layer with 10 dBm transmission power compared to 20 dBm.
Table 6 shows the storage requirements for the PC and PPC in terms of maximum number of certificates stored by a vehicle and the maximum size in bytes of a vehicle's verification queue. Again, none of the simulations resulted in a full verification queue. In general, the queue sizes are smaller than with 20 dBm because of the lower transmission power resulting in fewer packets being received.
Appendix Volume 3 G-2-17

VSC-A Final Report: Appendix G-2 Security Network Simulations – Hu and Haas
Figure 4 (a) Network Layer Reception Performance
Figure 4 (b) Application Layer Reception Performance
Appendix Volume 3 G-2-18

VSC-A Final Report: Appendix G-2 Security Network Simulations – Hu and Haas
Figure 4 (c) Average Packet Total Delay versus Distance
Figure 4 (d) Number of Packets versus Verification Latency
Appendix Volume 3 G-2-19

VSC-A Final Report: Appendix G-2 Security Network Simulations – Hu and Haas
Figure 4 (e) Inter-packet Arrival Time
Figure 4 (f) First Certificate Arrival Distance
Appendix Volume 3 G-2-20

VSC-A Final Report: Appendix G-2 Security Network Simulations – Hu and Haas
Figure 4 (g) Number of Packets versus MAC Layer Delay
Figure 4: Cook County, Illinois, Simulation Results: 10 dBm Transmit Power, PC Processor, No Channel Switching
Appendix Volume 3 G-2-21

VSC-A Final Report: Appendix G-2 Security Network Simulations – Hu and Haas
Figure 5 (a) Network Layer Reception Performance
Figure 5 (b) Application Layer Reception Performance
Appendix Volume 3 G-2-22

VSC-A Final Report: Appendix G-2 Security Network Simulations – Hu and Haas
Figure 5 (c) Average Packet Total Delay versus Distance
Figure 5 (d) Number of Packets versus Verification Latency
Appendix Volume 3 G-2-23

VSC-A Final Report: Appendix G-2 Security Network Simulations – Hu and Haas
Figure 5 (e) Inter-packet Arrival Time
Figure 5 (f) First Certificate Arrival Distance
Appendix Volume 3 G-2-24

VSC-A Final Report: Appendix G-2 Security Network Simulations – Hu and Haas
Figure 5 (g) Number of Packets versus MAC Layer Delay
Figure 5: Cook County, Illinois, Simulation Results: 10 dBm Transmit Power, PPC Processor, No Channel Switching
Table 6: Cook County, Illinois, No Channel Switching, 10 dBm Transmission Power: Certificate Storage Requirements and Maximum
Verification Queue Size Max Stored
Certificates (PC)
Max Queue Size (PC)
Max Stored Certificates
(PPC)
Max Queue Size
(PPC) ECDSA 94 44,846 96 46,421 TESLA
piggyback 94 25,149 94 27,129
TESLA optimum 90 78,669 90 20,910
Two signature
piggyback 94 27,716 94 50,727
Two signature optimum
90 20,908 90 39,737
Appendix Volume 3 G-2-25

VSC-A Final Report: Appendix G-2 Security Network Simulations – Hu and Haas
3.2 3.2 1609.4 Enabled
In this section, the urban simulation results with 1609.4 channel switching enabled are presented.
3.2.1 20 dBm Transmit Power
First, the results with 20 dBm transmission power are shown. The settings used in this section are given in Table 7. Figure 6 and Figure 7 show the performance of the security protocols for the urban environment using the PC processor and the PPC processor, respectively.
Table 7: Section 3.2.1 Settings
Transmit Power 20 dBm 1609.4 enabled
TESLA piggyback key interval 100 ms
TESLA optimum key interval 10 ms
Two signature piggyback key
interval 100 ms
Two signature optimum key
interval 10 ms
Figure 6(a) and Figure 7(a) show the OTA performance. There is a noticeable difference between these figures and the OTA performance with the same settings but no channel switching. For all the security protocols, the percent received with channel switching enabled at 200 m is approximately between 40 percent and 60 percent, whereas without channel switching they lie approximately between 70 percent and 85 percent. This difference in the percent received comes from there being less time to send packets with channel switching enabled.
Figure 6(b) and Figure 7(b) show the percent of packet correctly received at the application layer versus distance. A result of the fewer received packets, as mentioned in the previous paragraph, is that there are fewer packets to verify which results in a higher percentage of packets received correctly at the application layer at shorter distances for ECDSA. In other words, these short distance packets have been receive at the network layer previously, but due to processing delay, they were unverifiable within the specified 500 ms maximum latency. With the percent received graphs essentially shifted down, the total area under the curve for ECDSA short distance packets show increased performance. However, the relative rankings and their reasonings remain the same as was presented above with channel switching disabled.
Figure 6(c) and Figure 7(c) show the average total packet delay versus distance. At 300 m for ECDSA, approximately 22 percent of packets are received at the network layer. Additionally, at this distance, the number of drops due to the verification exceeding the maximum time of 500 ms is proportionally considerably less than at smaller distances.
Appendix Volume 3 G-2-26

VSC-A Final Report: Appendix G-2 Security Network Simulations – Hu and Haas
Thus, the delay induced by the verification queue is a smaller source of delay at distances of 300 m and beyond and results in a sharply reduced average total delay for ECDSA beyond 300 m. The rankings of the security protocols is the same as without channel switching. The major difference in this graph for the non-ECDSA protocols with channel switching compared to without channel switching is the larger delay, especially notable at very short distances. This extra delay comes from the extra MAC layer delay.
Figure 6(d) and Figure 7(d) show histograms of verification latency. The optimum variations and ECDSA result in the lowest latency of the security protocols. The non-ECDSA protocols do not show as clean of peaks and periodicity with channel switching enabled because of the delay of packets at the MAC layer. Using the PC processor, ECDSA does not have as sharp of a peak at the maximum verification delay due to fewer packets being received, indicating that there are times when vehicles have less full verification queues.
Figure 6(e) and Figure 7(e)show the time between heartbeat arrivals versus distance. TESLA piggyback performs the best at longer distances, and the median performance is very similar among all the security protocols at short distances. At longer distances, TESLA piggyback seems to outperform the no-security simulations, which is attributable to packets being delayed at the MAC layer from one CCH interval to the next. This results in a short time between a heartbeat and its key release in the following heartbeart, which arrives in the same CCH interval. For the PC, two signature piggyback and ECDSA perform closely as second best to TESLA piggyback. For the PPC, two signature piggyback is the second best and performs closely to TESLA piggyback.
Figure 6(f) and Figure 7(f) show the CCDF of the first certificate reception versus distance. With fewer packets being received with channel switching enabled versus channel switching disabled, the distance at which a vehicle's certificate is first received is shorter. However, the same relative rankings as without channel switching result. Figure 6(g) and Figure 7(g) show the histogram of packet delay at the MAC layer. The bimodal graph results from packets being delayed from one CCH interval to the next. Again, more packets are delayed longer with the optimum variations due to there being more packets sent. This bimodal form will appear in all MAC layer histograms with 1609.4 channel switching enabled.
Table 8 shows the storage requirements for the PC and PPC in terms of maximum number of certificates stored by a vehicle and the maximum size in bytes of a vehicle's verification queue. Again, none of the simulations resulted in a full verification queue. With all of the security protocols, the maximum size of a vehicle's verification queue is larger with the PPC compared to the PC because of the additional processing delay on the PPC.
Appendix Volume 3 G-2-27

VSC-A Final Report: Appendix G-2 Security Network Simulations – Hu and Haas
Table 8: Cook County, Illinois, with Channel Switching, 20 dBm Transmission Power: Certificate Storage Requirements and Max
Verification Queue Size Max Stored
Certificates (PC)
Max Queue Size (PC)
Max Stored Certificates
(PCC)
Max Queue Size
(PPC) ECDSA 129 44,131 125 45,888 TESLA
piggyback 123 25,149 123 118,600
TESLA optimum 115 97,209 115 102,795
Two signature
piggyback 118 31,874 119 88,494
Two signature optimum
112 29,691 110 110,122
Figure 6 (a) Network Layer Reception Performance
Appendix Volume 3 G-2-28

VSC-A Final Report: Appendix G-2 Security Network Simulations – Hu and Haas
Figure 6 (b) Application Layer Reception Performance
Figure 6 (c) Average Packet Total Delay versus Distance
Appendix Volume 3 G-2-29

VSC-A Final Report: Appendix G-2 Security Network Simulations – Hu and Haas
Figure 6 (d) Number of Packets versus Verification Latency
Figure 6 (e) Inter-packet Arrival Time
Appendix Volume 3 G-2-30

VSC-A Final Report: Appendix G-2 Security Network Simulations – Hu and Haas
Figure 6 (f) First Certificate Arrival Distance
Figure 6 (g) Number of Packets versus MAC Layer Delay
Figure 6: Cook County, Illinois, Simulation Results: 20 dBm Transmit Power, PC Processor, with Channel Switching
Appendix Volume 3 G-2-31

VSC-A Final Report: Appendix G-2 Security Network Simulations – Hu and Haas
Figure 7 (a) Network Layer Reception Performance
Figure 7 (b) Application Layer Reception Performance
Appendix Volume 3 G-2-32

VSC-A Final Report: Appendix G-2 Security Network Simulations – Hu and Haas
Figure 7 (c) Average Packet Total Delay versus Distance
Figure 7 (d) Number of Packets versus Verification Latency
Appendix Volume 3 G-2-33

VSC-A Final Report: Appendix G-2 Security Network Simulations – Hu and Haas
Figure 7 (e) Inter-packet Arrival Time
Figure 7 (f) First Certificate Arrival Distance
Appendix Volume 3 G-2-34
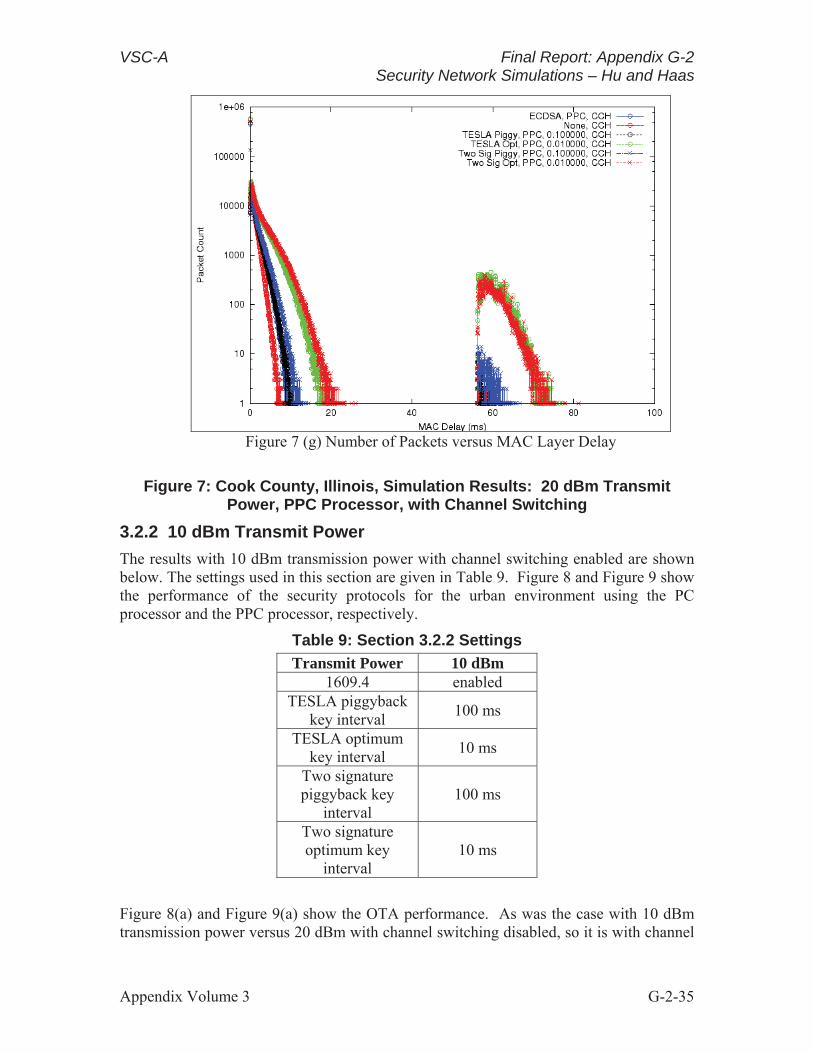
VSC-A Final Report: Appendix G-2 Security Network Simulations – Hu and Haas
Figure 7 (g) Number of Packets versus MAC Layer Delay
Figure 7: Cook County, Illinois, Simulation Results: 20 dBm Transmit Power, PPC Processor, with Channel Switching
3.2.2 10 dBm Transmit Power
The results with 10 dBm transmission power with channel switching enabled are shown below. The settings used in this section are given in Table 9. Figure 8 and Figure 9 show the performance of the security protocols for the urban environment using the PC processor and the PPC processor, respectively.
Table 9: Section 3.2.2 Settings
Transmit Power 10 dBm 1609.4 enabled
TESLA piggyback key interval 100 ms
TESLA optimum key interval 10 ms
Two signature piggyback key
interval 100 ms
Two signature optimum key
interval 10 ms
Figure 8(a) and Figure 9(a) show the OTA performance. As was the case with 10 dBm transmission power versus 20 dBm with channel switching disabled, so it is with channel
Appendix Volume 3 G-2-35

VSC-A Final Report: Appendix G-2 Security Network Simulations – Hu and Haas
switching enabled that 10 dBm transmission power results in the percent of packets received at the network layer being considerably lower than that of 20 dBm. With 10 dBm transmission power, the percent received for all of the simulations at 200 m lies between 20 percent and 40 percent compared to 40 percent and 60 percent with 20 dBm.
Figure 8(b) and Figure 9(b) show the percent of packets received at the application layer. With the PC processor, ECDSA performs very closely to the other protocols, which is a result of still fewer packets being received at the network layer due to using lower transmission power. TESLA piggyback still performs the best of the security protocols, and two signature piggyback performs second best.
Figure 8(c) and Figure 9(c) show the average total packet delay versus distance. As was the case above, the optimum variations provide the lowest average total delay. The performance of ECDSA with the PC improves versus using 20 dBm transmission power again because of fewer packets in total being received that need verification.
Figure 8(d) and Figure 9(d) show histograms of packet verification latency. ECDSA does not show the spike at the maximum verification delay of 500 ms using the PC because vehicles' queues are no longer as full. The performances of the non-ECDSA protocols are very similar to that of using 20 dBm transmission power.
Figure 8(e) and Figure 9(e) show the inter-packet arrival times versus distance. TESLA piggyback performs best for either processor. For the PC processor ECDSA and two signature perform similarly and next best after TESLA piggyback. Comparing the averages of two signature piggyback and ECDSA with the PPC shows that two signature piggyback performs better than ECDSA.
Figure 8(f) and Figure 9(f) show the CCDF of the distance at which a certificate is first received. TESLA piggyback performs slightly better than two signature piggyback and ECDSA, which perform next best. The rankings are so ordered for the reasoning stated in the previous section regarding certificate reception performance. Figure 8(g) and Figure 9(g) show the MAC layer delay histogram. These figures show that the MAC layer delay is decreased, especially the number of packets delayed to the following CCH interval, which is due to vehicles receiving or overhearing fewer packets due to lower transmission power compared to 20 dBm. Again, the MAC layer delay is worse for the optimum variations because they generate more packets.
Table 10 shows the storage requirements for the PC and PPC in terms of maximum number of certificates stored by a vehicle and the maximum size in bytes of a vehicle's verification queue. As was the case with 20 dBm and with channel switching, with all of the security protocols (except TESLA optimum here), the maximum size of a vehicle's verification queue is larger with the PPC compared to the PC because of the additional processing delay on the PPC. This is not the case for TESLA optimum, because there are fewer packets received and thus fewer to verify. This behavior is not shown for two signature optimum, since there are fewer packets received as well, verifications can take much longer since ECDSA is sometimes used and ECDSA signatures take much longer to verify.
Appendix Volume 3 G-2-36

VSC-A Final Report: Appendix G-2 Security Network Simulations – Hu and Haas
Table 10: Cook County, Illinois, with Channel Switching, 10 dBm Transmission Power: Certificate Storage Requirements and Max
Verification Queue Size Max stored
certs (PC) Max queue size (PC)
Max stored certs (PPC)
Max queue size (PPC)
ECDSA 85 37,200 88 38,109 TESLA piggyback
84 23,311 84 92,087
TESLA optimum
83 87,803 81 60,270
Two signature piggyback
81 27,134 84 46,218
Two signature optimum
75 21,784 76 36,946
Appendix Volume 3 G-2-37

VSC-A Final Report: Appendix G-2 Security Network Simulations – Hu and Haas
Figure 8 (a) Network Layer Reception Performance
Figure 8 (b) Application Layer Reception Performance
Appendix Volume 3 G-2-38

VSC-A Final Report: Appendix G-2 Security Network Simulations – Hu and Haas
Figure 8 (c) Average Packet Total Delay versus Distance
Figure 8 (d) Number of Packets versus Verification Latency
Appendix Volume 3 G-2-39

VSC-A Final Report: Appendix G-2 Security Network Simulations – Hu and Haas
Figure 8 (e) Inter-packet Arrival Time
Figure 8 (f) First Certificate Arrival Distance
Appendix Volume 3 G-2-40

VSC-A Final Report: Appendix G-2 Security Network Simulations – Hu and Haas
Figure 8 (g) Number of Packets versus MAC Layer Delay
Figure 8: Cook County, Illinois, Simulation Results: 10 dBm Transmit Power, PC Processor, with Channel Switching
Appendix Volume 3 G-2-41

VSC-A Final Report: Appendix G-2 Security Network Simulations – Hu and Haas
Figure 9 (a) Network Layer Reception Performance
Figure 9 (b) Application Layer Reception Performance
Appendix Volume 3 G-2-42

VSC-A Final Report: Appendix G-2 Security Network Simulations – Hu and Haas
Figure 9 (c) Average Packet Total Delay versus Distance
Figure 9 (d) Number of Packets versus Verification Latency
Appendix Volume 3 G-2-43

VSC-A Final Report: Appendix G-2 Security Network Simulations – Hu and Haas
Figure 9 (e) Inter-packet Arrival Time
Figure 9 (f) First Certificate Arrival Distance
Appendix Volume 3 G-2-44

4
VSC-A Final Report: Appendix G-2 Security Network Simulations – Hu and Haas
Figure 9 (g) Number of Packets versus MAC Layer Delay
Figure 9: Cook County, Illinois, Simulation Results: 10 dBm Transmit Power, PPC Processor, with Channel Switching
Interstate 80 Simulations
Data from the Next-Generation Simulation (NGSIM) project's recordings of Interstate 80 (I-80) in Emeryville, California, near San Fransisco was used. Specifically, the data recorded from 5:00 pm to 5:15 pm was used. This data only included traffic flowing in a single direction. To make this data more realistic for VANET scenarios, the data was copied, rotated, and offset such that the copied traffic was in the place of traffic that would have been flowing in the opposite direction. The result of these transformations was a trace with 3,672 vehicles, having 350 vehicles in the simulation on average (vehicles enter and exit the simulation as they move through the simulation area). The roadway is approximately 500 m long and has 6-7 lanes of traffic in each direction. The traffic in the left most lanes travels faster (high occupancy vehicle (HOV) lane where vehicles travel about 30-35 mph on average) than the congested traffic in the right most lanes (normal lanes where vehicles travel 10-20 mph on average).
4.1 Fading Model
The fading parameters used for the highway simulations are shown in Table 11 and were obtained from the default NS2 code. Figure 10 shows the theoretic reception probability of 10 and 20 dBm transmission power with the highway fading settings.
Appendix Volume 3 G-2-45

VSC-A Final Report: Appendix G-2 Security Network Simulations – Hu and Haas
Table 11: Highway Simulations Fading Model Settings
d0 200 m
cd 500 m
1 2
2 2 1
Figure 10: Theoretic Reception Probability for Highway Simulations with 10 and 20 dBm Transmission Power
Appendix Volume 3 G-2-46

VSC-A Final Report: Appendix G-2 Security Network Simulations – Hu and Haas
4.2 IEEE 1609.4 Disabled
The results with 1609.4 channel switching disabled are presented below.
4.2.1 20 dBm Transmit Power
First, the results with 20 dBm transmission power are shown. The settings used in this section are given in Table 12. Figure 11 and Figure 12 show the performance of the security protocols for the highway environment using the PC processor and the PPC processor, respectively. For the PC processor, a more detailed analysis of the best key interval for TESLA optimum was performed and found 30 ms to be best. However, as will be shown in this section and mentioned previously, the performance improvement is not enough to cause TESLA optimum to perform better than TESLA piggyback or two signature piggyback.
Table 12: Section 4.1.1 Settings
Transmit Power 20 dBm 1609.4 disabled
TESLA piggyback key interval 100 ms
TESLA optimum key interval
30 ms (PC)/10 ms (PPC)
Two signature piggyback key
interval 100 ms
Two signature optimum key
interval 10 ms
Figure 11(a) and Figure 12(a) show the OTA performance. The separation between the protocols' performances is more pronounced in the I-80 simulations than in the Cook County simulations because there are more vehicles in a smaller area, thus stressing the system more and amplifying how more packets and larger packets affect performance. TESLA piggyback performs the best out of the security protocols and ECDSA performs next best. However, there is a large gap between TESLA piggyback and not using any security.
Figure 11(b) and Figure 12(b) show the percent of packets received at the application layer versus distance. ECDSA performs far worse than any other protocol due to the computational load of verification. TESLA piggyback performs best, followed by two signature piggyback. The optimum variations perform significantly worse than the corresponding piggyback variations.
Figure 11(c) and Figure 12(c) show the average total packet delay versus distance. With the PC processor, two signature piggyback has longer delay compared to the optimum variation because there are 79 percent more packets verified with two signature piggyback compared to optimum, but the relative proportion of ECDSA signatures verified to TESLA signatures verified is about the same for the two variations. Thus, the
Appendix Volume 3 G-2-47

VSC-A Final Report: Appendix G-2 Security Network Simulations – Hu and Haas
additional delay for two signature piggyback is due to additional delay from verifications. There is a noticeable difference between the performance using the PC compared to using the PPC. Two signature piggyback and TESLA optimum perform similarly for either processor, but TESLA piggyback and two signature optimum perform worse with the PPC than with the PC; the discrepancy is due to processor overhead. TESLA piggyback performs worse; whereas, TESLA optimum does not, since there are 65 percent more packets verified with TESLA piggyback than with TESLA optimum and signature verifications require much more time with the PPC than with the PC. Two signature optimum performs worse because of the time required for verifying ECDSA signatures.
Figure 11(d) and Figure 12(d) show the histograms of verification latency. The effects of ECDSA signatures increasing the time required for verification on both two signature variations is evident in the PPC graph in most packet verifications taking 250 ms or longer. The effects of processor delay is visible in all non-ECDSA data series for the PPC in the level, high valleys between peaks. These level valleys are not as high in the PC figure, but they still exist. For either processor most ECDSA verifications occur at the very limit of the maximum allowed verification delay of 500 ms.
Figure 11(e) and Figure 12(e) show the inter-packet arrival times versus distance. TESLA piggyback and two signature piggyback are clearly the first and second best performers in this category.
Figure 11(f) and Figure 12(f) show the CCDF of the first certificate reception distance. Figure 11(g) and Figure 12(g) show the MAC layer delay histograms. The protocols are ranked in the same order as they were in the previous section for the same reasons.
Table 13 shows the storage requirements for the PC and PPC in terms of maximum number of certificates stored by a vehicle and the maximum size in bytes of a vehicle's verification queue. The certificate storage requirements for the highway simulation environment are much larger than those for the urban simulations. For all but two signature optimum, the verification queue is full at some time.
Table 13: I-80, No Channel Switching, 20 dBm Transmission Power: Certificate Storage Requirements and Maximum Verification Queue Size
Max stored certs (PC)
Max queue size (PC)
Max stored certs (PPC)
Max queue size (PPC)
ECDSA 625 167,146 623 204,795 TESLA
piggyback 637 204,800 632 204,800
TESLA optimum 609 204,800 602 204,800
Two signature
piggyback 604 138,253 610 204,798
Two signature optimum
565 98,060 563 180,196
Appendix Volume 3 G-2-48

VSC-A Final Report: Appendix G-2 Security Network Simulations – Hu and Haas
Figure 11 (a) Network Layer Reception Performance
Figure 11 (b) Application Layer Reception Performance
Appendix Volume 3 G-2-49

VSC-A Final Report: Appendix G-2 Security Network Simulations – Hu and Haas
Figure 11 (c) Average Packet Total Delay versus Distance
Figure 11 (d) Number of Packets versus Verification Latency
Appendix Volume 3 G-2-50

VSC-A Final Report: Appendix G-2 Security Network Simulations – Hu and Haas
Figure 11 (e) Inter-packet Arrival Time
Figure 11 (f) First Certificate Arrival Distance
Appendix Volume 3 G-2-51

VSC-A Final Report: Appendix G-2 Security Network Simulations – Hu and Haas
Figure 11 (g) Number of Packets versus MAC Layer Delay
Figure 11: I-80 Simulation Results: 20 dBm Transmit Power, PC Processor, No Channel Switching
Appendix Volume 3 G-2-52

VSC-A Final Report: Appendix G-2 Security Network Simulations – Hu and Haas
Figure 12 (a) Network Layer Reception Performance
Figure 12 (b) Application Layer Reception Performance
Appendix Volume 3 G-2-53

VSC-A Final Report: Appendix G-2 Security Network Simulations – Hu and Haas
Figure 12 (c) Average Packet Total Delay versus Distance
Figure 12 (d) Latency Inter-packet Arrival Time
Appendix Volume 3 G-2-54

VSC-A Final Report: Appendix G-2 Security Network Simulations – Hu and Haas
Figure 12 (e) Inter-packet Arrival Time
Figure 12 (f) First Certificate Arrival Distance
Appendix Volume 3 G-2-55

VSC-A Final Report: Appendix G-2 Security Network Simulations – Hu and Haas
Figure 12 (g) Number of Packets versus MAC Layer Delay
Figure 12: I-80 Simulation Results: 20 dBm Transmit Power, PPC Processor, No Channel Switching
Appendix Volume 3 G-2-56

VSC-A Final Report: Appendix G-2 Security Network Simulations – Hu and Haas
4.2.2 10 dBm Transmit Power
Figure 13 and Figure 14 show the performance of the security protocols for the highway environment using the PC processor and the PPC processor, respectively. The parameters that were used in this section are summarized in Table 14. In this section, and for the remainder of the optimum variation simulations, a key interval of 10 ms will be used because using 30 ms in the previous section did not change the relative rankings of the protocols. Nor was the performance close enough to warrant further investigation of the best key interval for the optimum variations.
Table 14: Section 4.1.2 Settings
Transmit Power
10 dBm
1609.4 disabled TESLA
piggyback key 100 ms interval TESLA
optimum key 10 ms interval
Two signature piggyback key 100 ms
interval Two signature optimum key 10 ms
interval
Figure 13(a) and Figure 14(a) show the OTA performance. The relative rankings are the same as in the previous section for the same reasons.
Figure 13(b) and Figure 14(b) show the percent received at the application layer versus distance. The relative rankings are the same here as in the previous section. Again, ECDSA shows a small improvement at shorter distances as was the case with the urban simulations when the simulations switched from 20 dBm to 10 dBm because there are fewer total packets to be verified.
Figure 13(c) and Figure 14(c) show the average total packet delay versus distance. TESLA piggyback and two signature optimum do not show the discrepancy in performance between PC and PPC processor with 10 dBm transmission power as they did with 20 dBm transmission power, because there are fewer packets received at the network layer that require verification; and thus, the processor load is smaller.
The effects of the processor not being as much of a bottleneck with 10 dBm transmission power compared to 20 dBm is seen in Figure 13(d) and Figure 14(d) since there are a significant number of packets being verified in less than 250 ms using the PPC. However, for ECDSA the processor is a major bottleneck hindering performance for either the PC or the PPC.
Appendix Volume 3 G-2-57

VSC-A Final Report: Appendix G-2 Security Network Simulations – Hu and Haas
Figure 13(e) and Figure 14(e) show the time between packet arrivals from the same vehicle versus distance. Figure 13(f) and Figure 14(f) show the CCDF of the distance of the first certificate reception from a vehicle. Figure 13(g) and Figure 14(g) show the MAC layer delay histograms all show the same relative performance as was shown in the previous section for the same reasons.
Table 15 shows the storage requirements for the PC and PPC in terms of maximum number of certificates stored by a vehicle and the maximum size in bytes of a vehicle's verification queue. Decreasing the transmission power from 20 dBm to 10 dBm results in fewer certificates needing to be stored, which is because only vehicles closer to the receiver are received from. Thus, some of the vehicles that are concurrently in the simulation never receive from each other. The maximum size of the verification queues here are similar to 20 dBm.
Table 15: I-80, No Channel Switching, 10 dBm Transmission Power: Certificate Storage Requirements and Maximum Verification Queue Size
Max stored certs (PC)
Max queue size (PC)
Max stored certs (PPC)
Max queue size (PPC)
ECDSA 577 146,789 577 180,328 TESLA
piggyback 583 204,800 586 204,800
TESLA optimum 525 204,800 528 204,800
Two signature
piggyback 563 123,807 564 204,798
Two signature optimum
516 44,005 519 121,119
Appendix Volume 3 G-2-58

VSC-A Final Report: Appendix G-2 Security Network Simulations – Hu and Haas
Figure 13 (a) Network Layer Reception Performance
Figure 13 (b) Application Layer Reception Performance
Appendix Volume 3 G-2-59

VSC-A Final Report: Appendix G-2 Security Network Simulations – Hu and Haas
Figure 13 (c) Average Packet Total Delay versus Distance
Figure 13 (d) Number of Packets versus Verification Latency
Appendix Volume 3 G-2-60

VSC-A Final Report: Appendix G-2 Security Network Simulations – Hu and Haas
Figure 13 (e) Inter-packet Arrival Time
Figure 13 (f) First Certificate Arrival Distance
Appendix Volume 3 G-2-61

VSC-A Final Report: Appendix G-2 Security Network Simulations – Hu and Haas
Figure 13 (g) Number of packets versus MAC layer delay
Figure 13: I-80 Simulation Results: 10 dBm Transmit Power, PC Processor, No Channel Switching
Appendix Volume 3 G-2-62

VSC-A Final Report: Appendix G-2 Security Network Simulations – Hu and Haas
Figure 14 (a) Network Layer Reception Performance
Figure 14 (b) Application Layer Reception Performance
Appendix Volume 3 G-2-63

VSC-A Final Report: Appendix G-2 Security Network Simulations – Hu and Haas
Figure 14 (c) Average Packet Total Delay versus Distance
Figure 14 (d) Number of Packets versus Verification Latency
Appendix Volume 3 G-2-64

VSC-A Final Report: Appendix G-2 Security Network Simulations – Hu and Haas
Figure 14 (e) Inter-packet Arrival Time
Figure 14 (f) First Certificate Arrival Distance
Appendix Volume 3 G-2-65

VSC-A Final Report: Appendix G-2 Security Network Simulations – Hu and Haas
Figure 14 (g) Number of Packets versus MAC Layer Delay
Figure 14: I-80 Simulation Results: 10 dBm Transmit Power, PPC Processor, No Channel Switching
Appendix Volume 3 G-2-66

VSC-A Final Report: Appendix G-2 Security Network Simulations – Hu and Haas
4.3 IEEE 1609.4 Enabled
The results with channel switching enabled for the I-80 environment is presented below.
4.3.1 20 dBm Transmit Power
The settings used in this section are given in Table 16. Figure 15 and Figure 16 show the performance of the security protocols for the highway environment using the PC processor and the PPC processor, respectively.
Table 16: Section 4.3.1 Settings
Transmit Power 20 dBm 1609.4 enabled
TESLA piggyback key interval 100 ms
TESLA optimum key interval 10 ms
Two signature piggyback key
interval 100 ms
Two signature optimum key
interval 10 ms
Figure 15(a) and Figure 16(a) show the OTA performance. The performance with channel switching enabled is much worse than with channel switching disabled; however, the relative rankings remain the same as in the previous section.
Figure 15(b) and Figure 16(b) show percent of packets received at the application layer versus distance. Using the PC and for very short distances, TESLA piggyback performs best; but at 25 m and beyond, two signature performs better, because verifications can be done using the ECDSA signature when a TESLA key is not received in time. This is not the case using the PPC because of the much longer verification time of ECDSA signatures compared to the PC.
Figure 15(c) and Figure 16(c) show the average total packet delay versus distance. The optimum variations result in the lowest delay, as was the case above. Two signature performs worse with the PPC than with the PC because of processing delay.
Figure 15(d) and Figure 16(d) show the histograms of packet verification latency. There are more peaks than just every 100 ms in the TESLA graphs because of packets getting delayed to the CCH interval following the one in which they were released.
Figure 15(e) and Figure 16(e) show the inter-packet arrival time versus distance. The medians of TESLA piggyback using the PC appears to perform better than not using any security at all. However, for TESLA piggyback, as was observed in our urban simulations, it is likely that this apparent better performance is due to heartbeats being delayed from one CCH interval to the following because of MAC layer delay. Two
Appendix Volume 3 G-2-67

VSC-A Final Report: Appendix G-2 Security Network Simulations – Hu and Haas
signature piggyback performs next best to TESLA piggyback; and at longer ranges, ECDSA is comparable to two signature piggyback.
Figure 15(f) and Figure 16(f) show the CCDF of the first certificate reception distance. TESLA piggyback and TESLA optimum perform best in these scenarios with TESLA piggyback performing better than optimum above approximately 60 percent and optimum being above piggyback below approximately 60 percent.
Figure 15(g) and Figure 16(g) show the number of packets versus MAC layer delay. The same bi-modal behavior occurs here as it did in the urban simulations, because channel congestion pushes packets to the following CCH interval. These graphs show TESLA piggyback and optimum having shorter tails than the no security simulations. This is because the reduced overhead of the no security packets (in size compared to either TESLA variation and in number compared to TESLA optimum) results in more packets being received (as shown in the OTA performance graphs). Thus, more backoffs will occur with the no security option.
Table 17 shows the storage requirements for the PC and PPC in terms of maximum number of certificates stored by a vehicle and the maximum size in bytes of a vehicle's verification queue. The maximum number of certificates stored by a vehicle is lower with channel switching enabled than it was without channel switching, which proceeds logically from there being fewer packets received due to there being a smaller amount of time to send them and the same number of cars contending for that time. Only TESLA optimum using the PPC resulted in packets being dropped because of the verification queue size limit being reached.
Table 17: I-80, with Channel Switching, 20 dBm Transmission Power: Certificate Storage Requirements and Maximum Verification Queue Size
Max stored certs (PC)
Max queue size (PC)
Max stored certs (PPC)
Max queue size (PPC)
ECDSA 501 74,376 509 86,347 TESLA
piggyback 526 153,467 528 180,577
TESLA optimum 502 202,031 502 204,799
Two signature
piggyback 487 49,070 474 107,126
Two signature optimum
356 41,871 360 119,985
Appendix Volume 3 G-2-68

VSC-A Final Report: Appendix G-2 Security Network Simulations – Hu and Haas
Figure 15 (a) Network Layer Reception Performance
Figure 15 (b) Application Layer Reception Performance
Appendix Volume 3 G-2-69

VSC-A Final Report: Appendix G-2 Security Network Simulations – Hu and Haas
Figure 15 (c) Average Packet Total Delay versus Distance
Figure 15 (d) Number of Packets versus Verification Latency
Appendix Volume 3 G-2-70

VSC-A Final Report: Appendix G-2 Security Network Simulations – Hu and Haas
Figure 15 (e) Inter-packet Arrival Time
Figure 15 (f) First Certificate Arrival Distance
Appendix Volume 3 G-2-71

VSC-A Final Report: Appendix G-2 Security Network Simulations – Hu and Haas
Figure 15 (g) Number of Packets versus MAC Layer Delay
Figure 15: I-80 Simulation Results: 20 dBm Transmit Power, PC Processor, with Channel Switching
Appendix Volume 3 G-2-72

VSC-A Final Report: Appendix G-2 Security Network Simulations – Hu and Haas
Figure 16 (a) Network Layer Reception Performance
Figure 16 (b) Application Layer Reception Performance
Appendix Volume 3 G-2-73

VSC-A Final Report: Appendix G-2 Security Network Simulations – Hu and Haas
Figure 16 (c) Average Packet Total Delay versus Distance
Figure 16 (d) Number of Packets versus Verification Latency
Appendix Volume 3 G-2-74

VSC-A Final Report: Appendix G-2 Security Network Simulations – Hu and Haas
Figure 16 (e) Inter-packet Arrival Time
Figure 16 (f) First Certificate Arrival Distance
Appendix Volume 3 G-2-75

VSC-A Final Report: Appendix G-2 Security Network Simulations – Hu and Haas
Figure 16 (g) Number of Packets versus MAC Layer Delay
Figure 16: I-80 Simulation Results: 20 dBm Transmit Power, PPC Processor, with Channel Switching
Appendix Volume 3 G-2-76

VSC-A Final Report: Appendix G-2 Security Network Simulations – Hu and Haas
4.3.2 10 dBm Transmit Power
The settings used in this section are given in Table 18. Figure 17 and Figure 18 show the performance of the security protocols for the highway environment using the PC processor and the PPC processor, respectively.
Table 18: Section 4.3.2 Settings
Transmit Power 10 dBm 1609.4 enabled
TESLA piggyback key interval 100 ms
TESLA optimum key interval 10 ms
Two signature piggyback key
interval 100 ms
Two signature optimum key
interval 10 ms
Figure 17(a) and Figure 18(a) show the OTA performance. At 100 m, no simulated security protocol has a reception percentage higher than 10 percent, and 10 dBm results in poorer OTA reception percentage than 20 dBm.
Figure 17(b) and Figure 18(b) show the percent of packets received at the application layer versus distance. For the PC, TESLA piggyback performs best under 25 m and along with it two signature piggyback or ECDSA beyond that, which is the same behavior as was witnessed with 20 dBm transmission power. For the PPC, TESLA piggyback performs best up to at least 150 m, after which all of the protocols perform similarly poorly.
Figure 17(c) and Figure 18(c) show the average total packet delay versus distance. For the PC, the processing overhead of ECDSA signatures for two signature optimum does not delay packets as significantly as had been the case with the other settings in our highway environment, and both optimum protocols perform similarly, having the lowest delay. For the PPC, the processing overhead is much more significant, and the TESLA variations have lower delay than the two signature variations with TESLA optimum performing slightly better because of separate key releases.
Figure 17(d) and Figure 18(d) show the packet histograms of verification latency. The relative rankings are the same as was shown above; that is, the optimum variations can lead to smaller verification latency. ECDSA performs as it has in the previous highway simulations with most verifications taking nearly the maximum allowed 500 ms. The verification latency of both two signature protocols show that the PC is sufficient for verifying ECDSA signatures but the PPC is not, resulting in the graphs being smoother for the PPC.
Appendix Volume 3 G-2-77

VSC-A Final Report: Appendix G-2 Security Network Simulations – Hu and Haas
Figure 17(e) and Figure 18(e) show the inter-packet arrival times versus distance. TESLA piggyback performs best for either processor, and two signature piggyback or ECDSA perform next best. TESLA piggyback again appears to perform better than no security overhead because of heartbeats and keys being delayed from one CCH interval to the next, resulting in some packets having a very small time between arrivals from the same vehicle.
Figure 17(f) and Figure 18(f) show the CCDF of the distance at which the first certificate is received from a vehicle. The relative performance of all the protocols is the same as was shown for 20 dBm transmission power and channel switching enabled. However, the difference between the security protocols and the no security simulations for 10 dBm is smaller than that distance for 20 dBm. The performance of the security protocols for 10 dBm and for 20 dBm are similar, but the performance with no security overhead is worse (closer distances) for 10 dBm than for 20 dBm, which indicates that the additional packet size and additional packets are the factor that most determines the certificate reception distance with channel switching enabled.
Figure 17(g) and Figure 18(g) show the number of packets versus MAC layer delay. Both 10 dBm transmission power and 20 dBm result in similar MAC layer delay.
Table 19 shows the storage requirements for the PC and PPC in terms of the maximum number of certificates stored by a vehicle and the maximum size in bytes of a vehicle's verification queue. The maximum number of certificates stored by a vehicle is again smaller with 10 dBm compared to using 20 dBm because fewer are received at the PHY layer. Only TESLA piggyback using the PPC results in packets being dropped because the verification queue is full.
Table 19: I-80, with Channel Switching, 10 dBm Transmission Power: Certificate Storage Requirements and Maximum Verification Queue Size
Max stored certs (PC)
Max queue size (PC)
Max stored certs (PPC)
Max queue size (PPC)
ECDSA 476 57,206 490 63,737 TESLA
piggyback 525 40,801 530 204,792
TESLA optimum 498 189,420 508 196,168
Two signature
piggyback 466 40,452 460 72,374
Two signature optimum
322 29,421 342 54,023
Appendix Volume 3 G-2-78

VSC-A Final Report: Appendix G-2 Security Network Simulations – Hu and Haas
Figure 17 (a) Network Layer Reception Performance
Figure 17 (b) Application Layer Reception Performance
Appendix Volume 3 G-2-79

VSC-A Final Report: Appendix G-2 Security Network Simulations – Hu and Haas
Figure 17 (c) Average Packet Total Delay versus Distance
Figure 17 (d) Number of Packets versus Verification Latency
Appendix Volume 3 G-2-80

VSC-A Final Report: Appendix G-2 Security Network Simulations – Hu and Haas
Figure 17 (e) Inter-packet Arrival Time
Figure 17 (f) First Certificate Arrival Distance
Appendix Volume 3 G-2-81

VSC-A Final Report: Appendix G-2 Security Network Simulations – Hu and Haas
Figure 17 (g) Number of Packets versus MAC Layer Delay
Figure 17: I-80 Simulation Results: 10 dBm Transmit Power, PC Processor, with Channel Switching
Appendix Volume 3 G-2-82

VSC-A Final Report: Appendix G-2 Security Network Simulations – Hu and Haas
Figure 18 (a) Network Layer Reception Performance
Figure 18 (b) Application Layer Reception Performance
Appendix Volume 3 G-2-83
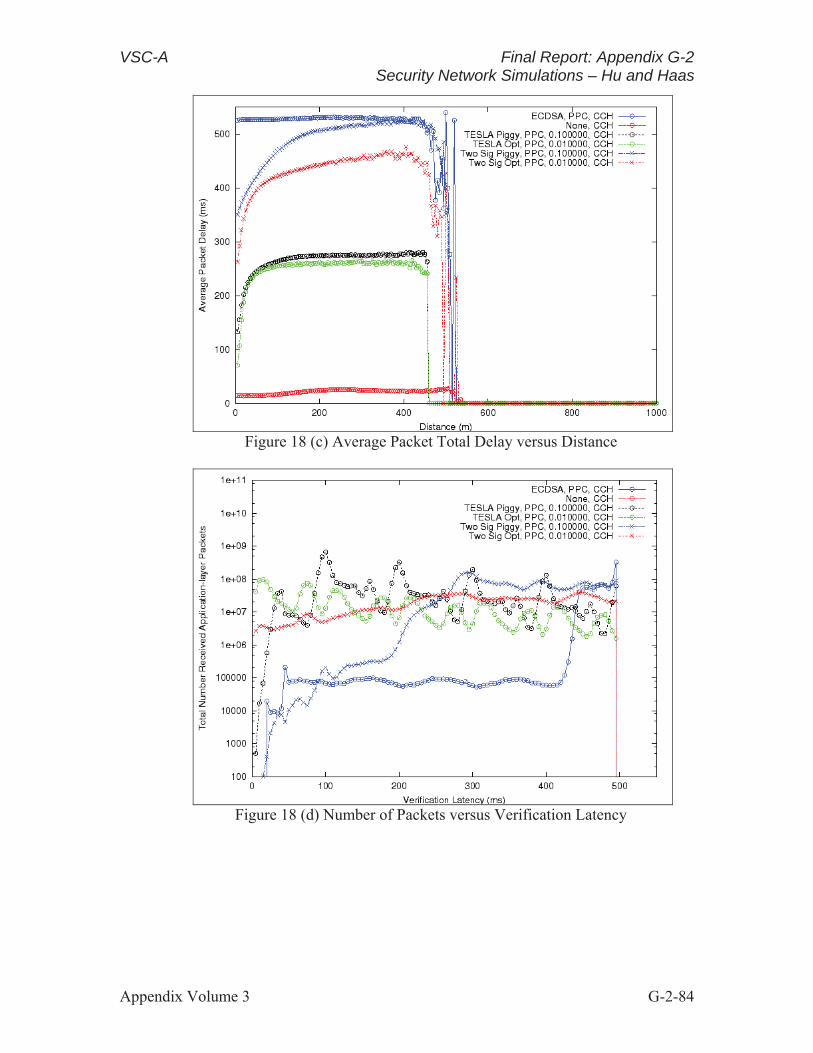
VSC-A Final Report: Appendix G-2 Security Network Simulations – Hu and Haas
Figure 18 (c) Average Packet Total Delay versus Distance
Figure 18 (d) Number of Packets versus Verification Latency
Appendix Volume 3 G-2-84

VSC-A Final Report: Appendix G-2 Security Network Simulations – Hu and Haas
Figure 18 (e) Inter-packet Arrival Time
Figure 18 (f) First Certificate Arrival Distance
Appendix Volume 3 G-2-85

VSC-A Final Report: Appendix G-2 Security Network Simulations – Hu and Haas
Figure 18 (g) Number of Packets versus MAC Layer Delay
Figure 18: I-80 Simulation Results: 10 dBm Transmit Power, PPC Processor, with Channel Switching
Appendix Volume 3 G-2-86

VSC-A Final Report: Appendix G-2 Security Network Simulations – Hu and Haas
4.4 I-80 Final Comparisons
Having seen that TESLA piggyback performs the best, with the highest percentage of packets received at the PHY layer, highest percentage of verified packets, and lowest time between receiving packets from the same vehicle, the performance of TESLA piggyback are compared in the different settings used in this section. Table 21 shows the settings of the data series graphed in Figure 19.
Table 20: Section 4.4 Settings
No security, 20 dBm transmit power, no channel switching No security, 10 dBm transmit power, with channel switching
TESLA piggyback, 20 dBm transmit power, PC processor, no
channel switching TESLA piggyback, 10 dBm
transmit power, PPC processor, no channel switching
TESLA piggyback, 10 dBm transmit power, PPC processor,
with channel switching TESLA piggyback, 20 dBm
transmit power, PPC processor, no channel switching
Figure 19(a) shows the OTA performance. This figure shows that using 10 dBm transmission power and using channel switching severely inhibits performance. Using 20 dBm and no channel switching clearly results in better performance.
Figure 19(b) shows the percentage of packets successfully verified. This figure shows that the overhead and failure modes of using security result in a large difference in performance. This performance gap is much larger than the difference between the type of processor used for 20 dBm transmission power with channel switching disabled. At shorter distances, 10 dBm performs better with the PPC; but at longer distance, 20 dBm results in a higher percent of verified packets. In total, with the PPC, 20 dBm results in a greater number of packets being verified than with 10 dBm (about 12.2 million more out of about 219 million or 5.6 percent).
Figure 19(c) shows the average total packet delay versus distance. The difference between the two 10 dBm PPC data series and the 20 dBm PPC data series comes from there being so many fewer packets that are verified with channel switching enabled and 10 dBm transmission power. The number of additional packets received with 20 dBm transmission power results in the greater delay because of the additional number of verifications required.
Figure 19(d) shows the packet count versus verification latency histogram. The PC clearly handles the computational load better as shown by the more defined peaks. Both
Appendix Volume 3 G-2-87

VSC-A Final Report: Appendix G-2 Security Network Simulations – Hu and Haas
data series with the PPC and no channel switching show significant time spent in the verification queue due to processing delay, resulting in less well defined peaks.
Figure 19(e) shows the MAC layer delay histogram. As expected, using channel switching is the major contributor to MAC layer delay, and as shown above, results in packets being delayed from one CCH interval to the following.
4.4.1 Failure Mode Analysis
The final two subfigures in Figure 19 show the failure modes (plotted on a logarithmic y-axis) for the two extreme settings used in this section (20 dBm, no channel switching, PC processor versus 10 dBm, with channel switching, PPC processor). The data series in each failure mode subfigure are (in the order they are listed in the subfigures' legends) PHY layer failures, not having a certificate, not receiving a key before 500 ms, the packet cannot be verified before 500 ms due to processor delay, and the packet cannot be verified due to having a full queue.
By far, the dominant failure mode is physical failures for both Figure 19(f) and Figure 19(g). Failing the TESLA security condition did not occur in these settings because the key interval is 100 ms and no packets are delayed that long or longer for any of the data series. Thus, this failure mode is omitted from the graphs21. Failing to be verified in less than the allowed 500 ms is the next largest failure mode. Only at distances beyond about 300 m for Figure 19(f) (20 dBm) and about 300 m for Figure 19(g) (10 dBm) do not have a certificate result in a larger number of failures.
Figure 19 (a) Network Layer Reception Performance
21 Failing the TESLA security condition did occur with channel switching enabled for TESLA optimum, since the key interval was much shorter.
Appendix Volume 3 G-2-88

VSC-A Final Report: Appendix G-2 Security Network Simulations – Hu and Haas
Figure 19 (b) Application Layer Reception Performance
Figure 19 (c) Average Packet Total Delay versus Distance
Appendix Volume 3 G-2-89

VSC-A Final Report: Appendix G-2 Security Network Simulations – Hu and Haas
Figure 19 (d) Number of Packets versus Verification Latency
Figure 19 (e) Number of Packets versus MAC Layer Delay
Appendix Volume 3 G-2-90

VSC-A Final Report: Appendix G-2 Security Network Simulations – Hu and Haas
Figure 19 (f) Failure Mode Analysis for I-80 Using TESLA Piggyback, PC, No Channel Switching, and 20 dBm Transmission Power
Figure 19 (g) Failure Mode Analysis for I-80 Using TESLA Piggyback, PPC, with Channel Switching, and 10 dBm Transmission Power
Figure 19: I-80 Simulation Results: Final Comparison of TESLA Piggyback with Settings Used in Section 4
Appendix Volume 3 G-2-91

VSC-A Final Report: Appendix G-2 Security Network Simulations – Hu and Haas
5 Certificate Distribution Optimization
The best way to send certificates by varying the power at which they are sent and how often they are sent was investigated. This part of the investigation beginning with varying the certificate broadcast power is presented below. Results for optimum variations will no longer be presented because they induce more channel congestion and result in significantly fewer messages being received compared to the piggyback variations.
5.1 Certificate Broadcast Power
The performance of ECDSA, TESLA piggyback, and two signature piggyback are presented separately in this section in order to more clearly compare their relative performances. All simulations in this section were performed using the I-80 trace as described in the previous section. Table 21 shows the settings used for the simulations. Four simulations for each protocol will be shown. Three of these simulations used 10 dBm transmission power and certificate transmission powers of 10, 13, and 20 dBm. The legends of the figures in this section reflect these three simulations being labeled as ”10 dBm certs,” ”13 dBm certs,” and ”20 dBm certs,” respectively. The fourth simulation used 20 dBm transmission power for all packets and is labeled in the legends of the figures in this section as ”20 dBm pwr.” Figure 20 shows the performance of ECDSA, Figure 21 that of TESLA piggyback, and Figure 22 that of two signature piggyback.
Table 21: Section 5.1Settings
Transmit Power 10, 20 dBm Certificate power 10, 13, 20 dBm
1609.4 disabled Processor PC
TESLA piggyback key interval 100 ms
Two signature piggyback key
interval 100 ms
Figure 20(a), Figure 21(a), and Figure 22(a) show the OTA performance versus distance for ECDSA, TESLA piggyback, and two signature piggyback, respectively. Each of the protocols show that for 10 dBm transmission power with any of the certificate broadcast powers, the performance is similar. Increasing the power for packets without certificates increases the percent of packets received at longer distances. Thus, reducing the broadcast power of packets without certificates results in a lower number receivable, which follows from the results shown in the previous section.
Figure 20(b), Figure 21(b), and Figure 22(b) show the time between packets arriving at the application layer from the same vehicle versus distance. These graphs reflect what was shown for the OTA performance, that is, keeping the broadcast power for heartbeats without certificates at 20 dBm results in better performance (here lower inter-packet arrival times) at longer distances, that is, beyond 150-200 m.
Appendix Volume 3 G-2-92

VSC-A Final Report: Appendix G-2 Security Network Simulations – Hu and Haas
Figure 20(c), Figure 21(c), and Figure 22(c) show the CCDF of the distance at which the first certificate from a vehicle is received. Each of the protocols show the combination of 20 dBm certificate broadcast power and 10 dBm otherwise resulting in the first certificate from a vehicle being received at longer distances. Constant 20 dBm transmission power is next best of the settings compared.
In conclusion, though certificates are received at longer distances for the 10 dBm/20 dBm combination, 20 dBm uniform transmission power is preferable; because it results in more packets being received at longer distances and smaller inter-packet arrival times. This is a logical result because not having a certificate is a less significant failure mode.
Figure 20 (a) Network Layer Reception Performance
Appendix Volume 3 G-2-93

VSC-A Final Report: Appendix G-2 Security Network Simulations – Hu and Haas
Figure 20 (b) Inter-packet Arrival Time
Figure 20 (c) First Certificate Arrival Distance
Figure 20: I-80 Simulation Results: Certificate Broadcast Power Variation, PC Processor, No Channel Switching, ECDSA
Appendix Volume 3 G-2-94

VSC-A Final Report: Appendix G-2 Security Network Simulations – Hu and Haas
Figure 21 (a) Network Layer Reception Performance
Figure 21 (b) Inter-packet Arrival Time
Appendix Volume 3 G-2-95
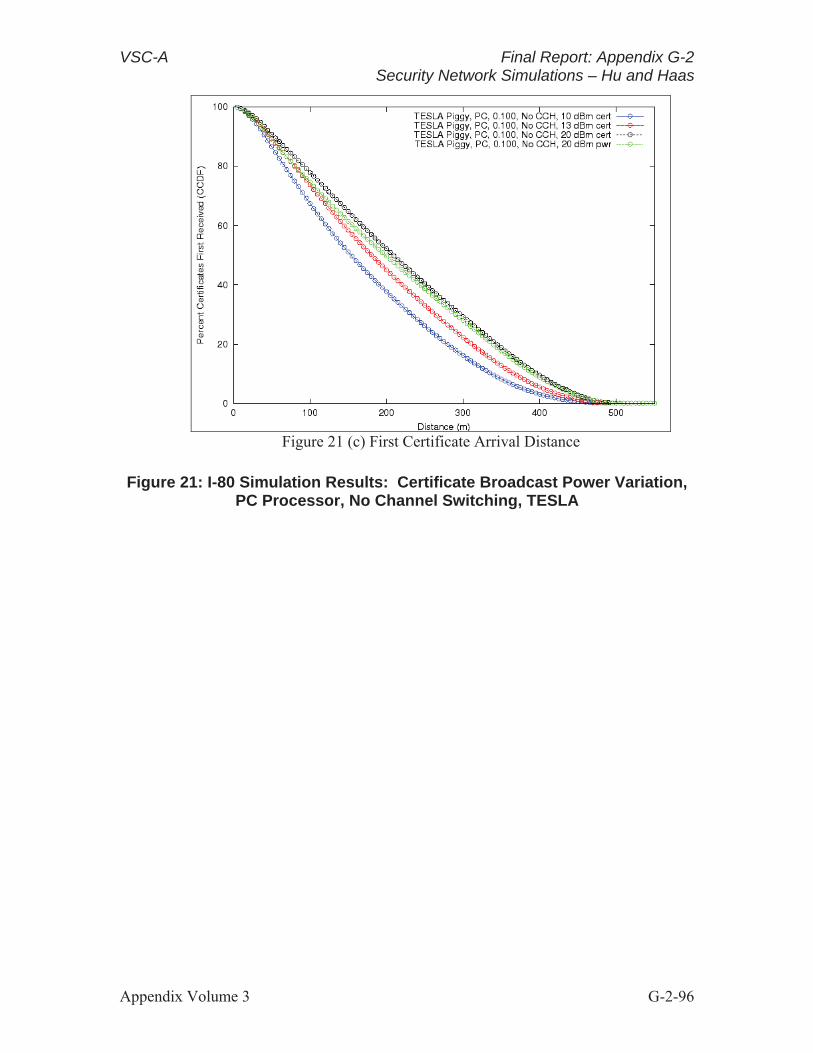
VSC-A Final Report: Appendix G-2 Security Network Simulations – Hu and Haas
Figure 21 (c) First Certificate Arrival Distance
Figure 21: I-80 Simulation Results: Certificate Broadcast Power Variation, PC Processor, No Channel Switching, TESLA
Appendix Volume 3 G-2-96

VSC-A Final Report: Appendix G-2 Security Network Simulations – Hu and Haas
Figure 22 (a) Network Layer Reception Performance
Figure 22 (b) Inter-packet Arrival Time
Appendix Volume 3 G-2-97

VSC-A Final Report: Appendix G-2 Security Network Simulations – Hu and Haas
Figure 22 (c) First Certificate Arrival Distance
Figure 22: I-80 Simulation Results: Certificate Broadcast Power Variation, PC Processor, No Channel Switching, Two Signature
5.2 Certificate Broadcast Period
In this section, the results from varying the rate at which certificates are sent are presented. The results for on-demand-certificates (ODC) and for various static certificate broadcast rates are shown. ODC works in the following way. When a vehicle receives a packet from another vehicle for which it does not have a certificate, it triggers the ODC mechanism. The ODC mechanism picks a random time within some specified interval, that is with some delay relative to the time at which the last certificate was sent ( d ) but no longer than some maximum delay ( d b ). If no such packet without a certificate is received, a vehicle sends certificates at a static rate ( p ). The legends in this section are labeled as `` ODC d - (d b) / p '' with all times being in seconds. Without ODC, that is with static rates only, the data series legend entries are labeled as `` p '' with p being in seconds. Table 22 summarizes the settings used in the simulations presented in this section. Figure 23 shows the performance of ECDSA, Figure 24 that of TESLA piggyback, and Figure 25 that of two signature piggyback.
Appendix Volume 3 G-2-98

VSC-A Final Report: Appendix G-2 Security Network Simulations – Hu and Haas
Table 22: Section 5.2 Settings
Transmit Power 20 dBm 1609.4 disabled
Processor PC TESLA piggyback key interval 100 ms
Two signature piggyback key interval 100 ms
ODC settings 1.0}== 0.9,= 0.1,{ pbd , 1.0}== 0.5,= 0.5,{ pbd ,
= 2.0}= 0.5,= 0.5,{ pbd s Static certificate period (no ODC) settings 1.0,2.0,3.0p = s
Figure 23(a), Figure 24(a), and Figure 25(a) show the OTA performance versus distance for ECDSA, TESLA piggyback, and two signature piggyback, respectively. All of the security protocols show that the ODC simulations result in a lower reception percentage at all distances, which is due to the additional overhead of sending larger packets on average. In our urban comparisons in Section 3 and our highway comparisons in Section 4, the increased packet size of two signature piggyback caused it to result in fewer packets received OTA compared to TESLA piggyback. Because new vehicles are being discovered very often in our highway simulations, vehicles will very often be sending certificates triggered by the ODC mechanism, resulting in a larger number of certificates being sent and more network congestion. Thus, in the case of highway scenarios where large numbers of new vehicles are being discovered, the ODC mechanism results in poorer performance.
Figure 23(b), Figure 24(b), and Figure 25(b) show the time between heartbeat arrivals at the application layer versus distance. These figures also reflect a small performance advantage for the static certificate broadcast periods over the ODC.
Figure 23(c), Figure 24(c), and Figure 25(c) show the CCDF of the distance at which the first certificate from a vehicle is received. These graphs show that the ODC mechanism causes certificates to be received at larger distances, as expected.
Because being unable to receive a packet at the PHY layer is the critical failure mode in general, decreasing the expected time until a certificate is first received from a vehicle actually adds to the number of PHY layer failures because the average packet size is larger. By using ODC, the number of packets that are dropped because the receiving vehicle does not have a certificate from the sender is decreased, but the increase in verified packets is smaller than the decrease in packets received at the PHY layer. Table 23, Table 24, and Table 25show the main failure modes (in number of packets) of ECDSA, TESLA piggyback, and two signature piggyback, respectively. We omit failures due to not satisfying the TESLA security criteria and drops due to having a full verification queue, that is, when the queue would exceed 200 kB because these failure modes are much less significant. We show the number of packets correctly verified for reference. For each security protocol, we compare the most aggressive ODC settings ({d = 0.1, b = 0.9, p = 1.0} ) with p = 1.0 s for the static certificate broadcast period. The numbers presented in these tables confirm that the number of failures due to not having a
Appendix Volume 3 G-2-99

VSC-A Final Report: Appendix G-2 Security Network Simulations – Hu and Haas
certificate is decreased by using the ODC mechanism, but fewer packets are verified when all failure modes are considered. ECDSA shows less of a difference in terms of the final number of packets verified because the processor is a bottleneck.
Table 23: ECDSA ODC versus Static Certificate Periods: Failure Mode Comparison (Packet Count)
PHY failure No certificate
Verification expiration
Correctly verified
ODC 1.0}== 0.9,= 0.1,{ pbd s 679,007,167 11,866,700 239,559,692 51,813,992
Static 1.0p = s 663,673,526 19,185,123 247,485,130 51,843,336
Table 24: TESLA Piggyback ODC versus Static Certificate Periods: Failure Mode Comparison (Packet Count)
PHY failure No certificate
Verification expiration
Correctly verified
ODC 1.0}== 0.9,= 0.1,{ pbd s 646,088,847 12,169,098 36,812,347 282,205,309
Static 1.0p = s 621,683,088 19,496,051 34,293,016 301,758,293
Table 25: Two Signature Piggyback ODC versus Static Certificate Periods: Failure Mode Comparison (Packet Count)
PHY failure No certificate
Verification expiration
Correctly verified
ODC 1.0}== 0.9,= 0.1,{ pbd s 722,283,533 12,404,841 39,704,765 208,461,258
Static 1.0p = s 705,398,575 20,261,756 38,572,680 218,552,683
Appendix Volume 3 G-2-100

VSC-A Final Report: Appendix G-2 Security Network Simulations – Hu and Haas
Figure 23 (a) Network Layer Reception Performance
Figure 23 (b) Inter-packet Arrival Time
Appendix Volume 3 G-2-101
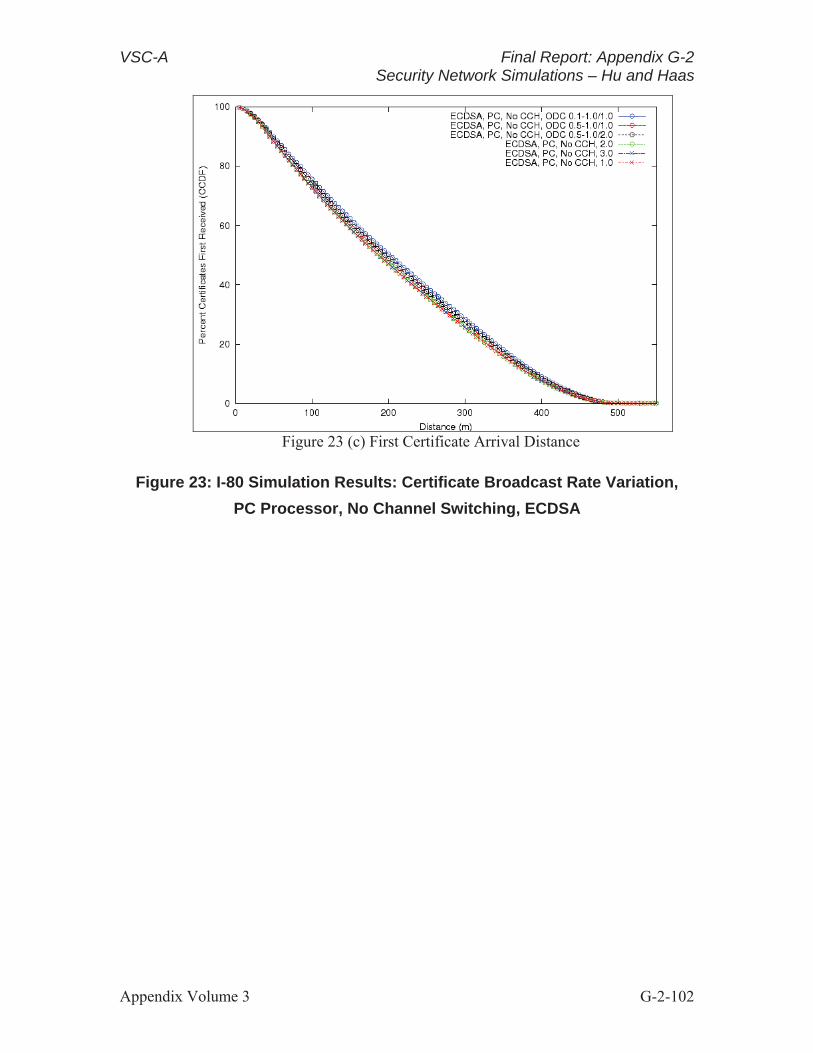
VSC-A Final Report: Appendix G-2 Security Network Simulations – Hu and Haas
Figure 23 (c) First Certificate Arrival Distance
Figure 23: I-80 Simulation Results: Certificate Broadcast Rate Variation,
PC Processor, No Channel Switching, ECDSA
Appendix Volume 3 G-2-102

VSC-A Final Report: Appendix G-2 Security Network Simulations – Hu and Haas
Figure 24 (a) Network Layer Reception Performance
Figure 24 (b) Inter-packet Arrival Time
Appendix Volume 3 G-2-103

VSC-A Final Report: Appendix G-2 Security Network Simulations – Hu and Haas
Figure 24 (c) First Certificate Arrival Distance
Figure 24: I-80 Simulation Results: Certificate Broadcast Rate Variation,
PC Processor, No Channel Switching, TESLA
Appendix Volume 3 G-2-104

VSC-A Final Report: Appendix G-2 Security Network Simulations – Hu and Haas
Figure 25 (a) Network Layer Reception Performance
Figure 25 (b) Inter-packet Arrival Time
Appendix Volume 3 G-2-105

6
VSC-A Final Report: Appendix G-2 Security Network Simulations – Hu and Haas
Figure 25 (c) First Certificate Arrival Distance
Figure 25: I-80 Simulation Results: Certificate Broadcast Rate Variation, PC Processor, No Channel Switching, Two Signature
Conclusion
Table 26 summarizes the results of the optimization of the parameters explored in this work.
Table 26: Final Results: Parameter Optimizations
ODC do not use Certificate maxmin pp , 1.0,3.0 s
Certificate repetitions ( r ) 1 Certificate transmission power ( c ) 20 dBm
Piggyback key interval ( ) 100 ms Heartbeat transmission power 20 dBm
Using TESLA piggyback resulted in better performance (except for lower latency) in every simulation. Two signature piggyback usually was next best (also except for lower latency). The optimum variations of TESLA and two signature could lead to lower latencies, but always had much poorer performance in every other aspect due to the additional key packets and the congestion they caused. ECDSA is unacceptable in almost all of our simulations because the processing overhead is too large even for the PC at times. Two signature tended to do better with verifying packets arriving from longer distances, because verifying packets does not necessarily require two packets as it does with TESLA (the heartbeat and the key).
Appendix Volume 3 G-2-106

7
VSC-A Final Report: Appendix G-2 Security Network Simulations – Hu and Haas
Additionally, as discussed at the final meeting, two signature provides two notable benefits that TESLA does not. First, two signature provides non-repudiation because of the ECDSA signature. Of course, for this property to hold, the ECDSA signature in the two signature packet must be valid; and verifying this requires potentially verifying the TESLA signature and the ECDSA signature. Second, if a high-priority message requires verification before the key attached to the next heartbeat is released, two signature can verify the message in time by verifying the ECDSA signature immediately.
After investigating certificate broadcast power, it was found that higher power does result in certificates being received for the first time at longer distances, but also increasing the broadcast power for heartbeats led to higher percentages of heartbeats being received and verified. Specifically, in all of the scenarios tested, using a uniform 20 dBm transmission power rather than 10 dBm for heartbeats and 20 dBm for heartbeats with attached certificates results in better performance.
It was found that in a highway environment where many vehicles may be new vehicles (e.g., vehicles from cross traffic and on-coming traffic), on-demand certificate broadcasts are detrimental to heartbeats being received successfully at the application layer. There was very little difference among broadcasting certificates with 1, 2, or 3 s periods. This is likely due to the relatively slow speeds in the vehicle trace data due to rush-hour traffic.
References
[1] Chen, Qi and Schmidt-Eisenlohr, Felix and Jiang, Daniel and Torrent-Moreno, Marc and Delgrossi, Luca and Hartenstein, Hannes. Overhaul Of Ieee 802.11 Modeling And Simulation In Ns-2. MSWiM '07: Proceedings of the 10th ACM Symposium on Modeling, analysis, and simulation of wireless and mobile systems, pages 159--168, New York, NY, USA, 2007. ACM.
[2] Lin Cheng and Henty, B.E. and Stancil, D.D. and Fan Bai and Mudalige, P. Mobile Vehicle-to-Vehicle Narrow-Band Channel Measurement and Characterization of the 5.9 GHz Dedicated Short Range Communication (DSRC) Frequency Band. Selected Areas in Communications, IEEE Journal on, 25(8):1501-1516, 2007.
[3] Härri, J. and Filali, F. and Bonnet, C. and Fiore, Marco. VanetMobiSim: Generating Realistic Mobility Patterns for VANETs. VANET '06: Proceedings Of The 3rd International Workshop On Vehicular Ad Hoc Networks, pages 96--97, New York, NY, USA, 2006. ACM.
[4] Yih-Chun Hu and Kenneth P. Laberteaux. Strong VANET Security On A Budget. In Proceedings Of Workshop On Embedded Security In Cars (ESCAR), 2006.
[5] Adrian Perrig and Ran Canetti and J. D. Tygar and Dawn Song. The TESLA Broadcast Authentication Protocol. RSA CryptoBytes, 5:2002, 2002.
[6] Robinson, C. L. and Caminiti, L. and Caveney, D. and Laberteaux, K. Efficient Coordination and Transmission of Data for Cooperative Vehicular Safety Applications. VANET '06: Proceedings of the 3rd international workshop on Vehicular ad hoc networks, pages 10--19, New York, NY, USA, 2006. ACM.
Appendix Volume 3 G-2-107

VSC-A Final Report: Appendix G-3
Security Network Simulations Prepared by
Mercedes-Benz RDNA
Appendix Volume 3 G-3-i

Acronym List
CAMP Crash Avoidance Metrics Partnership
CCH Control Channel
CDF Cumulative Distribution Function
CHSW Channel Switching
DCF Distributed Coordination Function
DSRC Dedicated Short-Range Communications
ECDSA Elliptic Curve Digital Signature Algorithm
FIFO First-In-First-Out HW Hardware
ITS Intelligent Transportation Systems
JPO Joint Program Office
MAC Medium Access Control (Layer)
NHTSA National Highway Traffic Safety Administration
OTA Over-the-Air
PDF Probability Density Function
PHY Physical (Layer)
SCH Service Channels
TADS TESLA and Digital Signatures
TESLA Timed Efficient Stream Loss-Tolerant Authentication
TX Transmission
USDOT United States Department of Transportation
UTC Coordinated Universal Time
V2V Vehicle-to-vehicle
VoD Verify-on-demand
VSC-A Vehicle Safety Communications-Applications
VTP Verify-then-Process
WAVE Wireless Access in Vehicular Environments
Appendix Volume 3 G-3-ii

Table of Contents Acronym List ................................................................................................ G-3-ii
1 Introduction ........................................................................................... G-3-1
2 Modeling and Implementation Framework ......................................... G-3-1 2.1 Protocol Stack .............................................................................................. G-3-1
2.2 Functional Module Architecture ................................................................. G-3-2
2.2.1 MAC Module ................................................................................. G-3-3
2.2.2 Application Module ....................................................................... G-3-6
2.2.3 Security Module ............................................................................. G-3-6 2.2.4 Certificate Module ......................................................................... G-3-9
2.2.5 WAVE Module ............................................................................ G-3-10
3 Implementation Details in NS-2 Simulator ........................................ G-3-11 3.1 MAC Module (Class Mac802_11Ext) ...................................................... G-3-11
3.1.1 Class ChannelSwitchTimer.......................................................... G-3-11
3.1.2 MAC Layer Extension ................................................................. G-3-13
3.1.3 Physical (PHY) Layer Extension ................................................. G-3-14
3.2 Application Module (Class DataGenerator) .............................................. G-3-15
3.2.1 Message Transmission ................................................................. G-3-15
3.2.2 Optimized Transmission Scheduling ........................................... G-3-17
3.2.3 Processing Validated Message and Statistics ............................... G-3-18
3.3 Certificate Module (Class CertificateManager) ........................................ G-3-18
3.3.1 Transmission of Certificate Messages ......................................... G-3-18
3.3.2 Processing of Certificate Messages .............................................. G-3-19
3.3.3 Certificates Management ............................................................. G-3-19
3.4 WAVE Module (Class MessageProcessor) ............................................... G-3-19
3.4.1 Message Transmission ................................................................. G-3-20
3.4.2 Message Reception ...................................................................... G-3-22
3.5 Security Module (Class Sec_CoreTESLA) ............................................... G-3-23
3.5.1 Interface to Other Modules .......................................................... G-3-24
3.5.2 Framework ................................................................................... G-3-24
3.5.3 Components Implementation Details ........................................... G-3-26
4 Simulation Setup and Configuration ................................................. G-3-27 4.1 Simulator Parameters ................................................................................ G-3-27
Appendix Volume 3 G-3-iii

4.2 Road and Vehicle Traffic Modeling.......................................................... G-3-32
4.2.1 Market Penetration Rate and Vehicle Density ............................. G-3-32
4.3 Urban Grid Configuration ......................................................................... G-3-34
5 Evaluation and Analysis..................................................................... G-3-35 5.1 Figures Overview ...................................................................................... G-3-35
5.1.1 Figure 1: Overall Performance Versus Distance ......................... G-3-35
5.1.2 Figure 2: Validation Delay versus Distance................................ G-3-35
5.1.3 Figure 3: Breakdown of Validation Delay .................................. G-3-35
5.1.4 Figure 4: Inter-Validated-Message Timing Gap Versus Distance........................................................................................ G-3-35
5.1.5 Figure 5: Certificate Distribution Performance .......................... G-3-35
5.1.6 Figure 6: MAC Access Delay ...................................................... G-3-36
5.2 Certificate Distribution Performance ........................................................ G-3-36
5.2.1 Study Methodology ...................................................................... G-3-36
5.3 Over-the-Air Performance Analysis .......................................................... G-3-39
5.4 Computational Demand versus Capability at Different Stages of Deployment ........................................................................................... G-3-43
5.5 Further Comparison with Congestion Controlled Considerations ............ G-3-46
6 Summary ............................................................................................. G-3-49 6.1 Certificate Distribution Mechanism .......................................................... G-3-49
6.2 Comparison of VSC Security Protocol Variants ....................................... G-3-49
7 All Simulation Results for Security Protocol Comparisons ............ G-3-51 7.1 First Batch, Comparison of All Protocols, 10 dBm TX Power ................. G-3-52
7.1.1 Channel Switching Off, 1 Gen and 40 Cars/km ........................... G-3-53
7.1.2 Channel Switching On, 1 Gen and 40 Cars/km ........................... G-3-61
7.1.3 Channel Switching Off, 2Gen and 80 Cars/km ............................ G-3-69 7.1.4 Channel Switching On, 2 Gen and 80 Cars/km ........................... G-3-77
7.1.5 Channel Switching Off, 3 Gen and 120 Cars/km ......................... G-3-85
7.1.6 Channel Switching On, 3 Gen and 120 Cars/km ......................... G-3-93
7.1.7 Channel Switching Off, 4 Gen and 160 Cars/km ....................... G-3-101
7.1.8 Channel Switching On, 4 Gen and 160 Cars/km ....................... G-3-109
7.2 Larger Buffer Size for TESLA Piggyback .............................................. G-3-117
7.3 20 dBm TX Power ................................................................................... G-3-122
Appendix Volume 3 G-3-iv

8
7.3.1 1 Gen and 40 Cars/km ................................................................ G-3-123
7.3.2 2 Gen and 80 Cars/km ................................................................ G-3-131
7.4 ECDSA, TESLA Piggyback and TADS Piggyback in Congestion-Controlled Scenarios ................................................................................................. G-3-139
7.4.1 Channel Switching Off and 400 MHz PowerPC ....................... G-3-140
7.4.2 Channel Switching Off and 1 GHz PowerPC ............................ G-3-143
7.4.3 Channel Switching Off and 2.4 GHz PC ................................... G-3-146
7.4.4 Channel Switching On and 400 MHz PowerPC ........................ G-3-149
7.4.5 Channel Switching On and 1 GHz PowerPC ............................. G-3-152
7.4.6 Channel Switching On and 2.4 GHz PC .................................... G-3-155
7.5 Urban Scenarios ...................................................................................... G-3-158
7.5.1 400MHz PPC ............................................................................. G-3-158
7.5.2 1GHz PPC .................................................................................. G-3-164
7.5.3 2.4GHz PC ................................................................................. G-3-170
Certification Distribution Study Results ......................................... G-3-176 8.1 10 dBm and 60 MPS Speed Differential ................................................. G-3-176
8.1.1 Channel Switching Off and 40 Cars/km .................................... G-3-177
8.1.2 Channel Switching On and 40 Cars/km ..................................... G-3-181
8.1.3 Channel Switching Off and 80 Cars/km .................................... G-3-185
8.1.4 Channel Switching On and 80 Cars/km ..................................... G-3-189
8.1.5 Channel Switching Off and 120 Cars/km .................................. G-3-193
8.1.6 Channel Switching On and 120 Cars/km ................................... G-3-197
8.1.7 Channel Switching Off and 160 Cars/km .................................. G-3-201
8.1.8 Channel Switching On and 160 Cars/km ................................... G-3-205
8.2 10 dBm and 30 MPS Speed Differential ................................................. G-3-207
8.3 10 dBm and 30 MPS Speed Differential ................................................. G-3-209 8.3.1 Channel Switching Off and 40 Cars/km .................................... G-3-210
8.3.2 Channel Switching Off and 80 Cars/km .................................... G-3-211
8.3.3 Channel Switching Off and 120 Cars/km .................................. G-3-212
8.3.4 Channel Switching Off and 160 Cars/km .................................. G-3-213
8.3.5 Channel Switching On and 40 Cars/km ..................................... G-3-214
8.3.6 Channel Switching On and 80 Cars/km ..................................... G-3-215
8.3.7 Channel Switching On and 120 Cars/km ................................... G-3-216
Appendix Volume 3 G-3-v

8.3.8 Channel Switching On and 160 Cars/km ................................... G-3-217
8.4 10 dBm and 15 MPS Speed Differential ................................................. G-3-218
8.4.1 Channel Switching Off and 40 Cars/km .................................... G-3-219
8.4.2 Channel Switching Off and 80 Cars/km .................................... G-3-219
8.4.3 Channel Switching Off and 120 Cars/km .................................. G-3-220
8.4.4 Channel Switching Off and 160 Cars/km .................................. G-3-220
8.4.5 Channel Switching On and 40 Cars/km ..................................... G-3-221
8.4.6 Channel Switching On and 80 Cars/km ..................................... G-3-221
8.4.7 Channel Switching On and 120 Cars/km ................................... G-3-222
8.4.8 Channel Switching On and 160 Cars/km ................................... G-3-222
8.5 13 dBm and 60 MPS Speed Differential ................................................. G-3-223
8.5.1 Channel Switching Off and 40 Cars/km .................................... G-3-224
8.5.2 Channel Switching Off and 80 Cars/km .................................... G-3-224
8.5.3 Channel Switching Off and 120 Cars/km .................................. G-3-225
8.5.4 Channel Switching Off and 160 Cars/km .................................. G-3-225
8.5.5 Channel Switching On and 40 Cars/km ..................................... G-3-226
8.5.6 Channel Switching On and 80 Cars/km ..................................... G-3-226
8.5.7 Channel Switching On and 120 Cars/km ................................... G-3-227
8.5.8 Channel Switching On and 160 Cars/km ................................... G-3-227
Appendix Volume 3 G-3-vi

List of Figures Figure 1: Vehicle Safety Communications Protocol Stack......................................... G-3-2 Figure 2: Modules in Implementation Framework ..................................................... G-3-2 Figure 3: Interactions among Modules ....................................................................... G-3-3 Figure 4: Presence of IEEE 1609.4 in the Stack......................................................... G-3-3 Figure 5: IEEE 1609.4 Time Divisions a Radio between CCH and SCH .................. G-3-4 Figure 6: Guard Intervals and Sync Intervals .............................................................. G-3-4 Figure 7: Signaling for Channel Switching in the Simulator ...................................... G-3-5 Figure 8: Channel Switching Timing and Signaling................................................... G-3-6 Figure 9: Security Computation Queuing Design....................................................... G-3-7 Figure 10: Activated Components for ECDSA .......................................................... G-3-8 Figure 11: Activated Components for TESLA and TESLA Piggyback..................... G-3-8 Figure 12: Activated Components for TADS and TADS Piggyback ......................... G-3-9 Figure 13: Certificate is Piggybacked to Safety Messages and Sent .......................... G-3-9 Figure 14: Message Assembly and Parsing in WAVE Module ................................ G-3-10 Figure 15: IEEE 802.11p MAC with Channel Switching Extension ........................ G-3-11 Figure 16: Registration for Receiving CCH Switch Signals .................................... G-3-12 Figure 17: Channel Switch Signals in Timeline ....................................................... G-3-12 Figure 18: CCH Signaling to Modules ..................................................................... G-3-13 Figure 19: Original Channel State Diagram ............................................................. G-3-14 Figure 20: Modification to State Diagram when CCH.end ...................................... G-3-14 Figure 21: Modification to State Diagram when CCH.start ..................................... G-3-14 Figure 22: Modifications to State Diagram for NAV timeout .................................. G-3-14 Figure 23: Original PHY State Diagram ................................................................... G-3-14 Figure 24: Extensions to State Diagram for PHY.abort ........................................... G-3-15 Figure 25: Optimized Message Generation Scheduling ........................................... G-3-17 Figure 26: Implementation of Optimized Data Generation ...................................... G-3-18 Figure 27: MessageProcessor ................................................................................... G-3-20 Figure 28: Transmission Policy ................................................................................ G-3-21 Figure 29: Piggyback of Certificates ........................................................................ G-3-23 Figure 30: Security Core ........................................................................................... G-3-24 Figure 31: A General Framework for Security Protocol Implementations ............... G-3-25 Figure 32: Buffer, Delay and Scheduler used in the Framework of Security
Module .................................................................................................... G-3-26 Figure 33: Buffer Structure ....................................................................................... G-3-26 Figure 34: Wrap Around Road Configuration .......................................................... G-3-32 Figure 35: Urban Road Grid Construction................................................................ G-3-34 Figure 36: Simulation Setup for Certificate Distribution Performance Study .......... G-3-37 Figure 37: Certificate Performance, CHSW off, 1 Hz, 10 dBm, 25 percent Scenario...................................................................................................................... G-3-38 Figure 38: Certificate Performance, CHSW on, 2 Hz, 10 dBm, 100 Percent Scenario...................................................................................................................... G-3-38 Figure 39: Certificate Performance, CHSW off, 1Hz, 10 dBm, 25 Percent Scenario...................................................................................................................... G-3-38 Figure 40: Certificate Performance, CHSW off, 2 Hz, 10 dBm, 75 Percent Scenario...................................................................................................................... G-3-39
Appendix Volume 3 G-3-vii

Figure 41: Certificate Performance, CHSW off, 1 Hz, 13 dBm, 75 Percent Scenario .................................................................................................. G-3-39
Figure 42: Over-the-Air Safety Message Performance Comparisons ...................... G-3-40 Figure 43: Number of Safety Messages Received Per Second, CHSW Off ............. G-3-41 Figure 44: Number of Safety Messages Received Per Second, CHSW On ............. G-3-41 Figure 45: MAC Access Delay, CHSW off, 10 Hz, 100 Percent Scenario .............. G-3-42 Figure 46: MAC Access Delay, CHSW on, 10 Hz, 50 Percent Scenario................. G-3-42 Figure 47: Overall Performances, 1 Gen Platform, 25 Percent Scenario ................. G-3-43 Figure 48: Verification Delay, 1 Gen Platform, 25 Percent Scenario ...................... G-3-43 Figure 49: Overall Performances, 2 Gen Platform, 50 Percent Scenario ................. G-3-44 Figure 50: Verification Delay, 2 Gen Platform, 50 Percent Scenario ...................... G-3-44 Figure 51: TESLA Piggyback with Larger Queue, 2 Gen Platform, 50 Percent Scenario................................................................................................... G-3-45 Figure 52: Overall Performances, 3 Gen Platform, 75 Percent Scenario ................. G-3-45 Figure 53: Verification Delay, 3 Gen Platform, 75 Percent Scenario ...................... G-3-45 Figure 54: Overall Performances, 4 Gen Platform, 100 Percent Scenario ............... G-3-46 Figure 55: Verification Delay, 4 Gen Platform, 100 Percent Scenario .................... G-3-46 Figure 56: ECDSA Performances with Varying Computation Power ...................... G-3-47 Figure 57: TESLA Piggyback Performance Stays the Same with Varying Computational Capabilities ...................................................................... G-3-47 Figure 58: TADS Piggyback Performances with Varying Computation Power ...... G-3-48 Figure 59: TADS Piggyback Verification Delays with Varying Computation
Power ....................................................................................................... G-3-48
Appendix Volume 3 G-3-viii

List of Tables Table 1: TX Power Conversions ............................................................................... G-3-31
Appendix Volume 3 G-3-ix
VSC-A Final Report: Appendix G-3 Security Network Simulations – Mercedes-Benz RDNA
1 Introduction
This study evaluates five variants of security protocols for vehicle safety communications. They include Elliptic Curve Digital Signature Algorithm (ECDSA), Timed Efficient Stream Loss-Tolerant Authentication (TESLA), TESLA Piggyback, TESLA and Digital Signature (TADS), and TADS Piggyback. The goal is to rank them for supporting vehicle safety communication. The simulation study focuses on the verify-then-process (VTP).
In this report, TESLA refers to the variant of the protocol with standalone key frames, as in the original proposal. This is the same as TESLA Optimal or TESLA Fixed in some other documents and presentations. TESLA Piggyback refers to the subsequent adjust proposal where the TESLA key is released via piggybacking in the next safety message. TADS and TADS Piggyback are similarly named.
The certificate distribution mechanism is also studied in this project. Since all five security protocol variants depend on certificate distribution as anchoring points, this mechanism is a common one to all and configured independently.
2 Modeling and Implementation Framework
This chapter provides a high level and abstract overview of the Vehicle Safety Communications-Applications (VSC-A) security modeling framework. This overall design is a generalized one and applies to all five variants of security protocols. Even the security module, where the logical details of the different security protocols are encapsulated, is designed in a generalized manner.
2.1 Protocol Stack The protocol stack for vehicle safety communications is illustrated in Figure 1 and further expanded in Figure 2. Vehicle safety applications locate at the top of all layers. Security protocols and certificate distribution mechanisms are not proper protocol layers per se and are modeled as functions/services provided by the Wireless Access in Vehicular Environments (WAVE) layer. Similarly, the IEEE 1609.4, which describes a channel switching mechanism, is attached to the IEEE 802.11p Medium Access Control layer (MAC) module.
Appendix Volume 3 G-3-1

VSC-A Final Report: Appendix G-3 Security Network Simulations – Mercedes-Benz RDNA
Safety App
Security Protocol WAVE
Certificate Distribution
1609.4 Mac 802.11p
PHY 802.11p
Wireless Channel
Figure 1: Vehicle Safety Communications Protocol Stack
Figure 2: Modules in Implementation Framework
2.2 Functional Module Architecture As discussed in the previous section, the design of this security simulation framework focuses on the interactions among five key modules: Application, Security Protocol, Certificate Distribution, WAVE, and MAC. Their interactions are shown in the figure below. The solid lines illustrate passing of real objects while the dashed lines are for signaling.
In this design, all the differences among the five variants of security protocols are encapsulated into the Security Protocol module.
Appendix Volume 3 G-3-2

VSC-A Final Report: Appendix G-3 Security Network Simulations – Mercedes-Benz RDNA
WAVE Module Certificate Distribution
Module
Security Protocol Module
Application Module
Mac Module
DATA/Key
Certificate
Msg
DATA
Msg
DATA
Certificate
DATA/Key
Certificate
Channel Interval Signal
Figure 3: Interactions among Modules
2.2.1 MAC Module
The MAC module is responsible for managing channel access for Dedicated Short-Range Communications (DSRC) radios. The MAC module in the NS-2 2.33 release supports IEEE 802.11p fully by implementing the distributed coordination function (DCF) of IEEE 802.11.
Figure 4: Presence of IEEE 1609.4 in the Stack
The only addition at the MAC needed in this security simulation is the ability to model IEEE 1609.4 style channel switching. Because this study does not involve true service channel activities, it is sufficient to emulate the channel switching by pause channel activities in the control channel periodically instead of actually simulating two or more channels in the simulator.
Appendix Volume 3 G-3-3

VSC-A Final Report: Appendix G-3 Security Network Simulations – Mercedes-Benz RDNA
2.2.1.1 Overview of IEEE 1609.4 Channel Switching Scheme The current DSRC channel map envisions a Control Channel (CCH) and multiple Service Channels (SCH). The IEEE 1609.4 defines a particular scheme for a single radio device to support both safety communications on the control channel and other services or applications in a service channel by jumping back and forth between the two frequently, as shown in the figure below. The time spent in CCH and SCH are called CCH interval and SCH interval correspondingly.
Figure 5: IEEE 1609.4 Time Divisions a Radio between CCH and SCH
Guard intervals are inserted between the CCH interval and SCH interval to account for variations in timing inaccuracies among different devices.
Figure 6: Guard Intervals and Sync Intervals
The sum of CCH, SCH, and guard intervals in each cycle is 100 ms, and is termed a Sync interval. 2.2.1.2 Simulator Support of 1609.4 Channel Switching As shown in Figure 7, a channel switching timer, which is setup inside the MAC to control the timing of channel switching, sends signals (scheduling resume/scheduling pause) to other modules to indicate the channel switching state.
Appendix Volume 3 G-3-4

VSC-A Final Report: Appendix G-3 Security Network Simulations – Mercedes-Benz RDNA
Figure 7: Signaling for Channel Switching in the Simulator
For this simulation setup, all communication activities occur in the CCH, which means all messages passed down from upper layers are routed to the CCH stack. All messages have the same priority and are transmitted with ACI =1 (AIFSN = 3, CW window = 15).
Each node installs a Coordinated Universal Time (UTC) timer giving the time signals. As shown in Figure 8, two signals are passed outside of the MAC: CCH.start and CCH.end. CCH.end terminates all active transmission and receiving. During the guard interval and SCH, the channel is set to be busy in the MAC. As a result, all activities are suspended at the CCH.end and resumed at the CCH.start.
Appendix Volume 3 G-3-5

VSC-A Final Report: Appendix G-3 Security Network Simulations – Mercedes-Benz RDNA
CCH CCHG GG SCH
GuardInterval.start
CC
H.start
SC
H.start
46ms 46ms 4ms
CCH
CC
H.start
CC
H.end
Figure 8: Channel Switching Timing and Signaling
2.2.2 Application Module
The application module simulates vehicle safety applications running on top of the WAVE protocol stack. This module generates safety messages and passes them to the Security Module to be signed and then transmitted. It is also responsible for the consumption of safety data messages by acting as a sink.
In order to prevent synchronized collisions at the start of the CCH interval, the application module is designed to only generate safety messages during the CCH interval and doing so uniformly over the interval.
2.2.3 Security Module
All details of the five security protocols are encapsulated inside this module. While the five security protocol variants are very different logic and behavior wise, the key differences can nevertheless be summarized as what security operations need to be done, in what order, and at what cost. As such, it is possible to create a generalized design and then implementing these protocols by activating some components of the general architecture.
Appendix Volume 3 G-3-6

VSC-A Final Report: Appendix G-3 Security Network Simulations – Mercedes-Benz RDNA
Figure 9: Security Computation Queuing Design
As illustrated in Figure 9, this general design focuses on modeling the scheduling of a single shared computation resource. This resource is used for all security operations, both symmetric and non-symmetric. All possible operations are placed in five queues, and the scheduler picks tasks from the queues to execute according to the following priority order:
Signing a node’s own outgoing message
Validating a previously unknown certificate received over-the–air (OTA)
Validating a TESLA key and then validating all associated and previously received messages
Validating messages using ECDSA signature It is important to note that such priority-based queue processing results in TADS and TADS Piggyback protocols that are different in behaviors than specified in the original reference provided by VSC-A. In this design, both TADS variants use TESLA-based validation whenever possible and then utilizes whatever leftover computation power there is to do ECDSA-based validations. As such, if computation power is plenty, this implementation will not wait for the TESLA key and will proactively validate the message using ECDSA signature earlier. In other words, this design results in enhanced TADS protocols.
All the queues are First-In-First-Out (FIFO) in nature. On the receiver side, whenever the scheduler goes to a queue to pick the next task, it would discard all queued items older than 500 ms until it finds one that is younger or the queue becomes empty.
As shown in the following three figures, the implementation of each security protocol is a matter of enabling some of the queues accordingly and configuring appropriate costs for each operation type.
Appendix Volume 3 G-3-7

VSC-A Final Report: Appendix G-3 Security Network Simulations – Mercedes-Benz RDNA
TX
cert data
CERT
Scheduler
RX
SignatureGEN
TX
RXProcessor
Buffer
Scheduler
Timer
DATA
DATA
EDSCAVerify
select oldest
Figure 10: Activated Components for ECDSA
TX
cert key data
Scheduler
RX
Timer
TX
RXProcessor
Buffer
Scheduler
Timer
KEY DATA
DATA
Figure 11: Activated Components for TESLA and TESLA Piggyback
Appendix Volume 3 G-3-8

TX
cert key
data
CERT KEY TESLAAuth Verify
Scheduler
RX
TESLAAuth GEN
Timer
TX
RXProcessor
Buffer
Scheduler
Timer
KEY DATA
DATA
EDSCAVerify
select <sender,key>
select oldest Validationbuffer
Figure 12: Activated Components for TADS and TADS Piggyback
Certificate Module
VSC-A Final Report: Appendix G-3 Security Network Simulations – Mercedes-Benz RDNA
2.2.4
CA Module Msg Processor
Data Generator
MessageCache
Data, TXPolicy 0
CA, TXPolicy 1
MAC IEEE802.11p
transmit recv
Figure 13: Certificate is Piggybacked to Safety Messages and Sent
Appendix Volume 3 G-3-9

VSC-A Final Report: Appendix G-3 Security Network Simulations – Mercedes-Benz RDNA
The certificate module manages a certificate database which caches all recently received and validated certificates. It answers queries regarding the presence of a corresponding certificate when signed messages are received over the air (OTA).
This module is also in charge the certificate distribution process. The certificate distribution mechanism runs in parallel and independent with the security protocols. It runs its own timer to issue certificates at a configurable frequency. These certificates are passed to the WAVE Module to be piggybacked on the next safety message to be transmitted. The WAVE Module would set the transmission (TX) power for such piggybacked messages differently if instructed.
2.2.5 WAVE Module
As shown in Figure 14, the WAVE module in the architecture is in charge of transmission and receiving of messages. It is responsible for the following functions:
Assemble outgoing frame from various parts, including safety message, certificate, key, signature, etc., to pass to the MAC
Parse incoming frames and distribute various parts including safety message, key, certificate, signature, etc., to other modules
Set appropriate TX power for each outgoing frame
Certificate Management Module
Security Protocol
Message RX (Parse messages &
distribute signal)
Message TX (add tag or piggyback
messages)
Message Buffer
Safety Message Generator/Sink
Mac 802.11p
DATA/Key
Certificate
Msg
DATA
Msg
DATA
Certificate
DATA/Key
Certificate
1609.4 Channel Switch
Channel Interval Signal
Figure 14: Message Assembly and Parsing in WAVE Module
Appendix Volume 3 G-3-10

VSC-A Final Report: Appendix G-3 Security Network Simulations – Mercedes-Benz RDNA
3 Implementation Details in NS-2 Simulator This chapter provides details of the implementations in all the modules. They correspond directly to the source code.
3.1 MAC Module (Class Mac802_11Ext) This module implements the IEEE802.11p MAC as well as emulates the IEEE1609.4 channel switching mechanism. The implementation is an extension of MAC-802_11Ext module in NS-2 version 2.33.
TransmissionCoordination
ReceptionCoordination
ChannelStateMgrTransmission Reception
Backoff Manager
Power Monitor
MAC
Upper Layers
PHYPHY State Manager
WirelessChannel
Channel Switching Timer
Figure 15: IEEE 802.11p MAC with Channel Switching Extension
3.1.1 Class ChannelSwitchTimer In the overall design, modules such as MAC, Physical layer (PHY), Security, or DataGenerator should be informed of the start and end of control channel intervals; therefore, a Class ChannelSwitchTimer is created to manage channel switching timing and generate events in NS-2 simulator whenever control channel interval starts and ends. Class ChannelSwitchTimer also notifies MAC, PHY, Security, and DataGenerator modules to handle those events.
In order to notify ChannelSwitchTimer which module is interested in listening channel switching signals, any module that needs the signals should register to the ChannelSwitchTimer through its member function register ToMac (pointer caller). Such register processes should be done in the NS-2 simulation initialization stage.
Appendix Volume 3 G-3-11

VSC-A Final Report: Appendix G-3 Security Network Simulations – Mercedes-Benz RDNA
Figure 16: Registration for Receiving CCH Switch Signals
To get proper timing, ChannelSwitchTimer has an internal clock running to tell the start and end of control channel interval. According to the specification, a control channel interval lasts for 46 ms and followed by a 54 ms service channel interval; therefore, the events CCHStart and CCHEnd are generated as shown in the figure below.
Figure 17: Channel Switch Signals in Timeline
ChannelSwitchTimer notifies a listening module about the above events by calling the specific handling functions, which every listening module has to implement.
Void handleCCHStart()
Void handleCCHEnd() Those two functions are virtual functions. Every listening module implements its specific logic in handling the start and end of a control channel.
On the arrival of a CCHStart, ChannelSwitchTimer calls the handleCCHStart function of every registered listening module. Similarly, handleCCHEnd functions are called every time CCHEnd arrives.
Appendix Volume 3 G-3-12

VSC-A Final Report: Appendix G-3 Security Network Simulations – Mercedes-Benz RDNA
Figure 18: CCH Signaling to Modules
3.1.2 MAC Layer Extension Class Mac802_11Ext is extended to support channel switching. In order to support channel switching, as mentioned in a previous subsection, Mac802_11Ext should register itself to ChannelSwitchTimer and implement the channel switch timer interface: handleCCHStart() and handleCCHEnd().
The end of the control channel interval terminates the access to the wireless channel. According to the design, such a blockage is similar to a channel busy. On the other hand, the start of the control channel interval resumes the access to the wireless channel, which is similar to a clear of physical channel busy. Therefore, the channel switch signals are handled by the channel state manager in Mac802_11Ext.
Implementation logic of the handle functions are shown in the following state transition diagrams.
Appendix Volume 3 G-3-13

VSC-A Final Report: Appendix G-3 Security Network Simulations – Mercedes-Benz RDNA
No CS No NAV
CSNo NAV
Wait IFS
When PHY Indicates channel Busy,
signal to backoff Mgr CS_BUSY
When PHY indicates channel IDLE,
start IFS timer
When IFS timer times out, signal to backoff Mgr CS_IDLE
When PHY Indicate channel Busy
CSNAV
No CS NAV
start new NAV timer signal to backoff Mgr CS_BUSY
When PHY Indicate channel Busy
When Reception signals a NAV, start new NAV timer
When NAV timer times out
When PHY Indicate
channel Idle
When Reception signals a NAV,
start new NAV timer
When Reception signals a NAV, When Reception signals a NAV, update NAV timer
When Reception signals a NAV, update NAV timer
When NAV timer times out
Figure 19: Original Channel State Figure 20: Modification to State Diagram Diagram when CCH.end
Figure 21: Modification to State Diagram Figure 22: Modifications to State Diagram when CCH.start for NAV timeout
3.1.3 Physical (PHY) Layer Extension Class WirelessPhyExt is also extended to support channel switching. Similarly WirelessPhyExt should register itself to ChannelSwitchTimer and implement the channel switch timer interface: handleCCHStart () and handleCCHEnd ().
Figure 23: Original PHY State Diagram
Appendix Volume 3 G-3-14

VSC-A Final Report: Appendix G-3 Security Network Simulations – Mercedes-Benz RDNA
Figure 24: Extensions to State Diagram for PHY.abort
3.2 Application Module (Class DataGenerator) A Class DataGenerator is created to implement the application module, which is responsible for generating safety data messages and processing validated safety data messages.
3.2.1 Message Transmission DataGenerator has an internal clock to control the generation of messages, which can be configured through Tool Command Language (TCL) parameters:
Data Message Frequency
Jitter
Switch On/OFF Data Generator The message generated is a NS-2 packet, which has the following structure:
Packet header Packet body Common header Security header IP header empty
Note that a NS-2 packet is not the same as data messages generated in a real machine, but it captures all the characteristics about a real data message from its birth to death. Most critical characteristics are stored in the common header, which includes:
Type of message (PT_SEC) Packet size Transmission power
For all the messages used for security study, the type of message is set to PT_SEC, which a security protocol header is created specifically to store characteristics for security protocol information, which includes:
Appendix Volume 3 G-3-15

VSC-A Final Report: Appendix G-3 Security Network Simulations – Mercedes-Benz RDNA
protType Type of security protocol msgType Type of security message
Pt_ Recommended transmission power timeStamp Message generation time
recvTimeStamp Message reception time sendTimeStamp Message transmission time
certID Certificate ID signatureTagged EDSCA signature flag
keyID For TESLA only certTagged Certificate piggyback flag
(for piggybacked certificate only) lastKeyTagged Key piggybacked flag
lastKeyID (for piggybacked key only)
The security protocol field marks the version of security protocol this packet is related to. Its value can be one of the following five:
Field value ECDSA TESLAPIGGY TESLAEXPLI DUO DUOPIGGY Corresponding protocol
ECDSA TESLA with piggybacked key
TESLA TADS TADS with piggybacked
key
The security message type marks the safety message format this packet is related to. Its value can be one of the following:
The type of security messagesRAWDATADATA_PKISIGNDATA_PKISIGN_CERTDATA_TESLASIGNDATA_TESLASIGN_CERTTESLA_KEYDATA_TESLASIGN_KEYDATA_TESLASIGN_CERT_KEYCERTDATA_DUOSIGNDATA_DUOSIGN_CERTDATA_DUOSIGN_KEYDATA_DUOSIGN_KEY_CERT
The IP header stores the routing information. For this security protocol study, all messages are broadcasted; therefore, the IP header will have the following information:
Destination address (-1) Source address
Appendix Volume 3 G-3-16

CCH SCH CCH SCH CCH
CCH SCH CCH SCH CCH
VSC-A Final Report: Appendix G-3 Security Network Simulations – Mercedes-Benz RDNA
3.2.2 Optimized Transmission Scheduling To avoid the synchronized collision at the beginning of the Control Channel Iinterval, the message generation scheduling was optimized. The same number of messages are generated per second; however, they are only generated while the Control Channel is active.
Default message scheduling
Optimized message scheduling
Figure 25: Optimized Message Generation Scheduling
The optimization scheduling relies on the timing knowledge of Control Channel intervals; therefore, the DataGenerator needs to implement the interface functions to the ChannelSwitchTimer as described in section 3.1.1.
Appendix Volume 3 G-3-17

VSC-A Final Report: Appendix G-3 Security Network Simulations – Mercedes-Benz RDNA
Figure 26: Implementation of Optimized Data Generation
3.2.3 Processing Validated Message and Statistics When a validated safety data message is delivered to the application module, the transmission and reception is considered to be complete. Some statistics are performed on the message reception and logged into the trace file upon request, such as the inter-arrival delay and message validation delay. The calculation of delays uses the timestamps stored in the security header.
3.3 Certificate Module (Class CertificateManager) Class CertificateManager is created to implement the certificate distribution protocol. The implementation of the certificate module is focused on the generation of certificate messages and the process of received certificate messages.
3.3.1 Transmission of Certificate Messages 3.3.1.1 Message Generation Timing The generation of certificate messages is similar to any message generation in NS-2. An internal timer is running in Class CertificateManager to tell the timing of generating a new certificate message. Bond TCL parameters customize the frequency of the transmission.
Appendix Volume 3 G-3-18

VSC-A Final Report: Appendix G-3 Security Network Simulations – Mercedes-Benz RDNA
3.3.1.2 Piggyback and Transmission Power Adjustment According to the project requirements, certificate messages are transmitted by piggyback with safety data messages. In addition, the certificate message can be sent with a higher power than regular data messages. Both requirements are implemented with the support of module “MessageProcessor.” 3.3.1.3 Security Message Type and Message Size Every certificate message is implemented with a NS-2 packet. The packet type is PT_SEC (same as the safety data messages). A regular certificate message has a security message type of CERT. In case of piggybacking with data messages, the type of security message can be:
DATA_PKISIGN_CERT, DATA_TESLASIGN_CERT, DATA_TESLASIGN_CERT_KEY, DATA_DUOSIGN_CERT, DATA_DUOSIGN_KEY_CERT.
3.3.2 Processing of Certificate Messages Upon a successful reception of a message containing a certificate at MessageProcessor, the certificate will be forwarded to the CertificateManager module for processing. The processing includes certificate information management and certification information logging.
3.3.3 Certificates Management According to the design, every CertificateManager module keeps a record of all the received certificates from other vehicles. A Class CertificateStore is created to handle any received certificates. It records the certificate sender’s ID and the reception time. When a Security Module tries to validate a received safety data message, it will ask for the availability of the sender’s certificate. The CertificateStore will respond positively if and only if the requested certificate has been received no more than a configurable time before.
3.4 WAVE Module (Class MessageProcessor) The WAVE Module is implemented by Class MessageProcessor, which handles the transmission and reception of all security-related messages. For message transmission, the MessageProcessor implements the message piggyback mechanism and the adjustment of message transmission power. For message reception, MessageProcessor implements the distribution mechanism of messages to their proper modules for processing.
Appendix Volume 3 G-3-19

VSC-A Final Report: Appendix G-3 Security Network Simulations – Mercedes-Benz RDNA
Figure 27: MessageProcessor
3.4.1 Message Transmission
3.4.1.1 Transmission Policy According to the design, key messages should get transmitted immediately, certificate message should get piggybacked with a data message, and a data message can be transmitted standalone or with a piggybacked certificate message. Based on the above requirements, a class TransmissionPolicy is created to define how a message should be transmitted. A TransmissionPolicy is a data structure containing the following two Boolean values that control the transmission logic: piggyback allowed and postpone allowed.
Int Transmission Policy ID Bool Piggyback allowed Bool Postpone allowed
Appendix Volume 3 G-3-20

VSC-A Final Report: Appendix G-3 Security Network Simulations – Mercedes-Benz RDNA
The logic is shown in the figure below:
Figure 28: Transmission Policy
Three TransmissionPolicy modules are created for three types of messages in this study.
Transmission Policy for Safety Data TransmissionPolicyID 0 Piggyback allowed Yes Postpone allowed No
Transmission Policy for Certificates TransmissionPolicyID 1
Piggyback allowed Yes Postpone allowed Yes
Transmission Policy for Keys TransmissionPolicyID 2
Piggyback allowed No Postpone allowed No
Appendix Volume 3 G-3-21

VSC-A Final Report: Appendix G-3 Security Network Simulations – Mercedes-Benz RDNA
3.4.1.2 Aggregate all Messages Messages generated by all modules are sent to the MessageProcessor before they are given to the MAC layer. The interface is:
handleMessageFromAbove( Packet *, Handler *, TransmissionPolicyID )
3.4.1.3 Piggyback Messages Given the transmission logic and transmission policy described in 3.4, key messages cannot piggyback any certificate message, and they are given to MAC as soon as the MessageProcessor gets them. A certificate message will stay in the buffer waiting for a data message. When a data message arrives and finds a pending certificate message, the piggyback procedure will be executed. The piggyback procedure includes redefinition of the security message type and adjusts the transmission power if necessary.
3.4.1.4 Adjust Transmission Power Every message generated has a transmission power setting entry in its NS-2 packet’s security part. The module, which generates the message, can define the power value. The MessageProcessor does not change the setting unless it piggybacks a certificate message to a safety data message. The resulting message will use the power defined by the certificate message.
3.4.2 Message Reception The MAC layer will deliver any successfully received NS-2 packet to the MessageProcessor. All those messages, except those with type, CERT, will be forwarded to the Sec_CoreTESLA for further processing. If the packet has a piggybacked certificate, it will forward the certificate part to the CertificateManager.
Appendix Volume 3 G-3-22

VSC-A Final Report: Appendix G-3 Security Network Simulations – Mercedes-Benz RDNA
Figure 29: Piggyback of Certificates
3.5 Security Module (Class Sec_CoreTESLA) A class Sec_CoreTESLA is created to implement the logic of five security protocols for this study:
ECDSA (parameters as defined in parameters document)
TESLA (piggyback key disclosure)
TESLA (optimum TESLA key: separate key disclosure, key is disclosed once: d=1)
TADS (duo signature)
TADS (duo signature with piggyback key)
Appendix Volume 3 G-3-23

VSC-A Final Report: Appendix G-3 Security Network Simulations – Mercedes-Benz RDNA
3.5.1 Interface to Other Modules
DataGenerator
SecurityCore
MessageProcessor
MAC
getDataFromDG
sendDataToMsgps getDataFromMsgPs
sendDataToDG
Figure 30: Security Core
3.5.2 Framework A general framework with switchable-components-based design is taken in the implementation. This framework allows a flexible combination and configuration of components to simulate each of the protocols.
Appendix Volume 3 G-3-24

VSC-A Final Report: Appendix G-3 Security Network Simulations – Mercedes-Benz RDNA
TX
cert key
data
CERT KEY TESLAAuth Verify
Scheduler
RX
TESLAAuth GEN
Timer
TX
RXProcessor
Buffer
Scheduler
Timer
KEY DATA
DATA
EDSCAVerify
selectl <sender,key>
select oldest Validationbuffer
Figure 31: A General Framework for Security Protocol Implementations
This framework has following components:
1. Delay
Signature/Authentication Generation Delay
Certificate Validation Delay
Key Validation Delay
Data TELSA Authentication Delay
Data EDSCA Authentication Delay
2. Buffer
Certificate Buffer
Key Buffer
Data Buffer
3. Timer
KeyTransmissionTimer 4. Scheduler
Appendix Volume 3 G-3-25

VSC-A Final Report: Appendix G-3 Security Network Simulations – Mercedes-Benz RDNA
3.5.3 Components Implementation Details A Scheduler is introduced to control the sequence of processing in case of the multiple Delay having packets to process.
Check caller
releaseCPU
Delay
Buffer
CPU
resume
recv
handleMsgFromBuffer
accessCPU
sched
buffer
block
handleBuffer
handleProcessTimer
Figure 32: Buffer, Delay and Scheduler used in the Framework of Security Module
handleMsgFromBuffer
BufferPacketQueue
recv
enque
deque
resume
buffer
Figure 33: Buffer Structure
Appendix Volume 3 G-3-26

4
VSC-A Final Report: Appendix G-3 Security Network Simulations – Mercedes-Benz RDNA
Buffer, a general class which can keep NS-2 packets in its internal queue, is added before almost every Delay component in the framework to hold NS-2 packets that are pending for processing.
Buffer Delay Sec_CertificationBuffer Sec_CertificationValidationDelay
Sec_KeyBuffer Sec_KeyValidationDelay Sec_DataBuffer
Sec_DataAuthenticationBuffer Sec_TESLAEDSCAVerificationDelay Sec_TESLAAuthenticationVerificationDelay
Simulation Setup and Configuration
4.1 Simulator Parameters
PHY Parameter Default value Description
CSThresh_ -96 dbm Carrier sensitivity threshold Noise_floor_ -99 dbm Environmental noise powerMonitorThresh_ -100 dbm If a receiving power is
lower than 1/3 of the sensible threshold it is ignored in the power Monitor
Pt_ Depends on the scenario Transmission power Freq_ 5.9e9 Radio frequency HeaderDuration 40us Frame header transmission
duration basicModulation BPSK BPSK and coding rate of ½
is the basic modulation scheme for header and ctrl packets
L 1.0 Pass loss over cables preambleCaptureSwitch ON Switch of the preamble
capture feature dataCaptureThresh OFF Switch of the data capture
feature SINR_preambleCapture 4 dB Minimal SINR required for
the preamble capture feature
SINR_dataCapture 10 dB Minimal SINR required for the data capture feature
Tracedist Infinity If a receiving node is located more than Tracedist
Appendix Volume 3 G-3-27

VSC-A Final Report: Appendix G-3 Security Network Simulations – Mercedes-Benz RDNA
PHY Parameter Default value Description
away from the sender, its events won’t get into the log file.
BPSK 5 db SINR Threshold (new) QPSK 8 db SINR Threshold (new) QAM16 15 db SINR Threshold (new) QAM64 20 db SINR Threshold (new)
Appendix Volume 3 G-3-28

VSC-A Final Report: Appendix G-3 Security Network Simulations – Mercedes-Benz RDNA
MAC Parameter Default value Description
cwMin_ 15 Minimal congestion window
cwMax_ 1023 Maximal congestion window
slotTime_ 13 us MAC SlotTime SIFS_ 32 us Mac SIFS preambleLenght_ 144 bit Preamble length of a frame PLCPHeaderLength 48 bit Length of PLCP header PLCPDataRate 1e6 data rate used to transmit
PLCP header RTSThreshold_ 2346 byte Threshold to activate
RTS/CTS shortRetryLimit_ 7 Retransmission limit for
short MAC frames longRetryLimit 4 Retransmission limit for
long MAC frames BeaconInterval_ 0.1 Beacon message interval ScanType Passive Not used probDelay 0.0001 Not used MaxChannelTime_ 0.011 Not used MinChannelTime_ 0.005 Not used channelTime_ 0.12 Not used HeaderDuartion_ 40 us Frame header transmission
duration for 802.11p SymbolDuration_ 8 us Symbol duration for
802.11p basicModulationScheme_ BSPK BPSK and coding rate of ½
is the basic modulation scheme for header and ctrl packets
Use_802_11a_flag_ True
Radio Frequency (RF) Model (parameters to set Nakagami equivalent to Rayleigh Model)
Parameter Default value Description Gamma0,1,2 2.0 Gamma is set to 2.0 for all
distances M0,1,2 1.0 M is set to 1.0 for all
distances D0_gamma_ 200 Not useful D0_gamma_ 500 Not useful
Appendix Volume 3 G-3-29

VSC-A Final Report: Appendix G-3 Security Network Simulations – Mercedes-Benz RDNA
Radio Frequency (RF) Model (parameters to set Nakagami equivalent to Rayleigh Model)
D0_m_ 80 Not useful D1_m_ 200 Not useful Use_nakagami_dist True Nakagami distribution
generator is turned on
Antenna (omni antenna) Parameter Default value Description
Gt 1 Transmission antenna gain Gr 1 Reception antenna gain
Application Parameter Default value description
payloadSize 200 Data payload size periodicBroadcastInterval 1 Transmission frequency periodicBroadcastVariance 0.1 Variance of the jitter
between messages ModulationScheme_ 1 Use 6Mbps as the default
data rate
With the above parameters, the settings for the TX power are: Pt_ is set to 4.94e-4 for theoretical reception range 100 m without RF fading and 19.6e-4 for theoretical reception range 200 m without RF fading.
Appendix Volume 3 G-3-30

VSC-A Final Report: Appendix G-3 Security Network Simulations – Mercedes-Benz RDNA
Table 1: TX Power Conversions
Distance in
Meters in (Watt) in dBm 1 100 4.85E-04 -3.1 2 200 1.94E-03 2.9 3 300 4.37E-03 6.4 4 400 7.76E-03 8.9 5 500 1.21E-02 10.8 6 600 1.75E-02 12.4 7 700 2.38E-02 13.8 8 800 3.10E-02 14.9 9 900 3.93E-02 15.9
10 1000 4.85E-02 16.9 11 1100 5.87E-02 17.7 12 1200 6.98E-02 18.4 13 1300 8.20E-02 19.1 14 1400 9.51E-02 19.8 15 1500 1.09E-01 20.4 16 1600 1.24E-01 20.9 17 1700 1.40E-01 21.5 18 1800 1.57E-01 22.0 19 1900 1.75E-01 22.4 20 2000 1.94E-01 22.9
For all studies, 10 dBm TX power is used unless otherwise noted. This is because at 10 dBm, the theoretic reception distance is already just under 500 m while the effective reception range is about 250 m. Such values match reasonably well with highway vehicle speed and general safety communication use cases. At 20 dBm, however, the range would go up to 1500 m and is clearly overkill. As shown in some of the 20 dBm-based simulations in the appendix, the channel becomes saturated even in relatively low traffic density levels.
Appendix Volume 3 G-3-31

VSC-A Final Report: Appendix G-3 Security Network Simulations – Mercedes-Benz RDNA
4.2 Road and Vehicle Traffic Modeling
Figure 34: Wrap Around Road Configuration
All roads used in the simulation are modeled as a straight and flat road but with both ends connected. Once a vehicle has reached one end, it will reappear on the other end. It should be envisioned as a circular road on which the RF signals travels along the circle but does not penetrate it. This arrangement eliminates boundary conditions and needs a smaller vehicle count to provide sufficient data points.
The length of the road (i.e., size of the circle) is dependent on the transmission power used in the simulation:
For 10 dBm, 3000 m is used
For 13 dBm, 6000 m is used
For 20 dBm, 9000 m is used
4.2.1 Market Penetration Rate and Vehicle Density
In all highway simulation scenarios, four vehicle density levels are used for the studies. These levels are defined according to the following considerations:
Appendix Volume 3 G-3-32

VSC-A Final Report: Appendix G-3 Security Network Simulations – Mercedes-Benz RDNA
First, a realistically, but not pathologically, stressful highway traffic scenario is constructed as the reference case. A highway with four lanes in each direction is modeled as a high throughput road model. Then vehicles are placed on each lane at 50 m separation distances. This number is based on measurements on I-880 in California that showed highway traffic is able to maintain free-flow highway speed at 50-60 m separation or more but breaks down below that level. Therefore, this 50 m per car per lane number is chosen to model a free-flowing highway traffic in a reasonable stressful level. In short, this reference traffic model allocates 160 cars per km road.
Then four DSRC market penetration rate levels are defined accordingly. Within the reference and full highway traffic model as described above, it is the DSRC market penetration rate parameter that helps define the number of cars that need to be placed on the road per km in actual simulations. These 4 levels are defined as 25 percent, 50 percent, 75 percent, and 100 percent to help study how security protocols fare at different stages of DSRC deployment. These 4 levels point to 40, 80, 120, and 160 cars per km per road in the simulation configurations.
Corresponding to such market penetration levels, four security computation capability levels are further defined to help model DSRC platform capabilities at different stages of DSRC deployment. Assumption is that DSRC deployment will start in five years and starts with the equivalent of 1GHz PowerPC computation capability for security processing. It is further assumed that such computation capability doubles every two years while maintaining the same cost level. Please note this is less than the trend predicted by Moore’s law. Therefore, corresponding to the four market penetration rate levels, four generations of platform capabilities are also defined.
Appendix Volume 3 G-3-33

VSC-A Final Report: Appendix G-3 Security Network Simulations – Mercedes-Benz RDNA
4.3 Urban Grid Configuration
Figure 35: Urban Road Grid Construction
For urban simulation scenarios, a 5x5 road grid is constructed. Each road is 1 km long and wraps around at the ends as described in the previous subsection.
Appendix Volume 3 G-3-34

5
VSC-A Final Report: Appendix G-3 Security Network Simulations – Mercedes-Benz RDNA
Evaluation and Analysis
5.1 Figures Overview
In this section, all figure types plotted for this study are described.
5.1.1 Figure 1: Overall Performance Versus Distance
This figure plots overall performances of a protocol verses distance. Four curves are shown in each figure:
Safety message reception rate (i.e., OTA performance)
Among those received messages, how many are from a sender whose certificate has been previously received and validated (i.e., messages that could be validated)
Among those messages possible to be validated, how many are received before the TESLA key interval expires (i.e., messages that further satisfy TESLA timing guarantees)
Finally, the messages that are actually validated
5.1.2 Figure 2: Validation Delay versus Distance
This figure illustrates the security processing delay within a receiver after a message is received OTA. This delay consists of both the queuing delay and the waiting time for subsequent key releases for those TESLA variants.
This figure plots the average, median, 10 percent - 90 percent confidence interval, and 30 percent - 70 percent confidence interval.
5.1.3 Figure 3: Breakdown of Validation Delay
This figure breaks down the validation delays within all successfully validated messages. Two types of figures are produced:
Probability Density Function (PDF) and Cumulative Distribution Function (CDF) of validation delays
Total number of instances of messages within each validation delay bin (note the Y-axis is in log scale)
5.1.4 Figure 4: Inter-Validated-Message Timing Gap Versus Distance
This figure shows the distribution of time intervals between successfully received and validated messages from the same sender. This figure plots the average, median, 10 percent - 90 percent confidence interval, and 30 percent - 70 percent confidence interval.
5.1.5 Figure 5: Certificate Distribution Performance
This figure shows the CDF and PDF curves of the distance at which a car receives the certificate of an approaching and previously unknown vehicle for the first time. Please note that the X-axis, which is the distance, include a negative value range. This is meant
Appendix Volume 3 G-3-35

VSC-A Final Report: Appendix G-3 Security Network Simulations – Mercedes-Benz RDNA
to show the cases in which the certificate is received only when the vehicles have crossed over each other in their paths.
5.1.6 Figure 6: MAC Access Delay
This figure shows the breakdown of channel access delay the senders experience while waiting for the radio to transmit a message. Two types of figures are produced:
PDF and CDF of MAC access delays
Absolute number of instances of each delay value
Please note for both figure types, the Y-axis is plotted in log scale.
5.2 Certificate Distribution Performance
5.2.1 Study Methodology
As shown in the figure below, for certificate distribution performance, data is collected between approaching vehicles in opposite directions. For each vehicle in the simulation, only data from vehicles sufficiently far away on the circular road with no chance of being heard from in the initial phase of simulation would be collected and considered. The simulation is run for the duration sufficient for the last vehicle in the interested group to travel at least 200 m past the receiver vehicle. The data collected in this process is marked so that distance values at which a certificate is heard can be assigned either a positive or negative value. The concept is that a certificate received before the sender and receiver has met on the road is assigned a positive distance value and a negative one if they have crossed over each other.
Appendix Volume 3 G-3-36

VSC-A Final Report: Appendix G-3 Security Network Simulations – Mercedes-Benz RDNA
Figure 36: Simulation Setup for Certificate Distribution Performance Study
Clearly, the approaching speed between the sender and receiver vehicles has a big impact on the certificate distribution performance. For this study, three levels of approaching speed are modeled: 60 m/s, 30 m/s, and 15m/s. They can be interpreted as following:
60 m/s speed differential is representative of two vehicles approaching each other in opposite directions at highway speed
30 m/s speed differential can help study communications between a disabled vehicle and traffic approaching at highway speed
15 m/s speed differential could be viewed as a fast vehicle catching up on slower ones in the same traffic direction
In the first batch of simulations, all five security protocol variants are studied across all four market penetration level scenarios. The speed differential is 60 m/s and messages with certificates attached are transmitted at 10 dBm, same as other safety messages. Certificates are sent at 1Hz, 1.5Hz, 2Hz, and 2.5Hz, respectively.
The first observation is that results for ECDSA, TESLA Piggyback, and TADS Piggyback are generally similar across all simulation scenarios. This is not surprising since all three share very similar message sizes and the same frame count. For example, see the following figures:
Appendix Volume 3 G-3-37

VSC-A Final Report: Appendix G-3 Security Network Simulations – Mercedes-Benz RDNA
ECDSA TESLA Piggyback TADS Piggyback
Figure 37: Certificate Performance, CHSW off, 1 Hz, 10 dBm, 25 percent Scenario
ECDSA TESLA PIGGYBACK TADS PIGGYBACK
Figure 38: Certificate Performance, CHSW on, 2 Hz, 10 dBm, 100 Percent Scenario
Therefore, ECDSA figures are used in place of TESLA Piggyback and TADS Piggyback in the subsequent comparisons with TESLA and TADS.
The second observation is that TESLA and TADS clearly suffer from their extra frame count very quickly as the market penetration rate level increases.
ECDSA TESLA TADS
Figure 39: Certificate Performance, CHSW off, 1Hz, 10 dBm, 25 Percent Scenario
As shown in the figure above, TESLA and TADS both show reasonable performances (i.e., above 90 percent certificate availability at 200 m) in the lowest 25 percent market penetration rate scenario. Yet they are also clearly falling behind ECDSA in this case.
Appendix Volume 3 G-3-38

VSC-A Final Report: Appendix G-3 Security Network Simulations – Mercedes-Benz RDNA
As shown in the figure below, once the market penetration rate level goes to 75 percent, the certificate distribution performances of TESLA and TADS quickly drop below an acceptable level even if the distribution frequency is doubled. Meanwhile, the ECDSA’s performance clearly benefitted from doubling of the frequency and stays in an acceptable level.
ECDSA TESLA TADS
Figure 40: Certificate Performance, CHSW off, 2 Hz, 10 dBm, 75 Percent Scenario
Another batch of simulations studies the impact of using a different TX power for messages with a certificate attached. The power level is set to 13 dBm, which is double the power level than 10 dBm and increases the range by about 50 percent. The distribution frequency is kept at 1 Hz.
ECDSA TESLA
Figure 41: Certificate Performance, CHSW off, 1 Hz, 13 dBm, 75 Percent Scenario
As shown in the figure above, ECDSA responds well to this approach. It is actually even better keeping the TX power at 10 dBm and doubling the frequency. For TESLA, however, it is still inadequate to boost its performance sufficiently.
5.3 Over-the-Air Performance Analysis
This section analyzes the impact of all five security protocol variants on vehicle safety message communication performances OTA. Each protocol variant introduces varying levels of bandwidth overhead to each safety message as well as the additional frames sent in the channel in the cases of TESLA and TADS. Given that security protocol is
Appendix Volume 3 G-3-39

VSC-A Final Report: Appendix G-3 Security Network Simulations – Mercedes-Benz RDNA
ultimately meant to assist the safety communications, it is important to understand how much impact a protocol has on the fundamental safety communication performances.
As shown below, each figure compares the safety message reception performance of all five protocol variants. Results for all four market penetration rate levels are shown. Both channel switching off and on results are compared as well.
Channel Switching Off Channel Switching On
40 c
ars/
km80
car
s/km
120
cars
/km
160
cars
/km
Figure 42: Over-the-Air Safety Message Performance Comparisons
Appendix Volume 3 G-3-40

VSC-A Final Report: Appendix G-3 Security Network Simulations – Mercedes-Benz RDNA
Similar to the observation obtained in the certificate distribution performance study section, ECDSA, TESLA Piggyback, and TADS Piggyback clearly have their performance curves bundled together throughout all simulation cases. TESLA and TADS, however, clearly show much less performance in all cases.
It is also clear that turning on channel switching has a strong and negative impact on safety communication performance.
While these reception rate versus distance figures illustrate clear trends of decreased individual safety message performance as channel stress increases, it is not immediately clear at what point the channel is saturated. The figures below answer the questions from another angle.
Figure 43: Number of Safety Messages Received Per Second, CHSW Off
Figure 44: Number of Safety Messages Received Per Second, CHSW On
These figures compare the average number of safety messages received per second per car in all simulation scenarios. For each protocol variant, an easy rule of thumb is that if this number shows minimum increase or stays flat while communication density increases in the channel, then the channel is effectively near or at saturation from a safety communication point of view.
Appendix Volume 3 G-3-41

VSC-A Final Report: Appendix G-3 Security Network Simulations – Mercedes-Benz RDNA
Again, TESLA Piggyback, ECDSA, and TADS Piggyback have somewhat similar performances because their frame sizes are relatively close. These three protocols are showing very small increases in messages received per second as the penetration rate goes up to 100 percent. More importantly, with channel switching off, the trend lines clearly imply that total security computation demand for these three protocols will be capped at about 600 per second or lower. Since safety communication has its own congestion control considerations that should keep the channel stress at levels reasonably lower than the saturation point, this effective upper bound on security computation demand should be no more than 500 per second. If the channel switching is on, this number is much lower.
TESLA and TADS have saturation points much earlier than the other three protocols, as expected.
ECDSA TESLA TADS
Figure 45: MAC Access Delay, CHSW off, 10 Hz, 100 Percent Scenario
Yet one more metric of channel stress is the MAC access delay distribution. As shown above, with channel switching off and in a 100 percent market penetration rate level, ECDSA (and similarly TESLA Piggyback and TADS Piggyback) has nontrivially extended but reasonably contained MAC access delay for safety messages to wait before they are transmitted OTA. TESLA and TADS have in comparison much wider distribution, up to 20 ms or beyond. As such, they are liable to suffer security timing failures as demanded by TESLA.
ECDSA TESLA TADS
Figure 46: MAC Access Delay, CHSW on, 10 Hz, 50 Percent Scenario
With channel switching on, there is another problem showing up. Even at 50 percent market penetration rate level, nontrivial numbers of messages sent not in their initial CCH interval but waiting for a SCH interval and more show up. These delayed messages
Appendix Volume 3 G-3-42

VSC-A Final Report: Appendix G-3 Security Network Simulations – Mercedes-Benz RDNA
will have low reception performance to begin with due to synchronized collisions at the start of the next CCH interval. And for TESLA and TADS variants, the TESLA security timing guarantees are also broken.
5.4 Computational Demand versus Capability at Different Stages of Deployment
Given the clear indications in the previous two sections, TESLA and TADS are both too expensive in their channel overheads to be realistically feasible candidates to be adapted as the VSC security protocol. Therefore, from this point on, the evaluation is limited to comparisons among ECDSA, TESLA Piggyback, and TADS Piggyback. In this section, these three protocol variants are compared in four market penetration rate scenarios, with the four associated computation capabilities. The first generation platform is assumed to have the equivalent of 1 GHz PowerPC level computation capability. It is able to verify a bit over 100 ECDSA signatures per second. Each subsequent generation has four times as much computational power as the previous one.
In this batch of simulations, all vehicles transmit safety messages at 10 Hz and with 10 dBm TX power. The certificate is attached to safety messages at 1 Hz and with 10 dBm TX power.
ECDSA TESLA PIGGYBACK TADS PIGGYBACK
Figure 47: Overall Performances, 1 Gen Platform, 25 Percent Scenario
ECDSA TESLA PIGGYBACK TADS PIGGYBACK
Figure 48: Verification Delay, 1 Gen Platform, 25 Percent Scenario
As shown in the figures above, in the 25 percent market penetration rate scenario and with the first generation platform, ECDSA is unable to keep up with the computational demand. Its validated message curve is clearly far below the messages with previously
Appendix Volume 3 G-3-43

VSC-A Final Report: Appendix G-3 Security Network Simulations – Mercedes-Benz RDNA
validated certificates. Because the computation resource is saturated, the queue of messages waiting to be processed in the receiver, set at 50, is always full. This causes the verification delay in the receiver for those actually verified messages to stay at an artificially high value.
In the TESLA Piggyback case, the computational capability is more than enough. However, there is still a small gap at far distances between the validated messages and successfully received ones. This is due to the lack of subsequent messages received from the same sender in some instances. TADS Piggyback does not have this gap, because it has the fallback option of using ECDSA signature for verification.
Please note that TESLA Piggyback has a clear lower bound of 100 ms in its verification delay figure due to the 10 Hz messaging rate. TADS Piggyback also has the same lower bound, because the 1 Gen platform is still unable to process all signatures using ECDSA. Nevertheless, its queuing design means that it is able to take advantage of some leftover computation capabilities to proactively verify messages using ECDSA after 100 ms. Therefore, its distribution in verification delay is nicely bounded and very close to 100 ms at all distances.
ECDSA TESLA PIGGYBACK TADS PIGGYBACK
Figure 49: Overall Performances, 2 Gen Platform, 50 Percent Scenario
ECDSA TESLA PIGGYBACK TADS PIGGYBACK
Figure 50: Verification Delay, 2 Gen Platform, 50 Percent Scenario
When the scenario goes up to 50 percent penetration rate and is at the second generation platform, ECDSA shows it is just at the point of keeping up with all verification demands. This also means that TADS Piggyback is able to verify all messages proactively with ECDSA signatures without waiting for TESLA keys to arrive in the subsequent messages.
Appendix Volume 3 G-3-44

VSC-A Final Report: Appendix G-3 Security Network Simulations – Mercedes-Benz RDNA
Please note that TESLA Piggyback shows an interesting gap between verified messages and those received successfully and in time. This is caused by the queue size parameter configured for the receiver. The nature of TESLA Piggyback means that it needs to hold all received messages for 100 ms and sometimes more in order to get the next message with the needed TESLA key from the same sender. The queue size used here (i.e., 50) is not enough, resulting in this gap. This problem is resolved by simply adding more queue space. As shown below, when the queue is increased to 300, the figures returned to expected shapes. All subsequent simulations use the bigger queue size for TESLA Piggyback.
Overall Performance Verification Delay
Figure 51: TESLA Piggyback with Larger Queue, 2 Gen Platform, 50 Percent Scenario
ECDSA TESLA PIGGYBACK TADS PIGGYBACK
Figure 52: Overall Performances, 3 Gen Platform, 75 Percent Scenario
ECDSA TESLA PIGGYBACK TADS PIGGYBACK
Figure 53: Verification Delay, 3 Gen Platform, 75 Percent Scenario
Appendix Volume 3 G-3-45
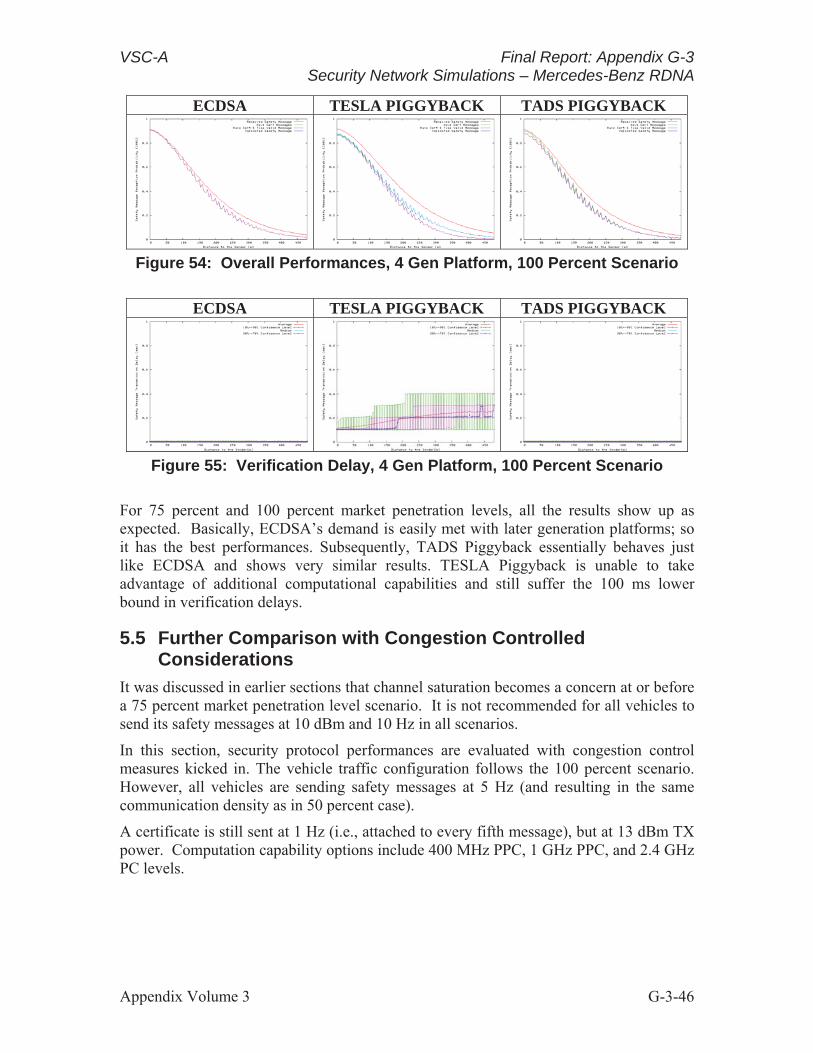
VSC-A Final Report: Appendix G-3 Security Network Simulations – Mercedes-Benz RDNA
ECDSA TESLA PIGGYBACK TADS PIGGYBACK
Figure 54: Overall Performances, 4 Gen Platform, 100 Percent Scenario
ECDSA TESLA PIGGYBACK TADS PIGGYBACK
Figure 55: Verification Delay, 4 Gen Platform, 100 Percent Scenario
For 75 percent and 100 percent market penetration levels, all the results show up as expected. Basically, ECDSA’s demand is easily met with later generation platforms; so it has the best performances. Subsequently, TADS Piggyback essentially behaves just like ECDSA and shows very similar results. TESLA Piggyback is unable to take advantage of additional computational capabilities and still suffer the 100 ms lower bound in verification delays.
5.5 Further Comparison with Congestion Controlled Considerations
It was discussed in earlier sections that channel saturation becomes a concern at or before a 75 percent market penetration level scenario. It is not recommended for all vehicles to send its safety messages at 10 dBm and 10 Hz in all scenarios.
In this section, security protocol performances are evaluated with congestion control measures kicked in. The vehicle traffic configuration follows the 100 percent scenario. However, all vehicles are sending safety messages at 5 Hz (and resulting in the same communication density as in 50 percent case).
A certificate is still sent at 1 Hz (i.e., attached to every fifth message), but at 13 dBm TX power. Computation capability options include 400 MHz PPC, 1 GHz PPC, and 2.4 GHz PC levels.
Appendix Volume 3 G-3-46

VSC-A Final Report: Appendix G-3 Security Network Simulations – Mercedes-Benz RDNA
400 MHz PPC 1 GHz PPC 2.4 GHz PC
Figure 56: ECDSA Performances with Varying Computation Power
With ECDSA, the rate control method used has no impact on the basic security protocol functioning. The different computational capabilities, however, clearly show up in the results. In general, ECDSA cannot keep up with the computation demand of the VTP architecture with all three computation resource levels modeled. However, with moderately capable resources (e.g., 1GHz PPC equivalent), ECDSA should function well in a verify-on-demand (VoD) architecture; because safety messages received per second in this congestion controlled setup is 450, whereas an 1 GHz PPC can verify 100 signatures per second. This means that a VoD ratio of 20 percent and less, which is reasonably achievable, would suffice.
Overall Performance Verification Delay
Figure 57: TESLA Piggyback Performance Stays the Same with Varying Computational Capabilities
TESLA Piggyback shows identical performance with computation resources ranging from 400 MHz Power PC to 2.4 GHz PC, because it is unable to take advantage of any of the extra capability due to its protocol nature.
Its verification delay, given the 5Hz messaging rate, rises as expected. Furthermore, due to policy of discarding any unverified message older than 500ms, each message depends on receiving one of the two subsequent massages from the same sender to have a chance to be verified. Those cases in which both subsequent messages failed to arrive cause the gap between verifiable and verified.
Appendix Volume 3 G-3-47

VSC-A Final Report: Appendix G-3 Security Network Simulations – Mercedes-Benz RDNA
400 MHz PPC 1 GHz PPC 2.4 GHz PC
Figure 58: TADS Piggyback Performances with Varying Computation Power
TADS Piggyback is able to take advantage of any leftover computation capability there is. Therefore, it produces equal and better results than TESLA Piggyback in all cases.
Furthermore, given sufficient computation power (e.g., 2.4 GHz PC), its verification delay becomes nicely bounded.
400 MHz PPC 1 GHz PPC 2.4 GHz PC
Figure 59: TADS Piggyback Verification Delays with Varying Computation Power
Appendix Volume 3 G-3-48

VSC-A Final Report: Appendix G-3 Security Network Simulations – Mercedes-Benz RDNA
6 Summary
6.1 Certificate Distribution Mechanism
The general approach of attaching certificate to a small fraction (i.e., 1 Hz) of safety messages works well for all five security protocol variants even in 60 m/s speed differential cases. While it is true that certificate distribution performance could deteriorate in high channel stress scenarios, such a performance drop can be managed via a few simple methods:
Increasing certificate distribution frequency (e.g., from 1 Hz to 2 Hz) works well
Using a higher TX power for certificate messages while maintaining the same low frequency could work even better
Congestion control based on general safety communication concerns will also help ensure a reasonable certificate distribution performance
The relative vehicle speed difference is the most important factor. For cases with lower speed differentials (e.g., 30m/s or 15m/s), certificate distribution performance is unlikely to be of concern.
6.2 Comparison of VSC Security Protocol Variants
TESLA and TADS, configured with standalone TESLA key frames, very quickly come to saturation points as the DSRC penetration rate increases due to a high number (i.e., double) of frame counts sent OTA. As such, these two variants negatively impact basic safety communication performance too much in comparison with the other three options to warrant adaptation. It is important to note that this is not the only shortcomings of these two variants. For example, the channel overhead issue also impacts the actual security protocol performances.
Of the remaining three options, TESLA Piggyback has the best OTA performance. However:
This channel overhead advantage over ECDSA and TADS Piggyback is rather insignificant due to similar frame sizes and same frame count
It is complex to implement due to stringent timing precision requirements
It imposes a minimum of 100 ms verification latency (and in some cases much more) no matter how critical the safety application’s need for immediate validation is
This minimum verification latency becomes much worse when congestion control is needed (i.e., less than 10 Hz messaging rate is used by all vehicles)
It cannot take advantage of improved computational capability in later generations of the DSRC platform
Appendix Volume 3 G-3-49

VSC-A Final Report: Appendix G-3 Security Network Simulations – Mercedes-Benz RDNA
In comparison, ECDSA is the simplest among the three to implement. However, for the verify-before-process model, its computational demand is so high that it is unrealistic to expect early generations of the DSRC platform to be able to keep up.
Therefore, given the verify-before-process assumption applied in this study, TADS Piggyback is the recommended protocol choice because:
Its OTA performance is only slightly less than the best protocol option (i.e., TESLA Piggyback)
It allows for fast verification for single critical message when needed
o If computation resource preemption is supported, then the latency is about 23 ms
o Otherwise, the latency is capped to about 45 ms
It can be implemented in such a way to take advantage of increased computational capabilities in later generations of DSRC platforms to improve its performance
It is also important to note that if the VoD model is accepted, then ECDSA is a very attractive option.
Appendix Volume 3 G-3-50

7VS
C-A
Fin
al R
epor
t: A
ppen
dix
G-3
S
ecur
ity N
etw
ork
Sim
ulat
ions
– M
erce
des-
Ben
z R
DN
A
All
Sim
ula
tio
n R
esu
lts
for
Sec
uri
ty P
roto
col C
om
par
iso
ns
This
cha
pter
pro
vide
s re
sults
/figu
res
of a
ll si
mul
atio
ns.
They
are
list
ed b
y ba
tche
s of
sim
ulat
ions
run
in th
is s
tudy
, eac
h in
its
own
sect
ion.
Ea
ch se
ctio
n st
arts
with
a ta
ble
listin
g al
l the
rele
vant
sim
ulat
or c
onfig
urat
ions
, as e
xpla
ined
bel
ow, a
nd is
follo
wed
by
tabl
es o
f fig
ures
.
Each
con
figur
atio
n ta
ble
look
s lik
e th
e fo
llow
ing
one.
Ea
ch r
ow c
once
rns
a pa
rticu
lar
conf
igur
atio
n pa
ram
eter
, as
labe
led
in t
he f
irst
colu
mn.
A
ll po
ssib
le v
alue
s/co
nfig
urat
ions
are
lis
ted
in t
he r
est
of t
he r
ow.
Any
par
amet
er v
alue
/con
figur
atio
n us
ed i
n a
batc
h of
si
mul
atio
ns is
hig
hlig
hted
.
Pro
toco
ls
TESL
A
TAD
S TA
DS
PIG
GY
BA
CK
C
hann
el S
wit
chin
g O
ff
On
Pro
cess
or/G
ener
atio
n 40
0 M
Hz
PPC
2.
4 G
Hz
PC
1 G
en
2 G
en
3 G
en
Veh
icle
Den
sity
40
car
s/km
80
car
s/km
12
0 ca
rs/k
m
160
cars
/km
50
0 ca
rs/k
m2
Veh
icle
Spe
ed
30 m
ps
15 m
ps
7.5m
ps
Roa
d L
engt
h 30
00 m
60
00 m
90
00m
M
essa
ge T
X P
ower
10
dB
m
20 d
bm
Mes
sagi
ng F
requ
ency
10
Hz
5 H
z C
erti
fica
tion
TX
Pow
er
10 d
Bm
13
dbm
C
erti
fica
tion
Fre
quen
cy
1 H
z 1.
5 H
z 2
Hz
2.5
Hz
Rec
eive
r B
uffe
r Si
ze
50
300
15
ECD
SA
TESL
A P
IGG
YB
AC
K
4 G
en
The
tabl
e ab
ove,
for
exa
mpl
e, d
escr
ibes
a b
atch
of
sim
ulat
ion
runs
com
parin
g EC
DSA
, TES
LA P
iggy
back
, and
TA
DS
Pigg
ybac
k.
The
IEEE
160
9.4
Cha
nnel
Sw
itchi
ng is
turn
ed o
ff.
The
com
puta
tiona
l res
ourc
e is
mod
eled
as
a 2.
4 G
Hz
PC.
The
traff
ic s
cena
rios
incl
ude
all 4
pe
netra
tion
case
s in
whi
ch a
ll ve
hicl
es tr
avel
at 3
0vm
per
sec
ond
on a
300
0 m
long
circ
ular
road
. A
ll no
des
trans
mit
safe
ty m
essa
ges
at 1
0 H
z an
d us
ing
10 d
Bm
pow
er.
Cer
tific
ates
are
atta
ched
to s
afet
y m
essa
ges
at 1
Hz
and
sent
at t
he s
ame
pow
er.
The
rece
iver
mai
ntai
ns a
qu
eue
size
of 5
0. T
he to
tal n
umbe
r of s
imul
atio
ns in
this
bat
ch is
3x4
=12.
App
endi
x V
olum
e 3
G-3
-51

VS
C-A
Fin
al R
epor
t: A
ppen
dix
G-3
S
ecur
ity N
etw
ork
Sim
ulat
ions
– M
erce
des-
Ben
z R
DN
A
7.1
Fir
st B
atch
, Co
mp
aris
on
of
All
Pro
toco
ls, 1
0 d
Bm
TX
Po
wer
Pro
toco
ls
ECD
SA
TESL
A P
IGG
YB
AC
K
TESL
A
TAD
S TA
DS
PIG
GY
BA
CK
C
hann
el S
wit
chin
g O
ff
On
Pro
cess
or/G
ener
atio
n 40
0 M
Hz
PPC
2.
4 G
Hz
PC
1 G
en
2 G
en
3 G
en
4 G
en
Veh
icle
Den
sity
40
car
s/km
80
car
s/km
12
0 ca
rs/k
m
160
cars
/km
80
0 ca
rs/k
m2
Veh
icle
Spe
ed
30 m
ps
15 m
ps
7.5
mps
R
oad
Len
gth
3000
m
6000
m
9000
m
Mes
sage
TX
Pow
er
10 d
Bm
20
dB
m
Mes
sagi
ng F
requ
ency
10
Hz
5 H
z C
erti
fica
tion
TX
Pow
er
10 d
Bm
13
dB
m
Cer
tifi
cati
on F
requ
ency
1
Hz
1.5
Hz
2 H
z 2.
5 H
z R
ecei
ver
Buf
fer
Size
50
30
0 15
In t
his
batc
h of
sim
ulat
ions
, al
l fiv
e se
curit
y pr
otoc
ols
are
com
pare
d in
all
four
mar
ket
pene
tratio
n ra
te s
cena
rios
and
each
with
a
corr
espo
ndin
g co
mpu
tatio
n po
wer
set
ting.
Th
e to
tal n
umbe
r of
sim
ulat
ions
run
is 5
pro
toco
ls x
2 c
hann
el s
witc
hing
con
figur
atio
ns x
4
scen
ario
s/pl
atfo
rm g
ener
atio
ns =
40.
The
figu
res a
re fu
rther
div
ided
into
gro
ups a
nd p
rese
nted
in su
bsec
tions
.
App
endi
x V
olum
e 3
G-3
-52

VS
C-A
Fin
al R
epor
t: A
ppen
dix
G-3
S
ecur
ity N
etw
ork
Sim
ulat
ions
– M
erce
des-
Ben
z R
DN
A
7.1.
1C
han
nel
Sw
itch
ing
Off
, 1 G
en a
nd
40
Car
s/km
E
CD
SA
TE
SLA
PIG
GY
BA
CK
T
AD
S P
IGG
YB
AC
K
1 2 App
endi
x V
olum
e 3
G-3
-53

VS
C-A
Fin
al R
epor
t: A
ppen
dix
G-3
S
ecur
ity N
etw
ork
Sim
ulat
ions
– M
erce
des-
Ben
z R
DN
A
3 3 App
endi
x V
olum
e 3
G-3
-54

VS
C-A
Fin
al R
epor
t: A
ppen
dix
G-3
S
ecur
ity N
etw
ork
Sim
ulat
ions
– M
erce
des-
Ben
z R
DN
A
4 6 App
endi
x V
olum
e 3
G-3
-55

VS
C-A
Fin
al R
epor
t: A
ppen
dix
G-3
S
ecur
ity N
etw
ork
Sim
ulat
ions
– M
erce
des-
Ben
z R
DN
A
6 App
endi
x V
olum
e 3
G-3
-56

VS
C-A
Fin
al R
epor
t: A
ppen
dix
G-3
S
ecur
ity N
etw
ork
Sim
ulat
ions
– M
erce
des-
Ben
z R
DN
A
TE
SLA
T
AD
S
App
endi
x V
olum
e 3
G-3
-57

VS
C-A
Fin
al R
epor
t: A
ppen
dix
G-3
S
ecur
ity N
etw
ork
Sim
ulat
ions
– M
erce
des-
Ben
z R
DN
A
App
endi
x V
olum
e 3
G-3
-58
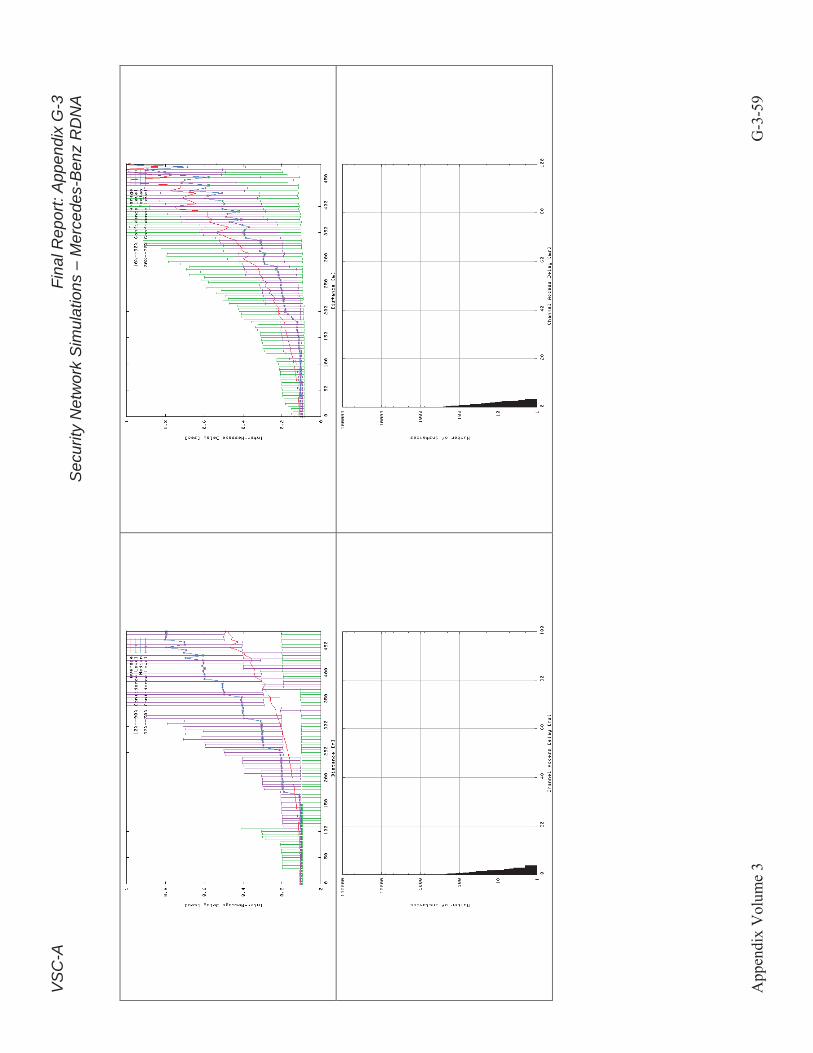
VS
C-A
Fin
al R
epor
t: A
ppen
dix
G-3
S
ecur
ity N
etw
ork
Sim
ulat
ions
– M
erce
des-
Ben
z R
DN
A
App
endi
x V
olum
e 3
G-3
-59

VS
C-A
Fin
al R
epor
t: A
ppen
dix
G-3
S
ecur
ity N
etw
ork
Sim
ulat
ions
– M
erce
des-
Ben
z R
DN
A
App
endi
x V
olum
e 3
G-3
-60

VS
C-A
Fin
al R
epor
t: A
ppen
dix
G-3
S
ecur
ity N
etw
ork
Sim
ulat
ions
– M
erce
des-
Ben
z R
DN
A
7.1.
2 C
han
nel
Sw
itch
ing
On
, 1 G
en a
nd
40
Car
s/km
E
CD
SA
TE
SLA
PIG
GY
BA
CK
T
AD
S P
IGG
YB
AC
K
1 2 App
endi
x V
olum
e 3
G-3
-61

VS
C-A
Fin
al R
epor
t: A
ppen
dix
G-3
S
ecur
ity N
etw
ork
Sim
ulat
ions
– M
erce
des-
Ben
z R
DN
A
3 3 App
endi
x V
olum
e 3
G-3
-62

VS
C-A
Fin
al R
epor
t: A
ppen
dix
G-3
S
ecur
ity N
etw
ork
Sim
ulat
ions
– M
erce
des-
Ben
z R
DN
A
4 6 App
endi
x V
olum
e 3
G-3
-63

VS
C-A
Fin
al R
epor
t: A
ppen
dix
G-3
S
ecur
ity N
etw
ork
Sim
ulat
ions
– M
erce
des-
Ben
z R
DN
A
6 App
endi
x V
olum
e 3
G-3
-64

VS
C-A
Fin
al R
epor
t: A
ppen
dix
G-3
S
ecur
ity N
etw
ork
Sim
ulat
ions
– M
erce
des-
Ben
z R
DN
A
TE
SLA
T
AD
S
App
endi
x V
olum
e 3
G-3
-65

VS
C-A
Fin
al R
epor
t: A
ppen
dix
G-3
S
ecur
ity N
etw
ork
Sim
ulat
ions
– M
erce
des-
Ben
z R
DN
A
App
endi
x V
olum
e 3
G-3
-66

VS
C-A
Fin
al R
epor
t: A
ppen
dix
G-3
S
ecur
ity N
etw
ork
Sim
ulat
ions
– M
erce
des-
Ben
z R
DN
A
App
endi
x V
olum
e 3
G-3
-67

VS
C-A
Fin
al R
epor
t: A
ppen
dix
G-3
S
ecur
ity N
etw
ork
Sim
ulat
ions
– M
erce
des-
Ben
z R
DN
A
App
endi
x V
olum
e 3
G-3
-68

VS
C-A
Fin
al R
epor
t: A
ppen
dix
G-3
S
ecur
ity N
etw
ork
Sim
ulat
ions
– M
erce
des-
Ben
z R
DN
A
7.1.
3C
han
nel
Sw
itch
ing
Off
, 2G
en a
nd
80
Car
s/km
E
CD
SA
TE
SLA
PIG
GY
BA
CK
T
AD
S P
IGG
YB
AC
K
1 2 App
endi
x V
olum
e 3
G-3
-69

VS
C-A
Fin
al R
epor
t: A
ppen
dix
G-3
S
ecur
ity N
etw
ork
Sim
ulat
ions
– M
erce
des-
Ben
z R
DN
A
3 3 App
endi
x V
olum
e 3
G-3
-70

VS
C-A
Fin
al R
epor
t: A
ppen
dix
G-3
S
ecur
ity N
etw
ork
Sim
ulat
ions
– M
erce
des-
Ben
z R
DN
A
4 6 App
endi
x V
olum
e 3
G-3
-71

VS
C-A
Fin
al R
epor
t: A
ppen
dix
G-3
S
ecur
ity N
etw
ork
Sim
ulat
ions
– M
erce
des-
Ben
z R
DN
A
6 App
endi
x V
olum
e 3
G-3
-72

VS
C-A
Fin
al R
epor
t: A
ppen
dix
G-3
S
ecur
ity N
etw
ork
Sim
ulat
ions
– M
erce
des-
Ben
z R
DN
A
TE
SLA
T
AD
S
App
endi
x V
olum
e 3
G-3
-73

VS
C-A
Fin
al R
epor
t: A
ppen
dix
G-3
S
ecur
ity N
etw
ork
Sim
ulat
ions
– M
erce
des-
Ben
z R
DN
A
App
endi
x V
olum
e 3
G-3
-74

VS
C-A
Fin
al R
epor
t: A
ppen
dix
G-3
S
ecur
ity N
etw
ork
Sim
ulat
ions
– M
erce
des-
Ben
z R
DN
A
App
endi
x V
olum
e 3
G-3
-75

VS
C-A
Fin
al R
epor
t: A
ppen
dix
G-3
S
ecur
ity N
etw
ork
Sim
ulat
ions
– M
erce
des-
Ben
z R
DN
A
App
endi
x V
olum
e 3
G-3
-76

VS
C-A
Fin
al R
epor
t: A
ppen
dix
G-3
S
ecur
ity N
etw
ork
Sim
ulat
ions
– M
erce
des-
Ben
z R
DN
A
7.1.
4C
han
nel
Sw
itch
ing
On
, 2 G
en a
nd
80
Car
s/km
E
CD
SA
TE
SLA
PIG
GY
BA
CK
T
AD
S P
IGG
YB
AC
K
1 2 App
endi
x V
olum
e 3
G-3
-77

VS
C-A
Fin
al R
epor
t: A
ppen
dix
G-3
S
ecur
ity N
etw
ork
Sim
ulat
ions
– M
erce
des-
Ben
z R
DN
A
3 3 App
endi
x V
olum
e 3
G-3
-78

VS
C-A
Fin
al R
epor
t: A
ppen
dix
G-3
S
ecur
ity N
etw
ork
Sim
ulat
ions
– M
erce
des-
Ben
z R
DN
A
4 6 App
endi
x V
olum
e 3
G-3
-79

VS
C-A
Fin
al R
epor
t: A
ppen
dix
G-3
S
ecur
ity N
etw
ork
Sim
ulat
ions
– M
erce
des-
Ben
z R
DN
A
6 App
endi
x V
olum
e 3
G-3
-80

VS
C-A
Fin
al R
epor
t: A
ppen
dix
G-3
S
ecur
ity N
etw
ork
Sim
ulat
ions
– M
erce
des-
Ben
z R
DN
A
TE
SLA
T
AD
S
App
endi
x V
olum
e 3
G-3
-81

VS
C-A
Fin
al R
epor
t: A
ppen
dix
G-3
S
ecur
ity N
etw
ork
Sim
ulat
ions
– M
erce
des-
Ben
z R
DN
A
App
endi
x V
olum
e 3
G-3
-82

VS
C-A
Fin
al R
epor
t: A
ppen
dix
G-3
S
ecur
ity N
etw
ork
Sim
ulat
ions
– M
erce
des-
Ben
z R
DN
A
App
endi
x V
olum
e 3
G-3
-83

VS
C-A
Fin
al R
epor
t: A
ppen
dix
G-3
S
ecur
ity N
etw
ork
Sim
ulat
ions
– M
erce
des-
Ben
z R
DN
A
App
endi
x V
olum
e 3
G-3
-84

VS
C-A
Fin
al R
epor
t: A
ppen
dix
G-3
S
ecur
ity N
etw
ork
Sim
ulat
ions
– M
erce
des-
Ben
z R
DN
A
7.1.
5C
han
nel
Sw
itch
ing
Off
, 3 G
en a
nd
120
Car
s/km
E
CD
SA
TE
SLA
PIG
GY
BA
CK
T
AD
S P
IGG
YB
AC
K
1 2 App
endi
x V
olum
e 3
G-3
-85

VS
C-A
Fin
al R
epor
t: A
ppen
dix
G-3
S
ecur
ity N
etw
ork
Sim
ulat
ions
– M
erce
des-
Ben
z R
DN
A
3 3 App
endi
x V
olum
e 3
G-3
-86
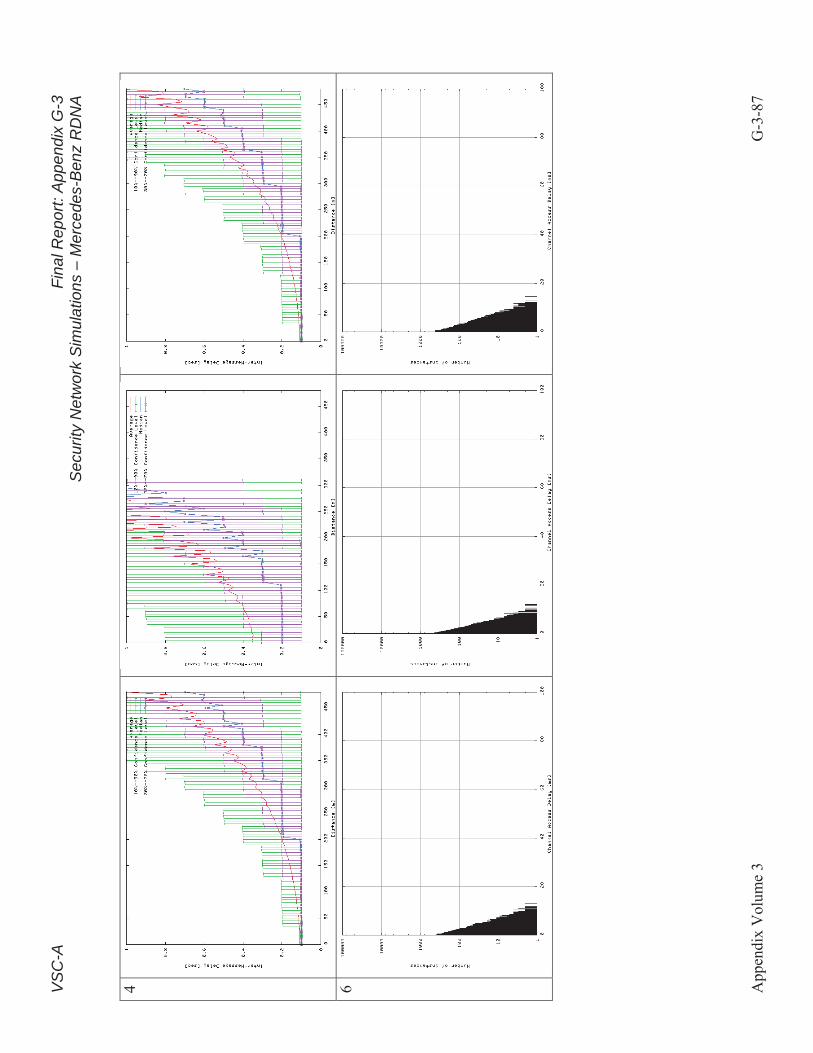
VS
C-A
Fin
al R
epor
t: A
ppen
dix
G-3
S
ecur
ity N
etw
ork
Sim
ulat
ions
– M
erce
des-
Ben
z R
DN
A
4 6 App
endi
x V
olum
e 3
G-3
-87

VS
C-A
Fin
al R
epor
t: A
ppen
dix
G-3
S
ecur
ity N
etw
ork
Sim
ulat
ions
– M
erce
des-
Ben
z R
DN
A
6 App
endi
x V
olum
e 3
G-3
-88

VS
C-A
Fin
al R
epor
t: A
ppen
dix
G-3
S
ecur
ity N
etw
ork
Sim
ulat
ions
– M
erce
des-
Ben
z R
DN
A
TE
SLA
T
AD
S
App
endi
x V
olum
e 3
G-3
-89

VS
C-A
Fin
al R
epor
t: A
ppen
dix
G-3
S
ecur
ity N
etw
ork
Sim
ulat
ions
– M
erce
des-
Ben
z R
DN
A
App
endi
x V
olum
e 3
G-3
-90

VS
C-A
Fin
al R
epor
t: A
ppen
dix
G-3
S
ecur
ity N
etw
ork
Sim
ulat
ions
– M
erce
des-
Ben
z R
DN
A
App
endi
x V
olum
e 3
G-3
-91

VS
C-A
Fin
al R
epor
t: A
ppen
dix
G-3
S
ecur
ity N
etw
ork
Sim
ulat
ions
– M
erce
des-
Ben
z R
DN
A
App
endi
x V
olum
e 3
G-3
-92

VS
C-A
Fin
al R
epor
t: A
ppen
dix
G-3
S
ecur
ity N
etw
ork
Sim
ulat
ions
– M
erce
des-
Ben
z R
DN
A
7.1.
6C
han
nel
Sw
itch
ing
On
, 3 G
en a
nd
120
Car
s/km
EC
DSA
T
ESL
A P
IGG
YB
AC
K
TA
DS
PIG
GY
BA
CK
1 2 A
ppen
dix
Vol
ume
3 G
-3-9
3

VS
C-A
Fin
al R
epor
t: A
ppen
dix
G-3
S
ecur
ity N
etw
ork
Sim
ulat
ions
– M
erce
des-
Ben
z R
DN
A
3 3 App
endi
x V
olum
e 3
G-3
-94

VS
C-A
Fin
al R
epor
t: A
ppen
dix
G-3
S
ecur
ity N
etw
ork
Sim
ulat
ions
– M
erce
des-
Ben
z R
DN
A
4 6 App
endi
x V
olum
e 3
G-3
-95

VS
C-A
Fin
al R
epor
t: A
ppen
dix
G-3
S
ecur
ity N
etw
ork
Sim
ulat
ions
– M
erce
des-
Ben
z R
DN
A
6 App
endi
x V
olum
e 3
G-3
-96

VS
C-A
Fin
al R
epor
t: A
ppen
dix
G-3
S
ecur
ity N
etw
ork
Sim
ulat
ions
– M
erce
des-
Ben
z R
DN
A
TE
SLA
T
AD
S
App
endi
x V
olum
e 3
G-3
-97

VS
C-A
Fin
al R
epor
t: A
ppen
dix
G-3
S
ecur
ity N
etw
ork
Sim
ulat
ions
– M
erce
des-
Ben
z R
DN
A
App
endi
x V
olum
e 3
G-3
-98

VS
C-A
Fin
al R
epor
t: A
ppen
dix
G-3
S
ecur
ity N
etw
ork
Sim
ulat
ions
– M
erce
des-
Ben
z R
DN
A
App
endi
x V
olum
e 3
G-3
-99
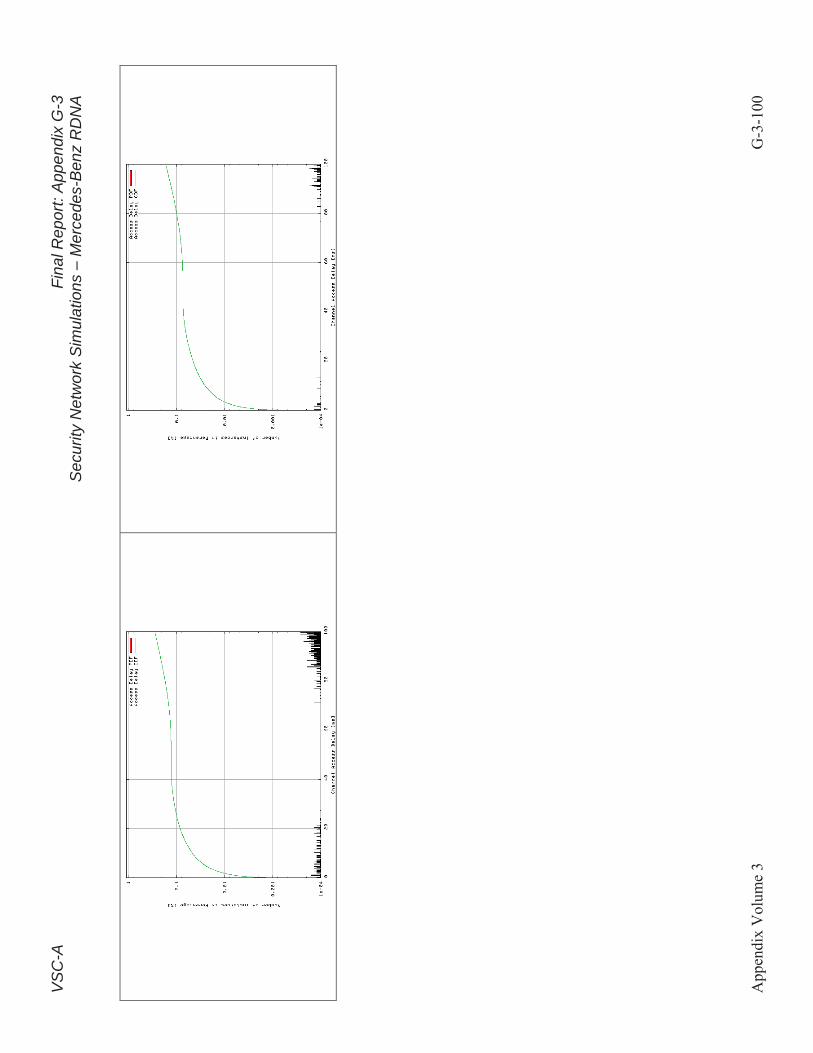
VS
C-A
Fin
al R
epor
t: A
ppen
dix
G-3
S
ecur
ity N
etw
ork
Sim
ulat
ions
– M
erce
des-
Ben
z R
DN
A
App
endi
x V
olum
e 3
G-3
-100

VS
C-A
Fin
al R
epor
t: A
ppen
dix
G-3
S
ecur
ity N
etw
ork
Sim
ulat
ions
– M
erce
des-
Ben
z R
DN
A
7.1.
7C
han
nel
Sw
itch
ing
Off
, 4 G
en a
nd
160
Car
s/km
E
CD
SA
TE
SLA
PIG
GY
BA
CK
T
AD
S P
IGG
YB
AC
K
1 2 App
endi
x V
olum
e 3
G-3
-101

VS
C-A
Fin
al R
epor
t: A
ppen
dix
G-3
S
ecur
ity N
etw
ork
Sim
ulat
ions
– M
erce
des-
Ben
z R
DN
A
3 3 App
endi
x V
olum
e 3
G-3
-102

VS
C-A
Fin
al R
epor
t: A
ppen
dix
G-3
S
ecur
ity N
etw
ork
Sim
ulat
ions
– M
erce
des-
Ben
z R
DN
A
4 6 App
endi
x V
olum
e 3
G-3
-103

VS
C-A
Fin
al R
epor
t: A
ppen
dix
G-3
S
ecur
ity N
etw
ork
Sim
ulat
ions
– M
erce
des-
Ben
z R
DN
A
6 App
endi
x V
olum
e 3
G-3
-104

VS
C-A
Fin
al R
epor
t: A
ppen
dix
G-3
S
ecur
ity N
etw
ork
Sim
ulat
ions
– M
erce
des-
Ben
z R
DN
A
TE
SLA
T
AD
S
App
endi
x V
olum
e 3
G-3
-105

VS
C-A
Fin
al R
epor
t: A
ppen
dix
G-3
S
ecur
ity N
etw
ork
Sim
ulat
ions
– M
erce
des-
Ben
z R
DN
A
App
endi
x V
olum
e 3
G-3
-106
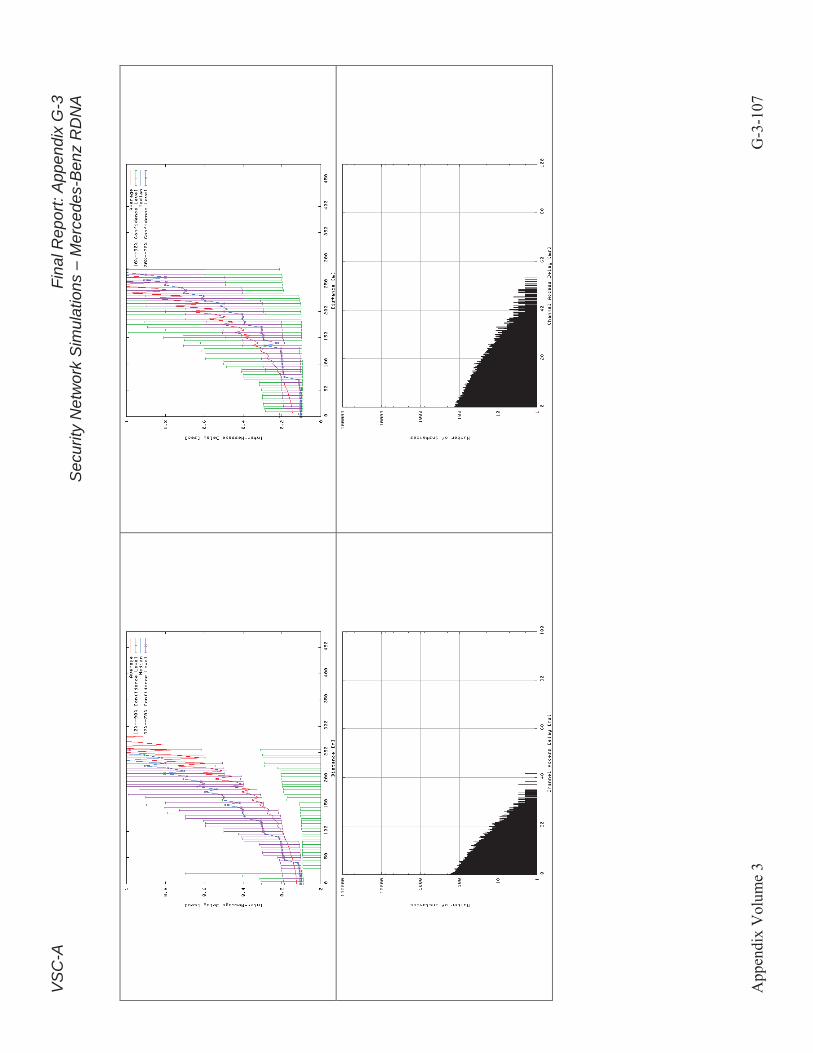
VS
C-A
Fin
al R
epor
t: A
ppen
dix
G-3
S
ecur
ity N
etw
ork
Sim
ulat
ions
– M
erce
des-
Ben
z R
DN
A
App
endi
x V
olum
e 3
G-3
-107

VS
C-A
Fin
al R
epor
t: A
ppen
dix
G-3
S
ecur
ity N
etw
ork
Sim
ulat
ions
– M
erce
des-
Ben
z R
DN
A
App
endi
x V
olum
e 3
G-3
-108

VS
C-A
Fin
al R
epor
t: A
ppen
dix
G-3
S
ecur
ity N
etw
ork
Sim
ulat
ions
– M
erce
des-
Ben
z R
DN
A
7.1.
8C
han
nel
Sw
itch
ing
On
, 4 G
en a
nd
160
Car
s/km
E
CD
SA
TE
SLA
PIG
GY
BA
CK
T
AD
S P
IGG
YB
AC
K
1 2 App
endi
x V
olum
e 3
G-3
-109

VS
C-A
Fin
al R
epor
t: A
ppen
dix
G-3
S
ecur
ity N
etw
ork
Sim
ulat
ions
– M
erce
des-
Ben
z R
DN
A
3 3 App
endi
x V
olum
e 3
G-3
-110

VS
C-A
Fin
al R
epor
t: A
ppen
dix
G-3
S
ecur
ity N
etw
ork
Sim
ulat
ions
– M
erce
des-
Ben
z R
DN
A
4 6 App
endi
x V
olum
e 3
G-3
-111

VS
C-A
Fin
al R
epor
t: A
ppen
dix
G-3
S
ecur
ity N
etw
ork
Sim
ulat
ions
– M
erce
des-
Ben
z R
DN
A
6 App
endi
x V
olum
e 3
G-3
-112

VS
C-A
Fin
al R
epor
t: A
ppen
dix
G-3
S
ecur
ity N
etw
ork
Sim
ulat
ions
– M
erce
des-
Ben
z R
DN
A
TE
SLA
T
AD
S
App
endi
x V
olum
e 3
G-3
-113

VS
C-A
Fin
al R
epor
t: A
ppen
dix
G-3
S
ecur
ity N
etw
ork
Sim
ulat
ions
– M
erce
des-
Ben
z R
DN
A
App
endi
x V
olum
e 3
G-3
-114

VS
C-A
Fin
al R
epor
t: A
ppen
dix
G-3
S
ecur
ity N
etw
ork
Sim
ulat
ions
– M
erce
des-
Ben
z R
DN
A
App
endi
x V
olum
e 3
G-3
-115

VS
C-A
Fin
al R
epor
t: A
ppen
dix
G-3
S
ecur
ity N
etw
ork
Sim
ulat
ions
– M
erce
des-
Ben
z R
DN
A
App
endi
x V
olum
e 3
G-3
-116

VS
C-A
Fin
al R
epor
t: A
ppen
dix
G-3
S
ecur
ity N
etw
ork
Sim
ulat
ions
– M
erce
des-
Ben
z R
DN
A
7.2
Lar
ger
Bu
ffer
Siz
e fo
r T
ES
LA
Pig
gyb
ack
Pro
toco
ls
ECD
SA
TESL
A P
IGG
YB
AC
K
TESL
A
TAD
S TA
DS
PIG
GY
BA
CK
C
hann
el S
wit
chin
g O
ff
On
Pro
cess
or/G
ener
atio
n 40
0 M
Hz
PPC
2.
4 G
Hz
PC
1 G
en
2 G
en
3 G
en
4 G
en
Veh
icle
Den
sity
40
car
s/km
80
car
s/km
12
0 ca
rs/k
m
160
cars
/km
80
0 ca
rs/k
m2
Veh
icle
Spe
ed
30 m
ps
15 m
ps
7.5
mps
R
oad
Len
gth
3000
m
6000
m
9000
m
Mes
sage
TX
Pow
er
10 d
Bm
20
dB
m
Mes
sagi
ng F
requ
ency
10
Hz
5 H
z C
erti
fica
tion
TX
Pow
er
10 d
Bm
13
dB
m
Cer
tifi
cati
on F
requ
ency
1
Hz
1.5
Hz
2 H
z 2.
5 H
z R
ecei
ver
Buf
fer
Size
50
30
0 15
Afte
r exa
min
ing
the
resu
lts o
f the
pre
viou
s ba
tch
of s
imul
atio
ns, i
t is
real
ized
that
TES
LA P
iggy
back
requ
ires
mor
e bu
ffer
siz
e th
an o
ther
pr
otoc
ols i
n 50
per
cent
pen
etra
tion
rate
scen
ario
s and
abo
ve. T
his i
s bec
ause
TES
LA P
iggy
back
dep
ends
on
buff
erin
g al
l rec
eive
d m
essa
ges
befo
re th
e ne
xt o
ne w
ould
com
e fr
om th
e sa
me
send
er to
hav
e a
chan
ce o
f val
idat
ion.
The
pre
viou
s co
nfig
urat
ion
of b
uffe
r siz
e 50
is n
o lo
nger
suf
ficie
nt g
iven
the
mor
e m
essa
ges
rece
ived
as
wel
l as
high
er li
kelih
ood
of s
ubse
quen
t mes
sage
s lo
st.
For
fair
com
paris
on, t
hese
si
mul
atio
ns a
re re
run
with
a la
rger
buf
fer s
ize
of 3
00.
App
endi
x V
olum
e 3
G-3
-117
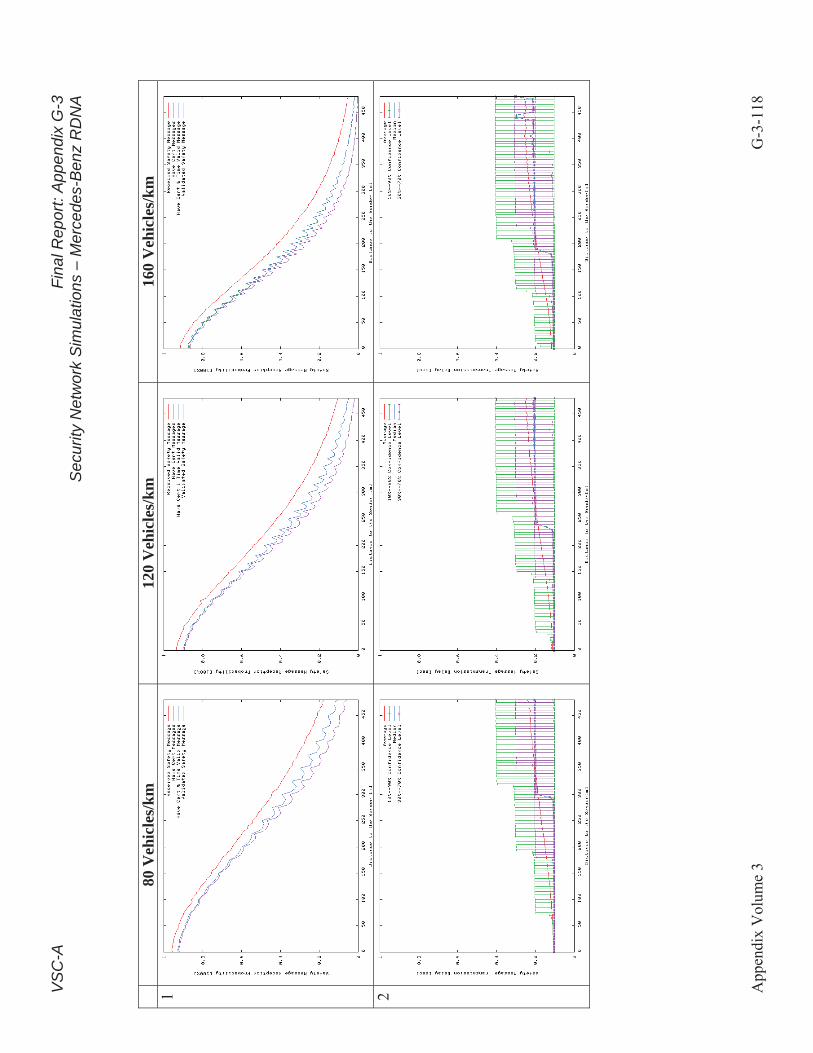
VS
C-A
Fin
al R
epor
t: A
ppen
dix
G-3
S
ecur
ity N
etw
ork
Sim
ulat
ions
– M
erce
des-
Ben
z R
DN
A
80 V
ehic
les/
km
120
Veh
icle
s/km
16
0 V
ehic
les/
km
1 2 App
endi
x V
olum
e 3
G-3
-118

VS
C-A
Fin
al R
epor
t: A
ppen
dix
G-3
S
ecur
ity N
etw
ork
Sim
ulat
ions
– M
erce
des-
Ben
z R
DN
A
3 3 App
endi
x V
olum
e 3
G-3
-119

VS
C-A
Fin
al R
epor
t: A
ppen
dix
G-3
S
ecur
ity N
etw
ork
Sim
ulat
ions
– M
erce
des-
Ben
z R
DN
A
4 6 App
endi
x V
olum
e 3
G-3
-120

VS
C-A
Fin
al R
epor
t: A
ppen
dix
G-3
S
ecur
ity N
etw
ork
Sim
ulat
ions
– M
erce
des-
Ben
z R
DN
A
6 App
endi
x V
olum
e 3
G-3
-121

VS
C-A
Fin
al R
epor
t: A
ppen
dix
G-3
S
ecur
ity N
etw
ork
Sim
ulat
ions
– M
erce
des-
Ben
z R
DN
A
7.3
20 d
Bm
TX
Po
wer
Pro
toco
ls
ECD
SA
TESL
A P
IGG
YB
AC
K
TESL
A
TAD
S TA
DS
PIG
GY
BA
CK
C
hann
el S
wit
chin
g O
ff
On
Pro
cess
or/G
ener
atio
n 40
0 M
Hz
PPC
2.
4 G
Hz
PC
1 G
en
2 G
en
3 G
en
4 G
en
Veh
icle
Den
sity
40
car
s/km
80
car
s/km
12
0 ca
rs/k
m
160
cars
/km
80
0 ca
rs/k
m2
Veh
icle
Spe
ed
30 m
ps
15 m
ps
7.5
mps
R
oad
Len
gth
3000
m
6000
m
9000
m
Mes
sage
TX
Pow
er
10 d
Bm
20
dB
m
Mes
sagi
ng F
requ
ency
10
Hz
5 H
z C
erti
fica
tion
TX
Pow
er
10 d
Bm
13
dB
m
20 d
Bm
C
erti
fica
tion
Fre
quen
cy
1 H
z 1.
5 H
z 2
Hz
2.5
Hz
Rec
eive
r B
uffe
r Si
ze
50
300
15
This
bat
ch o
f sim
ulat
ions
is m
eant
to il
lust
rate
the
impa
ct o
f 20
dBm
TX
pow
er o
n ch
anne
l stre
ss.
It sh
ows
that
at t
his
muc
h hi
gher
pow
er
(in c
ompa
rison
with
10
dBm
), th
e ch
anne
l alre
ady
beco
mes
sat
urat
ed a
t a 5
0 pe
rcen
t pen
etra
tion
rate
sce
nario
eve
n w
ith c
hann
el s
witc
hing
of
f.
App
endi
x V
olum
e 3
G-3
-122

VS
C-A
Fin
al R
epor
t: A
ppen
dix
G-3
S
ecur
ity N
etw
ork
Sim
ulat
ions
– M
erce
des-
Ben
z R
DN
A
E
CD
SA
TE
SLA
PIG
GY
BA
CK
T
AD
S P
IGG
YB
AC
K
1 2 App
endi
x V
olum
e 3
G-3
-123
7.3.
1 1
Gen
an
d 4
0 C
ars/
km

VS
C-A
Fin
al R
epor
t: A
ppen
dix
G-3
S
ecur
ity N
etw
ork
Sim
ulat
ions
– M
erce
des-
Ben
z R
DN
A
3 3 App
endi
x V
olum
e 3
G-3
-124

VS
C-A
Fin
al R
epor
t: A
ppen
dix
G-3
S
ecur
ity N
etw
ork
Sim
ulat
ions
– M
erce
des-
Ben
z R
DN
A
4 6 App
endi
x V
olum
e 3
G-3
-125

VS
C-A
Fin
al R
epor
t: A
ppen
dix
G-3
S
ecur
ity N
etw
ork
Sim
ulat
ions
– M
erce
des-
Ben
z R
DN
A
6 App
endi
x V
olum
e 3
G-3
-126

VS
C-A
Fin
al R
epor
t: A
ppen
dix
G-3
S
ecur
ity N
etw
ork
Sim
ulat
ions
– M
erce
des-
Ben
z R
DN
A
TE
SLA
T
AD
S
App
endi
x V
olum
e 3
G-3
-127

VS
C-A
Fin
al R
epor
t: A
ppen
dix
G-3
S
ecur
ity N
etw
ork
Sim
ulat
ions
– M
erce
des-
Ben
z R
DN
A
App
endi
x V
olum
e 3
G-3
-128

VS
C-A
Fin
al R
epor
t: A
ppen
dix
G-3
S
ecur
ity N
etw
ork
Sim
ulat
ions
– M
erce
des-
Ben
z R
DN
A
App
endi
x V
olum
e 3
G-3
-129

VS
C-A
Fin
al R
epor
t: A
ppen
dix
G-3
S
ecur
ity N
etw
ork
Sim
ulat
ions
– M
erce
des-
Ben
z R
DN
A
App
endi
x V
olum
e 3
G-3
-130

VS
C-A
Fin
al R
epor
t: A
ppen
dix
G-3
S
ecur
ity N
etw
ork
Sim
ulat
ions
– M
erce
des-
Ben
z R
DN
A
E
CD
SA
TE
SLA
PIG
GY
BA
CK
T
AD
S P
IGG
YB
AC
K
1 2 App
endi
x V
olum
e 3
G-3
-131
7.3.
2 2
Gen
an
d 8
0 C
ars/
km

VS
C-A
Fin
al R
epor
t: A
ppen
dix
G-3
S
ecur
ity N
etw
ork
Sim
ulat
ions
– M
erce
des-
Ben
z R
DN
A
3 3 App
endi
x V
olum
e 3
G-3
-132

VS
C-A
Fin
al R
epor
t: A
ppen
dix
G-3
S
ecur
ity N
etw
ork
Sim
ulat
ions
– M
erce
des-
Ben
z R
DN
A
4 6 App
endi
x V
olum
e 3
G-3
-133

VS
C-A
Fin
al R
epor
t: A
ppen
dix
G-3
S
ecur
ity N
etw
ork
Sim
ulat
ions
– M
erce
des-
Ben
z R
DN
A
6 App
endi
x V
olum
e 3
G-3
-134

VS
C-A
Fin
al R
epor
t: A
ppen
dix
G-3
S
ecur
ity N
etw
ork
Sim
ulat
ions
– M
erce
des-
Ben
z R
DN
A
TE
SLA
T
AD
S
App
endi
x V
olum
e 3
G-3
-135

VS
C-A
Fin
al R
epor
t: A
ppen
dix
G-3
S
ecur
ity N
etw
ork
Sim
ulat
ions
– M
erce
des-
Ben
z R
DN
A
App
endi
x V
olum
e 3
G-3
-136
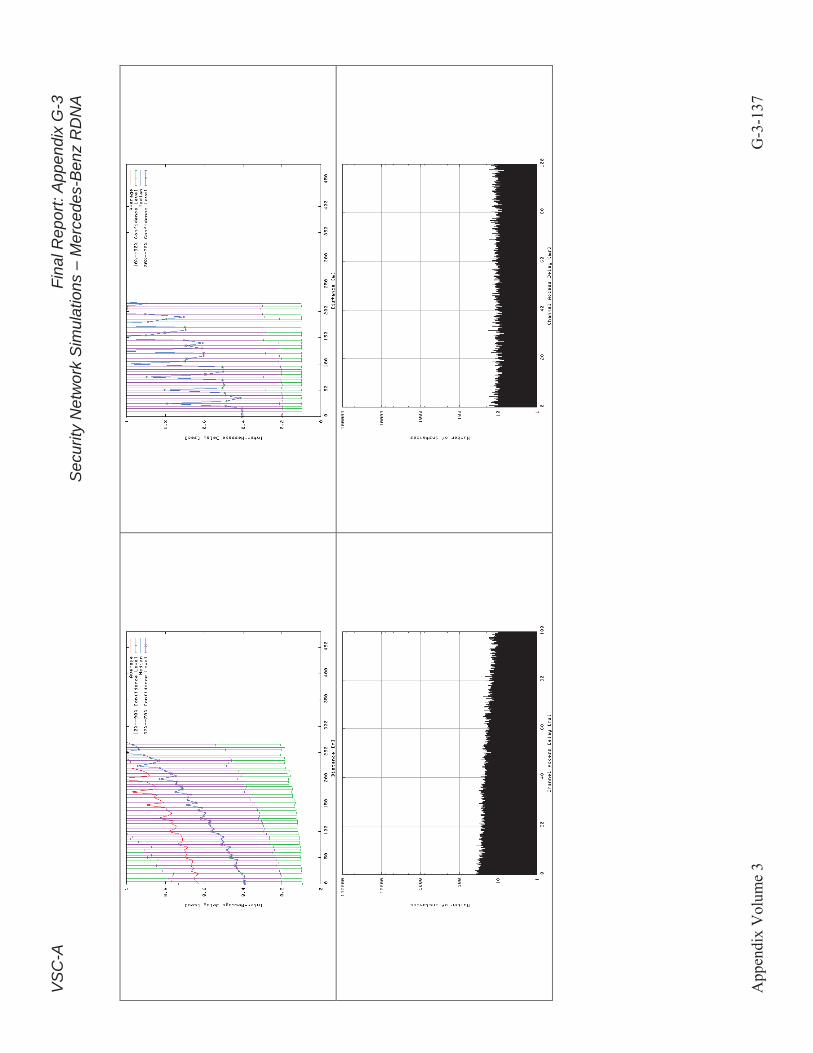
VS
C-A
Fin
al R
epor
t: A
ppen
dix
G-3
S
ecur
ity N
etw
ork
Sim
ulat
ions
– M
erce
des-
Ben
z R
DN
A
App
endi
x V
olum
e 3
G-3
-137

VS
C-A
Fin
al R
epor
t: A
ppen
dix
G-3
S
ecur
ity N
etw
ork
Sim
ulat
ions
– M
erce
des-
Ben
z R
DN
A
App
endi
x V
olum
e 3
G-3
-138

VS
C-A
Fin
al R
epor
t: A
ppen
dix
G-3
S
ecur
ity N
etw
ork
Sim
ulat
ions
– M
erce
des-
Ben
z R
DN
A
7.4
EC
DS
A, T
ES
LA
Pig
gyb
ack
and
TA
DS
Pig
gyb
ack
in C
on
ges
tio
n-C
on
tro
lled
Sce
nar
ios
Pro
toco
ls
ECD
SA
TESL
A P
IGG
YB
AC
K
TESL
A
TAD
S TA
DS
PIG
GY
BA
CK
C
hann
el S
wit
chin
g O
ff
On
Pro
cess
or/G
ener
atio
n 40
0 M
Hz
PPC
2.
4 G
Hz
PC
1 G
en
2 G
en
3 G
en
4 G
en
Veh
icle
Den
sity
40
car
s/km
80
car
s/km
12
0 ca
rs/k
m
160
cars
/km
80
0 ca
rs/k
m2
Veh
icle
Spe
ed
30 m
ps
15 m
ps
7.5
mps
R
oad
Len
gth
3000
m
6000
m
9000
m
Mes
sage
TX
Pow
er
10 d
Bm
20
dB
m
Mes
sagi
ng F
requ
ency
10
Hz
5 H
z C
erti
fica
tion
TX
Pow
er
10 d
Bm
13
dB
m
20 d
Bm
C
erti
fica
tion
Fre
quen
cy
1 H
z 1.
5 H
z 2
Hz
2.5
Hz
Rec
eive
r B
uffe
r Si
ze
50
300
15 *
Sinc
e TE
SLA
and
TA
DS
are
alre
ady
effe
ctiv
ely
elim
inat
ed fr
om c
onsi
dera
tions
thro
ugh
prev
ious
bat
ches
of s
imul
atio
ns, t
his
batc
h co
nsid
ers
only
th
e re
mai
ning
EC
DSA
, TES
LA P
iggy
back
, and
TA
DS
Pigg
ybac
k.
The
focu
s is
on
how
wel
l eac
h pr
otoc
ol w
orks
ass
umin
g co
nges
tion
cont
rol i
s en
gage
d. T
here
fore
, the
100
per
cent
mar
ket p
enet
ratio
n ra
te sc
enar
io is
use
d w
ith a
ll ve
hicl
es c
onfig
ured
to tr
ansm
it sa
fety
mes
sage
s at 5
Hz.
The
certi
ficat
e is
still
sent
at 1
Hz
(i.e.
, atta
ched
to e
very
fifth
safe
ty m
essa
ge) b
ut w
ith a
13
dBm
TX
pow
er.
Thre
e co
mpu
tatio
n ca
pabi
litie
s ar
e m
odel
ed in
this
bat
ch:
400
MH
z Po
wer
PC, 2
.4 G
Hz
PC, a
nd 1
GH
z Po
wer
PC
. Th
e fir
st tw
o ar
e th
e on
es
supp
lied
by V
SC-A
. The
third
one
is e
ssen
tially
the
mid
dle
valu
e be
twee
n th
e fir
st tw
o an
d is
mea
nt to
repr
esen
t a m
oder
ate
com
puta
tiona
l cap
abili
ty
assu
mpt
ion.
For E
CD
SA, s
ince
non
e of
the
thre
e co
mpu
tatio
n ca
pabi
litie
s m
odel
ed w
ould
be
suff
icie
nt fo
r its
dem
and,
its
queu
e w
ould
be
full
at a
ll tim
e. A
nd
sinc
e th
e qu
eue
is F
IFO
in
natu
re, a
lon
g qu
eue
wou
ld o
nly
artif
icia
lly e
xten
d th
e so
cal
led
valid
atio
n de
lay
to 5
00 m
s. Th
eref
ore,
all
ECD
SA
sim
ulat
ions
in th
is b
atch
use
a v
ery
smal
l que
ue si
ze o
f 15.
App
endi
x V
olum
e 3
G-3
-139

VS
C-A
Fin
al R
epor
t: A
ppen
dix
G-3
S
ecur
ity N
etw
ork
Sim
ulat
ions
– M
erce
des-
Ben
z R
DN
A
7.4.
1C
han
nel
Sw
itch
ing
Off
an
d 4
00 M
Hz
Po
wer
PC
ED
SCA
TE
SLA
PIG
GY
BA
CK
T
AD
S P
IGG
YB
AC
K
1 2 App
endi
x V
olum
e 3
G-3
-140

VS
C-A
Fin
al R
epor
t: A
ppen
dix
G-3
S
ecur
ity N
etw
ork
Sim
ulat
ions
– M
erce
des-
Ben
z R
DN
A
3 3 4 App
endi
x V
olum
e 3
G-3
-141

VS
C-A
Fin
al R
epor
t: A
ppen
dix
G-3
S
ecur
ity N
etw
ork
Sim
ulat
ions
– M
erce
des-
Ben
z R
DN
A
6 6 App
endi
x V
olum
e 3
G-3
-142

VS
C-A
Fin
al R
epor
t: A
ppen
dix
G-3
S
ecur
ity N
etw
ork
Sim
ulat
ions
– M
erce
des-
Ben
z R
DN
A
7.4.
2C
han
nel
Sw
itch
ing
Off
an
d 1
GH
z P
ow
erP
C
ED
SCA
TE
SLA
PIG
GY
BA
CK
T
AD
S P
IGG
YB
AC
K
1 2 App
endi
x V
olum
e 3
G-3
-143
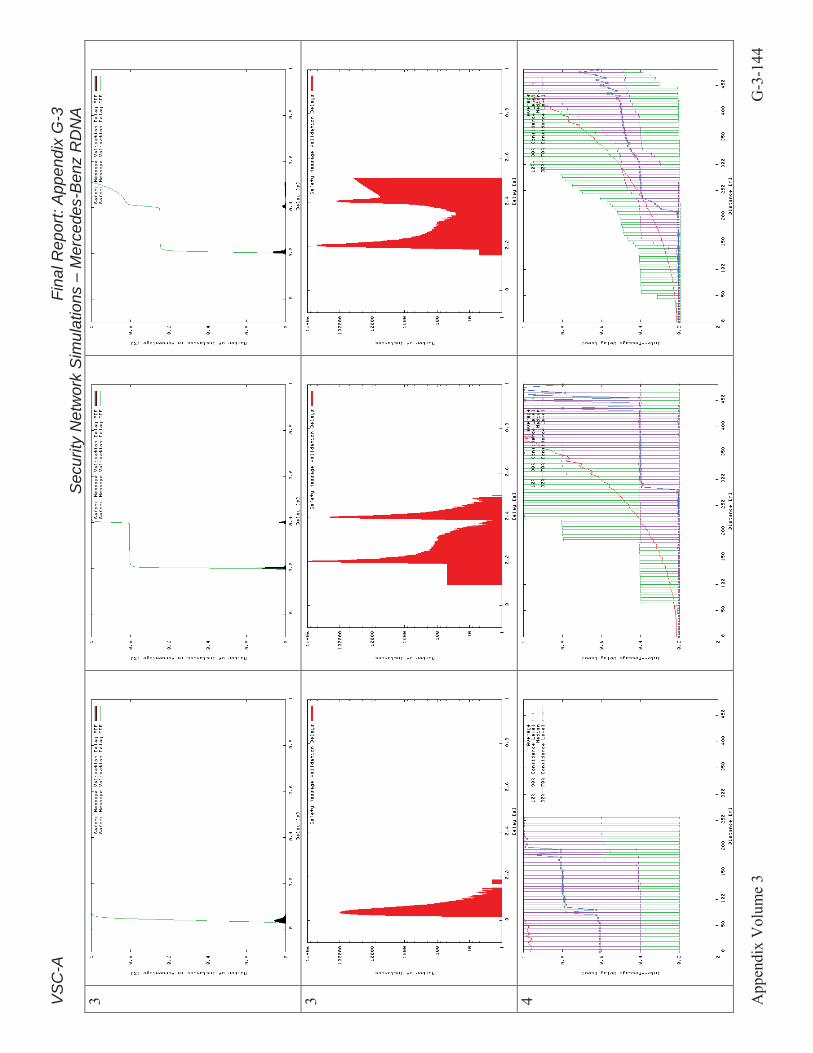
VS
C-A
Fin
al R
epor
t: A
ppen
dix
G-3
S
ecur
ity N
etw
ork
Sim
ulat
ions
– M
erce
des-
Ben
z R
DN
A
3 3 4 App
endi
x V
olum
e 3
G-3
-144

VS
C-A
Fin
al R
epor
t: A
ppen
dix
G-3
S
ecur
ity N
etw
ork
Sim
ulat
ions
– M
erce
des-
Ben
z R
DN
A
6 6 App
endi
x V
olum
e 3
G-3
-145

VS
C-A
Fin
al R
epor
t: A
ppen
dix
G-3
S
ecur
ity N
etw
ork
Sim
ulat
ions
– M
erce
des-
Ben
z R
DN
A
7.4.
3C
han
nel
Sw
itch
ing
Off
an
d 2
.4 G
Hz
PC
ED
SCA
TE
SLA
PIG
GY
BA
CK
T
AD
S P
IGG
YB
AC
K
1 2 App
endi
x V
olum
e 3
G-3
-146

VS
C-A
Fin
al R
epor
t: A
ppen
dix
G-3
S
ecur
ity N
etw
ork
Sim
ulat
ions
– M
erce
des-
Ben
z R
DN
A
3 3 4 App
endi
x V
olum
e 3
G-3
-147
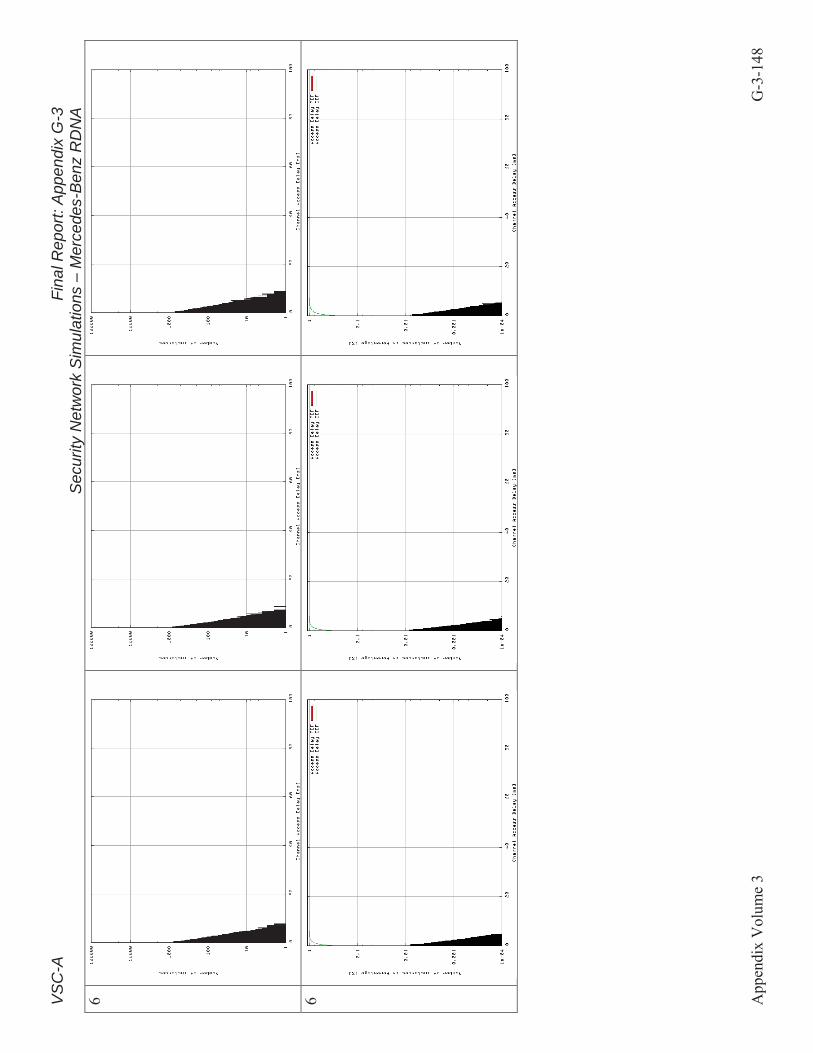
VS
C-A
Fin
al R
epor
t: A
ppen
dix
G-3
S
ecur
ity N
etw
ork
Sim
ulat
ions
– M
erce
des-
Ben
z R
DN
A
6 6 App
endi
x V
olum
e 3
G-3
-148

VS
C-A
Fin
al R
epor
t: A
ppen
dix
G-3
S
ecur
ity N
etw
ork
Sim
ulat
ions
– M
erce
des-
Ben
z R
DN
A
7.4.
4C
han
nel
Sw
itch
ing
On
an
d 4
00 M
Hz
Po
wer
PC
ED
SCA
TE
SLA
PIG
GY
BA
CK
T
AD
S P
IGG
YB
AC
K
1 2 App
endi
x V
olum
e 3
G-3
-149

VS
C-A
Fin
al R
epor
t: A
ppen
dix
G-3
S
ecur
ity N
etw
ork
Sim
ulat
ions
– M
erce
des-
Ben
z R
DN
A
3 3 4 App
endi
x V
olum
e 3
G-3
-150

VS
C-A
Fin
al R
epor
t: A
ppen
dix
G-3
S
ecur
ity N
etw
ork
Sim
ulat
ions
– M
erce
des-
Ben
z R
DN
A
6 6 App
endi
x V
olum
e 3
G-3
-151

VS
C-A
Fin
al R
epor
t: A
ppen
dix
G-3
S
ecur
ity N
etw
ork
Sim
ulat
ions
– M
erce
des-
Ben
z R
DN
A
7.4.
5C
han
nel
Sw
itch
ing
On
an
d 1
GH
z P
ow
erP
C
ED
SCA
TE
SLA
PIG
GY
BA
CK
T
AD
S P
IGG
YB
AC
K
1 2 App
endi
x V
olum
e 3
G-3
-152

VS
C-A
Fin
al R
epor
t: A
ppen
dix
G-3
S
ecur
ity N
etw
ork
Sim
ulat
ions
– M
erce
des-
Ben
z R
DN
A
3 3 4 App
endi
x V
olum
e 3
G-3
-153

VS
C-A
Fin
al R
epor
t: A
ppen
dix
G-3
S
ecur
ity N
etw
ork
Sim
ulat
ions
– M
erce
des-
Ben
z R
DN
A
6 6 App
endi
x V
olum
e 3
G-3
-154

VS
C-A
Fin
al R
epor
t: A
ppen
dix
G-3
S
ecur
ity N
etw
ork
Sim
ulat
ions
– M
erce
des-
Ben
z R
DN
A
7.4.
6C
han
nel
Sw
itch
ing
On
an
d 2
.4 G
Hz
PC
EDSC
A
TESL
A P
IGG
YB
AC
K
TAD
S PI
GG
YB
AC
K
1 2 App
endi
x V
olum
e 3
G-3
-155

VS
C-A
Fin
al R
epor
t: A
ppen
dix
G-3
S
ecur
ity N
etw
ork
Sim
ulat
ions
– M
erce
des-
Ben
z R
DN
A
3 3 4 App
endi
x V
olum
e 3
G-3
-156

VS
C-A
Fin
al R
epor
t: A
ppen
dix
G-3
S
ecur
ity N
etw
ork
Sim
ulat
ions
– M
erce
des-
Ben
z R
DN
A
6 6 App
endi
x V
olum
e 3
G-3
-157

VS
C-A
Fin
al R
epor
t: A
ppen
dix
G-3
S
ecur
ity N
etw
ork
Sim
ulat
ions
– M
erce
des-
Ben
z R
DN
A
7.5
Urb
an S
cen
ario
s
Pro
toco
ls
ECD
SA
TESL
A P
IGG
YB
AC
K
TESL
A
TAD
S TA
DS
PIG
GY
BA
CK
C
hann
el S
wit
chin
g O
ff
On
Pro
cess
or/G
ener
atio
n 40
0 M
Hz
PPC
2.
4 G
Hz
PC
1 G
en
2 G
en
3 G
en
4 G
en
Veh
icle
Den
sity
40
car
s/km
80
car
s/km
12
0 ca
rs/k
m
160
cars
/km
80
0 ca
rs/k
m2
Veh
icle
Spe
ed
30 m
ps
15 m
ps
7.5
mps
R
oad
Len
gth
3000
m
6000
m
9000
m
1000
m
Mes
sage
TX
Pow
er
10 d
Bm
20
dB
m
Mes
sagi
ng F
requ
ency
10
Hz
5 H
z C
erti
fica
tion
TX
Pow
er
10 d
Bm
13
dB
m
20 d
Bm
C
erti
fica
tion
Fre
quen
cy
1 H
z 1.
5 H
z 2
Hz
2.5
Hz
Rec
eive
r B
uffe
r Si
ze
50
300
15
In th
e ur
ban
scen
ario
, 800
car
s/km
2 cre
ates
a c
omm
unic
atio
n de
nsity
mor
e th
an 4
tim
es h
ighe
r tha
n th
e 10
0 pe
rcen
t mar
ket p
enet
ratio
n ra
te h
ighw
ay
case
. Th
eref
ore,
the
chan
nel i
s cle
arly
satu
rate
d ev
en w
ith c
hann
el sw
itchi
ng tu
rned
off
.
7.5.
1 40
0MH
z P
PC
EC
DSA
T
ESL
A P
IGG
YB
AC
K
TA
DS
PIG
GY
BA
CK
App
endi
x V
olum
e 3
G-3
-158

VS
C-A
Fin
al R
epor
t: A
ppen
dix
G-3
S
ecur
ity N
etw
ork
Sim
ulat
ions
– M
erce
des-
Ben
z R
DN
A
App
endi
x V
olum
e 3
G-3
-159

VS
C-A
Fin
al R
epor
t: A
ppen
dix
G-3
S
ecur
ity N
etw
ork
Sim
ulat
ions
– M
erce
des-
Ben
z R
DN
A
App
endi
x V
olum
e 3
G-3
-160

VS
C-A
Fin
al R
epor
t: A
ppen
dix
G-3
S
ecur
ity N
etw
ork
Sim
ulat
ions
– M
erce
des-
Ben
z R
DN
A
TESL
A
TAD
S
App
endi
x V
olum
e 3
G-3
-161

VS
C-A
Fin
al R
epor
t: A
ppen
dix
G-3
S
ecur
ity N
etw
ork
Sim
ulat
ions
– M
erce
des-
Ben
z R
DN
A
App
endi
x V
olum
e 3
G-3
-162

VS
C-A
Fin
al R
epor
t: A
ppen
dix
G-3
S
ecur
ity N
etw
ork
Sim
ulat
ions
– M
erce
des-
Ben
z R
DN
A
App
endi
x V
olum
e 3
G-3
-163

VS
C-A
Fin
al R
epor
t: A
ppen
dix
G-3
S
ecur
ity N
etw
ork
Sim
ulat
ions
– M
erce
des-
Ben
z R
DN
A
7.5.
2 1G
Hz
PP
C EC
DSA
T
ESL
A P
IGG
YB
AC
K
TA
DS
PIG
GY
BA
CK
App
endi
x V
olum
e 3
G-3
-164

VS
C-A
Fin
al R
epor
t: A
ppen
dix
G-3
S
ecur
ity N
etw
ork
Sim
ulat
ions
– M
erce
des-
Ben
z R
DN
A
App
endi
x V
olum
e 3
G-3
-165

VS
C-A
Fin
al R
epor
t: A
ppen
dix
G-3
S
ecur
ity N
etw
ork
Sim
ulat
ions
– M
erce
des-
Ben
z R
DN
A
App
endi
x V
olum
e 3
G-3
-166

VS
C-A
Fin
al R
epor
t: A
ppen
dix
G-3
S
ecur
ity N
etw
ork
Sim
ulat
ions
– M
erce
des-
Ben
z R
DN
A
TE
SLA
T
AD
S
App
endi
x V
olum
e 3
G-3
-167

VS
C-A
Fin
al R
epor
t: A
ppen
dix
G-3
S
ecur
ity N
etw
ork
Sim
ulat
ions
– M
erce
des-
Ben
z R
DN
A
App
endi
x V
olum
e 3
G-3
-168

VS
C-A
Fin
al R
epor
t: A
ppen
dix
G-3
S
ecur
ity N
etw
ork
Sim
ulat
ions
– M
erce
des-
Ben
z R
DN
A
App
endi
x V
olum
e 3
G-3
-169

VS
C-A
Fin
al R
epor
t: A
ppen
dix
G-3
S
ecur
ity N
etw
ork
Sim
ulat
ions
– M
erce
des-
Ben
z R
DN
A
7.5.
3 2.
4GH
z P
C EC
DSA
T
ESL
A P
IGG
YB
AC
K
TA
DS
PIG
GY
BA
CK
App
endi
x V
olum
e 3
G-3
-170

VS
C-A
Fin
al R
epor
t: A
ppen
dix
G-3
S
ecur
ity N
etw
ork
Sim
ulat
ions
– M
erce
des-
Ben
z R
DN
A
App
endi
x V
olum
e 3
G-3
-171

VS
C-A
Fin
al R
epor
t: A
ppen
dix
G-3
S
ecur
ity N
etw
ork
Sim
ulat
ions
– M
erce
des-
Ben
z R
DN
A
App
endi
x V
olum
e 3
G-3
-172

VS
C-A
Fin
al R
epor
t: A
ppen
dix
G-3
S
ecur
ity N
etw
ork
Sim
ulat
ions
– M
erce
des-
Ben
z R
DN
A
TE
SLA
T
AD
S
App
endi
x V
olum
e 3
G-3
-173

VS
C-A
Fin
al R
epor
t: A
ppen
dix
G-3
S
ecur
ity N
etw
ork
Sim
ulat
ions
– M
erce
des-
Ben
z R
DN
A
App
endi
x V
olum
e 3
G-3
-174

VS
C-A
Fin
al R
epor
t: A
ppen
dix
G-3
S
ecur
ity N
etw
ork
Sim
ulat
ions
– M
erce
des-
Ben
z R
DN
A
App
endi
x V
olum
e 3
G-3
-175

VS
C-A
Fin
al R
epor
t: A
ppen
dix
G-3
S
ecur
ity N
etw
ork
Sim
ulat
ions
– M
erce
des-
Ben
z R
DN
A
8C
erti
fica
tio
n D
istr
ibu
tio
n S
tud
y R
esu
lts
In th
is c
hapt
er, a
ll ce
rtific
ate
dist
ribut
ion
stud
y re
sults
are
list
ed.
A k
ey p
aram
eter
is th
e ve
hicl
e sp
eed.
Ple
ase
note
the
rela
tive
spee
d di
ffer
entia
l is
the
sum
of v
ehic
le sp
eeds
of t
raff
ic in
two
diff
eren
t dire
ctio
ns.
Ther
efor
e, a
veh
icle
spee
d va
lue
of 3
0 m
ps w
ould
resu
lt in
60
mps
spee
d di
ffer
entia
l.
8.1
10 d
Bm
an
d 6
0 M
PS
Sp
eed
Dif
fere
nti
al
Pro
toco
ls
ECD
SA
TESL
A P
IGG
YB
AC
K
TESL
A
TAD
S TA
DS
PIG
GY
BA
CK
C
hann
el S
wit
chin
g O
ff
On
Veh
icle
Den
sity
40
car
s/km
80
car
s/km
12
0 ca
rs/k
m
160
cars
/km
80
0 ca
rs/k
m2
Veh
icle
Spe
ed
30 m
ps
15 m
ps
7.5
mps
R
oad
Len
gth
3000
m
6000
m
9000
m
Mes
sage
TX
Pow
er
10 d
Bm
20
dB
m
Mes
sagi
ng F
requ
ency
10
Hz
5 H
z C
erti
fica
tion
TX
Pow
er
10 d
Bm
13
dB
m
20 d
Bm
C
erti
fica
tion
Fre
quen
cy
1 H
z 1.
5 H
z 2
Hz
2.5
Hz
App
endi
x V
olum
e 3
G-3
-176

VS
C-A
Fin
al R
epor
t: A
ppen
dix
G-3
S
ecur
ity N
etw
ork
Sim
ulat
ions
– M
erce
des-
Ben
z R
DN
A
8.1.
1C
han
nel
Sw
itch
ing
Off
an
d 4
0 C
ars/
km
E
CD
SA
TE
SLA
PIG
GY
BA
CK
T
AD
S P
IGG
YB
AC
K
1 Hz
1.5
Hz
App
endi
x V
olum
e 3
G-3
-177

VS
C-A
Fin
al R
epor
t: A
ppen
dix
G-3
S
ecur
ity N
etw
ork
Sim
ulat
ions
– M
erce
des-
Ben
z R
DN
A
2 Hz
2.5
Hz
App
endi
x V
olum
e 3
G-3
-178

VS
C-A
Fin
al R
epor
t: A
ppen
dix
G-3
S
ecur
ity N
etw
ork
Sim
ulat
ions
– M
erce
des-
Ben
z R
DN
A
TE
SLA
T
AD
S
App
endi
x V
olum
e 3
G-3
-179

VS
C-A
Fin
al R
epor
t: A
ppen
dix
G-3
S
ecur
ity N
etw
ork
Sim
ulat
ions
– M
erce
des-
Ben
z R
DN
A
App
endi
x V
olum
e 3
G-3
-180

VS
C-A
Fin
al R
epor
t: A
ppen
dix
G-3
S
ecur
ity N
etw
ork
Sim
ulat
ions
– M
erce
des-
Ben
z R
DN
A
8.1.
2C
han
nel
Sw
itch
ing
On
an
d 4
0 C
ars/
km
E
CD
SA
TE
SLA
PIG
GY
BA
CK
T
AD
S P
IGG
YB
AC
K
1 Hz
1.5
Hz
App
endi
x V
olum
e 3
G-3
-181

VS
C-A
Fin
al R
epor
t: A
ppen
dix
G-3
S
ecur
ity N
etw
ork
Sim
ulat
ions
– M
erce
des-
Ben
z R
DN
A
2 Hz
2.5
Hz
App
endi
x V
olum
e 3
G-3
-182

VS
C-A
Fin
al R
epor
t: A
ppen
dix
G-3
S
ecur
ity N
etw
ork
Sim
ulat
ions
– M
erce
des-
Ben
z R
DN
A
TE
SLA
T
AD
S
App
endi
x V
olum
e 3
G-3
-183

VS
C-A
Fin
al R
epor
t: A
ppen
dix
G-3
S
ecur
ity N
etw
ork
Sim
ulat
ions
– M
erce
des-
Ben
z R
DN
A
App
endi
x V
olum
e 3
G-3
-184

VS
C-A
Fin
al R
epor
t: A
ppen
dix
G-3
S
ecur
ity N
etw
ork
Sim
ulat
ions
– M
erce
des-
Ben
z R
DN
A
8.1.
3C
han
nel
Sw
itch
ing
Off
an
d 8
0 C
ars/
km
E
CD
SA
TE
SLA
PIG
GY
BA
CK
T
AD
S P
IGG
YB
AC
K
1 Hz
1.5
Hz
App
endi
x V
olum
e 3
G-3
-185

VS
C-A
Fin
al R
epor
t: A
ppen
dix
G-3
S
ecur
ity N
etw
ork
Sim
ulat
ions
– M
erce
des-
Ben
z R
DN
A
2 Hz
2.5
Hz
App
endi
x V
olum
e 3
G-3
-186

VS
C-A
Fin
al R
epor
t: A
ppen
dix
G-3
S
ecur
ity N
etw
ork
Sim
ulat
ions
– M
erce
des-
Ben
z R
DN
A
TE
SLA
T
AD
S
App
endi
x V
olum
e 3
G-3
-187

VS
C-A
Fin
al R
epor
t: A
ppen
dix
G-3
S
ecur
ity N
etw
ork
Sim
ulat
ions
– M
erce
des-
Ben
z R
DN
A
App
endi
x V
olum
e 3
G-3
-188

VS
C-A
Fin
al R
epor
t: A
ppen
dix
G-3
S
ecur
ity N
etw
ork
Sim
ulat
ions
– M
erce
des-
Ben
z R
DN
A
8.1.
4C
han
nel
Sw
itch
ing
On
an
d 8
0 C
ars/
km
E
CD
SA
TE
SLA
PIG
GY
BA
CK
T
AD
S P
IGG
YB
AC
K
1 Hz
1.5
Hz
App
endi
x V
olum
e 3
G-3
-189

VS
C-A
Fin
al R
epor
t: A
ppen
dix
G-3
S
ecur
ity N
etw
ork
Sim
ulat
ions
– M
erce
des-
Ben
z R
DN
A
2 Hz
2.5
Hz
App
endi
x V
olum
e 3
G-3
-190

VS
C-A
Fin
al R
epor
t: A
ppen
dix
G-3
S
ecur
ity N
etw
ork
Sim
ulat
ions
– M
erce
des-
Ben
z R
DN
A
TE
SLA
T
AD
S
App
endi
x V
olum
e 3
G-3
-191

VS
C-A
Fin
al R
epor
t: A
ppen
dix
G-3
S
ecur
ity N
etw
ork
Sim
ulat
ions
– M
erce
des-
Ben
z R
DN
A
App
endi
x V
olum
e 3
G-3
-192

VS
C-A
Fin
al R
epor
t: A
ppen
dix
G-3
S
ecur
ity N
etw
ork
Sim
ulat
ions
– M
erce
des-
Ben
z R
DN
A
8.1.
5C
han
nel
Sw
itch
ing
Off
an
d 1
20 C
ars/
km
E
CD
SA
TE
SLA
PIG
GY
BA
CK
T
AD
S P
IGG
YB
AC
K
1 Hz
1.5
Hz
App
endi
x V
olum
e 3
G-3
-193

VS
C-A
Fin
al R
epor
t: A
ppen
dix
G-3
S
ecur
ity N
etw
ork
Sim
ulat
ions
– M
erce
des-
Ben
z R
DN
A
2 Hz
2.5
Hz
App
endi
x V
olum
e 3
G-3
-194

VS
C-A
Fin
al R
epor
t: A
ppen
dix
G-3
S
ecur
ity N
etw
ork
Sim
ulat
ions
– M
erce
des-
Ben
z R
DN
A
TE
SLA
T
AD
S
App
endi
x V
olum
e 3
G-3
-195

VS
C-A
Fin
al R
epor
t: A
ppen
dix
G-3
S
ecur
ity N
etw
ork
Sim
ulat
ions
– M
erce
des-
Ben
z R
DN
A
App
endi
x V
olum
e 3
G-3
-196

VS
C-A
Fin
al R
epor
t: A
ppen
dix
G-3
S
ecur
ity N
etw
ork
Sim
ulat
ions
– M
erce
des-
Ben
z R
DN
A
8.1.
6C
han
nel
Sw
itch
ing
On
an
d 1
20 C
ars/
km
E
CD
SA
TE
SLA
PIG
GY
BA
CK
T
AD
S P
IGG
YB
AC
K
1 Hz
1.5
Hz
App
endi
x V
olum
e 3
G-3
-197

VS
C-A
Fin
al R
epor
t: A
ppen
dix
G-3
S
ecur
ity N
etw
ork
Sim
ulat
ions
– M
erce
des-
Ben
z R
DN
A
2 Hz
2.5
Hz
App
endi
x V
olum
e 3
G-3
-198

VS
C-A
Fin
al R
epor
t: A
ppen
dix
G-3
S
ecur
ity N
etw
ork
Sim
ulat
ions
– M
erce
des-
Ben
z R
DN
A
TE
SLA
T
AD
S
App
endi
x V
olum
e 3
G-3
-199

VS
C-A
Fin
al R
epor
t: A
ppen
dix
G-3
S
ecur
ity N
etw
ork
Sim
ulat
ions
– M
erce
des-
Ben
z R
DN
A
App
endi
x V
olum
e 3
G-3
-200

VS
C-A
Fin
al R
epor
t: A
ppen
dix
G-3
S
ecur
ity N
etw
ork
Sim
ulat
ions
– M
erce
des-
Ben
z R
DN
A
8.1.
7C
han
nel
Sw
itch
ing
Off
an
d 1
60 C
ars/
km
E
CD
SA
TE
SLA
PIG
GY
BA
CK
T
AD
S P
IGG
YB
AC
K
1 Hz
1.5
Hz
App
endi
x V
olum
e 3
G-3
-201

VS
C-A
Fin
al R
epor
t: A
ppen
dix
G-3
S
ecur
ity N
etw
ork
Sim
ulat
ions
– M
erce
des-
Ben
z R
DN
A
2 Hz
2.5
Hz
App
endi
x V
olum
e 3
G-3
-202

VS
C-A
Fin
al R
epor
t: A
ppen
dix
G-3
S
ecur
ity N
etw
ork
Sim
ulat
ions
– M
erce
des-
Ben
z R
DN
A
TE
SLA
T
AD
S
App
endi
x V
olum
e 3
G-3
-203

VS
C-A
Fin
al R
epor
t: A
ppen
dix
G-3
S
ecur
ity N
etw
ork
Sim
ulat
ions
– M
erce
des-
Ben
z R
DN
A
App
endi
x V
olum
e 3
G-3
-204

VS
C-A
Fin
al R
epor
t: A
ppen
dix
G-3
S
ecur
ity N
etw
ork
Sim
ulat
ions
– M
erce
des-
Ben
z R
DN
A
8.1.
8C
han
nel
Sw
itch
ing
On
an
d 1
60 C
ars/
km
E
CD
SA
TE
SLA
PIG
GY
BA
CK
T
AD
S P
IGG
YB
AC
K
1 Hz
1.5
Hz
App
endi
x V
olum
e 3
G-3
-205

VS
C-A
Fin
al R
epor
t: A
ppen
dix
G-3
S
ecur
ity N
etw
ork
Sim
ulat
ions
– M
erce
des-
Ben
z R
DN
A
2 Hz
2.5
Hz
App
endi
x V
olum
e 3
G-3
-206

VS
C-A
Fin
al R
epor
t: A
ppen
dix
G-3
S
ecur
ity N
etw
ork
Sim
ulat
ions
– M
erce
des-
Ben
z R
DN
A
8.2
10 d
Bm
an
d 3
0 M
PS
Sp
eed
Dif
fere
nti
al
TE
SLA
T
AD
S
App
endi
x V
olum
e 3
G-3
-207

VS
C-A
Fin
al R
epor
t: A
ppen
dix
G-3
S
ecur
ity N
etw
ork
Sim
ulat
ions
– M
erce
des-
Ben
z R
DN
A
App
endi
x V
olum
e 3
G-3
-208

VS
C-A
Fi
nal R
epor
t: A
ppen
dix
G-3
S
ecur
ity N
etw
ork
Sim
ulat
ions
– M
erce
des-
Ben
z R
DN
A
8.3
10 d
Bm
an
d 3
0 M
PS
Sp
eed
Dif
fere
nti
al
Pro
toco
ls
ECD
SA
TESL
A P
IGG
YB
AC
K
TESL
A
TAD
S TA
DS
PIG
GY
BA
CK
C
hann
el S
wit
chin
g O
ff
On
Veh
icle
Den
sity
40
car
s/km
80
car
s/km
12
0 ca
rs/k
m
160
cars
/km
80
0 ca
rs/k
m2
Veh
icle
Spe
ed
30 m
ps
15 m
ps
7.5
mps
R
oad
Len
gth
3000
m
6000
m
9000
m
Mes
sage
TX
Pow
er
10 d
Bm
20
dB
m
Mes
sagi
ng F
requ
ency
10
Hz
5 H
z C
erti
fica
tion
TX
Pow
er
10 d
Bm
13
dB
m
20 d
Bm
C
erti
fica
tion
Fre
quen
cy
1 H
z 1.
5 H
z 2
Hz
2.5
Hz
In th
is b
atch
, the
spe
ed d
iffer
entia
ls a
re a
djus
ted
to 3
0 m
ps b
y se
tting
all
vehi
cles
to tr
avel
at 1
5 m
ps.
One
cou
ld v
iew
thes
e re
sults
as
wha
t wou
ld h
appe
n if
a st
oppe
d ve
hicl
e is
sen
ding
its
certi
ficat
e (a
nd h
eartb
eat)
to a
ppro
achi
ng v
ehic
les
arriv
ing
at 6
5 M
PH.
As
a sa
nity
che
ck, r
esul
ts fo
r 1 H
z ce
rtific
ate
dist
ribut
ion
freq
uenc
y at
30
mps
spe
ed d
iffer
entia
l sho
uld
be a
bout
the
sam
e as
the
2 H
z ca
se
with
a 6
0 m
ps sp
eed
diff
eren
tial.
Sinc
e EC
DSA
, TES
LA P
iggy
back
, and
TA
DS
Pigg
ybac
k al
l yie
ld v
ery
sim
ilar c
ertif
icat
e di
strib
utio
n pe
rfor
man
ces,
only
EC
DSA
is
stud
ied
in th
is b
atch
.
App
endi
x V
olum
e 3
G-3
-209

VS
C-A
Fi
nal R
epor
t: A
ppen
dix
G-3
S
ecur
ity N
etw
ork
Sim
ulat
ions
– M
erce
des-
Ben
z R
DN
A
8.3.
1C
han
nel
Sw
itch
ing
Off
an
d 4
0 C
ars/
km
E
CD
SA
TE
SLA
T
AD
S P
IGG
YB
AC
K
1 Hz
2 Hz
App
endi
x V
olum
e 3
G-3
-210

VS
C-A
Fi
nal R
epor
t: A
ppen
dix
G-3
S
ecur
ity N
etw
ork
Sim
ulat
ions
– M
erce
des-
Ben
z R
DN
A
8.3.
2C
han
nel
Sw
itch
ing
Off
an
d 8
0 C
ars/
km
E
CD
SA
TE
SLA
T
AD
S P
IGG
YB
AC
K
1 Hz
2 Hz
App
endi
x V
olum
e 3
G-3
-211

VS
C-A
Fi
nal R
epor
t: A
ppen
dix
G-3
S
ecur
ity N
etw
ork
Sim
ulat
ions
– M
erce
des-
Ben
z R
DN
A
8.3.
3C
han
nel
Sw
itch
ing
Off
an
d 1
20 C
ars/
km
E
CD
SA
TE
SLA
T
AD
S P
IGG
YB
AC
K
1 Hz
2 Hz
App
endi
x V
olum
e 3
G-3
-212

VS
C-A
Fi
nal R
epor
t: A
ppen
dix
G-3
S
ecur
ity N
etw
ork
Sim
ulat
ions
– M
erce
des-
Ben
z R
DN
A
8.3.
4C
han
nel
Sw
itch
ing
Off
an
d 1
60 C
ars/
km
E
CD
SA
TE
SLA
T
AD
S P
IGG
YB
AC
K
1 Hz
2 Hz
App
endi
x V
olum
e 3
G-3
-213

VS
C-A
Fi
nal R
epor
t: A
ppen
dix
G-3
S
ecur
ity N
etw
ork
Sim
ulat
ions
– M
erce
des-
Ben
z R
DN
A
8.3.
5C
han
nel
Sw
itch
ing
On
an
d 4
0 C
ars/
km
E
CD
SA
TE
SLA
T
AD
S P
IGG
YB
AC
K
1 Hz
2 Hz
App
endi
x V
olum
e 3
G-3
-214

VS
C-A
Fi
nal R
epor
t: A
ppen
dix
G-3
S
ecur
ity N
etw
ork
Sim
ulat
ions
– M
erce
des-
Ben
z R
DN
A
8.3.
6C
han
nel
Sw
itch
ing
On
an
d 8
0 C
ars/
km
E
CD
SA
TE
SLA
T
AD
S P
IGG
YB
AC
K
1 Hz
2 Hz
App
endi
x V
olum
e 3
G-3
-215

VS
C-A
Fi
nal R
epor
t: A
ppen
dix
G-3
S
ecur
ity N
etw
ork
Sim
ulat
ions
– M
erce
des-
Ben
z R
DN
A
8.3.
7C
han
nel
Sw
itch
ing
On
an
d 1
20 C
ars/
km
E
CD
SA
TE
SLA
T
AD
S P
IGG
YB
AC
K
1 Hz
2 Hz
App
endi
x V
olum
e 3
G-3
-216

VS
C-A
Fi
nal R
epor
t: A
ppen
dix
G-3
S
ecur
ity N
etw
ork
Sim
ulat
ions
– M
erce
des-
Ben
z R
DN
A
8.3.
8C
han
nel
Sw
itch
ing
On
an
d 1
60 C
ars/
km
E
CD
SA
TE
SLA
T
AD
S P
IGG
YB
AC
K
1 Hz
2 Hz
App
endi
x V
olum
e 3
G-3
-217

VS
C-A
Fi
nal R
epor
t: A
ppen
dix
G-3
S
ecur
ity N
etw
ork
Sim
ulat
ions
– M
erce
des-
Ben
z R
DN
A
8.4
10 d
Bm
an
d 1
5 M
PS
Sp
eed
Dif
fere
nti
al
Pro
toco
ls
ECD
SA
TESL
A P
IGG
YB
AC
K
TESL
A
TAD
S TA
DS
PIG
GY
BA
CK
C
hann
el S
wit
chin
g O
ff
On
Veh
icle
Den
sity
40
car
s/km
80
car
s/km
12
0 ca
rs/k
m
160
cars
/km
80
0 ca
rs/k
m2
Veh
icle
Spe
ed
30 m
ps
15 m
ps
7.5
mps
R
oad
Len
gth
3000
m
6000
m
9000
m
Mes
sage
TX
Pow
er
10 d
Bm
20
dB
m
Mes
sagi
ng F
requ
ency
10
Hz
5 H
z C
erti
fica
tion
TX
Pow
er
10 d
Bm
13
dB
m
20 d
Bm
C
erti
fica
tion
Fre
quen
cy
1 H
z 1.
5 H
z 2
Hz
2.5
Hz
App
endi
x V
olum
e 3
G-3
-218

VS
C-A
Fi
nal R
epor
t: A
ppen
dix
G-3
S
ecur
ity N
etw
ork
Sim
ulat
ions
– M
erce
des-
Ben
z R
DN
A
8.4.
1C
han
nel
Sw
itch
ing
Off
an
d 4
0 C
ars/
km
E
CD
SA
TE
SLA
T
AD
S P
IGG
YB
AC
K
1 Hz
8.4.
2C
han
nel
Sw
itch
ing
Off
an
d 8
0 C
ars/
km
E
CD
SA
TE
SLA
T
AD
S P
IGG
YB
AC
K
1 Hz
App
endi
x V
olum
e 3
G-3
-219

VS
C-A
Fi
nal R
epor
t: A
ppen
dix
G-3
S
ecur
ity N
etw
ork
Sim
ulat
ions
– M
erce
des-
Ben
z R
DN
A
8.4.
3C
han
nel
Sw
itch
ing
Off
an
d 1
20 C
ars/
km
E
CD
SA
TE
SLA
T
AD
S P
IGG
YB
AC
K
1 Hz
8.4.
4C
han
nel
Sw
itch
ing
Off
an
d 1
60 C
ars/
km
E
CD
SA
TE
SLA
T
AD
S P
IGG
YB
AC
K
1 Hz
App
endi
x V
olum
e 3
G-3
-220

VS
C-A
Fi
nal R
epor
t: A
ppen
dix
G-3
S
ecur
ity N
etw
ork
Sim
ulat
ions
– M
erce
des-
Ben
z R
DN
A
8.4.
5C
han
nel
Sw
itch
ing
On
an
d 4
0 C
ars/
km
E
CD
SA
TE
SLA
T
AD
S P
IGG
YB
AC
K
1 Hz
8.4.
6C
han
nel
Sw
itch
ing
On
an
d 8
0 C
ars/
km
E
CD
SA
TE
SLA
T
AD
S P
IGG
YB
AC
K
1 Hz
App
endi
x V
olum
e 3
G-3
-221

VS
C-A
Fi
nal R
epor
t: A
ppen
dix
G-3
S
ecur
ity N
etw
ork
Sim
ulat
ions
– M
erce
des-
Ben
z R
DN
A
8.4.
7C
han
nel
Sw
itch
ing
On
an
d 1
20 C
ars/
km
E
CD
SA
TE
SLA
T
AD
S P
IGG
YB
AC
K
1 Hz
8.4.
8C
han
nel
Sw
itch
ing
On
an
d 1
60 C
ars/
km
E
CD
SA
TE
SLA
T
AD
S P
IGG
YB
AC
K
1 Hz
App
endi
x V
olum
e 3
G-3
-222

VS
C-A
Fi
nal R
epor
t: A
ppen
dix
G-3
S
ecur
ity N
etw
ork
Sim
ulat
ions
– M
erce
des-
Ben
z R
DN
A
8.5
13 d
Bm
an
d 6
0 M
PS
Sp
eed
Dif
fere
nti
al
Pro
toco
ls
ECD
SA
TESL
A P
IGG
YB
AC
K
TESL
A
TAD
S TA
DS
PIG
GY
BA
CK
C
hann
el S
wit
chin
g O
ff
On
Veh
icle
Den
sity
40
car
s/km
80
car
s/km
12
0 ca
rs/k
m
160
cars
/km
80
0 ca
rs/k
m2
Veh
icle
Spe
ed
30 m
ps
15 m
ps
7.5
mps
R
oad
Len
gth
3000
m
6000
m
9000
m
Mes
sage
TX
Pow
er
10 d
Bm
20
dB
m
Mes
sagi
ng F
requ
ency
10
Hz
5 H
z C
erti
fica
tion
TX
Pow
er
10 d
Bm
13
dB
m
20 d
Bm
C
erti
fica
tion
Fre
quen
cy
1 H
z 1.
5 H
z 2
Hz
2.5
Hz
In th
is b
atch
, a d
iffer
ent a
ppro
ach
to c
ertif
icat
e di
strib
utio
n en
hanc
emen
t is t
ried.
Ins
tead
of s
endi
ng it
out
mor
e fr
eque
ntly
than
1 H
z,
a hi
gher
TX
pow
er is
use
d in
stea
d.
The
pow
er c
hose
n is
13
dBm
, whi
ch is
dou
ble
the
pow
er o
f 10
dB
m a
nd r
ough
ly a
50
perc
ent
incr
ease
in ra
nge.
App
endi
x V
olum
e 3
G-3
-223

VS
C-A
Fi
nal R
epor
t: A
ppen
dix
G-3
S
ecur
ity N
etw
ork
Sim
ulat
ions
– M
erce
des-
Ben
z R
DN
A
8.5.
1C
han
nel
Sw
itch
ing
Off
an
d 4
0 C
ars/
km
E
CD
SA
TE
SLA
1 Hz
8.5.
2C
han
nel
Sw
itch
ing
Off
an
d 8
0 C
ars/
km
E
CD
SA
TE
SLA
1 Hz
App
endi
x V
olum
e 3
G-3
-224

VS
C-A
Fi
nal R
epor
t: A
ppen
dix
G-3
S
ecur
ity N
etw
ork
Sim
ulat
ions
– M
erce
des-
Ben
z R
DN
A
8.5.
3C
han
nel
Sw
itch
ing
Off
an
d 1
20 C
ars/
km
E
CD
SA
TE
SLA
1 H
z
8.5.
4C
han
nel
Sw
itch
ing
Off
an
d 1
60 C
ars/
km
E
CD
SA
TE
SLA
1 H
z
App
endi
x V
olum
e 3
G-3
-225

VS
C-A
Fi
nal R
epor
t: A
ppen
dix
G-3
S
ecur
ity N
etw
ork
Sim
ulat
ions
– M
erce
des-
Ben
z R
DN
A
8.5.
5C
han
nel
Sw
itch
ing
On
an
d 4
0 C
ars/
km
E
CD
SA
TE
SLA
1 H
z
8.5.
6C
han
nel
Sw
itch
ing
On
an
d 8
0 C
ars/
km
E
CD
SA
TE
SLA
1 H
z
App
endi
x V
olum
e 3
G-3
-226

VS
C-A
Fi
nal R
epor
t: A
ppen
dix
G-3
S
ecur
ity N
etw
ork
Sim
ulat
ions
– M
erce
des-
Ben
z R
DN
A
8.5.
7C
han
nel
Sw
itch
ing
On
an
d 1
20 C
ars/
km
E
CD
SA
TE
SLA
1 H
z
8.5.
8C
han
nel
Sw
itch
ing
On
an
d 1
60 C
ars/
km
E
CD
SA
TE
SLA
1 H
z
App
endi
x V
olum
e 3
G-3
-227

VSC-A Final Report: Appendix H-1
Analysis of Infrastructure and Communications Requirements for V2V PKI Security Management
Prepared by
Adrian Perrig and Ahren Studer
Appendix Volume 3 H-1-i

List of Acronyms
CAMP Crash Avoidance Metrics Partnership
CRL Certification Revocation List
DoS Denial of Service
DSRC Dedicated Short Range Communications
ECDSA Elliptic Curve Digital Signature Algorithm
EDR Event Data Recorder
EEBL Emergency Electronic Brake Lights
OBE On-Board Equipment PKI Public Key Infrastructure
RA Regional Authority
RSE Road Side Equipment
VSC2 Vehicle Safety Communications 2
VSC-A Vehicle Safety Communications - Applications
V-V or V2V Vehicle-to-Vehicle
Appendix Volume 3 H-1-ii

Table of Contents List of Acronyms.......................................................................................... H-1-ii
1 Introduction........................................................................................... H-1-1 1.1 General Approaches for Security ................................................................ H-1-1
1.2 An Architecture for Secure VANET ........................................................... H-1-2
1.3 Vehicular PKIs ............................................................................................ H-1-4
2 Problem Definition ................................................................................ H-1-5 2.1 PKI Properties ............................................................................................. H-1-6
2.2 Threat Model ............................................................................................... H-1-7 2.3 Cost Model .................................................................................................. H-1-8
3 Case 1: Zero Connectivity .................................................................... H-1-9 3.1 Acquiring and Revoking Certificates and Keys .......................................... H-1-9
3.2 Protecting Driver's Privacy ........................................................................ H-1-11
3.3 Misbehavior Detection and Reporting ...................................................... H-1-12
3.4 Data Sent Between the CA and Vehicles .................................................. H-1-12
3.5 Summary ................................................................................................... H-1-13
4 Case 2: Unidirectional Connectivity .................................................. H-1-14 4.1 Revocation Via One-way Communication................................................ H-1-15
4.2 Data Sent Between the CA and Vehicles .................................................. H-1-17
4.3 Summary ................................................................................................... H-1-19
5 Case 3: Limited Bidirectional Connectivity ...................................... H-1-21 5.1 Certifying Vehicle Generated Keys .......................................................... H-1-22
5.2 Reporting Misbehavior .............................................................................. H-1-23
5.3 Denial of Service Attacks .......................................................................... H-1-23
5.4 Data Between the CA and Vehicles .......................................................... H-1-23
5.5 Summary ................................................................................................... H-1-24
6 Case 4: High Availability, Low-Latency, Bidirectional Connectivity ....................................................................................... H-1-25
6.1 Bandwidth Between the CA and Vehicles ................................................ H-1-26
6.2 Comparison with Other Approaches ......................................................... H-1-26
7 Remaining Research Challenges ...................................................... H-1-27
8 Group Signatures Overview............................................................... H-1-28
9 References .......................................................................................... H-1-28
Appendix Volume 3 H-1-iii

List of Tables Table 1: Summary of Approaches to Secure a V2V PKI without Communication .. H-1-13
Appendix Volume 3 H-1-iv

VSC-A Final Report: Appendix H-1 V2V PKI Security Management – Perrig and Studer
1 Introduction
Securing Vehicular Ad-Hoc Network (VANET) communication is of critical importance. Without security, malicious or malfunctioning parties could send arbitrary data perturbing legitimate vehicles. Examples of specific attacks include:
Impersonation of another vehicle - This can be used for casting the blame on an innocent party. For example, speeding and someone else would receive the ticket. Impersonation can also be used for framing attacks.
Malice by harming vehicles - For example, environmental extremists may want to create accidents to scare drivers away from roads, or a service station may improve their business by causing nearby accidents.
Misrouting vehicles - A gas station or restaurant may benefit from vehicles exiting a highway or being re-routed. In another case, a vehicle may benefit if others ahead of it exit the road, thereby reducing traffic density.
Parking space finder applications have clear threat models - People want available parking spots, so they may engage in altering information to make available parking spots appear occupied.
Hide from law enforcement - Many drivers may enjoy tampering with trajectory information to run red lights and stop signs or to drive beyond the speed limit.
Impersonation of emergency vehicles - For example, taxis want vehicles ahead to make space for them.
Traffic light tampering - Impatient drivers want only green lights for themselves, others should wait.
These threats are only the tip of the proverbial iceberg. Once deployed, people would certainly work hard to obtain an advantage on the road. Even today, there is a booming market for gaining an advantage on the road: radar detectors, collaborative speed trap warning systems (e.g., Trapster), fast cars, real-time traffic information, fake emergency lights, etc.
Another important threat are Denial-of-Service (DoS) attacks. Especially when VANET-based traffic safety systems become widely deployed, people will start to rely on their operation. As a consequence, drivers may get a bit more careless, for example by increasingly engaging in cellular phone conversations, watching movies, reading, or grooming while driving. In such an environment, a DoS attack on VANET-based security systems will result in accidents because drivers have come to rely on the vehicle's safety alert.
1.1 General Approaches for Security
In general, four basic approaches to security exist: prevention, detection and recovery, resilience, and deterrence. To achieve a viable system, it is best to follow a defense-in-depth approach and combine all the approaches. The basic approaches are discussed in more detail.
Appendix Volume 3 H-1-1

VSC-A Final Report: Appendix H-1 V2V PKI Security Management – Perrig and Studer
Prevention - The prevention approach seeks to prevent a known attack, typically through application of cryptography. This is the most efficient basic approach, because a given attack is completely ruled out. However, prevention mechanisms can often be circumvented through new and unforeseen attacks.
Detection and Recovery - Detection involves monitoring of the real-time behavior of protocol participants. Once malicious behavior is detected, the team resorted to recovery techniques to eliminate malicious participants and restore network order and functionality that may have been impaired. Although this approach is less efficient than a prevention approach, it can handle unforeseen attacks because the approach only attempts to identify the effects of the attack, but not the attack itself.
Resilience - The resilience approach seeks to maintain a certain level of availability even in the face of attacks. Here a desirable property is graceful performance degradation in the presence of compromised network elements (i.e., the communication availability of the network should degrade no faster than a rate approximately proportional to the percentage of compromised elements). An example in this category is redundancy mechanisms, such as multipath routing. This approach is an important supplement to a detection and recovery approach; because in some cases, the effect of the attack cannot be detected.
Deterrence - Historically, it has proved impossible to prevent all attacks. If nothing else, most security problems are due to buggy software (SW). The network has only a limited ability to deal with such problems. Accordingly, it is desirable to deter such attacks. But deterrence tends to rely on the possibility of retribution, which in turn implies a need to be able to identify the source of the attack. Legal mechanisms can be used to provide disincentives for attackers. With effective attacker tracing and effective international laws and enforcement, risk-averse rational attackers may shy away from attacks.
1.2 An Architecture for Secure VANET
A solid security architecture for VANETs should utilize a combination of all four basic approaches to security, with an emphasis on the prevention category due to its low-error margin and high efficiency. In general, a prevention-based approach will handle and prevent the majority of all attacks (i.e., about 95 percent of most cases). Strong techniques for the other three approaches will enable us to focus on the remaining 5 percent of attacks.
Prevention - Probably the most important attacks to defend against are injection of malicious messages and alteration of messages. To prevent these attacks, authentication and/or non-repudiation of messages are needed. Both mechanisms require the establishment of trusted cryptographic keys to operate. The main purpose of this report is to study how to establish such cryptographic keys, and this topic will be discussed in more detail in the next section.
To prevent theft of the cryptographic secrets, the secret information should be embedded within an enclosure that resists physical tampering. Trusted hardware
Appendix Volume 3 H-1-2

VSC-A Final Report: Appendix H-1 V2V PKI Security Management – Perrig and Studer
(HW) that is truly robust to tampering is excessively expensive, for example the IBM 4758 or the more recent 4764 device cost on the order of thousands of dollars [10]. Moreover, their sensitive tamper-detection circuitry would likely trigger in harsh road conditions where vehicles are exposed to extreme levels of heat and cold, resulting in numerous false positives in which the device self-destructs all sensitive information.
Fortunately, much cheaper trusted HW exists in the form of smart card chips or trusted platform modules (TPM). Both are priced below $1 per piece. Unfortunately, at such low price levels, evidence of realistic attacks abound. However, the presence of attacks does not exclude the construction of a viable secure system, as long as the attack effort is sufficiently high to exclude ubiquitous compromise, detection, and recovery (e.g., revocation) mechanisms can be used to mitigate compromises, as described below. For example, if compromise requires local tampering and the malicious operation can be detected by law enforcement, sufficient disincentives can be created to retain a viable environment by relying on tamper-evident HW and deterrence, as described below.
For these reasons, it is assumed in this report that a local attacker can likely compromise the private key of the vehicle by physically accessing the tamper resistant device. To counteract this attack, three countermeasures are considered: (1) revocation, (2) short-lived keys to limit the usefulness of a compromised key, and (3) detection of malicious use of compromised keys by sporadic monitoring by law enforcement.
Detection and Recovery - To deal with the potential compromise of cryptographic HW, the team relied on a detection and recovery approach to handle such attacks. It is anticipated that the vast majority of people are honest and that only a small minority of people would engage in illegal physical attacks, especially if these attacks will result in fines because of the evidence of the tampering.
A detection-based approach will first detect the effect of an attack. For example, if a vehicle's cryptographic key is compromised and replicated to other devices (e.g., for performing a Sybil attack22), then a global duplicate-key detection algorithm will reveal the fraud.
Once malicious activity by a party is detected, then the corresponding cryptographic credentials can be revoked. Such revocation will render the compromised keys invalid. Since revocation is a dynamic event, the revocation information needs to be distributed to alert vehicles about the key compromise. In this report, the team studied how different communication parameters affect revocation.
Resilience - Since key revocation may lag key compromise by several hours, the vehicles need to be equipped with the ability to filter malicious messages even
22Section 2.1 contains more details on a Sybil attack.
Appendix Volume 3 H-1-3

VSC-A Final Report: Appendix H-1 V2V PKI Security Management – Perrig and Studer
though all cryptographic verifications indicate that the message is correct. Consequently, misbehavior detection mechanisms will assess message correctness based on the inherent message contents. An example is to use collaborative filtering mechanisms among neighboring vehicles [6].
Deterrence - A possible deterrence mechanism is to use tamper-evident devices on vehicles. Thus, if a driver tampers with OBE, law enforcement can detect such activity and issue a fine. Moreover, the pristine nature of the OBE can be validated periodically as part of the mandatory vehicle inspections.
1.3 Vehicular PKIs
To secure vehicular communication, two major mechanisms are needed: authentication and non-repudiation. Both mechanisms require the establishment of trusted cryptographic keys to operate. The challenge then is how to establish trust in these keys. Unfortunately, trust cannot be established out of thin air. There must be an initially trusted root of trust from which trust emanates. Using cryptography can extend and convert trust. For example, in a PKI-based system, the root of trust lies within the secrecy of the certification authority's (CA) private key and the authenticity of the CA's public key embedded in the verifier. By further trusting the CA's operations, the CA can then use the private key to digitally sign certificates, binding a public key to an identity. By verifying the digital signature on the certificate, trust extends to the public key in the certificate. For whichever system is analyzed, the root trust assumptions need to be absolutely clear in addition to what mechanisms are in use to extend this trust.
In an ideal world with infinite resources, the trust establishment problem could be solved relatively easily by using trusted HW in vehicles or pervasive road-side infrastructure (also called Road Side Equipment (RSE)). Unfortunately, both are unlikely to occur in the near term, because they would not be economically viable or achieve a sufficient level of security. Instead, detection of misbehavior in conjunction with short-lived cryptographic keys or revocation of misbehaving vehicles must be relied upon.
Timely revocation or distribution of short-lived cryptographic keys requires an online mechanism, since the local HW is not trusted to cease operation after misbehavior or to safely store a large number of keys. Unfortunately, online access may not always be possible, and, thus, the following cases are considered:
Zero connectivity - No online network access is available
Unidirectional network connectivity - the vehicle can only receive updates but cannot respond to the infrastructure. This case corresponds to unidirectional satellite communication or a wide-area wireless transmitter.
Bi-directional, limited communication - In this case, consider that a vehicle can communicate with the infrastructure at most once an hour. This case could be built through a very sparse set of RSEs, or WiFi networks.
Bi-directional, low-latency, high-availability communication - this case assumes constant network connectivity, through a medium such as WiMax, the cellular network, or widespread RSE deployment.
Appendix Volume 3 H-1-4

2
VSC-A Final Report: Appendix H-1 V2V PKI Security Management – Perrig and Studer
In this report, what security properties can be achieved under these different communication scenarios and approximate the costs associated with implementing and successfully attacking the solutions are analyzed.
Finally, arguments are provided that aim for a realistic, yet high level of security. The main points here are that attackers are very sophisticated, especially when monetary incentives exist to break a system.
To demonstrate the sophistication of current attackers, there is evidence of large-scale HW attacks and tampering to obtain an advantage. For example, some cellular phone manufacturers rely on HW protections to lock customers to a particular cellular phone provider network. Underground markets have developed HW hacks and SIM-card interposers that are easily obtainable to circumvent this limitation. In fact, the speed at which these hacks have become widely available was astounding.
An insufficient level of security may result in a lack of consumer confidence in the new technologies. Especially for safety-critical systems such as vehicles, people would feel uncomfortable to entrust their lives to a vehicle that may get hacked remotely. An analogy is 802.11 where the insecurity of wired equivalent privacy (WEP) has been one of the most important reasons for slow adoption. Another example is online gaming, where ”game cheats” have discouraged numerous gamers from participating in online games with unknown people.
Consequently, it is important to aim for a realistically high level of security to preempt the majority of threats. Unfortunately, perfect security is probably unachievable, yet certainly too expensive to implement. In the spirit of ”The perfect is the enemy of the good,” the aim should be a realistic level of security that is economically viable to ensure wide spread adoption.
Problem Definition
The core problem considered in this report is the identification and trust establishment between vehicles. The specific approach to accomplish this is via a PKI, where a CA would form the root of trust. The CA would issue public-key certificates for vehicles, and all vehicles would trust their locally stored public key of the CA to validate other vehicles' certificates.
In this section, the different properties that a PKI may fulfill and the different attacker's goals and capabilities when trying to undermine the PKI are discussed. A PKI serves to fulfill a number of goals: identification of valid participants and exclusion of unwanted participants, protecting participants' privacy, and revealing the identity of a participant known to have misbehaved. A malicious party may try to impersonate a valid entity, try to revoke a valid entity, associate a message with a person, or track a vehicle based on wireless messages. When a malicious entity is a valid entity within the PKI, the malicious party may abuse the system and attempt to elude misbehavior detection mechanisms and, if that fails, try to use PKI credentials that the authority has revoked.
Appendix Volume 3 H-1-5

VSC-A Final Report: Appendix H-1 V2V PKI Security Management – Perrig and Studer
2.1 PKI Properties
An ideal PKI for vehicle-to-vehicle (V2V) communication provides the following set of properties. However, to provide sufficient security at a reasonable cost, the PKI may fail to meet some properties or experience a delay between operations.
Valid OBEs Have Certified Credentials - A valid sender will possess a certificate which indicates some public value which receivers can use to verify the sender's messages and to identify the sender as a valid traffic participant. Receivers must be able to verify that the certificate is from a trusted source, or a certificate chain must exist that terminates with a trusted source (root of trust).
Revoked OBEs Are Identified - An entry in a Certificate Revocation List (CRL) or lack of a valid certificate can identify an OBE as invalid.
Privacy - A driver's privacy is violated when an unauthorized entity (e.g., a radio listening to wireless communication) can compromise the following two properties:
(a) Anonymity: Link a V2V message to personally identifiable information (e.g., a vehicle's registration number).
(b) Message Unlinkability: Determine that two messages were generated by the same vehicle.
Anonymity is easy to achieve provided certificates lack personal information, attackers cannot access authorities' databases which map certificates to owners, and the method used to acquire certificates is properly secured. The level of privacy achieved with respect to unlinkability depends on how many messages a malicious party can receive and the time between the two messages. Typically, a vehicle will use different pseudo-identities (e.g., certificates) at different times to prevent eavesdroppers from linking different messages back to the same source vehicle. Using the same identity for a short period of time provides linkability; but given vehicles' predictable driving patterns (i.e., along a road at a near constant speed), this fails to present a real violation of privacy. For example, knowing the same vehicle on a highway was at mile marker 76 and then one-minute later drove past mile marker 77 is hardly a violation of privacy. However, it is a violation of privacy if an eavesdropper can determine that messages broadcast (with different certificates) at mile marker 15, mile marker 45, and an off-ramp at mile marker 63 were generated by the same vehicle. To prevent such linking, the sender only has to periodically change certificates, assuming an eavesdropper only can listen to a small subset of V2V messages. However, if an eavesdropper can receive most messages broadcast (e.g., via a sensor network), a set of vehicles can change certificates at the same time to prevent the eavesdropper from linking an old certificate with a new certificate [17].
Authoritative Tracking - Malicious parties may abuse V2V communication or an OBE may malfunction and generate spurious messages. Before an authority can revoke the misbehaving or malfunctioning OBE, authorities need a way to identify the OBE based on the contents of a message and some other data (e.g., a
Appendix Volume 3 H-1-6
VSC-A Final Report: Appendix H-1 V2V PKI Security Management – Perrig and Studer
sequence number in a certificate and database linking that number to a vehicle).
Sybil Prevention - In a Sybil attack [4], one physical entity can pose as multiple entities during electronic communication. In V2V applications, there is no legitimate reason for one vehicle to pose as multiple vehicles in V2V communication. As such, a source is limited to a one-to-one mapping from current valid credentials to valid registered vehicles. However, if a malicious party steals X certificates and private keys from X vehicles, the malicious party can send messages as though it were X different vehicles.
2.2 Threat Model
In this subsection, the different threats that are related to a V2V PKI are discussed. Specifically, the different goals a malicious entity may have and the varying means an entity may have to carry out those goals are described.
When attacking a V2V PKI, a malicious party has a number of different goals:
Impersonate a Valid OBE - An attacker (with or without a vehicle) may want to impersonate a different valid OBE. This can be a targeted attack (e.g., an attacker impersonates the car in the next lane) or undirected attack where the goal is to pose as any valid vehicle outside of the attacker's control.
Use Invalid/Revoked Credentials - After authorities detect abuse, an attacker will want to use credentials for as long as possible. Depending on the infrastructure available, some recipients may lack recent revocation information and thus accept no longer valid vehicles' credentials for an extended amount of time. Given finite bandwidth and connectivity, an attacker will always be able to use invalid credentials for some period of time. However, techniques exist to limit that usage to minutes rather than weeks or longer.
Elude Misbehavior Detection - If misbehavior detection is imperfect, a malicious party may try to avoid being caught misbehaving. In schemes where majority voting is needed, a malicious party can use a set of valid identities to vote for itself and thus prevent revocation.
Evict Legitimate Vehicles - A malicious party could perform a targeted attack against a vehicle and vote to have the victim evicted in a misbehavior detection scheme. In schemes where vehicles frequently contact a service to acquire new certificates, an attacker could launch a DoS attack which prevents victims from acquiring new certificates. However, an attack that prevents access to the certificate service could consist of jamming the physical layer of the wireless network or attacking connections on the Internet. However, such DoS attacks are outside of the scope of this work and thus not discussed in the remainder of this document.
Identify a Vehicle Based on a Wireless Message - An attacker may wish to identify a vehicle based purely on a wireless message. During a successful attack, an eavesdropper overhears a VANET message and, without seeing the vehicle, can determine the VIN, license plate number, or some other personally identifiable information.
Appendix Volume 3 H-1-7

VSC-A Final Report: Appendix H-1 V2V PKI Security Management – Perrig and Studer
Track Other Vehicles - Even if an attacker fails to link a message to a physical vehicle, the attacker may determine multiple messages came from the same sender. For example, an attacker may be unable to determine which vehicle is using certificate X , but can identify any message signed using the key from X . Given vehicles move in easy to predict patterns based on road layout and speed limits, an attacker associating two messages with the same vehicle within a short period of time is of little concern. However, an attacker that can associate messages that are generated minutes or hours apart and are broadcast miles apart is a violation of the driver's privacy. To help quantify the threat associated with an attacker, what kind of capabilities a malicious party may have on a range dimensions are considered.
Access to Legitimate OBEs' Credentials - An attacker can learn keys for one or more legitimate vehicles. With enough money, a malicious party can simply buy a large number of vehicles. If keys are assigned during annual inspections, garage owners may be able to collect private keys before installing them in vehicles. If OBE storage is accessible while the vehicle is parked, a malicious party could crawl under a parking lot full of vehicles to learn a large number of keys.
Access to Various Entities' Data - An attacker may gain access to information in a CA's database or a data network that is used to manage the PKI. Successful exploitation of a vulnerability or an insider attack could permit access to this data.
Computation - An attacker's computation capabilities can range from a single computer to the resources of a nation-state.
2.3 Cost Model
To help analyze various security solutions, the monetary costs associated with implementing and attacking a given solution are quanitifed in this section. Costs need to be considered for different stake holders. Wherever applicable, costs incurred by government, industry, and consumers are split up. Industry costs can be furthermore split up into manufacturer, service stations, and insurance agencies.
Implementing a solution can have both one-time and recurring costs. One-time costs include items such as HW for vehicles and authorities. Recurring costs include fees associated with renewing keys, maintenance associated with infrastructure, and pay to support authorities' employees. The more work an authority must perform, the greater the recurring costs.
Malicious entities' capabilities are often limited by the funds available. For example, an attacker can buy N cars and extract the N keys to launch a Sybil attack with N identities. An attacker could also bribe/hire an insider to leak information from an authority to violate a driver's privacy or learn valid private keys. Finally, an attacker could buy more machines or rent compromised machines to parallelize and speed-up attempts to brute force cryptographic secrets.
Appendix Volume 3 H-1-8

VSC-A Final Report: Appendix H-1 V2V PKI Security Management – Perrig and Studer
3 Case 1: Zero Connectivity
This scenario represents the setting where vehicles may have some data installed during manufacturing or a periodic registration/inspection. However, any other communication between the certificate authority and a vehicle is very rare. In the remainder of this section, how the PKI can fulfill the various properties set forth in Section 2, how an attacker can launch attacks against those properties, and the amount of data sent between the CA and vehicles using the various approaches are discussed.
3.1 Acquiring and Revoking Certificates and Keys
With no messages to or from an authority, key/certificate installation and revocation of vehicles requires a mechanism outside of V2V communication. During annual inspection/registration, keys and certificates can be uploaded to the car. With so much time between acquiring keys, this approach requires storage to hold a year's worth of keys and presents the possibility of key theft. Once keys are disseminated, without a way to disseminate revocation information, the only way to remove a participant from V2V communication is to wait for the certificate to expire or have an authority physically disable the radio.
As part of an annual inspection or registration, a mechanic or owner can install certificates in the vehicle. Ideally, the certificate installation process will involve bi-directional communication such that the vehicle will randomly generate key pairs and request a certificate from the authority. However, the authority could act in a non-interactive fashion and generate and dispense both asymmetric keys and certificates. In both cases, the system must protect (e.g., encrypted with transport layer security (TLS)) the connection between the CA and the vehicle/garage/home computer. Otherwise, eavesdroppers can easily associate a certificate with a car (and learn the private key if the CA generates the keys). During certificate generation, the authority can record the vehicle and the certificates granted in a database to allow tracking if abuse is ever detected. This annual installation of keys presents a recurring cost. A small fee associated with key updates on the order of $10 per vehicle should provide authorities with ample funds to cover operational costs, provided the majority of vehicles utilize V2V capabilities.
Once keys (or any secrets) are installed in a vehicle, those keys will remain on the vehicle and be valid for the remainder of the year (and possibly longer to enable operation when a user forgets to schedule their annual inspection). There is a threat that physical access to the vehicle will allow a malicious party to steal the secrets. This physical access can occur while the car is left unattended or when an attacker may access the interior of the car (e.g., during a trip to the mechanic).
When left parked unattended, if a key(s) is stored in tamper-proof HW, malicious parties will be unable to steal secret keys and certificates. However, a tamper-proof HW costs thousands of dollars [10]. Smart cards or Trusted Platform Modules (TPMs) [7] could provide a cost-effective alternative with prices around $1 per vehicle. These tamper-resistant devices are vulnerable to attackers with physical access. However, successfully extracting secrets from these technologies is challenging and can be expensive. Extracting secrets from a smart card can be accomplished through a side-channel attack
Appendix Volume 3 H-1-9

VSC-A Final Report: Appendix H-1 V2V PKI Security Management – Perrig and Studer
(such as time-, RF-, or power consumption-based analysis) during operation or removing the card and directly scanning memory or reverse engineering the circuitry. TPMs are vulnerable to physical attacks, but most attacks are related to attestation rather than storage of secrets.23 The tools associated with extracting secrets from TPMs or smart cards (e.g., probes and analyzers for power analysis) can cost thousands of dollars. This is a one-time cost associated with the analyzing HW and can be used to extract multiple keys from several vehicles as part of a framing attack. However, if an attacker's goal is to launch a Sybil attack, an attacker could save money by buying a few used cars. In addition, inexpensive tamper-proof enclosures (e.g., steel boxes with tamper-proof screws) could prevent attackers from covertly accessing the card/module of unattended vehicles. Finally, simple and low-cost tamper-response circuitry could also help deter all but the most determined and sophisticated attackers.
If a malicious party can access the inside of a vehicle (e.g., as a mechanic), a malicious party may be able to extract secrets from the OBE's memory. TPMs and smart cards can protect secrets from some attacks but lack the processing power to perform signature generation at the 10 Hertz necessary for V2V communication. As such, the system may store secrets on secure mediums but expose the secrets during use. Unfortunately, tools that cost less than $100 24 allow access to a vehicle's computer and potentially any information stored within. In addition, access with such tools may be hard to differentiate from legitimate uses. SW defenses must be in place to enforce access control such that any read accesses from the general system bus to the vehicle's key storage are forbidden. Assuming such defenses are possible in SW or the OBE bus is easily isolated in HW, these defenses should be relatively inexpensive. These attacks are also difficult to launch since these key extraction activities require access to the vehicle's bus and memory while the vehicle is running. This would require the attacker to pose as a mechanic, valet, or any other position that would grant such access.
When a given vehicle is revoked, the lack of communication prevents authorities from informing other vehicles about the revocation. As such, the only way to remove a given certificate from use is to have some authority (e.g., police) to physically locate the vehicle and disable the radio or wait until the certificate disappears. If keys are revoked as a result of selling or wrecking a vehicle, users can simply wipe the memory before handing over the vehicle. However, if malicious users are being revoked, someone will need to pay for the expensive task of physically locating and disabling radios. Police are already overworked, so more police or a new organization will be needed to perform this task. Hiring, training, and equipping these ”revokers” will cost a large sum of money and incur significant recurring costs. Waiting until the certificates expire at the end of registration provides an unacceptable delay. Under both scenarios, malicious parties can easily operate during an extended time period until the compromised certificate is removed from use. As will be discussed later with misbehavior detection, policies, rather than technology, may be the only way to prevent abuses of V2V given the inability to efficiently evict malicious entities when communication is unavailable.
23http://www.cs.dartmouth.edu/ pkilab/sparks/24http://www.obd2allinone.com/sc/details.asp?item=obd2ser
Appendix Volume 3 H-1-10

VSC-A Final Report: Appendix H-1 V2V PKI Security Management – Perrig and Studer
3.2 Protecting Driver's Privacy
Generating ”privacy-preserving certificates” is fairly straightforward, assuming the link between the certificate authority and the intended vehicle is secure. All the CA must do is remove any identifying information from the certificate. However, to prevent eavesdroppers from tracking a vehicle based on a single certificate, vehicles either need to have multiple certificates [8], [9], [12], [16] or anonymously generate their own certificates [2]. Once a vehicle can use different certificates or make its own certificates it is infeasible for a stationary attacker to track a vehicle. However, small design changes are needed to prevent Sybil attacks if these schemes are used.
During the annual inspection/registration, the certificate authority can provide a vehicle with multiple certificates. Every few minutes, the vehicle will use a different certificate to sign messages. To prevent a vehicle from simultaneously using multiple certificates, the certificates should contain non-overlapping timestamps. The disadvantage to this scheme is that with short, valid periods a vehicle requires a large number of certificates to cover every possible minute of the year. If each certificate is valid for 5 minutes, a vehicle needs to store over 105,000 certificates per year. With less than 256 bytes per certificate and key pair, storage of authenticators requires 10s of megabytes. However, generating this many certificates for each vehicle does require significant computation for the CA. If the PKI is very small (i.e., only one or two CAs for a large number of vehicles), CAs may need significant HW to support signature generation. With so many certificates per vehicle, a simple database that maps a unique certificate ID to a driver is inefficient. Instead each certificate should contain a ciphertext copy of the driver's ID such that only the CA can decrypt the data.25 This will allow the CA to easily recover the identity of a driver based on the certificate associated with the message.
Rather than having the CA make all of the certificates, vehicles can use group signatures [1] to anonymously generate their own certificates [2] (see Section 8 for an overview on Group Signatures). In this scenario, vehicles using a given CA are part of the same group. Verifying the signature proves that the signer was a member of the group, but it is impossible to determine which member without the CA's group manager information. In this approach, the CA only provides a vehicle with one piece of information, a unique group member key, and records which vehicle received which key. Using group signatures to sign every V2V message is computationally too expensive so instead the group signature is used to generate certificates. A vehicle can generate traditional asymmetric keys as frequently as desired and will use a group signature to generate the corresponding certificate. The group signature on the certificate proves the certificate is from a valid vehicle. If necessary, the CA can use its secret to determine which group member generated a certificate and thus determine which vehicle generated a message. However, determining which vehicle generated a group signature requires time linear in the size of the group for the CA. Without a way to determine that a given vehicle generated a signature, a malicious vehicle could generate multiple certificates that are valid at the same time to launch a Sybil attack. To prevent such an attack, Boneh and Shacham [1] propose using less random information in the group signature. Rather than
25Of course randomized encryption is needed. If Electronic Code Book (ECB) mode encryption was used every certificate for a vehicle would have the same ciphertext.
Appendix Volume 3 H-1-11
VSC-A Final Report: Appendix H-1 V2V PKI Security Management – Perrig and Studer
random numbers, each signature will contain a number corresponding to the current interval. With standardized intervals, if a single vehicle generates two certificates in the same interval using a single group members' information, others will be able to determine that the two certificates were generated by the same group member. The additional cost associated with using group signatures and allowing vehicles to generate their own temporary certificates is minimal. This only requires the use of slightly faster HW in vehicles to handle the additional computation associated with group-signature-based certificates.
Once a vehicle has multiple certificates, changing certificates frequently can prevent eavesdroppers from associating various messages from vehicles. However, there is a small probability that an eavesdropper is present when a vehicle changes certificates. In that scenario, the eavesdropper may associate the old certificate with the new certificate. To increase eavesdropping capabilities, an attacker could construct a sensor network along roads to listen for key changes and track vehicles. To prevent eavesdroppers from associating old and new certificates, a set of vehicles has to collaborate to change certificates simultaneously [17]. However, there is a trade-off between the communication needed to coordinate the change and the number of vehicles changing certificates (and thus the level of tracking prevention achieved).
3.3 Misbehavior Detection and Reporting
Without a way to report malicious activity, misbehavior detection and reporting may remain as a task for specialized vehicles such as police cars, fire trucks, or ambulances which may have other means to contact the CA and request revocation. However, if these special vehicles do not overhear malicious or fake messages, authorities may miss the majority of V2V abuses. One exception could be messages that cause or are transmitted near an accident. After the accident, an Event Data Recorder (EDR) could relay suspicious messages to authorities. Authorities' vehicles will already possess V2V capabilities, and, thus, the only additional cost to implement misbehavior detection in this fashion would be the development of SW to run on vehicles which determine when misbehavior occurs.
One can think of this limited detection ability much like traffic violations today where few violations are detected and fear of punishment is the major factor preventing abuse. Previously, punishment for breaking traffic laws only occurred when a policeman witnessed the event or evidence at an accident proved reckless driving had occurred. With such limited detection capabilities, the best way to deter abuses of V2V would be large fines or jail time.
3.4 Data Sent Between the CA and Vehicles
In this subsection, a rough approximation of the amount of data that a CA will distribute to vehicles based on an accepted solution are presented. Given that vehicles lack any means to communicate with a CA during operation, all of this communication must occur during annual registration/inspection. For this model, it is assumed N total vehicles under the control of a CA, an ECDSA certificate is C bytes long, and a public/private key pair is K bytes. If multiple installed certificates are used for privacy, each vehicle
Appendix Volume 3 H-1-12

VSC-A Final Report: Appendix H-1 V2V PKI Security Management – Perrig and Studer
1will change certificates at a frequency F (e.g., F = means each certificate is only 120
valid for 2 minutes). If each vehicle uses a group signature to generate its own certificates, the CA will have to send the group public key (CG ) and one group member private key to each vehicle ( KG ).
225With approximately seconds in a year, the following equation describes the number of bytes a CA will have to distribute to provide all N vehicles with short-lived public/private key pairs and certificates.
225N (C K )F (1)
1With 1 key pair for every 2 minutes ( F ), 117 byte certificates, and 64 bytes for27
each ECDSA-256 public/private key pair, the CA must distribute roughly 45.25 MB per vehicle.
When vehicles use group signatures to generate their own short-lived keys, the amount of data distributed is much smaller. Each vehicle only receives a single copy of the public key and its private group key.
N (CG KG ) (2) When using the suggested group signature (see Section 9), the group public key is 3 items from the group, and the private key is 2 items. If using 256 bit EC, the public key requires 96 bytes, and the private key requires 64 bytes. A CA will have to distribute 160N bytes in total. However, group signatures require additional computation and bandwidth during vehicle interaction to exchange short-lived certificates and complete authentication.
3.5 Summary
Table 1 contains a summary of how a PKI can fulfill the various properties from Section 2 in the absence of any communication between vehicles and the CA.
Table 1: Summary of Approaches to Secure a V2V PKI without Communication
Goal Potential Solution Cost Drawbacks Certify Valid
Vehicles Install
certificates/keys during annual
inspection/registration
Small recurring annual fee
Secrets are on vehicles
for long periods of
time
Appendix Volume 3 H-1-13

VSC-A Final Report: Appendix H-1 V2V PKI Security Management – Perrig and Studer
Goal Potential Solution Cost Drawbacks Revoke Vehicles
Police disable radios Significant recurring cost of
supporting authorities
Delay between
revocation and locating
vehicles Wait for certificate to
expire Zero Average
delay is 1/2 of a year
Protect Secrets
Tamper-proof HW Thousands per vehicle
Cost
On Vehicles Smart card or TPM $1 per vehicle
Vulnerable to
sophisticated physical attacks
Privacy Install multiple certificates
Significant computation
for certificate generation
CA computation
Group signatures so vehicles generate
their own certificates
Faster OBE HW to support
group crypto
Complexity of group
signatures
Track Misbehavior
Certificate ciphertext allows CA to identify
vehicle
Small computation
per certificate
Track Group Signature
Depends on number of vehicles tracked
Sybil Prevention
Extensions to privacy schemes
No additional
cost
Case 2: Unidirectional Connectivity
Communication from an authority to vehicles could be implemented via a satellite downlink or over a wide-area radio transmission. Satellite downlinks and digital radios provide unidirectional communication that is available most of the time with outages on the order of a few minutes due to various obstructions (e.g., foliage, urban canyons, or tunnels). Such high availability to communication comes with the per-vehicle cost of installing HW to receive the signal. However, satellite and high definition (HD) radios
Appendix Volume 3 H-1-14
4

VSC-A Final Report: Appendix H-1 V2V PKI Security Management – Perrig and Studer
are becoming more popular; and drivers desire them in order to listen to music, news, weather, etc. Once such radios become standard equipment, V2V authorities can piggyback data over one or both of those mediums without requiring specific vehicular network HW.
Communication to vehicles only makes a difference with respect to some PKI properties. The major change is how revocation is performed. With communication from the authority to the vehicles, removal of vehicles is possible using a range of mechanisms, distribution of revocation information or short-lived certificates. Vehicles still need some type of initial installation and interaction with an authority. However, once the vehicle has established trust with the CA and a secure channel can be established, annual renewal can be performed over the network, rather than visiting a garage, lowering costs associated with certifying vehicles. The approaches to achieving privacy also remain the same (i.e., multiple installed certificates or group signatures). However, CAs could perform certificate generation in batches and deliver certificates closer to when they are needed. The CA's total amount of computation performed would remain the same (unless a vehicle is revoked and no longer requires certificates). However, the cost for OBE key storage would be less since key storage could be smaller. Finally, without a way to report back to an authority, misbehavior detection will remain the same as in Case 1.
Given revocation is the only operation that changes based on one-way communication this document only discusses it in the remainder of this section. The document also discusses the data exchanged as a result of the different solutions that assume one-way communication from the CA to vehicles.
4.1 Revocation Via One-way Communication
Once an authority can send information to vehicles, removal of vehicles from the V2V community without physically disabling the radio is possible. The CA can use the connectivity to push out new short-lived certificates to still valid vehicles or to distribute information about vehicles that are no longer valid as part of CRLs.
Delivering New Short-Lived Certificates - To prevent revoked vehicles from communicating, the CA can generate batches of short-lived certificates (e.g., enough certificates for a few days) and only provide new certificates for still valid vehicles. As such, whenever a vehicle is revoked, the CA will stop providing certificates for the vehicle in question. There are two possible approaches for this: periodic delivery of new keys and certificates or delivery of decryption keys which allow a vehicle to decrypt previously received certificates and keys.
When delivering new certificates, the CA will encrypt new certificates using the receiving vehicle's public key (or an established shared secret) and broadcast ciphertext containing the new certificates. The major drawback of this approach is the bandwidth needed to deliver new certificates to all still valid vehicles and the minimum lifetime of certificates. With satellite communication and millions of vehicles on the road, it would take some time to send one new certificate to every vehicle over the channel. In addition, the broadcast will need to repeat some certificates since the recipient vehicle may be off or unable to access the update at the appropriate time, increasing the bandwidth needed to update one certificate per vehicle. This slow update rate would require the use of longer
Appendix Volume 3 H-1-15

VSC-A Final Report: Appendix H-1 V2V PKI Security Management – Perrig and Studer
certificate lifetimes. With longer lifetimes for a single certificate, the delay to revocation will be longer, and privacy may suffer since vehicles will change certificates less frequently.
Rather than broadcasting the new certificates, an authority could install a year's worth of encrypted certificates and keys during an annual inspection and periodically disclose the decryption keys needed to reveal the underlying certificate and keys to the vehicle. Now the authority only has to broadcast a decryption key to allow a vehicle to access the next certificate. If a vehicle is revoked, the authority will keep the decryption key secret preventing the revoked vehicle from accessing any of its encrypted certificates. This drastically reduces the bandwidth consumption on the broadcast channel since the CA must only broadcast a decryption key (16 bytes) instead of a certificate and the corresponding key pair (181 bytes). In addition, a single broadcast key can be used to reveal multiple certificates allowing shorter certificate lifetime and better privacy. Finally, the decryption keys for a single vehicle could be part of a one-way hash chain [13] which enables a receiver to recover any older decryption keys (and thus older certificates) from the reception of one key without revealing any of the future decryption keys. Delivering Revocation Information - Rather than updating only valid vehicles, a CA could disseminate information about what vehicles are no longer valid as CRLs (lists of revoked certificates), invalid certificate identifiers [8], or revocation tokens (revocation information used to identify no longer valid group members). Now the broadcast messages will contain a list of no longer valid vehicles (or data which allows a vehicle to compute which certificate identifiers are no longer valid). One advantage of this approach is that after a vehicle downloads the revocation information, the receiver can use V2V to distribute the new information to other vehicles with out-of-date revocation information. Given the dynamic nature of the V2V network, data can quickly spread from a single vehicle to a large portion of the network if an infection algorithm is used [11]. However, distributing revocation information via V2V communication will consume additional DSRC bandwidth for security overhead. Another drawback is that OBEs must store the list of revoked vehicles to determine if a newly encountered vehicle is still valid. With short-lived certificates, Bloom filters can reduce the space required to check the validity of a newly encountered certificate but do present the possibility of a false positive (i.e., a not-yet-revoked vehicle labeled as revoked). To avoid a false positive, authorities could give vehicles the option to choose one of many certificates at a given time such that the probability of every available certificate being in the Bloom filter is small [8]. However, the option to use multiple certificates at the same time allows malicious vehicles to launch a Sybil attack.
Authorities could use a combination of the techniques to achieve various tradeoffs between efficiency and security. Vehicles could download new certificates for the next few days/weeks/months and only have to store revocation information for the same interval. After an interval is over, still valid vehicles will download new certificates, discard CRL information from the last interval, and only accept other vehicles with new certificates as valid. Future research should investigate the number of vehicles which may realistically be revoked in a year (or some other interval) to determine which approach requires the least storage and communication.
Appendix Volume 3 H-1-16

VSC-A Final Report: Appendix H-1 V2V PKI Security Management – Perrig and Studer
When using one-way communication to update certificates or revocation information, attackers may try to intercept or block communication. Malicious parties could attack these messages and try to pose as other vehicles, track other vehicles, continue to use invalid credentials, or simply prevent other vehicles from operating.
During certificate updates, an attacker may try to intercept and decrypt the new certificates to learn secrets and pose as or track the intended recipient. However, provided proper cryptography is used and the recipient's long-term secret(s) is secure, it is infeasible for anyone who intercepts the message to recover the contents of the certificate update.
When the system uses revocation lists to exclude invalid vehicles, malicious parties could try to block the revocation information to prevent revocation or utilize errors in space-saving structures to revoke legitimate vehicles. Blocking satellite communication in a small area is relatively easy given the low power used in satellite communication. However, broadcasting noise on a restricted channel can lead to fines or other punishments from the FCC. In addition, significant infrastructure may be needed to block a large portion of the V2V population from receiving revocation information. Once a few vehicles receive the CRL update, the V2V network can help distribute the revocation information.
If vehicles store revocation information in Bloom filters or use other probabilistic checking methods, malicious parties may try to have legitimate vehicles incorrectly evicted from the V2V network due to errors in the probabilistic checks. However, the authorities can specify parameters such that the probability of a false positive is negligible based on the expected number of revoked vehicles. An attacker could then go buy a number of vehicles and have their certificates revoked, generating more than the expected number of revocations, and increasing the chance of a false positive. However, such an attack would require a malicious party to buy vehicles and have those vehicles revoked, effectively rendering those vehicles useless with respect to V2V.
4.2 Data Sent Between the CA and Vehicles
When distributing short-lived certificates or revocation information, the amount of information a CA must distribute depends on how many vehicles are revoked at a given time. For simplicity, the following model assumes the system starts with N vehicles at time 0 (12:00:01 am January 1) and the number of vehicles revoked at time t is R(t) . It is also assumed that the distribution of revocation or new certificates is perfect in that the CA only must broadcast the information once.
With short-lived certificates, the CA must send out certificates for all of the not-yet-revoked vehicles. If zero vehicles are revoked, the CA must distribute the same amount of information as if no communication was possible (see Equation (1)). However, as vehicles are revoked, less data is sent over the broadcast medium.
tF (N R(t))(C K )dt = (3)
0
F (C K )(Nt R(t)dt) (4)0
t
Appendix Volume 3 H-1-17

VSC-A Final Report: Appendix H-1 V2V PKI Security Management – Perrig and Studer
As an example, consider the scenario where P percent of the vehicles are revoked
uniformly over the course of the year (i.e., R(t) = PN 2t 25 ). In that scenario, the CA will
have to distribute F (C K )(Nt PN t 2
) = F (C K )Nt(1 P t ) bytes up to time 25 262 2 2 t . With 10 percent of the population revoked in a year and the same certificate update parameters as before (see Section 3.4), the CA will have to distribute 45075660.8 N bytes or roughly 42.99 MB per vehicle.
With decrypted short-lived certificates, the CA will first distribute all of the encrypted key pairs and certificates (see Equation (1)) and later broadcast the decryption keys needed to access the certificates and keys. In this scenario, the CA will periodically broadcast a small decryption key of size k for every not-yet-revoked vehicle. Given that a single key can decrypt multiple certificates, there is now a decryption key frequency ( FD ) that can be much smaller than the certificate frequency ( F ). The amount of data broadcast can be approximated as follows.
tFD (N R(t))kdt = FDk(Nt
tR(t)dt) (5)
0 0
Overall, encrypted certificates require a CA to transmit more data but require the CA to consume less bandwidth on the broadcast channel. For example, if a single decryption
1allows a vehicle to access a day's worth of certificates ( FD = ), each decryption 86400
key is 16 bytes and 10 percent of the population is revoked in a uniform fashion, then the
CA must broadcast FDkNt(1 P t 26 ) up to time t or roughly 5903 N bytes over the
2 course of a year.
Distribution of revocation information will require the CA to send more information in total since the CA will begin by distributing a year’s worth of keys and certificates to all vehicles before distributing revocation information. If initial distribution of data can occur out-of-band (i.e., the scenarios discussed in Section 4) and few vehicles are revoked, an approach that distributes revocation information will put less stress on bandwidth–confined, one-way channels (i.e., satellite broadcasts). With short-lived certificates, revoking a vehicle means the CA must distribute revocation information about all of the revoked vehicle's remaining certificates. If certificates of length C are distributed to revoke vehicles, the following equation describes the amount of revocation data the CA will distribute.
25tCFdR(t)/dt(2 t)dt (6)
0
To reduce bandwidth consumption, the CA could distribute a hash of the certificate of length H , rather than the entire certificate. Using the same uniform revocation of P
t 2
percent of vehicles, the CA will have to distribute CFPN (t 26 ) up to time t or 2
Appendix Volume 3 H-1-18

VSC-A Final Report: Appendix H-1 V2V PKI Security Management – Perrig and Studer
25 24 24CFPN (2 2 ) = 2 CFPN . Over the course of a year, a CA will broadcast PN 14.625MB if using distributing certificates of length 117 or PN 2MB if using 16 byte MD5 hashes for revocation in addition to the initial 45.25MB per vehicle.
When using a Pseudo Random Function (PRF) to generate a vehicle's certificate identifiers, the authority only has to distribute the key for the PRF. Based on this key, vehicles can calculate all of the revoked vehicle's certificate IDs. As such, revoking a single key only requires a single message that is the size of the PRF key ( KP ).
KPR(t) (7)
With a PRF key of 16 bytes and 10% of the population revoked, the CA will broadcast 1.6N bytes over the course of a year.
When using group signatures to generate temporary certificates, the authority only has to distribute one revocation token of length A (32 bytes if using 256 bit elliptic curves) per vehicle that is revoked. Up to time t , a CA only has to distribute the following amount of data to revoke vehicles.
AR(t) (8)
Using the same running example of a uniform revocation pattern, the CA will distribute t t tAPN 25 = 32PN 25 = PN 20 by time t . Over the course of a year, the CA would
2 2 2 broadcast 32PN bytes for group member revocation and 160N bytes during the initial keying.
4.3 Summary
Within this section, five potential solutions were discussed which leverage one way communication to revoke misbehaving vehicles while maintaining driver privacy:
[ New Certs. ] Broadcast short-lived certificates for still valid vehicles.
[ Dec. Keys ] Install a year's worth of encrypted short-lived certificates and broadcast decryption keys for still valid vehicles.
[ CRL ] Install a year's worth of short-lived certificates and broadcast certificate revocation lists to identify no-longer-valid certificates.
[ PRF Keys ] Install a year's worth of short-lived certificates with PRF generated IDs and broadcast the key to the PRF to identify no-longer-valid vehicles.
[ Tokens ] Install a group member key and broadcast revocation tokens to identify revoked vehicles.
Each scheme has various advantages, disadvantages, and costs. All of these schemes require the owner/manufacturer to install a radio to listen to the broadcast medium and send the received data to the OBE.
Appendix Volume 3 H-1-19

VSC-A Final Report: Appendix H-1 V2V PKI Security Management – Perrig and Studer
Broadcasting new certificates requires the CA to distribute the least data but requires high bandwidth and availability of the broadcast channel. Without an initial installation of a year's worth of data, the CA only distributes data about still valid vehicles. This also removes the need for a large annual installation, removing the need for the vehicle to drive somewhere once a year. This is mostly an advantage for states which lack an annual inspection (e.g., Maryland only requires inspection when a vehicle changes ownership). However, this comes at the cost of broadcasting a large amount of data on the broadcast medium. Broadcasting so much data on satellite or digital radio would require multiple channels/stations and would represent significant cost to the CA. Our data calculations assume vehicles can hear every message the CA broadcast. However, in practice a vehicle may miss a certificate broadcast due to the vehicle being out-of-range or turned off. In such scenarios, the CA should broadcast the certificate again to ensure valid vehicles always have valid certificates. If access to the broadcast medium is limited, greater bandwidth is needed to ensure vehicles always have valid certificates.
When a CA broadcasts decryption keys, less broadcast bandwidth is needed but some form of an annual large download is required. The small size and flexibility associated with decryption keys presents a significant bandwidth savings over broadcasting the certificates. A single decryption key could reveal multiple certificates to a vehicle, reducing the amount of data broadcast from several kilobytes to less than 30 bytes. However, the CA must balance how many certificates a key decrypts (i.e., the bandwidth savings) with how many certificates a revoked vehicle can access revocation (i.e., the delay until a vehicle runs out of decrypted certificates). To install the encrypted certificates, the vehicle requires a large download as part of an annual inspection/registration using some medium other than the broadcast medium. Establishing the infrastructure to deliver a year's worth of keys will cost money for the CA both in terms of technology and human operators. However, if bandwidth on the broadcast medium is expensive, offloading the majority of the data distribution to another channel may save money.
Using CRLs represents the least-bandwidth-efficient means to manage vehicles when using a broadcast medium. If CA-signed, short-lived certificates are being used (as opposed to group signature signed certificates), the only advantage to CRLs is that vehicles are unable to launch small-scale Sybil attacks. Otherwise, using a PRF key requires the CA to distribute less data while achieving the same properties. With respect to cost, this approach would cost roughly as much as distributing decryption keys depending on how many vehicles are revoked. If few vehicles are revoked, the CA would have to distribute little data and would consume even less bandwidth (possibly reducing CA costs associated with broadcasts). However, if numerous vehicles are revoked, the CA may need more channels to broadcast all of the revocation information and vehicles may need more memory, a manufacturer cost, to hold the revocation information without accidentally revoking a vehicle based on a Bloom filter.
If a keyed PRF is used to generate certificate IDs, the CA can broadcast the key to revoke a vehicle while consuming little bandwidth and reducing storage requirements. However, to prevent accidental revocation of valid vehicles, each vehicle can use more than one certificate at a given time and thus can launch a Sybil attack. Compared to CRLs, this
Appendix Volume 3 H-1-20

5
VSC-A Final Report: Appendix H-1 V2V PKI Security Management – Perrig and Studer
approach will cost less due to lower bandwidth requirements for CAs and smaller memory requirements for OBE.
If vehicles use group signatures to generate their own short-lived certificates, CAs have to distribute the least amount of data. However, this approach is computationally intensive and may require increased processing and memory resources. With group signatures, the CA must distribute a single group member key to each vehicle once a year. To revoke a vehicle, the CA must distribute a revocation token which is roughly 32 bytes. Given how revocation checks are performed for group signatures, receivers must store all of the revocation tokens over the course of the year rather than using a Bloom filter or some other space-saving mechanism. Group signatures are also more computationally expensive to generate and verify, increasing the computation associated with verifying a newly encountered certificate represents a valid vehicle. Attackers could also broadcast invalid group signatures as a way to launch a computational denial of service attack against V2V. These additional computation and storage requirements would increase the cost for vehicle manufacturers and ultimately consumers.
Case 3: Limited Bidirectional Connectivity
Access to WiFi networks or a sparse deployment of RSE could allow a vehicle to send data to and receive data from an authority over the Internet. These connections may be periodic (i.e., at most once an hour) but provide high throughput during the connection.
Vehicles could periodically contact an authority over the Internet via WiFi. With WiFi, vehicle owners with fixed parking spots (e.g., off-street parking) could use a home or parking garage provided WiFi network and would add little to no additional cost since Internet connectivity in a home is already common and garages could distribute the cost across all drivers who rent spaces. Changes to vehicle HW would be minimal since vehicles would only need to have the radios use 802.11b, g, or n, in addition to 802.11p for V2V communication. However, for drivers without permanent parking spaces, access to WiFi may be limited. Unless access point owners are willing to open their wireless network to strangers, businesses may operate publicly available WiFi and expect some payment for the access. Once away from the parking space and with limited WiFi access, vehicles may only have sporadic connectivity to updates, with downloads or uploads occurring once every few hours (or even days) once outside of a city.
A sparse network of RSE could provide vehicles with periodic connectivity to the Internet. Rather than leveraging existing WiFi networks, RSE would act as a bridge allowing vehicles to connect to the Internet using 802.11p. This approach will save manufacturers money since DSRC would allow V2V communication and periodic access to the Internet via RSE. However, RSE installation and maintenance will introduce additional costs to a managing government or commercial entity.
With a way to send data to an authority, vehicles can now create their own key pairs for use with short-lived certificates and report misbehavior. One drawback to using Internet-based services and limited range communication is the vulnerability to DoS attacks where malicious parties overwhelm the CA's server or jam traffic from the vehicles to prevent communication between vehicles and the CA.
Appendix Volume 3 H-1-21

VSC-A Final Report: Appendix H-1 V2V PKI Security Management – Perrig and Studer
Bidirectional communication only impacts schemes that use short-lived certificates to manage vehicle identities. If revocation lists or tokens are used to remove vehicles, the vehicle will connect to the CA and download new information but has no information to send to the CA.
5.1 Certifying Vehicle Generated Keys
After installing a long-term key pair or group member key, a vehicle can use the bi-directional communication to authenticate itself to the CA and request certificates for vehicle-created key pairs. This approach increases the amount of data transmitted between vehicles and a CA. However, vehicle-generated keys can quell worries that ”big brother” may impersonate a vehicle since authorities will no longer know the private key for every vehicle.
While a vehicle is in range of a WiFi network or RSE, the vehicle can send several certificate requests to the CA and retrieve CA signed certificates in response. This certificate request and response mechanism will consume more bandwidth than uni-directional approaches where CAs distribute certificates and keys to vehicles. During the request for a single certificate, the vehicle will send the temporary public key, a certificate request signed using the temporary private key, and a signature using the vehicle's long-term private key/group member key. In response, the authority will return the certificate for the public key. When CAs generate certificates and key pairs, the CA will only have to send an encrypted copy of the new temporary certificate and the public/private key pair. Compared to the broadcast scenario, a CA can reduce the bandwidth and computation on a given server by setting up different servers to handle requests from different subsets of the vehicles. The cost associated with setting up numerous servers to handle the distribution is high in terms of both HW for the servers and hosting to keep the service running.
With limited bidirectional connectivity, vehicle's requesting short-lived certificates must acquire enough certificates to participate in V2V communication until encountering the next WiFi network or RSE. This wastes bandwidth and allows a vehicle to continue to operate for a short period of time after being revoked. Ideally, a vehicle would know when it will be on the road and only request certificates for those times. However, with limited connectivity, a vehicle will want to acquire enough certificates for the next few hours or days whenever a connection is possible. Otherwise, the vehicle may run out of certificates after being away from WiFi networks or RSE. If a malicious vehicle stockpiles a few days worth of certificates, the malicious vehicle could continue to use those certificates even after being revoked, depending on how revocation is performed. Distributing revocation information would prevent a revoked vehicle from using recently requested certificates. However, this approach uses bandwidth to distribute the revocation information. Instead, a CA could verify a certificate requestor has not-yet been revoked before issuing certificates. In that case, a revoked vehicles is prevented from acquiring new certificates, but can continue to use previously acquired certificates for the next few hours or days.
The major advantage to vehicle's generating their own key pairs is that the certificate authority no longer knows the private key associated with a vehicle's certificate. This
Appendix Volume 3 H-1-22

VSC-A Final Report: Appendix H-1 V2V PKI Security Management – Perrig and Studer
prevents the CA from ever impersonating the vehicle by generating a signature using that private key. However, if the certificate request is signed using a traditional signature, the CA is still able to link a vehicle to its certificates and possibly violate the driver's privacy. If group signatures were used during the certificate request, the CA would need help from the group manager to uncover which vehicle generated the certificate request and thus link a vehicle (and its driver) to a certificate.
5.2 Reporting Misbehavior
Once a vehicle can send data to a CA (or other authority), V2V participants have a means to report misbehavior. However, there are many remaining questions before general V2V participants can use a recorded message and the corresponding signature to influence the CA to revoke a vehicle. Given that some V2V abuses look like legitimate reports (e.g., false claims of braking or reports of debris or ice when the road is clear), authorities will need supporting evidence that a message was misbehavior. Multiple reports about a single event can ensure that some number of vehicles feel the message was misbehavior. However, colluding malicious vehicles could launch a ”slander attack”' where multiple malicious vehicles claim an innocent party was abusing V2V.
5.3 Denial of Service Attacks
Malicious parties are able to temporarily block access to Internet services both at the local WiFi/DSRC connection or at the server. Jamming the WiFi or DSRC network is one way to prevent vehicles from receiving updated keys or new revocation information. Authorities are unlikely to get involved during (or even detect) attacks that jam a small number of WiFi networks or RSE, but a large network of jammers is needed to prevent a significant portion of vehicles from receiving revocation updates if V2V communication is also used to distribute revocation information.
An Internet DoS attack could prevent access to servers for a few days, but sustained attacks will require significant resources (e.g., a large number of compromised machines) and thus large funds.
5.4 Data Between the CA and Vehicles
When vehicles generate their own key pairs and request certificates from the CA, additional bandwidth is needed to send the request to the CA. However, if vehicles start with a year's worth of certificates and keys installed and the servers are used to distribute revocation information, the CAs must distribute the same amount of information as when only uni-directional communication was possible.
If a vehicle generates its own key pairs and certificate requests, the vehicle can request multiple certificates at the same time using a single signature or group signature using the vehicle's long-term secret. As such, the vehicle will still receive a year's worth of certificates,26 but every batch of certificate requests will include one signature generated using the vehicle's long-term private key or group member key. With a smaller batch size
26If a vehicle remains parked and off for extended periods of time, the total number of certificate requests may be smaller since the parked vehicle will not request certificates while parked.
Appendix Volume 3 H-1-23

VSC-A Final Report: Appendix H-1 V2V PKI Security Management – Perrig and Studer
B , vehicles will download fewer certificates at a time and run out of certificates faster when revoked. A larger batch size ensures that a vehicle will have enough certificates even if the vehicle fails to encounter a WiFi network or RSE. Over the course of a year, the amount of data exchanged between vehicles and the CA depends on the frequency of certificate changes, the number of vehicles revoked at a given time, and the number of certificates acquired at a given time. If the vehicle's long-term key is a traditional asymmetric key, a certificate request includes one traditional signature of size S over Bpublic keys of size ( K/2 ) and B signatures from the corresponding private keys (each of size S ).
tF(N R(t))(C K/2 S S/B)dt = F (C K/2 S S/B)(Nt
tR(t)dt) (9)
0 0
With the same uniform revocation of 10% of vehicles, each batch is good for one day's worth of keys ( B = 86400F ), and a signature requires 64 bytes, up to time t the total
t 0.1tbandwidth used is F (C K/2 S S/B)Nt(1 P ) = 1.54Nt(1 ) . In a year, 46.8126 262 2 MB per vehicle are sent between the CA and the vehicle (as opposed to 42.99 MB per vehicle when the CA generates the certificate and the key).
If group signatures are used to sign batches of certificate requests, the request contains a group signature of size SG rather than a traditional signature.
F (C K/2 S SG /B)(Nt tR(t)dt) (10)
0
Under the same scenario as above and a 228 byte group signature, the average communication between the CA and a vehicle is 46.86 MB.
5.5 Summary
Limited bi-directional communication has limited impact on the overall security or cost of V2V. The only difference is that vehicles can now generate their own public/private key pairs and request a certificate from the CA. Under previously discussed techniques, drivers who distrust authorities may argue the CA could impersonate them using the CA-generated private key. However, if vehicles can keep the private key secret (i.e., the OBE lacks any malware or trojans), owners may feel more secure with the knowledge that only their OBE knows the private key. Sending the certificate request to the CA does consume additional bandwidth. However, CA costs will decrease since hosting a web server is much less expensive than broadcasting on a satellite or long-distance radio. Installation of RSE or access to WiFi networks will incur various costs to manufacturers, government agencies, and/or end users. With RSE, manufacturers or agencies will pay to install and maintain the service, but vehicles will require zero new HW or subscriptions. With WiFi, manufacturers will need to implement additional 802.11 protocols for the radios. Finally, a vehicle owner may have to pay for WiFi access if the vehicle is unable to access a free network.
Appendix Volume 3 H-1-24

6
VSC-A Final Report: Appendix H-1 V2V PKI Security Management – Perrig and Studer
Case 4: High Availability, Low-Latency, Bidirectional Connectivity
WiMax, cellular connections to the Internet, or widespread RSE deployment could provide highly available, low-latency communication to and from an authority or some intermediary service. This will allow OBEs to use protocols designed to provide on-demand, short-lived certificates [14], [20]. Such protocols reduce the time to revocation, remove the need to distribute revocation information to vehicles, and reduce bandwidth consumption. Using location-limited, short-lived certificates also improves driver privacy by preventing tracking [20]. One drawback to these schemes is that once a vehicle is revoked, entities can determine which short-lived certificates the revoked vehicle requested and, thus, track where that vehicle has been. In addition, colluding malicious parties can acquire certificates from multiple RAs.
Location-limited, short-lived certificates ensure that vehicles frequently update certificates while protecting driver privacy and reducing bandwidth consumption. In the scheme, vehicles use group signatures to anonymously request short-lived certificates from RAs. RAs are intermediary authorities which issue certificates that are only valid within a specific geographic region that is on the order of a few square kilometers. To reduce complexity, a single CA can act as all RAs and simply use different keys for different regions. When a vehicle requests a certificate for a region, the RA verifies the requester is not yet revoked and responds with a certificate that is only valid within the RA's region for the next few minutes. After those few minutes have passed or the vehicle has left a region, the vehicle must request another certificate from the RA for the current region. Since each new certificate request allows a RA to verify the requester is not yet revoked, revoked vehicles are quickly removed from operation without distributing any revocation information to vehicles (only the RAs need revocation information). In addition, switching certificates as vehicles enter a new region ensures physically nearby vehicles simultaneously update keys, preventing tracing [17], without any explicit communication between the vehicles. The group signature allows an OBE to prove it is still valid without revealing its identity to the RA. Optimizations to the group signature prevent Sybil attacks and allow efficient ( O(1) ) revocation checks. The group signature is constructed such that the RA can detect when the same OBE requests a second certificate while the first certificate is still valid. Finally, since certificate requests are done on-demand, this approach can reduce bandwidth consumption. A vehicle will only request a new certificate while the vehicle is driving and the previous certificate has expired or the vehicle has entered a new region.
When a group member is revoked, the revocation token allows an entity to determine which group signatures that group member generated. If a malicious party can intercept and record the certificate requests which contain group signatures, the malicious party can use later revocation information to track where the revoked vehicle has driven based on the RA associated with a certificate and the messages signed using the private key corresponding to the certificate.
Colluding attackers in different regions can leverage these approaches to acquire n certificates per vehicle if in n regions. For example, if vehicles A and B are colluding
Appendix Volume 3 H-1-25

VSC-A Final Report: Appendix H-1 V2V PKI Security Management – Perrig and Studer
and are in regions and , respectively, A can acquire two certificates in and Bcan acquire two certificates in .
6.1 Bandwidth Between the CA and Vehicles
If all vehicles were to drive 100% of the time (or request certificates for 100% of the time), Equation (10) would describe the amount of data sent between vehicles and the RAs. However, since vehicles only request certificates when they are driving, the amount of bandwidth needed is significantly smaller. For an accurate estimate of bandwidth usage, when a given vehicle is on the road and how frequently the vehicle changes regions (and region size) needs to be determined. With a smaller region size, tracking of a vehicle is more difficult for an eavesdropper since groups of vehicles are simultaneously changing certificates frequently [17]. However, these more frequent certificate changes also mean more bandwidth is consumed. However, if a vehicle (e.g., a taxi cab or bus) were to drive back and forth between two small regions within a short period of time, the vehicle would only need to perform two initial certificate requests and continue to use those same certificates over and over again. Further analysis is needed to determine if these simultaneous certificate changes may provide enough tracking prevention that longer certificate lifetimes are reasonable when in a given region.
6.2 Comparison with Other Approaches
Using location-limited, short-lived certificates has multiple advantages when compared with prior solutions. With frequent certificate updates, RAs can refuse to respond to certificate requests from revoked vehicles, removing revoked vehicles from V2X operation. Since vehicles only request certificates during operation, the total amount of communication between authorities and the vehicles is reduced. The way RAs check certificate requests ensures a single vehicle only receives a single certificate while in a region. Finally, the use of location-limited certificates ensures vehicles entering a region together change certificates together, preventing tracking of vehicles.
The main disadvantage is the need for highly available, low-latency, bidirectional communication with RAs. In addition, the scheme suffers from a lack of privacy for revoked vehicles and the potential for colluding vehicles to launch a Sybil attack. Once a vehicle is revoked, an entity can use the revocation token to determine which previous group signatures (and thus certificate requests) were generated by that vehicle. This enables the association of certificates and their associated region with a given group member, revealing the regions a vehicle has visited. A vehicle can send N certificate requests to N different RAs. If those RAs lack the means to compare recent requests, the vehicle can receive N certificates for the N different physical regions. However, given the vehicle can only be in 1 region at a given time, the vehicle can give N 1 other vehicles certificates (in exchange for more certificates in the current region) for use in the other regions.
Appendix Volume 3 H-1-26

7
VSC-A Final Report: Appendix H-1 V2V PKI Security Management – Perrig and Studer
Remaining Research Challenges
In this section, the area that still needs additional research attention is discussed in order to create the technologies for a viable VANET deployment. The focus will be on research topics in security.
First, security researchers need to know a desired level of security that should be targeted. Absolute security against all attacks is practically infeasible and would be economically infeasible as well. If the level of security is too low, consumers may be concerned to drive in VANET-enabled vehicles. In considering this, researchers need to be given a desired level of required security. For example if an engineer with an undergraduate degree in computer science/electrical engineering is given a budget of $1000, what is the likelihood of faking an Emergency Electronic Brake Light (EEBL) alert that other vehicles will accept as legitimate is below 1 percent within a 5-minute time period.
Specific VANET parameters should be presented, such as: how many vehicles need to be revoked per day, how long a malicious vehicle should be able to remain on the road, what budget is viable per vehicle, per mile of highway, etc. The number of vehicles that may be revoked in a given interval plays an important role when trying to balance revocation versus certificate update costs, or determining if instantaneous revocation checks are feasible when using more complex cryptographic systems.
Once these parameters are defined, researchers need to study trust anchors. Who are the entities that are initially trusted? How would this trust be translated into trust among vehicles? What level of network connectivity can be expected? What authorities need to collaborate to unveil the privacy of a vehicle: is it just the police, or the police and the Department of Motor Vehicles (DMV), or the police, the DMV, and the Department of Justice (DoJ)? Once these trust assumptions are defined, researchers can work out the details of security mechanisms.
In conjunction with trust establishment, location verification mechanisms are needed [19] not just to prevent attackers from claiming false positions but also to filter out malfunctioning vehicles. It is expected that such location validation mechanisms will play an important role in delivering relevant events to drivers.
Furthermore, systems with secure HW need to be studied. Even though a high effort may be able to penetrate relatively inexpensive secure HW mechanisms, such approaches nevertheless offer a defense against a large number of attackers.
To catch attackers who penetrated the secure HW, mechanisms to detect misbehavior must be set in place. This can either occur through monitoring of surrounding vehicles and/or monitoring by roadside infrastructure or law enforcement vehicles.
Finally, an area of critical importance is the development of incentive-compatible security schemes. government, industry (manufacturing, insurance, service stations), and consumers should have incentives to deploy VANETs.
Although this list may appear at first sight like another 10 years of research is required, it seems to us that given the substantial amount of research that was already performed will enable the team to move ahead quickly once the basic parameters and requirements are
Appendix Volume 3 H-1-27

VSC-A Final Report: Appendix H-1 V2V PKI Security Management – Perrig and Studer
clearly defined. However, a concerted effort is needed among academia, government, and industry to make VANET a reality within the next 5 to 10 years.
8 Group Signatures Overview
This section provides some background on group signatures, group member privacy, and the size and computation associated with a group signature. Group signatures were first introduced by Chaum and van Heyst [3]. In contrast to normal signatures, group signatures protect the signer's anonymity. A trusted entity (usually referred to as the group manager) assigns to each valid member of the group a group user key. This group user key allows a member of the group to sign a message and produce a group signature. Group signatures can be verified by anyone using the group's public key. A group signature reveals no information about the signer's identity. Only the group manager can trace the identity of the signer from a group signature. Once a group member misbehaves, the group manager would like to revoke the member such that verifiers can determine if a revoked group member generated a signature.
To allow verifies to check the validity of group signatures, one can use Verifier-Local Revocation (VLR) [1]. In VLR, the group manager computes and publishes a revocation list (RL) consisting of a revocation token for each revoked member. When verifying a group signature, the verifier tests the group signature against all revocation tokens in the RL,27 to make sure that the signer has not been revoked. With VLR, a revocation token allows a party to link a revoked group member to signatures that group member generated. As such, once a group member is revoked, anyone with access to the revocation tokens and a collection of old signatures can determine which signatures that group member generated.
VLR group signatures use bilinear groups, also referred to as pairings [5], where the type of pairing selected presents a tradeoff between the size and computation associated with a group signature. Among known pairing types, type A pairings [15] are the fastest to compute. With Type A pairings, a group signature is 228 bytes long and requires 40 ms to sign and 36 ms to verify on a 3.2GHz CPU [18]. With a similar security level, group signatures using type D pairing are only 149 bytes long. However, type D pairings are roughly 5 times slower than a type A pairing.
9 References
[1] Dan Boneh and Hovav Shacham. Group signatures with verifier-local revocation. Proceedings of the ACM conference on Computer and communications security (CCS), pages 168--177, 2004.
[2] G. Calandriello and Panagiotis Papadimitratos and A. Lloy and Jean-Pierre Hubaux. Efficient and Robust Pseudonymous Authentication in VANET. Proceedings of the Workshop on Vehicular Ad Hoc Networks (VANET), 2007.
[3] D. Chaum and E. van Heyst. Group Signatures. Proceedings of Eurocrypt, 1991.
27Optimizations are possible which make revocation checks O(1) rather than O(| RL |) .
Appendix Volume 3 H-1-28

VSC-A Final Report: Appendix H-1 V2V PKI Security Management – Perrig and Studer
[4] John R. Douceur. The Sybil Attack. Proceedings of the First International Workshop on Peer-to-Peer Systems (IPTPS '02), 2002.
[5] Ratna Dutta and Rana Barua and Palash Sarkar. Pairing-Based Cryptographic Protocols: A Survey. Cryptology ePrint Archive, Report 2004/064, 2004. http://eprint.iacr.org/.
[6] Philippe Golle and Daniel Greene and Jessica Staddon. Detecting and correcting malicious data in VANETs. Proceedings of the Workshop on Vehicular Ad Hoc Networks (VANET), pages 29-37, 2004. ACM.
[7] Trusted Computing Group. TPM Main Specification. Main Specification, Version 1.2 rev. 103, Trusted Computing Group, 2007.
[8] Jason J. Haas and Yih-Chun Hu and Kenneth P. Laberteaux. Design and Analysis of a Lightweight Certificate Revocation Mechanism for VANET. Proceedings of ACM VANET, 2009.
[9] Jean-Pierre Hubaux and Srdjan Capkun and Jun Luo. The Security and Privacy of Smart Vehicles. IEEE Security & Privacy magazine, 2(3):49--55, 2004.
[10] IBM. IBM PCI-X Cryptographic Coprocessor. http://www-03.ibm.com/security/cryptocards/pcixcc/order4764.shtml, 2007.
[11] Kenneth Laberteaux and Jason Haas and Yih-Chun Hu. Security Certificate Revocation List Distribution for VANET. Proceedings of the 5th ACM International Workshop on Vehicular Inter-Networking (VANET 2008), 2008.
[12] Kenneth P. Laberteaux and Jason J. Haas and Yih-Chun Hu. Security Certificate Revocation List Distribution for VANET. Proceedings of ACM VANET, 2008.
[13] Leslie Lamport. Password authentication with insecure communication. CACM, 24(11):770--772, 1981.
[14] Rongxing Lu and Xiaodong Lin and Haojin Zhu and Pin-Han Ho and Xuemin Shen. ECPP: Efficient Conditional Privacy Preservation Protocol for Secure Vehicular Communications. Proceedings of the 29th IEEE Conference on Computer Communications (INFOCOM 2008), 2008.
[15] Ben Lynn. The Pairing-Based Cryptography (PBC) library. http://crypto.stanford.edu/pbc.
[16] Maxim Raya and Jean-Pierre Hubaux. The Security of Vehicular Ad Hoc Networks. Proceedings of the ACM Workshop on Security of Ad Hoc and Sensor Networks (SASN), 2005.
[17] Krishna Sampigethaya and Leping Huang and Mingyan Li and Radha Poovendran and Kanta Matsuura and Kaoru Sezaki. CARAVAN: Providing Location Privacy for VANET. Proceedings of Embedded Security in Cars (ESCAR), 2005.
[18] Elaine Shi and John Bethencourt and Hubert Chan and Dawn Song and Adrian Perrig. Multi-Dimensional Range Query over Encrypted Data. IEEE Symposium on Security and Privacy, 2007.
Appendix Volume 3 H-1-29

VSC-A Final Report: Appendix H-1 V2V PKI Security Management – Perrig and Studer
[19] Ahren Studer and Mark Luk and Adrian Perrig. Efficient Mechanisms to Provide Convoy Member and Vehicle Sequence Authentication in VANETs. Proceedings of SecureComm, 2007.
[20] Ahren Studer and Elaine Shi and Fan Bai and Adrian Perrig. TACKing Together Efficient Authentication, Revocation, and Privacy in VANETs. Proceedings of the 6th Annual IEEE Communications Society Conference on Sensor, Mesh, and Ad Hoc Communications and Networks (SECON 2009), 2009.
Appendix Volume 3 H-1-30

VSC-A Final Report: Appendix H-2
Analysis of Infrastructure and Communications Requirements for V2V PKI Security Management
Prepared by
India Science Laboratory, General Motors Research & Development
Appendix Volume 3 H-2-i

List of Acronyms
CA Certificate Authority
CAMP Crash Avoidance Metrics Partnership
CRL Certificate Revocation List
DoS Denial of Service
DSRC Dedicated Short Range Communications
ECDSA Elliptic Curve Digital Signature Algorithm
FIPS Federal Information Processing Standard
GPS Global Positioning System HMI Human Machine Interfaces
HW Hardware
MDS Misbehavior Detection Scheme
OBU On-board Unit
OEM Original Equipment Manufacturers
PCN Post-crash Notification
PKI Public Key Infrastructure
RSE Road-Side Equipment
RSU Road-Side Unit
SW Software
SYN Synchronization (request)
TADS TESLA and Digital Signature
TESLA Timed Efficient Stream Loss-tolerant Authentication
TTL Time-to-Live
V2I Vehicle-to-Infrastructure
V2V Vehicle-to-Vehicle
V2X Vehicle-to-Vehicle / Infrastructure
VoD Verify-on-Demand
VSC-A Vehicle Safety Communications - Applications
Appendix Volume 3 H-2-i

Table of Contents List of Acronyms........................................................................................... H-2-i
1 Introduction........................................................................................... H-2-1
2 High-level Threat Analysis ................................................................... H-2-3 2.1 Denial-of-Service ........................................................................................ H-2-4
2.2 Creation of Spurious Messages ................................................................... H-2-5
2.3 Circumvention of Misbehavior Detection................................................... H-2-6
2.4 High Level Methodology of Credential Management ................................ H-2-6
3 Denial-of-Service Resilience and Tamper-Resistance ...................... H-2-7 3.1 Denial-of-Service Resilience ....................................................................... H-2-7
3.2 Tamper-resistance and Tamper-evidence .................................................... H-2-7
4 Eviction of Compromised Credentials................................................ H-2-9 4.1 General Consideration on Evicting Misbehaving Entities .......................... H-2-9
4.2 Summary of Observations on Infrastructure Requirement to Evict Misbehaving Nodes ................................................................................... H-2-11
4.3 Misbehavior Detection .............................................................................. H-2-13
4.3.1 Application Layer......................................................................... H-2-14
4.3.2 What is Learned from the Internet ............................................... H-2-14
4.3.3 Application Characteristics .......................................................... H-2-15
4.3.4 Expected-Behavior-Based Schemes............................................. H-2-15
4.3.5 The Essential Components for the MDS ...................................... H-2-16
4.3.6 Other Related Considerations/Approaches .................................. H-2-16
4.3.7 Base Rate Fallacy......................................................................... H-2-17
4.4 Need for Standardization........................................................................... H-2-17
4.5 Understanding the Revocation Rate .......................................................... H-2-17
5 Policy Issues in Credential Management ......................................... H-2-20 5.1 Trust Relationships and Policies ............................................................... H-2-20
5.2 Privacy Policy ............................................................................................ H-2-22
6 Summary of Observations ................................................................. H-2-23
7 References .......................................................................................... H-2-25
Appendix Volume 3 H-2-ii

List of FiguresFigure 1: A High-level Depiction of Threats to the Driver of a V2X-Equipped Vehicle ......................................................................................................................... H-2-3 Figure 2: Figure Showing the Window of Vulnerability for a Tagged Vehicle with Respect to the Misbehavior of Another Vehicle ......................................... H-2-11 Figure 3: Classes that a Node Can Belong to at Any Point in Time.......................... H-2-17
Appendix Volume 3 H-2-iii

List of Tables Table 1: Characterization of Packets (in Accept/Drop Schemes) or Decisions (in Misbehavior Detection Schemes) ................................................................ H-2-13 Table 2: Characterization of Packets (in Accept/Drop Schemes) or Decisions (in Misbehavior Detection Schemes) ................................................................ H-2-13 Table 3: Impact of a1, a2, and g on MU and LU ....................................................... H-2-20
Appendix Volume 3 H-2-iv

1
VSC-A Final Report: Appendix H-2 V2V PKI Security Management – India Science Laboratory, GM R&D
Introduction
Vehicle-to-Vehicle (V2V) and Vehicle-to-Infrastructure (V2I) wireless communications using the Dedicated Short Range Communication (DSRC) Standard enable vehicles to exchange useful information with one another and with the available infrastructure. Automotive safety applications make use of V2V and V2I communications to provide driver assistance. This is accomplished by having vehicles exchange with one another, kinematical information obtained from a Global Positioning System (GPS) receiver and alerts obtained from on-board sensors. At any given vehicle, the received information is processed to see if the driver needs to be warned or informed of any upcoming potentially hazardous event. Drivers are provided warnings or information through a variety of Human Machine Interfaces (HMIs) including a heads up display, warning lights, haptic feedback, etc. Drivers are expected to act upon these warnings in much the same way as they would to the brake light of a vehicle in front of them or to a traffic light turning amber (or yellow).
Now, the V2X (V2V and V2I) communication system needs to provide the drivers of V2X-equipped vehicles with enough confidence that they can rely on and perform driving maneuvers based upon the warnings and advisories that the V2X system provides them with. To this end, the IEEE 1609.2 standard recommends that each V2X message should be appended with a digital signature using the Elliptic Curve Digital Signature Algorithm (ECDSA). In order to certify the ECDSA public keys of all the participating vehicles in the V2X system, IEEE 1609.2 recommends the use of a Public Key Infrastructure (PKI). Owing to the computationally intensive nature of ECDSA, the Vehicle Safety Communications-Applications (VSC-A) project has investigated alternative security protocols and has specifically evaluated the performance of ECDSA, TESLA, TADS, and Verify-on-Demand (VoD). These security protocols require the availability of a PKI to establish trust among participating vehicles by certifying and managing the cryptographic credentials of the vehicles.
In order to better understand all the aspects that credential management entails, the requirements of the security protocols in the context of V2X communications are described below:
1. Message Integrity and Entity Authentication: A fundamental requirement for a vehicle processing and acting upon received messages is for the vehicle to have the confidence that the messages have not been tampered with in transit (message integrity) and that they have indeed been created by genuine vehicles (entity authentication). Signature algorithms, such as ECDSA, and broadcast authentication algorithms, such as TESLA, provide these properties. The level or strength of the security property is measured in number of bits n, where an algorithm which achieves n-bits of security is understood to require O(2n) operations for an attacker to break.
2. Traceability or Non-repudiation: For a security protocol to establish message integrity and entity authentication, it requires participants of the protocol to already trust the public keys of one another. One of the basic components of credential management is to establish this trust. However, a trusted or certified
Appendix Volume 3 H-2-1

VSC-A Final Report: Appendix H-2 V2V PKI Security Management – India Science Laboratory, GM R&D
vehicle could still start sending spurious messages. A spurious message is one with a valid signature or authentication tag, but with invalid payload contents. If a receiving vehicle determines the payload contents of an authentic packet to be inconsistent with other authentic information it has, then the receiving vehicle can submit such a packet as evidence of suspicion about the credential that has signed the packet. In order for an authority to act upon such a piece of evidence, it is required that either the evidence should be non-repudiable by the sender (to any third party) or that the evidence should be traceable to the sender by a designated authority.
In addition, the V2X system as a whole (consisting of the security protocols and the PKI) needs to provide participating vehicles with a certain level of privacy and support vehicle mobility (i.e., a vehicle subscribing to V2V services should be able to utilize them in visited geographic regions, as well as the region of their usual residence). The requirements listed above are not fool-proof. Cryptographic keys can be compromised to circumvent message integrity and entity authentication. Spurious messages (i.e., ones signed using compromised credentials) would pass the security protocols and “satisfy” message integrity and entity authentication, but they could have incorrect or malicious payload contents. The spurious messages need to be detected using misbehavior detection techniques, and reported to the authority or PKI. However, this requires non-repudiation or traceability respectively. Also, interaction between the authority and the vehicles is required for reporting misbehavior, for obtaining information about revoked entities, for obtaining newer credentials, and so on. This requires the availability of communication links and/or physical infrastructure in the vicinity of the vehicles. Further, for any security protocol, the system would be somewhat vulnerable to bogus messages. This would result in a waste of some computational resources in culling out bogus messages.
Thus, credential management (also referred to as certificate management) involves several aspects including:
Assignment/Certification of Credentials
Refresh/Reassignment of Credentials (e.g., for enhancing privacy, for participation in non-native geographic trust domains, or for re-instating mistakenly evicted entities)
Eviction/Removal of Credentials Upon Detection of Their Compromise
Trust Policies to Define “Authorities,” Their Designated Functions and Their Trust Relationships
Privacy Policy to Define the Extent of Anonymity (minimum and/or maximum) that a Vehicle May Enjoy Policies and Algorithms to Detect and Report Compromise of Credentials
Policies Governing Storage of Credentials On-Board/Off-Board the Vehicle The choice or design of each component of credential management would affect the extent to which the security requirements of the V2X system can be met. With each component, it is expected that there would be a tradeoff between cost and security, and further that this tradeoff would evolve with penetration.
Appendix Volume 3 H-2-2

2
VSC-A Final Report: Appendix H-2 V2V PKI Security Management – India Science Laboratory, GM R&D
The rest of this report is organized as follows. In Section 2 a high-level threat analysis of the V2X system is provided and various threat paths and applicable defense mechanisms against them are identified. A more detailed analysis of individual credential management components are captured in Sections 3, 4, and 5. This is followed by some initial recommendations, future research areas, and conclusions.
High-level Threat Analysis
In this section, the threat to a V2X system is looked at as a whole by constructing threat paths that an attacker may choose to exploit to have an impact on the driver of a V2X-equipped vehicle. Figure 1 illustrates the overall threat to the V2X system. The boxes with red lettering represent the threats, and the boxes with green lettering represent barriers against or defense mechanisms that can be used to combat the threats. A detailed threat analysis of all the depicted threat paths follows. The discussion is divided into three parts: (i) focusing on bogus messages; (ii) focusing on creation of spurious messages; and (iii) focusing on detection of keys signing spurious messages. For each of the paths, the barriers to the attack, its likelihood, its impact, applicable deterrence mechanisms, and finally defense mechanisms against the attack are discussed.
Figure 1: A High-level Depiction of Threats to the Driver of a V2X-Equipped Vehicle
Appendix Volume 3 H-2-3

VSC-A Final Report: Appendix H-2 V2V PKI Security Management – India Science Laboratory, GM R&D
2.1 Denial-of-Service
A bogus message, to recall briefly, is a message with an invalid signature or authentication tag. It is clearly a message that is not expected to be accepted or acted upon by a system. However, the on-board computer on a vehicle expends valuable computational resources in determining that the message is bogus. Evidently, it would disrupt the flow of non-bogus messages if the system were to spend a lot of time on bogus ones. Thus, bogus messages represent a “denial of computation” attack or a computational Denial-of-Service (DoS) attack. Another form of DoS attack is to jam the DSRC wireless band with a sufficiently powerful signal, to deny genuine vehicles a chance to transmit their packets. This is referred to as jamming and it represents a “denial of communication” attack or a communication DoS attack. Please refer to Figure 1.
Barrier: The only barrier to either of these attacks is the acquisition of a DSRC-capable radio. With such a radio, and the knowledge of message formats at various layers, an attacker can either emit random signals in the DSRC band, aggressively transmit packets by violating DSRC MAC layer etiquette, or transmit bogus messages which would consume computational resources at receiving vehicles.
Likelihood: Such an attack is very likely since it is not very difficult to launch. However, the likelihood may also get tempered with its limited impact.
Impact: The impact of such an attack is arguably limited since at worst it causes an outage of the V2X system and services from the perspective of the driver. So long as such services represent driver-assistance aids, the impact of such an attack could be argued to be limited. However, if V2X technology is being used to determine actions to control a vehicle, then this attack has a more serious impact.
Deterrence: Deterrence is usually a preferred security mechanism, as compared to detection and recovery. However, it is not clear whether such an attack can be deterred. Jamming of the wireless channel is very difficult to distinguish from genuine contention of the wireless channel or from genuinely poor quality of the channel. Extended periods of outages may be abnormal and could raise suspicion of a jamming attack underway. It is relatively easier to maintain statistics for bogus messages, and again it is possible to suspect a computational DoS attack, if an inordinate amount of computational resources are being spent on bogus messages. However, even after detection, these attacks are not attributable to any entity more than saying they are in a small geographic area. Possibly, detecting vehicles could alert officers of law enforcement about such attacks, and possibly law enforcement may search cars in the vicinity for stray DSRC equipment.
Defense: The two most straightforward defense mechanisms are to deploy computationally inexpensive security protocols and to deploy a powerful computer on-board a vehicle. Another defense mechanism is to use intelligent packet processing techniques, such as VoD. Such processing techniques could utilize computationally inexpensive processing to prioritize packets and execute security processing as per the priority.
Appendix Volume 3 H-2-4

VSC-A Final Report: Appendix H-2 V2V PKI Security Management – India Science Laboratory, GM R&D
2.2 Creation of Spurious Messages
A spurious message, to recall briefly, is one which has a valid signature or authentication tag but with incorrect payload contents. A spurious message would evidently pass through the verification process of a broadcast authentication protocol. However, blindly accepting or “acting upon” such a message is not desirable since it may have invalid (and possibly) malicious payload contents. Here the various aspects involved in an attacker successfully creating spurious messages (refer to Figure 1) are discussed.
Barrier: There are two broad ways in which an attacker can create a spurious message by compromising the private cryptographic credentials which are used to create the signature or authentication tag and by tampering with the sensor devices or GPS receiver which is providing input to the payload contents of messages. In the first case, the barrier an attacker has to circumvent would be the tamper-resistance of the module storing the private cryptographic credentials. In the case of tampering with vehicular sensors, the attacker would need to ensure that the normal vehicle functionality and operation are themselves not compromised. Otherwise, the vehicle cannot be expected to operate on the road, drive up to other vehicles' vicinity, and transmit malicious messages to them. In the case of the GPS receiver, its tamper resistance acts as a barrier. Now, even before these barriers apply, there is a more basic problem of getting physical access to a vehicle for an extended period of time.
Likelihood: For someone other than the owner of a vehicle, getting physical access to it would depend on the effectiveness of the vehicle's anti-theft solution. An attacker may essentially have to purchase or steal a vehicle to circumvent the barriers described above, making this attack relatively less likely. Another possibility is that of the attacker colluding with a rental agency or a repair garage to gain physical access to vehicles there. Even so, it must also be remarked that a basic level of tamper resistance already exists in a vehicle because of the complexity of hardware (HW) and software (SW) construction. So it would definitely take an attacker who is familiar with the vehicular architecture, to compromise a key, a sensor, or GPS receiver.
Impact: This attack results in spurious messages. The exact extent of impact one (or a coordinated set of) spurious message(s) can have is a matter for further research and investigation.
Deterrence: Tampering with cryptographic modules, vehicle sensors, or GPS receivers can be deterred quite effectively. It is possible to implement legal consequences upon detection of tampering of one's vehicle. It might also be possible to compromise vehicle operation upon tampering. These deterrents only apply to legitimate vehicle owners. A determined attacker who has stolen or purchased a vehicle for the sole purpose of attacking, is unlikely to get deterred. However, it limits the class of possible attackers.
Defense: The primary defense mechanism against spurious messages is misbehavior detection and eviction of compromised cryptographic credentials. The algorithms for misbehavior detection are also the subject of further research and investigation.
Appendix Volume 3 H-2-5

VSC-A Final Report: Appendix H-2 V2V PKI Security Management – India Science Laboratory, GM R&D
2.3 Circumvention of Misbehavior Detection
In this subsection, the class of attacks derived from spurious messages are discussed. It is assumed that the barriers to creating spurious messages have been circumvented, and now the attackers intend to defeat the misbehavior detection algorithms to get some packets through to the application layer where they may get “acted upon.”
Barrier: The barrier to this class of attacks is misbehavior detection. Misbehavior detection algorithms could also be assisted by contextual information from other channels such as raw GPS data.
Likelihood: Misbehavior detection algorithms would not be 100 percent accurate. There would always be some fraction of spurious messages that may go undetected. Further, there may be a finite delay in detecting that a particular cryptographic credential has been compromised. Subsequently, the authority may also take a finite amount of time in coming to the same conclusion. Finally, the authority would require a finite amount of time to evict the compromised credentials and disseminate this information to the other vehicles.
Impact: The impact of this class of attacks would be undetected spurious messages which would be passed on to the V2X application module.
Deterrence: There are no deterrence mechanisms available for this threat since specialized and determined attackers are being dealt with.
Defense: It is important to acknowledge that in the same way cryptographic mechanisms are not fool-proof, it is not realistic to expect misbehavior detection mechanisms to be fool-proof. Therefore, it is essential that the V2X application processing modules are designed in a way which is immune to some amount of spurious data.
2.4 High Level Methodology of Credential Management
Other than the threats described in the three subsections above, and as illustrated in Figure 1 some other threats to the system that are introduced as side-effects of misbehavior detection are briefly mentioned below. It is possible that attackers who have successfully compromised some cryptographic credentials may attempt to slander against or frame innocent vehicles by directly interacting with the authority via incorrect misbehavior reports. So the decision process of revocation at the authority level needs to be constructed with this possibility in mind. It is also possible that credentials belonging to innocent vehicles may get labeled as suspicious or malicious due to the false positives of the misbehavior detection algorithms themselves.
Now, as previously mentioned, credential management entails several components the design of each of which influences the threat diagram in Figure 1. Here the high-level methodology to credential management is described. In Sections 3, 4 and 5 which follow, detailed analysis of specific components is provided. The decisions and design of each of the components of credential management is closely related to the requirements/semantics of the V2V applications and the gravity of particular threats. These decisions are viewed as the general problem of preventing any threat from affecting the normal functioning of V2V applications. Each set of processing steps
Appendix Volume 3 H-2-6

VSC-A Final Report: Appendix H-2 V2V PKI Security Management – India Science Laboratory, GM R&D
performed on the messages, before these messages qualify to be “acted upon,” is viewed as a filter which uses its own set of schemes for control information collection and dissemination. The parameters associated with any such filter depend upon not only the application and threat model but crucially also on the way the control information available at the filter is obtained/estimated/gathered. It is expected that each such filter would exhibit some cost-performance tradeoff. A systematic picture of the various threat paths, the components of credential management which affect specific threat paths, and the tradeoffs involved with designing specific filters or components are provided.
3 Denial-of-Service Resilience and Tamper-Resistance
Although, DoS resilience is more of an attribute of the security protocol being used, it is still important to review how it can be defended against. Protecting against the tampering of V2V HW in a vehicle is certainly an important part of credential management.
3.1 Denial-of-Service Resilience
As noted in the previous section, DoS attacks are quite easy to launch; but at the same time, non-trivial to detect. Therefore, it is important to design the V2X security framework to be reasonably resilient to DoS attacks. To this end, the VSC-A Project has investigated security protocols alternative to ECDSA which has been proposed in the standard. The following are two kinds of solutions which have emerged from the research efforts of the VSC-A: lightweight authentication protocols such as TESLA and TADS and intelligent packet processing techniques like VoD. This document does not go into the details of these solutions since they are well-documented by the VSC-A. However, it must be pointed out that both of these solution techniques are actually compatible with each other. In fact, it is possible to perform more long-term research on investigating security protocols for V2X communications then to apply the intelligent verification paradigm to a number of security protocols.
Another way in which DoS resilience can be improved is by efficiently implementing the security protocols in HW and SW. It is known that asymmetric cryptography based schemes such as ECDSA do not experience as much reduction in computational overhead on specialized HW, as compared to symmetric cryptography based schemes such as TESLA or one-time signatures. If the security protocols are benchmarked on generic processors, then they would have a certain relative performance ranking in terms of computational overhead. But this could change significantly if each protocol was implemented on specialized HW most suited for that protocol. It is important as a long-term research effort to investigate efficient implementations of the available security protocols in addition to designing new ones and applying intelligent verification techniques.
3.2 Tamper-resistance and Tamper-evidence
In referring to Figure 1, it is clear that in order to create spurious messages, whether intentionally or otherwise), either the private cryptographic credentials need to be compromised or vehicular sensors and/or GPS receivers need to fail or be tampered with.
Appendix Volume 3 H-2-7

VSC-A Final Report: Appendix H-2 V2V PKI Security Management – India Science Laboratory, GM R&D
If each of these occurrences could be prevented completely, there would actually be no need for revocation for misbehavior detection and, therefore, for the associated connectivity to a backend infrastructure. While it is not realistic to believe that these occurrences can be completely prevented, it is important to focus on defense mechanisms against these threats in the early stages of the deployment of V2X services. As the V2X penetration increases, and as the society perceives its value, it would be reasonable to expect investment in a more widespread deployment of the backend infrastructure. However to begin with, it would be prudent to focus more on tamper resistance and tamper-evidence mechanisms to resist and/or deter tampering of private keys, vehicle sensors, and GPS receivers.
The FIPS-140-2 publication [24] by the Federal Information Processing Standard (FIPS) defines four security levels that can be used to evaluate the security provided by a tamper-resistant or tamper-evident security module:
1. Security Level 1 is defined to be that providing the lowest level of security. The security requirements of a cryptographic module providing Level 1 security are specified at the algorithm level. No additional physical security mechanisms are required.
2. Security Level 2 augments Level 1 by specifying additional requirements of tamper evidence over and above specifying which algorithms or key sizes need to be used. Thus, a cryptographic module which is Level 2 Secure needs to use tamper-evident seals or barriers to prevent physical access to private keying material or secret algorithm parameters.
3. Security Level 3 adds requirements for a cryptographic module to be tamper resistant or tamper proof. These mechanisms may include seals or enclosures which resist and detect tampering, and possibly even reset the contents being protected to some garbage values.
4. Security Level 4 provides the highest level of security. It employs specifications at all the three lower levels and is intended to certify modules for operation in physically unprotected conditions. A cryptographic module which is Level 4 Secure may even include circuitry to detect changes in environmental conditions and reset protected data to garbage values, in response.
Similar to the above, in a research paper [[25], [26]], IBM researchers propose a classification scheme for attackers as follows. The following discussion is adapted from [26]. Class 1 Attackers, or ’Clever Outsiders,’ may be skilled in the art of security and cryptography but may not have specialized or specific knowledge of the system that they are attacking. They would generally try to exploit an existing weakness rather than attempt to create one. Class 2 Attackers, or ’Knowledgeable Insiders,’ have definite and substantial specific knowledge and expertise relating to the systems they are attacking. They may have access to sufficient parts of the system to create more weaknesses that can be further exploited.
Appendix Volume 3 H-2-8

VSC-A Final Report: Appendix H-2 V2V PKI Security Management – India Science Laboratory, GM R&D
Class 3 Attackers, or ’Funded Organizations,’ have all the capabilities of Class 2 attackers and further have the ability to fund in-depth analysis or teardown of the system and launch very expensive and sophisticated attacks.
In the V2X context, Security Level 2 or 3 or Class 1 or 2 attackers seem appropriate to consider. In fact, even a mechanism as simple as a seal with a sticker which says “illegal to peel or violates warranty” might deter enough Class 1 attackers. A minority of Class 1 attackers or Class 2 attackers may require more sophisticated tamper-resistance solutions.
4 Eviction of Compromised Credentials
Vehicular Ad Hoc networks use a set of protocols/schemes to support various applications. These applications collect valid data from other valid participating vehicles. The two validity requirements (i.e., pertaining to data and to participating vehicles) open up the possibility of attacks based on sending an incorrect message or an external entity sending messages. The first possibility (i.e., an incorrect message being sent to the receiver by a valid participating entity) requires a misbehavior detection scheme (MDS) to detect the presence of such attacks. The second kind of attack (i.e., an external entity sending messages) is taken care of by adding another layer below the application layer where a message is checked for entity authentication.
Eviction of the source of an observed misbehavior is the subject of the current effort. This document is restricted to the case of a valid participating vehicle misbehaving.
4.1 General Consideration on Evicting Misbehaving Entities
Misbehaving nodes are nodes that are sending out incorrect data either due to faulty sensors or owing to intentional tampering (of data or sensors originating the data).
Node eviction is the end-to-end process of identifying the misbehavior of a vehicle and dissemination of this information to other vehicles. In the V2V context, the IEEE 1609.2 standard requires the Certifying Authority (CA) to revoke the certificate(s) of any misbehaving vehicle28. After revoking a certificate, it is imperative for the CA to inform the other participating vehicles of this revocation. Eviction of a misbehaving node thus consists of the following phases that need to be designed for V2V systems: a) Misbehavior Detection, b) Misbehavior Reporting, c) Certificate Revocation by the CA, and d) Revocation Information Dissemination. Vehicles in the network that may come in contact with the misbehaving vehicle, but are not aware of its misbehavior, are vulnerable. The time-to-eviction results in a window of vulnerability for the other vehicles in the system. Eviction delay of a misbehaving node is with respect to a particular legitimate node (i.e., the sampled window of vulnerability (for a given misbehaving node) would be different for different legitimate nodes depending on when they receive the revocation information, etc.). Figure 2, taken from [15], provides a generic sequence of events between the start of misbehavior of a node until the time a tagged node gets the corresponding revocation information. It is observed most frequently that the VANET literature tends to concentrate only on the dissemination
28 There could be schemes where the participating vehicles locally (in time and space) evict a misbehaving vehicle with eventual revocation by the CA [22].
Appendix Volume 3 H-2-9

VSC-A Final Report: Appendix H-2 V2V PKI Security Management – India Science Laboratory, GM R&D
delay while trying to understand the node eviction process. In [15], the importance of the other components and emphasis that all the components are important are noted. The foremost objective of node eviction schemes in V2V systems would be to minimize the impact of the window of vulnerability while incurring the lowest cost possible. The cost could be in terms of processing, communication, storage, or infrastructure deployment. If one of the various phases of node eviction is slow, then there may be only a very small gain in spending significant resources in the other phases. Further, the V2V service penetration cannot be dependent of the availability of the infrastructure and is expected to be compatible with the evolution of the infrastructure technology used for Vehicle to Infrastructure (V2I) communication [10]. In [15], the window of vulnerability by a random delay to unify the various components of the overall delay is abstracted out. The approach proposed in [15] can model smart revocation information dissemination schemes of [[16], [17]] along with the simple ones. Further, due to the resource constrained nature of V2V systems, the schemes of [[16], [17]] could suffer from an increased in-network processing [[4], [14], [13], [11], [12], [23]]. Schemes corresponding to the various phases of node eviction are abstracted out using their impact on the random delay of node eviction.
There are many factors that affect the eviction performance, and at the same time pose various decision problems, as listed below.
1. V2V Service Penetration - A large number of V2V-equipped vehicles could imply speedy detection of misbehavior and may also imply a higher rate of misbehaving vehicles.
2. Revocation Rate - A high certificate revocation rate may lower the eviction performance. However, a high revocation rate may also be because of an inefficient misbehavior detection system which results in a large number of false positives [[8], [9]].
3. Revocation Information Dissemination Scheme - This could either be explicit, like Certificate Revocation Lists (CRLs), or implicit, like in Freshness Checks [18].
4. Technology/Schemes used for Report Submission and Revocation Information Dissemination - Various technologies can be used for Vehicle-CA communication, for example, DSRC (via RSEs), home WiFi, Cellular link, etc. Technologies like DSRC (via RSEs), cellular link, XM broadcast, FM broadcast etc., can be used for CA-Vehicle communications (downlink). Further, schemes like the ones proposed in [[16], [17]] could use the V2V system itself as a virtual interface for vehicle-CA communication. These choices impact the delay in submission of a report, the delay in dissemination of revocation information, and the communication, storage and processing overhead for the resource constrained V2V system. Uplink and downlink choices may be coupled (e.g., XM or FM downlink requires an alternative uplink technology) implying additional cost. Clearly, all that one may need to know about infrastructure usage to help selecting from the various options is the total uplink and downlink usage per unit time.
Appendix Volume 3 H-2-10

VSC-A Final Report: Appendix H-2 V2V PKI Security Management – India Science Laboratory, GM R&D
Figure 2: Figure Showing the Window of Vulnerability for a Tagged Vehicle with Respect to the Misbehavior of Another Vehicle
4.2 Summary of Observations on Infrastructure Requirement to Evict Misbehaving Nodes
In [15], two schemes were considered for revocation information dissemination. One of these was the explicit scheme where the CA advertises the CRLs to the participating vehicles, as and when the participating entities request (or, possibly on a proactive basis, depending on the technology used for the CA-vehicle communication). In the other scheme the vehicles obtain Freshness Certificates from the CA repeatedly over time and use these certificates as proof of their legitimacy for communicating with the other vehicles. A receiving vehicle may discard a received message if the last time the sender performed the freshness check (as mentioned in the message) was beyond a threshold, Tf. Analysis and simulations for these two schemes were provided.
The CRL-based scheme was evaluated with respect to the probability that an accepted message is from a legitimate vehicle (see [18]). The presence of a window of vulnerability ensures that this probability is strictly below 1 (unless any misbehavior is detected, reported, revoked, and evicted instantaneously). Clearly, since the overall window of vulnerability is lower bounded by the delay in misbehavior detection, the choice of the technologies used for vehicle-CA and CA-vehicle communication can be influenced.
Simulations were performed using the ns2 simulator [3], in which m vehicles and a tagged vehicle followed the mobility model provided by [6], over a Manhattan grid of 2400 meters x 2400 meters with a maximum velocity of 20 m/sec. Packets were generated once every 100 ms [5] by each vehicle.
A summary of observations from the exercise carried out in [15] are listed below:
CRL-Based Scheme: In the CRL-based schemes, the marked node performed CRL updates with a probability Pu whenever it came in contact with the RSEs. Thus Pu gives
Appendix Volume 3 H-2-11

VSC-A Final Report: Appendix H-2 V2V PKI Security Management – India Science Laboratory, GM R&D
the spatial RSE density. The higher value of Pu is interpreted as increased vehicle CA communication, irrespective of the communication technology used even though the simulation uses only RSEs. When misbehavior is only due to devices becoming faulty, the eviction performance was found to depend only on the rate at which each vehicle starts misbehaving. Further, the eviction performance is a concave function of Pu and also depicts the existence of a knee with respect to Pu. Clearly, the knee shifts right as the revocation rate increases. These observations can be interpreted by the following statements. For a given revocation rate, the close-to-knee operating point is an indication of the desired rate of communication with the infrastructure, or in case of RSE deployments, the desired RSE density. Thus, if the uplink of reporting misbehavior is intermittent, making the downlink continuous for disseminating revocation information may not be required as it may not provide significant improvement in eviction performance, thus not justifying the use of another infrastructure (like FM or XM) for disseminating revocation information. Further, it is also observed that the infrastructure need not scale up as the V2V penetration increases. To simulate misbehavior due to intentional malicious behavior, it is assumed inter-revocation times are to be exponential and observed that the rate of communication with the infrastructure should increase as node density increases for a given revocation rate.
Please see [15] for a more detailed comparison of the required infrastructure density when the source of misbehavior is due to faulty sensors and/or malicious activity. Freshness-check-based Schemes: When misbehavior is due to intentional malicious activities, it was observed that, as in the case of CRL-based schemes, the fraction of true positives depends on the V2V penetration and the rate at which each of the vehicles start misbehaving. Further, the impact of Tf and the misbehavior rate are similar to the case of misbehavior due to faults in devices [19].
It is to be noted that the job of the misbehaving node eviction process is to provide the participating entities with information on the identified misbehaving entities. This information is, without loss of generality, assumed to be used by the security layer of the participating entities. This is because a PKI-based system is considered when the vehicles use a trust relationship assigned by the certification authority, hence is appropriately taken care of at the security layer. In the following section, the tradeoffs of the various phases in misbehaving node eviction (i.e., misbehavior detection) misbehavior report submission, certificate revocation, and revocation information dissemination is provided.
There are broadly two, misbehavior-related decision logic employed by a vehicle when it processes an incoming message accept/drop based on known behavior of the sending entity and inferring the misbehavior of the sending entity.
Both of these in-vehicle decision logics are addressed in a unified way by viewing them as filters with their own set of technologies/schemes (i.e., information collection mechanisms, etc.) and the associated cost (which could be in terms of processing, storage, monetary or other requirements associated with the employed schemes/technologies).
Appendix Volume 3 H-2-12

VSC-A Final Report: Appendix H-2 V2V PKI Security Management – India Science Laboratory, GM R&D
4.3 Misbehavior Detection
The accept/drop algorithms are viewed and also the misbehavior detection as a filter. The actual location, the layer at which this filter is implemented, could vary, with every layer having its own such filter. For simplicity, one can assume that each and every received message passes through such filters at the various layers. Any accept/drop mechanism has packets that can be characterized as one entry in Table 1. Similar is the case with any misbehavior detection scheme [[9], [8]]. This unified approach of characterizing the outcomes of any decision logic provides a significant ease in understanding the design of these schemes at various layers and quantifying the performance of these schemes without worrying about the layer-specific details. In the following section, specific examples of the schemes that can be implemented at the various layers along with their specific tradeoffs are provided.
Table 1: Characterization of Packets (in Accept/Drop Schemes) or Decisions (in Misbehavior Detection Schemes)
Status of Packet Source (Before Filter)
Action Taken by Receiver’s Accept/Drop (Misbehavior Detection)
Characterization of Packet (after Filter)
Legitimate Accept (Declare Legitimate) True Positive Misbehaving Reject (Declare Misbehaving) True Negative Misbehaving Accept (Declare Legitimate) False Positive Legitimate Reject (Declare Misbehaving) False Negative
The broad nomenclature scheme proposed in Table 2 will be used. It is to be noted that when the verified signature provides non-repudiation, the spurious messages can be attributed to a sending entity and, hence, can be reported back to the infrastructure (certifying authority), whereas the bogus messages cannot be attributed to any sender, even if the scheme provides non-repudiation. It is clearly desirable to achieve non-repudiation for each and every verified message before they are being acted upon by the application. However, non-repudiation usually comes with requiring significantly increased processing load on the processor.
Table 2: Characterization of Packets (in Accept/Drop Schemes) or Decisions (in Misbehavior Detection Schemes)
Message Verified Signature Classification Correct Valid Genuine Incorrect Valid Spurious Correct Invalid Bogus Incorrect Invalid Bogus
Thus, the scope of node eviction in the case of a sender sending bogus messages could be restricted to the spatial proximity of the sending vehicle. This may require local eviction schemes using, perhaps, directional antennas. Whereas the scope of eviction in the case of spurious messages would be required to be global to make use of the non-repudiation property to ensure that the sending misbehaving vehicle is not able to affect the system activities indefinitely.
Appendix Volume 3 H-2-13

VSC-A Final Report: Appendix H-2 V2V PKI Security Management – India Science Laboratory, GM R&D
4.3.1 Application Layer
The basic V2V applications require two entities to communicate with each other. The first security consideration of this minimal functionality indicates the need for resilience to incorrect messages, and/or the capability of identifying/inferring message correctness.
The second capability is achieved via what is called a MDS.
A message would be reaching the application layer if it has passed all the checks applied at the other lower layers. This would mean that the message passed the authentication check performed on the message at the security layer.
A general misbehavior detection scheme would require a vehicle to first have a notion of what is normal behavior and then a way of comparing the observed behavior with the normal one. The notion of normal behavior depends on the application being considered. The way of comparing the observed behavior with the normal behavior usually introduces some error in the final decision about the truth or falsity of the hypothesis of misbehavior. Thus, it is clear that a general approach to misbehavior detection would have considerations similar to those encountered in general hypothesis testing problems. The dynamic nature of the system under consideration adds one more dimension to the complexity of the problem. The minimal set of issues that need to be addressed while designing a misbehavior detection scheme are briefly mentioned below. The available examples in the literature [[8], [9]] will be followed below. However, before getting into the misbehavior detection in V2V setting, the approaches followed by the Internet community for anomaly/intrusion detection will be discussed.
4.3.2 What is Learned from the Internet
Several attacks that appear to be on top of the (prioritized) list of attacks that Internet community usually worries about are of DoS in nature. Among many ways of launching a DoS are synchronization (SYN) request flooding, tweaking the time-to-live (TTL) field, etc. It is to be noted that the simple DoS is aimed only at exhausting the limit of simultaneous connections that the web server is allowed to maintain, while not adding to the computation load of the server. Other attacks that aim at bringing the servers down try to overwhelm the server with work to be done. Note that these techniques are effective in the wire-line Internet usually because of the multi-hop nature of the system. However, if the server attempts to block all the messages coming from one particular link, it may be blocking the genuine traffic as well because the router that the server is connected to is serving many more sources, not all of which are malicious.
The objective of these attacks is to attack the very functionality of the web server (i.e., of providing the service). Of course, there are several other attacks which aim at causing irreparable damage to the systems. They do not always seem to be on the top of the priority list.
For this reason, the basic priority list of attacks that the V2V system be guarded against needs to be understood. Keep in mind that the static nature of the web servers makes it easier for the attackers to target a web server. However, in the case of vehicular ad-hoc networks, the dynamic nature of individual participating entities make it hard for an attacker to target and affect one particular entity for a prolonged period of time.
Appendix Volume 3 H-2-14

VSC-A Final Report: Appendix H-2 V2V PKI Security Management – India Science Laboratory, GM R&D
4.3.3 Application Characteristics
See [7] for a way of characterization of V2V applications that helps in designing the corresponding misbehavior detection schemes by binning the various applications into a smaller set determined by the properties of the applications.
4.3.4 Expected-Behavior-Based Schemes
An example of the MDS for Post Crash Notification (PCN) application is presented below. The details can be found in [[9], [8]].
Consider the Post-Crash Notification (PCN) application wherein a crashed vehicle sends out PCN alerts. The alert is broadcast and received by all nearby vehicles. The PCN alert contains the position of the crashed vehicle, heading, and vehicle status [23]. A misbehaving vehicle can either send out a false alert (i.e. alerts raised even if there is no crash) or a true alert (i.e., there is a crash) with false crash position information. Note that the second case can be further broken down into sub-cases where the reported crash position information is closer than or further than the actual crash position. In an earlier work [8], an MDS for PCN application was proposed and analyzed in which it was assumed that the alert can be true or false but the position information in the alert is correct. In this paper an MDS for PCN application that can handle both false alerts and true alerts with false position information is proposed. Moreover, the MDS can distinguish between and identify the different possible cases of false position information.
Misbehavior-Detection Scheme: An n lane highway is taken where each lane has a designated average speed. A discretized model is considered where the trajectory of the vehicle is broken up into fixed size slots, and the vehicle makes a decision on the lane to be followed in the next slot at the end of every slot. The vehicle's movement in the absence of any crash is assumed to follow some free-flow mobility model, in which the onboard unit (OBU) approximates the lane number of the vehicle at the ends of slots by a Markov chain with an n x n transition probability matrix P. Its movement under crash is assumed to follow some crash-modulated mobility model in which the movement of the vehicle at the crash site is governed by the transition probability matrix T. The movement of the vehicle at distance d from the crash site is modeled by a modulated transition probability matrix M(d) = (1 - (d))P + (d)T, where 0 < (d) < 1 and (d) increases as d decreases. More details of P,T, and can be found in [8]. The receiving vehicle is assumed to be at position 0 at the time it receives the alert. Let Dr
(> 0) be the distance to the crash site reported in the PCN alert. The sequence of actual vehicle location (of the vehicle running the MDS) information obtained from its own sensors is called the actual trajectory of the vehicle. Let Pexp[u,v] and Mexp[u,v] denote the expected free-flow and the expected crash-modulated trajectory from position u to position v respectively. The MDS now compares the expected trajectory and the actual sensed trajectory. Let x t and x’t denote the actual and the expected lane numbers respectively of the vehicle at the tth sample point. Then the deviation between two trajectories, expected and actual, over sample points starting from the position the alert is received is obtained using = t=1 [(x t - x’t )2]. Let M (0,Dr) and P (0,Dr) denote the deviations between the actual trajectory.
Appendix Volume 3 H-2-15

VSC-A Final Report: Appendix H-2 V2V PKI Security Management – India Science Laboratory, GM R&D
The thresholds 1 and 2 should be chosen judiciously in order to make the probability of not detecting a misbehavior of any type low. Let FNi( 1, 2) and FPi( 1, 2) denote the probabilities of a false negative and false positive respectively for Case i for a given 1, 2. Let Fi( 1, 2) = iFNi( 1, 2) + (1- i)FPi( 1, 2), 0 i 1. Thus Fi( 1, 2) represents the relative weightage given to false negative and false positive rate for Case i. Then the objective would be to find an *1 and *2 that minimizes U( 1, 2)= 5
i=1wiFi( 1, 2) where 5
i=1 wi = 1. The wi's represent the relative importance given to each case, which can represent for example, the expected frequency of occurrence of each case.
4.3.5 The Essential Components for the MDS
As mentioned already, the notion of normal behavior depends on the application and the attack that the MDS is being designed for. In the PCN alert case, and probably in the general cases because most of the applications are somehow related to the vehicle mobility, models for the mobility of the vehicles would be very important. In the foregoing example, a simplistic Markovian model for ease of understanding the performance of the MDS is assumed. Model Learning algorithms and the corresponding parameter estimation are crucial to MDSs to be able to characterize the normal behavior. Further, it is intuitive that a model and its parameter estimation are approximate. Hence, understanding the sensitivity of the MDS performance to a slight variation in the underlying parameters (and Model) is a must.
As the foregoing example of MDS for PCN application suggests, the driver's behavior in the case of an event defining the particular V2V application is also as important as the free-flow behavior. In this case, it was modeled using the simplistic function (.) and the Markovian matrix T. The considerations similar to those involved in the free-flow model selection and parameter estimation also apply here.
The example of the MDS for PCN also makes clear the importance of the metric used for comparing the observation (actual trajectory) and the expectation.
4.3.6 Other Related Considerations/Approaches
As mentioned earlier, the hypothesis-testing-like approach is usually the basic underlying principle in MDSs. However, trust-based approaches are usually used for Accept/Drop algorithms and not necessarily for misbehavior detection (see [21]). Aggregation techniques can be used for local eviction of misbehaving nodes or to assist the MDS (see [22]).
Appendix Volume 3 H-2-16

VSC-A Final Report: Appendix H-2 V2V PKI Security Management – India Science Laboratory, GM R&D
4.3.7 Base Rate Fallacy
Figure 3: Classes that a Node Can Belong to at Any Point in Time
After having discussed the tradeoffs in designing MDSs, as in any other hypothesis testing schemes, caution needs to be taken about what is commonly known as the base rate fallacy. Wikipedia (23:25, 19 October 2009) describes this as The base rate fallacy, also called base rate neglect, is an error that occurs when the conditional probability of some hypothesis H given some evidence E is assessed without taking sufficient account of the "base rate" or "prior probability" of H. Clearly, the prior probability that is referred to here is the rate of vehicles becoming misbehaving. If it is assumed that the rate at which a legitimate node encounters the misbehaving vehicles is approximated by the fraction of the vehicle population that is misbehaving, a certain handle on the prior probability mentioned above is ascertained. This could come from the vehicle sensor reliability point of view. However, this simplistic assumption rules out the possibility of malicious vehicles colluding and hence having a combined effect that is more than the combination of what all of them could individually incur.
4.4 Need for Standardization
A proprietary algorithm used by one OEM may be treated as misbehavior by the corresponding misbehavior detection scheme running at the same layer at the other OEMs' vehicles. This calls for standardization.
4.5 Understanding the Revocation Rate
The misbehavior detection schemes are abstracted based on their probability of detecting misbehavior and study the relative evolution of malicious and legitimate vehicles under a specific attack model while incorporating new arrivals into the system. This study is expected to provide guidelines on requirements for a misbehavior detection scheme. Recall that quantifying eviction performance with respect to the reporting and dissemination phases is relatively straightforward (i.e., false positives and false negatives). However, quantification of eviction performance with respect to misbehavior
Appendix Volume 3 H-2-17

VSC-A Final Report: Appendix H-2 V2V PKI Security Management – India Science Laboratory, GM R&D
detection phase is not straightforward if one is to allow for malicious behavior. This is because the eviction performance of the misbehavior detection schemes will then depend on the attack used by the malicious vehicles. This document presents the formalism of which using a particular attack where malicious vehicles may submit false reports of misbehavior from legitimate vehicles, resulting in revocation of the certificates of the legitimate vehicles, see [20]. Further, quantifying the honest majority becomes essential as vehicles are not expected to submit a positive report (no misbehavior detected) kind of certification.
A finite initial population model where N represents the total number of nodes at any time t 0. At any time t 0 is considered, any node can belong to one of the classes XY(t), as depicted in Figure 3 where X {L(legitimate), F(faulty), M(malicious)} and Y {U(unrevoked), R(revoked)}.
It is assumed that the infrastructure only processes reports related to misbehavior from nodes that are not revoked (belonging to the classes LU(t), MU(t) and FU(t) at the time of reporting. These reports result in a push to revoke some of the non-revoked certificates29.
a1 is used as a measure of efficiency of the misbehavior detection scheme. a1 is proportional to the probability that the detection scheme is able to detect misbehavior (this could depend on the number of messages required from the misbehaving entity to raise the flag by the legitimate entity). Let a2 indicate the rate at which unrevoked malicious (MU) nodes evict the unrevoked legitimate (LU) nodes after exchanging messages with the LU nodes. Thus, MU vehicles are keen on revoking certificates of legitimate vehicles if a2 > a1. It is also possible that the CA keeps per vehicle reputation, discarding significantly aggressive reporter's reports, thus controlling a2. a1 and a2 also abstract out the mobility pattern of vehicles as these quantities are proportional to the rate at which vehicles meet each other. The rate at which LU nodes meet MU nodes, and vice-versa, is proportional to LU(t)MU(t). It is also assumed that the MU vehicles do not make any attempt to hide misbehavior of other MU vehicles (no colluding). It is also assumed 1/r is proportional to the vehicle lifetime. The document also assumes all the faulty vehicles are detected and evicted successfully and instantaneously (FU(t) 0) . This is for simplicity of understanding the evolution, and is not a restriction. The rate of adding new LU vehicles is just the rate of adding a V2V-equipped vehicle to the system. It is assumed g is the rate of adding new V2V-equipped vehicles30.
Hence, the following functional forms are arrived at:
29 There is also a possibility that a revoked node submits a rebuttal to the infrastructure proving its innocence. Such rebuttals are not considered in this analysis; however, the analysis can be extended to consider such rebuttals. 30 In the absence of a complete understanding of the impact of the presence of malicious vehicles, only the quantity or number of these vehicles are looked at, rather than doing eviction performance with respect to the impact of the malicious vehicles.
Appendix Volume 3 H-2-18

VSC-A Final Report: Appendix H-2 V2V PKI Security Management – India Science Laboratory, GM R&D
d dMR(t) a1LU (t)MU (t), MU (t) 1 a LU (t)MU (t),dt dt
1
d dLR(t) a2MU (t)LU (t), LU (t) g 1 a2 LU (t)MU (t),dt dt
d and FR(t) rdt
The same functional form of reporting (by MU and also by LU) models the assumption that malicious nodes act independently (i.e., no colluding among the MU nodes to submit incorrect report to the CA). However, it is to be noted that this assumption of same functional forms is not a restriction.
Note that the functional form of any misbehavior detection scheme is expected to be similar to the one assumed above. However, the actual functional form of the impact of malicious vehicles will depend on the particular attack being looked at and on the possibility of colluding among the malicious vehicles. Further, any explicit colluding among the malicious vehicles is not assumed. However, by assuming that a malicious vehicle does not submit a false report against another misbehaving vehicle, it is assumed that an implicit cooperation among the malicious vehicles occurs.
The evolution of LU(t) and MU(t) governed by differential equations d dMU (t) 1 a1LU (t)MU (t), and LU (t) g 1 a2 LU (t)MU (t) , then hasdt dt asymptotic behavior as provided in Table 3.
Note that the final outcome (last column) has only two possible behaviors (i.e., either LU a 2vehicles are extinct or MU vehicles are extinct). This result states that ensuring a1
g 1 is necessary and sufficient to evict the malicious vehicles under the attack considered in
a1this section. In practice there will be g >> 1, thus there may be need for g or a1 > a2
a2, (i.e., malicious vehicles will have to be very aggressive to be able to revoke certificates of legitimate vehicles). Another way to look at it is that the legitimate vehicles can afford to be more conservative, thereby reducing the false reports since a fast misbehavior detection scheme could mean a high number of false reports [[8], [9]]. This also gives a guideline for credit based report accumulation scheme at the infrastructure. If the reputation of a report submitting vehicle goes below a threshold determined by g, CA can stop accepting further reports from this vehicle or maybe just tag this vehicle and, as an extreme step, revoke its certificate.
Appendix Volume 3 H-2-19

VSC-A Final Report: Appendix H-2 V2V PKI Security Management – India Science Laboratory, GM R&D
Table 3: Impact of a1, a2, and g on MU and LU
Coefficients Initial Conditions Limiting Behavior
1 2
1
g a a
2
1(0)(0) a
gMULU 0, MULU
1 2
1
g a a
21
1(0)(0)1 a
gMULU a
0, MULU
1 2
1
g a a
1
1(0)(0) a
MULU 0, MULU
1 2
1
g a a
1
1(0)(0) a
MULU MULU 0,
1 2
1
g a a
21
1(0)(0)1 a
gMULU a
MULU 0,
1 2
1
g a a
2
1(0)(0) a
gMULU MULU 0,
5 Policy Issues in Credential Management
5.1 Trust Relationships and Policies
Here the issues pertaining to how the trusted third-party or PKI should be structured is discussed. First, some trust terminology is introduced:
1. Trust Relationship – Exact relationship of who trusts whom
2. Trust Anchor – Point of trust which is pre-programmed (other trust relationships are derived from the anchor)
3. Trust Domain – Scope or range of validity of the trust
4. Trust Model – Logical structure of trust domain(s), anchor(s), and relationships
V2X security modules in vehicles would be pre-programmed to trust an appropriate authority or set of authorities (the trust anchors). The security modules would also be assigned a set of cryptographic credentials certified by a trust anchor. By furnishing these certified credentials to other vehicles within the trust domain, vehicles can start communicating with one another using the specified security protocols. The trust anchors would be related to one another in accordance with a specified trust model. Depending on
Appendix Volume 3 H-2-20

VSC-A Final Report: Appendix H-2 V2V PKI Security Management – India Science Laboratory, GM R&D
the structure of the trust domains and the trust relationships amongst the trust anchors, V2X-equipped vehicles could be assigned additional credentials to communicate or migrate across trust domains. The trust anchors within a trust domain are responsible for assigning trusting vehicles with additional credentials as necessary and also participating in misbehavior detection in the domain.
The following terms are used to describe the sources of overhead that the certifying authorities have to bear:
Trust Management Overhead – Proposing and maintaining trust relationships between “authorities” which are trusted by V2V participants (e.g., supporting change of attributes such as region (mobility))
Misbehavior Eviction Overhead – Processing misbehavior reports, revoking credentials and disseminating revocation information
There are mainly two trust model alternatives, a single rooted tree or multiple rooted trees with appropriately defined trust inter-relationships.
1. Single-Rooted Tree – Single trust anchor, Global trust domain 2. Multiple-Rooted Trees – Multiple trust anchors
Cross-certification (a) Hierarchical – Some anchors are “more trusted” than others (b) Flat – All anchors are “equally trusted”
Trust domain (a) Local – Participants only communicate with a rooted tree (b) Global – Participants communicate across all rooted trees
All these designs have different pros and cons which are discussed in the section below. A single-rooted tree provides a simple framework for trust management. But, it has a single point of failure. The misbehavior eviction process is also global in scope and would therefore have a higher overhead. A single-rooted tree also does not accommodate delegation or distribution of authority to multiple stakeholders, and it may, therefore, be inflexible with respect to certain trust policies. Multiple-rooted trees provide much more flexibility and more design options. With hierarchical cross-certification and local trust domain, the simple trust management framework of a single-rooted tree is retained, and the misbehavior eviction overhead is reduced to the local scope. The point of failure is distributed, but the “highest” authority is still a single point of failure. Also, the hierarchical relationships among the authorities can be tailored to suit any trust policy. If the trust domain is made global, the misbehavior eviction process becomes global in scope. If the cross-certification is flat instead of hierarchical, the point of failure is truly distributed, but the trust management process becomes slightly complex.
To summarize, there are fairly few choices when it comes to design the structure of the PKI authority. Based upon the operational constraints which may stem from legal and policy considerations, an appropriate structure for the PKI tree can be proposed. Some of the legal and policy considerations may include the following: (i) whether law enforcement is being used as a deterrent (ii) whether automotive OEMs agree to a government authority being the highest authority; (iii) whether the PKI is administrated
Appendix Volume 3 H-2-21

VSC-A Final Report: Appendix H-2 V2V PKI Security Management – India Science Laboratory, GM R&D
by a consortium, by OEMs separately, by the government, or by a security firm on contract.
Despite the uncertainty over some legal and policy considerations, the following PKI structure can be considered as a pragmatic choice. Considering that V2X communications is a cooperative technology which requires interoperability and standardization, it would be prudent to have a consortium of OEMs as one of the highest authorities. If law enforcement agencies are being used as a deterrent, then a government authority should also be one of the highest authorities. This is to enable law enforcement to furnish digitally signed electronic reports of their observations. Finally, based upon considerations of economic and legal liabilities, a contracted security agency may also be one of the highest authorities. Whether these three entities ought to be at the same level or whether one should have the power to overrule the others, is a matter to be debated. In order to keep the misbehavior eviction overhead and the trust management overhead bounded, it would be necessary to have an additional number of levels below the highest level of authorities. These levels can be created by classifying vehicles on the basis of some of their attributes. Although vehicles can be classified based upon make, model, segment, fuel economy, engine displacement, towing capacity, seating capacity, and so on, these sorts of attributes reveal some information about the vehicle and its owner. A security expert familiar with the PKI structure may be able to infer certain attributes of a vehicle by scrutinizing the messages and certificates sent by the vehicle. Therefore, it would be best to classify vehicles on the basis of their region of operation. The region attribute can become more and more fine-grained with an increasing number of levels in the PKI tree. For instance, in North America, the first level may be the country or time-zone or some other zone, the next may be state, the next the county, and so on.
These levels should be hierarchical with the trust domain extending up to an appropriate level like a county or a state. This would confine the overhead due to the misbehavior eviction process to within the trust domain. However, in order to accommodate users who frequently cross county or state boundaries, users could be furnished with sufficient credentials which would facilitate their usage patterns. Also, in order to accommodate users who cross borders infrequently, such users need only be granted credentials for their native trust domain, but they can request for additional credentials at the time of crossing. The process of issuance of additional credentials can be facilitated by having additional at cross-certification across neighboring trust domains, to minimize the need for interaction with higher level authorities.
While the authority structure described above is by no means complete, it does specify a high-level PKI structure for credential management.
5.2 Privacy Policy
There are two distinct notions of privacy both of which have to be dealt with. Privacy from an adversary should be part of any communication system. It needs to ensured that the addition of V2X messaging does not compromise privacy from an adversary any more than the privacy available to an average driver today.
1. Privacy from Adversary What is the level of privacy of an average vehicle driver today?
Appendix Volume 3 H-2-22

6
VSC-A Final Report: Appendix H-2 V2V PKI Security Management – India Science Laboratory, GM R&D
o Quantification needs to come from a legal perspective Right Level: Addition of V2V messaging should not compromise
privacy any more
2. Privacy from Authority Right Level: First and foremost, a privacy policy needs to be
defined o Needs to come from a legal standpoint
Cryptography can enable the V2X privacy policy o This will influence design of “Trusted Third-Party
Authority” Users of the V2X services need to “agree to the terms of” the V2X
privacy policy
The basic building block of providing privacy is to make users employ credentials which are not linkable to one another. Depending on how much privacy from the authority is required, one may design a system in which credentials are unlinkable even to the authority (except if required, under revocation or some special event). Unlinkable credentials can be assigned in the form of multiple certified ECDSA public keys or other schemes.
Summary of Observations
Given the doubts about whether a large-scale DSRC RSU network will be available at the time of deployment of V2V safety systems, the considerations around requirements of infrastructure to support secure V2V system were analyzed. Infrastructure here means the communication interface between the participating vehicles and a representative entity of the certification authority. The two primary functions of infrastructure are valid credential management and facilitating the eviction of a misbehaving credential.
Most challenging, from a point of view of research issues and resource requirements, is the functionality of evicting misbehaving vehicles. It was observed that the eviction performance depends on the following broad system parameters:
Misbehavior Rate - This depends crucially upon, among possibly several others, ease of compromising credentials and punitive actions in place. For example, an increased level of tamper resistance incorporated in implementation and integration of the V2V system in a vehicle could significantly reduce the chances of credentials being compromised.
Resilience to a Misbehavior - Higher resilience to a misbehavior (spurious message) would limit the impact of an attack, hence possibly placing a lower eviction performance demand on the misbehaving node eviction process. Resilience to misbehavior could come from several sources:
o V2V Penetration - In the case of a high V2V penetration, a vehicle could receive information from several vehicles, thus possibly helping filter out the incorrect information.
Appendix Volume 3 H-2-23

VSC-A Final Report: Appendix H-2 V2V PKI Security Management – India Science Laboratory, GM R&D
o Application Design - Some applications could be designed to be inherently insensitive to a target amount of incorrect information.
Tuning of Misbehaving Node Eviction - The fact that the participating vehicles are required to detect presence of misbehavior and assist the credential management system in evicting the identified misbehavior could result in stringent requirements on the performance of misbehavior detection schemes. Misbehavior detection schemes in general depend on the particular application and misbehavior in question. Proper tuning of misbehavior detection schemes is required to extract a good eviction performance. Higher V2V penetration could result in improved MDS performance.
Infrastructure Availability - An increase in the density of infrastructure would improve the eviction performance. Several technological options for realizing the vehicle-to-CA communication is provided in the text. These options tend to present the delay versus resource cost tradeoff. For a given budget, the delay could be a traded-off against the in-network resources versus out-of-network resource trade-off. Higher V2V penetration could bring down the delay for a given resource budget.
It is to be noted that high V2V penetration appears to be helping in improving resilience, increasing speed and accuracy of misbehavior detection, and misbehavior reporting and revocation information dissemination.
The basic building blocks required for a good performance of eviction process have been identified. The various parameters are abstracted-out versions of several technological/design choices. Several technological options for realizing the misbehavior reporting schemes were discussed. Detailed study of these choices needs to be carried out in order to arrive at a feasible infrastructure solution to support secure V2V communications. For example, an increase V2V penetration could help improve the performance of several constituents determining the eviction performance. Hence exploiting this dependence of eviction performance on V2V penetration should be a crucial objective. However, to achieve this, the impact of V2V penetration on the performance of the various constituents mentioned above needs to be understood. Further, the different trade-offs presented by the various components that need to be designed for the eviction process need to be studied.
One of the key observations to highlight here is that the eviction performance of the secure V2V system does not depend only on the infrastructure presence, and there are several other very important, which are possibly of much higher impact, design considerations/building blocks that affect the eviction performance.
Measuring the security performance (of misbehaving node eviction process) by considering the number of incorrect messages received and acted upon by the other vehicles is advocated. The delay in misbehaving node eviction by itself does not indicate the security performance. For example, a misbehaving vehicle with no other vehicle in vicinity will be hard to detect, but it also does not impact the system performance. This
Appendix Volume 3 H-2-24

7
VSC-A Final Report: Appendix H-2 V2V PKI Security Management – India Science Laboratory, GM R&D
consideration again brings in the dependence of security performance on the V2V penetration.
To conclude, the infrastructure presence required to support V2V systems to guard against misbehavior depends crucially on several factors. This problem thus presents a multi-dimensional trade-off and has to be explored further in order to be able to provide concrete quantitative recommendations.
References
[1] “Wireless Access in Vehicular Environments - Security Services for Applications and Management Messages", IEEE 1609.2, 2006.
[2] Standard Specification for Telecommunications and Information Exchange Between Roadside and Vehicle Systems - 5 GHz Band Dedicated Short Range Communications (DSRC) Medium Access Control (MAC) and Physical Layer (PHY) Specifications, ASTM, 2003, E2213-03.
[3] “The Network Simulator - ns-2,” http://www.isi.edu/nsnam/ns.
[4] CAMP VSC2 Consortium, “Vehicle Safety Communications – Applications: First Annual Report,” NHTSA Publication, 2008
[5] National Highway Safety Administration. Vehicle Safety Communication Project, Final Report. Technical Report DOT HS 810 591, U.S. Department of Transportation, April 2006.
[6] F. Bai, Narayanan Sadagopan, and A. Helmy. IMPORTANT: a framework to systematically analyze the Impact of Mobility on Performance of Routing Protocols for Adhoc Networks. INFOCOM 2003. Twenty-Second Annual Joint Conference of the IEEE Computer and Communications Societies., pages 825-835, vol.2, 30 March – 3 April 2003.
[7] Fan Bai, Hariharan Krishnan, Varsha Sadekar, Gavin Holland, and Tamer ElBatt. Towards characterizing and classifying communication-based automotive applications from a wireless networking perspective. In 1st IEEE Workshop on Automotive Networking and Applications (AutoNet 2006), 2006.
[8] M. Ghosh, A. Varghese, A. Kherani, and A. Gupta. Distributed Misbehavior Detection in VANETs. In Proceedings of IEEE WCNC 2009 Conference, 2009.
[9] M. Ghosh, A. Varghese, A. Kherani, A. Gupta, and Muthaiah S. Detection Scheme with Integrated Root Cause Detection in VANET. In ACM Mobicom 2009 (VANET'09 Workshop), 2009.
[10] Intelligent Transportation Society of America. Vehicle to Vehicle Safety Application Research Plan. In US DOT Vehicle Safety Communications Research Workshop, March 2009.
[11] Iyer, A. Kherani, A. Rao, and A. Karnik. Secure V2V Communications: Performance Impact of Computational Overheads. In IEEE Infocom 2008, Mobile Networking for Vehicular Environments workshop., 2008.
Appendix Volume 3 H-2-25

VSC-A Final Report: Appendix H-2 V2V PKI Security Management – India Science Laboratory, GM R&D
[12] Kherani, A. Iyer, A. Varghese, and R. Shorey. Performance of Broadcast Authentication for Secure V2V Safety Applications: A Holistic View. WISARD Workshop, 2008.
[13] Kherani, S. Muthaiah, and S Padhy. Stability of Resource Constrained Platforms Supporting Secure Broadcast Communication with Random Channel Access. Under Review, 2009.
[14] Kherani, S. Muthaiah, S Padhy, and D. Bhattacharya. Reliable and Secure Broadcast Communication Over Resource Constrained Systems. In VALUETOOLS. ICST, 2009.
[15] Kherani and A. Rao. Performance of Node Eviction Schemes in Vehicular Networks. IEEE Transactions on Vehicular Technology, 2009.
[16] K.P. Laberteaux, J.J. Haas, and Y.C. Hu. Security Certificate Revocation List Distribution for VANET. In Proceedings of the Fifth ACM International Workshop on VehiculAr Inter-NETworking, pages 88-89. ACM New York, NY, USA, 2008.
[17] P.P. Papadimitratos and J.P. Hubaux. Certificate revocation list distribution in vehicular communication systems. In Proceedings of the Fifth ACM International Workshop on VehiculAr Inter-NETworking, pp 86-87. ACM New York, NY, USA, 2008.
[18] Rao, A. Sangwan, A Kherani, A. Varghese, B. Bellur, and R. Shorey. Secure V2V Communication With Certificate Revocations. IEEE Infocom 2007, Mobile Networking for Vehicular Environments Workshop., pages 127-132, 2007.
[19] Ashwin Rao. Performance Evaluation of Secure Communication in Vehicular Networks. Master's thesis, Indian Institute of Technology Delhi, 2009.
[20] M. Raya, D. Jungels, P. Papadimitratos, I. Aad, and J.P. Hubaux. Certificate Revocation in Vehicular Networks. Laboratory for Computer Communications and Applications (LCA), EPFL, Tech. Rep. LCAREPORT-2006-006, 2006.
[21] M. Raya, P. Papadimitratos, VD Gligor, and J.P. Hubaux. On Data-Centric Trust Establishment in Ephemeral Ad Hoc Networks. In INFOCOM 2008. The 27th Conference on Computer Communications. IEEE, pages 1238-1246, 2008.
[22] Maxim Raya, Panagiotis Papadimitratos, Imad Aad, Daniel Jungels, and Jean-Pierre Hubaux. Eviction of Misbehaving and Faulty Nodes in Vehicular Networks. IEEE Journal on Selected Areas in Communications, Special Issue on Vehicular Networks, 2007.
[23] CAMP Vehicle Safety Communications Consortium. Vehicle Safety Communications Project Task 3 Final Report Identify: Intelligent Vehicle Safety Applications Enabled by DSRC. Technical Report 809859, National Highway Traffic Safety Administration, U. S. Department of Transportation (USDOT), Mar. 2005.
[24] The Federal Information Processing Standard Security Requirements for Cryptographic Modules FIPS PUB 140-2.
Appendix Volume 3 H-2-26

VSC-A Final Report: Appendix H-2 V2V PKI Security Management – India Science Laboratory, GM R&D
[25] D. G. Abraham, G. M. Dolan, G. P. Double, J. V. Stevens, Transaction Security System IBM Systems Journal, vol. 30, no. 2, pp. 206-229, 1991.
[26] Ross J. Anderson, Security Engineering: A Guide to Building Dependable Distributed Systems John Wiley & Sons, Inc. 2001.
Appendix Volume 3 H-2-27

VSC-A Final Report: Appendix H-3
Analysis of Infrastructure and Communications Requirements for V2V PKI Security Management
Prepared by
Yih-Chun Hu and Jerry T. Chiang
H-3-i

List of Acronyms
CA Certificate Authority
CAMP Crash Avoidance Metrics Partnership
CRL Certification Revocation List
DSRC Dedicated Short Range Communications
ECDSA Elliptic Curve Digital Signature Algorithm
GSM Global System for Mobile Communications
OEM Original Equipment Manufacturers
PGP Pretty Good Privacy RSU Road-Side Unit
V2I Vehicle-to-Infrastructure
V2V Vehicle-to-Vehicle
VANET Vehicular Ad Hoc Network
VIN Vehicle Identification Number
Appendix Volume 3 H-3-ii

Table of Contents List of Acronyms.......................................................................................... H-3-ii
1 Overview ................................................................................................ H-3-1
2 Security and Privacy Metrics ............................................................... H-3-1
3 Alternative VANET Infrastructures ...................................................... H-3-2
4 Vehicle Certificates ............................................................................... H-3-2
5 Misbehavior and Detection .................................................................. H-3-4 5.1 Threat Model ............................................................................................... H-3-4
5.2 Detection Methods ...................................................................................... H-3-5
6 Certificate Revocation .......................................................................... H-3-6 6.1 Revocation Delay Tolerance and Expected Number of Revocations ......... H-3-6
6.2 Revocation Schemes.................................................................................... H-3-6
6.3 Requirement on Revocation Authorities ..................................................... H-3-7
6.4 Storage Structure of the Certificate Revocation List ................................... H-3-8
6.5 CRL Distribution......................................................................................... H-3-8
6.5.1 CRL Update Message Structure ..................................................... H-3-9
6.5.2 Transmission Modes of CRL Distribution..................................... H-3-9
6.5.3 Bandwidth Requirement for CRL Distribution.............................. H-3-9
7 Privacy Protocols ............................................................................... H-3-10
8 Delegation of Power to Alternative Infrastructure ........................... H-3-10
9 Summary ............................................................................................. H-3-11
10 References .......................................................................................... H-3-12
Appendix Volume 3 H-3-iii

VSC-A Final Report: Appendix H-3 V2V PKI Security Management – Hu and Chiang
1 Overview
This document explores the issues regarding misbehavior detection, revocation, and privacy in a vehicular ad hoc network (VANET) in this report. Specifically, we consider the case when only limited communication infrastructure is present, whereas many previously proposed security protocols have assumed a dense deployment of road-side units (RSUs) with hardware supporting Dedicated Short Range Communication (DSRC).
Dense deployment of DSRC RSUs allow for a consistent link between individual vehicles and the central authorities responsible for maintaining the network. Therefore, the vehicles can simply report road condition to, and obtain any relevant information from, the RSUs. RSUs can also provide privacy from other vehicles by renewing certificates. The main security concern of a dense RSU deployment would be to secure the RSUs so that adversaries cannot tamper with the RSUs or pretend to be an RSU since other security issues would have been solved.
However, large-scale DSRC RSU deployment is likely to be unavailable for the near future. Thus, exploration of possible infrastructure substitutions and the resulting effects on the system design principles are presented. In particular, this document will explore the benefit and potential risk of using alternative infrastructure and vehicle-to-vehicle (V2V) communication as the primary mode of VANET.
2 Security and Privacy Metrics
The ultimate metric for measuring the success of a VANET is the number and severity of crashes the network can mitigate. However, the current literature does not discuss the relationship between the number and severity of crashes and other network and security metrics such as:
Packet delivery ratio
Detection and false detection probabilities
False VANET alerts
Revocation (false revocation) probability after detection (false detection)
Time between detection and revocation
Consequently, it is very difficult to determine how secure a system is or which security aspect requires more attention.
Mutual information can be used as a metric for privacy. However, in some cases where it is not feasible to model the distribution of the variable in question in a protocol, it is difficult to derive meaningful mutual information. More research needs to be done in how to quickly and accurately quantify and evaluate the “amount” of privacy offered by a protocol, since a privacy policy makes sense only if how much privacy is required can be quantified. Moreover, pertinent government agencies and the original equipment manufacturers (OEMs) must determine how much privacy they are willing to lose in order to reduce crashes by a certain amount.
Appendix Volume 3 H-3-1

VSC-A Final Report: Appendix H-3 V2V PKI Security Management – Hu and Chiang
In this report, it is assumed that the OEMs and government agencies will have addressed these metrics and established a suitable requirement on the “amount” of security and privacy.
3 Alternative VANET Infrastructures
Without a dense RSU deployment, existing infrastructures such as cell towers, civilian WiFi access points, and satellite radio have been suggested as possible alternatives. These alternative infrastructures all enjoy fast Internet connections. Thus, they can play the role of a proxy such that messages can be forwarded to the certificate authority (CA), and any CA response (e.g., an updated certificate revocation list) to these messages are sent back and disseminated through these alternative infrastructures. Alternative infrastructures can also provide services that do not require CA signatures. In Section 8 the security implication of allowing alternative infrastructures to perform tasks other than being proxies is discussed.
The potential risk of using alternative infrastructure include impact on the available bandwidth used by the alternative infrastructure, erroneous software implementation and validation by the alternative infrastructure, and the difficulty in implementing any other out-of-band verification of the broadcast claims by the alternative infrastructure. Reasonable pricing may be reachable with current market mechanisms such as bidding and auctions.
4 Vehicle Certificates
To prevent malicious parties from reducing the benefits of a VANET and causing crashes, each participating vehicle must acquire a certificate in order to join the network. Different regions (e.g., different countries) can set up different VANETs, and these VANETs may not trust each other. If a vehicle elects to join multiple networks over its lifetime, such vehicle will need to acquire certificates from each network. Each vehicle can be assigned a single certificate from each VANET. However, this scheme does not provide strong privacy since adversaries can track a vehicle by listening for its certificate.
Group signatures schemes have also been proposed [7, 16, 18]. Parno and Perrig noted that in order to attribute misbehavior to a particular vehicle, the group manager should be able to link a signature to an individual group member [16]. There are two different entities that can act as group managers: an online CA or other vehicles. If RSUs were densely deployed, they could be used as group managers and attribute misbehavior when necessary while maintaining the group privacy during normal operation. However, without densely deployed RSUs, a vehicle in a neighborhood must be selected as group manager. This vehicle can then leak private information since it knows how to associate signatures and individual vehicles and can falsely attribute misbehavior. Since there is no guarantee that a selected vehicle is benign, it is recommended not to choose a group manager unless there exists a dense RSU deployment and an RSU is chosen as group manager.
Without dense deployment of RSUs, prior work suggested that each vehicle be given a batch of certificates to provide both authenticity and privacy [13]. A vehicle can
Appendix Volume 3 H-3-2

VSC-A Final Report: Appendix H-3 V2V PKI Security Management – Hu and Chiang
periodically switch from one certificate to another to prevent other vehicles from tracking it by tracking a single certificate. Two issues are explored in this section: the certificate distribution hierarchy and the number of certificates given at once.
The document suggests using the existing vehicle control hierarchy to economically implement the certificate hierarchy. That is, the current administrative processes in assigning vehicle license plates, driver’s licenses, or vehicle identification numbers (VINs) can also be used to manage certificates. Since a vehicle license plate number may change over time and a single vehicle operator may have multiple vehicles, these identifications do not all form a one-to-one correspondence to a single vehicle. Thus, the document suggests using the process of administering the VINs in particular to also manage the vehicle certificates.
Prior work suggested separating the certificate management from certificate distribution to maintain privacy [13]. The driver’s license and vehicle plate administrative processes can thus be used to distribute certificates.
Based on the average time Americans stay in vehicles [9], Haas, et al., suggested that an average US vehicle may use up to 25,000 certificates over 5 years if each certificate is used once for a single, 10-minute period [11]. The document suggests more research be done in determining whether switching certificates every 10 minutes provides sufficient privacy. In particular, the document is interested in any implications of the duration of a certificate being valid on the duration of silent periods.
Depending on the frequency that a vehicle can replenish its certificates, a vehicle can be pre-loaded with more or less than 25,000 certificates. For example, if certificates are given when vehicle registration stickers are renewed every year, each vehicle can be loaded with 5,000 certificates at that time. On the other hand, if certificates are replenished every time a driver's license expires (typically every 5 years), vehicles need to be loaded with 25,000 certificates every time. Some prior research suggested that DSRC RSUs can be installed in gas stations and replenish certificates [13]. Similarly, vehicles can obtain new certificates when they go in for maintenance (e.g., oil change). In this case, it is harder to determine a fixed number of certificates to give out every time since the time between refilling gas or between oil changes can vary widely from vehicle to vehicle. Moreover, RSUs installed at these locations also present a security risk since more installed RSUs correspond to an increase of vulnerabilities. Finally, commercial vehicles that operate more frequently than average also utilize weigh stations for certificate replenishments.
The number of certificates given away should be limited to as few as possible while still satisfying all privacy requirements. For example, if each vehicle is given 50,000 certificates for operating 10 more years, an adversary may decide to operate the vehicle for only two more years and use the remaining 40,000 certificates to carry out attacks. There exists a cost-security tradeoff between the number of certificates and the overall security strength of the VANET. Namely, if a large number of certificates are given at once, each vehicle must be installed with a larger storage device, and the security strength provided by using certificates as authorization decreases. However, the total cost associated with replenishments also decreases since fewer replenishments are needed over the lifetime of the vehicle.
Appendix Volume 3 H-3-3

5
VSC-A Final Report: Appendix H-3 V2V PKI Security Management – Hu and Chiang
A VANET can mitigate attacks related to extraneous certificates by using time-sensitive certificates. That is, if each subset of certificates can only be used over a certain time period, then an attacker can only use certificates from one subset at any time instance. For example, if each certificate can only be used over a particular 10-minute period (i.e., the size of each subset equals 1), then an attacker could be prevented from using extra certificates as long as the attacker cannot break the elliptic curve digital signature algorithm (ECDSA) or obtain certificates from other vehicles. An attacker that can break ECDSA or obtain certificates from other vehicles can still attack the system with multiple certificates even when the attacker only operates one vehicle at a time.
Using small certificate subsets over time increases the amount of memory required. Using the example from the pervious paragraph, if each certificate can only be used in a particular 10-minute period, then a vehicle must be loaded with more than 52,500 certificates every year (one certificate for every 10 minutes), which is one order of magnitude higher than the 5,000/year figure when certificates are not time-sensitive. The tradeoff between security and memory requirement thus depends heavily on how much memory the manufacturers can install in each vehicle.
Misbehavior and Detection
In this report, a misbehaving node is defined to be one that deviates from the standard. A misbehaving node is further defined to be effective if its misbehavior may cause real-life safety concerns. For example, a misbehaving node that transmits incorrect windshield wiper status may be considered less effective than another misbehaving node that reports incorrect position and velocity. Local and CA detection methods can disregard detecting ineffective misbehaving nodes when computation power is limited. Further research is required to evaluate which attacks might credibly be effective.
5.1 Threat Model
Any misbehaving node will be considered a threat to the network; however, only a subset of them are effective. Three types of attackers that may be effective are specifically considered:
An attacker that injects false information
An attacker that exploits the authentication process
An attacker that leaks privacy information For example, by falsely reporting an accident ahead, an attacker can divert other traffic, thereby enjoying a faster speed. However, this traffic diversion decreases the speed of surrounding roadways and results in traffic pattern that is routed sub-optimally.
In another example, if vehicles are loaded with a large number of certificates at once so that many certificates can be used at a time instance, vehicles that do not operate as frequently as average are likely to have leftover certificates before periodic replenishment. These vehicles can then use these leftover certificates to carry out Sybil attacks, where each attacker disguises as a group of nodes in the system. If the certificate distribution mechanism does not rule out possible Sybil attacks, an attacker need not be
Appendix Volume 3 H-3-4

VSC-A Final Report: Appendix H-3 V2V PKI Security Management – Hu and Chiang
financially strong in order to appear as a large group of colluding nodes. The document does not suggest assuming any upper bound on the number or fraction of vehicles being malicious in a small region. In particular, an honest local majority is not assumed at any time or location. However, it is reasonable to assume that there is an honest global majority.
Privacy-leaking attack methods depend on the privacy-preservation mechanism in use by the network. For example, one privacy-preservation scheme relays all packets through a single network node. An attacker chosen to be this relay can compromise the privacy of any node that it services. In another example, if a benign vehicle switches between certificates without using silent period or mix zones in hope to prevent attackers from tracking the benign vehicle using its transmission certificates, an attacker that is physically close can still track the vehicle by linking its certificates together.
5.2 Detection Methods
Golle, et al., proposed detecting misbehavior in a distributed manner by detecting network graph inconsistencies [10]. In their scheme, a node compares the incoming messages against a VANET model. If the model shows that the incoming messages are impossible, the node traces the physical source of such message and marks that source as suspicious. However, graph inconsistencies can be caused by several different subgroups of nodes, each is potentially misbehaving. Golle, et al., thus suggested assigning blame on the simplest possible attack (i.e., smallest subgroup that is potentially misbehaving). A network without a local, honest plurality will likely result in wrongful allegations causing certificates belonging to benign vehicles to be revoked.
Yan, et al., proposed using active position verification to eliminate Sybil attackers [21]. In their scheme, each vehicle is equipped with radar, and any broadcasting node that cannot prove its claimed location is identified as suspicious. However, precise location verification systems often have heavy hardware overhead and must be universally deployed to secure all vehicles. Thus, the Sybil attack is considered a plausible attack. This consideration greatly affects the applicability of prior work on revocation schemes as described in Section 6.2.
A privacy-leaking attacker can be passive and abide by the standards except recording what it heard. Detection methods usually cannot prevent these type of attacks since outside observations alone cannot exhibit a definite inconsistency.
In general, if a detection scheme that results in no false alarms is wanted, there may be no detection at all. On the other hand, if perfect detections are desired, everyone may end up being suspected. Thus, it is suggested that more research be done regarding detection schemes without assuming a local honest majority and explore possible Pareto optimums where the benefit of the detection performance outweighs possible incorrect detections. Moreover, it is also suggested that more research be done in the countermeasures of Sybil attacks and false accusations.
Appendix Volume 3 H-3-5

VSC-A Final Report: Appendix H-3 V2V PKI Security Management – Hu and Chiang
6 Certificate Revocation
6.1 Revocation Delay Tolerance and Expected Number of Revocations
In order to prevent a malicious node from attacking the system further, a CA issues a global revocation where a vehicle is revoked from the VANET entirely. The time between detecting an attack and revoking the corresponding malicious vehicle is an important security parameter. There is a lack of literature on this topic, and we recommend studying the relationship between the effectiveness of an attack and the time between detection and revocation as mentioned in Section 2.
The bounds on the expected number of revocations is better understood when given the upper bound on the time between detection and revocation. For example, if revocation must follow detection within 1 second, then a time-triggered virus can disable the revocation process by attacking the system with an overwhelming number of vehicles at once. If revocation must follow detection within 1 week, then a pessimistic upper bound can be established by considering the scenario where every vehicle is revoked within one week.
Specific to the case of mitigating virus attacks, a signing key can be assigned to each version of the firmware. The CAs use these signing keys to generate certificates for each vehicle. When a virus attacks a particular set of versions of the firmware, a super-CA revokes the signing keys corresponding to those versions of the firmware, thereby mitigating the virus attack quickly compared to publishing revocation keys of individual vehicles. However, updating the firmware and assigning new keys for large number of vehicles is likely to be costly in both time and money.
A more optimistic bound can be derived by assuming that the maximum number of vehicles revoked at once is less than the number of vehicles leaving the control of their owners between replenishments. For example, if a valet service covertly collects certificates of cars temporarily in their possession, let each vehicle be given one batch of certificates every year, and finally let this rogue valet service handle 500 cars each day. Then the CA may need to revoke as many as (500)(365) = 182,000 vehicles at once.
6.2 Revocation Schemes
Revocation can be performed by special vehicles (e.g., police cars) since these vehicles act as authorities and all vehicles, by default, trust these special vehicles. Thus, if a special vehicle detects and concludes a particular node is being malicious, all other vehicles can safely assume that node is indeed malicious. However, without any dense deployment of authorized entities, revocation done in a distributed manner must be considered.
Distributed and collaborative revocation schemes have been proposed using voting schemes. Many authors have proposed revocation by voting with a fixed number of votes [3, 15, and 22], where a node is revoked if more than a fixed number of other nodes accuse that node of being malicious. Arboit, et al., proposed revocation by voting with a fixed fraction of nodes where a node is revoked if a fixed fraction of nodes present in the
Appendix Volume 3 H-3-6

VSC-A Final Report: Appendix H-3 V2V PKI Security Management – Hu and Chiang
neighborhood accuse that node of being malicious [1]. Voting schemes with a fixed number of votes is insecure since colluding or Sybil attackers can effectively vote out anyone in the network as they desire. Voting schemes using a fixed fraction, on the other hand, requires local honest plurality and that they have all detected misbehavior. Since some nodes in the neighborhood might not detect misbehaviors, and the assumption of a local, honest majority may not be reasonable, voting revocation schemes are not considered secure.
Clulow, et al., [5] and Raya, et al., [19] proposed revocation by suicide where a benign node revokes both its own certificate and a certificate held by adversaries. The self-sacrifice schemes again rely on having a local, honest majority. Otherwise, only certificates held by adversaries would stay in use in the region. Because adversaries are not likely to hold more certificates than benign nodes globally, the adversaries may only be able to deny service to others for a short period of time within a small region.
Without assuming the existence of special vehicles or a local honest majority, each vehicle can still decide to ignore other vehicles on its own, known as individual revocation. Individual revocation can allow a Pretty Good Privacy (PGP)–style, web-of-trust construction, similar to many reputation schemes (where a node trusts its own observations over time) [8]. However, in order to maintain privacy, each individual certificate is used for a short time. Thus, web-of-trust and reputation schemes may not be able to finish collecting definitive data before a misbehaving node changes its certificate.
Individual nodes may report to the CA about the reputation of a misbehaving certificate when it comes into contact with the CA. The node can then ask the CA to revoke the reported adversary. However, without a local, honest majority, it is possible that adversaries can cause many benign users to be wrongfully revoked. Unpublished results show that reputation-based approaches are a detection problem with a non-zero, false-positive probability. There exists a delicate relationship between individual revocation and privacy of VANET. Imagine there exists a scheme so that a node can use reputation or web-of--trust to individually revoke a misbehaving node even after such misbehaving node changes its certificate. An adversary can then accuse a benign node as being malicious. Even if the benign node changes its certificate, the adversary can still track the benign node since the benign node's new certificate must still be individually revoked. In other words, privacy-leaking adversaries can use any reputation scheme that can link corresponding certificates as a random oracle.
6.3 Requirement on Revocation Authorities
Voting and suicide can both be viewed as a means for bootstrapping from individual revocation to local revocation where a group of neighboring nodes agree on revoking a particular node. These schemes are secure only if assuming a local, honest majority, and such an assumption may not be reasonable in face of the Sybil attack.
More research may reveal whether bootstrapping individual revocation to local, and ultimately global, revocation is possible. If such bootstrapping is not possible, relying on an authority (e.g., special vehicles) to perform opportunistic detection and revocation may be the only local and global revocation method that is secure.
Appendix Volume 3 H-3-7

VSC-A Final Report: Appendix H-3 V2V PKI Security Management – Hu and Chiang
6.4 Storage Structure of the Certificate Revocation List
To revoke a certificate held by a malicious vehicle, the CA notified all vehicles to disregard any messages sent using that certificate. Each vehicle then updates its local certificate revocation list (CRL) by integrating the notification from the CA. Since each malicious vehicle may carry a large number of certificates, the CRL could grow quite large in size when all the certificates held by malicious parties are revoked and stored naively in memory. For example, if each certificate is roughly 100 bytes, 25,000 certificates are given to each vehicle, assuming there are 100 million vehicles in the U.S., and 1 in 100,000 vehicles are revoked, the CRL could grow to contain as many as 25 million certificates and as large as 2.3 GB. Naively storing the CRL in a file is inefficient in terms of searching whether a certificate is revoked. A binary tree structure could be used to cut the search time down from linear to logarithmic in the number of certificates contained.
The CRL can be reduced in size and complexity greatly if lossy compression is used. Raya, et al., and Haas, et al., suggested using Bloom filters as a possible compression mechanism [17, 11]. The Bloom filter has constant computation cost in insertion and search operations. However, it also has a false positive rate where an item is mistakenly identified as part of a group. That is, a certificate held by a benign vehicle may be identified as revoked if the CRL is stored in a Bloom filter. Haas, et al., showed that using the numbers from the previous paragraph, a 32 MB storage space could result in a 0.6 percent false-positive rate. Haas, et al., then sought to mitigate false positives by giving every vehicle more certificates such that in expectation, each vehicle would have the desired number of certificates after revocation due to false positives. Since a vehicle can detect that its certificate will be a false positive before use, a vehicle should not experience significant unavailability due to false positives. Unavailability is more likely when a vehicle is using time-sensitive certificates where all certificates belonging to that vehicle for a particular time are unusable due to false positives.
Haas, et al., compared the insertion and search times for each certificate and showed that the Bloom filter structure only requires half the time compared to binary trees in his implementations. Bloom filters can be used as a compact and lightweight mechanism of storing revoked certificates.
Haas, et al., also proposed letting the CA associate all certificates using a single revocation key for a node in VANET. The CA can thus publish the revocation key of a vehicle and all other vehicles can update their CRL by generating all corresponding certificates of the malicious node to revoke. That is, the memory usage can be greatly compressed by storing revoked keys instead of naively storing all certificates issued to a vehicle. When using Bloom filters as a means of compression, revoked certificates are computed and inserted into the Bloom filter, and revocation keys are stored separately in a list.
6.5 CRL Distribution
This subsection discusses the three major aspects of distributing the CRL as the structure of update messages, the mode of transmission, and the required bandwidth. Two update message structures are discussed below as updates (or pieces) of the CRL, or a lossy-
Appendix Volume 3 H-3-8

VSC-A Final Report: Appendix H-3 V2V PKI Security Management – Hu and Chiang
compressed CRL. An effective CRL distribution scheme must be able to reach a great portion of the vehicles circulating within the CA region within a short time.
6.5.1 CRL Update Message Structure
The number of entries in the CRL grows as more revocations are added over time. Cooper proposed the delta-CRL method, which breaks the CRL into updates and the updates are distributed periodically [6]. Laberteaux, et al., proposed using delta-CRLs to securely distribute the CRL in VANETs [14]. While Laberteaux, et al., showed that their distribution scheme is effective, some updates may not be received the first time they are broadcast either due to dropped transmission or due to the vehicle being out of a CA region for a long period of time. A CRL distribution scheme that uses delta-CRL thus must be able to distribute old broadcasts. Laberteaux, et al., suggested labeling each delta-CRL with a sequence number, and a vehicle can request from its neighbors any missing delta-CRLs.
If each vehicle's CRL is stored in a Bloom filter, the Bloom filter corresponding to the current CRL can be distributed to bring each vehicle up-to-date. Run-length coding can be used to distribute the Bloom filter and reduce the bandwidth usage. The choice of distributing the run-length Bloom filter update or individual updates is a trade off based on the number of revoked certificates within the last update. For example, if a 32 MB Bloom filter is chosen and uncompressed, each revocation key is 16 byte, and each certificate is 100 byte in size, then delta CRL updates should be distributed if there are less than 336,000 certificate revocations or 2.1 million revocation keys within the last update. The Bloom filter should be distributed otherwise.
The Bloom filter is much larger in size than that of the key of a vehicle. Thus if our revocation scheme is to revoke a vehicle by publishing its revocation key every time, then the Bloom filter is almost never transmitted. However, if our revocation scheme involves revoking individual certificates, such as a scheme based on suicide, then the Bloom filter may be transmitted in some cases.
6.5.2 Transmission Modes of CRL Distribution
Since it is assumed that RSU deployment is sparse, relying entirely on V2I CRL distribution is not reasonable. Laberteaux, et al., explored possible improvements when using V2V CRL distribution [14] and concluded that V2V distribution results in much faster and wider-spread CRL dissemination. It is thus suggested that V2V CRL distribution be used in conjunction to any limited infrastructure dissemination even when possible alternative infrastructures such as cell tower are present.
6.5.3 Bandwidth Requirement for CRL Distribution
Haas, et al., showed that revoking a node by publishing the revocation key associated with that node only requires 16 byte of memory [11]. A cell phone tower that operates using Global System for Mobile Communications (GSM) can support 9.6 kbps of data service per channel, equivalent to publish the revocation keys of at most 75 vehicles per second, or more than 6.4 million vehicles every day. If individual certificates are broadcast for revocation and each certificate is 100 byte, then one GSM channel is able to revoke at most 12 certificates per second, or more than 1 million certificates every day.
Appendix Volume 3 H-3-9

VSC-A Final Report: Appendix H-3 V2V PKI Security Management – Hu and Chiang
If a bound on the number of revocations over a period of time can be established, then the transmission rate required can be determined and a proper data service can be selected.
7 Privacy Protocols
If DSRC RSUs are densely deployed, then each vehicle can obtain a certificate from one RSU, which expires when the vehicle comes in association with the next RSU. An RSU can void certificates from a group of close-by vehicles at the same time, and then distribute new certificates in random order. Thus no one besides the RSU can determine the old and new certificates corresponding to a particular vehicle (as long as the group size is larger than 2). Sampigethaya, et al., suggested that vehicles can form groups, and most communications between the group and the RSUs can be done through only the group leader [20]. This approach is not secure for reasons mentioned in Section 4. Without dense deployment of RSUs, two methods have been proposed to provide privacy: silent periods and mix zones [12, 2].
Huang, et al., proposed that when a certificate expires, the certificate-holding vehicle waits a random period of time before switching to a new certificate [12]. Since a vehicle cannot broadcast messages without a certificate, the time a vehicle waits between switching is called a silent period. If numerous cars in a particular neighborhood switch certificates at roughly the same time, their silent periods overlap and others cannot link the old and new certificates of a particular vehicle.
Beresford suggested that if several vehicles switch their certificates at the same time and place, it also prevents others from discovering the temporal link between old and new certificates of a vehicle [2]. The place where vehicles gather to switch certificates is called a mix zone.
Silent periods and mix zones may provide a high level of privacy from non-authorized vehicles. However, these protocols do not provide privacy against authorized entities because CAs must be able to perform revocation [4]. Moreover, there exists a fundamental problem with these approaches. Silent periods and mix zones work best when there is a crowd; however, these are precisely where VANET safety is most important for preventing accidents. It is thus suggested that more research be done regarding optimizing the use of silent periods and mix zones to provide privacy while maintaining safety. That is, to provide privacy while reducing the number of crashes. It is also suggested that further research in understanding how to quantify the amount of privacy be conducted.
8 Delegation of Power to Alternative Infrastructure
To reduce the number of tasks performed by the CA and to reduce communication overhead and latency, alternative infrastructures can themselves provide services without requiring signatures from the CAs. For example, if they know all the certificates assigned to a particular node in the VANET, then these alternative infrastructures can decide to revoke all the certificates belonging to such a node in the case of a security breach. The revoked node then must be examined (with possible real-life consequences) before being allowed to join the VANET again.
Appendix Volume 3 H-3-10

9
VSC-A Final Report: Appendix H-3 V2V PKI Security Management – Hu and Chiang
Since a compromised CA can leak privacy, spread wrongful revocation, and generally stop the entire network from functioning correctly for a potentially extended period of time, if alternative infrastructures should be used to provide services without signatures from the CAs, these alternative infrastructures must achieve the same level of security as the CAs themselves. That is, the security requirement on alternative infrastructures would need to be significantly more stringent than if they were used only as proxies.
For example, a WiFi access point can be set up freely and easily by adversaries, relying on using WiFi access points for revocation or to provide privacy may result in system-wide wrongful revocations or privacy leaks. Previous reports also expressed concerns regarding privacy leaks when certificates are distributed by cell towers since cell phone service providers could know the identity of each node, adding many more points of failure [13]. This document does not suggest using alternative communication infrastructures except for distributing messages already signed by authorities such as CRLs.
Summary
The document recommends using alternative infrastructure only for proxying between vehicles and CAs. For example, using a cell tower to distribute CRLs allows CRLs to reach more nodes in the VANET with an impact to the bandwidth of the cell phone system. Since alternative infrastructure might be spoofed by adversaries, it is suggested not to use these alternatives for any service that does not require CA signatures.
It is recommended to use the existing process used for administering VINs to manage certificates and using other opportunities such as driver license renewal to provide certificate dissemination.
Misbehavior detection schemes may be implemented on every node and trigger individual revocation when a set of neighbor nodes appear suspicious.
CRL distribution schemes have been studied at length, and this document concludes that V2V schemes should be implemented in order to achieve faster and wider dissemination. Is it also suggested storing the CRL in two formats: storing the entire CRL in a binary tree format (which requires GBs of memory and long search time), or storing a lossy-compressed CRL in a Bloom filter where false positives are compensated.
In this report, it is recommended that more research be done to provide a security metric and a privacy metric that can be related to the number and severity of crashes; moreover, it is suggested studying various attacks and defense mechanisms to determine their effectiveness using said metrics. It is also recommended that researching the relationship between detection by untrusted nodes and global revocation especially in the case of a local malicious majority be conducted. Such research will provide insights on whether a secure network can rely only on special vehicles for global revocation. Finally, additional research needs to be conducted to study the tradeoff between privacy and safety when using mix zones and silent periods.
In this report, the OEMs and pertinent government agencies are invited to provide guidance on the amount of security and privacy necessary for practical deployment. Furthermore, it is also suggested that the OEMs determine the amount of installed
Appendix Volume 3 H-3-11

VSC-A Final Report: Appendix H-3 V2V PKI Security Management – Hu and Chiang
memory and select the parameters regarding number of certificates given during each replenishment. Finally, a definite rule on the tradeoff between privacy and number of crashes should be explored.
10 References
[1] Genevieve Arboit, Claude Crepeau, Carlton R. Davis, and Muthucumaru Maheswaran. A Localized Certificate Revocation Scheme For Mobile Ad Hoc Networks. Ad Hoc Netw., 6(1):17{31, 2008.
[2] Alastair R. Beresford and Frank Stajano. Mix zones: User Privacy In Location-Aware Services. In PERCOMW '04: Proceedings of the Second IEEE Annual Conference on Pervasive Computing and Communications Workshops, page 127, Washington, DC, USA, 2004. IEEE Computer Society.
[3] Haowen Chan, Virgil D. Gligor, Adrian Perrig, and Gautam Muralidharan. On The Distribution And Revocation Of Cryptographic Keys In Sensor Networks. IEEE Trans. Dependable Secur. Comput., 2(3):233-247, 2005.
[4] Yih-Chun Hu and Kenneth P. Laberteaux. Strong VANET Security On A Budget. In Proceedings of Workshop on Embedded Security in Cars (ESCAR), 2006.
[5] Jolyon Clulow and Tyler Moore. Suicide For The Common Good: A New Strategy For Credential Revocation In Self-Organizing Systems. SIGOPS Oper. Syst. Rev., 40(3):18-21, 2006.
[6] David A. Cooper. A more efficient use of delta-CRLs. In SP '00: Proceedings Of The 2000 IEEE Symposium On Security And Privacy, page 190, Washington, DC, USA, 2000. IEEE Computer Society.
[7] Florian Dotzer. Privacy Issues In Vehicular Ad Hoc Networks. In Proc. of the 2nd ACM International Workshop On Vehicular Ad Hoc Networks. ACM Press, 2005.
[8] Florian Dotzer, Lars Fischer, and Przemyslaw Magiera. Vars: A Vehicle Ad-Hoc Network Reputation System. In WOWMOM '05: Proceedings of the Sixth IEEE International Symposium on World of Wireless Mobile and Multimedia Networks, pages 454-456, Washington, DC, USA, 2005. IEEE Computer Society.
[9] Pierre Bouvard et al. The Arbitron National In-Car Study. Technical Report, 2003.
[10] Philippe Golle, Dan Greene, and Jessica Staddon. Detecting and Correcting Malicious Data In VANETs. In VANET '04: Proceedings of the 1st ACM International Workshop On Vehicular Ad Hoc Networks, pages 29-37, New York, NY, USA, 2004. ACM.
[11] Jason J. Haas, Yih-Chun Hu, and Kenneth P. Laberteaux. Design and Analysis Of A Lightweight Certificate Revocation Mechanism For VANET. In VANET '09: Proceedings Of The Sixth ACM International Workshop On VehiculAr Inter-NETworking, New York, NY, USA, 2009. ACM.
[12] Leping Huang, K. Matsuura, H. Yamane, and K. Sezaki. Enhancing Wireless Location Privacy Using Silent Period. In Wireless Communications and Networking Conference (WCNC), 2005.
Appendix Volume 3 H-3-12

VSC-A Final Report: Appendix H-3 V2V PKI Security Management – Hu and Chiang
[13] Noblis (in press). Footprint Analysis for IntelliDrive V2V Applications, Intersection Safety Applications, and Tolled Facilities.
[14] Kenneth P. Laberteaux, Jason J. Haas, and Yih-Chun Hu. Security Certificate Revocation List Distribution for VANET. In VANET '08: Proceedings of the Fifth ACM International Workshop on VehiculAr Inter-NETworking, pages 88-89, New York, NY, USA, 2008. ACM.
[15] Haiyun Luo, Jiejun Kong, Petros Zerfos, Songwu Lu, and Lixia Zhang. Ursa: Ubiquitous And Robust Access Control For Mobile Ad Hoc Networks. IEEE/ACM Trans. Netw., 12(6):1049{1063, 2004.
[16] Bryan Parno and Adrian Perrig. Challenges In Securing Vehicular Networks. In Workshop on Hot Topics in Networks (HotNets-IV), 2005.
[17] M. Raya, P. Papadimitratos, I. Aad, D. Jungels, and J. p. Hubaux. Eviction of Misbehaving and Faulty Nodes In Vehicular Networks. IEEE Journal on Selected Areas in Communications, 2007.
[18] Maxim Raya and Jean-Pierre Hubaux. Securing Vehicular Ad Hoc Networks. J. Comput. Secur., 15(1):39-68, 2007.
[19] Maxim Raya, Mohammad Hossein Manshaei, M_ark F_elegyhazi, and Jean-Pierre Hubaux. Revocation Games In Ephemeral Networks. In CCS '08: Proceedings of the 15th ACM Conference On Computer and Communications Security, pages 199-210, New York, NY, USA, 2008. ACM.
[20] Krishna Sampigethaya, Leping Huang, Mingyan Li, Radha Poovendran, Kanta Matsuura, and Kaoru Sezaki. Caravan: Providing Location Privacy for VANET. In Embedded Security in Cars (ESCAR), 2005.
[21] G. Yan, S. Olariu, and M. Weigle. Providing VANET Security Through Active Position Detection. Computer Communications, 31(12), 2008.
[22] S. Yi and R. Kravets. Moca: Mobile Certificate Authority For Wireless Ad Hoc Networks. In 2nd Annual PKI Research Workshop (PKI03), 2003.
Appendix Volume 3 H-3-13

VSC-A Final Report: Appendix H-4
Analysis of Infrastructure and Communications Requirements for V2V PKI Security Management
Prepared by
Security Innovations
Appendix Volume 3 H-4-i

List of Acronyms
AES Advanced Encryption Standard
API Application Programming Interface
CA Certificate Authority
CAMP Crash Avoidance Metrics Partnership
CRL Certificate Revocation Lists
ECDSA Elliptic Curve Digital Signature Algorithm
FIPS Federal Information Processing Standardization
FM Frequency Modulation GHz Gigahertz
HCI Human-Computer Interaction
HMI Human Machine Interaction
HSM Hardware Security Modules
HW Hardware
I2V Infrastructure-to-Vehicle
IP Internet Protocol
LDM Local Dynamic Map
OBE On-board Equipment
PKI Public Key Infrastructure
POC Proof-of-Concept
RSE Road-Side Equipment
SIM Subscriber Identity Module
SW Software
TADS TESLA and Digital Signature
TCP Transmission Control Protocol
TESLA Timed Efficient Steam Loss-Tolerant Authentication
TTP Trusted Third Party
UDP User Datagram Protocol
VoD Verify-on-Demand
VSC Vehicle Safety Communications
VSC-A Vehicle Safety Communications - Applications
Appendix Volume 3 H-4-ii

VII-C Vehicle Infrastructure Integration - Consortium
V2I Vehicle-to-Infrastructure
V2V Vehicle-to-Vehicle
Appendix Volume 3 H-4-iii

Table of Contents List of Acronyms.......................................................................................... H-4-ii
1 Technical Summary .............................................................................. H-4-1
2 System Overview / Review and Success Criteria .............................. H-4-2 2.1 Motivation and Brief System Description ................................................... H-4-2
2.2 Success Criteria ........................................................................................... H-4-3
2.2.1 Importance of Accuracy in In-Vehicle Information Systems ........ H-4-3
2.2.2 Channel Capacity ........................................................................... H-4-4
2.2.3 Success Definition and Criteria for Evaluating Solutions.............. H-4-4
3 Attacks and Countermeasures ............................................................ H-4-4 3.1 Overview ..................................................................................................... H-4-4
3.2 List of Attacks (Review) ............................................................................. H-4-5
3.2.1 AT1 Replay Attack ........................................................................ H-4-5
3.2.2 AT2 Tunneling Attack ................................................................... H-4-5
3.2.3 AT3 Forged Messages ................................................................... H-4-5
3.2.4 ATP1 Obtain Privacy Sensitive Information ................................. H-4-5
3.2.5 ATP2 Link Transmissions Based on Vehicle Status Transmissions ................................................................................ H-4-6
3.2.6 ATP3 Recover Identity .................................................................. H-4-6
3.3 Use of Certificates/Certificate Lifecycle (Review) ..................................... H-4-6
3.3.1 Initialize ......................................................................................... H-4-6
3.3.2 Use ................................................................................................. H-4-7
3.3.3 Revoke ........................................................................................... H-4-8
3.3.4 Update ............................................................................................ H-4-8
3.3.5 Expire ............................................................................................. H-4-8
3.4 What is a Forged Message? What is Misbehavior? .................................... H-4-8
3.5 Attacker Types and Attack Likelihood ....................................................... H-4-9
3.5.1 Attacker Types ............................................................................... H-4-9
3.5.2 Attack Likelihood .......................................................................... H-4-9
3.6 How Infrastructure Affects Attacks: Areas Covered in the Rest of the Paper .................................................................................................... H-4-11
4 Suitability of Different Anonymity Schemes for the Low-Infrastructure Case .................................................................................................... H-4-11
4.1 General ...................................................................................................... H-4-11
Appendix Volume 3 H-4-iv

5
4.2 Properties of Anonymous Authentication Systems ................................... H-4-12
4.2.1 Privacy Against CA/Law Enforcement ........................................ H-4-12
4.2.2 Eavesdroppers’ Ability to Back-link Following Revocation....... H-4-13
4.2.3 Vehicles Might Need to Reuse One-time Certificates ................. H-4-13
4.2.4 Storage Space Requirements/Certificate Issuance Message Size H-4-13
4.2.5 Time to Identify Attacking Vehicle ............................................. H-4-14
4.2.6 Revoked Vehicle Requires Others to Recertify ........................... H-4-14
4.2.7 Suitability for Local Revocation .................................................. H-4-14
4.2.8 Time to Eliminate Effects of Type 1 Attack ................................ H-4-14
4.2.9 Time to Eliminate Effects of Type 2 Attack ................................ H-4-15
4.2.10 Time to Eliminate Effects of Type 3 Attack ................................ H-4-15
4.2.11 Processing Time on Vehicle for Message with Known Certificate ..................................................................................... H-4-15
4.2.12 Processing Time on Vehicle for Message with Unknown Certificate ..................................................................................... H-4-15
4.2.13 Additional Costs ........................................................................... H-4-15
4.2.14 Notes: Efficiency and Bandwidth ................................................ H-4-16
4.3 Combinatorial Certificates ........................................................................ H-4-16
4.3.1 General ......................................................................................... H-4-16
4.3.2 Notes ............................................................................................ H-4-17
4.4 Linked........................................................................................................ H-4-19
4.5 Group Signatures on Message with Occasional Reissue ........................... H-4-21
4.6 Group Signatures on Certificate with Occasional Reissue ........................ H-4-22
4.7 Individual Certificates without Revocation, and Vehicle Removal .......... H-4-23
4.8 Semi-linked Certification Revocation + Vehicle Removal ....................... H-4-24
4.9 Comparison of Approaches ....................................................................... H-4-26
AT3 Forged Messages ........................................................................ H-4-28 5.1 Preventing Forged Message Attacks ......................................................... H-4-28
5.2 Local Assessment of Message Reliability................................................. H-4-28
5.2.1 Overview ...................................................................................... H-4-28
5.2.2 Suggestions for Future Research.................................................. H-4-30
5.3 Role of the Infrastructure in Mitigating Forged Message Attacks ............ H-4-30
5.4 Identify the Vehicle Responsible .............................................................. H-4-32
Appendix Volume 3 H-4-v

5.5 Warn Other Vehicles ................................................................................. H-4-32
6 ATP2 Link Transmissions Based on Vehicle StatusTransmissions ................................................................................... H-4-32
6.1 Attack Description..................................................................................... H-4-32
7 Mitigation of Threats: Possible V2I Topologies ............................... H-4-33 7.1 Overview ................................................................................................... H-4-33
7.2 Enhancing I2V with V2V: Epidemic Mode, Geo-networking.................. H-4-33
7.3 Types of I2V .............................................................................................. H-4-34
7.4 I2V Using Direct Non-5.9 GHz Access to Vehicle on Road .................... H-4-35
7.4.1 Cellular Communications Directly to Vehicles Using Driver’s Phone............................................................................................ H-4-35
7.4.2 Cellular Communications Directly to Vehicles Using Built-in Cellular Connection ..................................................................... H-4-37
7.4.3 Distribute Information Using Frequency Modulation (FM) Radio................................................................................... H-4-40
7.5 I2V Where There is Only 5.9 GHz Access to Vehicle on Road ............... H-4-42
7.5.1 Wired Access Only, Access When Vehicles are Serviced........... H-4-42
7.5.2 Require Fuel Stations to Set Up RSEs ......................................... H-4-44
7.5.3 Use Authorized Vehicles with a Wideband, Non-5.9 Uplink to Distribute Revocation Information .............................................. H-4-45
7.5.4 Widespread Infrastructure ............................................................ H-4-46
7.6 Comparison of approaches ........................................................................ H-4-48
8 Interaction Between Anonymity Mechanism and Infrastructure Access Mechanism ............................................................................ H-4-49
9 Summary of Questions to be Addressed in the Paper .................... H-4-50 9.1 Original Questions ..................................................................................... H-4-50 9.2 Additional VSC-A Questions .................................................................... H-4-52
10 References .......................................................................................... H-4-53
Appendix Volume 3 H-4-vi

List of Tables Table 1: Thresholds for Specific Levels of Disruption.............................................. H-4-18 Table 2: Comparison of Anonymity Mechanisms ..................................................... H-4-27 Table 3: Comparison of Local Message Credibility Assessment Mechanisms When There is Pseudonymity ................................................................................. H-4-29 Table 4: Comparison of Anonymity Mechanisms ..................................................... H-4-48 Table 5: Suitability of Different Infrastructure Access Models for Different Anonymous Authentication Approaches ..................................................... H-4-50
Appendix Volume 3 H-4-vii

1
VSC-A Final Report: Appendix H-4 V2V PKI Security Management – Security Innovations
Technical Summary
This paper examines the possibilities for successful deployment of a 5.9 GHz system supporting safety-of-life, vehicle-to-vehicle (V2V) applications when there is little or no widespread roadside infrastructure. In a system where the main messages are V2V safety-of-life messages, the main use of timely connection to the infrastructure is to access up-to-date security information. Lack of this connection has three main effects in that it takes more time to inform the infrastructure about misbehaving devices, it takes more time to distribute revocation information to devices that might need to consume it, and it takes more time to distribute new certificates to vehicles that may need them.
This paper does not contain significant original research, but instead surveys, in a systematic way, different options for solutions in the low-infrastructure case.
First, the document attempts to provide a definition of success. Based on recent human-machine interaction (HMI) research, this paper suggests that the system may still improve driving outcomes with as much as 30 percent of the messages being inaccurate. This provides a perspective that is useful in helping us to evaluate whether or not different solutions provide an acceptable outcome.
The document provides a qualitative overview of the likely level of attacks. This depends on attacker motivation and on the physical security of keying material within On-Board Equipment (OBE). It is strongly recommended that OBEs take steps to prevent attackers from extracting keying material by physically hardening the key storage location. The incremental cost of this will be $15 or less per OBE.
Next, the paper reviews the properties of anonymous authentication schemes. The anonymous authentication scheme used in the Vehicle Infrastructure Integration– Consortium (VII-C) Proof-of-Concept (POC), known as “combinatorial certificates,” requires a large number of vehicles to refresh certificates whenever a single certificate is revoked. The paper shows that the size of messages necessary to carry out this certificate renewal is not likely to overwhelm the system. For different ranges of parameters characterizing this combinatorial certificate scheme, the document estimates how many vehicles must be compromised between renewals to cause a significant level of disruption to the system. For the version of the system where each vehicle has 10 certificates out of 10,000, the paper shows that at least 1,500 vehicles must be compromised to make the system fail (as in 30 percent of received messages are of unknowable trustworthiness). This figure is based on several simplifying assumptions, which will in general result in the system being able to withstand a higher level of compromised vehicles than this baseline estimate suggests.
However, certain aspects of the combinatorial certificates approach (including the fact that compromise of vehicles from one manufacturer may inconvenience users of vehicles from another manufacturer) may make it unacceptable. The document, therefore, reviews other anonymous authentication schemes to identify other candidates that might be suitable for use in the low-infrastructure case. The most promising approach (in terms of robustness against intermittent access to the infrastructure) appears to be that of [1], which combines the cryptographic mechanism known as group signatures (for
Appendix Volume 3 H-4-1

VSC-A Final Report: Appendix H-4 V2V PKI Security Management – Security Innovations
certificates) with standard ECDSA signatures on messages. This approach is compatible with the Timed Efficient Stream Loss-tolerant Authentication (TESLA) optimization proposed by Vehicle Safety Communications–Applications (VSC-A) to the IEEE, although even with TESLA it may require specialized cryptographic hardware (HW).
The document also identifies issues with regard to anonymous authentication that can only be addressed at the policy level rather than the technical level. It is recommended that high priority is put on addressing these.
Next, incident detection and revocation times are reviewed. The time required to remove a device from the system into time to detect the misbehavior, identify the vehicle, revoke the certificate, and transmit revocation information have been split.
To help with detection in the low-infrastructure case, the document proposes that vehicles should use local plausibility tests to greatly restrict the range of incorrect messages that attackers can effectively send. The document considers that systems based on voting for trustworthy nodes are insufficiently robust against an attacker who controls multiple certificates and should not be used.
To help the infrastructure identify incidents, the document proposes that vehicles should keep logs of messages received, with a focus on messages received at the time when the vehicle experienced dangerous driving conditions (e.g., when the vehicle had to brake suddenly). These logs can be provided to the infrastructure when the vehicle has an opportunity.
Having described the use cases and requirements in general, the document considers possible ways of providing infrastructure connectivity to vehicles, from no infrastructure to widespread infrastructure. Intermittent infrastructure connectivity is more useful for distributing Certificate Revocation Lists (CRLs) than for allowing certificate renewal, which affects the usefulness of different anonymous authentication mechanisms. Using a qualitative rather than quantitative analysis, the document considers the suitability of mechanisms that involve a non-5.9 GHz connection from the infrastructure to the OBE and mechanisms that involve limited 5.9 access points from end-user vehicles to the OBE (e.g.,, via incident response vehicles or petrol stations). The document concludes that access from incident response vehicles is a promising solution, and that non-5.9 GHz access by a small number of end-user vehicles (which could be paid for by providing premium data services) would be a useful supplement to this solution.
2 System Overview / Review and Success Criteria
2.1 Motivation and Brief System Description The VSC-A system is a vehicular communications system primarily focused on V2V communications to support safety-of-life applications. It is widely accepted that the messages in this system will need to have their authenticity, integrity, and authorization assured by means of digital certificates or some similar mechanism. The VSC-A security system is based on the digital certificate format and other mechanisms defined in [2].
However, digital certificates are able to provide security only if bad actors are removed from the system in a timely fashion (e.g., the speed at which distribution of revocation
Appendix Volume 3 H-4-2

VSC-A Final Report: Appendix H-4 V2V PKI Security Management – Security Innovations
information is disseminated). The two methods for removing bad actors’ certificates, which are short certificate lifetimes and certificate revocation, both rely on decisions about certificate status that are made on the infrastructure. It is likely that in the early stages of national deployment of the VSC-A system, access to the infrastructure will not be widespread.
VSC-A has, therefore, sought a fuller analysis of the likely effectiveness of the system when access to the infrastructure is extremely limited. This document serves as part of that analysis.
2.2 Success Criteria
2.2.1 Importance of Accuracy in In-Vehicle Information Systems
Local dynamic traffic information received over 5.9 GHz may in principle be used in at least the following two ways:
To improve information to the driver, allowing them to make better driving decisions themselves
To enable on-board systems to automatically drive the vehicle There will always be a non-zero time to remove misbehaving devices from the system, so the accuracy of received messages can never be guaranteed even with widespread infrastructure deployment. Additionally, vehicles may innocently send out messages that are not accurate and would be misleading to a recipient. As such, the document recommends that 5.9 GHz messages should never be the basis for automatic driving. Instead, it is recommended that 5.9 GHz messages are used as one of the inputs to a driver information system. This is a more appropriate way of handling the inherent uncertainty about the accuracy and trustworthiness of received messages.
A necessary success criterion for the system, therefore, involves the ability of the system to provide information that is of value to the driver, even if it is not 100 percent accurate. There is ongoing research into the importance of the accuracy of the information that an in-vehicle system provides. Naively, it is clear that a system that is more accurate will be more trusted and will have better ability to improve driving behavior; but in order to establish success criteria for the system, it is necessary to quantify this in some way.
The authors of this paper are not Human-Computer Interaction (HCI) experts and it does not appear that significant research is publicly available addressing the importance of the accuracy of information presented to drivers. The main results found were from [3] and successor papers. These studied driving behavior for drivers with a 100 percent accurate information system, a 70 percent accurate information system, and no information system. The 70 percent accurate information system was inaccurate in that 30 percent of the prompts given were inappropriate or inaccurate. In other words, they provided false positives to the driver. The drivers with no information had on average 4.2 accidents per session, the drivers with 70 percent accuracy had on average 3.7 accidents per session, and the drivers with 100 percent accuracy had on average 2.8 accidents per session. Although instances of accidents went down as the quality of information went up, the total amount of bad driving (i.e., accidents, speeding, and swerving) was slightly higher
Appendix Volume 3 H-4-3

VSC-A Final Report: Appendix H-4 V2V PKI Security Management – Security Innovations
with the 70 percent accurate information than it was with no information. The paper concludes that something between 70 percent and 100 percent accuracy is likely to be useful.
2.2.2 Channel Capacity
The 20 MHz service channels in 5.9 GHz DSRC allow a data rate of up to 27 Mbps. Taking congestion and channel switching into account, this document categorizes the network load due to a solution as follows:
Low network load never requires more than 1 Mbps
Medium network load never requires more than 8 Mbps
High network load requires more than 8 Mbps This approach categorizes different solutions in terms of how long they require to recover from an attack without overloading the network with data.
2.2.3 Success Definition and Criteria for Evaluating Solutions
Based on this, there are a number of possible baseline success definitions for the system, including the following:
1. On average, 70 percent of the messages received by vehicles are accurate
2. A vehicle receives a non-negligible number of inaccurate messages no more than 30 percent of the time
If the system meets some criteria like the above, then it will be creating value by improving driving outcomes.
It is possible to consider alternative and more stringent success criteria, for example:
1. If an attack or other disruption causes less than 70 percent of messages received to be accurate, that attack must be resolved within X time
2. No attack should be able to affect more than 30 percent of the vehicles in the entire system
a. No attack should be able to affect more than 30 percent of vehicles in a specified region
However, Security Innovation has not been given specific guidance on what if any more stringent criteria should be used. In the analysis below, Security Innovation attempts to categorize possible solutions based on criteria including attack impact (defined roughly by how great an area will be dysfunctional under the 70 percent accuracy criteria) and likely time to mitigate attacks.
Attacks and Countermeasures
3.1 Overview
In this section, the attacks are reviewed to single out those that are affected by only intermittent access to the infrastructure. This will enable us to focus the discussion in the
Appendix Volume 3 H-4-4
3

VSC-A Final Report: Appendix H-4 V2V PKI Security Management – Security Innovations
later sections of this paper. The document also attempts to define the criteria for success for the system to provide a baseline for evaluating the different systems discussed in this paper.
3.2 List of Attacks (Review)
The following attacks have been identified for consideration: AT1 Replay Attack, AT2 Tunneling Attack, AT3 Forged Messages, ATP1 Obtain Privacy Sensitive Information, ATP2 Link Transmissions based on Vehicle Status Transmissions, and ATP3 Recover Identity.
In this section, the document identifies which of these attacks are affected by the use of certificates which will be the focus of the remainder of this document.
3.2.1 AT1 Replay Attack
In a replay attack, the attacker takes a valid message and replays it at a later point in time, hoping to fool receivers into thinking they’re communicating with a valid unit.
Mitigation includes authenticating messages (by signing them) and including the generation time in the signed portions. Receiving units check that a received message has not already been received and that its generation time is sufficiently close to the receiving unit’s locally measured time.
The prevention of replay attacks depends on the receiving unit being aware of its current time and location. It does not require access to the infrastructure.
3.2.2 AT2 Tunneling Attack
In a tunneling attack, the attacker takes a valid message and replays it at a different point in space, hoping to fool receivers into thinking they’re communicating with a valid unit.
Mitigation includes authenticating messages (by signing them) and including the generation location in the signed portions. Receiving units check that a received message has not already been received and that its generation location is sufficiently close to the receiving unit’s measured location.
The prevention of tunneling attacks depends on the receiving unit being aware of its current time and location. It does not require access to the infrastructure.
3.2.3 AT3 Forged Messages
In a forged message attack, the attacker creates a message containing false information (or alters an existing message so that it contains false information).
Mitigation is primarily provided by authenticating messages with digital certificates (see the more detailed discussion in section 5). The mitigation of this attack is critically dependent on access to up-to-date certificate information, which must originate on the infrastructure.
3.2.4 ATP1 Obtain Privacy Sensitive Information
In this attack, the attacker obtains a vehicle’s location and driving information and a time-stamp. This attack is not significant in itself, but allows the attacker to mount attacks
Appendix Volume 3 H-4-5

VSC-A Final Report: Appendix H-4 V2V PKI Security Management – Security Innovations
ATP 2 (section 3.2.5) and ATP3 (section 3.2.6). Mitigation of this attack does not depend on certificates.
3.2.5 ATP2 Link Transmissions Based on Vehicle Status Transmissions
In this attack, the attacker can determine information about a vehicle’s behavior by identifying multiple messages that originate from the same vehicle (known as “linking the messages”) and analyzing those messages to obtain information.
The linking may be carried out using:
Syntax: the attacker uses identifiers that appear in multiple messages and are unique to the vehicle, such as the IP address or the certificate (if these are in fact unique)
Semantics: the attacker uses the data in the message (location and velocity) to establish that with high probability the set of messages have come from the same unit
To mitigate the syntax-based version of this attack, a unit must be equipped with multiple certificates and have some mechanism to change them. This mitigation is dependent on the unit obtaining certificates from the infrastructure in sufficient number to run until it next accesses the infrastructure.
3.2.6 ATP3 Recover Identity
In this attack, the attacker recovers a real-world identifier such as the driver’s name, license plate, or vehicle identification number. This attack is most powerful when combined with ATP2 (section 3.2.5) to allow the attacker to recover the route taken by an identified driver. The mitigation of this attack depends on the use of certificates only in that it creates a requirement that if a certificate is sent unencrypted, it must not include a real-world identifier for the user.
3.3 Use of Certificates/Certificate Lifecycle (Review) The certificate lifecycle consists of the following stages:
1. Initialize
2. Use
3. Update
4. Revoke
5. Expire
3.3.1 Initialize
To communicate securely, a unit must have one or more private keys and their corresponding certificates. Certificates must be issued by a trusted third party (TTP), known as a Certificate Authority (CA). Options for obtaining these private key/certificate pairs are:
Appendix Volume 3 H-4-6

VSC-A Final Report: Appendix H-4 V2V PKI Security Management – Security Innovations
A unit may generate the private key locally and have the public key certified
One or more third parties may generate the key and certificate externally to the unit and then have them installed on the unit
During installation, the unit must demonstrate to the CA that it is valid, that is, it is a unit that has a right to be issued a certificate. The validity criteria for a unit have not been formally established, but they are likely to include some guarantee that the unit has been made by an accredited manufacturer, is equipped with all the components necessary to carry out VSC-A functions, and meets some standard of platform assurance (meaning that it is protected against unauthorized installation of new HW or software (SW)). The CA will then issue a certificate to the unit using one of the methods described above.
Units may have a number of different certificates, which are used in different contexts. For example, a unit may use one certificate for safety applications, and another for tolling applications31. It may also use one certificate for a given application and another to apply to the CA for a new application certificate if necessary.
3.3.2 Use
A unit sending a signed message will sign it with the private key corresponding to its appropriate certificate. The receiving unit verifies the message using the public key obtained from the certificate. The receiving unit must, therefore, have access to the certificate, which will be the case if the following conditions are met.
1. The certificate was included with the message
2. The receiving unit has already got a copy of the certificate (e.g., from a previous message)
3. The receiving unit can get a copy of the certificate by querying the infrastructure or other vehicles
In addition, the receiving unit must have assurance that the sender’s certificate is valid, which means that the following statements be applicable.
1. The sender’s certificate must permit the message to be issued. The message must be of a type permitted by the certificate, issued in a geographic location permitted by the certificate, at a time within the lifetime of the certificate.
2. The receiving unit must not have received an authenticated message telling it not to trust the certificate (for example, the certificate must not have been revoked).
31 Tolling is not included in the VSC-A safety applications set. It is used here as an example of a non-VSC A safety application. The safety model for tolling is otherwise out of the scope for this document.
Appendix Volume 3 H-4-7

VSC-A Final Report: Appendix H-4 V2V PKI Security Management – Security Innovations
3.3.3 Revoke
If a certificate’s user should no longer be given permissions to take the actions the certificate permits (e.g., if their subscription to a service has lapsed, if the unit is being decommissioned, if the user has been shown to be a bad actor, or if there is reason to suspect that a bad actor has accessed their keys), the other units in the system must be told not to trust that certificate. This can be done in a number of ways:
1. Receiving units can query the infrastructure as to whether or not the received cert should be trusted
2. Certificates can expire, and the infrastructure can choose not to reissue certificates to a misbehaving unit
3. The infrastructure can distribute CRLs containing a list of certificates that are no longer to be trusted
3.3.4 Update
If a user’s certificate is expired or accidentally revoked but the user is still entitled to take the actions identified by the certificate, the user may want the certificate to be updated. To do this, the user will have to communicate with the infrastructure to obtain a replacement for the certificate.
3.3.5 Expire
Certificates typically have an expiration date. Once this passes, the certificate is no longer valid.
3.4 What is a Forged Message? What is Misbehavior?
For purposes of this paper, misbehavior is defined as follows: Misbehavior consists of intentionally sending a message that does not actually reflect road conditions. This can be intended to produce a number of different outcomes:
Receiving vehicles take a different route than they otherwise would
Receiving vehicles brake suddenly, causing congestion (which may affect vehicles which did not even receive the fake message in the first place)
Incident response vehicles are attracted to a fake incident, using up resources which would otherwise be used elsewhere and giving the attacker more latitude to mount an attack at a different location
The document uses the word “intentionally” above to make it clear that this white paper is considering deliberate attackers. However, the following analysis is relevant to detecting and mitigating the effects of innocently malfunctioning devices as well.
In particular, note that inaccurate messages may appear in the system due to a number of causes, both malicious and accidental. The in-vehicle systems on each vehicle must be designed so as to handle a level of inaccuracy in messages while still helping, rather than confusing, the driver. This is an issue which has more to do with user interface design than with security, but it will be a fundamental requirement for general acceptance of the
Appendix Volume 3 H-4-8

VSC-A Final Report: Appendix H-4 V2V PKI Security Management – Security Innovations
system. Again, note that our basic definition of success, that 70 percent of the messages in the system are accurate, is independent of whether malicious messages come from compromised or innocently misbehaving vehicles.
3.5 Attacker Types and Attack Likelihood
3.5.1 Attacker Types
In line with standard analysis in this area, the document considers three basic types of attacker:
1. An attacker who is faking the sensor inputs to an intact OBE (this attacker can also be taken to cover the case of innocent malfunction)
2. An attacker who has extracted the key material from a single OBE
3. An attacker who has extracted the key material from multiple OBEs
(It is also possible to consider an attacker of type 4, an insider at the CA, but by definition this attacker is able to access the infrastructure so his capabilities are not affected by how widespread the infrastructure may be).
3.5.2 Attack Likelihood
In this paper the effectiveness of particular countermeasures against the three different types of attacker is evaluated. However, to complete the analysis, it would be useful to know how likely the different types of attacker are.
This is a difficult question to answer because it depends on decisions that have yet to be made. In particular, it depends on decisions about how cryptographic keys are to be protected on OBEs. As will be detailed below, a Type 3 attacker can cause a significant level of disruption to the system. Means to prevent an attacker from extracting keying material from a device include [4]:
Passive physical security to prevent access to the physical location where keys are stored. This can include epoxy, electromagnetic shielding, etc.
Active physical security to delete keys that are at risk of being revealed. This can include zeroizing memory when the environment goes outside expected temperature or other ranges.
Secure SW development and systems architecture to ensure that there is no application programming interface (API) that exposes key material, and also no API that allows an unauthorized entity to make use of the key material on an OBE, whether or not the key material is directly exposed.
Devices that provide these features may provide them to varying degrees. The spectrum of devices runs from “smartcards,” a term generally used to mean cheap devices that provide low physical security, to “dedicated Hardware Security Modules” (HSMs), a term generally used to mean more expensive devices that provide better physical security including advanced support for key zeroization.
A conventional way of expressing physical security properties, at least in the USA, is by reference to the physical security levels described in Federal Information Processing
Appendix Volume 3 H-4-9

VSC-A Final Report: Appendix H-4 V2V PKI Security Management – Security Innovations
Standardization (FIPS) 140-2 and other standards in the FIPS 140 series [5]. This defines a series of four levels, numbered 1 through 4, of which 1 amounts to essentially no physical security and 4 amounts to physical security that is intended to be effectively impregnable. Level 4 devices, such as the IBM 4758 crypto co-processor, cost in the thousands of dollars per unit and would not be suitable for the VSC system (in addition to the cost, their attack detection makes them extremely sensitive to changes in the operating environment).
At the lower end of the scale, it is extremely difficult to find data that would make it possible to estimate the numbers of type 2 or type 3 attackers per year in a system with 18 million new units per year, 250 million units in total, and typical unit lifetimes of 10 years or more. Clearly if keys are protected using only SW, there is a very high likelihood that there will be a very large number of type 2 and type 3 attackers. Regarding smartcards, [5] stated in 2006:
Attacking smartcards, especially recently designed ones, is now an expensive and time-consuming task. Only well-equipped laboratories with highly-qualified engineers generally succeed. However, progress in attack technology constantly forces chipmakers to improve their products.
Smartcards certified to FIPS 140-2 level 3 are currently available for about $15 dollars in small volumes; this would presumably decrease in large volumes. Use of these smartcards in new devices would greatly improve the security of the system against attackers with current technology. However, since the smartcards would have to stay in the field for 10 years or more, any vulnerability that was unknown or unexploitable at the time of deployment would not necessarily stay unexploited. The overall susceptibility of the system to attacks depends on the attackers’ motivation and the level of physical security on the devices, as follows:
Low attacker motivation, low physical security - Expect a small number of type 3 attacks and a moderate number of type 2 attacks due to hackers
Low attacker motivation, high physical security - Expect very few attacks
High attacker motivation, low physical security - Expect a large number of attacks, both type 2 and type 3
High attacker motivation, high physical security - Expect a low number of attacks, but that the attacks mounted will be type 3 attacks more than isolated type 2 attacks
Before deploying the system, it is hard to know the attacker’s level of motivation. This motivation level will depend on factors such as the prestige of the system and how widely it is relied upon (this second factor will affect both the level of disruption the attacker can cause, if that is their goal, and the ability of the attacker to divert traffic and allow the attacker an easier drive, if that is their goal). In the absence of firm knowledge that the attacker motivation will be low, it seems wise to ensure that the barriers to a successful attack are high and, therefore, that some level of physical security is built in to the OBE devices.
Appendix Volume 3 H-4-10

VSC-A Final Report: Appendix H-4 V2V PKI Security Management – Security Innovations
3.6 How Infrastructure Affects Attacks: Areas Covered in the Rest of the Paper
As identified above, two attack mitigations are highly dependent on live access to the infrastructure for up-to-date security information. This report will, therefore, focus on these two attacks:
1. AT3 Forged Messages - Here, lack of infrastructure affects the time the system takes to react to an attack
2. ATP2 Link Transmissions Based on Vehicle Status Transmissions - Here, lack of infrastructure affects the ability of the system to re-provision vehicles with certificates
In more detail, this paper investigates the following cases:
1. Choice of anonymity model - The properties of a range of different anonymity models in terms of infrastructure requirements and other security and implementation properties. This is intended to identify the most promising models for future work.
2. Mitigating forged message attacks without requiring active infrastructure - Mechanisms the system can use to reduce the impact of forged messages without requiring the use of revocation lists or other communications.
3. Certificate revocation - The time needed to get information to the infrastructure to allow revocation to take place, the time needed to make a decision to revoke, and the time needed to distribute revocation information. This will be highly dependent on the anonymity model so this paper spends some time detailing different possible models for anonymity.
This allows identification of two different communications models:
Broadcast - Such as CRL distribution, where a single message is of relevance to a large number of potential receivers
Unicast - Such as when new certificates are requested and issued when individual vehicles must enter into a transaction with a CA (or similar entity) as they move across the infrastructure
4 Suitability of Different Anonymity Schemes for the Low-Infrastructure Case
4.1 General Since the statement of work for this task did not specify which anonymous authentication scheme was to be used, the document reviews a range of possible anonymous authentication schemes. The strengths and weaknesses of the schemes are compared below.
Appendix Volume 3 H-4-11

VSC-A Final Report: Appendix H-4 V2V PKI Security Management – Security Innovations
Although the comparison is useful input into any decision about the anonymity scheme to be used, a more important input is a set of requirements that help determine which technical properties of a system are most important and which are less important. These requirements arise from policy analysis rather than simply technical analysis. Examples of open questions that have a policy aspect are:
What is the maximum trackable period for an innocent vehicle (i.e. how long must it be between certificate changes?)? Note that the ID change periods of 60 seconds or longer allow effective use of geonetworking ([6]; geonetworking is discussed in more detail in section 7).
Given that certificate changes must be synchronized with other vehicles and must involve a silent period, what is the acceptable trade-off between safety-of-life and anonymity? How long are vehicles allowed to be silent for and under what conditions? (See [7], [8] for more discussion.)
How acceptable is an insider attack at the CA? If CA functions can be partitioned (separating registration from issuance, or having multiple issuing authorities), does this affect the acceptability of inside attacks?
How acceptable is it for failures by one vehicle to affect others? How acceptable is it for failures in one manufacturer’s vehicle to affect other manufacturers’ vehicles?
If a vehicle is compromised at time A, is it acceptable for the revocation process to potentially leak information about its behavior before time A? If so, what is an acceptable leakage period?
There is a fundamental trade-off between effectiveness against insider attacks at the CA and the length of time it takes to revoke a compromised unit. It is strongly recommended that policymaking groups consider this tradeoff as a matter of urgency.
4.2 Properties of Anonymous Authentication Systems In this section the distinct properties that an anonymous authentication scheme may have are described.
4.2.1 Privacy Against CA/Law Enforcement Some anonymous authentication systems require that a certificate contains information that would allow the CA to determine who the sender is. An example of this is the “linked certificate” system described in [9], where senders’ certificates include a “linkage value” inserted by the CA. Other systems do not have this requirement. An example is the “combinatorial certificate” system of [10], in which certificates are shared between vehicles, so the only way to determine that a particular vehicle is compromised is to note that it is associated with more than the expected number of certificate replacement requests.
If the CA can identify the certificate owner, this is obviously a potential breach of privacy. The extent to which this is an actual problem can perhaps be mitigated by internal audit procedures at the CA (for example, linking a certificate to an owner could require the use of a specific decryption key, access to which is limited and whose use is
Appendix Volume 3 H-4-12

VSC-A Final Report: Appendix H-4 V2V PKI Security Management – Security Innovations
audited). Nevertheless, no auditing system is foolproof and the public perception of a risk may be more significant to the success of the VSC system than the risk itself.
Since a CA issues the certificates and that some part of the system must know the location that certificates are returned to, any system must have internal procedures to prevent an insider at the CA from abusing the issuance process. (This is even true in the combinatorial certificate case, where an insider could choose to issue a target vehicle with a set of certificates, none of which are issued to any other vehicle). It is considered that all systems under consideration in this paper have equal vulnerability to an insider attack at the time of issuance.
The distinction drawn under this heading is, therefore, how easy a corrupt insider, after issuance, would find it to track a vehicle based on its certificate use. “Good” means that an insider cannot, post-issuance, track a vehicle without requiring it to interact with the CA. “Bad” means that an insider can carry out one calculation and then track the vehicle. “Medium” means that a vehicle’s path can be split into (not necessarily continuous) intervals, and for each interval the insider can carry out one interval-specific calculation and then track the vehicle. If different CAs issue certificates for different intervals, the risk due to insider attacks can be greatly reduced.
4.2.2 Eavesdroppers’ Ability to Back-link Following Revocation Some anonymous authentication systems have the property that, even if an attacker cannot determine at the time of transmission which messages belonged to which vehicle, once a vehicle is revoked the attacker can use revocation information to “back-link” messages. In other words, to determine whether or not any given message from a collection of target messages assembled in the past was actually issued by the target vehicle. One such system is the linked certificate system of [9]. Other systems do not have this property. Even if a vehicle is revoked, it still has privacy against tracking for all messages issued before revocation. Here “high” implies that a revocation event allows an eavesdropper to link a large number of messages; “medium” implies that a revocation event allows an eavesdropper to link a significant number of messages, but lower than “high;” “low” implies that a revocation event does not give an eavesdropper information about a vehicle’s past path.
4.2.3 Vehicles Might Need to Reuse One-time Certificates In some systems, a CA issues a vehicle with a limited number of certificates which are not shared with other vehicles. In these systems a vehicle may use all of its certificates once before it is able to request more. In that case it must re-use existing certificates, reducing its anonymity. The linked certificate system of [9] is one such system.
4.2.4 Storage Space Requirements/Certificate Issuance Message Size Some systems can update a vehicle’s CA-certified information with relatively small messages. An example of this is the combinatorial certificate system of [10], where a certificate replacement message will (most likely) be no more than 2000 bytes. This document states that these systems are suited to opportunistic reissue in that, to improve their privacy properties, vehicles may be able to update their certificates over even a transient connection with the CA. Such systems are obviously particularly useful when
Appendix Volume 3 H-4-13

VSC-A Final Report: Appendix H-4 V2V PKI Security Management – Security Innovations
there is limited infrastructure and that infrastructure communicates mainly with vehicles in motion rather than vehicles at rest.
Systems that require a large certificate replacement message will, in general, also require a large amount of disk space for certificate storage, so these two issues are considered together.
4.2.5 Time to Identify Attacking Vehicle If a single vehicle is compromised and the system knows that a specific message has come from a compromised vehicle, how long does it take to identify that vehicle? Here “low” means that a single message will in general suffice, while “high” means that considerably more may be necessary. Note that this is in a sense the inverse of the “privacy against CA” property.
4.2.6 Revoked Vehicle Requires Others to Recertify If a vehicle is revoked, does this require any other vehicles to set up a unicast exchange with the CA (e.g., to obtain fresh certificates)? The answer here is yes for the combinatorial certificate system of [10] and no for the others. A “yes” here may be a showstopper for a system as it implies that one manufacturer’s vehicle may be caused to recertify by faults in another manufacturer’s vehicle, which may not be acceptable to manufacturers. A “yes” may also have the effect that a vehicle that is offline for some time may come back online to discover that all of its certificates are no longer acceptable, meaning that it must communicate with the CA before it can send additional safety-of-life messages. (With our 70 percent accuracy, success-rule-of–thumb rating, the system can clearly tolerate some background noise level of accidentally decertified vehicles, so this is not a showstopper).
4.2.7 Suitability for Local Revocation Informally, can it be characterized that: if a cert is associated with misbehavior, is it enough for the CA to tell all infrastructure nodes to look out for that cert; or is more local processing needed for an infrastructure node to tell it how to react?
How easily can the system tell the difference between a Type 1 and a Type 2 attack? If misbehavior is happening only in a single place, will it be possible to recognize that it is happening only in a single place based only on certificates and address it by distributing CRLs to all devices but only sending those CRLs OTA if they detect the compromised certificate? Or will it be necessary to carry out additional processing at other sites? (To an extent, this is simply another way of asking are certificates shared or not.)
4.2.8 Time to Eliminate Effects of Type 1 Attack If an attacker has only compromised one unit and has not extracted keying material from that unit (so they can only send messages in one place), how long does it take to address that attack? For example, for the combinatorial certificates system of [10], the attacker can continue the attack through multiple revocation cycles. While for the linked system, a single revocation will be sufficient. Here “low” means a single revocation cycle is enough and that that revocation cycle takes little time. “Moderate” means that a single
Appendix Volume 3 H-4-14

VSC-A Final Report: Appendix H-4 V2V PKI Security Management – Security Innovations
revocation cycle is enough, but the revocation cycle may take some time (longer than for “low” by a meaningful factor). “High” means that multiple revocation cycles are needed.
4.2.9 Time to Eliminate Effects of Type 2 Attack If an attacker has extracted keying material from one unit and so can mount a nationwide attack using those keys, how long does it take to address that attack? Note that the attacker can, in this case, use multiple certificates from the compromised unit simultaneously. Here “low” means that the attack can be removed in a single revocation cycle, “moderate” means it can be removed in a small number of revocation cycles, and “high” means that it may take a large number of revocation cycles
4.2.10 Time to Eliminate Effects of Type 3 Attack If an attacker has extracted keying material from multiple units, how long does it take to address that attack? Here “low” means that the traffic and effort involved is a low constant multiple of the number of vehicles compromised, “moderate” means that the cost measure is a high constant multiple of the number of vehicles compromised, and “high” means that the cost measure goes up faster than linearly in the number of vehicles compromised. Note that both “high” and “moderate” are potentially unacceptable. “Low” is the only safe answer here.
4.2.11 Processing Time on Vehicle for Message with Known Certificate
Including the time for a signature check and for a revocation check if necessary, how long does it take to process a message with a known certificate? “Low” means ECDSA or faster with no revocation check, “moderate” means a group signature verification with no revocation check, “high” means that the recipient needs to carry out some revocation check whose complexity grows as the number of revoked vehicles grows.
4.2.12 Processing Time on Vehicle for Message with Unknown Certificate
If a message with an unknown certificate comes in, how long does it take to carry out revocation checking and signature verification? (Note that after a CRL is issued, all certificates are considered “unknown,” so the frequency of CRL issue affects how important this consideration is). “Low” means that the cost of revocation checking increases more slowly than (time for table lookup) * (number of vehicles revoked). “Medium” means the cost of revocation checking is approximately equal to (time for table lookup) * (number of vehicles revoked). “High” means that the cost of revocation checking is considerably more than this.
4.2.13 Additional Costs This is an “any other thoughts” column. Costs are described for each scheme. “Low,” “medium,” and “high” here are somewhat arbitrary.
Appendix Volume 3 H-4-15

VSC-A Final Report: Appendix H-4 V2V PKI Security Management – Security Innovations
4.2.14 Notes: Efficiency and Bandwidth All of the schemes described here work with TESLA, TADS, and Verify-on-Demand (VoD). None of the schemes require significantly higher or lower message bandwidth than any of the other schemes.
4.3 Combinatorial Certificates
4.3.1 General
Description: There is a pool of N certificates, of which each vehicle has n. (Typical values: N = 1000-10,000, n – 5-10). Vehicles share certificates with each other although the full collection of n certificates will, with high likelihood, be unique to a vehicle. There is no way to link a certificate directly to a particular vehicle. If a certificate is seen to misbehave, it is revoked, and all vehicles with that certificate (a fraction n/N of the whole population) apply for a replacement. By tracking which vehicles apply for replacement certificates suspiciously often, the system can identify which vehicles are likely to be compromised and use out-of-band or physical enforcement means to reduce the damage caused by those vehicles.
Privacy Against CA/Law Enforcement - Good. Because certificates are shared, no individual vehicle can be directly linked to a specific misbehaving message.
Eavesdroppers’ Ability to Back-link Following Revocation - Low. Because certificates are shared, even if a certificate is known to exist on one particular vehicle, an eavesdropper cannot know that a previous message with the same certificates came from the same vehicle.
Vehicles Might Need to Reuse Certificates - No. Re-use of certificates is a feature, not a bug.
Storage Space Requirements/Certificate Issuance Message Size - Low. A vehicle only needs to store a small amount of information (on the order of KB). This can be obtained from a CA during an exchange when the vehicle is in motion.
Time to Identify Attacking Vehicle - Long. At least n revocation cycles, potentially more if there are multiple compromised vehicles.
Revoked Vehicle Requires Others to Recertify - Yes. As discussed in the list of policy questions above, this is a potential showstopper for the scheme.
Suitability for Local Revocation - No. The use of a bad certificate in a particular region does not necessarily mean a compromised vehicle is in that region.
Time to Eliminate Effects of Type 1 Attack - High by the definition in 4.2.8. Multiple revocation cycles are needed.
Time to Eliminate Effects of Type 2 Attack - Moderate by the definition in 4.2.9. A small number (n) of revocation cycles are needed. The size of the CRL will increase slightly slower than the number of vehicles compromised.
Appendix Volume 3 H-4-16

VSC-A Final Report: Appendix H-4 V2V PKI Security Management – Security Innovations
Time to Eliminate Effects of Type 3 Attack - A Type 3 attack in this system causes severe disruption to innocent vehicles, both in lack of reliability of on-road messages and in requiring physical intervention with many innocent vehicles. If k vehicles are revoked, the number of vehicles requiring physical intervention goes up much faster than k; so this is “high” by the definition in 4.2.10. (The maximum CRL size is small, which is good, but this is not enough on its own to bring the impact level down.)
Processing Time on Vehicle for Message with Known Certificate - Low. A single signature verification is required.
Processing Time on Vehicle for Message with Unknown Certificate - Low. Revocation lists are short, and the revocation check is a simple look-up.
4.3.2 Notes
4.3.2.1 Network Congestion Based on the analysis in this document, it does not seem that the network congestion caused by certificate message distribution needs be a problem for this approach. First, consider the case where there is widespread infrastructure. Using the mechanisms defined in POC, a certificate request and a certificate response containing a single certificate are both less than 500 bytes. Therefore, a request/response exchange is less than 1000 bytes = 8000 bits. Overload was earlier defined as a need to transmit more than 1 Mbps of information. This allows about 125 vehicles per second to complete a certificate transaction. If a transaction can in general be completed within a single communication zone, congestion in this case will only be seen if 125 vehicles per second are entering an RSE communication zone. Since typical headway between vehicles is 2 seconds, congestion would only be seen if there were 250-lane highways (or an intersection of two 125-lane highways). In other words, if a vehicle has access to the infrastructure, it is likely to have enough time to pick up a new certificate.
If certificate response messages need to contain more certificates, the message will be larger by about 200 bytes per certificate/key combination. The requests do not get significantly bigger as larger amounts of certificates are requested. Even if a vehicle needs to request 10 certificates, the request + response is unlikely to be above 2500 bytes = 20,000 bits. This allows 50 vehicles per second to carry out the interaction using our definition of congestion above, which will not be a problem. Therefore, lack of access to the infrastructure is likely to be a problem in that it delays rekeying, but the network traffic is likely to be acceptable. 4.3.2.2 Delaying Rekeying If r certificates have been revoked since a unit last rekeyed, its chance of having no certificates revoked is (1 – (1-n/N)r). Its chance of having exactly k certificates revoked is given by the hypergeometric distribution H(k, n, r, N).
To get a crude measure of the effects of a long time between accesses to the infrastructure, it is assumed that all vehicles obtained revocation information and new certificates at time t, that at a subsequent time r certificates have been revoked, and that revocation information is easy to distribute (via emergency vehicles, for example).
Appendix Volume 3 H-4-17

VSC-A Final Report: Appendix H-4 V2V PKI Security Management – Security Innovations
However, unicast communications with a CA are infrequent. This situation is considered because it is the one in which vehicles lose certificates fastest; so a worst-case analysis is discussed below.
Another quantity, k, is introduced which is called the threshold. This is the number such that if a vehicle has fewer than k distinct valid certificates it will choose not to transmit because the risk to its anonymity would be too great. This threshold k will clearly be more than 0 and will almost certainly be more than 1. For given values of (k, n, r, N), some percentage of vehicles will be below the threshold and will not transmit, reducing the effectiveness of the system.
Table 1 presents the results of this crude analysis. For given levels of n, r, and N, the level of the threshold is given that will result in 1 percent, 5 percent, and 30 percent of vehicles being unable to transmit in our model. Here, r is calculated from the number of compromised vehicles, c, as
r = N * (1 – (1– n/N)c)
If it is assume that revocation has removed all attackers so the only inaccuracy comes from information missing because vehicles are unable to send, this percentage gives a rough measure of the inaccuracy in the system due to failure to replace certificates. The number of vehicles compromised at which the 30 percent threshold drops below 2 is a crude estimate of the level of revocation at which innocent revocations make the system unusable.
Estimates are presented below for (n, N) = (5, 1000) and (10, 10,000). Other values are easy to obtain. Since this is a worst-case scenario, it does not allow us to rule particular (n, N) values out, but it does allow us to say that particular (n, N) values are likely to be acceptable. In particular, (n, N) = (10, 10,000) requires a significant number of vehicles (1483) to be compromised and revoked without any certificate replacement before the system shows 30 percent disruption at threshold 2. (1483 vehicles out of 250 million are considered to be a significant fraction because these are vehicles that are misbehaving badly enough and need to be removed from the system rather than simply generating local inaccurate information. In other words, this document is assuming that the system is subject to a Type 2 or Type 3 attack rather than simply a set of Type 1 attacks). This level of compromise is likely to cause a severe level of disruption to the system for other reasons, particularly if there is no access to the infrastructure for revocation purposes. However, lack of access for rekeying is unlikely to be a larger cause of disruption than the attack itself.
Table 1: Thresholds for Specific Levels of Disruption
N N Vehicles
Compromised r 1%
Threshold 5%
Threshold 30%
Threshold
5 1000 5 25 4 4 n/a
5 1000 10 49 3 4 n/a
5 1000 50 222 2 2 4
5 1000 100 394 1 1 2
Appendix Volume 3 H-4-18

VSC-A Final Report: Appendix H-4 V2V PKI Security Management – Security Innovations
N N Vehicles
Compromised r 1%
Threshold 5%
Threshold 30%
Threshold
5 1000 173 580 0 0 1
10 10,000 10 100 9 9 n/a
10 10,000 50 488 7 8 9
10 10,000 100 952 6 7 9
10 10,000 500 3936 2 3 5
10 10,000 1000 6323 0 1 3
10 10,000 1483 7732 0 0 1
4.4 Linked Description: A vehicle has a set of distinct certificates, each containing an index value i and a link value l. For each vehicle there is a unique key K such that l = encryptAES
32(K, i). Vehicles get anonymity from the volume of certificates they have. They should not repeat the use of a certificate. A vehicle changes certificates frequently. If a vehicle is to be revoked, a CA can carry out a certain amount of work on a single misbehaving message and from that determine K. The revocation list contains K. A vehicle receiving a signed message checks the revocation status by encrypting i from the certificate with all the Ks in the revocation list and seeing if that yields l. If so, the certificate is considered to be on the revocation list and the message is ignored.
Vehicles will need to store a large volume of certificates. The size of a certificate renewal message will depend on how often the vehicle renews certificates. It is likely that, if new certificates are provided to the vehicle in a low-infrastructure setting, this will need to be done through a formal mechanism as part of servicing rather than on an ad-hoc basis.
Privacy Against CA/Law Enforcement - Poor. The essence of the idea is that the CA can link back from a single message to the linkage key K. Once the CA has the linkage key, it can link messages undetectably. This approach is very vulnerable to an insider attack. Note that this can be mitigated somewhat by issuing a vehicle with multiple sets of certs from multiple CAs, though at the cost of increasing time to identify an attacker.
Eavesdroppers’ Ability to Back-link Following Revocation - High. K is common to all of a vehicle’s certificates. So, an attacker can easily determine whether or not a given certificate belongs to a target vehicle.
Vehicles Might Need to Ruse Certificates - Yes. A vehicle is issued a certain amount of certificates. Once it has used all of them, if it cannot communicate with the CA, it must start to reuse them.
32 “AES” here implies the AES algorithm, but any symmetric algorithm or keyed hash would be acceptable.
Appendix Volume 3 H-4-19

VSC-A Final Report: Appendix H-4 V2V PKI Security Management – Security Innovations
Storage Space Requirements/Certificate Issuance Message Size - The number of certificates needed depends on the maximum acceptable certificate lifetime (identified as a policy question above) and on the frequency of communication with the CA.
o Assuming certificate usage time of 1 min, vehicle lifetime of 10 years, and no reprovisioning, a vehicle requires 5,259,487 certificates. Say 200 bytes/certificate = ~ 1 GB of storage for certs.
o Assuming certificate usage time of 1 minute but vehicles are only driven for 2.4 hours a day, this requires 100 MB of storage for certificates (this is assuming that certificates do not have an explicit expiry date in them).
o Assuming certificate lifetime of 50 minutes, vehicles only driven for 2.4 hours a day, and certificates re-provisioned once a year, this requires less than 1 MB storage. This is an unrealistically long lifetime but gives a good idea of the lower bound on the size of a certificate store.
If certificates can be renewed once a week (e.g., at gas stations), then with a 5 minute usage time, no certificate expiration date, and an average time spent driving of 2.5 hours a day, a download will contain about 200 certificates ~ 40 Kbytes ~ .3 Mbits. This can be done when a vehicle is refueling if the radio can operate when the engine is turned off.
Time to Identify Attacking Vehicle - Low. The work to be done by a CA to recover K from the linkage value can be tuned but will effectively be a constant. Identification takes one revocation cycle.
Revoked Vehicle Requires Others to Recertify - No.
Suitability for Local Revocation - Good. If a revoked certificate is used near an RSE, that must mean an attack is going on. Identifying whether or not a revoked certificate is being used requires a relatively small amount of work for each of R revoked vehicles.
Time to Eliminate Effects of Type 1 Attack - Moderate by the definition in 4.2.8. A single revocation cycle is needed, but the level of effort within that revocation cycle is required to be high to discourage frivolous linking.
Time to Eliminate Effects of Type 2 Attack - Low by the definition in 4.2.9. A single revocation cycle is needed.
Time to Eliminate Effects of Type 3 Attack - Low by the definition in 4.2.10. Each attacker can be eliminated in a single revocation cycle, the size of the revocation list is a small number of bytes for each revoked vehicle, innocent vehicles are not impacted, and processing time for CRLs is not significant.
Processing Time on Vehicle for Message with Known Certificate - Low. One ECDSA signature verification.
Processing Time on Vehicle for Message with Unknown Certificate - Two ECDSA verifications, one for the message and one for the certificate, plus
Appendix Volume 3 H-4-20

VSC-A Final Report: Appendix H-4 V2V PKI Security Management – Security Innovations
revocation time. Revocation time is one Advanced Encryption Standard (AES) encryption for each entry on the list. This is orders of magnitude slower than a simple comparison, but orders of magnitude faster than, for example, running a bilinear pairing. This is categorized as moderate, although it is arguable that it should be high.
4.5 Group Signatures on Message with Occasional Reissue Description: Group signatures are a cryptographic operation that allow any member of a group to generate a digital signature that, without additional information, can be determined to have come from that group but cannot be traced to a specific member of the group. Additionally, group signatures allow for revocation of individual members. In the vehicular context, the vehicles are all members of the same group and sign their safety-of-life messages with a group signature. Receiving vehicles check each message to see if the sender has been revoked.
Since the group key is a small amount of data, it is straightforward to renew it opportunistically. This is done whenever possible.
Privacy Against CA/Law Enforcement - Low. The group key is linkable by the CA. Note that this can be mitigated somewhat by using multiple group keys from multiple CAs, though at the cost of increasing time to identify an attacker. The fact that the key is opportunistically renewable is only of limited value here, as the CA can keep a record of old group keys.
Eavesdroppers’ Ability to Back-link Following Revocation - Moderate. An eavesdropper can track back only to the last change of a group key, significantly limiting the information they can gain.
Vehicles Might Need to Reuse Certificates - No. The group key is intended for ongoing reuse. There is no possibility of reusing information that is intended only to be used once.
Storage Space Requirements/Certificate Issuance Message Size - Very small. The group key and all associated material is less than 1 Kbyte in size.
Time to Identify Attacking Vehicle - One revocation cycle.
Revoked Vehicle Requires Others to Recertify - No.
Suitability for Local Revocation - High.
Time to Eliminate Effects of Type 1 Attack - Low. One revocation cycle.
Time to Eliminate Effects of Type 2 Attack - Low. One revocation cycle.
Time to Eliminate Effects of Type 3 Attack - Low. One revocation cycle, and CRLs contain one entry per attacker.
Processing Time on Vehicle for Message with Known Certificate: High. A pairing operation is more expensive than an ECDSA signature. The receiver must carry out one pairing operation to check the signature, then one pairing operation for each entity on the CRL. Note that this approach does not use certificates as
Appendix Volume 3 H-4-21

VSC-A Final Report: Appendix H-4 V2V PKI Security Management – Security Innovations
such, so there is no such thing as a message with a known certificate (i.e., a message where cached information can be used to skip revocation and other checks).
Processing Time on Vehicle for Message with Unknown Certificate - High. The receiver must carry out one pairing operation to check the signature, then one pairing operation for each entity on the CRL.
Note: Additional costs are noted as “moderate” because of additional overhead associated with group signatures.
4.6 Group Signatures on Certificate with Occasional Reissue Description: As described above, the overhead due to revocation checking with group signatures on messages is very high. [1], therefore, proposes that messages are signed with ECDSA, but the ECDSA keys are generated on the OBE and distributed in a certificate that is signed by the OBE itself using a group key. The most expensive operations, revocation checking and pairings, need to only be carried out when a vehicle receives a new certificate. Since the group key encompasses a small amount of data, it is straightforward to renew it opportunistically. This is done whenever possible (this is not the primary feature of [1] but is supported by it, and improves privacy against back-linking by eavesdroppers at little additional cost, so it is considered part of the system here).
Privacy Against CA/Law Enforcement - Low. The group key is linkable by the CA. Note that this can be mitigated somewhat by using multiple group keys from multiple CAs, though at the cost of increasing time to identify an attacker. The fact that the key is opportunistically renewable is only of limited value here, as the CA can keep a record of old group keys.
Eavesdroppers’ Ability to Back-link Following Revocation - Moderate. An eavesdropper can track back only to the last change of a group key, significantly limiting the information they can gain.
Vehicles Might Need to Reuse Certificates - No. The group key is intended for ongoing reuse. There is no possibility of reusing information that is intended only to be used once.
Storage Space Requirements/Certificate Issuance Message Size - Very small. The group key and all associated material is less than 1 Kbyte in size. A vehicle need only store one certificate at a time.
Time to Identify Attacking Vehicle - One revocation cycle.
Revoked Vehicle Requires Others to Recertify - No.
Suitability for Local Revocation - High.
Time to Eliminate Effects of Type 1 Attack - Low. One revocation cycle.
Time to Eliminate Effects of Type 2 Attack - Low. One revocation cycle.
Appendix Volume 3 H-4-22

VSC-A Final Report: Appendix H-4 V2V PKI Security Management – Security Innovations
Time to Eliminate Effects of Type 3 Attack - Low. One revocation cycle, and CRLs contain one entry per attacker.
Processing Time on Vehicle for Message with Known Certificate - Low. One ECDSA signature.
Processing Time on Vehicle for Message with Unknown Certificate - High. The receiver must carry out one pairing operation to check the signature and then one pairing operation for each entity on the CRL.
Note: Additional costs are noted as “moderate” because the size of ECDSA signature, plus the certificate material, plus the group signature make this the solution with the largest message size. If the high cost of processing a message with an unknown certificate is spread uniformly over time, it might be straightforward to absorb. However, in practice the use of silent periods ([8], [7]) will result in multiple new certificates being received at almost the same time, which may result in a processing bottleneck.
4.7 Individual Certificates without Revocation, and Vehicle Removal
Description: This is an illustrative proposal, designed to show what can be done and what is difficult if CRLs are avoided altogether. There is no linkage value in certificates. A vehicle is provisioned with a large number of individual certificates. The CA keeps a record of who has received each certificate, but the record for each certificate is encrypted separately so that it requires a certain amount of effort to retrieve and a CA has to go through the same level of effort separately for each certificate. If a certificate is shown to misbehave, no CRL is issued. Instead the CA retrieves the owner’s identity, and a police vehicle is sent to physically intercept the vehicle and remove it from circulation.
Privacy Against CA/Law Enforcement - Medium. An attacker at the CA can find the vehicles that an arbitrary set of certificates belong to, but they cannot find the whole set of certificates belonging to an arbitrary vehicle.
Eavesdroppers’ Ability to Back-link Following Revocation - High. There is no linkage value. The removal process does not inherently reveal any information that would allow linking.
Vehicles Might Need to Reuse Certificates - Yes, if it uses all certificates before it has a chance to renew them.
Storage Space Requirements/Certificate Issuance Message Size - As with linked certificates, the number of certificates needed depends on the maximum acceptable certificate lifetime (identified as a policy question above) and on the frequency of communication with the CA.
o Assuming certificate usage time of 1 min, vehicle lifetime of 10 years, and no reprovisioning, a vehicle requires 5,259,487 certificates. Say 200 bytes / cert = ~ 1 GB of storage for certificates.
Appendix Volume 3 H-4-23

VSC-A Final Report: Appendix H-4 V2V PKI Security Management – Security Innovations
o Assuming certificate usage time of 1 min and vehicles are only driven for 2.4 hours a day, this requires 100 MB of storage for certificates (this is assuming that certificates do not have an explicit expiration date in them).
o Assuming certificate lifetime of 50 minutes, vehicles only driven for 2.4 hours a day, and certificates re-provisioned once a year, this requires less than 1 MB storage. This is an unrealistically long lifetime but gives a good indication of the lower bound on the size of a certificate store.
If certificates can be renewed once a week (for example, at gas stations), then with a 5 minute usage time, no certificate expiration date, and an average time spent driving of 2.4 hours a day, a download will contain about 200 certificates ~ 40 Kbytes ~ .3 Mbits. This can be done when a vehicle is refueling, if the radio can operate when the engine is turned off.
Time to Identify Attacking Vehicle - Low. One revocation cycle.
Revoked Vehicle Requires Others to Recertify - No. Certificates are not shared.
Suitability for Local Revocation - Suitable, but the aim of the system is not to use revocation at all.
Time to Eliminate Effects of Type 1 Attack - Low. If the attack is due to a malfunctioning unit, it can be tracked down and physically removed in one revocation cycle.
Time to Eliminate Effects of Type 2 Attack - High. Without revocation lists there is no effective way to remove a vehicle’s entire set of keys. Even with revocation lists, since there is no linkage value, there is no compact way to represent a vehicle’s entire set of keys. The list would have to contain all the certificates currently known to belong to the vehicle. This is enough to make the approach infeasible.
Time to Eliminate Effects of Type 3 Attack - High. Without revocation lists there is no effective way to remove a vehicle’s entire set of keys. Even with revocation lists, since there is no linkage value, there is no compact way to represent a vehicle’s entire set of keys. The list would have to contain all the certificates currently known to belong to the vehicle. This is enough to make the approach infeasible.
Processing Time on Vehicle for Message with Known Certificate - Low. One ECDSA signature verification for the message.
Processing Time on Vehicle for Message with Unknown Certificate - Low. One ECDSA signature verification for the message and one for the certificate.
Note: “Additional costs” are down as “high” due to the need for physical interception of compromised vehicles.
4.8 Semi-linked Certification Revocation + Vehicle Removal Description: This is an intermediate step between the revocationless approach of 4.7 and the linked approach of 4.4. This description is at a slightly higher level of detail than the
Appendix Volume 3 H-4-24

VSC-A Final Report: Appendix H-4 V2V PKI Security Management – Security Innovations
descriptions above, and as such, the comparisons in the table below might be somewhat unfair, as some of the privacy-enhancing techniques described here could be naturally applied to the other mechanisms in this section.
Certificates have a linkage value. A vehicle is provisioned with non-shared certificates belonging to a number of linkage groups. (These could be issued by different CAs.) The CA keeps a record of who has received each certificate, but the record for each certificate is encrypted separately so that it requires a certain amount of effort to retrieve. A CA then has to go through that same level of effort separately for each certificate. The linkage value is separately encrypted and held by a different authority. If a single certificate is shown to misbehave, no CRL is issued. Instead the CA retrieves the owner’s identity, and a police vehicle is sent to physically intercept the vehicle and remove it from circulation. If multiple certificates from the same vehicle are shown to misbehave, the linkage authority is asked to reveal the linkage information for each group (to prevent insider attacks, the linkage information could be split between the CA and the linkage authority). The linkage values are then published on a CRL.
Privacy Against CA/Law Enforcement - Medium. An attacker must work with an attacker at the linkage authority to find the whole set of certificates belonging to an arbitrary vehicle.
Eavesdroppers’ Ability to Back-link Following Revocation - Medium. An eavesdropper will not necessarily know which linkage values belong to which vehicle.
Vehicles Might Need to Reuse Certificates - Yes, if it uses all certificates before it has a chance to renew them.
Storage Space Requirements/Certificate Issuance Message Size - As with linked certificates, the number of certificates needed depends on the maximum acceptable certificate lifetime (identified as a policy question above) and on the frequency of communication with the CA.
o Assuming certificate usage time of 1 minute, vehicle lifetime of 10 years, and no reprovisioning, a vehicle requires 5,259,487 certificates. Say 200 bytes/certificate = ~ 1 GB of storage for certificates.
o Assuming certificate usage time of 1 minute and vehicles are only driven for 2.4 hours a day, this requires 100 MB of storage for certificates (this is assuming that certificates do not have an explicit expiry date in them).
o Assuming certificate lifetime of 50 minutes, vehicles only driven for 2.4 hours a day, and certificates re-provisioned once a year, this requires less than 1 MB storage. This is an unrealistically long lifetime but gives a good idea of the lower bound on the size of a certificate store.
If certificates can be renewed once a week (for example, at gas stations), then with a 5 minute usage time, no certificate expiration date, and an average time spent driving of 2.4 hours a day, a download will contain about 200 certificates ~ 40 Kbytes ~ .3 Mbits. This can be done when a vehicle is refueling if the radio can operate when the engine is turned off.
Appendix Volume 3 H-4-25

VSC-A Final Report: Appendix H-4 V2V PKI Security Management – Security Innovations
Time to Identify Attacking Vehicle - Low. One revocation cycle.
Revoked Vehicle Requires Others to Recertify - No. Certificates are not shared.
Suitability for Local Revocation - Suitable, but the aim of the system is not to use revocation at all.
Time to Eliminate Effects of Type 1 Attack - Low. If the attack is due to a malfunctioning unit, it can be tracked down and physically removed in one revocation cycle.
Time to Eliminate Effects of Type 2 Attack - Moderate. It takes a few revocation cycles to identify a Type 2 attack and publish the relevant CRL.
Time to Eliminate Effects of Type 3 Attack - Moderate. It takes a few revocation cycles to identify a Type 3attack and publish the relevant CRL. The number of entries on the revocation list is a small multiple of the number of vehicles revoked and the work required by the recipient to check the list is an AES encryption or similar for each linkage value.
Processing Time on Vehicle for Message with Known Certificate - Low. One ECDSA signature verification for the message.
Processing Time on Vehicle for Message with Unknown Certificate - Low. One ECDSA signature verification for the message and one for the certificate.
Note: “Additional costs” are down as “moderate,” because the system can use emergency vehicles for enforcement but does not rely on them.
4.9 Comparison of Approaches Table 2 presents a compact form of the discussion above with good, moderate, and bad results highlighted in green, orange, and red, respectively. Two summary columns have been added. The score in column 14 is obtained by giving +1 for each green, -1 for each red, and summing the values. The score in column 15 is obtained by treating columns 3 and 4 and columns 5, 6, and 7, as a single column because they give the same results and summing.
This document has not attempted to weight the different columns by other means. However, the columns that are most affected by low infrastructure deployment are “Space requirements/certificate issuance message size” (column 4) and “Suitability for local revocation” (Column 7). Based on this, it appears that the group-signed certificate with ECDSA-signed message approach of 4.6 is the most promising.
Appendix Volume 3 H-4-26

VS
C-A
Fi
nal R
epor
t: A
ppen
dix
H-4
V
2V P
KI S
ecur
ity M
anag
emen
t – S
ecur
ity In
nova
tions
Tab
le 2
: C
om
par
iso
n o
f A
no
nym
ity
Mec
han
ism
s C
olum
n N
o 1
2 3
4 5
6 7
8 9
10
11
12
13
14
15
Nam
e
Priv
acy
agai
nst
CA
/Law
en
forc
eme
nt
Eave
s-dr
op-
pers
’ ab-
ility
to
ba
ck-
link
Veh
icle
s m
ight
ne
ed
to
reus
e on
e-tim
e ce
rtif-
icat
es
Stor
age
spac
e re
quire
m
ents
/ce
rtific
ate
issu
ance
m
essa
ge
size
Tim
e to
id
entif
y at
tack
in
g vehi
cle
Rev
oked
ve
hicl
e re
quire
s ot
hers
to
re
certi
fy
Suita
-bi
lity
for
loca
l re
voc-
atio
n
Tim
e to
el
imin
ate
effe
cts
of
Type
1
atta
ck
Tim
e to
el
imin
ate
effe
cts
of
Type
2
atta
ck
Tim
e to
el
imin
ate
effe
cts
of
Type
3
atta
ck
Proc
ess-
ing
time
on v
ehic
le
for
mes
sage
w
ith
know
n ce
rtific
ate
Proc
ess-
ing
time
on
vehi
cle
for
mes
sage
w
ith
unkn
ow
n certi
ficat
e
Add
ition
al
cost
s Sc
ore
Scor
e co
untin
g co
lum
ns 5
, 6,
7 on
ce
in
tota
l an
d co
lum
ns
3 an
d 4
once
in
tota
l
Com
bina
toria
l H
igh
Low
N
o Lo
w
Hig
h Y
es
No
Hig
h M
oder
ate
Hig
h Lo
w
Low
Lo
w
2 3
Link
ed
Low
H
igh
Yes
H
igh
Low
N
o Y
es
Mod
erat
e Lo
w
Low
Lo
w
Mod
er-
ate
Low
3
2
Gro
up
sign
atur
es
on m
essa
ge w
ith
occa
sion
al re
issu
e Lo
w
Mod
er-
ate
No
Low
Lo
w
No
Yes
Lo
w
Low
Lo
w
Hig
h H
igh
Mod
erat
e 5
2
Gro
up
sign
atur
es
on c
ertif
icat
e w
ith
occa
sion
al re
issu
e Lo
w
Mod
er-
ate
No
Low
Lo
w
No
Yes
Lo
w
Low
Lo
w
Low
H
igh
Mod
erat
e 7
4
Indi
vidu
al
certi
ficat
es
with
out
revo
catio
n +
vehi
cle
rem
oval
Med
ium
Lo
w
Yes
H
igh
Low
N
o Y
es
Low
H
igh
Hig
h Lo
w
Low
H
igh
2 1
Sem
i-lin
ked
certi
ficat
e re
voca
tion
+ ve
hicl
e re
mov
al
Med
ium
M
oder
-at
e Y
es
Hig
h Lo
w
No
Yes
Lo
w
Mod
erat
e M
oder
ate
Low
Lo
w
Mod
erat
e 4
3
App
endi
x V
olum
e 3
H-4
-27

VSC-A Final Report: Appendix H-4 V2V PKI Security Management – Security Innovations
5 AT3 Forged Messages
5.1 Preventing Forged Message Attacks
Forged message attacks may be prevented by countermeasures on the send side or the receive side. On the send side, an OBE may include protections to prevent incorrect messages being sent out by policing the SW that is allowed to be installed and by carrying out checks on outgoing messages and sending only those messages that pass those checks. However, this is only a defense against Type 1 attackers. Type 2 and 3 attackers are assumed to have bypassed these checks. It is not within scope of this paper to examine the costs and benefits of including tamperproof cryptographic HW and a trusted computing base inside the OBE, though this document does consider these to be aspects of a solution that are worth considering. For now the expense necessary for these solutions is likely to rule them out for use at least in early-stage deployments.
On the receive side, there are two different approaches:
Local assessment of message reliability - which does not involve the infrastructure
Central distribution of revocation information - which does involve the infrastructure The rest of this section reviews options on the receive side for mitigating forged message attacks. This document strongly recommends the use of local plausibility checks to assess the reliability of received messages and review some of these methods. Then how the lack of access to the infrastructure affects the ability of the system to issue revocation information is discussed. This leads to Section 7 in which various intermediate states between zero infrastructure and full infrastructure are reviewed. The analysis in this section and the previous section allows us to categorize the value of different infrastructure models for security management operations.
5.2 Local Assessment of Message Reliability
5.2.1 Overview
Messages that may originate from a vehicle in a V2V system are categorized into two types:
Local messages that describe the instantaneous state of the sending vehicle position, location, and whether the vehicle is braking or not.
Wide-area messages that describe conditions elsewhere (and possibly at another time). Forwarded messages (other than forwarded security management messages) are not part of the system as understood at the moment. Consequently, these are not considered in detail here, but they will fall in general under “wide-area messages.”
A number of steps can be taken to protect vehicles against misbehavior, even in the absence of infrastructure to support revocation:
Diagnostics - This allows vehicles to determine whether an incoming message is likely to be trustworthy or not. For example, if a message seems to show that a vehicle has appeared from nowhere, is broadcasting from a position off the road, or is moving implausibly fast, the message may be considered implausible. There has been a lot of
Appendix Volume 3 H-4-28

VSC-A Final Report: Appendix H-4 V2V PKI Security Management – Security Innovations
research into suitable mechanisms that provide plausibility checks (see, for example, [11], [12], [13]).
When plausibility testing is in place, a recipient will evaluate how much stock they put in a received message. Typically, VSC messages are not sent straight to the driver, but are processed within a Local Dynamic Map (LDM) that determines when the driver should be alerted. A plausibility check might result in a decision to simply include or exclude a message from the LDM. Alternatively, the LDM might be more of a probabilistic mapping in which even an implausible message is represented but with lower weight than a plausible one.
One advantage of plausibility checks is that they severely restrict the types of inaccurate information that an attacker can send out (although a paradoxical result of this is that attacks, being more restricted in how they can diverge from reality, may be harder to track down).
One consideration with plausibility checks is that accidents are often caused by driver behavior that is anomalous. Plausibility tests must strike a balance between weeding out false positives and not weeding out false negatives. This argues for a probabilistic, rather than a black-and-white, approach to implementing the LDM.
Voting - This allows vehicles to determine whether a sender is trustworthy or not. This must be deployed in conjunction with a diagnostic system (e.g., the LEAVE system [11]). However, note that two considerations make a voting system at best a partial solution. First, a type 3 attacker may have multiple certificates and can forge both the message and the votes supporting a message (in fact, under all the anonymity schemes discussed above, except certain configurations of the combinatorial scheme, a type 2 attacker will have access to multiple certificates and may be able to impersonate multiple vehicles simultaneously with those certificates, allowing them to, in effect, behave as a type 3 attacker). Second, pseudonymity makes it very difficult to identify misbehaving vehicles in a persistent fashion, particularly if certificates are changed frequently.
Table 3 summarizes this review in table form. For all of the anonymous authentication systems considered in this paper, an attacker who can compromise a single system can impersonate multiple vehicles for at least one revocation cycle. This is slightly less of a consideration with the combinatorial certificate system, which may be considered to yield a “small” number of certificates in the language of Table 3.
Table 3: Comparison of Local Message Credibility Assessment Mechanisms When There is Pseudonymity
Name Effectiveness against
Type 1 attacker
Effectiveness against Type 2 attacker if a single OBE yields
only a small number of certificates
Effectiveness against Type 2 attacker if a single OBE yields a
large number of certificates, or
effectiveness against a Type 3 attacker
Purely local High High High Voting High Moderate Low
Appendix Volume 3 H-4-29

VSC-A Final Report: Appendix H-4 V2V PKI Security Management – Security Innovations
5.2.2 Suggestions for Future Research
Further research is recommended on the following areas within local assessment of message reliability:
1. The weight given to a message by the plausibility test should include a factor based on how long it is since revocation information was received. The more recent the revocation information, the more the system should be inclined to trust a message simply because it is signed by a valid certificate. Conversely, the longer it is since a CRL was received, the more other factors should count in assessing the plausibility of a message.
2. Local messages can be screened by plausibility tests, while wide-area messages, which refer to things that are outside the current LDM, have to be taken on trust. Therefore, as time-since-revocation information that was distributed increases, the ability of the system to trust a wide-area message decreases. OBEs should choose what messages to send in part on the basis of how likely those messages are to pass local plausibility tests. Therefore, in the absence of infrastructure, OBEs should reduce the number of wide-area messages they originate or forward.
3. Pseudonymity and voting - [14] proposes that vehicles in the area where a message is generated can endorse the message, providing a level of assurance to vehicles outside that area that the message is valid, even if those vehicles don’t have access to revocation information. This provides a means for vehicles to trust messages that they cannot themselves verify. However, as noted above, the presence of type 2 or 3 attackers greatly reduces the value of endorsement by other vehicles. This should be carefully studied.
In particular, to support voting systems in the presence of an attack, it might be possible for vehicles to locally decide to suspend anonymity or to lengthen the time between certificate changes. This would be enforced by requiring a certain number of messages to come from a given originator before that originator is trusted (or, in the continuous LDM model, to increase the weight given to messages from an originator in proportion to the number of messages received from that originator) and, in an attack situation, increase the number of messages required (or, in the continuous LDM model, to increase trustworthiness more slowly).
5.3 Role of the Infrastructure in Mitigating Forged Message Attacks
When a vehicle misbehaves, it must be removed from the system. This will involve three steps:
1. Detect the misbehavior
2. Identify the vehicle responsible for the misbehavior
3. Warn other vehicles about the misbehaving vehicle. This will have two substeps:
a. Take the decision to revoke the misbehaving vehicle.
b. Transmit the revocation information.
Infrastructure plays a role as follows.
1. Detect - The infrastructure has a greater ability to aggregate information and identify misbehavior than an individual vehicle, because it has more memory, better immediate
Appendix Volume 3 H-4-30

VSC-A Final Report: Appendix H-4 V2V PKI Security Management – Security Innovations
access to historical data, and more processing power. Some vehicles, such as incident response vehicles, may be better able than standard end-user vehicles to perform this detection, there will probably be a continuum of detection capabilities. In order to play the detection role, of course, the infrastructure has to have access to information from the misbehavior location. In assessing different infrastructure-to-vehicle (I2V) models, one thing taken into account is the length of time it is likely to take the infrastructure to be informed about an incident of misbehavior.
2. Identify - It is anticipated that vehicles will use pseudonyms (such as anonymous certificates) to authenticate messages. It is also anticipated that given a sufficient level of misbehavior, some entity on the infrastructure will be able to reverse the pseudonymity and identify the misbehaving unit. There are currently no proposed solutions that suggest any vehicle without access to the infrastructure should be able to reverse the pseudonymity. Without access to the infrastructure, identifying a misbehaving vehicle that has the ability to change its pseudonym is impossible.
3. Warn - “Warning” other vehicle consists of sending the identifier with a note that the vehicle using that identifier is not to be trusted. A warning generated without access to the identification function provided by the infrastructure can only refer to a vehicle’s current pseudonym. A warning generated by the infrastructure may, depending on the pseudonym structure, be able to revoke all of the pseudonyms belonging to a compromised or malfunctioning vehicle.
The times involved in reacting to an attack are identified as:
1. Time to detect bad action, D
2. Time to identify bad actor, I 3. Time to issue revocation, R
4. Time to transmit revocation list, T
This maps onto the different attacker types as follows:
1. Attacker with a single unit - A single set of certificates needs to be revoked; the information needs to be delivered to a single place. In this case, the time D is considerably increased due to the time it takes to receive a report back to the infrastructure. I and R are the same as in the ordinary infrastructure case assuming that the police vehicle has a good uplink. T is increased by the time it takes to locate the vehicle and get revocation information in place.
2. Attacker with keying material extracted from a single unit - A single set of certificates needs to be revoked; the information needs to be delivered to multiple places. In this case, as before, D is increased and I and R are about the same relative to the full-infrastructure case T is increased by the time it takes to locate the vehicle and get revocation information in place.
3. Attacker with keying material extracted from multiple units - Multiple sets of certificates need to be revoked; the information needs to be delivered to multiple places. D is increased and I and R are about the same relative to the full-infrastructure case. However, an attacker with keying material from multiple vehicles can mount an attack that is very
Appendix Volume 3 H-4-31

VSC-A Final Report: Appendix H-4 V2V PKI Security Management – Security Innovations
difficult to end simply by switching from one compromised vehicle to another before time D is up. As before, T is increased by the time it takes a message to be distributed to all areas.
5.4 Identify the Vehicle Responsible
It is assumed that there is pseudonymity on the vehicle-originating broadcast messages. Given this, it is very difficult for the vehicles at the scene of an incident to identify the attacking vehicle in a manner that is useful over a long time. A compromised vehicle must be removed from the system. To do this, there needs to be a way to pass information about suspect messages back to the infrastructure.
To this end, in the absence of infrastructure, the document proposes that vehicles have some form of logging. For example, if a vehicle brakes suddenly or takes some unexpected action, it could log the last X messages (or messages received in the last X minutes). Then there could be a mechanism by which it could report the messages to an authorized infrastructure representative. The exact mechanism to be used here would be a fruitful subject for future research.
5.5 Warn Other Vehicles
There are two main mechanisms to remove a vehicle from the system (or, more specifically, to ensure that other vehicles ignore transmissions signed with a given vehicle’s keys). These mechanisms are short-lived certificates or CRLs. Short-lived certificates remove a vehicle from the system by having all certificates, from valid and invalid vehicles, expire periodically and reissuing them only to valid vehicles. CRLs remove a vehicle by sending a signed message to every vehicle that might receive a message from the invalid vehicle, stating that the invalid vehicle’s certificates are no longer to be trusted.
In the short-lived certificates’ approach, the length of time that an attacker can do damage is equal to the lifetime of the certificate. For a lifetime L, all vehicles must, in principle, be able to contact the infrastructure at least once in L to download fresh certificates. For CRLs, there is no need for unicast communication with the CA. Vehicles are warned not to accept particular certificates via the CRL, which is broadcast. In practice, a system will combine elements of the two approaches. Finite certificate lifetimes help to keep the size of CRLs down, but CRLs provide responsiveness to serious attacks that would otherwise persist for about L time.
In section 7, different possible mechanisms for providing low but non-zero infrastructure to determine their suitability for use with both unicast and broadcast certificate management messages are reviewed.
6 ATP2 Link Transmissions Based on Vehicle Status Transmissions
6.1 Attack Description
Consideration of attacks against privacy based on the attacker using infrastructure to eavesdrop should be reviewed. These attacks do not require the attacker to have a full-service infrastructure that is capable of distributing CRLs, etc. The infrastructure in this case just has to listen.
Appendix Volume 3 H-4-32

VSC-A Final Report: Appendix H-4 V2V PKI Security Management – Security Innovations
Fraunhofer Fokus has estimated that an attacker who just wants to listen can cover the 900 km2
of Berlin for about 250,000 Euros with the necessary listening devices.
The government’s attack capabilities are downgraded. However, this attack vector does not go away. Having no deployed infrastructure does not make a significant difference to the risk to privacy due to eavesdroppers. There is still the tradeoff between privacy and the need to detect misbehavior. To remove vehicles they must be reported to the infrastructure. This system can be used to report innocent vehicles as well as genuinely suspect ones, so the risk still exists.
Privacy can also be compromised by the CA. Mechanisms to protect privacy, both technical and regulatory, are still required to be in place.
7 Mitigation of Threats: Possible V2I Topologies
7.1 Overview
In an ideal world, a V2V safety messaging system would use roadside infrastructure to distribute revocation information and new certificates directly to vehicles. “Infrastructure” here means devices by the roadside at interactions, toll plazas, etc. However, for cost reasons, the existence of widespread roadside infrastructure cannot be assumed.
In this section the document describes alternatives to the model of widespread roadside infrastructure and attempts to characterize them, to enable assessment later on in this paper whether any of these models provide an acceptable level of security.
7.2 Enhancing I2V with V2V: Epidemic Mode, Geo-networking
Many proposals for vehicular networks consider the use of vehicles to forward information, rather than simply receiving it. For example, the “epidemic” model for spreading CRL information described in [15] demonstrates that CRL information can be distributed to more than 90 percent of 250,000+ vehicles in an area about 300x300 km in less than half an hour, even if there is only a single point of entry to the system. (It should be noted that [15] does not address bandwidth congestion in detail.)
The epidemic model of [15] is one example of V2V internetworking. This has been the subject of much research in recent years and is known under names such as “geo-routing” and “geo-networking.” Other recent research into geo-routing includes [1] [16], and [17]. [16] and uses simulations to study the behavior of a single challenge response exchange between a source and a destination node and shows 60 percent transmission success probability over 5 km for that exchange. [17] studies the case where vehicles communicate via an access point and use one-hop and two-hop relays. The underlying communication protocol is Transmission Control Protocol (TCP)/Internet Protocol (IP) over 802.11b, which is less suited to the mobile environment than User Datagram Protocol (UDP)/IP over 802.11p. Nevertheless, the researchers showed that for low amounts of data exchange in the relayed case, the sessions lasted 60 percent longer than in the non-relayed case. The relayed case only had an advantage over the non-relayed case if 25 percent or fewer of the vehicles were sending TCP traffic.
It may be assumed that the broadcast will have considerably higher success probability, so this might be a good way to distribute CRLs. On the other hand, since most interactions of interest require at least two message exchanges, it is not clear that this is a good way to support, for
Appendix Volume 3 H-4-33

VSC-A Final Report: Appendix H-4 V2V PKI Security Management – Security Innovations
example, certificate requests. Certificate requests might be better supported when a vehicle has reliable access for transactions to the network, lasting for more than a few seconds.
In section 7.3, different mechanisms that can be used to provide partial infrastructure coverage and assess how suitable they are for the two communications models, broadcast and unicast, are reviewed..
7.3 Types of I2V
In this section, the means by which information can be distributed from the infrastructure to access points that are used by the relying vehicles are considered. In all cases, vehicles will need to be equipped with additional radio equipment and a processor capable of performing cryptographic operations. In all cases, there must be an initialization phase, either at manufacturing or at the initial point of sale, at which the OBEs have access to a CA (or to an intermediate device that is capable of provisioning the OBE with certificates).
In analyzing cost and suitability below, the document considers mainly the delta between the specific solution under discussion and the system defined by these basic assumptions. It is assumed that the decision to attempt to deploy the system at all is a decision to incur these basic costs.
For each model, the following is defined:
Pros and cons
Cost o Development cost on OBE - Here “low” means no change, “medium” means a
minor change or a change on only a certain number of OBEs, and “high” means a significant change on all OBEs.
o Development cost on infrastructure - Here “low” means existing infrastructure can be used, “moderate” means that some changes to infrastructure may be necessary but the cost of rollout will be in the millions, and “high” means the cost of rollout will be in the billions.
o Running cost (the cost of maintaining the network and sending data) - Here “low” means that there will be little transmission cost and maintenance costs will be small. “Moderate” means that there are non-negligible costs to send data or to maintain the network. “High” means that these costs are high.
Effectiveness:
o Percentage penetration (the estimate of how many vehicles will be directly reachable by this method) - This is used to estimate the following values.
o Detection time - The time D between the start of an attack and when the infrastructure becomes aware of it. “Good” means that there will be infrastructure access at the location in an hour or less. “Moderate” means an hour to a day. “Poor” means more than a day.
o Coverage against attack in single location (the time T for the system to get revocation information to a single location) - “Good” means that there will be
Appendix Volume 3 H-4-34

VSC-A Final Report: Appendix H-4 V2V PKI Security Management – Security Innovations
infrastructure access at the location in an hour or less. “Moderate” means an hour to a day. “Poor” means more than a day.
o Coverage against attacks in multiple locations (the time T for the system to spread revocation information system wide) - “Good” means that there will be infrastructure access at the location in an hour or less. “Moderate” means an hour to a day. “Poor” means more than a day.
o Effectiveness for unicast - This provides an estimate of whether infrastructure access will be available for the average vehicle for sufficiently long for it to perform a certificate update. “Good” means that a vehicle will frequently have a persistent, good quality uplink connection. “Moderate” means that there will be an infrequent good quality link. “Poor” means that the link will be poor quality.
Other o Suitability for use in aftermarket devices - How well will the system work in
aftermarket OBEs rather than in installed OBEs?
o Usefulness without V2V - If there is no V2V transmission to distribute CRLs beyond the infrastructure access point itself, does this significantly impact the usefulness of the system?
The two broad categories of mechanisms which are mechanisms that provide access to the infrastructure directly to the vehicle without requiring 5.9 GHz communications to an access point and mechanisms that use a 5.9 GHz access point. For the first type of mechanism, the document considers their effectiveness if only a low percentage (5 percent is chosen as an order-of-magnitude) of 5.9-equipped vehicles also have this additional access mechanism, as well as considering their effectiveness if all vehicles have this access mechanism.
7.4 I2V Using Direct Non-5.9 GHz Access to Vehicle on Road
7.4.1 Cellular Communications Directly to Vehicles Using Driver’s Phone
Description: The driver connects their phone to the OBE, and the OBE uses the data connection in the phone to get security management information from the infrastructure
Pros -
o Doesn’t use 5.9 GHz bandwidth
o Almost everyone has a phone
o Connection is almost always on
o Highly suited for unicast (e.g., certificate update)
Cons -
o Connecting phone to vehicle may not be easy for non-technically skilled drivers
o Use of cellular network may compromise anonymity
o Driver may forget to connect (though they can be prompted by UI)
o Requires additional design work compared to a system that uses only 5.9 GHz
Appendix Volume 3 H-4-35

VSC-A Final Report: Appendix H-4 V2V PKI Security Management – Security Innovations
o Cellular data connection may not be reliable enough to distribute data
o Difficulty working out who will pay for data connection
o Everyone has phones but not everyone has a data plan
o There may be issues with roaming
o Need to ensure cellular uplink does not compromise anonymity
o Risk of a public relations backlash if drivers think their phone is being used to spy on other drivers
Cost -o Vehicle non-recurring engineering (NRE) cost -
Vehicles must be equipped with a connector (wired or wireless). If wireless, there may be bandwidth or interference issues. If wired, there may be maintenance issues with the physical connection.
o Infrastructure NRE cost -
Cellular network already exists
o Ongoing incremental cost -
Cellular data rates
Coverage -o Percentage of vehicles covered -
An increasing number of cell phone owners have data plans, and this coverage will gradually rise over time. However, only a certain percentage of drivers will have their cell phones connected at any given time and some will never connect their cell phones. Coverage can probably be increased by using the cellular data connection to deliver additional content that is more immediately valuable to the driver or passengers.
o Time D -
Full coverage -
Good. The infrastructure will be made aware almost immediately of an attack using the cellular connection.
5 percent coverage -
Moderate. The infrastructure will take about 20 times as long to be made aware of an attack as in the full coverage case. On busy roads this too will be almost instantaneous. On less busy roads this may take some time (although the effectiveness of the attack will arguably also be less).
Coverage against attack in single location -
Full coverage -
Appendix Volume 3 H-4-36

VSC-A Final Report: Appendix H-4 V2V PKI Security Management – Security Innovations
o Good. CRLs can be distributed almost immediately. Care will need to be taken to ensure that the system is not flooded with multiple copies of CRLs.
5 percent coverage: Moderate. Response to an incident depends on an equipped vehicle happening to be there.
o Coverage against attacks in multiple locations:
Full coverage: Good. CRLs can be distributed almost immediately.
5 percent coverage: Moderate. Response depends on a vehicle happening to be in the location of an attack. In a lot of locations, response will be very fast; but some locations will remain uncovered for a significant length of time.
o Suitability for certificate request:
Full coverage: Good. Cellular uplink offers good quality, and vehicles can simply request a new certificate direct from the infrastructure.
5 percent coverage: Moderate. There may be liability issues with private vehicles acting as conduits for other vehicles’ unicast messages. An unequipped vehicle is not guaranteed access to an equipped vehicle, although when an unequipped vehicle and an equipped vehicle are travelling in the same direction there should be an acceptable quality uplink.
Suitability for aftermarket - Technically, aftermarket devices would be easy to design to support connecting a cell phone. However, the cell phone may be connected directly to the vehicle to support other data services. As such, the integration of the three devices (aftermarket VSC, car, and cell phone) may be awkward. The suitability, therefore, seems moderate.
Usefulness without V2V -
o Full coverage - High
o 5 percent coverage - Moderate. Information will get to people who need it eventually.
Note: If access to the infrastructure over cellular was used to provide premium data services as well as security management services, this might be an attractive option to some drivers.
7.4.2 Cellular Communications Directly to Vehicles Using Built-in Cellular Connection
Description: The OBE has a cellular radio built in to it.
Pros -
o Doesn’t use 5.9 GHz bandwidth
o Good bandwidth
Appendix Volume 3 H-4-37
VSC-A Final Report: Appendix H-4 V2V PKI Security Management – Security Innovations
o The connection is (almost) always on.
Cons –
o Additional manufacturing cost
o Potential difficulty for vehicle OEMs in establishing relationship with wireless service providers
o Cellular data connection may not be reliable enough to distribute data
o Difficulty working out who will pay for data connection
o Roaming
o Need to ensure cellular uplink does not compromise anonymity
o Risk of a public relations backlash if drivers think their phone is being used to spy on other drivers.
Cost: o Vehicle NRE cost -
Wire up Subscriber Identity Module (SIM), possibly change vehicle so SIM can be replaced, include cellular radio and perhaps antenna (though something suitable already exists on most vehicles).
o Infrastructure NRE cost -
Cellular network already exists
o Ongoing incremental cost -
Cellular data rates
Coverage:
o Percentage of vehicles covered -
An increasing number of cell phone owners have data plans, and this coverage will gradually rise over time. However, only a certain percentage of drivers will have their cell phones connected at any given time and some will never connect their cell phones. Coverage can probably be increased by using the cellular data connection to deliver additional content that is more immediately valuable to the driver or passengers.
o Time D:
Full coverage -
Good.
The infrastructure will be made aware almost immediately of an attack using the cellular connection
5 percent coverage -
Moderate
Appendix Volume 3 H-4-38

VSC-A Final Report: Appendix H-4 V2V PKI Security Management – Security Innovations
The infrastructure will take about 20 times as long to be made aware of an attack as in the full coverage case. On busy roads this too will be almost instantaneous. On less busy roads this may take some time (although the effectiveness of the attack will arguably also be less).
o Coverage against attack in single location -
Full coverage -
Good
CRLs can be distributed almost immediately. Care will need to be taken to ensure that the system is not flooded with multiple copies of CRLs.
5 percent coverage -
Moderate
Response to an incident depends on an equipped vehicle happening to be there
o Coverage against attacks in multiple locations -
Full coverage -
Good
CRLs can be distributed almost immediately 5 percent coverage -
Moderate
Response depends on a vehicle happening to be in the location of an attack. In a lot of locations, response will be very fast but some locations will remain uncovered for a significant length of time.
o Suitability for certificate request -
Full coverage -
Good
Cellular uplink offers good quality and vehicles can simply request a new certificate direct from the infrastructure.
5 percent coverage -
Moderate
There may be liability issues with private vehicles acting as conduits for other vehicles’ unicast messages. An unequipped vehicle is not guaranteed access to an equipped vehicle, although when an unequipped vehicle and an equipped vehicle are traveling in the same direction there should be an acceptable quality uplink.
Appendix Volume 3 H-4-39

VSC-A Final Report: Appendix H-4 V2V PKI Security Management – Security Innovations
Suitability for aftermarket -o High
Usefulness without V2V -
o Full coverage -
High.
o 5 percent coverage -
Moderate Information will get to people who need it eventually
Note: If access to the infrastructure over cellular was used to provide premium data services as well as security management services, this might be an attractive option to some drivers.
7.4.3 Distribute Information Using Frequency Modulation (FM) Radio
Description: The OBE uses the FM radio in the vehicle to obtain security management information over a reserved frequency.
Pros – o Doesn’t use 5.9 GHz bandwidth
o Good bandwidth (300 kbits/s for digital FM), and the connection is (almost) always on
o Highly suited for multicast (CRL distribution).
o Good nationwide coverage of transmitters
Cons - o Additional manufacturing cost
o Not well suited for unicast (certificate update) or uplink in general (how would infrastructure be informed of incidents?)
o Would need to establish which frequency was to be used for data distribution
o Use of FM radio for data distribution might interfere with vehicle occupants’ use of FM radio for entertainment
Cost -
o Vehicle NRE cost -
Connect FM radio to OBE
Address use of radio by both vehicle occupants and ITS system, and handle handoff as intelligent transportation system (ITS) information channel changes.
Appendix Volume 3 H-4-40

VSC-A Final Report: Appendix H-4 V2V PKI Security Management – Security Innovations
o Infrastructure NRE cost -
FM network already exists
Would need to establish frequency to be used. Since this would change in different regions, it would also need handoff protocol.
o Ongoing incremental cost -
Running FM transmitters
Coverage - o Percentage of vehicles covered -
Potentially high.
o Time D -
Full coverage -
Moderate due to poor uplink 5 percent coverage -
Moderate due to poor uplink
o Coverage against attack in single location -
Full coverage -
Good.
CRLs can be distributed almost immediately. Care will need to be taken to ensure that the system is not flooded with multiple copies of CRLs.
5 percent coverage -
Moderate
Response to an incident depends on an equipped vehicle happening to be there
o Coverage against attacks in multiple locations -
Full coverage -
Good
CRLs can be distributed almost immediately
5 percent coverage -
Moderate
Response depends on a vehicle happening to be in the location of an attack. In a lot of locations, response will be very fast; but some locations will remain uncovered for a significant length of time.
o Suitability for certificate request -
Appendix Volume 3 H-4-41

VSC-A Final Report: Appendix H-4 V2V PKI Security Management – Security Innovations
Full coverage -
Good
Cellular uplink offers good quality, and vehicles can simply request a new certificate direct from the infrastructure
5 percent coverage-
Moderate
There may be liability issues with private vehicles acting as conduits for other vehicles’ unicast messages. An unequipped vehicle is not guaranteed access to an equipped vehicle although when an unequipped vehicle and an equipped vehicle are travelling in the same direction, there should be an acceptable quality uplink.
Suitability for aftermarket -o Low
o Difficult to integrate with FM radio in car
o Awkward to set up a separate antenna if FM radio is not integrated
Usefulness without V2V -
o Full coverage -
High
o 5 percent coverage -
Moderate
Information will get to people who need it eventually
Note: If access to the infrastructure over cellular was used to provide premium data services as well as security management services, this might be an attractive option to some drivers.
7.5 I2V Where There is Only 5.9 GHz Access to Vehicle on Road
7.5.1 Wired Access Only, Access When Vehicles are Serviced
Description: Devices have access to security management information from the infrastructure only when a qualified technician has physical access to them (for example, during annual service).
Pros – o No roadside infrastructure necessary
Cons -
o Information distribution is slow
o People will not necessarily bring their vehicle in for annual service at the right time
Appendix Volume 3 H-4-42

VSC-A Final Report: Appendix H-4 V2V PKI Security Management – Security Innovations
Cost -o Vehicle NRE cost -
Low
Install 5.9 GHz system and means for wired access
o Infrastructure NRE cost -
Low
Set up CA and a way to distribute information to service centers
o Ongoing incremental cost -
Low
Run distribution network to service
Coverage: o Percentage of vehicles covered -
All
o Time D -
High
o Coverage against attack in single location
Poor
With service time of a few days, no attack can be reacted to within hours
o Coverage against attacks in multiple locations
Poor
o Suitability for certificate request –
Good
Certificates can be replaced as part of service. The anonymity mechanism used must ensure that a vehicle has enough certificates for a year or more.
Suitability for aftermarket -
o Moderate
o Service providers may need additional training to distribute data to aftermarket devices compared to built-in ones
Usefulness without V2V -
o Poor
o Information gets into the system so slowly that any improvement in information distribution will be significant
Appendix Volume 3 H-4-43

VSC-A Final Report: Appendix H-4 V2V PKI Security Management – Security Innovations
7.5.2 Require Fuel Stations to Set Up RSEs
Description: Filling stations run RSEs.
Pros -o Everyone fuels once a regularly so this will get the data to the vehicles fast
o Vehicles will be at rest so good bandwidth
o Little overlap with safety-of-life applications as vehicles are off the road
o A lot of filling stations (121,000+ in USA in 2002)
o Many gas stations already have broadband connections, so they don’t need additional wiring to reach the backhaul
Cons -
o May be difficult to install
o Gas stations may be going away as drivers move to electric vehicles
Cost - o Vehicle NRE cost -
Zero cost
o Infrastructure NRE cost -
At $10K/installation, about $1 billion. (On the other hand, based upon 138 billion gallons of gas sold per year in the US, a 1 cent additional gas tax would be enough.)
o Ongoing incremental cost –
Low
Coverage - o Percentage of vehicles covered -
All
o Time D -
Moderate
The first vehicle to visit a petrol station after an incident will make the infrastructure aware of an attack
o Coverage against attack in single location -
Moderate
All vehicles will eventually get the certificate information needed. It may take hours or more for revocation information to reach the location where it is needed.
o Coverage against attacks in multiple locations -
Appendix Volume 3 H-4-44

VSC-A Final Report: Appendix H-4 V2V PKI Security Management – Security Innovations
Moderate
All vehicles will eventually get the certificate information needed. It may take hours or more for revocation information to reach the location where it is needed. It is highly unlikely that any area of the country will remain unreached after a week.
o Suitability for certificate request -
Good
Vehicles are stationary and will have good uplink
Suitability for aftermarket - o Good
o No difference between aftermarket and built-in OBEs
Usefulness without V2V - o Poor
o Without V2V, information cannot reach attack locations
7.5.3 Use Authorized Vehicles with a Wideband, Non-5.9 Uplink to Distribute Revocation Information
Description: Emergency response vehicles have a backhaul infrastructure link over cellular or some other wireless network. They distribute revocation information and can act as an uplink access point for end-user vehicles in their vicinity.
Pros -o Emergency vehicles can be sent directly to the scene of an incident
o There are fewer privacy and liability concerns than in the case where end-user vehicles had an uplink
o The authorities have greater control over incident response vehicles than end-user vehicles, and as such can roll out the system in the most useful places first
Cons -o Emergency response organizations may have other priorities
o Paying for uplink might stretch budgets
Cost - o Vehicle NRE cost –
Zero cost
o Infrastructure NRE cost
Depends on how uplink is provided, but most likely this could be done using existing equipment
Appendix Volume 3 H-4-45

VSC-A Final Report: Appendix H-4 V2V PKI Security Management – Security Innovations
o Ongoing incremental cost -
Low
Coverage - o Percentage of coverage -
There are about 500,000 emergency response vehicles in the U.S
o Time D -
Moderate
If an attack is causing disruption significant enough to call an emergency response vehicle to the scene, that attack will be detected very quickly.
If an attack is simply causing sub-optimal traffic flow, it may go undetected for a long time
o Coverage against attack in single location -
Good
An emergency response vehicle can be sent directly to the location
o Coverage against attacks in multiple locations
Moderate
In the event of a large attack, emergency response vehicles may be needed to attend to physical damage and will have security management as a low priority
o Suitability for certificate request
Moderate
At an incident scene, an emergency vehicle will be stationary and probably provide a good quality uplink.
In the absence of an incident, end-user vehicles may go for some time without encountering an emergency vehicle and being able to obtain new certificates
Suitability for aftermarket -o Not applicable, counted as Good
Usefulness without V2V - o High
o Emergency response vehicles can be sent to a targeted location
7.5.4 Widespread Infrastructure
Description: One million or more infrastructure access points distributed nationwide at those places where they are most likely to be useful.
Appendix Volume 3 H-4-46

VSC-A Final Report: Appendix H-4 V2V PKI Security Management – Security Innovations
Pros – o High quality uplink available nationwide
Cons -
o Cost
Cost - o Vehicle NRE cost –
Zero cost
o Infrastructure NRE cost -
Very high
o Ongoing incremental cost -
Moderate to high.
Coverage - o Percentage of coverage -
Good
A significant portion of the country will be reachable directly
o Time D -
Good
The first vehicle to encounter an infrastructure access point after an incident will be able to report it
o Coverage against attack in single location -
Moderate
Dependent upon how far the nearest access point is from the attack
o Coverage against attacks in multiple locations-
Good
On average most incidents will be near an access point, and almost all vehicles will have access to the infrastructure regularly
o Suitability for certificate request
High
Suitability for aftermarket –
o Not applicable, counted as Good
Usefulness without V2V - o Moderate
o Without V2V, parts of the country will be uncovered
Appendix Volume 3 H-4-47

VS
C-A
Fi
nal R
epor
t: A
ppen
dix
H-4
V
2V P
KI S
ecur
ity M
anag
emen
t – S
ecur
ity In
nova
tions
7.6
Co
mp
aris
on
of
app
roac
hes
Ta
ble
4 pr
esen
ts a
com
pact
form
of t
he d
iscu
ssio
n ab
ove,
with
“G
ood,
” “M
oder
ate,
” an
d “B
ad”
resu
lts h
ighl
ight
ed in
gre
en, o
rang
e,
and
red,
resp
ectiv
ely.
Tw
o su
mm
ary
colu
mns
hav
e be
en a
dded
. The
“sc
ore”
is o
btai
ned
by g
ivin
g +1
for e
ach
gree
n, -1
for e
ach
red,
an
d th
en s
umm
ing
the
scor
es.
The
“sco
re, h
igh
cost
= -2
” is
obt
aine
d by
the
sam
e m
etho
d, e
xcep
t tha
t a re
d in
the
cost
sect
ion
coun
ts
as -2
rath
er th
an -1
. The
re h
as b
een
no a
ttem
pt to
wei
ght t
he d
iffer
ent c
olum
ns b
y ot
her m
eans
.
One
per
haps
surp
risin
g re
sult
is th
at w
ides
prea
d in
fras
truct
ure
is n
ot th
e id
eal s
olut
ion.
Bas
ed o
n th
is a
naly
sis,
it se
ems t
hat b
uild
ing
in
cellu
lar c
onne
ctiv
ity to
afte
rmar
ket O
BEs
and
to in
cide
nt re
spon
se v
ehic
les i
s an
attra
ctiv
e so
lutio
n at
mod
erat
e co
st.
Tab
le 4
: C
om
par
iso
n o
f A
no
nym
ity
Mec
han
ism
s
Nam
e
Cos
t Ef
fect
iven
ess
Oth
er
Scor
e
Scor
e,
high
co
st =
-2
V
ehic
le,
NR
E In
fras
truc-
ture
, NR
E O
ngoi
ng
Cov
erag
e ag
ains
t atta
ck
in si
ngle
lo
catio
n
Cov
erag
e ag
ains
t atta
cks
in m
ultip
le
loca
tions
Ti
me
D
Suita
bilit
y fo
r cer
t re
ques
t or
othe
r un
icas
t
Suita
bilit
y fo
r afte
r-m
arke
t U
sefu
lnes
s w
ithou
t V2V
Non
-5.9
to
ve
hicl
e
Cel
lula
r via
dr
iver
’s p
hone
A
ll D
evic
es
Hig
h Lo
w
Hig
h G
ood
Goo
d Lo
w
Goo
d M
oder
ate
Hig
h 4
2 5%
of d
evic
es
Mod
erat
e Lo
w
Hig
h M
oder
ate
Mod
erat
e Lo
w
Mod
erat
e M
oder
ate
Mod
erat
e 1
0 B
uilt-
in
cellu
lar
All
Dev
ices
H
igh
Low
H
igh
Goo
d G
ood
Low
G
ood
Goo
d H
igh
5 3
5% o
f dev
ices
M
oder
ate
Low
H
igh
Mod
erat
e M
oder
ate
Low
M
oder
ate
Goo
d M
oder
ate
2 1
FM
All
Dev
ices
H
igh
Mod
erat
e M
oder
ate
Goo
d G
ood
Mod
erat
e Po
or
Poor
H
igh
0 -1
5%
of d
evic
es
Mod
erat
e M
oder
ate
Mod
erat
e M
oder
ate
Mod
erat
e M
oder
ate
Poor
Po
or
Mod
erat
e -2
-2
N
o no
n- 5.9
wire
less
to
ve
hicl
e
Wire
d, a
cces
sed
whe
n se
rvic
ed
Low
Lo
w
Low
Po
or
Poor
H
igh
Goo
d G
ood
Poor
0
1 Pe
trol S
tatio
ns
Low
H
igh
Low
M
oder
ate
Mod
erat
e M
oder
ate
Goo
d G
ood
Poor
2
1 Em
erge
ncy
vehi
cles
with
non
-5
GH
z ba
ckha
ul a
cces
s Lo
w
Low
M
oder
ate
Goo
d M
oder
ate
Mod
erat
e M
oder
ate
Goo
d H
igh
5 5
Wid
espr
ead
Infr
astru
ctur
e Lo
w
Ver
y H
igh
Mod
erat
e M
oder
ate
Goo
d Lo
w
Goo
d G
ood
Mod
erat
e 2
0
App
endi
x V
olum
e 3
H-4
-48

8
VSC-A Final Report: Appendix H-4 V2V PKI Security Management – Security Innovations
Interaction Between Anonymity Mechanism and Infrastructure Access Mechanism
In section 3.6 the different possible anonymity mechanisms were reviewed. This analysis can be combined with the analysis of different infrastructure access mechanisms to determine which access mechanisms are suitable for which anonymity mechanisms.
The relevant characteristics of the different anonymity mechanisms are:
4.3, Combinatorial Certificates - Needs frequent unicast access to infrastructure, but access can be low-quality.
4.5, Group Signatures on Message with Occasional Reissue and 4.6, Group Signatures on Certificate with Occasional Reissue: Needs infrequent unicast access to infrastructure, access can be low-quality.
4.4, Linked, 4.7, Individual Certificates without Revocation, and Vehicle Removal, and 4.8, Semi-linked Certification Revocation + Vehicle Removal: Needs infrequent (once-yearly) access to infrastructure, but access must be high quality.
Table 5 demonstrates that group-signature based approaches are probably the most flexible with regard to different infrastructure access models. The downside of group– signature-based approaches is that they will almost certainly require a cryptographic HW accelerator. However, as has been suggested elsewhere in this paper, the risks to the system strongly suggest that some level of physical protection is necessary for the keying material on OBEs. If the cryptographic acceleration was provided as part of a general smartcard or HSM solution, the delta in cost due to the acceleration portion alone might well be small. In making this recommendation, recognize that relatively small changes in the weighting of the various factors identified in the tables above would result in a different outcome. However, it is hoped that the analysis above is clear and complete enough that if the weightings need to be changed, the resulting changes in recommendation will be relatively simple to identify.
Appendix Volume 3 H-4-49

9
VSC-A Final Report: Appendix H-4 V2V PKI Security Management – Security Innovations
Table 5: Suitability of Different Infrastructure Access Models for Different Anonymous Authentication Approaches
4.3,
Com
bina
toria
l C
ertif
icat
es
4.4,
Lin
ked
4.5,
Gro
upSi
gnat
ures
on
Mes
sage
with
O
ccas
iona
l Rei
ssue
4.6,
Gro
upSi
gnat
ures
on
Cer
tific
ate
with
O
ccas
iona
l Rei
ssue
4.7,
Indi
vidu
al
Cer
tific
ates
with
out
Rev
ocat
ion,
and
Veh
icle
Rem
oval
4.8,
Sem
i-lin
ked
Cer
tific
atio
n R
evoc
atio
n +
Veh
icle
Rem
oval
Non-5.9 to
vehicle
Good Good Good Good Good Poor Good Good Poor Poor Good Good Good Good Good Poor Good Good Poor Poor Poor Poor Poor Poor Poor Poor Poor Poor Poor Poor
No non-5.9
wireless to
vehicle
Good Good Good Good Good Petrol Stations Moderate Good Good Good Good Good
Emergency vehicles with non-5 GHz backhaul access Moderate Poor Moderate Moderate Poor Poor
Widespread Infrastructure Good Good Good Good Good Good
Name Cellular via Good
driver’s phone All Devices
5% of devices Moderate Built-in All Devices Good cellular 5% of devices Moderate
All Devices PoorFM 5% of devices Poor Wired, accessed when serviced Poor
Summary of Questions to be Addressed in the Paper
9.1 Original Questions
1. How should certificates be installed and updated in vehicles? Certificates should be installed at provisioning time. There are a range of possible options for updating depending on the type of access to the infrastructure. If there is no infrastructure access other than at service time, the combinatorial certificates approach seems unlikely to succeed.
2. How can misbehaving vehicles be detected and reported? A certain amount of access to the infrastructure needs to be assumed to detect misbehaving vehicles. For detection purposes, this access seems best provided by built-in cellular connections to the OBE. A second best solution is to equip emergency response vehicles with infrastructure access.
3. Is it feasible to rely on only special vehicles to perform this function, such as police vehicles? It is feasible. V2V communications will greatly assist this. Emergency vehicles are not well suited to providing uplink communications for certificate reissue but are well suited to respond to localized incidents. A system based only on emergency vehicles may be overwhelmed by a large-scale attack.
4. What is the definition of a misbehaving node and what are the available algorithms for detecting misbehaving nodes? A misbehaving node is one that sends out inaccurate information. Nodes can be detected for the purposes of revocation by plausibility checks. The infrastructure needs to be informed of the misbehavior in order to determine whether or not misbehavior amounts to revocation.
Appendix Volume 3 H-4-50

VSC-A Final Report: Appendix H-4 V2V PKI Security Management – Security Innovations
5. How should vehicles be revoked? What is the CRL distribution strategy and methods for distributing them to vehicles? This depends on the anonymous certification method and the infrastructure access method. There isn’t a practical alternative to CRLs for responding to incidents that need a response in real time. CRLs should be introduced to the system by access points (emergency vehicle, equipped end-user vehicles, petrol stations) and distributed by V2V. There was not sufficient time to analyze the impact on network traffic of epidemic distribution of CRLs, but it is recommended that this be an area for future study.
6. What is the optimal Public Key Infrastructure (PKI) hierarchy and structure? For anonymity, leaving performance to one side, it seems that group-signed certificates are the optimal approach. The PKI hierarchy has not been addressed as it is assumed that anonymous certificates will have a flat hierarchy.
7. How is the information about revoked vehicles distributed? See 5 above.
8. How is privacy provided? Different possible approaches to anonymous authentication have been reviewed, each of which has strengths and weaknesses. The ultimate decision as to how to provide privacy depends on policy decisions described in Section 4.1.
9. Does the situation change if there is no DSRC roadside infrastructure available? Should the government or another authority having control of the CA or deployed communication infrastructure still considered to be an attacker? The situation does not change significantly. An eavesdropper can still attack anonymity. However, in the absence of infrastructure access, the combinatorial certificate approach becomes less practical. Alternative approaches are more open to attacks by insiders at the CA that must be addressed by adoption of appropriate procedures at the CA.
10. How can the lack of infrastructure be used or abused by attackers? An attacker who knows fixed points where infrastructure is not available can focus on those points. This can be mitigated somewhat by having mobile access points, either from emergency vehicles or from infrastructure-equipped, end-user vehicles.
11. Does the threat model need to be modified? The most important thing missing from the threat model is the success definition as this allows a proper cost-benefit analysis of countermeasures. This paper has attempted to establish a rule-of-thumb of 70 percent reliability for the system as a baseline definition of success.
12. What are the threats, and who are the attackers? The threats and the attackers are the same as before, except that insider attacks at CAs appear to be more significant with low infrastructure.
13. How many bad actors need to be accounted for? The analysis in this paper is independent of the number of bad actors. Clearly, whatever the model, a type 3 attack will be seriously disruptive to the system. It is recommended that OBE manufacturers consider how OBEs can be hardened to prevent key material from being removed.
Appendix Volume 3 H-4-51

VSC-A Final Report: Appendix H-4 V2V PKI Security Management – Security Innovations
14. Which attacks will attackers mount (cost–gain analysis from the perspective of an attacker)? For type 1, 2, and 3 attackers, the most likely attacks are malicious/terroristic attacks or attempting to cause accidents and attract emergency vehicles or traffic redirection attacks with an attempt at reducing traffic flow on a route the attacker wants to use. The first is most likely for type 3, the second and third are most likely for types 1 and 2.
15. What is the potential cost and benefit associated with V2V versus potential risk from the perspective of the infrastructure provider? It is strongly recommended that further research into V2V distribution of CRLs be conducted. This seems like a practical way of distributing information to targeted locations if the network traffic can be managed so as not to overwhelm the system.
16. Which countermeasures will be run if a security breach occurs? Detect, revoke, or distribute revocation information. If necessary under the anonymity system, rekey.
17. What are system consequences of each of these potential attacks? Effects of attacks are traffic disruption, threats to safety-of-life, and loss of anonymity. In general, the better infrastructure access is, the faster attacks can be mitigated.
9.2 Additional VSC-A Questions
1. How often does the central credential authority need to communicate with an individual vehicle (this could be expressed as a probabilistic distribution)?
2. How much data will need to be transported during one of those encounters (again this could be expressed as a probabilistic distribution)?
3. How often do the individual vehicles need to communicate with the central credential authority (this could be expressed as a probabilistic distribution)?
4. How much data will need to be transported during one of those encounters (again this could be expressed as a probabilistic distribution)?
Answers to all of these questions depend on the anonymity model. For the combinatorial certificates model, this document has provided preliminary analysis in Section 4.3.2. For other models, communication does not need to be so frequent (see the analysis in Section 8.) The best communications channel requirements come from the use of the group-signed certificates with ECDSA-signed messages, but this comes at a cost in processing power on the OBE and loss of privacy at the CA.
Appendix Volume 3 H-4-52

VSC-A Final Report: Appendix H-4 V2V PKI Security Management – Security Innovations
10 References
[1] G. Calandriello, P. Papadimitratos, J. Hubaux, and A. Lioy, "Efficient And Robust Pseudonymous Authentication in VANET," Proceedings of the fourth ACM international workshop on Vehicular ad hoc networks - VANET '07, 2007, p. 19.
[2] IEEE 1609.2-2006, Trial-Use Standard for Wireless Access in Vehicular Environments— Security Services for Applications and Management Messages, Piscataway, NJ: IEEE Intelligent Transportation Standards Committee, 2006.
[3] Jonsson, C. Nass, H. Harris, and L. Takayama, "Got Info? Examining the Consequences of Inaccurate Information Systems," International Driving Symposium on Human Factors in Driver Assessment, Training, and Vehicle Design, Rockport, Maine, 2005, pp. 409-415.
[4] R. Anderson, M. Bond, J. Clulow, and S. Skorobogatov, "Cryptographic Processors-a Survey," Proceedings of the IEEE, vol. 94, 2006, pp. 357-369.
[5] NIST, "FIPS Publication 140-2: Security Requirements For Cryptographic Modules," National Institute of Standards and Technology, 2001.
[6] E. Schoch, F. Kargl, S. Schlott, T. Leinmüller, and P. Papadimitratos, "Impact of Pseudonym Changes on Geographic Routing in VANETs," Third European Workshop on Security and Privacy in Ad hoc and Sensor Networks (ESAS 2006), Hamburg: 2006.
[7] Studer, E. Shi, F. Bai, and A. Perrig, "TACKing Together Efficient Authentication, Revocation, and Privacy in VANETs," roceedings of the 7th Annual IEEE Communications Society Conference on Sensor, Mesh and Ad Hoc Communications and Networks (SECON 2009), Rome: 2009.
[8] L. Buttyán, T. Holczer, A. Weimerskirch, and W. Whyte, "SLOW: A Practical Pseudonym Changing Scheme for Location Privacy in VANETs," IEEE VNC, Tokyo, Japan: 2009.
[9] CAMP VSC Consortium, “Vehicle Safety Communications Project – Final Report,” Appendix H – WAVE DSRC Security, NHTSA Publication DOT HS 810 591, April 2006.
[10] VIIC, "Vehicle Infrastructure Integration (VII) Final Report," 2008.
[11] M. Raya, P. Papadimitratos, I. Aad, D. Jungels, and J. Hubaux, "Eviction of Misbehaving and Faulty Nodes in Vehicular Networks," IEEE Journal on Selected Areas in Communications, vol. 25, 2007, pp. 1557-1568.
[12] T. Leinmuller, E. Schoch, and F. Kargl, "Position Verification Approaches For Vehicular Ad Hoc Networks," IEEE Wireless Communications, vol. 13, 2006, p. 16-21.
[13] R. Schmidt, T. Leinmuller, E. Schoch, A. Held, and G. Schafer, "Vehicle Behavior Analysis To Enhance Security in VANETS," Proceedings of 4th Workshop on Vehicle to Vehicle Communications (V2VCOM 2008), 2008.
Appendix Volume 3 H-4-53

VSC-A Final Report: Appendix H-4 V2V PKI Security Management – Security Innovations
[14] Viejo, F. Sebe, and J. Domingo-ferrer, "Aggregation of Trustworthy Announcement Messages in Vehicular," Computer Engineering, 2009.
[15] K.P. Laberteaux, J.J. Haas, and Y. Hu, "Security Certificate Revocation List Distribution for VANET," Proceedings of the fifth ACM international workshop on VehiculAr Inter-NETworking - VANET '08, 2008, p. 88.
[16] M. Mauve, H. Hartenstein, M. Kasseman, and D. Vollmer, "A Comparison of Routing Strategies for Vehicular Ad-Hoc Networks," Networks, 2002.
[17] J. Zhao, T. Arnold, Y. Zhang, and G. Cao, "Extending Drive-Thru Data Access by Vehicle-to-Vehicle Relay," VANET '08, San Francisco: 2008.
Appendix Volume 3 H-4-54

VSC-A Final Report: Appendix H-5
Analysis of Infrastructure and Communications Requirements for V2V PKI Security Management
Prepared by
Telcordia Technologies, Inc.
Appendix Volume 3 H-5-i
(Material in Sections 3 and 5 were developed by Telcordia Technologies, Inc. prior to or outside performing activities under CAMP/NHTSA Cooperative Agreement No. DTNH22-05-H-01277. Telcordia has material in Sections 3 and 5 which is the
subject of pending patent applications.)

List of Acronyms
3GPP Third Generation Partnership Project
ACRL Anonymous Certificate Replacement List
BSW Blind Spot Warning
CA Certificate Authority
CAMP Crash Avoidance Metrics Partnership
CRL Certification Revocation List
DNPW Do Not Pass Warning
DSRC Dedicated Short Range Communications FCW Forward Collision Warning
HW Hardware
ITS Intelligent Transportation Systems
LCW Lane Change Warning
LTE Long Term Evolution
MAC Medium Access Control Layer
MGMM Manhattan Grid Mobility Model
PKI Public Key Infrastructure
RSU Road-side Unit
SW Software
USDOT United States Department of Transportation
V2I Vehicle-to-Infrastructure
VSC2 Vehicle Safety Communications 2
VSC-A Vehicle Safety Communications – Applications
V-V or V2V Vehicle-to-Vehicle
Appendix Volume 3 H-5-ii
(Material in Sections 3 and 5 were developed by Telcordia Technologies, Inc. prior to or outside performing activities under CAMP/NHTSA Cooperative Agreement No. DTNH22-05-H-01277. Telcordia has material in Sections 3 and 5 which is the
subject of pending patent applications.)

Table of Contents List of Acronyms.......................................................................................... H-5-ii
1 Introduction........................................................................................... H-5-1
2 Vehicle-to-Vehicle Communications Threat Analysis ....................... H-5-2 2.1 Malicious Agents and Motivations .............................................................. H-5-2
2.2 Security Threats and Security Requirements .............................................. H-5-3
2.3 Privacy Threats and Privacy Requirements ................................................. H-5-4
2.4 Impact of Limited Infrastructure Network Connectivity ............................ H-5-5
3 Mathematical Modeling of V2V Networks ........................................... H-5-6 3.1 V2V Network Graph with Simplified Geographical, Mobility and
Communication Models .............................................................................. H-5-7
3.2 V2V Network Graph with Generalized Geographical, Mobility, and Communication Models .............................................................................. H-5-9
4 Infrastructure Network Models .......................................................... H-5-12
5 New Solutions and Certificate Management Operations ................. H-5-14 5.1 Introduction to Certificate Management Operations ................................. H-5-15
5.2 Assignment and Installation of Initial Certificates .................................... H-5-16
5.3 Malicious Behavior Detection and Mitigation by Vehicles ...................... H-5-16
5.3.1 Approach 1 ................................................................................... H-5-18
5.3.2 Approach 2: Based on the Mafia Game Model ............................ H-5-22
5.4 Replacement of Expired and Revoked Certificates ................................... H-5-27
5.5 Certificate Revocation List Distribution ................................................... H-5-29
5.6 Message Security Operations .................................................................... H-5-31
5.7 Privacy Enhancements to Above Methods ................................................ H-5-32
6 Analysis of Required Infrastructure Network Connectivity ............ H-5-35 6.1 Main Factors .............................................................................................. H-5-35
6.2 An Analysis Framework ............................................................................ H-5-36
6.2.1 Estimate Sustainable Interval TS .................................................. H-5-38
6.2.2 Estimate Infrastructure Network Requirements Based on Sustainable Interval TS ................................................................. H-5-39
6.2.3 Analysis of Malicious Behavior Detection Interval Th ................ H-5-40
6.2.4 Estimate CRL Distribution Delay Td ........................................... H-5-40
Appendix Volume 3 H-5-iii
(Material in Sections 3 and 5 were developed by Telcordia Technologies, Inc. prior to or outside performing activities under CAMP/NHTSA Cooperative Agreement No. DTNH22-05-H-01277. Telcordia has material in Sections 3 and 5 which is the
subject of pending patent applications.)

6.3 Q&A for Using Sustainable Interval Analysis to Determine Infrastructure Network Requirements .............................................................................. H-5-41
7 Conclusion .......................................................................................... H-5-45
8 References .......................................................................................... H-5-45
Appendix Volume 3 H-5-iv
(Material in Sections 3 and 5 were developed by Telcordia Technologies, Inc. prior to or outside performing activities under CAMP/NHTSA Cooperative Agreement No. DTNH22-05-H-01277. Telcordia has material in Sections 3 and 5 which is the
subject of pending patent applications.)

List of FiguresFigure 1: Simplified Geographical Model ................................................................... H-5-7 Figure 2: Map of a Small Area in New York ............................................................. H-5-10 Figure 3: Spatial Distribution of Nodes Following MGMM on the Map
in Figure 2 ................................................................................................... H-5-11 Figure 4: Sustainable Interval .................................................................................... H-5-37
Appendix Volume 3 H-5-v
(Material in Sections 3 and 5 were developed by Telcordia Technologies, Inc. prior to or outside performing activities under CAMP/NHTSA Cooperative Agreement No. DTNH22-05-H-01277. Telcordia has material in Sections 3 and 5 which is the
subject of pending patent applications.)

1
VSC-A Final Report: Appendix H-5 V2V PKI Security Management – Telcordia Technologies, Inc.
Introduction
A prerequisite for real-world deployment of Vehicle-to-Vehicle (V2V) communications applications is a security system that can support critical functions such as message authentication and driver privacy. Digital certificates and the Public Key Infrastructure (PKI), also commonly referred to as certificate management system, provide a foundation for securing vehicle communications. However, a conventional PKI requires vehicles to have frequent infrastructure network connectivity to communicate with Certificate Authorities (CAs) to:
Obtain initial security keys and their certificates Obtain replacement keys and certificates for expired and revoked certificates Send information to the CAs or separate malicious behavior detection servers, which can be used to detect security attacks Obtain Certificate Revocation Lists (CRLs) from the CAs
Infrastructure networks refer to any short-range radio network (e.g., Dedicated Short Range Communications (DSRC)) or long-range radio network (e.g., cellular networks) that vehicles can use to communicate with fixed servers such as the CAs. Providing infrastructure networking capabilities along roadways nationwide and in all vehicles can be cost prohibitive. Therefore, an essential question that needs to be addressed before real-world deployment of (V2V) communications applications in a large scale is what levels of infrastructure network connectivity will be necessary to support vehicular PKI operations in a way that can ensure safe and secure V2V communications.
These infrastructure network requirements depend heavily on the certificate management methods used and especially on the methods used by vehicles to detect malicious behaviors and to mitigate their impact. This document presents new security and certificate management methods that can eliminate or significantly reduce the need for roadside infrastructure networks. It will describe an analytical framework for quantifying the infrastructure network requirements. Based on this framework, the document will provide a quantitative analysis of the certificate management methods proposed in this document and use the results to answer several critical questions related to infrastructure network requirements, including how frequently vehicles and the Certificate Authority (CA) have to communicate and how much data need to be exchanged each time.
The new certificate management methods use the following main principles:
Design new distributed methods for vehicles to rely only on themselves (i.e., without relying on any infrastructure network connectivity) to detect misused certificates and misbehaving vehicles and to mitigate the impact of malicious attacks. The document will show through preliminary mathematical analysis that these proposed methods can potentially allow safe and secure V2V communications to continue for unbounded time periods without any roadside infrastructure network connectivity. Design new methods to allow certificate management operations for all vehicles to be supported with the existing infrastructure networking capabilities already
Appendix Volume 3 H-5-1
(Material in Sections 3 and 5 were developed by Telcordia Technologies, Inc. prior to or outside performing activities under CAMP/NHTSA Cooperative Agreement No. DTNH22-05-H-01277. Telcordia has material in Sections 3 and 5 which is the
subject of pending patent applications.)
VSC-A Final Report: Appendix H-5 V2V PKI Security Management – Telcordia Technologies, Inc.
available on just a small set of the vehicles and with significantly reduced required level of infrastructure network connectivity. These methods will include, for example: o Approaches to use one-way communications (e.g., satellite broadcast) to
distribute CRLs and to replace expired and revoked certificates o Use of a small subset of vehicles as proxies (e.g., vehicles already with
cellular connectivity) to help retrieve CRLs and certificate replacement messages and then distribute them via V2V communications
The document will present preliminary analysis results to show that the proposed approaches could eliminate the need for roadside infrastructure networks. Deploying infrastructure network access points at a small number of hotspots such as vehicle dealerships (where these networks will be needed for initializing and updating security materials on vehicles) or shopping malls will sufficiently support secure V2V communications.
The rest of the document is organized as follows. Section XX2XX provides a discussion on the unique security threats in V2V communications environments, the impact of zero or highly limited infrastructure network connectivity on these threats, and high-level requirements to guide subsequent discussions. Section XX3XX provides a mathematical model of the V2V network connectivity which can be used to assist analysis of important issues such as delay of CRL. Section XX4XX summarizes various infrastructure network options and the basic models for using them to support certificate management operations. Section XX5XX
presents the proposed certificate management methods. Section XX6XX provides the analytical framework for estimating infrastructure network requirements and uses sample results to answer the key questions raised in the “Statement of Work (SoW) for VSC-A Security Workshop.” Section XX7XX is a brief summary. The document then presents a set of new certificate management methods designed to eliminate or significantly reduce the reliance on infrastructure network connectivity.
2 Vehicle-to-Vehicle Communications Threat Analysis
This section summarizes security and privacy threats in a V2V communications environment and discusses how the lack of infrastructure network connectivity may change the threats and impact the fundamental security and privacy requirements. Based on these discussions, the document will outline a small number of essential high-level requirements for V2V security and privacy.
2.1 Malicious Agents and Motivations Agents interested in malicious behaviors include all entities that may engage in such behaviors and/or profit from it. In the following classification, these agents are grouped into three categories according to the amount of resources they may have to cause harm to the vehicular network.
Category I - Category I attackers are solitary attackers who mainly operate on their own. They have limited monetary resources and use the Internet as their main source of information. Examples of attackers in this category include:
Appendix Volume 3 H-5-2
(Material in Sections 3 and 5 were developed by Telcordia Technologies, Inc. prior to or outside performing activities under CAMP/NHTSA Cooperative Agreement No. DTNH22-05-H-01277. Telcordia has material in Sections 3 and 5 which is the
subject of pending patent applications.)

VSC-A Final Report: Appendix H-5 V2V PKI Security Management – Telcordia Technologies, Inc.
Unscrupulous or opportunistic individuals Computer hackers Automotive, electronic, or computer hobbyists Very loosely organized groups
Category II - Category II attackers are typically one or more groups of individuals who are moderately coordinated, communicate on a regular basis, have moderate resources, and can obtain information not publicly known or available. Examples of attackers in this category include:
Corrupt insiders Unscrupulous businesses
Category III - Category III attackers are highly organized, have access to expansive resources, can infiltrate organizations and obtain closely held secrets, may consider life and individuals expendable to achieve their goals, and may be supported by governing bodies of foreign nations. Examples of attackers in this category include:
Organized crime
Foreign nations
The following list contains some of the potential motivations that may drive agents to exhibit malicious behaviors within a vehicular network (in order of increasing impact):
Sadistic pleasure in harming other vehicles or the entire vehicular network
Preferential treatment from the vehicular network for the purposes of evading law enforcement, assisting in criminal operations, or diverting attention from a primary attack
Prestige in a successful hack or a new virus launch
Manipulate traffic authority decisions
Acquiring personal advantages in driving conditions or economic gain (e.g., committing insurance fraud or car theft)
Promote national, political, and special interests
Civil, political, and economic disruption, including warfare
2.2 Security Threats and Security Requirements
Security attacks and malicious behaviors based on communications activities in a V2V environment can be categorized as follows:
1. Attackers could modify the communication content sent by their vehicles’ software (SW) or hardware (HW), including:
Appendix Volume 3 H-5-3
(Material in Sections 3 and 5 were developed by Telcordia Technologies, Inc. prior to or outside performing activities under CAMP/NHTSA Cooperative Agreement No. DTNH22-05-H-01277. Telcordia has material in Sections 3 and 5 which is the
subject of pending patent applications.)

VSC-A Final Report: Appendix H-5 V2V PKI Security Management – Telcordia Technologies, Inc.
a. Inaccurate traffic conditions, including false Forward Collision Warning (FCW), false Blind Spot Warning (BSW), false Lane Change Warning (LCW), and false Do Not Pass Warning (DNPW) messages
b. Inaccurate driving conditions or patterns, such as false statements about their vehicles’ speeds, directions, positions, braking status, and intersection movement
2. Attackers could modify the communication functionalities of their vehicles’ SW or HW to carry out attacks, such as one of the attacks in (1) and the following:
a. Modifying transmission timing intervals of messages b. Delaying the delivery of messages c. Sending more messages than the vehicle is designed to d. Disabling certain functions of a vehicle’s SW, say, because of privacy
concerns 3. Attackers could attempt to impersonate vehicles or other network entities (e.g.,
servers) to cause harm to the vehicular network operations
4. Attackers could act as intruders and attempt to use data stored on vehicles or other network entities (e.g., servers) to cause harm to the vehicular network operations
In principle, a general security requirement will be that any of the attacks listed above shall only succeed with negligible or a known acceptable probability, or requiring unfeasible amounts of attackers’ resources. In the real world, however, it is often difficult or impossible to prevent certain attacks. Therefore, this document considers the following requirement:
USecurity Requirement S-1 -U If any of the attacks listed in 1) through 4) succeeds with an unacceptably high probability, a method shall exist that allows the vehicular network to detect with high probability the attacks and the attackers and to contain and mitigate their impact.
2.3 Privacy Threats and Privacy Requirements Privacy breaches based on communications activities in a V2V environment can be summarized below:
1. Attackers could record messages exchanged between vehicles to increase the probability of correctly associating messages to specific vehicles and their owners (thus violating the vehicle owner anonymity), or correctly associating messages in different locations to the same vehicle (thus violating unlinkability).
2. Attackers could modify the communication functionalities of their vehicle’s SW or HW to carry out attacks, such as the attacks in 1).
3. Attackers could attempt to impersonate vehicles or other network entities (e.g., servers) to improve their chances of success in the attacks in item 1) and 2).
4. Attackers could act as intruders and attempt to use data stored on vehicles or other network entities (e.g., servers) to cause harm to the vehicular network operations, for instance, using the attacks in item 1., 2., and 3.
Appendix Volume 3 H-5-4
(Material in Sections 3 and 5 were developed by Telcordia Technologies, Inc. prior to or outside performing activities under CAMP/NHTSA Cooperative Agreement No. DTNH22-05-H-01277. Telcordia has material in Sections 3 and 5 which is the
subject of pending patent applications.)

VSC-A Final Report: Appendix H-5 V2V PKI Security Management – Telcordia Technologies, Inc.
In principle, a general requirement will be that any of the attacks listed in items 1 through 4 above shall only succeed with negligible probability or by requiring unfeasible amounts of attacker’s computing resources. However, keeping a vehicle owner completely anonymous in a nationwide vehicular network is difficult to enforce and often unnecessary, and it is typically just as satisfactory to require anonymity within a large number of vehicle owners. This document thus considers the following requirement:
Privacy Requirement P-1 - If any of the attacks listed in items 1 through 4 succeeds with an unacceptably high probability, a method shall exist that allows the vehicular network to detect with high probability the attacks and the attackers and to contain and mitigate their impact.
2.4 Impact of Limited Infrastructure Network Connectivity
Using a conventional certificate management system, vehicles require infrastructure network connectivity to communicate with Certificate Authorities (CAs) to perform the following operations:
1. Assignment and Installation of Initial Security Keys and Certificates 2. Replacement of Expired Certificates 3. Malicious Behavior Detection (i.e., to provide information to CAs or separate
intrusion detection systems for detecting misused certificates and malicious vehicles to determine which certificates and vehicles should be revoked)
4. Distribution of CRLs 5. Replacement of Revoked Certificates 6. Message security operations
A vehicle’s initial security keys and its certificates can be installed during the vehicle manufacturing process or at the vehicle dealerships before the vehicles are sold. This can be achieved without using roadside infrastructure networks. Message security operations are security measures that a vehicle can apply to messages and do not require roadside infrastructure network connectivity.
Next, the document discusses how the other certificate management operations can be impacted by limited or complete lack of infrastructure network connectivity. Impact on Malicious Behavior Detection and Mitigation - To ensure safe and secure V2V communications applications, malicious use of the certificates to cause harm to the vehicle networks and applications need to be detected so that these certificates can be revoked. Malicious vehicles used to cause significant harm to the vehicle networks and applications need to be detected and their privileges to receive future certificates should be revoked. If vehicles have frequent infrastructure network connectivity, trusted servers in the infrastructure network can be used to detect and respond to security threats based on input from the vehicles. These infrastructure servers could integrate information from a large number of vehicles and have sufficient processing capabilities to analyze the data to detect malicious activities. However, when vehicles have sporadic or zero infrastructure network connectivity, attackers could perform attacks without being monitored by highly trusted entities such as infrastructure servers. Vehicles can no longer rely on infrastructure-based servers to help detect malicious activities. As a result, the Appendix Volume 3 H-5-5
(Material in Sections 3 and 5 were developed by Telcordia Technologies, Inc. prior to or outside performing activities under CAMP/NHTSA Cooperative Agreement No. DTNH22-05-H-01277. Telcordia has material in Sections 3 and 5 which is the
subject of pending patent applications.)

VSC-A Final Report: Appendix H-5 V2V PKI Security Management – Telcordia Technologies, Inc.
attacks described in Section XX2.2XX can have higher chances to succeed, and attackers would have higher chances of being undetected. Vehicles will have to rely on themselves and interactions with other potentially untrusted vehicles to detect malicious activities and mitigate their impacts.
Impact on Replacement of Expired and Revoked Certificates - Vehicles need to have their expired and revoked certificates replaced with new ones. With conventional PKIs, only pre-established highly trusted CAs have the power to issue, revoke, and replace certificates. However, when there is limited or no infrastructure network connectivity, obtaining replacement certificates from the CAs will become difficult. When each vehicle has multiple certificates, such as when shared certificates are used to provide privacy protection, vehicle communications applications can continue to function should a subset of a vehicle’s certificates be revoked but possibly with lower privacy protection. This is because it will need to reuse the working subset of certificates more often. Once all of a vehicle’s certificates are revoked, the vehicle can no longer actively participate in V2V communications by sending messages. It can, however, still receive messages and report events to the driver should the system determine its integrity has not been compromised although its certificates are revoked. With limited or no infrastructure, the existing certificate management techniques could result in a large number of vehicles without valid certificates which could significantly reduce the effectiveness of the vehicle communications applications and could eventually bring the communications applications to a stop when a high percentage of the vehicles run out of valid certificates. Impact on CRL Distribution - Vehicles need to receive the current CRL in a timely fashion. Without proper management, CRLs can become very large in size, and, therefore, require significant wireless network bandwidth to distribute. When vehicles have little or no infrastructure network connectivity, they will have to rely on other means to receive CRLs or use new techniques to ensure continuous safe and secure operations without CRLs for extended periods of time.
Impact on Privacy - When vehicles have limited or no infrastructure network connectivity, it will be difficult for attackers in the infrastructure network to breach vehicles’ privacy by monitoring the vehicles from the infrastructure network. Hence, the main privacy concern becomes how attackers can use their vehicles or roadside devices they can deploy to breach the privacy of other vehicles by monitoring the messages to and from other vehicles.
For a V2V-communications environment where vehicles have little or no infrastructure network connectivity, the security and privacy requirements S-1 and P-1 in Section XX2.2XX
should continue to be satisfied.
Mathematical Modeling of V2V Networks
In this section, the document presents a mathematical model of the vehicle network that takes into account a number of factors related to vehicle communication, mobility, and vehicle density, the geography of the region, and infrastructure network assumptions. The model can be used to help answer important questions such as the ones in Section XX6XX.
Appendix Volume 3 H-5-6
(Material in Sections 3 and 5 were developed by Telcordia Technologies, Inc. prior to or outside performing activities under CAMP/NHTSA Cooperative Agreement No. DTNH22-05-H-01277. Telcordia has material in Sections 3 and 5 which is the
subject of pending patent applications.)
3

VSC-A Final Report: Appendix H-5 V2V PKI Security Management – Telcordia Technologies, Inc.
The document starts by showing that with simplified geographic, mobility, and communication models, the V2V wireless connectivity graph of the vehicles can be represented by a random geometric graph where the graph’s edge probability parameter can be expressed using an closed formula. Then the document shows that even with more generalized (and thus more realistic) geographic, mobility, and communication models, the vehicles form a random geometric graph with an algorithmically computable edge parameter. It is further shown that the expected number of neighbors of the vehicles can be computed with closed forms formulas.
3.1 V2V Network Graph with Simplified Geographical, Mobility and Communication Models
The document first derives the V2V connectivity graph using simplified geographical, mobility, and communications models:
A geographical model defines the possible vehicle positions. The document starts with a simplified geographical model: an m times m grid (i.e., a square divided into m2 subsquares having the same area (see XXFigure 1)). The grid has m+1 horizontal lines or rows, and m+1 vertical lines or columns, representing the roads. Each side of a sub-square is divided into s units. There are n vehicles (or nodes), and, for simplicity, the document assumes n to be fixed in time. For i=1,…,n, the position of the ith node at time t is represented as Pi(t)=(xi(t),yi(t)), where xi(t) {0,…,ms} and yi(t) {0,…,m} (on horizontal lines), or xi(t) {0,…,m} and yi(t) {0,…,ms} (on vertical lines). The initial positions of all vehicles, denoted as Pi(0), for i=1,…,n, are chosen randomly and independently among the above feasible values. An adversary vehicle’s index and position are denoted as adv {1,…,n} and Padv(t), respectively.
Figure 1: Simplified Geographical Model
A mobility model defines how vehicle positions evolve over time. The document starts with a simplified geographical model: an instance of the Manhattan Grid Mobility Model (MGMM) that is a modified discrete random walk on the geographic model, with a particular set of constraints on how moving directions are chosen.
Appendix Volume 3 H-5-7
(Material in Sections 3 and 5 were developed by Telcordia Technologies, Inc. prior to or outside performing activities under CAMP/NHTSA Cooperative Agreement No. DTNH22-05-H-01277. Telcordia has material in Sections 3 and 5 which is the
subject of pending patent applications.)

VSC-A Final Report: Appendix H-5 V2V PKI Security Management – Telcordia Technologies, Inc.
For i=1,…,n, the ith node is associated with a direction, represented, at time t as diri(t) from set {U,D,L,R} (for up, down left, right), where diri(t) {L,R} on horizontal lines and diri(t) {U,D} on vertical lines. The document considers a wrap-around model in which a node moving outside of the grid enters the grid again on the opposite side. The initial directions of all nodes, denoted as Pi(0), for i=1,...,n, are chosen randomly and independently. The document assumes a discrete time scale, where at each time step the nodes perform one additional movement step along their directions, according to the Manhattan Grid Mobility Model (MGMM). At each time step each node can move independently along a horizontal and vertical line. At an intersection, the node can turn left, right, go straight, or take a u-turn with a certain probability. The node is not allowed to change its direction inside a line segment between two intersections.
A communication model defines the conditions under which any pair of vehicles can or cannot communicate. It is assumed that the communication range or coverage area of each vehicle is a circle of radius r with the vehicle at its center. Formally, let V be the set of all vehicles represented as nodes and E(t) be the edges between these nodes at time t. Then, the communication graph G(t) = (V,E(t)) at time t is defined as the graph formed by nodes in V and edges such that (i,j) E(t) if and only if ||(Pi(t), Pj(t))|| r, where ||.|| is the Euclidean distance metric. The neighbor set of a node i at time t is also defined as Ni(t) = { j from V: ||(Pi(t), Pj(t))|| r }.
The document refers to the distribution of each vehicle’s positions at time t as a result of the initial placement of the node at time 0 and the node’s movements between times 0 and t as the spatial distribution. Given these geographic, mobility and communication models, it can be shown that there exists a spatial distribution of the vehicles that is stationary (i.e., it does not vary with the time variable t, regardless of the changes due to the mobility model). In other words, the document can show that the position of the n nodes is an n-tuple of independent and stationary stochastic processes. Moreover, the expression of the distribution has a closed formula and can be given as a function of n, the probabilities used in the mobility model, the parameters m, s related to the geographic model, and parameter r related to the communication model. This holds regardless of the distribution of the initial placement of the n nodes.
A quantity that is critical to characterize random graphs among vehicles is the number q of grid points covered by the communication range of any node. The exact closed formula of q is a function of parameters m, s, and r, and is a complex formula that is not elaborated on in this document. Given q, one can compute the probability pe that two nodes are connected at time 0. A surprising result that was found is that this parameter pe denoting the probability that two nodes are connected at time 0 will actually keep the same value for all time values t 1. In other words, the following holds:
Theorem 1 - Assuming an almost uniform initial placement of the n nodes on the grid, and given the above geographic model, mobility model, and communication model, at any given discrete time t 0, the communication graph G(t)=(V,E(t)) is a geometric random graph G(n,r). Its degree distribution is binomial, the same as
Appendix Volume 3 H-5-8
(Material in Sections 3 and 5 were developed by Telcordia Technologies, Inc. prior to or outside performing activities under CAMP/NHTSA Cooperative Agreement No. DTNH22-05-H-01277. Telcordia has material in Sections 3 and 5 which is the
subject of pending patent applications.)

VSC-A Final Report: Appendix H-5 V2V PKI Security Management – Telcordia Technologies, Inc.
for a random graph G(n,p) meaning a graph of n nodes where each edge appears with independent probability pe, where pe has a closed-form function of m, s, and r.
In the interest of practical analysis, a tractable approximation of the closed form for the value pe was investigated and the following approximation was obtained:
( 3-1)
Theorem 1 reveals interesting insights about the vehicles’ random geometric graph and, with additional simplification, can be further analyzed as follows. When r is close to s, the value pe can be approximated as cr2/s2m2 for some small constant c. This means that, as expected, pe is proportional to the ratio of the area of a vehicle’s communication circle to the area of the total grid. When r is much smaller than s, the value pe can be approximated as cr/sm2 for some small constant c, which is also expected, as in this case the circle does not entirely contain a single subsquare.
3.2 V2V Network Graph with Generalized Geographical, Mobility, and Communication Models
To capture realistic street maps, vehicle mobility, and communication capabilities, the result in Section XX3.1XX is extended by generalizing the models previously considered, and showing that the vehicles’ communication graph remains a random geometric graph with the same edge parameter that can be algorithmically computed.
Generalized Communication Model - In real-world environments, a vehicle’s radio coverage area may not be a circle, but may be arbitrary 2-dimensional shapes. The analysis done in the previous subsection has been modified to consider this case and obtained the same result, including a modified version of Theorem 1, where closed formulas are still obtained for the value of the edge parameter pe if the new shape has, although different from a circle, sufficient regularity. In the case of an arbitrary 2-dimensional shape, an algorithm was developed to compute the value pe, given a graphical representation of the shape.
Generalized Geographical Model - Now the geographical model is generalized and the consequences on the communication graph are studied. When modeling vehicular networks, one would like to consider arbitrary street maps. These maps can be abstracted as a planar graph Gmap=(Vmap,Emap), where Vmap is the set of all intersections or junctions on the street map, and Emap is the set of all streets joining any two intersections. Moreover, to each edge in Emap one could associate a weight proportional to the street length (thus further generalizing the previous constant parameter s in the grid). The approach used in Section XX3.1XX was found to find a stationary distribution over the grid generalizes to an arbitrary graph Gmap, except that it is only slightly harder to find an “essentially closed-form” expression for the distribution. In particular, an interesting fact Appendix Volume 3 H-5-9
(Material in Sections 3 and 5 were developed by Telcordia Technologies, Inc. prior to or outside performing activities under CAMP/NHTSA Cooperative Agreement No. DTNH22-05-H-01277. Telcordia has material in Sections 3 and 5 which is the
subject of pending patent applications.)

VSC-A Final Report: Appendix H-5 V2V PKI Security Management – Telcordia Technologies, Inc.
was found showing that the probability of finding a node at a given point in Vmap is proportional to the point’s degree in Gmap, which, in turn, models the number of directions that the point can be reached on the street map. An example demonstration of this can be found in XXFigure 2XX, which contains a small portion of New York City's street map, on which 100 nodes were deployed following, for simplicity, the MGMM.
Figure 2: Map of a Small Area in New York
The spatial distribution of the nodes on this map is plotted in XXFigure 3XX, where the x-axis and y-axis are the x and y coordinates on the map, respectively, and the z-axis is the probability of finding a node at that location. Points A, B, C, and D on the map represent intersections with different degrees. The probability at point A is the highest because it can be reached in five directions, and the probability of point D is the least because it can be reached from just one direction. Also, it can be seen that the probabilities are proportional to their degree at each intersection.
Appendix Volume 3 H-5-10
(Material in Sections 3 and 5 were developed by Telcordia Technologies, Inc. prior to or outside performing activities under CAMP/NHTSA Cooperative Agreement No. DTNH22-05-H-01277. Telcordia has material in Sections 3 and 5 which is the
subject of pending patent applications.)

VSC-A Final Report: Appendix H-5 V2V PKI Security Management – Telcordia Technologies, Inc.
Figure 3: Spatial Distribution of Nodes Following MGMM on the Map in Figure 2
Finally, the document used this new expression of the spatial distribution of nodes to modify the analysis done in the previous subsection and have obtained the same result, including a modified version of Theorem 1, where a simple and efficient algorithm to compute the value pe was obtained given a graphical representation of the street map and the appropriate abstracted graph Gmap=(Vmap,Emap). Thus, nodes moving with the MGMM and a fixed but arbitrary communication model will still form a random geometric graph on a geographical model directly modeling street maps, resulting in an efficiently computable edge parameter pes.
Generalized Mobility Model - Given fixed communication and geographic models, such as the generalized ones that were just described, the document now considers generalizing the mobility model and studying the consequences on the communication graph. Mobility models in part of the research literature are indeed relatively close to practice. For instance, they sometimes admit the existence of at least one of probabilistically, regulated, real-life vehicular situations, such as change of direction, u-turns, stopping time, higher or lower traffic. The document extends the previously considered MGMM by incorporating an arbitrary combination of these situations, as long as the next step of a vehicle depends at most on a finite number of its previous positions, which is believed to be a quite reasonable assumption, which also supported by probability theory whenever multiple vehicle routes are averaged. Using the theory of Markov chains, the document has given an algorithm that, for any such mobility model, can calculate a new representation of the map graph Gmap which is essentially a Markov chain simulating the behavior of a vehicle on the street map represented as Gmap. Again using well-known facts from the theory of Markov chains, the document proves that any such Markov chain is stationary, which implies that the spatial distribution of the vehicle following it is also stationary. Then, similarly as before, the communication graph among vehicles is a geometric graph with algorithmically computable edge parameter pe. Appendix Volume 3 H-5-11
(Material in Sections 3 and 5 were developed by Telcordia Technologies, Inc. prior to or outside performing activities under CAMP/NHTSA Cooperative Agreement No. DTNH22-05-H-01277. Telcordia has material in Sections 3 and 5 which is the
subject of pending patent applications.)

4
VSC-A Final Report: Appendix H-5 V2V PKI Security Management – Telcordia Technologies, Inc.
Spatial Distribution of Nodes - Overall, the three generalizations lead to an algorithmic of finding the parameter pe for the random geometric graph between vehicles that follow very realistic communication, geographical and mobility models. Thanks to the property of Markov Chains being independent of initial node distributions, this is further generalized to an arbitrary initial position of the vehicles on the street map. In other words, the following holds:
Theorem 2 - Under an arbitrary initial placement of the n vehicles on a street map, and given the above geographic model based on arbitrary street maps, the above generalized mobility model, and the above communication model based on a radio range of arbitrary shape, at any given discrete time t 0, the communication graph G(t)=(V,E(t)), whose degree distribution is approximately the same as that of a random graph G(n,p), meaning a graph of n nodes and where each edge appears with independent probability pe that is efficiently computable from all parameters in the mentioned geographical, mobility, and communication models.
Section 6, shows an example of how to derive the expected number of infrastructure network nodes, mobile and/or fixed, needed for vehicles to have target expected numbers of neighbors necessary to support malicious behavior detections. The aspect of the mathematical model used in the analysis in Section 6 is the following:
Lemma 1 - The degree distribution of the connectivity vehicle communications graph (or a connected components of the vehicle network) is stationary and is closely approximated by a Binomial distribution with parameters n and pe, where pe,is given in Theorem 1 and Theorem 2.
Infrastructure Network Models
In this section, various options for communication between vehicles and CAs are presented in abstract into infrastructure network models, which can be used to study and answer several important questions about vehicle certificate management system operations and requirements on infrastructure networks.
Several wireless networking technologies are available for vehicles to communicate with the CA. The main options can be classified into the following categories:
Roadside Short-Range Radio Networks - DSRC, WiFi, or other short-range radio networks deployed along roadways
Hotspot Networks - Hotspot networks are DSRC, WiFi, or other short-range radio networks deployed at hotspots where vehicles often visit but not necessarily along a roadside. These hotspots may include, for example, vehicle dealerships and parking lots at shopping centers. Each time a vehicle comes to such a hotspot, it can use the network to communicate with the CA. Since the vehicles often stay in these hotspots for relatively longer times compared to in a roadside, short-range, radio network, the end-to-end network capacity and delay become a less stringent requirement for such hotspot networks. Furthermore, the hotspot
Appendix Volume 3 H-5-12
(Material in Sections 3 and 5 were developed by Telcordia Technologies, Inc. prior to or outside performing activities under CAMP/NHTSA Cooperative Agreement No. DTNH22-05-H-01277. Telcordia has material in Sections 3 and 5 which is the
subject of pending patent applications.)

VSC-A Final Report: Appendix H-5 V2V PKI Security Management – Telcordia Technologies, Inc.
networks will be significantly easier to maintain than roadside, short-range, radio networks, hence reducing their operations expenses. In other words, establishing and operating hotspot networks can be more cost-effective than establishing roadside short-range radio networks.
Cellular Networks - Today, 2.5G and 3G cellular networks are widely available across the country and provide data rates from 10s of Kbps to 100s of Kbps. Deployment of 4G cellular systems are now being aggressively pursued by telecommunications providers worldwide. The major form of 4G wireless systems is Long Term Evolution (LTE) as specified by the Third-Generation Partnership Project (3GPP). LTE is designed to provide downlink data rates over 100 Mbps and an end-to-end latency in the order of several milliseconds. The first version of the end-to-end LTE system specification, 3GPP Release 8, was released in 2008. Extensive trials of LTE networks have been carried out over the past two years worldwide, demonstrating peak data rates over 100 Mbps, and end-to-end delays in the order of 10s of milliseconds. Most of the leading wireless network providers in the U.S. and worldwide have announced their commitments in deploying LTE.
Satellite Broadcast - Satellite broadcast provides the most ubiquitous coverage across the country. Today, many vehicles already have satellite receivers such as Sirius XM satellite radios and use them to receive traffic data information. Therefore, satellite broadcast provides a promising solution for supporting certificate management communications between CA and vehicles such as distributing CRLs to all vehicles. Section XX5XX also shows that, with proper enhancement to the certificate replacement protocol and mechanisms, satellite broadcast can also be used to broadcast replacement certificates to vehicles to replace the expired and revoked certificates in a way that does not jeopardize security. However, satellite broadcast is one-way, has relatively low bandwidth, and typically broadcasts a message to the entire country. For example, the Sirius XM radio satellite has two channels (with carrier frequencies of 1.84 MHz each) and transmits at 3.28 Mbps in each channel XX[1]XX, and the data communications delay for its geostationary satellites XX[2]XX is over 0.24 second XX[3]XX.
Infrastructure networks can also be classified as:
Static Infrastructure Access Points - These represent roadside, short-range, radio networks and hotspot networks. From a mathematical point of view, these will be modeled as special fixed nodes in the communication graph G(t) with a well-defined initial position distribution (which is in practice expected to somehow approximate vehicle density).
Mobile Infrastructure Access Points - These represent vehicles (e.g., police or emergency vehicles) that have both V2V and Vehicle-to-Infrastructure (V2I) communications capabilities. From a mathematical point of view, these will be modeled as special nodes in the communication graph G(t) with a well-defined initial position distribution and a well defined mobility process (which may or may not be similar to the ordinary vehicles’ mobility random process).
Appendix Volume 3 H-5-13
(Material in Sections 3 and 5 were developed by Telcordia Technologies, Inc. prior to or outside performing activities under CAMP/NHTSA Cooperative Agreement No. DTNH22-05-H-01277. Telcordia has material in Sections 3 and 5 which is the
subject of pending patent applications.)

5
VSC-A Final Report: Appendix H-5 V2V PKI Security Management – Telcordia Technologies, Inc.
Broadcast Infrastructure - These represent satellite broadcast networks. From a mathematical point of view, this may be modeled as a single, special fixed node in the communication graph G(t) that is connected to all other nodes. The position of such broadcast infrastructure will have no significant impact on the system. But the transmission latency and bandwidth may be constrained.
Using any one or any combination of the infrastructure network types and access point types, vehicles-CA communications may use the following main options:
Every vehicle uses an infrastructure network to communicate with the CA directly. This is the conventional way and can be costly.
Only a small number of vehicles use infrastructure networks to communicate with the CA directly and then serve as relay agents or proxies to relay messages to other vehicles using V2V communications. This can significantly reduce the need for infrastructure networks and the cost of vehicle onboard equipment. This approach is referred to as “seeding.”
New Solutions and Certificate Management Operations
In this section, the following new methods that can eliminate or significantly reduce the need for roadside infrastructure networks are presented. These include:
New distributed methods for vehicles to rely on themselves to detect malicious behaviors and to evict malicious vehicles. Preliminary analytical results are presented to show that these techniques have the potential to allow vehicles to sustain safe and secure V2V communications for unbounded time periods without having to communicating with the CA, hence eliminating the need for roadside infrastructure network connectivity.
New methods to allow the certificate management operations for all vehicles to be supported with the existing infrastructure networking capabilities already available on just a small set of the vehicles, and with a significantly reduced required level of infrastructure network connectivity.
In Section XX5.1XX, brief introductions to certificate management operations are provided. In Sections XX5.2XX through XX5.6XX, the solutions are presented. In Sections XX5.3.1XX and XX5.3.2XX, selected preliminary analysis results on how long the proposed malicious behavior detection methods can allow vehicles to sustain safe and secure V2V communications without having to communicate with the CA are presented. The document will also show how these results can be used to determine the infrastructure network requirements in both Sections XX5.3XX and XX6XX. Section XX5.7XX shows how to extend these solutions to add privacy support.
Appendix Volume 3 H-5-14
(Material in Sections 3 and 5 were developed by Telcordia Technologies, Inc. prior to or outside performing activities under CAMP/NHTSA Cooperative Agreement No. DTNH22-05-H-01277. Telcordia has material in Sections 3 and 5 which is the
subject of pending patent applications.)

VSC-A Final Report: Appendix H-5 V2V PKI Security Management – Telcordia Technologies, Inc.
5.1 Introduction to Certificate Management Operations
There are six main certificate management operations that vehicles need to perform to maintain the security and integrity of vehicle communications. These operations are:
1. Assignment and installation of initial security keys and certificates 2. Replacement of expired certificates 3. Malicious behavior detection 4. Distribution of CRL 5. Replacement of revoked certificates 6. Message security operations
With conventional certificate management systems, these operations require vehicles to communicate frequently through infrastructure networks with the CAs. To reduce or eliminate the reliance on roadside infrastructure networks, new approaches to support these operations are introduced.
The initial security keys and certificates can be assigned and installed on vehicles during the vehicle manufacturing process or at the vehicle dealerships before vehicles are sold, and, therefore, generally do not demand infrastructure network connectivity along roadways. DSRC or other types of wireless networks can be cost-effectively installed and used in dealerships to support the initialization of security keys on vehicles.
Digital certificates usually have an expiry attribute that is used to determine the validity of the certificates. Expired certificates need to be replaced with new ones. In a PKI-based vehicle network, certificate expiry is used for at least two purposes:
Helps prevent CRLs from monotonically growing without bound, by excluding expired certificates on the CRL. Large CRLs are undesirable because they take more network resources to distribute and consume vehicle computing resources when vehicles have to check whether a certificate is on the CRL.
Prevent credentials from remaining valid forever. It is advantageous, for instance, to let certificates in salvaged vehicles to expire rather to remain valid and a potential target of attackers.
Consequently, vehicles will periodically need to replace certificates that expire as part of their normal operation.
The integrity of a PKI system and a V2V communications network depends upon effective methods to detect malicious behaviors, misused certificates that should be revoked, malicious vehicles that are using V2V communications to cause harm to other vehicles or the communications system, and to mitigate the impact of these malicious behaviors. These methods are also required for the vehicles to maintain safe and secure communications by being aware of malicious behaviors and responding to them to mitigate the impact. Such malicious behavior detection and mitigation capabilities will be required regardless of the specific certificate management mechanisms being used. The rest of the document will show that the levels of infrastructure network connectivity required to support safe and secure V2V communications depends heavily on the ability of the malicious behavior detection and mitigation method used by the vehicles.
Appendix Volume 3 H-5-15
(Material in Sections 3 and 5 were developed by Telcordia Technologies, Inc. prior to or outside performing activities under CAMP/NHTSA Cooperative Agreement No. DTNH22-05-H-01277. Telcordia has material in Sections 3 and 5 which is the
subject of pending patent applications.)

VSC-A Final Report: Appendix H-5 V2V PKI Security Management – Telcordia Technologies, Inc.
Once a certificate is suspected or determined to be used in malicious activities, it can be revoked by a trusted authority such as the CA. CRLs are the primary means used in a PKI system to rescind certificates that have been previously provided to a user. Entities receiving data secured by a certificate will check the CRL to determine if the certificate has been revoked. In a PKI-based vehicle network, each vehicle needs an update to date a CRL issued by the CA to verify the authenticity and integrity of V2V messages that are, for instance, exchanged among vehicles to support safety applications. Since CRLs change over time with the addition and deletion of revoked certificates, a new CRL or updates to the CRL need to be distributed to vehicles, the frequency of which depends on the rate of certificate revocation.
When one or more certificates used by a vehicle have been revoked, these revoked certificates need to be replaced. When a vehicle’s privileges to receive certificates have been completely revoked, the system needs to be able to ensure that this vehicle will no longer be able to receive replacement certificates. When certificates are shared among vehicles to provide privacy benefits, such as in the Combinatorial Certificate scheme, the act of revoking a single certificate affects many vehicles that share the certificate.
5.2 Assignment and Installation of Initial Certificates
The assignment and installation of initial security keys and certificates on a vehicle can be done during the vehicle manufacturing process or at the vehicle dealerships before the vehicle is sold. The initialization procedure can be successfully completed without any roadside infrastructure network connectivity.
The generation of cryptographic keys for encryption and authentication can be done using existing cryptographic algorithms for asymmetric encryption and digital signatures. Each vehicle is envisioned to need, at any given time, at least the following keys (along with corresponding certificates): one pair of public and private keys for digital signature to achieve message authentication and integrity protection.
The current version of the CRL can also be uploaded to the vehicle. Since CRL contains time-sensitive information, it is best uploaded to the new vehicle at a vehicle dealership. The vehicle can then use V2V communications to distribute the CRL to other vehicles.
5.3 Malicious Behavior Detection and Mitigation by Vehicles
The ability to detect malicious behaviors is essential to ensure safe and secure vehicle communications. When digital certificates are used, the malicious behavior detection capability is also required to determine which certificates should be revoked. This section will further show that the level of infrastructure network connectivity required to support certificate management operations also depends heavily on the vehicles’ ability to detect and mitigate the impact of malicious behaviors.
In conventional certificate management, malicious behaviors are investigated by an intrusion detection system that is typically connected to the infrastructure network. The detection results are communicated to the CA, which in turn decides whether to revoke the attacker’s keys and whether to remove the attacker from the system (i.e., by not accepting any future re-keying requests or authentication attempts from this attacker). Appendix Volume 3 H-5-16
(Material in Sections 3 and 5 were developed by Telcordia Technologies, Inc. prior to or outside performing activities under CAMP/NHTSA Cooperative Agreement No. DTNH22-05-H-01277. Telcordia has material in Sections 3 and 5 which is the
subject of pending patent applications.)

VSC-A Final Report: Appendix H-5 V2V PKI Security Management – Telcordia Technologies, Inc.
In V2V communications with no or sporadic infrastructure network support, it is essential for the vehicles to be able to rely on themselves and distributed techniques to detect malicious communications activities and to mitigate the impact of malicious vehicles by evicting suspected malicious vehicles from the system (i.e., to ignore the messages sent from suspected malicious vehicles). Such a capability allows vehicles to communicate safely and securely without relying on infrastructure network connectivity.
Several approaches exist in the literature XX[9]XXXX[10]XXXX[11]XX in which vehicles decide locally whether or not to evict a suspected malicious vehicle. Two methods that have recently been considered for V2V vehicular communications networks are:
1) Voting mechanisms XX[9]XXXX[11] 2) “Sacrifice” by individual vehicles, in which a suspected device is evicted together
with its “accuser” (termed “suicide for the common good” in XX[10]XX).
In a voting mechanism, such as LEAVE XX[9]XX, vehicles vote by exchanging signed claims of impropriety of another vehicle. Each vehicle then adds these warning messages to its “Accusation List.” Once the warning votes against a vehicle exceed a threshold, the accused vehicle is placed on a “Blacklist,” which is similar to a local or temporary CRL. For nodes which are placed on the Blacklist, “Disregard this Vehicle” messages will be broadcast to other vehicles. Typically, the majority vote principle is used to decide when to deem a vehicle untrustworthy.
A majority vote detection mechanism relies on an “honest majority,” every node must have more good neighbors than bad. Otherwise, malicious vehicles can eliminate good vehicles if they form a local majority. Therefore, a local communication graph structure can have a significant effect on the dynamics of the voter model (see e.g., XX[12]XX). The analytical model described in Section 3 can be used to estimate the number of neighbors in a V2V network.
In a ‘sacrifice’-based model, any vehicle can evict any other vehicle by simultaneously agreeing to evict itself hence giving his decision more credibility. Therefore, in a sacrifice-based method, it is easier to evict a node than in a vote-based mechanism where majority votes from multiple vehicles are used to decide whether to evict a vehicle. However, abuse of the sacrifice-based mechanisms is made more costly by forcing simultaneous removal of the accuser. “Disregard this Vehicle” messages by an accuser cause simultaneous disregard of both the accused vehicle and its accuser. This means that if colluding “malicious” vehicles try to use their local majority to wrongly evict innocent vehicles, these malicious vehicles will also be evicted, therefore, significantly limiting their ability to abuse the system.
In the rest of this section, the document will:
Propose two sets of methods for vehicles to detect malicious behaviors and to mitigate the impact of these malicious behaviors. Typical malicious behaviors in a V2V communications environment is “message-based” malicious behavior that refers to malicious behaviors consisting of one or more vehicles generating messages differently from what is prescribed in the message security procedures.
Appendix Volume 3 H-5-17
(Material in Sections 3 and 5 were developed by Telcordia Technologies, Inc. prior to or outside performing activities under CAMP/NHTSA Cooperative Agreement No. DTNH22-05-H-01277. Telcordia has material in Sections 3 and 5 which is the
subject of pending patent applications.)

VSC-A Final Report: Appendix H-5 V2V PKI Security Management – Telcordia Technologies, Inc.
Present preliminary mathematical analysis to show how long each proposed method can allow the vehicles to communicate safely and securely without infrastructure network connectivity.
Show how the mathematical analysis results can be used to determine the required levels of infrastructure network connectivity.
5.3.1 Approach 1
First, the proposed Approach 1 is described and then an analysis is presented to estimate how long Approach 1 can allow the vehicles to sustain safe and secure V2V communications without any infrastructure network connectivity. The document will then show how to use this analysis result to estimate the worst-case requirement of infrastructure networks. 5.3.1.1 Description of Approach 1
This first approach is based on the following ingredients:
An authenticated voting procedure in the attacker’s neighborhood for vehicles to agree on whether a given vehicle’s messages are malicious
A V2V network flooding procedure to transmit the election transcript along with any resulting CRL updates to other vehicles
A threshold anomaly detection mechanism to check whether a given vehicle is taking part in an excessively large number of elections (say, to accuse many innocent vehicles by declaring their messages as malicious)
The basic form of the proposed method can be described as follows: 1) Each vehicle noting suspicious messages from another vehicle points out this fact
to all their neighbors and calls for an election to agree on whether these messages are “malicious.”
2) All neighbors send a digitally signed vote, say, from the set (malicious, not malicious, don’t know). A decision based on majority vote is generated and the certificates of both the suspected vehicle and the voters are placed on a Blacklist (a variation of the “suicide” effect as in XX[9]XX) and the Blacklist is sent to all other vehicles using a controlled network flooding procedure. Forcing the “accusing vehicles” to be evicted together with the “accused vehicles” helps limit the malicious vehicles’ ability to abuse the system to “gang up” on a small number of innocent vehicles.
3) Vehicles receiving new Blacklists will include the newly evicted keys on their Blacklist so that future messages based on these keys are ignored.
4) Each vehicle keeps a counter to track the number of election participations for each voter on the Blacklist. If a voter has exceeded a pre-specified threshold number of election participations (depending on timing parameters and traffic conditions in that specific geographic area), its votes will be ignored. Furthermore, these “excessive voters” will be reported to the CA when the discovering vehicles can establish a network connection with the CA, which could
Appendix Volume 3 H-5-18
(Material in Sections 3 and 5 were developed by Telcordia Technologies, Inc. prior to or outside performing activities under CAMP/NHTSA Cooperative Agreement No. DTNH22-05-H-01277. Telcordia has material in Sections 3 and 5 which is the
subject of pending patent applications.)

VSC-A Final Report: Appendix H-5 V2V PKI Security Management – Telcordia Technologies, Inc.
in turn revoke the associated certificates and the excessive voters’ privilege to receive future certificate replacements.
Overall, this proposed procedure can be proved to provide detection and containment of malicious behaviors as well as innocent vehicle framing behaviors.
Approach 1 has several differences from other existing methods: It combined the benefits of majority voting with the principle of sacrifice in a way
to make it difficult for malicious vehicles to evict innocent vehicles and also to significantly limit the impact of malicious vehicles. For example, if a group of malicious vehicles uses its majority in a local area to evict innocent vehicles, these malicious vehicles will have to sacrifice themselves in the process (i.e., having themselves evicted as well).
It incorporated a method to detect framings of multiple innocent vehicles by malicious vehicles, which is a potential weakness of all voting-based methods for the detection of malicious behaviors. Previous approaches have not considered solutions to detect such framing attacks.
5.3.1.2 Analysis of Approach 1
Here, the document addresses the question of how long can the system sustain itself with V2V communication only? The document refers to the time interval Ts during which the vehicles can sustain safe and secure V2V communications without infrastructure network connectivity as the Sustainable Interval. The document starts by observing some preliminary facts. Let Nm(t) be the number of malicious vehicles in the system at time t and Nv(t) be the number of victimized vehicles at time t. If there is no malicious vehicle, then there will be no victimized vehicle. In other words, if Nm=0, then Nv=0. In fact to simplify the discussion a single adversary can be thought of that coordinates all malicious vehicles to simultaneously maximize the number Nv of victimized nodes as well as the number Nm of malicious nodes. Towards this goal, the adversary has two options for in a malicious event:
(a) Setting a malicious vehicle to be the originator of malicious messages
(b) Setting a malicious vehicle to accuse a non-malicious vehicle
In case (a), because of the method for malicious behavior detection and vehicle eviction, the adversary is able to obtain Nv(t+1)= Nv(t) + d, where d is the number of neighbors of the malicious vehicle performing the attack, and where d can be estimated using Lemma 1 from Section 3. At the same time, the eviction scheme forces Nm = Nm -1.
In case (b), because of the method for malicious behavior detection and vehicle eviction, the adversary is able to obtain Nv(t+1)= Nv(t)+ 1, but the majority-based voting scheme forces Nm<=Nm -2,where d is the number of neighbors of the malicious vehicle performing the attack, and where d can be estimated using Lemma 1 from Section 3.
Let Nm’ be the threshold of the tolerable number of malicious vehicles in the system, and Nv’ be the threshold of victimized innocent vehicles that the system can tolerate. Note that whichever attack the adversary chooses, the number of malicious vehicles decreases Appendix Volume 3 H-5-19
(Material in Sections 3 and 5 were developed by Telcordia Technologies, Inc. prior to or outside performing activities under CAMP/NHTSA Cooperative Agreement No. DTNH22-05-H-01277. Telcordia has material in Sections 3 and 5 which is the
subject of pending patent applications.)

VSC-A Final Report: Appendix H-5 V2V PKI Security Management – Telcordia Technologies, Inc.
and thus it is convenient for the adversary to start attacking with the largest possible Nm (i.e., for analysis purposes the worst-case assumption can be made that Nm =Nm’). Also, note that before any attack occurs Nv = 0. Now, assume the adversary chooses, based on its resource and payoff, to mount ma(T) “distinct” attacks of type (a) and mb(T) “distinct” attacks of type (b) in a time interval of duration T (“distinct” attacks mean attacks that are unrelated and affect a significantly different neighborhood of vehicles).
The following notations are used:
Th : The time interval between the time a malicious behavior starts and the time the malicious behavior is detected. Td : The time interval between the time a malicious behavior is detected and the time the CRL carrying the misused certificate is distributed to all the affected vehicles.
Then the adversary can do the following:
1) Use 1 “Malicious” vehicle to mount ma(Th)+ ma(Td) attacks of type (a) to obtain d*(ma(Th)+ ma(Td)) victims before this vehicle is evicted, and/or
2) Use 2 “Malicious” vehicles to mount mb(Th)+ mb(Td) attacks of type (b) to obtain (mb(Th)+ mb(Td)) victims before these 2 vehicles are evicted.
This immediately implies that the highest value for Nv that the adversary can obtain at any given time is the following:
Nv<= Nm ’*d*(ma(Th)+ ma(Td))+ (Nm’/2)*(mb(Th)+ mb(Td)) ( 5-1)
In practice, ma(Th) is very unlikely to be greater than 1, the main intuition being that the time needed for communication among neighbor vehicles and for detecting that a vehicle’s messages are part of an attack is much smaller than the time needed by a vehicle to be in a scenario with a significantly different neighborhood of vehicles. (Here the reasonable assumption is made that there exists a way for a vehicle to determine, given a neighbor vehicle’s messages, whether these are malicious or not.) Formally speaking, this fact is justified by rigorously proving, using the models and modeling results in Section XX3XX, that at any given time, with “high” probability the time required by a “significant” change in the set of neighbors of a node in the communication graph is “significantly high”, where the probability is over the initial distribution and mobility of all nodes, and the words between quotes are quantifiable as a function of all parameters of interest.
In practice, ma(Td) is very unlikely to be greater than the number of “generalized connected components” in the vehicle communication graph, whereby generalized connected component, informally speaking, means the set of all vehicles which are reachable through a suitable flooding protocol over a time that is sufficiently large for the protocol to end. Here the main intuition behind this fact is that for each generalized connected component, the time needed to communicate the revocation of the malicious vehicle(s) to the network is much smaller than the time needed by a vehicle to be in a Appendix Volume 3 H-5-20
(Material in Sections 3 and 5 were developed by Telcordia Technologies, Inc. prior to or outside performing activities under CAMP/NHTSA Cooperative Agreement No. DTNH22-05-H-01277. Telcordia has material in Sections 3 and 5 which is the
subject of pending patent applications.)

VSC-A Final Report: Appendix H-5 V2V PKI Security Management – Telcordia Technologies, Inc.
scenario with a significantly different neighborhood of vehicles. Formally speaking, this fact is justified by proving, using the models and modeling results in Section 3, that at any given time, the following holds with “high” probability. The time required by the revocation message to be distributed to all nodes in the same generalized connected component on the vehicle communication graph is “much smaller than” the time needed by a vehicle to be in the same neighborhood as these vehicles. Here the probability is over the initial distribution of all nodes, the mobility of all nodes, and the choice of the specific distribution/flooding protocol over the vehicular network, and the words between quotes are quantifiable as a function of all parameters of interest.
In fact, by combining the two above arguments, it is expected that ma(Th)+ ma(Td) is also very unlikely to be greater than 1. Then, the (non-optimized) bound is obtained:
Nv<= Nm’*(d+1)*Ngcc ( 5-2)
where Ngcc is the number of generalized connected components in the vehicle’s communication graph. For practical values of d and Ngcc, this implies a quite satisfactory upper bound on the amount of damage that an adversary can do to a vehicular network. Showing that practical values of d are “sufficiently small” can be done using Lemma 1. Showing that with “high” probability practical values of Ngcc are “sufficiently small” can be done using the models and modeling results in Section 3, where the probability is over the initial distribution of all nodes, the mobility of all nodes, and the choice of the specific distribution/flooding protocol over the vehicular network. The words between quotes are quantifiable as a function of all parameters of interest.
Still, the bound can be further improved by considering variations over the malicious detection and vehicle eviction procedure (analysis omitted here).
The above bound implies that given a fixed set of adversary resources (i.e., Nm malicious vehicles) below the threshold in the above equation, there is a limited amount of damage to the vehicular network (i.e., it does not grow with time). In fact, note that the upper bound tends to decrease with time as does the number of generalized connected components due to vehicle mobility. The fact that the number of malicious vehicles can be assumed to remain smaller than a given threshold with time together with the above analysis that the number of victimized vehicles does not grow with time imply that
the Sustainable Interval is effectively unbounded.
Moreover, because in practice the adversary’s resources (i.e., the number of malicious vehicles) can be assumed to be relatively small, the damage done to the vehicular network is comparably small as well.
The above analysis was performed for the case where no privacy enhancements are made to the certificate management operations (i.e., only using the techniques in Sections XX5.2 XX, XX5.4XX, XX5.5XX, XX5.6XX, and XX5.7XX). Modifying the analysis for the privacy-enhanced certificate
Appendix Volume 3 H-5-21
(Material in Sections 3 and 5 were developed by Telcordia Technologies, Inc. prior to or outside performing activities under CAMP/NHTSA Cooperative Agreement No. DTNH22-05-H-01277. Telcordia has material in Sections 3 and 5 which is the
subject of pending patent applications.)

VSC-A Final Report: Appendix H-5 V2V PKI Security Management – Telcordia Technologies, Inc.
management scheme (i.e., using the techniques in Section XX5.7XX) is not hard and the results obtained only get worse by lower-order factors.
5.3.2 Approach 2: Based on the Mafia Game Model
The document first describes the Mafia Game model XX[8]XX and the insights obtained from this model to derive a practical method for detecting malicious behaviors and mitigating their impacts. The document then describes the proposed Approach 2. After that, an analysis is presented that estimates how long the approach can allow the vehicles to sustain safe and secure V2V communications without any infrastructure network connectivity. The document then shows how to use this analysis result to estimate the worst-case requirement of infrastructure networks. 5.3.2.1 The Mafia Game Model and Observations
In the Mafia Game model, the vehicles in a neighborhood are called “resident.” A neighborhood could be a broadcast area where all vehicles can have one-hop communications with each other or an area where vehicles can communicate with each other via multi-hops. Resident vehicles are divided in three categories: “malicious” (or Mafia), “civilians/citizens/residents,” and “detectives.” “Malicious” vehicles represent the misbehaving vehicles. “Civilian” vehicles are innocent vehicles. “Detectives” are special vehicles (e.g., police cars) which may have infrastructure network connectivity. The different categories of vehicles have different information and actions available to them. “Malicious” vehicles have full knowledge of who the other “malicious” vehicles in the neighborhood are. Collusion among “malicious” vehicles is possible. Through collusion, “malicious” vehicles could create a local majority to eliminate a non-malicious vehicle. “Malicious” vehicles could also adapt their behaviors to that of “civilian” vehicles to postpone detection (i.e., “malicious” vehicles do not have to behave maliciously all the time).
Formally, the Mafia Game takes place in rounds described below: 1) Resident’s Turn: All “Resident” vehicles pick one vehicle to eliminate by
majority vote. Each “Resident” vehicle picks one vehicle it wants to eliminate. The vehicle receiving the most votes is then eliminated. In case of a tie, a vehicle is chosen uniformly at random from the vehicles receiving the maximum number of votes. The identity of the eliminated vehicle is revealed publicly via dissemination of a “disregard” message.
This is a coarse model of the LEAVE majority vote elimination method (e.g., without considering whether the vehicle was rightly or wrongly eliminated).
2) Mafia’s Turn: “Malicious” vehicles choose a “citizen” vehicle to eliminate. The only information announced publicly by the “malicious” vehicles will be the identity of the vehicle eliminated and whether it was a “detective” vehicle or not. Again, the result can be disseminated via a “disregard” message.
This assumes the ability of the Mafia vehicles to create a local majority.
Appendix Volume 3 H-5-22
(Material in Sections 3 and 5 were developed by Telcordia Technologies, Inc. prior to or outside performing activities under CAMP/NHTSA Cooperative Agreement No. DTNH22-05-H-01277. Telcordia has material in Sections 3 and 5 which is the
subject of pending patent applications.)

VSC-A Final Report: Appendix H-5 V2V PKI Security Management – Telcordia Technologies, Inc.
3) Detective’s Turn: Each “detective” vehicle, if present in the system, queries the “malicious” or “citizen” status of a single vehicle. This status is then revealed only to the “detective” vehicles.
“Detective” vehicles can, for instance, represent police vehicles and querying in this context could correspond to monitoring the communications to and from other vehicles in an area. Here, the “detective” vehicle may collect messages from other vehicles and may communicate with infrastructure-based servers to help determine whether another vehicle is malicious or not.
Each round consists of the above three steps. After round , there are “resident” vehicles in the system. Denote by the number of “malicious” vehicles after round , and by the number of “detective” vehicles after round .
The Mafia Game has two possible outcomes:
The “citizen” vehicles win if all “Mafia” vehicles have been eliminated and there are still “citizen” vehicles alive.
The “Mafia” vehicles win if all “citizen” vehicles have been eliminated when there are still “Mafia” vehicles alive.
Next the document describes some important properties of the Mafia Game based on the analysis in XX[8]XX and how these properties will be used in the proposed Mafia Game based Malicious Vehicle Detection and Eviction Method.
First, the optimal strategies in the game without “detective” vehicles are:
Citizen Vehicle’s Optimal Strategy: In iteration t, each “resident” vehicle picks a random vehicle to eliminate. As long as the “citizen” vehicles
have the majority in each “resident” vehicle’s round, a random “resident” vehicle will be eliminated.
Malicious Vehicle’s Optimal Strategy: As long as the “citizen” vehicles have the majority, the “Mafia” vehicles may as well follow the same strategy of choosing a random citizen in each “resident” vehicle’s round.
Second, in the Mafia Game without Detectives, the “malicious” vehicles and “citizen” vehicles have comparable chances of winning in a group of resident vehicles when there is a group of “malicious” vehicles of size order . If the size of the “malicious” vehicles is larger than order , the “malicious” vehicles will surely win. The analysis in XX[8]XX suggests that the fraction of “resident” vehicles that are malicious, needed for the “malicious” group to win the Mafia Game, is related to how much faster the “malicious” vehicles can vote out a “resident.” In particular, if the “citizen/resident” vehicles only vote a fraction of times compared with the malicious vehicles, then the malicious group only needs to be of size . In the game description above, the malicious vehicles vote twice as frequently as “citizen” vehicles; therefore, they need a group of size .
This observation suggests that one way to contain a group of “malicious” vehicles is to slow down the voting of “Malicious” vehicles. In particular, a strategy which limits the
Appendix Volume 3 H-5-23
(Material in Sections 3 and 5 were developed by Telcordia Technologies, Inc. prior to or outside performing activities under CAMP/NHTSA Cooperative Agreement No. DTNH22-05-H-01277. Telcordia has material in Sections 3 and 5 which is the
subject of pending patent applications.)

VSC-A Final Report: Appendix H-5 V2V PKI Security Management – Telcordia Technologies, Inc.
number of times, or the frequency in which, a vehicle can take part in a vote may work well in practice. Another suggestion of the above result is to set the threshold for the size of the majority vote to be evicted adaptively, using an estimated number of “Resident” vehicles or the number of “malicious” vehicles.
Third, in the Mafia Game with detectives, The probability of the “malicious” vehicles winning is only comparable to the “citizens” winning when there are at least “malicious” vehicles, for some fraction . Therefore, an addition of a single infrastructure node can significantly decrease the power of “malicious” vehicles. With one vehicle, the optimal game for the “citizen” vehicles will be the following according to XX[8]XX:
Suppose there is one “detective” vehicle. During the first rounds, the “detective” collects information about vehicles at random. The other “citizens” vote in each round to eliminate a vehicle at random. After rounds, the “detective” compiles a list of so-called “vigilante” vehicles that are vehicles known to be “citizens.” At this stage, the number of “vigilante” vehicles should be larger than the number of “malicious” (Mafia) vehicles (since
for ). The group of “vigilante” vehicles act as an “anti-Mafia.” The “detective” encrypts the list of “vigilante” vehicles and sends the encrypted list to each member of so that the “vigilante” vehicles know which vehicles are also “vigilante” vehicles. The “detective” then asks everyone to eliminate him. Upon being eliminated, the identity of the “detective” is revealed, and, therefore, each “vigilante” knows that the messages and encrypted list they have received is genuine.
Once the “detective” is evicted, in each round, the highest ranking (numbered) member of selects a member outside of to be eliminated. All “citizen” vehicles abstain from voting in the secure anonymous vote.
“malicious” vehicles needed to dominate the game to
Also observe that establishing known good vehicles (vigilantes) rather than distributing more “disregard” messages, or CRLs, is a more effective approach to increase the chance of winning for the “citizen” vehicles. Furthermore, the suicide of the “detective” is particularly powerful, as opposed to the solitary act considered in other mechanisms XX[9]XXXX[10]XX. This solitary sacrifice is one interpretation of the elimination process after majority vote, which bypasses the need to model false decision probabilities.
There is also a simpler strategy for the “detective,” which makes no cryptographic assumptions nor private communication assumptions. The “detective” simply collects information about “resident” vehicles until time , when it knows that the identities of more than half of the residents alive known to be good “citizen” vehicles. After that, the detective publishes the list of vehicles known to be good “citizen” vehicles, and is eliminated to verify the claim (when its “detective” identity is revealed). This simple
Appendix Volume 3 H-5-24
This shows that a single “Detective” vehicle can significantly increase the number of from .
(Material in Sections 3 and 5 were developed by Telcordia Technologies, Inc. prior to or outside performing activities under CAMP/NHTSA Cooperative Agreement No. DTNH22-05-H-01277. Telcordia has material in Sections 3 and 5 which is the
subject of pending patent applications.)

ely, if the . Nam
VSC-A Final Report: Appendix H-5 V2V PKI Security Management – Telcordia Technologies, Inc.
strategy is successful in case the “detective” is not eliminated before time This simple strategy is particularly practical when there are more “Detective” vehicles.number of “detective” vehicles grows, then the chances of the simple strategy succeeding increase. 5.3.2.2 Description of Approach 2: Mafia Game based Malicious Vehicle Detection and
Eviction Method
Based on the above insights obtained from the Mafia Games, the document proposes the following Malicious Vehicle Detection and Eviction Method:
Resident’s Turn: All “resident” vehicles pick one vehicle to eliminate by majority vote. Each “resident” vehicle picks one vehicle it wants to eliminate. The vehicle receiving the most votes is then eliminated. In case of a tie, a vehicle is chosen uniformly at random from the vehicles receiving the maximum number of votes. The identity of the eliminated vehicle is revealed publicly via dissemination of a “disregard” message.
Detective’s Turn: In this round, each “detective” vehicle queries the “malicious” or “citizen” status of a single vehicle. This status is then revealed only to the “detective” vehicles (e.g., “detectives” can, for instance, be police vehicles). Querying in this context could correspond to monitoring the communications to and from other vehicles. Here, the “detective” vehicle may collect messages from other vehicles and may communicate with infrastructure-based servers to help determine whether another vehicle is malicious. During the first rounds, the “detective” collects information about vehicles at random. Other “citizen” vehicles vote in each round to eliminate a vehicle at random. After rounds, the “detective” compiles a list of “vigilante” vehicles that are vehicles known to be “citizen” vehicles. At this stage, the number of vigilantes should be larger than the number of “malicious” (Mafia) vehicles (since for ). The group of “vigilante” vehicles acts as an “anti-Mafia.” The “detective” encrypts the list V and sends it to each member of so that the “vigilante” vehicles know which vehicles are also “vigilante” vehicles. The “detective” then asks everyone to eliminate it. Upon being eliminated, the identity of the “detective” is revealed, and, therefore, each “vigilante” knows that the messages and encrypted list they have received are genuine. The “vigilante” list can be used as follows in the ‘cryptographic’ version where the identity of the “vigilante” vehicles is only known to the “vigilante” vehicles themselves, they can act as an “anti-Mafia.” In each “resident” round, the highest ranked “vigilante” selects a non-vigilante at random, and all other “vigilante” vehicles vote to eliminate this vehicle. After the “detective” is eliminated, all “non-vigilante citizen” vehicles abstain from voting. By construction, the group of “vigilante” vehicles is large enough to defeat the “Mafia” in a majority vote. If the “Mafia” vehicles want to ‘blend in’ in the “residents’” round, they will also abstain from voting in this round, after the “detective” is eliminated. In the non-
Appendix Volume 3 H-5-25
(Material in Sections 3 and 5 were developed by Telcordia Technologies, Inc. prior to or outside performing activities under CAMP/NHTSA Cooperative Agreement No. DTNH22-05-H-01277. Telcordia has material in Sections 3 and 5 which is the
subject of pending patent applications.)

VSC-A Final Report: Appendix H-5 V2V PKI Security Management – Telcordia Technologies, Inc.
cryptographic version, the assumption is that the “detective” stays alive until it has found an absolute majority of “known good” vehicles. After that, it publishes the list of “known good” vehicles, the “vigilante” list. Then, the vehicles on the “vigilante” list try to eliminate each vehicle not on the “vigilante” list. Because the list contains an absolute majority of vehicles, it will succeed in eliminating the “Mafia.”
In the original Mafia Game model, the voting rounds are sequential, and the votes are simultaneously revealed to meet the “independent voting” assumption (i.e., to prevent early votes from influencing later ones). The “independent voting” assumption is a common assumption in voting mechanisms, and there are multiple ways to meet this assumption without requiring simultaneous votes. As long as the independent voting assumption is satisfied, there is no requirement on the rounds being sequential. The Mafia Game is a method of analysis for practical majority voting schemes. In fact, what appears to matter most is how much more frequently the “malicious” vehicles can complete a voting procedure, compared to the “resident” vehicles. In particular, in the above description of the Mafia Game, the “citizen” vehicles only vote half as many times as the “Mafia” vehicles. This leads to the “critical mass” of the “Mafia” being on the order of
.
The amount of computational steps each vehicle needs to take is bounded by a polynomial in the number of “resident” vehicles. In practice, this means that vehicles have sufficient computational power, and the elimination decision algorithms are polynomial in R. In particular, this is satisfied by all practical (threshold, majority) voting mechanisms which require processing time linear in the length of the input, in conjunction with the above communication models (both broadcast and multi-hop communication, discarding duplicate messages, etc.). 5.3.2.3 Analysis of Approach 2
Here, the document addresses the question of how long can the system sustain itself with V2V communication only? The time interval Ts is referred to during which the vehicles can sustain safe and secure V2V communications without infrastructure network connectivity as the Sustainable Interval. The vehicles using the malicious behavior detection and mitigation method can sustain safe and secure communications for infinitely long as long as the number of “malicious” vehicles does not reach “critical mass.” The analysis based on the Mafia Game provides one indication of the size of this critical mass. In particular, the Mafia Game analysis indicates that the fraction of “malicious” vehicles should be kept below when the “malicious” vehicles can vote twice as frequently (this suggests a majority vote threshold on the order of ).
A similar bound holds for a majority vote scheme where the “Resident” voters get eliminated together with the evicted suspected “malicious” vehicle. In this scheme, the optimal strategy for “malicious” vehicles is to get voted out by as many “resident” (civilian) vehicles as possible. Each “malicious” vehicle can then eliminate a number of vehicles according to the majority vote threshold, . In the pure ‘suicide-for–the-
Appendix Volume 3 H-5-26
(Material in Sections 3 and 5 were developed by Telcordia Technologies, Inc. prior to or outside performing activities under CAMP/NHTSA Cooperative Agreement No. DTNH22-05-H-01277. Telcordia has material in Sections 3 and 5 which is the
subject of pending patent applications.)

VSC-A Final Report: Appendix H-5 V2V PKI Security Management – Telcordia Technologies, Inc.
common-good’ scheme, one “resident” voter votes out one suspected “malicious” vehicle. In that case, the system can sustain itself as long as the “civilian” vehicles form an absolute majority (i.e., ).
Let r be the rate of arrivals of the “malicious” vehicles into the system over time. For example, r can be expressed as x new malicious per unit time (e.g., day or month). The lower bound of the sustainable interval Ts can be estimated as follows assuming that the number of wrongly evicted “citizen” vehicles is below the acceptable level:
Ts if no detectives are in the system (5-3)
Ts if there is one detective in the system (5-4)
The above calculations represent a lower bound of Ts because it assumes that the vehicles will not be able to evict any “malicious” vehicle during Ts. In reality, “malicious” vehicles will be detected and evicted by the vehicles on a continuous basis; and, therefore, the sustainable interval should be longer than the above lower bound.
For example, considering a system with 250 million vehicles and assuming there will be 1000 new “malicious” vehicles entering the system every month, the vehicles will be able to sustain safe and secure V2V communications for at least 16 months without communicating with the CA, assuming no “detective” vehicles in the system. This makes the worst-case assumption that the proposed malicious behavior detection method cannot evict a single “malicious” vehicle within the sustainable interval. Furthermore, if “detective” vehicles are used, this worst-case sustainable interval will become significantly longer based on Equation (5-4).
If the detection method successfully evicts all the new “malicious” vehicles, the vehicles could sustain safe and secure communications continuously for any length of time period without any communications with the CA.
Given Ts, the level of infrastructure network connectivity required to ensure continuous safe and secure V2V communications can be readily estimated. In particular, each vehicle will need to be able to communicate with the CA once in every Ts time units to receive CRL and replacement certificates. Sections XX5.4XX and XX5.5XX described new methods to support such certificate management operations with only a small number of vehicles having highly infrequent infrastructure network connectivity.
Take the above worst-case estimate of Ts as an example, if Ts=16 months, it will typically be sufficient for the vehicles to wait until routine maintenance or repair visits to dealerships to use the DSRC hotspot at the dealerships to communicate with the CA. This means that there will be no need to deploy any roadside infrastructure networks.
5.4 Replacement of Expired and Revoked Certificates
The document proposes methods to replace expired and revoked certificates that guarantee that the new certificates are only received by the intended vehicles while reducing the need for infrastructure network connectivity. Replacing revoked certificates
Appendix Volume 3 H-5-27
(Material in Sections 3 and 5 were developed by Telcordia Technologies, Inc. prior to or outside performing activities under CAMP/NHTSA Cooperative Agreement No. DTNH22-05-H-01277. Telcordia has material in Sections 3 and 5 which is the
subject of pending patent applications.)

VSC-A Final Report: Appendix H-5 V2V PKI Security Management – Telcordia Technologies, Inc.
can be carried out in essentially the same way as replacing expired certificates, except that a separate investigation procedures may be needed to determine which certificate should be revoked and whether a vehicle should be allowed to continue to receive new replacement certificates. Thus, in the rest of this subsection only the replacement of expired certificates is discussed.
The proposed methods can adapt to fit the availability of infrastructure network options. For instance, when static or mobile infrastructure access points are available, they can send a certificate replacement message to vehicles either directly or first to a subset of vehicles which will in turn use V2V communications to distribute the message to the destination vehicles. In the case of satellite broadcast networks, one-way broadcast will be used to support the certificate replacement operation. In both cases, proper cryptographic protections will be used to ensure that this message will be successfully decrypted only by the intended vehicles.
With conventional certificate management, each user interacts directly with the CA to obtain replacement certificates. The user establishes a bidirectional network connection with the CA to mutually authenticate each other and then exchange the keying and certificate materials. This becomes difficult when vehicles have sparse infrastructure network connectivity.
The document proposes the following methods that work when only sparse infrastructure connectivity is available:
1) A method based on client-server proximity, using either static or mobile infrastructure access points
2) A method based on geographically controlled network flooding, using either static or mobile infrastructure access points
3) A method based on nationwide broadcasting, using broadcast infrastructure
With the first method, a vehicle with an expired certificate contacts the CA to perform certificate replacement operations when it moves into the radio coverage area of an infrastructure radio access point. Additionally, the vehicle may also receive from the CA certificate replacement messages with encrypted security materials intended to be received by other vehicles and then use V2V communications to forward the messages toward the destination vehicles.
With the second method, the vehicle with an expired certificate sends an encrypted and signed request for certificate update to its neighbor vehicles, which will use V2V communications to relay the message to the closest infrastructure server. Because vehicles know their current geographic positions and the approximate locations of the closest static or mobile infrastructure access point, this V2V relay can be efficiently restricted to the geographic area from the vehicle’s position to the location of the closet infrastructure server. After receiving the request, the infrastructure server replies with an encrypted (using a symmetric key sent by the requesting vehicle within its encrypted request message) and signed certificate replacement message, and it then sends the reply using a similarly geographically controlled flooding procedure. If required, a signed confirmation message may also be sent back from the vehicle to the server to guarantee
Appendix Volume 3 H-5-28
(Material in Sections 3 and 5 were developed by Telcordia Technologies, Inc. prior to or outside performing activities under CAMP/NHTSA Cooperative Agreement No. DTNH22-05-H-01277. Telcordia has material in Sections 3 and 5 which is the
subject of pending patent applications.)

VSC-A Final Report: Appendix H-5 V2V PKI Security Management – Telcordia Technologies, Inc.
that the procedure successfully completed. As in the first method, the vehicle may also receive from the CA certificate replacement messages with encrypted security materials intended to be received by other vehicles and then use V2V communications to forward the message toward the destination vehicles.
With the third method, a signed certificate replacement message containing encrypted key and certificate replacement materials are broadcast via one-way satellite broadcasting services to all vehicles. The vehicle with the expired certificate uses its satellite receiver to obtain this message and decrypts its replacement keys. This non-interactive procedure will be successful when the vehicle’s receiver is turned on. The same message could be broadcast multiple times (e.g., once a day, for a few days, etc.) so that the probability that a vehicle does not receive any one of these satellite’s messages can be estimated to be negligently low. This one-way broadcast method is particularly efficient for replacing a certificate that is shared by many vehicles to protect privacy.
It can be shown that any one of these three procedures provides effective and secure replacement of expired or revoked certificates, under widely used cryptographic assumptions.
The analytical model described in Section XX3XX can be used to show that the V2V dissemination of CRL can be sufficiently fast and let vehicles minimize the time interval during which they have no valid certificate. The end-to-end latency can be estimated with the analytical model in Section XX3XX.
Avanced variants of these three techniques to improve performance, such as computation time and bandwidth requirements, have been designed and analyzed. For instance, one important extension of the above described procedures would be to simultaneously handle multiple certificate replacements with a single certificate replacement message from the CA.
5.5 Certificate Revocation List Distribution The document proposes methods to update and distribute CRL to all vehicles to ensure that all vehicles in the country maintain a very recent version of it. These methods are based mainly on broadcasts from a satellite to the entire country or from infrastructure servers to all vehicles in their closest geographic area using appropriate flooding-based distribution protocol (here, a relatively large time period can be achieved). To take into consideration low or no connectivity scenarios (e.g., vehicles with their satellite receiver being turned off, or vehicles with limited mobility range in rural areas, or vehicles not receiving CRL updates due to any type of temporary lack of connectivity), a V2V procedure is proposed where the vehicle with the oldest CRL updates it to the other vehicle’s one.
CRLs are public data meant to be openly distributed to any entity or application that needs them. For time-stamping, integrity protection and authentication, a CRL is typically accompanied by a digital time-stamp, and both the CRL and the time-stamp are digitally signed by the CA that has issued it. In conventional certificate management, a user interacts directly with the CA to periodically obtain the most recent CRL. Specifically, a permanent connection can be established between the CA and its user, Appendix Volume 3 H-5-29
(Material in Sections 3 and 5 were developed by Telcordia Technologies, Inc. prior to or outside performing activities under CAMP/NHTSA Cooperative Agreement No. DTNH22-05-H-01277. Telcordia has material in Sections 3 and 5 which is the
subject of pending patent applications.)

VSC-A Final Report: Appendix H-5 V2V PKI Security Management – Telcordia Technologies, Inc.
during which the user and the CA mutually authenticate each other and then the CA sends the updated CRL to the user. In vehicular networks, this process is complicated by the fact that vehicles may have to remain disconnected for some non-trivial amount of time by any type of infrastructure servers and thus need some help to establish the required connection. Given the types of infrastructure servers formalized in Section XX4XX, the document proposes two procedures to provide such help to vehicles (the first applicable to both static and mobile infrastructure access points, and the second applicable to satellites) and a third procedure that is performed between any two neighbor vehicles:
1) A CRL distribution procedure based on geographically controlled network flooding using either static or mobile infrastructure access points
2) A CRL distribution procedure based on nationwide broadcasting using broadcast infrastructure
3) A CRL update procedure based on CRL comparison which is run between any two vehicles
The distribution procedure based on network flooding, in its most basic form, can be described as follows. With the time period depending on the rate of revoked certificates, the CA decides to periodically broadcast the most recent CRL, as follows. Each static or mobile infrastructure access point is given a copy of the same CRL and distributes it to all vehicles via a geographically controlled flooding protocol. For example, the country can be divided into geographic areas, each being covered by one or few infrastructure servers, and the CRL broadcasted from an infrastructure server is only forwarded by vehicles to other vehicles in this server’s allocated geographic area.
A variation on this method is that newly purchased vehicles or vehicles that just visited dealerships for maintenance or repair can receive at the dealership the CRL from the CA. These vehicles can then serve as relays to use V2V communications to distribute the CRL to other vehicles. The distribution procedure, based on nationwide broadcasting, is a simplified version of the above method. The simplification is in that there is only one server (a satellite) that is broadcasting the latest CRL to all vehicles in the country and there is no need for vehicles to serve as message relays.
The update procedure based on CRL comparison is typically run between a vehicle that has an old version of the CRL and the neighbor vehicles with a more recent CRL version. Here, the former vehicle replaces its CRL with the latter’s one.
Any one of two combinations of the above three procedures (specifically, techniques 1 and 3 when static or mobile infrastructure access points are deployed, or techniques 2 and 3 when satellites are) provides effective and secure nationwide provision of the most recent CRL, under standard cryptographic assumptions.
Avanced variants of these techniques to improve performance such as computational complexity and bandwidth requirement have been designed.
Appendix Volume 3 H-5-30
(Material in Sections 3 and 5 were developed by Telcordia Technologies, Inc. prior to or outside performing activities under CAMP/NHTSA Cooperative Agreement No. DTNH22-05-H-01277. Telcordia has material in Sections 3 and 5 which is the
subject of pending patent applications.)

VSC-A Final Report: Appendix H-5 V2V PKI Security Management – Telcordia Technologies, Inc.
5.6 Message Security Operations Message security refers to message authentication or integrity protection, vehicle authentication, and protection against replay attacks. From a certificate management perspective, performing these message security operations requires a vehicle to consider how to use keys and certificates to protect outgoing messages and to process incoming messages in ways that can meet critical requirements on, for example, delay, processing, over-the-air (OTA) message overhead, and privacy. Since these operations in a V2V environment do not have to rely on infrastructure network connectivity, this document will only provide the following summary of the promising techniques for achieving message security as follows:
PKIs + Digital Signatures - Each vehicle sends a digital signature of a time-stamped version of the current message together with the message itself and the certificate for the signature verification public key. The receiver checks that the time-stamp, the message’s signature, and the verification public key’s certificate are valid before processing the message’s content. This solution could result in excessive computation time and OTA message overhead. Computationally lighter variants of this technique are available in the literature. For instance, vehicles can check a message’s authenticity only if the message’s content is deemed to be important enough.
PKIs + Chain-based hashing - To reduce message overhead and processing time, a scheme based on chain-based hashing uses a chain of computations via a cryptographic hash function to generate a sequence of keys, of which only the output of the chain is authenticated via a certified digital signature. Each key is committed and used for message security and sender authentication at a given time (instead of using a digital signature) and only revealed in the clear at a later time. Assuming some weak but precise form of synchronization among sender and receivers, revealing the key used to compute the Media Access Control (MAC) does not help an attacker to forge a new message authentication procedure. These schemes have been argued to be suitable to lossy stream authentication, a scenario very similar to the one in the V2V networks that the document is considering. This solution needs the ability to maintain synchronization between sender and receivers.
PKIs + Tree-based Hashing - These methods use a tree of computations via a cryptographic hash function to generate a sequence of keys, of which only the root of the hash of the chain is authenticated via a certified digital signature. Each leaf in the tree together with a position counter is used for message security and sender authentication (instead of using a digital signature) along with the certification path to the tree root, where the nodes in the path are keys linked similarly as in the previous method. This solution expands the previous technique and inherits its properties by possibly providing efficiency improvements on the length of the message sub-stream that can be processed for each certified signature, with the possible drawback of no recovery of lost messages.
Appendix Volume 3 H-5-31
(Material in Sections 3 and 5 were developed by Telcordia Technologies, Inc. prior to or outside performing activities under CAMP/NHTSA Cooperative Agreement No. DTNH22-05-H-01277. Telcordia has material in Sections 3 and 5 which is the
subject of pending patent applications.)

VSC-A Final Report: Appendix H-5 V2V PKI Security Management – Telcordia Technologies, Inc.
5.7 Privacy Enhancements to Above Methods
Methods in Sections XX5.2XX through XX5.5XX only targeted provably achieving the security requirements from Section XX2.2XX. Here, it shows how to extend these methods so that the privacy requirements from Section XX2.3XX can provably be met.
A first natural question is whether those methods actually satisfy some form of privacy. To start discussing that, first note that the method in Sections XX5.2XX only assumed a single signature key per vehicle. In the rest of this section, the document considers how supporting a higher level of privacy could impact the methods proposed in the previous sections. As mentioned, the methods in Sections XX5.2XX, XX5.6XX, XX5.4XX, XX5.3XX, and XX5.5XX only required a single and independently generated signature key per vehicle. The document will still require that one independently generated signature key, called identifying key, is associated with each vehicle, although its use will be more limited than before.
To achieve higher privacy, the document considers methods where vehicles have additional signature keys, called anonymous keys (certificates), and consider the shared certificates approach for implementing anonymous keys. In other words, each anonymous certificate will be shared with some other vehicles. The basic idea is that if “many” vehicles share the same key, then any use of this key will not identify the vehicle that used it but will at best imply that any one of the many vehicles that had distributed this key might have used it.
The document will use shared certificate schemes as examples in the following discussions of the impact of supporting privacy on the proposed methods in the previous sections. A set of shared certificate methods are referred to as combinatorial schemes and have been analyzed extensively in XX[5]XX. With a combinatorial scheme, the CA selects a pool of N uniformly and independently distributed triples, each triple containing a public key and a secret key for a digital signature scheme and an associated certificate. For simplicity of discussion, the document will just refer to each triple as an (anonymous) certificate or key. Every newly purchased vehicle will be given a small number n of keys that are randomly and independently chosen from the pool. Note that each key from the pool is shared, on average, by Vn/N vehicles, where V is the total number of vehicles in the country.
Therefore, there will be two types of keys for each vehicle: identifying keys that are unique to each vehicle, and anonymous keys that are shared by many vehicles. A CRL will also make this distinction specifying whether its keys are of identifying or anonymous type.
Next the document discusses the potential impact of supporting privacy on the approaches proposed in Sections XX5.1XX through XX5.6XX.
Assignment of Initial Security Keys and Certificates - The same method as in Section XX5.2XX can be used. The only difference is that multiple and different types of certificates (i.e., identifying and anonymous certificates) are now required to be assigned and installed on each vehicle.
Appendix Volume 3 H-5-32
(Material in Sections 3 and 5 were developed by Telcordia Technologies, Inc. prior to or outside performing activities under CAMP/NHTSA Cooperative Agreement No. DTNH22-05-H-01277. Telcordia has material in Sections 3 and 5 which is the
subject of pending patent applications.)

VSC-A Final Report: Appendix H-5 V2V PKI Security Management – Telcordia Technologies, Inc.
Malicious Behavior Detection and Mitigation - The same malicious behavior detection method in Section XX5.3XX can continue to be used with the following extensions. Voters’ suicide effect is implemented with voters giving up their privacy and future privileges by using their identifying keys to sign their votes. Furthermore, voters request the suspected vehicle to also provide a signature based on this identifying key. This identifying key and the anonymous key will be revoked. If the suspected vehicle fails to provide a signature with its identifying key, the vehicle’s anonymous keys used in the suspected messages will be revoked. Finally, a pre-set threshold is used by infrastructure servers to verify whether there exists a vehicle for which too many of its anonymous keys have been revoked, in which case this vehicle’s identifying key is also revoked. Several methods are available for determining the value of such a threshold in ways that can meet given performance goals XX[7]XX.
Replacement of Expired Certificates - When shared certificates are used to protect privacy, each anonymous certificate is shared by many vehicles. When it expires, it has to be replaced on all the vehicles that share this certificate.
However, in conventional certificate management, each owner of a certificate has to initiate the process of updating the certificate by establishing a 2-way communication connection with the CA through the infrastructure networks for the vehicle and the CA to mutually authenticate each other and then exchange the keying and certificate materials.
An important observation was that this 2-way communication process is unnecessary for replacing expired certificates. Expiration of a certificate is not an indication of misuse, but simply a mechanism to help manage CRL growth and provide a means to cleanse the system of certificates that may no longer be in use.
Therefore, the document proposes a new method that uses any or both of the following one-way communications options with a new way for the CA to secure the certificate replacement message so that only the vehicles holding the to-be-replaced certificate can receive the replacement certificate:
Seeding and V2V distribution mechanism (Section XX4XX) One-way communication from the CA to the vehicles (e.g., satellite broadcast)
This new certificate replacement strategy using only one-way broadcast is especially efficient for replacing anonymous certificates that are shared by a large number of vehicles. It also makes it possible to use satellite broadcast receivers widely installed in the vehicles already to support certificate replacement.
The CA knows which certificates will expire soon and it periodically publishes a list that contains the certificates to be replaced along with their replacement certificates. This list is referred to as the Anonymous Certificate Replacement List (ACRL). An ACRL has more security requirements than a CRL. Specifically, all the entries in a CRL are meant to be received and processed by the entire vehicle population, while each entry in an ACRL is meant to be received and installed only on a subset of the vehicle population that shares the replacement certificate. Therefore, not only does the entire content of an ACRL need to be integrity-protected, like a CRL, but also each entry in the
Appendix Volume 3 H-5-33
(Material in Sections 3 and 5 were developed by Telcordia Technologies, Inc. prior to or outside performing activities under CAMP/NHTSA Cooperative Agreement No. DTNH22-05-H-01277. Telcordia has material in Sections 3 and 5 which is the
subject of pending patent applications.)

VSC-A Final Report: Appendix H-5 V2V PKI Security Management – Telcordia Technologies, Inc.
ACRL should be cryptographically secured so that only the authorized vehicles can have the private keys associated with a new certificates.
Therefore, an entry in an ACRL consists of the following elements:
SERIAL_NO, the serial number (or its hash) of old anonymous certificate being replaced {NEW_CERT}old_k, a new anonymous private/public key pair, the corresponding anonymous certificate, and the anonymous CA’s digital signature on the key pair, which are encrypted with the public key, old_k, of the old anonymous certificate that is to be replaced by this new certificate
As is the case with a CRL, the Anonymous CA’s digital signature secures the integrity of the entire content of a given ACRL. But note that only the current holder of an expired anonymous certificate on the ACRL can decrypt {NEW_CERT}old_k and gain access to the replacement key materials. When a vehicle receives an ACRL, it processes the list to determine if the vehicle has the anonymous certificates being replaced and installs new certificates and key pairs on an as-needed basis. The serial number of an old anonymous certificate is included to allow the vehicle to quickly determine if any of its certificates are on the list. Each replacement certificate also has its own, unique serial number.
Replacement of Revoked Certificates - The methods described in Section XX5.4XX should be enhanced to more efficiently replace a certificate that is shared by multiple vehicles. In particular, a single certificate replacement message may be broadcast to all vehicles that share the certificate to be replaced in a way the evicted vehicle will not be able to decode the replacement certificate. Telecordia has developed such a method and are performing work to make it more practical and scalable.
Distribution of CRL - Telecordia’s privacy-enhanced methods can use the same protocols as in Section XX5.5XX for CRL distribution and update.
Message Security Operations - To support vehicle privacy, each vehicle may use multiple anonymous certificates. In this case, the vehicle will also need techniques to determine which anonymous certificates they should use at any time. One such technique that helps increase privacy protection even in low vehicle density areas is presented in XX0XX.
Appendix Volume 3 H-5-34
(Material in Sections 3 and 5 were developed by Telcordia Technologies, Inc. prior to or outside performing activities under CAMP/NHTSA Cooperative Agreement No. DTNH22-05-H-01277. Telcordia has material in Sections 3 and 5 which is the
subject of pending patent applications.)

6
VSC-A Final Report: Appendix H-5 V2V PKI Security Management – Telcordia Technologies, Inc.
Analysis of Required Infrastructure Network Connectivity
The document focuses on answering the following four key questions:
1) How often does the central credential authority need to communicate with an individual vehicle?
2) How much data will need to be transported during one of those encounters?
3) How often do the individual vehicles need to communicate with the central credential authority?
4) How much data will need to be transported during one of those encounters?
In the rest of this section, the document first summarizes the main factors that impact the answers to these questions. Next the document describes an analytical framework for deriving answers to the questions. Then this proposed analytical framework and the mathematical analysis of the specific malicious behavior detection methods in Sections XX5.3.1.2XX and XX5.3.2.3XX is used to answer the above questions.
6.1 Main Factors
The main factors that impact the answers to the above questions are:
[F-1]. The Security Objective - The target level of security for the system and the way the security objective is expressed.
[F-2]. The Privacy Objective - The target level of privacy the system should support and the way the privacy objective is expressed.
[F-3]. The abilities of the malicious behavior detection and mitigation mechanisms used in the system to handle malicious activities such as: o How long the malicious behavior detection and mitigation mechanisms
can sustain safe, secure and privacy-preserving V2V communications without any infrastructure network connectivity. That is, how long can the vehicles rely on themselves to detect and evict malicious vehicles without relying on infrastructure network connectivity before jeopardizing their abilities to communicate with each other safely and securely?
o How quickly can the system detect malicious use of certificates and malicious vehicles?
o How quickly can the system distribute CRLs to vehicles? o What and how much data the certificate management mechanisms used in
the system need to be exchanged between the vehicle and the CAs? o What forms (i.e., bidirectional or 1-way) of vehicle-CA communications
the certificate management operations mechanisms used in the system have to use?
Appendix Volume 3 H-5-35
(Material in Sections 3 and 5 were developed by Telcordia Technologies, Inc. prior to or outside performing activities under CAMP/NHTSA Cooperative Agreement No. DTNH22-05-H-01277. Telcordia has material in Sections 3 and 5 which is the
subject of pending patent applications.)

VSC-A Final Report: Appendix H-5 V2V PKI Security Management – Telcordia Technologies, Inc.
[F-4]. Mechanisms used by the system to distribute essential data to vehicles such as: o Methods used to distribute CRLs, including whether infrastructure
network connectivity will be used to transport CRLs to every vehicle directly or only to some vehicles which will in turn serve as relays to distribute the CRL to other vehicles via V2V communications, and how many times each CRL will be sent by the infrastructure servers to ensure that it will be received by all or a targeted percentage of vehicles.
o How often keying materials and certificates used by vehicles will expire and, therefore, need to be replaced.
[F-5]. The V2V network environments - o Size of the network (i.e., number of equipped vehicles) o Size of geographical areas o Density of V2V-equipped vehicles
[F-6]. Attackers - o The number of malicious attackers in the system o The attackers’ capabilities, such as what levels of security breaches to the
vehicle on-board equipment they can achieve, whether they can collude, etc.
o The level of sophistication of the attackers. In other words, how difficult it will be to detect malicious activities and vehicles.
6.2 An Analysis Framework
Here, the document describes a framework for deriving answers to the four key questions described above. The analysis framework focuses on the sustainable interval Ts - the time interval during which vehicles can sustain safe and secure V2V communications without having to communicate with the CA. XXFigure 4XX illustrates the Sustainable Interval with the following additional time intervals:
Th - The time interval between the time a malicious behavior starts and the time the malicious behavior is detected.
Td - The time interval between the time a malicious behavior is detected and the time the CRL carrying the misused certificate is distributed to all the affected vehicles.
Appendix Volume 3 H-5-36
(Material in Sections 3 and 5 were developed by Telcordia Technologies, Inc. prior to or outside performing activities under CAMP/NHTSA Cooperative Agreement No. DTNH22-05-H-01277. Telcordia has material in Sections 3 and 5 which is the
subject of pending patent applications.)

VSC-A Final Report: Appendix H-5 V2V PKI Security Management – Telcordia Technologies, Inc.
Figure 4: Sustainable Interval
For a system to have sustainable secure operations for unbounded times, the sustainable interval Ts should typically be no shorter than the sum of Th and Td, i.e., Ts Tm+ Td.
The value of Th is impacted primarily by:
Sophistication level of the malicious behavior ( i.e., how difficult it is to detect the malicious behavior) Capability of the malicious behavior detection mechanism used by the system to detect malicious activities
The value of Td is impacted primarily by:
Speed in which CRLs can be distributed to the affected vehicles
Any V2V communications system will typically start with zero or a very small number of malicious vehicles. However, new “malicious” vehicles may enter the system and new malicious activities may continue to occur over time, which can cause the number Nv of victimized vehicles and the number Nm of “malicious” vehicles in the system to grow. When Nv exceeds a certain threshold Nv’, V2V communications applications will no longer be able to function properly. For example, when “malicious” vehicles cause the digital keys and certificates on many innocent vehicles to be wrongly revoked, many V2V-based vehicle safety applications, which rely on most or all neighboring vehicles to
Appendix Volume 3 H-5-37
(Material in Sections 3 and 5 were developed by Telcordia Technologies, Inc. prior to or outside performing activities under CAMP/NHTSA Cooperative Agreement No. DTNH22-05-H-01277. Telcordia has material in Sections 3 and 5 which is the
subject of pending patent applications.)

VSC-A Final Report: Appendix H-5 V2V PKI Security Management – Telcordia Technologies, Inc.
communicate with each other, may no longer be effective. When Nm exceeds a certain threshold Nm’, the overall vehicle communications system may lose the ability to detect and evict malicious vehicles, and consequently, the “malicious” vehicles could eventually victimize all other vehicles.
The values of Nm and Nv depend on the following primary factors:
Number of malicious attackers and their capabilities Capabilities of the specific certificate management mechanism used for detecting malicious activities and for evicting malicious vehicles
The tolerable thresholds Nm’ and Nv’ depend on the following primary factors:
Capabilities of the specific certificate management mechanism used for detecting malicious activities and for evicting malicious vehicles Rate of growth of the number of victimized vehicles. This grow rate is largely determined by the capability of the security system to control the number of victimized vehicles, for example, the ability for vehicles to recognize and ignore malicious messages so that they will not be victimized. Rate of growth of new malicious vehicles that enter the system
Next, Section XX6.2.1XX describes how to compute the Sustainable Interval Ts. Then XX6.2.2XX
shows how to estimate infrastructure network requirements based on Ts. Finally, how to estimate the other parameters Th and Td are shown and their impact on the analysis of Ts
and the analysis of the required infrastructure networks is discussed.
6.2.1 Estimate Sustainable Interval TS
During Ts, the following conditions need to be satisfied:
Nm Nm’ and Nv Nv’ ( 6-1)
Therefore, the key to increase Ts, and hence reducing the need for infrastructure network connectivity, is to develop a malicious vehicle detection and eviction method that can keep Nm Nm’ and Nv Nv’ for long time periods. This also means that the sustainable interval Ts should typically be no shorter than the sum of Th and Td, i.e., Ts Tm+ Td in order to keep the sustainable interval unbounded. In other words, the system should be capable of detecting and evicting malicious vehicles during each sustainable interval and hence help contain the valuse of Nm and Nv below their respective thresholds continuously without requiring vehicles and the CA to communicate. A lower bound of Ts can be estimated as follows. Let r be the rate of arrivals of the malicious vehicles into the system per unit time (e.g., a day or month). Let q be the rate at which innocent vehicles are wrongly evicted per unit time. The lower bound of the Sustainable Interval Ts can be estimated as follows:
Appendix Volume 3 H-5-38
(Material in Sections 3 and 5 were developed by Telcordia Technologies, Inc. prior to or outside performing activities under CAMP/NHTSA Cooperative Agreement No. DTNH22-05-H-01277. Telcordia has material in Sections 3 and 5 which is the
subject of pending patent applications.)

VSC-A Final Report: Appendix H-5 V2V PKI Security Management – Telcordia Technologies, Inc.
( 6-2)
The above calculation represents a lower bound of Ts, because it assumes that the system will not be able to evict any “malicious” vehicles during Ts. In reality, malicious vehicles will be detected and evicted by the vehicles on a continuous basis and, therefore, the sustainable interval should be longer than the above lower bound. As long as the malicious behavior detection method can keep Nm Nm’ and Nv Nv’, the vehicles will be able to communicate safely and securely continuously for unbounded time periods without having to communicate with the CA.
It is clear that the value of the sustainable interval Ts depends on the specific method used by the vehicles to detect malicious vehicles and the sophistication of the malicious activities. More detailed analysis of the sustainable intervals for the two malicious behavior detection methods proposed in Sections XX5.3.1XX and XX5.3.2XX are also presented in these two sections.
6.2.2 Estimate Infrastructure Network Requirements Based on Sustainable Interval TS
Given Ts, the level of infrastructure network connectivity (i.e., the number, density, and locations of short-range radio base stations) required to ensure continuous safe and secure V2V communications can be readily estimated. In particular, each vehicle will need to be able to communicate with the CA once in every Ts time units. The longer the Ts, the less frequently each vehicle has to communicate with the CA. For example, if Ts is longer than any one of the following, then installing infrastructure networks only at these static infrastructure access points (e.g., dealerships, shopping malls, etc.), only on police cars (or any other mobile infrastructure access point), or using satellite broadcasts will be sufficient to guarantee that the vehicular network has sustainable secure operations.:
The typical time intervals between vehicles’ visits to static infrastructure access points (e.g., dealerships, shopping malls, etc.) The typical time intervals during which vehicles will happen to be within communication radio range of police cars (or any other mobile infrastructure access point) The typical time intervals during which vehicles can receive satellite broadcasts from CAs (or from any other mobile infrastructure access point)
A specific numerical example is presented in Section XX5.3.2.3XX to show a worst-case Ts and how to derive the required infrastructure network requirements. For the assumptions given in that section, these results show that installing infrastructure access points only at dealerships should be sufficient.
In general, for any given value of Ts, Telecordia has algorithms that can determine the required number of infrastructure access points and their locations. These algorithms use, among other techniques, the mathematical models presented in Section 3.
Appendix Volume 3 H-5-39
(Material in Sections 3 and 5 were developed by Telcordia Technologies, Inc. prior to or outside performing activities under CAMP/NHTSA Cooperative Agreement No. DTNH22-05-H-01277. Telcordia has material in Sections 3 and 5 which is the
subject of pending patent applications.)

VSC-A Final Report: Appendix H-5 V2V PKI Security Management – Telcordia Technologies, Inc.
6.2.3 Analysis of Malicious Behavior Detection Interval Th
The malicious behavior detection interval Th depends on the specific method used by vehicles to detect malicious vehicles and the sophistication of the malicious activities. In Sections XX5.3.1.2XX and XX5.3.2.3XX, the malicious behavior detection intervals for the two malicious behavior detection methods proposed in Sections XX5.3.1XX and XX5.3.2XX are analyzed. It was found that the Th for both these two methods can be expressed as a polynomial number of V2V message exchanges within a limited and relatively small region.
The following important observations are important:
Recall that the main goal of estimating Th is to help estimate the sustainable interval Ts. An important observation is that lower bounds can be estimated on the sustainable interval Ts having to know the value of Th. Examples of such estimates is given in Sections XX5.3.1XX and XX5.3.2XX for the malicious behavior detection methods described in these same sections. For example, Section XX5.3.2XX shows how to compute the sustainable interval Ts and the worst-case infrastructure network requirements under the assumption that no malicious vehicles can be detected and evicted within the sustainable interval Ts.
Th is typically in polynomial in the number of V2V message exchanges within a limited and relatively small region, and is typically significantly smaller than the achievable sustainable interval for the two proposed malicious behavior detection methods. Therefore, Th may be ignored when estimating the Sustainable Interval.
6.2.4 Estimate CRL Distribution Delay Td
One method for keeping the number of malicious vehicles below the critical mass is timely distribution of CRLs. The delay and overhead associated with CRL distribution using V2V communication is discussed below and shows that it is generally significantly smaller than the achievable sustainable interval Ts.
V2V dissemination of a CRL starting with a single vehicle is as fast as a single V2V message dissemination round, requiring a number of V2V message exchanges that is polynomial in the number of resident vehicles . It is not assumed that all vehicles can be reached in a single hop. The same polynomial bound in the number of vehicles holds also if the message has to be propagated via point-to-point communication in a neighborhood and also in case of message flooding, in which case it is an overestimate.
Using simulation based on traffic traces, reference XX[13]XX finds that epidemic V2V CRL distribution using only a single Road-side Unit (RSU) for ‘seeding’ of the CRL on vehicles passing through the RSU’s coverage area performs better than CRL distribution using 325 RSUs without epidemic V2V distribution. When only fixed RSUs are used to distribute CRL, only a fraction of the vehicle population is reached. This fraction is determined by the locations of the RSUs. If vehicles do not pass an RSU, they do not obtain the CRL. On the contrary, with V2V CRL distribution, the CRL floods throughout the region. Reference XX[13]XX considers a CRL to be updated if vehicles are within 100 meters of each other for at least the duration of the association time. This can be verified in the traces. The RSUs are placed at the center of the densest areas observed in the trace.
Appendix Volume 3 H-5-40
(Material in Sections 3 and 5 were developed by Telcordia Technologies, Inc. prior to or outside performing activities under CAMP/NHTSA Cooperative Agreement No. DTNH22-05-H-01277. Telcordia has material in Sections 3 and 5 which is the
subject of pending patent applications.)

VSC-A Final Report: Appendix H-5 V2V PKI Security Management – Telcordia Technologies, Inc.
Performance was measured by considering the number of vehicles which were in possession of the CRL at the end of the simulation (76,000s). For the scenario with V2V CRL distribution, association time 2s and 1 RSU, 99 percent of the vehicles had the CRL at the end of the simulation. For the scenario with only RSU-based CRL distribution, 325 RSUs, and association time 0.1s, 91 percent of the vehicles had the CRL at the end of the simulation. It should be noted, that based on the presented figure in XX[13]XX, most vehicles already have the CRL well within 10,000 seconds after first dissemination.
The spread of CRLs via V2V “epidemic” dissemination can be modeled using the analytical framework presented in Section 3. Based on specific communication and mobility models, analytical and numerical results on the speed of the process can be obtained. Such analytical results can complement extensive simulations.
The speed of V2V dissemination of CRLs should be compared to the speed at which malicious vehicles can infect others. The only infection process of comparable speed to flooding of CRLs is V2V spread of a computer virus or worm (which is not yet a viable threat now, but could be in the future XX[15]XX.
Even a single ‘seed’ vehicle per neighborhood can thus have a dramatic effect on the ‘freshness’ of the CRLs in the absence of infrastructure support.
Overhead of the CRL distribution process can be kept low, for example, by only sending updates to CRLs instead of the entire CRL. With the malicious behavior detection methods proposed in this document, vehicles will be able to sustain safe and secure V2V communications without infrastructure network connectivity for long periods of times which will allow the vehicles to wait until their routine visits to the dealerships (or shopping malls) to obtain the CRLs from the CA. This means that the size of the CA could be readily made a non issue, as hotspot networks in these locations can be high speed and the vehicles have ample time to retrieve the CRL while staying in these locations.
6.3 Q&A for Using Sustainable Interval Analysis to Determine Infrastructure Network Requirements
Question 1. How often does the central credential authority need to communicate with an individual vehicle?
Answer. With the proposed malicious detection and vehicle eviction mechanisms, the sustainable interval can potentially be unbounded. The sustainable interval is the time interval during which the vehicles can sustain safe and secure V2V communications without having to communicate with the CA, and hence without using any infrastructure networks. This implies that vehicles can continue safe and secure V2V communication for unbounded time periods without any roadside infrastructure network.
One possible reason for the need of communication between CA and a vehicle is when a vehicle has not been participating in V2V communications for such a long time period that its certificates have all expired. With the proposed malicious behavior detection methods, this may become the case only when the vehicle has been powered off for
Appendix Volume 3 H-5-41
(Material in Sections 3 and 5 were developed by Telcordia Technologies, Inc. prior to or outside performing activities under CAMP/NHTSA Cooperative Agreement No. DTNH22-05-H-01277. Telcordia has material in Sections 3 and 5 which is the
subject of pending patent applications.)

VSC-A Final Report: Appendix H-5 V2V PKI Security Management – Telcordia Technologies, Inc.
months to years because the proposed methods allow the vehicle’s sustainable interval to be at least that long. Therefore, the number of such events is expected to be negligible.
Next the document considers the following events in more detail:
Key Initialization - This can occur during vehicle manufacturing or at the vehicle dealership before vehicles are sold and, therefore, does not require any roadside infrastructure networks.
Replacement of Expired or Revoked Certificates - Given the practically very long sustainable interval, certificate replacement can be performed only when the vehicles visit dealerships for routine maintenance or repair or when vehicles visit selected hotspots such as shopping malls. To support the rare cases where some vehicles need more frequent contact with the CA, the methods discussed in Section XX5.4XX may be used to provide secondary support. These secondary infrastructure communications are expected to be highly infrequent and are typically in intervals comparable to the sustainable interval (e.g., months to years as shown by the sample worst case quantitative analysis results in Section XX5.3.2.3XX).
Distribution of CRL - Similarly, because of the practically very long sustainable interval, CRL distribution can be performed only when the vehicles visit dealerships for routine maintenance or repair or when vehicles visit selected hotspots such as shopping malls. To support the rare cases where additional CRL distribution support is needed, the methods discussed in Section XX5.5XX may be used to provide secondary support. These secondary infrastructure communications are expected to be highly infrequent and typically in intervals comparable to the sustainable interval (e.g., months to years as shown by the sample worst case quantitative analysis results in Section XX5.3.2.3XX).
Upon Detection of Malicious Behavior Event - Given the practically very long sustainable interval, the proposed malicious behavior detection methods can record these events and wait until the vehicles’ routine visits to the dealerships and shopping malls to use the networks there to report the events to the CA.
Question 2. How much data will need to be transported during one of those encounters?
Answer. The most critical factors in this answer are whether to consider the no-privacy solution of Sections XX5.2XX, XX5.3XX, XX5.4XX, XX5.5XX, XX5.6XX, or the privacy-enhanced solution of Section XX5.7XX; what type of infrastructure servers are deployed, and which certificate management operation to consider, which is detailed as follows:
Key initialization: Here the data amount is the same regardless of which infrastructure servers are deployed. Overall, the amount of data is very small in the no-privacy solution (i.e., up to a small constant times the length of a digital signature key (that is, 1024 bits) plus the length of the current CRL (which can be minimized using standard techniques in certificate management)). It is only increased by a relatively small amount in the privacy-enhanced solution (i.e., there are n anonymous symmetric keys (of 128 bits each), where n can be chosen
Appendix Volume 3 H-5-42
(Material in Sections 3 and 5 were developed by Telcordia Technologies, Inc. prior to or outside performing activities under CAMP/NHTSA Cooperative Agreement No. DTNH22-05-H-01277. Telcordia has material in Sections 3 and 5 which is the
subject of pending patent applications.)

VSC-A Final Report: Appendix H-5 V2V PKI Security Management – Telcordia Technologies, Inc.
as a relatively small constant (e.g., 25), and, on average, about O(log (Vn/N)) anonymous symmetric keys (of 128 bits each), where N can be chosen as 5000, and thus log (Vn/N) is about 20).
Renewal of Expired or Revoked Certificates - The amount of data is very small in the no-privacy solution (i.e., up to a small constant times the length of a digital signature key (that is, 1024 bits)). It is only increased by a relatively small amount in the privacy-enhanced solution (i.e., the replacement of one anonymous symmetric key requires the transfer of about O(r+log (Vn/N)) management symmetric keys (of 128 bits each), where r is the number of evicted vehicles that had this anonymous key, which is on average the total number of evicted vehicles divided by N/n).
Distribution of CRL - In the no-privacy solution the amount of data is a small constant times the length of a digital signature key (e.g., 1024 bits) times the number of revoked but not expired keys; this is expected to be small under the reasonable assumption that the number of attacks is small. In the privacy-aware solution, this is increased by an amount proportional to the length of a symmetric key (e.g., 128 bits) times n times the set of evicted vehicles, plus the number of malicious attacks times the length of a symmetric key (e.g., 128 bits).
Upon Detection of Malicious Behavior Event - The amount of data is proportional to the number of framing attackers times a small constant times the length of a digital signature key (e.g., 1024 bits).
Question 3. How often do the individual vehicles need to communicate with the central credential authority?
Answer. Similar to the answer to Question 1, with the malicious detection and vehicle eviction mechanisms, vehicles can potentially sustain safe and secure V2V communications for unbounded time periods without requiring any infrastructure network connectivity. Hence, there will be no need for roadside infrastructure networks.
One possible reason for the need of communication between CA and a vehicle is when a vehicle has not been participating in V2V communications for such a long time period that its certificates have all expired. With the proposed malicious behavior detection methods, this may become the case only when the vehicle has been powered off for months to years because the proposed methods allow the vehicle’s sustainable interval to be at least that long. Therefore, the number of such events is expected to be negligible.
Next the document considers the following events in more detail:
Key Initialization - This can occur during vehicle manufacturing or at vehicle dealerships before vehicles are sold and, therefore, does not require any roadside infrastructure networks.
Replacement of Expired and Revoked Certificates - Given the practically very long sustainable interval, these procedures can be performed only when the vehicles visit dealerships for routine maintenance or repair or when they visit selected hotspots such as shopping malls. To support the rare cases where some
Appendix Volume 3 H-5-43
(Material in Sections 3 and 5 were developed by Telcordia Technologies, Inc. prior to or outside performing activities under CAMP/NHTSA Cooperative Agreement No. DTNH22-05-H-01277. Telcordia has material in Sections 3 and 5 which is the
subject of pending patent applications.)

VSC-A Final Report: Appendix H-5 V2V PKI Security Management – Telcordia Technologies, Inc.
vehicles need more frequent contact with the CA, the methods discussed in Section XX5.4XX may be used to provide secondary support. These secondary infrastructure communications are expected to be highly infrequent, typically in intervals comparable to the sustainable interval (e.g., months to years as shown by the sample worst case quantitative analysis results in Section XX5.3XX).
Distribution of CRL - Similarly, because of the practically very long sustainable interval, this procedure can be performed only when the vehicles visit dealerships for routine maintenance or repair or when they visit selected hotspots such as shopping malls. To support the rare cases where additional CRL distribution support is needed, the methods discussed in Section XX5.5XX may be used to provide secondary support. These secondary infrastructure communications are expected to be highly infrequent, typically in intervals comparable to the sustainable interval (e.g., months to years as shown by the sample worst case quantitative analysis results in Section XX5.3XX).
Upon Detection of Malicious Behavior Event - Similarly as before, given the practically very long sustainable interval, the proposed malicious behavior detection methods can record these events and wait until the vehicles’ routine visits to the dealerships or shopping malls to use the networks there to report the events to the CA.
Question 4. How much data will need to be transported during one of those encounters?
Answer. The most critical factors in this answer are whether to consider the no-privacy solution of Sections XX5.2XX, XX5.3XX XX5.4XX, XX5.5XX, and XX5.6XX, or the privacy-enhanced solution of Section XX5.7XX, what type of infrastructure servers are deployed, and which certificate management operation to consider, which is detailed as follows:
Key Initialization - Here the data amount is that required for a mere request for initialization keys.
Replacement of Expired or Revoked Certificates: In the no-privacy solution, this event happens either via client-server proximity or geographically controlled network flooding. In both cases, the data amount is at most a small constant times the length of the certificate to be renewed, which is, in turn, at most a small constant times the length of a signature key (e.g., 1024 bits). In the privacy-enhanced solution, a nationwide broadcast distribution mechanism would also be competitive in terms of efficiency, in which case the vehicle would not need to send any message to the server at all.
Distribution of CRL - Here the data amount is that required for a mere request for the CRL.
Upon Detection of Malicious Behavior Event - The amount of data is proportional to the number of voters times a small constant times the length of a digital signature key (e.g., 1024 bits). The number of voters is proportional to the number of neighbors, which was computed in Lemma 1.
Appendix Volume 3 H-5-44
(Material in Sections 3 and 5 were developed by Telcordia Technologies, Inc. prior to or outside performing activities under CAMP/NHTSA Cooperative Agreement No. DTNH22-05-H-01277. Telcordia has material in Sections 3 and 5 which is the
subject of pending patent applications.)

VSC-A Final Report: Appendix H-5 V2V PKI Security Management – Telcordia Technologies, Inc.
7 Conclusion
The document has described new certificate management methods including new methods for detecting malicious activities and mitigating their impact for a V2V communications environment. These methods are designed to eliminate or significantly reduce the reliance on roadside infrastructure network connectivity. The document has provided an analytical framework and specific mathematical analysis for quantitatively determining the required level of infrastructure network connectivity, including the required number of infrastructure network nodes, and their locations and density. The preliminary analysis results show that the proposed approaches could completely eliminate the need for roadside infrastructure networks. Deploying infrastructure network access points at a small number of hotspots such as vehicle dealerships (where such infrastructure network connectivity will typically be needed for initializing the security materials on the new vehicles) or shopping malls will be sufficient to support the operations of the proposed methods.
8 References
[1] HHhttp://hraunfoss.fcc.gov/edocs_public/attachmatch/DA-01-699A1.pdf?date=010316
[2] HHhttp://investor.sirius.com/releasedetail.cfm?ReleaseID=407919
[3] HHhttp://www.informit.com/articles/article.aspx?p=23761
[4] Telcordia, VII Vehicle Segment Certificate Management Concept of Operations, Jan 2007.
[5] Telcordia, VII Vehicle Segment Certificate Management Scalability Analysis, Jan 2007.
[6] Telcordia, VII Vehicle Segment Threat and Risk Analysis, Jan 2007.
[7] Telcordia, VII Vehicle Communications Intrusion, Malicious Behavior Detection, May 2007
[8] M. Braverman, O. Etesami, E. Mossel, “Mafia: A Theoretical Study of Players and Coalitions in a Partial Information Environment,” Annals of Applied Probability, Vol. 18, No. 3, 2008.
[9] T. Moore, et al. “Fast Exclusion Of Errant Devices From Vehicular Networks,” Proceedings IEEE SECON, San Francisco, CA, June 16-20, 2008.
[10] T. Moore, et al., “Suicide For The Common Good: A New Strategy For Credential Revocation In Self-Organizing Systems,” SIGOPS Per. Syst. Rev. 40 3 (Jul. 2006), pp. 18-21.
[11] M. Raya, et al. “Eviction of Misbehaving and Faulty Nodes in Vehicular Networks,” IEEE JSAC Vol. 25, No. 8, pp. 1557-1568, Oct. 2007.
[12] V. Sood, T. Antal, S. Redner, “Voter Models On Heterogeneous Networks,” Phys. Rev. E, April 2008.
Appendix Volume 3 H-5-45
(Material in Sections 3 and 5 were developed by Telcordia Technologies, Inc. prior to or outside performing activities under CAMP/NHTSA Cooperative Agreement No. DTNH22-05-H-01277. Telcordia has material in Sections 3 and 5 which is the
subject of pending patent applications.)

VSC-A Final Report: Appendix H-5 V2V PKI Security Management – Telcordia Technologies, Inc.
[13] K. P. Laberteaux, J.J. Hass, Y-C. Hu, “Secure Certificate Revocation List Distribution for VANET,” the 5th ACM Internaitonal Workshop on VehiculAr Inter-NETworking.
[14] P. Papadimitratos, G. Mezzour, J-P Hubaux, “Certificate Revocation List Distribution in Vehicular Communication Systems,” Proceedings ACM VANET’08, September 15, 2008, San Francisco, CA.
[15] J. Kleinberg, “The Wireless Epidemic,” Nature No. 449, pp. 287-288.
[16] E. van dan Berg, T. Zhang, S. Pietrowicz, “Blend-In: Privacy-Enhancing Certificate-Selection Method for Vehicular Communications,” IEEE Transactions on Vehicular Technology, 2009.
Appendix Volume 3 H-5-46
(Material in Sections 3 and 5 were developed by Telcordia Technologies, Inc. prior to or outside performing activities under CAMP/NHTSA Cooperative Agreement No. DTNH22-05-H-01277. Telcordia has material in Sections 3 and 5 which is the
subject of pending patent applications.)

DOT HS 811 492DSeptember 2011