Applications of optical spectroscopy and stable isotope analyses to organic aerosol source...
10
Author's personal copy Applications of optical spectroscopy and stable isotope analyses to organic aerosol source discrimination in an urban area N. Mladenov a, * , L. Alados-Arboledas b, c , F.J. Olmo b, c , H. Lyamani b , A. Delgado d , A. Molina c , I. Reche a a Departamento de Ecología, Universidad de Granada, 18071-Granada, Spain b Centro Andaluz de Medio Ambiente-CEAMA, Av. del Mediterráneo s/n, 18006-Granada, Spain c Departamento de Física Aplicada, Universidad de Granada, 18071-Granada, Spain d Instituto Andaluz de Ciencias de la Tierra (CSIC), 18100 Armilla, Granada, Spain article info Article history: Received 8 July 2010 Received in revised form 11 January 2011 Accepted 12 January 2011 Keywords: Fluorescence Absorbance PARAFAC Diesel Sun photometry African dust abstract Understanding the chemical character of organic aerosols is extremely important for evaluating their role in climate forcing and human respiratory health. Aerosol columnar properties retrieved by sun photometry represent a large dataset of information about the physical and light absorbing and scattering properties of the total aerosol, but lack more detailed chemical information about the organic fraction of atmospheric particulate matter. To obtain additional information about relationships between organic aerosol sources and columnar properties, we simultaneously examined stable isotope properties of PM 10 aerosols from urban (Granada, Spain) and remote (Sierra Nevada, Spain) sites and diesel exhaust, spec- troscopic properties of water soluble organic carbon (WSOC) of PM 10 aerosols, and sun photometry measurements. We demonstrated that C and N stable isotopes and parameters from UVevis and fluo- rescence spectroscopy are able to discriminate between aerosols receiving substantial fossil fuel pollution and those influenced by Saharan dust in an urban area. More depleted d 13 C was associated with low asymmetry parameter, g l , and high values of the spectral slope ratio, S R , were associated with high effective radius, typical of pollution situations. The humification index (HIX), used predominantly to evaluate the degree of organic matter humification, was significantly related to g l and the radius of fine mode particles, r f , and may reflect aging of the Saharan dust-influenced aerosols. Parallel factor analysis (PARAFAC) modeling identified a fluorescent component (C3) with a spectrum similar to that of naph- thalene, which was significantly related to g l and r f . The diesel exhaust sample represented a pollution end-member, with the lightest d 13 C value (26.4&), lowest S R (0.95), lowest HIX (2.77) and highest %C3 (20%) of all samples. Ó 2011 Elsevier Ltd. All rights reserved. 1. Introduction There is substantial interest in tracking organic aerosols and understanding their chemical quality due to their effects on visibility, human respiratory health, and climate change (Jacobson et al., 2000). The organic chemicals in diesel exhaust include quinones, nitro- aromatic hydrocarbons, aldehydes, aliphatic hydrocarbons, and polyaromatic hydrocarbons (PAHs), such as naphthalene (Baeza- Squiban et al., 1999). Soluble diesel exhaust particles have been shown to induce inflammation in bronchial epithelial cells (Baeza- Squiban et al., 1999), which can lead to numerous respiratory conditions. In particular, redox active quinones have been implicated in the production of reactive oxygen species that produce oxidative stress and damage to airway epithelial cells (Baeza-Squiban et al., 1999; Cho et al., 2004). Saharan- and north African-derived dust aerosols are responsible for more than half of the world’s aerosol load (Washington et al., 2003; Schütz et al., 1981), depositing between 6 and 16 g m 2 yr 1 at a high elevation site in southern Spain (Morales-Baquero et al., 2006; Mladenov et al., 2009) and equally large amounts in Italy (Perrino et al., 2009) and elsewhere in the Mediterranean region. Estimates of organic carbon in Saharan dust include 10% (Maria et al., 2004) and 15% (Mladenov et al., 2010) and Saharan dust is an important source of organic matter for remote areas of southern Spain (Mladenov et al., 2008, 2009, 2010). Saharan dust outbreaks have been linked to human health and mortality in Spain (Perez et al., 2008). Given the recent rise in dust outbreaks and expectations that frequency, intensity, and distribution of these events will continue to increase (Prospero and Lamb, 2003), it is extremely important * Corresponding author. Present address: INSTAAR, 450 UCB, University of Colorado, Boulder, CO 80309-0450, USA. Tel.: þ1 720 233 2007; fax: þ1 303 492 6388. E-mail address: [email protected] (N. Mladenov). Contents lists available at ScienceDirect Atmospheric Environment journal homepage: www.elsevier.com/locate/atmosenv 1352-2310/$ e see front matter Ó 2011 Elsevier Ltd. All rights reserved. doi:10.1016/j.atmosenv.2011.01.029 Atmospheric Environment 45 (2011) 1960e1969
Transcript of Applications of optical spectroscopy and stable isotope analyses to organic aerosol source...

Author's personal copy
Applications of optical spectroscopy and stable isotope analysesto organic aerosol source discrimination in an urban area
N. Mladenov a,*, L. Alados-Arboledas b,c, F.J. Olmo b,c, H. Lyamani b, A. Delgado d, A. Molina c, I. Reche a
aDepartamento de Ecología, Universidad de Granada, 18071-Granada, SpainbCentro Andaluz de Medio Ambiente-CEAMA, Av. del Mediterráneo s/n, 18006-Granada, SpaincDepartamento de Física Aplicada, Universidad de Granada, 18071-Granada, Spaind Instituto Andaluz de Ciencias de la Tierra (CSIC), 18100 Armilla, Granada, Spain
a r t i c l e i n f o
Article history:Received 8 July 2010Received in revised form11 January 2011Accepted 12 January 2011
Keywords:FluorescenceAbsorbancePARAFACDieselSun photometryAfrican dust
a b s t r a c t
Understanding the chemical character of organic aerosols is extremely important for evaluating their rolein climate forcing and human respiratory health. Aerosol columnar properties retrieved by sunphotometry represent a large dataset of information about the physical and light absorbing and scatteringproperties of the total aerosol, but lack more detailed chemical information about the organic fraction ofatmospheric particulate matter. To obtain additional information about relationships between organicaerosol sources and columnar properties, we simultaneously examined stable isotope properties of PM10
aerosols from urban (Granada, Spain) and remote (Sierra Nevada, Spain) sites and diesel exhaust, spec-troscopic properties of water soluble organic carbon (WSOC) of PM10 aerosols, and sun photometrymeasurements. We demonstrated that C and N stable isotopes and parameters from UVevis and fluo-rescence spectroscopy are able to discriminate between aerosols receiving substantial fossil fuel pollutionand those influenced by Saharan dust in an urban area. More depleted d13C was associated with lowasymmetry parameter, gl, and high values of the spectral slope ratio, SR, were associated with higheffective radius, typical of pollution situations. The humification index (HIX), used predominantly toevaluate the degree of organic matter humification, was significantly related to gl and the radius of finemode particles, rf, and may reflect aging of the Saharan dust-influenced aerosols. Parallel factor analysis(PARAFAC) modeling identified a fluorescent component (C3) with a spectrum similar to that of naph-thalene, which was significantly related to gl and rf. The diesel exhaust sample represented a pollutionend-member, with the lightest d13C value (�26.4&), lowest SR (0.95), lowest HIX (2.77) and highest %C3(20%) of all samples.
� 2011 Elsevier Ltd. All rights reserved.
1. Introduction
There is substantial interest in tracking organic aerosols andunderstanding their chemical quality due to their effects onvisibility,humanrespiratoryhealth, andclimate change (Jacobsonet al., 2000).The organic chemicals in diesel exhaust include quinones, nitro-aromatic hydrocarbons, aldehydes, aliphatic hydrocarbons, andpolyaromatic hydrocarbons (PAHs), such as naphthalene (Baeza-Squiban et al., 1999). Soluble diesel exhaust particles have beenshown to induce inflammation in bronchial epithelial cells (Baeza-Squiban et al., 1999), which can lead to numerous respiratoryconditions. Inparticular, redox active quinones have been implicated
in the production of reactive oxygen species that produce oxidativestress and damage to airway epithelial cells (Baeza-Squiban et al.,1999; Cho et al., 2004).
Saharan- and north African-derived dust aerosols are responsiblefor more than half of the world’s aerosol load (Washington et al.,2003; Schütz et al., 1981), depositing between 6 and 16 g m�2 yr�1
at a high elevation site in southern Spain (Morales-Baquero et al.,2006; Mladenov et al., 2009) and equally large amounts in Italy(Perrino et al., 2009) and elsewhere in the Mediterranean region.Estimates of organic carbon in Saharan dust include 10% (Maria et al.,2004) and 15% (Mladenov et al., 2010) and Saharan dust is animportant source of organic matter for remote areas of southernSpain (Mladenov et al., 2008, 2009, 2010). Saharan dust outbreakshavebeen linked to humanhealth andmortality in Spain (Perez et al.,2008). Given the recent rise in dust outbreaks and expectations thatfrequency, intensity, and distribution of these events will continueto increase (Prospero and Lamb, 2003), it is extremely important
* Correspondingauthor. Present address: INSTAAR, 450UCB,Universityof Colorado,Boulder, CO 80309-0450, USA. Tel.: þ1 720 233 2007; fax: þ1 303 492 6388.
E-mail address: [email protected] (N. Mladenov).
Contents lists available at ScienceDirect
Atmospheric Environment
journal homepage: www.elsevier .com/locate/atmosenv
1352-2310/$ e see front matter � 2011 Elsevier Ltd. All rights reserved.doi:10.1016/j.atmosenv.2011.01.029
Atmospheric Environment 45 (2011) 1960e1969
Author's personal copy
to understand the chemical character of desert dust aerosols andbe able to differentiate them from urban pollution aerosols.
Recently, optical spectroscopic techniques have been used totrack organic aerosol deposition to lakes (Mladenov et al., 2009)and provide information about the chemical character of watersoluble organic carbon (WSOC) in organic aerosols (Mladenov et al.,2010; Duarte et al., 2004, 2005) and wet deposition (Mladenovet al., 2010; Muller et al., 2008; Kieber et al., 2006). In particular,the use of UVevisible (UVevis) absorbance and fluorescencetechniques provides a vast amount of information about theprovenance of bulk organic material that is not hindered by thesample volume, processing, and time requirements of moredetailed chemical procedures, such as gas chromatography andliquid chromatography mass spectroscopy. UVevis absorptionprovides important information about the presence of chromo-phoric compounds (Andreae and Gelencser, 2006; Sun et al., 2007;Morris et al., 1995) and aromatic structures (Weishaar et al., 2003).Some fulvic and humic-like substances (HULIS) and other lightabsorbing organic compounds, known collectively as brown carbon(Cbrown) (Andreae and Gelencser, 2006), also emit fluorescencewhen excited by UV and visible light. Fluorescence spectroscopyprovides information about organic matter sources and trans-formations, and its use to characterize WSOC (Duarte et al., 2005)and monitor aerosols in situ (Pinnick et al., 2004) is increasing.Parallel factor analysis (PARAFAC) modeling has recently been usedin the study of aquatic organic matter to quantify dominant fluo-rescent components (Stedmon et al., 2003), but it has not yet beenapplied in the study of WSOC fluorescence. Stable isotopes of C andN also have been used extensively for DOM source characterization,and their use in aerosol characterization is on the rise (Widory,2007; Schefub et al., 2003; Cachier, 1989).
Recent work has shown that the spectroscopic properties oforganic aerosol deposition at a high mountain site were consistentwith columnar properties of the total aerosol, such as aerosoloptical depth and volume concentration of coarse particles(Mladenov et al., 2010). Three-dimensional fluorescence spectra ofWSOC in Saharan-derived aerosol deposition collected at the sameremote site were also found to be distinct from those of marine-derived aerosol WSOC (Mladenov et al., 2009). In contrast, little isknown about the spectroscopic or stable isotopic signatures oforganic aerosols in urban areas that are subject to both Saharandust deposition and fossil fuel emissions.
Our goals in this study were: 1) to evaluate whether spectro-scopic and stable isotopic signatures and commonly used absor-bance and fluorescence indices supported the characterization ofPM10 urban aerosols by ground based remote sensing, and 2) toidentify distinguishing features of Saharan dust- and pollution-derived aerosols using optical spectroscopic and stable isotopictechniques.
2. Abbreviated methods
2.1. PM10 aerosol sampling and analyses
PM10 aerosol samples were collected from a rooftop monitoringstation at the Andalucian Environmental Center in Granada(CEAMA), Spain weekly (one 24 h sampling per week) during thesummer of 2008 and on two dates (48 h sampling each) at theremote observatory at the Sierra Nevada monitoring station.Samples were collected on pre-combusted quartz and glass fiberfilters by means of a high volume PM10 sampler MCV PM1025(model CAV-A/MS) operated at an average flow rate of 30 m3 h�1.Because of the importance of particulate emissions from mobilesources, such as diesel exhaust, for air pollution in European cities,we also sampled PM10 aerosols of diesel exhaust from a light-duty
diesel truck run simultaneously in an enclosure with the PM1025sampler. Potential sampling artefacts due to adsorption or volatil-ization of carbonaceous species during aerosol sampling should beaddressed when considering the WSOC air concentration andWSOC spectroscopic character in an urban setting (Viana et al.,2006; Jacobson et al., 2000). To evaluate potential adsorptionartefacts under ambient conditions, we deployed a “control” filterin an inoperative PM1025 sampler positioned alongside the CEAMAPM1025 sampler.
2.1.1. Total carbon, total organic carbon, and total nitrogen contentTotal carbon (TC) content and total nitrogen (TN) content of a 1/8
portion of each CEAMA filter, a 1/16 portion of each diesel experi-ment filter, and a 1/4 portion of each Sierra Nevada filter weremeasured using a Carlo Elba NC1500 elemental analyzer on linewith a Delta Plus XL mass spectrometer (EA-IRMS). The organiccarbon (OC) content was measured after samples were exposed toconcentrate HCl to eliminate carbonates. Due to potential incom-plete removal of elemental carbon (EC), the OC measurements forthe urban samples of this study, where EC is expected to be high,may be biased toward higher values.
2.1.2. Stable isotopes analyses of PM10 filtersAnalyses of nitrogen and carbon isotopic composition were
performed using a Carlo Elba NC1500 elemental analyzer on linewith a Delta Plus XL mass spectrometer (EA-IRMS) with internalstandards for carbon and nitrogen. The stable isotope compositionis reported as d values per mil: d ¼ (Rsample/Rstandard e 1) *1000where R ¼ 13C/12C for d13C values and R ¼ 15N/14N for d15N .
2.2. Water soluble organic compound analyses
2.2.1. WSOC extractionWater soluble organic compoundswere extracted from the PM10
filters by agitating filter portions with purified water. To comparethe influence of extraction methods on fluorescence properties,samples from the diesel exhaust experiments were extracted induplicate via two commonly used methods, 1) mechanical shakingfor 20 min and 2) sonication for 20 min in an ice bath.
2.2.2. DOC concentrationDOC concentrations were measured on acidified (with HCl)
aqueous WSOC extracts from portions of each Granada, SierraNevada, and diesel experiment filters (Supplementary Materials).DOC concentration was measured in duplicate with a ShimadzuTOC-V CSH total organic carbon analyzer. WSOC air concentrationwas determined by multiplying DOC concentration by the extrac-tion volume and normalizing to the volume of aerosol representedby each filter portion.
2.2.3. UVevis absorbance measurementsUVevis absorbance scans were measured in duplicate using
a Perkin Elmer Lambda 40 spectrophotometer. After blanksubtraction, absorbance at 250 nm and 320 nm was expressed asthe Naperian absorption coefficient (a250 and a320) corrected for thevolume of air filtered and the volume of extractant used. The molarabsorption coefficient (e) (m2 mol�1) was calculated by dividing theabsorption coefficient at wavelengths of interest by the DOCconcentration in mmol L�1. The spectral slope from 275 to 295 nmand slope ratio (SR) were calculated according to Helms et al.(2008).
2.2.4. Fluorescence spectral acquisitionExcitation emission matrices (EEMs) are a 3-dimensional
representation of fluorescence intensities scanned over a range of
N. Mladenov et al. / Atmospheric Environment 45 (2011) 1960e1969 1961

Author's personal copy
excitation:emission (ex/em) wavelengths. EEMs were measuredusing a JY-Horiba Spex Fluoromax-4 spectrophotometer. Instru-ment-specific corrections, Raman normalization, inner-filtercorrection, and blank subtraction were performed (SupplementaryMaterials). The EEM of the filtrate extracted from the blank filterwas subtracted from each sample EEM. The fluorescence index (FI)and humification index (HIX) were calculated according to Coryand McKnight (2005) and Zsolnay et al. (1998), respectively.
2.2.5. PARAFAC modelingEEMs of the Granada WSOC were modeled with PARAFAC
according to Stedmon and Bro (2008) using the DOMFluor toolbox.Diesel experiment samples were subsequently fit to the PARAFACmodel with residual EEM intensities representing <10% ofmeasured EEM intensities. The fluorescence intensity was calcu-lated on a molar basis for each component (fC1, fC2, and fC3)(Mladenov et al., 2009) and the percentage of total DOM fluores-cence was also calculated for each component.
2.3. Ground-based remote sensing parameters
Measurements for atmospheric columnar characterization ofthe aerosol load were obtained using a Cimel CE-318 sun-photometer mounted on the roof of the CEAMA building, near thePM10 collector, and instrument-specific settings are described indetail in Holben et al. (1998) and Lyamani et al. (2006a,b).
Direct irradiance measurements at 340, 380, 440, 670, 870, 940,and 1020 nm were used to compute the aerosol optical depth, dAl,(dimensionless), at eachwavelength except for the 940 nm channel,which is used to retrieve total columnwater vapour. For the retrievalof dAl we first removed cloud-contaminated measurements(Smirnov et al., 2000). The dAl is derived from the total optical depthobtained from direct sun-photometermeasurements data using theappropriate calibration constant and subtracting the Rayleighoptical depth as well as the O3 and NO2 absorption optical depths(Alados-Arboledas et al., 2003; Lyamani et al., 2005, 2006b).For ozone content we used values measured by the Ozone Moni-toring Instrument (OMI) (http://toms.gsfc.nasa.gov/ozone/ozone_v8.html). The NO2 column contents were obtained from midlati-tude model atmospheres in the LOWTRAN7code (Kneizys et al.,1988). A ratio of dA440:dA1020 was developed, and, based on theresults of Lyamani et al. (2006b), this ratio is close to 1.0 for Saharandust-dominated days and >1.0 for high pollution conditions.
The Angström wavelength exponent, a (dimensionless) wascomputed from dAl data assuming themodel proposed byAngström,described in Lyamani et al., (2006b). Large values of a indicate theprevalence of fine particles from urban-industrial and biomassburning sources, while low values of a are related with the presenceof coarse particles, such as desert dust andmarine aerosols (Lyamaniet al., 2006b).
The sky radiance almucantar measurements at 440, 670, 870,and 1020 nm, in conjunction with aerosol optical depth measure-ments at these same wavelengths, were utilized to retrieve theaerosol size distribution (including volume (Vf, Vc) and radii (rf, rc)of fine and coarse mode particles, respectively), the single scat-tering albedo, u0Al, and the asymmetry parameter, gl, based on themethod of Nakajima et al. (1996) using the non-spherical approachproposed by Olmo et al. (2006, 2008). In this method the refractiveindex is invariant with wavelength. These parameters were derivedby iteration, minimizing the residuals between measured andcalculated radiances.
PM10 aerosols were characterized as Saharan-influenced (S) orEuro-dominated (E) based on their columnarproperties and airmassbackward trajectories. Daily backward trajectories (http://www.arl.noaa.gov/ready.html) were computed for Granada, Spain using the
HYSPLIT model (Draxler and Rolph, 2003) with archived data fromthe Global Data Assimilation System (GDAS) dataset and 120 h runtime. Backward trajectories from 500 m above ground level (a.g.l.)were consulted for each day of sampling, and representative trajec-tories are shown for Saharan-influenced and Euro-dominatedperiods (Fig. 1a and b). For the Granada urban setting (Fig. 1b),Mladenov et al. (2010) determined from LIDAR imagery that the highconcentration of Granada urban aerosols masked both the spectro-scopic signatures and columnar properties of marine aerosols. Moredetailed methods are available in the Supplementary Materials thataccompany this paper.
3. Results
3.1. C and N content and stable isotopes of PM10
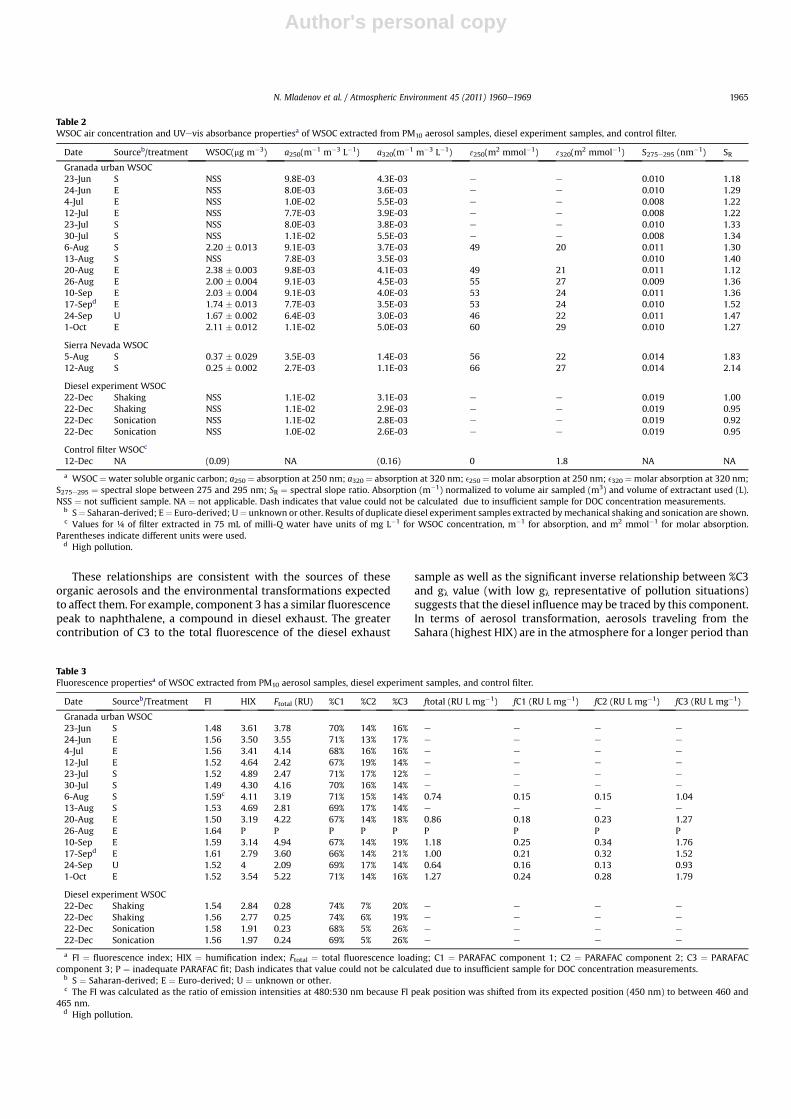
TC air concentrations of urban samples ranged from 2.04 to10.61 mg C m�3. OC concentrations ranged from 1.48 to 2.92 mgCm�3 and represented approximately 52%� 14% of the TC (Table 1).TN concentrations ranged from 0.64 to 1.45 mg N m�3 (Table 1). Forremote samples from the Sierra Nevada, TC, OC, and TN airconcentrations were substantially lower than for urban samples(Table 1).
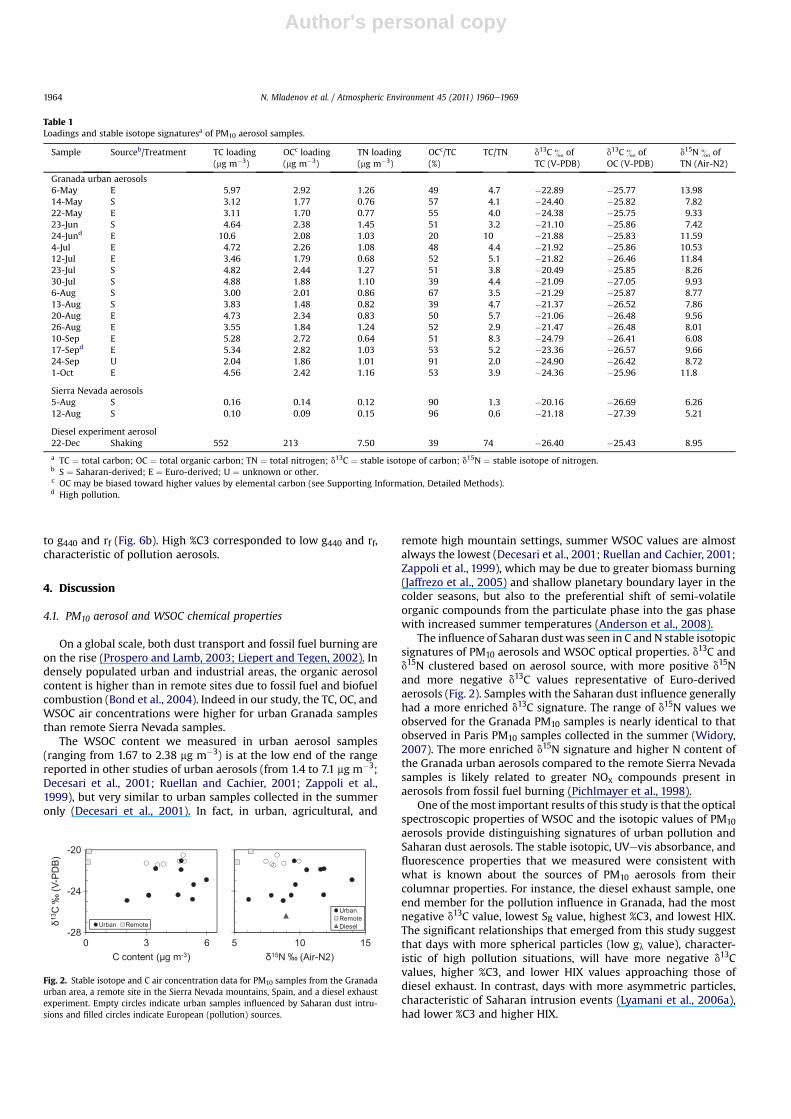
In terms of their d13C and d15N, samples from days with Saharan-influenced air masses plotted close to the remote Sierra Nevadasamples, whereas samples from Euro-dominated days plotted closeto the diesel sample (Fig. 2). In general, Saharan-influenced andEuro-dominated days had similar d13OC values (mean of �26.2&for both) (Table 1). The diesel exhaust sample had the lightest d13Cand d13OC values at �26.4& and �25.4&, respectively, and a d15Nvalue of 8.95&. Saharan-influenced days had substantially lighterd15N values (mean 8.4&) than Euro-dominated days (mean 10.2&)(Table 1).
3.2. WSOC air concentrations and spectroscopic properties
WSOC air concentrations in urban samples ranged from 1.67 to2.38 mg C m�3 and were substantially higher than for remote SierraNevada samples (Table 2). UVevis molar absorption at 250 nm and320 nm in urban samples ranged from 46 to 60 and 20e29 m2
mmol-1, respectively (Table 2). The spectral slope (S275e295) andslope ratio ranged from 0.008 to 0.011 nm-1 and 1.12 to 1.52,respectively. SR values from the diesel experiment were substan-tially lower than urban samples (Table 2). The absorption signatureof the control filter was negligible after blank subtraction (Table 2).
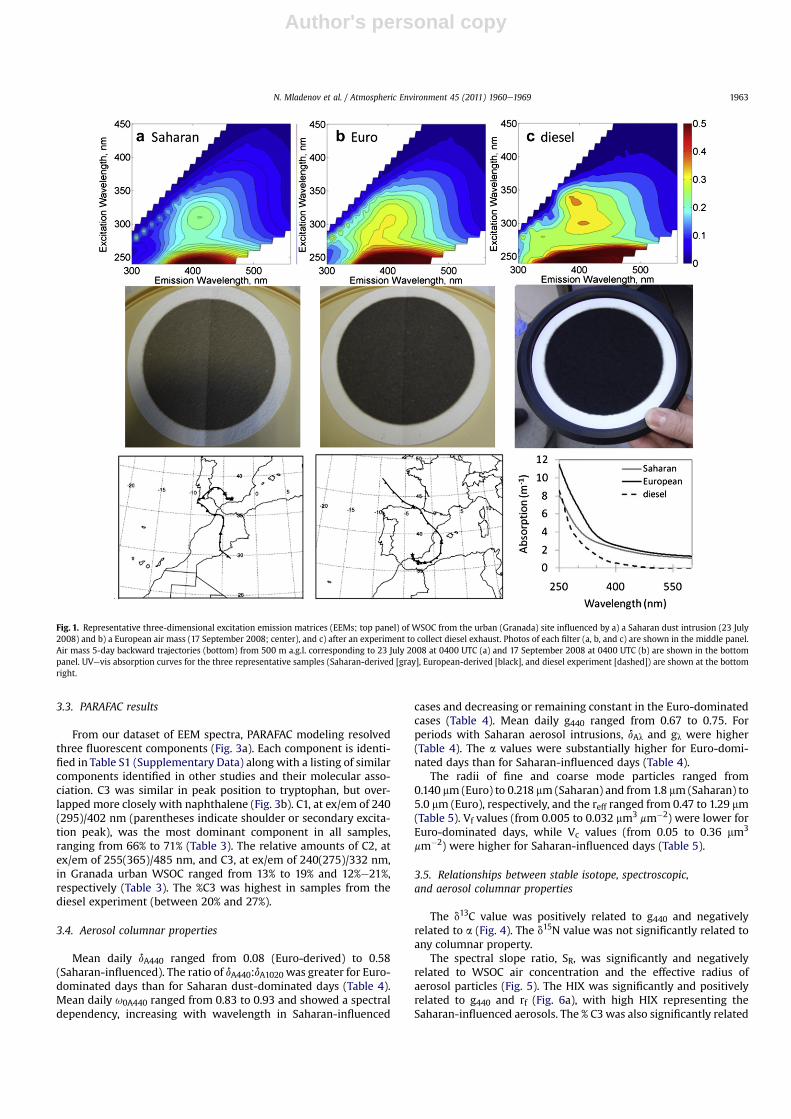
EEM spectra of Saharan-influenced and Euro-dominated WSOC(representative EEMs are shown in Fig. 1a and b) had a broad peakat an excitation of 240 nm that extended from 340 nm to 500 nmemission and another prominent peak extending from 290 to320 nm excitation and 380e420 nm emission. In WSOC samplesfrom Euro-dominated days (Fig. 1b), another peak was also visibleat ex/em of 270/330–350 nm and the peak at 240 nm excitationwasbroadened. The peak at 270 nm excitationwas also present in EEMsof WSOC from the diesel experiment along with a broadened peakat 240 nm excitation and dual peaks at approximately 290 nm and340 nm excitation and 400 nm emission. The FI ranged from 1.48 to1.64 (Table 3). HIX values for Granada urban WSOC ranged from2.79 to 4.89 and, with the exception of the 23 June and 12 July 2008samples, were generally higher in Saharan dust-derived WSOC(Table 3). HIX values for diesel experiment samples were between1.91 and 2.84 depending on the treatment employed (Table 3). Thefluorescence signature of the control filter was negligible afterblank subtraction with no fluorescence intensity exceeding 0.1 RU(Supplementary Materials, Figure S2).
N. Mladenov et al. / Atmospheric Environment 45 (2011) 1960e19691962
Author's personal copy
3.3. PARAFAC results
From our dataset of EEM spectra, PARAFAC modeling resolvedthree fluorescent components (Fig. 3a). Each component is identi-fied in Table S1 (Supplementary Data) along with a listing of similarcomponents identified in other studies and their molecular asso-ciation. C3 was similar in peak position to tryptophan, but over-lapped more closely with naphthalene (Fig. 3b). C1, at ex/em of 240(295)/402 nm (parentheses indicate shoulder or secondary excita-tion peak), was the most dominant component in all samples,ranging from 66% to 71% (Table 3). The relative amounts of C2, atex/em of 255(365)/485 nm, and C3, at ex/em of 240(275)/332 nm,in Granada urban WSOC ranged from 13% to 19% and 12%e21%,respectively (Table 3). The %C3 was highest in samples from thediesel experiment (between 20% and 27%).
3.4. Aerosol columnar properties
Mean daily dA440 ranged from 0.08 (Euro-derived) to 0.58(Saharan-influenced). The ratio of dA440:dA1020 was greater for Euro-dominated days than for Saharan dust-dominated days (Table 4).Mean daily u0A440 ranged from 0.83 to 0.93 and showed a spectraldependency, increasing with wavelength in Saharan-influenced
cases and decreasing or remaining constant in the Euro-dominatedcases (Table 4). Mean daily g440 ranged from 0.67 to 0.75. Forperiods with Saharan aerosol intrusions, dAl and gl were higher(Table 4). The a values were substantially higher for Euro-domi-nated days than for Saharan-influenced days (Table 4).
The radii of fine and coarse mode particles ranged from0.140 mm (Euro) to 0.218 mm (Saharan) and from 1.8 mm (Saharan) to5.0 mm (Euro), respectively, and the reff ranged from 0.47 to 1.29 mm(Table 5). Vf values (from 0.005 to 0.032 mm3 mm�2) were lower forEuro-dominated days, while Vc values (from 0.05 to 0.36 mm3
mm�2) were higher for Saharan-influenced days (Table 5).
3.5. Relationships between stable isotope, spectroscopic,and aerosol columnar properties
The d13C value was positively related to g440 and negativelyrelated to a (Fig. 4). The d15N value was not significantly related toany columnar property.
The spectral slope ratio, SR, was significantly and negativelyrelated to WSOC air concentration and the effective radius ofaerosol particles (Fig. 5). The HIX was significantly and positivelyrelated to g440 and rf (Fig. 6a), with high HIX representing theSaharan-influenced aerosols. The % C3was also significantly related
Fig. 1. Representative three-dimensional excitation emission matrices (EEMs; top panel) of WSOC from the urban (Granada) site influenced by a) a Saharan dust intrusion (23 July2008) and b) a European air mass (17 September 2008; center), and c) after an experiment to collect diesel exhaust. Photos of each filter (a, b, and c) are shown in the middle panel.Air mass 5-day backward trajectories (bottom) from 500 m a.g.l. corresponding to 23 July 2008 at 0400 UTC (a) and 17 September 2008 at 0400 UTC (b) are shown in the bottompanel. UVevis absorption curves for the three representative samples (Saharan-derived [gray], European-derived [black], and diesel experiment [dashed]) are shown at the bottomright.
N. Mladenov et al. / Atmospheric Environment 45 (2011) 1960e1969 1963
Author's personal copy
to g440 and rf (Fig. 6b). High %C3 corresponded to low g440 and rf,characteristic of pollution aerosols.
4. Discussion
4.1. PM10 aerosol and WSOC chemical properties
On a global scale, both dust transport and fossil fuel burning areon the rise (Prospero and Lamb, 2003; Liepert and Tegen, 2002). Indensely populated urban and industrial areas, the organic aerosolcontent is higher than in remote sites due to fossil fuel and biofuelcombustion (Bond et al., 2004). Indeed in our study, the TC, OC, andWSOC air concentrations were higher for urban Granada samplesthan remote Sierra Nevada samples.
The WSOC content we measured in urban aerosol samples(ranging from 1.67 to 2.38 mg m�3) is at the low end of the rangereported in other studies of urban aerosols (from 1.4 to 7.1 mg m�3;Decesari et al., 2001; Ruellan and Cachier, 2001; Zappoli et al.,1999), but very similar to urban samples collected in the summeronly (Decesari et al., 2001). In fact, in urban, agricultural, and
remote high mountain settings, summer WSOC values are almostalways the lowest (Decesari et al., 2001; Ruellan and Cachier, 2001;Zappoli et al., 1999), which may be due to greater biomass burning(Jaffrezo et al., 2005) and shallow planetary boundary layer in thecolder seasons, but also to the preferential shift of semi-volatileorganic compounds from the particulate phase into the gas phasewith increased summer temperatures (Anderson et al., 2008).
The influence of Saharan dust was seen in C and N stable isotopicsignatures of PM10 aerosols and WSOC optical properties. d13C andd15N clustered based on aerosol source, with more positive d15Nand more negative d13C values representative of Euro-derivedaerosols (Fig. 2). Samples with the Saharan dust influence generallyhad a more enriched d13C signature. The range of d15N values weobserved for the Granada PM10 samples is nearly identical to thatobserved in Paris PM10 samples collected in the summer (Widory,2007). The more enriched d15N signature and higher N content ofthe Granada urban aerosols compared to the remote Sierra Nevadasamples is likely related to greater NOx compounds present inaerosols from fossil fuel burning (Pichlmayer et al., 1998).
One of themost important results of this study is that the opticalspectroscopic properties of WSOC and the isotopic values of PM10aerosols provide distinguishing signatures of urban pollution andSaharan dust aerosols. The stable isotopic, UVevis absorbance, andfluorescence properties that we measured were consistent withwhat is known about the sources of PM10 aerosols from theircolumnar properties. For instance, the diesel exhaust sample, oneend member for the pollution influence in Granada, had the mostnegative d13C value, lowest SR value, highest %C3, and lowest HIX.The significant relationships that emerged from this study suggestthat days with more spherical particles (low gl value), character-istic of high pollution situations, will have more negative d13Cvalues, higher %C3, and lower HIX values approaching those ofdiesel exhaust. In contrast, days with more asymmetric particles,characteristic of Saharan intrusion events (Lyamani et al., 2006a),had lower %C3 and higher HIX.
Table 1Loadings and stable isotope signaturesa of PM10 aerosol samples.
Sample Sourceb/Treatment TC loading(mg m�3)
OCc loading(mg m�3)
TN loading(mg m�3)
OCc/TC(%)
TC/TN d13C & ofTC (V-PDB)
d13C & ofOC (V-PDB)
d15N & ofTN (Air-N2)
Granada urban aerosols6-May E 5.97 2.92 1.26 49 4.7 �22.89 �25.77 13.9814-May S 3.12 1.77 0.76 57 4.1 �24.40 �25.82 7.8222-May E 3.11 1.70 0.77 55 4.0 �24.38 �25.75 9.3323-Jun S 4.64 2.38 1.45 51 3.2 �21.10 �25.86 7.4224-Jund E 10.6 2.08 1.03 20 10 �21.88 �25.83 11.594-Jul E 4.72 2.26 1.08 48 4.4 �21.92 �25.86 10.5312-Jul E 3.46 1.79 0.68 52 5.1 �21.82 �26.46 11.8423-Jul S 4.82 2.44 1.27 51 3.8 �20.49 �25.85 8.2630-Jul S 4.88 1.88 1.10 39 4.4 �21.09 �27.05 9.936-Aug S 3.00 2.01 0.86 67 3.5 �21.29 �25.87 8.7713-Aug S 3.83 1.48 0.82 39 4.7 �21.37 �26.52 7.8620-Aug E 4.73 2.34 0.83 50 5.7 �21.06 �26.48 9.5626-Aug E 3.55 1.84 1.24 52 2.9 �21.47 �26.48 8.0110-Sep E 5.28 2.72 0.64 51 8.3 �24.79 �26.41 6.0817-Sepd E 5.34 2.82 1.03 53 5.2 �23.36 �26.57 9.6624-Sep U 2.04 1.86 1.01 91 2.0 �24.90 �26.42 8.721-Oct E 4.56 2.42 1.16 53 3.9 �24.36 �25.96 11.8
Sierra Nevada aerosols5-Aug S 0.16 0.14 0.12 90 1.3 �20.16 �26.69 6.2612-Aug S 0.10 0.09 0.15 96 0.6 �21.18 �27.39 5.21
Diesel experiment aerosol22-Dec Shaking 552 213 7.50 39 74 �26.40 �25.43 8.95
a TC ¼ total carbon; OC ¼ total organic carbon; TN ¼ total nitrogen; d13C ¼ stable isotope of carbon; d15N ¼ stable isotope of nitrogen.b S ¼ Saharan-derived; E ¼ Euro-derived; U ¼ unknown or other.c OC may be biased toward higher values by elemental carbon (see Supporting Information, Detailed Methods).d High pollution.
5 10 15
δ13C
‰ (V
-PD
B)
δ15N ‰ (Air-N2)
UrbanRemoteDiesel
-28
-24
-20
0 3 6
δ13C
‰ (V
-PD
B)
C content (μg m-3)
Urban Remote
Fig. 2. Stable isotope and C air concentration data for PM10 samples from the Granadaurban area, a remote site in the Sierra Nevada mountains, Spain, and a diesel exhaustexperiment. Empty circles indicate urban samples influenced by Saharan dust intru-sions and filled circles indicate European (pollution) sources.
N. Mladenov et al. / Atmospheric Environment 45 (2011) 1960e19691964
Author's personal copy
These relationships are consistent with the sources of theseorganic aerosols and the environmental transformations expectedto affect them. For example, component 3 has a similar fluorescencepeak to naphthalene, a compound in diesel exhaust. The greatercontribution of C3 to the total fluorescence of the diesel exhaust
sample as well as the significant inverse relationship between %C3and gl value (with low gl representative of pollution situations)suggests that the diesel influencemay be traced by this component.In terms of aerosol transformation, aerosols traveling from theSahara (highest HIX) are in the atmosphere for a longer period than
Table 3Fluorescence propertiesa of WSOC extracted from PM10 aerosol samples, diesel experiment samples, and control filter.
Date Sourceb/Treatment FI HIX Ftotal (RU) %C1 %C2 %C3 ftotal (RU L mg�1) fC1 (RU L mg�1) fC2 (RU L mg�1) fC3 (RU L mg�1)
Granada urban WSOC23-Jun S 1.48 3.61 3.78 70% 14% 16% e e e e
24-Jun E 1.56 3.50 3.55 71% 13% 17% e e e e
4-Jul E 1.56 3.41 4.14 68% 16% 16% e e e e
12-Jul E 1.52 4.64 2.42 67% 19% 14% e e e e
23-Jul S 1.52 4.89 2.47 71% 17% 12% e e e e
30-Jul S 1.49 4.30 4.16 70% 16% 14% e e e e
6-Aug S 1.59c 4.11 3.19 71% 15% 14% 0.74 0.15 0.15 1.0413-Aug S 1.53 4.69 2.81 69% 17% 14% e e e e
20-Aug E 1.50 3.19 4.22 67% 14% 18% 0.86 0.18 0.23 1.2726-Aug E 1.64 P P P P P P P P P10-Sep E 1.59 3.14 4.94 67% 14% 19% 1.18 0.25 0.34 1.7617-Sepd E 1.61 2.79 3.60 66% 14% 21% 1.00 0.21 0.32 1.5224-Sep U 1.52 4 2.09 69% 17% 14% 0.64 0.16 0.13 0.931-Oct E 1.52 3.54 5.22 71% 14% 16% 1.27 0.24 0.28 1.79
Diesel experiment WSOC22-Dec Shaking 1.54 2.84 0.28 74% 7% 20% e e e e
22-Dec Shaking 1.56 2.77 0.25 74% 6% 19% e e e e
22-Dec Sonication 1.58 1.91 0.23 68% 5% 26% e e e e
22-Dec Sonication 1.56 1.97 0.24 69% 5% 26% e e e e
a FI ¼ fluorescence index; HIX ¼ humification index; Ftotal ¼ total fluorescence loading; C1 ¼ PARAFAC component 1; C2 ¼ PARAFAC component 2; C3 ¼ PARAFACcomponent 3; P ¼ inadequate PARAFAC fit; Dash indicates that value could not be calculated due to insufficient sample for DOC concentration measurements.
b S ¼ Saharan-derived; E ¼ Euro-derived; U ¼ unknown or other.c The FI was calculated as the ratio of emission intensities at 480:530 nm because FI peak position was shifted from its expected position (450 nm) to between 460 and
465 nm.d High pollution.
Table 2WSOC air concentration and UVevis absorbance propertiesa of WSOC extracted from PM10 aerosol samples, diesel experiment samples, and control filter.
Date Sourceb/treatment WSOC(mg m�3) a250(m�1 m�3 L�1) a320(m�1 m�3 L�1) 3250(m2 mmol�1) 3320(m2 mmol�1) S275e295 (nm�1) SR
Granada urban WSOC23-Jun S NSS 9.8E-03 4.3E-03 e e 0.010 1.1824-Jun E NSS 8.0E-03 3.6E-03 e e 0.010 1.294-Jul E NSS 1.0E-02 5.5E-03 e e 0.008 1.2212-Jul E NSS 7.7E-03 3.9E-03 e e 0.008 1.2223-Jul S NSS 8.0E-03 3.8E-03 e e 0.010 1.3330-Jul S NSS 1.1E-02 5.5E-03 e e 0.008 1.346-Aug S 2.20 � 0.013 9.1E-03 3.7E-03 49 20 0.011 1.3013-Aug S NSS 7.8E-03 3.5E-03 0.010 1.4020-Aug E 2.38 � 0.003 9.8E-03 4.1E-03 49 21 0.011 1.1226-Aug E 2.00 � 0.004 9.1E-03 4.5E-03 55 27 0.009 1.3610-Sep E 2.03 � 0.004 9.1E-03 4.0E-03 53 24 0.011 1.3617-Sepd E 1.74 � 0.013 7.7E-03 3.5E-03 53 24 0.010 1.5224-Sep U 1.67 � 0.002 6.4E-03 3.0E-03 46 22 0.011 1.471-Oct E 2.11 � 0.012 1.1E-02 5.0E-03 60 29 0.010 1.27
Sierra Nevada WSOC5-Aug S 0.37 � 0.029 3.5E-03 1.4E-03 56 22 0.014 1.8312-Aug S 0.25 � 0.002 2.7E-03 1.1E-03 66 27 0.014 2.14
Diesel experiment WSOC22-Dec Shaking NSS 1.1E-02 3.1E-03 e e 0.019 1.0022-Dec Shaking NSS 1.1E-02 2.9E-03 e e 0.019 0.9522-Dec Sonication NSS 1.1E-02 2.8E-03 e e 0.019 0.9222-Dec Sonication NSS 1.0E-02 2.6E-03 e e 0.019 0.95
Control filter WSOCc
12-Dec NA (0.09) NA (0.16) 0 1.8 NA NA
a WSOC ¼water soluble organic carbon; a250 ¼ absorption at 250 nm; a320 ¼ absorption at 320 nm; e250 ¼molar absorption at 250 nm; e320 ¼molar absorption at 320 nm;S275e295 ¼ spectral slope between 275 and 295 nm; SR ¼ spectral slope ratio. Absorption (m�1) normalized to volume air sampled (m3) and volume of extractant used (L).NSS ¼ not sufficient sample. NA ¼ not applicable. Dash indicates that value could not be calculated due to insufficient sample for DOC concentration measurements.
b S¼ Saharan-derived; E¼ Euro-derived; U¼ unknown or other. Results of duplicate diesel experiment samples extracted bymechanical shaking and sonication are shown.c Values for ¼ of filter extracted in 75 mL of milli-Q water have units of mg L�1 for WSOC concentration, m�1 for absorption, and m2 mmol�1 for molar absorption.
Parentheses indicate different units were used.d High pollution.
N. Mladenov et al. / Atmospheric Environment 45 (2011) 1960e1969 1965

Author's personal copy
the Euro-derived aerosols (intermediate HIX) or diesel exhaust(lowest HIX) and are expected to undergo intense photoreactionsand chemical transformations (eg. Aymoz et al., 2004; Rudich et al.,2007), which result in aging of the organic aerosol and potentiallyhigher C:H ratios (Heald et al., 2010). A higher HIX value, whichreflects a shift of the fluorescence spectra toward longer emissionwavelengths, is indicative of more condensed molecules and anincrease in C:H ratios (Zsolnay, 2003). Although the HIX has beenapplied primarily in the study of soil and aquatic organic matter,the underlying chemical changes (increase in the C:H ratio) areconsistent with aging of aerosols.
Significant negative relationships between SR and WSOC airconcentration and reff (Fig. 5) may provide further insights into thesize of Euro-derived aerosol particles compared to Saharan-influ-enced aerosols. In aquatic environments, shifts in the SR reflectchanges in the ratio of low molecular weight (LMW):high molec-ular weight (HMW) compounds and changes due to photo-bleaching of dissolved organic matter (Helms et al., 2008). Thecombination of low SR and higher effective radius (Fig. 5), which isgenerally more the case for urban aerosols than Saharan dustaerosols, may suggest that the optically-active WSOC in urban airmasses comprise more HMW compounds or have received lesslight-exposure than the Saharan-influenced samples.
As the major contributor to urban aerosol fluorescence, repre-senting >70% of the total fluorescence in all urban samples, theprovenance of humic-like components C1 and C2 is also important.In studies conducted in redox-sensitive environments, a quinone-like component was identified that is similar to C1 (Fellman et al.,2009; Cory and McKnight, 2005). Component 2 (C2) has beenidentified as a terrestrial humic or fulvic acid-like component(Table 3). Quinones aremajor contributors to humic and fulvic acidswith observed fluorescence at higher emission wavelengths (Coryand McKnight, 2005). Some quinones, such as hydroxyquinone,are known reactive oxygen species and are associated with asthmaand respiratory illness (Cho et al., 2004) and quinones are formedby PAH photodegradation (Vione et al., 2006). The potential
Table 4Columnar propertiesa (daily mean value with standard deviation) for select dates in summer 2008 at Granada, Spain.
Date Sourceb dAl dA440:1020 u0Al gl a
1020 870 670 440 1020 870 670 440 1020 870 670 440
23-Jun S 0.45 0.48 0.51 0.58 1.28 0.94 0.94 0.93 0.91 0.70 0.71 0.72 0.73 0.28�0.07 �0.07 �0.06 �0.04 �0.03 �0.03 �0.03 �0.04 �0.04 �0.04 �0.04 �0.02 �0.06
24-Jun E 0.05 0.06 0.07 0.11 2.22 0.86 0.86 0.87 0.89 0.65 0.64 0.65 0.70 0.93�0.01 �0.01 �0.01 �0.03 �0.04 �0.04 �0.03 �0.02 �0.02 �0.02 �0.02 �0.01 �0.16
4-Jul E 0.09 0.10 0.10 0.13 1.46 0.85 0.84 0.83 0.83 0.70 0.69 0.70 0.72 0.58�0.04 �0.05 �0.05 �0.06 �0.04 �0.04 �0.04 �0.03 �0.03 �0.02 �0.02 �0.02 �0.19
12-Jul E 0.04 0.05 0.05 0.08 1.77 0.85 0.85 0.85 0.87 0.67 0.66 0.68 0.72 0.81�0.001 �0.01 �0.003 �0.01 �0.02 �0.02 �0.01 �0.01 �0.01 �0.01 �0.01 �0.01 �0.16
23-Jul S 0.25 0.28 0.28 0.31 1.21 0.92 0.91 0.90 0.87 0.72 0.72 0.73 0.75 0.25�0.05 �0.05 �0.05 �0.06 �0.05 �0.05 �0.05 �0.06 �0.04 �0.04 �0.04 �0.03 �0.32
30-Jul S 0.20 0.22 0.23 0.27 1.31 0.92 0.91 0.89 0.88 0.70 0.70 0.71 0.73 0.35�0.04 �0.05 �0.04 �0.05 �0.02 �0.02 �0.03 �0.03 �0.03 �0.03 �0.03 �0.02 �0.61
6-Aug S 0.15 0.17 0.16 0.20 1.34 0.89 0.88 0.86 0.85 0.70 0.70 0.71 0.73 0.36�0.04 �0.03 �0.04 �0.05 �0.03 �0.03 �0.03 �0.03 �0.02 �0.02 �0.02 �0.02 �0.05
13-Aug S 0.18 0.19 0.20 0.24 1.33 0.92 0.91 0.89 0.88 0.69 0.69 0.70 0.72 0.38�0.04 �0.05 �0.05 �0.06 �0.03 �0.03 �0.03 �0.03 �0.02 �0.02 �0.02 �0.01 �0.07
20-Aug E 0.05 0.06 0.06 0.10 2.00 0.83 0.83 0.84 0.87 0.68 0.67 0.67 0.70 0.93�0.02 �0.02 �0.02 �0.03 �0.02 �0.02 �0.02 �0.02 �0.02 �0.02 �0.02 �0.02 �0.19
26-Aug E 0.09 0.10 0.11 0.19 2.19 0.88 0.87 0.88 0.90 0.65 0.64 0.64 0.67 1.05�0.02 �0.02 �0.02 �0.04 �0.05 �0.05 �0.04 �0.03 �0.03 �0.03 �0.03 �0.01 �0.010
17-Sepc E 0.11 0.13 0.15 0.25 2.26 0.92 0.91 0.92 0.93 0.65 0.65 0.66 0.69 0.851-Oct E 0.07 0.09 0.12 0.24 3.38 0.88 0.89 0.91 0.93 0.58 0.59 0.63 0.70 1.19
a dAl ¼ aerosol optical depth (dimensionless) at 440, 670, 870 and 1020 nm; u0Al ¼ single scattering albedo (dimensionless); gl ¼ asymmetry parameter (dimensionless);a ¼ Angström wavelength exponent (dimensionless). Dash indicates no data were recorded on that day.
b S ¼ Saharan-derived; E ¼ Euro-derived; U ¼ unknown or other.c High pollution.
0
0.3
0.6
240 340 440 540C1
Load
ing
(RU
)
Wavelength (nm)
ExEm
0
0.3
0.6
240 340 440 540
Wavelength (nm)
0
0.3
0.6
240 340 440 540C3
Load
ing
(RU
)C
2 Lo
adin
g (R
U)
Wavelength (nm)
0
0.3
0.6
240 340 440 540Fluo
resc
Inte
nsity
(A
U)
Wavelength (nm)
Napth EmNapth ExTrp EmTrp Ex
a
b
Fig. 3. (a) The spectral loading (RU) of three components validated by the PARAFACmodel and (b) the fluorescence intensities (arbitrary units (AU)) of Napthalene (Napth)dissolved in cyclohexane and Tryptophan (Trp) dissolved in water (source: Du et al.,1998).
N. Mladenov et al. / Atmospheric Environment 45 (2011) 1960e19691966

Author's personal copy
contribution of quinone compounds to aerosol fluorescence,therefore, is an important area of future research with implicationsfor human respiratory health.
4.2. Methodological considerations for organicaerosol characterization
Our results identified important methodological considerationsregarding sampling, sample extraction, and fluorescence interpre-tation. First, the results from our control filter indicated thatexposure to ambient air did not result in additional adsorption offluorescent organic substances (Supplementary Data, Section 2).The main bias in this study is with respect to the OC air concen-trations for the urban samples, which may be biased toward highervalues due to potential incomplete removal of EC during samplepreparation (Supplementary Materials).
In terms of WSOC extraction, shaking and sonication extractionmethods did influence fluorescence properties. The HIX wassubstantially lower and the amount of C3 increased when sonica-tion was used compared to shaking. The total fluorescence loading(Ftotal) was nearly the same in shaking and sonication extractions(Table 3), suggesting that the same amount of fluorescent materialwas liberated by bothmethods. In other words, sonication probablydid not mobilize additional material, but may have instead trans-formed the organic material. We would not expect mechanicalshaking to alter the chemical composition of dissolved organicmatter, but sonication has been shown to induce destruction ofintact macromolecules (Stemmer et al., 1998), and this largerparticle breakdownwould be consistent with the lower HIX (fewercondensed molecules) observed in sonicated samples. Thesedifferences between mechanical shaking and sonication areimportant considerations for studies using fluorescence to char-acterize WSOC.
In our study, PARAFAC modeling identified three componentspreviously reported in the literature (Supplementary Data, Table S1).It has been recognized that these components represent the domi-nant fluorescing moieties in dissolved organic matter and that
Fig. 4. Relationships between the stable C isotope signature and asymmetry parameterat 440 nm (g440) and Angstrom exponent (a) recorded on the same dates. Onlysignificant relationships are shown. *p < 0.05.
Fig. 5. Relationships between the spectral slope ratio (SR) and WSOC air concentrationand effective radius (reff) measured on the same dates. Only significant relationshipsare shown. **p < 0.01; *p < 0.05.
Table 5Columnar propertiesa (daily mean value with standard deviation) for select dates insummer 2008 at Granada, Spain.
Date Sourceb rf(mm)
rc(mm)
reff(mm)
Vf
(mm3 mm�2)Vc
(mm3 mm�2)Vf:Vc
23-Jun S 0.214 1.91 0.93 0.032 0.36 0.09�0.078 �0.37 �0.23 �0.011 �0.09 �0.030
24-Jun E 0.168 3.73 0.93 0.008 0.05 0.18�0.012 �1.66 �0.50 �0.002 �0.02 �0.10
4-Jul E 0.166 3.58 1.29 0.008 0.09 0.09�0.016 1.79 �0.69 �0.004 �0.01 �0.05
12-Jul E 0.184 4.21 1.23 0.005 0.05 0.10�0.010 �0.59 �0.23 �0.0003 �0.01 �0.02
23-Jul S 0.218 1.88 0.93 0.017 0.18 0.09�0.027 �0.30 �0.14 �0.004 �0.05 �0.02
30-Jul S 0.174 1.92 0.84 0.015 0.16 0.10�0.016 �0.43 �0.10 �0.004 �0.05 �0.02
6-Aug S 0.206 2.67 1.10 0.010 0.12 0.09�0.024 �0.83 �0.30 �0.003 �0.04 �0.03
13-Aug S 0.185 1.82 0.85 0.013 0.13 0.10�0.015 �0.32 �0.10 �0.003 �0.04 �0.02
20-Aug E 0.149 4.96 1.24 0.007 0.08 0.09�0.012 �0.40 �0.20 �0.002 �0.04 �0.03
26-Aug E 0.140 3.86 0.75 0.015 0.10 0.18�0.011 �1.24 �0.26 �0.003 �0.05 �0.09
17-Sepc E 0.154 3.09 0.54 0.022 0.09 0.251-Oct E 0.176 4.06 0.47 0.022 0.05 0.46
a rf ¼ radius of fine mode particles; rc ¼ radius of coarse mode particles;reff ¼ effective radius; Vf ¼ volume concentration of fine mode particles;Vc ¼ volume concentration of coarse mode particles; Vf:Vc ¼ ratio of volumeconcentration of fine to coarsemode particles. Dash indicates no data were recordedon that day.
b S ¼ Saharan-derived; E ¼ Euro-derived; U ¼ unknown or other.c High pollution days.
Fig. 6. Relationships between WSOC fluorescence properties, a) humification indexand asymmetry parameter (g440), radius of fine mode particles (rf), and b) % Compo-nent 3 (%C3) and g440 and rf. Only significant relationships are shown. **p < 0.01;*p < 0.05.
N. Mladenov et al. / Atmospheric Environment 45 (2011) 1960e1969 1967

Author's personal copy
additional components would be resolved in a larger dataset(Holbrook et al., 2006). Component 3 (C3) has a fluorescence spec-trum (peak ex/em of 275/332 nm; Fig. 3a) very similar to diesel fuel(ex/em of 270/334 nm) (Courvoisier et al., 2006) and extracts ofnaphthalene (ex/em of 275/334 nm) and tryptophan (ex/em of 275/340nm) (Duet al.,1998). In the diesel experiment, C3 is related to theorganic compounds released from diesel combustion and not toaromatic amino acids. This demonstrates that cautionmust be takenwhen interpreting the nature of compounds from fluorescencepeaks. For example, in the study of Nakajima et al. (2008), a fluo-rescent peak at a similar location, at ex/emof 260e290/305e345 nmand present only in winter aerosol samples, was attributed to fluo-rescence from tyrosine and tryptophan, but our study suggests thata winter-time fossil fuel burning fluorescence signal may also beconsidered.
In situ fluorescence monitoring (Pinnick et al., 2004; Pan et al.,2009) has great potential for source apportionment of organicaerosols, and its use for measurements of biological aerosols hasalready been established at remote sites. The amount of C3 may bea useful metric for monitoring diesel pollution. However, given thesimilarities between the fluorescence spectra of diesel exhaust andtryptophan, associated with biological aerosols (Pan et al., 2009),multiple fluorescence wavelengths may need to be monitored todistinguish sources. Also, time resolved fluorescence can providea fourth dimension for organic matter source discrimination.
5. Conclusions
To our knowledge, this is the first study to relate columnarproperties of urban aerosols with WSOC spectroscopic propertiesand the first to quantitatively characterize three-dimensionalfluorescent components of urban aerosol WSOC with PARAFAC. Wefound several significant relationships between WSOC spectro-scopic properties and columnar properties related to size (rf) andshape (gl), which suggest that the water soluble organic fractionhas some bearing on the physical properties of the total aerosol. Wealso found that UVevis and fluorescence spectroscopy and stableisotope signatures of C and N were able to differentiate organicaerosols from Saharan origin and urban air pollution in an urbansetting. In particular, the following key findings provide importantinformation for the characterization of organic aerosols in urbanenvironments:
1) Greater fluorescence in the region of C3 reflected increaseddiesel pollution and this component could potentially be usedto track the urban pollution signal,
2) The humification index may be an indication of aerosol aging,particularly in Saharan-influenced urban air,
3) Low SR values may reflect higher molecular weight compoundsin Euro-derived than Saharan-influenced aerosols
The use of UVevis absorbance and fluorescence spectroscopyfor WSOC characterization is on the rise. Our study suggests thatthe use of these fairly low-cost, rapid techniques to discriminateorganic aerosol sources is especially valuable for urban centers thatare subject to substantial diesel and other fossil fuel pollution orreceive dust deposition, such as those in the Mediterranean region,where Saharan dust intrusion events are frequent and widespread.Columnar aerosol properties already distinguish the physicalcharacteristics of major aerosol sources, based on aerosol scatteringand absorption. These data are available at very frequent time steps(minutes or hours). Fluorescence spectroscopy, on the other hand,takes longer (although much less time than GCeMS analyses, forexample) and, at least at present, requires a water extraction, butoffers more detailed information about the light absorbing organic
matter in aerosols. This study has shown that fluorescence spec-troscopy supports columnar information from sun photometry andprovides chemical information that is consistent with organicaerosol sources and transformations. These findings are extremelyimportant in regards to 1) potentially augmenting the vast datasetof global columnar measurements, 2) developing new instrumentsfor in situ monitoring of organic aerosols, and 3) improving ourunderstanding of the chemical character and optical properties oforganic aerosols.
Acknowledgments
We would like to thank R. D. McGrath for DOC concentrationanalyses and S. Kim for editing assistance. The authors gratefullyacknowledge the National Oceanic and Atmospheric Administra-tion (NOAA) Air Resources Laboratory (ARL) for use of the HYbridSingle-Particle Lagrangian Integrated Trajectory (HYSPLIT) modeland Real-time Environmental Applications and Display sYstem(READY) website and the National Aeronotics and Space Adminis-tration (NASA) OMI for ozone measurements. Funding wasprovided by BBVA through the ECOSENSOR project, the AndalusianRegional Government through project P08-RNM-3568, the SpanishMinistry of Science and Technology through project CGL2010-18782, and the Spanish Ministry of the Environment through theMICROBIOGEOGRAPHY (080/2007) project, and the University ofColorado provided support through the Undergraduate ResearchOpportunities Program.
Appendix. Supplementary material
Supplementary material associated with this paper can befound, in the online version, at doi:10.1016/j.atmosenv.2011.01.029.
References
Alados-Arboledas, L., Lyamani, H., Olmo, F.J., 2003. Aerosol size properties atArmilla, Granada (Spain). Q. J. Roy. Meteor. Soc. 129 (590), 1395e1413.
Anderson, C., Dibb, J.E., Griffin, R.J., Bergin, M.H., 2008. Simultaneous measurementsof particulate and gas-phase water-soluble organic carbon concentrations atremote and urban-influenced locations. Geophys. Res. Lett. 35, L13706.doi:10.1029/2008GL033966.
Andreae, M.O., Gelencser, A., 2006. Black carbon or brown carbon? The nature oflight-absorbing carbonaceous aerosols. Atmos. Chem. Phys. 6, 3131e3148.
Aymoz, G., Jaffrezo, J.L., Jacob, V., Colomb, A., George, C., 2004. Evolution of organicand inorganic components of aerosol during a Saharan dust episode observedin the French Alps. Atmos. Chem.Phys. 4, 2499e2512.
Baeza-Squiban, A., Boland, S., Fournier, T., 1999. Diesel exhaust particles are takenup by human airway epithelial cells in vitro and alter cytokine expression. Am.J. Phys. 276, L604eL613.
Bond, T.C., Klimont, Z., Nelson, S.M., Streets, D.G., Woo, J., Yarber, K.F., 2004.A technology-based global inventory of black and organic carbon emissionsfrom combustion. J. Geophys. Res. 109, D14203. doi:10.1029/2003JD003697.
Cachier, H., 1989. Isotopic characterization of carbonaceous aerosols. Aerosol. Sci.Technol. 10, 379e385.
Cho, A.K., Stefano, E.D., You, Y., Rodriguez, C.E., Schmitz, D.A., Kumagai, Y.,Miguel, A.H., Eiguren-Fernandez, A., Kobayashi, T., Avol, E., Froines, J.R., 2004.Determination of four quinones in diesel exhaust particles, SRM 1649a, andatmospheric PM2.5. Aerosol. Sci. Technol. 38 (S1), 68e81.
Cory, R.M., McKnight, D.M., 2005. Fluorescence spectroscopy reveals ubiquitouspresence of oxidized and reduced quinones in dissolved organic matter.Environ. Sci. Technol. 39, 8142e8149.
Courvoisier, F., Boutou, V., Guyon, L., Roth, M., Rabitz, H., Wolf, J., 2006. Discrimi-nating bacteria from other atmospheric particles using femtosecond moleculardynamics. J. Photochem. Photobiol. A: Chem. 180, 300e306.
Decesari, S., Facchini, M.C., Matta, E., Lettin, F., Mircea, M., Fuzzi, S., Tagliavini, E.,Putaud, J.P., 2001. Chemical features and seasonal variation of fine aerosolwater-soluble organic compounds in the Po Valley, Italy. Atmos. Environ. 35,3691e3699.
Draxler, R.R., Rolph, G.D., 2003. HYSPLIT (HYbrid Single-Particle Lagrangian Inte-grated Trajectory) Model Access via NOAA ARL READY Website (). NOAA AirResources Laboratory, Silver Spring, MD. http://www.arl.noaa.gov/ready/hysplit4.html.
N. Mladenov et al. / Atmospheric Environment 45 (2011) 1960e19691968
Author's personal copy
Du, H., Fuh, R.A., Li, J., Corkan, A., Lindsey, J.S., 1998. PhotochemCAD: a computer-aided design and research tool in photochemistry. Photochemistry and Photo-biology 68, 141e142.
Duarte, R.M.B.O., Pio, C.A., Duarte, A.C., 2004. Synchronous scan and excitation-emission matrix fluorescence spectroscopy of water-soluble organiccompounds in atmospheric aerosols. J. Atmos. Chem. 48, 157e171.
Duarte, R.M.B.O., Pio, C.A., Duarte, A.C., 2005. Spectroscopic study of the water-soluble organic matter isolated from atmospheric aerosols collected underdifferent atmospheric conditions. Anal. Chim. Acta. 530, 7e14.
Fellman, J.B., Miller, M.P., Cory, R.M., D’Amore, D.V., White, D., 2009. Characterizingdissolved organic matter using PARAFAC modeling of fluorescence spectros-copy: a comparison of two Models. Environ. Sci. Technol. 43, 6228e6234.
Heald, C.L., Kroll, J.L., Jimenez, J.L., Docherty, K.S., DeCarlo, P.F., Aiken, A.C., Chen, Q.,Martin, S.T., Farmer, D.K., Artaxo, P., 2010. A simplified description of theevolution of organic aerosol composition in the atmosphere. Geophys. Res. Lett.37, L08803. doi:10.1029/2010GL042737.
Helms, J.R., Stubbins, A., Ritchie, J.D., Minor, E.C., Kieber, D.J., Mopper, K., 2008.Absorption spectral slopes and slope ratios as indicators of molecular weight,source, and photobleaching of chromophoric dissolved organic matter. Limnol.Oceanogr. 53 (3), 955e969.
Holben, B.N., Eck, T.F., Slutsker, I., Tanre, D., Buis, J.P., Setzer, A., Vermote, E.,Reagan, J.A., Kaufman, Y.J., Nakajima, T., Lavenu, F., Jankowiak, I., Smirnov, A.,1998. Aeronet- a federated instrument network and data archive for aerosolcharacterization. Remote Sensing Environ. 66, 1e19.
Holbrook, D.R., Yen, J.H., Grizzard, T.J., 2006. Characterizing natural organic materialfrom the Occoquan Watershed (Northern Virginia, US) using fluorescencespectroscopy and PARAFAC. Sci. Total. Environ. 361, 249e266.
Jacobson, M.C., Hansson, H.C., Noone, K.J., Charlson, R.J., 2000. Organic atmosphericaerosols: review and state of the science. Rev. Geophys. 38, 267e294.
Jaffrezo, J.L., Aymoz, G., Delaval, C., Cozic, J., 2005. Seasonal variations of the watersoluble organic carbon mass fraction of aerosol in two valleys of the FrenchAlps. Atmos. Chem. Phys. 5, 2809e2821.
Kieber, R.J., Whitehead, R.F., Reid, S.N., Willey, J.D., Seaton, P.J., 2006. Chromophoricdissolved organic matter (CDOM) in rainwater, southeastern North Carolina,USA. J. Atmos. Chem. 54, 21e41.
Kneizys, F.X., Shettle, E.P., Abreu, L.W., Chetwind, J.H., Anderson, G.P., Gallery, W.O.,Selby, J.E.A., Clough, S.A., 1988. Users Guide to LOWTRAN7. EnvironmentResearch Paper 1010. US Air Force Geophysics Laboratory, Bedford, MA.
Liepert, B., Tegen, I., 2002. Multi�Decadal solar radiation trends in the United Statesand Germany and direct tropospheric aerosol forcing 107, D12. doi:10.1029/2001JD000760.
Lyamani, H., Olmo, F.J., Alados-Arboledas, L., 2005. Saharan dust outbreak oversouth-eastern Spain as detected by sun photometer. Atmos. Environ. 39,7276e7284.
Lyamani, H., Olmo, F.J., Alcántara, A., Alados-Arboledas, L., 2006a. Atmosphericaerosols during the 2003 heat wave in southeastern Spain II: microphysicalcolumnar properties and radiative forcing. Atmos. Environ. 40, 6465e6476.
Lyamani, H., Olmo, F.J., Alcántara, A., Alados-Arboledas, L., 2006b. Atmosphericaerosols during the 2003 heat wave in southeastern Spain I: spectral opticaldepth. Atmos. Environ. 40, 6453e6464.
Maria, S.F., Russell, L.M., Gilles, M.K., Myneni, S.C.B., 2004. Organic aerosol growthmechanisms and their climate-forcing implications. Science 306, 1921e1924.doi:10.1126/science.1103491.
Mladenov, N., Pulido-Villena, E., Morales-Baquero, R., Ortega-Retuerta, E.,Sommaruga, R., Reche, I., 2008. Spatio-temporal drivers of dissolved organicmatter in high alpine lakes: the role of Saharan dust inputs and bacterialactivity. J. Geophys. Res. 113, G00D01. doi:10.1029/2008JG000699.
Mladenov, N., López -Ramos, J., McKnight, D.M., Reche, I., 2009. Alpine lake opticalproperties as sentinels of dust deposition and global change. Limnol. Oceanogr.54, 2386e2400.
Mladenov, N., Reche, I., Olmo-Reyes, F.J., Lyamani, H., Alados-Arboledas, L., 2010.Relationships between spectroscopic properties of high-altitude organic aero-sols and Sun photometry from ground-based remote sensing. J. Geophys. Res.115. doi:10.1029/2009JG000991.
Morales-Baquero, R., Pulido-Villena, E., Reche, I., 2006. Atmospheric inputs ofphosphorus and nitrogen to the southwest Mediterranean region: biogeo-chemical responses of high mountain lakes. Limnol. Oceanogr. 51 (2), 830e837.
Morris, D.P., Zagarese, H., Williamson, C.E., Balseiro, E.G., Hargreaves, B.R.,Modenutti, B., Moeller, R., Queimalinos, C., 1995. The attenuation of solar UVradiation in lakes and the role of dissolved organic carbon. Limnol. Oceanogr.40, 1381e1391.
Muller, C.L., Baker, A., Hutchinson, R., Fairchild, I.J., Chris Kidd, C., 2008. Analysis ofrainwater dissolved organic carbon compounds using fluorescence spectro-photometry. Atmos. Environ. 42, 8036e8045.
Nakajima, H., Okada, K., Kuroki, Y., Nakama, Y., Handa, D., Arakaki, T., Tanahara, A.,2008. Photochemical formation of peroxides and fluorescence characteristics ofthe water-soluble fraction of bulk aerosols collected in Okinawa, Japan. Atmos.Environ. 42, 3046e3058.
Nakajima, T., Tonna, G., Rao, R., Boi, P., Kaufamn, Y.J., Holben, B.N., 1996. Use of thebrightness measurements from ground for remote sensing of particulate pol-ydispersions. Appl. Opt. 35, 2672e2686.
Olmo, F.J., Quirantes, A., Alcántara, A., Lyamani, H., Alados-Arboledas, L., 2006.Preliminary results of a non-spherical aerosol method for the retrieval of theatmospheric aerosol optical properties. J. Quant. Spectrosc. Radiat. Transf. 100,305e314.
Olmo, F.J., Quirantes, A., Lara, V., Lyamani,H., Alados-Arboledas, L., 2008.Aerosol opticalproperties assessed by an inversion method using the solar principal plane fornon-spherical particles. J. Quant. Spectrosc. Radiat. Transf. 109, 1504e1516.
Pan, Y., Pinnick, R.G., Hill, S.C., Chang, R.K., 2009. Particle-fluorescence spectrometerfor real-time single-particle measurements of atmospheric organic carbonand biological aerosol. Environ. Sci. Technol. 43 (2), 429e434. doi:10.1021/es801544y.
Perez, L., Tobias, A., Querol, X., Kunzli, N., Pey, J., Alastuey, A., Viana, M., Valero, N.,Gonzalez-Cabree, M., Sunyer, J., 2008. Coarse particles from saharan dust anddaily mortality. Epidemiology 19 (6), 800e807.
Perrino, C., Canepari, S., Catrambone, M., Torre, S.D., Rantica, E., Sargolini, T., 2009.Influence of natural events on the concentration and composition of atmo-spheric particulate matter. Atmos. Environ. 43 (31), 4766e4779.
Pichlmayer, F., Schoner, W., Seibert, P., Stichler, W., Wagenbach, D., 1998. Stableisotope analysis for characterization of pollutants at high elevation alpine sites.Atmos. Environ. 32 (23), 4075e4085.
Pinnick, R.G., Hill, S.C., Pan, Y., Chang, R.K., 2004. Fluorescence spectra of atmo-spheric aerosol at Adelphi, Maryland, USA: measurement and classification ofsingle particles containing organic carbon. Atmos. Environ. 38, 1657e1672.
Prospero, J.M., Lamb, P.J., 2003. African droughts and dust transport to the carib-bean: climate change implications. Science 302, 1024e1027. doi:10.1126/science.1089915.
Rudich, Y., Donahue, N.M., Mentel, T.F., 2007. Aging of organic aerosol: bridging thegap between laboratory and field studies. Annu. Rev. Phys. Chem. 58, 321e352.
Ruellan, S., Cachier, H., 2001. Characterisation of fresh particulate vehicular exhaustsnear a Paris high flow road. Atmos. Environ. 35, 453e468.
Schefub, E., Ratmeyer, V., Stuut, J.W., Jansen, J.H.F., Sinninghe Damst, J.S., 2003.Carbon isotope analyses of n-alkanes in dust from the lower atmosphere overthe central eastern Atlantic. Geochimica et Cosmochimica Acta 60 (10),1757e1767.
Schütz, L., Jaenicke, R., Pietrek, H., 1981. Saharan dust transport over the NorthAtlantic Ocean, desert dust: origin, characteristics, and effects on man. Geol.Soc. America 186, 87e100.
Stedmon, C.A., Markager, S., Bro, R., 2003. Tracing dissolved organic matter inaquatic environments using a new approach to fluorescence spectroscopy. Mar.Chem. 82, 239e254.
Stedmon, C.A., Bro, R., 2008. Characterizing dissolved organic matter fluorescencewith parallel factor analysis: a tutorial. Limnol. Oceanogr. Methods 6, 572e579.
Stemmer, M., Gerzabek, M.H., Kandeler, E., 1998. Organic matter and enzymeactivity in particle-size fractions of soils obtained after low-energy sonication.Soil. Biol. Biochem. 30 (1), 9e17.
Smirnov, A., Holben, B.N., Eck, T.F., Dubovik, O., Slutsker, I., 2000. Cloud-screeningand quality control algorithms for the AERONET database. Remote SensingEnviron. 73 (3), 337e349.
Sun, H., Biedermann, L., Bond, T.C., 2007. The color of brown carbon: a model forultraviolet and visible light absorption by organic carbon aerosol. Geophys. Res.Lett. 34, L17813. doi:10.1029/2007GL029797.
Viana, M., Chi, X., Maenhaut, W., Cafmeyer, J., Querol, X., Alastuey, A., Mikuska, P.,Vecera, Z., 2006. Influence of sampling artefacts onmeasuredPM,OC, andEC levelsin carbonaceous aerosols in an urban area. Aerosol. Sci. Technol., 40,107e40,117.
Vione, D., Maurino, V., Minero, C., Pelizzetti, E., Harrison, M.A.J., Olariuc, R.,Arsene, C., 2006. Photochemical reactions in the tropospheric aqueous phaseand on particulate matter. Chem. Soc. Rev. 35, 441e453. doi:10.1039/b510796m.
Washington, R., Todd, M., Middleton, N.J., Goudie, A.S., 2003. Dust-storm sourceareas determined by the total ozone monitoring spectrometer and surfaceobservations. Ann. Assoc. Am. Geogr. 93 (2), 297e313.
Weishaar, J.L., Aiken, G.R., Bergamaschi, B.A., Fram, M.S., Fujii, R., Mopper, K., 2003.Evaluation of specific ultraviolet absorbance as an indicator of the chemicalcomposition and reactivity of dissolved organic carbon. Environ. Sci. Technol.37, 4702e4708.
Widory, D., 2007. Nitrogen isotopes: tracers of origin and processes affecting PM10in the atmosphere of Paris. Atmos. Environ. 41, 2382e2390.
Zappoli, S., Andracchio, A., Fuzzi, S., Facchini, M.C., Gelencser, A., Kiss, G., Krivacsy, Z.,Molnar, A., Meszaros, E., Hansson, H.C., Rosman, K., Zebuhr, Y., 1999. Inorganic,organic and macromolecular components of fine aerosol in different areas ofEurope in relation to their water solubility. Atmos. Environ. 33, 2733e2743.
Zsolnay, Á., 2003. Dissolved organic matter: artefacts, definitions, and functions.Geoderma 113, 187e209.
Zsolnay, A., Baigar, E., Jimenez, M., Steinweg, B., Saccomandi, F., 1998. Differentiatingwith fluorescence spectroscopy the sources of dissolved organic matter in soilssubjected to drying. Chemosphere 38 (1), 45e50.
N. Mladenov et al. / Atmospheric Environment 45 (2011) 1960e1969 1969