FarmConners Wind Farm Flow Control Benchmark: Blind Test ...
Upload
southwalesCategory
view
0download
0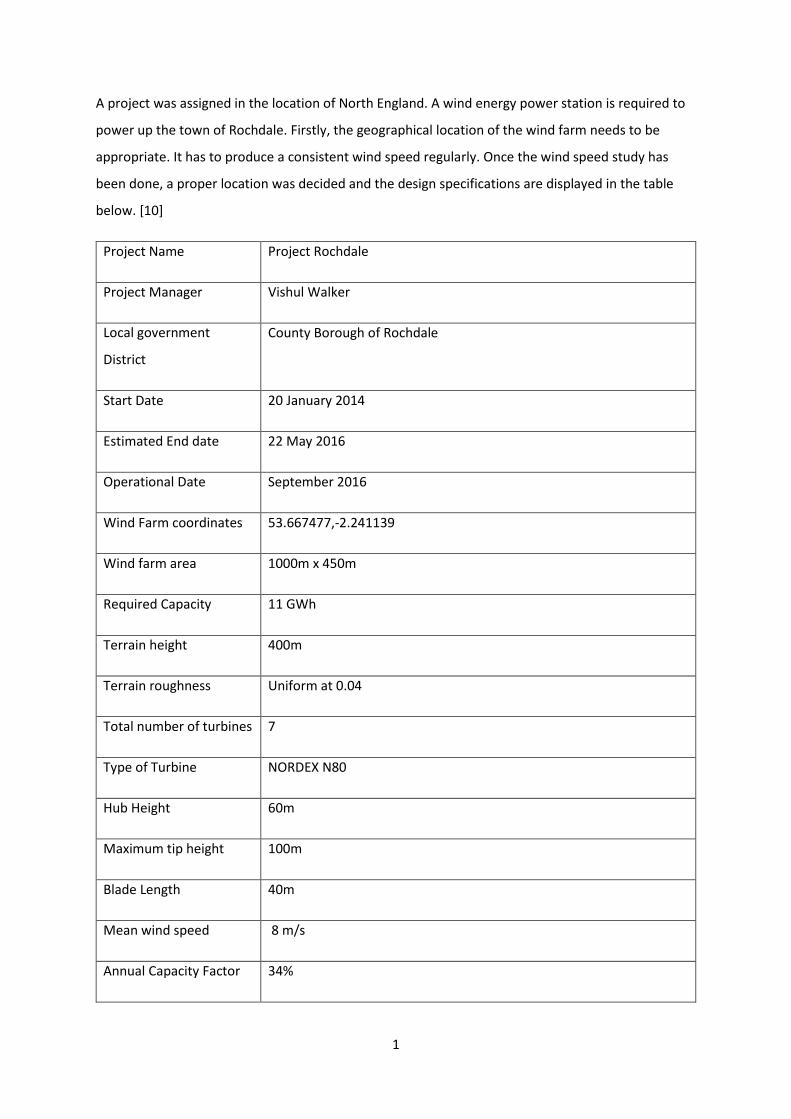
1
A project was assigned in the location of North England. A wind energy power station is required to
power up the town of Rochdale. Firstly, the geographical location of the wind farm needs to be
appropriate. It has to produce a consistent wind speed regularly. Once the wind speed study has
been done, a proper location was decided and the design specifications are displayed in the table
below. [10]
Project Name Project Rochdale
Project Manager Vishul Walker
Local government
District
County Borough of Rochdale
Start Date 20 January 2014
Estimated End date 22 May 2016
Operational Date September 2016
Wind Farm coordinates 53.667477,-2.241139
Wind farm area 1000m x 450m
Required Capacity 11 GWh
Terrain height 400m
Terrain roughness Uniform at 0.04
Total number of turbines 7
Type of Turbine NORDEX N80
Hub Height 60m
Maximum tip height 100m
Blade Length 40m
Mean wind speed 8 m/s
Annual Capacity Factor 34%
2
Site Wind Class 1a
Implement using the simulation package WindFarm/WindFarmer, WindPro or alike
Creating new Project
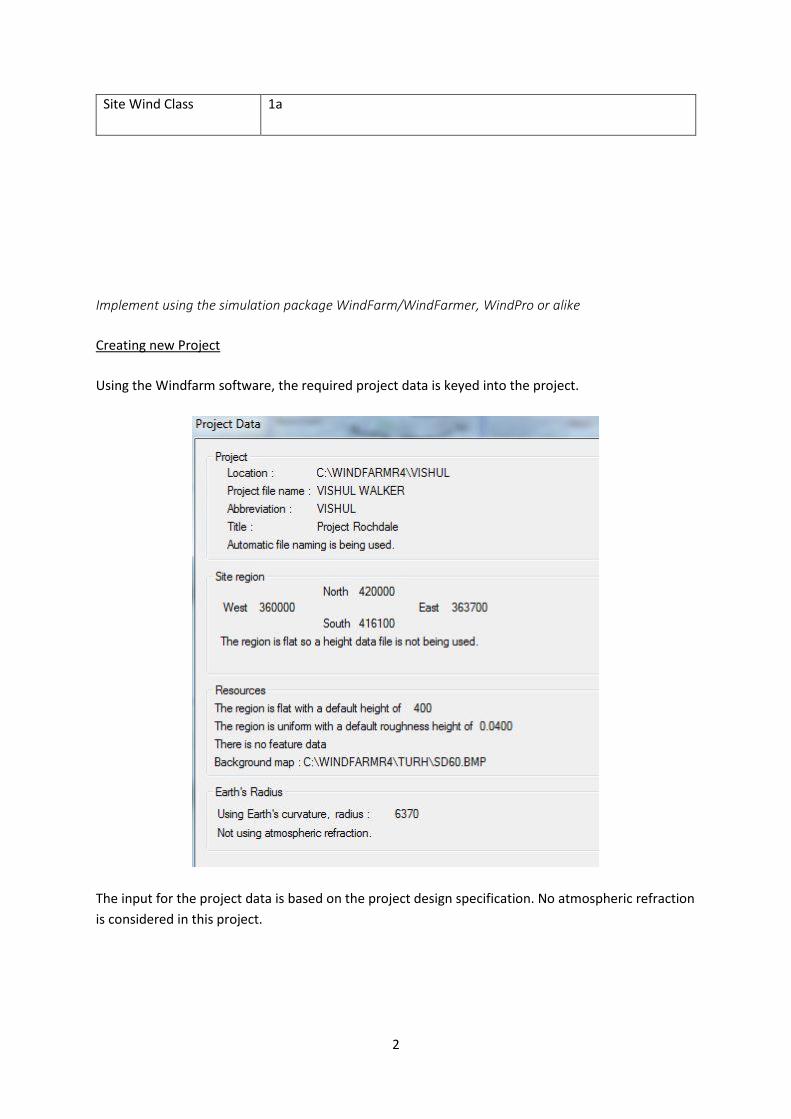
Using the Windfarm software, the required project data is keyed into the project.
The input for the project data is based on the project design specification. No atmospheric refraction
is considered in this project.
3
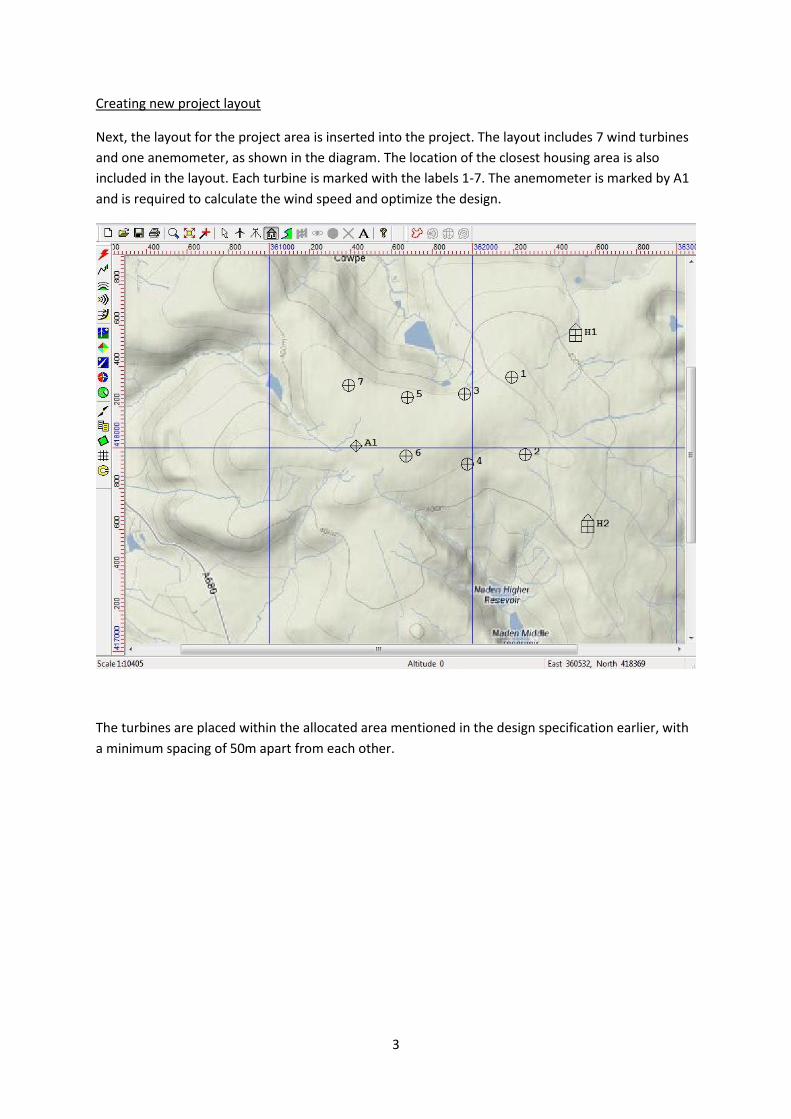
Creating new project layout
Next, the layout for the project area is inserted into the project. The layout includes 7 wind turbines
and one anemometer, as shown in the diagram. The location of the closest housing area is also
included in the layout. Each turbine is marked with the labels 1-7. The anemometer is marked by A1
and is required to calculate the wind speed and optimize the design.
The turbines are placed within the allocated area mentioned in the design specification earlier, with
a minimum spacing of 50m apart from each other.
4
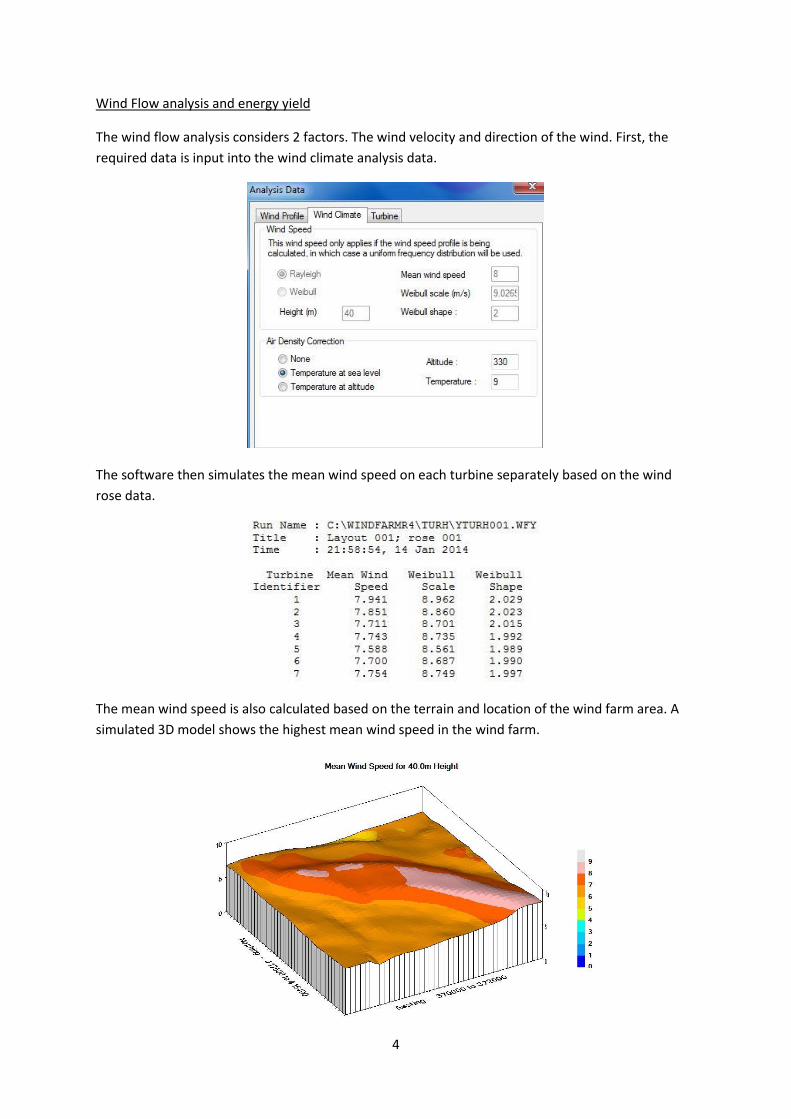
Wind Flow analysis and energy yield
The wind flow analysis considers 2 factors. The wind velocity and direction of the wind. First, the
required data is input into the wind climate analysis data.
The software then simulates the mean wind speed on each turbine separately based on the wind
rose data.
The mean wind speed is also calculated based on the terrain and location of the wind farm area. A
simulated 3D model shows the highest mean wind speed in the wind farm.
5
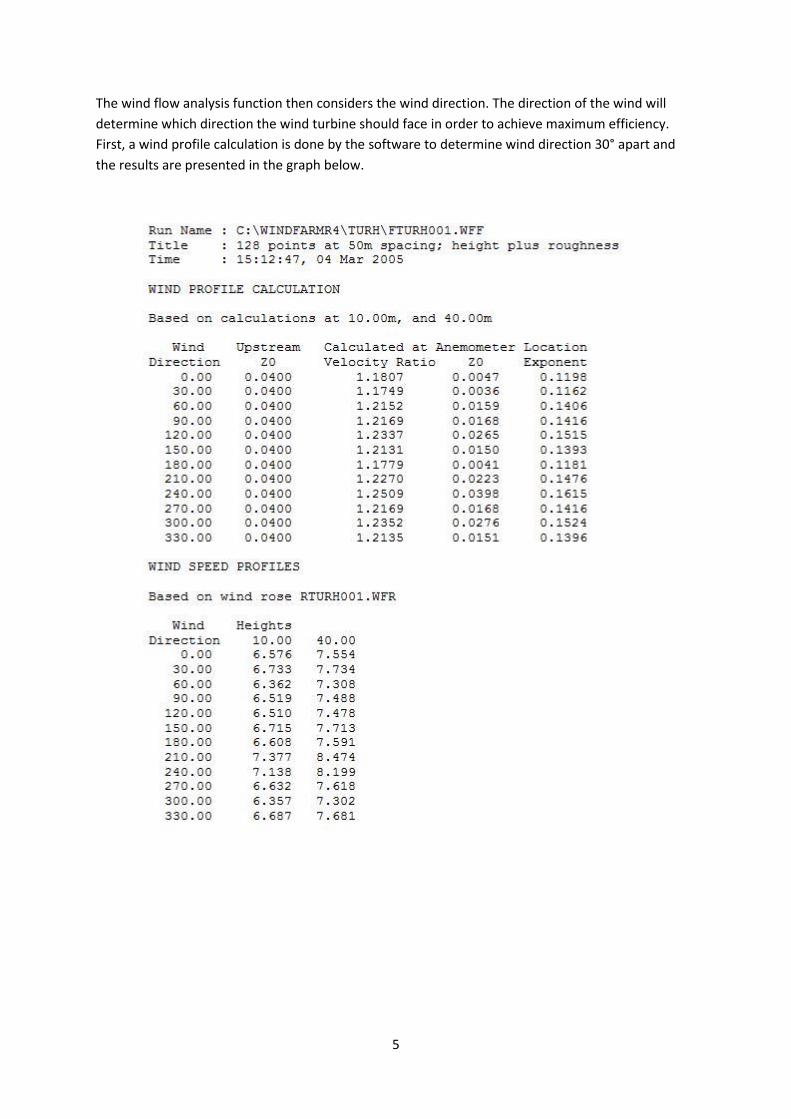
The wind flow analysis function then considers the wind direction. The direction of the wind will
determine which direction the wind turbine should face in order to achieve maximum efficiency.
First, a wind profile calculation is done by the software to determine wind direction 30° apart and
the results are presented in the graph below.
6
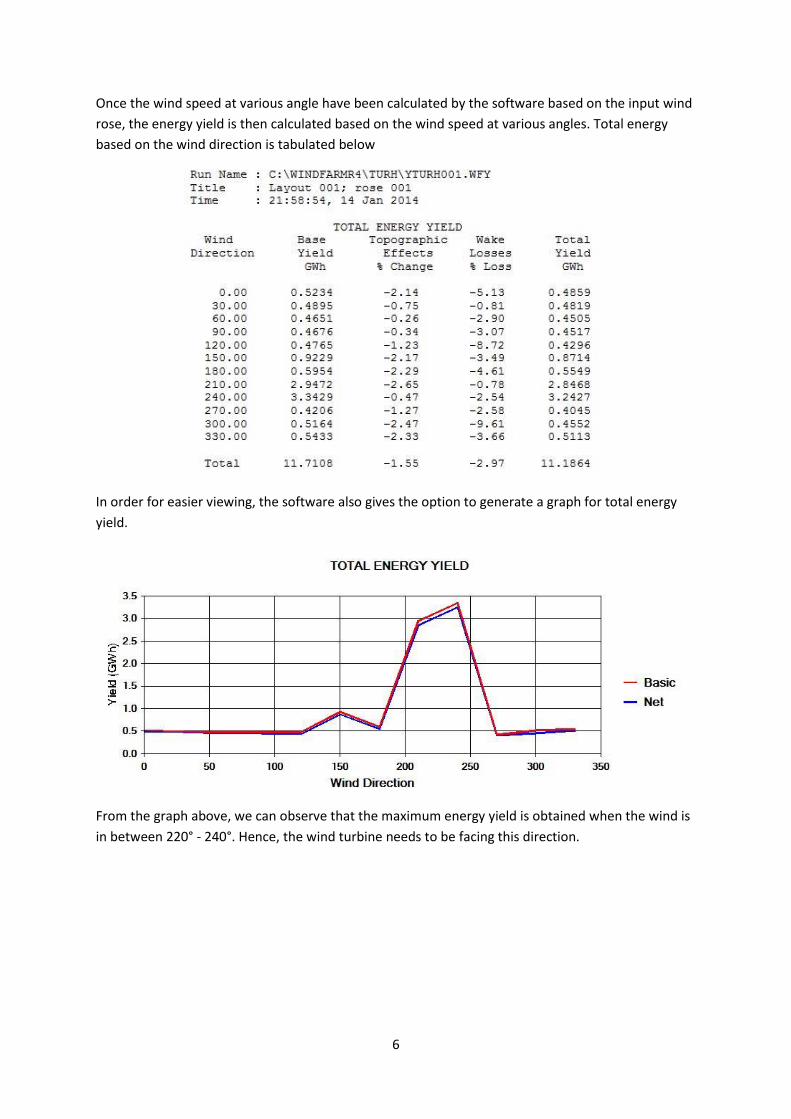
Once the wind speed at various angle have been calculated by the software based on the input wind
rose, the energy yield is then calculated based on the wind speed at various angles. Total energy
based on the wind direction is tabulated below
In order for easier viewing, the software also gives the option to generate a graph for total energy
yield.
From the graph above, we can observe that the maximum energy yield is obtained when the wind is
in between 220° - 240°. Hence, the wind turbine needs to be facing this direction.
7
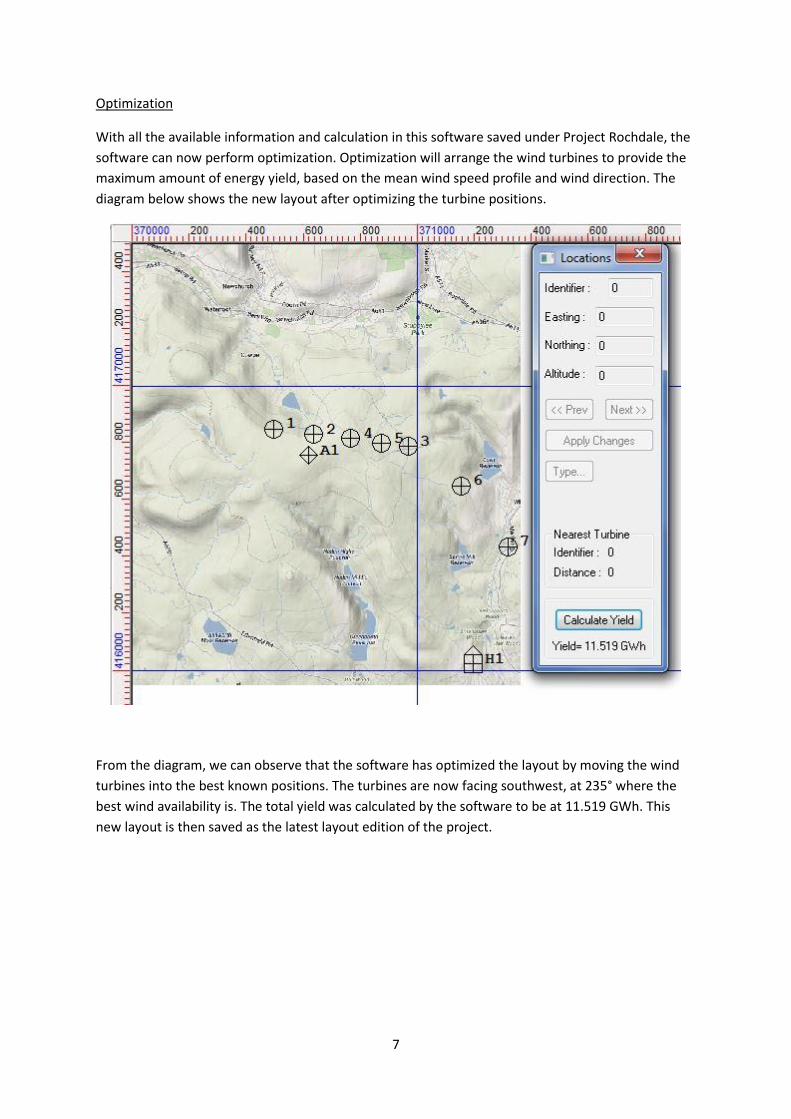
Optimization
With all the available information and calculation in this software saved under Project Rochdale, the
software can now perform optimization. Optimization will arrange the wind turbines to provide the
maximum amount of energy yield, based on the mean wind speed profile and wind direction. The
diagram below shows the new layout after optimizing the turbine positions.
From the diagram, we can observe that the software has optimized the layout by moving the wind
turbines into the best known positions. The turbines are now facing southwest, at 235° where the
best wind availability is. The total yield was calculated by the software to be at 11.519 GWh. This
new layout is then saved as the latest layout edition of the project.
8
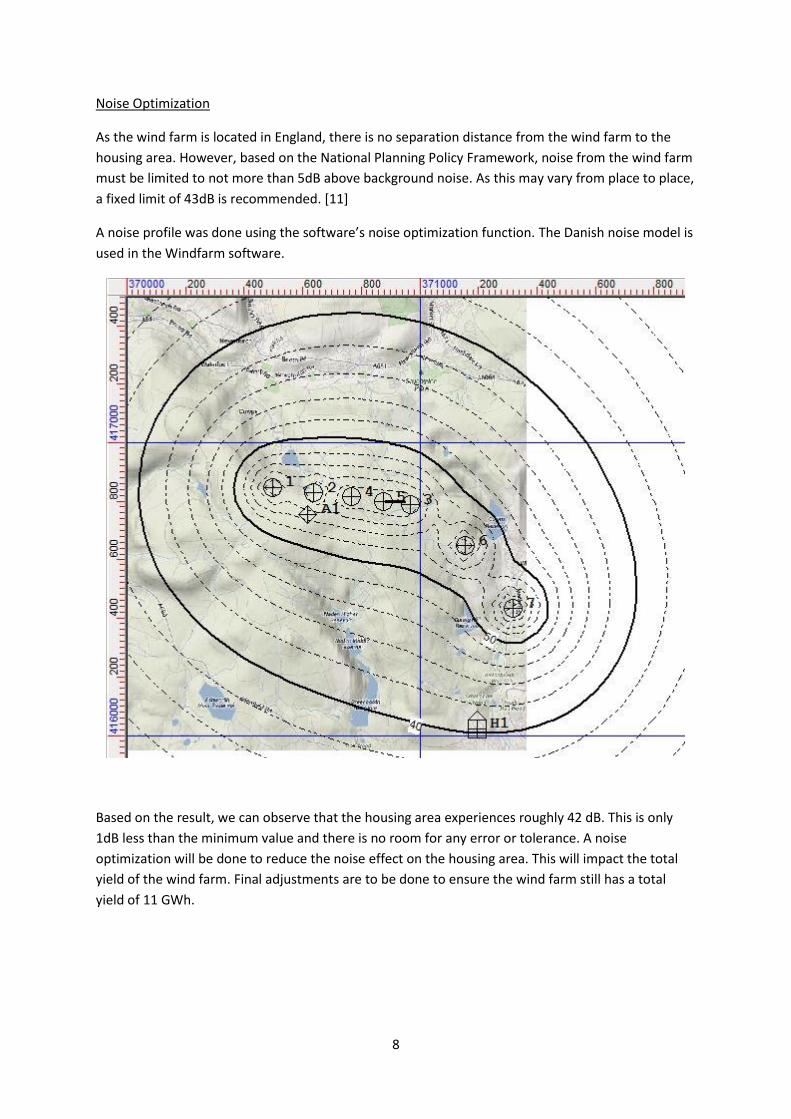
Noise Optimization
As the wind farm is located in England, there is no separation distance from the wind farm to the
housing area. However, based on the National Planning Policy Framework, noise from the wind farm
must be limited to not more than 5dB above background noise. As this may vary from place to place,
a fixed limit of 43dB is recommended. [11]
A noise profile was done using the software’s noise optimization function. The Danish noise model is
used in the Windfarm software.
Based on the result, we can observe that the housing area experiences roughly 42 dB. This is only
1dB less than the minimum value and there is no room for any error or tolerance. A noise
optimization will be done to reduce the noise effect on the housing area. This will impact the total
yield of the wind farm. Final adjustments are to be done to ensure the wind farm still has a total
yield of 11 GWh.
9
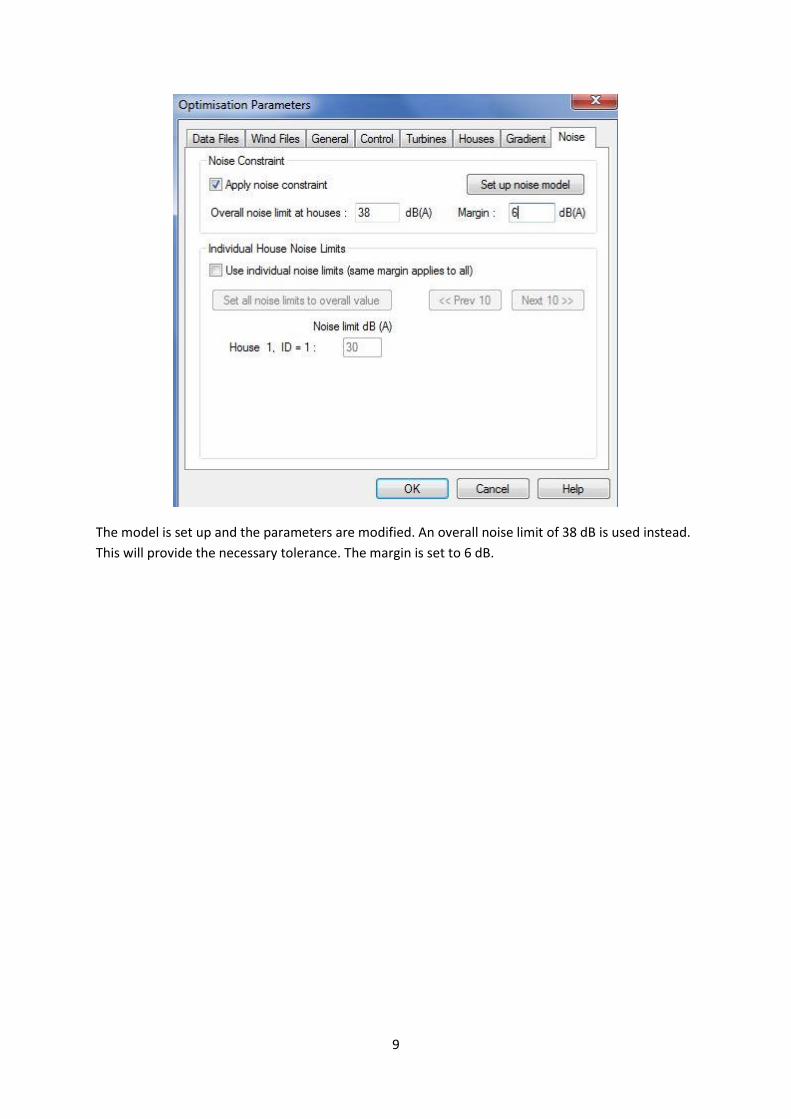
The model is set up and the parameters are modified. An overall noise limit of 38 dB is used instead.
This will provide the necessary tolerance. The margin is set to 6 dB.
10
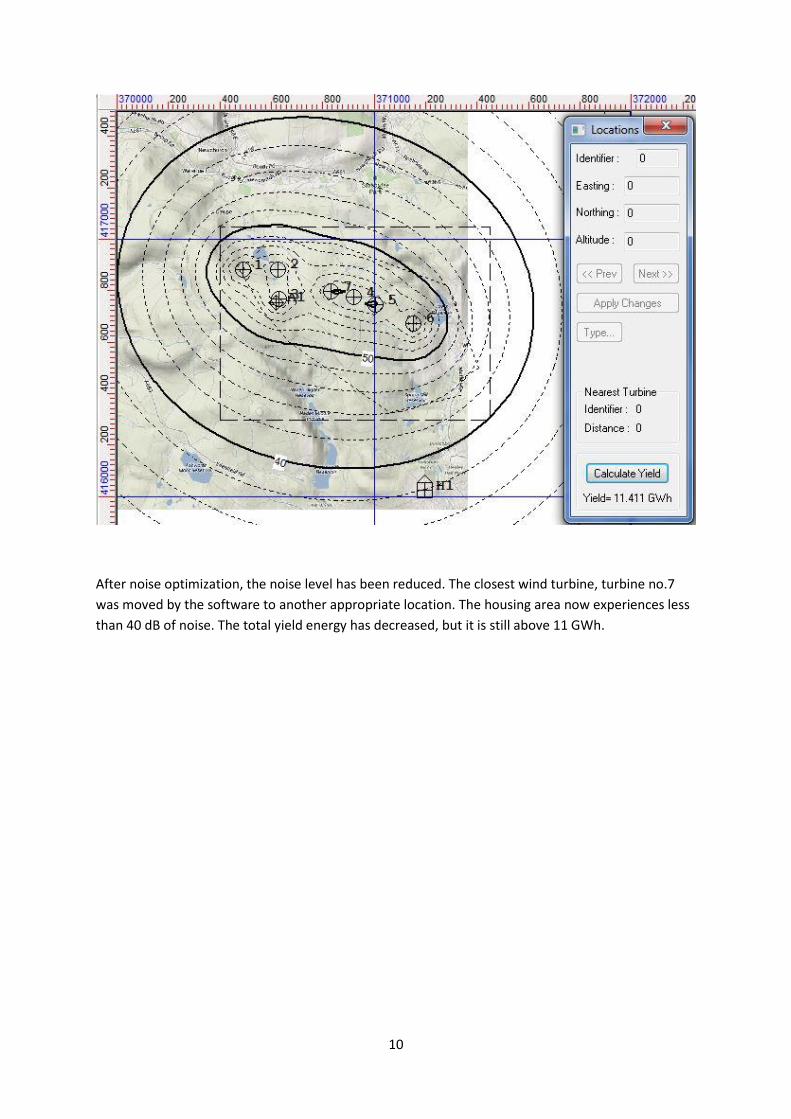
After noise optimization, the noise level has been reduced. The closest wind turbine, turbine no.7
was moved by the software to another appropriate location. The housing area now experiences less
than 40 dB of noise. The total yield energy has decreased, but it is still above 11 GWh.
11
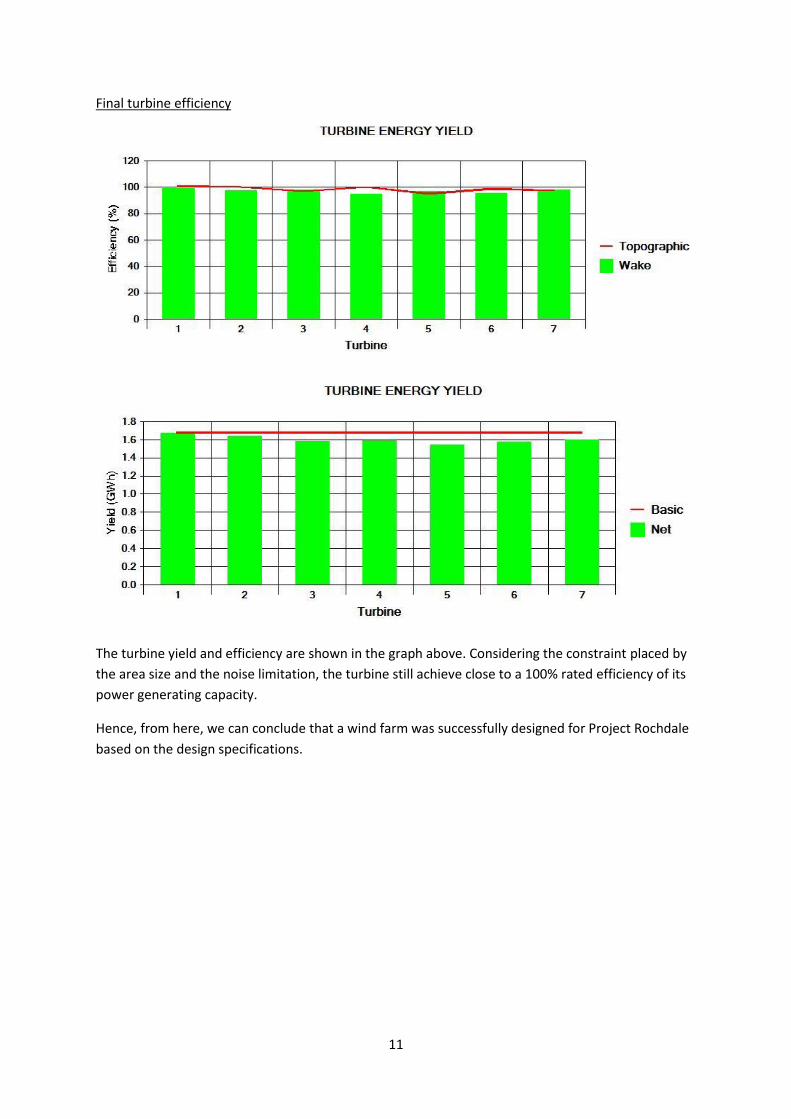
Final turbine efficiency
The turbine yield and efficiency are shown in the graph above. Considering the constraint placed by
the area size and the noise limitation, the turbine still achieve close to a 100% rated efficiency of its
power generating capacity.
Hence, from here, we can conclude that a wind farm was successfully designed for Project Rochdale
based on the design specifications.
Copyright © 2022 FDOKUMEN