
Spatial heterogeneity of surface roughness during different ...
Upload
independentCategory
view
1download
0
Procedia Materials Science 6 ( 2014 ) 741 – 751
Available online at www.sciencedirect.com
2211-8128 © 2014 Elsevier Ltd. This is an open access article under the CC BY-NC-ND license (http://creativecommons.org/licenses/by-nc-nd/3.0/).Selection and peer review under responsibility of the Gokaraju Rangaraju Institute of Engineering and Technology (GRIET)doi: 10.1016/j.mspro.2014.07.090
ScienceDirect
3rd International Conference on Materials Processing and Characterisation (ICMPC 2014)
Application of Artificial bee Colony Algorithm for Optimization of MRR and Surface Roughness in EDM of EN31 tool steel
Milan Kumar Dasa, Kaushik Kumarb, Tapan Kr. Barmana*and Prasanta Sahooa aDepartment of Mechanical Engineering, Jadavpur University, Kolkata 700032, India
bDepartment of Mechanical Engineering, BIT Mesra, Ranchi 835215, India
Abstract
The objective of this paper is to find out the combination of process parameters for optimum surface roughness and material removal rate (MRR) in electro discharge machining (EDM) of EN31 tool steel using artificial bee colony (ABC) algorithm. For experimentation, machining parameters viz., pulse on time, pulse off time, discharge current and voltage are varied based on central composite design (CCD). Second order response equations for MRR and surface roughness are found out using response surface methodology (RSM). For optimization, both single and multi-objective responses (MRR and surface roughness: Ra) are considered. From ABC analysis, the optimum combinations of process parameters are obtained and corresponding values of maximum MRR and minimum Ra are found out. Confirmation tests are carried out to validate the analyses and it is seen that the predicated values show good agreement with the experimental results. This study also investigates the influence of the machining parameters on machining performances. It is seen that with an increase in current and pulse on time, MRR and surface roughness increase in the experimental regime. Finally, surface morphology of machined surfaces is studied using scanning electron microscope (SEM) images. © 2014 The Authors. Published by Elsevier Ltd. Selection and peer-review under responsibility of the Gokaraju Rangaraju Institute of Engineering and Technology (GRIET).
Keywods: EDM, MRR, Surface Roughness, Optimization, ABC algorithm
1. Introduction
Electrical discharge machining (EDM) is a well-established machining option for manufacturing geometrically complex parts or hard materials that are extremely difficult-to-machine by conventional machining processes. Its
* Corresponding author. Tel.: +91 33 2457 2661; fax: +91 33 2414 6890.
E-mail address:[email protected]
© 2014 Elsevier Ltd. This is an open access article under the CC BY-NC-ND license (http://creativecommons.org/licenses/by-nc-nd/3.0/).Selection and peer review under responsibility of the Gokaraju Rangaraju Institute of Engineering and Technology (GRIET)

742 Milan Kumar Das et al. / Procedia Materials Science 6 ( 2014 ) 741 – 751
unique feature of using thermal energy to machine electrically conductive parts regardless of hardness has been its distinctive advantage in the manufacture of mould, die, automotive, aerospace and surgical components (Ho and Newman, 2003). It uses preciously controlled sparks that occur between an electrode and a work piece in presence of a dielectric fluid (Jameson, 2001).
EDM parameter selection is done in the industry based on experience. In some cases, selected parameters are conservative and far from the optimum, and at the same time selecting optimized parameter requires many costly and time consuming experiments. Many researchers tried to optimize the machining performance by adapting different optimization techniques. Pradhan and Biswas (2008) have presented a neuro-fuzzy model to predict MRR of AISI D2 tool steel with current (Ip), pulse on time (Ton) and duty cycle (τ) as process parameters. The model predictions are found to be in good agreement with the experimental results. Pradhan et al. (2009) have also proposed two neural network models for the prediction of surface roughness and compared with the experimental results. Kanagarajan et al. (2008) have chosen Ip, Ton, electrode rotation, and flushing pressure as design factors to study the process performance such as surface roughness and MRR on tungsten carbide/cobalt cemented carbide and the most influential parameters for minimizing surface roughness have been identified using RSM. Jaharah et al. (2008) have investigated the machining performance such as surface roughness, electrode wear rate and MRR with copper electrode and AISI H3 tool steel workpiece. Kuppan at el. (2007) have derived mathematical model for MRR and average Ra in deep hole drilling of Inconel 718. It revealed that MRR is more influenced by peak current and duty factor, and the parameters are optimized for maximum MRR with the desired Ra value using desirability function approach. Puertas at el. (2004) have analyzed the impact of EDM parameters on surface quality, MRR and electrode wear in cobalt-bonded tungsten carbide workpiece. Chiang (2008) has explained the influences of Ip, Ton and voltage on the responses viz., MRR, electrodes wear ratio, and Ra and the influence of parameters and their interactions are investigated using ANOVA. Asilturk and Cunkas (2010) have used artificial neural network (ANN) and multiple regression method to model surface roughness of AISI 1040 steel and it is seen that ANN estimates surface roughness with higher accuracy than the multiple regression method. Chen and Mahdivian (2000) have developed a theoretical model to estimate MRR and surface quality of the work-piece made of bright mild steel. Lin. et al. (2001) have used Taguchi method to study the feasibility of improving surface integrity through combined process of EDM with ball burnish machining (BBM). Mahdavinejad (2008) has presented the optimization and control of EDM process using the neural model predictive control method. Rao et al. (2008) have optimized MRR of die sinking EDM by considering the simultaneous affect of various input parameters using multi perceptron neural network models. Payal et al. (2008) have studied the parameters affecting surface roughness along with structural analysis of surfaces with respect to material removal parameters in EDM of EN 31 tool steel with copper brass and graphite as tool electrodes. Lajis et al. (2009) have discussed the feasibility of machining tungsten carbide ceramics with a graphite electrode. Taguchi method is used to determine the main effects, significant factors and optimum machining condition to the performance of EDM. Das et al. (2013) have optimized the multi-responses viz. material removal rate and surface roughness in EDM of EN 31 tool steel using weighted principal component analysis (WPCA). Rao and Pawar (2009) have attempted optimization of process parametric combination for better response in WEDM using artificial bee colony (ABC) method.
Machining operation should produce the final product with minimum time and at desired level of surface finish. Machining time is dependent on the material removal rate (MRR) of the process. For industrial purpose, it is obvious that MRR should be the maximum from the economic point of view. On the other hand, surface roughness plays an important role for the tribological operation of any component. It has large impact on the mechanical properties like fatigue behavior, corrosion resistance, creep life etc. Conventionally, surface roughness is the deviation of surface from the mid plane which can be expressed by different statistical parameters like variances of height, the slope, curvature etc (Sahoo, 2008).
This research is focused to find out the optimum combination of machining process parameters within a given range for better responses in EDM using artificial bee colony (ABC) algorithm. Four process parameter viz., pulse on time, pulse off time, discharge current and voltage are considered. Surface roughness parameter (Ra) and MRR are considered as the responses. The experimental observations and mathematical models are used for both single and multi objective optimization problems. EN 31 steel is used as work piece, which has high degree of hardness, compressive strength and abrasion resistance. Finally, the surface morphology is studied with the help of scanning electron microscopy (SEM).

743 Milan Kumar Das et al. / Procedia Materials Science 6 ( 2014 ) 741 – 751
2. Artificial bee colony (ABC) algorithm
Inspired by the intelligent foraging behavior of honey bees, Karaboga (2005) introduced ABC algorithm for optimizing numerical problems. It can be noted that three parameters are of prime importance in the foraging behavior of honey bees, those are, food source (nectar), employed foragers and unemployed foragers, and the foraging behavior leads to two modes, i.e., recruitment of nectar source and abandonment of nectar source. In ABC, the colony of artificial bees contains generally two groups of bees: employed bees and onlooker bees. The employed bees have all the idea about the food source (nectar position) and quality of food (nectar amount). In the hive all the employed bees with all their information of foods started waggle dance. This dance is the indication of all the characteristics of their foods, i.e., the amount as well as quality of foods. In the hive there are also some unemployed bees called onlooker bees. They watch the waggle dance and get the information about all the food sources and attracted to the best food source. In the next stage the onlooker bees become employed and they started consuming the nectar from the best food source. When this food source becomes abandoned the employed bee become a scout bee and starts to find new food source. As early as a scout finds a new food source it becomes an employed bee and the cycle goes on until the best food source (optimum solution) is obtained. In ABC algorithm the number of employed bee and onlooker bee is equal to the number of solutions in the population.
The artificial bee colony algorithm consists of four main phases viz. initial phase, employed bee phase, onlooker bee phase and scout bee phase. The clarification of each phase is defined as follows:
Initial phase
At the first step, ABC algorithm generates a randomly distributed initial population contains NS solution. Where NS is the number of food sources and is equal to the number of employed bees. Since each food source Xi is a solution vector to the optimization problem, each Xi vector holds n variables, (Xij, j=1.…….n) which are to be optimized. After initialization, the solution is subjected to repeated cycles C=1….MCN (maximum cycle number). This is for the search process of the employed bees, onlooker bees and scout bees.
Employed bee phase:
Employed bees search for new food sources (Vij) having more nectar within the neighborhood of the food source (Xij) in the memory. They find a neighbor food source and then evaluate its profitability (fitness). The neighbor food source (Vij) can be determined by using the formula given by:
ij ij ij ij kjv x r ( x x ) (1) Where Xkj is the randomly selected food source, i is randomly chosen parameter index k≠i and rij is a random number within the range of (0,1). After producing the new food source (Vij) its fitness calculated and a greedy selection is applied between Vij and Xij. This fitness value is the indication of waggle dance of the employed bee.
Onlooker bee phase
Unemployed bees consist of two groups of bees: onlooker bees and scouts. The employed bees share their food source information with onlooker bees waiting in the hive and then onlooker bees choose their food source depending on the probability values calculated using the fitness values provided by employed bees. The probability value Pi with which Xi is chosen by an onlooker bee can be calculated by:
i ii n
i ii 1
fitness ( x )pfitness ( x )
(2)
After a food source Xi for an onlooker bee is probabilistically chosen, a neighborhood source Vi is determined by using equation (1), and its fitness value is computed. As in the employed bees phase, a greedy selection is applied between Vi and Xi. Hence, more onlookers are recruited source and positive feedback behavior appears.

744 Milan Kumar Das et al. / Procedia Materials Science 6 ( 2014 ) 741 – 751
Scout bee phase
Employed bees whose solutions cannot be improved through a predetermined number of trials, specified by the user of ABC algorithm and called “limit” or “abandonment criteria” herein, become scouts and their solutions are abandoned. Then, the converted scouts start to search for new solutions, randomly. For instance discovered by the scout that was the employed bee of Xi. The artificial bee colony algorithm including main phases is visible in Fig. 1.
Fig. 1. Algorithm of artificial bee colony
3. Experimental study
3.1. Experimental details
The experiments are conducted on CNC EDM (EMT 43, Electronica). The tool is made up of copper with square cross section. Commercial grade EDM oil is used as dielectric fluid. Pulse on time (X1), pulse off time (X2), discharge current (X3) and applied voltage (X4) are considered as process parameters and material removal rate (MRR) and surface roughness (Ra) are chosen as the responses. The material used in these experiments is EN 31 tool steel. It has an excellent strength-to-weight ratio, high wear resistance, good corrosion resistance and is widely used in the tool and die making and aerospace industry. The dimension of the specimens is 20 mm X 20 mm rectangular and 15 mm height. The tensile test of EN 31 tool steel has been done at room temperature by using UTM made by Instron with 100 KN grip capacity, and 8810 controller; in displacement controlled mode. Chemical and mechanical properties of EN 31 tool steel are listed in Table 1. Experiments are conducted based on central composite design (CCD) with three levels of each of the four design factors. The levels of each factor are chosen as -2, -1, 0, 1, 2 in closed form to have a rotatable design. For four process variables, the design required 31 experiments with 16 factorial points, 8 axial points to form a central composite design with α=2 and 7 centre points. Table 2 shows the
Table 1.Chemical and Mechanical properties of EN 31 tool steel
Work piece material Chemical composition (wt%) Mechanical property
EN 31 tool steel 1.07% C, 0.57% Mn, 0.32% Si, 0.04% P, 0.03% S, 1.13% Cr and 96.84% Fe
Modulus of Elasticity-197.37 GPa, Yield Strength (2% Strain Offset)-528.97 MPa, Ultimate Tensile Strength-
615.40 Mpa and Poisson’s Ratio-0.294
Algorithm
1 : Initialize the population of solution Xi, i = 1 (1) NP 2 : Evaluate the population, cycle 1, k = 0. 3 : Memorize the best solution, Xbest and set Xbest1 = Xbest 4 : Repeat (Exploration phase) 5 : Produce new solution Xnew = Vi for the employee bees and evaluate them. 6 : Apply the greedy selection process for the employed bees. 7 : Rank the population and calculate the fitness. 8 : Calculate the probability Pi for the solution Xi. 9 : Produce the new solution Vi for the onlookers from the solution selected depending on Pi and evaluate
them. 10 : Apply the greedy selection process for the onlookers. 11 : Determine the abandoned solution for the scout if exist, and replace it with a new randomly produced
solution Xi. 12 : Memorize the best solution Xbest achieved so far. 13 : Set k = k + 1; cycle = cycle + 1. 14 : Until (termination condition is met, i.e., cycle = MCN)

745 Milan Kumar Das et al. / Procedia Materials Science 6 ( 2014 ) 741 – 751
Table 2. Experimental parameters and their levels
Design factors Unit Notation Levels
-2 -1 0 1 2
Pulse on time (Ton) μs X1 100 200 300 400 500
Pulse off time (Toff) μs X2 1900 1800 1700 1600 1500
Discharge Current (Ip) Amp X3 4 8 12 16 20
Voltage (V) Volt X4 20 40 60 80 100
Table 3. Experimental design matrix and results
Exp. No. X1 X2 X3 X4 MRR (gm/min) Ra (μm)
1 200 1800 16 80 0.2121 11.98
2 400 1800 8 40 0.1329 10.57
3 200 1800 8 80 0.0999 10.02
4 300 1700 12 60 0.2275 10.95
5 300 1700 12 20 0.3895 12.20
6 300 1500 12 60 0.3349 10.95
7 400 1800 16 40 0.3179 12.12
8 200 1800 8 40 0.1419 9.51
9 400 1800 8 80 0.1088 11.31
10 300 1700 12 60 0.2275 10.95
11 200 1600 16 80 0.3355 11.64
12 400 1600 8 40 0.2198 11.30
13 400 1600 16 80 0.3345 12.98
14 200 1600 8 40 0.2235 9.59
15 300 1700 12 60 0.2275 10.95
16 300 1700 12 60 0.2275 10.95
17 500 1700 12 60 0.2357 11.68
18 300 1700 12 100 0.2343 11.38
19 300 1700 20 60 0.4949 12.86
20 300 1900 12 60 0.1201 11.94
21 400 1600 8 80 0.1399 9.79
22 300 1700 4 60 0.0897 6.53
23 300 1700 12 60 0.2275 10.95
24 400 1600 16 40 0.4949 12.34
25 300 1700 12 60 0.2275 10.95
26 200 1600 8 80 0.1535 9.24
27 100 1700 12 60 0.2300 9.53
28 300 1700 12 60 0.2275 10.95
29 200 1800 16 40 0.3089 11.82
30 400 1800 16 80 0.2228 12.60
31 200 1600 16 40 0.4911 11.60
factors and their levels in coded and actual values. The experiment has been carried out as per the experimental layout shown in Table 3. The weight of test pieces is measured before and after machining by using a precision

746 Milan Kumar Das et al. / Procedia Materials Science 6 ( 2014 ) 741 – 751
weighing machine and machining time is set in the machine for calculating material removal rate. Roughness measurement is done using a stylus-type profilometer, Talysurf (Taylor Hobson, Surtronic 3+). Roughness measurements in the transverse direction on the work pieces are repeated five times and average of five measurements of surface roughness parameter values are recorded.
3.2. Response surface methodology
Response surface method (RSM) adopts both mathematical and statistical techniques which are useful for the modeling and analysis of problems in which a response of interest is influenced by several variables and the objective is to optimize the response. RSM helps in analyzing the influence of the independent variables on a specific dependent variable (response) by quantifying the relationships amongst one or more measured responses and the vital input factors. The mathematical models thus developed relating the machining responses and their factors facilitate the optimization of the machining process. In most of the RSM problems, the form of the relationship between the response and the independent variables is unknown. Thus the first step in RSM is to find a suitable approximation for the true functional relationship between response of interest ‘Yu’ and a set of controllable variables {X1, X2, ……Xn}. Usually when the response function is not known or non-linear, a second order model is utilized (Montgomery, 2001) and it can be described as follows:
k k k
2u 0 i i ii i ij i j
i 1 i 1 j iY X X X X (3)
where, uY represents the corresponding response, e.g. MRR and Ra of the EDM process in the present research. iX is
the input variables, 2iX and i jX X are the squares and interaction terms, respectively, of these input variables. The
unknown regression coefficients are 0 i ij, , and ii . The second term under the summation sign of this polynomial equation attributes to linear effects, whereas the third term of the above equation corresponds to the higher order effects and lastly the forth term of the equation includes the interactive effects of the parameters.
4. Result and discussion
The influences of the electrical discharge machining parameters (pulse on time, pulse off time, current and voltage) on the response variables selected have been assessed for EN 31 tool steel. The second order model is postulated in obtaining the relationship between MRR and Ra parameter and the machining variables using RSM. The analysis is carried out using MINITAB software (Minitab, 2001). Based on Eq. 3, empirical relationship between response and factors in un-coded forms are given as follows:
u 1 2 37 2 7 2 2
4 1 2 35 2 7 6
4 1 2 1 37
1 4
Y ( MRR ) 0.192508 0.000320325 X 0.000790717 X 0.107146 X
0.0158419 X 2.00747 10 X 3.34534 10 X 0.000803596 X
4.44251 10 X 2.13644 10 X X 6.27547 10 X X
1.51344 10 X X 5.3 5 62 3 2 4
3 4
2848 10 X X 6.49928 10 X X0.00022819 X X
(4)
u a 1 2 3 45 2 5 2 2 2
1 2 3 46 7
1 2 1 3 1 45
2 3 2 4
Y ( R ) 57.7911 0.0257658 X 0.0620792 X 1.06777 X 0.264396 X
1.1675 10 X 1.50 10 X 0.0158125 X 0.00178 X
6.7 10 X X 0.00025125 X X 1.25 10 X X
0.00024 X X 9.5875 10 X X 3 40.00151562 X X
(5)
747 Milan Kumar Das et al. / Procedia Materials Science 6 ( 2014 ) 741 – 751
ABC algorithm is now used to optimize the above mentioned equations. The corresponding computer code for ABC algorithm is developed in MATLAB 7.8 with the following control parameters (Table 4).
Table 4. Control parameters
Number of population = 10 Number of onlooker bees = 50% of population Number of cycles = 1000
Number of employed bees = 50% of population Number of scouts per cycle = 1 Limit = 500
4.1. Single objective optimization
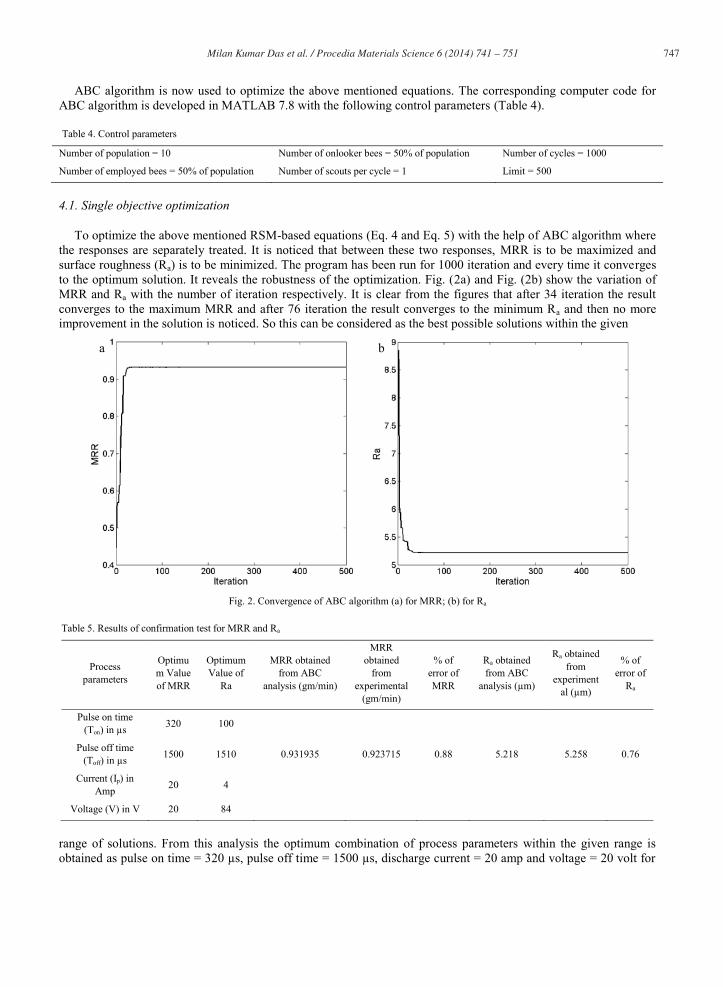
To optimize the above mentioned RSM-based equations (Eq. 4 and Eq. 5) with the help of ABC algorithm where the responses are separately treated. It is noticed that between these two responses, MRR is to be maximized and surface roughness (Ra) is to be minimized. The program has been run for 1000 iteration and every time it converges to the optimum solution. It reveals the robustness of the optimization. Fig. (2a) and Fig. (2b) show the variation of MRR and Ra with the number of iteration respectively. It is clear from the figures that after 34 iteration the result converges to the maximum MRR and after 76 iteration the result converges to the minimum Ra and then no more improvement in the solution is noticed. So this can be considered as the best possible solutions within the given
Fig. 2. Convergence of ABC algorithm (a) for MRR; (b) for Ra
Table 5. Results of confirmation test for MRR and Ra
Process parameters
Optimum Value of MRR
Optimum Value of
Ra
MRR obtained from ABC
analysis (gm/min)
MRR obtained
from experimental
(gm/min)
% of error of MRR
Ra obtained from ABC
analysis (μm)
Ra obtained from
experimental (μm)
% of error of
Ra
Pulse on time (Ton) in μs 320 100
Pulse off time (Toff) in μs 1500 1510 0.931935 0.923715 0.88 5.218 5.258 0.76
Current (Ip) in Amp 20 4
Voltage (V) in V 20 84
range of solutions. From this analysis the optimum combination of process parameters within the given range is obtained as pulse on time = 320 μs, pulse off time = 1500 μs, discharge current = 20 amp and voltage = 20 volt for
a b

748 Milan Kumar Das et al. / Procedia Materials Science 6 ( 2014 ) 741 – 751
maximum MRR and the optimum value of response i.e. MRR is =0.931935 gm/min. On the other hand, for minimum Ra, a combination of pulse on time = 100 μs, pulse off time = 1510 μs, current = 4 amp and voltage = 84 volt can be set and optimum value of response i.e. Ra is = 5.219 μm. An experiment is performed with those optimum values of process parameters obtained from the analysis to confirm the results of the analysis. For single response optimization the error is 0.88% for MRR and 0.76% for Ra. The results of the confirmation test show a good agreement with the predicted value. The confirmation result is shown in Table 5.
4.2. Multi-objective optimization
In multi-objective optimization of EDM process, instead of treating the response seperately, both of them are optimized simultaneously. For this, the following objective function is developed (Rao et al., 2008):
1 u a 2 u
amin max
w Y ( R ) w Y ( MRR )Min( Z )R MRR
(6)
Where uY ( MRR ) and uY ( Ra ) are the second order response surface equations, as given in Eqs. 4 and 5, respectively, Ramin and MRRmax are the minimum and the maximum values of Ra and MRR, respectively, and 1w and 2w are the weight values assigned to Ra and MRR, respectively. These weight values can be anything provided that sumation of the weights will be 1 and it depends on the priorities of the considered responses as set by the process engineers. Here, equal weights for both the responses are considered, i.e. 1 2w w 0.5 . The convergence of ABC algorithm for multi-responses i.e. MRR and Ra is shown in Fig. 3. The optimum combination of process parameters of multi-objective optimization is obtained using ABC algorithm. Thus, a combination of pulse on time = 100 μs, pulse off time = 1500μs, current = 20 amp and voltage = 20 volt can be set for obtaining maximum MRR and minimum Ra. MRR and Ra values are obtained as 0.922175 gm/min and 6.07936 μm, respectively, and the optimal solution (Z) is 0.09253.
In order to veryfy the obtained optimal results in the case of multi-objective optimization problem of this process a confirmation test has been carried out. For multi-response optimization the error is 0.97% for MRR and 0.91% for Ra. The results of the confirmation test show a good agreement with the predicted result. The confirmation result is shown in Table 6.
Fig. 3. Convergence of ABC algorithm for multi-reponses

749 Milan Kumar Das et al. / Procedia Materials Science 6 ( 2014 ) 741 – 751
Table 6. Results of confirmation test for multi-responses
Process parameters Optimization Value
MRR obtained from ABC
analysis (gm/min)
MRR obtained from
experimental (gm/min)
% of error of MRR
Ra obtained from ABC
analysis (μm)
Ra obtained from
experimental (μm)
% of error of Ra
Pulse on time (Ton) in μs 100
Pulse off time (Toff) in μs 1500 0.922175 0.91323 0.97 6.079 6.135 0.91
Current (Ip) in Amp 20
Voltage (V) in V 20
4.3. Effect of process parameters on responses
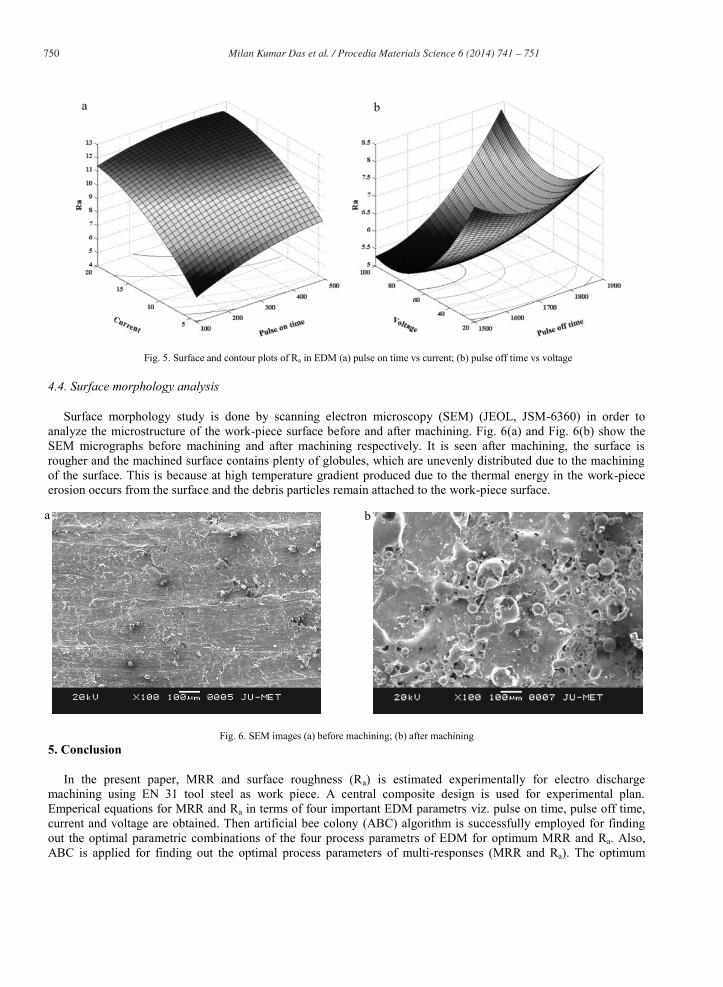
Fig. 4 and Fig. 5 show the estimated three-dimensional surface as well as contour plots for MRR and roughness parameter as function of the independent machining parameters. In all these figures, two of the four independent variables are held constant at centre level. All these figures depict the variation of MRR and roughness parameters with controlling variables within the experimental regime.
Fig. 4 shows the impact of, pulse on time, pulse off time, pulse current and voltage on material removal rate. It is revealed that with the increase of discharge current and pulse on time MRR increases and with the decrease of pulse off time and voltage MRR increases. With the increase of pulse current, the spark energy and consequently, the surface temperature of work piece rises, and material melting and MRR increase rapidly. Spark energy intensifies with the increase of pulse current and pulse on time. The increase of pulse off time causes the plasma channel to become smaller, which reduces the attack of positive ions on the workpiece surface and lowers MRR. Low values of voltage can give rise to increase in MRR. However, application of very low values has arcing tendency. Also, higher values of voltage can result in relatively lower metal removal rates.
On the other hand, the effect of input parameter of pulse on time, pulse off time, pulse current and voltage on surface roughness has been demonstrated in Fig. 5. Surface roughness decreases with decease in pulse on time, pulse off time, discharge current and an increase in voltage. As the discharge current increase, so does the discharge heat concentration on the work piece surface, which results in large craters, i.e., greater surface roughness. As the voltage increaes, spark also increases and due to this, larger but sallower craters are formed at higher voltage due to expansion of the plasma channel in the discharge gap.
Fig. 4. Surface and contour plots of MRR in EDM (a) pulse on time vs current; (b) pulse off time vs voltage
a b
750 Milan Kumar Das et al. / Procedia Materials Science 6 ( 2014 ) 741 – 751
Fig. 5. Surface and contour plots of Ra in EDM (a) pulse on time vs current; (b) pulse off time vs voltage
4.4. Surface morphology analysis
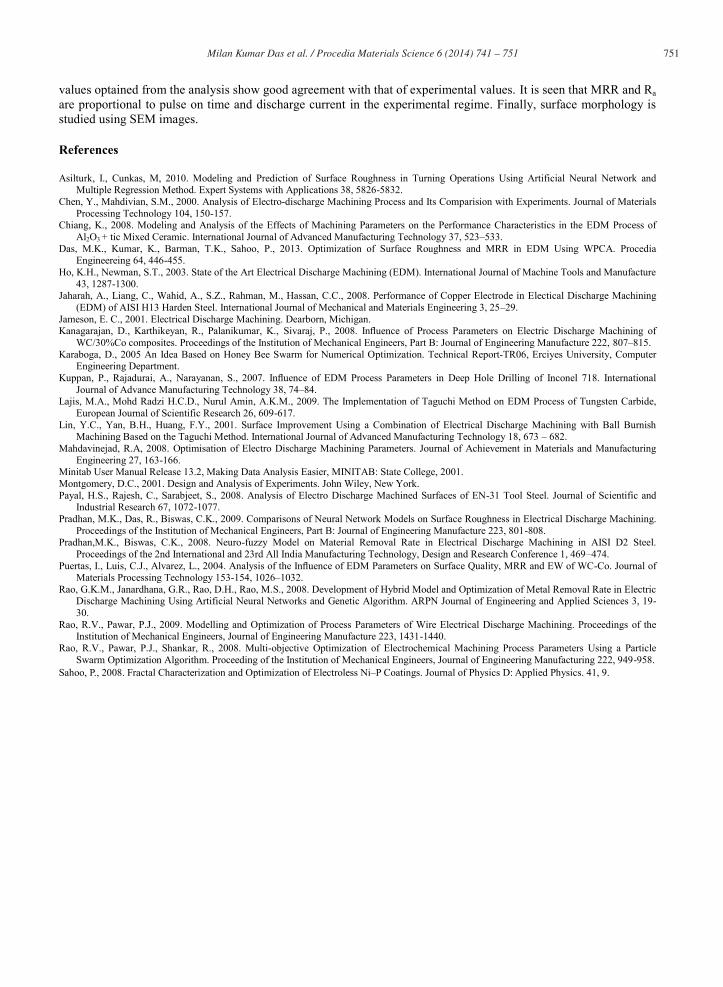
Surface morphology study is done by scanning electron microscopy (SEM) (JEOL, JSM-6360) in order to analyze the microstructure of the work-piece surface before and after machining. Fig. 6(a) and Fig. 6(b) show the SEM micrographs before machining and after machining respectively. It is seen after machining, the surface is rougher and the machined surface contains plenty of globules, which are unevenly distributed due to the machining of the surface. This is because at high temperature gradient produced due to the thermal energy in the work-piece erosion occurs from the surface and the debris particles remain attached to the work-piece surface.
Fig. 6. SEM images (a) before machining; (b) after machining 5. Conclusion
In the present paper, MRR and surface roughness (Ra) is estimated experimentally for electro discharge machining using EN 31 tool steel as work piece. A central composite design is used for experimental plan. Emperical equations for MRR and Ra in terms of four important EDM parametrs viz. pulse on time, pulse off time, current and voltage are obtained. Then artificial bee colony (ABC) algorithm is successfully employed for finding out the optimal parametric combinations of the four process parametrs of EDM for optimum MRR and Ra. Also, ABC is applied for finding out the optimal process parameters of multi-responses (MRR and Ra). The optimum
a b
a b
751 Milan Kumar Das et al. / Procedia Materials Science 6 ( 2014 ) 741 – 751
values optained from the analysis show good agreement with that of experimental values. It is seen that MRR and Ra are proportional to pulse on time and discharge current in the experimental regime. Finally, surface morphology is studied using SEM images.
References
Asilturk, I., Cunkas, M, 2010. Modeling and Prediction of Surface Roughness in Turning Operations Using Artificial Neural Network and Multiple Regression Method. Expert Systems with Applications 38, 5826-5832.
Chen, Y., Mahdivian, S.M., 2000. Analysis of Electro-discharge Machining Process and Its Comparision with Experiments. Journal of Materials Processing Technology 104, 150-157.
Chiang, K., 2008. Modeling and Analysis of the Effects of Machining Parameters on the Performance Characteristics in the EDM Process of Al2O3 + tic Mixed Ceramic. International Journal of Advanced Manufacturing Technology 37, 523–533.
Das, M.K., Kumar, K., Barman, T.K., Sahoo, P., 2013. Optimization of Surface Roughness and MRR in EDM Using WPCA. Procedia Engineereing 64, 446-455.
Ho, K.H., Newman, S.T., 2003. State of the Art Electrical Discharge Machining (EDM). International Journal of Machine Tools and Manufacture 43, 1287-1300.
Jaharah, A., Liang, C., Wahid, A., S.Z., Rahman, M., Hassan, C.C., 2008. Performance of Copper Electrode in Electical Discharge Machining (EDM) of AISI H13 Harden Steel. International Journal of Mechanical and Materials Engineering 3, 25–29.
Jameson, E. C., 2001. Electrical Discharge Machining. Dearborn, Michigan. Kanagarajan, D., Karthikeyan, R., Palanikumar, K., Sivaraj, P., 2008. Influence of Process Parameters on Electric Discharge Machining of
WC/30%Co composites. Proceedings of the Institution of Mechanical Engineers, Part B: Journal of Engineering Manufacture 222, 807–815. Karaboga, D., 2005 An Idea Based on Honey Bee Swarm for Numerical Optimization. Technical Report-TR06, Erciyes University, Computer
Engineering Department. Kuppan, P., Rajadurai, A., Narayanan, S., 2007. Influence of EDM Process Parameters in Deep Hole Drilling of Inconel 718. International
Journal of Advance Manufacturing Technology 38, 74–84. Lajis, M.A., Mohd Radzi H.C.D., Nurul Amin, A.K.M., 2009. The Implementation of Taguchi Method on EDM Process of Tungsten Carbide,
European Journal of Scientific Research 26, 609-617. Lin, Y.C., Yan, B.H., Huang, F.Y., 2001. Surface Improvement Using a Combination of Electrical Discharge Machining with Ball Burnish
Machining Based on the Taguchi Method. International Journal of Advanced Manufacturing Technology 18, 673 – 682. Mahdavinejad, R.A, 2008. Optimisation of Electro Discharge Machining Parameters. Journal of Achievement in Materials and Manufacturing
Engineering 27, 163-166. Minitab User Manual Release 13.2, Making Data Analysis Easier, MINITAB: State College, 2001. Montgomery, D.C., 2001. Design and Analysis of Experiments. John Wiley, New York. Payal, H.S., Rajesh, C., Sarabjeet, S., 2008. Analysis of Electro Discharge Machined Surfaces of EN-31 Tool Steel. Journal of Scientific and
Industrial Research 67, 1072-1077. Pradhan, M.K., Das, R., Biswas, C.K., 2009. Comparisons of Neural Network Models on Surface Roughness in Electrical Discharge Machining.
Proceedings of the Institution of Mechanical Engineers, Part B: Journal of Engineering Manufacture 223, 801-808. Pradhan,M.K., Biswas, C.K., 2008. Neuro-fuzzy Model on Material Removal Rate in Electrical Discharge Machining in AISI D2 Steel.
Proceedings of the 2nd International and 23rd All India Manufacturing Technology, Design and Research Conference 1, 469–474. Puertas, I., Luis, C.J., Alvarez, L., 2004. Analysis of the Influence of EDM Parameters on Surface Quality, MRR and EW of WC-Co. Journal of
Materials Processing Technology 153-154, 1026–1032. Rao, G.K.M., Janardhana, G.R., Rao, D.H., Rao, M.S., 2008. Development of Hybrid Model and Optimization of Metal Removal Rate in Electric
Discharge Machining Using Artificial Neural Networks and Genetic Algorithm. ARPN Journal of Engineering and Applied Sciences 3, 19-30.
Rao, R.V., Pawar, P.J., 2009. Modelling and Optimization of Process Parameters of Wire Electrical Discharge Machining. Proceedings of the Institution of Mechanical Engineers, Journal of Engineering Manufacture 223, 1431-1440.
Rao, R.V., Pawar, P.J., Shankar, R., 2008. Multi-objective Optimization of Electrochemical Machining Process Parameters Using a Particle Swarm Optimization Algorithm. Proceeding of the Institution of Mechanical Engineers, Journal of Engineering Manufacturing 222, 949-958.
Sahoo, P., 2008. Fractal Characterization and Optimization of Electroless Ni–P Coatings. Journal of Physics D: Applied Physics. 41, 9.
Copyright © 2022 FDOKUMEN