Application of analysis approach in Noise Estimation in Panoramic X- rays images using image...
11
Canadian Journal on Medicine Vol. 2, No. 3, July 2011 38 Application of analysis approach in Noise Estimation in Panoramic X- rays images using image processing program (MatLab) Yousif Mohamed Yousif Abdallah*, Arwa Ahamed Almoustafa, Gehan Elhadi, Mamdouh Mohammed, Osman Khalafallah & Tayseer Khalid College of Medical Radiologic Science, Sudan University of Science and Technology, Khartoum, Sudan Tel: +249911628004,+249126641065, Email [email protected] Abstract — This research presented an appropriate approach for the robust estimation of noise statistic in dental panoramic x-rays images. To achieve maximum image quality after denoising, a new, low order, local adaptive Gaussian Scale Mixture model is presented, which accomplishes nonlinearities from scattering. State of art methods use multi scale filtering of images to reduce the irrelevant part of information, based on generic estimation of noise. The usual assumption of a distribution of Gaussian and Poisson statistics only lead to overestimation of the noise variance in regions of low intensity (small photon counts), but to underestimation in regions of high intensity and therefore to non-optional results. The analysis approach is tested on 50 samples from a database of 50 panoramic X-rays images and the results are cross validated by medical experts. In this thesis, prominent constraints are firstly preservation of image's overall look; secondly preservation of the diagnostic content in the image and thirdly detection of small low contrast details in diagnostic content of the image. As shown in previously, state of the art methods provide non- convincing results. The new approach is funded on an attempt to interpret the problem from the view of blind source separation (BSS), thus to see the panoramic image as a simple mixture of (unwanted) background information, diagnostic information and noise. Key Words — image quality, Noise, blind source separation, matlab I. INTRODUCTION The “classic” 18-film intraoral radiograph examination of the teeth is relatively comfortable for the patient, and the overall radiation dose is generally acceptable; however, it is a time-consuming endeavor, and in some cases provides a less- than-optimum depiction of individual teeth. Nevertheless, it offers valuable information as a basis for treatment planning, is far superior to purely clinical observations, and often gives impetus for more extensive examination strategies. Finally, the 18-film“full series” exam provides a sense of security for both dentist and patient, and enhances confidence through communication. On the other hand, clear radiographic depiction of not only the teeth, but also the jaws, the temporomandibular joints, and the alveolar lobes of the maxillary sinuses will reduce the risk of an incomplete and possibly incorrect examination, which in the worst-case scenario could lead to malpractice. In this regard, the panoramic radiograph always leads to a broadening of horizons because it improves the dentist’s knowledge of radiographic anatomy and thus improves her/his skill in distinguishing between and among normal and pathologic conditions. This, in conjunction with a better understanding of the interrelationships of systemic medical problems and dental/oral problems can open new avenues for treatment planning (1) . The question of whether the treating dentist her/himself actually takes the radiographs or delegates this task to auxiliary personnel is really a question of responsibility for the radiographic quality that is achieved, and the radiation dose that this requires. If, for whatever reason, this assignment is delegated, the person who bears the primary responsibility must see to it that the auxiliary personnel are well-trained and have received legal certification (2) . They must not only become expert in the production of high-quality radiographs, but must also be knowledgeable regarding the dental indications and the procedures for protecting patients and staff from excessive radiation exposure. Auxiliary dental personnel who are given the responsibility of taking radiographs must remain current in all continuing education standards in order to insure high radiographic quality and the lowest possible radiation dose for every patient. This is critical. An image defined as it may be applied to a picture such as a photograph, a painting or a sketch which has a real physical existence. But it may be also being applied to an idea or concept which has a mental rather than physical existence. If asked to imagine an object such as apple, a mental image of an apple comes to mind. The existence of this visual image helps us to grasp the concept of an apple. Of course, a photograph of an apple represents only one aspect of an apple: its visual appearance. It provides no representation of the taste, smell or feel of the characteristics of an apple which we remember from past experiences (3) . There are two components are superimposed in the image. The presence of noise limits the amount of information which can be extended from image. In particular, the finer details of structure may be lost by being swamped by the effect of noise.
-
Upload
independent -
Category
Documents
-
view
0 -
download
0
Transcript of Application of analysis approach in Noise Estimation in Panoramic X- rays images using image...
Canadian Journal on Medicine Vol. 2, No. 3, July 2011
38
Application of analysis approach in Noise Estimation in Panoramic X-
rays images using image processing program (MatLab) Yousif Mohamed Yousif Abdallah*, Arwa Ahamed Almoustafa, Gehan Elhadi, Mamdouh Mohammed, Osman Khalafallah
& Tayseer Khalid
College of Medical Radiologic Science, Sudan University of Science and Technology, Khartoum, Sudan
Tel: +249911628004,+249126641065, Email [email protected]
Abstract — This research presented an appropriate
approach for the robust estimation of noise statistic in dental
panoramic x-rays images. To achieve maximum image quality
after denoising, a new, low order, local adaptive Gaussian
Scale Mixture model is presented, which accomplishes
nonlinearities from scattering. State of art methods use multi
scale filtering of images to reduce the irrelevant part of
information, based on generic estimation of noise. The usual
assumption of a distribution of Gaussian and Poisson
statistics only lead to overestimation of the noise variance in
regions of low intensity (small photon counts), but to
underestimation in regions of high intensity and therefore to
non-optional results. The analysis approach is tested on 50
samples from a database of 50 panoramic X-rays images and
the results are cross validated by medical experts.
In this thesis, prominent constraints are firstly preservation
of image's overall look; secondly preservation of the
diagnostic content in the image and thirdly detection of small
low contrast details in diagnostic content of the image. As
shown in previously, state of the art methods provide non-
convincing results. The new approach is funded on an attempt
to interpret the problem from the view of blind source
separation (BSS), thus to see the panoramic image as a simple
mixture of (unwanted) background information, diagnostic
information and noise.
Key Words — image quality, Noise, blind source separation,
matlab
I. INTRODUCTION
The “classic” 18-film intraoral radiograph examination of
the teeth is relatively comfortable for the patient, and the
overall radiation dose is generally acceptable; however, it is a
time-consuming endeavor, and in some cases provides a less-
than-optimum depiction of individual teeth. Nevertheless, it
offers valuable information as a basis for treatment planning, is
far superior to purely clinical observations, and often gives
impetus for more extensive examination strategies. Finally, the
18-film“full series” exam provides a sense of security for both
dentist and patient, and enhances confidence through
communication. On the other hand, clear radiographic
depiction of not only the teeth, but also the jaws, the
temporomandibular joints, and the alveolar lobes of the
maxillary sinuses will reduce the risk of an incomplete and
possibly incorrect examination, which in the worst-case
scenario could lead to malpractice. In this regard, the
panoramic radiograph always leads to a broadening of
horizons because it improves the dentist’s knowledge of
radiographic anatomy and thus improves her/his skill in
distinguishing between and among normal and pathologic
conditions. This, in conjunction with a better understanding of
the interrelationships of systemic medical problems and
dental/oral problems can open new avenues for treatment
planning (1)
.
The question of whether the treating dentist her/himself
actually takes the radiographs or delegates this task to
auxiliary personnel is really a question of responsibility for the
radiographic quality that is achieved, and the radiation dose
that this requires. If, for whatever reason, this assignment is
delegated, the person who bears the primary responsibility
must see to it that the auxiliary personnel are well-trained and
have received legal certification (2)
.
They must not only become expert in the production of
high-quality radiographs, but must also be knowledgeable
regarding the dental indications and the procedures for
protecting patients and staff from excessive radiation
exposure. Auxiliary dental personnel who are given the
responsibility of taking radiographs must remain current in all
continuing education standards in order to insure high
radiographic quality and the lowest possible radiation dose for
every patient. This is critical. An image defined as it may be
applied to a picture such as a photograph, a painting or a
sketch which has a real physical existence. But it may be also
being applied to an idea or concept which has a mental rather
than physical existence. If asked to imagine an object such as
apple, a mental image of an apple comes to mind. The
existence of this visual image helps us to grasp the concept of
an apple. Of course, a photograph of an apple represents only
one aspect of an apple: its visual appearance. It provides no
representation of the taste, smell or feel of the characteristics
of an apple which we remember from past experiences (3)
.
There are two components are superimposed in the image.
The presence of noise limits the amount of information which
can be extended from image. In particular, the finer details of
structure may be lost by being swamped by the effect of noise.
Canadian Journal on Medicine Vol. 2, No. 3, July 2011
39
Noise may see an unlikely term apply to a visual image which
is silent. The use of the term probably originates from radio
engineering, where the quality reception of radio signals is
often impaired by background noise (i.e. hisses and whistles),
particularly when the origin signal is rather weak and the radio
receiver is being used with maximum amplification. The effect
of such noise on the information communicated via a radio
link is very similar to the effect of noise on the information
carried by an image. Under optimum conditions the magnitude
of the signal is very much greater than the magnitude of the
noise. The signal-to-noise ratio is said to be high. Under
adverse conditions the signal-to-noise ratio is law, and much
information is lost. It is not uncommon for a radiographic
image to be fogged, perhaps due to an accidental exposure to
scattered radiation in X-ray room, or to poor conditions of
storage. When such a radiograph is examined its image
appears as viewed through a mist or fog. The information
content of the image is reduced. Some information is lost
entirely, whilst that which remains is more difficult to see. The
fogging contains no information about the subject of
radiograph. Such fogging is an example of one form of image
noise. Another type of noise may be seen on a television
image. In this case, the image appears as if viewed through a
snowstorm. The screen display a very large number of small
white specks which appear superimposed on the image. Again,
the effect is to reduce the information content of the image.
Such as appearance may be due to inferior design of the
electronic circuitry employed, causing electronic noise.
However, in many cases the basic is that the signal being
displayed is too weak, and those speaks represent the absence
of information, rather like the spaces left by missing pieces in
a jigsaw puzzle. It is possible for a similar effect to occur in
the image on a radiograph, expect that in this case the image
appears to have a large number of very small black specks
superimposed on it, giving it a grainy or mottled appearance
commonly known as quantum mottle or quantum noise. To be
able to identify a feature on an image, it must appear different
its surroundings. On a radiograph, a structure must be of a
different optical density (shade of grey) from adjacent
structures. On television image, the structure must be of a
different luminance (brightness). The term contrast is used to
describe these differences are small; it is difficult to identify
the structure will stand out well from its surroundings and it is
said the contrast is high (good). If the differences are small, it
is difficult to identify the structure against its background. The
contrast is said to be low (poor) (3).
II. QUANTITATIVE IMAGE ANALYSIS
This is the fastest growing application area of medical
workstations. The number of applications is vast, every major
vendor has research activities in this area, and many research
institutes are active. To quote from the scope of ‘Medical
Image Analysis’, one of the most influential scientific journals
in the field: “The journal is interested in approaches that utilize
biomedical image datasets at all spatial scales, ranging from
molecular/cellular imaging to tissue / organ imaging. While
not limited to these alone, the typical biomedical image
datasets of interest include those acquired from: magnetic
resonance, ultrasound, computed tomography, nuclear
medicine, X-ray, optical and confocal microscopy, video and
range data images. The types of papers accepted include those
that cover the development and implementation of algorithms
and strategies based on the use of various models (geometrical,
statistical, physical, functional, etc.) to solve the following
types of problems, using biomedical image datasets:
representation of pictorial data, visualization, feature
extraction, segmentation, inter-study and inter-subject
registration, longitudinal / temporal studies, image-guided
surgery and intervention, texture, shape and motion
measurements, spectral analysis, digital anatomical atlases,
statistical shape analysis, computational anatomy (modeling
normal anatomy and its variations), computational physiology
(modeling organs and living systems for image analysis,
simulation and training), virtual and augmented reality for
therapy planning and guidance, telemedicine with medical
images, telepresence in medicine, telesurgery and image-
guided medical robots, etc.” (4)
Segmentation is a basic necessity for many subsequent
viewing or analysis applications. Mostly thresholding and
2D/3D region growing are applied, but these often do not give
the required result. Proper segmentation is notoriously
difficult. There are dozens of techniques, such as model-based
segmentation, methods based on statistical shape variations
(‘active shape models’), clustering methods in a high-
dimensional feature space (e.g. for textures), histogram-based
methods, physical models of contours (‘snakes’, level sets),
region-growing methods, graph partitioning methods, and
multiscale segmentation. The current feeling is that fully
automated segmentation is a long way off, and a mix should be
made between some (limited, initial) user-interaction (semi-
automatic segmentation). Feature detection is the finding of
specific landmarks in the image, such as edges, corners, T-
junctions, highest curvature points, etc. The most often used
mathematical technique is multi-scale differential geometry (5)
.
It is interesting that the early stages of the human visual
perception system seem to employ this strategy. Image
enhancement is done by calculating specific properties which
then stand out relative to the (often noisy) background.
Examples are the likeness of voxels to a cylindrical structure
by curvature relations (‘vesselness’), edge preserving
smoothing, coherence enhancing, tensor voting, etc.
Commercial applications are, e.g. MUSICA (‘Multi-Scale
Image Contrast Amplification’, by Agfa), and the Swedish
Context Vision Enhancement is often used to cancel the noise
increasing effects of substantially lowering the X-ray dose,
such as in fluoroscopy and CT screening for virtual
colonoscopy. Quantitative MRI is possible by calculating the
real T1 and T2 figures from the T1 and T2 weighted
Canadian Journal on Medicine Vol. 2, No. 3, July 2011
40
acquisitions, using the Bloch equation of MRI physics. Multi-
modal MRI scans can be exploited for tissue classification:
when different MRI techniques are applied to the same
volume, each voxel is measured with a different physical
property, and a feature space can be constructed with the
physical units along the dimensional axes: e.g. in the
characterization of tissue types in atherosclerotic lesions with
T1, T2 and proton density weighted acquisitions, fat pixels
tend to cluster, as do blood voxels, muscle voxels, calcified
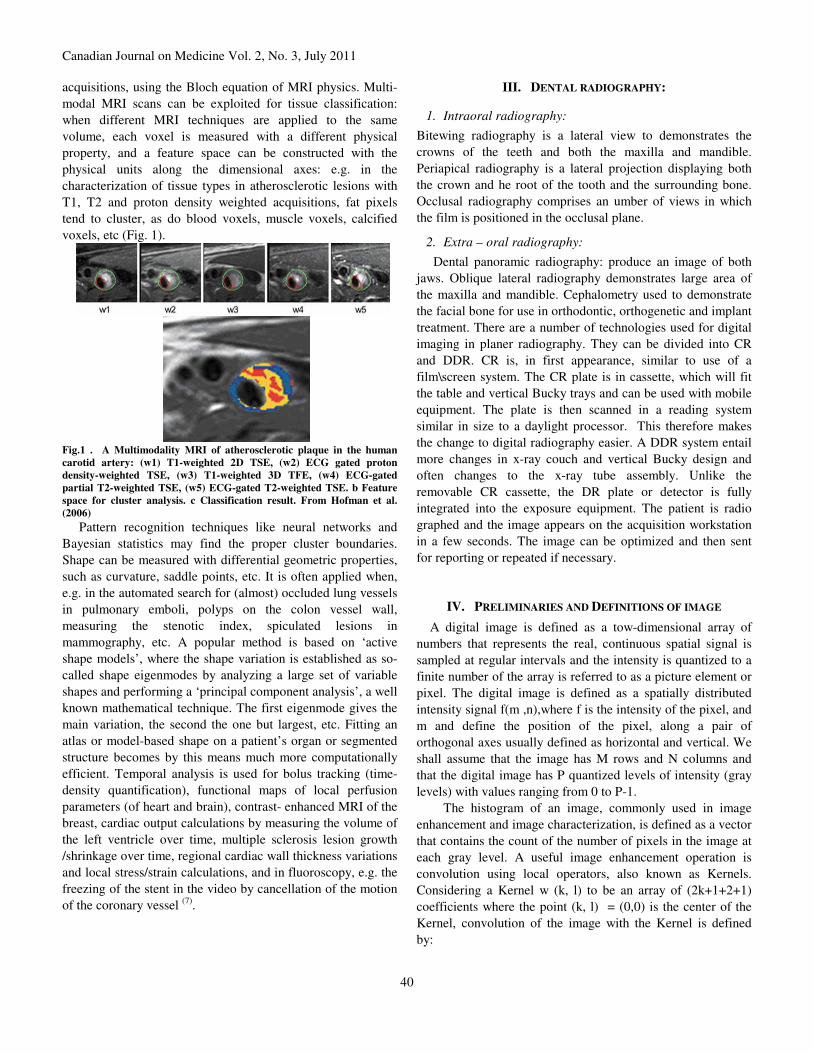
voxels, etc (Fig. 1).
Fig.1 . A Multimodality MRI of atherosclerotic plaque in the human
carotid artery: (w1) T1-weighted 2D TSE, (w2) ECG gated proton
density-weighted TSE, (w3) T1-weighted 3D TFE, (w4) ECG-gated
partial T2-weighted TSE, (w5) ECG-gated T2-weighted TSE. b Feature
space for cluster analysis. c Classification result. From Hofman et al.
(2006)
Pattern recognition techniques like neural networks and
Bayesian statistics may find the proper cluster boundaries.
Shape can be measured with differential geometric properties,
such as curvature, saddle points, etc. It is often applied when,
e.g. in the automated search for (almost) occluded lung vessels
in pulmonary emboli, polyps on the colon vessel wall,
measuring the stenotic index, spiculated lesions in
mammography, etc. A popular method is based on ‘active
shape models’, where the shape variation is established as so-
called shape eigenmodes by analyzing a large set of variable
shapes and performing a ‘principal component analysis’, a well
known mathematical technique. The first eigenmode gives the
main variation, the second the one but largest, etc. Fitting an
atlas or model-based shape on a patient’s organ or segmented
structure becomes by this means much more computationally
efficient. Temporal analysis is used for bolus tracking (time-
density quantification), functional maps of local perfusion
parameters (of heart and brain), contrast- enhanced MRI of the
breast, cardiac output calculations by measuring the volume of
the left ventricle over time, multiple sclerosis lesion growth
/shrinkage over time, regional cardiac wall thickness variations
and local stress/strain calculations, and in fluoroscopy, e.g. the
freezing of the stent in the video by cancellation of the motion
of the coronary vessel (7)
.
III. DENTAL RADIOGRAPHY:
1. Intraoral radiography:
Bitewing radiography is a lateral view to demonstrates the
crowns of the teeth and both the maxilla and mandible.
Periapical radiography is a lateral projection displaying both
the crown and he root of the tooth and the surrounding bone.
Occlusal radiography comprises an umber of views in which
the film is positioned in the occlusal plane.
2. Extra – oral radiography:
Dental panoramic radiography: produce an image of both
jaws. Oblique lateral radiography demonstrates large area of
the maxilla and mandible. Cephalometry used to demonstrate
the facial bone for use in orthodontic, orthogenetic and implant
treatment. There are a number of technologies used for digital
imaging in planer radiography. They can be divided into CR
and DDR. CR is, in first appearance, similar to use of a
film\screen system. The CR plate is in cassette, which will fit
the table and vertical Bucky trays and can be used with mobile
equipment. The plate is then scanned in a reading system
similar in size to a daylight processor. This therefore makes
the change to digital radiography easier. A DDR system entail
more changes in x-ray couch and vertical Bucky design and
often changes to the x-ray tube assembly. Unlike the
removable CR cassette, the DR plate or detector is fully
integrated into the exposure equipment. The patient is radio
graphed and the image appears on the acquisition workstation
in a few seconds. The image can be optimized and then sent
for reporting or repeated if necessary.
IV. PRELIMINARIES AND DEFINITIONS OF IMAGE
A digital image is defined as a tow-dimensional array of
numbers that represents the real, continuous spatial signal is
sampled at regular intervals and the intensity is quantized to a
finite number of the array is referred to as a picture element or
pixel. The digital image is defined as a spatially distributed
intensity signal f(m ,n),where f is the intensity of the pixel, and
m and define the position of the pixel, along a pair of
orthogonal axes usually defined as horizontal and vertical. We
shall assume that the image has M rows and N columns and
that the digital image has P quantized levels of intensity (gray
levels) with values ranging from 0 to P-1.
The histogram of an image, commonly used in image
enhancement and image characterization, is defined as a vector
that contains the count of the number of pixels in the image at
each gray level. A useful image enhancement operation is
convolution using local operators, also known as Kernels.
Considering a Kernel w (k, l) to be an array of (2k+1+2+1)
coefficients where the point (k, l) = (0,0) is the center of the
Kernel, convolution of the image with the Kernel is defined
by:
Canadian Journal on Medicine Vol. 2, No. 3, July 2011
41
G(m, n) = w(k, l) * f(m, n) (1)
Where G(m, n) is the out come of the convolution or out put
image. To convolute an image with a kernel, the kernel is
centered on an image pixel (m, n), the point-by-point products
of the kernel coefficients and corresponding image pixels are
obtained, and the subsequent summation of these products is
used as the pixel value of the out put image g (m, n) is
obtained by operating the same operation on an pixels of
original image. A convolution kernel can be applied to an
image in order to effect of specific enhancement operation or
change in the image characteristics. This typically results in
desirable attributes being amplified an d undesirable attributes
being suppressed. The specific values of the kernel coefficients
depend on the different types of enhancement that may be
desired. Attention is needed at the boundaries of the image
where parts of the kernel extend beyond the input image. One
approach is to simply use the portion of the kernel that
overlaps the input image. This approach can, however, lead to
artifacts in the boundaries of the out put image. The Fourier
transform F (u, v) of an image f(m, n) is defined as Where u
and v are the spatial frequency parameters. The Fourier
transform provides the spectral representations of an image,
which can be modified to enhance desired properties. The
forward or inverse Fourier transform of an N×N image,
computed directly with the preceding definitions, requires a
number of complex multiplications and additions proportional
to N2. By decomposing the expressions and eliminating
redundancies, the fast Fourier transform (FFT) algorithm
reduces the number of operations to the order of N
NLog2N (2)
The computational advantage of the FFT is significant and
increases with increasing N. when N =64 the number of
operation are reduced by an order of magnitude and when N =
1024, by two orders of magnitudes (3)
.
V. PIXEL OPERATIONS:
In this section we present methods of image enhancement that
depend only up on the pixel gray level and don’t take in to
account the pixel neighborhood or whole image
characteristics. Compensation for Nonlinear Characteristics of
Display or print Media Digital images are generally displayed
on cathode ray tube (CRT) type display systems or printed
using some type of photographic emulsion. Most display
mechanisms have non-linear intensity characteristics that result
in a non-linear intensity profile of the image when it is
observed on the display. This effect can be described
succinctly by the equation
e(m, n) = c(m, n) (3) where f(m, n) is the acquired intensity image, e(m, n)
represents the actual intensity output by the display system, in
order to correct for the nonlinear characteristics of the display,
a transform that is the inverse of the displays nonlinearity must
be applied.
G(m, n)= T(e(m, n))≈ C-1
(c(m, n)) (4)
G(m, n) ≈ f(m, n)
Where T () is a nonlinear operator which is approximately
equal to C-1
(), the inverse of the display system operator, and
G (m, n) is the output image. Determination of the
characteristics of the nonlinearity could be difficult in practice.
In general, if a linear intensity wedge is imaged, one can
obtain a test image that captures the complete intensity scale of
the image acquisition system. However, an intensity
measurement device that is linear is then required to assess the
output of the display system, in order to determine its actual
nonlinear characteristics. Intensity scaling is the method of
image enhancement that can be used when the dynamic range
of the acquired image data significantly exceeds the
characteristics of the display system, or vice versa. It may also
be the case that image information is present in specific narrow
intensity bands that may be of special interest to the observer.
Intensity scaling allows the observer to focus on specific
intensity bands in the image by modifying the image such that
the intensity band of interest spans the dynamic range of the
display.
For example, if f1 and f2 are known to define the intensity
band of interest, a scaling transformation may be defined as
e= (5)
. (f max)
Where e is an intermediate image, g is the output image, and f
max is maximum intensity of the display. These operation may
be seen through the images present an image with details in the
intensity band from 90 to 170 that may be of interest to, for
example a gum specialist. The image, however, is displayed
such that all gray level in the range 0 to 255 is seen (3)
.
Although intensity scaling can be very effective in enhancing
image information present in specific intensity bands, often
information is not available a priori to identify the use full
intensity bands. In such cases, it may be more use full to
maximize the information conveyed from the image to the user
by distributing the intensity information in the image as
uniformly as possible over the available intensity band. This
approach is based on the approximate realization of

Canadian Journal on Medicine Vol. 2, No. 3, July 2011
42
information – theoretic approach in which the normalized
histogram of the image is interpreted as the probability density
function of the intensity of the image. In histogram
equalization, the histogram of the input image is mapped to a
new maximally- flat histogram. The histogram is defined as
h(i), with 0 to p-1 gray levels in the image. The total number
of pixels in the image, M*N, is also the sum of all the values in
h(i). Thus, in order to distribute most uniformly the intensity
profile of the image, each bin of the histogram should have a
pixel count of (M*N)/p. It is, in general, possible to move the
pixel with a given intensity to another one, resulting in an
increase in the pixel count in the new intensity bin. On the
other hand, there is no acceptable way to reduce or divide the
pixel count at a specific intensity in order to reduce the pixel
count to the desired (M*N) /P. In order to achieve
approximate uniformity, the average value of the pixel count
over a number of pixel values can be made close to the
uniform level.
A simple and readily available procedure for distribution
of the pixels in the image is based in the normalized
cumulative histogram, defined as
H (j) = 1/M. N , j=0,1,… p – 1. (6)
The normalized cumulative histogram can be used as a
mapping between the original gray levels in the image and the
new gray levels required for enhancement. The enhanced
image g(m, n) will have a maximally uniform histogram if it is
defined as
G (m, n)= (p-1). H (f(m, n)) (7)
Local operators enhance the image by providing a new value
for each pixel in a manner that depends only on those pixels
and others in neighborhood around it. Many local operators
are linear spatial filters implemented with the kernel
convolution, some are non linear operators, and other imparts
histogram equalization with in a neighborhood. In this section
we present a set of established standard filters commonly used
for enhancement. These can be easily extended to obtain
slightly modified results by increasing the size of the
neighborhood while maintaining the structure and function of
the operator (8)
.
A) Noise Suppression by Mean Filtering
Mean filtering can be achieved by convolving the image with
(2K+1×2L+1) Kernel where each coefficient has a value equal
to the reciprocal of the number of coefficients in the Kernel.
For example, L=K=1, we obtain
W (k, l) =,
Referred to as the 3×3 averaging kernel or mask. Typically,
this type of smoothing reduces noise in the image, but at the
expense of the sharpness of edges [4, 5, 12, 13]. Note that the
size of the kernel is a critical factor in the successful
application of this type of enhancement. Image details that are
small relative to the size of the kernel are significantly
suppressed, while image details are significantly larger than
the kernel size are affected moderately. The degree of noise
suppression is related to the size of the kernel, with greater
suppression achieved by larger kernels. B) Noise Suppression by Median Filtering
Median filtering is a common nonlinear method for noise
suppression that has unique characteristics. It does not use
convolution to process the image with a kernel of coefficients.
Rather, in each position of the kernel frame, a pixel of the
input image contained in the frame is selected to be out put
pixel located at the coordinates of the kernel center. The kernel
frame is centered on each pixel (m, n) of the original image,
and the median value of pixels with in the kernel frame is
computed. The pixel at the coordinates (m, n) of the out put
image is set to this median value. In general, median filters
don’t have the same smoothing characteristics as the mean
filter [4,5,8,9,15]. Features that are smaller than half the size
of the median filter kernel are completely removed by the
filter. Large discontinuities such as edges and large changes in
image intensity are not affected in terms of gray level intensity
by the median filter, although their positions may be shifted by
a few pixels. This nonlinear operation of the median filter
allows significant reduction of specific types of noise. For
example, "shot noise" may be removed completely from an
image without attenuation of significant edges or image
characteristics.
C) Edge Enhancement
Edge enhancement in images is of unique importance because
the human visual system uses edges as a key factor in the
comprehension of the contents of an image. Edges in different
orientations can be selectively identified and enhanced. The
edge-n enhanced images may be combined with the original
image in order to preserve the context. Horizontal edges and
lines are enhanced with image can result in an output image
with both positive and negative values. An enhanced image
with only positive pixels can be obtained either by adding an
offset or by taking the absolute value of each pixel in the
output image. If we are interested in displaying edge – only
information, this may be a good approach. On the other hand,
if we are interested in enhancing edges that are consistent with
kernel and suppressing those that or not, the output image may
be added to the original input image. This addition will most
likely result in a nonnegative image. Edge enhancement
Canadian Journal on Medicine Vol. 2, No. 3, July 2011
43
appears to provide greater contrast than the original imagery
when diagnosis pathologies. Edges can be enhanced with
several edge operators other than those just mentioned and
illustrated (3)
.
D) Local- Area Histogram Equalization
A remarkably effective method of image enhancement is local-
area histogram equalization, obtained with a modification of
the pixel operation. Local area histogram equalization applies
the concepts of the whole- image histogram equalization to
small, overlapping local areas of the image. It is a nonlinear
operation and significantly increases the observability of subtle
features in the image. The method formulated as shown next is
applied at each pixel (m, n) of the input image. Local –area
histogram equalization is a computationally intensive
enhancement technique. The computational complexity of the
algorithm goes up as the square of the size of the kernel. It
should be noted that since the transformation that is applied to
the image depends on the local neighborhood only, each pixel
is transformed in a unique way. This results in higher visibility
for hidden details spanning very few pixels in relation to the
size of the full image. A significant limitation of this method is
that the mapping between the input and the output images is
nonlinear and highly no monotonic. This means that it is no
appropriate to make quantitative measurements of pixel
intensity on the output image, as the same gray level may be
transformed one way in one part of the image and a completely
different way in another part (4)
.
E) Noise Suppression by Image Averaging
Noise suppression using image averaging relies on three basic
assumptions; firstly; that a relatively large number of input
images are available, secondly; that each input images has
been corrupted by the same type of additive noise, and thirdly;
that the additive noise is random with zero mean value and
independent of the image. When assumptions hold, it may be
advantageous to acquire multiple images with the specific
purpose of using image averaging since with this approach
even severely corrupted images can be significantly enhanced
F) Change Enhancement by Image Subtraction
Image subtraction is generally performed between two images
that are not captured under the same or very similar condition
may need to be registered this may be the case if the images
have been acquired at different times or under different setting.
The output image may be have a very small dynamic range and
may need to be rescaled to the available display range given
tow image (7)
.
VI. NOISE
Noise injects a random or stochastic component into an image
many sources of noise in an image, noise add or subtracts to a
measurement value such that the recorded measurement differs
the actual value mean:
Standard deviation - measure of variability, either naturally
occurring or random fluctuation.
Gaussian Probability Distribution Function
e.g., the height of 1000 third grade school children.
Plot a histogram.
In Gaussian (normal) distribution, the mean describes where
the center of the curve is positioned alone the X- axis and
standard deviation governs how wide the bell curve is, many
commonly encountered measurements of people and things
make for this kind of normal distribution (Gaussian)
Gaussian probability density function
Generic Gaussian PDF with mean =100 and STDev=20
Probability of observing an observation in a range : integrate
area (forG):
1σ=68%
2σ=95 %
3σ=99%
Error bars and confidence intervals are plotted to include
2σ=95%.
VII. MATERIALS AND METHODS
This study was conduct in College of Medical Radiological
Sciences - Khartoum Dental Center and Elnasery Dental Clinic
in period of March 2011 to June 2011. For panoramic images
each film will scan using digitizer scanner then treat by using
image processing program (MatLab), where the enhancement
and contrast of the image was determined. The scanned image
was saved in a TIFF file format to preserve the quality of the
image. The data analyzed used to enhance the contrast within
the soft tissues, the gray levels which can be redistributed both
linearly and nonlinearly using the gray level frequencies and
noise estimation of the original panoramic images.
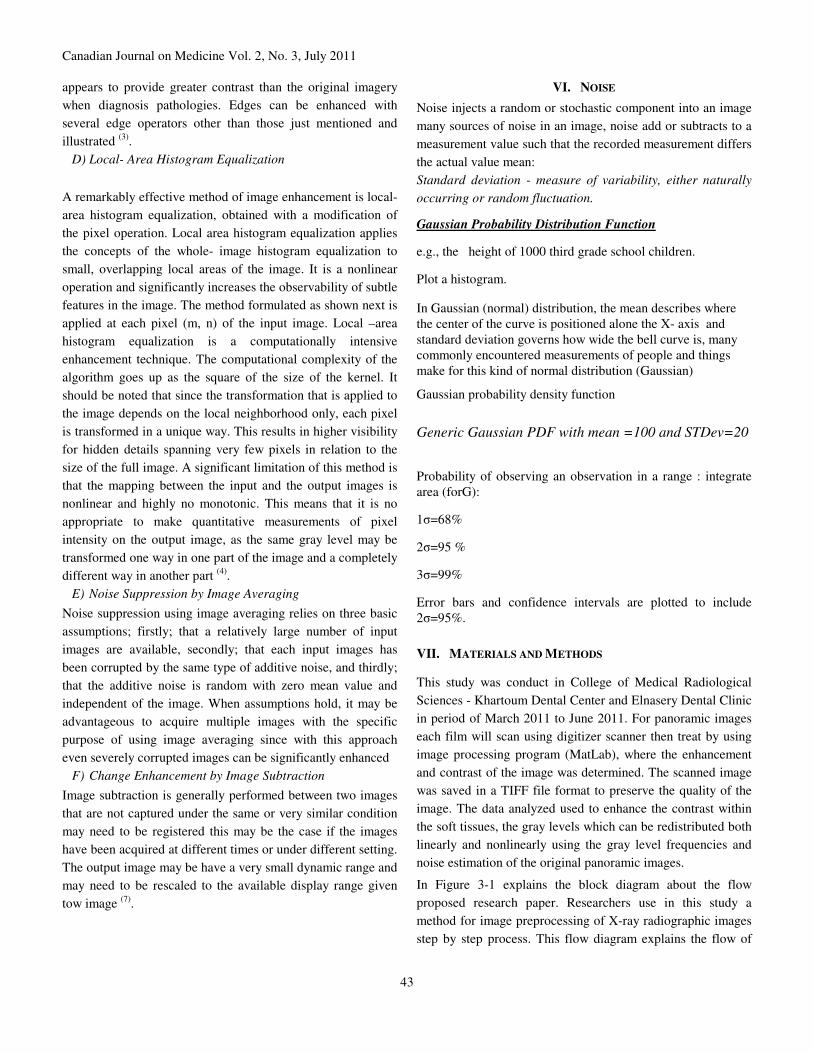
In Figure 3-1 explains the block diagram about the flow
proposed research paper. Researchers use in this study a
method for image preprocessing of X-ray radiographic images
step by step process. This flow diagram explains the flow of
Canadian Journal on Medicine Vol. 2, No. 3, July 2011
44
work. Collecting the X-ray images from Govt. Hospitals and
converting this image RGB into Gray color.
Figure 1. Flow chart of image analysis
Panoramic images were filtered by two different filtering
algorithms. The filtering algorithms are used for anisotropic
filtering and median filtering algorithm. The output results
were compared in PSNR and MSE values. The output of
filtering image applied for Image enhancement. That given
image improves the subjective quality of contrast, noise
reduction and edge sharpening. The targets for image
enhancing are better contrast, sharpness of detail and visibility
of features. Several algorithms are Histogram Equalization
(CLAHE). Here researchers applied contrast limited adaptive
histogram equalization algorithm. The best PSNR value of X-
ray image output is given into input of Contrast Limited
Adaptive Histogram Equalization (CLAHE) The data analyzed
by using statistical package, Statistical Package for Social
Studies (SPSS) under windows using t test to measure the
significant difference between contrast within the soft tissues,
the gray levels in both enhanced and unenhanced images and
noise variance (10).
VIII. THE RESULTS
This is an experimental study deals with propose a new
approach for independently identically Distributes (IID) noise
in panoramic images and reduction of the redundancy in the
image data using image processing technique (MatLab version
R2009a). In addition to highlight the role of the proposed
approach (noise variance) by preservation of the image's
overall look, preservation of the diagnostic content in the
image and detection of small and low contrast details in the
diagnostic content of the image and to highlight the role of
using image processing technique in Radiology. The target
population amount for this study was 50 patients present at the
area of the study Table 1.
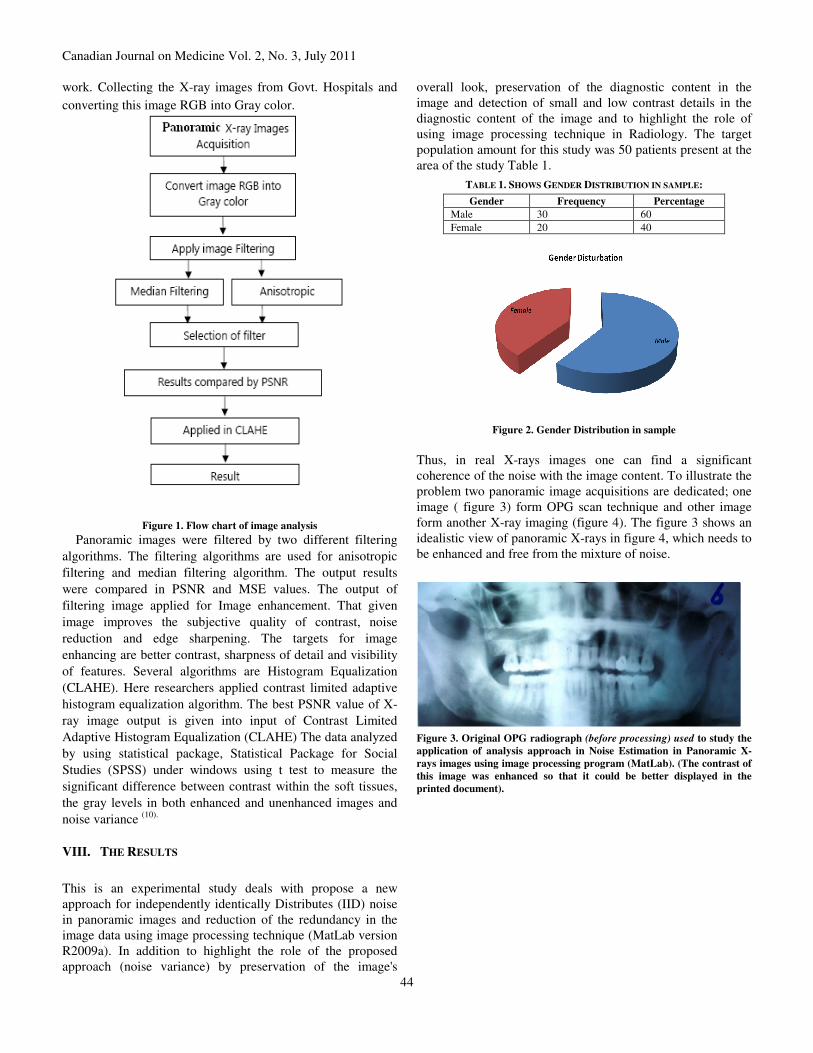
TABLE 1. SHOWS GENDER DISTRIBUTION IN SAMPLE:
Gender Frequency Percentage
Male 30 60
Female 20 40
Figure 2. Gender Distribution in sample
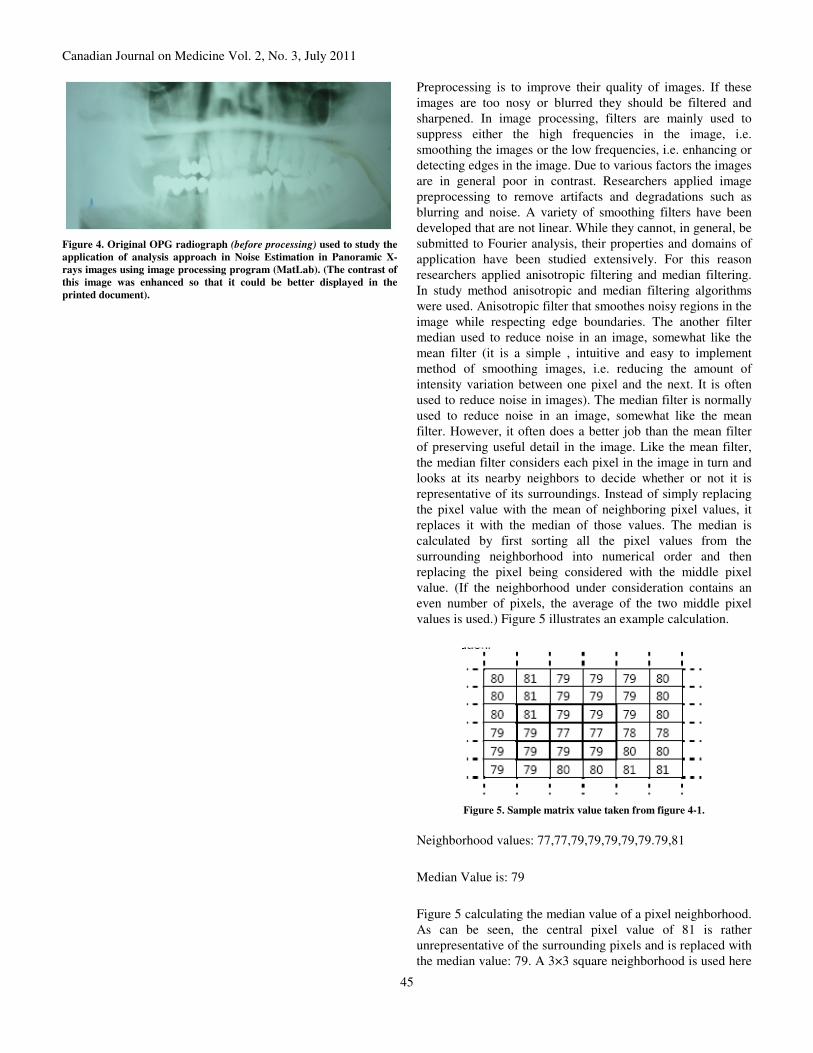
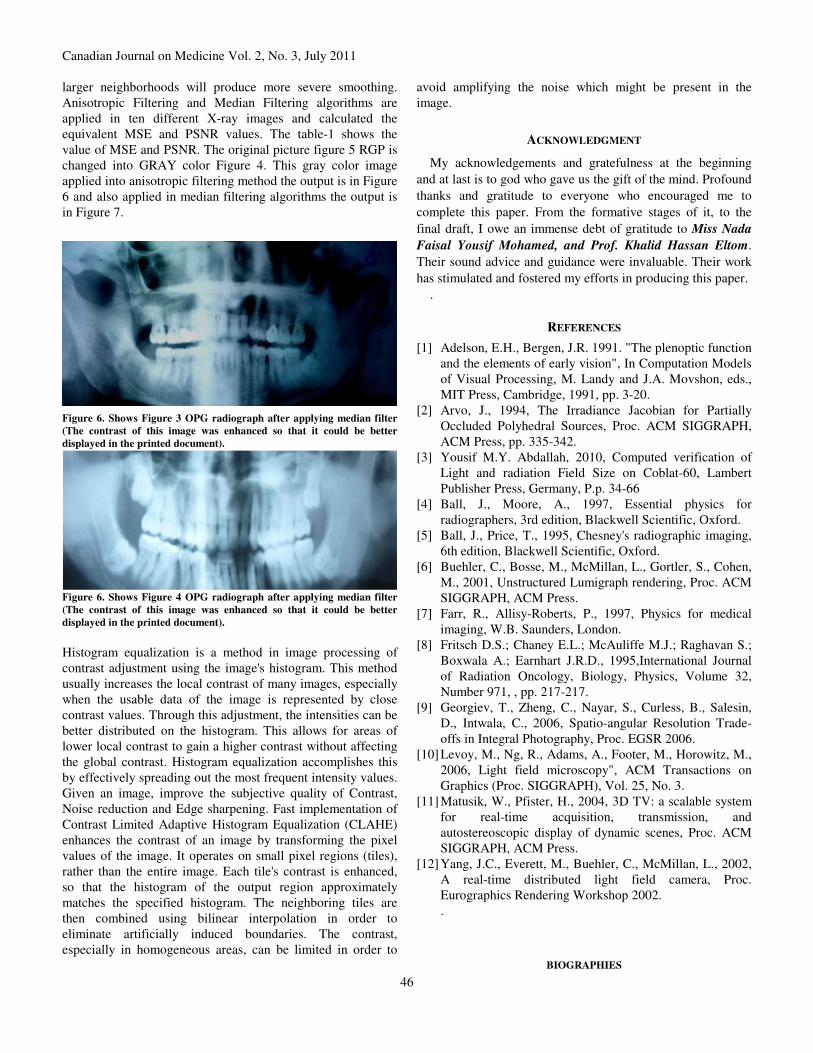
Thus, in real X-rays images one can find a significant
coherence of the noise with the image content. To illustrate the
problem two panoramic image acquisitions are dedicated; one
image ( figure 3) form OPG scan technique and other image
form another X-ray imaging (figure 4). The figure 3 shows an
idealistic view of panoramic X-rays in figure 4, which needs to
be enhanced and free from the mixture of noise.
Figure 3. Original OPG radiograph (before processing) used to study the
application of analysis approach in Noise Estimation in Panoramic X-
rays images using image processing program (MatLab). (The contrast of
this image was enhanced so that it could be better displayed in the
printed document).
Canadian Journal on Medicine Vol. 2, No. 3, July 2011
45
Figure 4. Original OPG radiograph (before processing) used to study the
application of analysis approach in Noise Estimation in Panoramic X-
rays images using image processing program (MatLab). (The contrast of
this image was enhanced so that it could be better displayed in the
printed document).
Preprocessing is to improve their quality of images. If these
images are too nosy or blurred they should be filtered and
sharpened. In image processing, filters are mainly used to
suppress either the high frequencies in the image, i.e.
smoothing the images or the low frequencies, i.e. enhancing or
detecting edges in the image. Due to various factors the images
are in general poor in contrast. Researchers applied image
preprocessing to remove artifacts and degradations such as
blurring and noise. A variety of smoothing filters have been
developed that are not linear. While they cannot, in general, be
submitted to Fourier analysis, their properties and domains of
application have been studied extensively. For this reason
researchers applied anisotropic filtering and median filtering.
In study method anisotropic and median filtering algorithms
were used. Anisotropic filter that smoothes noisy regions in the
image while respecting edge boundaries. The another filter
median used to reduce noise in an image, somewhat like the
mean filter (it is a simple , intuitive and easy to implement
method of smoothing images, i.e. reducing the amount of
intensity variation between one pixel and the next. It is often
used to reduce noise in images). The median filter is normally
used to reduce noise in an image, somewhat like the mean
filter. However, it often does a better job than the mean filter
of preserving useful detail in the image. Like the mean filter,
the median filter considers each pixel in the image in turn and
looks at its nearby neighbors to decide whether or not it is
representative of its surroundings. Instead of simply replacing
the pixel value with the mean of neighboring pixel values, it
replaces it with the median of those values. The median is
calculated by first sorting all the pixel values from the
surrounding neighborhood into numerical order and then
replacing the pixel being considered with the middle pixel
value. (If the neighborhood under consideration contains an
even number of pixels, the average of the two middle pixel
values is used.) Figure 5 illustrates an example calculation.
Figure 5. Sample matrix value taken from figure 4-1.
Neighborhood values: 77,77,79,79,79,79,79.79,81
Median Value is: 79
Figure 5 calculating the median value of a pixel neighborhood.
As can be seen, the central pixel value of 81 is rather
unrepresentative of the surrounding pixels and is replaced with
the median value: 79. A 3×3 square neighborhood is used here
Canadian Journal on Medicine Vol. 2, No. 3, July 2011
46
larger neighborhoods will produce more severe smoothing.
Anisotropic Filtering and Median Filtering algorithms are
applied in ten different X-ray images and calculated the
equivalent MSE and PSNR values. The table-1 shows the
value of MSE and PSNR. The original picture figure 5 RGP is
changed into GRAY color Figure 4. This gray color image
applied into anisotropic filtering method the output is in Figure
6 and also applied in median filtering algorithms the output is
in Figure 7.
Figure 6. Shows Figure 3 OPG radiograph after applying median filter
(The contrast of this image was enhanced so that it could be better
displayed in the printed document).
Figure 6. Shows Figure 4 OPG radiograph after applying median filter
(The contrast of this image was enhanced so that it could be better
displayed in the printed document).
Histogram equalization is a method in image processing of
contrast adjustment using the image's histogram. This method
usually increases the local contrast of many images, especially
when the usable data of the image is represented by close
contrast values. Through this adjustment, the intensities can be
better distributed on the histogram. This allows for areas of
lower local contrast to gain a higher contrast without affecting
the global contrast. Histogram equalization accomplishes this
by effectively spreading out the most frequent intensity values.
Given an image, improve the subjective quality of Contrast,
Noise reduction and Edge sharpening. Fast implementation of
Contrast Limited Adaptive Histogram Equalization (CLAHE)
enhances the contrast of an image by transforming the pixel
values of the image. It operates on small pixel regions (tiles),
rather than the entire image. Each tile's contrast is enhanced,
so that the histogram of the output region approximately
matches the specified histogram. The neighboring tiles are
then combined using bilinear interpolation in order to
eliminate artificially induced boundaries. The contrast,
especially in homogeneous areas, can be limited in order to
avoid amplifying the noise which might be present in the
image.
ACKNOWLEDGMENT
My acknowledgements and gratefulness at the beginning
and at last is to god who gave us the gift of the mind. Profound
thanks and gratitude to everyone who encouraged me to
complete this paper. From the formative stages of it, to the
final draft, I owe an immense debt of gratitude to Miss Nada
Faisal Yousif Mohamed, and Prof. Khalid Hassan Eltom.
Their sound advice and guidance were invaluable. Their work
has stimulated and fostered my efforts in producing this paper. .
REFERENCES
[1] Adelson, E.H., Bergen, J.R. 1991. "The plenoptic function
and the elements of early vision", In Computation Models
of Visual Processing, M. Landy and J.A. Movshon, eds.,
MIT Press, Cambridge, 1991, pp. 3-20.
[2] Arvo, J., 1994, The Irradiance Jacobian for Partially
Occluded Polyhedral Sources, Proc. ACM SIGGRAPH,
ACM Press, pp. 335-342.
[3] Yousif M.Y. Abdallah, 2010, Computed verification of
Light and radiation Field Size on Coblat-60, Lambert
Publisher Press, Germany, P.p. 34-66
[4] Ball, J., Moore, A., 1997, Essential physics for
radiographers, 3rd edition, Blackwell Scientific, Oxford.
[5] Ball, J., Price, T., 1995, Chesney's radiographic imaging,
6th edition, Blackwell Scientific, Oxford.
[6] Buehler, C., Bosse, M., McMillan, L., Gortler, S., Cohen,
M., 2001, Unstructured Lumigraph rendering, Proc. ACM
SIGGRAPH, ACM Press.
[7] Farr, R., Allisy-Roberts, P., 1997, Physics for medical
imaging, W.B. Saunders, London.
[8] Fritsch D.S.; Chaney E.L.; McAuliffe M.J.; Raghavan S.;
Boxwala A.; Earnhart J.R.D., 1995,International Journal
of Radiation Oncology, Biology, Physics, Volume 32,
Number 971, , pp. 217-217.
[9] Georgiev, T., Zheng, C., Nayar, S., Curless, B., Salesin,
D., Intwala, C., 2006, Spatio-angular Resolution Trade-
offs in Integral Photography, Proc. EGSR 2006.
[10] Levoy, M., Ng, R., Adams, A., Footer, M., Horowitz, M.,
2006, Light field microscopy", ACM Transactions on
Graphics (Proc. SIGGRAPH), Vol. 25, No. 3.
[11] Matusik, W., Pfister, H., 2004, 3D TV: a scalable system
for real-time acquisition, transmission, and
autostereoscopic display of dynamic scenes, Proc. ACM
SIGGRAPH, ACM Press.
[12] Yang, J.C., Everett, M., Buehler, C., McMillan, L., 2002,
A real-time distributed light field camera, Proc.
Eurographics Rendering Workshop 2002.
.
BIOGRAPHIES
Canadian Journal on Medicine Vol. 2, No. 3, July 2011
47
DR. YOUSIF MOHAMED YOUSIF ABDALLAH
Job position: B.Sc, M.Sc., PhD RT (Student)
Lecturer & Radiotherapy Technician
Address: Radiotherapy & Nuclear Medicine
Department, College of Medical Radiological
College- Sudan University of Science and Technology-Crossing
elguish St. and Elshahid St,, Khartoum, Sudan
e-mail: [email protected], [email protected]
web: http://sustech.edu/Colleges/College of Medical Radiologic
Science/Staff
ARWA AHAMED ALMOUSTAFA
Date of Birth: 4/12/1992,
Place of birth: Khartoum (Sudan)
Civil Status: Single, Nationality: Sudanese
Address: Radiotherapy & Nuclear Medicine Department, College of
Medical Radiological College- Sudan University of Science and
Technology-Crossing elguish St. and Elshahid St,, Khartoum, Sudan
GEHAN ELHADI
Date of Birth: 17/10/1990,
Place of birth: Khartoum (Sudan)
Civil Status: Single, Nationality: Sudanese
Address: Diagnostic Radiology Department, College of Medical
Radiological College- Sudan University of Science and Technology-
Crossing elguish St. and Elshahid St,, Khartoum, Sudan
MAMDOUH MOHAMMED
Date of Birth: 3/7/1991,
Place of birth: Khartoum (Sudan)
Civil Status: Single, Nationality: Sudanese
Address: Diagnostic Radiology Department, College of Medical
Radiological College- Sudan University of Science and Technology-
Crossing elguish St. and Elshahid St,, Khartoum, Sudan
OSMAN KHALAFALLAH
Date of Birth: 2/2/1990,
Place of birth: Khartoum (Sudan)
Civil Status: Single, Nationality: Sudanese
Address: Radiotherapy & Nuclear Medicine Department, College of
Medical Radiological College- Sudan University of Science and
Technology-Crossing elguish St. and Elshahid St,, Khartoum, Sudan
TAYSEER KHALID
Date of Birth: 15/1/1992,
Place of birth: Khartoum (Sudan)
Civil Status: Single, Nationality: Sudanese
Address: Radiotherapy & Nuclear Medicine Department, College of
Medical Radiological College- Sudan University of Science and
Technology-Crossing elguish St. and Elshahid St,, Khartoum, Sudan
REFERENCES
PROF. KHALID HASSAN ELTOM
Date of Birth: 1/1/1930,
Place of birth: Khartoum (Sudan)
Civil Status: Married, Nationality: British
Job position: MBCB, DMRT, FRCR, Consultant Clinical
Oncologist
Address: Radiotherapy & Nuclear Medicine Department, College of
Medical Radiological College- Sudan University of Science and
Technology-Crossing elguish St. and Elshahid St,, Khartoum, Sudan
Mobile: +249-911628004, +249-126641065
e-mail: [email protected]
web: http://sustech.edu/Colleges/College of Medical Radiologic
Science/Staff
DR. MOHAMED ELFADIL MOHAMED GAR-ELNABI
Canadian Journal on Medicine Vol. 2, No. 3, July 2011
48
Date of Birth: 1/1/1964,
Place of birth: Khartoum (Sudan)
Civil Status: Married, Nationality: Sudanese
Job position: B.Sc, M.Sc., PhD (Med. Phy.), Head of
Radiotherapy and Nuclear Medicine Department
Address: Radiotherapy & Nuclear Medicine Department, College of
Medical Radiological College- Sudan University of Science and
Technology-Crossing elguish St. and Elshahid St,, Khartoum, Sudan
Mobile: +249-924773235
e-mail: [email protected]
web: http://sustech.edu/Colleges/College of Medical Radiologic
Science/Staff
ENG. AZIS-ELDIEN GAFAR MOHAMED
Date of Birth: 1/1/1974,
Place of birth: Khartoum (Sudan)
Civil Status: Single, Nationality: Sudanese
Job position: IT engineering, B.Sc, M.Sc., Computer Science
& Information Technology, Computer Science & Information
Technology Department,
Address: National Cancer Institute, University of Gazeria, Madani,
Sudan