Ergonomic Design and Evaluation of an Electric Nail Removal ...
Application of AHP in Development of
Multi-Criteria Ergonomic Approach for Choosing
the Optimal Alternative for Material Handling- A
Case Study and Software Development to
Facilitate AHP Calculation
Md. Fashiar Rahman, Md. Bony Amin, Mahmud Parvez Department of Industrial Engineering and Management
Khulna University of Engineering & Technology
Khulna-9203, Bangladesh
Abstract— Manual materials handling is a known risk in
industry period. There should be no argument. Manual
handling task are responsible for a large proportion of work
related injuries and long term health problems amongst worker
in manufacturing industry. The ergonomic systems design
model requires an analysis of the key characteristics of a job and
its component tasks before potential solutions can be identified.
The Analytic Hierarchy Process (AHP) is a multi-criteria
decision making (MCDM) method that helps the decision-maker
facing a complex problem with multiple conflicting and
subjective criteria The objective of this paper is to demonstrate
the application of the Analytic Hierarchy Process (AHP), a
popular multi-criteria decision support tool, in development of
multi-criteria ergonomic approach for the selection of (best)
material handling way in an industry and also introduce a
software which is able to calculate local priorities and
consistency ratio. One of the major problems that modern
companies have a significant source of worker absence and high
costs due to compensation claims due to risks involved in
manual load handling. The examples of factors that influence
the choice of material handling procedure include i.e.:
anthropometry and biomechanics.
Keywords—AHP, MCDM, Ergonomic, Material Handling,
Software development.
I. INTRODUCTION
The Analytic Hierarchy Process (AHP) is a popular
decision support method developed in the 1970s by American
mathematician, Thomas L. Saaty. Since then it has been used
in real environment, including business, healthcare, politics
and education. There are many organizations that applied this
method in making their decisions. For example, IBM used
AHP to design the AS/400 computer as part of its quality
improvement strategy, and win the Baldridge Quality Award
[1]. The Nuclear Regulatory Commission (NRC) of the US
applied AHP to allocate money in information technology
projects with many competing priorities. The Xerox
Company also used this method for similar purpose. The
AHP was chosen as a decision support tool in many political
and military applications, i.e. whether to build or not to build
the National Missile Defense system in 2002 [2]. Over the
last three decades, a number of methods have been developed
which use pairwise comparisons of the alternatives and
criteria for solving multi-criteria decision-making (MCDM)
between finite alternatives. The analytic hierarchy process
(AHP) proposed by Saaty is a very popular approach to
multi-criteria decision-making (MCDM) that involves
qualitative data. In the pairwise comparison method, criteria
and alternatives are presented in pairs of one or more referees
(e.g. experts or decision makers). It is necessary to evaluate
individual alternatives, deriving weights for the criteria,
constructing the overall rating of the alternatives and
identifying the best one [3].
II. PROBLEM MODELING
Manual handling is any transporting or supporting of a
load by one or more workers. It includes the following
activities: lifting, holding, putting down, pushing, pulling,
carrying or moving of a load. The main risk factors or
conditions associated with the development of injuries in
MMH tasks include [4]:
Awkward postures (e.g. bending, twisting);
Repetitive motions (e.g. frequent reaching, lifting,
carrying);
Forceful exertions (e.g. carrying or lifting heavy
loads);
Pressure points (e.g. grasping [or contact from]
loads, leaning against parts or surfaces that are hard
or have sharp edges);
Static postures (e.g. maintaining fixed positions for
long periods of time).
Vol. 3 Issue 6, June - 2014
International Journal of Engineering Research & Technology (IJERT)
IJERT
IJERT
ISSN: 2278-0181
www.ijert.orgIJERTV3IS060831
International Journal of Engineering Research & Technology (IJERT)
1064
Repeated or continual exposure to one or more of these
factors may initially lead to fatigue and injuries. Injuries can
include damage to muscles, tendons, ligaments, nerves, and
blood vessels. Repetitive high-exertion lifting is a major
contributor to injuries of the low back [5]. MMH activities
are a significant source of worker absence and high costs due
to compensation claims. To reduce the risks involved in
manual load handling, engineers specify the use of material
handling devices (MHDs) to eliminate or reduce the lifting
requirements in MMH in many industrial facilities. Among
the major MHDs mentioned are chain blocks, cranes, hoists,
industrial manipulators, jib cranes and overhead cranes [4].
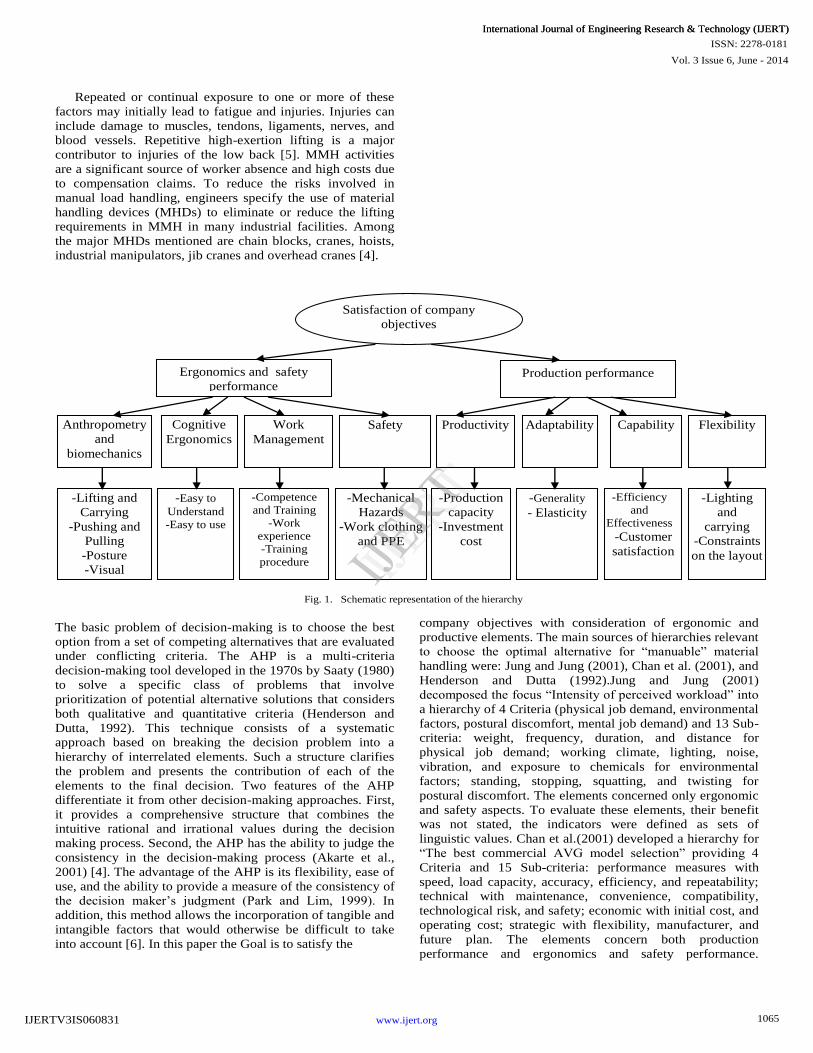
Fig. 1. Schematic representation of the hierarchy
The basic problem of decision-making is to choose the best
option from a set of competing alternatives that are evaluated
under conflicting criteria. The AHP is a multi-criteria
decision-making tool developed in the 1970s by Saaty (1980)
to solve a specific class of problems that involve
prioritization of potential alternative solutions that considers
both qualitative and quantitative criteria (Henderson and
Dutta, 1992). This technique consists of a systematic
approach based on breaking the decision problem into a
hierarchy of interrelated elements. Such a structure clarifies
the problem and presents the contribution of each of the
elements to the final decision. Two features of the AHP
differentiate it from other decision-making approaches. First,
it provides a comprehensive structure that combines the
intuitive rational and irrational values during the decision
making process. Second, the AHP has the ability to judge the
consistency in the decision-making process (Akarte et al.,
2001) [4]. The advantage of the AHP is its flexibility, ease of
use, and the ability to provide a measure of the consistency of
the decision maker’s judgment (Park and Lim, 1999). In
addition, this method allows the incorporation of tangible and
intangible factors that would otherwise be difficult to take
into account [6]. In this paper the Goal is to satisfy the
company objectives with consideration of ergonomic and
productive elements. The main sources of hierarchies relevant
to choose the optimal alternative for “manuable” material
handling were: Jung and Jung (2001), Chan et al. (2001), and
Henderson and Dutta (1992).Jung and Jung (2001)
decomposed the focus “Intensity of perceived workload” into
a hierarchy of 4 Criteria (physical job demand, environmental
factors, postural discomfort, mental job demand) and 13 Sub-
criteria: weight, frequency, duration, and distance for
physical job demand; working climate, lighting, noise,
vibration, and exposure to chemicals for environmental
factors; standing, stopping, squatting, and twisting for
postural discomfort. The elements concerned only ergonomic
and safety aspects. To evaluate these elements, their benefit
was not stated, the indicators were defined as sets of
linguistic values. Chan et al.(2001) developed a hierarchy for
“The best commercial AVG model selection” providing 4
Criteria and 15 Sub-criteria: performance measures with
speed, load capacity, accuracy, efficiency, and repeatability;
technical with maintenance, convenience, compatibility,
technological risk, and safety; economic with initial cost, and
operating cost; strategic with flexibility, manufacturer, and
future plan. The elements concern both production
performance and ergonomics and safety performance.
Satisfaction of company
objectives
Ergonomics and safety
performance Production performance
Cognitive
Ergonomics
Work
Management
Safety Productivity Adaptability Capability Flexibility Anthropometry
and
biomechanics
-Easy to
Understand
-Easy to use
-Competence
and Training
-Work
experience
-Training
procedure
-Mechanical
Hazards
-Work clothing
and PPE
-Production
capacity
-Investment
cost
-Generality
- Elasticity
-Efficiency
and
Effectiveness
-Customer
satisfaction
-Lighting
and
carrying
-Constraints
on the layout
-Lifting and
Carrying
-Pushing and
Pulling
-Posture
-Visual
requirement
Vol. 3 Issue 6, June - 2014
International Journal of Engineering Research & Technology (IJERT)
IJERT
IJERT
ISSN: 2278-0181
www.ijert.orgIJERTV3IS060831
International Journal of Engineering Research & Technology (IJERT)
1065

However, the latter is represented by one Sub-criterion
without further specifications. Henderson and Dutta (1992)
used the AHP in analysis of ergonomics guidelines. They
focused on manual lifting utilizing 9Criteria that are the main
risk factors (ISO 11228-1, 2003): frequency of lifting,
distance lifted, height lifted, size of load, design of load,
location of load, worker’s size, worker’s gender, worker ’ s
age. Other types of manual material handling (i.e. pushing,
pulling, carrying, and moving of a load) and Criteria of
production performance were not considered [4].
In this paper the Strategic Criteria are Ergonomics and safety
performance and Production performance. There are 4
Criteria related to Ergonomics and safety performance,
namely Anthropometry and biomechanics, Cognitive
ergonomics, Work management, and Safety. The criteria
associated with Production performance are Productivity,
Adaptability, Capability, and Flexibility. The last level of the
hierarchy is composed of 20 Sub-criteria. The schematic
representation of the hierarchy is showed in fig 1.
III. METHODOLOGY
A. Making Pairwise Comparisons and Obtaining the
Matrices of Element Evaluation
In this step, the elements of each level are compared
pairwise, weighting them as a function of their importance for
corresponding element of the higher level. The aim is to
construct a set of pairwise comparison matrices for each of
the lower levels of elements. An element in the higher level
governs the elements in the lower level [7].
Following each branch point in the hierarchy, the importance
of each element is compared, in turn, with every other
element immediately below that branch point. Evaluation,
denoted as A, will be formed using the comparisons. Each
entry aij of the matrix, in the position (i, j), is obtained
comparing the row element Ai with the column element Aj.
Where: aij is the relative importance of the element Ai respect
to the element Aj. The comparison of any two elements Ai
and Aj with respect to the higher level element is made using
questions of the type: “How much more is the element Ai
preferred over the element Aj under the higher level
element?” Saaty (1980) suggests the use of a 9-point
linguistic scale to convert the verbal responses into numerical
quantities representing the values of aij [4]. The scale is
explained in Table 1.
TABLE I. SCALE OF RELATIVE IMPORTANCE
ACCORDING TO SAATY (1980) AND SAATY (1987).
Intensity
of importance Definition
1 Equal importance between Ai and Aj
3 Weak or moderate importance of Ai over Aj
5 Essential or strong importance of Ai over Aj
7 Demonstrated or very strong importance of
Ai over Aj
9 Absolute or strong importance of Ai over Aj
2,4,6,8 Intermediate
B. Local Priorities / Eigen Vector Calculation
There are several methods for calculating the eigenvector.
The goal is to find a set of priorities p1… pn such that pi /pj
match the comparisons aij in a consistent matrix and when
slight inconsistencies are introduced, priorities should vary
only slightly. Different methods have been developed to
derive priorities.
1) Method 1:Psychologists using pair-wise matrices
before Saaty used the mean of the row. This old method is
based on three steps [8].
a) Sum of the elements of each column j :
b) Dividing each value by its column sum:
c) Mean of row i :
The table below gives a worked example in terms of five
attributes to be compared.
Production
performance PR AD CA FL
Local
priorities
Productivity (PR) 1 4 1/4 3 ……..
Adaptability (AD) 1/4 1 1/8 2 ……..
Capability (CA) 4 8 1 6 ……..
Flexibility (FL) 1/3 1/2 1/6 1 ……..
Vol. 3 Issue 6, June - 2014
International Journal of Engineering Research & Technology (IJERT)
IJERT
IJERT
ISSN: 2278-0181
www.ijert.orgIJERTV3IS060831
International Journal of Engineering Research & Technology (IJERT)
1066
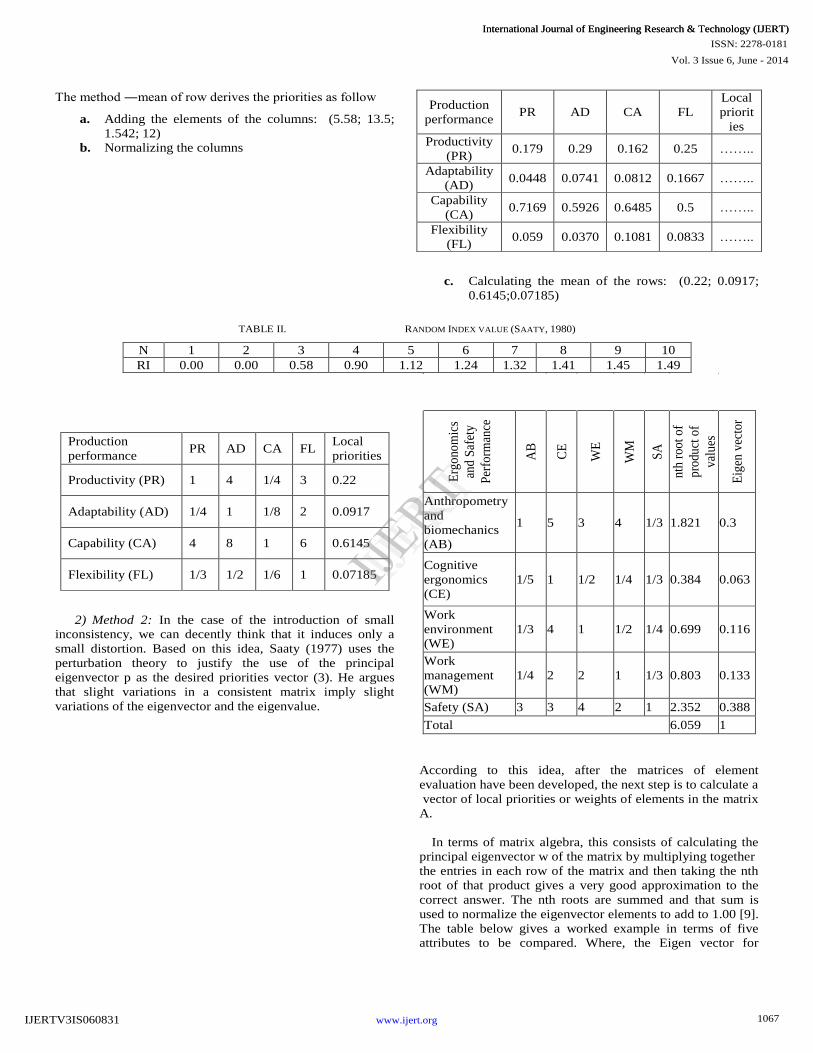
The method ―mean of row derives the priorities as follow
a. Adding the elements of the columns: (5.58; 13.5;
1.542; 12)
b. Normalizing the columns
Production
performance PR AD CA FL
Local
priorit
ies
Productivity
(PR) 0.179 0.29 0.162 0.25 ……..
Adaptability
(AD) 0.0448 0.0741 0.0812 0.1667 ……..
Capability
(CA) 0.7169 0.5926 0.6485 0.5 ……..
Flexibility
(FL) 0.059 0.0370 0.1081 0.0833 ……..
c. Calculating the mean of the rows: (0.22; 0.0917;
0.6145;0.07185)
TABLE II.
RANDOM INDEX VALUE (SAATY,
1980)
N
1
2
3
4
5
6
7
8
9
10
RI
0.00
0.00
0.58
0.90
1.12
1.24
1.32
1.41
1.45
1.49
Production
performance PR AD CA FL
Local
priorities
Productivity (PR) 1 4 1/4 3 0.22
Adaptability (AD) 1/4 1 1/8 2 0.0917
Capability (CA) 4 8 1 6 0.6145
Flexibility (FL) 1/3 1/2 1/6 1 0.07185
2) Method 2: In the case of the introduction of small
inconsistency, we can decently think that it induces only a
small distortion. Based on this idea, Saaty (1977) uses the
perturbation theory to justify the use of the principal
eigenvector p as the desired priorities vector (3). He argues
that slight variations in a consistent matrix imply slight
variations of the eigenvector and the eigenvalue.
Erg
ono
mic
s
and
Saf
ety
Per
form
ance
AB
CE
WE
WM
SA
nth
roo
t o
f
pro
duct
of
val
ues
Eig
en v
ecto
r
Anthropometry
and
biomechanics
(AB)
1 5 3 4 1/3 1.821 0.3
Cognitive
ergonomics
(CE)
1/5 1 1/2 1/4 1/3 0.384 0.063
Work
environment
(WE)
1/3 4 1 1/2 1/4 0.699 0.116
Work
management
(WM)
1/4 2 2 1 1/3 0.803 0.133
Safety (SA) 3 3 4 2 1 2.352 0.388
Total 6.059 1
According to this idea, after the matrices of element
evaluation have been developed, the next step is to calculate a
vector of local priorities or weights of elements in the matrix
A.
In terms of matrix algebra, this consists of calculating the
principal eigenvector w of the matrix by multiplying together
the entries in each row of the matrix and then taking the nth
root of that product gives a very good approximation to the
correct answer. The nth roots are summed and that sum is
used to normalize the eigenvector elements to add to 1.00 [9].
The table below gives a worked example in terms of five
attributes to be compared. Where, the Eigen vector for
Vol. 3 Issue 6, June - 2014
International Journal of Engineering Research & Technology (IJERT)
IJERT
IJERT
ISSN: 2278-0181
www.ijert.orgIJERTV3IS060831
International Journal of Engineering Research & Technology (IJERT)
1067
“Anthropometry and biomechanics” has been calculated as
(1.821/6.059) =0.3; “Cognitive ergonomics” as (0.384/6.059)
=0.063 and so on.
Here, A ω = ω
Where: is the largest eigenvalue of the matrix A and
the corresponding eigenvector ω contains only positive
entries. When the vector ω is normalized, it becomes the
vector of local priorities of the elements with respect to the
element of the higher level.
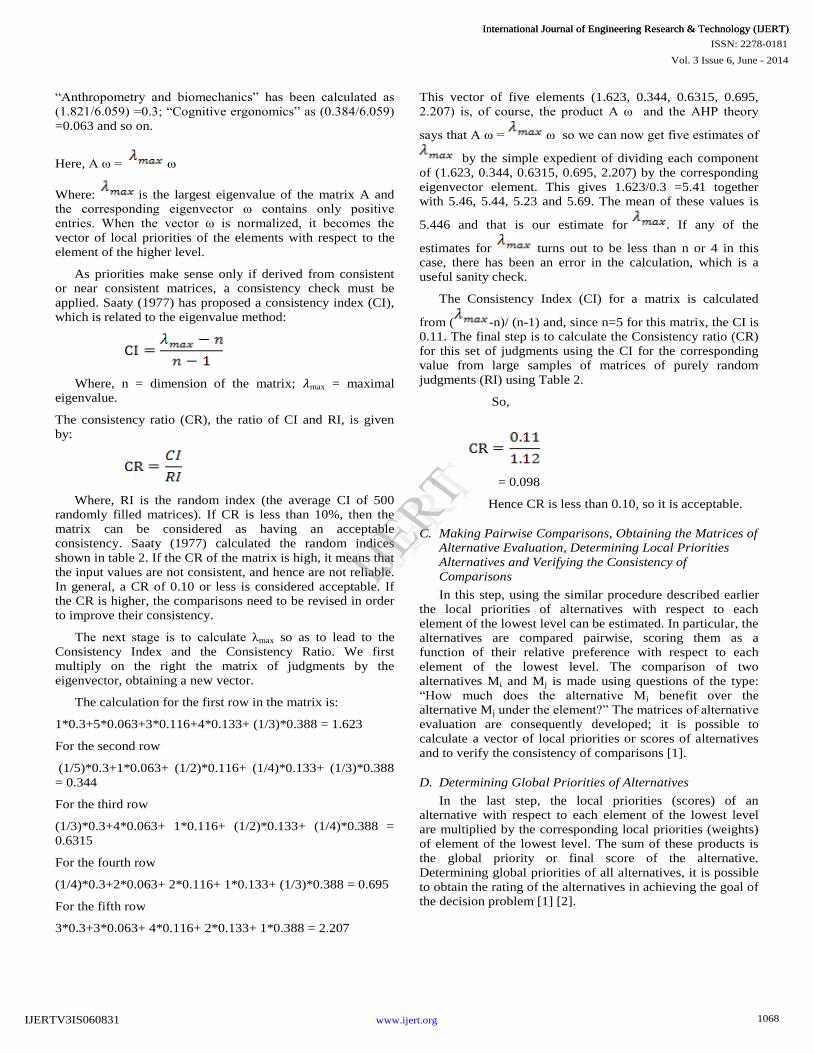
As priorities make sense only if derived from consistent
or near consistent matrices, a consistency check must be
applied. Saaty (1977) has proposed a consistency index (CI),
which is related to the eigenvalue method:
Where, n = dimension of the matrix; 𝜆max = maximal
eigenvalue.
The consistency ratio (CR), the ratio of CI and RI, is given
by:
Where, RI is the random index (the average CI of 500
randomly filled matrices). If CR is less than 10%, then the
matrix can be considered as having an acceptable
consistency. Saaty (1977) calculated the random indices
shown in table 2. If the CR of the matrix is high, it means that
the input values are not consistent, and hence are not reliable.
In general, a CR of 0.10 or less is considered acceptable. If
the CR is higher, the comparisons need to be revised in order
to improve their consistency.
The next stage is to calculate λmax so as to lead to the
Consistency Index and the Consistency Ratio. We first
multiply on the right the matrix of judgments by the
eigenvector, obtaining a new vector.
The calculation for the first row in the matrix is:
1*0.3+5*0.063+3*0.116+4*0.133+ (1/3)*0.388 = 1.623
For the second row
(1/5)*0.3+1*0.063+ (1/2)*0.116+ (1/4)*0.133+ (1/3)*0.388
= 0.344
For the third row
(1/3)*0.3+4*0.063+ 1*0.116+ (1/2)*0.133+ (1/4)*0.388 =
0.6315
For the fourth row
(1/4)*0.3+2*0.063+ 2*0.116+ 1*0.133+ (1/3)*0.388 = 0.695
For the fifth row
3*0.3+3*0.063+ 4*0.116+ 2*0.133+ 1*0.388 = 2.207
This vector of five elements (1.623, 0.344, 0.6315, 0.695,
2.207) is, of course, the product A ω and the AHP theory
says that A ω = ω so we can now get five estimates of
by the simple expedient of dividing each component
of (1.623, 0.344, 0.6315, 0.695, 2.207) by the corresponding
eigenvector element. This gives 1.623/0.3 =5.41 together
with 5.46, 5.44, 5.23 and 5.69. The mean of these values is
5.446 and that is our estimate for . If any of the
estimates for turns out to be less than n or 4 in this
case, there has been an error in the calculation, which is a
useful sanity check.
The Consistency Index (CI) for a matrix is calculated
from ( -n)/ (n-1) and, since n=5 for this matrix, the CI is
0.11. The final step is to calculate the Consistency ratio (CR)
for this set of judgments using the CI for the corresponding
value from large samples of matrices of purely random
judgments (RI) using Table 2.
So,
= 0.098
Hence CR is less than 0.10, so it is acceptable.
C. Making Pairwise Comparisons, Obtaining the Matrices of
Alternative Evaluation, Determining Local Priorities
Alternatives and Verifying the Consistency of
Comparisons
In this step, using the similar procedure described earlier
the local priorities of alternatives with respect to each
element of the lowest level can be estimated. In particular, the
alternatives are compared pairwise, scoring them as a
function of their relative preference with respect to each
element of the lowest level. The comparison of two
alternatives Mi and Mj is made using questions of the type:
“How much does the alternative Mi benefit over the
alternative Mj under the element?” The matrices of alternative
evaluation are consequently developed; it is possible to
calculate a vector of local priorities or scores of alternatives
and to verify the consistency of comparisons [1].
D. Determining Global Priorities of Alternatives
In the last step, the local priorities (scores) of an
alternative with respect to each element of the lowest level
are multiplied by the corresponding local priorities (weights)
of element of the lowest level. The sum of these products is
the global priority or final score of the alternative.
Determining global priorities of all alternatives, it is possible
to obtain the rating of the alternatives in achieving the goal of
the decision problem [1] [2].
Vol. 3 Issue 6, June - 2014
International Journal of Engineering Research & Technology (IJERT)
IJERT
IJERT
ISSN: 2278-0181
www.ijert.orgIJERTV3IS060831
International Journal of Engineering Research & Technology (IJERT)
1068
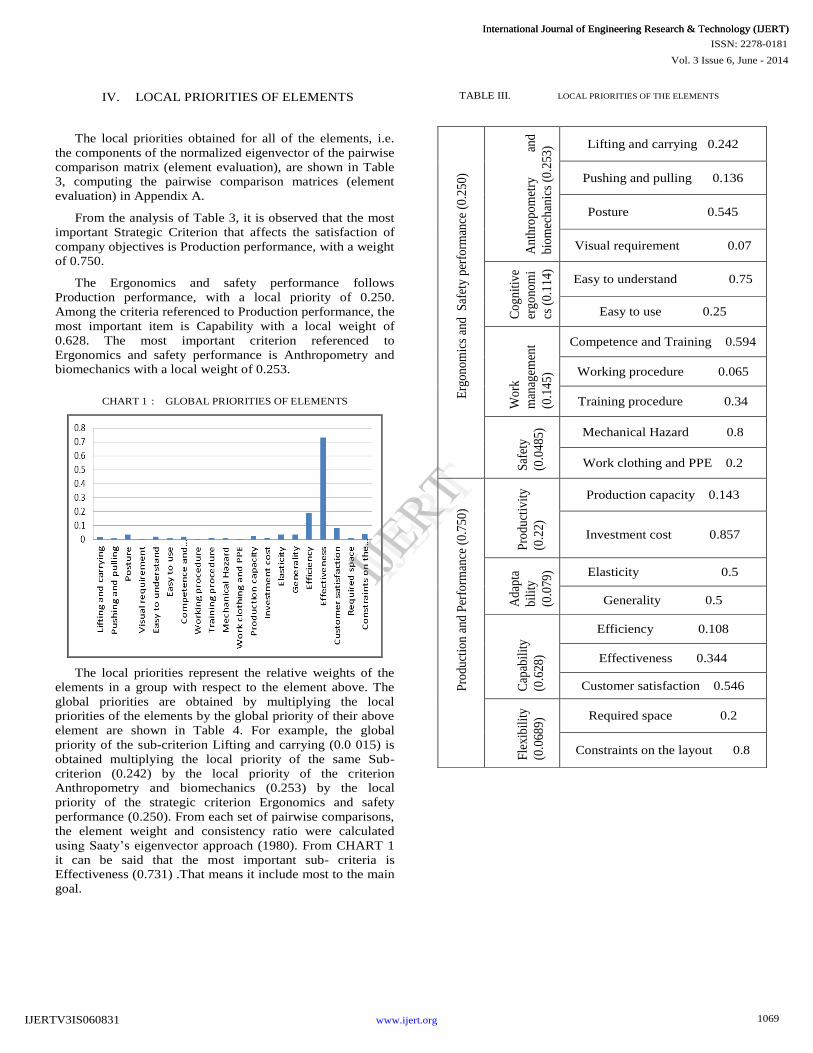
IV. LOCAL PRIORITIES OF ELEMENTS
The local priorities obtained for all of the elements, i.e.
the components of the normalized eigenvector of the pairwise
comparison matrix (element evaluation), are shown in Table
3, computing the pairwise comparison matrices (element
evaluation) in Appendix A.
From the analysis of Table 3, it is observed that the most
important Strategic Criterion that affects the satisfaction of
company objectives is Production performance, with a weight
of 0.750.
The Ergonomics and safety performance follows
Production performance, with a local priority of 0.250.
Among the criteria referenced to Production performance, the
most important item is Capability with a local weight of
0.628. The most important criterion referenced to
Ergonomics and safety performance is Anthropometry and
biomechanics with a local weight of 0.253.
CHART 1 : GLOBAL PRIORITIES OF ELEMENTS
The local priorities represent the relative weights of the
elements in a group with respect to the element above. The
global priorities are obtained by multiplying the local
priorities of the elements by the global priority of their above
element are shown in Table 4. For example, the global
priority of the sub-criterion Lifting and carrying (0.0 015) is
obtained multiplying the local priority of the same Sub-
criterion (0.242) by the local priority of the criterion
Anthropometry and biomechanics (0.253) by the local
priority of the strategic criterion Ergonomics and safety
performance (0.250). From each set of pairwise comparisons,
the element weight and consistency ratio were calculated
using Saaty’s eigenvector approach (1980). From CHART 1
it can be said that the most important sub- criteria is
Effectiveness (0.731) .That means it include most to the main
goal.
TABLE III. LOCAL PRIORITIES OF THE ELEMENTS
Erg
on
omic
s an
d S
afet
y p
erfo
rman
ce (
0.2
50)
An
thro
pom
etry
an
d
bio
mec
han
ics
(0.2
53) Lifting and carrying 0.242
Pushing and pulling 0.136
Posture 0.545
Visual requirement 0.07
Co
gn
itiv
e
erg
ono
mi
cs (
0.1
14)
Easy to understand 0.75
Easy to use 0.25
Wo
rk
man
agem
ent
(0.1
45
)
Competence and Training 0.594
Working procedure 0.065
Training procedure 0.34
Saf
ety
(0.0
485
) Mechanical Hazard 0.8
Work clothing and PPE 0.2
Pro
duct
ion
and
Per
form
ance
(0
.75
0)
Pro
du
ctiv
ity
(0.2
2)
Production capacity 0.143
Investment cost 0.857
Ad
apta
bil
ity
(0.0
79) Elasticity 0.5
Generality 0.5
Cap
abil
ity
(0.6
28)
Efficiency 0.108
Effectiveness 0.344
Customer satisfaction 0.546
Fle
xib
ilit
y
(0.0
689
) Required space 0.2
Constraints on the layout 0.8
Vol. 3 Issue 6, June - 2014
International Journal of Engineering Research & Technology (IJERT)
IJERT
IJERT
ISSN: 2278-0181
www.ijert.orgIJERTV3IS060831
International Journal of Engineering Research & Technology (IJERT)
1069

TABLE IV. GLOBAL PRIORITIES OF THE ELEMETS
Lifting and carrying 0.01530
Pushing and pulling 0.0086
Posture 0.0345
Visual requirement 0.0044
Easy to understand 0.0210
Easy to use 0.0071
Competence and Training 0.0215
Working procedure 0.0024
Training procedure 0.0123
Mechanical Hazard 0.0097
Work clothing and PPE 0.0024
Production capacity 0.0236
Investment cost 0.01414
Elasticity 0.0338
Generality 0.0338
Efficiency 0.188
Effectiveness 0.731
Customer satisfaction 0.081
Required space 0.0103
Constraints on the layout 0.0413
V. CASE STUDY
In an industry they used to convey their final product
from the store house to shipment truck manually by worker.
The tasks performed included the lifting of low-lying objects.
Actually the whole task is carrying the carton up to 50 meter
from the store house and after that released on to ground by a
worker. Then another worker lifts that carton from the ground
and put it on to the shipment truck. A forklift could be used
for this purpose. To choose the best method for this
conveying work AHP can be used.
The two alternatives (manual and forklift) are compared
with respect to each Sub-criterion, according to the AHP
procedure described earlier in this paper. To execute the
comparisons, the question is “How much does Forklift
benefit over Manual under Element?” For example, Table 5
represents the pairwise comparison matrix of the alternatives
with respect to the Lifting and carrying Sub-criterion and the
question is “How much does Forklift require less physical
effort then Manual under lifting and carrying?” In Table 5
also the local priorities are stated.
In table 5 the Forklift option was preferred by subjects 7
times over that of manual, the value 7 is entered into the (1,
2) position. The reciprocal value 1/7 is automatically entered
in the transpose position (2, 1).
TABLE V. EXAMPLE OF A PAIRWISE COMPARISON MATRIX
(ALTERNATIVE EVALUATION).
Lifting and
carrying Forklift Manual
Local
priorities
Forklift 1 7 0.875
Manual 1/7 1 0.125
All matrices of pairwise comparison (alternative evaluation
matrices) are in Appendix A.
According to AHP procedure, the final step is to weight
the results to obtain the final scores of the two alternatives,
i.e. the global priorities achieved and summarized in Table 6.
The values were calculated computing Table 4 and the
pairwise comparison matrices (alternative evaluation) in
Appendix.
TABLE VI. FINAL SCORES OF THE ALTERNATIVES
Alternatives Score
Forklift 1.02
Manual 0.276
The application of the AHP showed greater satisfaction of
the company objectives (the Goal) replacing manual handling
with forklift here.
VI. SOFTWARE TO CALCULATE LOCAL
PRIORITIES AND CONSISTENCY RATIO
Calculation of local priorities and consistency ratios are
more time consuming. So, software has been developed using
visual basic to minimize the effort to calculate the local
priorities and consistency ratio.
1) Software Algorithm :
Step1: Structure has been used to declare the order of
the matrix.
Step2: Input the name of the focus criteria
Step3: Input the name of the criteria or sub criteria to
make comparison.
Step4: Input the relative importance of an element over
another element according to saaty’s scale.
Step5: Show the local priorities and consistency ratio
for the given criteria or sub criteria.
2) Software Input:
Enter the order of the matrix: 3
Enter the focus criteria name: Work environment
Enter the name of the criteria / Sub-criteria:
“”Thermal environment””
“”Lighting environment””
Vol. 3 Issue 6, June - 2014
International Journal of Engineering Research & Technology (IJERT)
IJERT
IJERT
ISSN: 2278-0181
www.ijert.orgIJERTV3IS060831
International Journal of Engineering Research & Technology (IJERT)
1070

“”Noise exposure””
“”Space demands””
Enter the relative importance of “Thermal
environment” over “Lighting environment”: 4
Enter the relative importance of “Thermal
environment” over “Noise exposure”: 6
Enter the relative importance of “Thermal
environment” over “Space demands”: 3
Enter the relative importance of “Lighting
environment” over “Noise exposure”: 3
Enter the relative importance of “Lighting
environment” over “Space demands”: ¼
Enter the relative importance of “Noise exposure” over
“Space demands”: 1/5
3) Software Output:
Focus criteria:
Work environment
Consistency ratio:
0.07759
Local
priorities/
Eigen
vector
TE LE NE SD
0.5294 Thermal
environment
(TE)
1 4 6 3
0.1196 Lighting
environment
(LE)
0.25 1 3 0.25
0.0590 Noise
exposure
(NE)
0.17 0.33 1 0.2
0.2920 Space
demands
(SD)
0.33 4 5 1
4) Software Representation:
After initialization the following interface will appear.
Fig. 2. Interface to input order of the matrix.
Fig. 3. Updating the order of the matrix
After updating the order of the matrix it will ask to input the
focus criteria and after that it will also ask to input criteria or
sub-criteria related to focus criteria (Fig 4).
Fig. 4. Interface to input the type of criteria or sub-criteria
After updating focus criteria and related criteria or sub
criteria “Comparison” button will appear on screen. After
clicking “Comparison” button it will ask to type the
importance of an element over another element (Fig 5).
Fig. 5. Interface to input importance of the elements.
Fig. 6.
After updating the importance of the elements “Local
priorities/ Eigen vectors” button will appear on the screen.
Vol. 3 Issue 6, June - 2014
International Journal of Engineering Research & Technology (IJERT)
IJERT
IJERT
ISSN: 2278-0181
www.ijert.orgIJERTV3IS060831
International Journal of Engineering Research & Technology (IJERT)
1071
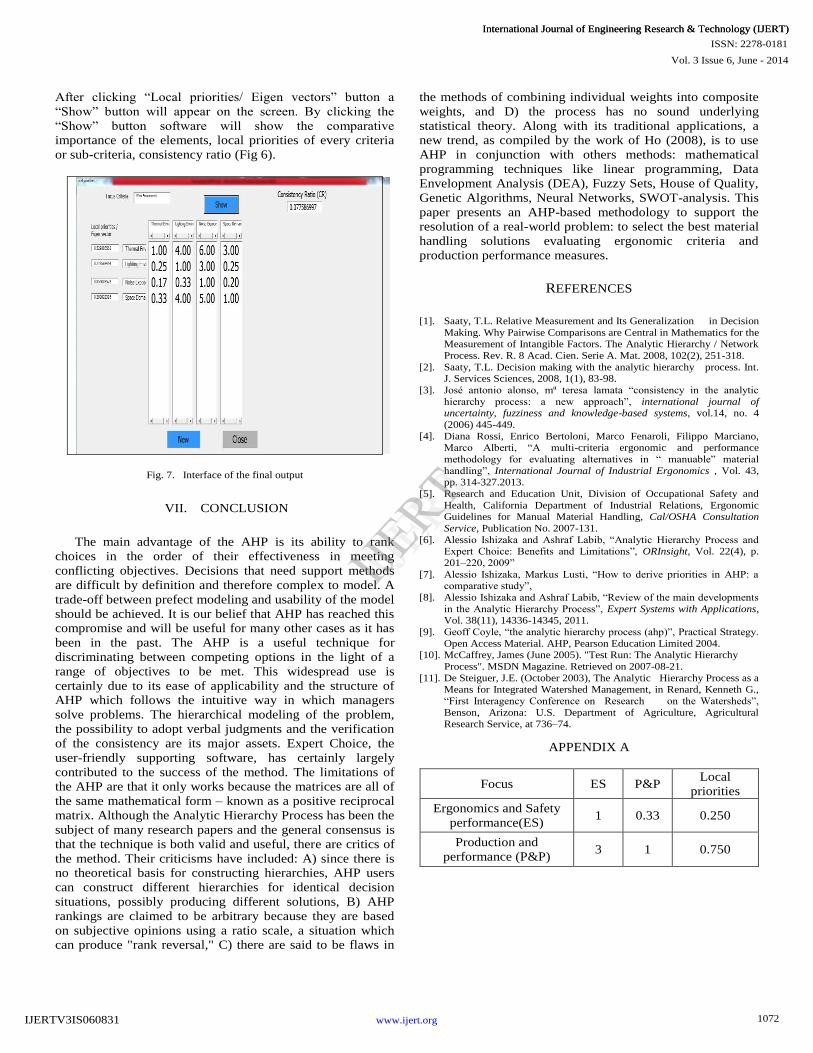
After clicking “Local priorities/ Eigen vectors” button a
“Show” button will appear on the screen. By clicking the
“Show” button software will show the comparative
importance of the elements, local priorities of every criteria
or sub-criteria, consistency ratio (Fig 6).
Fig. 7. Interface of the final output
VII. CONCLUSION
The main advantage of the AHP is its ability to rank
choices in the order of their effectiveness in meeting
conflicting objectives. Decisions that need support methods
are difficult by definition and therefore complex to model. A
trade-off between prefect modeling and usability of the model
should be achieved. It is our belief that AHP has reached this
compromise and will be useful for many other cases as it has
been in the past. The AHP is a useful technique for
discriminating between competing options in the light of a
range of objectives to be met. This widespread use is
certainly due to its ease of applicability and the structure of
AHP which follows the intuitive way in which managers
solve problems. The hierarchical modeling of the problem,
the possibility to adopt verbal judgments and the verification
of the consistency are its major assets. Expert Choice, the
user-friendly supporting software, has certainly largely
contributed to the success of the method. The limitations of
the AHP are that it only works because the matrices are all of
the same mathematical form – known as a positive reciprocal
matrix. Although the Analytic Hierarchy Process has been the
subject of many research papers and the general consensus is
that the technique is both valid and useful, there are critics of
the method. Their criticisms have included: A) since there is
no theoretical basis for constructing hierarchies, AHP users
can construct different hierarchies for identical decision
situations, possibly producing different solutions, B) AHP
rankings are claimed to be arbitrary because they are based
on subjective opinions using a ratio scale, a situation which
can produce "rank reversal," C) there are said to be flaws in
the methods of combining individual weights into composite
weights, and D) the process has no sound underlying
statistical theory. Along with its traditional applications, a
new trend, as compiled by the work of Ho (2008), is to use
AHP in conjunction with others methods: mathematical
programming techniques like linear programming, Data
Envelopment Analysis (DEA), Fuzzy Sets, House of Quality,
Genetic Algorithms, Neural Networks, SWOT-analysis. This
paper presents an AHP-based methodology to support the
resolution of a real-world problem: to select the best material
handling solutions evaluating ergonomic criteria and
production performance measures.
REFERENCES
[1]. Saaty, T.L. Relative Measurement and Its Generalization in Decision
Making. Why Pairwise Comparisons are Central in Mathematics for the Measurement of Intangible Factors. The Analytic Hierarchy / Network
Process. Rev. R. 8 Acad. Cien. Serie A. Mat. 2008, 102(2), 251-318.
[2]. Saaty, T.L. Decision making with the analytic hierarchy process. Int. J. Services Sciences, 2008, 1(1), 83-98.
[3]. José antonio alonso, mª teresa lamata “consistency in the analytic
hierarchy process: a new approach”, international journal of uncertainty, fuzziness and knowledge-based systems, vol.14, no. 4
(2006) 445-449.
[4]. Diana Rossi, Enrico Bertoloni, Marco Fenaroli, Filippo Marciano, Marco Alberti, “A multi-criteria ergonomic and performance
methodology for evaluating alternatives in “ manuable” material
handling”, International Journal of Industrial Ergonomics , Vol. 43, pp. 314-327.2013.
[5]. Research and Education Unit, Division of Occupational Safety and
Health, California Department of Industrial Relations, Ergonomic Guidelines for Manual Material Handling, Cal/OSHA Consultation
Service, Publication No. 2007-131.
[6]. Alessio Ishizaka and Ashraf Labib, “Analytic Hierarchy Process and
Expert Choice: Benefits and Limitations”, ORInsight, Vol. 22(4), p.
201–220, 2009”
[7]. Alessio Ishizaka, Markus Lusti, “How to derive priorities in AHP: a comparative study”,
[8]. Alessio Ishizaka and Ashraf Labib, “Review of the main developments
in the Analytic Hierarchy Process”, Expert Systems with Applications, Vol. 38(11), 14336-14345, 2011.
[9]. Geoff Coyle, “the analytic hierarchy process (ahp)”, Practical Strategy.
Open Access Material. AHP, Pearson Education Limited 2004. [10]. McCaffrey, James (June 2005). "Test Run: The Analytic Hierarchy
Process". MSDN Magazine. Retrieved on 2007-08-21.
[11]. De Steiguer, J.E. (October 2003), The Analytic Hierarchy Process as a Means for Integrated Watershed Management, in Renard, Kenneth G.,
“First Interagency Conference on Research on the Watersheds”,
Benson, Arizona: U.S. Department of Agriculture, Agricultural Research Service, at 736–74.
APPENDIX A
Focus ES P&P Local
priorities
Ergonomics and Safety
performance(ES) 1 0.33 0.250
Production and
performance (P&P) 3 1 0.750
Vol. 3 Issue 6, June - 2014
International Journal of Engineering Research & Technology (IJERT)
IJERT
IJERT
ISSN: 2278-0181
www.ijert.orgIJERTV3IS060831
International Journal of Engineering Research & Technology (IJERT)
1072
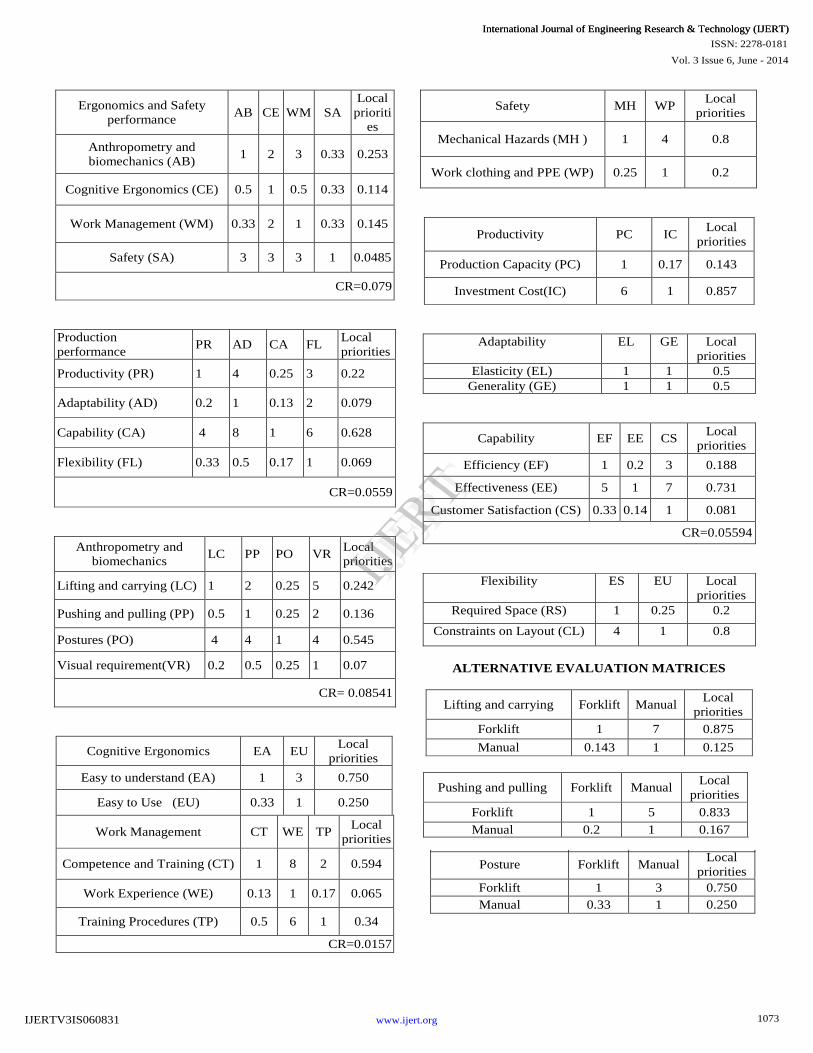
Ergonomics and Safety
performance AB CE WM SA
Local
prioriti
es
Anthropometry and
biomechanics (AB) 1 2 3 0.33 0.253
Cognitive Ergonomics (CE) 0.5 1 0.5 0.33 0.114
Work Management (WM) 0.33 2 1 0.33 0.145
Safety (SA) 3 3 3 1 0.0485
CR=0.079
Production
performance PR AD CA FL
Local
priorities
Productivity (PR) 1 4 0.25 3 0.22
Adaptability (AD) 0.2 1 0.13 2 0.079
Capability (CA) 4 8 1 6 0.628
Flexibility (FL) 0.33 0.5 0.17 1 0.069
CR=0.0559
Anthropometry and
biomechanics LC PP PO VR
Local
priorities
Lifting and carrying (LC) 1 2 0.25 5 0.242
Pushing and pulling (PP) 0.5 1 0.25 2 0.136
Postures (PO) 4 4 1 4 0.545
Visual requirement(VR) 0.2 0.5 0.25 1 0.07
CR= 0.08541
Cognitive Ergonomics EA EU Local
priorities
Easy to understand (EA) 1 3 0.750
Easy to Use (EU) 0.33 1 0.250
Work Management CT WE TP Local
priorities
Competence and Training (CT) 1 8 2 0.594
Work Experience (WE) 0.13 1 0.17 0.065
Training Procedures (TP) 0.5 6 1 0.34
CR=0.0157
Safety MH WP Local
priorities
Mechanical Hazards (MH ) 1 4 0.8
Work clothing and PPE (WP) 0.25 1 0.2
Productivity PC IC Local
priorities
Production Capacity (PC) 1 0.17 0.143
Investment Cost(IC) 6 1 0.857
Adaptability EL GE Local
priorities
Elasticity (EL) 1 1 0.5
Generality (GE) 1 1 0.5
Capability EF EE CS Local
priorities
Efficiency (EF) 1 0.2 3 0.188
Effectiveness (EE) 5 1 7 0.731
Customer Satisfaction (CS) 0.33 0.14 1 0.081
CR=0.05594
Flexibility ES EU Local
priorities
Required Space (RS) 1 0.25 0.2
Constraints on Layout (CL) 4 1 0.8
ALTERNATIVE EVALUATION MATRICES
Lifting and carrying Forklift Manual Local
priorities
Forklift 1 7 0.875
Manual 0.143 1 0.125
Pushing and pulling
Forklift
Manual
Local
priorities Forklift
1
5
0.833
Manual
0.2
1
0.167
Posture Forklift Manual Local
priorities
Forklift 1 3 0.750
Manual 0.33 1 0.250
Vol. 3 Issue 6, June - 2014
International Journal of Engineering Research & Technology (IJERT)
IJERT
IJERT
ISSN: 2278-0181
www.ijert.orgIJERTV3IS060831
International Journal of Engineering Research & Technology (IJERT)
1073
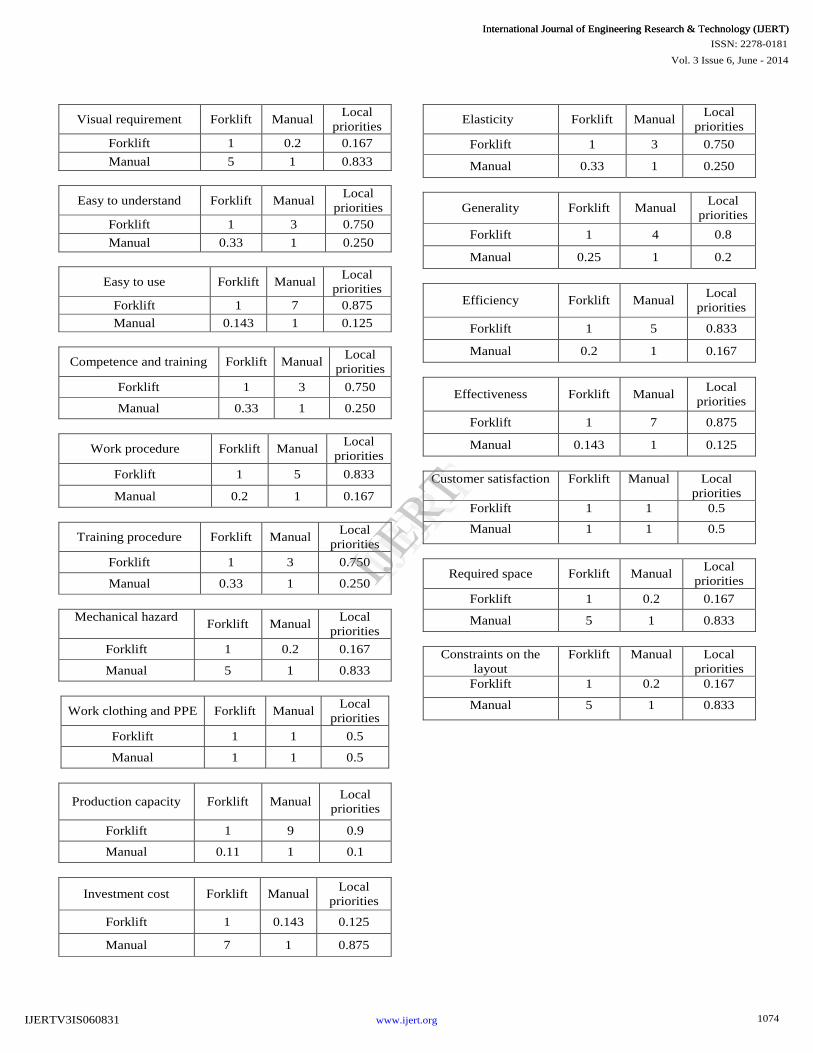
Visual requirement Forklift Manual Local
priorities
Forklift 1 0.2 0.167
Manual 5 1 0.833
Easy to understand Forklift Manual Local
priorities
Forklift 1 3 0.750
Manual 0.33 1 0.250
Easy to use Forklift Manual Local
priorities
Forklift 1 7 0.875
Manual 0.143 1 0.125
Competence and training Forklift Manual Local
priorities
Forklift 1 3 0.750
Manual 0.33 1 0.250
Work procedure Forklift Manual Local
priorities
Forklift 1 5 0.833
Manual 0.2 1 0.167
Training procedure Forklift Manual Local
priorities
Forklift 1 3 0.750
Manual 0.33 1 0.250
Mechanical hazard
Forklift Manual
Local
priorities
Forklift 1 0.2 0.167
Manual 5 1 0.833
Work clothing and PPE Forklift Manual Local
priorities
Forklift 1 1 0.5
Manual 1 1 0.5
Production capacity Forklift Manual Local
priorities
Forklift 1 9 0.9
Manual 0.11 1 0.1
Investment cost Forklift Manual Local
priorities
Forklift 1 0.143 0.125
Manual 7 1 0.875
Elasticity Forklift Manual Local
priorities
Forklift 1 3 0.750
Manual 0.33 1 0.250
Generality Forklift Manual Local
priorities
Forklift 1 4 0.8
Manual 0.25 1 0.2
Efficiency Forklift Manual Local
priorities
Forklift 1 5 0.833
Manual 0.2 1 0.167
Effectiveness Forklift Manual Local
priorities
Forklift 1 7 0.875
Manual 0.143 1 0.125
Customer satisfaction Forklift Manual Local
priorities
Forklift 1 1 0.5
Manual 1 1 0.5
Required space Forklift Manual Local
priorities
Forklift 1 0.2 0.167
Manual 5 1 0.833
Constraints on the
layout
Forklift Manual Local
priorities
Forklift 1 0.2 0.167
Manual 5 1 0.833
Vol. 3 Issue 6, June - 2014
International Journal of Engineering Research & Technology (IJERT)
IJERT
IJERT
ISSN: 2278-0181
www.ijert.orgIJERTV3IS060831
International Journal of Engineering Research & Technology (IJERT)
1074
Copyright © 2022 FDOKUMEN