Novel Hydrocolloids Obtained from Mango (Mangifera indica ...
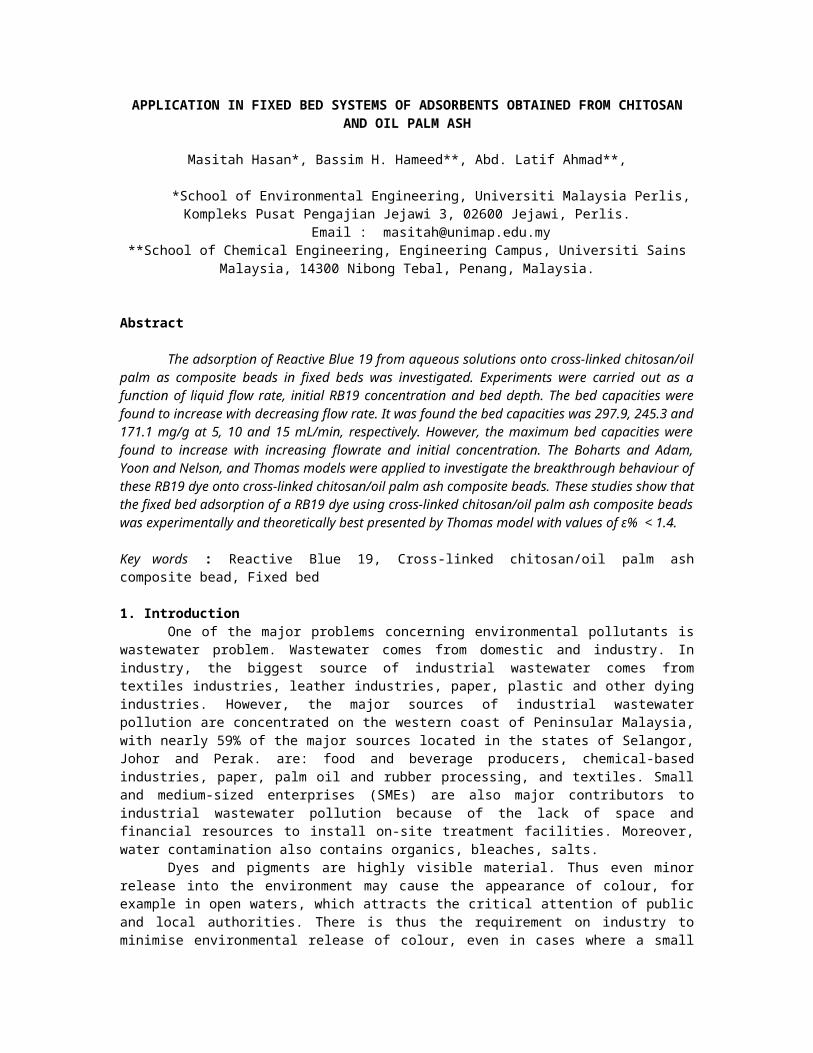
APPLICATION IN FIXED BED SYSTEMS OF ADSORBENTS OBTAINED FROM CHITOSANAND OIL PALM ASH
Masitah Hasan*, Bassim H. Hameed**, Abd. Latif Ahmad**,
*School of Environmental Engineering, Universiti Malaysia Perlis,Kompleks Pusat Pengajian Jejawi 3, 02600 Jejawi, Perlis.
Email : [email protected]**School of Chemical Engineering, Engineering Campus, Universiti Sains
Malaysia, 14300 Nibong Tebal, Penang, Malaysia.
Abstract
The adsorption of Reactive Blue 19 from aqueous solutions onto cross-linked chitosan/oilpalm as composite beads in fixed beds was investigated. Experiments were carried out as afunction of liquid flow rate, initial RB19 concentration and bed depth. The bed capacities werefound to increase with decreasing flow rate. It was found the bed capacities was 297.9, 245.3 and171.1 mg/g at 5, 10 and 15 mL/min, respectively. However, the maximum bed capacities werefound to increase with increasing flowrate and initial concentration. The Boharts and Adam,Yoon and Nelson, and Thomas models were applied to investigate the breakthrough behaviour ofthese RB19 dye onto cross-linked chitosan/oil palm ash composite beads. These studies show thatthe fixed bed adsorption of a RB19 dye using cross-linked chitosan/oil palm ash composite beadswas experimentally and theoretically best presented by Thomas model with values of ε% < 1.4.
Key words : Reactive Blue 19, Cross-linked chitosan/oil palm ashcomposite bead, Fixed bed
1. IntroductionOne of the major problems concerning environmental pollutants is
wastewater problem. Wastewater comes from domestic and industry. Inindustry, the biggest source of industrial wastewater comes fromtextiles industries, leather industries, paper, plastic and other dyingindustries. However, the major sources of industrial wastewaterpollution are concentrated on the western coast of Peninsular Malaysia,with nearly 59% of the major sources located in the states of Selangor,Johor and Perak. are: food and beverage producers, chemical-basedindustries, paper, palm oil and rubber processing, and textiles. Smalland medium-sized enterprises (SMEs) are also major contributors toindustrial wastewater pollution because of the lack of space andfinancial resources to install on-site treatment facilities. Moreover,water contamination also contains organics, bleaches, salts.
Dyes and pigments are highly visible material. Thus even minorrelease into the environment may cause the appearance of colour, forexample in open waters, which attracts the critical attention of publicand local authorities. There is thus the requirement on industry tominimise environmental release of colour, even in cases where a small
but visible release might be considered as toxicologically ratherinnocuous. A major source of release of colour into the environment isassociated with the incomplete exhaustion of dyes onto textile fibrefrom an aqueous dyeing process and the need to reduce the amount ofresidual dye in textile effluent has thus become a major concern inrecent years.
An alternative approach to addressing the problem of colour intextile dyeing effluent has involved the development of effluenttreatment methods to remove colour. These methods inevitably add to thecost of the overall process and some present the complication associatedwith the possible toxicity of degradation products.
Adsorption process has been a prominent method of treating aqueouseffluent in industrial processes (Benkli et al., 2005) for a variety ofseparation and purification purposes. This technique is also found to behighly efficient for the removal of colour in terms of initial cost,simplicity of design, ease of operation and insensitivity to toxicsubstances (Garg et al., 2004). Therefore, adsorption using activatedcarbon is currently of great interest for removal of dyes and pigments.
Activated carbon has been the most popular and widely usedadsorbent in wastewater treatment applications throughout the world.This is due to its high adsorption capacity, high surface area,microporous structure, and high degree of surface reactivity (Ozcan etal., 2004). In spite of its prolific use, activated carbon remains anexpensive material since the higher the quality of activated carbon, thegreater it costs. Therefore, this situation makes it no longerattractive to be widely used in small-scale industries because of costinefficiency. Due to the problems mentioned previously, researchinterest into the production of alternative adsorbent to replace thecostly activated carbon has intensified in recent years. Today,attention has been focused on the low-cost adsorbents as alternativeadsorbent materials. Fytianos et al., (2002) investigated the removal ofdyes on three low-cost adsorbents, fly ash, bentionite, bleaching earthand also on activated carbon. A large number of low-cost adsorbents havebeen treated for dyes removal. The successful removal using low costadsorbents has been carried out by several researchers (Mall et al., 1996and Bailey et al., 1999). Armagan et al., (2004) have studied theadsorption of reactive azo dyes on zeolite and modified zeolite. Besidesthat, waste materials from seafood processing industry such as chitosan(Sakkayawong et al., 2005) was used to adsorb anionic dyes. Naturalmaterials such as rice husk, sawdust and palm kernels also occupy aposition in the production of inexpensive adsorbents (Davila-Jimenez etal., 2005).
Recently, chitosan that is used as an adsorbent has drawnattentions due to its high contents of amino and hydroxy functionalgroups showing high potentials of the adsorption of dyes (Uzun et al.,2004), metal ions (Wu et.al., 2000) and proteins (Zeng et al., 1998).Chitosan is the deacetylated form of chitin, which is linear polymer of

acetylamino-D-glucose. Other useful features of chitosan include itsabundance, non-toxicity, hydro-philicity, biocompatibility,biodegradability and anti-bacterial property (Ravi Kumar, 2000).Moreover, the adsorption of reactive dyes (Reactive Red 189, ReactiveRed 222, Reactive Yellow 2 and Reactive Black 5), basic dyes (methyleneblue), and acidic dyes (Acid Orange 51, Acid Green 25) in naturalsolutions using chitosan shows large adsorption capacities (Uzun et al.,2004 and Yoshida et al., 1991). Although chitosan shows better adsorptionability in the bead form than in the flake form due to its higherspecific surface area (Wu et. al., 2000), the weak mechanical property(highly swollen in water) and low specific gravity of the beads makethem inconvenient for practical use in column mode adsorption.
The palm oil industry is one of the most important agriculturalindustries in Malaysia. Oil palm ash, a waste material from oil palmindustries, cause a disposal problem. However, oil palm ash has receivedattention for its unique combination of physical and chemical properties(high oxide contents). Zainuddin et al., (2005) reported that the palm ashcontents a very high oxide (SiO2 40.0% : Al2O3 6.1% : Fe2O3 2.5% ) whichgive its structure the credibility as a good adsorbent. Moreover, Ahmadet al., 2006 reported that the oil palm ash showed very high adsorptioncapacity to remove direct dye.
The dynamic behavior for adsorption process in column typecontinuous flow operations are more useful for application in wastewatertreatment system. It is simple to operate, attains a high yield and itcan be easily scaled up from a laboratory-scale procedure (Aksu et al.,2006). Therefore, the concentration-time profile or breakthrough curvesfor the effluent should be applied to find column capacity in order topredict the scale-up of a unit plant.
In the dynamic adsorption studies, the adsorbent is loaded incolumns which form a bed which the aqueous solution of the adsorbate ispassed. During its passed through the bed, the solution continuouslymeets a fresh part of the adsorbent and tends to establish a newequilibrium. However, as the time of contact with a given part of theadsorbent is limited, a true equilibrium is never attained. As solutionis passed continuously, the adsorption zone moves downwards, and at atime TB, the adsorption zone just reached the bottom of the bed andconcentration has suddenly risen to an appreciable value for the firsttime. This adsorption zone is the active portion of the column in whichconcentration varies from a maximum at the top of the zone, to a minimuma the end, this minimum progressively increasing as the column becomessaturated (Rozada et al., 2003). The performance of continuous system isusually described through the concept of the breakthrough curve or aplot of ratio of the outlet-to-inlet solute concentration (C/C0) as afunction of time (t) from the start of the flow. The total amount of dyeadsorbed in the column can be calculated using the following equation(Han et al., 2006):
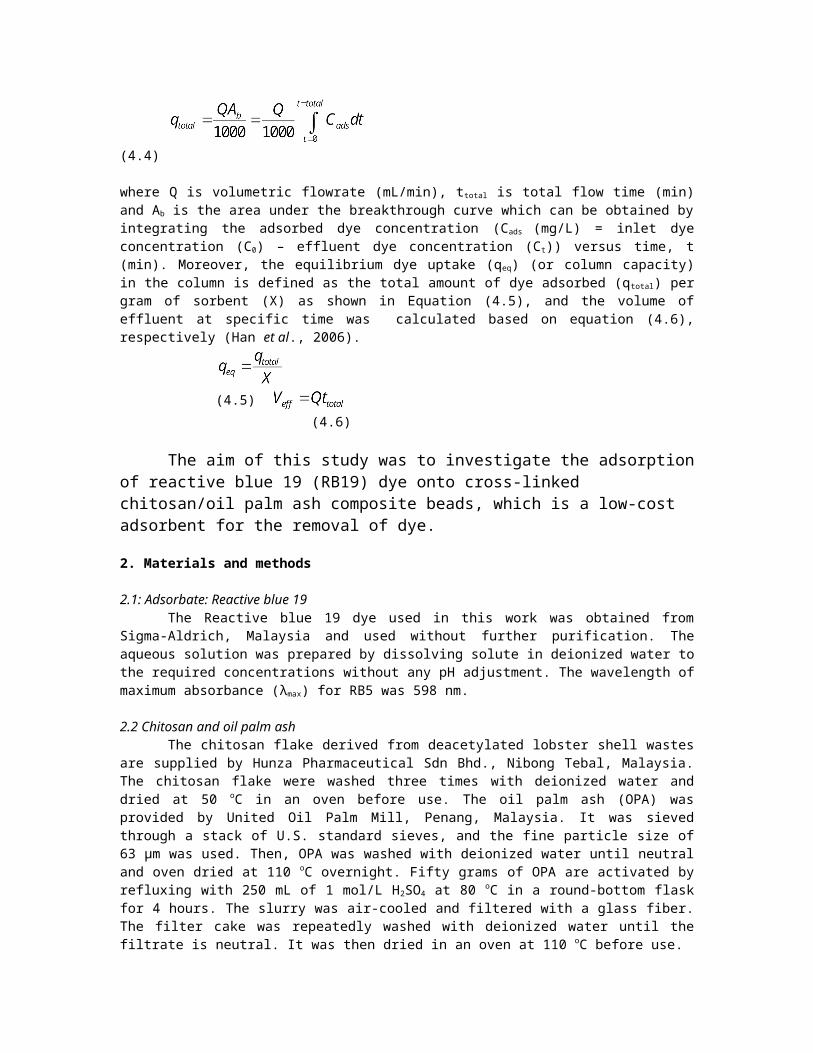
(4.4)
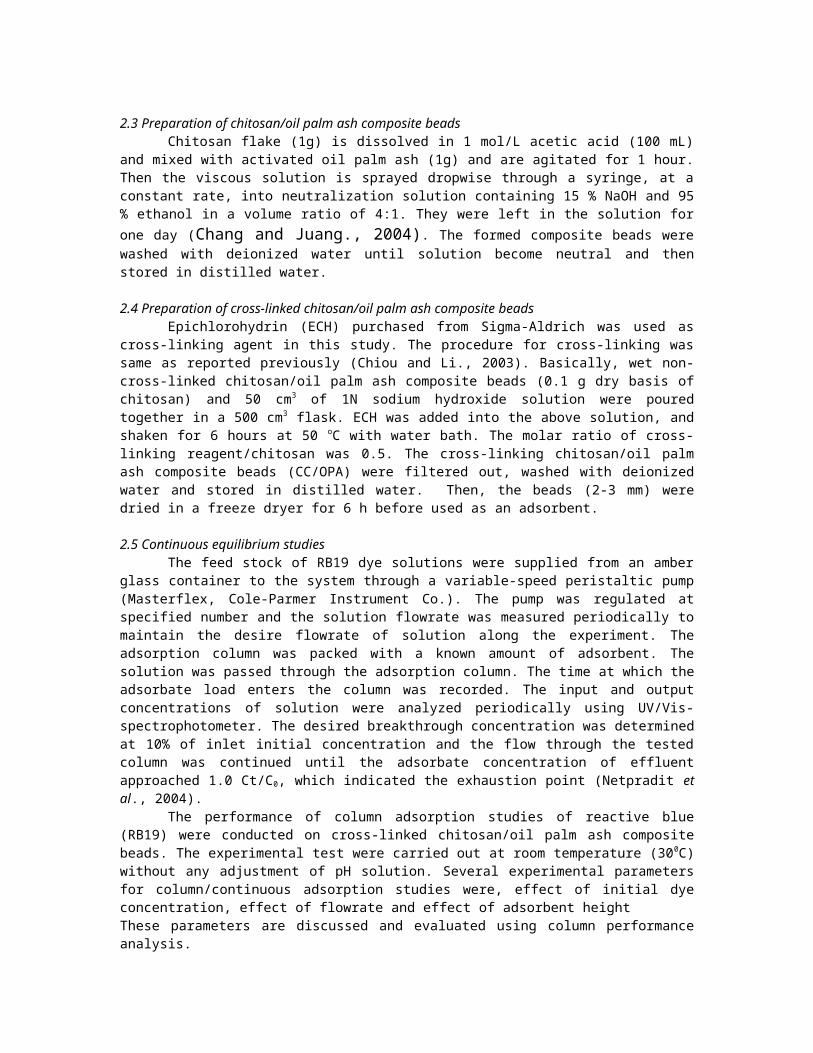
where Q is volumetric flowrate (mL/min), ttotal is total flow time (min)and Ab is the area under the breakthrough curve which can be obtained byintegrating the adsorbed dye concentration (Cads (mg/L) = inlet dyeconcentration (C0) – effluent dye concentration (Ct)) versus time, t(min). Moreover, the equilibrium dye uptake (qeq) (or column capacity)in the column is defined as the total amount of dye adsorbed (qtotal) pergram of sorbent (X) as shown in Equation (4.5), and the volume ofeffluent at specific time was calculated based on equation (4.6),respectively (Han et al., 2006).
(4.5) (4.6)
The aim of this study was to investigate the adsorptionof reactive blue 19 (RB19) dye onto cross-linked chitosan/oil palm ash composite beads, which is a low-cost adsorbent for the removal of dye.
2. Materials and methods
2.1: Adsorbate: Reactive blue 19The Reactive blue 19 dye used in this work was obtained from
Sigma-Aldrich, Malaysia and used without further purification. Theaqueous solution was prepared by dissolving solute in deionized water tothe required concentrations without any pH adjustment. The wavelength ofmaximum absorbance (λmax) for RB5 was 598 nm.
2.2 Chitosan and oil palm ashThe chitosan flake derived from deacetylated lobster shell wastes
are supplied by Hunza Pharmaceutical Sdn Bhd., Nibong Tebal, Malaysia.The chitosan flake were washed three times with deionized water anddried at 50 oC in an oven before use. The oil palm ash (OPA) wasprovided by United Oil Palm Mill, Penang, Malaysia. It was sievedthrough a stack of U.S. standard sieves, and the fine particle size of63 µm was used. Then, OPA was washed with deionized water until neutraland oven dried at 110 oC overnight. Fifty grams of OPA are activated byrefluxing with 250 mL of 1 mol/L H2SO4 at 80 oC in a round-bottom flaskfor 4 hours. The slurry was air-cooled and filtered with a glass fiber.The filter cake was repeatedly washed with deionized water until thefiltrate is neutral. It was then dried in an oven at 110 oC before use.
2.3 Preparation of chitosan/oil palm ash composite beadsChitosan flake (1g) is dissolved in 1 mol/L acetic acid (100 mL)
and mixed with activated oil palm ash (1g) and are agitated for 1 hour.Then the viscous solution is sprayed dropwise through a syringe, at aconstant rate, into neutralization solution containing 15 % NaOH and 95% ethanol in a volume ratio of 4:1. They were left in the solution forone day (Chang and Juang., 2004). The formed composite beads werewashed with deionized water until solution become neutral and thenstored in distilled water.
2.4 Preparation of cross-linked chitosan/oil palm ash composite beadsEpichlorohydrin (ECH) purchased from Sigma-Aldrich was used as
cross-linking agent in this study. The procedure for cross-linking wassame as reported previously (Chiou and Li., 2003). Basically, wet non-cross-linked chitosan/oil palm ash composite beads (0.1 g dry basis ofchitosan) and 50 cm3 of 1N sodium hydroxide solution were pouredtogether in a 500 cm3 flask. ECH was added into the above solution, andshaken for 6 hours at 50 oC with water bath. The molar ratio of cross-linking reagent/chitosan was 0.5. The cross-linking chitosan/oil palmash composite beads (CC/OPA) were filtered out, washed with deionizedwater and stored in distilled water. Then, the beads (2-3 mm) weredried in a freeze dryer for 6 h before used as an adsorbent.
2.5 Continuous equilibrium studiesThe feed stock of RB19 dye solutions were supplied from an amber
glass container to the system through a variable-speed peristaltic pump(Masterflex, Cole-Parmer Instrument Co.). The pump was regulated atspecified number and the solution flowrate was measured periodically tomaintain the desire flowrate of solution along the experiment. Theadsorption column was packed with a known amount of adsorbent. Thesolution was passed through the adsorption column. The time at which theadsorbate load enters the column was recorded. The input and outputconcentrations of solution were analyzed periodically using UV/Vis-spectrophotometer. The desired breakthrough concentration was determinedat 10% of inlet initial concentration and the flow through the testedcolumn was continued until the adsorbate concentration of effluentapproached 1.0 Ct/C0, which indicated the exhaustion point (Netpradit etal., 2004).
The performance of column adsorption studies of reactive blue(RB19) were conducted on cross-linked chitosan/oil palm ash compositebeads. The experimental test were carried out at room temperature (300C)without any adjustment of pH solution. Several experimental parametersfor column/continuous adsorption studies were, effect of initial dyeconcentration, effect of flowrate and effect of adsorbent heightThese parameters are discussed and evaluated using column performanceanalysis.
2.6 Mathematical modeling of breakthrough curves Many mathematical models were developed to describe contaminant
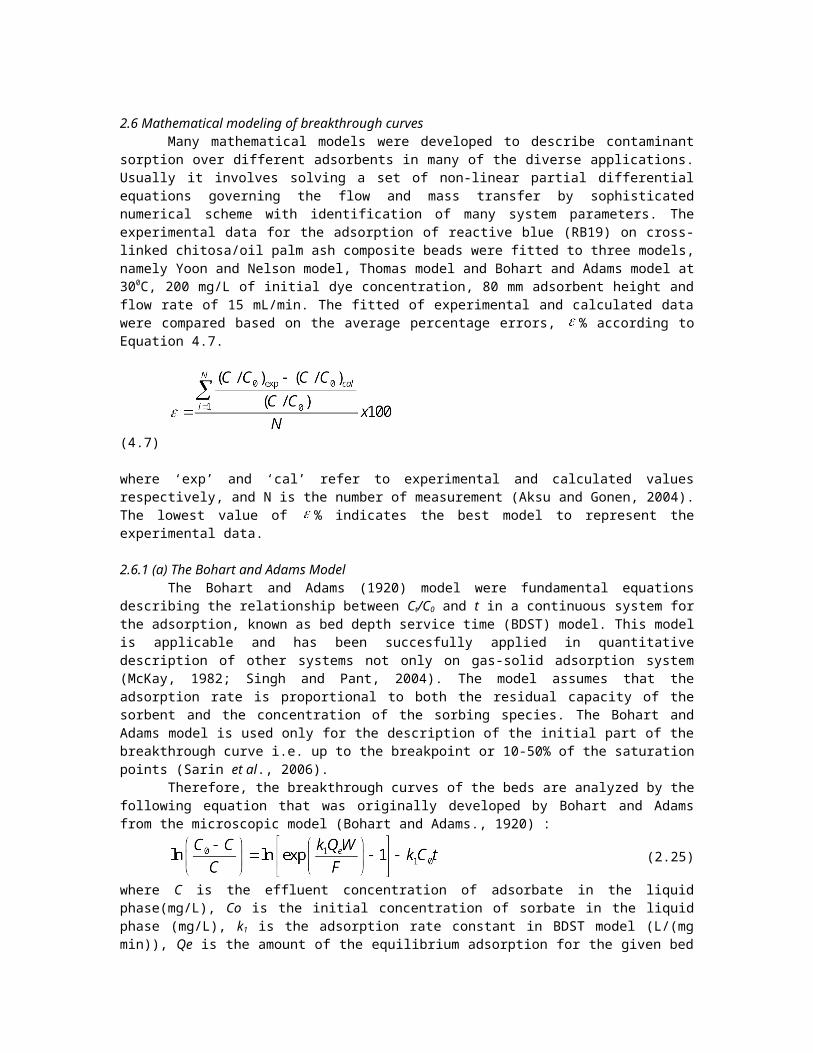
sorption over different adsorbents in many of the diverse applications.Usually it involves solving a set of non-linear partial differentialequations governing the flow and mass transfer by sophisticatednumerical scheme with identification of many system parameters. Theexperimental data for the adsorption of reactive blue (RB19) on cross-linked chitosa/oil palm ash composite beads were fitted to three models,namely Yoon and Nelson model, Thomas model and Bohart and Adams model at300C, 200 mg/L of initial dye concentration, 80 mm adsorbent height andflow rate of 15 mL/min. The fitted of experimental and calculated datawere compared based on the average percentage errors, % according toEquation 4.7.
(4.7)
where ‘exp’ and ‘cal’ refer to experimental and calculated valuesrespectively, and N is the number of measurement (Aksu and Gonen, 2004).The lowest value of % indicates the best model to represent theexperimental data.
2.6.1 (a) The Bohart and Adams ModelThe Bohart and Adams (1920) model were fundamental equations
describing the relationship between Ct/C0 and t in a continuous system forthe adsorption, known as bed depth service time (BDST) model. This modelis applicable and has been succesfully applied in quantitativedescription of other systems not only on gas-solid adsorption system(McKay, 1982; Singh and Pant, 2004). The model assumes that theadsorption rate is proportional to both the residual capacity of thesorbent and the concentration of the sorbing species. The Bohart andAdams model is used only for the description of the initial part of thebreakthrough curve i.e. up to the breakpoint or 10-50% of the saturationpoints (Sarin et al., 2006).
Therefore, the breakthrough curves of the beds are analyzed by thefollowing equation that was originally developed by Bohart and Adamsfrom the microscopic model (Bohart and Adams., 1920) :
(2.25)
where C is the effluent concentration of adsorbate in the liquidphase(mg/L), Co is the initial concentration of sorbate in the liquidphase (mg/L), k1 is the adsorption rate constant in BDST model (L/(mgmin)), Qe is the amount of the equilibrium adsorption for the given bed
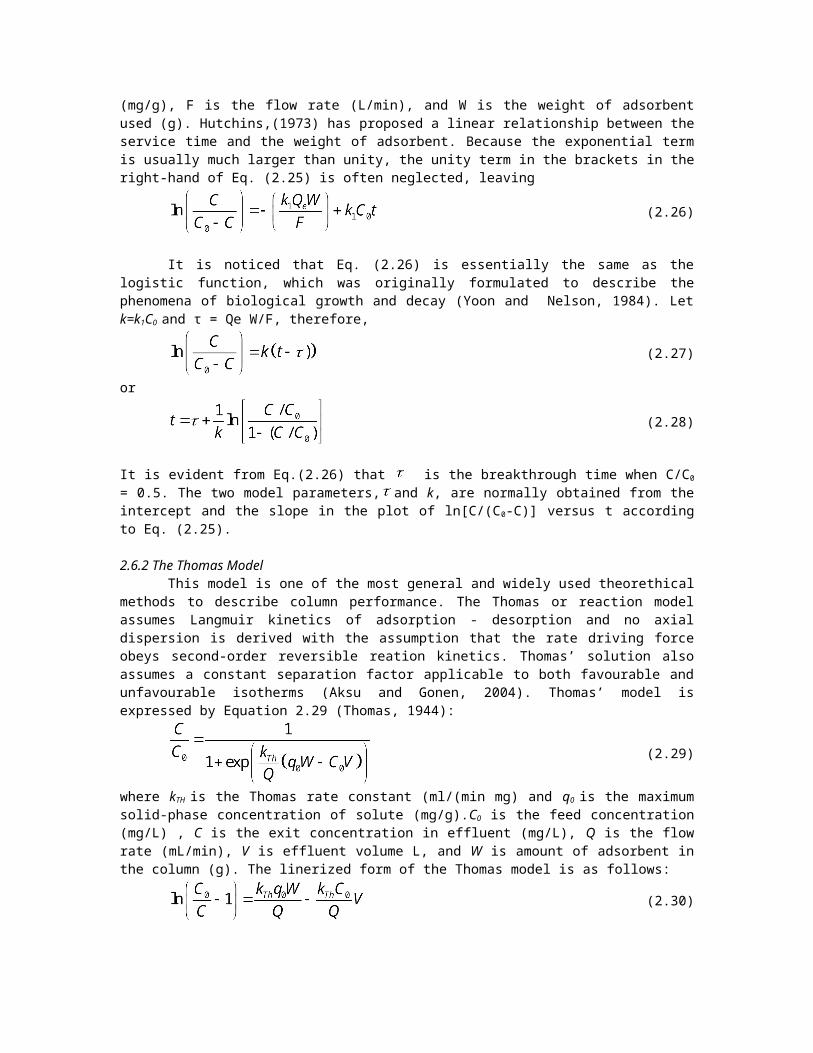
(mg/g), F is the flow rate (L/min), and W is the weight of adsorbentused (g). Hutchins,(1973) has proposed a linear relationship between theservice time and the weight of adsorbent. Because the exponential termis usually much larger than unity, the unity term in the brackets in theright-hand of Eq. (2.25) is often neglected, leaving
(2.26)
It is noticed that Eq. (2.26) is essentially the same as thelogistic function, which was originally formulated to describe thephenomena of biological growth and decay (Yoon and Nelson, 1984). Letk=k1C0 and τ = Qe W/F, therefore,
(2.27)
or
(2.28)
It is evident from Eq.(2.26) that is the breakthrough time when C/C0
= 0.5. The two model parameters, and k, are normally obtained from theintercept and the slope in the plot of ln[C/(C0-C)] versus t accordingto Eq. (2.25).
2.6.2 The Thomas ModelThis model is one of the most general and widely used theorethical
methods to describe column performance. The Thomas or reaction modelassumes Langmuir kinetics of adsorption - desorption and no axialdispersion is derived with the assumption that the rate driving forceobeys second-order reversible reation kinetics. Thomas’ solution alsoassumes a constant separation factor applicable to both favourable andunfavourable isotherms (Aksu and Gonen, 2004). Thomas’ model isexpressed by Equation 2.29 (Thomas, 1944):
(2.29)
where kTH is the Thomas rate constant (ml/(min mg) and q0 is the maximumsolid-phase concentration of solute (mg/g).C0 is the feed concentration(mg/L) , C is the exit concentration in effluent (mg/L), Q is the flowrate (mL/min), V is effluent volume L, and W is amount of adsorbent inthe column (g). The linerized form of the Thomas model is as follows:
(2.30)

The kinetic coefficient kTH and the adsorption capacity of the column q0
can be determines from the plot of ln (C0/C-1) againts V at a given flowrate.
2.6.3 The Yoon Nelson ModelA relatively simple model addressing the adsorption and
breakthrough of adsorbate was developed by Yoon and Nelson (1981). Themodel is based on the assumption that the rate of decrease in theprobability of adsorption for each adsorbate molecule is proportional tothe probability of adsorbate adsorption and the probability of adsorbatebreakthrough on the adsorbent (Aksu and Gonen, 2004; Yoon and Nelson,1999). The model does not required the details on the characteristics ofadsorbate, the type of adsorbent and the physical properties ofadsorption bed. The linear form of the Yoon-Nelson model regarding to asingle-component system is expressed as :
(2.31)
where KYN is the Yoon-Nelson rate constant (1/min), t is the breakthroughtime (min) and τ is the time required for 50% adsorbate breakthrough.The parameters kYN and τ can be determined by plotting of ln [C/(C0-C)]versus sampling time,t. If the theoretical model accuratelycharacterizes the experimental data, this plot will result in a straightline.
3. Results and discussion
3.1 Effect of initial dye concentration
Figure 1 show the effect of initial dye concentration on the shapeof breakthrough curves at of 30± 0.1oC varying the adsorbateconcentration 100, 200 and 300 mg/L, respectively. This concentrationwas chosen because the textile industry effluents discharge higherintensity of colour (dye). The amount of adsorbent was fixed at 1.4 gwhile the flowrate was maintained at 15 mL/min. As shown in Figure 4.19(a), in the interval of 10 min, the value of Ct/C0 reached 0.48, 0.54 and0.84 when influent concentration was 100, 200 and 300 mg/L,respectively. Results showed that higher the influent reactive blue 19(RB19) dye concentration, the lower will be the breakthrough time. Atlower influent RB19 dye concentrations, breakthrough curves weredispersed and slower. As influent concentration increased, sharperbreakthrough curves were obtained. These results demonstrate that thechange of concentration gradient affects the saturation rate andbreakthrough time (Kadirvelu et al., 2005). This can be explained by thefact that more adsorption sites were covered as the RB19 dyeconcentration increased. The result in Table 1 showed higher amount ofdyes were adsorbed (qtotal) when the initial dye concentration is 300

mg/L. Similarly, an increase in initial dye concentration would increasethe capacity of column (qe). The larger the influent dye concentration,the steeper is the slope of breakthrough curve and smaller is thebreakthrough time.
Figure 1: Breakthrough curve of reactive blue 19 dye on cross-linkedchitosan/oil palm ash composite
beads at different initial concentrations. (80 mm bed height ; 15 mL/minflowrate ; 30 0C temperature)
Table 1: The performance of column for adsorption of reactive blue 19on cross-linked chitosan/palm ash composite beads at different initialconcentration, 80mm height of adsorbent and 15 mL/min flowrate
Initialconcentration
(mg/L)
qtotal
(mg)ttotal
(min)qeq
(mg/g)
100 139.09 130 99.35
200 343.46 110 245.32
300 354.06 80 252.90
3.2 Effect of flow rate Figure 2 shows the breakthrough curves for different flow rate of
RB19 dye. The experiment were conducted at different flowrate of 5, 15and 25 mL/min at 30± 0.1oC. The bed was packed with 1.4 g of adsorbent(80 mm) and the initial concentration of dyes solution was fixed at 200mg/L. It was shown that the breakthrough occurred faster at higher flowrate. The breakthrough time reach a saturation period faster with a
0.00.10.20.30.40.50.60.70.80.91.0
0 10 20 30 40 50 60 70 80 90 100 110 120 130 140Time (min)
Ct/C0
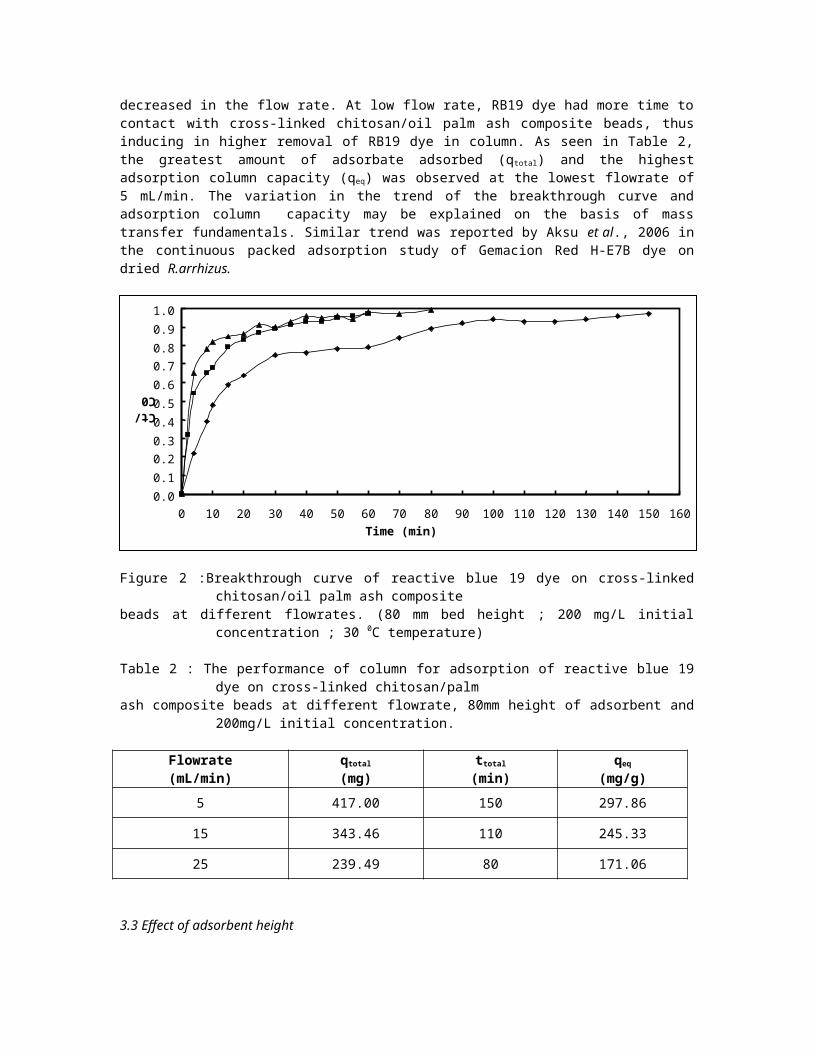
decreased in the flow rate. At low flow rate, RB19 dye had more time tocontact with cross-linked chitosan/oil palm ash composite beads, thusinducing in higher removal of RB19 dye in column. As seen in Table 2,the greatest amount of adsorbate adsorbed (qtotal) and the highestadsorption column capacity (qeq) was observed at the lowest flowrate of5 mL/min. The variation in the trend of the breakthrough curve andadsorption column capacity may be explained on the basis of masstransfer fundamentals. Similar trend was reported by Aksu et al., 2006 inthe continuous packed adsorption study of Gemacion Red H-E7B dye ondried R.arrhizus.
Figure 2 :Breakthrough curve of reactive blue 19 dye on cross-linkedchitosan/oil palm ash composite
beads at different flowrates. (80 mm bed height ; 200 mg/L initialconcentration ; 30 0C temperature)
Table 2 : The performance of column for adsorption of reactive blue 19dye on cross-linked chitosan/palm
ash composite beads at different flowrate, 80mm height of adsorbent and200mg/L initial concentration.
Flowrate(mL/min)
qtotal
(mg)ttotal
(min)qeq
(mg/g)5 417.00 150 297.86
15 343.46 110 245.33
25 239.49 80 171.06
3.3 Effect of adsorbent height
0.00.10.20.30.40.50.60.70.80.91.0
0 10 20 30 40 50 60 70 80 90 100 110 120 130 140 150 160Time (min)
Ct/C0
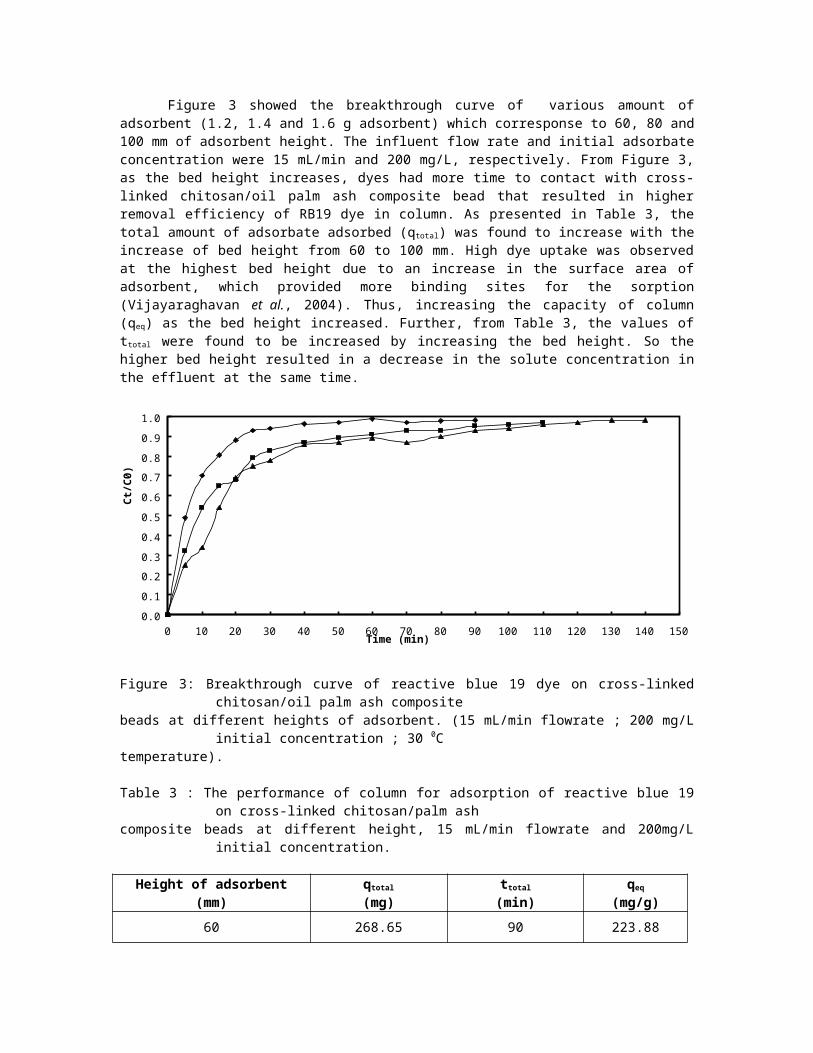
Figure 3 showed the breakthrough curve of various amount ofadsorbent (1.2, 1.4 and 1.6 g adsorbent) which corresponse to 60, 80 and100 mm of adsorbent height. The influent flow rate and initial adsorbateconcentration were 15 mL/min and 200 mg/L, respectively. From Figure 3,as the bed height increases, dyes had more time to contact with cross-linked chitosan/oil palm ash composite bead that resulted in higherremoval efficiency of RB19 dye in column. As presented in Table 3, thetotal amount of adsorbate adsorbed (qtotal) was found to increase with theincrease of bed height from 60 to 100 mm. High dye uptake was observedat the highest bed height due to an increase in the surface area ofadsorbent, which provided more binding sites for the sorption(Vijayaraghavan et al., 2004). Thus, increasing the capacity of column(qeq) as the bed height increased. Further, from Table 3, the values ofttotal were found to be increased by increasing the bed height. So thehigher bed height resulted in a decrease in the solute concentration inthe effluent at the same time.
Figure 3: Breakthrough curve of reactive blue 19 dye on cross-linkedchitosan/oil palm ash composite
beads at different heights of adsorbent. (15 mL/min flowrate ; 200 mg/Linitial concentration ; 30 0C
temperature).
Table 3 : The performance of column for adsorption of reactive blue 19on cross-linked chitosan/palm ash
composite beads at different height, 15 mL/min flowrate and 200mg/Linitial concentration.
Height of adsorbent(mm)
qtotal
(mg)ttotal
(min)qeq
(mg/g)60 268.65 90 223.88
0.00.10.20.30.40.50.60.70.80.91.0
0 10 20 30 40 50 60 70 80 90 100 110 120 130 140 150Time (min)
Ct/C
0)
80 343.46 110 245.32
100 365.00 140 228.13
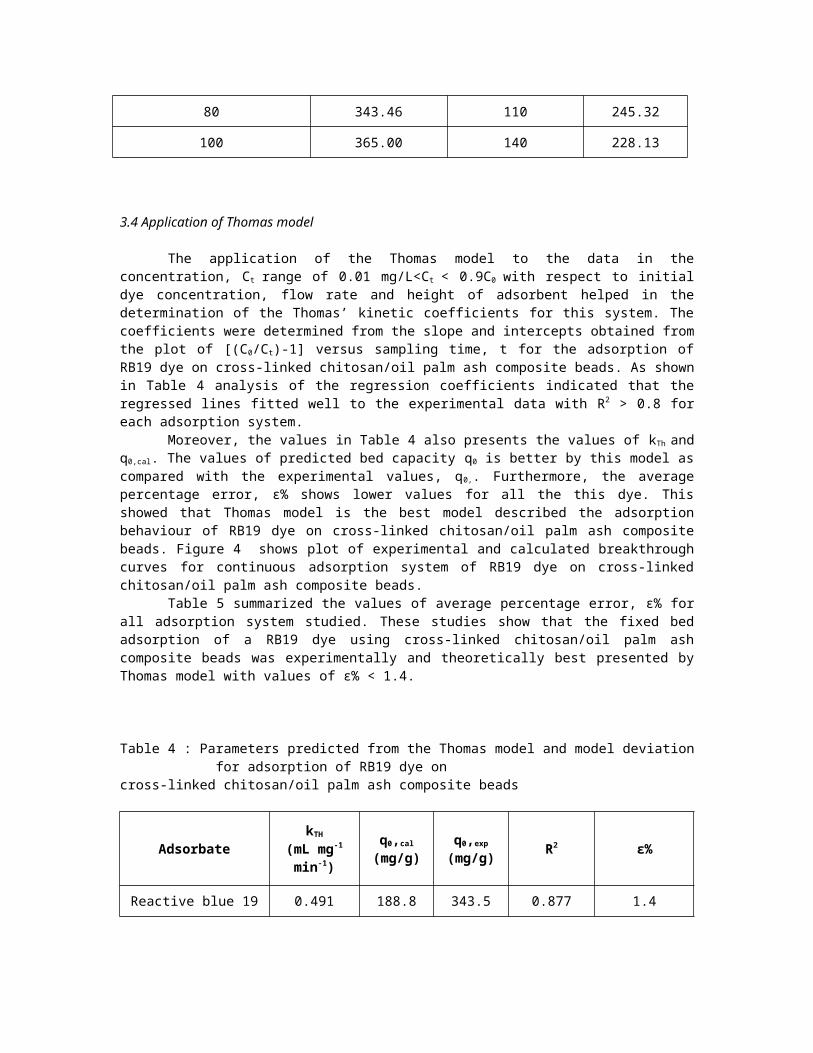
3.4 Application of Thomas model
The application of the Thomas model to the data in theconcentration, Ct range of 0.01 mg/L<Ct < 0.9C0 with respect to initialdye concentration, flow rate and height of adsorbent helped in thedetermination of the Thomas’ kinetic coefficients for this system. Thecoefficients were determined from the slope and intercepts obtained fromthe plot of [(C0/Ct)-1] versus sampling time, t for the adsorption ofRB19 dye on cross-linked chitosan/oil palm ash composite beads. As shownin Table 4 analysis of the regression coefficients indicated that theregressed lines fitted well to the experimental data with R2 > 0.8 foreach adsorption system.
Moreover, the values in Table 4 also presents the values of kTh andq0,cal. The values of predicted bed capacity q0 is better by this model ascompared with the experimental values, q0,. Furthermore, the averagepercentage error, ε% shows lower values for all the this dye. Thisshowed that Thomas model is the best model described the adsorptionbehaviour of RB19 dye on cross-linked chitosan/oil palm ash compositebeads. Figure 4 shows plot of experimental and calculated breakthroughcurves for continuous adsorption system of RB19 dye on cross-linkedchitosan/oil palm ash composite beads.
Table 5 summarized the values of average percentage error, ε% forall adsorption system studied. These studies show that the fixed bedadsorption of a RB19 dye using cross-linked chitosan/oil palm ashcomposite beads was experimentally and theoretically best presented byThomas model with values of ε% < 1.4.
Table 4 : Parameters predicted from the Thomas model and model deviationfor adsorption of RB19 dye on
cross-linked chitosan/oil palm ash composite beads
AdsorbatekTH
(mL mg-1
min-1)
q0,cal
(mg/g)q0,exp
(mg/g) R2 ε%
Reactive blue 19 0.491 188.8 343.5 0.877 1.4

Figure 4: Comparison of experimental and calculated breakthrough curves for continuous adsorption system of RB19 dye on cross-linked chitosan/oil palm ash composite beads
according to the Thomas model.
Table 5 : Summarization of values of average percentage error, ε% forall adsorption systems studied.
ε%
Boharts and Adam Thomas Yoon and Nelson
38.9 1.4 78.1
4. Conclusions
The cross-linked chitosan/oil palm ash composite beads have aconsiderable potential as low-cost and highly efficient adsorbent forthe removal of reactive dyes from wastewaters using continuousadsorption systems. The adsorption capacity in column study was stronglydependent on the flowrate, initial dye concentration and height ofadsorbent. The breakthrough occurred faster with increasing initialconcentration and flowrate while slowly at higher height of adsorbent.The Thomas model gave good agreement between experimental and calculatedbreakthrough curves. Acknowledgement
The authors acknowledge the research grant provided by UniversityScience Malaysia, under short term grant and Univesiti Malaysia Perlisunder FRGS grant that has resulted in this article.
References
Benkli, Y.E., Can, M.F., Turan, M., Celik, M.S., (2005). Modification oforgano-zeolite surface for the removal of reactive azo dyes in fixed-bedreactors. Water Resources. 39, p. 487–493.
Garg, V.K., Amita, M., Kumar, R., Gupta, R., (2004a). Basic dye(methylene blue) removal from simulated wastewater by adsorption usingIndian Rosewood sawdust: a timber industry waste. Dyes Pigments. 63, p.243–250.
Ozcan, A.S., Erdem, B., Ozcan, A., (2004). Adsorption of Acid Blue 193from aqueous solutions onto Na–bentonite and DTMA–bentonite. Journal ofColloid and Interface Science. 280, p. 44-54.
Fytianos, K., Voudrias, E., Kokkalis, E., (2000). Sorption-desorptionbehavior of 2,4-dichlorophenol by marine sediments. Chemosphere. 40. p.3-6.
Mall, I.D., Upadhyay, S.N., Sharma, Y.C., (1996 ). A review oneconomical treatment of wastewaters, effluents by adsorption. InternationalJournal Environmental Studies. 51, p. 77-124.
Bailey, S.E., Olin, T.J., Bricka, R.M., Adrian, D.D., (1999). A reviewof potentially low cost sorbents for heavy metals. Water Resources. 33, p.2469-2479.
Armagan, B., Turan, M., Celik, M.S., (2004). Equilibrium studies on theadsorption of reactive azo dyes into zeolite. Desalination. 170, p. 33–39.
Dávila-Jiménez, M.M., Elizalde-González M.P., Peláez-CidA.A., (2005).Adsorption interaction between natural adsorbents and textile dyes inaqueous solution. Colloids and Surfaces A: Physicochemical and Engineering Aspects.254, p. 107-114.
Uzun, I., Guzel, F., (2004). Kinetics and thermodynamics of theadsorption of the adsorption of some dyestuffs and p-nitrophenol bychitosan and MCM-chitosan from aqueous solution. Journal of Colloid andInterface Science. 274, p. 398-412.
Zeng, X., Ruckenstein, E., (1998). Cross-linked macroporous chitosananion-exchange
membranes for protein separations. Journal Membrane Science. 148, p. 195-205.
Ravi Kumar, M.V.V., (2000). A review of chitin and chitosanapplications. Reaction Function Polymers. 46, p. 1-27.
Yoshida, H., Fukuda, S., Okamato, A., Kataoka, T., (1991). Recovery ofdirect dye and acid dye by adsorption on chitosan fiber-equilibria.Water Science Technology. 23, p. 1667-1676.
Wu, F.C., Tseng, R.L., Juang, R.S., (2000). Comparative adsorption ofmetal and dye on flake-and bead- types of chitosans prepared fromfishery waste. Journal of Hazardous Materials. 73, p. 63-75.
Zainuddin, N.F., Lee, K.T., Kamaruddin, A.H., Bhatia, S., Mohamed, A.R.,(2005). Study of adsorbent prepared from oil palm ash (OPA) for the fluegas desulfurization, Separation and Purification Teachnology. 45,p. 50-60.
Aksu, Z., Cagatay, S.S., Gonen, F. (2006). Continuous fixed bedbiosorption of reactive dyes by dried Rhizopus arrhizus: Determinationof column capacity, Journal of Hazardous Materials. 143, p. 362-371.
Rozada, F., Calvo, L.F., Garcia, A.I., Martin –Villacorta, J., Otera,M., (2003). Dye adsorption by sewage sludge-based activated carbons inbatch and fixed-bed systems. Bioresources Technology. 87, p. 221-230.
Han, R., Lu, Z., Zou, W., Daotong, W., Shi, J., Jiujun, Y., (2006).Removal of copper(II) and lead(II) from aqueous solution by manganeseoxide coated sand: II. Equilibrium study and competitive adsorption.Journal of Hazardous Materials. 137, p. 480-488.
Chang MY, Juang RS. Adsorption of tannic acid, humic acid, and dyes fromwater using the composite of chitosan and activated clay. J Colloid Interface Sci 2004;278:18-25
Chiou MS, Li HY. Adsorption behavior of reactive dye in aqueous solutionon chemical cross-linked chitosan beads. Chemosphere 2003;50:1095-1105.
Netpradit, S., Thiravetyan, P., Towprayoon, S., (2004). Adsorption ofthree azo reactive dyes by metal hydroxide sludge: effect oftemperature, pH and electrolytes. Journal of Colloid and Interface Science. 270, p.255–261.
McKay, G., (1982). Adsorption of dyestuff from aqueous solution withactivated carbon I: equilibrium and batch contact time studies. JournalChemical Technology Biotechnology. 32, p. 759-772.
Singh, T.S., Pant, K.K., (2004). Equilibrium, kinetic and thermodynamicsstudies for adsorption of As(III) on activated alumina. SeparationPurification Technology. 36, p. 139-147.
Sarin, V., Singh, T.S., Pant, K.K., (2006). Thermodynamic andbreakthrough column studies for the selective sorption of chromium fromindustrial effluent on activated eucalyptus bark. Bioresources Technology.97, p. 1986-1993.
Bohart, G.S., Adams, E.Q., (1920). Some aspects of behavior of charcoalwith respect to chlorine, Journal American Chemical Society. 42, Pp. 523-529.
Hutchins, R.C., (1973). New method simplifies design of activated carbonsystems, Chemical Engineering Journal. 80 (19), p. 133-136.
Aksu, Z., Gonen, F., (2004). Biosorption of phenol by immobilizedactivated sludge in a continous packed bed: prediction of breakthroughcurves. Process Biochemistry. 66, p. 599-613.
Thomas, T.C., (1944). Heteregenous ion exchange in a flowing system.Journal American Chemical Society. 66, p. 1664-6.
Yoon, Y.H., Nelson, J.H., (1981). Application of gas adsorptionkinetics: A theoretical model for respirator cartridge service life, J.Am. Ind. Hyg. Assoc. 45, p. 509-516.
Yoon, Y.H., Nelson, J.H., (1999). Application of gas adsorptionkinetics. I.A.Theoretical model for respirator cartridge service time.Am. Ind Hyg Assoc. J. 69, p. 53-66.
Kadirvelu, K., Karthika, C., Vennilamani, N., Pattabhi, S., (2005).Activated carbon from industrial solid waste as an adsorbent for theremoval of Rhodamine-B from aqueous solution: Kinetic and equilibriumstudies. Chemosphere. 60, p. 1009-1017.
Aksu, Z., Cagatay, S.S., Gonen, F. (2006). Continuous fixed bedbiosorption of reactive dyes by dried Rhizopus arrhizus: Determinationof column capacity, Journal of Hazardous Materials. 143, p. 362-371.
Vijayaraghavan, K., Jegan, J., Palanivelu, K., Velan, M., (2004).Removal of nickel(II) ions from aqueous solution using crab shellparticles in a packed bed up-flow columnJournal of Hazardous Materials. 113, p. 223-230.
Copyright © 2022 FDOKUMEN