Appendix 4D - NET
32
Cleanaway Waste Management Limited ABN 74 101 155 220 Registered Office: Level 4, 441 St Kilda Road, Melbourne VIC 3004 Australia P P+61 03 8397 5100 FF+61 03 8397 5180 cleanaway.com.au Appendix 4D Results for announcement to the market for the half-year ended 31 December 2021. ASX Listing Rule 4.2A.3. Reporting period Reporting period: 31 December 2021 Previous corresponding period: 31 December 2020 The Half-Year Consolidated Financial Report should be read in conjunction with the 2021 Annual Report. Results for announcement to the market 31 DEC 2021 $’M 31 DEC 2020 $’M UP/DOWN MOVEMENT Revenue from ordinary activities 1,364.6 1,170.3 Up 16.6% Profit after income tax 52.5 79.4 Down 33.9% Attributable to: Ordinary equity holders of the parent 51.5 78.3 Down 34.2% Non-controlling interest 1.0 1.1 Down 9.1% Profit after income tax 52.5 79.4 Dividends DIVIDEND INFORMATION AMOUNT PER SHARE (CENTS) TAX RATE FOR FRANKING CREDIT Final 2021 fully franked dividend (paid 5 October 2021) 2.35 30% Interim 2022 partially franked dividend (to be paid 6 April 2022) 2.45 30% Interim dividend dates: Record date 1 March 2022 Payment date 6 April 2022 An interim dividend of 2.45 cents per share has been declared, partially franked to 25% based on tax paid at 30%. The Dividend Reinvestment Plan (DRP), will be in operation for the interim dividend. The DRP election date is 2 March 2022. Under the DRP, Cleanaway shares will be issued at the average of the daily Volume Weighted Average Price (VWAP) of all shares sold on the ASX over the period from 3 March 2022 to 9 March 2022. No discount will be applied to shares issued under the DRP. Net Tangible Assets (NTA) per security 31 DEC 2021 CENTS 30 JUNE 2021 CENTS NTA per security (including right-of-use assets) (5.4) 15.3 Commentary on the results for the period Refer to the Half-Year Consolidated Financial Report, the Media Release and Investor Presentation for the half-year ended 31 December 2021. Status of audit The Consolidated Financial Report for the half-year ended 31 December 2021, which contains the independent auditor’s review report, is attached. D J F Last Company Secretary 17 February 2022
-
Upload
khangminh22 -
Category
Documents
-
view
0 -
download
0
Transcript of Appendix 4D - NET

Cleanaway Waste Management Limited ABN 74 101 155 220
Registered Office: Level 4, 441 St Kilda Road, Melbourne VIC 3004 Australia
P P+61 03 8397 5100 F F+61 03 8397 5180
cleanaway.com.au
Appendix 4D Results for announcement to the market for the half-year ended 31 December 2021.
ASX Listing Rule 4.2A.3.
Reporting period Reporting period: 31 December 2021
Previous corresponding period: 31 December 2020
The Half-Year Consolidated Financial Report should be read in conjunction with the 2021 Annual Report.
Results for announcement to the market
31 DEC 2021 $’M
31 DEC 2020
$’M UP/DOWN MOVEMENT
Revenue from ordinary activities 1,364.6 1,170.3 Up 16.6% Profit after income tax 52.5 79.4 Down 33.9% Attributable to: Ordinary equity holders of the parent 51.5 78.3 Down 34.2% Non-controlling interest 1.0 1.1 Down 9.1% Profit after income tax 52.5 79.4
Dividends
DIVIDEND INFORMATION
AMOUNT PER SHARE
(CENTS)
TAX RATE FOR FRANKING
CREDIT
Final 2021 fully franked dividend (paid 5 October 2021) 2.35 30% Interim 2022 partially franked dividend (to be paid 6 April 2022) 2.45 30% Interim dividend dates:
Record date 1 March 2022 Payment date 6 April 2022
An interim dividend of 2.45 cents per share has been declared, partially franked to 25% based on tax paid at 30%. The Dividend Reinvestment Plan (DRP), will be in operation for the interim dividend. The DRP election date is 2 March 2022. Under the DRP, Cleanaway shares will be issued at the average of the daily Volume Weighted Average Price (VWAP) of all shares sold on the ASX over the period from 3 March 2022 to 9 March 2022. No discount will be applied to shares issued under the DRP.
Net Tangible Assets (NTA) per security
31 DEC 2021
CENTS
30 JUNE 2021
CENTS
NTA per security (including right-of-use assets) (5.4) 15.3
Commentary on the results for the period Refer to the Half-Year Consolidated Financial Report, the Media Release and Investor Presentation for the half-year ended 31 December 2021.
Status of audit The Consolidated Financial Report for the half-year ended 31 December 2021, which contains the independent auditor’s review report, is attached.
D J F Last Company Secretary 17 February 2022

Cleanaway Waste Management Limited ABN 74 101 155 220
Consolidated Financial Report For the half-year ended 31 December 2021
Contents of Financial Statements Directors’ Report 2 Auditor’s Independence Declaration 9 Consolidated Income Statement 10 Consolidated Statement of Comprehensive Income 11 Consolidated Balance Sheet 12 Consolidated Statement of Changes in Equity 13 Consolidated Statement of Cash Flows 14 Notes to the Consolidated Financial Statements 15 Directors’ Declaration 30 Independent Auditor’s Review Report 31
This interim Consolidated Financial Report does not include all notes of the type normally included in an Annual Financial Report. Accordingly, this report is to be read in conjunction with the Annual Report for the year ended 30 June 2021 and any public announcements made by Cleanaway Waste Management Limited during the interim reporting period in accordance with the continuous disclosure requirements of the Corporations Act 2001.

Cleanaway Waste Management Limited 2
Directors’ Report
The Directors present their Report together with the Consolidated Financial Statements of the Group, consisting of Cleanaway Waste Management Limited (the Company) and its controlled entities (Cleanaway or the Group), for the half-year ended 31 December 2021.
Directors The names of Directors of the Company at any time during or since the end of the financial period are set out below. Directors were in office for this entire period unless otherwise stated.
M P Chellew Chairman and Non-Executive Director (Executive Chairman up to 30 September 2021) M J Schubert Chief Executive Officer and Managing Director (appointed 30 August 2021) R M Smith Non-Executive Director T A Sinclair Non-Executive Director R M Harding Non-Executive Director P G Etienne Non-Executive Director S L Hogg Non-Executive Director I A Player Non-Executive Director A M Kelly Non-Executive Director (appointed 1 December 2021)
The office of Company Secretary is held by D J F Last, LLB (Hons), B.Com, FGIA, GAICD.
On 15 November 2021 the Group announced the appointment of Mr Michael Kelly as an Independent Non-Executive Director of the Company. The appointment was effective from 1 December 2021.
Review of results The Group’s statutory profit after income tax (attributable to ordinary equity holders) for the half-year ended 31 December 2021 was $51.5 million (2020: $78.3 million).
The Group’s underlying profit after income tax (attributable to ordinary equity holders) for the half-year ended 31 December 2021 of $75.3 million decreased by 3.3% on the prior period (2020: $77.9 million).
Operating cash flows increased 10.5% to $223.6 million (2020: $202.4 million). On 18 December 2021 the Group acquired a group of assets known as the Sydney Resource Network for consideration of $503.1 million. This acquisition has been funded by a three-year $500.0 million term loan facility.
The Group’s net assets increased from $2,636.3 million at 30 June 2021 to $2,647.3 million at 31 December 2021.
At 31 December 2021 the Group had a net current asset deficiency of $115.3 million (30 June 2021: net current asset deficiency of $71.5 million). As set out in note 7 to the Consolidated Financial Statements, the Group has unutilised committed debt facilities of $506.0 million at 31 December 2021 available to repay the Group’s creditors as required and therefore the Directors are satisfied that the Group can meet its financial obligations as and when they fall due.
Net tangible assets have decreased by $426.6 million during the period to negative net tangible assets of $110.7 million at 31 December 2021 (30 June 2021: net tangible assets of $315.9 million). Net tangible assets are calculated as net assets less intangible assets. The reason for the decrease since 30 June 2021 is the increase in intangible assets of $437.6 million mainly due to the acquisition of the Sydney Resource Network for which the purchase price allocation remains preliminary and unidentified net assets of $451.6 million have been classified as intangible assets at 31 December 2021 (refer note 12 to the Consolidated Financial Statements).
Rounding of amounts The Company is of a kind referred to in ASIC Legislative Instrument 2016/191 issued by the Australian Securities and Investments Commission (ASIC), relating to the “rounding off” of amounts in the Directors’ Report. Amounts in the Directors’ Report have been rounded off in accordance with that Legislative Instrument to the nearest hundred thousand dollars or, in certain cases, to the nearest dollar.

Cleanaway Waste Management Limited 3
Directors’ Report
Operating review (continued)
Group results for the half-year ended 31 December 2021 UNDERLYING ADJUSTMENTS
STATUTORY 1 $’M
ACQUISITION & INTEGRATION
COSTS 4 $’M
CEO TRANSITION &
RESTRUCTURING PROJECTS 5
$’M
WRITE OFF SYDNEY
EFW 6 $’M
GAIN ON SALE AND
LEASEBACK OF
PROPERTY 7 OTHER 8
$’M UNDERLYING 1
$’M
Solid Waste Services 209.1 Industrial & Waste Services 23.6 Liquid Waste & Health Services 53.4 Equity accounted investments (0.1) Waste management 286.0 Corporate (12.3) EBITDA 2 253.2 16.1 7.9 6.0 (8.2) (1.3) 273.7 Depreciation and amortisation (143.8) – – – – – (143.8) Impairment of assets (8.9) 8.9 – – – – – EBIT 3 100.5 25.0 7.9 6.0 (8.2) (1.3) 129.9 Net finance costs (25.2) 2.5 – – – (0.2) (22.9) Profit before income tax 75.3 27.5 7.9 6.0 (8.2) (1.5) 107.0 Income tax expense (22.8) (6.7) (2.4) (1.8) 2.5 0.5 (30.7) Profit after income tax 52.5 20.8 5.5 4.2 (5.7) (1.0) 76.3 Attributable to: Ordinary equity holders 51.5 20.8 5.5 4.2 (5.7) (1.0) 75.3 Non-controlling interest 1.0 – – – – – 1.0
1 The use of the term ‘Statutory’ refers to IFRS financial information and ‘Underlying’ refers to non-IFRS financial information. Underlying earnings are categorised as non-IFRS financial information and therefore have been presented in compliance with ASIC Regulatory Guide 230 – Disclosing non-IFRS information. The exclusion of underlying adjustments provides a result which, in the Directors’ view, more closely reflects the ongoing operations of the Group. The non-IFRS financial information is unaudited.
2 EBITDA represents earnings before interest, income tax, and depreciation, amortisation and impairments.
3 EBIT represents earnings before interest and income tax.
4 Acquisition and integration costs include transaction costs and other costs associated with the acquisition and integration of the Sydney Resource Network of $17.5 million offset by $1.4 million remeasurement of the contingent consideration in relation to the acquisition of the Grasshopper Group. In addition, a $8.9 million impairment charge was recognised related to assets which will have no future economic benefit to the Group post acquisition and $2.5 million of net finance costs were incurred to retain the financing for the acquisition of the Sydney Resource Network.
5 On 30 August 2021 Mr Mark Schubert commenced in the role of CEO. Costs related to his sign-on bonus and performance rights costs incurred in the current period total $0.7 million. On commencement, Mr Schubert commissioned some initiatives to enhance compliance and safety processes across the Group, appointed consultants to conduct a review into the future strategy of the Group and has appointed new members of the Group Executive Committee. Costs incurred on these projects and related to the termination of outgoing Executive Committee members total $7.2 million.
6 Following the NSW Government release of their Energy from Waste Infrastructure Plan on 10 September 2021, the Eastern Creek site designated by the Western Sydney Energy and Resource Recovery Centre Pty Ltd project, and owned 51% by the Group, is no longer considered a viable site for development of an Energy from Waste facility. Costs related to the environmental impact study of $6.0 million, which were to be recovered from the joint venture company upon the project reaching financing stage, have been written off.
7 On 15 July 2021 the Group completed the sale of a depot located in Erskine Park, New South Wales for a sum of $15.7 million and will lease it back over a term of seven years with five, five-year options to extend the lease. A gain of $8.2 million resulted from the transaction.
8 The credit to EBITDA of $1.3 million relates to the increase in discount rate on measurement of remediation liabilities related to closed landfill sites and industrial properties. Net finance costs relate to the fair value gain on cross currency interest rate swaps (CCIRS) of $6.8 million offset by the fair value loss on the related USPP Notes of $6.6 million.

Cleanaway Waste Management Limited 4
Directors’ Report
Operating review (continued)
Group results for the half-year ended 31 December 2020 UNDERLYING ADJUSTMENTS
STATUTORY 1 $’M
MRF FIRE 4 $’M
ACQUISITION & INTEGRATION
COSTS 5 $’M
CHANGE IN REMEDIATION
PROVISION DISCOUNT
RATE 6 $’M
OTHER 6 $’M
UNDERLYING 1 $’M
Solid Waste Services 198.4 Industrial & Waste Services 23.8 Liquid Waste & Health Services 55.1 Equity accounted investments (1.3) Waste management 276.0 Corporate (12.2) EBITDA 2 256.9 5.1 3.3 (1.5) – 263.8 Depreciation and amortisation (131.6) – – – – (131.6) EBIT 3 125.3 5.1 3.3 (1.5) – 132.2 Net finance costs (13.9) – – – (7.6) (21.5) Profit before income tax 111.4 5.1 3.3 (1.5) (7.6) 110.7 Income tax expense (32.0) (1.5) (1.0) 0.5 2.3 (31.7) Profit after income tax 79.4 3.6 2.3 (1.0) (5.3) 79.0 Attributable to: Ordinary equity holders 78.3 3.6 2.3 (1.0) (5.3) 77.9 Non-controlling interest 1.1 – – – – 1.1
1 The use of the term ‘Statutory’ refers to IFRS financial information and ‘Underlying’ refers to non-IFRS financial information. Underlying earnings are categorised as non-IFRS financial information and therefore have been presented in compliance with ASIC Regulatory Guide 230 – Disclosing non-IFRS information. The exclusion of underlying adjustments provides a result which, in the Directors’ view, more closely reflects the ongoing operations of the Group. The non-IFRS financial information is unaudited.
2 EBITDA represents earnings before interest, income tax, and depreciation, amortisation and impairments.
3 EBIT represents earnings before interest and income tax.
4 On 25 November 2019 a fire occurred at the Materials Recycling Facility (MRF) in Guildford, Western Australia. Business interruption costs of $5.1 million have been incurred in the current period.
5 Acquisition and integration costs include transaction costs and other costs associated with the acquisition of businesses during the period of $1.4 million and the ongoing integration costs related to these acquisitions of $1.9 million.
6 Relates to the increase in discount rate on measurement of remediation liabilities related to closed landfill sites and industrial properties.
7 Net finance costs relate to the gain on modification of CEFC fixed rate borrowing of $7.9 million, the fair value gain on USPP Notes of $53.8 million offset by the fair value loss on cross currency interest rate swaps (CCIRS) of $54.1 million.

Cleanaway Waste Management Limited 5
Directors’ Report
Operating review (continued) The Group comprises three operating segments being Solid Waste Services, Industrial & Waste Services and Liquid Waste & Health Services. Unallocated balances include the Group’s share of profits from equity accounted investments and corporate balances. A description of the operating segments and a summary of the associated segment results are set out below:
Solid Waste Services
31 DEC 2021
$’M 31 DEC 2020
$’M
Underlying EBITDA 1 209.1 198.4 Underlying EBIT 2 107.0 108.3
Core business The Solid Waste Services segment comprises the collection, recovery and disposal of all types of solid waste, including putrescible waste, inert waste, household waste and recovered waste. Waste streams are generally processed through our resource recovery and recycling facilities, transfer stations and landfills.
Financial metrics Total revenue for the Solid Waste Services segment increased by 19.2% to $969.1 million due to higher Melbourne Regional Landfill (MRL) volumes, new municipal and commercial & industrial (C&I) contracts, the $40 per tonne landfill levy increase in Victoria, higher commodity volumes and prices, recommencement of the Perth materials recycling facility (MRF) and an initial contribution from the acquired Sydney Resource Network. This was partially offset by lower post collections volumes at New Chum and Erskine Park and the impact of COVID-19 lockdowns, particularly in NSW.
Underlying EBITDA increased by 5.4% to $209.1 million due to higher revenue partially offset by higher fuel costs, higher commodity rebates and the fixed cost impact of the COVID-19 related lockdowns. Underlying EBIT decreased by 1.2% to $107.0 million reflecting higher depreciation and amortisation expenses associated with the new municipal and C&I contracts and a higher contribution from recent acquisitions and the Perth MRF.
Performance Compared to the prior corresponding period the segment benefited from the additional Metropolitan Waste and Resource Recovery Group (MWRRG) volumes into MRL, several large council collection contracts, the commencement of operations at the rebuilt Perth MRF, higher contributions from Grasshopper Environmental (NSW construction & demolition (C&D) collections) and an initial contribution from the Sydney Resource Network, acquired from Suez on 18 December 2021.
We continue to await the outcome of the height extension court appeal at New Chum and Stage 1 of the Erskine Park mechanically stabilised earth (MSE) wall was completed during the period. Each resulted in a lower contribution from those assets.
During the period Cleanaway won and retained multiple municipal contracts including the Eurobodalla municipal contract. Cleanaway was recently awarded Supplier Service Champion of the year by Coles for supporting its landfill diversion goal.
The segment completed the acquisition of the Sydney Resource Network and the integration team have onboarded ~100 new employees. The integration has been completed with a full operational handover to the NSW business unit.
1 EBITDA represents earnings before interest, income tax, and depreciation, amortisation and impairments.
2 EBIT represents earnings before interest and income tax.

Cleanaway Waste Management Limited 6
Directors’ Report
Operating review (continued)
Industrial & Waste Services
31 DEC 2021
$’M 31 DEC 2020
$’M
Underlying EBITDA 23.6 23.8 Underlying EBIT 10.6 11.9
Core business The Industrial & Waste Services segment provides a wide variety of services to the Infrastructure, Industrial and Resources markets. Services include drain cleaning, non-destructive digging, vacuum loading, high pressure cleaning, pipeline maintenance and CCTV.
Financial metrics Total revenue increased by 7.6% to $163.3 million driven by strong performances in Western Australia from increased industrial services volumes from newly mobilised contracts for Southern Ports in Esperance and Australian Shipbuilding Corporation in Kwinana, and in South Australia predominantly from the Olympic Dam Project. This was partially offset by COVID-19 impacting infrastructure activity in New South Wales and Victoria where key customers have postponed work and ongoing restrictions have reduced available labour.
Underlying EBITDA decreased by 0.8% from $23.8 million to $23.6 million. The variance is largely attributable to a change in mix being higher low margin business as usual activity compared to one-off project work and higher short-term direct labour costs compared to the prior corresponding period. Underlying EBIT decreased by 10.9% from $11.9 million to $10.6 million.
Performance During the period the segment has re-signed and or secured all available contract extensions, while also securing new business. There is strong activity in the mining and mineral processing and the oil and gas segments, and the business has a pipeline of large contract and project opportunities that it is currently competing for.

Cleanaway Waste Management Limited 7
Directors’ Report
Operating review (continued)
Liquid Waste & Health Services
31 DEC 2021
$’M 31 DEC 2020
$’M
Underlying EBITDA 53.4 55.1 Underlying EBIT 31.5 34.2
Core business The Liquid Waste & Health Services segment comprises:
• Liquid Waste – the collection, treatment, processing, refining and recycling and destruction of hazardous and non-hazardous liquids, hydrocarbons and chemical waste, specialised packaged and hazardous waste.
• Health Services – the provision of services to the health sector for the safe treatment and disposal of health-related waste which includes sharps management, medical waste, pharmaceutical waste, healthcare hazardous waste and quarantine waste.
Financial metrics Total revenue increased by 10.1% to $278.1 million resulting from significant project work and increased activity in Victoria and Queensland in Liquid and Technical Services (LTS), ongoing higher COVID-19 related activities in the Health Services business. This was partially offset by lower LTS activity in NSW during the lockdown. The Hydrocarbons business was steady with some volume and price increases being offset by the non-recurrence of the product stewardship for oil supplement implemented during the first COVID-19 lockdowns in 2020.
Underlying EBITDA decreased by 3.1% from $55.1 million to $53.4 million largely due to higher costs in the Health Services business as it managed the surge activities associated with the COVID-19 pandemic. More broadly higher labour costs, higher fleet costs and higher treatment and disposal costs impacted the segment. Underlying EBIT decreased by 7.9% from $34.2 million to $31.5 million reflecting the factors described above and slightly higher depreciation and amortisation.
Performance The LTS business benefited from the Tottenham and Kaniva clean-up projects, general recovery in Queensland and Victoria relative to the prior corresponding period and growth in the Western Australian market. This was offset by the impact of the NSW delta-wave lockdowns and higher disposal costs due to interstate consignment authorisation challenges.
In the Hydrocarbons business higher production and prices at the oil refineries offset lower collection volumes, higher freight costs and the non-recurrence of the oil recycling COVID-19 relief payments that were provided to offset lower benchmark oil prices during the first COVID-19 lockdowns.
The surge in COVID-19 cases and related activity in multiple states at the same time added significant costs to the Health Services business including higher costs from third party disposal and challenges related to labour and transportation. Increased clinical waste from hotel quarantine, testing sites and hospitals and higher general hospital waste was partially offset by lower waste from aged care facilities.

Cleanaway Waste Management Limited 8
Directors’ Report
Environmental regulation The Group’s operations are subject to significant environmental regulation and where required by law the Group holds environmental licences for its sites.
The Group is committed to achieving the highest standards of environmental performance. There were no material breaches of environmental statutory requirements and no material prosecutions during the half-year under review.
The Group is registered under the National Greenhouse and Energy Reporting Act 2007, under which it is required to report energy consumption, energy production and greenhouse gas emissions for its Australian facilities.
Significant changes in the state of affairs Other than matters mentioned in this Report, no other significant changes in the state of affairs of the Group occurred during the half-year under review.
Events subsequent to reporting date There have been no matters or circumstances that have arisen since the end of the half-year that have affected the Group’s operations not otherwise disclosed in this report.
Auditor’s independence declaration A copy of the Auditor’s Independence Declaration as required under section 307C of the Corporations Act 2001 is set out on page 9.
Auditor rotation Mr Ashley Butler, Partner at Ernst & Young, commenced as the Group’s Audit Partner from the Company’s 2021 AGM. Mr Butler succeeded Mr Brett Croft, Partner at Ernst & Young, as Mr Croft rotated off the Cleanaway Group engagement in accordance with independence requirements of Section 324DA of the Corporations Act 2001 and Ernst & Young’s policy.
This Report is made in accordance with a resolution of the Board.
M P Chellew M J Schubert Chairman and Non-Executive Director Chief Executive Officer and Managing Director
Melbourne,
16 February 2022

Cleanaway Waste Management Limited 9
Auditor’s Independence Declaration
A member firm of Ernst & Young Global Limited Liability limited by a scheme approved under Professional Standards Legislation
Auditor’s Independence Declaration to the Directors of Cleanaway Waste Management Limited
As lead auditor for the review of the half-year financial report of Cleanaway Waste Management Limited for the half-year ended 31 December 2021, I declare to the best of my knowledge and belief, there have been:
a. No contraventions of the auditor independence requirements of the Corporations Act 2001 in relation to the review;
b. No contraventions of any applicable code of professional conduct in relation to the review; and
c. No non-audit services provided that contravene any applicable code of professional conduct in relation to the review.
This declaration is in respect of Cleanaway Waste Management Limited and the entities it controlled during the financial period.
Ernst & Young
Ashley Butler Partner 16 February 2022
Ernst & Young 8 Exhibition Street Melbourne VIC 3000 Australia GPO Box 67 Melbourne VIC 3001
Tel: +61 3 9288 8000 Fax: +61 3 8650 7777 ey.com/au

Cleanaway Waste Management Limited 10
Consolidated Income Statement For the half-year ended 31 December 2021
NOTES
31 DEC 2021 $’M
31 DEC 2020
$’M
Revenue 3 1,364.6 1,170.3 Other income 1.0 1.2 Labour related expenses (500.3) (439.4) Collection, recycling and waste disposal expenses (388.0) (300.4) Fleet operating expenses (140.6) (114.3) Property expenses (25.6) (24.2) Other expenses (60.0) (35.0) Gain on sale and leaseback of property 2 8.2 – Write down loan to equity accounted investment 2 (6.0) – Share of losses from equity accounted investments 5 (0.1) (1.3) Depreciation and amortisation expense (143.8) (131.6) Impairment of plant and equipment 2 (8.9) – Profit from operations 100.5 125.3 Net finance costs 6 (25.2) (13.9) Profit before income tax 75.3 111.4 Income tax expense (22.8) (32.0) Profit after income tax 52.5 79.4 Attributable to: Ordinary equity holders 51.5 78.3 Non-controlling interest 1.0 1.1 Profit after income tax 52.5 79.4
The above Consolidated Income Statement should be read in conjunction with the accompanying notes.

Cleanaway Waste Management Limited 11
Consolidated Statement of Comprehensive Income For the half-year ended 31 December 2021
NOTES
31 DEC 2021 $’M
31 DEC 2020
$’M
Profit after income tax 52.5 79.4 Other comprehensive income (to be reclassified to profit or loss in subsequent periods) Net gain/(loss) on currency basis on cross currency interest rate swaps (net of tax) 2.1 (2.7) Net comprehensive income/(loss) recognised directly in equity 2.1 (2.7) Total comprehensive income for the period 54.6 76.7 Attributable to: Ordinary equity holders 53.6 75.6 Non-controlling interest 1.0 1.1 Total comprehensive income for the period 54.6 76.7 Earnings per share attributable to the ordinary equity holders of the Company: Basic earnings per share (cents) 8 2.5 3.8 Diluted earnings per share (cents) 8 2.5 3.8
The above Consolidated Statement of Comprehensive Income should be read in conjunction with the accompanying notes.
Cleanaway Waste Management Limited 12
Consolidated Balance Sheet As at 31 December 2021
NOTES
31 DEC 2021 $’M
30 JUNE 2021 $’M
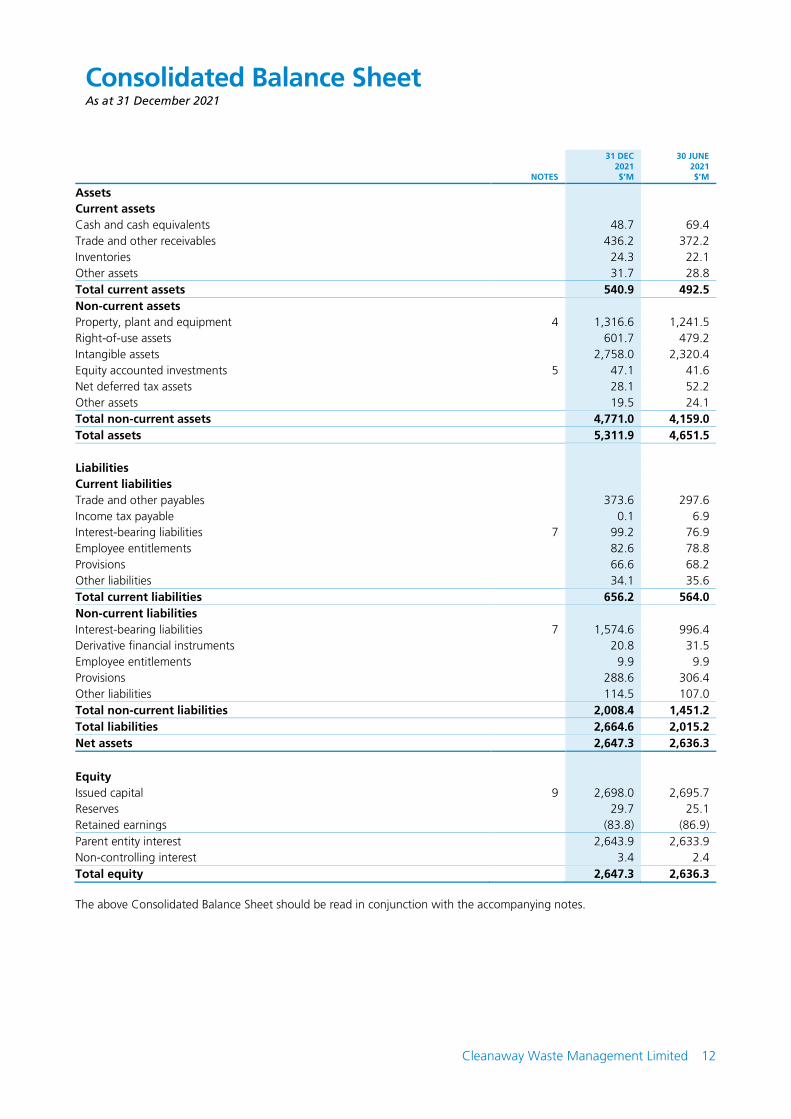
Assets Current assets Cash and cash equivalents 48.7 69.4 Trade and other receivables 436.2 372.2 Inventories 24.3 22.1 Other assets 31.7 28.8 Total current assets 540.9 492.5 Non-current assets Property, plant and equipment 4 1,316.6 1,241.5 Right-of-use assets 601.7 479.2 Intangible assets 2,758.0 2,320.4 Equity accounted investments 5 47.1 41.6 Net deferred tax assets 28.1 52.2 Other assets 19.5 24.1 Total non-current assets 4,771.0 4,159.0 Total assets 5,311.9 4,651.5 Liabilities Current liabilities Trade and other payables 373.6 297.6 Income tax payable 0.1 6.9 Interest-bearing liabilities 7 99.2 76.9 Employee entitlements 82.6 78.8 Provisions 66.6 68.2 Other liabilities 34.1 35.6 Total current liabilities 656.2 564.0 Non-current liabilities Interest-bearing liabilities 7 1,574.6 996.4 Derivative financial instruments 20.8 31.5 Employee entitlements 9.9 9.9 Provisions 288.6 306.4 Other liabilities 114.5 107.0 Total non-current liabilities 2,008.4 1,451.2 Total liabilities 2,664.6 2,015.2 Net assets 2,647.3 2,636.3 Equity Issued capital 9 2,698.0 2,695.7 Reserves 29.7 25.1 Retained earnings (83.8) (86.9) Parent entity interest 2,643.9 2,633.9 Non-controlling interest 3.4 2.4 Total equity 2,647.3 2,636.3
The above Consolidated Balance Sheet should be read in conjunction with the accompanying notes.

Cleanaway Waste Management Limited 13
Consolidated Statement of Changes in Equity For the half-year ended 31 December 2021
PARENT ENTITY INTEREST NON-
ORDINARY SHARES
$’M RESERVES
$’M
RETAINED EARNINGS
$’M TOTAL
$’M
CONTROLLING INTEREST
$’M
TOTAL EQUITY
$’M
At 1 July 2021 2,695.7 25.1 (86.9) 2,633.9 2.4 2,636.3 Profit for period – – 51.5 51.5 1.0 52.5 Other comprehensive income – 2.1 – 2.1 – 2.1 Total comprehensive income for the period – 2.1 51.5 53.6 1.0 54.6 Share-based payment expense – 2.5 – 2.5 – 2.5 Dividends reinvested/(paid) 2.3 – (48.4) (46.1) – (46.1) Balance at 31 December 2021 2,698.0 29.7 (83.8) 2,643.9 3.4 2,647.3 At 1 July 2020 2,688.7 23.9 (142.6) 2,570.0 1.0 2,571.0 Profit for period – – 78.3 78.3 1.1 79.4 Other comprehensive income – (2.7) – (2.7) – (2.7) Total comprehensive income for the period – (2.7) 78.3 75.6 1.1 76.7 Share-based payment expense – 1.7 – 1.7 – 1.7 Dividends reinvested/(paid) 3.4 – (43.2) (39.8) – (39.8) Balance at 31 December 2020 2,692.1 22.9 (107.5) 2,607.5 2.1 2,609.6 The above Consolidated Statement of Changes in Equity should be read in conjunction with the accompanying notes.
Cleanaway Waste Management Limited 14
Consolidated Statement of Cash Flows For the half-year ended 31 December 2021
31 DEC 2021 $’M
31 DEC 2020 $’M
Cash flows from operating activities Profit before income tax 75.3 111.4 Adjustments for:
Depreciation and amortisation expense 143.8 131.6 Impairment of plant and equipment 2 8.9 – Net finance costs 6 25.2 13.9 Share-based payment expense 2.0 1.3 Remediation and rectification provision remeasurement (1.3) (1.5) Share of losses from equity accounted investments 0.1 1.3 Write down loan to equity accounted investment 2 6.0 – Net gain on sale and leaseback of property 2 (8.2) – Net gain on disposal of property, plant and equipment (1.1) (0.9) Other non-cash items (1.6) 1.9
Net cash from operating activities before changes in assets and liabilities 249.1 259.0 Changes in assets and liabilities:
Increase in receivables (64.5) (7.5) Decrease/(increase) in other assets 0.8 (1.1) (Increase)/decrease in inventories (2.2) 0.1 Increase/(decrease) in payables 72.8 (3.0) Increase in employee entitlements 1.2 3.3 Decrease in other liabilities (0.1) (0.5) Decrease in provisions (12.0) (11.5)
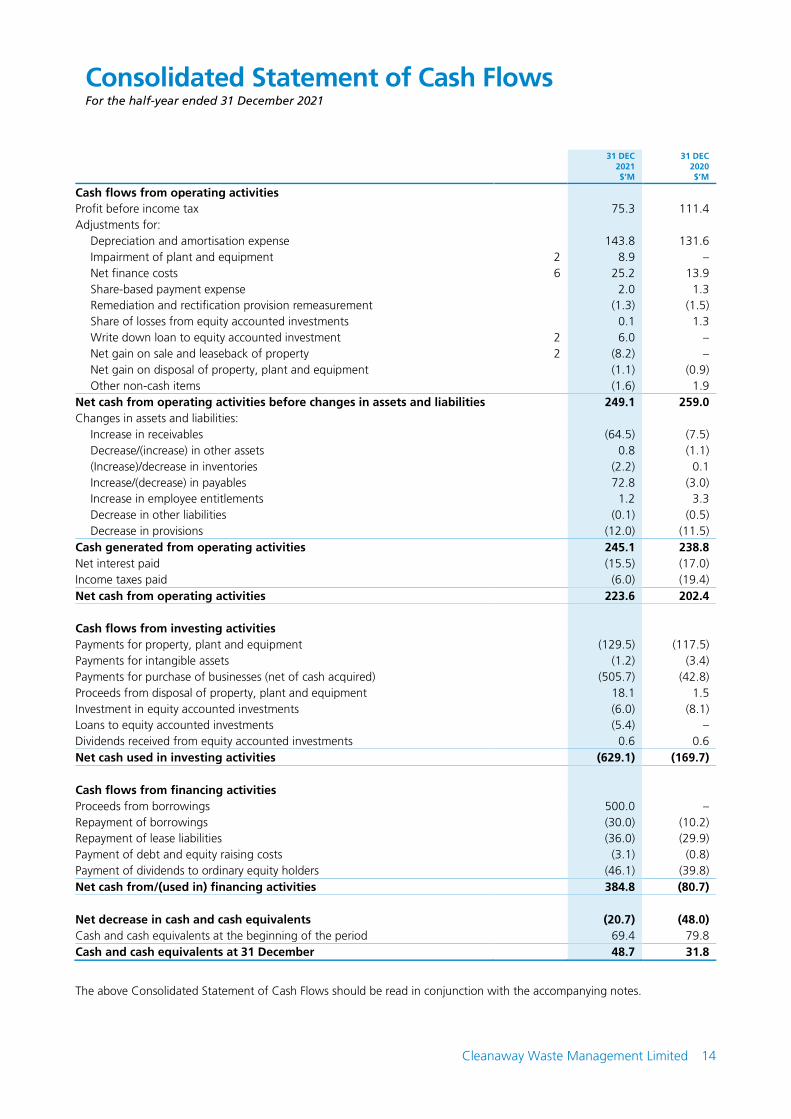
Cash generated from operating activities 245.1 238.8 Net interest paid (15.5) (17.0) Income taxes paid (6.0) (19.4) Net cash from operating activities 223.6 202.4 Cash flows from investing activities Payments for property, plant and equipment (129.5) (117.5) Payments for intangible assets (1.2) (3.4) Payments for purchase of businesses (net of cash acquired) (505.7) (42.8) Proceeds from disposal of property, plant and equipment 18.1 1.5 Investment in equity accounted investments (6.0) (8.1) Loans to equity accounted investments (5.4) – Dividends received from equity accounted investments 0.6 0.6 Net cash used in investing activities (629.1) (169.7) Cash flows from financing activities Proceeds from borrowings 500.0 – Repayment of borrowings (30.0) (10.2) Repayment of lease liabilities (36.0) (29.9) Payment of debt and equity raising costs (3.1) (0.8) Payment of dividends to ordinary equity holders (46.1) (39.8) Net cash from/(used in) financing activities 384.8 (80.7) Net decrease in cash and cash equivalents (20.7) (48.0) Cash and cash equivalents at the beginning of the period 69.4 79.8 Cash and cash equivalents at 31 December 48.7 31.8
The above Consolidated Statement of Cash Flows should be read in conjunction with the accompanying notes.

Cleanaway Waste Management Limited 15
Notes to the Consolidated Financial Statements For the half-year ended 31 December 2021
1. Summary of significant accounting policies
Statement of compliance
The Half-Year Consolidated Financial Report is a general purpose financial report which has been prepared in accordance with the Corporations Act 2001 and AASB 134 Interim Financial Reporting. Compliance with AASB 134 ensures compliance with International Financial Reporting Standard IAS 34 Interim Financial Reporting. The half-year report does not include all the notes of the type normally included in an annual financial report and should be read in conjunction with the most recent annual financial report. It is also recommended that the half-year report be considered together with any public announcements made by the Group during the half-year ended 31 December 2021 in accordance with continuous disclosure obligations arising under the Corporations Act 2001.
Basis of preparation
The Half-Year Consolidated Financial Report has been prepared on the basis of historical cost except derivative financial instruments, which are measured at fair value. For assets and liabilities recognised in business combinations, the cost is measured at fair value except for employee entitlements and taxation balances. Cost is otherwise based on the fair value of the consideration given in exchange for assets.
The Half-Year Consolidated Financial Report is presented in Australian dollars and all values are rounded to the nearest hundred thousand dollars, except when otherwise indicated. This presentation is consistent with the requirements of Legislative Instrument 2016/191, issued by the Australian Securities and Investments Commission, relating to the ‘rounding off’ of amounts in the Financial Statements.
The accounting policies and methods of computation adopted in the preparation of the Half-Year Consolidated Financial Report are consistent with those adopted and disclosed in the Group’s Annual Financial Report for the financial year ended 30 June 2021. These accounting policies are consistent with Australian Accounting Standards and with International Financial Reporting Standards.
The Group’s net assets increased from $2,636.3 million at 30 June 2021 to $2,647.3 million at 31 December 2021.
At 31 December 2021 the Group had a net current asset deficiency of $115.3 million (30 June 2021: net current asset deficiency of $71.5 million). As set out in note 7 to the Financial Statements, the Group has unutilised committed debt facilities of $506.0 million at 31 December 2021 available to repay the Group’s creditors as required and therefore the Directors are satisfied that the Group can meet its financial obligations as and when they fall due.
New and revised standards
There are no new standards or amendments, which are effective for the current reporting period, that are relevant to the Group.

Cleanaway Waste Management Limited 16
Notes to the Consolidated Financial Statements For the half-year ended 31 December 2021
1. Summary of significant accounting policies (continued)
Standards issued but not yet effective
New standards are effective for annual periods beginning after 1 July 2022 and have not been applied in preparing these Consolidated Financial Statements. Those which may be relevant to the Group are set out below. The Group does not plan to adopt these standards early.
• Improvements to AASB 2018-2020 cycle – Reference to the Conceptual Framework – Amendments to AASB 3 (to be initially applied in the financial year ending 30 June 2023)
The amendments are intended to update a reference to the new Conceptual Framework without significantly changing the requirements of AASB 3. The amendments also add a new paragraph to AASB 3 to clarify that contingent assets do not qualify for recognition at the acquisition date. This is not expected to have any impact on the Consolidated Financial Statements. This amendment will be applied to business combinations post adoption and is not expected to have a significant impact on the Group.
• Classification of Liabilities as Current or Non-current – Amendments to AASB 101 (to be initially applied in the financial year ending 30 June 2024)
In January 2020, the Board issued amendments to AASB 101 Presentation of Financial Statements to specify the requirements for classifying liabilities as current or non-current. The amendments clarify:
• What is meant by a right to defer settlement
• That a right to defer must exist at the end of the reporting period
• That classification is unaffected by the likelihood that an entity will exercise its deferral right
• That only if an embedded derivative in a convertible liability is itself an equity instrument, would the terms of a liability not impact its classification
Cleanaway does not intend to early adopt this amendment. The impact of this amendment to the Group’s Financial Statements is yet to be determined.
• Definition of Accounting Estimates – Amendments to AASB 108 (to be initially applied in the financial year ending 30 June 2024)
The AASB has issued amendments to AASB 108 Accounting Policies, Changes in Accounting Estimates and Errors in which it introduced a new definition of ‘accounting estimates’. The amendments clarify the distinction between changes in Accounting Policy and correction of errors. Also, they clarify how entities use measurement techniques and inputs to develop estimates. Cleanaway does not intend to early adopt this change.
• Deferred Tax related to Assets and Liabilities arising from a Single Transaction – Amendments to AASB 112 (to be initially applied in the year ending 30 June 2024)
The AASB issued amendments to AASB 112 Income Taxes which narrow the scope of the initial recognition exception under AASB 112 so that it no longer applies to transactions that give rise to equal taxable and deductible differences. Currently Cleanaway applies the gross up method to both lease liabilities and remediation obligations whereby it recognises deferred tax assets in respect of the liabilities and deferred tax liabilities in respect of the assets.
Cleanaway have assessed this change and as the Group already account for deferred tax in accordance with the requirements in the amendment, there will be no impact to the Group on adoption of this amendment.
• Disclosure of Accounting Policies – Amendments to AASB 101 and IFRS Practice Statement 2 (to be initially applied in the year ending 30 June 2024)
The AASB has issued amendments to AASB 101 Presentation of Financial Statements and IFRS Practise Statement 2 Making Materiality Judgements in which it provides guidance and examples to help entities apply materiality judgements to accounting policy disclosures with the aim to making the accounting policies more useful.
Cleanaway does not intend to early adopt this amendment.

Cleanaway Waste Management Limited 17
Notes to the Consolidated Financial Statements For the half-year ended 31 December 2021
2. Segment reporting
The Group has identified its operating segments based on how the Chief Operating Decision Maker reviews internal reports about components of the Group, in order to assess the performance and allocation of resources to a particular segment. Information reported to the Group’s Chief Executive Officer (Chief Operating Decision Maker) for the purpose of performance assessment and resource allocation is specifically focused on the following segments:
Solid Waste Services
Comprises the collection, recovery and disposal of all types of solid waste, including putrescible waste, inert waste, household waste and recovered waste. Waste streams are generally processed through our resource recovery and recycling facilities, transfer stations and landfills.
Industrial & Waste Services
Comprises a wide variety of services provided to the Infrastructure, Industrial and Resources markets. Services include drain cleaning, non-destructive digging, vacuum loading, high pressure cleaning, pipeline maintenance and CCTV.
Liquid Waste & Health Services
Liquid Waste comprises the collection, treatment, processing, refining and recycling and destruction of hazardous and non-hazardous liquids, hydrocarbons and chemical waste, specialised packaged and hazardous waste.
Health Services comprises the provision of services to the health sector for the safe treatment and disposal of health-related waste which includes sharps management, medical waste, pharmaceutical waste, healthcare hazardous waste and quarantine waste.
Unallocated balances include the Group’s share of profits from equity accounted investments and corporate balances. Corporate balances relate to shared services functions that are not directly attributable to an identifiable segment. These functions include management, finance, legal, information technology, marketing, and human resources that provide support to the other segments identified above.
No operating segments have been aggregated to form the reportable segments.
Segment results include items directly attributable to a segment as well as those that can be allocated on a reasonable basis. Segment capital expenditure is the total cost incurred during the period to acquire segment assets that are expected to be used for more than one period.
The Group has the following allocation policies:
Sales between segments are on normal commercial terms; and
• Corporate charges are allocated where possible based on estimated usage of corporate resources.
Segment assets and liabilities have not been disclosed as these are not provided to the Chief Operating Decision Maker. This information is provided at a Group level only.
Net finance costs are not allocated to individual segments as the underlying instruments are managed on a Group basis. Current taxes, deferred taxes and certain financial assets and liabilities are not allocated to those segments as they are also managed on a Group basis.
Inter-segment revenues are eliminated on consolidation.

Cleanaway Waste Management Limited 18
Notes to the Consolidated Financial Statements For the half-year ended 31 December 2021
2. Segment reporting (continued)
OPERATING SEGMENTS UNALLOCATED
31 DECEMBER 2021
SOLID WASTE
SERVICES $’M
INDUSTRIAL & WASTE SERVICES
$’M
LIQUID WASTE
& HEALTH SERVICES
$’M ELIMINATIONS
$’M
TOTAL OPERATING SEGMENTS
$’M
EQUITY ACCOUNTED
INVESTMENTS $’M
CORPORATE $’M
GROUP $’M
Revenue Revenue from customers 940.5 158.9 248.6 – 1,348.0 – – 1,348.0 Other revenue 5.7 – 10.9 – 16.6 – – 16.6 Inter-segment sales 22.9 4.4 18.6 (45.9) – – – – Total revenue 969.1 163.3 278.1 (45.9) 1,364.6 – – 1,364.6 Underlying EBITDA 209.1 23.6 53.4 – 286.1 (0.1) (12.3) 273.7 Depreciation and amortisation (102.1) (13.0) (21.9) – (137.0) – (6.8) (143.8) Underlying EBIT 107.0 10.6 31.5 – 149.1 (0.1) (19.1) 129.9 Acquisition and integration costs 2 (25.0) CEO transition and restructuring 3 (7.9) Write down loan to Sydney EfW 4 (6.0) Gain on sale and leaseback of property 5 8.2 Remediation and rectification provision remeasurement 6 1.3 Profit from operations (EBIT) 100.5 Net finance costs (25.2) Profit before income tax 75.3 Income tax expense (22.8) Profit after income tax 52.5 Capital expenditure: Property, plant and equipment 98.2 9.4 16.8 – 124.4 – 5.1 129.5 Intangible assets 0.5 – 0.2 – 0.7 – 0.5 1.2
1 Underlying earnings are categorised as non-IFRS financial information and therefore have been presented in compliance with ASIC Regulatory Guide 230 – Disclosing non-IFRS information. The exclusion of underlying adjustments provides a result which, in the Directors’ view, more closely reflects the ongoing operations of the Group.
2 Acquisition and integration costs include transaction costs and other costs associated with the acquisition and integration of the Sydney Resource Network of $17.5 million offset by $1.4 million remeasurement of the contingent consideration in relation to the acquisition of the Grasshopper Group. In addition, a $8.9 million impairment charge was recognised related to assets which will have no future economic benefit to the Group post acquisition of the Sydney Resource Network.
3 On 30 August 2021 Mr Mark Schubert commenced in the role of CEO. Costs related to his sign-on bonus and performance rights costs incurred in the current period total $0.7 million. On commencement, Mr Schubert commissioned some initiatives to enhance compliance and safety processes across the Group, appointed consultants to conduct a review into the future strategy of the Group and has appointed new members of the Group Executive Committee. Costs incurred on these projects and related to the termination of outgoing Executive Committee members total $7.2 million.
4 Following the NSW Government release of their Energy from Waste Infrastructure Plan on 10 September 2021, the Eastern Creek site designated by the Western Sydney Energy and Resource Recovery Centre Pty Ltd project and owned 51% by the Group, is no longer considered a viable site for development of an Energy from Waste facility. Costs related to the environmental impact study of $6.0 million, which were to be recovered from the joint venture company upon the project reaching financing stage, have been written off.
5 On 15 July 2021 the Group completed the sale of a depot located in Erskine Park, New South Wales for a sum of $15.7 million and will lease it back over a term of seven years with five, five-year options to extend the lease. A gain of $8.2 million resulted from the transaction.
6 The credit of $1.3 million relates to the increase in discount rate on measurement of remediation liabilities related to closed landfill sites and industrial properties.
Cleanaway Waste Management Limited 19
Notes to the Consolidated Financial Statements For the half-year ended 31 December 2021
2. Segment reporting (continued)
OPERATING SEGMENTS UNALLOCATED
31 DECEMBER 2020
SOLID WASTE
SERVICES $’M
INDUSTRIAL & WASTE SERVICES
$’M
LIQUID WASTE
& HEALTH SERVICES
$’M ELIMINATIONS
$’M
TOTAL OPERATING SEGMENTS
$’M
EQUITY ACCOUNTED
INVESTMENTS $’M
CORPORATE $’M
GROUP $’M
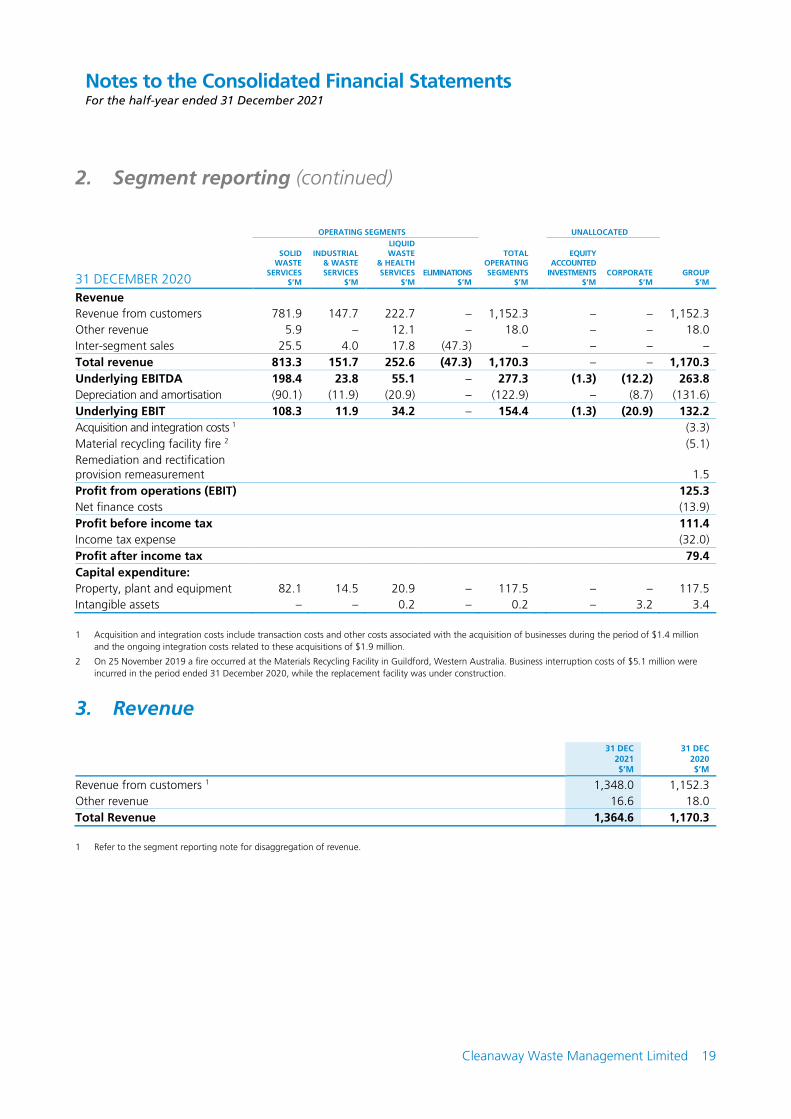
Revenue Revenue from customers 781.9 147.7 222.7 – 1,152.3 – – 1,152.3 Other revenue 5.9 – 12.1 – 18.0 – – 18.0 Inter-segment sales 25.5 4.0 17.8 (47.3) – – – – Total revenue 813.3 151.7 252.6 (47.3) 1,170.3 – – 1,170.3 Underlying EBITDA 198.4 23.8 55.1 – 277.3 (1.3) (12.2) 263.8 Depreciation and amortisation (90.1) (11.9) (20.9) – (122.9) – (8.7) (131.6) Underlying EBIT 108.3 11.9 34.2 – 154.4 (1.3) (20.9) 132.2 Acquisition and integration costs 1 (3.3) Material recycling facility fire 2 (5.1) Remediation and rectification provision remeasurement 1.5 Profit from operations (EBIT) 125.3 Net finance costs (13.9) Profit before income tax 111.4 Income tax expense (32.0) Profit after income tax 79.4 Capital expenditure: Property, plant and equipment 82.1 14.5 20.9 – 117.5 – – 117.5 Intangible assets – – 0.2 – 0.2 – 3.2 3.4
1 Acquisition and integration costs include transaction costs and other costs associated with the acquisition of businesses during the period of $1.4 million and the ongoing integration costs related to these acquisitions of $1.9 million.
2 On 25 November 2019 a fire occurred at the Materials Recycling Facility in Guildford, Western Australia. Business interruption costs of $5.1 million were incurred in the period ended 31 December 2020, while the replacement facility was under construction.
3. Revenue
31 DEC 2021 $’M
31 DEC 2020 $’M
Revenue from customers 1 1,348.0 1,152.3 Other revenue 16.6 18.0 Total Revenue 1,364.6 1,170.3
1 Refer to the segment reporting note for disaggregation of revenue.

Cleanaway Waste Management Limited 20
Notes to the Consolidated Financial Statements For the half-year ended 31 December 2021
4. Property, plant and equipment
NON-LANDFILL LAND AND BUILDINGS
$’M
LANDFILL ASSETS 3
$’M
LEASEHOLD IMPROVEMENTS
$’M
PLANT AND EQUIPMENT
$’M
CAPITAL WORK IN PROGRESS
$’M TOTAL
$’M
Opening balance at 1 July 2021 194.4 268.0 59.8 600.9 118.4 1,241.5 Additions – – – – 133.4 133.4 Acquisitions of businesses 1 52.1 – – 2.4 – 54.5 Net movement in remediation assets 2 – (8.6) (0.3) – – (8.9) Disposals (4.7) – – (0.7) – (5.4) Transfers of assets 16.1 45.8 (0.7) 58.1 (119.2) 0.1 Depreciation (1.6) (22.6) (3.1) (62.4) – (89.7) Impairment of assets – – – (8.9) – (8.9) Closing balance at 31 December 2021 256.3 282.6 55.7 589.4 132.6 1,316.6 1 Refer Note 12. 2 Net movement in remediation assets reflects adjustments to the remediation provision for open landfill sites and leasehold improvements. 3 Landfill assets are depreciated using airspace related to the current licensed areas and expected extensions of that landfill area. Total landfill assets related
to the New Chum Landfill are currently being depreciated assuming that the height rise application, currently subject to appeal by Cleanaway in the Land and Environment Court in Queensland, will be awarded in our favour. This position is based on our expectation that a height rise application will be granted, given all relevant facts and circumstances, our own internal analysis and the views expressed by our third party experts. Should the current appeal and any other future remedies not be successful, the available airspace will need to be revised. Assets related to the New Chum landfill and subject to the appeal total $30.8 million ($28.2 million at 30 June 2021).
5. Equity accounted investments
The Group holds an interest in the following equity accounted investments but does not have control. Control is achieved when the Group is exposed, or has rights, to variable returns from its involvement with the investee and has the ability to affect those returns through its power over the investee. The Group does not have power over these entities either through management control or voting rights.
DIRECT OWNERSHIP INTEREST CARRYING VALUE OF INVESTMENT
NAME OF ENTITY COUNTRY REPORTING
DATE
31 DEC 2021
%
30 JUNE 2021
%
31 DEC 2021 $’M
30 JUNE 2021 $’M
Joint ventures: Cleanaway ResourceCo RRF Pty Ltd Australia 30 June 45 45 17.7 19.2 Circular Plastics Australia Pty Ltd 1 Australia 30 June 50 – 4.2 – Earthpower Technologies Sydney Pty Ltd 2 Australia 30 June – 50 – – Tomra Cleanaway Pty Ltd Australia 30 June 50 50 4.6 3.6 Western Sydney Energy and Resource Recovery Centre Pty Ltd Australia 30 June 51 51 9.5 9.5 Wonthaggi Recyclers Pty Ltd Australia 30 June 50 50 0.3 0.3 Associates: Circular Plastics Australia (PET) Pty Ltd 3 Australia 30 June – 40 – 9.0 Circular Plastics (PET) Holdings Pty Ltd 3 Australia 30 June 33 – 10.8 – 47.1 41.6
1 On 1 August 2021 Cleanaway Pty Ltd subscribed for 7,675,998 party paid shares in Circular Plastics Australia Pty Ltd, representing 50% of the paid-up capital of the entity.
2 On 21 October 2021 Cleanaway Solid Waste Pty Ltd, a 100% owned subsidiary of Cleanaway Waste Management Limited, sold its 50% interest in Earthpower Technologies Sydney Pty Ltd for consideration of $1.
3 On 17 December 2021 the 40% interest in Circular Plastics Australia (PET) Pty Ltd (formally Circular Plastics Australia Pty Ltd) was sold to an intermediary Holding Company (Circular Plastics (PET) Holdings Pty Ltd) in which the Group also held a 40% interest. Subsequent to this, Coca-Cola Europacific Partners subscribed to shares in Circular Plastics (PET) Holdings Pty Ltd which has had the effect of diluting the Group’s interest in Circular Plastics (PET) Holdings Pty Ltd to 33%. No profit or loss was recognised on effective sell down in the Group’s interest in Circular Plastics (PET) Holdings Pty Ltd from 40% to 33%.

Cleanaway Waste Management Limited 21
Notes to the Consolidated Financial Statements For the half-year ended 31 December 2021
5. Equity accounted investments (continued)
(a) Share of (loss)/profit from joint ventures
31 DEC 2021 $’M
31 DEC 2020 $’M
Revenues 107.8 109.6 Expenses (107.9) (113.1) Loss before income tax (100%) (0.1) (3.5) Share of profit/(loss) before income tax 0.1 (1.6) Income tax (expense)/benefit (0.2) 0.3 Share of net loss recognised (0.1) (1.3)
(b) Transactions with equity accounted investments The following table provides the total amount of transactions with equity accounted investments during the half-year ended 31 December 2021.
SALES TO EQUITY
ACCOUNTED INVESTMENTS 1 PURCHASES FROM EQUITY ACCOUNTED INVESTMENTS
INTEREST REVENUE FROM EQUITY ACCOUNTED INVESTMENTS
31 DEC 2021 $’M
31 DEC 2020 $’M
31 DEC 2021 $’M
31 DEC 2020 $’M
31 DEC 2021 $’M
31 DEC 2020 $’M
Joint ventures 38.6 42.4 2.1 2.4 – 0.2 Associates 0.3 – – – – – 1 Sales to equity accounted investments comprise $37.6 million to Tomra Cleanaway Pty Ltd (31 Dec 2020: $40.9 million), $0.3 million to Earthpower
Technologies Sydney Pty Ltd (31 Dec 2020: $0.6 million), $0.4 million to Wonthaggi Recyclers Pty Ltd (31 Dec 2020: $0.5 million) and $0.3 million to Cleanaway ResourceCo RRF Pty Ltd (31 Dec 2020: $0.4 million).
TRADE AMOUNTS OWED BY EQUITY ACCOUNTED
INVESTMENTS
TRADE AMOUNTS OWED TO EQUITY ACCOUNTED
INVESTMENTS
LOANS TO EQUITY ACCOUNTED
INVESTMENTS 1
31 DEC 2021 $’M
30 JUNE 2021 $’M
31 DEC 2021 $’M
30 JUNE 2021 $’M
31 DEC 2021 $’M
30 JUNE 2021 $’M
Joint ventures 0.8 0.9 4.5 2.5 17.3 17.6 Associates 0.3 – – – – – 1 This represents an unsecured loan to Tomra Cleanaway Pty Ltd of $3.8 million (30 June 2021: $3.8 million) repayable in full on 22 November 2022, an
unsecured loan to Cleanaway ResourceCo RRF Pty Ltd of $13.5 million (30 June 2021: $8.5 million) and an unsecured loan to Western Sydney Energy and Resource Recovery Centre Pty Ltd of nil (30 June 2021: $5.3 million), which is no longer expected to be repaid due to the project being unlikely to reach the financing stage and consequently has been impaired to nil in the current period.

Cleanaway Waste Management Limited 22
Notes to the Consolidated Financial Statements For the half-year ended 31 December 2021
6. Net finance costs
31 DEC 2021 $’M
31 DEC 2020 $’M
Finance costs Interest on borrowings (7.7) (7.5) Interest on leases (8.6) (7.9) Amortisation of capitalised transaction costs (0.3) (1.3) Unwind of discount on provisions and other liabilities (5.5) (4.6) Gain on modification of fixed rate borrowings 1 – 7.9 Transaction costs expensed (2.5) – Amortisation of gain on modification of fixed rate borrowings (0.9) (0.4) Fair value (loss)/gain on USPP Notes (6.6) 53.8 Fair value gain/(loss) on cross currency interest rate swaps (CCIRS) 6.8 (54.1) (25.3) (14.1) Finance income Interest income 0.1 0.2 0.1 0.2 Net finance costs (25.2) (13.9)
1 On 19 October 2020 the $90.0 million Clean Energy Finance Corporation term loan facility was amended including a reduction in the fixed interest rate. The $7.9 million gain on modification of fixed rate debt is net of fees of $1.7 million, paid to the lender.

Cleanaway Waste Management Limited 23
Notes to the Consolidated Financial Statements For the half-year ended 31 December 2021
7. Interest-bearing liabilities
UNSECURED SECURED
BANK LOANS
$’M
CLEAN ENERGY FINANCE
CORPORATION $’M
USPP NOTES $’M
LEASE LIABILITIES
$’M
TOTAL INTEREST-BEARING
LIABILITIES $’M
Opening balance at 1 July 2021 125.7 81.5 366.7 499.4 1,073.3 Net proceeds/(repayment) of borrowings 470.0 – – (36.0) 434.0 Borrowing costs paid (0.6) – – – (0.6)
Cash flows 469.4 – – (36.0) 433.4 Lease drawdowns – – – 41.4 41.4 Remeasurement of lease liabilities – – – (5.3) (5.3) Non-cash drawdowns/(repayments) (3.7) – – – (3.7) Interest bearing liabilities acquired 1 – – – 126.1 126.1 Fair value changes – – 6.6 – 6.6 Borrowing costs reversed/(accrued) – – 0.8 – 0.8 Amortisation of modification gain – 0.9 – – 0.9 Amortisation of borrowing costs 0.2 – 0.1 – 0.3 Closing balance at 31 December 2021 591.6 82.4 374.2 625.6 1,673.8 1 Refer Note 12.
The headroom available in the Group’s facilities at 31 December 2021 is summarised below:
AVAILABLE
$’M UTILISED
$’M NOT UTILISED
$’M
Syndicated Facility Agreement Facility A 1,2,3 180.0 (113.4) 66.6 Facility B 3 200.0 (90.0) 110.0 Facility C 3 315.0 – 315.0 Facility E 4 500.0 (500.0) – US Private Placement (USPP) Notes 374.2 (374.2) – Clean Energy Finance Corporation 5 90.0 (90.0) – Bank guarantee facilities 1 95.0 (80.6) 14.4 1,754.2 (1,248.2) 506.0 1 These facilities include $173.8 million (30 June 2021: $174.5 million) in guarantees and letters of credit, which only give rise to a liability where the Group
fails to perform its contractual obligations.
2 This facility includes $4.5 million (30 June 2021: $4.5 million) of corporate credit card limit utilisation and $15.0 million of overdraft utilisation (30 June 2021: $15.0 million).
3 Amounts utilised exclude capitalised transaction costs of $2.9 million (30 June 2021: $2.4 million) and $4.0 million (30 June 2021: $7.6 million) of bank loans advanced under uncommitted facilities.
4 This facility was put in place to fund the purchase of the Sydney Resource Network. Refer Note 12. 5 The amount utilised excludes unamortised borrowing costs of $0.4 million (30 June 2021: $0.4 million) and unamortised gain on fixed rate debt of
$7.4 million (30 June 2021: $8.3 million).

Cleanaway Waste Management Limited 24
Notes to the Consolidated Financial Statements For the half-year ended 31 December 2021
8. Earnings per share
31 DEC
2021 31 DEC
2020
Basic earnings per share (cents) 2.5 3.8 Diluted earnings per share (cents) 2.5 3.8
31 DEC 2021 $’M
31 DEC 2020 $’M
Profit after income tax 52.5 79.4 (Profit)/loss attributable to non-controlling interests (1.0) (1.1) Profit after income tax attributable to ordinary equity holders 51.5 78.3
A reconciliation of weighted average number of ordinary shares is provided in the table below:
31 DEC
2021 31 DEC
2020
Weighted average number of ordinary shares used as the denominator Number for basic earnings per share Effect of potential ordinary shares
2,060,717,015 6,229,870
2,056,181,369 7,504,485
Number for diluted earnings per share 2,066,946,885 2,063,685,854
9. Issued capital
31 DEC 2021 30 JUNE 2021
NUMBER
OF SHARES $’M NUMBER
OF SHARES $’M
Opening balance 2,059,434,558 2,695.7 2,053,944,831 2,688.7 Issue of shares under dividend reinvestment plan 841,152 2.3 3,112,469 7.0 Issue of shares under employee incentive plans 1,353,408 – 2,377,258 – Closing balance 2,061,629,118 2,698.0 2,059,434,558 2,695.7
10. Dividends
31 DEC 2021
CENTS PER SHARE
31 DEC 2020
CENTS PER SHARE
31 DEC 2021
$’M
31 DEC 2020
$’M
Dividends paid during the period Final dividend relating to prior period 2.35 2.10 48.4 43.2 Dividends determined in respect of the period Interim dividend relating to current period 2.45 2.25 50.5 46.3

Cleanaway Waste Management Limited 25
Notes to the Consolidated Financial Statements For the half-year ended 31 December 2021
11. Share-based Payments
Total share-based payment expense of $2.0 million (31 December 2020: $1.3 million) is included in the Consolidated Income Statement. Performance rights outstanding at the reporting date consist of the following grants:
OFFER GRANT DATE
END OF PERFORMANCE
OR SERVICE PERIOD
PERFORMANCE RIGHTS AT
30 JUNE 2021
GRANTED DURING THE
PERIOD VESTED DURING
THE PERIOD
FORFEITED/ EXPIRED
DURING THE PERIOD
PERFORMANCE RIGHTS AT
31 DEC 2021
LONG-TERM INCENTIVE PLAN 2019 LTI 2 Nov 2018 30 Jun 2021 2,597,532 – (1,261,641) (1,335,891) – 2020 LTI 30 Oct 2019 30 Jun 2022 2,223,603 – – (140,368) 2,083,235 2021 LTI 16 Dec 2020 30 Jun 2023 1,991,571 – (157,661) 1,833,910 2022 LTI 25 Oct 2021 30 Jun 2024 – 2,318,546 – (34,090) 2,284,456
SHORT-TERM INCENTIVE PLAN 2020 STI 16 Dec 2020 30 Jun 2021 91,767 – (91,767) – – 2021 STI 25 Oct 2021 30 Jun 2022 – 189,161 – – 189,161 OTHER GRANTS CEO Tranche 1 22 Oct 2021 30 Aug 2022 – 152,091 – – 152,091 CEO Tranche 2 22 Oct 2021 30 Aug 2023 – 190,114 – – 190,114 CEO Tranche 3 22 Oct 2021 30 Aug 2024 – 190,114 – – 190,114 Total 6,904,473 3,040,026 (1,353,408) (1,668,010) 6,923,081 Vested and exercisable at 31 Dec 2021 –
The vesting date for LTI offers is on or after 14 days after the date on which the annual financial results of the Group for the financial year, associated with the end of the performance period, is released to the ASX. Other offers vest on or after the end of the relevant performance or service period. Awards granted in the current period are set out below:
(a) 2022 Long Term Incentive award During the period, the Group issued performance rights attached to the Group’s LTI plan to the CEO and other senior executives. The performance rights are subject to three performance hurdles: • 50% of performance rights vest if a certain relative TSR ranking is achieved against constituents of the S&P/ASX 200
Industrial Sector Index. • 50% of performance rights vest if a certain underlying EPS CAGR target is achieved. • The ROIC for the year ending 30 June 2024 acts as a gateway to EPS CAGR. Performance rights granted during the period were fair valued by an external party using Monte Carlo Simulation and a Black Scholes Option Pricing Model. The following sets out the assumptions made in determining the fair value of these performance rights: SCHEME 2022 LTI
Number of rights 2,318,546 Grant date 25 October 2021 Performance period 1 July 2021 – 30 June 2024 Risk-free interest rate (%) 0.66% Volatility 1 (%) 35.0% Fair value per right – Relative TSR tranche 2 $1.765 Fair value per right – EPS CAGR tranche 2 $2.710 1 Expected volatility is based on the historic volatility of Cleanaway shares over a range of periods.
2 The fair value is reduced to reflect there is no dividend entitlement during the performance period.

Cleanaway Waste Management Limited 26
Notes to the Consolidated Financial Statements For the half-year ended 31 December 2021
11. Share-based Payments (continued)
(a) 2022 Long Term Incentive award (continued) The performance targets of the 2022 LTI award are set out in the table below.
Relative TSR performance measured over three years from 1 July 2021 to 30 June 2024
Relative Total Shareholder Return (TSR) Ranking against the constituents of the S&P/ASX200 Industrial Sector Index:
• Below 50th percentile – 0% vesting
• At 50th percentile – 50% vesting
• 50th to 75th percentile – straight line vesting between 50% and 100%
• Above 75th percentile – 100% vesting
EPS CAGR performance as measured over three years from 1 July 2021 to 30 June 2024
Earnings per Share Compound Annual Growth Rate (EPS CAGR) to be achieved:
• < 5.0% – 0% vesting
• 5.0% – 30% vesting
• > 5.0% – ≤ 10.0% – straight line vesting between 30% and 80%
• > 10.0% – ≤ 11.0% – straight line vesting between 80% and 100%
• > 11.0 – 100% vesting
ROIC performance for the year ending 30 June 2024
Performance rights under EPS CAGR will only vest if ROIC is at least 5.6% or more for the year ending 30 June 2024
(b) Short-term Incentive (STI) plan The Cleanaway STI plan is an annual plan that is used to motivate and reward senior executives across a range of performance measures over the financial year. Under the plan, participants are granted a combination of cash and rights to deferred shares if certain performance standards are met. The Group uses EBIT targets as the main performance standard for the STI plan. Vesting of the performance rights granted is deferred for one year.
(c) CEO sign-on performance rights Cleanaway has offered equity-settled restricted rights to CEO and Managing Director, Mr Mark Schubert to compensate for incentive opportunities lost from leaving his previous role. The fair value of the rights has been adjusted to reflect there is no dividend entitlement paid over the life of the rights, unlike ordinary equity holders. SCHEME CEO RIGHTS
CEO Tranche 1 fair value per right $2.794 CEO Tranche 2 fair value per right $2.742 CEO Tranche 3 fair value per right $2.691

Cleanaway Waste Management Limited 27
Notes to the Consolidated Financial Statements For the half-year ended 31 December 2021
12. Business combinations
Half-year ended 31 December 2021 On 18 December 2021 the Group acquired a group of assets, located in Sydney, NSW from Suez Groupe (S.A.S) and Suez International (S.A.S). The Group of assets, which constitute a Business are known as the ‘Sydney Resource Network’ and comprise the properties, right-of-use assets, plant & equipment and customer contracts to enable waste management businesses to be conducted at the following sites (the Sites):
• Kemps Creek landfill which accepts dry /restricted waste and is an organics processing site; • Lucas Heights landfill which accepts putrescible waste; • Artarmon transfer station; • Auburn transfer station; • Belrose transfer station; • Rockdale transfer station; and • Ryde transfer station. This business has been included in the Solid Waste Services operating segment.
The purchase consideration for the Business was $503.1 million and was paid to the vendor on 18 December 2021. This price was determined by modelling the future cashflows from the landfills and transfer stations and determining a net present value for the Business. A post-tax discount rate of 7.0% was applied and the following assumptions were used:
• airspace from the landfills assuming a completion date of June 2022 • high level assumptions regarding capital expenditure and remediation on the landfill sites • cash flows related to the transfer stations were determined using a terminal value calculation • high level assumptions regarding known onerous contracts. The fair values of the identifiable assets and liabilities, of the business combination at the date of acquisition have not been finalised as the acquisition occurred close to the reporting date and competition law did not allow for information required to complete the valuations, to be passed between the seller and Cleanaway prior to acquisition date. A project is underway and preliminary fair values of the assets and liabilities will be determined in the fourth quarter of FY22, utilising valuation and technical experts as appropriate. As a result, at the date of this report it is not possible to provide a range of outcomes or a reliable estimate of all fair values and obligations. Where preliminary estimates have already been determined and are reflected in the balance sheet this information has been provided below, otherwise the purchase price is classified in intangible assets on the balance sheet.
The assets and liabilities acquired are described below:
• Property, plant and equipment on the Sites, including major infrastructure assets located on the landfills is subject to valuation by experts. The fair value of land and buildings acquired has been determined by experts and $52.1 million has been recognised in property, plant and equipment. In addition, Cleanaway reimbursed the vendor $2.4 million for the recent payout by the vendor of plant and equipment leases.
• Intangibles acquired include landfill airspace, customer contracts and relationships and waste management licenses associated with the transfer stations.
• Lease liabilities relating to property leases and equipment leases have been provisionally valued at $126.1 million. The right of use assets have been recognised at the same value of the lease liabilities and will be adjusted once make good provisions are determined and any unfavourable or favourable terms related to the leases are assessed.
• Employee entitlements: Suez employees previously employed on the Sites have been transferred to Cleanaway. Cleanaway has assumed all related employee entitlements of $2.6 million.
• Together with the Sites listed above, Cleanaway has also acquired the site on which Eastern Creek Global Renewables Eastern Creek Pty Ltd (GRL) operate their business located on Wallgrove Road, Eastern Creek, and a contract between GRL and Suez for the supply of waste volumes to GRL’s alternative waste treatment facility. This contract is considered an onerous contract due to a change in legislation that occurred in October 2018 whereby the NSW EPA revoked orders and exemptions relating to the supply and application of mixed waste organic outputs (MWOO) to land. The revocation removed GRL’s ability to sell MWOO to third parties for land application and removed the waste exemption on MWOO. It had significant implications for the GRL contract resulting in a series of claims by Suez and GRL, seeking to reset the economics of the contract. The fair value of this onerous contract provision and any other onerous contracts identified, will be finalised in conjunction with the project currently underway to determine the fair value of the net assets during the fourth quarter of FY22.

Cleanaway Waste Management Limited 28
Notes to the Consolidated Financial Statements For the half-year ended 31 December 2021
12. Business combinations (continued)
Half-year ended 31 December 2021 (continued)
• Remediation and make good provisions: In respect of the landfills the capping remediation provision related to only the “disturbed landfill area” is recognised. The cashflow models to determine the price paid for the acquisition included all future cash outflows in respect of the landfills.
• Deferred tax assets and liabilities arising from the acquired assets and liabilities. • Any residual value will be goodwill and reflects the synergies expected to be derived by having an established network of
transfer stations and landfills to service the current customers of Cleanaway. At 31 December 2021 $451.6 million has been classified as an intangible asset pending the finalisation of the purchase price allocation. Adjustments to assets and liabilities will change this intangible asset amount, associated with the acquisition currently reflected in the half year financial statements, with no impact to profit or net assets recognised.
Given the short period of time between the acquisition and reporting dates, the contribution to profit by this business since the acquisition date to the reporting date was immaterial. Revenue contributed by this business since the acquisition date to the reporting date was $18.9 million and excluding landfill levies collected was $9.1 million.
13. Financial assets and liabilities at fair value
All assets and liabilities for which fair value is measured or disclosed in the financial statements are classified within the fair value hierarchy on the basis of nature, characteristics and risks and described as follows based on the lower level of input that is significant to the fair value measurement as a whole.
Level 1 – the fair value is calculated using prices in active markets.
Level 2 – the fair value is estimated using inputs other than quoted prices included in Level 1 that are observable for the asset or liability, either directly (as prices) or indirectly (derived from prices).
Level 3 – the fair value is estimated using inputs for the asset or liability that are not based on observable market data.
There were no transfers between levels during the half-year.
The following table provides the fair value measurement of the Group’s financial instruments which have been valued using market observable inputs (level 2), including interest and foreign currency rates and models using present value and future potential exposure calculations where applicable:
FIXED RATE BORROWINGS MEASURED AT AMORTISED COST
DERIVATIVES MEASURED AT FAIR VALUE
31 DECEMBER 2021
CLEAN ENERGY FINANCE CORPORATION
$’M
USPP NOTES (HEDGED ITEMS)
$’M
CCIRS 1
(HEDGING INSTRUMENTS) $’M
Opening fair value of asset/(liability) as at 1 July 2021 (91.6) (370.9) (31.5) Amortisation of fair value loss on recognition – – 0.8 Movement relating to changes in AUD or USD interest rates: Fair value hedges – 4.7 (4.9) Other 0.8 – 1.5 Movement relating to change in AUD/USD exchange rates: Cash flow hedges – (11.3) 10.2 Movement relating to change in AUD/USD currency basis – – 3.1 Closing fair value of asset/(liability) as at 31 December 2021 (90.8) (377.5) (20.8) Carrying amount of asset/(liability) as at 31 December 2021 (82.4) (374.2) (20.8) Accumulated fair value adjustments on the hedged items – 20.1 n/a
1 Fair value movements in interest rates related to the hedging instruments of $(4.9) million includes an effective portion of $4.7 million and an ineffective portion of $0.2 million. Cash flow hedges movements of $10.2 million includes an effective portion of $(11.3) million and an ineffective portion of $1.1 million. The notional amount of the derivatives is US$270.0/$397.6 million.
Cleanaway Waste Management Limited 29
Notes to the Consolidated Financial Statements For the half-year ended 31 December 2021
14. Contingent assets and liabilities
There have been no material changes to the contingent liabilities which were disclosed in the 30 June 2021 Annual Report.
15. Events occurring after the reporting date
There have been no matters or circumstances that have arisen since the end of the half-year that have significantly affected the Group’s operations not otherwise disclosed in this report.

Cleanaway Waste Management Limited 30
Directors’ Declaration
In the Directors’ opinion:
(a) the financial statements and notes for the half-year ended 31 December 2021 are in accordance with the Corporations Act 2001, including:
(i) giving a true and fair view of the Group’s financial position as at 31 December 2021 and of its performance for the half-year ended on that date; and
(ii) complying with Australian Accounting Standard AASB 134 Interim Financial Reporting and the Corporations Regulations 2001;
(b) there are reasonable grounds to believe that the Company will be able to pay its debts as and when they become due and payable.
This declaration is made in accordance with a resolution of the Directors.
M P Chellew M J Schubert
Chairman and Non-Executive Director Chief Executive Officer and Managing Director
Melbourne, 16 February 2022

A member firm of Ernst & Young Global Limited Liability limited by a scheme approved under Professional Standards Legislation
Cleanaway Waste Management Limited 31
Independent Auditor’s Review Report to the members of Cleanaway Waste Management Limited
Independent Auditor’s Review Report to the members of Cleanaway Waste Management Limited Conclusion We have reviewed the accompanying half-year financial report of Cleanaway Waste Management Limited (the Company) and its subsidiaries (collectively the Group), which comprises the Consolidated Balance Sheet as at 31 December 2021, the Consolidated Income Statement, Consolidated Statement of Comprehensive Income, Consolidated Statement of Changes in Equity and Consolidated Statement of Cash Flows for the half-year ended on that date, notes comprising a summary of significant accounting policies and other explanatory information, and the Directors’ Declaration.
Based on our review, which is not an audit, we have not become of any matter that makes us believe that the half-year financial report of the Group does not comply with the Corporations Act 2001, including:
a. giving a true and fair view of the consolidated financial position of the Group as at 31 December 2021 and of its consolidated financial performance for the half-year ended on that date; and
b. complying with Accounting Standard AASB 134 Interim Financial Reporting and the Corporations Regulations 2001.
Basis for conclusion We conducted our review in accordance with ASRE 2410 Review of a Financial Report Performed by the Independent Auditor of the Entity (ASRE 2410). Our responsibilities are further described in the Auditor’s responsibilities for the review of the half-year financial report section of our report. We are independent of the Group in accordance with the auditor independence requirements of the Corporations Act 2001 and the ethical requirements of the Accounting Professional and Ethical Standards Board’s APES 110 Code of Ethics for Professional Accountants (including Independence Standards) (the Code) that are relevant to our audit of the annual financial report in Australia. We have also fulfilled our other ethical responsibilities in accordance with the Code.
Directors’ responsibility for the half-year financial report The Directors of the Company are responsible for the preparation of the half-year financial report that gives a true and fair view in accordance with Australian Accounting Standards and the Corporations Act 2001 and for such internal control as the Directors determine is necessary to enable the preparation of the half-year financial report that gives a true and fair view and is free from material misstatement, whether due to fraud or error.
Auditor’s responsibilities for the half-year financial report Our responsibility is to express a conclusion on the half-year financial report based on our review. ASRE 2410 requires us to conclude whether we have become aware of any matter, that makes us believe that the half-year financial report is not in accordance with the Corporations Act 2001 including giving a true and fair view of the Group’s financial position as at 31 December 2021 and its performance for the half-year ended on that date; and complying with Accounting Standard AASB 134 Interim Financial Reporting and the Corporations Regulations 2001.
A review of a half-year financial report consists of making enquiries, primarily of persons responsible for financial and accounting matters, and applying analytical and other review procedures. A review is substantially less in scope than an audit conducted in accordance with Australian Auditing Standards and consequently does not enable us to obtain assurance that we would become aware of all significant matters that might be identified in an audit. Accordingly, we do not express an audit opinion.
Ernst & Young Ashley Butler
Partner Melbourne, 16 February 2022
Ernst & Young 8 Exhibition Street Melbourne VIC 3000 Australia GPO Box 67 Melbourne VIC 3001
Tel: +61 3 9288 8000 Fax: +61 3 8650 7777 ey.com/au