AP Statistics Course and Exam Description, Effective Fall 2020
278
Effective Fall 2020 AP ® Statistics COURSE AND EXAM DESCRIPTION INCLUDES Course framework Instructional section Sample exam questions Classroom poster
-
Upload
khangminh22 -
Category
Documents
-
view
0 -
download
0
Transcript of AP Statistics Course and Exam Description, Effective Fall 2020

Effective Fall 2020
AP®
StatisticsCOURSE AND EXAM DESCRIPTION
INCLUDES Course framework
Instructional section
Sample exam questions
Classroom poster

AP COURSE AND EXAM DESCRIPTIONS ARE UPDATED PERIODICALLYPlease visit AP Central (apcentral.collegeboard.org) to determine whether a more recent course and exam description is available.
Effective Fall 2020
AP® Statistics COURSE AND EXAM DESCRIPTION

About College BoardCollege Board is a mission-driven not-for-profit organization that connects students to college success and opportunity. Founded in 1900, College Board was created to expand access to higher education. Today, the membership association is made up of over 6,000 of the world’s leading educational institutions and is dedicated to promoting excellence and equity in education. Each year, College Board helps more than seven million students prepare for a successful transition to college through programs and services in college readiness and college success—including the SAT® and the Advanced Placement® Program. The organization also serves the education community through research and advocacy on behalf of students, educators, and schools.
For further information, visit collegeboard.org.
AP Equity and Access PolicyCollege Board strongly encourages educators to make equitable access a guiding principle for their AP programs by giving all willing and academically prepared students the opportunity to participate in AP. We encourage the elimination of barriers that restrict access to AP for students from ethnic, racial, and socioeconomic groups that have been traditionally underrepresented. Schools should make every effort to ensure their AP classes reflect the diversity of their student population. College Board also believes that all students should have access to academically challenging coursework before they enroll in AP classes, which can prepare them for AP success. It is only through a commitment to equitable preparation and access that true equity and excellence can be achieved.
Designers: Sonny Mui and Bill Tully
© 2020 College Board. College Board, Advanced Placement, AP, AP Central, and the acorn logo are registered trademarks of College Board. All other products and services may be trademarks of their respective owners.
Visit College Board on the web: collegeboard.org.

Contents
v Acknowledgments 1 About AP 4 AP Resources and Supports 6 Instructional Model 7 About the AP Statistics Course 7 College Course Equivalent 7 Prerequisites
COURSE FRAMEWORK
11 Introduction 13 Course Framework Components 15 Course Skills 17 Course Content 20 Course at a Glance 25 Unit Guides 27 Using the Unit Guides 31 UNIT 1: Exploring One-Variable Data 51 UNIT 2: Exploring Two-Variable Data 69 UNIT 3: Collecting Data 85 UNIT 4: Probability, Random Variables, and Probability Distributions 105 UNIT 5: Sampling Distributions 123 UNIT 6: Inference for Categorical Data: Proportions 151 UNIT 7: Inference for Quantitative Data: Means 177 UNIT 8: Inference for Categorical Data: Chi-Square 193 UNIT 9: Inference for Quantitative Data: Slopes
INSTRUCTIONAL APPROACHES
209 Selecting and Using Course Materials 213 Instructional Strategies 224 Developing Course Skills
EXAM INFORMATION
235 Exam Overview 240 Sample Exam Questions
SCORING GUIDELINES
251 Question 1: Focus on Exploring Data 254 Question 2: Focus on Probability and Sampling Distributions
APPENDIX
259 Formula Sheet and Tables

THIS PAGE IS INTENTIONALLY LEFT BLANK.

Acknowledgments
College Board would like to acknowledge the following committee members, consultants, and reviewers for their assistance with and commitment to the development of this course. All individuals and their affiliations were current at the time of contribution.
Ellen Breazel, Clemson University, Clemson, SC
Christy Brown, Clemson University, Clemson, SC
Paul Buckley, Gonzaga College High School, Washington, DC
Mine Cetinkaya-Rundel, Duke University, Durham, NC
Jeff Eicher, Jr., Classical Academy High School, Escondido, CA
Kerri Swails Freeland, University High School, Morgantown, WV
Kenneth Koehler, Iowa State University, Ames, IA
Michael Lacey, Peters Township High School, McMurray, PA
Laura Marshall, Phillips Exeter Academy, Exeter, NH
S. Leigh Nataro, Kent Place School, Summit, NJ
Kathleen Petko, Palatine High School, Palatine, IL
Paul Rodriguez, Troy High School, Fullerton, CA
Penny Smeltzer, Austin Peace Academy, Austin, TX
David Spohn, Hudson High School, Hudson, OH
Daren Starnes, The Lawrenceville School, Lawrenceville, NJ
Robert Stephenson, Iowa State University, Ames, IA
Jessica Utts, University of California, Irvine, Irvine, CA
Adam Yankay, Western Reserve Academy, Hudson, OH
College Board StaffSara Hunter, Associate Director, AP Curricular Publications
Tiffany Judkins, Director, AP Instructional Design and PD Resource Development
Claire Lorenz, Senior Director, AP Instructional Design and PD Resource Development
Daniel McDonough, Senior Director, AP Content Integration
Stephanie Ogden, Director, AP Mathematics Content Development
SPECIAL THANKS
John R. Williamson, Brian Robinson, and Benjamin Hedrick
Return to Table of Contents© 2020 College Board
V.1 | vAP Statistics Course and Exam Description

THIS PAGE IS INTENTIONALLY LEFT BLANK.

About AP
College Board’s Advanced Placement® Program (AP®) enables willing and academically prepared students to pursue college-level studies—with the opportunity to earn college credit, advanced placement, or both—while still in high school. Through AP courses in 38 subjects, each culminating in a challenging exam, students learn to think critically, construct solid arguments, and see many sides of an issue—skills that prepare them for college and beyond. Taking AP courses demonstrates to college admission officers that students have sought the most challenging curriculum available to them, and research indicates that students who score a 3 or higher on an AP Exam typically experience greater academic success in college and are more likely to earn a college degree than non-AP students. Each AP teacher’s syllabus is evaluated and approved by faculty from some of the nation’s leading colleges and universities, and AP Exams are developed and scored by college faculty and experienced AP teachers. Most four-year colleges and universities in the United States grant credit, advanced placement, or both on the basis of successful AP Exam scores; more than 3,300 institutions worldwide annually receive AP scores.
AP Course DevelopmentIn an ongoing effort to maintain alignment with best practices in college-level learning, AP courses and exams emphasize challenging, research-based curricula aligned with higher education expectations.
Individual teachers are responsible for designing their own curriculum for AP courses, selecting appropriate college-level readings, assignments, and resources. This course and exam description presents the content and skills that are the focus of the corresponding college course and that appear on the AP Exam. It also organizes the content and skills into a series of units that represent a sequence found in widely adopted college textbooks and that many AP teachers have told us they follow in order to focus their instruction. The intention of this publication is to respect teachers’ time and expertise by providing a roadmap that they can modify and adapt to their local priorities and preferences. Moreover, by organizing the AP course content and skills into units, the AP Program is able
to provide teachers and students with free formative assessments—Personal Progress Checks—that teachers can assign throughout the year to measure student progress as they acquire content knowledge and develop skills.
Enrolling Students: Equity and AccessCollege Board strongly encourages educators to make equitable access a guiding principle for their AP programs by giving all willing and academically prepared students the opportunity to participate in AP. We encourage the elimination of barriers that restrict access to AP for students from ethnic, racial, and socioeconomic groups that have been traditionally underserved. College Board also believes that all students should have access to academically challenging coursework before they enroll in AP classes, which can prepare them for AP success. It is only through a commitment to equitable preparation and access that true equity and excellence can be achieved.
Offering AP Courses: The AP Course AuditThe AP Program unequivocally supports the principle that each school implements its own curriculum that will enable students to develop the content understandings and skills described in the course framework.
While the unit sequence represented in this publication is optional, the AP Program does have a short list of curricular and resource requirements that must be fulfilled before a school can label a course “Advanced Placement” or “AP.” Schools wishing to offer AP courses must participate in the AP Course Audit, a process through which AP teachers’ course materials are reviewed by college faculty. The AP Course Audit was created to provide teachers and administrators with clear guidelines on curricular and resource requirements for AP courses and to help colleges and universities validate courses marked “AP” on students’ transcripts. This process ensures that AP teachers’ courses meet or exceed the curricular and resource expectations that college and secondary school faculty have established for college-level courses.
Return to Table of Contents© 2020 College Board
V.1 | 1AP Statistics Course and Exam Description

The AP Course Audit form is submitted by the AP teacher and the school principal (or designated administrator) to confirm awareness and understanding of the curricular and resource requirements. A syllabus or course outline, detailing how course requirements are met, is submitted by the AP teacher for review by college faculty.
Please visit collegeboard.org/apcourseaudit for more information to support the preparation and submission of materials for the AP Course Audit.
How the AP Program Is DevelopedThe scope of content for an AP course and exam is derived from an analysis of hundreds of syllabi and course offerings of colleges and universities. Using this research and data, a committee of college faculty and expert AP teachers work within the scope of the corresponding college course to articulate what students should know and be able to do upon the completion of the AP course. The resulting course framework is the heart of this course and exam description and serves as a blueprint of the content and skills that can appear on an AP Exam.
The AP Test Development Committees are responsible for developing each AP Exam, ensuring the exam questions are aligned to the course framework. The AP Exam development process is a multiyear endeavor; all AP Exams undergo extensive review, revision, piloting, and analysis to ensure that questions are accurate, fair, and valid, and that there is an appropriate spread of difficulty across the questions.
Committee members are selected to represent a variety of perspectives and institutions (public and private, small and large schools and colleges), and a range of gender, racial/ethnic, and regional groups. A list of each subject’s current AP Test Development Committee members is available on apcentral.collegeboard.org.
Throughout AP course and exam development, College Board gathers feedback from various stakeholders in both secondary schools and higher education institutions. This feedback is carefully considered to ensure that AP courses and exams are able to provide students with a college-level learning experience and the opportunity to demonstrate their qualifications for advanced placement or college credit.
How AP Exams Are ScoredThe exam scoring process, like the course and exam development process, relies on the expertise of both AP teachers and college faculty. While multiple-choice questions are scored by machine, the free-response
questions and through-course performance assessments, as applicable, are scored by thousands of college faculty and expert AP teachers. Most are scored at the annual AP Reading, while a small portion is scored online. All AP Readers are thoroughly trained, and their work is monitored throughout the Reading for fairness and consistency. In each subject, a highly respected college faculty member serves as Chief Faculty Consultant and, with the help of AP Readers in leadership positions, maintains the accuracy of the scoring standards. Scores on the free-response questions and performance assessments are weighted and combined with the results of the computer-scored multiple-choice questions, and this raw score is converted into a composite AP score on a 1–5 scale.
AP Exams are not norm-referenced or graded on a curve. Instead, they are criterion-referenced, which means that every student who meets the criteria for an AP score of 2, 3, 4, or 5 will receive that score, no matter how many students that is. The criteria for the number of points students must earn on the AP Exam to receive scores of 3, 4, or 5—the scores that research consistently validates for credit and placement purposes—include:
§ The number of points successful college students earn when their professors administer AP Exam questions to them.
§ The number of points researchers have found to be predictive that an AP student will succeed when placed into a subsequent higher-level college course.
§ Achievement-level descriptions formulated by college faculty who review each AP Exam question.
Using and Interpreting AP Scores The extensive work done by college faculty and AP teachers in the development of the course and exam and throughout the scoring process ensures that AP Exam scores accurately represent students’ achievement in the equivalent college course. Frequent and regular research studies establish the validity of AP scores as follows:
AP ScoreCredit Recommendation
College Grade Equivalent
5 Extremely well qualified A
4 Well qualified A-, B+, B
3 Qualified B-, C+, C
2 Possibly qualified n/a
1 No recommendation n/a
Return to Table of Contents© 2020 College Board
V.1 | 2AP Statistics Course and Exam Description

While colleges and universities are responsible for setting their own credit and placement policies, most private colleges and universities award credit and/or advanced placement for AP scores of 3 or higher. Additionally, most states in the U.S. have adopted statewide credit policies that ensure college credit for scores of 3 or higher at public colleges and universities. To confirm a specific college’s AP credit/placement policy, a search engine is available at apstudent .collegeboard.org/creditandplacement/search -credit-policies.
BECOMING AN AP READEREach June, thousands of AP teachers and college faculty members from around the world gather for seven days in multiple locations to evaluate and score the free-response sections of the AP Exams. Ninety-eight percent of surveyed educators who took part in the AP Reading say it was a positive experience.
There are many reasons to consider becoming an AP Reader, including opportunities to:
§ Bring positive changes to the classroom: Surveys show that the vast majority of returning AP Readers—both high school and college
educators—make improvements to the way they teach or score because of their experience at the AP Reading.
§ Gain in-depth understanding of AP Exam and AP scoring standards: AP Readers gain exposure to the quality and depth of the responses from the entire pool of AP Exam takers, and thus are better able to assess their students’ work in the classroom.
§ Receive compensation: AP Readers are compensated for their work during the Reading. Expenses, lodging, and meals are covered for Readers who travel.
§ Score from home: AP Readers have online distributed scoring opportunities for certain subjects. Check collegeboard.org/apreading for details.
§ Earn Continuing Education Units (CEUs): AP Readers earn professional development hours and CEUs that can be applied to PD requirements by states, districts, and schools.
How to ApplyVisit collegeboard.org/apreading for eligibility requirements and to start the application process.
Return to Table of Contents© 2020 College Board
V.1 | 3AP Statistics Course and Exam Description

AP Resources and Supports
By completing a simple activation process at the start of the school year, teachers and students receive access to a robust set of classroom resources.
AP ClassroomAP Classroom is a dedicated online platform designed to support teachers and students throughout their AP experience. The platform provides a variety of powerful resources and tools to provide yearlong support to teachers and enable students to receive meaningful feedback on their progress.
UNIT GUIDESAppearing in this publication and on AP Classroom, these planning guides outline all required course content and skills, organized into commonly taught units. Each unit guide suggests a sequence and pacing of content, scaffolds skill instruction across units, organizes content into topics, and provides tips on taking the AP Exam.
PERSONAL PROGRESS CHECKSFormative AP questions for every unit provide feedback to students on the areas where they need to focus. Available online, Personal Progress Checks measure knowledge and skills through multiple-choice questions with rationales to explain correct and incorrect answers, and free-response questions with scoring information. Because the Personal Progress Checks are formative, the results of these assessments cannot be used to evaluate teacher effectiveness or assign letter grades to students, and any such misuses are grounds for losing school authorization to offer AP courses.*
PROGRESS DASHBOARDThis dashboard allows teachers to review class and individual student progress throughout the year. Teachers can view class trends and see where students struggle with content and skills that will be assessed on the AP Exam. Students can view their own progress over time to improve their performance before the AP Exam.
AP QUESTION BANKThis online library of real AP Exam questions provides teachers with secure questions to use in their classrooms. Teachers can find questions indexed by course topics and skills, create customized tests, and assign them online or on paper. These tests enable students to practice and get feedback on each question.
*To report misuses, please call, 877-274-6474 (International: +1-212-632-1781).
Return to Table of Contents© 2020 College Board
V.1 | 4AP Statistics Course and Exam Description
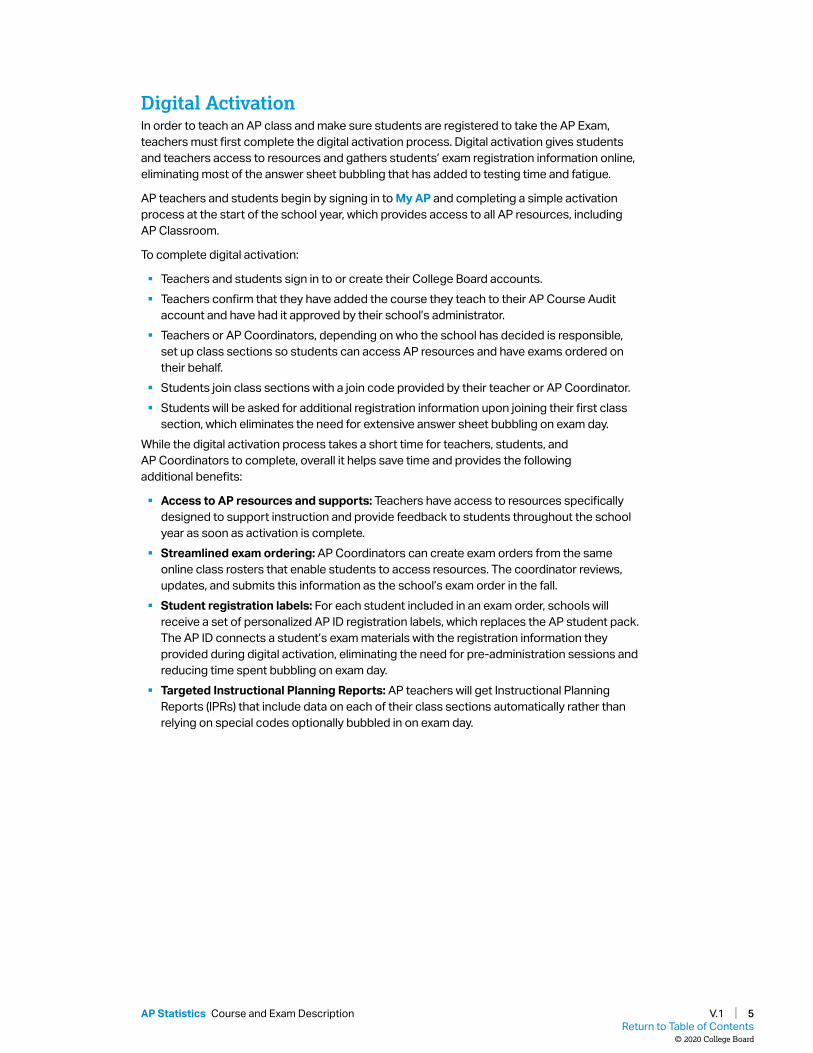
Digital ActivationIn order to teach an AP class and make sure students are registered to take the AP Exam, teachers must first complete the digital activation process. Digital activation gives students and teachers access to resources and gathers students’ exam registration information online, eliminating most of the answer sheet bubbling that has added to testing time and fatigue.
AP teachers and students begin by signing in to My AP and completing a simple activation process at the start of the school year, which provides access to all AP resources, including AP Classroom.
To complete digital activation:
§ Teachers and students sign in to or create their College Board accounts. § Teachers confirm that they have added the course they teach to their AP Course Audit
account and have had it approved by their school’s administrator. § Teachers or AP Coordinators, depending on who the school has decided is responsible,
set up class sections so students can access AP resources and have exams ordered on their behalf.
§ Students join class sections with a join code provided by their teacher or AP Coordinator. § Students will be asked for additional registration information upon joining their first class
section, which eliminates the need for extensive answer sheet bubbling on exam day.While the digital activation process takes a short time for teachers, students, and AP Coordinators to complete, overall it helps save time and provides the following additional benefits:
§ Access to AP resources and supports: Teachers have access to resources specifically designed to support instruction and provide feedback to students throughout the school year as soon as activation is complete.
§ Streamlined exam ordering: AP Coordinators can create exam orders from the same online class rosters that enable students to access resources. The coordinator reviews, updates, and submits this information as the school’s exam order in the fall.
§ Student registration labels: For each student included in an exam order, schools will receive a set of personalized AP ID registration labels, which replaces the AP student pack. The AP ID connects a student’s exam materials with the registration information they provided during digital activation, eliminating the need for pre-administration sessions and reducing time spent bubbling on exam day.
§ Targeted Instructional Planning Reports: AP teachers will get Instructional Planning Reports (IPRs) that include data on each of their class sections automatically rather than relying on special codes optionally bubbled in on exam day.
Return to Table of Contents© 2020 College Board
V.1 | 5AP Statistics Course and Exam Description

Instructional Model
Integrating AP resources throughout the course can help students develop skills and conceptual understandings. The instructional model outlined below shows possible ways to incorporate AP resources into the classroom.
PlanTeachers may consider the following approaches as they plan their instruction before teaching each unit.
§ Review the overview at the start of each unit guide to identify essential questions, conceptual understandings, and skills for each unit.
§ Use the Unit at a Glance table to identify related topics that build toward a common understanding, and then plan appropriate pacing for students.
§ Identify useful strategies in the Instructional Approaches section to help teach the concepts and skills.
TeachWhen teaching, supporting resources could be used to build students’ conceptual understanding and their mastery of skills.
§ Use the topic pages in the unit guides to identify the required content. § Integrate the content with a skill, considering any appropriate scaffolding. § Employ any of the instructional strategies previously identified. § Use the available resources on the topic pages to bring a variety of assets into the
classroom.
AssessTeachers can measure student understanding of the content and skills covered in the unit and provide actionable feedback to students.
§ At the end of each unit, use AP Classroom to assign students the online Personal Progress Checks, as homework or as an in-class task.
§ Provide question-level feedback to students through answer rationales; provide unit- and skill-level feedback using the progress dashboard.
§ Create additional practice opportunities using the AP Question Bank and assign them through AP Classroom.
Return to Table of Contents© 2020 College Board
V.1 | 6AP Statistics Course and Exam Description
About the AP Statistics Course
The AP Statistics course introduces students to the major concepts and tools for collecting, analyzing, and drawing conclusions from data. There are four themes evident in the content, skills, and assessment in the AP Statistics course: exploring data, sampling and experimentation, probability and simulation, and statistical inference. Students use technology, investigations, problem solving, and writing as they build conceptual understanding.
College Course EquivalentThe AP Statistics course is equivalent to a one-semester, introductory, non-calculus-based college course in statistics.
PrerequisitesThe AP Statistics course is an excellent option for any secondary school student who has successfully completed a second-year course in algebra and who possesses sufficient mathematical maturity and quantitative reasoning ability. Because second-year algebra is the prerequisite course, AP Statistics is usually taken in either the junior or senior year. Decisions about whether to take AP Statistics and when to take it depend on a student’s plans:
§ Students planning to take a science course in their senior year will benefit greatly from taking AP Statistics in their junior year.
§ For students who would otherwise take no mathematics in their senior year, AP Statistics allows them to continue to develop their quantitative skills.
§ Students who wish to leave open the option of taking calculus in college should include precalculus in their high school program and perhaps take AP Statistics concurrently with precalculus.
§ Students with the appropriate mathematical background are encouraged to take both AP Statistics and AP Calculus in high school.
Return to Table of Contents© 2020 College Board
V.1 | 7AP Statistics Course and Exam Description

THIS PAGE IS INTENTIONALLY LEFT BLANK.
Course Framework
AP STATISTICS


Introduction
The AP Statistics course outlined in this framework reflects a commitment to what college faculty value and mirrors the core curricula found in corresponding college courses. This framework defines content students must know and skills students must master in order to learn and retain an understanding of statistics they can apply in academic and everyday endeavors. Teachers may adjust the framework to meet state and local requirements.
The framework is organized in a logical sequence, based on teacher input and commonly used textbooks. These sequences represent one reasonable learning pathway for the course, among many. Teachers may adjust the suggested sequencing of units or topics, although they will want to carefully consider how to account for such changes as they access course resources for planning, instruction, and assessment.
Balancing guidance and flexibility, this approach helps to prepare students for college credit and placement.
Return to Table of Contents© 2020 College Board
Course Framework V.1 | 11AP Statistics Course and Exam Description

THIS PAGE IS INTENTIONALLY LEFT BLANK.

Course Framework Components
OverviewThis course framework provides a clear and detailed description of the course requirements necessary for student success.
The course framework includes two essential components:
1 COURSE SKILLSThe course skills are central to the study and practice of statistics. Students should develop and apply the described skills on a regular basis over the span of the course.
2 COURSE CONTENTThe course content is organized into commonly taught units of study that provide a suggested sequence for the course. These units comprise the content and conceptual understandings that colleges and universities typically expect students to master to qualify for college credit and/or placement. This content is grounded in big ideas, which are cross-cutting concepts that build conceptual understanding and spiral throughout the course.
Return to Table of Contents© 2020 College Board
Course Framework V.1 | 13AP Statistics Course and Exam Description

THIS PAGE IS INTENTIONALLY LEFT BLANK.

AP STATISTICS
Course SkillsThe AP Statistics course skills describe what a student should be able to do while exploring course concepts. The table that follows presents these skills, which students should develop during the AP Statistics course. These skills form the basis of the tasks on the AP Exam.
The unit guides later in this publication embed and spiral these skills throughout the course, providing teachers with one way to integrate them in the course content with sufficient repetition to prepare students to transfer those skills when taking the AP Exam. Because the course skills are aligned to specific learning objectives, AP Exam questions will also reflect this pairing.
More detailed information about teaching the course skills can be found in the Instructional Approaches section of this publication.
1
Return to Table of Contents© 2020 College Board
Course Framework V.1 | 15AP Statistics Course and Exam Description

AP STATISTICS
Course Skills
Skill Category 1 Skill Category 2 Skill Category 3 Skill Category 4
Selecting Statistical Methods 1
Select methods for collecting and/or analyzing data for statistical inference.
Data Analysis 2
Describe patterns, trends, associations, and relationships in data.
Using Probability and Simulation 3
Explore random phenomena.
Statistical Argumentation 4
Develop an explanation or justify a conclusion using evidence from data, definitions, or statistical inference.
1.A Identify the question to be answered or problem to be solved (not assessed).
1.B Identify key and relevant information to answer a question or solve a problem.
1.C Describe an appropriate method for gathering and representing data.
2.A Describe data presented numerically or graphically.
2.B Construct numerical or graphical representations of distributions.
2.C Calculate summary statistics, relative positions of points within a distribution, correlation, and predicted response.
2.D Compare distributions or relative positions of points within a distribution.
3.A Determine relative frequencies, proportions, or probabilities using simulation or calculations.
3.B Determine parameters for probability distributions.
3.C Describe probability distributions.
4.A Make an appropriate claim or draw an appropriate conclusion.
4.B Interpret statistical calculations and findings to assign meaning or assess a claim.
1.D Identify an appropriate inference method for confidence intervals.
1.E Identify an appropriate inference method for significance tests.
1.F Identify null and alternative hypotheses.
3.D Construct a confidence interval, provided conditions for inference are met.
3.E Calculate a test statistic and find a p-value, provided conditions for inference are met.
4.C Verify that inference procedures apply in a given situation.
4.D Justify a claim based on a confidence interval.
4.E Justify a claim using a decision based on significance tests.
SKILLS
INFERENCE
Return to Table of Contents© 2020 College Board
Course Framework V.1 | 16AP Statistics Course and Exam Description

AP STATISTICS
Course ContentBased on the Understanding by Design® (Wiggins and McTighe) model, this course framework provides a clear and detailed description of the course requirements necessary for student success. The framework specifies what students must know, be able to do, and understand, with a focus on three big ideas that encompass the principles and processes in the discipline of statistics. The framework also encourages instruction that prepares students for advanced coursework in statistics or other fields using statistical reasoning and for active, informed engagement with a world of data to be interpreted appropriately and applied wisely to make informed decisions.
Big IdeasThe big ideas serve as the foundation of the course and allow students to create meaningful connections among concepts. They are often overarching concepts or themes that become threads that run throughout the course. Revisiting the big ideas and applying them in a variety of contexts allows students to develop deeper conceptual understanding. Below are the big ideas of the course and a brief description of each.
2
BIG IDEA 1: VARIATION AND DISTRIBUTION (VAR)The distribution of measures for individuals within a sample or population describes variation. The value of a statistic varies from sample to sample. How can we determine whether differences between measures represent random variation or meaningful distinctions? Statistical methods based on probabilistic reasoning provide the basis for shared understandings about variation and about the likelihood that variation between and among measures, samples, and populations is random or meaningful.
BIG IDEA 2: PATTERNS AND UNCERTAINTY (UNC)Statistical tools allow us to represent and describe patterns in data and to classify departures from patterns. Simulation and probabilistic reasoning allow us to anticipate patterns in data and to determine the likelihood of errors in inference.
continued on next page
Return to Table of Contents© 2020 College Board
Course Framework V.1 | 17AP Statistics Course and Exam Description

UNITSThe course content is organized into commonly taught units. The units have been arranged in a logical sequence frequently found in many college courses and textbooks.
The nine units in AP Statistics, and their weighting on the multiple-choice section of the AP Exam, are listed below.
Pacing recommendations at the unit level and on the Course at a Glance provide suggestions for how to teach the required course content and administer the Personal Progress Checks. The suggested class
periods are based on a schedule in which the class meets five days a week for 45 minutes each day. While these recommendations have been made to aid planning, teachers should of course adjust the pacing based on the needs of their students, alternate schedules (e.g., block scheduling), or their school’s academic calendar.
TOPICSEach unit is broken down into teachable segments called topics. The topic pages (starting on p. 36) contain all required content for each topic.
BIG IDEA 3: DATA-BASED PREDICTIONS, DECISIONS, AND CONCLUSIONS (DAT)Data-based regression models describe relationships between variables and are a tool for making predictions for values of a response variable. Collecting data using random sampling or randomized experimental design means that findings may be generalized to the part of the population from which the selection was made. Statistical inference allows us to make data-based decisions.
Exam Weighting for the Multiple-Choice Section of the AP Exam
Units Exam Weighting
Unit 1: Exploring One-Variable Data 15–23%
Unit 2: Exploring Two-Variable Data 5–7%
Unit 3: Collecting Data 12–15%
Unit 4: Probability, Random Variables, and Probability Distributions
10–20%
Unit 5: Sampling Distributions 7–12%
Unit 6: Inference for Categorical Data: Proportions 12–15%
Unit 7: Inference for Quantitative Data: Means 10–18%
Unit 8: Inference for Categorical Data: Chi-Square 2–5%
Unit 9: Inference for Quantitative Data: Slopes 2–5%
Return to Table of Contents© 2020 College Board
Course Framework V.1 | 18AP Statistics Course and Exam Description

Sp
iral
ing
th
e B
ig I
dea
s
Big
Idea
sU
nit
1U
nit
2U
nit
3U
nit
4U
nit
5U
nit
6U
nit
7U
nit
8U
nit
9
Exp
lori
ng
One
-Var
iabl
e D
ata
Exp
lori
ng
Tw
o-V
aria
ble
Dat
a
Col
lect
ing
Dat
aP
roba
bilit
y,
Ran
dom
V
aria
bles
, and
P
roba
bilit
y D
istr
ibut
ions
Sam
plin
g D
istr
ibut
ions
Infe
renc
e fo
r C
ateg
oric
al
Dat
a:
Pro
port
ions
Infe
renc
e fo
r Q
uant
itat
ive
Dat
a:
Mea
ns
Infe
renc
e fo
r C
ateg
oric
al
Dat
a:
Chi
-Squ
are
Infe
renc
e fo
r Q
uant
itativ
e D
ata:
Slo
pes
Varia
tion
and
Dis
trib
utio
n
VA
R
Patt
erns
and
Un
cert
aint
y
UN
C
Data
-Bas
ed
Pred
ictio
ns,
Dec
isio
ns, a
nd
Conc
lusi
ons
DA
T
The
follo
win
g ta
ble
show
s ho
w th
e bi
g id
eas
spira
l acr
oss
units
.
19Return to Table of Contents
© 2020 College Board
Course Framework V.1 | 19AP Statistics Course and Exam Description

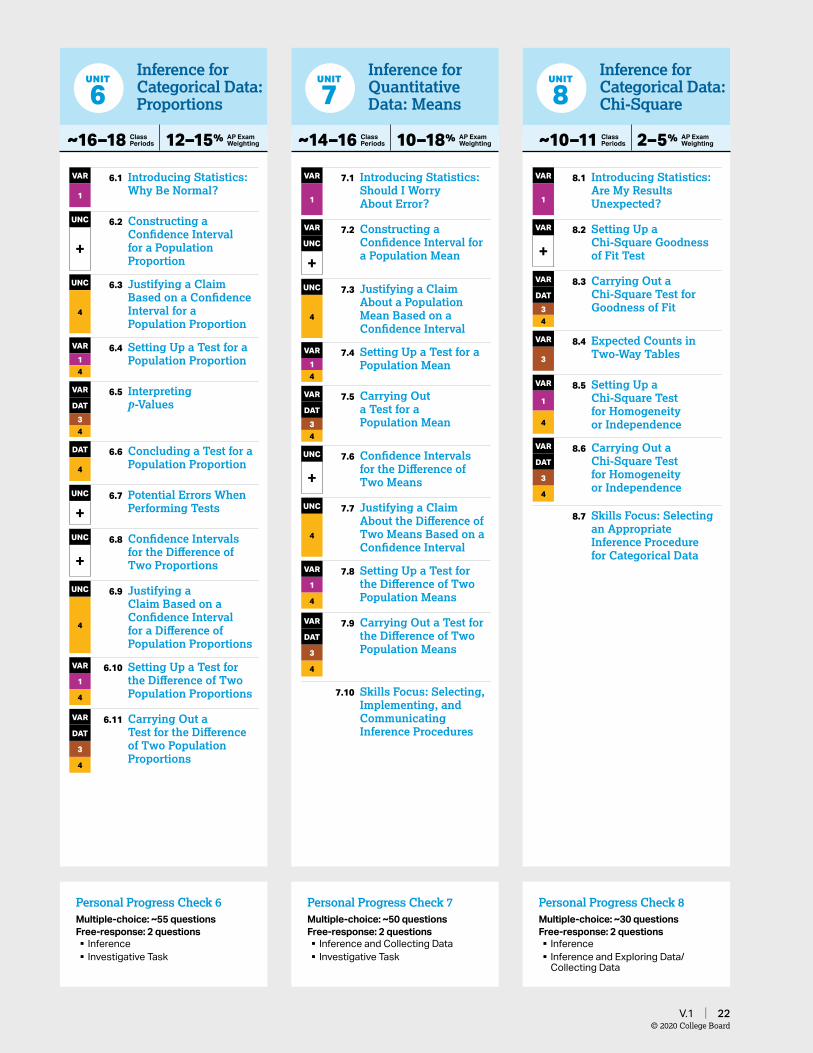
Course at a Glance
PlanThe Course at a Glance provides a useful visual organization of the AP Statistics curricular components, including:
§ Sequence of units, along with approximate weighting and suggested pacing. Please note, pacing is based on 45-minute class periods, meeting five days each week for a full academic year.
§ Progression of topics within each unit
§ Spiraling of the big ideas and course skills across units
TeachSKILL CATEGORIESSkill categories spiral throughout the course.
Selecting Statistical Methods
Data Analysis
Using Probability and Simulation
Statistical Argumentation
+ �Indicates�3�or�more�skills�for�a�given�topic. See�the�individual�topic�for�all�the�relevant�skills.
BIG IDEASBig ideas spiral across topics and units.
Variation and Distribution
Patterns and Uncertainty
Data-Based Predictions, Decisions, and Conclusions
AssessAssign the Personal Progress Checks—either as homework or in class—for each unit. Each Personal Progress Check contains formative multiple-choice and free-response questions. The feedback from the Personal Progress Checks shows students the areas where they need to focus.
1
2
3
4
VAR
UNC
DAT
Personal Progress Check 1Multiple-choice: ∼35 questionsFree-response: 2 questions
§ Exploring Data § Exploring Data
Exploring One-Variable Data
UNIT
1
VAR 1.1 Introducing Statistics: What Can We Learn from Data?1
VAR 1.2 The Language of Variation: Variables2
UNC 1.3 Representing a Categorical Variable with Tables2
UNC 1.4 Representing a Categorical Variable with Graphs2
UNC 1.5 Representing a Quantitative Variable with Graphs2
UNC 1.6 Describing the Distribution of a Quantitative Variable2
UNC 1.7 Summary Statistics for a Quantitative Variable2
4
UNC 1.8 Graphical Representations of Summary Statistics2
UNC 1.9 Comparing Distributions of a Quantitative Variable2
VAR 1.10 The Normal Distribution2
3
~14–16 Class Periods 15–23% AP Exam
Weighting
Personal Progress Check 2Multiple-choice: ∼35 questionsFree-response: 2 questions
§ Exploring Data § Investigative Task
UNIT
2Exploring Two-Variable Data
VAR 2.1 Introducing Statistics: Are Variables Related?1
UNC 2.2 Representing Two Categorical Variables2
UNC 2.3 Statistics for Two Categorical Variables2
UNC 2.4 Representing the Relationship Between Two Quantitative Variables
DAT
2
DAT 2.5 Correlation24
DAT 2.6 Linear Regression Models2
DAT 2.7 Residuals
2
DAT 2.8 Least Squares Regression2
4
DAT 2.9 Analyzing Departures from Linearity2
~10–11 Class Periods 5–7% AP Exam
Weighting
© 2020 College BoardV.1 | 20

Personal Progress Check 3Multiple-choice: ∼20 questionsFree-response: 2 questions
§ Exploring Data and Collecting Data § Collecting Data
Collecting DataUNIT
3
VAR 3.1 Introducing Statistics: Do the Data We Collected Tell the Truth?1
DAT 3.2 Introduction to Planning a Study1
4
DAT 3.3 Random Sampling and Data Collection1
DAT 3.4 Potential Problems with Sampling1
VAR 3.5 Introduction to Experimental Design1
VAR 3.6 Selecting an Experimental Design1
VAR 3.7 Inference and Experiments4
~9–10 Class Periods 12–15% AP Exam
Weighting
Probability, Random Variables, and Probability Distributions
UNIT
4
VAR 4.1 Introducing Statistics: Random and Non-Random Patterns?1
UNC 4.2 Estimating Probabilities Using Simulation3
VAR 4.3 Introduction to Probability3
4
VAR 4.4 Mutually Exclusive Events4
VAR 4.5 Conditional Probability
3
VAR 4.6 Independent Events and Unions of Events3
VAR 4.7 Introduction to Random Variables and Probability Distributions
2
4
VAR 4.8 Mean and Standard Deviation of Random Variables
3
4
VAR 4.9 Combining Random Variables3
UNC 4.10 Introduction to the Binomial Distribution3
UNC 4.11 Parameters for a Binomial Distribution3
4
UNC 4.12 The Geometric Distribution3
4
~18–20 Class Periods 10–20% AP Exam
Weighting
Personal Progress Check 4Multiple-choice: ∼45 questionsFree-response: 2 questions
§ Probability § Investigative Task
Personal Progress Check 5Multiple-choice: ∼35 questionsFree-response: 2 questions
§ Probability and Sampling Distributions
§ Investigative Task
Sampling Distributions
UNIT
5
VAR 5.1 Introducing Statistics: Why Is My Sample Not Like Yours?1
VAR 5.2 The Normal Distribution, Revisited3
UNC 5.3 The Central Limit Theorem3
UNC 5.4 Biased and Unbiased Point Estimates4
3
VAR 5.5 Sampling Distributions for Sample Proportions3
4
UNC 5.6 Sampling Distributions for Differences in Sample Proportions
3
4
UNC 5.7 Sampling Distributions for Sample Means3
4
UNC 5.8 Sampling Distributions for Differences in Sample Means
3
4
~10–12 Class Periods 7–12% AP Exam
Weighting
21© 2020 College Board
V.1 | 21
Inference for Categorical Data: Proportions
UNIT
6
~16–18 Class Periods 12–15% AP Exam
Weighting
VAR 6.1 Introducing Statistics: Why Be Normal?1
UNC 6.2 Constructing a Confidence Interval for a Population Proportion
+
UNC 6.3 Justifying a Claim Based on a Confidence Interval for a Population Proportion
4
VAR 6.4 Setting Up a Test for a Population Proportion1
4
VAR 6.5 Interpreting p-ValuesDAT
34
DAT 6.6 Concluding a Test for a Population Proportion4
UNC 6.7 Potential Errors When Performing Tests+
UNC 6.8 Confidence Intervals for the Difference of Two Proportions+
UNC 6.9 Justifying a Claim Based on a Confidence Interval for a Difference of Population Proportions
4
VAR 6.10 Setting Up a Test for the Difference of Two Population Proportions
1
4
VAR 6.11 Carrying Out a Test for the Difference of Two Population Proportions
DAT
3
4
Personal Progress Check 6Multiple-choice: ∼55 questionsFree-response: 2 questions
§ Inference § Investigative Task
Inference for Quantitative Data: Means
UNIT
7
Personal Progress Check 7Multiple-choice: ∼50 questionsFree-response: 2 questions
§ Inference and Collecting Data § Investigative Task
VAR 7.1 Introducing Statistics: Should I Worry About Error?1
VAR 7.2 Constructing a Confidence Interval for a Population Mean
UNC
+UNC 7.3 Justifying a Claim
About a Population Mean Based on a Confidence Interval
4
VAR 7.4 Setting Up a Test for a Population Mean1
4
VAR 7.5 Carrying Out a Test for a Population Mean
DAT
34
UNC 7.6 Confidence Intervals for the Difference of Two Means+
UNC 7.7 Justifying a Claim About the Difference of Two Means Based on a Confidence Interval
4
VAR 7.8 Setting Up a Test for the Difference of Two Population Means
1
4
VAR 7.9 Carrying Out a Test for the Difference of Two Population Means
DAT
3
4
7.10 Skills Focus: Selecting, Implementing, and Communicating Inference Procedures
~14–16 Class Periods 10–18% AP Exam
Weighting
Personal Progress Check 8Multiple-choice: ∼30 questionsFree-response: 2 questions
§ Inference § Inference and Exploring Data/Collecting Data
UNIT
8Inference for Categorical Data: Chi-Square
VAR 8.1 Introducing Statistics: Are My Results Unexpected?1
VAR 8.2 Setting Up a Chi-Square Goodness of Fit Test+
VAR 8.3 Carrying Out a Chi-Square Test for Goodness of Fit
DAT
34
VAR 8.4 Expected Counts in Two-Way Tables3
VAR 8.5 Setting Up a Chi-Square Test for Homogeneity or Independence
1
4
VAR 8.6 Carrying Out a Chi-Square Test for Homogeneity or Independence
DAT
3
4
8.7 Skills Focus: Selecting an Appropriate Inference Procedure for Categorical Data
~10–11 Class Periods 2–5% AP Exam
Weighting
© 2020 College BoardV.1 | 22

Personal Progress Check 9Multiple-choice: ∼25 questionsFree-response: 1 question
§ Inference and Exploring Data
Inference for Quantitative Data: Slopes
UNIT
9
VAR 9.1 Introducing Statistics: Do Those Points Align?1
UNC 9.2 Confidence Intervals for the Slope of a Regression Model+
UNC 9.3 Justifying a Claim About the Slope of a Regression Model Based on a Confidence Interval
4
VAR 9.4 Setting Up a Test for the Slope of a Regression Model
1
4
VAR 9.5 Carrying Out a Test for the Slope of a Regression Model
DAT
34
9.6 Skills Focus: Selecting an Appropriate Inference Procedure
~7–8 Class Periods 2–5% AP Exam
Weighting
23© 2020 College Board
V.1 | 23

THIS PAGE IS INTENTIONALLY LEFT BLANK.

AP STATISTICS
Unit Guides
IntroductionDesigned with extensive input from the community of AP Statistics educators, the unit guides offer teachers helpful guidance in building students’ skills and knowledge. The suggested sequence was identified through a thorough analysis of the syllabi of highly effective AP teachers and the organization of typical college textbooks.
This unit structure respects new AP teachers’ time by providing one possible sequence they can adopt and modify rather than having to build from scratch. An additional benefit is that these units enable the AP Program to provide interested teachers with formative assessments—the Personal Progress Checks—that they can assign their students at the end of each unit to gauge progress toward success on the AP exam. However, experienced AP teachers who are satisfied with their current course organization and exam results should feel no pressure to adopt these units, which comprise an optional sequence for this course.
25Return to Table of Contents
© 2020 College Board
Course Framework V.1 | 25AP Statistics Course and Exam Description

THIS PAGE IS INTENTIONALLY LEFT BLANK.

Using the Unit Guides
UNIT OPENERSDeveloping Understanding provides an overview that contextualizes and situates the key content of the unit within the scope of the course.
Big ideas serve as the foundation of the course and help develop understanding as they spiral throughout the course. The essential questions are thought-provoking questions that motivate students and inspire inquiry.
Building Course Skills describes specific skills that are appropriate to focus on in that unit.
Preparing for the AP Exam provides helpful tips and common student misunderstandings identified from prior exam data.
15–23% AP EXAM WEIGHTING
Building Course Skills2.A 2.B 2.D
Having access to a world of data is meaningless without the ability to organize and analyze that information. To develop these skills, students will need multiple opportunities to interact with data presented in different formats, i.e., as a table, a graph, or even just a list of values. Students should be asked to verbally describe the patterns and characteristics they see in the data (including shape, center, variability, and unusual features for a quantitative variable) and then compare the characteristics of two different sets of data. Students should also create displays that appropriately represent the data (e.g., using a bar graph for categorical data).
Teachers can provide explicit feedback on students’ verbal responses so they understand the level of detail needed. For example, when students are asked to describe a distribution of quantitative data, they often provide an acronym associated with that type of distribution (e.g., SOCS or CUSS) but then struggle to discuss
all the elements the acronym stands for. In particular, students often neglect to discuss unusual features such as gaps or outliers. Teachers can reinforce that these elements must be addressed in their descriptions and that all data has context (e.g., the variable of interest, including any units of measurement).
Preparing for the AP ExamIn preparation for the AP Exam, teachers can encourage students to carefully read each question and completely answer the question asked. When interpreting representations of quantitative data, for example, students should describe shape, center, and variability, as well as unusual features, such as outliers. A response focused only on the center, for example, would be considered incomplete. Students should also provide complete explanations in context for all conclusions made from data. If asked to justify the selection of a particular conclusion over other options, students should include both a reasoning for their choice and rationales for not choosing the others.
BIG IDEA 1Variation and Distribution VAR
§ Is my cat old, compared to other cats?
BIG IDEA 2Patterns and Uncertainty UNC
§ How certain are we that what seems to be a pattern is not just a coincidence?
UNIT
1
Developing UnderstandingUnit 1 introduces students to data and the vocabulary of statistics. Students also learn to talk about data in real-world contexts. Variability in data may seem to suggest certain conclusions about the data distribution, but not all variation is meaningful. Statistics allows us to develop shared understandings of uncertainty and variation. In this unit, students will define and represent categorical and quantitative variables, describe and compare distributions of one-variable data, and interpret statistical calculations to assess claims about individual data points or samples. Students will also begin to apply the normal distribution model as an introduction to how theoretical models for populations can be used to describe some distributions of sample data. Later units will more fully develop probabilistic modeling and inference.
~14–16 CLASS PERIODS
Exploring One-Variable Data
Course Framework V.1 | 33AP Statistics Course and Exam Description
Exploring One-Variable DataUNIT
1
UNIT AT A GLANCE
Endu
ring
Unde
rsta
ndin
g
Topic Skills
Class Periods
~14–16 CLASS PERIODS
VA
R-1
1.1 Introducing Statistics What Can We Learn from Data?
1.A Identify the question to be answered or problem to be solved (not assessed).
1.2 The Language of Variation: Variables
2.A Describe data presented numerically or graphically.
UN
C-1
1.3 Representing a Categorical Variable with Tables
2.B Construct numerical or graphical representations of distributions.
2.A Describe data presented numerically or graphically.
1.4 Representing a Categorical Variable with Graphs
2.B Construct numerical or graphical representations of distributions.
2.A Describe data presented numerically or graphically.
2.D Compare distributions or relative positions of points within a distribution.
1.5 Representing a Quantitative Variable with Graphs
2.A Describe data presented numerically or graphically.
2.B Construct numerical or graphical representations of distributions.
1.6 Describing the Distribution of a Quantitative Variable
2.A Describe data presented numerically or graphically.
1.7 Summary Statistics for a Quantitative Variable
2.C Calculate summary statistics, relative positions of points within a distribution, correlation, and predicted response.
4.B Interpret statistical calculations and findings to assign meaning or assess a claim.
1.8 Graphical Representations of Summary Statistics
2.B Construct numerical or graphical representations of distributions.
2.A Describe data presented numerically or graphically.
1.9 Comparing Distributions of a Quantitative Variable
2.D Compare distributions or relative positions of points within a distribution.
VA
R-2
1.10 The Normal Distribution 2.D Compare distributions or relative positions of points within a distribution.
3.A Determine relative frequencies, proportions, or probabilities using simulation or calculations.
Go to AP Classroom to assign the Personal Progress Check for Unit 1. Review the results in class to identify and address any student misunderstandings.
34 | Course Framework V.1 AP Statistics Course and Exam Description
The Unit at a Glance table shows the topics, related enduring understandings, and skills. The class periods column has been left blank so that teachers can customize the time they spend on each topic.
The table includes skills for each topic to show how to link the content in that topic to a specific AP Statistics skill or skills. The questions on the Personal Progress Checks are based on this pairing. Because the course skills are aligned to specific learning objectives, AP Exam questions also reflect this pairing.
Return to Table of Contents© 2020 College Board
Course Framework V.1 | 27AP Statistics Course and Exam Description

Using the Unit Guides
The Sample Instructional Activities page includes optional activities that can help teachers tie together the content and skills of a particular topic.
Exploring One-Variable DataUNIT
1
SAMPLE INSTRUCTIONAL ACTIVITIESThe sample activities on this page are optional and are offered to provide possible ways to incorporate various instructional approaches into the classroom. They were developed in partnership with teachers from the AP community to share ways that they approach teaching some of the topics in this unit. Please refer to the Instructional Approaches section beginning on p. 207 for more examples of activities and strategies.
Activity Topic Sample Activity
1 1.5 Gallery WalkHave students work in groups of four to construct a dotplot, a stem-and-leaf plot, a histogram, or a boxplot for a set of student-generated data (e.g., time in minutes to get to school). After the gallery walk, discuss what information can be seen more easily in each graph (e.g., boxplots can easily show the IQR).
2 1.61.8
FRQ Partner QuizHave students work in pairs to answer 2017 FRQ 4. Have one student write and the other perform the calculations. (Although the first part of the question does not require any calculations, the second part requires calculations to justify the solution.) Discussing and crafting a solution with a partner may require more time than if students completed the FRQ individually.
3 1.9 Notice and WonderDisplay just the graphs from 2018 FRQ 5. Have students think individually for one minute about how the graphs compare. Then ask them, “What do you notice? What do you wonder? What questions could be answered with these graphs?” Have students share their ideas with a partner then debrief the ideas as a class.
4 1.10 Reversing InterpretationsGive pairs of students four pictures of normal distributions with various parts shaded. Have students create the question that could have resulted in the picture shown (e.g., if a value of 15 is labeled and the distribution is shaded to the right of 15, students could write “What is the probability that a value is more than 15?”).
Course Framework V.1 | 35AP Statistics Course and Exam Description
Sampling DistributionsUNIT
5
Required Course Content
SKILLS
Using Probability and Simulation
3.B
Determine parameters for probability distributions.3.C
Describe probability distributions.
Statistical Argumentation
4.B
Interpret statistical calculations and findings to assign meaning or assess a claim.
TOPIC 5.5
Sampling Distributions for Sample Proportions
AVAILABLE RESOURCES § Classroom Resources >
◆ Sampling Distributions
◆ Calculations Aren’t Enough! The Importance of Communication in AP Statistics
ENDURING UNDERSTANDINGUNC-3
Probabilistic reasoning allows us to anticipate patterns in data.
LEARNING OBJECTIVEUNC-3.K
Determine parameters of a sampling distribution for sample proportions. [Skill 3.B]
UNC-3.L
Determine whether a sampling distribution for a sample proportion can be described as approximately normal. [Skill 3.C]
UNC-3.M
Interpret probabilities and parameters for a sampling distribution for a sample proportion. [Skill 4.B]
ESSENTIAL KNOWLEDGEUNC-3.K.1
For independent samples (sampling with replacement) of a categorical variable from a population with population proportion, p, the sampling distribution of the sample proportion, p , has a mean, p pμ = and a standard deviation,
( )ˆ
1p
p pn
σ−
= .
UNC-3.K.2
If sampling without replacement, the standard deviation of the sample proportion is smaller than what is given by the formula above. If the sample size is less than 10% of the population size, the difference is negligible.
UNC-3.L.1
For a categorical variable, the sampling distribution of the sample proportion, p , will have an approximate normal distribution, provided the sample size is large enough:
10np ≥ and (1 ) 10n p− ≥
UNC-3.M.1
Probabilities and parameters for a sampling distribution for a sample proportion should be interpreted using appropriate units and within the context of a specific population.
Course Framework V.1 | 115AP Statistics Course and Exam Description
TOPIC PAGESThe skills note the course skills that are paired with the learning objectives for that topic.
Enduring understandings are the long-term takeaways related to the big ideas that leave a lasting impression on students.
Learning objectives define what a student needs to be able to do with content knowledge in order to progress toward the enduring understandings.
Where possible, available resources are provided that might help teachers address a particular topic.
Essential knowledge statements describe the knowledge required to perform the learning objective.
Clarifying statements provide guidance about using the formula sheet for certain topics in the course.
Return to Table of Contents© 2020 College Board
Course Framework V.1 | 28AP Statistics Course and Exam Description
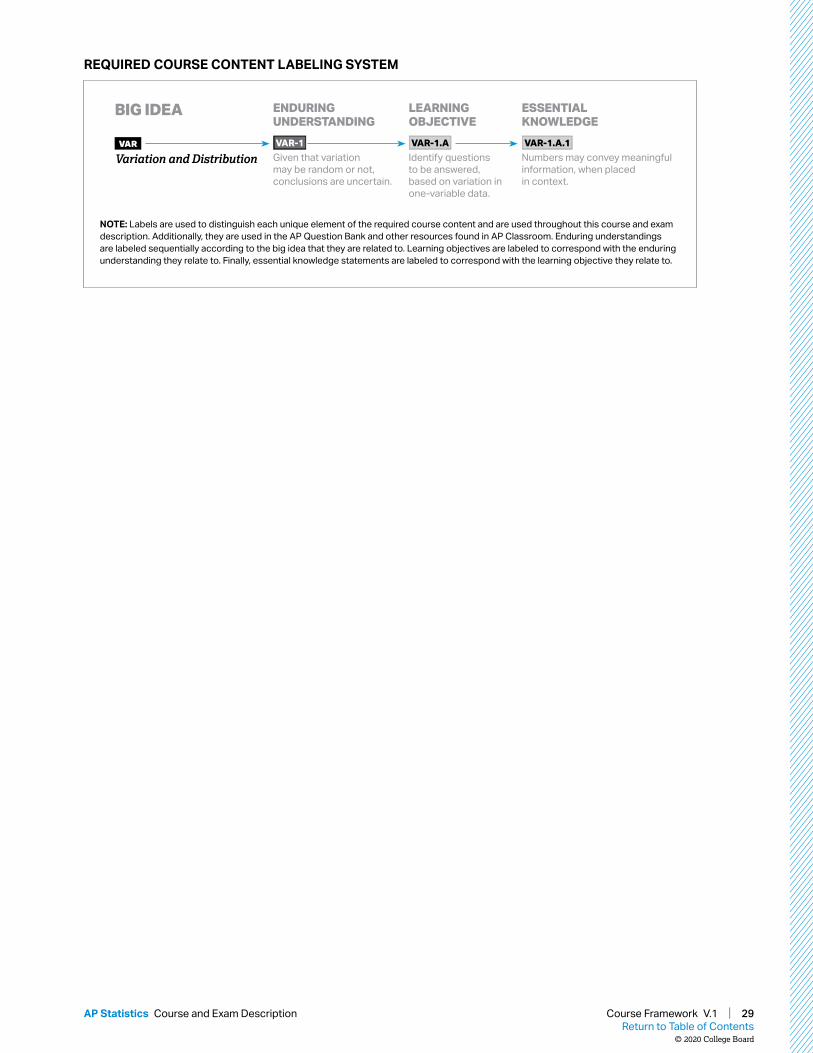
REQUIRED COURSE CONTENT LABELING SYSTEM
BIG IDEA
VAR
Variation and Distribution
ENDURING UNDERSTANDING
VAR-1
Given that variation may be random or not, conclusions are uncertain.
LEARNING OBJECTIVE
VAR-1.A
Identify questions to be answered, based on variation in one-variable data.
ESSENTIAL KNOWLEDGE
VAR-1.A.1
Numbers may convey meaningful information, when placed in context.
NOTE: Labels are used to distinguish each unique element of the required course content and are used throughout this course and exam description. Additionally, they are used in the AP Question Bank and other resources found in AP Classroom. Enduring understandings are labeled sequentially according to the big idea that they are related to. Learning objectives are labeled to correspond with the enduring understanding they relate to. Finally, essential knowledge statements are labeled to correspond with the learning objective they relate to.
Return to Table of Contents© 2020 College Board
Course Framework V.1 | 29AP Statistics Course and Exam Description

THIS PAGE IS INTENTIONALLY LEFT BLANK.

AP STATISTICS
UNIT
Exploring One-Variable Data
15–23%
AP EXAM WEIGHTING
~14–16CLASS PERIODS
1
31Return to Table of Contents
© 2020 College Board
Course Framework V.1 | 31AP Statistics Course and Exam Description
Remember to go to AP Classroom to assign students the online Personal Progress Check for this unit.
Whether assigned as homework or completed in class, the Personal Progress Check provides each student with immediate feedback related to this unit’s topics and skills.
Personal Progress Check 1Multiple-choice: ~35 questions Free-response: 2 questions
§ Exploring Data § Exploring Data
Return to Table of Contents© 2020 College Board
Course Framework V.1 | 32AP Statistics Course and Exam Description

15–23% AP EXAM WEIGHTING
Building Course Skills2.A 2.B 2.D
Having access to a world of data is meaningless without the ability to organize and analyze that information. To develop these skills, students will need multiple opportunities to interact with data presented in different formats, i.e., as a table, a graph, or even just a list of values. Students should be asked to verbally describe the patterns and characteristics they see in the data (including shape, center, variability, and unusual features for a quantitative variable) and then compare the characteristics of two different sets of data. Students should also create displays that appropriately represent the data (e.g., using a bar graph for categorical data).
Teachers can provide explicit feedback on students’ verbal responses so they understand the level of detail needed. For example, when students are asked to describe a distribution of quantitative data, they often provide an acronym associated with that type of distribution (e.g., SOCS or CUSS) but then struggle to discuss
all the elements the acronym stands for. In particular, students often neglect to discuss unusual features such as gaps or outliers. Teachers can reinforce that these elements must be addressed in their descriptions and that all data has context (e.g., the variable of interest, including any units of measurement).
Preparing for the AP ExamIn preparation for the AP Exam, teachers can encourage students to carefully read each question and completely answer the question asked. When interpreting representations of quantitative data, for example, students should describe shape, center, and variability, as well as unusual features, such as outliers. A response focused only on the center, for example, would be considered incomplete. Students should also provide complete explanations in context for all conclusions made from data. If asked to justify the selection of a particular conclusion over other options, students should include both a reasoning for their choice and rationales for not choosing the others.
BIG IDEA 1Variation and Distribution VAR
§ Is my cat old, compared to other cats?
BIG IDEA 2Patterns and Uncertainty UNC
§ How certain are we that what seems to be a pattern is not just a coincidence?
UNIT
1
Developing UnderstandingUnit 1 introduces students to data and the vocabulary of statistics. Students also learn to talk about data in real-world contexts. Variability in data may seem to suggest certain conclusions about the data distribution, but not all variation is meaningful. Statistics allows us to develop shared understandings of uncertainty and variation. In this unit, students will define and represent categorical and quantitative variables, describe and compare distributions of one-variable data, and interpret statistical calculations to assess claims about individual data points or samples. Students will also begin to apply the normal distribution model as an introduction to how theoretical models for populations can be used to describe some distributions of sample data. Later units will more fully develop probabilistic modeling and inference.
~14–16 CLASS PERIODS
Exploring One-Variable Data
Return to Table of Contents© 2020 College Board
Course Framework V.1 | 33AP Statistics Course and Exam Description

Exploring One-Variable DataUNIT
1
UNIT AT A GLANCE
Endu
ring
Unde
rsta
ndin
g
Topic Skills
Class Periods
~14–16 CLASS PERIODS
VA
R-1
1.1 Introducing Statistics: What Can We Learn from Data?
1.A Identify the question to be answered or problem to be solved (not assessed).
1.2 The Language of Variation: Variables
2.A Describe data presented numerically or graphically.
UN
C-1
1.3 Representing a Categorical Variable with Tables
2.B Construct numerical or graphical representations of distributions.
2.A Describe data presented numerically or graphically.
1.4 Representing a Categorical Variable with Graphs
2.B Construct numerical or graphical representations of distributions.
2.A Describe data presented numerically or graphically.
2.D Compare distributions or relative positions of points within a distribution.
1.5 Representing a Quantitative Variable with Graphs
2.A Describe data presented numerically or graphically.
2.B Construct numerical or graphical representations of distributions.
1.6 Describing the Distribution of a Quantitative Variable
2.A Describe data presented numerically or graphically.
1.7 Summary Statistics for a Quantitative Variable
2.C Calculate summary statistics, relative positions of points within a distribution, correlation, and predicted response.
4.B Interpret statistical calculations and findings to assign meaning or assess a claim.
1.8 Graphical Representations of Summary Statistics
2.B Construct numerical or graphical representations of distributions.
2.A Describe data presented numerically or graphically.
1.9 Comparing Distributions of a Quantitative Variable
2.D Compare distributions or relative positions of points within a distribution.
VA
R-2
1.10 The Normal Distribution 2.D Compare distributions or relative positions of points within a distribution.
3.A Determine relative frequencies, proportions, or probabilities using simulation or calculations.
Go to AP Classroom to assign the Personal Progress Check for Unit 1. Review the results in class to identify and address any student misunderstandings.
Return to Table of Contents© 2020 College Board
Course Framework V.1 | 34AP Statistics Course and Exam Description

Exploring One-Variable DataUNIT
1
SAMPLE INSTRUCTIONAL ACTIVITIESThe sample activities on this page are optional and are offered to provide possible ways to incorporate various instructional approaches into the classroom. They were developed in partnership with teachers from the AP community to share ways that they approach teaching some of the topics in this unit. Please refer to the Instructional Approaches section beginning on p. 207 for more examples of activities and strategies.
Activity Topic Sample Activity
1 1.5 Gallery WalkHave students work in groups of four to construct a dotplot, a stem-and-leaf plot, a histogram, or a boxplot for a set of student-generated data (e.g., time in minutes to get to school). After the gallery walk, discuss what information can be seen more easily in each graph (e.g., boxplots can easily show the IQR).
2 1.61.8
FRQ Partner QuizHave students work in pairs to answer 2017 FRQ 4. Have one student write and the other perform the calculations. (Although the first part of the question does not require any calculations, the second part requires calculations to justify the solution.) Discussing and crafting a solution with a partner may require more time than if students completed the FRQ individually.
3 1.9 Notice and WonderDisplay just the graphs from 2018 FRQ 5. Have students think individually for one minute about how the graphs compare. Then ask them, “What do you notice? What do you wonder? What questions could be answered with these graphs?” Have students share their ideas with a partner then debrief the ideas as a class.
4 1.10 Reversing InterpretationsGive pairs of students four pictures of normal distributions with various parts shaded. Have students create the question that could have resulted in the picture shown (e.g., if a value of 15 is labeled and the distribution is shaded to the right of 15, students could write “What is the probability that a value is more than 15?”).
Return to Table of Contents© 2020 College Board
Course Framework V.1 | 35AP Statistics Course and Exam Description

Exploring One-Variable DataUNIT
1
Required Course Content
TOPIC 1.1
Introducing Statistics: What Can We Learn from Data?
SKILL
Selecting Statistical Methods
1.A
Identify the question to be answered or problem to be solved.
AVAILABLE RESOURCE § Classroom Resource >
Coke® Versus Pepsi®: An Introductory Activity for Test of Significance (may be used in Topic 1.1 to introduce the course or in Topic 6.4 to introduce inference tests)
ENDURING UNDERSTANDINGVAR-1
Given that variation may be random or not, conclusions are uncertain.
LEARNING OBJECTIVEVAR-1.A
Identify questions to be answered, based on variation in one-variable data. [Skill 1.A]
ESSENTIAL KNOWLEDGEVAR-1.A.1
Numbers may convey meaningful information, when placed in context.
Return to Table of Contents© 2020 College Board
Course Framework V.1 | 36AP Statistics Course and Exam Description

Exploring One-Variable DataUNIT
1
Required Course Content
TOPIC 1.2
The Language of Variation: Variables
SKILL
Data Analysis
2.A
Describe data presented numerically or graphically.
ILLUSTRATIVE EXAMPLESCategorical variables:
§ Dominant hand § Age group (young or old) § Highest degree earned
Quantitative variables: § Age of a structure § Height of a child § Concentration of
a sample
ENDURING UNDERSTANDINGVAR-1
Given that variation may be random or not, conclusions are uncertain.
LEARNING OBJECTIVEVAR-1.B
Identify variables in a set of data. [Skill 2.A]
ESSENTIAL KNOWLEDGEVAR-1.B.1
A variable is a characteristic that changes from one individual to another.
VAR-1.C
Classify types of variables. [Skill 2.A]
VAR-1.C.1
A categorical variable takes on values that are category names or group labels.VAR-1.C.2
A quantitative variable is one that takes on numerical values for a measured or counted quantity.
Return to Table of Contents© 2020 College Board
Course Framework V.1 | 37AP Statistics Course and Exam Description

Exploring One-Variable DataUNIT
1
Required Course Content
TOPIC 1.3
Representing a Categorical Variable with Tables
SKILLS
Data Analysis
2.B
Construct numerical or graphical representations of distributions.2.A
Describe data presented numerically or graphically.
ENDURING UNDERSTANDINGUNC-1
Graphical representations and statistics allow us to identify and represent key features of data.
LEARNING OBJECTIVEUNC-1.A
Represent categorical data using frequency or relative frequency tables. [Skill 2.B]
ESSENTIAL KNOWLEDGEUNC-1.A.1
A frequency table gives the number of cases falling into each category. A relative frequency table gives the proportion of cases falling into each category.
UNC-1.B
Describe categorical data represented in frequency or relative tables. [Skill 2.A]
UNC-1.B.1
Percentages, relative frequencies, and rates all provide the same information as proportions.UNC-1.B.2
Counts and relative frequencies of categorical data reveal information that can be used to justify claims about the data in context.
Return to Table of Contents© 2020 College Board
Course Framework V.1 | 38AP Statistics Course and Exam Description

Exploring One-Variable DataUNIT
1
Required Course Content
TOPIC 1.4
Representing a Categorical Variable with Graphs
SKILLS
Data Analysis
2.B
Construct numerical or graphical representations of distributions.2.A
Describe data presented numerically or graphically. 2.D
Compare distributions or relative positions of points within a distribution.
ENDURING UNDERSTANDINGUNC-1
Graphical representations and statistics allow us to identify and represent key features of data.
LEARNING OBJECTIVEUNC-1.C
Represent categorical data graphically. [Skill 2.B]
ESSENTIAL KNOWLEDGEUNC-1.C.1
Bar charts (or bar graphs) are used to display frequencies (counts) or relative frequencies (proportions) for categorical data.UNC-1.C.2
The height or length of each bar in a bar graph corresponds to either the number or proportion of observations falling within each category.UNC-1.C.3
There are many additional ways to represent frequencies (counts) or relative frequencies (proportions) for categorical data.
UNC-1.D
Describe categorical data represented graphically. [Skill 2.A]
UNC-1.D.1
Graphical representations of a categorical variable reveal information that can be used to justify claims about the data in context.
UNC-1.E
Compare multiple sets of categorical data. [Skill 2.D]
UNC-1.E.1
Frequency tables, bar graphs, or other representations can be used to compare two or more data sets in terms of the same categorical variable.
Return to Table of Contents© 2020 College Board
Course Framework V.1 | 39AP Statistics Course and Exam Description

Exploring One-Variable DataUNIT
1
Required Course Content
TOPIC 1.5
Representing a Quantitative Variable with Graphs
SKILLS
Data Analysis
2.A
Describe data presented numerically or graphically. 2.B
Construct numerical or graphical representations of distributions.
ILLUSTRATIVE EXAMPLESA discrete variable:
§ Number of students in a class
A continuous variable: § Height of a child
ENDURING UNDERSTANDINGUNC-1
Graphical representations and statistics allow us to identify and represent key features of data.
LEARNING OBJECTIVEUNC-1.F
Classify types of quantitative variables. [Skill 2.A]
ESSENTIAL KNOWLEDGEUNC-1.F.1
A discrete variable can take on a countable number of values. The number of values may be finite or countably infinite, as with the counting numbers.UNC-1.F.2
A continuous variable can take on infinitely many values, but those values cannot be counted. No matter how small the interval between two values of a continuous variable, it is always possible to determine another value between them.
UNC-1.G
Represent quantitative data graphically. [Skill 2.B]
UNC-1.G.1
In a histogram, the height of each bar shows the number or proportion of observations that fall within the interval corresponding to that bar. Altering the interval widths can change the appearance of the histogram.UNC-1.G.2
In a stem and leaf plot, each data value is split into a “stem” (the first digit or digits) and a “leaf” (usually the last digit).
continued on next page
Return to Table of Contents© 2020 College Board
Course Framework V.1 | 40AP Statistics Course and Exam Description

Exploring One-Variable DataUNIT
1
LEARNING OBJECTIVEUNC-1.G
Represent quantitative data graphically. [Skill 2.B]
ESSENTIAL KNOWLEDGEUNC-1.G.3
A dotplot represents each observation by a dot, with the position on the horizontal axis corresponding to the data value of that observation, with nearly identical values stacked on top of each other.UNC-1.G.4
A cumulative graph represents the number or proportion of a data set less than or equal to a given number.UNC-1.G.5
There are many additional ways to graphically represent distributions of quantitative data.
Return to Table of Contents© 2020 College Board
Course Framework V.1 | 41AP Statistics Course and Exam Description

Exploring One-Variable DataUNIT
1
Required Course Content
TOPIC 1.6
Describing the Distribution of a Quantitative Variable
SKILL
Data Analysis
2.A
Describe data presented numerically or graphically.
ENDURING UNDERSTANDINGUNC-1
Graphical representations and statistics allow us to identify and represent key features of data.
LEARNING OBJECTIVEUNC-1.H
Describe the characteristics of quantitative data distributions. [Skill 2.A]
ESSENTIAL KNOWLEDGEUNC-1.H.1
Descriptions of the distribution of quantitative data include shape, center, and variability (spread), as well as any unusual features such as outliers, gaps, clusters, or multiple peaks.UNC-1.H.2
Outliers for one-variable data are data points that are unusually small or large relative to the rest of the data.UNC-1.H.3
A distribution is skewed to the right (positive skew) if the right tail is longer than the left. A distribution is skewed to the left (negative skew) if the left tail is longer than the right. A distribution is symmetric if the left half is the mirror image of the right half.UNC-1.H.4
Univariate graphs with one main peak are known as unimodal. Graphs with two prominent peaks are bimodal. A graph where each bar height is approximately the same (no prominent peaks) is approximately uniform.UNC-1.H.5
A gap is a region of a distribution between two data values where there are no observed data.
continued on next page
Return to Table of Contents© 2020 College Board
Course Framework V.1 | 42AP Statistics Course and Exam Description

Exploring One-Variable DataUNIT
1
LEARNING OBJECTIVEUNC-1.H
Describe the characteristics of quantitative data distributions. [Skill 2.A]
ESSENTIAL KNOWLEDGEUNC-1.H.6
Clusters are concentrations of data usually separated by gaps.UNC-1.H.7
Descriptive statistics does not attribute properties of a data set to a larger population, but may provide the basis for conjectures for subsequent testing.
Return to Table of Contents© 2020 College Board
Course Framework V.1 | 43AP Statistics Course and Exam Description

Exploring One-Variable DataUNIT
1
Required Course Content
TOPIC 1.7
Summary Statistics for a Quantitative Variable
SKILLS
Data Analysis
2.C
Calculate summary statistics, relative positions of points within a distribution, correlation, and predicted response.
Statistical Argumentation
4.B
Interpret statistical calculations and findings to assign meaning or assess a claim.
ENDURING UNDERSTANDINGUNC-1
Graphical representations and statistics allow us to identify and represent key features of data.
LEARNING OBJECTIVEUNC-1.I
Calculate measures of center and position for quantitative data. [Skill 2.C]
ESSENTIAL KNOWLEDGEUNC-1.I.1
A statistic is a numerical summary of sample data.UNC-1.I.2
The mean is the sum of all the data values divided by the number of values. For a sample,
the mean is denoted by x-bar: 1
1 n
ii
x xn =
= , where xi represents the i th data point in the sample and n represents the number of data values in the sample.UNC-1.I.3
The median of a data set is the middle value when data are ordered. When the number of data points is even, the median can take on any value between the two middle values. In AP Statistics, the most commonly used value for the median of a data set with an even number of values is the average of the two middle values.UNC-1.I.4
The first quartile, Q1, is the median of the half of the ordered data set from the minimum to the position of the median. The third quartile, Q3, is the median of the half of the ordered data set from the position of the median to the maximum. Q1 and Q3 form the boundaries for the middle 50% of values in an ordered data set.
continued on next page
Return to Table of Contents© 2020 College Board
Course Framework V.1 | 44AP Statistics Course and Exam Description

Exploring One-Variable DataUNIT
1
LEARNING OBJECTIVEUNC-1.I
Calculate measures of center and position for quantitative data. [Skill 2.C]
ESSENTIAL KNOWLEDGEUNC-1.I.5
The pth percentile is interpreted as the value that has p% of the data less than or equal to it.
UNC-1.J
Calculate measures of variability for quantitative data. [Skill 2.C]
UNC-1.J.1
Three commonly used measures of variability (or spread) in a distribution are the range, interquartile range, and standard deviation.UNC-1.J.2
The range is defined as the difference between the maximum data value and the minimum data value. The interquartile range (IQR) is defined as the difference between the third and first quartiles: Q3 − Q1. Both the range and the interquartile range are possible ways of measuring variability of the distribution of a quantitative variable.UNC-1.J.3
Standard deviation is a way to measure variability of the distribution of a quantitative variable. For a sample, the standard deviation
is denoted by s: 21 ( )1x is x x
n= −
− . The
square of the sample standard deviation, s2, is called the sample variance.UNC-1.J.4
Changing units of measurement affects the values of the calculated statistics.
UNC-1.K
Explain the selection of a particular measure of center and/or variability for describing a set of quantitative data. [Skill 4.B]
UNC-1.K.1
There are many methods for determining outliers. Two methods frequently used in this course are: i. An outlier is a value greater than 1.5 × IQR
above the third quartile or more than 1.5 × IQR below the first quartile.
ii. An outlier is a value located 2 or more standard deviations above, or below, the mean.
UNC-1.K.2
The mean, standard deviation, and range are considered nonresistant (or non-robust) because they are influenced by outliers. The median and IQR are considered resistant (or robust), because outliers do not greatly (if at all) affect their value.
Return to Table of Contents© 2020 College Board
Course Framework V.1 | 45AP Statistics Course and Exam Description

Exploring One-Variable DataUNIT
1
Required Course Content
TOPIC 1.8
Graphical Representations of Summary Statistics
SKILLS
Data Analysis
2.B
Construct numerical or graphical representations of distributions.2.A
Describe data presented numerically or graphically.
UNC-1.M.1
Summary statistics of quantitative data, or of sets of quantitative data, can be used to justify claims about the data in context.UNC-1.M.2
If a distribution is relatively symmetric, then the mean and median are relatively close to one another. If a distribution is skewed right, then the mean is usually to the right of the median. If the distribution is skewed left, then the mean is usually to the left of the median.
UNC-1.M
Describe summary statistics of quantitative data represented graphically. [Skill 2.A]
ENDURING UNDERSTANDINGUNC-1
Graphical representations and statistics allow us to identify and represent key features of data.
LEARNING OBJECTIVEUNC-1.L
Represent summary statistics for quantitative data graphically. [Skill 2.B]
ESSENTIAL KNOWLEDGEUNC-1.L.1
Taken together, the minimum data value, the first quartile (Q1), the median, the third quartile (Q3), and the maximum data value make up the five-number summary.UNC-1.L.2
A boxplot is a graphical representation of the five-number summary (minimum, first quartile, median, third quartile, maximum). The box represents the middle 50% of data, with a line at the median and the ends of the box corresponding to the quartiles. Lines (“whiskers”) extend from the quartiles to the most extreme point that is not an outlier, and outliers are indicated by their own symbol beyond this.
Return to Table of Contents© 2020 College Board
Course Framework V.1 | 46AP Statistics Course and Exam Description

Exploring One-Variable DataUNIT
1
Required Course Content
ENDURING UNDERSTANDINGUNC-1
Graphical representations and statistics allow us to identify and represent key features of data.
LEARNING OBJECTIVEUNC-1.N
Compare graphical representations for multiple sets of quantitative data. [Skill 2.D]
ESSENTIAL KNOWLEDGEUNC-1.N.1
Any of the graphical representations, e.g., histograms, side-by-side boxplots, etc., can be used to compare two or more independent samples on center, variability, clusters, gaps, outliers, and other features.
UNC-1.O
Compare summary statistics for multiple sets of quantitative data. [Skill 2.D]
UNC-1.O.1
Any of the numerical summaries (e.g., mean, standard deviation, relative frequency, etc.) can be used to compare two or more independent samples.
TOPIC 1.9
Comparing Distributions of a Quantitative Variable
SKILL
Data Analysis
2.D
Compare distributions or relative positions of points within a distribution.
Return to Table of Contents© 2020 College Board
Course Framework V.1 | 47AP Statistics Course and Exam Description

Exploring One-Variable DataUNIT
1
Required Course Content
TOPIC 1.10
The Normal Distribution
SKILLS
Data Analysis
2.D
Compare distributions or relative positions of points within a distribution.
Using Probability and Simulation
3.A
Determine relative frequencies, proportions, or probabilities using simulation or calculations.
ILLUSTRATIVE EXAMPLESVariables that can by modeled by a normal distribution:
§ Body temperature § Weight of a loaf of bread
continued on next page
ENDURING UNDERSTANDINGVAR-2
The normal distribution can be used to represent some population distributions.
LEARNING OBJECTIVEVAR-2.A
Compare a data distribution to the normal distribution model. [Skill 2.D]
ESSENTIAL KNOWLEDGEVAR-2.A.1
A parameter is a numerical summary of a population.VAR-2.A.2
Some sets of data may be described as approximately normally distributed. A normal curve is mound-shaped and symmetric. The parameters of a normal distribution are the population mean, µ, and the population standard deviation, σ.VAR-2.A.3
For a normal distribution, approximately 68% of the observations are within 1 standard deviation of the mean, approximately 95% of observations are within 2 standard deviations of the mean, and approximately 99.7% of observations are within 3 standard deviations of the mean. This is called the empirical rule.VAR-2.A.4
Many variables can be modeled by a normal distribution.
Return to Table of Contents© 2020 College Board
Course Framework V.1 | 48AP Statistics Course and Exam Description

Exploring One-Variable DataUNIT
1
VAR-2.C
Compare measures of relative position in data sets. [Skill 2.D]
VAR-2.C.1
Percentiles and z-scores may be used to compare relative positions of points within a data set or between data sets.
LEARNING OBJECTIVEVAR-2.B
Determine proportions and percentiles from a normal distribution. [Skill 3.A]
ESSENTIAL KNOWLEDGEVAR-2.B.1
A standardized score for a particular data value is calculated as (data value – mean)/(standard deviation), and measures the number of standard deviations a data value falls above or below the mean.VAR-2.B.2
One example of a standardized score is a z-score, which is calculated as
-score ixz
. A z-score measures how
many standard deviations a data value is from the mean.VAR-2.B.3
Technology, such as a calculator, a standard normal table, or computer-generated output, can be used to find the proportion of data values located on a given interval of a normally distributed random variable.VAR-2.B.4
Given the area of a region under the graph of the normal distribution curve, it is possible to use technology, such as a calculator, a standard normal table, or computer-generated output, to estimate parameters for some populations.
Return to Table of Contents© 2020 College Board
Course Framework V.1 | 49AP Statistics Course and Exam Description

THIS PAGE IS INTENTIONALLY LEFT BLANK.

AP STATISTICS
UNIT
Exploring Two-Variable Data
2
5–7%
AP EXAM WEIGHTING
~10–11CLASS PERIODS
51Return to Table of Contents
© 2020 College Board
Course Framework V.1 | 51AP Statistics Course and Exam Description

Remember to go to AP Classroom to assign students the online Personal Progress Check for this unit.
Whether assigned as homework or completed in class, the Personal Progress Check provides each student with immediate feedback related to this unit’s topics and skills.
Personal Progress Check 2Multiple-choice: ~35 questions Free-response: 2 questions
§ Exploring Data § Investigative Task
Return to Table of Contents© 2020 College Board
Course Framework V.1 | 52AP Statistics Course and Exam Description

5–7% AP EXAM WEIGHTING
Building Course Skills2.C 2.D 4.B
In Unit 2, students are looking at the relationship between variables. The ability to calculate and describe statistical values, such as a conditional relative frequency or the slope of a regression line, is critical for data analysis because students must be able to analyze patterns before drawing conclusions about the data. Students should be allowed to perform their calculations using technology to help them become more aware of procedural errors. Students will also need practice translating output from technology (“calculator speak”) into appropriate statistical language.
As any statistician will assert, a numerical calculation is only as good as one’s ability to interpret what it means in the real world. Rather than just reporting values from their calculations, students must be able to connect their numerical results to the scenario’s context and formulate a verbal response that makes that connection clear. Teachers can model good communication and provide high-quality feedback to help students use accurate statistical language
when comparing side-by-side bar graphs, for example, and to avoid common errors in reasoning, such as using the word “line” to explain why a relationship is linear.
Preparing for the AP ExamStudents need ongoing practice with interpretation of vocabulary and calculated values in context. It is typically not sufficient to speak generally about the direction of a relationship, for example. If the question is about a linear model for predicting the weight of a wolf based on its length, students should write that a positive relationship means that longer wolves tend to have higher weights (see 2017 FRQ 1). Students can communicate statistical uncertainty by using words such as “tend to have” and “on average,” being careful to be precise with language. For example, when explaining evidence of a linear relationship, the difference between discussing a rate of change, as opposed to a change, is the difference between right and wrong. For the sake of clarity, the word “correlation” should be reserved for discussions about relationships between two quantitative variables.
BIG IDEA 1Variation and Distribution VAR
§ Does the fact that the number of shark attacks increases with ice cream sales necessarily mean that ice cream sales cause shark attacks?
BIG IDEA 2Patterns and Uncertainty UNC
§ How might you represent incomes of individuals with and without a college degree to help describe similarities and/or differences between the two groups?
BIG IDEA 3Data-Based Predictions, Decisions, and Conclusions DAT
§ How can you determine the effectiveness of a linear model that uses the number of cricket chirps per minute to predict temperature?
UNIT
2
Developing UnderstandingBuilding on Unit 1, students will explore relationships in two-variable categorical or quantitative data sets. They will use graphical and numerical methods to investigate an association between two categorical variables. Skills learned while working with two-way tables will transfer to calculating probabilities in Unit 4.
Students will describe form, direction, strength, and unusual features for an association between two quantitative variables. They will assess correlation and, if appropriate, use a linear model to predict values of the response variable from values of the explanatory variable. Students will interpret the least-squares regression line in context, analyze prediction errors (residuals), and explore departures from a linear pattern.
~10–11 CLASS PERIODS
Exploring Two-Variable Data
Return to Table of Contents© 2020 College Board
Course Framework V.1 | 53AP Statistics Course and Exam Description

Exploring Two-Variable DataUNIT
2
UNIT AT A GLANCE
Endu
ring
Unde
rsta
ndin
g
Topic Skills
Class Periods
~10–11 CLASS PERIODS
VA
R-1 2.1 Introducing Statistics:
Are Variables Related?1.A Identify the question to be answered or problem to be solved (not assessed).
UN
C-1
2.2 Representing Two Categorical Variables
2.D Compare distributions or relative positions of points within a distribution.
2.3 Statistics for Two Categorical Variables
2.C Calculate summary statistics, relative positions of points within a distribution, correlation, and predicted response.
2.D Compare distributions or relative positions of points within a distribution.
UN
C-1
, D
AT-
1 2.4 Representing the Relationship Between Two Quantitative Variables
2.B Construct numerical or graphical representations of distributions.
2.A Describe data presented numerically or graphically.
DA
T-1
2.5 Correlation 2.C Calculate summary statistics, relative positions of points within a distribution, correlation, and predicted response.
4.B Interpret statistical calculations and findings to assign meaning or assess a claim.
2.6 Linear Regression Models 2.C Calculate summary statistics, relative positions of points within a distribution, correlation, and predicted response.
2.7 Residuals 2.B Construct numerical or graphical representations of distributions.
2.A Describe data presented numerically or graphically.
2.8 Least Squares Regression 2.C Calculate summary statistics, relative positions of points within a distribution, correlation, and predicted response.
4.B Interpret statistical calculations and findings to assign meaning or assess a claim.
2.9 Analyzing Departures from Linearity
2.A Describe data presented numerically or graphically.
2.C Calculate summary statistics, relative positions of points within a distribution, correlation, and predicted response.
Go to AP Classroom to assign the Personal Progress Check for Unit 2. Review the results in class to identify and address any student misunderstandings.
Return to Table of Contents© 2020 College Board
Course Framework V.1 | 54AP Statistics Course and Exam Description
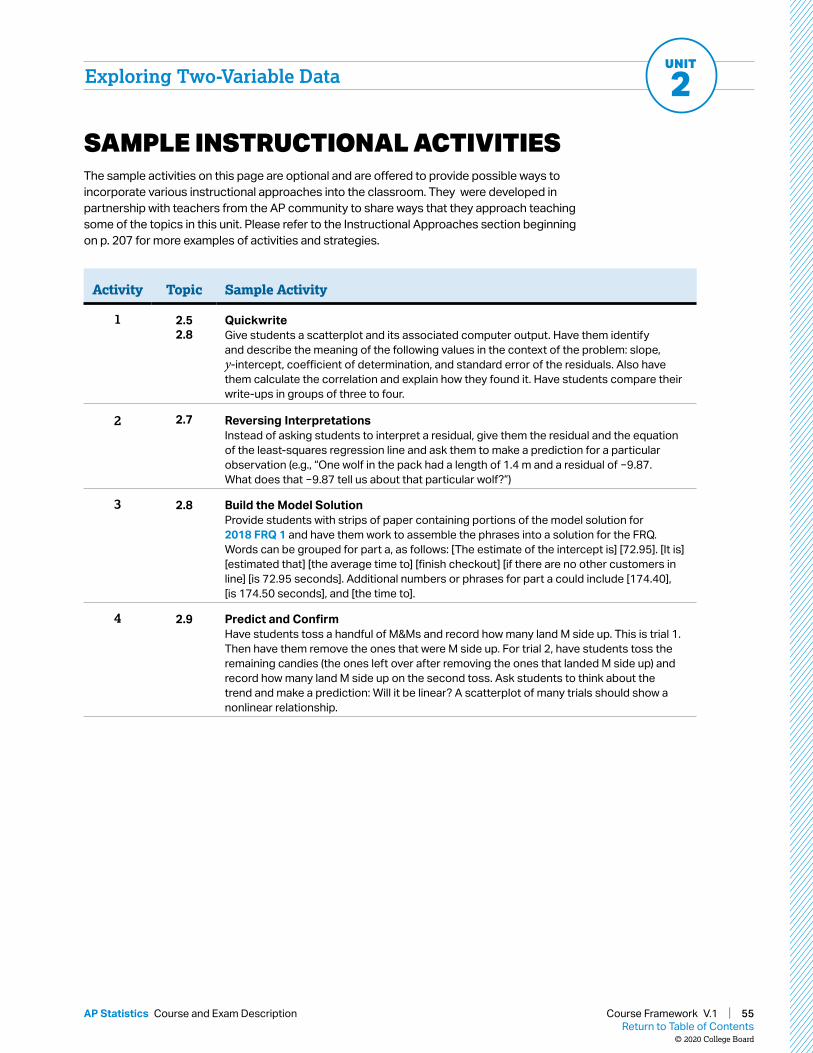
Exploring Two-Variable DataUNIT
2
SAMPLE INSTRUCTIONAL ACTIVITIESThe sample activities on this page are optional and are offered to provide possible ways to incorporate various instructional approaches into the classroom. They were developed in partnership with teachers from the AP community to share ways that they approach teaching some of the topics in this unit. Please refer to the Instructional Approaches section beginning on p. 207 for more examples of activities and strategies.
Activity Topic Sample Activity
1 2.52.8
QuickwriteGive students a scatterplot and its associated computer output. Have them identify and describe the meaning of the following values in the context of the problem: slope, y-intercept, coefficient of determination, and standard error of the residuals. Also have them calculate the correlation and explain how they found it. Have students compare their write-ups in groups of three to four.
2 2.7 Reversing InterpretationsInstead of asking students to interpret a residual, give them the residual and the equation of the least-squares regression line and ask them to make a prediction for a particular observation (e.g., “One wolf in the pack had a length of 1.4 m and a residual of −9.87. What does that −9.87 tell us about that particular wolf?”)
3 2.8 Build the Model SolutionProvide students with strips of paper containing portions of the model solution for 2018 FRQ 1 and have them work to assemble the phrases into a solution for the FRQ. Words can be grouped for part a, as follows: [The estimate of the intercept is] [72.95]. [It is] [estimated that] [the average time to] [finish checkout] [if there are no other customers in line] [is 72.95 seconds]. Additional numbers or phrases for part a could include [174.40], [is 174.50 seconds], and [the time to].
4 2.9 Predict and ConfirmHave students toss a handful of M&Ms and record how many land M side up. This is trial 1. Then have them remove the ones that were M side up. For trial 2, have students toss the remaining candies (the ones left over after removing the ones that landed M side up) and record how many land M side up on the second toss. Ask students to think about the trend and make a prediction: Will it be linear? A scatterplot of many trials should show a nonlinear relationship.
Return to Table of Contents© 2020 College Board
Course Framework V.1 | 55AP Statistics Course and Exam Description

Exploring Two-Variable DataUNIT
2
Required Course Content Required Course Content
TOPIC 2.1
Introducing Statistics: Are Variables Related?
SKILL
Selecting Statistical Methods
1.A
Identify the question to be answered or problem to be solved.
ENDURING UNDERSTANDINGVAR-1
Given that variation may be random or not, conclusions are uncertain.
LEARNING OBJECTIVEVAR-1.D
Identify questions to be answered about possible relationships in data. [Skill 1.A]
ESSENTIAL KNOWLEDGEVAR-1.D.1
Apparent patterns and associations in data may be random or not.
Return to Table of Contents© 2020 College Board
Course Framework V.1 | 56AP Statistics Course and Exam Description

Exploring Two-Variable DataUNIT
2
Required Course Content
TOPIC 2.2
Representing Two Categorical Variables
SKILL
Data Analysis
2.D
Compare distributions or relative positions of points within a distribution.
ENDURING UNDERSTANDINGUNC-1
Graphical representations and statistics allow us to identify and represent key features of data.
LEARNING OBJECTIVEUNC-1.P
Compare numerical and graphical representations for two categorical variables. [Skill 2.D]
ESSENTIAL KNOWLEDGEUNC-1.P.1
Side-by-side bar graphs, segmented bar graphs, and mosaic plots are examples of bar graphs for one categorical variable, broken down by categories of another categorical variable.UNC-1.P.2
Graphical representations of two categorical variables can be used to compare distributions and/or determine if variables are associated.UNC-1.P.3
A two-way table, also called a contingency table, is used to summarize two categorical variables. The entries in the cells can be frequency counts or relative frequencies.UNC-1.P.4
A joint relative frequency is a cell frequency divided by the total for the entire table.
Return to Table of Contents© 2020 College Board
Course Framework V.1 | 57AP Statistics Course and Exam Description

Exploring Two-Variable DataUNIT
2
Required Course Content
TOPIC 2.3
Statistics for Two Categorical Variables
SKILLS
Data Analysis
2.C
Calculate summary statistics, relative positions of points within a distribution, correlation, and predicted response.2.D
Compare distributions or relative positions of points within a distribution.
UNC-1.R.1
Summary statistics for two categorical variables can be used to compare distributions and/or determine if variables are associated.
ENDURING UNDERSTANDINGUNC-1
Graphical representations and statistics allow us to identify and represent key features of data.
LEARNING OBJECTIVEUNC-1.Q
Calculate statistics for two categorical variables. [Skill 2.C]
ESSENTIAL KNOWLEDGEUNC-1.Q.1
The marginal relative frequencies are the row and column totals in a two-way table divided by the total for the entire table.UNC-1.Q.2
A conditional relative frequency is a relative frequency for a specific part of the contingency table (e.g., cell frequencies in a row divided by the total for that row).
UNC-1.R
Compare statistics for two categorical variables. [Skill 2.D]
Return to Table of Contents© 2020 College Board
Course Framework V.1 | 58AP Statistics Course and Exam Description

Exploring Two-Variable DataUNIT
2SKILLS
Data Analysis
2.B
Construct numerical or graphical representations of distributions.2.A
Describe data presented numerically or graphically.
Required Course Content
TOPIC 2.4
Representing the Relationship Between Two Quantitative Variables
ENDURING UNDERSTANDINGUNC-1
Graphical representations and statistics allow us to identify and represent key features of data.
LEARNING OBJECTIVEUNC-1.S
Represent bivariate quantitative data using scatterplots. [Skill 2.B]
ESSENTIAL KNOWLEDGEUNC-1.S.1
A bivariate quantitative data set consists of observations of two different quantitative variables made on individuals in a sample or population.UNC-1.S.2
A scatterplot shows two numeric values for each observation, one corresponding to the value on the x-axis and one corresponding to the value on the y-axis.UNC-1.S.3
An explanatory variable is a variable whose values are used to explain or predict corresponding values for the response variable.
continued on next page
Return to Table of Contents© 2020 College Board
Course Framework V.1 | 59AP Statistics Course and Exam Description

Exploring Two-Variable DataUNIT
2
LEARNING OBJECTIVEDAT-1.A
Describe the characteristics of a scatter plot. [Skill 2.A]
ESSENTIAL KNOWLEDGEDAT-1.A.1
A description of a scatter plot includes form, direction, strength, and unusual features.DAT-1.A.2
The direction of the association shown in a scatterplot, if any, can be described as positive or negative.DAT-1.A.3
A positive association means that as values of one variable increase, the values of the other variable tend to increase. A negative association means that as values of one variable increase, values of the other variable tend to decrease.DAT-1.A.4
The form of the association shown in a scatterplot, if any, can be described as linear or non-linear to varying degrees.DAT-1.A.5
The strength of the association is how closely the individual points follow a specific pattern, e.g., linear, and can be shown in a scatterplot. Strength can be described as strong, moderate, or weak.DAT-1.A.6
Unusual features of a scatter plot include clusters of points or points with relatively large discrepancies between the value of the response variable and a predicted value for the response variable.
ENDURING UNDERSTANDINGDAT-1
Regression models may allow us to predict responses to changes in an explanatory variable.
Return to Table of Contents© 2020 College Board
Course Framework V.1 | 60AP Statistics Course and Exam Description

Exploring Two-Variable DataUNIT
2
Required Course Content
SKILLS
Data Analysis
2.C
Calculate summary statistics, relative positions of points within a distribution, correlation, and predicted response.
Statistical Argumentation
4.B
Interpret statistical calculations and findings to assign meaning or assess a claim.
TOPIC 2.5
Correlation
continued on next page
ESSENTIAL KNOWLEDGEDAT-1.B.1
The correlation, r, gives the direction and quantifies the strength of the linear association between two quantitative variables.DAT-1.B.2
The correlation coefficient can be calculated by:
11
i i
x y
x x y yrn s s
− −= −
. However,
the most common way to determine r is by using technology.DAT-1.B.3
A correlation coefficient close to 1 or −1 does not necessarily mean that a linear model is appropriate.
LEARNING OBJECTIVEDAT-1.B
Determine the correlation for a linear relationship. [Skill 2.C]
ENDURING UNDERSTANDINGDAT-1
Regression models may allow us to predict responses to changes in an explanatory variable.
Return to Table of Contents© 2020 College Board
Course Framework V.1 | 61AP Statistics Course and Exam Description

Exploring Two-Variable DataUNIT
2
ESSENTIAL KNOWLEDGEDAT-1.C.1
The correlation, r, is unit-free, and always between −1 and 1, inclusive. A value of 0r indicates that there is no linear association. A value of 1r or 1r indicates that there is a perfect linear association.DAT-1.C.2
A perceived or real relationship between two variables does not mean that changes in one variable cause changes in the other. That is, correlation does not necessarily imply causation.
LEARNING OBJECTIVEDAT-1.C
Interpret the correlation for a linear relationship. [Skill 4.B]
Return to Table of Contents© 2020 College Board
Course Framework V.1 | 62AP Statistics Course and Exam Description

Exploring Two-Variable DataUNIT
2
Required Course Content
SKILL
Data Analysis
2.C
Calculate summary statistics, relative positions of points within a distribution, correlation, and predicted response.
TOPIC 2.6
Linear Regression Models
ENDURING UNDERSTANDINGDAT-1
Regression models may allow us to predict responses to changes in an explanatory variable.
LEARNING OBJECTIVEDAT-1.D
Calculate a predicted response value using a linear regression model. [Skill 2.C]
ESSENTIAL KNOWLEDGEDAT-1.D.1
A simple linear regression model is an equation that uses an explanatory variable, x, to predict the response variable, y.DAT-1.D.2
The predicted response value, denoted by y , is calculated as y a bx= + , where a is the y-intercept and b is the slope of the regression line, and x is the value of the explanatory variable.DAT-1.D.3
Extrapolation is predicting a response value using a value for the explanatory variable that is beyond the interval of x-values used to determine the regression line. The predicted value is less reliable as an estimate the further we extrapolate.
Return to Table of Contents© 2020 College Board
Course Framework V.1 | 63AP Statistics Course and Exam Description

Exploring Two-Variable DataUNIT
2
Required Course Content
SKILLS
Data Analysis
2.B
Construct numerical or graphical representations of distributions. 2.A
Describe data presented numerically or graphically.
TOPIC 2.7
Residuals
ENDURING UNDERSTANDINGDAT-1
Regression models may allow us to predict responses to changes in an explanatory variable.
LEARNING OBJECTIVEDAT-1.E
Represent differences between measured and predicted responses using residual plots. [Skill 2.B]
DAT-1.F
Describe the form of association of bivariate data using residual plots. [Skill 2.A]
ESSENTIAL KNOWLEDGEDAT-1.E.1
The residual is the difference between the actual value and the predicted value: residual = ˆy y− .DAT-1.E.2
A residual plot is a plot of residuals versus explanatory variable values or predicted response values.
DAT-1.F.1
Apparent randomness in a residual plot for a linear model is evidence of a linear form to the association between the variables.DAT-1.F.2
Residual plots can be used to investigate the appropriateness of a selected model.
Return to Table of Contents© 2020 College Board
Course Framework V.1 | 64AP Statistics Course and Exam Description

Exploring Two-Variable DataUNIT
2
Required Course Content
SKILLS
Data Analysis
2.C
Calculate summary statistics, relative positions of points within a distribution, correlation, and predicted response.
Statistical Argumentation
4.B
Interpret statistical calculations and findings to assign meaning or assess a claim.
TOPIC 2.8
Least Squares Regression
ENDURING UNDERSTANDINGDAT-1
Regression models may allow us to predict responses to changes in an explanatory variable.
LEARNING OBJECTIVEDAT-1.G
Estimate parameters for the least-squares regression line model. [Skill 2.C]
ESSENTIAL KNOWLEDGEDAT-1.G.1
The least-squares regression model minimizes the sum of the squares of the residuals and contains the point ( , )x y .DAT-1.G.2
The slope, b, of the regression line can
be calculated as y
x
sb r
s
=
where r is the
correlation between x and y, sy is the sample standard deviation of the response variable, y, and sx is the sample standard deviation of the explanatory variable, x.DAT-1.G.3
Sometimes, the y-intercept of the line does not have a logical interpretation in context.DAT-1.G.4
In simple linear regression, 2r is the square of the correlation, r. It is also called the coefficient of determination. 2r is the proportion of variation in the response variable that is explained by the explanatory variable in the model.
continued on next page
Return to Table of Contents© 2020 College Board
Course Framework V.1 | 65AP Statistics Course and Exam Description

Exploring Two-Variable DataUNIT
2
LEARNING OBJECTIVEDAT-1.H
Interpret coefficients for the least-squares regression line model. [Skill 4.B]
ESSENTIAL KNOWLEDGEDAT-1.H.1
The coefficients of the least-squares regression model are the estimated slope and y-intercept.DAT-1.H.2
The slope is the amount that the predicted y-value changes for every unit increase in x.DAT-1.H.3
The y-intercept value is the predicted value of the response variable when the explanatory variable is equal to 0 . The formula for the y-intercept, a, is a y bx= − .
Return to Table of Contents© 2020 College Board
Course Framework V.1 | 66AP Statistics Course and Exam Description

Exploring Two-Variable DataUNIT
2
Required Course Content
SKILLS
Data Analysis
2.A
Describe data presented numerically or graphically. 2.C
Calculate summary statistics, relative positions of points within a distribution, correlation, and predicted response.
TOPIC 2.9
Analyzing Departures from Linearity
continued on next page
ENDURING UNDERSTANDINGDAT-1
Regression models may allow us to predict responses to changes in an explanatory variable.
LEARNING OBJECTIVEDAT-1.I
Identify influential points in regression. [Skill 2.A]
ESSENTIAL KNOWLEDGEDAT-1.I.1
An outlier in regression is a point that does not follow the general trend shown in the rest of the data and has a large residual when the Least Squares Regression Line (LSRL) is calculated.DAT-1.I.2
A high-leverage point in regression has a substantially larger or smaller x-value than the other observations have.DAT-1.I.3
An influential point in regression is any point that, if removed, changes the relationship substantially. Examples include much different slope, y-intercept, and/or correlation. Outliers and high leverage points are often influential.
Return to Table of Contents© 2020 College Board
Course Framework V.1 | 67AP Statistics Course and Exam Description

Exploring Two-Variable DataUNIT
2
LEARNING OBJECTIVEDAT-1.J
Calculate a predicted response using a least-squares regression line for a transformed data set. [Skill 2.C]
ESSENTIAL KNOWLEDGEDAT-1.J.1
Transformations of variables, such as evaluating the natural logarithm of each value of the response variable or squaring each value of the explanatory variable, can be used to create transformed data sets, which may be more linear in form than the untransformed data.DAT-1.J.2
Increased randomness in residual plots after transformation of data and/or movement of 2r to a value closer to 1 offers evidence that the least-squares regression line for the transformed data is a more appropriate model to use to predict responses to the explanatory variable than the regression line for the untransformed data.
Return to Table of Contents© 2020 College Board
Course Framework V.1 | 68AP Statistics Course and Exam Description

AP STATISTICS
UNIT
Collecting Data
3
12–15%
AP EXAM WEIGHTING
~9–10CLASS PERIODS
69Return to Table of Contents
© 2020 College Board
Course Framework V.1 | 69AP Statistics Course and Exam Description

Remember to go to AP Classroom to assign students the online Personal Progress Check for this unit.
Whether assigned as homework or completed in class, the Personal Progress Check provides each student with immediate feedback related to this unit’s topics and skills.
Personal Progress Check 3Multiple-choice: ~20 questions Free-response: 2 questions
§ Exploring Data and Collecting Data
§ Collecting Data
Return to Table of Contents© 2020 College Board
Course Framework V.1 | 70AP Statistics Course and Exam Description

12–15% AP EXAM WEIGHTING
Building Course Skills1.B 1.C 4.A 4.B
Statisticians must be adept at determining “What is this question asking?” Students should get into the habit of identifying the task in the given prompt before they begin, then checking that their response addresses that task. For example, when asked if it would be appropriate to generalize the results of a given experiment, students need to provide a clear “yes” or “no” decision in their response, along with an explanation that supports their decision.
Although students may recognize that they need to justify their reasoning, they often struggle to include explicit evidence supporting their claims. For instance, claims about non-response bias should be supported with evidence indicating whether the sample result is likely to be too high or too low compared to the population value that is being estimated. As another example, students need to clearly explain why a particular variable might lead to confounding in a given setting.
Preparing for the AP ExamStudents should continue to practice using precise language in their writing for the AP Exam. For example, some students refer to random selection when they should be writing about random assignment, or vice versa. Students should write about random selection when discussing generalizing results of a sample to the population. Students should write about random assignment when discussing experiments or their results. Because random assignment to treatments in an experiment tends to balance the effects of uncontrolled variables across groups, researchers can conclude that statistically significant differences in the response are caused by the effects of the treatments. When justifying a claim that experimental treatments cause such statistically significant differences, students should cite the random assignment of treatments and should not refer to other irrelevant elements of well-designed experiments. Students should also continue to practice connecting responses to the specific context of the question.
BIG IDEA 1Variation and Distribution VAR
§ What do our data tell us?
BIG IDEA 3Data-Based Predictions, Decisions, and Conclusions DAT
§ Why might the data we collected not be valid for drawing conclusions about an entire population?
UNIT
3
Developing UnderstandingDepending on how data are collected, we may or may not be able to generalize findings or establish evidence of causal relationships. For example, if random selection is not used to obtain a sample from a population, bias may result and statistics from the sample cannot be assumed to generalize to the population. For data collected using well-designed experiments, statistically significant differences between or among experimental treatment groups are evidence that the treatments caused the effect. Students learn important principles of sampling and experimental design in this unit; they will learn about statistical inference in Units 6–9.
~9–10 CLASS PERIODS
Collecting Data
Return to Table of Contents© 2020 College Board
Course Framework V.1 | 71AP Statistics Course and Exam Description

Collecting DataUNIT
3UNIT
3 Collecting Data
UNIT AT A GLANCE
Endu
ring
Unde
rsta
ndin
g
Topic Skills
Class Periods
~9–10 CLASS PERIODS
VA
R-1 3.1 Introducing Statistics:
Do the Data We Collected Tell the Truth?
1.A Identify the question to be answered or problem to be solved (not assessed).
DA
T-2
3.2 Introduction to Planning a Study
1.C Describe an appropriate method for gathering and representing data.
4.A Make an appropriate claim or draw an appropriate conclusion.
3.3 Random Sampling and Data Collection
1.C Describe an appropriate method for gathering and representing data.
3.4 Potential Problems with Sampling
1.C Describe an appropriate method for gathering and representing data.
VA
R-3
3.5 Introduction to Experimental Design
1.C Describe an appropriate method for gathering and representing data.
1.B Identify key and relevant information to answer a question or solve a problem.
3.6 Selecting an Experimental Design
1.C Describe an appropriate method for gathering and representing data.
3.7 Inference and Experiments 4.B Interpret statistical calculations and findings to assign meaning or assess a claim.
Go to AP Classroom to assign the Personal Progress Check for Unit 3. Review the results in class to identify and address any student misunderstandings.
Return to Table of Contents© 2020 College Board
Course Framework V.1 | 72AP Statistics Course and Exam Description

Collecting DataUNIT
3UNIT
3Collecting Data
SAMPLE INSTRUCTIONAL ACTIVITIESThe sample activities on this page are optional and are offered to provide possible ways to incorporate various instructional approaches into the classroom. They were developed in partnership with teachers from the AP community to share ways that they approach teaching some of the topics in this unit. Please refer to the Instructional Approaches section beginning on p. 207 for more examples of activities and strategies.
Activity Topic Sample Activity
1 3.2 Graphic OrganizerProvide students with a table listing all possible combinations of whether a study involves random sampling (yes or no) and random assignment (yes or no). Ask them to fill in each cell with both the type of conclusion that is appropriate (association or causation) and the generalizability of the results (to the population or to only those similar to the study participants).
2 3.2 Odd One OutAfter modeling an odd one out example, have students form groups of four and give each of them a description of a statistical study. Explain that three of the studies are of the same type (observational or experimental) and one is different. Have students work together in their groups to determine which study is the odd one out and explain why.
3 3.23.3
Password-Style GamesAfter completing the lessons on sampling and surveying, use the following 10 terms in a password-style game: census, simple random sample, stratified random sample, cluster sample, systematic random sample, bias, voluntary response bias, undercoverage, nonresponse bias, and response bias. The winner is the pair whose partner guesses the most terms correctly from the descriptions given.
4 3.5 Sentence StartersProvide students with the scenario from 2006 Form B FRQ 5. Have them complete the following sentence starter to explain confounding: “ are confounded with
because each was used in only one . If a difference in the draft is observed, we will not know whether the difference is due to the or the .”
5 3.5 Think-Pair-ShareProvide students with a description of a well-designed experiment (e.g., 2010 FRQ 1) and ask them to individually identify the type of design, the experimental units, the treatments, and how the study addresses the principles of a well-designed experiment (including random assignment, control, blinding, and replication). Then have students share their thoughts with their neighbor.
Return to Table of Contents© 2020 College Board
Course Framework V.1 | 73AP Statistics Course and Exam Description

Collecting DataUNIT
3
Required Course Content Required Course Content
UNIT
3
TOPIC 3.1
Introducing Statistics: Do the Data We Collected Tell the Truth?
SKILL
Selecting Statistical Methods
1.A
Identify the question to be answered or problem to be solved.
ENDURING UNDERSTANDINGVAR-1
Given that variation may be random or not, conclusions are uncertain.
LEARNING OBJECTIVEVAR-1.E
Identify questions to be answered about data collection methods. [Skill 1.A]
ESSENTIAL KNOWLEDGEVAR-1.E.1
Methods for data collection that do not rely on chance result in untrustworthy conclusions.
Return to Table of Contents© 2020 College Board
Course Framework V.1 | 74AP Statistics Course and Exam Description

Collecting DataUNIT
3
Required Course Content
TOPIC 3.2
Introduction to Planning a Study
SKILLS
Selecting Statistical Methods
1.C
Describe an appropriate method for gathering and representing data.
Statistical Argumentation
4.A
Make an appropriate claim or draw an appropriate conclusion.
continued on next page
ENDURING UNDERSTANDINGDAT-2
The way we collect data influences what we can and cannot say about a population.
LEARNING OBJECTIVEDAT-2.A
Identify the type of a study. [Skill 1.C]
ESSENTIAL KNOWLEDGEDAT-2.A.1
A population consists of all items or subjects of interest.DAT-2.A.2
A sample selected for study is a subset of the population.DAT-2.A.3
In an observational study, treatments are not imposed. Investigators examine data for a sample of individuals (retrospective) or follow a sample of individuals into the future collecting data (prospective) in order to investigate a topic of interest about the population. A sample survey is a type of observational study that collects data from a sample in an attempt to learn about the population from which the sample was taken.DAT-2.A.4
In an experiment, different conditions (treatments) are assigned to experimental units (participants or subjects).
DAT-2.B
Identify appropriate generalizations and determinations based on observational studies. [Skill 4.A]
DAT-2.B.1
It is only appropriate to make generalizations about a population based on samples that are randomly selected or otherwise representative of that population.
Return to Table of Contents© 2020 College Board
Course Framework V.1 | 75AP Statistics Course and Exam Description
Collecting DataUNIT
3
ESSENTIAL KNOWLEDGEDAT-2.B.2
A sample is only generalizable to the population from which the sample was selected.DAT-2.B.3
It is not possible to determine causal relationships between variables using data collected in an observational study.
LEARNING OBJECTIVEDAT-2.B
Identify appropriate generalizations and determinations based on observational studies. [Skill 4.A]
Return to Table of Contents© 2020 College Board
Course Framework V.1 | 76AP Statistics Course and Exam Description

Collecting DataUNIT
3
Required Course Content
TOPIC 3.3
Random Sampling and Data Collection
SKILL
Selecting Statistical Methods
1.C
Describe an appropriate method for gathering and representing data.
ENDURING UNDERSTANDINGDAT-2
The way we collect data influences what we can and cannot say about a population.
LEARNING OBJECTIVEDAT-2.C
Identify a sampling method, given a description of a study. [Skill 1.C]
ESSENTIAL KNOWLEDGEDAT-2.C.1
When an item from a population can be selected only once, this is called sampling without replacement. When an item from the population can be selected more than once, this is called sampling with replacement.DAT-2.C.2
A simple random sample (SRS) is a sample in which every group of a given size has an equal chance of being chosen. This method is the basis for many types of sampling mechanisms. A few examples of mechanisms used to obtain SRSs include numbering individuals and using a random number generator to select which ones to include in the sample, ignoring repeats, using a table of random numbers, or drawing a card from a deck without replacement.DAT-2.C.3
A stratified random sample involves the division of a population into separate groups, called strata, based on shared attributes or characteristics (homogeneous grouping). Within each stratum a simple random sample is selected, and the selected units are combined to form the sample.
continued on next page
Return to Table of Contents© 2020 College Board
Course Framework V.1 | 77AP Statistics Course and Exam Description

Collecting DataUNIT
3
ESSENTIAL KNOWLEDGEDAT-2.C.4
A cluster sample involves the division of a population into smaller groups, called clusters. Ideally, there is heterogeneity within each cluster, and clusters are similar to one another in their composition. A simple random sample of clusters is selected from the population to form the sample of clusters. Data are collected from all observations in the selected clusters.DAT-2.C.5
A systematic random sample is a method in which sample members from a population are selected according to a random starting point and a fixed, periodic interval.DAT-2.C.6
A census selects all items/subjects in a population.
LEARNING OBJECTIVEDAT-2.C
Identify a sampling method, given a description of a study. [Skill 1.C]
DAT-2.D
Explain why a particular sampling method is or is not appropriate for a given situation. [Skill 1.C]
DAT-2.D.1
There are advantages and disadvantages for each sampling method depending upon the question that is to be answered and the population from which the sample will be drawn.
Return to Table of Contents© 2020 College Board
Course Framework V.1 | 78AP Statistics Course and Exam Description

Collecting DataUNIT
3
Required Course Content
TOPIC 3.4
Potential Problems with Sampling
SKILL
Selecting Statistical Methods
1.C
Describe an appropriate method for gathering and representing data.
ENDURING UNDERSTANDINGDAT-2
The way we collect data influences what we can and cannot say about a population.
LEARNING OBJECTIVEDAT-2.E
Identify potential sources of bias in sampling methods. [Skill 1.C]
ESSENTIAL KNOWLEDGEDAT-2.E.1
Bias occurs when certain responses are systematically favored over others.DAT-2.E.2
When a sample is comprised entirely of volunteers or people who choose to participate, the sample will typically not be representative of the population (voluntary response bias).DAT-2.E.3
When part of the population has a reduced chance of being included in the sample, the sample will typically not be representative of the population (undercoverage bias).DAT-2.E.4
Individuals chosen for the sample for whom data cannot be obtained (or who refuse to respond) may differ from those for whom data can be obtained (nonresponse bias).DAT-2.E.5
Problems in the data gathering instrument or process result in response bias. Examples include questions that are confusing or leading (question wording bias) and self-reported responses.DAT-2.E.6
Non-random sampling methods (for example, samples chosen by convenience or voluntary response) introduce potential for bias because they do not use chance to select the individuals.
Return to Table of Contents© 2020 College Board
Course Framework V.1 | 79AP Statistics Course and Exam Description

Collecting DataUNIT
3
Required Course Content
TOPIC 3.5
Introduction to Experimental Design
SKILLS
Selecting Statistical Methods
1.C
Describe an appropriate method for gathering and representing data.1.B
Identify key and relevant information to answer a question or solve a problem.
ENDURING UNDERSTANDINGVAR-3
Well-designed experiments can establish evidence of causal relationships.
LEARNING OBJECTIVEVAR-3.A
Identify the components of an experiment. [Skill 1.C]
ESSENTIAL KNOWLEDGEVAR-3.A.1
The experimental units are the individuals (which may be people or other objects of study) that are assigned treatments. When experimental units consist of people, they are sometimes referred to as participants or subjects.VAR-3.A.2
An explanatory variable (or factor) in an experiment is a variable whose levels are manipulated intentionally. The levels or combination of levels of the explanatory variable(s) are called treatments.VAR-3.A.3
A response variable in an experiment is an outcome from the experimental units that is measured after the treatments have been administered.VAR-3.A.4
A confounding variable in an experiment is a variable that is related to the explanatory variable and influences the response variable and may create a false perception of association between the two.
continued on next page
Return to Table of Contents© 2020 College Board
Course Framework V.1 | 80AP Statistics Course and Exam Description

Collecting DataUNIT
3
ESSENTIAL KNOWLEDGE VAR-3.B.1
A well-designed experiment should include the following:a. Comparisons of at least two treatment
groups, one of which could be a control group.
b. Random assignment/allocation of treatments to experimental units.
c. Replication (more than one experimental unit in each treatment group).
d. Control of potential confounding variables where appropriate.
LEARNING OBJECTIVEVAR-3.B
Describe elements of a well-designed experiment. [Skill 1.B]
VAR-3.C.1
In a completely randomized design, treatments are assigned to experimental units completely at random. Random assignment tends to balance the effects of uncontrolled (confounding) variables so that differences in responses can be attributed to the treatments.VAR-3.C.2
Methods for randomly assigning treatments to experimental units in a completely randomized design include using a random number generator, a table of random values, drawing chips without replacement, etc.VAR-3.C.3
In a single-blind experiment, subjects do not know which treatment they are receiving, but members of the research team do, or vice versa.VAR-3.C.4
In a double-blind experiment neither the subjects nor the members of the research team who interact with them know which treatment a subject is receiving.VAR-3.C.5
A control group is a collection of experimental units either not given a treatment of interest or given a treatment with an inactive substance (placebo) in order to determine if the treatment of interest has an effect.VAR-3.C.6
The placebo effect occurs when experimental units have a response to a placebo.
VAR-3.C
Compare experimental designs and methods. [Skill 1.C]
continued on next page
Return to Table of Contents© 2020 College Board
Course Framework V.1 | 81AP Statistics Course and Exam Description

Collecting DataUNIT
3
ESSENTIAL KNOWLEDGEVAR-3.C.7
For randomized complete block designs, treatments are assigned completely at random within each block.VAR-3.C.8
Blocking ensures that at the beginning of the experiment the units within each block are similar to each other with respect to at least one blocking variable. A randomized block design helps to separate natural variability from differences due to the blocking variable.VAR-3.C.9
A matched pairs design is a special case of a randomized block design. Using a blocking variable, subjects (whether they are people or not) are arranged in pairs matched on relevant factors. Matched pairs may be formed naturally or by the experimenter. Every pair receives both treatments by randomly assigning one treatment to one member of the pair and subsequently assigning the remaining treatment to the second member of the pair. Alternately, each subject may get both treatments.
LEARNING OBJECTIVEVAR-3.C
Compare experimental designs and methods. [Skill 1.C]
Return to Table of Contents© 2020 College Board
Course Framework V.1 | 82AP Statistics Course and Exam Description
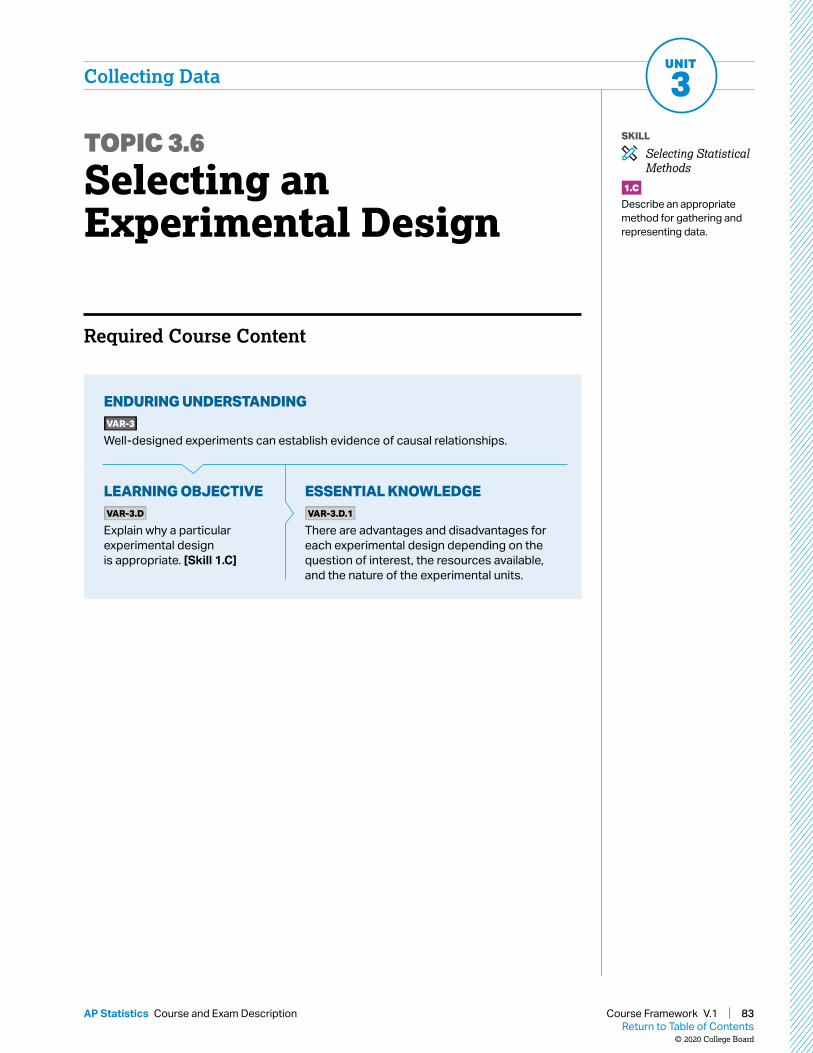
Collecting DataUNIT
3
Required Course Content
TOPIC 3.6
Selecting an Experimental Design
SKILL
Selecting Statistical Methods
1.C
Describe an appropriate method for gathering and representing data.
ENDURING UNDERSTANDINGVAR-3
Well-designed experiments can establish evidence of causal relationships.
LEARNING OBJECTIVEVAR-3.D
Explain why a particular experimental design is appropriate. [Skill 1.C]
ESSENTIAL KNOWLEDGEVAR-3.D.1
There are advantages and disadvantages for each experimental design depending on the question of interest, the resources available, and the nature of the experimental units.
Return to Table of Contents© 2020 College Board
Course Framework V.1 | 83AP Statistics Course and Exam Description

Collecting DataUNIT
3
Required Course Content
TOPIC 3.7
Inference and Experiments
SKILL
Statistical Argumentation
4.B
Interpret statistical calculations and findings to assign meaning or assess a claim.
ENDURING UNDERSTANDINGVAR-3
Well-designed experiments can establish evidence of causal relationships.
LEARNING OBJECTIVEVAR-3.E
Interpret the results of a well-designed experiment. [Skill 4.B]
ESSENTIAL KNOWLEDGEVAR-3.E.1
Statistical inference attributes conclusions based on data to the distribution from which the data were collected.VAR-3.E.2
Random assignment of treatments to experimental units allows researchers to conclude that some observed changes are so large as to be unlikely to have occurred by chance. Such changes are said to be statistically significant.VAR-3.E.3
Statistically significant differences between or among experimental treatment groups are evidence that the treatments caused the effect.VAR-3.E.4
If the experimental units used in an experiment are representative of some larger group of units, the results of an experiment can be generalized to the larger group. Random selection of experimental units gives a better chance that the units will be representative.
Return to Table of Contents© 2020 College Board
Course Framework V.1 | 84AP Statistics Course and Exam Description

4
10–20%
AP EXAM WEIGHTING
~18–20CLASS PERIODS
AP STATISTICS
UNIT
Probability, Random Variables, and Probability Distributions
85Return to Table of Contents
© 2020 College Board
Course Framework V.1 | 85AP Statistics Course and Exam Description

Remember to go to AP Classroom to assign students the online Personal Progress Check for this unit.
Whether assigned as homework or completed in class, the Personal Progress Check provides each student with immediate feedback related to this unit’s topics and skills.
Personal Progress Check 4Multiple-choice: ~45 questions Free-response: 2 questions
§ Probability § Investigative Task
Return to Table of Contents© 2020 College Board
Course Framework V.1 | 86AP Statistics Course and Exam Description

BIG IDEA 1Variation and Distribution VAR
§ How can an event be both random and predictable?
BIG IDEA 2Patterns and Uncertainty UNC
§ About how many rolls of a fair six-sided die would we anticipate it taking to get three 1s?
10–20% AP EXAM WEIGHTINGUNIT
4
Developing UnderstandingProbabilistic reasoning allows statisticians to quantify the likelihood of random events over the long run and to make statistical inferences. Simulations and concrete examples can help students to understand the abstract definitions and calculations of probability. This unit builds on understandings of simulated or empirical data distributions and fundamental principles of probability to represent, interpret, and calculate parameters for theoretical probability distributions for discrete random variables. Interpretations of probabilities and parameters associated with a probability distribution should use appropriate units and relate to the context of the situation.
~18–20 CLASS PERIODS
Probability, Random Variables, and Probability Distributions
Building Course Skills2.B 3.A 3.B 4.B
Probability is a notoriously difficult topic for students to grasp because it’s difficult to conceptualize future outcomes in concrete ways. Before introducing new formulas, teachers can help students get an intuitive feel for why the formulas (and related notation) make sense. For example, the probability formulas for or P A B and for |P A B can be presented intuitively with two-way tables. Simulations can also help students internalize what it means to quantify random behavior. To help students understand when to apply different probability rules, teachers can use explicit strategies such as matching verbal scenarios to their corresponding probability formulas.
Students frequently misinterpret probability distributions and parameters for random variables. Teachers can reinforce that a complete interpretation will include context and units. A common misconception later in the course is that every question involving probability requires a significance test. Students should practice making predictions and decisions based on probability alone to avoid this misconception early on.
They should revisit these problems in later units to practice differentiating between inference and probability problems.
Preparing for the AP ExamTo help students prepare for the AP Exam, teachers can model showing all steps in probability calculations and expect students to do the same. Calculations on the AP Exam should include presentation of an appropriate expression that communicates the structure of the formula, substitution of relevant values extracted from the problem, and an answer. In 2017 FRQ 3, for example, a student who writes “ ( ) ( | ) ( ) P( | ) ( ) (0.2119)(0.7) (0.8413)(0.3) 0.4007P G P G J P J G K P K= ⋅ + ⋅ = + =
( ) ( | ) ( ) P( | ) ( ) (0.2119)(0.7) (0.8413)(0.3) 0.4007P G P G J P J G K P K= ⋅ + ⋅ = + = ( ) ( | ) ( ) P( | ) ( ) (0.2119)(0.7) (0.8413)(0.3) 0.4007P G P G J P J G K P K= ⋅ + ⋅ = + = ” has communicated
the products in the multiplication rule, the sum in the addition rule, and an understanding that the events are mutually exclusive—all components of a complete response. To avoid a common error, students who present the same work using a tree diagram should practice using probabilities in the diagram correctly. Students importing incorrect solutions from one part of a multipart question to solve another will not be penalized a second time, unless the subsequent result is not a reasonable value (like a probability less than 0 or greater than 1).
Return to Table of Contents© 2020 College Board
Course Framework V.1 | 87AP Statistics Course and Exam Description

UNIT
4 Probability, Random Variables, and Probability Distributions
UNIT AT A GLANCE
Endu
ring
Unde
rsta
ndin
g
Topic Skills
Class Periods
~18–20 CLASS PERIODS
VA
R-1 4.1 Introducing Statistics:
Random and Non-Random Patterns?
1.A Identify the question to be answered or problem to be solved (not assessed).
UN
C-2 4.2 Estimating Probabilities
Using Simulation3.A Determine relative frequencies, proportions, or probabilities using simulation or calculations.
VA
R-4
4.3 Introduction to Probability 3.A Determine relative frequencies, proportions, or probabilities using simulation or calculations.
4.B Interpret statistical calculations and findings to assign meaning or assess a claim.
4.4 Mutually Exclusive Events 4.B Interpret statistical calculations and findings to assign meaning or assess a claim.
4.5 Conditional Probability 3.A Determine relative frequencies, proportions, or probabilities using simulation or calculations.
4.6 Independent Events and Unions of Events
3.A Determine relative frequencies, proportions, or probabilities using simulation or calculations.
VA
R-5
4.7 Introduction to Random Variables and Probability Distributions
2.B Construct numerical or graphical representations of distributions.
4.B Interpret statistical calculations and findings to assign meaning or assess a claim.
4.8 Mean and Standard Deviation of Random Variables
3.B Determine parameters for probability distributions.
4.B Interpret statistical calculations and findings to assign meaning or assess a claim.
4.9 Combining Random Variables
3.B Determine parameters for probability distributions.
3.C Describe probability distributions.
continued on next page
Return to Table of Contents© 2020 College Board
Course Framework V.1 | 88AP Statistics Course and Exam Description

UNIT
4Probability, Random Variables, and Probability DistributionsEn
durin
g Un
ders
tand
ing
Topic Skills
Class Periods
~18–20 CLASS PERIODS
UN
C-3
4.10 Introduction to the Binomial Distribution
3.A Determine relative frequencies, proportions, or probabilities using simulation or calculations.
4.11 Parameters for a Binomial Distribution
3.B Determine parameters for probability distributions.
4.B Interpret statistical calculations and findings to assign meaning or assess a claim.
4.12 The Geometric Distribution
3.A Determine relative frequencies, proportions, or probabilities using simulation or calculations.
3.B Determine parameters for probability distributions.
4.B Interpret statistical calculations and findings to assign meaning or assess a claim.
Go to AP Classroom to assign the Personal Progress Check for Unit 4. Review the results in class to identify and address any student misunderstandings.
UNIT AT A GLANCE (cont’d)
Return to Table of Contents© 2020 College Board
Course Framework V.1 | 89AP Statistics Course and Exam Description

UNIT
4 Probability, Random Variables, and Probability Distributions
SAMPLE INSTRUCTIONAL ACTIVITIESThe sample activities on this page are optional and are offered to provide possible ways to incorporate various instructional approaches into the classroom. They were developed in partnership with teachers from the AP community to share ways that they approach teaching some of the topics in this unit. Please refer to the Instructional Approaches section beginning on p. 207 for more examples of activities and strategies.
Activity Topic Sample Activity
1 4.34.54.8
Error AnalysisUsing 2015 FRQ 3, provide students with several answers containing errors for each part. Provide some responses with incorrect notation, incorrect work, missing work, work that shows calculator commands only, an incorrect formula or approach, and an incorrect final answer. Then ask students to identify the errors.
2 4.34.54.6
Think-Pair-ShareProvide students with a set of five probability questions: one for the complement rule, the conditional probability formula, the general multiplication rule, the multiplication rule for independent events, and the general addition rule. Ask students to individually identify the formula needed to solve each problem, without doing the final calculations. Then have them share their thoughts with a partner.
3 4.54.6
Create RepresentationsProvide students with the scenario from 2018 FRQ 3. Ask them to create a tree diagram to organize the information in the problem. Then ask them to use the information in the problem to set up a hypothetical 100,000 table (to make the decimals easy to work with), such as the one below. Encourage students to try both representations when solving probability questions in the future.
Multiple Birth Single Birth Total
Left handed 770 10,615 11,385
Right handed 2,730 85,885 88,615
Total 3,500 96,500 100,000
4 4.104.12
Odd One OutAfter modeling an odd one out example, have students form groups of four and give each of them a description of either a binomial or a geometric random variable. Explain that three of their variables follow the same probability distribution and one is different. Have students work together in their groups to determine whose is the odd one out and explain why.
5 4.24.12
Predict and ConfirmAsk students to consider couples who plan to continue having children until they have one girl and predict how many children they think these couples will have, on average. Then ask each student to perform 10 trials using a coin toss where Heads = Girl and Tails = Boy. A trial is finished once one girl is observed and the number of total children is recorded. Combine the class results and calculate the average. Confirm with the geometric mean formula once it is discussed.
Return to Table of Contents© 2020 College Board
Course Framework V.1 | 90AP Statistics Course and Exam Description

UNIT
4
Required Course Content
Probability, Random Variables, and Probability Distributions
TOPIC 4.1
Introducing Statistics: Random and Non-Random Patterns?
SKILL
Selecting Statistical Methods
1.A
Identify the question to be answered or problem to be solved.
ENDURING UNDERSTANDINGVAR-1
Given that variation may be random or not, conclusions are uncertain.
LEARNING OBJECTIVEVAR-1.F
Identify questions suggested by patterns in data. [Skill 1.A]
ESSENTIAL KNOWLEDGEVAR-1.F.1
Patterns in data do not necessarily mean that variation is not random.
Return to Table of Contents© 2020 College Board
Course Framework V.1 | 91AP Statistics Course and Exam Description
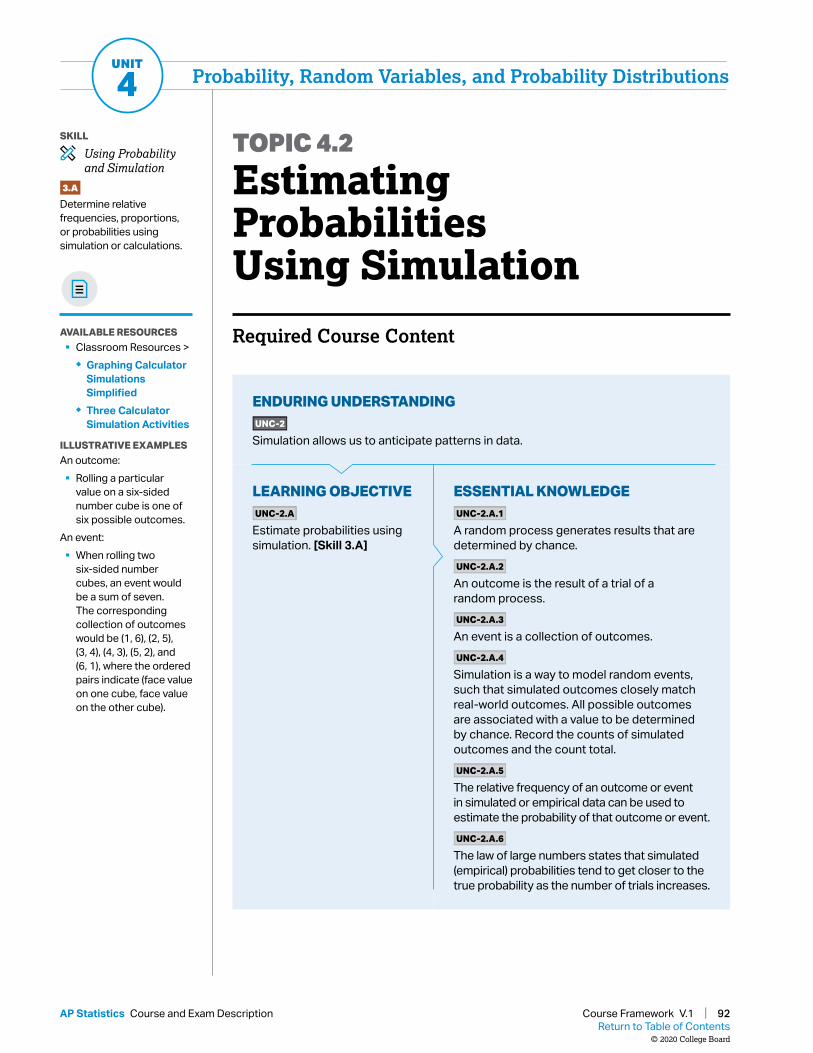
UNIT
4
Required Course Content
Probability, Random Variables, and Probability Distributions
TOPIC 4.2
Estimating Probabilities Using Simulation
SKILL
Using Probability and Simulation
3.A
Determine relative frequencies, proportions, or probabilities using simulation or calculations.
AVAILABLE RESOURCES § Classroom Resources >
◆ Graphing Calculator Simulations Simplified
◆ Three Calculator Simulation Activities
ILLUSTRATIVE EXAMPLESAn outcome:
§ Rolling a particular value on a six-sided number cube is one of six possible outcomes.
An event: § When rolling two
six-sided number cubes, an event would be a sum of seven. The corresponding collection of outcomes would be (1, 6), (2, 5), (3, 4), (4, 3), (5, 2), and (6, 1), where the ordered pairs indicate (face value on one cube, face value on the other cube).
ENDURING UNDERSTANDINGUNC-2
Simulation allows us to anticipate patterns in data.
LEARNING OBJECTIVEUNC-2.A
Estimate probabilities using simulation. [Skill 3.A]
ESSENTIAL KNOWLEDGEUNC-2.A.1
A random process generates results that are determined by chance.UNC-2.A.2
An outcome is the result of a trial of a random process.UNC-2.A.3
An event is a collection of outcomes.UNC-2.A.4
Simulation is a way to model random events, such that simulated outcomes closely match real-world outcomes. All possible outcomes are associated with a value to be determined by chance. Record the counts of simulated outcomes and the count total.UNC-2.A.5
The relative frequency of an outcome or event in simulated or empirical data can be used to estimate the probability of that outcome or event.UNC-2.A.6
The law of large numbers states that simulated (empirical) probabilities tend to get closer to the true probability as the number of trials increases.
Return to Table of Contents© 2020 College Board
Course Framework V.1 | 92AP Statistics Course and Exam Description

UNIT
4
Required Course Content
Probability, Random Variables, and Probability Distributions
TOPIC 4.3
Introduction to Probability
SKILLS
Using Probability and Simulation
3.A
Determine relative frequencies, proportions, or probabilities using simulation or calculations.
Statistical Argumentation
4.B
Interpret statistical calculations and findings to assign meaning or assess a claim.
VAR-4.B
Interpret probabilities for events. [Skill 4.B]
VAR-4.B.1
Probabilities of events in repeatable situations can be interpreted as the relative frequency with which the event will occur in the long run.
ENDURING UNDERSTANDINGVAR-4
The likelihood of a random event can be quantified.
LEARNING OBJECTIVEVAR-4.A
Calculate probabilities for events and their complements. [Skill 3.A]
ESSENTIAL KNOWLEDGEVAR-4.A.1
The sample space of a random process is the set of all possible non-overlapping outcomes.VAR-4.A.2
If all outcomes in the sample space are equally likely, then the probability an event E will occur is defined as the fraction:
VAR-4.A.3
The probability of an event is a number between 0 and 1, inclusive.VAR-4.A.4
The probability of the complement of an event E, E′ or CE , (i.e., not E) is equal to 1 ( )P E− .
number of outcomes in event Etotal number of outcomes in sample space
Return to Table of Contents© 2020 College Board
Course Framework V.1 | 93AP Statistics Course and Exam Description

UNIT
4
Required Course Content
Probability, Random Variables, and Probability Distributions
TOPIC 4.4
Mutually Exclusive Events
SKILL
Statistical Argumentation
4.B
Interpret statistical calculations and findings to assign meaning or assess a claim.
ENDURING UNDERSTANDINGVAR-4
The likelihood of a random event can be quantified.
LEARNING OBJECTIVEVAR-4.C
Explain why two events are (or are not) mutually exclusive. [Skill 4.B]
ESSENTIAL KNOWLEDGEVAR-4.C.1
The probability that events A and B both will occur, sometimes called the joint probability, is the probability of the intersection of A and B, denoted ( )P A B∩ .VAR-4.C.2
Two events are mutually exclusive or disjoint if they cannot occur at the same time. So ( ) 0P A B∩ = .
Return to Table of Contents© 2020 College Board
Course Framework V.1 | 94AP Statistics Course and Exam Description

UNIT
4
Required Course Content
Probability, Random Variables, and Probability Distributions
TOPIC 4.5
Conditional Probability
SKILL
Using Probability and Simulation
3.A
Determine relative frequencies, proportions, or probabilities using simulation or calculations.
LEARNING OBJECTIVEVAR-4.D
Calculate conditional probabilities. [Skill 3.A]
ESSENTIAL KNOWLEDGEVAR-4.D.1
The probability that event A will occur given that event B has occurred is called a conditional probability and denoted
( )( | )( )
P A BP A BP B
∩= .
VAR-4.D.2
The multiplication rule states that the probability that events A and B both will occur is equal to the probability that event A will occur multiplied by the probability that event B will occur, given that A has occurred. This is denoted ( ) ( ) ( | )P A B P A P B A∩ = ⋅ .
ENDURING UNDERSTANDINGVAR-4
The likelihood of a random event can be quantified.
Return to Table of Contents© 2020 College Board
Course Framework V.1 | 95AP Statistics Course and Exam Description

UNIT
4
Required Course Content
Probability, Random Variables, and Probability Distributions
TOPIC 4.6
Independent Events and Unions of Events
SKILL
Using Probability and Simulation
3.A
Determine relative frequencies, proportions, or probabilities using simulation or calculations.
LEARNING OBJECTIVEVAR-4.E
Calculate probabilities for independent events and for the union of two events. [Skill 3.A]
ESSENTIAL KNOWLEDGEVAR-4.E.1
Events A and B are independent if, and only if, knowing whether event A has occurred (or will occur) does not change the probability that event B will occur.VAR-4.E.2
If, and only if, events A and B are independent, then ( | ) ( )P A B P A= , ( | ) ( )P B A P B= , and
( ) ( ) ( )P A B P A P B∩ = ⋅ .VAR-4.E.3
The probability that event A or event B (or both) will occur is the probability of the union of A and B, denoted ( )P A B∪ .VAR-4.E.4
The addition rule states that the probability that event A or event B or both will occur is equal to the probability that event A will occur plus the probability that event B will occur minus the probability that both events A and B will occur. This is denoted
( ) ( ) ( ) ( )P A B P A P B P A B∪ = + − ∩ .
ENDURING UNDERSTANDINGVAR-4
The likelihood of a random event can be quantified.
Return to Table of Contents© 2020 College Board
Course Framework V.1 | 96AP Statistics Course and Exam Description

UNIT
4Probability, Random Variables, and Probability Distributions
Required Course Content
TOPIC 4.7
Introduction to Random Variables and Probability Distributions
SKILLS
Data Analysis
2.B
Construct numerical or graphical representations of distributions.
Statistical Argumentation
4.B
Interpret statistical calculations and findings to assign meaning or assess a claim.
ILLUSTRATIVE EXAMPLESOutcomes of trials of a random process:
§ The sum of the outcomes for rolling two dice
§ The number of puppies in a randomly selected litter for a certain breed of dogLEARNING OBJECTIVE
VAR-5.A
Represent the probability distribution for a discrete random variable. [Skill 2.B]
ESSENTIAL KNOWLEDGEVAR-5.A.1
The values of a random variable are the numerical outcomes of random behavior.VAR-5.A.2
A discrete random variable is a variable that can only take a countable number of values. Each value has a probability associated with it. The sum of the probabilities over all of the possible values must be 1.VAR-5.A.3
A probability distribution can be represented as a graph, table, or function showing the probabilities associated with values of a random variable.VAR-5.A.4
A cumulative probability distribution can be represented as a table or function showing the probability of being less than or equal to each value of the random variable.
ENDURING UNDERSTANDINGVAR-5
Probability distributions may be used to model variation in populations.
VAR-5.B
Interpret a probability distribution. [Skill 4.B]
VAR-5.B.1
An interpretation of a probability distribution provides information about the shape, center, and spread of a population and allows one to make conclusions about the population of interest.
Return to Table of Contents© 2020 College Board
Course Framework V.1 | 97AP Statistics Course and Exam Description

UNIT
4
Required Course Content
Probability, Random Variables, and Probability Distributions
TOPIC 4.8
Mean and Standard Deviation of Random Variables
SKILLS
Using Probability and Simulation
3.B
Determine parameters for probability distributions.
Statistical Argumentation
4.B
Interpret statistical calculations and findings to assign meaning or assess a claim.
ENDURING UNDERSTANDINGVAR-5
Probability distributions may be used to model variation in populations.
LEARNING OBJECTIVEVAR-5.C
Calculate parameters for a discrete random variable. [Skill 3.B]
ESSENTIAL KNOWLEDGEVAR-5.C.1
A numerical value measuring a characteristic of a population or the distribution of a random variable is known as a parameter, which is a single, fixed value.VAR-5.C.2
The mean, or expected value, for a discrete random variable X is ( )X i ix P xμ = ⋅ .VAR-5.C.3
The standard deviation for a discrete random variable X is ( ) ( )2
X i X ix P xσ μ= − ⋅ .
VAR-5.D.1
Parameters for a discrete random variable should be interpreted using appropriate units and within the context of a specific population.
VAR-5.D
Interpret parameters for a discrete random variable. [Skill 4.B]
Return to Table of Contents© 2020 College Board
Course Framework V.1 | 98AP Statistics Course and Exam Description

UNIT
4
Required Course Content
Probability, Random Variables, and Probability Distributions
TOPIC 4.9
Combining Random Variables
SKILLS
Using Probability and Simulation
3.B
Determine parameters for probability distributions. 3.C
Describe probability distributions.
ENDURING UNDERSTANDINGVAR-5
Probability distributions may be used to model variation in populations.
LEARNING OBJECTIVEVAR-5.E
Calculate parameters for linear combinations of random variables. [Skill 3.B]
ESSENTIAL KNOWLEDGEVAR-5.E.1
For random variables X and Y and real numbers a and b, the mean of aX bY+ is
x ya bμ μ+ .VAR-5.E.2
Two random variables are independent if knowing information about one of them does not change the probability distribution of the other.VAR-5.E.3
For independent random variables X and Y and real numbers a and b, the mean of aX bY+ is x ya bμ μ+ , and the variance of aX bY+ is
2 2 2 2x ya b .
VAR-5.F.1
For Y a bX= + , the probability distribution of the transformed random variable, Y, has the same shape as the probability distribution for X, so long as 0a > and 0b > . The mean of Y is
y xa bμ μ= + . The standard deviation of Y is y xbσ σ= .
VAR-5.F
Describe the effects of linear transformations of parameters of random variables. [Skill 3.C]
Return to Table of Contents© 2020 College Board
Course Framework V.1 | 99AP Statistics Course and Exam Description

UNIT
4
Required Course Content
Probability, Random Variables, and Probability Distributions
TOPIC 4.10
Introduction to the Binomial Distribution
SKILL
Using Probability and Simulation
3.A
Determine relative frequencies, proportions, or probabilities using simulation or calculations.
ENDURING UNDERSTANDINGUNC-3
Probabilistic reasoning allows us to anticipate patterns in data.
LEARNING OBJECTIVEUNC-3.A
Estimate probabilities of binomial random variables using data from a simulation. [Skill 3.A]
ESSENTIAL KNOWLEDGEUNC-3.A.1
A probability distribution can be constructed using the rules of probability or estimated with a simulation using random number generators.UNC-3.A.2
A binomial random variable, X, counts the number of successes in n repeated independent trials, each trial having two possible outcomes (success or failure), with the probability of success p and the probability of failure 1 – p.
UNC-3.B.1
The probability that a binomial random variable, X, has exactly x successes for n independent trials, when the probability of success is p, is calculated
as ( ) (1 )x n xnP X x p p
x−
= = −
, x = 0, 1, 2, . . . , n.
This is the binomial probability function.
UNC-3.B
Calculate probabilities for a binomial distribution. [Skill 3.A]
Return to Table of Contents© 2020 College Board
Course Framework V.1 | 100AP Statistics Course and Exam Description

UNIT
4
Required Course Content
Probability, Random Variables, and Probability Distributions
TOPIC 4.11
Parameters for a Binomial Distribution
SKILLS
Using Probability and Simulation
3.B
Determine parameters for probability distributions.
Statistical Argumentation
4.B
Interpret statistical calculations and findings to assign meaning or assess a claim.
ENDURING UNDERSTANDINGUNC-3
Probabilistic reasoning allows us to anticipate patterns in data.
LEARNING OBJECTIVEUNC-3.C
Calculate parameters for a binomial distribution. [Skill 3.B]
ESSENTIAL KNOWLEDGEUNC-3.C.1
If a random variable is binomial, its mean, xμ , is np and its standard deviation, xσ , is
(1 )np p− .
UNC-3.D.1
Probabilities and parameters for a binomial distribution should be interpreted using appropriate units and within the context of a specific population or situation.
UNC-3.D
Interpret probabilities and parameters for a binomial distribution. [Skill 4.B]
Return to Table of Contents© 2020 College Board
Course Framework V.1 | 101AP Statistics Course and Exam Description

UNIT
4
Required Course Content
Probability, Random Variables, and Probability Distributions
TOPIC 4.12
The Geometric Distribution
SKILLS
Using Probability and Simulation
3.A
Determine relative frequencies, proportions, or probabilities using simulation or calculations.3.B
Determine parameters for probability distributions.
Statistical Argumentation
4.B
Interpret statistical calculations and findings to assign meaning or assess a claim.
ENDURING UNDERSTANDINGUNC-3
Probabilistic reasoning allows us to anticipate patterns in data.
LEARNING OBJECTIVEUNC-3.E
Calculate probabilities for geometric random variables. [Skill 3.A]
ESSENTIAL KNOWLEDGEUNC-3.E.1
For a sequence of independent trials, a geometric random variable, X, gives the number of the trial on which the first success occurs. Each trial has two possible outcomes (success or failure) with the probability of success p and the probability of failure 1 – p.UNC-3.E.2
The probability that the first success for repeated independent trials with probability of success p occurs on trial x is calculated as
1( ) (1 ) , 1,2,3,...xP X x p p x−= = − = . This is the geometric probability function.
UNC-3.F.1
If a random variable is geometric, its mean,
xμ , is 1p
and its standard deviation, x , is
(1 )pp− .
UNC-3.F
Calculate parameters of a geometric distribution. [Skill 3.B]
UNC-3.G.1
Probabilities and parameters for a geometric distribution should be interpreted using appropriate units and within the context of a specific population or situation.
UNC-3.G
Interpret probabilities and parameters for a geometric distribution. [Skill 4.B]
Return to Table of Contents© 2020 College Board
Course Framework V.1 | 102AP Statistics Course and Exam Description

UNIT
4Probability, Random Variables, and Probability DistributionsQ
UIC
K R
EFE
RE
NC
E FO
R N
OTA
TIO
N A
ND
FO
RM
ULA
S F
OR
PR
OB
AB
ILIT
Y D
IST
RIB
UT
ION
S
Note
: Oth
er n
otat
ion
coul
d al
so b
e co
rrect
if p
rope
rly d
efine
d. In
corre
ct n
otat
ion
will
resu
lt in
lost
poi
nts
on th
e AP
exa
m.
Dis
trib
uti
onN
otes
Para
met
er(s
)R
ando
m
Var
iabl
eC
ondi
tion
sM
ean
for
Dis
trib
uti
onS
tan
dard
Dev
iati
on
for
Dis
trib
uti
on
Prob
abilit
y di
strib
utio
n fo
r a
rand
om v
aria
ble
§Re
pres
ent d
iscr
ete
rand
om v
aria
bles
usi
ng
frequ
ency
/ rel
ativ
e fre
quen
cy ta
bles
or
hist
ogra
ms
§Re
pres
ent c
ontin
uous
ra
ndom
var
iabl
es w
ith
dens
ity fu
nctio
ns.
xμ ,
x
X
§Al
l pro
babi
litie
s m
ust b
e be
twee
n 0
and
1.
§Pr
obab
ilitie
s
= 1.
()
Xi
ix
Px
μ=
⋅
“e
xpec
ted
valu
e”(
)(
)2
Xi
Xi
xP
xσ
μ=
−⋅
Sum
or d
iffer
ence
of
inde
pend
ent
rand
om v
aria
bles
See
Unit
5 fo
r dis
tribu
tions
of
othe
r lin
ear t
rans
form
atio
ns
of ra
ndom
var
iabl
es.
µ X , σ
X , µ
Y , σ
YX
Y+
or
XY−
To
cal
cula
te th
e va
rianc
e or
sta
ndar
d de
viat
ion
of th
e di
ffere
nce,
the
rand
om v
aria
bles
mus
t be
inde
pend
ent.
XY
XY
μμ
μ+
=+
or
X
YX
Yμ
μμ
−=
− Va
rianc
e,
22
2σ
σσ
+
=+
XY
XY
Va
rianc
e,
22
2σ
σσ
−
=+
XY
XY
Bino
mia
l pr
obab
ility
dist
ribut
ion
Bino
mia
l pro
babi
lity
func
tion:
()
()
(1)
nx
nx
xPX
xp
p−
==
−
0,1,
2,3,
...,
xn
= .
n an
d p
X
§n
is p
rede
term
ined
.
§Bi
nary
§In
depe
nden
t
§p
is th
e sa
me
for
each
tria
l.
xnp
μ=
(
)1
Xnp
pσ
=−
Geo
met
ric
prob
abilit
y di
strib
utio
n
Geo
met
ric
prob
abilit
y fo
rmul
a: 1
()
(1)
,x
PX
xp
p−
==
−
1,2,
3,...
x=
.
p
X
§n
is n
ot
pred
eter
min
ed.
§Bi
nary
§In
depe
nden
t §p
is th
e sa
me
for
each
repe
titio
n (ra
ndom
).
1 pμ
=
expe
cted
num
ber
of tr
ials
to g
et th
e fir
st s
ucce
ss
1p
pσ
−=
Return to Table of Contents© 2020 College Board
Course Framework V.1 | 103AP Statistics Course and Exam Description

THIS PAGE IS INTENTIONALLY LEFT BLANK.

AP STATISTICS
UNIT
Sampling Distributions
5
7–12%
AP EXAM WEIGHTING
~10–12CLASS PERIODS
105Return to Table of Contents
© 2020 College Board
Course Framework V.1 | 105AP Statistics Course and Exam Description

Remember to go to AP Classroom to assign students the online Personal Progress Check for this unit.
Whether assigned as homework or completed in class, the Personal Progress Check provides each student with immediate feedback related to this unit’s topics and skills.
Personal Progress Check 5Multiple-choice: ~35 questions Free-response: 2 questions
§ Probability and Sampling Distributions
§ Investigative Task
Return to Table of Contents© 2020 College Board
Course Framework V.1 | 106AP Statistics Course and Exam Description

7–12% AP EXAM WEIGHTING
Building Course Skills3.B 3.C 4.B
The probabilities associated with the normal distribution are what statisticians use to justify claims about populations they’ll never be able to measure directly. Revisiting these properties early in Unit 5 will reinforce why sampling distributions allow statisticians to approximate parameters for the population of interest. Sketching, shading, and labeling a normal distribution aids in understanding the probability being calculated. Students should practice creating graphical representations, labeling the mean, and marking off values 1, 2, and 3 standard deviations from the mean.
Students often struggle to interpret parameters of probability distributions in context, simply describing features of the graph rather than explicitly connecting those features to the situation described in the problem. Teachers can remind students that context is about a variable (“tip amounts,” for example), not just the units (dollars). It’s also critical that students explicitly show that the appropriate conditions have been verified, and that they avoid using nonspecific language
like “it” in their interpretations. Using an error analysis strategy with sample responses can help familiarize students with these issues before they make similar mistakes.
Preparing for the AP ExamResponses on the AP Exam often uncover gaps in understanding of sampling distributions. Students must clearly communicate whether they are talking about the distribution of a population, a sample of values (heights, for example), or a sample statistic from repeated samples (mean heights, for example). Broad generalizations, such as “larger samples have less variability,” leave the exam reader unsure of whether the student is referring to variability within a sample (for which the statement would be false) or a sampling distribution. The word “it” often introduces ambiguity to a response. Students frequently show confusion about what condition to check when asserting that the sampling distribution of a given statistic is approximately normal. Students should support normal probability calculations with a sketch or a calculation of a standardized score (z-score), rather than relying on calculator syntax.
BIG IDEA 1Variation and Distribution VAR
§ How likely is it to get a value this large just by chance?
BIG IDEA 2Patterns and Uncertainty UNC
§ How can we anticipate patterns in the values of a statistic from one sample to another?
UNIT
5
Developing UnderstandingThis unit applies probabilistic reasoning to sampling, introducing students to sampling distributions of statistics they will use when performing inference in Units 6 and 7. Students should understand that sample statistics can be used to estimate corresponding population parameters and that measures of center (mean) and variability (standard deviation) for these sampling distributions can be determined directly from the population parameters when certain sampling criteria are met. For large enough samples from any population, these sampling distributions can be approximated by a normal distribution. Simulating sampling distributions helps students to understand how the values of statistics vary in repeated random sampling from populations with known parameters.
~10–12 CLASS PERIODS
Sampling Distributions
Return to Table of Contents© 2020 College Board
Course Framework V.1 | 107AP Statistics Course and Exam Description

Sampling DistributionsUNIT
5
UNIT AT A GLANCE
Endu
ring
Unde
rsta
ndin
g
Topic Skills
Class Periods
~10–12 CLASS PERIODS
VA
R-1 5.1 Introducing Statistics:
Why Is My Sample Not Like Yours?
1.A Identify the question to be answered or problem to be solved (not assessed).
VA
R-6
5.2 The Normal Distribution, Revisited
3.A Determine relative frequencies, proportions, or probabilities using simulation or calculations.
3.C Describe probability distributions.
UN
C-3
5.3 The Central Limit Theorem 3.C Describe probability distributions.
5.4 Biased and Unbiased Point Estimates
4.B Interpret statistical calculations and findings to assign meaning or assess a claim.
3.B Determine parameters for probability distributions.
5.5 Sampling Distributions for Sample Proportions
3.B Determine parameters for probability distributions.
3.C Describe probability distributions.
4.B Interpret statistical calculations and findings to assign meaning or assess a claim.
5.6 Sampling Distributions for Differences in Sample Proportions
3.B Determine parameters for probability distributions.
3.C Describe probability distributions.
4.B Interpret statistical calculations and findings to assign meaning or assess a claim.
5.7 Sampling Distributions for Sample Means
3.B Determine parameters for probability distributions.
3.C Describe probability distributions.
4.B Interpret statistical calculations and findings to assign meaning or assess a claim.
5.8 Sampling Distributions for Differences in Sample Means
3.B Determine parameters for probability distributions.
3.C Describe probability distributions.
4.B Interpret statistical calculations and findings to assign meaning or assess a claim.
Go to AP Classroom to assign the Personal Progress Check for Unit 5. Review the results in class to identify and address any student misunderstandings.
Return to Table of Contents© 2020 College Board
Course Framework V.1 | 108AP Statistics Course and Exam Description

Sampling DistributionsUNIT
5
SAMPLE INSTRUCTIONAL ACTIVITIESThe sample activities on this page are optional and are offered to provide possible ways to incorporate various instructional approaches into the classroom. They were developed in partnership with teachers from the AP community to share ways that they approach teaching some of the topics in this unit. Please refer to the Instructional Approaches section beginning on p. 207 for more examples of activities and strategies.
Activity Topic Sample Activity
1 5.2 Think AloudGroup students into pairs within a larger group of four. Have each student individually read 2014 FRQ 3 and think aloud with their partner, brainstorming ways to begin each part of the question. Each student then independently completes all parts. Have the pairs compare answers within their groups, improving their individual responses as necessary. Groups can then compare their responses with other groups. Finally, have students score their responses according to the rubric.
2 5.3 Use ManipulativesFrom a large container of pennies, have each student take two random samples of size 5, two of size 10, and two of size 25, and record the dates on those pennies. Have students calculate the mean of the dates in each sample and then construct four “dotplots” on the floor: one using the pennies, one using nickels placed at the mean of the student’s sample size 5, one using dimes placed at the mean of the sample size 10, and one using quarters placed at the mean of the sample size 25.
3 5.55.7
Password-Style GamesHave partners sit facing opposite sides of the room. Display vocabulary terms from the unit on the classroom screen. Have the students facing the screen describe the terms to their partner who then tries to guess the terms described. After half of the terms have been used, have students switch roles. Terms to include: parameter, statistic, sampling distribution, distribution of sample data, sample distribution, unbiased estimator, sampling variability of a statistic, bias, sample proportion, sample mean, pμ , pσ , xμ , xσ , and central limit theorem.
Return to Table of Contents© 2020 College Board
Course Framework V.1 | 109AP Statistics Course and Exam Description

Sampling DistributionsUNIT
5
Required Course Content
TOPIC 5.1
Introducing Statistics: Why Is My Sample Not Like Yours?
SKILL
Selecting Statistical Methods
1.A
Identify the question to be answered or problem to be solved.
ENDURING UNDERSTANDINGVAR-1
Given that variation may be random or not, conclusions are uncertain.
LEARNING OBJECTIVEVAR-1.G
Identify questions suggested by variation in statistics for samples collected from the same population. [Skill 1.A]
ESSENTIAL KNOWLEDGEVAR-1.G.1
Variation in statistics for samples taken from the same population may be random or not.
Return to Table of Contents© 2020 College Board
Course Framework V.1 | 110AP Statistics Course and Exam Description

Sampling DistributionsUNIT
5
Required Course Content ILLUSTRATIVE EXAMPLEContinuous random variable:If one looks at a clock at a random time, the probability that the minute hand is between the 3 and the 6 is one fourth.
TOPIC 5.2
The Normal Distribution, Revisited
SKILLS
Using Probability and Simulation
3.A
Determine relative frequencies, proportions, or probabilities using simulation or calculations.3.C
Describe probability distributions.
ESSENTIAL KNOWLEDGEVAR-6.A.1
A continuous random variable is a variable that can take on any value within a specified domain. Every interval within the domain has a probability associated with it.VAR-6.A.2
A continuous random variable with a normal distribution is commonly used to describe populations. The distribution of a normal random variable can be described by a normal, or “bell-shaped,” curve.VAR-6.A.3
The area under a normal curve over a given interval represents the probability that a particular value lies in that interval.
VAR-6.B.1
The boundaries of an interval associated with a given area in a normal distribution can be determined using z-scores or technology, such as a calculator, a standard normal table, or computer-generated output.
LEARNING OBJECTIVEVAR-6.A
Calculate the probability that a particular value lies in a given interval of a normal distribution. [Skill 3.A]
ENDURING UNDERSTANDINGVAR-6
The normal distribution may be used to model variation.
VAR-6.B
Determine the interval associated with a given area in a normal distribution. [Skill 3.A]
continued on next page
Return to Table of Contents© 2020 College Board
Course Framework V.1 | 111AP Statistics Course and Exam Description

Sampling DistributionsUNIT
5
ESSENTIAL KNOWLEDGEVAR-6.B.2
Intervals associated with a given area in a normal distribution can be determined by assigning appropriate inequalities to the boundaries of the intervals:
a. ( )100apP X x< = means that the lowest %p
of values lie to the left of ax .b. ( )
100a b
pP x X x< < = means that %p of
values lie between ax and bx .c. ( )
100b
pP X x> = means that the highest %p
of values lie to the right of bx .d. To determine the most extreme %p
of values requires dividing the area associated with %p into two equal areas on either extreme of the distribution:
1( )2 100a
pP X x< = and 1( )2 100b
pP X x> = means that half of the %p most extreme values lie to the left of ax and half of the %p most extreme values lie to the right of bx .
xa xb
VAR-6.C
Determine the appropriateness of using the normal distribution to approximate probabilities for unknown distributions. [Skill 3.C]
VAR-6.C.1
Normal distributions are symmetrical and “bell-shaped.” As a result, normal distributions can be used to approximate distributions with similar characteristics.
LEARNING OBJECTIVEVAR-6.B
Determine the interval associated with a given area in a normal distribution. [Skill 3.A]
Return to Table of Contents© 2020 College Board
Course Framework V.1 | 112AP Statistics Course and Exam Description

Sampling DistributionsUNIT
5
Required Course Content
SKILL
Using Probability and Simulation
3.C
Describe probability distributions.
TOPIC 5.3
The Central Limit Theorem
ENDURING UNDERSTANDINGUNC-3
Probabilistic reasoning allows us to anticipate patterns in data.
LEARNING OBJECTIVEUNC-3.H
Estimate sampling distributions using simulation. [Skill 3.C]
ESSENTIAL KNOWLEDGEUNC-3.H.1
A sampling distribution of a statistic is the distribution of values for the statistic for all possible samples of a given size from a given population.UNC-3.H.2
The central limit theorem (CLT) states that when the sample size is sufficiently large, a sampling distribution of the mean of a random variable will be approximately normally distributed.UNC-3.H.3
The central limit theorem requires that the sample values are independent of each other and that n is sufficiently large.UNC-3.H.4
A randomization distribution is a collection of statistics generated by simulation assuming known values for the parameters. For a randomized experiment, this means repeatedly randomly reallocating/reassigning the response values to treatment groups.UNC-3.H.5
The sampling distribution of a statistic can be simulated by generating repeated random samples from a population.
Return to Table of Contents© 2020 College Board
Course Framework V.1 | 113AP Statistics Course and Exam Description

Sampling DistributionsUNIT
5
Required Course Content
SKILLS
Statistical Argumentation
4.B
Interpret statistical calculations and findings to assign meaning or assess a claim.
Using Probability and Simulation
3.B
Determine parameters for probability distributions.
TOPIC 5.4
Biased and Unbiased Point Estimates
ENDURING UNDERSTANDINGUNC-3
Probabilistic reasoning allows us to anticipate patterns in data.
LEARNING OBJECTIVEUNC-3.I
Explain why an estimator is or is not unbiased. [Skill 4.B]
ESSENTIAL KNOWLEDGEUNC-3.I.1
When estimating a population parameter, an estimator is unbiased if, on average, the value of the estimator is equal to the population parameter.
UNC-3.J
Calculate estimates for a population parameter. [Skill 3.B]
UNC-3.J.1
When estimating a population parameter, an estimator exhibits variability that can be modeled using probability.UNC-3.J.2
A sample statistic is a point estimator of the corresponding population parameter.
Return to Table of Contents© 2020 College Board
Course Framework V.1 | 114AP Statistics Course and Exam Description

Sampling DistributionsUNIT
5
Required Course Content
LEARNING OBJECTIVELOR-1.A
ESSENTIAL KNOWLEDGELOR-1.A.1
ENDURING UNDERSTANDINGLOR-1
SKILLS
Using Probability and Simulation
3.B
Determine parameters for probability distributions.3.C
Describe probability distributions.
Statistical Argumentation
4.B
Interpret statistical calculations and findings to assign meaning or assess a claim.
TOPIC 5.5
Sampling Distributions for Sample Proportions
AVAILABLE RESOURCES § Classroom Resources >
◆ Sampling Distributions
◆ Calculations Aren’t Enough! The Importance of Communication in AP Statistics
ENDURING UNDERSTANDINGUNC-3
Probabilistic reasoning allows us to anticipate patterns in data.
LEARNING OBJECTIVEUNC-3.K
Determine parameters of a sampling distribution for sample proportions. [Skill 3.B]
UNC-3.L
Determine whether a sampling distribution for a sample proportion can be described as approximately normal. [Skill 3.C]
UNC-3.M
Interpret probabilities and parameters for a sampling distribution for a sample proportion. [Skill 4.B]
ESSENTIAL KNOWLEDGEUNC-3.K.1
For independent samples (sampling with replacement) of a categorical variable from a population with population proportion, p, the sampling distribution of the sample proportion, p , has a mean, p pμ = and a standard deviation,
( )ˆ
1p
p pn
σ−
= .
UNC-3.K.2
If sampling without replacement, the standard deviation of the sample proportion is smaller than what is given by the formula above. If the sample size is less than 10% of the population size, the difference is negligible.
UNC-3.L.1
For a categorical variable, the sampling distribution of the sample proportion, p , will have an approximate normal distribution, provided the sample size is large enough:
10np ≥ and (1 ) 10n p− ≥
UNC-3.M.1
Probabilities and parameters for a sampling distribution for a sample proportion should be interpreted using appropriate units and within the context of a specific population.
Return to Table of Contents© 2020 College Board
Course Framework V.1 | 115AP Statistics Course and Exam Description
https://apcentral.collegeboard.org/pdf/statistics-sampling-distributions-sf.pdf?course=ap-statistics

Sampling DistributionsUNIT
5SKILLS
Using Probability and Simulation
3.B
Determine parameters for probability distributions.3.C
Describe probability distributions.
Statistical Argumentation
4.B
Interpret statistical calculations and findings to assign meaning or assess a claim.
AVAILABLE RESOURCES § Classroom Resource >
◆ Sampling Distributions
◆ Calculations Aren’t Enough! The Importance of Communication in AP Statistics
TOPIC 5.6
Sampling Distributions for Differences in Sample Proportions
Required Course Content
ENDURING UNDERSTANDINGUNC-3
Probabilistic reasoning allows us to anticipate patterns in data.
LEARNING OBJECTIVEUNC-3.N
Determine parameters of a sampling distribution for a difference in sample proportions. [Skill 3.B]
ESSENTIAL KNOWLEDGEUNC-3.N.1
For a categorical variable, when randomly sampling with replacement from two independent populations with population proportions 1p and 2p , the sampling distribution of the difference in sample proportions 1 2
ˆ ˆp p− has mean,
1 2ˆ ˆ 1 2p p p pμ − = − and standard
deviation, 1 2
1 1 2 2ˆ ˆ
1 2
(1 ) (1 )p p
p p p pn n
σ −
− −= + .
UNC-3.N.2
If sampling without replacement, the standard deviation of the difference in sample proportions is smaller than what is given by the formula above. If the sample sizes are less than 10% of the population sizes, the difference is negligible.
continued on next page
Return to Table of Contents© 2020 College Board
Course Framework V.1 | 116AP Statistics Course and Exam Description
https://apcentral.collegeboard.org/pdf/statistics-sampling-distributions-sf.pdf?course=ap-statistics
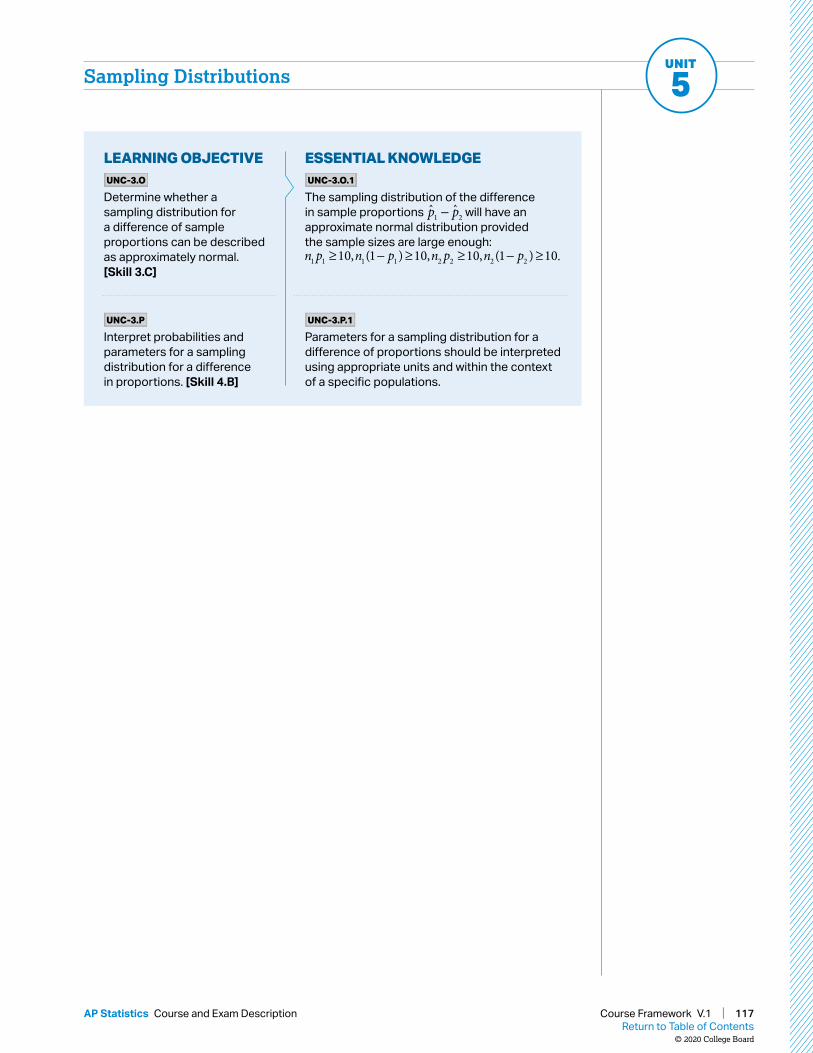
Sampling DistributionsUNIT
5
ESSENTIAL KNOWLEDGEUNC-3.O.1
The sampling distribution of the difference in sample proportions 1 2
ˆ ˆp p− will have an approximate normal distribution provided the sample sizes are large enough:
1 1 1 1 2 2 2 210, (1 ) 10, 10, (1 ) 10n p n p n p n p≥ − ≥ ≥ − ≥ .
UNC-3.P.1
Parameters for a sampling distribution for a difference of proportions should be interpreted using appropriate units and within the context of a specific populations.
LEARNING OBJECTIVEUNC-3.O
Determine whether a sampling distribution for a difference of sample proportions can be described as approximately normal. [Skill 3.C]
UNC-3.P
Interpret probabilities and parameters for a sampling distribution for a difference in proportions. [Skill 4.B]
Return to Table of Contents© 2020 College Board
Course Framework V.1 | 117AP Statistics Course and Exam Description
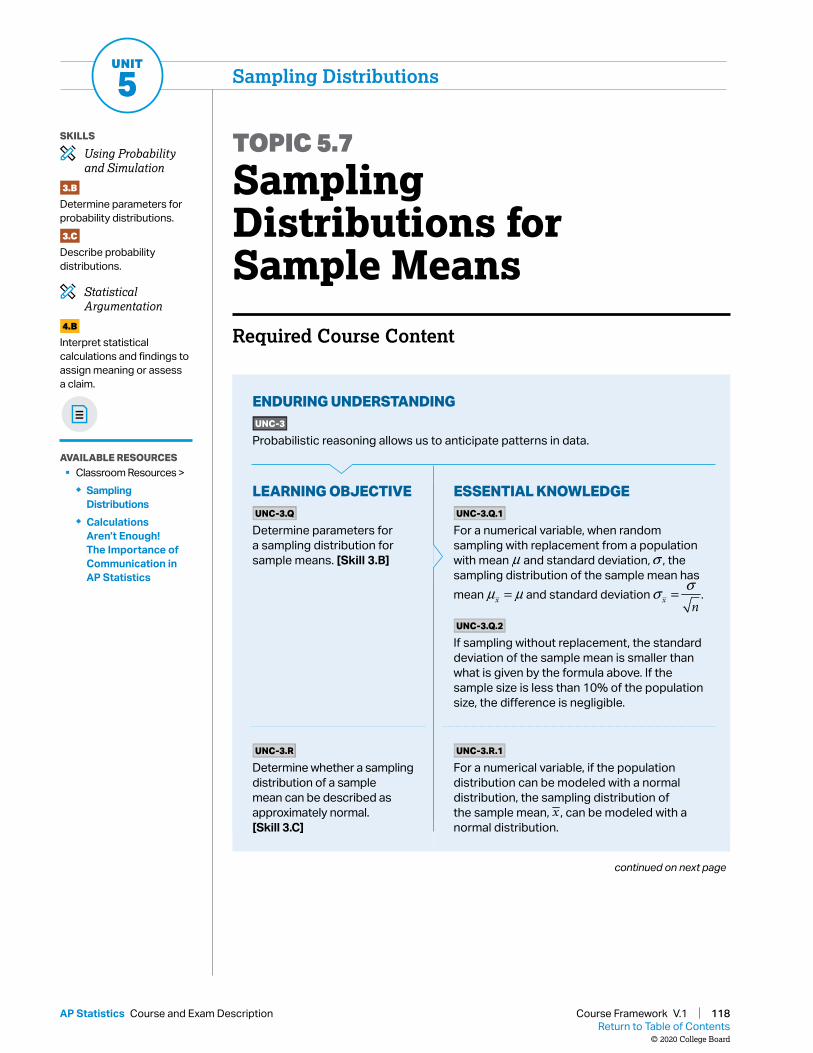
Sampling DistributionsUNIT
5
Required Course Content
LEARNING OBJECTIVELOR-1.A
ESSENTIAL KNOWLEDGELOR-1.A.1
ENDURING UNDERSTANDINGLOR-1
SKILLS
Using Probability and Simulation
3.B
Determine parameters for probability distributions.3.C
Describe probability distributions.
Statistical Argumentation
4.B
Interpret statistical calculations and findings to assign meaning or assess a claim.
AVAILABLE RESOURCES § Classroom Resources >
◆ Sampling Distributions
◆ Calculations Aren’t Enough! The Importance of Communication in AP Statistics
TOPIC 5.7
Sampling Distributions for Sample Means
continued on next page
ENDURING UNDERSTANDINGUNC-3
Probabilistic reasoning allows us to anticipate patterns in data.
LEARNING OBJECTIVEUNC-3.Q
Determine parameters for a sampling distribution for sample means. [Skill 3.B]
ESSENTIAL KNOWLEDGEUNC-3.Q.1
For a numerical variable, when random sampling with replacement from a population with mean μ and standard deviation, pσ , the sampling distribution of the sample mean has mean xμ μ= and standard deviation x n
σσ = .
UNC-3.Q.2
If sampling without replacement, the standard deviation of the sample mean is smaller than what is given by the formula above. If the sample size is less than 10% of the population size, the difference is negligible.
UNC-3.R
Determine whether a sampling distribution of a sample mean can be described as approximately normal. [Skill 3.C]
UNC-3.R.1
For a numerical variable, if the population distribution can be modeled with a normal distribution, the sampling distribution of the sample mean, x , can be modeled with a normal distribution.
Return to Table of Contents© 2020 College Board
Course Framework V.1 | 118AP Statistics Course and Exam Description
https://apcentral.collegeboard.org/pdf/statistics-sampling-distributions-sf.pdf?course=ap-statistics

Sampling DistributionsUNIT
5
UNC-3.S
Interpret probabilities and parameters for a sampling distribution for a sample mean. [Skill 4.B]
LEARNING OBJECTIVEUNC-3.R
Determine whether a sampling distribution of a sample mean can be described as approximately normal. [Skill 3.C]
ESSENTIAL KNOWLEDGEUNC-3.R.2
For a numerical variable, if the population distribution cannot be modeled with a normal distribution, the sampling distribution of the sample mean, x , can be modeled approximately by a normal distribution, provided the sample size is large enough, e.g., greater than or equal to 30.
UNC-3.S.1
Probabilities and parameters for a sampling distribution for a sample mean should be interpreted using appropriate units and within the context of a specific population.
Return to Table of Contents© 2020 College Board
Course Framework V.1 | 119AP Statistics Course and Exam Description

Sampling DistributionsUNIT
5SKILLS
Using Probability and Simulation
3.B
Determine parameters for probability distributions.3.C
Describe probability distributions.
Statistical Argumentation
4.B
Interpret statistical calculations and findings to assign meaning or assess a claim.
TOPIC 5.8
Sampling Distributions for Differences in Sample Means
Required Course Content
AVAILABLE RESOURCES § Classroom Resources >
◆ Sampling Distributions
◆ Calculations Aren’t Enough! The Importance of Communication in AP Statistics
ENDURING UNDERSTANDINGUNC-3
Probabilistic reasoning allows us to anticipate patterns in data.
LEARNING OBJECTIVEUNC-3.T
Determine parameters of a sampling distribution for a difference in sample means. [Skill 3.B]
ESSENTIAL KNOWLEDGEUNC-3.T.1
For a numerical variable, when randomly sampling with replacement from two independent populations with population means 1μ and 2μ and population standard deviations 1σ and 2σ , the sampling distribution of the difference in sample means 1 2x x− has mean ( )1 2
1 2x x−μ = μ − μ and standard deviation,
( )1 2
2 21 2
1 2x x n n
σ σσ−
= + .
UNC-3.T.2
If sampling without replacement, the standard deviation of the difference in sample means is smaller than what is given by the formula above. If the sample sizes are less than 10% of the population sizes, the difference is negligible.
continued on next page
Return to Table of Contents© 2020 College Board
Course Framework V.1 | 120AP Statistics Course and Exam Description
https://apcentral.collegeboard.org/pdf/statistics-sampling-distributions-sf.pdf?course=ap-statistics

Sampling DistributionsUNIT
5
ESSENTIAL KNOWLEDGEUNC-3.U.1
The sampling distribution of the difference in sample means 1 2x x− can be modeled with a normal distribution if the two population distributions can be modeled with a normal distribution.UNC-3.U.2
The sampling distribution of the difference in sample means 1 2x x− can be modeled approximately by a normal distribution if the two population distributions cannot be modeled with a normal distribution but both sample sizes are greater than or equal to 30.
UNC-3.V.1
Probabilities and parameters for a sampling distribution for a difference of sample means should be interpreted using appropriate units and within the context of a specific populations.
UNC-3.V
Interpret probabilities and parameters for a sampling distribution for a difference in sample means. [Skill 4.B]
LEARNING OBJECTIVEUNC-3.U
Determine whether a sampling distribution of a difference in sample means can be described as approximately normal. [Skill 3.C]
Return to Table of Contents© 2020 College Board
Course Framework V.1 | 121AP Statistics Course and Exam Description

Sampling DistributionsUNIT
5Q
UIC
K R
EFE
RE
NC
E FO
R N
OTA
TIO
N A
ND
FO
RM
ULA
S F
OR
SA
MP
LIN
G D
IST
RIB
UT
ION
S
Note
: Oth
er n
otat
ion
coul
d al
so b
e co
rrect
if p
rope
rly d
efine
d. In
corre
ct n
otat
ion
will
resu
lt in
lost
poi
nts
on th
e AP
exa
m.
Dis
trib
uti
onN
otes
Para
met
er(s
)S
tati
stic
Con
diti
ons
Mea
n fo
r D
istr
ibu
tion
Sta
nda
rd D
evia
tion
fo
r D
istr
ibu
tion
Norm
al d
istri
butio
nA
cont
inuo
us
rand
om p
roba
bilit
y di
strib
utio
n
μ an
d p
σ
μ
pσ
Sam
plin
g di
strib
utio
n fo
r a
sam
ple
prop
ortio
n
Com
pare
to th
e m
ean
and
stan
dard
de
viat
ion
of a
bi
nom
ial r
ando
m
varia
ble,
X
p
§Si
mpl
e ra
ndom
sam
ple
(Ran
dom
) §
Norm
al o
r 10
np≥
and
(1)
10n
p−
≥ , (L
arge
cou
nts)
§F o
r sta
ndar
d de
viat
ions
: po
pula
tion
10n
(1
0% ru
le)
ˆ(1
)p
pp
nσ
−=
Sam
plin
g di
strib
utio
n fo
r a
diffe
renc
e in
sa
mpl
e pr
opor
tions
12
pp
−
§Si
mpl
e ra
ndom
sam
ples
(R
ando
m)
§La
rge
coun
ts §
10%
rule
12
ˆˆ
12
()
pp
pp
μ−
=−
1
2
11
22
ˆˆ
12
(1)
(1)
pp
pp
pp
nn
σ−
−−
=+
Sam
plin
g di
strib
utio
n fo
r the
sa
mpl
e m
ean
μ
§SR
S (R
ando
m)
§No
rmal
or s
ampl
e si
ze ≥
30 §
10%
rule
xμμ
=
xnσ
σ=
Sam
plin
g di
strib
utio
n fo
r th
e di
ffere
nce
in
sam
ple
mea
ns
12
μμ
−
§SR
S (R
ando
m)
§No
rmal
or s
ampl
e si
zes
≥30
§10
% ru
le
()
12
12
xx
μμ
μ−
=−
(
)1
2
22
12
12
xx
nn
σσ
σ−
=+
Stan
dard
dev
iatio
np
σ
sp
pp
μ=
12
pp
−
x
12
xx
−
Return to Table of Contents© 2020 College Board
Course Framework V.1 | 122AP Statistics Course and Exam Description

AP STATISTICS
UNIT
Inference for Categorical Data: Proportions
12–15%
AP EXAM WEIGHTING
~16–18CLASS PERIODS
6
123Return to Table of Contents
© 2020 College Board
Course Framework V.1 | 123AP Statistics Course and Exam Description

Remember to go to AP Classroom to assign students the online Personal Progress Check for this unit.
Whether assigned as homework or completed in class, the Personal Progress Check provides each student with immediate feedback related to this unit’s topics and skills.
Personal Progress Check 6Multiple-choice: ~55 questions Free-response: 2 questions
§ Inference § Investigative Task
Return to Table of Contents© 2020 College Board
Course Framework V.1 | 124AP Statistics Course and Exam Description
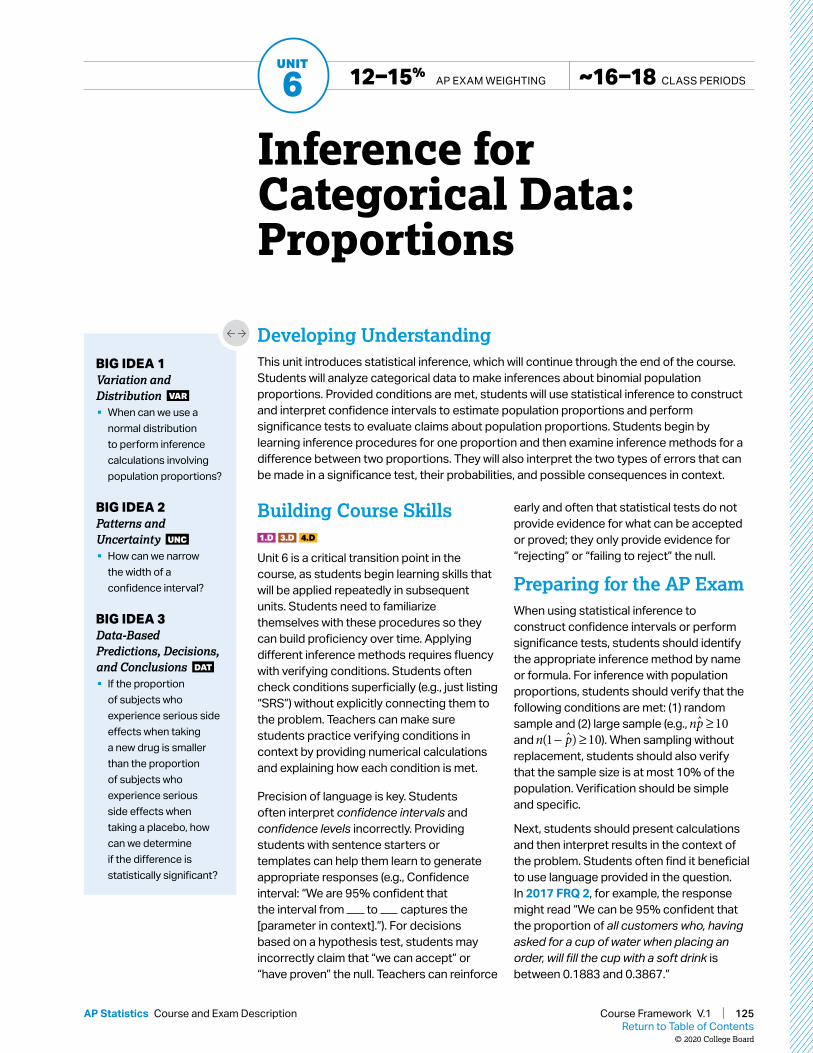
Inference for Categorical Data: Proportions
12–15% AP EXAM WEIGHTINGUNIT
6 ~16–18 CLASS PERIODS
Developing UnderstandingThis unit introduces statistical inference, which will continue through the end of the course. Students will analyze categorical data to make inferences about binomial population proportions. Provided conditions are met, students will use statistical inference to construct and interpret confidence intervals to estimate population proportions and perform significance tests to evaluate claims about population proportions. Students begin by learning inference procedures for one proportion and then examine inference methods for a difference between two proportions. They will also interpret the two types of errors that can be made in a significance test, their probabilities, and possible consequences in context.
BIG IDEA 1Variation and Distribution VAR
§ When can we use a normal distribution to perform inference calculations involving population proportions?
BIG IDEA 2Patterns and Uncertainty UNC
§ How can we narrow the width of a confidence interval?
BIG IDEA 3Data-Based Predictions, Decisions, and Conclusions DAT
§ If the proportion of subjects who experience serious side effects when taking a new drug is smaller than the proportion of subjects who experience serious side effects when taking a placebo, how can we determine if the difference is statistically significant?
Building Course Skills1.D 3.D 4.D
Unit 6 is a critical transition point in the course, as students begin learning skills that will be applied repeatedly in subsequent units. Students need to familiarize themselves with these procedures so they can build proficiency over time. Applying different inference methods requires fluency with verifying conditions. Students often check conditions superficially (e.g., just listing “SRS”) without explicitly connecting them to the problem. Teachers can make sure students practice verifying conditions in context by providing numerical calculations and explaining how each condition is met.
Precision of language is key. Students often interpret confidence intervals and confidence levels incorrectly. Providing students with sentence starters or templates can help them learn to generate appropriate responses (e.g., Confidence interval: “We are 95% confident that the interval from to captures the [parameter in context].”). For decisions based on a hypothesis test, students may incorrectly claim that “we can accept” or “have proven” the null. Teachers can reinforce
early and often that statistical tests do not provide evidence for what can be accepted or proved; they only provide evidence for “rejecting” or “failing to reject” the null.
Preparing for the AP ExamWhen using statistical inference to construct confidence intervals or perform significance tests, students should identify the appropriate inference method by name or formula. For inference with population proportions, students should verify that the following conditions are met: (1) random sample and (2) large sample (e.g., ˆ 10np ≥ and ˆ(1 ) 10n p− ≥ ). When sampling without replacement, students should also verify that the sample size is at most 10% of the population. Verification should be simple and specific.
Next, students should present calculations and then interpret results in the context of the problem. Students often find it beneficial to use language provided in the question. In 2017 FRQ 2, for example, the response might read “We can be 95% confident that the proportion of all customers who, having asked for a cup of water when placing an order, will fill the cup with a soft drink is between 0.1883 and 0.3867.”
Return to Table of Contents© 2020 College Board
Course Framework V.1 | 125AP Statistics Course and Exam Description

Inference for Categorical Data: ProportionsUNIT
6
UNIT AT A GLANCE
Endu
ring
Unde
rsta
ndin
g
Topic Skills
Class Periods
~16–18 CLASS PERIODS
VA
R-1 6.1 Introducing Statistics:
Why Be Normal?1.A Identify the question to be answered or problem to be solved (not assessed).
UN
C-4
6.2 Constructing a Confidence Interval for a Population Proportion
1.D Identify an appropriate inference method for confidence intervals.
4.C Verify that inference procedures apply in a given situation.
3.D Construct a confidence interval, provided conditions for inference are met.
6.3 Justifying a Claim Based on a Confidence Interval for a Population Proportion
4.B Interpret statistical calculations and findings to assign meaning or assess a claim.
4.D Justify a claim based on a confidence interval.
4.A Make an appropriate claim or draw an appropriate conclusion.
VA
R-6
6.4 Setting Up a Test for a Population Proportion
1.F Identify null and alternative hypotheses.
1.E Identify an appropriate inference method for significance tests.
4.C Verify that inference procedures apply in a given situation.
VA
R-6
, D
AT-
3
6.5 Interpreting p -Values 3.E Calculate a test statistic and find a p-value, provided conditions for inference are met.
4.B Interpret statistical calculations and findings to assign meaning or assess a claim.
DA
T-3 6.6 Concluding a Test for a
Population Proportion4.E Justify a claim using a decision based on significance tests.
continued on next page
Return to Table of Contents© 2020 College Board
Course Framework V.1 | 126AP Statistics Course and Exam Description

Inference for Categorical Data: ProportionsUNIT
6En
durin
g Un
ders
tand
ing
Topic Skills
Class Periods
~16–18 CLASS PERIODS
UN
C-5
6.7 Potential Errors When Performing Tests
1.B Identify key and relevant information to answer a question or solve a problem.
3.A Determine relative frequencies, proportions, or probabilities using simulation or calculations.
4.A Make an appropriate claim or draw an appropriate conclusion.
4.B Interpret statistical calculations and findings to assign meaning or assess a claim.
UN
C-4
6.8 Confidence Intervals for the Difference of Two Proportions
1.D Identify an appropriate inference method for confidence intervals.
4.C Verify that inference procedures apply in a given situation.
3.D Construct a confidence interval, provided conditions for inference are met.
6.9 Justifying a Claim Based on a Confidence Interval for a Difference of Population Proportions
4.B Interpret statistical calculations and findings to assign meaning or assess a claim.
4.D Justify a claim based on a confidence interval.
VA
R-6
6.10 Setting Up a Test for the Difference of Two Population Proportions
1.F Identify null and alternative hypotheses.
1.E Identify an appropriate inference method for significance tests.
4.C Verify that inference procedures apply in a given situation.
VA
R-6
, DA
T-3
6.11 Carrying Out a Test for the Difference of Two Population Proportions
3.E Calculate a test statistic and find a p-value, provided conditions for inference are met.
4.B Interpret statistical calculations and findings to assign meaning or assess a claim.
4.E Justify a claim using a decision based on significance tests.
Go to AP Classroom to assign the Personal Progress Check for Unit 6. Review the results in class to identify and address any student misunderstandings.
UNIT AT A GLANCE (cont’d)
Return to Table of Contents© 2020 College Board
Course Framework V.1 | 127AP Statistics Course and Exam Description

Inference for Categorical Data: ProportionsUNIT
6
SAMPLE INSTRUCTIONAL ACTIVITIESThe sample activities on this page are optional and are offered to provide possible ways to incorporate various instructional approaches into the classroom. They were developed in partnership with teachers from the AP community to share ways that they approach teaching some of the topics in this unit. Please refer to the Instructional Approaches section beginning on p. 207 for more examples of activities and strategies.
Activity Topic Sample Activity
1 6.46.76.8
Error AnalysisGive student pairs a worksheet with 20 sets of hypotheses (including hypotheses for a population proportion and for the difference of two proportions), each with a common student mistake. Have students circle the incorrect part, write why the circled component is incorrect, and then write the correct hypotheses. Include errors such as using statistics instead of parameters, and interchanging the = and > in the two hypotheses.
2 6.56.6
6.11
Sentence StartersFor a given question, provide students with a set of hypotheses, p-value, significance level, and context. Have them compare the p-value to the significance level to determine whether or not to reject the null hypothesis. Using a given sentence starter with blanks to fill in, have students write a sentence in context explaining if they have enough evidence to “reject 0H ”, or if they will “fail to reject 0H .” Make sure students avoid the common mistake of implying that evidence supports an “accept 0H ” conclusion or a “reject aH ” conclusion.
3 6.26.8
The Scribe and the CalculatorHave students work with a partner to construct and interpret a confidence interval for a population proportion. Only one partner is allowed to use the calculator, and only the other partner is allowed to write. When a calculation needs to be made, the scribe can only describe to the calculator operator which buttons to push; when writing needs to be done, the calculator operator can only describe to the scribe what needs to be written. Have students switch roles when constructing and interpreting a confidence interval for the difference of two population proportions.
Return to Table of Contents© 2020 College Board
Course Framework V.1 | 128AP Statistics Course and Exam Description

Inference for Categorical Data: ProportionsUNIT
6
Required Course Content
TOPIC 6.1
Introducing Statistics: Why Be Normal?
SKILL
Selecting Statistical Methods
1.A
Identify the question to be answered or problem to be solved.
ENDURING UNDERSTANDINGVAR-1
Given that variation may be random or not, conclusions are uncertain.
LEARNING OBJECTIVEVAR-1.H
Identify questions suggested by variation in the shapes of distributions of samples taken from the same population. [Skill 1.A]
ESSENTIAL KNOWLEDGEVAR-1.H.1
Variation in shapes of data distributions may be random or not.
Return to Table of Contents© 2020 College Board
Course Framework V.1 | 129AP Statistics Course and Exam Description

Inference for Categorical Data: ProportionsUNIT
6
TOPIC 6.2
Constructing a Confidence Interval for a Population Proportion
SKILLS
Selecting Statistical Methods
1.D
Identify an appropriate inference method for confidence intervals.
Statistical Argumentation
4.C
Verify that inference procedures apply in a given situation.
Using Probability and Simulation
3.D
Construct a confidence interval, provided conditions for inference are met.
Required Course Content
ESSENTIAL KNOWLEDGEUNC-4.A.1
The appropriate confidence interval procedure for a one-sample proportion for one categorical variable is a one sample z-interval for a proportion.
LEARNING OBJECTIVEUNC-4.A
Identify an appropriate confidence interval procedure for a population proportion. [Skill 1.D]
ENDURING UNDERSTANDINGUNC-4
An interval of values should be used to estimate parameters, in order to account for uncertainty.
UNC-4.B
Verify the conditions for calculating confidence intervals for a population proportion. [Skill 4.C]
UNC-4.B.1
In order to make assumptions necessary for inference on population proportions, means, and slopes, we must check for independence in data collection methods and for selection of the appropriate sampling distribution.
continued on next page
Return to Table of Contents© 2020 College Board
Course Framework V.1 | 130AP Statistics Course and Exam Description

Inference for Categorical Data: ProportionsUNIT
6
continued on next page
LEARNING OBJECTIVEUNC-4.B
Verify the conditions for calculating confidence intervals for a population proportion. [Skill 4.C]
ESSENTIAL KNOWLEDGEUNC-4.B.2
In order to calculate a confidence interval to estimate a population proportion, p, we must check for independence and that the sampling distribution is approximately normal.a. To check for independence:
i. Data should be collected using a random sample or a randomized experiment.
ii. When sampling without replacement, check that 10%n N≤ , where N is the size of the population.
b. To check that the sampling distribution of p is approximately normal (shape):i. For categorical variables, check that both
the number of successes, ˆnp , and the number of failures, ˆ(1 )n p− are at least 10 so that the sample size is large enough to support an assumption of normality.
UNC-4.C
Determine the margin of error for a given sample size and an estimate for the sample size that will result in a given margin of error for a population proportion. [Skill 3.D]
UNC-4.C.1
Based on sample data, the standard error of a statistic is an estimate for the standard deviation for the statistic. The standard error
of p is ˆ
ˆ ˆ(1 )p
p pSEn−= .
UNC-4.C.2
A margin of error gives how much a value of a sample statistic is likely to vary from the value of the corresponding population parameter.UNC-4.C.3
For categorical variables, the margin of error is the critical value ( *z ) times the standard error (SE) of the relevant statistic, which equals
* ˆ ˆ(1 )p pzn− for a one sample proportion.
UNC-4.C.4
The formula for margin of error can be rearranged to solve for n, the minimum sample size needed to achieve a given margin of error. For this purpose, use a guess for p or use ˆ 0.5p = in order to find an upper bound for the sample size that will result in a given margin of error.
Return to Table of Contents© 2020 College Board
Course Framework V.1 | 131AP Statistics Course and Exam Description

Inference for Categorical Data: ProportionsUNIT
6
LEARNING OBJECTIVEUNC-4.D
Calculate an appropriate confidence interval for a population proportion. [Skill 3.D]
ESSENTIAL KNOWLEDGEUNC-4.D.1
In general, an interval estimate can be constructed as point estimate ± (margin of error). For a one-sample proportion, the
interval estimate is * ˆ ˆ(1 )ˆ p pp zn−± .
CLARIFYING STATEMENT:
Formulas for interval estimates do not appear explicitly on the AP Statistics Formula Sheet provided with the AP Statistics Exam. However, these formulas do not need to be memorized, as they can be constructed based on the general test statistic formula and the relevant standard error formulas that are provided on the formula sheet.
UNC-4.D.2
Critical values represent the boundaries encompassing the middle C% of the standard normal distribution, where C% is an approximate confidence level for a proportion.
UNC-4.E
Calculate an interval estimate based on a confidence interval for a population proportion. [Skill 3.D]
UNC-4.E.1
Confidence intervals for population proportions can be used to calculate interval estimates with specified units.
Return to Table of Contents© 2020 College Board
Course Framework V.1 | 132AP Statistics Course and Exam Description

Inference for Categorical Data: ProportionsUNIT
6
TOPIC 6.3
Justifying a Claim Based on a Confidence Interval for a Population Proportion
SKILLS
Statistical Argumentation
4.B
Interpret statistical calculations and findings to assign meaning or assess a claim.4.D
Justify a claim based on a confidence interval.4.A
Make an appropriate claim or draw an appropriate conclusion.
AVAILABLE RESOURCE § Classroom Resource >
Calculations Aren’t Enough! The Importance of Communication in AP Statistics
ILLUSTRATIVE EXAMPLEUNC-4.F.4:For interpreting a 99% confidence interval of (0.268, 0.292), based on the proportion of a nationally representative sample of twelfth-grade students who answered a particular multiple choice question correctly: “We are 99 percent confident that the interval from 0.268 to 0.292 contains the population proportion of all United States twelfth-grade students who would answer this question correctly” (2011 FRQ 6(a)).
Required Course Content
ENDURING UNDERSTANDINGUNC-4
An interval of values should be used to estimate parameters, in order to account for uncertainty.
LEARNING OBJECTIVEUNC-4.F
Interpret a confidence interval for a population proportion. [Skill 4.B]
ESSENTIAL KNOWLEDGEUNC-4.F.1
A confidence interval for a population proportion either contains the population proportion or it does not, because each interval is based on random sample data, which varies from sample to sample.UNC-4.F.2
We are C% confident that the confidence interval for a population proportion captures the population proportion.UNC-4.F.3
In repeated random sampling with the same sample size, approximately C% of confidence intervals created will capture the population proportion.UNC-4.F.4
Interpreting a confidence interval for a one-sample proportion should include a reference to the sample taken and details about the population it represents.
continued on next page
Return to Table of Contents© 2020 College Board
Course Framework V.1 | 133AP Statistics Course and Exam Description

Inference for Categorical Data: ProportionsUNIT
6
LEARNING OBJECTIVEUNC-4.G
Justify a claim based on a confidence interval for a population proportion. [Skill 4.D]
ESSENTIAL KNOWLEDGEUNC-4.G.1
A confidence interval for a population proportion provides an interval of values that may provide sufficient evidence to support a particular claim in context.
UNC-4.H
Identify the relationships between sample size, width of a confidence interval, confidence level, and margin of error for a population proportion. [Skill 4.A]
UNC-4.H.1
When all other things remain the same, the width of the confidence interval for a population proportion tends to decrease as the sample size increases. For a population proportion, the width of the interval is proportional to 1
n .
UNC-4.H.2
For a given sample, the width of the confidence interval for a population proportion increases as the confidence level increases.UNC-4.H.3
The width of a confidence interval for a population proportion is exactly twice the margin of error.
Return to Table of Contents© 2020 College Board
Course Framework V.1 | 134AP Statistics Course and Exam Description

Inference for Categorical Data: ProportionsUNIT
6
Required Course Content
TOPIC 6.4
Setting Up a Test for a Population Proportion
SKILLS
Selecting Statistical Methods
1.F
Identify null and alternative hypotheses.
1.E
Identify an appropriate inference method for significance tests.
Statistical Argumentation
4.C
Verify that inference procedures apply in a given situation.
AVAILABLE RESOURCES § Classroom Resources >
◆ Inference ◆ Coke® Versus Pepsi®:
An Introductory Activity for Test of Significance
ENDURING UNDERSTANDINGVAR-6
The normal distribution may be used to model variation.
LEARNING OBJECTIVEVAR-6.D
Identify the null and alternative hypotheses for a population proportion. [Skill 1.F]
ESSENTIAL KNOWLEDGEVAR-6.D.1
The null hypothesis is the situation that is assumed to be correct unless evidence suggests otherwise, and the alternative hypothesis is the situation for which evidence is being collected.VAR-6.D.2
For hypotheses about parameters, the null hypothesis contains an equality reference (=, ≥, or ≤), while the alternative hypothesis contains a strict inequality (<, >, or ≠). The type of inequality in the alternative hypothesis is based on the question of interest. Alternative hypotheses with < or > are called one-sided, and alternative hypotheses with ≠ are called two-sided. Although the null hypothesis for a one-sided test may include an inequality symbol, it is still tested at the boundary of equality.VAR-6.D.3
The null hypothesis for a population proportion is:
0 0:H p p= , where 0p is the null hypothesized value for the population proportion.VAR-6.D.4
A one-sided alternative hypothesis for a proportion is either 0:aH p p< or 0:aH p p> . A two-sided alternate hypothesis is 1 2:aH p p≠ .
continued on next page
Return to Table of Contents© 2020 College Board
Course Framework V.1 | 135AP Statistics Course and Exam Description

Inference for Categorical Data: ProportionsUNIT
6
VAR-6.F.1
In order to make statistical inferences when testing a population proportion, we must check for independence and that the sampling distribution is approximately normal:a. To check for independence:
i. Data should be collected using a random sample or a randomized experiment.
ii. When sampling without replacement, check that 10%n N≤ .
b. To check that the sampling distribution of p is approximately normal (shape):i. Assuming that 0H is true 0( )p p= , verify
that both the number of successes, 0np , and the number of failures, 0(1 )n p− are at least 10 so that that the sample size is large enough to support an assumption of normality.
VAR-6.E.1
For a single categorical variable, the appropriate testing method for a population proportion is a one-sample z-test for a population proportion.
LEARNING OBJECTIVEVAR-6.D
Identify the null and alternative hypotheses for a population proportion. [Skill 1.F]
ESSENTIAL KNOWLEDGEVAR-6.D.5
For a one-sample z-test for a population proportion, the null hypothesis specifies a value for the population proportion, usually one indicating no difference or effect.
VAR-6.E
Identify an appropriate testing method for a population proportion. [Skill 1.E]
VAR-6.F
Verify the conditions for making statistical inferences when testing a population proportion. [Skill 4.C]
Return to Table of Contents© 2020 College Board
Course Framework V.1 | 136AP Statistics Course and Exam Description

Inference for Categorical Data: ProportionsUNIT
6
Required Course Content
TOPIC 6.5
Interpreting p-ValuesSKILLS
Using Probability and Simulation
3.E
Calculate a test statistic and find a p-value, provided conditions for inference are met.
Statistical Argumentation
4.B
Interpret statistical calculations and findings to assign meaning or assess a claim.
AVAILABLE RESOURCE § Classroom Resource >
Inference
ENDURING UNDERSTANDINGVAR-6
The normal distribution may be used to model variation.
LEARNING OBJECTIVEVAR-6.G
Calculate an appropriate test statistic and p-value for a population proportion. [Skill 3.E]
ESSENTIAL KNOWLEDGEVAR-6.G.1
The distribution of the test statistic assuming the null hypothesis is true (null distribution) can be either a randomization distribution or when a probability model is assumed to be true, a theoretical distribution (z ).VAR-6.G.2
When using a z-test, the standardized test statistic can be written:
sample statistic-null value of the parametertest statistic = standard deviation of the statistic
.
This is called a z-statistic for proportions.VAR-6.G.3
The test statistic for a population proportion is:
0
0 0(1 )p pzp p
n
.
CLARIFYING STATEMENT:
The formulas for test statistics do not appear explicitly on the AP Statistics Formula Sheet provided with the AP Statistics Exam. However, these formulas do not need to be memorized, as they can be constructed based on the general test statistic formula and the relevant standard error formulas that are provided on the formula sheet.
continued on next page
Return to Table of Contents© 2020 College Board
Course Framework V.1 | 137AP Statistics Course and Exam Description

Inference for Categorical Data: ProportionsUNIT
6
ESSENTIAL KNOWLEDGEVAR-6.G.4
A p-value is the probability of obtaining a test statistic as extreme or more extreme than the observed test statistic when the null hypothesis and probability model are assumed to be true. The significance level may be given or determined by the researcher.
LEARNING OBJECTIVEVAR-6.G
Calculate an appropriate test statistic and p-value for a population proportion. [Skill 3.E]
ENDURING UNDERSTANDINGDAT-3
Significance testing allows us to make decisions about hypotheses within a particular context.
LEARNING OBJECTIVEDAT-3.A
Interpret the p-value of a significance test for a population proportion. [Skill 4.B]
ESSENTIAL KNOWLEDGEDAT-3.A.1
The p-value is the proportion of values for the null distribution that are as extreme or more extreme than the observed value of the test statistic. This is:a. The proportion at or above the
observed value of the test statistic, if the alternative is >.
b. The proportion at or below the observed value of the test statistic, if the alternative is <.
c. The proportion less than or equal to the negative of the absolute value of the test statistic plus the proportion greater than or equal to the absolute value of the test statistic, if the alternative is ≠.
DAT-3.A.2
An interpretation of the p-value of a significance test for a one-sample proportion should recognize that the p-value is computed by assuming that the probability model and null hypothesis are true, i.e., by assuming that the true population proportion is equal to the particular value stated in the null hypothesis.
Return to Table of Contents© 2020 College Board
Course Framework V.1 | 138AP Statistics Course and Exam Description

Inference for Categorical Data: ProportionsUNIT
6
Required Course Content
TOPIC 6.6
Concluding a Test for a Population Proportion
SKILL
Statistical Argumentation
4.E
Justify a claim using a decision based on significance tests.
AVAILABLE RESOURCES § Classroom Resource >
◆ Inference ◆ Calculations
Aren’t Enough! The Importance of Communication in AP Statistics
ENDURING UNDERSTANDINGDAT-3
Significance testing allows us to make decisions about hypotheses within a particular context.
LEARNING OBJECTIVEDAT-3.B
Justify a claim about the population based on the results of a significance test for a population proportion. [Skill 4.E]
ESSENTIAL KNOWLEDGEDAT-3.B.1
The significance level, , is the predetermined probability of rejecting the null hypothesis given that it is true.DAT-3.B.2
A formal decision explicitly compares the p-value to the significance level, . If the p-value ≤ , reject the null hypothesis. If the p-value > , fail to reject the null hypothesis.DAT-3.B.3
Rejecting the null hypothesis means there is sufficient statistical evidence to support the alternative hypothesis. Failing to reject the null means there is insufficient statistical evidence to support the alternative hypothesis.DAT-3.B.4
The conclusion about the alternative hypothesis must be stated in context.DAT-3.B.5
A significance test can lead to rejecting or not rejecting the null hypothesis, but can never lead to concluding or proving that the null hypothesis is true. Lack of statistical evidence for the alternative hypothesis is not the same as evidence for the null hypothesis.
continued on next page
Return to Table of Contents© 2020 College Board
Course Framework V.1 | 139AP Statistics Course and Exam Description

Inference for Categorical Data: ProportionsUNIT
6
ESSENTIAL KNOWLEDGEDAT-3.B.6
Small p-values indicate that the observed value of the test statistic would be unusual if the null hypothesis and probability model were true, and so provide evidence for the alternative. The lower the p-value, the more convincing the statistical evidence for the alternative hypothesis.DAT-3.B.7
p-values that are not small indicate that the observed value of the test statistic would not be unusual if the null hypothesis and probability model were true, so do not provide convincing statistical evidence for the alternative hypothesis nor do they provide evidence that the null hypothesis is true.DAT-3.B.8
A formal decision explicitly compares the p-value to the significance . If the p-value ≤ , then reject the null hypothesis,
0 0:H p p= . If the p-value > , then fail to reject the null hypothesis.DAT-3.B.9
The results of a significance test for a population proportion can serve as the statistical reasoning to support the answer to a research question about the population that was sampled.
LEARNING OBJECTIVEDAT-3.B
Justify a claim about the population based on the results of a significance test for a population proportion. [Skill 4.E]
Return to Table of Contents© 2020 College Board
Course Framework V.1 | 140AP Statistics Course and Exam Description

Inference for Categorical Data: ProportionsUNIT
6
Required Course Content
TOPIC 6.7
Potential Errors When Performing Tests
SKILLS
Selecting Statistical Methods
1.B
Identify key and relevant information to answer a question or solve a problem.
Using Probability and Simulation
3.A
Determine relative frequencies, proportions, or probabilities using simulation or calculations.
Statistical Argumentation
4.A
Make an appropriate claim or draw an appropriate conclusion.4.B
Interpret statistical calculations and findings to assign meaning or assess a claim.
ENDURING UNDERSTANDINGUNC-5
Probabilities of Type I and Type II errors influence inference.
LEARNING OBJECTIVEUNC-5.A
Identify Type I and Type II errors. [Skill 1.B]
ESSENTIAL KNOWLEDGEUNC-5.A.1
A Type I error occurs when the null hypothesis is true and is rejected (false positive).UNC-5.A.2
A Type II error occurs when the null hypothesis is false and is not rejected (false negative).
Table of Errors
Actual Population Value
H0 true Ha true
Dec
isio
n Reject H0 Type I Error Correct Decision
Fail to Reject H0
Correct Decision
Type II Error
continued on next page
Return to Table of Contents© 2020 College Board
Course Framework V.1 | 141AP Statistics Course and Exam Description

Inference for Categorical Data: ProportionsUNIT
6
UNC-5.D.1
Whether a Type I or a Type II error is more consequential depends upon the situation.UNC-5.D.2
Since the significance level, , is the probability of a Type I error, the consequences of a Type I error influence decisions about a significance level.
UNC-5.D
Interpret Type I and Type II errors. [Skill 4.B]
UNC-5.C.1
The probability of a Type II error decreases when any of the following occurs, provided the others do not change: i. Sample size(s) increases. ii. Significance level () of a test increases.iii. Standard error decreases.iv. True parameter value is farther from the null.
LEARNING OBJECTIVEUNC-5.B
Calculate the probability of a Type I and Type II errors. [Skill 3.A]
ESSENTIAL KNOWLEDGEUNC-5.B.1
The significance level, , is the probability of making a Type I error, if the null hypothesis is true.UNC-5.B.2
The power of a test is the probability that a test will correctly reject a false null hypothesis.UNC-5.B.3
The probability of making a Type II error 1 power= − .
UNC-5.C
Identify factors that affect the probability of errors in significance testing. [Skill 4.A]
Return to Table of Contents© 2020 College Board
Course Framework V.1 | 142AP Statistics Course and Exam Description

Inference for Categorical Data: ProportionsUNIT
6
Required Course Content
TOPIC 6.8
Confidence Intervals for the Difference of Two Proportions
SKILLS
Selecting Statistical Methods
1.D
Identify an appropriate inference method for confidence intervals.
Statistical Argumentation
4.C
Verify that inference procedures apply in a given situation.
Using Probability and Simulation
3.D
Construct a confidence interval, provided conditions for inference are met.
continued on next page
ENDURING UNDERSTANDINGUNC-4
An interval of values should be used to estimate parameters, in order to account for uncertainty.
LEARNING OBJECTIVEUNC-4.I
Identify an appropriate confidence interval procedure for a comparison of population proportions. [Skill 1.D]
ESSENTIAL KNOWLEDGEUNC-4.I.1
The appropriate confidence interval procedure for a two-sample comparison of proportions for one categorical variable is a two-sample z-interval for a difference between population proportions.
UNC-4.J.1
In order to calculate confidence intervals to estimate a difference between proportions, we must check for independence and that the sampling distribution is approximately normal:a. To check for independence:
i. Data should be collected using two independent, random samples or a randomized experiment.
ii. When sampling without replacement, check that 1 110%n N≤ and 2 210%n N≤ .
b. To check that sampling distribution of 1 2ˆ ˆp p−
is approximately normal (shape).i. For categorical variables, check that
1 1ˆn p , 1 1
ˆ(1 )n p− , 2 2ˆn p , and 2 2
ˆ1n p are all greater than or equal to some predetermined value, typically either 5 or 10.
UNC-4.J
Verify the conditions for calculating confidence intervals for a difference between population proportions. [Skill 4.C]
Return to Table of Contents© 2020 College Board
Course Framework V.1 | 143AP Statistics Course and Exam Description

Inference for Categorical Data: ProportionsUNIT
6
LEARNING OBJECTIVEUNC-4.K
Calculate an appropriate confidence interval for a comparison of population proportions. [Skill 3.D]
ESSENTIAL KNOWLEDGEUNC-4.K.1
For a comparison of proportions, the interval estimate is
1 1 2 21 2
1 2
ˆ ˆ ˆ ˆ(1 ) (1 )ˆ ˆ( ) p p p pp p zn n
.
CLARIFYING STATEMENT:
Formulas for interval estimates do not appear explicitly on the AP Statistics Formula Sheet provided with the AP Statistics Exam. However, these formulas do not need to be memorized, as they can be constructed based on the general test statistic formula and the relevant standard error formulas that are provided on the formula sheet.
UNC-4.L.1
Confidence intervals for a difference in proportions can be used to calculate interval estimates with specified units.
UNC-4.L
Calculate an interval estimate based on a confidence interval for a difference of proportions. [Skill 3.D]
Return to Table of Contents© 2020 College Board
Course Framework V.1 | 144AP Statistics Course and Exam Description

Inference for Categorical Data: ProportionsUNIT
6
Required Course Content
TOPIC 6.9
Justifying a Claim Based on a Confidence Interval for a Difference of Population Proportions
SKILLS
Statistical Argumentation
4.B
Interpret statistical calculations and findings to assign meaning or assess a claim.4.D
Justify a claim based on a confidence interval.
AVAILABLE RESOURCE § Classroom Resource >
Calculations Aren’t Enough! The Importance of Communication in AP Statistics
ENDURING UNDERSTANDINGUNC-4
An interval of values should be used to estimate parameters, in order to account for uncertainty.
LEARNING OBJECTIVEUNC-4.M
Interpret a confidence interval for a difference of proportions. [Skill 4.B]
ESSENTIAL KNOWLEDGEUNC-4.M.1
In repeated random sampling with the same sample size, approximately C% of confidence intervals created will capture the difference in population proportions.UNC-4.M.2
Interpreting a confidence interval for difference between population proportions should include a reference to the sample taken and details about the population it represents.
UNC-4.N.1
A confidence interval for difference in population proportions provides an interval of values that may provide sufficient evidence to support a particular claim in context.
UNC-4.N
Justify a claim based on a confidence interval for a difference of proportions. [Skill 4.D]
Return to Table of Contents© 2020 College Board
Course Framework V.1 | 145AP Statistics Course and Exam Description

Inference for Categorical Data: ProportionsUNIT
6
Required Course Content
TOPIC 6.10
Setting Up a Test for the Difference of Two Population Proportion
SKILLS
Selecting Statistical Methods
1.F
Identify null and alternative hypotheses.
1.E
Identify an appropriate inference method for significance tests.
Statistical Argumentation
4.C
Verify that inference procedures apply in a given situation.
AVAILABLE RESOURCE § Classroom Resource >
Inference
ENDURING UNDERSTANDINGVAR-6
The normal distribution may be used to model variation.
LEARNING OBJECTIVEVAR-6.H
Identify the null and alternative hypotheses for a difference of two population proportions. [Skill 1.F]
ESSENTIAL KNOWLEDGEVAR-6.H.1
For a two-sample test for a difference of two proportions, the null hypothesis specifies a value of 0 for the difference in population proportions, indicating no difference or effect.VAR-6.H.2
The null hypothesis for a difference in proportions is: 0 1 2:H p p= , or 0 1 2: 0H p p− = .VAR-6.H.3
A one-sided alternative hypothesis for a difference in proportions is 1 2:aH p p< , or,
1 2:aH p p> . A two-sided alternative hypothesis for a difference of proportions is 1 2:aH p p≠ .
VAR-6.I.1
For a single categorical variable, the appropriate testing method for the difference of two population proportions is a two-sample z-test for a difference between two population proportions.
VAR-6.I
Identify an appropriate testing method for the difference of two population proportions. [Skill 1.E]
continued on next page
Return to Table of Contents© 2020 College Board
Course Framework V.1 | 146AP Statistics Course and Exam Description
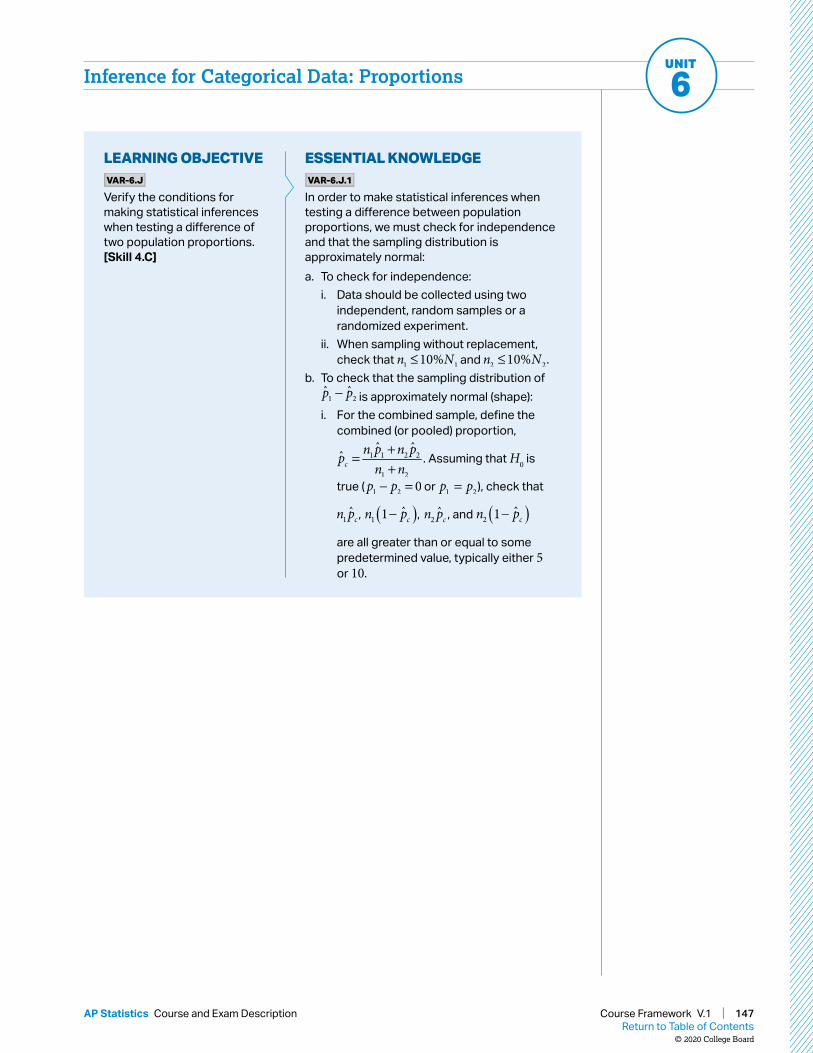
Inference for Categorical Data: ProportionsUNIT
6
LEARNING OBJECTIVEVAR-6.J
Verify the conditions for making statistical inferences when testing a difference of two population proportions. [Skill 4.C]
ESSENTIAL KNOWLEDGEVAR-6.J.1
In order to make statistical inferences when testing a difference between population proportions, we must check for independence and that the sampling distribution is approximately normal:a. To check for independence:
i. Data should be collected using two independent, random samples or a randomized experiment.
ii. When sampling without replacement, check that 1 110%n N≤ and 2 210%n N≤ .
b. To check that the sampling distribution of 1 2
ˆ ˆp p− is approximately normal (shape):i. For the combined sample, define the
combined (or pooled) proportion,
1 1 2 2
1 2
ˆ ˆˆc
n p n ppn n
+=+
. Assuming that H0 is
true ( 1 2 0p p− = or =1 2p p ), check that
1ˆcn p , 1
ˆ1 cn p , 2ˆcn p , and 2
ˆ1 cn p
are all greater than or equal to some predetermined value, typically either 5 or 10.
Return to Table of Contents© 2020 College Board
Course Framework V.1 | 147AP Statistics Course and Exam Description

Inference for Categorical Data: ProportionsUNIT
6
Required Course Content
TOPIC 6.11
Carrying Out a Test for the Difference of Two Population Proportions
SKILLS
Using Probability and Simulation
3.E
Calculate a test statistic and find a p-value, provided conditions for inference are met.
Statistical Argumentation
4.B
Interpret statistical calculations and findings to assign meaning or assess a claim.4.E
Justify a claim using a decision based on significance tests.
AVAILABLE RESOURCE § Classroom Resource >
Inference
ENDURING UNDERSTANDINGVAR-6
The normal distribution may be used to model variation.
LEARNING OBJECTIVEVAR-6.K
Calculate an appropriate test statistic for the difference of two population proportions. [Skill 3.E]
ESSENTIAL KNOWLEDGEVAR-6.K.1
The test statistic for a difference in proportions is:
1 2
1 2
ˆ ˆ( ) 0 = 1 1ˆ ˆ(1 )c c
p pzp p
n n
,
where 1 1 2 2
1 2
ˆ ˆˆc
n p n ppn n
+=+
.
CLARIFYING STATEMENT:
The formulas for test statistics do not appear explicitly on the AP Statistics Formula Sheet provided with the AP Statistics Exam. However, these formulas do not need to be memorized, as they can be constructed based on the general test statistic formula and the standard error formulas for each of the relevant test statistics that are provided on the formula sheet.
continued on next page
Return to Table of Contents© 2020 College Board
Course Framework V.1 | 148AP Statistics Course and Exam Description

Inference for Categorical Data: ProportionsUNIT
6
ENDURING UNDERSTANDINGDAT-3
Significance testing allows us to make decisions about hypotheses within a particular context.
LEARNING OBJECTIVEDAT-3.C
Interpret the p-value of a significance test for a difference of population proportions. [Skill 4.B]
ESSENTIAL KNOWLEDGEDAT-3.C.1
An interpretation of the p-value of a significance test for a difference of two population proportions should recognize that the p-value is computed by assuming that the null hypothesis is true, i.e., by assuming that the true population proportions are equal to each other.
DAT-3.D.1
A formal decision explicitly compares the p-value to the significance . If the p-value ≤ , then reject the null hypothesis, 0 1 2:H p p= , or
0 1 2: 0H p p− = . If the p-value > , then fail to reject the null hypothesis.DAT-3.D.2
The results of a significance test for a difference of two population proportions can serve as the statistical reasoning to support the answer to a research question about the two populations that were sampled.
DAT-3.D
Justify a claim about the population based on the results of a significance test for a difference of population proportions. [Skill 4.E]
Return to Table of Contents© 2020 College Board
Course Framework V.1 | 149AP Statistics Course and Exam Description

THIS PAGE IS INTENTIONALLY LEFT BLANK.

AP STATISTICS
UNIT
Inference for Quantitative Data: Means
7
10–18%
AP EXAM WEIGHTING
~14–16CLASS PERIODS
151Return to Table of Contents
© 2020 College Board
Course Framework V.1 | 151AP Statistics Course and Exam Description

Remember to go to AP Classroom to assign students the online Personal Progress Check for this unit.
Whether assigned as homework or completed in class, the Personal Progress Check provides each student with immediate feedback related to this unit’s topics and skills.
Personal Progress Check 7Multiple-choice: ~50 questions Free-response: 2 questions
§ Inference and Collecting Data § Investigative Task
Return to Table of Contents© 2020 College Board
Course Framework V.1 | 152AP Statistics Course and Exam Description

10–18% AP EXAM WEIGHTING
Building Course Skills1.E 1.F 4.C 4.E
Unit 7 focuses on means, which has many similarities to the conditions and procedures for proportions. Since students sometimes confuse t-tests with z-tests, it will help to review the underlying rationales each time conditions come up. This will help students develop understanding through repeated practice in new situations. Teachers can encourage students to be mindful of notation and use the formula sheet as a reference.
Teachers can reinforce that inference testing requires careful selection of a procedure based on specific conditions for a given problem. Common errors include mislabeling conditions (e.g., incorrectly associating the large sample condition with independence), relying upon vague references to the normal distribution, or applying an inappropriate large sample condition. The null and alternative hypotheses must be clearly stated in terms of population parameters, not sample statistics. A formal decision compares the p-value to the level of significance. Students should also practice providing a
numerical reference to support their claim (e.g., “Because 0.05p < , we reject the null hypothesis.”) and interpreting findings within the context of the question.
Preparing for the AP ExamIt is critical for students to recognize that free-response questions asking whether data provide convincing evidence of some finding are asking for a significance test, not just a descriptive analysis. When using statistical inference for significance tests, students should identify the correct parameter and hypotheses, identify an appropriate test procedure and check conditions, calculate a test statistic and p-value, and provide a conclusion in context, along with a justification based on linkage between the p-value and the conclusion. For inference with means, the appropriate test will often be a t -test, but if is known, a z -test would be appropriate (see 2018 FRQ 6(a)). For a t -test, conditions are (1) random sample and (2) large sample (e.g., 30n > ). When sampling without replacement, students should also verify that the sample size is at most 10% of the population.
BIG IDEA 1Variation and Distribution VAR
§ How do we know whether to use a t -test or a z -test for inference with means?
BIG IDEA 2Patterns and Uncertainty UNC
§ How can we make sure that samples are independent?
BIG IDEA 3Data-Based Predictions, Decisions, and Conclusions DAT
§ Why is it inappropriate to accept a hypothesis as true based on the results of statistical inference testing?
UNIT
7
Developing UnderstandingIn this unit, students will analyze quantitative data to make inferences about population means. Students should understand that t∗ and t -tests are used for inference with means when the population standard deviation, , is not known. Using s for in the formula for z gives a slightly different value, t , whose distribution, which depends on sample size, has more area in the tails than a normal distribution. The boundaries for rejecting a null hypothesis using a t -distribution tend to be further from the mean than for a normal distribution. Students should understand how and why conditions for inference with proportions and means are similar and different.
~14–16 CLASS PERIODS
Inference for Quantitative Data: Means
Return to Table of Contents© 2020 College Board
Course Framework V.1 | 153AP Statistics Course and Exam Description

Inference for Quantitative Data: MeansUNIT
7UNIT
7 Inference for Quantitative Data: Means
UNIT AT A GLANCE
Endu
ring
Unde
rsta
ndin
g
Topic Skills
Class Periods
~14–16 CLASS PERIODS
VA
R-1 7.1 Introducing Statistics:
Should I Worry About Error?
1.A Identify the question to be answered or problem to be solved (not assessed).
VA
R-7
, UN
C-4
7.2 Constructing a Confidence Interval for a Population Mean
3.C Describe probability distributions.
1.D Identify an appropriate inference method for confidence intervals.
4.C Verify that inference procedures apply in a given situation.
3.D Construct a confidence interval, provided conditions for inference are met.
UN
C-4
7.3 Justifying a Claim About a Population Mean Based on a Confidence Interval
4.B Interpret statistical calculations and findings to assign meaning or assess a claim.
4.D Justify a claim based on a confidence interval.
4.A Make an appropriate claim or draw an appropriate conclusion.
VA
R-7
7.4 Setting Up a Test for a Population Mean
1.E Identify an appropriate inference method for significance tests.
1.F Identify null and alternative hypotheses.
4.C Verify that inference procedures apply in a given situation.
VA
R-7
, DA
T-3
7.5 Carrying Out a Test for a Population Mean
3.E Calculate a test statistic and find a p-value, provided conditions for inference are met.
4.B Interpret statistical calculations and findings to assign meaning or assess a claim.
4.E Justify a claim using a decision based on significance tests.
continued on next page
Return to Table of Contents© 2020 College Board
Course Framework V.1 | 154AP Statistics Course and Exam Description

Inference for Quantitative Data: MeansUNIT
7En
durin
g Un
ders
tand
ing
Topic Skills
Class Periods
~14–16 CLASS PERIODS
UN
C-4
7.6 Confidence Intervals for the Difference of Two Means
1.D Identify an appropriate inference method for confidence intervals.
4.C Verify that inference procedures apply in a given situation.
3.D Construct a confidence interval, provided conditions for inference are met.
7.7 Justifying a Claim About the Difference of Two Means Based on a Confidence Interval
4.B Interpret statistical calculations and findings to assign meaning or assess a claim.
4.D Justify a claim based on a confidence interval.
4.A Make an appropriate claim or draw an appropriate conclusion.
VA
R-7
7.8 Setting Up a Test for the Difference of Two Population Means
1.E Identify an appropriate inference method for significance tests.
1.F Identify null and alternative hypotheses.
4.C Verify that inference procedures apply in a given situation.
VA
R-7
, DA
T-3
7.9 Carrying Out a Test for the Difference of Two Population Means
3.E Calculate a test statistic and find a p-value, provided conditions for inference are met.
4.B Interpret statistical calculations and findings to assign meaning or assess a claim.
4.E Justify a claim using a decision based on significance tests.
7.10 Skills Focus: Selecting, Implementing, and Communicating Inference Procedures
N/A
Go to AP Classroom to assign the Personal Progress Check for Unit 7. Review the results in class to identify and address any student misunderstandings.
UNIT AT A GLANCE (cont’d)
Return to Table of Contents© 2020 College Board
Course Framework V.1 | 155AP Statistics Course and Exam Description

Inference for Quantitative Data: MeansUNIT
7
SAMPLE INSTRUCTIONAL ACTIVITIESThe sample activities on this page are optional and are offered to provide possible ways to incorporate various instructional approaches into the classroom. They were developed in partnership with teachers from the AP community to share ways that they approach teaching some of the topics in this unit. Please refer to the Instructional Approaches section beginning on p. 207 for more examples of activities and strategies.
Activity Topic Sample Activity
1 7.2 Predict and ConfirmAfter introducing the confidence interval formula for a population mean when sigma is known, *x z
n , have students discuss in small groups what will happen if we
substitute the sample standard deviation s into the formula when σ is unknown. Have students use the Simulating Confidence Intervals for Population Parameter applet to test their conjectures (see link for Rossman/Chance Applets on page 210).
2 7.27.37.5
Team ChallengeGive each team of three to four students a copy of 2004 FRQ 6, which focuses on the connection between a one-sample t-interval, a one-sample t-test, and the unfamiliar concept of a one-sided confidence interval. Challenge teams to collaboratively produce a model solution in 30 minutes.
3 7.4 Discussion GroupsAsk each group of three to four students to identify the conditions for performing a test about a population mean. For each condition, have them explain why the condition is required and what would go wrong with the test if the condition were violated. Have groups pair up and compare answers.
4 7.9 Team FRQGive each team of four students copies of a free-response question that involves performing a two-sample t-test (e.g., 2011 FRQ 4). Have each team member take responsibility for writing one part of the model solution (hypotheses, procedure and conditions, calculations, conclusion) with group input.
5 7.10 Graphic OrganizerHave students work in teams of two to three to develop a flowchart for determining which inference procedure from Units 6 and 7 to use in a given setting.
Return to Table of Contents© 2020 College Board
Course Framework V.1 | 156AP Statistics Course and Exam Description

Inference for Quantitative Data: MeansUNIT
7
Required Course Content
TOPIC 7.1
Introducing Statistics: Why Should I Worry About Error?
SKILL
Selecting Statistical Methods
1.A
Identify the question to be answered or problem to be solved.
ENDURING UNDERSTANDINGVAR-1
Given that variation may be random or not, conclusions are uncertain.
LEARNING OBJECTIVEVAR-1.I
Identify questions suggested by probabilities of errors in statistical inference. [Skill 1.A]
ESSENTIAL KNOWLEDGEVAR-1.I.1
Random variation may result in errors in statistical inference.
Return to Table of Contents© 2020 College Board
Course Framework V.1 | 157AP Statistics Course and Exam Description

Inference for Quantitative Data: MeansUNIT
7
Required Course Content
TOPIC 7.2
Constructing a Confidence Interval for a Population Mean
SKILLS
Using Probability and Simulation
3.C
Describe probability distributions.3.D
Construct a confidence interval, provided conditions for inference are met.
Selecting Statistical Methods
1.D
Identify an appropriate inference method for confidence intervals.
Statistical Argumentation
4.C
Verify that inference procedures apply in a given situation.
ENDURING UNDERSTANDINGVAR-7
The t-distribution may be used to model variation.
LEARNING OBJECTIVEVAR-7.A
Describe t-distributions. [Skill 3.C]
ESSENTIAL KNOWLEDGEVAR-7.A.1
When s is used instead of to calculate a test statistic, the corresponding distribution, known as the t-distribution, varies from the normal distribution in shape, in that more of the area is allocated to the tails of the density curve than in a normal distribution.VAR-7.A.2
As the degrees of freedom increase, the area in the tails of a t-distribution decreases.
continued on next page
Return to Table of Contents© 2020 College Board
Course Framework V.1 | 158AP Statistics Course and Exam Description

Inference for Quantitative Data: MeansUNIT
7
LEARNING OBJECTIVEUNC-4.O
Identify an appropriate confidence interval procedure for a population mean, including the mean difference between values in matched pairs. [Skill 1.D]
ENDURING UNDERSTANDINGUNC-4
An interval of values should be used to estimate parameters, in order to account for uncertainty.
ESSENTIAL KNOWLEDGEUNC-4.O.1
Because is typically not known for distributions of quantitative variables, the appropriate confidence interval procedure for estimating the population mean of one quantitative variable for one sample is a one-sample t-interval for a mean.UNC-4.O.2
For one quantitative variable, X , that is normally
distributed, the distribution of ( )xt sn
μ−= is a
t-distribution with 1n− degrees of freedom.UNC-4.O.3
Matched pairs can be thought of as one sample of pairs. Once differences between pairs of values are found, inference for confidence intervals proceeds as for a population mean.
UNC-4.P
Verify the conditions for calculating confidence intervals for a population mean, including the mean difference between values in matched pairs. [Skill 4.C]
UNC-4.P.1
In order to calculate confidence intervals to estimate a population mean, we must check for independence and that the sampling distribution is approximately normal:a. To check for independence:
i. Data should be collected using a random sample or a randomized experiment.
ii. When sampling without replacement, check that 10%n N≤ , where N is the size of the population.
b. To check that the sampling distribution of x is approximately normal (shape):i. If the observed distribution is skewed,
n should be greater than 30.ii. If the sample size is less than 30, the
distribution of the sample data should be free from strong skewness and outliers.
continued on next page
Return to Table of Contents© 2020 College Board
Course Framework V.1 | 159AP Statistics Course and Exam Description

Inference for Quantitative Data: MeansUNIT
7
LEARNING OBJECTIVEUNC-4.Q
Determine the margin of error for a given sample size for a one-sample t-interval. [Skill 3.D]
ESSENTIAL KNOWLEDGEUNC-4.Q.1
The critical value *t with 1n− degrees of freedom can be found using a table or computer-generated output.UNC-4.Q.2
The standard error for a sample mean is given by sSE
n= , where s is the sample
standard deviation.UNC-4.Q.3
For a one-sample t-interval for a mean, the margin of error is the critical value ( *t ) times the
standard error (SE), which equals * stn
.
UNC-4.R
Calculate an appropriate confidence interval for a population mean, including the mean difference between values in matched pairs. [Skill 3.D]
UNC-4.R.1
The point estimate for a population mean is the sample mean, x .UNC-4.R.2
For the population mean for one sample with unknown population standard deviation, the confidence interval is * sx t
n .
CLARIFYING STATEMENT:
Formulas for interval estimates do not appear explicitly on the AP Statistics Formula Sheet provided with the AP Statistics Exam. However, these formulas do not need to be memorized, as they can be constructed based on the general test statistic formula and the relevant standard error formulas that are provided on the formula sheet.
Return to Table of Contents© 2020 College Board
Course Framework V.1 | 160AP Statistics Course and Exam Description

Inference for Quantitative Data: MeansUNIT
7
Required Course Content
TOPIC 7.3
Justifying a Claim About a Population Mean Based on a Confidence Interval
SKILLS
Statistical Argumentation
4.B
Interpret statistical calculations and findings to assign meaning or assess a claim.4.D
Justify a claim based on a confidence interval.4.A
Make an appropriate claim or draw an appropriate conclusion.
UNC-4.T
Justify a claim based on a confidence interval for a population mean, including the mean difference between values in matched pairs. [Skill 4.D]
ENDURING UNDERSTANDINGUNC-4
An interval of values should be used to estimate parameters, in order to account for uncertainty.
LEARNING OBJECTIVEUNC-4.S
Interpret a confidence interval for a population mean, including the mean difference between values in matched pairs. [Skill 4.B]
ESSENTIAL KNOWLEDGEUNC-4.S.1
A confidence interval for a population mean either contains the population mean or it does not, because each interval is based on data from a random sample, which varies from sample to sample.UNC-4.S.2
We are C% confident that the confidence interval for a population mean captures the population mean.UNC-4.S.3
An interpretation of a confidence interval for a population mean includes a reference to the sample taken and details about the population it represents.
UNC-4.T.1
A confidence interval for a population mean provides an interval of values that may provide sufficient evidence to support a particular claim in context.
continued on next page
ILLUSTRATIVE EXAMPLEUNC-4.S.3:For interpreting a 96% confidence interval for mean foot length for all footprints found in a cave based on a particular randomly selected sample of footprints in the cave:“We are 96% confident that the mean foot length for all footprints found in the cave falls within the confidence interval” (based on 2000 FRQ 2).
Return to Table of Contents© 2020 College Board
Course Framework V.1 | 161AP Statistics Course and Exam Description

Inference for Quantitative Data: MeansUNIT
7
LEARNING OBJECTIVEUNC-4.U
Identify the relationships between sample size, width of a confidence interval, confidence level, and margin of error for a population mean. [Skill 4.A]
ESSENTIAL KNOWLEDGEUNC-4.U.1
When all other things remain the same, the width of a confidence interval for a population mean tends to decrease as the sample size increases.UNC-4.U.2
For a single mean, the width of the interval is proportional to 1
n .
UNC-4.U.3
For a given sample, the width of the confidence interval for a population mean increases as the confidence level increases.
Return to Table of Contents© 2020 College Board
Course Framework V.1 | 162AP Statistics Course and Exam Description
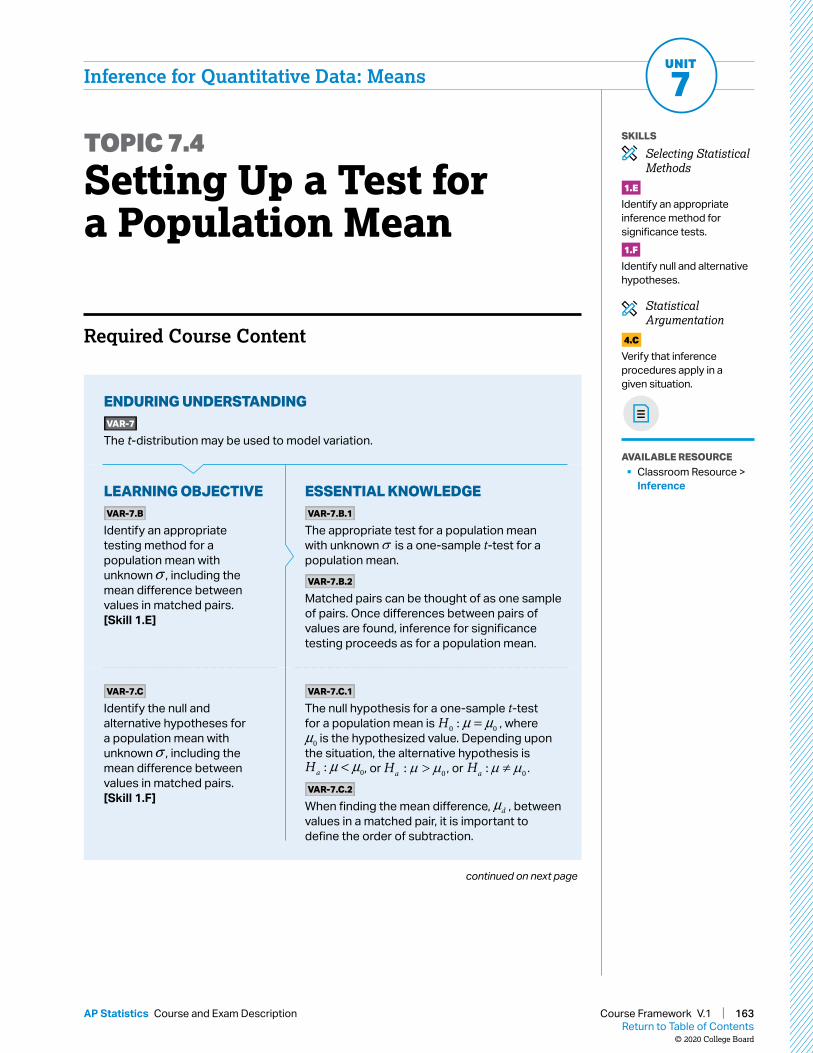
Inference for Quantitative Data: MeansUNIT
7
Required Course Content
TOPIC 7.4
Setting Up a Test for a Population Mean
SKILLS
Selecting Statistical Methods
1.E
Identify an appropriate inference method for significance tests.1.F
Identify null and alternative hypotheses.
Statistical Argumentation
4.C
Verify that inference procedures apply in a given situation.
AVAILABLE RESOURCE § Classroom Resource >
Inference
ENDURING UNDERSTANDINGVAR-7
The t-distribution may be used to model variation.
LEARNING OBJECTIVEVAR-7.B
Identify an appropriate testing method for a population mean with unknown σ , including the mean difference between values in matched pairs. [Skill 1.E]
ESSENTIAL KNOWLEDGEVAR-7.B.1
The appropriate test for a population mean with unknown is a one-sample t-test for a population mean.VAR-7.B.2
Matched pairs can be thought of as one sample of pairs. Once differences between pairs of values are found, inference for significance testing proceeds as for a population mean.
VAR-7.C
Identify the null and alternative hypotheses for a population mean with unknown σ , including the mean difference between values in matched pairs. [Skill 1.F]
VAR-7.C.1
The null hypothesis for a one-sample t-test for a population mean is 0 0:H μ μ= , where μ 0 is the hypothesized value. Depending upon the situation, the alternative hypothesis is
0:aH μ μ< , or 0:aH , or 0:aH .VAR-7.C.2
When finding the mean difference, dμ , between values in a matched pair, it is important to define the order of subtraction.
continued on next page
Return to Table of Contents© 2020 College Board
Course Framework V.1 | 163AP Statistics Course and Exam Description

Inference for Quantitative Data: MeansUNIT
7
LEARNING OBJECTIVEVAR-7.D
Verify the conditions for the test for a population mean, including the mean difference between values in matched pairs. [Skill 4.C]
ESSENTIAL KNOWLEDGEVAR-7.D.1
In order to make statistical inferences when testing a population mean, we must check for independence and that the sampling distribution is approximately normal:a. To check for independence:
i. Data should be collected using a random sample or a randomized experiment.
ii. When sampling without replacement, check that 10%n N≤ .
b. To check that the sampling distribution of x is approximately normal (shape):i. If the observed distribution is skewed,
n should be greater than 30.ii. If the sample size is less than 30, the
distribution of the sample data should be free from strong skewness and outliers.
Return to Table of Contents© 2020 College Board
Course Framework V.1 | 164AP Statistics Course and Exam Description

Inference for Quantitative Data: MeansUNIT
7
Required Course Content
TOPIC 7.5
Carrying Out a Test for a Population Mean
SKILLS
Using Probability and Simulation
3.E
Calculate a test statistic and find a p-value, provided conditions for inference are met.
Statistical Argumentation
4.B
Interpret statistical calculations and findings to assign meaning or assess a claim.4.E
Justify a claim using a decision based on significance tests.
AVAILABLE RESOURCE § Classroom Resource >
Inference
ENDURING UNDERSTANDINGVAR-7
The t-distribution may be used to model variation.
LEARNING OBJECTIVEVAR-7.E
Calculate an appropriate test statistic for a population mean, including the mean difference between values in matched pairs. [Skill 3.E]
ESSENTIAL KNOWLEDGEVAR-7.E.1
For a single quantitative variable when random sampling with replacement from a population that can be modeled with a normal distribution with mean and standard deviation , the sampling distribution of xt s
n
μ−= has a
t-distribution with n – 1 degrees of freedom.
CLARIFYING STATEMENT:
The formulas for test statistics do not appear explicitly on the AP Statistics Formula Sheet provided with the AP Statistics Exam. However, these formulas do not need to be memorized, as they can be constructed based on the general test statistic formula and the relevant standard error formulas that are provided on the formula sheet.
continued on next page
Return to Table of Contents© 2020 College Board
Course Framework V.1 | 165AP Statistics Course and Exam Description

Inference for Quantitative Data: MeansUNIT
7
ENDURING UNDERSTANDINGDAT-3
Significance testing allows us to make decisions about hypotheses within a particular context.
LEARNING OBJECTIVEDAT-3.E
Interpret the p-value of a significance test for a population mean, including the mean difference between values in matched pairs. [Skill 4.B]
ESSENTIAL KNOWLEDGEDAT-3.E.1
An interpretation of the p-value of a significance test for a population mean should recognize that the p-value is computed by assuming that the null hypothesis is true, i.e., by assuming that the true population mean is equal to the particular value stated in the null hypothesis.
DAT-3.F
Justify a claim about the population based on the results of a significance test for a population mean. [Skill 4.E]
DAT-3.F.1
A formal decision explicitly compares the p-value to the significance . If the p-value ≤ , then reject the null hypothesis,
0 0:H μ μ= . If the p-value > , then fail to reject the null hypothesis.DAT-3.F.2
The results of a significance test for a population mean can serve as the statistical reasoning to support the answer to a research question about the population that was sampled.
Return to Table of Contents© 2020 College Board
Course Framework V.1 | 166AP Statistics Course and Exam Description
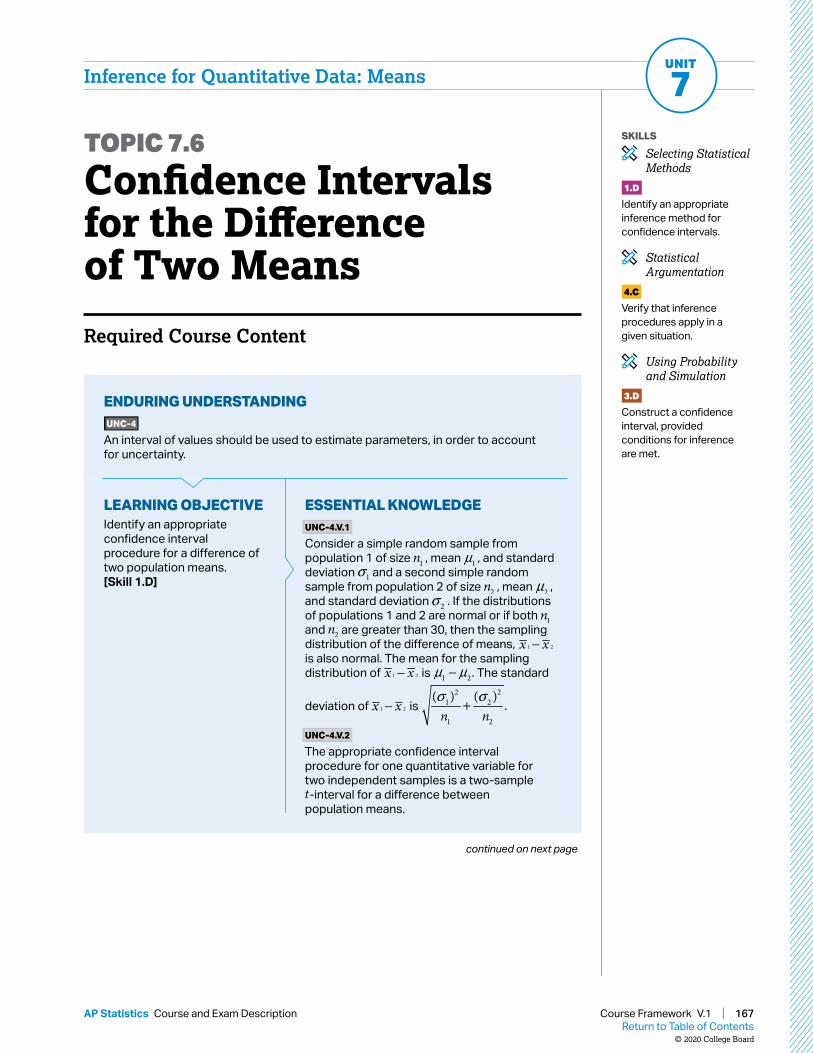
Inference for Quantitative Data: MeansUNIT
7
Required Course Content
TOPIC 7.6
Confidence Intervals for the Difference of Two Means
SKILLS
Selecting Statistical Methods
1.D
Identify an appropriate inference method for confidence intervals.
Statistical Argumentation
4.C
Verify that inference procedures apply in a given situation.
Using Probability and Simulation
3.D
Construct a confidence interval, provided conditions for inference are met.
ENDURING UNDERSTANDINGUNC-4
An interval of values should be used to estimate parameters, in order to account for uncertainty.
LEARNING OBJECTIVEIdentify an appropriate confidence interval procedure for a difference of two population means. [Skill 1.D]
ESSENTIAL KNOWLEDGEUNC-4.V.1
Consider a simple random sample from population 1 of size 1n , mean 1μ , and standard deviation 1σ and a second simple random sample from population 2 of size 2n , mean 2μ , and standard deviation 2σ . If the distributions of populations 1 and 2 are normal or if both 1n and 2n are greater than 30, then the sampling distribution of the difference of means, −1 2x x is also normal. The mean for the sampling distribution of −1 2x x is 1 2μ μ− . The standard
deviation of −1 2x x is 2 2
1 2
1 2
( ) ( )n n
σ σ+ .
UNC-4.V.2
The appropriate confidence interval procedure for one quantitative variable for two independent samples is a two-sample t -interval for a difference between population means.
continued on next page
Return to Table of Contents© 2020 College Board
Course Framework V.1 | 167AP Statistics Course and Exam Description
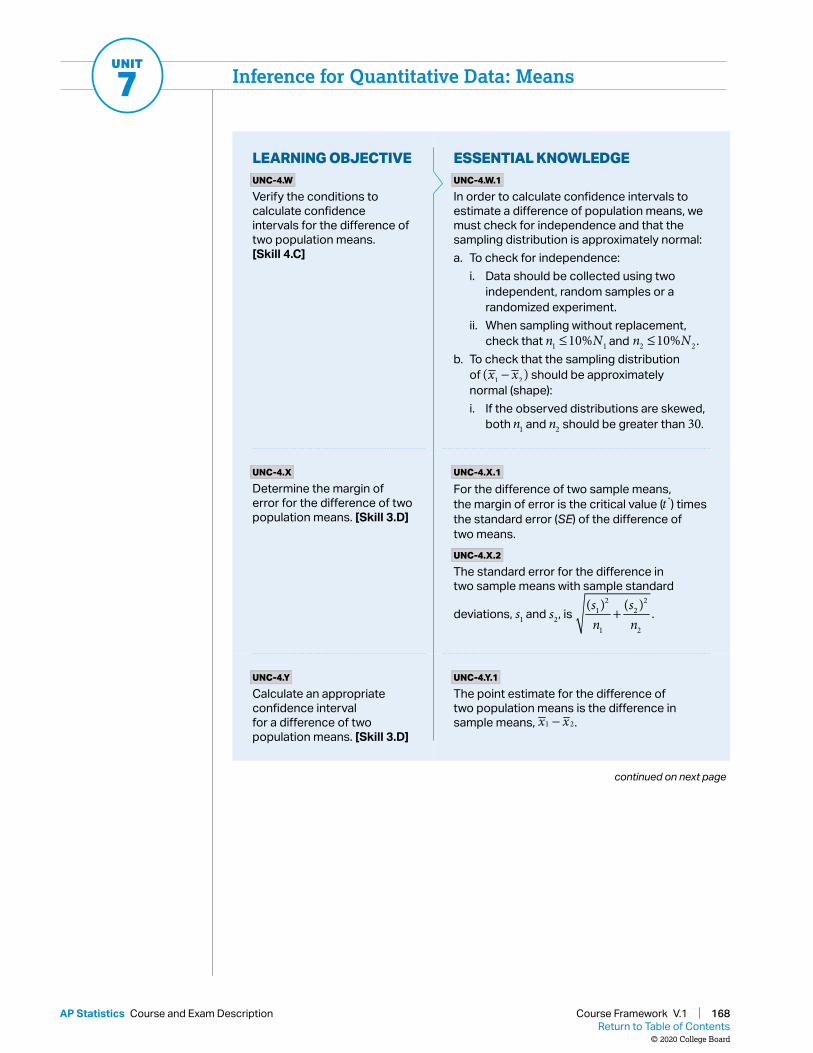
Inference for Quantitative Data: MeansUNIT
7
LEARNING OBJECTIVEUNC-4.W
Verify the conditions to calculate confidence intervals for the difference of two population means. [Skill 4.C]
ESSENTIAL KNOWLEDGEUNC-4.W.1
In order to calculate confidence intervals to estimate a difference of population means, we must check for independence and that the sampling distribution is approximately normal:a. To check for independence:
i. Data should be collected using two independent, random samples or a randomized experiment.
ii. When sampling without replacement, check that 1 110%n N≤ and 2 210%n N≤ .
b. To check that the sampling distribution of 1 2( )x x− should be approximately normal (shape):i. If the observed distributions are skewed,
both 1n and 2n should be greater than 30.
UNC-4.X
Determine the margin of error for the difference of two population means. [Skill 3.D]
UNC-4.X.1
For the difference of two sample means, the margin of error is the critical value ( *t ) times the standard error (SE) of the difference of two means.UNC-4.X.2
The standard error for the difference in two sample means with sample standard
deviations, 1s and 2s , is 2 2
1 2
1 2
( ) ( )s sn n
+ .
UNC-4.Y
Calculate an appropriate confidence interval for a difference of two population means. [Skill 3.D]
UNC-4.Y.1
The point estimate for the difference of two population means is the difference in sample means, 1 2x x− .
continued on next page
Return to Table of Contents© 2020 College Board
Course Framework V.1 | 168AP Statistics Course and Exam Description

Inference for Quantitative Data: MeansUNIT
7
LEARNING OBJECTIVE UNC-4.Y
Calculate an appropriate confidence interval for a difference of two population means. [Skill 3.D]
ESSENTIAL KNOWLEDGEUNC-4.Y.2
For a difference of two population means where the population standard deviations are not known, the confidence interval is
2 2
* 1 21 2
1 2
s sx x tn n
where ± *t are the critical
values for the central C% of a t-distribution with appropriate degrees of freedom that can be found using technology.
CLARIFYING STATEMENT:
Formulas for interval estimates do not appear explicitly on the AP Statistics Formula Sheet provided with the AP Statistics Exam. However, these formulas do not need to be memorized, as they can be constructed based on the general test statistic formula and the relevant standard error formulas that are provided on the formula sheet.
Return to Table of Contents© 2020 College Board
Course Framework V.1 | 169AP Statistics Course and Exam Description

Inference for Quantitative Data: MeansUNIT
7
Required Course Content
TOPIC 7.7
Justifying a Claim About the Difference of Two Means Based on a Confidence Interval
SKILLS
Statistical Argumentation
4.B
Interpret statistical calculations and findings to assign meaning or assess a claim.4.D
Justify a claim based on a confidence interval. 4.A
Make an appropriate claim or draw an appropriate conclusion.
ENDURING UNDERSTANDINGUNC-4
An interval of values should be used to estimate parameters, in order to account for uncertainty.
LEARNING OBJECTIVEUNC-4.Z
Interpret a confidence interval for a difference of population means. [Skill 4.B]
ESSENTIAL KNOWLEDGEUNC-4.Z.1
In repeated random sampling with the same sample size, approximately C% of confidence intervals created will capture the difference of population means.UNC-4.Z.2
An interpretation for a confidence interval for the difference of two population means should include a reference to the samples taken and details about the populations they represent.
UNC-4.AA
Justify a claim based on a confidence interval for a difference of population means. [Skill 4.D]
UNC-4.AA.1
A confidence interval for a difference of population means provides an interval of values that may provide sufficient evidence to support a particular claim in context.
UNC-4.AB
Identify the effects of sample size on the width of a confidence interval for the difference of two means. [Skill 4.A]
UNC-4.AB.1
When all other things remain the same, the width of the confidence interval for the difference of two means tends to decrease as the sample sizes increase.
ILLUSTRATIVE EXAMPLEUNC-4.Z.2:For interpreting a confidence interval for a difference between mean response times for two fire stations (northern – southern): “Based on these samples, one can be 95 percent confident that the difference in the population mean response times (northern – southern) is between −2.37 minutes and 0.37 minutes” (2009 FRQ 4).
Return to Table of Contents© 2020 College Board
Course Framework V.1 | 170AP Statistics Course and Exam Description

Inference for Quantitative Data: MeansUNIT
7
Required Course Content
TOPIC 7.8
Setting Up a Test for the Difference of Two Population Means
SKILLS
Selecting Statistical Methods
1.E
Identify an appropriate inference method for significance tests.1.F
Identify null and alternative hypotheses.
Statistical Argumentation
4.C
Verify that inference procedures apply in a given situation.
VAR-7.G
Identify the null and alternative hypotheses for a difference of two population means. [Skill 1.F]
VAR-7.G.1
The null hypothesis for a two-sample t-test for a difference of two population means,
1μ and 2μ , is: 0 1 2: 0H μ μ− = , or 0 1 2:H μ μ= . The alternative hypothesis is 1 2: 0aH μ μ− < , or 1 2: 0aH μ μ− > , or 1 2: 0aH μ μ− ≠ , or
1 2:aH μ μ> , or 1 2:aH μ μ< , or 1 2:aH μ μ≠ .
ENDURING UNDERSTANDINGVAR-7
The t-distribution may be used to model variation.
LEARNING OBJECTIVEVAR-7.F
Identify an appropriate selection of a testing method for a difference of two population means. [Skill 1.E]
ESSENTIAL KNOWLEDGEVAR-7.F.1
For a quantitative variable, the appropriate test for a difference of two population means is a two-sample t-test for a difference of two population means.
continued on next page
Return to Table of Contents© 2020 College Board
Course Framework V.1 | 171AP Statistics Course and Exam Description

Inference for Quantitative Data: MeansUNIT
7
LEARNING OBJECTIVEVAR-7.H
Verify the conditions for the significance test for the difference of two population means. [Skill 4.C]
ESSENTIAL KNOWLEDGEVAR-7.H.1
In order to make statistical inferences when testing a difference between population means, we must check for independence and that the sampling distribution is approximately normal:a. Individual observations should be
independent:i. Data should be collected using simple
random samples or a randomized experiment.
ii. When sampling without replacement, check that 1 110%n N≤ and 2 210%n N≤ .
b. The sampling distribution of 1 2x x− should be approximately normal (shape).i. If the observed distribution is skewed,
both 1n and 2n should be greater than 30.ii. If the sample size is less than 30, the
distribution of the sample data should be free from strong skewness and outliers. This should be checked for BOTH samples.
Return to Table of Contents© 2020 College Board
Course Framework V.1 | 172AP Statistics Course and Exam Description

Inference for Quantitative Data: MeansUNIT
7
Required Course Content
TOPIC 7.9
Carrying Out a Test for the Difference of Two Population Means
SKILLS
Using Probability and Simulation
3.E
Calculate a test statistic and find a p-value, provided conditions for inference are met.
Statistical Argumentation
4.B
Interpret statistical calculations and findings to assign meaning or assess a claim.4.E
Justify a claim using a decision based on significance tests.
AVAILABLE RESOURCE § Classroom Resource >
Inference
ILLUSTRATIVE EXAMPLEVAR-7.I.1:In a study comparing mean recovery times for two surgical procedures to repair a torn anterior cruciate ligament (ACL), the group receiving one procedure had a sample size of 110, while the group receiving the other procedure had a sample size of 100. The degrees of freedom fall between 100 (the smaller of 110 and 100) and 208 (110 + 100 − 2). The degrees of freedom may be determined using technology. If the test statistic for this study is
7.13t ≈ , then the p -value is the area greater than 7.13 for a t -distribution with
207.18df = (2018 FRQ 4).
ENDURING UNDERSTANDINGVAR-7
The t-distribution may be used to model variation.
LEARNING OBJECTIVEVAR-7.I
Calculate an appropriate test statistic for a difference of two means. [Skill 3.E]
ESSENTIAL KNOWLEDGEVAR-7.I.1
For a single quantitative variable, data collected using independent random samples or a randomized experiment from two populations, each of which can be modeled with a normal distribution, the sampling distribution of
1 2 1 22 21 2
1 2
( ) ( )x xts sn n
μ μ− − −=+
is an approximate
t-distribution with degrees of freedom that can be found using technology. The degrees of freedom fall between the smaller of 1 1n − and
2 1n − and 1 2 2n n+ − .CLARIFYING STATEMENT:
The formulas for test statistics do not appear explicitly on the AP Statistics Formula Sheet provided with the AP Statistics Exam. However, these formulas do not need to be memorized, as they can be constructed based on the general test statistic formula and the standard error formulas for each of the relevant test statistics that are provided on the formula sheet.
continued on next page
Return to Table of Contents© 2020 College Board
Course Framework V.1 | 173AP Statistics Course and Exam Description

Inference for Quantitative Data: MeansUNIT
7
ENDURING UNDERSTANDINGDAT-3
Significance testing allows us to make decisions about hypotheses within a particular context.
LEARNING OBJECTIVEDAT-3.G
Interpret the p-value of a significance test for a difference of population means. [Skill 4.B]
ESSENTIAL KNOWLEDGEDAT-3.G.1
An interpretation of the p-value of a significance test for a two-sample difference of population means should recognize that the p-value is computed by assuming that the null hypothesis is true, i.e., by assuming that the true population means are equal to each other.
DAT-3.H
Justify a claim about the population based on the results of a significance test for a difference of two population means in context. [Skill 4.E]
DAT-3.H.1
A formal decision explicitly compares the p-value to the significance . If the p-value ≤ , then reject the null hypothesis, 0 1 2: 0H μ μ− = , or 0 1 2:H μ μ= . If the p-value > , then fail to reject the null hypothesis.DAT-3.H.2
The results of a significance test for a two-sample test for a difference between two population means can serve as the statistical reasoning to support the answer to a research question about the populations that were sampled.
Return to Table of Contents© 2020 College Board
Course Framework V.1 | 174AP Statistics Course and Exam Description

Inference for Quantitative Data: MeansUNIT
7
Required Course Content
This topic is intended to focus on the skill of selecting an appropriate inference procedure, now that students have a range of options. Students should be given opportunities to practice when and how to apply all learning objectives relating to inference involving proportions or means.
TOPIC 7.10
Skills Focus: Selecting, Implementing, and Communicating Inference Procedures
Return to Table of Contents© 2020 College Board
Course Framework V.1 | 175AP Statistics Course and Exam Description

THIS PAGE IS INTENTIONALLY LEFT BLANK.

AP STATISTICS
UNIT
Inference for Categorical Data: Chi-Square
2–5%
AP EXAM WEIGHTING
~10–11CLASS PERIODS
8
177Return to Table of Contents
© 2020 College Board
Course Framework V.1 | 177AP Statistics Course and Exam Description

Remember to go to AP Classroom to assign students the online Personal Progress Check for this unit.
Whether assigned as homework or completed in class, the Personal Progress Check provides each student with immediate feedback related to this unit’s topics and skills.
Personal Progress Check 8Multiple-choice: ~30 questions Free-response: 2 questions
§ Inference § Inference and Exploring Data/
Collecting Data
Return to Table of Contents© 2020 College Board
Course Framework V.1 | 178AP Statistics Course and Exam Description

2–5% AP EXAM WEIGHTINGUNIT
8 ~10–11 CLASS PERIODS
Inference for Categorical Data: Chi-Square
BIG IDEA 1Variation and Distribution VAR
§ How does increasing the degrees of freedom influence the shape of the chi-square distribution?
BIG IDEA 3Data-Based Predictions, Decisions, and Conclusions DAT
§ Why is it inappropriate to use statistical inference to justify a claim that there is no association between variables?
Developing UnderstandingUnit 6 introduced inference for proportions of categorical data. Unit 8 introduces chi-square tests, which can be used when there are two or more categories. Students need to understand how to select from the following tests: the chi-square test for goodness of fit (for a distribution of proportions of one categorical variable in a population), the chi-square test for independence (for associations between categorical variables within a single population), or the chi-square test for homogeneity (for comparing distributions of a categorical variable across populations or treatments). To integrate conceptual understanding, teachers can make connections between frequency tables, conditional probability, and calculating expected counts. The chi-square statistic is introduced to measure the distance between observed and expected counts relative to expected counts.
Building Course Skills1.E 3.E 4.C 4.E
In Unit 8, students should continue applying the same problem-solving structure to chi-square significance testing: State the hypotheses in words, explicitly identify the correct procedure, verify conditions, calculate the test statistic and the p-value, and then draw a conclusion in context that is directly linked to the p-value. Students should have opportunities to practice the distinctive elements for each type of chi-square test, such as analysis of expected counts, degrees of freedom, verbally stated hypotheses, and two-way tables.
When the p-value is large, drawing an appropriate conclusion is challenging for students. Saying there is “no association” between two variables is equivalent to incorrectly “accepting the null hypothesis.” Instead, teachers can teach students to use nondeterministic language in their conclusions, that is, “The data do not provide strong enough evidence to conclude that the variables are associated.” Students should have frequent opportunities to practice writing, with detailed feedback to help them improve.
Preparing for the AP ExamWhen writing hypotheses, students should refer to the population, using language from the question. For example, “The null hypothesis is that the age group at diagnosis and gender are independent (i.e., they are not associated) for the population of people currently being treated for schizophrenia” (see Scoring Guidelines for 2017 FRQ 5). As always, students should name the test and provide evidence verifying appropriate conditions. For chi-square tests, the conditions are (1) random selection or randomized experiment and (2) large counts. Students should be sure to say that all expected counts (rather than actual counts) are at least 5. Students need to clearly present calculations and state the conclusion in context with linkage to p -values. Students should avoid tacitly accepting the null hypothesis. If the p -value is greater than conventional significance levels, the correct conclusion of a chi-square test for independence would be that there is insufficient evidence that there is an association.
Return to Table of Contents© 2020 College Board
Course Framework V.1 | 179AP Statistics Course and Exam Description

Inference for Categorical Data: Chi-SquareUNIT
8
UNIT AT A GLANCE
Endu
ring
Unde
rsta
ndin
g
Topic Skills
Class Periods
~10–11 CLASS PERIODS
VA
R-1 8.1 Introducing Statistics: Are
My Results Unexpected?1.A Identify the question to be answered or problem to be solved (not assessed).
VA
R-8
8.2 Setting Up a Chi-Square Goodness of Fit Test
3.C Describe probability distributions.
1.F Identify null and alternative hypotheses.1.E Identify an appropriate inference method for significance tests.3.A Determine relative frequencies, proportions, or probabilities using simulation or calculations.4.C Verify that inference procedures apply in a given situation.
VA
R-8
, DA
T-3
8.3 Carrying Out a Chi-Square Test for Goodness of Fit
3.E Calculate a test statistic and find a p-value, provided conditions for inference are met.
4.B Interpret statistical calculations and findings to assign meaning or assess a claim.4.E Justify a claim using a decision based on significance tests.
VA
R-8
8.4 Expected Counts in Two-Way Tables
3.A Determine relative frequencies, proportions, or probabilities using simulation or calculations.
8.5 Setting Up a Chi-Square Test for Homogeneity or Independence
1.F Identify null and alternative hypotheses.
1.E Identify an appropriate inference method for significance tests.4.C Verify that inference procedures apply in a given situation.
VA
R-8
, DA
T-3
8.6 Carrying Out a Chi-Square Test for Homogeneity or Independence
3.E Calculate a test statistic and find a p-value, provided conditions for inference are met.
4.B Interpret statistical calculations and findings to assign meaning or assess a claim.4.E Justify a claim using a decision based on significance tests.
8.7 Skills Focus: Selecting an Appropriate Inference Procedure for Categorical Data
N/A
Go to AP Classroom to assign the Personal Progress Check for Unit 8. Review the results in class to identify and address any student misunderstandings.
Return to Table of Contents© 2020 College Board
Course Framework V.1 | 180AP Statistics Course and Exam Description

Inference for Categorical Data: Chi-SquareUNIT
8
SAMPLE INSTRUCTIONAL ACTIVITIESThe sample activities on this page are optional and are offered to provide possible ways to incorporate various instructional approaches into the classroom. They were developed in partnership with teachers from the AP community to share ways that they approach teaching some of the topics in this unit. Please refer to the Instructional Approaches section beginning on p. 207 for more examples of activities and strategies.
Activity Topic Sample Activity
1 8.1 SimulationPrepare several bags with an identical mix of at least 250 chips or beads of three colors in different proportions (e.g., red = 0.5, white = 0.3, blue = 0.2). Have each student take a random sample of 25 chips or beads from the bag, calculate
2( )Observed count Expected countExpected count
− , and plot their value on a class dotplot.
Use this graph to introduce the chi-square distribution with df = 2.
2 8.5 Discussion GroupsGive each group of three to four students an example of a chi-square test involving a two-way table. Have students work together to state appropriate hypotheses, describe a Type 1 and Type 2 error in context, and give a possible consequence of each of those errors.
3 8.7 Graphic OrganizerHave students work in teams of two to three to develop a chart that summarizes the three types of chi-square tests, including when each is appropriate, as well as the hypotheses, conditions, and degrees of freedom.
Return to Table of Contents© 2020 College Board
Course Framework V.1 | 181AP Statistics Course and Exam Description

Inference for Categorical Data: Chi-SquareUNIT
8
Required Course Content
TOPIC 8.1
Introducing Statistics: Are My Results Unexpected?
SKILL
Selecting Statistical Methods
1.A
Identify the question to be answered or problem to be solved.
ENDURING UNDERSTANDINGVAR-1
Given that variation may be random or not, conclusions are uncertain.
LEARNING OBJECTIVEVAR-1.J
Identify questions suggested by variation between observed and expected counts in categorical data. [Skill 1.A]
ESSENTIAL KNOWLEDGEVAR-1.J.1
Variation between what we find and what we expect to find may be random or not.
Return to Table of Contents© 2020 College Board
Course Framework V.1 | 182AP Statistics Course and Exam Description
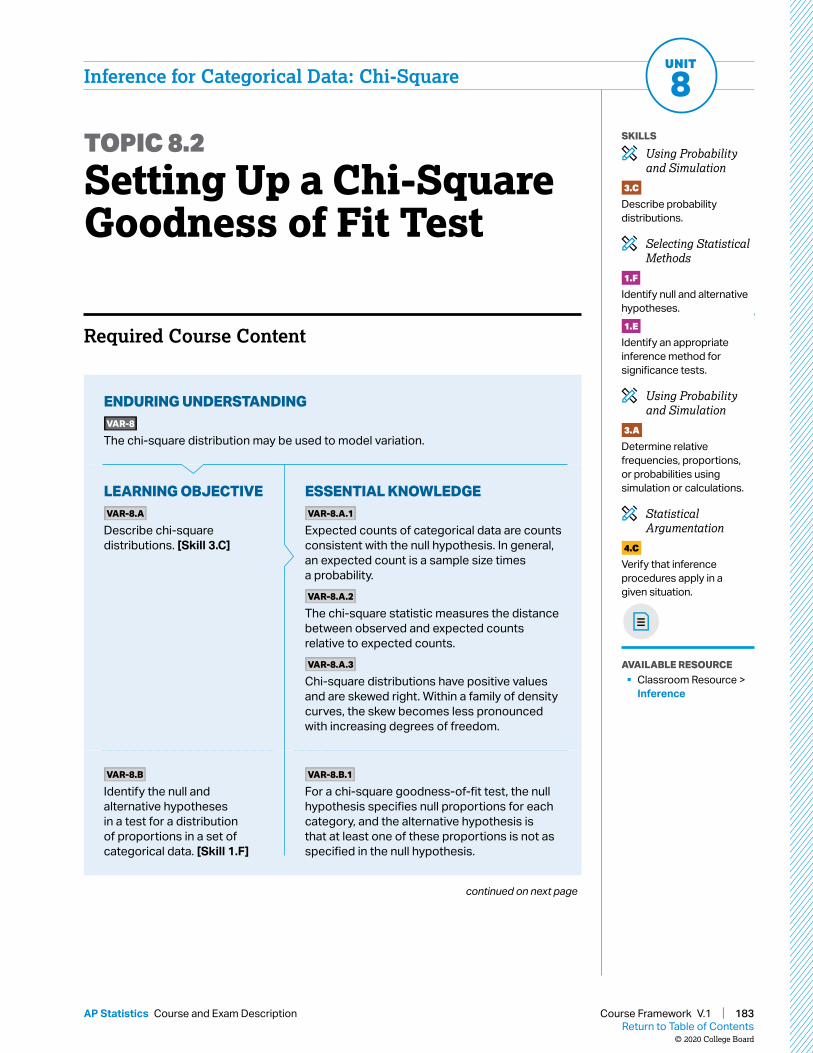
Inference for Categorical Data: Chi-SquareUNIT
8
Required Course Content
TOPIC 8.2
Setting Up a Chi-Square Goodness of Fit Test
SKILLS
Using Probability and Simulation
3.C
Describe probability distributions.
Selecting Statistical Methods
1.F
Identify null and alternative hypotheses.1.E
Identify an appropriate inference method for significance tests.
Using Probability and Simulation
3.A
Determine relative frequencies, proportions, or probabilities using simulation or calculations.
Statistical Argumentation
4.C
Verify that inference procedures apply in a given situation.
AVAILABLE RESOURCE § Classroom Resource >
Inference
ENDURING UNDERSTANDINGVAR-8
The chi-square distribution may be used to model variation.
LEARNING OBJECTIVEVAR-8.A
Describe chi-square distributions. [Skill 3.C]
ESSENTIAL KNOWLEDGEVAR-8.A.1
Expected counts of categorical data are counts consistent with the null hypothesis. In general, an expected count is a sample size times a probability.VAR-8.A.2
The chi-square statistic measures the distance between observed and expected counts relative to expected counts.VAR-8.A.3
Chi-square distributions have positive values and are skewed right. Within a family of density curves, the skew becomes less pronounced with increasing degrees of freedom.
VAR-8.B.1
For a chi-square goodness-of-fit test, the null hypothesis specifies null proportions for each category, and the alternative hypothesis is that at least one of these proportions is not as specified in the null hypothesis.
VAR-8.B
Identify the null and alternative hypotheses in a test for a distribution of proportions in a set of categorical data. [Skill 1.F]
continued on next page
Return to Table of Contents© 2020 College Board
Course Framework V.1 | 183AP Statistics Course and Exam Description

Inference for Categorical Data: Chi-SquareUNIT
8
ESSENTIAL KNOWLEDGEVAR-8.C.1
When considering a distribution of proportions for one categorical variable, the appropriate test is the chi-square test for goodness of fit.
LEARNING OBJECTIVEVAR-8.C
Identify an appropriate testing method for a distribution of proportions in a set of categorical data. [Skill 1.E]
VAR-8.D.1
Expected counts for a chi-square goodness-of-fit test are (sample size)(null proportion).
VAR-8.D
Calculate expected counts for the chi-square test for goodness of fit. [Skill 3.A]
VAR-8.E.1
In order to make statistical inferences for a chi-square test for goodness of fit we must check the following:a. To check for independence:
i. Data should be collected using a random sample or randomized experiment.
ii. When sampling without replacement, check that 10%n N≤ .
b. The chi-square test for goodness of fit becomes more accurate with more observations, so large counts should be used (shape).i. A conservative check for large counts
is that all expected counts should be greater than 5.
VAR-8.E
Verify the conditions for making statistical inferences when testing goodness of fit for a chi-square distribution. [Skill 4.C]
Return to Table of Contents© 2020 College Board
Course Framework V.1 | 184AP Statistics Course and Exam Description

Inference for Categorical Data: Chi-SquareUNIT
8
Required Course Content
TOPIC 8.3
Carrying Out a Chi-Square Test for Goodness of Fit
SKILLS
Using Probability and Simulation
3.E
Calculate a test statistic and find a p-value, provided conditions for inference are met.
Statistical Argumentation
4.B
Interpret statistical calculations and findings to assign meaning or assess a claim. 4.E
Justify a claim using a decision based on significance tests.
AVAILABLE RESOURCE § Classroom Resource >
Inference
ENDURING UNDERSTANDINGVAR-8
The chi-square distribution may be used to model variation.
LEARNING OBJECTIVEVAR-8.F
Calculate the appropriate statistic for the chi-square test for goodness of fit. [Skill 3.E]
ESSENTIAL KNOWLEDGEVAR-8.F.1
The test statistic for the chi-square test for goodness of fit is
22 ( )Observed count Expected count
Expected count
,
with 1degreesof freedom number of categories= − .
VAR-8.F.2
The distribution of the test statistic assuming the null hypothesis is true (null distribution) can be either a randomization distribution or, when a probability model is assumed to be true, a theoretical distribution (chi-square).
VAR-8.G.1
The p-value for a chi-square test for goodness of fit for a number of degrees of freedom is found using the appropriate table or computer generated output.
VAR-8.G
Determine the p-value for chi-square test for goodness of fit significance test. [Skill 3.E]
continued on next page
Return to Table of Contents© 2020 College Board
Course Framework V.1 | 185AP Statistics Course and Exam Description

Inference for Categorical Data: Chi-SquareUNIT
8
ENDURING UNDERSTANDINGDAT-3
Significance testing allows us to make decisions about hypotheses within a particular context.
LEARNING OBJECTIVEDAT-3.I
Interpret the p-value for the chi-square test for goodness of fit. [Skill 4.B]
ESSENTIAL KNOWLEDGEDAT-3.I.1
An interpretation of the p-value for the chi-square test for goodness of fit is the probability, given the null hypothesis and probability model are true, of obtaining a test statistic as, or more, extreme than the observed value.
DAT-3.J.1
A decision to either reject or fail to reject the null hypothesis is based on comparison of the p-value to the significance level, .DAT-3.J.2
The results of a chi-square test for goodness of fit can serve as the statistical reasoning to support the answer to a research question about the population that was sampled.
DAT-3.J
Justify a claim about the population based on the results of a chi-square test for goodness of fit. [Skill 4.E]
Return to Table of Contents© 2020 College Board
Course Framework V.1 | 186AP Statistics Course and Exam Description
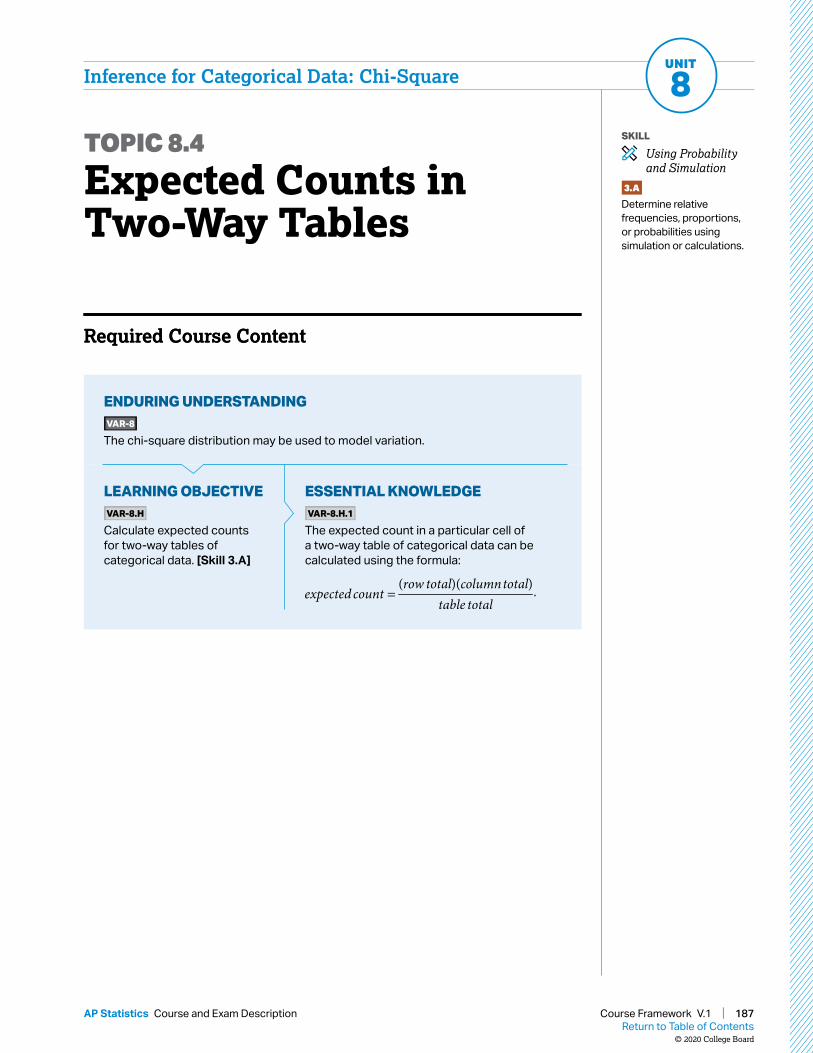
Inference for Categorical Data: Chi-SquareUNIT
8
Required Course Content Required Course Content
TOPIC 8.4
Expected Counts in Two-Way Tables
SKILL
Using Probability and Simulation
3.A
Determine relative frequencies, proportions, or probabilities using simulation or calculations.
ENDURING UNDERSTANDINGVAR-8
The chi-square distribution may be used to model variation.
LEARNING OBJECTIVEVAR-8.H
Calculate expected counts for two-way tables of categorical data. [Skill 3.A]
ESSENTIAL KNOWLEDGEVAR-8.H.1
The expected count in a particular cell of a two-way table of categorical data can be calculated using the formula:
( )( )row total columntotalexpected count
table total= .
Return to Table of Contents© 2020 College Board
Course Framework V.1 | 187AP Statistics Course and Exam Description

Inference for Categorical Data: Chi-SquareUNIT
8
Required Course Content
TOPIC 8.5
Setting Up a Chi-Square Test for Homogeneity or Independence
AVAILABLE RESOURCE § Classroom Resource >
Inference
SKILLS
Selecting Statistical Methods
1.F
Identify null and alternative hypotheses.1.E
Identify an appropriate inference method for significance tests.
Statistical Argumentation
4.C
Verify that inference procedures apply in a given situation.
ENDURING UNDERSTANDINGVAR-8
The chi-square distribution may be used to model variation.
LEARNING OBJECTIVEVAR-8.I
Identify the null and alternative hypotheses for a chi-square test for homogeneity or independence. [Skill 1.F]
ESSENTIAL KNOWLEDGEVAR-8.I.1
The appropriate hypotheses for a chi-square test for homogeneity are:
0H : There is no difference in distributions of a categorical variable across populations or treatments.
aH : There is a difference in distributions of a categorical variable across populations or treatments.VAR-8.I.2
The appropriate hypotheses for a chi-square test for independence are:
0H : There is no association between two categorical variables in a given population or the two categorical variables are independent.
aH : Two categorical variables in a population are associated or dependent.
continued on next page
Return to Table of Contents© 2020 College Board
Course Framework V.1 | 188AP Statistics Course and Exam Description
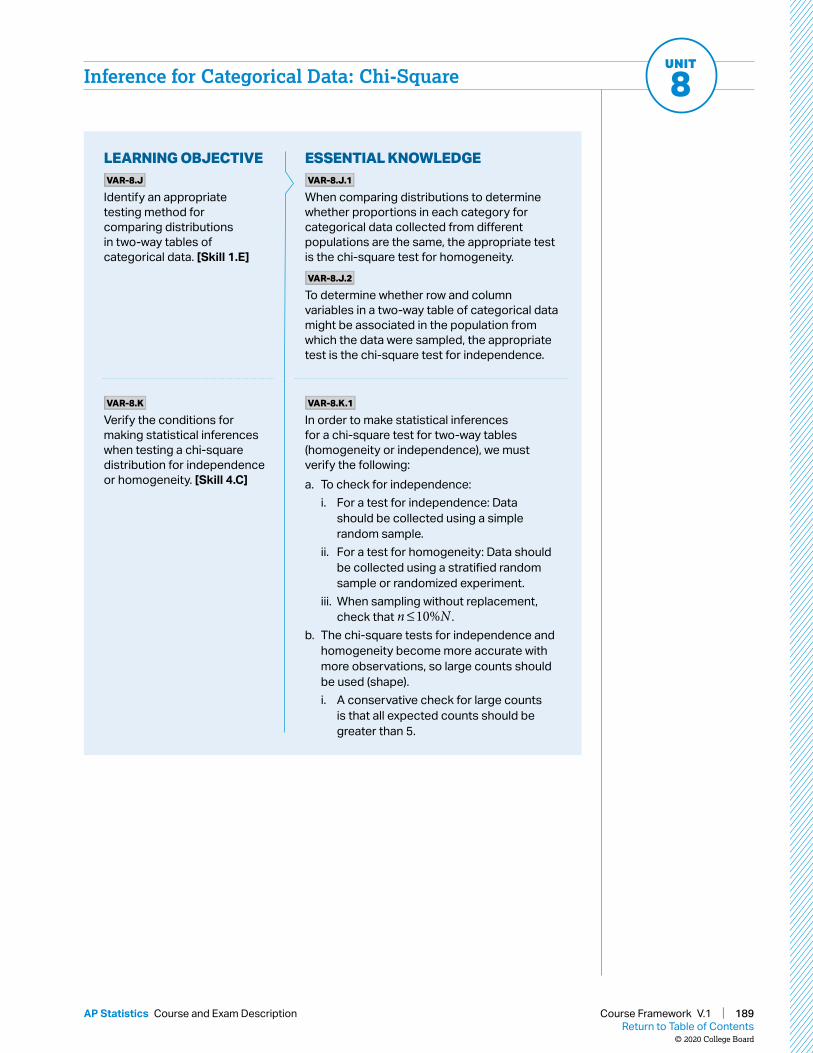
Inference for Categorical Data: Chi-SquareUNIT
8
ESSENTIAL KNOWLEDGEVAR-8.J.1
When comparing distributions to determine whether proportions in each category for categorical data collected from different populations are the same, the appropriate test is the chi-square test for homogeneity.VAR-8.J.2
To determine whether row and column variables in a two-way table of categorical data might be associated in the population from which the data were sampled, the appropriate test is the chi-square test for independence.
LEARNING OBJECTIVEVAR-8.J
Identify an appropriate testing method for comparing distributions in two-way tables of categorical data. [Skill 1.E]
VAR-8.K.1
In order to make statistical inferences for a chi-square test for two-way tables (homogeneity or independence), we must verify the following:a. To check for independence:
i. For a test for independence: Data should be collected using a simple random sample.
ii. For a test for homogeneity: Data should be collected using a stratified random sample or randomized experiment.
iii. When sampling without replacement, check that 10%n N≤ .
b. The chi-square tests for independence and homogeneity become more accurate with more observations, so large counts should be used (shape).i. A conservative check for large counts
is that all expected counts should be greater than 5.
VAR-8.K
Verify the conditions for making statistical inferences when testing a chi-square distribution for independence or homogeneity. [Skill 4.C]
Return to Table of Contents© 2020 College Board
Course Framework V.1 | 189AP Statistics Course and Exam Description

Inference for Categorical Data: Chi-SquareUNIT
8
TOPIC 8.6
Carrying Out a Chi-Square Test for Homogeneity or Independence
SKILLS
Using Probability and Simulation
3.E
Calculate a test statistic and find a p-value, provided conditions for inference are met.
Statistical Argumentation
4.B
Interpret statistical calculations and findings to assign meaning or assess a claim. 4.E
Justify a claim using a decision based on significance tests.
AVAILABLE RESOURCE § Classroom Resource >
Inference
Required Course Content
ENDURING UNDERSTANDINGVAR-8
The chi-square distribution may be used to model variation.
LEARNING OBJECTIVEVAR-8.L
Calculate the appropriate statistic for a chi-square test for homogeneity or independence. [Skill 3.E]
VAR-8.M
Determine the p-value for a chi-square significance test for independence or homogeneity. [Skill 3.E]
ESSENTIAL KNOWLEDGEVAR-8.L.1
The appropriate test statistic for a chi-square test for homogeneity or independence is the chi-square statistic:
22 ( )Observed count Expected count
Expected count
,
with degrees of freedom equal to:( 1)( 1)number of rows number of columns− − .
VAR-8.M.1
The p-value for a chi-square test for independence or homogeneity for a number of degrees of freedom is found using the appropriate table or technology.VAR-8.M.2
For a test of independence or homogeneity for a two-way table, the p -value is the proportion of values in a chi-square distribution with appropriate degrees of freedom that are equal to or larger than the test statistic.
continued on next page
Return to Table of Contents© 2020 College Board
Course Framework V.1 | 190AP Statistics Course and Exam Description

Inference for Categorical Data: Chi-SquareUNIT
8
ENDURING UNDERSTANDINGDAT-3
Significance testing allows us to make decisions about hypotheses within a particular context.
LEARNING OBJECTIVEDAT-3.K
Interpret the p-value for the chi-square test for homogeneity or independence. [Skill 4.B]
DAT-3.L
Justify a claim about the population based on the results of a chi-square test for homogeneity or independence. [Skill 4.E]
ESSENTIAL KNOWLEDGEDAT-3.K.1
An interpretation of the p-value for the chi-square test for homogeneity or independence is the probability, given the null hypothesis and probability model are true, of obtaining a test statistic as, or more, extreme than the observed value.
DAT-3.L.1
A decision to either reject or fail to reject the null hypothesis for a chi-square test for homogeneity or independence is based on comparison of the p-value to the significance level, .DAT-3.L.2
The results of a chi-square test for homogeneity or independence can serve as the statistical reasoning to support the answer to a research question about the population that was sampled (independence) or the populations that were sampled (homogeneity).
Return to Table of Contents© 2020 College Board
Course Framework V.1 | 191AP Statistics Course and Exam Description

Inference for Categorical Data: Chi-SquareUNIT
8
TOPIC 8.7Skills Focus: Selecting an Appropriate Inference Procedure for Categorical Data
AVAILABLE RESOURCE § Classroom Resource >
Inference
Required Course Content
This topic is intended to focus on the skill of selecting an appropriate inference procedure now that students have a range of options. Students should be given opportunities to practice when and how to apply all learning objectives relating to inference for categorical data.
Return to Table of Contents© 2020 College Board
Course Framework V.1 | 192AP Statistics Course and Exam Description

AP STATISTICS
UNIT
Inference for Quantitative Data: Slopes
2–5%
AP EXAM WEIGHTING
~7–8CLASS PERIODS
69
193Return to Table of Contents
© 2020 College Board
Course Framework V.1 | 193AP Statistics Course and Exam Description

Remember to go to AP Classroom to assign students the online Personal Progress Check for this unit.
Whether assigned as homework or completed in class, the Personal Progress Check provides each student with immediate feedback related to this unit’s topics and skills.
Personal Progress Check 9Multiple-choice: ~25 questions Free-response: 1 question
§ Inference and Exploring Data
Return to Table of Contents© 2020 College Board
Course Framework V.1 | 194AP Statistics Course and Exam Description

Inference for Quantitative Data: Slopes
2–5% AP EXAM WEIGHTINGUNIT
9 ~7–8 CLASS PERIODS
Developing UnderstandingStudents may be surprised to learn that there is variability in slope. In their experience in previous courses, the slope of the line of best fit does not vary for a particular set of bivariate quantitative data. However, suppose that every student in a university physics course collects data on spring length for 10 different hanging masses and calculates the least-squares regression line for their sample data. The students’ slopes would likely vary as part of an approximately normal sampling distribution centered at the (true) slope of the population regression line relating spring length to hanging mass. In this unit, students will learn how to construct confidence intervals for and perform significance tests about the slope of a population regression line when appropriate conditions are met.
BIG IDEA 1Variation and Distribution VAR
§ How can there be variability in slope if the slope statistic is uniquely determined for a line of best fit?
BIG IDEA 2Patterns and Uncertainty UNC
§ When is it appropriate to perform inference about the slope of a population regression line based on sample data?
BIG IDEA 3Data-Based Predictions, Decisions, and Conclusions DAT
§ Why do we not conclude that there is no correlation between two variables based on the results of a statistical inference for slopes?
Building Course Skills1.A 4.B 4.E
In Unit 9, students should have multiple opportunities to practice interpreting the slope, y-intercept, 2r , standard deviation of the residual s , and standard error of the slope in context from computer output. They should refrain from using deterministic language such as “a 1-foot increase in X is associated with a 0.445-point increase in Y,” instead framing the association in terms of potential outcomes (i.e., “a predicted 0.445-point increase”). Students should also practice writing “increase” or “additional” for both variables, not just the dependent variable.
Students should practice identifying what the question is asking or what needs to be solved. Without careful reading, students often provide answers that are not relevant or required, for example, conducting a significance test when the question does not call for one, or giving the expected number of successes or failures when asked to calculate a probability. Teachers can have
them practice identifying the task before they begin, then checking that the response they’ve provided addresses the task.
Preparing for the AP ExamStudents should pay attention to timing as they work through full-length sections of past exams in order to leave enough time to complete the investigative task, which is weighted more heavily than the other free-response questions. The investigative task includes both familiar course content and questions requiring extended reasoning. As an example of a straightforward application of a topic from this unit, 2007 Form B FRQ 6 part b asks students to find a 95% confidence interval for the slope of a regression line. This familiar task gives students an opportunity to gain confidence and earn some credit, and it serves as an entry to subsequent parts of the question. Although the investigative task will require students to transfer course skills to unfamiliar settings, students who understand course content will have everything they need to complete the task.
Return to Table of Contents© 2020 College Board
Course Framework V.1 | 195AP Statistics Course and Exam Description

Inference for Quantitative Data: SlopesUNIT
9
UNIT AT A GLANCE
Endu
ring
Unde
rsta
ndin
g
Topic Skills
Class Periods
~7–8 CLASS PERIODS
VA
R-1 9.1 Introducing Statistics:
Do Those Points Align?1.A Identify the question to be answered or problem to be solved (not assessed).
UN
C-4
9.2 Confidence Intervals for the Slope of a Regression Model
1.D Identify an appropriate inference method for confidence intervals.
4.C Verify that inference procedures apply in a given situation.
3.D Construct a confidence interval, provided conditions for inference are met.
9.3 Justifying a Claim About the Slope of a Regression Model Based on a Confidence Interval
4.B Interpret statistical calculations and findings to assign meaning or assess a claim.
4.D Justify a claim based on a confidence interval.
4.A Make an appropriate claim or draw an appropriate conclusion.
VA
R-7
9.4 Setting Up a Test for the Slope of a Regression Model
1.E Identify an appropriate inference method for significance tests.
1.F Identify null and alternative hypotheses.
4.C Verify that inference procedures apply in a given situation.
VA
R-7
, D
AT-
3
9.5 Carrying Out a Test for the Slope of a Regression Model
3.E Calculate a test statistic and find a p-value, provided conditions for inference are met.
4.B Interpret statistical calculations and findings to assign meaning or assess a claim.
4.E Justify a claim using a decision based on significance tests.
9.6 Skills Focus: Selecting an Appropriate Inference Procedure
N/A
Go to AP Classroom to assign the Personal Progress Check for Unit 9. Review the results in class to identify and address any student misunderstandings.
Return to Table of Contents© 2020 College Board
Course Framework V.1 | 196AP Statistics Course and Exam Description
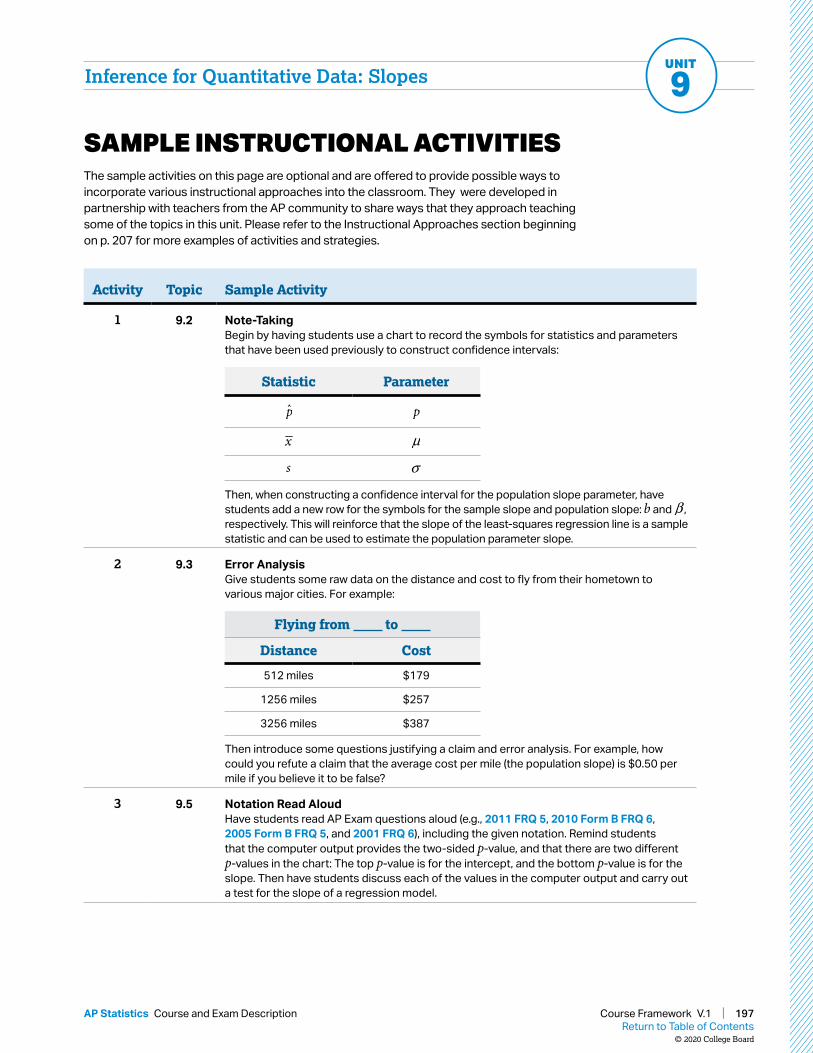
Inference for Quantitative Data: SlopesUNIT
9
SAMPLE INSTRUCTIONAL ACTIVITIESThe sample activities on this page are optional and are offered to provide possible ways to incorporate various instructional approaches into the classroom. They were developed in partnership with teachers from the AP community to share ways that they approach teaching some of the topics in this unit. Please refer to the Instructional Approaches section beginning on p. 207 for more examples of activities and strategies.
Activity Topic Sample Activity
1 9.2 Note-TakingBegin by having students use a chart to record the symbols for statistics and parameters that have been used previously to construct confidence intervals:
Statistic Parameter
p p
x μ
s σ
Then, when constructing a confidence interval for the population slope parameter, have students add a new row for the symbols for the sample slope and population slope: b and β , respectively. This will reinforce that the slope of the least-squares regression line is a sample statistic and can be used to estimate the population parameter slope.
2 9.3 Error AnalysisGive students some raw data on the distance and cost to fly from their hometown to various major cities. For example:
Flying from to
Distance Cost
512 miles $179
1256 miles $257
3256 miles $387
Then introduce some questions justifying a claim and error analysis. For example, how could you refute a claim that the average cost per mile (the population slope) is $0.50 per mile if you believe it to be false?
3 9.5 Notation Read AloudHave students read AP Exam questions aloud (e.g., 2011 FRQ 5, 2010 Form B FRQ 6, 2005 Form B FRQ 5, and 2001 FRQ 6), including the given notation. Remind students that the computer output provides the two-sided p-value, and that there are two different p-values in the chart: The top p-value is for the intercept, and the bottom p-value is for the slope. Then have students discuss each of the values in the computer output and carry out a test for the slope of a regression model.
Return to Table of Contents© 2020 College Board
Course Framework V.1 | 197AP Statistics Course and Exam Description

Inference for Quantitative Data: Slopes
Required Course Content
UNIT
9
TOPIC 9.1
Introducing Statistics: Do Those Points Align?
SKILL
Selecting Statistical Methods
1.A
Identify the question to be answered or problem to be solved.
ENDURING UNDERSTANDINGVAR-1
Given that variation may be random or not, conclusions are uncertain.
LEARNING OBJECTIVEVAR-1.K
Identify questions suggested by variation in scatter plots. [Skill 1.A]
ESSENTIAL KNOWLEDGEVAR-1.K.1
Variation in points’ positions relative to a theoretical line may be random or non-random.
Return to Table of Contents© 2020 College Board
Course Framework V.1 | 198AP Statistics Course and Exam Description

Inference for Quantitative Data: Slopes
Required Course Content
UNIT
9
TOPIC 9.2
Confidence Intervals for the Slope of a Regression Model
SKILLS
Selecting Statistical Methods
1.D
Identify an appropriate inference method for confidence intervals.
Statistical Argumentation
4.C
Verify that inference procedures apply in a given situation.
Using Probability and Simulation
3.D
Construct a confidence interval, provided conditions for inference are met.
AVAILABLE RESOURCE § Classroom Resource >
Inference
continued on next page
ENDURING UNDERSTANDINGUNC-4
An interval of values should be used to estimate parameters, in order to account for uncertainty.
LEARNING OBJECTIVEUNC-4.AC
Identify an appropriate confidence interval procedure for a slope of a regression model. [Skill 1.D]
ESSENTIAL KNOWLEDGEUNC-4.AC.1
Consider a response variable, y, that is linearly related to an explanatory variable, x. For a simple random sample of n observations, the sample regression line, y =a+bx , is an estimate of the population regression line µy =α+βx . For a particular observation, (xi , yi), the residual from the sample regression line, yi − yi = yi −(a+bxi ), is an estimate of yi −(α+βxi ), the deviation of the response variable from the population regression line. For all points (x, y) in the population, the standard deviation of all of the deviations of the response variable from the population regression line, σ, can be estimated by the standard deviation of the residuals from the sample regression line,
2
2i iy y
sn
. (Note: This formula
uses n – 2 in the denominator instead of n – 1 because two parameters, α and β, must be estimated to obtain the predicted values from the least-squares regression line.)
UNC-4.AC.2
For a simple random sample of n observations, let b represent the slope of a sample regression line. Then the mean of the sampling distribution for b equals the population slope: bµ β= . The standard deviation of the sampling distribution for b is b
x nσσ
σ= , where
( )2i
x
x xn
σ−
= .
UNC-4.AC.3
The appropriate confidence interval for the slope of a regression model is a t-interval for the slope.
Return to Table of Contents© 2020 College Board
Course Framework V.1 | 199AP Statistics Course and Exam Description

Inference for Quantitative Data: SlopesUNIT
9
UNC-4.AE.1
For the slope of a regression line, the margin of error is the critical value ( *t ) times the standard error (SE) of the slope.UNC-4.AE.2
The standard error for the slope of a regression line with sample standard deviation, s , is
1x
sSEs n
=−
, where s is the estimate of
and xs is the sample standard deviation of the x values.
UNC-4.AF.1
The point estimate for the slope of a regression model is the slope of the line of best fit, b.UNC-4.AF.2
For the slope of a regression model, the interval estimate is *
bb t SE .
LEARNING OBJECTIVEUNC-4.AD
Verify the conditions to calculate confidence intervals for the slope of a regression model. [Skill 4.C]
ESSENTIAL KNOWLEDGEUNC-4.AD.1
In order to calculate a confidence interval to estimate the slope of a regression line, we must check the following:a. The true relationship between x and y is
linear. Analysis of residuals may be used to verify linearity.
b. The standard deviation for y, y , does not vary with x. Analysis of residuals may be used to check for approximately equal standard deviations for all x.
c. To check for independence:i. Data should be collected using a random
sample or a randomized experiment.ii. When sampling without replacement,
check that 10%n N≤ .d. For a particular value of x, the responses
(y-values) are approximately normally distributed. Analysis of graphical representations of residuals may be used to check for normality.i. If the observed distribution is skewed,
n should be greater than 30.
UNC-4.AE
Determine the given margin of error for the slope of a regression model. [Skill 3.D]
UNC-4.AF
Calculate an appropriate confidence interval for the slope of a regression model. [Skill 3.D]
Return to Table of Contents© 2020 College Board
Course Framework V.1 | 200AP Statistics Course and Exam Description

Inference for Quantitative Data: SlopesUNIT
9
Required Course Content
TOPIC 9.3
Justifying a Claim About the Slope of a Regression Model Based on a Confidence Interval
SKILLS
Statistical Argumentation
4.B
Interpret statistical calculations and findings to assign meaning or assess a claim.4.D
Justify a claim based on a confidence interval.4.A
Make an appropriate claim or draw an appropriate conclusion.
AVAILABLE RESOURCE § Classroom Resource >
InferenceENDURING UNDERSTANDINGUNC-4
An interval of values should be used to estimate parameters, in order to account for uncertainty.
LEARNING OBJECTIVEUNC-4.AG
Interpret a confidence interval for the slope of a regression model. [Skill 4.B]
ESSENTIAL KNOWLEDGEUNC-4.AG.1
In repeated random sampling with the same sample size, approximately C% of confidence intervals created will capture the slope of the regression model, i.e., the true slope of the population regression model.UNC-4.AG.2
An interpretation for a confidence interval for the slope of a regression line should include a reference to the sample taken and details about the population it represents.
UNC-4.AH.1
A confidence interval for the slope of a regression model provides an interval of values that may provide sufficient evidence to support a particular claim in context.
UNC-4.AH
Justify a claim based on a confidence interval for the slope of a regression model. [Skill 4.D]
UNC-4.AI
Identify the effects of sample size on the width of a confidence interval for the slope of a regression model. [Skill 4.A]
UNC-4.AI.1
When all other things remain the same, the width of the confidence interval for the slope of a regression model tends to decrease as the sample size increases.
Return to Table of Contents© 2020 College Board
Course Framework V.1 | 201AP Statistics Course and Exam Description

Inference for Quantitative Data: Slopes
Required Course Content
UNIT
9
TOPIC 9.4
Setting Up a Test for the Slope of a Regression Model
SKILLS
Selecting Statistical Methods
1.E
Identify an appropriate inference method for significance tests.1.F
Identify null and alternative hypotheses.
Statistical Argumentation
4.C
Verify that inference procedures apply in a given situation.
AVAILABLE RESOURCE § Classroom Resource >
Inference
ENDURING UNDERSTANDINGVAR-7
The t-distribution may be used to model variation.
LEARNING OBJECTIVEVAR-7.J
Identify the appropriate selection of a testing method for a slope of a regression model. [Skill 1.E]
ESSENTIAL KNOWLEDGEVAR-7.J.1
The appropriate test for the slope of a regression model is a t-test for a slope.
VAR-7.K.1
The null hypothesis for a t-test for a slope is:
0 0:H β β= , where 0β is the hypothesized value from the null hypothesis. The alternative hypothesis is 0 0:H β β< or 0 0:H β β> , or
0 0:H β β≠ .
VAR-7.K
Identify appropriate null and alternative hypotheses for a slope of a regression model. [Skill 1.F]
continued on next page
Return to Table of Contents© 2020 College Board
Course Framework V.1 | 202AP Statistics Course and Exam Description

Inference for Quantitative Data: SlopesUNIT
9
LEARNING OBJECTIVEVAR-7.L
Verify the conditions for the significance test for the slope of a regression model. [Skill 4.C]
ESSENTIAL KNOWLEDGEVAR-7.L.1
In order to make statistical inferences when testing for the slope of a regression model, we must check the following:a. The true relationship between x and y is
linear. Analysis of residuals may be used to verify linearity.
b. The standard deviation for y, y , does not vary with x. Analysis of residuals may be used to check for approximately equal standard deviations for all x.
c. To check for independence:i. Data should be collected using a random
sample or a randomized experiment.ii. When sampling without replacement,
check that 10%n N≤ .d. For a particular value of x, the responses
(y-values) are approximately normally distributed. Analysis of graphical representations of residuals may be used to check for normality.i. If the observed distribution is skewed,
n should be greater than 30.ii. If the sample size is less than 30, the
distribution of the sample data should be free from strong skewness and outliers.
Return to Table of Contents© 2020 College Board
Course Framework V.1 | 203AP Statistics Course and Exam Description

Inference for Quantitative Data: Slopes
Required Course Content
UNIT
9
TOPIC 9.5
Carrying Out a Test for the Slope of a Regression Model
SKILLS
Using Probability and Simulation
3.E
Calculate a test statistic and find a p-value, provided conditions for inference are met.
Statistical Argumentation
4.B
Interpret statistical calculations and findings to assign meaning or assess a claim.4.E
Justify a claim using a decision based on significance tests.
AVAILABLE RESOURCE § Classroom Resource >
Inference
ENDURING UNDERSTANDINGVAR-7
The t-distribution may be used to model variation.
LEARNING OBJECTIVEVAR-7.M
Calculate an appropriate test statistic for the slope of a regression model. [Skill 3.E]
ESSENTIAL KNOWLEDGEVAR-7.M.1
The distribution of the slope of a regression model assuming all conditions are satisfied and the null hypothesis is true (null distribution) is a t-distribution.VAR-7.M.2
For simple linear regression when random sampling from a population for the response that can be modeled with a normal distribution for each value of the explanatory variable,
the sampling distribution of b
btSE
β−= has a
t-distribution with degrees of freedom equal to 2n . When testing the slope in a simple linear
regression model with one parameter, the slope, the test for the slope has 1df n .
continued on next page
Return to Table of Contents© 2020 College Board
Course Framework V.1 | 204AP Statistics Course and Exam Description

Inference for Quantitative Data: SlopesUNIT
9
ENDURING UNDERSTANDINGDAT-3
Significance testing allows us to make decisions about hypotheses within a particular context.
LEARNING OBJECTIVEDAT-3.M
Interpret the p-value of a significance test for the slope of a regression model. [Skill 4.B]
ESSENTIAL KNOWLEDGEDAT-3.M.1
An interpretation of the p-value of a significance test for the slope of a regression model should recognize that the p-value is computed by assuming that the null hypothesis is true, i.e., by assuming that the true population slope is equal to the particular value stated in the null hypothesis.
DAT-3.N.1
A formal decision explicitly compares the p-value to the significance . If the p-value ≤ , then reject the null hypothesis,
0 0:H . If the p-value > , then fail to reject the null hypothesis.DAT-3.N.2
The results of a significance test for the slope of a regression model can serve as the statistical reasoning to support the answer to a research question about that sample.
DAT-3.N
Justify a claim about the population based on the results of a significance test for the slope of a regression model. [Skill 4.E]
Return to Table of Contents© 2020 College Board
Course Framework V.1 | 205AP Statistics Course and Exam Description

Inference for Quantitative Data: Slopes
Required Course Content
UNIT
9
AVAILABLE RESOURCE § Classroom Resource >
Inference
TOPIC 9.6
Skills Focus: Selecting an Appropriate Inference Procedure
Required Course Content
This topic is intended to focus on the skill of selecting an appropriate inference procedure now that students have a range of options. Students should be given opportunities to practice when and how to apply all learning objectives relating to inference.
Return to Table of Contents© 2020 College Board
Course Framework V.1 | 206AP Statistics Course and Exam Description

Instructional Approaches
AP STATISTICS

Selecting and Using Course Materials
This section includes descriptions of available resources and materials that many AP Statistics teachers have found helpful. Teachers are encouraged to get involved in some of the online communities to ask questions, discuss ideas, and trade thoughts with other teachers.
TextbooksThe foundational component for most classes is still the textbook, and there are many excellent textbooks to choose from. Most current textbooks come with an array of resources designed to provide reinforcement for the students and facilitate the assessment process for the teacher. For example, some textbooks provide an accompanying pacing guide, a bank of practice questions, activities for each unit, video tutorials, or online homework problems that coincide with each chapter.
While the College Board provides examples of textbooks on AP Central to help determine whether a text is considered appropriate in meeting the AP Statistics Course Audit curricular requirement, teachers select textbooks locally. Also note that many publishers offer teachers the opportunity to request a sample copy of a textbook they are interested in adopting for classroom use. This process allows teachers to review materials in order to determine what book will work best for them and their students.
The Use of TechnologyThe AP Statistics course depends heavily on the availability of technology suitable for the interactive, investigative aspects of data analysis. Ideally, students should have access to both computers and calculators for work in and outside the classroom.
A computer does more than eliminate the drudgery of hand computation and graphing—it is an essential tool for structured inquiry. First, it produces graphs that are specifically designed for data analysis. These graphical displays make it easier to observe patterns in data, to identify important subgroups of the data, and to locate any unusual data points. Second, the computer allows the student to fit complex mathematical models
to the data and to assess how well the model fits the data by examining the residuals. Finally, the computer is helpful in identifying an observation that has an undue influence on the analysis and in isolating its effects.
In addition to its use in data analysis, the computer facilitates the simulation approach to probability that is emphasized in the AP Statistics course. Probabilities of random events, probability distributions of random variables, and sampling distributions of statistics can be studied conceptually, using simulation. This frees the student and teacher from a narrow approach that depends on a few simple probabilistic models.
Because the computer is central to what statisticians do, it is considered essential for teaching the AP Statistics course. However, it is not yet possible for students to have access to a computer during the AP Statistics Exam. Without a computer and under the conditions of a timed exam, students cannot be asked to perform the amount of computation that is needed for many statistical investigations. Consequently, standard computer output will be provided as necessary and students will be expected to interpret it. For an example of computer output, see sample multiple-choice question #16 on p. 247.
Currently, the graphing calculator is the only computational aid that is available to students for use as a tool for data analysis on the AP Statistics Exam. Computational capabilities of graphing calculators used in the course and on the exam should include standard statistical univariate and bivariate summaries through linear regression. Graphical capabilities should include common univariate and bivariate displays such as histograms, boxplots, and scatterplots. Students find calculators where data are entered into a spreadsheet format particularly easy to use.
Students may not use minicomputers, pocket organizers, electronic writing pads, or calculators with QWERTY (i.e., typewriter) keyboards on the AP Statistics Exam. For a complete list of calculators eligible for use on the exam, see Calculator Policy for AP Statistics, found on the AP Statistics course page on apstudent .collegeboard.org. The calculator memory will not
Return to Table of Contents© 2020 College Board
Instructional Approaches V.1 | 209AP Statistics Course and Exam Description

be cleared, but students may only use the memory to store programs, not notes. For the exam, students are not allowed to access any information in their graphing calculators or elsewhere if it's not directly related to upgrading the statistical functionality of older graphing calculators to make them comparable to statistical features found on newer models. The only acceptable upgrades are those that improve the computational functionalities and/or graphical functionalities for data they key into the calculator while taking the examination. Unacceptable enhancements include, but are not limited to, keying or scanning text or response templates into the calculator. Students attempting to augment the capabilities of their graphing calculators in any way other than for the purpose of upgrading features as described above will be considered to be cheating on the exam.
Online Tools and ResourcesIn addition to the resources offered through a teacher's choice of textbook, many great resources exist online—and are often free. These include sample test questions, applets, simulations, question banks, and best practices. Teachers can sample these resources to find which ones can most benefit their students.
APPLETS AND SIMULATIONSThe use of internet-based applets or simulation sites is fast becoming a critical component of the AP Statistics pedagogy. Interpreting data procured through a simulation process is an important skill not only for the AP Exam but also for sound statistical reasoning in other contexts. Thus, it is important that students have experience with producing and interpreting data. Below are a few examples of free applets and simulation programs that are easily incorporated into classroom activities and instruction. This is not a comprehensive list, nor is it an endorsement of any of these resources.
§ StatKey lock5stat.com/StatKey Designed by the authors of Statistics: Unlocking the Power of Data (published by John Wiley & Sons) “to help introductory students understand and easily implement bootstrap intervals and randomization tests.”1
§ StatCrunch statcrunch.com/explore.php This web-based statistical software allows users to share data sets, results, and reports. In conjunction with Pearson publishers.
1 “StatKey: Online Tools for Bootstrap Intervals and Randomization Tests,” iase-web.org/icots/9/proceedings/pdfs/ICOTS9_9B2_LOCKMORGAN.pdf
§ Rossman/Chance Applet Collection rossmanchance.com/applets Designed by a former AP Statistics Chief Reader, this site has lots of applets with simulations for use in the classroom (in conjunction with Workshop Statistics: Discovery with Data, published by John Wiley & Sons).
§ Stapplet stapplet.com This online tool has a simple interface organized around different topics in the AP Statistics curriculum (in conjunction with The Practice of Statistics, published by W.H. Freeman & Co).
§ Art of Stat artofstat.com Designed by a former Chief Reader, this site has interactive web apps, downloadable data sets, and user-friendly how-to guides (in conjunction with Statistics: The Art and Science of Learning from Data, published by Pearson).
STUDENT PRACTICEEven with the best lessons in place, students will still need additional reinforcement with particular concepts from time to time. These sites provide additional practice for students who want to review specific content areas on their own time.
§ STATS4STEM AP Review Assignments stats4stem.org Supported by the National Science Foundation (NSF), this site provides a collection of learning, assessment, tutoring, data, and computing resources for statistics educators and their students. The assessment and tutoring features allow for instantaneous student feedback with question-specific hints for students who are struggling.
§ LOCUS locus.statisticseducation.org LOCUS is a project funded by the National Science Foundation (NSF), focused on developing assessments of statistical understanding. They provide assessments that measure students’ understanding across levels of development as identified in the Guidelines for Assessment and Instruction in Statistics Education (GAISE) Report. The items and resources can be viewed according to grade level or by components of the statistical problem-solving process. Their content has been reviewed and endorsed by the American Statistical Association (ASA) and National Council of Teachers of Mathematics (NCTM).
Return to Table of Contents© 2020 College Board
Instructional Approaches V.1 | 210AP Statistics Course and Exam Description

CONTENT REINFORCEMENTIf a teacher is looking for resources or activities to use for a particular unit, there are many sites offering activities that can be used throughout the course. Some of these sites offer a listing of best practices. Others will offer guidance on how to present or explain certain content that may be useful.
§ Stats Medic statsmedic.com This site includes pacing guides, daily schedules, and activities for both AP Statistics and Intro Statistics courses.
§ StatsMonkey apstatsmonkey.com This site provides additional notes and resources for AP Statistics topics. It also contains dozens of references and activities.
§ mathcoachblog mathcoachblog.com/ap-statistics-reading This site contains best practices presentation files created by AP Statistics readers as well as many examples of how to use desmos.com in class.
ONLINE COMMUNITIESOnline communities provide opportunities for collaboration. While some teachers are the only AP Statistics teacher in their school or district, online communities offer a place to discuss strategies, plan timelines, or share insights. Students can also benefit from interactive online discussions and statistics activities.
§ What’s Going On in This Graph nytimes.com/column/whats-going-on-in -this-graph These activities are designed by The Learning Network and hosted by The New York Times. Students interpret graphs based on their
statistical knowledge and participate in live discussions with other students and teachers from across the country. New graphs are posted on a regular basis throughout the school year.
§ Twitter twitter.com There are many AP Statistics teachers on Twitter who share ideas and insights into teaching the course. Search hashtags like #edchat and #statschat to find the latest educational conversations.
§ Facebook - AP Statistics Groups facebook.com There are multiple Facebook groups set up for AP Statistics teachers to share ideas, swap resources, and offer advice and other support. Groups include AP Stats Survival, AP Stats Teachers Support Group, and the AP Statistics Readers Group (this group is limited to readers of the AP Statistics Exam).
§ Census at School ww2.amstat.org/censusatschool Census at School is an international classroom project that engages students in grades 4–12 in statistical problem solving. Students complete a brief online survey, analyze their class census results, and compare their class with random samples of students in the United States and other countries.
§ This is Statistics thisisstatistics.org Sponsored by the American Statistical Association (ASA), this site contains many resources for teachers, students, and counselors for use in the classroom. It also highlights the opportunities and advantages gained from enrolling in statistics courses in high school and college. This is a great source to help recruit students to take AP Statistics.
Return to Table of Contents© 2020 College Board
Instructional Approaches V.1 | 211AP Statistics Course and Exam Description

Hands-on ManipulativesSince a major component of the AP Statistics course deals with the proper gathering and interpreting of data, it is important that students spend at least part of the year gathering data of their own.
Activities that involve gathering data through simulation exercises should be incorporated throughout the year. Computer programs are useful for working in large scales of data and running greater numbers of simulations, but the initial process of simulating a chance event and generating data from that event is more valuable to students if they are actively generating that data themselves.
For that reason, running an exercise that simulates the event in a convenient way for students to do in class is strongly encouraged. Often this can be done with simple everyday items, including dice, cards, coins, beads, and bead counters. Or, there are many activities online that simulate the use of candy, beads, or other simple items. Large post-it easel paper can be used to display the results around the classroom, summarize the work, and keep it visible to refer to later in the year.
Professional OrganizationsProfessional organizations also serve as excellent resources for best practices and professional development opportunities. Below is a list of prominent organizations that serve the statistics and math education communities.
§ American Statistical Association (ASA) amstat.org The American Statistical Association is the world’s largest community of statisticians, supporting excellence in the development, application, and
dissemination of statistical science through meetings, publications, membership services, education, accreditation, and advocacy.
§ National Math and Science Initiative (NMSI) nms.org NMSI is a nonprofit organization whose mission is to improve student performance in the subjects of science, technology, engineering, and math (STEM) in the United States. It employs experienced AP teachers to train students and teachers in the STEM courses.
§ Consortium for the Advancement of Undergraduate Statistics Education (CAUSE) causeweb.org/cause CAUSE is a national organization whose mission is to support and advance undergraduate statistics education, in four target areas: resources, professional development, outreach, and research. The site includes simulations, data sets, sample lectures, fun activities, and cartoons to use in the classroom.
§ National Council of Teachers of Mathematics (NCTM) nctm.org Founded in 1920, NCTM is the world’s largest mathematics education organization, advocating for high-quality mathematics teaching and learning for each and every student.
Return to Table of Contents© 2020 College Board
Instructional Approaches V.1 | 212AP Statistics Course and Exam Description

Instructional Strategies
The AP Statistics course framework outlines the concepts and skills students must master in order to be successful on the AP Exam. In order to address those concepts and skills effectively, it helps to incorporate a variety of instructional approaches into daily lessons and activities. Important components of the course should include the use of technology, projects and laboratories, cooperative group problem-solving, and writing.
Note that the AP Statistics course lends itself naturally to a mode of teaching that engages students in constructing their own knowledge. For example, students working
individually or in small groups can plan and perform data collection and analyses where the teacher serves in the role of a facilitator rather than a lecturer. This gives students ample opportunity to think through problems, make decisions, and share questions and conclusions with other students as well as with the teacher.
These approaches, along with targeted strategies for teaching AP Statistics, will allow students to build interdisciplinary connections with other subjects and with their world outside of school. The following table presents strategies that can help students apply their understanding of course concepts.
Strategy Definition Purpose Example
Ask the Expert Students are assigned as “experts” on problems they have mastered; groups rotate through the expert stations to learn about problems they have not yet mastered.
Provides opportunities for students to share their knowledge and learn from one another.
When practicing probability problems, assign students as “experts” on mutually exclusive events, conditional probability, independent events, and unions of events. Have students rotate through stations in groups, working with the station expert to complete a small batch of problems that apply a particular probability rule.
Build the Model Solution
Students work in pairs to assemble a sentence representing a model solution to a free-response question.
Helps students build proficiency with precise language and communication, especially for topics that involve interpretations (e.g., confidence intervals and correlation coefficients).
Take a printed version of a model solution and cut it apart into sections (e.g., grouped by phrases). Print and cut out additional words that do not belong in the response (e.g., include the word “mean” if the response is supposed to be about a “proportion”). Distribute sets of these strips to student pairs and have them select which strips are relevant and assemble those into a model solution. They should set aside the strips that are not relevant to the solution.
continued on next page
Return to Table of Contents© 2020 College Board
Instructional Approaches V.1 | 213AP Statistics Course and Exam Description

Strategy Definition Purpose Example
Create Representations
Students create pictures, tables, graphs, lists, equations, models, and/or verbal expressions to interpret text or data.
Helps organize information using multiple ways to present data and to answer a question or show a problem solution.
Pair students up and give one partner a graphical display and the other student a blank piece of paper. Without sharing their papers with their partners, the student with the graph should describe their distribution to the other student. The other student should draw the graph based solely on the description they were given. Next, have students compare graphs and discuss how the instructions could have been clearer.
Debriefing Students discuss their understanding of a concept to lead to consensus on its meaning.
Helps clarify misconceptions and deepen understanding of content.
Provide students with a dotplot of 50 individuals’ heights, as well as a numbered list of those heights (from 01 to 50). First, ask each student to randomly select two heights from the list using a random number generator or a random number table and then find the mean of these two heights. Have all students collectively create a dotplot of their sample means. Inform students that this is called a sampling distribution with a sample size of 2. Next, have students discuss with a partner and develop an explanation of what a sampling distribution is and why it is utilized.
Discussion Groups
Students work within groups to discuss content, to create problem solutions, and to explain and justify a solution.
Aids understanding through the sharing of ideas, interpretation of concepts, and analysis of problem scenarios.
Give each group of students an example of a statistical test. Have students work together to write out the null and alternative hypothesis in words. They should then work together to determine Type I and Type II errors as well as potential consequences of those errors. Different groups would then compare answers, and if there is any disagreement, they will need to rationalize their decisions.
Error Analysis Students analyze an existing solution to determine whether (or where) errors have occurred.
Allows students to troubleshoot existing errors so they can solve correctly when they do the same types of problems on their own.
Provide students a sample response that implicitly accepts the null hypothesis and ask them to explain the faulty reasoning.
continued on next page
Return to Table of Contents© 2020 College Board
Instructional Approaches V.1 | 214AP Statistics Course and Exam Description

Strategy Definition Purpose Example
FRQ Partner Quiz (also see The Scribe and the Calculator)
Students work with a partner to solve a problem. However, only one of the partners is allowed to write on the paper, and only the other is allowed to use the calculator.
Students must communicate and discuss how to do the problem more so than in a typical group setting.
Have students work with partners on a statistical situation (test or interval). Have them discuss which test or interval they need to do. The student with the calculator will find the test statistic and p-value (or will find the interval). The student with the paper will write down the hypothesis (if a test) and assumptions/conditions. Once they get the test statistic and p-value (or the interval), have them write up the decision and/or conclusion. Have students switch jobs for the next problem.
Gallery Walk Student pairs write their solution on a large piece of paper and post on a wall in the room. Students stand in front of their solutions and then move to the right to the next solution. Using sticky notes, students write a positive comment about the response; then move to the right again and continue the process until they’ve visited all posted responses. Pairs then return to their original solution and read the feedback.
Provides feedback from multiple perspectives, is more immediate than teacher feedback on students’ writing, and gives students practice reading and doing error analysis on existing responses.
This strategy can be used anytime students are practicing free-response questions (FRQs), especially when asked to justify their answer. It also serves well as a method for end-of-unit or end-of-course review.
Graphic Organizer
Students represent ideas and information visually (e.g., Venn diagrams, flowcharts).
Provides students a visual system for organizing multiple ideas and details related to a particular concept.
Have students create their own flowchart for determining which inference procedure applies for a given situation.
Look for a Pattern Students observe information or create visual representations to find a trend.
Helps to identify patterns that may be used to make predictions.
Give partners a tape measure and have them measure each other’s heights and arm spans. On a large group scatterplot, have students plot the data point that represents their measurements. Then have them describe to their partners what trends or patterns they see. Once every student has added their point to the scatterplot, ask them to predict arm spans based on different heights that you give them, including at least one instance where they are asked to extrapolate.
continued on next page
Return to Table of Contents© 2020 College Board
Instructional Approaches V.1 | 215AP Statistics Course and Exam Description

Strategy Definition Purpose Example
Marking the Text Students highlight, underline, and/or annotate text to focus on key information to help understand the text or solve the problem.
Helps the student identify important information in the text and make notes about the interpretation of tasks required and concepts to apply to reach a solution.
Give students examples of statistical situations. Have students highlight or underline the key phrases to help them determine which statistical test to use for each situation. For example, does it require a significance test or a confidence interval? Does it involve means or proportions? Is there only one variable or are there two or more variables?
Match Mine Students work in pairs to describe the layout of cards on their game board, without being able to see each other’s boards.
Emphasizes the use of appropriate vocabulary and allows students to practice accurate communication around different representations.
Create a blank 3x3 grid as a “game board” and 9 index cards depicting distributions of differing shapes, center, skewness, clustering, etc. Pair up students and insert a folder between the partners so they can’t see each other’s boards. Distribute a blank grid and a set of cards to each partner. Student A arranges the cards however they choose on their grid then describes that arrangement so that Student B can attempt to match it on their own board. When the pair thinks that they have correctly made all matches, have them compare their arrangements to see how well they did.
Model Questions Students answer questions from released AP Statistics Exams.
Provides rigorous practice and assesses students’ ability to apply multiple skills on content being presented in either a multiple choice or a free-response question.
After learning the three different chi-square tests, have students practice by completing free-response questions in which they are asked to determine which chi-square test to use and then carry out the test to find a solution.
Notation Read Aloud
Students read symbols and notational representations aloud.
Helps students to accurately interpret symbolic representations.
This strategy can be used to introduce new symbols and statistical notation to ensure that students learn proper terminology from the start. For example, after introducing symbolic notation for conditional probability, ask students to write or say aloud the verbal translation of a given problem that uses that notation.
continued on next page
Return to Table of Contents© 2020 College Board
Instructional Approaches V.1 | 216AP Statistics Course and Exam Description

Strategy Definition Purpose Example
Note-Taking Students create a record of information while reading a text or listening to a speaker.
Helps in organizing ideas and processing information.
Have students write down the conditions to be verified when calculating confidence intervals for a population proportion so they can refer to those conditions at a later point in time.
Notice and Wonder
Students are shown a data display on its own with little or no context around it. Students comment on what they notice or wonder about it.
Allows students to access the relevant information being conveyed by the graph without worrying about having to answer something “correctly.”
This strategy works equally well for a 5-minute warm-up or for a lengthier, in-depth discussion. Select an interesting graph, or one they will be seeing in an upcoming lesson, and ask students to write down three things they “notice” or “wonder” as they look at it. Then have student volunteers share their observations in groups or with the class.
Odd One Out In groups of four, students are given four problems, images, or graphs. Three of the items should have something in common. Each student in the group works with one of the four items and must decide individually whether their item fits with the other three items and then write a reason why. Students then respond within their groups.
Allows students to explore relationships and graphical features that are similar to or different from one another.
Begin by modeling an example: three images that are four-legged animals and one that’s an inanimate object. Explain why the object is the “odd one out.” Then provide each student in the group with one of four images displaying distribution graphs. Three of the graphs, for instance, could be approximately normal, while the fourth graph is bimodal. Have students examine their graph and write on mini whiteboards “Mine is in because . . .” or “Mine is out because . . . ." Have each group discuss and signal when they’ve reached consensus. Then reveal the answer and explain what the three similar graphs have in common and why the other is the odd one out.
Paraphrasing Students restate in their own words the essential information in a text or problem description.
Assists with comprehension, recall of information, and problem solving.
After reading a free-response question, have students re-express the scenario in their own words. For example, on an experimental design question, have them restate the important facets of the experiment (control, randomization, replication, the variable being measured, comparison) before reading what the question itself asks.
continued on next page
Return to Table of Contents© 2020 College Board
Instructional Approaches V.1 | 217AP Statistics Course and Exam Description

Strategy Definition Purpose Example
Password-Style Games
Students are in pairs with one student facing the teacher and the other with their back to the teacher. The teacher projects a word and the student facing the teacher describes the word to their partner. This repeats every 10 seconds for six words. Students then switch roles.
Reinforces understanding of key vocabulary terms by having students use different approaches for describing those terms.
Have students arrange themselves into partners (or triads), with one partner seated so their back is to the teacher. When projecting the term, “normal distribution,” the students facing the teacher provide clues to try to get their partner to write the term on their mini whiteboard. After 10 seconds, project a new term: “chi-square test.” Continue the process for as many terms as there are for that activity.
Peer Critique Students work in teams or with partners to critique student solutions and responses to free-response questions.
Helps to establish criteria for a model response based on content and communication.
Project an anonymous student solution to a homework question (e.g., a description of the shape, center, spread, and outliers for a histogram in context). Have students discuss/critique in their groups and share with the whole class.
Predict and Confirm
Students make conjectures about what results will develop in an activity, confirming or modifying the conjectures based on outcomes.
Stimulates thinking by making, checking, and correcting predictions based on evidence from the outcome.
Before performing a class simulation, have students discuss with their neighbor what values the distribution may take and how often they expect/predict those values to occur. For instance, what might the distribution look like for a binomial setting with 0.5p = and 16n = , when we perform 20 trials? Have students perform the simulation, then confirm their predictions.
Quickwrite Students write for a short, specific amount of time about a designated topic.
Helps generate ideas in a short time.
Provide students with a prompt, such as “Describe how to construct a sampling distribution.” Then allow 1–2 minutes for them to write a response (e.g., “obtain sample, collect responses, calculate statistic, plot statistic, repeat”). Allow more writing time for more difficult prompts.
continued on next page
Return to Table of Contents© 2020 College Board
Instructional Approaches V.1 | 218AP Statistics Course and Exam Description

Strategy Definition Purpose Example
Quiz-Quiz-Trade Students answer a question independently and then quiz a partner on the same question.
Allows students to talk to multiple peers and solve many problems while coaching each other and hearing different ways of solving or arriving at a solution.
Give students a card containing a question and have them write the answer on the back. Then have them stand up and find a partner. One student quizzes the other and then they reverse roles. Have them switch cards, find a new partner, and the process repeats.
Relief Pitcher In teams of four, students rotate from “bull pen” to “pitcher’s mound” to answer questions and earn points for the team.
Allows students to work together toward a common goal as they practice applying their statistics knowledge and skills.
This strategy works well to review multiple concepts at the end of a unit or to spiral review at the end of the course. For instance, when reviewing for a unit test, students can earn 5 points if they get a question correct when up at the “pitcher’s mound” and 3 points if they don’t know the answer but their team in the “bull pen” helps them answer it.
Reversing Interpretations
Students are provided with an interpretation and then they generate the value and a possible scenario rather than providing students the value and having them generate the interpretation.
Helps students explore the same concept from multiple approaches and deepens their understanding of why a certain interpretation aligns with a particular value in context.
Instead of only asking students to interpret the slope and y-intercept of a least-squares regression line, provide them with an interpretation and ask them to unpack it. For example, “Weight increases by 35.02 kg for each 1-meter increase in length, on average. What does this describe?”
Round Table Students are given a worksheet with multiple problems, and work individually to solve, then rotate after each problem to allow other group members to check their work.
Allows students the chance to analyze each other’s work and coach their peers, if necessary.
In groups of four, each student has an identical paper with four different problems on it. Have students complete the first one on their paper and then pass the paper clockwise to another member in their group. That student checks the first problem and then completes the second problem on the paper. Have students rotate again, and the process continues until each student has their original paper back.
continued on next page
Return to Table of Contents© 2020 College Board
Instructional Approaches V.1 | 219AP Statistics Course and Exam Description

Strategy Definition Purpose Example
Scavenger Hunt Provide students with a “starter” question. Then place solution cards around the room—each card should contain the solution to a previous problem, along with the next problem in the “scavenger hunt.” Students walk around answering each new problem and finding the corresponding solution around the room.
Allows students to self-correct and analyze their own work if they get an answer they don’t see posted.
When practicing probability calculations, place a card with a starter question somewhere in the classroom, for example:Calculate the expected number of tardy students for the probability distribution:
X 0 1 2 3
( )P X 0.5 0.3 0.1 0.1
Place another card somewhere in the room with the solution to that card, plus another question, for example: “Solution: 0.8 Next problem: Jeff’s bowling scores are roughly normal with mean 120 and a standard deviation of 20. Jared’s bowling scores are roughly normal with mean 180 and a standard deviation of 10. If their scores are independent, what is their combined standard deviation of their team score?” The answer is written on the next card (“Solution: 22.4”).Continue posting solution cards with new problems until the final card presents a problem whose solution is on the original starter card (note that this solution would be added to the starter card above). Students can begin the scavenger hunt at any question, then search around the room for the solution they found, as this will lead them to the next problem they need to solve, until they end up at the first card they started with.
continued on next page
Return to Table of Contents© 2020 College Board
Instructional Approaches V.1 | 220AP Statistics Course and Exam Description

Strategy Definition Purpose Example
Sentence Starters Students respond to a prompt by filling in the missing parts of a given sentence template.
Helps students practice communication skills by providing a starting point and modeling a sentence structure that would apply for a particular type of problem.
For linear regression models, provide a scenario that includes a least-squares equation. Then have students use a given sentence starter to interpret the meaning of the slope in context. For example, students could be given the scenario in 2017 FRQ 1, including the least-squares equation ˆ 16.46 35.02y x= − + . To help students begin writing their interpretations, provide a sentence starter such as “The least-squares regression line predicts that the would increase by approximately for each
.” The sentence starter provided could become more open ended as students become more comfortable with writing interpretations in context.
Simulation Students develop a “best guess” for a parameter by collecting data through simulation, then investigating the distribution of data collected by the class.
Helps students understand what sampling distribution is by crowdsourcing data from the class; also helps make abstract problems more accessible and reinforces the role of probability in inference.
When estimating a population proportion of red cards in a standard deck, put students in pairs and have them draw n cards and then record the proportion that are red. Repeat a large number of times and then create a class dotplot and estimate the parameter value based on the center of the dotplot.
Sketch and Switch
Students create a sketch of a distribution that has a given set of characteristics then switch papers to review each other’s work.
Reinforces key vocabulary, provides exposure to varying solutions based on the same characteristics, and allows students to give and receive feedback on each other’s work.
For distributions of a single variable, have students sketch a “bimodal, left-skewed” distribution or a “symmetric, bimodal distribution with two outliers.” For scatterplots, have them sketch a “weak negative non-linear association.”
Team Challenge Students work in teams of three or four to solve an unfamiliar problem that requires transfer of knowledge and skills from multiple areas of the course.
Builds confidence in approaching complex questions by sharing ideas and providing feedback to peers.
To introduce the investigative task, have students work in teams to develop a model solution to a question that is beyond most students’ ability to fully complete on their own.
continued on next page
Return to Table of Contents© 2020 College Board
Instructional Approaches V.1 | 221AP Statistics Course and Exam Description

Strategy Definition Purpose Example
Team FRQ Each student in a group of four completes one step of the four-step process for inference with the rest of the group’s input.
Allows students to integrate their own knowledge with that of their teammates in order to create a comprehensive solution to a free-response question.
Give student groups a free-response question (FRQ) that requires students to identify, set up, perform, and interpret the results of an appropriate significance test to answer a particular question. Student A states a pair of hypotheses with group input. Student B identifies a test procedure while the group checks that the conditions have been verified. Student C finds the value of the test statistic while others find the p-value. Student D states the conclusion while the group checks for linkage to p-value and context. When groups are finished, have them score their responses as a class using the free-response question scoring guidelines.
The Scribe and the Calculator (also see FRQ Partner Quiz)
Students do problems together in pairs; only one student is allowed to use the calculator, and only the other student is allowed to write on the paper.
Allows students to practice communication and use of technology with a peer.
Group students into pairs and present them with the following scenario: “A basketball player makes 80% of her free throws. Assuming her shots are independent and she takes 20 shots, calculate the probability that at least 15 of the shots are made.” Instruct students to begin working on a solution, noting that one student can only write (but can’t touch the calculator), while the other student can only use the calculator (but can’t write anything). Consider assigning the “calculator” role to the student who is weaker on technology to help them practice.
Think Aloud Students talk through a difficult problem by describing what the text means.
Helps in comprehending the text, understanding the components of a problem, and thinking about possible paths to a solution.
When students have learned the different types of inference tests and intervals, have them talk through key questions, such as “How many groups?” “Is this a categorical or quantitative variable?” “How was the data collected?” or “Am I testing a claim or estimating an amount?”
continued on next page
Return to Table of Contents© 2020 College Board
Instructional Approaches V.1 | 222AP Statistics Course and Exam Description

Strategy Definition Purpose Example
Think-Pair-Share (or Wait, Turn, and Talk)
Students are given time to think through a problem on their own, followed by sharing their ideas with a partner and then concluding by sharing results with the class.
Allows students uninterrupted time to process their initial ideas and then revise those ideas with a partner in preparation for sharing them with a larger group.
When looking at a dotplot or boxplot, have students first think individually about what features are the most interesting to them (or about the center, shape, and variability) and then have them share their thoughts with their neighbor. Call on pairs of students to share their thoughts.
Two Wrongs Make a Right
Students list all the reasonably likely ways in which a student could answer a question incorrectly.
Helps students to recognize the common errors and misconceptions that occur so they are less likely to make those errors themselves.
When comparing distributions, have students provide examples that do not describe all relevant features (shape, center, spread, and unusual points).
Use Manipulatives
Students use objects to examine relationships between the information given.
Supports comprehension by providing a tangible or visual representation of a problem or concept.
When constructing the sampling distribution of the sample mean, have students put dot stickers with an x written on them to reinforce the idea that the dots on the dotplot are means, not single observations.
When performing simulations, use concrete objects to help students understand how often certain values of a variable would occur just by chance. For example, if a simulation has 10 freshmen and six seniors, use 10 blue beads to represent “freshmen” and six red beads to represent “seniors.”
Return to Table of Contents© 2020 College Board
Instructional Approaches V.1 | 223AP Statistics Course and Exam Description

Developing Course Skills
Throughout the AP Statistics course, students will develop skills that are fundamental to the discipline of statistics. Students will benefit from multiple opportunities to develop these skills in a scaffolded manner.
The tables that follow look at each of the course skills and provide examples of questions or tasks for each skill, along with sample activities and strategies for incorporating that skill into the course.
Return to Table of Contents© 2020 College Board
Instructional Approaches V.1 | 224AP Statistics Course and Exam Description
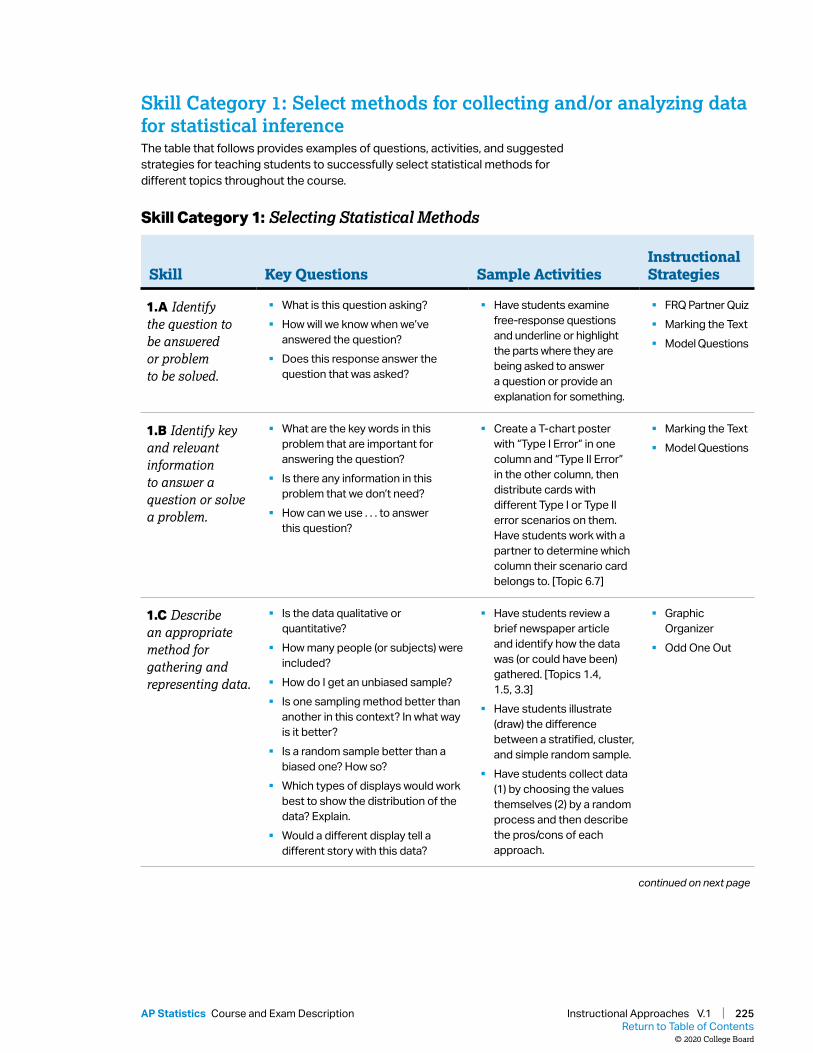
continued on next page
Skill Category 1: Selecting Statistical Methods
Skill Key Questions Sample ActivitiesInstructional Strategies
1.A Identify the question to be answered or problem to be solved.
§ What is this question asking? § How will we know when we’ve
answered the question? § Does this response answer the
question that was asked?
§ Have students examine free-response questions and underline or highlight the parts where they are being asked to answer a question or provide an explanation for something.
§ FRQ Partner Quiz § Marking the Text § Model Questions
1.B Identify key and relevant information to answer a question or solve a problem.
§ What are the key words in this problem that are important for answering the question?
§ Is there any information in this problem that we don’t need?
§ How can we use . . . to answer this question?
§ Create a T-chart poster with “Type I Error” in one column and “Type II Error” in the other column, then distribute cards with different Type I or Type II error scenarios on them. Have students work with a partner to determine which column their scenario card belongs to. [Topic 6.7]
§ Marking the Text § Model Questions
1.C Describe an appropriate method for gathering and representing data.
§ Is the data qualitative or quantitative?
§ How many people (or subjects) were included?
§ How do I get an unbiased sample? § Is one sampling method better than
another in this context? In what way is it better?
§ Is a random sample better than a biased one? How so?
§ Which types of displays would work best to show the distribution of the data? Explain.
§ Would a different display tell a different story with this data?
§ Have students review a brief newspaper article and identify how the data was (or could have been) gathered. [Topics 1.4, 1.5, 3.3]
§ Have students illustrate (draw) the difference between a stratified, cluster, and simple random sample.
§ Have students collect data (1) by choosing the values themselves (2) by a random process and then describe the pros/cons of each approach.
§ Graphic Organizer
§ Odd One Out
Skill Category 1: Select methods for collecting and/or analyzing data for statistical inferenceThe table that follows provides examples of questions, activities, and suggested strategies for teaching students to successfully select statistical methods for different topics throughout the course.
Return to Table of Contents© 2020 College Board
Instructional Approaches V.1 | 225AP Statistics Course and Exam Description

Skill Category 1: Selecting Statistical Methods (continued)
Skill Key Questions Sample ActivitiesInstructional Strategies
INFERENCE
1.D Identify an appropriate inference method for confidence intervals.
§ Were the data gathered from one sample or two samples?
§ Is the population standard deviation known?
§ Are the data in counts or in proportions?
§ Is the most appropriate summary statistic a sample mean or a sample proportion?
§ What formula on the formula sheet could help with the construction of the interval?
§ What is the name of the confidence interval procedure?
§ How many samples/groups are there?
§ Do I want to estimate an unknown quantity (interval) or do I want to test a claim (test)?
§ What type of data will I obtain/am I given: categorical or quantitative?
§ Given summary statistics based on data gathered in class (hours of sleep, drive to school or not, etc.), have students determine what confidence interval could be constructed. [Topics 6.2, 6.8, 7.2, 7.6, 9.2]
§ Have students develop a flowchart of questions that leads to each inference method.
§ Have students use Categorizing Statistics to practice identifying the appropriate inference procedure for a given scenario.
§ Graphic Organizer
§ Peer Critique
1.E Identify an appropriate inference method for significance tests.
§ How many samples were taken? § What procedure would be needed
to test this? § What procedure would be needed
to see if a certain percentage has changed?
§ Given summary statistics based on data gathered in class (hours of sleep, drive to school or not, etc.), have students create a question and determine what inference procedure could be used. [Topics 6.4, 6.10, 7.4, 7.8, 8.2, 8.5, 9.4]
§ Graphic Organizer
§ Peer Critique
1.F Identify null and alternative hypotheses.
§ Are we looking for there to be a difference from the hypothesized value (two-tailed test) or are we looking for a change in a specific direction (one-tailed test)?
§ What is our parameter(s) of interest and what symbol(s) do we need to use to represent our parameter(s) of interest?
§ Are the data paired? If I shuffled the data, would we lose information? (If so, then it’s paired.)
§ Do I have two independent samples? § Is it a matched pairs design or a
completely randomized design?
§ Present students with a given scenario and a guiding question, for example, “We suspect the average amount of sleep of all students is less than eight hours. What would be the null and alternative hypotheses?” [Topics 6.4, 6.10, 7.4, 7.8, 8.2, 8.5, 9.4]
§ Give students a context and ask them to write hypotheses (1) for a paired test and (2) a two-sample test and then ask which is the better design.
§ Quickwrite § Quiz-Quiz-Trade
Return to Table of Contents© 2020 College Board
Instructional Approaches V.1 | 226AP Statistics Course and Exam Description

Skill Category 2: Describe patterns, trends, associations, and relationships in dataThe table that follows provides examples of questions, activities, and suggested strategies for teaching students to analyze data successfully.
Skill Category 2: Data Analysis
Skill Key Questions Sample ActivitiesInstructional Strategies
2.A Describe data presented numerically or graphically.
§ Are the distributions symmetric or skewed?
§ How do the centers of the distributions compare?
§ How should I talk about the “tendency”?
§ How should I talk about the “variability”? What are the best statistics to use in each case?
§ Where does the mean fall relative to the medians in each of the distributions?
§ Given a pair of parallel boxplots, have students describe how the distributions are similar and how they are different.
§ Match Mine § Notice and
Wonder § Sentence Starters § Think-Pair-Share § Quickwrite
2.B Construct numerical or graphical representations of distributions.
§ Does this graphical representation tell an honest, authentic, and complete story about the situation?
§ Have students create various graphical displays (stemplot, dotplot, boxplot, histogram) for the time it takes to get to school.
§ Create Representations
§ Look for a Pattern § Sketch and Switch
2.C Calculate summary statistics, relative positions of points within a distribution, correlation, and predicted response.
§ Is this quantitative or categorical data?
§ Have students use technology to calculate summary statistics and then remove/change/add data to see how each statistic is affected.
§ Round Table § Scavenger Hunt
continued on next page
Return to Table of Contents© 2020 College Board
Instructional Approaches V.1 | 227AP Statistics Course and Exam Description

Skill Category 2: Data Analysis (continued)
Skill Key Questions Sample ActivitiesInstructional Strategies
2.D Compare distributions or relative positions of points within a distribution.
§ If there is a difference, is it significant?
§ Is this quantitative or categorical data?
§ Is this a small data set? (If so, use a dotplot or stemplot.) Or is this a large data set? (If so, use a histogram or boxplot.)
§ What is the most interesting similarity (or difference) between these graphs?
§ Describe the context for each of these distributions.
§ Give students the same data set but with different graphs so they can explain the pros/cons of each graphical display (boxplot vs. histogram vs. stemplot). Technology can make this exercise more efficient (like stapplet.com).
§ With a focus on real-world data, give students scatterplots or dotplots that are similar and different and have them describe the similarities and differences.
§ Provide students with a set of cards containing different representations of data (e.g., summary statistics, boxplots, histograms, and context descriptions) and then have students match the ones that came from the same data set.
§ Discussion Groups
§ Quickwrite § Think-Pair-Share § Two Wrongs Make
a Right
INFERENCE
not applicable
Return to Table of Contents© 2020 College Board
Instructional Approaches V.1 | 228AP Statistics Course and Exam Description

Skill Category 3: Explore random phenomenaThe table that follows provides examples of questions, activities, and suggested strategies for helping students to develop the skill of using probability and simulation.
Skill Category 3: Using Probability and Simulation
Skill Key Questions Sample ActivitiesInstructional Strategies
3.A Determine relative frequencies, proportions, or probabilities using simulation or calculations.
§ How can I use a random process to model this scenario?
§ What population does this dotplot represent?
§ If your dotplot is not approximately normal, why not?
§ How is a population distribution different from a sampling distribution?
§ How is a sampling distribution of sample size 2 similar to and different from a sampling distribution of sample size 5 from the same population?
§ Before doing a simulation to find a probability (p-value), ask students what the initial evidence is for the claim. Then calculate the p-value to see how plausible/strong this evidence is.
§ Have students shoot free throws or toss bean bags to determine the frequency of shots made.
§ Have students compare and contrast two sampling distributions of different sample sizes to explore the effect of increasing sample size on a distribution.
§ Present students with a probability scenario with guiding questions, for example, “What was the success rate after 2 free throws of a basketball? After 4? 10? 30? What does this mean?”
§ Debriefing § Simulation § The Scribe and
the Calculator § Use Manipulatives
3.B Determine parameters for probability distributions.
§ Why might the mean of a probability distribution for a discrete random variable be less than (or greater than) the average of possible values?
§ As an introduction, provide students with estimates of probabilities of litter size for black bears:
( )1 cub 0.06P = , ( )2 cubs 0.23P = , ( )3 cubs 0.63P = , ( )4 cubs 0.08P = ,
and ( )5 or more cubs 0.01P < . Ask student groups to represent this probability distribution for a sample of 30 litters in a table to predict the mean and standard deviation of the number of cubs in a litter for black bears. Students should explain their reasoning in groups. Class discussion should lead to the correct formulas. Ask students to consider interesting questions a scientist studying black bears might ask (see North American Bear Center).
§ Debriefing § Predict and
Confirm
continued on next page
Return to Table of Contents© 2020 College Board
Instructional Approaches V.1 | 229AP Statistics Course and Exam Description

Skill Category 3: Using Probability and Simulation (continued)
Skill Key Questions Sample ActivitiesInstructional Strategies
3.B Determine parameters for probability distributions.
(continued)
§ Why might the mean of a probability distribution for a discrete random variable be less than (or greater than) the average of possible values?
§ Ask students to determine the following: for a bat colony in a given year, if 1X equals the number of bats born,
2X equals the number of bats who die, 3X equals the number of bats who move
in, and 4X equals the number of bats who move out, what do each of the following represent: 1 3X X+ , 1 2 3 4X X X X ? Have them represent the net change in population owing to immigration/emigration. For a scenario in which the death rate is doubled and the number of bats moving out is halved, have students write a linear combination of 1X , 2X , 3X , and 4X that gives the net population change in bats.
§ Debriefing § Predict and
Confirm
3.C Describe probability distributions.
§ When rolling two six-sided dice, why are the outcomes of the sum of the dice not equally likely?
§ Have students conduct a simulation in which they roll two six-sided dice, record the sum of the values, and then create a table representing the probability distribution from their simulation.
§ Predict and Confirm
§ Sentence Starters § Simulation
INFERENCE
3.D Construct a confidence interval, provided conditions for inference are met.
§ Are the conditions for inference met? How do I check the “normal” condition for this context?
§ Is there random assignment or random selection?
§ Is this quantitative or categorical data? Are there one or two samples?
§ Give students a large population from which to sample. Have each student group collect a different random sample, calculate statistic, then calculate interval. Students then compare their intervals (sampling variability) and the class calculates their “capture rate” (confidence level).
§ Give students multiple-choice questions with intervals already constructed and ask them to identify the correct interval.
§ Error Analysis § Model Questions § Think Aloud
3.E Calculate a test statistic and find a p-value, provided conditions for inference are met.
§ How do we know which test statistic, t or z , is appropriate for a test for a population mean?
§ In terms of probability, what does it mean to say that a p-value is less than 0.05?
§ Give each student a pair of hypotheses for significance testing. Ask each student to identify an appropriate test statistic and formula. Have groups share findings with each other and check notation.
§ Use the same hypotheses to follow up when learning to draw conclusions: (1) Identify at least one conclusion for p = 0.12 that would be incorrect because it would be equivalent to accepting the null hypothesis and (2) write an appropriate conclusion for p = 0.12.
§ Ask the Expert § Error Analysis § Gallery Walk § Notation Read
Aloud § The Scribe and
the Calculator § Think Aloud
Return to Table of Contents© 2020 College Board
Instructional Approaches V.1 | 230AP Statistics Course and Exam Description

Skill Category 4: Develop an explanation or justify a conclusion using evidence from data, definitions, or statistical inferenceStudents consistently struggle with communicating their arguments on the AP Exam. Students often need targeted support to develop this skill, so teachers should remind students that communicating reasoning is at least as important as finding a solution. Well-communicated reasoning validates solutions.
Teachers can also reinforce that when students are asked to provide reasoning or a justification for their solution, a successful response will include:
§ A logical sequence of steps § An argument that explains why those steps
are appropriate § An accurate interpretation of the solution (with
units), always in the context of the situation
In order to help students develop these communication skills, teachers can:
§ Have students practice explaining their solutions orally to a small group or to the class.
§ Present an incomplete argument or explanation and have students supplement it for greater clarity or completeness.
§ Provide sentence starters, template guides, and communication tips to help scaffold the writing process.
Skill Category 4: Statistical Argumentation
Skill Key Questions Sample ActivitiesInstructional Strategies
4.A Make an appropriate claim or draw an appropriate conclusion.
§ What do you expect to be true about the number of red cards in a fair deck of cards? What seems to be true?
§ How would proportions be different when drawing cards from a deck without replacement, as opposed to with replacement?
§ What are your assumptions about this scenario?
§ What, if anything, can we conclude about causation in this scenario?
§ Does our conclusion imply that we have “accepted” the null, that we are “certain” about something, or that we have “proven” something?
§ Manipulate a deck of cards by stacking it with more reds, for example (the class is not aware of this). Have one student pick cards one at a time, with replacement, and shuffling between each pick. Have another student tally the number of reds/blacks. Have students discuss expectations (50% reds) and what they’re seeing. This can be used as an introduction to the concept of significance tests. [Topic 6.4]
§ Have students look at student samples of inappropriate claims or drawing inappropriate conclusions from released FRQs. Then have them compare these samples to the scoring guidelines or notes from the Chief Reader Report. Finally, have students correct a set of new incorrect samples so that the samples are making appropriate claims or drawing appropriate conclusions.
§ After displaying scatterplots with strong correlation, ask students to make predictions using extrapolation.
§ Build the Model Solution
§ Error Analysis § Gallery Walk § Sentence
Starters
continued on next page
Return to Table of Contents© 2020 College Board
Instructional Approaches V.1 | 231AP Statistics Course and Exam Description

Skill Category 4: Statistical Argumentation (continued)
Skill Key Questions Sample ActivitiesInstructional Strategies
4.B Interpret statistical calculations and findings to assign meaning or assess a claim.
§ At what point did you become suspicious?
§ How can we tell whether the results should be acceptable?
§ See activity in Skill 4.A. If the deck is very unfairly stacked, the class will eventually become suspicious and start questioning whether it is actually a fair deck. This can lead to a discussion of how likely it is to see the results assuming we’re dealing with a fair deck.
§ Quickwrite § Reversing
Interpretations § Sentence
Starters
INFERENCE
4.C Verify that inference procedures apply in a given situation.
§ Are the assumptions met? § How many cards must be
selected in order to meet the conditions?
§ Why is this condition necessary?
§ What would go wrong with the inference procedure if this condition is violated?
§ See activity in Skill 4.A. Have students discuss the assumptions required for a one-proportion significance test (or for a confidence interval).
§ After students have studied all of the inference procedures in the course, have them make a chart that summarizes the conditions required for each procedure to be valid.
§ Think Aloud § Think-Pair-Share
4.D Justify a claim based on a confidence interval.
§ Is 0P in the interval? § How can you be more
confident about your conclusion?
§ See activity in Skill 4.A. Have students identify the confidence interval and state their conclusion. [Topic 6.2, 6.3]
§ Use examples of confidence intervals with 0P in, not in, at the center of, and near the edges of the confidence interval.
§ Error Analysis
4.E Justify a claim using a decision based on significance tests.
§ To what populations can I infer these claims (based on how the data was collected)?
§ Did we use language that implies absolute knowledge (i.e., that we’ve “proven” something)?
§ See activity in Skill 4.A. Have students conclude the significance test. Have them determine the test statistic, obtain p-value, make their decision, and state their conclusion.
§ Present students with a scenario involving a significance test and ask students to be explicit about three things: How does the p-value compare to alpha? What do we say about the null? What do we say about the alternative?
§ Error Analysis § Two Wrongs
Make a Right
Return to Table of Contents© 2020 College Board
Instructional Approaches V.1 | 232AP Statistics Course and Exam Description

Exam Information
AP STATISTICS


Exam Overview
The AP Statistics Exam assesses student understanding of the skills and learning objectives outlined in the course framework. The exam is 3 hours long and includes 40 multiple-choice questions and 6 free-response questions. The details of the exam, including exam weighting and timing, can be found below:
Section Question TypeNumber of Questions
Exam Weighting Timing
I Multiple-choice questions 40 50% 90 minutes
II Free-response questions 6
Part A: Questions 1–5 37.5% 65 minutes
Part B: Question 6: Investigative task 12.5% 25 minutes
Formulas and tables are furnished to students taking the AP Statistics Exam (see p. 259). Each student is expected to bring a graphing calculator with statistical capabilities to the exam. Students may not use minicomputers, pocket organizers, electronic writing pads, or calculators with QWERTY (i.e., typewriter) keyboards on the AP Statistics Exam. See the Calculator Policy for AP Statistics on apstudent.collegeboard.org for a complete list of eligible calculators and policies concerning enhancements to eligible calculators.
The exams assess content from the three big ideas of the course.
Big Idea 1: Variation and Distribution
Big Idea 2: Patterns and Uncertainty
Big Idea 3: Data-Based Predictions, Decisions, and Conclusions
Return to Table of Contents© 2020 College Board
Exam Information V.1 | 235AP Statistics Course and Exam Description

The multiple-choice section of the AP Exam assesses the nine units of the course with the following exam weighting:
Exam Weighting for the Multiple-Choice Section of the AP Exam
Units Exam Weighting
Unit 1: Exploring One-Variable Data 15–23%
Unit 2: Exploring Two-Variable Data 5–7%
Unit 3: Collecting Data 12–15%
Unit 4: Probability, Random Variables, and Probability Distributions 10–20%
Unit 5: Sampling Distributions 7–12%
Unit 6: Inference for Categorical Data: Proportions 12–15%
Unit 7: Inference for Quantitative Data: Means 10–18%
Unit 8: Inference for Categorical Data: Chi-Square 2–5%
Unit 9: Inference for Quantitative Data: Slopes 2–5%
Return to Table of Contents© 2020 College Board
Exam Information V.1 | 236AP Statistics Course and Exam Description

How Student Learning Is Assessed on the AP Exam
The four AP Statistics skill categories are assessed on the AP Exam as detailed below.
Skill Category Multiple-Choice Section Free-Response Section
Skill 1: Selecting Statistical Methods
Multiple-choice questions assess students’ ability to select methods for collecting and/or analyzing data for statistical inference.
Students will need to identify key and relevant information to answer a question or solve a problem (including appropriate inference methods), describe appropriate methods for gathering and representing data, and identify null and alternative hypotheses.
One free-response question will primarily focus on collecting data, assessing Skills 1.B and/or 1.C.
Other free-response questions may also assess this skill category.
Skill 2: Data Analysis
Multiple-choice questions will assess students’ ability to describe patterns, trends, associations, and relationships in data.
Students will need to describe data presented numerically or graphically, perform statistical calculations, and compare distributions.
One free-response question will primarily focus on exploring data, assessing some combination of Skills 2.A, 2.B, 2.C, and/or 2.D.
Other free-response questions may also assess this skill category.
Skill 3: Using Probability and Simulation
Multiple-choice questions will assess students’ ability to explore random phenomena.
Students will need to determine relative frequencies, proportions, or probabilities using simulation or calculations. Additionally, students will need to describe and determine parameters for probability distributions. Students will also need to construct confidence intervals and calculate test statistics.
One free-response question will primarily focus on probability and sampling distributions, assessing some combination of Skills 3.A, 3.B, and/or 3.C.
Other free-response questions may also assess this skill category.
Skill 4: Statistical Argumentation
Multiple-choice questions will assess students’ ability to develop an explanation or justify a conclusion using evidence from data, definitions, or statistical inference.
Students will need to make appropriate claims, interpret statistical calculations, verify application of inference procedures, and justify statistical claims.
At least three of the first five free- response questions, as well as the investigative task, will assess statistical argumentation.
Return to Table of Contents© 2020 College Board
Exam Information V.1 | 237AP Statistics Course and Exam Description
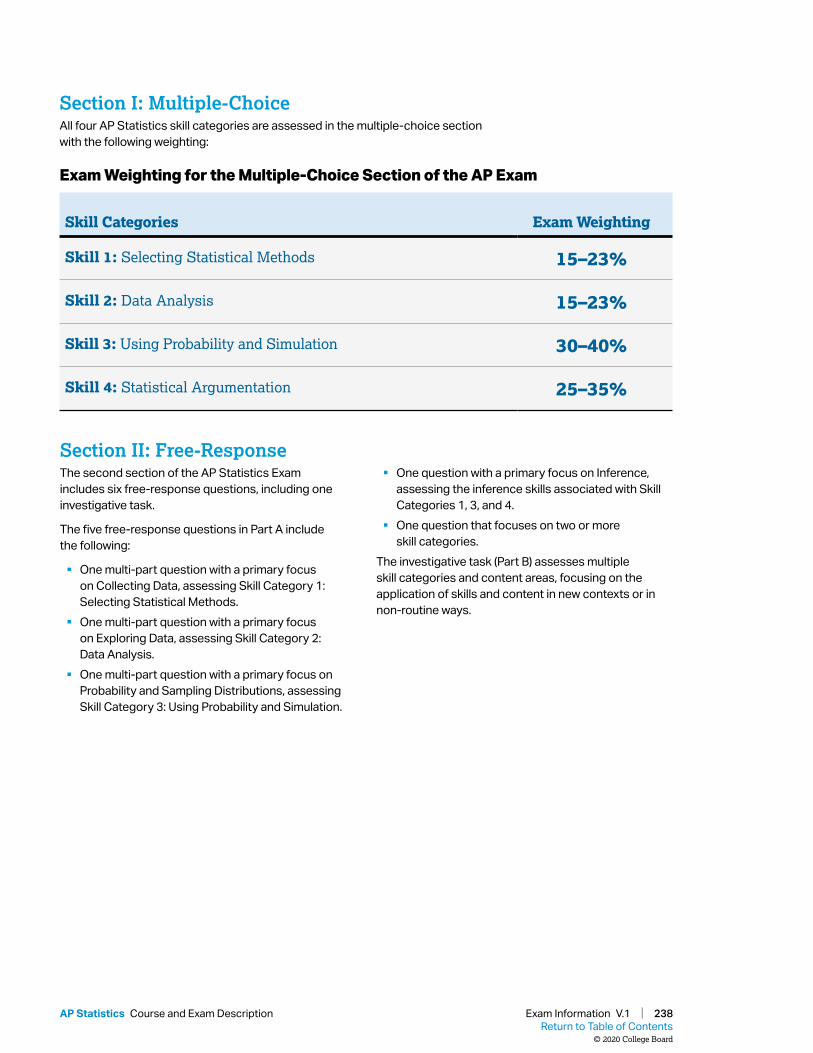
Section I: Multiple-ChoiceAll four AP Statistics skill categories are assessed in the multiple-choice section with the following weighting:
Exam Weighting for the Multiple-Choice Section of the AP Exam
Skill Categories Exam Weighting
Skill 1: Selecting Statistical Methods 15–23%
Skill 2: Data Analysis 15–23%
Skill 3: Using Probability and Simulation 30–40%
Skill 4: Statistical Argumentation 25–35%
Section II: Free-ResponseThe second section of the AP Statistics Exam includes six free-response questions, including one investigative task.
The five free-response questions in Part A include the following:
§ One multi-part question with a primary focus on Collecting Data, assessing Skill Category 1: Selecting Statistical Methods.
§ One multi-part question with a primary focus on Exploring Data, assessing Skill Category 2: Data Analysis.
§ One multi-part question with a primary focus on Probability and Sampling Distributions, assessing Skill Category 3: Using Probability and Simulation.
§ One question with a primary focus on Inference, assessing the inference skills associated with Skill Categories 1, 3, and 4.
§ One question that focuses on two or more skill categories.
The investigative task (Part B) assesses multiple skill categories and content areas, focusing on the application of skills and content in new contexts or in non-routine ways.
Return to Table of Contents© 2020 College Board
Exam Information V.1 | 238AP Statistics Course and Exam Description

Task Verbs Used in Free-Response Questions
The following task verbs are commonly used in the free-response questions:
Calculate: Perform mathematical steps to arrive at a final answer (e.g., algebraic expressions or diagrams with properly substituted numbers and correct labeling). Calculate tasks are also phrased with “Find” or interrogatory questions such as “How many?”, “What is?”, “What values?”, “How likely?”, or “How often?”
Compare: Provide a description or explanation of similarities and/or differences.
Construct/Complete: Represent data in graphical or numerical form.
Describe: Provide the relevant characteristics of representations, distributions, or methods.
Determine: Apply an appropriate definition or perform calculations to identify values, intervals, or solutions. Determine tasks are also phrased with interrogatory questions such as “Do the data support?”, “Do the data provide?”, “Is there evidence?”, “Which is better?”, “Does your answer match?”, or “Can it be assumed?”
Estimate: Use models or representations to find approximate values for functions.
Explain: Provide information about how or why a relationship, process, pattern, position, situation, or outcome occurs, using evidence and/or reasoning to support or qualify a claim. “Explain” tasks may also be phrased as “Give a reason for . . . .”
Give a point estimate or interval estimate: Use models or representations to find approximate values for uncertain figures.
Give examples: Provide a specific example that meets given criteria.
Identify/Indicate/Circle: Indicate or provide information about a specified topic in words or by circling, shading, or marking given information, without elaboration or explanation. Also phrased as “What is? or “Which?”
Interpret: Describe the connection between a mathematical expression, representation, or solution and its meaning within the realistic context of a problem, sometimes including consideration of units.
Justify: Provide evidence to support, qualify, or defend a claim and/or provide statistical reasoning to explain how that evidence supports or qualifies the claim.
Verify: Confirm that the conditions of a particular definition, distribution, or inference method are met in order to verify that it is applicable in a given situation. Verify tasks may also be phrased as “Have the conditions been met?” or “Can it be assumed?”
Return to Table of Contents© 2020 College Board
Exam Information V.1 | 239AP Statistics Course and Exam Description

Sample Exam Questions
The sample exam questions that follow illustrate the relationship between the course framework and AP Statistics Exam and serve as examples of the types of questions that appear on the exam. After the sample questions is a table that shows which skill, learning objective(s), and unit each question relates to. The table also provides the answers to the multiple-choice questions.
Section I: Multiple-ChoiceThe following are examples of the kinds of multiple-choice questions found on the exam.
1. Which of the following histograms has a shape that is approximately uniform?
(A) (B)
(C) (D)
(E)
Return to Table of Contents© 2020 College Board
Exam Information V.1 | 240AP Statistics Course and Exam Description

2. A recent study reported that 45 percent of adults in the United States now get all their news online. A random sample of 8 adults in the United States will be selected. What is the probability that 6 of the selected adults get all their news online?
(A) 8 260.45 0.55
2
(B) 6 260.45 0.55
2
(C) 2 880.45 0.55
6
(D) 6 280.45 0.55
6
(E) 8 680.45 0.55
6
3. In 2011, 17 percent of a random sample of 200 adults in the United States indicated that they consumed at least 3 pounds of bacon that year. In 2016, 25 percent of a random sample of 600 adults in the United States indicated that they consumed at least 3 pounds of bacon that year.
Assuming all conditions for inference are met, which of the following is the most appropriate test statistic to use to investigate whether the proportion of all adults in the United States who consume at least 3 pounds of bacon in 2016 is different from that of 2011?
(A)
0.17 0.250.17 0.83 0.25 0.75
200 600
z
(B)
0.17 0.250.17 0.83 0.25 0.75
600 200
z
(C)
0.17 0.251 10.21 0.79
200 600
z
(D)
0.17 0.251 10.23 0.77
200 600
z
(E)
0.17 0.251 10.50 0.50
200 600
z
Return to Table of Contents© 2020 College Board
Exam Information V.1 | 241AP Statistics Course and Exam Description

4. In a recent year, the distribution of age for senators in the United States Senate was unimodal and roughly symmetric with mean 65 years and standard deviation 10.6 years. Consider a simulation with 200 trials in which, for each trial, a random sample of 5 senators’ ages is selected and the mean age calculated.
Which of the following best describes the distribution of the 200 sample mean ages?(A) Approximately normal with mean 65 years and standard deviation
10.6 years(B) Approximately normal with mean 65 years and standard deviation
10.65
years
(C) Approximately normal with mean 65 years and standard deviation 10.6200
years
(D) Approximately uniform with mean 65 years and standard deviation 10.6
5 years
(E) Approximately uniform with mean 65 years and standard deviation 10.6200
years
5. An athletic director believes that more than 50 percent of the students in a certain school district exercise at least 3.5 hours per week. To investigate the belief, the director selected a random sample of 40 students in the school district and found that 60 percent of the students in the sample exercise at least 3.5 hours per week. Let p represent the proportion of all students in the school district who exercise at least 3.5 hours per week.
Which of the following is the most appropriate alternative hypothesis to test the director’s claim?(A) aH : 0.5p (B) aH : 0.5p (C) aH : 0.5p (D) aH : 0.6p (E) aH : 0.6p
6. For a certain population of penguins, the distribution of weight is approximately normal with mean 15.1 kilograms (kg) and standard deviation 2.2 kg. Approximately what percent of the penguins from the population have a weight between 13.0 kg and 16.5 kg?(A) 17%(B) 34%(C) 57%(D) 68%(E) 74%
Return to Table of Contents© 2020 College Board
Exam Information V.1 | 242AP Statistics Course and Exam Description

7. A researcher collected data on the latitude, in degrees north of the equator, and the average low temperature, in degrees Fahrenheit, for a random sample of cities in Europe. The data were used to create the following equation for the least-squares regression line.
predicted average low temperature 65.5 0.70 latitude
Which of the following is the best interpretation of the slope of the line?(A) For each one degree north of the equator increase, the predicted average
low temperature increases on average by 0.70 degree Fahrenheit.(B) For each one degree north of the equator increase, the predicted average
low temperature decreases on average by 0.70 degree Fahrenheit.(C) For each 0.7 degree north of the equator increase, the predicted average low
temperature decreases on average by 1 degree Fahrenheit.(D) For each one degree Fahrenheit increase in average low temperature, the
predicted latitude increases on average by 0.70 degree north of the equator.(E) For each one degree Fahrenheit increase in average low temperature, the
predicted latitude decreases on average by 0.70 degree north of the equator.
8. An independent polling agency was hired to track the preferences of registered voters in a district for an upcoming election. The polling agency divided the district into twenty regions and believes that the regions are similar to one another in their composition. The agency then randomly selected two of the regions and surveyed all registered voters in both regions.
Which of the following best describes the sampling method used by the polling agency?(A) Convenience sampling(B) Simple random sampling(C) Stratified random sampling(D) Systematic sampling(E) Cluster sampling
9. A sports physician conducted a study to investigate whether there is an association between running experience and the occurrence of a certain sport injury for marathon runners while training for a marathon. Data were collected on a random sample of 51 marathon runners. Each runner from the sample was categorized by running experience (low, medium, high) and whether or not the runner experienced the sport injury while training for a marathon. The conditions for inference were met, and a c
2 test statistic of approximately 8.12 was calculated.
Which of the following describes the p-value of the test?(A) -value 0.25p (B) 0.10 -value 0.25p (C) 0.05 -value 0.10p (D) 0.01 -value 0.05p (E) -value 0.01p
Return to Table of Contents© 2020 College Board
Exam Information V.1 | 243AP Statistics Course and Exam Description

10. An agricultural engineer selected a random sample of 30 farms in the United States to construct a 95 percent confidence interval for the mean size, in acres, of farms in the United States. The resulting interval was (367, 558).
Which of the following is an appropriate interpretation of the 95 percent confidence level?(A) Approximately 95% of the farm sizes in the sample are between 367 acres
and 558 acres.(B) Approximately 95% of all farm sizes in the United States are between
367 acres and 558 acres.(C) Approximately 95% of all random samples of size 30 from the population
will have a mean farm size between 367 acres and 558 acres.(D) Approximately 95% of all random samples of size 30 from the population
will produce intervals that contain the mean size of farms in the United States.
(E) Approximately 95% of all random samples of size 30 from the population will produce intervals that contain the sample mean.
11. An experiment was designed to investigate the relationship between the dosage of a certain migraine medication and the amount of time until relief from the headache was experienced. Four dosages in milligrams (mg)—2.5, 5.0, 7.5, and 10—of the medication were used. The 20 participants in the experiment were known to experience migraines. Each participant was randomly assigned one of the four dosages. When the participants experienced a migraine, they took the assigned medication and recorded the number of minutes it took to experience relief from the headache. The mean number of minutes it took each group to experience relief was compared.
What were the experimental units in the experiment?(A) The number of minutes to experience relief(B) The mean number of minutes it took each group to experience relief(C) The four dosages(D) The 20 participants(E) The relationship between the dosage and the amount of time
12. The recommended dietary allowance of iron for women under the age of 51 is 18 milligrams (mg) per day. A medical researcher studying women living in a certain region suspected that the women were getting less than the daily allowance of iron, on average. The researcher took a random sample of women under the age of 51 from the region and measured their daily iron intakes. The following hypotheses were tested at the significance level of 0.05 for the population mean u of the daily iron intake for women in the region.
0
a
H : 18H : 18
Return to Table of Contents© 2020 College Board
Exam Information V.1 | 244AP Statistics Course and Exam Description

All conditions for inference were met, and the resulting p-value was 0.031. Which of the following is an appropriate conclusion?(A) The p-value is less than α, and the null hypothesis should be rejected. There
is convincing statistical evidence that the mean daily intake of iron for women in the region is less than the recommended 18 mg.
(B) The p-value is less than α, and the null hypothesis should be rejected. There is not convincing statistical evidence that the mean daily intake of iron for women in the region is less than the recommended 18 mg.
(C) The p-value is less than α, and the null hypothesis should not be rejected. There is not convincing statistical evidence that the mean daily intake of iron for women in the region is less than the recommended 18 mg.
(D) The p-value is greater than α, and the null hypothesis should be rejected. There is convincing statistical evidence that the mean daily intake of iron for women in the region is less than the recommended 18 mg.
(E) The p-value is greater than α, and the null hypothesis should not be rejected. There is not convincing statistical evidence that the mean daily intake of iron for women in the region is less than the recommended 18 mg.
13. At a small company, 40 percent of the employees are classified as junior level, and 32 percent of the employees work in department A. Of those classified as junior level, 55 percent work in department A. One employee will be selected at random.
What is the probability that the selected employee works in department A and is not classified as junior level?(A) 0.10(B) 0.19(C) 0.22(D) 0.32(E) 0.50
14. A one-sample z-test for a proportion at the significance level of 0.10 will be conducted for the following set of hypotheses.
0
a
H : 0.50H : 0.50
pp
For which of the following is the probability of a Type II error the greatest?(A) A sample size of 200 and a true proportion of 0.45(B) A sample size of 200 and a true proportion of 0.40(C) A sample size of 200 and a true proportion of 0.35(D) A sample size of 100 and a true proportion of 0.45(E) A sample size of 100 and a true proportion of 0.35
Return to Table of Contents© 2020 College Board
Exam Information V.1 | 245AP Statistics Course and Exam Description

15. A small-business owner collected data from a random sample on the amount spent on an order and the time it takes to fill the order. The resulting data were used to complete a linear regression analysis of time, in minutes, versus amount spent, in dollars, and to create the following residual plot.
Based on the residual plot, which condition for inference for the slope of the regression line does not appear to be satisfied?(A) The true relationship between the number of items and the amount spent
on an order is linear.(B) For each amount spent on an order, the distribution of time to fill the order
is approximately normal.(C) The standard deviation of the distribution of time to fill an order is the same
for each amount spent on the order.(D) The data are collected using a random sample or randomized experiment.(E) The sample size is less than 10% of the population size.
Return to Table of Contents© 2020 College Board
Exam Information V.1 | 246AP Statistics Course and Exam Description

16. An athletic trainer wanted to investigate the relationship between an athlete’s resting heart rate and the heart rate after exercise. From a sample of 12 athletes, the athletic trainer recorded each athlete’s resting heart rate, in beats per minute, and heart rate, in beats per minute, after 5 minutes of moderate exercise. The results of a regression analysis of the data are shown in the following computer output.
Predictor Coef SE Coef T PConstant 17.5 29.2 0.60 0.563
Resting Heart Rate 1.786 0.453 3.94 0.003
S 9.9702= R-Sq 60.88%=
Assume the conditions for inference are met. Which of the following represents a 95 percent confidence for the slope of the population regression line?(A) ( )17.5 1.96 29.2± (B) ( )1.786 1.96 0.453±
(C) 0.4531.786 1.9612
±
(D) 0.4531.786 2.22812
±
(E) ( )1.786 2.228 0.453±
Return to Table of Contents© 2020 College Board
Exam Information V.1 | 247AP Statistics Course and Exam Description

Section II: Free-ResponseThe following are examples of the kinds of free-response questions found on the exam. Note that on the actual AP Exam, there are six free-response questions.
1. A geologist studying lead concentration in soil selected random samples of soil from two regions: region A and region B. The following histograms show the distribution of lead concentration, in parts per million (ppm), for the two samples.
(A) Write a few sentences comparing the distributions of lead concentration in the two samples.
(B) To investigate whether the mean lead concentration is different in region A than in region B, the geologist conducted the appropriate test. All conditions for inference are met, and the p-value of the test is 0.007. Based on the p-value, is there convincing statistical evidence, at a level of significance of 0.05 , that there is a difference between the mean lead concentration of region A and the mean lead concentration of region B? Justify your answer.
2. Past records from a certain movie theater indicate that 80 percent of moviegoers make a purchase at the movie theater’s snack bar. A random sample of 3 moviegoers from the theater will be selected at random. Let the random variable S represent the number of moviegoers who make a purchase at the snack bar from the 3 selected.(A) Complete the following table to create the probability distribution of S .
s 0 1 2 3
P s 0.008 0.512
(B) Calculate and interpret the expected value of S.
Return to Table of Contents© 2020 College Board
Exam Information V.1 | 248AP Statistics Course and Exam Description

Answer Key and Question Alignment to Course Framework
Multiple-Choice Question Answer Skill Learning Objective Unit
1 A 2.A UNC-1.H 1
2 D 3.A UNC-3.B 4
3 D 3.E VAR-6.K 6
4 B 3.C UNC-3.R 5
5 B 1.F VAR-6.D 6
6 C 3.A VAR-2.B 1
7 B 4.B DAT-1.H 2
8 E 1.C DAT-2.C 3
9 D 3.E VAR-8.M 8
10 D 4.B UNC-4.S 7
11 D 1.C VAR-3.A 3
12 A 4.E DAT-3.F 7
13 A 3.A VAR-4.D 4
14 D 4.A UNC-5.C 6
15 C 4.C VAR-7.L 9
16 E 3.D UNC-4.AF 9
Free-Response Question Skill Learning Objective Unit
1 2.A, 2.D, 4.E UNC-1.H, UNC-1.M, UNC-1.O, DAT-3.H 1, 7
2 2.B, 3.A, 3.B, 4.B UNC-3.B, VAR-5.A, VAR-5.C, UNC-3.C, VAR-5.D 4
The scoring information for the questions within this course and exam description, along with further exam resources, can be found on the AP Statistics Exam Page on AP Central.
Return to Table of Contents© 2020 College Board
Exam Information V.1 | 249AP Statistics Course and Exam Description

THIS PAGE IS INTENTIONALLY LEFT BLANK.

Scoring Guidelines V.1 | 251Return to Table of Contents
© 2020 College Board
AP STATISTICS
Scoring Guidelines
1. A geologist studying lead concentration in soil selected random samples of soil from two regions: region A and region B. The following histograms show the distribution of lead concentration, in parts per million (ppm), for the two samples.
(A) Write a few sentences comparing the distributions of lead concentration in the two samples.(B) To investigate whether the mean lead concentration is different in region A than in region B, the geologist
conducted the appropriate test. All conditions for inference are met, and the p-value of the test is 0.007. Based on the p-value, is there convincing statistical evidence, at a level of significance of 0.05 , that there is a difference between the mean lead concentration of region A and the mean lead concentration of region B? Justify your answer.
Question 1: Focus on Exploring Data
AP Statistics Course and Exam Description

Return to Table of Contents© 2020 College Board
Scoring Guidelines V.1 | 252AP Statistics Course and Exam Description
Scoring Guidelines for Question 1: Focus on Exploring Data 4 points
General Scoring Notes Each part of the question (indicated by a letter) is initially scored by determining if it meets the criteria for essentially correct, partially correct, or incorrect. The response is then categorized based on the scores assigned to each letter part and awarded a score between 0 and 4 (see the table at the end of each question).
Model Solution Scoring
Part (A)
2.A
2.D
UNC-1.H
UNC-1.M
UNC-1.O
The distributions of lead concentration for both Region A and Region B are skewed to the right.
The median lead concentration of Region B (between 100 ppm and 150 ppm) is greater than the median lead concentration of Region A (between 50 ppm and 100 ppm).
The range of lead concentration of Region A (between 400 ppm and 500 ppm) is greater than the range of lead concentration of Region B (between 250 ppm and 350 ppm
Essentially correct (E) if the response addresses the following five components:1. Shape (right skewed)2. Center (e.g., correct location of mean and/or median)3. Variability (e.g., correct range and/or IQR)4. Comparison between regions of at least one of the
following: shapes, centers, or variability 5. Context (lead concentration)
Partially correct (P) if the response includes only three or four of the five components listed above.
Incorrect (I) if the response does not satisfy the criteria for E or P.
Part (B)
4.E
DAT-3.H
Because the p-value of 0.007 is less than the level of significance of 0.05, the data provide convincing statistical evidence that there is a difference between the mean lead concentration in the two regions.
Essentially correct (E) if the response provides both of the following:1. Correct conclusion (Yes, the data provide convincing
statistical evidence) in context (lead concentration) 2. Justification based on comparing the p-value to the
significance level, α
Partially correct (P) Option 1:The response provides both of the following:1. Correct conclusion (Yes) but without context 2. Justification based on comparing the p-value to the
significance level, α
Partially correct (P) Option 2:The response provides both of the following:1. Correct conclusion (Yes) in context (lead
concentration) 2. Justification based on the p-value, but without
comparison of the p-value to the significance level, α
Incorrect (I) if the response does not satisfy the criteria for E or P.

Scoring Guidelines V.1 | 253Return to Table of Contents
© 2020 College Board
AP Statistics Course and Exam Description
Scoring for Question 1 Score
Complete ResponseBoth parts essentially correct
4
Substantial ResponseOne part essentially correct and one part partially correct
3
Developing responseBoth parts partially correct OR one part essenially correct and one part incorrect
2
Minimal ResponseOne part partially correct and one part incorrect
1

Return to Table of Contents© 2020 College Board
Scoring Guidelines V.1 | 254AP Statistics Course and Exam Description
2. Past records from a certain movie theater indicate that 80 percent of moviegoers make a purchase at the movie theater’s snack bar. A random sample of 3 moviegoers from the theater will be selected at random. Let the random variable S represent the number of moviegoers who make a purchase at the snack bar from the 3 selected.
(A) Complete the following table to create the probability distribution of S .
s 0 1 2 3
P s 0.008 0.512
(B) Calculate and interpret the expected value of S.
Question 2: Focus on Probability and Sampling Distributions

Scoring Guidelines V.1 | 255Return to Table of Contents
© 2020 College Board
AP Statistics Course and Exam Description
Scoring Guidelines for Question 2: Focus on Probability and Sampling Distributions 4 points
General Scoring NotesEach part of the question (indicated by a letter) is initially scored by determining if it meets the criteria for essentially correct, partially correct, or incorrect. The response is then categorized based on the scores assigned to each letter part and awarded a score between 0 and 4 (see the table at the end of each question).
Learning Objectives: UNC-3.B VAR-5.A VAR-5.C UNC-3.C VAR-5.D
Model Solution Scoring
Part (A)
2.B 3.A
UNC-3.B
VAR-5.A
Random variable S has a binomial distribution with = 3n and = 0.8.p
= =
=P s( 1)
3
1(0.8) (0.2) 0.0961 2
= =
=P s( 2)
3
2(0.8) (0.2) 0.3842 1
s 0 1 2 3 P(s) 0.008 0.096 0.384 0.512
Essentially correct (E) if the response includes the following three components.1. Shows evidence that the calculation of at least one
probability necessary to complete the table is based on a binomial with = 3n and = 0.8.p , either by using the binomial formula with correct values substituted in, or by using the notation B (3, 0.8), or by using a calculator command, such as binompdf (n = 3, p = 0.8, s = 2). However, an unlabeled calculator command such as binompdf(3, 0.8, 2) does not satisfy component 1.
Note:• A normal approximation is not appropriate because
the sample size is too small.2. Correct calculation of =( 1)P s or =( 2).P s3. The probabilities of the probability distribution sum to 1.
Partially correct (P) if the response includes only two of the three components.
Incorrect (I) if the response does not satisfy the criteria for E or P.
Part (B)
3.B 4.B
VAR-5.C
UNC-3.C
VAR-5.D
Calculation, Option 1:The expected value of S is E(S) = ∑sP(s)= 0(0.008) + 1(0.096) + 2(0.384) + 3(0.512)= 2.4Calculation, Option 2:Because S is a binomial random variable, E(S) = np = 3(0.8) = 2.4.Interpretation:If the process of randomly selecting 3 moviegoers is repeated many times, the average number of moviegoers who make a purchase at the snack bar will be very close to 2.4.
Essentially correct (E) if the response satisfies the following four components.1. Calculates the expected value correctly.
A correct expected value calculation that is consistent with incorrect probabilities reported in part (a) satisfies component 1. If the expected value calculation is rounded to an integer, the response does not satisfy component 1.
2. Interpretation—includes reference to long run, many samples or repeated sampling.
3. Interpretation—includes reference of average.4. Context.
Partially correct (P) if the response includes only three of the four components.
Incorrect (I) if the response does not satisfy the criteria for E or P.

Return to Table of Contents© 2020 College Board
Scoring Guidelines V.1 | 256AP Statistics Course and Exam Description
Scoring for question 2 Score
Complete ResponseBoth parts essentially correct
4
Substantial ResponseOne part essentially correct and one part partially correct
3
Developing responseBoth parts partially correct OR one part essentially correct and one part incorrect
2
Minimal ResponseOne part partially correct and one part incorrect
1

Appendix
AP STATISTICS


AP STATISTICS
Formula Sheet and Tables
Return to Table of Contents© 2020 College Board
Appendix V.1 | 259AP Statistics Course and Exam Description

Formulas for AP Statistics
I. Descriptive Statistics
1 ii
xx x
n n 2
211 1
ix i
x xs x x
n n
y a bx y a bx
11
i i
x y
x x y yrn s s
y
x
sb r
s
II. Probability and Distributions
P A B P A P B P A B ( )( | )
( )P A BP A BP B
Probability Distribution Mean Standard Deviation
Discrete random variable, X ( ) ( )X i iE X x P xμ = = ⋅ ( ) ( )2X i X ix P xσ μ= − ⋅
If X has a binomial distribution with parameters n and p , then:
1 n xxnP X x p p
x
where 0, 1, 2, 3, ,x n
X np 1X np p
If X has a geometric distribution with parameter p , then:
11 xP X x p p
where 1, 2, 3,x
1X p
1X
pp
III. Sampling Distributions and Inferential Statistics
Standardized test statistic: statistic parameterstandard error of the statistic
−
Confidence interval: ( )( )statistic critical value standard error of statistic±
Chi-square statistic:
( )22 observed expected
expectedχ
−=
Return to Table of Contents© 2020 College Board
Appendix V.1 | 260AP Statistics Course and Exam Description

III. Sampling Distributions and Inferential Statistics (continued)Sampling distributions for proportions:
Random Variable Parameters of Sampling DistributionStandard Error* of Sample Statistic
For one population:p p p
ˆ
1p
p pn
ˆ
ˆ ˆ1p
p ps
n
For two populations:1 2
ˆ ˆp p− 1 2ˆ ˆ 1 2p p p p
1 2
1 1 2 2ˆ ˆ
1 2
1 1p p
p p p pn n
1 2
1 1 2 2ˆ ˆ
1 2
ˆ ˆ ˆ ˆ1 1p p
p p p ps
n n
When 1 2p p is assumed:
( )1 2ˆ ˆ
1 2
1 1ˆ ˆ1c cp ps p pn n−
= − +
where 1 2
1 2
ˆc
X Xpn n
Sampling distributions for means:
Random Variable Parameters of Sampling DistributionStandard Error* of Sample Statistic
For one population:X X X n
Xssn
For two populations:1 2X X
1 2 1 2X X 1 2
2 21 2
1 2X X n n
1 2
2 21 2
1 2X X
s ssn n
Sampling distributions for simple linear regression:
Random Variable Parameters of Sampling DistributionStandard Error* of Sample Statistic
For slope:b b b
x n
,
where 2
ix
x xn
1bx
sss n
,
where 2
2i iy y
sn
and 2
1i
x
x xs
n
*Standard deviation is a measurement of variability from the theoretical population. Standard error is the estimate of the standard deviation. If the standard deviation of the statistic is assumed to be known, then the standard deviation should be used instead of the standard error.
Return to Table of Contents© 2020 College Board
Appendix V.1 | 261AP Statistics Course and Exam Description

Tables for AP Statistics
Table entry for z is the probability lying below z.
Table A Standard Normal Probabilities
z .00 .01 .02 .03 .04 .05 .06 .07 .08 .09
−3.4 .0003 .0003 .0003 .0003 .0003 .0003 .0003 .0003 .0003 .0002
−3.3 .0005 .0005 .0005 .0004 .0004 .0004 .0004 .0004 .0004 .0003
−3.2 .0007 .0007 .0006 .0006 .0006 .0006 .0006 .0005 .0005 .0005
−3.1 .0010 .0009 .0009 .0009 .0008 .0008 .0008 .0008 .0007 .0007
−3.0 .0013 .0013 .0013 .0012 .0012 .0011 .0011 .0011 .0010 .0010
−2.9 .0019 .0018 .0018 .0017 .0016 .0016 .0015 .0015 .0014 .0014
−2.8 .0026 .0025 .0024 .0023 .0023 .0022 .0021 .0021 .0020 .0019
−2.7 .0035 .0034 .0033 .0032 .0031 .0030 .0029 .0028 .0027 .0026
−2.6 .0047 .0045 .0044 .0043 .0041 .0040 .0039 .0038 .0037 .0036
−2.5 .0062 .0060 .0059 .0057 .0055 .0054 .0052 .0051 .0049 .0048
−2.4 .0082 .0080 .0078 .0075 .0073 .0071 .0069 .0068 .0066 .0064
−2.3 .0107 .0104 .0102 .0099 .0096 .0094 .0091 .0089 .0087 .0084
−2.2 .0139 .0136 .0132 .0129 .0125 .0122 .0119 .0116 .0113 .0110
−2.1 .0179 .0174 .0170 .0166 .0162 .0158 .0154 .0150 .0146 .0143
−2.0 .0228 .0222 .0217 .0212 .0207 .0202 .0197 .0192 .0188 .0183
−1.9 .0287 .0281 .0274 .0268 .0262 .0256 .0250 .0244 .0239 .0233
−1.8 .0359 .0351 .0344 .0336 .0329 .0322 .0314 .0307 .0301 .0294
−1.7 .0446 .0436 .0427 .0418 .0409 .0401 .0392 .0384 .0375 .0367
−1.6 .0548 .0537 .0526 .0516 .0505 .0495 .0485 .0475 .0465 .0455
−1.5 .0668 .0655 .0643 .0630 .0618 .0606 .0594 .0582 .0571 .0559
continued on next page
Return to Table of Contents© 2020 College Board
Appendix V.1 | 262AP Statistics Course and Exam Description

continued on next page
Table A Standard Normal Probabilities (continued)
z .00 .01 .02 .03 .04 .05 .06 .07 .08 .09
−1.4 .0808 .0793 .0778 .0764 .0749 .0735 .0721 .0708 .0694 .0681
−1.3 .0968 .0951 .0934 .0918 .0901 .0885 .0869 .0853 .0838 .0823
−1.2 .1151 .1131 .1112 .1093 .1075 .1056 .1038 .1020 .1003 .0985
−1.1 .1357 .1335 .1314 .1292 .1271 .1251 .1230 .1210 .1190 .1170
−1.0 .1587 .1562 .1539 .1515 .1492 .1469 .1446 .1423 .1401 .1379
−0.9 .1841 .1814 .1788 .1762 .1736 .1711 .1685 .1660 .1635 .1611
−0.8 .2119 .2090 .2061 .2033 .2005 .1977 .1949 .1922 .1894 .1867
−0.7 .2420 .2389 .2358 .2327 .2296 .2266 .2236 .2206 .2177 .2148
−0.6 .2743 .2709 .2676 .2643 .2611 .2578 .2546 .2514 .2483 .2451
−0.5 .3085 .3050 .3015 .2981 .2946 .2912 .2877 .2843 .2810 .2776
−0.4 .3446 .3409 .3372 .3336 .3300 .3264 .3228 .3192 .3156 .3121
−0.3 .3821 .3783 .3745 .3707 .3669 .3632 .3594 .3557 .3520 .3483
−0.2 .4207 .4168 .4129 .4090 .4052 .4013 .3974 .3936 .3897 .3859
−0.1 .4602 .4562 .4522 .4483 .4443 .4404 .4364 .4325 .4286 .4247
−0.0 .5000 .4960 .4920 .4880 .4840 .4801 .4761 .4721 .4681 .4641
Return to Table of Contents© 2020 College Board
Appendix V.1 | 263AP Statistics Course and Exam Description

Table A Standard Normal Probabilities (continued)
z .00 .01 .02 .03 .04 .05 .06 .07 .08 .09
0.0 .5000 .5040 .5080 .5120 .5160 .5199 .5239 .5279 .5319 .5359
0.1 .5398 .5438 .5478 .5517 .5557 .5596 .5636 .5675 .5714 .5753
0.2 .5793 .5832 .5871 .5910 .5948 .5987 .6026 .6064 .6103 .6141
0.3 .6179 .6217 .6255 .6293 .6331 .6368 .6406 .6443 .6480 .6517
0.4 .6554 .6591 .6628 .6664 .6700 .6736 .6772 .6808 .6844 .6879
0.5 .6915 .6950 .6985 .7019 .7054 .7088 .7123 .7157 .7190 .7224
0.6 .7257 .7291 .7324 .7357 .7389 .7422 .7454 .7486 .7517 .7549
0.7 .7580 .7611 .7642 .7673 .7704 .7734 .7764 .7794 .7823 .7852
0.8 .7881 .7910 .7939 .7967 .7995 .8023 .8051 .8078 .8106 .8133
0.9 .8159 .8186 .8212 .8238 .8264 .8289 .8315 .8340 .8365 .8389
1.0 .8413 .8438 .8461 .8485 .8508 .8531 .8554 .8577 .8599 .8621
1.1 .8643 .8665 .8686 .8708 .8729 .8749 .8770 .8790 .8810 .8830
1.2 .8849 .8869 .8888 .8907 .8925 .8944 .8962 .8980 .8997 .9015
1.3 .9032 .9049 .9066 .9082 .9099 .9115 .9131 .9147 .9162 .9177
1.4 .9192 .9207 .9222 .9236 .9251 .9265 .9279 .9292 .9306 .9319
1.5 .9332 .9345 .9357 .9370 .9382 .9394 .9406 .9418 .9429 .9441
1.6 .9452 .9463 .9474 .9484 .9495 .9505 .9515 .9525 .9535 .9545
1.7 .9554 .9564 .9573 .9582 .9591 .9599 .9608 .9616 .9625 .9633
1.8 .9641 .9649 .9656 .9664 .9671 .9678 .9686 .9693 .9699 .9706
1.9 .9713 .9719 .9726 .9732 .9738 .9744 .9750 .9756 .9761 .9767
2.0 .9772 .9778 .9783 .9788 .9793 .9798 .9803 .9808 .9812 .9817
2.1 .9821 .9826 .9830 .9834 .9838 .9842 .9846 .9850 .9854 .9857
2.2 .9861 .9864 .9868 .9871 .9875 .9878 .9881 .9884 .9887 .9890
2.3 .9893 .9896 .9898 .9901 .9904 .9906 .9909 .9911 .9913 .9916
2.4 .9918 .9920 .9922 .9925 .9927 .9929 .9931 .9932 .9934 .9936
Table entry for z is the probability lying below z.
continued on next page
Return to Table of Contents© 2020 College Board
Appendix V.1 | 264AP Statistics Course and Exam Description

Table A Standard Normal Probabilities (continued)
z .00 .01 .02 .03 .04 .05 .06 .07 .08 .09
2.5 .9938 .9940 .9941 .9943 .9945 .9946 .9948 .9949 .9951 .9952
2.6 .9953 .9955 .9956 .9957 .9959 .9960 .9961 .9962 .9963 .9964
2.7 .9965 .9966 .9967 .9968 .9969 .9970 .9971 .9972 .9973 .9974
2.8 .9974 .9975 .9976 .9977 .9977 .9978 .9979 .9979 .9980 .9981
2.9 .9981 .9982 .9982 .9983 .9984 .9984 .9985 .9985 .9986 .9986
3.0 .9987 .9987 .9987 .9988 .9988 .9989 .9989 .9989 .9990 .9990
3.1 .9990 .9991 .9991 .9991 .9992 .9992 .9992 .9992 .9993 .9993
3.2 .9993 .9993 .9994 .9994 .9994 .9994 .9994 .9995 .9995 .9995
3.3 .9995 .9995 .9995 .9996 .9996 .9996 .9996 .9996 .9996 .9997
3.4 .9997 .9997 .9997 .9997 .9997 .9997 .9997 .9997 .9997 .9998
Return to Table of Contents© 2020 College Board
Appendix V.1 | 265AP Statistics Course and Exam Description

Table entry for p and C is the point *t with probability p lying above it and probability C lying between − *t and *t .
Table B t Distribution Critical Values
dfTail Probability p
.25 .20 .15 .10 .05 .025 .02 .01 .005 .0025 .001 .0005
1 1.000 1.376 1.963 3.078 6.314 12.71 15.89 31.82 63.66 127.3 318.3 636.6
2 .816 1.061 1.386 1.886 2.920 4.303 4.849 6.965 9.925 14.09 22.33 31.60
3 .765 .978 1.250 1.638 2.353 3.182 3.482 4.541 5.841 7.453 10.21 12.92
4 .741 .941 1.190 1.533 2.132 2.776 2.999 3.747 4.604 5.598 7.173 8.610
5 .727 .920 1.156 1.476 2.015 2.571 2.757 3.365 4.032 4.773 5.893 6.869
6 .718 .906 1.134 1.440 1.943 2.447 2.612 3.143 3.707 4.317 5.208 5.959
7 .711 .896 1.119 1.415 1.895 2.365 2.517 2.998 3.499 4.029 4.785 5.408
8 .706 .889 1.108 1.397 1.860 2.306 2.449 2.896 3.355 3.833 4.501 5.041
9 .703 .883 1.100 1.383 1.833 2.262 2.398 2.821 3.250 3.690 4.297 4.781
10 .700 .879 1.093 1.372 1.812 2.228 2.359 2.764 3.169 3.581 4.144 4.587
11 .697 .876 1.088 1.363 1.796 2.201 2.328 2.718 3.106 3.497 4.025 4.437
12 .695 .873 1.083 1.356 1.782 2.179 2.303 2.681 3.055 3.428 3.930 4.318
13 .694 .870 1.079 1.350 1.771 2.160 2.282 2.650 3.012 3.372 3.852 4.221
14 .692 .868 1.076 1.345 1.761 2.145 2.264 2.624 2.977 3.326 3.787 4.140
15 .691 .866 1.074 1.341 1.753 2.131 2.249 2.602 2.947 3.286 3.733 4.073
16 .690 .865 1.071 1.337 1.746 2.120 2.235 2.583 2.921 3.252 3.686 4.015
17 .689 .863 1.069 1.333 1.740 2.110 2.224 2.567 2.898 3.222 3.646 3.965
18 .688 .862 1.067 1.330 1.734 2.101 2.214 2.552 2.878 3.197 3.611 3.922
19 .688 .861 1.066 1.328 1.729 2.093 2.205 2.539 2.861 3.174 3.579 3.883
20 .687 .860 1.064 1.325 1.725 2.086 2.197 2.528 2.845 3.153 3.552 3.850
continued on next page
Return to Table of Contents© 2020 College Board
Appendix V.1 | 266AP Statistics Course and Exam Description

Table B t Distribution Critical Values (continued)
dfTail Probability p
.25 .20 .15 .10 .05 .025 .02 .01 .005 .0025 .001 .0005
21 .686 .859 1.063 1.323 1.721 2.080 2.189 2.518 2.831 3.135 3.527 3.819
22 .686 .858 1.061 1.321 1.717 2.074 2.183 2.508 2.819 3.119 3.505 3.792
23 .685 .858 1.060 1.319 1.714 2.069 2.177 2.500 2.807 3.104 3.485 3.768
24 .685 .857 1.059 1.318 1.711 2.064 2.172 2.492 2.797 3.091 3.467 3.745
25 .684 .856 1.058 1.316 1.708 2.060 2.167 2.485 2.787 3.078 3.450 3.725
26 .684 .856 1.058 1.315 1.706 2.056 2.162 2.479 2.779 3.067 3.435 3.707
27 .684 .855 1.057 1.314 1.703 2.052 2.158 2.473 2.771 3.057 3.421 3.690
28 .683 .855 1.056 1.313 1.701 2.048 2.154 2.467 2.763 3.047 3.408 3.674
29 .683 .854 1.055 1.311 1.699 2.045 2.150 2.462 2.756 3.038 3.396 3.659
30 .683 .854 1.055 1.310 1.697 2.042 2.147 2.457 2.750 3.030 3.385 3.646
40 .681 .851 1.050 1.303 1.684 2.021 2.123 2.423 2.704 2.971 3.307 3.551
50 .679 .849 1.047 1.299 1.676 2.009 2.109 2.403 2.678 2.937 3.261 3.496
60 .679 .848 1.045 1.296 1.671 2.000 2.099 2.390 2.660 2.915 3.232 3.460
80 .678 .846 1.043 1.292 1.664 1.990 2.088 2.374 2.639 2.887 3.195 3.416
100 .677 .845 1.042 1.290 1.660 1.984 2.081 2.364 2.626 2.871 3.174 3.390
1000 .675 .842 1.037 1.282 1.646 1.962 2.056 2.330 2.581 2.813 3.098 3.300
∞ .674 .841 1.036 1.282 1.645 1.960 2.054 2.326 2.576 2.807 3.091 3.291
50% 60% 70% 80% 90% 95% 96% 98% 99% 99.5% 99.8% 99.9%
Confidence level C
Return to Table of Contents© 2020 College Board
Appendix V.1 | 267AP Statistics Course and Exam Description

Table entry for p is the point ( χ2) with probability p lying above it.
Table C χ2 Critical Values
dfTail probability p
.25 .20 .15 .10 .05 .025 .02 .01 .005 .0025 .001 .0005
1 1.32 1.64 2.07 2.71 3.84 5.02 5.41 6.63 7.88 9.14 10.83 12.12
2 2.77 3.22 3.79 4.61 5.99 7.38 7.82 9.21 10.60 11.98 13.82 15.20
3 4.11 4.64 5.32 6.25 7.81 9.35 9.84 11.34 12.84 14.32 16.27 17.73
4 5.39 5.99 6.74 7.78 9.49 11.14 11.67 13.28 14.86 16.42 18.47 20.00
5 6.63 7.29 8.12 9.24 11.07 12.83 13.39 15.09 16.75 18.39 20.51 22.11
6 7.84 8.56 9.45 10.64 12.59 14.45 15.03 16.81 18.55 20.25 22.46 24.10
7 9.04 9.80 10.75 12.02 14.07 16.01 16.62 18.48 20.28 22.04 24.32 26.02
8 10.22 11.03 12.03 13.36 15.51 17.53 18.17 20.09 21.95 23.77 26.12 27.87
9 11.39 12.24 13.29 14.68 16.92 19.02 19.68 21.67 23.59 25.46 27.88 29.67
10 12.55 13.44 14.53 15.99 18.31 20.48 21.16 23.21 25.19 27.11 29.59 31.42
11 13.70 14.63 15.77 17.28 19.68 21.92 22.62 24.72 26.76 28.73 31.26 33.14
12 14.85 15.81 16.99 18.55 21.03 23.34 24.05 26.22 28.30 30.32 32.91 34.82
13 15.98 16.98 18.20 19.81 22.36 24.74 25.47 27.69 29.82 31.88 34.53 36.48
14 17.12 18.15 19.41 21.06 23.68 26.12 26.87 29.14 31.32 33.43 36.12 38.11
15 18.25 19.31 20.60 22.31 25.00 27.49 28.26 30.58 32.80 34.95 37.70 39.72
16 19.37 20.47 21.79 23.54 26.30 28.85 29.63 32.00 34.27 36.46 39.25 41.31
17 20.49 21.61 22.98 24.77 27.59 30.19 31.00 33.41 35.72 37.95 40.79 42.88
18 21.60 22.76 24.16 25.99 28.87 31.53 32.35 34.81 37.16 39.42 42.31 44.43
19 22.72 23.90 25.33 27.20 30.14 32.85 33.69 36.19 38.58 40.88 43.82 45.97
20 23.83 25.04 26.50 28.41 31.41 34.17 35.02 37.57 40.00 42.34 45.31 47.50
continued on next page
Return to Table of Contents© 2020 College Board
Appendix V.1 | 268AP Statistics Course and Exam Description
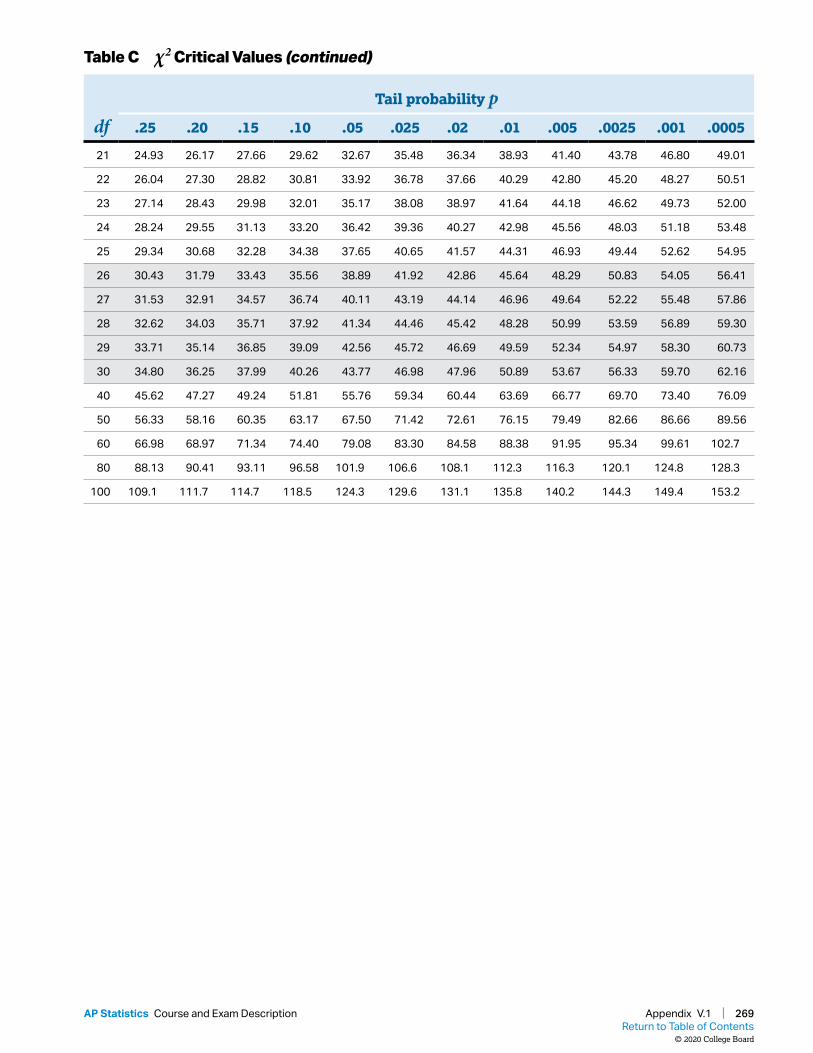
Table C χ2 Critical Values (continued)
dfTail probability p
.25 .20 .15 .10 .05 .025 .02 .01 .005 .0025 .001 .0005
21 24.93 26.17 27.66 29.62 32.67 35.48 36.34 38.93 41.40 43.78 46.80 49.01
22 26.04 27.30 28.82 30.81 33.92 36.78 37.66 40.29 42.80 45.20 48.27 50.51
23 27.14 28.43 29.98 32.01 35.17 38.08 38.97 41.64 44.18 46.62 49.73 52.00
24 28.24 29.55 31.13 33.20 36.42 39.36 40.27 42.98 45.56 48.03 51.18 53.48
25 29.34 30.68 32.28 34.38 37.65 40.65 41.57 44.31 46.93 49.44 52.62 54.95
26 30.43 31.79 33.43 35.56 38.89 41.92 42.86 45.64 48.29 50.83 54.05 56.41
27 31.53 32.91 34.57 36.74 40.11 43.19 44.14 46.96 49.64 52.22 55.48 57.86
28 32.62 34.03 35.71 37.92 41.34 44.46 45.42 48.28 50.99 53.59 56.89 59.30
29 33.71 35.14 36.85 39.09 42.56 45.72 46.69 49.59 52.34 54.97 58.30 60.73
30 34.80 36.25 37.99 40.26 43.77 46.98 47.96 50.89 53.67 56.33 59.70 62.16
40 45.62 47.27 49.24 51.81 55.76 59.34 60.44 63.69 66.77 69.70 73.40 76.09
50 56.33 58.16 60.35 63.17 67.50 71.42 72.61 76.15 79.49 82.66 86.66 89.56
60 66.98 68.97 71.34 74.40 79.08 83.30 84.58 88.38 91.95 95.34 99.61 102.7
80 88.13 90.41 93.11 96.58 101.9 106.6 108.1 112.3 116.3 120.1 124.8 128.3
100 109.1 111.7 114.7 118.5 124.3 129.6 131.1 135.8 140.2 144.3 149.4 153.2
Return to Table of Contents© 2020 College Board
Appendix V.1 | 269AP Statistics Course and Exam Description

THIS PAGE IS INTENTIONALLY LEFT BLANK.