STAT 200 Fall 2019 Exam 2 - atlas
10
STATS 200 EXAM 2 Nov. 13, 2019 PRINT Name _______________________ ___________________ Last (family) name First name Net ID _____________________ Signature ________________________ Instructions- This is a closed book, closed notes exam. You have 1.5 hours to complete it. • At the end of this exam, you must return this exam with all pages, and you must return your scantron sheet. Please circle all of your answers on this exam and fill in all of your answers on the scantron. • If you do not turn in a complete exam and scantron form, you will receive the grade AB (Absent) for this exam. • Use a #2 pencil. Each question has only one answer. If you bubble in more than one answer it will automatically be marked wrong. Erase mistakes completely. • This exam is either Form A, or B. You don’t know which test form you have so you MUST turn in your scantron with the exam so the TAs can correctly mark the test form box on your scantron sheet after the exam. READ àHow to fill out the Scantron form • Print and bubble in your LAST NAME with NO SPACES or DASHES starting in the left most column. Print your FIRST INITIAL in the right-most column. • Print and bubble in your Student ID number (UIN) NO SPACES or DASHES in the Student Number box. • Print and bubble in the date in the Date box. • Print and bubble in your NET ID with NO SPACES or DASHES in the NETWORK ID box. • Print and bubble in the Section Box. See section codes. à • Write Stat 200 on the COURSE line. • Write your instructor’s name on the INSTRUCTOR line. • Write your section on the SECTION line. • Sign your name, and right underneath the student signature line PRINT your name Warning -All Cheating including being caught with a non-permissible calculator or formula sheet will result in a 0 and an academic integrity violation on your University record. CHECK NOW THAT YOU HAVE COMPLETED ALL OF THE STEPS. Before starting the exam, check to make sure that your test booklet is complete. You should have 9 pages (63 problems), including 3 tables: the normal table, the chi-square table, and F, but you may not need them all. Formulas: SD errors = 1 − r 2 *SD y SEslope = SD errors n *SD x = 1 − r 2 n ∗ SD y SD x Circle Section: L1 ONL S1 S2 S3 S4 Section Codes: ONL (Fireman) = 00001 L1 (Fireman TR 9:30am) = 00002 S1 (Yu MWF 10am) = 00003 S2 (Chakrabarty MWF 1pm)= 00004 S3 (Liu MWF 9am)= 00005 S4 (Zhou TR 2pm) = 00006 There is class tomorrow!
-
Upload
khangminh22 -
Category
Documents
-
view
3 -
download
0
Transcript of STAT 200 Fall 2019 Exam 2 - atlas

STATS200EXAM2 Nov.13,2019
PRINT Name _______________________ ___________________ Last (family) name First name Net ID _____________________ Signature ________________________ Instructions- This is a closed book, closed notes exam. You have 1.5 hours to complete it.
• At the end of this exam, you must return this exam with all pages, and you must return your scantron sheet. Please circle all of your answers on this exam and fill in all of your answers on the scantron.
• If you do not turn in a complete exam and scantron form, you will receive the grade AB (Absent) for this exam. • Use a #2 pencil. Each question has only one answer. If you bubble in more than one answer it will automatically be
marked wrong. Erase mistakes completely.
• This exam is either Form A, or B. You don’t know which test form you have so you MUST turn in your scantron with the exam so the TAs can correctly mark the test form box on your scantron sheet after the exam.
READ àHow to fill out the Scantron form • Print and bubble in your LAST NAME with NO SPACES or DASHES starting in the left most column.
Print your FIRST INITIAL in the right-most column.
• Print and bubble in your Student ID number (UIN) NO SPACES or DASHES in the Student Number box.
• Print and bubble in the date in the Date box.
• Print and bubble in your NET ID with NO SPACES or DASHES in the NETWORK ID box.
• Print and bubble in the Section Box. See section codes. à
• Write Stat 200 on the COURSE line.
• Write your instructor’s name on the INSTRUCTOR line.
• Write your section on the SECTION line.
• Sign your name, and right underneath the student signature line PRINT your name
Warning -All Cheating including being caught with a non-permissible calculator or formula sheet will result in a 0 and an academic integrity violation on your University record.
CHECK NOW THAT YOU HAVE COMPLETED ALL OF THE STEPS. Before starting the exam, check to make sure that your test booklet is complete. You should have 9 pages (63 problems), including 3 tables: the normal table, the chi-square table, and F, but you may not need them all.
Formulas:SDerrors = 1− r2 *SDy SEslope=SDerrors
n *SDx
= 1− r2
n∗SDy
SDx
SERA = SERB = SEU = nAnB(N +1)12
H = 12N(N +1)
(obsRi − expRi )2
nii=1
g
∑
CircleSection:L1ONLS1S2S3S4
Section Codes: ONL (Fireman) = 00001 L1 (Fireman TR 9:30am) = 00002 S1 (Yu MWF 10am) = 00003 S2 (ChakrabartyMWF 1pm)= 00004 S3 (Liu MWF 9am)= 00005 S4 (Zhou TR 2pm) = 00006
Thereisclasstomorrow!
STATS200EXAM2 Nov.13,2019
1
Questions1-6
Foreachplotlistedbelow,determinewhetherrisappropriatetouse.Ifso,choosetherwhichbestrepresentstheplot.(Choosea,b,c,d,eorforeachplot.Oneofthe5choiceswillbeusedtwiceandtheotherswilleachbeusedonce.)1) Plot A a) Not appropriate to use r b) r = 0.9 c) r = 0 d) r =0.5 e) r = -0.5 2) Plot B a) Not appropriate to use r b) r = 0.9 c) r = 0 d) r =0.5 e) r = -0.5 3) Plot C a) Not appropriate to use r b) r = 0.9 c) r = 0 d) r =0.5 e) r = -0.5 4) Plot D a) Not appropriate to use r b) r = 0.9 c) r = 0 d) r =0.5 e) r = -0.5 5) Plot E a) Not appropriate to use r b) r = 0.9 c) r = 0 d) r =0.5 e) r = -0.5 6) Plot F a) Not appropriate to use r b) r = 0.9 c) r = 0 d) r =0.5 e) r = -0.5
Questions 7-9 pertain to X and Y are 2 sets of numbers with a correlation coefficient of r = - 0.4. 7) If all the X values are multiplied by negative 2, the new correlation coefficient would be a) 0.4 b) -0.4 c) 0.8 d) -0.8 e) Not enough information given
8) If the original X and Y values are all multiplied by negative 2, the new correlation coefficient would be a) 0.4 b) -0.4 c) 0.8 d) -0.8 e) Not enough information given
9) If the original X and Y values were converted to Z scores the new correlation coefficient would be
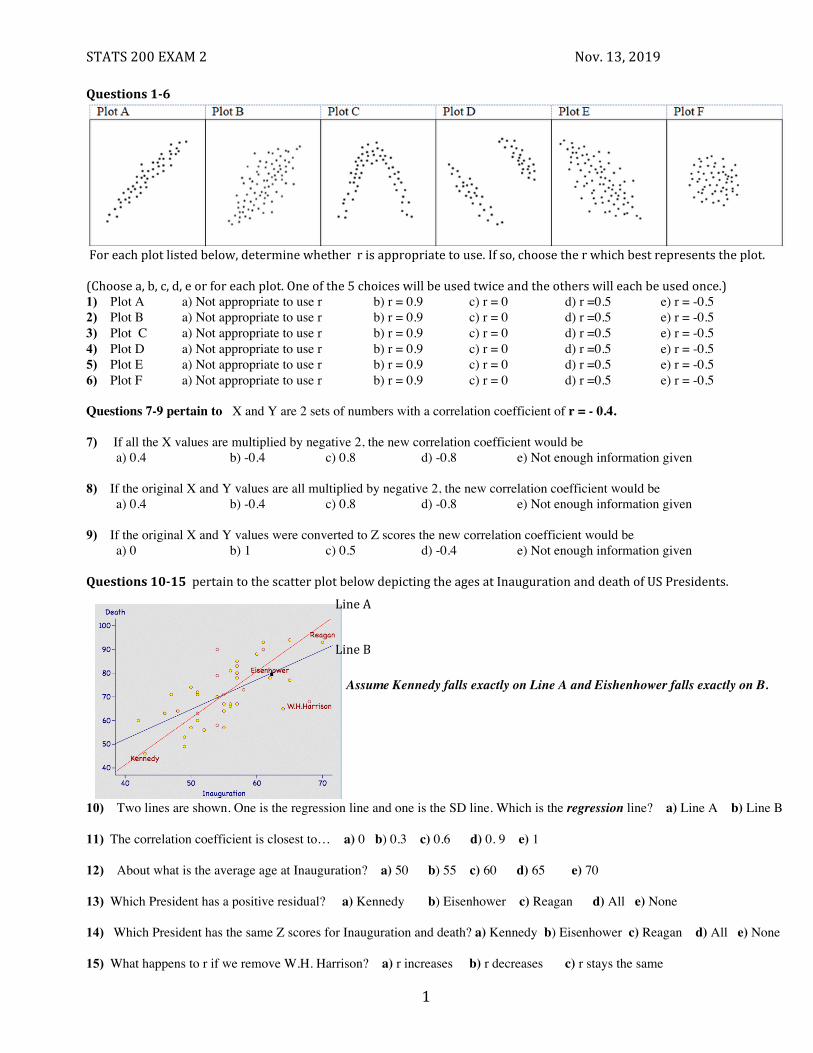
a) 0 b) 1 c) 0.5 d) -0.4 e) Not enough information given Questions10-15pertaintothescatterplotbelowdepictingtheagesatInaugurationanddeathofUSPresidents.
10) Two lines are shown. One is the regression line and one is the SD line. Which is the regression line? a) Line A b) Line B 11) The correlation coefficient is closest to… a) 0 b) 0.3 c) 0.6 d) 0. 9 e) 1
12) About what is the average age at Inauguration? a) 50 b) 55 c) 60 d) 65 e) 70 13) Which President has a positive residual? a) Kennedy b) Eisenhower c) Reagan d) All e) None
14) Which President has the same Z scores for Inauguration and death? a) Kennedy b) Eisenhower c) Reagan d) All e) None
15) What happens to r if we remove W.H. Harrison? a) r increases b) r decreases c) r stays the same
.
LineA
LineB
Assume Kennedy falls exactly on Line A and Eishenhower falls exactly on B.

STATS200EXAM2 Nov.13,2019
2
Questions 16-29 Below are the 5 summary statistics for the ACT(verbal) and Final Exam scores of 81 students in Stat 100. (Assume the scatter plot is roughly football shaped.)
16) One student has a Z = -2 on the Verbal ACT, what’s the regression estimate for his Z score on the Final Exam? a) -2 b) -1.2 c) -0.4 d) – 0.2 e) 0.2
17) Another student has a Verbal ACT of 32, what’s the regression estimate for her Final Exam score? a) 90 b) 87 c) 78 d) 77 e) 75
18) What is the slope of the regression line for predicting Final scores from ACT scores? a) 0.25 b) 2.5 c) 0.08 d) 0.2 e) 0.5
Now suppose the 81 students were randomly drawn from the entire population of 2000 students enrolled in Stat 100
19) This corresponds to drawing 81 points at random without replacement from a scatter plot depicting the a) Final and ACT scores of the 100 randomly drawn students b) Final and ACT scores of all students in the University c) Final and ACT scores of all 2000 students in the larger class.
20) The SEslope = 0.27 , a 95% Confidence Interval for the population slope (β1) using the normal curve is closest to
a) (0.23, 0.77) b) (-0.54, 54) c) (-0.04, 1.04) d) (-4.5, 1.45) e) not enough info
21) To change the SEslope above to the SE+
slope you would multiple by
a) 7981
b) 8179
c) 8180
d) 8079
22) A 95% Confidence Interval for β1 using the t curve would be _______ than the one above using the normal curve.
a) wider than b) narrower than c) exactly the same as
23) To test H0: β1=0 against HA: β1≠ 0 in the model Final = β0 + β1 (ACT) which of the following significance tests would not be
appropriate? a) Z b) t c) χ2 d) F e) They’d all be appropriate
24) Z = a) 1.85 b) 0.5 c) 3.43 d) 2 e) not enough info (Assume Z test is appropriate)
Questions 25-29 Assume the Z-test yielded a p-value = 6.43%. 25) Would we Reject Ho at 5% significance level? a) Yes b) No
26) Would our 95% CI for β1 include 0? a) Yes b) No
27) The t-test would yield a p-value _____6.43% a) > b) < c) = d) not enough info
28) The χ2 test would yield a p-value _____6.43% a) > b) < c) = d) not enough info 29) If we changed to a 1-sided HA: β1 > 0, the Z stat would give a p-value =
a) 6.43% b) 3.215% c) 12. 86%
Avg SDACT(verbal) 26 4FinalExam 75 10
r=0.2

STATS200EXAM2 Nov.13,2019
3
Question30-32pertaintothescatterplotsbelowshowtheresultsonthe398studentswhoreportedtheirshoesizeandheight(ininches)onSurvey1.Theplotontheleftshowsall398students.Themalesareshownaslightcoloredpointsandfemalesasdarkcoloredpoints.The2scatterplotsontherightsplitthedataintoseparateplotsformalesandfemales.
30) Why is r lower in the separate male and female plots on the right compared to the combined plot on the left?
a) r is lower in the separate plots because n is lower (The separate plots have 236 males and 162 females, instead of 398 for the combined plot) b) r is higher in the combined plot because males have higher values for both shoe size and height which increases r. c) The absolute value of r is always lower when you stratify data.
31) Translate the male and female regression equations above into an equivalent multiple regression. Code Males=0 and Females=1 for the Gender variable. a) Height=54.11+1.548(ShoeSize)+4.2(Gender)-0.359(ShoeSize*Gender)b) Height=58.75+0.807(ShoeSize)-0.44(Gender)+0.3863(ShoeSize*Gender)c) Height=58.31+1.189(ShoeSize)+0.44(Gender)-0.3863(ShoeSize*Gender)d) Height=58.31+1.189(ShoeSize)-0.3863(Gender)+0.44(ShoeSize*Gender)
32) If you switched the code to Females=0 and Males=1, which one of the following would change? a)ScatterPlotspicturedaboveb)MultipleRegressionEquationc)SimpleRegressionEquations
Questions33-34refer to the 4 plots below, each displaying 2 separate groups. Let's say we're trying to figure out if X causes Y and the data consists of 2 prior groups, A and B. Which of the plots display confounding and which display interactions.
Plot1 Plot2 Plot3 Plot4
33) Plot 1 has a) Only Confounding b) Only Interaction c) Both d) Neither 34) Plot 4 has a) Only Confounding b) Only Interaction c) Both d) Neither
Male Height = 58.31 + 1.189 × Shoe Size r = 0.4976 Female Height = 58.75 + 0.8027 × Shoe Size r = 0.4073
Height = 54.11 + 1.548 × Shoe Size r = 0.7249

STATS200EXAM2 Nov.13,2019
4
35) The numbers in the table show the average hourly wages classified by Gender and Job Category for a group of workers. Fill in the blank in the equation to make the equation match the table :
Questions36-48On our first Survey 398 Stat 200 students reported their height, gender and weight. Here is the multiple regression equation predicting weight (in lbs.), from gender (Males=0, Females=1) and height(in inches). Weight = -57 -17(Gender)+ 3(Height) (Numbers were rounded to whole numbers.)
36) The above equation describes the best fitting ____________ a) line b) plane c) ellipsoid
37) through all the points so as to minimize the sum of squared errors in _______ a) Weight b) Gender c) Height
38) Two males differ by 2 inches in height. The regression equation predicts that the taller man will weigh ____lbs more.
a) 3 b) 6 c) 20 d) 23 e) 57
39) A male is 2 inches taller than a female. The regression equation predicts that the male will weigh ____lbs more. a) 3 b) 6 c) 20 d) 23 e) 57
40) The multiple correlation coefficient is R= 0.62 (rounded) How was that calculated?
a) Risthecorrelationbetweenthe3variablesonceeachvariablehasbeencontrolledfortheothertwo.b) Risthecorrelationbetweenthestudents’predictedweightsandtheiractualweights.c) Riscorrelationofthe3variablesonceconvertedtoZscores.
Imagine that the 398 students were chosen from a much larger population of all Stat 200 students. Compute χ2 and F stats to test. Ho: All slope β’s= 0 against HA: At least one slope β≠ 0 for the model Y= β0 + β1X1 + β2X2
41) χ2 test statistic = a) 248.53 b) 15.76 c) 123.33 d) 11.11
42) F test statistic = a) 248.53 b) 15.76 c) 123.33 d) 11.11
43) When the null is true the mean of the χ2 distribution = ______ and the mean of the F distribution = _______. a) 2, 1 b) 3, 1 c) 0, 0 d) 1, 1 e) 398, 395
44) Comparing our χ2 and F stats to those means (and looking at the tables), we know that the p-values for both tests are very close to _____. a) 0% b) 1% c) 2.5% d) 5% e) 10%
45) Conclusion: a) Reject the null and conclude at least one of the slopes is significant. b) Reject the null and conclude both slopes must be significant. c) Cannot reject the null.
46) Totesttheindividualslopestoseewhichonewassignificant,thecomputerdidat-test.Howmanydegreesof
freedomforthet-testsa)2 b)c c)395 d)396e)39747) Anotherwaytocomputethep-valuefortheoverallregressionmodelisbythere-randomizationtest.
Thehistogramontherightshowstherandomizationtestresultsof100,000randomizationsshowingthedistributionofR’s.Whatdoestheverticallinemark?
a)R=0.62,oursampleRb)0.62%significancelevelc)Thesignificancelevelcorrespondingto100,000randomizations.
48) Thep-valuegivenbytherandomizationisclosestto
a)0% b)0.1%c)0.6%
Male (Gender=0) Female (Gender=1) Service (Job=0) $15 $10 White Collar (Job=1) $25 $17
Hourly Wage = 15 + -5 G + 10 J + ___ JG a) 6 b) -8 c) 17 d) -3 e) 3

STATS200EXAM2 Nov.13,2019
5
Questions49-56
Questions 49-51 ask you to fill in 3 of the missing cells in the ANOVA table is below. 49) How many degrees of freedom for the Model ? a) 2 b) 3 c) 4 d) 312 e) 313
50) The F-stat for testing the null hypothesis that all group means are the same in the population is:
a) 0.345 b) 0.28 c) 1 d) 2.895 e) Not enough info
51) R2 is closest to a) 0.027 b) 0. 164 c) 0.34 d) 1.2 e) Not enough info
Source SS(SumofSquares) df MeanSquare FStatistic P-valueModel SSB=41.14
df=______
MSB=13.71
F=_________
<0.005%
Error SSW=__________
df=______
MSW=4.736
SD+errors=___________
Total SST=1523.65
df=316 R2=________
52) What do you conclude?
a) That all the group averages are significantly different from each other. b) That at least one of the group averages is significantly different than the others. c) That none of the group averages are significantly different from each other.
Compute the t-statistic to test whether the difference between White and Other is significant. 53) Whatisthe
SEdifference
+ ?UseSD+errors=2.176.
a) 2.176
178
+1
34b)
2.176
1
2.072+
1
2.573 c)
2.1761
78+
1153
54) Whatisthet-statistic?a) 0.498SEdifference
+ b)
0.873SEdifference
+ * 313 c) 0.873SEdifference
+ *313 d) 0.873SEdifference
+
55) Howmanydegreesoffreedom?a)33b)77c)313 d)316
56) Thep-valueis5.2%.TheBonferronicorrectionwould____________thep-valueby_____
a)multiply,2b)multiply,3c)multiply,6d)divide,2e)divide,3
57) ThedifferencebetweenWhitesandEastAsiansissmallerthanbetweenWhitesandOtherbutit’smoresignificant(p=0.417%comparedtop=5.2%).Why?
a)nislargerforEastAsians(153vs.34)whichlowerstheSEdifference+ makingasmallerdifferencemoresignificant.
b)TheBonferronicorrectionadjustsforsuchcontradictionsmakingthelargerdifferencesthemoresignificant.
Ethnicity Average SD n PC rating White 6.167 2.072 78 PC rating East Asian 5.307 2.200 153 PC rating South Asian 5.635 1.871 52
PC rating Other 5.294 2.573 34
The table displays the survey responses of 317 Stat 200 students to the question: “On a scale of 0-10, how do feel about the amount of "political correctness" there is on this Campus today?” 0 is not nearly enough and 10 is way too much. The students also identified their ethnicity. Imagine the 317 students were randomly sampled from a much larger population of all Stat 200 students.

STATS200EXAM2 Nov.13,2019
6
Questions 58-59 pertain to this situation: 40 numbers are divided into 4 groups of 10 numbers each. The 4 group means are: 1, 4 and -2, and -3. The overall mean of the 40 numbers is 0.
58) Calculate the SSB a) 300 b) 30 c) 90 d) 100 e) Not enough info to calculate
59) Do you have enough information to calculate the SSW and the SST?
a) Yes, both b) No, only the SST c) No, only the SSW d) No, neither.
60) In an ANOVA analysis comparing group means, if SSB = 0, then what must be true: a) Allgroupmeans=0 b) Theoverallmean=0 c) All group means are the same. d) Alloftheabove e) Noneoftheabove
61) In an ANOVA analysis comparing group means, if SSW= 0, then what must be true:
a) The numbers within each group must sum to 0. b) The numbers within each group are the same. c) Allgroupmeans=0 d) Alloftheabove e) Noneoftheabove
Questions 62-63Suppose a random sample yields these 3 points: (1,9), (3,1), (8,20). The sample regression equation is y =2+2x The 3 points and the regression line are shown below.
62) SST = a) 182 b) 200 c) 96 d) 104 c) 78
63) SSM= a) 182 b) 200 c) 96 d) 104 c) 78
Youarenowfinishedwiththisexam.GobackandcheckedthatyouansweredallthequestionsandfilledinyourScantroncorrectly.

STATS200EXAM2 Nov.13,2019
7
STANDARDNORMALTABLE
z Area z Area z Area 0.00 0.05 0.10 0.15 0.20
0.25 0.30 0.35 0.40 0.45
0.50 0.55 0.60 0.65 0.70
0.75 0.80 0.85 0.90 0.95
1.00 1.05 1.10 1.15 1.20
1.25 1.30 1.35 1.40 1.45
0.00 3.99 7.97
11.92 15.85
19.74 23.58 27.37 31.08 34.73
38.29 41.77 45.15 48.43 51.61
54.67 57.63 60.47 63.19 65.79
68.27 70.63 72.87 74.99 76.99
78.87 80.64 82.30 83.85 85.29
1.50 1.55 1.60 1.65 1.70
1.75 1.80 1.85 1.90 1.95
2.00 2.05 2.10 2.15 2.20
2.25 2.30 2.35 2.40 2.45
2.50 2.55 2.60 2.65 2.70
2.75 2.80 2.85 2.90 2.95
86.64 87.89 89.04 90.11 91.09
91.99 92.81 93.57 94.26 94.88
95.45 95.96 96.43 96.84 97.22
97.56 97.86 98.12 98.36 98.57
98.76 98.92 99.07 99.20 99.31
99.40 99.49 99.56 99.63 99.68
3.00 3.05 3.10 3.15 3.20
3.25 3.30 3.35 3.40 3.45
3.50 3.55 3.60 3.65 3.70
3.75 3.80 3.85 3.90 3.95
4.00 4.05 4.10 4.15 4.20
4.25 4.30 4.35 4.40 4.45
99.730 99.771 99.806 99.837 99.863 99.885 99.903 99.919 99.933 99.944 99.953 99.961 99.968 99.974 99.978 99.982 99.986 99.988 99.990 99.992 99.9937 99.9949 99.9959 99.9967 99.9973 99.9979 99.9983 99.9986 99.9989 99.9991
Area (percent)

STATS200EXAM2 Nov.13,2019
8
Chi-SquareTable
Degreesoffreedom↓ 30% 10% 5% 1% 0.1% ← p-value 1 1.07 2.71 3.84 6.63 10.832 2.41 4.61 5.99 9.21 13.823 3.66 6.25 7.81 11.34 16.274 4.88 7.78 9.49 13.28 18.475 6.06 9.24 11.07 15.09 20.526 7.23 10.64 12.59 16.81 22.467 8.38 12.02 14.07 18.48 24.328 9.52 13.36 15.51 20.09 26.129 10.66 14.68 16.92 21.67 27.8810 11.78 15.99 18.31 23.21 29.5911 12.90 17.28 19.68 24.72 31.2612 14.01 18.55 21.03 26.22 32.9113 15.12 19.81 22.36 27.69 34.5314 16.22 21.06 23.68 29.14 36.1215 17.32 22.31 25.00 30.58 37.7016 18.42 23.54 26.30 32.00 39.2517 19.51 24.77 27.59 33.41 40.7918 20.60 25.99 28.87 34.81 42.3119 21.69 27.20 30.14 36.19 43.8220 22.77 28.41 31.41 37.57 45.3121 23.86 29.62 32.67 38.93 46.8022 24.94 30.81 33.92 40.29 48.2723 26.02 32.01 35.17 41.64 49.7324 27.10 33.20 36.42 42.98 51.18
←Chi-square

STATS200EXAM2 Nov.13,2019
9