Stat. Supplement 2020-21 - Finance Division
216
-
Upload
khangminh22 -
Category
Documents
-
view
0 -
download
0
Transcript of Stat. Supplement 2020-21 - Finance Division


Complimentary Copy
NOT FOR SALE
STATISTICAL SUPPLEMENT
Pakistan Economic Survey
2020-21
Economic Adviser’s Wing, Finance Division, Government of Pakistan, Islamabad

(i)
PREFACE
The Statistical Supplement is a follow up document of the Pakistan Economic
Survey to provide complete data on all sectors of the economy for the entire
outgoing fiscal year. It is hoped that this statistical supplement, which contains
a series of data and information on socio-economic development, will be useful
for policy-makers, researchers, people’s representatives and students, as well as
those persons who have an interest in Pakistan’s economy. Economic
Adviser’s Wing has made concerted efforts to present time series data on
financial, economic and social sectors in detail at the aggregate and sector-wise
for convenience of policy makers, researchers and other users.
I would like to thank various Ministries/Divisions/Agencies and Departments
for efficiently supplying the required data to the Economic Adviser’s Wing.
Without their help, it would not have been possible to release the Statistical
Supplement in time. I would also like to thank my team/staff members of the
Economic Adviser’s Wing for their invaluable support and hard work that
enables me to complete the Statistical Supplement in time.
We would welcome comments and suggestions for improvement of this
document. Soft version of the Statistical Supplement is also available on the
Website of the Finance Division.
Dr. Imtiaz Ahmad Economic Adviser FINANCE DIVISION Islamabad, December 10, 2021

Dr. Imtiaz Ahmad
Economic Adviser ̸ Team Leader
Dr. Hasan Muhammad Mohsin Joint Economic Adviser
Muhammad Shoaib Malik Deputy Economic Adviser
Mr. Attaullah Shah Assistant Economic Adviser
Ms. Nazia Gul Assistant Economic Adviser
Ms. Samina Khatoon Assistant Economic Adviser
Ms. Tahira Islam Assistant Economic Adviser
Mr. Abdul Basit Bhatti Assistant Economic Adviser
Ms. Rabia Akbar Research Officer
Mr. Faheem Anwar Webmaster
Ms. Naila Abbas Dar
Joint Economic Adviser
Mr. Zille Hasnain Deputy Economic Adviser
Mr. Omer Farooq Assistant Economic Adviser
Ms. Nargis Mazhar Assistant Economic Adviser
Mr. Allah Nawaz Assistant Economic Adviser
Hafiz Syed Muhammad Azeem Research Officer
Muhammad Umar Zahid Acting DG (Debt), DPCO
Muhammad Abdullah Research Associate, DPCO
Mr. Saqib Ameer Technical Officer
Muhammad Faisal Shamim Composer

(v)
Preface ............................................................................................................................................................. i Research Team ............................................................................................................................................. iii Economic and Social Indicators .................................................................................................................. 1-8 GROWTH AND INVESTMENT 1.1 Gross National Product at Constant Basic Prices of 2005-06 ......................................................... 11 1.2 Sectoral Share in GDP (%).............................................................................................................. 12 1.3 Growth Rates (%) ............................................................................................................................ 13 1.4 Expenditure on Gross National Product at Constant Prices of 2005-06 .......................................... 14 1.5 Gross National Product at Current Prices ........................................................................................ 15 1.6 Expenditure on Gross National Product at Current Prices ............................................................. 16 1.7 Gross Fixed Capital Formation (GFCF) in Private, Public and General Government Sectors by Economic Activity at Current Market Prices .............................. 17 1.7 a Gross Fixed Capital Formation (GFCF) in Private Sector by Economic Activity at Current Market Prices ................................................................................................................. 18 1.7 b Gross Fixed Capital Formation (GFCF) in Public & General Government Sectors by Economic Activity at Current Market Prices ............................................................................. 19 1.8 Gross Fixed Capital Formation (GFCF) in Private, Public & General Government Sectors by Economic Activity at Constant Market Prices of 2005-06 ............................................ 20 1.8 a Gross Fixed Capital Formation (GFCF) in Private Sector by Economic Activity at Constant Prices (2005-06) ........................................................................................................... 21 1.8 b Gross Fixed Capital Formation (GFCF) in Public & General Government Sectors by Economic Activity at Constant Prices (2005-06) ....................................................................... 22 1.9 Foreign Private Investment ............................................................................................................. 23
AGRICULTURE 2.1 Index of Agriculture Production...................................................................................................... 27 2.2 Basic Data on Agriculture ............................................................................................................... 28 2.3 Land Utilization .............................................................................................................................. 30 2.4 Area under Important Crops ............................................................................................................ 31 2.5 Production of Important Crops ........................................................................................................ 32 2.6 Yield Per Hectare of Major Agricultural Crops .............................................................................. 33 2.7 Production & Exports of Fruits ....................................................................................................... 34 2.8 A Crop-wise Composition of Value Added Major Agricultural Crops (at Constant Factor Cost) Base Year 1999-2000 ............................................................................. 35 2.8 B Crop-wise Composition of Output of Important Agricultural Crops (at Constant Factor Cost) Base Year 2005-06 ................................................................................. 35 2.9 Tenure Classification of Farms & Farm Area by Provinces............................................................ 36 2.10 Summary Data on Number, Size, Area & Operational Status of Farms by Tenure Based on Agricultural Census Data .................................................................................... 37 2.11 Number & Area of Private Farms, Classified by Size (Census 2010) ............................................. 38 2.12 Credit Disbursed by Agencies ......................................................................................................... 39 2.13 Fertilizer Offtake & Import of Pesticides ........................................................................................ 40 2.14 Average Retail Sale Price of Fertilizers .......................................................................................... 41 2.15 Fertilizer Consumption in relation to Cultivated Area in Selected Countries ................................. 42 2.16 Area Irrigated by Various Sources .................................................................................................. 43 2.17 Procurement/Support Prices of Agricultural Commodities ............................................................. 44 2.18 Procurement, Releases & Stocks of Wheat ..................................................................................... 45 2.19 Livestock Population ....................................................................................................................... 46 2.20 Livestock Products .......................................................................................................................... 47 2.21 Rainfall at Selected Cities Centers .................................................................................................. 48

(vi)
2.22 Temperature at Selected Cities Centers ........................................................................................... 49 2.23 Consumption of Electricity & Petroleum Oil in Agriculture Sector ............................................... 50 MANUFACTURING & MINING 3.1 Reserves & Deposits of Principal Minerals..................................................................................... 53 3.1 A Extraction of Principal Minerals ..................................................................................................... 54 3.2 Production Index of Mining & Manufacturing ............................................................................... 56 3.3 CMI Value of Production & Value Added of Major Industries ...................................................... 57 3.4 CMI Employment Cost and Average Daily Employment in Major Industries ............................... 58 3.5 CMI Indirect Tax Contribution & Value of Fixed Assets in Major Industries ................................ 59 3.6 Cotton Textile Statistics .................................................................................................................. 60 3.7 Production of Fertilizers, Vegetable Ghee, Sugar & Cement .......................................................... 61 3.8 Production of Selected Industrial Items .......................................................................................... 62 3.9 Percent Growth of Selected Industrial Items ................................................................................... 65 FISCAL DEVELOPMENT 4.1 Federal Government Overall Budgetary Position ........................................................................... 69 4.2 Summary of Public Finance (Consolidated Federal & Provincial Governments) ........................... 70 4.3 Consolidated Federal & Provincial Government Revenues ............................................................ 71 4.4 Consolidated Federal & Provincial Government Expenditures....................................................... 72 4.5 Debt Servicing. ................................................................................................................................ 73 MONEY & CREDIT 5.1 Components of Broad Money (M2) ................................................................................................ 77 5.2 Causative Factors Associated with Broad Money (M2) .................................................................. 78 5.3 Scheduled Banks’ Position Based on Last Weekend Position of Liabilities & Assets (All Banks) ..................................................................................................... 79 5.4 Income Velocity of Money ............................................................................................................. 80 5.5 List of Domestic, Foreign Banks & DFIs ....................................................................................... 81 5.6 Security and Nature Wise Weighted Average Lending Rates / Financing Rates (All Scheduled Banks) ........................................................................................................... 82 5.7 Sale of Market Treasury Bills Through Auction (MTBs) ............................................................... 85 5.8 Sale of Pakistan Investment Bonds Through Auction (PIBs) ......................................................... 86 CAPITAL MARKETS 6.1 National Saving Schemes (Net Investment) .................................................................................... 91 6.2 Loans disbursed by DFIs & other Financial Institutions ................................................................. 92 6.3 Mark Up Rate/Profit Rate on Debt Instruments Currently Available in the Market ....................... 93 INFLATION 7.1 Price Indices (CPI) Consumer Price Index by Group...................................................................... 97 7.2 Price Indices (% Change in CPI) ..................................................................................................... 98 7.3 Price Indices (WPI) ......................................................................................................................... 99 7.4 Price Indices (% Change in WPI).................................................................................................. 100 7.5 Price Indices & GDP Deflator ....................................................................................................... 101 7.6 Percentage Change in Price Indices & GDP Deflator ................................................................... 102 7.7 Consumer Price Indices by Income Groups .................................................................................. 103 7.8 Average Retail Prices of Essential Items....................................................................................... 104 7.9 Indices of Wholesale Prices of Selected Commodities ................................................................. 109 7.10 Average Wholesale Prices of Selected Commodities .................................................................... 111 TRADE & PAYMENTS 8.1 Balance of Payments ..................................................................................................................... 117 8.2 Components of Balance of Payments (As Percent of GDP).......................................................... 118 8.3 Exports, Imports & Trade Balance ................................................................................................ 119 8.4 Unit Value Indices & Terms of Trade (T.O.T) ............................................................................. 120

(vii)
8.5 Economic Classification of Exports .............................................................................................. 123 8.6 Economic Classification of Imports .............................................................................................. 124 8.7 Major Exports by Value, Quantity & Unit Value .......................................................................... 125 8.8 Rice Exports .................................................................................................................................. 131 8.9 Quantity & Unit Value of Selected Imports .................................................................................. 132 8.10 A Major Exports ............................................................................................................................... 133 8.10 B Major Imports ............................................................................................................................... 134 8.11 Direction of Trade ......................................................................................................................... 135 8.12 Destination of Exports & Origin of Imports.................................................................................. 142 8.13 Workers' Remittances.................................................................................................................... 145 8.14 Gold & Cash Foreign Exchange Reserves held & controlled by State Bank of Pakistan (in Rs.) ...................................................................................................... 148 8.15 Gold & Cash Foreign Exchange Reserves held & controlled by State Bank of Pakistan (in US $) ................................................................................................... 149 8.16 Exchange Rate Position (Pakistan Rupees in Terms of
One Unit of Selected Foreign Currencies) .................................................................................... 150 PUBLIC DEBT 9.1-A Pakistan External Debt and Foreign Exchange Liabilities ........................................................... 155 9.1-B Public & Publicly Guaranteed Debt Disbursed & Outstanding as on 30-06-2021 ........................ 156 9.2 Commitments & Disbursements of Loans & Grants (By Type) ................................................... 157 9.3 Annual Commitments, Disbursements, Service Payments & External Debt Outstanding ............................................................................................................ 158 9.4 Debt Service Payments on Foreign Loans (Paid in Foreign Exchange) ........................................ 159 9.5 Terms of Foreign Loans/Credits Contracted by Pakistan .............................................................. 161 9.6 Grant Assistance, Agreements Signed .......................................................................................... 164 9.7 Total Loans & Credits Contracted................................................................................................. 165 EDUCATION 10.1 Number of Educational Institutions by Kind, Level & Sex .......................................................... 169 10.2 Enrolment in Educational Institutions by Kind, Level & Sex ....................................................... 170 10.3 Number of Teachers in Educational Institutions in Pakistan, by Kind, Level & Sex .................... 171 HEALTH 11.1 National Medical & Health Establishments ................................................................................. 175 11.2 Registered Medical & Paramedical Personnel & Expenditure on Health ..................................... 176 11.3 Data on Expanded Program of Immunization Vaccination Performance (0-5 years) .................. 177 11.4 Doctors’ Consulting Fee in Various Cities .................................................................................... 178 POPULATION, LABOUR FORCE AND EMPLOYMENT 12.1 Population ..................................................................................................................................... 181 12.2 Population in Rural, Urban Areas ................................................................................................. 182 12.3 Population in Urban, Rural Areas 1972, 1981, 1998 and 2017 Censuses ..................................... 183 12.4 Population by Age in Urban, Rural Areas 1981 & 1998 Censuses ............................................... 184 12.5 Population of Pakistan by Province, Land Area & Percentage Distribution ................................. 185 12.6 Literacy Rate of Population by Gender, Region and Urban / Rural Areas, 1998 & 1981 Censuses ....................................................................................................... 186 12.7 Land Area, Population & Percentage Distribution ....................................................................... 187 12.8 Percentage Distribution of Population of 10 years & above & Civilian Labour Force by Gender and Area 2018-19 ................................................................ 188 12.9 Labour Force & Employment ....................................................................................................... 189 12.10 Population & Labour Force ........................................................................................................... 190 12.11 Distribution of Employed Persons of 10 Years Age & above by Major Industries ...................... 191 12.12 Percentage Distribution of Employed Persons of 10 Years Age & above by Major Industries (2018-19) ........................................................................................................... 192 12.13 Age Specific Labour Force Participation Rate .............................................................................. 193

(viii)
12.14 Daily Wages of Construction Workers in Different Cities ............................................................ 194 TRANSPORT & COMMUNICATIONS 13.1 Transport (Roads).......................................................................................................................... 197 13.2 Transport (Railways) ..................................................................................................................... 198 13.3 Transport (Shipping) ..................................................................................................................... 199 13.4 Transport (Ports) ........................................................................................................................... 200 13.5 Pakistan International Airlines Corporation .................................................................................. 201 13.6 Number of Motor Vehicles Registered ......................................................................................... 202 13.7 Motor Vehicles on Roads .............................................................................................................. 203 13.8 Motor Vehicles – Production ........................................................................................................ 204 13.9 Motor Vehicles – Imports ............................................................................................................. 205 13.10 Pakistan Post ................................................................................................................................. 206 13.11 Pakistan Telecommunications ....................................................................................................... 207 ENERGY 14.1 Commercial Energy Consumption ................................................................................................ 211 14.2 Commercial Energy Supplies (Electricity) ................................................................................... 214 14.3 Commercial Energy Supplies (Oil, Gas, Petroleum, Coal) .......................................................... 215 14.4 Schedule of Electricity Tariffs ...................................................................................................... 216 14.5 Oil Sale Prices ............................................................................................................................... 218 14.6 Gas Sale Prices .............................................................................................................................. 227 WEIGHTS & MEASURES ...................................................................................................................... 229
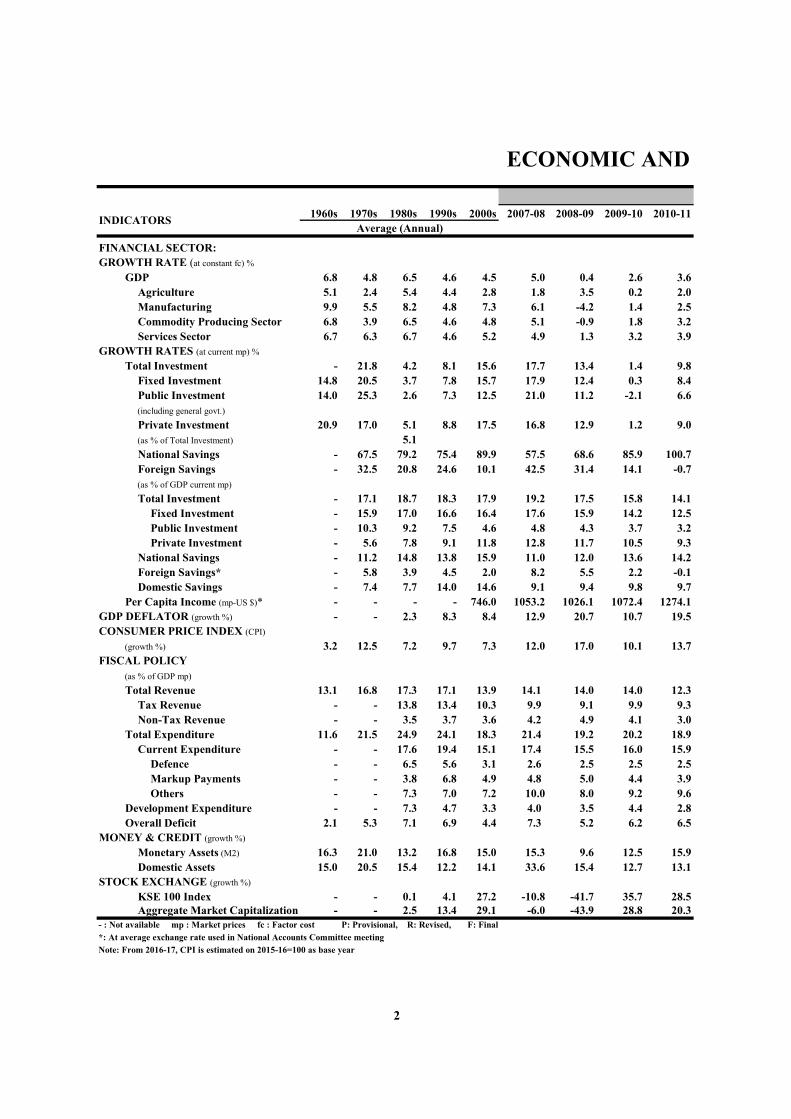
ECONOMIC AND
1960s 1970s 1980s 1990s 2000s 2007-08 2008-09 2009-10 2010-11
FINANCIAL SECTOR:GROWTH RATE (at constant fc) %
GDP 6.8 4.8 6.5 4.6 4.5 5.0 0.4 2.6 3.6Agriculture 5.1 2.4 5.4 4.4 2.8 1.8 3.5 0.2 2.0Manufacturing 9.9 5.5 8.2 4.8 7.3 6.1 -4.2 1.4 2.5Commodity Producing Sector 6.8 3.9 6.5 4.6 4.8 5.1 -0.9 1.8 3.2Services Sector 6.7 6.3 6.7 4.6 5.2 4.9 1.3 3.2 3.9
GROWTH RATES (at current mp) %
Total Investment - 21.8 4.2 8.1 15.6 17.7 13.4 1.4 9.8Fixed Investment 14.8 20.5 3.7 7.8 15.7 17.9 12.4 0.3 8.4Public Investment 14.0 25.3 2.6 7.3 12.5 21.0 11.2 -2.1 6.6(including general govt.)
Private Investment 20.9 17.0 5.1 8.8 17.5 16.8 12.9 1.2 9.0(as % of Total Investment) 5.1National Savings - 67.5 79.2 75.4 89.9 57.5 68.6 85.9 100.7Foreign Savings - 32.5 20.8 24.6 10.1 42.5 31.4 14.1 -0.7(as % of GDP current mp)
Total Investment - 17.1 18.7 18.3 17.9 19.2 17.5 15.8 14.1Fixed Investment - 15.9 17.0 16.6 16.4 17.6 15.9 14.2 12.5Public Investment - 10.3 9.2 7.5 4.6 4.8 4.3 3.7 3.2Private Investment - 5.6 7.8 9.1 11.8 12.8 11.7 10.5 9.3
National Savings - 11.2 14.8 13.8 15.9 11.0 12.0 13.6 14.2Foreign Savings* - 5.8 3.9 4.5 2.0 8.2 5.5 2.2 -0.1Domestic Savings - 7.4 7.7 14.0 14.6 9.1 9.4 9.8 9.7
Per Capita Income (mp-US $)* - - - - 746.0 1053.2 1026.1 1072.4 1274.1GDP DEFLATOR (growth %) - - 2.3 8.3 8.4 12.9 20.7 10.7 19.5CONSUMER PRICE INDEX (CPI)
(growth %) 3.2 12.5 7.2 9.7 7.3 12.0 17.0 10.1 13.7FISCAL POLICY
(as % of GDP mp)
Total Revenue 13.1 16.8 17.3 17.1 13.9 14.1 14.0 14.0 12.3Tax Revenue - - 13.8 13.4 10.3 9.9 9.1 9.9 9.3Non-Tax Revenue - - 3.5 3.7 3.6 4.2 4.9 4.1 3.0
Total Expenditure 11.6 21.5 24.9 24.1 18.3 21.4 19.2 20.2 18.9Current Expenditure - - 17.6 19.4 15.1 17.4 15.5 16.0 15.9
Defence - - 6.5 5.6 3.1 2.6 2.5 2.5 2.5Markup Payments - - 3.8 6.8 4.9 4.8 5.0 4.4 3.9Others - - 7.3 7.0 7.2 10.0 8.0 9.2 9.6
Development Expenditure - - 7.3 4.7 3.3 4.0 3.5 4.4 2.8Overall Deficit 2.1 5.3 7.1 6.9 4.4 7.3 5.2 6.2 6.5
MONEY & CREDIT (growth %)
Monetary Assets (M2) 16.3 21.0 13.2 16.8 15.0 15.3 9.6 12.5 15.9Domestic Assets 15.0 20.5 15.4 12.2 14.1 33.6 15.4 12.7 13.1
STOCK EXCHANGE (growth %)
KSE 100 Index - - 0.1 4.1 27.2 -10.8 -41.7 35.7 28.5Aggregate Market Capitalization - - 2.5 13.4 29.1 -6.0 -43.9 28.8 20.3
- : Not available mp : Market prices fc : Factor cost P: Provisional, R: Revised, F: Final*: At average exchange rate used in National Accounts Committee meetingNote: From 2016-17, CPI is estimated on 2015-16=100 as base year
INDICATORSAverage (Annual)
2

SOCIAL INDICATORS
2011-12 2012-13 2013-14 2014-15 2015-16 2016-17 2017-18 2018-19 2019-20 2020-21F R P
3.8 3.7 4.1 4.1 4.6 5.2 5.5 2.1 -0.5 3.93.6 2.7 2.5 2.1 0.2 2.2 4.0 0.6 3.3 2.82.1 4.9 5.7 3.9 3.7 5.8 5.4 -0.7 -7.4 8.73.1 1.7 3.5 3.6 2.9 3.4 4.3 -0.5 -0.3 3.24.4 5.1 4.5 4.4 5.7 6.5 6.3 3.8 -0.6 4.4
17.1 10.8 10.0 17.0 5.8 13.0 16.4 -0.8 7.0 13.918.1 10.7 9.7 18.0 5.8 13.4 17.3 -1.9 6.7 13.827.2 4.9 1.2 29.0 7.0 30.5 25.4 -24.4 -3.7 38.1
14.9 12.9 12.8 14.5 5.4 7.1 13.7 9.2 10.3 6.6
86.3 92.8 91.3 93.4 88.9 74.4 64.9 69.3 89.0 100.513.8 7.2 8.7 6.6 11.1 25.6 35.1 3.7 11.0 -0.4
15.1 15.0 14.6 15.7 15.7 16.2 17.3 15.6 15.3 15.213.5 13.4 13.0 14.1 14.1 14.6 15.7 14.0 13.7 13.6
3.7 3.5 3.2 3.7 3.8 4.5 5.2 3.6 3.2 3.89.7 9.8 9.9 10.4 10.3 10.1 10.5 10.5 10.6 9.8
13.0 13.9 13.4 14.7 13.9 12.0 11.3 10.8 13.6 15.32.1 1.1 1.3 1.0 1.7 4.1 6.1 4.8 1.7 -0.17.8 8.7 7.7 8.6 7.8 6.5 5.9 4.1 5.8 5.8
1320.5 1333.7 1388.8 1514.0 1529.4 1630.1 1651.9 1459.1 1360.9 1542.55.7 7.1 7.4 4.3 0.5 4.0 2.4 8.6 10.1 9.8
11.0 7.4 8.6 4.5 2.9 4.8 4.7 6.8 10.7 8.9
12.8 13.3 14.5 14.3 15.3 15.5 15.1 12.9 15.1 14.510.2 9.8 10.2 11.0 12.6 12.4 12.9 11.8 11.4 11.1
2.6 3.5 4.3 3.3 2.7 3.0 2.2 1.1 3.7 3.421.6 21.5 20.0 19.6 19.9 21.3 21.6 22.0 23.2 21.617.3 16.4 15.9 16.1 16.1 16.3 16.9 18.7 20.5 19.0
2.5 2.4 2.5 2.5 2.6 2.8 3.0 3.0 2.9 2.84.5 4.5 4.6 4.8 4.3 4.2 4.3 5.5 6.3 5.8
10.3 9.5 8.9 8.8 9.2 9.3 9.6 10.2 11.3 10.53.9 5.1 4.9 4.2 4.5 5.3 4.6 3.1 2.8 2.68.8 8.2 5.5 5.3 4.6 5.8 6.5 9.0 8.1 7.1
14.1 15.9 12.5 13.2 13.7 13.7 9.7 11.3 17.5 16.220.2 20.9 9.1 11.7 12.9 18.3 15.9 19.1 11.0 10.1
10.4 52.2 41.2 16.0 9.8 23.2 -10.0 -19.1 0.1 38.96.2 47.6 36.2 5.7 2.3 25.5 -9.0 -20.5 -6.8 29.2
(Contd...)
Base Year 2005-06
3

ECONOMIC AND1960s 1970s 1980s 1990s 2000s 2006-07 2007-08 2008-09 2009-10
TRADE AND PAYMENTS (growth %)
Exports (fob) - 13.5 8.5 5.6 9.9 4.5 18.0 -6.4 2.9Imports (fob) - 16.6 4.5 3.2 13.7 8.0 31.6 -10.3 -1.7Workers' Remittances - - 1.9 -5.3 26.8 19.4 17.4 21.1 14.0
As % of GDP (mp)
Exports (fob) - - 9.8 13.0 12.3 11.2 12.0 11.4 11.1Imports (fob) - - 18.7 17.4 16.2 17.5 20.8 18.9 17.5Trade Deficit - - 8.9 4.4 3.9 6.2 8.8 7.5 6.5Current Account Deficit - - 3.9 4.5 3.8 4.8 8.2 5.5 2.2
COMMODITY SECTOR:Agriculture
Total Cropped Area mln. hectares - - 20.3 22.4 22.9 23.6 23.9 24.1 23.9Production
Wheat mln. tons - - 12.5 17.0 20.8 23.3 20.9 24.0 23.3Rice mln. tons - - 3.3 3.9 5.2 5.4 5.6 6.9 6.9Sugarcane mln. tons - - 33.1 44.6 50.4 54.7 63.9 50.0 49.4Cotton mln. bales - - 6.3 9.7 11.6 12.9 11.7 11.8 12.9
Fertilizer Offtake mln.N/tons - - 1.4 2.3 3.3 3.7 3.6 3.7 4.4Credit Disbursed bln. Rs. - - 11.2 23.8 112.9 168.8 211.6 233.0 248.1
ManufacturingCotton Yarn mln. Kg. 5.6 3.4 10.0 1884.4 2236.2 2727.6 2809.4 2913.0 2787.3Cotton Cloth mln. sq. mtr. 3.1 -5.2 -1.1 487.8 763.3 1012.9 1016.4 1016.9 1009.4Fertilizer mln. tons 27.5 13.2 10.7 4.9 5.3 5.9 6.1 6.3 6.5Sugar mln. tons 34.3 2.2 14.4 3.6 3.4 3.5 4.7 3.2 3.1Cement mln. tons 10.7 2.5 8.6 11.2 16.4 22.8 26.7 28.4 31.3Soda Ash 000 tons 12.0 2.6 6.7 269.0 292.6 330.6 365.0 365.3 409.6Caustic Soda 000 tons 24.4 5.0 6.6 147.2 195.0 242.2 248.3 245.3 182.3Cigarettes bln. nos. 10.7 4.9 -0.4 55.4 60.0 66.0 67.4 75.6 65.3Jute Goods 000 tons - 3.4 9.5 101.1 105.0 118.1 129.0 137.4 106.2
INFRASTRUCTURE:Energy
Crude Oil Extraction mln. barrels - 2.8 10.9 26.1 23.3 24.6 25.6 24.0 23.7Gas (supply) bcf - 165.4 385.2 908.0 1186.8 1413.6 1454.2 1460.7 1482.8Electricity (installed capacity) 000 MW - 1.3 3.1 12.9 18.7 19.4 19.4 19.8 20.9
Transport & CommunicationsRoads 000 km 70.5 74.1 123.8 279.3 255.6 261.8 258.4 260.2 260.8Motor Vehicles on Roads mln. nos. - 0.4 1.4 4.6 6.4 8.1 8.8 9.4 9.8Post Offices 000 nos. 7.1 9.0 11.8 15.8 12.3 12.3 12.4 12.3 12.0Telephones mln. nos. 0.1 0.2 0.6 3.3 4.2 4.8 4.5 3.5 3.4Mobile Phones mln. nos. - - - - 30.3 63.2 88.0 94.3 99.2
- : Not available P: Provisional, R: Revised, F: Final
INDICATORSAverage (Annual)
4

SOCIAL INDICATORS2010-11 2011-12 2012-13 2013-14 2014-15 2015-16 2016-17 2017-18 2018-19 2019-20 2020-21
F R P
28.9 -2.6 0.3 1.1 -3.9 -8.8 0.1 12.6 -2.1 -7.1 13.714.9 12.8 -0.6 3.8 -0.8 -0.6 16.7 16.0 -6.8 -15.9 23.325.8 17.7 5.6 13.7 18.2 6.4 -2.8 2.9 9.2 6.4 26.9
11.9 11.0 10.7 10.2 8.9 7.9 7.2 7.9 8.7 8.6 8.616.7 18.0 17.4 17.0 15.3 14.7 15.7 17.7 18.5 16.6 18.0
4.9 7.0 6.6 6.8 6.4 6.9 8.5 9.8 9.9 8.0 9.4+0.1 2.1 1.1 1.3 1.0 1.8 4.0 6.1 4.8 1.7 0.6
22.7 22.5 22.6 23.2 23.3 24.0 23.0 23.5 23.2 24.1 24.1
25.2 23.5 24.2 26.0 25.1 25.6 26.7 25.1 24.4 25.2 27.54.8 6.2 5.5 6.8 7.0 6.8 6.8 7.5 7.2 7.4 8.4
55.3 58.4 63.8 67.5 62.8 65.5 75.5 83.3 67.2 66.4 81.011.5 13.6 13.0 12.8 14.0 9.9 10.7 11.9 9.9 9.2 7.1
3.9 3.9 3.6 4.1 4.3 3.7 5.0 4.8 4.6 4.5 5.0263.0 293.9 336.2 391.4 515.9 598.3 704.5 972.6 1174.0 1214.7 1365.9
2939.5 2954.6 3017.9 3066.0 3360.0 3405.6 3428.1 3430.7 3431.3 3049.6 3441.61020.3 1023.4 1029.1 1036.1 1036.1 1039.2 1043.3 1043.7 1046.0 931.0 969.8
5.9 6.0 5.7 6.7 7.0 8.0 8.1 7.2 7.7 8.1 7.34.2 4.6 5.1 5.6 5.1 5.1 7.0 6.6 5.3 4.9 5.7
28.8 29.5 31.1 31.4 32.2 35.4 37.0 41.1 39.9 39.1 49.8378.0 370.7 366.2 409.1 437.1 468.5 479.7 509.8 572.1 550.6 594.3172.0 179.1 182.9 167.5 184.0 225.3 223.9 270.1 246.6 342.4 394.165.4 62.0 67.4 64.5 62.7 53.5 34.3 59.1 60.7 46.1 51.593.2 94.1 102.8 101.7 94.3 55.3 59.8 74.2 67.1 65.0 70.0
24.0 24.6 27.8 31.6 34.5 31.7 32.3 32.6 32.5 28.1 27.61471.6 1559.0 1505.8 1493.5 1465.8 1481.6 1471.9 1458.9 1436.5 1316.6 1279.2
22.5 22.8 22.8 23.5 23.8 25.9 29.9 33.6 35.1 36.1 37.2
259.5 261.6 263.4 263.8 265.4 265.9 267.0 268.9 271.0 501.4 500.710.4 11.5 11.6 13.2 13.9 15.6 21.9 24.3 25.2 30.0 31.012.0 12.0 12.8 12.1 12.1 11.7 11.5 11.5 10.1 10.1 9.6
5.7 5.8 6.4 5.7 4.2 3.3 2.6 2.6 2.6 2.4 2.5108.9 120.2 128.9 140.0 114.7 133.2 139.8 150.2 161.0 168.5 183.5
(Contd...)
5

ECONOMIC AND1960s 1970s 1980s 1990s 2000s 2005-06 2006-07 2007-08 2008-09
HUMAN RESOURCES:Population* million - - 96.3 124.6 150.9 155.4 158.2 161.0 163.8Crude Birth Rate per 1000 person - - - - 27.4 26.1 26.1 26.1 24.3Crude Death Rate per 1000 person - - - - 7.9 8.2 7.1 7.1 7.3Infant Mortality Rate per 1000 person - - - - 79.6 77.0 76.7 76.7 68.2
Labour Force & Employment**Labour Force million - - 11.6 35.1 45.5 46.8 50.5 50.8 52.2Employed Labour Force million - - 11.2 33.1 42.4 43.2 47.3 48.1 49.5Un-employed Labour Force million - - 0.4 2.0 3.6 3.6 3.1 2.7 2.7Un-employment Rate % per annum - - 1.4 5.7 6.8 7.6 6.2 5.2 5.2
SOCIAL DEVELOPMENT:Education
Primary Schools 000 nos. - - 88.8 143.5 155.2 157.5 158.7 157.4 156.7Male 000 nos. - - 64.6 96.4 96.6 97.7 97.8 92.5 93.3Female 000 nos. - - 24.2 47.1 58.6 59.8 60.9 64.9 63.4
Middle Schools 000 nos. - - 6.8 15.3 31.9 39.4 40.1 40.8 40.9Male 000 nos. - - 4.6 8.8 16.7 20.1 22.6 20.2 20.5Female 000 nos. - - 2.2 6.5 15.2 19.3 17.5 20.6 20.4
High Schools 000 nos. - - 5.4 10.6 18.6 22.9 23.6 24.0 24.3Male 000 nos. - - 3.9 7.4 12.2 14.8 14.6 15.0 15.1Female 000 nos. - - 1.5 3.2 6.3 8.1 9.0 9.0 9.2
Technical / VocationalInstitutions nos. - - 508.6 572.2 1623.8 3059.0 3090.0 3125.0 3159.0
Male - - 282.2 328.7 874.8 1584.0 1599.0 1618.0 1636.0Female - - 235.2 243.5 749.0 1475.0 1491.0 1507.0 1523.0
Literacy Rate percent - - 29.5 40.7 52.6 54.0 55.0 56.0 57.0 Male - - 39.0 51.6 65.7 65.0 67.0 69.0 69.0Female - - 18.7 28.6 41.4 42.0 42.0 44.0 45.0
Expenditure on Education(as % of GDP) 1.4 1.7 2.3 2.0 1.7 1.7 1.8 1.8 1.8
Health*Registered Doctors 000 nos. 2.0 6.3 28.1 68.9 109.7 123.1 128.0 133.9 139.5Registered Nurses 000 nos. - 2.9 9.9 24.1 48.7 57.6 62.6 65.4 69.3Registered Dentists 000 nos. 0.2 0.7 1.4 2.8 6.0 7.4 8.2 9.0 9.8Hospitals nos. 380.0 521.0 651.0 823.0 917.5 924.0 945.0 948.0 968.0Dispensaries 000 nos. 1.7 2.8 3.5 4.3 4.7 4.7 4.7 4.8 4.8Rural Health Centers nos. - 1.0 127.0 330.0 494.0 560.0 562.0 561.0 572.0TB Centres nos. - 90.0 122.0 245.0 283.7 288.0 290.0 293.0 293.0Total Beds 000 nos. 25.5 38.4 55.6 83.8 99.3 102.1 103.3 103.0 103.7Expenditure on Health(as % of GDP) - 0.6 0.8 0.7 0.6 0.5 0.6 0.6 0.5
P: Provisional, R: Revised, F: Final - : Not available* : on Calendar Year basis **: Labour Force Survey 2018-19 Notes:Total may differ due to rounding offPopulation Data revised from 2016 on the basis of projections provided by NIPS (NIPS projected data based on Census 1998)
INDICATORSAverage (Annual)
6

SOCIAL INDICATORS2009-10 2010-11 2011-12 2012-13 2013-14 2014-15 2015-16 2016-17 2017-18 2018-19 2019-20 2020-21
F R P
173.5 177.1 180.7 184.4 188.0 191.7 198.8 202.9 207.0 211.2 215.3 -28.0 27.5 27.2 26.8 26.4 26.1 27.8 27.3 26.7 26.1 25.4 -
7.4 7.3 7.2 7.0 6.9 6.8 7.0 6.9 6.8 6.7 6.6 -72.0 70.5 69.0 67.5 66.1 64.6 62.4 61.4 60.5 59.5 58.5 -
53.7 58.1 59.3 60.3 60.1 61.04 - - 65.5 68.8 - -50.8 54.7 55.8 56.6 56.5 57.4 - - 61.7 64.0 - -
2.9 3.5 3.5 3.8 3.6 3.62 - - 3.8 4.7 - -5.5 6.0 6.0 6.2 6.0 5.9 - - 5.8 6.9 - -
157.5 155.5 154.6 159.7 157.9 165.9 164.6 168.9 172.5 180.1 183.9 187.996.9 93.6 93.6 99.6 97.6 99.9 99.3 102.8 99.0 99.4 98.6 97.560.6 58.2 57.0 60.1 60.3 66.0 65.3 66.1 73.5 80.7 85.3 90.441.3 41.6 42.0 42.1 42.9 44.8 45.7 49.1 46.7 47.3 48.3 49.321.8 21.9 21.6 20.7 21.8 22.4 18.7 21.2 23.2 23.6 24.2 24.819.5 20.4 21.0 21.4 21.1 22.4 27.0 27.9 23.5 23.7 24.1 24.524.8 25.2 28.7 29.9 30.6 31.3 31.7 31.6 31.4 31.7 32.0 32.314.2 14.4 14.3 17.6 18.0 18.2 16.1 16.9 17.9 18.0 18.1 18.110.6 9.5 11.6 12.3 12.6 13.1 15.6 14.7 13.5 13.7 13.9 14.2
3192.0 3224.0 3257.0 3290.0 3323.0 3579.0 3746.0 3798.0 3740.0 3740.0 3825.0 3914.01010.0 1018.0 1028.0 1037.0 1047.0 1760.0 2232.0 2262.0 2410.0 2410.0 2586.0 2754.02182.0 2206.0 2229.0 2253.0 2276.0 1819.0 1514.0 1536.0 1330.0 1330.0 1239.0 1160.0
57.7 58.0 58.0 60.0 58.0 60.0 58.0 - 62.3 ** 60.0 60.0 -69.5 69.0 70.0 71.0 70.0 70.0 70.0 - 72.5 ** 71.0 70.0 -45.2 46.0 47.0 48.0 47.0 49.0 48.0 - 51.8 ** 49.0 50.0 -
1.7 1.8 2.0 2.1 2.1 2.2 2.3 2.2 2.4 2.3 1.5 -
144.9 152.4 160.9 167.7 175.2 184.7 195.9 208.0 220.8 233.3 246.0 -73.2 77.7 82.1 86.1 90.3 94.8 99.2 103.8 108.5 112.1 116.7 -10.5 11.6 12.7 13.7 15.1 16.7 18.3 20.5 22.6 24.9 27.4 -
972.0 980.0 1092.0 1113.0 1143.0 1172.0 1243.0 1264.0 1279.0 1282.0 1289.0 -4.8 5.0 5.2 5.4 5.5 5.7 6.0 5.6 5.7 5.7 5.8 -
577.0 579.0 640.0 667.0 669.0 684.0 668.0 688.0 686.0 670.0 719.0 -304.0 345.0 326.0 329.0 334.0 339.0 345.0 431.0 441.0 412.0 410.0 -104.1 107.5 111.8 118.4 118.2 119.5 124.8 131.0 132.2 133.7 147.1 -
0.5 0.2 0.7 0.6 0.7 0.7 0.9 1.0 1.2 1.1 1.2 -
7

GROWTH AND INVESTMENT
HIGHLIGHTS 2020-21 P
Growth Rates Percent
GDP (fc) 3.94
Agriculture 2.77
Manufacturing 8.71
Commodity Sector 3.17
Service Sector 4.43
Aggregates at Current Market Prices Rs. Billion
GDP (mp) 47,709.3
GNP (mp) 52,222.6
Total Investment 7,255.4
National Savings 7,289.0
Foreign Savings -33.0
Per Capita Income (mp)
Rupees 246,414
US $ 1,542.5
P : Provisional
9
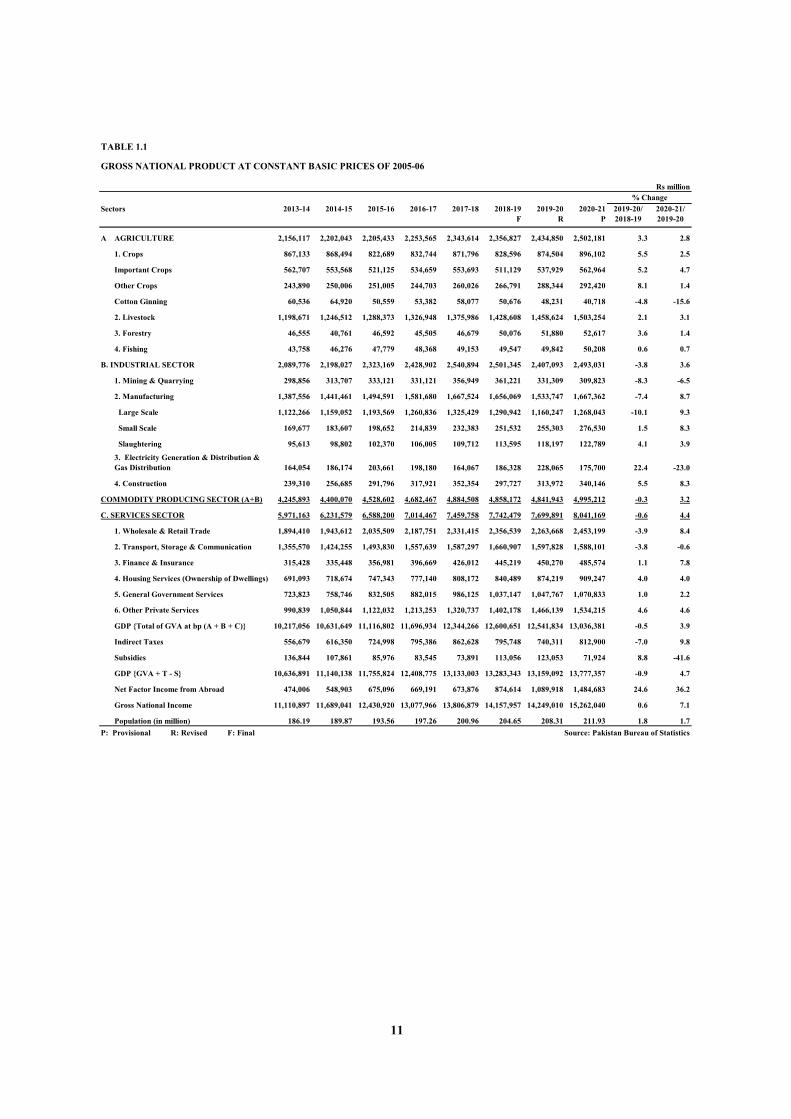
TABLE 1.1
Rs million
Sectors 2013-14 2014-15 2015-16 2016-17 2017-18 2018-19F
2019-20R
2020-21P
2019-20/2018-19
2020-21/2019-20
A AGRICULTURE 2,156,117 2,202,043 2,205,433 2,253,565 2,343,614 2,356,827 2,434,850 2,502,181 3.3 2.8
1. Crops 867,133 868,494 822,689 832,744 871,796 828,596 874,504 896,102 5.5 2.5
Important Crops 562,707 553,568 521,125 534,659 553,693 511,129 537,929 562,964 5.2 4.7
Other Crops 243,890 250,006 251,005 244,703 260,026 266,791 288,344 292,420 8.1 1.4
Cotton Ginning 60,536 64,920 50,559 53,382 58,077 50,676 48,231 40,718 -4.8 -15.6
2. Livestock 1,198,671 1,246,512 1,288,373 1,326,948 1,375,986 1,428,608 1,458,624 1,503,254 2.1 3.1
3. Forestry 46,555 40,761 46,592 45,505 46,679 50,076 51,880 52,617 3.6 1.4
4. Fishing 43,758 46,276 47,779 48,368 49,153 49,547 49,842 50,208 0.6 0.7
B. INDUSTRIAL SECTOR 2,089,776 2,198,027 2,323,169 2,428,902 2,540,894 2,501,345 2,407,093 2,493,031 -3.8 3.6
1. Mining & Quarrying 298,856 313,707 333,121 331,121 356,949 361,221 331,309 309,823 -8.3 -6.5
2. Manufacturing 1,387,556 1,441,461 1,494,591 1,581,680 1,667,524 1,656,069 1,533,747 1,667,362 -7.4 8.7
Large Scale 1,122,266 1,159,052 1,193,569 1,260,836 1,325,429 1,290,942 1,160,247 1,268,043 -10.1 9.3
Small Scale 169,677 183,607 198,652 214,839 232,383 251,532 255,303 276,530 1.5 8.3
Slaughtering 95,613 98,802 102,370 106,005 109,712 113,595 118,197 122,789 4.1 3.9
3. Electricity Generation & Distribution & Gas Distribution 164,054 186,174 203,661 198,180 164,067 186,328 228,065 175,700 22.4 -23.0
4. Construction 239,310 256,685 291,796 317,921 352,354 297,727 313,972 340,146 5.5 8.3
COMMODITY PRODUCING SECTOR (A+B) 4,245,893 4,400,070 4,528,602 4,682,467 4,884,508 4,858,172 4,841,943 4,995,212 -0.3 3.2
C. SERVICES SECTOR 5,971,163 6,231,579 6,588,200 7,014,467 7,459,758 7,742,479 7,699,891 8,041,169 -0.6 4.4
1. Wholesale & Retail Trade 1,894,410 1,943,612 2,035,509 2,187,751 2,331,415 2,356,539 2,263,668 2,453,199 -3.9 8.4
2. Transport, Storage & Communication 1,355,570 1,424,255 1,493,830 1,557,639 1,587,297 1,660,907 1,597,828 1,588,101 -3.8 -0.6
3. Finance & Insurance 315,428 335,448 356,981 396,669 426,012 445,219 450,270 485,574 1.1 7.8
4. Housing Services (Ownership of Dwellings) 691,093 718,674 747,343 777,140 808,172 840,489 874,219 909,247 4.0 4.0
5. General Government Services 723,823 758,746 832,505 882,015 986,125 1,037,147 1,047,767 1,070,833 1.0 2.2
6. Other Private Services 990,839 1,050,844 1,122,032 1,213,253 1,320,737 1,402,178 1,466,139 1,534,215 4.6 4.6
GDP {Total of GVA at bp (A + B + C)} 10,217,056 10,631,649 11,116,802 11,696,934 12,344,266 12,600,651 12,541,834 13,036,381 -0.5 3.9
Indirect Taxes 556,679 616,350 724,998 795,386 862,628 795,748 740,311 812,900 -7.0 9.8
Subsidies 136,844 107,861 85,976 83,545 73,891 113,056 123,053 71,924 8.8 -41.6
GDP {GVA + T - S} 10,636,891 11,140,138 11,755,824 12,408,775 13,133,003 13,283,343 13,159,092 13,777,357 -0.9 4.7
Net Factor Income from Abroad 474,006 548,903 675,096 669,191 673,876 874,614 1,089,918 1,484,683 24.6 36.2
Gross National Income 11,110,897 11,689,041 12,430,920 13,077,966 13,806,879 14,157,957 14,249,010 15,262,040 0.6 7.1
Population (in million) 186.19 189.87 193.56 197.26 200.96 204.65 208.31 211.93 1.8 1.7P: Provisional R: Revised F: Final Source: Pakistan Bureau of Statistics
GROSS NATIONAL PRODUCT AT CONSTANT BASIC PRICES OF 2005-06
% Change
11

TABLE 1.2
(%)Sector 2013-14 2014-15 2015-16 2016-17 2017-18 2018-19 2019-20 2020-21
F R P
A. AGRICULTURE 21.10 20.71 19.84 19.27 18.99 18.70 19.41 19.19
1. Crops 8.49 8.17 7.40 7.12 7.06 6.58 6.97 6.87
Important Crops 5.51 5.21 4.69 4.57 4.49 4.06 4.29 4.32
Other Crops 2.39 2.35 2.26 2.09 2.11 2.12 2.30 2.24
Cotton Ginning 0.59 0.61 0.45 0.46 0.47 0.40 0.38 0.31
2. Livestock 11.73 11.72 11.59 11.34 11.15 11.34 11.63 11.53
3. Forestry 0.46 0.38 0.42 0.39 0.38 0.40 0.41 0.40
4. Fishing 0.43 0.44 0.43 0.41 0.40 0.39 0.40 0.39
B. INDUSTRIAL SECTOR 20.45 20.67 20.90 20.77 20.58 19.85 19.19 19.12
1. Mining & Quarrying 2.93 2.95 3.00 2.83 2.89 2.87 2.64 2.38
2. Manufacturing 13.58 13.56 13.44 13.52 13.51 13.14 12.23 12.79
Large Scale 10.98 10.90 10.74 10.78 10.74 10.25 9.25 9.73
Small Scale 1.66 1.73 1.79 1.84 1.88 2.00 2.04 2.12
Slaughtering 0.94 0.93 0.92 0.91 0.89 0.90 0.94 0.943. Electricity Generation & Distribution & Gas Distribution 1.61 1.75 1.83 1.69 1.33 1.48 1.82 1.35
4. Construction 2.34 2.41 2.62 2.72 2.85 2.36 2.50 2.61
COMMODITY PRODUCING SECTOR (A+B 41.56 41.39 40.74 40.03 39.57 38.55 38.61 38.32
C. SERVICES SECTOR 58.44 58.61 59.26 59.97 60.43 61.45 61.39 61.68
1. Wholesale & Retail Trade 18.54 18.28 18.31 18.70 18.89 18.70 18.05 18.82
2. Transport, Storage & Communication 13.27 13.40 13.44 13.32 12.86 13.18 12.74 12.18
3. Finance & Insurance 3.09 3.16 3.21 3.39 3.45 3.53 3.59 3.72
4. Housing Services (Ownership of Dwelling 6.76 6.76 6.72 6.64 6.55 6.67 6.97 6.97
5. General Government Services 7.08 7.14 7.49 7.54 7.99 8.23 8.35 8.21
6. Other Private Services 9.70 9.88 10.09 10.37 10.70 11.13 11.69 11.77
GDP {Total of GVA at bp (A + B + C)} 100.00 100.00 100.00 100.00 100.00 100.00 100.00 100.00
P: Provisional R: Revised F: Final Source: Pakistan Bureau of Statistics
SECTORAL SHARE IN GDP (%)
12

TABLE 1.3
(%)Sector 2013-14 2014-15 2015-16 2016-17 2017-18 2018-19 2019-20 2020-21
F R P
A. Agriculture 2.50 2.13 0.15 2.18 4.00 0.56 3.31 2.77
1. Crops 2.64 0.16 -5.27 1.22 4.69 -4.96 5.54 2.47
Important Crops 7.22 -1.62 -5.86 2.60 3.56 -7.69 5.24 4.65
Other Crops -5.71 2.51 0.40 -2.51 6.26 2.60 8.08 1.41
Cotton Ginning -1.33 7.24 -22.12 5.58 8.80 -12.74 -4.82 -15.58
2. Livestock 2.48 3.99 3.36 2.99 3.70 3.82 2.10 3.06
3. Forestry 1.88 -12.45 14.31 -2.33 2.58 7.28 3.60 1.42
4. Fishing 0.98 5.75 3.25 1.23 1.62 0.80 0.60 0.73
B. INDUSTRIAL SECTOR 4.53 5.18 5.69 4.55 4.61 -1.56 -3.77 3.57
1. Mining & Quarrying 1.40 4.97 6.19 -0.60 7.80 1.20 -8.28 -6.49
2. Manufacturing 5.65 3.88 3.69 5.83 5.43 -0.69 -7.39 8.71
Large Scale 5.46 3.28 2.98 5.64 5.12 -2.60 -10.12 9.29
Small Scale 8.29 8.21 8.19 8.15 8.17 8.24 1.50 8.31
Slaughtering 3.38 3.34 3.61 3.55 3.50 3.54 4.05 3.893. Electricity Generation & Distribution & Gas Distribution -0.74 13.48 9.39 -2.69 -17.21 13.57 22.40 -22.96
4. Construction 5.96 7.26 13.68 8.95 10.83 -15.50 5.46 8.34
COMMODITY PRODUCING SECTOR (A+B) 3.49 3.63 2.92 3.40 4.31 -0.54 -0.33 3.17
C. SERVICES SECTOR 4.46 4.36 5.72 6.47 6.35 3.79 -0.55 4.43
1. Wholesale & Retail Trade 4.77 2.60 4.73 7.48 6.57 1.08 -3.94 8.37
2. Transport, Storage & Communication 3.90 5.07 4.89 4.27 1.90 4.64 -3.80 -0.61
3. Finance & Insurance 4.31 6.35 6.42 11.12 7.40 4.51 1.13 7.84
4. Housing Services (Ownership of Dwellings 4.00 3.99 3.99 3.99 3.99 4.00 4.01 4.01
5. General Government Services 2.86 4.82 9.72 5.95 11.80 5.17 1.02 2.20
6. Other Private Services 6.22 6.06 6.77 8.13 8.86 6.17 4.56 4.64
GDP {Total of GVA at bp (A + B + C)} 4.05 4.06 4.56 5.22 5.53 2.08 -0.47 3.94
P: Provisional R: Revised F: Final Source: Pakistan Bureau of Statistics
GROWTH RATES (%)
13

TABLE 1.4
Rs million
Flows 2013-14 2014-15 2015-16 2016-17 2017-18 2018-19F
2019-20R
2020-21P
2019-20/2018-19
2020-21/2019-20
Household Final Consumption Expenditure 8,304,881 8,545,418 9,196,738 9,978,329 10,598,522 10,922,533 10,470,713 11,242,554 -4.14 7.37
General Government Final Consumption Expenditure 1,129,117 1,220,931 1,321,395 1,390,837 1,510,861 1,523,036 1,626,355 1,692,596 6.78 4.07
Total Investment 1,536,447 1,760,001 1,887,998 2,073,722 2,295,850 2,037,035 2,016,039 2,130,826 -1.03 5.69
Gross Fixed Capital Formation 1,366,256 1,581,759 1,699,905 1,875,181 2,085,722 1,824,501 1,805,494 1,910,389 -1.04 5.81
A. Private Sector 1,062,261 1,190,708 1,278,275 1,334,422 1,427,631 1,388,633 1,436,843 1,418,203 3.47 -1.30
B. Public Sector 82,094 110,647 93,165 142,146 175,590 151,844 84,970 127,383 -44.04 49.92
C. General Govt. 221,902 280,404 328,466 398,614 482,500 284,024 283,681 364,802 -0.12 28.60
Change in Inventories 170,190 178,242 188,093 198,540 210,128 212,533 210,545 220,438 -0.94 4.70
Export of Goods and Non-Factor Services 1,225,028 1,147,318 1,128,923 1,121,671 1,263,892 1,447,078 1,482,911 1,575,286 2.48 6.23
Less Imports of Goods and Non-Factor Services 1,558,582 1,533,530 1,779,230 2,155,784 2,536,122 2,646,339 2,436,926 2,863,905 -7.91 17.52
Expenditure on GDP at Market Prices 10,636,891 11,140,138 11,755,824 12,408,775 13,133,003 13,283,343 13,159,092 13,777,357 -0.94 4.70
Plus Net Factor Income from the Rest of the World 474,006 548,903 675,096 669,191 673,876 874,614 1,089,918 1,484,683 24.62 36.22
Expenditure on GNP at Market Prices 11,110,897 11,689,041 12,430,920 13,077,966 13,806,879 14,157,957 14,249,010 15,262,040 0.64 7.11
Less Indirect Taxes 556,679 616,350 724,998 795,386 862,628 795,748 740,311 812,900 -6.97 9.81
Plus Subsidies 136,844 107,861 85,976 83,545 73,891 113,056 123,053 71,924 8.84 -41.55
GNP at Factor Cost 10,691,062 11,180,552 11,791,898 12,366,125 13,018,142 13,475,265 13,631,752 14,521,064 1.16 6.52P: Provisional R: Revised F: Final Source: Pakistan Bureau of Statistics
EXPENDITURE ON GROSS NATIONAL PRODUCT AT CONSTANT PRICES OF 2005-06
% Change
14

TABLE 1.5
Rs million
2013-14 2014-15 2015-16 2016-17 2017-18 2018-19F
2019-20R
2020-21P
2019-20/2018-19
2020-21/2019-20
A. Agriculture 5,976,217 6,536,122 6,749,966 7,318,465 7,911,779 8,368,631 9,612,331 11,542,998 14.86 20.09
1. Crops 2,612,933 2,690,102 2,620,390 2,826,463 2,964,894 2,888,671 3,702,887 4,642,762 28.19 25.38
Important Crops 1,760,329 1,735,888 1,718,029 1,827,252 1,890,555 1,803,359 2,333,252 3,068,717 29.38 31.52
Other Crops 695,138 769,867 739,842 811,971 874,378 909,337 1,170,812 1,376,753 28.75 17.59
Cotton Ginning 157,467 184,347 162,519 187,240 199,961 175,975 198,822 197,293 12.98 -0.77
2. Livestock 3,129,682 3,612,244 3,846,646 4,180,531 4,615,565 5,119,066 5,509,117 6,470,351 7.62 17.45
3. Forestry 153,722 142,902 170,706 172,578 183,199 202,162 220,332 244,184 8.99 10.83
4. Fishing 79,880 90,873 112,223 138,893 148,121 158,732 179,995 185,701 13.40 3.17
B. INDUSTRIAL SECTOR 5,040,094 5,239,146 5,308,368 5,683,545 6,200,543 7,010,231 7,364,291 8,128,397 5.05 10.38
1. Mining & Quarrying 741,022 707,236 652,814 644,686 755,778 1,004,203 1,095,298 976,819 9.07 -10.82
2. Manufacturing 3,408,468 3,510,536 3,512,556 3,830,210 4,217,685 4,730,014 4,764,739 5,621,560 0.73 17.98
Large Scale 2,824,463 2,853,222 2,801,169 3,044,603 3,331,305 3,722,568 3,646,994 4,282,289 -2.03 17.42
Small Scale 327,030 373,595 406,648 457,088 506,839 572,034 624,546 755,325 9.18 20.94
Slaughtering 256,975 283,719 304,739 328,520 379,542 435,412 493,199 583,946 13.27 18.403. Electricity Generation & Distribution & Gas Distribution 406,192 480,515 541,909 529,040 435,889 530,908 717,505 611,169 35.15 -14.82
4. Construction 484,412 540,859 601,089 679,609 791,191 745,106 786,749 918,849 5.59 16.79
COMMODITY PRODUCING SECTOR (A+B) 11,016,311 11,775,268 12,058,334 13,002,010 14,112,322 15,378,862 16,976,622 19,671,395 10.39 15.87
C. SERVICES SECTOR 13,012,586 14,314,423 15,343,961 16,975,549 18,270,699 20,518,341 22,374,227 25,223,552 9.05 12.73
1. Wholesale & Retail Trade 4,924,462 5,045,262 5,104,854 5,792,701 6,232,618 6,902,928 7,196,739 8,419,076 4.26 16.98
2. Transport, Storage & Communication 2,474,818 3,107,785 3,518,864 3,697,932 3,523,539 3,866,033 4,065,331 4,785,777 5.16 17.72
3. Finance & Insurance 584,074 595,961 544,301 594,362 684,623 908,121 1,106,187 916,265 21.81 -17.17
4. Housing Services (Ownership of Dwelling 1,229,110 1,371,443 1,506,385 1,668,521 1,848,594 2,059,629 2,275,293 2,485,965 10.47 9.26
5. General Government Services 1,660,434 1,818,477 2,050,560 2,263,393 2,629,924 2,968,885 3,332,876 3,670,326 12.26 10.126. Other Private Services 2,139,688 2,375,495 2,618,997 2,958,640 3,351,401 3,812,745 4,397,801 4,946,143 15.34 12.47
GDP {Total of GVA at bp (A + B + C)} 24,028,897 26,089,690 27,402,295 29,977,559 32,383,021 35,897,203 39,350,849 44,894,947 9.62 14.09
Indirest Taxes 1,480,099 1,633,881 1,901,743 2,170,448 2,435,629 2,515,836 2,599,306 3,065,120 3.32 17.92
Subsidies 340,191 280,549 228,405 225,704 202,348 326,807 393,829 250,742 20.51 -36.33
GDP {GVA + T - S} 25,168,805 27,443,022 29,075,633 31,922,303 34,616,302 38,086,232 41,556,326 47,709,325 9.11 14.81
Net Factor Income from Abroad 1,428,227 1,674,811 1,782,860 1,743,643 1,846,151 2,550,025 3,242,724 4,513,289 27.16 39.18
Gross National Product (mp) 26,597,032 29,117,833 30,858,493 33,665,946 36,462,453 40,636,257 44,799,050 52,222,614 10.24 16.57
Population (in million) 186.19 189.87 193.6 197.3 201.0 204.7 208.3 211.9 1.79 1.74
Per Capita Income(Rs) 142,849 153,357 159,426 170,672 181,441 198,565 215,060 246,414 8.31 14.58
Per Capita Income(US $) 1,388.8 1,514.0 1,529.4 1,630.1 1,651.9 1,459.1 1,360.9 1,542.5 -6.73 13.35
GDP Deflator Index 235.18 245.40 246.49 256.29 262.33 284.88 313.76 344.38 10.14 9.76
GDP Deflator (Growth %) 7.39 4.34 0.45 3.97 2.36 8.60 10.14 9.76 - -P: Provisional R: Revised F: Final Source : Pakistan Bureau of Statistics
GROSS NATIONAL PRODUCT AT CURRENT PRICES
% ChangeSectors
15

TABLE 1.6
Rs million
Flows 2013-14 2014-15 2015-16 2016-17 2017-18 2018-19F
2019-20R
2020-21P
2019-20/2018-19
2020-21/2019-20
Household Final Consumption Expenditure 20,391,214 21,890,279 23,266,454 26,148,647 28,400,347 31,547,687 32,949,371 38,501,127 4.44 16.85
General Government Final Consumption Expenditure 2,708,918 3,011,195 3,287,930 3,599,000 4,054,823 4,457,033 5,318,942 5,925,068 19.34 11.40
Total Investment 3,683,523 4,310,484 4,560,840 5,155,623 6,003,330 5,954,753 6,369,596 7,255,379 6.97 13.91
Gross Fixed Capital Formation 3,280,822 3,871,396 4,095,630 4,644,866 5,449,469 5,345,374 5,704,695 6,492,030 6.72 13.80
A. Private Sector 2,483,817 2,843,159 2,995,889 3,209,360 3,649,178 3,984,517 4,393,570 4,681,348 10.27 6.55
B. Public Sector 207,012 284,912 238,143 347,770 437,951 463,085 314,753 435,158 -32.03 38.25
C. General Govt. 589,993 743,325 861,598 1,087,737 1,362,340 897,771 996,372 1,375,524 10.98 38.05
Change in Inventories 402,701 439,088 465,210 510,757 553,861 609,380 664,901 763,349 9.11 14.81
Export of Goods and Non-Factor Services 3,081,312 2,910,171 2,659,178 2,635,927 3,105,763 3,842,425 4,168,760 4,733,736 8.49 13.55
Less Imports of Goods and Non-Factor Services 4,696,162 4,679,107 4,698,769 5,616,894 6,947,961 7,715,666 7,250,343 8,705,985 -6.03 20.08
Expenditure on GDP at Market Prices 25,168,805 27,443,022 29,075,633 31,922,303 34,616,302 38,086,232 41,556,326 47,709,325 9.11 14.81
Plus Net Factor Income from the Rest of the World 1,428,227 1,674,811 1,782,860 1,743,643 1,846,151 2,550,025 3,242,724 4,513,289 27.16 39.18
Expenditure on GNP at at Market Prices 26,597,032 29,117,833 30,858,493 33,665,946 36,462,453 40,636,257 44,799,050 52,222,614 10.24 16.57
Less Indirect Taxes 1,480,099 1,633,881 1,901,743 2,170,448 2,435,629 2,515,836 2,599,306 3,065,120 3.32 17.92
Plus Subsidies 340,191 280,549 228,405 225,704 202,348 326,807 393,829 250,742 20.51 -36.33
GNP at Factor Cost 25,457,124 27,764,501 29,185,155 31,721,202 34,229,172 38,447,228 42,593,573 49,408,236 10.78 16.00P: Provisional R: Revised F: Final Source: Pakistan Bureau of Statistics
EXPENDITURE ON GROSS NATIONAL PRODUCT AT CURRENT PRICES
% Change
16

TABLE 1.7
Rs million
Sector 2013-14 2014-15 2015-16 2016-17 2017-18 2018-19F
2019-20R
2020-21P
2019-20/2018-19
2020-21/2019-20
GFCF (A+B+C) 3,280,822 3,871,396 4,095,630 4,644,866 5,449,469 5,345,374 5,704,695 6,492,030 6.7 13.8
A. Private Sector 2,483,817 2,843,159 2,995,889 3,209,360 3,649,178 3,984,517 4,393,570 4,681,348 10.3 6.5
B. Public Sector 207,012 284,912 238,143 347,770 437,951 463,085 314,753 435,158 -32.0 38.3
C. General Govt. 589,993 743,325 861,598 1,087,737 1,362,340 897,771 996,372 1,375,524 11.0 38.1
Private & Public (A+B) 2,690,829 3,128,071 3,234,032 3,557,129 4,087,129 4,447,603 4,708,323 5,116,506 5.9 8.7
SECTOR-WISE:
1. Agriculture 725,388 820,391 850,088 929,275 1,046,432 1,160,319 1,270,317 1,482,145 9.5 16.7
2. Mining and Quarrying 70,138 74,361 105,418 97,825 69,000 67,012 71,603 55,878 6.9 -22.0
3. Manufacturing (A+B) 381,421 429,484 485,495 548,025 622,217 699,843 727,537 793,687 4.0 9.1
A. Large Scale 357,556 403,087 456,222 514,830 585,895 656,628 676,513 731,892 3.0 8.2
B. Small Scale (including Slaughtering) 23,865 26,397 29,273 33,195 36,322 43,215 51,024 61,795 18.1 21.14. Electricity Generation & Distribution & Gas Distribution 104,926 218,447 178,264 163,917 359,779 428,620 272,496 260,966 -36.4 -4.2
5. Construction 49,042 39,700 49,009 88,241 59,512 27,516 34,776 28,277 26.4 -18.7
6. Wholesale and Retail Trade 73,000 74,712 77,462 86,643 95,549 108,170 115,515 134,300 6.8 16.3
7. Transport & Communication 436,682 538,926 507,856 564,504 651,987 591,103 728,493 707,254 23.2 -2.9
8. Finance & Insurance 40,770 49,559 57,775 66,920 63,162 74,355 80,536 79,542 8.3 -1.2
9. Housing Services (Ownership of Dwellings) 525,816 568,524 577,278 622,467 680,241 788,716 824,083 918,920 4.5 11.5
10. Other Private Services 283,646 313,967 345,387 389,312 439,250 501,948 582,967 655,537 16.1 12.4P: Provisional R: Revised F: Final (Contd...)
GROSS FIXED CAPITAL FORMATION (GFCF) IN PRIVATE, PUBLIC, AND GENERAL GOVERNMENT SECTORS BY ECONOMIC ACTIVITY AT CURRENT MARKET PRICES
% Change
17

TABLE 1.7 a
Rs million
Sector 2013-14 2014-15 2015-16 2016-17 2017-18 2018-19F
2019-20R
2020-21P
2019-20/2018-19
2020-21/2019-20
PRIVATE SECTOR 2,483,817 2,843,159 2,995,889 3,209,360 3,649,178 3,984,517 4,393,570 4,681,348 10.3 6.5
1. Agriculture 725,292 820,265 849,943 929,152 1,046,251 1,160,176 1,270,098 1,481,789 9.5 16.7
2. Mining and Quarrying 48,205 42,658 77,365 35,296 44,754 48,889 46,476 39,261 -4.9 -15.5
3. Manufacturing (A+B) 375,567 427,724 483,781 519,820 613,582 698,078 718,918 761,408 3.0 5.9
A. Large Scale 351,702 401,327 454,508 486,625 577,260 654,863 667,894 699,613 2.0 4.7
B. Small Scale (including Slaughtering) 23,865 26,397 29,273 33,195 36,322 43,215 51,024 61,795 18.1 21.14. Electricity Generation & Distribution & Gas Distribution 20,855 55,220 23,156 17,298 99,122 53,380 43,658 14,415 -18.2 -67.0
5. Construction 29,122 30,128 43,831 82,429 52,906 26,546 30,620 23,395 15.3 -23.6
6. Wholesale and Retail Trade 73,000 74,712 77,462 86,643 95,549 108,170 115,515 134,300 6.8 16.3
7. Transport & Communication 366,473 465,937 466,875 476,971 520,954 532,133 690,140 580,850 29.7 -15.8
8. Finance & Insurance 35,841 44,024 50,811 49,971 56,569 66,481 71,095 71,473 6.9 0.5
9. Housing Services (Ownership of Dwellings) 525,816 568,524 577,278 622,467 680,241 788,716 824,083 918,920 4.5 11.5
10. Other Private Services 283,646 313,967 345,387 389,312 439,250 501,948 582,967 655,537 16.1 12.4P: Provisional R: Revised F: Final (Contd...)
GROSS FIXED CAPITAL FORMATION (GFCF) IN PRIVATE SECTOR BY ECONOMIC ACTIVITYAT CURRENT MARKET PRICES
% Change
18

TABLE 1.7 b
Rs million
Sector 2013-14 2014-15 2015-16 2016-17 2017-18 2018-19F
2019-20R
2020-21P
2019-20/2018-19
2020-21/2019-20
Public Sector and
General Govt. (A+B) 797,005 1,028,237 1,099,741 1,435,507 1,800,291 1,360,856 1,311,125 1,810,682 -3.7 38.1
A. Public Sector (Autonomous & Semi Auto-Bodies) 207,012 284,912 238,143 347,770 437,951 463,085 314,753 435,158 -32.0 38.3
1. Agriculture 96 126 145 123 181 143 219 356 53.1 62.6
2. Mining and Quarrying 21,933 31,703 28,053 62,529 24,246 18,123 25,127 16,617 38.6 -33.9
3. Manufacturing 5,854 1,760 1,714 28,205 8,635 1,765 8,619 32,279 388.3 274.54. Electricity Generation & Distribution & Gas Distribution 84,071 163,227 155,108 146,619 260,657 375,240 228,838 246,551 -39.0 7.7
5. Construction 19,920 9,572 5,178 5,812 6,606 970 4,156 4,882 328.3 17.5
6. Transport & Communication 70,209 72,989 40,981 87,533 131,033 58,970 38,353 126,404 -35.0 229.6
Railways 8,767 6,196 5,825 39,407 8,627 14,612 6,261 4,485 -57.2 -28.4
Post Office & PTCL 18,137 18,232 13,644 16,376 15,450 17,228 14,812 4,702 -14.0 -68.3
Others 43,305 48,561 21,512 31,750 106,956 27,130 17,280 117,217 -36.3 578.3
7. Finance & Insurance 4,929 5,535 6,964 16,949 6,593 7,874 9,441 8,069 19.9 -14.5
B. General Govt. 589,993 743,325 861,598 1,087,737 1,362,340 897,771 996,372 1,375,524 11.0 38.1
Federal 164,736 208,953 229,128 312,699 362,287 353,735 388,098 450,561 9.7 16.1
Provincial 358,791 442,650 527,461 686,665 909,116 463,854 527,970 777,116 13.8 47.2
District Governments 66,466 91,722 105,009 88,373 90,937 80,182 80,304 147,847 0.2 84.1P: Provisional R: Revised F: Final Source: Pakistan Bureau of Statistics
GROSS FIXED CAPITAL FORMATION (GFCF) IN PUBLIC AND GENERAL GOVERNMENT SECTORS BY ECONOMIC ACTIVITY AT CURRENT MARKET PRICES
% Change
19

TABLE 1.8
Rs million
Sector 2013-14 2014-15 2015-16 2016-17 2017-18 2018-19F
2019-20R
2020-21P
2019-20/2018-19
2020-21/2019-20
GFCF (A+B+C) 1,366,256 1,581,759 1,699,905 1,875,181 2,085,722 1,824,501 1,805,494 1,910,389 -1.0 5.8
A. Private Sector 1,062,261 1,190,708 1,278,275 1,334,422 1,427,631 1,388,633 1,436,843 1,418,203 3.5 -1.3
B. Public Sector 82,094 110,647 93,165 142,146 175,590 151,844 84,970 127,383 -44.0 49.9
C. General Govt. 221,902 280,404 328,466 398,614 482,500 284,024 283,681 364,802 -0.1 28.6
Private & Public (A+B) 1,144,354 1,301,355 1,371,440 1,476,568 1,603,221 1,540,477 1,521,813 1,545,586 -1.2 1.6
SECTOR-WISE:
1. Agriculture 296,850 315,526 315,864 331,977 351,942 355,206 352,602 361,190 -0.7 2.4
2. Mining and Quarrying 25,880 26,868 38,002 35,837 25,185 21,237 17,798 13,564 -16.2 -23.8
3. Manufacturing (A+B) 144,694 163,023 185,697 201,304 221,076 222,302 208,252 210,895 -6.3 1.3
A. Large Scale 134,480 152,057 173,925 188,665 207,507 207,735 192,613 194,105 -7.3 0.8
B. Small Scale (including Slaughtering) 10,215 10,966 11,773 12,639 13,569 14,567 15,639 16,790 7.4 7.44. Electricity Generation & Distribution & Gas Distribution 38,716 78,930 64,262 60,049 131,321 135,833 67,733 63,347 -50.1 -6.5
5. Construction 24,268 18,897 23,893 41,492 26,631 11,045 13,894 10,537 25.8 -24.2
6. Wholesale and Retail Trade 27,456 28,184 29,531 31,751 33,841 34,221 32,889 35,618 -3.9 8.3
7. Transport & Communication 180,484 242,486 263,083 297,844 314,271 237,353 283,924 284,518 19.6 0.2
8. Finance & Insurance 15,334 18,695 22,025 24,524 22,370 23,523 22,930 21,095 -2.5 -8.0
9. Housing Services (Ownership of Dwellings) 260,202 270,610 281,434 292,691 304,399 316,575 329,238 342,408 4.0 4.0
10. Other Private Services 130,470 138,136 147,647 159,097 172,186 183,183 192,554 202,415 5.1 5.1P: Provisional R: Revised F: Final (Contd...)
GROSS FIXED CAPITAL FORMATION (GFCF) IN PRIVATE, PUBLIC, AND GENERAL GOVERNMENT SECTORS BY ECONOMIC ACTIVITY AT CONSTANT PRICES (2005-06)
% Change
20

TABLE 1.8 a
Rs million
Sector 2013-14 2014-15 2015-16 2016-17 2017-18 2018-19F
2019-20R
2020-21P
2019-20/2018-19
2020-21/2019-20
PRIVATE SECTOR 1,062,261 1,190,708 1,278,275 1,334,422 1,427,631 1,388,633 1,436,843 1,418,203 3.5 -1.3
1. Agriculture 296,800 315,461 315,789 331,915 351,852 355,139 352,509 361,059 -0.7 2.4
2. Mining and Quarrying 17,787 15,413 27,889 12,930 16,335 15,493 11,552 9,530 -25.4 -17.5
3. Manufacturing (A+B) 142,493 162,359 185,044 190,968 218,017 221,744 205,798 202,334 -7.2 -1.7
A. Large Scale 132,278 151,393 173,271 178,329 204,448 207,176 190,159 185,544 -8.2 -2.4
B. Small Scale (including Slaughtering) 10,215 10,966 11,773 12,639 13,569 14,567 15,639 16,790 7.4 7.44. Electricity Generation & Distribution & Gas Distribution 7,695 19,952 8,348 6,337 36,180 16,916 10,852 3,499 -35.9 -67.8
5. Construction 14,411 14,341 21,368 38,759 23,675 10,655 12,233 8,717 14.8 -28.7
6. Wholesale and Retail Trade 27,456 28,184 29,531 31,751 33,841 34,221 32,889 35,618 -3.9 8.3
7. Transport & Communication 151,467 209,645 241,854 251,660 251,111 213,674 268,977 233,667 25.9 -13.1
8. Finance & Insurance 13,480 16,607 19,371 18,312 20,035 21,032 20,242 18,955 -3.8 -6.4
9. Housing Services (Ownership of Dwellings) 260,202 270,610 281,434 292,691 304,399 316,575 329,238 342,408 4.0 4.0
10. Other Private Services 130,470 138,136 147,647 159,097 172,186 183,183 192,554 202,415 5.1 5.1P: Provisional R: Revised F: Final (Contd...)
GROSS FIXED CAPITAL FORMATION (GFCF) IN PRIVATE SECTOR BY ECONOMIC ACTIVITY AT CONSTANT PRICES (2005-06)
% Change
21

TABLE 1.8 b
Rs million
Sector 2013-14 2014-15 2015-16 2016-17 2017-18 2018-19F
2019-20R
2020-21P
2019-20/2018-19
2020-21/2019-20
Public Sector and General Govt. (A+B) 303,996 391,051 421,630 540,759 658,091 435,868 368,651 492,186 -15.4 33.5
A. Public Sector (Autonomous & Semi Auto-Bodies) 82,094 110,647 93,165 142,146 175,590 151,844 84,970 127,383 -44.0 49.9
1. Agriculture 50 65 75 62 90 67 93 131 38.8 40.9
2. Mining and Quarrying 8,093 11,455 10,113 22,907 8,850 5,743 6,246 4,034 8.7 -35.4
3. Manufacturing 2,202 664 653 10,336 3,058 558 2,454 8,561 339.5 248.94. Electricity Generation & Distribution & Gas Distribution 31,021 58,978 55,915 53,712 95,141 118,916 56,881 59,848 -52.2 5.2
5. Construction 9,857 4,556 2,524 2,733 2,956 390 1,660 1,819 326.3 9.6
6. Transport & Communication 29,017 32,841 21,229 46,184 63,161 23,679 14,948 50,850 -36.9 240.2
Railways 3,623 2,788 3,018 20,792 4,158 5,867 2,440 1,804 -58.4 -26.1
Post Office & PTCL 7,496 8,203 7,068 8,640 7,447 6,918 5,773 1,892 -16.6 -67.2
Others 17,898 21,850 11,144 16,752 51,555 10,894 6,735 47,155 -38.2 600.2
7. Finance & Insurance 1,854 2,088 2,655 6,211 2,335 2,491 2,688 2,140 7.9 -20.4
B. General Govt. 221,902 280,404 328,466 398,614 482,500 284,024 283,681 364,802 -0.1 28.6
Federal 61,959 78,823 87,350 114,592 128,311 111,910 110,497 119,493 -1.3 8.1
Provincial 134,945 166,981 201,083 251,636 321,982 146,747 150,320 206,099 2.4 37.1
District Governments 24,998 34,600 40,032 32,385 32,207 25,367 22,864 39,210 -9.9 71.5P: Provisional R: Revised F: Final Source: Pakistan Bureau of Statistics
GROSS FIXED CAPITAL FORMATION (GFCF) IN PUBLIC AND GENERAL GOVERNMENT SECTORS BY ECONOMIC ACTIVITY AT CONSTANT PRICES (2005-06)
% Change
22

TABLE 1.9
FOREIGN PRIVATE INVESTMENT US $ Million
Fiscal Year
2001-02 Direct 326.4 30.3 21.5 11.2 -6.9 2.8 0.1Portfolio -1.7 -32.4 -3.1 0.0 0.3 20.6 -Total 324.7 -2.1 18.4 11.2 -6.5 23.4 0.1
2002-03 Direct 211.5 219.4 119.6 3.7 2.6 5.6 0.2Portfolio 15.1 -34.6 0.4 0.1 0.0 -0.5 -0.3Total 226.6 184.8 120.0 3.8 2.6 5.2 -0.1
2003-04 Direct 238.4 64.9 134.6 7.0 -5.6 6.3 1.9Portfolio 21.4 -23.0 11.9 -3.0 0.0 -1.3 -1.9Total 259.8 41.9 146.5 4.0 -5.6 4.9 0.0
2004-05 Direct 326.0 181.5 367.5 13.1 -3.6 32.4 0.4Portfolio 47.1 17.6 49.8 2.1 0.1 28.9 -Total 373.0 199.1 417.3 15.2 -3.5 61.2 0.4
2005-06 Direct 516.7 244.0 1424.5 28.6 3.2 24.0 0.1Portfolio 303.8 -19.5 63.3 -3.5 0.0 31.2 -Total 820.5 224.5 1487.8 25.1 3.2 55.2 0.1
2006-07 Direct 913.3 860.0 662.2 78.9 -0.1 32.6 0.3Portfolio 853.5 960.1 14.9 7.0 1.5 -72.6 -Total 1766.8 1820.1 677.0 85.9 1.5 -40.0 0.3
2007-08 Direct 1309.7 460.1 588.5 69.6 8.4 339.8 0.4Portfolio 439.2 -100.1 4.3 -0.5 -0.8 -245.5 -Total 1748.9 360.0 592.8 69.1 7.6 94.3 0.4
2008-09 Direct 869.9 263.4 178.1 76.9 6.4 156.1 1.2Portfolio -442.5 -77.7 49.9 0.1 0.2 2.5 -0.0Total 427.4 185.7 228.0 77.0 6.5 158.7 1.2
2009-10 Direct 468.3 294.6 242.7 53.0 8.0 9.9 1.6Portfolio 472.3 1.2 5.5 0.7 -0.8 19.2 -0.0Total 940.6 295.8 248.2 53.7 7.2 29.1 1.6
2010-11 Direct 238.1 207.0 284.2 21.2 17.9 125.6 2.6Portfolio 261.6 25.1 7.5 -1.5 0.0 23.3 -Total 499.7 232.1 291.7 19.7 17.8 148.8 2.6
2011-12 Direct 227.6 205.8 37.1 27.2 -0.5 80.3 200.5Portfolio 42.1 -28.1 17.0 1.0 -0.4 -133.2 0.0Total 269.7 177.8 54.1 28.1 -0.9 -52.9 200.5
2012-13 Direct 227.1 633.0 22.5 5.5 27.0 242.6 199.4Portfolio 72.6 -65.9 7.1 12.2 -1.8 -71.0 0.0Total 299.7 567.0 29.5 17.7 25.2 171.6 199.4
2013-14 Direct 212.1 157.0 -47.1 -5.7 96.3 228.5 97.6Portfolio 148.2 223.9 6.9 -20.0 0.0 66.1 0.1Total 360.3 380.9 -40.2 -25.7 96.2 294.6 97.7
2014-15 Direct 223.9 169.6 235.3 -15.8 -214.9 136.2 115.4Portfolio 599.4 229.5 11.6 0.1 0.0 -63.5 0.0Total 823.3 399.1 246.9 -15.7 -214.9 72.7 115.4
2015-16 Direct 15.7 151.7 114.6 -10.6 94.7 187.0 105.4Portfolio -45.8 -141.7 3.3 -9.9 0.0 -18.1 0.0Total -30.0 10.0 117.9 -20.5 94.7 168.9 105.4
2016-17 Direct 45.7 215.8 120.1 -0.1 35.4 123.0 61.5Portfolio 574.9 -342.1 -23.1 -1.5 16.9 -263.0 0.0Total 620.7 -126.2 97.0 -1.6 52.3 -140.0 61.5
2017-18 Direct 161.7 304.6 -4.4 35.5 6.8 183.6 56.6Portfolio 414.2 -93.0 -55.5 3.6 1.4 -187.0 0.0Total 575.9 211.6 -59.9 39.0 8.2 -3.4 56.7
2018-19 Direct 88.1 185.0 103.7 52.2 12.4 171.0 51.9Portfolio -244.0 45.1 -0.6 2.8 -2.3 -2.9 0.0Total -155.9 230.1 103.1 55.0 10.1 168.0 51.9
2019-20 Direct 99.2 119.1 -44.0 59.9 -1.1 190.7 57.4Portfolio -141.8 -34.6 1.1 0.7 0.5 24.6 0.0Total -42.5 84.4 -42.9 60.6 -0.6 215.3 57.4
2020-21 Direct 168.4 143.5 102.1 53.0 3.9 157.2 36.2Portfolio -189.5 -170.2 161.4 -0.8 1.5 5.3 0.0Total -21.2 -26.8 263.5 52.2 5.3 162.5 36.2
- : Not available (Contd…)
ItalyUSA UK UAE Germany France Hong Kong
23

TABLE 1.9
FOREIGN PRIVATE INVESTMENTUS $ Million
Fiscal Year Japan Saudi Arabia Canada Netherland S. Korea Others Total
2001-02 Direct 6.5 1.3 3.5 -5.1 0.5 92.8 484.8Portfolio 0.2 0.1 2.7 -0.8 0.0 5.0 -9.0Total 6.7 1.4 6.2 -5.9 0.5 97.8 475.8
2002-03 Direct 14.1 43.5 0.5 3.0 0.2 174.0 798.0Portfolio -0.3 0.1 0.0 0.0 -6.9 45.1 18.2Total 13.8 43.6 0.5 3.1 -6.7 219.1 816.3
2003-04 Direct 15.1 7.2 0.5 14.0 1.0 464.1 949.4Portfolio -3.5 -1.9 0.0 -2.0 -9.4 -15.0 -27.7Total 11.7 5.3 0.5 12.0 -8.4 449.1 921.7
2004-05 Direct 45.2 18.4 1.9 36.7 1.4 503.2 1524.0Portfolio -3.4 -0.2 0.1 23.2 0.0 -12.6 152.6Total 41.8 18.2 2.0 59.8 1.4 490.7 1676.6
2005-06 Direct 57.0 277.8 4.8 121.1 1.6 817.7 3521.0Portfolio -8.7 0.8 0.2 -0.7 0.0 -15.2 351.5Total 48.2 278.5 5.0 120.4 1.6 802.4 3872.5
2006-07 Direct 64.4 105.0 10.8 771.7 1.5 1638.9 5139.6Portfolio 3.9 0.1 0.2 6.2 0.0 45.7 1820.4Total 68.4 105.1 10.9 777.9 1.5 1684.5 6959.9
2007-08 Direct 131.2 46.2 13.3 121.6 1.2 2320.1 5410.2Portfolio 9.9 -1.6 0.4 24.5 1.7 -87.2 44.3Total 141.1 44.7 13.7 146.1 2.9 2232.9 5454.4
2008-09 Direct 74.3 -92.3 2.4 41.8 1.9 2139.7 3719.9Portfolio -6.1 2.1 0.2 5.8 -2.8 -42.1 -510.3Total 68.2 -90.2 2.6 47.6 -0.9 2097.6 3209.6
2009-10 Direct 26.8 -133.8 1.1 278.6 2.3 897.7 2150.8Portfolio 11.4 0.0 0.1 0.4 3.6 74.1 587.9Total 38.2 -133.7 1.2 279.1 5.8 971.8 2738.8
2010-11 Direct 3.2 6.5 3.0 -44.3 7.7 762.2 1634.8Portfolio 5.2 0.1 1.1 3.7 -1.6 40.1 364.6Total 8.4 6.6 4.1 -40.6 6.1 802.3 1999.3
2011-12 Direct 29.7 -79.9 10.8 22.1 25.5 34.6 820.6Portfolio 1.2 0.1 -1.4 -9.1 -0.8 51.6 -60.0Total 31.0 -79.8 9.4 13.0 24.7 86.1 760.7
2012-13 Direct 30.1 3.2 -12.5 -118.7 25.8 171.4 1456.5Portfolio 4.4 0.0 -0.5 10.3 -0.6 152.8 119.6Total 34.5 3.3 -13.0 -108.4 25.2 324.2 1576.0
2013-14 Direct 30.1 -40.1 -20.9 5.5 24.4 961.1 1698.6Portfolio 17.2 0.0 2.1 2.7 -5.4 181.1 622.8Total 47.2 -40.1 -18.8 8.1 19.1 1142.2 2321.4
2014-15 Direct 71.1 -64.8 -29.9 -34.5 14.3 427.9 1033.8Portfolio 2.9 0.5 4.2 -1.4 -9.7 143.8 917.3Total 74.0 -64.4 -25.7 -35.9 4.5 571.7 1951.1
2015-16 Direct 35.4 24.0 0.4 29.9 4.0 1640.7 2392.9Portfolio 0.8 0.9 12.4 15.1 0.2 -137.0 -319.7Total 36.2 24.9 12.8 45.0 4.2 1503.7 2073.2
2016-17 Direct 57.7 14.5 0.4 457.6 12.3 1262.6 2406.6Portfolio 0.4 1.1 35.2 -7.1 4.8 -509.3 -512.8Total 58.1 15.6 35.6 450.5 17.1 753.2 1893.8
2017-18 Direct 59.8 3.8 -0.8 100.2 22.3 1850.7 2780.3Portfolio 4.0 -0.7 -1.2 -4.3 -0.2 -322.1 -240.7Total 63.8 3.1 -1.9 95.9 22.0 1528.6 2539.6
2018-19 Direct 117.3 19.2 0.5 69.0 88.3 403.7 1362.4Portfolio 1.0 -0.6 0.8 -2.6 -0.6 -211.1 -415.2Total 118.4 18.6 1.3 66.4 87.7 192.6 947.2
2019-20 Direct 62.5 21.8 0.3 133.2 50.6 1847.8 2597.5Portfolio 1.0 0.4 -3.8 2.6 0.5 -132.8 -281.7Total 63.4 22.2 -3.5 135.8 51.1 1715.0 2315.8
2020-21 Direct -11.4 6.9 -0.1 107.1 11.0 1085.1 1862.8Portfolio 0.9 0.1 2.5 -4.4 0.3 401.9 209.0Total -10.5 7.0 2.5 102.6 11.3 1487.0 2071.8
- : Not available Source: State Bank of PakistanNote : Direct investment consists of cash, capital equipment brought in and reinvested earnings
24

AGRICULTURE
HIGHLIGHTS Unit 2020-21 (P)
I. Agriculture ProductionWheat 000 Tons 27,464Rice 000 Tons 8,420Maize 000 Tons 8,939Gram 000 Tons 234Sugarcane 000 Tons 81,009Cotton 000 Bales 7,064Meat 000 Tons 5,122Milk 000 Tons 51,340Fish 000 Tons 810
II. Other IndicatorsCropped Area Million Hectare 24.1Water Availability Million Acre Feet 131.5Fertilizer Offtake 000 Nutrient Tons 5,006.0Improved Seeds Distribution 000 Tons 616.8Credit Disbursed Rs. Billion 1,365.9Production of Tractors Numbers 50,486
P : Provisional
25

TABLE 2.1
INDEX OF AGRICULTURE PRODUCTION
YearsAll Food Fibre Other Cash crops Fibre crops
crops crops crops crops Wheat Maize Rice Surgcane Cotton2000-01 93.0 91.2 95.5 94.0 - - - - -
2001-02 96.5 85.2 94.4 103.6 - - - - -
2002-03 104.0 91.8 90.8 112.1 - - - - -
2003-04 106.9 94.9 89.4 115.1 - - - - -
2004-05 104.1 106.3 126.9 101.9 - - - - -
2005-06 101.0 107.0 116.0 95.6 100.0 100.0 100.0 100.0 100.0
2006-07 117.0 115.0 114.0 118.0 109.5 99.3 98.0 122.6 98.7
2007-08 126.0 108.0 104.0 138.0 98.5 115.9 100.3 143.1 89.5
2008-09 114.0 124.0 105.0 108.0 113.0 115.5 125.3 112.0 90.8
2009-10 111.0 119.0 115.0 106.0 109.6 104.9 124.1 110.5 99.2
2010-11 119.0 120.0 102.0 119.0 118.5 119.2 87.0 123.8 88.0
2011-12 123.0 120.0 121.0 125.0 110.3 139.5 111.1 130.7 104.4
2012-13 - - - - 113.8 135.7 99.8 142.7 100.1
2013-14 - - - - 122.1 159.0 122.6 151.0 98.1
2014-15 - - - - 117.9 158.7 126.2 140.7 107.2
2015-16 - - - - 120.5 169.5 122.6 146.6 76.2
2016-17 - - - - 125.4 197.2 123.5 169.0 82.0
2017-18 - - - - 117.9 189.8 134.3 186.6 91.8
2018-19 - - - - 114.4 219.5 129.8 150.4 75.7
2019-20 P - - - - 118.7 253.5 133.7 148.6 70.3
2020-21 P - - - - 128.3 272.2 151.8 181.4 54.3P : Provisional - : Not available Source: Pakistan Bureau of Statistics
Food crops1999-2000 Base Year 2005-06 Base Year
27

TABLE 2.2
BASIC DATA ON AGRICULTURE
Crop- Improved Water FertilizerYears ped Area seed dis- Availa- offtake
(million tribution bility @ (000 N/T)hectares) (000 Tons) (MAF)
2000-01 22.04 193.80 134.77 2,966.03
2001-02 22.12 191.57 134.63 2,929.00
2002-03 21.85 172.07 134.48 3,020.00
2003-04 22.94 178.77 134.78 3,222.00
2004-05 22.78 218.12 135.68 3,694.04
2005-06 23.13 226.07 137.38 3,804.19
2006-07 23.56 218.60 137.80 3,672.00
2007-08 23.85 264.67 138.00 3,581.22
2008-09 24.12 314.63 131.51 3,711.33
2009-10 23.87 312.63 133.70 4,360.49
2010-11 22.72 331.02 137.16 3,932.80
2011-12 22.50 346.38 135.86 3,861.00
2012-13 22.56 327.08 137.51 3,621.20
2013-14 23.20 389.23 138.71 4,089.00
2014-15 23.30 306.94 138.59 4,316.00
2015-16 24.00 473.15 133.00 3,699.30
2016-17 23.00 308.09 132.70 5,040.10
2017-18 23.50 398.73 133.40 4,763.40
2018-19 23.20 646.63 127.40 4,614.00
2019-20 24.10 550.77 130.00 4,548.00
2020-21 P 24.10 616.76 131.50 5,006.00P : Provisional (Contd.)
28
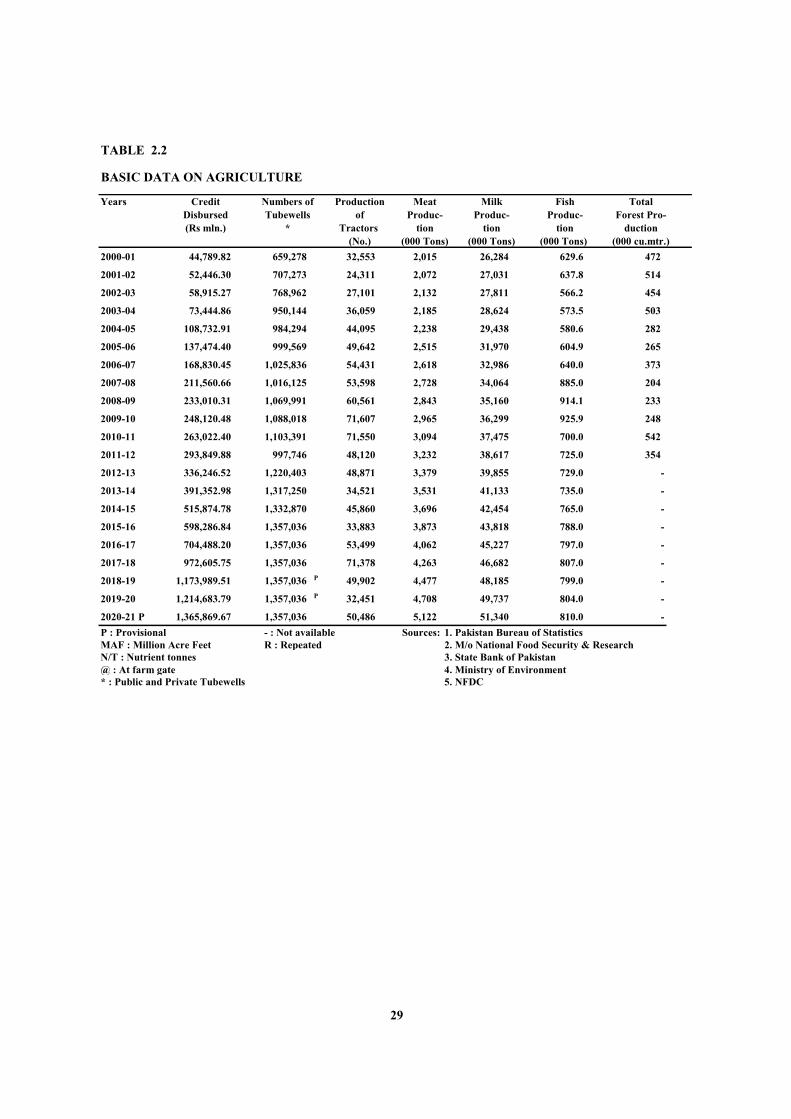
TABLE 2.2
BASIC DATA ON AGRICULTURE
Years Credit Numbers of Production Meat Milk Fish TotalDisbursed Tubewells of Produc- Produc- Produc- Forest Pro-(Rs mln.) * Tractors tion tion tion duction
(No.) (000 Tons) (000 Tons) (000 Tons) (000 cu.mtr.)2000-01 44,789.82 659,278 32,553 2,015 26,284 629.6 472
2001-02 52,446.30 707,273 24,311 2,072 27,031 637.8 514
2002-03 58,915.27 768,962 27,101 2,132 27,811 566.2 454
2003-04 73,444.86 950,144 36,059 2,185 28,624 573.5 503
2004-05 108,732.91 984,294 44,095 2,238 29,438 580.6 282
2005-06 137,474.40 999,569 49,642 2,515 31,970 604.9 265
2006-07 168,830.45 1,025,836 54,431 2,618 32,986 640.0 373
2007-08 211,560.66 1,016,125 53,598 2,728 34,064 885.0 204
2008-09 233,010.31 1,069,991 60,561 2,843 35,160 914.1 233
2009-10 248,120.48 1,088,018 71,607 2,965 36,299 925.9 248
2010-11 263,022.40 1,103,391 71,550 3,094 37,475 700.0 542
2011-12 293,849.88 997,746 48,120 3,232 38,617 725.0 354
2012-13 336,246.52 1,220,403 48,871 3,379 39,855 729.0 -
2013-14 391,352.98 1,317,250 34,521 3,531 41,133 735.0 -
2014-15 515,874.78 1,332,870 45,860 3,696 42,454 765.0 -
2015-16 598,286.84 1,357,036 33,883 3,873 43,818 788.0 -
2016-17 704,488.20 1,357,036 53,499 4,062 45,227 797.0 -
2017-18 972,605.75 1,357,036 71,378 4,263 46,682 807.0 -
2018-19 1,173,989.51 1,357,036 P 49,902 4,477 48,185 799.0 -
2019-20 1,214,683.79 1,357,036 P 32,451 4,708 49,737 804.0 -
2020-21 P 1,365,869.67 1,357,036 50,486 5,122 51,340 810.0 -P : Provisional - : Not available Sources: 1. Pakistan Bureau of StatisticsMAF : Million Acre Feet R : Repeated 2. M/o National Food Security & ResearchN/T : Nutrient tonnes 3. State Bank of Pakistan@ : At farm gate 4. Ministry of Environment* : Public and Private Tubewells 5. NFDC
29

TABLE 2.3LAND UTILIZATION Million hectares
Not Avail- TotalTotal Reported Forest able for Culturable Current Net Area Total Area Area Sown Cropped
Years Area Area Area Cultivation Waste Fallow Sown Cultivated more than Area(4+5+6+9) (7+8) once (8+10)
1 2 3 4 5 6 7 8 9 10 11
2000-01 79.61 59.44 3.77 24.37 9.17 6.73 15.40 22.13 6.64 22.04
2001-02 79.61 59.33 3.80 24.31 8.95 6.60 15.67 22.27 6.45 22.12
2002-03 79.61 59.45 4.04 24.25 8.95 6.61 15.60 22.21 6.25 21.85
2003-04 79.61 59.46 4.01 24.23 9.10 6.23 15.89 22.12 7.05 22.94
2004-05 79.61 59.48 4.02 24.39 8.94 6.86 15.27 22.13 7.51 22.78
2005-06 79.61 57.22 4.03 22.87 8.21 6.72 15.39 22.11 7.74 23.13
2006-07 79.61 57.07 4.19 22.70 8.30 5.72 16.16 21.88 7.40 23.56
2007-08 79.61 57.08 4.21 23.41 8.19 4.93 16.34 21.27 7.51 23.85
2008-09 79.61 57.21 4.21 23.47 8.15 5.04 16.34 21.38 7.78 24.12
2009-10 79.61 57.21 4.23 23.49 8.09 5.20 16.20 21.40 7.67 23.87
2010-11 79.61 57.64 4.26 23.37 7.98 6.38 15.65 22.03 7.07 22.72
2011-12 79.61 57.73 4.26 23.25 8.19 7.05 14.98 22.03 7.52 22.50
2012-13 79.61 57.78 4.26 23.06 8.21 7.04 15.22 22.26 7.34 22.56
2013-14 79.61 58.00 4.55 25.56 8.27 6.68 15.40 22.10 7.76 23.20
2014-15 79.60 58.00 4.50 25.50 8.30 6.70 15.50 23.20 7.80 23.30
2015-16 79.60 58.00 4.00 25.60 8.30 10.10 15.60 22.70 7.90 24.00
2016-17 79.60 58.00 4.50 25.50 8.40 9.50 15.60 22.10 7.50 23.00
2017-18 79.60 58.00 4.50 25.60 8.60 9.40 15.70 22.20 7.70 23.50
2018-19 79.60 57.90 4.50 23.00 8.30 9.50 15.60 22.10 7.60 23.20
2019-20 79.60 57.90 4.50 23.10 8.30 9.40 15.70 22.10 8.40 24.10
2020-21 P 79.60 57.90 4.50 23.10 8.30 9.40 15.70 22.10 8.40 24.10P: Provisional Source: M/o National Food Security & Research
Note:1. Total Area Reported is the total physical area of the villages/deh, tehsils or districts etc.
2.
3.
4.
5.
Cultivated Area is that area which was sown at least during the year under reference or during the previous year.Cultivated Area = Net Area sown + Current Fallow.
6. Net Area Sown is that area which is sown at least once during (Kharif & Rabi) the year under reference.
7. Area Sown more than once is the difference between the total cropped area and the net area sown.
8. Total Cropped Area means the aggregate area of crops raised in a farm during the year under reference including the area under fruit trees.
Forest Area is the area of any land classed or administered as forest under any legal enactment dealing withforests. Any cultivated area which may exist within such forest is shown under heading "cultivated area".
Area Not Available for Cultivation is that uncultivated area of the farm which is under farm home-steads, farm roads and other connected purposes and not available for cultivation.
Culturable Waste is that uncultivated farm area which is fit for cultivation but was not cropped during theyear under reference nor in the year before that.
Cultivated Area
Current Fallow (ploughed but uncropped) is that area which is vacant during the year under reference butwas sown at least once during the previous year.
30

TABLE 2.4
AREA UNDER IMPORTANT CROPS000 hectares
Years Wheat Rice Bajra Jowar Maize Barley Total Gram Sugar- Rapeseed Sesa- Cotton TobaccoFood cane & mum
Grains Mustard2000-01 8,181 2,377 390 354 944 113 12,359 905 961 272 101 2,928 46
2001-02 8,057 2,114 417 358 942 111 11,999 934 1,000 269 136 3,116 49
2002-03 8,034 2,225 349 338 936 108 11,990 963 1,100 281 88 2,794 47
2003-04 8,216 2,461 539 393 947 102 12,658 982 1,075 280 60 2,989 46
2004-05 8,358 2,520 343 308 982 93 12,604 1,094 966 257 67 3,193 50
2005-06 8,448 2,621 441 254 1,042 90 12,896 1,029 907 217 82 3,103 56
2006-07 8,578 2,581 504 292 1,017 94 13,066 1,052 1,029 256 71 3,075 51
2007-08 8,550 2,515 531 281 1,052 91 13,020 1,107 1,241 224 76 3,054 51
2008-09 9,046 2,963 470 263 1,052 86 13,880 1,081 1,029 233 91 2,820 50
2009-10 9,132 2,883 476 248 935 84 13,758 1,067 943 178 80 3,106 56
2010-11 8,901 2,365 548 229 974 77 13,094 1,054 988 212 78 2,689 51
2011-12 8,650 2,571 458 214 1,087 72 13,052 1,008 1,058 201 76 2,835 46
2012-13 8,660 2,309 461 199 1,060 73 12,762 992 1,129 221 71 2,879 50
2013-14 9,199 2,789 475 198 1,169 72 13,901 975 1,173 227 82 2,806 49
2014-15 9,205 2,891 462 195 1,142 68 13,963 936 1,141 214 83 2,961 54
2015-16 9,224 2,739 487 274 1,191 66 13,982 940 1,131 206 79 2,902 50
2016-17 8,972 2,724 469 256 1,348 61 13,831 971 1,218 191 76 2,489 47
2017-18 8,797 2,901 489 225 1,251 58 13,721 975 1,342 214 83 2,699 51
2018-19 8,662 2,890 456 242 1,374 56 13,680 943 1,102 271 83 2,373 49
2019-20 8,805 3,034 522 198 1,404 49 14,013 944 1,040 397 139 2,517 51
2020-21 P 9,154 3,336 349 116 1,418 42 14,415 883 1,165 249 170 2,079 55P : Provisional Note : 1 ha = 2.47 acres M/o National Food Security & Research
Pakistan Bureau of StatisticsSource:
31

TABLE 2.5
PRODUCTION OF IMPORTANT CROPS
000 tonsYears Wheat Rice Bajra Jowar Maize Barley Total Gram Sugar- Rapeseed Tobacco
Food cane & Sesamum (000 (000Grains Mustard tons) Bales)
2000-01 19,024 4,803 199 218 1,643 99 25,986 397 43,606 231 50.7 1,825 10,732 85
2001-02 18,227 3,882 216 222 1,664 100 24,310 362 48,042 221 69.6 1,805 10,613 95
2002-03 19,183 4,479 189 203 1,737 100 25,891 675 52,056 235 19.2 1,737 10,211 88
2003-04 19,500 4,848 274 238 1,897 98 26,855 611 53,419 238 24.7 1,709 10,048 86
2004-05 21,612 5,025 193 186 2,797 92 29,905 868 47,244 216 29.8 2,426 14,265 101
2005-06 21,277 5,547 221 153 3,110 87 30,395 480 44,666 172 35.1 2,214 13,019 113
2006-07 23,295 5,438 238 180 3,088 93 32,332 838 54,742 212 30.4 2,187 12,856 103
2007-08 20,959 5,563 305 170 3,605 87 30,689 475 63,920 176 32.8 1,982 11,655 108
2008-09 24,033 6,952 296 165 3,593 82 35,121 741 50,045 188 41.0 2,010 11,819 105
2009-10 23,311 6,883 293 154 3,262 71 33,974 562 49,373 151 33.4 2,196 12,913 119
2010-11 25,214 4,823 346 141 3,707 71 34,302 496 55,309 188 31.1 1,949 11,460 103
2011-12 23,473 6,160 304 137 4,338 66 34,478 284 58,397 164 30.3 2,312 13,595 98
2012-13 24,211 5,576 311 123 4,220 67 34,508 751 63,750 205 29.1 2,216 13,031 108
2013-14 25,979 6,798 301 118 5,044 67 38,307 474 67,460 213 33.0 2,172 12,769 130
2014-15 25,086 7,003 294 115 4,937 62 37,497 379 62,827 202 35.0 2,374 13,959 120
2015-16 25,633 6,801 299 161 5,271 61 38,226 286 65,482 194 32.0 1,687 9,917 119
2016-17 26,674 6,849 305 148 6,134 58 40,168 330 75,482 181 34.0 1,815 10,671 113
2017-18 25,076 7,450 339 152 5,902 56 38,975 324 83,333 209 35.0 2,032 11,946 121
2018-19 24,358 7,215 350 149 6,826 68 38,966 441 67,174 348 36.0 1,677 9,861 112
2019-20 25,248 7,414 384 120 7,883 47 41,096 498 66,380 561 65.0 1,556 9,152 133
2020-21 P 27,464 8,420 264 93 8,939 41 45,221 234 81,009 338 102.0 1,202 7,064 168P : Provisional Source: M/o National Food Security & Research
Pakistan Bureau of Statistics
Cotton
32

TABLE 2.6
YIELD PER HECTARE OF MAJOR AGRICULTURAL CROPSKg/Hectare
Years Wheat Rice Sugarcane Maize Gram Cotton
2000-01 2,325 2,021 45,385 1,741 439 624
2001-02 2,262 1,836 48,056 1,768 388 579
2002-03 2,388 2,013 47,341 1,857 701 622
2003-04 2,373 1,970 49,738 2,003 622 572
2004-05 2,586 1,994 48,887 2,849 794 760
2005-06 2,519 2,116 49,246 2,984 466 714
2006-07 2,716 2,107 53,199 3,037 796 711
2007-08 2,451 2,212 51,507 3,427 429 649
2008-09 2,657 2,347 48,635 3,415 685 713
2009-10 2,553 2,387 52,357 3,488 526 707
2010-11 2,833 2,039 55,981 3,805 471 725
2011-12 2,714 2,396 55,196 3,990 282 815
2012-13 2,796 2,415 56,466 3,981 757 768
2013-14 2,824 2,437 57,111 4,316 487 774
2014-15 2,725 2,422 55,063 4,323 405 802
2015-16 2,779 2,483 57,897 4,426 304 581
2016-17 2,974 2,514 61,972 4,550 340 729
2017-18 2,851 2,568 62,096 4,718 332 753
2018-19 2,812 2,497 60,956 4,968 468 707
2019-20 2,867 2,444 63,827 5,615 528 619
2020-21 P 3,000 2,524 69,536 6,304 265 578P : Provisional Source: M/o National Food Security & Research
Pakistan Bureau of Statistics
33

TABLE 2.7
Years Citrus Mango Apple Banana Apricot Almonds Grapes Guava Qty (000 Valuetons) (Mln. Rs)
2000-01 1,898 990 439 139 126 33 51 526 260 4,586
2001-02 1,830 1,037 367 150 125 26 53 538 290 5,097
2002-03 1,702 1,035 315 143 130 24 52 532 263 4,361
2003-04 1,760 1,056 334 154 211 24 51 550 354 5,912
2004-05 1,944 1,671 352 158 205 23 49 572 281 5,408
2005-06 2,458 1,754 351 163 197 23 49 552 455 7,508
2006-07 1,472 1,719 348 151 177 23 47 555 343 6,894
2007-08 2,295 1,754 442 158 240 27 75 539 411 9,085
2008-09 2,132 1,728 441 157 238 27 76 512 469 12,519
2009-10 2,150 1,845 366 154 194 22 65 509 687 20,094
2010-11 1,982 1,889 526 141 190 21 64 547 669 25,017
2011-12 2,147 1,700 599 98 190 21 64 495 737 32,068
2012-13 2,002 1,680 556 116 179 21 64 500 718 38,085
2013-14 2,168 1,659 606 119 178 22 66 496 784 45,196
2014-15 2,396 1,717 617 118 171 22 66 488 682 44,375
2015-16 2,344 1,636 620 135 173 21 66 523 677 44,607
2016-17 2,180 1,784 670 137 166 22 66 548 646 39,878
2017-18 2,351 1,734 565 135 142 21 67 586 697 43,842
2018-19 2,469 1,723 544 136 108 20 68 548 756 56,272
2019-20 2,358 1,639 604 151 94 20 82 706 798 67,769
2020-21 P - - - - - - - - 975 76,846P : Provisional - : Not available Source: M/o National Food Security & Research* : Quantity and Value is for all fruits Pakistan Bureau of Statistics
Production of Important Fruit (000 tons)
PRODUCTION AND EXPORTS OF FRUITS
Exports*
34

TABLE 2.8 A
% shareFiscal Year / 1999-00 2000-01 2001-02 2002-03 2003-04 2004-05 2005-06 2006-07 2007-08 2008-09 2009-10 2010-11 2011-12CropsAll Major Crops 100.0 100.0 100.0 100.0 100.0 100.0 100.0 100.0 100.0 100.0 100.0 100.0 100.0
Food Crops 63.20 62.31 60.34 62.66 63.52 61.55 63.37 63.85 62.24 66.69 64.61 65.86 62.57
Rice 15.40 15.62 14.54 15.85 16.94 15.28 17.45 15.78 16.63 17.20 17.84 15.02 15.37
Wheat 41.30 40.39 39.48 39.26 38.98 37.58 38.23 39.27 37.12 40.43 39.01 42.60 39.22
Barley 0.20 0.20 0.21 0.19 0.19 0.15 0.15 0.15 0.15 0.13 0.11 0.11 0.11
Jowar 0.40 0.44 0.46 0.39 0.46 0.31 0.27 0.29 0.29 0.26 0.24 0.22 0.21
Bajra 0.30 0.45 0.50 0.41 0.59 0.36 0.42 0.43 0.58 0.53 0.52 0.63 0.54
Maize 2.80 3.10 3.21 3.13 3.32 4.14 4.70 4.42 5.37 5.08 4.57 5.22 5.93
Gram 2.80 2.11 1.95 3.41 3.05 3.73 2.14 3.51 2.10 3.06 2.32 2.06 1.19
Fibre Crop 24.00 24.89 25.26 22.98 22.06 27.21 25.58 23.65 22.67 21.85 24.17 21.61 24.61
Cotton 24.00 24.89 25.26 22.98 22.84 27.21 25.58 23.65 22.67 21.85 24.17 21.61 24.61
Cash Crop 11.00 11.27 12.63 12.95 13.00 9.95 9.75 11.20 13.82 10.20 10.05 11.36 11.68
Sugarcane 11.00 11.27 12.63 12.95 13.00 9.95 9.75 11.20 13.82 10.20 10.05 11.36 11.68
Other Crops 1.60 1.52 1.77 1.41 1.43 1.28 1.31 1.29 1.27 1.26 1.17 1.17 1.14
Rape Seed &
Mustard 0.80 0.70 0.75 0.81 0.81 0.65 0.57 0.67 0.58 0.58 0.47 0.55 0.57
Sesamum 0.20 0.34 0.47 0.12 0.15 0.16 0.20 0.16 0.18 0.21 0.17 0.16 0.15
Tobacco 0.60 0.84 0.55 0.48 0.46 0.47 0.54 0.46 0.51 0.47 0.53 0.46 0.42Source: Pakistan Bureau of Statistics
TABLE 2.8 B
% ShareFiscal Year/ 2008-09 2009-10 2010-11 2011-12 2012-13 2013-14 2014-15 2015-16 2016-17 2017-18 2018-19 2019-20 2020-21Crops PImportant Crops 100 100 100 100 100 100 100 100 100 100 100 100 100
Food Crops 62.82 60.43 61.92 58.94 58.79 61.21 59.94 65.26 64.22 61.14 65.88 68.27 71.22
Wheat 41.75 40.14 44.07 38.92 40.21 40.29 38.63 42.24 40.95 37.69 39.22 39.75 41.01
Maize 7.08 6.47 7.50 8.32 8.09 8.88 8.83 10.08 10.98 10.33 12.86 14.52 14.89
Rice 13.99 13.83 10.34 11.69 10.49 12.04 12.49 12.94 12.29 13.12 13.80 14.00 15.32
Cash Crop 10.77 10.66 12.03 11.83 13.15 13.09 12.11 13.51 14.48 15.56 13.47 13.03 15.01
Sugarcane 10.77 10.66 12.03 11.83 13.15 13.09 12.11 13.51 14.48 15.56 13.47 13.03 15.01
Fibre Crop 26.40 28.91 26.05 29.23 28.06 25.70 27.95 21.22 21.29 23.30 20.65 18.69 13.76
Cotton 26.40 28.91 26.05 29.23 28.06 25.70 27.95 21.22 21.29 23.30 20.65 18.69 13.76P: Provisional Source: Pakistan Bureau of Statistics
CROPWISE COMPOSITION OF VALUE ADDED MAJOR AGRICULTURAL CROPS(AT CONSTANT FACTOR COST) BASE YEAR 1999-2000
CROP WISE COMPOSITION OF OUTPUT OF IMPORTANT AGRICULTURAL CROPS(AT CONSTANT FACTOR COST) BASE YEAR 2005-06
35

TABLE 2.9
Unit Total Owner Owner-Cum Tenant Total Owner Owner-Cum TenantTenant Tenant
(1960 Census)Pakistan 4.860 1.998 0.834 2.028 48.930 18.723 11.012 19.195Khyber Pakhtunkhwa 0.674 0.325 0.137 0.212 5.464 1.871 1.871 1.722
Punjab 3.326 1.422 0.623 1.282 29.214 11.169 7.180 10.865Sindh 0.676 0.135 0.061 0.482 9.623 2.775 1.401 5.446Balochistan 0.183 0.116 0.015 0.053 4.629 2.908 0.559 1.162
(1972 Census)Pakistan 3.762 1.569 0.897 1.296 49.061 19.400 15.160 14.500Khyber Pakhtunkhwa 0.466 0.256 0.103 0.107 4.252 1.615 1.713 0.923
Punjab 2.375 1.008 0.683 0.684 31.030 11.951 11.051 8.028Sindh 0.748 0.178 0.097 0.472 9.460 2.909 1.760 4.791Balochistan 0.173 0.126 0.013 0.033 4.319 2.925 0.637 0.757
(1980 Census)Pakistan 4.069 2.227 0.789 1.054 47.095 24.533 12.396 10.165Khyber Pakhtunkhwa 0.528 0.361 0.072 0.095 4.099 2.388 1.103 0.608
Punjab 2.544 1.385 0.618 0.542 29.898 14.883 9.334 5.681Sindh 0.795 0.323 0.085 0.386 9.207 4.350 1.528 3.328Balochistan 0.202 0.159 0.014 0.030 3.892 2.912 0.431 0.549
(1990 Census)Pakistan 5.071 3.491 0.626 0.954 47.319 30.723 8.982 7.614Khyber Pakhtunkhwa 1.069 0.835 0.089 0.144 5.828 4.251 0.902 0.675
Punjab 2.957 2.054 0.464 0.439 27.107 16.656 6.604 3.847Sindh 0.802 0.406 0.061 0.335 8.604 5.098 1.040 2.466Balochistan 0.243 0.196 0.012 0.035 5.780 4.718 0.436 0.626
(2000 Census)Pakistan 6.620 5.135 0.559 0.927 50.425 36.969 7.323 6.133Khyber Pakhtunkhwa 1.356 1.124 0.084 0.148 5.589 4.243 0.805 0.541
Punjab 3.864 3.037 0.424 0.403 27.762 19.249 5.401 3.113Sindh 1.070 0.704 0.043 0.323 10.687 8.113 0.736 1.838Balochistan 0.330 0.270 0.009 0.051 6.387 5.365 0.381 0.642
Pakistan 8.264 6.744 0.604 0.916 52.910 39.432 7.584 5.894Khyber Pakhtunkhwa 1.540 1.340 0.093 0.107 5.570 4.348 0.797 0.424
Punjab 5.250 4.325 0.452 0.473 29.326 20.602 5.368 3.356Sindh 1.115 0.784 0.045 0.286 9.869 7.830 0.746 1.294Balochistan 0.360 0.296 0.014 0.050 8.145 6.652 0.673 0.821Note : 1 ha = 2.47 acres Source: Pakistan Bureau of Statistics
(Agricultural Censuses)
TENURE CLASSIFICATION OF FARMS & FARM AREA BY PROVINCES
Number of Farms (million) Farm Area (million acres)
(2010 Census)
36

TABLE 2.10
Farms in million nos.Area in million acres
Private Farms Owner Tenant All PrivateFarms Self operated Tenant operated Total Farms Farms
Numbers1960 1.998 - - 0.834 2.028 4.8601972 1.569 - - 0.897 1.296 3.7621980 2.227 - - 0.789 1.054 4.0691990 3.491 - - 0.626 0.954 5.0712000 5.135 - - 0.559 0.927 6.6212010 6.744 - - 0.604 0.916 8.264
Average Farm Size1960 9.37 - - 13.20 9.47 10.071972 12.37 - - 16.91 11.18 13.041980 11.02 - - 15.71 9.65 11.571990 8.80 - - 14.34 7.98 9.332000 7.20 - - 13.10 6.62 7.622010 5.85 - - 12.55 6.43 6.40
Farm Area1960 18.723 6.235 6.107 12.342 17.864 48.9291972 19.400 6.988 8.172 15.160 14.500 49.0611980 24.533 5.741 6.655 12.396 10.166 47.0951990 30.723 4.057 4.925 8.982 7.614 47.3192000 36.969 3.199 4.124 7.323 6.133 50.4252010 39.432 3.099 4.485 7.584 5.894 52.910
Area Operated byOwners
1960 18.723 6.235 - - - 24.9581972 19.400 6.988 - - - 26.3881980 24.533 5.741 - - - 30.2741990 30.723 4.057 - - - 34.7802000 36.969 3.199 - - - 40.1682010 39.432 3.099 - - - 42.531
Share Cropper1960 - - 7.776 - 16.495 21.2711972 - - 6.351 - 12.564 18.9151980 - - 5.078 - 8.511 13.5891990 - - 3.368 - 5.698 9.0662000 - - 2.662 - 4.664 7.3262010 - - 2.961 - 4.350 7.311
Lease Holder1960 - - 0.979 - 0.962 1.9411972 - - 1.584 - 1.760 3.3441980 - - 1.421 - 1.479 2.9001990 - - 1.440 - 1.770 3.2102000 - - 1.311 - 1.397 2.7082010 - - 1.248 - 1.470 2.718
Other1960 - - 0.352 - 0.407 0.7591972 - - 0.237 - 0.176 0.4131980 - - 0.156 - 0.175 0.3321990 - - 0.117 - 0.146 0.2632000 - - 0.151 - 0.072 0.2232010 - - 0.276 - 0.074 0.351
- : Not available Source: Pakistan Bureau of Statistics(Agricultural Censuses)
Note:
SUMMARY DATA ON NUMBER, SIZE, AREA & OPERATIONAL STATUS OFFARMS BY TENURE BASED ON AGRICULTURAL CENSUS DATA
Owner-cum-Tenant Farms
The 1960 Census based on an extractive survey of land revenuerecords, may not be comparable to the rest of Censuses, basedon household surveys.
37

TABLE 2.11
NUMBER & AREA OF PRIVATE FARMS, CLASSIFIED BY SIZE (Census 2010)
In hectaresFarms Farm Area Cultivated Area
Farm size Number Percent Total Percent Total Percent(Hectares) (million) hectare hectare
(million) (million)
Under 0.5 2.071 25 0.546 3 0.498 3
0.5 to under 1.0 1.526 19 1.144 5 1.066 6
1.0 to under 2.0 1.754 21 2.432 11 2.267 13
2.0 to under 3.0 1.132 14 2.628 12 2.446 14
3.0 to under 5.0 0.915 11 3.531 16 3.221 19
5.0 to under 10.0 0.562 7 3.794 18 3.352 19
10.0 to under 20.0 0.211 3 2.724 13 2.182 13
20.0 to under 40.0 0.067 1 1.678 8 1.214 7
40.0 to under 60.0 0.013 * 0.568 3 0.382 2
60.0 and above 0.013 * 2.369 11 0.621 4
Total Farms 8.26 101 21.41 100 17.25 100* : Value less than 0.5 Source: Pakistan Bureau of Statistics
(Agricultural Censuses)
38
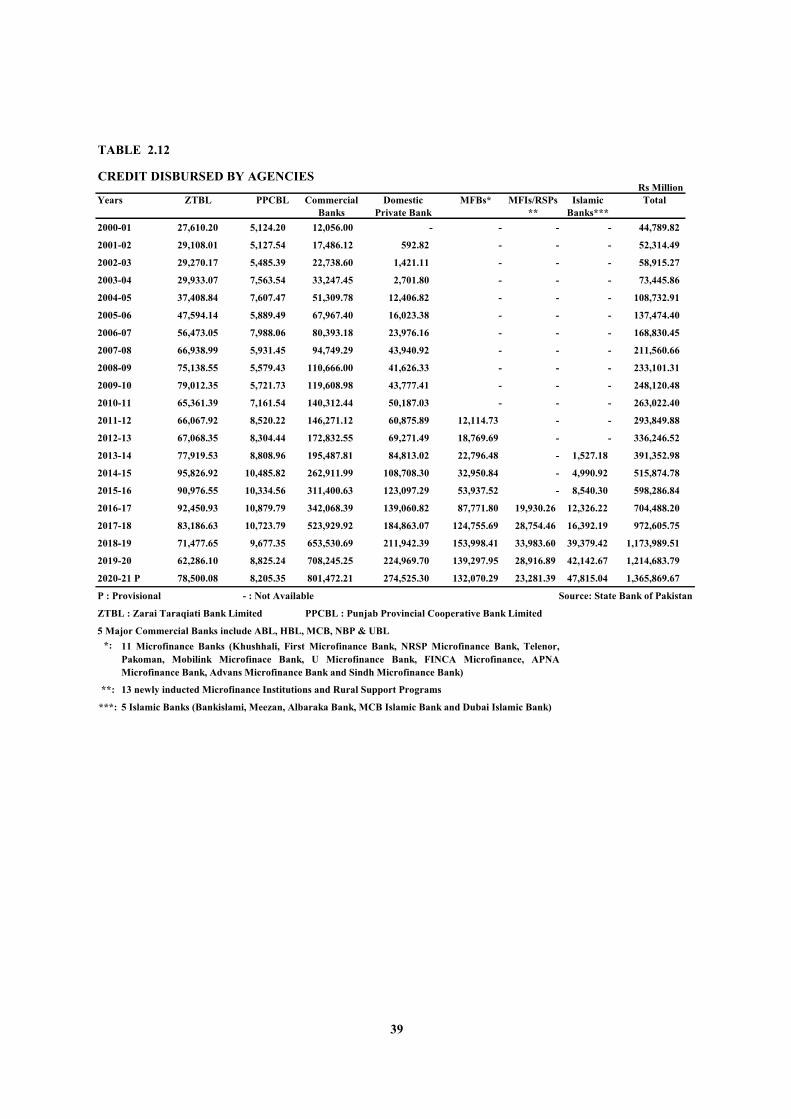
TABLE 2.12
CREDIT DISBURSED BY AGENCIESRs Million
Years ZTBL PPCBL Commercial Domestic MFBs* MFIs/RSPs Islamic TotalBanks Private Bank ** Banks***
2000-01 27,610.20 5,124.20 12,056.00 - - - - 44,789.82
2001-02 29,108.01 5,127.54 17,486.12 592.82 - - - 52,314.49
2002-03 29,270.17 5,485.39 22,738.60 1,421.11 - - - 58,915.27
2003-04 29,933.07 7,563.54 33,247.45 2,701.80 - - - 73,445.86
2004-05 37,408.84 7,607.47 51,309.78 12,406.82 - - - 108,732.91
2005-06 47,594.14 5,889.49 67,967.40 16,023.38 - - - 137,474.40
2006-07 56,473.05 7,988.06 80,393.18 23,976.16 - - - 168,830.45
2007-08 66,938.99 5,931.45 94,749.29 43,940.92 - - - 211,560.66
2008-09 75,138.55 5,579.43 110,666.00 41,626.33 - - - 233,101.31
2009-10 79,012.35 5,721.73 119,608.98 43,777.41 - - - 248,120.48
2010-11 65,361.39 7,161.54 140,312.44 50,187.03 - - - 263,022.40
2011-12 66,067.92 8,520.22 146,271.12 60,875.89 12,114.73 - - 293,849.88
2012-13 67,068.35 8,304.44 172,832.55 69,271.49 18,769.69 - - 336,246.52
2013-14 77,919.53 8,808.96 195,487.81 84,813.02 22,796.48 - 1,527.18 391,352.98
2014-15 95,826.92 10,485.82 262,911.99 108,708.30 32,950.84 - 4,990.92 515,874.78
2015-16 90,976.55 10,334.56 311,400.63 123,097.29 53,937.52 - 8,540.30 598,286.84
2016-17 92,450.93 10,879.79 342,068.39 139,060.82 87,771.80 19,930.26 12,326.22 704,488.20
2017-18 83,186.63 10,723.79 523,929.92 184,863.07 124,755.69 28,754.46 16,392.19 972,605.75
2018-19 71,477.65 9,677.35 653,530.69 211,942.39 153,998.41 33,983.60 39,379.42 1,173,989.51
2019-20 62,286.10 8,825.24 708,245.25 224,969.70 139,297.95 28,916.89 42,142.67 1,214,683.79
2020-21 P 78,500.08 8,205.35 801,472.21 274,525.30 132,070.29 23,281.39 47,815.04 1,365,869.67
P : Provisional - : Not Available Source: State Bank of Pakistan
ZTBL : Zarai Taraqiati Bank Limited PPCBL : Punjab Provincial Cooperative Bank Limited
5 Major Commercial Banks include ABL, HBL, MCB, NBP & UBL*:
**: 13 newly inducted Microfinance Institutions and Rural Support Programs
***: 5 Islamic Banks (Bankislami, Meezan, Albaraka Bank, MCB Islamic Bank and Dubai Islamic Bank)
11 Microfinance Banks (Khushhali, First Microfinance Bank, NRSP Microfinance Bank, Telenor,Pakoman, Mobilink Microfinace Bank, U Microfinance Bank, FINCA Microfinance, APNAMicrofinance Bank, Advans Microfinance Bank and Sindh Microfinance Bank)
39

TABLE 2.13
FERTILIZER OFFTAKE & IMPORT OF PESTICIDES
Import of Years Nitrogen Phosphate Potassium Total Fertilizers Quantity Value
000 N/T (Tons) (Mln Rs)2000-01 2,264.49 676.73 22.75 2,963.97 579.60 21,255.0 3,476.50
2001-02 2,285.30 624.54 18.75 2,928.60 625.70 31,783.2 5,320.49
2002-03 2,349.10 650.17 20.49 3,019.76 766.00 22,241.7 3,440.86
2003-04 2,526.73 673.46 21.79 3,221.98 764.10 41,406.4 7,156.66
2004-05 2,796.42 865.11 32.51 3,694.04 784.80 41,561.4 8,260.60
2005-06 2,926.62 850.53 27.04 3,804.19 1,268.30 33,953.9 6,804.00
2006-07 2,649.74 978.76 43.11 3,671.61 795.90 29,089.4 5,848.40
2007-08 2,924.62 629.68 26.92 3,581.22 876.34 27,814.2 6,330.20
2008-09 3,034.91 651.17 25.26 3,711.33 568.18 28,839.2 8,980.58
2009-10 3,476.28 860.44 23.76 4,360.49 1,444.06 38,226.5 13,472.61
2010-11 3,133.50 767.00 32.30 3,932.80 644.66 36,182.7 13,178.24
2011-12 3,206.50 633.20 21.20 3,861.00 1,176.70 32,152.2 12,255.03
2012-13 2,853.40 746.90 20.80 3,621.20 734.50 17,882.3 8,507.10
2013-14 3,185.00 881.00 24.00 4,089.00 1,148.40 23,545.7 12,571.82
2014-15 3,309.00 975.00 33.00 4,316.00 984.20 23,157.4 14,058.49
2015-16 2,671.90 1,007.30 20.00 3,699.30 901.30 17,386.3 15,974.39
2016-17 3,729.80 1,268.90 41.40 5,040.10 961.50 18,087.7 16,680.03
2017-18 3,434.80 1,278.60 49.90 4,763.40 1,190.90 26,480.0 19,162.20
2018-19 3,408.00 1,153.00 53.00 4,614.00 1,093.00 29,116.5 25,909.23
2019-20 3,415.00 1,084.00 49.00 4,548.00 890.00 32,088.8 29,571.63
2020-21 P 3,710.00 1,226.00 70.00 5,006.00 877.00 37,441.2 30,082.95P : Provisional Source: National Fertilizer Development Centre
Pakistan Bureau of Statistics
Fertilizer off-take (000 N/Tons) Import of Pesticides
40

TABLE 2.14
AVERAGE RETAIL SALE PRICE OF FERTILIZERSRs per bag of 50 Kg
Urea AN/CAN AS NP SSP(G) DAP SOP46% N 26% N 21% N 23:23 18% 18:46 50% K
2000-01 363.0 233.0 300.0 468.0 253.0 669.0 682.0
2001-02 394.0 268.0 308.0 519.0 280.0 710.0 765.0
2002-03 411.0 282.0 344.0 539.0 287.0 765.0 780.0
2003-04 421.0 298.0 373.0 622.0 316.0 913.0 809.0
2004-05 468.0 353.0 405.0 704.0 373.0 1,001.0 996.0
2005-06 509.0 395.0 744.0 710.0 407.0 1,079.0 1,170.0
2006-07 527.0 396.0 779.0 670.0 334.0 993.0 985.0
2007-08 581.0 471.0 865.0 1,294.0 560.0 1,931.0 1,495.0
2008-09 751.0 704.0 1,330.0 1,700.0 874.0 2,578.0 2,175.0
2009-10 806.3 703.2 956.3 1,456.7 724.5 2,267.2 2,300.3
2010-11 1,035.0 843.0 1,124.0 2,108.0 896.0 3,236.0 2,807.0
2011-12 1,718.0 1,392.0 - 2,691.0 1,260.0 4,054.0 3,797.0
2012-13 1,699.0 1,443.0 - 2,524.0 1,172.0 3,902.0 3,945.0
2013-14 1,826.0 1,566.0 - 2,513.0 1,050.0 3,640.0 4,233.0
2014-15 1,883.0 1,606.0 - 2,584.0 1,012.0 3,677.0 4,904.0
2015-16 1,860.0 1,564.0 - 2,339.0 973.0 3,343.0 5,131.0
2016-17 1,377.0 1,198.0 - 1,869.0 886.0 2,596.0 4,100.0
2017-18 1,386.0 1,241.0 - 2,175.0 890.0 2,882.0 3,659.0
2018-19 1,745.0 1,571.0 - 2,829.0 1,002.0 3,518.0 3,945.0
2019-20 1,850.0 1,700.0 - 2,695.0 1,068.0 3,558.0 4,299.0
2020-21 P 1,697.0 1,546.0 - 3,132.0 1,243.0 4,412.0 4,459.0P : Provisional - : Not available Source: National Fertilizer Development CentreASN : Ammonium Super Nitrate SSP : Single Super Phosphate Pakistan Bureau of StatisticsAS : Ammonium Sulphate DAP : Diammonium PhosphateNP : Nitrophosphate SOP : Sulphate of Potash
Date/Years
AN/CAN : Ammonium Nitrate/Calcium Ammonium Nitrate
41
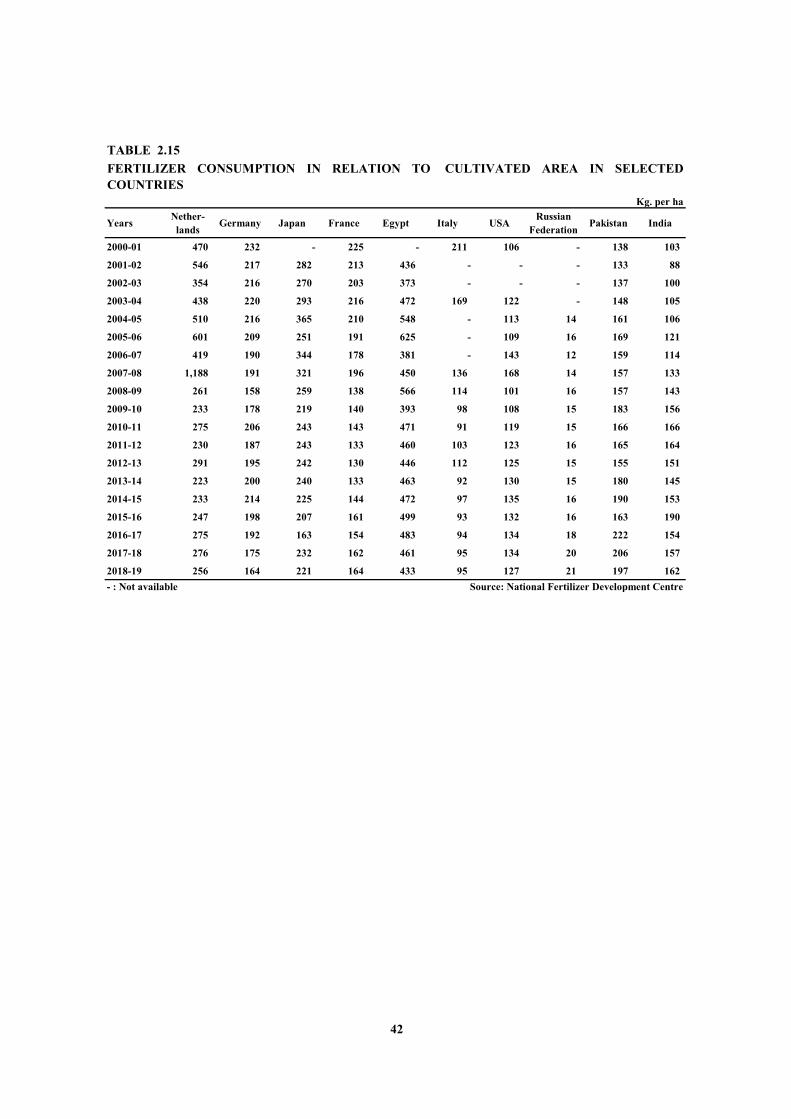
TABLE 2.15
Kg. per ha
Years Nether-lands Germany Japan France Egypt Italy USA Russian
Federation Pakistan India
2000-01 470 232 - 225 - 211 106 - 138 103
2001-02 546 217 282 213 436 - - - 133 88
2002-03 354 216 270 203 373 - - - 137 100
2003-04 438 220 293 216 472 169 122 - 148 105
2004-05 510 216 365 210 548 - 113 14 161 106
2005-06 601 209 251 191 625 - 109 16 169 121
2006-07 419 190 344 178 381 - 143 12 159 114
2007-08 1,188 191 321 196 450 136 168 14 157 133
2008-09 261 158 259 138 566 114 101 16 157 143
2009-10 233 178 219 140 393 98 108 15 183 156
2010-11 275 206 243 143 471 91 119 15 166 166
2011-12 230 187 243 133 460 103 123 16 165 164
2012-13 291 195 242 130 446 112 125 15 155 151
2013-14 223 200 240 133 463 92 130 15 180 145
2014-15 233 214 225 144 472 97 135 16 190 153
2015-16 247 198 207 161 499 93 132 16 163 190
2016-17 275 192 163 154 483 94 134 18 222 154
2017-18 276 175 232 162 461 95 134 20 206 157
2018-19 256 164 221 164 433 95 127 21 197 162- : Not available Source: National Fertilizer Development Centre
FERTILIZER CONSUMPTION IN RELATION TO CULTIVATED AREA IN SELECTEDCOUNTRIES
42

TABLE 2.16
AREA IRRIGATED BY VARIOUS SOURCES
Million Hectares
Years Canals Wells CanalWells Tubewells Canal
Tubewells Others Total
2000-01 6.98 0.16 0.10 3.19 7.22 0.17 17.82
2001-02 6.81 0.20 0.16 3.45 7.24 0.18 18.04
2002-03 7.06 0.21 0.17 3.37 7.21 0.20 18.22
2003-04 7.22 0.22 0.15 3.48 7.50 0.21 18.78
2004-05 7.00 0.25 0.19 3.46 7.70 0.24 18.84
2005-06 7.06 0.28 0.20 3.58 7.78 0.22 19.12
2006-07 6.78 0.67 0.22 3.89 7.78 0.25 19.59
2007-08 6.52 0.31 0.17 3.83 7.79 0.28 19.29
2008-09 6.42 0.31 0.20 3.82 7.94 0.24 19.39
2009-10 6.39 0.31 0.26 3.88 7.07 0.28 20.06
2010-11 6.00 0.36 0.25 3.92 7.60 0.72 19.16
2011-12 5.59 0.35 0.19 4.03 7.86 0.72 18.99
2012-13 5.22 0.30 0.19 3.81 7.86 0.19 18.68
2013-14 5.55 0.38 0.27 3.71 8.15 0.17 19.28
2014-15 5.55 0.38 0.27 3.71 8.15 0.17 19.28
2015-16 5.59 0.35 0.30 4.48 8.19 0.26 19.33
2016-17 5.56 0.10 0.30 3.57 7.89 0.21 18.91
2017-18 5.66 0.43 0.28 3.57 8.19 0.21 19.31
2018-19 5.42 0.27 0.28 3.57 8.23 0.16 19.16
2019-20 5.55 0.26 0.25 4.04 8.51 0.25 19.90
2020-21 P 5.55 0.26 0.25 4.04 8.51 0.25 19.90P: Provisional Source: Pakistan Bureau of Statistics
M/o National Food Security & Research
43

TABLE 2.17
PROCUREMENT / SUPPORT PRICES OF AGRICULTURE COMMODITIES
Rs per 40 kgCotton Seed
Years Wheat Basmati IRRI-6 Basmati Basmati IRRI-6 (Phutti) Khyber Punjab Sindh Baloch-385 (F.A.Q) 385 Super/2000 B-557 Pakhtunkhwa istan
F-1492000-01 300.00 - - 385.00 460.00 205.00 725.00 @ 35.00 35.00 36.00 36.00
2001-02 300.00 - - 385.00 460.00 205.00 780.00 ^ 42.00 42.00 43.00 43.00
2002-03 300.00 - - 385.00 460.00 205.00 800.00 ^ 42.00 42.00 43.00 43.00
2003-04 350.00 - - 400.00 485.00 215.00 850.00 ^ 42.00 42.00 43.00 43.00
2004-05 400.00 - - 415.00 510.00 - 925.00 ^ 42.00 42.00 43.00 43.00
2005-06 415.00 - - 460.00 560.00 300.00 975.00 ^ 48.00 45.00 60.00 -
2006-07 425.00 - - - - 306.00 1,025.00 65.00 60.00 67.00 -
2007-08 625.00 - - - - - 1,025.00 65.00 60.00 63.00 -
2008-09 950.00 2,500.00 1,400.00 1,250.00 1,500.00 * 700.00 1,465.00 80.00 80.00 81.00 -
2009-10 950.00 - - 1,000.00 1,250.00 * 600.00 - 100.00 100.00 102.00 -
2010-11 950.00 - - - - - - 125.00 125.00 125.00 -
2011-12 1,050.00 - - - - - - 150.00 150.00 154.00 -
2012-13 1,200.00 - - - - - - 170.00 170.00 172.00 -
2013-14 1,200.00 - - - - - - 170.00 170.00 172.00 -
2014-15 1,300.00 - - - - - 3,000.00 180.00 180.00 182.00 -
2015-16 1,300.00 - - - - - 3,000.00 ^ 180.00 180.00 172.00 -
2016-17 1,300.00 - - - - - - 180.00 180.00 182.00 -
2017-18 1,300.00 - - - - - - 180.00 180.00 182.00 -
2018-19 1,300.00 - - - - - - 180.00 180.00 182.00 -
2019-20 1,400.00 - - - - - - 190.00 190.00 192.00 -
2020-21 1,800.00 - - - - - - 200.00 200.00 202.00 -F.A.Q : Fair Average Quality - : Not available Source: Pakistan Bureau of Statistics* : Price of Basmati Super (Paddy) Rs. 1500/40 kg for 2008-09 and Rs. 1250/40 kg for 2009-10 Agriculture Policy Institute (API)** : Sugarcane prices are fixed by the respective Provincial Governments. Provincial Agriculture Departments@ : Niab-78, CIM-107 ^ : As recommended by API M/o National Food Security and Research
Rice Paddy Sugarcane**
44

TABLE 2.18
PROCUREMENT, RELEASES AND STOCKS OF WHEAT
000 TonsWheat (May-May)
Years Procurement Releases Stocks (on 1st May)
2000-01 8,582.0 5,537.0 3,552.0
2001-02 4,081.0 3,376.0 3,683.0
2002-03 4,045.0 5,130.0 992.0
2003-04 3,514.0 4,104.0 161.0
2004-05 3,939.0 4,500.0 350.0
2005-06 4,514.0 2,088.4 2,107.4
2006-07 4,422.0 5,985.4 499.1
2007-08 3,918.0 6,357.9 136.9
2008-09 9,200.0 5,784.4 821.9
2009-10 6,715.0 5,985.0 4,223.0
2010-11 6,150.0 6,404.0 3,186.0
2011-12 5,792.0 5,820.0 3,506.0
2012-13 7,910.0 6,363.0 1,618.0
2013-14 5,948.0 6,149.0 7,566.0
2014-15 6,139.0 3,380.0 6,447.0
2015-16 5,806.0 4,468.1 6,284.0
2016-17 6,516.0 - 4,531.0
2017-18 5,942.0 - 9,858.0
2018-19 4,034.0 - 3,777.0
2019-20 6,596.0 1,846.3 602.2
2020-21 5,828.0 7,264.8 * 6,559.8- : Not available Source: Pakistan Bureau of Statistics*: As on 1st May, 2021 Agriculture Policy Institute (API)Procurement and stocks as on 13-08-2021 Provincial Agriculture Departments
M/o National Food Security and Research
45

TABLE 2.19
LIVESTOCK POPULATIONIn Million Numbers
Years Buffalo Cattle Goats Sheep Poultry Camels Asses Horses Mules
2000-01 23.3 22.4 49.1 24.2 292.4 0.8 3.9 0.3 0.2
2001-02 24.0 22.8 50.9 24.4 330.0 0.8 3.9 0.3 0.2
2002-03 24.8 23.3 52.8 24.6 346.1 0.8 4.1 0.3 0.2
2003-04 25.5 23.8 54.7 24.7 352.6 0.7 4.1 0.3 0.2
2004-05 26.3 24.2 56.7 24.9 372.0 0.7 4.2 0.3 0.3
2005-06* 27.3 29.6 53.8 26.5 433.8 0.9 4.3 0.3 0.2
2006-07** 28.2 30.7 55.2 26.8 477.0 0.9 4.3 0.3 0.2
2007-08 29.0 31.8 56.7 27.1 518.0 1.0 4.4 0.3 0.2
2008-09 29.9 33.0 58.3 27.4 562.0 1.0 4.5 0.4 0.2
2009-10 30.8 34.3 59.9 27.8 610.0 1.0 4.6 0.4 0.2
2010-11 31.7 35.6 61.5 28.1 663.0 1.0 4.7 0.4 0.2
2011-12 32.7 36.9 63.1 28.4 721.0 1.0 4.8 0.4 0.2
2012-13 33.7 38.3 64.9 28.8 785.0 1.0 4.9 0.4 0.2
2013-14 34.6 39.7 66.6 29.1 855.0 1.0 4.9 0.4 0.2
2014-15 35.6 41.2 68.4 29.4 932.0 1.0 5.0 0.4 0.2
2015-16 36.6 42.8 70.3 29.8 1,016.0 1.0 5.1 0.4 0.2
2016-17 37.7 44.4 72.2 30.1 1,108.0 1.1 5.2 0.4 0.2
2017-18 38.9 46.1 74.1 30.5 1,209.0 1.1 5.3 0.4 0.2
2018-19 40.0 47.8 76.1 30.9 1,321.0 1.1 5.4 0.4 0.2
2019-20 41.2 49.6 78.2 31.2 1,443.0 1.1 5.5 0.4 0.2
2020-21 P 42.4 51.5 80.3 31.6 1,577.0 1.1 5.6 0.4 0.2P : Provisional Source: M/o National Food Security & Research* : Actual figures of Livestock Census 2006 Pakistan Bureau of Statistics** : From 2006-07 to onward figures estimates are based on inter census growth rate of Livestock Census 1996 and 2006
46

TABLE 2.20
LIVESTOCK PRODUCTS
In 000 TonsYears Milk* Beef Mutton Poultry Wool Hair Bones Fat Blood Eggs Hides Skins
Meat (Mln.Nos.) (Mln.Nos.) (Mln.Nos.)
2000-01 26,284.0 1,010.0 666.0 339.0 39.2 18.6 331.4 123.5 41.8 7,505.0 7.8 38.2
2001-02 27,031.0 1,034.0 683.0 355.0 39.4 19.3 339.4 126.5 42.9 7,679.0 7.9 39.2
2002-03 27,811.0 1,060.0 702.0 370.0 39.7 19.9 347.6 129.7 44.0 7,860.0 8.2 40.3
2003-04 28,624.0 1,087.0 720.0 378.0 39.9 20.7 356.2 132.9 45.2 8,102.0 8.4 42.4
2004-05 29,438.0 1,115.0 739.0 384.0 40.0 20.7 365.1 136.3 45.2 8,529.0 8.6 42.6
2005-06** 31,970.0 1,449.0 554.0 512.0 40.1 20.3 633.5 203.3 51.4 9,712.0 11.4 43.3
2006-07*** 32,996.0 1,498.0 566.0 554.0 40.6 20.8 652.5 209.2 52.7 10,197.0 11.8 44.3
2007-08 34,064.0 1,549.0 578.0 601.0 41.0 21.4 672.2 215.3 54.1 10,711.0 12.2 45.3
2008-09 35,160.0 1,601.0 590.0 652.0 41.5 22.0 692.4 221.6 55.4 11,258.0 12.6 46.3
2009-10 36,299.0 1,655.0 603.0 707.0 42.0 22.6 713.4 228.1 56.8 11,839.0 13.0 47.4
2010-11 37,475.0 1,711.0 616.0 767.0 42.5 23.2 735.1 234.8 58.3 12,857.0 13.5 48.5
2011-12 38,617.0 1,769.0 629.0 834.0 43.0 23.8 757.5 241.7 59.8 13,114.0 13.9 49.6
2012-13 39,855.0 1,829.0 643.0 907.0 43.6 24.4 780.5 248.8 61.3 13,813.0 14.4 50.7
2013-14 41,134.0 1,887.0 657.0 987.0 44.1 25.1 802.9 255.8 62.8 14,556.0 14.9 51.9
2014-15 42,454.0 1,951.0 671.0 1,074.0 44.6 25.8 827.2 263.3 64.4 15,346.0 15.4 53.1
2015-16 43,818.0 2,017.0 686.0 1,170.0 45.1 26.5 852.3 271.0 66.1 16,188.0 15.9 54.3
2016-17 45,227.0 2,085.0 701.0 1,276.0 45.7 27.2 878.2 279.0 67.8 17,083.0 16.4 55.5
2017-18 46,682.0 2,155.0 717.0 1,391.0 46.2 27.9 904.9 287.3 69.5 18,037.0 16.9 56.8
2018-19 48,185.0 2,227.0 732.0 1,518.0 46.8 28.6 932.5 295.8 71.3 19,052.0 17.5 58.1
2019-20 49,737.0 2,303.0 748.0 1,657.0 47.3 29.4 961.0 304.5 73.1 20,133.0 18.1 59.5
2020-21 P 51,340.0 2,380.0 765.0 1,977.0 47.9 30.2 990.3 313.6 75.0 21,285.0 18.8 60.8P : Provisional Source: M/o National Food Security & Research
Federal Bureau of Statistics* : Human Consumption
** : Figures are computed using actual population of Livestock Census 2005-06*** : Figures are computed using estimated Livestock population of 2006-07 using inter census growth rate of 1996 and 2006Note: The figures for livestock products for the year 2020-21 were calculated by applying production parameters to
the projected population of 2020-21
47

TABLE 2.21
RAINFALL AT SELECTED CITIES CENTRES
In MillimetresIslamabad Lahore Multan Karachi Jacobabad Peshawar Quetta
Years507 213 122 21 55 359 1600
2001 1,177.7 535.7 297.9 100.4 17.8 263.1 93.5
2002 930.5 333.7 101.4 55.8 17.1 388.0 179.3
2003 1,247.0 627.6 159.8 324.9 210.0 904.5 249.5
2004 1,026.3 495.2 189.8 65.9 49.6 454.0 121.8
2005 979.0 652.2 300.5 97.2 61.8 625.0 310.5
2006 1,598.0 750.8 144.7 301.1 94.2 497.5 206.5
2007 1,796.0 660.3 262.0 465.6 183.0 685.0 297.0
2008 1,388.0 614.0 247.5 121.6 187.7 779.0 134.5
2009 607.0 372.2 119.2 279.9 42.8 623.0 289.0
2010 1,088.0 540.7 287.0 372.9 - 839.0 133.0
2011 1,254.0 856.9 186.0 290.2 293.3 568.0 459.0
2012 1,029.5 582.9 239.0 152.1 583.8 461.5 313.0
2013 1,900.0 902.8 225.7 168.9 345.3 596.0 286.5
2014 1,667.0 785.9 257.5 30.7 21.3 360.4 180.0
2015 1,779.0 857.2 394.6 53.2 155.5 825.5 212.0
2016 922.0 806.5 198.6 167.7 46.0 360.5 159.0
2017 957.5 628.1 237.9 232.2 79.0 503.0 192.5
2018 1,213.0 610.6 59.6 0.8 20.2 511.9 122.0
2019 1,212.0 897.9 287.9 367.3 194.5 461.0 513.4
2020 1,399.9 880.6 357.8 474.2 202.0 477.0 242.0
2021* 739.3 482.6 77.0 45.4 85.0 236.0 50.0- : Not available *: Total of first eight months Source: Pakistan Meteorological Department
Height above sea Level (in metres)
48

TABLE 2.22
TEMPERATURE AT SELECTED CITIES CENTRES
In CentigradesIslam- Lahore Multan Karachi Jacob- Pesha- Quetta Islam- Lahore Multan Karachi Jacob- Pesha- Quetta
Years abad abad war abad abad war
2001 15.4 19.5 18.8 22.2 20.2 17.3 8.9 30.2 30.7 32.8 32.6 35.1 30.2 26.4
2002 15.5 20.1 19.0 21.4 20.6 17.5 9.1 30.1 31.1 33.5 32.2 35.2 29.6 25.9
2003 14.9 19.5 18.5 21.2 20.6 16.7 8.9 28.8 29.9 32.7 32.8 34.3 29.1 25.2
2004 15.4 20.3 19.1 21.9 21.0 17.3 9.3 29.5 30.8 33.1 32.8 35.0 30.2 26.3
2005 14.6 19.4 18.1 21.8 20.5 16.3 8.8 28.3 29.9 31.7 32.1 33.5 28.7 23.9
2006 16.0 20.3 19.6 22.5 21.6 17.7 10.9 29.3 30.6 32.9 32.3 34.5 29.7 26.3
2007 15.1 19.8 19.0 22.2 21.3 16.9 8.6 29.1 30.5 32.5 32.9 34.2 29.6 25.1
2008 15.6 19.8 18.8 21.6 20.9 16.6 8.5 28.7 30.2 32.0 32.0 34.0 29.2 25.8
2009 15.6 20.0 18.9 22.3 21.0 16.9 9.4 29.5 31.1 32.8 32.9 34.3 29.8 25.4
2010 16.2 20.1 19.4 21.9 - 17.1 9.5 29.8 30.8 32.9 33.0 - 30.0 26.0
2011 15.9 19.5 19.3 21.7 20.8 17.1 9.7 28.9 29.9 32.2 32.4 33.6 29.5 26.7
2012 15.7 18.4 18.7 21.5 20.2 16.5 8.4 29.2 30.3 32.1 32.0 33.5 28.9 24.1
2013 16.2 17.9 19.7 21.9 20.8 17.2 9.7 28.8 30.0 32.0 32.4 33.7 28.9 25.0
2014 15.6 17.9 19.0 21.7 19.1 16.5 9.2 28.3 29.8 31.4 32.7 34.0 28.8 24.8
2015 16.0 18.8 19.3 22.4 19.5 16.5 10.0 28.2 29.8 31.4 32.9 33.1 28.7 25.6
2016 16.8 19.0 20.4 22.5 20.9 17.7 10.5 30.1 31.2 32.8 33.0 35.0 30.2 26.5
2017 16.7 19.2 19.9 22.2 20.4 17.4 9.9 29.5 30.9 32.1 32.8 34.7 29.6 25.1
2018 16.3 19.5 19.7 22.2 21.4 17.1 10.5 30.2 31.8 33.3 33.9 36.8 29.8 26.3
2019 16.2 19.2 19.5 22.2 20.6 16.6 10.5 28.0 29.7 31.0 32.5 33.6 28.6 24.2
2020 16.0 19.0 19.4 21.9 20.2 16.5 9.6 28.0 29.8 31.1 33.1 33.6 28.6 23.8
2021* 17.5 19.3 21.2 23.2 21.6 18.6 12.5 30.0 31.4 33.5 33.8 36.2 31.2 27.1- : Not available *: Average of first eight months Source: Pakistan Meteorological Department
MEAN OF MINIMUM MEAN OF MAXIMUM
49

TABLE 2.23
CONSUMPTION OF ELECTRICITY & PETROLEUM OIL IN AGRICULTURE SECTOR
Years Consumption % Share in Total Consumption % Share in TotalGwh Electricity Consumption 000 Tons Oil Consumption
2000-01 4,924 10.1 254.8 1.4
2001-02 5,607 11.1 225.7 1.3
2002-03 6,016 11.4 196.7 1.2
2003-04 6,669 11.6 183.5 1.4
2004-05 6,988 11.4 142.1 1.0
2005-06 7,949 11.8 81.9 0.6
2006-07 8,176 11.2 97.2 0.6
2007-08 8,472 11.5 109.4 0.6
2008-09 8,795 12.5 69.8 0.4
2009-10 9,689 13.0 58.1 0.3
2010-11 8,971 11.6 40.6 0.2
2011-12 8,548 11.1 23.3 0.1
2012-13 7,697 10.0 31.8 0.2
2013-14 8,290 9.9 46.7 0.2
2014-15 8,033 9.4 37.2 0.2
2015-16 8,526 9.4 14.5 0.1
2016-17 9,221 9.7 12.7 0.05
2017-18 10,128 9.5 14.5 0.1
2018-19 9,809 9.0 15.0 0.1
2019-20 9,757 9.0 12.0 0.1
2020-21 P 10,116 10.2 12.1 0.1P : Provisional Source: Ministry of Petroleum & Natural ResourcesNote:
Petroleum OilElectricity
HSD consumption in agriculture sector is not available seprately and is included under transport sector. Agricultural sector represents Light Diesel Oil (LDO) only.
50

MANUFACTURING & MINING
2020-21 (P)Growth Rate (%)
Quantum Index of LSM 148.71LSM Growth Rate 14.79
Cotton Yarn 12.47Cotton Cloth 12.19Fertilizer 7.23Cement 27.31Electronics (4.43)Engineering Products (15.37)Leather Products (26.45)
P : Provisional
Note: Figures in parenthesis represent negative growth
HIGHLIGHTS
51

TABLE 3.1
RESERVES & DEPOSITS OF PRINCIPAL MINERALS
Mineral Reserves / Deposits (In Million tons)
Aragonite / Marble 297,000
Barite 13.7
Bauxite / Laterrite Small Deposits
China Clay Medium Deposits
Chromite 2.5
Coal 186,000
Copper Ore >6000
Crude Oil 266 million US barrels
Dolomite Large Deposits
Fire Clay >100
Fullers Earth Fairly Large Deposits
Gypsum / Ahydrite 4,850
Iron Ore 1,427
Lead-Zinc 23.7
Lime Stone Very Large Deposits
Natural Gas 21.2 trillion cubic feet
Rock Salt Very Large Deposits
Silica Sand 557
Soapstone Medium to Large Deposits
Sulphur 0.8
Source: Ministry of Energy (Petroleum Division)
53

TABLE 3.1 A
EXTRACTION OF PRINCIPAL MINERALS
Fiscal Anti- Argonite/ Baryte Bauxite/ Celestite China Chromite Coal Crude DolomiteYears/ mony Marble Laterite Clay OilDeposits tons 000 tons 000 tons tons tons 000 tons 000 tons 000 tons m. barrels tons
2000-01 95 620 28 35,114 807 47 22 3,285 21.08 352,689
2001-02 37 685 21 37,182 382 54 24 3,512 23.19 312,886
2002-03 - 1,066 41 67,536 402 40 31 3,609 23.46 340,864
2003-04 - 994 44 88,044 570 25 29 3,325 22.62 297,419
2004-05 5 1,280 42 78,288 1,855 38 56 3,367 24.12 199,653
2005-06 91 1,836 52 60,370 3,160 53 65 3,881 23.94 183,952
2006-07 119 1,980 47 150,842 1,530 31 104 3,702 24.62 342,463
2007-08 245 1,537 54 174,223 1,310 32 115 4,066 25.48 359,994
2008-09 75 1,145 63 137,485 470 17 90 3,679 24.03 249,918
2009-10 25 1,065 57 190,077 160 23 257 3,536 23.71 130,408
2010-11 25 1,133 32 308,027 - 16 148 3,292 24.04 240,111
2011-12 12 1,751 49 323,848 - 22 179 3,179 24.57 198,392
2012-13 89 2,360 118 353,355 - 23 136 2,813 27.84 335,819
2013-14 979 2,920 134 480,054 - 16 86 3,340 31.58 720,633
2014-15 114 2,816 205 451,818 - 19 102 3,408 34.49 222,378
2015-16 21 4,747 158 772,692 - 21 69 3,749 31.65 669,920
2016-17 65 4,906 92 719,030 - 29 105 3,954 32.27 301,124
2017-18 - 8,813 89 995,855 - 19 97 4,478 32.56 488,825
2018-19 R - 7,736 116 779,118 - 21 138 5,407 32.50 472,474
2019-20 R - 5,797 55 666,894 - 15 121 8,599 28.09 302,045
2020-21 P - 1,808 23 844,208 - 11 115 6,560 25.30 127,646 P : Provisional (data from July - May FY2021) (Contd..)R: Revised - : Not available
54

TABLE 3.1 A
EXTRACTION OF PRINCIPAL MINERALS
Fiscal Fire Clay Fullers Gypsum Iron Lime Magne- Natural Ochre Rock Silica Soap SulphurYears/ Earth Anhydrite Ore Stone site Gas Salt Sand StoneDeposits 000 tons 000 tons 000 tons tons 000 tons tons 000 m.cu.mtr. tons 000 tons 000 tons 000 tons tons
2000-01 164 13 364 24,765 10,870 4,645 24.78 4,691 1,394 155 47 17,428
2001-02 171 16 402 4,942 10,820 4,637 26.16 5,064 1,423 157 39 22,580
2002-03 117 15 424 11,483 11,880 2,645 28.11 6,733 1,426 185 66 19,402
2003-04 193 14 467 84,946 13,150 6,074 34.06 7,861 1,640 259 53 23,873
2004-05 254 17 552 104,278 14,857 3,029 38.08 18,686 1,648 309 21 24,158
2005-06 333 16 601 131,259 18,428 1,161 39.65 34,320 1,859 411 21 24,695
2006-07 347 12 624 150,695 25,512 3,445 40.03 61,665 1,873 402 45 27,710
2007-08 330 11 660 286,255 31,794 3,940 41.17 46,215 1,849 403 38 29,485
2008-09 389 10 800 320,214 33,186 2,639 41.37 56,617 1,917 370 14 25,784
2009-10 329 11 854 447,541 37,137 5,159 41.99 55,352 1,944 411 54 26,641
2010-11 274 4 885 329,100 32,021 4,908 41.68 36,078 1,954 301 48 27,645
2011-12 408 7 1,260 384,893 35,016 5,444 44.15 42,107 2,136 270 56 25,560
2012-13 455 4 1,250 412,108 38,932 6,705 42.65 37,769 2,160 356 93 20,610
2013-14 465 6 1,326 197,074 38,787 3,770 42.30 32,634 2,220 298 89 35,672
2014-15 405 8 1,417 328,702 40,470 4,581 41.51 33,909 2,136 268 116 19,730
2015-16 551 14 1,872 432,156 46,123 35,228 41.96 68,352 3,553 396 126 14,869
2016-17 584 18 2,080 501,664 52,149 19,656 41.68 86,080 3,534 338 152 23,740
2017-18 842 9 2,476 677,206 70,819 23,596 41.32 75,939 3,654 376 142 22,040
2018-19 R 671 11 2,518 627,464 75,596 42,996 40.68 81,502 3,799 805 157 20,715
2019-20 R 884 3 2,150 573,691 65,810 16,165 37.29 132,144 3,369 780 150 19,948
2020-21 P 925 1 1,566 630,366 56,984 10,021 33.34 100,816 3,042 407 121 17,839 P : Provisional (data from July - May FY2021) Source: Pakistan Bureau of StatisticsR: Revised
55

TABLE 3.2
Mining Manufacturing
Year
2000-01 105.6 101.0
2001-02 112.5 114.8
2002-03 119.6 123.1
2003-04 134.8 146.4
2004-05 148.7 173.0
2005-06 100.0 100.0
2006-07 103.7 109.5
2007-08 108.9 116.1
2008-09 108.1 109.1
2009-10 110.2 109.6
2010-11 108.0 111.1
2011-12 113.7 112.4
2012-13 115.3 117.4
2013-14 118.5 123.7
2014-15 120.5 127.9
2015-16 121.6 131.9
2016-17 123.2 139.6
2017-18 129.8 146.9
2018-19 131.0 143.5
2019-20 R 119.8 129.5
2020-21 P 107.7 * 148.7P : Provisional R : Revised Source: Pakistan Bureau of Statistics* : data from July - May FY2021
PRODUCTION INDEX OF MINING AND MANUFACTURING
Base Year 1999-2000 = 100
2005-06=100
56

TABLE 3.3
Rs millionMajor Industry/Fiscal Year 1987-88 1988-89 1990-91 1995-96 2000-01 2005-06 1987-88 1988-89 1990-91 1995-96 2000-01 2005-06Food 43,791 52,458 62,235 122,774 188,610 455,487 11,854 13,608 15,600 32,283 50,130 149,790
Beverages 2,379 2,890 3,092 7,136 15,566 28,782 1,333 1,711 1,558 3,389 7,928 13,650
Tobacco 9,074 6,161 8,767 16,108 23,954 52,402 7,488 5,042 7,050 13,133 17,939 46,347
Textiles 40,361 50,460 91,736 199,515 320,932 766,980 12,895 16,401 29,251 47,428 93,017 269,690
Wearing Apparels 4,152 5,036 7,019 10,105 38,252 102,595 1,167 1,016 1,512 2,898 10,777 47,216
Leather & Products 7,552 8,603 10,782 9,712 18,655 26,742 991 1,170 1,717 2,736 5,362 9,816
Ginning, Pressing &
Bailing 12,095 11,976 19,838 35,027 55,573 130,680 1,091 790 1,292 2,477 10,493 28,986
Wood & Products 662 580 792 1,452 1,161 11,775 254 223 296 499 289 5,905
Furniture & Fixture 305 292 562 351 2,690 769 89 103 174 96 612 362
Paper & Products 2,952 3,840 5,575 10,396 21,542 54,955 828 1,056 1,745 3,422 5,309 27,409
Printing & Publishing 1,947 2,042 3,752 6,915 3,173 9,488 707 1,032 2,513 4,267 1,274 3,575
Drugs & Pharmaceutical
Products 7,532 9,998 14,102 25,536 46,554 90,146 2,802 3,797 5,140 10,101 21,581 49,348
Industrial Chemicals 11,484 13,333 20,186 40,191 70,916 143,030 5,185 5,934 8,713 18,121 31,187 80,298
Other Chemical Products 5,875 6,811 8,425 18,237 21,314 118,222 2,598 2,530 2,838 6,345 8,077 44,126
Petroleum Refining - - - - - - - - - - - -
Petroleum & Coal
Products 21,272 18,356 32,798 33,635 94,253 271,523 4,929 2,293 3,301 6,509 17,716 55,699
Rubber Products 2,040 2,693 3,035 5,118 3,939 5,644 695 1,088 1,067 1,865 1,647 2,319
Plastic Products 1,340 1,462 1,985 3,917 10,459 26,545 344 422 607 865 2,726 8,281
Non-Metallic Mineral
Products 11,723 11,171 16,034 29,481 32,517 138,075 6,480 5,799 8,416 16,302 17,043 81,193
Iron & Steel Basic
Industries 16,112 18,353 21,868 27,125 39,425 130,492 4,827 5,362 6,146 8,828 17,269 44,687
Fabricated Metal
Products 2,109 2,484 3,326 4,722 12,444 21,945 770 856 956 1,519 5,308 8,991
Non-Electrical Goods 5,562 8,351 8,754 12,547 18,000 60,022 1,319 2,158 2,801 3,429 4,709 20,943
Electrical Machinery 8,668 9,850 12,408 30,926 32,780 56,906 2,428 2,919 4,561 16,298 13,184 23,321
Transport Equipment 10,195 10,665 14,529 29,780 47,400 201,646 2,706 1,722 2,875 7,449 11,987 70,655
Measuring, Photographic,
Optical Goods 706 343 1,056 2,238 4,173 11,333 202 115 262 526 1,629 5,226
Sports & Athletic goods 518 527 1,489 3,742 6,547 8,704 141 137 421 774 3,258 3,906
Others 480 481 712 2,435 3,076 4,431 187 159 194 1,000 1,232 1,676
Total 230,886 259,216 374,858 693,010 1,139,672 2,929,320 74,310 77,443 111,006 212,559 364,018 1,103,414 Note: CMI has not released since 2005-06 Source: Pakistan Bureau of Statistics
CENSUS OF MANUFACTURING INDUSTRIES (CMI) VALUE OF PRODUCTION AND VALUE ADDED OFMAJOR INDUSTRIES
Value of Production Value Added
57

TABLE 3.4
Major Industry/Fiscal Year 1986-87 1987-88 1988-89 1990-91 1995-96 2000-01 2005-06 1986-87 1987-88 1988-89 1990-91 1995-96 2000-01 2005-06
Food 1,913 2,116 2,601 3,321 5,104 6,496 13,815 69 67 72 84 78 85 127
Beverages 131 165 193 218 372 810 1,031 5 6 6 5 5 8 8
Tobacco 198 232 196 225 425 400 1,711 9 9 8 6 6 4 4
Textiles 3,382 3,537 4,058 7,062 11,672 20,191 49,207 188 171 178 238 227 316 439
Wearing Apparels 269 312 386 726 929 3,944 7,146 12 12 13 20 14 51 62
Leather & Products 329 371 425 612 869 881 2,191 11 12 12 15 13 9 17
Ginning, Pressing &
Bailing 175 291 198 372 297 556 1,355 10 10 9 10 9 15 14
Wood & Products 66 78 85 86 143 124 281 3 3 3 3 4 2 4
Furniture & Fixture 33 34 32 54 35 59 72 2 2 2 2 1 1 1
Paper & Products 180 247 299 360 606 1,022 2,019 7 9 9 8 10 10 14
Printing & Publishing 339 403 384 396 669 497 827 11 12 9 8 8 4 4
Drugs & Pharmaceutical
Products 643 826 1,066 1,545 2,653 5,277 8,614 14 15 17 18 21 25 36
Industrial Chemicals 853 881 1,030 1,483 2,672 4,321 6,068 18 16 16 18 20 16 14
Other Chemical Products 408 393 422 467 1,092 1,620 4,655 13 11 9 9 9 11 21
Petroleum Refining - - - - - - - 0 0 0 0 0 0 0
Petroleum & Coal
Products 174 207 220 313 574 885 2,415 4 3 3 4 2 3 4
Rubber Products 180 205 257 312 514 356 406 7 8 9 8 9 4 2
Plastic Products 119 113 131 195 322 593 1,024 5 4 4 5 5 5 7
Non-Metallic Mineral
Products 996 1,137 1,236 1,620 2,256 1,859 6,406 27 28 28 28 22 14 40
Iron & Steel Basic
Industries 1,763 1,731 2,056 3,206 4,395 4,158 7,216 42 39 39 44 33 24 30
Fabricated Metal
Products 220 237 350 358 463 1,496 1,068 9 9 12 12 6 10 9
Non-Electrical Goods 536 561 849 1,215 1,660 1,830 3,940 19 19 24 25 17 14 25
Electrical Machinery 632 742 806 933 1,983 2,384 1,941 19 20 18 19 20 19 17
Transport Equipment 713 882 876 1,100 1,396 3,065 6,920 21 23 20 19 14 20 34
Measuring, Photographic,
Optical Goods 60 88 49 108 178 467 981 3 3 1 4 4 4 9
Sports & Athletic goods 32 40 44 169 176 600 612 2 1 1 8 4 11 5
Others 48 63 65 90 149 90 490 2 3 3 2 2 1 6
Total 14,392 15,892 18,314 26,546 41,604 63,981 132,413 532 515 525 622 563 697 941Note: CMI has not released since 2005-06 Source: Pakistan Bureau of Statistics
CENSUS OF MANUFACTURING INDUSTRIES (CMI) EMPLOYMENT COST AND AVERAGE DAILYEMPLOYMENT IN MAJOR INDUSTRIES
Average Daily Employment (000 Nos.)Employment Cost (Rs Million)
58

TABLE 3.5
Rs MillionMajor Industry/Fiscal Year 1987-88 1988-89 1990-91 1995-96 2000-01 2005-06 1987-88 1988-89 1990-91 1995-96 2000-01 2005-06Food 2,660 3,266 4,629 5,832 8,392 26,506 12,264 10,224 14,944 32,639 50,275 138,965
Beverages 737 937 767 1,688 3,019 5,196 793 876 1,140 1,822 3,580 5,212
Tobacco 4,790 3,708 5,828 10,461 16,213 31,365 291 524 515 942 5,716 9,388
Textiles 1,026 1,460 3,846 3,922 7,848 4,312 15,959 18,461 35,979 95,435 153,537 427,490
Wearing Apparels 4 6 12 18 229 (775) 473 522 921 1,919 10,688 26,268
Leather & Products 16 19 24 21 385 536 598 1,152 1,571 1,487 2,410 4,758
Wood Products & Furnitur 9 11 48 87 68 145 909 744 610 718 1,015 7,495
Paper & Products 128 168 374 1,291 2,586 4,791 1,514 1,766 2,344 4,993 6,186 27,025
Printing & Publishing 14 16 19 64 156 633 923 1,177 1,006 1,386 1,211 8,223
Drugs & Pharmaceutical
Products 93 101 206 416 283 1,508 1,512 1,813 2,572 4,286 8,527 24,460
Industrial Chemicals 211 289 459 1,105 6,562 15,123 6,796 6,913 8,497 18,352 56,232 122,255
Other Chemical Products 505 630 623 2,194 1,484 3,696 1,016 925 1,068 2,034 3,341 51,141
Petroleum Refining - - - - - - - - - - - -
Petroleum & Coal
Products 2,912 1,366 1,761 1,667 3,848 24,787 2,178 2,250 2,026 4,481 3,490 9,864
Rubber Products 133 202 32 533 73 627 738 754 782 606 556 1,321
Plastic Products 33 44 92 167 552 2,713 395 411 569 1,846 7,509 12,441
Non-Metallic Mineral
Products 2,519 2,908 3,962 7,905 10,083 26,623 9,229 9,639 12,348 20,042 37,500 163,372
Iron & Steel Basic
Industries 75 623 334 243 643 8,791 23,764 23,494 23,783 21,239 35,033 29,253
Fabricated Metal
Products 54 4,664 81 224 541 1,992 592 1,032 962 970 4,222 3,879
Non-Electrical Goods 24 29 53 279 205 2,032 1,947 1,887 2,406 4,700 6,689 8,779
Electrical Machinery 360 577 554 1,867 1,997 3,076 1,678 2,455 3,132 5,817 12,714 14,525
Transport Equipment 16 25 53 351 3,991 16,627 1,816 2,234 2,628 6,828 10,302 42,401
Measuring, Photographic,
Optical Goods 8 1 5 8 130 313 188 82 183 506 2,844 5,329
Sports & Athletic goods - 1 2 5 70 (203) 68 85 178 500 1,938 1,406
Others 237 113 157 99 - 310 105 109 159 503 - 2,066
Total 16,564 16,546 23,921 40,654 69,360 180,723 89,346 92,641 125,620 235,774 425,516 1,147,318 - : Not available Source: Pakistan Bureau of StatisticsNote: CMI has not released since 2005-06
CENSUS OF MANUFACTURING INDUSTRIES (CMI) INDIRECT TAX CONTRIBUTION & VALUE OFFIXED ASSETS IN MAJOR INDUSTRIES
Indirect Tax Contribution Value of Fixed Assets
59

TABLE 3.6
COTTON TEXTILE STATISTICS
No. of Spindle Loom Consump- Total Surplus Total Pro-Mills Hours Hours tion of Yarn Pro- Yarn duction
No. of No. of No. of No. of Worked Worked Cotton duced of ClothSpindles Looms Spindles Looms
(000) (000) (000) (000) (Million) (Million) (Million Kgs) (Million Kgs) (Million Kgs) (mln. sq mtr.)
2005-06 437 11,168 9 9,631 4 74,884 24.8 2,932.6 2,556.3 2,457.6 915.3
2006-07 427 11,266 8 10,057 4 76,892 21.7 3,143.5 2,727.6 2,623.2 1,012.9
2007-08 427 11,834 8 9,960 4 76,400 21.5 3,153.2 2,809.4 2,700.3 1,016.4
2008-09 431 11,280 8 10,241 4 75,893 23.0 3,195.6 2,862.4 2,754.0 1,019.7
2009-10 439 11,392 7 10,632 4 74,654 22.4 3,372.4 2,881.0 2,776.6 1,009.6
2010-11 439 11,392 7 10,850 5 75,000 23.0 3,456.7 2,938.6 2,831.8 1,029.8
2011-12 433 11,762 7 10,660 5 76,932 22.6 3,427.1 2,964.6 2,857.5 1,024.3
2012-13 477 11,946 8 10,872 5 76,757 23.0 3,539.3 3,069.7 2,334.7 1,029.1
2013-14 442 12,310 8 11,000 5 76,950 23.0 3,675.5 3,333.4 2,558.7 1,036.1
2014-15 411 13,184 8 11,058 5 79,185 24.2 2,732.7 3,369.7 3,256.2 1,036.9
2015-16 408 13,142 8 11,263 5 78,549 28.0 2,732.5 3,415.3 3,301.6 1,039.2
2016-17 408 13,409 9 11,338 6 77,213 29.7 2,733.1 3,428.1 3,315.3 1,043.3
2017-18 408 13,409 9 11,313 6 77,355 29.5 2,735.2 3,430.7 3,318.3 1,044.1
2018-19 408 13,409 9 11,338 6 80,292 30.1 2,740.1 3,431.3 3,314.4 1,046.0
2019-20 R 408 13,409 9 11,338 6 71,606 26.9 2,467.3 3,049.6 2,945.6 931.0
2020-21 P 408 13,409 9 11,338 6 80,315 30.2 2,743.1 3,441.6 3,324.7 969.8P : Provisional (Jul-Jun) R : Revised Source: Textile Commissioners Organization
CapacityWorking at the end
of the periodInstalled
FiscalYear
60

TABLE 3.7
PRODUCTION OF FERTILIZERS, VEGETABLE GHEE, SUGAR & CEMENT000 tons
Super Ammo- Nitro Dia-AmmoniumPhos- nium Phos- Phosphatephate Nitrate phate Tons
2000-01 4,005.1 159.6 374.4 282.5 320.1 835 2,956 9,672
2001-02 4,259.6 161.0 329.4 305.7 66.6 797 3,247 9,935
2002-03 4,401.9 147.2 335.3 304.9 0.0 772 3,686 10,845
2003-04 4,431.6 167.7 350.4 363.5 267.9 888 4,021 12,862
2004-05 4,606.4 163.1 329.9 338.9 408.5 1,048 3,116 16,353
2005-06 4,806.4 160.8 327.9 356.6 436.0 1,152 2,960 18,564
2006-07 4,732.5 148.9 330.8 325.8 397.6 1,180 3,527 22,739
2007-08 4,925.0 157.7 343.7 329.7 356.2 1,137 4,733 26,751
2008-09 4,918.4 187.4 344.3 305.7 530.3 1,060 3,190 28,380
2009-10 5,056.5 148.7 345.5 304.4 625.8 1,075 3,143 31,358
2010-11 4,552.1 173.3 275.1 252.3 663.8 1,091 4,169 28,716
2011-12 4,470.1 114.7 432.3 337.6 622.6 1,103 4,634 29,557
2012-13 4,215.1 79.3 401.3 291.9 729.9 1,139 5,074 31,055
2013-14 4,930.3 87.8 519.1 447.2 693.1 1,185 5,582 31,418
2014-15 5,073.1 63.6 569.2 501.9 754.9 1,185 5,150 32,185
2015-16 5,846.9 89.5 647.4 594.6 787.6 1,241 5,115 35,432
2016-17 5,912.7 81.6 664.7 630.2 802.4 1,280 7,049 37,022
2017-18 5,405.2 65.2 518.9 471.4 758.4 1,347 6,566 41,148
2018-19 5,957.9 78.1 448.9 443.9 785.1 1,392 5,260 39,924
2019-20 R 6,159.8 55.8 545.7 602.7 737.7 1,454 4,881 39,121
2020-21 P 5,184.8 89.8 649.9 729.7 638.1 1,430 5,694 49,803P : Provisional R : Revised Source: Pakistan Bureau of Statistics
UreaVegetable
GheeFiscal Year
Sugar CementFertilizers
61

TABLE 3.8
JuteBeverages Cigarettes Textiles Motor Motor Cycle Cycle(Million (Million (000 Tyres Tubes Tyres TubesLitres) Nos) tons) (000 Nos) (000 Nos) (000 Nos) (000 Nos)
2000-01 2,542 58,259 89 2,439 3,387 4,056 5,892
2001-02 2,492 55,100 82 2,694 3,419 4,652 7,058
2002-03 2,289 49,365 96 3,360 4,091 5,330 8,942
2003-04 2,691 55,399 104 5,175 4,964 4,768 8,270
2004-05 3,424 61,097 105 5,336 6,279 4,900 9,612
2005-06 1,162 64,137 105 5,942 7,164 5,287 10,204
2006-07 1,551 65,980 118 7,027 10,277 5,182 10,420
2007-08 1,842 67,446 129 6,990 9,627 4,243 9,224
2008-09 1,896 75,609 137 7,089 14,515 3,213 6,876
2009-10 1,551 65,292 106 8,672 20,152 3,405 7,273
2010-11 1,492 65,403 93 9,222 19,108 2,879 6,534
2011-12 1,813 61,954 94 7,011 20,338 3,431 6,846
2012-13 2,079 67,377 103 7,864 20,269 3,429 7,746
2013-14 2,552 64,482 102 8,802 20,825 4,038 8,061
2014-15 2,956 62,667 94 9,058 22,001 4,633 8,391
2015-16 3,137 53,522 55 9,735 24,467 4,205 7,285
2016-17 3,565 34,341 60 9,710 24,635 3,930 7,577
2017-18 3,440 59,058 74 10,392 24,665 3,753 7,717
2018-19 3,459 60,729 67 10,807 25,514 4,584 9,907
2019-20 R 3,232 46,085 65 11,128 24,550 4,438 9,058
2020-21 P 3,449 51,554 70 9,458 22,447 3,519 6,795P : Provisional R : Revised (Contd.)
PRODUCTION OF SELECTED INDUSTRIAL ITEMS
Beverages and Tobacco RubberFiscalYear
62

TABLE 3.8
PRODUCTION OF SELECTED INDUSTRIAL ITEMS
Transport, Machinery &Soda Sulphuric Caustic Chlorine Paints & Polishes & Electrical AppliancesAsh Acid Soda Gas Varnishes Creams for Bicycles Sewing TV Sets
Footwear Machines(000 tons) (000 tons) (000 tons) (000 tons) (tons) (mln. grams) (000 Nos.) (000 Nos.) (000 Nos.)
2000-01 217.9 57.1 145.5 14.5 10,922 906.7 569.6 26.9 97.4
2001-02 215.2 59.4 150.3 15.1 10,341 920.9 553.4 24.0 450.0
2002-03 280.3 56.0 164.4 15.9 3,899 935.3 629.7 30.6 764.6
2003-04 286.5 64.7 187.5 17.2 5,406 950.1 664.1 35.0 843.1
2004-05 297.3 91.3 206.7 19.1 15,023 959.6 587.9 36.1 908.8
2005-06 318.7 94.4 219.3 18.3 17,147 969.2 589.6 39.1 935.1
2006-07 330.6 96.3 242.2 17.2 23,936 978.8 486.3 52.2 608.6
2007-08 364.9 102.8 248.3 18.2 26,308 988.6 535.5 57.3 716.1
2008-09 365.3 97.1 245.3 16.5 29,831 998.5 419.9 50.8 402.3
2009-10 409.6 84.7 182.3 16.1 30,749 1,008.5 447.2 48.6 342.9
2010-11 378.0 114.7 172.0 15.1 25,673 1,018.6 345.2 47.0 425.5
2011-12 370.7 100.4 179.1 15.8 23,026 1,028.8 262.1 39.6 268.8
2012-13 366.2 89.4 182.8 15.5 28,048 1,039.0 232.9 32.8 462.9
2013-14 409.1 85.3 167.5 15.0 37,236 1,049.4 203.7 19.8 426.6
2014-15 437.1 70.2 184.0 17.4 48,631 975.7 210.9 19.3 428.2
2015-16 468.5 75.1 225.3 16.4 53,651 985.5 199.0 13.5 453.2
2016-17 479.7 56.0 223.9 16.3 49,173 995.3 200.2 18.3 438.9
2017-18 509.8 49.0 270.1 16.6 51,930 1,005.3 200.3 23.4 400.3
2018-19 572.1 49.4 246.6 17.5 52,265 1,015.3 173.5 35.4 380.7
2019-20 R 550.6 40.3 342.4 15.8 51,761 1,025.5 141.1 28.6 282.1
2020-21 P 594.3 72.5 394.1 17.1 89,822 1,035.7 79.3 20.2 209.7 P : Provisional R: Revised (Contd...)
Chemicals
FiscalYear
63

TABLE 3.8
PRODUCTION OF SELECTED INDUSTRIAL ITEMS
Electric Electric Paper Paper Coke Pig Iron BilletsBulbs Tubes Board (All Types)
(Mln.Nos) (000 metres) (000 tons) (000 tons) (000 tons) (000 tons) (000 tons)
2000-01 55.2 10,548.0 246.3 531.1 717.3 1,071.2 1,664.7
2001-02 52.8 10,441.0 165.1 137.9 694.6 1,042.9 1,874.2
2002-03 58.3 10,844.0 203.8 148.0 775.2 1,140.2 1,874.2
2003-04 139.4 14,630.0 225.7 156.8 785.5 1,179.9 2,118.9
2004-05 146.7 19,819.0 236.5 163.7 772.8 1,137.2 2,430.1
2005-06 143.6 19,992.0 286.1 167.7 182.3 768.0 3,380.6
2006-07 145.0 21,400.0 280.4 161.7 326.3 1,008.8 3,677.8
2007-08 129.8 19,524.0 227.6 192.0 290.9 993.4 2,873.8
2008-09 91.8 11,101.0 168.8 252.5 423.7 791.1 1,943.4
2009-10 75.5 2,914.0 178.1 248.7 342.8 483.3 1,663.8
2010-11 79.6 1,180.0 206.1 228.7 301.7 433.1 1,628.9
2011-12 79.0 1,266.0 283.0 246.3 192.9 249.1 1,616.4
2012-13 79.7 - 381.9 232.4 203.3 201.5 1,638.5
2013-14 75.1 - 465.8 218.7 31.9 89.4 2,128.3
2014-15 64.6 - 415.7 204.0 275.8 265.5 2,731.0
2015-16 73.9 - 376.9 233.1 57.4 1.5 3,183.3
2016-17 72.4 - 404.6 263.9 0.0 0.0 4,099.0
2017-18 76.4 - 457.3 273.9 0.0 0.0 5,186.0
2018-19 R 63.7 - 447.3 256.7 0.0 0.0 3,874.0
2019-20 P 57.8 - 448.9 257.6 0.0 0.0 3,164.0
2020-21 51.6 - 501.2 229.0 0.0 0.0 4,777.0 P : Provisional R : Revised Source: Pakistan Bureau of Statistics- : Not available Ministry of Industries & Production
Electrical Appliances Papers & Board Steel ProductsFiscalYear
64

TABLE 3.9
PERCENT GROWTH OF SELECTED INDUSTRIAL ITEMS
Fiscal Cotton Cotton Jute Veg.Ghee Cigarettes Fertilizers Cement Soda Ash Caustic SugarYear Yarn Cloth Goods Soda
2000-01 3.10 12.10 4.60 19.60 24.02 11.10 3.80 (11.30) 3.00 21.70
2001-02 5.10 16.00 (8.70) (4.50) (5.40) (1.80) 2.70 (1.20) 3.30 9.80
2002-03 5.90 2.40 16.90 (3.30) (10.40) 2.50 9.20 30.30 9.30 13.50
2003-04 0.70 17.40 8.90 15.10 12.20 9.00 18.60 2.20 14.10 9.10
2004-05 18.20 35.30 0.80 18.00 10.30 7.50 27.10 3.80 10.20 (22.50)
2005-06 11.73 (2.30) (0.30) 9.90 5.00 4.30 13.50 7.20 6.10 (5.00)
2006-07 11.73 8.18 12.97 2.45 2.87 (2.76) 22.49 3.74 10.45 19.16
2007-08 2.44 3.95 9.29 (3.63) 2.22 3.27 17.64 10.37 2.50 34.20
2008-09 (0.04) 0.05 6.50 (6.75) 12.10 1.58 6.09 0.11 (1.18) (32.61)
2009-10 (4.33) (0.74) (22.68) 1.38 (13.65) 3.58 10.49 12.12 (25.70) (1.44)
2010-11 5.46 1.08 (12.30) 1.57 0.17 (8.88) (8.43) (7.70) (5.62) 32.62
2011-12 0.52 0.30 0.98 1.01 (5.27) 0.08 2.93 (1.93) 4.11 11.16
2012-13 3.57 0.56 9.28 3.25 8.75 (4.02) 5.07 (1.22) 2.11 9.48
2013-14 8.62 0.68 (1.07) 4.08 (4.30) 16.50 1.17 11.72 (8.42) 10.03
2014-15 1.09 0.08 (7.21) (0.04) (2.81) 4.56 2.44 6.83 9.85 (7.75)
2015-16 1.36 0.22 (41.33) 4.78 (14.59) 13.87 10.09 7.18 22.45 (0.68)
2016-17 0.66 0.40 8.15 3.12 (35.84) 1.66 4.49 2.39 (0.62) 37.80
2017-18 0.06 0.04 23.86 5.21 71.98 (9.88) 11.14 6.26 20.67 (6.85)
2018-19 R 0.04 0.22 (9.54) 3.34 2.83 7.68 (2.97) 12.22 (8.70) (19.89)
2019-20 P (10.83) (10.66) (3.08) 4.50 (24.11) 4.39 (2.01) (3.75) 38.85 (7.20)
2020-21 12.47 12.19 7.33 (1.70) 11.87 7.23 27.31 7.93 15.10 16.66 P : Provisional R : Revised Source : Pakistan Bureau of StatisticsNote : Figures in parenthesis represent negative growth
65

FISCAL DEVELOPMENT Rs BillionHIGHLIGHTSCONSOLIDATED BUDGETARY POSITION 2019-20 2020-21 P
I. Total Expenditure 9,648.5 10,306.7i) Current 8,532.0 9,084.0ii) Development 1,155.2 1,238.7iii) Net Lending to Public Sector Enterprises etc. 48.5 76.9iv) Statistical discrepency -87.3 -93.0
II. Total Revenues 6,272.2 6,903.4i) Tax Revenues 4,747.8 5,272.7ii) Non-Tax revenues 1,524.4 1,630.7
III. Overall deficit 3,376.3 -3,403.3IV. Financing 3,376.3 3,403.3
i) External Borrowing 895.5 1,338.1ii) Domestic 2,480.8 2,065.2
a) Non-Banking Borrowing 540.2 196.2b) Bank Borrowing 1,940.6 1,869.0c) Privatization Proceeds - -
V. Overall Deficit as % of GDP 8.1 7.1P: Provisional
67

TABLE 4.1
FEDERAL GOVERNMENT OVERALL BUDGETARY POSITION
Rs Million
Fiscal Year / Item 2019-20 2020-21 P(July-June)
A. REVENUE
3,997,921 4,764,302
1. Direct Taxes 1,524,252 1,731,860
2. Indirect Taxes 2,473,669 3,032,442
i. Customs 626,378 765,184
ii. Sales Tax 1,596,821 1,990,186
iii. Federal Excise 250,470 277,072
336,264 * ^
Non-Tax Revenue 1,448,088 1,505,423
5,782,273 6,269,725
B. EXPENDITURE
Current Expenditure 6,092,581 6,348,670
i. Defence 1,213,281 1,316,418
ii. Mark-up payments 2,619,739 2,749,729
iii. Grants 928,237 911,572
vi. Others** 1,331,324 1,370,951
Development Expenditure and Net Lending 726,343 789,060
Statistical Discrepency 60,602 107,036
Total Expenditure 6,879,526 7,244,766
P : Provisional Source: Budget Wing, Finance Division, Islamabad
*
^
** Includes other categories not shown here
Others
FBR Tax Revenue (1 +2)
Gross Revenue Receipts
Includes Petroleum Levy, Airport tax , other taxes of ICT, Gas Infrastructure Development Cess and Natural Gas Development Surcharge
According to the re classification, of data as per PFM procedures, federal taxes other than FBR have now been included under Non tax revenues
69

TABLE 4.2
SUMMARY OF PUBLIC FINANCE (CONSOLIDATED FEDERAL & PROVINCIAL GOVERNMENTS)
Rs Million
Fiscal Year / Items 2013-14 2014-15 2015-16 2016-17 2017-18 2018-19 2019-20 2020-21 P(July-June)
Total Revenues (i+ii) 3,637,297 3,931,042 4,446,979 4,936,723 5,228,014 4,900,724 6,272,168 6,903,370
Federal 3,397,954 3,649,604 4,070,392 4,535,452 4,679,945 4,412,625 5,756,162 6,244,698
Provincial 239,343 281,438 376,587 401,271 548,069 488,099 516,006 658,672
i) Tax Revenues 2,564,509 3,017,596 3,660,418 3,969,248 4,467,160 4,473,422 4,747,802 5,272,699
Federal 2,374,540 2,811,773 3,377,145 3,647,476 4,065,788 4,071,619 4,334,185 4,764,302
Provincial 189,969 205,823 283,273 321,772 401,372 401,803 413,617 508,397
ii) Non-Tax Revenues 1,072,788 913,446 786,561 967,475 760,854 427,302 1,524,366 1,630,671
Federal 1,023,414 837,831 693,247 887,976 614,157 341,006 1,421,977 1,480,396
Provincial 49,374 75,615 93,314 79,499 146,697 86,296 102,389 150,275
Total Expenditures (a+b+c+d) 5,026,016 5,387,767 5,796,302 6,800,520 7,488,394 8,345,640 9,648,488 10,306,691
a) Current 4,004,582 4,424,747 4,694,294 5,197,854 5,854,266 7,104,031 8,532,020 9,084,010
Federal 2,831,249 3,037,584 3,144,276 3,472,150 3,789,767 4,776,150 6,016,192 6,264,821
Provincial 1,173,333 1,387,163 1,550,018 1,725,704 2,064,499 2,327,881 2,515,828 2,819,189
b) DevelopmeDevelopment 1,135,918 1,113,223 1,301,473 1,693,474 1,584,057 1,178,442 1,155,213 1,238,738
c) Net Lending to PSE's 100,610 27,381 12,631 -12,817 37,625 40,750 48,528 76,938
d) Statistical Discrepancy -215,094 -177,584 -212,096 -77,991 12,446 22,417 -87,273 -92,995
Overall Balance -1,388,719 -1,456,725 -1,349,323 -1,863,797 -2,260,380 -3,444,916 -3,376,320 -3,403,321
Financing (net) 1,388,719 1,456,725 1,349,323 1,863,797 2,260,380 3,444,916 3,376,320 3,403,321
External (net) 511,727 181,032 370,465 541,390 785,166 416,706 895,510 1,338,091
Domestic (i+ii+iii) 876,992 1,275,693 978,858 1,322,407 1,475,214 3,028,210 2,480,810 2,065,230
i) Non-Bank 553,330 366,138 191,843 276,629 352,719 764,986 540,250 196,189
ii) Bank 323,662 892,057 787,015 1,045,778 1,120,495 2,263,224 1,940,561 1,869,041
iii) Privatization Proceeds 0 17,498 0 0 2,000 - - -
Memorandum Item
GDP (mp) in Rs. Billion 25,169 27,443 29,076 31,922 34,616 38,086 41,556 47,709
Total Revenue 14.5 14.3 15.3 15.5 15.1 12.9 15.1 14.5
Tax Revenue 10.2 11.0 12.6 12.4 12.9 11.7 11.4 11.1
Non-Tax Revenue 4.3 3.3 2.7 3.0 2.2 1.1 3.7 3.4
Expenditure 20.0 19.6 19.9 21.3 21.6 21.9 23.2 21.6
Current 15.9 16.1 16.1 16.3 16.9 18.7 20.5 19.0
4.9 4.2 4.5 5.3 4.7 3.2 2.9 2.8
Overall Balance -5.5 -5.3 -4.6 -5.8 -6.5 -9.0 -8.1 -7.1P : Provisional Source: Budget Wing, Finance Division, Islamabad
Development Expenditure & net Lending
(As Percent of GDP at Market Price)
70

TABLE 4.3
CONSOLIDATED FEDERAL & PROVINCIAL GOVERNMENT REVENUES
Rs Million
Fiscal Year/Items 2012-13 2013-14 2014-15 2015-16 2016-17 2017-18 2018-19 2019-20 2020-21 P(July-June)
Total Revenue (I+II) 2,982,436 3,637,297 3,931,042 4,446,979 4,936,723 5,228,014 4,900,724 6,272,168 6,903,370
Federal 2,760,436 3,397,954 3,649,604 4,070,392 4,535,452 4,679,945 4,412,625 5,756,162 6,244,698
Provincial 222,000 239,343 281,438 376,587 401,271 548,069 488,099 516,006 658,672
I. Tax Revenues (A+B) 2,199,232 2,564,509 3,017,596 3,660,418 3,969,248 4,467,160 4,473,422 4,747,802 5,272,699
Federal 2,048,509 2,374,540 2,811,773 3,377,145 3,647,476 4,065,788 4,071,619 4,334,185 4,764,302
Provincial 150,723 189,969 205,823 283,273 321,772 401,372 401,803 413,617 508,397
A. Direct Taxes (1+2) 742,488 893,351 1,040,038 1,195,462 1,350,233 1,542,187 1,452,620 1,533,903 1,731,860
1 Federal 735,758 884,118 1,029,244 1,191,602 1,343,197 1,536,636 1,445,594 1,524,252 1,731,860
2 Provincial 6,730 9,233 10,794 3,860 7,036 5,551 7,026 9,651
B. Indirect Taxes 1,456,744 1,671,158 1,977,558 2,464,956 2,619,015 2,924,973 3,020,802 3,213,899 3,540,839
3. Excise Duty 124,349 144,540 170,004 197,461 205,205 214,431 242,865 258,113 285,290
Federal 119,453 139,084 163,969 190,581 198,570 205,877 233,591 250,470 277,072
Provincial 4,896 5,456 6,035 6,880 6,635 8,554 9,274 7,643 8,218
4. Sales Tax* 841,324 1,002,110 1,088,823 1,323,685 1,323,261 1,491,310 1,464,887 1,596,821 1,990,186
5. Taxes on Interna-
tional Trade 239,608 240,997 306,140 406,180 496,018 608,325 685,397 626,378 765,184
6. Surcharges* 141,837 142,064 157,231 181,944 239,959 203,086 211,612 306,037 447,177
6.1 Gas 32,171 38,530 25,874 32,654 73,262 24,212 5,304 12,356 22,523
6.2 Petroleum 109,666 103,534 131,357 149,290 166,697 178,874 206,308 293,681 424,654
7. Other Taxes ** 141,797 179,977 255,360 355,686 354,572 407,821 416,041 426,550 500,179
7.1 Sales Tax on services GST - - - 129,752 170,791 223,860 202,881 232,969 293,645
7.2 Stamp Duties 18,306 21,790 29,476 35,484 38,167 62,754 70,396 59,148 55,217
7.3 Motor Vehicle Taxes 13,975 15,565 15,872 19,077 21,282 24,123 24,850 17,979 26,779
7.4 Gas Infrastructure Development Cess (GIDC)* - - 57,021 79,771 42,149 15,176 21,471 9,346 19,438 ^
7.5 Others 109,516 142,622 152,991 91,602 82,183 81,908 96,443 107,108 124,538 ***
II. Non-Tax Revenues 783,204 1,072,788 913,446 786,561 967,475 760,854 427,302 1,524,366 1,630,671
Federal 711,927 1,023,414 837,831 693,247 887,976 614,157 341,006 1,421,977 1,480,396
Provincial 71,277 49,374 75,615 93,314 79,499 146,697 86,296 102,389 150,275P: Provisional Source: Budget Wing, Finance Division* : Revenues under these heads are exclusively Federal** : Mainly includes Provincial Revenues *** : Includes other provincial tax revenues^ : GIDC is included in Non-Tax Revenues from FY2021 as per reclassification of dataNote: According to the re classification, of data as per PFM procedures, federal taxes other than FBR have now been included under Non tax revenues
71

TABLE 4.4
CONSOLIDATED FEDERAL & PROVINCIAL GOVERNMENT EXPENDITURES
Rs Million
Fiscal Year/Items 2013-14 2014-15 2015-16 2016-17 2017-18 2018-19 2019-20 2020-21 P(July-June)
Current Expenditure 4,004,582 4,424,747 4,694,294 5,197,854 5,854,266 7,104,031 8,532,020 9,084,010
Federal 2,831,249 3,037,584 3,144,276 3,472,150 3,789,767 4,776,150 6,016,192 6,264,821
Provincial 1,173,333 1,387,163 1,550,018 1,725,704 2,064,499 2,327,881 2,515,828 2,819,189
Defence 623,085 697,821 757,653 888,078 1,030,407 1,146,793 1,213,281 1,316,418
Mark-up Payments 1,147,793 1,303,767 1,263,368 1,348,435 1,499,922 2,091,126 2,619,739 2,749,729
Current Subsidies 305,748 241,593 207,161 153,717 114,194 195,345 359,923 425,023
Others 754,623 794,403 916,094 1,081,920 1,145,244 1,342,886 1,823,249 1,773,651
1,135,918 1,113,223 1,301,473 1,693,474 1,584,057 1,178,442 1,155,213 1,238,738
Net Lending to PSEs 100,610 27,381 12,631 -12,817 37,625 40,750 48,528 76,938
-215,094 -177,584 -212,096 -77,991 12,446 22,417 -87,273 -92,995
Expenditure Booked excl discrepency 5,241,110 5,565,351 6,008,398 6,878,511 7,475,948 8,323,223 9,735,761 10,399,686
Total Expenditure 5,026,016 5,387,767 5,796,302 6,800,520 7,488,394 8,345,640 9,648,488 10,306,691
Memorandum Items:
Current Expenditure 9.4 10.5 6.1 10.7 12.6 21.3 20.1 6.5
Defence 15.3 12.0 8.6 17.2 16.0 11.3 5.8 8.5
Mark-up Payments 15.8 13.6 -3.1 6.7 11.2 39.4 25.3 5.0
Current Subsidies -14.6 -21.0 -14.3 -25.8 -25.7 71.1 84.2 18.1
Development Expenditure 46.2 -2.0 16.9 30.1 -6.5 -25.6 -2.0 7.2
Expenditure Booked excl discrepency 9.2 6.2 8.0 14.5 8.7 11.3 17.0 6.8
4.4 7.2 7.6 17.3 10.1 11.4 15.6 6.8
Current Expenditure 79.7 82.1 81.0 76.4 78.2 85.1 88.4 88.1
Defence 12.4 13.0 13.1 13.1 13.8 13.7 12.6 12.8
22.8 24.2 21.8 19.8 20.0 25.1 27.2 26.7
Current Subsidies 6.1 4.5 3.6 2.3 1.5 2.3 3.7 4.1
Development Expenditure* 24.6 21.2 22.7 24.7 21.7 14.6 12.5 12.8P: Provisional Source: Budget Wing, Finance Division * : Include Net Lending
Development Expenditure
Statistical Discrepancy
Total Expenditure
Mark-up Payments
(Percent Growth over preceding period)
As % of total expenditures
72

TABLE 4.5
DEBT SERVICING
Rs Million
Fiscal Year / Item 2013-14 2014-15 2015-16 2016-17 2017-18 2018-19 2019-20 2020-21 P(July-June)
A. 1,147,793 1,303,767 1,263,368 1,348,435 1,499,922 2,091,126 2,619,739 2,749,729
1,072,813 1,208,105 1,150,809 1,220,265 1,322,645 1,820,821 2,313,133 2,523,811
74,980 95,662 112,559 128,170 177,277 270,305 306,606 225,918
B. 312,112 285,193 335,307 544,314 450,189 974,001 1,362,353 940,278
C. 1,459,905 1,588,960 1,598,675 1,892,749 1,950,111 3,065,127 3,982,092 3,690,007
4.3 4.4 4.0 3.8 3.8 4.8 5.6 5.3
0.3 0.3 0.4 0.4 0.5 0.7 0.7 0.5
1.2 1.0 1.2 1.7 1.3 2.6 3.3 2.0
5.8 5.8 5.5 5.9 5.6 8.0 9.6 7.7
P; Provisional Source: Budget Wing, Finance Division
Mark-up Payments
Servicing of Domestic Debt
Servicing of Foreign Debt
(As Percent of GDP)
Total Debt Servicing
MEMORANDUM ITEMS
Servicing of Domestic Debt
Repayment/Amortization of Foreign Debt
Total Debt Servicing (A+B)
Servicing of Foreign Debt
Repayment/Amortization of Foreign Debt
73

MONEY & CREDITRs million
HIGHLIGHTS
Components of Monetary AssetsCurrency in Circulation 6,142,016 6,909,937
Other Deposits with SBP 41,218 68,004Total Demand & Time Deposits incl. RFCDs 14,724,770 17,319,755of which Residents Foreign Currency Deposits 1,074,511 1,046,156Broad Money (M2) 20,908,004 24,297,697Growth 17.5 16.2
1. Public Sector Borrowing (net)i. Net Budgetary Support 13,748,309 15,460,724ii. Commodity Operations 813,435 903,999iii. Zakat Fund etc. -14,510 -12,344
2. Non-Government Sectori. Autonomous Bodies 258,059 266,372ii. Net Credit to Private Sector 8,114,369 8,825,935
& PSCEsa. Private Sector* 6,862,862 7,629,069b. Public Sector Corp. other than 2(i) 1,232,463 1,170,373c. PSEs Special Account Debt Repayment -24,244 -24,244d. Other Financial Institutions (NBFIs) 43,288 50,736
3. Other Items (Net)* -1,495,505 -1,871,8044. Domestic Credit 21,424,157 23,572,8825. Foreign Assets (Net) -516,153 724,814P : Provisional Source: State Bank of Pakistan
* : Islamic Financing, Advances (against Murabaha etc) and other related items previously reported under other Assets has been reclassified as credit to private sector w.e.f. Jan-13 onwards.
2020-21 PItems/Years 2019-20
75

TABLE 5.1
COMPONENTS OF BROAD MONEY (M2)Rs million
2016 2017 2018 2019 2020 2021
1. Currency Issued 3,563,749 4,176,915 4,644,900 5,294,754 6,468,725 7,288,807
2. Currency held by SBP 634 973 1,181 1,199 1,201 568
3. Currency in title of Scheduled Banks 229,331 264,627 255,891 343,516 325,508 378,302
4. Currency in circulation (1-2-3) 3,333,784 3,911,315 4,387,828 4,950,039 6,142,016 6,909,937
5. Other deposits with SBP* 18,756 22,692 26,962 33,636 41,218 68,004
6. Scheduled Banks Total Deposits** 9,472,313 10,646,875 11,582,372 12,814,820 14,724,770 17,319,755 7. Resident Foreign Currency Deposits
(RFCD) 587,258 655,340 829,355 1,109,780 1,074,511 1,046,156
8. Broad Money (4+5+6) 12,824,853 14,580,882 15,997,162 17,798,494 20,908,004 24,297,697
9. Growth rate (%) 13.7 13.7 9.7 11.3 17.5 16.2
Memorandum
1. Currency / Money ratio 26.0 26.8 27.4 27.8 29.4 28.4
2. Demand Deposits / Money ratio 63.9 64.3 63.0 62.8 60.6 63.2
3. Time Deposits / Money ratio 5.4 4.2 4.2 3.0 4.7 3.8
4. Other Deposits / Money ratio 0.1 0.2 0.2 0.2 0.2 0.3
5. RFCD / Money ratio 4.6 4.5 5.2 6.2 5.1 4.3
6. Income Velocity of Money*** 2.4 2.2 2.1 2.1 2.0 2.0 P : Provisional Source: State Bank of Pakistan* : The deposits of other institutions are part of 'other deposits' from July 03, 2020 onwards.
*** : Income velocity of money is taken as GDP at current factor cost / quarterly average of monetary assets (M2)
** : Excluding inter banks deposits and deposits of federal and provincial governments, foreign constituents and international organization etc.
Stock End June
77

CAUSATIVE FACTORS ASSOCIATED WITH BROAD MONEY (M2)Rs million
2016 2017 2018 2019 2020 2021 P
1. Public Sector Borrowing (net)(i + ii + iii + iv + v + vi ) 7,819,545 8,955,597 10,199,670 12,336,664 14,547,233 16,352,380i. Net Budgetary Support 7,194,814 8,282,074 9,392,960 11,596,468 13,748,309 15,460,724ii. Commodity Operations 636,574 686,508 819,680 756,416 813,435 903,999iii. Zakat Fund etc. -11,843 -12,985 -12,971 -16,220 -14,510 -12,344
2. Non-Government Sector 5,012,588 6,011,267 7,033,598 8,072,803 8,372,428 9,092,306i. Autonomous Bodies* 200,760 250,244 324,787 285,745 258,059 266,372ii. Net Credit to Private Sector &PSEs 4,811,828 5,761,023 6,708,811 7,787,058 8,114,369 8,825,935
a. Private Sector 4,449,547 5,197,473 5,972,968 6,666,505 6,862,862 7,629,069b. Public Sector Corp. other than 2(i) 367,297 572,553 743,413 1,108,476 1,232,463 1,170,373c. PSEs Special Account Debt Repayme -24,244 -24,244 -24,244 -24,244 -24,244 -24,244d. Other Financial Institutions (NBFIs) 19,228 15,241 16,675 36,321 43,288 50,736
3. Counterpart Funds -530 -530 -530 -560 -534 -5344. Other Items (Net) -1,014,348 -987,502 -1,027,153 -1,103,333 -1,494,971 -1,871,2695. Domestic Credit (1+2+3+4) 11,817,255 13,978,833 16,205,586 19,305,575 21,424,157 23,572,8826. Foreign Assets (Net) 1,007,598 602,049 -208,423 -1,507,081 -516,153 724,8147. Broad Money (5+6) 12,824,853 14,580,882 15,997,162 17,798,494 20,908,004 24,297,697
8. Public Sector Borrowing (net)(i+ii+iii+iv+v+vi) 861,330 1,136,052 1,244,073 2,136,994 2,210,569 1,805,147i. Net Budgetary Support 791,255 1,087,260 1,110,887 2,203,507 2,151,841 1,712,415ii. Commodity Operations 72,115 49,934 133,172 -63,264 57,019 90,565iii. Zakat Fund etc. -2,040 -1,142 14 -3,249 1,709 2,166
9. Non-Government Sector 556,587 998,679 1,022,331 1,039,205 299,625 719,878i. Autonomous Bodies* 58,581 49,484 74,543 -39,042 -27,686 8,313ii. Net Credit to Private Sector & PSCEs 498,006 949,195 947,788 1,078,247 327,311 711,566
a. Private Sector 446,463 747,926 775,495 693,537 196,357 766,207b. Public Sector Corp. other than 2(i) 50,736 205,256 170,859 365,064 123,987 -62,090c. PSEs Special Account Debt Repayme -169 0 0 0 0 0d. Other Financial Institutions (NBFIs) 975 -3,987 1,433 19,646 6,967 7,448
10. Counterpart Funds 0 0 0 -30 25 011. Other Items (Net)* -70,060 26,846 -39,651 -76,180 -391,638 -376,29812. Domestic Credit Expansion (8+9+10+11) 1,347,857 2,161,578 2,226,753 3,099,989 2,118,582 2,148,72513. Foreign Assets (Net) 194,851 -405,549 -810,473 -1,298,658 990,928 1,240,96714. Monetary Expansion (12+13) 1,542,708 1,756,029 1,416,280 1,801,332 3,109,510 3,389,693P : Provisional* : Autonomous bodies are WAPDA , OGDCL, SSGC, SNGPL, PIA, Pakistan Steel and Pakistan Railway.
Source: State Bank of Pakistan
TABLE 5.2
A. Stock End June
B. Changes over the year (July-June)
78

TABLE 5.3
Rs millionItem Description 2016 2017 2018 2019 2020 2021Assets
Cash & Balances with Treasury Banks 781,400 1,122,866 1,349,450 1,966,692 1,408,559 1,528,246 Balances with other Banks 126,065 185,623 186,038 195,992 212,150 213,911 Lending to Financial Institutions 262,861 503,760 612,681 717,249 843,513 966,673 Investments 7,542,990 8,166,143 8,178,723 7,624,217 10,681,288 13,615,840 Gross Advances 5,113,688 6,176,306 7,361,622 8,096,771 8,202,328 8,831,088 Less: Provision for Non- Performing Advances 460,632 456,701 463,772 488,093 546,797 629,039 Advances – Net of Provision 4,653,056 5,719,604 6,897,850 7,608,677 7,655,531 8,202,049 Operating Fixed Assets 317,857 345,652 417,591 468,981 567,753 635,575 Deferred Tax Assets 54,749 47,428 52,835 59,834 56,161 70,764 Other Assets 626,331 711,952 715,125 943,951 950,083 908,754
Total Assets 14,365,309 16,803,028 18,410,293 19,585,594 22,375,037 26,141,812
LiabilitiesBills Payable 223,062 201,124 230,357 299,737 245,363 322,389 Borrowings 2,245,107 2,654,899 3,014,680 2,412,023 2,865,768 4,097,113 Deposits and other Accounts 10,060,188 11,980,697 13,062,787 14,458,307 16,229,036 18,695,178 Sub-ordinated Loans 47,696 46,910 79,460 108,670 126,296 112,732 Liabilities Against Assets Subject to Finance Lease 48 35 20 0 2,134 1,823 Deferred Tax Liabilities 44,774 35,556 22,070 22,591 47,329 17,288 Other Liabilities 411,820 446,232 577,934 803,227 964,493 997,101 Total Liabilities 13,032,696 15,365,453 16,987,306 18,104,555 20,480,420 24,243,625
Net Assets 1,332,613 1,437,575 1,422,987 1,481,039 1,894,617 1,898,187
Represented by:Paid up Capital / Head Office Capital Account 538,631 651,359 525,796 546,922 556,465 561,451Reserves 227,497 199,217 285,610 340,060 357,675 379,965Un-appropriated / Un-remitted Profit 337,664 392,033 440,846 480,816 618,864 696,938Sub total 1,103,792 1,242,609 1,252,252 1,367,798 1,533,004 1,638,354Surplus/ (Deficit) on Revaluation of Assets 228,821 194,964 170,736 113,241 361,613 259,833Total 1,332,613 1,437,573 1,422,988 1,481,039 1,894,617 1,898,187
Scheduled Banks’ Consolidated Position Based on last Weekend Position of Liabilities & Assets (All Banks
Source: State Bank of Pakistan
79

TABLE 5.4
Rs BillionEnd June Stocks Narrow Money1 Monetary Assets2 (M2) Growth Income Velocity of Monetary
M1 Percentage Assets (M2)
2000-01 1,275.61 1,526.04 9.0 3.0
2001-02 1,494.14 1,751.88 14.8 2.8
2002-03 1,797.36 2,078.48 18.6 2.6
2003-04 2,174.74 2,485.49 19.6 2.5
2004-05 2,512.21 2,960.64 19.1 2.4
2005-06 2,720.68 3,406.91 15.1 2.4
2006-07 3,155.63 4,065.16 19.3 2.3
2007-08 4,339.50 4,689.14 15.3 2.4
2008-09 3,621.22 5,137.21 9.6 2.6
2009-10 - 5,777.23 12.5 2.6
2010-11 - 6,695.19 15.9 2.8
2011-12 - 7,641.79 14.1 2.7
2012-13 - 8,856.36 15.9 2.6
2013-14 - 9,966.58 12.5 2.6
2014-15 - 11,282.14 13.2 2.5
2015-16 - 12,824.85 13.7 2.4
2016-17 - 14,580.88 13.7 2.2
2017-18 - 15,997.16 9.7 2.1
2018-19 - 17,798.49 11.3 2.1
2019-20 - 20,908.00 17.5 2.2
2020-21 P - 24,297.70 16.2 2.0P : Provisional Source: State Bank of PakistanExplanatory Notes:
INCOME VELOCITY OF MONEY
1. It may be noted that data series of M1 from 2000-01 is not comparable as compilation of M1 based on weekly data has been discontinued by the SBP. Now M1 is being compiled on the basis of monthly returns and as reported in the monthly Statistical Bulletin of the SBP beginning from April 2008 in its table 2.1. Now its compilation has been discontinued.
2. Income velocity of money is estimated using GDP at current factor cost/ Average of quarter end monetary assets (M2).
80
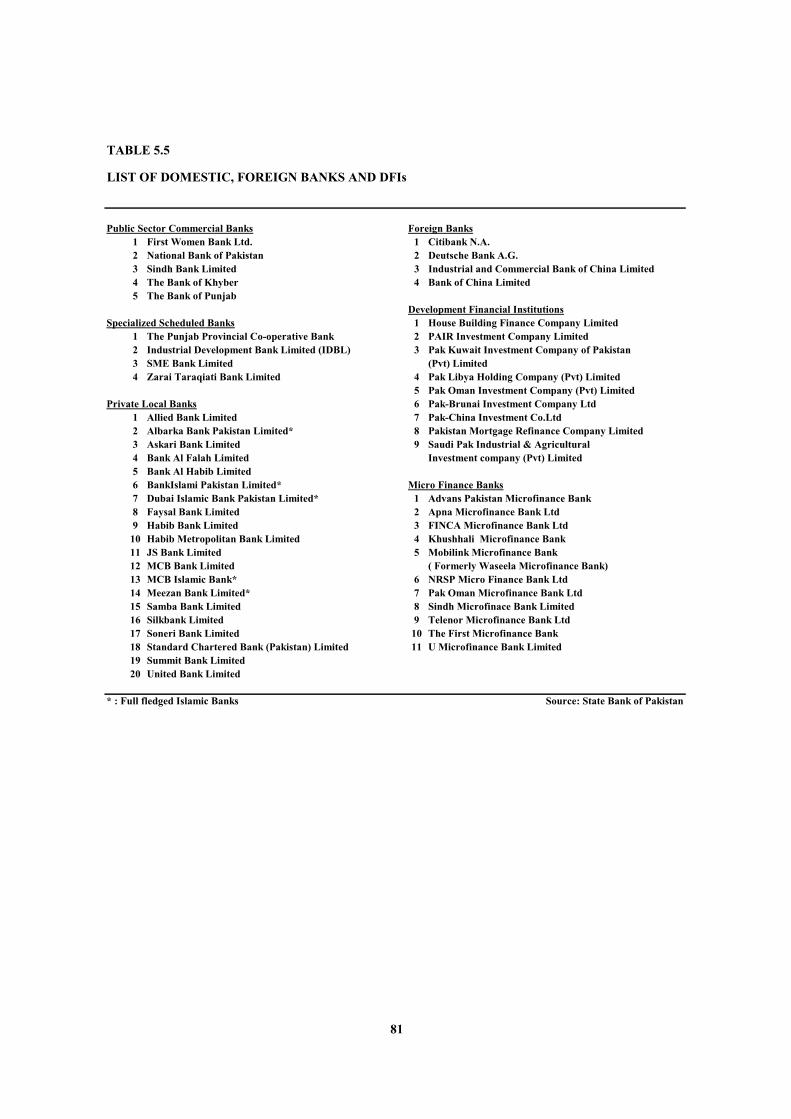
TABLE 5.5
LIST OF DOMESTIC, FOREIGN BANKS AND DFIs
Public Sector Commercial Banks Foreign Banks1 First Women Bank Ltd. 1 Citibank N.A.2 National Bank of Pakistan 2 Deutsche Bank A.G.3 Sindh Bank Limited 3 Industrial and Commercial Bank of China Limited4 The Bank of Khyber 4 Bank of China Limited5 The Bank of Punjab
Development Financial InstitutionsSpecialized Scheduled Banks 1 House Building Finance Company Limited
1 The Punjab Provincial Co-operative Bank 2 PAIR Investment Company Limited2 Industrial Development Bank Limited (IDBL) 3 Pak Kuwait Investment Company of Pakistan 3 SME Bank Limited (Pvt) Limited4 Zarai Taraqiati Bank Limited 4 Pak Libya Holding Company (Pvt) Limited
5 Pak Oman Investment Company (Pvt) LimitedPrivate Local Banks 6 Pak-Brunai Investment Company Ltd
1 Allied Bank Limited 7 Pak-China Investment Co.Ltd2 Albarka Bank Pakistan Limited* 8 Pakistan Mortgage Refinance Company Limited3 Askari Bank Limited 9 Saudi Pak Industrial & Agricultural 4 Bank Al Falah Limited Investment company (Pvt) Limited5 Bank Al Habib Limited6 BankIslami Pakistan Limited* Micro Finance Banks7 Dubai Islamic Bank Pakistan Limited* 1 Advans Pakistan Microfinance Bank8 Faysal Bank Limited 2 Apna Microfinance Bank Ltd9 Habib Bank Limited 3 FINCA Microfinance Bank Ltd
10 Habib Metropolitan Bank Limited 4 Khushhali Microfinance Bank11 JS Bank Limited 5 Mobilink Microfinance Bank 12 MCB Bank Limited ( Formerly Waseela Microfinance Bank)13 MCB Islamic Bank* 6 NRSP Micro Finance Bank Ltd14 Meezan Bank Limited* 7 Pak Oman Microfinance Bank Ltd15 Samba Bank Limited 8 Sindh Microfinace Bank Limited16 Silkbank Limited 9 Telenor Microfinance Bank Ltd17 Soneri Bank Limited 10 The First Microfinance Bank18 Standard Chartered Bank (Pakistan) Limited 11 U Microfinance Bank Limited19 Summit Bank Limited20 United Bank Limited
* : Full fledged Islamic Banks Source: State Bank of Pakistan
81

TABLE 5.6
in PercentageAs at the Precious Stock Merchan- Machinery Real Financial Others TotalEnd of Metal Exchange dise Estate Obli- Advances*
Securities gationsI. INTEREST BEARING2005 Jun 8.51 6.86 6.09 4.59 6.68 6.76 8.86 7.01
(8.51) (8.29) (6.01) (4.07) (6.68) (6.70) (9.02) (7.01) 2006 Jun 11.58 14.84 8.68 8.55 10.23 10.31 9.59 9.71
(11.58) (14.09) (8.51) (8.55) (10.23) (10.31) (9.99) (9.66) 2007 Jun 10.87 11.37 10.73 11.07 12.30 11.05 10.76 11.25
(10.87) (12.11) (10.68) (11.06) (12.30) (11.05) (10.81) (11.30) Dec 11.45 10.36 9.82 11.09 12.85 10.02 11.93 11.64
(11.45) (10.42) (9.82) (11.09) (12.85) (10.02) (11.98) (11.66) 2008 Jun 13.62 12.37 11.78 13.16 12.21 13.32 13.02 12.53
(13.62) (12.60) (11.77) (13.16) (12.21) (13.32) (13.14) (12.57) Dec 14.64 13.88 13.83 12.05 13.60 16.55 13.74 13.60
(14.64) (14.11) (13.83) (12.04) (13.60) (16.55) (13.52) (13.66) 2009 Jun 14.86 12.15 13.45 11.91 14.14 15.30 13.21 13.54
(14.86) (10.11) (13.07) (11.91) (13.75) (15.27) (13.10) (13.54) Dec 14.07 11.62 12.38 12.78 13.70 12.43 12.35 12.66
(14.07) (10.28) (12.17) (12.78) (13.70) (11.87) (11.99) (12.48) 2010 Jun 14.85 13.86 10.90 9.63 12.77 12.07 13.02 12.20
(14.85) (14.30) (9.77) (9.63) (12.77) (12.07) (13.20) (12.03) Dec 14.72 13.36 11.69 12.02 12.48 13.45 12.92 12.36
(14.72) (12.30) (11.32) (11.95) (12.47) (13.45) (12.81) (12.19) 2011 Jun 15.78 12.42 11.33 11.11 12.01 11.04 12.85 12.01
(15.78) (13.26) (10.50) (11.11) (12.01) (11.04) (12.69) (11.72) Dec 14.78 10.20 11.53 8.89 11.46 13.12 12.90 11.81
(14.78) (9.95) (11.27) (8.85) (11.46) (13.12) (12.88) (11.68) 2012 Jun 12.80 12.86 11.89 11.07 12.49 12.30 13.29 12.43
(12.80) (15.01) (11.48) (11.02) (12.49) (12.30) (13.24) (12.28) Dec 15.40 12.28 10.55 8.31 10.20 8.40 11.41 10.77
(15.40) (12.25) (10.15) (8.28) (10.20) (8.40) (11.92) (10.81)2013 Jun 14.86 11.72 8.71 8.45 10.80 9.40 10.64 9.97
(14.86) (11.95) (8.61) (8.42) (10.80) (9.40) (10.58) (9.89)Dec 9.66 11.65 10.77 9.67 11.11 7.79 11.49 10.91
(9.66) (11.97) (10.50) (9.66) (11.11) (7.79) (12.22) (11.04)2014 Jun 15.46 12.03 10.11 9.92 11.61 7.10 11.72 11.20
(15.46) (12.49) (9.66) (9.92) (11.61) (7.10) (11.72) (11.10)Dec 15.32 11.93 9.58 9.64 11.65 7.39 12.33 11.30
(15.32) (12.73) (9.07) (9.64) (11.65) (7.39) (12.33) (11.20)2015 Jun 12.99 11.15 9.13 8.64 9.91 7.32 11.51 10.27
(12.99) (11.06) (8.73) (8.64) (9.91) (7.32) (11.51) (10.14) Dec 14.45 9.44 8.69 8.79 9.29 6.65 11.38 9.90
(14.45) (10.49) (8.92) (8.79) (9.29) (6.65) (11.38) (10.07)2016 Jun 11.60 8.30 8.76 8.59 8.80 9.58 10.03 9.25
(11.60) (9.40) (8.18) (8.80) (8.80) (9.58) (10.72) (9.44)Dec 11.35 9.18 7.94 8.44 8.49 4.76 10.92 9.28
(11.35) (9.50) (7.94) (8.44) (8.49) (4.76) (11.21) (9.36) 2017 Jun 14.51 7.31 7.11 8.38 8.67 4.52 11.03 8.88
(14.51) (9.56) (7.85) (8.38) (8.67) (4.52) (11.55) (9.35) Dec 14.13 7.4 7.16 8.33 8.31 8.89 10.35 8.67
(14.13) (9.31) (7.16) (8.33) (8.77) (8.89) (11.62) (9.17) 2018 Jun 11.95 8.18 7.81 9.42 9.34 4.88 11.86 9.71
(11.93) (9.88) (7.83) (9.37) (9.34) (4.88) (11.88) (9.79) Dec 11.96 9.98 10.76 10.19 10.37 8.67 13.08 11.47
(11.96) (10.85) (10.76) (10.19) (10.37) (8.67) (13.10) (11.52)
(Contd…)
SECURITY AND NATURE WISE WEIGHTED AVERAGE LENDING RATES(ALL SCHEDULED BANKS)
82

TABLE 5.6
in PercentageAs at the Precious Stock Merchan- Machinery Real Financial Others TotalEnd of Metal Exchange dise Estate Obli- Advances*
Securities gationsII. ISLAMIC MODES OF FINANCING2005 Jun 9.03 7.15 7.93 7.80 10.16 8.21 10.15 8.94
(9.03) (7.17) (7.95) (7.88) (10.22) (8.19) (10.67) (9.13) 2006 Jun 10.66 10.03 9.63 9.14 11.23 9.25 12.37 10.68
(10.66) (10.20) (9.66) (9.20) (11.26) (9.25) (12.90) (10.83) 2007 Jun 12.04 11.26 10.11 10.80 11.92 10.43 13.02 11.57
(12.04) (11.34) (10.03) (10.84) (11.92) (10.49) (13.40) (11.68) Dec 9.70 11.27 10.26 10.76 11.80 10.58 12.93 11.55
(9.70) (11.41) (10.23) (10.82) (11.79) (10.62) (13.26) (11.65) 2008 Jun 11.75 12.87 11.53 12.26 12.11 11.23 13.90 12.48
(11.75) (12.93) (11.55) (12.22) (12.12) (11.23) (14.21) (12.55) Dec 15.02 15.76 14.42 14.62 13.51 15.00 15.89 14.72
(15.02) (15.66) (14.19) (14.67) (13.49) (15.02) (15.96) (14.72) 2009 Jun 14.18 15.01 14.19 14.20 13.27 15.83 15.08 14.31
(14.18) (15.03) (13.73) (14.10) (13.30) (16.79) (15.20) (14.30)Dec 14.18 13.61 12.10 12.72 12.71 11.93 14.88 13.22
(14.14) (14.02) (12.18) (12.70) (12.71) (11.55) (14.96) (13.10)2010 Jun 15.08 14.26 13.16 13.81 12.25 13.59 14.83 13.73
(15.74) (14.34) (12.80) (13.79) (12.24) (13.67) (14.94) (13.52)Dec 15.20 13.80 13.01 13.10 12.24 12.86 14.59 13.43
(15.20) (13.59) (12.69) (13.18) (12.23) (12.79) (14.82) (13.23)2011 Jun 16.24 11.04 12.81 13.74 12.57 12.81 14.73 13.55
(16.24) (14.41) (12.36) (14.22) (12.53) (12.83) (14.43) (13.32)Dec 13.50 13.06 13.40 14.18 12.46 12.42 15.04 13.83
(13.50) (13.21) (13.17) (14.14) (12.46) (12.51) (14.92) (13.62)2012 Jun 9.46 11.63 12.84 12.51 11.84 14.11 13.68 12.84
(9.63) (12.89) (12.43) (13.17) (11.81) (14.10) (13.52) (12.72)Dec 9.53 11.10 11.19 12.10 12.43 13.30 12.80 12.02
(9.53) (11.67) (10.91) (12.03) (12.40) (13.21) (13.02) (11.93)2013 Jun 12.80 11.65 11.02 11.74 12.05 13.80 12.20 11.78
(13.69) (11.44) (10.92) (11.46) (12.04) (12.57) (12.88) (11.81)Dec 14.20 10.80 10.52 11.14 11.23 9.10 11.79 11.20
(15.26) (10.99) (10.48) (11.03) (11.29) (10.67) (12.59) (11.37)2014 Jun 14.22 11.27 10.12 9.48 12.03 10.65 12.29 11.18
(15.12) (11.25) (10.44) (11.16) (11.71) (10.65) (12.90) (11.58)Dec 13.73 11.00 10.35 10.72 11.50 10.22 11.94 11.11
(15.03) (11.01) (10.31) (11.04) (11.50) (10.19) (12.91) (11.28)2015 Jun 11.59 8.83 8.48 8.22 10.49 10.19 9.48 9.13
(12.22) (8.79) (8.68) (8.62) (10.56) (9.58) (10.46) (9.54)Dec 13.15 8.42 7.32 8.16 9.12 9.70 8.76 8.33
(13.85) (7.94) (7.43) (8.18) (9.20) (8.57) (10.05) (8.65)2016 Jun 11.28 6.73 7.44 8.01 9.56 10.17 8.94 8.34
(11.28) (8.21) (7.48) (8.24) (9.75) (9.37) (10.69) (8.85)Dec 11.18 7.75 6.47 7.10 8.07 4.84 8.42 7.51
(11.19) (7.58) (6.88) (7.00) (9.03) (7.94) (9.71) (8.05)2017 Jun 8.25 7.40 6.93 5.88 8.79 6.74 8.43 7.41
(8.25) (7.24) (6.90) (7.11) (8.99) (6.74) (9.58) (7.98)Dec 7.87 7.17 6.94 7.21 8.69 6.99 8.32 7.71
(7.87) (7.82) (7.04) (7.37) (8.91) (6.99) (9.74) (8.12) 2018 Jun 10.98 7.74 7.19 7.85 8.75 7.17 8.46 8.00
(12.10) (7.63) (7.16) (7.95) (8.88) (7.17) (9.92) (8.36)Dec 9.48 9.81 8.70 9.53 10.24 8.65 10.39 9.67
(9.48) (10.14) (8.80) (9.30) (10.29) (8.52) (11.05) (9.71)
(Contd…)
SECURITY AND NATURE WISE WEIGHTED AVERAGE LENDING RATES(ALL SCHEDULED BANKS)
83

TABLE 5.6
Percent
As at the End of
Precious Metal
Stock Exchange Securities
Merchandise Machinery Real Estate Financial Obligations Others Unsecured
AdvancesTotal
Advances*
Conventional Banking
2019 Jun 11.20 12.34 10.32 11.74 11.09 10.74 11.88 28.12 11.64 (11.20) (12.41) (10.19) (11.58) (11.09) (10.74) (12.00) (28.12) (11.56)
Dec 12.67 14.08 11.20 12.89 11.55 12.01 14.08 26.14 12.92 (12.67) (13.79) (10.99) (12.64) (11.53) (11.65) (13.80) (26.14) (12.42)
2020R Jun 14.13 10.79 8.87 9.60 9.25 8.65 10.96 28.20 10.30 (14.13) (10.73) (8.60) (9.69) (9.25) (8.71) (10.96) (28.20) (10.10)
Dec 10.58 7.85 6.91 7.83 7.24 7.01 8.06 27.42 8.03 (10.58) (7.83) (6.84) (7.80) (7.24) (6.90) (7.79) (27.42) (7.96)
2021 Jun 10.40 8.38 6.63 7.85 6.80 7.19 8.78 28.30 8.16 (10.40) (8.37) (6.51) (7.68) (6.80) (7.07) (9.51) (28.30) (8.13)
Islamic Banking
2019 Jun - 11.26 10.99 11.07 10.87 9.31 11.34 5.76 11.13 - (8.00) (10.95) (10.90) (10.87) (9.31) (11.23) (5.24) (10.99)
Dec - 10.95 11.59 12.63 12.14 10.35 12.92 12.92 12.40 - (7.13) (11.53) (12.63) (12.16) (10.35) (11.85) (10.52) (11.96)
2020R Jun 10.25 13.12 9.55 11.10 10.30 9.30 10.56 6.86 10.38 (10.25) (11.43) (9.46) (11.16) (10.25) (8.83) (10.20) (6.72) (10.18)
Dec - 7.96 7.50 8.41 7.75 6.57 7.40 9.82 7.68 - (9.56) (7.51) (8.42) (7.71) (6.48) (7.32) (9.82) (7.72)
2021 Jun - 8.90 6.84 8.01 7.59 5.03 7.71 16.06 7.53 - (8.93) (6.79) (7.99) (7.48) (5.03) (7.66) (16.06) (7.44)
* : Weighted average rates shown in parentheses represent Private Sector. Source: State Bank of Pakistan
SECURITY AND NATURE WISE WEIGHTED AVERAGE LENDING RATES / FINANCING RATES(ALL SCHEDULED BANKS)
84

TABLE 5.7
SALE OF MARKET TREASURY BILLS THROUGH AUCTION
Rs million
No. Securities 2016 2017 2018 2019 2020 2021
Market Treasury Bills*A. Three Months Maturity
Amount Offeredi) Face value 2,726,618 5,287,269 19,826,420 23,757,544 14,913,709 15,505,232 ii) Discounted value 2,681,109 5,223,172 19,549,300 23,222,877 14,486,853 15,250,389 Amount Acceptedi) Face value 1,457,485 3,824,534 16,231,950 18,866,489 8,811,853 8,698,476 ii) Discounted value 1,436,402 3,772,951 16,005,555 18,448,036 8,554,064 8,556,387 Weighted Average Yieldi) Minimum % p.a. 5.8998 5.7873 5.9902 6.7575 7.6896 6.4267ii) Maximum % p.a. 6.9308 5.9910 6.7595 12.7454 13.7490 7.4418
B. Six Months MaturityAmount Offeredi) Face value 2,873,573 4,632,304 1,620,207 120,484 4,345,673 9,989,084 ii) Discounted value 2,780,740 4,495,594 1,560,051 101,275 4,115,593 9,627,168 Amount Acceptedi) Face value 1,629,803 2,974,251 1,271,001 8,928 1,705,828 5,585,878 ii) Discounted value 1,579,538 2,888,666 1,233,895 8,502 1,613,386 5,384,224 Weighted Average Yieldi) Minimum % p.a. 5.8910 5.8214 6.0093 7.8526 7.4786 6.4666ii) Maximum % p.a. 6.9511 6.0109 6.8322 12.6958 13.9498 7.7463
C. Twelve Months MaturityAmount Offeredi) Face value 3,656,106 1,708,636 86,406 29,073 14,210,931 2,462,402 ii) Discounted value 3,434,144 1,611,283 78,882 15,431 12,653,509 2,287,089 Amount Acceptedi) Face value 1,821,670 936,611 47,687 500 4,649,744 580,918 ii) Discounted value 1,712,268 884,431 44,979 443 4,133,139 542,086 Weighted Average Yieldi) Minimum % p.a. 5.9101 5.8370 6.0273 13.1500 7.2892 6.5475ii) Maximum % p.a. 6.9710 6.0499 6.0386 13.1500 14.2169 7.7908
Note : Amount includes Non-competitive Bids. Source: State Bank of Pakistan
85

TABLE 5.8
SALE OF PAKISTAN INVESTMENT BONDS THROUGH AUCTION
Rs millionNo. Securities 2016 2017 2018 2019 2020 2021
Pakistan Investment Bonds A. Amount Offered (Face Value) 2,559,922 1,761,044 348,935 3,156,891 - -
02 Years (Floater) Maturity (PFL) Quarterly 213,423 03 Years Maturity 1,315,268 1,039,668 235,367 976,869 2,389,228 1,181,021 05 Years Maturity 982,167 451,788 48,467 653,189 1,643,278 866,330 07 Years Maturity - - - - - - 10 Years Maturity 262,487 266,846 65,101 815,509 1,216,358 445,052 03 Years (Floater) Maturity (PFL) Semi-Annual - - - - 84,100 1,193,302 05 Years (Floater) Maturity (PFL) Semi-Annual - - - - 48,500 776,785 10 Years (Floater) Maturity (PFL) Semi-Annual - - - 706,324 1,445,471 384,124 03 Years (Floater) Maturity (PFL) Quarterly - - - - - 365,931 05 Years (Floater) Maturity (PFL) Quarterly - - - - - 107,600 10 Years (Floater) Maturity (PFL) Quarterly - - - - - 130,050 15 Years Maturity - - - - 22,925 96,589 20 Years Maturity - 2,743 - 5,000 22,659 72,061 30 Years Maturity - - - - - -
B. Amount Accepted (Face Value) 963,600 894,017 101,732 1,183,510 - - (a) 02 Years (Floater) Quarterly Maturity (PFL)
(i) Amount Accepted - - - - - 175,664 (ii) Cut-Off Price
(1) Minimum Cut-Off Price - - - - - 99.5239 (2) Maximum Cut-Off Price - - - - - 99.6467
(b) 03 Years Maturity.((i) Amount Accepted 484,812 522,756 37,915 418,859 1,102,152 479,261 ((ii) Weighted Average Yield
(1) Minimum % p.a. 6.2948 6.1444 6.4029 12.0002 7.5239 7.2359 (2) Maximum % p.a. 8.0647 6.4043 7.4677 13.6770 14.1519 9.3343
(c) 03 Years (Floater) Maturity (PFL) Semi-Annual**(i) Amount Accepted - - - - 60,552 624,763 (ii) Margin* / Cut-Off Price
(1) Minimum bps / Cut-Off Price - - - - 45bps 98.8132 (2) Maximum bps / Cut-Off Price - - - - 45bps 100.4413
(d) 03 Years (Floater) Quarterly Maturity (PFL)(i) Amount Accepted - - - - - 228,976 (ii) Cut-Off Price
(1) Minimum Cut-Off Price - - - - - 98.9923 (2) Maximum Cut-Off Price - - - - - 99.2323
(e) 05 Years Maturity(i) Amount Accepted 407,561 239,114 14,932 199,680 612,849 301,239 (ii) Weighted Average Yield
(1) Minimum % p.a. 6.8824 6.6364 6.8960 9.2500 7.8740 8.2139 (2) Maximum % p.a. 8.9652 6.8998 8.4795 13.7687 13.7740 9.8296
(f) 05 Years (Floater) Maturity (PFL) Semi-Annual**(i) Amount Accepted - - - - 34,500 306,271 (ii) Margin* / Cut-Off Price
(1) Minimum bps / Cut-Off Price - - - - 49bps 98.1794 (2) Maximum bps / Cut-Off Price - - - - 49bps 100.4845
(g) 05 Years (Floater) Quarterly Maturity (PFL)(i) Amount Accepted - - - - - 90,500 (ii) Cut-Off Price
(1) Minimum Cut-Off Price - - - - - 97.9779 (2) Maximum Cut-Off Price - - - - - 98.0119
(h) 7 Years Maturity(i) Amount Accepted - - - - - - (ii) Weighted Average Yield -
(1) Minimum % p.a. - - - - - - (2) Maximum % p.a. - - - - - -
(Contd...)
86

TABLE 5.8
SALE OF PAKISTAN INVESTMENT BONDS THROUGH AUCTION
Rs millionNo. Securities 2016 2017 2018 2019 2020 2021
(i) 10 Years Maturity(i) Amount Accepted 71,227 132,147 48,885 253,195 332,797 149,729 (ii) Weighted Average Yield
(1) Minimum % p.a. 7.9981 7.7222 7.9359 12.8267 8.4767 8.8570 (2) Maximum % p.a. 9.4007 7.9414 8.6999 13.6820 13.4548 10.2140
(j) 10 Years (Floater) Maturity (PFL) Semi-Annual**(i) Amount Accepted *** - - - 311,776 723,417 136,707 (ii) Margin* / Cut-Off Price
(1) Minimum bps / Cut-Off Price - - - 8.5526 70bps 100.0 (2) Maximum bps / Cut-Off Price - - - 13.6000 75bps 101.0536
(k) 10 Years (Floater) Quarterly Maturity (PFL)(i) Amount Accepted - - - - - 98,542 (ii) Cut-Off Price
(1) Minimum Cut-Off Price - - - - - 95.2412 (2) Maximum Cut-Off Price - - - - - 95.2853
(l) 15 Years Maturity(i) Amount Accepted - - - - 16,800 64,000 (ii) Weighted Average Yield
(1) Minimum % p.a. - - - - 9.6640 9.7020 (2) Maximum % p.a. - - - - 10.4540 10.0000
(m) 20 Years Maturity - (i) Amount Accepted - - - - 6,113 62,061 (ii) Weighted Average Yield
(1) Minimum % p.a. - - - - 10.5100 10.3400 (2) Maximum % p.a. - - - - 11.7999 10.5624
(n) 30 Years Maturity(i) Amount Accepted - - - - - - (ii) Weighted Average Yield -
(1) Minimum % p.a. - - - - - - (2) Maximum % p.a. - - - - - -
Note: Amounts include non-competitive bids & short sale accomodation as well.* The benchmark for coupon rtae is defined in clause 'B' of DMMD Circular No. 9 dated May 07, 2018.** Margins quoted ober benchmark rate in fresh auctions of floating rate PIB (PFL)
Source: State Bank of Pakistan
*** A special issuance in PFL-SA 10 Years Issued by GoP to Independent Power Producers (IPPs) against their receivables from GoP on 4th June, 2021 ( Rs 28,905.10 million)
87

CAPITAL MARKETS
YEAR KSE 100 INDEX * Aggregate Market Capitalization *(Rs. billion)
2000-01 1,364 3392001-02 1,770 4082002-03 3,403 7462003-04 5,279 1,4032004-05 7,450 2,0372005-06 9,989 2,7662006-07 13,773 4,0192007-08 12,289 3,7782008-09 7,162 2,1212009-10 9,722 2,7322010-11 12,496 3,2882011-12 13,801 3,5182012-13 21,006 5,1552013-14 29,343 6,9662014-15 34,398 7,4212015-16 37,784 7,5892016-17 46,565 9,5222017-18 41,911 8,6652018-19 33,902 6,8872019-20 33,939 6,4222020-21 47,137 8,297* : End June
HIGHLIGHTS
89

TABLE 6.1
NATIONAL SAVINGS SCHEMES (NET INVESTMENT)
Rs. million
Name of Scheme 2011-12 2012-13 2013-14 2014-15 2015-16 2016-17 2017-18 2018-19 2019-20 2020-21
1 Defence Savings Certificates 7,295.5 29,892.0 12,970.8 16,183.3 8,053.0 16,620.0 10,743.6 57,171.0 92,783.1 (9,132.6)
2 National Deposit Scheme (0.9) (0.6) (0.3) (1.0) (0.3) (0.7) 0.05 (0.03) - 0.00
3 Khaas Deposit Scheme (0.6) (1.2) (0.8) (4.3) (2.0) (51.4) (0.19) (0.04) (0.05) (0.24)
4 Special Savings Certificates (R) (52,834.2) 46,401.5 57,619.6 28,547.1 (1,932.8) (39,344.6) (51,180.1) 31,842.5 13,945.7 (6,327.9)
5 Special Savings Certificates (B) (0.9) (0.3) (0.8) - - (0.8) (0.6) - (0.01) (0.50)
6 Regular Income Certificates 43,971.6 36,047.0 62,783.3 50,582.1 (16,223.0) (20,950.7) 8,726.3 142,088.1 83,232.3 26,711.2
7 Bahbood Saving Certificates 52,254.5 47,622.7 53,963.0 45,927.8 63,761.1 57,432.1 45,395.3 119,573.1 83,380.0 2,549.4
8 Pensioners' Benefit Account 16,359.5 17,538.9 18,471.2 15,701.9 20,645.1 18,716.7 21,504.4 43,367.4 33,876.0 16,347.2
9 Savings Accounts 3,978.5 1,098.9 283.2 3,859.4 3,807.7 4,684.4 3,413.0 (166.2) 4,537.0 1,083.5
10 Special Savings Accounts 61,098.8 150,836.0 (53,463.7) 100,124.9 30,924.1 65,246.6 59,939.2 (132,393.5) 200,770.6 (39,659.1)
11 Mahana Amdani Accounts (90.5) (78.5) (72.5) (73.0) (63.0) (55.2) (46.7) (73.8) (60.4) (47.5)
12 Prize Bonds 56,324.2 56,175.4 57,058.4 75,884.6 123,901.9 97,791.6 101,575.7 40,432.1 (171,109.9) (315,531.7)
13 Postal Life Insurance - - - - - 2,529.8 875.5 1,248.4 628.0 (1,311.9)
14 National Savings Bonds - (3,425.6) - (62.6) - - - - (137.0) -
15 Short Term Saving Certificates - 3,969.7 (2,628.9) 389.1 157.9 2,077.4 560.6 761.0 19,254.6 (20,362.2)
16 Premium Prize Bonds (R) - - - - - 2,921.7 2,323.2 2,820.0 11,322.7 25,147.2
17 Shuhda Welfare Accounts - - - - - - - 42.1 27.0 24.2
Grand Total 188,355.6 386,075.9 206,982.4 337,059.3 233,029.6 207,617.0 203,829.1 306,712.0 372,449.4 (320,510.9)Figures in Parenthesis represent negative growth Source : Central Directorate of National SavingsR : RegisteredB : Bearer
91

TABLE 6.2
LOANS DISBURSED BY DFIs & OTHER FINANCIAL INSTITUTIONS
Rs. billion
2011-12 2012-13 2013-14 2014-15 2015-16 2016-17 2017-18 2018-19 2019-20 2020-21
1. - - - - - - - - - -
2. - - - - - - - - - -
3. - - - - - - - - - -
4. - - - - - - - - - -
5. - - - - 1.5 59.6 107.2 127.5 113.1 119.2
6. - 3.8 14.5 16.9 15.9 14.9 3.7 2.8 1.2 1.97.
- 2.8 0.9 0.9 0.5 - 31.3 25.7 20.1 22.38. 37.2 14.8 5.8 6.9 8.6 10.4 11.1 10.0 7.6 10.7
9. - - - - - - - - - -
10. Investment Finance Companies - - - - - 4.7 - - - -
11. - - - - - - - - - -- : Not available Sources : Security Exchange Commission of Pakistan
Leasing CompaniesInvestment Banks / Investment Finance CompaniesModarabas
Housing Finance
Discount Houses
Microfinance Institutions
Name of Institution
DFIs
Special Banks
Islamic Banks
Khushali Bank
92

TABLE 6.3
S.No. Schemes Coupon/Profit Rate Remarks Tax Status
1. Pakistan Investment Bonds (PIBs) Coupon RateFixed-rate PIBs
a) 3 year maturity 7.00% 3 years PIB first issued on 20-Aug-2020 Taxableb) 5 year maturity 7.50% 5 years PIB first issued on 15-Oct-2020 Taxablec) 10 year maturity 8.00% 10 years PIB first issued on 10-Dec-2020 Taxabled) 15 year maturity 10.50% 15 years PIB first issued on 16-Apr-2020 Taxablee) 20 year maturity 11.00% 20 years PIB first issued on 19-Sep-2019 Taxablef) 30 year maturity 11.00% 30 years PIB first issued on 07-Jan-2021 Taxable
Floating Rate PIBs
a) 2 year maturity2 years PIBs coupon reset is fortnightlyand coupon payment is quarterly; firstissued on 05-Nov-2020
Taxable
b) 3 year maturity3 years PIBs coupon reset and couponpayment is half yearly; first issued on 22-Oct-2020
Taxable
c) 5 year maturityCoupon rate is benchmarked to 6 month t-bill auction'sweighted-average yield
5 years PIBs coupon payment and profitrate reset are half yearly; security firstauctioned on 16-May-2021
Taxable
2. Naya Pakistan Certificatesa) 3 years maturity PKR Certificate 10.75% Taxableb) 5 years maturity PKR Certificate 11.00% Taxablec) 3 years maturity USD Certificate 6.75% Taxabled) 5 years maturity USD Certificate 7.00% Taxablee) 3 years maturity EUR Certificate 5.50% Taxablef) 5 years maturity EUR Certificate 5.75% Taxableg) 3 years maturity GBP Certificate 6.25% Taxableh) 5 years maturity GBP Certificate 6.50% Taxable
Schemes Profit Rate Maturity Period Tax Status
3. National Saving Schemes w.e.f 13-08-2021(i) Defence Saving Certificates 9.37%p.a 10 Years Taxable(ii) Special Saving Certificates / Accounts 8.40% (Average) 3 Years Taxable(iii) Regular Income Certificates 8.76%p.a 5 Years Taxable(iv) Saving Accounts 5.50%p.a Running Account Taxable(v) Pensioners' Benefit Account 11.04%p.a 10 Years Tax Exempt(vi) Bahbood Savings Certificate 11.04%p.a 10 Years Tax Exempt(vii) Shuhada Family Welfare Account 11.04%p.a 10 Years Tax Exempt(viii) National Prize Bonds (Bearer) 10.00%p.a Perpetual Taxable(ix) Premium Prize Bonds (R)* 8.84%p.a Perpetual Taxable(x) Short Term Savings Certificate (STSC)
6.88%p.a 3 Months Taxable7.12%p.a 6 Months Taxable7.30%p.a 12 Months Taxable
p.a : Per annum R : Registered Source: State Bank of Pakistan and* : Effective from 10-09-2021 Central Directorate of National Savings
MARK UP RATE/PROFIT RATE ON DEBT INSTRUMENTSCURRENTLY AVAILABLE IN THE MARKET
Coupon rate is benchmarked to 3 month t-bill auction'sweighted-average yield
Mudaraba-based Shariah compliant mode of investment is also available for investors
STSC 12 Months
STSC 3 MonthsSTSC 6 Months
93

INFLATION
Price Indices (2015-16=100)*2020-21
Consumer Price Index (National) 141.31
Consumer Price Index (Urban) 140.57- Food 144.74- Non-Food 138.15
Consumer Price Index (Rural) 142.42- Food 147.74- Non-Food 137.89
Wholesale Price Index 153.87
Sensitive Price Indicator 150.09
* : Pakistan Bureau of Statistics has updated the base year period of Price indices from 2007-08 to 2015-16.
HIGHLIGHTS
95

TABLE 7.1
PRICE INDICES
General Food Apparel House Energy Household Fur Transport Recreation Education Cleaning, Laun- MedicareBeverages Textile & Rent niture, Equip- & Commu- Enter- dry & Personal& Tobacco Footwear ments etc. nication tainment Appearance
2000-01 100.00 100.00 100.00 100.00 100.00 100.00 100.00 100.00 100.00 100.00 100.00
2001-02 103.54 102.50 103.23 102.80 107.76 103.80 103.80 106.30 104.97 102.50 102.37
2002-03 106.75 105.40 106.75 103.80 118.39 105.29 105.29 107.21 109.72 103.37 105.59
2003-04 111.63 111.74 109.69 108.20 120.26 115.72 115.72 106.08 114.19 111.29 106.89
2004-05 121.98 125.69 112.98 120.42 128.46 117.33 120.18 105.86 117.55 115.90 107.94
2005-06 131.64 134.39 117.58 132.36 147.24 124.25 130.99 105.65 125.03 119.49 110.66
2006-07 141.87 148.21 123.70 141.21 156.65 131.64 134.63 105.76 133.82 124.55 120.91
2007-08 158.90 174.36 133.79 154.47 165.17 141.08 138.66 107.86 140.88 138.28 132.23
2008-09 191.90 215.69 152.82 180.90 198.92 159.58 192.55 120.00 165.27 163.17 147.25
2009-10 214.41 242.59 162.49 205.88 226.90 169.76 204.15 127.09 185.74 180.52 157.02
2010-11 244.26 286.15 181.97 220.90 261.67 187.04 233.52 139.63 197.14 203.16 180.67
General Food & Beverages Clothing Housing, Household Health Transport Commu- Recreation Education Restaurant Miscellan-Non & & Water, Equipment & nication & & eous
Alcholic Tobaco Foot Elec.Gas Repair Culture HotelsBeverages wear & Fuel Maintenance
2008-09 117.03 123.13 113.64 111.74 112.01 115.97 108.03 125.15 105.59 114.27 108.15 123.53 117.65
2009-10 128.85 139.05 136.71 119.22 122.14 123.93 114.33 132.79 109.65 127.87 119.39 140.36 133.63
2010-11 146.45 164.10 151.64 133.35 135.27 135.59 123.79 149.01 122.47 134.62 128.17 164.04 152.45
2011-12 162.57 182.20 165.01 153.45 146.17 160.28 137.97 171.39 122.94 145.35 143.83 185.82 181.47
2012-13 174.53 195.18 191.02 175.58 151.34 179.87 156.56 186.43 126.16 169.07 156.69 203.63 199.49
2013-14 189.58 212.74 223.38 198.01 164.60 195.85 167.15 195.15 129.76 183.77 172.57 228.61 210.15
2014-15 198.16 220.20 269.93 213.82 174.93 208.68 176.19 187.22 130.09 190.29 196.40 244.58 221.13
2015-16 203.82 219.42 329.25 224.18 183.90 217.38 182.69 174.25 130.56 194.21 213.02 256.79 228.22
2016-17 212.29 226.59 368.88 233.36 192.91 223.90 201.82 172.93 131.79 196.31 235.72 256.79 240.23
2017-18 220.62 232.95 310.09 244.45 202.50 233.06 218.13 182.18 133.26 200.24 264.79 285.88 254.99
2018-19 236.81 242.62 345.33 260.88 221.07 251.44 235.29 211.50 141.29 215.90 289.97 302.04 276.48
General Food and Alcoholic Clothing Housing, Furnishing Health Transport Commun Recreation Education Restaurants Misc.non- Beverages and Water, and ication and culture and goods and
alcholic Tobacco footwear Elec., Gas household hotels servicesBeverages and other equipment
fuels Maintenance2016-17 104.81 104.27 110.76 105.29 105.98 102.34 107.97 99.26 100.03 102.26 110.83 106.04 104.39
2017-18 109.72 107.49 100.83 110.94 111.23 106.00 114.98 108.04 100.65 104.91 123.88 113.14 109.93
2018-19 117.18 112.24 112.26 118.13 120.08 114.00 122.92 125.31 103.28 111.53 134.72 119.11 118.85
2019-20 129.76 129.59 135.80 129.56 128.33 125.70 136.81 138.71 106.84 118.70 141.90 127.76 132.96
2020-21 141.31 146.74 143.36 142.61 136.35 136.23 148.36 140.38 107.62 123.99 143.71 138.66 148.34Note: i) CPI 2000-01base year series converted into base year 2007-08. Source: Pakistan Bureau of Statistics
ii) The base year period of Price indices has been updated from 2007-08 to 2015-16.
Groups/FiscalYear
Base Year : 2015-16 = 100
A. COMBINED CONSUMER PRICE INDEX BY GROUPSGroups/FiscalYear
Base Year : 2000-01 = 100
Groups/FiscalYear
Base Year : 2007-08 = 100
97

TABLE 7.2
Percent Change in Consumer Price Index (CPI) (By Groups)
General
Food Beverages
& Tobacco
Apparel Textile & Footwear
House Rent
Fuel & Lighting
Household Furniture,
Equipments etc.
Transport & Commu-
nication
Recreation Entertain-
ment & Education
Education
Cleaning, Laundry &
Personal Appearance
Medicare
2001-02 3.54 2.50 3.23 2.80 9.47 3.93 5.96 6.30 4.97 2.50 2.37
2002-03 3.10 2.83 3.44 0.72 7.62 2.86 5.32 0.86 4.72 4.75 3.15
2003-04 4.57 6.01 2.74 4.50 2.96 3.54 3.43 -1.06 3.89 3.65 1.23
2004-05 9.28 12.49 3.00 11.29 3.68 6.01 8.39 -0.14 2.94 4.14 0.99
2005-06 7.92 6.92 4.07 9.42 9.00 5.18 16.61 -0.27 6.37 3.10 2.51
2006-07 7.77 10.28 5.21 6.69 9.00 6.67 2.10 0.10 7.03 4.23 9.27
2007-08 12.00 17.64 8.16 9.39 6.06 7.17 4.42 1.99 5.28 11.02 9.36
2008-09 20.77 23.70 14.23 17.11 25.52 13.11 23.79 11.25 17.32 18.00 11.35
2009-10 11.73 12.47 6.32 13.81 14.07 6.38 6.03 5.87 12.38 9.10 6.64
2010-11 13.92 17.95 11.99 7.29 15.32 10.18 14.38 9.87 6.14 12.54 15.06
Year GeneralFood &
Non- alcoholic
Alcoholic Bev. &
Tobacco
Clothing &
Footwear
Housing, water,
Elec., Gas & Fuels
Furnishing & Household Equipment
Maintenance
Health Transport Commun-ication
Recreation & Culture Educa-tion Restaurant
& HotelsMiscella-
neous
2008-09 17.03 23.50 13.64 11.74 12.01 15.97 8.03 25.15 5.59 14.27 8.15 23.53 17.65
2009-10 10.10 12.63 20.30 6.69 9.04 6.86 5.83 6.10 3.85 11.90 10.39 13.62 13.58
2010-11 13.66 18.34 10.92 11.85 10.76 9.41 8.27 12.21 11.69 5.28 7.35 16.88 14.08
2011-12 11.01 11.03 8.81 15.07 8.06 18.21 11.45 15.02 0.38 7.97 12.22 13.28 19.04
2012-13 7.36 6.72 15.77 14.42 3.54 12.23 13.47 8.78 2.62 16.32 8.94 9.58 9.93
2013-14 8.62 8.56 16.94 12.78 8.76 8.88 6.77 4.68 2.85 8.70 10.14 12.27 5.35
2014-15 4.53 2.63 20.84 7.98 6.28 6.55 5.41 -4.06 0.26 3.55 13.80 6.99 5.22
2015-16 2.86 0.97 21.98 4.84 5.13 4.17 3.69 -6.93 0.36 2.05 8.46 4.99 3.21
2016-17 4.16 3.27 12.04 4.09 4.90 3.00 10.47 -0.76 0.94 1.09 10.66 5.11 5.26
2017-18 3.92 2.81 -15.94 4.75 4.97 4.09 8.08 5.35 1.12 2.00 12.37 5.91 6.14
2018-19 7.34 4.15 11.36 6.72 9.17 7.89 7.87 16.09 6.03 7.82 9.51 5.65 8.43
2016-17 4.81 4.27 10.76 5.29 5.98 2.34 7.97 -0.74 0.03 2.26 10.83 6.04 4.39
2017-18 4.69 6.68 -8.96 5.37 4.96 3.57 6.49 8.85 0.62 2.59 11.78 6.70 5.30
2018-19 6.80 -4.56 11.33 6.47 7.96 7.55 6.90 15.98 2.61 6.31 8.77 5.27 8.12
2019-20 10.74 15.46 20.96 9.68 6.87 10.27 11.30 10.69 3.46 6.42 5.32 7.28 11.87
2020-21 8.90 13.23 5.57 10.07 6.25 8.37 8.44 1.20 0.72 4.46 1.28 8.52 11.57Source: Pakistan Bureau of Statistics
CONSUMER PRICE INDEX BY GROUPS
Fiscal Year
Base Year : 2015-16 = 100
Base Year : 2007-08 = 100
Base Year : 2000-01 = 100
98

TABLE 7.3
Groups/ Raw Fuel, Lighting Manufac- BuildingFiscal Year General Food Materials & Lubricants tures Materials
2000-01 100.00 100.00 100.00 100.00 100.00 100.00
2001-02 102.01 101.95 100.31 103.14 101.87 101.10
2002-03 107.77 105.62 115.51 115.95 103.67 102.90
2003-04 116.29 112.99 135.12 119.23 111.83 126.48
2004-05 124.14 125.03 110.44 138.01 113.05 143.79
2005-06 136.68 133.78 121.93 174.57 116.27 144.18
2006-07 146.17 145.67 138.85 184.10 119.91 151.93
2007-08 170.15 173.27 156.57 223.34 128.33 177.18
2008-09 201.10 213.54 184.45 258.96 140.67 213.00
2009-10 226.49 239.01 238.11 296.48 154.94 201.40
2010-11 279.30 285.93 374.44 348.19 197.39 226.63Groups/ General Agriculture Ores & Food Product, Other MetalFiscal Year Forestry & Minerals, Beverages & Transportable Products
Fishery Materials Tobacco, Goods Machinery &Product electricity Textiles Appreal Equipment
gas & water Leather Products
2008-09 118.93 119.10 125.31 114.57 125.21 109.07
2009-10 135.40 142.02 139.76 135.02 135.41 111.10
2010-11 164.17 183.20 159.13 166.49 155.77 128.10
2011-12 181.28 185.03 182.74 176.07 194.64 152.55
2012-13 194.61 198.23 211.17 188.39 203.93 159.29
2013-14 210.48 219.00 240.37 200.70 214.59 168.31
2014-15 209.85 220.56 245.47 206.76 197.12 172.72
2015-16 207.65 226.43 245.91 213.58 171.21 171.46
2016-17 216.02 248.00 242.08 225.59 168.07 174.40
2017-18 223.52 256.02 242.99 229.90 198.27 184.00
2018-19 250.28 276.64 279.87 254.78 220.88 190.87
2016-17 104.48 108.26 99.32 105.63 101.79 103.22
2017-18 109.99 113.40 100.88 107.80 115.52 106.06
2018-19 127.55 124.35 127.07 119.30 147.71 115.26
2019-20 140.63 137.80 163.40 131.68 147.95 131.83
2020-21 153.87 155.69 167.57 149.24 151.61 151.92Source: Pakistan Bureau of Statistics
Note: The base for price indices have been changed and different new groups have been included.Therefore, data may differ from the previous one.
PRICES INDICES (WPI)
B. Wholesale Price Index by Groups
Base Year : 2015-16 = 100
Base Year : 2000-01 = 100
Base Year : 2007-08 = 100
99

TABLE 7.4
SensitiveGeneral Food Raw Fuel & Lighting Manufac- Building Price
Materials & Lubricants tures Materials Indicator
2001-02 2.08 2.05 0.95 3.08 1.91 1.13 3.37
2002-03 5.57 3.50 14.42 12.48 1.73 1.70 3.58
2003-04 7.91 6.97 16.98 2.83 7.87 22.90 6.83
2004-05 6.75 10.66 -18.26 15.76 1.09 13.71 11.55
2005-06 10.10 7.00 10.40 26.48 2.08 0.27 7.02
2006-07 6.94 8.89 13.88 5.46 3.06 5.38 10.82
2007-08 16.41 18.95 12.76 21.31 7.02 16.62 16.81
2008-09 18.19 23.24 17.81 15.95 9.62 20.21 23.41
2009-10 12.63 11.92 29.09 14.49 10.15 (5.44) 13.30
2010-11 23.32 19.64 57.26 17.44 27.39 12.53 18.18
General Agricul-ture Forestry &
Fishery
Ores / Minerals,
Elec., Gas & Water
Other Transport-able Goods
Metal Product,
Machinery & Equipment
2008-09 18.93 19.10 25.31 15.90 25.21 9.07 21.14
2009-10 13.85 19.24 11.54 17.85 8.15 1.86 12.93
2010-11 21.25 29.00 13.86 23.31 15.04 15.30 16.58
2011-12 10.43 1.00 14.83 5.75 24.95 19.08 7.08
2012-13 7.35 7.13 15.56 7.00 4.77 4.42 7.77
2013-14 8.15 10.48 13.83 6.53 5.23 5.66 9.30
2014-15 -0.30 0.71 2.12 3.02 -8.14 2.62 1.74
2015-16 -1.05 2.66 0.23 3.30 -13.14 -0.73 1.31
2016-17 4.04 9.53 -1.58 5.62 -1.83 1.72 1.56
2017-18 3.47 3.23 0.38 1.91 9.48 2.72 0.88
2018-19 11.97 8.05 15.18 10.82 20.04 6.55 5.15
2016-17 4.48 8.26 -0.68 5.63 1.79 3.22 7.62
2017-18 5.27 4.74 1.56 2.05 13.49 2.75 2.47
2018-19 15.99 9.71 25.96 10.67 27.87 8.67 5.11
2019-20 10.25 10.82 28.59 10.38 0.16 14.38 13.74
2020-21 9.41 12.98 2.55 13.34 2.47 15.24 13.83Source: Pakistan Bureau of Statistics
Base Year : 2015-16 = 100
Base Year : 2007-08 = 100
Percent Change in Wholesale Price Index (WPI) (By Groups)
Wholesale Price Index by GroupsFiscalYear
Wholesale Price Index by Groups Sensitive Price
Indicator
Base Year : 2000-01 = 100
Food, Beverages, Tobacco, Textiles,
Leather
100

TABLE 7.5
Fiscal Consumer Wholesale Sensitive GDPYear Price Price Price Deflator
Index Index Indicator1999-00
2001-02 103.54 102.08 103.37 110.71
2002-03 106.75 107.77 107.06 115.61
2003-04 111.63 116.30 114.38 124.55
2004-05 121.98 124.14 127.59 133.30
2005-06 131.64 136.68 136.56 147.28
2006-07 141.87 146.18 151.34 158.60
2007-08 158.90 170.15 176.78 184.33
2008-09 191.90 201.10 218.16 221.77
2009-10 214.41 226.49 247.22 247.58
2010-11 244.26 279.30 292.16 294.07
2005-06
2008-09 117.03 118.93 121.14 146.18
2009-10 128.85 135.40 136.81 161.89
2010-11 146.45 164.17 159.48 193.50
2011-12 162.57 181.28 170.77 204.45
2012-13 174.53 194.61 184.04 219.00
2013-14 189.58 210.48 201.15 235.18
2014-15 198.16 209.85 204.66 245.40
2015-16 203.82 207.64 207.35 246.49
2016-17 212.29 216.02 210.59 256.29
2017-18 220.62 223.52 212.44 262.33
2018-19 236.81 250.28 223.35 284.44
Wholesale Sensitive GDPPrice Price DeflatorIndex Indicator
2016-17 104.81 104.83 104.77 107.62 107.62 256.29
2017-18 109.72 110.18 109.04 110.28 110.28 262.33
2018-19 117.18 117.99 115.95 115.92 115.92 284.88
2019-20 129.76 129.99 129.43 131.85 131.85 313.76
2020-21 141.31 140.57 142.42 153.87 150.09 344.38Source: Pakistan Bureau of Statistics
PRICE INDICES & GDP DEFLATOR
Base Year : 2007-08 = 100
Base Year : 2000-01 = 100
Consumer Price Index
CPI(N) CPI(U) CPI(R)
Base Year : 2015-16 = 100
101

TABLE 7.6
Fiscal Consumer Wholesale Sensitive AnnualYear Price Price Price GDP
Index Index Indicator DeflatorNational Urban Rural
1999-00
2000-01 4.41 - - 6.21 4.84 6.72
2001-02 3.54 - - 2.08 3.37 2.49
2002-03 3.10 - - 5.57 3.58 4.42
2003-04 4.57 - - 7.91 6.83 7.74
2004-05 9.28 - - 6.75 11.55 7.02
2005-06 7.92 - - 10.10 7.02 10.49
2006-07 7.77 - - 6.94 10.82 7.28 *
2007-08 12.00 - - 16.64 16.81 12.91
2008-09 20.77 - - 18.19 23.41 20.68
2009-10 11.73 - - 12.63 13.32 10.75
2010-11 13.92 - - 23.32 18.18 19.54
2005-06
2008-09 17.0 - - 18.9 21.1 20.68
2009-10 10.1 - - 13.8 12.9 10.75
2010-11 13.7 - - 21.2 16.6 19.52
2011-12 11.0 - - 10.4 7.1 5.66
2012-13 7.4 - - 7.4 7.8 7.12
2013-14 8.6 - - 8.2 9.3 7.39
2014-15 4.5 - - -0.3 1.7 4.34
2015-16 2.9 - - -1.0 1.3 0.45
2016-17 4.2 - - 4.0 1.6 3.97
2017-18 3.9 - - 3.5 0.9 2.36
2018-19 7.34 - - 11.97 5.15 8.43
2016-17 4.81 5.10 4.08 4.45 7.62 3.97
2017-18 4.68 7.08 6.34 3.90 7.38 2.36
2018-19 6.80 7.09 6.34 15.99 5.11 8.60
2019-20 10.74 10.17 11.62 10.24 13.74 10.14
2020-21 8.90 8.15 10.04 9.41 13.83 9.76Source: Pakistan Bureau of Statistics
PERCENTAGE CHANGE IN PRICE INDICES & GDP DEFLATOR
Base Year : 2000-01 = 100
Base Year : 2007-08 = 100
Base Year : 2015-16 = 100
102

TABLE 7.7
Income Group/ All Income Upto Rs 3001 to Rs 5001 to AboveFiscal Year Groups Rs 3000 5000 12000 Rs 12,000
2000-01 100.00 100.00 100.00 100.00 100.002001-02 103.54 102.97 104.88 103.44 103.642002-03 106.75 105.95 106.70 106.68 106.832003-04 111.63 111.61 112.18 111.72 111.392004-05 121.98 123.01 123.16 122.26 121.352005-06 131.64 132.47 132.44 131.51 131.452006-07 141.87 143.52 143.42 142.05 141.192007-08 158.90 163.98 163.64 160.24 156.322008-09 191.90 200.20 199.83 194.91 186.862009-10 214.41 224.33 223.81 218.07 208.342010-11 244.26 258.35 257.12 249.10 236.38
Income Group/ All Income Upto Rs 8001 to Rs 12000 to Rs 18001 to AboveFiscal Year Groups Rs 8000 12000 18000 35000 Rs 35,0002008-09 117.03 117.95 117.77 118.11 117.61 116.832009-10 128.85 130.39 130.19 130.61 129.77 128.252010-11 146.45 149.04 148.56 147.59 148.91 145.342011-12 162.57 164.00 164.37 163.06 165.01 162.092012-13 174.53 176.93 178.55 176.83 176.28 172.482013-14 189.58 192.57 193.69 193.00 192.26 186.722014-15 198.16 199.60 201.15 201.33 200.80 195.762015-16 203.82 204.45 206.72 206.14 206.80 201.652016-17 212.29 212.28 214.84 214.22 215.25 210.422017-18 220.62 218.23 221.44 221.15 222.70 220.092018-19 236.81 230.11 234.06 234.21 238.88 239.16
Consumption Group
Fiscal Year2016-17 104.83 104.21 104.38 104.49 104.60 105.052017-18 110.18 108.00 108.52 108.90 109.39 110.982018-19 117.99 113.92 115.00 115.57 116.31 119.902019-20 129.99 126.97 127.47 129.29 129.29 131.60
2016-17 104.77 104.54 104.66 104.69 104.84 104.952017-18 109.04 108.25 108.54 108.77 109.11 109.502018-19 115.95 114.33 114.94 115.31 115.83 118.022019-20 129.42 129.30 129.08 128.87 128.85 130.652020-21 142.42 144.61 143.31 142.26 141.40 141.82
Source: Pakistan Bureau of StatisticsNote: The base year period of Price indices has been updated from 2007-08 to 2015-16.
(Upto Rs. 17,732)
(Rs. 22,889 to
29,517)
(Rs. 17,733 to
22,888)
(Rs. 29,518 to
44,175)
(Upto Rs. 17,732)
PRICE INDICES BY CONSUMER INCOME GROUPS
Base Year : 2000-01 = 100
Base Year : 2015-16 = 100Urban
(Rs. 17,733 to
22,888)
(Rs. 29,518 to
44,175)
(Above Rs.
44,175)
(Above Rs.
44,175)
Rural
Combined
Combined(Rs. 22,889
to 29,517)
Spliced with Base Year : 2007-08 = 100
103

TABLE 7.8
(Price in Rs.)(Weight in Kg.)
Fiscal Wheat Wheat Basmati* Moong Gram Beef Chicken Mutton Eggs Hen Potato Dry TomatoYear (Av.Qlty) Flour Rice Pulse Pulse (Cow/ (Farm) (Goat) (Farm) (Av.Qlty) Onion (Av.Qlty)
(Av.Qlty) (Broken (Washed) (Av.Qlty) Buffalo (Av.Qlty) Doz. (Av.Qlty)withbone)
2000-01 8.67 9.80 15.35 30.30 29.52 56.01 50.65 109.38 26.35 9.74 10.72 17.24
2001-02 8.29 9.67 15.49 34.36 34.89 55.19 52.04 111.53 28.57 11.43 9.59 17.12
2002-03 8.73 10.14 18.07 30.46 31.13 61.21 54.01 124.95 30.69 9.43 8.70 13.30
2003-04 10.25 11.71 19.04 27.98 24.17 75.45 57.50 154.31 30.03 8.58 11.09 19.10
2004-05 11.68 13.28 20.19 31.66 29.35 94.83 66.43 185.19 37.45 14.94 13.82 25.03
2005-06 11.55 13.06 20.16 47.28 31.12 106.84 66.08 202.10 35.07 18.18 12.05 19.48
2006-07 11.96 13.64 23.11 56.53 41.38 117.87 74.16 224.07 38.31 17.22 20.95 27.43
2007-08 16.44 18.07 37.77 52.67 44.78 123.30 83.39 236.49 49.45 15.22 16.28 28.50
2008-09 23.87 25.64 47.12 50.10 57.15 143.82 103.12 262.03 58.80 20.35 25.77 29.67
2009-10 25.40 28.77 43.92 78.02 53.34 174.49 126.22 316.52 65.67 23.74 25.56 27.72
2010-11 25.79 29.56 50.32 136.49 70.25 215.42 130.98 411.48 72.78 27.59 33.27 44.86
2008-09 24.07 25.53 47.12 50.10 57.15 143.82 103.13 262.03 58.80 20.36 25.77 29.70
2009-10 25.51 28.73 43.92 78.02 53.34 174.49 126.22 316.52 65.67 23.74 25.56 27.72
2010-11 25.98 29.41 50.32 136.49 70.25 215.42 130.98 411.48 72.78 27.58 33.28 44.86
2011-12 26.74 30.26 60.36 127.90 83.32 252.41 150.07 482.04 86.95 25.33 32.24 46.46
2012-13 30.61 34.53 69.01 115.95 99.70 268.38 143.93 517.83 92.02 26.09 36.71 49.80
2013-14 37.02 40.98 74.09 137.64 74.77 283.99 161.40 559.49 97.61 42.79 41.63 58.36
2014-15 34.56 39.28 72.38 161.94 79.33 301.55 153.64 592.56 98.71 42.49 35.80 55.05
2015-16 33.92 38.57 63.00 160.30 123.53 316.37 151.95 627.94 89.84 25.75 44.29 49.14
2016-17 33.77 37.99 63.90 139.93 149.85 327.52 145.88 662.65 101.86 34.09 30.08 51.82
2017-18 33.11 37.45 72.07 118.15 118.76 348.64 158.87 733.68 103.17 33.89 48.59 59.62
2018-19 34.95 39.36 76.82 128.64 123.10 376.47 163.06 783.88 102.93 27.21 36.91 64.85
2019-20 - 897.48* 81.92 213.44 142.21 431.29 169.73 896.00 106.71 44.57 59.90 56.83
2020-21 - 1010.32 90.41 231.42 143.81 482.26 207.39 1004.05 153.10 53.41 43.01 61.38
- Not Available (Contd.)Note: i) The base year period of Price indices has been updated from 2007-08 to 2015-16.
ii) The base for price indices have been changed and different new groups have been included.Therefore, data may differ from the previous one.
iii)iv) * : The unit of Wheat Flour bag has changed from 1kg to 20 kg. in base year 2015-16.
AVERAGE RETAIL PRICES OF ESSENTIAL ITEMS (Average of 17 centres)
Base Year : 2000-01 = 100
Base Year : 2007-08 = 100
Base Year : 2015-16 = 100
In the new base year 2015-16, prices are disseminated w.e.f July, 2019.
104

TABLE 7.8
AVERAGE RETAIL PRICES OF ESSENTIAL ITEMS (Average of 17 Centres)
(Price in Rs.)(Weight in Kg.)
Fiscal Mustard Vegeta- Rock Red Sugar Gur Milk Tea in*Year Oil ble Ghee Salt Chilies (Open (Sup. Fresh Packet
(Mill) (Loose) (Powder) (Av.Qlty) Market) Qlty) Ltr. (Sup.Qlty)250 grams
2000-01 56.92 44.82 3.43 66.75 27.11 26.31 18.23 53.73
2001-02 59.01 49.20 3.19 78.34 22.87 23.12 17.92 57.00
2002-03 60.80 55.25 3.21 75.87 20.77 20.45 18.35 61.50
2003-04 63.51 59.84 3.22 73.80 19.01 19.79 19.21 64.68
2004-05 65.63 59.60 3.50 76.64 23.45 23.98 21.28 61.99
2005-06 66.70 58.95 3.94 70.79 31.16 35.90 23.90 62.62
2006-07 76.71 70.81 4.68 94.66 31.85 39.26 26.72 68.39
2007-08 119.71 108.43 5.12 147.84 27.92 32.87 30.45 68.28
2008-09 142.25 110.63 6.08 145.32 38.72 43.65 36.62 97.94
2009-10 133.56 112.04 6.69 152.38 57.11 70.74 42.32 120.77
2010-11 156.56 150.31 7.23 230.27 72.72 83.86 50.10 139.17
2008-09 142.25 110.62 6.09 145.32 38.72 43.65 36.62 88.89
2009-10 133.55 112.04 6.69 152.38 57.11 70.74 42.32 108.98
2010-11 156.56 150.31 7.28 230.27 72.72 83.86 50.10 123.19
2011-12 178.29 166.26 8.13 299.42 60.99 78.27 58.17 135.15
2012-13 185.88 160.73 8.74 254.06 53.25 74.50 65.24 146.01
2013-14 184.48 160.57 9.37 221.33 53.82 82.83 69.86 154.58
2014-15 183.08 151.90 9.98 261.42 57.14 83.95 76.21 133.80
2015-16 179.67 138.35 10.43 274.03 62.60 89.28 78.24 172.76
2016-17 181.15 143.34 10.64 272.60 64.94 88.20 80.59 177.24
2017-18 183.83 146.22 11.10 266.58 53.70 81.49 82.75 189.44
2018-19 195.43 161.85 12.29 335.21 59.84 85.75 86.74 210.27
2019-20 208.50 225.75 29.90 157.44** 76.60 115.20 93.43 225.54
2020-21 254.12 269.95 30.01 318.56 94.21 128.82 105.17 230.17*: Tea packet prices in Bases year 2007-08=100 is quoted of 200 grams packet price. (Contd.)*: Tea packet prices in Bases year 2015-16=100 is quoted of 190 grams packet price.**: Red chilli packet price in Bases year 2015-16=100 is quoted.
Base Year : 2000-01 = 100
Base Year : 2007-08 = 100
Base Year : 2015-16 = 100
In the new base year 2015-16, prices are disseminated w.e.f July, 2019.
105

TABLE 7.8
AVERAGE RETAIL PRICES OF ESSENTIAL ITEMS (Average of 17 Centres)
(Rs/unit)Fiscal Cigaret- Coarse Voil Shoes Firewood Match Washing Life-Year tes Latha Printed Gents (Kikar/ Box (40/ Soap buoy
Pkt Mtr. Mtr. Concord Babul) 50 Sticks) 707/555 SoapBata 40 Kgs. Each Cake Cake
2000-01 5.01 24.11 33.04 399.00 104.04 0.50 6.90 9.50
2001-02 5.82 26.81 33.30 399.00 99.30 0.51 7.37 10.02
2002-03 6.06 26.84 33.74 428.17 104.20 0.51 7.48 11.00
2003-04 6.08 28.80 34.52 499.00 118.40 0.51 7.48 10.82
2004-05 6.90 32.08 36.13 492.33 135.96 0.53 7.47 14.00
2005-06 7.23 34.26 36.74 399.00 166.03 0.62 7.73 13.93
2006-07 7.98 35.05 37.90 429.00 191.72 0.71 8.13 14.18
2007-08 8.38 39.04 40.29 499.00 220.74 0.92 9.78 17.38
2008-09 9.11 44.69 46.02 499.00 264.12 1.00 12.51 21.59
2009-10 11.55 47.25 48.91 499.00 296.64 1.00 12.87 22.00
2010-11 13.72 57.52 56.67 499.00 354.29 1.00 15.14 25.47
2008-09 18.19 135.35 59.29 499.00 264.12 1.00 12.51 21.59
2009-10 23.11 135.69 63.31 499.00 296.64 1.00 12.87 22.00
2010-11 27.44 148.57 72.35 499.00 354.29 1.00 15.14 25.47
2011-12 29.10 111.21 88.07 499.00 441.74 1.06 18.39 30.50
2012-13 32.34 151.14 101.61 549.00 491.55 1.10 21.00 32.29
2013-14 38.45 176.59 112.40 671.92 538.12 1.42 23.34 35.86
2014-15 45.85 200.22 122.90 699.00 566.85 1.74 24.33 36.06
2015-16 57.75 203.29 123.29 699.00 593.42 1.99 24.74 36.16
2016-17 64.85 206.13 124.12 699.00 604.81 2.14 25.74 38.06
2017-18 50.86 215.80 127.34 699.00 621.24 2.24 26.39 40.67
2018-19 57.29 268.31 154.69 699.00 566.61 2.42 36.35 46.66
2019-20 81.24 306.67 146.50 899.00 668.45 2.51 45.13 44.66
2020-21 83.42 359.53 165.77 1013.00 716.92 3.11 53.78 47.04Note: Prices of Long Cloth and Georgerette have been quoted in base year 2007-08 and 2015-16 (Contd.)
instead of prices of Coarse Latha and Voil Printed in previous base year.
Base Year 2000-01 = 100
Base Year : 2007-08 = 100
Base Year : 2015-16 = 100
In the new base year 2015-16, prices are disseminated w.e.f July, 2019.
106

TABLE 7.8
(Rs/unit)Electric Cooked Cooked Rice Masoor Mash Cooking Vegetable
Fiscal Bulb Beef Dal Irri-6 Pulse Pulse Garlic Oil Dalda GheeYear (60-W) Plate Plate Kg Kg Kg Kg 2.5 Ltr 2.5 Kg
2000-01 14.10 18.53 11.87 11.56 36.97 48.38 28.07 155.64 153.43
2001-02 14.00 18.58 12.42 11.51 38.41 44.25 39.93 170.97 169.24
2002-03 13.30 18.88 13.09 12.23 38.41 37.56 34.11 199.68 196.77
2003-04 12.69 20.95 13.86 13.06 35.40 35.57 32.82 203.98 200.28
2004-05 12.07 24.21 14.71 15.41 43.11 38.52 44.22 204.99 204.15
2005-06 11.43 26.07 15.65 16.05 45.01 52.91 58.09 204.41 203.63
2006-07 11.95 29.80 17.84 17.59 44.54 70.51 61.81 224.48 224.06
2007-08 12.68 33.26 20.46 29.32 71.41 71.36 46.18 316.32 312.97
2008-09 14.83 40.18 25.59 39.35 122.16 77.31 41.64 371.38 356.44
2009-10 19.79 44.82 28.07 34.43 121.92 129.88 131.52 359.05 356.58
2010-11 24.07 52.88 33.65 38.87 117.72 163.16 198.92 435.88 435.98
2008-09 112.96 40.18 25.59 39.35 122.16 77.31 41.68 371.38 356.44
2009-10 118.78 44.82 28.07 34.43 121.92 129.88 131.52 359.05 356.58
2010-11 124.75 52.88 33.65 38.87 117.72 163.16 198.92 435.88 435.98
2011-12 139.93 60.54 37.27 45.68 102.64 145.82 107.89 502.66 501.91
2012-13 151.82 68.55 40.16 49.90 100.39 132.72 123.18 535.55 519.06
2013-14 162.69 77.84 45.46 54.05 120.49 134.21 129.71 538.73 511.77
2014-15 165.49 82.86 48.41 51.99 135.32 163.82 139.00 513.55 495.00
2015-16 166.95 87.19 52.62 47.16 146.36 238.59 200.32 457.61 448.92
2016-17 167.79 92.56 56.70 48.71 140.36 223.70 273.46 460.79 452.682017-18 168.98 101.49 58.83 51.53 118.44 164.91 166.10 471.26 464.462018-19 173.40 113.60 64.17 54.59 107.55 152.18 157.72 497.94 483.96
2019-20 185.73 133.64 68.75 62.54 141.16 211.13 280.43 1199.22 586.30
2020-21 199.66 148.96 75.60 71.09 156.48 250.28 216.42 1374.94 690.38(Contd.)
Note: Prices of Energy Saver (14-volts) have been quoted in new base year 2007-08 and 2015-16 instead of Electric Bulb (60 volts) prices in previous base year. * : The unit of cooking oil Dalda has changed from 2.5 Ltr. to 5 Ltr. in base year 2015-16In the new base year 2015-16, prices are disseminated w.e.f July, 2019.
AVERAGE RETAIL PRICES OF ESSENTIAL ITEMS (Average of 17 Centres)
Base Year : 2000-01 = 100
Base Year : 2007-08 = 100
Base Year : 2015-16=100
107

TABLE 7.8
(Rs/Unit)Curd Tea Pre- Banana Lawn Shirting Shoes Chappal Bread Milk Pow-
Fiscal Kg pared Doz. Hussain Hussain Lady Gents Plain der NidoYear Cup Mtr. Mtr. Bata Spang M.Size 500 grams*
2000-01 22.43 4.03 22.11 77.77 59.10 319.00 79.00 11.17 114.03
2001-02 21.90 4.18 22.14 70.79 55.17 319.00 79.00 11.14 116.00
2002-03 23.35 4.46 21.96 69.92 55.59 342.23 79.00 11.16 88.00
2003-04 23.33 4.72 23.01 69.96 56.78 364.00 79.00 11.77 94.75
2004-05 25.75 5.12 25.11 72.61 59.94 252.33 86.53 13.25 102.62
2005-06 28.38 5.77 28.18 76.42 62.36 299.00 89.00 14.23 108.50
2006-07 31.34 6.31 32.51 79.69 65.45 299.00 92.00 15.34 121.47
2007-08 35.76 6.91 35.43 83.45 71.01 299.00 101.50 18.43 145.93
2008-09 43.38 8.41 39.62 91.00 78.38 372.33 127.33 24.17 168.48
2009-10 49.74 10.07 40.94 96.46 81.55 379.00 129.00 26.42 183.31
2010-11 58.41 12.66 49.15 110.53 88.80 397.33 138.17 28.24 204.38
2008-09 43.38 8.41 39.62 126.32 78.38 372.33 129.00 24.17 168.48
2009-10 49.74 10.07 40.94 137.48 81.55 379.00 129.00 26.42 183.31
2010-11 58.41 12.66 49.16 150.31 88.80 397.33 139.00 28.24 204.38
2011-12 68.19 14.25 65.10 166.26 108.37 399.00 152.08 31.23 247.85
2012-13 75.74 15.30 68.83 166.52 124.22 449.00 179.00 34.23 289.78
2013-14 81.88 16.97 70.63 198.05 144.91 499.00 179.00 39.17 310.50
2014-15 89.48 18.70 76.77 239.61 157.72 499.00 179.00 40.78 251.69
2015-16 92.10 19.36 75.70 244.90 162.32 500.61 179.02 40.82 372.70
2016-17 94.66 20.28 78.87 251.98 164.85 502.39 179.09 41.11 378.43
2017-18 99.15 21.23 81.04 260.65 171.58 524.53 183.65 42.07 379.46
2018-19 101.24 22.28 77.11 316.04 206.01 599.00 199.00 44.10 401.08
2019-20 108.22 25.81 78.82 355.16 201.32 599.00 199.00 47.82 448.85
2020-21 121.53 28.35 86.09 389.20 234.43 599.00 218.48 55.55 478.05Source: Pakistan Bureau of Statistics
* : The unit has changed from 500 gms to 400 gms in base year 2000-01* : The unit has changed from 500 gms to 390 gms in base year 2015-16In the new base year 2015-16, prices are disseminated w.e.f July, 2019.
AVERAGE RETAIL PRICES OF ESSENTIAL ITEMS (Average of 17 Centers)
Base Year : 2000-01 = 100
Base Year : 2007-08 = 100
Base Year : 2015-16 = 100
108

TABLE 7.9
Fiscal Wheat Rice Gram Sugar Vegetab- Tea Meat Vegeta- Fresh Cotton MotorYear (Whole) Refined le Ghee bles Milk Fuels
2000-01 100.00 100.00 100.00 100.00 100.00 100.00 100.00 100.00 100.00 100.00 100.00
2001-02 96.10 109.64 84.23 82.36 114.12 99.28 102.04 107.57 99.79 91.31 102.90
2002-03 101.12 126.09 71.40 75.32 130.34 96.93 111.10 101.65 100.50 110.46 106.80
2003-04 191.89 138.50 74.17 67.72 141.44 96.94 137.55 116.00 105.41 144.44 111.03
2004-05 137.24 153.40 95.52 85.18 137.41 93.78 169.19 144.06 113.43 95.23 134.78
2005-06 135.61 154.78 127.43 120.70 136.94 93.99 185.95 160.14 122.83 103.91 181.46
2006-07 139.21 175.54 147.79 118.80 164.73 100.48 201.01 161.14 133.31 110.92 181.38
2007-08 190.75 285.63 139.22 98.78 249.36 100.92 207.99 163.85 154.42 136.71 192.88
2008-09 277.87 356.43 181.83 142.52 254.49 134.83 242.43 204.04 184.75 153.12 216.16
2009-10 300.58 317.20 215.86 209.50 262.63 160.82 292.57 267.37 206.54 203.26 219.11
2010-11 301.21 365.48 242.04 267.79 354.09 179.71 370.99 370.80 242.21 386.09 244.87
2008-09 148.02 125.90 126.16 142.39 97.19 129.05 115.53 132.22 119.35 121.12 113.68
2009-10 157.54 111.40 144.32 209.80 94.75 151.22 139.74 151.74 135.32 144.08 119.93
2010-11 159.53 123.39 169.24 251.13 118.21 165.31 174.86 173.43 157.40 171.48 126.84
2011-12 163.44 149.45 - 229.24 141.37 192.23 214.40 211.52 190.29 189.55 155.00
2012-13 188.52 165.42 - 201.93 141.75 203.24 228.80 216.66 213.81 168.92 168.70
2013-14 227.13 177.67 - 206.98 141.51 215.49 238.93 254.41 225.98 185.58 184.99
2014-15 209.29 172.20 - 189.35 147.13 145.16 236.14 255.40 249.87 208.86 167.79
2015-16 209.07 147.58 - 237.16 119.85 242.82 267.79 258.45 255.23 249.16 120.71
2016-17 208.21 154.49 - 242.70 124.63 243.24 282.23 280.77 266.08 268.07 115.52
2017-18 202.02 172.15 - 201.60 127.22 261.70 311.25 294.16 275.05 262.92 134.99
2018-19 211.14 191.38 - 226.24 135.10 285.16 348.60 293.46 287.20 269.50 164.47
2019-20 119.09 145.34 - 123.16 138.46 126.36 139.45 178.87 116.22 127.20 150.35
2020-21 158.62 166.97 - 150.78 167.12 129.72 162.32 161.91 141.12 138.85 148.00-: Not available (Contd.)Note: In the new base year 2007-08 and 2015-16 prices of Motor Spirit has been quoted instead of Motor Fuel
prices in previous base year 2000-01.
INDICES OF WHOLESALE PRICES OF SELECTED COMMODITIES
Base Year : 2000-01 = 100
Base Year : 2007-08 = 100
Base Year : 2015-16=100
109

TABLE 7.9
Fiscal Other Fire Cotton Matches Soaps Ferti- Trans- Leather Timber CementYear Oils Wood Yarn lizers port
2000-01 100.00 100.00 100.00 100.00 100.00 100.00 100.00 100.00 100.00 100.00
2001-02 103.59 101.33 95.35 100.55 103.89 102.26 106.66 100.00 101.45 100.42
2002-03 128.10 103.94 98.06 100.55 109.00 113.59 106.82 95.23 101.25 102.77
2003-04 139.86 115.41 121.03 105.61 110.68 123.64 108.70 93.64 121.75 102.45
2004-05 169.56 127.94 106.36 107.66 122.81 140.95 110.39 102.77 140.93 104.82
2005-06 227.55 152.23 108.07 107.67 122.05 156.16 111.71 110.65 142.05 122.67
2006-07 237.63 176.28 112.66 107.67 127.73 147.70 114.94 111.86 162.09 127.42
2007-08 264.00 205.70 112.15 111.86 147.59 215.18 114.99 121.84 170.93 111.61
2008-09 372.04 247.76 104.21 124.26 176.29 310.97 123.95 129.83 201.11 139.83
2009-10 434.55 273.93 138.40 124.26 182.99 296.52 128.03 134.14 210.60 129.35
2010-11 511.36 322.67 222.84 131.38 203.92 357.86 159.78 216.90 227.95 132.15
2008-09 126.68 118.08 106.00 122.07 111.35 147.58 109.26 103.63 114.01 129.08
2009-10 122.94 129.86 150.86 108.52 117.69 143.70 113.20 104.89 118.75 117.30
2010-11 141.73 151.43 182.87 110.37 130.52 174.65 116.77 107.07 127.27 140.80
2011-12 166.98 190.47 196.06 118.84 151.04 258.65 - 109.08 139.00 162.19
2012-13 177.67 215.48 208.38 132.57 167.01 261.38 - 111.60 149.51 185.77
2013-14 178.30 238.11 213.03 143.20 180.26 266.33 - 168.48 170.36 203.42
2014-15 179.03 252.59 246.11 175.76 160.21 235.83 - 216.67 200.60 225.95
2015-16 162.08 263.90 173.44 162.62 183.87 260.00 - 220.42 214.44 212.15
2015-16 161.99 263.88 173.41 162.62 183.87 260.10 - 220.40 214.35 212.23
2016-17 178.77 272.97 198.86 165.53 189.10 219.37 - 222.98 225.62 214.45
2017-18 186.98 282.43 216.99 171.36 191.32 222.52 - 215.78 233.96 217.99
2018-19 232.43 290.68 267.72 172.07 198.37 258.49 - 224.79 243.08 236.62
2019-20 131.64 111.12 164.90 1164.79 110.25 101.84 - 106.04 111.87 113.42
2020-21 141.77 124.41 179.14 1172.40 113.18 102.06 - 119.27 152.12 122.71-: Not available Source: Pakistan Bureau of StatisticsNote: In the base year 2007-08 and 2015-16 prices of Kerosene Oil has been quoted instead of Other Oils
in previous base year of 2000-01 and prices of Motor Cycles instead of Transport.
INDICES OF WHOLESALE PRICES OF SELECTED COMMODITIES
Base Year : 2000-01 = 100
Base Year : 2007-08 = 100
Base Year : 2015-16 = 100
110

TABLE 7.10
AVERAGE WHOLESALE PRICES OF SELECTED COMMODITIES
Rs./UnitsFiscal Wheat Rice Gram Masoor Mash Moong Chilies Gur Sugar VegetableYear FAQ Basmati Whole Split Whole Split Dry Red FAQ Refined Ghee
FAQ FAQ FAQ FAQ FAQ RationShop
40 Kg 40 Kg 40 Kg 40 Kg 40 Kg 40 Kg 40 Kg 40 Kg 40 Kg 16 Kg
(a) (a) (a) (a) (a)2001-02 784.15 910.00 3162.83 3213.07 3241.69 2858.39 2601.67 750.52 1077.67 b 749.58
2002-03 833.85 1009.09 2589.65 2843.82 2387.96 2287.45 1934.41 684.88 988.45 b 848.71
2003-04 984.75 1225.95 2725.66 3005.36 2169.17 2065.89 1969.84 630.20 884.99 b 922.75
2004-05 1127.26 1257.44 3510.44 3779.17 2533.45 2539.22 2069.72 805.68 1113.18 896.50
2005-06 1113.80 1290.06 4682.60 3739.70 4000.30 4173.70 1532.00 1236.20 1577.30 893.30
2006-07 1143.30 1476.90 5430.80 3853.20 5153.00 4925.30 2872.70 1282.00 1552.50 1074.70
2007-08 1566.70 2344.10 5115.90 6186.00 5036.20 4127.00 4756.90 1019.80 1290.80 1626.80
2008-09 2282.02 3026.30 6572.02 10907.60 5382.90 3885.80 3755.80 1364.90 1862.40 1660.30
2009-10 2468.80 2691.20 7932.00 10386.80 8535.00 6703.40 4159.10 2357.20 2737.70 1713.40
2010-11 2474.00 2955.80 8894.10 9398.50 10707.00 12086.00 7244.30 2822.20 3499.50 2310.10
2008-09 2321.36 a 3002.72 6829.46 a 11014.28 a 5691.52 a 3894.89 a 3756.62 1368.11 1850.27 b 1700.63
2009-10 2470.68 a 2647.67 7917.32 a 10534.83 a 8797.32 a 6476.40 a 4229.58 2288.67 2679.62 b 1735.74
2010-11 2501.99 a 2878.95 8541.95 a 9874.11 a 10225.89 a 10163.61 a 7124.95 2598.25 3231.50 b 2271.28
2011-12 2563.30 a 3320.47 12182.87 a 8043.17 a 10680.36 a 10496.76 a 10229.28 2518.15 2924.89 b 2603.92
2012-13 2956.64 a 4098.96 10745.76 a 8254.10 a 9734.23 a 9558.75 a 6700.93 2365.61 2551.31 b 2450.77
2013-14 3596.88 a 4704.81 8471.34 a 10223.89 a 9495.24 a 12021.40 a 6123.24 2729.36 2553.76 b 2480.00
2014-15 3282.28 a 4328.13 8593.78 a 11635.83 a 12391.07 a 14225.16 a 8566.51 2725.17 2723.39 b 2304.00
2015-16 3278.89 a 3532.00 10503.57 a 12410.69 a 18298.51 a 13685.90 a 8430.09 2906.63 2974.61 b 2118.00
2016-17 3265.48 a 3807.86 15755.80 a 11051.08 a 16587.27 a 11005.69 a 7530.74 2846.06 3065.99 b 2240.96
2017-18 3168.29 a 4589.79 15665.92 a 8338.40 a 12450.08 a 9299.80 a 8001.16 2479.11 2527.15 b 2269.08
2018-19 3311.34 a 4968.94 12846.71 a 8666.14 a 10342.41 a 10742.57 a 11302.41 2848.22 2824.79 b 2398.16
2019-20 3889.04 a 6972.84 4838.83 a 4588.97 a 6550.98 a 7586.36 a 15136.86 3805.90 3621.16 b 2960.84
2020-21 5222.44 a 7111.54 4869.24 a 5410.10 a 7619.11 a 8067.74 a 28475.70 4177.69 4499.13 b 3693.12(Contd…)
a : New base year unit has changed to 100 kgb : 50 Kg
Base Year : 2000-01 = 100
Base Year : 2007-08 = 100
Base Year : 2015-16 = 100
111

TABLE 7.10
Rs./unitFiscal Beef Mutton Milk Eggs Potatoes Onion Mustard Cotton Tea Pkt. Cotton*Year White Oil Seed Oil & Blended NT Sindh
Lipton RCGold Label
40 Kg 40 Kg 40 Kg 000 Nos 40 Kg 40 Kg 40 Kg 40 Kg 250 gm 40 Kg2001-02 2048.93 3986.62 633.10 786.62 300.89 287.66 1844.79 1656.17 285.04 b 2667.95 c
2002-03 2178.04 4408.60 644.52 818.40 243.92 256.39 1972.20 1806.52 285.04 b 2764.93 c
2003-04 2623.33 5527.08 705.28 821.23 198.24 319.22 2146.44 1998.47 342.77 d 3615.22 e
2004-05 3257.92 6702.31 785.19 1024.87 400.23 412.79 2144.53 1919.23 340.28 d 2383.63 e
2005-06 3638.50 7186.10 866.30 959.80 502.00 340.90 2165.80 1902.00 345.30 d 2600.70 e
2006-07 3915.30 7823.60 969.00 1025.40 564.50 601.70 2560.10 2206.60 375.10 d 2776.30 e
2007-08 4055.90 8081.00 1109.20 1340.20 366.40 466.90 3906.20 3430.70 377.80 d 3421.90 e
2008-09 4778.10 9261.80 1329.70 1640.20 454.00 743.50 4502.00 3833.00 503.00 d 3832.40 e
2009-10 5819.20 11013.10 1504.50 1863.40 584.40 775.30 4183.20 3885.20 584.84 d 5087.50 e
2010-11 7248.90 14368.90 1718.20 2045.90 876.40 1028.40 5299.50 4845.10 658.78 d 9633.90 e
2008-09 4708.33 9253.93 584.63 1642.39 a 438.83 814.92 4562.65 3828.57 503.00 d -
2009-10 5741.02 11009.95 645.60 2049.70 a 580.01 779.30 4241.70 3775.52 584.84 d -
2010-11 7005.68 14484.72 758.57 1992.32 a 780.13 830.35 5138.62 4489.07 658.78 d -
2011-12 8665.00 17460.65 893.98 2412.59 a 610.00 1004.04 6143.83 5673.66 752.98 d -
2012-13 9275.46 18520.37 1018.05 2557.83 a 503.29 1133.94 6170.04 5544.91 804.51 d -
2013-14 9558.71 19808.80 - 2687.31 a 1076.44 1354.29 6076.63 5601.29 892.21 d -
2014-15 10314.77 21351.39 2581.87 2738.40 a 1093.98 1091.92 5924.73 5244.21 746.48 d -
2015-16 10600.00 22691.67 2637.32 2501.62 a 475.58 1389.80 5723.79 4827.35 968.81 d -
2016-17 11039.39 24436.57 1268.15 2802.69 a 783.17 831.79 5730.08 4972.06 988.48 d -
2017-18 12195.83 26865.74 1401.80 2902.50 a 733.92 1564.49 5944.33 5088.72 1060.77 d -
2018-19 13778.03 29619.91 2967.60 2821.22 a 625.67 1114.79 6315.13 5115.09 1182.58 d -
2019-20 15171.76 32465.83 3095.01 2868.01 1113.43 1856.31 6875.95 5640.37 1267.45 f 9448.37
2020-21 17712.61 36728.82 3583.06 4286.78 1273.75 1276.67 8663.51 6808.30 1276.09 f 10602.14a : Crate of 30 dozen d : Tea Lipton Yellow Label 200 grm. Pkt (Contd…)b : Tea Brook Bond (BB Tips) 250 gm pkt e : Cotton Spot rate ex-Karachi 40 kgc : Cotton Nayab 78 S.G. f : Tea Lipton Yellow Label 190 grm. 6 Pkt
* : Cotton NT Sindh RC in the new base year 2007-08 = 100 is not quoted
AVERAGE WHOLESALE PRICES OF SELECTED COMMODITIES
Base Year : 2015-16 = 100
Base Year : 2007-08 = 100
112

TABLE 7.10
Rs./UnitFiscal Timber Salt Motor Diesel oil Kerosene Pig Iron * Cement *Year CMT Rock Spirit Bulk Light Oil Bulk and Steel
Continental40 Kg Ltrs Ltrs Ltrs Tons Tons
2001-02 20,984.73 a 72.31 31.56 c 14.26 15.54 12500.00 3809.05
2002-03 20,984.51 a 71.36 32.75 c 17.23 19.55 12808.33 3951.83
2003-04 29,954.14 a 69.70 34.05 d 18.88 22.00 16916.67 4190.67 e
2004-05 45,316.59 a 78.69 41.34 d 23.67 26.07 20680.56 4190.68 e
2005-06 43,207.50 a 85.50 55.60 d 30.80 32.80 23614.50 5059.20 e
2006-07 56,722.00 a 92.30 55.60 d 32.50 35.00 24066.60 5285.00 e
2007-08 56,830.80 a 96.90 59.10 36.40 38.10 31014.50 4775.00 e
2008-09 63,060.10 111.30 66.30 50.70 55.10 39310.80 6133.30 e
2009-10 65,166.00 121.80 67.20 59.20 62.10 40079.40 5666.60 e
2010-11 69,574.60 133.00 75.10 70.30 73.15 40000.00 5623.30 e
2008-09 26,946.93 f 114.49 67.26 d 50.73 55.85 41211.67 6133.33 e
2009-10 29,645.33 f 123.63 70.95 d 60.15 62.79 40291.67 5641.67 e
2010-11 31,774.17 f 136.51 75.04 d 70.34 73.52 40000.00 5623.33 e
2011-12 35,565.23 f 171.60 91.70 d 87.95 90.57 40000.00 6391.67 e
2012-13 38,874.38 f 199.07 99.80 d 92.97 97.53 40000.00 8345.00 e
2013-14 46,016.34 f 232.86 109.47 d 98.13 106.17 40000.00 9518.33 e
2014-15 53,394.46 f 267.56 87.45 d 94.23 85.40 40000.00 10093.33 e
2015-16 57,771.03 f 272.14 71.41 d 47.32 51.65 40000.00 10110.00 e
2016-17 61,614.53 f 280.95 68.34 d 43.51 43.37 40000.00 10521.67 e
2017-18 104,861.19 f 296.96 79.86 d 56.28 61.73 40000.00 11236.37 e
2018-19 106,203.91 f 321.91 97.30 d 79.28 87.04 40000.00 12118.33 e
2019-20 107,742.75 f 370.40 101.93 d 75.10 82.82 - 13798.15 b
2020-21 123,613.41 414.25 101.38 69.72 71.85 - 13072.72a : Timber Deodar e : Cement Javedan Source: Pakistan Bureau of Statisticsb: Cement Lucky f : Timber Sheeshamc : S.G. Petrol (oct-87)d : Motor Spirit (87-RON)
AVERAGE WHOLESALE PRICE OF SELECTED COMMODITIES
Base Year : 2007-08 = 100
Base Year : 2015-16 = 100
113

TABLE 7.10
Rs./unitFiscal Caustic Robbialac Matches Cycle Cycle Bata Lifebuoy Cotton Textile CigarettesYear Soda VIP 50 Sticks Tyre Tube Shoes Soap Yarn 20/ Long Ordinary
Solid White Gross Servis service Slippers 2 Sindh 5-P Kohi-Ladies Fin Bri- noor
50 Kg. Ltrs Rani (Pair) Doz dge 5 Kg Metre 000
2001-02 1764.17 571.85 b 79.75 118.00 a 48.00 c 344.80 112.68 438.02 820.00 495.10 e
2002-03 1578.61 589.24 b 79.75 118.00 a 48.00 c 361.60 122.98 479.38 820.00 504.00 e
2003-04 1415.76 606.62 b 81.28 125.00 a 44.11 f 360.38 g 116.83 582.88 h 1478.50 i 504.00 e
2004-05 1472.01 597.50 b 81.42 129.17 a 46.30 f 343.14 g 160.02 525.42 h 1680.83 i 571.17 e
2005-06 1749.10 554.70 b 81.30 102.20 a 51.60 f 343.10 g 159.40 537.50 h 1675.80 i 653.80 e
2006-07 1619.90 520.00 b 81.30 102.50 a 52.00 f 328.80 g 161.00 550.60 h 1711.60 i 698.00 e
2007-08 2066.70 575.20 b 46.90 119.30 a 54.50 f 300.10 g 174.60 550.00 h 1740.00 i 720.00 e
2008-09 2412.20 757.00 53.00 165.80 a 76.80 f 378.90 g 226.50 664.90 1929.10 i 767.80 e
2009-10 2188.30 890.00 53.00 166.20 a 79.10 f 386.10 g 236.00 879.10 2144.10 i 897.50 e
2010-11 2232.90 940.80 57.10 195.60 96.10 f 396.80 g 266.50 1493.10 2670.00 i 1301.60
2008-09 2413.96 911.87 j 10.06 d 160.42 a 79.42 f 86.00 k 235.85 m 680.12 n 1937.50 i 767.89 e
2009-10 2189.69 930.83 j 8.94 d 161.25 a 81.75 f 86.00 k 238.86 m 906.67 n 2177.50 i 908.33 e
2010-11 2240.91 949.93 j 9.09 d 177.81 a 91.56 f 86.00 k 266.22 m 1555.63 n 2602.92 i 1265.00 e
2011-12 3081.30 1004.86 j 9.79 d 207.08 a 104.27 f 94.03 k 340.85 m 1224.73 n 3040.42 i 1376.67 e
2012-13 3480.42 1134.72 j 10.92 d 218.75 a 115.21 f 120.67 k 360.54 m 1311.25 n 3416.25 i 1550.00 e
2013-14 4055.94 1294.17 j 11.80 d 225.00 a 117.50 f 117.32 k 389.78 m 1352.50 n 3811.67 i 1790.00 e
2014-15 3866.15 1541.95 j 12.07 d 232.29 a 118.23 f 109.52 k 396.81 m 1191.25 n 3865.00 i 2164.58 e
2015-16 3787.69 1625.92 j 13.40 d 234.62 a 117.71 f 109.52 k 401.97 m 1156.92 n 3916.54 i 2751.92 e
2016-17 3904.17 1635.91 j 13.64 d 223.33 a 102.58 f 109.52 k 350.70 m 1314.54 n 4055.00 i 3114.58 e
2017-18 4360.00 1678.26 j 14.12 d 220.00 a 102.04 f 118.71 k 355.40 m 1404.17 n 4086.67 i 2400.00 e
2018-19 4982.29 1952.78 j 14.18 d 246.46 a 115.83 f 146.27 k 470.86 m 1509.63 n 4245.00 i 2850.00 e
2019-20 5178.25 21609.33 j 755.53 p 3477.93 q 1676.32 q 147.54 k 497.11 m 1758.24 n 4687.87 i 6000.00 o2020-21 5018.08 23820.11 766.38 3477.93 1645.25 150.12 514.75 1948.88 6515.18 6000.00
Source: Pakistan Bureau of Statisticsa : Cycle tyres and tubes nylon service each h : Cotton Yarn 20/2 Yousaf Textileb : Syn. enamel 413 (Buxly's) 3.6 ltr. i : Latha Mast Qalandar 40 metrec : Shoes ladies flaties (3-5) pair j : 4 litred : Matches (70-75) stick 10 Box packet. k : Spoung Chapplee : K-2 special (RSF 1000) m : Lux soap dozenf : Cycle Tube Diamond each n : Unit is 10 LBg : Ladies Flatties (554-6513) o : Capstan 20 sticks (10 bandles)p : Matches (70-75) stick 50 Box packet. q : Cycle tyres and tubes nylon servis dozen
AVERAGE WHOLESALE PRICES OF SELECTED COMMODITIES
Base Year: 2007-08=100
Base Year: 2015-16=100
114

TRADE & PAYMENTSUS $ Million
Trade Balance -28,188Export (f.o.b) 25,630Imports (f.o.b) 53,818
Services (net) -1,957
Balance on secondary Income 32,842Workers' Remittances 29,370
Current Account Balance -1,916
Capital Account 235 Financial Account -8,225
HIGHLIGHTS 2020-21
115

TABLE 8.1
SUMMARY BALANCE OF PAYMENTS AS PER BPM6
(Million US$)
ITEM 2012-13 2013-14 2014-15 2015-16 2016-17 2017-18 2018-19 2019-20 2020-21 P
Current Account Balance -2,496 -3,130 -2,815 -4,961 -12,270 -19,195 -13,434 -4,449 -1,916Current Account Balance without off. transfers -2,898 -3,464 -3,141 -5,546 -12,844 -20,165 -14,177 -4,898 -2,172
Exports of Goods FOB 24,802 25,078 24,090 21,972 22,003 24,768 24,257 22,536 25,630Imports of Goods FOB 40,157 41,668 41,357 41,118 48,001 55,671 51,869 43,645 53,818
Balance on Trade in Goods -15,355 -16,590 -17,267 -19,146 -25,998 -30,903 -27,612 -21,109 -28,188Exports of Services 6,724 5,345 5,872 5,456 5,915 5,851 5,966 5,437 5,882Imports of Services 8,288 7,995 8,848 9,002 10,576 12,277 10,936 8,753 7,839
of whichTransportation 3,297 3,874 4,160 3,272 3,808 3,956 3,639 3,036 2,929Travel 1,233 1,073 1,518 1,839 2,000 2,289 1,709 1,229 824
Balance on Trade in Services -1,564 -2,650 -2,976 -3,546 -4,661 -6,426 -4,970 -3,316 -1,957Balance on Trade in Goods and Services -16,919 -19,240 -20,243 -22,692 -30,659 -37,329 -32,582 -24,425 -30,145
Primary Income credit 488 508 644 610 696 726 578 479 580Primary Income debit 4,157 4,463 5,243 5,955 5,710 6,163 6,188 5,938 5,193
of which: Interest Payments 1,217 1,323 1,605 1,733 1,993 2,600 3,066 3,109 2,389Balance on Primary Income -3,669 -3,955 -4,599 -5,345 -5,014 -5,437 -5,610 -5,459 -4,613Balance on Goods, Services and Primary Income -20,588 -23,195 -24,842 -28,037 -35,673 -42,766 -38,192 -29,884 -34,758
Secondary Income credit 18,183 20,222 22,291 23,204 23,604 23,800 24,990 25,802 33,135of which: Workers' Remittances 13,922 15,837 18,721 19,917 19,351 19,914 21,740 23,131 29,370
Secondary Income debit 91 157 264 128 201 229 232 367 293Balance on secondary Income 18,092 20,065 22,027 23,076 23,403 23,571 24,758 25,435 32,842
Capital Account Balance 264 1,857 375 273 375 376 229 285 235Capital Account credit 266 1,857 375 279 375 376 229 288 235Capital Account debit 2 0 0 6 0 0 0 3 0
Net lending (+) / Net borrowing (–) (Current and Capital Accounts) -2,232 -1,273 -2,440 -4,688 -11,895 -18,819 -13,205 -4,164 -1,681
Financial Account -549 -5,553 -5,119 -6,878 -9,855 -13,611 -11,759 -9,313 -8,225Direct investment -1,258 -1,572 -960 -2,374 -2,320 -2,772 -1,436 -2,652 -1,786
Direct Investment Abroad 198 128 73 19 86 10 -74 -54 76Direct Investment in Pakistan 1,456 1,700 1,033 2,393 2,406 2,782 1,362 2,598 1,862
Portfolio investment -26 -2,762 -1,886 429 250 -2,257 1,274 409 -2,770Portfolio Investment Abroad 99 -23 -44 100 -1 -48 -144 -115 -7Portfolio Investment in Pakistan 125 2,739 1,842 -329 -251 2,209 -1,418 -524 2,763
Financial Derivatives (other than reserves) and ESOs* 0 2 -2 0 0 0 0 -8 0Other Investment 735 -1,221 -2,271 -4,933 -7,785 -8,582 -11,597 -7,062 -3,669
Net Acquisition of Financial Assets 314 -211 -71 96 1,180 273 -67 -127 471Net Incurrence of Liabilities -421 1,010 2,200 5,029 8,965 8,855 11,530 6,935 4,140
of whichGeneral Government 248 1,610 1,400 3,445 5,040 4,894 4,294 5,919 5,731
Disbursements 2,530 4,349 4,243 6,159 9,414 8,507 8,255 13,181 9,803Credit and Loans with the IMF (Other than Reserves)@ 0 0 0 0 0 0 0 2,834 499Other Long Term 2,274 3,617 3,088 4,498 8,251 6,782 6,610 8,736 8,056Short Term 256 732 1,155 1,661 1,163 1,725 1,645 1,611 1,248
Amortization 2,282 2,734 2,841 2,714 4,374 4,107 5,982 7,299 5,855Credit and Loans with the IMF (Other than Reserves) 361 900 563 53 0 0 0 0 0Other Long Term 1,530 1,834 1,696 1,927 2,981 2,619 4,444 6,117 5,071Short Term 391 0 582 734 1,393 1,488 1,538 1,182 784
Other Liabilities (Net) 0 -5 -2 0 0 494 2,021 37 1,783Net Errors and Omissions -309 -422 -33 462 94 -933 -58 150 -991Overall Balance 1,992 -3,858 -2,646 -2,652 1,946 6,141 1,504 -5,299 -5,553Reserves and Related Items -1,992 3,858 2,646 2,652 -1,946 -6,141 -1,504 5,299 5,553
Use of Fund Credit and Loans -2,538 -573 1,949 2,009 102 -86 -376 -745 -1,080 Exceptional Financing 0 0 0 0 0 0 0 0 0
SBP Gross Reserves 7,197 10,509 14,836 19,446 17,550 11,341 9,301 13,724 18,716P: Provisional; R: RevisedTotals may differ due to rounding off.* Employee Stock Options
Source: State Bank of Pakistan
117

TABLE 8.2
COMPONENTS OF BALANCE OF PAYMENTS (AS PERCENT OF GDP)
Year Exports * Imports * Trade Worker's CurrentDeficit * Remittances # Account
Balance #2000-01 12.9 15.1 2.1 1.5 -0.7
2001-02 12.8 14.4 1.7 3.3 1.9
2002-03 13.5 14.8 1.3 5.1 4.9
2003-04 12.6 15.9 3.3 3.9 1.8
2004-05 13.0 18.6 5.6 3.8 -1.4
2005-06** 12.0 20.9 8.9 3.4 -4.1
2006-07 11.1 20.0 8.9 3.6 -4.8
2007-08 11.2 23.5 12.3 3.8 -8.2
2008-09 10.5 20.7 10.2 4.6 -5.5
2009-10 10.9 19.6 8.7 5.0 -2.2
2010-11 11.6 18.9 7.3 5.2 0.1
2011-12 10.5 20.0 9.5 5.9 -2.1
2012-13 10.6 19.4 8.9 6.0 -1.1
2013-14 10.3 18.4 8.2 6.5 -1.3
2014-15 8.7 16.9 8.2 6.9 -1.0
2015-16 7.4 16.0 8.6 7.1 -1.7
2016-17 6.7 17.4 10.7 6.3 -4.0
2017-18 7.4 19.3 11.9 6.3 -6.1
2018-19 8.7 20.8 -12.1 7.8 -4.8
2019-20 8.1 16.9 -8.8 8.8 -1.7
2020-21 P 8.5 18.9 -10.4 9.8 -0.6P : Provisional Source: PBS, SBP & E.A.Wing, Finance Division* : Based on the data compiled by PBS**: Based on revised GDP base year since 2005-06 onwards# : Based on the data compiled by SBP
118

TABLE 8.3
EXPORTS, IMPORTS & TRADE BALANCE
Year Current Prices Exports Imports Balance Current Prices Exports Imports BalanceExports Imports Balance Exports Imports Balance
2000-01 539,070 627,000 -87,930 21.50 17.46 -2.42 9,202 10,729 -1,527 7.39 4.07 -12.24
2001-02 560,947 634,630 -73,683 4.06 1.22 -16.20 9,135 10,340 -1,205 -0.73 -3.63 -21.09
2002-03 652,294 714,372 -62,078 16.28 12.57 -15.75 11,160 12,220 -1,060 22.17 18.18 -12.03
2003-04 709,036 897,825 -188,789 8.70 25.68 204.12 12,313 15,592 -3,279 10.33 27.59 209.34
2004-05 854,088 1,223,079 -368,991 20.46 36.23 95.45 14,391 20,598 -6,207 16.88 32.11 89.30
2005-06 984,841 1,711,158 -726,317 15.31 39.91 96.84 16,451 28,581 -12,130 14.31 38.76 95.42
2006-07 1,029,312 1,851,806 -822,494 4.52 8.22 13.24 16,976 30,540 -13,564 3.19 6.85 11.82
2007-08 1,196,638 2,512,072 -1,315,434 16.26 35.66 59.93 19,052 39,966 -20,914 12.23 30.86 54.19
2008-09 1,383,718 2,723,570 -1,339,852 15.63 8.42 1.86 17,688 34,822 -17,134 -7.16 -12.87 -18.07
2009-10 1,617,458 2,910,975 -1,293,517 16.89 6.88 -3.46 19,290 34,710 -15,420 9.06 -0.32 -10.00
2010-11 2,120,847 3,455,287 -1,334,440 31.12 18.70 3.16 24,810 40,414 -15,604 28.62 16.43 1.19
2011-12 2,110,605 4,009,093 -1,898,488 -0.48 16.03 42.27 23,624 44,912 -21,288 -4.78 11.13 36.43
2012-13 2,366,478 4,349,880 -1,983,402 12.12 8.50 4.47 24,460 44,950 -20,490 3.54 0.08 -3.75
2013-14 2,583,463 4,630,521 -2,047,058 9.17 6.45 3.21 25,110 45,073 -19,963 2.66 0.27 -2.57
2014-15 2,397,513 4,644,152 -2,246,639 -7.20 0.29 9.75 23,667 45,826 -22,159 -5.75 1.67 11.00
2015-16 2,166,846 4,658,749 -2,491,903 -9.62 0.31 10.92 20,787 44,685 -23,898 -12.17 -2.49 7.85
2016-17 2,138,186 5,539,721 -3,401,535 -1.32 18.91 36.50 20,422 52,910 -32,488 -1.76 18.41 35.94
2017-18 2,555,043 6,694,897 -4,139,854 19.50 20.85 21.71 23,212 60,795 -37,583 13.66 14.90 15.68
2018-19 3,128,230 7,443,253 -4,315,023 22.43 11.18 4.23 22,958 54,763 -31,805 -1.09 -9.92 -15.37
2019-20 3,369,782 7,029,819 -3,660,037 7.72 -5.55 -15.18 21,394 44,553 -23,159 -6.81 -18.64 -27.18
2020-21 P 4,041,927 8,982,441 -4,940,514 19.95 27.78 34.99 25,304 56,380 -31,076 18.28 26.55 34.19P : Provisional Source: Pakistan Bureau of Statistics
Rs. million US $ million Growth Rate (%)Growth Rate (%)
119

TABLE 8.4
UNIT VALUE INDICES & TERMS OF TRADE (T.O.T) (1990-91 = 100)
Groups 2000-01 2001-02 2002-03 2003-04 2004-05 2005-06 2006-07
All GroupsExports 271.47 271.18 254.02 279.65 288.84 299.31 310.03Imports 298.44 298.56 309.52 355.43 392.45 460.38 495.33T.O.T. 90.96 90.83 82.07 78.68 73.60 65.01 62.59
Food & Live AnimalsExports 249.32 260.55 258.11 267.55 303.93 327.47 350.75Imports 278.82 277.41 259.76 282.18 314.36 323.95 431.20T.O.T. 89.42 93.92 99.36 94.82 96.68 101.09 81.34
Beverages & TobaccoExports 171.44 169.82 146.52 175.33 162.96 191.13 208.44Imports 698.92 790.14 598.00 521.88 561.23 621.67 675.14T.O.T. 24.53 21.49 24.50 33.60 29.04 30.74 30.87
Crude Materials(inedible except fuels)
Exports 192.12 158.90 171.58 218.86 195.64 209.97 225.52Imports 218.95 228.14 232.37 245.01 293.06 329.71 350.19T.O.T. 87.75 69.65 73.84 89.33 66.76 63.68 64.40
Minerals, Fuels & LubricantsExports 373.65 314.40 365.14 416.09 525.75 644.33 733.54Imports 276.87 249.66 297.20 306.38 389.16 615.00 632.08T.O.T. 134.96 125.93 122.86 135.81 135.10 104.77 116.05
ChemicalsExports 282.36 281.54 270.05 265.61 277.23 312.89 362.50Imports 228.06 239.29 245.60 313.15 334.10 372.17 392.87T.O.T. 123.81 117.66 109.96 84.82 82.98 84.07 92.27
Animal & VegetableOils, Fats & WaxesExports - - - - - - -Imports 195.10 224.82 300.36 347.94 358.48 341.40 406.00T.O.T. - - - - - - -
Manufactured GoodsExports 279.04 281.83 248.93 274.02 284.72 289.58 300.76Imports 251.50 244.97 240.82 287.80 301.00 340.71 375.06T.O.T. 110.95 115.05 103.37 95.21 94.59 84.99 80.19
Machinery & TransportEquipmentExports 453.20 579.13 572.31 396.09 342.97 414.01 430.91Imports 470.20 481.18 450.67 537.55 561.15 538.14 580.85T.O.T. 96.38 120.36 126.99 73.68 61.12 76.93 74.19
Miscellaneous Manufac-tured ArticlesExports 292.47 298.40 294.67 318.55 324.17 342.71 340.99Imports 323.02 320.35 299.60 333.22 343.13 414.94 418.65T.O.T. 90.54 93.15 98.35 95.60 94.47 82.59 81.45
- : Not available (Contd...)
120

TABLE 8.4
Groups 2007-08 2008-09 2009-10 2010-11 2011-12 2012-13 2013-14
All GroupsExports 350.40 450.40 478.07 593.19 679.44 715.45 752.86 Imports 632.30 790.82 839.60 1013.10 1,233.49 1,329.56 1,387.15 T.O.T. 55.42 56.95 56.94 58.55 55.08 53.81 54.27
Food & Live AnimalsExports 496.58 758.42 693.35 747.72 800.09 884.48 954.07 Imports 551.25 622.23 689.76 743.82 791.79 802.28 838.74 T.O.T. 90.08 121.89 100.52 100.52 101.05 110.25 113.75
Beverages & TobaccoExports 202.67 431.15 629.08 804.61 935.29 1,052.54 1,127.89 Imports 635.41 884.26 961.43 1060.35 1,230.10 1,339.47 1,446.20 T.O.T. 31.02 48.76 65.43 75.88 76.03 78.58 77.99
Crude Materials(inedible except fuels)
Exports 328.53 494.08 573.05 647.55 848.74 958.74 1,009.57 Imports 445.35 613.16 677.43 803.59 881.00 995.65 1,046.35 T.O.T. 73.77 80.58 84.59 80.58 96.34 96.29 96.48
Minerals, Fuels & LubricantsExports 979.83 840.28 1115.54 1333.56 1,500.63 1,615.08 1,682.81 Imports 877.47 982.09 975.40 1255.86 1,651.93 1,720.77 1,757.91 T.O.T. 111.67 85.56 114.37 106.19 90.84 93.86 95.73
ChemicalsExports 397.29 480.24 534.75 620.91 739.66 876.11 939.50 Imports 471.77 659.24 725.54 796.89 897.56 994.50 1,098.60 T.O.T. 84.21 72.85 73.70 77.92 82.41 88.10 85.52
Animal & VegetableOils, Fats & WaxesExports - - - - - - -Imports 647.28 793.22 881.02 1005.72 1,240.29 1,103.29 1,054.13 T.O.T. - - - - - - -
Manufactured GoodsExports 318.97 387.90 411.00 559.56 641.15 689.62 698.49 Imports 427.60 559.24 612.77 747.32 823.33 887.02 899.66 T.O.T. 74.60 69.36 67.07 74.88 77.87 77.75 77.64
Machinery & TransportEquipmentExports 518.62 806.33 988.72 1286.13 1,517.96 1,603.48 1,650.17 Imports 639.86 897.86 965.15 1183.62 1,407.29 1,738.91 1,866.32 T.O.T. 81.05 89.81 102.44 108.66 107.86 92.21 88.42
Miscellaneous Manufac-tured ArticlesExports 351.77 442.64 498.40 558.25 650.31 657.15 700.75 Imports 605.24 763.29 964.44 1174.99 1,274.46 1,342.66 1,458.63 T.O.T. 58.12 57.99 51.68 47.61 51.03 48.94 48.04
P : Provisional (Contd…)
UNIT VALUE INDICES & TERMS OF TRADE (T.O.T) (1990-91 = 100)
121

TABLE 8.4
Groups 2014-15 2015-16 2016-17 2017-18 2018-19 2019-20 2020-21 P
All GroupsExports 759.21 705.02 701.43 735.50 794.77 841.44 903.14 Imports 1,394.75 1,215.80 1,199.54 1,261.25 1,342.30 1,369.71 1,450.51 T.O.T. 54.43 57.99 58.47 58.32 59.21 61.43 62.26
Food & Live AnimalsExports 1,057.47 944.46 923.60 1,134.29 1,229.51 1,280.54 1,355.88 Imports 891.28 839.11 829.56 943.23 908.93 1,172.18 1,179.43 T.O.T. 118.65 112.55 111.34 120.26 135.27 109.24 114.96
Beverages & TobaccoExports 1,148.80 1,217.42 1,225.01 1,061.25 860.48 830.28 776.77 Imports 1,620.65 1,700.77 1,762.07 1,656.22 1,325.61 1,287.99 1,488.28 T.O.T. 70.89 71.58 69.52 64.08 64.91 64.46 52.19
Crude Materials(inedible except fuels) 1,119.52 1,327.78 1,210.79
Exports 999.87 920.79 888.69 1,043.30 1,102.13 1,228.58 1,284.58 Imports 1,048.08 1,031.47 1,019.86 1,020.56 101.58 108.07 94.26 T.O.T. 95.40 89.27 87.14 102.23
Minerals, Fuels & LubricantsExports 1,713.20 1,092.25 1,126.22 1,485.92 2,016.59 1,894.55 1,624.56 Imports 1,511.85 919.48 811.76 1,030.32 1,564.46 1,411.00 1,259.52 T.O.T. 113.32 118.79 138.74 144.22 128.90 134.27 128.98
ChemicalsExports 935.18 1,000.41 1,017.19 1,054.28 1,129.18 1,252.79 1,256.13 Imports 1,256.50 1,193.67 1,277.08 1,264.05 1,335.10 1,455.62 1,426.78 T.O.T. 74.43 83.81 79.65 83.40 84.58 86.07 88.04
Animal & VegetableOils, Fats & WaxesExports - - - - - - -Imports 1,037.83 1,011.65 1,090.65 1,010.73 995.35 1,133.53 1,451.50 T.O.T. - - - - - - -
Manufactured GoodsExports 667.05 607.38 595.81 580.96 616.90 647.03 669.74 Imports 1,026.39 920.53 927.03 939.97 1,110.15 1,289.64 1,333.21 T.O.T. 64.99 65.98 64.27 61.81 55.57 50.17 50.24
Machinery & TransportEquipmentExports 1,789.37 1,873.58 1,741.77 1,838.42 1,466.32 1,129.99 1,393.65 Imports 1,985.27 1,913.99 1,872.19 1,913.85 1,458.64 1,387.32 1,895.14 T.O.T. 90.13 97.89 93.03 96.06 100.53 81.45 73.54
Miscellaneous Manufac-tured ArticlesExports 728.76 774.38 786.63 820.87 887.27 982.56 1,185.14 Imports 1,854.42 2,376.63 2,494.45 2,652.61 2,186.14 2,019.53 1,989.64 T.O.T. 39.30 32.58 31.54 30.95 40.59 48.65 59.57
P : Provisional - : Not available Source: Pakistan Bureau of Statistics
UNIT VALUE INDICES & TERMS OF TRADE (T.O.T) (1990-91 = 100)
122

TABLE 8.5
Rs millionYear Primary Commodities Semi-Manufactured Manufactured Goods
Value Percentage Value Percentage Value Percentage TotalShare Share Share Value *
2000-01 67,783 13 81,288 15 389,999 72 539,070
2001-02 60,346 11 80,438 14 420,163 75 560,947
2002-03 71,194 11 71,323 11 509,777 78 652,294
2003-04 70,716 10 83,361 12 554,959 78 709,036
2004-05 92,018 11 86,483 10 675,586 79 854,088
2005-06 112,268 11 106,029 11 766,543 78 984,841
2006-07 113,954 11 121,930 12 793,428 77 1,029,312
2007-08 171,670 14 127,090 11 897,877 75 1,196,638
2008-09 224,873 16 130,693 10 1,028,151 74 1,383,718
2009-10 287,491 18 170,609 10 1,159,358 72 1,617,458
2010-11 377,536 18 274,500 13 1,468,811 69 2,120,847
2011-12 362,404 17 261,831 12 1,486,370 71 2,110,605
2012-13 364,127 15 391,151 17 1,611,199 68 2,366,478
2013-14 420,496 16 369,066 14 1,793,901 70 2,583,463
2014-15 402,750 17 352,074 15 1,642,689 68 2,397,513
2015-16 356,584 16 254,329 12 1,555,933 72 2,166,846
2016-17 331,040 15 246,319 12 1,560,826 73 2,138,186
2017-18 454,351 18 307,567 12 1,793,125 70 2,555,043
2018-19 567,876 18 307,322 10 2,253,032 72 3,128,230
2019-20 629,112 19 283,213 8 2,457,457 73 3,369,782
2020-21 P 629,971 16 284,605 7 3,127,350 77 4,041,927 P : Provisional Source: Pakistan Bureau of Statistics* : Total may differ due to rounding off figure
ECONOMIC CLASSIFICATION OF EXPORTS
123

TABLE 8.6
Rs million
Capital Goods Capital Goods Consumer GoodsYear Value Percentage Value Percentage Value Percentage Value Percentage Total
Share Share Share Share Value *2000-01 157,091 25 34,371 6 345,770 55 89,768 14 627,000
2001-02 176,702 28 39,038 6 346,865 55 72,025 11 634,630
2002-03 220,942 31 41,216 6 380,035 53 72,179 10 714,372
2003-04 316,082 35 57,310 7 441,586 49 82,847 9 897,825
2004-05 441,528 36 101,719 8 557,226 46 122,607 10 1,223,079
2005-06 631,644 37 124,480 7 769,336 45 185,698 11 1,711,158
2006-07 670,539 36 134,519 7 864,736 47 182,011 10 1,851,806
2007-08 731,017 29 202,538 8 1,322,329 53 256,187 10 2,512,072
2008-09 790,327 29 246,600 9 1,337,986 49 348,657 13 2,723,570
2009-10 812,016 28 209,051 7 1,509,081 52 380,827 13 2,910,975
2010-11 829,005 24 239,525 7 1,826,243 53 560,512 16 3,455,285
2011-12 911,561 23 262,212 7 2,292,309 57 543,011 14 4,009,093
2012-13 1,049,775 24 293,733 7 2,353,818 54 652,553 15 4,349,880
2013-14 1,081,329 23 306,810 7 2,462,189 53 780,192 17 4,630,521
2014-15 1,233,341 27 388,167 8 2,214,664 48 807,980 17 4,644,152
2015-16 1,482,878 31 417,210 9 1,887,884 41 870,977 19 4,658,748
2016-17 1,887,928 34 470,891 9 2,199,168 40 981,733 18 5,539,721
2017-18 2,084,584 31 660,986 10 2,878,788 43 1,070,539 16 6,694,897
2018-19 2,062,358 28 747,761 10 3,301,354 44 1,331,780 18 7,443,253
2019-20 2,016,700 29 757,355 11 2,978,352 42 1,277,412 18 7,029,819
2020-21 P 2,497,994 28 980,837 11 3,844,593 43 1,659,015 18 8,982,441 P : Provisional Source: Pakistan Bureau of Statistics* : Total may differ due to rounding off figures
ECONOMIC CLASSIFICATION OF IMPORTS
Industrial Raw Material ForConsumer Goods
124

TABLE 8.7
Fish & Fish Preparations Rice Hides & Skins Raw WoolYear Value Qty U.V. Value Qty U.V. Value Qty U.V. Value Qty U.V.
Rs mln. m.kg Rs/kg Rs mln. 000 mt Rs/mt Rs mln. 000 kg Rs/kg Rs mln. m.kg Rs/kg2000-01 7,994 82 97 30,849 2,294 13,446 13 359 37 37 0.5 69.3
2001-02 7,746 84 92 27,509 1,684 16,333 24 580 41 58 1.1 53.4
2002-03 7,867 93 84 32,433 1,820 17,820 10 157 61 78 1.5 52.4
2003-04 8,806 103 85 36,535 1,823 20,044 49 727 67 81 1.5 53.0
2004-05 8,259 97 85 55,392 2,891 19,159 10 101 103 60 1.0 62.7
2005-06 11,624 128 90 69,325 3,689 18,794 2 - - 128 2.5 50.7
2006-07 11,419 124 92 68,286 3,129 21,823 15 55 273 124 2.2 55.1
2007-08 13,228 132 101 117,088 2,809 41,681 - - - 250 4.1 60.7
2008-09 18,465 127 145 154,763 2,729 56,703 2 2 140 191 2.3 84.7
2009-10 19,050 106 180 183,370 4,180 43,866 81 113 717 455 3.9 115.6
2010-11 25,314 134 189 186,675 3,670 50,320 141 92 1,535 501 3.1 161.0
2011-12 28,598 132 217 184,405 3,630 50,803 37 29 1,262 298 1.8 165.6
2012-13 30,759 139 222 186,623 3,408 54,765 15 11 1,441 796 5.7 139.5
2013-14 37,918 150 252 222,907 3,717 59,966 77 243 318 809 5.8 138.4
2014-15 35,429 137 258 206,266 3,461 53,417 53 190 277 452 2.8 161.8
2015-16 33,918 127 265 194,246 4,246 45,743 80 226 356 330 1.8 181.8
2016-17 41,214 155 266 168,244 3,523 47,754 11 8 1,362 126 0.1 237.6
2017-18 49,755 197 253 224,739 4,097 54,861 9 7 1,247 146 0.1 250.1
2018-19 60,405 196 307 285,031 4,120 69,180 16 43 381 177 0.7 270.1
2019-20 64,118 178 360 343,916 4,149 82,887 4 11 350 98 0.5 182.1
2020-21 P 66,040 185 358 325,585 3,685 88,356 0.2 1 205 85 0.5 171.6P : Provisional U.V : Unit Value rounded off (Contd...)- : Not available
MAJOR EXPORTS BY VALUE, QUANTITY & UNIT VALUE
125

TABLE 8.7
Raw Cotton Cotton Waste Leather Cotton YarnYear Value Qty U.V. Value Qty U.V. Value Qty U.V. Value Qty U.V.
Rs mln. 000 mt Rs/mt Rs mln. m kg Rs/kg Rs mln. m.sq.m Rs/sq.m Rs mln. m.kg Rs/kg2000-01 8,072 135 59,755 2,279 95.2 23.9 13,723 17.5 782.7 62,914 545.1 115.4
2001-02 1,502 35 42,969 2,187 95.3 23.0 14,740 17.3 852.5 57,135 540.0 105.8
2002-03 2,873 55 52,134 2,111 93.5 22.6 13,733 15.3 894.7 54,314 519.3 104.6
2003-04 2,741 37 73,484 2,196 95.3 23.0 14,491 16.0 902.9 64,851 499.1 129.9
2004-05 6,549 117 55,936 2,399 93.1 25.8 18,013 18.4 977.1 62,749 504.7 124.3
2005-06 4,080 63 65,111 2,622 87.1 30.1 17,505 17.4 1,007.3 82,794 671.7 123.3
2006-07 3,048 45 67,632 2,502 70.5 35.5 19,474 21.3 1,014.9 86,588 665.5 130.1
2007-08 443 56 79,134 2,476 61.7 40.1 26,027 26.0 1,072.9 81,320 554.8 146.6
2008-09 6,826 78 87,513 1,706 26.8 63.7 23,393 19.5 1,199.6 87,354 523.7 166.8
2009-10 16,366 160 102,198 3,406 50.4 67.5 28,698 24.3 1,181.0 120,067 625.4 192.0
2010-11 31,168 144 216,039 4,531 76.7 59.1 39,744 28.7 1,385.0 188,200 536.1 351.0
2011-12 41,393 257 161,349 6,448 56.7 113.8 39,841 25.0 1,594.6 162,004 575.8 281.3
2012-13 14,888 93 160,886 7,827 66.6 117.5 48,456 27.3 1,773.1 218,045 737.6 295.6
2013-14 21,353 115 186,207 8,124 69.2 117.3 56,496 29.3 1,925.3 205,660 663.9 309.8
2014-15 14,933 94 158,734 5,168 44.4 116.4 49,583 22.3 2,226.1 187,376 642.1 291.8
2015-16 7,948 49 161,171 4,607 43.5 105.9 37,803 17.1 2,214.2 131,700 423.6 310.9
2016-17 4,559 25 179,050 4,985 38.6 129.2 36,183 23.3 1,554.2 130,216 456.1 285.5
2017-18 6,184 35 175,360 7,123 50.8 140.3 36,330 26.2 1,387.7 151,063 522.4 289.2
2018-19 2,709 13 208,511 5,859 38.3 153.0 34,269 21.3 1,606.3 152,726 434.0 351.9
2019-20 2,669 13 208,893 9,374 42.9 218.3 29,009 16.9 1,714.4 155,158 412.6 376.1
2020-21 P 131 1 220,481 7,636 31.5 242.1 25,791 12.0 2,150.4 161,781 390.6 414.2P : Provisional U.V : Unit Value rounded off (Contd...)
MAJOR EXPORTS BY VALUE, QUANTITY & UNIT VALUE
126

TABLE 8.7
Cotton Thread Cotton Cloth Petroleum & Products Synthetic TextilesYear Value Qty U.V. Value Qty U.V. Value Qty U.V. Value Qty U.V.
Rs mln. m.kg Rs/kg Rs mln. m.sq.m Rs/sq.m Rs mln. 000 mt Rs/mt Rs mln. m.sq.m Rs/sq.m2000-01 61 0.2 268.9 60,486 1,735.8 34.8 10,833 825 13,138 31,911 843.0 38.0
2001-02 31 0.1 255.1 69,297 1,909.3 36.3 11,764 1,021 11,517 25,232 654.9 38.5
2002-03 28 0.1 292.1 78,665 2,036.3 38.6 14,507 1,005 14,439 33,534 787.9 42.6
2003-04 17 0.1 298.0 98,542 2,409.4 40.9 16,958 987 17,182 27,114 654.6 44.4
2004-05 56 0.2 287.5 110,579 2,399.5 46.1 28,281 1,205 23,462 17,812 402.3 44.3
2005-06 19 0.1 242.8 126,195 2,634.0 47.9 49,438 1,566 31,567 11,991 289.5 41.4
2006-07 82 0.4 226.0 122,873 2,211.7 5.6 52,043 1,475 35,287 25,463 533.8 47.7
2007-08 426 1.9 226.5 126,172 2,035.1 62.0 79,336 1,687 47,017 25,493 254.9 57.6
2008-09 459 2.1 218.9 153,037 1,898.5 80.6 62,912 1,332 47,228 21,739 322.0 67.5
2009-10 700 3.0 234.6 150,936 1,787.7 80.4 86,742 1,503 57,726 37,423 435.2 86.0
2010-11 71 1.8 390.6 224,257 2,337.8 95.9 115,589 1,616 71,506 51,918 557.4 93.2
2011-12 1400 3.9 358.9 218,160 2,066.6 105.6 79,887 880 90,784 48,817 417.5 116.9
2012-13 972 2.6 378.2 260,238 2,160.8 120.4 2,743 32 84,675 39,317 335.6 117.2
2013-14 1,540 3.5 443.8 285,130 2,520.5 113.1 74,303 837 88,788 39,508 331.9 119.0
2014-15 1,240 2.7 454.2 248,431 2,074.2 119.8 59,306 816 72,721 33,485 267.4 125.2
2015-16 2,328 5.5 421.6 230,757 2,152.1 107.2 16,685 413 40,439 30,005 272.2 110.2
2016-17 1,597 3.7 427.6 223,675 2,049.1 109.2 19,819 454 43,610 19,638 160.3 122.5
2017-18 140 0.3 440.9 242,374 2,369.4 102.3 43,328 762 56,824 34,069 309.0 110.3
2018-19 279 0.5 524.7 285,625 2,827.1 101.0 64,323 868 74,077 40,433 385.7 104.8
2019-20 690 1.1 646.9 287,877 2,365.9 121.7 42,941 655 65,578 49,548 456.0 108.7
2020-21 P 759 1.2 607.7 307,157 993.6 309.1 29,164 450 64,831 59,106 147.1 401.9 P : Provisional U.V : Unit Value rounded off (Contd...)
MAJOR EXPORTS BY VALUE, QUANTITY & UNIT VALUE
127

TABLE 8.7
Foot Wear Animal Casings Cement & Products Guar & ProductsYear Value Qty U.V. Value Qty U.V. Value Qty U.V. Value Qty U.V.
Rs mln. m.pair Rs/pair Rs mln. 000 kg Rs/kg Rs mln. 000 mt Rs/mt Rs mln. 000 mt Rs/mt2000-01 2,400 7.5 318.5 590 835 707 47 - - 1,205 22 54,431
2001-02 3,327 9.2 361.2 528 668 791 198 - - 1,008 23 42,953
2002-03 5,018 13.3 377.0 593 1,539 385 635 - - 1,389 26 54,464
2003-04 5,114 12.4 413.8 803 1,392 577 1,572 - - 1,162 24 47,449
2004-05 8,180 18.7 437.6 909 1,547 588 3,650 - - 1,571 25 63,038
2005-06 8,694 22.2 391.6 919 1,154 796 6,227 - - 1,109 16 69,063
2006-07 6,941 15.1 460.6 791 1,102 718 8,864 - - 520 7 73,754
2007-08 7,811 13.6 572.6 159 134 1,192 25,992 - - 2,300 30 77,220
2008-09 10,044 14.5 694.3 1,436 135 1,082 45,575 - - 2,206 26 85,550
2009-10 7,763 115.2 673.9 2,117 1,731 1,222 40,531 - - 2,227 22 100,776
2010-11 9,343 124.8 748.5 3,338 1,777 1,878 39,108 - - 3,994 28 142,680
2011-12 8,861 12.4 717.0 5,254 1,706 3,079 44,619 - - 14,334 36 402,626
2012-13 10,109 13.0 776.5 3,704 987 3,753 55,849 - - 14,116 23 606,589
2013-14 12,208 16.1 759.1 4,673 1,127 4,145 52,147 - - 7,008 24 287,113
2014-15 13,304 13.0 1,021.4 2,536 699 3,625 44,943 - - 5,791 25 227,433
2015-16 11,453 12.0 953.8 1,619 509 3,182 33,468 - - 2,598 16 155,768
2016-17 10,024 9.9 1,008.2 1,217 411 2,962 24,896 - - 3,128 24 130,587
2017-18 11,913 10.1 1,181.8 1,908 793 2,406 24,420 - - 4,016 24 168,368
2018-19 16,734 13.1 1,272.6 2,752 1,600 1,720 36,550 - - 4,779 23 209,534
2019-20 19,839 13.6 1,457.6 2,881 1,196 2,409 40,849 - - 5,841 28 207,899
2020-21 P 21,125 16.5 1,277.6 4,060 2,196 1,849 42,959 - - 5,645 29 191,865 P : Provisional U.V : Unit Value rounded off (Contd...)- : Not available
MAJOR EXPORTS BY VALUE, QUANTITY & UNIT VALUE
128

TABLE 8.7
Paints & Varnishes Tobacco Raw & Ready Made GarmentsManufactured & Hosiery
Year Value Qty U.V. Value Qty U.V. Value Qty U.V.Rs mln. m.kg Rs/kg Rs mln. Rs mln.
2000-01 17 0.2 113.7 587 - - 101,560 - -
2001-02 54 0.4 134.3 286 - - 105,854 - -
2002-03 117 1.4 85.9 362 - - 130,935 - -
2003-04 302 3.4 89.7 767 - - 141,221 - -
2004-05 2,989 21.3 140.5 674 - - 161,493 - -
2005-06 1,275 20.3 62.9 386 - - 183,252 - -
2006-07 886 7.8 112.9 570 - - 202,829 - -
2007-08 884 6.9 128.1 454 - - 208,144 - -
2008-09 926 2.1 453.1 839 - - 232,515 - -
2009-10 1,391 5.8 241.5 1,242 - - 106,445 - -
2010-11 2,024 7.7 261.4 2,334 - - 151,620 - -
2011-12 2,655 10.1 263.4 2,743 - - 144,269 - -
2012-13 2,949 11.8 249.5 2,527 - - 371,616 - -
2013-14 3,296 11.3 291.1 2,447 - - 431,762 - -
2014-15 3,280 9.1 361.6 1,517 - - 455,929 - -
2015-16 3,543 11.1 354.3 1,234 - - 475,128 - -
2016-17 1,799 7.1 253.2 1,649 - - 490,025 - -
2017-18 2,761 9.9 279.1 2,833 - - 581,872 - -
2018-19 2,839 10.3 276.3 3,378 - - 757,068 - -
2019-20 3,023 9.7 312.7 6,702 - - 841,459 - -
2020-21 P 4,463 23.0 194.2 8,252 - - 1,094,637 - -P : Provisional U.V : Unit Value rounded off (Contd...)- : Not available
MAJOR EXPORTS BY VALUE, QUANTITY & UNIT VALUE
129

TABLE 8.7
Year Value Qty U.V. Value Qty U.V. Value Qty U.V. Value Qty U.V. Value Qty U.V.Rs mln. Rs mln. Rs mln. m.sq.m Rs/sq.m Rs mln. Rs mln.
2000-01 6,077 - - 7,293 - - 17,015 6.3 2,666.1 15,919 - - 157,099 - -
2001-02 6,176 - - 8,896 - - 15,275 5.1 3,006.9 18,623 - - 183,497 - -
2002-03 14,746 - - 8,767 - - 12,690 3.6 3,489.4 19,579 - - 217,316 - -
2003-04 14,786 - - 7,631 - - 13,173 3.7 3,604.3 18,700 - - 231,424 - -
2004-05 23,817 - - 10,860 - - 16,217 4.5 3,621.6 18,236 - - 295,333 - -
2005-06 24,582 - - 9,762 - - 15,248 3.8 4,003.3 20,560 - - 337,104 - -
2006-07 22,741 - - 11,571 - - 13,924 3.4 4,040.9 17,483 - - 348,108 - -
2007-08 38,915 - - 16,366 - - 13,295 3.2 4,092.5 19,013 - - 391,046 - -
2008-09 47,289 - - 19,871 - - 11,159 2.4 4,678.0 21,391 - - 459,705 - -
2009-10 62,252 - - 19,202 - - 11,119 2.4 4,729.1 25,021 - - 545,550 - -
2010-11 70,232 - - 22,279 - - 11,034 2.3 4,803.1 28,208 - - 911,224 - -
2011-12 86,008 - - 27,126 - - 10,114 2.5 4,094.5 30,241 - - 843,347 - -
2012-13 84,800 - - 29,360 - - 11,485 2.5 4,635.4 32,375 - - 936,909 - -
2013-14 120,319 - - 34,726 - - 12,616 2.8 4,457.0 37,260 - - 911,156 - -
2014-15 99,339 - - 34,575 - - 11,772 2.2 5,342.2 34,294 - - 848,511 - -
2015-16 83,752 - - 37,408 - - 9,897 1.6 6,033.9 33,862 - - 782,477 - -
2016-17 92,176 - - 35,574 - - 8,054 1.6 5,051.5 32,285 - - 787,092 - -
2017-18 114,350 - - 41,618 - - 8,189 1.6 5,249.7 37,710 - - 928,193 - -
2018-19 154,532 - - 52,970 - - 8,980 1.5 6,185.2 41,995 - - 1,113,801 - -
2019-20 159,377 - - 55,960 - - 8,288 1.3 6,540.8 41,286 - - 1,198,875 - -
2020-21 P 183,253 - - 68,506 - - 11,604 1.3 8,858.0 44,443 - - 1,569,745 - -P : Provisional U.V : Unit Value rounded off Source: Pakistan Bureau of Statistics- : Not available
MAJOR EXPORTS BY VALUE, QUANTITY & UNIT VALUE
Drugs & Chemicals Surgical Instruments Woolen Carpets & Rugs Sports Goods Other Exports
130

TABLE 8.8
(US $ Million)Years Basmati Other Varieties Total
Qty(ton) Value Qty(ton) Value Qty(ton) Value2000-01 502,061 236.46 1,792,224 289.09 2,294,285 525.55
2001-02 550,033 257.97 1,134,265 190.26 1,684,298 448.23
2002-03 716,726 360.81 1,103,256 194.65 1,819,982 555.46
2003-04 816,339 421.75 1,006,400 212.71 1,822,739 634.46
2004-05 814,857 439.24 2,076,396 493.31 2,891,253 932.55
2005-06 839,002 479.62 2,849,740 678.20 3,688,742 1,157.82
2006-07 907,906 556.32 2,221,236 569.50 3,129,142 1,125.82
2007-08 1,138,093 1,068.86 1,671,055 767.20 2,809,148 1,836.06
2008-09 974,274 1,070.34 1,755,086 912.89 2,729,360 1,983.23
2009-10 1,032,259 855.83 3,147,458 1,328.03 4,179,717 2,183.87
2010-11 1,170,588 962.70 2,499,449 1,197.56 3,670,037 2,160.26
2011-12 953,253 826.36 2,676,569 1,235.68 3,629,822 2,062.04
2012-13 674,048 666.60 2,733,640 1,255.78 3,407,688 1,922.38
2013-14 667,503 769.99 3,049,694 1,393.14 3,717,217 2,163.13
2014-15 523,450 601.27 3,337,956 1,433.99 3,861,406 2,035.25
2015-16 479,974 447.42 3,766,471 1,413.08 4,246,445 1,860.50
2016-17 469,263 453.44 3,053,891 1,153.39 3,523,154 1,606.83
2017-18 561,034 581.93 3,535,487 1,453.74 4,096,521 2,035.67
2018-19 659,571 634.53 3,460,566 1,435.09 4,120,137 2,069.62
2019-20 865,949 783.28 3,283,264 1,392.25 4,149,213 2,175.52
2020-21 P 619,428 569.49 3,065,509 1,472.25 3,684,937 2,041.74P : Provisional Source: Pakistan Bureau of Statistics
RICE EXPORTS
131

TABLE 8.9
Year Quantity U.V. Quantity U.V. Quantity U.V.000 mt Rs/mt 000 kg Rs/kg 000 kg Rs/kg
2003-04 108 12,550 115,967 95.53 1,360,717 27.87
2004-05 427 12,924 134,610 98.08 1,604,536 28.03
2005-06 816 9,730 127,071 104.95 1,695,834 26.07
2006-07 136 18,520 112,136 115.62 1,758,929 32.97
2007-08 1,820 29,717 100,391 126.04 1,770,400 60.82
2008-09 3,103 27,398 96,932 179.68 1,865,424 62.27
2009-10 94 36,242 94,463 240.43 1,729,079 64.94
2010-11 23 40,504 118,657 240.69 201,750 88.43
2011-12 - - 120,422 259.85 2,148,257 100.73
2012-13 10 70,565 123,441 288.65 2,224,108 88.47
2013-14 377 30,076 133,145 231.53 2,382,842 86.85
2014-15 687 27,635 150,538 229.39 2,449,243 75.952015-16 - - 173,785 307.80 2,860,192 68.252016-17 - - 194,833 281.47 2,698,868 78.672017-18 - - 181,853 331.96 3,000,069 79.522018-19 - - 222,732 347.35 3,298,461 80.472019-20 - - 221,337 381.11 3,055,091 98.202020-21 P 3,613 43,675 258,491 359.14 3,314,385 132.85
(Contd…)
TABLE 8.9
Year Quantity U.V. Quantity U.V. Quantity U.V.000 mt Rs/mt 000 mt Rs/mt 000 mt Rs/mt
2003-04 7,892 12,879.68 5,412 14,909.32 1,348 12,171.0
2004-05 7,851 16,234.90 5,721 19,214.34 1,654 14,988.0
2005-06 8,738 25,992.58 6,092 28,322.62 2,445 16,679.36
2006-07 8,208 26,592.54 8,586 26,361.75 1,466 18,486.61
2007-08 8,460 38,965.95 10,151 38,878.97 1,998 27,613.72
2008-09 7,903 39,082.15 10,546 40,717.04 1,109 35,347.05
2009-10 6,342 41,876.45 13,150 43,752.79 2,556 31,118.56
2010-11 7,504 54,756.61 11,202 55,577.78 1,211 37,954.21
2011-12 5,972 74,100.88 13,146 69,907.35 2,588 42,745.75
2012-13 6,566 75,597.81 12,240 76,235.01 1,271 49,793.67
2013-14 7,010 84,725.45 12,046 77,524.16 1,833 39,851.58
2014-15 5,697 74,680.75 11,733 65,588.87 2,027 45,699.58
2015-16 5,929 40,254.06 10,129 54,898.57 1,619 46,743.60
2016-17 8,368 31,869.04 13,491 53,068.82 1,700 39,437.94
2017-18 10,405 44,979.76 15,082 54,450.15 2,146 42,355.59
2018-19 9,029 68,701.71 10,423 82,000.99 1,931 54,456.30
2019-20 6,677 63,935.06 10,938 68,113.65 1,684 53,187.70
2020-21 P 8,815 56,124.91 14,082 58,381.77 1,780 64,349.13P : Provisional - : Not available Source: Pakistan Bureau of StatisticsU.V : Unit value rounded off
Crude Petroleum Petroleum Products Chemical Fertilizer
QUANTITY & UNIT VALUE OF SELECTED IMPORTS
Wheat unmilled Tea Edible Oil
QUANTITY & UNIT VALUE OF SELECTED IMPORTS
132

TABLE 8.10 A
MAJOR EXPORTSRs million
1. Rice 184,405 186,304 222,906 206,266 194,246 168,244 224,739 285,031 343,916 325,585
2. Fish and Fish preparations
28,590 30,755 37,918 35,429 33,918 41,214 49,755 60,405 64,118 66,040
3. Fruits 32,068 37,772 45,196 44,375 44,607 39,878 43,842 56,272 67,769 76,846
4. Wheat 11,178 6,064 732 291 17 109 27,109 20,124 1,815 -
5. Sugar 2,576 51,643 29,638 32,686 13,818 16,867 56,379 31,147 11,063 -
6. Meat and Meat Preparations
15,522 20,362 23,650 24,657 28,036 23,103 24,920 33,438 48,021 52,978
7. Raw Cotton 41,393 14,882 21,353 14,931 7,948 4,559 6,184 2,709 2,669 131
8. Cotton Yarn 162,004 217,123 205,660 187,376 131,700 130,216 151,063 152,726 155,158 161,781
9. Cotton Fabrics 218,160 260,347 285,130 248,431 230,757 223,675 242,374 285,625 287,877 307,157
10. Hosiery (K i )
176,682 196,408 235,564 243,719 246,267 247,242 298,374 394,748 440,104 609,576
11. Bedwear 155,108 172,538 219,962 213,018 210,543 223,812 248,538 307,202 338,750 443,286
12. Towels 61,326 75,060 78,889 80,778 83,681 83,819 87,633 107,043 111,969 149,783
13. Readymade G
144,269 175,662 196,198 212,210 228,861 242,782 283,498 362,320 401,355 485,061
14. Art Silk and Synthetic Textiles
48,817 39,369 39,508 33,485 30,005 19,638 34,069 40,433 49,548 59,106
15. Carpets, Carpeting Rugs & Mats
10,757 11,839 12,935 12,098 10,186 8,219 8,317 9,147 8,516 11,844
16. Sports Goods excl. Toys
30,240 31,888 37,256 34,294 33,862 32,285 37,710 41,995 41,286 44,443
17. Leather Excluding Reptile Leather (Tanned)
39,841 48,378 56,496 49,583 37,803 36,180 36,330 34,269 29,001 25,791
18. Leather Manufactures
46,536 54,000 64,360 60,429 54,788 51,421 57,422 66,146 74,588 41,563
19. Foot wear 8,860 10,037 12,209 13,304 11,453 10,024 11,913 16,734 19,839 21,125
20. Medical & Surgical Instruments
27,126 29,316 34,725 34,576 37,408 35,574 41,618 52,970 55,960 68,506
21. Chemicals and Pharmaceuticals
96,009 84,213 120,391 99,339 83,752 92,176 114,350 154,532 159,377 183,253
22. Engineering goods 24,726 28,030 33,487 22,675 19,645 18,238 22,882 23,518 27,229 36,042
23. Jewellery 82,774 112,419 33,844 668 833 610 644 661 506 2,162
24. Cement and cement Products
44,619 55,878 52,147 44,943 33,468 24,896 24,420 36,550 40,849 42,959
25. All other items 417,019 421,592 483,295 447,952 359,244 363,405 420,960 552,485 588,499 826,909
Total Exports 2,110,605 2,371,879 2,583,463 2,397,513 2,166,846 2,138,186 2,555,043 3,128,230 3,369,782 4,041,927P: Provisional Source: Pakistan Bureau of Statistics
2020-21 P2019-202018-192017-182011-12 2016-172014-15 2012-13 2013-14 2015-16
133

TABLE 8.10 B
MAJOR IMPORTS
Rs million
Items 2011-12 2012-13 2013-14 2014-15 2015-16 2016-17 2017-18 2018-19 2019-20 2020-21 P
1. Chemicals 435,801 447,521 498,340 532,197 540,558 579,959 719,354 865,613 851,989 1,063,394
2. Drugs &medicines 62,268 80,736 81,399 96,183 96,135 102,110 118,122 148,428 157,763 221,027
3. Dyes andcolours 29,129 29,932 38,601 40,221 43,345 47,334 55,255 72,491 65,958 87,948
4. Chemical Fertilizers 110,626 63,277 73,058 92,641 75,667 67,063 90,879 105,162 89,580 114,521
5. Electrical goods 72,608 81,728 114,784 122,183 187,163 243,082 236,896 239,618 349,334 259,081
6. Machinery (non-electrical) 435,139 473,258 551,829 633,733 712,920 996,128 1,045,502 984,410 1,042,935 1365097
7. Transportequipments 192,247 228,987 219,877 263,622 297,225 332,549 462,630 397,772 229,955 455,168
8. Paper, board &stationery 38,081 38,970 44,362 56,130 56,930 59,960 69,096 78,298 66,947 75,259
9. Tea 31,292 35,632 30,827 34,532 53,491 54,839 60,368 77,367 84,354 92,834
10. Sugar-refined 1,167 501 635 631 645 535 554 534 608 20,893
11. Art-silk yarn 52,939 52,328 63,596 69,028 64,612 66,478 72,996 94,611 79,126 104,697
12. Iron, steel & manu-factures thereof 156,683 193,543 180,530 226,030 261,291 288,719 344,595 401,045 319,554 390,487
13. Non-ferrous metals 35,370 37,693 44,389 44,709 51,722 55,534 67,736 61,698 49,606 77,951
14. Petroleum &products 1,361,511 1,447,531 1,527,753 1,195,025 794,697 982,619 1,289,222 1,475,012 1,171,969 1,316,909
15. Edible oils 216,387 196,776 206,955 186,010 195,200 212,327 238,563 265,430 300,008 440,317
16. Grains, pulses& flour 48,691 45,239 52,710 71,742 77,525 110,483 72,603 84,754 112,183 286,736
17. Other imports 729,154 896,228 900,876 979,535 1,149,623 1,340,002 1,750,526 2,091,010 2,057,949 2,610,122
Grand Total 4,009,093 4,349,880 4,630,521 4,644,152 4,658,749 5,539,721 6,694,897 7,443,253 7,029,818 8,982,441P : Provisional Source: Pakistan Bureau of Statistics
134

TABLE 8.11
DIRECTION OF TRADE
Rs millionA. Organization of Islamic Countries (OIC)*
(a) Arab LeagueYears Al- Bahrain Iraq Jordan Kuwait Lebanon Libya Oman Qatar Saudi Soma- UAE Yemen Syria Total
geria Arabia lia2003-04
Exports 438 2,190 162 1,260 4,136 771 154 2,878 2,163 20,071 346 54,304 2,921 1,430 93,224Imports 35 4,283 9 1,634 57,062 131 9 888 5,632 102,437 91 98,392 494 942 272,039
2004-05Exports 780 2,517 736 1,246 4,717 956 226 2,934 2,008 20,937 123 65,054 3,435 897 106,566Imports 20 3,476 58 1,947 55,810 605 57 2,291 9,059 147,166 235 101,054 302 955 323,035
2005-06Exports 671 2,744 1,449 1,271 4,345 1,216 158 3,342 2,538 19,710 281 785,873 443 428 120,183Imports 369 3,230 108 1,716 101,935 904 47 4,209 29,137 179,258 264 203,923 162 146 525,408
2006-07Exports 1,528 3,256 2,932 1,556 5,116 700 275 3,860 3,646 17,530 208 83,990 4,723 642 129,962Imports 106 10,388 83 1,500 104,850 1,712 142 4,810 35,745 211,751 253 167,907 242 95 539,584
2007-08Exports 1,555 4,811 1,494 1,678 7,592 981 305 14,411 8,676 23,981 374 130,549 7,121 1,010 204,538Imports 251 5,734 94 1,637 188,502 1,811 46 5,948 45,047 336,590 620 214,559 429 184 801,452
2008-09Exports 1,848 5,980 5,708 2,374 8,126 1,512 706 14,565 13,522 35,699 4,034 114,752 5,988 1,530 216,344Imports 1,031 6,897 56 729 180,947 1,481 28 11,295 33,890 334,132 726 247,136 567 431 819,346
2009-10Exports 1,880 5,442 8,424 2,486 7,301 1,364 793 11,582 10,023 32,959 6,081 144,233 8,202 1,369 242,139Imports 554 22,038 2,116 1,138 201,803 193 1 18,530 11,997 283,555 345 422,040 83 153 964,546
2010-11Exports 2,739 7,302 8,331 3,392 8,117 1,373 470 14,175 10,433 36,548 4,924 154,616 14,005 1,074 267,499Imports 216 27,407 212 1,715 284,755 842 5 16,937 16,329 388,756 467 469,490 149 286 1,207,566
2011-12Exports 3,291 5,475 5,023 3,058 7,345 1,852 601 14,106 8,484 37,429 5,698 205,562 8,374 1,399 307,697Imports 93 14,194 566 2,031 358,754 884 - 30,779 27,053 449,622 791 685,149 204 166 1,570,286
2012-13 Exports 3,122 7,634 2,610 5,484 8,218 2,082 1,515 17,013 7,477 47,279 8,728 205,413 11,858 1,052 329,485Imports 74 8,643 330 1,732 392,490 350 1 82,449 25,113 334,507 527 837,403 1,460 60 1,685,139
2013-14Exports 3,933 10,025 3,473 4,748 10,394 3,239 1,070 19,444 8,180 50,958 3,881 180,040 13,930 2,483 315,798Imports 46 11,032 1,280 2,412 346,696 355 3,530 137,528 18,080 459,138 787 757,090 277 82 1,738,333
2014-15 Exports 2,973 7,591 4,253 5,057 9,769 2,840 798 20,893 6,686 45,583 2,038 102,913 7,771 1,775 220,940Imports 54 4,468 1,753 3,642 250,859 429 322 105,133 29,873 364,526 979 681,956 835 71 1,444,900
2015-16Exports 2,373 6,925 2,529 4,122 10,453 2,338 501 11,065 5,980 43,469 2,993 85,493 9,768 1,268 189,277Imports 22 8,012 968 2,448 139,467 244 789 27,623 43,672 237,235 529 572,660 338 159 1,034,166
2016-17Exports 2,121 5,160 2,067 5,216 9,125 1,535 477 10,758 5,254 35,686 3,861 83,041 6,653 1,949 172,903Imports 5 8,490 3,682 3,211 141,868 298 964 46,428 131,258 227,705 707 774,471 2,134 145 1,341,366
2017-18 PExports 1,847 5,926 2,440 3,466 10,038 2,208 334 14,648 10,480 33,242 6,024 103,560 7,012 1,064 202,289Imports 2,881 10,888 7,821 2,954 159,694 395 430 90,303 212,240 356,424 664 893,253 1,262 54 1,739,263
2018-19Exports 1,776 8,654 4,024 4,328 13,430 3,137 598 19,090 14,025 44,806 6,644 125,805 8,787 2,297 257,401Imports 3,997 6,230 4,816 3,827 185,788 685 668 98,012 340,580 401,330 748 1,020,143 3,056 66 2,069,946
2019-20Exports 2,300 11,114 4,500 6,077 16,459 2,104 1,002 25,177 21,792 69,961 10,455 178,916 13,000 2,475 365,332Imports 21,064 7,568 5,753 2,432 178,667 594 887 93,655 265,643 273,640 262 812,700 3,311 33 1,666,209
2020-21 PExports 2,235 9,409 5,907 4,380 18,524 1,681 1,652 23,955 22,448 66,539 10,351 160,894 12,859 2,884 343,717Imports 5,143 14,411 3,757 3,786 247,371 667 651 78,252 313,713 426,023 1,391 878,610 6,947 52 1,980,773
P : Provisional - : Not available (Contd...)* : Excluding Maldives, Malaysia and Indonesia
135

TABLE 8.11
Rs millionB. OECD
(b) E.C.O (c) Other Asian (d) Other African Total (a) ConsortiumYears Iran Turkey Total Afgha- Others Total Egypt Came- Sierra- Others Total (OIC) USA Canada
nistan roun leone2003-04
Exports 5,324 12,598 17,922 28,393 196 28,589 2,669 311 99 4,287 7,368 147,103 169,512 10,460Imports 16,349 4,482 20,831 2,732 13 2,745 2,393 614 - 3,865 6,872 302,487 76,513 11,824
2004-05Exports 8,728 15,340 24,068 44,393 57 44,450 2,785 2,180 219 6,807 11,991 187,075 204,426 11,511Imports 14,375 6,109 20,484 2,314 72 2,386 6,033 511 2 4,367 10,913 356,818 92,813 11,672
2005-06Exports 11,258 18,228 29,486 63,671 144 63,815 3,677 1,205 574 1,047 815,934 229,418 250,990 12,510Imports 26,942 11,302 38,244 2,843 54 2,897 7,284 490 4 2,900 10,678 577,227 99,220 19,242
2006-07Exports 10,161 23,645 33,806 45,686 37 45,723 4,626 857 1,203 6,356 13,042 222,533 253,584 12,222Imports 24,596 9,283 33,879 4,622 6 4,628 7,157 379 - 6,300 13,837 591,928 139,453 29,982
2007-08Exports 13,727 27,244 40,971 71,974 18 71,992 5,517 1,796 506 11,646 19,465 336,966 232,758 12,347Imports 34,654 9,742 44,396 5,683 21 5,704 14,226 390 46 11,618 26,280 877,832 153,278 31,927
2008-09Exports 31,270 31,548 62,818 109,330 24 109,354 7,975 2,085 852 21,797 32,709 421,225 261,362 13,595Imports 72,111 10,093 82,204 7,279 24 7,303 10,051 157 6 4,969 15,183 924,036 146,205 37,419
2009-10Exports 17,356 42,284 59,640 131,739 26 131,765 8,392 2,576 2,242 24,733 37,943 471,487 281,683 16,710Imports 80,634 13,271 93,905 11,684 197 11,881 12,419 48 3 6,550 19,020 1,089,352 134,999 33,729
2010-11Exports 13,852 77,482 91,334 199,645 67 199,712 12,158 3,695 1,495 24,018 41,366 599,911 338,324 19,109Imports 48,940 15,068 64,008 14,697 42 14,739 12,774 246 3 13,405 26,428 1,312,741 154,706 49,311
2011-12Exports 13,691 40,756 54,447 200,573 45 200,618 19,713 1,808 2,653 20,874 45,048 607,810 315,280 18,859Imports 13,612 15,724 29,336 17,801 1 17,802 14,560 434 67 3,740 18,801 1,636,225 132,028 57,465
2012-13Exports 9,412 37,463 46,875 199,991 50 200,041 16,649 2,319 2,859 28,911 50,738 627,139 341,283 20,846Imports 16,217 14,564 30,781 27,867 3 27,870 12,181 37 109 4,917 17,244 1,761,034 156,599 13,519
2013-14Eports 5,430 41,169 46,599 192,452 55 192,507 16,436 1,781 1,598 27,329 47,144 602,048 381,543 24,102Imports 16,926 17,783 34,709 36,900 2 36,902 12,107 78 28 4,091 16,304 1,826,248 180,109 20,073
2014-15 Exports 3,040 31,321 34,361 198,782 66 198,848 15,284 2,905 2,439 27,244 47,872 502,021 374,395 23,114Imports 24,271 19,354 43,625 32,695 - 32,695 13,858 133 57 6,408 20,456 1,541,676 180,733 43,497
2015-16Exports 3,699 23,473 27,172 149,883 62 149,945 12,054 1,376 2,005 21,484 36,919 403,313 364,843 22,546Imports 29,563 25,273 54,836 42,744 7 42,751 13,385 192 17 4,685 18,279 1,150,032 185,298 66,705
2016-17Exports 3,294 28,880 32,174 133,088 56 133,144 8,824 1,747 2,984 16,593 30,148 368,369 361,137 24,111Imports 30,091 26,387 56,478 35,877 0 35,877 14,507 229 4 4,320 19,060 1,452,781 267,851 76,992
2017-18Exports 2,310 36,872 39,182 165,153 78 165,231 8,562 2,042 3,074 26,997 40,675 447,377 400,448 28,050Imports 41,415 33,523 74,938 48,763 5 48,768 15,676 262 8 6,549 22,495 1,885,464 316,417 69,512
2018-19Exports 2,151 39,214 41,365 176,371 105 176,476 12,298 1,782 2,069 30,451 46,600 521,842 532,849 36,851Imports 56,087 51,640 107,727 73,512 7 73,519 20,590 262 15 22,929 43,796 2,294,988 368,868 68,678
2019-20Exports 41,375 41,375 134,250 187 134,437 12,666 2,174 2,437 35,970 53,247 594,391 585,400 43,066Imports 68,580 56,301 124,881 73,884 6 73,890 45,205 533 144 10,256 56,138 1,921,118 396,732 79,397
2020-21 PExports 43,832 43,832 163,806 186 163,992 14,030 2,145 591 26,840 43,606 595,147 823,580 51,198Imports 84,656 77,041 161,697 97,565 17 97,582 53,746 1,289 177 16,041 71,252 2,311,303 459,358 100,296
P : Provisional - : Not available (Contd...)* : Excluding Maldives, Malaysia and Indonesia
DIRECTION OF TRADE
A. Organization of Islamic Countries (OIC)*
136

TABLE 8.11
DIRECTION OF TRADE
Rs millionB. Organization for Economic Cooperation & Development (OECD)
(a) Consortium (b) Other than ConsortiumYears Bel- France West Italy Nether- U.K. Nor- Swe- Japan Total Den- Finland Aust Portu- Switzer-
gium Germany lands way den mark ria gal land2003-04
Exports 15,109 19,502 34,927 26,147 19,296 54,174 1,573 4,119 7,759 362,578 2,607 1,306 1,402 5,842 1,806Imports 15,079 9,245 35,227 18,002 12,686 25,228 405 3,879 53,913 262,001 1,627 3,334 1,667 661 19,013
2004-05Exports 18,567 21,809 40,862 34,920 20,477 52,993 2,289 4,675 9,758 422,287 2,809 1,863 1,752 6,137 1,838Imports 10,511 12,324 53,267 21,598 8,718 31,602 949 11,950 86,046 341,450 3,323 9,197 4,305 315 25,123
2005-06Exports 19,266 20,155 41,142 35,045 23,889 53,530 3,630 5,688 7,668 473,513 3,265 2,335 1,889 7,328 2,189Imports 21,137 20,380 70,424 31,353 14,940 48,194 547 27,554 110,175 463,166 6,414 26,668 5,549 549 28,231
2006-07Exports 21,833 20,988 42,527 38,794 26,799 57,610 2,839 5,840 7,524 490,560 3,860 2,917 2,192 9,575 1,233Imports 13,617 25,399 73,073 32,977 14,894 42,383 1,620 25,144 105,484 504,026 4,648 20,324 5,080 678 19,488
2007-08Exports 25,743 22,905 51,255 45,391 32,303 64,597 3,068 6,089 8,585 505,041 4,740 3,310 1,198 10,226 1,445Imports 14,946 30,776 79,950 34,639 22,282 48,373 1,889 26,895 114,510 559,465 3,683 23,058 6,836 703 23,475
2008-09Exports 30,803 24,601 57,731 45,321 36,343 68,470 3,932 6,866 8,668 557,692 6,319 3,550 1,195 9,772 973Imports 20,828 30,422 102,534 66,338 27,682 71,652 6,074 20,578 98,549 628,281 6,156 26,701 11,759 1,272 24,894
2009-10Exports 36,082 26,739 66,514 50,822 31,237 86,115 3,962 6,618 8,817 615,299 5,846 3,581 1,398 10,260 1,140Imports 20,786 35,747 98,663 47,636 25,193 50,022 2,382 11,142 128,832 589,131 9,638 32,082 10,591 1,469 31,406
2010-11Exports 56,340 34,135 108,754 67,558 41,131 103,123 4,855 8,967 13,846 796,142 7,463 5,589 1,615 14,317 1,250Imports 19,527 31,456 80,239 47,364 30,771 53,773 1,430 18,597 142,189 629,363 13,922 11,730 9,160 1,370 28,653
2011-12Exports 46,567 29,829 93,957 51,755 41,639 105,674 4,167 8,206 18,043 733,976 7,702 5,661 1,527 9,722 1,184Imports 24,184 45,292 100,147 48,977 21,075 49,642 2,346 18,185 171,364 670,705 19,321 8,098 10,051 1,597 25,153
2012-13 Exports 48,014 93,680 93,550 52,157 47,948 121,172 4,227 9,816 16,083 848,776 8,933 7,460 1,721 12,516 1,165Imports 21,161 40,421 131,039 45,557 26,546 68,700 2,768 18,907 197,257 722,474 29,422 5,325 9,400 1,341 23,251
2013-14Exports 66,583 42,680 117,918 75,643 68,789 161,509 5,587 12,762 20,464 977,580 10,328 7,232 2,114 17,583 1,263Imports 23,738 38,178 126,050 50,061 28,376 60,807 1,327 22,151 182,609 733,479 17,523 5,827 11,241 2,064 32,739
2014-15 Exports 62,205 38,207 118,980 67,580 68,336 160,250 5,150 12,922 18,438 949,577 10,234 4,393 1,750 15,352 1,316Imports 19,352 41,759 97,456 42,827 34,086 61,252 1,246 24,836 170,621 717,665 19,168 10,893 13,048 1,227 29,214
2015-16Exports 63,374 35,968 117,967 67,738 66,663 164,716 4,420 12,450 18,385 939,070 13,290 3,177 1,579 17,142 1,258Imports 56,441 41,013 97,594 51,670 45,114 64,799 891 19,877 190,306 819,708 11,907 6,173 16,969 2,922 27,147
2016-17Exports 66,299 38,810 125,068 68,579 71,759 163,087 4,675 14,401 18,085 956,011 15,150 3,322 1,361 17,469 1,247Imports 36,491 71,084 114,306 57,573 54,432 71,190 1,293 21,813 217,443 990,468 8,569 5,655 13,380 2,602 27,481
2017-18Exports 78,246 45,549 146,726 84,476 95,198 186,736 5,811 15,451 21,374 1,108,065 18,240 3,417 1,600 21,965 1,722Imports 35,790 50,265 146,427 72,834 100,222 86,389 11,942 27,749 266,521 1,184,068 15,688 9,893 19,260 3,156 33,414
2018-19Exports 84,843 53,910 173,380 107,414 132,209 226,848 7,787 18,388 26,819 1,401,298 24,815 3,924 1,900 24,618 1,793Imports 52,408 60,435 142,625 132,089 82,042 109,574 3,248 31,614 246,094 1,297,675 12,469 24,078 22,758 3,000 46,966
2019-20Exports 87,114 57,735 199,000 115,019 160,464 239,634 9,035 19,207 27,052 1,542,726 29,104 4,408 1,847 26,571 2,021Imports 42,211 62,904 124,221 77,209 96,543 96,732 3,505 30,682 174,706 1,184,842 20,516 8,499 17,403 3,398 42,632
2020-21 PExports 101,782 66,002 241,190 125,895 199,330 324,657 9,159 25,478 28,189 1,996,461 39,805 5,119 1,927 33,355 2,269Imports 56,947 66,734 162,187 79,594 82,534 106,357 6,123 38,880 249,037 1,408,046 15,160 8,399 25,737 3,370 52,505
P : Provisional (Contd...)
137

TABLE 8.11
DIRECTION OF TRADE
Rs millionB. Organization for Economic
Cooperation & Development (OECD) C. Council for Mutual Economic Assistance (CMEA) D. SAARCYears (b) Other than Consortium Total Russian
Spain Greece Austra- New Total (OECD) Feder- Bulga- Czech Hung- Poland Roma- Total Bangla- Indialia Zealand ation ria Republic ary nia desh
2003-04Exports 17,356 5,186 7,494 2,077 45,076 407,654 1,179 148 570 1,059 1,759 287 5,002 11,226 5,398Imports 4,542 517 17,700 823 49,884 311,885 7,730 288 308 1,033 563 1,203 11,125 2,644 22,004
2004-05Exports 20,232 6,055 6,600 2,113 49,399 471,686 2,607 215 622 1,070 2,296 460 7,270 12,226 17,126Imports 5,124 1,472 33,270 1,297 83,426 424,876 16,604 312 556 3,508 2,039 2,065 25,084 3,635 32,488
2005-06Exports 24,876 4,922 7,362 2,308 56,474 529,987 3,137 419 752 1,481 2,286 566 8,641 16,075 17,557Imports 5,778 1,382 14,611 2,163 91,345 554,511 27,491 450 869 2,145 3,738 2,567 37,260 3,864 48,072
2006-07Exports 28,231 5,756 7,462 1,985 63,211 553,771 5,060 270 1,170 1,550 3,123 747 11,921 15,884 20,805Imports 6,223 1,716 17,984 3,684 79,825 583,851 16,727 3,489 1,849 7,273 1,254 3,158 33,750 3,540 74,938
2007-08Exports 33,991 6,291 8,689 2,252 72,142 577,184 6,194 977 1,386 1,222 3,561 1,326 14,666 21,501 15,905Imports 7,919 2,553 32,589 3,818 104,634 664,100 21,791 1,164 3,620 6,682 2,235 2,614 38,106 4,352 106,872
2008-09Exports 31,674 5,760 10,101 2,327 71,671 629,363 8,211 856 1,268 1,208 3,534 1,596 16,673 30,073 24,350Imports 9,912 4,098 39,039 5,061 128,892 757,173 46,638 14,734 2,809 2,885 4,373 12,373 83,812 6,233 93,471
2009-10Exports 36,412 5,782 10,682 2,500 77,601 692,900 10,015 964 1,365 1,158 3,352 1,992 18,846 40,593 22,489Imports 10,215 1,167 47,441 4,819 148,828 737,959 15,749 3,187 1,840 1,486 4,267 7,746 34,275 6,774 102,872
2010-11Exports 48,855 5,048 14,256 3,340 101,733 897,875 15,691 1,178 2,134 1,265 5,659 2,265 28,192 86,783 22,602Imports 15,623 1,388 28,887 5,812 116,545 745,908 13,970 2,108 1,515 3,998 5,683 10,182 37,456 6,813 149,047
2011-12Exports 43,732 4,805 14,915 3,230 92,478 826,454 16,979 1,158 2,036 1,179 5,767 2,390 29,509 56,645 30,297Imports 12,291 2,121 43,550 4,428 126,610 797,315 18,111 1,245 1,969 4,069 3,697 15,513 44,604 5,796 134,738
2012-13 Exports 50,998 4,690 16,255 3,708 107,446 956,222 20,102 1,243 2,609 1,010 7,679 2,017 34,660 68,673 31,700Imports 15,401 4,008 74,789 4,491 167,428 889,902 26,835 1,582 2,091 2,108 5,560 4,301 42,477 5,882 175,529
2013-14Exports 72,027 6,771 26,008 3,938 147,264 1,124,844 19,244 1,575 3,307 1,285 13,347 2,729 41,487 71,835 42,016Imports 17,934 2,083 30,928 5,092 125,431 858,910 24,150 1,430 3,047 3,291 6,035 8,027 45,980 5,739 210,541
2014-15 Exports 81,680 7,096 16,499 4,029 142,349 1,091,926 18,623 1,735 3,477 1,094 14,032 2,389 41,350 70,663 36,295Imports 15,515 884 39,076 6,061 135,086 852,751 20,914 1,381 6,732 2,845 9,833 18,604 60,309 6,302 172,171
2015-16Exports 84,265 6,535 23,039 3,995 154,280 1,093,350 15,248 1,318 3,675 1,215 16,643 1,995 40,094 72,261 31,663Imports 26,563 1,004 53,450 6,735 152,870 972,578 22,615 1,304 3,020 3,928 9,181 3,323 43,371 5,283 185,812
2016-17 Exports 85,503 6,554 24,548 4,184 159,338 1,115,349 13,555 1,557 4,377 1,187 19,209 2,280 42165 65,429 37,600Imports 23,461 1,026 61,510 7,019 150,703 1,141,171 34,938 1,679 4,122 5,158 15,409 8,030 69336 6,250 178,170
2017-18 Exports 104,486 8,536 27,177 3,925 191,068 1,299,133 16,087 2,038 4,508 1,319 24,123 3,076 51151 80,690 39,248Imports 23,876 1,684 43,812 9,658 160,441 1,344,509 37,609 2,189 5,085 7,476 10,711 4,728 67798 8,533 207,521
2018-19Exports 126,496 12,109 30,835 5,108 231,598 1,632,896 20,995 2,778 6,590 1,563 34,863 3,476 70265 101,790 34,855Imports 28,060 2,693 40,343 6,363 186,730 1,484,405 38,195 2,005 5,700 4,217 13,884 6,549 70550 7,271 204,785
2019-20 PExports 130,293 11,784 32,703 5,983 244,714 1,787,440 20,293 4,423 7,449 1,618 38,212 4,353 76348 102,591 1,272Imports 25,536 5,252 41,609 6,253 171,098 1,355,940 46,200 2,458 4,477 3,500 14,501 3,365 74501 7,231 59,949
2020-21 PExports 140,288 12,361 44,994 7,513 287,630 2,284,091 27,458 6,027 9,682 2,986 49,370 6,770 102293 104,121 12Imports 34,239 5,797 77,970 8,609 231,785 1,639,832 123,993 10,384 7,294 5,166 20,281 3,020 170138 11,919 50,671
P : Provisional (Contd...)
138

TABLE 8.11
DIRECTION OF TRADE
Rs millionF. Central G. South
South East Asian Countries (ASEAN) America America H. Other European CountriesYears Maldi- Nepal Sri Total Malay- Singa- Indone- Thai- Philip- Total Malta Yugo- Others Total
ves Lanka sia pore sia land pines slavia2003-04
Exports 109 266 5,633 22,632 4,804 6,738 2,563 3,642 1,521 19,268 6,479 5,327 207 - 4,576 4,783Imports 10 197 2,786 27,641 34,697 28,292 20,593 15,499 621 99,702 646 4,910 590 - 6,780 7,370
2004-05Exports 152 163 9,260 38,927 3,891 3,379 4,188 4,578 1,956 17,992 7,782 7,940 108 - 5,817 5,925Imports 205 223 2,663 39,214 40,266 22,172 34,131 24,579 1,013 122,161 1,398 13,522 1,026 - 39,941 40,967
2005-06Exports 153 187 9,531 43,503 3,830 2,276 3,474 4,043 2,991 16,614 9,015 10,151 148 - 8,618 8,766Imports 9 197 4,269 56,411 42,405 27,735 45,379 3,892 41,614 1,560 5,722 23,240 5,423 - 30,851 30,874
2006-07Exports 221 99 12,166 49,175 4,406 4,140 4,418 4,077 2,900 19,941 11,246 14,220 169 - 8,778 8,947Imports 2 192 3,843 82,515 57,319 29,225 51,333 36,201 1,991 176,069 2,725 14,310 253 - 33,464 33,717
2007-08Exports 283 49 13,413 51,151 5,967 2,815 3,848 4,370 6,952 23,952 12,645 18,268 97 - 11,882 11,979Imports - 75 3,852 115,151 96,935 48,764 73,998 37,259 2,882 259,838 2,804 42,756 21 - 61,807 61,828
2008-09Exports 436 56 14,872 69,787 9,668 2,584 3,793 7,044 5,299 28,388 14,306 19,023 137 - 11,534 11,671Imports - 88 5,111 104,903 125,582 43,140 65,742 46,102 3,521 284,087 5,692 32,783 18 - 34,456 34,474
2009-10Exports 358 59 23,781 87,280 16,330 3,196 6,094 7,021 13,180 45,821 14,802 19,981 130 - 13,674 13,804Imports 15 85 4,580 114,326 146,345 68,235 53,773 60,128 2,891 331,372 6,971 16,305 5 - 28,946 28,951
2010-11Exports 384 52 28,369 138,190 14,146 5,729 11,913 8,202 8,790 48,780 17,789 31,257 197 - 20,470 20,667Imports 163 4,900 160,923 210,250 57,416 68,756 72,074 3,197 411,693 4,949 38,357 3,825 - 17,389 21,214
2011-12Exports 478 124 27,270 114,814 20,138 4,327 19,422 9,866 9,734 63,487 16,900 30,406 222 - 23,291 23,513Imports 3 168 6,159 146,864 216,853 74,779 104,366 74,260 3,025 473,283 4,083 24,947 12 - 42,773 42,785
2012-13 Exports 650 106 31,718 132,847 22,887 7,180 18,940 11,102 5,996 66,105 19,532 33,169 240 - 25,083 25,323Imports 9 83 7,397 188,900 202,928 75,951 125,341 69,912 3,245 477,377 5,854 34,623 30 - 43,533 43,563
2013-14Exports 868 67 26,748 141,534 22,123 11,060 12,675 11,603 10,525 67,986 19,313 35,930 704 - 29,710 30,414Imports 2 76 6,373 222,731 174,360 99,808 162,725 67,649 3,440 507,982 5,224 35,456 22 - 92,799 92,821
2014-15 Exports 868 220 27,041 135,087 20,779 30,468 14,504 12,737 7,132 85,620 18,447 30,631 605 - 26,094 26,699Imports 299 77 5,858 184,707 96,272 99,208 209,602 85,454 4,904 495,440 6,703 60,568 13 - 116,024 116,037
2015-16Exports 773 98 25,760 130,555 16,644 8,813 13,207 11,186 6,704 56,554 18,262 25,258 486 - 23,377 23,863Imports 3 59 7,776 198,933 96,469 65,216 222,695 88,125 4,242 476,747 11,466 102,969 100 - 110,923 111,023
2016-17 Exports 547 80 26,112 129,768 13,606 5,370 14,634 14,198 12,456 60,264 16,415 25,326 408 - 26,703 27,111Imports 820 196 10,715 196,151 100,244 80,729 240,441 116,126 3,868 541,408 9,582 78,965 41 - 106,604 106,645
2017-18Exports 677 334 35,231 156,180 16,129 9,963 34,651 21,015 11,763 93,521 19,047 30,639 387 - 33,763 34,150Imports 3 46 11,262 227,365 132,031 114,166 278,479 152,176 8,752 685,604 17,234 98,969 58 - 127,883 127,941
2018-19Exports 796 126 42,797 180,364 22,570 12,320 22,419 30,844 19,258 107,411 21,045 34,355 607 - 40,626 41,233Imports 37 68 10,296 222,457 145,502 103,818 327,287 180,286 8,453 765,346 18,355 86,541 33 - 136,919 136,952
2019-20 PExports 1,210 3,246 47,177 155,496 42,314 8,496 17,538 28,407 15,597 112,352 22,371 35,123 559 - 47,508 48,067Imports 5 85 9,385 76,655 148,833 99,526 339,639 133,611 7,313 728,922 26,150 140,565 240 - 120,819 121,059
2020-21 PExports 920 616 44,098 149,767 38,079 13,269 23,893 27,526 20,864 123,631 22,281 45,256 717 - 51,683 52,400Imports 1 417 13,113 76,121 175,843 89,068 506,906 197,208 10,038 979,063 22,191 238,606 306 - 203,121 203,427
P : Provisional - : Not available (Contd….)
E. Association of D. SAARC
139

TABLE 8.11
DIRECTION OF TRADERs million
I. Other Asian Countries J. Central Asian StatesYears China Hong N. S. Burma/ Others Total Kazakhs- Kyrghyzs- Uzbek- Tajik- Turkmen- Total
Kong Korea Korea Myanmar tan tan istan istan istan2003-04
Exports 16,588 33,511 69 11,625 209 5,075 67,077 518 378 187 18 77 1,178Imports 66,423 8,416 149 21,909 768 13,001 110,666 15 - 300 165 222 702
2004-05Exports 21,027 33,121 515 10,993 118 8,321 74,095 570 83 167 47 59 926Imports 109,391 5,619 784 32,935 1,874 417,193 167,796 62 3 669 582 803 2,119
2005-06Exports 27,773 40,660 107 11,447 142 7,802 87,931 561 105 150 68 54 938Imports 161,991 9,800 640 36,915 2,189 21,854 233,388 60 24 643 302 397 1,426
2006-07Exports 34,927 39,645 64 10,556 238 9,327 94,757 487 47 125 26 61 746Imports 214,275 11,714 1,184 40,699 3,421 23,842 295,135 180 - 1,396 142 599 2,317
2007-08Exports 43,164 32,595 24 12,523 279 10,808 99,393 528 110 176 11 62 887Imports 294,684 11,797 909 42,567 3,540 28,982 382,479 2,992 39 1,132 746 1,407 6,316
2008-09Exports 54,888 29,602 99 19,358 532 13,430 117,909 228 94 165 28 55 570Imports 319,640 9,469 1,040 50,449 3,839 28,563 413,000 171 1 996 366 748 2,282
2009-10Exports 96,669 35,306 11 19,056 714 29,446 181,202 308 94 233 86 61 782Imports 370,231 8,238 892 57,989 3,991 32,986 474,327 2,103 1 884 560 1,131 4,679
2010-11Exports 139,735 42,475 8 31,932 863 34,573 249,586 688 63 296 64 164 1,275Imports 494,910 9,212 2,160 61,063 5,038 42,760 615,143 1,485 8 898 210 3,553 6,154
2011-12Exports 195,927 35,245 1 33,818 891 39,311 305,193 354 79 268 178 61 940Imports 599,503 9,624 3,477 72,171 6,520 40,566 731,861 1,368 - 883 15 1,102 3,368
2012-13 Exports 252,522 38,869 7 27,997 1,292 43,720 364,407 586 92 408 674 227 1,987Imports 642,371 11,542 5,044 84,273 1,924 46,842 791,996 437 9 47 44 1,345 1,882
2013-14Exports 249,014 37,197 7 42,839 1,357 53,919 384,333 534 45 332 925 183 2,019Imports 792,957 10,908 4,094 67,826 2,214 55,168 933,167 365 5 56 8 1,668 2,102
2014-15Exports 219,866 28,970 3 34,591 1,830 51,929 337,189 669 100 136 752 1,199 2,856Imports 1,053,038 8,202 4,119 67,671 699 55,296 1,189,025 492 12 166 7 1,345 2,022
2015-16Exports 174,044 17,325 - 26,778 1,137 43,745 263,029 2,869 110 216 471 420 4,086Imports 1,261,896 7,677 3,855 80,435 2,769 72,853 1,429,485 273 8 193 1,168 2,026 3,668
2016-17Exports 153,808 12,681 35,400 1,634 43,091 246,614 5,484 119 393 290 448 6,734Imports 1,584,315 7,949 3,303 78,403 584 78,171 1,752,725 475 21 369 1,474 2,381 4,720
2017-18Exports 185,723 12,105 35,680 2,057 53,435 289,000 9,359 137 792 874 213 11,375Imports 1,731,764 14,479 2,109 106,838 478 102,980 1,958,648 582 8 305 647 2,579 4,121
2018-19Exports 259,562 13,936 37,500 2,278 57,487 370,763 11,251 251 2,946 1,083 178 15,709Imports 1,734,330 15,467 368 112,509 386 143,811 2,006,871 308 9 529 27 1,277 2,150
2019-20 PExports 273,360 11,551 27,967 2,095 42,076 357,049 10,214 275 3,397 671 335 14,892Imports 1,909,193 23,156 206 124,794 217 165,158 2,222,724 130 18 878 88 631 1,745
2020-21 PExports 387,956 14,897 30,132 1,835 44,907 479,726 18,515 306 6,038 338 529 25,725Imports 2,473,815 20,120 15 225,459 302 188,722 2,908,433 71 7 4,329 126 1,201 5,734
P : Provisional - : Not available (Contd...)
140

TABLE 8.11
Rs millionK. Other African Countries Grand
Years Libe- Ghana Kenya Mauri- Nige- Tanza- Mala- Others Total Totalria tius ria nia wi land
2003-04Exports 82 260 3,450 2,204 3,857 811 52 11,817 22,533 709,036Imports 1 6 8,218 60 720 1,075 73 10,538 20,691 897,825
2004-05Exports 295 931 3,827 1,910 3,236 732 82 23,457 34,470 854,088Imports 73 1 10,101 68 418 622 110 17,731 29,124 1,223,079
2005-06Exports 132 966 3,914 2,027 2,474 1,223 118 29,023 39,877 984,841Imports 19 67 10,061 77 898 1,151 140 25,314 37,727 1,711,158
2006-07Exports 17 668 5,643 2,185 1,404 1,434 125 30,580 42,055 1,029,312Imports 67 31 9,258 36 603 1,725 310 23,459 35,489 1,851,806
2007-08Exports 68 1,020 6,393 2,680 1,578 1,599 76 36,133 49,547 1,196,638Imports 1 200 8,889 24 1,824 2,268 550 47,106 60,862 2,512,072
2008-09Exports 121 663 9,478 2,453 1,872 2,920 124 37,172 54,803 1,383,718Imports 1 88 11,168 72 2,045 1,087 535 66,332 81,328 2,723,570
2009-10Exports 385 769 13,426 2,308 3,431 3,611 135 46,487 70,552 1,617,457Imports - 81 15,828 58 1,314 967 765 53,445 72,458 2,910,975
2010-11Exports 376 2,487 17,950 2,983 2,567 4,231 132 56,598 87,324 2,120,846Imports 3,392 212 20,337 316 814 1,607 537 73,532 100,747 3,455,285
2011-12Exports 1,251 1,884 21,006 2,642 2,429 6,825 204 55,338 91,579 2,110,605Imports 62 341 20,559 84 319 1,462 155 80,776 103,758 4,009,093
2012-13 Exports 339 945 21,449 2,282 3,660 13,039 193 63,180 105,087 2,366,478Imports 265 834 25,351 1,691 2,849 1,283 335 79,664 112,272 4,349,880
2013-14Expotrs 112 1,843 30,637 3,119 5,889 12,295 171 79,489 133,555 2,583,463Imports 4 318 24,859 2,356 753 1,033 334 70,243 99,900 4,630,521
2014-15 Exports 228 2,112 31,736 2,824 6,758 11,345 150 70,534 125,687 2,397,513Imports 789 411 27,728 3,994 2,127 1,848 204 97,813 134,914 4,644,152
2015-16Exports 92 1,210 26,861 1,784 3,470 13,899 206 60,960 108,482 2,166,846Imports 322 261 41,793 3,247 3,319 2,394 22 107,119 158,477 4,658,749
2016-17 Exports 53 1,364 32,084 1,818 5,375 9,810 93 49,474 100,071 2,138,186Imports 2 319 45,219 404 2,665 2,433 16 135,179 186,237 5,539,721
2017-18Expotrs 215 4,488 31,596 2,246 5,588 11,632 83 67,622 123,470 2,555,043Imports 14 304 51,479 167 25,458 1,929 273 197,620 277,244 6,694,897
2018-19Exports 117 5,042 35,900 2,279 4,948 13,433 250 70,378 132,347 3,128,230Imports 2 347 63,572 1,035 31,775 5,203 244 252,460 354,638 7,443,253
2019-20Exports 441 8,525 45,609 3,170 3,747 15,610 967 88,184 166,253 3,369,782Imports 5 316 70,770 816 42,741 15,145 29 230,618 360,440 7,029,819
2020-21 PExports 571 7,105 38,486 2,045 5,564 14,464 1,807 91,568 161,610 4,041,927Imports 38 356 81,580 982 11,614 10,893 16 322,114 427,593 8,982,441
P : Provisional - : Not available Source: Pakistan Bureau of Statistics
DIRECTION OF TRADE
141

TABLE 8.12
DESTINATION OF EXPORTS & ORIGIN OF IMPORTS
% Share
REGION 2000-01 2001-02 2002-03 2003-04 2004-05 2005-06 2006-07
1. Developed CountriesExports 58.1 56.1 58.2 55.9 55.9 54.7 54.7Imports 34.3 34.4 35.5 38.0 38.0 34.2 33.3a. OECD
Exports 57.6 55.6 57.5 55.2 55.2 53.8 53.8Imports 33.7 33.5 34.7 34.7 34.7 32.4 31.5
b. Other European CountriesExports 0.5 0.5 0.7 0.7 0.7 0.9 0.9Imports 0.6 0.9 0.8 3.3 3.3 1.8 1.8
2. CMEA*Exports 0.5 0.6 0.7 0.9 0.9 0.9 1.1Imports 1.1 0.8 1.2 2.1 2.1 2.2 1.8
3. Developing CountriesExports 41.4 43.3 41.1 43.2 43.2 44.4 44.2Imports 64.6 64.8 63.3 59.9 59.9 63.6 64.9a. OIC
Exports 19.2 22.3 20.7 21.9 21.9 23.3 21.6Imports 36.0 35.2 33.7 29.2 29.2 33.7 32.0
b. SAARCExports 2.5 2.4 3.2 4.6 4.6 4.4 4.8Imports 2.4 1.9 3.1 3.2 3.2 3.3 4.5
c. ASEANExports 2.7 2.9 2.7 2.1 2.1 1.7 1.9Imports 11.7 12.2 11.1 10.0 10.0 9.1 9.5
d. Central AmericaExports 1.0 0.9 0.9 0.9 0.9 0.9 1.1Imports 0.1 0.1 0.1 0.1 0.1 0.1 0.2
e. South AmericaExports 0.9 0.7 0.8 0.9 0.9 1.0 1.4Imports 0.7 0.6 0.6 1.1 1.1 1.4 0.8
f. Other Asian CountriesExports 11.4 9.9 9.4 8.7 8.7 8.9 9.2Imports 10.9 12.5 12.3 13.7 13.7 13.7 15.9
g. Other African CountriesExports 3.5 4.0 3.2 4.0 4.0 4.1 4.1Imports 2.7 2.3 2.3 2.4 2.4 2.2 1.9
h. Central Asian StatesExports 0.2 0.2 0.2 0.1 0.1 0.1 0.1Imports 0.1 - 0.1 0.2 0.2 0.1 0.1
Total 100 100 100 100 100 100 100(Contd…)
142

TABLE 8.12
DESTINATION OF EXPORTS & ORIGIN OF IMPORTS
% Share
REGION 2007-08 2008-09 2009-10 2010-11 2011-12 2012-13 2013-14
1. Developed CountriesExports 51.0 46.4 43.7 43.3 40.3 41.5 44.7Imports 30.2 29.1 26.3 22.7 21.0 21.5 20.5a. OECD
Exports 50.0 45.5 42.8 42.3 39.2 40.4 43.5Imports 27.1 27.8 25.3 21.6 19.9 20.5 18.5
b. Other European CountriesExports 1.0 0.9 0.9 1.0 1.1 1.1 1.2Imports 3.1 1.3 1.0 0.6 1.1 1.0 2.0
2. CMEA*Exports 1.2 1.2 1.2 1.3 1.4 1.5 1.6Imports 1.4 3.1 1.2 1.1 1.1 1.0 1.0
3. Developing CountriesExports 47.8 52.4 55.1 55.4 58.3 57.0 53.7Imports 68.4 67.8 72.5 76.7 77.9 77.6 78.5a. OIC
Exports 26.4 30.4 29.1 28.3 28.8 26.5 23.3Imports 33.4 33.9 37.4 38.0 40.8 40.5 39.4
b. SAARCExports 4.4 5.0 5.4 6.5 5.4 5.6 5.5Imports 5.0 3.8 3.9 4.7 3.7 4.3 4.8
c. ASEANExports 1.7 2.1 2.8 2.3 3.0 2.8 2.6Imports 9.9 10.4 11.4 11.9 11.8 11.0 11.0
d. Central AmericaExports 1.0 1.0 0.9 0.8 0.8 0.8 0.7Imports 0.1 0.2 0.2 0.1 0.1 0.1 0.1
e. South AmericaExports 1.6 1.4 1.2 1.5 1.4 1.4 1.4Imports 1.8 1.2 0.6 1.1 0.6 0.8 0.8
f. Other Asian CountriesExports 8.4 8.5 11.2 11.8 14.5 15.4 14.9Imports 15.7 15.2 16.3 17.8 18.3 18.2 20.2
g. Other African CountriesExports 4.2 4.0 4.4 4.1 4.3 4.4 5.2Imports 2.2 3.0 2.5 2.9 2.6 2.6 2.2
h. Central Asian StatesExports 0.1 - 0.1 0.1 - 0.1 0.1Imports 0.3 0.1 0.2 0.2 0.1 - -
Total 100 100 100 100 100 100 100(Contd…)
143

TABLE 8.12
DESTINATION OF EXPORTS & ORIGIN OF IMPORTS
% Share
REGION 2014-15 2015-16 2016-17 2017-18 2018-19 2019-20 2020-21 P
1. Developed CountriesExports 46.7 51.6 53.4 52.2 53.6 54.5 57.8Imports 20.9 23.3 22.5 22.0 21.8 21.0 20.5a. OECD
Exports 45.5 50.5 52.2 50.8 52.3 53.0 56.5Imports 18.4 20.9 20.6 20.1 19.9 19.3 18.3
b. Other European CountriesExports 1.1 1.1 1.2 1.3 1.3 1.4 1.3Imports 2.5 2.4 1.9 1.9 1.8 1.7 2.3
2. CMEA*Exports 1.7 1.9 2.1 2.0 2.2 2.3 2.5Imports 1.3 0.9 1.3 1.0 0.9 1.1 1.9
3. Developing CountriesExports 51.6 46.6 44.6 45.8 44.2 43.3 39.7Imports 77.8 75.8 76.2 77.0 77.3 77.9 77.6a. OIC
Exports 20.9 18.6 17.2 17.5 16.7 17.6 14.7Imports 33.2 24.7 26.2 28.2 30.8 27.3 25.7
b. SAARCExports 5.6 6.0 6.1 6.1 5.8 4.6 3.7Imports 4.0 4.3 3.5 3.4 3.0 1.1 0.8
c. ASEANExports 3.6 2.6 2.8 3.7 3.4 3.3 3.1Imports 10.7 10.2 9.8 10.2 10.3 10.4 10.9
d. Central AmericaExports 0.8 0.8 0.8 0.7 0.7 0.7 0.6Imports 0.1 0.2 0.2 0.3 0.2 0.4 0.2
e. South AmericaExports 1.3 1.2 1.2 1.2 1.1 1.0 1.1Imports 1.3 2.2 1.4 1.5 1.2 2.0 2.7
f. Other Asian CountriesExports 14.1 12.1 11.5 11.3 11.9 10.6 11.9Imports 25.6 30.7 31.6 29.3 27.0 31.6 32.4
g. Other African CountriesExports 5.2 5.0 4.7 4.8 4.2 4.9 4.0Imports 2.9 3.4 3.4 4.1 4.8 5.1 4.8
h. Central Asian StatesExports 0.1 0.2 0.3 0.4 0.5 0.4 0.6Imports - 0.1 0.1 0.1 0.0 0.0 0.1
Total 100 100 100 100 100 100 100P : Provisional Source: Pakistan Bureau of Statistics* : Council for Mutual Economic Assistance
144

TABLE 8.13
US $ million
COUNTRY 2000-01 2001-02 2002-03 2003-04 2004-05 2005-06 2006-07
I. Cash Flow 1,021.59 2,340.79 4,190.73 3,826.16 4,152.29 4,588.03 5,490.97 Bahrain 23.87 39.58 71.46 80.55 91.22 100.57 136.28 Canada 4.90 20.52 15.19 22.90 48.49 81.71 87.20 Germany 9.20 13.44 26.87 46.52 53.84 59.03 76.87 Japan 3.93 5.97 8.14 5.28 6.51 6.63 4.26 Kuwait 123.39 89.66 221.23 177.01 214.78 246.75 288.71 Norway 5.74 6.55 8.89 10.19 18.30 16.82 22.04 Qatar 13.38 31.87 87.68 88.69 86.86 118.69 170.65 Saudi Arabia 304.43 376.34 580.76 565.29 627.19 750.44 1,023.56 Sultanat-e-Oman 38.11 63.18 93.65 105.29 119.28 130.45 161.69 U.A.E. 190.04 469.49 837.87 597.48 712.61 716.30 866.49
Abu Dhabi 48.11 103.72 212.37 114.92 152.51 147.89 200.40 Dubai 129.69 331.47 581.09 447.49 532.93 540.24 635.60 Sharjah 12.21 34.05 42.60 34.61 26.17 26.87 28.86 Others 0.03 0.25 1.81 0.46 1.00 1.30 1.63
U.K. 81.39 151.93 273.83 333.94 371.86 438.65 430.04 U.S.A. 134.81 778.98 1,237.52 1,225.09 1,294.08 1,242.49 1,459.64 Other Countries 88.40 293.28 727.64 567.93 507.27 679.50 763.54
II.Encashment* 64.98 48.26 46.12 45.42 16.50 12.09 2.68 Total (I+II) 1,086.57 2,389.05 4,236.85 3,871.58 4,168.79 4,600.12 5,493.65 * :Encashment and Profit in Pak Rs. of Foreign Exchange Bearer Certificates (FEBCs) (Contd…)
& Foreign Currency Bearer Certificates (FCBCs)
TABLE 8.13
% Share
COUNTRY 2000-01 2001-02 2002-03 2003-04 2004-05 2005-06 2006-07
Cash FlowBahrain 2.34 1.69 1.71 2.11 2.20 2.19 2.48 Canada 0.48 0.88 0.36 0.60 1.17 1.78 1.59 Germany 0.9 0.57 0.64 1.22 1.30 1.29 1.40 Japan 0.38 0.26 0.19 0.14 0.16 0.14 0.08 Kuwait 12.08 3.83 5.28 4.63 5.17 5.38 5.26 Norway 0.56 0.28 0.21 0.27 0.44 0.37 0.40 Qatar 1.31 1.36 2.09 2.32 2.09 2.59 3.11 Saudi Arabia 29.8 16.08 13.86 14.77 15.10 16.36 18.64 Sultanat-e-Oman 3.73 2.7 2.23 2.75 2.87 2.84 2.94 U.A.E. 18.6 20.06 19.99 15.62 17.16 15.61 15.78
Abu Dhabi 4.71 4.43 5.07 3.00 3.67 3.22 3.65 Dubai 12.69 14.16 13.87 11.70 12.83 11.77 11.58 Sharjah 1.2 1.45 1.02 0.90 0.63 0.59 0.53 Others 0 0.01 0.04 0.01 0.02 0.03 0.03
U.K. 7.97 6.49 6.53 8.73 8.96 9.56 7.83 U.S.A. 13.2 33.28 29.53 32.02 31.17 27.08 26.58 Other Countries 8.65 12.53 17.36 14.84 12.22 14.81 13.91
Total 100 100 100 100 100 100 100 (Contd…)
WORKERS' REMITTANCES
WORKERS' REMITTANCES
145

TABLE 8.13
WORKERS' REMITTANCES
US $ million
COUNTRY 2007-08 2008-09 2009-10 2010-11 2011-12 2012-13 2013-14
I. Cash Flow 6,448.84 7,810.95 8,904.88 11,200.9 13,186.6 13,921.6 15,837.7Bahrain 140.51 153.27 151.35 167.3 211.0 282.8 318.8Canada 100.62 79.07 115.12 184.6 177.7 177.2 160.0Germany 73.33 100.71 81.21 106.6 88.7 83.2 85.6Japan 4.75 5.10 5.68 8.1 9.0 5.2 7.1Kuwait 384.58 432.05 445.09 495.2 582.6 619.0 681.4Norway 28.78 24.94 34.68 37.0 38.5 37.8 30.8Qatar 233.36 339.51 354.15 306.1 318.8 321.3 329.2Saudi Arabia 1,251.32 1,559.56 1,917.66 2,670.1 3,687.0 4,104.7 4,729.4Sultanat-e-Oman 224.94 277.82 287.27 337.6 382.7 384.8 530.5U.A.E. 1,090.30 1,688.59 2,038.52 2,597.7 2,848.9 2,750.2 3,109.5
Abu Dhabi 298.80 669.40 1,130.32 1,328.8 1,367.6 1,485.0 1,512.5Dubai 761.24 970.42 851.54 1,201.2 1,411.3 1,213.8 1,550.0Sharjah 28.58 47.84 54.55 63.8 67.3 49.8 45.5Others 1.68 0.93 2.11 4.0 2.7 1.5 1.5
U.K. 458.87 605.59 876.38 1,199.7 1,521.1 1,946.0 2,180.2U.S.A 1,762.03 1,735.87 1,771.19 2,068.7 2,334.5 2,186.2 2,467.7Other Countries 695.45 808.87 826.58 1,022.2 986.2 1,023.2 1,207.4
II.Encashment* 2.40 0.48 1.02 0.1 0.0 0.1 0.0Total (I+II) 6,451.24 7,811.43 8,905.90 11,201.0 13,186.6 13,921.7 15,837.7
(Contd…)* :Encashment and Profit in Pak Rs. of Foreign Exchange Bearer Certificates (FEBCs)
& Foreign Currency Bearer Certificates (FCBCs)
TABLE 8.13
WORKERS' REMITTANCES
% Share
COUNTRY 2007-08 2008-09 2009-10 2010-11 2011-12 2012-13 2013-14
Cash FlowBahrain 2.18 1.96 1.70 1.49 1.60 2.03 2.01 Canada 1.56 1.01 1.29 1.65 1.35 1.27 1.01 Germany 1.14 1.29 0.91 0.95 0.67 0.60 0.54 Japan 0.07 0.07 0.06 0.07 0.07 0.04 0.04 Kuwait 5.96 5.53 5.00 4.42 4.42 4.45 4.30 Norway 0.45 0.32 0.39 0.33 0.29 0.27 0.19 Qatar 3.62 4.35 3.98 2.73 2.42 2.31 2.08 Saudi Arabia 19.40 19.97 21.53 23.84 27.96 29.48 29.86 Sultanat-e-Oman 3.49 3.56 3.23 3.01 2.90 2.76 3.35 U.A.E. 16.91 21.62 22.89 23.19 21.60 19.75 19.63
Abu Dhabi 4.63 8.57 12.69 11.86 10.37 10.67 9.55 Dubai 11.80 12.42 9.56 10.72 10.70 8.72 9.79 Sharjah 0.44 0.61 0.61 0.57 0.51 0.36 0.29 Others 0.03 0.01 0.02 0.04 0.02 0.01 0.01
U.K. 7.12 7.75 9.84 10.71 11.54 13.98 13.77 U.S.A 27.32 22.22 19.89 18.47 17.70 15.70 15.58 Other Countries 10.78 10.36 9.28 9.13 7.48 7.35 7.62
Total 100 100 100 100 100 100 100 (Contd…)
146

TABLE 8.13
WORKERS' REMITTANCES
US $ million
COUNTRY 2014-15 2015-16 2016-17 2017-18 2018-19 2019-20 2020-21 P
I. Cash Flow 18,719.8 19,916.8 19,351.4 19,913.6 21,739.4 23,132.3 29,370.9 Bahrain 389.0 448.4 396.4 355.7 340.2 417.1 464.7 Canada 171.0 176.0 187.4 211.0 213.0 313.4 586.0 Germany 78.1 93.7 94.1 127.8 123.5 392.2 426.8 Japan 7.8 13.2 14.3 22.8 23.0 66.4 84.9 Kuwait 748.1 774.0 763.8 774.2 725.8 738.6 858.6 Norway 27.6 34.9 41.3 47.8 43.5 69.7 111.0 Qatar 350.2 380.9 404.4 371.1 385.9 760.2 903.0 Saudi Arabia 5,630.4 5,968.3 5,469.8 4,858.8 5,003.0 6,613.5 7,667.0 Sultanat-e-Oman 685.7 819.4 760.9 657.3 667.2 994.3 1,083.5 U.A.E. 4,231.8 4,365.3 4,328.2 4,359.0 4,617.3 5,611.8 6,114.0
Abu Dhabi 1,750.7 1,418.3 1,426.8 1,132.7 1,488.0 810.4 944.7 Dubai 2,412.0 2,877.7 2,845.3 3,173.7 3,075.5 4,768.2 5,065.3 Sharjah 67.6 66.5 50.5 47.6 37.2 25.1 79.4 Others 1.5 2.8 5.5 5.0 16.7 8.1 24.6
U.K. 2,376.2 2,579.7 2,341.7 2,892.4 3,412.3 2,569.0 4,067.1 U.S.A 2,702.7 2,524.7 2,452.9 2,838.0 3,309.1 1,742.8 2,754.2 Other Countries 1,321.3 1,738.4 2,096.2 2,397.7 2,875.7 2,843.3 4,250.2
II.Encashment* 0.2 0.0 0.0 0.0 0.0 0.0 0.0Total (I+II) 18,720.0 19,916.8 19,351.5 19,913.6 21,739.4 23,132.3 29,370.9
Source: State Bank of Pakistan* :Encashment and Profit in Pak Rs. of Foreign Exchange Bearer Certificates (FEBCs)
& Foreign Currency Bearer Certificates (FCBCs)
TABLE 8.13
WORKERS' REMITTANCES
% Share
COUNTRY 2014-15 2015-16 2016-17 2017-18 2018-19 2019-20 2020-21 P
Cash FlowBahrain 2.08 2.25 2.0 1.8 1.6 1.8 1.6 Canada 0.91 0.88 1.0 1.1 1.0 1.4 2.0 Germany 0.42 0.47 0.5 0.6 0.6 1.7 1.5 Japan 0.04 0.07 0.1 0.1 0.1 0.3 0.3 Kuwait 4.00 3.89 3.9 3.9 3.3 3.2 2.9 Norway 0.15 0.18 0.2 0.2 0.2 0.3 0.4 Qatar 1.87 1.91 2.1 1.9 1.8 3.3 3.1 Saudi Arabia 30.08 29.97 28.3 24.4 23.0 28.6 26.1 Sultanat-e-Oman 3.66 4.11 3.9 3.3 3.1 4.3 3.7 U.A.E. 22.61 21.92 22.4 21.9 21.2 24.3 20.8
Abu Dhabi 9.35 7.12 7.4 5.7 6.8 3.5 3.2 Dubai 12.88 14.45 14.7 15.9 14.1 20.6 17.2 Sharjah 0.36 0.33 0.3 0.2 0.2 0.1 0.3 Others 0.01 0.01 0.0 0.0 0.1 0.0 0.1
U.K. 12.69 12.95 12.1 14.5 15.7 11.1 13.8 U.S.A 14.44 12.68 12.7 14.3 15.2 7.5 9.4 Other Countries 7.06 8.73 10.8 12.0 13.2 12.3 14.5
Total 100 100 100 100 100 100 100 Source: State Bank of Pakistan
147

TABLE 8.14
Rs millionTotal Cash (2)
Period Jun* Dec.* Low High Jun* Dec.* Low High Jun* Dec.* Low High2001 170,786 252,249 100,825 252,249 134,587 216,050 65,083 216,050 36,199 36,199 34,015 36,199
2002 326,715 501,291 259,497 501,291 286,695 461,271 223,298 461,271 40,020 40,020 36,199 40,020
2003 616,683 662,663 532,661 662,673 576,640 620,734 492,641 620,744 40,043 41,929 40,020 41,929
2004 691,051 638,332 634,239 702,725 642,746 590,027 585,934 660,742 48,305 48,305 41,929 48,305
2005 669,957 653,680 676,803 649,495 615,236 599,713 573,421 652,465 54,721 53,967 49,296 54,721
2006 771,157 772,963 646,033 772,963 694,840 695,786 592,016 716,000 76,317 77,177 54,017 77,177
2007 992,439 954,189 785,296 1,031,030 911,162 847,828 708,325 931,848 81,277 106,361 76,873 106,361
2008 R 784,159 761,302 477,146 931,355 652,439 619,658 353,900 811,637 131,720 141,644 116,489 143,112
2009 992,653 1,276,214 789,906 1,276,214 835,109 1,083,632 632,399 1,083,632 157,544 192,582 147,291 203,346
2010 R 1,413,294 1,537,264 1,205,987 1,537,264 1,193,108 1,288,062 1,011,828 1,288,062 220,186 294,203 189,972 249,203
2011 R 1,696,181 1,584,975 1,556,926 1,775,642 1,428,227 1,299,849 1,294,186 1,445,662 267,954 285,126 235,433 329,980
2012 1,438,698 1,314,155 1,299,786 1,584,430 1,125,621 980,592 954,440 1,257,965 313,077 333,563 303,074 348,805
2013 963,392 774,197 753,136 1,302,120 717,295 512,038 471,447 965,052 246,097 262,159 246,097 337,068
2014 1,307,510 1,449,882 754,644 1,449,882 1,038,202 1,200,107 481,286 1,200,107 269,308 249,275 248,274 288,264
2015 1,757,189 2,034,391 1,452,365 2,034,391 1,510,039 1,803,668 1,188,267 1,803,668 247,151 230,723 230,723 264,097
2016 2,325,799 2,307,147 2,001,893 2,404,776 2,038,628 2,055,633 1,759,993 2,128,176 287,170 251,514 241,900 291,829
2017 2,110,682 2,037,749 1,789,701 2,229,859 1,840,320 1,740,610 1,509,347 1,966,073 270,361 297,139 263,786 297,139
2018 1,693,453 1,631,886 1,590,720 1,906,897 1,377,842 1,262,167 1,258,993 1,598,188 315,611 369,719 302,540 369,719
2019 1,957,315 2,546,110 1,766,630 2,546,110 1,488,690 2,056,041 1,386,208 2,056,041 468,625 490,069 376,650 498,191
2020 2,923,806 3,006,317 2,546,494 3,021,459 2,306,312 2,379,318 1,960,582 2,379,318 617,495 626,999 508,578 681,860
2021 P 3,525,969 - 2,813,795 3,525,969 2,948,613 - 2,276,950 2,948,613 577,356 - 536,845 620,127 P : Provisional R : Revised Source: State Bank of Pakistan- : Not available * : Last day of the month1 : Gold excludes unsettled claims of Gold on RBI2 : Cash includes Sinking fund, Foreign currencies cash holdings and excludes unsettled claims on RBI
GOLD & CASH FOREIGN EXCHANGE RESERVES HELD & CONTROLLED BY STATE BANK OF PAKISTAN IN RUPPEES
Gold (1)
148

TABLE 8.15
US $ MillionTotal Cash (2) Gold (1)
Jun* Dec.* Low High Jun* Dec.* Low High Jun* Dec.* Low High2001 2,666 4,161 1,664 4,198 2,100 3,595 1,098 3,595 566 566 566 603
2002 5,439 8,569 4,183 8,569 4,772 7,902 3,617 7,902 667 667 566 667
2003 10,700 11,532 9,135 11,532 9,975 10,807 8,468 10,807 725 725 667 725
2004 11,883 10,756 10,529 12,290 11,052 9,925 9,804 11,459 831 831 725 831
2005 11,404 10,933 10,545 11,812 10,487 10,030 9,714 10,895 917 903 831 917
2006 12,810 12,697 10,795 13,191 11,542 11,429 9,892 11,923 1,268 1,268 903 1,268
2007 16,414 15,536 12,934 17,088 15,070 13,804 11,666 15,356 1,344 1,732 1,268 1,732
2008 11,465 9,625 5,857 14,969 9,539 7,834 4,344 12,958 1,926 1,791 1,513 2,011
2009 12,190 15,149 9,742 15,297 10,255 12,863 7,913 12,863 1,935 2,286 1,829 2,434
2010 16,528 17,951 14,266 17,951 13,953 15,041 12,033 15,041 2,575 2,910 2,233 2,910
2011 19,731 17,621 18,166 20,440 16,614 14,451 15,419 16,661 3,117 3,170 2,747 3,779
2012 15,216 13,527 13,457 17,593 11,905 10,094 9,881 13,914 3,311 3,433 3,226 3,679
2013 9,667 7,351 6,814 13,322 7,197 4,862 4,344 9,873 2,469 2,489 2,469 3,449
2014 13,235 14,429 6,976 14,691 10,509 11,943 4,563 11,943 2,726 2,486 2,413 2,748
2015 17,265 19,423 14,365 19,423 14,836 17,220 11,753 17,220 2,428 2,203 2,202 2,612
2016 22,185 22,057 19,080 22,936 19,446 19,653 16,775 20,298 2,739 2,405 2,306 2,783
2017 20,130 18,455 16,963 21,268 17,551 15,764 14,306 18,752 2,578 2,691 2,516 2,723
2018 13,938 11,752 11,752 17,249 11,341 9,089 9,089 14,457 2,598 2,662 2,466 2,792
2019 R 12,229 16,443 12,229 16,443 9,301 13,278 9,301 13,278 2,928 3,165 2,664 3,176
2020 17,398 18,809 15,613 18,809 13,724 14,886 12,021 14,886 3,674 3,923 3,292 4,083
2021 P 22,381 - 18,068 22,381 18,716 - 14,406 18,716 3,665 - 3,514 3,949P : Provisional R : Revised Source: State Bank of Pakistan- : Not available * : Last day of the month1 : Gold excludes unsettled claims of Gold on RBI2 : Cash includes Sinking fund, Foreign currencies cash holdings and excludes unsettled claims on RBI
GOLD & CASH FOREIGN EXCHANGE RESERVES HELD & CONTROLLED BY STATE BANK OF PAKISTAN IN US $
Period
149

TABLE 8.16
2001-02 2002-03 2003-04 2004-05 2005-06 2006-07
Australia Dollar 32.1607 34.2101 41.0626 44.7141 44.7564 47.6760
Bangladesh Taka 1.0826 1.0108 0.9842 0.9774 0.9121 0.8723
Canada Dollar 39.1719 38.8234 42.8526 47.5567 51.4986 53.5778
China Yuan 7.4149 7.0613 6.9497 7.1676 7.4161 7.7526
Hong Kong Dollar 7.8720 7.4990 7.3970 7.6176 7.7127 7.7772
India Rupee 1.2787 1.2219 1.2682 1.3253 1.3389 1.3746
Iran Rial 0.0307 0.0073 0.0069 0.0067 0.0066 0.0066
Japan Yen 0.4884 0.4888 0.5203 0.5558 0.5216 0.5122
Kuwait Dinar 200.7861 194.5677 194.3681 202.3816 205.3258 209.8118
Malaysia Ringgit 16.1621 15.3944 15.1532 15.6244 16.0515 17.0649
Nepal Rupee 0.8033 0.7515 0.7802 0.8169 0.8296 0.8575
Norway Krone 7.0288 8.1021 8.2191 9.1841 9.2141 9.7161
Singapore Dollar 33.9503 33.3406 33.5098 35.6797 36.4149 39.1651
Sri Lanka Rupee 0.6624 0.6057 0.5920 0.5813 0.5872 0.5649
Sweden Krona 5.9117 6.691 7.5195 8.2949 7.7867 8.6143
Switzerland Franc 37.1824 41.4643 44.2489 49.0657 46.8551 49.2385
S. Arabia Riyal 16.3792 15.5961 15.3488 15.8027 15.9608 16.1656
Thailand Baht 1.4000 1.3742 - 1.4763 1.5005 1.6789
UAE Dirham 16.7231 15.9261 15.6727 16.1586 16.2972 16.5107
UK Pound 88.5691 92.7433 100.1672 110.2891 106.4344 117.1852
USA Dollar 61.4258 58.4995 57.5745 59.3576 59.8566 60.6342
EMU Euro 54.9991 61.3083 68.6226 75.5359 72.8661 79.1763
IMF SDR 78.0627 79.3198 83.2470 88.5631 86.9594 90.7726- : Not available (Contd…)
CurrencyCountry
EXCHANGE RATE POSITION(Pakistan Rupees in Terms of One Unit of Selected Foreign Currencies)
(Average During the Year)
150

TABLE 8.16
2007-08 2008-09 2009-10 2010-11 2011-12 2012-13 2013-14
Australia Dollar 56.1958 58.2931 73.9643 84.6185 91.8961 99.2813 94.4043
Bangladesh Taka 0.9088 1.1423 1.2118 1.2101 1.1385 1.2059 1.3232
Canada Dollar 61.9742 67.5867 79.4785 85.4711 88.8631 96.3207 96.1939
China Yuan 8.6128 11.4930 12.2840 12.9120 14.0507 15.5063 16.7639
Hong Kong Dollar 8.0273 10.1246 10.8074 11.0019 11.4768 12.4764 13.2668
India Rupee 1.5417 1.6468 1.7995 1.8881 1.7836 1.7658 1.6757
Iran Rial 0.0067 0.0081 0.0084 0.0082 0.0079 0.0079 0.0041
Japan Yen 0.5711 0.8012 0.9164 1.0301 1.1352 1.1116 1.0180
Kuwait Dinar 228.2954 281.2742 291.6604 304.4159 322.3284 342.4219 364.0262
Malaysia Ringgit 18.9021 22.3290 24.8037 27.7427 28.9142 31.3927 31.6823
Nepal Rupee 0.9593 1.0285 1.1251 1.1800 1.1164 1.1044 1.0477
Norway Krone 11.6417 12.4113 14.0698 14.7356 15.5404 16.8037 17.0596
Singapore Dollar 43.6846 53.5502 59.6004 66.1304 70.7611 78.0767 81.6310
Sri Lanka Rupee 0.5676 0.7024 0.7336 0.7694 0.7625 0.7524 0.7862
Sweden Krona 9.8890 10.4330 11.5692 12.8272 13.2669 14.6811 15.7629
Switzerland Franc 56.6736 70.0527 78.9664 89.9297 99.3752 102.7673 113.7726
S. Arabia Riyal 16.6973 20.9341 22.3482 22.8047 23.7943 25.8099 27.4313
Thailand Baht 1.8786 2.2651 2.5326 2.7963 2.8943 3.1909 3.2278
UAE Dirham 17.0391 21.3856 22.8216 23.2883 24.2894 26.3384 28.0070
UK Pound 125.2948 126.0915 132.4866 135.9640 141.1402 151.5965 167.2207
USA Dollar 62.5465 78.4983 83.8017 85.5017 89.2359 96.7272 102.8591
EMU Euro 92.1700 107.4327 116.4991 116.5981 119.1998 125.1227 139.4950
IMF SDR 98.6265 119.9599 129.7431 133.3407 138.9409 147.2259 158.0043P : Provisional (Contd…)
CurrencyCountry
EXCHANGE RATE POSITION(Pakistan Rupees in Terms of One Unit of Selected Foreign Currencies)
(Average During the Year)
151

TABLE 8.16
2014-15 2015-16 2016-17 2017-18 2018-19 2019-20 2020-21 P
Australia Dollar 84.6706 75.8551 78.9703 85.1230 97.1750 105.9281 119.3876
Bangladesh Taka 1.3045 1.3327 1.3263 1.3414 1.6203 1.8636 1.8864
Canada Dollar 86.6031 78.6541 78.9236 86.5105 102.7630 117.6982 124.7096
China Yuan 16.3639 16.1983 15.4059 16.9332 19.9618 22.4714 24.1827
Hong Kong Dollar 13.0664 13.4416 13.5015 14.0663 17.3843 20.2849 20.6442
India Rupee 1.6354 1.5735 1.5778 1.6903 1.9323 2.1845 2.1727
Iran Rial 0.0037 0.0035 0.0033 0.0030 0.0032 0.0038 0.0038
Japan Yen 0.8865 0.8959 0.9611 0.9965 1.2257 1.4617 1.5034
Kuwait Dinar 346.1203 345.2872 345.0024 364.9610 448.8278 516.4404 526.2587
Malaysia Ringgit 29.3817 25.2457 24.4675 27.0716 33.0115 37.5510 38.7926
Nepal Rupee 1.0222 0.9838 0.9861 1.0565 1.2070 1.3770 1.3550
Norway Krone 14.2794 12.4110 12.4644 13.7701 16.0675 16.9236 18.2895
Singapore Dollar 77.3079 74.9776 75.1927 81.9160 99.7173 114.1680 118.7881
Sri Lanka Rupee 0.7701 0.7372 0.7031 0.7107 0.7853 0.8669 0.8409
Sweden Krona 13.1103 12.4006 11.8827 13.2473 14.8779 16.3999 18.6777
Switzerland Franc 107.4720 106.3904 105.5866 113.2043 136.7574 161.7409 175.8046
S. Arabia Riyal 27.0040 27.7996 27.9260 29.2998 36.2985 42.1047 42.6535
Thailand Baht 3.1076 2.9393 3.0034 3.3964 4.2335 5.0949 5.1892
UAE Dirham 27.5787 28.3865 28.5170 29.9164 37.0585 43.0181 43.5597
UK Pound 159.4351 154.4878 132.7123 148.0433 175.9308 199.0651 215.2793
USA Dollar 101.2947 104.2351 104.6971 109.8444 136.0901 158.0253 160.0219
EMU Euro 121.6726 115.6294 114.0341 131.0859 155.0710 174.5851 190.7393
IMF SDR 146.9546 145.8777 143.8126 156.7849 189.5557 217.2951 228.2827P : Provisional Source: State Bank of Pakistan
Country Currency (Average During the Year)
EXCHANGE RATE POSITION(Pakistan Rupees in Terms of One Unit of Selected Foreign Currencies)
152

EXTERNAL DEBT SUMMARY$ Million
HIGHLIGHTS 30-Jun-21
External Debt & Liabilities 122,209 External Debt 113,447
Foreign Exchange Liabilities 8,763
External Public Debt 86,424
Public & Publicly Guaranteed Debt* 84,391
Service Payments (Jul 2020 - Jun 2021)*Principal 5,913
Interest 1,381
Debt Servicing* as % ofExport Receipts 28.5%
Foreign Exchange Earnings 11.2%
GDP 2.4%
*: Excluding IMF Loans
153

TABLE 9.1-A
PAKISTAN EXTERNAL DEBT & FOREIGN EXCHANGE LIABILITIES
$ Million30-Jun-13 30-Jun-14 30-Jun-15 30-Jun-16 30-Jun-17 30-Jun-18 30-Jun-19 30-Jun-20 30-Jun-21
I. Central Government Debt (A+B+C) 43,752 48,440 46,861 51,714 56,430 64,142 67,800 70,314 79,040
A Medium and Long Term 41,936 44,143 41,267 45,441 50,747 55,225 60,210 63,318 69,079 (Paris Club, Multilateral, Other Bilateral, Commercial loans)
B Other Medium and Long Term 1,552 3,566 4,582 4,585 4,800 7,300 6,326 5,455 9,103 (Eurobonds/Pakistan Investment Bonds/Pakistan Banao Certificates/Naya Pakistan Certificates)
C Short Term (IDB, Treasury Bills, Commercial Loans) 264 731 1,012 1,688 882 1,617 1,264 1,542 858
II. Public Sector Enterprises (PSEs) - Guaranteed Debt 598 537 970 1,265 1,214 1,384 2,800 4,244 5,351
III. Public Sector Enterprises (PSEs) - Non-Guaranteed Debt 1,250 1,525 1,512 1,541 1,505 1,287 1,067 927 1,394
IV. Private Sector Debt 3,143 3,076 3,011 4,073 6,759 9,195 10,496 11,009 10,886
V. IMF 4,387 3,020 4,103 6,043 6,109 6,095 5,648 7,680 7,384
VI Banks 1,554 1,989 2,286 2,695 4,522 4,417 4,721 4,620 5,267
VII. Debt Liabilities to Direct Investors - Intercompany Debt 3,110 3,400 2,717 3,013 3,375 3,597 3,328 4,329 4,125
Total External Debt (I+II+III+IV+V+VI+VII) 57,793 61,987 61,461 70,345 79,913 90,117 95,861 103,123 113,447
VIII. Foreign Exchange Liabilities 3,106 3,281 3,709 3,600 3,564 5,121 10,488 9,891 8,763
Total External Debt and Liabilities (I+II+III+IV+V+VI+VII+VIII) 60,899 65,268 65,170 73,945 83,477 95,237 106,349 113,013 122,209
Out of which External Public Debt (I+V) 48,139 51,460 50,964 57,757 62,539 70,237 73,449 77,994 86,424
External Public and Publicly Guaranteed Debt (Excluding IMF) - (I+II) 44,350 48,978 47,832 52,979 57,643 65,526 70,601 74,558 84,391Source: Economic Affairs Division and State Bank of Pakistan
155

TABLE 9.1 B
Country/Creditor 30-June-2021
I. BILATERAL a. Paris Club Countries AUSTRIA 26 BELGIUM 18 CANADA 50 FINLAND 3 FRANCE 1,725 GERMANY 1,386 ITALY 171 JAPAN 5,427 KOREA 422 THE NETHERLANDS 84 NORWAY 10 RUSSIA 68 SPAIN 59 SWEDEN 73 SWITZERLAND 79 UNITED KINGDOM 5 UNITED STATES 1,118
Sub Total I.a. Paris Club Countries 10,726
CHINA 14,434 KUWAIT 158 LIBYA 1 SAUDI ARABIA 961 UNITED ARAB EMIRATES 28
Sub Total I.b. Non-Paris Club Countries 15,581 c. Commercial Banks 10,287 d. Safe Deposit 4,000
Total I. (a+b+c+d) 40,594 II. MULTILATERAL & Others
ASIAN DEVELOPMENT BANK (ADB) 13,423 INTERNATIONAL BANK FOR RECONSTRUCTION AND DEVELOPMENT (IBRD) 1,840 INTERNATIONAL DEVELOPMENT ASSOCIATION (IDA) 16,295
Other 2,277 ASIAN INFRASTRUCTURE INVESTMENT BANK (AIIB) 835 EUROPEAN INVESTMENT BANK (EIB) - ISLAMIC DEVELOPMENT BANK (IDB) 1,006 INTERNATIONAL FUND FOR AGRICULTURAL DEVELOPMENT (IFAD) 310 NORDIC DEVELOPMENT FUND 7 OPEC FUND 80 ECO TRADE BANK 40
Sub Total II. Multilateral & Others 33,836 III. BONDS 7,800 IV. IDB (SHORT TERM CREDIT) 506 V. LOCAL CURRENCY BONDS (TBs & PIBs) 815 VI. NAYA PAKISTAN CERTIFICATE (NPCS) AND PAKISTAN BANAO CERTIFICATE (PBCs) 840
Grand Total: (I+II+III+IV+V+VI) 84,391 Excluding IMF Loans Source: Economic Affairs Division
PUBLIC & PUBLICLY GUARANTEED DEBT OUTSTANDING
Amount
b. Non Paris Club Countries
156

TABLE 9.2
COMMITMENTS AND DISBURSEMENTS OF LOANS AND GRANTS (BY TYPE)$ Million
2000-01 396 1,030 - - 91 23 1,128 1,128 21 5 1,637 2,186
2001-02 973 741 - - 40 114 2,589 1,880 0 21 3,603 2,756
2002-03 700 846 - - - 9 1,089 1,057 11 8 1,800 1,920
2003-04 1,214 622 - - - - 1,263 755 2 3 2,479 1,380
2004-05 2,089 918 - - - - 1,202 1,803 - 2 3,291 2,723
2005-06 3,250 2,084 - - 22 10 1,225 1,262 1 1 4,498 3,357
2006-07 1,365 1,308 133 - - 12 2,649 2,058 3 3 4,151 3,381
2007-08 2,440 1,565 - 80 - - 1,309 2,013 2 2 3,751 3,660
2008-09 2,296 1,272 125 175 18 - 3,947 3,238 2 2 6,389 4,688
2009-10 3,729 1,213 100 100 - - 2,846 2,305 68 49 6,744 3,668
2010-11 2,384 1,076 - - - - 397 648 1,799 895 4,580 2,620
2011-12 3,341 1,753 100 73 - - 1,135 949 103 314 4,679 3,089
2012-13 1,848 2,071 100 51 - - 708 466 4 268 2,660 2,855
2013-14 9,809 2,015 125 80 - - 5,019 4,612 4 133 14,957 6,840
2014-15 2,038 2,449 - 10 - - 2,671 3,163 12 134 4,721 5,756
2015-16 12,325 2,337 - - - - 5,069 5,199 6 15 17,400 7,551
2016-17 4,257 3,609 - - - - 7,803 7,072 11 1 12,071 10,682
2017-18 3,510 4,159 - - - - 8,566 8,173 2 45 12,078 12,678
2018-19 1,280 3,466 - - - - 7,129 7,352 1 1 8,410 10,819
2019-20 1,962 3,117 - - - - 7,922 8,783 0 0 9,884 11,900
2020-21 4,332 3,376 - - - - 12,127 10,908 0 2 16,459 14,285
*: Excluding IMF Loans Source: Economic Affairs DivisionNotes:Project Aid includes commitments and disbursements for Earthquake Rehabilitation & ConstructionBOP includes commitment and disbursement for Bonds, Commercial Banks, BOP Programme Loans, IDB Short-term credit and Tokyo PledgesRelief includes commitment and disbursement for Afghan Refugees, IDPs, Earthquake and Flood Assistance
Fiscal Year
Project Aid
Disbursement
Commitment
Disbursement
Commitment
Non-Project Aid
BOP
Disbursement
Non-Food
Commitment
Disbursement
Disbursement
FoodTotal*
Commitment
Commitment
Disbursement
Commitment
Relief
157

TABLE 9.3
ANNUAL COMMITMENTS, DISBURSEMENTS, SERVICE PAYMENTS AND EXTERNAL DEBT OUTSTANDING
Disbursed* Undisbursed* Commit-ment**
Disburse-ment** Principal Interest Total
2000-01 25,608 2,860 1,167 1,846 1,004 663 1,668 18.7% 11.7% 2.3%
2001-02 27,215 3,504 3,293 2,423 772 538 1,309 14.3% 8.5% 1.8%
2002-03 28,301 3,811 1,747 1,729 971 613 1,583 14.4% 7.7% 1.9%
2003-04 28,900 5,392 2,125 1,372 2,513 702 3,215 25.8% 14.6% 3.3%
2004-05 30,813 4,975 3,113 2,452 1,072 669 1,742 12.0% 6.5% 1.6%
2005-06 33,033 5,838 4,507 3,163 1,424 712 2,136 12.9% 6.7% 1.6%
2006-07 35,673 6,277 4,059 3,356 1,283 819 2,102 12.2% 6.4% 1.4%
2007-08 40,770 6,540 3,398 3,160 1,130 949 2,079 10.2% 5.6% 1.2%
2008-09 42,567 7,451 5,792 4,032 2,566 873 3,439 18.0% 9.7% 2.0%
2009-10 43,187 9,634 6,171 3,099 2,339 756 3,095 15.7% 8.1% 1.7%
2010-11 46,458 9,797 4,580 2,620 1,925 762 2,687 10.6% 5.6% 1.3%
2011-12 46,349 10,316 4,679 3,089 1,534 717 2,251 9.1% 4.7% 1.0%
2012-13 44,350 9,954 1,278 2,486 1,903 709 2,612 10.5% 5.2% 1.1%
2013-14 48,978 15,770 11,263 3,760 2,074 736 2,810 11.2% 5.5% 1.1%
2014-15 47,832 18,559 3,621 3,601 2,262 949 3,211 13.3% 6.1% 1.2%
2015-16 52,979 20,669 14,215 4,693 3,202 1,092 4,294 19.5% 8.4% 1.5%
2016-17 57,643 21,524 5,651 4,859 5,195 1,242 6,437 29.3% 12.3% 2.1%
2017-18 65,526 19,573 4,120 4,320 4,175 1,636 5,811 23.5% 10.5% 1.8%
2018-19 70,601 17,739 3,119 5,578 7,054 2,067 9,121 37.6% 16.3% 3.3%
2019-20 74,558 19,032 5,803 7,327 8,569 1,985 10,554 46.8% 19.5% 4.0%
2020-21 84,391 21,867 6,931 6,168 5,913 1,381 7,294 28.5% 11.2% 2.4%* : Excluding grants Source: Economic Affairs Division ** : Excluding IMF, Short Term Credit, Commercial Credits and Bonds*** : Excluding IMF Loans@: Public and Publically Guaranteed Loans (Excluding IMF)
Fiscal Year
Debt Outstanding @Transactions during period Debt Servicing as % of
Service Payments***Export
Receipts
Foreign Exchange Earning
GDP
158

TABLE 9.4
DEBT SERVICE PAYMENTS OF FOREIGN LOANS (Paid in Foreign Exchange)
US$ Million
Kind 2012-13 2013-14 2014-15 2015-16 2016-17 2017-18 2018-19 2019-20 2020-21
I. PARIS CLUB COUNTRIESPrincipal - - - - - - - - - Interest - - - - - - - - - Principal 3.66 4.92 3.77 3.77 3.99 3.93 2.81 1.52 - Interest 2.98 3.01 2.31 1.99 1.77 1.69 1.45 0.66 - Principal 1.01 1.22 1.22 1.32 1.50 1.84 2.02 1.09 - Interest 1.75 1.77 1.49 1.34 1.24 1.24 1.09 0.49 - Principal 2.72 3.12 3.56 4.08 4.68 5.36 6.13 3.38 - Interest 0.99 0.75 0.67 0.80 1.16 1.34 1.90 0.84 - Principal - - - - - - - - Interest - - - - - - - - Principal 39.78 52.27 53.41 57.91 79.26 109.60 115.57 66.64 - Interest 77.53 79.17 66.81 60.55 57.91 58.56 52.72 25.68 0.27 Principal 0.18 0.21 0.42 0.27 0.31 0.35 0.40 0.50 - Interest 0.06 0.05 0.07 0.05 0.08 0.09 0.12 0.08 - Principal 17.88 14.46 16.85 15.99 39.52 66.75 67.80 34.48 0.17 Interest 16.51 26.69 25.12 24.76 22.37 22.92 19.90 10.06 0.46 Principal 0.65 0.76 0.83 0.92 1.05 1.24 1.40 0.76 - Interest 0.22 0.16 0.14 0.16 0.19 0.22 0.30 0.12 - Principal 61.46 55.90 51.16 62.49 175.52 281.79 293.96 179.64 0.55 Interest 117.64 103.27 88.09 90.45 93.76 89.94 86.18 48.20 0.06 Principal 14.49 16.63 19.01 22.18 25.85 30.20 33.99 22.28 8.39 Interest 6.91 5.93 5.48 6.06 7.96 9.33 11.81 5.89 0.57 Principal 0.57 0.65 0.72 0.80 0.89 1.08 1.20 0.65 - Interest 0.27 0.20 0.18 0.17 0.22 0.26 0.34 0.15 - Principal 0.35 0.51 0.51 0.54 2.44 4.65 4.56 2.28 - Interest 2.97 3.22 2.96 2.59 2.54 2.69 2.48 2.08 - Principal 3.71 4.26 4.86 5.57 6.39 7.31 8.37 4.62 - Interest 5.71 5.51 5.40 5.05 4.74 4.42 4.03 1.85 - Principal 4.68 5.37 6.13 7.03 8.05 9.22 10.55 5.82 - Interest 1.63 1.23 1.10 1.32 1.94 2.25 3.21 1.40 - Principal 0.82 0.96 1.09 1.25 2.57 3.91 4.13 2.16 - Interest 1.85 1.78 1.75 1.78 1.74 1.88 1.98 0.95 - Principal 2.88 3.43 3.72 4.10 5.23 6.41 7.10 3.95 - Interest 1.23 3.89 1.09 0.98 0.96 0.91 0.85 0.41 - Principal 5.34 6.12 7.00 8.03 25.51 43.15 45.03 22.96 - Interest 28.67 28.41 29.40 27.68 27.26 26.11 24.72 11.78 - Principal 0.28 0.34 0.37 0.40 0.40 0.48 0.53 0.29 - Interest 0.16 0.07 0.09 0.09 0.07 0.06 0.07 0.03 - Principal 160.46 171.13 174.63 196.64 383.13 577.25 605.53 353.02 9.11 Interest 267.07 265.12 232.18 225.82 225.90 223.90 213.13 110.67 1.36
II. NON-PARIS CLUB COUNTRIESPrincipal 72.73 121.26 127.99 170.39 712.30 216.09 341.99 421.58 135.47 Interest 74.58 103.49 139.30 141.46 205.75 240.34 388.16 445.92 169.82 Principal - - - - - - - - Interest - - - - - - - - Principal 8.07 7.06 7.55 10.28 9.48 11.23 12.12 12.02 11.49 Interest 2.84 3.12 3.06 3.20 3.79 4.10 3.99 3.48 3.44 Principal - - - - - - - - Interest - - - - - - - - Principal 76.12 166.67 121.93 111.22 167.13 30.73 32.85 29.99 - Interest 4.20 7.55 5.70 5.39 7.83 4.29 5.11 10.66 - Principal 4.11 4.51 4.51 6.35 6.35 6.35 6.35 6.32 - Interest 1.88 3.03 1.70 1.72 1.55 1.38 1.00 0.81 - Principal 6.32 7.26 8.30 9.51 10.90 12.48 14.28 7.89 - Interest 1.20 1.17 1.11 1.06 1.15 1.93 3.55 1.82 - Principal 1.15 1.15 1.15 1.15 3.15 5.14 4.78 3.14 - Interest 2.94 2.92 1.53 2.89 2.86 2.75 2.56 1.29 - Principal 8.46 9.71 11.10 12.72 14.58 16.69 19.10 10.52 - Interest 15.75 15.21 14.59 13.93 13.08 12.16 11.10 5.12 - Principal 176.98 317.62 282.54 321.62 923.87 298.70 431.46 491.46 146.96 Interest 103.38 136.47 167.00 169.65 236.02 266.94 415.46 469.10 173.26
(Contd..)
TOTAL (II)
7. EXIM Bank (FE)
8. PL-480
9. CCC
4. Libya
5. Saudi Arabia
6. UAE
1. China
2. Czecho-Slovakia
3. Kuwait
Russia
18. USA
19. UK
TOTAL (I)
15. Sweden
16. Spain
10. Japan
11. Korea
Switzerland
12. Norway
13. The Netherlands
14.
17.
8. Germany
9. Italy
4. Canada
5. Denmark
6. France
Fiscal Year
1. Australia
2. Austria
3. Belgium
7. Finland
159

TABLE 9.4
DEBT SERVICE PAYMENTS OF FOREIGN LOANS (Paid in Foreign Exchange)
US$ Million
Kind 2012-13 2013-14 2014-15 2015-16 2016-17 2017-18 2018-19 2019-20 2020-21Fiscal Year
III. MULTILATERALPrincipal 737.09 728.13 721.22 755.35 778.36 757.57 744.00 803.00 846.62 Interest 101.56 82.58 80.63 84.76 107.43 138.85 184.14 201.83 174.38 Principal 177.06 165.64 156.07 147.32 128.00 136.75 117.24 85.00 87.90 Interest 13.88 8.11 5.92 8.03 13.41 17.08 41.96 40.61 22.43 Principal 222.63 236.29 253.49 256.76 278.96 344.82 370.17 452.27 512.33 Interest 92.77 96.22 113.08 125.36 151.12 173.97 178.42 187.21 213.26 Principal 8.11 4.80 5.28 5.45 6.60 7.94 7.76 7.75 9.20 Interest 1.70 1.62 1.65 1.67 1.70 1.81 1.83 1.93 2.31 Principal 17.44 23.60 31.61 44.58 50.78 58.52 80.83 93.08 87.73 Interest 4.83 10.20 13.65 16.38 18.11 20.74 29.80 39.76 30.05 Principal 390.29 412.95 409.09 734.53 877.89 836.26 1,082.08 836.67 757.17 Interest 11.19 15.74 18.37 47.59 51.46 61.25 52.02 48.36 40.77 Principal 1,552.62 1,571.42 1,576.77 1,944.00 2,120.60 2,141.86 2,402.09 2,277.77 2,300.95 Interest 225.93 214.47 233.29 283.80 343.23 413.69 488.16 519.70 483.20
IV.Principal 1.87 1.59 0.84 0.57 0.57 0.61 0.58 0.27 0.61 Interest 0.14 0.12 0.06 0.07 0.07 0.07 0.06 0.02 0.06 Principal 3.02 3.02 4.45 6.35 6.08 6.12 9.45 9.44 9.44 Interest 0.83 1.24 1.61 2.04 2.37 3.09 2.47 2.42 2.06 Principal - 0.67 31.34 1.33 1.33 1.33 41.34 1.32 1.34 Interest 0.22 0.19 0.88 0.70 1.47 1.64 1.83 1.99 2.00 Principal 8.08 8.37 8.17 6.96 5.46 5.00 5.00 - - Interest 0.85 0.63 0.40 0.33 0.36 0.34 0.34 0.07 0.07
Principal - - 172.50 225.00 1,003.79 1,138.87 2,552.00 4,434.72 3,444.06 Interest - 6.95 12.29 55.01 65.88 284.18 443.20 485.26 357.16 Principal 12.97 13.63 217.29 240.22 1,017.23 1,151.93 2,608.37 4,445.75 3,455.45 Interest 2.04 9.13 15.24 58.15 70.15 289.32 447.90 489.76 361.35
V. 0Principal - - - 500.00 750.00 - 1,000.00 1,000.00 - Interest 110.85 110.82 301.43 354.33 366.95 422.83 502.66 395.84 361.84 Principal - - - - - - - - - Interest - - - - - - - - Principal - - - - - - - - Interest - - - - - - - - Principal - - - 500.00 750.00 - 1,000.00 1,000.00 - Interest 110.85 110.82 301.43 354.33 366.95 422.83 502.66 395.84 361.84 Principal 1,903.02 2,073.80 2,251.23 3,202.48 5,194.82 4,169.74 7,047.45 8,568.00 5,912.47 Interest 709.27 735.99 949.13 1,091.75 1,242.24 1,616.69 2,067.31 1,985.07 1,381.01
Total (P+I) 2,612.29 2,809.79 3,200.37 4,294.23 6,437.06 5,786.43 9,114.76 10,553.07 7,293.48 VI. OTHERS
Principal - - - - - - - - Interest - - - - - - - - Principal - - - - - - - - Interest - - - - - - - - Principal - - - - - - - - Interest - - - - - - - - Principal - - - - - - - - Interest - - - - - - - - Principal - - - - - - - - Interest - - - - - - - - Principal - - - - - - - - Interest - - - - - - - - Principal - - - - - - - - Interest 0.19 0.16 - - - - - - Principal - - - - - - - - Interest - - - - - 19.35 - - Principal - - 10.69 - 5.28 6.73 1.12 0.13 Interest - - - - - - - Principal - - 10.69 - - 5.28 6.73 1.12 0.13 Interest 0.19 0.16 - - - 19.35 - - - Principal 1,903.02 2,073.80 2,261.92 3,202.48 5,194.82 4,175.02 7,054.18 8,569.12 5,912.60 Interest 709.46 736.15 949.13 1,091.75 1,242.24 1,636.04 2,067.31 1,985.07 1,381.01
2,612.48 2,809.95 3,211.05 4,294.23 6,437.06 5,811.06 9,121.50 10,554.19 7,293.61 Note: Excluding IMF Loans Source: Economic Affairs Division
9 Unspent Balance
TOTAL (VI)
TOTAL (I+II+III+IV+V+VI)
Grand Total (P+I)
6. Cash (ST)
7. OTF
8 Exchange Loss
3. NBP Bahrain
4. ANZ Bank
5. US Dollar Bonds
1. NBP
2. Bank of Indosuez
2. Saindak Bonds
3. US Dollar Bonds (NHA)
TOTAL (V)
TOTAL (I+II+III+IV+V)
5. ANZ Bank / StandardCharted Bank
TOTAL (IV)
1. Euro BondsGLOBAL BONDS
2. OPEC Fund
3. Turkey (EXIM Bank)
4. E.I.Bank
6. IDB (ST)
TOTAL (III)
1. NORDICDEVELOPMENT FUNDS
3. IDA
4. IFAD
5. IDB
1. ADB
2. IBRD
160

TABLE 9.5
TERMS OF FOREIGN LOANS/CREDITS CONTRACTED BY PAKISTAN*
Amount Interest Rate Amortization Amount Interest Rate Amortization$ Million Commission (%) years $ Million Commission (%) years
A. Paris Club Countries1. Germany 27.3 0.75 Fixed 402. Japan 49.3 LIBOR Yen 6 Month + 0.34 403.France 83.3 EIBOR+0.93 204. Italy 88.9 LIBOR 6 months + 0.93 15
Sub-Total A 88.9 159.9 B. Non-Paris Club
1. China 448.0 LIBOR 6 months + 2.8 10 6,493.8 1 , 2 and 6 Fixed 28 to 302. Kuwait
3. Saudi Arabia 100.0 LIBOR 12 months + 1.25 10 282.8 LIBOR 12 months + 1.25 and 2 Fixed For Fixed 6 and for LIBOR 25
4. KoreaSub-Total B 548.0 6,776.6
C. Multilateral
1. IDB Short-term 1,006.5 5.25 Fixed, LIBOR 12 Months + 4.5, LIBOR 6 Months + 4.5, LIBOR Euro 12 Months+2.3 1
2. IDB 227.0 LIBOR 6 months + 1.35 24 264.4 2 to 2.5 Fixed 253. IDA 242.9 1.25 Fixed 25 1,554.1 1.25 to 2 Fixed 304. ADB 170.8 1.5 & LIBOR 6 months + 0.6 20-28 2,148.8 2 Fixed & LIBOR 6 months + 0.6 305. OPEC 50.0 1.75 Fixed 256.IBRD7. IFAD
8. EIB 136.5 LIBOR + spread, Euribor + spread and Fixed 30
9. E.C.O BANK 30.0 LIBOR 6 MONTHS + 2 1Sub-Total C 640.7 5,190.3
D. Commercial Banks1. SCB (London) 172.5 LIBOR 3 Months + 4 12. SUISSE AG, UBL, ABL 200.0 LIBOR 3 Months + 4 1Sub-Total (D) - 372.5
E. Bonds1. Eurobonds 1,000.0 7.25 Fixed 52. Eurobonds 1,000.0 8.25 Fixed 103. Sukuk - Sub-Total (E) - 2,000.0
Total (A+B+C+D+E) 1,277.6 14,499.2
Amount Interest Rate Amortization Amount Interest Rate Amortization$ Million Commission (%) years $ Million Commission (%) years
A. Paris Club Countries1. Germany 44.6 0.75 Fixed 402. Japan 109.8 LIBOR Yen 6 Months + 0.1 30 to 403.France 46.3 EIBOR + 0.25 204. Italy 5. Korea 139.8 0.10 Fixed 40
Sub-Total A 0.0 340.4B. Non-Paris Club
1. China 37.7 Fixed 2 20 9,422.7 2 and 5.2 Fixed 18 to 202. Kuwait3. Saudi Arabia 55.0 2 Fixed 20
Sub-Total B 37.7 9,477.7C. Multilateral
1. IDB Short-term 488.8 5.0126 Fixed, LIBOR 6 Months 4.5, LIBOR EURO 12 Months 1 1,237.0 4.9 Fixed, LIBOR 12 months + 4.5 to 5.5 1
2. IDB 100.0 2 Fixed, LIBOR 6 months +1.35 163. IDA 1,425.4 1.25 to 2 Fixed 30 1,598.6 1.83 to 2 Fixed 24
4. ADB 762.1 2 Fixed & LIBOR 6 Months + 0.6 30 1,713.1 2 Fixed & LIBOR 6 months + 0.6 6 to 24
5. OPEC6. IBRD 100.0 LIBOR 6 months + 0.75 187. IFAD 31.6 Fixed 0.75 67.9 88. EIB9. E.C.O BANK 35.0 LIBOR 6 months + 2.5 110. AIIB 100.0 LIBOR 6 months + 0.75 20
Sub-Total C 2,707.9 4,951.6D. Commercial Banks
1. SCB (London) 100.1 LIBOR 3 Months + 4.25 42. SUISSE AG, UBL, ABL 983.0 LIBOR 3 months +2.66 & 3.25 13. Dubai Bank 125.0 LIBOR 6 months + 2.5 14. Noor Bank 340.0 LIBOR 3 months + 3.75 & 4.1 1Sub-Total (D) 100.1 1,448.0
E. Bonds1. Sukuk 1,000.0 6.75 Fixed 52. Eurobonds 500.0 8.25 Fixed 10Sub-Total (E) 1,000.0 500.0Total (A+B+C+D+E) 3,845.7 16,717.7
*Excluding IMF Loans (Contd.)
Lending Country/Agency2012-13 2013-14
Lending Country/Agency2014-15 2015-16
161

TABLE 9.5
TERMS OF FOREIGN LOANS/CREDITS CONTRACTED BY PAKISTAN*
Amount Interest Rate Amortization Amount Interest Rate Amortization$ Million Commission (%) years $ Million Commission (%) years
A. Paris Club Countries1. Germany
2. Japan 23.8 Fixed 0.1 & LIBOR Yen 06 Months + 0.1 30
3.France 114.0 LIBOR EURO 06 Months + 0.52 20 192.1 LIBOR EURO 06 Months + 0.47 & 0.52 20
4. Italy 5. Korea 76.3 Fixed 0.1 40
Sub-Total A 214.1 192.1B. Non-Paris Club
1. China** 729.4 Fixed 2 & LIBOR 06 Months + 2.8 20 500.0 LIBOR 12 Months + 1 2
2. Kuwait 14.9 Fixed 2.5 213. Saudi Arabia
Sub-Total B 729.4 514.9C. Multilateral
1. IDB Short-term 700.0 LIBOR 12 Months + 2.22 1 694.4 Fixed 4 & LIBOR 12 Months + 2.22 1
2. IDB3. IDA 761.2 1.88 to 3.2 Fixed 25 1,386.3 Fixed 2 to 3.36 25
4. ADB 2,001.0 2 Fixed & LIBOR 6 Months + 0.6 25 1,589.6 Fixed 2 & LIBOR 6 Months + 0.6 24
5. OPEC6. IBRD 690.0 LIBOR 6 Months + 0.5 & 0.75 21 855.0 LIBOR 6 Months + 0.75 217. IFAD 50.0 Fixed 1.75 20 82.6 Fixed 0.75 408. EIB9. E.C.O BANK 40.0 LIBOR 6 Months + 1.9 210.AIIB 300.0 LIBOR 6 Months + 0.75 20
Sub-Total C 4,542.2 4,607.9D. Commercial Banks
1. SCB (London) 700.0 Fixed 4.47 10 200.0 LIBOR 12 Months + 1.4 12. SUISSE AG, UBL, ABL 1,000.0 LIBOR 6 Months + 2 to 3 1 & 9 1,200.0 LIBOR 3 Months + 2 13. Dubai Bank 80.0 LIBOR 3 Months + 2.6 24. Noor Bank 445.0 LIBOR 3 Months + 2.3 to 2.5 2 220.0 LIBOR 3 Months + 2 15. Bank of China 300.0 LIBOR 3 Months + 2.93 3 200.0 LIBOR CHF 3 MONTHS + 2 36. China Development Bank 1,700.0 LIBOR 6 Months + 3.02 3 1,000.0 LIBOR 3 Months + 3 37. Citi Bank 275.0 LIBOR 3 Months + 2.7 2 267.0 LIBOR 3 Months + 2.7 28. ICBC-China 300.0 LIBOR 3 Months + 2.75 2 1,000.0 LIBOR 3 Months + 3.25 3Sub-Total (D) 4,720.0 4,167.0
E. Bonds1. Eurobond 2021 1,000.0 Fixed 5.5 52. Eurobond 2027 1,500.0 Fixed 6.875 103. Sukuk 2022 1,000.0 Fixed 5.625 5Sub-Total (E) 1,000.0 2,500.0Total (A+B+C+D+E) 11,205.7 11,981.9
Amount Interest Rate Amortization Amount Interest Rate Amortization$ Million Commission (%) years $ Million Commission (%) years
A. Paris Club Countries1. Germany2. Japan3.France 148.0 LIBOR EURO 6 MONTH +0.25 204. Italy 23.0 Interest Free 285. Korea 80.0 Fixed +1.5 25
Sub-Total A 148.0 103.0B. Non-Paris Club
1. China** 2,000.0 LIBOR 12 Months +1 12. Kuwait3. Saudi Arabia
Sub-Total B 2,000.0 0.0C. Multilateral
1. IDB Short-term 926.0 LIBOR 12 Months + 2.7 1 555.8 LIBOR 12 Months + 2.7 12. IDB 200.03. IDA 615.6 Fixed 1.25 30 1,449.0 Fixed 1.25 304. ADB 355.0 LIBOR 6 Months + 0.6 25 2,823.3 LIBOR 6 Months + 0.6 255. OPEC6. IBRD 652.0 LIBOR 6 Months + 0.5 257. IFAD 36.08. EIB9. E.C.O BANK 40.0 LIBOR 12 Months + 1.9 110.AIIB 540.0 LIBOR 6 MONTHS +0.6 16
Sub-Total C 1,936.6 6,256.1D. Commercial Banks
1. SCB (London) 200.02. SUISSE AG, UBL, ABL 495.0 LIBOR 3 Months + 3.25 1 200.0 LIBOR 3 Months + 3.25 13. Dubai Bank 685.0 LIBOR 12 Months + 2 1 445.0 LIBOR 3 Months + 2.2 14. Noor Bank 225.0 LIBOR 12 Months + 2.255. Bank of China 500.0 LIBOR 6 Months + 2.93 and 2.65 2 and 36. China Development Bank 2,183.7 SHIBOR 6 Months + 2.5 3 1,700.0 LIBOR 6 Months +3 37. Citi Bank 150.0 LIBOR 3 Months + 2.28. ICBC China 300.0 LIBOR 6 Months + 2.75 29. Ajman Bank 274.0 LIBOR 6 Months + 2.20 1 267.5 LIBOR 6 Months + 2.20 1Sub-Total (D) 4,162.7 3,462.5Total (A+B+C+D) 8,247.2 9,821.6
*Excluding IMF Loans ** Including SAFE Deposits Source: Economic Affairs Division
Lending Country/Agency2016-17 2017-18
Lending Country/Agency 2018-19 2019-20
162

TABLE 9.5
TERMS OF FOREIGN LOANS/CREDITS CONTRACTED BY PAKISTAN
Amount Interest Rate Amortization$ Million Commission (%) years
A. Paris Club Countries1. Germany 32.1 Fixed 0.75 402. Japan3. France 77.3 Fixed 0.254. Italy 5. Korea
Sub-Total A 109.4B. Non-Paris Club
1. China * 1,000.0 LIBOR 12 Months + 1.0 12. Kuwait3. Saudi Arabia
Sub-Total B 1,000.0C. Multilateral
1. IDB Short-term 951.5 LIBOR 12 Months + 2.7 12. IDB3. IDA 3,633.6 Fixed 1.25, 2 304. ADB 900.0 LIBOR 6 Months + 0.6, Fixed 2 15, 255. OPEC 50.0 Fixed 1.5 116. IBRD 854.0 LIBOR 6 Months + 0.5, 0.25 257. IFAD 62.3 Fixed 1.258. EIB9. E.C.O BANK10.AIIB 321.8 LIBOR 6 Months + 0.6, 0.25 16, 23
Sub-Total C 6,773.2D. Commercial Banks
1. SCB (London) 600.0 LIBOR 12 Months + 2.4 12. Suisse, AG, UBL, ABL 215.0 LIBOR 12 Months + 2.0 13. Dubai Bank 825.0 LIBOR 12 Months + 2.05 14. China Development Bank 1,000.0 LIBOR 12 Months + 3.0 15. ICBC-China 1,300.0 LIBOR 3 Months + 2.75 26. Ajman Bank 350.0 LIBOR 12 Months + 2.0 17. Emirates NBD 370.0 LIBOR 12 Months + 2.05 18. NBP Bahrain 142.0 LIBOR 3 Months + 4.5 2Sub-Total (D) 4,802.0
E. Bonds1. Eurobond 1,000.0 Fixed + 6.000 52. Eurobond 1,000.0 Fixed +7.375 103. Eurobond 500.0 Fixed + 8.875 30Sub-Total (E) 2,500.0Total (A+B+C+D+E) 15,184.6
* China SAFE Deposit Source: Economic Affairs Division
Lending Country/Agency 2020-21
163

TABLE 9.6GRANT ASSISTANCE AGREEMENTS SIGNED
($ Million)2012-13 2013-14 2014-15 2015-16 2016-17 2017-18 2018-19 2019-20 2020-21
I. Paris Club Countries1. Australia - - - - - - - - - 2. Austria - - - - - - - - - 3. Canada - - - - - - - - - 4. France 0.5 3.4 - 6.5 - - - - - 5. Germany 13.1 18.4 9.0 56.8 1.1 11.6 5.7 13.5 5.96. Japan 28.4 19.2 79.7 38.1 10.7 26.2 3.0 71.57. The Netherlands - - - - - - - - - 8. Norway 12.4 - - - - - - - - 9. Korea - - - - - - - - - 10. Switzerland - - - - - - - - - 11. UK 1,173.3 - 534.4 - 49.8 - - - - 12. USA 70.0 150.0 - 43.0 677.3 - - - - 13. Italy - - - - - - - - - 14. Denmark - - - - - - - - Sub-Total (I) 1,297.6 191.0 623.0 144.5 738.9 37.8 8.7 13.5 77.4
II. Non Paris Club Countries1. China 11.4 - 123.9 4.5 - 21.2 - - - 2. Iran - - - - - - - - - 3. UAE - - - - - - - - - 4. Oman - - - - - - - - - 5. Saudi Arabia - 26.7 - 53.5 16.1 - - Sub-Total (II) 11.4 26.7 123.9 58.0 - 21.2 16.1 - 0.0
III. Multilateral1. ADB - - - 247.6 3.5 19.2 4.0 5.0 2.02. EEC / EU 19.6 200.7 - 230.2 130.9 14.63. Islamic Development Bank - - - 0.6 0.3 - - 4. IDA - 9.0 - - 2.0 10.2 117.75. IBRD 39.4 18.1 127.2 - 111.2 15.6 - 15.0 69.96. IFAD - - 0.5 - - - - 2.9 3.17. AIIB 1.5 4.18. UN and Specialised Agencies - 2.4 - - - - - - - 9. UNDP Special Grant - - - - - - - - - 10. World Food Programme - - - - - - - - - 11. UNFPA - - - - - - Sub-Total (III) 59.0 230.2 127.8 478.3 114.9 34.8 136.9 49.1 196.8
IV. Relief Assistance for A. Afghan Refugees 4.2 - 1.0 1.3 1.1 1.9 0.9 0.27 - B. Earthquake - - - - - - 1. Afghanistan - - - - - - - - - 2. Algeria - - - - - - - - - 3. Austria - - - - - - - - - 4. Azerbaijan - - - - - - - - - 5. Bhutan - - - - - - - - - 6. Brunei - - - - - - - - - 7. China - - - - - - - - - 8. Cyprus - - - - - - - - - 9. Indonesia - - - - - - - - - 10. Jordan - - - - - - - - - 11. Malaysia - - - - - - - - - 12. Morocco - - - - - - - - - 13. Oman - - - - - - - - - 14. Pak-Turk foundation - - - - - - - - - 15. Saudi Arabia - - - - - - - - - 16. South Korea - - - - - - - - - 17. Thailand - - - - - - - - - 18. Turkey for FATA TDPs - - - - 10.0 - - - - 19. UK - - - - - - - - - 20. ADB - - - - - - - - - 21. WB (IDA) 10.0 - - - - - - - - 22. Germany - - - - - - - - - 23. IDB - - - - - - - - - 24. Mauritius - - - - - - - - - Sub-Total (IV) 14.2 - 1.0 1.3 11.1 1.9 0.9 0.3 - Grand Total (I+II+III+IV) 1,382.3 447.9 875.6 682.1 864.9 95.7 162.6 62.9 274.2
Source : Economic Affairs Division
164

TABLE 9.7
TOTAL LOANS AND CREDITS CONTRACTED($ Million)
2012-13 2013-14 2014-15 2015-16 2016-17 2017-18 2018-19 2019-20 2020-21
A. Paris Club Countries 1. Austria - - - - - - - - - 2. Australia - - - - - - - - - 3. Belgium - - - - - - - - - 4. Canada - - - - - - - - - 5. France 88.9 83.3 - 46.3 114.0 192.1 148.0 - 77.3 6. Germany - 27.3 - 44.6 - - - - 32.1 7. Japan - 49.3 - 109.8 23.8 - - - - 8. Korea - - - 139.8 76.3 - - 80.0 - 9. Netherlands - - - - - - - - - 10. Norway - - - - - - - - - 11. Spain - - - - - - - - - 12. UK - - - - - - - - - 13. USA - - - - - - - - - 14. Italy - - - - - - - 23.0 - 15. Sweden - - - - - - - - - Sub-Total (A) 88.9 159.9 - 340.4 214.1 192.1 148.0 103.0 109.4
B. Non-Paris Club Countries 1. China 448.0 6,493.8 37.7 9,422.7 729.4 500.0 2,000.0 - 1,000.0 2. Kuwait - - - - - 14.9 - - - 3. Saudi Arabia 100.0 282.8 - 55.0 - - - - - 4. Turkey (EXIM Bank) - - - - - - - - - 5. Abu Dhabi Fund - - - - - - - - - Sub-Total (B) 548.0 6,776.6 37.7 9,477.7 729.4 514.9 2,000.0 - 1,000.0
C. Multilateral 1. IBRD - - - 100.0 690.0 855.0 - 652.0 854.0 2. IDA 242.9 1,554.1 1,425.4 1,598.6 761.2 1386.3 615.6 1,449.0 3,633.6 3. ADB 170.8 2,148.8 762.1 1,713.1 2001.0 1589.6 355.0 2,823.3 900.0 4. IFAD - - 31.6 67.9 - 82.6 - 36.0 62.3 5. European Investment Bank - 136.5 - - - - - - 6. ECOTDB - 30.0 - 35.0 40.0 - 40.0 - 7. OPEC Fund - 50.0 - - 50.0 - - - 50.0 8. IDB 227.0 264.4 - 100.0 - - - 200.0 9.IDB (ST) - 1,006.5 488.8 1,237.0 700.0 694.4 926.0 555.8 951.510.AIIB - - - 100.0 300.0 - - 540.0 321.8Sub-Total (C) 640.7 5,190.3 2,707.9 4,951.6 4,542.2 4,607.9 1,936.6 6,256.1 6,773.2
D. Eurobonds / Sukuks 1. Eurobonds / Sukuks - 2,000.0 1,000.0 500.0 1,000.0 2,500.0 - - 2,500.0Sub-Total (D) - 2,000.0 1,000.0 500.0 1,000.0 2,500.0 - - 2,500.0
E. Commercial Banks1. SCB London - 172.5 100.1 - 700.0 200.0 - 200.0 600.02. Dubai Bank - - - 125.0 - 80.0 685.0 445.0 825.03. Noor Bank - - - 340.0 445.0 220.0 225.0 - 4. SUISSE AG, UBL, ABL - 200.0 - 983.0 1000.0 1,200.0 495.0 200.0 215.05. Bank of China - - - - 300.0 200.0 - 500.06. China Development Bank - - - - 1700.0 1,000.0 2,183.7 1,700.0 1,000.07. ICBC-China - - - - 300.0 1,000.0 300.0 - 1,300.08. Citi Bank - - - - 275.0 267.0 - 150.009. Ajman Bank - - - - - - 274.0 267.50 350.0010. Emirates NBD 370.0011. NBP BAHRAIN 142.00Sub-Total (E) - 372.5 100.1 1,448.0 4,720.0 4,167.0 4,162.7 3,462.5 4,802.0Grand-Total (A+B+C+D+E) 1,277.6 14,499.2 3,845.7 16,717.7 11,205.7 11,981.9 8,247.3 9,821.6 15,184.6
Note: Total may differ due to rounding off Source : Economic Affairs Division
Lending Country/Agency
165

EDUCATION
HIGHLIGHTSEducational InstitutionsPrimary Schools 187.9
Middle Schools 49.3
High Schools 32.3
Technical and Vocational Institutions 3.9
Higher Secondary / Inter Colleges 6.2
Degree Colleges 3.9
Universities (Numbers) 233E : Estimated
2020-21 (E)(000 Numbers)
167

TABLE 10.1
NUMBER OF EDUCATIONAL INSTITUTIONS BY KIND, LEVEL & SEX
NumbersYear Middle Technical & Voca- Higher Sec/ Degree Univer-
tional Institutions Inter Colleges Colleges sitiesTotal Female Total Female Total Female Total Female Total Female Total Female Total
2000-01 147.7 54.3 25.5 12.0 14.8 4.6 630 236 1,710 691 366 171 59
2001-02 149.1 55.3 26.8 12.8 15.1 4.6 607 239 1,784 731 376 177 74
2002-03 150.8 56.1 28.0 13.5 15.6 4.8 585 230 1,855 768 386 186 96
2003-04 155.0 57.6 28.7 13.9 16.1 5.1 624 228 1,989 822 426 206 106
2004-05 157.2 58.7 30.4 14.8 16.6 5.3 747 328 1,604 684 677 331 108
2005-06 157.5 59.8 39.4 19.3 22.9 8.1 3,059 1,475 2,996 1,484 1,135 664 111
2006-07 158.4 60.9 40.1 17.5 23.6 9.0 3,090 1,491 3,095 1,420 1,166 631 120
2007-08 157.4 64.9 40.8 20.6 24.0 9.0 3,125 1,507 3,213 1,642 1,202 700 124
2008-09 156.7 63.4 40.9 20.4 24.3 9.2 3,159 1,523 3,242 1,707 1,336 733 129
2009-10 157.5 60.6 41.3 19.5 24.8 10.6 3,192 2,182 3,329 1,763 1,439 821 132
2010-11 155.5 58.2 41.6 20.4 25.2 9.5 3,224 2,206 3,435 1,690 1,558 814 135
2011-12 154.7 57.0 41.9 21.0 28.7 11.6 3,257 2,229 4,515 2,184 1,384 643 139
2012-13 159.7 60.1 42.2 21.4 29.9 12.3 3,290 2,253 5,030 2,410 1,534 683 147
2013-14 157.9 60.3 42.9 21.1 30.6 12.6 3,323 2,276 5,179 2,462 1,086 518 161
2014-15 165.9 66.0 44.8 22.4 31.3 13.1 3,579 1,819 5,393 2,567 1,410 308 163
2015-16 164.6 65.3 45.7 27.0 31.7 15.6 3,746 1,514 5,470 1,437 1,418 260 163
2016-17 168.9 66.1 49.1 27.9 31.6 14.7 3,798 1,536 5,130 2,689 1,431 344 185
2017-18 172.5 73.5 46.7 23.5 31.4 13.5 3,740 1,330 5,754 2,654 1,659 834 186
2018-19 (P) 180.1 80.7 47.3 23.7 31.7 13.7 3,740 1,330 5,876 2,634 2,893 1,425 202
2019-20 (E) 183.9 85.3 48.3 24.1 32.0 13.9 3,825 1,239 6,041 2,675 3,320 1,683 218
2020-21 (E) 187.9 90.4 49.3 24.5 32.3 14.2 3,914 1,160 6,214 2,717 3,872 2,035 233P : Provisional E: Estimated *: Including Pre-Primary, Mosque Schools and Non-Formal Basic Education (NFBE)Notes:1. All figures include Public and Private Sector data2. Female institutions include percentage of mixed institutions
Sources:
3. Figures of Private School data from 2000-01 to 2004-05 is based on 'Census of Private Education Institution 1999-2000', Pakistan Bureau of Statistics, Islamabad.4. Figures of Private Schools data for 2005-06 is based on 'National Education Census, 2005', NEMIS, AEPAM, Islamabad.5. Figures of Private Schools data from 2006-07 onward is provided by Provincial/Regional EMIS.6. Figures of Technical & Vocational from 2003-04 onward is based on Pakistan Education Statistics Reports, NEMIS, AEPAM, Islamabad.7. Figures of Universities is provided by Higher Education Commission (HEC), Islamabad.
High
1. Figures of Primary, Middle, High and Higher Sec. From 2000-01 to 2017-18 is based on Annual Pakistan Education Statistics Reports, NEMIS, AEPAM, Islamabad.2. Figures of Inter Colleges and Degree Colleges from 2004-05 onward is based on Annual Pakistan Education Statistics Reports, NEMIS, AEPAM, Islamabad.
Schools (000) Schools (000) Schools (000)Primary*
169

TABLE 10.2
Year Primary Stage Middle Stage High Stage Technical & Higher Sec/ Degree UniversitiesI-V VI-VIII IX-X Vocational Inter Colleges Colleges Numbers
in 000 in 000 in 000 in 000 in 000 NumbersTotal Female Total Female Total Female Total Female Total Female Total Female Total Female
2000-01 14,105 5,559 3,759 1,706 1,565 675 83 14 582 283 305,200 149,600 124,944 36,699
2001-02 14,560 5,871 3,821 1,506 1,574 644 83 15 582 285 300,400 148,000 276,274 101,770
2002-03 15,094 6,132 3,918 1,551 1,589 658 94 19 625 306 320,800 158,400 331,745 128,066
2003-04 16,207 6,606 4,321 1,737 1,800 709 105 14 691 338 329,007 163,059 423,236 178,723
2004-05 18,190 7,642 4,612 1,885 1,936 780 114 21 307 141 453,275 220,118 471,964 195,555
2005-06 17,757 7,710 5,322 2,191 2,188 905 239 90 891 444 355,705 209,806 521,473 212,997
2006-07 17,993 7,848 5,431 2,264 2,373 974 251 94 942 473 380,012 224,263 605,885 255,695
2007-08 18,360 8,032 5,427 2,279 2,484 1,022 256 96 960 452 383,810 226,517 741,092 342,125
2008-09 18,468 8,144 5,414 2,298 2,556 1,071 265 99 1,074 508 366,518 222,850 803,507 356,233
2009-10 18,772 8,320 5,504 2,337 2,583 1,078 273 102 1,166 495 383,954 217,621 935,599 426,323
2010-11 18,063 7,971 5,644 2,421 2,630 1,103 281 106 1,188 408 431,180 218,374 1,107,682 521,284
2011-12 18,677 7,905 6,020 2,573 2,753 1,155 290 109 1,294 367 497,152 222,098 1,319,799 642,198
2012-13 18,790 8,278 6,188 2,653 2,898 1,215 302 113 1,400 395 641,539 234,006 1,594,648 805,062
2013-14 19,441 8,567 6,461 2,798 3,109 1,303 309 117 1,234 497 465,435 240,585 1,594,648 805,062
2014-15 19,847 8,778 6,582 2,843 3,501 1,493 320 112 1,665 662 510,588 82,479 1,299,160 602,550
2015-16 21,551 9,534 6,922 3,026 3,653 1,580 315 112 1,698 675 518,144 86,134 1,355,649 602,509
2016-17 21,686 9,660 6,996 3,088 3,583 1,541 345 120 1,595 618 537,407 89,512 1,463,279 667,912
2017-18 22,931 10,093 7,362 3,273 3,861 1,692 433 148 1,688 765 604,614 294,388 1,575,793 695,028
2018-19 (P) 23,588 10,625 7,634 3,426 3,969 1,755 433 148 2,140 984 725,631 402,603 1,858,704 832,299
2019-20 (E) 24,592 11,127 7,931 3,593 4,214 1,885 465 155 2,328 1,071 741,483 411,398 1,910,001 836,992
2020-21 (E) 25,676 11,674 8,251 3,775 4,487 2,033 500 164 2,549 1,332 757,986 455,951 1,963,960 841,734P : Provisional E : EstimatedNotes:1. All figures include Public and Private Sector data2. Enrolment of Deeni Madaris & Non-Formal Basic Education (NFBE) are included
Sources:
3. Figures of Private School data from 2000-01 to 2004-05 is based on 'Census of Private Education Institution 1999-2000', Pakistan Bureau of Statistics, Islamabad.4. Figures of Private Schools data for 2005-06 is based on 'National Education Census, 2005', NEMIS, AEPAM, Islamabad.5. Figures of Private Schools data from 2006-07 onward is provided by Provincial/Regional EMIS.6. Figures of Technical & Vocational from 2003-04 onward is based on Pakistan Education Statistics Reports, NEMIS, AEPAM, Islamabad.7. Figures of Universities is provided by Higher Education Commission (HEC), Islamabad.
ENROLMENT IN EDUCATIONAL INSTITUTIONS BY KIND, LEVEL & SEX
1. Figures of Primary, Middle, High and Higher Sec. From 2000-01 to 2017-18 is based on Annual Pakistan Education Statistics Reports, NEMIS, AEPAM, Islamabad.2. Figures of Inter Colleges and Degree Colleges from 2004-05 onward is based on Annual Pakistan Education Statistics Reports, NEMIS, AEPAM, Islamabad.
170

TABLE 10.3
Year Primary Schools* Middle Schools High Schools Technical & Voca- Higher Sec/ Degree Universitiesin 000 in 000 in 000 tional Institutions Inter Colleges Colleges Numbers
Numbers Numbers NumbersTotal Female Total Female Total Female Total Female Total Female Total Female Total
2000-01 408.9 183.6 209.7 127.8 260.3 125.3 9,441 1,959 48,054 21,506 11,019 4,218 5,988
2001-02 413.9 183.5 230.1 139.3 270.2 126.1 7,192 1,863 55,146 23,016 10,598 4,164 5,160
2002-03 433.5 191.7 236.3 145.8 278.0 131.9 7,273 1,623 57,681 24,146 11,164 4,410 6,180
2003-04 432.2 195.3 239.4 146.6 276.9 134.2 7,042 1,325 57,881 24,190 11,245 4,505 37,428
2004-05 450.1 206.5 246.7 151.5 282.1 138.6 7,356 1,450 57,661 24,366 15,653 6,690 37,469
2005-06 454.2 210.6 310.8 201.6 417.1 209.9 14,565 4,658 69,425 33,959 20,568 10,485 37,509
2006-07 456.0 212.6 313.5 203.3 421.7 213.0 14,622 4,676 71,246 34,996 20,768 10,587 44,537
2007-08 452.6 216.0 320.6 208.2 429.9 219.7 14,914 4,770 74,223 36,162 20,971 10,690 46,893
2008-09 465.3 216.2 320.5 209.0 439.3 225.5 15,264 5,061 76,184 37,149 21,176 10,794 52,833
2009-10 441.7 208.9 331.5 216.6 447.1 230.4 15,338 4,905 77,248 37,595 30,754 14,313 57,780
2010-11 440.5 210.1 335.0 220.3 452.8 235.3 15,591 4,993 81,183 39,378 36,349 16,181 63,557
2011-12 427.4 198.6 351.4 233.9 458.7 271.3 15,847 5,079 97,633 52,746 40,191 16,815 70,053
2012-13 428.8 209.1 362.6 241.5 489.6 287.2 16,109 5,168 132,011 71,121 48,809 19,319 77,557
2013-14 420.1 209.5 364.8 243.6 500.5 296.3 16,377 5,259 124,336 58,867 25,964 7,599 77,557
2014-15 430.9 218.9 380.8 256.1 514.2 306.2 19,393 5,353 118,079 63,569 36,587 7,239 88,288
2015-16 444.6 226.3 394.2 270.3 529.5 318.0 18,157 4,384 123,061 66,528 37,082 7,379 83,375
2016-17 475.2 258.9 455.4 325.7 560.6 342.6 18,207 4,304 120,336 63,386 37,857 7,541 58,733
2017-18 522.4 284.0 448.1 319.8 563.3 342.9 18,207 4,304 123,154 64,320 41,233 17,803 56,885
2018-19 (P) 494.9 276.5 448.7 322.0 567.3 348.5 18,207 4,304 136,008 70,818 61,602 27,260 60,279
2019-20 (E) 507.6 291.4 466.4 339.8 582.3 360.9 18,602 4,184 136,694 70,768 64,293 29,128 58,041
2020-21 (E) 522.8 307.7 485.0 359.0 595.9 372.2 18,963 4,062 138,635 72,812 77,852 40,916 55,954P : Provisional E : Estimated * : Including Pre-Primary, Mosque Schools and Non-Formal Basic Education (NFBE)Note: All figures include Public and Private Sector data
Sources:
3. Figures of Private School data from 2000-01 to 2004-05 is based on 'Census of Private Education Institution 1999-2000', Pakistan Bureau of Statistics, Islamabad.4. Figures of Private Schools data for 2005-06 is based on 'National Education Census, 2005', NEMIS, AEPAM, Islamabad.5. Figures of Private Schools data from 2006-07 onward is provided by Provincial/Regional EMIS.6. Figures of Technical & Vocational from 2003-04 onward is based on Pakistan Education Statistics Reports, NEMIS, AEPAM, Islamabad.7. Figures of Universities is provided by Higher Education Commission (HEC), Islamabad.
NUMBER OF TEACHERS IN EDUCATIONAL INSTITUTIONS IN PAKISTAN, BY KIND, LEVEL & SEX
1. Figures of Primary, Middle, High and Higher Sec. From 2000-01 to 2017-18 is based on Annual Pakistan Education Statistics Reports, NEMIS, AEPAM, Islamabad.2. Figures of Inter Colleges and Degree Colleges from 2004-05 onward is based on Annual Pakistan Education Statistics Reports, NEMIS, AEPAM, Islamabad.
171
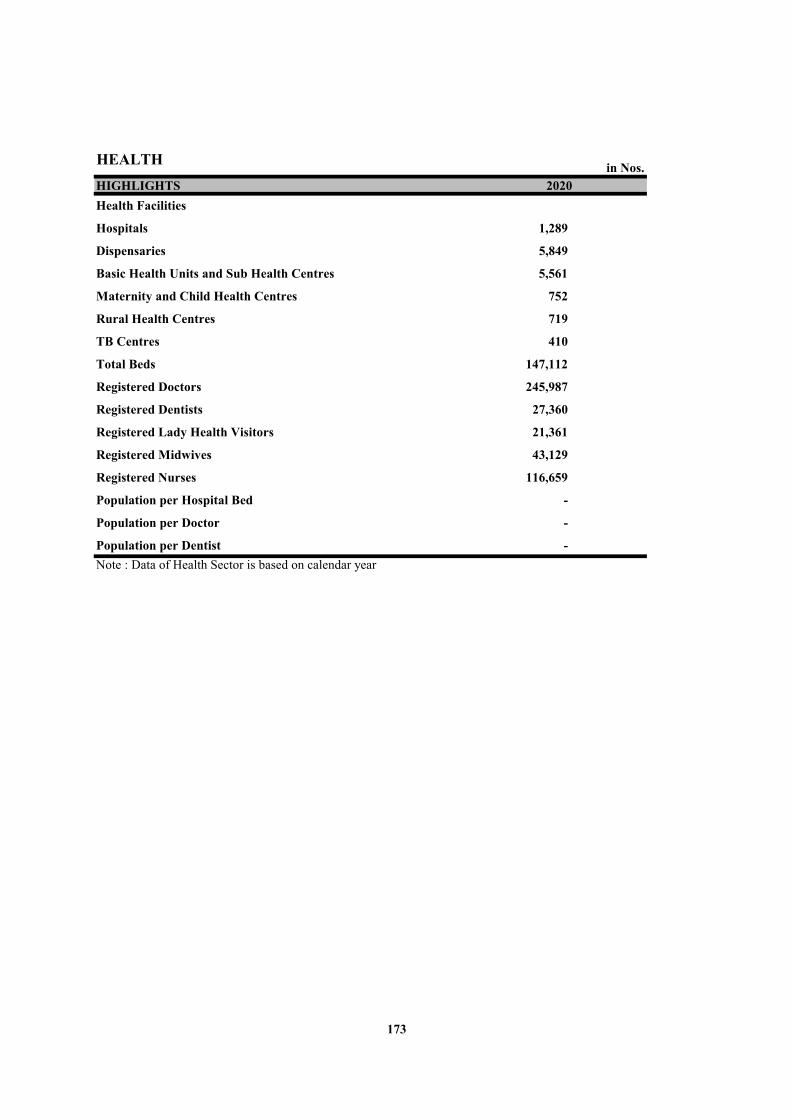
HEALTH in Nos.HIGHLIGHTS 2020Health Facilities
Hospitals 1,289
Dispensaries 5,849
Basic Health Units and Sub Health Centres 5,561
Maternity and Child Health Centres 752
Rural Health Centres 719
TB Centres 410
Total Beds 147,112
Registered Doctors 245,987
Registered Dentists 27,360
Registered Lady Health Visitors 21,361
Registered Midwives 43,129
Registered Nurses 116,659
Population per Hospital Bed -
Population per Doctor -
Population per Dentist -Note : Data of Health Sector is based on calendar year
173

TABLE 11.1
NumberYear Hospitals Dispen- BHUs Maternity Rural TB Total Population
saries Sub & Child Health Centres Beds perHealth Health Centres BedCentres Centres
2000 876 4,635 5,171 856 531 274 93,907 1,456
2001 907 4,625 5,230 879 541 272 97,945 1,427
2002 906 4,590 5,308 862 550 285 98,264 1,454
2003 906 4,554 5,290 907 552 289 98,684 1,479
2004 916 4,582 5,301 906 552 289 99,908 1,492
2005 919 4,632 5,334 907 556 289 101,490 1,483
2006 924 4,712 5,336 906 560 288 102,073 1,508
2007 945 4,755 5,349 903 562 290 103,285 1,544
2008 948 4,794 5,310 908 561 293 103,037 1,575
2009 968 4,813 5,345 906 572 293 103,708 1,592
2010 972 4,842 5,344 909 577 304 104,137 1,701
2011 980 5,039 5,449 851 579 345 107,537 1,647
2012 1,092 5,176 5,478 628 640 326 111,802 1,6162013 1,113 5,413 5,471 687 667 329 118,378 1,557
2014 1,143 5,548 5,438 670 669 334 118,170 1,591
2015 1,172 5,695 5,478 733 684 339 119,548 1,604
2016 1,243 5,971 5,473 755 668 345 124,821 15,65
2017 1,264 5,654 5,505 727 688 431 131,049 15,85
2018 1,279 5,671 5,527 747 686 441 132,227 1,608
2019 1,282 5,743 5,472 752 670 412 133,707 -
2020 (P) 1,289 5,849 5,561 752 719 410 147,112 -- : Not available P : Provisional Source: Pakistan Bureau of Statistics
NATIONAL MEDICAL AND HEALTH ESTABLISHMENTS, Progressive
175

TABLE 11.2
NumberRegis- Regis- Regis- Register- Register-
Year tered tered tered ed Mid- ed Lady Expenditure (Rs. mn)Doctors Dentists Nurses wives Health Develop- Non-Deve-
* * * Visitors ment lopment
2000 92,838 4,165 37,528 22,525 5,443 1,529 33,629 5,944 18,337
2001 97,260 4,612 40,019 22,711 5,669 1,516 31,579 6,688 18,717
2002 102,644 5,058 44,520 23,084 6,397 1,466 29,405 6,609 22,205
2003 108,164 5,531 46,331 23,318 6,599 1,404 27,414 8,500 24,305
2004 113,309 6,128 48,446 23,559 6,741 1,359 25,107 5,568 21,441
2005 118,113 6,734 51,270 23,897 7,073 1,310 25,297 6,649 24,777
2006 123,146 7,438 57,646 24,692 8,405 1,254 20,839 9,793 29,410
2007 128,042 8,215 62,651 25,261 9,302 1,245 19,417 13,898 39,268
2008 133,925 9,012 65,387 25,534 10,002 1,212 18,010 17,748 44,659
2009 139,488 9,822 69,313 26,225 10,731 1,184 16,814 26,456 57,258
2010 144,901 10,508 73,244 27,153 11,510 1,222 16,854 28,301 66,098
2011 152,368 11,649 77,683 30,722 12,621 1,162 15,203 27,658 78,359
2012 160,880 12,692 82,119 31,503 13,678 1,123 14,238 29,898 104,284
2013 167,759 13,716 86,183 32,677 14,388 1,099 13,441 31,781 129,421
2014 175,223 15,106 90,276 33,687 15,325 1,073 12,447 55,904 146,082
2015 184,711 16,652 94,766 34,668 16,448 1,038 11,513 65,213 165,959
2016 195,896 18,333 99,228 36,326 17,384 997 10,658 75,249 192,704
2017 208,007 20,463 103,777 38,060 18,400 957 9,730 99,005 229,957
2018 220,829 22,595 108,474 40,272 19,910 963 9,413 87,434 329,033
2019 233,261 24,930 112,123 41,810 20,565 - - 58,624 363,154
2020 245,987 27,360 116,659 43,129 21,361 - - 77,496 427,915- : Not available Source: Pakistan Bureau of Statistics* : Registered with Pakistan Medical and Dental Council and Pakistan Nursing Council.
REGISTERED MEDICAL AND PARAMEDICAL PERSONNEL (Progressive) ANDEXPENDITURE ON HEALTH
Population per
Doctor Dentist
176

TABLE 11.3
Nos. in 1000
Vaccine/doze. 2012 2013 2014 2015 2016 2017 2018 2019 2020
B.C.G. 6,062.0 6,186.4 6,150.8 5,848.5 6,233.7 6,356.5 6,608.4 7,261.5 7,019.4
POLIO0 4,200.3 4,464.2 4,746.2 4,796.7 5,120.1 5,420.8 5,818.8 6,220.4 6,339.8 I 5,822.8 5,905.2 5,838.7 5,743.6 5,990.7 6,001.4 6,138.1 6,618.3 6,607.1 II 5,445.9 5,538.9 5,494.8 5,387.8 5,537.9 5,618.4 6,138.1 6,249.3 6,239.1III 5,330.5 5,398.0 5,369.4 5,257.4 5,378.7 5,455.2 5,672.4 6,115.9 6,124.0
Pentavalent I 5,773.2 5,921.6 5,843.5 5,713.7 5,933.6 6,009.0 5,526.7 6,725.8 6,145.7 II 5,400.2 5,552.8 5,491.0 5,353.2 5,532.2 5,625.0 6,139.5 6,360.6 5,766.4III 5,275.6 5,411.6 5,370.8 5,225.9 5,371.7 5,472.0 5,676.0 6,231.3 5,665.8
T.T I 5,361.9 5,157.2 4,536.5 5,048.2 4,569.7 4,690.3 4,874.9 5,272.2 4,993.8 II 4,279.0 4,235.0 3,708.5 4,063.1 3,934.9 3,993.8 4,103.6 4,560.7 4,366.7III 815.1 783.2 577.7 586.7 398.5 191.4 192.5 250.7 225.1 IV 229.8 312.3 185.4 157.9 97.8 51.9 57.9 70.8 60.1 V 128.4 130.1 105.8 86.6 56.8 27.5 30.7 37.0 27.6
MEASLESI 9,085.8 4,490.3 5,370.8 5,192.1 5,516.8 5,606.5 5,455.4 6,216.6 6,284.2
II - 5,622.7 4,536.5 4,193.5 4,684.7 4,710.9 4,734.0 5,492.7 5,617.2
Pneumococcal (PCV10) I - 3,588.7 5,526.3 5,641.8 5,884.3 5,994.4 5,528.7 6,724.8 6,590.8 II - 3,195.3 5,197.4 5,388.6 5,505.8 5,605.1 6,135.8 6,356.5 6,225.8III - 3,008.4 5,072.4 5,175.9 5,374.9 5,470.6 5,673.4 6,228.7 6,127.0
- : Not available Source: Pakistan Bureau of StatisticsNational Institute of Health (NIH)
PENTAVALENT = DPT + HBV + Diphtheria + pertosis + HIB (Heamoinflunza - Type B)Pneumococcal (PCV10): Viccine of Nomonia I,II,III,IV,V stands for 1st, 2nd, 3rd, 4th & 5th dossesB.C.G : Bacilus + Calamus + GuerinD.P.T: Diphteria + Perussia + TetanusT.T : Tetanus Toxoid
DATA ON EXPANDED PROGRAMME OF IMMUNIZATION VACCINATION PERFORMANCE
177

TABLE 11.4
DOCTOR CONSULTING FEE IN VARIOUS CITIES
In rupeesPeriod* Faisal- Gujran- Hyder- Islam- Karachi Lahore Pesha- Quetta Rawal- Sukkur Pakistan
abad wala abad abad war pindi
2000 40.00 40.00 33.75 33.13 32.40 38.93 30.00 107.50 32.92 30.00 41.86
2001 40.00 40.00 33.75 33.13 33.00 41.96 43.33 107.50 33.75 30.00 43.64
2002 40.00 50.00 30.00 33.13 35.00 41.25 43.33 95.00 33.96 30.00 43.17
2003 40.00 50.00 31.25 45.00 36.35 41.96 50.00 100.00 38.75 30.00 46.33
2004 41.25 50.00 33.00 45.00 36.25 41.96 50.00 100.00 38.75 30.00 46.62
2005 41.25 50.00 33.75 46.25 38.08 44.29 50.00 100.00 42.08 30.00 47.57
2006 41.25 50.00 33.75 55.00 41.73 52.68 50.00 100.00 43.75 50.00 51.81
2007 43.75 50.00 50.00 55.00 55.00 52.68 50.00 120.00 43.75 75.00 59.52
2008 75.00 65.00 50.00 75.00 80.00 63.21 100.00 130.00 61.67 75.00 77.49
2009 75.00 65.00 50.00 75.00 93.85 68.93 100.00 120.00 61.67 75.00 78.45
2010 75.00 75.00 60.00 90.00 93.85 68.93 125.00 130.00 71.67 100.00 88.95
2011 80.00 75.00 68.75 100.00 93.85 70.00 166.67 180.00 85.00 100.00 101.93
2012 90.00 75.00 80.00 200.00 100.00 70.36 191.61 200.00 110.00 100.00 121.70
2013 90.00 75.00 100.00 146.25 100.00 100.00 225.00 200.00 135.00 100.00 127.13
2014 90.00 75.00 100.00 175.00 100.00 100.00 220.83 200.00 166.67 100.00 132.75
2015 125.00 75.00 100.00 175.00 100.00 100.00 266.67 200.00 166.67 100.00 140.83
2016 125.00 75.00 100.00 175.00 100.00 100.00 266.67 200.00 166.67 100.00 140.83
2017 135.42 77.08 100.00 220.83 141.28 100.00 266.67 200.00 212.50 100.00 155.38
2018 250.00 100.00 100.00 225.00 173.39 118.75 266.67 200.00 216.67 135.42 178.59
2019 250.00 100.00 100.00 225.00 197.43 125.00 266.67 200.00 216.67 150.00 228.16
2020 264.47 100.00 100.00 334.56 210.18 160.14 462.83 212.09 305.87 185.38 254.29
2021 300.00 183.33 109.63 389.13 226.41 195.33 589.43 216.94 354.74 200.00 289.61Note : In the new base year 2015-16, prices are disseminated w.e.f July, 2019 Source: Pakistan Bureau of Statistics
AVERAGE DOCTOR CALL FEE IN VARIOUS CITIES
178
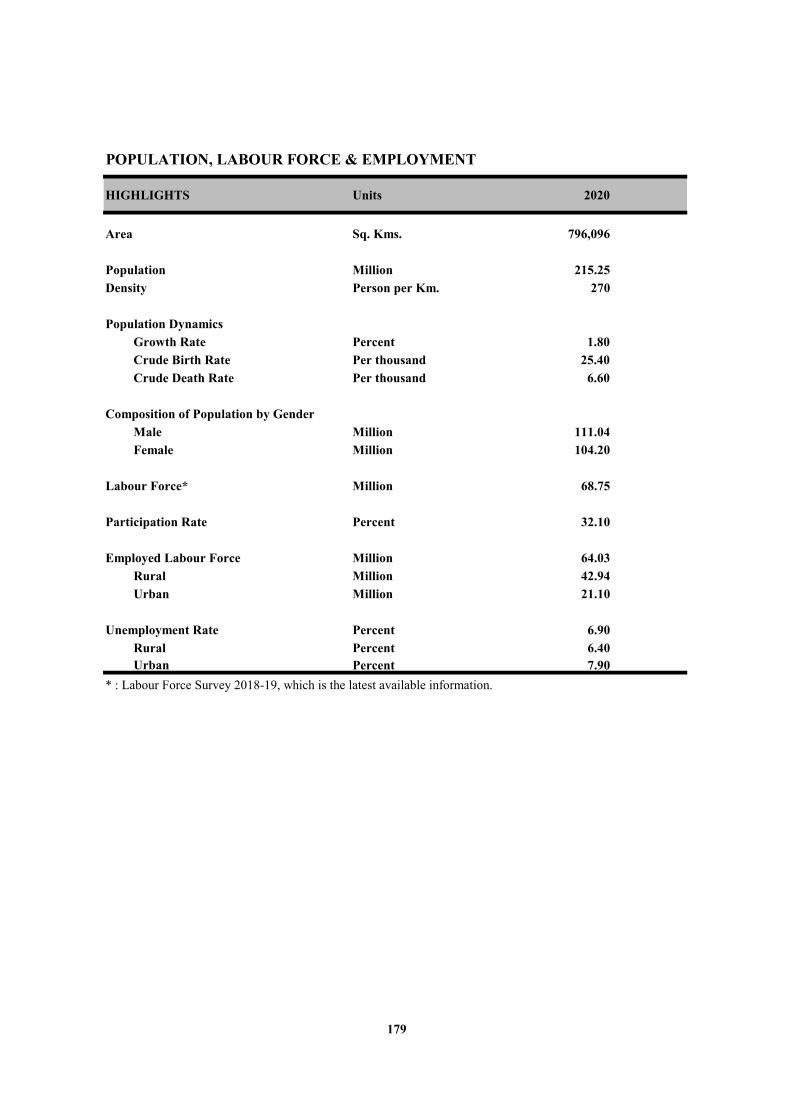
POPULATION, LABOUR FORCE & EMPLOYMENT
HIGHLIGHTS Units 2020
Area Sq. Kms. 796,096
Population Million 215.25Density Person per Km. 270
Population DynamicsGrowth Rate Percent 1.80Crude Birth Rate Per thousand 25.40Crude Death Rate Per thousand 6.60
Composition of Population by GenderMale Million 111.04Female Million 104.20
Labour Force* Million 68.75
Participation Rate Percent 32.10
Employed Labour Force Million 64.03Rural Million 42.94Urban Million 21.10
Unemployment Rate Percent 6.90Rural Percent 6.40Urban Percent 7.90
* : Labour Force Survey 2018-19, which is the latest available information.
179

TABLE 12.1
POPULATION
Year Popu- Labour Civilian Employed Crude Crude Infant Growthlation Force Labour Total Birth Death Mortality Rate(mln) Participation Force (mln) Rate Rate Rate
Rate(%) (mln)2000 139.55 28.97 40.38 37.22 - - - 2.60
2001 142.76 28.48 41.23 38.00 - - - 2.61
2002 146.02 29.61 43.01 39.45 27.03 8.20 85.00 -
2003 149.32 29.61 43.88 40.25 27.30 8.00 83.00 1.90
2004 152.66 30.41 45.95 42.42 27.80 8.70 79.90 -
2005 156.04 30.41 46.82 43.22 - - - -
2006 159.46 32.22 50.50 47.37 26.10 7.10 76.70 -
2007 162.91 31.82 50.78 48.07 25.50 7.90 72.40 1.76
2008 166.41 32.17 52.23 49.52 25.00 7.70 70.20 1.73
2009 169.94 32.81 55.76 52.71 28.40 7.60 73.50 2.08
2010 173.51 32.98 57.22 54.05 28.00 7.40 72.00 2.05
2011 177.10 32.98 58.41 55.17 27.50 7.30 70.50 2.03
2012 180.71 32.83 59.33 55.80 27.20 7.20 69.00 2.00
2013 184.35 32.88 60.35 56.58 26.80 7.00 67.50 1.97
2014 188.02 32.28 60.09 56.52 26.40 6.90 66.10 1.95
2015 191.71 32.30 61.04 57.42 26.10 6.80 64.60 1.92
2016* 198.78 - - - 27.80 7.00 62.40 2.08
2017 202.93 - - - 27.30 6.90 61.40 2.04
2018 207.06 31.70 65.50 61.71 26.70 6.80 60.50 1.99
2019 211.17 32.10 ** 68.75 ** 64.03 ** 26.10 6.70 59.50 1.94
2020 215.25 - - - 25.40 6.60 58.50 1.80- : Not available Source: Pakistan Bureau of Statistics* : Population Data revised from 2016 on the basis of projections provided by NIPS **: Data taken from Labour Force Survey 2018-19
(per 1000 persons)
181

TABLE 12.2
Population in Million
Year All Areas Male Female Rural areas Urban areas
2000 139.96 72.65 67.11 93.63 46.13
2001 142.86 74.23 68.63 95.36 47.50
2002 146.02 75.69 70.33 97.76 48.26
2003 149.32 77.38 71.93 99.74 49.57
2004 152.66 79.10 73.57 101.34 51.33
2005 156.04 80.83 75.21 102.12 53.92
2006 159.46 82.57 76.88 103.66 55.80
2007 162.91 84.34 78.57 105.20 57.72
2008 166.41 86.13 80.28 106.73 59.68
2009 169.94 87.94 82.01 108.08 61.87
2010 173.51 89.76 83.75 109.41 64.09
2011 177.10 91.59 85.51 110.73 66.37
2012 180.71 93.43 87.28 112.02 68.69
2013 184.35 95.29 89.06 113.28 71.07
2014 188.02 97.16 90.86 115.52 72.50
2015 191.71 99.04 92.67 116.52 75.19
2016* 198.79 102.69 96.10 115.85 82.93
2017 202.93 104.80 98.13 117.25 85.69
2018 207.07 106.90 100.17 118.59 88.48
2019 211.17 108.98 102.19 119.88 91.30
2020 215.25 111.04 104.20 121.10 94.15Source: Ministry of Planning, Development & Special Initiatives
* : Population Data revised from 2016 on the basis of projections provided by NIPS
POPULATION IN RURAL / URBAN AREAS
182

TABLE 12.3
POPULATION IN URBAN, RURAL AREAS 1972, 1981, 1998 AND 2017 CENSUS
In ThousandsPopulation* Density
Region/ Total Urban Rural (Per sq.Province Both Sexes Male Female Both Sexes Male Female Both Sexes Male Female km)
1972 CENSUS
PAKISTAN 65,309 34,833 30,476 16,594 9,027 7,567 48,716 25,806 22,909 82
Islamabad** 238 131 106 77 46 31 161 86 75 259
Punjab** 37,607 20,209 17,398 9,183 4,977 4,206 28,424 15,232 13,192 183
Sindh 14,156 7,574 6,582 5,726 3,131 2,595 8,430 4,443 3,987 100
Khyber Pakhtunkhwa 8,388 4,363 4,026 1,196 647 549 7,193 3,716 3,477 113
Balochistan 2,429 1,290 1,139 399 218 181 2,029 1,071 958 7
FATA 2,491 1,266 1,225 13 8 5 2,478 1,258 1,220 92
1981 CENSUS
PAKISTAN 84,253 44,232 40,021 23,841 12,767 11,074 60,412 31,465 28,947 106
Islamabad 340 185 155 204 113 91 136 72 64 376
Punjab 47,292 24,860 22,432 13,052 6,952 6,100 34,241 17,909 16,332 230
Sindh 19,029 9,999 9,030 8,243 4,433 3,810 10,786 5,566 5,220 135
Khyber Pakhtunkhwa 11,061 5,761 5,300 1,665 898 767 9,396 4,863 4,533 148
Balochistan 4,332 2,284 2,048 677 371 306 3,655 1,913 1,742 13
FATA 2,199 1,143 1,056 - - - 2,199 1,143 1,056 81
1998 CENSUS
PAKISTAN 132,352 68,874 63,478 43,036 22,752 20,284 89,316 46,122 43,194 166
Islamabad 805 434 371 529 291 238 276 144 133 889
Punjab 73,621 38,094 35,527 23,019 12,071 10,948 50,602 26,023 24,579 359
Sindh 30,440 16,098 14,342 14,840 7,904 6,935 15,600 8,193 7,407 216
Khyber Pakhtunkhwa 17,744 9,089 8,655 2,994 1,589 1,405 14,750 7,500 7,250 238
Balochistan 6,566 3,057 3,059 1,569 849 719 4,997 2,657 2,340 19
FATA 3,176 1,652 1,524 85 46 39 3,091 1,606 1,485 117
PAKISTAN 207,685 106,340 101,345 75,671 39,163 36,508 132,014 66,877 64,837 261
Islamabad 2,003 1,053 951 1,009 536 473 994 517 478 2,211
Punjab 109,990 55,922 54,067 40,547 20,829 19,719 69,442 35,094 34,349 536
Sindh 47,855 24,882 22,972 24,833 12,952 11,881 23,022 11,930 11,092 340
Khyber Pakhtunkhwa 30,509 15,446 15,062 5,735 2,975 2,760 24,773 12,471 12,302 409
Balochistan 12,335 6,485 5,851 3,407 1,798 1,608 8,928 4,686 4,242 36
FATA 4,993 2,552 2,441 140 73 66 4,853 2,479 2,375 183- : Not available Source: Pakistan Bureau of Statistics* : This population does not include the population of AJK and Gilgit Baltistan** : Adjusted due to transfer of some mouzas from Rawalpindi to Islamabad districtNote : Total may differ due to rounding off figures
2017 CENSUS
183

TABLE 12.4
POPULATION BY AGE, IN URBAN, RURAL AREAS 1981 AND 1998 CENSUS
In ThousandsAge Total Rural Urban
(in years) Both Male Female Both Male Female Both Male Female
All ages 82,055 43,090 38,965 58,214 30,323 27,891 23,841 12,767 11,074 0- 4 12,574 6,200 6,373 8,995 4,387 4,608 3,579 1,813 1,766 5- 9 13,142 6,811 6,331 9,591 4,973 4,618 3,552 1,839 1,71310-14 10,803 5,857 4,946 7,684 4,204 3,480 3,119 1,653 1,46715-19 7,763 4,193 3,571 5,223 2,828 2,395 2,540 1,365 1,17520-24 6,228 3,270 2,958 4,119 2,111 2,008 2,108 1,159 95025-29 5,479 2,891 2,588 3,760 1,948 1,812 1,719 944 77630-34 4,617 2,388 2,229 3,226 1,631 1,595 1,391 757 63435-39 4,197 2,121 2,077 2,922 1,452 1,469 1,276 668 60840-44 3,865 1,937 1,928 2,733 1,332 1,402 1,132 606 52645-49 3,076 1,610 1,466 2,194 1,121 1,074 882 490 39250-54 2,966 1,638 1,328 2,170 1,179 991 796 459 33755-59 1,611 859 751 1,187 618 569 424 242 18260-64 2,216 1,299 917 1,667 973 695 549 327 22265-69 987 555 431 755 420 334 232 135 9770-74 1,161 678 484 900 526 374 261 152 10975 and above 1,369 782 588 1,088 622 466 281 160 121
All ages 129,176 67,222 61,954 86,225 44,516 41,709 42,951 22,705 20,245 0- 4 19,118 9,761 9,357 13,534 6,907 6,627 5,584 2,854 2,730 5- 9 20,215 10,571 9,644 14,211 7,466 6,745 6,004 3,105 2,89910-14 16,732 8,909 7,822 11,106 5,973 5,133 5,625 2,935 2,69015-19 13,400 6,909 6,490 8,553 4,396 4,158 4,846 2,514 2,33320-24 11,588 5,815 5,773 7,402 3,610 3,791 4,186 2,205 1,98125-29 9,521 4,879 4,643 6,092 3,024 3,067 3,429 1,854 1,57530-34 8,040 4,232 3,807 5,083 2,604 2,479 2,956 1,628 1,32835-39 6,167 3,254 2,912 3,846 1,984 1,862 2,320 1,270 1,05040-44 5,745 2,931 2,815 3,660 1,812 1,848 2,086 1,119 96745-49 4,563 2,360 2,203 2,995 1,512 1,483 1,569 849 72050-54 4,148 2,201 1,948 2,776 1,459 1,318 1,372 742 63055-59 2,777 1,505 1,272 1,868 1,001 867 909 504 40560-64 2,637 1,418 1,219 1,838 987 851 799 431 36865-69 1,554 850 704 1,076 585 491 478 265 21470-74 1,408 778 631 1,022 564 458 386 214 17275 and above 1,563 849 714 1,162 632 531 400 217 183
All ages 207,685 106,340 101,345 132,014 132,004 64,837 75,671 39,163 36,50800-04 29,163 14,944 14,219 19,821 19,821 9,665 9,342 4,788 4,55405-09 30,026 15,643 14,384 20,473 20,473 9,772 9,553 4,942 4,61110-14 24,527 12,947 11,580 16,193 16,193 7,607 8,334 4,360 3,97415-19 21,367 11,097 10,269 13,449 13,448 6,481 7,918 4,130 3,78820-24 18,496 9,248 9,248 11,132 11,131 5,652 7,364 3,768 3,59625-29 16,401 7,940 8,462 9,863 9,862 5,191 6,538 3,268 3,27030-34 14,152 6,948 7,203 8,410 8,409 4,381 5,741 2,919 2,82235-39 12,049 6,091 5,958 7,267 7,266 3,653 4,782 2,476 2,30540-44 9,627 4,849 4,778 5,692 5,692 2,899 3,935 2,056 1,87945-49 7,932 4,062 3,869 4,795 4,794 2,383 3,137 1,651 1,48650-54 6,946 3,645 3,301 4,146 4,146 1,987 2,799 1,486 1,31455-59 4,975 2,648 2,327 3,003 3,003 1,430 1,972 1,075 89760-64 4,312 2,248 2,064 2,670 2,670 1,298 1,642 876 76565-69 2,952 1,558 1,394 1,918 1,917 913 1,034 554 48070-74 2,134 1,132 1,002 1,406 1,406 660 728 386 34275 and above 2,627 1,339 1,288 1,775 1,774 863 852 427 425* : Figures regarding FATA is not included Source: Pakitan Bureau of Statistics
1981 Census
1998 Census*
2017 Census
184

TABLE 12.5
AreaSq km 1951 1961 1972 1981 1998 2017
PAKISTAN 796,096 33,740 42,880 65,309 84,254 132,352 207,685(100) (100) (100) (100) (100) (100) (100)
Khyber Pakhtunkhwa 74,521 4,557 5,731 8,389 11,061 17,744 30,509(9.4) (13.5) (13.4) (12.8) (13.1) (13.4) (14.7)
FATA 27,220 1,332 1,847 2,491 2,199 3,176 4,993(3.4) (3.9) (4.3) (3.8) (2.6) (2.4) (2.4)
Punjab 205,345 20,541 25,464 37,607 47,292 73,621 109,990(25.8) (60.9) (59.4) (57.6) (56.1) (55.6) (53.0)
Sindh 140,914 6,048 8,367 14,156 19,029 30,440 47,885(17.7) (17.9) (19.5) (21.7) (22.6) (23.0) (23.0)
Balochistan 347,190 1,167 1,353 2,429 4,332 6,566 12,335(43.6) (3.5) (3.2) (3.7) (5.1) (5.0) (5.9)
Islamabad 906 96 118 238 340 805 2,003(0.1) (0.3) (0.3) (0.4) (0.4) (0.6) (1.0)
Note : Percentage distribution is given in parenthesis
POPULATION OF PAKISTAN BY PROVINCE, LAND AREA AND PERCENTAGE DISTRIBUTION 1951-2017
Population (In thousand)
Source: Pakistan Bureau of Statistics
185

TABLE 12.6
1981 1981 198115 Years 10 Years 15 Years 10 Years 10 Years 15 Years 10 Years 15 Years 10 Years 10 Years 15 Years 10 Years 15 Years 10 Years 10 Years& Above & Above & Above & Above & Above & Above & Above & Above & Above & Above & Above & Above & Above & Above & Above
PakistanBoth 56.1 58.9 41.0 43.9 26.2 71.3 73.2 60.5 63.1 47.1 46.4 50.1 30.4 33.6 17.3Male 65.8 67.8 53.0 54.8 35.1 76.7 78.0 68.7 70.0 55.3 58.6 61.3 44.0 46.4 26.2Female 46.2 49.7 28.0 32.0 16.0 65.6 68.1 51.0 55.2 37.3 34.2 38.6 16.2 20.1 7.3
IslamabadBoth 80.4 81.5 69.7 72.4 47.8 80.3 81.1 75.2 77.3 57.6 80.5 81.8 58.4 62.5 32.5Male 86.1 86.5 79.5 80.6 59.1 85.7 85.9 82.2 83.2 65.8 86.5 87.2 73.2 75.1 48.1Female 74.0 75.8 57.7 62.4 33.5 74.1 75.6 65.9 69.7 46.8 73.9 76.0 42.1 48.8 14.7
PunjabBoth 60.9 64.0 43.4 46.6 27.4 74.6 76.6 61.9 64.5 46.7 52.3 56.2 34.5 38.0 20.0Male 68.9 71.2 55.2 57.2 36.8 78.7 80.1 69.8 70.9 55.2 62.6 65.5 47.9 50.4 29.6Female 52.8 56.7 30.8 35.1 16.8 70.3 73.0 53.0 57.2 36.7 42.1 46.9 20.5 24.8 9.4
SindhBoth 53.1 54.6 43.9 45.3 31.4 69.0 70.4 62.6 63.7 50.8 32.6 35.2 23.9 25.7 15.6Male 61.7 62.5 54.5 54.5 39.7 74.3 75.1 70.0 69.8 57.8 45.1 46.9 37.2 37.9 24.5Female 43.8 45.9 32.0 34.8 21.6 63.2 65.3 54.9 56.7 42.2 19.5 22.6 9.8 12.2 5.2
Khyber PakhtunkhwaBoth 49.7 54.0 31.5 35.4 16.7 64.0 67.1 51.0 54.3 35.8 46.1 50.8 27.2 31.3 13.2Male 66.3 69.2 48.2 51.4 25.9 76.1 78.0 65.5 67.5 47.0 63.6 67.0 44.1 47.7 21.7Female 33.5 38.7 14.6 18.8 6.5 50.9 55.4 33.9 39.1 21.9 29.3 34.8 10.6 14.7 3.8
BalochistanBoth 40.5 43.6 22.4 24.8 10.3 56.3 59.6 43.4 46.9 32.2 33.7 37.0 15.2 17.5 6.2Male 52.1 54.1 32.5 34.0 15.2 68.4 70.3 55.9 58.1 42.4 45.1 47.4 24.0 25.8 9.8Female 27.9 31.9 11.0 14.1 4.3 43.0 47.6 28.0 33.1 18.5 21.6 25.5 5.6 7.9 1.7
FATABoth 31.4 36.1 - 17.4 6.4 50.3 54.1 - 39.3 - 30.8 35.5 - 16.8 6.4Male 51.7 56.0 - 29.5 10.9 71.6 73.4 - 59.7 - 51.0 55.5 - 28.6 10.9Female 11.4 15.7 - 3.0 0.8 26.9 32.7 - 12.0 - 10.9 15.3 - 2.8 0.8
FATA: Federally Administered Tribal Areas Source: Pakistan Bureau of Statistics- : Not available
LITERACY RATIOS OF POPULATION BY SEX, REGION AND URBAN/RURAL AREAS, 1981 TO 2017 CENSUS
1998 1998 1998Total
2017 2017Urban
2017Rural
Sex
186

TABLE 12.7
LAND AREA, POPULATION AND PERCENTAGE DISTRIBUTION
Population in ThousandArea Sq.
Kms
796,096 33,740 84,254 132,352 188,019 191,708 198,785 202,934 207,067 211,177 215,254 100 100 100 100 100 100 100 100 100 100 100
205,345 20,541 47,292 73,621 102,005 103,837 107,959 110,036 112,095 114,137 116,153 25.79 60.88 56.13 55.63 54.25 54.16 54.31 54.22 54.13 54.05 54.00
140,914 6,048 19,029 30,440 45,032 45,988 46,568 47,580 48,591 49,595 50,593 17.70 17.93 22.59 23.00 23.95 23.98 23.43 23.45 23.47 23.49 23.50
74,521 4,556 11,061 17,744 25,308 25,836 27,714 28,363 29,013 29,660 30,304 9.36 13.50 13.13 13.41 13.46 13.47 13.94 13.98 14.01 14.05 14.07
347,190 1,167 4,332 6,566 9,717 9,942 10,408 10,667 10,930 11,193 11,458 43.61 3.46 5.14 4.96 5.17 5.18 5.24 5.26 5.28 5.30 5.32
27,220 1,332 2,199 3,176 4,516 4,623 4,927 5,056 5,187 5,320 5,454 3.42 3.95 2.61 2.40 2.40 2.41 2.48 2.49 2.50 2.52 2.53
906 96 340 805 1,441 1,479 1,207 1,228 1,249 1,269 1,289 0.11 0.28 0.40 0.61 0.77 0.77 0.60 0.60 0.60 0.60 0.60
* : Population Data revised from 2016 on the basis of projections provided by N Sources : Ministry of Planning, Development & Special InitiativesPakistan Bureau of StatisticsNational Institute for Population Studies (NIPS)
Punjab
2015 2016 2017
vi. Islamabad
iii. KhyberPakhtunkhwa
iv. Balochistan
v. FATA
2020
ii. Sindh
2014 Region / Years 1951 1981 1998 2018 2019
Pakistan
i.
187

TABLE 12.8
Percent ShareCivilian Labour Force
Total Male Female Total Male Female Total Male Female Total Male Female
PAKISTAN 100 50.44 49.56 44.79 34.14 10.65 41.72 32.14 9.58 3.07 2.01 1.07
Rural 100 49.87 50.13 48.71 34.37 14.34 45.61 32.49 13.12 3.10 1.88 1.22
Urban 100 51.35 48.65 38.58 33.79 4.79 35.55 31.58 3.97 3.03 2.21 0.82
Punjab 100 48.76 51.24 38.52 30.71 7.81 34.57 28.18 6.38 3.96 2.53 1.43
Rural 100 48.55 51.45 39.28 30.60 8.67 35.23 28.12 7.11 4.05 2.48 1.57
Urban 100 49.71 50.29 35.07 31.19 3.88 31.53 28.46 3.07 3.53 2.73 0.80
Sindh 100 49.36 50.64 47.42 34.10 13.32 43.91 31.84 12.07 3.51 2.25 1.26
Rural 100 48.59 51.41 52.07 34.24 17.82 48.53 32.16 16.37 3.53 2.08 1.45
Urban 100 50.60 49.40 39.91 33.86 6.05 36.44 31.32 5.11 3.47 2.53 0.94
100 52.81 47.19 43.25 36.17 7.08 41.52 34.97 6.55 1.73 1.20 0.53
Rural 100 53.35 46.65 50.42 38.47 11.95 49.26 37.69 11.57 1.16 0.78 0.38
Urban 100 52.38 47.62 37.46 34.32 3.15 35.27 32.77 2.50 2.19 1.55 0.65
Balochistan 100 55.98 44.02 40.80 35.18 5.63 38.92 33.71 5.21 1.89 1.47 0.42
Rural 100 55.94 44.06 43.03 36.09 6.94 41.54 34.95 6.59 1.49 1.14 0.35
Urban 100 56.06 43.94 35.12 32.84 2.28 32.21 30.52 1.69 2.91 2.32 0.59Source: Pakistan Bureau of Statistics
Labour Force Survey 2018-19
Khyber Pakhtunkhwa
PERCENTAGE DISTRIBUTION OF POPULATION OF 10 YEARS AND ABOVE AND CIVILIAN LABOUR FORCE BY GENDER AND AREA 2018-19
Population Total CivilianLabour Force Employed Unemployed
188

TABLE 12.9
LABOUR FORCE AND EMPLOYMENTIn Million
Mid Year 2008-09 2009-10 2010-11 2011-12* 2012-13 2013-14 2014-15 2017-18 2018-19
Population 168.99 172.57 176.20 180.71 183.57 186.19 189.19 206.62 214.49
Rural 104.38 105.70 107.00 120.10 121.66 121.56 123.36 131.19 135.39
Urban 64.61 66.87 69.20 60.61 61.91 64.63 65.83 75.43 79.10
Working Age Population 121.42 124.06 126.60 129.84 132.07 132.24 134.99 147.91 153.49
Rural 78.28 80.08 81.77 83.87 84.96 83.62 85.60 91.02 94.14
Urban 43.14 43.98 44.83 45.97 47.11 48.62 49.39 56.89 59.35
Labour Force 55.91 56.92 57.84 59.33 59.74 60.10 61.04 65.50 68.75
Rural 38.82 39.56 40.12 41.15 41.23 41.14 41.95 42.91 45.85
Urban 17.09 17.36 17.72 18.18 18.15 18.96 19.09 22.59 22.90
Employed Labour Force 52.86 53.76 54.40 55.80 56.01 56.52 57.42 61.71 64.03
Rural 36.99 37.66 38.24 39.22 39.14 39.07 39.85 40.75 42.94
Urban 15.87 16.10 16.16 16.58 16.87 17.45 17.57 20.96 21.10
Unemployed Labour Force 3.05 3.16 3.44 3.53 3.73 3.58 3.62 3.79 4.71
Rural 1.83 1.90 1.88 1.93 2.09 2.06 2.10 2.15 2.91
Urban 1.22 1.26 1.56 1.60 1.64 1.52 1.52 1.64 1.80
Unemployment Rate (%) 5.46 5.55 5.95 5.95 6.24 6.00 5.90 5.80 6.90
Rural 4.73 4.82 4.68 4.68 5.08 5.01 5.00 5.00 6.40
Urban 7.11 7.21 8.84 8.84 8.83 8.02 8.00 7.20 7.90Labour Force Partici-pation Rates (%) 32.81 32.98 32.83 32.83 32.88 32.28 32.30 31.70 32.10
Rural 34.29 34.50 34.26 34.26 34.23 33.84 34.00 32.70 33.90
Urban 29.87 29.99 29.99 29.99 30.21 29.35 29.00 30.00 28.90Source : Pakistan Bureau of Statistics (Labour Force Survey)
*Ministry of Planning, Development & Special Initiatives
189

TABLE 12.10
POPULATION AND LABOUR FORCEIn Million
Years Popula- Crude Labour Unemp- Employed Agricul- Mining Const- Electricity Transport Whole- Otherstion Activity Force loyed Labour ture & Manu- ruction & Gas Storage Sale &
Rate(%) Labour Force facturing Distri- & Commu- RetailForce bution cation Trade
2000-01 142.86 28.97 41.38 3.24 38.14 18.47 4.40 2.21 0.26 1.92 5.15 5.73
2001-02 145.96 28.97 43.21 3.57 39.64 16.68 5.51 2.40 0.32 2.34 5.89 6.50
2002-03 149.03 28.97 44.12 3.65 40.47 17.03 5.63 2.45 0.33 2.39 6.01 6.63
2003-04 150.47 30.41 45.76 3.52 42.24 18.18 5.83 2.46 0.28 2.42 6.25 6.82
2004-05 153.96 30.41 46.82 3.60 43.22 18.60 5.96 2.52 0.29 2.48 6.39 6.98
2005-06 156.77 32.22 50.50 3.13 47.37 20.54 6.60 2.91 0.31 2.72 6.95 7.34
2006-07 161.98 31.82 51.55 2.75 48.80 21.29 6.66 3.21 0.37 2.63 7.03 7.61
2007-08 165.45 32.17 53.22 2.77 50.45 22.52 6.61 3.18 0.36 2.75 7.38 7.65
2008-09 168.99 32.81 55.91 3.05 52.86 23.63 6.89 3.46 0.36 2.74 8.63 7.15
2009-10 172.57 32.98 56.92 3.16 53.76 24.18 7.17 3.62 0.43 2.82 8.75 6.79
2010-11 176.20 32.83 57.84 3.44 54.40 24.51 7.51 3.78 0.26 2.78 8.78 6.78
2011-12* 180.71 32.83 59.33 5.95 55.80 25.14 7.70 3.88 0.27 2.85 8.28 7.68
2012-13 183.57 32.88 60.34 3.76 56.58 24.73 8.03 4.21 0.30 2.82 8.14 8.35
2013-14 186.19 32.28 60.10 3.58 56.52 24.57 8.00 4.15 0.27 3.07 8.24 8.21
2014-15 189.19 32.30 61.04 3.62 57.42 24.27 8.89 4.20 0.45 3.11 8.41 8.09
2017-18 206.62 31.70 65.50 3.79 61.71 23.76 10.05 4.70 0.45 3.50 9.21 10.05
2018-19 214.49 32.10 68.75 4.71 64.03 25.07 9.76 5.13 0.50 3.98 9.28 10.30Source: Pakistan Bureau of Statistics
(Labour Force Survey)*Ministry of Planning, Development & Special Initiatives
Note: Labour Force Survey was not conducted in the years 2000-01, 2002-03, 2004-05, 2011-12, 2015-16 and 2016-17.
190

TABLE 12.11
in PercentageYears Agricul- Mining & Const- Electricity Transport Whole- Others
ture Manu- ruction & Gas Storage Sale &facturing Distri- & Commu- Retail
bution cation Trade2000-01 48.42 11.55 5.78 0.70 5.03 13.50 15.02
2001-02 42.09 13.91 6.05 0.81 5.90 14.85 16.39
2002-03 42.09 13.91 6.05 0.81 5.90 14.85 16.39
2003-04 43.05 13.80 5.83 0.67 5.73 14.80 16.12
2004-05 43.05 13.80 5.83 0.67 5.73 14.80 16.12
2005-06 43.37 13.93 6.13 0.66 5.74 14.67 15.49
2006-07 43.61 13.65 6.56 0.75 5.39 14.42 15.60
2007-08 44.65 13.11 6.29 0.70 5.46 14.62 15.17
2008-09 45.08 13.14 6.62 0.69 5.23 16.47 12.77
2009-10 44.96 13.34 6.74 0.80 5.24 16.28 12.64
2010-11 45.05 13.80 6.95 0.48 5.11 16.15 12.46
2011-12* - - - - - - -
2012-13 43.71 14.20 7.44 0.53 4.98 14.39 14.75
2013-14 43.48 14.16 7.33 0.48 5.44 14.58 14.53
2014-15 42.27 15.49 7.31 0.79 5.00 14.64 14.09
2017-18 38.50 16.28 7.61 0.73 5.67 14.92 16.29
2018-19 39.16 15.25 8.01 0.78 5.76 14.50 16.54- : Not available Source: Pakistan Bureau of Statistics* : Labour Force Survey was not conducted in 2011-12
DISTRIBUTION OF EMPLOYED PERSONS OF 10 YEARS AGE AND ABOVE BY MAJORINDUSTRIES
191

TABLE 12.12
In PercentageMajor Industry Division Pakistan Punjab Sindh Balochistan
Total Rural Urban Total Rural Urban Total Rural Urban Total Rural Urban Total Rural Urban
Total 100.0 67.05 32.95 100.0 66.28 31.72 100.0 53.02 46.98 100.0 83.67 16.33 100.0 76.72 23.281. Agriculture, Forestry and
Fishing39.16 37.03 2.13 40.75 38.81 1.94 37.82 34.81 3.00 32.34 31.19 1.16 42.62 39.94 2.69
2. Mining and Quarrying 0.27 0.21 0.06 0.11 0.08 0.04 0.21 0.12 0.09 0.59 0.57 0.03 1.52 1.27 0.263. Manufacturing 14.98 7.08 7.91 16.84 8.53 8.31 14.38 3.43 10.94 11.67 9.00 2.67 4.05 2.07 1.984. Electricity, Gas Steam and
Air Conditioning Supply0.44 0.17 0.27 0.41 0.17 0.25 0.61 0.18 0.43 0.26 0.17 0.09 0.42 0.14 0.27
5. Water Supply, Sewerage, Waste, Management & Remediation Activity
0.34 0.12 0.22 0.26 0.08 0.18 0.51 0.14 0.37 0.32 0.22 0.10 0.57 0.29 0.29
6. Construction 8.01 5.45 2.56 7.32 5.00 2.32 7.39 3.62 3.77 12.85 11.27 1.58 7.54 5.21 2.337. Wholesale and Retail Trade,
Repair of Motor Vehicles, Motorcycles
14.50 6.26 8.24 13.89 6.09 7.80 15.63 3.76 11.87 14.80 10.43 4.38 15.69 9.64 6.05
8. Transport, storage 5.76 3.25 2.51 4.82 2.81 2.02 6.42 2.10 4.32 8.55 6.82 1.74 7.08 5.15 1.949. Accomodation and Food
Services Activities2.08 1.00 1.08 1.98 0.90 1.08 2.24 0.69 1.56 2.25 1.87 0.39 2.21 1.53 0.67
10. Information and Communication
0.46 0.07 0.38 0.49 0.08 0.41 0.55 0.03 0.52 0.21 0.13 0.07 0.22 0.03 0.19
11. Financial and Insurance Activities
0.62 0.14 0.48 0.59 0.19 0.40 0.99 0.06 0.92 0.23 0.08 0.15 0.18 0.03 0.16
12. Real Estate Activities 0.55 0.14 0.41 0.63 0.18 0.45 0.54 0.04 0.50 0.28 0.13 0.15 0.38 0.26 0.1313. Professional, Scientific and
Technical Activities0.50 0.17 0.33 0.62 0.22 0.41 0.37 0.08 0.29 0.28 0.18 0.10 0.20 0.08 0.11
14. Administrative and Support Service Activities
0.53 0.20 0.33 0.59 0.24 0.35 0.56 0.12 0.44 0.34 0.17 0.17 0.16 0.11 0.05
15. Public Administration and Defence Compulsory Scocial Security
2.58 1.10 1.49 1.82 0.64 1.18 3.13 0.82 2.31 3.15 2.34 0.81 7.57 4.64 2.93
16. Education 3.89 1.98 1.91 3.66 1.71 1.95 3.38 1.32 2.06 5.46 4.01 1.45 5.12 3.24 1.8817. Human Health and Social
Work Activities1.49 0.54 0.95 1.28 0.49 0.79 1.95 0.35 1.60 1.64 1.06 0.58 1.61 0.85 0.76
18. Arts, Entertainment & Recreation
0.18 0.09 0.10 0.21 0.10 0.11 0.13 0.05 0.08 0.20 0.09 0.11 0.02 0.00 0.02
19. Other Services Activities 2.09 1.14 0.96 2.23 1.29 0.93 1.89 0.49 1.40 2.13 1.74 0.39 1.36 0.85 0.51
20. Activities of Households as Employer; Undifferentiated Goods & Services - Producing Activities of Household for own use
1.55 0.92 0.63 1.49 0.67 0.82 1.31 0.81 0.50 2.41 2.21 0.20 1.44 1.38 0.07
21. Activities Extraterritorial Organizations and Bodies
0.01 0.01 0.00 0.01 0.01 0.00 0.00 0.00 0.00 0.03 0.02 0.01 0.02 0.01 0.01
Source: Pakistan Bureau of Statistics(Labour Force Survey 2018-19)
PERCENTAGE DISTRIBUTION OF EMPLOYED PERSONS OF 10 YEARS AGE AND ABOVE BY MAJOR INDUSTRY 2018-19
Khyper Pakhtunkhwa
192

TABLE 12.13
AGE SPECIFIC LABOUR FORCE PARTICIPATION RATE
In Percentage
Age Group 2006-07 2007-08 2008-09 2009-10 2010-11 2012-13 2013-14 2014-15 2017-18 2018-19
10 years & overBoth Sexes 45.18 45.17 45.66 45.89 45.69 45.70 45.45 45.22 44.30 44.80Male 70.14 69.54 69.31 68.83 68.70 68.89 68.07 67.78 68.00 67.70Female 19.10 19.59 20.66 21.51 21.67 21.50 22.17 22.02 20.10 21.5010-14Male 16.92 17.09 16.20 15.42 14.27 14.46 12.62 11.22 9.80 8.80Female 9.18 9.69 9.48 9.24 8.83 7.98 8.37 7.71 6.40 5.6015-19Male 56.29 53.94 52.74 52.68 51.59 51.16 49.68 47.55 47.60 44.90Female 16.60 17.61 18.90 19.17 19.58 18.19 19.32 18.01 15.60 17.2020-24Male 86.76 85.12 85.39 84.54 84.27 82.38 81.71 82.32 84.60 81.20Female 20.66 20.98 22.76 23.88 24.20 24.41 25.14 25.74 23.30 26.8025-34Male 97.16 96.90 97.19 96.89 97.42 96.73 96.91 97.33 97.00 98.30Female 21.66 21.87 23.63 25.48 25.44 26.01 26.57 27.15 25.57 27.2035-44Male 98.01 97.87 98.37 97.53 98.34 98.45 98.06 98.33 98.38 99.40Female 25.93 26.75 27.67 27.88 29.46 28.72 30.00 29.43 27.97 29.2045-54Male 96.62 96.65 96.69 96.96 97.29 97.02 97.13 97.24 96.77 99.20Female 25.01 24.42 25.86 29.41 28.35 29.11 29.37 30.75 26.07 29.9055-59Male 92.20 92.54 93.71 93.26 92.24 92.61 92.78 93.80 91.70 94.80Female 22.45 25.53 26.37 27.98 26.27 26.60 27.48 27.29 23.40 24.4060+Male 58.52 59.46 56.38 55.49 54.95 52.42 53.33 55.16 51.30 48.60Female 15.70 15.50 15.22 13.54 14.62 13.58 12.77 11.95 11.50 8.90
Source: Pakistan Bureau of Statistics(Labour Force Surveys)
193
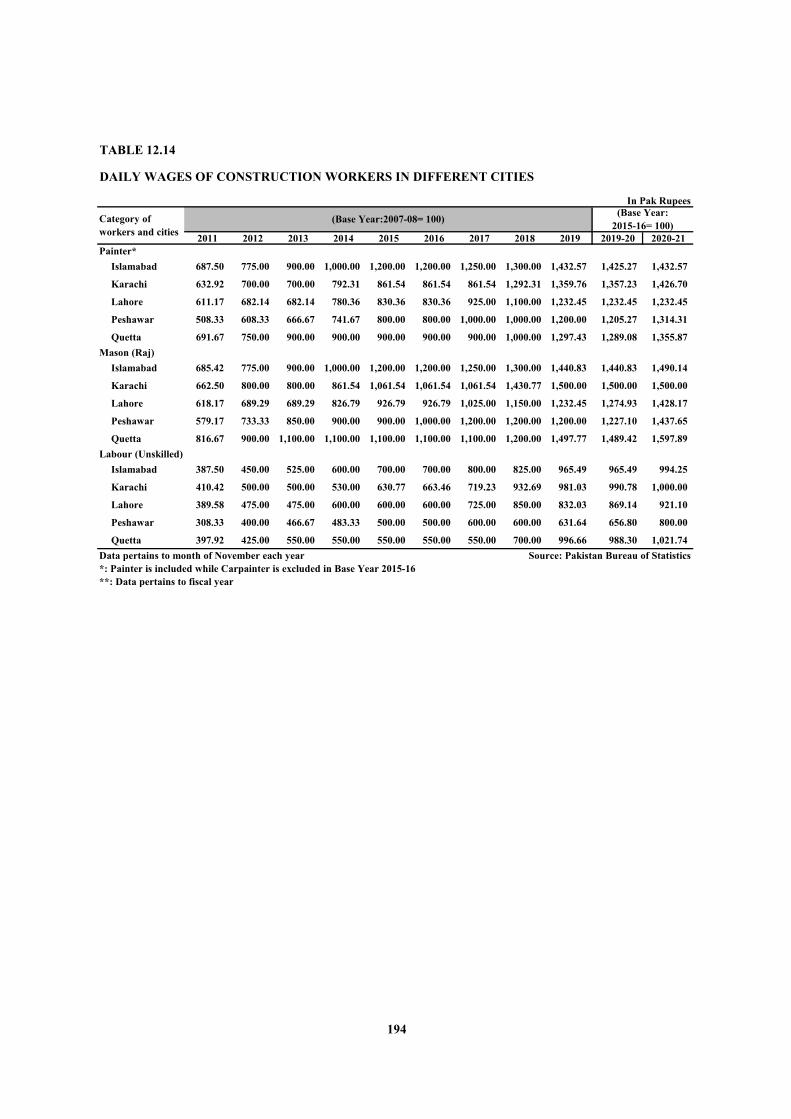
TABLE 12.14
DAILY WAGES OF CONSTRUCTION WORKERS IN DIFFERENT CITIES
In Pak Rupees
2011 2012 2013 2014 2015 2016 2017 2018 2019 2019-20 2020-21Painter*
Islamabad 687.50 775.00 900.00 1,000.00 1,200.00 1,200.00 1,250.00 1,300.00 1,432.57 1,425.27 1,432.57
Karachi 632.92 700.00 700.00 792.31 861.54 861.54 861.54 1,292.31 1,359.76 1,357.23 1,426.70
Lahore 611.17 682.14 682.14 780.36 830.36 830.36 925.00 1,100.00 1,232.45 1,232.45 1,232.45
Peshawar 508.33 608.33 666.67 741.67 800.00 800.00 1,000.00 1,000.00 1,200.00 1,205.27 1,314.31
Quetta 691.67 750.00 900.00 900.00 900.00 900.00 900.00 1,000.00 1,297.43 1,289.08 1,355.87Mason (Raj)
Islamabad 685.42 775.00 900.00 1,000.00 1,200.00 1,200.00 1,250.00 1,300.00 1,440.83 1,440.83 1,490.14
Karachi 662.50 800.00 800.00 861.54 1,061.54 1,061.54 1,061.54 1,430.77 1,500.00 1,500.00 1,500.00
Lahore 618.17 689.29 689.29 826.79 926.79 926.79 1,025.00 1,150.00 1,232.45 1,274.93 1,428.17
Peshawar 579.17 733.33 850.00 900.00 900.00 1,000.00 1,200.00 1,200.00 1,200.00 1,227.10 1,437.65
Quetta 816.67 900.00 1,100.00 1,100.00 1,100.00 1,100.00 1,100.00 1,200.00 1,497.77 1,489.42 1,597.89Labour (Unskilled)
Islamabad 387.50 450.00 525.00 600.00 700.00 700.00 800.00 825.00 965.49 965.49 994.25
Karachi 410.42 500.00 500.00 530.00 630.77 663.46 719.23 932.69 981.03 990.78 1,000.00
Lahore 389.58 475.00 475.00 600.00 600.00 600.00 725.00 850.00 832.03 869.14 921.10
Peshawar 308.33 400.00 466.67 483.33 500.00 500.00 600.00 600.00 631.64 656.80 800.00
Quetta 397.92 425.00 550.00 550.00 550.00 550.00 550.00 700.00 996.66 988.30 1,021.74Data pertains to month of November each year Source: Pakistan Bureau of Statistics*: Painter is included while Carpainter is excluded in Base Year 2015-16**: Data pertains to fiscal year
Category of workers and cities
(Base Year:2007-08= 100) (Base Year:2015-16= 100)
194

TRANSPORT & COMMUNICATIONS
HIGHLIGHTSItems
RoadsTotal Roads Kilometers 500,749
RailwaysRoute Kilometers 7,791Passengers carried Millions Nos. 28.4Freight carried Million tons 8.2Locomotives Nos. 467.0Freight Wagons Nos. 14448.0
Pakistan International AirlinesRoute 000 Kilometers 705,820PIA Fleet No. of Planes Nos. 30
Pakistan National Shipping CorporationVessels Nos. 11Dead weight Tons 831,711
Cargo Handled at Karachi PortTotal 000 Tons 52,279Imports 000 Tons 36,469Exports 000 Tons 15,810
Cargo Handled at Port QasimTotal 000 Tons 57,993Imports 000 Tons 50,339Exports 000 Tons 7,654
Cargo Handled at Gawadar PortTotal 000 Tons 6,567,091Imports 000 Tons 6,555,621Exports 000 Tons 11,470
Telecommunications and Postal ServicesBroad Band Connections Million 101.5Mobile Phones 000 Nos. 183,480.0Telephones 000 Nos. 2,540.0TV Sets 000 Nos. 20513.1
Postal ServicesPost Offices (Total) Nos. 9,586Rural Nos. 8,072Urban Nos. 1,514
Unit 2020-21
195
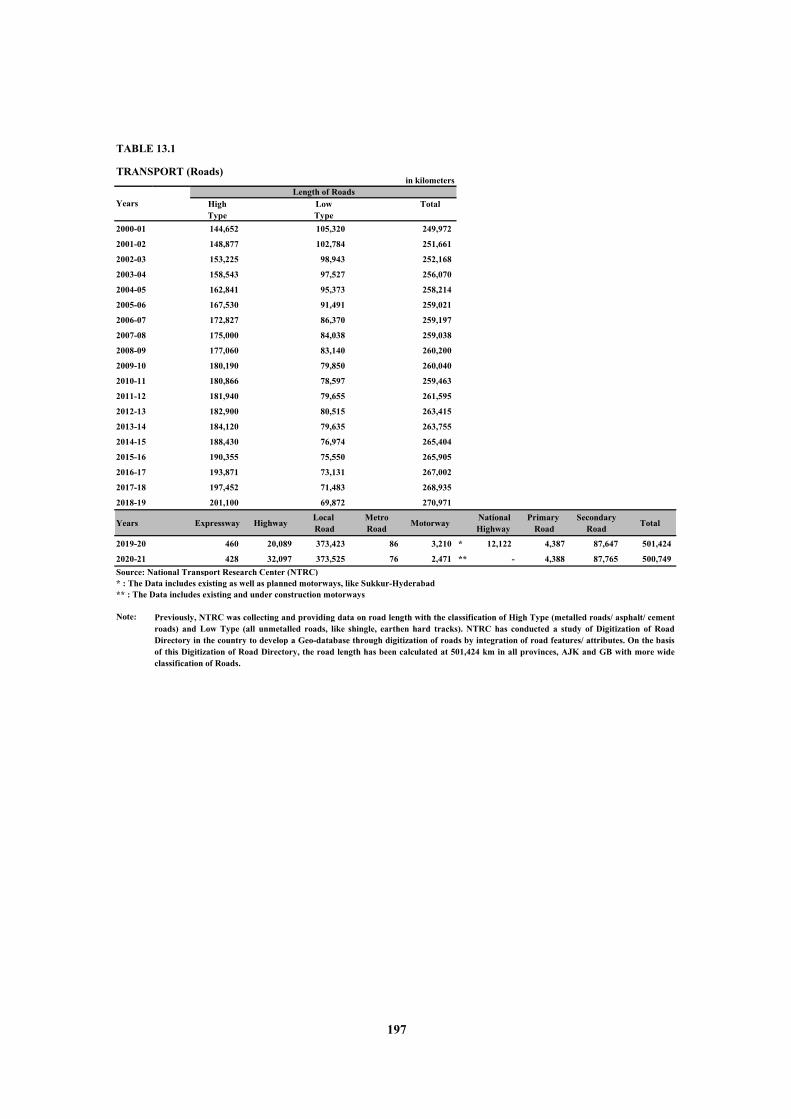
TABLE 13.1
TRANSPORT (Roads)in kilometers
High Low TotalType Type
2000-01 144,652 105,320 249,972
2001-02 148,877 102,784 251,661
2002-03 153,225 98,943 252,168
2003-04 158,543 97,527 256,070
2004-05 162,841 95,373 258,214
2005-06 167,530 91,491 259,021
2006-07 172,827 86,370 259,197
2007-08 175,000 84,038 259,038
2008-09 177,060 83,140 260,200
2009-10 180,190 79,850 260,040
2010-11 180,866 78,597 259,463
2011-12 181,940 79,655 261,595
2012-13 182,900 80,515 263,415
2013-14 184,120 79,635 263,755
2014-15 188,430 76,974 265,404
2015-16 190,355 75,550 265,905
2016-17 193,871 73,131 267,002
2017-18 197,452 71,483 268,935
2018-19 201,100 69,872 270,971
Years Expressway Highway Local Road
Metro Road Motorway National
HighwayPrimary
RoadSecondary
Road Total
2019-20 460 20,089 373,423 86 3,210 * 12,122 4,387 87,647 501,424
2020-21 428 32,097 373,525 76 2,471 ** - 4,388 87,765 500,749Source: National Transport Research Center (NTRC)* : The Data includes existing as well as planned motorways, like Sukkur-Hyderabad** : The Data includes existing and under construction motorways
Note:
Length of Roads
Previously, NTRC was collecting and providing data on road length with the classification of High Type (metalled roads/ asphalt/ cementroads) and Low Type (all unmetalled roads, like shingle, earthen hard tracks). NTRC has conducted a study of Digitization of RoadDirectory in the country to develop a Geo-database through digitization of roads by integration of road features/ attributes. On the basisof this Digitization of Road Directory, the road length has been calculated at 501,424 km in all provinces, AJK and GB with more wideclassification of Roads.
Years
197
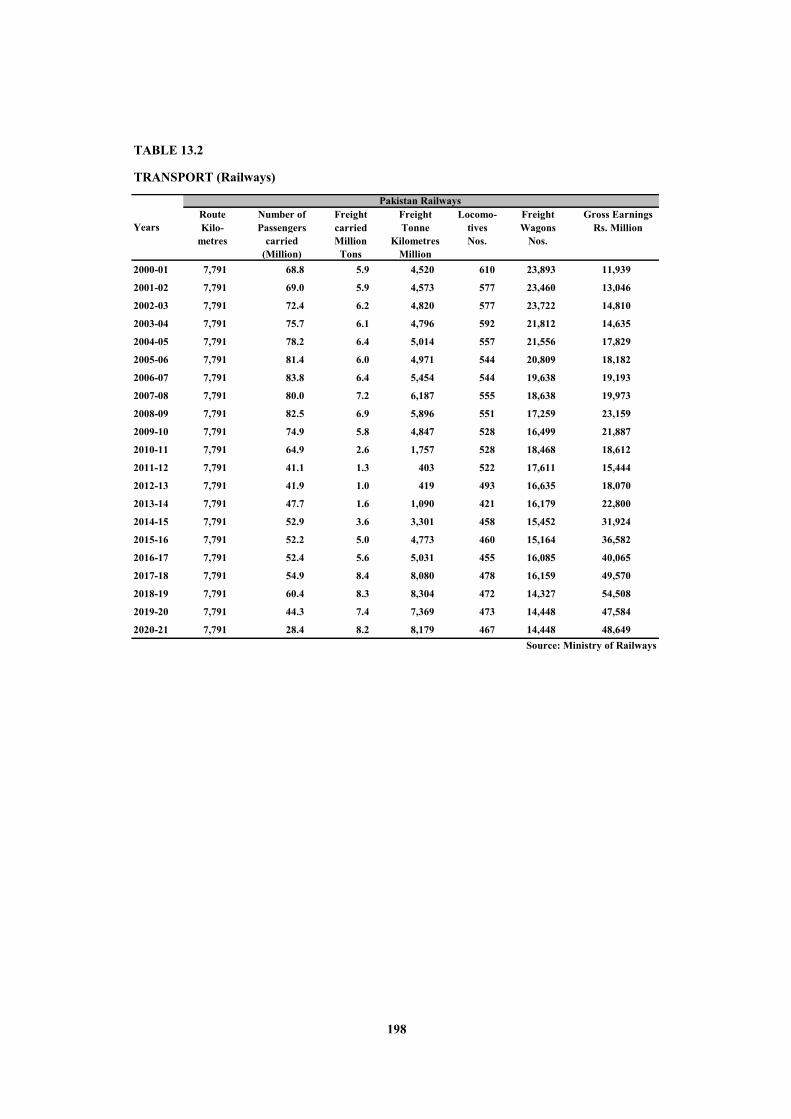
TABLE 13.2
TRANSPORT (Railways)
Route Number of Freight Freight Locomo- Freight Gross EarningsKilo- Passengers carried Tonne tives Wagons Rs. Million
metres carried Million Kilometres Nos. Nos.(Million) Tons Million
2000-01 7,791 68.8 5.9 4,520 610 23,893 11,939
2001-02 7,791 69.0 5.9 4,573 577 23,460 13,046
2002-03 7,791 72.4 6.2 4,820 577 23,722 14,810
2003-04 7,791 75.7 6.1 4,796 592 21,812 14,635
2004-05 7,791 78.2 6.4 5,014 557 21,556 17,829
2005-06 7,791 81.4 6.0 4,971 544 20,809 18,182
2006-07 7,791 83.8 6.4 5,454 544 19,638 19,193
2007-08 7,791 80.0 7.2 6,187 555 18,638 19,973
2008-09 7,791 82.5 6.9 5,896 551 17,259 23,159
2009-10 7,791 74.9 5.8 4,847 528 16,499 21,887
2010-11 7,791 64.9 2.6 1,757 528 18,468 18,612
2011-12 7,791 41.1 1.3 403 522 17,611 15,444
2012-13 7,791 41.9 1.0 419 493 16,635 18,070
2013-14 7,791 47.7 1.6 1,090 421 16,179 22,800
2014-15 7,791 52.9 3.6 3,301 458 15,452 31,924
2015-16 7,791 52.2 5.0 4,773 460 15,164 36,582
2016-17 7,791 52.4 5.6 5,031 455 16,085 40,065
2017-18 7,791 54.9 8.4 8,080 478 16,159 49,570
2018-19 7,791 60.4 8.3 8,304 472 14,327 54,508
2019-20 7,791 44.3 7.4 7,369 473 14,448 47,584
2020-21 7,791 28.4 8.2 8,179 467 14,448 48,649Source: Ministry of Railways
Years
Pakistan Railways
198

TABLE 13.3
TRANSPORT (Shipping)
No. of Dead Weight Gross EarningVessels Tons Rs. Million
1999-00 15 261,836 3,483.0
2000-01 14 243,802 5,458.7
2001-02 14 243,749 4,555.5
2002-03 13 229,579 5,405.0
2003-04 14 469,931 6,881.9
2004-05 14 570,466 7,860.0
2005-06 15 636,182 7,924.6
2006-07 14 636,821 9,089.1
2007-08 14 636,821 10,753.5
2008-09 14 477,238 11,474.0
2009-10 10 633,273 8,738.8
2010-11 11 646,666 9,293.0
2011-12 9 610,167 8,875.3
2012-13 9 642,207 12,252.9
2013-14 9 642,207 15,726.5
2014-15 9 681,806 15,536.3
2015-16 9 681,806 12,543.0
2016-17 9 681,806 12,477.0
2017-18 9 681,806 10,070.0
2018-19 11 831,711 10,862.5
2019-20 11 831,711 13,803.0
2020-21 11 831,711 12,788.5
PNSC ShippingYears
Source: Pakistan National Shipping Corporation
199

TABLE 13.4
TRANSPORT (Ports)
Cargo Handled at Cargo Handled atYears Karachi Port (000 tons) Port Qasim (000 tons)
Total Imports Exports Total Imports Exports Total Imports Exports
2000-01 25,981 20,063 5,918 13,588 11,841 1,747 - - -
2001-02 26,692 20,330 6,362 13,317 10,932 2,385 - - -
2002-03 25,852 19,609 6,244 15,109 11,980 3,129 - - -
2003-04 27,813 21,732 6,081 14,123 11,264 2,859 - - -
2004-05 28,615 22,100 6,515 19,437 16,006 3,431 - - -
2005-06 32,270 25,573 6,697 21,573 17,588 3,985 - - -
2006-07 30,846 23,329 7,517 24,350 19,511 4,839 - - -
2007-08 37,192 25,517 11,675 26,424 21,502 4,922 63,607.8 63,607.0 -
2008-09 38,732 25,367 13,364 25,030 19,445 5,584 1,496,514.5 1,496,515 -
2009-10 41,420 27,892 13,528 25,626 19,226 6,380 1,261,842.4 1,261,842.4 -
2010-11 41,431 28,589 12,842 26,168 19,511 6,657 475,966.1 475,966.1 -
2011-12 37,875 26,201 11,674 24,025 18,075 5,950 1,426,003.7 1,426,003.7 -
2012-13 38,850 26,700 21,150 24,801 17,754 7,047 507,582.3 507,582.3 -
2013-14 41,350 30,343 11,007 25,775 18,076 7,699 648,987.9 648,987.9 -
2014-15 43,422 29,672 13,750 30,014 21,608 8,405 439,150.0 439,880.0 270.0
2015-16 50,045 34,594 15,451 33,321 25,857 7,464 51,354.8 50,603.0 750.0
2016-17 52,493 42,638 9,855 37,358 30,995 6,363 82,334.6 80,409.6 1,925.0
2017-18 54,685 41,669 13,016 45,555 38,471 7,084 26,836.4 24,087.4 2,749.0
2018-19 46,893 32,863 14,031 49,031 41,878 7,153 4,954.1 3,696.9 1,317.0
2019-20 41,840 27,206 14,634 51,017 43,509 7,508 27,260.1 26,553.2 706.0
2020-21 52,279 36,469 15,810 57,993 50,339 7,654 54,697.9 50,945.5 3,752.4- : Not available Source: Karachi Port Trust
Port Qasim AuthorityGwadar Port Authority
Gwadar Port (000 tons)Cargo Handled at
200

TABLE 13.5
PAKISTAN INTERNATIONAL AIRLINES CORPORATION-Operational
PIA Fleet Available Route Passenger Available OperatingNo. of Seat Kms. Load Tonne ExpensesPlanes (Million Kms.) Factor (%) (Million Kms.) (Million Rs.)
2000* 45 18,692 317,213 65.0 2,631 42,033
2001 45 17,756 265,643 66.0 2,541 43,242
2002 44 15,776 257,858 68.0 2,242 38,097
2003 43 17,259 290,129 70.0 2,476 42,574
2004 42 20,354 354,664 66.0 2,973 55,872
2005 42 20,816 343,525 70.0 3,103 67,075
2006 42 22,092 446,570 69.0 3,369 79,164
2007 39 20,313 383,574 67.0 3,126 76,415
2008 44 18,528 311,131 71.0 2,934 120,499
2009 42 19,859 380,917 70.0 2,933 98,629
2010 40 21,219 424,570 74.0 3,091 106,811
2011 40 21,726 460,719 72.0 2,972 135,023
2012 38 19,850 448,120 70.0 2,859 133,930
2013 38 17,412 411,936 70.0 2,471 129,588
2014 34 16,537 389,455 72.0 2,396 114,944
2015 34 16,666 367,251 70.0 2,436 108,478
2016 37 19,201 382,057 72.0 2,798 121,863
2017 36 19,108 360,937 73.2 2,659 122,193
2018 32 18,081 332,303 77.3 2,521 170,447
2019 31 18,372 389,725 81.3 2,610 166,917
2020* 30 8,902 705,820 74.5 1,327 95,670(Contd.)
TABLE 13.5
PAKISTAN INTERNATIONAL AIRLINES CORPORATION-Revenue
Revenue Revenue Revenue Revenue Revenue Revenue OperatingPassengers Passengers Load Kilometers Tonne Hours Revenue
(Million Kms.) Carried (000) Factor (%) Flown (000) (Million Kms.) Flown (Million Rs.)2000* 12,056 5,297 55.0 76,212 1,452 134,066 39,228
2001 11,652 4,877 57.0 70,958 1,438 121,860 43,608
2002 10,780 4,166 59.0 61,921 1,331 105,553 43,674
2003 12,009 4,556 59.0 68,851 1,448 115,017 47,951
2004 13,520 5,120 55.0 80,087 1,635 130,977 57,786
2005 14,506 5,499 56.0 82,550 1,729 134,039 64,074
2006 15,124 5,732 54.0 88,302 1,801 141,479 70,587
2007 13,681 5,415 51.0 80,759 1,593 132,416 70,481
2008 13,925 5,617 54.0 79,580 1,581 132,378 88,863
2009 13,891 5,535 52.0 80,108 1,525 132,155 94,564
2010 15,657 5,538 56.0 81,588 1,746 142,940 107,532
2011 15,664 5,953 56.0 84,898 1,678 141,727 116,551
2012 13,874 5,236 53.0 75,750 1,513 127,268 112,130
2013 12,237 4,449 55.0 63,144 1,351 106,476 95,771
2014 11,903 4,202 52.0 61,389 1,242 101,556 99,519
2015 11,711 4,394 49.0 67,630 1,191 111,455 91,269
2016 13,751 5,486 49.0 79,842 1,375 131,838 88,998
2017 13,988 5,342 55.2 75,207 1,469 122,081 90,288
2018 13,975 5,203 58.4 70,089 1,472 110,050 100,051
2019 14,938 5,290 59.0 70,515 1,539 110,640 147,500
2020* 6,629 2,541 52.4 37,403 695 57,370 94,989* : PIA Financial Year has changed to Calendar Year Source: Pakistan International Airlines Corporation
Year
Year
201

TABLE 13.6
NUMBER OF MOTOR VEHICLES REGISTERED
Motor Cars Motor Buses Trucks Motor Motor Others TotalYears Jeeps & Sta- Cabs/ Cycle Cycle
tion Wagons Taxis 2 Wheels 3 Wheels2001 1,198,918 90,062 161,507 155,793 2,283,381 107,555 786,907 4,784,123
2002 1,279,362 90,077 155,555 169,274 2,341,051 120,569 814,239 4,970,127
2003 1,289,854 90,424 165,846 177,478 2,379,260 127,360 834,424 5,064,646
2004 1,298,353 90,460 166,136 179,727 2,609,442 138,153 848,688 5,330,959
2005 1,318,488 91,893 168,713 182,516 2,649,910 101,058 861,851 5,374,429
2006 1,372,191 105,373 175,589 189,950 2,757,842 136,394 896,014 5,633,353
2007 1,440,801 103,397 184,368 199,447 2,895,734 143,215 940,851 5,907,813
2008 1,549,854 104,431 187,367 202,574 3,039,815 156,068 961,646 6,201,755
2009 1,657,860 106,463 195,163 210,944 3,215,583 167,910 1,005,441 6,559,364
2010 1,726,347 122,882 198,790 216,119 4,305,121 201,827 1,081,916 7,853,002
2011 1,881,560 124,651 202,476 225,075 5,781,953 266,390 1,178,890 9,660,995
2012 2,094,289 143,859 215,374 240,888 7,500,182 323,189 1,270,788 11,788,569
2013 2,281,083 145,234 220,347 247,197 9,169,582 380,579 1,340,963 13,784,931
2014 2,437,735 145,424 224,403 253,574 11,006,421 466,185 1,406,819 15,940,561
2015 2,715,322 167,678 229,290 261,845 13,081,400 559,114 1,487,460 18,502,109
2016 2,932,619 170,759 235,521 269,302 15,223,925 670,507 1,555,279 21,057,912
2017 3,195,405 170,890 242,076 277,930 17,507,747 761,420 1,642,682 23,798,150
2018 3,494,007 171,117 249,047 284,683 19,783,957 841,445 1,724,426 26,548,682
2019 3,703,649 171,179 253,996 288,652 22,001,277 919,020 1,799,789 29,137,562
2020 P 3,833,616 171,462 255,409 293,460 23,407,865 951,425 1,844,302 30,757,539
2021 P* 3,859,264 171,520 255,893 294,066 23,849,010 959,049 1,852,959 31,241,761 P : Provisional Source: Pakistan Bureau of StatisticsNote : Calendar year data
* : The data is compiled cumulatively , therefore the figure of 2021 is added up into previous years cumulative figure of 2020 (P) to get the cumulative figure of 2021 (P)*
202

TABLE 13.7
MOTOR VEHICLES ON ROADS000 Number
Motor Motor Jeeps Station Tractors Buses Taxi Rick- Delivery Trucks Pickup Ambu- Tankers Others TotalYears Cycles/ Cars Wagons Cabs shaws Vans lance (Oil &
Scooters Water)
2000-01 2218.9 928.0 18.3 93.8 579.4 86.6 79.8 72.4 72.4 132.3 68.4 1.7 8.0 89.0 4,471.0
2001-02 2481.1 1040.0 43.4 122.7 630.5 96.6 96.4 80.8 116.9 145.2 78.3 4.1 8.4 71.5 5,016.0
2002-03 2656.2 1109.6 44.4 126.4 663.2 98.3 104.1 80.9 120.3 146.7 80.6 4.3 8.4 71.4 5,315.0
2003-04 2882.5 1193.1 47.8 132.4 722.7 100.4 112.6 81.0 121.3 149.2 84.4 4.4 8.6 71.3 5,711.9
2004-05 3064.9 1264.7 51.8 140.5 778.1 102.4 120.3 81.5 121.9 151.8 87.6 4.5 8.5 69.4 6,048.3
2005-06 3791.0 1499.2 65.7 140.8 822.3 103.6 122.1 77.8 143.3 151.8 93.5 4.5 8.6 60.2 7,084.5
2006-07 4463.9 1682.2 85.4 169.1 877.8 108.4 119.1 79.0 148.9 173.3 104.6 4.6 8.8 38.6 8,063.6
2007-08 5037.0 1853.4 82.9 163.2 900.5 109.9 129.8 89.3 163.5 177.8 115.3 5.2 9.8 40.7 8,878.4
2008-09 5368.0 2029.1 79.0 155.6 911.7 111.1 138.6 88.4 167.2 181.9 125.5 5.6 10.8 41.3 9,413.7
2009-10 5412.1 2387.2 78.3 171.4 940.8 123.3 146.4 89.1 170.4 200.5 130.3 4.0 11.1 21.8 9,886.4
2010-11 5468.8 2822.2 78.5 175.2 970.9 125.6 154.6 89.8 173.6 209.5 135.3 4.5 11.4 24.0 10,443.8 2011-12 6015.7 3104.4 86.4 192.7 1068.0 138.2 170.0 98.8 191.0 230.5 148.8 5.0 12.5 26.4 11,488.2 2012-13 5550.0 3600.0 78.7 180.1 1128.7 130.2 160.7 120.5 180.0 220.5 150.2 3.7 12.3 60.5 11,576.1 2013-14 6100.0 4600.0 60.0 185.0 1228.0 140.0 168.8 108.0 181.0 240.0 150.0 4.0 12.6 65.0 13,242.4 2014-15 6405.0 4820.0 64.0 191.0 1283.0 148.0 178.0 112.0 190.0 252.0 158.0 4.0 12.6 68.0 13,885.6 2015-16 6669.3 6131.7 54.2 192.0 1351.6 150.6 186.5 118.1 191.4 263.8 166.3 3.8 14.0 75.5 15,568.8 2016-17 11975.3 6954.0 69.6 201.9 1430.1 156.3 197.4 122.0 204.2 276.2 176.4 5.7 14.8 74.7 21,858.6
2017-18 14060.9 7183.5 80.0 206.6 1460.2 159.2 197.7 128.1 210.1 280.0 187.2 6.9 15.2 92.4 24,268.0
2018-19 14623.3 7470.8 83.2 214.9 1518.6 165.6 205.6 133.2 218.5 291.2 194.7 7.2 15.8 96.1 25,238.7
2019-20 22808.8 3960.2 150.9 903.4 628.0 193.7 116.1 721.3 139.9 325.6 513.5 8.8 24.3 287.1 29,968.8
2020-21 23701.8 4048.7 155.2 913.2 636.5 164.6 116.5 767.7 141.3 313.3 521.6 9.1 20.8 289.1 30,977.9 Source: National Transport Research Center
203

TABLE 13.8
MOTOR VEHICLES-PRODUCTIONin Nos.
Fiscal Year Motor Cycle Cars & Jeeps
L.C.Vs Buses Trucks Tractors
2000-01 117,858 39,573 6,960 1,332 948 32,556
2001-02 133,334 41,171 8,491 1,099 1,141 24,331
2002-03 176,591 63,267 12,174 1,340 1,950 26,501
2003-04 327,446 100,070 14,089 1,380 2,022 36,103
2004-05 571,145 128,381 23,613 1,762 3,204 43,746
2005-06 751,667 163,114 29,581 825 4,518 49,439
2006-07 839,224 179,314 19,672 993 4,410 54,610
2007-08 1,057,751 166,300 21,354 1,146 4,993 53,607
2008-09 917,628 85,240 16,158 657 3,135 60,107
2009-10 1,389,047 122,819 15,568 628 3,425 71,730
2010-11 1,638,457 134,855 19,142 490 2,810 70,855
2011-12 1,649,532 154,706 20,929 568 2,597 48,152
2012-13 1,675,071 121,807 14,517 522 1,923 50,871
2013-14 1,728,137 117,498 17,477 559 2,674 34,524
2014-15 1,777,251 153,633 28,189 575 4,039 48,883
2015-16 2,071,123 180,717 35,836 1,070 5,666 34,914
2016-17 2,500,650 190,466 24,265 1,118 7,712 53,975
2017-18 2,825,071 231,138 29,055 784 9,187 71,894
2018-19 2,459,849 216,780 24,453 913 6,035 49,902
2019-20 P 1,881,533 97,889 12,068 532 2,945 32,608
2020-21 P 2,475,874 163,122 19,744 570 3,808 50,486P : Provisional Source: Pakistan Bureau of Statistics
204

TABLE 13.9
MOTOR VEHICLES-IMPORTSin Nos.
Fiscal Year
Bicycle Motorised Cycles
Motor Cycles
Motor Rickshaw
Rickshaw chassis with
Engine
Cars Passengers M. Cars (NES)
Car Chassis
with Engine
Pickup Jeeps
2001-02 20,240 -- 111,711 -- 36 40,079 161 1 3,600 6662002-03 37,836 509 143,952 101 10 60,554 194 -- 5,162 6,0102003-04 39,894 675 127,861 3 2 88,130 243 -- 6,857 11,4352004-05 61,187 4,143 189,721 3 144 66,338 244 -- 5,394 5,4092005-06 52,022 9,472 167,626 15 315 36,563 1,587 -- 23,303 2,1082006-07 28,509 12,467 164,078 1,727 421 202,785 1,174 6 21,898 1,9382007-08 38,249 18,512 209,098 1,029 187 540,025 690 -- 8,169 2102008-09 42,966 20,726 200,745 125 6 425,721 557 20 1,871 142009-10 99,349 33,596 175,577 10,816 84 750,888 176 1 21,096 272010-11 184,023 103,694 216,080 14,746 -- 675,810 344 163 35,462 272011-12 199,876 29,645 246,332 51,142 -- 874,386 137 2 63,786 352012-13 211,535 36,839 275,931 19,043 -- 671,531 923 -- 35,101 292013-14 260,532 42,840 213,466 32,745 -- 778,073 54 -- 29,459 142014-15 386,981 58,270 291,882 97,591 -- 1,854,622 10 2 65,751 212015-16 541,381 102,593 327,001 44,911 1 1,384,775 5 -- 69,146 132016-17 715,496 106,046 323,290 30,811 192 1,568,723 - -- 110,247 32017-18 1351813 140,778 393,790 33,489 161 1,855,468 - 2 251,019 762018-19 692,174 124,283 290,091 30,823 - 2,119,541 - - 88,945 382019-20 262,867 108,502 302,046 28,089 - 1,212,456 - - 87,340 12020-21 P 377,087 69,457 398,502 35,155 - 1,493,580 - 4 84,911 4
(Contd.)
Fiscal Year
Station Wagon
Delivery Van
Lorries Trucks
Ambulance
Passenger Vehicles Public
Special Lorries
Trucks & Vans
Bus etc. Chassis
Buses, Trolly Buses
Motor Vehicles
for Goods
Spl. Truck etc.
Chassis
Road Tractors
for Trailers
2001-02 165 2,120 728 6 157 60 700 2 -- 182002-03 440 471 14,036 473 54 46 1,230 234 -- 1222003-04 154 26 2,883 721 95 164 2,429 511 -- 1242004-05 37 178 2,616 1,519 1,544 18 411 269 -- 1172005-06 284 2,586 13,463 5,228 551 7 2,104 3,844 38 4982006-07 2,817 1,583 16,610 2,123 573 24 652 297 48 9972007-08 345 311 4,331 836 875 314 217 22 335 2,4092008-09 28 37 2,405 363 1,203 1,017 232 2 9 2,1492009-10 109 2 12,819 364 5,325 671 285 -- 12 2,1542010-11 29 4 24,728 225 3,371 1,553 861 5 233 1,3452011-12 73 1 11,942 441 563 1,828 1,555 2 16 1,5982012-13 42 735 31,027 16,947 2,832 1,586 668 -- 9 1,2522013-14 8 2,732 23,946 1,282 1,406 3,997 425 7 17 1,3092014-15 18 5,477 33,489 2,810 927 4,818 847 -- 3,063 9,9912015-16 126 8,707 47,645 3,036 1,398 9,136 1,234 1 3,267 4,4422016-17 4 10,553 50,380 2,649 1,929 21,046 720 10 81 1,8362017-18 4 12,810 38,095 3,316 1,098 2,152 685 1,313 152 1,3072018-19 - 8,596 20,872 1,335 518 1,568 611 1 85 1,2782019-20 - 2,361 10,701 227 197 494 404 7 406 1,4932020-21 P - 3,812 12,549 1,353 187 1,409 314 5 24 4,262
(Contd.)
Fiscal Year
Tractor Agricul-
tural
Tractor Cater-pillar
Tractor Heavy Duty
for const.
TractorRoads
Tractor (NES)
Electric Vehicles
Electric Bikes
Sport Utility Vehicle
3-Wheel Loader
2001-02 220 44 4 15,174 115 -- -- --
2002-03 14,000 1 120 1,115 496 -- -- --
2003-04 11,420 30 219 2,104 736 -- -- --
2004-05 6,543 232 563 1,646 2,167 -- -- --
2005-06 20,769 12 632 2,284 3,378 -- -- --
2006-07 30,588 1 845 904 7,213 -- -- --
2007-08 8,914 1 744 1,892 19,623 -- -- --
2008-09 2,636 -- 402 434 14,205 -- -- --
2009-10 12,052 -- 245 165 6,189 -- -- --
2010-11 905 -- 148 144 12,208 -- -- --
2011-12 3,684 -- 68 0 12,930 -- -- --
2012-13 1,988 -- 131 225 18,773 -- -- --
2013-14 2,088 -- 347 157 16,796 13 15 1 --
2014-15 3,086 -- 476 434 28,743 13 104 14 1002015-16 1,843 4 369 675 30,464 25 64 10 10,2022015-16 4,831 -- 646 737 51,864 12 59 42 3,4592016-17 4,831 -- 843 703 51,864 12 59 42 2,9562017-18 3,796 44 643 713 63,638 - - 11 16,9292018-19 2,270 - 95 887 2,468 - - 9 2,1802019-20 1,366 - 86 488 12,835 - - - -2020-21 P 2,244 - 105 166 2,466 - - 4 2P : Provisional - : Not Available Source: Pakistan Bureau of Statistics
205

TABLE 13.10
PAKISTAN POST
Urban Rural Total
2000-01 2,302 9,932 12,233
2001-02 1,983 10,284 12,267
2002-03 1,808 10,446 12,254
2003-04 2,267 9,840 12,107
2004-05 1,831 10,499 12,330
2005-06 1,845 10,494 12,339
2006-07 1,849 10,494 12,343
2007-08 1,849 10,493 12,342
2008-09 1,852 10,514 12,366
2009-10 1,580 10,455 12,035
2010-11 1,580 10,455 12,0352011-12 1,797 10,238 12,0352012-13 2,178 10,650 12,8282013-14 1,813 10,264 12,0772014-15 1,813 10,264 12,0772015-16 1,782 9,962 11,7442016-17 2,046 9,450 11,4962017-18 2,046 9,450 11,4962018-19 1,717 8,352 10,0692019-20 1,519 8,626 10,1452020-21 1,514 8,072 9,586
No. of Post Offices Years
Source: Pakistan Post
206

TABLE 13.11
PAKISTAN TELECOMMUNICATIONS
Broad Band Mobile Telephones No. of TV SetsYears Subscribers Phones 000 Nos. PCOs 000 Nos.
(millions) 000 Nos.2000-01 0.80 742.6 3,252.0 66,968 3,432.0
2001-02 1.00 1,698.5 3,655.5 97,751 3,604.0
2002-03 1.60 2,404.4 3,982.0 127,910 3,604.0
2003-04 2.00 5,022.9 4,501.2 184,920 3,829.0
2004-05 2.10 12,771.2 5,227.5 279,320 6,762.0
2005-06 2.40 34,506.6 5,240.2 353,194 7,971.0
2006-07 0.05 63,160.9 4,806.2 387,490 9,003.0
2007-08 0.17 88,019.8 4,546.4 449,121 9,940.0
2008-09 0.41 94,342.0 3,523.2 405,359 10,556.0
2009-10 0.90 99,185.8 3,417.8 337,740 11,136.0
2010-11 1.40 108,894.5 5,720.0 * 313,723 11,704.0
2011-12 2.10 120,151.2 5,803.3 * 287,580 12,491.0
2012-13 2.72 128,933.6 6,370.8 * 289,252 13,729.1
2013-14 3.80 139,974.8 5,713.4 * 144,795 14,245.0
2014-15 16.89 114,658.4 4,230.5 * 53,887 14,758.4
2015-16 32.22 133,241.5 3,264.9 * - 15,424.6
2016-17 44.59 139,758.1 2,643.0 - 16,618.6
2017-18 58.34 150,238.7 2,568.6 - 17,766.7
2018-19 71.57 162,280.0 2,650.0 - 19,251.4
2019-20 83.85 168,560.0 2,490.0 - 20,512.1
2020-21 101.45 183,480.0 2,540.0 - 20,513.1- : Not available Source: Pakistan Telecommunications Company Ltd* : Including Fixed Local Loop and Wireless Local Loop Pakistan Television Corporation
Pakistan Telecommunication Authority
207

ENERGY
Production of Crude Oil 000 barrels 27,568
Production of Gas mmcf 1,279,242
Production of Coal 000 tons 9,300Import of Coal 000 tons 18,900
Installed Capacity ElectricityHydel MW 9,874Thermal MW 23,262Nuclear MW 2,490Renewable MW 1,635
Total Capacity MW 37,261
HIGHLIGHTS UnitsEnergy Supplies
2020-21
209

TABLE 14.1
1. Oil/Petroleum (tons)Agricul-
Households Industry ture Transport Power Other Govt. Total2000-01 450,960 1,924,048 254,833 8,157,893 6,487,988 372,176 17,647,898
2001-02 334,501 1,611,995 225,742 8,018,777 6,305,419 463,654 16,960,088
2002-03 282,521 1,604,068 196,747 8,082,273 6,019,958 266,387 16,451,954
2003-04 231,459 1,493,080 183,506 8,464,042 2,739,763 309,263 13,421,113
2004-05 192,750 1,542,398 142,062 9,024,783 3,452,581 316,686 14,671,260
2005-06 128,651 1,681,517 81,896 8,156,831 4,218,982 358,807 14,626,684
2006-07 106,148 1,595,981 97,232 7,981,893 6,740,559 325,318 16,847,131
2007-08 120,961 1,071,191 109,351 9,384,482 7,083,933 310,501 18,080,419
2008-09 97,332 969,193 69,793 8,837,197 7,570,418 367,266 17,911,199
2009-10 90,312 984,690 58,072 8,860,880 8,814,274 323,472 19,131,700
2010-11 85,449 1,355,443 40,597 8,892,268 8,138,956 373,794 18,886,507
2011-12 79,448 1,419,125 23,297 9,265,883 7,594,663 295,847 18,678,263
2012-13 97,847 1,379,096 31,828 9,817,546 7,749,007 317,805 19,393,129
2013-14 100,679 1,297,035 46,655 10,299,718 9,006,085 358,512 21,108,684
2014-15 89,017 1,300,190 37,235 11,372,924 8,995,231 365,471 22,160,068
2015-16 74,357 2,023,377 14,512 13,022,534 7,765,629 386,232 23,286,641
2016-17 77,169 1,990,398 12,671 14,582,925 8,531,825 366,958 25,561,946
2017-18 66,075 1,784,781 14,527 16,047,392 6,377,388 387,801 24,677,964
2018-19 60,557 1,299,437 15,021 14,673,564 2,759,465 409,132 19,217,176
2019-20 45,844 1,221,474 11,993 13,861,073 1,526,796 371,303 17,038,484
2020-21 29,816 1,472,777 12,134 15,776,895 2,364,586 306,961 19,963,169 (-) : Not available (Contd...)
COMMERCIAL ENERGY CONSUMPTION
Note : HSD consumption in agricultural sector is not available seprately and is included under transport sector. Agricultural sector represents LDO only.
FiscalYear
211

TABLE 14.1
2. Gas (mm cft)*Transport
Households Commercial Cement Fertilizer Power Industry CNG** Total2000-01 140,899 20,618 6,977 175,393 281,255 138,503 4,423 768,068
2001-02 144,186 22,130 7,063 177,589 314,851 151,416 7,369 824,604
2002-03 153,508 22,776 3,445 180,611 335,636 164,968 11,320 872,264
2003-04 155,174 24,192 7,711 185,350 469,738 193,395 15,858 1,051,418
2004-05 172,103 27,191 13,383 190,409 507,398 226,116 24,443 1,161,043
2005-06 171,109 29,269 15,335 198,175 491,766 278,846 38,885 1,223,385
2006-07 185,533 31,375 14,686 193,682 433,672 306,600 56,446 1,221,994
2007-08 204,035 33,905 12,736 200,063 429,892 322,563 72,018 1,275,212
2008-09 214,113 35,536 7,305 201,100 404,140 319,003 88,236 1,269,433
2009-10 219,382 36,955 1,944 220,124 366,906 333,508 99,002 1,277,821
2010-11 232,244 36,466 1,378 228,460 337,401 291,668 113,055 1,240,672
2011-12 261,915 39,627 1,266 211,828 358,381 296,181 119,000 1,288,198
2012-13 291,917 40,689 586 188,020 362,262 284,278 100,228 1,267,980
2013-14 269,135 38,117 522 216,517 349,535 259,032 87,634 1,220,492
2014-15 278,069 35,187 831 225,512 371,562 247,214 66,517 1,224,893
2015-16 271,302 33,633 497 238,632 419,802 238,998 64,050 1,266,914
2016-17 290,868 32,858 583 276,805 446,941 262,006 67,245 1,377,306
2017-18 284,428 32,096 886 248,104 544,654 274,074 70,455 1,454,697
2018-19 311,887 31,205 387 233,834 511,140 299,967 65,099 1,453,517
2019-20 325,348 26,999 266 248,204 424,579 251,882 46,448 1,323,725
2020-21 314,995 25,550 365 266,450 457,345 259,150 39,785 1,363,640 P : Provisional - : Not available (Contd...)* : Excluding LPG ** : Compressed Natural Gas
COMMERCIAL ENERGY CONSUMPTION
FiscalYear
212

TABLE 14.1
COMMERCIAL ENERGY CONSUMPTION
Trac- House- Comm- Indus Agricul- Street Other Total House- Power Brick Cement Other Totaltion hold ercial trial tural Lights Govt. hold Kilns * Govt.
2000-01 13 22765 2,774 14349 4,924 213 3547 48,585 1.0 205.8 2,837.9 1,000.0 - 4,044.7 2001-02 11 23210 2,951 15141 5,607 212 3490 50,622 1.1 249.4 2,577.5 1,580.6 - 4,408.6 2002-03 10 23624 3,218 16181 6,016 244 3363 52,656 1.1 203.6 2,607.0 2,078.2 - 4,889.9 2003-04 9 25846 3,689 17366 6,669 262 3650 57,491 1.0 184.9 2,589.4 3,289.2 - 6,064.5 2004-05 12 27601 4,080 18591 6,988 305 3750 61,327 - 179.9 3,906.7 3,807.2 - 7,893.8 2005-06 13 30720 4,730 19803 7,949 353 4035 67,603 - 149.3 4,221.8 3,342.8 - 7,714.0 2006-07 12 33335 5,363 21066 8,176 387 4373 72,712 1.0 164.4 3,277.5 4,451.2 - 7,894.1 2007-08 8 33704 5,572 20729 8,472 415 4500 73,400 1.0 162.0 3,760.7 6,186.9 - 10,110.6 2008-09 5 32282 5,252 19330 8,795 430 4277 70,371 0.8 112.5 3,274.8 5,001.8 - 8,389.9 2009-10 2 34272 5,605 19823 9,689 458 4499 74,348 - 125.5 3,005.2 5,007.8 - 8,138.5 2010-11 1 35885 5,782 21207 8,971 456 4797 77,099 - 96.5 3,003.6 4,617.1 - 7,717.1 2011-12 1 35589 5,754 21801 8,548 478 4590 76,761 - 104.6 3,108.2 4,456.9 - 7,669.7 2012-13 - 36116 6,007 22313 7,697 457 4199 76,789 - 63.0 2,696.0 4,129.9 - 6,889.0 2013-14 - 39549 6,375 24356 8,290 458 4381 83,409 - 160.7 2,727.6 3,669.2 - 6,557.5 2014-15 - 41450 6,512 24979 8,033 441 4403 85,818 - 151.2 3,010.4 5,553.8 - 8,715.4 2015-16 - 44486 7,181 25035 8,526 459 4744 90,431 - 204.4 3,541.1 5,485.3 - 9,230.8 2016-17 - 48698 7,856 24010 9,221 484 5260 95,529 - 859.6 2,855.3 7,470.8 - 11,185.8 2017-18 - 54028 8,606 27468 10,128 475 6223 106,928 - 4,436.1 3,941.7 9,603.3 - 17,981.1 2018-19 - 53685 8,513 28760 9,809 452 8242 109,461 - 5,901.5 5,391.2 10,234.3 - 21,527.1 2019-20 - 55963 7,975 25708 9,757 385 8584 108,371 1.0 10,897 8,184 6,075 - 25,156.9 2020-21 (P) 49815 6,689 24663 10,116 315 7775 99,373 - 12,500 9,000 6,700 - 28,200.0 P : Provisional - : Not available Source: Hydrocarbon Development Institute of Pakistan (HDIP)* : Electricity Consumption from K-Electric & AJK is not available Ministry of Energy (Petroleum Division)** : Estimated
4. Coal (000 metric ton)**3. Electricity (Gwh)FiscalYear
213

TABLE 14.2
Fiscal Installed Generation Hydroelectric Thermal Nuclear Renewable ImportedYear Capacity GW/h(b) Installed Generation Installed Generation Installed Generation Installed Generation (GW/h)
MW(a) Capacity (GW/h) Capacity (GW/h) Capacity (GW/h) Capacity (GW/h)(MW) (MW) (MW) (MW)
2000-01 17,498 68,117 4,867 17,194 12,169 48,926 462 1,997 - - -2001-02 17,799 72,405 5,051 18,941 12,286 51,174 462 2,291 - - -2002-03 17,798 75,682 5,051 22,351 12,285 51,591 462 1,740 - - 0.362003-04 19,257 80,900 6,496 26,944 12,299 52,122 462 1,760 - - 732004-05 19,384 85,738 6,499 25,671 12,423 57,162 462 2,795 - - 1092005-06 19,450 93,774 6,499 30,862 12,489 60,283 462 2,484 - - 1462006-07 19,420 98,384 6,479 31,953 12,478 63,972 462 2,288 - - 1712007-08 19,420 95,860 6,480 28,707 12,478 63,877 462 3,077 - - 1992008-09 19,786 91,843 6,481 27,784 12,842 62,214 462 1,618 - - 2272009-10 20,922 95,608 6,481 28,093 13,978 64,371 462 2,894 - - 2492010-11 22,447 94,653 6,481 31,811 15,209 59,153 787 3,420 - - 2692011-12 22,797 95,365 6,557 28,542 15,384 56,586 * 787 5,266 - - 2762012-13 22,812 96,497 6,773 29,857 15,289 61,711 750 4,553 - - 3752013-14 23,531 104,089 6,893 31,873 15,887 66,707 750 5,090 - - 4192014-15 23,759 107,408 7,030 32,474 15,541 67,886 750 5,804 438 802 4432015-16 25,889 111,763 7,122 34,633 17,115 70,512 750 4,605 902 1,549 4632016-17 29,944 123,614 7,129 32,183 20,488 81,268 1,090 6,999 1,237 2,668 4962017-18 33,553 131,276 7,139 27,925 23,347 89,614 1,430 9,880 1,637 3,857 5562018-19 35,114 128,532 8,639 27,339 23,347 86,602 1,430 9,909 1,698 4,682 4872019-20 36,701 128,673 8,668 33,585 24,682 80,121 1,430 10,815 1,921 4,152 5142020-21 P 37,261 130,193 9,874 38,943 23,262 76,282 2,490 10,878 1,635 3,585 505P : Provisional - : Not available Source: Ministry of Energy (Power Division)(a) MW: Mega Watt (b) GWh: Giga Watt hour Hydrocarbon Development Institute of Pakistan (HDIP)* : Installed Capacity and Electricity Generation from some of the IPPs is missing.
COMMERCIAL ENERGY SUPPLIES (ELECTRICITY)
214

TABLE 14.3
COMMERCIAL ENERGY SUPPLIES (OIL, GAS, PETROLEUM, COAL)
Fiscal Oil Gas Petroleum Products CoalYear Crude Local mmcf Imports Produc- Imports Produc-
Oil Crude 000 tons tion 000 tons tionImports Extraction 000 tons 000 tons
000 barrels 000 barrels
2000-01 52,505 21,084 857,433 10,029 8,337 950 3,095
2001-02 51,982 23,195 923,758 9,023 9,028 1,081 3,328
2002-03 52,512 23,458 992,589 8,437 9,084 1,578 3,312
2003-04 57,699 22,625 1,202,750 5,170 9,740 2,789 3,275
2004-05 61,161 24,119 1,344,953 5,676 10,474 3,307 4,587
2005-06 63,546 23,936 1,400,026 6,009 10,498 2,843 4,871
2006-07 60,694 24,615 1,413,581 8,330 10,314 4,251 3,643
2007-08 64,912 25,603 1,454,194 9,025 10,754 5,987 4,124
2008-09 62,115 24,033 1,460,679 9,974 9,828 4,652 3,738
2009-10 53,081 23,706 1,482,847 11,178 8,996 4,658 3,481
2010-11 51,306 24,041 1,471,591 12,371 8,911 4,267 3,450
2011-12 47,104 24,573 1,558,959 11,507 8,845 4,057 3,613
2012-13 57,037 27,841 1,505,841 10,489 10,380 3,710 3,179
2013-14 61,933 31,585 1,493,508 11,523 11,386 3,119 3,438
2014-15 64,208 34,490 1,465,760 13,347 11,733 5,004 3,712
2015-16 66,855 31,652 1,481,551 13,550 11,639 4,885 4,142
2016-17 64,555 32,269 1,471,855 15,145 12,063 7,021 4,165
2017-18 77,004 32,557 1,458,936 14,324 13,613 13,684 4,297
2018-19 66,833 32,496 1,436,546 8,807 12,346 15,686 5,841
2019-20 50,022 28,087 1,316,635 7,539 9,739 16,422 8,735
2020-21 (P) 65,075 27,568 1,279,242 10,074 10,346 18,900 9,300 P : Provisional Source: Ministry of Energy (Petroleum Division)(a) MW: Mega Watt (b) GWh: Giga Watt hour Hydrocarbon Development Institute of Pakistan (HDIP)
215

TABLE 14.4
Variable Charges Variable Charges Variable Charges Variable Charges Variable Charges Variable Charges
Rs./ kW/M Rs./kWh Rs./kWh Rs./kWh Rs./kWh Rs./kWh Rs./kWhA B C D E F G= B+C+D+E+F
A1- Residential Up to 50 Units 2.00 - - - 2.00 For peak load requirement less than 5 kW 01-100 Units 5.79 - - - 5.79 101-200 Units 8.11 - - - 8.11 201-300 Units 10.2 - - - 10.20 301-700Units 17.6 0.75 0.83 0.07 19.25 Above 700 Units 20.7 0.75 0.83 0.07 22.35 For peak load requirement exceeding 5 kW) Time of Use (TOU) - Peak 20.7 0.75 0.83 0.07 22.35 Time of Use (TOU) - Off-Peak 14.38 0.75 0.83 0.07 16.03
Temporary Supply 20.84 1.80 0.83 0.07 23.54
A2- CommercialFor peak load requirement less than 5 kW 18 0 0.83 0.26 19.09For peak load requirement exceeding 5 kW Regular 400 19.68 1.8 0.83 0.26 22.57 Time of Use (TOU) - Peak 21.6 1.8 0.83 0.26 24.49 Time of Use (TOU) - Off-Peak 400 15.63 1.8 0.83 0.26 18.52
Temporary Supply 18.39 1.8 0.83 0.26 21.28
A3- General Services 17.56 1.8 0.83 0.26 20.45
B- Industrial B1 15.28 1.8 0.83 0.26 18.17 B1 Peak 18.84 (3.00) 1.80 0.83 0.26 18.73 B1 Off Peak 13.28 1.80 0.83 0.26 16.17 B2 400 14.78 1.80 0.83 0.26 17.67 B2 - TOU (Peak) 18.78 (3.00) 1.80 0.83 0.26 18.67 B2 - TOU (Off-peak) 400 13.07 1.80 0.83 0.26 15.96 B3 - TOU (Peak) 18.78 (3.00) 1.80 0.83 0.26 18.67 B3 - TOU (Off-peak) 380 12.98 1.80 0.83 0.26 15.87 B4 - TOU (Peak) 18.78 (3.00) 1.80 0.83 0.26 18.67 B4 - TOU (Off-peak) 360 12.88 1.80 0.83 0.26 15.77
Temporary Supply 16.36 1.80 0.83 0.26 19.25
C - Single Point Supply C1(a) Supply at 400 Volts-less than 5 kW 18.68 1.80 0.83 0.26 21.57 C1(b) Supply at 400 Volts-exceeding 5 kW 400 18.18 1.80 0.83 0.26 21.07 Time of Use (TOU) - Peak 21.6 1.80 0.83 0.26 24.49 Time of Use (TOU) - Off-Peak 400 15 1.80 0.83 0.26 17.89 C2 Supply at 11 kV 380 17.98 1.80 0.83 0.26 20.87 Time of Use (TOU) - Peak 21.6 1.80 0.83 0.26 24.49 Time of Use (TOU) - Off-Peak 380 14.8 1.80 0.83 0.26 17.69 C3 Supply above 11 kV 360 17.88 1.80 0.83 0.26 20.77 Time of Use (TOU) - Peak 21.6 1.80 0.83 0.26 24.49 Time of Use (TOU) - Off-Peak 360 14.7 1.80 0.83 0.26 17.59
D- Agricultural Scarp 15.68 1.80 0.83 0.26 18.57 Time of Use (TOU) - Peak 18.6 1.80 0.83 0.26 21.49 Time of Use (TOU) - Off-Peak 200 11.35 1.80 0.83 0.26 14.24 Agricultual Tube-wells 200 5.35 1.49 0.83 0.26 7.934 Time of Use (TOU) - Peak 5.35 1.49 0.83 0.26 7.934 Time of Use (TOU) - Off-Peak 200 5.35 1.49 0.83 0.26 7.934
Public Lighting - Tariff G 18.68 1.80 0.83 0.26 21.57 Residential Colonies - Tariff H 18.68 1.80 0.83 0.26 21.57 Railway Traction Tariff I 18.68 1.80 0.83 0.26 21.57 Tariff K - AJK 360 15.9 1.80 0.83 0.26 18.79 Time of Use (TOU) - Peak 21.6 1.80 0.83 0.26 24.49 Time of Use (TOU) - Off-Peak 360 14.7 1.80 0.83 0.26 17.59 Tariff K -Rawat Lab 18.68 1.80 0.83 0.26 21.57
J- Special Contract J-1 For Supply at 66 kV & above 360 17.88 1.80 0.83 0.26 20.77 Time of Use (TOU) - Peak 21.6 1.80 0.83 0.26 24.49 Time of Use (TOU) - Off-Peak 360 14.7 1.80 0.83 0.26 17.59 J-2 (a) For Supply at 11, 33 kV 380 17.98 1.80 0.83 0.26 20.87 Time of Use (TOU) - Peak 21.6 1.80 0.83 0.26 24.49 Time of Use (TOU) - Off-Peak 380 14.8 1.80 0.83 0.26 17.69 J-2 (b) For Supply at 66 kV & above 360 17.88 1.80 0.83 0.26 20.77 Time of Use (TOU) - Peak 21.6 1.80 0.83 0.26 24.49 Time of Use (TOU) - Off-Peak 360 14.7 1.80 0.83 0.26 17.59 J-3 (a) For Supply at 11, 33 kV 380 17.98 1.80 0.83 0.26 20.87 Time of Use (TOU) - Peak 21.6 1.80 0.83 0.26 24.49 Time of Use (TOU) - Off-Peak 380 14.8 1.80 0.83 0.26 17.69 J-3 (b) For Supply at 66 kV & above 360 17.88 1.80 0.83 0.26 20.77 Time of Use (TOU) - Peak 21.6 1.80 0.83 0.26 24.49 Time of Use (TOU) - Off-Peak 360 14.7 1.80 0.83 0.26 17.59* Industrial Support Package (ISP) reduction shall be inclusive of any downward revision of Fuel Price Adjustment notified from time to time. Source: NEPRA
Note:FC Surcharge @ Rs. 0.43/kWh and NJ Surcharge @ 0.10/kWh are applicable in addition to above on all cosumer categories except life line.
CONSUMER-END APPLICABLE TARIFF
Description
Fixed Charges
Notified Tariff w.e.f. 01-01-2019
* Industrial Support Package
w.e.f. July 01,
Qtr. Adjust. for 1st & 2nd quarter, Notified
w.e.f
Qtr. Adjust. for 3rd & 4th quarter and interim increase on
account Distribution Margin,
Quarterly Uniform Tariff 1st QTR 2019-20 w.e.f. 1 December
Total Applicable Tariff
216

TABLE 14.4
Variable Charges Variable ChargesRs./ kW/M Rs./kWh Rs./ kW/M Rs./kWh
A1- Residential Up to 50 Units 2.00 3.95 For peak load requirement less than 5 kW 01-100 Units 5.79 7.74 101-200 Units 8.11 10.06 201-300 Units 10.2 12.15 301-700Units 19.25 21.43 Above 700 Units 22.35 24.53 For peak load requirement exceeding 5 kW) Time of Use (TOU) - Peak 22.35 24.56 Time of Use (TOU) - Off-Peak 16.03 18.24
Temporary Supply 23.54 25.68
A2- CommercialFor peak load requirement less than 5 kW 19.09 21.22For peak load requirement exceeding 5 kW Regular 400 22.57 440 24.4 Time of Use (TOU) - Peak 24.49 26.44 Time of Use (TOU) - Off-Peak 400 18.52 440 20.47
Temporary Supply 21.28 23.23
A3- General Services 20.45 22.4
B- Industrial B1 18.17 20.12 B1 Peak 21.73 23.68 B1 Off Peak 16.17 18.12 B2 400 17.67 440 19.62 B2 - TOU (Peak) 21.67 23.62 B2 - TOU (Off-peak) 400 15.96 440 17.91 B3 - TOU (Peak) 21.67 23.62 B3 - TOU (Off-peak) 380 15.87 420 17.82 B4 - TOU (Peak) 21.67 23.62 B4 - TOU (Off-peak) 360 15.77 400 17.72
Temporary Supply 19.25 21.2
C - Single Point Supply C1(a) Supply at 400 Volts-less than 5 kW 21.57 23.52 C1(b) Supply at 400 Volts-exceeding 5 kW 400 21.07 440 23.02 Time of Use (TOU) - Peak 24.49 26.44 Time of Use (TOU) - Off-Peak 400 17.89 440 19.84 C2 Supply at 11 kV 380 20.87 420 22.82 Time of Use (TOU) - Peak 24.49 26.44 Time of Use (TOU) - Off-Peak 380 17.69 420 19.64 C3 Supply above 11 kV 360 20.77 400 22.72 Time of Use (TOU) - Peak 24.49 26.44 Time of Use (TOU) - Off-Peak 360 17.59 400 19.54
D- Agricultural Scarp 18.57 20.52 Time of Use (TOU) - Peak 21.49 23.44 Time of Use (TOU) - Off-Peak 200 14.24 200 16.19 Agricultual Tube-wells 200 7.93 200 9.88 Time of Use (TOU) - Peak 7.93 9.88 Time of Use (TOU) - Off-Peak 200 7.93 200 9.88
Public Lighting - Tariff G 21.57 23.52 Residential Colonies - Tariff H 21.57 23.52 Railway Traction Tariff I 21.57 23.52 Tariff K - AJK 18.79 20.74 Time of Use (TOU) - Peak 24.49 26.44 Time of Use (TOU) - Off-Peak 17.59 19.54 Tariff K -Rawat Lab 21.57 23.52
J- Special Contract J-1 For Supply at 66 kV & above 360 20.77 Time of Use (TOU) - Peak 24.49 Time of Use (TOU) - Off-Peak 360 17.59 J-2 (a) For Supply at 11, 33 kV 380 20.87 Time of Use (TOU) - Peak 24.49 Time of Use (TOU) - Off-Peak 380 17.69 J-2 (b) For Supply at 66 kV & above 360 20.77 Time of Use (TOU) - Peak 24.49 Time of Use (TOU) - Off-Peak 360 17.59 J-3 (a) For Supply at 11, 33 kV 380 20.87 Time of Use (TOU) - Peak 24.49 Time of Use (TOU) - Off-Peak 380 17.69 J-3 (b) For Supply at 66 kV & above 360 20.77 Time of Use (TOU) - Peak 24.49 Time of Use (TOU) - Off-Peak 360 17.59
Source: NEPRA
Fixed Charges
Applicable Tariff from February 12,2021 to June 2021 (Including
Quartely adjustments)
Note: the above tariff is without industrial support package, finance cost and Nelum Jehlum Surcharge as notified by the federal government from time to time . The above tariff also not includes monthly Fuel Charges Adjustment\
CONSUMER-END APPLICABLE TARIFF
Description Fixed Charges
Applicable Tariff from July 2020 to February 11,2021
(Including Quartely adjustments)
217

TABLE 14.5
OIL SALE PRICES
Rs/Ltrs
Date 22-11-2012 22-12-2012 22-01-2013 01-03-2013 04-03-2013 01-07-2013
EX-NRL/PRL KARACHIMotor Gasoline 102.65 101.42 103.07 106.60 103.07 69.40HOBC (Automotive 100 Octane) - - - - - 87.68Super (90 Octane) Blend of Motor
Gasoline @ 60% and HOBC 40%)Kerosene 99.03 98.81 99.90 103.69 99.90 72.28HSD 109.77 110.13 109.21 113.56 109.21 78.49LDO 93.89 94.34 94.33 98.26 94.78 71.47Aviation gasoline (100LL)JP-1:
i) For sale to PIA Domestic Flight 88.22 88.04 89.24 93.52 93.52 72.54ii) For sale to PIA foreign
flights & foreign airlineiii) For Cargo & Technical
Landing FlightsJP-4 - - - - - -JP-8 87.90 87.72 88.80 93.21 93.21 72.28- : Not available (Contd…)
TABLE 14.5OIL SALE PRICES
Rs/Ltrs
Date 01-08-2013 01-09-2013 01-10-2013 01-11-2013 01-12-2013 01-01-2014
EX-NRL/PRL KARACHIMotor Gasoline 71.74 75.52 80.05 77.82 78.26 80.83HOBC (Automotive 100 Octane) 92.52 97.47 102.19 99.84 104.30 107.38Super (90 Octane) Blend of Motor
Gasoline @ 60% and HOBC 40%)Kerosene 76.54 80.30 82.11 82.05 82.98 85.31HSD 82.33 85.27 87.54 81.40 82.36 84.43LDO 74.84 76.99 78.75 79.48 80.13 81.63Aviation gasoline (100LL)JP-1: 76.80 80.57 82.39 82.33 83.26 -
i) For sale to PIA Domestic Flightii) For sale to PIA foreign
flights & foreign airlineiii) For Cargo & Technical
Landing FlightsJP-4JP-8 76.54 80.30 82.11 82.05 82.98 -- : Not available (Contd…)
218

TABLE 14.5
OIL SALE PRICES
Rs/Ltrs
Date 01-02-2014 02-03-2014 01-04-2014 01-05-2014 01-06-2014 01-07-2014
EX-NRL/PRL KARACHIMotor Gasoline 78.31 75.43 74.02 73.68 74.89 107.97HOBC (Automotive 100 Octane) 103.55 100.97 95.87 94.25 96.45Super (90 Octane) Blend of Motor
Gasoline @ 60% and HOBC 40%)Kerosene 81.13 81.33 75.97 73.88 74.19 97.40HSD 80.79 80.86 77.53 73.93 75.30 109.34LDO 78.07 78.47 74.07 72.83 73.67 94.13Aviation gasoline (100LL)JP-1: - - - - - 86.71
i) For sale to PIA Domestic Flightii) For sale to PIA foreign
flights & foreign airlineiii) For Cargo & Technical
Landing FlightsJP-4JP-8 - - - - - 87.06- : Not available (Contd…)
TABLE 14.5
OIL SALE PRICES
Rs/Ltrs
Date 01-08-2014 01-09-2014 01-10-2014 01-11-2014 01-12-2014 01-01-2015
EX-NRL/PRL KARACHIMotor Gasoline 107.97 106.56 103.62 94.19 84.53 78.28HOBC (Automotive 100 Octane)Super (90 Octane) Blend of Motor
Gasoline @ 60% and HOBC 40%)Kerosene 97.05 96.99 95.68 87.52 83.18 71.92HSD 109.34 108.34 107.39 101.21 94.09 86.23LDO 93.27 92.08 91.94 83.37 77.98 67.50Aviation gasoline (100LL)JP-1: 86.74 84.84 85.00 77.60 73.05 59.10
i) For sale to PIA Domestic Flightii) For sale to PIA foreign
flights & foreign airlineiii) For Cargo & Technical
Landing FlightsJP-4JP-8 86.42 85.52 84.66 77.01 72.72 58.76- : Not available (Contd…)
219

TABLE 14.5
OIL SALE PRICES
Rs/Ltrs
Date 01-02-2015 01-03-2015 01-07-2015 01-08-2015 01-09-2015 01-10-2015 01-11-2015
EX-NRL/PRL KARACHIMotor Gasoline 70.29 70.29 77.79 76.76 73.76 73.76 76.26HOBC (Automotive 100 Octane) 83.81 82.79 79.79 79.79 79.79Super (90 Octane) Blend of Motor
Gasoline @ 60% and HOBC 40%)Kerosene 61.44 61.44 64.94 60.11 57.11 57.11 57.11HSD 80.61 80.61 87.11 85.05 82.04 82.04 83.79LDO 57.94 57.94 61.51 56.59 53.59 53.59 53.59Aviation gasoline (100LL)JP-1: 47.30 53.59 55.81 49.33 42.65 45.31 46.12
i) For sale to PIA Domestic Flightii) For sale to PIA foreign
flights & foreign airlineiii) For Cargo & Technical
Landing FlightsJP-4JP-8 46.96 53.25 55.47 48.99 42.31 44.96 45.77- : Not available (Contd…)
TABLE 14.5
OIL SALE PRICES
Rs/Ltrs
Date 01-12-2015 01-01-2016 01-02-2016 01-03-2016 01-04-2016 01-05-2016 01-06-2016
EX-NRL/PRL KARACHIMotor Gasoline 76.26 76.25 71.25 62.77 64.27 64.27 64.27HOBC (Automotive 100 Octane) 80.66 80.66 75.66 72.68 72.68 72.68 72.68Super (90 Octane) Blend of Motor
Gasoline @ 60% and HOBC 40%)Kerosene 56.32 48.25 43.25 43.25 43.25 43.25 43.25HSD 83.79 80.79 75.79 71.12 72.52 72.52 72.52LDO 53.23 44.94 39.94 37.97 37.97 37.97 37.97Aviation gasoline (100LL)JP-1: 45.24 37.50 29.66 32.67 36.35 38.87 44.53
i) For sale to PIA Domestic Flightii) For sale to PIA foreign
flights & foreign airlineiii) For Cargo & Technical
Landing FlightsJP-4JP-8 44.90 37.15 29.31 31.36 36.01 37.37 42.07- : Not available (Contd…)
220

TABLE 14.5
OIL SALE PRICES
Rs/Ltrs
Date 01-07-2016 01-08-2016 01-09-2016 01-10-2016 01-11-2016 01-12-2016 01-01-2017
EX-NRL/PRL KARACHIMotor Gasoline 64.27 64.27 64.27 64.27 64.27 66.27 67.27HOBC (Automotive 100 Octane)Super (90 Octane) Blend of Motor
Gasoline @ 60% and HOBC 40%)Kerosene 43.25 43.25 43.25 43.25 43.25 43.25 43.25HSD 72.52 72.52 72.52 72.52 72.52 75.22 75.22LDO 43.35 43.35 43.34 43.34 43.34 43.34 43.34Aviation gasoline (100LL)JP-1:
i) For sale to PIA Domestic Flightii) For sale to PIA foreign
flights & foreign airlineiii) For Cargo & Technical
Landing FlightsJP-4JP-8- : Not available (Contd…)
TABLE 14.5
OIL SALE PRICES
Rs/Ltrs
Date 16-01-2017 01-02-2017 16-02-2017 01-03-2017 01-04-2017 01-05-2017 01-06-2017
EX-NRL/PRL KARACHIMotor Gasoline 68.04 70.29 71.29 73.00 74.00 74.00 72.80HOBC (Automotive 100 Octane)Super (90 Octane) Blend of Motor
Gasoline @ 60% and HOBC 40%)Kerosene 43.25 43.25 43.25 44.00 44.00 44.00 44.00HSD 77.22 49.48 80.48 82.00 83.00 83.00 81.40LDO 43.34 43.34 43.34 44.00 44.00 44.00 44.00Aviation gasoline (100LL)JP-1:
i) For sale to PIA Domestic Flightii) For sale to PIA foreign
flights & foreign airlineiii) For Cargo & Technical
Landing FlightsJP-4JP-8- : Not available (Contd…)
221

TABLE 14.5
OIL SALE PRICES
Rs/Ltrs
Date 1-7-2017 1-8-2018 6-8-2017 1-9-2017 1-10-2017 1-11-2017 1-12-2017
EX-NRL/PRL KARACHIMotor Gasoline 71.30 71.30 69.50 71.50 73.50 75.99 77.47HOBC (Automotive 100 Octane)Super (90 Octane) Blend of Motor
Gasoline @ 60% and HOBC 40%)Kerosene 44.00 44.00 44.00 44.00 48.00 53.19 57.58HSD 79.90 79.90 77.40 77.40 79.40 84.59 85.95LDO 44.00 44.00 44.00 44.00 46.00 49.00 52.12Aviation gasoline (100LL)JP-1:
i) For sale to PIA Domestic Flightii) For sale to PIA foreign
flights & foreign airlineiii) For Cargo & Technical
Landing FlightsJP-4JP-8- : Not available (Contd…)
TABLE 14.5
OIL SALE PRICES
Rs/LtrsDate 1-1-2018 1-2-2018 1-3-2018 1-4-2018 1-5-2018 1-6-2018 12-6-2018EX-NRL/PRL KARACHIMotor Gasoline 81.53 84.51 88.07 86.00 87.70 87.70 91.96HOBC (Automotive 100 Octane)Super (90 Octane) Blend of Motor
Gasoline @ 60% and HOBC 40%)Kerosene 64.32 70.26 76.46 76.46 79.87 79.88 84.34HSD 89.91 95.83 98.45 96.45 98.76 98.76 105.31LDO 58.37 64.30 65.30 65.30 68.85 68.85 74.99Aviation gasoline (100LL)JP-1:
i) For sale to PIA Domestic Flightii) For sale to PIA foreign
flights & foreign airlineiii) For Cargo & Technical
Landing FlightsJP-4JP-8- : Not available (Contd…)
222

TABLE 14.5
OIL SALE PRICES
Rs/Ltrs
Date 1-7-2018 8-7-2018 1-8-2018 1-9-2018 1-10-2018 1-11-2018 1-12-2018
EX-Depot Sale Price:Motor Gasoline 99.50 95.24 95.24 92.83 92.83 97.83 95.83HOBC (Automotive 100 Octane)
Super (90 Octane) Blend of MotorGasoline @ 60% and HOBC 40%)
Kerosene 87.70 83.96 83.96 83.50 83.50 86.50 83.50HSD 119.31 112.94 112.94 106.57 106.57 112.94 110.94LDO 80.91 75.37 75.37 76.96 75.96 82.44 77.44Aviation gasoline (100LL)JP-1: 76.18 76.18 81.44 80.94 84.83 92.34 84.42
i) For sale to PIA Domestic Flightii) For sale to PIA foreign
flights & foreign airlineiii) For Cargo & Technical
Landing FlightsJP-4JP-8 76.16 76.16 81.24 80.75 84.64 92.15 81.23- : Not available (Contd…)
TABLE 14.5
OIL SALE PRICES
Rs/Ltrs
Date 1-1-2019 1-2-2019 1-3-2019 1-4-2019 1-5-2019 5-5-2019 1-6-2019
EX-Depot Sale Price:Motor Gasoline 90.97 90.38 92.89 98.89 98.89 108.42 112.68HOBC (Automotive 100 Octane)
Super (90 Octane) Blend of MotorGasoline @ 60% and HOBC 40%)
Kerosene 82.98 82.31 86.31 89.31 89.31 96.77 98.46HSD 106.68 106.68 111.43 117.43 117.43 122.32 126.82LDO 75.28 75.03 77.54 80.54 80.54 86.94 88.62Aviation gasoline (100LL)JP-1: 73.59 73.39 73.48 81.95 85.75 85.75 87.45
i) For sale to PIA Domestic Flightii) For sale to PIA foreign
flights & foreign airlineiii) For Cargo & Technical
Landing FlightsJP-4JP-8 73.41 73.20 73.29 81.92 85.73 85.73 87.42- : Not available (Contd…)
Note: HOBC prices has been totally deregulated since 01-11-2016
223

TABLE 14.5
OIL SALE PRICES
Rs/Ltrs
Date 1-7-2019 1-8-2019 1-9-2019 1-10-2019 1-11-2019 1-12-2019 1-1-2020
EX-Depot Sale Price:Motor Gasoline 112.68 117.83 113.24 113.24 114.24 113.99 116.60HOBC (Automotive 100 Octane)
Super (90 Octane) Blend of MotorGasoline @ 60% and HOBC 40%)
Kerosene 98.46 103.84 99.57 99.57 97.18 96.35 99.45HSD 126.82 132.47 127.14 127.14 127.41 125.01 127.26LDO 88.62 97.52 91.89 91.89 85.33 82.43 84.51Aviation gasoline (100LL)JP-1: 83.99 92.30 87.90 89.33 86.15 85.34 93.02
i) For sale to PIA Domestic Flightii) For sale to PIA foreign
flights & foreign airlineiii) For Cargo & Technical
Landing FlightsJP-4JP-8 83.97 92.28 87.68 89.31 86.12 85.32 87.91- : Not available (Contd…)
TABLE 14.5
OIL SALE PRICES
Rs/Ltrs
Date 1-2-2020 1-3-2020 25-3-2020 1-5-2020 1-6-2020 27-6-2020 1-8-2020
EX-Depot Sale Price:Motor Gasoline 116.60 111.59 96.58 81.58 74.52 100.11 103.97HOBC (Automotive 100 Octane)
Super (90 Octane) Blend of MotorGasoline @ 60% and HOBC 40%)
Kerosene 99.45 92.45 77.45 47.44 35.56 59.32 65.29HSD 127.26 122.25 107.25 80.10 80.15 101.46 106.46LDO 84.51 77.51 62.51 47.51 38.14 56.24 62.86Aviation gasoline (100LL)JP-1: 80.99 80.92 77.37 49.05 24.85 48.64 54.38
i) For sale to PIA Domestic Flightii) For sale to PIA foreign
flights & foreign airlineiii) For Cargo & Technical
Landing FlightsJP-4JP-8 87.22 74.06 51.46 19.31 24.84 48.61 54.36- : Not available (Contd…)
Note: HOBC prices has been totally deregulated since 01-11-2016
224
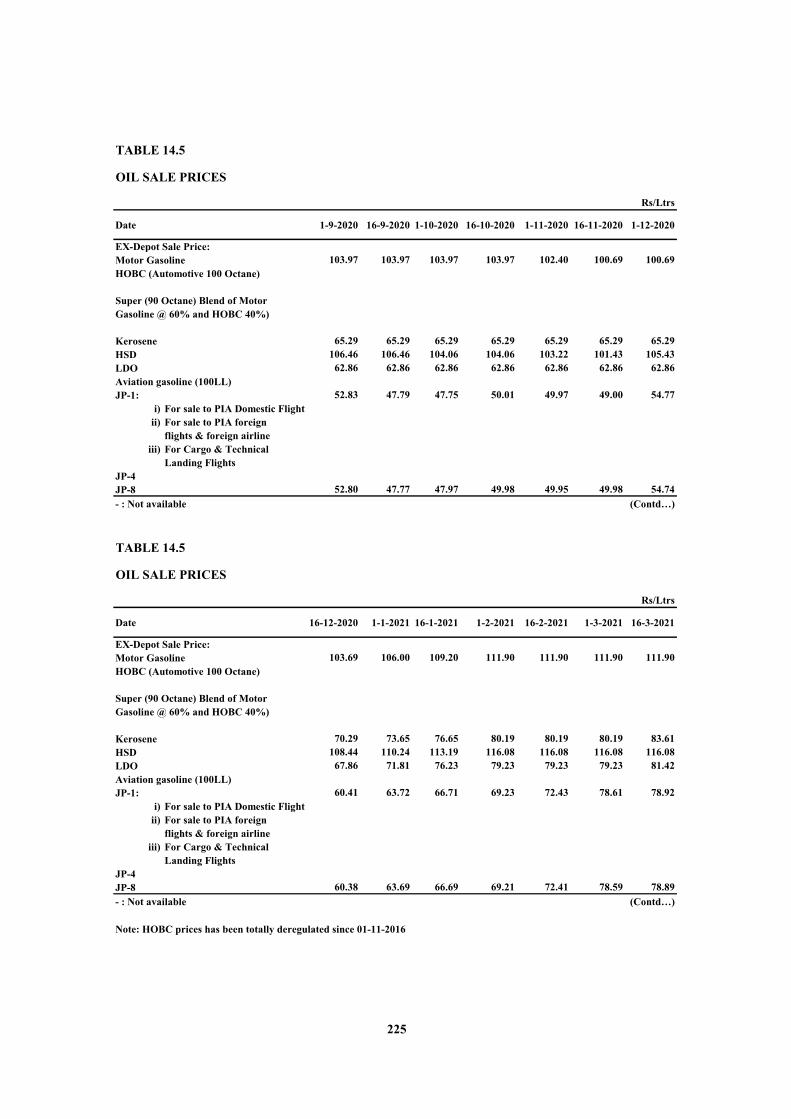
TABLE 14.5
OIL SALE PRICES
Rs/Ltrs
Date 1-9-2020 16-9-2020 1-10-2020 16-10-2020 1-11-2020 16-11-2020 1-12-2020
EX-Depot Sale Price:Motor Gasoline 103.97 103.97 103.97 103.97 102.40 100.69 100.69HOBC (Automotive 100 Octane)
Super (90 Octane) Blend of MotorGasoline @ 60% and HOBC 40%)
Kerosene 65.29 65.29 65.29 65.29 65.29 65.29 65.29HSD 106.46 106.46 104.06 104.06 103.22 101.43 105.43LDO 62.86 62.86 62.86 62.86 62.86 62.86 62.86Aviation gasoline (100LL)JP-1: 52.83 47.79 47.75 50.01 49.97 49.00 54.77
i) For sale to PIA Domestic Flightii) For sale to PIA foreign
flights & foreign airlineiii) For Cargo & Technical
Landing FlightsJP-4JP-8 52.80 47.77 47.97 49.98 49.95 49.98 54.74- : Not available (Contd…)
TABLE 14.5
OIL SALE PRICES
Rs/Ltrs
Date 16-12-2020 1-1-2021 16-1-2021 1-2-2021 16-2-2021 1-3-2021 16-3-2021
EX-Depot Sale Price:Motor Gasoline 103.69 106.00 109.20 111.90 111.90 111.90 111.90HOBC (Automotive 100 Octane)
Super (90 Octane) Blend of MotorGasoline @ 60% and HOBC 40%)
Kerosene 70.29 73.65 76.65 80.19 80.19 80.19 83.61HSD 108.44 110.24 113.19 116.08 116.08 116.08 116.08LDO 67.86 71.81 76.23 79.23 79.23 79.23 81.42Aviation gasoline (100LL)JP-1: 60.41 63.72 66.71 69.23 72.43 78.61 78.92
i) For sale to PIA Domestic Flightii) For sale to PIA foreign
flights & foreign airlineiii) For Cargo & Technical
Landing FlightsJP-4JP-8 60.38 63.69 66.69 69.21 72.41 78.59 78.89- : Not available (Contd…)
Note: HOBC prices has been totally deregulated since 01-11-2016
225

TABLE 14.5
OIL SALE PRICES
Rs/Ltrs
Date 1-4-2021 16-4-2021 1-5-2021 18-5-2021 1-6-2021 16-6-2021
EX-Depot Sale Price:Motor Gasoline 110.35 108.56 108.56 108.56 108.56 110.69HOBC (Automotive 100 Octane)
Super (90 Octane) Blend of MotorGasoline @ 60% and HOBC 40%)
Kerosene 82.06 80.00 80.00 80.00 80.00 81.89HSD 113.08 110.76 110.76 110.76 110.76 112.55LDO 79.86 77.65 77.65 77.65 77.65 79.68Aviation gasoline (100LL)JP-1: 75.30 71.19 77.35 77.35 80.79 84.84
i) For sale to PIA Domestic Flightii) For sale to PIA foreign
flights & foreign airlineiii) For Cargo & Technical
Landing FlightsJP-4JP-8 75.28 71.17 76.45 76.45 80.77 84.81- : Not available Source: Hydrocarbon Development Institute of Pakistan (HDIP)Note: HOBC prices has been totally deregulated since 01-11-2016
226

TABLE 14.6
GAS SALE PRICES
Unit: Rupees/MMbtu.
Category 1-1-14 1-9-2015 1-1-2016 1-4-2016 1-7-2016 15-12-16
DOMESTIC (Slab) i) Upto 1.77 M cu.ft./month ii) Upto 1.77 to 3.55 M cu.ft./month 106.14 110.00 110.00 110.00 iii) Upto 3.55 to 7.10 M cu.ft./month iv) Upto 7.10 to 10.64 Mcu.ft./month 212.28 220.00 220.00 220.00 v) Upto 10.64 to 14.20 M cu.ft./month 530.69 600.00 600.00 600.00 vi) Upto 14.20 to 17.75 M cu.ft./month vii) All over 17.75 BULK METER 530.69 600.00 600.00 600.00COMMERCIAL 636.83 700.00SPECIAL COMMERCIAL ROTI TANDOOR*Upto 50Over 50 upto 100 106.14 110.00 110.00 110.00Over 100 upto 200Over 200 upto 300 212.28 220.00 220.00 220.00Over 300 636.83 700.00ICE FACTORIES 636.83 700.00 700.00 700.00General Industry 488.23 700.00 600.00 600.00Cement 742.97 750.00 750.00 750.00CNG Station 656.32 700.00 700.00 700.00Pakistan SteelCaptive Power 573.28 600.00 600.00 600.00Independent Power Projects 488.23 600.00 613.00 613.00 400.00FERTILIZER SNGPL'S SYSTEM(i) For Feed Stock Pak American Fertilizer Ltd. 123.41 200.00 123.41 123.00 123.00 F.F.C Jorden Engro Fertilizer Ltd. 73.17 70.61 72.73 72.72 72.72 Dawood Hercules/ Pak Arab 123.41 200.00 123.41 123.00 123.00 Pak China /Hazara 123.41 200.00 123.41 123.00 123.00 SSGCL'S SYSTEM F.F.Bin Qasim Ltd. 123.41 200.00 123.41 123.00 123.00 F.F.Bin Qasim Ltd. (Add. 10mmcfd FS) 73.17 70.61 72.73 72.72 72.72(ii) For Fuel Generation all Fertilizer Co. 488.23 600.00 600.00 600.00 FOR MARI GAS CO. SYSTEM(i) For Feed Stock (a) Engro Chemical 123.41 200.00 123.41 123.00 123.00 FFC (Goth Machi) 123.41 200.00 123.41 123.00 123.00 Fatima Fertilizer 73.17 70.61 72.73 72.72 72.72 FFC (Mirpur M) 123.41 123.00 123.00 Foundation Power Company 488.23 613.00 400.00(ii) For Power Generation 488.23POWER Stations SNGPL & SSGCL'S SYSTEM 488.23 600.00Liberty Power Limited 1,505.20 713.89 648.52 443.58 443.58GAS DIRECTLY SOLD TOWAPDA'S GUDDU POWER STATIONSUI FIELD (917 BTU) 488.23 600.00 613.00KANDKOT FIELD (866 BTU) 488.23 600.00 613.00MARI FIELD (754 BTU) 488.23 600.00 613.00 613.00 400.00SARA /SURI FIELDSFoundation Power Company 488.23 600.00 613.00 613.00 400.00
Source : Directorate General of Gas
227

TABLE 14.6
GAS SALE PRICES
Sectors w.e.f27-09-18
w.e.f01-01-2019 Sectors * w.e.f
01-07-2019 Sectors * w.e.f01-09-2020
1. DOMESTIC 1. DOMESTIC 1. DOMESTICUpto 50 M3 per month 121 Upto 50 M3 per month 121 Upto 0.5 hm3 per month 121Upto 100 M3 per month 127 Upto 100 M3 per month 300 Upto 1 hm3 per month 300Upto 200 M3 per month 264 Upto 200 M3 per month 553 Upto 2 hm3 per month 553Upto 300 M3 per month 275 Upto 300 M3 per month 738 Upto 3 hm3 per month 738Upto 400 M3 per month 780 Upto 400 M3 per month 1107 Upto 4 hm3 per month 1107Upto 500 M3 per month 1460 Above 400 M3 per month 1460 Above 4hm3 per month 1460Over 500 M3 per month 1460
2. Bulk Consumers 780 780 2. Bulk Consumers 780
3. Special Commercial (Roti Tanoor) revert back on14-12-2018 3. Special Commercial (Roti Tanoor)
Upto 50 M3 per month 121 Upto 0.5 hm3 per month 110Upto 100 M3 per month 127 Upto 1 hm3 = 110 Upto 100 M3 per month 110 Upto 1 hm3 per month 110Upto 200 M3 per month 264 Upto 2 hm3 per month 220Upto 300 M3 per month 275 Upto 3 hm3 = 220 Upto 300 M3 per month 220 Upto 3 hm3 per month 220Upto 400 M3 per month 780 Over 3 hm3 per month 700Over 400 M3 per month 980 Above 3 hm3 = 700 Over 400 M3 per month 700
4. Commercial 980 1283 4. Commercial 12835. Ice Factories 980 1283 5. Ice Factories 12836. Textile (Including Jute), carpets, 6. General Industries 1054
leather, sports and surgical goods 600 786 7. Export Oriented (General Industries) 8197 Industrial 780 1021 8. Export Oriented (Captive) 8528. Captive Power 780 1021 8. Captive Power (General Industries) 10879. Compressed Natural Gas(CNG) 980 1283 CNG Region-I 137110. Cement 975 1277 CNG Region-II 1350
Cement 127711. Fertilizer Companies 11. Fertilizer CompaniesOn SNGPL's System On SNGPL's System(a) For Feed Stock (a) For Feed Stock
i. Pak American Fertilizer Limited. 185 1283 i. Pak American Fertilizer Limited. 302ii. Dawood Hercules Chemical Limited 185 1283 ii. Dawood Hercules Chemical Limited 302
iii. Pak Arab Fertilizer Limited 185 iii. Pak Arab Fertilizer Limited 302iv. Pak China Fertilizer Limited 185 786 iv. Pak China Fertilizer Limited 302v. 1021 v. Hazara Phosphate Fertilizer Plant 302
185 1021 Limitedvi. FFC Jordan Fertilizer 1283 vii. ENGRO Fertilizer Limited US$ 0.70
vii. ENGRO Fertilizer Limited US$ 0.70 1277On SSGCL's System On SSGCL's System
Fauji Fertilizer Bin Qasim Limited 185 300 i) Fauji Fertilizer Bin Qasim Limited 302FFBQL - additional 10 MMCFD feed stock
(b) For Fuel - All Fertilizer Companies 780 1021 (b) For Fuel - All Fertilizer Companies 1023
On MARI's SYSTEM On MARI's SYSTEM(a) For Feed Stock (a) FOR FEED STOCK
i. Engro Fertilizer Company Limited 185 300 i. Engro Fertilizer Company Limited 302ii. 302
185 300iii. Fatima Fertilizer Company Limited US$ 0.70 US$ 0.70 iii. Fatima Fertilizer Company Limited US$ 0.70iv. 857
(b) For Fuel 780 1021 (b) For Fuel 1023
12. Power Station (WAPDA's and KESCS's 12. Power Station (WAPDA's and KESCS'si. WAPDA & KESC Power Station 629 824 i. WAPDA & KESC Power Station 857
ii.629 824 857
iii. Liberty Power Limited 1005.19 1283.47 1283.47
13. Independent Power Producers 629 824 13. Independent Power Producers 857
14. RAW Gas Sold to WAPDA'sGUDDU Power Stationi.
629 824ii. Mari (754)-MGCL 629 824iii.
629 824iv. Sara/Suri Fields-Tullow
*: Effective till to date Source : Directorate General of Gas.
ii. Fauji Fertilizer Company Limited (Goth Machi/Mirpur Mathelo)
iv. Foundation Power Company (Dharki) Limited
ii. WAPDA's Gas Turbine Power Station Nishatabad, Faislabad
Hazara Phosphate Fertilizer Plant Limited
Foundation Power Company (Dharki) Limited
Fauji Fertilizer Company Limited, Mirpur Mathelo, District Gholki
WAPDA's Gas Turbine Power Station Nishatabad, Faislabad
Fauji Fertilizer Company Limited (Goth Machi/Mirpur Mathelo)
Sui Field (917 BTU) and Kanhkot (866 BTU)-PPL
228

229
WEIGHTS & MEASURES
RUPEES
One Lakh = One hundred thousand = 100,000 Ten Lakh = One million = 1,000,000 One Crore = Ten million = 10,000,000 One Billion = One thousand million One Trillion = One thousand billion WEIGHTS
One Gram = 0.035 Ounce = 0.0857 Tola One Pound = 16 ounces = 453.592 grams One Kilogram = 1000 grams = 1.07 seers = 2.205 pounds One Metric ton = 1000 Kilograms = 0.9842 ton = 26.792 Maunds One Maund = 37.3242 Kilograms One Ton = 2240 pounds = 1.016 metric tons One cotton bale = 375 Ibs. = 170.2 kg One bushel = 0.73 mds = 27.25 kg LENGTH
One yard = 3 feet =36 inches = 0.914 metre One mile = 1760 yards = 1.609 kilometres One sq. yard = 0.83613 sq. metres One sq. metre = 1.196 sq. yards One Acre = 4840 sq. yards = 0.4049 hectare One Hectare = 2.47 Acres VOLUME
One cubic metre = 35.315 cubic feet LIQUID MEASURE
One barrel = 36 imperial gallons = 163.656 litres YEAR
Fiscal Year and Agriculture Year starts from 1st July ends on 30th June Before 1959-60, the fiscal year was from April 1 to March 31 CROPPING SEASONS
Kharif – Crops sown in late Spring or in the beginning of Summer and harvested in Autumn. Rabi – Crops sown in Autumn and harvested in the following Spring.
Note : Indigenous system (seers, yards etc.) and Imperial system (pound, foot etc.) in Pakistan have been replaced by International system of weights and measures (kilograms, metre etc.) w.e.f. December, 1978.