annual report on the securities market. 2003 - CNMV
341
20 0 3 Annual report
-
Upload
khangminh22 -
Category
Documents
-
view
0 -
download
0
Transcript of annual report on the securities market. 2003 - CNMV

2003Annual report

COMISIÓN NACIONAL DEL MERCADO DE VALORES
ANNUAL REPORT ON THESECURITIES MARKET. 2003

© Comisión Nacional del Mercado de Valores.All information in this publication may bereproduced with attribution
I.S.B.N.: 84-87870-40-6Depósito Legal: M. 36.115-2004
Printed by: NEOGRAFIS, S. L. - Pol. Ind. San José de Valderas IC/ Vidrio, 12-14. 28918 LEGANÉS (Madrid)

General Index
1. Overview of the Securities Markets . . . . . . . . . . . . . . . . . . . . . . . . . . . . . . . . . . . . . .1.1 Economic situation . . . . . . . . . . . . . . . . . . . . . . . . . . . . . . . . . . . . . . . . . . . . . . . . . . . . . . . . . . .1.2 Financial flows in the Spanish economy . . . . . . . . . . . . . . . . . . . . . . . . . . . . . . . . . . . . . .1.3 World financial markets . . . . . . . . . . . . . . . . . . . . . . . . . . . . . . . . . . . . . . . . . . . . . . . . . . . . . .1.4 Securities and derivatives markets in Spain . . . . . . . . . . . . . . . . . . . . . . . . . . . . . . . . . .
2. Primary markets . . . . . . . . . . . . . . . . . . . . . . . . . . . . . . . . . . . . . . . . . . . . . . . . . . . . . . . . . . . . . . .2.1 General overview . . . . . . . . . . . . . . . . . . . . . . . . . . . . . . . . . . . . . . . . . . . . . . . . . . . . . . . . . . . . .2.2 Equities . . . . . . . . . . . . . . . . . . . . . . . . . . . . . . . . . . . . . . . . . . . . . . . . . . . . . . . . . . . . . . . . . . . . . .2.3 Fixed-income . . . . . . . . . . . . . . . . . . . . . . . . . . . . . . . . . . . . . . . . . . . . . . . . . . . . . . . . . . . . . . . .2.4 Other issues registered at the CNMV . . . . . . . . . . . . . . . . . . . . . . . . . . . . . . . . . . . . . . . . .
3. Secondary markets . . . . . . . . . . . . . . . . . . . . . . . . . . . . . . . . . . . . . . . . . . . . . . . . . . . . . . . . . . . .3.1 Equity markets . . . . . . . . . . . . . . . . . . . . . . . . . . . . . . . . . . . . . . . . . . . . . . . . . . . . . . . . . . . . . .3.2 Fixed-income markets . . . . . . . . . . . . . . . . . . . . . . . . . . . . . . . . . . . . . . . . . . . . . . . . . . . . . . . .3.3 Margin trading and security lending . . . . . . . . . . . . . . . . . . . . . . . . . . . . . . . . . . . . . . . . . .3.4 Securities clearing and settlement . . . . . . . . . . . . . . . . . . . . . . . . . . . . . . . . . . . . . . . . . . . .
4. Derivatives markets . . . . . . . . . . . . . . . . . . . . . . . . . . . . . . . . . . . . . . . . . . . . . . . . . . . . . . . . . . .4.1 International situation . . . . . . . . . . . . . . . . . . . . . . . . . . . . . . . . . . . . . . . . . . . . . . . . . . . . . . . .4.2 Spain’s derivatives markets . . . . . . . . . . . . . . . . . . . . . . . . . . . . . . . . . . . . . . . . . . . . . . . . . .
5. Collective investment schemes and venture capital companies . . . . .5.1 General overview . . . . . . . . . . . . . . . . . . . . . . . . . . . . . . . . . . . . . . . . . . . . . . . . . . . . . . . . . . . . .5.2 Securities investment funds and companies . . . . . . . . . . . . . . . . . . . . . . . . . . . . . . . . . .5.3 Foreign collective investment schemes marketed in Spain . . . . . . . . . . . . . . . . . . .5.4 Real estate investment funds and companies . . . . . . . . . . . . . . . . . . . . . . . . . . . . . . . . .5.5 Venture capital firms . . . . . . . . . . . . . . . . . . . . . . . . . . . . . . . . . . . . . . . . . . . . . . . . . . . . . . . . .
6. Securities firms and fund management companies . . . . . . . . . . . . . . . . . .6.1 Securities firms . . . . . . . . . . . . . . . . . . . . . . . . . . . . . . . . . . . . . . . . . . . . . . . . . . . . . . . . . . . . . . .6.2 Collective investment scheme management companies (SGIIC) . . . . . . . . . . . . . .6.3 Portfolio management companies (SGC) . . . . . . . . . . . . . . . . . . . . . . . . . . . . . . . . . . . . .6.4 Venture capital firm management companies (SGECR) . . . . . . . . . . . . . . . . . . . . . . .
Annex 1: Primary markets . . . . . . . . . . . . . . . . . . . . . . . . . . . . . . . . . . . . . . . . . . . . . . . . . . . . . .A.1.1 Primary markets. Issues and outstanding balances . . . . . . . . . . . . . . . . . . . . . .A.1.2 Issues and public offerings, by instruments. Amounts registered at the
CNMV . . . . . . . . . . . . . . . . . . . . . . . . . . . . . . . . . . . . . . . . . . . . . . . . . . . . . . . . . . . . . . . . . . . .A.1.3 Capital increases through issues of new stock registered at the CNMV,
except primary public offerings. 2003. Detail by issuer . . . . . . . . . . . . . . . . . .A.1.4 Primary public offerings registered at the CNMV. 2003 . . . . . . . . . . . . . . . . . .A.1.5 Secondary public offerings registered at the CNMV. 2003 . . . . . . . . . . . . . . . .A.1.6 Fixed-income issues registered at the CNMV. Main issuers. 2003 . . . . . . . .A.1.7 Fixed-income issues registered at the CNMV. Preference shares. 2003.
Detail by issuer . . . . . . . . . . . . . . . . . . . . . . . . . . . . . . . . . . . . . . . . . . . . . . . . . . . . . . . . . .
3
Índex
1515182328
3535373845
4949576263
676771
797983909090
9595
103104105
109111
112
113114114115
116

4
Annual report on the securities markets. 2003
A.1.8 Fixed-income issues registered at the CNMV. Convertible bonds. 2003 . .Detail by issuer . . . . . . . . . . . . . . . . . . . . . . . . . . . . . . . . . . . . . . . . . . . . . . . . . . . . . . . . .
A.1.9 Fixed-income issues registered at the CNMV. Non-convertibl bonds.2003. Detail by issuer . . . . . . . . . . . . . . . . . . . . . . . . . . . . . . . . . . . . . . . . . . . . . . . . . . . . . . . . .
A.1.10. Fixed-income issues registered at the CNMV. Mortgage bonds. 2003. Detail by issuer . . . . . . . . . . . . . . . . . . . . . . . . . . . . . . . . . . . . . . . . . . . . . . . . . . . . . . . . .
A.1.11 Fixed-income issues registered at the CNMV. Territorial bonds. 2003. Detail by issuer . . . . . . . . . . . . . . . . . . . . . . . . . . . . . . . . . . . . . . . . . . . . . . . . . . . . . . . . .
A.1.12 Fixed-income issues registered at the CNMV. Asset-backed bonds andnotes. 2003. Detail by issuer . . . . . . . . . . . . . . . . . . . . . . . . . . . . . . . . . . . . . . . . . . . .
A.1.13 Fixed-income issues registered at the CNMV. Commercial paper. 2003. Detail by issuer . . . . . . . . . . . . . . . . . . . . . . . . . . . . . . . . . . . . . . . . . . . . . . . . . . . . . . . . .
A.1.14 Fixed-income issues registered at the CNMV. Other issues. 2003. Detail by issuer . . . . . . . . . . . . . . . . . . . . . . . . . . . . . . . . . . . . . . . . . . . . . . . . . . . . . . . . . . . . . . . .
A.1.15 Issues of warrants and other financial contracts registered at the CNMV. 2003. Detail by issuer . . . . . . . . . . . . . . . . . . . . . . . . . . . . . . . . . . . . . . . . . . . . . . . . . . .
Annex 2: Secondary markets . . . . . . . . . . . . . . . . . . . . . . . . . . . . . . . . . . . . . . . . . . . . . . . . . .A.2.1 Secondary markets. Net revenues and earnings of listed companies.
2003 . . . . . . . . . . . . . . . . . . . . . . . . . . . . . . . . . . . . . . . . . . . . . . . . . . . . . . . . . . . . . . . . . . . .A.2.2.1 Secondary markets. Equities. World markets in 2003. Stock market in-
dexes. . . . . . . . . . . . . . . . . . . . . . . . . . . . . . . . . . . . . . . . . . . . . . . . . . . . . . . . . . . . . . . . . . . .A.2.2.2 Secondary markets. Equities. World markets in 2003. Trading volume,
P/E and dividend yield. . . . . . . . . . . . . . . . . . . . . . . . . . . . . . . . . . . . . . . . . . . . . . . . . .A.2.3 Secondary markets. Equities. Spanish stock market indexes in 2003 . .A.2.4 Secondary markets. Equities. Sector indexes (Madrid Stock Exchange).
2003 . . . . . . . . . . . . . . . . . . . . . . . . . . . . . . . . . . . . . . . . . . . . . . . . . . . . . . . . . . . . . . . . . . .A.2.5 Secondary markets. Equities. Market capitalisation and companies listed
on the Spanish stock exchanges . . . . . . . . . . . . . . . . . . . . . . . . . . . . . . . . . . . . . . . .A.2.6 Secondary markets. Equities. Concentration of capital on the Spanish
stock markets, by sector. 2003 . . . . . . . . . . . . . . . . . . . . . . . . . . . . . . . . . . . . . . . . .A.2.7 Secondary markets. Equities. capitalisation on the Spanish stock mar-
kets, by sector. 2003 . . . . . . . . . . . . . . . . . . . . . . . . . . . . . . . . . . . . . . . . . . . . . . . . . . .A.2.8 Secondary markets. Equities. Ownership of shares of listed companies
(Madrid Stock Exchange) . . . . . . . . . . . . . . . . . . . . . . . . . . . . . . . . . . . . . . . . . . . . . . . .A.2.9 Secondary and derivatives markets. Trading volume . . . . . . . . . . . . . . . . . . . .A.2.10 Secondary markets. Equities. Effective trading in equities on the Spanish
stock exchanges. 2003 . . . . . . . . . . . . . . . . . . . . . . . . . . . . . . . . . . . . . . . . . . . . . . . . .A.2.11 Secondary markets. Equities. Effective trading by type. 2003 . . . . . . . . . .A.2.12 Secondary markets. Equities. Effective trading in the electronic market
by type. 2003 . . . . . . . . . . . . . . . . . . . . . . . . . . . . . . . . . . . . . . . . . . . . . . . . . . . . . . . . . . .A.2.13 Secondary markets. Equities. Trading by non-residents . . . . . . . . . . . . . . . .A.2.14 Secondary markets. Equities. Order types on the electronic market.
2000-2003 . . . . . . . . . . . . . . . . . . . . . . . . . . . . . . . . . . . . . . . . . . . . . . . . . . . . . . . . . . . . .A.2.15 Secondary markets. Equities. Concentration of trading on the Spanish
stock markets by sector. 2003 . . . . . . . . . . . . . . . . . . . . . . . . . . . . . . . . . . . . . . . . . .A.2.16 Secondary markets. Equities. Trading frequency on the Spanish stock
exchanges 2003 . . . . . . . . . . . . . . . . . . . . . . . . . . . . . . . . . . . . . . . . . . . . . . . . . . . . . . . .A.2.17 Secondary markets. Equities. Trading on the Spanish stock markets by
sector. 2003 . . . . . . . . . . . . . . . . . . . . . . . . . . . . . . . . . . . . . . . . . . . . . . . . . . . . . . . . . . . .A.2.18 Secondary markets. Equities. Electronic market. Listed companies. 2003 .A.2.19 Secondary markets. Equities. Outcry market. Listed companies. 2003 . .A.2.20 Secondary markets. Equities. Second market . . . . . . . . . . . . . . . . . . . . . . . . . .
116
117
119
119
120
122
124
125
127
129
130
131132
133
134
135
136
136137
138139
140141
142
142
143
144145150204

A.2.21 Secondary markets. Equities. Effective trading in Spanish securities on he New York Stock Exchange . . . . . . . . . . . . . . . . . . . . . . . . . . . . . . . . . . . . . . . . . . . .
A.2.22 Secondary markets. Fixed-income. Trading volume in organised fixed-income markets . . . . . . . . . . . . . . . . . . . . . . . . . . . . . . . . . . . . . . . . . . . . . . . . . . . . . . . .
A.2.23 Secondary markets. Fixed-income. Government debt book-entry system. Outstanding balances . . . . . . . . . . . . . . . . . . . . . . . . . . . . . . . . . . . . . . . . . . . . . . . . . . .
A.2.24 Secondary markets. Fixed-income. Government debt book-entry system. Trading volume. Outright spot trades . . . . . . . . . . . . . . . . . . . . . . . . . . . . . . . . . . .
A.2.25 Secondary markets. Fixed-income. AIAF. Number of issuers and issues, and outstanding balances at 31/December . . . . . . . . . . . . . . . . . . . . . . . . . . . . . .
A.2.26 Secondary markets. Fixed-income. AIAF. Trading volume. 2003 . . . . . . . .A.2.27 Secondary markets. Fixed-income. AIAF. Trading volume by sector. 2003 A.2.28 Secondary markets. Fixed-income. Stock exchanges. Number of issuers
and issues, and listed capital at 31/December . . . . . . . . . . . . . . . . . . . . . . . . . .A.2.29 Secondary markets. Fixed-income. Stock exchanges. Issuers by sector. 2003 A.2.30 Secondary markets. Fixed-income. Stock exchanges. Issues listed by
sector. 2003 . . . . . . . . . . . . . . . . . . . . . . . . . . . . . . . . . . . . . . . . . . . . . . . . . . . . . . . . . . . .A.2.31 Secondary markets. Fixed-income. Stock exchanges. Outstanding bala-
ces by sector. 2003 . . . . . . . . . . . . . . . . . . . . . . . . . . . . . . . . . . . . . . . . . . . . . . . . . . . . .A.2.32 Secondary markets. Fixed-income. Stock exchanges. Convertible issues.
Numbers and listed capital at 31/December . . . . . . . . . . . . . . . . . . . . . . . . . . . . .A.2.33 Secondary markets. Fixed-income. Stock exchanges. Effective trading
volume. 2003 . . . . . . . . . . . . . . . . . . . . . . . . . . . . . . . . . . . . . . . . . . . . . . . . . . . . . . . . . .A.2.34 Secondary markets. Fixed-income. Stock exchanges. Trading volume by
sector . . . . . . . . . . . . . . . . . . . . . . . . . . . . . . . . . . . . . . . . . . . . . . . . . . . . . . . . . . . . . . . . . . .A.2.35 Secondary markets. Fixed-income. Stock exchanges. Trading volume by
issuer. 2003 . . . . . . . . . . . . . . . . . . . . . . . . . . . . . . . . . . . . . . . . . . . . . . . . . . . . . . . . . . . .A.2.36 Secondary markets. Fixed-income. Stock exchanges. Trading volume by
issue. 2003 . . . . . . . . . . . . . . . . . . . . . . . . . . . . . . . . . . . . . . . . . . . . . . . . . . . . . . . . . . . . .A.2.37 Secondary markets. Stock exchanges and SCLV. Margin trading and
security lending. 2003 . . . . . . . . . . . . . . . . . . . . . . . . . . . . . . . . . . . . . . . . . . . . . . . . . .A.2.38 Secondary markets. Stock exchanges and SCLV. Two-way security len-
ding by sector. 2003 . . . . . . . . . . . . . . . . . . . . . . . . . . . . . . . . . . . . . . . . . . . . . . . . . . . .
Annex 3: Derivatives markets . . . . . . . . . . . . . . . . . . . . . . . . . . . . . . . . . . . . . . . . . . . . . . . . .A.3.1.a Total trading volume in organised derivatives markets. Detail by ins-
trument . . . . . . . . . . . . . . . . . . . . . . . . . . . . . . . . . . . . . . . . . . . . . . . . . . . . . . . . . . . . . . . . .A.3.1.b Open interest in OTC derivatives markets. Detail by risk category . . . . . .A.3.2 International markets. Trading volume. . . . . . . . . . . . . . . . . . . . . . . . . . . . . . . . . .A.3.3 International markets. Trading volume. Prominent products . . . . . . . . . . . . .A.3.4 MEFF. Index contracts. Trading volume. Annual and monthly performan-
ce in 2003 . . . . . . . . . . . . . . . . . . . . . . . . . . . . . . . . . . . . . . . . . . . . . . . . . . . . . . . . . . . . . .A.3.5 MEFF. Index contracts. Open interest at end of period. Annual and
monthly performance in 2003 . . . . . . . . . . . . . . . . . . . . . . . . . . . . . . . . . . . . . . . . . .A.3.6 MEFF. Ibex-35 contracts. Trading frequency, number of trades (daily ave-
rage) and volume per trade. 2003 . . . . . . . . . . . . . . . . . . . . . . . . . . . . . . . . . . . . . .A.3.7 MEFF. Futures and options on stocks. Trading volume and open interest.
Annual and monthly performance in 2003 . . . . . . . . . . . . . . . . . . . . . . . . . . . . . .A.3.8 MEFF. Stock options. Trading volume and open interest. Detail by con-
tract type . . . . . . . . . . . . . . . . . . . . . . . . . . . . . . . . . . . . . . . . . . . . . . . . . . . . . . . . . . . . . . .A.3.9 MEFF. Government bond contracts. Trading volume. Annual performanceA.3.10 MEFF. Government bond contracts. Open interest. Annual performance
5
Índex
204
205
205
206
207208209
210211
212
213
214
215
216
217
218
219
220
221
223223224225
226
227
228
229
230231232

A.3.11 MEFF. Futures on 10Y government bonds. Trading frequency, number of trades (daily average) and volume per trade . . . . . . . . . . . . . . . . . . . . . . . . . . . .
A.3.12 MEFF. Contracts on short-term interest rates. Trading volume and open interest. Annual performance . . . . . . . . . . . . . . . . . . . . . . . . . . . . . . . . . . . . . . . . . . .
A.3.13 FC&M. Trading volume and open interest. Annual performance . . . . . . . . . .A.3.14 Market members. 2003. Number per category . . . . . . . . . . . . . . . . . . . . . . . . .A.3.15 Market members. 2003. No. of members required to attain a given per-
centage of total trading . . . . . . . . . . . . . . . . . . . . . . . . . . . . . . . . . . . . . . . . . . . . . . . . .A.3.16 Breakdown of trading, by account type. 2003 . . . . . . . . . . . . . . . . . . . . . . . . . .A.3.17 Breakdown of trading, by customer type. 2003 . . . . . . . . . . . . . . . . . . . . . . . . .A.3.18 Breakdown of trading, by type. 2003 . . . . . . . . . . . . . . . . . . . . . . . . . . . . . . . . . . .A.3.19 Warrant trading on the Madrid Stock Exchange . . . . . . . . . . . . . . . . . . . . . . . . .A.3.20 Equities warrants, by underlying asset. 2003 . . . . . . . . . . . . . . . . . . . . . . . . . . .
Annex 4: Collective investment schemes and venturecapital companies . . . . . . . . . . . . . . . . . . . . . . . . . . . . . . . . . . . . . . . . . . . . . . . . . . . . . . . . . . . . . . . .
A.4.1 Investment in securities. Number of institutions, assets and number of investors . . . . . . . . . . . . . . . . . . . . . . . . . . . . . . . . . . . . . . . . . . . . . . . . . . . . . . . . . . . . . . . .
A.4.2 Investment in securities. Yield on mutual funds by portfolio type . . . . . . .A.4.3 Investment in securities. FIM. Breakdown of assets at market value . . .A.4.4. Investment in securities. FIM. Transactions in derivatives . . . . . . . . . . . . . .A.4.5. Investment in securities .FIM. Breakdown of the foreign portfolio by region A.4.6 Investment in securities. FIM. Breakdown of change in assets . . . . . . . . . .A.4.7 Investment in securities. FIM and FIAMM. Assets, number of investors
and number of funds . . . . . . . . . . . . . . . . . . . . . . . . . . . . . . . . . . . . . . . . . . . . . . . . . . .A.4.8 Investment in securities. FIM. Yields, volatility and duration . . . . . . . . . . .A.4.9 Investment in securities. FIAMM. Breakdown of assets at market valueA.4.10 Investment in securities. FIAMM. Transactions in derivatives . . . . . . . . . . . .A.4.11 Investment in securities. FIAMM. Breakdown of change in assets . . . . . .A.4.12 Investment in securities. FIAMM. Yields, volatility and duration . . . . . . . .A.4.13 Investment in securities. Guaranteed funds. Breakdown of assets . . . . . .A.4.14 Investment in securities. Guaranteed funds. Transactions in derivatives .A.4.15 Investment in securities. SIM. Breakdown of assets at market value . . .A.4.16 Investment in securities. SIM. Transactions in derivatives . . . . . . . . . . . . . .A.4.17 Investment in securities. SIMCAV. Breakdown of assets at market value .A.4.18 Investment in securities. SIMCAV. Transactions in derivatives . . . . . . . . . . .A.4.19 Investment in securities. Foreign collective investment schemes marke-
ted in Spain . . . . . . . . . . . . . . . . . . . . . . . . . . . . . . . . . . . . . . . . . . . . . . . . . . . . . . . . . . . . .A.4.20 Investment in real estate. FII. Number, assets and investors . . . . . . . . . . .A.4.21 Investment in real estate. FII. Breakdown of assets . . . . . . . . . . . . . . . . . . . .A.4.22 Number of venture capital institutions . . . . . . . . . . . . . . . . . . . . . . . . . . . . . . . . . .A.4.23 Breakdown of funds raised by venture capital institutions, by type of
investor . . . . . . . . . . . . . . . . . . . . . . . . . . . . . . . . . . . . . . . . . . . . . . . . . . . . . . . . . . . . . . . .A.4.24 Breakdown of investment by venture capital institutions, by phase of
development . . . . . . . . . . . . . . . . . . . . . . . . . . . . . . . . . . . . . . . . . . . . . . . . . . . . . . . . . . . .A.4.25 Breakdown of investments by venture capital institutions, by sector . . . .
Annex 5: Securities firms and fund management companies . . . . . . . .A.5.1 Securities firms. Number, branches and agents . . . . . . . . . . . . . . . . . . . . . . . . .A.5.2.1 Securities firms. Ownership by financial institutions . . . . . . . . . . . . . . . . . . . . .A.5.2.2 Securities firms. Ownership by financial institutions. Percentage of share
capital . . . . . . . . . . . . . . . . . . . . . . . . . . . . . . . . . . . . . . . . . . . . . . . . . . . . . . . . . . . . . . . . . .A.5.3.1 Securities firms. Aggregate balance sheet. . . . . . . . . . . . . . . . . . . . . . . . . . . . . . .
6
Annual report on the securities markets. 2003
233
234235235
235236236236237238
239
241242243244244245
246248304305306307311312313314315316
316317317317
318
318319
321323323
323324

A.5.3.2 Securities firms. Broker-dealers. Aggregate balance sheet. . . . . . . . . . . . . .A.5.3.3 Securities firms. Brokers. Aggregate balance sheet. . . . . . . . . . . . . . . . . . . . . .A.5.4.1 Securities firms. Aggregate income statement . . . . . . . . . . . . . . . . . . . . . . . . . .A.5.4.2 Securities firms. Broker-dealers. Aggregate income statement . . . . . . . . . .A.5.4.3 Securities firms. Brokers. Aggregate income statement . . . . . . . . . . . . . . . . .A.5.5.1 Securities firms. Aggregate income statement. Quarterly performance A.5.5.2 Securities firms. Broker-dealers. Aggregate income statement. Quarterly
performance . . . . . . . . . . . . . . . . . . . . . . . . . . . . . . . . . . . . . . . . . . . . . . . . . . . . . . . . . . . .A.5.5.3 Securities firms. Brokers. Aggregate income statement. Quarterly per-
formance . . . . . . . . . . . . . . . . . . . . . . . . . . . . . . . . . . . . . . . . . . . . . . . . . . . . . . . . . . . . . . .A.5.6.1 Securities firms. Return on equity (ROE) before taxes in 2003 . . . . . . . . .A.5.6.2 Securities firms. Return on equity (ROE) after taxes in 2003 . . . . . . . . . . .A.5.7 Securities firms. Surplus equity over capital adequacy requirements
in 2003 . . . . . . . . . . . . . . . . . . . . . . . . . . . . . . . . . . . . . . . . . . . . . . . . . . . . . . . . . . . . . . . . .A.5.8 Securities firms. Volume traded . . . . . . . . . . . . . . . . . . . . . . . . . . . . . . . . . . . . . . . . .A.5.9 Securities firms. Results of proprietary trading . . . . . . . . . . . . . . . . . . . . . . . . . .A.5.10 Securities firms. Commission revenues . . . . . . . . . . . . . . . . . . . . . . . . . . . . . . . . .A.5.11 Securities firms. Consolidable groups. Type, concentration and compo-
sition . . . . . . . . . . . . . . . . . . . . . . . . . . . . . . . . . . . . . . . . . . . . . . . . . . . . . . . . . . . . . . . . . . .A.5.12 Securities firms. Consolidable groups. Aggregate balance sheet.. . . . . . . .A.5.13 Securities firms. Consolidable groups. Aggregate income statement . . . .A.5.14 Securities firms. Consolidable groups. Commission revenues and expen-
ses. 2003 . . . . . . . . . . . . . . . . . . . . . . . . . . . . . . . . . . . . . . . . . . . . . . . . . . . . . . . . . . . . . .A.5.15 Securities firms. Consolidable groups. Detail of items eliminated in the
2003 income statement . . . . . . . . . . . . . . . . . . . . . . . . . . . . . . . . . . . . . . . . . . . . . . . . .A.5.16 Collective investment scheme management companies (SGIIC) and
portfolio management companies (SGC). Number of companies and assets under management or advice . . . . . . . . . . . . . . . . . . . . . . . . . . . . . . . . . . .
A.5.17 Collective investment scheme management companies (SGIIC) and portfolio management companies (SGC). Aggregate balance sheet . . . . .
A.5.18 Collective investment scheme management companies (SGIIC) and portfolio management companies (SGC). Aggregate income statement
Annex 6 Composition of the CNMV Board . . . . . . . . . . . . . . . . . . . . . . . . . . . . . . . . . .
Annex 7 Composition of the CNMV Executive Committee . . . . . . . . . . . . .
Annex 8 Composition of the CNMV Advisory Committee . . . . . . . . . . . . . .
Annex 9 CNMV Directors . . . . . . . . . . . . . . . . . . . . . . . . . . . . . . . . . . . . . . . . . . . . . . . . . . . . . . . .
7
Índex
326328330331332333
334
335336336
337338339340
341342344
345
346
346
347
349
351
355
359
363

Index of tables:
Chapter 1
1.1 International economic indicators . . . . . . . . . . . . . . . . . . . . . . . . . . . . . . . . . . . . . . . . . . . . . . .1.2 The Spanish economy: Economic indicators . . . . . . . . . . . . . . . . . . . . . . . . . . . . . . . . . . . . .1.3 Net increase in households’ financial assets . . . . . . . . . . . . . . . . . . . . . . . . . . . . . . . . . . . . .1.4 Breakdown (%) of households’ financial assets . . . . . . . . . . . . . . . . . . . . . . . . . . . . . . . . . .1.5 Net increase in non-financial companies’ financial liabilities . . . . . . . . . . . . . . . . . . . . . .1.6 Net increase in financial institutions’ financial liabilities (excluding the Bank of Spain) 1.7 Equities markets: indexes and trading in 2003 . . . . . . . . . . . . . . . . . . . . . . . . . . . . . . . . . .1.8 New Markets: Index performance and volatility . . . . . . . . . . . . . . . . . . . . . . . . . . . . . . . . . .1.9 Gross issues and public offerings . . . . . . . . . . . . . . . . . . . . . . . . . . . . . . . . . . . . . . . . . . . . . . . .1.10 Trading in the secondary and derivatives markets . . . . . . . . . . . . . . . . . . . . . . . . . . . . . . . .1.11 Assets of collective investment schemes . . . . . . . . . . . . . . . . . . . . . . . . . . . . . . . . . . . . . . . . .1.12 Pre-tax earnings of securities firms and asset management firms . . . . . . . . . . . . . . . .
Chapter 2
2.1 Fixed-income securities issued by euro zone residents . . . . . . . . . . . . . . . . . . . . . . . . . . .2.2 Gross issues in Spain . . . . . . . . . . . . . . . . . . . . . . . . . . . . . . . . . . . . . . . . . . . . . . . . . . . . . . . . . . .2.3 Capital increases . . . . . . . . . . . . . . . . . . . . . . . . . . . . . . . . . . . . . . . . . . . . . . . . . . . . . . . . . . . . . . . . .2.4 Fixed-income issues in Spanish markets . . . . . . . . . . . . . . . . . . . . . . . . . . . . . . . . . . . . . . . .2.5 Fixed-income issues and shelf registrations filed with the CNMV. Breakdown by
instrument . . . . . . . . . . . . . . . . . . . . . . . . . . . . . . . . . . . . . . . . . . . . . . . . . . . . . . . . . . . . . . . . . . . . . . .
Chapter 3
3.1 Sector index performance. Madrid Stock Exchange. 2003. . . . . . . . . . . . . . . . . . . . . . . .3.2 Pre-tax profit of IGBM companies . . . . . . . . . . . . . . . . . . . . . . . . . . . . . . . . . . . . . . . . . . . . . . . .3.3 Change in the number of listed companies, by market. 2003 . . . . . . . . . . . . . . . . . . . .3.4 Equities trading in Spanish stock markets . . . . . . . . . . . . . . . . . . . . . . . . . . . . . . . . . . . . . . .3.5 Trading in Spanish stock markets, by sector . . . . . . . . . . . . . . . . . . . . . . . . . . . . . . . . . . . . .3.6 Effective trading of Spanish securities in the New York Stock Exchange . . . . . . . . . .3.7 Trading in organised fixed-income markets . . . . . . . . . . . . . . . . . . . . . . . . . . . . . . . . . . . . . .3.8 Issuers, listed issues and outstanding balances on AIAF at 31 December . . . . . . . .3.9 Issuers, listed issues and outstanding balances on the stock exchange at 31 De-
cember . . . . . . . . . . . . . . . . . . . . . . . . . . . . . . . . . . . . . . . . . . . . . . . . . . . . . . . . . . . . . . . . . . . . . . . . .3.10 Margin trading . . . . . . . . . . . . . . . . . . . . . . . . . . . . . . . . . . . . . . . . . . . . . . . . . . . . . . . . . . . . . . . . . . .
Chapter 4
4.1 International derivatives markets. Total trading by instrument . . . . . . . . . . . . . . . . . . .4.2 International derivatives markets. Trading in certain leading products . . . . . . . . . . .4.3 International derivative markets. Total trading . . . . . . . . . . . . . . . . . . . . . . . . . . . . . . . . . .4.4 Trading on Spain’s derivative markets . . . . . . . . . . . . . . . . . . . . . . . . . . . . . . . . . . . . . . . . . . .4.5 Trading in MEFF renta variable . . . . . . . . . . . . . . . . . . . . . . . . . . . . . . . . . . . . . . . . . . . . . . . . . . .4.6 Open interest in MEFF renta variable . . . . . . . . . . . . . . . . . . . . . . . . . . . . . . . . . . . . . . . . . . . .4.7 Trading in equities derivatives via EuroMEFF . . . . . . . . . . . . . . . . . . . . . . . . . . . . . . . . . . . . .4.8 Trading on MEFF renta fija. Futures: trading volume and market size . . . . . . . . . . . .4.9 Fixed-income derivatives via EuroMEFF . . . . . . . . . . . . . . . . . . . . . . . . . . . . . . . . . . . . . . . . . .4.10 Trading in warrants on the Madrid Stock Exchange . . . . . . . . . . . . . . . . . . . . . . . . . . . . . . .
8
Annual report on the securities markets. 2003
151719202122262829303131
35363738
39
5051525455565760
6162
67686971737474757576

Chapter 5
5.1 UCITS assets by country in 2003 . . . . . . . . . . . . . . . . . . . . . . . . . . . . . . . . . . . . . . . . . . . . . . . .5.2 Mutual fund assets by type in 2003 . . . . . . . . . . . . . . . . . . . . . . . . . . . . . . . . . . . . . . . . . . . . . .5.3 Ratio of fund assets to deposits at banks and thrifts (%) . . . . . . . . . . . . . . . . . . . . . . . .5.4 Breakdown of changes in fund assets . . . . . . . . . . . . . . . . . . . . . . . . . . . . . . . . . . . . . . . . . . . .5.5 Funds' domestic portfolio in relation to the outstanding balance of the Spanish
market . . . . . . . . . . . . . . . . . . . . . . . . . . . . . . . . . . . . . . . . . . . . . . . . . . . . . . . . . . . . . . . . . . . . . . . . .5.6 Basic features of new venture capital firms created under the Venture Capital
Law: status of firms created in 2003 as at 31 December 2003 . . . . . . . . . . . . . . . . . . .
Chapter 6
6.1 Broker-dealers: aggregate income statement in 2003 . . . . . . . . . . . . . . . . . . . . . . . . . . .6.2 Brokers: aggregate income statement in 2003 . . . . . . . . . . . . . . . . . . . . . . . . . . . . . . . . . .6.3 Securities firms: commission revenues . . . . . . . . . . . . . . . . . . . . . . . . . . . . . . . . . . . . . . . . . . .6.4 Securities firms: earnings on proprietary trading . . . . . . . . . . . . . . . . . . . . . . . . . . . . . . . . .
9
Índex
80818284
85
91
969699
100

Index of figures
Chapter 1
1.1 The Spanish economy’s savings and borrowing requirements . . . . . . . . . . . . . . . . . . . .1.2 Savings and non-financial investment by households and non-profit institution
serving households . . . . . . . . . . . . . . . . . . . . . . . . . . . . . . . . . . . . . . . . . . . . . . . . . . . . . . . . . . . . . .1.3 Savings and non-financial investment by non-financial companies . . . . . . . . . . . . . . .1.4 Official interest rates . . . . . . . . . . . . . . . . . . . . . . . . . . . . . . . . . . . . . . . . . . . . . . . . . . . . . . . . . . . . .1.5 Dollar-euro and yen-euro exchange rates . . . . . . . . . . . . . . . . . . . . . . . . . . . . . . . . . . . . . . .1.6 10-year government bond yields and private debt curve (BBB-AAA) . . . . . . . . . . . . .1.7 Stock market index performance . . . . . . . . . . . . . . . . . . . . . . . . . . . . . . . . . . . . . . . . . . . . . . . . .
Chapter 2
2.1 Gross issues in Spain, by type of instrument and sector . . . . . . . . . . . . . . . . . . . . . . . . .2.2 Fixed-income issues in the euro zone: breakdown of outstanding balance by
issuer . . . . . . . . . . . . . . . . . . . . . . . . . . . . . . . . . . . . . . . . . . . . . . . . . . . . . . . . . . . . . . . . . . . . . . . . . . .2.3 Securitisation issues filed with the CNMV . . . . . . . . . . . . . . . . . . . . . . . . . . . . . . . . . . . . . . . .2.4 Commercial paper: placements and yields . . . . . . . . . . . . . . . . . . . . . . . . . . . . . . . . . . . . . . .2.5 Commercial paper: breakdown of placements by maturity . . . . . . . . . . . . . . . . . . . . . .
Chapter 3
3.1 Ibex-35 index performance and implicit volatility . . . . . . . . . . . . . . . . . . . . . . . . . . . . . . . .3.2 Companies listed in the Spanish equity markets at year-end . . . . . . . . . . . . . . . . . . . .3.3 Capitalisation of the Spanish equity markets . . . . . . . . . . . . . . . . . . . . . . . . . . . . . . . . . . . . .3.4 Market capitalisation of equities by sector . . . . . . . . . . . . . . . . . . . . . . . . . . . . . . . . . . . . . . .3.5 Yearly turnover velocity in the Spanish electronic market . . . . . . . . . . . . . . . . . . . . . . . .3.6 Equities trading in Spanish stock markets by non-residents (half-yearly figures)3.7 Shares held by FIM funds . . . . . . . . . . . . . . . . . . . . . . . . . . . . . . . . . . . . . . . . . . . . . . . . . . . . . . . .3.8 Interest rates on 3-month commercial paper, interbank deposits and repos in
2003 . . . . . . . . . . . . . . . . . . . . . . . . . . . . . . . . . . . . . . . . . . . . . . . . . . . . . . . . . . . . . . . . . . . . . . . . . . . .3.9 Long-term fixed-income yields in 2003 (corporate vs. public) . . . . . . . . . . . . . . . . . . . .3.10 Public debt. Trading and outstanding balance. 2003 . . . . . . . . . . . . . . . . . . . . . . . . . . . . .3.11 Trading on AIAF by segment . . . . . . . . . . . . . . . . . . . . . . . . . . . . . . . . . . . . . . . . . . . . . . . . . . . . .3.12 Trading in fixed-income securities on the stock exchanges . . . . . . . . . . . . . . . . . . . . . . .3.13 Securities lending . . . . . . . . . . . . . . . . . . . . . . . . . . . . . . . . . . . . . . . . . . . . . . . . . . . . . . . . . . . . . . . .
Chapter 4
4.1 Trading in Ibex-35 futures and options as a percentage of trading on the electro-nic market . . . . . . . . . . . . . . . . . . . . . . . . . . . . . . . . . . . . . . . . . . . . . . . . . . . . . . . . . . . . . . . . . . . . . . .
Chapter 5
5.1 Assets managed by UCITS in 2003: by type . . . . . . . . . . . . . . . . . . . . . . . . . . . . . . . . . . . . .5.2 Worldwide assets managed by UCITS: 4Q03 (market share, %) . . . . . . . . . . . . . . . .5.3 Mutual fund assets . . . . . . . . . . . . . . . . . . . . . . . . . . . . . . . . . . . . . . . . . . . . . . . . . . . . . . . . . . . . . . .5.4 Annual yield on Mutual Funds . . . . . . . . . . . . . . . . . . . . . . . . . . . . . . . . . . . . . . . . . . . . . . . . . . . .
FIAMM . . . . . . . . . . . . . . . . . . . . . . . . . . . . . . . . . . . . . . . . . . . . . . . . . . . . . . . . . . . . . . . . . . . . . . . . .Fixed-income FIM . . . . . . . . . . . . . . . . . . . . . . . . . . . . . . . . . . . . . . . . . . . . . . . . . . . . . . . . . . . . . . . .Mixed fixed-income FIM . . . . . . . . . . . . . . . . . . . . . . . . . . . . . . . . . . . . . . . . . . . . . . . . . . . . . . . . . .
10
Annual report on the securities markets. 2003
18
192123242527
37
39414444
50525353545556
575859606163
75
79808186868687

Mixed equity FIM . . . . . . . . . . . . . . . . . . . . . . . . . . . . . . . . . . . . . . . . . . . . . . . . . . . . . . . . . . . . . . . . .Spanish, Euro and European equity FIM . . . . . . . . . . . . . . . . . . . . . . . . . . . . . . . . . . . . . . . . .Guaranteed FIM and global funds . . . . . . . . . . . . . . . . . . . . . . . . . . . . . . . . . . . . . . . . . . . . . . . .
Chapter 6
6.1 Broker-dealers: pre-tax earnings and ROE . . . . . . . . . . . . . . . . . . . . . . . . . . . . . . . . . . . . . . .6.2 Brokers: earnings and ROE after taxes . . . . . . . . . . . . . . . . . . . . . . . . . . . . . . . . . . . . . . . . . . .6.3 Securities firms: brokerage of equities traded in domestic markets. Volume and
brokerage fee revenues . . . . . . . . . . . . . . . . . . . . . . . . . . . . . . . . . . . . . . . . . . . . . . . . . . . . . . . . . .6.4 Pre-tax earnings of consolidable groups. Contribution by securities firms and
other entities . . . . . . . . . . . . . . . . . . . . . . . . . . . . . . . . . . . . . . . . . . . . . . . . . . . . . . . . . . . . . . . . . . . .6.5 IIC management companies: managed assets and pre-tax earnings . . . . . . . . . . . . .6.6 Portfolio management companies: asset under management or advice and pre-
tax earnings . . . . . . . . . . . . . . . . . . . . . . . . . . . . . . . . . . . . . . . . . . . . . . . . . . . . . . . . . . . . . . . . . . . . .
11
Índex
878788
9797
99
101104
105

Index of boxes:
■ Public accounts in industrialised countries ...........................................................................................■ The euro-dollar exchange rate.....................................................................................................................■ Performance of technological stocks in the main international markets ...............................■ Synthetic securitisation....................................................................................................................................■ The first transatlantic members in Latibex............................................................................................■ Earnings improvement at listed companies .........................................................................................■ MEFF’s central counterparty for public debt..........................................................................................■ International competition in the financial futures and options markets ...............................■ New category of member at MEFF.............................................................................................................■ New Collective Investment Schemes Law..............................................................................................■ Hedge funds...........................................................................................................................................................■ Regulation of research and advice activities in the securities markets..................................
12
Annual report on the securities markets. 2003
1624284223242570728288
102

CHAPTER 1
OVERVIEW OF THE SECURITIESMARKETS

1. Overview of the securities markets
1.1 Economic situation
There was a generalised recovery of the global economy in 2003, with stronger growth thanthe previous year and no notable inflation problems, at least in the largest economies. In theUS, there was a notable increase in GDP and imports, which boosted international economicactivity, and the strong growth in Japan suggests that it is finally overcoming the crisis thathas hampered its economy for more than a decade. Latin America also performed positivelyfollowing the difficulties suffered in 2002. The main exception in this healthy global economicscenario was the euro zone, where overall growth was affected by the stagnation of the French,German and Italian economies.
15
Overview of the securities markets
Table 1.1International economic indicators
GDP(a) International demand(a) Unemploment rate(b)
2001 2002 2003 2001 2002 2003 2001 2002 2003
OECD 1.0 1.7 2.2 0.7 1.9 2.5 6.4 6.9 7.1US 0.5 2.2 3.1 0.7 2.8 3.3 4.8 5.8 6.0Japan 0.4 -0.3 2.7 1.2 -1.0 2.0 5.0 5.4 5.3Euro zone 1.7 0.9 0.5 1.1 0.5 1.2 8.0 8.4 8.8
Germany 1.0 0.2 -0.1 -0.7 -1.6 0.3 7.4 8.1 8.7Spain 2.8 2.0 2.4 3.0 2.6 3.4 10.5 11.4 11.2France 2.1 1.1 0.5 2.0 1.5 1.3 8.7 9.0 9.7Italy 1.7 0.4 0.4 1.4 1.3 1.3 9.6 9.1 8.8
UK 2.1 1.6 2.2 2.7 2.8 2.5 5.1 5.2 5.0Latin America 0.4 -0.4 1.5 - - - 9.8 10.6 10.7
Inflación(c)Saldo Saldo cuenta
presupuestario(d) corriente(d)
2001 2002 2003 2001 2002 2003 2001 2002 2003
OECD 2.8 2.1 1.9 -1.1 -2.9 -3.7 -1.1 -1.2 -1.2US 2.0 1.4 1.8 -0.2 -3.3 -4.8 -3.9 -4.6 -4.9Japan -1.6 -1.3 -1.4 -6.1 -7.9 -8.0 2.1 2.8 3.1Euro zone 2.3 2.2 1.9 -1.7 -2.3 -2.7 0.2 0.9 0.4
Germany 1.6 1.3 1.0 -2.8 -3.5 -3.9 0.2 2.2 2.2Spain 3.3 3.5 3.1 -0.4 0.0 0.3 -2.8 -2.4 -2.8France 1.4 1.7 1.8 -1.5 -3.3 -4.1 1.6 1.9 1.0Italy 2.7 3.1 2.5 -2.7 -2.4 -2.5 -0.1 -0.8 -1.5
UK 2.2 1.3 1.5 0.7 -1.6 -3.2 -2.4 -1.7 -1.7Latin America 6.0 12.1 9.0 -3.2 -3.0 -2.4 -2.8 -0.9 0.4(a) Annual rate of change, in real terms (%).(b) Annual average (% of active population). (c) Consumer spending deflator (%).(d) Surplus (+) or deficit (-) as a % of GDPSources: OECD, INE and ECLAC.
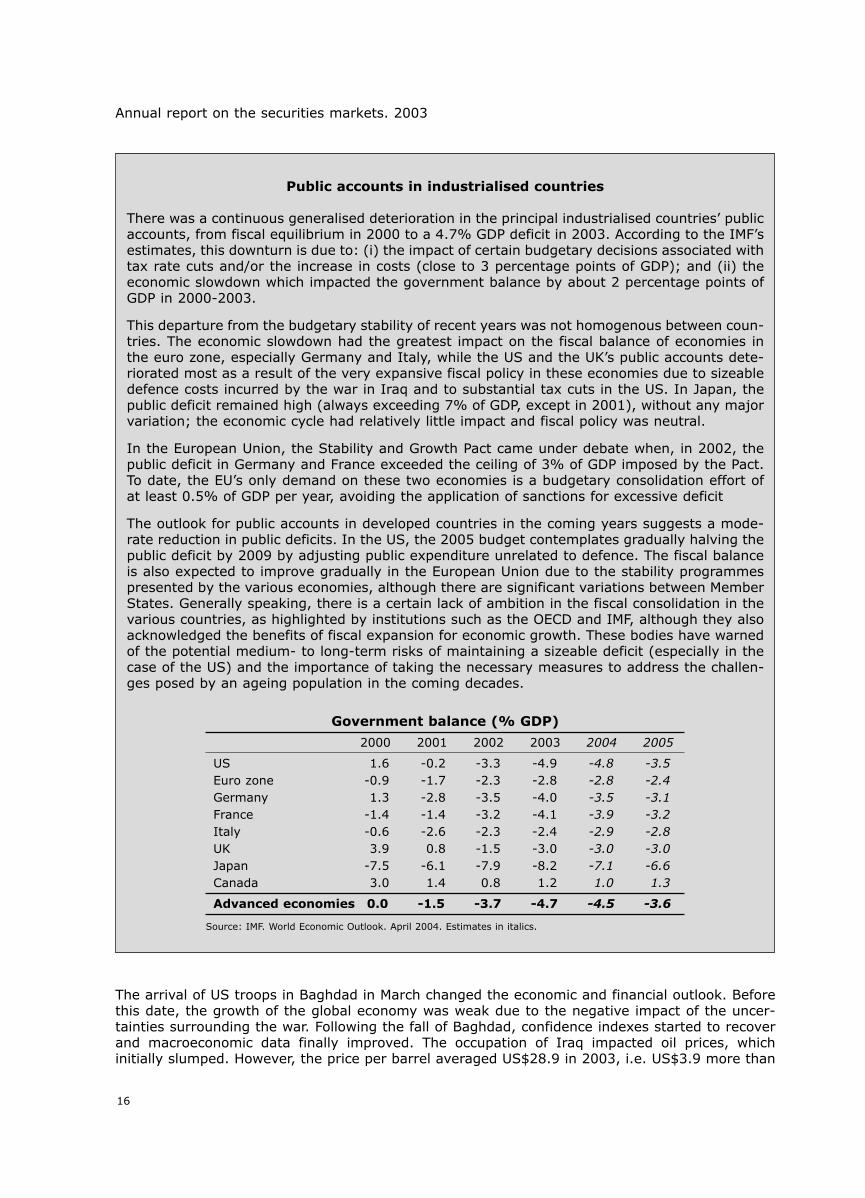
Public accounts in industrialised countries
There was a continuous generalised deterioration in the principal industrialised countries’ publicaccounts, from fiscal equilibrium in 2000 to a 4.7% GDP deficit in 2003. According to the IMF’sestimates, this downturn is due to: (i) the impact of certain budgetary decisions associated withtax rate cuts and/or the increase in costs (close to 3 percentage points of GDP); and (ii) theeconomic slowdown which impacted the government balance by about 2 percentage points ofGDP in 2000-2003.
This departure from the budgetary stability of recent years was not homogenous between coun-tries. The economic slowdown had the greatest impact on the fiscal balance of economies inthe euro zone, especially Germany and Italy, while the US and the UK’s public accounts dete-riorated most as a result of the very expansive fiscal policy in these economies due to sizeabledefence costs incurred by the war in Iraq and to substantial tax cuts in the US. In Japan, thepublic deficit remained high (always exceeding 7% of GDP, except in 2001), without any majorvariation; the economic cycle had relatively little impact and fiscal policy was neutral.
In the European Union, the Stability and Growth Pact came under debate when, in 2002, thepublic deficit in Germany and France exceeded the ceiling of 3% of GDP imposed by the Pact.To date, the EU’s only demand on these two economies is a budgetary consolidation effort ofat least 0.5% of GDP per year, avoiding the application of sanctions for excessive deficit
The outlook for public accounts in developed countries in the coming years suggests a mode-rate reduction in public deficits. In the US, the 2005 budget contemplates gradually halving thepublic deficit by 2009 by adjusting public expenditure unrelated to defence. The fiscal balanceis also expected to improve gradually in the European Union due to the stability programmespresented by the various economies, although there are significant variations between MemberStates. Generally speaking, there is a certain lack of ambition in the fiscal consolidation in thevarious countries, as highlighted by institutions such as the OECD and IMF, although they alsoacknowledged the benefits of fiscal expansion for economic growth. These bodies have warnedof the potential medium- to long-term risks of maintaining a sizeable deficit (especially in thecase of the US) and the importance of taking the necessary measures to address the challen-ges posed by an ageing population in the coming decades.
16
Annual report on the securities markets. 2003
Government balance (% GDP)
2000 2001 2002 2003 2004 2005
US 1.6 -0.2 -3.3 -4.9 -4.8 -3.5Euro zone -0.9 -1.7 -2.3 -2.8 -2.8 -2.4Germany 1.3 -2.8 -3.5 -4.0 -3.5 -3.1France -1.4 -1.4 -3.2 -4.1 -3.9 -3.2Italy -0.6 -2.6 -2.3 -2.4 -2.9 -2.8UK 3.9 0.8 -1.5 -3.0 -3.0 -3.0Japan -7.5 -6.1 -7.9 -8.2 -7.1 -6.6Canada 3.0 1.4 0.8 1.2 1.0 1.3
Advanced economies 0.0 -1.5 -3.7 -4.7 -4.5 -3.6
Source: IMF. World Economic Outlook. April 2004. Estimates in italics.
The arrival of US troops in Baghdad in March changed the economic and financial outlook. Beforethis date, the growth of the global economy was weak due to the negative impact of the uncer-tainties surrounding the war. Following the fall of Baghdad, confidence indexes started to recoverand macroeconomic data finally improved. The occupation of Iraq impacted oil prices, whichinitially slumped. However, the price per barrel averaged US$28.9 in 2003, i.e. US$3.9 more than

in 2002 due, inter alia, to political problems in exporting countries, the OPEC agreements, strongdemand in China, and the persisting uncertainty regarding the conflict in the Middle East.
Borrowing requirements increased in 2003 due to the greater public deficit in the world’s largesteconomies (see table 1.1). Owing to expansive fiscal policy in the US, the deficit stood at 4.8% ofGDP in 2003, while the deficit in the euro zone was 2.7% of GDP due to the reduction in revenuescaused by the economic slowdown (see box). There was an additional increase in the already-largeUS current account deficit, which rose 3 tenths of a point to 4.9% of GDP. This current accountdeficit was financed in part by the acquisition of financial assets in the US by a number of mone-tary institutions in Asia in order to avoid a greater depreciation of the US dollar against theircurrencies. In the euro zone, the current account surplus fell to 0.4% of GDP in 2003, a year inwhich the euro appreciated sharply.
The economic environment in Spain
The Spanish economy was a positive exception within the euro zone. Spain’s GDP grew 2.4%, i.e.4 tenths of point more than in 2002 and 1.9% more than the average in the euro zone. The num-ber of people in work rose substantially, and inflation was lower than in 2002 despite economicgrowth. The public accounts also contributed to Spain’s healthy economy, generated a surplus of0.3% of GDP. The deficit in the current and capital account balance increased by 3 tenths of apoints, to 1.6% of GDP. Economic growth in Spain was underpinned mainly by consumer spending.
17
Overview of the securities markets
Table 1.2The Spanish economy: Economic indicators
Year-on-year change, except where indicated otherwise
1999 2000 2001 2002 2003
GDP (constant prices)GDP (at market prices) 4.2 4.2 2.8 2.0 2.4
Domestic demand (1) 5.6 4.6 3.0 2.6 3.4Household spending (2) 4.7 4.0 2.8 2.6 3.0Public expenditure 4.2 5.1 3.6 4.4 4.6Gross fixed capital formation 8.8 5.7 3.3 1.0 3.0Machinery and equipment 8.6 5.1 0.4 -2.7 2.2Construction 9.0 6.1 5.8 4.2 3.7
Net external demand (1) -1.4 -0.4 -0.2 -0.6 -1.3Exports 7.7 10.0 3.6 0.0 4.0Imports 12.6 10.6 4.0 1.8 6.7
Other indicators
CPI December to December 2.9 4.0 2.7 4.0 2.6Employment: 4Q labour force survey (3) 5.7 5.5 3.1 1.6 3.0Unemployment: 4Q labour force survey (% of active population) 15.3 13.4 10.5 11.5 11.2Current & capital account balance (% of GDP) -1.2 -2.6 -2.0 -1.3 -1.6Public administrations budget balance (% of GDP) -1.2 -0.9 -0.4 0.0 0.3(1) Contribution to GDP growth.(2) Includes data of non-profit institutions serving households.(3) The Labour Force Survey data since 2001 were obtained under the National Statistics Institute's (INE) new methodology for this survey.Sources: INE, Bank of Spain and European Commission.
Economic growth in Spain was underpinned mainly by consumer spending and investment inhomes and capital goods. Accordingly, national savings were maintained at around 22.8% of GDP,while gross fixed capital formation rose by 4 tenths of a point to 25.9%. Owing to the mismatchbetween savings and investment, the Spanish economy’s borrowing requirement increased to2.0% of GDP (compared with 1.6% in 2002).1.2.
Households1
Households registered financial savings2 equivalent to 0.8% of GDP in 2003 (1.5% of GDP in2002), which is the lowest level since 1995. Their net acquisitions of financial assets reached10.8% of GDP due to the increase in investments in equities and mutual funds. Acquisitions offinancial liabilities grew to 10% of GDP due to the sharp increase in long-term loans associatedwith financing property investments by households.
The net acquisition of financial assets exceeded €80 billion in 2003, which is significantly higherthan 2002 (€62.4 billion, see Table 1.3). The distribution of financial investments in this sectorchanged in 2003 since the some higher-risk assets gained importance at the expense of more con-servative assets. Investments in mutual funds were the destination for close to 30% of house-holds’ financial flows (compared with 12% in 2002), whereas the weighting of acquisitions of cash,
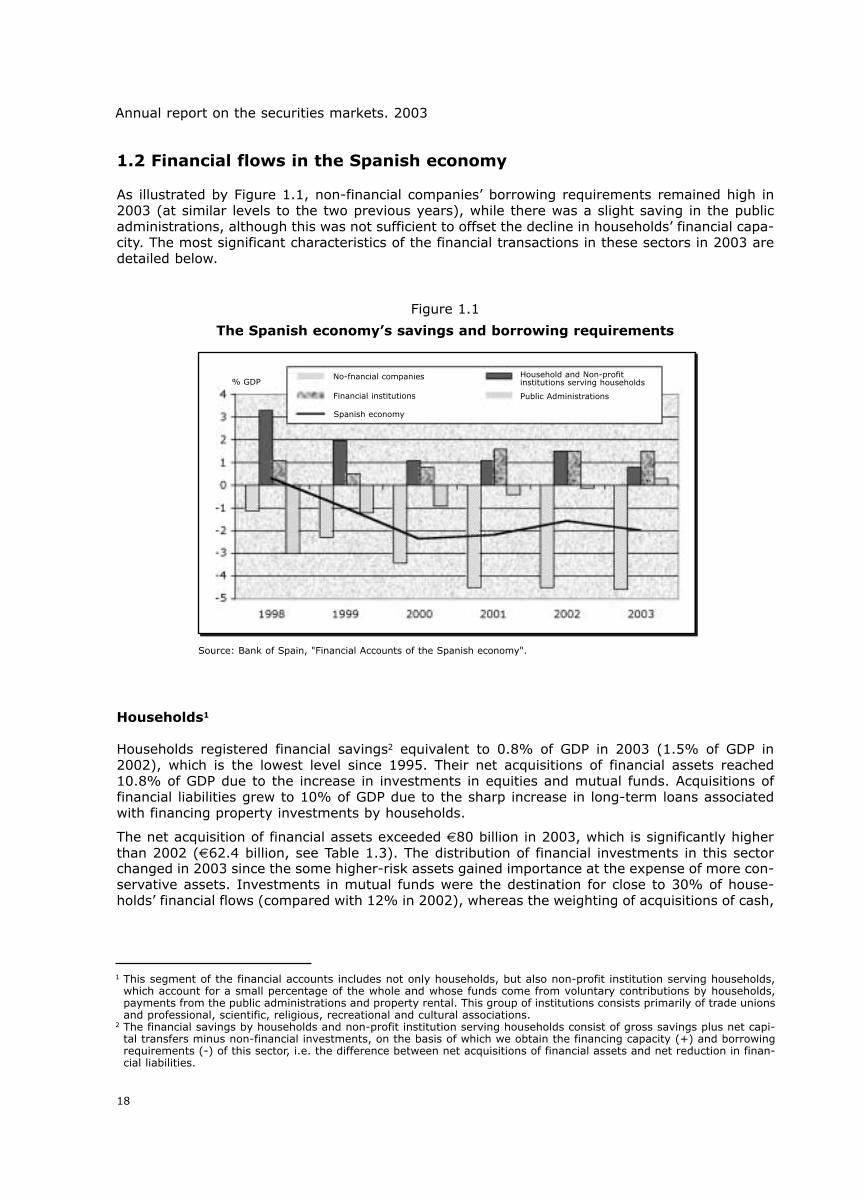
1.2 Financial flows in the Spanish economy
As illustrated by Figure 1.1, non-financial companies’ borrowing requirements remained high in2003 (at similar levels to the two previous years), while there was a slight saving in the publicadministrations, although this was not sufficient to offset the decline in households’ financial capa-city. The most significant characteristics of the financial transactions in these sectors in 2003 aredetailed below.
18
Annual report on the securities markets. 2003
Figure 1.1
The Spanish economy’s savings and borrowing requirements
Source: Bank of Spain, "Financial Accounts of the Spanish economy".
1 This segment of the financial accounts includes not only households, but also non-profit institution serving households,which account for a small percentage of the whole and whose funds come from voluntary contributions by households,payments from the public administrations and property rental. This group of institutions consists primarily of trade unionsand professional, scientific, religious, recreational and cultural associations.
2 The financial savings by households and non-profit institution serving households consist of gross savings plus net capi-tal transfers minus non-financial investments, on the basis of which we obtain the financing capacity (+) and borrowingrequirements (-) of this sector, i.e. the difference between net acquisitions of financial assets and net reduction in finan-cial liabilities.
Spanish economy
Financial institutions
No-fnancial companies% GDP
Public Administrations
Household and Non-profitinstitutions serving households

19
Overview of the securities markets
3 These items appear under the section for insurance underwriting provisions, along with the reserves for premiums andclaims.
Figure 1.2
Savings and non-financial investment by households and non-profitinstitution serving households
Source: Bank of Spain, "Financial Accounts of the Spanish economy".
Table 1.3Net increase in households’ financial assets (1)
Amounts in millions of euros
1998 1999 2000 2001 2002 2003
Cash and deposits 10,328 40,034 42,646 29,443 37,807 31,818Securities other than shares -2,820 2,973 -1,033 549 -203 3,859LoansShares and other equities 27,826 -12,049 -11,263 4,537 7,635 22,687
Shares -1,637 -3,238 5,514 -2,823 3,820 3,194Other equities 1,706 1,845 2,919 2,373 2,553 2,085Mutual funds 27,757 -10,656 -19,696 4,988 1,262 17,408
Insurance underwriting provisions 12,554 18,788 20,051 16,923 18,034 15,325Other accounts receivable 3,250 5,956 6,682 -84 -851 6,888Total 51,139 55,702 57,084 51,367 62,422 80,578
(1) Includes private non-profit institutions.Source: Bank of Spain, "Financial accounts of the Spanish economy".
deposits and hedging instruments (life insurance and pension funds3) declined from 90% of thetotal in 2002 to 59% in 2003, although they continue to be the largest group. Investments infixed-income securities also increased, especially long-term securities, following a somewhatmixed performance in the preceding years.
The value of the financial assets held by households at 2003 year-end amounted to €1.27 trillion,which represents an increase of almost €156.603 billion compared with 2002. This difference bet-ween this figure and the value of financial assets acquired by households (see Table 1.3) amounts
Millions of euros
Gross savings plus net capital transfers (LH scale)
Gross capital expenditure plus inventory variation (LH scale)
Financing capacity (+)/Borrowing requirement (-) (RH scale)
Millions of euros

to €76.025 billion and was caused by rallying prices of financial assets in portfolios, especially sha-res, in line with the stock market recovery during the year4 .
The main characteristics of household investment in financial assets were as follows (see Table1.4):
• Cash and deposits are still the largest component, with over 40% of the portfolio. However, thisrepresents a decline on 2002.
• The accumulated balance of shares represented close to 26% of households’ financial assets, i.e.there was a recovery in their relative weighting following a decline of over 6 percentage pointsin the three preceding years. Similarly, the decline in investments in mutual funds was turnedaround and they once again account for over 12% of households’ portfolios. However, they arestill far from the record-high attained in 1998 (18.5%).
• Contingency hedging instruments retained their weighting in households’ portfolios (around15%).
• Fixed-income securities continued to play a minor role, although they increased slightly.
20
Annual report on the securities markets. 2003
Table 1.4Breakdown (%) of households’ financial assets(1)
BalanceCash and Fixedincome Mutual
Insurancemillons
deposits securitisShares
fundsunderwriting Other
of euros provisions
1996 699,990 46.7 3.3 20.1 13.9 10.8 5.1
1997 796,115 40.8 2.8 24.1 17.7 11.3 3.4
1998 935,789 35.8 2.4 28.8 18.8 11.1 3.2
1999 1,029,312 36.4 2.4 29.3 16.6 12.0 3.3
2000 1,066,743 39.1 2.5 27.8 13.4 13.6 3.6
2001 1,125,450 39.6 2.3 27.9 12.5 14.2 3.4
2002 1,109,489 43.0 2.4 23.1 11.9 15.8 3.8
2003 1,266,092 40.2 2.9 26.1 12.1 15.1 3.7(1) Includes private non-profit institutions.Source: Bank of Spain, "Financial accounts of the Spanish economy".
4 In 2002, net acquisitions of financial assets had totalled €62.422 billion, although asset depreciation in that period due tomajor stock market losses caused the balance of financial assets of households and non-profit institution serving house-holds to fall by €15.961 billion to €1.1 trillion.
Financing of companies
Non-financial companies
Non-financial companies’ borrowing requirements continued to be higher than the rest of the resi-dent sectors in the Spanish economy. These companies have a financial deficit due to their ordi-nary activity and capital expenditure.
In 2003, their net financial transactions were negative to the tune of €34.4 billion (4.6% of GDP),which represents a small increase on 2002 when borrowing requirements amounted to 4.5% ofGDP.

21
Overview of the securities markets
Figure 1.3
Savings and non-financial investment by non-financial companies
Source: Bank of Spain, "Financial accounts of the Spanish economy".
Table 1.5Net increase in non-financial companies’ financial liabilities
Amounts in millions of euros
1999 2000 2001 2002 2003
Shares, held by 29,210 78,208 34,442 42,018 37,812Non-financial companies 2,625 22,412 6,386 8,990 11,720Financial institutions 4,209 5,520 -588 3,144 11,829Public administrations 632 -92 681 997 1,863Households and non-profit institutions 165 3,555 1,394 4,557 5,156Rest of world 21,579 46,814 26,569 24,329 7,244
Securities other than shares, held by 2,314 -7,217 -717 -2,597 -1,024Non-financial companies 299 -3,740 -323 -855 -666Financial institutions 970 -2,868 -707 -1,228 -216Public administrations 2 2 2 4 5Households and non-profit institutions 265 -2,116 118 -593 72Rest of world 777 1,505 193 75 -218
Loans, granted by 47,717 67,832 70,670 66,603 75,397Non-financial companies 368 158 -391 -191 -57Financial institutions 29,282 45,538 42,707 43,915 52,709Public administrations 1,007 626 2,031 1,924 1,924Rest of world 17,061 21,510 26,323 20,956 20,821
Trade credit and advances 44,787 41,256 36,652 41,120 50,249Others 355 -1,823 -2,145 -1,606 -228
Total 124,382 178,256 138,902 145,539 162,206
Source: Bank of Spain, "Financial accounts of the Spanish economy".
The net acquisition of financial assets by non-financial companies amounted to €127.8 billion in2003 (€114.5 billion in 2002) due to the increase in assets classed as "Other accounts receiva-ble", which are linked to the credit granted by these entities to other companies in the perfor-mance of their ordinary activity.
Millions of euros Millions of euros
Gross savings plus net capital transfers (LH scale)
Gross capital expenditure plus inventory variation (LH scale)
Financing capacity (+)/Borrowing requirement (-) (RH scale)

22
Annual report on the securities markets. 2003
Table 1.6Net increase in financial institutions’ financial liabilities
(excluding the Bank of Spain)
Amounts in millions of euros
1999 2000 2001 2002 2003
Monetary financial institutions Total 77,458 87,092 127,679 104,004 168,714
Cash and deposits 48,495 82,613 99,718 85,806 120,125Fixed-income 28,598 -2,066 14,445 12,520 41,397Loans 224 194 318 288 49Shares and other equities -6,303 1,585 11,204 11,794 6,880Insurance underwriting provisions 766 -17 187 -467 684Other accounts receivable 5,678 4,783 1,808 -5,937 -422
Non-monetary financial institutionsTotal 33,574 38,632 25,721 37,397 80,968
Cash and deposits 629 745 -1,614 444 -811Fixed-income 6,014 6,376 10,133 19,346 32,304Loans 454 -1,354 -1,573 213 -52Shares and other equities 7,605 2,922 -159 -3,545 29,173Insurance underwriting provisions 20,202 24,487 21,720 23,584 17,118Other accounts receivable -1,330 5,456 -2,786 -2,646 3,236
Source: Bank of Spain, "Financial accounts of the Spanish economy
Non-financial companies acquired €162.2 billion of net financial liabilities in 2003, compared with€145.5 billion in 2002. Commercial loans continued to be the main form of financing for non-finan-cial companies, representing close to 78% of the total acquisition of liabilities. Their relative impor-tance increased in 2003 compared with other sources of financing, such as shares (see Table 1.5).
As for counterparties in financing, the importance of non-residents continued to decline, and theyprovided close to 20% of funds raised in 2003 (compared with 40% in 2000). All the resident ins-titutional categories gained in importance in financing in this sector, especially financial institutionsand non-financial companies
Financial institutions5
Together with households and non-profit institutions and, more recently, public administrations,financial institutions tend to present positive net financial savings. As in 2002, this positive balan-ce amounted to 1.5% of GDP, although there was a sharp increase in the acquisition of financialassets and liabilities.
The acquisition of financial assets by financial institutions increased to 37.1% of GDP in 2003 (com-pared with 22.7% of GDP in 2002) due to growth in loans and to the acquisition of fixed-incomesecurities. Acquisitions of liabilities rose to 35.6% of GDP (21.2% in 2002) due to the large volu-me of funds raised through the issuance of fixed-income securities, deposits and shares and otherequities.
5 In accordance with SEC-95, this sector includes monetary financial institutions (Bank of Spain, private sector banks, thrifts,credit cooperatives, ICO, credit finance institutions and some FIAMM) and non-monetary financial institutions (all other IICs,securitisation funds, venture capital companies and funds, broker-dealers, private insurance companies, prudential institu-tions, Consorcio de Compensación de Seguros, pension funds and other financial services providers such as securities bro-kers, stock market management companies, IIC management companies, etc.).

23
Overview of the securities markets
Figure 1.4
Official interest rates
Table 1.6 illustrates the breakdown of funds raised by both monetary and non-monetary financialinstitutions. Monetary financial institutions, excluding the Bank of Spain, raised close to €169billion in funds, 62% more than the previous year. Cash and deposits continued to be the mainfunding source for these institutions, although their weighting declined in favour of fixed-income,which accounted for close to 25% of funds. The third-largest source of funds continued to be theissuance of shares and other equities, which performed in line with FIAMM subscriptions during theyear.
Non-monetary financial institutions increased their financial liabilities by 116% in 2003 to €80billion. This large volume of funds was raised primarily in the form of fixed-income instruments(40%) and shares and other equities (36%) due to sizeable subscriptions in FIM (see Chapter 5).Insurance underwriting provisions were the third-largest source of funding (21%).
1.3 World financial markets
Securities markets were affected by several factors in 2003. The war in Iraq triggered a change intrend in the markets of assets issued by private institutions, debt and shares, whose prices roseconsiderably as the uncertainty decreased. In addition, these securities appreciated due to incre-ased liquidity caused by expansive monetary policies and low returns on more conservative inves-tments, such as developed countries’ public debt.
Official interest rates
The European Central Bank (ECB) and the Federal Reserve maintained a lax monetary policy,which was reinforced with additional interest rate cuts. In the first half of 2003, the FederalReserve showed that it was concerned about a potential deflationary situation, and cut the inter-vention rate to 1.0% in June, the lowest rate in over forty years. The ECB cut its minimum ratetwice (in March and June) to 2.0% because of the economic stagnation in the euro zone, wheregrowth and inflation data and projections fell gradually throughout the year.
USA: Fed Fund rateJapan: discount rateEuro zone: weekly auction minimum rate
Jan-00 Jul-00 Jul-01Jan-01 Jul-02Jan-02 Jul-03Jan-03

Currency markets
The euro again appreciated against the major currencies. In 2003, the dollar depreciated 20.4%against the euro, 8.6% against the Japanese yen and 8.3% against the pound sterling. As in 2002,the dollar depreciated sharply because the interest rate differential favoured the euro and therewas substantial trade and public deficit in the US economy, where no major correction is expec-ted in the short-term.
24
Annual report on the securities markets. 2003
Figure 1.5
Dollar-euro and yen-euro exchange rates
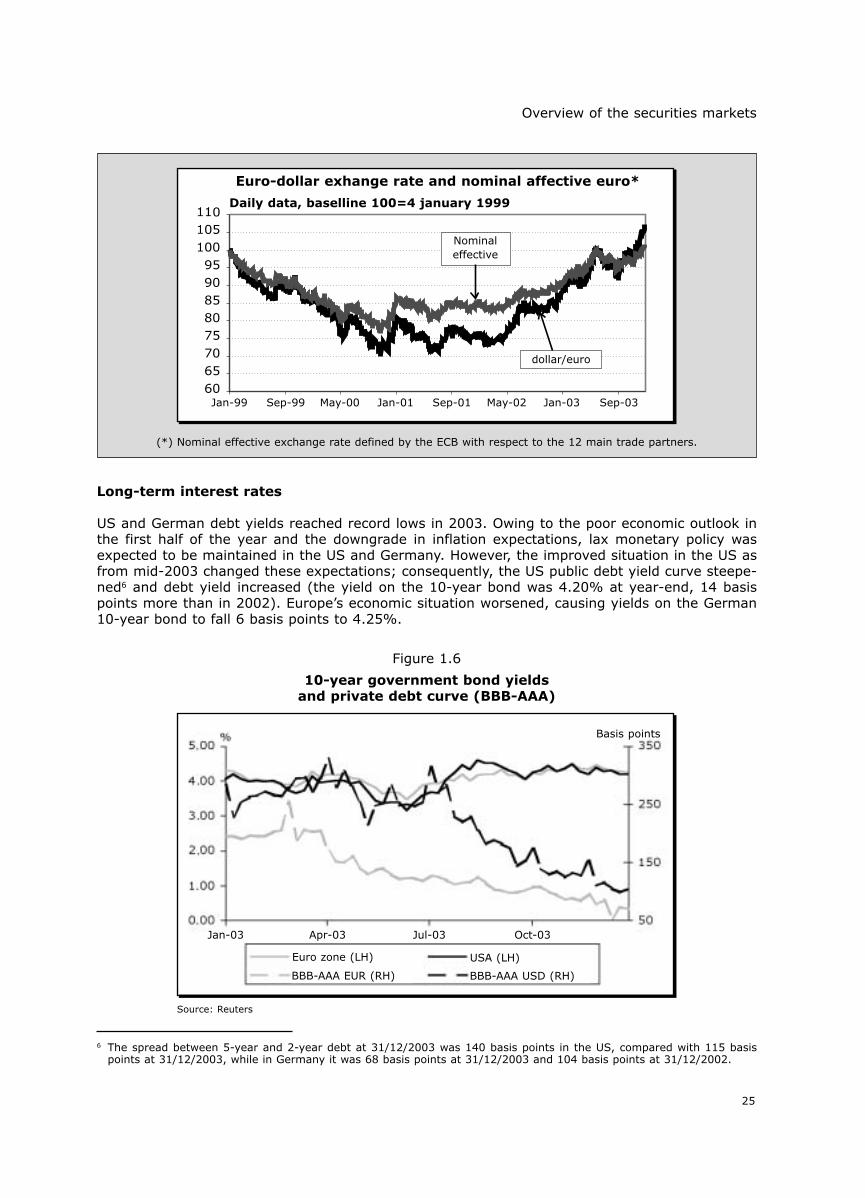
The euro-dollar exchange rate
The exchange rate of the euro against the dollar has undergone several very different phasessince 1999. The euro depreciated constantly until November 2000 due to stronger economicgrowth and higher short-term interest rates in the US. The losses accumulated by the euro inthis period amounted to 30%, and it reached a low of US$0.825.
The euro-dollar exchange rate was marked by volatility from the end of 2000 until the secondquarter of 2002, when the euro recovered slightly to US$0.87. This was due mainly to theuncertainty about the recovery of the US economy, which slowed greatly in 2001, and to theinstability following the terrorist attacks on 11 September.
Since then, the euro has appreciated continuously against the dollar (with the exception ofsummer 2003) because, despite the improvement in economic growth in the US, the exchan-ge market paid more attention to the potential medium-term negative effects of the persis-tent, huge current account deficit in the US and the increase in its budget deficit (see Table1.1). In addition, the appreciation of the euro was favoured by higher interest rates in theeuro zone in both the money market (see Figure 1.3) and in the long-term debt market (seeFigure 1.5).
Jan-99 Jan-00 Jan-01 Jan-02 Jan-03
yen/euro(RH)
dollar/euro(LH)
25
Overview of the securities markets
(*) Nominal effective exchange rate defined by the ECB with respect to the 12 main trade partners.
Figure 1.6
10-year government bond yieldsand private debt curve (BBB-AAA)
Source: Reuters
6 The spread between 5-year and 2-year debt at 31/12/2003 was 140 basis points in the US, compared with 115 basispoints at 31/12/2003, while in Germany it was 68 basis points at 31/12/2003 and 104 basis points at 31/12/2002.
Long-term interest rates
US and German debt yields reached record lows in 2003. Owing to the poor economic outlook inthe first half of the year and the downgrade in inflation expectations, lax monetary policy wasexpected to be maintained in the US and Germany. However, the improved situation in the US asfrom mid-2003 changed these expectations; consequently, the US public debt yield curve steepe-ned6 and debt yield increased (the yield on the 10-year bond was 4.20% at year-end, 14 basispoints more than in 2002). Europe’s economic situation worsened, causing yields on the German10-year bond to fall 6 basis points to 4.25%.
Euro-dollar exhange rate and nominal affective euro*
Daily data, baselline 100=4 january 1999
Jan-99 Sep-99 May-00 Jan-01 Sep-01 May-02 Jan-03 Sep-03
dollar/euro
Nominaleffective
Basis points
Jan-03 Apr-03 Jul-03 Oct-03
USA (LH)Euro zone (LH)
BBB-AAA USD (RH)BBB-AAA EUR (RH)

The spread between private and public debt in both dollars and euros declined in 2003. A compa-rison of yields on 10-year bonds with BBB and AAA ratings illustrates a sharp decline in the costof financing for companies with a low credit rating7 (see Figure 1.6). This reduction can be explai-ned by: (i) the improvement in corporate earnings and balance sheets; (ii) the reduction in thenumber of company bankruptcies; (iii) market liquidity caused by low intervention rates; and (iv)low yields on alternative investments, such as public debt.
Equities markets
Following three consecutive years of declining share prices, there was a significant generalisedrally in the world’s stock markets. This upswing was due, inter alia, to (i) the reduction in geopo-litical uncertainty, (ii) the acceleration of global economic growth, (iii) lower volatility of theseassets, and (iv) low yields on fixed-income securities, which boosted investments in higher-riskassets.
The Dow Jones Industrial Average (DJIA) rose 25.3%, the Nikkei rose 24.5% and the EuroStoxx-50 gained 15.7%. In Europe, Germany’s Dax-30 gained most (37.1%), despite the stagnation ofthe German economy, while Italy’s Mib-30 gained least (only 11.8%)8. There were generalisedgains in Latin America and Asia, particularly Argentina and Brazil.
26
Annual report on the securities markets. 2003
Table 1.7Equities markets: indexes and trading in 2003
MarketIndixes Trading
Name Change (%) US$ billion Change. ($)(1)
Developed countries
New York DJIA 25.3 9.692.3 17.2Nasdaq Nasdaq 50.0 7.068.2 6.6Tokyo Nikkei 24.5 2.130.7 -2.8London FTSE 100 13.6 3.624.0 -5.9Euro zone (2) Euro Stoxx 50 15.7 4.295.7 -7.4Euronext (3) Euronext 100 12.7 1.905.4 -7.0Germany DAX 30 37.1 1.305.0 -13.3Italy MIB 30 11.8 823.1 -10.4Spain Ibex 35 28.2 566.2 11.4Latin America
Buenos Aires Merval 104.2 3.1 89.3São Paulo Bovespa 97.3 68.0 22.3Santiago de Chile IGPA 46.2 6.8 -22.1Mexico City IPC 43.5 25.9 -30.9Lima IGRA 74.9 1.1 19.4
Southeast AsiaSouth Korea Korea Com Ex 29.2 459.2 -4.9The Philippines Manila Composite 41.6 2.7 -31.6Hong Kong Hang Seng 34.9 296.4 35.4Indonesia Yakarta Comp. 62.8 14.8 70.4Malaysia Kuala Lumpur Comp. 22.8 52.2 -5.7Singapore SES All-Share 36.4 92.0 -29.0Thailand Bangkok SET 116.6 105.1 24.3Taiwan Taiwan Weighted Pr. 32.3 592.5 -14.9
(1) In local currency.(2) Volume traded in the stock exchanges of the euro zone countries.(3) Refers to the markets integrated into Euronext (Paris, Brussels, Amsterdam and the Portuguese bourses).Source: World Federation of Exchanges.
7 The spread between debt rated BBB and AAA narrowed by 125 basis points to 71 basis points in the euro zone and by178 basis points to 106 basis points in the US.
8 Poorer performance in the Italian index reflects the losses caused by the Parmalat financial scandal.
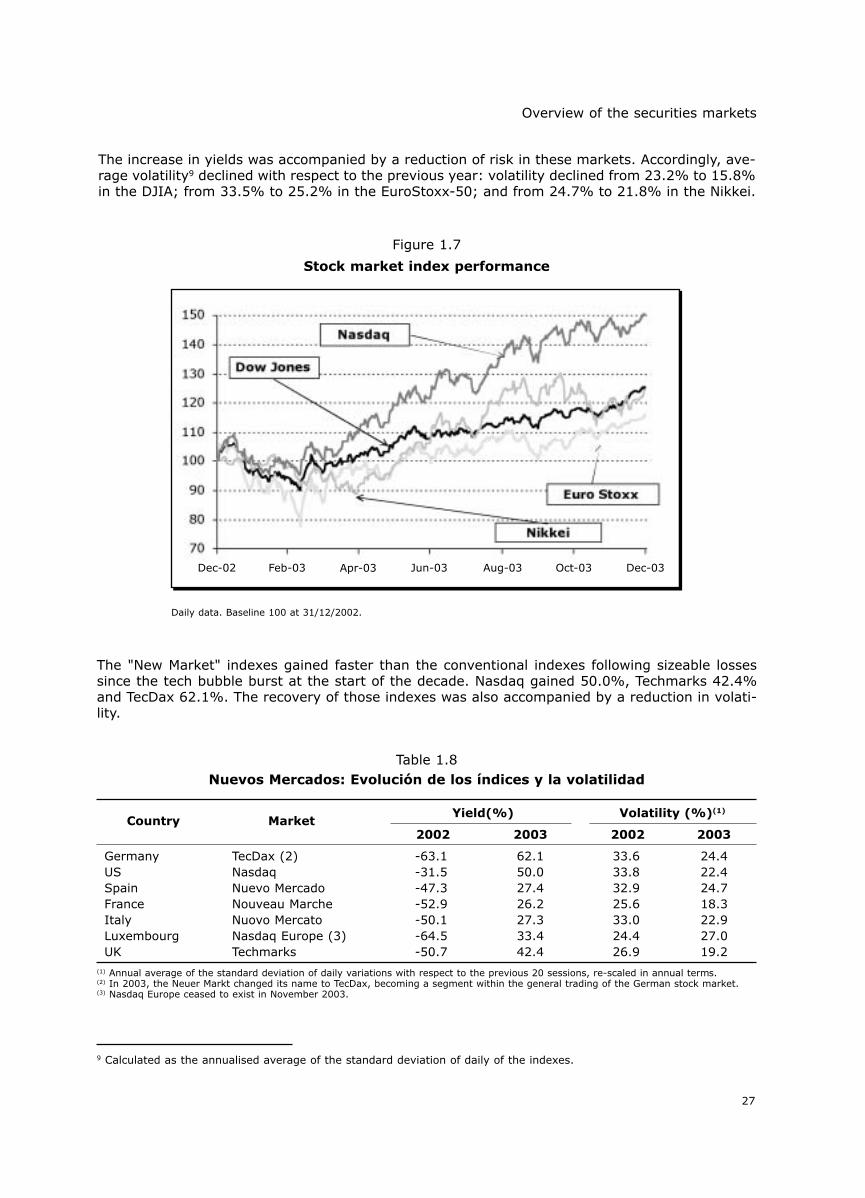
The increase in yields was accompanied by a reduction of risk in these markets. Accordingly, ave-rage volatility9 declined with respect to the previous year: volatility declined from 23.2% to 15.8%in the DJIA; from 33.5% to 25.2% in the EuroStoxx-50; and from 24.7% to 21.8% in the Nikkei.
27
Overview of the securities markets
Table 1.8Nuevos Mercados: Evolución de los índices y la volatilidad
Country MarketYield(%) Volatility (%)(1)
2002 2003 2002 2003
Germany TecDax (2) -63.1 62.1 33.6 24.4US Nasdaq -31.5 50.0 33.8 22.4Spain Nuevo Mercado -47.3 27.4 32.9 24.7France Nouveau Marche -52.9 26.2 25.6 18.3Italy Nuovo Mercato -50.1 27.3 33.0 22.9Luxembourg Nasdaq Europe (3) -64.5 33.4 24.4 27.0UK Techmarks -50.7 42.4 26.9 19.2
(1) Annual average of the standard deviation of daily variations with respect to the previous 20 sessions, re-scaled in annual terms.(2) In 2003, the Neuer Markt changed its name to TecDax, becoming a segment within the general trading of the German stock market.(3) Nasdaq Europe ceased to exist in November 2003.
9 Calculated as the annualised average of the standard deviation of daily of the indexes.
Figure 1.7
Stock market index performance
Daily data. Baseline 100 at 31/12/2002.
The "New Market" indexes gained faster than the conventional indexes following sizeable lossessince the tech bubble burst at the start of the decade. Nasdaq gained 50.0%, Techmarks 42.4%and TecDax 62.1%. The recovery of those indexes was also accompanied by a reduction in volati-lity.
Dec-02 Feb-03 Apr-03 Jun-03 Aug-03 Oct-03 Dec-03
28
Annual report on the securities markets. 2003
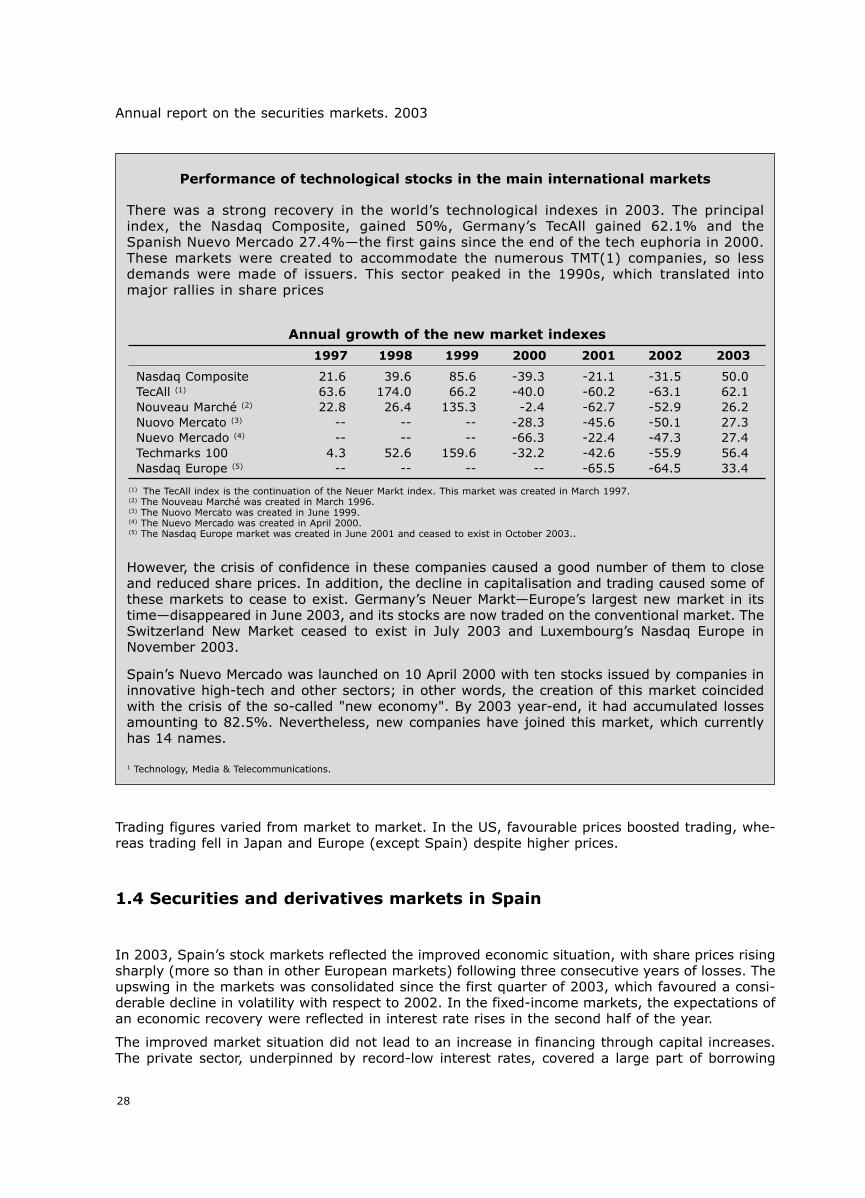
Performance of technological stocks in the main international markets
There was a strong recovery in the world’s technological indexes in 2003. The principalindex, the Nasdaq Composite, gained 50%, Germany’s TecAll gained 62.1% and theSpanish Nuevo Mercado 27.4%—the first gains since the end of the tech euphoria in 2000.These markets were created to accommodate the numerous TMT(1) companies, so lessdemands were made of issuers. This sector peaked in the 1990s, which translated intomajor rallies in share prices
However, the crisis of confidence in these companies caused a good number of them to closeand reduced share prices. In addition, the decline in capitalisation and trading caused some ofthese markets to cease to exist. Germany’s Neuer Markt—Europe’s largest new market in itstime—disappeared in June 2003, and its stocks are now traded on the conventional market. TheSwitzerland New Market ceased to exist in July 2003 and Luxembourg’s Nasdaq Europe inNovember 2003.
Spain’s Nuevo Mercado was launched on 10 April 2000 with ten stocks issued by companies ininnovative high-tech and other sectors; in other words, the creation of this market coincidedwith the crisis of the so-called "new economy". By 2003 year-end, it had accumulated lossesamounting to 82.5%. Nevertheless, new companies have joined this market, which currentlyhas 14 names.
1 Technology, Media & Telecommunications.
Annual growth of the new market indexes
1997 1998 1999 2000 2001 2002 2003
Nasdaq Composite 21.6 39.6 85.6 -39.3 -21.1 -31.5 50.0TecAll (1) 63.6 174.0 66.2 -40.0 -60.2 -63.1 62.1Nouveau Marché (2) 22.8 26.4 135.3 -2.4 -62.7 -52.9 26.2Nuovo Mercato (3) -- -- -- -28.3 -45.6 -50.1 27.3Nuevo Mercado (4) -- -- -- -66.3 -22.4 -47.3 27.4Techmarks 100 4.3 52.6 159.6 -32.2 -42.6 -55.9 56.4Nasdaq Europe (5) -- -- -- -- -65.5 -64.5 33.4
(1) The TecAll index is the continuation of the Neuer Markt index. This market was created in March 1997.(2) The Nouveau Marché was created in March 1996.(3) The Nuovo Mercato was created in June 1999.(4) The Nuevo Mercado was created in April 2000.(5) The Nasdaq Europe market was created in June 2001 and ceased to exist in October 2003..
Trading figures varied from market to market. In the US, favourable prices boosted trading, whe-reas trading fell in Japan and Europe (except Spain) despite higher prices.
1.4 Securities and derivatives markets in Spain
In 2003, Spain’s stock markets reflected the improved economic situation, with share prices risingsharply (more so than in other European markets) following three consecutive years of losses. Theupswing in the markets was consolidated since the first quarter of 2003, which favoured a consi-derable decline in volatility with respect to 2002. In the fixed-income markets, the expectations ofan economic recovery were reflected in interest rate rises in the second half of the year.
The improved market situation did not lead to an increase in financing through capital increases.The private sector, underpinned by record-low interest rates, covered a large part of borrowing

29
Overview of the securities markets
requirements through issues of private fixed-income securities, with notable growth in asset-bac-ked securities. The stock market recovery also boosted investments in assets with a certain degreeof risk, although net subscriptions continued to be concentrated in FIAMM, guaranteed equitiesfunds and short-term fixed-income funds.
Interest rates and share prices
Yields on Spanish short-term public debt fell by 75 basis points to 2.25%, while benchmark 10-year bonds remained unchanged around 4.25%. Accordingly, the slope of the yield curve betwe-en three and ten years increased significantly, to 157 basis points. Yields on private fixed-incomeperformed in line with public debt, so the credit risk spread remained unchanged at 10-15 basispoints (short-term) and 75 basis points (long-term).
The Ibex-35 gained 28% and the Madrid Stock Exchange General Index (IGBM) gained 27%, follo-wing three consecutive years of losses. In the first quarter of 2003, share prices continued to decli-ne, and then the first signs of an economic recovery led to an upswing which was maintained untilyear-end. The stock market recovery was accompanied by a reduction in volatility due to thereduction of the uncertainty perceived by investors.
Primary markets and public offerings of securities
Gross issues of securities totalled €235 billion in 2003, 44.5% more than the previous year duemainly to private fixed-income issues to take advantage of low interest rates.
Public administrations increased their gross issues by 5.3% to €78.5 billion. This is the secondconsecutive year of growth after several years of significant declines. The favourable performan-ce by Spain’s public accounts together with low interest rates enabled debt to be redeemed andrestructured; new issues were mainly in the short-term segment.
Private sector fixed-income issues soared by over 83% in 2003, exceeding €153 billion (almostdouble the issues by the public administrations). Issues in Spain grew faster than in the rest ofthe euro zone because the Spanish economy is performing better and because of the boost fromthe mortgage market, which has greatly increased issues of mortgage-backed securities.
However, although share prices recovered, capital increases fell by 30% in 2003 and, following athree-year slide, they amounted to little more than €3 billion, very far from the record high in2000 (when they approached €44 billion). There was also a sharp reduction in secondary publicofferings (see Table 1.9)10.
Table 1.9Gross issues and public offerings
Millions of euros
1999 2000 2001 2002 2003
Gross issues 164,496 180,033 153,814 162,853 235,313Capital increases (1) 14,748 43,937 9,623 4,692 3,289
of which primary offerings (2) 7,373 17,811 155 0 0Marketable public debt (3) 92,130 87,316 69,570 74,549 78,480Private fixed-income (1) 57,591 52,300 74,626 83,702 153,543
Secondary offerings (4) 4,419 9,446 3,044 3,330 470
(1) Effective value.(2) Primary public offerings.(3) Nominal value.(4) Includes volume offered in the domestic and international tranches.
10 In 2003, the number of secondary offerings registered with the CNMV was the same as the previous year (four), althoughthe total amount was _470 million, compared with _3.3 billion in 2002. Close to 89% of the total amount correspondsto a single offering by electricity companies to divest their shares in Red Eléctrica de España.

30
Annual report on the securities markets. 2003
Table 1.10Trading in the secondary and derivatives markets
Amounts in millions of euros, unless otherwise indicated
1999 2000 2001 2002 2003
Equities (1)
Stock exchanges 289.354 492.302 444.302 444.936 495.494
Fixed-incomePublic debt book-entry system (2) 2.360.914 1.703.704 1.964.678 2.310.943 2.246.881Stock exchanges (1) 44.710 39.802 57.463 71.140 75.058AIAF (3) 85.766 100.759 143.733 272.470 384.089
DerivativesMEFF RF (4) 3.597 1.036 285 51 1,4MEFF RV (4) 12.838 20.966 30.652 27.867 21.747Warrants (5) 205 898 1.636 1.232 1.610FC&M (4) 0 0 0 0 0
Pro memoria:EuroMEFF (4) 17 1.440 3.239 4.199 5.234
(1) Effective value.(2) Outright spot trades. Includes unstripped debt and STRIPs.(3) Nominal value.(4) Thousand contracts, adjusted for changes in contract size.(5) Premiums traded.
Trading in the secondary and derivatives markets
Trading in equities on the Spanish stock exchanges increased by 11.4% in 2003 to €495.5 billiondue partly to higher prices and partly to the launch of several public offerings in the year whichgenerated considerable activity in the days following settlement.
Trading increased only in the Electronic Market (SIBE), while it fell 10.5% in the open outcry seg-ment and 25.5% in the second market.
In the secondary fixed-income markets, trading fell 2.8% in the public debt book-entry system,while it increased in the other markets (5.5% in fixed-income securities traded in the stock mar-kets and 41% in the AIAF private fixed-income market).
Record-low yields on public debt, together with the increase in private fixed-income issues, boos-ted trading in the latter, especially in commercial paper, debentures, bonds and mortgage coveredbonds. In the public debt book-entry system, trading declined in bonds and debentures while itsurged in treasury bills. Trading in fixed-income securities on the stock exchanges continued togrow due mainly to debt issues by Generalitat de Catalunya (the Catalan regional government).
Trading in derivatives declined in 2003 for the second consecutive year. The reduction was mostnotable on MEFF and was due mainly to the decline in trading of options on individual stocks.Conversely, there was a considerable increase in trading in derivatives on other markets (mainlythe German-Swiss market Eurex through broker-dealer MEFF Euroservices S.V.—EuroMEFF) in con-tracts on both European stock indexes and German public debt. There was also strong growth intrading of warrants.
Collective Investment Schemes (IIC)
The assets of collective investment schemes which invest in securities amounted to €232.8 billionat 2003 year-end, 20.2% more than at the end of the previous year. As illustrated by Table 1.11,growth in FIM assets was especially strong. There was a considerable inflow of investment intoFIMs in 2003, especially the short-term fixed income and guaranteed equities classes. Equity fundsbenefited from portfolio appreciation in the second half of the year.
Assets of real estate IIC grew by close to 35% in 2003, although they continued to represent onlya small proportion of total assets of collective investment schemes (1.2%).

31
Overview of the securities markets
Table 1.11Assets of collective investment schemes
Billions of euros
1999 2000 2001 2002 2003
Securities investment 219,5 201,5 200,6 193,6 232,8Mutual funds 206,3 186,1 181,3 174,7 210,6
FIAMM 42,6 33,4 43,8 53,4 58,1FIM 163,7 152,7 137,5 121,4 152,6
Investment companies 13,2 15,4 19,3 18,9 22,2SIM 3,3 2,8 2,5 2,0 2,0SIMCAV 9,8 12,7 16,9 16,9 20,2
Real estate investment 0,9 1,2 1,5 2,1 2,8
Total IIC 220,3 202,7 202,2 195,7 235,7
Securities firms and asset management firms
Securities firms (brokers and broker-dealers) obtained a total of €250 million in pre-tax earningsin 2003, which represented a 14.9% increase year-on-year.
Commission revenues fell with respect to 2002. Although the stock markets were quite dynamic in2003, securities firms did not feel all the benefits of this since they lost market share in the han-dling and execution of orders due to competition from credit entities.
However, owing to the containment of operating expenses, especially significant in the case of bro-ker-dealers, operating margins narrowed by less. In the case of broker-dealers, the improvementin the "Other gains and losses" item was vital to the increase in pre-tax earnings.
IIC management companies (SGIIC) obtained €444 million in pre-tax earnings, slightly less thanin 2002 (€447 million euros). The increase in commissions received for the management of IIC,linked to the strong growth in assets of IIC managed by these institutions (20.7%), offset only partof the increase in commissions paid to fund marketers.
As for portfolio management companies, pre-tax earnings fell considerably from €6.2 million in2002 to €3.8 million in 2003. This decline reflects the removal of seven entities during 2003 andthe sharp decline in commission revenues for assets under advice, which fell by close to 40% in2003.
Table 1.12Pre-tax earnings of securities firms and asset management firms
Millions of euros
1999 2000 2001 2002 2003
Securities firms 400.8 617 303.9 217.3 249.7Broker-dealers 369.7 587.2 284.4 202.3 223.4
Market members 326.8 551.3 264.3 170.8 195.8Non-market members 42.9 35.8 20.1 31.4 27.7
Brokers 31 29.8 19.5 15.0 26.2Market members 10.4 17.6 7.8 0.2 6.0Non-market members 20.7 12.2 11.8 14.8 20.2
IIC management companies 1,012.80 1,007.00 703.6 447.2 443.9
Portfolio management companies 6.1 8.6 2.5 6.2 3.8

CHAPTER 2
PRIMARY MARKETS

2. Primary markets
2.1 General overview
Euro zone
Fixed-income issues in the euro zone rose significantly in the year, with issues by euro zoneresidents totalling €7.2 trillion, up 8.4% on 2002. Euro-denominated issues (which accoun-ted for 93.6% of the total amount) grew 8.9%, while issues in other currencies increased1.6%1.
35
Primary markets
Table 2.1Fixed-income securities issued by euro zone residents
Amounts in billions of euros
Amount Change (%)
2002 2003 2002 2003
Gross issues(*) 6,627.9 7,184.6 -1.8 8.4Public administrations 1,368.2 1,561.5 20.6 14.1
Short term 672.3 794.6 23.9 18.2Long term 695.9 766.9 17.6 10.2
Financial institutions 4,442.2 4,717.1 -4.5 6.2Short term 3,579.5 3,735.5 -4.6 4.4Long term 862.7 981.6 -4.0 13.8
Non-financial companies 817.5 906.0 -15.2 10.8Short term 741.4 798.4 -11.4 7.7Long term 76.1 107.6 -40.6 41.4
Outstanding balance(*) 96,795.2 102,587.4 6.8 6.0Public administrations 46,930.6 49,300.0 4.9 5.0
Short term 3,885.9 4,614.0 12.6 18.7Long term 43,044.7 44,686.0 4.3 3.8
Financial institutions 43,454.1 46,393.4 8.6 6.8Short term 4,284.7 4,648.4 5.1 8.5Long term 39,169.4 41,745.0 9.0 6.6
Non-financial companies 6,410.5 6,894.0 7.9 7.5Short term 1,136.5 1,202.3 -8.0 5.8Long term 5,274.0 5,691.7 12.1 7.9
(*) Nominal valueSource: European Central Bank.
The bulk of fixed-income issues were by the private sector (Table 2.1), boosted by low inte-rest rates and the expected growth in the economy (albeit less concrete than in other partsof the world and to a differing extent in each member country). There was also a significantimprovement in perceived issuer credit risk, following better performance in their accounts.As for public administrations, poor performance by the national accounts of several member
1 Issues in euros totalled €6.7 trillion while issues in other currencies totalled €456 billion. In 2002, euro issues declined1.1% and other currency issues 10%.
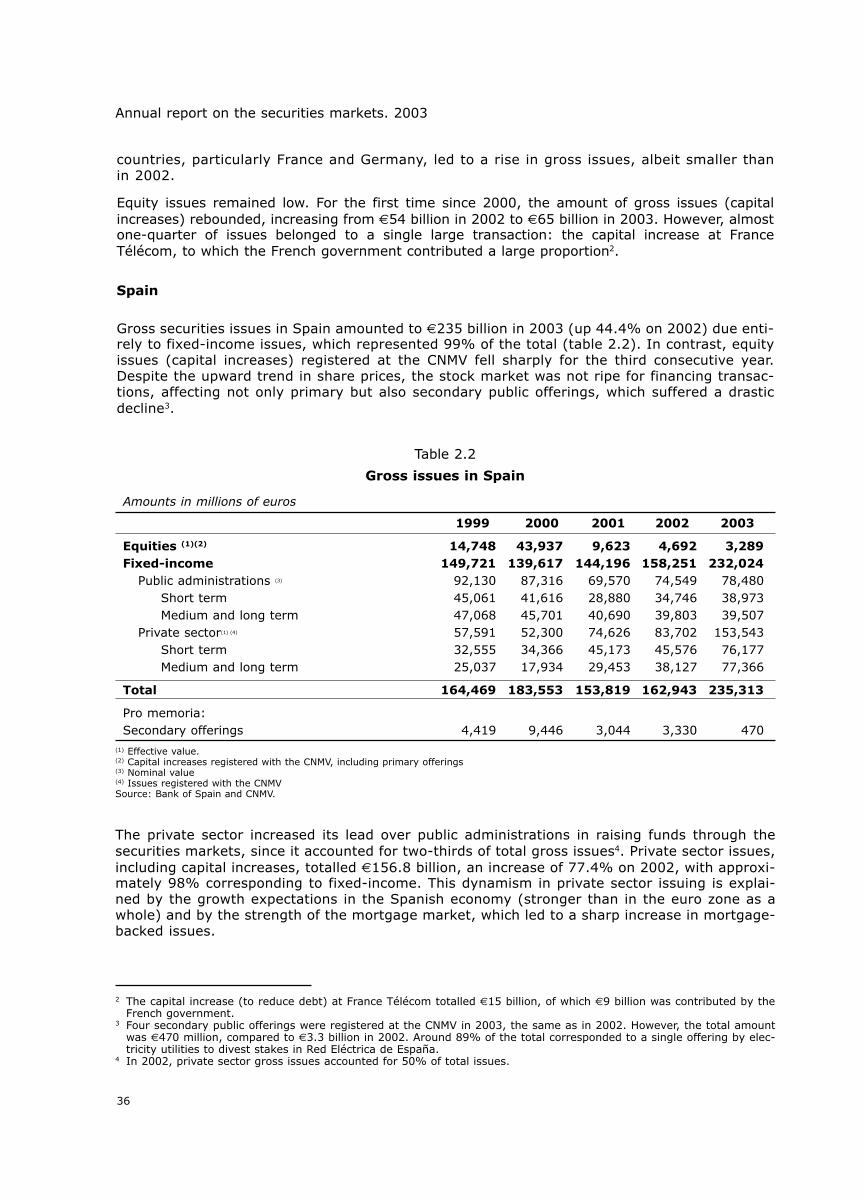
countries, particularly France and Germany, led to a rise in gross issues, albeit smaller thanin 2002.
Equity issues remained low. For the first time since 2000, the amount of gross issues (capitalincreases) rebounded, increasing from €54 billion in 2002 to €65 billion in 2003. However, almostone-quarter of issues belonged to a single large transaction: the capital increase at FranceTélécom, to which the French government contributed a large proportion2.
Spain
Gross securities issues in Spain amounted to €235 billion in 2003 (up 44.4% on 2002) due enti-rely to fixed-income issues, which represented 99% of the total (table 2.2). In contrast, equityissues (capital increases) registered at the CNMV fell sharply for the third consecutive year.Despite the upward trend in share prices, the stock market was not ripe for financing transac-tions, affecting not only primary but also secondary public offerings, which suffered a drasticdecline3.
36
Annual report on the securities markets. 2003
Table 2.2
Gross issues in Spain
Amounts in millions of euros
1999 2000 2001 2002 2003
Equities (1)(2) 14,748 43,937 9,623 4,692 3,289Fixed-income 149,721 139,617 144,196 158,251 232,024
Public administrations (3) 92,130 87,316 69,570 74,549 78,480Short term 45,061 41,616 28,880 34,746 38,973Medium and long term 47,068 45,701 40,690 39,803 39,507
Private sector(1) (4) 57,591 52,300 74,626 83,702 153,543Short term 32,555 34,366 45,173 45,576 76,177Medium and long term 25,037 17,934 29,453 38,127 77,366
Total 164,469 183,553 153,819 162,943 235,313
Pro memoria:Secondary offerings 4,419 9,446 3,044 3,330 470
(1) Effective value.(2) Capital increases registered with the CNMV, including primary offerings(3) Nominal value(4) Issues registered with the CNMVSource: Bank of Spain and CNMV.
The private sector increased its lead over public administrations in raising funds through thesecurities markets, since it accounted for two-thirds of total gross issues4. Private sector issues,including capital increases, totalled €156.8 billion, an increase of 77.4% on 2002, with approxi-mately 98% corresponding to fixed-income. This dynamism in private sector issuing is explai-ned by the growth expectations in the Spanish economy (stronger than in the euro zone as awhole) and by the strength of the mortgage market, which led to a sharp increase in mortgage-backed issues.
2 The capital increase (to reduce debt) at France Télécom totalled €15 billion, of which €9 billion was contributed by theFrench government.
3 Four secondary public offerings were registered at the CNMV in 2003, the same as in 2002. However, the total amountwas €470 million, compared to €3.3 billion in 2002. Around 89% of the total corresponded to a single offering by elec-tricity utilities to divest stakes in Red Eléctrica de España.
4 In 2002, private sector gross issues accounted for 50% of total issues.

Gross issues by public administrations amounted to €78.5 billion, 5.3% more than in 2002. Goodperformance in public finances took pressure off issuing and led to debt amortisation and restruc-turing operations. Nevertheless, as in 2002, issues continued to rise moderately, concentratedexclusively in the short-term segment.
37
Primary markets
5 See tables A.1.3 and A.1.4 in the Annex.
Figure 2.1
Gross issues in Spain, by type of instrument and sector
2.2 Equities
The stock market recovery did not lead to a rise in capital increases in 2003; on the contrary, theeffective amount of new shares issued fell from €4.7 billion in 2002 to €3.3 billion in 2003, whilethe number of issuers dropped from 35 to 32. Nine companies undertook bonus capital increasestotalling €186.6 million, compared with 17 companies and €293.8 million in 2002. No warrantissues were registered5.
Table 2.3Capital increases
Effective amount in millions of euros
1999 2000 2001 2002 2003
Primary offerings 7,373 17,811 155 – –Other capital increases 7,375 26,126 9,468 4,692 3,289
Total 14,748 43,937 9,623 4,692 3,289
Pro memoria:Domestic tranche of primary offerings
Amount 4,403 13,448 155 – –% of total 59.7 75.5 100.0 – –
Public administration fixed-income Private fixed-income Equities
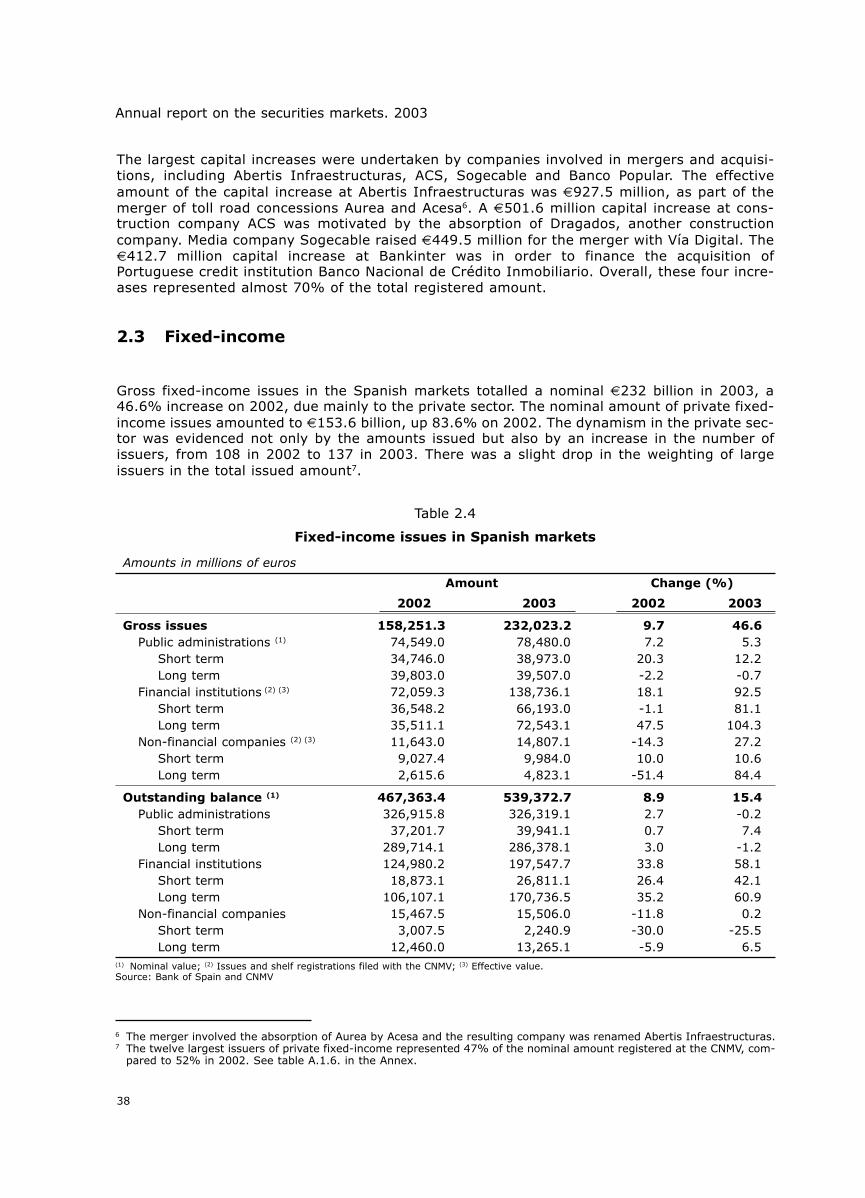
The largest capital increases were undertaken by companies involved in mergers and acquisi-tions, including Abertis Infraestructuras, ACS, Sogecable and Banco Popular. The effectiveamount of the capital increase at Abertis Infraestructuras was €927.5 million, as part of themerger of toll road concessions Aurea and Acesa6. A €501.6 million capital increase at cons-truction company ACS was motivated by the absorption of Dragados, another constructioncompany. Media company Sogecable raised €449.5 million for the merger with Vía Digital. The€412.7 million capital increase at Bankinter was in order to finance the acquisition ofPortuguese credit institution Banco Nacional de Crédito Inmobiliario. Overall, these four incre-ases represented almost 70% of the total registered amount.
2.3 Fixed-income
Gross fixed-income issues in the Spanish markets totalled a nominal €232 billion in 2003, a46.6% increase on 2002, due mainly to the private sector. The nominal amount of private fixed-income issues amounted to €153.6 billion, up 83.6% on 2002. The dynamism in the private sec-tor was evidenced not only by the amounts issued but also by an increase in the number ofissuers, from 108 in 2002 to 137 in 2003. There was a slight drop in the weighting of largeissuers in the total issued amount7.
38
Annual report on the securities markets. 2003
Table 2.4
Fixed-income issues in Spanish markets
Amounts in millions of euros
Amount Change (%)
2002 2003 2002 2003
Gross issues 158,251.3 232,023.2 9.7 46.6Public administrations (1) 74,549.0 78,480.0 7.2 5.3
Short term 34,746.0 38,973.0 20.3 12.2Long term 39,803.0 39,507.0 -2.2 -0.7
Financial institutions (2) (3) 72,059.3 138,736.1 18.1 92.5Short term 36,548.2 66,193.0 -1.1 81.1Long term 35,511.1 72,543.1 47.5 104.3
Non-financial companies (2) (3) 11,643.0 14,807.1 -14.3 27.2Short term 9,027.4 9,984.0 10.0 10.6Long term 2,615.6 4,823.1 -51.4 84.4
Outstanding balance (1) 467,363.4 539,372.7 8.9 15.4Public administrations 326,915.8 326,319.1 2.7 -0.2
Short term 37,201.7 39,941.1 0.7 7.4Long term 289,714.1 286,378.1 3.0 -1.2
Financial institutions 124,980.2 197,547.7 33.8 58.1Short term 18,873.1 26,811.1 26.4 42.1Long term 106,107.1 170,736.5 35.2 60.9
Non-financial companies 15,467.5 15,506.0 -11.8 0.2Short term 3,007.5 2,240.9 -30.0 -25.5Long term 12,460.0 13,265.1 -5.9 6.5
(1) Nominal value; (2) Issues and shelf registrations filed with the CNMV; (3) Effective value.Source: Bank of Spain and CNMV
6 The merger involved the absorption of Aurea by Acesa and the resulting company was renamed Abertis Infraestructuras.7 The twelve largest issuers of private fixed-income represented 47% of the nominal amount registered at the CNMV, com-
pared to 52% in 2002. See table A.1.6. in the Annex.

As in previous years, financial institutions were the leading issuers of private fixed-income securi-ties, doubling the number of issues and accounting for almost 60% of total fixed-income issues inSpain (table 2.4). Financial sector issues were concentrated in short-term securities (commercialpaper) and asset-backed securities. At non-financial companies, there was a sharp increase inlong-term issues, accompanied by a more moderate increase in commercial paper, the core seg-ment of this market.
Issuing by public administrations performed differently according to the term. Gross short-termissues amounted to €39 billion (up 12.2% on 2002), whereas gross long-term issues declinedslightly, from €39.8 billion in 2002 to €39.6 billion in 2003.
The outstanding balance of fixed-income securities issued by Spanish residents rose 15.4% in2003 to €539.4 billion, solely due to private fixed-income, since redemption of securities issuedby public administrations slightly exceeded gross new issues. As a result, there was a surge in theweighting of private sector issues in the total outstanding fixed-income balance, rising from 30%in 2002 to 39.5% in 2003.
39
Primary markets
Figure 2.2
Fixed-income issues in the euro zone: breakdown of outstanding balance by issuer
Issues filed with the CNMV
Medium- and long-term issues
A nominal €77.5 billion in medium- and long-term fixed-income issues were registered at theCNMV (compared with €38 billion in 2002) and the number of issuers rose from 73 to 95. The mostsignificant increase was with regard to asset-backed issues (mortgage and securitisation bonds)and in non-convertible bonds and debentures. One of the main new features in 2003 was the intro-duction of territorial covered bond issues (cédulas territoriales) and the regulation, for the firsttime in Spain, of synthetic securitisation issues.
There was a strong recovery in the non-convertible bonds and debentures segment. Issues tota-lled €15 billion nominal, over four times greater than in 2002. The number of issuers rose from 30to 43. Financial institutions (38 issuers) accounted for almost 84% of the amount registered in this
Bill
ions
of
euro
s
Public administrations Financial institutions Non-financial companies

segment, with the two main issuers being BBVA (€3.3 billion) and Banesto Banco de Emisiones(€2.5 billion). The main issuer in the non-financial sector was RTVE (€1.5 billion). The bulk ofissues were at floating rates, with most maturing at 10 years or more, although shorter termbonds represented a greater amount8.
40
Annual report on the securities markets. 2003
Table 2.5Fixed-income issues and shelf registrations filed with the CNMV
Breakdown by instrument
Nominal amounts in millions of euros
1999 2000 2001 2002 2003
Long term 23,773 17,938 29,463 38,129 77,465Non-convertible bonds and debentures 7,354 4,974 7,076 3,587 15,021Convertible bonds and debentures 800 132 456 238 179Mortgage covered bonds 4,433 2,643 6,078 11,704 17,864Territorial covered bonds – – – – 4,200Securitisation bonds 6,770 7,308 11,793 18,803 36,740Preferred shares 4,416 2,880 4,060 3,737 3,360Other issues – – – 60 100Short term 32,555 34,366 45,173 45,576 76,177Commercial paper 32,555 34,366 45,173 45,576 76,177Of which asset-backed 301 1,399 1,144 1,120 1,090
Total 56,328 52,304 74,635 83,705 153,642
Issues of convertible bonds and debentures totalled a nominal amount of €179 million, com-pared with €238 million in 2002. There were just two issuers in this segment (three in 2002):real estate company Bami, with an issue of around €150 million, and Iberia (around €30million)9.
The boom in the property market led to renewed growth in the issue of mortgage covered bonds(cédulas hipotecarias), with the nominal amount rising from €11.7 billion in 2002 to €17.9billion, while the number of issuers in this important segment remained unchanged (8). Themain issuers were: La Caixa (€5.2 billion), SCH (€5 billion) and BBVA (€3 billion). A furtherthree entities (Banco Sabadell, Banesto and Caja Madrid) registered €1.5 billion each. In con-trast to the non-convertible bonds and debentures segment, fixed-rate issues predominated overfloating-rate issues, both in number and volume10. With regard to maturities, in terms of num-ber and volume, the bulk of issues were under 10 years11.
As indicated above, the first issues of territorial covered bonds took place in 2003 following regu-lation of this instrument by Law 44/2002, of 22 November, on Measures to Reform the FinancialSystem12. Three issuers participated in this segment, with issues totalling a nominal amount of€4.2 billion13. The main issuer was SCH (€2 billion), followed by Banco de Crédito Local de España(€1.5 billion) and Dexia Sabadell Banco Local (€700 million).
8 Floating rate issues represented around 82% of the registered total. Issues with maturities greater than or equal to tenyears accounted for 43% of the total. See table A.1.9 of the Annex for further information.
9 See table A.1.8 in the Annex.10 Fixed-rate issues accounted for 88% of the registered total. See table A.1.10 of the Annex for further information.11 Issues with maturities under 10 years amounted to 64% of the total registered amount. See table A.1.10 of the Annex
for further information.12 From an investor’s standpoint, territorial covered bonds are very similar to mortgage covered bonds in that they can only
be issued by credit institutions and their purpose is to finance loans from the issuer to territorial public administrations.Like mortgage covered bonds, they are backed by the entirety of the issuer’s portfolio of loans to territorial public admi-nistrations.
13 See table A.1.11 of the Annex.

Issues of medium- and long-term securitisation bonds rose 95% on 2002, to €36.7 billion14. Thissurge in issues was entirely due to asset-backed bonds, which represented 86% of the issuedamount, and the number of issuers (asset securitisation funds–FTA) increased from 16 to 31. Aconsiderable number of asset-backed bonds were placed with foreign investors, who absorbed31% of the total. The amount of mortgage-backed bond issues fell 26% and the number of issuers(mortgage securitisation funds, FTH) decreased from 11 in 2002 to 6. All issues in this segmentwere placed in the domestic market.
Despite the decline in mortgage-backed issues, mortgages continued to play a vital role in secu-ritisation: 71% of asset-backed issues corresponded to one-off mortgage covered bonds, mortga-ge participations and mortgage transfer certificates15. Also significant was the securitisation ofloans to SMEs, which accounted for 20% of asset-backed issues. In addition to these assets, one-
41
Primary markets
14 Among securitisation issues, there were two short-term commercial paper issues amounting to €1.1 billion. For furtherinformation see table A.1.12 of the Annex.
15 In accordance with Article 18 of Law 44/2002, of 22 November, on Measures to Reform the Financial System, mortgagebonds relating to loans which do not fulfil the requirements established in Section 2 of Law 2/1981, of 25 March, regu-lating the mortgage market, may be issued and sold under this denomination.
16 The securitisation of one-off territorial bonds accounted for 4% of asset-backed bond issues, the same as the securiti-sation of consumer loans. Transactions backed by construction certificates and other receivables originated by construc-tion companies and other services companies represented just under 1% of the total.
Figure 2.3
Securitisation issues filed with the CNMV
off territorial covered bonds and consumer loans, both originated by financial institutions, weresecuritised, as well as construction certificates and other receivables originated by construction andservices companies16. Synthetic securitisation transactions were regulated in 2003 although therewere no such issues in the year (see box below for further information).
Of the most significant individual securitisation operations, the largest transactions were in theasset-backed bond segment, where four separate issues amounted to €2 million or more. Thetwo largest issues (€3.8 billion and €3.1 billion) were backed by one-off mortgage coveredbonds originated by several savings banks and undertaken by two asset securitisation fundsmanaged by Ahorro y Titulización. The other two issues (€2.1 billion and €2 billion) involved the
Bill
ions
of
euro
s
Mortgage-backed Other asset-backed

securitisation of real estate financing receivables and were undertaken by FTA’s managed byEuropea de Titulización and Titulización de Activos, respectively. One of the most noteworthyissues backed by other assets or receivables was the securitisation of SME loans worth €1.8billion by an FTA managed by Santander Central Hispano Titulización. With regard to mortgage-backed bonds, only two issues exceeded €1 billion. The largest (€1.5 billion) was placed bySantander Central Hispano Titulización and the second (€1.25 billion) corresponded to an FTAmanaged by Gesticaixa.
Total preferred share issues filed with the CNMV in 2003 amounted to €3.4 billion in nominalterms, a 10.1% drop on 2002. As in 2002, there were eight issuers, of which six were subsidia-ries of Spanish financial institutions and the remaining two were subsidiaries of Spanish electricitycompanies17. The largest issue was €1.5 billion by Santander Central Hispano Finance. The otherissues were below €1 billion.
The medium- and long-term issues filed with the CNMV included two subordinated financial con-tributions performed by Basque cooperatives under the regulation established for these institu-tions in the corresponding autonomous region legislation18. In nominal terms, the issues amoun-ted to €100 million (included under Other issues in Table 2.5), of which €70 million were issuedby the cooperative Eroski, and the remainder by the cooperative Fagor Electrodomésticos19. Eroskihad also filed an issue of this nature in 2002, with a nominal amount of €90 million.
42
Annual report on the securities markets. 2003
17 See Table A.1.7 of the Annex.18 Article 57 of Law 4/1993, dated 24 June, on Cooperatives in the Basque Country, amended by Article 8 of Law 1/2000,
dated 29 June. In accordance with that law, subordinated financial contributions (i) do not grant voting rights to theirholders in the general assemblies of cooperative partners, (ii) may accrue fixed or variable remuneration, (iii) their termis until the company is dissolved, although the issuer may call them after five years, and (iv) in terms of the order ofprecedence, they come after all common creditors.
19 See Table A.1.14 of the Annex.
Synthetic securitisation
Law 62/2003, dated 30 December, on fiscal, administrative and labour measures, increased theoperating possibilities of asset securitisation funds since it authorised those funds to performthe synthetic securitisation of loans and other receivables, thus recognising and regulating anactivity that has grown significantly in the international arena and in which, to date, Spanishfinancial entities could participate only by establishing special purpose vehicles in other coun-tries.
The objective of synthetic securitisation is to transfer all or part of the credit risk of loans orother receivables to the securitisation fund in return for a consideration or premium. Thistransfer is performed through a credit derivative, normally a credit default swap (CDS). Inorder to fulfil its commitments in the event of the non-payment of the loans or receivablescovered, the securitisation fund raises third-party funds by issuing fixed-income securities,whose repayment is conditional on the evolution of credit protection payments made obliga-torily by the securitisation fund. Funds thus raised are normally invested in highly-liquid,high-rating assets (see diagram below).
Unlike traditional securitisation, synthetic securitisation is not intended to securitise a port-folio of loans or receivables by removing it from an entity’s balance sheet, but to facilitatethe management of the portfolio’s credit risk. The covered assets remain on the entity’sbalance sheet, while the securitisation fund assumes the credit risk in the terms agreed inthe credit derivative contract. These operations can be especially beneficial to credit insti-tutions as an alternative to traditional securitisation and other credit risk management tech-niques.
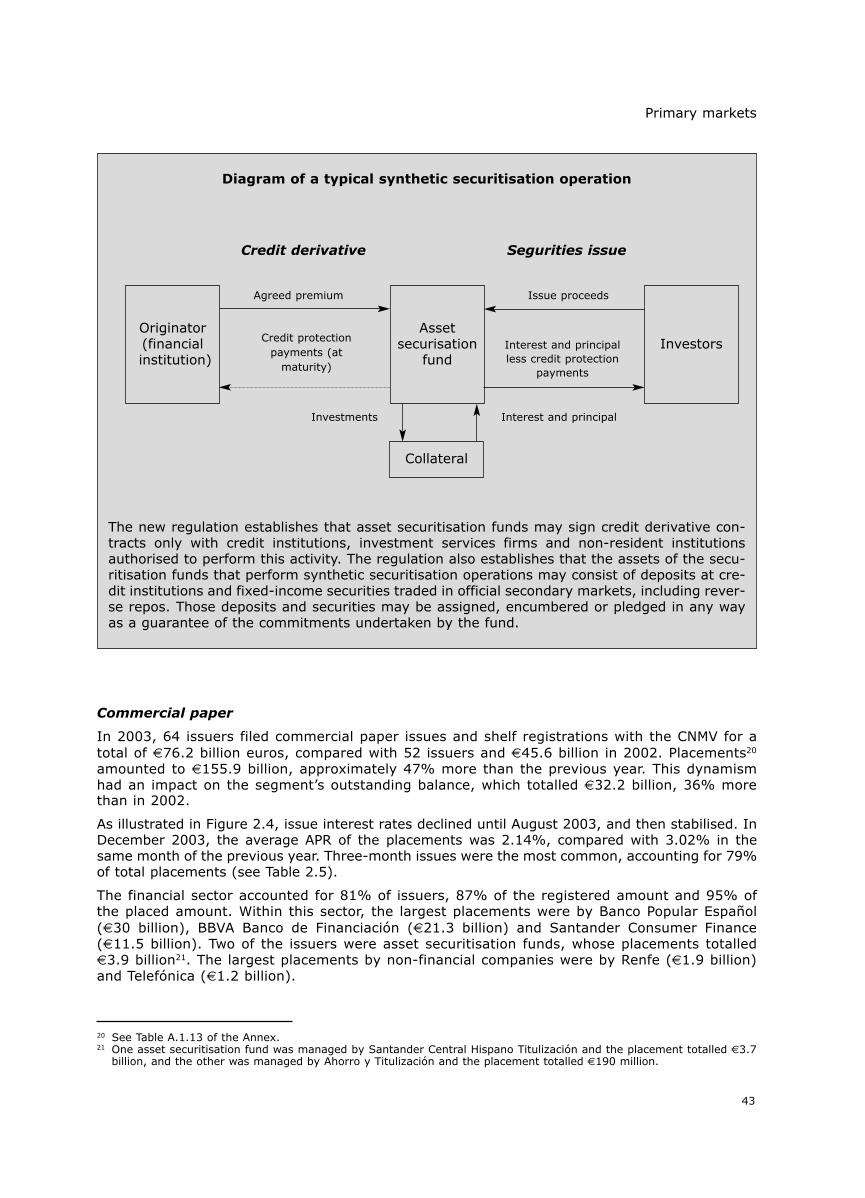
43
Primary markets
20 See Table A.1.13 of the Annex.21 One asset securitisation fund was managed by Santander Central Hispano Titulización and the placement totalled €3.7
billion, and the other was managed by Ahorro y Titulización and the placement totalled €190 million.
Diagram of a typical synthetic securitisation operation
The new regulation establishes that asset securitisation funds may sign credit derivative con-tracts only with credit institutions, investment services firms and non-resident institutionsauthorised to perform this activity. The regulation also establishes that the assets of the secu-ritisation funds that perform synthetic securitisation operations may consist of deposits at cre-dit institutions and fixed-income securities traded in official secondary markets, including rever-se repos. Those deposits and securities may be assigned, encumbered or pledged in any wayas a guarantee of the commitments undertaken by the fund.
Commercial paper
In 2003, 64 issuers filed commercial paper issues and shelf registrations with the CNMV for atotal of €76.2 billion euros, compared with 52 issuers and €45.6 billion in 2002. Placements20
amounted to €155.9 billion, approximately 47% more than the previous year. This dynamismhad an impact on the segment’s outstanding balance, which totalled €32.2 billion, 36% morethan in 2002.
As illustrated in Figure 2.4, issue interest rates declined until August 2003, and then stabilised. InDecember 2003, the average APR of the placements was 2.14%, compared with 3.02% in thesame month of the previous year. Three-month issues were the most common, accounting for 79%of total placements (see Table 2.5).
The financial sector accounted for 81% of issuers, 87% of the registered amount and 95% ofthe placed amount. Within this sector, the largest placements were by Banco Popular Español(€30 billion), BBVA Banco de Financiación (€21.3 billion) and Santander Consumer Finance(€11.5 billion). Two of the issuers were asset securitisation funds, whose placements totalled€3.9 billion21. The largest placements by non-financial companies were by Renfe (€1.9 billion)and Telefónica (€1.2 billion).
Originator(financialinstitution)
Assetsecurisation
fundInvestors
Collateral
Agreed premium
Credit derivative Segurities issue
Issue proceeds
Investments Interest and principal
Credit protectionpayments (at
maturity)
Interest and principalless credit protection
payments

2.4 Other issues registered at the CNMV22
Warrant issues registered with the CNMV amounted to €1.3 billion in notional terms, down appro-ximately €1 billion on 2002. The number of issuers fell from nine to seven. The main underlyingswere the shares of listed companies (57% of the notional amount registered) and equities inde-
44
Annual report on the securities markets. 2003
Figure 2.4
Comercial paper: placement and yields
22 See Table A.1.15 of the Annex.
Bill
ions
of
euro
s
Placements Average percentage rate (APR)
jan
jan
APR
(%
)
Figure 2.5
Commercial paper: break-down of placements by maturity
Up to 3 moths 3 to 6 moths 6 to 12 moths Over 12 moths

xes (37%). The principal issuer was Société Générale Acceptance (€505 million), followed by CajaGuipúzcoa (€298 million) 23.
The CNMV also registered issues of other financial contracts marketed by financial institutions,mainly deposits associated with options. These issues amounted to €501 million euros, comparedwith €1.7 billion in 2002. The number of issuers fell from 14 to eight. As in the case of warrants,shares of listed companies were the most common underlyings, accounting for 95% of the regis-tered amount. Contracts on indexes accounted for the remaining 5%. A single bank, Banesto,accounted for almost 51% of the registered amount in this segment.
45
Primary markets
23 A rare occurrence last year was the participation of a non-financial company, Sogecable, as an issuer in this segment.The underlying of the issue, whose notional amount was €11.4 million, were the shares of Sogecable itself, and the issuewas in the context of the merger of digital platforms Canal Satélite and Vía Digital.

CHAPTER 3
SECONDARY MARKETS

3. Secondary markets
3.1 Equity markets
The Spanish stock market ended 2003 with a sizeable gain for the first time in four years. In 2003,trading volume increased by 11.4% to 495.5 billion euros and market capitalisation gained 28.7%to 615.6 billion euros.
Index performance
The Ibex-35 index closed the year at 7,737 points, i.e. 28.2% more than at 2002 year-end, afterlosing a total of 48.1% in the three previous years. The IGBM (Madrid Stock Exchange GeneralIndex) closed the year at 808.0 points, i.e. 27.4% higher than in 2002. In addition to the gene-ral factors stated in chapter 1, the improvement in Latin America, where many large Spanish com-panies have invested heavily, contributed positively to Spain’s equity performance. The annualisedimplicit volatility of Ibex-35 derivatives declined by 21.6% to 13.1% at 2003 year-end. In theIGBM, the best performer was the communications and information services sector (+44.5%),followed by financial services (+31.5%). The only loser was the consumer goods sector (-4.1%)as a result of large losses by a single stock1.
As in other Western countries, there were two clearly distinct phases in 2003 (see figure 3.1). Thefirst quarter was shaped by losses in all the Spanish stock markets and strong index volatility dueto instability in the Middle East. The rest of the year was characterised by a bullish trend and lowervolatility.
The shares listed on Latibex (the Latin American market) gained considerably in 2003 due to eco-nomic and financial improvement in the region. In 2003, the FTSE Latibex All-Share index gained37.3% and its volatility decreased.
49
Secondary markets
1 The share price of Industria de Diseño Textil, S.A. (Inditex) fell 28.5% in 2003.
The first transatlantic members in Latibex
The first transatlantic (i.e. remote) members joined Latibex in 2003: Bradesco Corretora (aSão Paulo Stock Exchange broker) and Banchile Corredores de Bolsa (a Santiago de Chilebroker).
The Latin American Stock Exchange (Latibex) regulation(1) and one of its operating instruc-tions(2) detail the procedure and conditions for becoming a non-resident member of this mar-ket. Firms that are already members of Latin American stock markets whose securities are lis-ted on Latibex can be remote members. The requirements include: (i) existence of an agree-ment between the CNMV and the supervisor of the home market; (ii) compliance with therequirements for investment services firms not resident in Spain; (iii) membership of a LatinAmerican stock market whose securities are listed on Latibex and where there are supervisioncollaboration mechanisms between that market and Latibex; and (iv) having the necessarycapacity.

50
Annual report on the securities markets. 2003
Latibex provides liquidity, facilitates arbitraging between the various markets, and providesexperience in trading in those securities. Moreover, since BME(3) had already exported techno-logy to several markets in the region, the technical costs of listing are lower (4).
There are now 31 American(5) securities listed on Latibex and their market capitalisation totals95.5 billion euros, making it one of the largest Latin American securities markets. Moreover,since it operates within the European time zone, it provides liquidity when the home marketsare closed.(1) Latin American Securities Market Regulation, dated 18 November 1999.(2) Operating instruction No. 9/2001, dated 16 November 2001, regarding admission of members of Latin American stock markets to the
Latin American securities market.(3) Bolsas y Mercados Españoles.(4) Visual Trader, the multilateral platform used by remote members to trade in Latibex, is owned by BME.(5) Mexico, Puerto Rico, Panama, Brazil, Peru, Chile, Argentina and the US.
Figure 3.1
Ibex-35 index performance and implicit volatility(1)
(1) Implicit volatility published by MEFF-RV for the front derivative contract.
Table 3.1
Sector index performance. Madrid Stock Exchange. 2003
Yield (% change)
Sector 2002 2003 1Q 2Q 3Q 4Q
Consumer goods -1.0 -4.1 -9.5 14.8 -6.0 -1.7Capital and intermediate goods -8.4 29.6 -14.5 16.4 7.3 21.2Energy -20.3 25.0 2.8 13.8 -2.8 10.0Construction 4.2 25.4 4.7 3.6 4.2 11.0Financial services -26.3 31.5 -8.0 22.6 -2.6 19.8Communications and information services -41.6 44.5 3.4 20.2 1.5 14.6Market services -7.3 21.3 3.7 10.0 2.8 3.5
IGBM -23.1 27.4 -3.1 17.2 -0.9 13.3
Volatility% (RH)
Ibex-35(LH)
Jan. 03
8,000
7,000
6,000
5,000
Mar. 03 Jun. 03 Sep. 03 Dic. 03

Corporate earnings
After sizeable corporate losses in 2002, the companies in the Madrid Stock Exchange GeneralIndex (IGBM) attained pre-tax profit of 35.2 billion euros in 2003 (see figure 3.2) due mainlyto an improvement in Latin American countries, which enabled Spanish companies with inves-tments in the region to reduce their provisions. There were gains in the telecommunications andbank subsectors with investments in America, and in the electronics and software subsectors,due to narrower losses at Terra. Conversely, advertising, press and TV companies registered anaggregate loss of 179 million euros2 and the beverages and tobacco subsector saw profit decli-ne by 27.4%. Of the 106 companies belonging to the IGBM, pre-tax profit increased at 74 com-panies and decreased at 28 companies in 2003.
51
Secondary markets
Earnings improvement at listed companies
Listed companies’ pre-tax profit grew substantially in 2003. IGBM companies, which posteda loss of 3.099 billion euros in 2002, recorded a pre-tax profit of 35.229 billion euros in2003(1).
The bulk of the improvement in listed companies’ earnings was due not only to an increase inordinary profit but also to a reduction in extraordinary losses at companies with sizeable inves-tments in Latin America. The telecommunications sector performed superbly: from a loss of25.470 billion euros in 2002 to a profit of 5.628 billion euros in 2003 due to narrower extraor-dinary losses at the Telefónica Group(2). The banking sector also substantially reduced extraor-dinary expenses related to financial investment write-downs(3) in Latin America so, despitelower operating profit, pre-tax profit increased by 17.5% to 10.811 billion euros.
The gain by two other leading sectors was due to the general economic improvement. Profitsin the energy sector increased by 21.5% to 9.498 billion euros due mainly to higher oil prices,which boosted earnings at Repsol YPF(4) and Cepsa. The construction sector reflected strongperformance in Spain and doubled pre-tax profit to 4.297 billion euros.
Two sectors registered a decline in 2003: the advertising, press and television sector recor-ded a loss of 179.8 million euros due to heavy losses at Sogecable as a result of restruc-turing costs related to the digital platform merger, whereas the beverages and tobacco sec-
Table 3.2
Pre-tax profit of IGBM companies
Million euros and %
2000 2001 2002 2003 2003/02 (%)
Consumer goods 1,008.3 1,372.1 1,600.3 1,459.9 -8.8%Capital and intermediate goods 1,167.0 766.7 917.4 897.0 -2.2%Energy 9,979.8 7,308.2 7,816.2 9,498.0 21.5%Construction 1,478.1 1,816.3 2,141.2 4,297.4 100.7%Financial services 10,160.1 10,717.9 9,679.9 11,444.2 18.2%Communications and information
services 2,427.9 2,645.6 -26,938.9 5,373.9 –Market services 1,607.5 1,377.9 1,751.5 2,259.1 29.0%
Total IGBM 27,646.7 26,004.6 -3,099.5 35,229.4 -
Source: Bolsa de Madrid magazine
2 Due to higher losses at Sogecable (+384.2 million euros).

Performance of companies listed in Spanish stock markets
At 2003 year-end, there were 3,235 companies listed in the Spanish stock markets (211 morethan in 2002), of which 159 traded on the electronic market (132 in the Spanish market and 27in Latibex), 3,054 by open outcry (2,989 SIMs/SIMCAVs and 65 other companies) and 22 in thesecond market (see figure 3.2).
52
Annual report on the securities markets. 2003
Figure 3.2
Companies listed in the Spanish equity markets at year-end
The electronic market figures include Latibex.
Table 3.3Change in the number of listed companies, by market. 2003
TotalElectronic market Open Second
Total Domestic Latibex outcry market
Listings 275 6 2 4 268 1
New listings 273 5 1 4 267 1Listings due to mergers 0 0 0 0 0 0Change of market 2 1 1 0 1 0
Delistings 64 11 11 0 50 3
Exclusions 53 6 6 0 45 2Exclusions due to mergers 10 5 5 0 5 0Change of market 1 0 0 0 0 1
Net change 211 -5 -9 4 218 -2
Pro memoria
Listed at 31/12/02 3,024 164 141 23 2,836 24Listed at 31/12/03 3,235 159 132 27 3,054 22
Electronic market SIM/SIMCAV Other open outcry Second market
3,000
2,500
2,000
1,500
1,000
tor’s earnings were positive but they fell substantially due to lower profit at Altadis as aresult of restructuring costs to absorb Moroccan tobacco company Régie des Tabacs duMaroc.(1) Madrid Stock Exchange data.(2) The Telefónica Group recorded an extraordinary loss of 1.249 billion euros in 2003, much lower than the 16.218 billion euros in 2002.(3) Consolidated extraordinary items at Banco Bilbao Vizcaya Argentaria plus Banco Santander Central Hispano went from a loss of 771
million euros in 2002 to a gain of 566 million euros in 2003.(4) Repsol YPF’s ordinary profit increased from 2.202 billion euros to 3.432 billion euros in 2003.

A total of 275 companies were listed in 2003 due almost entirely to additions in the open outcry seg-ment (see table 3.3). Four new companies were listed in Latibex, two from Mexico, one from Braziland one from the US. A total of 64 companies were delisted, 11 of them in the electronic market.
Market capitalisation
As observed in figure 3.3, at 2003 year-end the market capitalisation of Spain’s bourses totalled615.6 billion euros (28.7% more than in 2002); 70.5% corresponded to domestic companies inthe electronic market, 15.5% to Latibex and 8.1% to foreign companies in the electronic market3
(7.7% in 2002). The open outcry market’s capitalisation increased by 17.3%.
53
Secondary markets
Figure 3.3
Capitalisation of the Spanish equity markets
Figure 3.4
Market capitalisation of equities by sector
3 Foreign companies that are listed in the Spanish markets are: Bayer, Volkswagen, Jazztel, EADS, Reno de Medici, MeliáInversiones Americanas, Commerzbank, Lafarge and Arcelor.
Electronic market-Spanish companies Electronic market-foreign companies Latibex
billion euros
OilEnergy &
water
Minig
Metal
ConstructionTransport &comunications
Banks
SIMCAV
Other Oil Energy &water
Minig
Metal
ConstructionTransport &
comunications
Banks
SIMCAV
Other
Open outcry

The main increases in the sector weightings in 2003 were in oil and metal-mechanical. The weigh-ting of textile & paper and SIMCAVs decreased. Transport & communications became the largestsector in terms of market capitalisation (20.3%), followed by banks (19.7%).
Trading
Trading amounted to 495.5 billion euros in 2003, i.e. 11.4% higher than in 2002 (see table 3.4)due mainly to price increases. The electronic market, whose activity rose by 11.6%, concentrated99.1% of total trading. Regular session trading in the electronic market grew by 12.6% to 457.5billion euros4 due mainly to an increase in block trading.
Trading was concentrated in a small number of securities. In the electronic market, ten securitiesaccounted for 81.0% of total trading and the 35 most-traded securities represented 94.8%.
54
Annual report on the securities markets. 2003
Table 3.4Equities trading in Spanish stock markets
Amounts in million euros
Trading Change (%) Share (%)
2001 2002 2003 2002/01 2003/02 2002 2003
Electronic market 440,604.8 439,950.4 491,035.9 -0.1 11.6 98.9 99.1Open outcry 3,672.1 4,967.3 4,444.7 35.3 -10.5 1.1 0.9Madrid 2,469.6 3,235.3 3,009.8 31.0 -7.0 0.7 0.6Barcelona 660.2 948.6 871.1 43.7 -8.2 0.2 0.2Bilbao 296.7 297.8 147.5 0.4 -50.5 0.1 0.0Valencia 245.6 485.5 416.3 97.7 -14.3 0.1 0.1
Total stock markets 444,301 444,935 495,494 0.1 11.4 100.0 100.0
Figure 3.5
Yearly turnover velocity in the Spanish electronic market (1)
4 See Annex 2.2.12
Increased activity in the Spanish stock markets was also reflected in turnover velocity (ratio bet-ween regular session trading and market capitalisation), which stood at 102.5%, i.e. 14.2 percen-tage points higher than in 2002 (see figure 3.5).
(1) Regular session trading as a % of market capitalisation.
Turn
over
vel
oci
ty
59.0
73.2 71.5
92.188.2 88.4
102.5

Trading in individual sectors was very mixed (see table 3.5). Trading increased in ten sectors,especially banks and oil, and decreased in seven sectors, especially transport & communications.Turnover velocity in the electronic market was greatest in food (159.0%) and banks (148.6%),and lowest in finance companies (4.1%) and metal-mechanical (4.7%)
55
Secondary markets
Figure 3.6
Equities trading in Spanish stock markets by non-residents (half-yearly figures)
Table 3.5Trading in Spanish stock markets, by sector(1)
Million euros
1999 2000 2001 2002 2003
Oil 15,810.6 29,020.0 30,699.3 34,511.2 30,056.7Energy & water 52,940.4 46,101.3 56,658.4 57,691.7 62,515.9Mining & basic metals 4,663.3 3,583.2 4,163.2 6,476.5 7,622.4Cement & construction materials 2,131.1 1,154.2 888.9 785.4 763.4Chemicals 1,161.3 978.6 6,355.2 3,321.4 1,670.7Textile & paper 2,669.3 834.1 1,577.8 10,666.0 7,899.7Metal-mechanical 3,322.2 3,851.0 2,639.4 2,237.3 1,109.4Food 12,409.4 10,019.4 13,314.0 9,409.7 13,947.9Construction 7,223.6 10,345.8 9,046.1 9,257.2 15,287.0Real estate 3,124.5 3,148.4 2,940.0 2,257.1 5,664.3Transport & communications 53,970.8 60,756.9 161,057.4 144,379.6 111,475.3Other 6,622.9 18,291.7 65,422.0 32,159.6 20,013.8Total non-financial sector 166,049.2 188,084.8 354,761.8 313,152.7 278,026.5
Banks 87,409.1 95,085.3 129,536.5 122,665.5 158,505.0Insurance companies 2,309.7 1,201.9 1,566.1 1,233.8 1,192.7Portfolio companies 2,747.1 2,258.2 3,259.8 3,748.5 2,755.9SIM/SIMCAV 2,538.3 2,664.4 3,048.1 3,472.4 4,422.7Finance companies 0.0 28.3 0.6 4.1 15.0Total financial sector 95,004.3 101,238.0 137,411.1 131,124.2 166,891.2Total 261,053.5 289,322.8 492,172.9 444,276.9 444,917.6
(1) Second market data not included.
Other factors in Spanish equities
Despite the 9.7% increase in trading by non-resident investors in 2003, their share of the totalmarket fell to 50.7% of total trading (54.5% in 2002). As in 2002, they were net sellers, divesting14.3 billion euros (21.0 billion euros in 2002).
150,000
125,000
100,000
75,000
50,000
25,000
0
Purchases (LH) Sales (LH) % Non-residents/total trading (RH)
mill
on e
uro
s

Spanish FIM funds’ portfolio of Spanish stocks stood at 1.5% of market capitalisation at 2003 year-end (see figure 3.7), one-tenth of a point more than in 2002. Their portfolio of foreign stocksaccounted for 63.8% of the shares held by FIM funds.
56
Annual report on the securities markets. 2003
Figure 3.7
Shares held by FIM funds
In 2003, trading of Spanish securities in the New York Stock Exchange decreased to 4.410 billiondollars, i.e. 22.1% less than in 2003. Trading of Spanish securities on foreign stock markets decre-ased to 1.2% of trading on Spanish bourses, i.e. two-tenths of a point less than in 2002.
Table 3.6Effective trading of Spanish securities in the New York Stock Exchange
BBVA BSCH Endesa Repsol YPF Telefónica Tel. Móviles Total
Million dollars1997 410.1 697.5 1,043.5 2,640.9 4,682.7 - 9,474.71998 674.2 699.4 1,107.3 2,119.4 3,513.8 - 8,114.21999 331.4 323.8 566.8 1,373.3 2,183.3 - 4,778.62000 292.0 609.9 569.2 1,688.5 23,163.9 16.6 26,340.02001 790.6 555.1 430.3 1,161.7 6,300.2 11.0 9,249.02002 607.7 627.1 511.7 1,277.2 2,629.5 10.9 5,664.22003 496.1 520.7 435.5 890.9 2,042.3 24.4 4,409.8% of trading on Spanish markets 1997 4.3 6.4 4.9 15.0 12.7 5.01998 3.1 2.9 3.3 12.4 6.2 2.61999 1.2 0.7 1.8 5.1 3.6 1.52000 0.4 1.1 1.8 5.1 14.1 0.2 4.92001 1.5 1.2 1.8 3.8 5.2 0.3 2.32002 0.9 0.9 2.0 4.6 2.7 0.5 1.42003 0.6 0.6 1.2 2.0 1.9 1.0 1.2
Source: Madrid Stock Exchange
Nuevo Mercado and second market
In 2003, the number of securities listed in the Nuevo Mercado remained unchanged at 145. Theprice increases in technological securities (the Ibex-Nuevo Mercado index gained 27.4%) boos-
5 Abengoa, Amper, Amadeus Global Travel Distribution, Avanzit, Puleva Biotech, Befesa Medio Ambiente, TecnocomTelecomunicaciones y Energía, Indra Sistemas, Jazztel, Natraceutical, Service Point Solutions, Telefonica Publicidad eInformacion, Terra Networks and Zeltia.
35,000
30,000
25,000
20,000
15,000
10,000
5,000
0
Million euros
Foreign
Spanish
Spanish shares as a% of capitalisation
(RH)

ted market capitalisation to 11.9 billion euros (1.9% of total Spanish equities). Trading volu-me increased by 14.1% to 14.3 billion euros (2.9% of total trading in the Spanish markets).
Trading in the second market remained low in 2003. Twenty-two companies were listed at 2003year-end (two less than in 2002). Market capitalisation grew by 1.5% to 388.6 million euros buttrading declined by 25.5% to 13.3 million euros.
3.2 Fixed-income markets
In 2003, Spain’s secondary markets in fixed-income securities operated in a context of low short-and long-term interest rates. Low yields on public debt meant that investors preferred corporatefixed-income: trading increased in bonds and debentures listed in the stock markets (+5.5%) andin the AIAF market (+41.0%), but decreased in the government debt book-entry market (-2.8%)(see table 3.7).
57
Secondary markets
Table 3.7Trading in organised fixed-income markets
Nominal trading in million euros
2001 2002 2003 Change (%)
Government debt book-entry market(1) 1,964,678 2,310,943 2,246,881 -2.8Bonds and debentures 1,899,590 2,270,847 2,157,130 -5.0Treasury bills 65,088 40,096 89,751 123.8
Stock exchanges(2) 57,463 71,140 75,058 5.5Electronic market 2,384 2,046 2,354 15.1Open outcry 55,079 69,094 72,704 5.2
AIAF 143,733 272,470 384,089 41.0Commercial paper 100,812 212,702 265,604 24.9Matador bonds 2,001 3,458 3,107 -10.1Mortgage bonds 2,100 4,164 20,684 396.8Bonds and debentures 38,820 52,146 94,694 81.6
(1) Outright spot trades only(2) Effective amountSource: Bank of Spain, AIAF and CNMV
Figure 3.8
Interest rates on 3-month commercial paper, interbank deposits and repos in 2003
Comercialpaper
Interbankdeposit Repo
Jan.
3,00
2,75
2,50
2,25
2,00
1,75
1,50Feb. Mar. Abr. May. Jun. Jul. Aug. Sep. Oct. Nov. Dic.

58
Annual report on the securities markets. 2003
Figure 3.9
Long-term fixed-income yields in 2002 (corporate vs. public)
The Spanish ten-year public debt yield stood at 4.25% at 2003 year-end (the same as at 2002year-end) and the three-year yield narrowed 75 basis points to 2.25%, so the slope curve increa-sed significantly. The spread with respect to German long-term public debt fell from 10 basis pointsto five. Yields on over 10-year corporate debt traded in the AIAF market performed in parallel withsovereign debt and closed 2003 at 4.95%.
Public debt book-entry market
Outright spot trades in the public debt book-entry market decreased by 2.8% to 2.2 trillion eurosin 20036. Trading decreased in bonds and debentures (-5.0%) but increased in Treasury bills(123.8%). Trading for third parties represented 63.7% of the total debt market, i.e. less than the65.6% registered in 2002.
AIAF
The private debt market benefited from low yields on public securities. The number of issuersand issues in the AIAF market increased in 20037. The number of issuers was 270 at 2003 year-end, 42 more than at the end of 2002. The outstanding listed balance increased by 55.2% to197.1 billion euros due to sharp growth in commercial paper and asset-backed securities (secu-ritisation bonds, and mortgage bonds and territorial covered bonds).
Trading on AIAF increased by 39.5% to 384.1 billion euros in 2003 (see figure 3.11). Commercialpaper was the most dynamic segment of AIAF: trading amounted to 261.6 billion euros, i.e. 56billion euros more than in 2002, and it accounted for 68.1% of the total volume traded on AIAF.
6 Repos attained a nominal amount of 11.2 trillion euros, a 9.7% increase on 2002.7 See Chapter 2.
In the AIAF market, the average yield on 3-month commercial paper fell by 77 basis points and on12-month commercial paper by 51 basis points; their spread against public debt repos narrowedslightly (see figure 3.9).
Jan.
5.5
5.0
4.5
4.0
3.5
3.0
Feb. Mar. Abr. May. Jun. Jul.
AIAF Public debt
Aug. Sep. Oct. Nov. Dic.

59
Secondary markets
Figure 3.10
Public debt. Trading and outstanding balance. 2003Million euros
MEFF’s central counterparty for public debt
In September 2003, Meffclear began providing central counterparty (CCP) services for MEFFRenta Fija’s fixed-income transactions. This activity is not completely new for the MEFF groupsince it expands the other CCP services that it has provided since 1989 regarding futures andoptions trading. Until then, the Spanish financial system had only provided CCP services forderivatives transactions. Nevertheless, CCP services have been provided in Europe for severalyears by prestigious companies such as LCH.Clearnet(1) and Eurex Clearing(2).
A central counterparty’s main activity is to act as a single counterparty for the parties involvedin transactions with securities or financial instruments, i.e. when a trade is registered in theCCP, the latter acts as a seller to the buyer and as a buyer to the seller, thus eliminating coun-terparty risk. The parties are committed to settling their net position with the CCP at the end.
Central counterparties are very advantageous for financial institutions since they provide secu-rity and ensure successful trades. Improved risk management and control enables the institu-tions to save on equity by reducing the necessary amount for complying with their solvencycoefficients. CCP services also eliminate bilateral credit facilities between counterparties.
Meffclear provides counterparty services for the public debt market in both repo and spot tra-des in the SENAF electronic system and other trading platforms. Its main characteristics are asfollows:
(i) conditions for access: the parties with direct responsibility are the counterparty’s clearingmembers who can maintain their own accounts and those of clients. Those members and theclients must own an Iberclear account and have a treasury account at the Bank of Spain.Clearing members must also have at least 100 million euros in equity and deposit an initialgeneral guarantee based on their activity for their own account and for third parties.
(ii) clearing of initial positions and margins: the CCP acts as a direct counterparty to clearingmembers and clients, so clients are not affected if clearing members fail to comply. Clearing isnot allowed between own accounts and client accounts, so daily margins are calculated inde-pendently for each account.(1) LCH.Clearnet is the CCP resulting from the merger between the London Clearing House and Clearnet in mid-2003. LCH.Clearnet pro-
vides services to the London Stock Exchange and Euronext.(2) Eurex Clearing provides CCP services to Deutsche Börse.
Jan.
250.000
200.000
150.000
100.000
300,000
290,000
280,000
270,000
Feb. Mar. Abr. May. Jun. Jul. Aug. Sep. Oct. Nov. Dic.
Bond and debenturetrading (LH)
Treasury bill trading(LH)
Total outstanding balance(RH)

Table 3.8Issuers, listed issues and outstanding balances on AIAF at 31 December
Amounts in million euros
SegmentsIssuers Issues
Outstanding balances
2002 2003 2002 20032002 2003
Amount % of total Amount % of totalChange%
Commercial paper(1) 49 58 1,459 1,504 21,114 16.6 30,282 15.4 43.4Matador bonds 25 21 56 40 3,747 3.0 2,976 1.5 -20.6Covered bonds(2) 8 10 22 34 22,052 17.4 41,913 21.3 90.1Bonds and debentures(3)169 216 453 581 80,090 63.1 121,972 61.9 52.3
Total 228 270 1,990 2,159 127,003 100.0 197,142 100.0 55.2(1) Includes securitised commercial paper.(2) Includes mortgage and territorial covered bonds.(3) Includes non-convertible bonds and debentures, mortgage-backed bonds and asset-backed bonds.
Trading for third-party accounts exceeded 85.7% of total trading, compared with 84.7% in 2002and 77.6% in 2001. Retail trading (trading with third parties) was especially significant in the seg-ments of territorial and mortgage covered bonds, commercial paper and non-convertible bonds(see Annex A.2.26).
Stock exchanges
In 2003, ten exchange-traded fixed-income securities were delisted while ten new issues were lis-ted, and the outstanding balance increased by 14.7% to 14.5 billion euros. In absolute terms, the
60
Annual report on the securities markets. 2003
Asset-backed bonds were the fastest-growing segment (224.2% to 36.7 billion euros) while mort-gage-backed bonds expanded by 40.1% to 33.3 billion euros. Trading in territorial covered bondsamounted to 3.9 billion euros.
Figure 3.11
Trading on AIAF by segmentMillion euros
Commercialpaper
280,0000
240,000
200,000
160,000
120,000
80,000
40,000
0
Debenturesand bonds
Mortagecoveredbonds
Territorialcoveredbonds
Matadorbonds

61
Secondary markets
Table 3.9Issuers, listed issues and outstanding balances
on the stock exchange at 31 December
Outstanding balances in million euros
SegmentsIssuers Issues Outstanding balances
2002 2003 2002 2003 2002 2003 Change (%)
Corporate 41 37 130 122 3,758 5,175 37.7Energy & water 3 2 8 8 55 99 80.7Transport & communications 5 5 14 15 877 1,070 22.0Banks 24 22 91 82 2,354 2,430 3.2Finance companies 3 1 5 10 397 1,347 239.3Other 9 7 12 7 76 230 204.0Public sector and
international agencies 28 22 135 153 8,886 9,325 4.9Regional governments 3 3 43 78 3,134 6,160 96.5State agencies 2 2 33 26 274 269 -1.7International bodies 11 6 32 17 4,805 1,771 -63.1Other 12 11 27 32 673 1,124 67.0
Total 69 59 265 275 12,644 14,500 14.7
Sources: Stock exchanges and CNMV
In 2003, stock-exchange trading in fixed-income securities totalled 73.4 billion euros, a 5.1%increase on 2002, and was concentrated mainly in the open outcry segments in Barcelona andBilbao, where public debt securities issued by the Catalunya and Basque regional governments,respectively, are traded (71.5 billion euros).
largest increase was in regional government debt. The sharpest increase in the outstanding balan-ce of debt was by finance companies (239.3%).
Figure 3.12
Trading in fixed-income securities on the stock exchanges
Reg
ional
gov
ernm
ent
deb
t (%
)
Mill
ion e
uro
s80,000
65,000
50,000
35,000
Trading
Regionalgovern-mentsdebt(%)

3.3 Margin trading and security lending
Margin trading involves granting credit directly related to the buying and selling of securities lis-ted in securities markets8. Margin buying declined by 9.6% to 346.1 million euros whereas short-selling increased by 23.9% (but was still below the buying volume). The outstanding balance grewslightly in margin buying and significantly in short-selling (see table 3.10).
62
Annual report on the securities markets. 2003
Table 3.10
Margin trading
Amounts in thousand euros
Margin trading Outstanding balance(1)
Margin buying Short-selling Margin buying Short-selling
1995 31,571 9,009 3,211 2431996 115,665 15,176 9,318 1,1221997 467,239 37,299 11,240 3,5011998 810,770 125,392 23,668 3,5881999 677,184 167,512 32,606 6,0132000 1,121,315 151,422 54,687 4,4002001 534,132 174,106 43,114 8,5312002 382,859 161,211 31,452 7,7582003 346,065 199,768 32,831 17,316
(1) Amounts at year-end Source: Madrid Stock Exchange, SCLV and CNMV
The balance of securities lending through securities markets more than doubled in 2003, to 28.9billion euros9 (see figure 3.13). Securities lending in 2003 amounted to 161.8 billion euros,51.2% more than in 2002. Securities lending enables investors to borrow Ibex-35 shares for amaximum of three-and-a-half months from other investors, who receive a specific interest whilesaving on deposit and custody fees. When the borrowed securities are sold, the amount of thistransaction remains as collateral at the broker until the transaction is finalised and the securi-ties are returned.
3.4 Securities clearing and settlement
In 2002, the Law on Measures to Reform the Financial System introduced a new legal frameworkfor securities clearing and settlement systems in Spain. It established the creation of a holdingcompany through the merger of the SCLV (the Spanish Securities Clearance and SettlementService) and CADE (the Government Debt Book-Entry System) to provide clearing and settlementservices for securities listed in Spain.
On 1 April 2003, Iberclear—the trade name for Sociedad de Gestión de los Sistemas de Registro,Compensación y Liquidación de Valores, S.A. Unipersonal—took on the two aforementioned com-panies’ responsibilities for registering, clearing and settling securities and became the central secu-rities depository in Spain. Since September 2003, Iberclear is wholly owned by Bolsas y MercadosEspañoles (BME) since the Bank of Spain exchanged its SCLV stake for a stake in BME.
8 Ministerial Order dated 25 March 1991 on the margin system in stock market transactions.9 The average outstanding balance was 19.4 billion euros in 2003, i.e. 30.9% higher than in 2002.

Equities settlement increased significantly in 2003, boosted by good stock market performance.The number of settlements grew by 4.5% to 16.2 million and the total amount rose by 9.3% to978.3 billion euros.
Iberclear settled 9.8 million fixed-income transactions in the public debt book-entry market in2003 and 1.5 million transactions in the AIAF market. The nominal value of settlements was 81.0billion euros in the public debt book-entry market and 3.5 billion euros in the AIAF market.
63
Secondary markets
Figure 3.13
Securities lending
% of electronic marckettraininh (RH)
% of electronicmarcketcapitalisation (RH)

CHAPTER 4
DERIVATIVES MARKETS

4. Derivative markets
4.1 International situation
Trading in derivatives continued to grow rapidly in 2003, although to a lesser extent than inthe previous two years due to lower volatility in the international financial markets, especiallystock markets. According to the Bank for International Settlements (BIS), the total number ofcontracts traded in organised markets worldwide exceeded eight billion in 2003 (see Table 4.1),i.e. 33% more than the previous year, compared with the year-on-year increase of 37% in2002 and 47% in 2001. In terms of notional value, trading amounted to $873.7 trillion1. Over-the-counter (OTC) trading also grew significantly, even more so than in previous years. Thenotional value of open interest at year-end amounted to $195.5 trillion, 38% more than in2002, exceeding the 28% and 18% growth recorded in the previous two years (see AnnexA.3.1.b).
67
Derivative markets
1 In these figures, BIS does not include derivatives on individual stocks and commodities.
Table 4.1International derivatives markets.
Total trading by instrumentMillions of contracts
2002 2003 Change %
Futures 2,156.4 2,836.4 31.5Interest rates 1,147.9 1,573.5 37.1Securities indexes 530.3 725.1 36.7Currencies 42.6 58.3 36.9Commodities 435.6 479.5 10.1Options 3,906.7 5,209.5 33.3Interest rates 240.3 302.3 25.8Securities indexes 2,235.5 3,234.3 44.7Individual stocks 1,366.5 1,608.0 17.7Currencies 16.1 14.2 –11.8Commodities 48.3 50.7 5.0
Total 6,063.1 8,045.9 32.7
Source: BIS.
Trend in derivatives trading, by underlying
The increase in trading in organised derivatives markets was particularly intense in interest ratefutures and options; the number of contracts rose by 35% and the notional value by 27%,accentuating the difference in size between this segment and the other groups of derivatives. Innotional value, trading in this segment represented 90.8% of the total in 2003 (see AnnexA.3.1.a).
Products on short-term interest rates referenced to Euribor grew faster than Eurodollar derivati-ves. Table 4.2 and Annex A.3.3 illustrate that growth in Euribor futures and options traded inEuronext.Liffe was especially strong, whereas Eurodollar futures traded in the Chicago MercantileExchange (CME) increased slightly and Eurodollar options fell.

This performance can be explained by the following factors: (i) greater uncertainty about theperformance of official interest rates in the euro zone; (ii) strong growth in the OTC InterestRate Swap (IRS) market denominated in euros, which boosted hedging with Euribor futures; and(iii) the shift in activity from the OTC markets to the organised markets in the euro zone, under-pinned by the use of totally electronic trading systems in the organised markets in the eurozone.
Trading in long-term interest rate derivatives increased due to intense movement in the underl-ying market throughout the year (see Chapter 1, section 3). As illustrated by Table 4.2, the incre-ase was greater in contracts traded on the Chicago Board of Trade (CBOT), the direct competitorof the German-Swiss Eurex market.
68
Annual report on the securities markets. 2003
Table 4.2International derivatives markets.
Trading in certain leading products(1)
Thousands of contracts
Underlying Product Market(2)No. contracts traded
2002 2003 % change
Short-term 3-m Eurodollar (f) CME 202,081 208,771 3.3interest rates 3-m Euribor (f) Euronext.Liffe 105,757 137,692 30.2
3-m Eurodollar (o) CME 105,581 100,819 –4.53-m Euribor (o) Euronext.Liffe 33,480 57,730 72.4
Long-term Euro-Bund (f) Eurex 191,263 244,414 27.8interest rates Euro-Böbl (f) Eurex 114,679 150,087 30.9
10 year T bonds (f) CBOT 95,786 146,745 53.230 year T bonds (f) CBOT 50,512 73,746 46.0
Securities indexes KOSPI 200 (o) KSE 1,889,882 2,837,725 50.2E-mini S&P 500 (f) CME 115,742 161,177 39.3DJ EuroStoxx 50 (f) Eurex 86,355 116,035 34.4CAC 40 (o) Euronext Paris 84,343 73,668 –12.7
(1) Trading refers to the number of contracts. Differences in the value of the underlying instruments prevent direct comparisons betweenmarkets, but inter-year comparisons are meaningful.
(2) CBOT: Chicago Board of Trade; CME: Chicago Mercantile Exchange; Eurex: Deutsche Terminbörse (DTB) and Swiss Options & FinancialsFutures Exchange (SOFFEX); Euronext.Liffe: Liffe (London International Financial Futures Exchange) after integrating into Euronext;Euronext Paris: French branch of Euronext; KSE: Korea Stock Exchange.
Sources: Futures Industry Association and “Futures and OTC World”.
Trading in equities derivatives also surged in 2003, despite the lower volatility in the stock exchan-ges. The increase in trading was not homogenous among the various contracts, but was characte-rised by the following trends (see Table 4.2 and Annex A.3.3): (i) the concentration of activity incontracts referenced to the pan-European indexes, in particular the DJ EuroStoxx 50; (ii) the shiftin US markets towards contracts traded on electronic systems (E-mini S&P 500 and E-mini Nasdaq100), to the detriment of those traded via the traditional open outcry system; and (iii) exponen-tial growth in products referenced to Korea’s KOSPI 200 index, mainly options.
Futures and options on the KOSPI 200 index have grown spectacularly since they were introducedby the Korean Stock Exchange (KSE) in May 1996 and July 1997, respectively. The largest growthwas in options, which have continued to be the most traded contract worldwide in recent years interms of both the number of contracts and the notional value. The success of these products is aresult of two factors: the fact that they are smaller than the other contracts in this segment2, and
2 According to market data at the end of April 2004, the nominal value of options on the KOSPI 200 index was 10,005dollars, clearly below the 113,811 dollars corresponding to options on the S&P 500 index traded on the Chicago BoardOptions Exchange (CBOE) and the 33,710 dollars corresponding to options on the DJ Euro Stoxx 50 of Eurex. The nominalvalue of futures on the KOSPI 200 index was 50.025 dollars at the same date.

the high participation of retail investors (two-thirds of trading) in this market, mainly via theInternet.
There was also a substantial increase in trading in currency derivatives on organised markets (up23%, including futures and options). This growth came after a lengthy slowdown, although thissegment continues to have limited weighting in total trading in organised markets, as these ins-truments are basically traded via OTC operations. The sharp depreciation of the dollar in 2003encouraged the use of contracts referenced to the dollar’s exchange rate against the major inter-national currencies (euro, yen, Canadian dollar, Swiss franc) which are chiefly contracted in theCME market (see Annex A.3.3).
Trading by market
Sharp growth continued in the Korean Stock Exchange (KSE), which continued to record the mostrobust levels of trading worldwide due to strong activity in contracts on stock indexes.
Europe’s two largest derivatives markets maintained their leading positions on the internationalarea. Eurex continued to grow due to its lead in derivatives trading in long-term interest rates,and it further consolidated its competitive position in products referenced to the Pan-Europeanindexes. Owing to Euronext.Liffe’s dominance in trading in short-term interest rate derivatives,Euronext maintained the business volumes recorded the previous year despite the decline in equi-ties contracts.
In the US markets, there were no changes in the competitive positions of the CME and CBOT.The CME continues to focus mainly on contracts referenced to the dollar’s short-term interestrate and activity in the CBOT is centred on public debt. The strongest growth in the main deri-vative markets was in the electronic International Stock Exchange, which reinforced its compe-titive position in options on individual stocks, at the expense of the Chicago Board OptionsExchange (CBOE).
69
Derivative markets
Table 4.3International derivative markets.
Total trading(1)
Thousands of contracts
2002 2003 Change %
KSE 1,932,750 2,899,938 50.0Eurex 801,201 1,014,932 26.7Euronext 689,208 693,232 0.6CME 558,448 640,210 14.6CBOT 343,883 454,191 32.1CBOE 267,616 283,946 6.1ISE 152,399 244,968 60.7
Euronext.Liffe 253,986 335,826 32.2Euronext Paris 357,512 277,882 –22.3OM 60,921 72,137 18.4
(1) Trading refers to the number of contracts. Differences in the value of the underlying instruments prevent direct comparisons betweenmarkets, but inter-year comparisons are meaningful.
(2) CBOE: Chicago Board Options Exchange; CBOT: Chicago Board of Trade; CME: Chicago Mercantile Exchange; Eurex: DeutscheTerminbörse (DTB) and Swiss Options & Financials Futures Exchange (SOFFEX); Euronext.Liffe: Liffe (London International FinancialFutures Exchange) after integrating into Euronext; Euronext Paris: French branch of Euronext; ISE: International Stock Exchange; KSE:Korea Stock Exchange: OM: Stockholm Options Market.
Source: Futures Industry Association and “Futures and OTC World”.

70
Annual report on the securities markets. 2003
International competition in the financial futuresand options markets
Strategic decisions of importance for derivative markets were adopted in 2003. The two mainEuropean markets, Eurex and Euronext, announced plans to create their own derivatives mar-kets in the US to compete directly with the Chicago markets, CBOT and CME, in contracts oninterest rates denominated in dollars. These two new market were launched on February 2004and March 2004, respectively.
As illustrated in the table below, the European markets clearly had a greater market share in2003 than in 1997. Eurex’s competitive position was greatly strengthened by the introductionof the euro in the securities markets in 1999: by 2001, Eurex accounted for 61% of trading inlong-term interest rate derivatives. In the last two years, it has lost ground to CBOT. The situa-tion was different in short-term interest rate derivatives, where the US market maintained theleading position it has held since 1997, although the gap between CME and Euronext.Liffenarrowed in 2003.
Trading on the main interest rate derivatives markets
The most significant strategic decisions involved long-term interest rate derivatives. In 2002,CBOT decided to abandon the traditional open outcry system, which is standard in the US secu-rities markets, and introduce an electronic trading system using Eurex’s ACE platform. Thismove, together with the favourable financial climate, explains its growth in market share in thelast two years. CBOT decided to end the technological alliance with Eurex in 2003, and to intro-duce the Liffe.Connect trading system, which belongs to the Euronext group. Immediatelyafterwards, Eurex announced plans to launch its own electronic market in the US to trade, interalia, futures and options on US public debt.
The distribution of trading among the main international derivatives markets in the future isnow an open question, in which improvements in the markets’ efficiency will be a determiningfactor. This was the objective behind the decision by CBOT and CME to connect their clearingservices, which will enable those who are members of both markets to obtain operating gainsand cost savings (reduced capital requirements, collateral, etc.).
Long-term interest rates Short-term interest rates
% of total Eurex CBOT Euronext.Liffe CME1997 14.9 41.7 30.2 48.4
1998 29.9 45.9 40.1 45.4
1999 51.6 39.9 35.7 49.8
2000 53.2 31.3 30.7 43.4
2001 61.4 29.1 31.0 52.4
2002 58.7 35.2 32.1 52.6
2003 57.3 37.3 38.3 45.3

4.2. Spain’s derivatives markets
Trading in Spain’s derivatives markets declined considerably in 2003, accentuating the trendthat commenced the previous year. The reduction in trading in Mercado Español de Futuros yOpciones Financieros (MEFF) continued due mainly to lower trading in options on individualstocks as a result of lower volatility in the Ibex 35 blue chips. In addition, there was a migra-tion towards the European markets, basically Eurex, channelled through MEFF Euroservices S.V.(EuroMEFF).
The main development in the commodities derivatives markets was the authorisation of the OliveOil Futures Market (MFAO) in November 2003. The MFAO—Spain’s second commodities market—opened for trading on 6 February 2004 with futures on minimum quality lampante virgin olive oil.One of this market’s distinguishing features is the presence of a category of industrial members,which gives non-financial firms the possibility to trade for their account3.
71
Derivative markets
Table 4.4Trading on Spain’s derivative markets
No. of contracts, unless otherwise stated
2002 2003 Change (%)
MEFF RF 51,060 1,371 –97.3Debt futures 51,060 1,371 –97.3Debt options — — —MIBOR futures and options — — —Euribor futures — — —
MEFF RV 27,866,867 21,746,693 –22.0Ibex 35 futures(1) 3,515,016 3,227,206 –8.2Ibex 35 options 441,745 243,844 –44.8Stock futures 9,630,899 9,768,607 1.4Stock options 14,278,332 8,507,035 –40.4S&P contracts(2) 875 0 –100.0
Total MEFF 27,917,927 21,748,064 –22.1
Total EuroMEFF 4,198,861 5,233,561 24.6European debt futures(3) 2,583,383 2,879,779 11.5European indexes contracts(4) 1,604,330 2,322,356 44.8Others(5) 11,148 31,427 181.9
Total MEFF and EuroMEFF 32,116,788 26,981,625 –16.0
Madrid Stock Exchange 1,232,351 1,609,839 30.6Warrants(6) 1,232,351 1,609,839 30.6
FC&M 0 0 —(1) Includes MINI Ibex 35 futures homogenised to the size of Ibex 35 futures.(2) Futures and options on S&P Europe 350 and sector indexes (Financial, Technology and Telecommunications).(3) Includes futures on German debt (Bund, Böbl, Schatz) traded on Eurex and futures on the 10-year notional bond traded on Euronext
Paris.(4) Includes futures on the DAX 30, DJ Eurostoxx 50 and DJ Stoxx 50 indexes traded on Eurex, futures on the CAC 40, DJ Eurostoxx 50 and
DJ Stoxx 50 indexes traded on Euronext Paris, and futures and options on the PSI 20 index traded on Euronext Lisbon.(5) Includes futures on Euribor traded on Euronext Paris and futures and options on individual stocks traded on Euronext Lisbon (Portugal
Telecom and EDP).(6) Premiums traded, in thousands of euros.
3 For more information on the new Olive Oil Futures Market, see the box in Chapter 3 of the 2002 Annual Report on theSecurities Market.

MEFF
Strategic actions
The introduction of a new category of member—Proprietary Trading Members—was one MEFF’smain strategic decisions taken in 2003 (see box). Other noteworthy actions were the creation ofthe Central Counterpart for the settlement of trades on public debt (MEFFClear4), and the agree-ment with the Mexican Derivatives Market (MexDer), according to which MEFF will provide tech-nological support for the development of Mexico’s options market.
Trading on MEFF and EuroMEFF
Trading on MEFF totalled 21.7 million contracts in 2003; this represents a 22.1% decline year-on-year, i.e. sharper than the reduction in 2002 (-9.8%). Although the decline was generalised, tra-ding in individual stocks, which account for a large part of total trading on MEFF (close to 85% inthe last three years), fell most rapidly. Trading in options declined 40.4%; however, unlike the pre-vious year, this was not offset by the increase in stock futures (very moderate in 2003).
The performance of individual stock derivatives varied. Option trading fell in only nine of atotal of 20 contracts, including options on blue chips; this was determining factor in the decli-
72
Annual report on the securities markets. 2003
New category of member at MEFF
In January 2004, MEFF introduced a new category of membership—Proprietary TradingMembers (PTM). Entities that acquire this status may operate only on their own behalf, whichexcludes both direct and indirect investments for third parties. Equity obligations tend to belower than for other members who may invest for third parties. PTMs normally perform a largepart of their trading on international derivatives markets and their presence is key to giving themarket depth.
PTMs can be divided into two areas: the first group basically operates intraday, so they do nottend to hold positions at the closing bell (they are called “scalpers” or “day traders”); thesecond group, which is smaller than the first, focuses on large arbitrage transactions.
MEFF has established minimum legal, technical and solvency requirements for ProprietaryTrading Members. PTMs must adopt a mercantile legal form which grants them their ownlegal personality and the capacity to trade autonomously, although they are not required tobe investment services firms or credit institutions, unlike the other types of member (traders,clearing members and clearing-custodian members). Accordingly, the equity requirementsare much less demanding since PTMs need only have at least 100 thousand euros in capitalstock(1). Proprietary Trading Members require an electronic connection with the MEFF RV tra-ding system through a single clearing member who will be answerable for the PTM’s obliga-tions.
Once an entity receives authorisation by MEFF to act as a PTM(2), it is obliged to file its auditedfinancial statements at least once per year, unless the entity normally acts as a day trader, inwhich case, given that the amount of daily collateral will be zero, the financial statements willbe valid without being audited.
(1) The minimum capital stock required is two million euros for securities companies and between 300 and 500 thousand euros for bro-kers. The requirements for banks and savings banks amount to 18.03 million euros.
(2) At the time of publication of this report, two entities had been authorised to act as Proprietary Trading Members: Marquette PartnersUK LTD and Timber Hill (Europe) AG.
4 For more information on MEFFClear, see the box in Chapter 3.

73
Derivative markets
Table 4.5
Trading in MEFF renta variable
No. of contracts
Ibex 35 European indexes Shares
Futures(1) Options EuroMEFF(2) S&P contracts(3) Futures Options(4)
1992 161,394 132,951 — — — —1993 624,926 193,868 — — — 131,8001994 1,616,411 429,263 — — — 222,4111995 1,641,892 455,868 — — — 766,6521996 1,694,383 466,638 — — — 854,7961997 3,534,491 743,938 — — — 1,345,6791998 5,059,814 877,856 — — — 2,349,9401999 5,028,458 789,707 17,216 — — 7,020,1522000 4,320,152 723,794 179,630 — — 15,291,8772001 4,206,094 537,127 617,278 13,943 7,389,886 18,505,3502002 3,515,016 441,745 1,604,330 875 9,630,899 14,278,3322003 3,227,206 243,844 2,322,356 0 9,768,607 8,507,035
(1) Includes MINI Ibex 35 futures homogenised to the size of Ibex 35 futures.(2) Includes contracts traded on other markets via EuroMEFF: futures on the DAX 30, DJ Eurostoxx 50 and DJ Stoxx 50 indexes traded on
Eurex, futures on the CAC 40, DJ Eurostoxx 50 and DJ Stoxx 50 indexes traded on Euronext Paris, and futures and options on the PSI 20index traded on Euronext Lisbon.
(3) Includes futures and options on Standard & Poor’s European indexes (S&P Europe 350 and sectorial indexes).(4) Figures for stock options are not strictly comparable due to changes in the par value of some underlying shares.
ne in total trading in this segment. The lower volatility in some of the largest stocks in theIbex 35 explains the sharp decline in trading in these products: 41% in contracts onTelefónica and more than 50% on SCH, Repsol and BBVA (see Annex A.3.8). There was alsoa significant increase in trading in other products whose weighting in the total is limited, inparticular trading in options on Inditex and Sogecable, which tripled compared with the pre-vious year.
Slower growth in stock futures was due mainly to the 10.5% decline in trading in Telefónicafutures.
Trading in futures and options on stock indexes by Spanish members increased by 4.2% to 5.8million contracts, in line with the trend observed in international derivatives markets. However,trading in this segment continued to shift from contracts on the Ibex 35 index to contracts on otherEuropean indexes, especially DJ EuroStoxx 50. Trading in futures and options on Ibex 35 continuedto decline in 2003, falling 12.3% in terms of the numbers of contracts. Effective trading in Ibex 35futures and options as a proportion of electronic market trading decreased gradually to 55%, com-pared with over 200% in 1997-99 (see Figure 4.1).
Conversely, trading in derivatives on indexes of other European stock markets traded throughEuroMEFF rose 44.8%. There was a 46% increase in trading of all equities derivatives viaEuroMEFF (to over 2.3 million contracts in 2003), especially in Eurex contracts and, in particu-lar, DJ EuroStoxx 50 futures, which represented the bulk of total trading in these products (seeTable 4.7).
For the last three years, the bulk of interest rate derivatives traded by Spanish members have beenEurex products traded via EuroMEFF. Trading in futures on German debt (Bund, Böbl and Schatz)increased by 11.5% in 2003, to 2.9 million contracts (see Table 4.9). Trading in 10-year notionalbond futures, the only contract on MEFF with a fixed-income underlying, decreased once again, tomarginal levels (see Table 4.8)
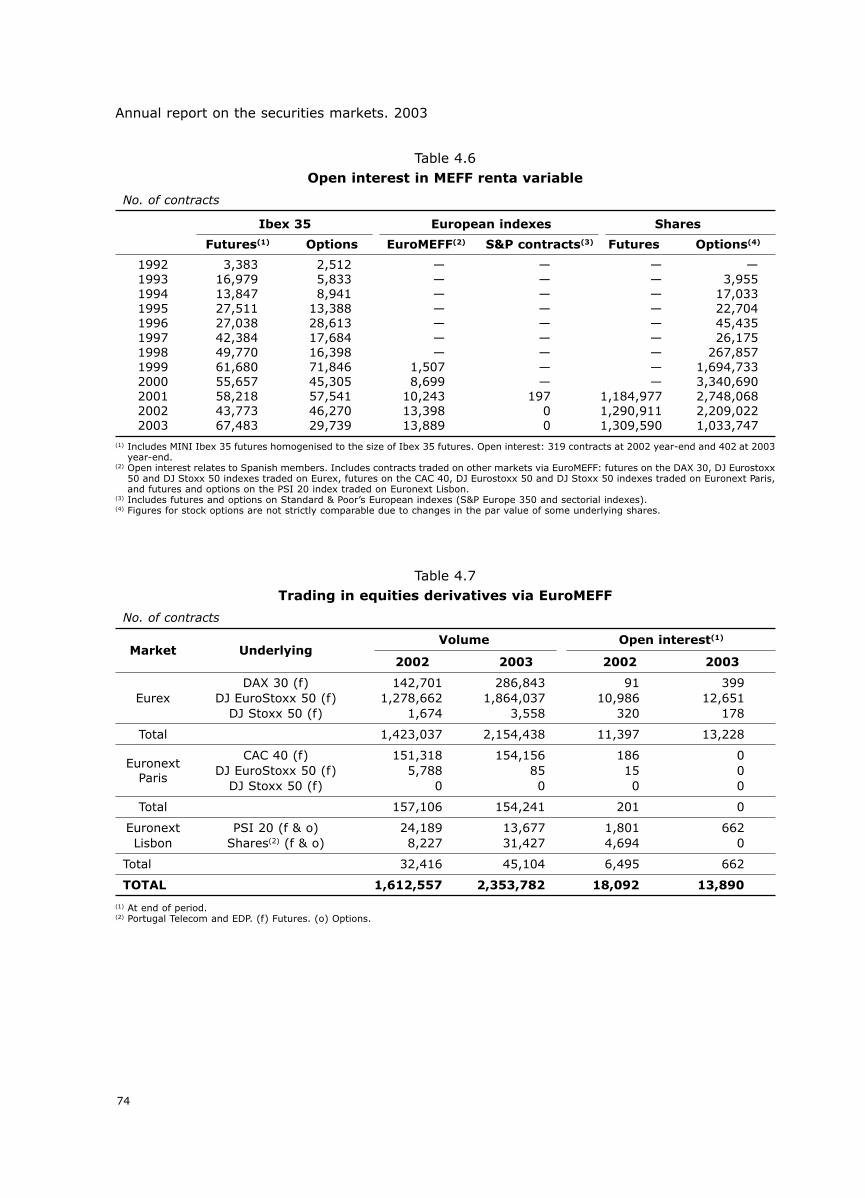
74
Annual report on the securities markets. 2003
Table 4.7Trading in equities derivatives via EuroMEFF
No. of contracts
Market UnderlyingVolume Open interest(1)
2002 2003 2002 2003
DAX 30 (f) 142,701 286,843 91 399Eurex DJ EuroStoxx 50 (f) 1,278,662 1,864,037 10,986 12,651
DJ Stoxx 50 (f) 1,674 3,558 320 178
Total 1,423,037 2,154,438 11,397 13,228
EuronextCAC 40 (f) 151,318 154,156 186 0
DJ EuroStoxx 50 (f) 5,788 85 15 0Paris
DJ Stoxx 50 (f) 0 0 0 0
Total 157,106 154,241 201 0
Euronext PSI 20 (f & o) 24,189 13,677 1,801 662Lisbon Shares(2) (f & o) 8,227 31,427 4,694 0
Total 32,416 45,104 6,495 662
TOTAL 1,612,557 2,353,782 18,092 13,890
(1) At end of period.(2) Portugal Telecom and EDP. (f) Futures. (o) Options.
Table 4.6Open interest in MEFF renta variable
No. of contracts
Ibex 35 European indexes Shares
Futures(1) Options EuroMEFF(2) S&P contracts(3) Futures Options(4)
1992 3,383 2,512 — — — —1993 16,979 5,833 — — — 3,9551994 13,847 8,941 — — — 17,0331995 27,511 13,388 — — — 22,7041996 27,038 28,613 — — — 45,4351997 42,384 17,684 — — — 26,1751998 49,770 16,398 — — — 267,8571999 61,680 71,846 1,507 — — 1,694,7332000 55,657 45,305 8,699 — — 3,340,6902001 58,218 57,541 10,243 197 1,184,977 2,748,0682002 43,773 46,270 13,398 0 1,290,911 2,209,0222003 67,483 29,739 13,889 0 1,309,590 1,033,747
(1) Includes MINI Ibex 35 futures homogenised to the size of Ibex 35 futures. Open interest: 319 contracts at 2002 year-end and 402 at 2003year-end.
(2) Open interest relates to Spanish members. Includes contracts traded on other markets via EuroMEFF: futures on the DAX 30, DJ Eurostoxx50 and DJ Stoxx 50 indexes traded on Eurex, futures on the CAC 40, DJ Eurostoxx 50 and DJ Stoxx 50 indexes traded on Euronext Paris,and futures and options on the PSI 20 index traded on Euronext Lisbon.
(3) Includes futures and options on Standard & Poor’s European indexes (S&P Europe 350 and sectorial indexes).(4) Figures for stock options are not strictly comparable due to changes in the par value of some underlying shares.

75
Derivative markets
Table 4.8Trading on MEFF renta fija. Futures: trading volume and market size(1)
No. of contracts
Volume Open interest(2)
5 year 10 year 30 yearDEBS(3) 5 year 10 year 30 year
DEBS(3)bond bond bond bond bond bond
1992 4,422 437,674 — — — 6,041 — —1993 — 2,637,441 — — — 50,833 — —1994 — 7,738,080 — — — 27,945 — —1995 — 7,714,010 — — — 37,219 — —1996 — 10,893,254 — — — 56,531 — —1997 5,140 12,455,467 — — 150 65,865 — —1998 26,027 9,228,552 32,396 — 38 13,870 96 —1999 13 3,580,215 0 10 0 10,621 0 02000 0 1,035,330 0 0 0 16,128 0 02001 — 284,642 — — — 3,223 — —2002 — 51,060 — — — 200 — —2003 — 1,371 — — — 10 — —
(1) Data adjusted to the contracts’ new nominal value.(2) At end of period.(3) Futures on a basket of bonds from Germany, France, Italy and Spain.
Table 4.9Fixed-income derivatives via EuroMEFF
No. of contracts
Market UnderlyingVolume Open interest(1)
2002 2003 2002 2003
Bund (f) 1,776,321 1,878,692 4,551 4,763Eurex Bobl (f) 246,158 419,091 3,322 3,545
Schatz (f) 560,905 581,997 5,511 6,070
Total 2,583,383 2,879,779 13,383 14,377
Euronext Euribor (f) 2,921 0 0 0Paris Notionnel (f) 0 0 0 0
Total 2,921 0 0 0
TOTAL 2,586,304 2,879,779 13,383 14,377(1) At end of period. (f) Futures.
Figure 4.1
Trading in Ibex 35 futures and options as a percentage of tradingon the electronic market
.
.
.
.
.
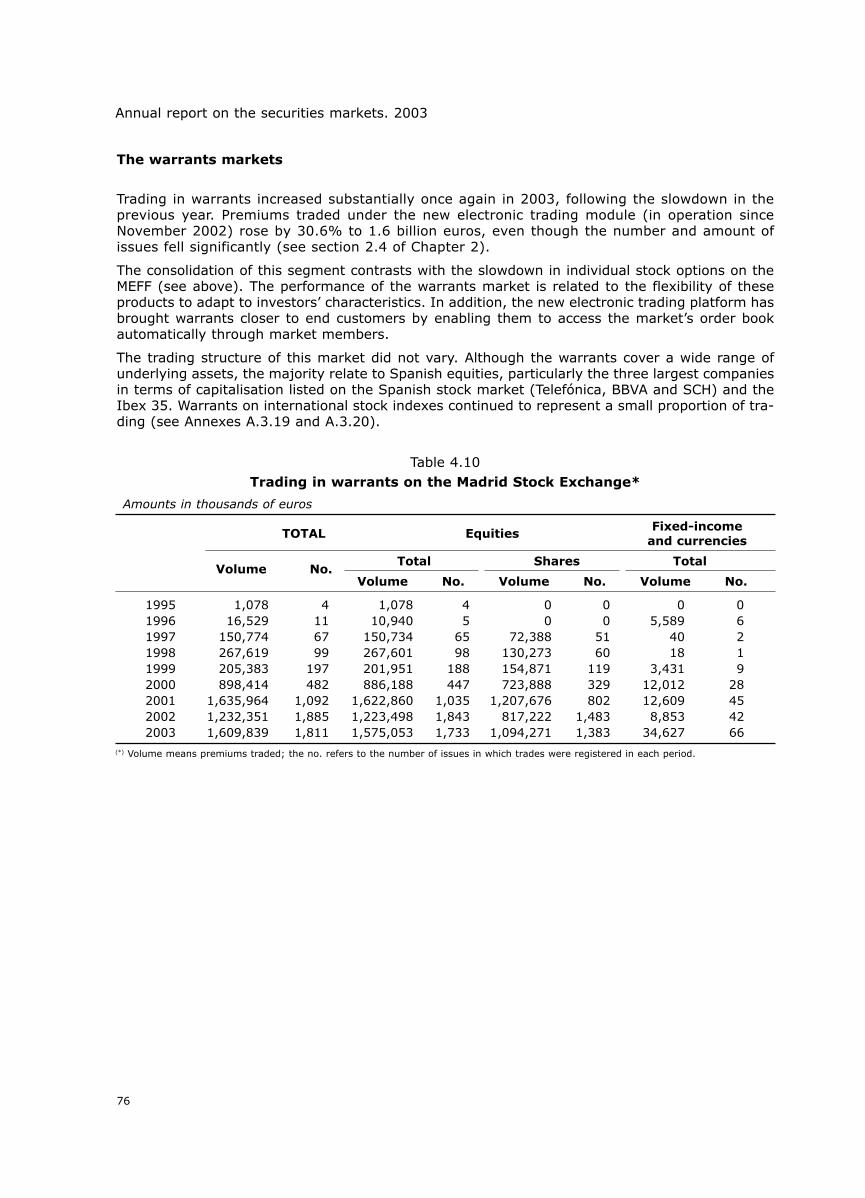
The warrants markets
Trading in warrants increased substantially once again in 2003, following the slowdown in theprevious year. Premiums traded under the new electronic trading module (in operation sinceNovember 2002) rose by 30.6% to 1.6 billion euros, even though the number and amount ofissues fell significantly (see section 2.4 of Chapter 2).
The consolidation of this segment contrasts with the slowdown in individual stock options on theMEFF (see above). The performance of the warrants market is related to the flexibility of theseproducts to adapt to investors’ characteristics. In addition, the new electronic trading platform hasbrought warrants closer to end customers by enabling them to access the market’s order bookautomatically through market members.
The trading structure of this market did not vary. Although the warrants cover a wide range ofunderlying assets, the majority relate to Spanish equities, particularly the three largest companiesin terms of capitalisation listed on the Spanish stock market (Telefónica, BBVA and SCH) and theIbex 35. Warrants on international stock indexes continued to represent a small proportion of tra-ding (see Annexes A.3.19 and A.3.20).
76
Annual report on the securities markets. 2003
Table 4.10Trading in warrants on the Madrid Stock Exchange*
Amounts in thousands of euros
TOTAL EquitiesFixed-income
and currencies
Volume No.Total Shares Total
Volume No. Volume No. Volume No.
1995 1,078 4 1,078 4 0 0 0 01996 16,529 11 10,940 5 0 0 5,589 61997 150,774 67 150,734 65 72,388 51 40 21998 267,619 99 267,601 98 130,273 60 18 11999 205,383 197 201,951 188 154,871 119 3,431 92000 898,414 482 886,188 447 723,888 329 12,012 282001 1,635,964 1,092 1,622,860 1,035 1,207,676 802 12,609 452002 1,232,351 1,885 1,223,498 1,843 817,222 1,483 8,853 422003 1,609,839 1,811 1,575,053 1,733 1,094,271 1,383 34,627 66
(*) Volume means premiums traded; the no. refers to the number of issues in which trades were registered in each period.

CHAPTER 5
COLLECTIVE INVESTMENT SCHEMESAND VENTURE CAPITAL COMPANIES

5. Collective investment schemes and venturecapital companies
5.1 General overview
Europe
After declining 7% in 2002, assets managed by European UCITS1 rose 12.7% in 2003 to a totalof €3.7 trillion. The growth was mainly in funds with more conservative strategies —bonds, deben-tures and the money markets— in the first half of the year and equity funds in the second half ofthe year, following the recovery of stock exchanges worldwide (see figure 5.1).
At 2003 year-end, assets managed by collective investment schemes in Europe represented33.5% of total sector assets worldwide (compared to 30.9% in 2002). US collective investmentschemes continued in the lead, managing 53.1% of total assets (see figure 5.2) although theydropped almost four percentage points in market share.
79
Collective Investment Schemes
1 The term UCITS refers to open-end collective investment schemes which invest in marketable securities and the moneymarket. The European Federation of Investment Funds and Companies (FEFSI) also offers statistics on schemes which arenot classed as UCITS as they are nationally-regulated funds not offered to the public and/or are closed-end schemes. Thevolume of assets managed by these schemes totalled 1.05 billion euros, up 9.9% on December 2002.
Figure 5.1
Assets managed by UCITS in 2003: by type
Source: European Federation of Investment Funds and Companies (FEFSI).
France and Luxemburg continued to dominate the sector in Europe and slightly increased their res-pective market shares. The volume of assets managed in other major European countries also rosebut with no significant increase in market share (see table 5.1).
Equities
Billions of euros
Mixed
12/31/2002 12/31/2003
Bonds Money market Others
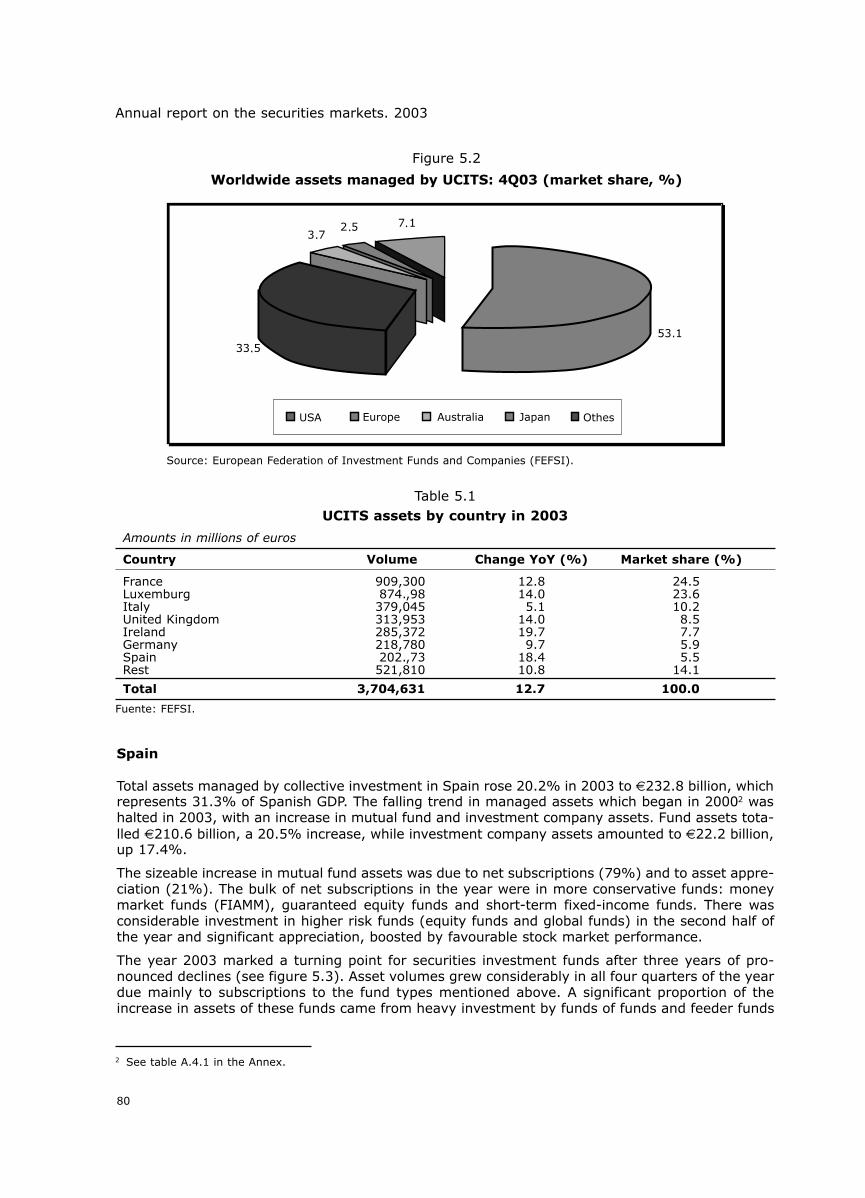
Spain
Total assets managed by collective investment in Spain rose 20.2% in 2003 to €232.8 billion, whichrepresents 31.3% of Spanish GDP. The falling trend in managed assets which began in 20002 washalted in 2003, with an increase in mutual fund and investment company assets. Fund assets tota-lled €210.6 billion, a 20.5% increase, while investment company assets amounted to €22.2 billion,up 17.4%.
The sizeable increase in mutual fund assets was due to net subscriptions (79%) and to asset appre-ciation (21%). The bulk of net subscriptions in the year were in more conservative funds: moneymarket funds (FIAMM), guaranteed equity funds and short-term fixed-income funds. There wasconsiderable investment in higher risk funds (equity funds and global funds) in the second half ofthe year and significant appreciation, boosted by favourable stock market performance.
The year 2003 marked a turning point for securities investment funds after three years of pro-nounced declines (see figure 5.3). Asset volumes grew considerably in all four quarters of the yeardue mainly to subscriptions to the fund types mentioned above. A significant proportion of theincrease in assets of these funds came from heavy investment by funds of funds and feeder funds
80
Annual report on the securities markets. 2003
Figure 5.2
Worldwide assets managed by UCITS: 4Q03 (market share, %)
Source: European Federation of Investment Funds and Companies (FEFSI).
USA Europe Australia Japan Othes
2 See table A.4.1 in the Annex.
Table 5.1UCITS assets by country in 2003
Amounts in millions of euros
Country Volume Change YoY (%) Market share (%)
France 909,300 12.8 24.5Luxemburg 874.,98 14.0 23.6Italy 379,045 5.1 10.2United Kingdom 313,953 14.0 8.5Ireland 285,372 19.7 7.7Germany 218,780 9.7 5.9Spain 202.,73 18.4 5.5Rest 521,810 10.8 14.1
Total 3,704,631 12.7 100.0
Fuente: FEFSI.

which invest in other securities investment companies3. With regard to money market funds(FIAMM), the increase in assets was notably lower than in the last two years, since growth tailedoff as the year progressed. Declining short-term interest rates limited the appeal of these funds,which experienced net divestments4 in 4Q03.
As shown in Chapter 1, the weighting of mutual funds in household financial assets rose slightlyto around 12%, still some way short of the high achieved in 19985. Improved conditions in thesecurities markets had a positive effect on fund sales. Accordingly, this explains the performanceof mutual funds managed by banks and savings banks, compared with these entities' deposits. Ofthe total combined assets of funds and deposits managed by banks and savings banks, the per-centage of funds has stabilised at around 20% and shows a slight recovery (see table 5.3).
With regard to performance by other collective investment schemes, assets managed by securi-ties investment companies rose considerably (by 17.2% to €22.19 billion), again concentrated inopen-end securities investment companies (SIMCAV). There was also a sharp increase (over 40%)in funds managed by foreign collective investment schemes sold in Spain. Assets managed by real
81
Collective Investment Schemes
Figure 5.3
Mutual fund assets
Dec- Dec- Dec- Dec- Dec- Dec- Dec- Dec- Dec- Dec- Dec- Dec- Dec- Dec-
Bill
ions
of
euro
s
3 Of the €32.1 billion asset increase at securities investment companies, almost €9 billion represented units acquired byfunds of funds and feeder funds. These investment affected mainly short-term fixed-income funds.
4 See annex A.4.6 and A.4.11.5 See section 1.2 of Chapter 1.
Table 5.2Mutual fund assets by type in 2003
Amounts in millions of euros
Type Assets Change YoY (%) % of total assets
Fixed-income 66,574 18.0 31.6Mixed fixed-income 12,398 -8.1 5.9Mixed equity 10,340 -6.7 4.9Equity 55,907 47.8 26.5Rest 7,353 187.5 3.5Total FIM 152,573 25.7 72.4Total FIAMM 58,054 8.8 27.6Total Funds 210,627 20.5 100.0

estate investment fund rose over 34%, with a 25% increase in the number of investors, althoughthe number of funds remained unchanged. Once again, the yield offered by these funds was sig-nificantly higher, on average, than that offered by securities investment funds, due to the dyna-mism of the Spanish real estate sector.
82
Annual report on the securities markets. 2003
6 Law 35/2003 of 4 November, on collective investment schemes.7 Law 46/1984, of 26 December, regulating collective investment schemes.8 Law 46/2002, of 18 December, on the partial amendment to Personal Income Tax.
Table 5.3Ratio(1) of fund assets(2) to deposits(3) at banks and thrifts (%)
Banks Thrifts Total
December 1995 20 11 15December 1996 28 14 21December 1997 35 19 27December 1998 41 21 32December 1999 38 19 29December 2000 35 15 25December 2001 31 13 22December 2002 29 11 20December 2003 29 13 21
(1) Percentages represent the ratio of fund assets to the sum of fund assets plus deposits.(2) Managed by operators belonging to the financial groups of banks and thrifts.(3) Using total Spanish-resident private sector liabilities in banks and thrifts, consisting mainly of deposits but also including
reposSource: Bank of Spain Statistical Bulletin and CNMV.
New Collective Investment Schemes Law
The new Collective Investment Schemes Law, which came into force on 5 February 2004, aims toadapt regulation of such schemes to the changing needs of a sector characterised by increasingquality- and price-driven demand and greater competition between providers of management ser-vices. The basic principles of the Law, whose specific technical features will be implemented byregulation, are:
• Liberalisation of investment policy. The approach based on multiple legally-defined catego-ries of IIC and restricting assets eligible for investment has been abandoned in favour ofgreater flexibility and freedom in the definition of IIC investment profiles.
• Reinforcement of investor protection. In order to prevent possible conflicts of interest, it wasconsidered appropriate to reinforce the transparency obligations and codes of conduct.
• Improvement of the regime regulating administrative intervention. In order to speed up theadministrative process and reinforce legal certainty for investors.
The year 2003 was particularly important in terms of sector regulation, with the approval of thenew Collective Investment Schemes Law6, repealing the previous law introduced in 19847. Themain features introduced by the new law, whose implementing regulations have still to be appro-ved, are detailed in the box below. The new tax regime governing collective investment schemes8
also came into effect in 2003, enabling tax on the redemption or transmission of investments incollective investment schemes to be deferred when the proceeds are reinvested in another collec-tive investment scheme.

83
Collective Investment Schemes
Although the ultimate impact will depend essentially on the implementing regulations, themany significant new features introduced will make it possible to anticipate future neces-sary changes. The main new features of the Law are detailed below, grouped by area ofincidence:
• Legal regime. The most significant features in this area are: (i) relaxation of the regimeregulating the IIC offering, in line with existing legislation in other countries, by enablingthe creation of IIC broken into divisions and the possibility of offering different classes ofshares or units within a single IIC; (ii) replacement of the existing classifications used forfinancial investment funds with categories based exclusively on the investment approach,to be determined by the CNMV; (iii) the new regime relating to investment firms, underwhich only open-end securities investment company (SICAVs1) will qualify as IICs; (iv) eli-mination of the listing requirement for these companies; and (v) the speeding-up of theadministrative process.
• Financial regime. The most significant aspect in this area has been the broadening of therange of assets in which IICs can invest (deposits at credit institutions, unlisted money mar-ket instruments, and any derivative of an eligible asset). Other noteworthy aspects include:(i) greater flexibility with regard to certain investment limits (allowing investment of over5% but less than 50% in other IICs); and (ii) the possibility, within the scope of the newlaw and the corresponding implementing regulation, of regulating hedge funds (see box onthis type of IIC below)
• Investor protection regime. The most significant provisions in this area are: (i) periodicreporting, particularly the obligation to disclose all fund or company expenses in the sim-plified prospectus and in quarterly reports; (ii) fund management companies must nowhave an investor relations department and may appoint an investor ombudsman; (iii) fundmanagers must inform investors how they vote the shares owned by the funds they mana-ge and must justify their decisions in this area; and (iv) it is possible to regulate caseswhere exercise of the aforementioned voting rights is obligatory (according to the size andstability of the stake held by the fund in a listed company).
• Regime regulating IIC managers and depositories. Fund managers may also provide indivi-dual portfolio management services and investment advice. With regard to depositories, thenew IIC law requires them to be members of the clearing, settlement and registrationsystems of the markets in which they operate.
• Cross-border transactions. The new law incorporates the latest EU amendments regardingIICs into Spanish legislation and regulates, among other aspects, the use of the Europeanpassport by Spanish fund managers that wish to provide services in other EU countries and,reciprocally, to fund managers from other EU countries wishing to operate in Spain.
(1) Accordingly, closed-end investment companies (SIMs) will no longer be considered as collective investment sche-mes. The former open-end securities investment companies (SIMCAVs) will now be known as open-end investmentcompanies (SICAVs).
5.2 Securities investment funds and companies
Funds
Assets and portfolio composition
Growth in mutual funds in 2003 was centred mainly in securities investment funds (FIMs). FIMassets rose 25.7% to €152.6 million, while FIAMM assets grew 8.8% to €58.1 million. The increa-se in assets was accompanied by a rise in investor numbers: up 350,000 at FIMs9 and over 182,000
9 Between 2000 and 2002, FIMs lost almost one million investors. For further information see table A.4.1 of the Annex.

Fund investment policy in 2003 was as follows12:
• A slight increase in the weighting of international assets, both in FIM and FIAMM13. Within inter-national assets, new investment was concentrated in the euro zone.
• A sharp rise in investment in other mutual funds, boosted by funds of funds and feeder funds.The weighting of these investments in total FIM assets has risen considerably14.
• Growth in investment in equities, particularly Spanish equities. Nevertheless, investment inequities fell slightly as a percentage of total assets15.
• Increase in the percentage of FIM assets invested in fixed-income securities, due to Spanishprivate fixed-income investments and foreign euro-denominated securities16. However, theweighting of fixed-income in total17 assets fell significantly.
at FIAMMs. At 2003 year-end, the sector had a total of 7.6 million investors, of which 75% belon-ged to FIMs. The number of funds grew moderately, due to mergers aimed at streamlining fundmanager's offerings. At the end of the year, there were 2,554 funds registered, 16 more than in2002.
Of the increase in assets at securities investment funds, 79% came from net fund subscriptionsand 21% from returns generated by the portfolio. The rise in net fund subscriptions marks a sig-nificant change in trend with respect to 2002, when redemptions totalled almost _7 billion. Thepositive contribution from net returns also contrasts with over €9 billion in losses in 2002, and isdue mainly to the stock market recovery which began in 2H0310 (see table 5.4).
With respect to FIAMMs, the bulk of the increase in assets also came from net subscriptions,although they were significantly lower than in 2002, as was portfolio appreciation, due to thereduction in short-term interest rates11.
84
Annual report on the securities markets. 2003
10 See annex A.4.6.11 See annex A.4.11.12 See annexes A.4.3 and A.4.9.13 International assets rose from 53.3% to 54% of total assets at FIMs, and 1.4 percentage points at FIAMMs, to 46.4%.14 Stakes in other investment funds as a percentage of total FIM assets rose from 5.2% in 2002 to 13% in 2003.15 Securities investment fund assets invested in shares rose 15.1%. however, the weighting of shares in the total assets of
securities investment funds fell from 13.5% in 2002 to 12.4% in 2003.16 As shown in table A.4.3 of the Annex, assets invested in Spanish government bonds fell while short-term investment
grew moderately.17 The weighting of fixed-income in total FIM assets dropped from 76.9% in 2002 to 69.8% in 2003.
Table 5.4Breakdown of changes in fund assets
Amounts in millions of euros
FIM FIAMM
2002 2003 2002 2003
Change in assets -15,989.9 31,204.3 9,544.8 4,687.9Subscriptions/redemptions (net) -6,961.7 24,528.0 8,356.4 3,843.1Net yields, of which (*) -9,028.2 6,676.3 1,192.3 847.5
Interest 3,994.4 3,561.1 1,867.0 1,609.1Change in equity prices -9,731.2 3,633.0 0.0 0.0Change in fixed-income prices 679.9 -271.1 -143.3 -170.8Gain/loss on derivatives -2,519.4 1,335.9 -9.8 -6.2Commission revenues 1,832.2 1,792.3 515.3 577.2
Gross profit distributed 0.0 0.0 -3.9 -2.7(*) See tables A.4.6 and A.4.11 for a more detailed breakdown.

• In FIAMMs, there was a decline in the relative weighting of public fixed-income and repos anda moderate increase in private fixed-income.
Mutual funds continued to invest heavily in domestic organised markets (see table 5.5), particu-larly in the fixed-income markets, where they accounted for 19% of the outstanding public debtbalance and almost 10% of the outstanding corporate debt balance at 2003 year-end.Nevertheless, these percentages continued to fall due mainly to greater opportunities to diversifythe fixed-income portfolio through foreign investment. Spectacular growth in the corporate fixed-income market also accelerated this trend. With respect to the stock market, fund assets investedin domestic shares were equivalent to 1.5% of the capitalisation of the domestic stock markets,excluding foreign securities.
Total assets of guaranteed securities funds rose more than 29% in 2003 and the number of inves-tors exceeded two million at year-end. The investment policy of these funds was characterised byan increase in the weighting of international assets (from 63.3% to 67.9% of total assets), mainlyin fixed-income18. There was a greater weighting of reverse repos in the domestic portfolio, to thedetriment of government bonds and debentures.
85
Collective Investment Schemes
18 See Annex A.4.13.19 See Annex A.4.2.
Table 5.5Funds' domestic portfolio in relation to the outstanding balance
of the Spanish market
In %
1999 2000 2001 2002 2003
Listed equities (1) 3,6 2,1 1,6 1,4 1,5
Corporate fixed-income (2) 25,9 16,9 14,4 10,6 9,9
Short term 43,2 21,4 28,6 21,2 16,0
Long term 18,4 14,8 7,8 5,2 6,4
Government fixed-income 38,0 27,2 22,0 20,1 19,2
Short term 100,1 94,4 110,5 115,2 106,4
Long term 22,0 13,9 8,8 6,3 5,5
(1) Realisation value. The outstanding balance data relate to the capitalisation of Spanish securities in the Electronic Marketand open outcry market.
(2) Nominal amounts.Source: CNMV and Bank of Spain.
Yields
There was a significant shift in the trend of mutual fund yields19. All fund types registered positi-ve yields, with the most pronounced increases in equity funds. Funds with a greater percentageof Spanish equities obtained the biggest yields, as in previous years. Yields fluctuated between10% in US equity funds (RVIU) and 29% in Spanish equity funds (RVN).
Fixed-income funds obtained positive but much more moderate yields. The reduction in short-terminterest rates led to a decline in the yield on funds investing in short-term fixed income, which ran-ged between 1.5% at FIAMMs and 1.9% at RFCPs (short-term fixed-income funds). Longer termfixed-income funds obtained higher yields but which tended to decline following the growth in long-term interest rates in the second half of the year. Mixed fund yields improved due to the greater

86
Annual report on the securities markets. 2003
20 International fixed-income (RFI), International mixed fixed-income (RFMI), International mixed equities. (RVMI).21 A large proportion of the growth in global funds in 2003 was associated with the development of hedge funds in Spain
(see box).
Figure 5.4
Annual yield on mutual funds
FIAMM
Fixed-income FIM
FIAMM: Money market funds.
RFCP: Short-term fixed-income. RFLP: Long-term fixed-income. RFI: International fixed-income.
weighting of equities. Several international fund types20 were negatively affected by the depreciationof the dollar against the euro.
Yields on other funds such as GRV (guaranteed equity) and FGL (global funds), which had a highvolume of subscriptions in 2003, were relatively modest although higher than in 2002.Guaranteed funds obtained yields of 2.7% (vs. 0.4% in 2002) and global funds 5.8% (vs. -12.4%in 200221).
% per year
% per year

87
Collective Investment Schemes
Mixed fixed-income FIM
RFM: Mixed fixed-income. RFMI: International mixed fixed-income.
Mixed equity FIM
RVM: Mixed equities. RVMI: International mixed equity.
Spanish, Euro and European equity FIM
RVE: Euro equities. RVN: Spanish equity. RVIE: European international equity
% per year
% per year
% per year
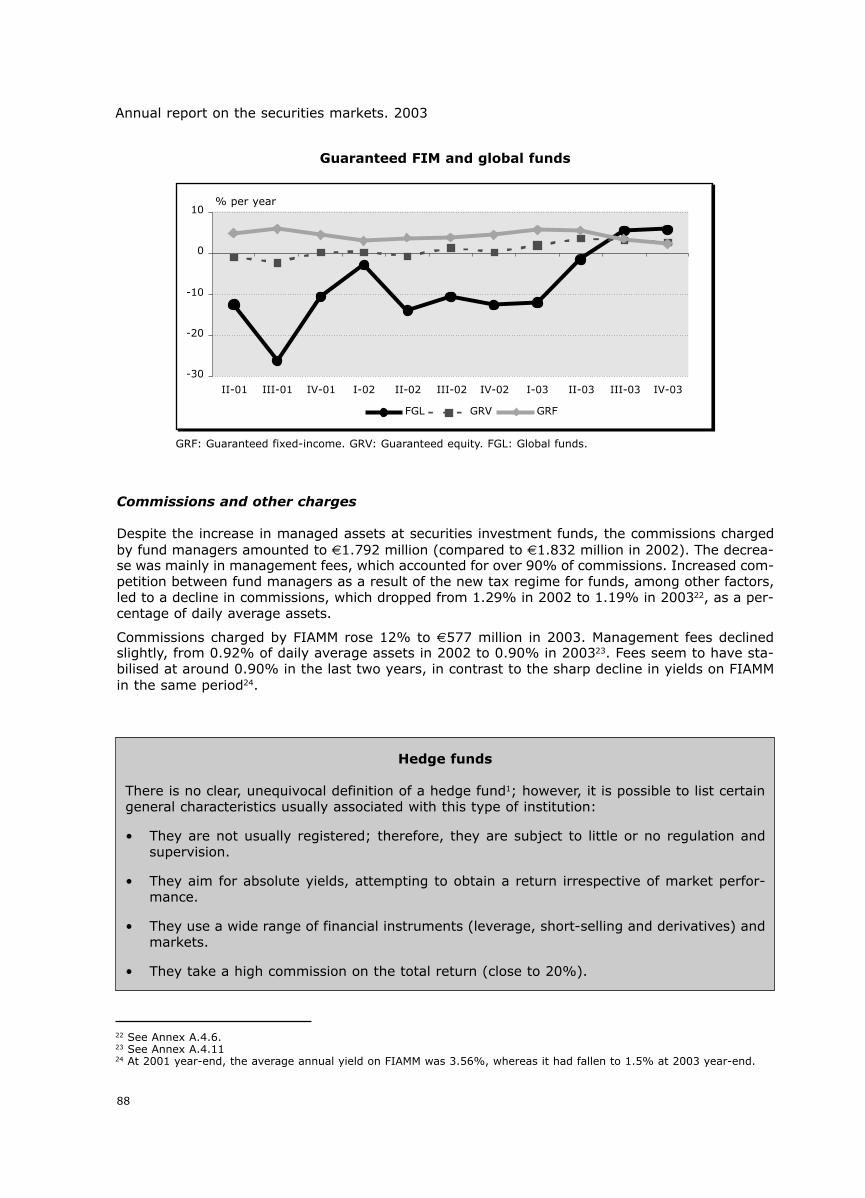
88
Annual report on the securities markets. 2003
Guaranteed FIM and global funds
GRF: Guaranteed fixed-income. GRV: Guaranteed equity. FGL: Global funds.
Hedge funds
There is no clear, unequivocal definition of a hedge fund1; however, it is possible to list certaingeneral characteristics usually associated with this type of institution:
• They are not usually registered; therefore, they are subject to little or no regulation andsupervision.
• They aim for absolute yields, attempting to obtain a return irrespective of market perfor-mance.
• They use a wide range of financial instruments (leverage, short-selling and derivatives) andmarkets.
• They take a high commission on the total return (close to 20%).
Commissions and other charges
Despite the increase in managed assets at securities investment funds, the commissions chargedby fund managers amounted to €1.792 million (compared to €1.832 million in 2002). The decrea-se was mainly in management fees, which accounted for over 90% of commissions. Increased com-petition between fund managers as a result of the new tax regime for funds, among other factors,led to a decline in commissions, which dropped from 1.29% in 2002 to 1.19% in 200322, as a per-centage of daily average assets.
Commissions charged by FIAMM rose 12% to €577 million in 2003. Management fees declinedslightly, from 0.92% of daily average assets in 2002 to 0.90% in 200323. Fees seem to have sta-bilised at around 0.90% in the last two years, in contrast to the sharp decline in yields on FIAMMin the same period24.
22 See Annex A.4.6.23 See Annex A.4.1124 At 2001 year-end, the average annual yield on FIAMM was 3.56%, whereas it had fallen to 1.5% at 2003 year-end.
% per year

89
Collective Investment Schemes
• The fund manager tends to invest in the fund, occasionally holding a sizeable stake.
• They require significant minimum investment and/or are not generally available to thepublic.
Although there are no official figures for the sector (reporting requirements are low), variousestimates indicate that hedge fund assets have grown steadily worldwide, from $100 billion inthe early 1990s to $700 billion in 20032. Estimates indicate that yields have also been higherthan the usual reference indices for the financial markets and that, in some cases, they havebeen more stable3.
Hedge funds use a wide range of strategies which, in simplified terms, can be divided into thefollowing three categories: (i) "market neutral", which attempt to minimise or significantlyreduce the market risk (almost all types of arbitrage are included in this group); (ii) "marketdriven", which look to profit from specific market events such as mergers or bankruptcy; and(iii) "market trend", which look to exploit trends in the equity, fixed-income or commoditiesmarkets.
The extraordinary growth in the sector in recent years and related concerns regarding syste-mic crises (the collapse of LTCM), market integrity, money laundering and, particularly, inves-tor protection, have led to a partial review of the regulation in some jurisdictions. Some of thelatest possibilities discussed include: (i) making registration obligatory for hedge fund mana-gers, which would increase the quantity and quality of information available; (ii) enabling retailinvestors to access these products, albeit indirectly through funds of funds, provided adequateinformation is disclosed regarding their characteristics and risks. There is also a clear need forcooperation between supervisory authorities, fundamentally to enable the exchange of infor-mation.
In Spain, it is estimated that around 100 IICs (around 130,00 investors and 3% of total sectorassets) could be considered as hedge funds. Almost all of these IICs are global funds and inmany cases they are set up as funds of funds. Hedge funds are subject to the same restrictionsas all collective investment schemes (regarding trading in derivatives and unlisted assets andconcentration of investments) as there is currently no specific regulation for hedge funds orhedge fund managers.
(1) The term hedge fund was first coined in 1949 to describe a fund which combined long and short positions on secu-rities in order to hedge the portfolio against market movements.
(2) Some financial institutions offering data on the sector include: Van Hedge Fund Advisors, Tremont CapitalManagement and Credit Suisse First Boston.
(3) Estimates can be biased in two ways: (i) "survival", meaning that occasionally they do not contain data on hedgefunds which have disappeared; and (ii) "sector", which are generally estimates based on information voluntarily sup-plied by hedge funds.
Investment companies
In 2003, investment companies (SIM and SIMCAV) managed a total of €22.19 billion (up 17.4% on2002), slightly reducing their weighting in total assets managed by collective investment schemes to9.5%. Collective investment company performance continues to be driven by SIMCAVs: the numberof SIMCAVs increased from 2,646 in 2002 to close to 2,900, and managed assets rose from €16.93billion to €20.16 billion at 2003 year-end. The number of SIMs fell, as did the number of investors;however, there was a moderate increase in managed assets.
With regard to investment patterns, the foreign portfolio increased its weighting in total assets25, withthe rise concentrated mainly in euro-denominated assets. Within the domestic portfolio, there was a
25 At SIMCAVs, the weighting of the foreign portfolio in total assets rose from 39.1% in 2002 to 43.8% in 2003. At SIMs, thispercentage rose from 20.9% to 23.3%. See Annex A.4.15 and A.4.17 for further details.

greater weighting of investment in equities and mutual fund shares at both entities, to the detrimentof reverse repos.
5.3 Foreign collective investment schemes marketed in Spain
The total volume of funds managed by foreign IICs marketed in Spain rose 40.1% to €9.2 billionin 200326, i.e. 3.9% of Spanish IIC assets (vs. 3.4% in 2002). The rise in investment volume wasdue to the growth in company assets (up 32.0% to €7.4 billion) and fund assets (90.9% to €1.7billion).
The total number of foreign IICs rose from 218 in 2002 to 233 in 200327, with the rise concentra-ted almost exclusively in investment funds. The number of investors at 2003 year-end was225,214, following an increase at both funds (13,615) and companies (10,841). The largest incre-ase in foreign UCITS marketed in Spain was in those registered in Luxembourg, Ireland andFrance: of the 233 schemes marketed in 2003, 165 (i.e. more than 70%) were registered inLuxembourg.
5.4 Real estate investment funds and companies
Assets managed by real estate investment funds (FII) rose over 34% to €2.8 billion in 2003 andinvestor numbers increased by more than 25% to over 88,00028. The sector has registered anupward trend since 1995, in line with the property boom.
Two new funds were registered in 200329 and two FIIs were de-registered30 (one as a result of amerger), taking the total number of funds to five31. The fund resulting from the aforementionedmerger is the largest property fund in the sector, representing 68% of assets and 78% of inves-tors. One of the two existing real estate investment companies was de-registered in the year32 anda new company was registered in February 200433.
The dynamism of the property sector meant that the average yield at these institutions wasalmost 7% in 2003 which, albeit one percentage point less than the yield obtained in the pre-vious four years, exceeded the yield obtained on all securities investment funds except equityfunds. With regard to the composition of real estate fund assets, property rose from 73.9%to 80.2% of total investment in 2003, to the detriment of the securities portfolio (down from30.1% to 22.4%) Investments in rental assets accounted for 58.6% of total assets, compa-red with 48.7% in 200234.
5.5 Venture capital firms
The improvement in the global economy in 2003 was not immediately transferred to the ven-ture capital industry in either the US or Europe, where capital invested fell 14% and 16%, res-
90
Annual report on the securities markets. 2003
26 See Annex A.4.19.27 Many foreign IICs are structured in different subfunds (compartments).28 See Annex A.4.20.29 Agrupación Fondo Inmobiliario and Madrid Patrimonio Inmobiliario FII.30 Segurfondo Inmobiliario FII and SCH Inmobiliario 2 FII.31 Another fund (Sabadell BS Inmobiliario, FII) was registered in January 2004.32 Vallehermoso Patrimonio.33 BBVA Real Estate 200334 See Annex A.4.21.
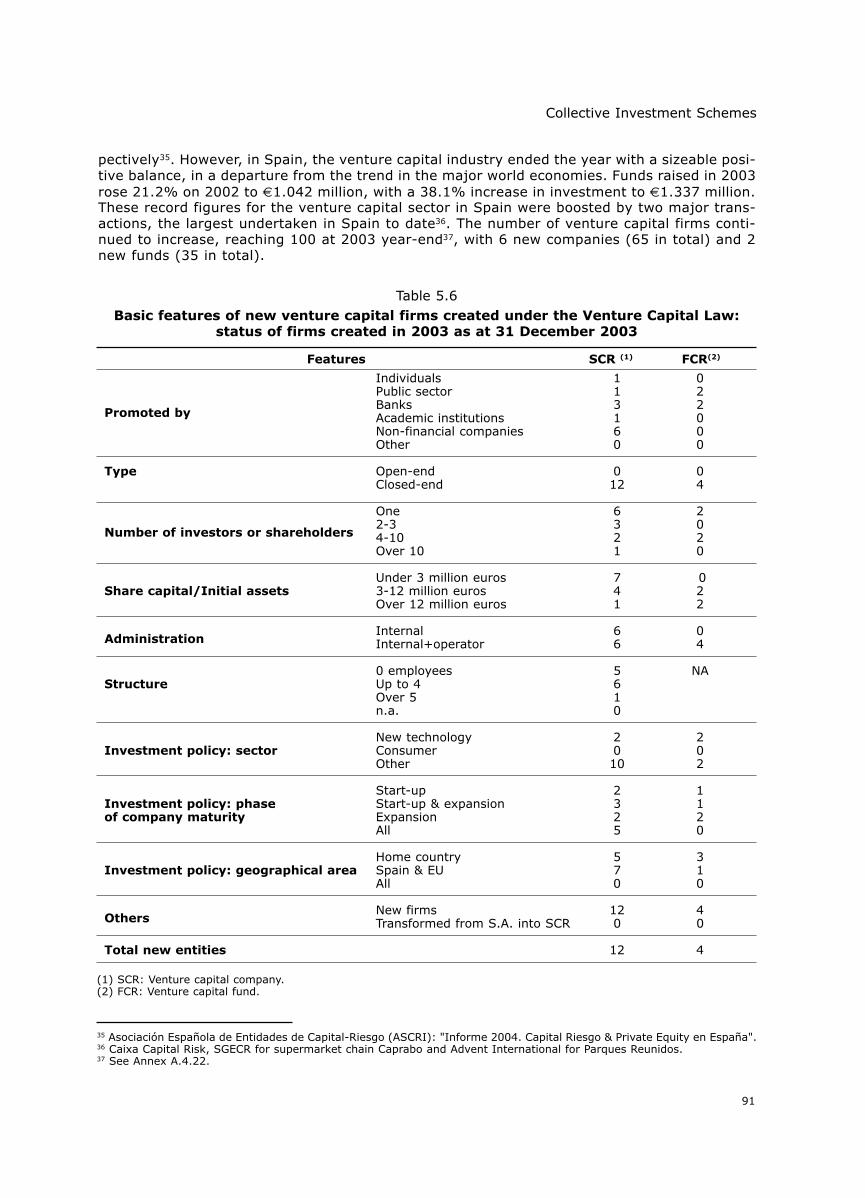
91
Collective Investment Schemes
pectively35. However, in Spain, the venture capital industry ended the year with a sizeable posi-tive balance, in a departure from the trend in the major world economies. Funds raised in 2003rose 21.2% on 2002 to €1.042 million, with a 38.1% increase in investment to €1.337 million.These record figures for the venture capital sector in Spain were boosted by two major trans-actions, the largest undertaken in Spain to date36. The number of venture capital firms conti-nued to increase, reaching 100 at 2003 year-end37, with 6 new companies (65 in total) and 2new funds (35 in total).
35 Asociación Española de Entidades de Capital-Riesgo (ASCRI): "Informe 2004. Capital Riesgo & Private Equity en España".36 Caixa Capital Risk, SGECR for supermarket chain Caprabo and Advent International for Parques Reunidos.37 See Annex A.4.22.
Table 5.6Basic features of new venture capital firms created under the Venture Capital Law:
status of firms created in 2003 as at 31 December 2003
Features SCR (1) FCR(2)
Individuals 1 0Public sector 1 2
Promoted byBanks 3 2Academic institutions 1 0Non-financial companies 6 0Other 0 0
Type Open-end 0 0Closed-end 12 4
One 6 2
Number of investors or shareholders2-3 3 04-10 2 2Over 10 1 0
Under 3 million euros 7 0Share capital/Initial assets 3-12 million euros 4 2
Over 12 million euros 1 2
AdministrationInternal 6 0Internal+operator 6 4
0 employees 5 NAStructure Up to 4 6
Over 5 1n.a. 0
New technology 2 2Investment policy: sector Consumer 0 0
Other 10 2
Start-up 2 1Investment policy: phase Start-up & expansion 3 1of company maturity Expansion 2 2
All 5 0
Home country 5 3Investment policy: geographical area Spain & EU 7 1
All 0 0
OthersNew firms 12 4Transformed from S.A. into SCR 0 0
Total new entities 12 4
(1) SCR: Venture capital company.(2) FCR: Venture capital fund.

92
Annual report on the securities markets. 2003
Financial institutions continued to be the sector’s main source of funding (42.1% of total con-tributions in 2003), followed by non-financial companies (14.9% vs. 8.1% in 2002) and public-sector investors (14.2% vs. 14.4% in 2002). Foreign pension funds also made a sizeable con-tribution (8.6%) to funds38.
For the third year running, venture capital firms invested more funds than they raised, so una-llocated funds were used to cover part of the investment. Some of the significant characteris-tics of investment made by these firms were as follows:
• Investment in expanding companies not only remained the largest segment but also increasedits weighting, representing for 66% of total investment39. Leveraged buy-outs40 accounted for27.6% of investment, while seed and start-up investment in developing companies totalled just4.2%, a record low.
• Investments continued to be concentrated in consumer-related sectors (27.9%), followedby the leisure and hospitality sector (20.3%)41. Industrial products and services received11.2% of total investment42.
Table 5.6 shows the main features of the venture capital firms created in 2003 under the VentureCapital Law43 and registered at the CNMV. There are 16 closed-end entities (12 companies and 4funds), promoted mainly by banks and non-financial companies, which cover all the phases of com-pany development in a broad range of sectors and regions.
Venture capital companies and funds promoted under the Venture Capital Law both registered apronounced increase in aggregate assets in 2003. Fund assets grew 18.2% to €811 million andcompany assets rose 24.1% to €1.923 million. With regard to asset composition, there was signi-ficant growth in investment in unlisted securities of non-financial companies44 in both relative andabsolute terms. Current assets, which include investments in listed securities, cash and otheraccounts receivable as well as unlisted securities represented 98% of total company assets and74% of fund assets.
There was significant growth in uncalled capital on the asset side of the balance sheet at funds,rising from 20.3% of total assets in 2002 to 25.7% in 2003.
38 See Annex A.4.23.39 See Annex A.4.24.40 MBO (Management Buy-Out) and MBI (Management Buy-In), which consist of acquisitions financed mainly by debt par-
tially guaranteed by the purchased company’s own assets and with instruments intermediate between equities and debt.In an MBO, the acquirers belong to the management team of the company itself. In an MBI, the acquirers belong to themanagement team of a different company
41 In 2002, the leisure industry accounted for 9.5% of investment. The sharp rise in 2003 is due to Advent International'sbid for Parques Reunidos, mentioned in a previous footnote.
42 See Annex A.4.25.43 Law 1/1999, dated 5 January, regulating venture capital firms and their operators.44 At venture capital funds, the weighting of this investment as a percentage of total assets rose from 32% in 2002 to 38%
in 2003, while at venture capital companies it rose from 57% to 65%.

CHAPTER 6
SECURITIES FIRMS AND FUNDMANAGEMENT COMPANIES

6. Securities firms and fund management companies
6.1 Securities firms
Overview
At 2003 year-end, there were 105 securities firms (compared with 110 in 2002). Of these 105firms, 46 were broker-dealers (sociedad de valores) and 59 were brokers (agencia de valores).Two broker-dealers registered and seven brokers de-registered during the year. The number ofregistered stock exchange members decreased from 55 to 51, of which 37 were broker-dealersand 14 brokers.
Broker-dealers and brokers had a more favourable year in 2003 than in 2002. Nevertheless, theimprovement in the stock markets was only partially passed on to business volumes due to thecompetition from credit institutions for stockbroking business1. The greater competitive pressurehad a negative effect on revenues although the decline was offset by the containment of opera-ting costs. Accordingly, with the improvement in the "Other gains and losses" line-item, the sec-tor as a whole registered earnings before tax of €250 million, up 14.9% on 2002, when earningsfell 28.5%.
Broker-dealers obtained €223 million in aggregated pre-tax earnings, compared with €202 millionin 2002, due to the improvement in results at stock exchange members (non-members registereda decline in earnings).
Market members’ ordinary income fell substantially due to negative performance by net fees,which was not sufficiently offset by the considerable containment of operating costs; accordingly,operating profit also fell sharply (see table 6.1). However, a reduction in depreciation & amortisa-tion and provisions, and a rise in "Other gains and losses" led to a 14.6% increase in aggregatedpre-tax earnings to €195.8 million (compared with €170.8 million in 2002).
The sharp increase in the "Other gains and losses" line-item, which is usually marginal, requiresfurther explanation2 given that, on this occasion, it determined to some extent the positive per-formance of the sector aggregated earnings. This line-item contains several subheadings and therise was due mainly to positive performance by two of these subheadings: "Translation gains" and"Gains on sale of permanent portfolio and release and application of related provisions". The firstsubheading corresponds to a single firm (Merrill Lynch Capital Markets España, S.A. Sociedad deValores y Bolsa) and the second subheading to four broker-dealers, all of which made an equalcontribution to the increase3, mainly through the divestment of their holdings in Bolsas y MercadosEspañoles S.A.
Ordinary income remained practically flat at non-market-members. The aggregated pre-tax ear-nings of non-members declined 11.9% on 2002 to €27.7 million, due to a sizeable increase in ope-rating expenses, depreciation and amortisation.
95
Securities firms and fund management companies
1 The volume of equities traded by securities firms in 1999 represented 100% of total market trading. In 2003, it repre-sented 86.5%; in terms of trading on behalf of third parties, the percentage fell from 86.4% to 74.6% in the same period.
2 The increase in earnings before tax at broker-dealers with regard to 2002 was approximately _21 million, while the incre-ase in the "Other gains and losses" line-item was over _52 million, of which _22 million correspond to "Translation gains".
3 Three of which increased their earnings (Deutsche Securities, Sociedad de Valores y Bolsa, S.A., Eurosafei, Sociedad deValores y Bolsa, S.A. and Invercaixa Valores, Sociedad de Valores, S.A.) and the fourth reduced its losses (MorganStanley, Sociedad de Valores, S.A.).

The aggregated pre-tax earnings of both stock exchange members and non-members increased:brokers that are stock exchange members registered a rise from under €0.2 million to almost €6million, while non-members saw an increase from €14.8 million to €20.2 million.
Brokers posted €26 million in pre-tax earnings (see table 6.2), i.e. up 74.4% on 2002. Stockexchange members and non-members performed differently; the former registered a considera-ble drop in ordinary revenues due to a reduction in fees, and the latter posted an increase on 2002.Both groups undertook substantial cost cuts.
96
Annual report on the securities markets. 2003
Table 6.1Broker-dealers: aggregate income statement in 2003
Amounts in millions of euros
Total Stock exchange Non-membersmembers
Amount Chg. (%) Amount Chg. (%) Amount Chg. (%)
Financial income 47.7 -34.7 44.2 -36.3 3.6 -2.9Net income from securities trading 24.0 23.6 21.8 7.7 2.2 -Net commission revenues 495.8 -8.7 449.4 -9.0 46.4 -5.3Total net revenues 567.5 -10.7 515.4 -11.7 52.1 0.6Operating expenses 357.0 -7.1 333.1 -8.6 23.9 18.4Operating income 210.5 -16.1 182.3 -16.9 28.2 -10.8Depreciation & other charges 39.2 -18.8 38.3 19.4 1.0 20.7Other gains & losses 52.2 - 51.8 - 0.4 -27.4Earnings before taxes 223.4 -10.5 195.8 14.6 27.7 -11.9Corporate income tax 77.0 9.2 67.6 13.7 9.5 -14.8Earnings after taxes 146.4 -11.1 128.2 15.1 18.2 -10.3
Note: The dashes in the table represent changes that are not meaningful. In both cases, there was a shift from losses togains, with a significant improvement.
Table 6.2Brokers: aggregate income statement in 2003
Amounts in millions of euros
Total Stock exchange Non-membersmembers
Amount Chg. (%) Amount Chg. (%) Amount Chg. (%)
Financial income 6.7 2.8 2.1 -18.1 4.6 16.2Net income from securities trading 1.5 396.7 1.3 299.7 0.2 121.4Net commission revenues 135.6 -4.5 28.0 -29.0 107.7 4.9Total net revenues 143.9 -2.8 31.4 -25.8 112.5 6.4Operating expenses 127.4 -19.7 25.3 -37.6 102.1 -13.5Operating income 16.4 - 6.1 250.6 10.4 183.8Depreciation & other charges 6.3 -30.6 1.0 -69.9 5.3 -9.2Other gains & losses 16.0 -53.8 0.9 -48.3 15.2 -54.0Earnings before taxes 26.2 74.4 6.0 2,977.8 20.2 36.4Corporate income tax 10.3 -5.3 2.1 86.5 8.2 -15.6Earnings after taxes 15.9 282.7 3.9 - 12.0 136.9
Note: The dashes in the table represent changes that are not meaningful. In both cases, there was a shift from losses togains, with a significant improvement.

Figures 6.1 and 6.2 shows the annual ROE before and after taxes of broker-dealers and brokers,including stock exchange members and non-members.
97
Securities firms and fund management companies
Figure 6.1
Broker-dealers: pre-tax earnings and ROE
Member earnings (LH) Non-member earnings (LH)
Member ROE (RH) Non-member ROE (RH)
Mill
ions
of
euro
s
Figure 6.2
Brokers: earnings and ROE after taxes
Member earnings (LH) Non-member earnings (LH)
Member ROE (RH) Non-member ROE (RH)
Mill
ions
of
euro
s

Overall, average ROE before taxes at securities firms rose significantly from 17% to 23% due toa reduction in the number of loss-making entities (mainly non-member brokers), which accoun-ted for under a quarter of the total in 2003 (compared with one-third in 2002), and the sizeableincrease in entities registering ROE of over 30%, rising from 11% to 22% of the total.
In line with earnings performance, ROE rose at broker-dealers that are stock exchange membersand at brokers (both members or non-members) taken as a whole. Meanwhile, ROE at non-mem-ber broker-dealers fell in 2003.
ROE at broker-dealers grew from 19% to 24%, with a decline in the number of loss-making enti-ties (from 8 to 5). At brokers, average ROE doubled from 7.5% to 15% and although the numberof loss-making entities fell (from 28 to 22), it remains high. A breakdown of ROE by intervals atbroker-dealers and brokers (further divided into stock exchange members and non-members) isavailable in Annexes A.5.6.1 and A.5.6.2.
In a context of a moderate rise in earnings but with a significant number of entities still making aloss, the overall decline in the surplus equity registered at securities firms in the last few yearscontinued in 2003. This is due principally to the performance of broker-dealers that are stockexchange members, as they are adjusting their capital to the legal requirements established in theCapital Adequacy Directive4.
Nevertheless, the sector maintained significant surplus equity coverage in 2003; the coveragemargin or surplus of sector computable equity with respect to the equity required for the solvencycoefficient was 472% at broker-dealers and 192% at brokers, on average (see Annex A.5.7). 98%of broker-dealers and 73% of brokers had over 100% coverage margin, compared with 91% and64%, respectively, in 2002.
In 2003, the sector's ownership structure and control underwent a considerable change, with non-resident entities losing ground. At broker-dealers, the percentage of ownership by Spanish finan-cial institutions (banks and savings banks) rose while that of non-residents fell. At 2003 year-end,38% of broker-dealers’ capital belonged to non-residents, 46% to resident financial institutionsand the rest to resident individuals or firms.
At brokers, the percentage of ownership held by Spanish non-financial entities rose and that ofresident financial entities and non-resident entities fell. At 2003 year-end, 18% of brokers' capi-tal belonged to non-residents, 27% to resident financial institutions and 55% to resident indivi-duals or firms.
Third-party trading
Securities firms collected €831 million in service fees in 2003, 2.5% less than in 20025. Of thatamount, 80% was collected by broker-dealers and 20% by brokers. The greatest reduction, inboth absolute and relative terms, was in order processing and execution; however, this continuedto be the main revenue source, although its weighting decreased as a proportion of the total, from63% to 56%.
Gross revenues for processing and execution of equities orders fell 12% as the moderate increa-se in brokerage volume was not sufficient to offset the decline in brokerage fees in the year.
The volume of equities brokerage increased from €717 billion in 2002 to €763 billion in 2003, ofwhich €739 billion related to transactions in domestic markets. Equity brokerage revenues amoun-ted to €331 million, of which €289 million related to transactions in Spain’s markets. The avera-ge effective brokerage fees in Spain’s stock markets fell from 0.47‰ in 2002 to 0.39‰ in 2003.
98
Annual report on the securities markets. 2003
4 Directive 31/98: European Parliament and Council Directive 98/31/EC of 22 June 1998 amending Council Directive93/6/EEC on capital adequacy of investment firms and credit institutions.
5 Since fees were liberalised in 1992, they have gradually declined year-on-year. Performance in the last 10 years is shownin figure 6.3.

In fixed-income, the volume of third-party trading by securities firms rose considerably (+88%),taking the traded volume to €16.3 billion, of which over 99% related to public debt. Despite theincrease in volumes, gross fee revenues dropped 12% on 2002, to €47.9 million.
A notional €3.7 billion in derivatives were traded for third parties (+5.6% vs. 2002), with firmscollecting €89 million in fee revenues (-13%). Products traded in foreign markets accounted for53% of the brokerage volume in this segment and 28% of gross fees.
99
Securities firms and fund management companies
Table 6.3Securities firms: commission revenues
Amounts in millions of euros
1999 2000 2001 2002 2003
Brokering 699.3 838.4 640.4 533.9 467.8IIC subscription and reimbursement 138.5 157.7 138.3 121.2 116.5Placement and underwriting 112.9 147.9 55.0 49.3 91.9Transaction advice and design 38.5 38.8 15.2 18.7 34.7Portfolio management and securities custody 33.3 32.7 35.1 32.5 34.6Other 109.4 103.7 108.6 95.9 85.2
Total 1,131.9 1,319.1 992.6 851.5 830.6Broker-dealers (%) 79.4 83.4 80.5 78.4 80.2Brokers (%) 20.6 16.6 19.5 21.6 19.8
Figure 6.3
Securities firms: brokerage of equities traded in domestic markets.Volume and brokerage fee revenues
Brokerage volume (LH) Average effective brokerage (RH)
. .
.
. .
.
.
..
.
.
.
.
.
.
.
Bill
ions
of
euro
s
%o
,

With respect to other services, the largest contribution to gross revenues came from collectiveinvestment scheme marketing (subscriptions and reimbursements), which amounted to €116million, down 3.9% on 2002. However, there was a sizeable increase in revenues from issue place-ment and underwriting (+86%), transaction advice and design (+86%) and, to a lesser extent,portfolio management and securities deposits (+7%). Gross revenues from all other services fell11% overall. A breakdown of fee performance is given in Annex A.5.10
Proprietary trading
Net revenues (financial income plus trading portfolio net of provisions for derivatives posi-tions) from proprietary trading at securities firms fell 12% on 2002 to €70 million.
The sector’s financial income amounted to €54 million, a 32% reduction on 2002, brokendown as follows: 50% of net revenues related to securities portfolio yields (interest and divi-dends) and 25% to margins on repos, although they both decreased with respect to 2002(–17% and –26%, respectively). The decline in financial income was due mainly to a reduc-tion in net revenues from Spanish equity yields, repos and various other transactions, sinceforeign fixed-income and equity portfolio yields improved on 2002.
After three years of consecutive declines, net revenues from the trading portfolio rose subs-tantially in 2003 to €25.5 million (€18.9 million in 2002). This rise was due to a sharp incre-ase in earnings on equities, which registered gains of €79 million (compared to a loss of €93million in 2002) and, to a lesser extent, on fixed-income (€18 million compared with €17million in 2002). In contrast, derivatives results declined from a gain of €96 million in 2002to a loss of €70 million in 2003. Provisions for derivatives depressed total revenues by €9.6million, 48% less than in 2002.
100
Annual report on the securities markets. 2003
Table 6.4Securities firms: earnings on proprietary trading
Amounts in millions of euros
1999 2000 2001 2002 2003
Money market and fixed-income assets 2.9 -3.5 9.9 17.0 18.0
Equities 250.8 -220.5 -145.9 -93.3 78.6
Derivatives -177.2 292.9 185.5 96.2 -70.5
Other operations 26.3 0.4 0.8 -1.0 -0.5
Total 102.8 69.3 50.3 18.9 25.5
Pro memoria: proprietary trading volume (billions of euros)
Money market and fixed-income assets 423.5 372.8 297.0 263.6 244.2
Equities 70.5 123.0 134.7 136.0 128.9
Derivatives 339.1 196.9 192.6 183.5 72.2
Total 833.1 692.7 624.3 583.1 445.2
Consolidable groups
The CNMV supervised 53 financial groups in 2003, comprising 514 entities of different types,representing a decrease in the number of groups and an increase in the number of entities on2002. Of these entities, 21% were agents or representatives of broker-dealers and brokers, 17%

101
Securities firms and fund management companies
Figure 6.4
Pre-tax earnings of consolidable groups. Contribution by securities firmsand other entities
-100
0
100
200
300
400
500
600
700
800
900
1999 2000 2001 2002 2003
Broker-dealers and dealers
Other entities 184.3
616.8
400.8
-17.6
70.8
303.9
56.1
217.3
392.3
249.7
Mill
ions
of
euro
s
6 See A.5.11.7 See A.5.13.8 See A.5.14.
The sector’s consolidated pre-tax earnings amounted to €335 million, 23% more than in2002. Despite the decline in financial and ordinary income, earnings rose due to containmentof operating costs and a gain in the "Other gains and losses" item.
Broker-dealers and brokers made the greatest contribution to earnings, since other entitiescontributed 26% of the consolidated pre-tax earnings (compared to 21% in 2002). Given thatentities other than broker-dealers and brokers increased both their financial and ordinaryincome, their contribution to consolidated earnings increased in both line-items. The afore-mentioned improvement in income was sufficient to offset poorer performance in operatingexpenses and in the "Other gains and losses" line-item7.
Among consolidable entities, IIC management companies accounted for a large proportion(42%) of net fee revenues8.
were the securities firms themselves, 13% were IIC and FTH management companies and the restwere other types of firms. 84% of all entities belonged to a group6 and 57% of groups comprisedfive or more entities.

102
Annual report on the securities markets. 2003
Regulation of research and advice activities in the securities markets
Financial scandals in the last decade have highlighted the fact that, on occasion, analysts'recommendations have not accurately evaluated the difficulties experienced by certaincompanies. Although they have not been found specifically responsible, reports preparedby analysts and research companies have been cited in legal and regulatory proceedingsinitiated in the US.
Securities analysts linked to investment banks or to securities market intermediaries canfind themselves in a conflict of interest if they have an incentive to issue positive recom-mendations on securities or companies, either because their remuneration is in some waylinked to sales of securities by the company for which they work or because they are underpressure from investment banking departments. Even independent analysts can have someform of relationship with the companies that they analyse.
These issues began to be regulated in the US with the introduction of the Sarbanes-OxleyAct in 2002. The Act published an amendment to be included within a year in the SecuritiesExchange Act of 1934 by which the Securities and Exchange Commission (SEC), or the ins-titution empowered by it, must establish regulations to control conflicts of interest arisingwhen analysts recommend securities in their reports or presentations, to improve theobjectivity of such reports and to supply investors with more reliable information. To thisend, the Sarbanes-Oxley Act included a series of regulations aimed at: (i) fostering grea-ter public trust in securities research reports and protecting the independence and objec-tivity of analysts; (ii) preventing brokers or dealers who have participated or will partici-pate in securities offerings as underwriters or dealers from publishing or distributingreports relating to the securities or the issuer; (iii) establishing structural and institutionalsafeguards to ensure that securities analysts work separately and independently ofdepartments relating to investment banking; and (iv) any other issue which the SEC deemspertinent.
At the end of July 2003, the SEC approved a series of regulations drawn up by self-regu-latory bodies* regarding analysts' activities in line with the provisions of the Sarbanes-Oxley Act. Basically, the regulations: (i) separate analyst remuneration from investmentbanking influence; (ii) isolate research activities from investment banking; (iii) require bet-ter information to be published about agreements between entities which could affectanalysts; (iv) make it obligatory to advise clients when coverage of a company ends; (v)ensure analysts' independence by preventing them from being threatened by investmentbanking departments against issuing an adverse recommendation; and finally (vi) imposecompulsory registration of analysts, and qualification and ongoing training requirements.
Other international bodies such as IOSCO and the EU subsequently addressed these issues.On 25 September 2003, IOSCO issued a statement of principles to advise securities regu-lators on how to deal with conflicts of interests in securities research. These recommen-dations are in line with those approved in the US. The IOSCO Technical Committee publis-hed a report on analyst conflicts of interest, which described the different types of conflictsaffecting analysts and measures introduced in various countries to deal with these issues.
On 22 December 2003, a European Commission Directive was published regarding the fairpresentation of investment recommendations and the disclosure of conflicts of interest.The Directive, which took into account recommendations from the CESR TechnicalCommittee, establishes rules for the fair presentation of investment recommendations andthe disclosure of conflicts of interest affecting analysts. It draws a distinction between per-sons producing investment recommendations (who must meet stricter standards) andthose disseminating recommendations made by third parties. In accordance with Article 6of the Directive on Market Abuse, it should be noted that journalists are covered by speci-

103
Securities firms and fund management companies
fic rules, often involving self-regulation. Nevertheless, financial journalists who produce ordisseminate investment recommendations must respect certain general principles, thuspreserving the freedom of the press while protecting investors and issuers against any riskof market manipulation by journalists exploiting their considerable influence for their owngain. The Directive also clearly states that it refers exclusively to public recommendationsand not to private advice.
Following a number of conceptual definitions, the Directive contains two main sections, oneregarding the preparation of recommendations and the other regarding their dissemina-tion. With regard to the former, member states must ensure that: (i) the identity of theauthor of the recommendations is clear; (ii) there is a general regulation regarding fairpresentation of investment recommendations (distinction between facts and interpreta-tions, reliability of sources, assumptions used in projections and valuations, and other obli-gations regarding the analysts' activities); and (iii) they have regulations to ensure theindividuals involved disclose interests and conflicts of interest.
With respect to the dissemination of recommendations made by third parties, the Directiveurges member states to implement appropriate regulation to identify those disseminatingrecommendations and a general rules regarding dissemination of recommendations. Thefinal date for implementation of the Directive in national legislation is 12 October 2004.
In Spain, the Securities Market Law, amended by Law 44/2002 on Measures to Reform theFinancial System, includes a series of measures affecting analysts' activities in Article 79,which relates to codes of conduct for investment services firms (paragraphs f, g and h).The measures include the obligation to ensure equal treatment of customers when distri-buting recommendations and reports, a ban on analysts taking positions for their ownaccount in securities or financial instruments on which they are carrying out researchduring specific periods, and the obligation to disclose to clients any possible conflict of inte-rests relating to advice or investment services offered.
(1) NASD, NYSE, SIA and AIMR.
9 The number of FIAMMs managed by SGIICs rose by 3 on 2002, FIMs by 13, SIMCAVs by 207. The number of SIMs managed fell by 10 and real estate funds and companies remained unchanged.
10 See A.5.16.
6.2 Collective investment scheme management companies (SGIIC)
At 2003 year-end, there were 119 SGIICs registered with the CNMV, five less than in 2002. Thenumber of managed institutions increased from 5,110 to 5,323, due mainly to the creation of newSIMCAVs and, to a lesser extent, mutual funds9. Overall, SGIICs managed €233 billion in assetsat 2003 year-end, up 20.7% on 2002. Securities investment funds (FIM and FIAMM) accounted for90.4% of managed assets, securities investment companies (SIM and SIMCAV) for 8.4%, and realestate funds for 1.2%10.
There was a rise in managed assets at all types of institutions (€40 billion overall), even at SIMs,despite the reduction in numbers. The greatest increase, in absolute terms, was registered atsecurities investment funds (€31.2 billion).
Despite the growth in managed assets, commission revenues rose just 2.3% to €2.3 billion11. Thisis explained by the decline in commissions charged by FIMs (see Chapter 5). In contrast, com-

missions paid to marketers increased 3.4%, and their weighting in commission revenues rose from71% in 2002 to 72% in 2003. Consequently, net commission revenues declined 0.5%.
104
Annual report on the securities markets. 2003
Figure 6.5
IIC management companies: managed assets and pre-tax earnings
Mill
ions
of
euro
s
Mill
ions
of
euro
s
Assets (LH) Earnings (RH)
,
,
,
,
,
,
,
11 Of which 98% corresponded to management fees.12 See A.5.18.13 Two other companies were removed from the register in early January 2003, having been dissolved in 2002; they belon-
ged to the SCH Group and accounted for a large proportion of assets under management or advice in the sector.
The decrease in net commissions was accompanied by a moderate increase (2.7%) in financialincome and considerably lower losses on securities portfolios than in 2002, leading to a 1.1%increase in ordinary income to €693 million. Operating expenses fell 2.3% to €228 million.However, losses in the "Other gains and losses" line-item led to a 0.7% decline in pre-tax earningson 2002, to €444 million12. Sector ROE after taxes stood at 33%, compared with 28% in 2002.The number of loss-making institutions fell from 30 to 21.
6.3 Portfolio management companies (SGC)
The sector restructuring process continued in 2003, with a further reduction in the number of port-folio management companies. At 2003 year-end, there were 24 SGCs registered at the CNMV,seven less than in 2002. One new institution was registered in 2003 and eight were removed. Thenew institution and four of the eight removed were independent and the other four were linked tomajor banks: three of them to Spanish banks13 (SCH and Banco Zaragozano) and the other toItalian bank Capitalia.
The number of portfolio management contracts remained practically flat but assets under mana-gement or advice fell almost 15%. Managed assets rose from €1.8 billion in 2002 to €2.2 billionin 2003 and assets under advice fell from €4.9 billion to €3.5 billion. Of the managed assets, 89%

105
Securities firms and fund management companies
Figure 6.6
Portfolio management companies: asset under management or adviceand pre-tax earnings
Mill
ions
of
euro
s
Mill
ions
of
euro
s
Assets under management Assets under advice (LH) Earning (RH)
,
,
,
,
,
,
,
.
.
.
.
.
.
.
.
.
.
.
14 Ver A.5.16.15 Ver A.5.18.
related to individual portfolios and the rest to securities investment companies (SIM and SIM-CAV)14.
The reduction in assets under management and advice led to a slight decrease in commission reve-nues: while management commissions rose from €6.1 million in 2002 to €7.8 million in 2003,advisory service fees fell from €7.6 million to €3.3 million. The volume discounts collected fromother financial institutions for trading in the managed portfolios also fell: from €3.1 million in 2002to €2.8 million in 2003. Overall, commission revenues fell 18% to €14 million15.
Following the decline in commissions, pre-tax earnings in the sector fell 38% on 2002 from €6.2million to €3.8 million. ROE after taxes in the sector stood at 7.80%, compared with 10.25% in2002. The number of loss-making institutions decreased from 10 to 8.
6.4 Venture capital firm management companies (SGECR)
At 2003 year-end, there were 31 SGECRs registered at the CNMV, five more than in 2002. In 2003,one company was removed and six were registered. In addition to the 35 venture capital fundsfiled with the CNMV at 2003 year-end, SGECRs managed 20 registered venture capital firms (com-pared to 33 venture capital funds and 13 venture capital firms in 2002).
At 2003 year-end, the aggregated pre-tax earnings of SGECRs amounted to €4.9 million, down16% on 2002. ROE after taxes in the sector fell from 13.1% in 2002 to 11.0% in 2003.

STATISTICAL ANNEXES

ANNEX 1
PRIMARY MARKETS

1999 2000 2001 2002 2003
Gross issues
– Public administrations(1) 92,130 87,316 69,570 74,549 78,480Short term 45,061 41,616 28,880 34,746 38,973Medium and long term 47,068 45,701 40,690 39,803 39,507
– Issues registered at the CNMV 72,339 96,237 84,249 88,395 156,832Capital increases(2) (*) 14,748 43,937 9,623 4,692 3,289
of which primary public offerings(3) 7,373 17,811 155 0 0Fixed-income(2) 57,591 52,300 74,626 83,702 153,543
Short term 32,555 34,366 45,173 45,576 76,177Medium and long term 25,037 17,934 29,453 38,127 77,366
Secondary public offerings(3) 4,419 9,446 3,044 3,330 470
Fixed-income issued by residents: outstanding income(1)
– Total resident issuers 391,392 400,636 429,153 467,363 539,373Short term 77,047 59,996 56,155 59,082 68,993Medium and long term 314,345 340,641 372,998 408,281 470,380
Public administrations 301,627 313,776 318,187 326,916 326,319Short term 54,335 45,730 36,927 37,202 39,941Medium and long term 247,292 268,045 281,261 289,714 286,378
Financial institutions 69,183 70,224 93,434 124,980 197,548Short term 15,365 11,052 14,932 18,873 26,811Medium and long term 53,818 59,172 78,502 106,107 170,737
Non-financial companies 20,581 16,637 17,532 15,467 15,506Short term 7,347 3,214 4,296 3,008 2,241Medium and long term 13,234 13,423 13,235 12,460 13,265
Pro memoria:Commercial paper registered at the CNMV:
outstanding balance(1) 18,339 17,316 24,472 23,614 32,205
111
Annex 1: Primary markets
A.1.1.Primary markets. Issues and outstanding balances
(1) Nominal amount.(2) Effective value.(3) Domestic and international tranches.(*) The total in 2001 includes a € 4.696 billion capital increase performed by Arcelor, registered on 12/21/2001. This issue relates to
Arcelor’s bild for Aceralia, vetted by the CNMV on 01/03/2002.Sources: Bank of Spain and CNMV.
Amounts in millions of euros

112
Annual rep
ort o
n th
e securities m
arket. 2003
(1) Domestic and international tranches.(* ) The total in 2001 includes a capital increase with an effective amount of € 4.696 billion and a nominal amount of € 2.581 billion performed by Arcelor, registered on 12/21/2001. This issuerealtes to Arcelor’s bid for Aceralia, vetted by the CNMV on 01/03/2002.
2001 2002 2003
Effective Nominal Effective Nominal Effective Nominal
Amount Chg. (%) Amount Amount Chg. (%) Amount Amount Chg. (%) Amount
Equities and fixed-income issues 84,248.9 –12.5 78,623.8 88,394.7 4.9 84,838.2 156,832.5 77.4 155,032.9
Capital increases (*) 9,622.9 –78.1 3,988.5 4,692.4 –51.2 1,133.6 3,289.3 –29.9 1,391.4of which primary public offerings (1) 155.0 –99.1 93.0 0.0 –100.0 0.0 0.0 — 0.0
Fixed-income 74,626.0 42.7 74,635.3 83,702.3 12.2 83,704.6 153,543.2 83.4 153,641.5Preference shares 4,060.0 41.0 4,060.0 3,736.7 –8.0 3,736.7 3,360.0 –10.1 3,360.0Mortgage covered bonds 6,078.2 130.0 6,078.2 11,704.0 92.6 11,704.0 17,781.0 51.9 17,864.0Territorial covered bonds — — — — — — 4,179.8 — 4,200.0Non-convertible bonds and debentures 7,066.2 42.2 7,075.5 3,585.1 –49.3 3,587.4 15,020.0 319.0 15,020.8Convertible/exchangeable bonds and debenture 455.8 244.7 455.8 237.7 –47.8 237.7 179.3 –24.6 179.3Asset-backed bonds (1) 11,793.3 61.4 11,793.3 18,803.2 59.4 18,803.2 36,740.4 95.4 36,740.4Commercial paper-shelf registrations 45,172.5 31.4 45,172.5 45,575.6 0.9 45,575.6 76,177.0 67.1 76,177.0Other fixed-income issues 0.0 — 0.0 60.0 — 60.0 105.7 76.2 100.0
Secondary public offerings (1) 3,044.3 –67.8 406.6 3,329.8 9.4 314.6 469.5 –85.9 126.9
Total 87,293.3 –17.4 79,030.4 91,724.5 5.1 85,152.8 157,302.0 71.5 155,159.8
A.1.2.Issues and public offerings, by instrument. Amounts registered at the CNMV
Amounts in millions of euros

113
Annex 1: Primary markets
No. of Effective Nominal amount
Issuers Issues amount TotalBonusissues
Energy and water 2 2 12,044 11,444 0SOCIEDAD GENERAL DE AGUAS DE BARCELONA, S.A. 1 1 1,444 1,444 0FERSA ENERGIAS RENOVABLES, S.A. 1 1 10,600 10,000 0
Chemical industry 2 2 19,000 30,941 890FAES FARMA, S.A. 1 1 0 890 890LA SEDA DE BARCELONA, S.A. 1 1 19,000 30,051 0
Food, beverages and tobacco 2 2 40,955 39,586 0SOS CUETARA, S.A. 1 1 31,446 38,413 0SOCIEDAD ANONIMA DAMM 1 1 9,509 1,173 0
Construction 1 1 501,623 81,698 0ACS, ACTIVIDADES DE CONSTRUCCION Y SERVICIOS, S.A. 1 1 501,623 81,698 0
Transport and communications 3 8 1,039,589 744,058 174,188TELEFONICA, S.A. 1 2 97,213 196,370 99,157ABERTIS INFRAESTRUCTURAS, S.A. 1 2 927,480 538,771 75,031JAZZTEL, PLC. 1 4 14,896 8,917 0
Financial institutions and insurance companies 4 5 502,730 16,869 1,783BANCO DE VALENCIA, S.A. 1 2 60,631 7,846 1,783GRUPO INMOCARAL, S.A. 1 1 25,154 3,551 0BANCO POPULAR ESPAÑOL, S.A. 1 1 412,672 5,116 0VALENCIANA DE NEGOCIOS, S.A. 1 1 4,273 356 0
Real estate 5 5 348,653 99,902 2,870URBANIZACIONES Y TRANSPORTES, S.A. 1 1 1,646 1,646 0SOTOGRANDE, S.A. 1 1 70,225 4,339 0SACYR VALLEHERMOSO, S.A. 1 1 276,782 91,047 0INMOBILIARIA DEL SUR, S.A. 1 1 0 2,760 2,760COMPAÑIA ESPAÑOLA DE VIVIENDAS EN ALQUILER, S.A. 1 1 0 110 110
Other businesses 3 3 41,494 9,800 0INYPSA INFORMES Y PROYECTOS, S.A. 1 1 1,500 1,500 0CALPE INVEST, S.A. 1 1 12,708 2,843 0SERVICE POINT SOLUTIONS, S.A. 1 1 27,286 5,457 0
Recreational and cultural services 1 1 449,497 57,962 0SOGECABLE, S.A. 1 1 449,497 57,962 0
Other 9 10 333,736 299,157 6,859TAVEX ALGODONERA, S.A. 1 1 0 2,550 2,550INDRA SISTEMAS, S.A. 1 2 19,918 573 0ZARDOYA OTIS, S.A. 1 1 0 1,789 1,789RENO DE MEDICI, S.P.A. 1 1 72,105 72,105 0TABLEROS DE FIBRAS, S.A. 1 1 208,400 208,400 0DOGI INTERNATIONAL FABRICS, S.A. 1 1 24,850 3,728 0EUROPEAN AERONAUTIC DEFENCE AND SPACE CO.
EADS, N.V. 1 1 2,205 177 0UNIPAPEL, S.A. 1 1 0 2,520 2,520URALITA, S.A. 1 1 6,258 7,315 0
TOTAL 32 39 3,289,321 1,391,417 186,590
A.1.3.Capital increases through issues of new stock registered at the CNMV, except primarypublic offerings. 2003.Detail by issuer
Amounts in millions of euros
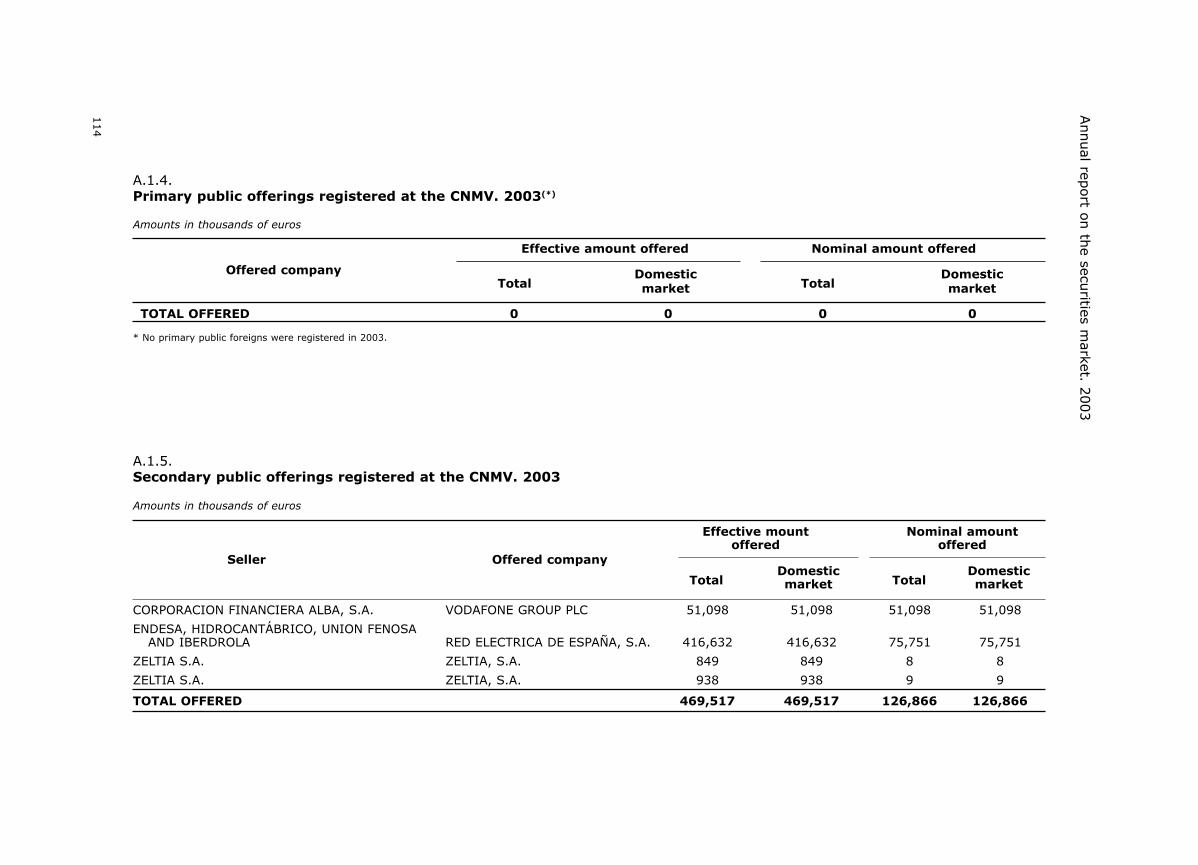
114
Annual rep
ort o
n th
e securities m
arket. 2003
Effective amount offered Nominal amount offered
Offered companyTotal
DomesticTotal
Domesticmarket market
* No primary public foreigns were registered in 2003.
TOTAL OFFERED 0 0 0 0
Effective mount Nominal amountoffered offered
A.1.5.Secondary public offerings registered at the CNMV. 2003
Seller Offered company
TotalDomestic
TotalDomestic
market market
CORPORACION FINANCIERA ALBA, S.A. VODAFONE GROUP PLC 51,098 51,098 51,098 51,098
ENDESA, HIDROCANTÁBRICO, UNION FENOSAAND IBERDROLA RED ELECTRICA DE ESPAÑA, S.A. 416,632 416,632 75,751 75,751
ZELTIA S.A. ZELTIA, S.A. 849 849 8 8
ZELTIA S.A. ZELTIA, S.A. 938 938 9 9
TOTAL OFFERED 469,517 469,517 126,866 126,866
Amounts in thousands of euros
A.1.4.Primary public offerings registered at the CNMV. 2003(*)
Amounts in thousands of euros

115
Annex 1
: Primary m
arkets
Commercial paper Non-convertible bonds and debentures Total fixed-income
A.1.6.Fixed-income issues registered at the CNMV. Main issuers. 2003
Issuer Amount % Issuer Amount % Issuer Amount %
BANESTO BANCO DE EMISIONES, S.A. 6,000,000 7.90 BANCO BILBAO VIZCAYA ARGENTARIA, S.A. 3,350,000 22.48 BANCO SANTANDER CENTRAL HISPANO, S.A. 14,000,000 9.11
BANCO SANTANDER CENTRAL HISPANO, S.A. 6,000,000 7.90 BANESTO BANCO DE EMISIONES, S.A. 2,500,000 16.78 BANESTO BANCO DE EMISIONES, S.A. 8,500,000 5.53
SANTANDER CENTRAL HISPANO CAJA DE AHORROS Y PENSIONESINVESTMENT, S.A. 6,000,000 7.90 ENTE PUBLICO RTVE 1,500,000 10.07 DE BARCELONA 6,750,000 4.39
BBVA BANCO DE FINANCIACION, S.A. 6,000,000 7.90 REPSOL INTERNATIONAL FINANCE 1,000,000 6.71 BANCO BILBAO VIZCAYA ARGENTARIA, S.A. 6,350,000 4.13
BANCO DE SABADELL, S.A. 4,500,000 5.92 BANCO SANTANDER CENTRAL HISPANO, S.A. 1,000,000 6.71 BANCO DE SABADELL, S.A. 6,000,000 3.91
BANCO POPULAR ESPAÑOL, S.A. 4,200,000 5.53 BANCO DE CREDITO LOCAL DE ESPAÑA, S.A. 750,000 5.03 SANTANDER CENTRAL HISPANOINVESTMENT, S.A. 6,000,000 3.91
SANTANDER CONSUMER FINANCE, S.A. 3,500,000 4.61 BANCO PASTOR, S.A. 620,000 4.16 BBVA BANCO DE FINANCIACION, S.A. 6,000,000 3.91
REPSOL YPF, S.A. 3,000,000 3.95 CAJA DE GALICIA 450,000 3.02 BANCO POPULAR ESPAÑOL, S.A. 4,200,000 2.73
BANKINTER, S.A. 3,000,000 3.95 CORES 350,000 2.35 CAJA DE AHORROS Y MONTE DE PIEDADDE MADRID 3,800,000 2.47
BANCO PASTOR, S.A. 3,000,000 3.95 ABERTIS 350,000 2.35 AYT CEDULAS CAJAS IV, FTA 3,800,000 2.47
ENDESA, S.A. 2,000,000 2.63 CAJA MADRID 300,000 2.01 BANCO PASTOR, S.A. 3,620,000 2.36
CAJA DE AHORROS Y MONTE DE PIEDADDE MADRID 2,000,000 2.63 CAJA DEL MEDITERRANEO 300,000 1.72 SANTANDER CONSUMER FINANCE, S.A. 3,500,000 2.28
12 LARGEST ISSUERS 49,200,000 64.59 12 LARGEST ISSUERS 12,470,000 83.02 12 LARGEST ISSUERS 72,520,000 47.20REMAINDER (52 ISSUERS) 26,977,000 35.41 REMAINDER (31 ISSUERS) 2,550,800 16.98 REMAINDER (125 ISSUERS) 81,121,525 52.80
TOTAL (64 ISSUERS) 76,177,000 100,00 TOTAL (43 ISSUERS) 15,020,800 100.00 TOTAL (137 ISSUERS) 153,641,525 100.00
Nominal amounts in thousands of euros

116
Annual report on the securities market. 2003
A.1.7.Fixed-income issues registered at the CNMV.Preference shares. 2003Detail by issuer
Coupon
Amounts in thousands of euros
Issuedate Type(1) Initial (%)
Nominal Effectiveamount amount
BANESTO PREFERENTES, S.A. 12/18/2003 V 2.34 150,000 150,000BBVA CAPITAL FINANCE, S.A. 12/16/2003 V 3.00 350,000 350,000BPE PREFERENCE INTERNATIONAL (*) 12/27/2002 V 2.25 100,000 100,000CAIXA GALICIA PREFERENTES, S.A.,
SOCIEDAD UNIPERSONAL 12/29/2003 V 3.50 140,000 140,000CANTABRIA PREFERENTES, S.A.
SOCIEDAD UNIPERSONAL 12/18/2003 V 3.00 55,000 55,000ENDESA CAPITAL FINANCE, LLC. 03/28/2003 V 3.94 1,500,000 1,500,000SANTANDER CENTRAL HISPANO FINANCE, S.A. 10/07/2003 V 3.00 450,000 450,000UNION FENOSA FINANCIAL SERVICES USA, LLC. 05/20/2003 V 4.18 615,000 615,000
TOTAL 3,360,000 3,360,000
A.1.8.Fixed-income issues registered at the CNMV.Convertible bonds. 2003Detail by issuer
Coupon
Amounts in thousands of euros
Issue Maturitydate date(1)
Type (2) Initial (%)
Nominalamount
(*) Capital increase.(1) F: fixed; V: variable; Z "0": zero coupon.
(1) Last maturity date.(2) F: fixed; V: variable; Z "0": zero coupon.
Construction 149,745BAMI, S.A. INMOBILIARIA DE CONSTRUCCIONES
Y TERRENOS 07/30/2003 07/30/2006 F 3.00 149,745Transport and communications 29,580IBERIA LINEAS AEREAS DE ESPAÑA, S.A. 05/30/2003 05/11/2008 V 2.71 29,580
TOTAL 179,325

117
Annex 1: Primary markets
A.1.9.Fixed-income issues registered at the CNMV.Non-convertible bonds. 2003Detail by issuer
Coupon
Amounts in thousands of euros
Issue Maturitydate date(1)
Type(2) Initial (%)
Nominalamount
Transport and communications 543,000ABERTIS INFRAESTRUCTURAS, S.A. 350,000
12/15/2003 12/09/2005 V 150,00008/08/2003 08/08/2013 F 4.95 200,000
AUTOPISTAS DEL ATLANTICO, CONCESIONARIA ESPAÑOLA, S.A 06/26/2003 06/26/2013 F 3.83 193,000
Financial institutions and insurance companies 12,597,800BANCAJA 09/18/2003 09/18/2015 F 3.94 210,000BANCO ATLANTICO, S.A. 10/01/2003 10/01/2011 2.54 30,000BANCO BILBAO VIZCAYA ARGENTARIA, S.A. .......................................................................................................................... 3,350,000
11/12/2003 11/12/2015 V 4.50 750,00010/08/2003 10/20/2005 V 2.16 2,000,00007/17/2003 07/17/2013 V 2.48 600,000
BANCO DE CREDITO LOCAL DE ESPAÑA, S.A. 09/29/2003 03/30/2005 2.15 750,000BANCO DE VALENCIA, S.A. 08/08/2003 08/08/2007 F 2.85 120,000BANCO GALLEGO, S.A. ........................................................................................................................................................ 36,000
10/30/2003 10/30/2013 V 3.25 18,00006/30/2003 06/30/2013 V 3.75 18,000
BANCO PASTOR, S.A. .......................................................................................................................................................... 620,00012/19/2003 12/19/2005 V 500,00009/30/2003 09/30/2013 V 120,000
BANCO SANTANDER CENTRAL HISPANO, S.A. 12/31/2003 06/30/2005 V 1,000,000BANESTO BANCO DE EMISIONES, S.A. 2,500,000
09/17/2003 09/29/2013 V 2.53 500,00010/21/2003 10/21/2005 V 2.18 2,000,000
BANKINTER, S.A. ................................................................................................................................................................ 130,00009/30/2003 09/30/2013 V 2.65 50,00006/26/2003 06/26/2013 V 2.70 80,000
CAIXA DE AFORROS DE VIGO, OURENSE E PONTEVEDRA (CAIXANOVA) ........................................................................................ 240,00008/04/2003 08/04/2018 V 3.50 120,00001/26/2004 01/26/2019 V 3.50 120,000
CAIXA D´ESTALVIS COMARCAL DE MANLLEU 12/01/2003 06/01/2013 V 2.75 10,000CAIXA D´ESTALVIS DE CATALUNYA ....................................................................................................................................... 256,800
08/19/2003 08/19/2013 C 20,00008/19/2003 08/19/2013 V 0.97 15,00008/19/2003 08/19/2008 V 1.06 12,00007/16/2003 06/27/2013 V 2.31 2,50007/29/2003 07/29/2016 V 2.31 2,00010/29/2003 05/19/2015 V 200,00003/31/2003 10/31/2008 C 5,300
CAIXA D´ESTALVIS DE SABADELL 09/26/2003 10/01/2013 V 2.96 50,000CAIXA D´ESTALVIS DE TARRAGONA 07/15/2003 07/27/2018 V 2.75 20,000CAIXA D´ESTALVIS DE TERRASSA 09/29/2003 12/30/2013 V 2.48 60,000CAJA DE AHORRO PROVINCIAL DE GUADALAJARA 10/10/2003 10/01/2013 V 3.25 4,000CAJA DE AHORROS DE GALICIA ............................................................................................................................................ 450,000
08/01/2003 08/01/2008 F 3.25 240,00002/28/2003 04/01/2008 F 3.25 120,00011/03/2003 11/03/2013 F 3.00 90,000
CAJA DE AHORROS DE LA INMACULADA DE ARAGON 12/22/2003 12/22/2013 V 4.00 100,000CAJA DE AHORROS DE LA RIOJA 06/20/2003 06/20/2013 V 3.00 12,000CAJA DE AHORROS DE MURCIA 06/30/2003 06/30/2023 V 3.00 70,000CAJA DE AHORROS DE VITORIA Y ALAVA 04/02/2003 10/01/2004 V 2.81 100,000CAJA DE AHORROS DEL MEDITERRANEO 11/11/2003 — 2.30 300,000CAJA DE AHORROS PROVINCIAL SAN FERNANDO DE SEVILLA Y JEREZ 12/15/2003 12/15/2013 V 3.00 60,000CAJA DE AHORROS Y MONTE DE PIEDAD DE CORDOBA ........................................................................................................... 210,000
12/01/2003 12/01/2013 V 3.25 60,00012/05/2003 12/05/2013 V 150,000
CAJA DE AHORROS Y MONTE DE PIEDAD DE MADRID.............................................................................................................. 300,00002/11/2004 02/11/2009 F 4.00 100,00003/28/2003 03/28/2013 V 200,000
CAJA DE AHORROS Y MONTE DE PIEDAD DE ONTINYENT 04/04/2003 05/28/2013 V 4.00 6,000CAJA DE AHORROS Y MONTE DE PIEDAD DE SEGOVIA 06/10/2003 06/10/2013 V 3.25 20,000
03/28/2003 03/28/2015 V 4.00 90,00012/29/2003 12/29/2018 V 4.50 100,000
CAJA ESPAÑA DE INVERSIONES 10/30/2003 12/29/2018 V 3.75 100,000CAJA GENERAL DE AHORROS DE GRANADA 06/11/2003 06/11/2009 V 4.00 75,000CAJA INSULAR DE AHORROS DE CANARIAS 11/10/2003 11/01/2013 V 2.75 30,000CAJA RURAL DE JAEN, SOCIEDAD COOPERATIVA DE CREDITO 02/28/2003 02/28/2010 V 4.05 21,000DEUTSCHE BANK, SOCIEDAD ANONIMA ESPAÑOLA 12/30/2003 12/30/2013 V 3.00 70,000IBERCAJA ........................................................................................................................................................................... 190,000MONTE DE PIEDAD Y CAJA DE AHORROS DE HUELVA Y SEVILLA 06/30/2003 06/30/2013 V 3.00 25,000MONTE DE PIEDAD Y CAJA GENERAL DE AHORROS DE BADAJOZ 06/10/2003 06/10/2023 V 2.50 12,000
(Continues over)

118
Annual report on the securities market. 2003
A.1.9.Fixed-income issues registered at the CNMV.Non-convertible bonds. 2003Detail by issuer
Coupon
Amounts in thousands of euros
(Continued)
Issue Maturitydate date(1)
Type(2) Initial (%)
Nominalamount
(1) Last maturity date.(2) F: fixed; V: variable; Z "0": zero coupon.
REPSOL INTERNATIONAL FINANCE, B.V. 07/22/2003 07/22/2013 F 5.00 1,000,000UNICAJA 09/18/2003 12/18/2013 V 2.00 60,000
Real estate 30,000CATALONIA PROMODIS 3, S.A............................................................................................................................................... 30,000
07/30/2003 08/01/2007 V 3.40 10,00007/30/2003 07/30/2007 V 3.30 20,000
Public administration, deference and security,and obligatory social security 350,000
CORP. DE RESERVAS ESTRATEGICA DE PRODUCTOSPETROLIFEROS 07/15/2003 07/15/2013 F 4.00 350,000
Recreational and cultural services 1,500,000ENTE PUBLICO RTVE............................................................................................................................................................ 1,500,000
12/04/2003 12/04/2008 V 850,00005/09/2003 05/09/2006 V 650,000
TOTAL 15,020,800

119
Annex 1: Primary markets
A.1.10.Fixed-income issues registered at the CNMV.Mortage bonds. 2003Detail by issuer
Coupon
Amounts in thousands of euros
Type(2) Initial (%)
(1) Last maturity date(2) F: fixed; V: variable; Z "0": zero coupon.
Financial institutions and insurancecompanies 17,864,000
BANCO SABADELL 1,500,0001,500,000 04/29/2003 04/29/2013 F 4.50
BANESTO 1,500,0001,500,000 05/23/2003 05/23/2010 F 4.00
BBVA 3,000,0003,000,000 01/29/2003 01/29/2013 F 4.25
CAIXANOVA 90,00090,000 07/28/2003 10/06/2008 V 3.00
CAJA BADAJOZ 24,00024,000 06/10/2003 12/10/2006 V 2.25
CAJA MADRID 1,500,0001,500,000 10/22/2003 10/22/2009 F 3.75
LA CAIXA 5,250,000750,000 05/07/2003 04/05/2011 F 5.25750,000 11/24/2003 11/24/2018 F 4.75
1,250,000 12/24/2003 11/24/2013 F 4.252,500,000 02/27/2003 03/04/2010 F 3.50
SCH 5,000,0002,000,000 09/05/2003 09/10/2010 V 4.001,500,000 03/12/2003 03/12/2006 F 2.751,500,000 12/19/2003 12/19/2008 F 3.75
TOTAL 17,864,000
A.1.11.Fixed-income issues registered at the CNMV.Territorial bonds. 2003Detail by issuer
Coupon
Amounts in thousands of euros
Nominal Issue Maturityamount date date(1)
Type(2) Initial (%)
(1) Last maturity date(2) F: fixed; V: variable; Z "0": zero coupon.
Financial institutions and insurance companies 4,200,000BANCO DE CREDITO LOCAL 1,500,000 04/07/2003 04/07/2010 F 3.75SCH 2,000,000 07/02/2003 07/08/2013 F 3.92DEXIA SABADELL BANCO LOCAL 700,000 12/02/2003 12/12/2006 V 2.16
TOTAL 4.200.000
Nominal Issue Maturityamount date date(1)

120
Annual rep
ort o
n th
e securities m
arket. 2003
Effective amount offered Nominal amount offered
A.1.12.Fixed-income issues registered at the CNMV.Asset-backed bonds and notes. 2003Detail by issuer
TotalDomestic
TotalDomestic
market market
Amounts in thousands of euros
MORTGAGE-BACKED BONDS 5,030,000 5,030,000 5,030,000 5,030,000AYT GENOVA HIPOTECARIO II, FONDO DE TITULIZACION HIPOTECARIA 05/23/2003 800,000 800,000 800,000 800,000AYT GENOVA HIPOTECARIO III, FONDO DE TITULIZACION HIPOTECARIA 10/31/2003 800,000 800,000 800,000 800,000AYT HIPOTECARIO III, FONDO DE TITULIZACION HIPOTECARIA 07/03/2003 330,000 330,000 330,000 330,000AYT HIPOTECARIO IV, FONDO DE TITULIZACION HIPOTECARIA 07/17/2003 350,000 350,000 350,000 350,000FONCAIXA HIPOTECARIO 7, FONDO DE TITULIZACION HIPOTECARIA 09/26/2003 1,250,000 1,250,000 1,250,000 1,250,000FONDO DE TITULIZACION HIPOTECARIA, BANESTO 4 12/15/2003 1,500,000 1,500,000 1,500,000 1,500,000
ASSET-BACKED BONDS 31,710,400 22,007,600 31,710,400 22,007,600AYT CEDULAS CAJAS IV, FONDO DE TITULIZACION DE ACTIVOS 03/11/2003 3,800,000 3,800,000 3,800,000 3,800,000AYT CEDULAS CAJAS V, FONDO DE TITULIZACION DE ACTIVOS 12/02/2003 3,100,000 3,100,000 3,100,000 3,100,000AYT CEDULAS TERRITORIALES CAJAS I, FONDO DE TITULIZACION DE ACTIVOS 10/22/2003 1,400,000 1,400,000 1,400,000 1,400,000AYT FTPYME I, FONDO DE TITULIZACION DE ACTIVOS 12/16/2003 677,800 677,800 677,800 677,800AYT PRESTAMOS CONSUMO II, FONDO DE TITULIZACION DE ACTIVOS 06/02/2003 200,000 200,000 200,000 200,000BANCAJA 5, FONDO DE TITULIZACION DE ACTIVOS 04/14/2003 1,000,000 1,000,000 1,000,000 1,000,000BANCAJA 6, FONDO DE TITULIZACION DE ACTIVOS 12/01/2003 2,080,000 2,080,000 2,080,000 2,080,000BANKINTER 6, FONDO DE TITULIZACION DE ACTIVOS 09/24/2003 1,350,000 1,350,000 1,350,000 1,350,000BANKINTER I FTPYME FONDO DE TITULIZACION DE ACTIVOS 09/08/2003 250,000 250,000 250,000 250,000CAP-TDA 1, FONDO DE TITULIZACION DE ACTIVOS 06/25/2003 300,000 150,000 300,000 150,000CEDULAS TDA 1, FONDO DE TITULIZACION DE ACTIVOS 06/12/2003 1,750,000 437,500 1,750,000 437,500CEDULAS TDA 2, FONDO DE TITULIZACION DE ACTIVOS 11/19/2003 2,000,000 500,000 2,000,000 500,000CIBELES III FTPYME, FONDO DE TITULIZACION DE ACTIVOS 12/19/2003 500,000 500,000 500,000 500,000FONCAIXA FTPYME 1, FONDO DE TITULIZACION DE ACTIVOS 11/27/2003 600,000 600,000 600,000 600,000FONDO DE TITULIZACION DE ACTIVOS CONSUMO SANTANDER I 03/04/2003 1,080,000 423,900 1,080,000 423,900FONDO DE TITULIZACION DE ACTIVOS FTPYME SANTANDER 1 09/24/2003 1,800,000 1,800,000 1,800,000 1,800,000FONDO DE TITULIZACION DE ACTIVOS UCI 9 06/16/2003 1,250,000 239,600 1,250,000 239,600FTPYME BANCAJA 2 FONDO DE TITULIZACION DE ACTIVOS 09/19/2003 500,000 93,800 500,000 93,800FTPYME TDA 4, FONDO DE TITULIZACION DE ACTIVOS 10/10/2003 250,000 246,000 250,000 246,000FTPYME TDA SABADELL 2, FONDO DE TITULIZACION DE ACTIVOS 11/12/2003 500,000 136,500 500,000 136,500GC FTGENCAT II, FONDO DE TITULIZACION DE ACTIVOS 03/28/2003 950,000 950,000 950,000 950,000GC FTPYME PASTOR 1, FONDO DE TITULIZACION DE ACTIVOS 10/28/2003 225,000 225,000 225,000 225,000HIPOCAT 6, FONDO DE TITULIZACION DE ACTIVOS 09/18/2003 850,000 192,100 850,000 192,100RURAL HIPOTECARIO V FONDO DE TITULIZACION DE ACTIVOS 10/28/2003 695,000 695,000 695,000 695,000
Issuedate
(Continues over)

121
Annex 1
: Primary m
arkets
(1) Shelf registration.(2) Programme registration date.
Effective amount offered Nominal amount offered
A.1.12.Fixed-income issues registered at the CNMV.Asset-backed bonds and notes. 2003Detail by issuer
TotalDomestic
TotalDomestic
market market
Amounts in thousands of euros
TDA 16 - MIXTO, FONDO DE TITULIZACION DE ACTIVOS 05/26/2003 532,000 145,200 532,000 145,200TDA 17 - MIXTO, FONDO DE TITULIZACION DE ACTIVOS 10/24/2003 455,000 455,000 455,000 455,000TDA 18 - MIXTO, FONDO DE TITULIZACION DE ACTIVOS 11/14/2003 421,000 180,200 421,000 180,200TDA CAM 1, FONDO DE TITULIZACION DE ACTIVOS 03/13/2003 1,000,000 20,000 1,000,000 20,000TDA CAM 2, FONDO DE TITULIZACION DE ACTIVOS 06/27/2003 1,100,000 1,100,000TDA IBERCAJA 1, FONDO DE TITULIZACION DE ACTIVOS 10/08/2003 600,000 60,000 600,000 60,000TDA PASTOR 1, FONDO DE TITULIZACION DE ACTIVOS 02/21/2003 494,600 100,000 494,600 100,000
ASSET-BACKED NOTES(1) 1,090,000 1,090,000 1,090,000 1,090,000AYT.4, GRANDES PRESTAMOS, FONDO DE TITULIZACION
DE ACTIVOS 04/24/2003(2) 90,000 90,000 90,000 90,000FONDO DE TITULIZACION DE ACTIVOS SANTANDER I 11/26/2003(2) 1,000,000 1,000,000 1,000,000 1,000,000
TOTAL BONDS 36,740,400 27,037,600 36,740,400 27,037,600TOTAL NOTES 1,090,000 1,090,000 1,090,000 1,090,000TOTAL 37,830,400 28,127,600 37,830,400 28,127,600
Issuedate
(Continued)

122
Annual report on the securities market. 2003
A.1.13.Fixed-income issues registered at the CNMV.Commercial paper. 2003Detail by issuer
Registered programmes
Amounts in thousands of euros
No. Amount
OutstandingPlacements balances at
12/31/03
Energy and water 6 7,848,000 3,203,516 895,537ENDESA, S.A. 1 2,000,000 893,973 249,950HIDROELECTRICA DEL CANTABRICO, S.A. 1 180,000 130,275 8,500IBERDROLA, S.A. 1 1,500,000 798,720 276,920RED ELECTRICA DE ESPAÑA, S.A. 1 168,000 286,000 17,750REPSOL YPF, S.A. 1 3,000,000 286,135 128,860UNION FENOSA, S.A. 1 1,000,000 808,413 213,557
Transport and communications 2 1,886,000 3,416,712 1,160,115RED NACIONAL DE LOS FERROCARRILES ESPAÑOLES 1 700,000 1,884,575 553,665TELEFONICA, S.A. 1 1,000,000 1,346,137 606,450AUTOPISTA CONCESIONARIA ASTUR-LEONESA, S.A. (1) 186,000 186,000
Financial institutions and insurance companies 64 66,193,000 148,640,394 29,824,608AYT.4, GRANDES PRESTAMOS, FONDO DE TITULIZACION DE ACTIVOS (2) 1 90,000 189,900 52,200BANCA MARCH, S.A. 1 200,000 873,923 132,537BANCA PUEYO, S.A. 1 50,000 16,696 16,696BANCO ATLANTICO, S.A. 3 378,000 2,853,744 241,080BANCO DE ANDALUCIA, S.A. 3 1,110,000 4,305,315 406,623BANCO DE CASTILLA, S.A. 1 120,000 442,116 25,698BANCO DE CREDITO BALEAR, S.A. 1 30,000 60,975 5,154BANCO DE GALICIA, S.A. 1 150,000 1,170,747 84,162BANCO DE LA PEQUEÑA Y MEDIANA EMPRESA, S.A. 3,508BANCO DE SABADELL, S.A. 3 4,500,000 8,249,163 1,977,997BANCO DE VASCONIA, S.A. 1 90,000 836,118 65,646BANCO GUIPUZCOANO, S.A. 1 200,000 57,298 46,997BANCO PASTOR, S.A. 2 3,000,000 2,856,947 732,276BANCO POPULAR ESPAÑOL, S.A. 1 4,200,000 22,966,602 2,136,699BANCO SANTANDER CENTRAL HISPANO, S.A. 1 6,000,000 8,584,899 473,142BANCO ZARAGOZANO, S.A. 1 1,000,000 10,125,201 346,530BANESTO BANCO DE EMISIONES, S.A. 1 6,000,000 4,000,000 4,000,000BANKINTER, S.A. 2 3,000,000 10,509,954 1,876,962BARCLAYS BANK, S.A. 1 1,500,000BBVA BANCO DE FINANCIACION, S.A. 1 6,000,000 21,344,480 5,273,664BILBAO BIZKAIA KUTXA, AURREZKI KUTXA ETA BAHITETXEA 1 900,000 5,428,980 857,181BILBAO HIPOTECARIA, E.F.C., S.A. 1 12,000 19,030 1,268CAIXA DE AFORROS DE VIGO, OURENSE E PONTEVEDRA (CAIXANOVA) 1 600,000 2,134,273 570,053CAIXA D´ESTALVIS DE CATALUNYA 1 1,800,000 6,078,040 1,716,800CAJA DE AHORROS DE CASTILLA-LA MANCHA 1 500,000 329,200 105,900CAJA DE AHORROS DE GALICIA 1 1,000,000 265,768 265,768CAJA DE AHORROS DE LA INMACULADA DE ARAGON 1 300,000 480,200 226,800CAJA DE AHORROS DE LA RIOJA 1 100,000 252,600 53,300CAJA DE AHORROS DE MURCIA 1 600,000 376,652 265,071CAJA DE AHORROS DE SANTANDER Y CANTABRIA 1 600,000 1,376,840 577,160CAJA DE AHORROS DE VALENCIA, CASTELLON Y ALICANTE, BANCAJA 2 1,200,000 3,566,810 429,540CAJA DE AHORROS DE VITORIA Y ALAVA 1 100,000 273,500 100,000CAJA DE AHORROS DEL MEDITERRANEO 1 1,200,000 1,446,582 440,856CAJA DE AHORROS MUNICIPAL DE BURGOS 1 300,500 608,800 301,800CAJA DE AHORROS PROVINCIAL SAN FERNANDO DE SEVILLA Y JEREZ 1 300,000 610,100 78,700CAJA DE AHORROS Y MONTE DE PIEDAD DE GIPUZKOA Y SAN SEBASTIAN 1 300,500CAJA DE AHORROS Y MONTE DE PIEDAD DE LAS BALEARES 1 300,000 89,600 89,600
(Continues over)

123
Annex 1: Primary markets
A.1.13.Fixed-income issues registered at the CNMV.Commercial paper. 2003Detail by issuer
Registered programmes
Amounts in thousands of euros
No. Amount
OutstandingPlacements balances at
12/31/03
CAJA DE AHORROS Y MONTE DE PIEDAD DE MADRID 1 2,000,000CAJA DE AHORROS Y MONTE DE PIEDAD DE NAVARRA 1 600,000 851,200 327,000CAJA DE AHORROS Y PENSIONES DE BARCELONA 1 1,500,000 172,925 104,425CAJA ESPAÑA DE INVERSIONES 1 300,000 238,000 113,700CAJA GENERAL DE AHORROS DE CANARIAS 1 90,000 430,491 25,435CAJA GENERAL DE AHORROS DE GRANADA 1 300,000 500,000 149,400CAJA INSULAR DE AHORROS DE CANARIAS 1 150,000CAJA LABORAL POPULAR COOP. DE CREDITO 1 450,000 3,874,551 151,135CAJA RURAL DE NAVARRA, S. COOP. DE CREDITO 1 90,000 203,600 60,200CORPORACION ANDINA DE FOMENTO 1 500,000 593,700 286,900CREDITER, SOCIEDAD ANONIMA, E.F.C. 2 20,000 46,645 14,772EDAMLEASING, E.F.C., S.A. 14,284FONDO DE TITULIZACION DE ACTIVOS SANTANDER I(1) 1 1,000,000 3,680,000 999,800LICO LEASING, S.A. SOCIEDAD DE ARRENDAMIENTO FINANCIERO 1 350,000 564,900 349,600MONTE DE PIEDAD Y CAJA DE AHORROS DE HUELVA Y SEVILLA 1 600,000 1,081,449 312,504SANTANDER CENTRAL HISPANO INVESTMENT, S.A. 1 6,000,000 510,000SANTANDER CONSUMER FINANCE, S.A. 1 3,500,000 11,495,872 2,275,291UNICAJA 1 1,000,000 1,588,700 654,000UNION FINANCIERA ASTURIANA, S.A. 1 12,000 27,308 8,794
Real estate 1 250,000 672,886 324,950PROMOTORA CATALUNYA MEDITERRANEA S.A. 73,782 75,000SACYR VALLEHERMOSO, S.A. 1 250,000 599,104 249,950
TOTAL 73 76,177,000 155,933,508 32,205,210
(1) Commercial paper issued without a programme.(2) Asset securitisation. The amount of the registered programmes is also included in the total of table A.1.12.
(Continued)
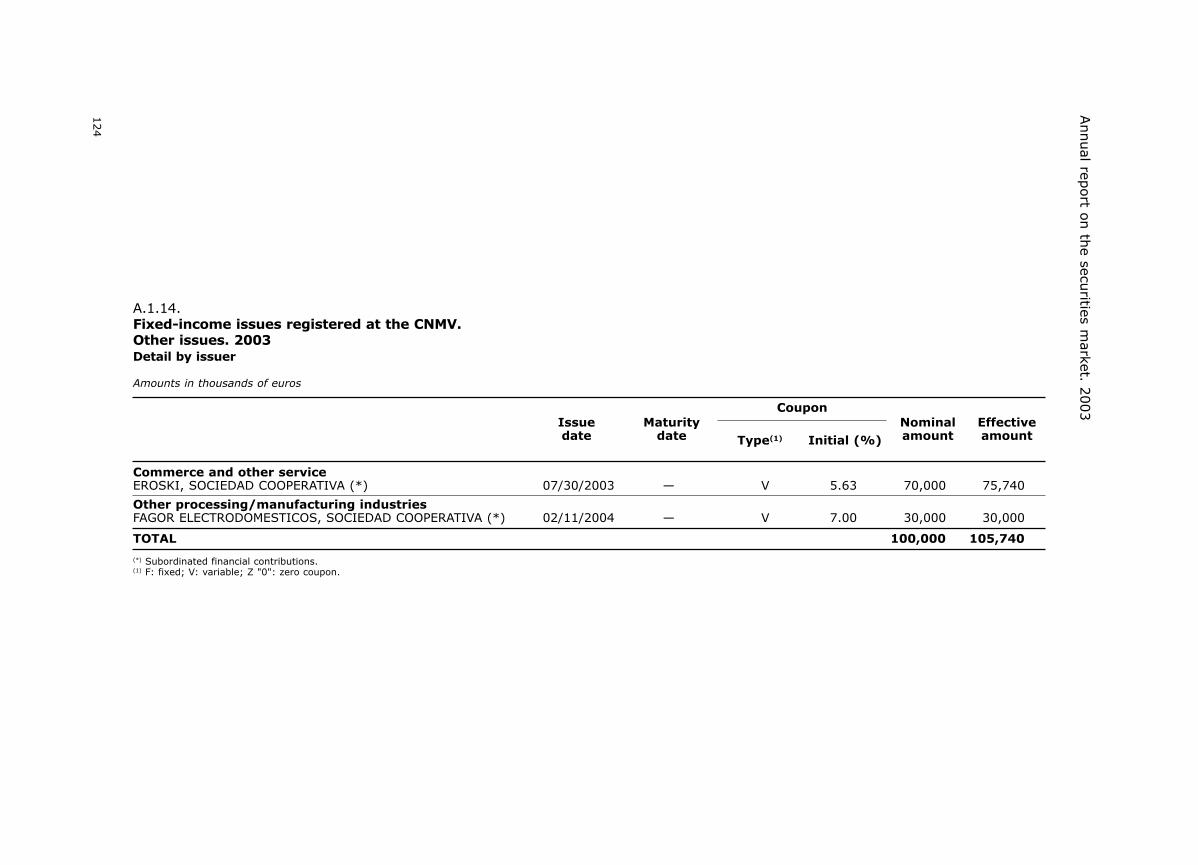
124
Annual rep
ort o
n th
e securities m
arket. 2003Coupon
A.1.14.Fixed-income issues registered at the CNMV.Other issues. 2003Detail by issuer
Issue Maturitydate date
Nominal Effectiveamount amountType(1) Initial (%)
Amounts in thousands of euros
Commerce and other serviceEROSKI, SOCIEDAD COOPERATIVA (*) 07/30/2003 — V 5.63 70,000 75,740
Other processing/manufacturing industriesFAGOR ELECTRODOMESTICOS, SOCIEDAD COOPERATIVA (*) 02/11/2004 — V 7.00 30,000 30,000
TOTAL 100,000 105,740
(*) Subordinated financial contributions.(1) F: fixed; V: variable; Z "0": zero coupon.

125
Annex 1
: Primary m
arkets
(1) Premium amount(2) Nominal amount of contract
Warrants Other financial contracts
A.1.15.Issues of warrants and other financial contracts registered at the CNMV. 2003Detail by issuer
No. of Amount(1) No. of Amount(2)
Issuers Issues Total Shares Indexes Other Other Issuers Total Shares Indexes Other
Amounts in thousands of euros
B. GUIPUZCOANO — — — — — — 1 9 66,000 66,000 — —B. VITORIA — — — — — — 1 8 8,000 8,000 — —BANESTO — — — — — — 1 8 255,000 255,000 — —BANESTO EMISIONES 1 63 168,630 142,440 26,190 — — — — — — —BANKINTER 1 42 76,660 15,660 61,000 — — — — — — —BBVA — — — — — — 1 2 105,000 105,000 — —BBVA BANCO DE FINANCIACION 1 172 124,620 92,278 9,380 22,962 — — — — — —CAJA RURAL ARAGONESA Y PIRINEOS, C.C. — — — — — — 1 1 1,800 1,800 — —CAJAMAR — — — — — — 1 2 4,711 4,711 — —COMMERZBANK 1 126 298,194 145,139 153,055 — — — — — — —LA KUTXA - CAJA GUIPUZCOA — — — — — — 1 4 14,327 8,000 6,327 —SABADELL BANCA PRIVADA — — — — — — 1 7 46,000 26,000 20,000 —SCH INVESTMENT 1 301 143,029 101,414 25,011 16,604 — — — — — —SOCIETE GENERALE ACCEPTANCE 1 343 504,655 245,675 214,320 44,660 — — — — — —SOGECABLE 1 1 11,378 11,378 — — — — — — — —
TOTAL 7 1,048 1,327,166 753,984 488,956 84,226 8 41 500,838 474,511 26,327 —

ANNEX 2
SECONDARY MARKETS
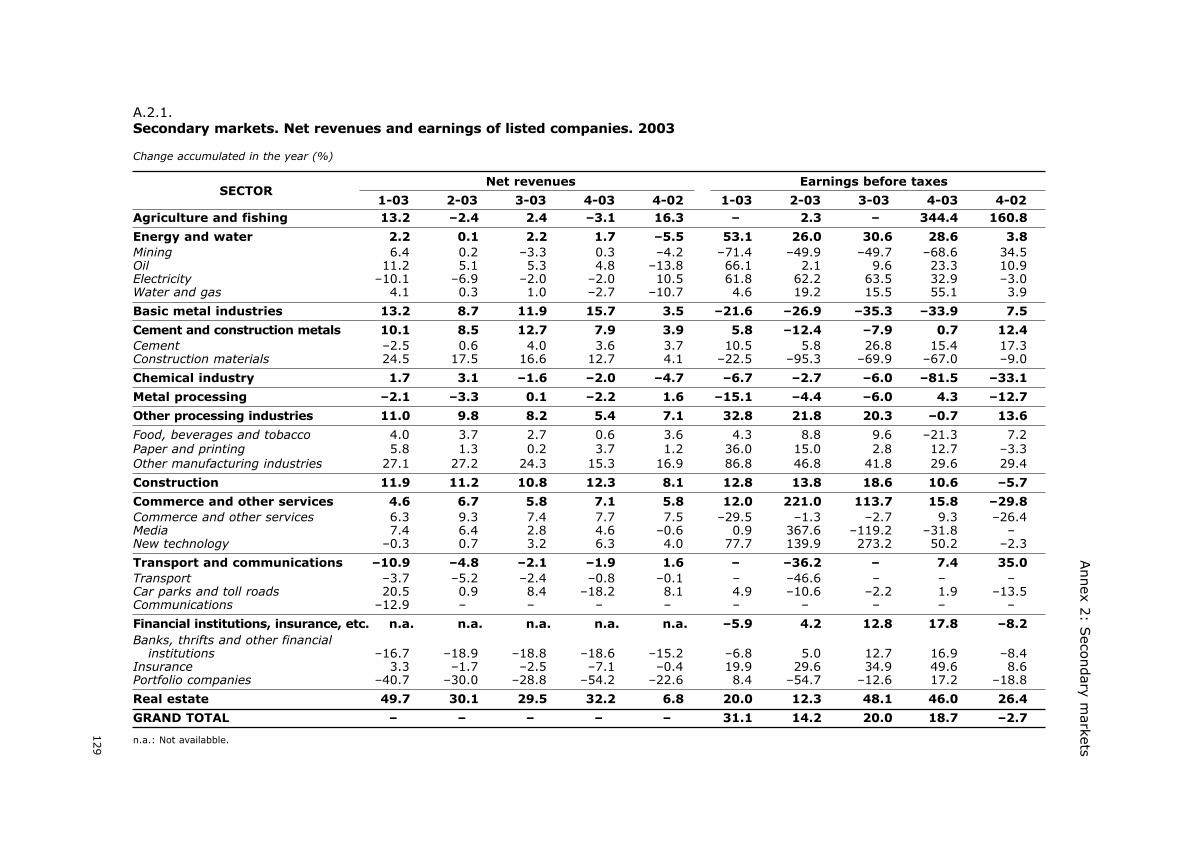
129
Annex 2
: Seco
ndary m
arketsA.2.1.Secondary markets. Net revenues and earnings of listed companies. 2003
Change accumulated in the year (%)
SECTOR1-03 2-03 3-03 4-03 4-02 1-03 2-03 3-03 4-03 4-02
Net revenues Earnings before taxes
Agriculture and fishing 13.2 –2.4 2.4 –3.1 16.3 – 2.3 – 344.4 160.8
Energy and water 2.2 0.1 2.2 1.7 –5.5 53.1 26.0 30.6 28.6 3.8Mining 6.4 0.2 –3.3 0.3 –4.2 –71.4 –49.9 –49.7 –68.6 34.5Oil 11.2 5.1 5.3 4.8 –13.8 66.1 2.1 9.6 23.3 10.9Electricity –10.1 –6.9 –2.0 –2.0 10.5 61.8 62.2 63.5 32.9 –3.0Water and gas 4.1 0.3 1.0 –2.7 –10.7 4.6 19.2 15.5 55.1 3.9
Basic metal industries 13.2 8.7 11.9 15.7 3.5 –21.6 –26.9 –35.3 –33.9 7.5
Cement and construction metals 10.1 8.5 12.7 7.9 3.9 5.8 –12.4 –7.9 0.7 12.4Cement –2.5 0.6 4.0 3.6 3.7 10.5 5.8 26.8 15.4 17.3Construction materials 24.5 17.5 16.6 12.7 4.1 –22.5 –95.3 –69.9 –67.0 –9.0
Chemical industry 1.7 3.1 –1.6 –2.0 –4.7 –6.7 –2.7 –6.0 –81.5 –33.1
Metal processing –2.1 –3.3 0.1 –2.2 1.6 –15.1 –4.4 –6.0 4.3 –12.7
Other processing industries 11.0 9.8 8.2 5.4 7.1 32.8 21.8 20.3 –0.7 13.6
Food, beverages and tobacco 4.0 3.7 2.7 0.6 3.6 4.3 8.8 9.6 –21.3 7.2Paper and printing 5.8 1.3 0.2 3.7 1.2 36.0 15.0 2.8 12.7 –3.3Other manufacturing industries 27.1 27.2 24.3 15.3 16.9 86.8 46.8 41.8 29.6 29.4
Construction 11.9 11.2 10.8 12.3 8.1 12.8 13.8 18.6 10.6 –5.7
Commerce and other services 4.6 6.7 5.8 7.1 5.8 12.0 221.0 113.7 15.8 –29.8Commerce and other services 6.3 9.3 7.4 7.7 7.5 –29.5 –1.3 –2.7 9.3 –26.4Media 7.4 6.4 2.8 4.6 –0.6 0.9 367.6 –119.2 –31.8 –New technology –0.3 0.7 3.2 6.3 4.0 77.7 139.9 273.2 50.2 –2.3
Transport and communications –10.9 –4.8 –2.1 –1.9 1.6 – –36.2 – 7.4 35.0Transport –3.7 –5.2 –2.4 –0.8 –0.1 – –46.6 – – –Car parks and toll roads 20.5 0.9 8.4 –18.2 8.1 4.9 –10.6 –2.2 1.9 –13.5Communications –12.9 – – – – – – – – –
Financial institutions, insurance, etc. n.a. n.a. n.a. n.a. n.a. –5.9 4.2 12.8 17.8 –8.2Banks, thrifts and other financial
institutions –16.7 –18.9 –18.8 –18.6 –15.2 –6.8 5.0 12.7 16.9 –8.4Insurance 3.3 –1.7 –2.5 –7.1 –0.4 19.9 29.6 34.9 49.6 8.6Portfolio companies –40.7 –30.0 –28.8 –54.2 –22.6 8.4 –54.7 –12.6 17.2 –18.8
Real estate 49.7 30.1 29.5 32.2 6.8 20.0 12.3 48.1 46.0 26.4
GRAND TOTAL – – – – – 31.1 14.2 20.0 18.7 –2.7
n.a.: Not availabble.

130
Annual report on the securities market. 2003
A.2.2.1.Secondary markets. Equities.World markets in 2003. Stock market indexes
PeriodDow Jones Nasdaq Nikkei FTSE 100 CAC 40 DAX 30 Mib 30 IBEX 35 Euro Stoxx 50 Euronext 100
Index yields (%) (a)
1995 33.5 39.9 0.7 20.3 –0.5 7.0 –4.2 17.6 – –1996 26.0 22.7 –2.6 11.6 23.7 28.2 11.1 42.0 – –1997 22.6 21.6 –21.2 24.7 29.5 47.1 58.9 40.8 – –1998 16.1 39.6 –9.3 14.6 31.5 17.8 40.9 35.6 – –1999 25.2 85.6 36.8 16.2 52.8 39.0 22.3 18.3 46.7 –2000 –6.2 –39.3 –27.2 –10.2 –0.5 –7.5 1.7 –21.7 –2.7 –2001 –7.1 –21.1 –23.5 –16.2 –22.0 –19.8 –26.2 –7.8 –20.2 –2002 –16.8 –31.5 –18.6 –24.5 –33.7 –43.9 –26.0 –28.1 –37.3 –32.52003 25.3 50.0 24.5 13.6 16.1 37.1 11.8 28.2 15.7 12.71Q –4.2 0.4 –7.1 –8.3 –14.5 –16.2 –8.0 –2.8 –14.6 –14.82Q 12.4 21.0 13.9 11.6 17.8 32.9 14.2 16.9 18.8 15.33Q 3.2 10.1 12.5 1.5 1.7 1.1 –1.3 –2.3 –1.0 2.94Q 12.7 12.1 4.5 9.4 13.5 21.8 7.9 15.4 15.2 11.6
1995 9.5 12.3 21.2 9.8 16.8 12.8 19.0 13.1 – –1996 11.2 14.8 14.3 9.1 12.5 11.3 18.1 12.2 – –1997 17.5 17.1 24.4 13.9 20.9 22.2 21.7 20.3 – –1998 18.0 24.0 27.5 19.7 24.1 26.2 30.4 27.7 – –1999 15.8 27.1 19.8 18.2 19.1 22.0 20.4 19.7 19.3 –2000 19.6 45.8 21.7 18.3 22.8 22.7 21.2 23.1 22.0 –2001 20.8 43.2 28.3 20.8 24.7 27.0 24.1 26.0 25.5 –2002 23.8 33.9 25.8 24.1 32.2 36.0 27.1 29.0 34.0 30.82003 16.3 22.5 22.4 18.7 24.5 31.2 18.5 20.1 26.2 22.9
1Q 21.5 26.4 19.7 26.3 31.0 42.5 26.2 27.5 35.5 29.42Q 19.5 22.9 21.1 23.8 31.4 38.6 21.9 24.0 33.0 29.53Q 13.1 20.2 21.1 13.0 19.0 22.0 13.7 15.8 19.5 17.54Q 11.3 20.8 27.7 11.9 17.0 22.3 12.4 13.1 17.1 15.3
PeriodDow Jones Nasdaq Nikkei FTSE 100 CAC 40 DAX 30 Mib 30 IBEX 35 Euro Stoxx 50 Euronext 100
Index volatility (%) (b)
(a) Change at end of period over last session of previous period.(b) Arithmetic mean of annualised daily volatilities in the period. Daily volatility is defined as the standard deviation of the daily index yield
in the last 30 sessions.Sources: IFSE and CNMV.
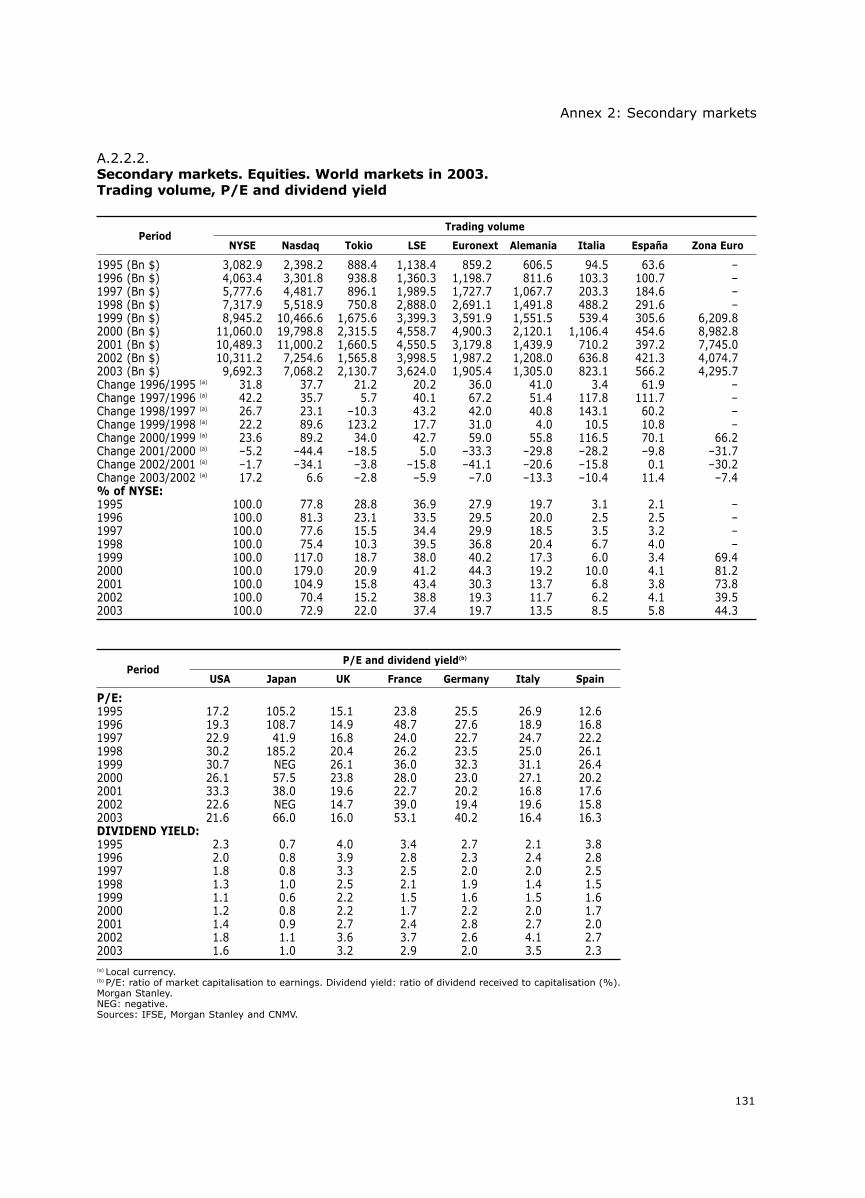
131
Annex 2: Secondary markets
A.2.2.2.Secondary markets. Equities. World markets in 2003.Trading volume, P/E and dividend yield
PeriodNYSE Nasdaq Tokio LSE Euronext Alemania Italia España Zona Euro
Trading volume
1995 (Bn $) 3,082.9 2,398.2 888.4 1,138.4 859.2 606.5 94.5 63.6 –1996 (Bn $) 4,063.4 3,301.8 938.8 1,360.3 1,198.7 811.6 103.3 100.7 –1997 (Bn $) 5,777.6 4,481.7 896.1 1,989.5 1,727.7 1,067.7 203.3 184.6 –1998 (Bn $) 7,317.9 5,518.9 750.8 2,888.0 2,691.1 1,491.8 488.2 291.6 –1999 (Bn $) 8,945.2 10,466.6 1,675.6 3,399.3 3,591.9 1,551.5 539.4 305.6 6,209.82000 (Bn $) 11,060.0 19,798.8 2,315.5 4,558.7 4,900.3 2,120.1 1,106.4 454.6 8,982.82001 (Bn $) 10,489.3 11,000.2 1,660.5 4,550.5 3,179.8 1,439.9 710.2 397.2 7,745.02002 (Bn $) 10,311.2 7,254.6 1,565.8 3,998.5 1,987.2 1,208.0 636.8 421.3 4,074.72003 (Bn $) 9,692.3 7,068.2 2,130.7 3,624.0 1,905.4 1,305.0 823.1 566.2 4,295.7Change 1996/1995 (a) 31.8 37.7 21.2 20.2 36.0 41.0 3.4 61.9 –Change 1997/1996 (a) 42.2 35.7 5.7 40.1 67.2 51.4 117.8 111.7 –Change 1998/1997 (a) 26.7 23.1 –10.3 43.2 42.0 40.8 143.1 60.2 –Change 1999/1998 (a) 22.2 89.6 123.2 17.7 31.0 4.0 10.5 10.8 –Change 2000/1999 (a) 23.6 89.2 34.0 42.7 59.0 55.8 116.5 70.1 66.2Change 2001/2000 (a) –5.2 –44.4 –18.5 5.0 –33.3 –29.8 –28.2 –9.8 –31.7Change 2002/2001 (a) –1.7 –34.1 –3.8 –15.8 –41.1 –20.6 –15.8 0.1 –30.2Change 2003/2002 (a) 17.2 6.6 –2.8 –5.9 –7.0 –13.3 –10.4 11.4 –7.4% of NYSE:1995 100.0 77.8 28.8 36.9 27.9 19.7 3.1 2.1 –1996 100.0 81.3 23.1 33.5 29.5 20.0 2.5 2.5 –1997 100.0 77.6 15.5 34.4 29.9 18.5 3.5 3.2 –1998 100.0 75.4 10.3 39.5 36.8 20.4 6.7 4.0 –1999 100.0 117.0 18.7 38.0 40.2 17.3 6.0 3.4 69.42000 100.0 179.0 20.9 41.2 44.3 19.2 10.0 4.1 81.22001 100.0 104.9 15.8 43.4 30.3 13.7 6.8 3.8 73.82002 100.0 70.4 15.2 38.8 19.3 11.7 6.2 4.1 39.52003 100.0 72.9 22.0 37.4 19.7 13.5 8.5 5.8 44.3
P/E:1995 17.2 105.2 15.1 23.8 25.5 26.9 12.61996 19.3 108.7 14.9 48.7 27.6 18.9 16.81997 22.9 41.9 16.8 24.0 22.7 24.7 22.21998 30.2 185.2 20.4 26.2 23.5 25.0 26.11999 30.7 NEG 26.1 36.0 32.3 31.1 26.42000 26.1 57.5 23.8 28.0 23.0 27.1 20.22001 33.3 38.0 19.6 22.7 20.2 16.8 17.62002 22.6 NEG 14.7 39.0 19.4 19.6 15.82003 21.6 66.0 16.0 53.1 40.2 16.4 16.3DIVIDEND YIELD:1995 2.3 0.7 4.0 3.4 2.7 2.1 3.81996 2.0 0.8 3.9 2.8 2.3 2.4 2.81997 1.8 0.8 3.3 2.5 2.0 2.0 2.51998 1.3 1.0 2.5 2.1 1.9 1.4 1.51999 1.1 0.6 2.2 1.5 1.6 1.5 1.62000 1.2 0.8 2.2 1.7 2.2 2.0 1.72001 1.4 0.9 2.7 2.4 2.8 2.7 2.02002 1.8 1.1 3.6 3.7 2.6 4.1 2.72003 1.6 1.0 3.2 2.9 2.0 3.5 2.3(a) Local currency.(b) P/E: ratio of market capitalisation to earnings. Dividend yield: ratio of dividend received to capitalisation (%).Morgan Stanley.NEG: negative.Sources: IFSE, Morgan Stanley and CNMV.
PeriodUSA Japan UK France Germany Italy
P/E and dividend yield(b)
Spain

132
Annual report on the securities market. 2003
A.2.3.Secondary markets. Equities.Spanish stock market indexes in 2003
1995 12.3 13.1 20.4 18.7 17.6 – –1996 39.0 42.8 47.8 44.2 42.0 – –1997 42.2 40.0 45.6 40.7 40.8 – –1998 37.8 33.5 40.0 34.0 35.6 – –1999 16.2 23.2 21.4 18.3 18.3 – –2000 –12.7 –6.8 –18.6 –12.0 –21.7 –66.3 –23.42001 –6.4 –9.6 –9.9 –7.6 –7.8 –22.4 6.62002 –23.1 –31.2 –26.2 –27.8 –28.1 –47.3 –34.42003 27.4 32.0 26.8 32.5 28.2 27.4 37.31Q –3.1 –2.7 –3.9 –1.9 –2.8 5.4 –7.62Q 17.2 18.9 17.0 18.2 16.9 18.4 13.83Q –0.9 –1.7 –1.4 –0.9 –2.3 1.7 12.24Q 13.3 16.0 14.3 15.3 15.4 0.2 16.3
1995 11.8 13.7 12.6 14.4 13.1 – –1996 11.0 13.5 11.9 12.3 12.2 – –1997 19.0 19.9 19.2 19.4 20.3 – –1998 24.8 25.3 25.6 24.8 27.7 – –1999 17.7 18.4 18.5 17.5 19.7 – –2000 20.7 19.5 22.4 21.2 23.1 46.5 38.82001 23.5 28.0 23.8 26.4 26.0 43.1 23.82002 25.2 30.0 26.2 29.0 29.0 33.1 26.72003 17.6 21.8 18.6 20.3 20.1 25.1 21.21Q 23.8 30.0 26.3 27.9 27.5 35.4 25.92Q 20.8 26.7 22.0 25.0 24.0 27.5 23.13Q 14.1 16.5 14.6 15.5 15.8 22.0 17.14Q 11.7 14.1 11.7 13.0 13.1 15.4 18.6(a) the Nuevo Mercado became operative at 04/11/00. Its index value started at 10,000 points, assigned to 04/07/00.(b) The arithmetic mean of annualised daily volatilities in the period. Daily volatility is defined as the standard deviation of the daily index
yield in the last 30 sessions.
PeriodMadrid Barcelona Bilbao Valencia IBEX 35 N. Mercado (*) Latibex
Yield (% change over previous period)
PeriodMadrid Barcelona Bilbao Valencia IBEX 35 N. Mercado (*) Latibex
Volatility (%)(**)

2001 –3.6 19.2 –1.6 17.3 –10.5 –12.4 –3.2 –6.42002 –1.0 –8.4 –20.3 4.2 –26.3 –41.6 –7.3 –23.12003 –4.1 29.6 25.0 25.4 31.5 44.5 21.3 27.4
1Q –9.5 –14.5 2.8 4.7 -8.0 3.4 3.7 –3.12Q 14.8 16.4 13.8 3.6 22.6 20.2 10.0 17.23Q –6.0 7.3 –2.8 4.2 –2.6 1.5 2.8 –0.94Q –1.7 21.2 10.0 11.0 19.8 14.6 3.5 13.3
2001 18.9 17.3 16.1 20.0 30.6 39.2 16.3 23.52002 20.3 22.4 21.9 19.4 34.6 39.5 14.4 25.52003 18.9 17.3 16.1 20.0 30.6 39.2 16.3 23.5
1Q 18.4 26.3 22.8 18.1 31.8 37.0 15.6 23.82Q 20.4 21.9 18.5 16.9 28.9 30.3 12.6 20.83Q 14.4 19.8 11.7 12.5 19.7 17.5 10.7 14.14Q 15.9 17.4 9.9 9.4 14.4 17.2 9.4 11.7
Investment
133
Annex 2
: Seco
ndary m
arkets
A.2.4.Secondary markets. Equities.Sector indexes (Madrid Stock Exchange). 2003 (1)
PeriodConsumer Investment Energy Construction Finance Communications Market General
Yield (rate of change over previous period, in % terms)
PeriodConsumer Energy Construction Finance Communications Market General
Volatility (%) (2)
(1) In early 2002, in order to better represent current market operations, the Madrid Stock Exchange implemented a new classification of sector indexes comprising seven sectors. The 2001 datais based on the information from the Madrid Stock Exchange itself and is set out for comparison purposes. Information on the previous classification can be found in previous annual reports.
(2) The volatility in each period is defined as the arithmetic mean of annualised daily volatilities. Daily volatility is defined as the standard deviation of the daily index yield on the calculation dateand the previous 30 sessions.

134
Annual report on the securities market. 2003
A.2.5.Secondary markets. Equities.Market capitalisation and companies listed on the Spanish stock exchanges
Barcelona Bilbao ValenciaTotal EM(*) Outcry Latibex
Market capitalisation (€Mn):1994 122,068.0 114,985.6 83,886.3 79,391.9 125,582.1 116,110.1 9,472.0 –1995 138,205.7 130,690.1 99,953.1 90,611.6 142,015.0 131,796.5 10,218.4 –1996 190,425.3 182,185.7 139,279.9 126,742.8 194,990.1 183,575.7 11,414.4 –1997 267,420.0 255,181.2 201,179.9 185,754.5 273,691.3 259,020.0 14,671.3 –1998 345,827.0 327,499.0 276,507.3 259,563.2 355,660.3 333,138.0 22,521.7 –1999 445,674.5 425,508.0 362,926.2 340,599.3 464,453.7 419,815.3 39,564.4 5,073.92000 555,609.4 529,125.1 501,051.8 483,718.3 581,090.8 471,123.8 55,100.6 54,866.42001 552,403.9 515,398.6 485,526.5 469,971.4 580,028.8 444,603.3 69,334.3 66,091.12002 451,441.9 418,392.4 409,327.8 414,081.1 478,342.4 339,634.5 74,020.0 64,687.92003 583,872.2 547,702.3 536,643.5 540,243.5 615,577.9 433,971.0 86,057.7 95,549.2
No. of listed companies:1994 375 313 262 215 652 127 525 –1995 363 305 240 209 615 127 488 –1996 358 303 242 211 606 134 472 –1997 384 321 248 215 663 143 520 –1998 481 375 250 275 872 149 723 –1999 719 483 270 380 1,367 143 1,219 52000 1,022 567 305 455 1,869 144 1,714 112001 1,477 715 413 593 2,512 143 2,352 172002 1,843 800 433 617 3,000 141 2,836 232003 1,994 837 421 639 3,213 132 3,054 27
No. of active companies:1994 223 177 117 106 608 127 481 –1995 205 161 114 98 585 126 459 –1996 206 159 117 102 593 134 459 –1997 222 155 105 100 650 143 507 –1998 283 205 114 146 816 149 667 –1999 459 299 116 235 1,365 146 1,219 52000 955 569 321 467 1,761 149 1,600 122001 1,374 653 364 532 2,384 147 2,220 172002 1,769 733 366 551 2,899 140 2,737 222003 1,938 778 369 555 3,137 131 2,980 26
(*) EM: Electronic market.Active companies are those which were listed at the end of the period and had registered a trade during the year.Their market capitalisation is calculated using the price of the last trade.Companies in which there were no trades are assigned zero capital as there is no reference price.
Pro-memoria:Listed capital of foreign companies (effective, in millions of euros)
1996 1997 1998 1999 2000 2001 2002 2003
Bayer 20,394.7 20,740.3 22,123.3 26,910.9 32,911.6 23,325.7 13,100.7 14,730.4Volkswagen 7,805.3 13,809.5 17,704.0 14,715.1 14,391.1 13,635.1 9,450.1 11,907.1Jazztel - - - - 810.5 346.5 275.8 184.6EADs - - - - 18,805.6 10,883.4 7,949.7 15,331.0Reno de Medici - - 458.0 314.5 245.2 163.6 95.6 196.9Melía Inv. Americanas - - - - 289.3 - - -Commerzbank 6,276.4 11,779.2 - - - - - -Lafarge 4,190.3 5,614.7 6,806.5 - - - - -Arcelor - - - - - - 6,119.5 7,282.4TOTAL 38,666.7 51,943.7 47,091.7 41,940.4 67,453.4 48,354.4 36,991.5 49,632.4% of total market capitalisation 19.8 19.0 13.2 9.0 11.6 8.3 7.7 8.0
Data for end of period
Period MadridPro Memoria

135
Annex 2: Secondary markets
A.2.6.Secondary markets Equities.Concentration of capital on the Spanish stock markets, by sector. 2003
Number of issuers required to attain a given level of capitalisation
Sector25% 50% 75% Total 25% 50% 75% Total
Outcry (4 exchanges)Electronic market
0 Oil 1 2 2 4 0 0 0 01 Energy and water 1 3 5 11 1 1 1 22 Mining and base metals 1 1 2 14 1 1 2 33 Cement and construction materials 1 1 2 3 1 1 2 44 Chemicals 1 1 1 5 0 0 0 05 Textile & paper 1 1 2 17 1 2 3 66 Metal-mechanical 1 2 3 17 1 1 1 37 Food 1 1 2 15 1 1 1 38 Construction 2 3 4 6 1 1 1 29 Real estate 1 2 4 8 1 2 4 17
10 Transport and communications 1 2 2 9 1 1 1 211 Other 2 5 9 20 1 1 2 6
Total non-financial sector 1 1 4 129 2 4 8 48
12 Banks 1 2 4 22 1 1 1 113 Insurance 1 1 1 2 1 1 1 114 Portfolio companies 1 1 2 4 1 1 2 1515 SIM 1 1 1 1 135 748 1,602 2,98916 Finance companies 1 1 1 1 0 0 0 0
Total financial sector 1 2 4 30 131 740 1,600 3,006
Total 2003 1 1 7 159 99 669 1,571 3,054Total 2002 3 10 23 164 85 575 1,397 2,836Total 2001 3 7 19 161 63 400 1,105 2,356
2003 Gini index 0.90 0.412002 Gini index 0.78 0.442001 Gini index 0.80 0.44
Notes:The total columns indicate the number of companies listed at the end of the related year.In the case of issuers listed on more than one market, the capitalisation was taken as that on the market where the share is traded mostfrequently.

(*) Excluding LatibexNotes:Electronic market: Percentage of the sector capitalisation for shares traded on the electronic market.In the case of issuers listed on more than one market, the capitalisation was taken as that on the market where the shares is traded mostfrequently.
136
Annual report on the securities market. 2003
Sector2002 2003 2002 2003 2002 2003 2002 2003
Electronic market* Outcry (4 exchanges) LatibexTotal
0 Oil 7.4 8.4 5.9 6.0 0.0 0.0 23.7 26.71 Energy and water 9.7 10.1 11.7 11.2 0.2 0.1 9.9 14.22 Mining and base metals 4.8 4.9 3.3 2.9 0.1 0.1 17.8 18.23 Cement and construction materials 0.6 0.5 0.6 0.5 1.3 1.3 0.0 0.04 Chemicals 3.1 2.8 4.4 3.8 0.1 0.0 0.0 0.95 Textile & paper 3.5 2.3 4.5 2.8 0.2 0.1 2.2 1.86 Metal-mechanical 4.4 5.5 6.2 7.5 0.0 0.0 0.0 1.57 Food 2.3 2.1 3.0 2.4 1.1 1.0 0.0 1.38 Construction 2.9 3.1 4.1 4.3 0.0 0.0 0.0 0.09 Real estate 1.6 1.2 1.8 1.3 2.1 2.0 0.0 0.0
10 Transport and communications 20.4 20.2 22.5 23.7 0.7 0.0 31.5 22.811 Other 4.0 5.0 5.3 6.7 0.4 0.4 1.4 1.6
Total non-financial sector 64.8 66.1 73.4 73.1 6.1 5.2 86.5 88.8
12 Banks 19.5 19.7 25.0 25.6 0.1 0.1 13.2 10.713 Insurance 0.7 0.5 0.9 0.6 0.6 0.5 0.0 0.014 Portfolio companies 0.6 0.5 0.7 0.6 0.5 0.3 0.0 0.015 SIM 14.3 13.1 0.0 0.0 92.7 93.9 0.0 0.016 Finance companies 0.0 0.1 0.0 0.0 0.0 0.0 0.3 0.4
Total sector financiero 35.2 33.9 26.6 26.9 93.9 94.8 13.5 11.2
Total 100.0 100.0 100.0 100.0 100.0 100.0 100.0 100.0Total (€Mn) 478,342.4 615,966.5 339,634.5 433,971.0 74,020.0 86,057.7 64,687.9 95,549.2
Banks Insurance Collective Public Non-financial Households Foreign Totaland thrifts companies investment administration companies
1992 15.56 3.37 1.65 16.64 7.72 24.44 30.61 100.001993 13.44 2.24 1.95 16.39 6.86 24.75 34.38 100.001994 15.09 2.68 3.04 13.77 6.80 22.76 35.86 100.001995 15.09 2.79 4.23 12.21 6.74 22.22 36.73 100.001996 14.06 2.20 5.02 10.87 6.90 23.59 37.36 100.001997 12.89 2.60 7.55 5.56 5.87 29.96 35.57 100.001998 11.73 2.82 7.41 0.58 5.48 35.08 36.89 100.001999 12.78 3.00 5.82 0.34 10.13 33.63 34.30 100.002000 7.29 2.29 4.77 0.21 20.26 30.52 34.67 100.002001 7.93 2.31 4.86 0.21 21.73 27.96 35.00 100.002002 7.08 2.21 5.19 0.44 22.00 28.31 34.77 100.00
(*) Only domestic companies.Source: Madrid Stock Exchange magazine dated August-September 2003.
A.2.7.Secondary markets. Equities.Capitalisation on the Spanish stock markets, by sector. 2003
Percentage of capitalisation
A.2.8.Secondary markets. Equities.Ownership of shares of listed companies(*) (Madrid Stock Exchange)

137
Annex 2: Secondary markets
EQUITIES (a) 444,935.5 495,493.9 11.4Electronic market 439,950.4 491,035.9 11.6Outcry market (b) 4,967.3 4,444.7 –10.5Second market 17.9 13.3 –25.7
FIXED-INCOMEGovt. debt book-entry market(c) (d) 2,310,943.1 2,246,881.5 –2.8
Bonds and debentures 2,270,847.2 2,157,130.3 –5.0Treasury bills 40,095.9 89,751.2 123.8
Exchanges (a) 71,140.2 75,058.4 5.5Electronic market 2,046.3 2,354.4 15.1Outcry market 69,093.9 72,704.0 5.2
AIAF (c) 272,469.9 384,089.2 41.0Commercial paper 212,701.6 265,603.6 24.9Matador bonds 3,458.0 3,107.2 –10.1Mortgage covered bonds 4,164.0 20,684.5 396.8Bonds and debentures 52,146.3 94,693.9 81.6
MEFF RF 51,060 1,371 –97.3Govt. bond futures 51,060 1,371 –97.3Govt. bond options 0 0 –Mibor futures & options 0 0 –Euribor futures 0 0 –
MEFF RV 27,866,867 21,746,693 –22.0Ibex-35+ futures 3,515,016 3,227,206 –8.2Ibex-35+ options 441,745 243,844 –44.8Stock futures 9,630,899 9,768,607 1.4Stock options 14,278,332 8,507,035 –40.4S&P contracts 875 0 –100.0
TOTAL MEFF 27,917,927 21,748,064 –22.1
TOTAL EUROMEFF 4,198,261 5,233,561 24.7European govt. bond futures 2,583,383 2,879,779 11.5European index contracts 1,604,330 2,322,356 44.8Other 10,548 31,427 197.9
Madrid Stock Exchange Warrants (e) 1,232.4 1,609.8 30.6
FC&M. Futures 0 0 –(a) Effective amount.(b) Includes second market.(c) Nominal amount.(d) Includes only outright spot trades.(e) Traded premiums, in million euros.Sources: Bank of Spain and CNMV.
SECONDARY MARKETS2002 2003 Change (%)
Trading volume, in million euros
FUTURES & OPTIONS MARKETS2002 2003 Change (%)
Number of contracts, unless stated otherwise
A.2.9.Secondary and derivatives markets. Trading volume
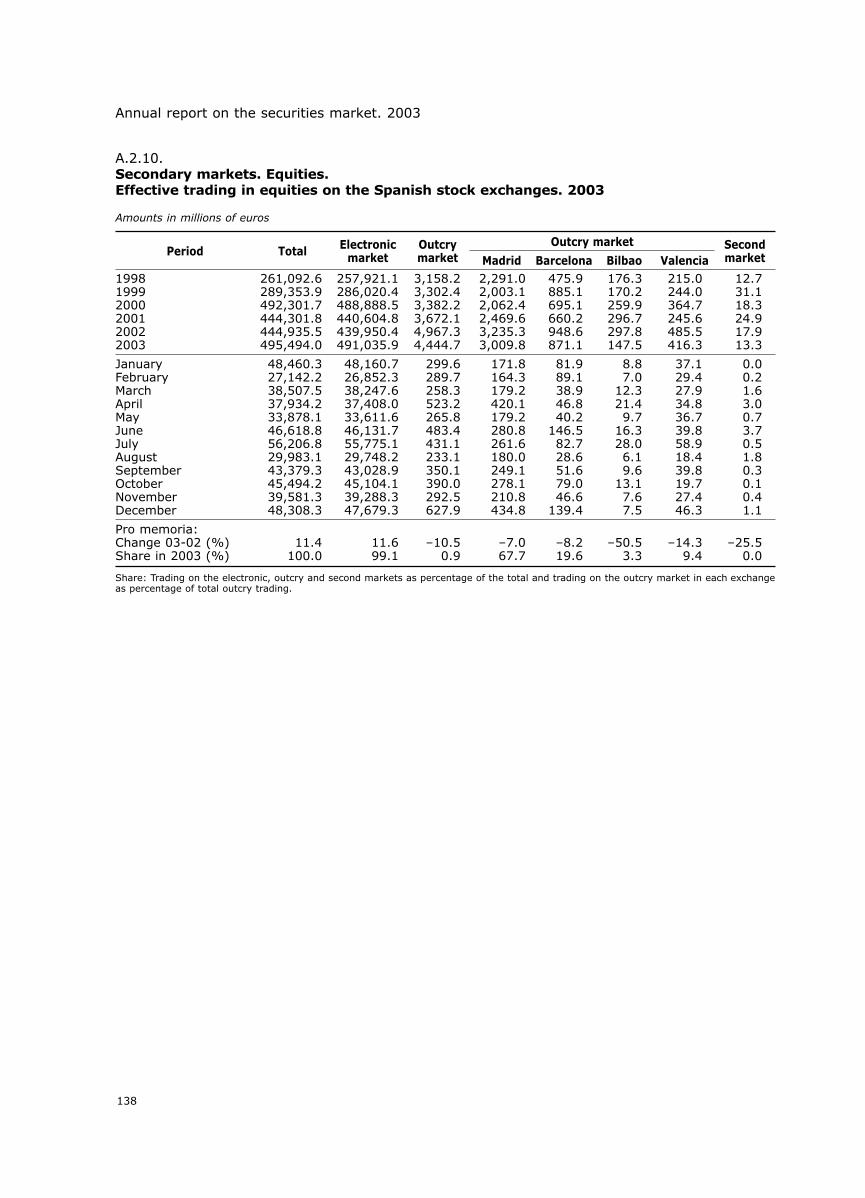
138
Annual report on the securities market. 2003
Period Total Electronicmarket
Outcrymarket Madrid Barcelona Bilbao Valencia
Secondmarket
Outcry market
1998 261,092.6 257,921.1 3,158.2 2,291.0 475.9 176.3 215.0 12.71999 289,353.9 286,020.4 3,302.4 2,003.1 885.1 170.2 244.0 31.12000 492,301.7 488,888.5 3,382.2 2,062.4 695.1 259.9 364.7 18.32001 444,301.8 440,604.8 3,672.1 2,469.6 660.2 296.7 245.6 24.92002 444,935.5 439,950.4 4,967.3 3,235.3 948.6 297.8 485.5 17.92003 495,494.0 491,035.9 4,444.7 3,009.8 871.1 147.5 416.3 13.3
January 48,460.3 48,160.7 299.6 171.8 81.9 8.8 37.1 0.0February 27,142.2 26,852.3 289.7 164.3 89.1 7.0 29.4 0.2March 38,507.5 38,247.6 258.3 179.2 38.9 12.3 27.9 1.6April 37,934.2 37,408.0 523.2 420.1 46.8 21.4 34.8 3.0May 33,878.1 33,611.6 265.8 179.2 40.2 9.7 36.7 0.7June 46,618.8 46,131.7 483.4 280.8 146.5 16.3 39.8 3.7July 56,206.8 55,775.1 431.1 261.6 82.7 28.0 58.9 0.5August 29,983.1 29,748.2 233.1 180.0 28.6 6.1 18.4 1.8September 43,379.3 43,028.9 350.1 249.1 51.6 9.6 39.8 0.3October 45,494.2 45,104.1 390.0 278.1 79.0 13.1 19.7 0.1November 39,581.3 39,288.3 292.5 210.8 46.6 7.6 27.4 0.4December 48,308.3 47,679.3 627.9 434.8 139.4 7.5 46.3 1.1
Pro memoria:Change 03-02 (%) 11.4 11.6 –10.5 –7.0 –8.2 –50.5 –14.3 –25.5Share in 2003 (%) 100.0 99.1 0.9 67.7 19.6 3.3 9.4 0.0
Share: Trading on the electronic, outcry and second markets as percentage of the total and trading on the outcry market in each exchangeas percentage of total outcry trading.
A.2.10.Secondary markets. Equities.Effective trading in equities on the Spanish stock exchanges. 2003
Amounts in millions of euros

139
Annex 2
: Seco
ndary m
arkets
Total trading 495,480.6 100.0 491,035.9 100.0 4,444.7 100.0 3,009.8 100.0 871.1 100.0 147.5 100.0 416.3 100.0Regular trading 461,500.7 93.1 457,474.4 93.2 4,026.3 90.6 2,611.8 86.8 851.8 97.8 146.6 99.4 416.0 99.9
– Orders 276,421.2 55.8 272,394.9 55.5 4,026.3 90.6 2,611.8 86.8 851.8 97.8 146.6 99.4 416.0 99.9– Put-throughts 60,399.8 12.2 60,399.8 12.3 0.0 0.0 0.0 0.0 0.0 0.0 0.0 0.0 0.0 0.0– Block trades 124,679.6 25.2 124,679.6 25.4 0.0 0.0 0.0 0.0 0.0 0.0 0.0 0.0 0.0 0.0
Off-hours 15,980.9 3.2 15,947.6 3.2 33.3 0.7 28.4 0.9 4.6 0.5 0.3 0.2 0.0 0.0Authorised trades 3,088.7 0.6 3,009.8 0.6 78.9 1.8 73.5 2.4 5.1 0.6 0.3 0.2 0.0 0.0Art. 36.1 SML trades 4,704.1 0.9 4,704.1 1.0 0.0 0.0 0.0 0.0 0.0 0.0 0.0 0.0 0.0 0.0Tender offers 5,119.4 1.0 4,823.7 1.0 295.7 6.7 288.1 9.6 7.3 0.8 0.2 0.2 0.0 0.0Public offerings 417.4 0.1 417.4 0.1 0.0 0.0 0.0 0.0 0.0 0.0 0.0 0.0 0.0 0.0Declared trades 758.4 0.2 747.8 0.2 10.6 0.2 8.0 0.3 2.4 0.3 0.0 0.0 0.3 0.1Exercise of options 3,911.0 0.8 3,911.0 0.8 0.0 0.0 0.0 0.0 0.0 0.0 0.0 0.0 0.0 0.0
Amount
Total* Electronicmarket
Share (%)
Total Madrid Barcelona Bilbao Valencia
Amount Share (%) Amount Share (%) Amount Share (%) Amount Share (%) Amount Share (%) Amount Share (%)
Outcry market
* Does not include the second market.
A.2.11.Secondary markets. Equities. Effective trading by type. 2003.
Amounts in millions of euros

140
Annual rep
ort o
n th
e securities m
arket. 2003
1999 285,940.4 246,395.0 181,245.4 53,665.3 11,484.3 9,948.3 14,465.7 2,158.4 234.8 11,339.6 187.9 1,210.72000 488,888.5 445,731.2 307,696.2 98,243.8 39,791.2 9,141.6 807.2 11,002.9 1,267.6 14,423.2 2,909.7 3,605.02001 440,604.8 420,905.3 281,051.9 90,531.9 49,321.5 3,738.7 856.8 382.0 5,361.9 3,264.4 1,290.5 4,805.22002 439,950.4 406,291.7 259,170.3 76,129.9 70,991.5 18,685.0 4,822.4 2,116.1 1,571.2 1,800.5 566.5 4,096.92003 491,035.9 457,474.4 272,394.9 60,399.8 124,679.6 15,947.6 3,009.8 4,704.1 4,823.7 417.4 747.8 3,911.0
January 48,160.7 43,079.6 24,642.6 5,321.8 13,115.1 4,097.0 185.1 0.0 789.7 0.0 0.0 9.2February 26,852.3 26,077.3 18,309.5 3,644.5 4,123.3 590.4 120.1 0.0 0.0 0.0 9.0 55.6March 38,247.6 35,245.8 23,228.1 5,873.6 6,144.1 784.6 1,008.9 0.0 382.7 0.7 0.0 824.8April 37,408.0 34,730.6 22,786.5 5,177.1 6,767.0 2,317.2 331.1 0.0 28.2 0.0 0.7 0.2May 33,611.6 30,043.2 19,486.9 4,098.3 6,458.1 1,011.6 550.2 1,895.4 0.0 0.0 101.1 10.1June 46,131.7 42,853.4 26,057.9 6,060.0 10,735.5 1,760.3 147.6 0.0 0.0 416.6 186.4 767.3July 55,775.1 49,428.6 25,309.2 5,867.0 18,252.3 3,353.3 43.1 0.0 2,515.3 0.0 398.1 36.7August 29,748.2 29,158.5 16,228.1 3,924.5 9,005.9 463.2 74.4 0.0 48.9 0.0 0.0 3.2September 43,028.9 41,519.5 26,145.6 4,876.1 10,497.8 59.1 328.2 0.0 0.0 0.0 0.0 1,122.2October 45,104.1 43,683.4 25,190.1 4,760.7 13,732.7 801.0 144.8 420.0 0.0 0.0 31.3 23.5November 39,288.3 37,511.9 21,602.5 5,501.3 10,408.1 422.7 58.3 374.0 908.9 0.0 0.0 12.5December 47,679.3 44,142.5 23,407.9 5,294.9 15,439.7 287.1 18.2 2,014.6 150.1 0.0 21.3 1,045.5
Change (%)2002-2003 11.6 12.6 5.1 –20.7 75.6 –14.7 –37.6 122.3 207.0 –76.8 32.0 –4.5
Grandtotal
Off-hours
Special autho-rised trades
Art 36.1 SML(*)
tradesTenderoffers
Publicofferings
Declaredtrades
Exercise ofoptionsTotal Orders Put-throughs Block trades
Regular trading
A.2.12.Secondary markets. Equities.Effective trading in the electronic market by type. 2003.Amounts in millions of euros

141
Annex 2: Secondary markets
YearPurchases (a) Sales (b) Net investment Purchases Sales Total (a+b) Purchases Sales Total
Thousands of euros Year-on-year change (%) (1) % of total trading (2)
1994 20,306,240 19,920,156 386,084 37.2 36.5 36.81995 20,766,934 18,037,822 2,729,112 2.3 –9.4 –3.5 43.7 37.9 40.81996 30,740,351 31,026,414 –286,064 48.0 72.0 59.2 39.9 40.3 40.11997 61,571,629 62,027,406 –455,778 100.3 99.9 100.1 37.8 38.1 37.91998 115,765,750 110,594,756 5,170,994 88.0 78.3 83.1 44.3 42.4 43.41999 134,567,556 130,123,354 4,444,202 16.2 17.7 16.9 46.5 45.0 45.72000 258,422,404 272,416,125 –13,993,721 92.0 109.4 100.6 52.5 55.3 53.92001 228,288,291 251,951,605 –23,663,314 –11.7 –7.5 –9.5 51.6 56.9 54.32002 218,737,982 239,732,773 –20,994,791 -4.2 –4.8 –4.5 49.2 53.9 51.52003 244,301,011 258,626,134 –14,325,123 11.7 7.9 9.7 49.3 52.2 50.8
January 24,706,330 26,678,803 –1,972,473 11.7 5.5 8.4 51.0 55.1 53.0February 16,111,254 15,788,902 322,352 –8.6 –19.3 –14.3 59.4 58.2 58.8March 18,733,855 20,790,753 –2,056,898 –1.0 3.4 1.3 48.6 54.0 51.3April 18,174,417 19,471,164 –1,296,747 –22.5 –21.5 –21.9 47.9 51.3 49.6May 18,742,807 20,040,016 –1,297,209 –13.7 –13.7 –13.7 55.3 59.2 57.2June 25,667,939 28,860,450 –3,192,511 47.4 28.7 36.9 55.1 61.9 58.5July 29,017,204 30,097,323 –1,080,119 18.7 18.7 18.7 51.6 53.5 52.6August 12,281,921 13,757,788 –1,475,867 –26.9 –19.8 –23.3 41.0 45.9 43.4September 14,011,793 13,652,485 359,308 6.7 –10.8 –2.7 32.3 31.5 31.9October 14,694,031 15,798,920 –1,104,889 31.7 18.8 24.7 32.3 34.7 33.5November 26,765,320 26,812,130 –46,810 55.2 58.3 56.8 67.6 67.7 67.7December 25,394,140 26,877,400 –1,483,260 69.7 55.2 61.9 52.6 55.6 54.1
(1) Year-on-year change for montly data.(2) The total columns indicate the average of purchases and sales.
A.2.13.Secondary markets. Equities.Trading by non-residents

142
Annual report on the securities market. 2003
25% 50% 75% Total 25% 50% 75% Total
Number (1) Percentage of total
2000 2001 2002 2003 2000 2001 2002 2003
Orders and trades
Total orders entered 105,846 93,711 110,267 114,184 100.0 100.0 100.0 100.0Buy orders 50,944 45,228 55,103 56,239 48.1 48.3 50.0 49.3Sell orders 54,903 48,483 55,164 57,945 51.9 51.7 50.0 50.7Trades (2) 66,878 57,846 62,794 56,114 63.2 61.7 56.9 49.1
Day orders 79,451 76,399 93,846 97,294 74.6 81.0 83.6 83.3Time-limit orders 26,395 17,312 16,421 16,890 24.8 18.4 14.6 14.5Fill-or-kill orders 716 612 1,934 2,579 0.7 0.6 1.7 2.2(1) Daily average(2) Trades actually matchedSource: Sociedad de Bolsas
Use
Number of issuers required to attain a given level of trading
SectorElectronic market Outcry market (4 exchanges)
0 Oil 1 1 1 4 0 0 0 01 Energy & water 1 2 2 11 1 1 2 22 Mining & base metals 1 1 2 14 1 1 2 33 Cement & construction materials 1 1 2 3 1 1 2 44 Chemicals 1 1 1 5 0 0 0 05 Textile & paper 1 1 1 17 1 1 1 66 Metal-mechanical 1 3 4 17 1 1 1 37 Food 1 1 1 15 1 1 1 38 Construction 2 3 4 6 1 1 1 29 Real estate 1 1 1 8 1 2 3 17
10 Transport & communications 1 1 1 9 1 1 1 211 Other 2 4 7 20 1 1 1 6
Total non-financial sector 1 3 8 129 1 3 6 48
12 Banks 1 2 2 22 1 1 1 113 Insurance 1 1 1 2 1 1 1 114 Portfolio companies 1 1 1 4 1 1 2 1515 SIM 1 1 1 1 23 97 284 298916 Finance companies 1 1 1 1 0 0 0 0
Total financial sector 1 2 2 30 22 95 283 3,006
Total 2003 2 3 7 159 23 96 288 3,054
Total 2002 2 3 7 164 8 50 192 2,834
2003 Gini index 0.91 0.862002 Gini index 0.92 0.89
Notes:The total columns indicate the number of companies listed in the year.In the case of issuers listed on more than one market, the trading volume was taken as the sum of trading volume on all markets.Trades in stocks which were listed on the electronic market as at 31/12/03 are included in the electronic market total for 2003, regardlessof when they joined the market.
A.2.14.Secondary markets. Equities.Order types on the electronic market. 2000-2003
A.2.15.Secondary markets. Equities.Concentration of trading on the Spanish stock markets by sector

143
Annex 2: Secondary markets
0-50% 50-85% 85-100% Total 0-50% 50-85% 85-100% TotalSector
Electronic market Outcry market
Notes:Frequency: Percentage of sessions in which stocks were traded.The total columns indicate the number of companies listed at 31/12/03.In the case of issuers listed on more than one market, the frequency was calculated using the number of days on which trades were regis-tered in any market.
Number of issuers in each frequency group
A.2.16.Secondary markets. Equities.Trading frequency on the Spanish stock exchanges. 2003
Total 2000 2 9 152 163 1,686 29 26 1,741Total 2001 4 12 149 165 2,799 31 20 2,850Total 2002 9 15 148 172 2,799 31 20 2,850Total 2003 7 13 150 170 3,066 25 12 3,103
0 Oil 1 0 3 4 0 0 0 01 Energy and water 0 0 11 11 2 0 0 22 Mining and base metals 0 2 12 14 4 0 0 43 Cement and construction materials 0 0 4 4 5 0 0 54 Chemicals 0 0 6 6 1 0 0 15 Textile & paper 2 1 14 17 8 0 0 86 Metal-mechanical 0 4 13 17 3 0 0 37 Food 0 2 14 16 3 0 1 48 Construction 0 0 7 7 2 0 0 29 Real estate 0 2 7 9 21 2 0 23
10 Transport and communications 0 0 11 11 3 0 0 311 Other 1 0 20 21 8 0 0 8
Total non-financial sector 4 11 122 137 60 2 1 63
12 Banks 3 1 20 24 0 1 0 113 Insurance 0 0 3 3 1 0 0 114 Portfolio companies 0 1 3 4 22 1 0 2315 SIM 0 0 1 1 2,983 21 11 3,01516 Finance companies 0 0 1 1 0 0 0 0
Total financial sector 3 2 28 33 3,006 23 11 3,040
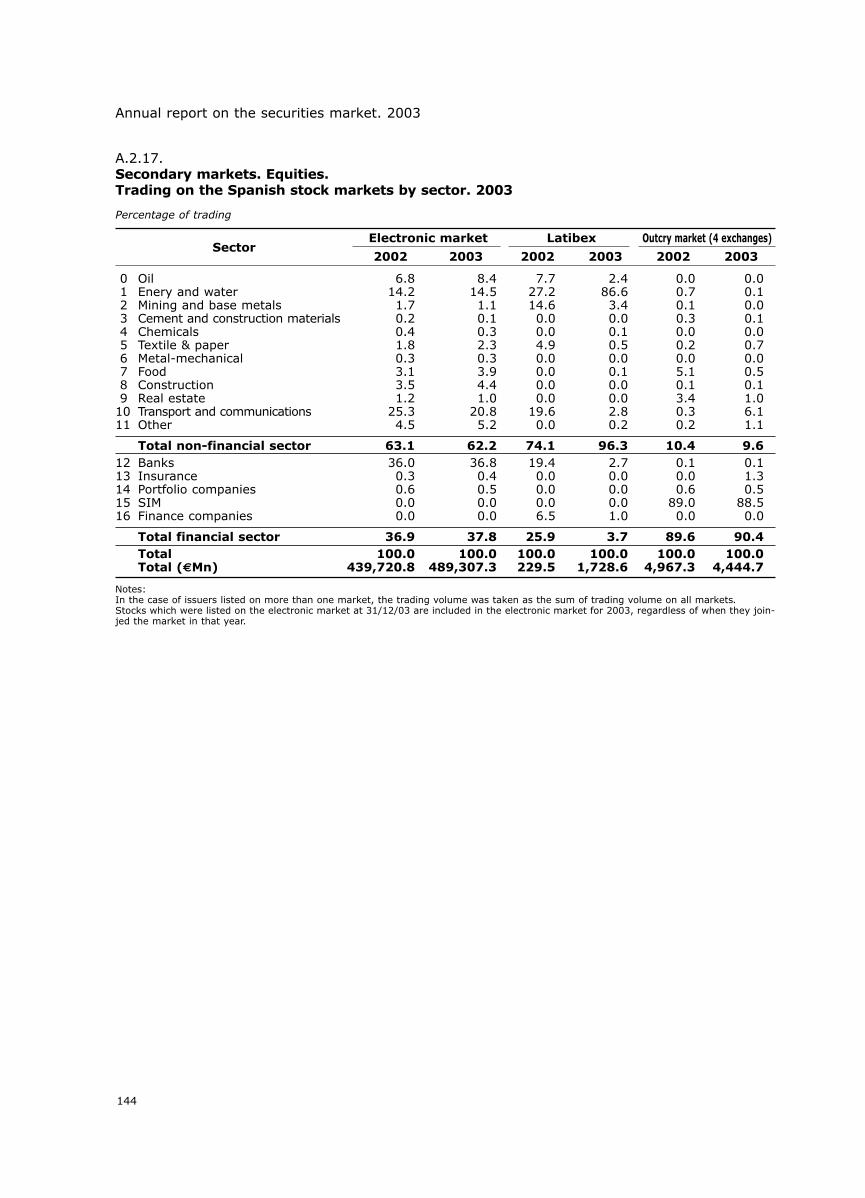
144
Annual report on the securities market. 2003
2002 2003 2002 2003 2002 2003Sector
Electronic market Latibex Outcry market (4 exchanges)
0 Oil 6.8 8.4 7.7 2.4 0.0 0.01 Enery and water 14.2 14.5 27.2 86.6 0.7 0.12 Mining and base metals 1.7 1.1 14.6 3.4 0.1 0.03 Cement and construction materials 0.2 0.1 0.0 0.0 0.3 0.14 Chemicals 0.4 0.3 0.0 0.1 0.0 0.05 Textile & paper 1.8 2.3 4.9 0.5 0.2 0.76 Metal-mechanical 0.3 0.3 0.0 0.0 0.0 0.07 Food 3.1 3.9 0.0 0.1 5.1 0.58 Construction 3.5 4.4 0.0 0.0 0.1 0.19 Real estate 1.2 1.0 0.0 0.0 3.4 1.0
10 Transport and communications 25.3 20.8 19.6 2.8 0.3 6.111 Other 4.5 5.2 0.0 0.2 0.2 1.1
Total non-financial sector 63.1 62.2 74.1 96.3 10.4 9.612 Banks 36.0 36.8 19.4 2.7 0.1 0.113 Insurance 0.3 0.4 0.0 0.0 0.0 1.314 Portfolio companies 0.6 0.5 0.0 0.0 0.6 0.515 SIM 0.0 0.0 0.0 0.0 89.0 88.516 Finance companies 0.0 0.0 6.5 1.0 0.0 0.0
Total financial sector 36.9 37.8 25.9 3.7 89.6 90.4Total 100.0 100.0 100.0 100.0 100.0 100.0Total (€Mn) 439,720.8 489,307.3 229.5 1,728.6 4,967.3 4,444.7
Notes:In the case of issuers listed on more than one market, the trading volume was taken as the sum of trading volume on all markets.Stocks which were listed on the electronic market at 31/12/03 are included in the electronic market for 2003, regardless of when they join-jed the market in that year.
Percentage of trading
A.2.17.Secondary markets. Equities.Trading on the Spanish stock markets by sector. 2003

145
Annex 2: Secondary markets
(Continues over)
DOMESTIC STOCKS
Non-financial sectors
OIL
COMPAÑÍA ESPAÑOLA DE PETRÓLEOS - CEPSA 4,653,128 7,358,311 883,730 2,349,507REPSOL YPF 15,382,880 18,874,549 29,155,211 38,655,339
ENERGY & WATER
ENAGÁS 1,384,659 2,053,115 1,903,493 1,574,460ENDESA 11,805,086 16,145,970 27,310,665 31,460,448GAS NATURAL SDG 8,091,313 8,306,245 9,148,038 5,946,824IBERDROLA 12,035,682 14,127,276 16,872,470 24,479,200RED ELÉCTRICA DE ESPAÑA 1,304,003 1,758,510 662,570 2,397,471SOCIEDAD GENERAL DE AGUAS DE BARCELONA 1,386,509 1,725,597 582,271 645,786UNIÓN FENOSA 3,823,726 4,536,675 5,842,464 4,351,489 Former Unión Eléctrica
Fenosa
MINING & BASE METALS
ACERALIA CORPORACIÓN SIDERÚRGICA 1,912,500 2,112,500 793,184 99,336ACERINOX 2,302,342 2,459,604 3,154,676 3,809,784BEFESA MEDIO AMBIENTE 393,145 355,729 43,183 2,941CIE AUTOMOTIVE 140,220 224,580 8,708 34,417 Former AFORASAESPAÑOLA DEL ZINC 22,230 17,199 5,131 2,816GRUPO DURO FELGUERA 83,314 90,157 16,752 17,308NUEVA MONTAÑA QUIJANO 13,268 14,474 8,925 1,556S A HULLAS DEL COTO CORTES 31,675 34,892 3,165 6,199 Listed 11/08/03 Comes
from outcry marketTUBOS REUNIDOS 139,466 131,497 3,939 7,003 Former Tubos Forjados
CEMENT & CONSTRUCTION MATERIALS
CEMENTOS PORTLAND 999,378 1,308,377 101,438 175,537UNILAND CEMENTERA 402,840 0 12,293 33,020 Delisted 05/08/2003URALITA 366,563 485,850 334,903 63,459VIDRALA 175,560 233,035 60,150 37,808
CHEMICALS
ENERGÍA E INDUSTRIAS ARAGONESAS EIA 194,250 0 12,406 16,596 Delisted 12/22/2003ERCROS 79,528 84,206 50,065 40,158FAES FARMA 420,706 570,290 83,871 77,938ZELTIA 1,087,938 1,124,069 1,517,746 1,505,881
TEXTILE & PAPER
ADOLFO DOMÍNGUEZ 69,690 128,403 21,663 27,219DOGI 31,230 55,069 21,238 6,640EPPIC (EN LIQUIDACIÓN) 0 0 0 0 Suspended on 08/06/01GRUPO EMPRESARIAL ENCE 354,288 436,811 174,308 135,170IBERPAPEL GESTIÓN 165,300 179,284 16,801 25,827INDO INTERNACIONAL 33,390 40,847 1,922 2,799INDUSTRIA DE DISEÑO TEXTIL (INDITEX) 14,031,167 10,035,619 7,417,817 10,657,745LA SEDA DE BARCELONA 57,902 61,949 28,576 18,513MIQUEL Y COSTAS 147,542 224,450 38,645 46,604PAPELES Y CARTONES DE EUROPA - EUROPA & C - 91,422 115,845 40,952 79,407SNIACE 20,988 25,427 14,342 17,971TABLEROS DE FIBRAS - TAFISA - 111,315 438,472 9,876 261,809TAVEX ALGODONERA 87,041 96,355 52,404 39,416UNIPAPEL 109,605 148,155 38,900 28,712
A.2.18.Secondary markets. Equities.Electronic market. Listed companies. 2003
2002 2003 2002 2003Companies
Capitalisation (at 31 Dec.) Annual tradingComments
Amounts in thousands of euros

146
Annual report on the securities market. 2003
(Continued)
(Continues over)
METAL-MECHANICAL
ABENGOA 506,630 522,010 224,084 237,095AMPER 50,236 102,148 50,454 121,351AVANZIT 34,708 74,149 172,900 414,309 Suspended on 12/30/2003AZKOYEN 84,710 92,605 124,600 38,544CONSTRUCCIONES Y AUXILIAR DE FERROCARRILES 127,696 202,599 23,931 29,758ELECNOR 198,450 288,000 10,832 24,741GLOBAL STEEL WIRE 48,423 58,244 11,729 1,752LINGOTES ESPECIALES 34,944 45,120 2,995 2,724MECALUX 56,217 84,658 51,113 21,666NICOLÁS CORREA 19,890 27,270 2,717 2,568SOCIEDAD ESPAÑOLA DEL ACUMULADOR TUDOR 102,810 124,033 709 878TECNOCOM, TELECOMUNICACIONES Y ENERGÍA 52,046 69,566 26,976 36,856TUBACEX 166,223 188,830 96,630 79,103ZARDOYA OTIS 2,245,244 3,247,105 231,538 341,519
FOOD
ALTADIS 6,640,949 6,535,607 12,124,153 17,268,458BARÓN DE LEY 211,802 293,740 111,829 109,915BODEGAS RIOJANAS 36,611 43,466 2,004 3,159CAMPOFRÍO ALIMENTACIÓN 431,679 511,697 62,682 136,812COMPAÑÍA VINÍCOLA DEL NORTE DE ESPAÑA -CVNE- 179,550 156,038 13,081 34,092EBRO PULEVA 1,193,995 1,383,250 450,955 418,386FEDERICO PATERNINA 28,564 34,707 1,953 1,650KOIPE 387,628 0 3,851 5,026 Delisted 02/24/2003NATRA 46,580 68,742 72,763 50,308NATRACEUTICAL 92,220 121,496 25,734 65,097PESCANOVA 128,050 165,100 77,944 43,564PULEVA BIOTECH 174,253 188,989 171,932 18,360SOS CUETARA 255,830 494,798 88,195 117,814TELE PIZZA 167,698 275,025 228,257 382,618VISCOFÁN 315,962 344,286 243,216 190,217
CONSTRUCTION
ACCIONA 2,494,338 3,066,288 1,868,683 2,593,441ACS, ACTIVIDADES DE CONSTRUCCIÓN Y SERVICIOS 1,963,495 4,586,988 2,256,845 3,210,993FOMENTO DE CONSTRUCCIONES Y CONTRATAS 2,794,144 3,817,793 2,066,966 2,768,853GRUPO DRAGADOS 2,792,092 0 6,386,660 6,579,453 Delisted 12/15/2003GRUPO FERROVIAL 3,387,394 3,896,555 2,539,490 3,007,640OBRASCÓN HUARTE LAIN 360,862 530,100 165,152 161,650SACYR VALLEHERMOSO 1,532,164 2,949,730 2,469,590 3,228,721 Former Vallehermoso
REAL ESTATE
BAMI 307,293 0 179,058 165,288 Delisted 11/24/2003GRUPO INMOCARAL 86,665 296,269 3,744 91,443INBESOS 12,599 21,389 500 2,032 Suspended on 12/29/2003INMOBILIARIA COLONIAL - ICSA - 827,345 1,064,290 530,961 594,140INMOBILIARIA URBIS 727,247 1,001,559 264,897 341,822METROVACESA 1,324,189 1,559,464 1,759,178 3,464,010SOTOGRANDE 232,172 270,157 5,082 7,620TESTA INMUEBLES EN RENTA 1,163,996 1,271,388 5,304 2,389URBANIZACIONES Y TRANSPORTES - URBAS - 5,229 8,330 4,375 49,174
TRANSPORT & COMMUNICATIONS
ABERTIS INFRAESTRUCTURAS 3,555,051 6,297,392 2,437,878 3,098,775 Former ACESAAÚREA CONCESIONES DE INFRAESTRUCTURAS C.E. 1,700,330 0 836,920 369,066 Delisted 06/02/2003EUROPISTAS CONCESIONARIA ESPAÑOLA 558,227 566,471 60,427 123,226IBERIA LÍNEAS AÉREAS DE ESPAÑA 1,278,147 2,095,359 1,586,174 1,943,239IBÉRICA DE AUTOPISTAS - IBERPISTAS - 949,139 0 1,018,836 13,146 Delisted 01/30/2003
A.2.18.Secondary markets. Equities.Electronic market. Listed companies. 2003
2002 2003 2002 2003Companies
Capitalisation (at 31 Dec.) Annual tradingComments
Amounts in thousands of euros

147
Annex 2: Secondary markets
(Continued)
2002 2003 2002 2003
(Continues over)
CompaniesCapitalisation (at 31 Dec.) Annual trading
Comments
TELEFÓNICA 41,461,441 57,686,575 103,281,737 94,041,764TELEFÓNICA MÓVILES 26,849,416 35,856,961 2,131,940 2,099,328TRANSPORTES AZKAR 218,700 252,720 60,379 50,645
OTHER
ALDEASA 294,630 420,000 264,489 205,453AMADEUS GLOBAL TRAVEL DISTRIBUTION 2,318,700 3,038,500 3,650,346 3,744,925ANTENA 3 DE TELEVISIÓN 0 1,941,127 0 1,474,161 Listed 10/29/2003CENTROS COMERCIALES CARREFOUR 3,773,892 4,607,658 1,883,742 2,891,662COMPAÑÍA DE DISTRIBUCIÓN INTEGRAL LOGISTA 965,552 1,133,887 393,368 402,130CORTEFIEL 340,214 570,933 346,683 334,141ENACO 157,564 0 198,675 175 Delisted 03/18/2003FUNESPAÑA 45,150 54,495 11,363 8,523GAMESA 1,265,971 2,115,898 1,261,248 1,709,917INDRA SISTEMAS 981,936 1,570,207 1,587,854 2,380,287PARQUES REUNIDOS 65,378 165,781 41,638 257,581PROMOTORA DE INFORMACIONES (PRISA) 1,358,826 2,516,344 948,366 923,815PROSEGUR COMPAÑÍA DE SEGURIDAD 598,611 796,091 327,022 396,819RECOLETOS COMPAÑÍA EDITORIAL 535,926 769,904 83,106 145,781SERVICE POINT SOLUTIONS 76,400 113,691 147,039 189,313SOGECABLE 829,553 3,485,281 2,627,144 4,497,825SOL MELIÁ 696,608 1,055,075 633,073 472,738TELEFONICA PUBLICIDAD E INFORMACIÓN 1,115,750 1,601,819 1,068,983 1,024,253TERRA NETWORKS 2,438,723 2,887,046 3,840,026 3,608,382
Financial sectors
BANKS
BANCO ATLÁNTICO 606,737 1,484,459 1,292 8,265BANCO BILBAO VIZCAYA ARGENTARIA 29,146,171 34,994,580 68,203,669 74,544,306BANCO DE ANDALUCÍA 1,145,131 1,499,318 23,340 28,499BANCO DE CASTILLA 512,470 616,179 2,758 2,231BANCO DE CRÉDITO BALEAR 197,491 259,375 10,447 1,640BANCO DE GALICIA 468,607 527,943 3,891 2,305BANCO DE SABADELL 2,815,238 3,470,087 220,159 375,666BANCO DE VALENCIA 1,065,508 1,426,051 111,108 130,961BANCO DE VASCONIA 272,000 300,800 1,688 678BANCO ESPAÑOL DE CRÉDITO - BANESTO - 4,908,914 6,596,136 1,399,147 762,972BANCO FINANTIA SOFINLOC 25,793 0 305 46 Former Banco Esfinge -
Delisted 03/18/2003BANCO GUIPUZCOANO 514,488 620,880 26,234 65,398BANCO PASTOR 968,236 1,326,963 72,549 155,954BANCO POPULAR ESPAÑOL 8,462,496 10,755,382 13,044,180 17,614,263BANCO SANTANDER CENTRAL HISPANO 31,185,355 44,775,304 73,306,428 83,271,156BANCO ZARAGOZANO 744,300 0 118,998 1,349,576 Delisted 11/20/2003BANKÍNTER 1,788,940 2,471,983 1,910,873 1,994,826
INSURANCE
CATALANA DE OCCIDENTE 478,800 591,600 40,333 39,620CORPORACIÓN MAPFRE 1,403,494 2,038,970 1,149,171 1,865,259MAPFRE VIDA 1,153,027 0 2,979 5,885 Delisted 02/03/2003
PORTFOLIO COMPANIES
CORPORACIÓN FINANCIERA ALBA 1,314,720 1,567,809 746,873 494,191DINAMIA CAPITAL PRIVADO 97,898 107,645 36,348 42,860FASTIBEX 5,993 1,690 3,291 3,627NH HOTELES 978,974 1,088,945 1,941,706 2,020,096
SIM /SIMCAV
COMPAÑÍA GENERAL DE INVERSIONES 10,410 15,987 3,732 4,496
Amounts in thousands of euros
A.2.18.Secondary markets. Equities.Electronic market. Listed companies. 2003

148
Annual report on the securities market. 2003
(Continued)
(Continues over)
FOREIGN STOCKS
MINING & BASE METALS
ARCELOR 6,119,463 7,282,413 3,550,618 1,300,981
CHEMICALS
BAYER AKTIENGESELLSCHAFT 13,100,746 14,730,351 5,874 11,236
TEXTILE & PAPER
RENO DE MEDICI 95,644 196,892 2,624 2,721
METAL-MECHANICAL
EUROPEAN AERONAUTIC DEFENCE 7,949,745 15,331,015 75,190 241,163VOLKSWAGEN AKTIENGESELLSCHAFT 9,450,089 11,907,112 3,011 6,738
OTHER
JAZZTEL 275,839 182,934 681,766 945,464
LATIBEX STOCKS
Financial sectors
OIL
PETRÓLEO BRASILEIRO 15,324,929 25,459,404 17,760 42,344SUZANO PETRO QUÍMICA 0 22,288 0 1
ENERGY & WATER
CENTRAIS ELÉTRICAS ELETROBRAS 3,439,546 6,932,835 10,290 8,058COMPAÑÍA PARANAENSE DE ENERGÍA 336,686 484,468 1,178 3,028ENDESA CHILE 1,965,687 2,583,553 25,505 20,307ENERSIS 650,016 3,563,382 25,455 1,466,159
MINING & BASE METALS
COMPAÑÍA ENERGÉTICA DE MINAS GERAIS 621,886 1,271,431 3,682 12,004GERDAU 664,764 16,008,633 259 42,888COMPANHIA VALE DO RIO DOCE 10,219,103 1,625 28,859 3,660VOLCÁN COMPAÑÍA MINERA 30,548 66,172 788 487
CHEMICALS
BRASKEM 0 812,473 0 1,440 Listed 08/10/2003
TEXTILE & PAPER
ARACRUZ CELULOSE 1,024,614 1,699,928 11,132 9,086COMPANHIA SUZANO DE PAPEL E CELULOSE 376,413 0 57 0
METAL-MECHANICAL
ALFA 0 1,428,000 0 773 Listed 11/12/2003
FOOD
GRUPO MODELO 0 1,238,920 0 1,703 Listed 11/13/2003
TRANSPORT & COMMUNICATIONS
AMÉRICA MÓVIL 7,457,047 11,478,109 19,016 23,965NET SEVIÇOS DE COMUNICAÇAO 13,755 39,184 1,848 1,722 Former Globo CaboTELÉFONOS DE MÉXICO 12,927,268 10,263,039 24,100 23,322
OTHER
DISTRIBUCION Y SERVICIOS D&S 894,240 1,536,400 107 3,194
A.2.18.Secondary markets. Equities.Electronic market. Listed companies. 2003
2002 2003 2002 2003Companies
Capitalisation (at 31 Dec.) Annual tradingComments
Amounts in thousands of euros

149
Annex 2: Secondary markets
(Continued)
Financial sectors
BANKS
BANCO BRADESCO 1,986,932 3,068,439 10,787 11,104BANCO DE CHILE 1,748,516 2,518,952 934 4,787BANCO RÍO DE LA PLATA 344,877 173,459 4 2BBVA BANCO FRANCÉS 586,969 450,709 21 45CORPORACIÓN UBC INTERNACIONAL 0 43,400 0 673 Listed 11/18/2003GRUPO FINANCIERO BBVA BANCOMER 3,322,788 3,129,602 13,781 13,192SANTANDER BANCORP 546,355 846,723 18,953 17,242
FINANCE COMPANIES
BRADESPAR 204,990 428,068 14,961 17,437
A.2.18.Secondary markets. Equities.Electronic market. Listed companies. 2003
2002 2003 2002 2003Companies
Capitalisation (at 31 Dec.) Annual tradingComments
Amounts in thousands of euros

150
Annual report on the securities market. 2003
(Continues over)
Non-financial companies
OIL
ENERGY & WATER
AGUAS DE VALENCIA 111,867 109,905 36,125 1,888COMPAÑÍA DE AGUAS DE SABADELL 18,847 17,591 763 700
MINING & BASE METALS
FORJAS DE BERRIZ VIUDA DE GASTELURRUTIA 0 0 0 0 Delisted 09/172003MINERALES Y PRODUCTOS DERIVADOS - MINERSA - 7,577 7,603 2 7MINERO SIDERÚRGICA DE PONFERRADA 11,892 13,379 41 190SOCIEDAD ANÓNIMA HULLERA VASCO-LEONESA 33,242 36,115 522 395
CEMENT & CONSTRUCTION MATERIALS
CELO 1,315 1,315 13 13CEMENTOS ALFA 61,903 111,426 874 10CEMENTOS LEMONA 235,200 280,000 5,137 1,635CEMENTOS MOLINS 669,274 696,045 7,256 1,309IBERTUBO 0 0 0 0 Delisted 12/30/2003
CHEMICALS
LA UNIÓN RESINERA ESPAÑOLA 45,252 0 699 57 Delisted 10/01/2003
TEXTILE & PAPER
ARMANDO ÁLVAREZ 29,955 0 22 222 Delisted 01/08/2003CARROGGIO S A DE EDICIONES 0 0 0 0INDUSTRIAS DEL ACETATO DE CELULOSA - INACSA - 17,675 18,227 1,959 986INDUSTRIAS DEL CURTIDO - INCUSA - 4,845 4,695 697 181LIWE ESPAÑOLA 8,439 8,095 590 24MANUFACTURAS DE ESTAMBRE 1,378 0 19 0 Delisted 12/03/2003PAPELERA DE NAVARRA 45,326 57,640 3,622 27,792PRIM 19,967 33,660 1,551 3,060
METAL-MECHANICAL
IBÉRICA DE MANTENIMIENTO INDUSTRIAL - IMISA - 2,575 2,454 14 294JUMBERCA 0 0 0 0 Delisted
12/19/2001PMRK INVESTMENT 0 0 0 0
FOOD
BODEGAS BILBAINAS 28,774 28,774 78 42PASCUAL HERMANOS 5,508 0 3,999 34 Delisted 05/15/2003POPULARINSA 87,974 109,210 883 4,698 Former Naarden
InternacionalSOCIEDAD ANÓNIMA DAMM 676,697 763,828 241,329 15,897
CONSTRUCTION
CLEOP 14,977 15,355 3,219 2,886OBRAS Y SERVICIOS PÚBLICOS 3,240 3,240 26 23
REAL ESTATE
AHORRO FAMILIAR 72,879 75,355 28,868 711ALCINVER - 0 0 0 0AYCO GRUPO INMOBILIARIO 31,128 31,128 136 59COMPAÑÍA DE INVERSIONES CINSA 6,942 7,657 736 103COMPAÑÍA DE TRANSPORTES E INVERSIONES 6,075 5,625 35 3
A.2.19.Secondary markets. Equities.Outcry market. Listed companies. 2003
2002 2003 2002 2003Companies
Capitalisation (at 31 Dec.) Annual trading Date of listing in2003 & other comments
Amounts in thousands of euros

151
Annex 2: Secondary markets
(Continued)
(Continues over)
COMPAÑÍA ESPAÑOLA DE VIVIENDAS EN ALQUILER 91,245 122,112 3,117 2,538 11/14/2003COMPAÑÍA INMOBILIARIA VALENCIANA - CIVSA - 3,420 3,960 16 54EGUARÁS 2,239 0 556 92 Delisted 07/22/2003FINANZAS INMUEBLES CISNEROS 101,955 103,476 1,082 1,108FINEX 171 0 0 0 Delisted 01/08/2003FORUM INMOBILIARIO CISNEROS 39,993 29,328 2,665 1,902INCRECISA 4,801 0 296 729 Delisted 01/08/2003INMOBILIARIA BARRIO DE BILBAO 2,355 0 35 6 Delisted 07/22/2003INMOBILIARIA DEL SUR 151,662 340,032 1,982 4,185 01/10/2003INMOLEVANTE 18,947 27,068 65 104LEUCAN 347 359 41 149LIBERTAS 7 122,080 185,339 916 432 01/15/2003MONTEBALITO 21,600 33,000 2,981 8,456PROMOCIONES Y CONCIERTOS INMOBILIARIOS 807,689 770,430 103,507 21,414RENFILA 44,235 0 286 62 Delisted 12/02/2003S A PLAYA DE ALBORAYA - SAPLAYA - 25,625 28,457 376 3,900S A RONSA 367 353 45 157
TRANSPORT & COMMUNICATIONS
COMPAÑÍA TRASMEDITERRÁNEA 477,409 0 393 269,993 Delisted 06/23/2003FLETAMENTOS MARÍTIMOS - MARFLET - 14,563 18,307 2,450 1,505NAVIERA MURUETA 0 0 0 308
OTHER
ALMACENES GENERALES INTERNACIONALES - AGISA - 1,333 0 3,008 85 Delisted 01/08/2003COMPAÑÍA LOGISTICA DE HIDROCARBUROS-CLH- 49,813 48,034 1,192 540EL SARDINERO 7,460 22,080 14 73FRIGORÍFICOS DE VIGO 2,129 0 24 0 Delisted 06/24/2003GRAND TIBIDABO 0 0 0 0 Delisted 10/18/1999GRUCYCSA 159,782 203,852 0 39,914 Delisted 12/30/2003INFORMES Y PROYECTOS - INYPSA - 4,770 8,100 419 2,718 03/03/2003RÚSTICAS 62,000 90,000 6,686 5,084
Financial companies
BANKS
BANCO DE PROMOCIÓN DE NEGOCIOS - PROMOBANC - 55,548 55,982 3,439 3,862
INSURANCE
BANCO VITALICIO 439,012 417,444 171 57,130
PORTFOLIO COMPANIES
CALPE INVEST 0 8,009 0 520 Previously in secondmarket
CARTERAS REUNIDAS - CARTEMASA - 1,515 0 130 816 Delisted 11/03/2003CASGO 4,888 0 44 663 Delisted 04/04/2003CÍRCULO DE VALORES MOBILIARIOS 1,080 1,116 89 68COMPAÑÍA DE INVERSIONES MOBILIARIAS BARCINO 5,619 5,467 426 330DALTAR 2,150 0 6 10 Delisted 05/08/2003DESARROLLO MOBILIARIO - DEMOSA - 2,955 2,955 55 68FOMENTO BALEAR DE INVERSIONES 2,048 2,048 0 0GAESCO HOLDING 41,553 62,330 4,104 968GORBEA 3,258 0 26 1,623 Delisted 09/15/2003HISPANA HOLDING 1,327 1,327 200 1INVERPYME 12,133 10,176 121 27INVERSIONES AZALBA 2,319 2,666 915 155INVERSIONES IBERSUIZAS 146,985 0 14,475 0 Delisted 09/01/2003INVERSORA CONDAL DE VALORES MOBILIARIOS 2,322 0 35 893 Delisted 09/12/2003
A.2.19.Secondary markets. Equities.Outcry market. Listed companies. 2003
2002 2003 2002 2003Companies
Capitalisation (at 31 Dec.) Annual trading Date of listing in2003 & other comments
Amounts in thousands of euros

152
Annual report on the securities market. 2003
MERCAPITAL 21,811 21,016 1,722 318RENTA VARIABLE 1,550 1,546 18 25SAMOSA 5,757 0 56 7 Delisted 04/04/2003TERREVA 722 722 1 0UNIÓN CATALANA DE VALORES - UCAVASA - 4,745 3,640 31 1,636UNIÓN DE VALORES - UNIVAL - 3,317 5,520 197 1,720UNIÓN EUROPEA DE INVERSIONES 119,250 150,030 4,936 12,927XAROA 1,326 0 76 134 Delisted 11/20/2003
S.I.M. /SIMCAV
1948 INVERSIONS, SIMCAV 14,719 16,186 5,707 4,2071955 INVERSIONES, SIMCAV 8,078 8,871 241 82002 GLOBAL FLECHA, SIMCAVF 0 27,327 0 69 01/27/20033-R VALORES, SIMCAV 27,947 28,849 10 226V DE VALORES MOBILIARIOS SIMCAV 20,843 21,781 341 348860 INVERSIONES, SIMCAV 23,858 24,483 0 149A PONTICELA DE VALORES, SIMCAV 17,670 17,165 23 40A&G BOLSA 32,320 33,520 2,871 5,903A&G RENTA FIJA I 58,278 58,509 3,878 5,098A.A. INVER PLUSQUAM, SIMCAV 11,500 12,750 1 0A.M.J EVALUATION, SIMCAV 4,970 5,370 30 11AAMM DE VALORES SIMCAV 0 24,642 0 2,225 02/04/2003AB CEUTA 60,100 61,600 1,220 2,465ABAE VALORES SIMCAVF SA 21,510 22,616 1,046 567ABANDO EQUITIES SIMCAV SA 32,650 38,700 541 311ABARCAPITAL INVERSIONES, SIMCAV 19,954 20,675 10 614ABC DE INVERSION MOBILIARIA 5,238 46,040 0 14ABDUIT 2002, SIMCAV 0 35,627 0 0 02/04/2003ABEDUL 1999, SIMCAV 21,935 23,980 243 672ABENLENDA INVERSIONES, SIMCAV 0 24,521 0 0 02/14/2003ABENOJAR INVERSIONES, SIMCAVF 17,870 19,313 162 0ABILITY 4,872 25,718 115 143ABISAL 72, SIMCAVF 25,100 26,600 10,300 663ABLAÑA INVEST, SIMCAV 17,160 18,509 26 153ABRE DE INVERSIONES, SIMCAV 19,120 20,400 183 403ABRIL 28 INVESTMENT, SIMCAV 17,526 10,818 2,254 853ABUVILLA INVERSIONES, SIMCAV 29,405 29,705 1,226 22ACACIA BONOMIX, SIMCAV 24,630 25,932 358 422ACACIA PREMIUM, SIMCAV 13,978 29,169 2,447 420ACANTO DE INVERSIONES SIMCAVF 6,912 7,252 0 8ACATES INVESTMENTS, SIMCAV 19,217 20,567 394 9ACCIONES, CUPONES Y OBLIGACIONES SEGOVIANAS 98,954 118,750 2,778 59ACE GLOBAL, SIMCAV 22,050 29,300 6,125 2,240ACENT EUROPA INVERSIONES, SIMCAV 51,527 52,408 3,950 12,021ACERVO VALORES, SIMCAV 29,350 32,944 1 576ACHERFOR INVERSIONES, SIMCAV 22,487 22,968 5 151ACOPA INVERSIONES, SIMCAV 22,270 24,723 42 5ACQUA GESTIÓN GLOBAL SIMCAV 21,396 22,358 13 12ACROPOLIS 2001 71,700 76,000 4,562 6,954ACTAD INVERSIONES, SIMCAV 18,199 20,410 45 46ACTEDADI, SIMCAV 24,041 25,579 14 66ACTIMAAF ACCIONES IBÉRICA, SIMCAV 18,570 23,040 43 5,103ACTIUM DE INVERSIONES, SIMCAV 26,695 28,548 3,269 3,209ACTIVILLO, SIMCAV 0 24,041 0 19 08/01/2003ACTIVOS AKRA LEUKA, SIMCAV 23,473 24,291 6 645ACTIVOS CLYS, SIMCAV 23,244 24,010 685 348ACTIVOS EN RENTA CAPITAL VARIABLE SIMCAV 16,667 70,579 4,202 3,181 Former AR CAPITAL
VARIABLE I, SIMCAVACTIVOS LUCENTUM, SIMCAV 23,521 24,435 6 644
A.2.19.Secondary markets. Equities.Outcry market. Listed companies. 2003
2002 2003 2002 2003Companies
Capitalisation (at 31 Dec.) Annual trading Date of listing in2003 & other comments
Amounts in thousands of euros
(Continued)
(Continues over)

153
Annex 2: Secondary markets
(Continued)
(Continues over)
ACTIVOS MOBILIARIOS CAHISPA, SIMCAV, S 28,250 30,250 6,252 4,186 Former OCTUBRE NORANTANOU, SIMCAV
ACTUACIONES BURSATILES SIMCAV 25,643 27,406 65 47ACUARIO 98, SIMCAV 8,880 10,100 209 571ACUEDUCTO 2002, SIMCAV 0 25,002 0 72 02/04/2003ADABAR INVERSIONES, SIMCAVF 22,358 22,838 11 2,315ADAGALIA INVERSIONES SIMCAV 15,146 16,588 50 189ADDITION 16,980 17,850 35 14ADNO INVERSIONES, SIMCAV 0 26,396 0 1 07/28/2003ADORO 99, SIMCAV 18,278 19,481 393 394ADRASAM INVERSIÓN 12,300 13,560 28 0ADRIANA INVERSIONES, SIMCAV 9,604 11,984 297 141ADSVARA INVERSIONES, SIMCAV 11,299 12,862 0 14AFINA DARWIN SYSTEMS, SIMCAV 16,880 16,600 4,808 6,823 Former A Y G
INTERNATIONALMARKETS, SIMCAV
AGABA INVERSIONES, SIMCAV 37,265 37,927 43,141 7,450AGALIA PATRIMONIO, SIMCAV 0 27,406 0 6,013 04/09/2003AGARUS INVERSIONES SIMCAV 20,675 21,636 15 22AGATA 55,096 57,004 25 16AGAVE ATTENUATA DE INVERSIONES SIMCAV SA 0 24,161 0 0 10/27/2003AGENDA DE INVERSIONES, SIMCAV 9,220 9,400 11,240 4AGISTER 1, SIMCAV 24,690 25,771 16,068 7,537AGIUM INVESTIUM, SIMCAV 18,151 19,353 2 11AGROPE SANFER, SIMCAV 21,040 22,320 99 150AGROPEM DE INVERSIONES, SIMCAV 8,486 10,530 1,296 44AGUAZUL DE INVERSIONES, SIMCAV 0 25,122 0 2,201 06/03/2003AGUILON DE GATERUELA, SIMCAV 23,560 25,724 0 0AGUSTINA SIMON ACTIVOS, SIMCAV 6,130 6,311 13 350AHORRO BURSÁTIL 97,240 95,600 125 760AHORRO COLECTIVO, SIMF 2,906 2,906 146 2AHORRO CORPORACION GESTION GLOBAL SIMCAV 14,575 14,400 169 1,012AHORROACTIVO, SIMCAV 11,785 12,506 155 437AHORROCAPITAL 2,416 2,448 68 2,147AIRESE SIMCAVF 19,601 21,789 36 547AIRUN-INVERSIONES, SIMCAV 53,500 57,900 609 65AJALVIR 36,312 38,704 778 526AKENATON INVERSIONES, SIMCAVF 13,492 14,190 1,221 959AKORG FINACIERA, SIMCAV 23,560 26,204 4,049 57ALADINO DE INVERSIONES, SIMCAV 16,955 17,941 2 651ALALAY INVERSIONES, SIMCAV 22,237 23,740 26 22ALAMEDA DE VALORES, SIMCAV 17,076 18,038 18 0ALANJE INVERSIONES SIMCAV 16,828 16,348 4,815 5,994ALAR 2000, SIMCAV 0 16,668 0 0ÁLAVA INVERSIONES, SIMCAV 15,640 15,600 2 3,189ALAZÁN INVERSIONES 2001, SIMCAV 705,600 770,400 200,036 18,467ALBATROS BOLSA SIMCAV 49,884 54,241 36,288 5,544ALBERANA INVERSIONES SIMCAV 14,232 13,847 4,482 2,815ALBORÁN ASSETS MANAGEMENT, SIMCAV 23,367 25,435 0 0ALBUS INVESTMENT, SIMCAV 0 36,662 0 3,340ALCAMA DE VALORES, SIMCAV 18,591 18,832 75 32ALCANADA 2000 SIMCAV 17,196 18,206 152 0ALCE VALORES SIMCAV 24,531 26,936 0 65ALCIDES INVERSIONES, SIMCAV 16,828 17,550 10 21ALCO INVERSIONES FINANCIERAS, SIMCAVF 20,915 22,863 1,062 886ALCOFAM, SIMCAV 0 24,474 0 2 02/14/2003ALCOR CARTERA, SIMCAV 0 24,441 0 35 03/14/2003ALCUMAR FINANCIERA, SIMCAV 19,954 20,194 15 21ALDARA GESTION, SIMCAV 25,640 26,160 229 3ALDEBORAN 5000 INVERSIONES, SIMCAV 14,484 16,227 432 1,655
A.2.19.Secondary markets. Equities.Outcry market. Listed companies. 2003
2002 2003 2002 2003Companies
Capitalisation (at 31 Dec.) Annual trading Date of listing in2003 & other comments
Amounts in thousands of euros

154
Annual report on the securities market. 2003
ALDECON INVESTMENTS, SIMCAV 21,693 23,208 0 38ALDERETE DE INVERSIONES, SIMCAV 28,524 30,039 5,010 82ALDEU, SIMCAVF 21,877 22,919 170 101ALEA INVERSIONES, SIMCAV 22,246 23,930 1 281ALEDAÑOS DE INVERSION, SIMCAV 14,574 15,007 1 0ALEDO INVERSIONES, SIMCAV 24,481 24,882 0 17ALEFOMA 4,700 4,780 15 14ALEGRANZA DE INVERSIONES, SIMCAV 17,124 16,955 1 0ALEKOS INVESTMENT, SIMCAV 17,029 17,109 2 25ALFA CAPITAL 44,440 47,680 34 22ALFA INVERSIONES 27,924 29,225 82 193ALFA INVERSIONES BURSATILES, SIMCAV 22,358 23,223 1 2ALFACARTERA 39,238 39,166 430 2,256ALFAGON 1 7,730 8,100 552 46ALFAMAR INVERSIONES, SIMCAV 30,111 30,592 5 1,189ALFATEGO SIMCAV 18,907 19,765 10 2ALFAVAL 2000 INVERSIONES SIMCAV 21,958 23,401 0 196ALFIVAL XXI INVERSIONES, SIMCAV 6,563 6,924 12 22ALFOZ INVERSIONES, SIMCAVF 0 10,319 0 14ALGENID INVERSIONES, SIMCAVF 0 0 0 0 05/29/2003ALGORA HOWEA SIMCAV SA 0 26,765 0 359 04/28/2003ALIA 2001, SIMCAV 0 25,723 0 12 07/02/2003ALIALIA, SIMCAV 14,075 14,316 127 271ALIANTO INVESTMENT, SIMCAV 19,272 19,954 3 622ALIBUS INVERSIONES, SIMCAV 30,952 31,553 3,725 1,849ALJABA DE INVERSIONES, SIMCAV 8,626 9,174 446 526ALKEH 2000 SIMCAV 21,035 21,588 51 20ALKENENCIA, SIMCAV 23,079 24,041 279 22ALLOCATION 396,000 418,000 48 7,280ALLURE INVESTMENTS SIMCAVF 29,840 31,072 0 1ALMABAR 2001, SIMCAV 22,598 23,800 2,548 3,151ALMADIL INVERSIONES, SIMCAV 9,360 10,520 29 22AL-MANSUC INVERSIONES, SIMCAV 23,978 24,483 0 1,243ALMARO 112,600 119,600 4,057 3,027ALMAVIAL DE INVERSIONES SIMCAV 18,615 20,130 1 855ALMED DE INVERSIONES, SIMCAV 23,521 24,820 3 1ALMENDORA INVERSIONES SIMCAV 18,992 18,824 27 22ALMENSA INVER 21, SIMCAV 24,320 25,560 7 14ALMORADIEL DE INVERSIONES, SIMCAV 12,680 17,760 26 6ALMU VALORES, SIMCAVF 23,800 23,872 0 2ALMUDENA INVERSIONES, SIMCAV 15,450 15,700 46 685ALMUNIA PATRIMONIO SIMCAVF 24,962 25,523 12 2,382ALNAMA STOCK SIMCAV 15,392 17,076 754 1,041ALOR CARTERA, SIMCAV 21,160 22,400 700 6,341ALPES 2000, SIMCAVF 22,126 27,754 2,171 1ALPRO CARTERA, SIMCAV 54,091 58,905 12,621 36,001ALRAYA DE INVERSIONES, SIMCAVF 26,560 27,040 7,073 1,373ALTAE GESTION, SIMCAV 44,520 18,915 1,628 3,519ALTAIS INVEST SIMCAV 1,880 2,400 27 12ALTEA 99, SIMCAV 9,075 9,748 88 125ALTEMAR INVERSIONES 99, SIMCAVF 17,880 17,360 105 57ALTOIS FINANCIERA SIMCAV 21,160 21,401 13 21ALTOMORO INVERSIONES, SIMCAV 20,434 20,915 10 22ALTRES XXI 34,950 35,750 16 3,991ALTUR INVERSIONES, SIMCAV 0 25,025 0 2 12/18/2003ALVAMAN INVERSIONES, SIMCAV 19,954 20,915 59 8ALVASIL DE INVERSIONES, SIMCAV 23,064 23,377 0 0AM68, SIMCAV 13,160 14,680 402 2AMA 899, SIMCAV 193,412 194,719 3,904 907AMADE VALORES, SIMCAV 0 24,401 0 58 06/13/2003
A.2.19.Secondary markets. Equities.Outcry market. Listed companies. 2003
2002 2003 2002 2003Companies
Capitalisation (at 31 Dec.) Annual trading Date of listing in2003 & other comments
Amounts in thousands of euros
(Continued)
(Continues over)

155
Annex 2: Secondary markets
(Continued)
(Continues over)
AMANITA CAESAREA INVERSIONES, SIMCAV 20,434 20,915 18 30AMARVI DE INVERSIONES, SIMCAV 17,484 17,845 8,108 327AMAZONIA INVERSIONES, SIMCAV 0 25,012 0 511 02/27/2003AMER 2000, SIMCAVF 2,789 2,909 1,811 717AMIC BOLSA SIMCAV 19,954 22,598 55 209AMICUS 2001, SIMCAV 24,864 25,747 3 242AMIEVA INVERSIONES, SIMCAVF 13,383 14,104 0 142AMISTRA GLOBAL, SIMCAV 29,396 32,192 1,492 7,524AMOLAP INVERSIONES, SIMCAVF 20,915 23,800 13 22AMOTESA INVERSIONES, SIMCAV 9,548 9,307 0 2AMPIL DE INVERSIONES, SIMCAV 23,220 23,400 35 34AMYMOD 02, SIMCAV 0 24,642 0 0 07/232003ANÁLISIS DE VALORES, SIMCAV 59,100 91,000 0 50ANÁLISIS Y GESTIÓN DE CARTERAS, SIMCAV 18,459 18,869 15 4ANARA INVERSIONES, SIM 2,960 2,800 59 113ANATECO INVERSIONES, SIMCAV 0 28,956 0 2,550 12/05/2003ANATOL INVERSIONES, SIMCAV 29,474 32,022 90 80ANAYEN FINANCE, SIMCAV 16,588 16,828 11 21ANBOMA FINANZAS E INVERSIONES, SIMCAV 24,149 26,613 0 0ANCHOR INVERSIONES, SIMCAV 0 24,291 0 154ANCORA CONDAL, SIMCAV 23,560 24,920 222 312ANDABO INVERSIONES SIMCAV 21,156 21,877 13 20ANDES INVESTMENTS SIMCAV SA 0 24,727 0 1,998 11/27/2003ANDROMEDA INVESTMENT, SIMCAV 21,200 21,950 332 6,055ANESGAR FREE, SIMCAV 27,080 27,320 13 29ANETO GLOBAL INVESTMENT SIMCAV 23,377 27,667 6 5ANGONZALSA, SIMCAV 25,964 26,445 13 22ANILLO INVERSIONES, SIMCAV 0 0 0 0ANMAPA INVERSIONES SIMCAV 0 24,772 0 0 03/24/2003ANOA FINANZAS, SIMCAV 18,752 18,511 10 363ANSOLA INVERSIONES, SIMCAV 0 0 0 0 12/30/2003ANTA DIVERSIFICACION, SIMCAV 34,323 39,066 1,663 471ANTA GESTION PATRIMONIAL, SIMCAV 16,354 16,354 769 262ANTA INTERNACIONAL INVERSION MOBILIARIA, SIM, 2,762 0 11 0ANTA TESORERIA, SIMCAV 0 24,762 0 3,480 04/28/2003ANTALYA 30,495 31,635 119 3,856ANTAT INVERSIONES 2000, SIMCAV 11,876 48,638 6,739 17ANTELI INVERSIONES SIMCAV 16,643 18,086 62 4ANTER 99, SIMCAV 11,503 11,804 786 74ANTIGUA COMPAÑIA TASTAVINS, SIMCAV 4,003 4,171 0 0ANTLIA INVESTMENT SIMCAV 20,675 22,838 1 1ANTOSERRA, SIMCAV 17,429 20,915 1 1ANTRESMA DE INVERSIONES, SIMCAV 21,717 22,879 2 1ANZARES INVERSIONES, SIMCAV 33,512 36,880 0 0ANZOBRE DE INVERSIONES 2001, SIMCAV 23,840 24,521 1 1APARELLADORS ACTIUS MOBILIARIS, SIMCAV 0 18,575 0 1APLINSA INVERSIONES, SIMCAV 0 25,243 0 3 06/11/2003APM 2001, SIMCAV 22,838 23,800 618 0APROIN 3000, SIMCAV 17,149 17,910 0 10APUS INVESTMENT SIMCAV 16,508 18,471 3 928AQUILA VALORES, SIMCAV 0 27,972 0 27 05/15/2003AQUILES INVERSIONES SIMCAV 24,321 24,682 188 455AQUINCUM, SIMCAV 0 25,964 0 22 03/10/2003ARAGÓN CINCO VILLAS, SIMCAV 20,371 21,012 362 784ARAGÓN TERCER MILENIO, SIMCAVF 19,609 20,812 631 405ARALAR DE INVERSIONES 60,800 62,000 24,244 2,259ARALUZ INVERSIONES, SIMCAV 0 26,445 0 22ARANGOI FINANCIERA, SIMCAV 16,588 17,069 11 22ARANJUEZ BOLSA, SIMCAV 217,592 287,580 40,931 47,415ARBACHU DE INVERSIONES, SIMCAV 18,519 23,906 5 55
A.2.19.Secondary markets. Equities.Outcry market. Listed companies. 2003
2002 2003 2002 2003Companies
Capitalisation (at 31 Dec.) Annual trading Date of listing in2003 & other comments
Amounts in thousands of euros
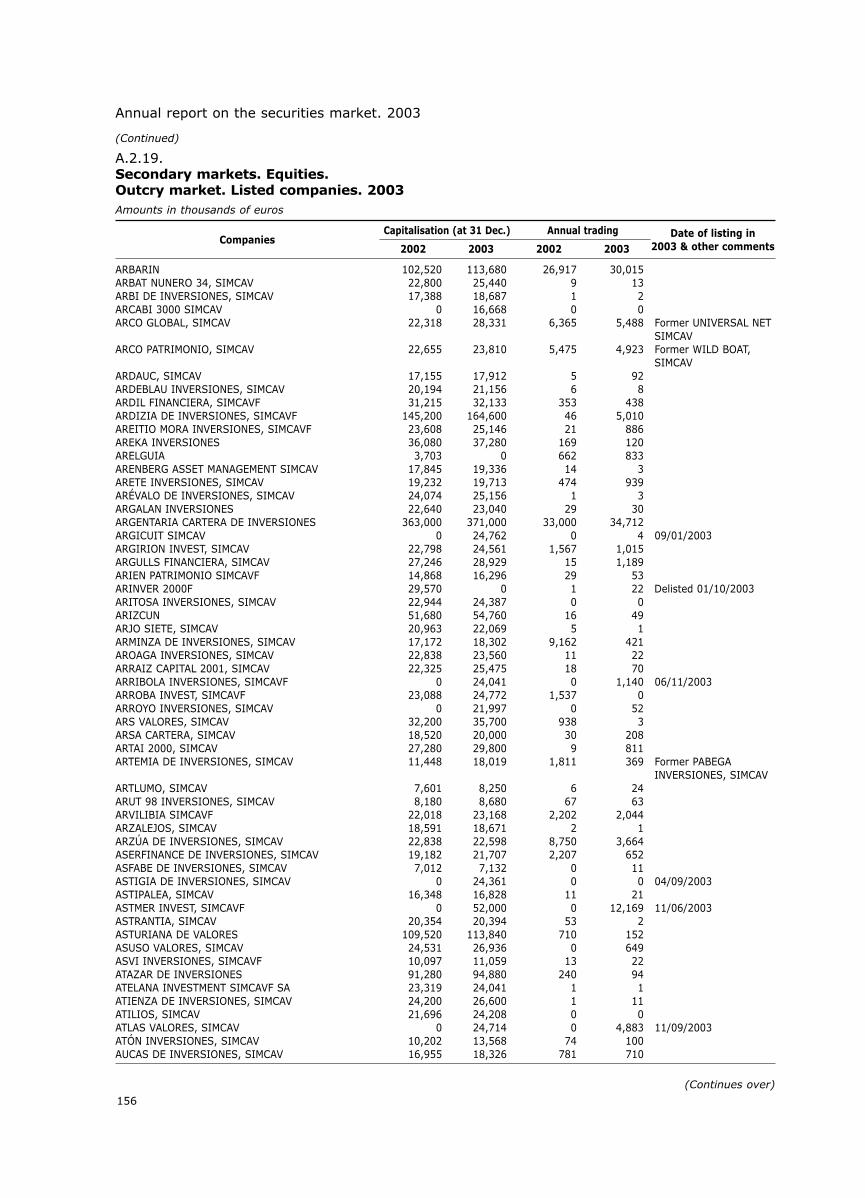
156
Annual report on the securities market. 2003
ARBARIN 102,520 113,680 26,917 30,015ARBAT NUNERO 34, SIMCAV 22,800 25,440 9 13ARBI DE INVERSIONES, SIMCAV 17,388 18,687 1 2ARCABI 3000 SIMCAV 0 16,668 0 0ARCO GLOBAL, SIMCAV 22,318 28,331 6,365 5,488 Former UNIVERSAL NET
SIMCAVARCO PATRIMONIO, SIMCAV 22,655 23,810 5,475 4,923 Former WILD BOAT,
SIMCAVARDAUC, SIMCAV 17,155 17,912 5 92ARDEBLAU INVERSIONES, SIMCAV 20,194 21,156 6 8ARDIL FINANCIERA, SIMCAVF 31,215 32,133 353 438ARDIZIA DE INVERSIONES, SIMCAVF 145,200 164,600 46 5,010AREITIO MORA INVERSIONES, SIMCAVF 23,608 25,146 21 886AREKA INVERSIONES 36,080 37,280 169 120ARELGUIA 3,703 0 662 833ARENBERG ASSET MANAGEMENT SIMCAV 17,845 19,336 14 3ARETE INVERSIONES, SIMCAV 19,232 19,713 474 939ARÉVALO DE INVERSIONES, SIMCAV 24,074 25,156 1 3ARGALAN INVERSIONES 22,640 23,040 29 30ARGENTARIA CARTERA DE INVERSIONES 363,000 371,000 33,000 34,712ARGICUIT SIMCAV 0 24,762 0 4 09/01/2003ARGIRION INVEST, SIMCAV 22,798 24,561 1,567 1,015ARGULLS FINANCIERA, SIMCAV 27,246 28,929 15 1,189ARIEN PATRIMONIO SIMCAVF 14,868 16,296 29 53ARINVER 2000F 29,570 0 1 22 Delisted 01/10/2003ARITOSA INVERSIONES, SIMCAV 22,944 24,387 0 0ARIZCUN 51,680 54,760 16 49ARJO SIETE, SIMCAV 20,963 22,069 5 1ARMINZA DE INVERSIONES, SIMCAV 17,172 18,302 9,162 421AROAGA INVERSIONES, SIMCAV 22,838 23,560 11 22ARRAIZ CAPITAL 2001, SIMCAV 22,325 25,475 18 70ARRIBOLA INVERSIONES, SIMCAVF 0 24,041 0 1,140 06/11/2003ARROBA INVEST, SIMCAVF 23,088 24,772 1,537 0ARROYO INVERSIONES, SIMCAV 0 21,997 0 52ARS VALORES, SIMCAV 32,200 35,700 938 3ARSA CARTERA, SIMCAV 18,520 20,000 30 208ARTAI 2000, SIMCAV 27,280 29,800 9 811ARTEMIA DE INVERSIONES, SIMCAV 11,448 18,019 1,811 369 Former PABEGA
INVERSIONES, SIMCAVARTLUMO, SIMCAV 7,601 8,250 6 24ARUT 98 INVERSIONES, SIMCAV 8,180 8,680 67 63ARVILIBIA SIMCAVF 22,018 23,168 2,202 2,044ARZALEJOS, SIMCAV 18,591 18,671 2 1ARZÚA DE INVERSIONES, SIMCAV 22,838 22,598 8,750 3,664ASERFINANCE DE INVERSIONES, SIMCAV 19,182 21,707 2,207 652ASFABE DE INVERSIONES, SIMCAV 7,012 7,132 0 11ASTIGIA DE INVERSIONES, SIMCAV 0 24,361 0 0 04/09/2003ASTIPALEA, SIMCAV 16,348 16,828 11 21ASTMER INVEST, SIMCAVF 0 52,000 0 12,169 11/06/2003ASTRANTIA, SIMCAV 20,354 20,394 53 2ASTURIANA DE VALORES 109,520 113,840 710 152ASUSO VALORES, SIMCAV 24,531 26,936 0 649ASVI INVERSIONES, SIMCAVF 10,097 11,059 13 22ATAZAR DE INVERSIONES 91,280 94,880 240 94ATELANA INVESTMENT SIMCAVF SA 23,319 24,041 1 1ATIENZA DE INVERSIONES, SIMCAV 24,200 26,600 1 11ATILIOS, SIMCAV 21,696 24,208 0 0ATLAS VALORES, SIMCAV 0 24,714 0 4,883 11/09/2003ATÓN INVERSIONES, SIMCAV 10,202 13,568 74 100AUCAS DE INVERSIONES, SIMCAV 16,955 18,326 781 710
A.2.19.Secondary markets. Equities.Outcry market. Listed companies. 2003
2002 2003 2002 2003Companies
Capitalisation (at 31 Dec.) Annual trading Date of listing in2003 & other comments
Amounts in thousands of euros
(Continued)
(Continues over)

157
Annex 2: Secondary markets
(Continued)
(Continues over)
AÚREO INVERSIONES 2,640 2,808 3 41AURIGA CAPITAL, SIMCAV 20,440 21,320 44 185AURIGA INVESTMENT, SIMCAV 26,750 27,600 111 4AURRECHE INVERSIONES, SIMCAV 24,281 25,002 11 20AUTÍN INVERSIONES, SIMCAVF 0 40,800 0 9 04/28/2003AVAL DE INVERSIONES, SIMCAV 0 26,696 0 136 10/27/2003AVALLE AHORRO, SIMCAVF 22,215 22,616 0 0AVEJA INVERSIONES, SIMCAV 0 12,480 0 3 10/27/2003AVIA INVERSIONES, SIMCAV 24,441 24,962 13 319AVILUGAM, SIMCAV 15,681 18,494 2,180 475AVOLATIL DE INVERSIONES SIMCAV 21,886 23,329 0 0AVONDALE, SIMCAV 0 25,200 0 13 06/02/2003AVORIAZ INVERSIONES, SIMCAV 19,136 20,963 23 49AYEDO DE INVERSIONES, SIMCAV 19,312 19,697 0 0AYNASA, SIMCAV 18,062 20,996 681 97AYORA PARTICIPACIONES, SIMCAV 12,799 13,288 621 57AYUA INVERSIONES, SIMCAVF 101,850 86,250 0 34,405AZAGRA INVERSIONES, SIMCAV 9,977 10,458 94 958AZAHAR ORANGE INVERSIONES, SIMCAV 24,320 25,400 608 14AZAREN INVERSIONES, SIMCAV 21,958 21,910 0 2AZEVREC, SIMCAV 14,000 14,880 194 2,841AZORÍN INVERSIONES, SIMCAV 10,600 11,460 2,489 43AZSEVI INVERSIONES, SIMCAV 0 24,521 0 6,000AZVERCA DE INVERSIONES, SIMCAV 24,840 28,160 122 3,600 Former VINCKE
INVESTMENTS, SIMCAVB&B DE VALORES, SIMCAV 4,888 5,528 27 22BABUTA INVEST SIMCAV 10,050 10,710 2,403 0BACESA DE INVERSIONES, SIMCAV 21,156 23,319 13 25BACKGROUND INVERSIONES, SIMCAV 3,440 3,959 294 522BACOARA 21, SIMCAV 21,156 21,636 11 22BAFOR INVERSIONES, SIMCAV 0 23,880 0 665BAGAL CARTERA, SIMCAV 17,172 18,350 0 0BAHAUS INVESTMENT, SIMCAVF 0 25,243 0 1 10/04/2003BAIMOBEL LINE, SIMCAV 20,680 21,840 2,836 69BAJOMIR DE INVERSIONES, SIMCAV 13,901 17,003 1 2BALAGUER 98 DE INVERSIONES, SIMCAV 15,840 16,480 1,227 2,054BALAITUS INVERSIONES, SIMCAV 60,702 63,707 27 22BALAYO INVERSIONES, SIMCAV 39,942 40,824 31,319 54BALEAR AHORRO, SIMCAV 36,277 39,162 8,991 18,219BALEARES TERCER MILENIO, SIMCAV 15,559 16,962 785 25BALEMA INVERSIONES SIMCAV 24,601 24,962 707 157BALGAR INVEST, SIMCAV 7,816 7,816 0 0BALINCO DE INVERSIONES, SIMCAV 20,955 21,476 2 1BALINVEST PREMIUM, SIMCAV 0 0 0 0 05/12/2003BALLESTEROS FINANZAS, SIMCAV 52,288 21,160 13 20BAMBÚ 2001 DE INVERSIONES, SIMCAV 23,834 24,651 0 0BANCAJA GESTION 112,000 127,000 7,226 1,868BANCOMERCIO AHORRO I 19,560 20,440 175 14BANDESCO GLOBAL 52,820 109,560 3,181 86,721 Former BANESTO BANCAPRIVADA GLOBALBANDESCO INVERSIONES 87,800 88,700 7,868 72,542 Former BANESTO BANCA
PRIVADA INVERSIONESBANESTO CEUTA Y MELILLA 25,600 26,080 162 1,260BANKAL INVERSIONES 98, SIMCAV 18,520 19,960 608 206BANKINTER DE INVERSIONES 7,415 7,055 0 0BANSALIBER 134,746 0 2,670 1,619 Delisted 11/17/2003BANSAPA 24,600 25,480 35 20BANSODAD 30,288 96,944 3 6BAÑEZA DE INVERSIONES, SIMCAV 16,619 17,268 1 37BAPUSA INVERSIONES, SIMCAVF 23,319 25,243 2,607 1,380
A.2.19.Secondary markets. Equities.Outcry market. Listed companies. 2003
2002 2003 2002 2003Companies
Capitalisation (at 31 Dec.) Annual trading Date of listing in2003 & other comments
Amounts in thousands of euros

158
Annual report on the securities market. 2003
BARASONA DE INVERSIONES SIMCAVF SA 19,208 23,007 446 54BARBATE DE INVERSIONES, SIMCAV 17,364 17,340 0 1BARCAPITAL SIMCAV 26,125 29,150 339 125BARCELONA BLACK KNIGHTS 2002, SIMCAV 27,947 34,510 2,176 74BARCLAYS PREMIER ACCIONES, SIMCAV 16,040 19,520 1,562 749BARCLAYS PREMIER DIVERSIFICADA, SIMCAV 21,440 24,280 474 5,637BARGAS INVERSIONES FINANCIERAS, SIMCAV 18,040 18,640 195 12BARGELD SIMCAV 20,212 20,753 1,044 697BARIA ASSET MANAGEMENT, SIMCAVF 14,622 15,392 5,206 1,435BARIGUA, SIMCAV 38,100 40,260 178 40BARLOVENTO DE INVERSIONES MOBILIARIAS, SIMCAV 24,040 25,874 3,130 1,085BARNAMOLINS, SIMCAV 25,450 27,250 218 1BARNEVAL INVERSIONES, SIMCAV 21,040 21,800 115 31BARRA ALTA, SIMCAV 20,002 20,338 24 3,005BARRANCO 2000, SIMCAV 21,156 21,636 1,436 1,414BARRARO 23,418 23,940 331 28BASARTE 3,724 29,658 12 30BASASIM INVERSIONES, SIMCAV 17,550 18,030 3,051 518BASE RIOJA 2, SIMCAV 15,876 19,365 1 426BASEN INVESTMENT, SIMCAV 14,102 17,226 1,095 206BATFAM INVERSIONES 2000, SIMCAV 18,359 19,553 21 22BAYAHIBE CAPITAL, SIMCAV 21,164 21,741 21 29BBVA ARAGON, SIMCAV 137,500 146,500 6,220 5,784BBVA CARTERA, SIMCAV 267,301 289,859 34,326 32,251BBVA CATALANA CARTERA, SIMCAV 91,600 98,800 4,681 2,859BBVA CEME INVERSIONES, SIMCAV 55,530 63,180 1,306 458BBVA PRIVANZA 25 CARTERA, SIMCAV 116,400 125,200 2,760 14,931BBVA PRIVANZA 50 CARTERA, SIMCAV 100,400 109,800 8,069 3,024BBVA PRIVANZA 75 CARTERA, SIMCAV 85,200 94,000 3,624 2,169BEACON GROWTH INVESTMENTS, SIMCAV 18,605 20,630 3 2BECARMON DE INVERSIONES, SIMCAV 21,621 22,150 1 0BECRIGO, SIMCAV 0 37,140 0 3,325 06/27/2003BEDINVER INTERNACIONAL, SIMCAV 19,986 20,539 2 0BEFINSER, SIMCAVF 0 36,953 0 1 03/14/2003BEGOINVEST DE INVERSIONES, SIMCAV 0 31,890 0 3 11/27/2003BEJUVIAL, SIMCAV 21,280 22,760 636 123BELATLANS, SIMCAV 25,000 25,520 27 36BELEÑA INVERSIONES, SIMCAV 21,476 21,677 20 7BELGRAVIA BETA, SIMCAV 41,301 47,706 3,633 10,042 Former EURO
INVERSIONES XXI SIMCAVBELGRAVIA DELTA, SIMCAV 26,757 25,146 2,090 1,673 Former EURO DELTA
XXI SIMCAVBELORADO AHORRO, SIMCAV 15,314 20,555 600 631BEMASA INVERSIONES, SIMCAV 94,950 97,500 38 243BENARRABA DE INVERSIONES, SIMCAV 16,138 16,065 1 1BENAZAIRE INVERSIONES 2000, SIMCAV 7,609 7,416 49 203BENCARPO, SIMCAV 19,930 20,555 1,811 66BENCAVA INVERSIONES, SIMCAV 18,903 20,106 25 26BERCIAL INVERSIONES, SIMCAV 18,992 19,473 16 21BERDOS INVERSIONES, SIMCAV 21,877 22,358 10 22BERGELL SOCIEDAD DE CARTERA, SIMCAVF 0 24,895 0 4 07/18/2003BERMAN INVERSIONES FINANCIERAS, SIMCAV 0 23,575 0 812 06/03/2003BERPARLA INVERSIONES, SIMCAV 21,680 22,640 36 1,792BERZOSA DE INVERSIONES 6,588 6,462 4 990BESSER INVERSIONES 26,200 27,280 226 1,159BESTER ZINS, SIMCAV 20,386 21,612 794 2BETA FONDOS INTERNACIONAL 24,400 26,480 2,986 638BETA TECH INVERSIONES SIMCAV 31,750 33,625 3,191 1,432BETEL INVESTMENT, SIMCAV 20,875 21,797 3 4BETUS INVERSIONES, SIMCAV 14,665 16,011 30 52
A.2.19.Secondary markets. Equities.Outcry market. Listed companies. 2003
2002 2003 2002 2003Companies
Capitalisation (at 31 Dec.) Annual trading Date of listing in2003 & other comments
Amounts in thousands of euros
(Continued)
(Continues over)

159
Annex 2: Secondary markets
(Continued)
(Continues over)
BEXCARTERA 131,040 123,840 2,117 14BI GRAN PREMIERE, SIMCAV 16,949 17,309 538 231BI PREMIERE, SIMCAV 20,400 20,800 466 243BICHAR DE INVERSIONES FINANCIERAS, SIMCAV, S 21,080 21,920 1,404 7BIERZO 99 DE INVERSIONES, SIMCAV 12,722 14,791 1 1BIFERO 49,260 55,080 3,950 3,116BILBAO ELCANO INVERSIONES SIMCAV 16,645 0 719 0BILBAO EQUITY, SIMCAV 20,240 20,920 0 1BILUTOR 3,960 4,320 1,066 1,655BINITAREF, SIMCAV 15,554 15,867 47 50BINITERM CARTERA, SIMCAVF 0 29,990 0 19 09/01/2003BIRIGARRO, SIMCAV 12,626 14,021 19 17BITACORA DE VALORES, SIMCAV 22,198 24,194 326 10BIZCOCHERO INVERSIONES, SIMCAV 0 24,569 0 58 08/04/2003BLACADER CAMINOS SIMCAV 0 24,880 0 2 05/29/2003BLACK-SCHOLES, SIMCAV 8,655 8,895 97 52BLOPA INVESTIMENT, SIMCAV 19,954 20,627 17 49BLUE CHIP INVERSIONES 1,160 0 18 0 Delisted 04/06/2003BLUE DOVE INVERSIONES, SIMCAV 42,119 47,600 765 515BLUE SEA CARTERA, SIMCAV 21,492 23,319 103 73BMS BLUE CHIPS, SIMCAV 29,200 30,800 2 1BMS CARTERA, SIMCAV 52,300 54,900 30 1BOCCACCIO PLAYA, SIMCAV 0 0 0 0BOGEY INVERSIONES, SIMCAV 19,473 20,194 18 262BOI DE INVERSIONES SIMCAV 20,154 21,260 0 1BOJ INVESTMENT, SIMCAV 16,307 18,631 3 3BOLINVER 2,700 2,813 3,154 14BOLSA ACTIVA, SIMCAV 0 22,558 0 800BOLSA INTEGRAL SIMCAV 37,700 40,200 841 1BOLSA MIXTA SIMCAVF 45,300 45,900 4,006 4,771BOLSA TRANSOCEANICA, SIMCAV 6,400 6,496 0 1BOLSADUERO, SIMCAV 8,040 8,490 252 1,329BOLSAGAR 0 0 0 0BOLSAID INVERSIONES 27,120 29,080 295 1,732BOLSHISPANIA 49,600 54,400 17 464BOLSIBER 4,017 2,500 393 1BOMBAY INVESTMENT OFFICE 12,520 13,360 4 18BOND EQUITY, SIMCAV 25,500 28,750 962 19BOND INVERSIONES 16,420 17,100 52 853BONDARRIBI INVESTMENTS, SIMCAV 24,680 26,880 3 3BONINSA BOLSA, SIMCAV 11,080 13,080 2,689 25BOOM CAPITAL, SIMCAV 0 24,441 0 2,833 03/24/2003BOOMING INVERSIONES 10,260 10,580 176 421BOOTES INVESTMENT SIMCAVF 16,187 16,828 3 1,901BORACMO 6,250 0 120 73 Delisted 04/12/2003BORAU INVERSIONES, SIMCAV 22,237 24,617 1,504 1,955BORDOLIQUE, SIMCAV 23,096 21,996 483 1,301BORDONAL INVERSIONES, SIMCAVF 19,962 21,356 49 6,903BORIZO DE INVERSIONES, SIMCAV 18,520 19,440 17 223BOSFORO INVERSIONES, SIMCAV 0 30,291 0 8,998 05/29/2003BOTILAN INVER 5 SIMCAV 22,800 24,120 602 12BOTINO INVERSIONES , SIMCAV 15,633 16,114 11 22BOTTOM UP INVERSIONES, SIMCAV 21,429 23,617 21 1,504BOURDET INVERSIONES, SIMCAV 0 25,108 0 0 01/27/2003BOUSQUET INVERSIONES, SIMCAVF 0 0 0 0 09/12/2003BOVILA DE INVERSIONES, SIMCAV 17,941 18,927 878 0BOYSEP INVESTMENT SIMCAV 13,198 16,203 1,212 1BRAININVEST SIMCAV 20,635 21,156 2 1BRANCH DE INVERSIONES SIMCAV 4,560 4,864 100 100BRARIOS-3, SIMCAV 23,761 24,291 4,184 40
A.2.19.Secondary markets. Equities.Outcry market. Listed companies. 2003
2002 2003 2002 2003Companies
Capitalisation (at 31 Dec.) Annual trading Date of listing in2003 & other comments
Amounts in thousands of euros

160
Annual report on the securities market. 2003
BRASILITO SIMCAV 21,877 22,334 13 948BREIXO INVERSIONES SIMCAV 298,800 316,800 50,005 0BRENT INVERSIONES, SIMCAV 0,400 10,860 2 886BRIMO DE INVERSIONES 0 0 0 0BRISEIDA DIVERSIFICADA, SIMCAV 9,620 8,778 3 1BROKREUS 7,000 0 1,045 26 Delisted 04/12/2003BROSNA, SIMCAV 22,280 23,240 4 3,206BRUNARA 369,950 400,050 41,180 32,497BRUNO 2000 DE INVERSIONES SIMCAV 38,160 39,168 2 0BS INVERSIONES 97, SIMCAV 21,588 22,470 79 56BSA FINANZAS, SIMCAV 19,640 20,440 103 213BSN ELITE 10-30,SIMCAV 22,919 23,960 2,456 949BSN ELITE 30-50, SIMCAV 24,726 26,258 579 1,886BSN ELITE 50-70, SIMCAV 22,794 24,364 256 280BSN ELITE 70-90, SIMCAV 13,783 15,346 336 338BUCALLAR SIMCAV 10,145 10,854 55 68BUCLE INVERSOR, SIMCAVF 23,560 24,257 1,518 803BUDULAQUE ALDAMA, SIMCAV 17,629 18,446 656 86BUENAVISTA FOG INVERSIONES, SIMCAV 20,120 20,920 5 3,009BUENBAS INVERSIONES SIMCAV 16,348 19,473 25 241BUENDÍA DE INVERSIONES 44,080 45,800 5 31BUJARA DE INVERSIONES, SIMCAV 18,013 17,244 140 0BULK INVERSIONES, SIM 3,080 3,190 32 13BULL INVEST 19,420 21,820 475 1,341BURBIA-99 DE INVERSIONES, SIMCAV 11,219 13,302 0 2,349BURMAS INVERSIONES, SIMCAV 22,317 22,775 335 595BURPLAN, SIMCAV 15,320 14,574 2 0BURSATIL 2000, SIMCAV 25,450 24,350 1,863 1,149BUSMONDO 3,080 4,860 1 20BUSSOLA 99, SIMCAV 16,931 15,753 2 1BUTAL INVERSIONES, SIMCAV 0 24,521 0 9 02/04/2003C&S PAMEL INVERSIONES, SIMCAV 15,686 15,867 10 21CABDAL INVERSIONES, SIMCAV 23,079 23,560 11 21CABMAR DE INVERSIONES, SIMCAV 17,941 19,360 1 2CABORIA INVERSIONES, SIMCAV 0 30,952 0 49 01/27/2003CADI VALORES, SIMCAV 12,266 13,468 57 97CADOGAN 37, SIMCAV 24,040 25,200 6 14CAELU INVESTMENT SIMCAV 32,022 34,474 3 1,737CAESAR IMPERATOR I, SIMCAV 11,160 11,720 0 0CAIXA CASTILLA Y LEON, SIMCAV 24,521 25,082 2,789 782CAIXA GLOBAL, SIMCAV 0 24,561 0 6,189 03/26/2003CAIXA INVERSIONES 1, SIMCAV 52,600 53,400 3,950 3,248CAIXA TERRASSA RF, SIMCAV 0 208,000 0 63,985 03/25/2003CAIXA TERRASSA VIDA 1, SIMCAV 0 36,210 0 311 06/18/2003CAIXASABADELL INVEST, SIMCAV 13,050 13,950 901 521CAJALUNA INVERSIONES, SIMCAVF,SA 25,002 25,483 11 1,206CAJARIOJA INVERSION, SIMCAV 20,850 21,800 1,097 453CALACONTA DE INVERSIONES, SIMCAV 20,154 21,717 866 830CALAINVEST-98, SIMCAV 11,160 11,740 0 13CALAIS DE INVERSIONES SIMCAV 17,364 19,288 522 4CALANISA, SIMCAV 17,838 18,776 5 2CALCEDONIA, SIMCAV 17,640 19,320 3 31CALIMA INVEST, SIMCAV 19,393 19,753 27 22CALLAL INVERSIONES, SIMCAV 13,523 13,974 11 22CAMABI VALORES, SIMCAV 14,424 16,828 12 196CAMBRIDGE AVENUE INVERSIONES SIMCAV 22,838 23,800 199 388CAMELLE INVESTMENT, SIMCAV 34,558 37,203 8,042 11,202CAMERFRAN, SIMCAV 19,480 20,103 0 4CAMINO PASTORA, SIMCAV 10,307 10,758 12 20CAMPO DE ORO INVERSIONES, SIMCAV 19,713 21,156 11 11CAMPOSENA, SIMCAV 20,130 20,707 3 0
A.2.19.Secondary markets. Equities.Outcry market. Listed companies. 2003
2002 2003 2002 2003Companies
Capitalisation (at 31 Dec.) Annual trading Date of listing in2003 & other comments
Amounts in thousands of euros
(Continued)
(Continues over)

161
Annex 2: Secondary markets
(Continued)
(Continues over)
CAN VENTURA INVERSIONES, SIMCAV 24,521 24,762 11 21CAN WK FIN SIETE SIMCAV 0 25,203 0 48CAN XULINO, SIMCAV 24,281 25,747 45 66CANALES 2001 SIMCAV 22,175 23,258 3 0CANARIAS AHORRO, SIMCAV 36,349 39,234 5,931 6,431CANAY DE INVERSIONES, SIMCAV 17,844 21,231 153 77CANEELTOO INVESTMENTS, SIMCAV 22,944 23,930 58 321CANET DE INVERSIONES, SIMCAV 0 24,281 0 6 12/05/2003CANIGO INVERSIONES SIMCAVF 17,870 18,511 1,866 11CÁNOVAS 98, SIMCAV 30,700 35,099 501 2,498CANSILU, SIMCAV 23,103 23,992 61 77CANTALAPIEDRA INVERSIONES, SIMCAV 21,108 21,733 157 129 Former DELTA INVERSIO-
NES BURSATILES, SIMCAVCANTO ASTIAL INVERSIONES, SIMCAV 14,640 17,040 118 1CANTUESO INVERSIONES, SIMCAV 16,687 18,491 780 477CANYAMEL INVERSIONES, SIMCAV 35,159 36,602 7,000 4,941CAPCHICOT, SIMCAV 22,767 24,113 1 2CAPDAMUNT INVERSIONES, SIMCAV 22,838 23,560 10 22CAPGESA 2,855 2,855 5 7CAPILOPA, SIMCAV 22,310 23,560 65 74CAPINVER 1,204 0 181 0CAPITAL 18 BR, SIMCAVF 9,280 8,244 496 367CAPITAL LANGENBURG, SIMCAVF 0 24,642 0 1 02/04/2003CAPITAL MEP 23,080 25,520 37 761CAPITAL PAV 21,600 24,320 38 59CAPITAL PENEDES MIXT, SIMCAV 34,680 40,260 42 334CAPITAL XXI INVERSIONES, SIMCAVF 14,016 14,352 1,176 14CAPITALZA 10,480 10,780 7 829CAPPA Y LAMDA, SIMCAV 0 50,500 0 2,127 09/10/2003CAPQUERS INVERSIONES, SIMCAVF 11,299 12,982 2,010 22 Former ESCRITURA
INVERSIONES, SIMCAVCAR 2000 INVERSIONES MOBILIARIAS, SIMCAV 22,838 24,762 5 1CAR 2003 INVERSIONES MOBILIARIAS, SIMCAV 0 24,161 0 42 01/08/2003CARAMA DE INVERSIONES, SIMCAV 18,960 20,280 26 4CARAUNA INVERSIONES, SIMCAVF 15,626 16,131 98 73CARBAR 2002, SIMCAV 0 24,170 0 0 07/21/2003CARBONERA MOBILIARIA SIMCAV 18,831 19,745 49 531CARCANTI, SIMCAV 20,915 22,358 25 22CARDIEL DE INVERSIONES, SIMCAV 19,840 20,200 1 3CARFY 20,867 24,304 200 1,360CARHEBAPE 1 10,005 0 6 0 Delisted 11/11/2003CARINA INVESTMENT, SIMCAVF 16,267 16,949 269 9CARISA INVERSIONES, SIMCAV 22,310 25,074 4,420 959CARIVEGA DE INVERSIONES SIMCAV 24,266 25,204 2 971CARO INVERSIONES, SIMCAVF 20,400 20,160 72 65CAROLA 2000, SIMCAV 16,360 15,880 1 7CARPE DIEM INVESTMENT, SIMCAV 17,333 18,463 27 22CARRAN DE INVERSIONES, SIMCAV 38,150 39,750 3 2CARRASPIENTES SIMCAVF 23,011 23,251 526 138CARRIEDO, SIMCAV 25,002 25,964 151 206CARTEALAR, SIMCAV 41,161 43,264 11 4,183CARTEBANC 7,716 29,511 1,623 540CARTERA 100, SIMCAV 16,027 15,506 524 1,751CARTERA 2M5, SIMCAVF 16,508 16,828 57 50CARTERA 30, SIMCAV 24,240 24,560 7 7,480CARTERA ALARCOS, SIMCAV 34,580 39,195 75 76CARTERA ALFABIA SIMCAV 23,840 24,561 6,718 10,894CARTERA ALHAMAR SIMCAV SA 0 37,140 0 41 11/03/2003CARTERA ASEGURADORA 23,220 24,085 399 248CARTERA BASEIBAR 66,769 68,069 1,515 6,422CARTERA BELLVER 4, SIMCAV 18,111 19,313 539 81
A.2.19.Secondary markets. Equities.Outcry market. Listed companies. 2003
2002 2003 2002 2003Companies
Capitalisation (at 31 Dec.) Annual trading Date of listing in2003 & other comments
Amounts in thousands of euros

162
Annual report on the securities market. 2003
CARTERA BELLVER 5, SIMCAV 15,266 17,670 581 69CARTERA BELLVER 7, SIMCAV 18,992 19,152 540 4,866CARTERA BELLVER, SIMCAV 25,600 27,960 4,306 15,744CARTERA CABRERA SIMCAV 21,356 22,598 6,301 14,163CARTERA CALOBRA 2 SIMCAV 23,279 23,640 2,759 2,300CARTERA CALOBRA 3, SIMCAV 25,563 25,803 113 112CARTERA CALOBRA 4, SIMCAV 25,603 25,844 113 113CARTERA CALOBRA SIMCAV 22,838 24,922 689 222CARTERA CRESA, SIMCAV 13,222 16,828 4 4CARTERA DABERNI, SIMCAV 21,741 22,799 2 30CARTERA DANOA, SIMCAV 0 25,160 0 19 03/03/2003CARTERA DE ACCIONES - TACISA - 62,140 68,380 31 43CARTERA DE INVERSION BURSATIL, SIMCAV 5,329 5,890 1 0CARTERA DE INVERSIONES ERTIS, SIMCAV 21,997 21,957 1,405 3CARTERA DE INVERSIONES INVERGAL, SIMCAV 14,865 14,945 157 36CARTERA DE INVERSIONES SG4, SIMCAV 14,010 14,010 10 22CARTERA DE VALORES IAF, SIMCAV 18,920 20,280 30 32CARTERA DELFI 92,400 102,600 4,807 13,062CARTERA DELFI 2 27,800 75,600 1,346 5,114CARTERA DRAGONERA SIMCAV 25,643 25,964 114 7,616CARTERA EMPORDA 2000, SIMCAV 14,190 15,248 54 150CARTERA EUTOPÍA, SIMCAV 0 28,248 0 339 11/08/2003CARTERA EXTRAMUN, SIMCAV 23,560 24,640 1,048 87 06/11/2003CARTERA GALATIFE, SIMCAV 20,579 21,492 823 2,493CARTERA GLOBAL, SIMCAV 19,521 20,461 481 18CARTERA INTEGRAL, SIMCAVF 9,120 93,400 920 6CARTERA INVERONIA, SIMCAV 25,320 29,800 39 44CARTERA INVERSORA DEL EBRO, SIMCAV 21,800 23,920 2,474 22CARTERA KAMINSKI SIMCAV 20,635 21,621 118 148CARTERA KEFREN, SIMCAVF 22,117 24,041 2,261 5,943CARTERA LD 78 SIMCAV 18,086 18,519 254 25CARTERA MACAM, SIMCAV 19,593 21,276 93 88CARTERA MAEN, SIMCAVF 0 25,243 0 1,800CARTERA MENDIBILE, SIMCAV 19,673 20,715 22 13CARTERA MILLENNIUM, SIMCAV 10,738 26,499 648 179CARTERA MOBILIARIA - CARMOSA - 149,370 472,210 1,806 20,238 03/11/2003CARTERA MUDEJAR, SIMCAV 0 28,087 0 400 11/03/2003CARTERA MUNDIAL, SIMCAV 12,020 11,099 318 1,629CARTERA MUSA, SIMCAV 23,848 21,444 7,792 1,293CARTERA OPTURSA, SIMCAV 23,740 26,745 129 236CARTERA PIRINEO 4,240 5,480 655 445CARTERA ROIS, SIMCAV 20,000 22,560 32 63CARTERA SERTORIO, SIMCAV 25,964 29,570 141 345CARTERA SUROESTE, SIMCAV 17,840 19,000 31 30CARTERA TRAMO I, SIMCAV 0 22,942 0 3CARTERA URQUIJO 2, SIMCAV 34,343 36,556 12,951 4,455CARTERA URQUIJO, SIMCAV 22,040 23,480 8,267 4,002CARTERA VILADECANS SIMCAV 0 27,262 0 112 11/26/2003CARTERA XEITOSIÑA, SIMCAV,SA 0 24,435 0 305CARTESOR, SIMCAV 26,394 22,037 27 23CASA-SANZ SIMCAV 18,030 20,434 0 0CASAYU INVERSIONES SIMCAV 26,600 27,650 74 1CASIGRAMA INVERSIONES, SIMCAV 24,906 25,868 8,623 110CASIVIDA, SIMCAV 18,319 19,857 178 1,376CASSIOPEIA INVESTMENT, SIMCAV 19,353 19,272 2,737 4CASTALIA AHORRO, SIMCAV 13,943 15,626 1,131 1,215CASTEINVER 0 54,376 0 4CASTEPLAN-12, SIMCAV 34,456 33,194 0 8,565CASTLEWOOD, SIMCAV 21,810 21,481 18 2,198CASVA DE INVERSIONES, SIMCAV 24,642 24,561 80 301
A.2.19.Secondary markets. Equities.Outcry market. Listed companies. 2003
2002 2003 2002 2003Companies
Capitalisation (at 31 Dec.) Annual trading Date of listing in2003 & other comments
Amounts in thousands of euros
(Continued)
(Continues over)

163
Annex 2: Secondary markets
(Continued)
(Continues over)
CAT PATRIMONIS, SIMCAV 30,360 37,080 7,129 3,630CATAFIM, SIMCAV 0 24,081 0 7 06/16/2003CATAY INVESTMENT, SIMCAV 23,079 25,483 1,603 1,521CATIMSA 16,920 17,610 127 4,018CATOC 40,553 44,903 775 4,240CAULES DE INVERSIONES, SIMCAV 27,680 26,040 2 8CAVER CRESPI, SIMCAV 23,728 24,666 31 64CAVOLO INVERSIONES, SIMCAV 23,439 23,271 3,642 5,458CBH GLOBAL, SIMCAVF 19,600 20,750 35 25CCR INVEST 2001 SIMCAV SA 11,304 11,785 0 0CEBAL INVERSIONES, SIMCAV 20,603 21,420 417 7,125CEBEMAR DE INVERSIONES SIMCAV 23,569 24,002 1 0CEIBA INVERSIONES, SIMCAVF 22,029 23,164 728 3CELEBES INVERSIONES, SIMCAV 23,079 23,319 161 314CENTAURUS 2002, SIMCAV 0 25,600 0 3,614 03/07/2003CENTRAL DE INVERSIONES EN VALORES - CEIVASA - 101,068 0 2,004 1,596 Delisted 11/08/2003CENTRAL DE VALORES - CEVALSA - 81,000 97,200 2,516 587CERAL 2000 INVERSIONES, SIMCAV 0 0 0 0CERALF INVERSIONES, SIMCAV 24,441 24,481 91 5CERES INVERSIONES, SIMCAV 26,000 27,720 77 83CETUS INVERSIONES, SIMCAV 27,250 28,150 72 71CF GENERAL DE INVERSIONES FINANCIERAS, SIMC 9,568 10,001 3 0CHAGABER, SIMCAV 21,156 20,675 11 21CHAMBERTIN, SIMCAV,S A 21,877 23,800 13 22CHART INVERSIONES 160,020 181,610 36 315CHERAC 2000 SIMCAV 15,338 16,660 109 1,616CHERSA 2001, SIMCAV 0 24,762 0 17 03/13/2003CHERSA 2002, SIMCAVF 0 26,204 0 637 11/032003CHERSWIT, SIMCAV 9,420 9,700 75 32CHESTER INVESTMENTS, SIMCAV 8,775 9,256 32 617 Former BARBADOS
INVERSIONES, SIMCAVCHIA INVERSIONES XXI SIMCAVF 22,838 23,560 4,995 0CHISPUM INVERSIONES, SIMCAV 0 26,685 0 8 09/16/2003CHIVILCOY INVERSIONES, SIMCAV 10,738 12,601 0 14CHORRONTON INVERSIONES, SIMCAV 23,920 24,281 66 3,250CHOWPATTY, SIMCAV 22,382 23,151 5 55CHULAPICO, SIMCAV 24,050 25,012 0 0CIFUENTES DE INVERSIONES SIMCAV 18,855 19,216 1 1CIGARRAL DE INVERSIONES, SIMCAV 22,703 23,473 5 0CIGNUS VALORES, SIMCAVF 16,321 17,524 0 529CILAR INVERSIONES, SIMCAV 21,637 22,598 15 20CIMBALARIA, SIMCAV 4,394 4,639 534 854CINAMON INVESTMENT, SIMCAV 0 24,500 0 1CININVER FINANZAS, SIMCAV 48,181 49,383 13 27CISEVI INVERSIONES, SIMCAV 0 24,387 0 10 02/05/2003CJ PROFIT SIMCAV 25,483 24,762 997 17,167CJ TRADITIONAL, SIMCAV 28,608 28,608 692 2,409CLARA INVERSIONES SIMCAV 0 24,561 0 0 06/30/2003CLARIANO DE INVERSIONES, SIMCAV 20,467 21,068 2 2,175CLAROL INVERSIONES, SIMCAV 24,281 24,762 10 1,396CLAVIJO INVERSIONES, SIMCAV,SA 26,402 27,917 12,948 1,538CLEAR INVERSIONES 6,560 6,560 171 174CLEOMER, SIMCAV 17,920 73,200 16,885 26CLINVER GESTIÓN PATRIMONIAL SIMCAV 19,016 21,156 0 19CLOVELLY INVESTMENT, SIMCAV 21,196 21,957 1,279 4CLUB BANCOMERCIO CIBELES 26,320 29,720 671 1,461CLYTES-2001, SIMCAV 22,406 24,065 1 2CMA GLOBAL 1999, SIMCAVF 23,720 23,680 1,616 6,753CMA GLOBAL 2000, SIMCAVF 20,915 22,798 33 9,403CMA GLOBAL INVESTMENTS, SIMCAV 21,997 56,796 33 5
A.2.19.Secondary markets. Equities.Outcry market. Listed companies. 2003
2002 2003 2002 2003Companies
Capitalisation (at 31 Dec.) Annual trading Date of listing in2003 & other comments
Amounts in thousands of euros

164
Annual report on the securities market. 2003
COANTISA INVERSIONES, SIMCAV 18,800 19,720 30 31COBATILLA INVERSIONES, SIMCAV 24,160 25,320 806 14COBOS EMPRESAS REUNIDAS, SIMCAV 23,689 24,411 760 9,005COKEFIN 99, SIMCAVF 17,400 18,500 0 17COLEVI INVERSIONES, SIMCAV 11,900 12,501 12 22COLIGAR DE VALORES, SIMCAV 14,190 16,787 6 3COLLBATO INVEST, SIMCAVF 8,500 8,580 31 21COLUMBUS INVERSIONES 2000, SIMCAV 25,513 20,483 228 4,708COMEBACK CONSULTANCY, SIMCAVF 34,618 37,503 12 4,673COMERMATICA-KABAKH, SIMCAV,SA 30,195 28,897 76 505COMPAÑÍA DE INVERSIONES ANAIL, SIMCAV 15,160 15,880 24 25COMPASS INVERSIONES, SIMCAV 20,322 31,878 3,930 5,476COMPETITIVE INVESTMENT, SIMCAV 0 24,579 0 0CONCORDIA DE INVERSIONES MEDITERRÁNEAS, SIMCAV 19,000 18,000 1,780 4,988CONOMA INVERSIONES, SIMCAV 19,713 26,925 225 22CONSENTUS 2000, SIMCAV 0 23,100 0 4CONSULBIC 46,720 56,800 1,275 705CONSULBOLSA 38,960 45,920 754 1,243CONSULMIX 60-40, SIMCAVF 17,249 18,889 215 219CONSULNOR EUROACCIONES, SIMCAV 14,760 16,200 3,050 1,154CONSULNOR INVERSIONES FINANCIERAS LA RIOJA SI 15,968 17,449 721 521CONSULNOR MULTINACIONALES, SIMCAV 18,529 19,930 347 110CONTEMPORANIA D´INVERSIONS, SIMCAV 22,655 25,661 58 153CONTINENTAL DEL MAR, SIMCAV 16,973 18,944 70 21COOPERATIVISME, SIMCAV 23,250 21,250 1,705 2,209COPEY INVESTMENT, SIMCAV 22,758 24,241 434 289CORATRIL, SIMCAV 17,333 18,343 39 29CORELLA PATRIMONIO, SIMCAV 0 24,281 0 0 05/21/2003CORFIN INVERSIONES, SIMCAV 18,511 22,838 14 0CORO PATRIMONIO, SIMCAV 0 24,281 0 0 05/21/2003CORONA AUSTRALIS INVESTMENT, SIMCAV 24,992 26,695 4 4CORONDEL INVERSIONES, SIMCAV 34,258 35,700 0 0CORPORACIÓN DE INVERSIONES MOBILIARIAS 28,391 29,265 30,565 316CORPORAT INVERSIONES 22,600 24,000 62 39CORTES VICENTE INVERSIONES, SIMCAV 23,906 24,411 2,039 18,001CORTIGOSO INVERSIONES, SIMCAVF 22,983 27,046 33 664COSTA PLATA INVERSIONES, SIMCAV 17,484 16,378 2 0COSTA RICA INVERSIONES, SIMCAV 21,356 25,830 1,242 172COSTAGES, SIMCAV 30,040 33,880 589 47COTOMAR INVERSIONES, SIMCAVF 22,400 23,520 384 73COVA INVERSIONES SIMCAV SA 22,078 22,896 29 31COVEN INVERSIONES SIMCAV SA 23,319 25,002 41 87CRECIMIENTO INVERSIONES, SIMCAVF 23,079 24,041 27 22CREDIT SUISSE COLUMBUS-75, SIMCAV 1,925 1,805 2,310 137CREDIT SUISSE ELCANO-50, SIMCAV 18,711 18,951 4,720 1,486CREDIT SUISSE MAGALLANES-25, SIMCAVF 25,000 27,425 2,724 1CRINUM INVERSIONES, SIMCAV 15,194 16,636 97 1,439CRISTOBALMEMDI, SIMF 2,509 1,878 3 26CRONISTA CARRERES DE INVERSIONES, SIMCAV 12,480 15,360 80 401CROSS ROADS INVERSIONES, SIMCAV 18,848 21,348 0 0CRUCERO DE INVERSIONES SIMCAV 21,212 21,765 1 0CRUNVER FINANCIERA, SIMCAV 22,838 23,319 3,302 81CUBAHORRO, SIMCAV 15,633 21,164 744 378CUERNAVACA INVEST, SIMCAV 19,425 19,833 11 48CUETO CALERO, SIMCAVF 25,002 31,974 13 1,496CUFATUM, SIMCAV 25,368 26,544 9 5CUGONRI, SIMCAV 23,319 28,368 25 23CUINVER 2000, SIMCAV 17,160 19,520 250 10CUSTREL, SIMCAV 6,776 7,438 1,457 22CYNARA DE INVERSIONES, SIMCAV 22,358 24,561 3,999 497
A.2.19.Secondary markets. Equities.Outcry market. Listed companies. 2003
2002 2003 2002 2003Companies
Capitalisation (at 31 Dec.) Annual trading Date of listing in2003 & other comments
Amounts in thousands of euros
(Continued)
(Continues over)

165
Annex 2: Secondary markets
(Continued)
(Continues over)
D&F ROALBA, SIMCAV 15,921 16,017 296 193DABIFINSA, SIMCAVF 17,920 19,880 114 124DACINVER 0 74,806 0 3,961DAEN INVESTMENT, SIMCAVF 20,434 21,156 1 1,999DAF INVERSIONES, SIMCAV 27,132 28,495 2,463 90DAIMON INVERSIONES, SIMCAVF 14,274 15,476 3,249 335DAJAMA INVERSIONES, SIMCAV 22,598 23,079 10 21DALINVEST INVERSIONES, SIMCAV 17,838 19,497 27 22DALITA INVERSIONES, SIMCAV 0 24,041 0 0 03/24/2003DANBUR 2000, SIMCAVF 60,702 61,904 3,751 3,640DAPA DE INVERSIONES, SIMCAV 16,600 16,120 2 7DAPHNE INVESTMENTS SIMCAV 17,798 17,930 57 409DAR 18,620 18,620 3 3DASC INVESTMENTS, SIMCAV 12,164 12,453 67 682DASHUR INVESTMENT SIMCAV 54,492 62,305 88 46DAVMES 118,880 0 547 239 Delisted 12/30/2003DAYMIO INVESTMENTS, SIMCAVF 60,000 61,200 28,555 10,010DAYNEWS SIMCAV SA 27,406 28,288 2 705DB INSTITUCIONAL, SIMCAV 22,427 23,843 1,599 2,958DEALING INVERSIONES, SIMCAV 11,159 11,460 52 21DEBARAN DE VALORES MOBILIARIOS SIMCAV 23,139 23,950 27 22DEHASA INVERSIONES FINANCIERAS, SIMCAV 19,232 19,954 13 22DEHESA LOS CHOPOS, SIMCAV 23,966 25,248 25,622 19DEIMO INVESTMENT, SIMCAVF 24,281 24,521 1 0DELCASTRO INVERSIONES, SIMCAV 20,194 21,156 11 22DELFI BOLSA, SIMCAV 21,640 24,120 99 98DELTAHORRO, SIMCAV 25,012 25,734 646 372DELZAPEG, SIMCAV 22,318 24,699 6,938 1,058DENARIO INVERSIONES 2001, SIMCAV 11,672 15,350 978 514DENURB INVERSIONES, SIMCAV 29,930 29,930 0 69DERRICK INVEST, SIMCAV 15,802 17,215 25 24DESEMBRE NORANTA-NOU, SIMCAV 21,250 21,000 1,311 1,621DEVON ISLAND, SIMCAVF 19,160 21,400 1 8DIANA BOAT, SIMCAVF 23,050 23,050 0 2,280DIAPASON GESTION, SIMCAV 16,483 17,392 89 2,439DIBICO INVERSIONES, SIMCAV 23,840 24,321 12 34DICASTILLO INVERSIONES, SIMCAV 21,826 24,536 1,950 4,675DIGIT INVERSIONES, SIMCAV 11,020 11,240 108 1,517DIMOMGLA INVERSIONES, SIMCAVF 0 26,705 0 0 10/04/2003DINER INVERSION 2000 SIMCAV 18,783 19,721 2,179 0DINERAHORRO, SIMCAV 16,595 18,759 3 0DINERCAPITAL, SIMCAV 19,080 18,720 204 306DINERCARTERA, SIMCAV 18,759 20,443 121 2,398DINERGLOBAL, SIMCAV 21,880 22,040 0 601DINERINVER 29,000 29,000 3 6DINERINVERSION, SIMCAV 15,873 17,316 0 0DINERISCAL, SIMCAV 15,873 20,443 0 1,649DINERVALOR, SIMCAV 18,400 19,480 223 6DINERVERA SIMCAV 15,633 20,683 234 835DIORAMAX INVERSIONES, SIMCAV 0 24,954 0 6 01/27/2003DIPACHAR DE INVERSIONES, SIMCAV 18,655 21,252 1,282 2,335DIRDAM LAER, SIMCAV 23,377 23,425 0 0DIROJU, SIMCAV 0 24,521 0 0DITA INVERSIONES SIMCAVF 17,189 17,237 31 240DIVALSA DE INVERSIONES, SIMCAV 20,875 27,465 42 293DIVERSIFICACION FINANCIERA 27,720 28,350 260 1,727DIVERSITY INVERSIONES, SIMCAVF 23,858 28,884 1,374 2,892DIVIDENDOS E INCREMENTOS, SIMCAV 6,784 7,120 0 1DOBLE F STOCKS, SIMCAV 6,371 7,020 66 21DOBLERS 31,840 36,080 286 165
A.2.19.Secondary markets. Equities.Outcry market. Listed companies. 2003
2002 2003 2002 2003Companies
Capitalisation (at 31 Dec.) Annual trading Date of listing in2003 & other comments
Amounts in thousands of euros

166
Annual report on the securities market. 2003
DOBRA INVERSIONES, SIMCAV 23,800 0 1,199 0DOCE LUNAS INVERSIONES, SIMCAV 24,401 24,642 40 10DOCK INVERSIONES, SIMCAVF 4,700 5,000 29 13DOCRES, SIMCAV 19,978 21,011 90 2DOCUMENTO FILM INVERSIONES SIMCAV 26,835 28,037 30 57DOGALSA, SIMCAVF 42,552 43,754 1,362 1DON CURRO INVERSIONES, SIMCAV 9,448 10,073 61 62DONADOS 2000 SIMCAV 24,641 24,672 1,030 3,102DONALD INVERSIONES, SIMCAV 0 7,380 0 10 04/29/2003DOOHAN INVESTMENT SIMCAV 21,636 23,319 1 1DOPOL INVERSIONES, SIMCAV 0 11,977 0 4 10/17/2003DORALEX DE INVERSIONES, SIMCAV 18,271 18,992 11 22DORMA VALORES, SIMCAVF 15,266 15,386 95 40DORNEDA DE INVERSIONES 2002, SIMCAV 16,348 17,309 9,794 922 Former GUADAJIRA
CARTERA, SIMCAVDOSANE, SIMCAV 23,606 23,886 16 32DOSSAU DE INVERSIONES SIMCAV 26,525 28,929 14 2,713DRACO INVERSIONES, SIMCAV 16,595 21,405 2 3DRAFT INVERSIONES, SIMCAV 14,839 16,570 41 14DREI INVEST, SIMCAV 25,002 25,483 1,513 20DREYER INVESTMENT, SIMCAV 0 25,002 0 1 04/28/2003DRIER INVERSIONES, SIMCAVF 14,040 15,819 0 0DRIVE INVESTMENTS, SIMCAVF 11,980 12,380 292 404DRIVER INVERSIONES, SIMCAV 17,196 18,470 4 48DUBHE DE INVERSIONES, SIMCAV 23,777 23,236 0 1DULCE NOMBRE INVERSIONES SIMCAV 20,924 21,525 2 0DUNCAN DE INVERSIONES SIMCAV 21,837 22,879 602 251DUNIE 98 DE INVERSIONES, SIMCAV 16,040 15,480 76 6DURBANA I, SIMCAV 0 11,320 0 0DURIEN SIMCAV 20,234 21,396 2 1DUVEN-00, SIMCAV 14,360 15,618 368 5DYM FINANZAS, SIMCAV 0 0 0 0 07/21/2003DZ 2000 INVERSIONES, SIMCAV 18,326 19,913 24 712EARNING INVERSIONES, SIMCAV 0 0 0 0EAST STAR 33,080 33,760 493 7,661EAST WIND INVERSIONES, SIMCAVF 13,035 13,612 34 6,013EBURY INVERSIONES, SIMCAV,SA 0 24,281 0 0 08/26/2003ECHO DE INVERSIONES, SIMCAV 18,440 18,720 28 7ECOLOGIA VIVA, SIMCAV 30,131 31,702 173 2,437EDIGA 11, SIMCAV 17,720 19,280 0 2EDUMONE, SIMCAVF 20,675 21,636 6 11EFFICIENT ASSET ALLOCATION INVESTMENTS, SIMCA 24,772 25,180 0 1,043EFIMA BERGIDUM, SIMCAV 24,218 24,579 0 0EIDETESA DE INVERSIONES, SIMCAV 18,415 18,439 16,438 45 Former GARBIZU DE
INVERSIONES, SIMCAV EIKON 99, SIMCAV 19,400 20,250 415 1EIXAMPLE 2000, SIMCAV 8,577 8,973 284 343EIZAFI 1, SIMCAV 21,934 24,050 5,934 3,027EIZAFI 2, SIMCAV 21,982 24,050 5,934 4,346EL DORADO INVERSIONES, SIMCAV 30,520 31,200 1,121 6,142EL HAYADAL, SIMCAVF 20,362 20,939 120 110EL VANTAROS SIMCAV 19,473 21,396 2 506ELIM AHORRO, SIMCAV 21,636 23,079 25 22ELMIRON 2000 SIMCAV 17,508 17,532 0 0ELORBE, SIMCAV 15,560 16,320 2 3ELORZABAS DE INVERSIONES, SIMCAV 0 6,120 0 0 07/28/2003ELVERTON BRATON, SIMCAV 24,360 25,760 156 448ELYOB CARTERA, SIMCAV 24,241 24,601 309 90EMENUR DE INVERSIONES, SIMCAV 15,960 16,520 2 7EMIBE BOLSA SIMCAV 23,570 24,534 1,124 851
A.2.19.Secondary markets. Equities.Outcry market. Listed companies. 2003
2002 2003 2002 2003Companies
Capitalisation (at 31 Dec.) Annual trading Date of listing in2003 & other comments
Amounts in thousands of euros
(Continued)
(Continues over)

167
Annex 2: Secondary markets
(Continued)
(Continues over)
EMUJAL, SIMCAVF 24,041 25,002 0 5,811ENAR 8, SIMCAV 0 30,360 0 7,528 04/02/2003ENDURA CARTERA, SIMCAV 8,655 9,015 3,482 9ENREDO INVERSIONES, SIMCAV 0 24,361 0 1 09/10/2003ENTRECAR INVERSIONES, SIMCAV 30,000 38,700 2 3ENTROPIA-PRAXIS, SIMCAV 0 20,875 0 1,011 03/13/2003ENVILU INVERSIONES, SIMCAV 11,780 12,381 12 22EONIA INVERSIONES, SIMCAV 17,388 0 16 0EPEHIA INVERSIONES, SIMCAV 27,900 30,000 1 1,957EPOMENES 37,560 38,920 177 76EPSILON INVERSIONES BURSATILES, SIMCAV 21,396 22,117 555 8EQIOMVEST 2000, SIMCAV 18,560 20,531 55 4,412EQUAL INVERSIONES, SIMCAV 22,030 22,270 120 57EQUIVALIA INVERSIONES, SIMCAV 24,521 25,723 3,011 9,350ERCIA DE VALORES MOBILIARIOS 5,400 5,400 51 89ERDAC INVERSIONES, SIMCAV 18,271 20,434 13 22EREAGA INVERSIONES, SIMCAV 14,384 15,266 2 414EREGOS, SIMCAV 29,480 30,400 4,660 567EREMUA DE INVERSIONES, SIMCAV 18,280 18,800 0 0ERISONO, SIMCAV 28,849 30,051 0 0ERNES INVESTMENT, SIMCAV 0 49,920 0 26 11/03/2003ERNIO INGENIEROS, SIMCAV 20,683 22,848 263 94ESALIBUZ, SIMCAV 17,850 20,750 18 836ESAR PATRIMONIO SIMCAV 19,237 19,958 11 22ESASER INVERSIONES, SIMCAV 12,902 14,264 97 2,872ESBA DE INVERSIONES, SIMCAV 21,080 21,920 2,122 0ESCAL 2000 INVERSIONS, SIMCAV 18,752 19,473 10 22ESCOPELDOS, SIMCAV 19,954 20,675 13 22ESF EURORENT, SIMCAV 30,600 31,980 6,374 3,313ESFIBOR, SIMCAV 11,250 14,250 119 241ESGER INVERSIONES SIMCAV 17,800 19,680 1,236 142ESGUEVA DE INVERSIONES, SIMCAV 16,880 18,120 22 7ESJAPIOL, SIMCAV 14,256 17,357 602 101ESKARRA BOLSA SIMCAV 17,405 18,319 27 22ESM NOVO SIMCAV 13,222 16,588 873 9,944ESMOMA 49, SIMCAV 23,175 23,873 7,818 0ESNALI, SIMCAV 19,755 20,925 15 20ESPEJO DE INVERSIONES, SIMCAV 19,016 18,343 1,492 1,134ESPELT INVERSIONS, SIMCAV 19,954 20,915 11 17ESSAOUIRA, SIMCAV 15,987 19,184 1 1ESTUDIOS FINANCIEROS DE VALORES 29,675 28,093 151 1,402ETIMO SIMCAV 0 0 0 0ETORKIZUNA DE INVERSIONES, SIMCAV 16,426 17,220 1 1EUGEMOR, SIMCAV 19,713 22,358 286 180EUMAÑI INVERSIONES, SIMCAVF 21,895 22,256 2 0EUMAR INVERSIONES SIMCAV 17,622 19,593 27 1,647EURE K INVERSIONES, SIMCAV 19,962 20,250 20,161 28 Former URQUIJO PORTFOLIO
INTERNACIONAL, SIMCAVEURIPIDES, SIMCAV 22,200 24,200 138 161EURO 21 DE INVERSIONES, SIMCAVF 104,336 98,566 13,198 7,742EUROARGA 24,920 26,000 27 1EUROARRADI, SIMCAV 36,060 37,142 9,692 3,000EUROBIRDIE, SIMCAV 22,678 23,079 2 1EUROBOLSA SELECCION, SIMCAV 23,600 29,080 3,741 2,644EUROBOLSA XXI, SIMCAV 17,786 19,449 709 1,087EUROBRICK DE INVERSIONES SIMCAV 14,857 15,410 34 39EUROCAIXA 1, SIM 52,000 55,800 1,859 1,078EUROCOSTERGO DE INVERSIONES, SIMCAV 20,918 21,820 12 8EURODOLAR INVERSION, SIMCAV 0 35,750 0 3 04/28/2003EURODUERO 2002, SIMCAV 213,299 216,665 0 0
A.2.19.Secondary markets. Equities.Outcry market. Listed companies. 2003
2002 2003 2002 2003Companies
Capitalisation (at 31 Dec.) Annual trading Date of listing in2003 & other comments
Amounts in thousands of euros

168
Annual report on the securities market. 2003
EUROEQUITY INVESTMENT, SIMCAV 12,677 27,391 1,695 2,372EUROFINANZAS RENTA, SIMCAV 10,241 11,071 867 1,677EUROHISPANO OPCIONES, SIMCAV 23,367 24,449 1,229 7,276 Former AFINA INVERSORES
REUNIDOS, SIMCAVEUROHUNTERS, SIMCAVF 15,726 17,198 298 24EUROJUCAR 2002, SIMCAV 101,500 103,600 0 2EUROLEVANTE INVERSIONES, SIMCAV 17,718 19,833 27 22EUROMIX 32,880 36,120 518 399EURONARCEA 2002, SIMCAV 245,213 250,742 115 3,316EUROPEA DE GESTION EUROGESA 4, SIMCAVF 0 27,454 0 0 05/29/2003EUROPEAN STOCK EXCHANGE, SIMCAV 15,320 16,760 0 3EUROSTAR ACTIVOS 23,700 0 0 0 Delisted 08/07/2003EUROTALAVE 2002, SIMCAV 183,347 186,957 1 9,245EUROTER 2002, SIMCAV 24,041 24,906 1 0EUROTITULOS 3,400 3,400 0 0EUROZITRO, SIMCAV 44,520 45,420 21 111EUROZONA INVERSION, SIMCAV 25,661 27,321 2,655 171 Former RUA NOVA
INVERSIONES, SIMCAV EVEREST 8848, SIMCAV 27,288 30,456 11 24EVIMUR DE INVERSIONES, SIMCAV 17,725 18,398 3 1EVLO INVERSIONES SIMCAV 48,900 45,450 3 0EXPANDMENTS INVERSIONES, SIMCAV 23,617 24,363 8,383 23FA GLOBAL, SIMCAV 20,675 22,117 27 22FACETA INVEST, SIMCAV 19,858 21,208 271 262FACTOR AHORRO, SIMCAV 0 24,281 0 492 03/07/2003FACTOR INVERSIONES 15,804 16,308 691 706FAGISAQ-1, SIMCAV 0 27,130 0 3FAIMSA 55,224 67,680 140 564FAIRWAY INVERSIONES, SIMCAV 17,220 16,955 620 1,455FAITX DE INVERSIONES, SIMCAV 24,218 24,916 0 0FAMEGA INVESTMENTS, SIMCAV 17,520 20,560 413 2FAMGILPAR, SIMCAV SA 22,174 22,294 276 36FAMI-CUATRO DE INVERSIONES, SIMCAVF 113,000 120,000 48,422 16FAMQUIR INVERSIONES, SIMCAV 21,000 22,920 2,374 66FANIUL INVERSIONES, SIMCAV 98,662 24,763 4,889 714FAPAC INVERSIONES MOBILIARIAS, SIMCAV 96,520 101,760 147 27 06/03/2003FAPERNA INVERSIONES SIMCAV,SA 20,098 20,915 216 289FAR99 INVERSIONES, SIMCAV 9,348 10,524 27 441FARWIN WORLWIDE INVESTMENT, SIMCAV 25,002 26,054 15 38FAZYX INVERSIONES MOBILIARIAS, SIMCAV 21,492 22,814 2,674 7,127FCBARHER INVERSIONES, SIMCAVF 24,281 25,243 12 22FEBRER NORANTAVUIT, SIMCAV 16,650 16,785 171 253FELICIA INVERSIONES, SIMCAV 12,982 14,905 8,705 783FELICITY LP SIMCAV 17,124 16,835 607 182FEMAINSA INVERSIONES, SIMCAVF 124,800 127,200 1,827 2,549FENIDES INVERSIONES, SIMCAV 13,901 13,949 3 3FERNANFLOR DE INVERSIONES 673 673 6 9FERRARI 7 INVERSIONES SIMCAV 19,312 22,751 1 0FERROMAIG, SIMCAV 19,994 22,919 2,236 4,155FEVSA 3000, SIMCAV 19,016 18,319 24 43FH TEOGAR SIMCAV 0 24,882 0 1FIAMPI INVERSIONES, SIMCAV 40,581 42,360 348 483FIB ARCA FUTURA, SIMCAV 23,760 25,680 88 2,666FIBUR 58,380 61,460 362 1,894FIBUR 3000 DE INVERSIONES SIMCAV 14,344 15,266 26 601FILIPON CMA 2000 SIMCAVF 16,908 19,393 1,490 1,941FIMAD INVERSIONES, SIMCAV 18,752 18,992 19 21FIMAR DE VALORES, SIMCAV 16,660 17,814 15 21FIMARSE INVERSIONES, SIMCAVF 21,564 22,526 94 1,527FIMBROBOLSA 40,760 49,920 52 596FINA DE INVERSIONES 97, SIMCAV 22,840 23,360 858 9
A.2.19.Secondary markets. Equities.Outcry market. Listed companies. 2003
2002 2003 2002 2003Companies
Capitalisation (at 31 Dec.) Annual trading Date of listing in2003 & other comments
Amounts in thousands of euros
(Continued)
(Continues over)
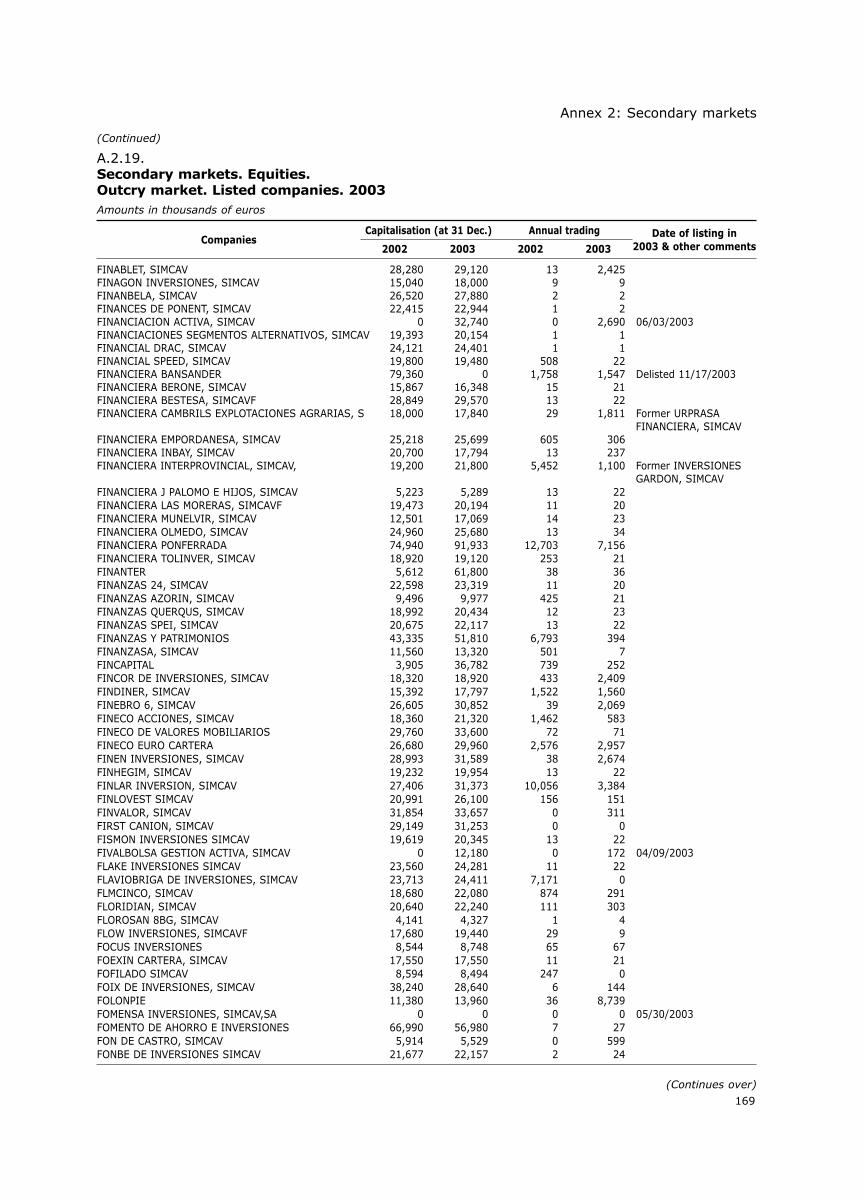
169
Annex 2: Secondary markets
(Continued)
(Continues over)
FINABLET, SIMCAV 28,280 29,120 13 2,425FINAGON INVERSIONES, SIMCAV 15,040 18,000 9 9FINANBELA, SIMCAV 26,520 27,880 2 2FINANCES DE PONENT, SIMCAV 22,415 22,944 1 2FINANCIACION ACTIVA, SIMCAV 0 32,740 0 2,690 06/03/2003FINANCIACIONES SEGMENTOS ALTERNATIVOS, SIMCAV 19,393 20,154 1 1FINANCIAL DRAC, SIMCAV 24,121 24,401 1 1FINANCIAL SPEED, SIMCAV 19,800 19,480 508 22FINANCIERA BANSANDER 79,360 0 1,758 1,547 Delisted 11/17/2003FINANCIERA BERONE, SIMCAV 15,867 16,348 15 21FINANCIERA BESTESA, SIMCAVF 28,849 29,570 13 22FINANCIERA CAMBRILS EXPLOTACIONES AGRARIAS, S 18,000 17,840 29 1,811 Former URPRASA
FINANCIERA, SIMCAVFINANCIERA EMPORDANESA, SIMCAV 25,218 25,699 605 306FINANCIERA INBAY, SIMCAV 20,700 17,794 13 237FINANCIERA INTERPROVINCIAL, SIMCAV, 19,200 21,800 5,452 1,100 Former INVERSIONES
GARDON, SIMCAV FINANCIERA J PALOMO E HIJOS, SIMCAV 5,223 5,289 13 22FINANCIERA LAS MORERAS, SIMCAVF 19,473 20,194 11 20FINANCIERA MUNELVIR, SIMCAV 12,501 17,069 14 23FINANCIERA OLMEDO, SIMCAV 24,960 25,680 13 34FINANCIERA PONFERRADA 74,940 91,933 12,703 7,156FINANCIERA TOLINVER, SIMCAV 18,920 19,120 253 21FINANTER 5,612 61,800 38 36FINANZAS 24, SIMCAV 22,598 23,319 11 20FINANZAS AZORIN, SIMCAV 9,496 9,977 425 21FINANZAS QUERQUS, SIMCAV 18,992 20,434 12 23FINANZAS SPEI, SIMCAV 20,675 22,117 13 22FINANZAS Y PATRIMONIOS 43,335 51,810 6,793 394FINANZASA, SIMCAV 11,560 13,320 501 7FINCAPITAL 3,905 36,782 739 252FINCOR DE INVERSIONES, SIMCAV 18,320 18,920 433 2,409FINDINER, SIMCAV 15,392 17,797 1,522 1,560FINEBRO 6, SIMCAV 26,605 30,852 39 2,069FINECO ACCIONES, SIMCAV 18,360 21,320 1,462 583FINECO DE VALORES MOBILIARIOS 29,760 33,600 72 71FINECO EURO CARTERA 26,680 29,960 2,576 2,957FINEN INVERSIONES, SIMCAV 28,993 31,589 38 2,674FINHEGIM, SIMCAV 19,232 19,954 13 22FINLAR INVERSION, SIMCAV 27,406 31,373 10,056 3,384FINLOVEST SIMCAV 20,991 26,100 156 151FINVALOR, SIMCAV 31,854 33,657 0 311FIRST CANION, SIMCAV 29,149 31,253 0 0FISMON INVERSIONES SIMCAV 19,619 20,345 13 22FIVALBOLSA GESTION ACTIVA, SIMCAV 0 12,180 0 172 04/09/2003FLAKE INVERSIONES SIMCAV 23,560 24,281 11 22FLAVIOBRIGA DE INVERSIONES, SIMCAV 23,713 24,411 7,171 0FLMCINCO, SIMCAV 18,680 22,080 874 291FLORIDIAN, SIMCAV 20,640 22,240 111 303FLOROSAN 8BG, SIMCAV 4,141 4,327 1 4FLOW INVERSIONES, SIMCAVF 17,680 19,440 29 9FOCUS INVERSIONES 8,544 8,748 65 67FOEXIN CARTERA, SIMCAV 17,550 17,550 11 21FOFILADO SIMCAV 8,594 8,494 247 0FOIX DE INVERSIONES, SIMCAV 38,240 28,640 6 144FOLONPIE 11,380 13,960 36 8,739FOMENSA INVERSIONES, SIMCAV,SA 0 0 0 0 05/30/2003FOMENTO DE AHORRO E INVERSIONES 66,990 56,980 7 27FON DE CASTRO, SIMCAV 5,914 5,529 0 599FONBE DE INVERSIONES SIMCAV 21,677 22,157 2 24
A.2.19.Secondary markets. Equities.Outcry market. Listed companies. 2003
2002 2003 2002 2003Companies
Capitalisation (at 31 Dec.) Annual trading Date of listing in2003 & other comments
Amounts in thousands of euros

170
Annual report on the securities market. 2003
FONCYG SIMCAV 6,779 7,068 1 1FONLAR FUTURO, SIMCAV 28,739 32,311 551 401FONMOBA, SIMCAV 20,480 22,040 11 36FONSIGNIA, SIMCAVF 0 0 0 0 02/25/2003FONT ROCHA, SIMCAV 17,800 17,400 1,064 386FONTECILLA 0 3,904 0 12FONTS FINANZAS, SIMCAVF 18,271 19,713 27 22FONVIMAR 2000, SIMCAVF 8,198 8,174 0 500FORALEX 4,715 11,669 93 235FORAS INVERSIONES SIMCAVF 16,835 17,917 397 6,121FORILDOS, SIMCAV 23,184 25,156 213 0FORSTECT INVESTMENT, SIMCAV 20,715 21,677 68 80FOURSOME, SIMCAV 22,160 22,760 12,038 10,157FRAGUAS DE INVERSIONES SIMCAV 17,989 18,374 1 2,997FRAMADEMO SIMCAVF 0 23,800 0 13FRANCAT INVERSIONES, SIMCAV 23,079 23,800 10 20FRAY INVERSIONES SIMCAVF 0 7,356 0 63 08/01/2003FREEHOLD INVERSIONES, SIMCAV 11,556 11,568 1,188 60FRESTON SWAN, SIMCAV 0 26,466 0 14 06/02/2003FRINVER MERCADOS, SIMCAV 0 130,000 0 30 07/28/2003FUENTE CLARIN, SIMCAV 22,160 28,440 5 10FUERFIN, SIMCAV 20,900 21,100 0 14,468FUNRENT MILENIO, SIMCAV 5,818 5,920 71 2FUP 99, SIMCAV 21,925 21,829 28 2FUSOPAR SIMCAV 95,802 100,802 6,079 14,464FUTURVALOR, SIMCAV 14,496 16,997 1,884 182GAAP OPTIMA, SIMCAVF 24,593 26,637 4,565 16,767GABOR INVESTMENT, SIMCAVF 24,281 24,762 0 1GADES FINANZAS DOS, SIMCAV 19,793 20,924 50 18GADES FINANZAS, SIMCAV 17,790 18,511 13 21GAESCO CREIXEMENT INVERSIONS, SIMCAV 9,960 56,628 1,330 1,212 Former MANRESA
CAPITAL, SIMCAVGAHERVI, SIMCAV 18,759 19,024 1 0GAIA CARTERA, SIMCAVF 0 24,185 0 1,232 09/16/2003GAIA CRECIMIENTO, SIMCAVF 0 24,257 0 2,228 09/16/2003GAIF 2001 SIMCAV 16,348 16,588 10 22GALA CAPITAL, SIMCAVF 16,107 15,867 12 21GALAFATE INVERSIONES SIMCAV 48,081 52,216 0 2GALENOS CENTENARIO INVERSIONES, SIMCAV 23,883 25,980 661 223GALIRUBEN INVERSIONES SIMCAV 17,069 18,511 27 22GALLEVILLE INVERSIONES, SIMCAV 20,675 22,694 0 0GAMA BURSATIL 1,680 1,680 3 2GAMA RENTA INMOBILIARIA, SIMCAV 17,526 16,684 21 39GAMAZO 20, SIMCAV 24,762 25,162 2,812 1,209GAMBIT 2000, SIMCAV 11,340 12,080 7 9GAMMA INVERSIONES BURSATILES, SIMCAV 16,588 16,924 328 0GANABIEN, SIMCAV 20,014 20,825 27 22GANANCIA PATRIMONIAL, SIM,SA 2,165 2,020 3 301GARABOLSA, SIM 1,806 2,180 222 183GARADASA 97,000 105,250 19 8GARATO INVERSIONES, SIMCAV 27,181 24,962 4 57GARBI DE VALORES, SIMCAV 21,405 22,367 0 2GARDAMA DE INVERSIONES, SIMCAV 26,600 28,600 1,484 3GARESA DE INVERSIONES, SIMCAV 20,915 21,396 62 22GAREZ INVERSIONES, SIMCAV 21,156 24,041 1,120 95GARION INVERSIONES, SIMCAV 23,079 24,281 10 22GARNO INVESTMENTS, SIMCAV 3,194 3,688 33 2GAROS DE INVERSIONES, SIMCAV 19,312 20,010 6 7GAROZCO 2000, SIMCAV 17,550 19,713 39 22 Former FINANZAS
ALCANTARA, SIMCAV
A.2.19.Secondary markets. Equities.Outcry market. Listed companies. 2003
2002 2003 2002 2003Companies
Capitalisation (at 31 Dec.) Annual trading Date of listing in2003 & other comments
Amounts in thousands of euros
(Continued)
(Continues over)

171
Annex 2: Secondary markets
(Continued)
(Continues over)
GARROGAR INVERSIONES SIMCAV 20,915 21,877 10 22GASCONA INVERSIONES, SIMCAV 5,577 6,587 145 1,511GAUDI INVERSIONS 2, SIMCAVF 17,309 18,271 3,573 1,344 Former NISU
INVERSIONES SIMCAVGAUDI INVERSIONS SIMCAV 17,309 19,473 2,759 935GAYAR DE INVERSIONES, SIMCAVF 7,192 12,287 5,079 8GAZAMIA INVERSIONES, SIMCAV 15,729 16,354 21 22GAZTELUMENDI INVESTMENTS, SIMCAV 0 24,727 0 2,731 06/11/2003GBI 9000, SIMCAV 20,050 29,514 2,005 0GECIP PATRIMONIO, SIMCAV 22,518 22,558 212 24GEFIX INVERSIONES, SIMCAV 0 0 0 0 07/112003GEINCO ACTIUS MOBILIARIS SIMCAV 24,481 24,922 106 14GEISER INVERSIONES 2000, SIMCAV 9,364 9,881 60 155GENERA FINANZAS, SIMCAV,SA 23,319 23,800 10 221GENERACION 21, SIMCAV 6,064 6,096 2,524 154GENIL DE INVERSIONES, SIMCAV 17,869 19,577 0 0GERCAFOND, SIMCAV 8,758 9,621 10 28GERION INVERSIONES, SIMCAV 21,156 21,636 911 21GERLOCAPITAL, SIMCAVF 17,360 17,840 1,247 502GERMINA INVEST, SIMCAV 0 30,411 0 4,026 05/21/2003GESAMER INVERSIONES, SIMCAV 14,889 14,808 2 0GESAPI INVERSIONES, SIMCAVF 21,156 21,396 147 21GESBOLSA INVERSIONES, SIMCAV 20,646 26,646 11 832GESCAT XXI SIMCAV 22,920 24,600 4 612GESGLOBAL INVERSIONES SIMCAV 58,630 59,759 8,583 6,923GESINBESA VALORES, SIMCAV 35,977 39,919 154 5GESINBOL DE INVERSIONES 43,330 46,690 6 21GESPRISA INVERSIONES, SIMCAV 35,725 57,615 3,685 6,186GESRENTA, SIMCAV 12,747 15,152 166 87GESTBOS SIMCAV 19,713 20,675 97 22GESTIÓN DE INVERSIONES DEL EBRO, SIMCAVF 15,338 20,579 2,201 21GESTIÓN PATRIMONIAL MARTHA´S, SIMCAV 20,434 22,638 4,921 386GESTRISA 10,080 7,400 6 6GG HORIZONE, SIMCAV 23,439 24,962 1 3GIBARA INVERSIONES, SIMCAV 17,429 17,429 1,166 331GIESSEN INVERSIONES, SIMCAV 27,360 28,140 0 0GIGIA QUINTAS INVERSIONES SIMCAV 0 24,146 0 0 08/01/2003GIL AGUEDA INVERSIONES, SIMCAV 0 24,281 0 0 07/28/2003GILONDE INVERSIONES, SIMCAVF 23,319 24,521 13 136GIMKO DE INVERSIONES, SIMCAV 18,158 20,443 1,885 1,017GIROTAI INVERSIONES, SIMCAV 24,361 24,682 689 159GIZA INVESTMENT, SIMCAV 19,906 21,132 5 7GLOBAL ANANDA SIMCAV 16,107 17,790 27 23GLOBAL EFFICIENCY CMA 2001 SIMCAVF 24,481 23,560 12 295GLOBAL EQUITY, SIMCAV 22,880 29,480 2,424 4,255 PAU INVERSIONES
Former TPJ MOLTAFINANCIERAS, SIMCAV
GLOBAL GROWTH, SIMCAV 5,474 6,278 10 217GLOBAL INVESTMENTS XXI, SIMCAVF 24,400 29,960 112 1,208GLOBAL INVESTOR 2000 ACTIUS MOBILIARIS SIMCAV 23,325 23,525 631 635GLOBAL PENTA INVERSIONES SIMCAV 17,309 17,718 23 45GLOBALFINANZAS, SIMCAV 22,840 24,280 1 172GLOBALMIX, SIMCAV 19,920 21,000 242 290GLOVAL PROCESOS BOLSA SIMCAV 17,309 18,030 11 9GOALCIA 2001 SIMCAV 52,649 51,146 0 2GOC 2002, SIMCAV 11,756 11,876 21 76GODIL CIA DE INVERSIONES, SIMCAV 19,288 20,298 1 1GOLDA INVERSIONES, SIMCAV 22,398 23,279 2 1GOLDEN GROWTH INVESTMENT, SIMCAVF 16,588 17,501 2,008 638GOLDEN SHARE INVERSIONES, SIMCAV 0 24,747 0 8 06/18/2003
A.2.19.Secondary markets. Equities.Outcry market. Listed companies. 2003
2002 2003 2002 2003Companies
Capitalisation (at 31 Dec.) Annual trading Date of listing in2003 & other comments
Amounts in thousands of euros

172
Annual report on the securities market. 2003
GOMENAR INVERSIONES, SIMCAV 12,829 14,134 15 115GOMPOR BOLSA, SIMCAV 18,680 20,400 3 8GONARA CARTERA, SIMCAV 23,560 24,281 1,334 623GONPEMI INVERSIONES, SIMCAV 20,720 21,920 2 578GONRAPA INVERSIONES, SIMCAV 23,127 24,858 1 29GOOD LION INVESTMENT, SIMCAV 21,236 23,560 4 932GORBEIALDE INVERSIONES, SIMCAV 9,866 10,003 0 528GORINVEST ACTIUS MOBILIARIS, SIMCAV 30,050 35,200 181 3GOVER ACTIUS MOBILIARIS, SIMCAV 27,700 32,150 5 3GRALEU INVERSIONES, SIMCAV 20,491 20,418 5 48GRAMER INVERSIONES, SIMCAV 20,600 22,240 3 7GRAN CANARIA INVERSIONES, SIMCAV 15,488 15,488 1 1GRAN SOL INVERSIONES, SIMCAV 16,388 17,670 48 172GRANADOS CARTERA, SIMCAV 0 26,936 0 500GRAND SLAM INVERSIONES SIMCAV 0 24,401 0 691 06/18/2003GRATIL INVEST, SIMCAV 19,962 22,848 6,334 745GRATTAROLA INVERSIONES, SIMCAV 33,441 34,158 1 2GRAZALEMA INVERSIONES, SIMCAVF 19,232 21,677 1,525 1,023GREEN CARTERA, SIMCAV 23,683 25,909 3,904 1,000GREEN FOREST INVEST, SIMCAV 6,578 7,078 23 23GREGAL INVESTMENTS 2000, SIMCAVF 24,041 24,041 2 1GRIAL INVERSIONES, SIMCAV 33,023 33,717 42 27GRIPA, SIMCAVF,SA 5,269 5,782 66 3GROWTH INVERSIONES, SIMCAV 11,496 11,712 55 229GRUCALTOR, SIMCAVF 20,058 21,164 26 28GRUFALER, SIMCAV 19,040 20,400 167 246GRUNBLICK, SIMCAV 20,418 21,260 1 0GRUP ARRAHONA 2002, SIMCAV 0 24,858 0 43 06/18/2003GRUPO ARCE DE INVERSIONES, SIMCAV 22,751 25,878 268 31GRUPO ASUNCIÓN DE INVERSIONES, SIMCAV 18,900 16,588 13 21GRUPO DE INVERSIONES GESTIÓN 10 SIMCAVF 20,929 22,328 61 19GRUPO FCM5, SIMCAV 10,253 10,866 29 10,267GRUPO FINANCIERO CABEMA, SIMCAV 12,741 12,741 12 231GRUPO MARINA D´OR, SICMAV 17,870 18,351 608 3GRUPO SATOCÁN INVEST, SIMCAV 29,730 29,790 0 56GSTAAD INVERSIONES, SIMCAV SA 11,227 13,198 20 2,276GU IRAU, SIMCAV 19,857 20,507 59 75GUADALEN DE INVERSIONES SIMCAV 11,231 11,111 498 25GUADALQUIVIR 2000 DE INVERSIONES SIMCAV 18,302 18,735 1 1GUADIX99 VALORES, SIMCAV 19,954 21,636 12 22GUAICANAMAR INVERSIONES, SIMCAVF 4,000 4,257 1,300 233GUANABACOBA SIMCAV 18,992 19,088 24 45GUARDALAVACA INVERSIONES, SIMCAV 12,261 12,092 16 29GUATEN DE INVERSIONES, SIMCAV 23,930 24,459 6,799 16,057GUERFAL INVERSIONES, SIMCAV 24,521 25,243 8 2GUESINVER 69,854 78,115 749 231GUIALMAR, SIMCAV 23,480 23,760 0 0GURIA INVERSIONES, SIMCAV 24,858 25,267 97 323GURUGUACTIVOS, SIMCAV 16,600 17,850 26 23GUZFER INVESTMENT, SIMCAV 0 24,361 0 270 02/26/2003H2 O2 INVERSIONES SIMCAV 16,684 17,093 297 1,427H2HB INVERSIONES, SIMCAV 19,040 19,857 17 31HACIENDA DE COVI, SIMCAV 23,400 25,110 996 101HARVESTER INVESTMENT SIMCAV 23,392 26,938 208 960HARWICK INVERSIONES MOBILIARIAS, SIMCAVF 0 12,152 0 1 12/30/2003HASMINE INVESTMENT SIMCAV SA 0 25,002 0 0 08/26/2003HATHOR INVEST, SIMCAVF 15,897 16,378 1,544 831HAVEN INVERSIONES, SIMCAV 19,072 21,380 48 1,824HAWASS INVESTMENTF 13,943 0 2,933 0 Delisted 01/29/2003HAYA INVERSIONES, SIMCAV,SA 22,425 24,100 121 95
A.2.19.Secondary markets. Equities.Outcry market. Listed companies. 2003
2002 2003 2002 2003Companies
Capitalisation (at 31 Dec.) Annual trading Date of listing in2003 & other comments
Amounts in thousands of euros
(Continued)
(Continues over)

173
Annex 2: Secondary markets
(Continued)
(Continues over)
HAZAS DE INVERSIONES, SIMCAV 16,138 17,797 11 1HEAL INVEST SIMCAV 24,241 24,882 12 0HECLASAN, SIMCAV 22,280 23,880 123 45HEDGE INVERSIONES, SIMCAV 5,070 5,610 22 8HEDWING INVESTMENT SIMCAV 18,391 18,952 3 114HELDALIN INVERSIONES, SIMCAV 26,445 27,148 2 2,940HELP INVERSIONES, SIMCAV 17,550 17,550 37 3,014HENA TRES 19,305 22,260 106 133HERCASOL 45,760 49,440 3,017 1,535HERDOSA, SIMCAV 26,160 33,000 3,080 4,713HEREDEROS TEMPRADO TRIAS, SIMCAV 6,094 6,431 4 1HEREMARC INVERSIONES SIMCAV 20,194 20,434 11 22HERLOPAR 2000, SIMCAV 25,663 28,127 27 192HERMYSO INVERSIONES, SIMCAV 0 22,935 0 54HERNANZAR, SIMCAV 10,260 10,719 987 1,189HERPLAN 99 INVERSIONS, SIMCAV 21,396 21,636 10 22HERTASA INVERSIONES, SIMCAV,S A 21,877 22,598 10 21HEXASTAR, SIMCAV 16,828 17,309 11 86HIANA INVERSIONES CARTERA, SIMCAV 15,146 18,511 480 637HIE DE INVERSIONES 38,280 45,960 326 523HIGH PROFIT INVERSIONES, SIMCAV 17,790 18,271 69 22HIJULE, SIMCAV 25,120 25,440 10 33HIPEMA 2000, SIMCAV 3,575 4,025 742 4HISPALIS INVERSION XXI, SIMCAV 13,840 14,680 10 9HISPANA CINCO 7,493 47,465 0 115HISPANA DOS 2,164 6,082 52 0HISPASIM SIMCAV 20,443 20,683 0 14,476HITERO DE INVERSIONES, SIMCAVF 23,760 24,882 0 1HMHM FINANCIERA, SIMCAV 15,386 17,309 13 21HOLDER INVERSIONES, SIMCAV 10,040 10,400 73 11HOLGUINFRAN, SIMCAV 18,230 18,663 6 3,757HOLOP INVERSIONES, SIMCAV 17,797 18,615 24 25HONTANAS DE INVERSIONES SIMCAV 22,900 27,225 529 135HORTUS 2001 SIMCAV 21,886 23,088 2 31HOSIFE 2002, SIMCAV 23,359 21,717 500 703HUBBLE INVEST, SIM 5,000 5,700 29 11HUERCEMES, SIMCAV 0 26,215 0 6 09/162003HUEROS INVERSIONES, SIMCAV 17,310 17,766 0 0HUPASA DE VALORES MOBILIARIOS 52,739 54,656 563 2IBERFAMA INVERSIONES SIMCAV 17,720 18,880 267 1,774IBERMILENIUM, SIMCAV 0 23,800 0 830 02/04/2003IBERSECURITIES INVERSION, SIMCAV 17,003 19,240 653 284IBIAS DE INVERSIONES SIMCAV 20,563 21,260 1 2IBIDA 33,560 36,800 147 35IBS RESERVA, SIMCAV 18,800 18,583 29 42ICARO 2000, SIMCAV 12,855 13,230 1,353 139ICEAM INVERSIONES, SIMCAVF 28,037 29,870 3,664 670ICLES INVESTMENTS, SIMCAVF 8,269 8,342 277 11IDEST INVERSIONES, SIMCAV 0 0 0 0 04/28/2003IDO INVERSIONES FINANCIERAS, SIMCAV 0 11,347 0 40 07/172003IFOL, SIMCAV 23,239 24,561 1 37IGANVAL DE INVERSIONES, SIMCAV 22,838 23,640 130 7ILERCAVONIA INVERSIONES, SIMCAVF 0 39,769 0 2,094 06/11/2003ILOROPE INVERSIONES, SIMCAV 22,946 23,925 21,664 1ILUSTRACIÓN 26,344 27,125 1,075 755IMASI SIMCAV 24,645 24,129 979 1IMF 2000, SIMCAV 8,871 9,544 52 59IMPACT INVERSIONES, SIMCAV 18,759 20,611 29 121IMPERIAL ACTIUS MOBILIARIS SIMCAV 10,250 18,750 5,106 914 Former GENER
NORANTANOU BORSA, SIMCAV
A.2.19.Secondary markets. Equities.Outcry market. Listed companies. 2003
2002 2003 2002 2003Companies
Capitalisation (at 31 Dec.) Annual trading Date of listing in2003 & other comments
Amounts in thousands of euros

174
Annual report on the securities market. 2003
IMPERIAL DE VALORES, SIMCAV 19,016 22,310 1,930 1,958 Former TER DE VALORESMOBILIARIOS, SIMCAV
INAHFAE, SIMCAV 21,614 22,496 256 147INAMOSA, SIMCAVF 8,160 8,800 1,081 517INAT DE INVERSIONES SIMCAV 20,010 20,034 1 1INBARRE GESTIÓN, SIMCAV 28,100 28,450 13 339INBARSAVE 5,140 5,400 81 84INCHORTA, SIMCAV 28,081 29,161 92 99INCOME INVERSIONES, SIMCAV 27,676 28,097 53 337INCREASING, SIMCAV 9,256 9,977 10 21INDEX INVERSIONES, SIMCAV 24,800 24,960 2,710 955INDEX PRESTIGIO, SIMCAV 24,281 0 1,830 0INDICES BURSATILES SIMCAV 5,264 17,500 3,937 245INDICO DE INVERSIONES SIMCAV 17,532 17,773 0 1,500INDIVISA INVERSIONES, SIMCAV 15,867 16,588 11 22INDOSUEZ GESTIÓN SIMCAV 25,020 27,690 1,592 8,447INDUS INVESTMENT SIMCAV 21,115 24,272 67 87INDUVISA 6,150 8,275 8 8,327INEDER INVERSIONES, SIMCAV 11,857 13,203 32 792INFAR 2000, SIMCAV 16,739 17,244 231 0INFASA 99, SIMCAV 4,712 5,998 356 76INFEGAR AHORRO SIMCAV 21,116 22,077 666 745INFINIUM INVERSIONES, SIMCAV 17,412 18,326 109 141INFINOIZ, SIMCAV 6,561 6,480 27 22INFIPER 2 VALORES, SIMCAV 19,713 21,877 13 22INFIPER 3 VALORES, SIMCAVF 22,911 22,766 0 1INFIPER VALORES, SIMCAV 20,440 22,520 34 35INFLUX INVERSIONES, SIMCAV 18,374 19,625 699 722INFRAN 95 2,820 2,820 8 9INGAES INVERSIONES, SIMCAVF 37,081 37,801 32 1,836INGERCOVER 53,920 54,760 257 296INGOAN ACTIUS MOBILIARIS, SIMCAV 26,700 27,750 141 14INGOSO 2000, SIMCAVF,SA 21,539 22,271 31 3INGUNZA, SIMCAV 24,720 25,640 2,327 796INICIO 2000, SIMCAV 10,000 10,750 901 601INITAU, SIMCAV 0 24,762 0 0 02/14/2003INLEX DE INVERSION, SIMCAV 23,319 25,002 27 22INMADEL INVERSIONES, SIMCAV 26,714 29,602 5 5INMEVAL INVERSIONES, SIMCAV 23,232 23,665 329 0INMOBASA 32,310 36,517 45 63INMOBILIARIA CALERA Y CHOZAS CARTERA, SIMCAV, 23,560 24,521 10 1,368INNSBRUCK INVERSIONES, SIMCAVF 22,766 23,415 0 57INOINVERSORA 11,130 12,460 431 53INPAMOSA 1,924 1,924 1 1INPAYER INVERSIONES, SIMCAV 23,880 24,682 2 1INPECUARIAS, SIMCAV 22,598 23,319 13 21 Former SOL
FINANZAS SIMCAVINPISA DOS 47,635 75,300 929 5,578INPUT INVERSIONES, SIMCAV 20,800 21,200 69 52INQUIRABE, SIMCAV 15,920 17,800 162 173INRA DE INVERSIONES, SIMCAV 18,295 18,607 12 17,128INRESA FINANZAS, SIMCAV 0 24,281 0 2 11/08/2003INSALAZA SIMCAV 21,492 23,151 102 101INSAPI 55,860 55,920 3,051 2,274INTERCONTINENTAL DE CARTERA 111,424 138,608 1,699 14INTERKALENDA, SIMCAVF 16,138 16,835 136 13INTERLAKEN INVERSIONES, SIMCAV 20,963 20,314 26 49INTERMONEY 1, SIMCAV 24,882 25,747 10,397 368INTERVALOR 1,344 1,368 168 60INTOSSALS, SIMCAV 6,978 6,707 27 22
A.2.19.Secondary markets. Equities.Outcry market. Listed companies. 2003
2002 2003 2002 2003Companies
Capitalisation (at 31 Dec.) Annual trading Date of listing in2003 & other comments
Amounts in thousands of euros
(Continued)
(Continues over)

175
Annex 2: Secondary markets
(Continued)
(Continues over)
INVACO 0 0 0 0INVEFERSA CAPITAL, SIMCAV 0 25,002 0 1,193 03/13/2003INVEMASA CARTERA, SIMCAV 0 12,140 0 0 02/14/2003INVER 15575 EQUITIES SIMCAVF 21,636 22,838 28 2,390INVER-99 SIMCAV 30,702 28,767 0 4,376INVERA GRN 2000, SIMCAVF 24,041 24,722 0 0INVERACCIONES CARTERA, SIMCAV 22,598 24,041 11 718INVERAGUDO 2000, SIMCAV 26,204 22,550 15 5,917INVERAL INVERSIONES, SIMCAV,SA 0 25,002 0 879 02/14/2003INVERALIA GESTIÓN, SIMCAVF 0 24,916 0 67 09/10/2003INVERANAYET, SIMCAV 20,840 27,320 61 61INVERAVANCE, SIMCAV 18,440 18,480 3 9INVERBELA SIMCAV 55,800 57,300 181 2INVERBLAVA INVERSIONS, SIMCAV 23,560 24,521 11 30INVERBLOC 2000, SIMCAV 16,160 16,400 3,129 0INVERCAT ACTIUS MOBILIARIS SIMCAV 26,000 26,000 162 0INVERCELLA ACTIUS MOBILIARIS 5,640 0 187 30 Delisted 04/12/03INVERCHICO, SIMCAV 18,807 18,807 688 3INVERCODOLS, SIMCAV 0 26,250 0 0 11/09/2003INVERCOMPI, SIMCAV 19,232 19,473 74 5,085INVERCORIA INVERSIONES, SIMCAV 19,232 19,954 11 22INVERDINCO 21,400 24,240 212 596INVERDOCUN ACTIUS MOBILIARIS, SIMCAV 11,500 12,000 1 29INVERELID, SIMCAV 27,106 21,781 610 490INVERETIRO, SIMCAV 15,600 16,800 27 22INVERFINA 764 6,332 3 4INVERFRUT-2001, SIMCAV 23,521 23,858 1 0INVERGALDANA, SIMCAV 28,727 30,926 514 1,322INVERGEINSA, SIMCAVF 23,271 25,675 241 253INVERGLOBAL ASSISTENCIA ACTIUS MOBILIARIS, SI 0 20,225 0 4INVERGRAMA CARTERA, SIMCAV 19,713 20,194 27 1,189INVERIMPAR VALORES, SIMCAV 30,891 28,848 7 1INVERKAL BOLSA, SIMCAV 16,323 16,660 15 39INVERKLEIN, SIMCAV 0 25,002 0 22 03/24/2003INVERLAN 2000, SIMCAV 18,872 18,463 0 0INVERLENDO 31,287 33,798 257 277INVERLUGAR DE INVERSIONES, SIMCAV 13,655 16,837 172 53INVERLUMA DE VALORES SIMCAV 20,924 21,886 13 7INVERMANHER 83,480 33,938 68 3,796INVERMARINADA DE INVERSIONES, SIMCAV 20,178 21,549 0 2INVERMAY 282,660 311,100 15,556 55,130INVERMAY 2 141,440 152,480 23,796 31,463INVERMAY 3 99,900 110,100 42,202 35,989INVERMAY 4 VALORES 24,480 27,200 1,928 11,489INVERMUAL, SIMCAV 24,241 24,682 10 499INVEROC FINANCIERA, SIMCAV 25,240 25,560 16 32INVEROD INVERSIONES, SIMCAV 20,915 21,156 13 11 09/26/2003INVEROSCA XXI, SIMCAV 23,480 24,920 2,083 13INVERPASTOR 120,080 130,400 56 80INVERPOLO VEINTIUNO, SIMCAVF 0 24,617 0 8INVER-RENT 30,680 36,360 28 389INVER-RISK, SIMCAV 36,061 36,782 11 11INVERSALIA DE VALORES, SIMCAV 21,876 22,838 10 20INVERSALINAS, SIMCAV 20,939 23,199 618 736INVERSENECA, SIMCAV 17,160 16,040 2,402 790INVERSIO ACTIVA PENEDES 3, SIMCAV 26,850 27,150 66 61INVERSIO ACTIVA PENEDES, SIMCAV 113,250 123,125 2,492 1,055INVERSIÓN EN VALORES 3 DE ABRIL, SIMCAV 20,160 20,360 30 32INVERSIÓN GLOBAL 2000, SIMCAVF 21,372 22,165 312 493INVERSIÓN GLOBAL 2001 SIMCAVF 0 19,473 0 47
A.2.19.Secondary markets. Equities.Outcry market. Listed companies. 2003
2002 2003 2002 2003Companies
Capitalisation (at 31 Dec.) Annual trading Date of listing in2003 & other comments
Amounts in thousands of euros
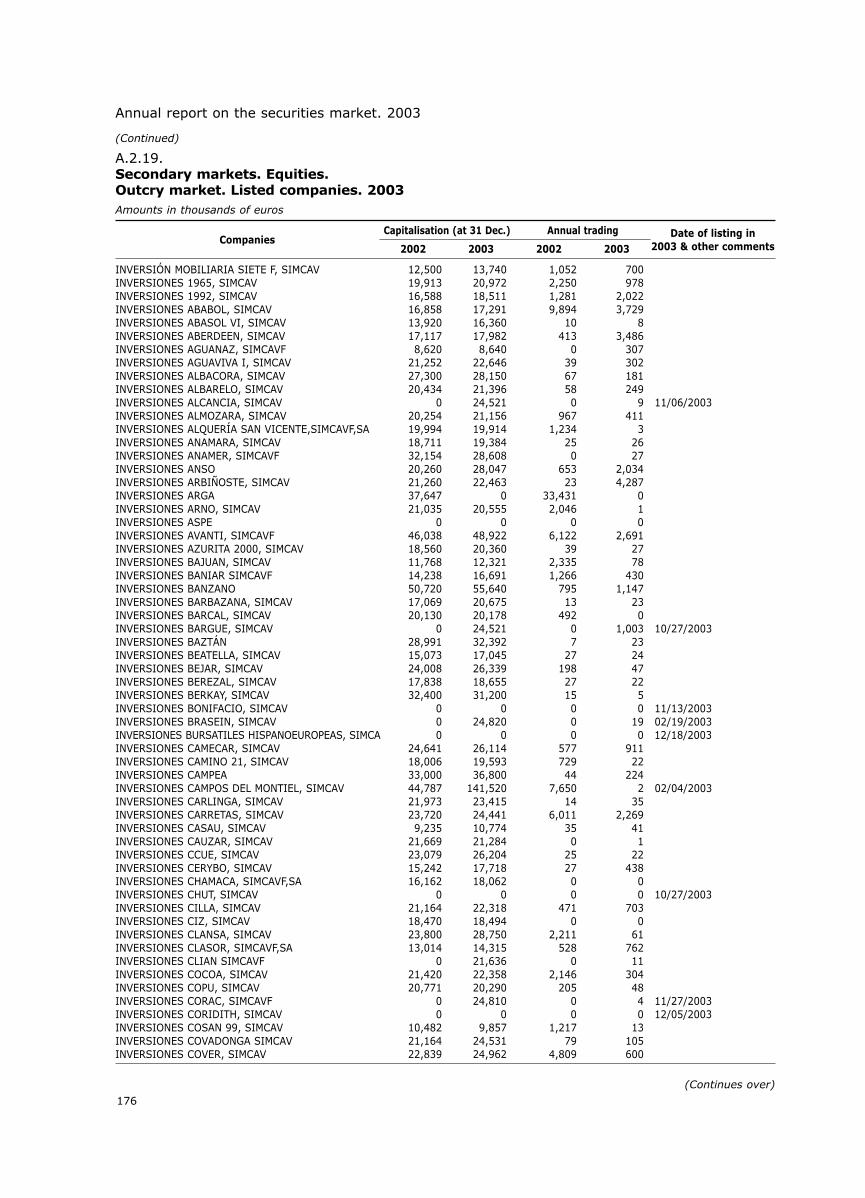
176
Annual report on the securities market. 2003
INVERSIÓN MOBILIARIA SIETE F, SIMCAV 12,500 13,740 1,052 700INVERSIONES 1965, SIMCAV 19,913 20,972 2,250 978INVERSIONES 1992, SIMCAV 16,588 18,511 1,281 2,022INVERSIONES ABABOL, SIMCAV 16,858 17,291 9,894 3,729INVERSIONES ABASOL VI, SIMCAV 13,920 16,360 10 8INVERSIONES ABERDEEN, SIMCAV 17,117 17,982 413 3,486INVERSIONES AGUANAZ, SIMCAVF 8,620 8,640 0 307INVERSIONES AGUAVIVA I, SIMCAV 21,252 22,646 39 302INVERSIONES ALBACORA, SIMCAV 27,300 28,150 67 181INVERSIONES ALBARELO, SIMCAV 20,434 21,396 58 249INVERSIONES ALCANCIA, SIMCAV 0 24,521 0 9 11/06/2003INVERSIONES ALMOZARA, SIMCAV 20,254 21,156 967 411INVERSIONES ALQUERÍA SAN VICENTE,SIMCAVF,SA 19,994 19,914 1,234 3INVERSIONES ANAMARA, SIMCAV 18,711 19,384 25 26INVERSIONES ANAMER, SIMCAVF 32,154 28,608 0 27INVERSIONES ANSO 20,260 28,047 653 2,034INVERSIONES ARBIÑOSTE, SIMCAV 21,260 22,463 23 4,287INVERSIONES ARGA 37,647 0 33,431 0INVERSIONES ARNO, SIMCAV 21,035 20,555 2,046 1INVERSIONES ASPE 0 0 0 0INVERSIONES AVANTI, SIMCAVF 46,038 48,922 6,122 2,691INVERSIONES AZURITA 2000, SIMCAV 18,560 20,360 39 27INVERSIONES BAJUAN, SIMCAV 11,768 12,321 2,335 78INVERSIONES BANIAR SIMCAVF 14,238 16,691 1,266 430INVERSIONES BANZANO 50,720 55,640 795 1,147INVERSIONES BARBAZANA, SIMCAV 17,069 20,675 13 23INVERSIONES BARCAL, SIMCAV 20,130 20,178 492 0INVERSIONES BARGUE, SIMCAV 0 24,521 0 1,003 10/27/2003INVERSIONES BAZTÁN 28,991 32,392 7 23INVERSIONES BEATELLA, SIMCAV 15,073 17,045 27 24INVERSIONES BEJAR, SIMCAV 24,008 26,339 198 47INVERSIONES BEREZAL, SIMCAV 17,838 18,655 27 22INVERSIONES BERKAY, SIMCAV 32,400 31,200 15 5INVERSIONES BONIFACIO, SIMCAV 0 0 0 0 11/13/2003INVERSIONES BRASEIN, SIMCAV 0 24,820 0 19 02/19/2003INVERSIONES BURSATILES HISPANOEUROPEAS, SIMCA 0 0 0 0 12/18/2003INVERSIONES CAMECAR, SIMCAV 24,641 26,114 577 911INVERSIONES CAMINO 21, SIMCAV 18,006 19,593 729 22INVERSIONES CAMPEA 33,000 36,800 44 224INVERSIONES CAMPOS DEL MONTIEL, SIMCAV 44,787 141,520 7,650 2 02/04/2003INVERSIONES CARLINGA, SIMCAV 21,973 23,415 14 35INVERSIONES CARRETAS, SIMCAV 23,720 24,441 6,011 2,269INVERSIONES CASAU, SIMCAV 9,235 10,774 35 41INVERSIONES CAUZAR, SIMCAV 21,669 21,284 0 1INVERSIONES CCUE, SIMCAV 23,079 26,204 25 22INVERSIONES CERYBO, SIMCAV 15,242 17,718 27 438INVERSIONES CHAMACA, SIMCAVF,SA 16,162 18,062 0 0INVERSIONES CHUT, SIMCAV 0 0 0 0 10/27/2003INVERSIONES CILLA, SIMCAV 21,164 22,318 471 703INVERSIONES CIZ, SIMCAV 18,470 18,494 0 0INVERSIONES CLANSA, SIMCAV 23,800 28,750 2,211 61INVERSIONES CLASOR, SIMCAVF,SA 13,014 14,315 528 762INVERSIONES CLIAN SIMCAVF 0 21,636 0 11INVERSIONES COCOA, SIMCAV 21,420 22,358 2,146 304INVERSIONES COPU, SIMCAV 20,771 20,290 205 48INVERSIONES CORAC, SIMCAVF 0 24,810 0 4 11/27/2003INVERSIONES CORIDITH, SIMCAV 0 0 0 0 12/05/2003INVERSIONES COSAN 99, SIMCAV 10,482 9,857 1,217 13INVERSIONES COVADONGA SIMCAV 21,164 24,531 79 105INVERSIONES COVER, SIMCAV 22,839 24,962 4,809 600
A.2.19.Secondary markets. Equities.Outcry market. Listed companies. 2003
2002 2003 2002 2003Companies
Capitalisation (at 31 Dec.) Annual trading Date of listing in2003 & other comments
Amounts in thousands of euros
(Continued)
(Continues over)

177
Annex 2: Secondary markets
(Continued)
(Continues over)
INVERSIONES CRESA II, SIMCAV 11,328 13,925 2,289 2INVERSIONES CRESA-3, SIMCAV 11,059 12,421 0 0INVERSIONES DEMETER, SIMCAV 18,950 21,450 2,131 900INVERSIONES DEVA 48,954 43,172 101 1,070INVERSIONES DIEMA, SIMCAVF 8,733 9,065 498 75INVERSIONES DOLOMITAS, SIMCAV 0 24,727 0 2,428 09/12/2003INVERSIONES DUBLIN, SIMCAV 18,750 20,450 750 10INVERSIONES ECHEMU 4,445 4,445 119 137INVERSIONES EFESO, SIMCAV 0 26,973 0 359 10/04/2003INVERSIONES EL FRUTAL, SIMCAV 8,294 8,534 13 21INVERSIONES ELIZONDO 21,200 22,920 0 25INVERSIONES EN BOLSA SIGLO XXI, SIMCAV 25,734 34,392 1,532 3INVERSIONES EN VALORES SIGLO XXI 13,176 80,233 36 0INVERSIONES ENLOR, SIMCAV 19,817 21,308 19 28INVERSIONES ERILO, SIMCAV 198,400 206,800 13,265 32,137INVERSIONES ERISTE, SIMCAV 24,339 30,399 9,939 503INVERSIONES ERUAIN, SIMCAV 22,944 23,761 936 32INVERSIONES ESBE, SIMCAV 0 0 0 0 07/30/2003INVERSIONES ESFIMO SIMCAV 17,364 19,144 23 22INVERSIONES ESTRELLA 3,184 21,920 0 2INVERSIONES EUROMAR, SIMCAV 15,426 15,346 1 1INVERSIONES EVEREST, SIMCAVF 24,242 23,810 0 0INVERSIONES FAMCAS SIMCAVF 0 25,637 0 20 09/01/2003INVERSIONES FAMEI 10,800 11,080 45 649INVERSIONES FERBA, SIMCAV 4,084 4,549 28 27INVERSIONES FILVOS 0 0 0 0 Delisted 06/10/2003INVERSIONES FINANCIERAS ARAGONESAS 47,360 49,760 42 154INVERSIONES FINANCIERAS ARENAS, SIMCAVF 18,929 20,610 528 35 Former INVERSIONES
FILVOS, SIMCAVINVERSIONES FINANCIERAS CBA SIMCAVF 0 29,629 0 116INVERSIONES FINANCIERAS CINCINATTI,SIMCAV, S 22,157 22,598 4,843 3INVERSIONES FINANCIERAS CRESA, SIMCAV 20,625 23,125 2 1INVERSIONES FINANCIERAS CUBI, SIMCAV 22,600 23,360 268 4INVERSIONES FINANCIERAS EUROKAS, SIMCAVF 15,968 17,329 194 307INVERSIONES FINANCIERAS FERRINVEST, SIMCAVF, 19,866 21,715 3 329INVERSIONES FINANCIERAS GLASS CERAMICA, SIMCA 14,464 13,623 6 582INVERSIONES FINANCIERAS MENDEXA, SIMCAVF 0 29,151 0 541INVERSIONES FINANCIERAS NORMAX, SIMCAV 8,081 8,941 430 2,793 Former FADOGUE, SIMCAVINVERSIONES FINANCIERAS PEPES, SIMCAVF 23,850 26,501 4 21INVERSIONES FINANCIERAS PERSONALES, SIMCAV, S 25,040 26,240 2 2INVERSIONES FINANCOR, SIMCAV 16,756 19,016 1,717 93INVERSIONES FINANZAS VALDELANDINGA SIMCAV, S 9,857 10,217 11 22INVERSIONES FLEXIM, SIMCAV 17,653 19,721 594 526INVERSIONES FOCALIZADAS, SIMCAV 23,319 30,531 2,968 1,343 Former MAPISU
FINANZAS, SIMCAVINVERSIONES FONLANA, SIMCAV 28,620 30,660 38 26INVERSIONES FRANTRAMI, SIMCAV 0 24,194 0 0 08/01/2003INVERSIONES FROFER, SIMCAV 10,686 12,056 1 22INVERSIONES FUND NET 2001, SIMCAV 6,671 7,609 1,224 1,103INVERSIONES GALA XXI, SIMCAV 7,904 8,288 6 11INVERSIONES GALERNA, SIMCAV 8,132 8,582 27 22INVERSIONES GARBI 6,236 6,508 10 21INVERSIONES GARIBAS SIMCAV 15,633 15,344 1 0INVERSIONES GARODIES, SIMCAV 17,120 17,720 11 21INVERSIONES GCU, SIMCAV 0 0 0 0 12/18/2003INVERSIONES GELMA, SIMCAV 23,560 25,483 13 22INVERSIONES GELRO, SIMCAV 23,319 25,243 13 22INVERSIONES GEM 2000, SIMCAVF 19,232 19,713 0 11INVERSIONES GERESA, SIMCAV 62,078 64,395 150 141INVERSIONES GESCAMAR, SIMCAV 23,079 24,762 36 122
A.2.19.Secondary markets. Equities.Outcry market. Listed companies. 2003
2002 2003 2002 2003Companies
Capitalisation (at 31 Dec.) Annual trading Date of listing in2003 & other comments
Amounts in thousands of euros

178
Annual report on the securities market. 2003
INVERSIONES GFISA 1199, SIMCAV 9,869 10,277 62 65INVERSIONES GIRALBA, SIMCAV 24,931 26,198 89 2,561INVERSIONES GIRALDA, SIMCAV 13,775 13,703 870 13,734INVERSIONES GOCAL, SIMCAV 11,455 12,140 915 220INVERSIONES GOYSAMAR SIMCAV 15,320 14,526 1 0INVERSIONES GUMIEL 2002, SIMCAV 19,769 20,659 979 478INVERSIONES HABANA 2000, SIMCAV 19,080 21,120 36 1,604INVERSIONES HELGUERA, SIMCAV 17,989 17,532 1 873INVERSIONES HERCA 4,025 16,354 29 248INVERSIONES HERRERO 64,130 81,100 31,084 6,873INVERSIONES HIFLOR, SIMCAV 18,711 19,817 19 26INVERSIONES IBERBAUM, SIMCAV 24,041 25,098 0 2INVERSIONES IC49, SIMCAV 14,863 17,268 2,319 1,141INVERSIONES IMABAR, SIMCAV 13,222 15,963 124 256INVERSIONES INDASA EJEA, SIMCAV 19,240 20,960 1 8INVERSIONES INESFI, SIMCAV 10,097 12,116 1,130 53INVERSIONES INFANTES, SIMCAV 20,600 22,000 19 4,228INVERSIONES INMENSA, SIMCAV 28,921 41,600 22,464 6,054INVERSIONES INSANCO, SIMCAVF 45,360 42,560 11 14INVERSIONES INSTITUCIONALES, SIMCAV 18,922 20,528 1,743 1,365INVERSIONES INTERMARKETS, SIMCAV 29,520 30,924 47 31INVERSIONES INVERARTE SIMCAV 12,958 15,482 384 10INVERSIONES INVERJOTA, SIMCAV 27,300 30,960 36 27INVERSIONES INVESTU, SIMCAV 10,738 12,721 0 14INVERSIONES IPCUS SIMCAV 19,232 19,954 32 0INVERSIONES IPSON, SIMCAV 18,679 18,463 27 22INVERSIONES IRADA, SIMCAV 22,880 24,760 641 902INVERSIONES IREBUA, SIMCAV 23,319 25,243 13 22INVERSIONES IRURITA 5,492 6,044 6 16INVERSIONES ITACA AHORRO, SIMCAV 87,750 93,750 227 5,090INVERSIONES ITZIAR, SIMCAV 27,046 28,127 13 22INVERSIONES JALABUN, SIMCAV 19,830 22,290 121 216INVERSIONES JALAMA AHORRO, SIMCAV 22,558 25,483 24,719 13,680INVERSIONES JALAMA CRECIMIENTO SIMCAV,SA 13,062 14,625 4,625 1,804INVERSIONES JALAMA RENTA SIMCAV 20,474 25,763 15,118 10,534INVERSIONES JOMANEL, SIMCAV 0 31,493 0 9 08/26/2003INVERSIONES JOSCELOCARTE, SIMCAV 0 25,483 0 1,039 11/03/2003INVERSIONES JULGAB SIMCAV 25,541 27,513 1,424 36INVERSIONES KISHOO, SIMCAV 20,483 23,488 29 71INVERSIONES LA MATA DEL MORAL, SIMCAV 23,480 24,121 4 8INVERSIONES LA PILONA, SIMCAV 24,762 25,483 96 154INVERSIONES LABRADOR, SIMCAVF 25,320 26,080 30 18,850INVERSIONES LAGASCA 75, SIMCAV 23,319 24,041 13 22INVERSIONES LARISA, SIMCAV 0 0 0 0 03/13/2003INVERSIONES LEAL 23,520 19,560 98 1,965INVERSIONES LEALTAD 89,200 57,744 28 199INVERSIONES LECAROZ 86,360 88,357 193 317INVERSIONES LELO, SIMCAV 13,131 15,584 2 1INVERSIONES LES BEDULES, SIMCAV 16,065 16,210 1 1INVERSIONES LIXVA 6, SIMCAV 10,638 11,143 46 61INVERSIONES LLONER 78,679 93,694 342 421INVERSIONES LOIDA, SIMCAV 26,362 21,347 60 48INVERSIONES LONHER 19,880 22,480 73 112INVERSIONES LOS AZULES, SIMCAV 9,139 11,424 255 614INVERSIONES LUTIMO, SIMCAVF 15,633 16,065 1,587 1,648INVERSIONES MACBETH, SIMCAV 23,319 26,445 12 287INVERSIONES MACHAQUITO, SIMCAVF 23,319 23,800 13 21INVERSIONES MADEGO 2000, SIMCAV 16,835 17,893 23 23INVERSIONES MADRID SUR, SIMCAV 13,342 13,583 2 3INVERSIONES MARITIMA PASOAL, SIMCAV 21,156 22,358 25 22
A.2.19.Secondary markets. Equities.Outcry market. Listed companies. 2003
2002 2003 2002 2003Companies
Capitalisation (at 31 Dec.) Annual trading Date of listing in2003 & other comments
Amounts in thousands of euros
(Continued)
(Continues over)

179
Annex 2: Secondary markets
(Continued)
(Continues over)
INVERSIONES MARREBA, SIMCAV 21,240 24,520 0 4INVERSIONES MARYGLO,SIMCAV 19,256 20,338 15 1INVERSIONES MATIPE SIMCAV 14,466 16,388 59 2,482INVERSIONES MAZONSO, SIMCAV 19,096 16,739 202 172INVERSIONES MEDARA, SIMCAV 0 24,722 0 56 10/02/2003INVERSIONES MEDIALUNA, SIMCAV 0 22,318 0 1,787 09/01/2003INVERSIONES MEERLEN, SIMCAV 18,680 19,040 37 5INVERSIONES MENÉNDEZ PELAYO, SIMCAV 70,560 76,800 48,563 18INVERSIONES MERCOMEDINA, SIMCAV 5,169 6,401 28 22INVERSIONES MIDMAR, SIMCAV 16,828 18,030 1,226 22INVERSIONES MILAMAR 2000, SIMCAV 22,960 26,200 38 1,899INVERSIONES MISI, SIMCAV 17,862 18,247 24 22INVERSIONES MOBILIARIAS ALICANTE, SIMCAV 17,292 18,182 897 1,681INVERSIONES MOBILIARIAS GRUPO ADAN 52,800 61,120 2,141 3,095INVERSIONES MOBILIARIAS IMAGO, SIMCAV 12,795 12,314 0 0INVERSIONES MOBILIARIAS URQUIOLA 33,143 34,395 194 173INVERSIONES MOLUTI, SIMCAVF 7,792 8,009 1,544 830INVERSIONES MONEGROS-BAJO ARAGON SIMCAVF 18,030 19,954 6 420INVERSIONES MONSEVI, SIMCAV 23,199 23,840 4 5INVERSIONES MONTALBÁN, SIMCAV 12,200 13,720 43 155INVERSIONES MONTARTO, SIMCAV 21,092 21,765 22 2,177INVERSIONES MONTISIELLO, SIMCAV 14,560 16,320 4 41INVERSIONES MONTLLOR, SIMCAV 22,185 22,770 332 1,547INVERSIONES MOURA SIMCAV 16,378 16,474 4 4,600INVERSIONES NAIRA, SIMCAVF 36,421 42,191 11,506 32,775INVERSIONES NANON, SIMCAV 0 0 0 0 09/16/2003INVERSIONES NEOCLASICAS, SIMCAVF 24,762 27,166 133 981INVERSIONES NEÓN CMA, SIMCAVF 20,354 21,035 32 3INVERSIONES NIBANI, SIMCAV 20,178 19,168 17 6,031INVERSIONES OLABERRIA, SIMCAVF 7,140 7,350 1,695 4,592INVERSIONES OMNITOT, SIMCAV 9,965 10,566 187 599INVERSIONES ÓPTIMUS, SIMCAV 24,040 25,363 27 22INVERSIONES ORELLANA, SIMCAV 0 24,098 0 1INVERSIONES PADUA, SIMCAV 17,797 19,673 522 4INVERSIONES PANTER, SIMCAV 19,680 21,520 289 390INVERSIONES PARAMONTES, SIMCAV 0 24,882 0 4 01/27/2003INVERSIONES PATRICIO Y AMANCIA SIMCAV 14,406 13,973 1 0INVERSIONES PECUNIA, SIMCAV 20,731 21,068 17 8,063INVERSIONES PEMASA, SIMCAV 22,838 24,281 25 22INVERSIONES PERMON, SIMCAV 20,483 24,644 24 36INVERSIONES PICO TRES MARES, SIMCAV 22,117 22,358 11,310 2,742INVERSIONES PIKAIA, SIMCAV 34,050 36,450 8,209 6,270INVERSIONES PIRO, SIMCAV 18,760 21,120 45 2,474INVERSIONES PLANTEN SIMCAV 13,733 12,915 0 0INVERSIONES POLIVALENTE, SIMCAV 37,260 39,600 410 699INVERSIONES PROGRAMADAS 13,400 14,600 192 82INVERSIONES PUERTO ALEGRE, SIMCAV 24,321 24,601 0 2,842INVERSIONES QUINTA DIMENSION, SIMCAV 18,000 19,400 30 30INVERSIONES RANZA 25,303 26,534 19 182INVERSIONES REALTTA, SIMCAV 18,020 19,890 125 5INVERSIONES REMELLAN, SIMCAV 17,557 19,240 213 5INVERSIONES RETAMA, SIMCAV 15,170 16,540 27 6,425INVERSIONES RIO HUECHA, SIMCAV 5,589 5,710 11 20INVERSIONES RIOCOBO, SIMCAV 19,353 20,483 63 45INVERSIONES ROBINIA, SIMCAV 26,400 28,200 43 22INVERSIONES ROSCHELL, SIMCAV 22,320 23,560 38 27INVERSIONES RUGETES SIMCAV 24,041 26,204 13 22INVERSIONES RUSH, SIMCAV 18,567 21,934 312 2,120INVERSIONES SACARA, SIMCAV 31,152 31,753 15,549 14,963INVERSIONES SALESAS I, SIM 2,020 2,080 687 379
A.2.19.Secondary markets. Equities.Outcry market. Listed companies. 2003
2002 2003 2002 2003Companies
Capitalisation (at 31 Dec.) Annual trading Date of listing in2003 & other comments
Amounts in thousands of euros

180
Annual report on the securities market. 2003
INVERSIONES SANFE SIMCAV 13,703 15,097 38 1,164INVERSIONES SANTA MARINA, SIMCAV 22,983 24,233 33 77INVERSIONES SELECTIVAS 53,844 58,128 0 46INVERSIONES SERRABLO 60,920 50,800 388 67INVERSIONES SEZUR 47,672 32,360 0 1,023INVERSIONES SIENA, SIMCAV 19,545 19,689 911 3,860INVERSIONES SIERRA DE SAN PEDRO, SIMCAVF 39,300 21,003 0 11INVERSIONES SINGLADURA SIMCAV 23,575 24,000 2 15INVERSIONES SOINVISA, SIMCAV 15,867 17,309 48 53INVERSIONES SOLBUS, SIMCAV 18,903 20,587 26 28INVERSIONES TAMBRE, SIMCAV 24,041 24,481 0 1,505INVERSIONES TEBAICA, SIMCAV 0 0 0 0 09/29/2003INVERSIONES TEIDE 52,250 59,000 572 575INVERSIONES TELEBE, SIM 2,154 2,217 64 67INVERSIONES TORCAL, SIMCAV 21,429 21,332 0 0INVERSIONES TORRES DE CUART, SIMCAV 15,626 16,588 85 876INVERSIONES TOSCANA SIMCAV 56,675 59,620 440 241INVERSIONES TRENTO SIMCAV 17,220 19,192 522 4INVERSIONES UGUESI, SIMCAV 15,633 19,192 3,707 395INVERSIONES URANET, SIMCAVF,SA 13,943 18,056 488 119INVERSIONES VALDELINARES, SIMCAVF 24,560 25,000 31 106INVERSIONES VALIX-6, SIMCAV 0 0 0 0INVERSIONES VALLADOLID SIGLO XXI, SIMCAVF, S 0 24,960 0 13 02/17/2003INVERSIONES VALLE ASON, SIMCAVF,SA 22,560 23,160 41 234INVERSIONES VALLE PALLIN, SIMCAV 16,973 18,535 29 0INVERSIONES VALLIER, SIMCAV 23,920 22,157 173 372INVERSIONES VAZPI, SIMCAV 0 24,041 0 0 07/17/2003INVERSIONES VERAL 3,040 3,595 21 16INVERSIONES VERDES SIMCAV 23,656 25,435 173 53INVERSIONES VERFANI SIMCAV 28,849 19,958 11 21INVERSIONES VERMA 21 26,751 0 369 0 Delisted 05/14/2003INVERSIONES VIBET, SIMCAV 16,828 18,030 1,198 20INVERSIONES VICEDO SIMCAV 5,680 5,950 12 20INVERSIONES VILLA DE PARIS I 3,834 0 880 364 Delisted 05/29/2003INVERSIONES VILLA DE PARIS II 3,096 3,096 1 0INVERSIONES VILLA DE PARIS III 3,784 0 54 0INVERSIONES VISANSA 11,760 13,400 274 370INVERSIONES Y ANÁLISIS ESTRATEGICOS, SIMCAV 11,340 13,600 294 499INVERSIONES ZAGA 25,296 28,671 76 7,397INVERSIONES ZAM, SIMCAV 14,625 18,471 793 138INVERSIONES ZIARREH, SIMCAV 16,696 18,048 27 114INVERSIONES ZUBITEL, SIMCAVF 8,240 8,500 475 21INVERSIONS 4T´S, SIMCAV 25,555 26,541 2,275 86INVERSIONS AGO, SIMCAV 30,285 34,695 483 4INVERSIONS DCINC 2000, SIMCAV 11,125 12,116 50 1,221INVERSIONS EGERIA, SIMCAV 18,487 19,353 168 92INVERSIONS EL CIRERER, SIMCAV 11,304 11,785 6 0INVERSIONS L´OLIVERA, SIMCAV 0 0 0 0INVERSIONS MOIX, SIMCAV 13,198 14,665 42 64INVERSIONS PATRIMONI CAPITAL FH, SIMCAV 24,320 26,200 37 35INVERSIONS POBLE NOU, SIMCAV 12,312 13,870 37 32INVERSIONS PUIGCERDA 2000 35,700 0 0 0 Delisted 09/09/2003INVERSIONS SACONCA, SIMCAV 10,770 11,359 31 71INVERSIONS TONA 2000, SIMCAV 60,502 61,604 2 5,836INVERSORA MOBILIARIA ESPAÑOLA 55,920 28,613 6,217 9,696INVERSORA OLARIZU 18,200 0 3,453 0INVERSORA PATRIMONIAL 7,600 10,800 35 80INVERSORA SORRIBO, SIMCAV 18,728 20,723 27 22INVERSUM CARTERA, SIMCAV 27,346 27,947 7,373 407INVERSUS INVERSIONES, SIMCAV 21,541 22,815 840 4,271
A.2.19.Secondary markets. Equities.Outcry market. Listed companies. 2003
2002 2003 2002 2003Companies
Capitalisation (at 31 Dec.) Annual trading Date of listing in2003 & other comments
Amounts in thousands of euros
(Continued)
(Continues over)

181
Annex 2: Secondary markets
(Continued)
(Continues over)
INVERSUS PLUS INVERSIONES, SIMCAV 21,129 26,210 2,537 1,075INVERTIA DE GESTIÓN SIMCAV 14,274 13,418 0 424INVERUN INVERSIONES, SIMCAV 36,061 37,503 0 0INVERURBASA 28,053 30,693 147 803INVERVALOR 2,236 2,456 0 1INVERVULCANO, SIMCAV 27,040 28,560 330 788INVERZETA 11,000 10,890 8 0INVESBECADA, SIMCAV 11,083 11,684 345 163INVESBRA 2001, SIMCAV 22,598 31,060 453 3,450INVESCA CARTERA, SIMCAV 35,534 27,521 273 722INVESJUST XXI, SIMCAV 23,800 24,281 10 21INVESMOL SIMCAV 0 42,492 0 246 06/30/2003INVESNET 99 SIMCAV 17,965 18,711 2 2,803INVEST 2000-2001 DE INVERSIONES, SIMCAV 22,439 22,968 541 2,508INVEST NETWORKS WORLDWIDE, SIMCAV 0 24,074 0 0 06/11/2003INVEST VALOR, SIMCAV 18,295 19,040 162 597INVESTALBERT 4,576 4,840 87 68INVESTBLUE ACTIVOS, SIMCAV 28,758 30,982 8,284 5,867INVESTBLUE DOS ASSETS, SIMCAV 14,236 16,040 0 3,389INVESTFAM, SIMCAV 19,720 20,800 1 2,440INVESTGODAMA, SIMCAV 19,313 20,114 1,081 29INVESTIGACIÓN, DESARROLLO E IMPLANTACIÓN, SIM 19,056 15,892 291 431INVESTMENTS AKNAM, SIMCAV 0 24,810 0 15,297 10/02/2003INVESTMENTS ANSAVE, SIMCAV 0 30,321 0 10 06/11/2003INVESTMENTS MASAVE, SIMCAV 36,890 37,900 68 82INVESTOR VM40, SIMCAV 22,117 22,838 1,348 2,467IRADIER DE INVERSIONES 11,965 12,386 177 119IRARTEL INVERSIONES SIMCAVF,SA 13,216 13,361 1,174 948IRASA INVERSIONS MOBILIARIES, SIMCAV 20,840 21,680 15 29IRASBALEAK, SIMCAV 18,511 18,752 11 20IRINEAL, SIMCAVF 0 21,413 0 0IRON ONE 22,320 23,800 38 29IRU DE INVERSIONES SIMCAV 18,086 19,240 4 2IRUR GESTION, SIMCAV 20,242 20,747 1,464 322IRVING INVEST SIMCAV 21,571 25,013 1,806 1,727ISAGA 2001, SIMCAVF 25,050 25,900 9,702 2ISANVAL DE INVERSIONES, SIMCAV 1,418 1,635 12 11ISCAR FINANZAS, SIMCAV 21,645 23,425 1,677 901ISCOSAN FINANCIERA, SIMCAV 18,271 19,713 15 1,675ISLA ESMERALDA DE INVERSIONES, SIMCAV 20,515 21,284 99 5,935ISLETA DEL MORO INVERSIONES, SIMCAV 21,636 24,041 250 0ISUNTZA BOLSA, SIMCAV 20,292 22,220 170 396ITEM INVERSIONES, SIMCAVF 18,062 18,134 56 1,143ITH BOLSA SIMCAV 12,815 15,513 5,790 3,594ITUERO INVERSIONES, SIMCAV 24,041 24,762 11 4,905ITURINVER 26,560 28,760 0 0IZAGA DE INVERSIONES 32,873 33,094 24 6IZNAJAR DE INVERSIONES SIMCAV 11,179 12,020 154 101J&P ALCARAZ INVERSIONES, SIMCAV 11,359 12,032 72 78JABATO INVERSIONES, SIMCAV 0 24,281 0 0 07/28/2003JAITER INVERSIONES SIMCAV 16,372 17,357 4 5JANUS INVESTMENT SIMCAV 18,752 20,534 605 1,190JAP 99, SIMCAV 22,040 22,840 0 0JAQUISA INVERSIONES, SIMCAV 22,838 23,560 10 21JARA BOLSA, SIMCAV 17,349 18,872 468 763JARAMIEL 50,880 61,230 3,896 5,746JARBA 2000, SIMCAV 7,172 7,833 1,493 828JASOCA 4,728 0 12 0JATMOS 99, SIMCAV 11,960 12,633 11,966 72 06/03/2003JAURINVER INVERSIONES, SIMCAV 0 25,243 0 13 07/02/2003
A.2.19.Secondary markets. Equities.Outcry market. Listed companies. 2003
2002 2003 2002 2003Companies
Capitalisation (at 31 Dec.) Annual trading Date of listing in2003 & other comments
Amounts in thousands of euros

182
Annual report on the securities market. 2003
JECOAL INVERSIONES, SIMCAV 0 24,531 0 2 07/30/2003JEDI DE INVERSIONES, SIMCAV 22,574 23,776 2 2JENKINGS INVERSIONES, SIMCAV 17,352 19,800 413 77JENUSA DE VALORES MOBILIARIOS 1,764 1,764 2 0JEREMIAS INVERSIONES, SIMCAV 0 24,531 0 18JERIGONDOR, SIMCAV 7,800 8,600 1,454 947JERTE DE INVERSIONES, SIMCAV,SA 16,520 18,680 492 786JFM 2001 CARTERA SIMCAV 24,882 25,002 206 219JIBACOA INVERSIONES, SIMCAV 24,680 27,160 18 40JJ CARTERA ACTIVA, SIMCAV 23,512 24,858 5 1JLC INVEST 2001, SIMCAV 22,439 23,112 2 4,000JOGAMI DE INVERSIONES SIMCAV 61,423 25,421 6,595 4,426JOI RECURSOS LIQUIDOS, SIMCAV 0 24,521 0 9 04/28/2003JOJUSA 99, SIMCAV 9,877 10,678 1 1JONATA INVERSIONES, SIMCAVF 22,598 22,838 6 12JOPA INVERSIONES, SIMCAV 18,030 19,954 12 22JORICK INVESTMENT SIMCAV 17,670 18,431 3 4JOSA FINANCE SIMCAV 16,147 17,352 27 22JOSAN INVERSIONES, SIMCAV 0 22,418 0 0JOTAHORRO, SIMCAV 14,911 17,316 0 511JQ41 DE VALORES, SIMCAV 41,250 43,650 37 5,011JS WANER 2000, SIMCAV 21,685 20,699 0 2,073JUDBEM DE INVERSIONES, SIMCAV 23,304 24,315 1 0JULPER ALPER 2003, SIMCAV,SA 0 27,190 0 4 11/06/2003JUMARLU INVERSIONES, SIMCAV 0 24,481 0 1,202 02/05/2003JUMI CARTERA, SIMCAV 45,196 23,079 10 21,514JUNIO 99, SIMCAV 6,451 6,631 1,613 8JUNLAS INVERSIONES 99, SIMCAVF 19,292 21,917 0 12JUOSDE INVERSIONES, SIMCAV 0 24,820 0 20JUPASA INVERSIONES, SIMCAV 0 25,782 0 0 07/21/2003JUPITER DE INVERSIONES, SIMCAV 16,378 16,402 1 2JUSA PATRIMONIO 2001, SIMCAV 23,079 23,560 11 21JUVITEC INVERSIONES, SIMCAV 24,435 25,325 707 206JVCM ACTIVOS, SIMCAV 24,242 25,012 701 125JYCARTE, INVERSIONES, SIMCAV 0 24,960 0 51 10/04/2003KALMIA DE INVERSIONES SIMCAV 13,783 19,606 1 1KALYANI, SIMCAV 69,700 71,600 6,979 6,293KAPEMA DE INVERSIONES, SIMCAV 20,731 21,429 3,320 1,002 Former BRIO 21, SIMCAVKAPITAL GELD 22,360 24,160 431 424KARKIPA SIMCAVF 18,200 19,690 356 145KATAKANA, SIMCAVF 14,402 15,335 0 8KAWAB INVESTMENT, SIMCAV 25,343 26,445 3,305 581KEBEKA 2002, SIMCAVF 0 25,098 0 0 06/27/2003KEBLAR DE INVERSIONES, SIMCAVF 1,900,736 1,946,383 32,493 89,451KEEPER INVERSIONES, SIMCAV 168,800 183,200 56 19KELSO BRATON, SIMCAV 24,720 27,640 5 14KEY 98, SIMCAV 20,760 21,360 32 4KEY DE VALORES, SIMCAV 17,550 18,992 24 22KEY RATE INVERSIONES, SIMCAVF 25,240 27,320 98 24KEY WEST INVERSIONES, SIMCAVF 21,044 22,150 1,706 171KGINVES 10, SIMCAV 13,949 16,691 3,048 2KGINVES 11, SIMCAVF 22,607 24,627 3,664 2KGINVES 7, SIMCAVF 11,977 13,420 2 1KGINVES 8, SIMCAV 20,635 22,799 7,044 62KGINVES 9, SIMCAVF 14,719 16,114 1,054 1,413KGINVES1 SIMCAVF 11,111 12,554 1,657 213KGINVES100, SIMCAVF 0 25,493 0 0KGINVES101, SIMCAVF 0 26,503 0 0KGINVES102, SIMCAVF 0 25,301 0 754 04/30/2003KGINVES103, SIMCAV 24,228 25,301 300 0
A.2.19.Secondary markets. Equities.Outcry market. Listed companies. 2003
2002 2003 2002 2003Companies
Capitalisation (at 31 Dec.) Annual trading Date of listing in2003 & other comments
Amounts in thousands of euros
(Continued)
(Continues over)

183
Annex 2: Secondary markets
(Continued)
(Continues over)
KGINVES104, SIMCAVF 0 25,782 0 0KGINVES105, SIMCAVF 0 25,445 0 0KGINVES107, SIMCAV 0 0 0 0 07/10/2003KGINVES12, SIMCAV 22,896 29,678 3 3KGINVES13, SIMCAV 19,769 22,174 3,590 4,148KGINVES14 SIMCAV 46,022 46,854 82 52KGINVES15, SIMCAV 19,529 21,741 20,597 11,142KGINVES16, SIMCAV 22,367 25,589 3,148 1,672KGINVES17, SIMCAV 21,116 25,012 2,811 766KGINVES2, SIMCAV 15,392 16,787 2 3,004KGINVES3,SIMCAVF 12,698 13,660 2 1KGINVES4, SIMCAVF 11,111 11,640 58 294KGINVES5 SIMCAV 14,141 16,017 39,490 5,138KGINVES6 SIMCAVF 11,015 11,304 182 241KILMOR INVERSIONES, SIMCAV 21,156 22,358 135 115KINGSTON INVESTMENT SIMCAV 18,832 19,994 392 2,467KIORA INVERSIONES, SIMCAV 0 24,401 0 2,056 06/03/2003KITZBUHEL INVERSIONES, SIMCAV 13,775 15,482 26 5,529KIUKET INVERSIONES, SIMCAV 9,816 12,773 1 7KLANDUR, SIMCAV 16,680 17,520 1,267 8KLAPPEN INVERSIONES 19,120 19,880 118 66KOKINO INVERSIONES SIMCAV 21,805 23,512 2,017 0KONTACT EXCHANGE 3,125 3,250 186 167KOOPMANS INVERSIONES, SIMCAV 14,863 16,570 24 1KROPNICK INVERSIONES, SIMCAV,SA 0 25,002 0 3,120 08/01/2003KRUGER INVERSIONES, SIMCAV 8,570 9,652 43 36KURSAAL 2000, SIMCAV 6,174 6,219 51 63KURSAAL FINANCE, SIMCAV 7,335 7,452 1,541 7,067KUTXACAPITAL, SIMCAV 12,891 14,622 2 1LA ADRADA INVERSIONES, SIMCAV 23,608 24,353 20 6,579LA ALAMEDA DEL SOL XXI, SIMCAV 24,560 25,960 3 13LA ALCAZABA FINANCIERA, SIMCAV 17,550 18,271 11 13LA AYERDENSE, SIMCAV 22,848 25,758 1,576 1,668LA BOQUERA INVERSIONES, SIMCAV 18,752 19,232 13 20LA CAIXA EXTREMADURA SIMCAV 0 24,481 0 4,720 05/15/2003LA LEGITIMA, SIMCAV 21,380 21,789 0 1,200LA LINDARAJA INVERSIONES, SIMCAV 7,628 7,709 10 20LA MUZA INVERSIONES, SIMCAV 42,980 55,020 809 561LA NOGUERA AHORRO, SIMCAV 14,717 15,559 2,405 0LA NOGUERA DE ORO, SIMCAVF,SA 24,041 30,796 0 4LA RIPERA DE INVERSIONES, SIMCAV 4,135 4,135 149 2,539LA ROMANA INVERSIONES, SIMCAV 21,586 25,142 31 31LABIERNAG 2000, SIMCAV 22,737 24,204 23 0LACERTA INVERSIONES, SIMCAV 17,760 19,280 59 789LAFUVER 2000, SIMCAV 26,364 27,526 21 27LAGUN INVERSIONES SIMCAV 17,718 19,449 3,697 123LAJARINVEST, SIMCAV 24,280 25,040 3 10LALLO INVERSIONES, SIMCAV 20,758 22,381 5 6LAMDA INVERSIONES BURSATILES, SIMCAV 16,444 17,453 0 1LAMPEDUSA INVERSIONES, SIMCAV 21,781 24,642 12 755LANCE INVERSIONES SIMCAV 22,358 23,319 10 20LANDON CARTERA DE INVERSIONES, SIMCAVF 123,808 127,415 40,636 57,941LANDSA FINANCIERA, SIMCAV 17,893 18,422 13 167LANGRE DE INVERSIONES, SIMCAV 17,581 18,663 2,408 2LANGREO FINANZAS, SIMCAVF 11,419 11,660 401 600LAR & MAC 02, SIMCAV 0 14,785 0 60 04/15/2003LARK UNITED INVESTMENT SIMCAV 22,718 24,353 1,179 2LAS ABRAS DE FUENTES, SIMCAV 10,001 11,011 2,279 1,557LAS ARROYADAS INVERSIONES, SIMCAV 18,000 18,240 1,247 5,330LAS CALLEJAS 2000, SIMCAV 30,051 31,193 0 3
A.2.19.Secondary markets. Equities.Outcry market. Listed companies. 2003
2002 2003 2002 2003Companies
Capitalisation (at 31 Dec.) Annual trading Date of listing in2003 & other comments
Amounts in thousands of euros
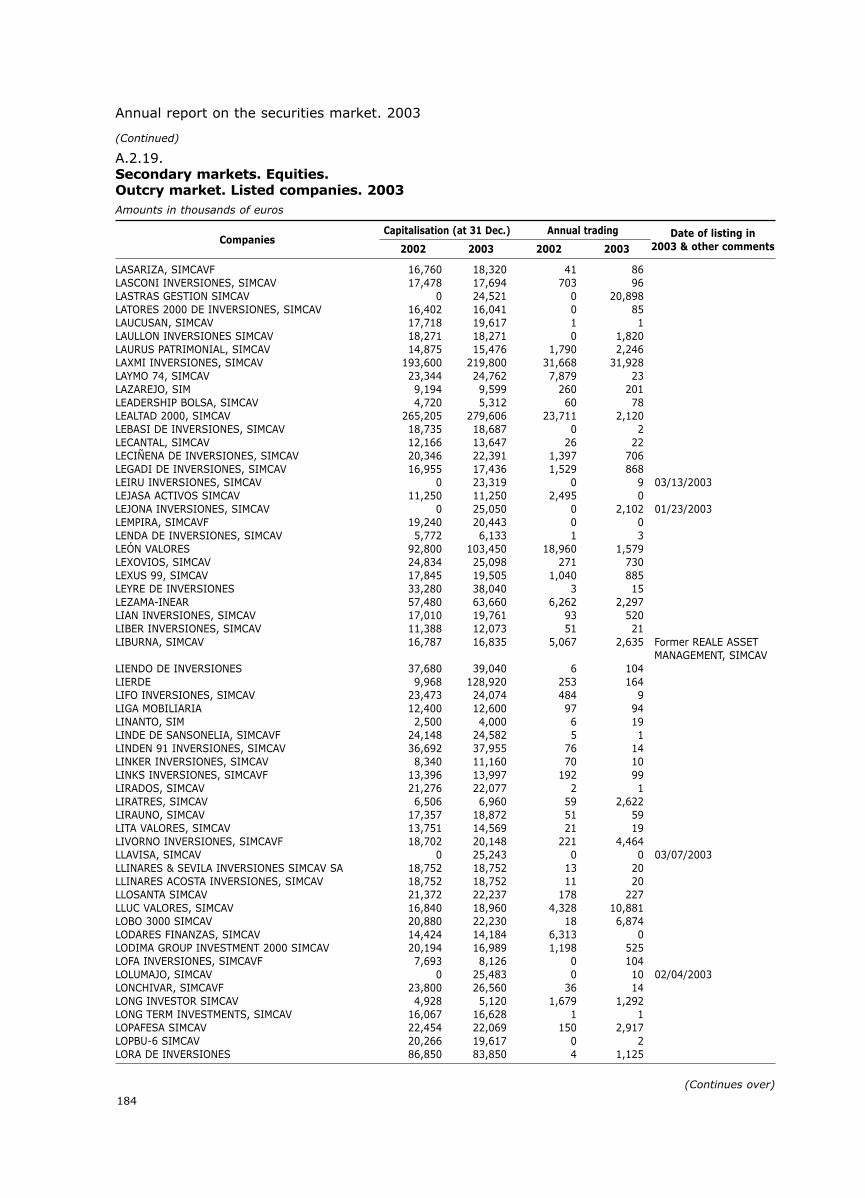
184
Annual report on the securities market. 2003
LASARIZA, SIMCAVF 16,760 18,320 41 86LASCONI INVERSIONES, SIMCAV 17,478 17,694 703 96LASTRAS GESTION SIMCAV 0 24,521 0 20,898LATORES 2000 DE INVERSIONES, SIMCAV 16,402 16,041 0 85LAUCUSAN, SIMCAV 17,718 19,617 1 1LAULLON INVERSIONES SIMCAV 18,271 18,271 0 1,820LAURUS PATRIMONIAL, SIMCAV 14,875 15,476 1,790 2,246LAXMI INVERSIONES, SIMCAV 193,600 219,800 31,668 31,928LAYMO 74, SIMCAV 23,344 24,762 7,879 23LAZAREJO, SIM 9,194 9,599 260 201LEADERSHIP BOLSA, SIMCAV 4,720 5,312 60 78LEALTAD 2000, SIMCAV 265,205 279,606 23,711 2,120LEBASI DE INVERSIONES, SIMCAV 18,735 18,687 0 2LECANTAL, SIMCAV 12,166 13,647 26 22LECIÑENA DE INVERSIONES, SIMCAV 20,346 22,391 1,397 706LEGADI DE INVERSIONES, SIMCAV 16,955 17,436 1,529 868LEIRU INVERSIONES, SIMCAV 0 23,319 0 9 03/13/2003LEJASA ACTIVOS SIMCAV 11,250 11,250 2,495 0LEJONA INVERSIONES, SIMCAV 0 25,050 0 2,102 01/23/2003LEMPIRA, SIMCAVF 19,240 20,443 0 0LENDA DE INVERSIONES, SIMCAV 5,772 6,133 1 3LEÓN VALORES 92,800 103,450 18,960 1,579LEXOVIOS, SIMCAV 24,834 25,098 271 730LEXUS 99, SIMCAV 17,845 19,505 1,040 885LEYRE DE INVERSIONES 33,280 38,040 3 15LEZAMA-INEAR 57,480 63,660 6,262 2,297LIAN INVERSIONES, SIMCAV 17,010 19,761 93 520LIBER INVERSIONES, SIMCAV 11,388 12,073 51 21LIBURNA, SIMCAV 16,787 16,835 5,067 2,635 Former REALE ASSET
MANAGEMENT, SIMCAVLIENDO DE INVERSIONES 37,680 39,040 6 104LIERDE 9,968 128,920 253 164LIFO INVERSIONES, SIMCAV 23,473 24,074 484 9LIGA MOBILIARIA 12,400 12,600 97 94LINANTO, SIM 2,500 4,000 6 19LINDE DE SANSONELIA, SIMCAVF 24,148 24,582 5 1LINDEN 91 INVERSIONES, SIMCAV 36,692 37,955 76 14LINKER INVERSIONES, SIMCAV 8,340 11,160 70 10LINKS INVERSIONES, SIMCAVF 13,396 13,997 192 99LIRADOS, SIMCAV 21,276 22,077 2 1LIRATRES, SIMCAV 6,506 6,960 59 2,622LIRAUNO, SIMCAV 17,357 18,872 51 59LITA VALORES, SIMCAV 13,751 14,569 21 19LIVORNO INVERSIONES, SIMCAVF 18,702 20,148 221 4,464LLAVISA, SIMCAV 0 25,243 0 0 03/07/2003LLINARES & SEVILA INVERSIONES SIMCAV SA 18,752 18,752 13 20LLINARES ACOSTA INVERSIONES, SIMCAV 18,752 18,752 11 20LLOSANTA SIMCAV 21,372 22,237 178 227LLUC VALORES, SIMCAV 16,840 18,960 4,328 10,881LOBO 3000 SIMCAV 20,880 22,230 18 6,874LODARES FINANZAS, SIMCAV 14,424 14,184 6,313 0LODIMA GROUP INVESTMENT 2000 SIMCAV 20,194 16,989 1,198 525LOFA INVERSIONES, SIMCAVF 7,693 8,126 0 104LOLUMAJO, SIMCAV 0 25,483 0 10 02/04/2003LONCHIVAR, SIMCAVF 23,800 26,560 36 14LONG INVESTOR SIMCAV 4,928 5,120 1,679 1,292LONG TERM INVESTMENTS, SIMCAV 16,067 16,628 1 1LOPAFESA SIMCAV 22,454 22,069 150 2,917LOPBU-6 SIMCAV 20,266 19,617 0 2LORA DE INVERSIONES 86,850 83,850 4 1,125
A.2.19.Secondary markets. Equities.Outcry market. Listed companies. 2003
2002 2003 2002 2003Companies
Capitalisation (at 31 Dec.) Annual trading Date of listing in2003 & other comments
Amounts in thousands of euros
(Continued)
(Continues over)

185
Annex 2: Secondary markets
(Continued)
(Continues over)
LOS BOTEJARES INVERSIONES, SIMCAV 21,636 23,560 10 20LOS LAPONES INVESTMENT, SIMCAV 16,396 19,353 0 1LOS MADROÑALES DE INVERSIONES, SIMCAV 21,573 21,453 1 0LOSIRAM CUATRO, SIMCAV 0 23,920 0 0LOSVA, SIMCAVF 20,120 21,000 1 2LOTAMAR INVERSIONES, SIMCAVF 16,108 17,574 371 129LOUCA 98, SIMCAV 118,560 125,540 3 18,047LOUPRI INVERSIONES, SIMCAV 16,114 18,398 2,543 4,406LUBIA DE INVERSIONES, SIMCAV 58,900 62,200 2 14LUCA INVEST 2000, SIMCAV 14,760 15,300 2,205 0LUCEL INVERSIONES SIMCAV 17,834 18,171 367 179LUCERNARIUM 2000, SIMCAV 20,170 21,901 59 68LUCKY STAR INVESTMENT SIMCAV 21,353 22,703 2,326 1,617LUCUENS, SIMCAV 23,079 25,483 25 22LUMBTIN, SIMCAV 14,328 15,386 44 47LUZALVAR INVERSIONES SIMCAV 22,679 23,064 1 0LUZON VALORES, SIMCAV 25,480 26,560 11 31LYNDON INVERSIONES SIMCAV SA 96,210 102,960 28 10,055MAASTRICHT INVERSIONES, SIMCAV 12,073 13,083 230 797MABINVER 2000, SIMCAV 19,473 20,194 13 20MACALUMA INVERSIONES, SIMCAV 21,276 23,488 1 1MACAMJU SIMCAV 20,630 21,304 27 21,355MACKEREL 85,560 104,480 26,089 43,301MACOIGMA, SIMCAV 0 24,321 0 1 09/05/2003MACONHA INVERSIONES, SIMCAV 21,949 21,829 40 51MACRISON DE INVERSIONES, SIMCAV 24,411 25,060 37 0MADEVILAR INVERSIONS, SIMCAV 24,714 25,603 4,114 83MADRIGAL DE INVERSIONES, SIMCAV 23,800 24,200 18 982MAESMA INVERSIONES SIMCAV 25,403 26,284 2 167MAF MARCO, SIMCAV 11,972 12,597 0 0MAFASA JULSA, SIMCAV 25,782 26,118 3 2MAFRAMA DE INVERSIONES, SIMCAV 14,400 14,800 2 539MAGASA VALORES, SIMCAV 22,117 26,655 27 23MAGESCQ 2000, SIMCAV 19,680 21,040 20 1MA-GO DE INVERSIONES, SIMCAV 18,615 18,903 2 0MAGO VALORS 2001, SIMCAV 19,473 20,434 139 21MAHOGANY INVERSIONES MOBILIARIAS, SIMCAV 17,220 19,048 964 2,970MAIMONA INVERSIONES, SIMCAV 0 93,936 0 33 05/21/2003MAIVAREN INVERSIONES, SIMCAV 21,693 22,415 319 803MAIVAREN, SIMCAV 22,825 23,300 0 2MAJADAS ALTAS, SIMCAV 21,396 22,598 27 22 Former BARRI CARTERA
DE INVERSIONES,SIMCAV
MAJAI INVERSIONES, SIMCAVF 25,002 25,483 749 320MAJESTIC DE INVERSIONES, SIMCAV 15,272 15,320 0 1MAKER INVERSIONES, SIMCAVF 9,608 10,149 76 161MALI INVERSIONES, SIMCAV 8,205 8,895 130 22MALLORQUINA DE TITULOS 181,116 187,920 8,759 6,125MALODEI INVERSIONES, SIMCAV 21,492 22,838 542 4,612MANATI INVERSIONES, SIMCAV 18,919 19,184 20 1,241MANEED INVERSIONES, SIMCAV 22,598 25,002 11 2,521MANEL INVERSIONES, SIMCAVF 21,396 22,358 25 22MANENSPA INVERSIONES, SIMCAVF 11,900 12,140 1,011 1,200MANHATTAN CMB GLOBAL, SIMCAVF 14,625 15,546 839 463MANILA INVERSIONES GLOBALES, SIMCAV 60,702 63,707 18,966 601MANLIU CARTERA, SIMCAV 7,933 8,384 11 20MANOCAP, SIMCAV 19,168 20,707 7,525 41MANRESA ESTALVI, SIMCAV 26,250 27,250 1,392 1,948MAPEA, SIMCAV 0 24,480 0 1,221 03/23/2003MAQUEDA 2000, SIMCAV 18,975 19,192 0 1,898
A.2.19.Secondary markets. Equities.Outcry market. Listed companies. 2003
2002 2003 2002 2003Companies
Capitalisation (at 31 Dec.) Annual trading Date of listing in2003 & other comments
Amounts in thousands of euros

186
Annual report on the securities market. 2003
MARALBA INVERSIONES, SIMCAV 20,924 21,837 21 29MARCEN INVERSIONES, SIMCAV 14,629 20,678 0 592MARCRIS INVERSIONES SIMCAVF 19,310 19,365 207 27MARELE INVERSIONES, SIMCAV 20,266 20,290 1 10,618MARFAM VALORES, SIMCAV 0 24,772 0 599 12/05/2003MARGIN INVERSIONES, SIMCAV 21,035 23,980 44 16MARIBA INVERSIONES, SIMCAV 14,136 15,434 43 327MARIÑAN INVERSIONES, SIMCAVF 18,968 19,617 572 1,304MARISA FINANZAS, SIMCAV 16,828 17,069 13 1,232MARJAMI 2, SIMCAV 19,713 21,156 13 22MARKT INVERSIONES 46,320 30,950 144 93MARLIN INVERSIONES, SIMCAV 23,000 23,880 12 4,452MARMIRE INVERSIONS, SIMCAV 20,750 22,350 54 48MARONE DE INVERSIONES, SIMCAV 20,675 24,521 11 21MARTON Y BERNET SIMCAV 12,020 12,982 12 186MARU FINANCE, SIMCAV 10,938 11,660 13 22MARVIKUM INVESTIUM SIMCAV 24,836 25,297 11,314 8,688MARZAL INVERSIONES, SIMCAV 18,027 22,654 10,714 1,000MASVOLTES, SIMCAV 20,520 21,800 3 10MATCH TEN INVERSIONES, SIMCAVF 18,519 19,649 697 233MATELCO 234, SIMCAV 23,271 24,377 2,713 3,760MATEUS INV SIMCAV 21,501 22,448 510 267MATRIX INVERSIONES, SIMCAVF 6,170 6,280 36 14MATTERHORN INVESTMENTS, SIMCAV 0 28,438 0 3 08/01/2003MATURITY INVERSIONES SIMCAV 19,553 21,861 55 18MATXITXAKO DIVERSIFICADA, SIMCAV 9,540 10,940 27 23MAVAGO 1999, SIMCAV 19,718 20,920 13 843MAVER-21 SIMCAV 18,367 17,670 66 147MAXIMUS INVERSIONES, SIMCAV 0 38,000 0 3,649 04/28/2003MAYMER INVEST, SIMCAV 24,041 24,834 0 2MAYPRAT INVERSIONES, SIMCAV 20,132 20,055 34 291MBUMBA SIMCAV 24,682 25,924 190 1,319MC 1000 CORPORATE, SIMCAV 0 24,617 0 58 05/29/2003MED 2001 INVERSIONES, SIMCAV 20,915 21,156 10 6,935MEDIC PRESTIGIO, SIMCAV 23,001 24,121 2,957 2,535MEDIO AMBIENTE Y FINANZAS, SIMCAV 20,202 21,549 6 58MEDISA 2000, SIMCAVF 18,440 18,840 3,013 193MEDITERRANEA 2000 INVERSIONES, SIMCAV 41,040 21,640 5 2,141MEGEVE INVERSIONES SIMCAVF 23,536 23,920 0 8,190MEJANA 172,320 0 334 267 Delisted 12/30/2003MEJORANA INVERSIONES, SIMCAV 0 0 0 0 06/11/2003MELVA CARTERA, SIMCAV 0 24,241 0 13 03/06/2003MENDIBILE DE INVERSIONES, SIMCAV 22,246 22,607 0 0MENDILAST, SIMCAV 20,850 22,350 433 1MEÑALER, SIMCAV 0 29,870 0 0 07/21/2003MERCADAL DE VALORES, SIMCAV 18,278 19,673 1,789 1,888MERCAVENIR, SIMCAV 5,232 5,563 314 463MERCOR GLOBAL SIMCAV 20,683 23,761 7,295 1,788MEREU DE INVERSIONES, SIMCAV 17,100 17,725 1 0MERI DACE, SIMCAV 19,237 21,160 13 15MERIBEL INVERSIONES SIMCAV 19,881 20,218 25 120MERIDIONAL DE TITULOS, SIMCAV 13,439 15,747 623 415MERINILLAS INVERSIONES, SIMCAV 17,600 17,200 3,920 7,084MERMELADA AND BENJI, SIMCAV 0 25,483 0 604 10/23/2003MERRYHOUSE INVERSIONES, SIMCAV 17,773 18,591 606 284MERSIR 4,312 4,704 94 110MESA ERMITA, SIMCAV 21,396 22,117 15 20MESANA INVERSIONES, SIMCAV 24,281 25,002 1,122 237MESSINA ASSET MANAGEMENT, SIMCAVF 21,907 23,377 1 1METID DE INVERSIONES, SIMCAV 22,598 23,079 11 170
A.2.19.Secondary markets. Equities.Outcry market. Listed companies. 2003
2002 2003 2002 2003Companies
Capitalisation (at 31 Dec.) Annual trading Date of listing in2003 & other comments
Amounts in thousands of euros
(Continued)
(Continues over)

187
Annex 2: Secondary markets
(Continued)
(Continues over)
METODI FINANCIERA, SIMCAV 18,030 18,511 2 4METROPOLI PATRIMONIO, SIMCAV 24,777 25,798 0 10,608MEYKINVER, SIMCAVF 0 24,802 0 2,923 02/19/2003MEZQUITA DE INVERSIONES, SIMCAV 20,875 21,813 2,802 1,129MICRON INVERSIONES 12,600 13,020 1 13MIDDLE YOUNG, SIMCAV 18,150 20,350 378 127MIGJORN INVERSIONS, SIMCAVF 16,960 17,160 3,007 6,013MIJALU, SIMCAV 0 0 0 0MILENIO PATRIMONIO, SIMCAV 24,642 25,042 236 23MILLENIUM INVEST 2000, SIMCAV 20,210 20,892 2 0MIMBRALES INVERSIONES, SIMCAVF 18,175 19,857 0 0MINOS INVESTMENT SIMCAVF 23,079 23,560 1 883MINT INVERSIONES SIMCAVF 20,755 21,693 53 17,380MINTREVOD 1600, SIMCAV 24,281 24,762 11 20MIRA DE INVERSIONES 48,100 54,050 29 351MIRACLE 2000, SIMCAV 21,877 21,420 0 2,072MIRAFLOR FINANCIERA, SIMCAV 28,856 29,457 27,061 2,960MIRENI, SIMCAV 17,405 20,987 1 1MIRNOVA INVESTMENT SIMCAV 49,403 52,048 50 69MIRRIAX, SIMCAV 14,224 16,147 243 38MIRTA DE INVERSIONES, SIMCAV 23,600 28,175 378 62MISTE INVERSIONES, SIMCAV 21,156 21,636 14,656 20MITEGAMA 2000, SIMCAV 14,550 15,488 1 1MITICA INVERSIONES, SIMCAVF 55,293 56,315 8,868 9,048MIX-GLOBAL INVERSIONS, SIMCAV 0 12,453 0 6,999MIXTO EUROPA 15, SIMCAV 17,290 17,694 1,470 9,535MIXTO EUROPA 30, SIMCAV 15,078 15,655 1,646 836MIXTO EUROPA 50, SIMCAV 12,578 13,386 2,191 5,042MIZAR INVEST, SIM 1,580 1,620 143 282MIZUNO, SIMCAVF 20,120 21,440 3,071 1,500MJB SANZGA INVERSIONES, SIMCAV 23,840 24,241 93 44MLM VALORES, SIMCAVF 30,021 30,051 0 1MM 4437 INVERSIONES SIMCAV 10,650 10,938 61 70MOALA INVEST, SIMCAV 27,887 35,610 0 1MOBILACTIVO SIMCAV 15,392 20,443 103 420MOBILCAPITAL 63,160 72,160 11 31MOBILCARTERA 68,820 71,100 822 873MOBILINVERSION SIMCAV 13,949 14,911 0 0MOBINVER 2,250 2,350 138 260MOBINVERSORA 5,932 6,350 2,439 1,700MODERATE, SIMCAV 23,561 24,441 0 15 Former CAM MODERATE,
SIMCAVMODIGLIANI INVERSIONES, SIMCAV 22,598 23,319 11 20MOENSA 22,320 23,520 30 31MOLIETE 24,120 26,920 3 25MOLINA DEL PINAR, SIMCAV 13,895 15,626 115 9MOLOBA INVERSIONES, SIMCAV 0 26,685 0 0 03/24/2003MONCAYO GLOBAL INVESTMENTS SIMCAV 20,437 22,509 2 2MONITOR CAPITAL, SIMCAV 21,444 22,454 25 53MONJOFI INVERSIONES, SIMCAV 24,281 24,722 8 35MONMA INVERSIONES, SIMCAV 5,472 5,838 16 73MONTALTO INVERSIONES, SIMCAV,SA 25,243 23,840 8 0MONTE DE VALORES 3,300 3,000 92 276MONTE GENIL, SIMCAV 8,880 9,560 1,393 339MONTECILLO DE INVERSIONES SIMCAV 22,775 27,575 63 103MONTECRISTO GLOBAL, SIMCAV 0 24,201 0 0 10/14/2003MONTECRISTO INVERSIONS SIMCAV 23,184 25,180 740 677MONTESANCHA DE INVERSIONES, SIMCAV 15,777 16,017 2,931 15MONTINVERT CARTERA, SIMCAV 23,560 24,521 10 20MONTMARTRE DE INVERSIONES, SIMCAV 18,543 19,913 1 21
A.2.19.Secondary markets. Equities.Outcry market. Listed companies. 2003
2002 2003 2002 2003Companies
Capitalisation (at 31 Dec.) Annual trading Date of listing in2003 & other comments
Amounts in thousands of euros

188
Annual report on the securities market. 2003
MONTRIGALES, SIMCAV 8,054 8,775 27 22MONTSIRESA, SIMCAVF 41,877 49,043 51 529MORA DE INVERSIONES, SIMCAV 22,880 23,640 659 171MORALEJA 2002 INVERSIONES, SIMCAV 0 26,781 0 531 03/13/2003MORALZARZAL DE INVERSIONES, SIMCAV 27,050 29,400 3 192MORCOTE INVERSIONES, SIMCAV 12,020 12,946 170 83MORGAN STANLEY DINER CEUTA, SIMCAV 2,500 2,548 4,977 2,950MORI ONE, SIMCAV 30,952 31,253 13 20MORINVEST, SIMCAVF 1,057,500 1,261,500 435,131 79MORMEDI INVESTMENT, SIMCAV 24,123 24,429 0 2MORO 2, SIMCAV 25,100 26,350 224 7MOSEFRA, SIMCAV 16,800 17,200 4,217 295MOSEL FINANCE, SIMCAV 19,080 20,360 27 22MOSEL INVEST,SIMCAV 19,029 20,462 51 56MOTERFIN, SIMCAV 30,270 30,750 20,999 601MOTIVASA DE INVERSIONES 2,940 10,200 0 1MOULDER INVERSIONES, SIMCAV 17,634 18,283 56 10,055MSP EUROGESTION BOLSA 7,040 0 188 37 Delisted 04/12/03MSP INVESTMENT 2000 SIMCAV 16,388 18,070 3,436 185MUDRIN, SIMCAV 0 0 0 0 05/12/2003MUFOLLSA SIMCAV 18,752 18,992 13 20MUGUR INVEST, SIMCAV 17,821 17,316 0 411MULINSAR 0 71,820 0 598MULTICARTERA 1,204 1,204 1 59MULTIGESTORES TRADING, SIMCAVF 23,367 24,353 4,786 2,549 Former INVERSIONES
MONTERRON, SIMCAVFMULTIRESORTS INVERSIONES FINANCIERAS, SIMCAV 18,712 18,511 2 3MURADA DE INVERSIONES, SIMCAV 18,720 19,760 1 8MURASI INVERSIONES, SIMCAVF 0 23,872 0 22MURMENDI, SIMCAV 14,880 15,280 1 5MUSKARIA INVERSIONES, SIMCAV 8,480 9,220 12 10MUTUALSASA INVERSIONES, SIMCAV 22,766 23,920 8 9,680MUTUAVALOR I 5,400 6,150 44 19MUVI FINANCIERA, SIMCAV 2,212 2,260 16 20NABOA INVERSIONES SIMCAV 17,261 17,886 2,756 3,182NADIR 98, SIMCAV 10,320 11,460 57 32NADU INVEST, SIMCAV 24,561 24,922 337 54NAITAN INVERSIONES, SIMCAV 23,367 25,531 27 22NAJE ALE DE INVERSION, SIMCAV 15,386 17,309 27 22NAMACAR, SIMCAV 41,879 43,465 0 13,036NANTENI INVERSIONES, SIMCAV 22,790 24,185 0 0NAPIER INVERSIONES, SIMCAV 16,684 17,309 0 0NAPOLSI, SIMCAV 6,102 6,615 27 269NAPULIA DE INVERSIONES, SIMCAV 24,360 25,840 3 159NARA, SIMCAVF 60,180 61,200 4,219 946NAROGIV, SIMCAV 18,191 21,797 120 3,412NASECAD INVERSIONES, SIMCAV 24,882 27,959 2,459 1,522NASHIRA CAPITAL, SIMCAV 0 24,140 0 9,998 05/29/2003NAVALLE INVERSIONES SIMCAV 24,121 24,682 22 26NAVEDA BOLSA, SIMCAV 18,300 19,425 5 7NAVIERA INVERSIONES, SIMCAV 14,352 14,424 48 19NAZLET INVESTMENT, SIMCAV 19,713 20,595 5 54NEMAR INVERSIONES, SIMCAV 21,877 22,678 370 513NEMESIS TERCER MILENIO, SIMCAVF 19,007 0 103 0NEMORINO SIMCAV 9,700 11,155 59 66NEMOSA INVERSIONES, SIMCAV 23,800 24,521 10 1,207NEPEFRAN INVERSIONES, SIMCAV 15,777 17,797 922 23NEREI INVERSIONES, SIMCAV 93,038 96,015 24 25NEREIDA CARTERA, SIMCAV 8,474 8,835 4,818 1,045NEREN INVERSIONES, SIMCAV 10,686 11,227 8,393 810
A.2.19.Secondary markets. Equities.Outcry market. Listed companies. 2003
2002 2003 2002 2003Companies
Capitalisation (at 31 Dec.) Annual trading Date of listing in2003 & other comments
Amounts in thousands of euros
(Continued)
(Continues over)

189
Annex 2: Secondary markets
(Continued)
(Continues over)
NERIUM INVESTIUM, SIMCAV 34,378 37,082 1,151 232NERVIÓN INVEST, SIMCAV 24,840 25,880 31 148NESS DE INVERSIONES, SIMCAV 15,560 16,186 4,660 715NETTING INVERSIONES, SIMCAV 19,841 21,621 993 3,712NEUTRAL INVERSIONES SIMCAV 12,741 11,588 3,975 1,062NEVA DE INVERSIONES, SIMCAV 10,898 11,940 4 0NEW DEAL INVERSIONES, SIMCAV 0 12,252 0 176 11/272003NEWSIF INVERSIONES, SIMCAV 0 0 0 0NIBAFER INVERSIONES 2001, SIMCAV 9,075 11,227 64 426NIBAÑETA AHORRO, SIMCAV 19,400 20,450 257 551NICOGUAMA INVERSIONES , SIMCAV 22,838 23,079 13 20NIKARIC DE INVERSIONES SIMCAV 21,188 21,789 779 588NIKOBRI, SIMCAV 17,475 18,625 781 566NISOC INVERSIONS, SIMCAV 19,575 21,500 51 45NITE HAWK, SIMCAV 21,680 22,400 80 20NOCEDAL INVERSIONES 2002, SIMCAV 0 24,579 0 469 09/04/2003NODO DEL MUNIFICHE, SIMCAV 0 0 0 0 11/262003NODOR 1991, SIMCAV 24,257 25,675 45 66NOFASURC, SIMCAV 7,465 8,210 197 50NOGRARO INVESTMENT, SIMCAV 23,750 28,225 557 1,358NOMENTANA INVERSIONES, SIMCAV 25,699 25,699 8,955 8,413NOMIT III INTERNACIONAL SIMCAVF 126,814 146,947 25,389 30NOMIT INVERSIONES, SIMCAVF 80,415 85,644 32,593 30NOMIT IV GLOBAL SIMCAVF 251,223 289,087 57,953 27NORAM INVERSIONES 2000, SIMCAV 29,149 30,652 16,261 510NORCAFIX 3,230 3,839 47 66NORDTRADING INVERSIONES, SIMCAV 0 24,146 0 11,176 10/23/2003NORFEU RENTA 24, SIMCAV 16,011 19,238 3,000 62NORMANDIA INVESTMENTS, SIMCAV 23,570 27,667 600 2NORTEÑA DE VALORES 40,480 0 1,543 922 Delisted 11/18/2003NORTH CAPE INVERSIONES 36,440 38,080 96 5,991NOTE-INVEST SIMCAV 5,232 5,456 1,399 1,800NOTIFIX, SIMCAV 13,583 13,262 27 2,701NOVA EUROPA ACTIUS MOBILIARIS, SIMCAV 14,500 16,250 262 108NOVAFILLOLA SIMCAV 19,168 19,336 292 0NOVAGESTION INVERSIONES, SIMCAVF SA 29,450 29,700 2,944 4,851NOVAINVER INVESTMENTS 2000, SIMCAVF 24,041 24,882 1 0NOVAMER 0 0 0 0 Delisted 02/18/2003NOVELDA INVERSIONES, SIMCAVF 22,400 23,240 171 151NOXAR INVERSIONES, SIMCAV 21,817 22,928 1 8NSARASATE VALORES, SIMCAV 18,406 19,328 267 277NÚCLEO FINANZAS, SIMCAV 26,445 27,647 13 80NUEVA GESTION SIGLO XXI, SIMCAV 18,600 19,840 30 31NUEVA OLTAL BURSATIL, SIMCAV 8,720 8,736 649 0NUEVA RIMATRA BURSATIL, SIMCAV 8,176 8,272 0 0NUEVA RIOJA BURSATIL, SIMCAV 25,765 28,184 0 178NUEVA XICAL SIMCAV 11,880 12,301 6 20NUEVOS VALORES 26,000 28,200 334 82NUMIDE INVERSIONES, SIMCAV 17,630 19,954 5 1NYATI INVERSIONES, SIMCAV 0 25,202 0 888 09/10/2003NYMEX INVERSIONES, SIMCAV 7,588 7,840 690 80OBAM 99, SIMCAV 11,119 11,680 78 185OBIS INVERSIONES SIMCAV 66,660 77,700 4,802 9,125OCEJÓN INVERSIONES SIMCAV 21,324 26,589 1,220 59OCHO 99 INVERSIONES SIMCAV 9,476 9,897 1,396 403ODAMI DE VALORES, SIMF 3,150 3,150 2 2ODIEL INVERSIONES, SIMCAV 13,992 14,046 46 19OFFER INVERSIONES, SIMCAV 23,954 24,627 123 756OFFICE INVERSIONS, SIMCAV 23,560 25,002 12 20OFRIS DE INVERSIONES, SIMCAV 0 18,445 0 17 04/15/2003
A.2.19.Secondary markets. Equities.Outcry market. Listed companies. 2003
2002 2003 2002 2003Companies
Capitalisation (at 31 Dec.) Annual trading Date of listing in2003 & other comments
Amounts in thousands of euros

190
Annual report on the securities market. 2003
OKER INVERSIONES, SIMCAV 28,248 33,657 5,068 3,700OLARBI 72,360 75,330 2 115OLEIROS DE INVERSIONES, SIMCAV 21,164 22,246 362 3,283OLH INVERSIONES SIMCAV 19,713 21,636 452 22OLIVARDA, SIMCAV 11,400 11,895 59 59OLIVENZA GESTIÓN DIVERSIFICADA, SIMCAV 21,396 22,117 586 22OLLER INVERSIONES, SIMCAVF 18,000 18,720 1,799 710OMBU INVERSIONES SIMCAVF 15,666 16,628 3 9OMICRON 23,951 24,572 448 70ONDA GLOBAL DE INVERSIONES, SIMCAV 15,608 17,532 0 1ONDARZAS E INVERSIONES, SIMCAV 22,850 27,200 145 60ONEGIN CAPITAL SIMCAV 0 26,469 0 3,532 04/23/2003OPEC INVERSIONES SIMCAV 16,606 18,634 652 88OPEN CAPITAL 3000, SIMCAV 43,321 46,158 432 912OPEN CAPITAL SIMCAV 40,547 42,732 112 114OPEN MARKET INVERSIONES, SIMCAV 20,226 21,886 50 19OPORTUNIDAD BURSATIL 32,200 43,540 9,892 7,773ORAFLA 2000 SIMCAV 18,951 19,432 1 1ORCA EQUITY, SIMCAVF 0 24,041 0 916 04/28/2003ORDEF 11,920 13,420 0 15ORECA INVERSIONES, SIMCAV 18,560 23,440 24 24OREGON 2000, SIMCAV 17,557 17,749 1 0OREJAS XXI, SIMCAV 17,581 18,374 1,488 101ORESTES INVESTMENT, SIMCAV 22,117 23,560 15 85ORGOR DE VALORES, SIMCAV 17,934 24,642 43 911ORIA-SARA SIMCAV 0 30,051 0 1,999 01/27/2003ORIOLA DE INVERSIONES SIMCAV 14,286 13,973 580 0ORMIBASA 22,540 22,560 31 22OROBAL GESTION, SIMCAV 21,636 21,877 13 20ORONSIDE, SIMCAV 0 0 0 0ORS INVESTMENT, SIMCAV 0 26,300 0 4 09/162003ORSEVEN 19,120 20,020 306 421ORTENFENO SIMCAV 16,595 17,003 451 349ORTESICA, SIMCAV 24,425 25,194 3 547ORTO-INVERSIONES, SIMCAVF 15,700 32,200 0 0OSMA DE INVERSIONES, SIMCAV 19,720 20,240 4 4OSMOSIS INVESTMENT SIMCAV 32,034 34,017 27 0OTAGO INVERSIONES, SIMCAV 22,839 33,609 4,679 3,449OTIXE VALORES, SIMCAV 0 26,036 0 261 06/18/2003OUTLAY 2010, SIMCAV 6,640 6,768 0 1OUTLOOK INVERSIONES, SIMCAV 20,755 21,501 1,005 19OVERALL INVERSIONES SIMCAV 8,742 9,187 43 16OVIEDO CAPITAL, SIMCAVF 0 25,243 0 9 03/07/2003P70 ELECTRA INVERSION, SIMCAV 33,206 34,769 206 566PACJOR SIGLO XXI, SIMCAV 0 24,521 0 12 07/02/2003PADINVER 90,557 107,249 4,262 2,380PAGASARRI DE INVERSIONES, SIMCAV 16,979 18,206 1 11PALMERAL ACTIVOS, SIMCAV 24,100 25,160 1,000 0PALSORI INVERSIONES, SIMCAV 0 27,927 0 1 03/07/2003PAMCALERO SPAIN, SIMCAV 21,540 22,718 26 72PAMPALONA GRUP, SIMCAV 7,270 7,616 12 5,098PANAYA INVERSIONES, SIMCAV 14,959 14,310 3,201 0PANDO 2000, SIMCAVF 20,010 20,731 1,984 16PANDORA FINANCIERA SIMCAV 18,761 19,001 13 20PANELTA INVERSIONES, SIMCAV 0 0 0 0 09/12/2003PANIKIRITO DE INVERSIONES, SIMCAV 20,346 20,948 52 142PAPER FUTURO, SIMCAV 17,790 18,992 27 22PARFIDES, SIMCAV 20,675 22,670 60 5,771 Former MAITE
CARTERA, SIMCAVPARITY 32,215 29,197 7 380
A.2.19.Secondary markets. Equities.Outcry market. Listed companies. 2003
2002 2003 2002 2003Companies
Capitalisation (at 31 Dec.) Annual trading Date of listing in2003 & other comments
Amounts in thousands of euros
(Continued)
(Continues over)

191
Annex 2: Secondary markets
(Continued)
(Continues over)
PARKIA INVESTMENT, SIMCAV 21,276 21,957 124 4PARNUERA 5,742 61,955 4 11PARQUE INDEPENDENCIAF 8,254 0 1 0 Delisted 10/24/2003PARTNER GM INVERSIONES, SIMCAV 19,232 19,232 11 20PARVATI INVERSIONES, SIM 6,010 6,130 44 22PASGOM INVERSIONES, SIMCAV 26,204 35,340 33 4PASHMINA 2000, SIMCAV 11,732 13,919 0 400PATLLARI INVERSION, SIMCAV 23,280 24,266 1,959 178PATRICOMPA 30,231 31,063 52 161PATRIMIX 33,240 36,840 1,466 1,718PATRIMONIAL GLOCESA, SIMCAV 20,675 20,434 10 20PATRIMONIO BURSATIL SIMCAV 8,550 11,375 1 0PATRIMONIO DE VALORES 9,604 104,280 162 4,893PATRIMONIO GLOBAL, SIMCAV 37,890 26,879 4 440PATRIMONIOS ZAMORANOS, SIMCAV 20,260 19,401 1 273PATRINVEST AHORRO, SIMCAV 12,080 14,292 980 1,707PATRINVEST INVERSIÓN, SIMCAV 7,465 8,366 178 920PATRIRENT DE INVERSIONES, SIMCAV 17,797 21,886 13 78PATROON INVERSIONES, SIMCAV 0 24,844 0 711 04/28/2003PAY OUT INVERSIONES, SIMCAV 21,140 21,477 201 422PCJ YEGOMI, SIMCAV 13,342 13,703 1,799 22PEALMA 1, SIMCAV 19,841 20,899 1 42PEGASIDES, SIMCAV 23,954 35,490 16,780 19,238PEMYC INVERSIONES, SIMCAV 26,743 27,871 3 2,065PENTACORE INVERSIONES, SIM 15,000 11,775 9 268PENYA EL FRARE, SIMCAV 20,000 21,520 2 10PEÑA CABRA, SIMCAVF 5,220 5,460 0 0PEÑAFIEL DE INVERSIONES, SIMCAV 30,250 31,650 2 2PEÑALARA DE INVERSIONES 31,560 34,280 29 22PEÑALVER DOCE 1,200 1,320 34 36PEÑASANTA DE VALORES, SIMCAV 8,904 8,556 603 0PEÑASEN 2002, SIMCAVF 0 24,762 0 3,169PEÑOTE INVERSIONES, SIMCAV 0 24,425 0 0 07/28/2003PEOPEI INVERSIONES SIMCAV 34,979 36,421 91 152PEOPLENET, SIMCAV 61,634 69,101 11 30PERCAPITAL, SIMCAV 25,080 28,000 647 372PERCO PATRIMONIAL, SIMCAV 123,808 127,415 19,190 3,061PEREL VALORES SIMCAV 8,060 8,480 131 201PERICLES INVERSIONES, SIMCAV 0 36,936 0 5,310 10/04/2003PERIGORD CARTERA, SIMCAV 24,722 25,243 199 294PERLORA INVERSIONES, SIMCAV 23,960 24,161 1 0PERSEO DE INVERSIONES, SIMCAV 22,959 24,281 341 74PERSEUS INVERSIONES, SIMCAV 21,200 22,200 23 40PERUARGO, SIMCAVF 9,680 10,080 0 11PERUGGIA INVERSIONES, SIMCAV 12,092 14,088 24 3,341PERYGON DE INVERSIONES, SIMCAVF 24,281 24,521 11 20PETO INVERSIONES, SIMCAV 16,508 17,349 578 48PETRES 2002, SIMCAV 0 24,762 0 2,550 07/28/2003PETRONILA 2000, SIMCAV 22,310 22,574 36 53PETU, SIMCAV 19,016 19,569 56 63PHALAENOPSIS, SIMCAV 24,435 25,228 1 0PHRONESIS DE INVERSIONES, SIMCAV 20,587 21,934 1,442 720PIGMANORT, SIMCAV 23,608 24,545 0 39PIGOYSA DE INVERSIONES, SIMCAV 19,914 21,396 2 1PIMA XXI, SIMCAV 24,699 26,575 430 871PINTOFON 24,440 25,960 1,202 41PISUEÑA DE INVERSIONES SIMCAV 17,718 16,900 27 22PISUERGA ARROYO, SIMCAV 11,720 11,870 33 3,614PIXELL INVERSIONES SIMCAVF 20,474 21,436 773 562PLANAHUR, SIMCAV 19,232 19,713 13 646
A.2.19.Secondary markets. Equities.Outcry market. Listed companies. 2003
2002 2003 2002 2003Companies
Capitalisation (at 31 Dec.) Annual trading Date of listing in2003 & other comments
Amounts in thousands of euros
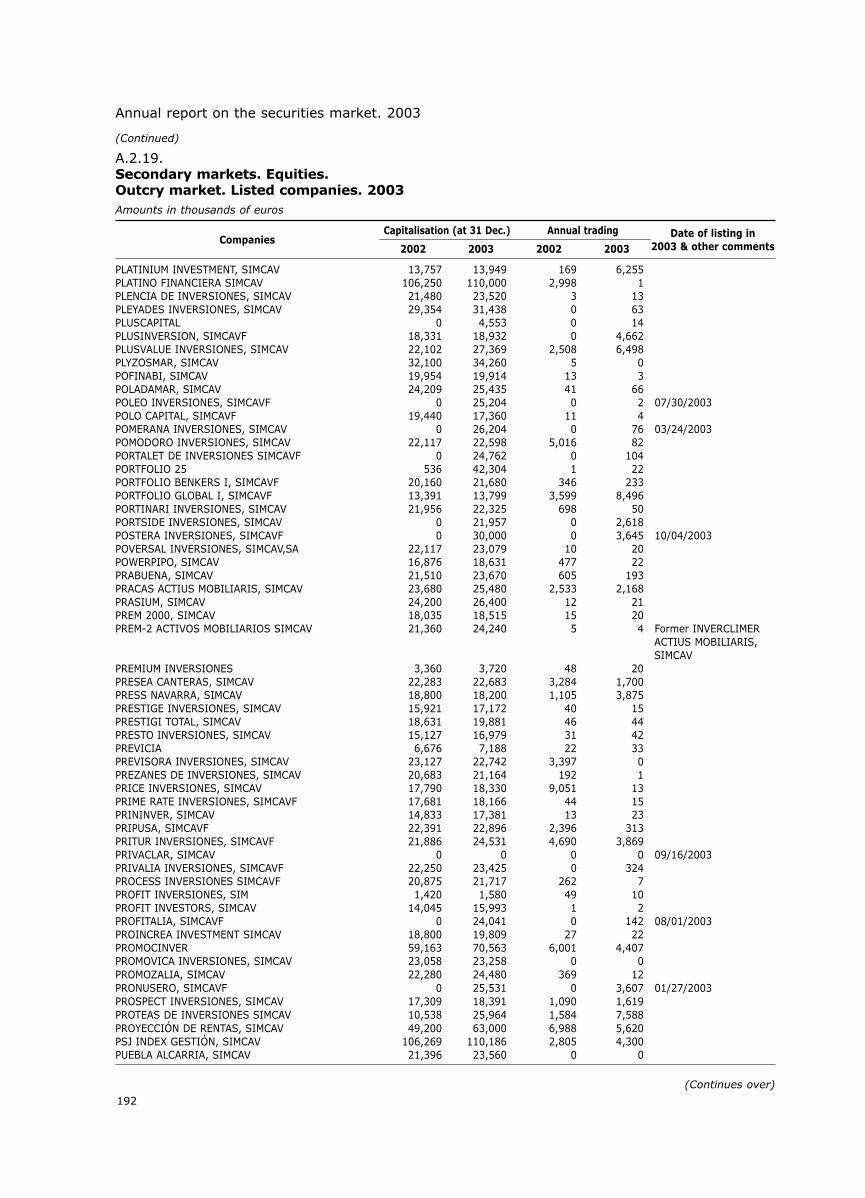
192
Annual report on the securities market. 2003
PLATINIUM INVESTMENT, SIMCAV 13,757 13,949 169 6,255PLATINO FINANCIERA SIMCAV 106,250 110,000 2,998 1PLENCIA DE INVERSIONES, SIMCAV 21,480 23,520 3 13PLEYADES INVERSIONES, SIMCAV 29,354 31,438 0 63PLUSCAPITAL 0 4,553 0 14PLUSINVERSION, SIMCAVF 18,331 18,932 0 4,662PLUSVALUE INVERSIONES, SIMCAV 22,102 27,369 2,508 6,498PLYZOSMAR, SIMCAV 32,100 34,260 5 0POFINABI, SIMCAV 19,954 19,914 13 3POLADAMAR, SIMCAV 24,209 25,435 41 66POLEO INVERSIONES, SIMCAVF 0 25,204 0 2 07/30/2003POLO CAPITAL, SIMCAVF 19,440 17,360 11 4POMERANA INVERSIONES, SIMCAV 0 26,204 0 76 03/24/2003POMODORO INVERSIONES, SIMCAV 22,117 22,598 5,016 82PORTALET DE INVERSIONES SIMCAVF 0 24,762 0 104PORTFOLIO 25 536 42,304 1 22PORTFOLIO BENKERS I, SIMCAVF 20,160 21,680 346 233PORTFOLIO GLOBAL I, SIMCAVF 13,391 13,799 3,599 8,496PORTINARI INVERSIONES, SIMCAV 21,956 22,325 698 50PORTSIDE INVERSIONES, SIMCAV 0 21,957 0 2,618POSTERA INVERSIONES, SIMCAVF 0 30,000 0 3,645 10/04/2003POVERSAL INVERSIONES, SIMCAV,SA 22,117 23,079 10 20POWERPIPO, SIMCAV 16,876 18,631 477 22PRABUENA, SIMCAV 21,510 23,670 605 193PRACAS ACTIUS MOBILIARIS, SIMCAV 23,680 25,480 2,533 2,168PRASIUM, SIMCAV 24,200 26,400 12 21PREM 2000, SIMCAV 18,035 18,515 15 20PREM-2 ACTIVOS MOBILIARIOS SIMCAV 21,360 24,240 5 4 Former INVERCLIMER
ACTIUS MOBILIARIS,SIMCAV
PREMIUM INVERSIONES 3,360 3,720 48 20PRESEA CANTERAS, SIMCAV 22,283 22,683 3,284 1,700PRESS NAVARRA, SIMCAV 18,800 18,200 1,105 3,875PRESTIGE INVERSIONES, SIMCAV 15,921 17,172 40 15PRESTIGI TOTAL, SIMCAV 18,631 19,881 46 44PRESTO INVERSIONES, SIMCAV 15,127 16,979 31 42PREVICIA 6,676 7,188 22 33PREVISORA INVERSIONES, SIMCAV 23,127 22,742 3,397 0PREZANES DE INVERSIONES, SIMCAV 20,683 21,164 192 1PRICE INVERSIONES, SIMCAV 17,790 18,330 9,051 13PRIME RATE INVERSIONES, SIMCAVF 17,681 18,166 44 15PRININVER, SIMCAV 14,833 17,381 13 23PRIPUSA, SIMCAVF 22,391 22,896 2,396 313PRITUR INVERSIONES, SIMCAVF 21,886 24,531 4,690 3,869PRIVACLAR, SIMCAV 0 0 0 0 09/16/2003PRIVALIA INVERSIONES, SIMCAVF 22,250 23,425 0 324PROCESS INVERSIONES SIMCAVF 20,875 21,717 262 7PROFIT INVERSIONES, SIM 1,420 1,580 49 10PROFIT INVESTORS, SIMCAV 14,045 15,993 1 2PROFITALIA, SIMCAVF 0 24,041 0 142 08/01/2003PROINCREA INVESTMENT SIMCAV 18,800 19,809 27 22PROMOCINVER 59,163 70,563 6,001 4,407PROMOVICA INVERSIONES, SIMCAV 23,058 23,258 0 0PROMOZALIA, SIMCAV 22,280 24,480 369 12PRONUSERO, SIMCAVF 0 25,531 0 3,607 01/27/2003PROSPECT INVERSIONES, SIMCAV 17,309 18,391 1,090 1,619PROTEAS DE INVERSIONES SIMCAV 10,538 25,964 1,584 7,588PROYECCIÓN DE RENTAS, SIMCAV 49,200 63,000 6,988 5,620PSJ INDEX GESTIÓN, SIMCAV 106,269 110,186 2,805 4,300PUEBLA ALCARRIA, SIMCAV 21,396 23,560 0 0
A.2.19.Secondary markets. Equities.Outcry market. Listed companies. 2003
2002 2003 2002 2003Companies
Capitalisation (at 31 Dec.) Annual trading Date of listing in2003 & other comments
Amounts in thousands of euros
(Continued)
(Continues over)

193
Annex 2: Secondary markets
(Continued)
(Continues over)
PULSA 1 INVERSIONES, SIMCAV 7,453 7,933 22 20PULSA INVERSIONES II, SIMCAV 18,151 20,218 28 46PULSO ACTUAL INVERSIONES, SIMCAV 23,920 24,441 126 2,681PYSACO INVERSIONES, SIMCAV 13,280 15,520 22 8Q-GESTIO MIXTE PLUS, SIMCAV 12,862 13,607 6,516 5,121QUADROPHENIA, SIMCAVF 18,717 21,559 7,322 5,571QUAESTOR INVESTMENTS, SIMCAV 41,136 42,288 3,736 671QUANTOP INVESTMENTS SIMCAVF 22,919 24,201 401 603QUANTUM 2001, SIMCAV 18,470 19,048 2 25QUEMBRE DE INVERSIONES SIMCAVF 20,675 0 0 0QUEMEN INVESTMENT SIMCAV 7,693 6,900 1,563 278QUERQUS INVERSIONES, SIMCAV 0 25,865 0 0 05/29/2003QUIESCELL, SIMCAV 28,860 31,746 52 3QUINCUNCE, SIMCAV 19,890 19,642 0 0QUINTANS INVERSIONES, SIMCAVF 21,636 24,281 12 1,236QUORUM 98, SIMCAVF 8,520 8,880 826 1,345QUORUM INVERSIONES, SIMCAV 17,962 18,469 1,069 316QUOTA INVERSIONES, SIMCAV 6,581 7,230 47 47QUOTATION 12,240 12,420 1,500 45RACAFER INVERSIONES SIMCAV SA 24,201 24,521 764 702RADISA INVERSIONES SIMCAV 17,484 17,845 1 0RAFRA 2000, SIMCAV 13,757 16,330 0 110RAICHU INVERSIONES SIMCAV 25,286 0 1 0RALLACZED, SIMCAV 14,809 16,155 45 49RALLY INVESTMENTS, SIMCAV 23,279 23,840 1 1RANDE SIGLO XXI, SIMCAV 0 25,243 0 6 09/16/2003RANGALI & ATOL INVERSIONES, SIMCAVF 23,800 24,041 11 20RANK INVERSIONES 29,739 32,602 41 15RASAL CARTERA, SIMCAV 21,645 22,607 122 105RASEC INVERSIONES, SIMCAVF 23,750 25,800 30 22RATEVIN VALORES, SIMCAV 28,999 30,301 216 715RATING INVERSIONES, SIMCAV 14,646 14,791 38 15RAVISTAR, SIMCAV 0 24,321 0 204 06/18/2003RCSCCH 1604, SIMCAV 17,922 18,661 2 80REBECO-98, SIMCAV 26,200 27,120 82 3RED JUNGLE PARTICIPACIONES SIMCAV 20,115 19,257 9 4REINVER INVERSIONES, SIMCAV 10,377 11,580 1,000 147REINVERPLUS 20,920 22,480 387 142RELLTEMA INVERSIONES SIMCAVF SA 23,360 23,480 11 5REMAR AHORRO, SIMCAV 13,794 15,038 428 62REMAST INVEST SIMCAVF SA 0 25,000 0 3,750 04/28/2003RENTA INSULAR CANARIA - RINCASA - 44,200 48,280 12,916 88RENTA PROCURADORES, SIMCAV 17,364 16,763 0 14,300 Former GESTIGOBE,
SIMCAVRENTABILIDAD 2009, SIMCAV 9,540 9,732 0 0RENTACTIVO CAPITAL, SIMCAV 32,406 35,291 3,135 8,988 Former URQUIJO
PORTFOLIO GLOBAL, SIMCAV
RENTAPLUS 46, SIMCAV 11,850 12,450 3 2RENTINVER 43,020 44,620 2,331 2,610RENTIVAL DE INVERSIONES, SIM 1,690 3,005 162 1RENTIVASA DE INVERSIONES 24,600 26,440 868 176RENVALOR 2,706 2,706 2 2RENVASA, SIMCAV 21,880 22,880 95 1,310REOLSO DE INVERSIONES, SIMCAV 24,600 27,240 40 20REPORT INVERSIONES, SIMCAVF 23,040 24,747 414 1,341RESULT INVERSIONES, SIMCAV 15,176 16,354 2,094 1,823RETINTO INVERSIONES SIMCAV 23,064 23,473 1,746 1,901RETSA INVERSIONES 16,700 0 17 0 Delisted 09/17/2003REVIEW INVERSIONES, SIMCAV 10,121 11,551 51 19
A.2.19.Secondary markets. Equities.Outcry market. Listed companies. 2003
2002 2003 2002 2003Companies
Capitalisation (at 31 Dec.) Annual trading Date of listing in2003 & other comments
Amounts in thousands of euros

194
Annual report on the securities market. 2003
REX ROYAL BLUE, SIMCAV 17,343 18,752 113 21REYZA INVERSIONES Y GESTION, SIMCAV 23,880 26,560 786 10RG 27, SIMCAV 56,630 66,500 73 347RHEVILO INVERSIONES, SIMCAV 9,304 9,905 53 61RHODES INVESTMENT, SIMCAV 20,434 21,636 1 1RHYDON INVERSIONES, SIMCAV,SA 24,800 30,040 512 369RIBADEO DE INVERSIONES, SIMCAV 20,130 21,861 377 2RIBASARO, SIMCAV 8,474 8,835 11 20RIBERAS DEL SOR INVESTMENT, SIMCAV 0 24,521 0 59RICAB 2001 INVERSIONES SIMCAV 23,824 24,978 336 416RICLA DE INVERSIONES SIMCAV 21,813 22,342 1 1RIDEO2, SIMCAV 30,051 31,613 4,456 2,934RIJEKA INVESTMENT, SIMCAV 23,439 24,241 3 4RIMAKVALOR, SIMCAV 23,810 24,772 5,117 1,166RIMALO INVERSIONES, SIMCAV 0 0 0 0 09/292003RIO INVERSIONES 99, SIMCAV 23,824 24,401 1,513 141RIO PERLA INVERSIONES, SIMCAV 0 24,387 0 0 11/032003RIO URUMEA DE INVERSIONES, SIMCAV 18,120 19,000 4 6RIOFISA INVERSIONES, SIMCAV 20,194 20,434 13 20RIOTIRON, SIMCAV 16,828 17,309 31 46RISK EQUITY, SIMCAV 21,348 22,598 0 2RM 99 DE INVERSIONES, SIMCAV 12,626 14,141 9 1ROA PATRIMONIO, SIMCAV 23,848 23,993 0 0ROCILLO DE INVERSIONES, SIMCAV 18,759 20,972 203 386RODAON INVERSIONES SIMCAV 32,455 42,311 48 8,963RODASIL INVERSIONES 2002, SIMCAV 0 24,738 0 80 02/25/2003RODEO DE INVERSIONES, SIMCAV 21,917 22,718 2 1ROINVER PORTFOLIO, SIMCAV 20,915 21,156 10 20ROLAVI INVERSIONES, SIMCAV 20,915 21,636 613 20ROLLBACK INVERSIONES, SIMCAV 7,785 8,400 34 12ROMERCAPITAL, SIMCAV 29,209 29,930 0 145ROMERO INVERSIONES MOBILIARIAS, SIMCAV 18,711 21,765 49 21RONDINVER INVERSIONES SIMCAV 22,838 23,560 3,070 20ROSALOLES INVERSIONES, SIMCAV 0 26,977 0 1,443 08/01/2003ROSILNU, SIMCAV 18,800 20,080 1 2ROSSI Y BERTONI INVERSIONES, SIMCAV 0 25,243 0 9 11/062003ROSTERAL SIMCAV 23,519 23,764 13 20ROTRESA INVERSIONES, SIMCAVF 10,337 16,323 67 1,147ROVIME INVERSIONES, SIMCAV 23,319 23,800 13 20ROYALTY INVERSIONES, SIMCAVF 0 12,386 0 34 03/14/2003RSA 2000 INVESTMENT, SIMCAV 19,288 20,106 752 27RSA 2001 CARTERA, SIMCAV 0 24,161 0 1,202 04/30/2003RUAL FINANZAS, SIMCAVF 12,240 12,840 0 8,717RUBICON INVERSIONES, SIMCAV 2,596 3,750 26 25RUBICON XXI 69,700 75,600 7,322 4,390RUCANDIO INVERSIONES, SIMCAVF 18,271 19,857 3,017 23RUIDERA INVERSIONES SIMCAV 20,443 20,924 440 20RURAL PATRIMONIOS AGRUPADOS, SIMCAV 16,138 16,474 146 29RUTEMA DE INVERSIONES, SIMCAV 4,000 17,120 3 1,850RUVECAPITAL INVERSIONES, SIMCAV 0 23,199 0 55S&P EUROPE 350 INDICE, SIMCAV 24,401 24,802 232 733SABBIA INVERSIONES, SIMCAVF 17,982 17,982 32 42SABOCO INVERSIONES, SIMCAV 25,795 26,781 1,085 982SABUC INVERSIONES SIMCAV 22,838 24,281 4,368 5,615SAFETY INVERSIONES, SIMCAVF 22,342 22,896 1,407 2,653SAGEI 47,850 58,003 5,511 1,074SAGGIA INVERSIONES, SIMCAV 14,665 15,001 5,118 35SAGIAL INVERSIONES, SIMCAV 13,183 13,966 432 25SAGITARI 2000, SIMCAV 28,548 30,531 3,971 1,488SAINT RANDY, SIMCAV 10,658 17,004 661 5
A.2.19.Secondary markets. Equities.Outcry market. Listed companies. 2003
2002 2003 2002 2003Companies
Capitalisation (at 31 Dec.) Annual trading Date of listing in2003 & other comments
Amounts in thousands of euros
(Continued)
(Continues over)

195
Annex 2: Secondary markets
(Continued)
(Continues over)
SAKAKI INVESTMENT, SIMCAV 23,319 26,204 0 1SALAMANCA I 23,891 24,991 8 441SALAMINA INVESTMENT, SIMCAV 22,358 26,204 0 1SALDAMOVIL NORANTANOU, SIMCAV 9,500 11,000 1 0SALDAÑA DE INVERSIONES, SIMCAV 21,020 22,823 1 2SALIMAR INVESTMENTS, SIMCAV 31,760 36,240 2,458 2,476SALIME DE INVERSIONES 26,486 26,732 10 17SALINAS DE INVERSIONES, SIMCAV 15,753 17,316 2 2SALIONA DE INVERSIONES, SIMCAV 21,092 21,886 3 3SALLIERCA, SIMCAV 24,041 25,194 0 2SALVAGO DE INVERSIONES, SIMCAV 17,148 18,086 1 6SALVIA DE INVERSIONES, SIMCAV 27,800 28,920 7,507 183SAMAJOFE, SIMCAV 17,526 15,891 33 39SAMAROCA, SIMCAV 86,400 88,950 83 77SAMBOAL DE INVERSIONES, SIMCAVF 23,545 23,810 5,999 2,891SAMMAR 7,784 6,124 0 12SAN AMARO DE INVERSIONES, SIMCAV 20,520 21,040 21 8SAN ANTONIO TORRE, SIMCAVF 20,915 21,877 27 2,067SANAL 2001, SIMCAVF 22,838 23,319 11 20SANBABILES, SIMCAV 0 24,233 0 421 10/15/2003SANCLAVE, SIMCAV 18,013 19,024 0 87SANDALOS 2001 SIMCAV 21,973 22,550 0 1,200SANINVER INVERSIONES, SIMCAV 33,536 35,700 12 22SANINVERPA, SIMCAV 27,922 32,876 2 0SANSEMISA 137,520 139,095 438 29SANT BERNAT DE INVERSIONES, SIMCAV 23,785 25,565 1 19SANTA CLARA DE VALORES, SIMCAV 26,204 27,446 4,871 32SANTA CROYA DE INVERSIONES SIMCAV 9,616 10,085 0 1SANTA MARGARITA INVERSIONES SIMCAVF 6,251 8,895 626 200SANTACABE, SIMCAV 14,760 14,760 11 20SANTANDER INVERSIONES CEUTA MELILLA 47,040 26,801 11,338 11SANTEUL INVEST, SIMCAV 20,763 21,384 3 270SANTOS NUEVOS, SIMCAV 10,987 23,488 37 869SANZCOR INVERSIONES SIMCAV 18,992 20,434 2 0SANZCORIN INVERSIONES, SIMCAV 23,800 23,920 36 19SAPPHIRE INVERSIONES, SIMCAV 11,291 11,460 474 297SAPRI INVERSIONES 2000, SIMCAVF 16,011 16,323 0 0SARLARDU DE INVERSIONES, SIMCAV 16,426 18,831 1,799 1,131SARSUIL INVERSIONES, SIMCAV 24,762 25,002 13 20SASABE INVERSIONES SIMCAV 16,114 18,038 46 1,226SATAFONA, SIMCAV 0 24,281 0 0 12/05/2003SATIREV, SIMCAVF 17,845 18,038 201 1,799SATLY GLOBAL SECURITIES, SIMCAV 18,511 18,030 11 11SATNER INVERSIONES, SIMCAV 0 25,500 0 10 11/08/2003SATRAPA SIMCAV 11,071 13,198 664 147SAU D´INVERSIONS, SIMCAV 17,640 18,400 2 7SAUCE VALORES, SIMCAVF 30,051 30,952 0 2SAVIR 2000 DE INVERSIONES SIMCAV 59,616 61,200 0 1,315SAVIR PATRIMONIO, SIMCAVF 20,531 23,560 0 0SAVOY INVERSIONES, SIMCAVF 21,396 22,838 13 22SAYCAN-2001, SIMCAV 0 0 0 0 07/28/2003SAYOA 68,600 70,000 909 1,399SBP GLOBAL 1, SIMCAV 42,180 43,500 4,436 362 Former MB GLOBAL 1SBP GLOBAL 10, SIMCAV 26,234 28,037 3,908 2,053SBP GLOBAL 2, SIMCAV 30,300 32,400 5,923 5,643 Former MB GLOBAL 2SBP GLOBAL 3, SIMCAV 28,350 30,650 1,081 3,543 Former MB GLOBAL 3SBP GLOBAL 4, SIMCAV 27,800 28,500 2,458 69SBP GLOBAL 5, SIMCAV 25,303 26,985 613 147 Former MB GLOBAL 5,
SIMCAVSBP GLOBAL 7, SIMCAV 20,885 22,869 82 194 Former MB GLOBAL 7,
SIMCAV
A.2.19.Secondary markets. Equities.Outcry market. Listed companies. 2003
2002 2003 2002 2003Companies
Capitalisation (at 31 Dec.) Annual trading Date of listing in2003 & other comments
Amounts in thousands of euros

196
Annual report on the securities market. 2003
SBP GLOBAL 8, SIMCAV 22,117 22,718 636 15,201SBP GLOBAL 9, SIMCAV 30,561 31,433 16,843 20,690SC MERCADOS GLOBALES INVERSIONES SIMCAV 19,000 18,398 0 0SCHAELCHLI INVERSIONES SIMCAV 7,993 8,390 6 0SCHILARACU INVERSIONES, SIMCAV 24,962 25,844 2 2SCHOLA DE INVERSIONES, SIMCAV 24,778 26,455 58 73SEA WOLF SIMCAVF 20,779 20,587 0 2,044SEBORUCO, SIMCAV 16,131 16,323 29 38SECRAM INVERSIONES SIMCAV 15,146 18,030 14 10,196SECUOYA DE INVERSIONES, SIMCAV 21,525 22,511 770 1,001SECURE INVERSIONES 26,080 0 704 66 Delisted 04/24/2003SECURITY ANALYSIS INVESTMENTS, SIMCAV 24,561 25,283 9,024 9,305SEDOR GLOBAL, SIMCAV 0 24,281 0 3,273 05/21/2003SEGRE 2000, SIMCAV 21,480 21,480 972 5SEISBECISA, SIM 3,241 3,212 1,424 0SELACO 99 INVERSIONES, SIMCAVF 7,533 8,034 413 133SELECCIÓN DIVERSIFICADA, SIMCAV 48,960 50,320 0 3,941SELEGNA RENTA VARIABLE, SIMCAV 25,002 28,608 0 1,496SELEGNA, SIMCAVF 6,900 7,920 66 92SEMOB 2001, SIMCAV 23,800 24,762 10 20SENDA DE VITE, SIMCAV 0 25,002 0 9 02/04/2003SENESTRELLA, SIMCAV 3,990 4,220 428 276SENTANI DE VALORES MOBILIARIOS, SIMCAV 27,075 35,200 2,595 2,017SENY 97, SIMCAV 24,276 25,284 954 90SEQUIA INVERSIONS SIMCAV 4,135 4,568 40 26SERANTES CARTERA, SIMCAVF 27,695 28,464 1,555 0SERECO INVERSIONES, SIMCAV 1,372 0 33 0SERGAMA INVERSIONES, SIMCAV 17,886 17,910 572 44SERGROBE DE INVERSIONES 26,080 28,960 3 690SETOBA DE INVERSIONES, SIMCAV 24,266 24,916 300 6SEVIDON, SIMCAV 19,920 20,440 1 2SG 2000 INVERSIONES, SIMCAV 5,349 6,852 194 2SHARE INVERSIONES 3,080 3,160 44 17SHILLING INVERSIONS, SIMCAVF 0 24,209 0 7 01/08/2003SHUTTLE INVERSIONES, SIMCAV 8,177 8,418 1,033 966SICBI, SIMCAV 22,454 23,704 253 1,627SICEUTA 28,440 29,360 478 1,656SIERRA JAPI, SIMCAVF 0 24,569 0 140 02/04/2003SIERRA TOLEDANA DE INVERSIONES, SIMCAV 0 24,531 0 0SIGLO XXI BOLSA, SIMCAV 24,920 25,280 165 141SIGLO XXI INVERSIONES GLOBALES, SIMCAVF 23,800 24,762 2,405 13SIGMA DIVERSIFICACION 17,120 18,280 2,348 495SIJUCRI, SIMCAV 10,758 11,359 312 161SILENO INVESTMENT SIMCAVF SA 25,002 25,964 0 1SILEO 6 INVERSIONS, SIMCAV 30,170 31,132 16,257 3,402 Former BETA MULTIMEDIA,
SIMCAVSILGA GESTION, SIMCAV 14,162 15,377 2 2SILGARPO SIMCAV 0 24,820 0 2 09-17/2003SILLA INVERSIONES SIMCAV 0 25,747 0 58SILLEIRO DE INVERSIÓN, SIMCAV 251,944 26,599 96,541 19,587SILOBAR 18,752 16,400 21 14SILURIC, SIMCAV 6,130 6,251 10 270SILURO INVERSIONES, SIMCAV 24,942 25,844 132 940SIMA AHORRO, SIMCAV 7,653 8,494 0 10SIMA INVERSIONES, SIMCAV 23,325 24,046 16 20SIMAR INVERSIONES, SIMCAV 20,960 22,160 112 1,215SIMCOVAS GRUP, SIMCAV 15,681 16,306 22 21SIMHERSAN 61,440 72,000 0 0SIMI PARILLION, SIMCAV 0 0 0 0 09/12/2003SIMPLICITY SELECT, SIMCAV 23,159 24,121 1 1
A.2.19.Secondary markets. Equities.Outcry market. Listed companies. 2003
2002 2003 2002 2003Companies
Capitalisation (at 31 Dec.) Annual trading Date of listing in2003 & other comments
Amounts in thousands of euros
(Continued)
(Continues over)

197
Annex 2: Secondary markets
(Continued)
(Continues over)
SIMSON 2000, SIMCAV 20,370 21,453 26 0SINAMA INVERSIONES, SIMCAV 11,059 11,419 11 20SINE QUO NUM, SIMCAV 16,299 17,886 871 254SINIPOLI 19,760 21,760 32 192SIROCO EXPECTATIONS, SIMCAV 99,167 101,210 1 0SIRVAL 0 0 0 0 Delisted 05/15/2003SISAPON INVERSORES, SIMCAV 16,797 18,199 227 430SJJ VALORES COROLYPSO SA, SIMCAV 0 18,160 0 1SNOOPY INVERSIONES, SIMCAV 19,336 20,034 2,349 18SOANDRES DE ACTIVOS SIMCAVF 331,200 0 50,005 0SOCIEDAD DE CARTERA DEL VALLES - SOCARVE - 5,600 6,200 63 121SOCIEDAD INSTITUCIONAL FINANCIERA, SIMCAV, S 12,922 13,262 0 15 Former SAFEI
TECNOLOGIA, SIMCAVSOCIEDAD MADRILEÑA DE INVERSIÓN MOBILIARIA 33,952 15,000 0 101SOCIEDAD MEDITERRÁNEA ASSET MANAGEMENT,SIMCAV 32,840 35,360 103 804SOCIEDAD VALENCIANA TENEDORA DE VALORES, SIMC 0 25,685 0 2 04/30/2003SOCIETY FAMITEX, SIMCAV 20,194 19,713 2 0SOCYAM, SIMCAV 73,724 73,724 967 633SOFORT GESTIÓN, SIMCAV 35,460 37,560 110 242SOFROSINE, SIMCAV 19,100 21,100 24 26SOGAPRIM, SIMCAV 17,520 18,960 139 128SOGAZA DE INVERSIONES, SIMCAV 20,467 21,717 190 35SOIXA 26,963 26,963 3 6SOL Y SOMBRA, INVERSIONES SIMCAV 5,950 6,491 27 22SOLCA INVERSIONES, SIMCAV 10,770 11,455 58 2,971SOLE BOADA INVERSIONS, SIMCAV 15,031 15,007 2 0SOLEMEG, SIMCAV 19,800 21,700 1,339 1SOLGIM INVERSIONES, SIMCAV 0 0 0 0 11/03/2003SOLMA INVERSIONES, SIMCAV 21,636 23,319 33 22SOLRAC INVERSIONES 2000 SIMCAV 18,132 19,439 21 21SOMOLINOS INVERSIONES, SIMCAV 23,401 29,052 889 114SOMOSUSA, SIMCAV 21,880 22,760 433 20SONORA GLOBAL SIMCAV 17,309 16,828 147 16SOOLHASI, SIMCAV 24,440 25,160 24 14SORIELA INVERSIONES, SIMCAV 0 19,180 0 22 11/03/2003SORNI CAPITAL, SIMCAV 18,422 18,759 54 55SOROA INVERSIONES, SIMCAV 14,617 14,040 18 33SORRAL INVERSIONES SIMCAVF 24,041 24,978 0 2SORUGES DE INVERSIONES, SIMCAV 20,680 21,401 94 167SOSMART INVERSIONES 17,400 17,660 419 205SOTAVENTO DE VALORES SIMCAV 13,324 15,921 2 2SOUK-EL- ARBA SIMCAV 23,377 24,437 0 0SOUTH HILL 146,000 150,000 104 47,484SPILBO INVERSIONES, SIMCAV 13,463 13,895 331 1,535SPLIT INVERSIONES, SIMCAV 4,952 21,955 409 110SPOT INVERSIONES, SIMCAVF 11,480 12,900 0 1SPQLA DE VALORES, SIMCAVF 13,880 15,360 28 75SPRINGMAX, SIMCAV 23,656 24,810 0 0ST MORITZ INVERSIONES, SIMCAV 16,900 16,155 32 38STAMVALOR INVERSIONES, SIMCAV 19,954 21,156 11 386STARDUST, SIMCAV 23,920 25,182 13 11 Former EPECUEN, SIMCAVSTELLARIA, SIMCAV 0 12,552 1 29STEP GESTIÓN, SIMCAV 22,021 23,175 5 6STERLING INVERSIONES, SIMCAV 0 9,171 0 7 01/08/2003STOCK AREA, SIMCAV 25,280 30,560 207 64STOCK INVERSIONES 3,288 3,540 387 14STRATEGIC CARTERA, SIMCAV 30,240 31,880 1,113 5STRIP INVERSIONES, SIMCAV 19,140 52,240 13,571 2,038SUALFER INVERSIONES, SIMCAV 22,320 23,080 181 1,030SUBAIDA FINANCIERA, SIMCAVF 26,640 29,280 414 637
A.2.19.Secondary markets. Equities.Outcry market. Listed companies. 2003
2002 2003 2002 2003Companies
Capitalisation (at 31 Dec.) Annual trading Date of listing in2003 & other comments
Amounts in thousands of euros
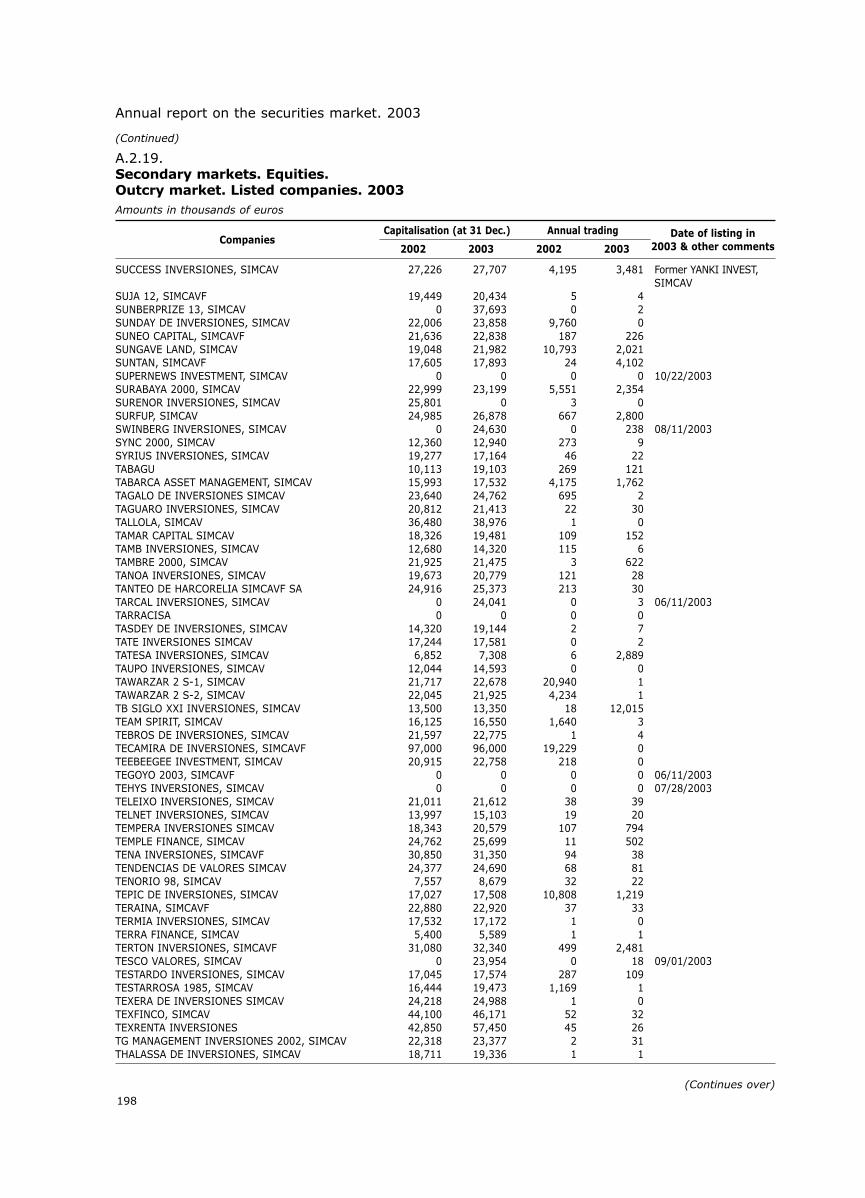
198
Annual report on the securities market. 2003
SUCCESS INVERSIONES, SIMCAV 27,226 27,707 4,195 3,481 Former YANKI INVEST,SIMCAV
SUJA 12, SIMCAVF 19,449 20,434 5 4SUNBERPRIZE 13, SIMCAV 0 37,693 0 2SUNDAY DE INVERSIONES, SIMCAV 22,006 23,858 9,760 0SUNEO CAPITAL, SIMCAVF 21,636 22,838 187 226SUNGAVE LAND, SIMCAV 19,048 21,982 10,793 2,021SUNTAN, SIMCAVF 17,605 17,893 24 4,102SUPERNEWS INVESTMENT, SIMCAV 0 0 0 0 10/22/2003SURABAYA 2000, SIMCAV 22,999 23,199 5,551 2,354SURENOR INVERSIONES, SIMCAV 25,801 0 3 0SURFUP, SIMCAV 24,985 26,878 667 2,800SWINBERG INVERSIONES, SIMCAV 0 24,630 0 238 08/11/2003SYNC 2000, SIMCAV 12,360 12,940 273 9SYRIUS INVERSIONES, SIMCAV 19,277 17,164 46 22TABAGU 10,113 19,103 269 121TABARCA ASSET MANAGEMENT, SIMCAV 15,993 17,532 4,175 1,762TAGALO DE INVERSIONES SIMCAV 23,640 24,762 695 2TAGUARO INVERSIONES, SIMCAV 20,812 21,413 22 30TALLOLA, SIMCAV 36,480 38,976 1 0TAMAR CAPITAL SIMCAV 18,326 19,481 109 152TAMB INVERSIONES, SIMCAV 12,680 14,320 115 6TAMBRE 2000, SIMCAV 21,925 21,475 3 622TANOA INVERSIONES, SIMCAV 19,673 20,779 121 28TANTEO DE HARCORELIA SIMCAVF SA 24,916 25,373 213 30TARCAL INVERSIONES, SIMCAV 0 24,041 0 3 06/11/2003TARRACISA 0 0 0 0TASDEY DE INVERSIONES, SIMCAV 14,320 19,144 2 7TATE INVERSIONES SIMCAV 17,244 17,581 0 2TATESA INVERSIONES, SIMCAV 6,852 7,308 6 2,889TAUPO INVERSIONES, SIMCAV 12,044 14,593 0 0TAWARZAR 2 S-1, SIMCAV 21,717 22,678 20,940 1TAWARZAR 2 S-2, SIMCAV 22,045 21,925 4,234 1TB SIGLO XXI INVERSIONES, SIMCAV 13,500 13,350 18 12,015TEAM SPIRIT, SIMCAV 16,125 16,550 1,640 3TEBROS DE INVERSIONES, SIMCAV 21,597 22,775 1 4TECAMIRA DE INVERSIONES, SIMCAVF 97,000 96,000 19,229 0TEEBEEGEE INVESTMENT, SIMCAV 20,915 22,758 218 0TEGOYO 2003, SIMCAVF 0 0 0 0 06/11/2003TEHYS INVERSIONES, SIMCAV 0 0 0 0 07/28/2003TELEIXO INVERSIONES, SIMCAV 21,011 21,612 38 39TELNET INVERSIONES, SIMCAV 13,997 15,103 19 20TEMPERA INVERSIONES SIMCAV 18,343 20,579 107 794TEMPLE FINANCE, SIMCAV 24,762 25,699 11 502TENA INVERSIONES, SIMCAVF 30,850 31,350 94 38TENDENCIAS DE VALORES SIMCAV 24,377 24,690 68 81TENORIO 98, SIMCAV 7,557 8,679 32 22TEPIC DE INVERSIONES, SIMCAV 17,027 17,508 10,808 1,219TERAINA, SIMCAVF 22,880 22,920 37 33TERMIA INVERSIONES, SIMCAV 17,532 17,172 1 0TERRA FINANCE, SIMCAV 5,400 5,589 1 1TERTON INVERSIONES, SIMCAVF 31,080 32,340 499 2,481TESCO VALORES, SIMCAV 0 23,954 0 18 09/01/2003TESTARDO INVERSIONES, SIMCAV 17,045 17,574 287 109TESTARROSA 1985, SIMCAV 16,444 19,473 1,169 1TEXERA DE INVERSIONES SIMCAV 24,218 24,988 1 0TEXFINCO, SIMCAV 44,100 46,171 52 32TEXRENTA INVERSIONES 42,850 57,450 45 26TG MANAGEMENT INVERSIONES 2002, SIMCAV 22,318 23,377 2 31THALASSA DE INVERSIONES, SIMCAV 18,711 19,336 1 1
A.2.19.Secondary markets. Equities.Outcry market. Listed companies. 2003
2002 2003 2002 2003Companies
Capitalisation (at 31 Dec.) Annual trading Date of listing in2003 & other comments
Amounts in thousands of euros
(Continued)
(Continues over)

199
Annex 2: Secondary markets
(Continued)
(Continues over)
THISHUL INVESTMENT SIMCAV 22,438 23,279 1,126 2,312TIBEST CINCO 14,539 19,375 2,104 21TIBEST DOS 23,310 139,860 36 1,600TICAN DIVERSIFICADA, SIMCAV 21,010 21,791 267 57TIEBAS DE INVERSIONES, SIMCAV 15,801 17,797 2 14TIÉTAR DE INVERSIONES 10,308 7,392 12 74TIGNA VENTURA, SIMCAV 54,820 55,241 0 0TIGRIS INVERSIONES, SIMCAV 6,977 9,281 1,530 3TIMBERLINE INVESTMENT, SIMCAV 0 0 0 0 12/23/2003TIMING INVERSIONES, SIMCAV 18,735 19,721 207 173TIQUE INVESTMENT, SIMCAVF 0 24,521 0 1 05/29/2003TISU INVEST, SIMCAV 20,314 21,476 2,031 1TÍTULOS ALCALA, SIMCAV 0 39,306 0 36 03/13/2003TÍTULOS BALBOA, SIMCAV 0 36,782 0 4,590 11/27/2003TÍTULOS BILBAO 33,440 40,000 842 644TÍTULOS CUZCO, SIMCAV 3,291 3,887 1,028 380TÍTULOS ESTRAUNZA, SIMCAV 19,240 23,088 968 834TÍTULOS GALICIA 5,160 5,867 76 41TÍTULOS IGUELDO, SIMCAV 25,741 29,632 965 1,420TÍTULOS IMBACA, SIMCAV 22,030 23,377 2,678 121TIZONA INVEST SIMCAV 20,987 21,877 103 363TOFI DE INVERSIONES, SIMCAVF 23,480 24,201 2,499 3,155TOGAEST INVERSIONES, SIMCAV 18,671 20,074 514 30TOGOINVEST, SIMCAV 0 24,880 0 68 04/03/2003TOJABI INVERSIONES, SIMCAV 21,636 22,358 10 1,673TOMASON DE INVERSIONES, SIMCAV 12,640 13,040 2 502TOMKA INVERSIONES SIMCAV 25,393 26,174 979 1,015TOPAZ INVERSIONES SIMCAV 26,599 28,908 997 723TORDESILLAS DE INVERSIONES, SIMCAV 21,068 22,342 790 21TORRELLA INVERSIONES, SIMCAV 14,880 16,920 280 402TORRENOVA INVERSIONES 230,516 245,200 4,453 16,740 01/10/2003TORREVALORES, SIMCAV 17,960 19,720 2,189 27TORRIJOS INVERSIONES, SIMCAV 12,314 13,781 5 432TORRLA INVERSIONES 2000, SIMCAV 20,675 21,877 0 0TOVACOR INVERSIONES, SIMCAV 20,755 21,982 611 1,559TRANSFORMACION DE INVERSIONES, SIMCAV 18,038 20,322 0 1,043TRASCASA DE INVERSIONES, SIMCAV 20,779 22,006 16 20TRAXIS 26,213 83,901 3 5TREDICON INVERSIONES, SIMCAV 16,877 18,006 137 2TREDOS DE INVERSIONES, SIMCAV 20,611 20,948 1 0TREND INVERSIONES 18,040 25,320 33 12TRESIM INVERSIONES SIMCAV 0 17,268 0 0TRETZE 01, SIMCAV 15,434 16,155 5,318 887TREVEGIL INVERSIONES, SIMCAV 20,587 20,924 837 29TRICON INVERSIONES, SIMCAV 12,333 13,270 82 77TRIENTE INVERSIONES, SIMCAV 20,340 23,670 19 155TRIFU INVEST, SIMCAVF,SA 0 24,962 0 41 03/24/2003TRIGAL INVERSIONES, SIMCAV 20,603 22,141 1 1TRINIDAD INVERSIONES SIMCAV 10,241 9,833 119 1,504TRONADORA DE INVERSIONES, SIMCAVF 25,150 25,400 1,660 3,497 Former TORROFISA,
SIMCAVTRUCHA INVERSIONES, SIMCAV 19,040 20,002 0 271TRURE CAPITAL, SIMCAV 19,962 20,587 11 10TRUST IN ITACA, SIMCAVF 25,290 26,612 1,420 4,462TRUVI DE INVERSIONES, SIMCAV 15,897 16,715 538 2TTH DE INVERSIONES, SIMCAV 20,370 21,789 2 3TUCANA INVERSIONES, SIMCAV 21,720 22,680 27 22TUGO INVERSIONES, SIMCAV 10,340 10,900 352 293TULIACAN, SIMCAVF 0 25,143 0 17TULIPÁN DE INVERSIONES, SIMCAV 20,875 20,322 1 0
A.2.19.Secondary markets. Equities.Outcry market. Listed companies. 2003
2002 2003 2002 2003Companies
Capitalisation (at 31 Dec.) Annual trading Date of listing in2003 & other comments
Amounts in thousands of euros

200
Annual report on the securities market. 2003
TULUM INVESTMENT, SIMCAV 15,633 16,017 21 2,102TUNDRA 99 SIMCAVF 7,513 8,414 0 9TURA INVESTMENT, SIMCAV 16,548 19,353 676 152TURQUESA 2000 INVERSIONES, SIMCAV 20,194 21,156 13 20TUSAK INVERSAM, SIMCAV 18,752 19,232 13 20TXILUAGI, SIMCAV 18,049 22,331 7,174 373TYROL INVERSIONES, SIMCAVF 21,733 22,959 639 1,253UBS SELECCIÓN CRECIMIENTOF 24,281 0 0 1 Delisted 11/24/2003UBS SELECCIÓN EQUILIBRADA, SIMCAVF 21,396 22,438 19,008 11,869UBS SELECCIÓN RENTA VARIABLE, SIMCAVF SA 24,281 29,570 0 19,693UGBA INVERSIONES, SIMCAV 18,268 19,762 196 2,325ULEILA SANTA MARIA INVERSIONES, SIMCAV 14,665 18,030 12 20ULLS NOUS, SIMCAV 19,713 20,434 27 22UMASGES, SIMCAV 8,915 9,416 3,360 20UNDARTE DE INVERSIONES, SIMCAV 19,577 20,467 1 2,400UNIFIN INVESTMENTS, SIMCAVF 10,440 11,000 33 2UNIFOND 27,480 28,120 1,944 1,383UNIMAT INVERSIONES, SIMCAV 21,925 23,464 0 0UNIÓN 400 SIMCAV 23,625 24,306 136 440UNIÓN ESPAÑOLA DE INVERSIONES 8,600 37,248 8 19UNIÓN TIRRENIA, SIMCAV 23,520 24,081 1 1UNIPROM 98 SIMCAV 12,480 13,080 8 3UNIVEL INVERSIONES, SIMCAV 24,617 30,435 5,664 325UNIVERSAL DE INVERSIONES 1,444 1,444 114 2UPTREND INVESTMENTS, SIMCAVF 29,149 31,253 13 13URBEL 2000 DE INVERSIONES, SIMCAV 12,506 13,684 642 12URC PATRIMONIS, SIMCAV 23,593 25,277 1,074 980URCUIT, SIMCAV 20,675 21,636 11 20URMAR INVERSIONES, SIMCAVF 18,992 21,396 13 22URO INVERSIONES, SIMCAV 11,568 13,059 4 562URQUIJO CARTERA DINAMICA, SIMCAV 17,737 20,693 2,201 1,384URQUIJO CARTERA FONDOS INTERNACIONALES , SIMC 0 24,579 0 14,706 11/06/2003URQUIJO COOPERACION SIMCAV 17,200 36,437 22,122 19,309 Former EMESA
GLOBAL, SIMCAVUSATEGI INVERSIONES, SIMCAV 0 12,862 0 1,202UVAFS, SIMCAVF 0 24,521 0 22 01/27/2003UXAMA INVERSIONES 8,940 10,340 90 4,960VABUVA, SIMCAV 12,958 12,453 27 2,433VACONTE INVERSIONES SIMCAV 23,560 25,243 0 0VADERCAP INVERSIONES, SIMCAV 14,424 20,194 12 20VAIMESA 38,320 39,240 106 231VAINGU INVERSIONES, SIMCAV 22,358 23,079 1,070 22VALAIS INVESTMENTS, SIMCAV 26,799 27,040 116 27VALBORSA, SIMCAV 23,250 25,000 12,035 162VALBRAN DE INVERSIONES, SIMCAV 12,261 18,271 14 21VALCORONA INVERSIONES, SIMCAV ,SA 24,040 25,440 4 14VALDARBI INVEST, SIMCAVF 22,598 23,800 134 872VALDEARENAS INVERSIONES, SIMCAV 0 12,501 0 0VALDECAÑAS 99, SIMCAV 15,993 17,965 1 300VALDECARROS 2000, SIMCAV 17,862 17,333 1,333 340VALDECRUZ INVERSIONES, SIMCAV 11,600 16,119 0 0VALDEFRADES DE INVERSIONES, SIMCAV 24,582 24,967 12 151VALDEOLEA DE INVERSIONES SIMCAV 15,440 16,234 2 1VALDEREY CAPITAL, SIMCAV 18,422 19,000 502 7VALDILLANA INVERSIONES, SIMCAVF 25,747 26,586 39 137VALDIS DE INVERSIONES, SIMCAV 3,899 4,250 382 3,616VALDORBA INVERSIONES, SIMCAV 10,878 10,890 0 3VALENCIANA DE VALORES 10,944 143,520 560 1,259VALIBESA 46,570 49,711 119 230VALINRE, SIMCAV 21,925 26,375 454 122
A.2.19.Secondary markets. Equities.Outcry market. Listed companies. 2003
2002 2003 2002 2003Companies
Capitalisation (at 31 Dec.) Annual trading Date of listing in2003 & other comments
Amounts in thousands of euros
(Continued)
(Continues over)

201
Annex 2: Secondary markets
(Continued)
(Continues over)
VALLISOLETANA DE VALORES 58,280 62,280 258 264VALMER DE INVERSIONES, SIMCAV 16,240 16,640 3 6VALMON INVERSIONES, SIMCAV 21,156 22,117 27 22VALOR GLOBAL MUNDIAL 2000, SIMCAV 18,271 18,271 27 21VALOR XXI 22,360 28,400 424 1,355VALORES BILBAINOS 21,216 35,616 17 26VALORES CORONA 2,321 2,321 175 1,268VALORES DE VALDERRAMA, SIMCAVF 29,600 30,051 0 1VALORES DEL DARRO, SIMCAV 27,767 30,652 18,466 5,000VALORES DEL PRINCIPADO 1,720 4,368 104 348VALORES DIVERSIFICADOS, SIMCAVF 19,445 21,165 1,726 22VALORES GLOBALES, SIMCAV 21,645 22,367 1 1VALORES INDUSTRIALES 0 0 0 0VALORES MADRID 3,080 3,080 0 4VALORES MEDITERRÁNEOS 6,466 8,420 0 4VALORES MOBILIARIOS DEL EBRO, SIMCAV 16,640 18,280 1,876 37VALORES MOBILIARIOS HERRERO 13,452 16,254 6,858 660VALORES RIOVAL, SIMCAV 0 25,464 0 15 03/06/2003VALORES TRADICIONALES, SIMCAV 0 26,386 0 4,272 11/06/2003VALRENT 3,660 3,480 60 22VALRIMA, SIMCAV 18,800 19,640 165 108VALRRUBIO SIMCAV 24,411 25,854 31 361VALSEL INVERSIONES, SIMCAVF 6,130 6,972 2,431 22VALSIP INVERSIONES, SIMCAV 21,640 22,960 61 21VALTISA 1,996 0 39 0VALUE INVERSIONES 8,983 9,818 703 2,200VALVANERA INVERSIONES, SIMCAV 16,550 18,575 1,510 557VALVERDE INVERSIONES, SIMCAV 0 0 0 0 05/29/2003VANCOUVER INVERSIONES, SIMCAV 9,833 8,871 20 22VAPALSA 2002, SIMCAV 21,789 24,411 1,402 0VASAN FINANCIERA, SIMCAV 24,281 25,002 2,974 3,820VASANVA, SIMCAV 10,200 12,140 1 601VAYOMER, SIMCAV 16,588 17,069 13 20VAZABI GESTION SIMCAV 15,626 16,348 13 21VELABOIT, SIMCAV 16,600 16,920 164 7VELLON INVESTMENT, SIMCAV 23,439 24,762 1,350 2VENETO INVERSIONES SIMCAV 21,372 22,165 35 49VENTURADA DE INVERSIONES, SIMCAV 21,236 21,765 2 2VERIESA 34,720 37,200 27 21VERTIENTE INVERSIONES, SIMCAV 63,120 68,160 7 63VERTISOL CARTERA SIMCAVF SA 24,281 24,762 1 1VERTRA INVERSIONES, SIMCAV 23,415 24,762 6 1VESENAZ INVERSIONES, SIMCAV 0 22,511 0 17 09/01/2003VIATANEXIS, SIMCAV 0 24,121 0 1VICENTE FINANZAS, SIMCAV 18,992 19,473 11 20VICOLO INVERSIONES, SIMCAVF 23,776 25,026 42 58VICTORIA VALORES 19,160 19,800 87 49VIDEOWAVE INVERSIONES, SIMCAV 0 24,050 0 2,599 03/07/2003VIDMES FINANCIAL SIMCAV SA 0 24,401 0 1 03/24/2003VIDRIOLA INVERSIONES, SIMCAV 23,800 24,281 10 20VIFAG 2002, SIMCAV 0 24,603 0 0VIGIL 2001, SIMCAV 12,360 12,840 535 9VIGORINVERSION SIMCAV 24,291 25,734 904 1,066VIKINVEST,SIMCAV,SA 18,038 20,106 829 1,091VILACASA DE INVERSIONES, SIMCAV 17,532 19,769 1 4VILLAMAR INVERSIONES, SIMCAV 17,950 18,550 1,524 177 Former PEDEMA
INVERSIONES, SIMCAVVILLAMARTA FINANCE SIMCAV 8,550 35,175 8,755 38 Former KAREGO
FINANCE, SIMCAVVILLANDRY DE INVERSIONES, SIMCAV 35,953 40,136 3,177 3
A.2.19.Secondary markets. Equities.Outcry market. Listed companies. 2003
2002 2003 2002 2003Companies
Capitalisation (at 31 Dec.) Annual trading Date of listing in2003 & other comments
Amounts in thousands of euros

202
Annual report on the securities market. 2003
VILLANUEVA DE INVERSIONES, SIMCAV 15,296 15,921 3 2VILLARIN INVERSIONES SIMCAV 14,641 16,179 763 1,318VILLCAD BOLSA, SIMCAV 11,191 12,201 607 1,320VIMAL DE INVERSIONES, SIMCAV 11,340 11,592 27 22VIMASOL INVERSIONES, SIMCAVF, SA 0 29,750 0 9 11/06/2003VINADIVIA INVERSIONS, SIMCAV 23,545 24,146 6 0VINARIA INVERSIONES, SIMCAV 0 27,706 0 21 04/25/2003VINCIT-93 22,880 24,120 56 97VINIDIS INVERSIONES, SIMCAV 21,156 21,877 732 20VIÑALES INVERSIONES, SIMCAVF 21,080 21,440 26 30VIRALSA DE INVERSIONES, SIMCAVF 9,180 10,120 35 25VIRIATO DE INVERSIONES 4,563 3,790 2 9VIRIDIA 2000, SIMCAV 20,170 20,555 0 0VIRKKALA, SIMCAVF 21,636 22,358 0 0VISCASA 21,600 22,840 2 3VISIFM, SIMCAV 0 51,650 0 58 12/05/2003VISOLDIC, SIMCAV 0 24,329 0 10,010 11/18/2003VIVAR INVERSIONES, SIMCAVF 17,280 18,080 102 257VIVERO DE INVERSIONES SIMCAV 125,011 138,233 7,155 20,716VOLGA DE VALORES MOBILIARIOS 12,200 6,705 0 26VOLGA INVERSIONES, SIMCAV 20,194 20,675 329 828VUIT-NORANTANOU, SIMCAV 25,500 29,000 353 477WALDO-PHALDO INVESTMENT, SIMCAV 18,520 19,280 25 105WALFIS FINANCE, SIMCAV 9,432 9,702 3,268 1,433WANA INVERSIONES, SIMCAVF 23,872 25,795 843 61WATERLANE, SIMCAV 23,360 24,720 963 264WATT INVERSIONES MOBILIARIAS, SIMCAV 6,869 7,668 18 3,021WAWY REEF, SIMCAV 11,832 12,521 854 24WEBSTER INVERSIONES, SIMCAV 23,640 23,960 34 13WEST RIVER 33,840 33,800 239 8,515WHITE COAST INVESTMENT, SIMCAV 22,398 23,119 1 636WIENER BLUT 25,120 26,400 405 2,514WOLYSEN INVERSIONES, SIMCAV 24,792 25,874 25,526 1WORLD POLICY SIMCAV 23,594 23,787 241 102XAELA INVERSIONS, SIMCAV 12,200 12,537 3,001 1,079XAIGA 2001, SIMCAV 23,040 23,473 1 0XALOC-MESTRAL, SIMCAV 17,646 19,112 52 59XAXELS FINANCE, SIMCAV 14,400 15,465 1,820 2XITRUSA INVERSIONES, SIMCAV 0 24,521 0 0 02/27/2003XYLON-94 38,080 40,960 1 23YACARETE, SIMCAV 24,762 25,243 98 238YAINCOA SIMCAV 18,511 19,232 13 20YAK INVESTMENT, SIMCAV 29,885 30,607 4 10,534YBARVI DE INVERSIONES, SIMCAV 42,096 49,248 1 0YIELD INVERSIONES 13,929 14,007 432 585YLANG DE INVERSIONES, SIMCAV 21,116 21,765 605 1,200YOQUI INVERSIONES, SIMCAV 0 0 0 0YORBALINDA 2000 INVERSIONES FINANZAS, SIMCAV 16,588 18,992 134 226ZABIMA INVERSIONES FINANCIERAS, SIMCAV 95,850 26,567 16 20ZAMARRÓN, SIMCAV 17,790 18,992 27 22ZAMBOA 2001 SIMCAV 0 24,762 0 1,300 02/14/2003ZANETT INVERSIONES, SIMCAVF 10,360 12,060 349 3,356ZANISA DE INVERSIONES 7,412 82,380 2 83ZANZIBAR INVERSIONES SIMCAV 13,316 15,111 1,918 2,128ZAÑARTU 2000, SIMCAV 20,400 21,960 982 115ZAVALAGA 14,300 15,680 113 52ZAWAZKY DE INVERSIONES SIMCAV 15,079 16,402 0 2ZELESTE 4, SIMCAV 27,480 27,800 73 2ZELETA DE INVERSIONES 44,055 0 79 0 Delisted 11/02/2003ZERAIN DE INVERSIONES SIMCAV 19,553 21,453 0 11
A.2.19.Secondary markets. Equities.Outcry market. Listed companies. 2003
2002 2003 2002 2003Companies
Capitalisation (at 31 Dec.) Annual trading Date of listing in2003 & other comments
Amounts in thousands of euros
(Continued)
(Continues over)

203
Annex 2: Secondary markets
(Continued)
ZEREPDOM, SIMCAV 19,329 20,194 416 65ZERMATT-2000, SIMCAV 25,060 27,850 111 1,042 Former MULBAL
INVERSIONES, SIMCAVZESTAO DE INVERSIONES, SIMCAV 36,120 40,620 8,062 732ZIAMVE 3,928 4,312 4 5ZIORVEL, SIMCAVF 20,850 22,500 0 16ZIRI DE INVERSIONES, SIMCAV 19,408 20,443 1 100ZONA EURO 3D 8,250 0 86 23 Delisted 04/12/2003ZOOM INVERSIONES, SIMCAVF 20,491 23,232 51 141ZUBAYDA GESTION DIVERSIFICADA, SIMCAV 27,707 22,887 522 518ZUBIGON INVERSIONES 2002, SIMCAV 0 24,747 0 709 12/05/2003ZUBIREN CAPITAL, SIMCAV 0 6,150 0 10 05/21/2003ZUBIRENT INVESTMENTS, SIMCAV 22,003 23,570 5 4ZUBISE FINANCIERA SIMCAV 14,875 17,794 14 23,616ZUGARRAMURDI DE INVERSIONES, SIMCAV 21,260 21,501 295 55
A.2.19.Secondary markets. Equities.Outcry market. Listed companies. 2003
2002 2003 2002 2003Companies
Capitalisation (at 31 Dec.) Annual trading Date of listing in2003 & other comments
Amounts in thousands of euros
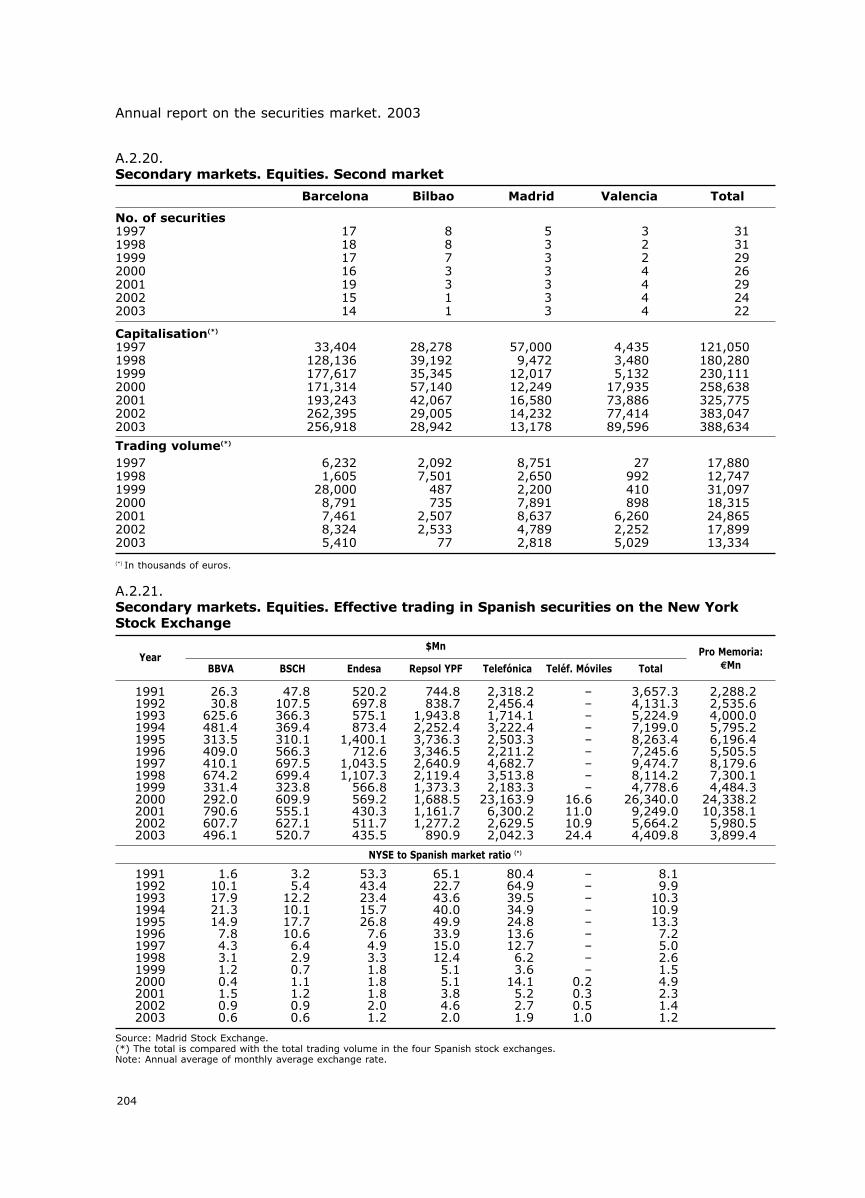
204
Annual report on the securities market. 2003
1991 26.3 47.8 520.2 744.8 2,318.2 – 3,657.3 2,288.21992 30.8 107.5 697.8 838.7 2,456.4 – 4,131.3 2,535.61993 625.6 366.3 575.1 1,943.8 1,714.1 – 5,224.9 4,000.01994 481.4 369.4 873.4 2,252.4 3,222.4 – 7,199.0 5,795.21995 313.5 310.1 1,400.1 3,736.3 2,503.3 – 8,263.4 6,196.41996 409.0 566.3 712.6 3,346.5 2,211.2 – 7,245.6 5,505.51997 410.1 697.5 1,043.5 2,640.9 4,682.7 – 9,474.7 8,179.61998 674.2 699.4 1,107.3 2,119.4 3,513.8 – 8,114.2 7,300.11999 331.4 323.8 566.8 1,373.3 2,183.3 – 4,778.6 4,484.32000 292.0 609.9 569.2 1,688.5 23,163.9 16.6 26,340.0 24,338.22001 790.6 555.1 430.3 1,161.7 6,300.2 11.0 9,249.0 10,358.12002 607.7 627.1 511.7 1,277.2 2,629.5 10.9 5,664.2 5,980.52003 496.1 520.7 435.5 890.9 2,042.3 24.4 4,409.8 3,899.4
NYSE to Spanish market ratio (*)
1991 1.6 3.2 53.3 65.1 80.4 – 8.11992 10.1 5.4 43.4 22.7 64.9 – 9.91993 17.9 12.2 23.4 43.6 39.5 – 10.31994 21.3 10.1 15.7 40.0 34.9 – 10.91995 14.9 17.7 26.8 49.9 24.8 – 13.31996 7.8 10.6 7.6 33.9 13.6 – 7.21997 4.3 6.4 4.9 15.0 12.7 – 5.01998 3.1 2.9 3.3 12.4 6.2 – 2.61999 1.2 0.7 1.8 5.1 3.6 – 1.52000 0.4 1.1 1.8 5.1 14.1 0.2 4.92001 1.5 1.2 1.8 3.8 5.2 0.3 2.32002 0.9 0.9 2.0 4.6 2.7 0.5 1.42003 0.6 0.6 1.2 2.0 1.9 1.0 1.2
No. of securities1997 17 8 5 3 311998 18 8 3 2 311999 17 7 3 2 292000 16 3 3 4 262001 19 3 3 4 292002 15 1 3 4 242003 14 1 3 4 22
Capitalisation(*)
1997 33,404 28,278 57,000 4,435 121,0501998 128,136 39,192 9,472 3,480 180,2801999 177,617 35,345 12,017 5,132 230,1112000 171,314 57,140 12,249 17,935 258,6382001 193,243 42,067 16,580 73,886 325,7752002 262,395 29,005 14,232 77,414 383,0472003 256,918 28,942 13,178 89,596 388,634
Trading volume(*)
1997 6,232 2,092 8,751 27 17,8801998 1,605 7,501 2,650 992 12,7471999 28,000 487 2,200 410 31,0972000 8,791 735 7,891 898 18,3152001 7,461 2,507 8,637 6,260 24,8652002 8,324 2,533 4,789 2,252 17,8992003 5,410 77 2,818 5,029 13,334
A.2.20.Secondary markets. Equities. Second market
A.2.21.Secondary markets. Equities. Effective trading in Spanish securities on the New YorkStock Exchange
(*) In thousands of euros.
Barcelona Bilbao Madrid Valencia Total
$Mn Pro Memoria:€Mn
YearBBVA BSCH Endesa Repsol YPF Telefónica Teléf. Móviles Total
Source: Madrid Stock Exchange.(*) The total is compared with the total trading volume in the four Spanish stock exchanges.Note: Annual average of monthly average exchange rate.

205
Annex 2: Secondary markets
Treasury bills 35,831 12.6 38,766 13.6 8.2Unstripped bonds and debentures 235,029 82.9 233,313 81.8 -0.7Principal STRIPs 12,582 4.4 13,155 4.6 4.6
TOTAL 283,441 100.0 285,235 100.0 0.6
Pro memoria:Coupon STRIPs 8,012 2.8 8,367 2.9 4.4
Nominal trading in millions of euros
A.2.22.Secondary markets. Fixed-income.Trading volume in organised markets
Amounts in millions of euros
A.2.23.Secondary markets. Fixed-income. Government debt book-entry system.Outstanding balances
Change (%)
(*) Includes only outright spot trades.(**) Effective amount.(1) Includes preference shares.Sources: Bank of Spain, AIAF and CNMV.
2000 2001 2002 20032001/00 2002/01 2003/02
12/31/02 12/31/03
Source: Bank of Spain.
Change (%)2003-2002Amount % of total Amount % of total
Government debt book-entry system (*) 1,639,772.0 2,041,757.7 2,310,943.1 2,246,881.5 24.5 13.2 -2.8Bonds and debentures 1,559,952.2 1,983,641.5 2,270,847.2 2,157,130.3 27.2 14.5 -5.0Treasury bills 79,819.8 58,116.2 40,095.9 89,751.2 -27.2 -31.0 123.8
Stock exchanges (**) 40,704.0 57,463.1 71,140.2 75,058.4 41.2 23.8 5.5Electronic market 1,965.3 2,383.8 2,046.3 2,354.4 21.3 -14.2 15.1Outcry market 38,738.7 55,079.3 69,093.9 72,704.0 42.2 25.4 5.2
AIAF 100,758.8 143,732.8 272,470 384,089.2 42.7 89.6 41.0Commercial paper 47,342.4 100,812 212,702 265,603.6 112.9 111.0 24.9Matador bonds 1,140.6 2,000.7 3,458.0 3,107.2 75.4 72.8 -10.1Mortage and territorial covered bonds 2,260.4 2,100.1 4,164.0 20,684.5 -7.1 98.3 396.8Bonds and debentures(1) 50,015.5 38,820 52,146 94,693.9 -22.4 34.3 81.6

206
Annual report on the securities market. 2003
Bonds and debenturesTreasury
bills Total Maturing Maturing Maturing Maturingunder 1 year 1-2 years 2-4 years over 4 years
Source: Bank of Spain.
1998 100,554 1,653,950 76,187 79,628 375,078 1,123,0571999 79,839 1,774,765 75,618 107,920 388,767 1,202,4602000 79,820 1,559,952 80,327 61,732 344,487 1,073,4062001 58,116 1,983,641 75,031 222,720 397,529 1,288,3612002 40,096 2,270,847 179,855 114,683 417,820 1,558,4902003 89,751 2,157,130 65,937 181,551 413,344 1,496,299
January 2,970 244,307 15,046 14,197 53,053 162,010February 3,494 217,301 3,316 19,033 48,377 146,575March 4,061 197,888 3,466 27,818 41,434 125,170April 6,630 177,504 3,828 17,105 26,919 129,652May 9,515 198,271 4,505 15,850 31,005 146,912June 7,540 198,553 4,562 13,178 40,555 140,258July 7,881 207,997 8,976 10,926 36,149 151,946August 7,240 166,891 4,213 14,418 35,802 112,459September 5,151 163,436 3,602 14,231 27,101 118,502October 8,145 158,967 2,892 13,964 25,934 116,176November 16,379 121,394 7,085 9,042 22,534 82,733December 10,745 104,620 4,445 11,788 24,482 63,906
Nominal amounts in millions of euros
A.2.24.Secondary markets. Fixed-income. Government debt book-entry system.Trading volume (outright spot trades)
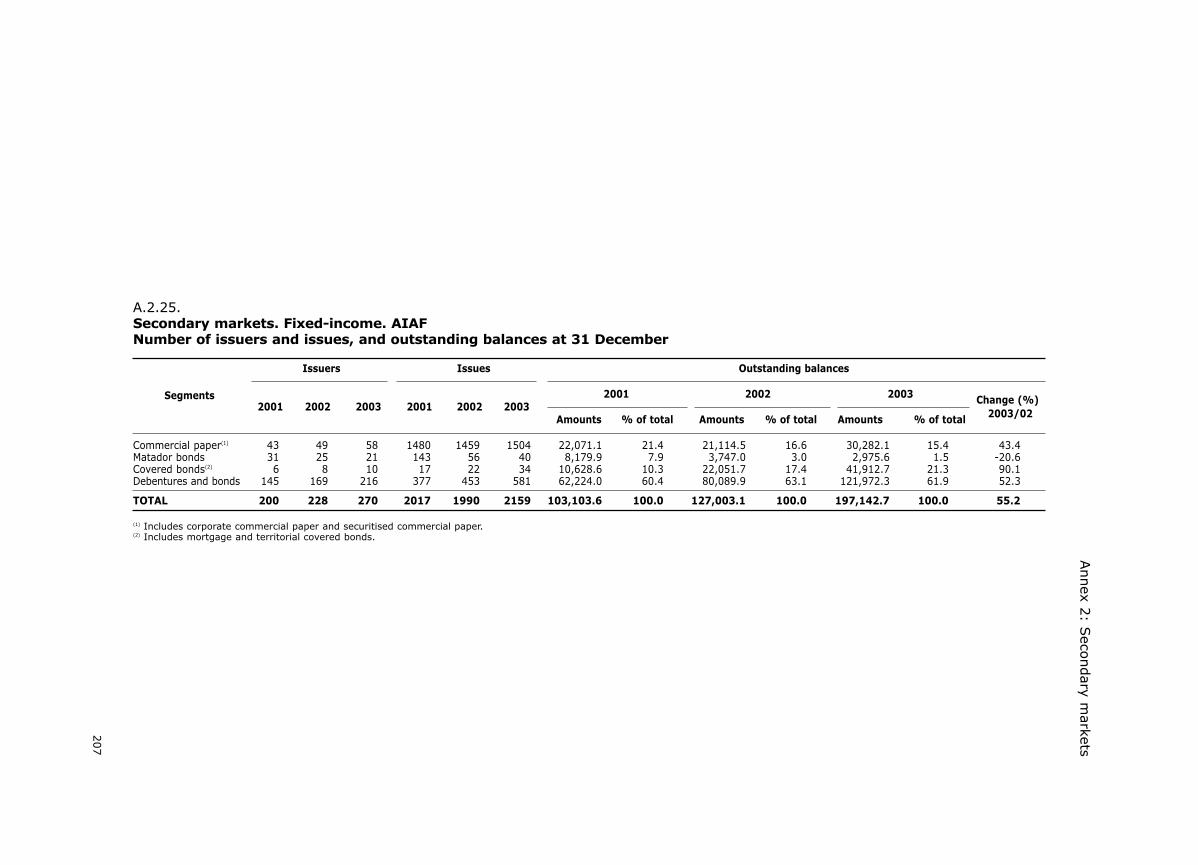
207
Annex 2
: Seco
ndary m
arkets
Issuers Issues Outstanding balances
Segments 2001 2002 2003 Change (%)2001 2002 2003 2001 2002 2003
Amounts % of total Amounts % of total Amounts % of total 2003/02
(1) Includes corporate commercial paper and securitised commercial paper.(2) Includes mortgage and territorial covered bonds.
Commercial paper(1) 43 49 58 1480 1459 1504 22,071.1 21.4 21,114.5 16.6 30,282.1 15.4 43.4Matador bonds 31 25 21 143 56 40 8,179.9 7.9 3,747.0 3.0 2,975.6 1.5 -20.6Covered bonds(2) 6 8 10 17 22 34 10,628.6 10.3 22,051.7 17.4 41,912.7 21.3 90.1Debentures and bonds 145 169 216 377 453 581 62,224.0 60.4 80,089.9 63.1 121,972.3 61.9 52.3
TOTAL 200 228 270 2017 1990 2159 103,103.6 100.0 127,003.1 100.0 197,142.7 100.0 55.2
A.2.25.Secondary markets. Fixed-income. AIAFNumber of issuers and issues, and outstanding balances at 31 December

208
Annual rep
ort o
n th
e securities m
arket. 2003
Total Matador Non-cover- Non-covertible Mortgage- Asset-backed Mortgage Territorial Commercial Securitised Preferencebonds tible bonds debentures backed bonds bonds bonds bonds paper omm. paper shares
2002 272,470 3,458 1,495 13,306 23,793 11,321 4,164 - 205,540 7,162 2,231
2003 384,089 3,107 6,591 14,608 33,341 36,696 16,745 3,939 261,612 3,991 3,457
January 30,344 321 31 1,028 2,218 1,049 3,879 0 21,093 481 242February 26,250 304 33 1,033 2,207 1,473 755 0 19,859 245 343March 28,164 314 280 961 2,340 2,388 1,193 0 20,076 434 178April 31,172 333 365 945 3,504 1,219 1,492 1,522 22,594 415 306May 29,391 287 829 954 3,125 1,084 769 8 21,802 261 280June 32,814 168 141 366 2,697 4,276 845 7 23,648 414 259July 35,045 281 84 2,411 3,218 1,696 1,160 2,073 25,504 286 405August 22,055 166 53 1,215 3,325 1,066 630 68 15,337 142 121September 30,013 414 795 1,852 2,041 2,589 1,017 132 20,652 447 206October 37,878 340 2,280 1,466 2,278 3,672 1,908 31 24,822 455 657November 37,198 169 267 1,614 2,497 5,698 1,926 33 24,654 127 246December 39,826 11 1,434 764 3,891 10,487 1,170 67 21,571 286 212
Change (%) 2003/02 39.5 -10.1 340.9 9.8 40.1 224.2 302.1 - 27.3 -44.3 54.9
Pro memoria: proprietary trading (%)2002 15.3 94.7 3.8 68.6 83.2 30.6 4.9 - 2.3 12.7 2.42003 14.3 96.3 1.2 50.7 95.8 25.6 1.1 0.1 1.1 1.7 1.6
Nominal amounts in millions of euros
A.2.26.Secondary markets. Fixed-income. AIAF.Trading volume. 2003
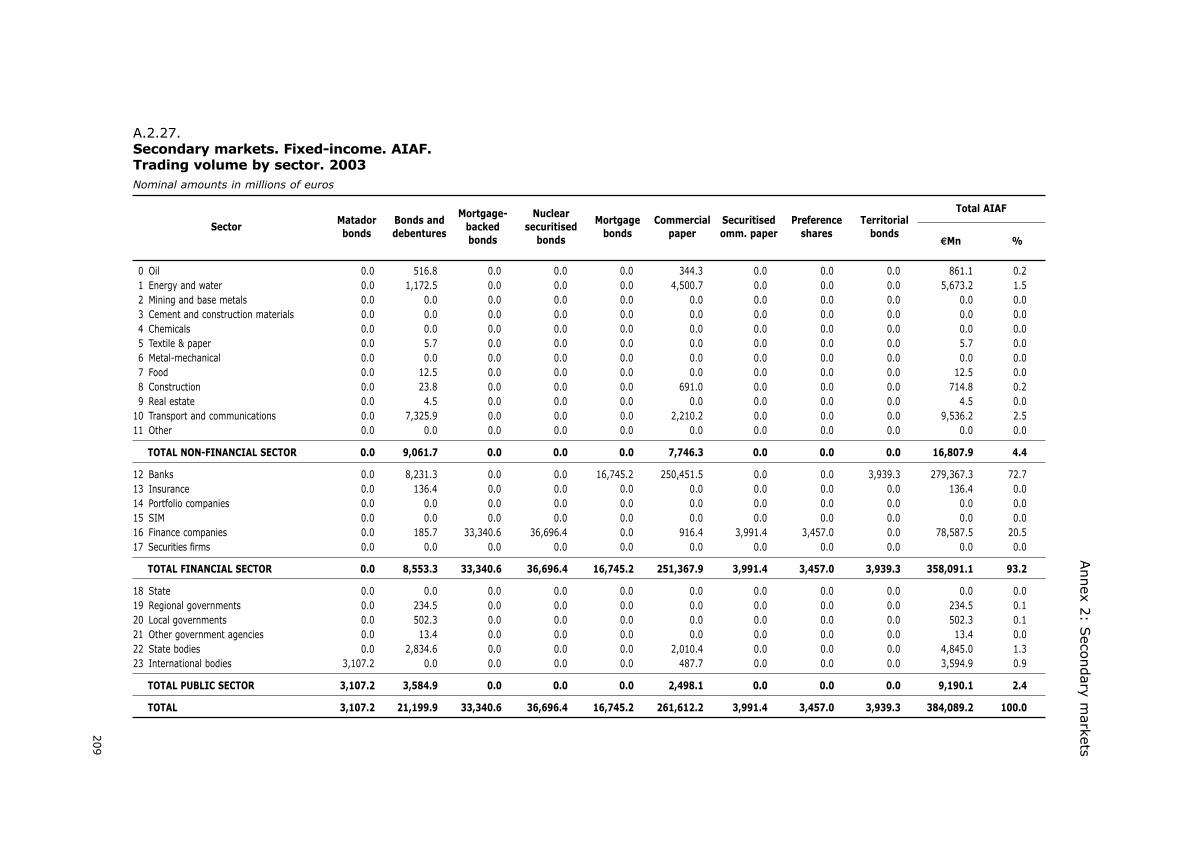
209
Annex 2
: Seco
ndary m
arkets
0 Oil 0.0 516.8 0.0 0.0 0.0 344.3 0.0 0.0 0.0 861.1 0.21 Energy and water 0.0 1,172.5 0.0 0.0 0.0 4,500.7 0.0 0.0 0.0 5,673.2 1.52 Mining and base metals 0.0 0.0 0.0 0.0 0.0 0.0 0.0 0.0 0.0 0.0 0.03 Cement and construction materials 0.0 0.0 0.0 0.0 0.0 0.0 0.0 0.0 0.0 0.0 0.04 Chemicals 0.0 0.0 0.0 0.0 0.0 0.0 0.0 0.0 0.0 0.0 0.05 Textile & paper 0.0 5.7 0.0 0.0 0.0 0.0 0.0 0.0 0.0 5.7 0.06 Metal-mechanical 0.0 0.0 0.0 0.0 0.0 0.0 0.0 0.0 0.0 0.0 0.07 Food 0.0 12.5 0.0 0.0 0.0 0.0 0.0 0.0 0.0 12.5 0.08 Construction 0.0 23.8 0.0 0.0 0.0 691.0 0.0 0.0 0.0 714.8 0.29 Real estate 0.0 4.5 0.0 0.0 0.0 0.0 0.0 0.0 0.0 4.5 0.0
10 Transport and communications 0.0 7,325.9 0.0 0.0 0.0 2,210.2 0.0 0.0 0.0 9,536.2 2.511 Other 0.0 0.0 0.0 0.0 0.0 0.0 0.0 0.0 0.0 0.0 0.0
TOTAL NON-FINANCIAL SECTOR 0.0 9,061.7 0.0 0.0 0.0 7,746.3 0.0 0.0 0.0 16,807.9 4.4
12 Banks 0.0 8,231.3 0.0 0.0 16,745.2 250,451.5 0.0 0.0 3,939.3 279,367.3 72.713 Insurance 0.0 136.4 0.0 0.0 0.0 0.0 0.0 0.0 0.0 136.4 0.014 Portfolio companies 0.0 0.0 0.0 0.0 0.0 0.0 0.0 0.0 0.0 0.0 0.015 SIM 0.0 0.0 0.0 0.0 0.0 0.0 0.0 0.0 0.0 0.0 0.016 Finance companies 0.0 185.7 33,340.6 36,696.4 0.0 916.4 3,991.4 3,457.0 0.0 78,587.5 20.517 Securities firms 0.0 0.0 0.0 0.0 0.0 0.0 0.0 0.0 0.0 0.0 0.0
TOTAL FINANCIAL SECTOR 0.0 8,553.3 33,340.6 36,696.4 16,745.2 251,367.9 3,991.4 3,457.0 3,939.3 358,091.1 93.2
18 State 0.0 0.0 0.0 0.0 0.0 0.0 0.0 0.0 0.0 0.0 0.019 Regional governments 0.0 234.5 0.0 0.0 0.0 0.0 0.0 0.0 0.0 234.5 0.120 Local governments 0.0 502.3 0.0 0.0 0.0 0.0 0.0 0.0 0.0 502.3 0.121 Other government agencies 0.0 13.4 0.0 0.0 0.0 0.0 0.0 0.0 0.0 13.4 0.022 State bodies 0.0 2,834.6 0.0 0.0 0.0 2,010.4 0.0 0.0 0.0 4,845.0 1.323 International bodies 3,107.2 0.0 0.0 0.0 0.0 487.7 0.0 0.0 0.0 3,594.9 0.9
TOTAL PUBLIC SECTOR 3,107.2 3,584.9 0.0 0.0 0.0 2,498.1 0.0 0.0 0.0 9,190.1 2.4
TOTAL 3,107.2 21,199.9 33,340.6 36,696.4 16,745.2 261,612.2 3,991.4 3,457.0 3,939.3 384,089.2 100.0
Total AIAFMatador Bonds and
Mortgage- NuclearMortgage Commercial Securitised Preference Territorial
Sectorbonds debentures
backed securitisedbonds paper omm. paper shares bonds
bonds bonds €Mn %
Nominal amounts in millions of euros
A.2.27.Secondary markets. Fixed-income. AIAF.Trading volume by sector. 2003

210
Annual report on the securities market. 2003
Excluding securities listed on the Government Debt Book-Entry market, even where they could be traded on the stock exchange.
Madrid Barcelona Bilbao Valencia Total
Number of issuers1996 126 81 86 56 1531997 117 69 72 54 1421998 95 65 67 52 1151999 61 91 93 84 1102000 73 81 81 77 952001 51 54 55 53 632002 41 47 49 45 582003 38 45 46 42 56
Number of issues1996 683 553 569 503 8511997 753 508 477 451 9371998 657 477 405 410 8351999 569 584 513 546 7642000 454 491 420 469 6362001 267 272 274 285 2992002 176 200 192 221 2602003 149 220 168 186 275
Listed capital(€Mn)1996 17,963 10,813 15,211 9,320 22,4241997 16,929 8,988 11,567 7,036 22,0161998 13,998 8,204 9,286 5,806 19,8511999 13,265 14,934 12,537 11,609 20,5212000 10,419 14,197 10,428 10,673 18,2662001 9,174 9,250 9,237 10,501 10,6392002 7,181 10,039 8,145 8,824 12,6442003 4,678 11,965 5,736 6,155 14,500
A.2.28.Secondary markets. Fixed-income. Stock exchanges.Number of issuers and issues, and listed capital at 31 December
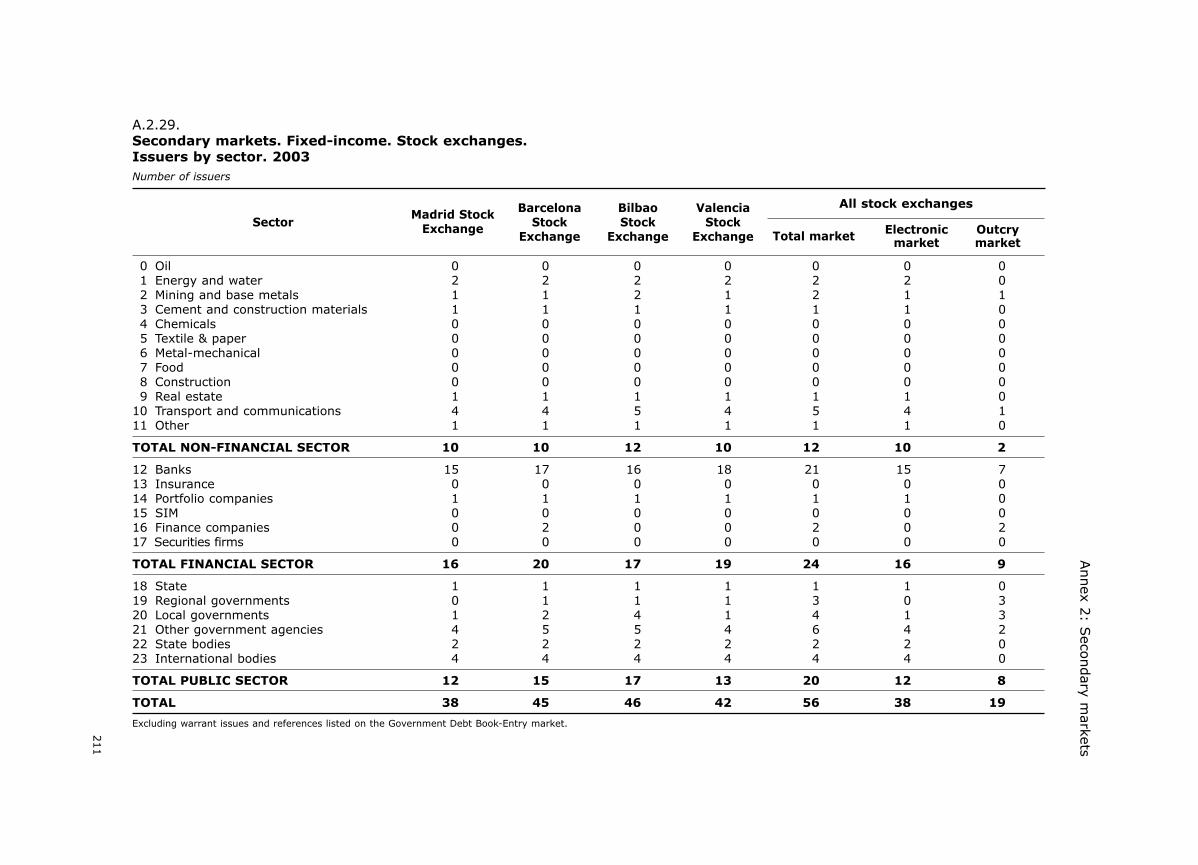
211
Annex 2
: Seco
ndary m
arkets
Excluding warrant issues and references listed on the Government Debt Book-Entry market.
All stock exchangesMadrid Stock Barcelona Bilbao Valencia
Sector Exchange Stock Stock StockExchange Exchange Exchange Total market Electronic Outcry
market market
0 Oil 0 0 0 0 0 0 01 Energy and water 2 2 2 2 2 2 02 Mining and base metals 1 1 2 1 2 1 13 Cement and construction materials 1 1 1 1 1 1 04 Chemicals 0 0 0 0 0 0 05 Textile & paper 0 0 0 0 0 0 06 Metal-mechanical 0 0 0 0 0 0 07 Food 0 0 0 0 0 0 08 Construction 0 0 0 0 0 0 09 Real estate 1 1 1 1 1 1 0
10 Transport and communications 4 4 5 4 5 4 111 Other 1 1 1 1 1 1 0
TOTAL NON-FINANCIAL SECTOR 10 10 12 10 12 10 2
12 Banks 15 17 16 18 21 15 713 Insurance 0 0 0 0 0 0 014 Portfolio companies 1 1 1 1 1 1 015 SIM 0 0 0 0 0 0 016 Finance companies 0 2 0 0 2 0 217 Securities firms 0 0 0 0 0 0 0
TOTAL FINANCIAL SECTOR 16 20 17 19 24 16 9
18 State 1 1 1 1 1 1 019 Regional governments 0 1 1 1 3 0 320 Local governments 1 2 4 1 4 1 321 Other government agencies 4 5 5 4 6 4 222 State bodies 2 2 2 2 2 2 023 International bodies 4 4 4 4 4 4 0
TOTAL PUBLIC SECTOR 12 15 17 13 20 12 8
TOTAL 38 45 46 42 56 38 19
Number of issuers
A.2.29.Secondary markets. Fixed-income. Stock exchanges.Issuers by sector. 2003

212
Annual rep
ort o
n th
e securities m
arket. 2003
Excluding warrant issues and references listed on the Government Debt Book-Entry market.
All stock exchanges
SectorMadrid Stock Barcelona Bilbao Stock Valencia Stock
Exchange total Exchange Exchange Exchange Total market Electronic Outcrymarket market
0 Oil 0 0 0 0 0 0 01 Energy and water 8 8 8 8 8 8 02 Mining and base metals 1 1 2 1 2 1 13 Cement and construction materials 1 1 1 1 1 1 04 Chemicals 0 0 0 0 0 0 05 Textile & paper 0 0 0 0 0 0 06 Metal-mechanical 0 0 0 0 0 0 07 Food 0 0 0 0 0 0 08 Construction 0 0 0 0 0 0 09 Real estate 1 1 1 1 1 1 0
10 Transport and communications 14 14 15 14 15 14 111 Other 2 2 2 2 2 2 0
TOTAL NON-FINANCIAL SECTOR 27 27 29 27 29 27 2
12 Banks 60 62 65 75 82 60 2213 Insurance 0 0 0 0 0 0 014 Portfolio companies 1 1 1 1 1 1 015 SIM 0 0 0 0 0 0 016 Finance companies 0 10 0 0 10 0 1017 Securities firms 0 0 0 0 0 0 0
TOTAL FINANCIAL SECTOR 61 73 66 76 93 61 32
18 State 8 8 8 8 8 8 019 Regional governments 0 51 5 22 78 0 7820 Local governments 2 4 7 2 8 2 621 Other government agencies 8 14 10 8 16 8 822 State bodies 26 26 26 26 26 26 023 International bodies 17 17 17 17 17 17 0
TOTAL PUBLIC SECTOR 61 120 73 83 153 61 92
TOTAL 149 220 168 186 275 149 126
Number of issues
A.2.30.Secondary markets. Fixed-income. Stock exchanges.Issues listed by sector. 2003
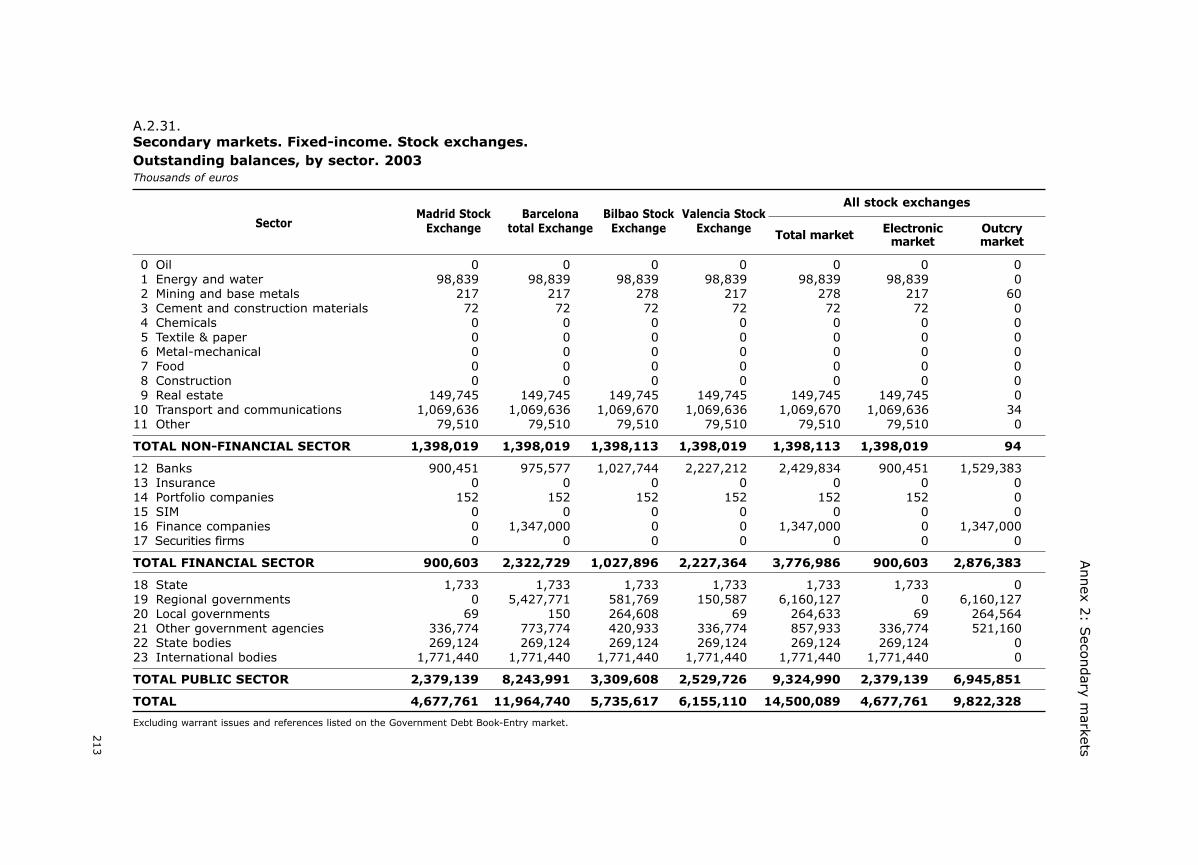
213
Annex 2
: Seco
ndary m
arkets
Excluding warrant issues and references listed on the Government Debt Book-Entry market.
All stock exchanges
SectorMadrid Stock Barcelona Bilbao Stock Valencia Stock
Exchange total Exchange Exchange Exchange Total market Electronic Outcrymarket market
0 Oil 0 0 0 0 0 0 01 Energy and water 98,839 98,839 98,839 98,839 98,839 98,839 02 Mining and base metals 217 217 278 217 278 217 603 Cement and construction materials 72 72 72 72 72 72 04 Chemicals 0 0 0 0 0 0 05 Textile & paper 0 0 0 0 0 0 06 Metal-mechanical 0 0 0 0 0 0 07 Food 0 0 0 0 0 0 08 Construction 0 0 0 0 0 0 09 Real estate 149,745 149,745 149,745 149,745 149,745 149,745 0
10 Transport and communications 1,069,636 1,069,636 1,069,670 1,069,636 1,069,670 1,069,636 3411 Other 79,510 79,510 79,510 79,510 79,510 79,510 0
TOTAL NON-FINANCIAL SECTOR 1,398,019 1,398,019 1,398,113 1,398,019 1,398,113 1,398,019 94
12 Banks 900,451 975,577 1,027,744 2,227,212 2,429,834 900,451 1,529,38313 Insurance 0 0 0 0 0 0 014 Portfolio companies 152 152 152 152 152 152 015 SIM 0 0 0 0 0 0 016 Finance companies 0 1,347,000 0 0 1,347,000 0 1,347,00017 Securities firms 0 0 0 0 0 0 0
TOTAL FINANCIAL SECTOR 900,603 2,322,729 1,027,896 2,227,364 3,776,986 900,603 2,876,383
18 State 1,733 1,733 1,733 1,733 1,733 1,733 019 Regional governments 0 5,427,771 581,769 150,587 6,160,127 0 6,160,12720 Local governments 69 150 264,608 69 264,633 69 264,56421 Other government agencies 336,774 773,774 420,933 336,774 857,933 336,774 521,16022 State bodies 269,124 269,124 269,124 269,124 269,124 269,124 023 International bodies 1,771,440 1,771,440 1,771,440 1,771,440 1,771,440 1,771,440 0
TOTAL PUBLIC SECTOR 2,379,139 8,243,991 3,309,608 2,529,726 9,324,990 2,379,139 6,945,851
TOTAL 4,677,761 11,964,740 5,735,617 6,155,110 14,500,089 4,677,761 9,822,328
Thousands of euros
A.2.31.Secondary markets. Fixed-income. Stock exchanges.Outstanding balances, by sector. 2003

214
Annual report on the securities market. 2003
Total Madrid Barcelona Bilbao Valencia
ISSUESFinancial institutions1997 0 0 0 0 01998 1 1 1 1 01999 3 3 3 3 32000 3 3 3 3 32001 3 3 3 3 32002 2 2 2 2 22003 0 0 0 0 0
Non-financial companies1997 11 11 6 6 11998 7 7 4 4 01999 5 5 5 5 52000 5 5 5 5 52001 2 2 2 2 22002 3 3 3 3 32003 6 6 6 6 6
TOTAL1997 11 11 6 6 11998 8 8 5 5 01999 8 8 8 8 82000 8 8 8 8 82001 5 5 5 5 52002 5 5 5 5 52003 6 6 6 6 6
LISTED CAPITALFinancial institutions1997 0 0 0 0 01998 126 126 126 126 01999 719,579 719,579 719,579 719,579 719,5792000 251,204 251,204 251,204 251,204 251,2042001 206,803 206,803 206,803 206,803 206,8032002 71,024 71,024 71,024 71,024 71,0242003 0 0 0 0 0
Non-financial companies1997 114,322 114,322 102,164 74,675 67,6141998 70,913 70,913 59,524 7,807 01999 55,973 55,973 55,973 55,973 55,9732000 19,529 19,529 19,529 19,529 19,5292001 1,427 1,427 1,427 1,427 1,4272002 75,689 75,689 75,689 75,689 75,6892003 360,660 360,660 360,660 360,660 360,660
TOTAL1997 114,322 114,322 102,164 74,675 67,6141998 71,040 71,040 59,650 7,933 01999 775,552 775,552 775,552 775,552 775,5522000 270,733 270,733 270,733 270,733 270,7332001 208,230 208,230 208,230 208,230 208,2302002 146,713 146,713 146,713 146,713 146,7132003 360,660 360,660 360,660 360,660 360,660
Capital in thousands of euros
A.2.32.Secondary markets. Fixed-income. Stock exchanges.Convertible issues. Numbers and listed capital at 31 December
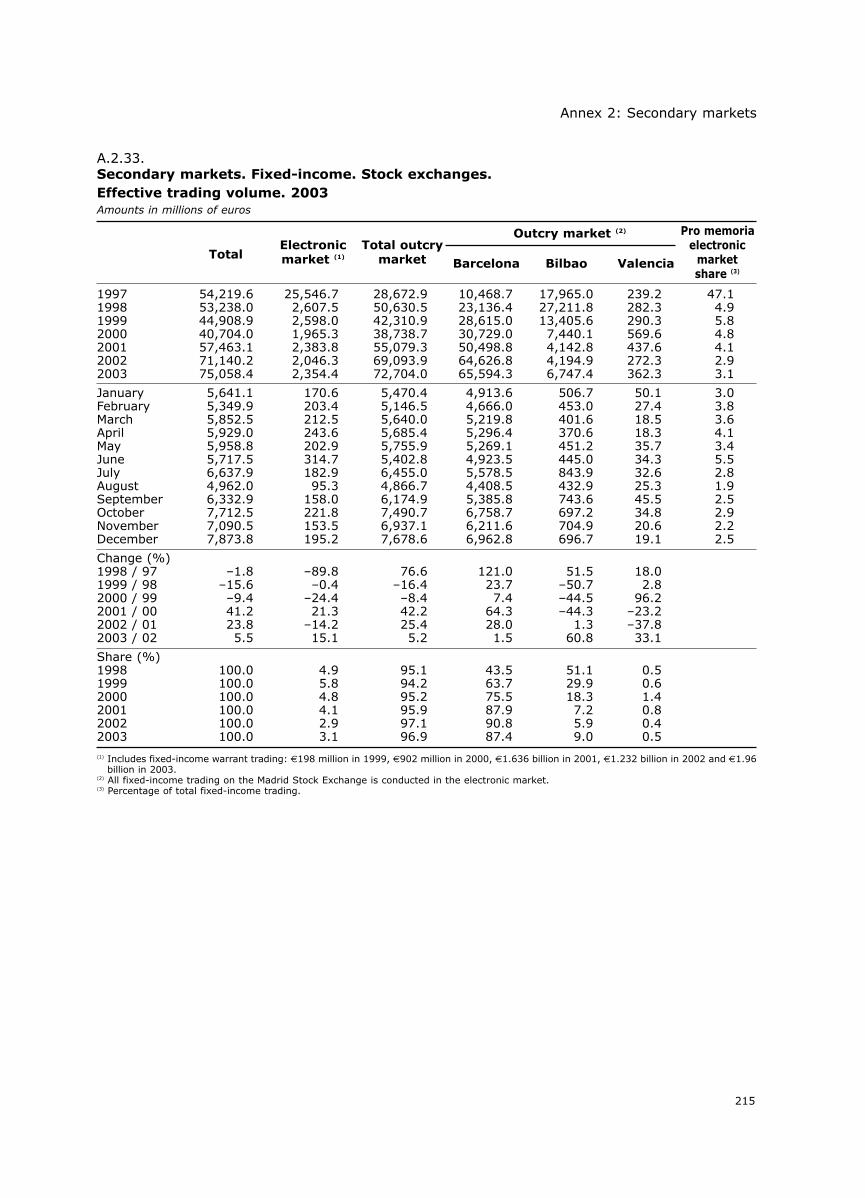
215
Annex 2: Secondary markets
Outcry market (2)
TotalElectronic Total outcrymarket (1) market Barcelona Bilbao Valencia
Pro memoriaelectronic
marketshare (3)
(1) Includes fixed-income warrant trading: €198 million in 1999, €902 million in 2000, €1.636 billion in 2001, €1.232 billion in 2002 and €1.96billion in 2003.
(2) All fixed-income trading on the Madrid Stock Exchange is conducted in the electronic market.(3) Percentage of total fixed-income trading.
1997 54,219.6 25,546.7 28,672.9 10,468.7 17,965.0 239.2 47.11998 53,238.0 2,607.5 50,630.5 23,136.4 27,211.8 282.3 4.91999 44,908.9 2,598.0 42,310.9 28,615.0 13,405.6 290.3 5.82000 40,704.0 1,965.3 38,738.7 30,729.0 7,440.1 569.6 4.82001 57,463.1 2,383.8 55,079.3 50,498.8 4,142.8 437.6 4.12002 71,140.2 2,046.3 69,093.9 64,626.8 4,194.9 272.3 2.92003 75,058.4 2,354.4 72,704.0 65,594.3 6,747.4 362.3 3.1
January 5,641.1 170.6 5,470.4 4,913.6 506.7 50.1 3.0February 5,349.9 203.4 5,146.5 4,666.0 453.0 27.4 3.8March 5,852.5 212.5 5,640.0 5,219.8 401.6 18.5 3.6April 5,929.0 243.6 5,685.4 5,296.4 370.6 18.3 4.1May 5,958.8 202.9 5,755.9 5,269.1 451.2 35.7 3.4June 5,717.5 314.7 5,402.8 4,923.5 445.0 34.3 5.5July 6,637.9 182.9 6,455.0 5,578.5 843.9 32.6 2.8August 4,962.0 95.3 4,866.7 4,408.5 432.9 25.3 1.9September 6,332.9 158.0 6,174.9 5,385.8 743.6 45.5 2.5October 7,712.5 221.8 7,490.7 6,758.7 697.2 34.8 2.9November 7,090.5 153.5 6,937.1 6,211.6 704.9 20.6 2.2December 7,873.8 195.2 7,678.6 6,962.8 696.7 19.1 2.5
Change (%)1998 / 97 –1.8 –89.8 76.6 121.0 51.5 18.01999 / 98 –15.6 –0.4 –16.4 23.7 –50.7 2.82000 / 99 –9.4 –24.4 –8.4 7.4 –44.5 96.22001 / 00 41.2 21.3 42.2 64.3 –44.3 –23.22002 / 01 23.8 –14.2 25.4 28.0 1.3 –37.82003 / 02 5.5 15.1 5.2 1.5 60.8 33.1
Share (%)1998 100.0 4.9 95.1 43.5 51.1 0.51999 100.0 5.8 94.2 63.7 29.9 0.62000 100.0 4.8 95.2 75.5 18.3 1.42001 100.0 4.1 95.9 87.9 7.2 0.82002 100.0 2.9 97.1 90.8 5.9 0.42003 100.0 3.1 96.9 87.4 9.0 0.5
Amounts in millions of euros
A.2.33.Secondary markets. Fixed-income. Stock exchanges.Effective trading volume. 2003

216
Annual rep
ort o
n th
e securities m
arket. 2003
Millions of euros % of total trading Change (%)
Excluding fixed-income warrant trading.
1999 2000 2001 2002 2003 1999 2000 2001 2002 2003 2000/99 2001/00 2002/01 2003/02Sector
0 Oil 0.0 0.0 0.0 0.0 0.0 0.0 0.0 0.0 0.0 0.0 – – – –1 Energy and water 36.6 16.8 15.7 58.4 21.1 0.1 0.0 0.0 0.1 0.0 –54.0 –6.6 271.9 –63.82 Mining and base metals 0.3 0.1 0.0 0.0 0.0 0.0 0.0 0.0 0.0 0.0 –42.6 –81.9 –45.8 –96.23 Cement and construction materials 0.0 0.0 0.0 0.0 0.0 0.0 0.0 0.0 0.0 0.0 – – – –4 Chemicals 0.0 0.0 0.0 0.0 0.0 0.0 0.0 0.0 0.0 0.0 –74.9 297.3 –50.3 –100.05 Textile & paper 0.0 0.0 2.8 0.9 0.0 0.0 0.0 0.0 0.0 0.0 – – –66.9 –100.06 Metal-mechanical 0.0 0.0 0.0 0.0 0.0 0.0 0.0 0.0 0.0 0.0 –48.3 –57.8 –100.0 –7 Food 0.3 0.0 0.0 0.0 0.0 0.0 0.0 0.0 0.0 0.0 –100.0 – – –8 Construction 0.0 0.0 0.0 0.0 0.0 0.0 0.0 0.0 0.0 0.0 – – – –9 Real estate 17.9 0.0 0.0 0.0 7.3 0.0 0.0 0.0 0.0 0.0 –100.0 – – –
10 Transport and communications 668.8 189.3 117.7 123.7 182.5 1.5 0.5 0.2 0.2 0.2 –71.7 –37.8 5.1 47.511 Other 0.0 0.0 0.0 0.0 0.1 0.0 0.0 0.0 0.0 0.0 100.0 – – –
TOTAL NON-FINANCIAL SECTOR 723.9 206.3 136.2 183.0 211.0 1.6 0.5 0.2 0.3 0.3 –71.5 –34.0 34.4 15.3
12 Banks 910.6 753.7 358.2 259.3 230.5 2.0 1.9 0.6 0.4 0.3 –17.2 –52.5 –27.6 –11.113 Insurance 0.0 0.0 0.0 0.0 0.0 0.0 0.0 0.0 0.0 0.0 – – – –14 Portfolio companies 0.0 0.0 0.0 0.0 0.0 0.0 0.0 0.0 0.0 0.0 –62.1 –35.5 68.4 127.815 SIM 0.0 0.0 0.0 0.0 0.0 0.0 0.0 0.0 0.0 0.0 – – – –16 Finance companies 0.0 0.0 10.8 159.9 588.7 0.0 0.0 0.0 0.2 0.8 – – 1.377.5 268.217 Securities firms 0.0 0.0 0.0 0.0 0.0 0.0 0.0 0.0 0.0 0.0 –100.0 – – –
TOTAL FINANCIAL SECTOR 910.6 753.7 369.0 419.2 819.2 2.0 1.9 0.7 0.6 1.1 –17.2 –51.0 13.6 95.4
18 State 162.0 58.6 58.6 62.6 55.5 0.4 0.1 0.1 0.1 0.1 –63.8 –0.1 6.9 –11.319 Regional governments 42,076.3 38,297.5 54,659.8 68,710.3 71,498.3 94.1 96.2 97.9 98.4 97.5 –9.0 42.7 25.7 4.120 Local governments 127.6 21.7 152.3 62.0 49.9 0.3 0.1 0.3 0.1 0.1 –83.0 601.4 –59.3 –19.521 Other government agencies 149.6 170.3 187.7 96.7 458.8 0.3 0.4 0.3 0.1 0.6 13.8 10.2 –48.4 374.222 State bodies 74.1 121.5 75.1 222.6 124.8 0.2 0.3 0.1 0.3 0.2 63.9 –38.2 196.3 –43.923 International bodies 486.3 172.8 188.4 57.2 145.1 1.1 0.4 0.3 0.1 0.2 –64.5 9.0 –69.7 153.9
TOTAL PUBLIC SECTOR 43,076.0 38,842.4 55,321.9 69,211.4 72,332.4 96.3 97.6 99.1 99.1 98.6 –9.8 42.4 25.1 4.5
TOTAL 44,710.5 39,802.4 55,827.1 69,813.6 73,362.7 100.0 100.0 100.0 100.0 100.0 –11.0 40.3 25.1 5.1
Amounts in millions of euros
A.2.34.Secondary markets. Fixed-income. Stock exchanges.Trading volume by sector

217
Annex 2: Secondary markets
Number of issuers required to attain a given percentage of tradingSector
25% 50% 75% 90% 100%
Excluding fixed-income warrant trading.Pro memoria. List of main issuers in terms of trading volume in 2003.1. Catalonia government ...................................................88.05%2. Basque government .......................................................9.12%
0 Oil 0 0 0 0 01 Energy and water 1 1 2 2 22 Mining and base metals 1 1 1 1 13 Cement and construction materials 1 1 1 1 14 Chemicals 1 1 1 1 15 Textile & paper 0 0 0 0 06 Metal-mechanical 0 0 0 0 07 Food 0 0 0 0 08 Construction 0 0 0 0 09 Real estate 1 1 1 1 1
10 Transport and communications 1 1 2 3 411 Other 1 1 1 1 1
TOTAL NON-FINANCIAL SECTOR 1 2 3 5 10
12 Banks 1 1 4 9 2113 Insurance 0 0 0 0 014 Portfolio companies 1 1 1 1 115 SIM 0 0 0 0 016 Finance companies 1 1 1 1 217 Securities firms 0 0 0 0 0
TOTAL FINANCIAL SECTOR 1 1 2 4 24
18 State 1 1 1 1 119 Regional governments 1 1 1 1 320 Local governments 1 1 1 1 121 Other government agencies 1 1 1 2 422 State bodies 1 1 2 2 223 International bodies 1 1 1 1 6
TOTAL PUBLIC SECTOR 1 1 1 2 17
TOTAL 1 1 1 2 51
A.2.35.Secondary markets. Fixed-income. Stock exchanges.Trading volume by issuer. 2003

218
Annual report on the securities market. 2003
Number of issuers required to attain a given percentage of trading
Sector25% 50% 75% 90% 100%
Excluding fixed-income warrant trading.
0 Oil 0 0 0 0 01 Energy and water 1 1 2 2 82 Mining and base metals 1 1 1 1 13 Cement and construction materials 1 1 1 1 14 Chemicals 1 1 1 1 15 Textile & paper 0 0 0 0 06 Metal-mechanical 0 0 0 0 07 Food 0 0 0 0 08 Construction 0 0 0 0 09 Real estate 1 1 1 1 1
10 Transport and communications 2 3 6 8 1311 Other 1 1 1 1 1
TOTAL NON-FINANCIAL SECTOR 2 4 8 11 25
12 Banks 1 5 13 27 8313 Insurance 0 0 0 0 014 Portfolio companies 1 1 1 1 115 SIM 0 0 0 0 016 Finance companies 1 1 1 3 817 Securities firms 0 0 0 0 0
TOTAL FINANCIAL SECTOR 1 1 4 14 92
18 State 3 9 18 28 5519 Regional governments 2 3 7 12 10720 Local governments 1 1 2 3 321 Other government agencies 1 1 2 4 822 State bodies 1 2 4 5 2023 International bodies 1 2 4 6 17
TOTAL PUBLIC SECTOR 2 3 8 13 210
TOTAL 2 3 8 14 327
A.2.36.Secondary markets. Fixed-income. Stock exchanges.Trading volume by issue. 2003

219
Annex 2: Secondary markets
Margin trading (1) Security lending (2)
Outstanding balances (3) Trading volume Outstanding balances Trading volume
% of % of electro-Purchases Sales Purchases Sales Adjusted (4) electronic Amounts nic market
market volume (5)
(1) Trades executed under Order dated 25 March 1991, regulating spot transactions on margin.(2) Trades executed other than under Order dated 25 March 1991, regulating spot transactions on margin.(3) End of period figures.(4) Total balances less amount of re-loans.(5) Compared with trading on the electronic market during the regular session.Source: Madrid Stock Exchange bulletins, Madrid Stock Exchange, SCLV and CNMV.
1998 23.668 3.588 810.770 125.392 7.581.431 2,3 48.448.734 20,91999 32.606 6.013 677.184 167.512 10.439.268 2,5 62.098.309 21,72000 54.687 4.400 1.121.315 151.422 12.101.952 2,3 87.406.420 19,62001 43.114 8.531 534.132 174.106 20.141.394 3,9 89.605.980 21,32002 31.452 7.758 382.859 161.211 14.125.307 3,5 106.983.175 26,32003 32.831 17.316 346.065 199.768 28.873.050 5,5 161.775.159 35,4
January 26.480 9.175 24.315 18.439 15.205.829 3,9 18.404.248 42,7February 24.585 10.894 24.838 18.201 13.837.169 3,6 5.492.751 21,1March 32.076 9.678 34.120 22.637 14.111.847 3,7 10.695.926 30,3April 30.824 15.234 30.072 18.678 15.573.634 3,7 11.670.716 33,6May 31.948 15.299 30.057 18.334 15.467.357 3,7 9.890.893 32,9June 32.288 17.928 31.596 18.947 21.342.205 4,8 17.262.470 40,3July 34.884 16.273 38.015 13.780 24.021.944 5,2 20.984.560 42,5August 35.843 13.811 19.150 10.799 19.054.034 4,0 7.520.557 25,8September 40.630 8.614 38.870 15.271 19.541.399 4,3 10.872.770 26,2October 39.011 14.906 26.405 20.625 23.215.173 4,7 16.762.507 38,4November 38.005 14.705 26.386 13.260 22.845.120 4,6 11.714.653 31,2December 32.831 17.316 22.241 10.797 28.873.050 5,5 20.503.109 46,4
Amounts in thousands of euros
A.2.37.Secondary markets. Stock exchanges and SCLV.Margin trading and security lending. 2003

220
Annual rep
ort o
n th
e securities m
arket. 2003
Sector January February March April May June July August Sept. October Nov. Dec. Total % oftotal
% oftrading
0 Oil 2,801,647 563,747 563,413 468,632 812,760 954,638 3,276,752 972,147 562,392 752,541 779,936 2,462,009 14,970,614 9.3 36.471 Energy and water 1,443,416 1,032,574 1,794,420 656,995 3,119,647 6,317,613 1,817,450 1,271,861 1,439,618 1,497,021 2,430,075 5,476,088 28,296,778 17.5 39.112 Mining and base metals 48,420 54,199 120,418 420,455 184,371 113,784 367,998 45,517 83,942 92,475 159,460 286,948 1,977,985 1.2 37.033 Cement and construction materials 3,309 68 0 443 1 0 125 434 5,563 17,673 20,576 1,717 49,909 0.0 16.114 Chemicals 349 236 113 709 5,630 0 0 0 118 653 0 6,705 14,513 0.0 0.885 Textile and paper 143,629 53,032 180,481 68,343 135,727 326,243 1,367,934 500,541 300,190 323,871 164,064 292,963 3,857,019 2.4 33.956 Metal-mechanical 2,075 1,606 1,180 2,450 4,972 21,550 5,975 1,036 10,522 2,265 6,306 18,388 78,326 0.0 4.897 Food 229,055 615,389 2,560,738 268,994 629,238 3,242,464 521,134 175,574 301,555 311,347 161,517 364,897 9,381,902 5.8 49.788 Construction 2,265,267 315,420 399,461 652,358 1,269,658 431,204 875,574 478,957 479,432 1,109,156 594,004 679,885 9,550,377 5.9 44.329 Real estate 335,265 258,013 138,283 95,954 211,864 160,595 33,867 60,118 66,861 185,618 107,658 77,464 1,731,559 1.1 36.70
10 Transport and communications 1,835,543 937,430 1,552,505 878,295 656,199 1,186,055 763,811 764,112 917,883 1,191,481 810,748 1,275,727 12,769,790 7.9 12.5511 Other 182,789 200,018 114,701 178,775 405,048 537,385 819,759 281,946 408,222 965,155 1,147,042 521,970 5,762,809 3.6 22.50
Total non-financial sector 9,290,765 4,031,733 7,425,712 3,692,405 7,435,115 13,291,529 9,850,379 4,552,242 4,576,298 6,449,256 6,381,385 11,464,760 88,441,580 54.7 28.88
12 Banks 9,092,439 1,455,846 3,257,296 7,962,824 2,073,375 3,893,205 11,015,849 2,961,975 6,268,563 10,257,633 4,811,927 9,014,679 72,065,612 44.5 39.9613 Insurance 7,382 3,220 11,930 14,348 350,544 35,620 29,992 5,187 21,570 54,418 498,794 23,427 1,056,434 0.7 55.2914 Portfolio companies 13,663 1,951 987 1,139 31,858 42,115 88,339 1,152 6,339 1,200 22,546 242 211,532 0.1 8.2615 SIM 0 0 0 0 0 0 0 0 0 0 0 0 0 0.0 0.0016 Finance companies 0 0 0 0 0 0 0 0 0 0 0 0 0 0.0 0.00
Total financial sector 9,113,483 1,461,018 3,270,214 7,978,311 2,455,778 3,970,941 11,134,181 2,968,314 6,296,472 10,313,251 5,333,268 9,038,349 73,333,578 45.3 39.67
Total 18,404,248 5,492,751 10,695,926 11,670,716 9,890,893 17,262,470 20,984,560 7,520,557 10,872,770 16,762,507 11,714,653 20,503,109 161,775,159 100.0 32.95
Note: The last column (% of trading) refers to all trading on the electronic market, not just within the regular sessions.
Thousands of euros
A.2.38.Secondary markets. Stock exchanges and SCLV.Two-way security lending by sector. 2003

ANNEX 3
DERIVATIVES MARKET

2002 2003 Change (%) 2002 2003 Change (%)
Notional value ($Bn)Number of contracts (millions)
Annex 3: Derivatives markets
223
Futures 2,156.4 2,836.4 31.5 501,220.3 624,691.4 24.6Interest rates 1,147.9 1,573.5 37.1 472,200.9 588,326.6 24.6Securities indexes 530.3 725.1 36.7 26,506.3 32,428.1 22.3Currencies 42.6 58.3 36.9 2,513.1 3,936.7 56.6Commodities 435.6 479.5 10.1 n.a. n.a. —
Options 3,906.7 5,209.5 33.3 191,302.1 248,990.4 30.2Interest rates 240.3 302.3 25.8 154,509.8 205,384.6 32.9Securities indexes 2,235.5 3,234.3 44.7 36,369.6 43,115.9 18.5Individual stocks 1,366.5 1,608.0 17.7 n.a. n.a. —Currencies 16.1 14.2 –11.8 422.7 489.9 15.9Commodities 48.3 50.7 5.0 n.a. n.a. —
Total 6,063.1 8,045.9 32.7 692,522.4 873,681.8 26.2
n.a.: Not available.
June 02 June 03 Change (%) June 02 June 03 Change (%)
Gross market value ($Bn)Notional value ($Bn)
Interest rates 89,955 121,799 35.4 2,467 5,459 121.3Equities 2,214 2,799 26.4 243 260 7.0Currencies 18,068 22,088 22.2 1,052 996 –5.3Commodities 777 1,040 33.8 79 110 39.2Other 16,496 21,952 33.1 609 1,083 77.8
Total 127,510 169,678 33.1 4,450 7,908 77.7
Source: Bank for International Settlements.
A.3.1.a.Total trading volume in organised derivatives markets.Detail by instrument
A.3.1.b.Open interest in OTC derivatives markets.Detail by risk category

Annual report on the securities market. 2003
224
Exchange 2002 2003 Change (%)
KSE 1,932,749,868 2,899,937,895 50.0EUREX 801,200,873 1,014,932,312 26.7EURONEXT 689,207,697 693,232,284 0.6CME 558,447,820 640,209,634 14.6CBOT 343,882,529 454,190,749 32.1CBOE 267,616,496 283,946,495 6.1ISE 152,399,279 244,968,190 60.7AMEX 186,039,445 180,074,778 –3.2Bovespa 90,884,897 177,223,140 95.0MexDer 84,274,979 173,820,944 106.3
Pro-memoria:EURONEXT.LIFFE 253,986,231 335,825,947 32.2EURONEXT PARIS 357,511,863 277,881,912 –22.3EURONEXT AMSTERDAM 77,709,603 79,524,425 2.3OM 60,920,817 72,137,347 18.4MEFF 27,917,927 21,748,064 –22.1IDEM/MIF 17,246,629 17,731,980 2.8
(1) Trading volume refers to number of contracts.Differences in the underlying security prevent direct comparison between markets, but year-on-yearcomparisons are meaningful.Source: Futures Industry Association, Eurex and CNMV.
AMEX American Stock ExchangeBOVESPA Bolsa de Valores de São PauloCBOE Chicago Board Options ExchangeCBOT Chicago Board of TradeCME Chicago Mercantile ExchangeEUREX Deutsche Terminbörse (DTB) y Swiss Options & Financial Futures Exchange (SOFFEX)EURONEXT Comprises the spot and derivatives markets of Paris, Amsterdam, Brussels, Lisbon and OportoEURONEXT AMSTERDAM Dutch branch of EuronextEURONEXT PARIS French branch of Euronext, comprising former MATIF and MONEPEURONEXT.LIFFE Former LIFFE: London International Financial Futures ExchangeIDEM/MIF Italian Derivatives Market/Italian Futures MarketISE International Securities ExchangeKSE Korea Stock ExchangeMEFF Mercado Español de Futuros y Opciones FinancierosMexDer Mexican Derivatives ExchangeOM Stockholm Options Market
A.3.2.International markets. Trading volume(1).

Annex 3: Derivatives markets
225
Underlying asset Product(2) Exchange2002 2003 Change (%)
No. of contracts traded
Long-term Euro-Bund (f) EUREX 191,263,413 244,414,274 27.8interest rates Euro-Bobl (f) EUREX 114,678,996 150,087,139 30.9
Euro-Schatz (f) EUREX 108,760,955 117,370,528 7.910yr Treasury bonds (f) CBOT 95,786,299 146,745,281 53.230 yr Treasury bonds (f) CBOT 50,512,085 73,746,445 46.05 yr Treasury notes (f) CBOT 56,082,284 63,521,507 13.3
Short-term 3M Eurodollar (f) CME 202,080,832 208,771,164 3.3interest rates Interbank Equilibrium (TIIE28) MexDer 80,595,381 162,077,312 101.1
3M Euribor (f) EURONEXT.LIFFE 105,756,584 137,692,190 30.23M Eurodollar (o) CME 105,580,961 100,819,260 –4.53M Euribor (o) EURONEXT.LIFFE 33,480,000 57,730,000 72.4Overnight interest rates (f) BM&F 48,568,402 57,640,979 18.7
Securities indexes KOSPI 200 (o) KSE 1,889,881,704 2,837,724,953 50.2E-Mini S&P 500 (f) CME 115,741,691 161,176,639 39.3DJ EuroStoxx 50 (f) EUREX 86,354,731 116,035,326 34.4CAC 40 (o) EURONEXT PARIS 84,342,670 73,668,131 –12.7E-Mini Nasdaq 100 (f) CME 54,491,180 67,888,938 24.6KOSPI 200 (f) KSE 42,867,330 62,204,783 45.1
Currencies US dollar/Brazilian real (f) BM&F 16,132,798 16,784,939 4.0Euro FX (f) CME 6,986,600 11,193,922 60.2Shekel/US dollar (o) TASE 11,542,809 8,312,746 –28.0Yen (f) CME 4,394,982 6,085,209 38.5Canadian dollar (f) CME 3,134,963 4,219,618 34.6Swiss franc (f) CME 2,830,738 3,596,658 27.1
Pro-memoria:Long-term
interest rates 10Y Bono (f) MEFF 51,060 1,371 –97.3Securities indexes IBEX (f) MEFF 3,450,985 3,129,313 –9.3Stocks Telefónica (o) MEFF 3,681,651 2,172,817 –41.0
(1) Trading volume refers to number of contracts. Differences in the underlying security prevent direct comparison between markets, but year-on-year comparisons are meaningful.Source: Futures Industry Association, “Futures and OTC World” and CNMV.(2) (f) future (o) option.
BM&F Bolsa de Mercadorias & FuturosCBOT Chicago Board of TradeCME Chicago Mercantile ExchangeEUREX Deutsche Terminbörse (DTB) y Swiss Options & Financial Futures Exchange (SOFFEX)EURONEXT. LIFFE Former LIFFE: London International Financial Futures ExchangeEURONEXT PARIS French branch of Euronext, comprises former MATIF and MONEPKSE Korea Stock ExchangeMEFF Mercado Español de Futuros y Opciones FinancierosMexDer Mexican Derivatives ExchangeTASE Tel Aviv Stock Exchange
A.3.3.International markets. Trading volume. Prominent products(1).

Annual rep
ort o
n th
e securities m
arket. 2003
226
1992 161,394 – 161,394 73,556 59,395 132,951 294,345 – – –1993 624,926 – 624,926 107,235 86,632 193,868 818,793 – – –1994 1,616,411 – 1,616,411 217,167 212,096 429,263 2,045,675 – – –1995 1,641,892 – 1,641,892 220,152 235,716 455,868 2,097,760 – – –1996 1,694,383 – 1,694,383 246,979 219,660 466,638 2,161,021 – – –1997 3,534,491 – 3,534,491 391,662 352,276 743,938 4,278,430 – – –1998 5,059,814 – 5,059,814 497,378 380,477 877,856 5,937,670 – – –1999 5,028,458 – 5,028,458 440,576 349,131 789,707 5,818,165 17,216 – 17,2162000 4,320,152 – 4,320,152 341,250 382,544 723,794 5,043,946 179,630 – 179,6302001 4,204,211 1,883 4,206,094 273,877 263,250 537,127 4,743,222 617,278 13,943 631,2212002 3,450,985 64,031 3,515,016 233,364 208,381 441,745 3,956,761 1,604,330 875 1,605,2052003 3,129,313 97,893 3,227,206 124,495 119,349 243,844 3,471,051 2,322,356 0 2,322,356
January 261,112 8,315 269,427 9,573 8,883 18,457 287,884 188,683 0 188,683February 251,978 9,690 261,668 9,833 7,705 17,538 279,206 177,873 0 177,873March 282,858 11,230 294,088 13,549 13,731 27,280 321,368 258,006 0 258,006April 222,638 8,917 231,555 8,682 10,740 19,423 250,978 215,581 0 215,581May 238,542 9,252 247,794 10,235 10,231 20,465 268,259 179,942 0 179,942June 294,737 8,065 302,802 11,630 8,381 20,011 322,813 209,719 0 209,719July 297,217 7,817 305,034 15,951 14,878 30,829 335,863 165,078 0 165,078August 240,076 5,245 245,321 9,501 8,282 17,783 263,104 125,060 0 125,060September 258,533 7,746 266,279 8,140 7,616 15,756 282,035 273,451 0 273,451October 295,219 8,826 304,045 7,361 8,121 15,482 319,527 203,178 0 203,178November 229,750 7,266 237,016 10,222 10,913 21,135 258,151 158,922 0 158,922December 256,653 5,524 262,177 9,818 9,868 19,686 281,862 166,865 0 166,865
Ibex 35 MINI Ibex Total Call Put Total Total Total
Future Option Interconnection(1) S&P contracts (2)
On European indexes
(1) Includes the contracts traded in other markets via EuroMEFF: futures on the DAX 30, DJ EuroStoxx 50 and DJ Stoxx 50 indexes traded in Eurex, futures on the CAC 40, DJ Eurostoxx 50 andDJ Stoxx 50 indexes traded in Euronext France, and PSI 20 futures and options traded in Euronext Lisbon.(2) Includes the futures and options contracts on Standard & Poor’s European indexes (S&P Europe 350 and sectorial).Notes:1. Data prior to 1999 have been adjusted for comparison with the contracts’ new nominal value.2. From 22 November 2001, MINI Ibex 35 futures contracts are adjusted to the Ibex-35 futures contracts’ nominal value; the Ibex-35 options were adjusted to the old nominal value.
Total
On Ibex-35 index
Total
A.3.4.MEFF. Index contracts. Trading volume. Annual and monthly performance in 2003
No. of contracts

Annex 3
: Derivatives m
arkets
227
1992 3,383 – 3,383 1,300 1,212 2,512 5,894 – – –1993 16,979 – 16,979 2,992 2,841 5,833 22,813 – – –1994 13,847 – 13,847 5,009 3,932 8,941 22,788 – – –1995 27,511 – 27,511 7,771 5,617 13,388 40,900 – – –1996 27,038 – 27,038 15,769 12,844 28,613 55,650 – – –1997 42,384 – 42,384 9,846 7,838 17,684 60,068 – – –1998 49,770 – 49,770 9,336 7,062 16,398 66,168 – – –1999 61,680 – 61,680 47,607 24,239 71,846 133,526 1,507 – 1,5072000 55,657 – 55,657 28,566 16,739 45,305 100,962 8,699 – 8,6992001 58,115 103 58,218 35,511 22,029 57,541 115,758 10,243 197 10,4402002 43,454 319 43,773 26,622 19,648 46,270 90,043 13,398 0 13,3982003 67,081 402 67,483 15,682 14,058 29,739 97,222 13,889 0 13,889
January 43,089 370 43,459 30,880 23,560 54,440 97,899 15,685 0 15,685February 39,905 278 40,183 33,469 24,184 57,653 97,837 18,548 0 18,548March 39,439 419 39,858 20,804 17,236 38,040 77,898 16,475 0 16,475April 44,611 317 44,928 23,887 18,928 42,816 87,743 14,068 0 14,068May 44,547 399 44,946 26,635 22,542 49,177 94,122 14,187 0 14,187June 57,590 349 57,939 17,952 14,177 32,129 90,068 11,851 0 11,851July 61,432 375 61,807 24,960 22,225 47,184 108,991 12,997 0 12,997August 67,206 322 67,528 28,256 25,186 53,441 120,969 15,804 0 15,804September 62,981 559 63,540 22,119 17,623 39,742 103,282 13,002 0 13,002October 65,898 513 66,411 24,391 19,673 44,063 110,474 13,473 0 13,473November 65,271 457 65,728 26,233 21,895 48,127 113,855 15,373 0 15,373December 67,081 402 67,483 15,682 14,058 29,739 97,222 13,889 0 13,889
Ibex 35 MINI Ibex Total Call Put Total Total Total
Future Option Interconnection(1) S&P contracts(2)
On European indexes
(1) Open interest corresponds to Spanish members. Includes the contracts traded in other markets via EuroMEFF: futures on the DAX 30, DJ EuroStoxx 50indexes traded in Eurex, futures on the CAC 40, DJ EuroStoxx 50 and DJ Stoxx 50 indexes traded in Euronext Paris, and PSI 20 futures and options traded in Euronext Lisbon.(2) Includes the futures and options contracts on Standard & Poor’s European indexes (S&P Europe 350 and sectorial).Notes:1. Data prior to 1999 have been adjusted for comparison with the contracts’ new nominal value.2. From 22 November 2001, MINI Ibex 35 futures contracts are adjusted to the Ibex-35 futures contracts’ nominal value; the Ibex-35 options were adjusted to the old nominal value.
Total
On Ibex-35 index
Total
A.3.5.MEFF. Index contracts. Open interest at end of period. Annual and monthly performance in 2003
No. of contracts

Trading frequency (%)Fourth maturity contract 18.3 33.3 33.3Third maturity contract 26.3 68.3 64.3Second maturity contract 76.7 97.9 98.8Front contract: up to 2 weeks before maturity 100.0 100.0 100.0Front contract: second last-week before matur 100.0 100.0 100.0Front contract: last week before maturity 100.0 100.0 100.0
No. of trades (daily average)Fourth maturity contract 0.5 9.9 10.9Third maturity contract 0.8 15.5 15.9Second maturity contract 211.6 35.3 35.3Front contract: up to 2 weeks before maturity 4,599.6 104.6 115.2Front contract: second last-week before matur 4,868.5 108.4 102.8Front contract: last week before maturity 4,564.5 236.4 260.2
Volume per trade (No. of contracts) 3.0 27.6 27.5
Annual report on the securities market. 2003
228
A.3.6.MEFF. Ibex-35 contracts.Trading frequency, number of trades (daily average)and volume per trade. 2003
Ibex-35 FutureCall Put
Option (*)
(*) Since 2001 year-end, the option’s multiplier is 1 euro.

Call Put Total
Annex 3
: Derivatives m
arkets
229
1993 – 90,267 41,533 131,800 131,800 – 3,705 250 3,955 3,9551994 – 134,668 87,743 222,411 222,411 – 12,313 4,720 17,033 17,0331995 – 383,582 383,070 766,652 766,652 – 16,154 6,550 22,704 22,7041996 – 616,375 238,421 854,796 854,796 – 37,299 8,136 45,435 45,4351997 – 832,456 513,223 1,345,679 1,345,679 – 15,399 10,776 26,175 26,1751998 – 1,314,397 1,035,543 2,349,940 2,349,940 – 134,908 132,949 267,857 267,8571999 – 3,692,319 3,327,833 7,020,152 7,020,152 – 876,278 818,455 1,694,733 1,694,7332000 – 8,959,285 6,962,592 15,921,877 15,921,877 – 1,774,402 1,566,288 3,340,690 3,340,6902001 7,389,886 10,297,543 8,207,807 18,505,350 25,895,236 1,184,977 1,453,738 1,294,330 2,748,068 3,933,0452002 9,630,899 7,128,201 7,150,131 14,278,332 23,909,231 1,290,911 1,055,684 1,153,338 2,209,022 3,499,9332003 9,768,607 4,913,096 3,593,939 8,507,035 18,275,642 1,309,590 502,600 531,147 1,033,747 2,343,337
January 464,155 411,464 293,908 705,372 1,169,527 1,364,319 1,337,528 1,378,983 2,716,511 4,080,830February 274,552 504,491 364,080 868,571 1,143,123 1,360,308 1,660,772 1,543,094 3,203,866 4,564,174March 1,823,821 498,256 590,451 1,088,707 2,912,528 1,170,630 1,086,955 993,891 2,080,846 3,251,476April 196,099 485,874 275,564 761,438 957,537 1,190,187 1,433,712 1,193,792 2,627,504 3,817,691May 239,738 438,721 332,462 771,183 1,010,921 1,228,401 1,653,528 1,410,953 3,064,481 4,292,882June 1,947,085 682,046 312,530 994,576 2,941,661 1,502,678 1,094,046 978,156 2,072,202 3,574,880July 175,493 338,883 370,503 709,386 884,879 1,530,756 1,264,050 1,270,653 2,534,703 4,065,459August 122,028 339,579 186,976 526,555 648,583 1,556,161 1,411,581 1,380,195 2,791,776 4,347,937September 1,658,686 347,876 302,366 650,242 2,308,928 1,100,093 1,034,226 951,521 1,985,747 3,085,840October 135,010 298,233 288,382 586,615 721,625 1,119,711 1,182,600 1,130,012 2,312,612 3,432,323November 139,408 287,548 160,031 447,579 586,987 1,143,662 1,281,113 1,193,381 2,474,494 3,618,156December 2,592,532 280,125 116,686 396,811 2,989,343 1,309,590 502,600 531,147 1,033,747 2,343,337
Call Put TotalFuture
Option (*) Option (*)
(*) The data are not fully comparable due to changes in the nominal value of the underlying shares of some contracts.
Trading volume Open interest at end of period
TotalTotal Future
A.3.7.MEFF. Futures and options on stocks. Trading volume and open interest. Annual and monthly performance in 2003
No. of contracts

Annual rep
ort o
n th
e securities m
arket. 2003
230
Call Put Total Call Put Total Call Put Total Call Put Total Tradingvolume
Openinterest
Tradingvolume
Openinterest
Trading volume
2002 2003 2002 2003
Open interest at end of period
Options Futures
20032002
(1) Replaced Acesa since its merger with Aurea in April 2003.
A.3.8.MEFF. Stock options. Trading volume and open interest. Detail by contract type
No. of contracts
Acerinox 8,416 10,835 19,251 13,253 11,175 24,428 523 1,080 1,603 445 2,022 2,467 – – – –Abertis (1) 8,907 7,382 16,289 15,760 18,361 34,121 770 489 1,259 1,013 2,020 3,033 – – – –Altadis 34,193 31,662 65,855 56,203 45,339 101,542 716 1,018 1,734 8,338 1,596 9,934 – – – –Amadeus 18,709 14,564 33,273 32,896 22,406 55,302 1,114 732 1,846 1,923 936 2,859 – – – –Banco Popular 63,304 58,849 122,153 53,462 49,024 102,486 14,892 3,648 18,540 4,772 4,301 9,073 – – – –Bankinter 8,110 8,734 16,844 18,594 13,477 32,071 281 395 676 708 1,552 2,260 – – – –BBVA 1,442,086 1,255,893 2,697,979 758,736 505,338 1,264,074 173,071 135,664 308,735 83,914 89,388 173,302 1,588,559 236,258 1,708,074 229,410Endesa 279,993 387,331 667,324 570,972 322,462 893,434 53,690 74,323 128,013 47,489 44,494 91,983 405,986 72,169 495,232 100,649Gas Natural 73,249 72,531 145,780 27,311 29,502 56,813 1,170 642 1,812 1,040 1,791 2,831 – – – –Iberdrola 128,957 104,158 233,115 208,447 161,599 370,046 39,856 21,814 61,670 13,880 46,326 60,206 194,403 47,652 404,427 57,779Inditex 5,312 17,431 22,743 37,956 34,728 72,684 1,073 931 2,004 5,924 12,435 18,359 16,989 341 42,856 1,818Indra 14,245 10,456 24,701 19,006 10,567 29,573 1,027 953 1,980 804 536 1,340 – – – –Repsol 946,716 1,925,922 2,872,638 862,400 517,938 1,380,338 137,898 405,944 543,842 68,132 75,295 143,427 452,777 27,050 445,643 32,813SCH 1,805,443 1,565,698 3,371,141 884,269 700,770 1,585,039 224,439 271,009 495,448 158,412 97,693 256,105 2,556,715 342,829 2,707,548 321,632Sogecable 13,306 5,964 19,270 44,567 17,612 62,179 57 39 96 662 795 1,457 – – – –Telefónica 2,144,595 1,537,056 3,681,651 1,130,098 1,042,719 2,172,817 397,088 230,405 627,493 98,595 146,879 245,474 4,316,050 557,166 3,864,321 564,061Telefónica Móviles 4,765 26,932 31,697 8,855 10,295 19,150 504 329 833 559 962 1,521 16,589 370 34,196 424Terra Networks 80,897 58,584 139,481 123,442 38,664 162,106 2,227 1,123 3,350 455 40 495 82,831 7,076 66,310 1,004TPI 11,709 11,385 23,094 12,365 9,706 22,071 730 813 1,543 441 541 982 – – – –Unión Fenosa 35,289 38,764 74,053 34,504 32,257 66,761 4,558 1,987 6,545 5,094 1,545 6,639 – – – –
TOTAL MARKET 7,128,201 7,150,131 14,278,332 4,913,096 3,593,939 8,507,035 1,055,684 1,153,338 2,209,022 502,600 531,147 1,033,747 9,630,899 1,290,911 9,768,607 1,309,590

Annex 3
: Derivatives m
arkets
231
1990 159,952 – – – – 103,038 – – – – – – – – 56,9141991 561,762 29,072 – – – 279,691 6,686 2,614 9,301 – – – – – 282,0711992 776,172 4,422 437,674 – – 576,528 – – – 67,802 88,801 156,603 – – 199,6441993 3,134,239 – 2,637,441 – – 2,644,479 – – – 238,422 251,339 489,761 – – 489,7611994 8,646,056 – 7,738,080 – – 7,743,647 – – – 463,418 438,991 902,408 – – 902,4081995 8,614,228 – 7,714,010 – – 7,714,267 – – – 476,609 423,352 899,962 – – 899,9621996 12,660,928 – 10,893,254 – – 11,095,515 – – – 704,563 856,504 1,561,067 – – 1,565,4121997 13,628,773 5,140 12,455,467 – – 12,472,534 0 0 0 544,909 611,301 1,156,210 – – 1,156,2401998 9,731,343 26,027 9,228,552 32,396 – 9,289,337 120 0 120 198,228 243,658 441,886 0 – 442,0071999 3,580,874 13 3,580,215 0 10 3,580,238 0 0 0 62 574 636 0 0 6362000 1,035,330 0 1,035,330 0 0 1,035,330 0 0 0 0 0 0 0 0 02001 284,642 – 284,642 – – 284,642 – – – – – – – – –2002 51,060 – 51,060 – – 51,060 – – – – – – – – –2003 1,371 – 1,371 – – 1,371 – – – – – – – – –
5 YBono
10YBono
30YBono DEBS Total*
Totalmarket
Call Put Total Call Put Total Total Total
5Y Bono 10Y Bono 30Y Bono DEBS
Futures Options
Total*
(*) The total figures include trading in futures and options on the 3Y notional bond and DIFF contracts in the corresponding period.Data prior to 1999 have been adjusted for comparison with the contracts’ new nominal value.
A.3.9.MEFF. MEFF. Government bond contracts. Trading volume. Annual performance
No. of contracts

Annual rep
ort o
n th
e securities m
arket. 2003
232
1990 7,516 – – – – 2,048 – – – – – – – – 5,4671991 14,070 60 – – – 4,673 0 0 0 – – – – – 9,3971992 8,653 – 6,041 – – 6,041 – – – 850 1,761 2,611 – – 2,6111993 76,847 – 50,833 – – 50,893 – – – 12,237 13,718 25,954 – – 25,9541994 44,946 – 27,945 – – 27,945 – – – 9,474 7,526 17,001 – – 17,0011995 75,514 – 37,219 – – 37,219 – – – 20,666 17,628 38,294 – – 38,2941996 95,480 – 56,531 – – 57,118 – – – 17,306 21,056 38,361 – – 38,3611997 89,374 150 65,865 – – 66,271 0 0 0 11,021 12,082 23,104 – – 23,1041998 14,224 38 13,870 96 – 14,004 0 0 0 5 215 220 0 – 2201999 10,621 0 10,621 0 0 10,621 0 0 0 0 0 0 0 0 02000 16,128 0 16,128 0 0 16,128 0 0 0 0 0 0 0 0 02001 3,223 – 3,223 – – 3,223 – – – – – – – – –2002 200 – 200 – – 200 – – – – – – – – –2003 10 – 10 – – 10 – – – – – – – – –
5YBono
10YBono
30YBono DEBS Total*
Totalmarket
Call Put Total Call Put Total Total Total
5Y Bono Bono 10 años 30Y Bono DEBS
Futures Options
Total*
(*) The total figures include open interest in futures and options on the 3Y notional bond and DIFF contracts in the corresponding period.Data prior to 1999 have been adjusted for comparison with the contracts’ new nominal value.
A.3.10.MEFF. Government bond contracts. Open interest. Annual performance
No. of contracts

Annex 3: Derivatives markets
233
2002 2003
Trading frequency (%)9-12 months to maturity 0.0 0.06-9 months to maturity 0.0 0.03-6 months to maturity 10.4 4.11-3 months to maturity 98.1 31.02 weeks to 1 month to maturity 93.8 21.3Last 2 weeks to maturity 100.0 70.0
No. of trades (daily average)9-12 months to maturity 0.0 0.06-9 months to maturity 0.0 0.03-6 months to maturity 1.3 0.21-3 months to maturity 7.6 0.72 weeks to 1 month to maturity 10.2 0.3Last 2 weeks to maturity 21.6 2.3
Volume per trade (No. of contracts) 22.2 6.1
Note: Calculations based on average of all maturities in the year.
A.3.11.MEFF. Futures on 10Y government bonds.Trading frequency, number of trades (daily average) and volume per trade
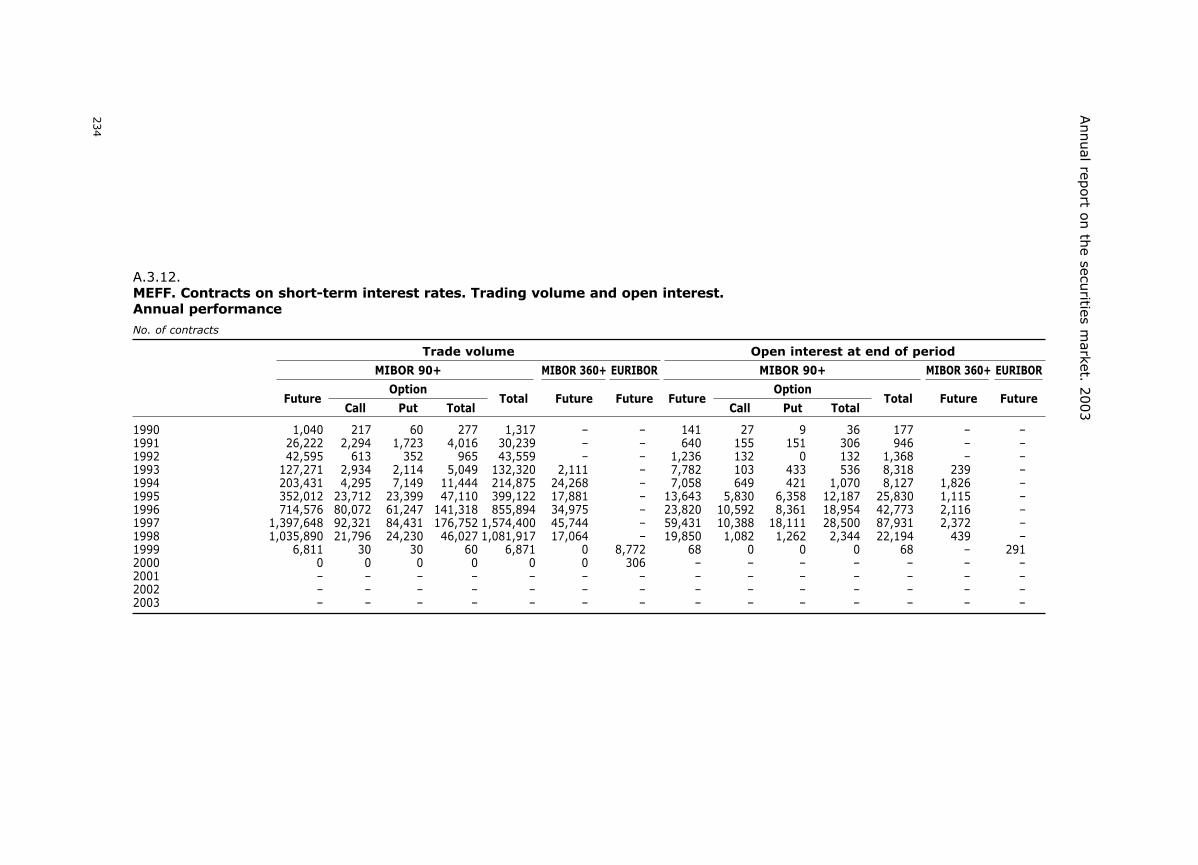
Annual rep
ort o
n th
e securities m
arket. 2003
234
1990 1,040 217 60 277 1,317 – – 141 27 9 36 177 – –1991 26,222 2,294 1,723 4,016 30,239 – – 640 155 151 306 946 – –1992 42,595 613 352 965 43,559 – – 1,236 132 0 132 1,368 – –1993 127,271 2,934 2,114 5,049 132,320 2,111 – 7,782 103 433 536 8,318 239 –1994 203,431 4,295 7,149 11,444 214,875 24,268 – 7,058 649 421 1,070 8,127 1,826 –1995 352,012 23,712 23,399 47,110 399,122 17,881 – 13,643 5,830 6,358 12,187 25,830 1,115 –1996 714,576 80,072 61,247 141,318 855,894 34,975 – 23,820 10,592 8,361 18,954 42,773 2,116 –1997 1,397,648 92,321 84,431 176,752 1,574,400 45,744 – 59,431 10,388 18,111 28,500 87,931 2,372 –1998 1,035,890 21,796 24,230 46,027 1,081,917 17,064 – 19,850 1,082 1,262 2,344 22,194 439 –1999 6,811 30 30 60 6,871 0 8,772 68 0 0 0 68 – 2912000 0 0 0 0 0 0 306 – – – – – – –2001 – – – – – – – – – – – – – –2002 – – – – – – – – – – – – – –2003 – – – – – – – – – – – – – –
MIBOR 90+
FutureCall Put Total
OptionTotal Future Future
MIBOR 360+ EURIBOR
Trade volume Open interest at end of period
MIBOR 90+
FutureCall Put Total
OptionTotal Future Future
MIBOR 360+ EURIBOR
A.3.12.MEFF. Contracts on short-term interest rates. Trading volume and open interest.Annual performance
No. of contracts

Annex 3: Derivatives markets
235
Valencia-Late Navel-Navelina Clementina Total
Open interest at end of periodTrading volume
Valencia-Late Navel-Navelina Clementina Total
1995* — 27,031 — 27,031 — 80 — 801996 48,258 67,079 30,113 145,450 0 138 101 2391997 38,442 20,659 945 60,046 0 11 0 111998 248 66 — 314 0 0 — 01999 0 0 — 0 0 0 — 02000 0 0 — 0 0 0 — 02001 0 0 — 0 0 0 — 02002 0 0 — 0 0 0 — 02003 0 0 — 0 0 0 — 0
* Data from September 1995, when FC&M commenced trading.
Category MEFF RentaVariable MEFF Renta Fija
Custodians 53 58Clearing members 46 27Clearing-custodian traders 22 16Clearing-custodian members – 1Traders – 35
Total 121 137
15% 30% 50% 75% 90% 100%
MEFF RVIbex 35 futures(*) 2 4 8 17 29 84Ibex 35 options 1 2 4 8 14 66Stock futures 1 2 4 10 21 71Stock options 1 3 6 10 15 69
MEFF RF10Y bond futures 1 1 2 4 6 11
Trading is measured as the sum of contracts bought and sold(*) Includes MINI Ibex futures.
A.3.13.FC&M. Trading volume and open interest. Annual performance
A.3.14.Market members. 2002. Number per category
A.3.15.Market members. 2003No. of members required to attain a given percentage of total trading
No. of contracts

Annual report on the securities market. 2003
236
PropietaryPro memoria:
MarketmakersTotal Residents Non-residents
Customers
Ibex-35 futures(*) 40.3 59.7 31.9 27.8 14.4Ibex-35 options 36.1 63.9 21.6 42.3 20.1
Total Ibex 35 38.8 61.2 28.2 33.0 16.5
Stock futures 38.6 61.4 43.7 17.7 4.4Stock options 30.1 69.9 9.8 60.0 10.9
Total stock trading 34.7 65.3 27.9 37.4 7.4
10Y bond futures 63.2 36.8 12.7 24.1 1.7
Trading is measured as the sum of contracts bought and sold.The market makers’ percentage also includes all the trades they conducted for their own account, not just those conducted in their capa-city as market makers.(*) Includes MINI Ibex futures.
MEFF RV MEFF RF
Banks and thrifts 28.6 11.9Broker-dealers and brokers 5.6 0.0Mutual funds 27.1 29.6Pension funds 1.3 0.0Insurance companies 0.3 0.0Other financial institutions 24.7 53.5Other corporate 5.9 0.0Individuals 6.4 4.9Other 0.1 0.0
Total customers 100.0 100.0
Pro memoria: non-residents/custome 57.8 65.5
Trading is measured as the sum of contracts bought and sold
A.3.16.Breakdown of trading, by account type. 2003
Percentage of trading out of total market
A.3.17.Breakdown of trading, by customer type. 2003
Percentage of trading
Off-session(1)Regular session Put-throughs(2) Pro memoria:
spread ops.(3)
Ibex-35 futures (*) 80.7 17.6 1.6 26.8Ibex-35 options 54.1 40.9 5.0 0.0
Total Ibex-35 69.7 27.3 3.0 15.6
Stock futures 18.9 78.6 2.5 10.4Stock options 22.1 72.0 5.9 0.0
Total stock contracts 20.6 75.2 4.3 5.1
10Y bond futures 100.0 0.0 0.0 23.9(1) Trades outside the regular session.(2) Trade executed by a single broker for two or more customers.(3) Purchase (sale) of a number of contracts with a given maturity combined with a simultaneous sale (purchase) of a subsequent maturity.(*) Includes MINI Ibex futures.
A.3.18.Breakdown of trading, by type. 2003
Percentage of contracts out of total

Annex 3
: Derivatives m
arkets
237
1995 1,078 4 0 0 1,078 4 0 0 0 0 0 0 0 0 1,078 41996 10,940 5 0 0 10,940 5 60 2 5,529 4 5,589 6 0 0 16,529 111997 78,345 14 72,388 51 150,734 65 40 2 0 0 40 2 0 0 150,774 671998 137,328 38 130,273 60 267,601 98 18 1 0 0 18 1 0 0 267,619 991999 47,080 69 154,871 119 201,951 188 49 2 3,382 7 3,431 9 0 0 205,382 1972000 162,300 118 723,888 329 886,188 447 338 2 11,674 26 12,012 28 214 7 898,414 4822001 415,185 233 1,207,676 802 1,622,860 1,035 31 1 12,577 44 12,609 45 495 12 1,635,964 1,0922002 406,276 360 817,222 1,483 1,223,498 1,843 551 1 8,301 41 8,853 42 0 0 1,232,351 1,8852003 480,781 350 1,094,271 1,383 1,575,053 1,733 0 0 34,627 66 34,627 66 160 12 1,609,839 1,811
January 36,496 165 79,083 699 115,579 674 0 0 1,426 16 1,426 25 0 0 117,005 699February 37,732 139 67,841 595 105,574 673 0 0 1,720 14 1,720 18 0 0 107,294 691March 43,876 171 131,397 672 175,272 701 0 0 2,267 13 2,267 17 0 0 177,539 718April 47,782 185 159,069 738 206,851 680 0 0 2,149 27 2,149 14 13 8 209,012 694May 41,598 179 127,433 699 169,032 737 0 0 2,396 27 2,396 19 6 5 171,434 756June 55,583 185 111,763 710 167,346 699 0 0 1,689 26 1,689 23 8 6 169,043 722July 57,578 164 71,062 621 128,640 723 0 0 2,368 28 2,368 22 9 7 131,017 745August 24,110 145 51,137 593 75,248 631 0 0 2,536 29 2,536 15 6 3 77,790 646September 38,770 166 75,135 627 113,904 580 0 0 5,116 36 5,116 15 6 5 119,026 595October 39,001 163 81,441 622 120,441 750 0 0 4,686 32 4,686 19 35 7 125,163 769NNovember 35,328 155 79,495 603 114,823 942 0 0 4,680 35 4,680 21 42 8 119,545 963December 22,928 162 59,415 598 82,343 941 0 0 3,594 32 3,594 20 35 7 85,972 961
Indexes Shares Total Interest rates Currencies Total Oil
Volume Volume Volume Volume Volume Volume Volume VolumeNo. No. No. No. No. No. No. Nº
Equities Fixed-income and currenciesTOTAL
* The number refers to issues traded in each period, so monthly data do not necessarily coincide with the year’s total.
Commodities
A.3.19.Warrant trading on the Madrid Stock Exchange(*)
Amounts in thousands of euros
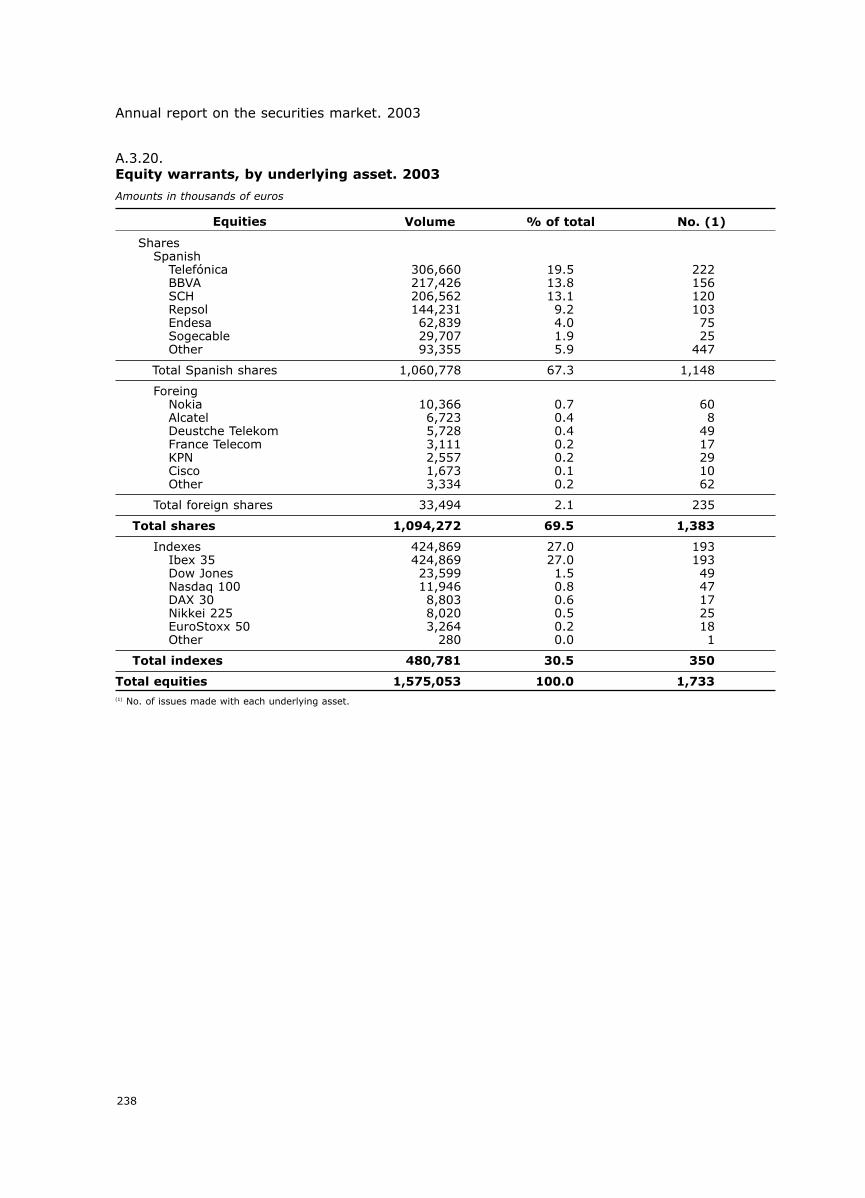
Annual report on the securities market. 2003
238
VolumeEquities % of total No. (1)
SharesSpanish
Telefónica 306,660 19.5 222BBVA 217,426 13.8 156SCH 206,562 13.1 120Repsol 144,231 9.2 103Endesa 62,839 4.0 75Sogecable 29,707 1.9 25Other 93,355 5.9 447
Total Spanish shares 1,060,778 67.3 1,148
ForeingNokia 10,366 0.7 60Alcatel 6,723 0.4 8Deustche Telekom 5,728 0.4 49France Telecom 3,111 0.2 17KPN 2,557 0.2 29Cisco 1,673 0.1 10Other 3,334 0.2 62
Total foreign shares 33,494 2.1 235
Total shares 1,094,272 69.5 1,383
Indexes 424,869 27.0 193Ibex 35 424,869 27.0 193Dow Jones 23,599 1.5 49Nasdaq 100 11,946 0.8 47DAX 30 8,803 0.6 17Nikkei 225 8,020 0.5 25EuroStoxx 50 3,264 0.2 18Other 280 0.0 1
Total indexes 480,781 30.5 350
Total equities 1,575,053 100.0 1,733(1) No. of issues made with each underlying asset.
A.3.20.Equity warrants, by underlying asset. 2003
Amounts in thousands of euros

ANNEX 4
COLLECTIVE INVESTMENT SCHEMESAND VENTURE CAPITAL
COMPANIES

AssetsThousands of euros
241
Annex 4: Collective investment schemes and venture capital companies
A.4.1.Investment in securities. Number of institutions, assets and number of investors
FIM FIAMM TotalYear SIM SIMCAV TOTAL
Total Gauranteed Total Guaranteed Funds Companies
1992 17,985,618 0 19,760,136 0 1,872,435 212,680 37,745,754 2,085,115 39,830,8691993 33,403,273 0 28,468,345 0 2,136,784 356,304 61,871,618 2,493,088 64,364,7061994 31,777,235 0 35,834,037 0 1,934,610 450,302 67,611,272 2,384,912 69,996,1841995 31,251,986 1,345,011 42,030,141 145,325 1,935,457 573,618 73,282,127 2,509,075 75,791,2021996 55,364,898 10,245,453 57,074,742 274,374 2,257,534 944,370 112,439,640 3,201,904 115,641,5441997 101,352,512 28,277,217 61,097,358 365,163 2,694,554 2,122,402 162,449,870 4,816,956 167,266,8261998 153,130,870 48,073,011 50,643,167 338,550 3,151,197 4,977,618 203,774,037 8,128,815 211,902,8521999 163,695,776 45,551,674 42,598,008 268,522 3,326,852 9,832,465 206,293,784 13,159,317 219,453,1012000 152,700,270 42,380,475 33,368,089 28,012 2,777,924 12,661,185 186,068,359 15,439,109 201,507,4682001 137,470,645 40,507,979 43,830,303 13,153 2,491,168 16,854,507 181,300,948 19,345,675 200,646,6232002 121,368,392 36,674,316 53,366,474 11,485 1,974,492 16,925,915 174,734,866 18,900,407 193,635,2732003 152,572,747 49,230,784 58,054,417 0 2,024,539 20,163,057 210,627,164 22,187,596 232,814,760
Number of investorsThousands
FIM FIAMM TotalAño SIM SIMCAV TOTAL
Total Guaranteed Total Guaranteed Funds Companies
1992 900 0 777 0 84 34 1,677 117 1,7951993 1,447 0 1,101 0 75 26 2,548 101 2,6491994 1,441 0 1,356 0 64 32 2,797 97 2,8931995 1,334 58 1,611 9 60 33 2,946 93 3,0381996 2,184 424 2,107 15 57 33 4,291 90 4,3811997 3,946 1,140 2,274 18 54 40 6,221 93 6,3141998 5,976 1,975 2,012 16 53 49 7,988 102 8,0901999 6,349 1,828 1,689 15 50 77 8,038 127 8,1652000 6,351 1,802 1,343 2 43 144 7,693 187 7,8802001 5,842 1,775 1,612 1 40 254 7,454 294 7,7482002 5,363 1,642 1,727 0 32 306 7,090 338 7,4282003 5,709 2,057 1,909 0 30 337 7,618 367 7,985
Number of institutionsUnits
FIM FIAMM TotalYear SIM SIMCAV TOTAL
Total Guaranteed Total Guaranteed Funds Companies
1992 371 0 106 0 230 25 477 255 7321993 441 0 130 0 224 27 571 251 8221994 528 0 138 0 222 41 666 263 9291995 602 34 154 1 215 53 756 268 1,0241996 788 132 181 1 217 68 969 285 1,2541997 1,277 390 204 3 218 137 1,481 355 1,8361998 1,675 553 206 3 230 361 1,881 591 2,4721999 1,964 547 203 3 211 883 2,167 1,094 3,2612000 2,266 577 201 2 172 1,498 2,467 1,670 4,1372001 2,421 609 178 1 153 2,115 2,599 2,268 4,8672002 2,373 579 165 1 129 2,646 2,538 2,775 5,3132003 2,386 607 168 0 108 2,894 2,554 3,002 5,556

242
Annual rep
ort o
n th
e securities m
arket. 2003
A.4.2.Investment in securities. Yield on mutual funds by portfolio type
FIAMM FIM
FIAMM IFIAMM RFCP RFLP RFM RVM RVN RFI RFMI RVMI RVE RVI RVIE RVIJ RVIU RVIM RVIO GRF GRV FGL
2001 3.56 5.47 3.84 4.02 –0.50 –6.61 –8.80 2.89 –1.33 –8.61 –19.03 –20.85 – – – – – 4.42 0.24 –10.442002 2.42 – 2.72 4.34 –3.84 –15.92 –26.91 –0.64 –2.42 –17.96 –33.45 – –33.78 –25.41 –34.25 –24.53 –35.16 4.46 0.37 –12.422003 2.42 – 2.72 4.34 –3.84 –15.92 –26.91 –0.64 –2.42 –17.96 –33.45 – –33.78 –25.41 –34.25 –24.53 –35.16 4.46 0.37 –12.42
2003 1Q 0.59 0.00 0.64 1.09 –0.86 –4.16 –2.1 0.44 –0.63 –4.15 –12.31 – –12.79 –11.3 –6.17 –7.06 –8.23 1.04 0.49 –1.442Q 0.49 0.00 0.63 1.45 3.78 8.82 16.32 1.18 1.69 6.43 18.41 – 15.61 6.88 9.14 13.74 11.67 0.99 1.54 3.783Q 0.43 0.00 0.35 0.15 –0.03 –0.18 –0.78 0.2 –0.15 1.06 0.03 – 0.86 17.35 1.3 10.53 3.11 0.2 0.23 0.634Q 0.3 0.00 0.36 –0.08 2.33 6.93 14.05 –0.5 1.18 3.68 13.27 – 10.82 –0.49 5.33 7.96 5.51 0.11 1.01 1.86
FIAMM:FIAMM: assets are denominated in euros, with a maximun of 5% in non-euro currencies.FIAMM Internacional: more than 5% of assets are denominated in non-euro currencies.
FIM:RFCP: short-term fixed-income FIM. The average duration of the portfolio cannot exceed 2 years. It does not include equities or equity derivatives.Assets are denominated in euros, with a maximun of 5% in non-euro currencies.RFLP: long-term fixed-income FIM. The average duration of the portfolio must be over 2 years. It does not include equities or equity derivatives.Assets are denominated in euros, with a maximum of 5% in non-euro currencies.RFM: mixed fixed-income FIM. Less than 30% of the portfolio in equities.Assets are denominated in euros, with a maximun of 5% in non-euro currencies.RVM: mixed equity FIM. Between 30% and 75% of the portfolio in equities.Assets are denominated in euros, with a maximum of 30% in non-euro currencies.RVN: Spanish equity FIM. More than 75% of the portfolio in equities traded on Spanish markets and assets from Spanish issuers traded on other markets.Assets are denominated in euros, with a maximum of 30% in non-euro currencies.RFI: foreign fixed-income FIM. The portfolio does not include equities or equity derivatives.More than 5% of assets are denominated in non-euro currencies.RFMI: foreign mixed fixed-income FIM. Less than 30% of the portfolio in equities. More than 5% of assets are denominated in non-euro currencies.RVMI: foreign mixed equity FIM. Between 30% and 75% of the portfolio in equities. More than 30% of assets are denominated in non-euro currencies.RVE: euro equity FIM. More than 75% of the portfolio in equities. Spanish equities may not exceed 75% of the portfolio.Assets are denominated in euros, with a maximum of 30% in non-euro currencies.RVI: foreign equity FIM. More than 75% of the portfolio in equities. More than 30% of assets are denominated in non-euro currencies.RVIE: More than 75% in equities and more than 30% in assts not denominated in euros. European securities represent more than 75% of the equities portfolio.RVIJ: More than 75% in equities and more than 30% in assets not denominated in euros. Japanese securities represent more than 75% of the equities portfolio.RVIU: More than 75% in equities and more than 30% in assets not denominated in euros. US securities represent more than 75% of the equities portfolio.RVIM: More than 75% in equities and more than 30% in assets not denominated in euros. Securities from emerging countries represent more than 75% of the equities portfolio.RVIO: More than 75% in equities and more than 30% in assets not denominated in euros. Other.GRF: guaranteed fixed-income FIM. Fund for which there is a third-party guarantee and which guarantees only a fixed yield.GRV: guaranteed equity FIM. Fund for which there is a third-party guarantee and which guarantees an amount either completely or partially linked toperformance of equity or currency instruments.FGL: global funds. Funds with no precise definition of investment policy, which do not fit into any of the previous categories.
%
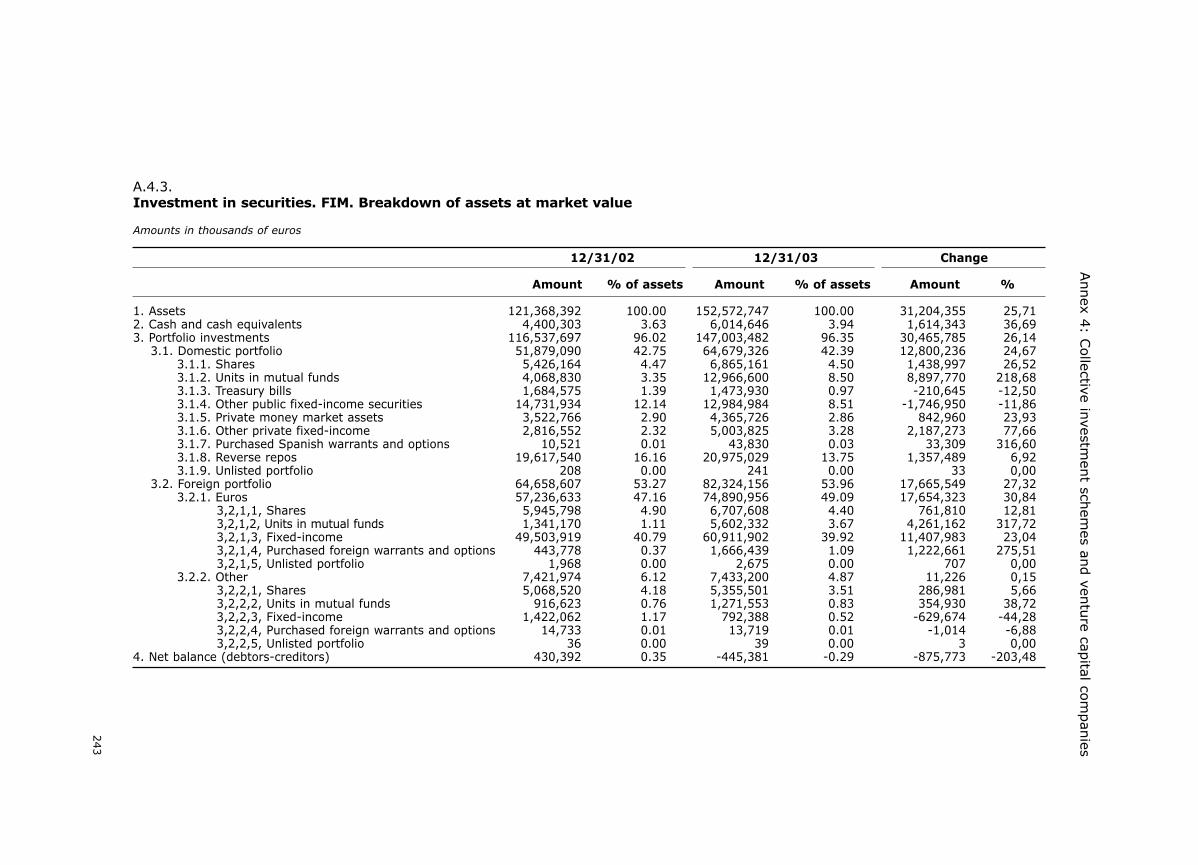
243
Annex 4
: Collective in
vestmen
t schem
es and ven
ture cap
ital com
pan
ies
A.4.3.Investment in securities. FIM. Breakdown of assets at market value
12/31/02 12/31/03 Change
Amount % of assets Amount % of assets Amount %
1. Assets 121,368,392 100.00 152,572,747 100.00 31,204,355 25,712. Cash and cash equivalents 4,400,303 3.63 6,014,646 3.94 1,614,343 36,693. Portfolio investments 116,537,697 96.02 147,003,482 96.35 30,465,785 26,14
3.1. Domestic portfolio 51,879,090 42.75 64,679,326 42.39 12,800,236 24,673.1.1. Shares 5,426,164 4.47 6,865,161 4.50 1,438,997 26,523.1.2. Units in mutual funds 4,068,830 3.35 12,966,600 8.50 8,897,770 218,683.1.3. Treasury bills 1,684,575 1.39 1,473,930 0.97 -210,645 -12,503.1.4. Other public fixed-income securities 14,731,934 12.14 12,984,984 8.51 -1,746,950 -11,863.1.5. Private money market assets 3,522,766 2.90 4,365,726 2.86 842,960 23,933.1.6. Other private fixed-income 2,816,552 2.32 5,003,825 3.28 2,187,273 77,663.1.7. Purchased Spanish warrants and options 10,521 0.01 43,830 0.03 33,309 316,603.1.8. Reverse repos 19,617,540 16.16 20,975,029 13.75 1,357,489 6,923.1.9. Unlisted portfolio 208 0.00 241 0.00 33 0,00
3.2. Foreign portfolio 64,658,607 53.27 82,324,156 53.96 17,665,549 27,323.2.1. Euros 57,236,633 47.16 74,890,956 49.09 17,654,323 30,84
3,2,1,1, Shares 5,945,798 4.90 6,707,608 4.40 761,810 12,813,2,1,2, Units in mutual funds 1,341,170 1.11 5,602,332 3.67 4,261,162 317,723,2,1,3, Fixed-income 49,503,919 40.79 60,911,902 39.92 11,407,983 23,043,2,1,4, Purchased foreign warrants and options 443,778 0.37 1,666,439 1.09 1,222,661 275,513,2,1,5, Unlisted portfolio 1,968 0.00 2,675 0.00 707 0,00
3.2.2. Other 7,421,974 6.12 7,433,200 4.87 11,226 0,153,2,2,1, Shares 5,068,520 4.18 5,355,501 3.51 286,981 5,663,2,2,2, Units in mutual funds 916,623 0.76 1,271,553 0.83 354,930 38,723,2,2,3, Fixed-income 1,422,062 1.17 792,388 0.52 -629,674 -44,283,2,2,4, Purchased foreign warrants and options 14,733 0.01 13,719 0.01 -1,014 -6,883,2,2,5, Unlisted portfolio 36 0.00 39 0.00 3 0,00
4. Net balance (debtors-creditors) 430,392 0.35 -445,381 -0.29 -875,773 -203,48
Amounts in thousands of euros

244
Annual report on the securities market. 2003
A.4.4.Investment in securities. FIM. Transactions in derivatives
Committed nominal amount
12/31/2002 12/31/2003
Amount % of assets Amount % of assets
Forward purchases 1,253,019 1.03 850,601 0.56Spot purchases 514,138 0.42 391,731 0.26Purchased futures 12,743,648 10.50 15,027,130 9.85Options and warrats (call purchase, put sale) 18,620,032 15.34 31,129,659 20.40Financial swaps. Collection rights 1,079,745 0.89 5,932,743 3.89Other purchase commitments 0 0.00 0 0.00Forward sales 1,329,830 1.10 1,464,061 0.96Spot sales 22,535 0.02 53,575 0.04Sold futures 4,361,249 3.59 7,301,966 4.79Options and warrants (call sale, put purchase) 3,864,030 3.18 5,718,180 3.75Financial swaps. Payment obligations 1,379,720 1.14 6,106,205 4.00Other sale commitments 0 0.00 0 0.00
TOTAL 45,167,946 37.22 73,975,851 48.49
A.4.5.Investment in securities. FIM.Breakdown of the foreign portfolio by region
Fixed-income Equities Warrants
Euro zone 2002 2003 2002 2003 2002 2003
TOTAL EURO ZONE 49,467,427 60,904,845 8,792,119 13,796,219 430,670 1,666,452EURO 49,260,144 60,814,473 7,260,853 12,307,697 430,465 1,666,439DANISH KRONE 44,551 17,006 13,591 11,348 0 0POUND STERLING 118,179 59,987 1,478,693 1,391,306 205 13SWEDISH KRONA 44,553 13,379 38,982 85,868 0 0
REST OF WORLD 1,458,461 799,258 4,482,136 5,143,489 27,677 13,706US DOLLAR 1,089,405 627,260 3,197,113 3,836,309 14,461 13,686JAPANESE YEN 73,247 35,860 556,099 524,663 28 3REST OF EUROPE 16,094 13,067 592,482 636,752 29 0SOUTH AMERICA 0 0 46,178 48,092 10 17OTHER 279,715 123,071 90,264 97,673 13,149 0
TOTAL 50,925,888 61,704,103 13,274,255 18,939,708 458,347 1,680,158
Amounts in thousands of euros
Amounts in thousands of euros

245
Annex 4
: Collective in
vestmen
t schem
es and ven
ture cap
ital com
pan
ies
A.4.6.Investment in securities. FIM. Breakdown of change in assets
2003 Accumulated
1Q 2Q 3Q 4Q 2003 2002
% of % of % of % of % of % ofAmount average Amount average Amount average Amount average Amount average Amount average
daily assets daily assets daily assets daily assets daily assets daily assets
Change in assets 9,086,800 7.11 9,950,574 7.30 5,554,727 3.84 6,612,209 4.41 31,204,310 22.87 –15,989,859 –12.41
Net subscriptions andreimbursements 10,255,942 8.02 5,690,077 4.17 5,106,410 3.53 3,475,598 2.32 24,528,027 17.98 –6,961,736 –5.40
Gross distributed profits 0 0.00 0 0.00 0 0.00 0 0.00 0 0.00 0 0.00
Net yields –1,169,148 –0.91 4,260,508 3.12 448,317 0.31 3,136,612 2.09 6,676,289 4.89 –9,028,154 –7.00
Total yields –760,848 –0.59 4,698,376 3.45 906,318 0.63 3,624,703 2.42 8,468,549 6.21 –7,195,934 –5.58Interest 907,282 0.71 900,022 0.66 895,717 0.62 858,126 0.57 3,561,147 2.61 3,994,448 3.10Dividends 77,527 0.06 167,233 0.12 109,241 0.08 58,273 0.04 412,274 0.30 458,281 0.36Total change in price of
fixed-income (whetherrealised or not) 468,616 0.37 418,331 0.31 –686,617 –0.47 –471,434 –0.31 –271,104 –0.20 679,931 0.53
Total change in price ofequities (whetherrealised or not) –1,926,450 –1.51 2,711,083 1.99 549,009 0.38 2,299,376 1.53 3,633,018 2.66 –9,731,212 –7.55
Results on derivatives –193,899 –0.15 571,069 0.42 44,945 0.03 913,828 0.61 1,335,943 0.98 –2,519,361 –1.95Other yields 5,188 0.00 –26,128 –0.02 1,772 0.00 –12,031 –0.01 –31,199 –0.02 51,987 0.04Foreign exchange differences –99,112 –0.08 –43,234 –0.03 –7,749 –0.01 –21,435 –0.01 –171,530 –0.13 –130,008 –0.10
Total expenses 408,300 0.32 437,868 0.32 458,001 0.32 488,091 0.33 1,792,260 1.31 1,832,220 1.42Management fees 370,386 0.29 395,200 0.29 413,889 0.29 443,358 0.30 1,622,833 1.19 1,659,701 1.29Custody fees 32,268 0.03 34,202 0.03 36,259 0.03 37,623 0.03 140,352 0.10 141,633 0.11Other operating costs 5,646 0.00 8,466 0.01 7,853 0.01 7,110 0.00 29,075 0.02 30,886 0.02
Amount in thousands of euros
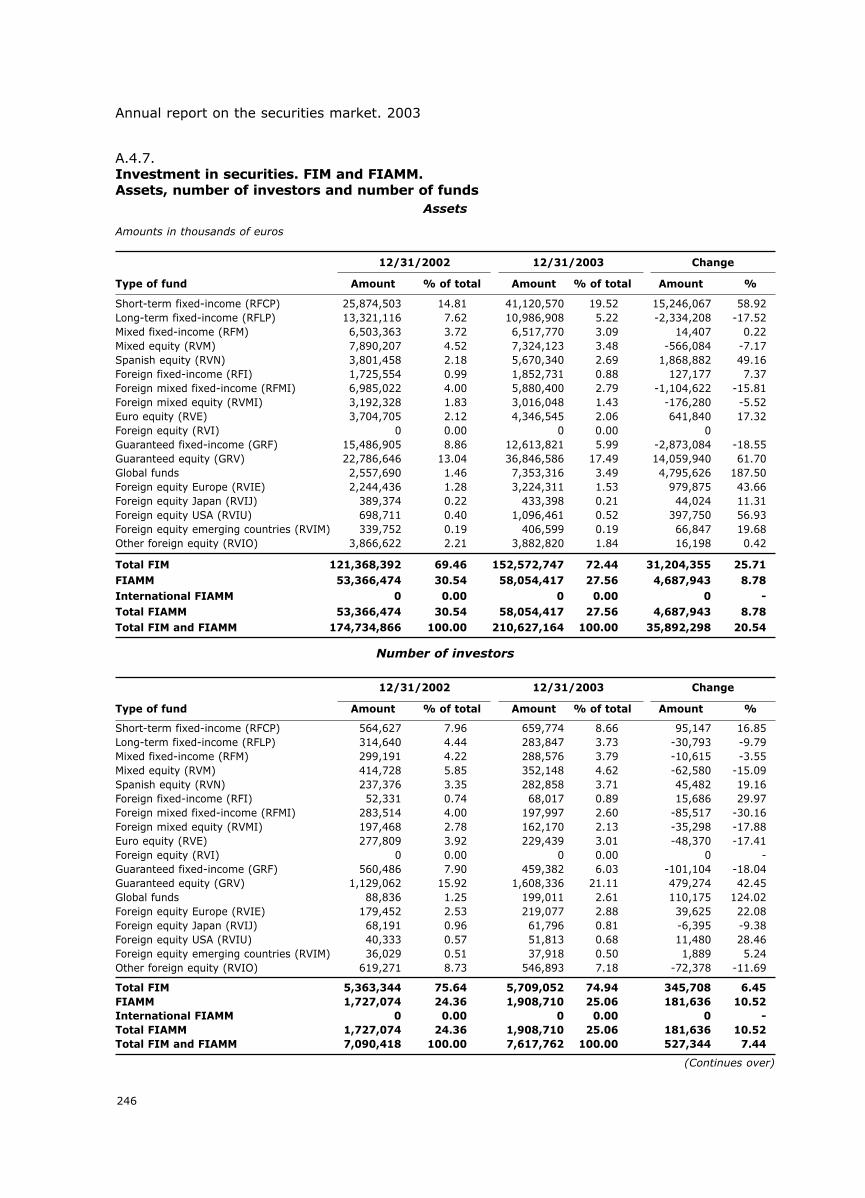
246
Annual report on the securities market. 2003
A.4.7.Investment in securities. FIM and FIAMM.Assets, number of investors and number of funds
12/31/2002 12/31/2003 Change
Type of fund Amount % of total Amount % of total Amount %
Short-term fixed-income (RFCP) 25,874,503 14.81 41,120,570 19.52 15,246,067 58.92Long-term fixed-income (RFLP) 13,321,116 7.62 10,986,908 5.22 -2,334,208 -17.52Mixed fixed-income (RFM) 6,503,363 3.72 6,517,770 3.09 14,407 0.22Mixed equity (RVM) 7,890,207 4.52 7,324,123 3.48 -566,084 -7.17Spanish equity (RVN) 3,801,458 2.18 5,670,340 2.69 1,868,882 49.16Foreign fixed-income (RFI) 1,725,554 0.99 1,852,731 0.88 127,177 7.37Foreign mixed fixed-income (RFMI) 6,985,022 4.00 5,880,400 2.79 -1,104,622 -15.81Foreign mixed equity (RVMI) 3,192,328 1.83 3,016,048 1.43 -176,280 -5.52Euro equity (RVE) 3,704,705 2.12 4,346,545 2.06 641,840 17.32Foreign equity (RVI) 0 0.00 0 0.00 0Guaranteed fixed-income (GRF) 15,486,905 8.86 12,613,821 5.99 -2,873,084 -18.55Guaranteed equity (GRV) 22,786,646 13.04 36,846,586 17.49 14,059,940 61.70Global funds 2,557,690 1.46 7,353,316 3.49 4,795,626 187.50Foreign equity Europe (RVIE) 2,244,436 1.28 3,224,311 1.53 979,875 43.66Foreign equity Japan (RVIJ) 389,374 0.22 433,398 0.21 44,024 11.31Foreign equity USA (RVIU) 698,711 0.40 1,096,461 0.52 397,750 56.93Foreign equity emerging countries (RVIM) 339,752 0.19 406,599 0.19 66,847 19.68Other foreign equity (RVIO) 3,866,622 2.21 3,882,820 1.84 16,198 0.42
Total FIM 121,368,392 69.46 152,572,747 72.44 31,204,355 25.71FIAMM 53,366,474 30.54 58,054,417 27.56 4,687,943 8.78International FIAMM 0 0.00 0 0.00 0 -Total FIAMM 53,366,474 30.54 58,054,417 27.56 4,687,943 8.78Total FIM and FIAMM 174,734,866 100.00 210,627,164 100.00 35,892,298 20.54
Assets
Amounts in thousands of euros
12/31/2002 12/31/2003 Change
Type of fund Amount % of total Amount % of total Amount %
Short-term fixed-income (RFCP) 564,627 7.96 659,774 8.66 95,147 16.85Long-term fixed-income (RFLP) 314,640 4.44 283,847 3.73 -30,793 -9.79Mixed fixed-income (RFM) 299,191 4.22 288,576 3.79 -10,615 -3.55Mixed equity (RVM) 414,728 5.85 352,148 4.62 -62,580 -15.09Spanish equity (RVN) 237,376 3.35 282,858 3.71 45,482 19.16Foreign fixed-income (RFI) 52,331 0.74 68,017 0.89 15,686 29.97Foreign mixed fixed-income (RFMI) 283,514 4.00 197,997 2.60 -85,517 -30.16Foreign mixed equity (RVMI) 197,468 2.78 162,170 2.13 -35,298 -17.88Euro equity (RVE) 277,809 3.92 229,439 3.01 -48,370 -17.41Foreign equity (RVI) 0 0.00 0 0.00 0 -Guaranteed fixed-income (GRF) 560,486 7.90 459,382 6.03 -101,104 -18.04Guaranteed equity (GRV) 1,129,062 15.92 1,608,336 21.11 479,274 42.45Global funds 88,836 1.25 199,011 2.61 110,175 124.02Foreign equity Europe (RVIE) 179,452 2.53 219,077 2.88 39,625 22.08Foreign equity Japan (RVIJ) 68,191 0.96 61,796 0.81 -6,395 -9.38Foreign equity USA (RVIU) 40,333 0.57 51,813 0.68 11,480 28.46Foreign equity emerging countries (RVIM) 36,029 0.51 37,918 0.50 1,889 5.24Other foreign equity (RVIO) 619,271 8.73 546,893 7.18 -72,378 -11.69
Total FIM 5,363,344 75.64 5,709,052 74.94 345,708 6.45FIAMM 1,727,074 24.36 1,908,710 25.06 181,636 10.52International FIAMM 0 0.00 0 0.00 0 -Total FIAMM 1,727,074 24.36 1,908,710 25.06 181,636 10.52Total FIM and FIAMM 7,090,418 100.00 7,617,762 100.00 527,344 7.44
Number of investors
(Continues over)

247
Annex 4: Collective investment schemes and venture capital companies
A.4.7.Investment in securities. FIM and FIAMM.Assets, number of investors and number of funds
12/31/2002 12/31/2003 Change
Type of fund Amount % of total Amount % of total Amount %
Short-term fixed-income (RFCP) 203 8.09 242 9.59 39 19.21Long-term fixed-income (RFLP) 162 6.46 162 6.42 0 0.00Mixed fixed-income (RFM) 173 6.90 167 6.62 -6 -3.47Mixed equity (RVM) 205 8.17 182 7.21 -23 -11.22Spanish equity (RVN) 101 4.03 110 4.36 9 8.91Foreign fixed-income (RFI) 69 2.75 66 2.62 -3 -4.35Foreign mixed fixed-income (RFMI) 81 3.23 84 3.33 3 3.70Foreign mixed equity (RVMI) 103 4.11 83 3.29 -20 -19.42Euro equity (RVE) 124 4.94 108 4.28 -16 -12.90Foreign equity (RVI) 0 0.00 0 0.00 0 -Guaranteed fixed-income (GRF) 214 8.53 191 7.57 -23 -10.75Guaranteed equity (GRV) 388 15.47 433 17.16 45 11.60Global funds 132 5.26 195 7.73 63 47.73Foreign equity Europe (RVIE) 47 1.87 53 2.10 6 12.77Foreign equity Japan (RVIJ) 29 1.16 24 0.95 -5 -17.24Foreign equity USA (RVIU) 46 1.83 41 1.63 -5 -10.87Foreign equity emerging countries (RVIM) 42 1.67 42 1.66 0 0.00Other foreign equity (RVIO) 226 9.01 172 6.82 -54 -23.89
Total FIM 2,345 93.50 2,355 93.34 10 0.43FIAMM 163 6.50 168 6.66 5 3.07International FIAMM 0 0.00 0 0.00 0 -Total FIAMM 163 6.50 168 6.66 5 3.07Total FIM and FIAMM 2,508 100.00 2,523 100.00 15 0.60
Number of funds
(Continued)

248
Annual rep
ort o
n th
e securities m
arket. 2003
A.4.8.Investment in securities. FIM. Yields, volatility and duration
1Q 2Q 3Q 4Q 2003
Yield Vol Dur Yield Vol Dur Yield Vol Dur Yield Vol Dur Yield Vol(1) (2) Type (1) (2) Type (1) (2) Type (1) (2) Type (1)% % % % %
AC DEUDA FT FIM 0.72 0.88 1.28 RFCP 0.74 0.90 1.21 RFCP 0.18 0.99 1.34 RFCP -0.06 0.90 0.78 RFCP 1.59 0.92 12.45 1.41 0.00 0.00 0.00 0.00 0.00 0.07AC DINERPLUS FIM 0.71 0.23 0.64 RFCP 0.65 0.19 0.46 RFCP 0.48 0.19 0.43 RFCP 0.47 0.12 0.60 RFCP 2.34 0.19 16.26 0.50 0.00 0.00 0.00 0.50 0.00 0.06AF TESORERIA FIM 0.43 1.12 0.00 RFCP 0.36 1.17 0.00 RFCP 0.27 4.94 0.00 RFCP 0.26 1.22 0.00 RFCP 1.32 0.01 12.50 0.80 0.00 0.00 0.00 0.00 0.00 0.07AHORRO CORP. RENDIMIENTO FIM 0.29 0.59 1.52 RFCP 0.61 0.49 0.96 RFCP 0.56 0.66 1.23 RFCP 0.26 0.69 1.67 RFCP 1.74 0.61 10.76 1.40 0.00 0.00 0.00 2.00 0.00 0.05ALLIANZ RF CORTO EUROLAND FIMF 0.61 0.19 0.00 RFCP 0.54 0.22 0.00 RFCP 0.33 0.19 0.00 RFCP 0.27 0.42 0.01 RFCP 1.76 0.27 NA 0.00 0.00 0.00 0.00 1.00 0.00 0.14ALTAE INSTITUCIONES FIM 0.68 0.10 0.26 RFCP 0.59 8.55 0.23 RFCP 0.43 0.11 0.00 RFCP 0.44 6.75 0.22 RFCP 2.17 0.09 NA 0.20 0.00 0.00 0.00 0.00 0.00 0.05ALTAE RENTA FIM 0.81 0.66 0.73 RFCP 0.63 0.62 0.68 RFCP 0.13 0.73 0.00 RFCP -0.05 0.48 0.38 RFCP 1.52 0.63 11.50 1.25 0.00 0.00 0.00 0.00 0.00 0.10ARCALIA INTERES FIM 0.83 0.54 1.13 RFCP 0.71 0.55 0.80 RFCP 0.34 0.40 0.44 RFCP 0.31 0.25 0.40 RFCP 2.20 0.45 15.34 0.50 0.00 0.00 0.00 0.00 0.00 0.10ASTURFONDO RENTA FIJA FIM 0.75 0.73 2.06 RFCP 0.91 0.57 1.82 RFCP 0.44 0.81 1.51 RFCP 0.24 0.68 1.73 RFCP 2.36 0.71 9.24 1.75 0.00 0.00 0.00 0.00 0.00 0.14ASTURFONDO RENTAS FIM 0.56 0.03 0.18 RFCP 0.49 1.08 0.17 RFCP 0.41 1.26 0.21 RFCP 0.40 0.01 0.25 RFCP 1.87 2.53 15.37 0.45 0.00 0.00 0.00 0.00 0.00 0.05AVIVA DINERO FIM 0.76 0.53 1.21 RFCP 0.80 0.60 1.10 RFCP 0.34 0.43 1.32 RFCP 0.52 0.83 1.13 RFCP 2.43 0.62 NA 0.50 0.00 0.00 0.00 0.00 0.00 0.11BANCAJA RENTA FIJA A CORTO 1 FIMS NA 9.50 0.00 RFCP 0.51 9.50 0.00 RFCP 0.44 0.10 0.00 RFCP 0.44 0.09 0.01 RFCP NA 9.97 NA 0.25 0.00 0.00 0.00 0.00 0.00 0.05BANCAJA RENTA FIJA A CORTO 2 FIMS NA 9.61 0.00 RFCP 0.44 0.11 0.00 RFCP 0.40 0.10 0.00 RFCP 0.38 0.10 0.01 RFCP NA 0.10 NA 0.45 0.00 0.00 0.00 0.00 0.00 0.05BANESDEUDA FT FIM 0.98 1.48 2.33 RFCP 0.88 1.49 1.87 RFCP 0.08 1.69 2.18 RFCP -0.29 1.46 1.94 RFCP 1.67 1.54 13.82 1.50 0.00 0.00 0.00 0.00 0.00 0.00BANESDEUDA FV FIM 0.96 1.44 2.30 RFCP 0.93 1.50 1.87 RFCP 0.04 1.58 2.02 RFCP -0.28 1.33 1.91 RFCP 1.65 1.47 14.02 1.50 0.00 0.00 0.00 0.00 0.00 0.15BANESTO DINERO FIM 0.34 0.13 0.35 RFCP 0.32 0.14 0.34 RFCP 0.12 0.10 0.31 RFCP 0.16 8.50 0.17 RFCP 0.95 0.12 8.16 1.50 0.00 0.00 0.00 0.00 0.00 0.20BANESTO EMPRESAS FIM 0.58 0.18 0.37 RFCP 0.53 0.16 0.23 RFCP 0.31 0.14 0.23 RFCP 0.33 9.21 0.18 RFCP 1.77 0.15 NA 0.60 0.00 0.00 0.00 0.00 0.00 0.15BANESTO ESPECIAL DR FIM 0.60 0.16 0.40 RFCP 0.57 0.12 0.27 RFCP 0.39 0.12 0.27 RFCP 0.41 0.10 0.15 RFCP 1.99 0.13 15.73 0.50 0.00 0.00 0.00 0.00 0.00 0.10BANIF INSTITUCIONES FIM 0.62 0.16 0.42 RFCP 0.60 0.14 0.29 RFCP 0.41 0.12 0.25 RFCP 0.43 0.10 0.15 RFCP 2.09 0.13 16.30 0.45 0.00 0.00 0.00 0.00 0.00 0.05BANIF RF CORTO PLAZO FIM 0.91 0.71 0.18 RFCP 0.49 0.11 0.21 RFCP 0.48 0.07 0.15 RFCP 0.45 8.62 0.20 RFCP 2.35 0.36 14.33 1.10 0.00 0.00 0.00 0.00 0.00 0.20BANKINTER SOLIDARIDAD FIM NA NA NA NA NA NA NA NA NA NA 0.49 0.19 RFCP NA 0.49 NA 0.70 0.00 0.00 0.00 0.00 0.00 0.50BANKINTER TESORERIA EMPRESAS FIM 0.67 4.57 0.29 RFCP 0.55 0.04 0.32 RFCP 0.43 2.12 0.31 RFCP 0.42 9.72 0.23 RFCP 2.08 6.39 16.07 0.20 0.00 0.00 0.00 0.00 0.00 0.20BANKOA-AHORRO FONDO FIM 0.57 6.90 0.43 RFCP 0.53 0.08 0.50 RFCP 0.45 5.20 0.52 RFCP 0.39 8.87 0.54 RFCP 1.95 7.72 21.24 0.50 0.00 0.00 0.00 0.00 0.00 0.00BARCLAYS BONOS CORPORATIVOS FIM 1.43 1.52 2.16 RFCP 1.23 2.22 2.33 RFCP 0.15 2.78 2.46 RFCP -0.55 2.05 2.93 RFCP 2.26 2.20 NA 0.70 0.00 0.00 0.00 2.00 0.00 0.15BARCLAYS BONOS CORTO FIM 1.35 1.63 2.34 RFCP 1.11 2.16 2.52 RFCP 0.02 2.51 2.32 RFCP -0.34 1.90 2.28 RFCP 2.16 2.08 15.62 1.00 0.00 0.00 0.00 1.00 0.00 0.20BARCLAYS GESTION FIMF 1.08 0.95 0.01 RFCP 1.01 1.60 0.01 RFCP 0.11 1.60 0.01 RFCP -0.18 1.31 0.01 RFCP 2.04 1.40 NA 0.05 0.00 0.00 0.00 2.00 0.00 0.00BARCLAYS MONETARIO FIM 0.59 0.08 0.11 RFCP 0.54 0.18 0.14 RFCP 0.43 4.13 0.19 RFCP 0.42 3.40 0.14 RFCP 1.99 0.10 NA 0.35 0.00 0.00 0.00 0.00 0.00 0.10BARCLAYS RENDIMIENTO EFECTIVO FIM NA 1.19 0.01 RFCP 0.53 0.16 0.11 RFCP 0.45 2.76 0.23 RFCP 0.44 4.20 0.10 RFCP NA 0.25 NA 0.20 0.00 0.00 0.00 0.00 0.00 0.10BARCLAYS TESORERIA FIM 0.57 5.65 0.13 RFCP 0.48 0.03 0.12 RFCP 0.38 5.14 0.17 RFCP 0.38 7.18 0.14 RFCP 1.83 5.84 14.99 0.50 0.00 0.00 0.00 0.00 0.00 0.15BBK TESORERIA FIM 0.54 1.37 0.18 RFCP 0.46 0.01 0.14 RFCP 0.39 5.66 0.14 RFCP 0.39 1.31 0.17 RFCP 1.80 1.84 14.93 0.40 0.00 0.00 0.00 0.00 0.00 0.09BBVA AGROCASH FIM NA NA NA NA NA NA NA 0.01 0.01 RFCP -0.35 7.34 0.14 RFCP NA 5.83 NA 0.25 0.00 0.00 0.00 0.00 0.00 0.10BBVA CASH EMPRESAS FIM NA NA NA NA NA NA NA 2.22 0.20 RFCP 0.47 2.56 0.23 RFCP NA 0.02 NA 0.10 0.00 0.00 0.00 0.00 0.00 0.05BBVA CORTO PLUS EMPRESAS FIM NA NA NA NA NA NA NA 8.45 0.16 RFCP 0.53 8.18 0.16 RFCP NA 8.42 NA 0.25 0.00 0.00 0.00 0.00 0.00 0.05BBVA RENTA FIJA CORTO FIM 0.41 0.10 0.36 RFCP 0.31 0.11 0.37 RFCP 0.16 0.11 0.59 RFCP 0.17 0.10 0.67 RFCP 1.05 0.11 9.63 1.50 0.00 0.00 0.00 0.00 0.00 0.15BBVA RENTA FIJA CORTO PLUS FIM 0.76 0.55 0.95 RFCP 0.80 0.92 0.65 RFCP 0.54 1.03 2.14 RFCP 0.29 0.76 2.22 RFCP 2.41 0.84 9.43 0.85 0.00 0.00 0.00 0.00 0.00 0.15BBVA TESORERIA FIM 0.62 7.73 0.28 RFCP 0.52 7.41 0.37 RFCP 0.42 8.41 0.32 RFCP 0.40 8.43 0.32 RFCP 1.97 8.24 15.99 0.50 0.00 0.00 0.00 0.00 0.00 0.10BBVA TESORERIA II FIM NA NA NA NA NA NA NA 3.72 0.25 RFCP 0.47 6.41 0.26 RFCP NA 5.46 NA 0.20 0.00 0.00 0.00 0.00 0.00 0.10BETA TESORERIA FIM 0.68 0.19 0.20 RFCP 0.65 0.10 0.14 RFCP 0.51 7.59 0.19 RFCP 0.51 0.10 0.28 RFCP 2.37 0.13 NA 0.20 0.00 0.00 0.00 0.00 0.00 0.05BG FOND EMPRESA FIM 0.58 2.50 0.09 RFCP 0.52 1.85 0.08 RFCP 0.41 9.80 0.07 RFCP 0.39 9.31 0.11 RFCP 1.90 2.41 NA 0.50 0.00 0.00 0.00 0.00 0.00 0.09BG ONDAR RENTA FIM 0.79 1.01 1.38 RFCP 0.48 0.58 0.82 RFCP 0.15 0.53 0.81 RFCP 0.06 0.46 0.93 RFCP 1.49 0.68 12.02 1.30 0.00 0.00 0.00 1.00 0.00 0.18BK MONETARIO DINAMICO FIMF 0.64 0.10 0.28 RFCP 0.49 6.23 0.33 RFCP 0.46 0.15 0.02 RFCP 0.71 0.46 0.01 RFCP 2.33 0.25 NA 0.70 0.00 0.00 0.00 0.00 0.00 0.10BNP PARIBAS CASH PLUS FIM 0.58 8.95 0.25 RFCP 0.51 8.14 0.44 RFCP 0.40 0.13 0.50 RFCP 0.33 6.56 0.00 RFCP 1.83 9.96 15.17 1.00 0.00 0.00 0.00 0.00 0.00 0.05BNP PARIBAS EVOLUTION FIM 0.57 3.38 0.00 RFCP 0.56 0.16 0.00 RFCP 0.44 1.82 0.00 RFCP 0.48 5.35 0.01 RFCP 2.07 9.02 2.10 0.10 0.00 0.00 0.00 0.00 0.00 0.00CAAM MONETARIO DINAMICO FIMS 0.79 0.35 0.00 RFCP 0.97 0.48 0.00 RFCP 0.62 0.33 0.00 RFCP 0.61 0.26 0.00 RFCP 3.03 0.36 NA 0.20 0.00 0.00 0.00 0.00 0.00 0.04CAI RENTA FIJA FIM 0.81 0.79 1.81 RFCP 1.16 0.79 1.92 RFCP 0.65 0.90 2.04 RFCP 0.23 0.76 0.97 RFCP 2.88 0.82 13.30 1.25 0.00 0.00 0.00 0.00 0.00 0.10CAI TESORERIA FIM 0.66 0.22 0.55 RFCP 0.62 0.18 0.48 RFCP 0.43 0.18 0.41 RFCP 0.44 0.11 0.43 RFCP 2.15 0.18 14.92 0.60 0.00 0.00 0.00 0.00 0.00 0.05CAIXA CAT. MERCAT MONETARI FIMP NA 0.14 0.26 RFCP 0.91 0.15 0.21 RFCP 0.60 4.17 0.18 RFCP 0.67 6.48 0.26 RFCP NA 0.10 NA 0.15 0.00 0.00 0.00 0.00 0.00 0.05CAIXA CAT. RENDA FIXA CURT FIMP NA 89.53 2.52 RFCP 1.99 1.28 2.46 RFCP 0.47 0.98 2.26 RFCP 0.62 0.94 1.88 RFCP NA 30.50 NA 0.35 0.00 0.00 0.00 0.00 0.00 0.05CAIXA CATALUNYA 3 FIM -0.12 0.30 0.22 GRF 0.29 1.24 0.05 GRF 0.17 2.26 0.05 RFCP 0.27 6.92 0.03 RFCP 0.62 0.16 13.69 0.99 0.00 0.00 0.00 2.00 0.00 0.15CAIXA CATALUNYA DINER FIMS NA 0.17 0.00 RFCP 0.65 0.14 0.00 RFCP 0.35 3.88 0.00 RFCP 0.42 6.16 0.01 RFCP NA 0.10 NA 0.84 0.00 0.00 0.00 0.00 0.00 0.10
% fees
Management Front end Back endCustody
of assets of yield Max. Min. Max. Min.
Yieldsince1996
Short-term fixed-income FIM(RFCP)
(Continues over)
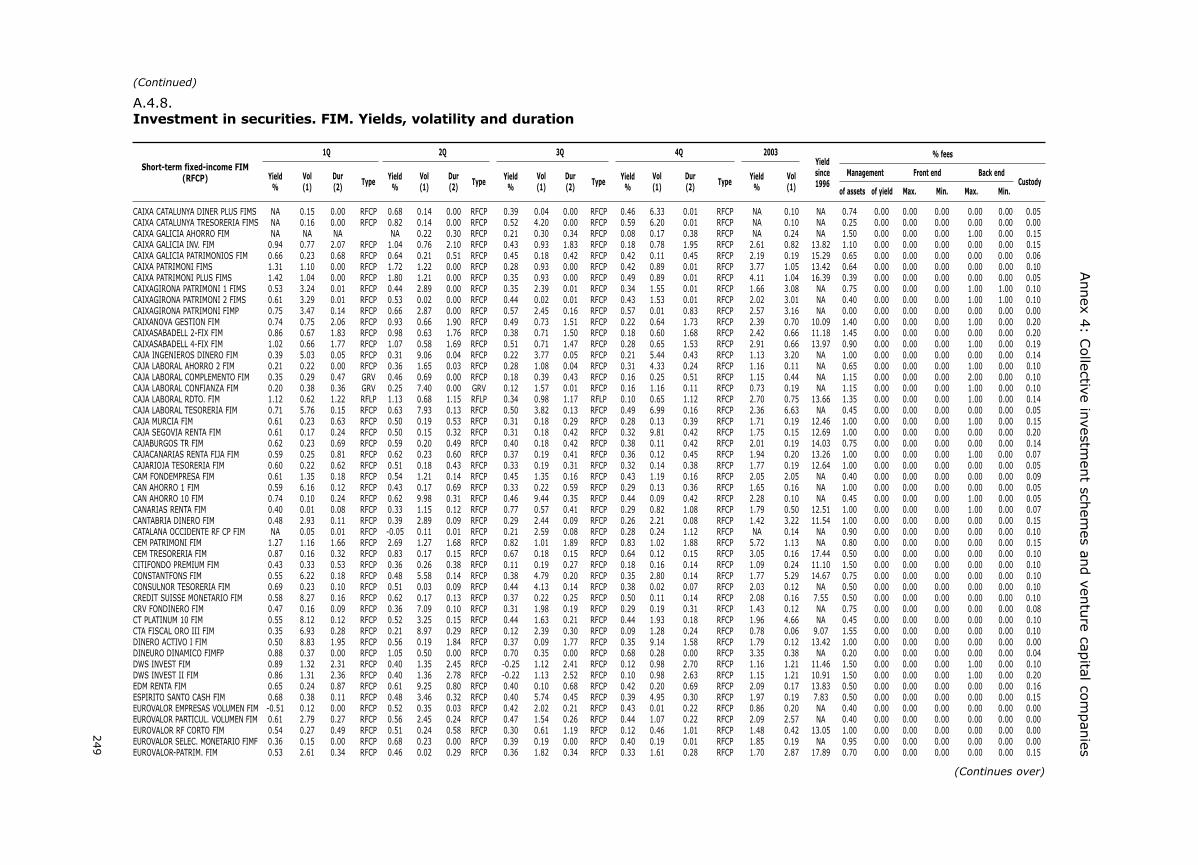
249
Annex 4
: Collective in
vestmen
t schem
es and ven
ture cap
ital com
pan
iesA.4.8.Investment in securities. FIM. Yields, volatility and duration
1Q 2Q 3Q 4Q 2003
Yield Vol Dur Yield Vol Dur Yield Vol Dur Yield Vol Dur Yield Vol(1) (2) Type (1) (2) Type (1) (2) Type (1) (2) Type (1)% % % % %
% fees
Management Front end Back endCustody
of assets of yield Max. Min. Max. Min.
Yieldsince1996
Short-term fixed-income FIM(RFCP)
CAIXA CATALUNYA DINER PLUS FIMS NA 0.15 0.00 RFCP 0.68 0.14 0.00 RFCP 0.39 0.04 0.00 RFCP 0.46 6.33 0.01 RFCP NA 0.10 NA 0.74 0.00 0.00 0.00 0.00 0.00 0.05CAIXA CATALUNYA TRESORERIA FIMS NA 0.16 0.00 RFCP 0.82 0.14 0.00 RFCP 0.52 4.20 0.00 RFCP 0.59 6.20 0.01 RFCP NA 0.10 NA 0.25 0.00 0.00 0.00 0.00 0.00 0.00CAIXA GALICIA AHORRO FIM NA NA NA NA 0.22 0.30 RFCP 0.21 0.30 0.34 RFCP 0.08 0.17 0.38 RFCP NA 0.24 NA 1.50 0.00 0.00 0.00 1.00 0.00 0.15CAIXA GALICIA INV. FIM 0.94 0.77 2.07 RFCP 1.04 0.76 2.10 RFCP 0.43 0.93 1.83 RFCP 0.18 0.78 1.95 RFCP 2.61 0.82 13.82 1.10 0.00 0.00 0.00 0.00 0.00 0.15CAIXA GALICIA PATRIMONIOS FIM 0.66 0.23 0.68 RFCP 0.64 0.21 0.51 RFCP 0.45 0.18 0.42 RFCP 0.42 0.11 0.45 RFCP 2.19 0.19 15.29 0.65 0.00 0.00 0.00 0.00 0.00 0.06CAIXA PATRIMONI FIMS 1.31 1.10 0.00 RFCP 1.72 1.22 0.00 RFCP 0.28 0.93 0.00 RFCP 0.42 0.89 0.01 RFCP 3.77 1.05 13.42 0.64 0.00 0.00 0.00 0.00 0.00 0.10CAIXA PATRIMONI PLUS FIMS 1.42 1.04 0.00 RFCP 1.80 1.21 0.00 RFCP 0.35 0.93 0.00 RFCP 0.49 0.89 0.01 RFCP 4.11 1.04 16.39 0.39 0.00 0.00 0.00 0.00 0.00 0.05CAIXAGIRONA PATRIMONI 1 FIMS 0.53 3.24 0.01 RFCP 0.44 2.89 0.00 RFCP 0.35 2.39 0.01 RFCP 0.34 1.55 0.01 RFCP 1.66 3.08 NA 0.75 0.00 0.00 0.00 1.00 1.00 0.10CAIXAGIRONA PATRIMONI 2 FIMS 0.61 3.29 0.01 RFCP 0.53 0.02 0.00 RFCP 0.44 0.02 0.01 RFCP 0.43 1.53 0.01 RFCP 2.02 3.01 NA 0.40 0.00 0.00 0.00 1.00 1.00 0.10CAIXAGIRONA PATRIMONI FIMP 0.75 3.47 0.14 RFCP 0.66 2.87 0.00 RFCP 0.57 2.45 0.16 RFCP 0.57 0.01 0.83 RFCP 2.57 3.16 NA 0.00 0.00 0.00 0.00 0.00 0.00 0.00CAIXANOVA GESTION FIM 0.74 0.75 2.06 RFCP 0.93 0.66 1.90 RFCP 0.49 0.73 1.51 RFCP 0.22 0.64 1.73 RFCP 2.39 0.70 10.09 1.40 0.00 0.00 0.00 1.00 0.00 0.20CAIXASABADELL 2-FIX FIM 0.86 0.67 1.83 RFCP 0.98 0.63 1.76 RFCP 0.38 0.71 1.50 RFCP 0.18 0.60 1.68 RFCP 2.42 0.66 11.18 1.45 0.00 0.00 0.00 0.00 0.00 0.20CAIXASABADELL 4-FIX FIM 1.02 0.66 1.77 RFCP 1.07 0.58 1.69 RFCP 0.51 0.71 1.47 RFCP 0.28 0.65 1.53 RFCP 2.91 0.66 13.97 0.90 0.00 0.00 0.00 1.00 0.00 0.19CAJA INGENIEROS DINERO FIM 0.39 5.03 0.05 RFCP 0.31 9.06 0.04 RFCP 0.22 3.77 0.05 RFCP 0.21 5.44 0.43 RFCP 1.13 3.20 NA 1.00 0.00 0.00 0.00 0.00 0.00 0.14CAJA LABORAL AHORRO 2 FIM 0.21 0.22 0.00 RFCP 0.36 1.65 0.03 RFCP 0.28 1.08 0.04 RFCP 0.31 4.33 0.24 RFCP 1.16 0.11 NA 0.65 0.00 0.00 0.00 1.00 0.00 0.10CAJA LABORAL COMPLEMENTO FIM 0.35 0.29 0.47 GRV 0.46 0.69 0.00 RFCP 0.18 0.39 0.43 RFCP 0.16 0.25 0.51 RFCP 1.15 0.44 NA 1.15 0.00 0.00 0.00 2.00 0.00 0.10CAJA LABORAL CONFIANZA FIM 0.20 0.38 0.36 GRV 0.25 7.40 0.00 GRV 0.12 1.57 0.01 RFCP 0.16 1.16 0.11 RFCP 0.73 0.19 NA 1.15 0.00 0.00 0.00 1.00 0.00 0.10CAJA LABORAL RDTO. FIM 1.12 0.62 1.22 RFLP 1.13 0.68 1.15 RFLP 0.34 0.98 1.17 RFLP 0.10 0.65 1.12 RFCP 2.70 0.75 13.66 1.35 0.00 0.00 0.00 1.00 0.00 0.14CAJA LABORAL TESORERIA FIM 0.71 5.76 0.15 RFCP 0.63 7.93 0.13 RFCP 0.50 3.82 0.13 RFCP 0.49 6.99 0.16 RFCP 2.36 6.63 NA 0.45 0.00 0.00 0.00 0.00 0.00 0.05CAJA MURCIA FIM 0.61 0.23 0.63 RFCP 0.50 0.19 0.53 RFCP 0.31 0.18 0.29 RFCP 0.28 0.13 0.39 RFCP 1.71 0.19 12.46 1.00 0.00 0.00 0.00 1.00 0.00 0.15CAJA SEGOVIA RENTA FIM 0.61 0.17 0.24 RFCP 0.50 0.15 0.32 RFCP 0.31 0.18 0.42 RFCP 0.32 9.81 0.42 RFCP 1.75 0.15 12.69 1.00 0.00 0.00 0.00 0.00 0.00 0.20CAJABURGOS TR FIM 0.62 0.23 0.69 RFCP 0.59 0.20 0.49 RFCP 0.40 0.18 0.42 RFCP 0.38 0.11 0.42 RFCP 2.01 0.19 14.03 0.75 0.00 0.00 0.00 0.00 0.00 0.14CAJACANARIAS RENTA FIJA FIM 0.59 0.25 0.81 RFCP 0.62 0.23 0.60 RFCP 0.37 0.19 0.41 RFCP 0.36 0.12 0.45 RFCP 1.94 0.20 13.26 1.00 0.00 0.00 0.00 1.00 0.00 0.07CAJARIOJA TESORERIA FIM 0.60 0.22 0.62 RFCP 0.51 0.18 0.43 RFCP 0.33 0.19 0.31 RFCP 0.32 0.14 0.38 RFCP 1.77 0.19 12.64 1.00 0.00 0.00 0.00 0.00 0.00 0.05CAM FONDEMPRESA FIM 0.61 1.35 0.18 RFCP 0.54 1.21 0.14 RFCP 0.45 1.35 0.16 RFCP 0.43 1.19 0.16 RFCP 2.05 2.05 NA 0.40 0.00 0.00 0.00 0.00 0.00 0.09CAN AHORRO 1 FIM 0.59 6.16 0.12 RFCP 0.43 0.17 0.69 RFCP 0.33 0.22 0.59 RFCP 0.29 0.13 0.36 RFCP 1.65 0.16 NA 1.00 0.00 0.00 0.00 0.00 0.00 0.05CAN AHORRO 10 FIM 0.74 0.10 0.24 RFCP 0.62 9.98 0.31 RFCP 0.46 9.44 0.35 RFCP 0.44 0.09 0.42 RFCP 2.28 0.10 NA 0.45 0.00 0.00 0.00 1.00 0.00 0.05CANARIAS RENTA FIM 0.40 0.01 0.08 RFCP 0.33 1.15 0.12 RFCP 0.77 0.57 0.41 RFCP 0.29 0.82 1.08 RFCP 1.79 0.50 12.51 1.00 0.00 0.00 0.00 1.00 0.00 0.07CANTABRIA DINERO FIM 0.48 2.93 0.11 RFCP 0.39 2.89 0.09 RFCP 0.29 2.44 0.09 RFCP 0.26 2.21 0.08 RFCP 1.42 3.22 11.54 1.00 0.00 0.00 0.00 0.00 0.00 0.15CATALANA OCCIDENTE RF CP FIM NA 0.05 0.01 RFCP -0.05 0.11 0.01 RFCP 0.21 2.59 0.08 RFCP 0.28 0.24 1.12 RFCP NA 0.14 NA 0.90 0.00 0.00 0.00 0.00 0.00 0.10CEM PATRIMONI FIM 1.27 1.16 1.66 RFCP 2.69 1.27 1.68 RFCP 0.82 1.01 1.89 RFCP 0.83 1.02 1.88 RFCP 5.72 1.13 NA 0.80 0.00 0.00 0.00 0.00 0.00 0.15CEM TRESORERIA FIM 0.87 0.16 0.32 RFCP 0.83 0.17 0.15 RFCP 0.67 0.18 0.15 RFCP 0.64 0.12 0.15 RFCP 3.05 0.16 17.44 0.50 0.00 0.00 0.00 0.00 0.00 0.10CITIFONDO PREMIUM FIM 0.43 0.33 0.53 RFCP 0.36 0.26 0.38 RFCP 0.11 0.19 0.27 RFCP 0.18 0.16 0.14 RFCP 1.09 0.24 11.10 1.50 0.00 0.00 0.00 0.00 0.00 0.10CONSTANTFONS FIM 0.55 6.22 0.18 RFCP 0.48 5.58 0.14 RFCP 0.38 4.79 0.20 RFCP 0.35 2.80 0.14 RFCP 1.77 5.29 14.67 0.75 0.00 0.00 0.00 0.00 0.00 0.10CONSULNOR TESORERIA FIM 0.69 0.23 0.10 RFCP 0.51 0.03 0.09 RFCP 0.44 4.13 0.14 RFCP 0.38 0.02 0.07 RFCP 2.03 0.12 NA 0.50 0.00 0.00 0.00 0.00 0.00 0.10CREDIT SUISSE MONETARIO FIM 0.58 8.27 0.16 RFCP 0.62 0.17 0.13 RFCP 0.37 0.22 0.25 RFCP 0.50 0.11 0.14 RFCP 2.08 0.16 7.55 0.50 0.00 0.00 0.00 0.00 0.00 0.10CRV FONDINERO FIM 0.47 0.16 0.09 RFCP 0.36 7.09 0.10 RFCP 0.31 1.98 0.19 RFCP 0.29 0.19 0.31 RFCP 1.43 0.12 NA 0.75 0.00 0.00 0.00 0.00 0.00 0.08CT PLATINUM 10 FIM 0.55 8.12 0.12 RFCP 0.52 3.25 0.15 RFCP 0.44 1.63 0.21 RFCP 0.44 1.93 0.18 RFCP 1.96 4.66 NA 0.45 0.00 0.00 0.00 0.00 0.00 0.10CTA FISCAL ORO III FIM 0.35 6.93 0.28 RFCP 0.21 8.97 0.29 RFCP 0.12 2.39 0.30 RFCP 0.09 1.28 0.24 RFCP 0.78 0.06 9.07 1.55 0.00 0.00 0.00 0.00 0.00 0.10DINERO ACTIVO I FIM 0.50 8.83 1.95 RFCP 0.56 0.19 1.84 RFCP 0.37 0.09 1.77 RFCP 0.35 9.14 1.58 RFCP 1.79 0.12 13.42 1.00 0.00 0.00 0.00 0.00 0.00 0.00DINEURO DINAMICO FIMFP 0.88 0.37 0.00 RFCP 1.05 0.50 0.00 RFCP 0.70 0.35 0.00 RFCP 0.68 0.28 0.00 RFCP 3.35 0.38 NA 0.20 0.00 0.00 0.00 0.00 0.00 0.04DWS INVEST FIM 0.89 1.32 2.31 RFCP 0.40 1.35 2.45 RFCP -0.25 1.12 2.41 RFCP 0.12 0.98 2.70 RFCP 1.16 1.21 11.46 1.50 0.00 0.00 0.00 1.00 0.00 0.10DWS INVEST II FIM 0.86 1.31 2.36 RFCP 0.40 1.36 2.78 RFCP -0.22 1.13 2.52 RFCP 0.10 0.98 2.63 RFCP 1.15 1.21 10.91 1.50 0.00 0.00 0.00 1.00 0.00 0.20EDM RENTA FIM 0.65 0.24 0.87 RFCP 0.61 9.25 0.80 RFCP 0.40 0.10 0.68 RFCP 0.42 0.20 0.69 RFCP 2.09 0.17 13.83 0.50 0.00 0.00 0.00 0.00 0.00 0.16ESPIRITO SANTO CASH FIM 0.68 0.38 0.11 RFCP 0.48 3.46 0.32 RFCP 0.40 5.74 0.45 RFCP 0.39 4.95 0.30 RFCP 1.97 0.19 7.83 0.50 0.00 0.00 0.00 0.00 0.00 0.15EUROVALOR EMPRESAS VOLUMEN FIM -0.51 0.12 0.00 RFCP 0.52 0.35 0.03 RFCP 0.42 2.02 0.21 RFCP 0.43 0.01 0.22 RFCP 0.86 0.20 NA 0.40 0.00 0.00 0.00 0.00 0.00 0.00EUROVALOR PARTICUL. VOLUMEN FIM 0.61 2.79 0.27 RFCP 0.56 2.45 0.24 RFCP 0.47 1.54 0.26 RFCP 0.44 1.07 0.22 RFCP 2.09 2.57 NA 0.40 0.00 0.00 0.00 0.00 0.00 0.00EUROVALOR RF CORTO FIM 0.54 0.27 0.49 RFCP 0.51 0.24 0.58 RFCP 0.30 0.61 1.19 RFCP 0.12 0.46 1.01 RFCP 1.48 0.42 13.05 1.00 0.00 0.00 0.00 0.00 0.00 0.00EUROVALOR SELEC. MONETARIO FIMF 0.36 0.15 0.00 RFCP 0.68 0.23 0.00 RFCP 0.39 0.19 0.00 RFCP 0.40 0.19 0.01 RFCP 1.85 0.19 NA 0.95 0.00 0.00 0.00 0.00 0.00 0.00EUROVALOR-PATRIM. FIM 0.53 2.61 0.34 RFCP 0.46 0.02 0.29 RFCP 0.36 1.82 0.34 RFCP 0.33 1.61 0.28 RFCP 1.70 2.87 17.89 0.70 0.00 0.00 0.00 0.00 0.00 0.15
(Continues over)
(Continued)

250
Annual rep
ort o
n th
e securities m
arket. 2003
A.4.8.Investment in securities. FIM. Yields, volatility and duration
1Q 2Q 3Q 4Q 2003
Yield Vol Dur Yield Vol Dur Yield Vol Dur Yield Vol Dur Yield Vol(1) (2) Type (1) (2) Type (1) (2) Type (1) (2) Type (1)% % % % %
% fees
Management Front end Back endCustody
of assets of yield Max. Min. Max. Min.
Yieldsince1996
Short-term fixed-income FIM(RFCP)
EVEREST 2000 FIM 1.14 1.41 2.05 RFCP 2.72 1.41 2.29 RFCP 0.65 0.94 2.23 RFCP 0.86 1.09 2.27 RFCP 5.46 1.24 NA 1.75 0.00 0.00 0.00 2.00 0.00 0.15EXTRARENTA FIM 0.44 1.69 0.00 RFCP 0.40 2.70 0.12 RFCP 0.37 2.69 0.51 RFCP 0.37 0.11 0.43 RFCP 1.59 6.34 NA 0.55 0.00 0.00 0.00 0.00 0.00 0.05F.SOLIDARIO FUN.BERNABE RUIZ FIM -0.09 0.02 0.01 RFCP 1.63 3.84 0.01 RFCP 0.01 0.47 0.01 RFCP -0.07 0.49 0.01 RFCP 1.48 1.95 NA 1.50 0.00 0.00 0.00 0.00 0.00 0.00FAV-ARQUITECTOS FIM NA 0.17 0.28 RFCP 0.68 0.34 0.68 RFCP 0.48 0.33 0.64 RFCP -0.31 0.80 0.66 RFCP NA 0.49 NA 0.90 0.00 0.00 0.00 0.00 0.00 0.20FEMP CORTO PLAZO FIM 0.72 0.19 0.19 RFCP 0.64 0.19 0.30 RFCP 0.49 0.16 0.32 RFCP 0.52 0.12 0.34 RFCP 2.39 0.17 NA 0.10 0.00 0.00 0.00 0.00 0.00 0.09FIBANC ACTIVO FIM 0.55 0.45 0.54 RFCP 0.55 0.36 0.55 RFCP 0.32 0.30 0.60 RFCP 0.32 0.27 0.51 RFCP 1.75 0.35 16.60 0.80 0.00 0.00 0.00 0.00 0.00 0.10FONALAVA FIM 0.61 9.95 1.16 RFCP 0.61 0.11 1.14 RFCP 0.42 7.07 1.29 RFCP 0.42 0.07 1.22 RFCP 2.08 9.45 16.35 0.50 0.00 0.00 0.00 0.00 0.00 0.00FONCAIXA 10 RF CORTO EURO FIMS 0.39 0.42 0.00 RFCP 0.38 0.52 0.00 RFCP -0.16 0.34 0.00 RFCP 0.02 0.15 0.00 RFCP 0.64 0.38 6.53 2.00 0.00 0.00 0.00 0.00 0.00 0.20FONCAIXA 102 CARTERA TR EURO FIMS NA NA NA NA 0.25 0.00 RFCP 0.47 7.52 0.00 RFCP 0.46 1.94 0.00 RFCP NA 0.12 NA 0.23 0.00 0.00 0.00 0.00 0.00 0.04FONCAIXA 103 FONDANDALUCIA FIM NA 0.68 1.22 RFCP 0.85 1.11 1.62 RFCP 0.08 0.71 1.44 RFCP 0.04 0.55 1.58 RFCP NA 0.80 NA 1.10 0.00 0.00 0.00 0.00 0.00 0.15FONCAIXA 107 CARTERA RFC EURO FIMS NA NA NA NA 0.73 0.00 RFCP 0.21 0.36 0.00 RFCP 0.44 0.15 0.00 RFCP NA 0.41 NA 0.50 0.00 0.00 0.00 0.00 0.00 0.00FONCAIXA 11 RF CORTO EURO FIMS 0.52 0.42 0.00 RFCP 0.52 0.52 0.00 RFCP -0.01 0.34 0.00 RFCP 0.17 0.15 0.00 RFCP 1.21 0.38 10.00 1.50 0.00 0.00 0.00 0.00 0.00 0.13FONCAIXA 2 RF CORTO EURO FIMS 0.36 0.42 0.00 RFCP 0.38 0.52 0.00 RFCP -0.16 0.34 0.00 RFCP 0.02 0.15 0.00 RFCP 0.61 0.39 6.52 2.00 0.00 0.00 0.00 0.00 0.00 0.20FONCAIXA 30 RF CORTO EURO FIMS 0.60 0.41 0.00 RFCP 0.62 0.52 0.00 RFCP 0.09 0.34 0.00 RFCP 0.27 0.15 0.00 RFCP 1.59 0.38 12.07 1.10 0.00 0.00 0.00 0.00 0.00 0.12FONCAIXA 31 RF CORTO EURO FIMS 0.49 0.42 0.00 RFCP 0.50 0.53 0.00 RFCP -0.03 0.34 0.00 RFCP 0.15 0.16 0.00 RFCP 1.12 0.39 9.25 1.50 0.00 0.00 0.00 0.00 0.00 0.20FONCAIXA 34 RF CORTO EURO FIMS 0.66 0.41 0.00 RFCP 0.69 0.52 0.00 RFCP 0.15 0.34 0.00 RFCP 0.33 0.15 0.00 RFCP 1.85 0.38 13.56 0.80 0.00 0.00 0.00 0.00 0.00 0.17FONCAIXA 36 RF CORTO EURO FIMS 0.53 0.43 0.00 RFCP 0.52 0.52 0.00 RFCP -0.01 0.34 0.00 RFCP 0.16 0.15 0.00 RFCP 1.20 0.39 9.92 1.50 0.00 0.00 0.00 0.00 0.00 0.12FONCAIXA 4 RF CORTO EURO FIMS 0.34 0.42 0.00 RFCP 0.35 0.52 0.00 RFCP -0.19 0.34 0.00 RFCP -0.01 0.15 0.00 RFCP 0.49 0.39 6.13 2.10 0.00 0.00 0.00 0.00 0.00 0.20FONCAIXA 46 TESORERIA EURO FIMS 0.60 2.42 0.00 RFCP 0.52 2.56 0.00 RFCP 0.44 3.48 0.00 RFCP 0.41 1.46 0.00 RFCP 1.98 3.04 15.70 0.45 0.00 0.00 0.00 0.00 0.00 0.04FONCAIXA 7 RF CORTO EURO FIMS 0.70 0.41 0.00 RFCP 0.68 0.52 0.00 RFCP 0.15 0.34 0.00 RFCP 0.33 0.15 0.00 RFCP 1.87 0.38 13.48 1.00 0.00 0.00 0.00 0.00 0.00 0.00FONCAIXA 8 RF CORTO EURO FIMS 0.34 0.41 0.00 RFCP 0.35 0.52 0.00 RFCP -0.19 0.34 0.00 RFCP -0.01 0.15 0.00 RFCP 0.49 0.38 5.81 2.10 0.00 0.00 0.00 0.00 0.00 0.20FONCAIXA 84 RF CORTO EURO FIMS NA 0.37 0.00 RFCP 0.67 0.48 0.00 RFCP 0.19 0.32 0.00 RFCP 0.35 0.14 0.00 RFCP NA 0.35 NA 0.60 9.00 0.00 0.00 0.00 0.00 0.15FONCAIXA 9 RF CORTO EURO FIMS 0.37 0.42 0.00 RFCP 0.35 0.52 0.00 RFCP -0.18 0.34 0.00 RFCP 0.00 0.15 0.00 RFCP 0.53 0.39 6.26 2.10 0.00 0.00 0.00 0.00 0.00 0.20FONCAIXA 95 TESORERIA EURO FIMS NA 3.44 0.00 RFCP 0.44 0.02 0.00 RFCP 0.36 3.15 0.00 RFCP 0.33 0.01 0.00 RFCP NA 2.89 NA 0.65 0.00 0.00 0.00 0.00 0.00 0.15FONCAIXA FC 59 FIM 0.63 0.92 1.38 RFCP 0.85 1.19 1.85 RFCP 0.07 0.64 1.56 RFCP 0.10 0.51 1.70 RFCP 1.65 0.86 NA 1.10 0.00 0.00 0.00 0.00 0.00 0.13FONCAIXA RENTA FIJA CORTO EURO FIMP NA 0.44 0.51 RFCP 0.95 0.55 0.87 RFCP 0.40 0.36 0.48 RFCP 0.59 0.16 0.55 RFCP NA 0.40 NA 0.00 0.00 0.00 0.00 0.00 0.00 0.00FONCAIXA TESORERIA EURO FIMP NA 2.64 0.19 RFCP 0.65 2.49 0.15 RFCP 0.57 3.69 0.18 RFCP 0.54 1.90 0.14 RFCP NA 1.16 NA 0.00 0.00 0.00 0.00 0.00 0.00 0.00FONCONSUL FIM 0.79 1.53 2.29 RFCP 0.68 1.49 2.01 RFCP 0.13 1.37 1.99 RFCP 0.05 1.03 1.71 RFCP 1.67 1.37 13.32 1.10 0.00 0.00 0.00 0.00 0.00 0.10FOND21 FIM 0.79 0.78 2.41 RFCP 0.95 0.68 1.65 RFCP 0.34 0.78 1.63 RFCP 0.14 0.61 1.63 RFCP 2.23 0.72 10.63 1.50 0.00 0.00 0.00 0.00 0.00 0.14FONDACOFAR FIM 1.29 1.36 0.94 RFCP 0.94 1.42 0.93 RFCP 0.14 1.62 0.86 RFCP -0.18 1.26 0.88 RFCP 2.20 1.43 18.68 0.80 0.00 0.00 0.00 0.00 0.00 0.19FONDCIRCULO FIM 0.72 0.73 1.81 RFCP 0.95 0.70 1.60 RFCP 0.43 0.69 1.55 RFCP 0.26 0.61 1.90 RFCP 2.38 0.69 9.75 1.50 0.00 0.00 0.00 0.00 0.00 0.09FONDEGA SEGURIDAD FIM 0.43 0.01 0.10 RFCP 0.34 9.81 0.15 RFCP 0.27 1.62 0.24 RFCP 0.24 5.15 0.22 RFCP 1.28 3.23 11.86 0.90 0.00 0.00 0.00 0.00 0.00 0.10FONDESPAÑA AHORRO FIM 0.48 0.55 1.45 RFCP 0.65 0.69 1.32 RFCP 0.13 0.45 1.02 RFCP 0.18 0.26 0.64 RFCP 1.45 0.51 12.25 1.10 0.00 0.00 0.00 1.50 0.00 0.15FONDESPAÑA I FIM 0.87 0.64 2.00 RFCP 1.07 0.59 1.56 RFCP 0.43 0.83 1.55 RFCP 0.11 0.74 1.79 RFCP 2.51 0.71 11.55 1.50 0.00 0.00 0.00 0.00 0.00 0.20FONDGUISSONA FIM 0.52 8.74 0.36 RFCP 0.49 8.81 0.56 RFCP 0.30 0.25 0.69 RFCP 0.37 0.22 0.64 RFCP 1.69 0.18 15.91 0.55 0.00 0.00 0.00 0.00 0.00 0.00FONDICAJA FIM 0.87 0.67 1.97 RFCP 0.97 0.60 1.60 RFCP 0.38 0.75 1.52 RFCP 0.14 0.62 1.63 RFCP 2.37 0.67 10.95 1.60 0.00 0.00 0.00 0.00 0.00 0.09FONDMUSINI I FIM 0.48 1.08 0.13 RFCP 0.63 0.45 0.31 RFCP 0.18 0.21 0.28 RFCP 0.23 0.17 0.27 RFCP 1.53 0.27 11.67 1.00 0.00 0.00 0.00 0.00 0.00 0.10FONDO EXTRA FIM 1.01 1.37 1.18 RFCP 1.01 1.35 1.04 RFCP 0.29 1.47 1.26 RFCP 0.07 1.33 1.53 RFCP 2.39 1.38 15.45 0.88 0.00 0.00 0.00 0.00 0.00 0.00FONDO VALENCIA EMPRESAS FIM 0.54 9.70 0.11 RFCP 0.46 8.57 0.11 RFCP 0.38 4.06 0.09 RFCP 0.36 1.30 0.11 RFCP 1.75 1.81 14.51 0.55 0.00 0.00 0.00 0.00 0.00 0.05FONDOATLANTICO FIM 0.56 0.66 0.73 RFCP 0.50 0.63 0.82 RFCP 0.08 0.89 1.18 RFCP -0.07 0.69 0.89 RFCP 1.07 0.73 9.84 1.50 0.00 0.00 0.00 0.00 0.00 0.20FONDOATLANTICO PREMIER FIM 0.61 1.19 1.11 RFCP 0.84 0.94 0.00 RFCP 0.23 1.22 0.00 RFCP 0.05 1.00 1.36 RFCP 1.74 1.09 NA 0.65 0.00 0.00 0.00 0.00 0.00 0.10FONDOMIX TESORERIA FIM 0.55 3.31 0.25 RFCP 0.55 1.74 0.08 RFCP 0.39 0.10 0.10 RFCP 0.43 3.57 0.08 RFCP 1.94 6.29 14.69 0.35 0.00 0.00 0.00 0.00 0.00 0.10FONDPAMPLONA FIM 0.38 9.91 0.02 RFCP 0.31 1.27 0.01 RFCP 0.21 8.49 0.01 RFCP 0.19 3.38 0.01 RFCP 1.09 2.51 11.29 1.00 0.00 0.00 0.00 0.00 0.00 0.20FONJALON RENTA FIJA FIM 0.42 0.01 0.01 RFCP 0.34 1.56 0.00 RFCP 0.23 1.39 0.00 RFCP 0.23 1.56 0.01 RFCP 1.22 2.24 10.37 0.95 0.00 0.00 0.00 0.00 0.00 0.04FONPASTOR DINERO FIM 0.67 0.14 0.40 RFCP 0.65 0.16 0.46 RFCP 0.48 0.77 0.30 RFCP 0.44 0.10 0.30 RFCP 2.26 0.40 NA 0.25 0.00 0.00 0.00 0.00 0.00 0.05FONPREMIUM RF FIM 0.73 0.11 0.18 RFCP 0.60 4.29 0.13 RFCP 0.47 1.00 0.10 RFCP 0.45 1.26 0.04 RFCP 2.26 6.63 NA 0.15 0.00 2.50 0.00 0.00 0.00 0.10FONSCATALONIA 1 FIM 0.68 1.13 1.60 RFCP 0.97 1.24 1.68 RFCP -0.01 1.37 1.65 RFCP -0.38 1.13 1.94 RFCP 1.26 1.23 12.52 1.35 0.00 0.00 0.00 0.00 0.00 0.20FONSGIRONA FIM 0.28 5.82 0.18 RFCP 0.21 0.06 0.00 RFCP 0.10 0.04 0.15 RFCP 0.07 4.74 0.05 RFCP 0.66 5.59 8.29 1.60 0.00 0.00 0.00 0.00 0.00 0.20FONSGIRONA II FIM 0.39 3.58 0.19 RFCP 0.32 3.96 0.07 RFCP 0.21 3.21 0.16 RFCP 0.18 2.69 0.14 RFCP 1.10 3.85 10.86 1.20 0.00 0.00 0.00 0.00 0.00 0.20FONSMANLLEU ESTALVI FIM 0.49 0.23 0.73 RFCP 0.46 0.26 0.74 RFCP 0.26 0.23 0.33 RFCP 0.19 0.12 0.47 RFCP 1.40 0.22 11.33 1.20 0.00 0.00 0.00 0.00 0.00 0.14
(Continues over)
(Continued)

251
Annex 4
: Collective in
vestmen
t schem
es and ven
ture cap
ital com
pan
iesA.4.8.Investment in securities. FIM. Yields, volatility and duration
1Q 2Q 3Q 4Q 2003
Yield Vol Dur Yield Vol Dur Yield Vol Dur Yield Vol Dur Yield Vol(1) (2) Type (1) (2) Type (1) (2) Type (1) (2) Type (1)% % % % %
% fees
Management Front end Back endCustody
of assets of yield Max. Min. Max. Min.
Yieldsince1996
Short-term fixed-income FIM(RFCP)
FONSNOSTRO FIM 1.00 0.69 2.10 RFCP 1.05 0.58 1.65 RFCP 0.51 0.74 1.42 RFCP 0.33 0.61 1.53 RFCP 2.92 0.66 13.05 1.00 0.00 0.00 0.00 1.00 0.00 0.20FONTESORERIA FIM 0.62 0.19 0.30 RFCP 0.63 0.15 0.27 RFCP 0.42 0.11 0.30 RFCP 0.45 0.10 0.24 RFCP 2.14 0.14 17.72 0.40 0.00 0.00 0.00 0.00 0.00 0.15FONVALOR FIM 0.91 0.69 1.96 RFCP 1.04 0.62 1.65 RFCP 0.48 0.85 1.67 RFCP 0.18 0.75 1.89 RFCP 2.63 0.74 11.53 1.40 0.00 0.00 0.00 0.00 0.00 0.08FONVITORIA FIM 0.66 0.98 1.14 RFCP 0.73 0.92 1.06 RFCP 0.15 1.17 1.14 RFCP -0.11 0.95 0.96 RFCP 1.42 1.01 12.87 1.50 0.00 0.00 0.00 0.00 0.00 0.20GEBASA RENTA FIJA CORTO PLAZO FIMP NA 9.38 0.12 RFCP 0.60 9.06 0.11 RFCP 0.53 9.39 0.08 RFCP 0.52 0.09 0.11 RFCP NA 9.36 NA 0.00 0.00 0.00 0.00 0.00 0.00 0.00HERRERO AHORRO ESTUDIOS FIMS 0.85 1.28 0.01 RFCP 0.62 1.19 0.01 RFCP 0.08 1.07 0.01 RFCP -0.08 0.46 0.01 RFCP 1.48 1.05 9.01 1.35 0.00 0.00 0.00 0.00 0.00 0.05HERRERO DINERO FIMS 0.58 0.26 0.01 RFCP 0.56 0.27 0.01 RFCP 0.32 0.20 0.01 RFCP 0.28 0.11 0.01 RFCP 1.75 0.22 NA 0.70 0.00 0.00 0.00 0.00 0.00 0.05HERRERO MONETARIO FIMS 0.52 0.26 0.01 RFCP 0.49 0.27 0.01 RFCP 0.25 0.20 0.01 RFCP 0.21 0.11 0.01 RFCP 1.47 0.22 NA 1.00 0.00 0.00 0.00 0.00 0.00 0.05HERRERO TESORERIA FIMS 0.62 0.26 0.01 RFCP 0.60 0.48 0.01 RFCP 0.36 0.20 0.01 RFCP 0.32 0.11 0.01 RFCP 1.92 0.30 NA 0.60 0.00 0.00 0.00 0.00 0.00 0.00HSBC TESORERIA FIM 0.49 1.50 0.00 RFCP 0.42 2.26 0.00 RFCP 0.33 0.03 0.00 RFCP 0.31 4.34 0.01 RFCP 1.56 3.57 12.37 0.40 0.00 0.00 0.00 0.00 0.00 0.05IBERAGENTES POPULAR TESORERIA FIM 0.67 7.29 0.29 RFCP 0.64 0.09 0.26 RFCP 0.48 0.10 0.37 RFCP 0.48 0.12 0.61 RFCP 2.29 0.10 NA 0.09 0.00 0.00 0.00 0.00 0.00 0.05IBERCAJA AHORRO FIM 0.89 0.93 1.78 RFCP 0.76 1.36 1.71 RFCP 0.41 1.20 1.62 RFCP 0.27 0.95 1.53 RFCP 2.36 1.13 12.13 1.20 0.00 0.00 0.00 1.00 0.00 0.20IBERCAJA CASH 2 FIM 0.60 0.10 0.46 RFCP 0.65 0.19 0.37 RFCP 0.39 0.27 0.46 RFCP 0.36 0.18 0.42 RFCP 2.02 0.20 NA 0.55 0.00 0.00 0.00 0.00 0.00 0.15IBERCAJA CASH 3 FIM NA NA NA NA NA NA NA 0.18 0.41 RFCP 0.32 0.12 0.36 RFCP NA 0.15 NA 0.85 0.00 0.00 0.00 0.00 0.00 0.10IBERCAJA CASH FIM 0.70 0.12 0.47 RFCP 0.73 0.19 0.34 RFCP 0.48 0.27 0.48 RFCP 0.47 0.17 0.43 RFCP 2.41 0.20 19.06 0.25 0.00 5.00 0.00 0.00 0.00 0.15IBERCAJA TESORERIA FIM 0.42 0.11 0.45 RFCP 0.47 0.19 0.36 RFCP 0.21 0.30 0.54 RFCP 0.19 0.17 0.43 RFCP 1.30 0.21 11.10 1.20 0.00 0.00 0.00 0.00 0.00 0.20IBERSECURITIES TESORERIA FIM 0.71 7.56 0.37 RFCP 0.56 6.88 0.32 RFCP 0.45 0.10 0.34 RFCP 0.44 7.15 0.44 RFCP 2.19 8.59 NA 0.20 0.00 0.00 0.00 0.00 0.00 0.05INTERDIN TESORERIA FIM NA NA NA NA 9.78 0.16 RFCP 0.24 4.78 0.08 RFCP 0.20 8.97 0.05 RFCP NA 0.06 NA 1.00 0.00 0.00 0.00 0.00 0.00 0.10INTERES 2.000 FIM 0.94 1.11 1.41 RFCP 0.75 0.75 0.88 RFCP 0.00 0.77 0.85 RFCP 0.33 0.42 0.77 RFCP 2.03 0.80 16.75 1.00 0.00 0.00 0.00 0.00 0.00 0.13INTERMONEY TESORERIA FIM 0.61 3.68 0.16 RFCP 0.55 6.21 2.09 RFCP 0.45 4.27 0.00 RFCP 0.42 2.57 0.14 RFCP 2.06 4.69 NA 0.25 0.00 0.00 0.00 0.00 0.00 0.10INVERBAN DINERO FIM 0.50 0.13 0.18 RFCP 0.38 3.94 0.13 RFCP 0.28 4.78 0.00 RFCP 0.27 4.46 0.20 RFCP 1.44 0.07 13.11 0.80 0.00 0.00 0.00 0.00 0.00 0.10INVERCAJA 31 FIM 0.41 1.40 0.01 RFLP 0.31 1.58 0.01 RFLP 0.26 3.06 0.11 RFCP 0.50 0.45 0.83 RFCP 1.48 0.22 13.78 1.00 0.00 0.00 0.00 1.00 0.00 0.05INVERFONDO FIM 0.83 0.67 1.86 RFCP 0.92 0.62 1.68 RFCP 0.28 0.83 1.72 RFCP 0.11 0.62 1.74 RFCP 2.15 0.69 10.20 1.75 0.00 0.00 0.00 0.00 0.00 0.15INVERMONTE FIM 0.50 0.24 0.61 RFCP 0.51 0.23 0.47 RFCP 0.38 0.20 0.49 RFCP 0.38 0.12 0.39 RFCP 1.77 0.20 11.93 0.85 0.00 0.00 0.00 0.00 0.00 0.15IURISFOND FIM 0.37 0.10 0.23 RFCP 0.38 8.37 0.24 RFCP 0.20 6.06 0.21 RFCP 0.27 0.26 1.27 RFCP 1.23 0.15 16.93 1.00 0.00 0.00 0.00 0.00 0.00 0.20KUTXAMONETARIO2 FIM 0.64 0.12 0.81 RFCP 0.74 0.19 0.21 RFCP 0.53 0.15 0.31 RFCP 0.48 0.11 0.28 RFCP 2.40 0.15 NA 0.25 0.00 0.00 0.00 0.00 0.00 0.05LEASETEN III FIM 0.84 0.12 0.14 RFCP 0.75 8.39 0.15 RFCP 0.66 5.29 0.15 RFCP 0.62 5.93 0.13 RFCP 2.90 8.83 16.09 0.05 0.00 0.00 0.00 0.00 0.00 0.00LEASETEN RENTA FIJA CORTO FIM 0.81 6.06 0.23 RFCP 0.75 6.95 0.26 RFCP 0.62 7.33 0.28 RFCP 0.57 7.13 0.17 RFCP 2.78 0.07 NA 0.04 0.00 0.00 0.00 0.00 0.00 0.01MADRID DINERO FIM 0.64 0.23 0.53 RFCP 0.57 0.18 0.34 RFCP 0.32 0.16 0.00 RFCP 0.31 0.13 0.39 RFCP 1.86 0.18 14.46 0.65 0.00 0.00 0.00 0.00 0.00 0.10MADRID RENTABILIDAD ANUAL FIM 0.95 0.28 0.06 RFCP 0.77 0.46 1.06 RFCP 0.31 0.49 0.00 RFCP 0.28 0.30 0.69 RFCP 2.32 0.40 NA 0.45 0.00 0.00 0.00 1.00 0.00 0.05MADRID TESORERIA FIM 0.82 0.49 0.71 RFCP 0.72 0.45 1.14 RFCP 0.14 0.53 0.00 RFCP 0.28 0.40 1.84 RFCP 1.98 0.47 18.14 0.50 0.00 0.00 0.00 0.00 0.00 0.09MAPFRE FT FIM 0.62 0.67 1.11 RFCP 0.63 0.77 1.11 RFCP 0.18 0.85 1.32 RFCP -0.06 1.01 1.20 RFCP 1.38 0.84 11.33 1.45 0.00 0.00 0.00 0.85 0.00 0.04MARCH PREMIER TR FIM 0.65 2.51 0.21 RFCP 0.53 4.44 0.19 RFCP 0.44 1.90 0.13 RFCP 0.41 1.76 0.14 RFCP 2.04 3.50 14.57 0.65 0.00 0.00 0.00 0.00 0.00 0.00METROPOLIS RENTA FIM 0.56 1.00 0.05 RFCP 0.49 1.04 0.05 RFCP 0.42 9.97 0.03 RFCP 0.40 9.04 0.05 RFCP 1.89 1.73 14.35 0.33 0.00 0.00 0.00 0.00 0.00 0.05MONETARIO DINAMICO PLUS FIMS NA NA NA NA NA NA NA 0.33 0.00 RFCP 0.43 0.40 0.00 RFCP NA 0.39 NA 0.70 0.00 0.00 0.00 0.00 0.00 0.02MORGAN STANLEY TESORERIA PLUS FIMP 0.78 6.34 0.31 RFCP 0.67 0.04 0.16 RFCP 0.54 3.31 0.17 RFCP 0.57 3.91 0.15 RFCP 2.59 5.10 NA 0.10 0.00 0.00 0.00 0.00 0.00 0.05MS TESORERIA PLUS 100 FIMS 0.68 6.19 0.00 RFCP 0.57 4.35 0.00 RFCP 0.44 3.12 0.00 RFCP 0.47 3.75 0.01 RFCP 2.18 4.93 NA 0.30 0.00 0.00 0.00 0.00 0.00 0.05MS TESORERIA PLUS 500 FIMS 0.73 6.18 0.00 RFCP 0.62 4.33 0.00 RFCP 0.49 3.24 0.00 RFCP 0.52 3.70 0.01 RFCP 2.38 4.94 NA 0.10 0.00 0.00 0.00 0.00 0.00 0.05MUTUAFONDO CORTO PLAZO FIM 0.77 7.64 0.21 RFCP 0.66 5.72 0.23 RFCP 0.60 4.75 0.20 RFCP 0.58 5.23 0.20 RFCP 2.65 6.15 NA 0.10 0.00 0.00 0.00 0.00 0.00 0.04NMAS1 TESORERIA FIM NA NA NA NA NA NA NA 0.18 0.13 RFCP 0.52 4.50 0.08 RFCP NA 0.13 NA 0.20 0.00 0.00 0.00 0.00 0.00 0.00P&G CRECIMIENTO FIM 0.19 0.33 0.64 RFCP 0.65 0.38 0.71 RFCP 0.08 0.38 1.24 RFCP 0.47 0.68 2.06 RFCP 1.40 0.47 11.85 1.50 0.00 0.00 0.00 0.00 0.00 0.15P&G MASTER RENTA FIJA FIMP 0.38 3.21 0.16 RFCP 0.37 6.29 0.09 RFCP 0.25 4.17 0.16 RFCP 0.48 0.29 0.11 RFCP 1.48 0.15 NA 1.00 0.00 0.00 0.00 0.00 0.00 0.70PATAGON DINERO FIM 0.37 0.31 0.26 RFCP 0.66 0.46 0.22 RFCP 0.51 0.36 0.18 RFCP 0.50 0.36 0.13 RFCP 2.05 0.38 NA 0.10 0.00 2.00 0.00 3.00 0.00 0.10PBP CORTO PLAZO PLUS FIM 0.89 1.66 2.82 RFLP 1.05 1.98 2.82 RFLP -0.25 1.57 2.33 RFCP -0.34 1.10 1.05 RFCP 1.34 1.61 11.75 1.60 0.00 0.00 0.00 0.00 0.00 0.10PREMIUM RENTA FIJA FIM NA NA NA NA 6.95 0.00 RFCP -0.01 0.21 0.59 RFCP 0.39 0.57 0.10 RFCP NA 0.41 NA 0.90 0.00 0.00 0.00 0.00 0.00 0.20PRUDFONDO DINERO FIM 0.44 9.51 0.15 RFCP 0.38 0.09 0.16 RFCP 0.22 0.03 0.14 RFCP 0.25 0.11 0.15 RFCP 1.31 9.29 NA 1.30 0.00 0.00 0.00 0.00 0.00 0.15PSN. RENTA FIJA FIMS 0.32 3.92 0.00 RFCP 0.31 0.02 0.00 RFCP 0.19 0.65 0.00 RFCP 0.41 0.28 0.00 RFCP 1.24 0.35 NA 0.10 0.00 0.00 0.00 0.00 0.00 0.03RENDIMIENTO ABSOLUTO FIMFP NA NA NA NA NA NA NA 0.34 0.00 RFCP 0.72 0.44 0.00 RFCP NA 0.41 NA 0.26 0.00 0.00 0.00 0.00 0.00 0.02RENTA 4 EUROCASH FIM 0.75 2.18 0.11 RFCP 0.58 0.03 0.20 RFCP 0.42 3.63 0.14 RFCP 0.41 4.39 0.16 RFCP 2.17 0.04 NA 0.10 0.00 0.00 0.00 0.00 0.00 0.05RENTA 4 FT FIM 0.84 0.64 0.73 RFCP 0.57 0.36 0.51 RFCP 0.21 0.69 0.66 RFCP 0.19 0.29 0.71 RFCP 1.82 0.52 16.48 0.78 0.00 0.00 0.00 0.00 0.00 0.18
(Continues over)
(Continued)

252
Annual rep
ort o
n th
e securities m
arket. 2003
A.4.8.Investment in securities. FIM. Yields, volatility and duration
1Q 2Q 3Q 4Q 2003
Yield Vol Dur Yield Vol Dur Yield Vol Dur Yield Vol Dur Yield Vol(1) (2) Type (1) (2) Type (1) (2) Type (1) (2) Type (1)% % % % %
% fees
Management Front end Back endCustody
of assets of yield Max. Min. Max. Min.
Yieldsince1996
Short-term fixed-income FIM(RFCP)
RENTMADRID FIM 0.62 1.22 1.69 RFCP 0.76 1.31 1.90 RFCP -0.12 1.30 0.00 RFCP -0.63 0.96 2.21 RFCP 0.61 1.21 11.43 2.00 0.00 0.00 0.00 0.00 0.00 0.10RURAL RENTA FIJA II FIM 0.20 0.13 0.25 RFCP 0.34 0.11 0.18 RFCP 0.19 0.14 0.20 RFCP 0.12 0.11 0.30 RFCP 0.86 0.12 NA 1.50 0.00 0.00 0.00 0.00 0.00 0.05RURAL TOLEDO I FIM 0.31 6.12 0.02 RFCP 0.27 4.52 0.01 RFCP 0.18 0.19 0.01 RFCP 0.15 8.61 0.22 RFCP 0.91 0.11 10.39 1.50 0.00 0.00 0.00 0.00 0.00 0.00SABADELL BS DINERO FIMS 0.51 0.26 0.01 RFCP 0.49 0.26 0.01 RFCP 0.25 0.20 0.01 RFCP 0.21 0.11 0.01 RFCP 1.47 0.22 NA 1.00 0.00 0.00 0.00 0.00 0.00 0.05SABADELL BS EURO MONETARIO FIMP 0.79 0.27 0.72 RFCP 0.77 0.28 0.60 RFCP 0.52 0.21 0.56 RFCP 0.48 0.11 0.18 RFCP 2.57 0.23 NA 0.00 0.00 0.00 0.00 0.00 0.00 0.05SABADELL BS FT FIM 0.69 1.73 3.06 RFCP 0.52 1.11 1.66 RFCP 0.29 0.96 1.35 RFCP 0.21 0.35 0.54 RFCP 1.72 1.14 NA 0.60 0.00 0.00 0.00 0.00 0.00 0.05SABADELL BS TESORERIA INSTITUC.FIMS NA NA NA NA NA NA NA NA NA NA 4.74 0.01 RFCP NA 4.74 NA 0.30 0.00 0.00 0.00 0.00 0.00 0.00SABADELL CORTO PLAZO EURO FIMP 1.24 1.34 1.57 RFCP 1.02 1.26 1.43 RFCP 0.45 1.12 1.24 RFCP 0.26 0.48 0.99 RFCP 3.00 1.11 NA 0.00 0.00 0.00 0.00 0.00 0.00 0.10SABADELL INTERES EURO 1 FIMS 0.86 1.28 0.01 RFCP 0.64 1.20 0.01 RFCP 0.09 1.07 0.01 RFCP -0.08 0.46 0.01 RFCP 1.52 1.05 9.65 1.30 0.00 0.00 0.00 0.00 0.00 0.10SABADELL INTERES EURO 3 FIMS 1.06 1.28 0.01 RFCP 0.84 1.19 0.01 RFCP 0.29 1.07 0.01 RFCP 0.12 0.46 0.01 RFCP 2.33 1.05 14.24 0.50 0.00 0.00 0.00 0.00 0.00 0.10SABADELL INTERES EURO 4 FIMS 0.92 1.28 0.01 RFCP 0.70 1.19 0.01 RFCP 0.16 1.07 0.01 RFCP -0.01 0.46 0.01 RFCP 1.78 1.05 11.04 1.00 0.00 0.00 0.00 0.00 0.00 0.10SABADELL TESORERIA EMPRESA FIMS 0.64 0.26 0.01 RFCP 0.61 0.27 0.01 RFCP 0.37 0.20 0.01 RFCP 0.33 0.11 0.01 RFCP 1.97 0.22 NA 0.50 0.00 0.00 0.00 0.00 0.00 0.05SABADELL TESORERIA PYME FIMS 0.59 0.26 0.01 RFCP 0.56 0.26 0.01 RFCP 0.32 0.20 0.01 RFCP 0.28 0.11 0.01 RFCP 1.77 0.22 NA 0.70 0.00 0.00 0.00 0.00 0.00 0.05SAFEI AHORRO FT FIM 0.54 0.86 1.33 RFCP 0.61 0.83 1.34 RFCP 0.16 0.88 1.15 RFCP 0.01 0.74 0.95 RFCP 1.32 0.83 8.09 1.35 0.00 0.00 0.00 0.00 0.00 0.15SAFEI CRECIMIENTO FIM 0.37 0.17 0.30 RFCP 0.41 0.13 0.26 RFM 0.23 9.54 0.31 RFCP 0.27 0.10 0.34 RFCP 1.28 0.13 13.32 0.90 9.00 0.00 0.00 0.00 0.00 0.15SAN FERNANDO MAXIFONDO FIM 0.75 0.51 1.25 RFCP 0.87 0.48 1.24 RFCP 0.38 0.59 1.36 RFCP 0.33 0.50 1.62 RFCP 2.35 0.52 8.75 1.50 0.00 0.00 0.00 1.00 0.00 0.20SBP SABADELL TESORERIA FIMS NA 0.44 0.01 RFCP 0.56 0.27 0.01 RFCP 0.36 0.20 0.01 RFCP 0.34 0.11 0.01 RFCP NA 0.23 NA 0.50 0.00 0.00 0.00 0.00 0.00 0.05SCH AHORRO CORTO PLAZO FIM 0.15 1.13 1.79 RFCP 0.83 0.71 0.58 RFCP -0.07 0.80 0.57 RFCP 0.22 0.47 0.32 RFCP 1.13 0.81 17.68 0.50 0.00 0.00 0.00 0.00 0.00 0.07SCH AHORRO DIARIO 1 FIM 0.26 4.62 0.18 RFCP 0.15 2.66 0.16 RFCP 0.07 1.72 0.20 RFCP 0.04 0.02 0.13 RFCP 0.52 0.03 7.36 1.90 0.00 0.00 0.00 0.00 0.00 0.10SCH AHORRO DIARIO 2 FIM 0.25 3.09 0.17 RFCP 0.15 1.77 0.14 RFCP 0.07 2.15 0.19 RFCP 0.04 2.08 0.12 RFCP 0.52 2.88 7.29 1.90 0.00 0.00 0.00 0.00 0.00 0.10SCH CORTO PLAZO PLUS FIM 0.63 0.01 0.17 RFCP 0.56 1.88 0.13 RFCP 0.49 4.57 0.14 RFCP 0.48 2.04 0.14 RFCP 2.17 3.11 NA 0.25 0.00 0.00 0.00 0.00 0.00 0.05SCH DINERO PLUS FIM -2.04 8.61 3.62 RFCP 0.81 0.54 0.12 RFCP 0.47 0.15 0.14 RFCP 0.50 6.44 0.11 RFCP -0.28 4.29 25.65 0.29 0.00 0.00 0.00 0.00 0.00 0.15SCH LIQUIDEZ EMPRESAS FIM 0.60 0.10 0.17 RFCP 0.49 6.44 0.16 RFCP 0.45 7.91 0.12 RFCP 0.41 3.92 0.12 RFCP 1.97 7.73 14.02 0.60 0.00 0.00 0.00 0.00 0.00 0.10SCH LIQUIDEZ FIM 0.34 9.18 0.25 RFCP 0.27 3.66 0.17 RFCP 0.16 5.62 0.13 RFCP 0.14 5.08 0.11 RFCP 0.92 6.47 NA 1.40 0.00 0.00 0.00 0.00 0.00 0.15SCH ONG´S FIM 0.59 0.16 0.42 RFCP 0.50 0.14 0.31 RFCP 0.33 0.12 0.26 RFCP 0.34 9.01 0.21 RFCP 1.78 0.13 NA 0.70 0.00 0.00 0.00 0.00 0.00 0.10SCH TESORERIA EMPRESAS FIM 0.61 0.10 0.20 RFCP 0.50 6.07 0.11 RFCP 0.38 0.05 0.13 RFCP 0.39 3.42 0.11 RFCP 1.89 7.15 15.61 0.50 0.00 0.00 0.00 0.00 0.00 0.10SEGURFONDO MONETARIO FIM 0.78 5.39 1.00 RFCP 0.69 3.20 0.82 RFCP 0.61 3.64 0.76 RFCP 0.59 3.83 0.72 RFCP 2.69 4.42 NA 0.15 0.00 0.00 0.00 0.00 0.00 0.10SOLBANK DINERO FIMS 0.51 0.26 0.01 RFCP 0.48 0.27 0.01 RFCP 0.24 0.20 0.01 RFCP 0.20 0.11 0.01 RFCP 1.45 0.22 NA 1.00 0.00 0.00 0.00 0.00 0.00 0.05SOLBANK INTERES EURO FIMS 0.84 1.28 0.01 RFCP 0.61 1.19 0.01 RFCP 0.07 1.07 0.01 RFCP -0.11 0.46 0.01 RFCP 1.42 1.05 9.02 1.40 0.00 0.00 0.00 0.00 0.00 0.10TARRAGONAFONS 10 FIM 0.65 0.22 0.63 RFCP 0.60 0.21 0.00 RFCP 0.27 0.12 0.40 RFCP 0.32 0.14 0.45 RFCP 1.86 0.18 12.75 0.90 0.00 0.00 0.00 0.00 0.00 0.09TARRAGONAFONS CASH FIM NA NA NA NA 4.80 0.02 RFCP 0.37 4.75 0.35 RFCP 0.42 0.13 0.45 RFCP NA 9.93 NA 0.50 3.00 0.00 0.00 0.00 0.00 0.10TECNOFIM FIMS 0.87 1.28 0.01 RFCP 0.64 1.19 0.01 RFCP 0.11 1.07 0.01 RFCP -0.06 0.46 0.01 RFCP 1.57 1.05 9.97 1.15 0.00 0.00 0.00 0.00 0.00 0.10TELEFONICO CORTO FIM 0.60 5.34 0.29 RFCP 0.48 4.76 0.33 RFCP 0.35 4.30 0.30 RFCP 0.36 0.11 0.23 RFCP 1.81 7.34 14.38 0.45 0.00 0.00 0.00 0.00 0.00 0.20UBS DINERO FIM NA NA 0.00 RFCP 0.54 7.41 0.26 RVMI 0.45 0.20 0.50 RFCP 0.45 9.50 0.61 RFCP NA 0.13 NA 0.25 0.00 0.00 0.00 0.00 0.00 0.08UNIFOND IX FIM 0.35 0.99 0.08 GRV 2.66 2.54 0.01 GRV 0.82 1.40 0.00 RFCP 0.02 9.77 0.01 RFCP 3.89 1.55 5.38 1.25 0.00 0.00 0.00 0.00 0.00 0.05UNO-E DINERO FIM 0.44 8.93 0.64 RFCP 0.51 0.13 0.43 RFCP 0.46 0.11 0.33 RFCP 0.41 0.12 0.30 RFCP 1.83 0.11 NA 0.25 0.00 0.00 0.00 0.00 0.00 0.05URQUIJO EMPRESA 1 FIM 0.54 6.12 0.11 RFCP 0.47 6.66 0.11 RFCP 0.38 1.03 0.22 RFCP 0.39 1.09 0.19 RFCP 1.79 1.64 14.93 0.50 0.00 0.00 0.00 0.00 0.00 0.10URQUIJO RENTA FIM 0.53 0.64 0.81 RFCP 0.47 0.70 1.16 RFCP -0.01 0.80 1.01 RFCP -0.12 0.46 0.51 RFCP 0.87 0.67 9.86 1.60 0.00 0.00 0.00 0.00 0.00 0.10VENTURE CASH FIM NA 0.21 0.23 RFCP 0.52 0.23 0.21 RFCP 0.27 6.63 0.13 RFCP 0.24 5.54 0.28 RFCP NA 0.16 NA 0.80 0.00 0.00 0.00 0.00 0.00 0.12VENTURE TESORERIA FIM NA 0.24 0.11 RFCP 0.61 0.20 0.23 RFCP 0.36 0.12 0.22 RFCP 0.37 0.12 0.50 RFCP NA 0.18 NA 0.50 0.00 0.00 0.00 0.00 0.00 0.12VITAL DEUDA I FIM 0.64 1.26 4.04 RFCP 0.43 1.01 3.87 RFCP 0.05 1.47 3.27 RFCP 0.19 1.00 3.22 RFCP 1.30 1.20 NA 1.40 0.00 0.00 0.00 0.00 0.00 0.10ZARAGOZANO RF FIM 0.48 0.41 0.76 RFCP 0.63 0.40 0.60 RFCP 0.35 0.29 0.64 RFCP 0.09 0.32 0.62 RFCP 1.56 0.36 10.07 1.50 0.00 0.00 0.00 0.00 0.00 0.20
(Continues over)
(Continued)

253
Annex 4
: Collective in
vestmen
t schem
es and ven
ture cap
ital com
pan
iesA.4.8.Investment in securities. FIM. Yields, volatility and duration
1Q 2Q 3Q 4Q 2003
Yield Vol Dur Yield Vol Dur Yield Vol Dur Yield Vol Dur Yield Vol(1) (2) Type (1) (2) Type (1) (2) Type (1) (2) Type (1)% % % % %
% fees
Management Front end Back endCustody
of assets of yield Max. Min. Max. Min.
Yieldsince1996
Long-term fixed-income FIM(RFLP)
AC LARGO FT FIM 0.91 1.63 2.57 RFLP 1.14 1.68 2.36 RFLP 0.26 1.87 2.79 RFLP -0.24 1.66 2.63 RFLP 2.07 1.72 14.02 1.35 0.00 0.00 0.00 1.00 0.00 0.08ADEPA FT FIM 0.88 1.26 1.02 RFLP 0.78 1.20 1.52 RFLP 0.09 1.85 2.12 RFLP -0.32 1.48 2.03 RFLP 1.43 1.48 9.26 1.50 0.00 0.00 0.00 0.00 0.00 0.00ALCALA RENTA FIM 0.46 0.55 1.06 RFLP 0.45 0.80 0.67 RFLP 0.33 0.47 0.56 RFLP 0.29 0.37 0.65 RFLP 1.54 0.57 12.65 0.50 0.00 0.00 0.00 0.00 0.00 0.02ALCALA UNO FIM 0.69 0.41 0.91 RFLP 0.36 0.76 0.49 RFLP 0.38 0.29 0.38 RFLP 0.36 0.25 0.53 RFLP 1.79 0.47 16.32 0.50 0.00 0.00 0.00 0.00 0.00 0.02ALLIANZ FONDO FIM 1.27 1.96 3.12 RFLP 1.55 2.54 3.46 RFLP -0.18 2.61 3.19 RFLP -0.38 1.61 3.00 RFLP 2.27 2.23 10.89 1.50 0.00 0.00 0.00 1.00 0.00 0.14ALMAGRO FIM 0.72 1.89 2.00 RFLP 1.13 2.03 2.84 RFLP -0.60 2.49 1.93 RFLP -0.09 1.22 1.67 RFLP 1.15 1.97 12.10 1.50 0.00 0.00 0.00 0.00 0.00 0.10ARCALIA AHORRO FIM 1.01 2.09 4.83 RFLP 1.26 2.26 3.57 RFLP 0.19 1.60 2.08 RFLP -0.01 1.39 1.95 RFLP 2.46 1.87 15.22 1.17 0.00 0.00 0.00 0.00 0.00 0.15ASTURFONDO AHORRO FIM 0.45 0.93 1.02 RFLP 0.76 0.75 1.36 RFLP 0.19 0.77 1.31 RFLP 0.00 0.66 1.36 RFLP 1.40 0.79 10.30 1.40 0.00 0.00 0.00 0.00 0.00 0.15ATLANTICO PLUS 3 FIM 1.19 1.99 2.41 RFLP 1.08 1.81 1.94 RFLP 0.10 2.24 2.53 RFLP -0.16 1.71 2.34 RFLP 2.22 1.95 16.29 0.65 0.00 0.00 0.00 0.00 0.00 0.10ATLANTICO PREMIER FIM 1.34 1.98 1.55 RFLP 1.48 2.19 2.85 RFLP -0.02 3.16 3.47 RFLP -0.28 2.38 2.91 RFLP 2.54 2.48 15.70 0.65 0.00 0.00 0.00 0.00 0.00 0.09AVIVA RENTA FIJA FIM 1.00 1.61 2.61 RFLP 1.33 1.85 2.23 RFLP 0.02 1.51 2.67 RFLP 0.11 1.11 2.33 RFLP 2.48 1.55 NA 1.00 0.00 0.00 0.00 0.00 0.00 0.11BANCAJA RENTA FIJA FIM 0.96 1.59 2.59 RFLP 1.14 1.69 2.81 RFLP -0.04 1.70 2.88 RFLP -0.46 1.44 2.92 RFLP 1.60 1.61 13.22 1.50 0.00 0.00 0.00 1.00 0.00 0.20BANESTO ESPECIAL RF FIM 1.06 2.11 2.93 RFLP 1.32 2.08 3.22 RFLP 0.16 2.02 3.61 RFLP -0.30 1.66 3.65 RFLP 2.25 1.98 17.48 0.85 0.00 0.00 0.00 0.00 0.00 0.15BANESTO RENTA FIJA BONOS FIM 0.99 2.29 2.90 RFLP 1.02 2.13 3.17 RFLP 0.03 2.00 3.48 RFLP -0.35 1.60 4.03 RFLP 1.69 2.02 13.73 1.50 0.00 0.00 0.00 0.00 0.00 0.20BANESTO RF PRIVADA FIM 1.36 2.77 3.84 RFLP 3.12 2.79 3.71 RFLP 0.34 3.12 3.86 RFLP -0.06 2.79 4.14 RFLP 4.82 2.88 NA 1.65 0.00 0.00 0.00 0.00 0.00 0.10BANIF RENTA FIJA FIM 0.79 2.40 3.02 RFLP 0.87 2.24 3.18 RFLP 0.09 2.35 3.25 RFLP -0.36 1.74 3.75 RFLP 1.39 2.20 15.59 1.10 0.00 0.00 0.00 0.00 0.00 0.20BANIF RF DURACION FIM 1.37 2.33 3.19 RFLP 1.04 2.20 3.19 RFLP 0.30 2.32 3.17 RFLP -0.24 1.73 3.12 RFLP 2.48 2.16 19.66 0.60 0.00 0.00 0.00 0.00 0.00 0.10BANIF RF HIGH YIELD FIM 3.51 3.81 3.87 RFLP 6.34 2.84 3.70 RFLP 1.56 2.29 4.42 RFLP 2.23 1.89 4.34 RFLP 14.28 2.82 NA 1.40 0.00 0.00 0.00 0.00 0.00 0.20BANIF RF LARGO PLAZO FIM 0.90 2.29 3.30 RFLP 0.90 2.22 3.19 RFLP 0.21 2.34 3.35 RFLP -0.35 1.78 4.47 RFLP 1.68 2.17 14.45 1.15 0.00 0.00 0.00 0.00 0.00 0.20BANKOA RENTA FONDO FIM 0.50 2.41 5.19 RFLP 1.48 2.97 3.08 RFLP -0.31 2.49 3.34 RFLP -0.48 1.86 2.84 RFLP 1.18 2.47 12.14 1.75 0.00 0.00 0.00 0.00 0.00 0.20BANKPYME BROKERFOND FIM 2.08 1.72 2.00 RFLP 2.23 1.59 2.53 RFLP 1.16 1.65 2.93 RFLP -1.99 3.06 3.45 RFLP 3.47 2.13 18.24 0.50 0.00 0.00 0.00 0.00 0.00 0.10BANKPYME FC EUROFIX RF FIM 1.50 1.88 1.89 RFLP 1.10 1.50 1.82 RFLP 0.15 0.46 0.56 RFLP 0.15 0.33 0.50 RFLP 2.92 1.24 NA 0.85 0.00 0.00 0.00 0.00 0.00 0.15BANKPYME FT FIM 1.36 2.25 2.26 RFLP 1.07 1.84 2.18 RFLP -0.07 1.50 1.66 RFLP -0.19 1.20 1.50 RFLP 2.18 1.74 15.68 1.25 0.00 0.00 0.00 0.00 0.00 0.20BANKPYME MULTIVALOR FIM 2.24 1.91 2.48 RFLP 4.73 2.21 3.73 RFLP 1.63 1.73 3.39 RFLP -1.68 2.90 3.72 RFLP 6.99 2.28 15.74 1.00 0.00 0.00 0.00 0.00 0.00 0.15BARCLAYS BONOS LARGO FIM 1.55 3.39 2.67 RFLP 1.98 3.91 3.20 RFLP -0.14 3.90 3.12 RFLP -0.78 3.38 3.29 RFLP 2.60 3.66 18.94 1.00 0.00 0.00 0.00 1.00 0.00 0.20BARCLAYS INSTITUCIONES FIM NA 1.19 0.01 RFLP 0.56 1.25 2.08 RFLP 0.21 1.45 2.01 RFLP -0.05 1.21 1.97 RFLP NA 1.31 NA 0.65 0.00 0.00 0.00 0.00 0.00 0.10BASKEFOND FIM 1.27 1.46 1.96 RFLP 1.05 1.43 1.84 RFLP 0.09 1.39 1.86 RFLP -0.07 1.27 1.88 RFLP 2.36 1.39 14.56 1.50 0.00 0.00 0.00 0.00 0.00 0.09BBK BONO FIM 1.25 1.10 1.47 RFLP 1.05 1.06 1.18 RFLP 0.33 1.07 1.17 RFLP 0.28 1.20 1.06 RFLP 2.94 1.11 18.19 0.65 0.00 0.00 0.00 0.00 0.00 0.09BBVA DEUDA FIM 0.91 1.94 3.02 RFLP 1.00 2.23 2.88 RFLP -0.03 2.10 2.90 RFLP -0.38 1.78 2.83 RFLP 1.50 2.02 11.85 1.55 0.00 0.00 0.00 1.00 0.00 0.15BBVA DURACION FIM 1.89 3.60 4.31 RFLP 2.11 4.23 4.36 RFLP 0.14 4.60 4.76 RFLP -0.47 3.55 4.74 RFLP 3.69 4.03 25.38 0.65 0.00 0.00 0.00 2.00 0.00 0.15BBVA EUSKOFONDO FIM 1.76 3.74 5.99 RFLP 2.21 3.33 4.86 RFLP 0.14 3.06 5.17 RFLP -0.39 2.49 5.12 RFLP 3.76 3.19 NA 0.50 0.00 0.00 0.00 0.00 0.00 0.10BBVA FV FIM 1.06 2.00 2.93 RFLP 1.16 2.27 2.90 RFLP -0.10 2.19 2.90 RFLP -0.46 1.93 2.91 RFLP 1.66 2.11 12.38 1.75 0.00 0.00 0.00 1.00 0.00 0.00BBVA PATRIMONIO FIM 1.37 2.19 3.64 RFLP 1.63 2.35 4.06 RFLP 0.48 2.59 3.89 RFLP 0.03 2.12 3.70 RFLP 3.55 2.33 28.21 0.60 0.00 0.00 0.00 2.00 0.00 0.10BBVA RENTA FIJA LARGO 6 FIM 1.80 3.79 4.51 RFLP 2.08 4.25 4.38 RFLP 0.22 4.20 4.59 RFLP -0.23 3.50 4.43 RFLP 3.91 3.95 23.03 0.40 0.00 0.00 0.00 1.00 0.00 0.10BBVA RENTA FIJA LARGO FIM 1.15 2.20 4.05 RFLP 1.31 2.21 4.29 RFLP 0.20 2.53 4.27 RFLP -0.20 2.01 3.83 RFLP 2.48 2.25 13.33 1.50 0.00 0.00 0.00 2.00 0.00 0.15BCH BONOS FV FIM 1.08 2.05 3.27 RFLP 1.24 2.13 2.77 RFLP -0.25 2.09 2.93 RFLP -0.40 1.88 3.02 RFLP 1.68 2.05 13.17 1.50 0.00 0.00 0.00 1.00 0.00 0.00BETA DEUDA FT FIM 1.08 1.62 1.93 RFLP 0.91 1.47 1.80 RFLP 0.17 1.61 2.11 RFLP -0.27 1.47 2.05 RFLP 1.89 1.55 12.10 1.40 0.00 0.00 0.00 0.00 0.00 0.09BETA RENTA FIM 1.22 1.00 1.30 RFLP 0.78 0.77 1.21 RFLP 0.38 0.93 1.68 RFLP 0.00 0.86 1.39 RFLP 2.39 0.90 15.87 1.00 0.00 0.00 0.00 0.00 0.00 0.12BETA Z-SCORE I FIM 1.74 3.88 5.52 RFLP 2.10 4.26 5.51 RFLP 0.17 3.99 4.55 RFLP -0.31 2.54 4.16 RFLP 3.73 3.73 NA 0.25 0.10 5.00 5.00 0.00 0.00 0.10BG URGULL PATRIMONIO FIM 1.03 1.51 2.07 RFLP 0.99 1.35 1.93 RFLP 0.07 1.36 1.87 RFLP -0.14 1.17 1.87 RFLP 1.96 1.35 10.85 1.60 0.00 0.00 0.00 1.00 0.00 0.20BI EUROBONOS FIM 1.15 2.94 3.94 RFLP 1.36 3.06 4.90 RFLP -0.33 2.97 4.15 RFLP -0.86 2.24 2.78 RFLP 1.30 2.83 10.71 1.00 0.00 0.00 0.00 0.00 0.00 0.00BIZKAIRENT FT FIM 1.06 1.72 2.48 RFLP 0.96 1.71 2.37 RFLP -0.06 1.51 2.28 RFLP -0.22 1.33 2.23 RFLP 1.74 1.58 15.60 1.40 0.00 0.00 0.00 2.00 0.00 0.09BK FONDO BONOS FIM 1.12 1.90 1.05 RFLP 1.33 1.90 2.26 RFLP 1.04 1.74 0.57 RFLP -0.74 1.94 1.81 RFLP 2.76 1.88 16.95 1.00 0.00 0.00 0.00 2.00 0.00 0.20BK FONDO FIJO FIM 1.24 2.34 3.27 RFLP 1.37 2.11 4.01 RFLP 1.17 1.86 3.65 RFLP -1.07 2.19 4.77 RFLP 2.72 2.14 14.83 1.50 0.00 0.00 0.00 1.00 1.00 0.20BK FT 2 FIM 0.66 2.39 3.25 RFLP 1.85 2.99 2.57 RFLP 0.08 1.95 3.17 RFLP -0.74 2.04 2.26 RFLP 1.84 2.39 13.08 1.20 0.00 0.00 0.00 0.00 0.00 0.14BK RENTA FIJA PRIVADA FIM NA NA NA NA NA NA NA NA NA NA 0.83 0.00 RFLP NA 0.83 NA 1.20 0.00 0.00 0.00 1.00 1.00 0.10BNP AHORRO FIM 0.79 1.21 3.10 RFLP 1.37 1.52 3.03 RFLP -0.07 1.58 2.98 RFLP -0.26 1.28 2.95 RFLP 1.84 1.42 12.34 1.50 0.00 0.00 0.00 0.00 0.00 0.15BNP PARIBAS RENTA FIJA PLUS FIM 1.48 2.29 2.97 RFLP 1.97 2.68 2.33 RFLP -0.07 4.06 2.67 RFLP -0.48 2.61 3.24 RFLP 2.90 3.00 27.44 1.00 9.00 0.00 0.00 0.00 0.00 0.00CAIXA CATALUNYA CAPITAL FIM 1.55 2.03 2.52 RFLP 2.20 2.31 2.59 RFLP 0.22 1.94 2.58 RFLP 0.03 1.64 1.85 RFLP 4.03 2.00 15.93 1.25 0.00 0.00 0.00 0.00 0.00 0.20CAIXA CATALUNYA FC FIM 0.63 0.53 0.84 RFLP 0.59 0.54 0.81 RFLP 0.15 0.42 0.55 RFLP 0.55 0.91 1.34 RFLP 1.93 0.63 NA 1.10 0.00 0.00 0.00 0.00 0.00 0.14
(Continues over)
(Continued)
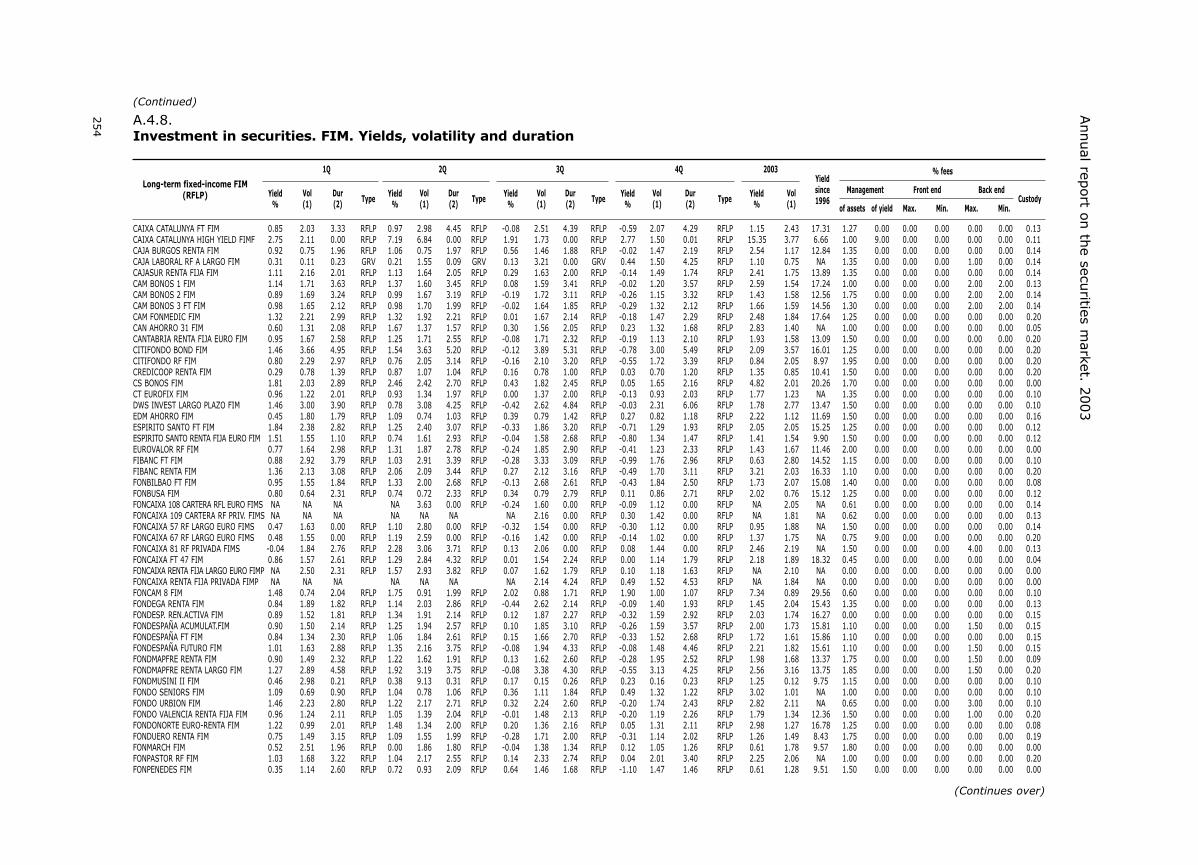
254
Annual rep
ort o
n th
e securities m
arket. 2003
A.4.8.Investment in securities. FIM. Yields, volatility and duration
1Q 2Q 3Q 4Q 2003
Yield Vol Dur Yield Vol Dur Yield Vol Dur Yield Vol Dur Yield Vol(1) (2) Type (1) (2) Type (1) (2) Type (1) (2) Type (1)% % % % %
% fees
Management Front end Back endCustody
of assets of yield Max. Min. Max. Min.
Yieldsince1996
Long-term fixed-income FIM(RFLP)
CAIXA CATALUNYA FT FIM 0.85 2.03 3.33 RFLP 0.97 2.98 4.45 RFLP -0.08 2.51 4.39 RFLP -0.59 2.07 4.29 RFLP 1.15 2.43 17.31 1.27 0.00 0.00 0.00 0.00 0.00 0.13CAIXA CATALUNYA HIGH YIELD FIMF 2.75 2.11 0.00 RFLP 7.19 6.84 0.00 RFLP 1.91 1.73 0.00 RFLP 2.77 1.50 0.01 RFLP 15.35 3.77 6.66 1.00 9.00 0.00 0.00 0.00 0.00 0.11CAJA BURGOS RENTA FIM 0.92 0.75 1.96 RFLP 1.06 0.75 1.97 RFLP 0.56 1.46 1.88 RFLP -0.02 1.47 2.19 RFLP 2.54 1.17 12.84 1.35 0.00 0.00 0.00 0.00 0.00 0.14CAJA LABORAL RF A LARGO FIM 0.31 0.11 0.23 GRV 0.21 1.55 0.09 GRV 0.13 3.21 0.00 GRV 0.44 1.50 4.25 RFLP 1.10 0.75 NA 1.35 0.00 0.00 0.00 1.00 0.00 0.14CAJASUR RENTA FIJA FIM 1.11 2.16 2.01 RFLP 1.13 1.64 2.05 RFLP 0.29 1.63 2.00 RFLP -0.14 1.49 1.74 RFLP 2.41 1.75 13.89 1.35 0.00 0.00 0.00 0.00 0.00 0.14CAM BONOS 1 FIM 1.14 1.71 3.63 RFLP 1.37 1.60 3.45 RFLP 0.08 1.59 3.41 RFLP -0.02 1.20 3.57 RFLP 2.59 1.54 17.24 1.00 0.00 0.00 0.00 2.00 2.00 0.13CAM BONOS 2 FIM 0.89 1.69 3.24 RFLP 0.99 1.67 3.19 RFLP -0.19 1.72 3.11 RFLP -0.26 1.15 3.32 RFLP 1.43 1.58 12.56 1.75 0.00 0.00 0.00 2.00 2.00 0.14CAM BONOS 3 FT FIM 0.98 1.65 2.12 RFLP 0.98 1.70 1.99 RFLP -0.02 1.64 1.85 RFLP -0.29 1.32 2.12 RFLP 1.66 1.59 14.56 1.30 0.00 0.00 0.00 2.00 2.00 0.14CAM FONMEDIC FIM 1.32 2.21 2.99 RFLP 1.32 1.92 2.21 RFLP 0.01 1.67 2.14 RFLP -0.18 1.47 2.29 RFLP 2.48 1.84 17.64 1.25 0.00 0.00 0.00 0.00 0.00 0.20CAN AHORRO 31 FIM 0.60 1.31 2.08 RFLP 1.67 1.37 1.57 RFLP 0.30 1.56 2.05 RFLP 0.23 1.32 1.68 RFLP 2.83 1.40 NA 1.00 0.00 0.00 0.00 0.00 0.00 0.05CANTABRIA RENTA FIJA EURO FIM 0.95 1.67 2.58 RFLP 1.25 1.71 2.55 RFLP -0.08 1.71 2.32 RFLP -0.19 1.13 2.10 RFLP 1.93 1.58 13.09 1.50 0.00 0.00 0.00 0.00 0.00 0.20CITIFONDO BOND FIM 1.46 3.66 4.95 RFLP 1.54 3.63 5.20 RFLP -0.12 3.89 5.31 RFLP -0.78 3.00 5.49 RFLP 2.09 3.57 16.01 1.25 0.00 0.00 0.00 0.00 0.00 0.20CITIFONDO RF FIM 0.80 2.29 2.97 RFLP 0.76 2.05 3.14 RFLP -0.16 2.10 3.20 RFLP -0.55 1.72 3.39 RFLP 0.84 2.05 8.97 1.95 0.00 0.00 0.00 0.00 0.00 0.20CREDICOOP RENTA FIM 0.29 0.78 1.39 RFLP 0.87 1.07 1.04 RFLP 0.16 0.78 1.00 RFLP 0.03 0.70 1.20 RFLP 1.35 0.85 10.41 1.50 0.00 0.00 0.00 0.00 0.00 0.20CS BONOS FIM 1.81 2.03 2.89 RFLP 2.46 2.42 2.70 RFLP 0.43 1.82 2.45 RFLP 0.05 1.65 2.16 RFLP 4.82 2.01 20.26 1.70 0.00 0.00 0.00 0.00 0.00 0.00CT EUROFIX FIM 0.96 1.22 2.01 RFLP 0.93 1.34 1.97 RFLP 0.00 1.37 2.00 RFLP -0.13 0.93 2.03 RFLP 1.77 1.23 NA 1.35 0.00 0.00 0.00 0.00 0.00 0.10DWS INVEST LARGO PLAZO FIM 1.46 3.00 3.90 RFLP 0.78 3.08 4.25 RFLP -0.42 2.62 4.84 RFLP -0.03 2.31 6.06 RFLP 1.78 2.77 13.47 1.50 0.00 0.00 0.00 0.00 0.00 0.10EDM AHORRO FIM 0.45 1.80 1.79 RFLP 1.09 0.74 1.03 RFLP 0.39 0.79 1.42 RFLP 0.27 0.82 1.18 RFLP 2.22 1.12 11.69 1.50 0.00 0.00 0.00 0.00 0.00 0.16ESPIRITO SANTO FT FIM 1.84 2.38 2.82 RFLP 1.25 2.40 3.07 RFLP -0.33 1.86 3.20 RFLP -0.71 1.29 1.93 RFLP 2.05 2.05 15.25 1.25 0.00 0.00 0.00 0.00 0.00 0.12ESPIRITO SANTO RENTA FIJA EURO FIM 1.51 1.55 1.10 RFLP 0.74 1.61 2.93 RFLP -0.04 1.58 2.68 RFLP -0.80 1.34 1.47 RFLP 1.41 1.54 9.90 1.50 0.00 0.00 0.00 0.00 0.00 0.12EUROVALOR RF FIM 0.77 1.64 2.98 RFLP 1.31 1.87 2.78 RFLP -0.24 1.85 2.90 RFLP -0.41 1.23 2.33 RFLP 1.43 1.67 11.46 2.00 0.00 0.00 0.00 0.00 0.00 0.00FIBANC FT FIM 0.88 2.92 3.79 RFLP 1.03 2.91 3.39 RFLP -0.28 3.33 3.09 RFLP -0.99 1.76 2.96 RFLP 0.63 2.80 14.52 1.15 0.00 0.00 0.00 0.00 0.00 0.10FIBANC RENTA FIM 1.36 2.13 3.08 RFLP 2.06 2.09 3.44 RFLP 0.27 2.12 3.16 RFLP -0.49 1.70 3.11 RFLP 3.21 2.03 16.33 1.10 0.00 0.00 0.00 0.00 0.00 0.20FONBILBAO FT FIM 0.95 1.55 1.84 RFLP 1.33 2.00 2.68 RFLP -0.13 2.68 2.61 RFLP -0.43 1.84 2.50 RFLP 1.73 2.07 15.08 1.40 0.00 0.00 0.00 0.00 0.00 0.08FONBUSA FIM 0.80 0.64 2.31 RFLP 0.74 0.72 2.33 RFLP 0.34 0.79 2.79 RFLP 0.11 0.86 2.71 RFLP 2.02 0.76 15.12 1.25 0.00 0.00 0.00 0.00 0.00 0.12FONCAIXA 108 CARTERA RFL EURO FIMS NA NA NA NA 3.63 0.00 RFLP -0.24 1.60 0.00 RFLP -0.09 1.12 0.00 RFLP NA 2.05 NA 0.61 0.00 0.00 0.00 0.00 0.00 0.14FONCAIXA 109 CARTERA RF PRIV. FIMS NA NA NA NA NA NA NA 2.16 0.00 RFLP 0.30 1.42 0.00 RFLP NA 1.81 NA 0.62 0.00 0.00 0.00 0.00 0.00 0.13FONCAIXA 57 RF LARGO EURO FIMS 0.47 1.63 0.00 RFLP 1.10 2.80 0.00 RFLP -0.32 1.54 0.00 RFLP -0.30 1.12 0.00 RFLP 0.95 1.88 NA 1.50 0.00 0.00 0.00 0.00 0.00 0.14FONCAIXA 67 RF LARGO EURO FIMS 0.48 1.55 0.00 RFLP 1.19 2.59 0.00 RFLP -0.16 1.42 0.00 RFLP -0.14 1.02 0.00 RFLP 1.37 1.75 NA 0.75 9.00 0.00 0.00 0.00 0.00 0.20FONCAIXA 81 RF PRIVADA FIMS -0.04 1.84 2.76 RFLP 2.28 3.06 3.71 RFLP 0.13 2.06 0.00 RFLP 0.08 1.44 0.00 RFLP 2.46 2.19 NA 1.50 0.00 0.00 0.00 4.00 0.00 0.13FONCAIXA FT 47 FIM 0.86 1.57 2.61 RFLP 1.29 2.84 4.32 RFLP 0.01 1.54 2.24 RFLP 0.00 1.14 1.79 RFLP 2.18 1.89 18.32 0.45 0.00 0.00 0.00 0.00 0.00 0.04FONCAIXA RENTA FIJA LARGO EURO FIMP NA 2.50 2.31 RFLP 1.57 2.93 3.82 RFLP 0.07 1.62 1.79 RFLP 0.10 1.18 1.63 RFLP NA 2.10 NA 0.00 0.00 0.00 0.00 0.00 0.00 0.00FONCAIXA RENTA FIJA PRIVADA FIMP NA NA NA NA NA NA NA 2.14 4.24 RFLP 0.49 1.52 4.53 RFLP NA 1.84 NA 0.00 0.00 0.00 0.00 0.00 0.00 0.00FONCAM 8 FIM 1.48 0.74 2.04 RFLP 1.75 0.91 1.99 RFLP 2.02 0.88 1.71 RFLP 1.90 1.00 1.07 RFLP 7.34 0.89 29.56 0.60 0.00 0.00 0.00 0.00 0.00 0.10FONDEGA RENTA FIM 0.84 1.89 1.82 RFLP 1.14 2.03 2.86 RFLP -0.44 2.62 2.14 RFLP -0.09 1.40 1.93 RFLP 1.45 2.04 15.43 1.35 0.00 0.00 0.00 0.00 0.00 0.13FONDESP. REN.ACTIVA FIM 0.89 1.52 1.81 RFLP 1.34 1.91 2.14 RFLP 0.12 1.87 2.27 RFLP -0.32 1.59 2.92 RFLP 2.03 1.74 16.27 0.00 0.00 0.00 0.00 0.00 0.00 0.15FONDESPAÑA ACUMULAT.FIM 0.90 1.50 2.14 RFLP 1.25 1.94 2.57 RFLP 0.10 1.85 3.10 RFLP -0.26 1.59 3.57 RFLP 2.00 1.73 15.81 1.10 0.00 0.00 0.00 1.50 0.00 0.15FONDESPAÑA FT FIM 0.84 1.34 2.30 RFLP 1.06 1.84 2.61 RFLP 0.15 1.66 2.70 RFLP -0.33 1.52 2.68 RFLP 1.72 1.61 15.86 1.10 0.00 0.00 0.00 0.00 0.00 0.15FONDESPAÑA FUTURO FIM 1.01 1.63 2.88 RFLP 1.35 2.16 3.75 RFLP -0.08 1.94 4.33 RFLP -0.08 1.48 4.46 RFLP 2.21 1.82 15.61 1.10 0.00 0.00 0.00 1.50 0.00 0.15FONDMAPFRE RENTA FIM 0.90 1.49 2.32 RFLP 1.22 1.62 1.91 RFLP 0.13 1.62 2.60 RFLP -0.28 1.95 2.52 RFLP 1.98 1.68 13.37 1.75 0.00 0.00 0.00 1.50 0.00 0.09FONDMAPFRE RENTA LARGO FIM 1.27 2.89 4.58 RFLP 1.92 3.19 3.75 RFLP -0.08 3.38 4.30 RFLP -0.55 3.13 4.25 RFLP 2.56 3.16 13.75 1.85 0.00 0.00 0.00 1.50 0.00 0.20FONDMUSINI II FIM 0.46 2.98 0.21 RFLP 0.38 9.13 0.31 RFLP 0.17 0.15 0.26 RFLP 0.23 0.16 0.23 RFLP 1.25 0.12 9.75 1.15 0.00 0.00 0.00 0.00 0.00 0.10FONDO SENIORS FIM 1.09 0.69 0.90 RFLP 1.04 0.78 1.06 RFLP 0.36 1.11 1.84 RFLP 0.49 1.32 1.22 RFLP 3.02 1.01 NA 1.00 0.00 0.00 0.00 0.00 0.00 0.10FONDO URBION FIM 1.46 2.23 2.80 RFLP 1.22 2.17 2.71 RFLP 0.32 2.24 2.60 RFLP -0.20 1.74 2.43 RFLP 2.82 2.11 NA 0.65 0.00 0.00 0.00 3.00 0.00 0.10FONDO VALENCIA RENTA FIJA FIM 0.96 1.24 2.11 RFLP 1.05 1.39 2.04 RFLP -0.01 1.48 2.13 RFLP -0.20 1.19 2.26 RFLP 1.79 1.34 12.36 1.50 0.00 0.00 0.00 1.00 0.00 0.20FONDONORTE EURO-RENTA FIM 1.22 0.99 2.01 RFLP 1.48 1.34 2.00 RFLP 0.20 1.36 2.16 RFLP 0.05 1.31 2.11 RFLP 2.98 1.27 16.78 1.25 0.00 0.00 0.00 0.00 0.00 0.08FONDUERO RENTA FIM 0.75 1.49 3.15 RFLP 1.09 1.55 1.99 RFLP -0.28 1.71 2.00 RFLP -0.31 1.14 2.02 RFLP 1.26 1.49 8.43 1.75 0.00 0.00 0.00 0.00 0.00 0.19FONMARCH FIM 0.52 2.51 1.96 RFLP 0.00 1.86 1.80 RFLP -0.04 1.38 1.34 RFLP 0.12 1.05 1.26 RFLP 0.61 1.78 9.57 1.80 0.00 0.00 0.00 0.00 0.00 0.00FONPASTOR RF FIM 1.03 1.68 3.22 RFLP 1.04 2.17 2.55 RFLP 0.14 2.33 2.74 RFLP 0.04 2.01 3.40 RFLP 2.25 2.06 NA 1.00 0.00 0.00 0.00 0.00 0.00 0.20FONPENEDES FIM 0.35 1.14 2.60 RFLP 0.72 0.93 2.09 RFLP 0.64 1.46 1.68 RFLP -1.10 1.47 1.46 RFLP 0.61 1.28 9.51 1.50 0.00 0.00 0.00 0.00 0.00 0.00
(Continues over)
(Continued)

255
Annex 4
: Collective in
vestmen
t schem
es and ven
ture cap
ital com
pan
iesA.4.8.Investment in securities. FIM. Yields, volatility and duration
1Q 2Q 3Q 4Q 2003
Yield Vol Dur Yield Vol Dur Yield Vol Dur Yield Vol Dur Yield Vol(1) (2) Type (1) (2) Type (1) (2) Type (1) (2) Type (1)% % % % %
% fees
Management Front end Back endCustody
of assets of yield Max. Min. Max. Min.
Yieldsince1996
Long-term fixed-income FIM(RFLP)
FONPENEDES INVER. FIM 0.45 1.58 3.84 RFLP 0.70 1.12 1.81 RFLP 0.58 1.31 1.18 RFLP -1.04 1.31 1.04 RFLP 0.68 1.35 11.54 1.00 0.00 0.00 0.00 0.00 0.00 0.00GENERAL RENTA FIM 1.36 1.03 1.72 RFLP 0.17 0.71 0.87 RFLP -0.10 2.07 4.95 RFLP 0.00 1.58 5.24 RFLP 1.42 1.45 11.20 2.00 0.00 0.00 0.00 0.00 0.00 0.10HERRERO RENTA FIJA FIMS 0.97 4.14 0.01 RFLP 2.24 3.93 0.01 RFLP -0.88 2.72 0.01 RFLP -0.46 1.53 0.01 RFLP 1.85 3.25 6.49 1.50 0.00 0.00 0.00 0.00 0.00 0.10IBERCAJA FUTURO FIM 0.70 1.50 3.11 RFLP 1.32 1.98 3.00 RFLP 0.54 2.46 2.95 RFLP 0.28 1.48 2.85 RFLP 2.86 1.90 12.90 1.00 0.00 0.00 0.00 2.50 0.00 0.20IBERCAJA HORIZONTE FIM 0.50 1.62 3.20 RFLP 1.78 2.42 3.70 RFLP 0.34 3.24 3.92 RFLP 0.25 1.90 3.83 RFLP 2.89 2.38 15.59 1.20 0.00 0.00 0.00 1.00 0.00 0.20IBERCAJA PREMIER FIM NA NA NA NA NA NA NA 0.73 1.78 RFLP -0.11 1.04 1.20 RFLP NA 0.92 NA 1.15 0.00 0.00 0.00 2.00 0.00 0.10INDOSUEZ FT FIM 1.28 2.19 3.62 RFLP 1.72 2.66 3.46 RFLP -0.32 2.77 3.27 RFLP -0.44 1.94 3.32 RFLP 2.24 2.42 14.41 1.40 0.00 0.00 0.00 0.00 0.00 0.10INTERDIN HIGH YIELD FIM 3.10 2.22 4.50 RFLP 4.24 3.43 4.43 RFLP 1.90 2.39 4.20 RFLP 0.78 0.89 0.01 RFLP 10.36 2.42 NA 1.35 9.00 0.00 0.00 0.00 0.00 0.10INTERVALOR RENTA FIM 0.80 1.22 3.10 RFLP 1.14 1.64 3.09 RFLP 1.26 2.86 2.65 RFLP -4.08 5.82 2.33 RFLP -0.98 3.44 9.79 1.50 0.00 0.00 0.00 0.00 0.00 0.10INVERCAJA 32 FIM 0.54 0.33 0.68 RFLP 0.45 0.26 0.46 RFLP 0.24 0.12 0.22 RFLP 0.18 6.53 0.01 RFLP 1.42 0.22 16.31 1.00 0.00 0.00 0.00 1.00 0.00 0.05INVERDEUDA FT RENTA FIM 0.86 1.46 3.06 RFLP 1.26 1.58 1.99 RFLP -0.21 1.72 1.96 RFLP -0.18 1.12 1.91 RFLP 1.73 1.49 11.74 1.30 0.00 0.00 0.00 0.00 0.00 0.19INVERMADRID FT FIM 0.84 1.24 1.63 RFLP 0.78 1.62 2.69 RFLP -0.03 1.54 0.00 RFLP -0.27 1.19 1.86 RFLP 1.31 1.41 13.21 1.40 0.00 0.00 0.00 0.00 0.00 0.09IPARFONDO FIM 0.53 0.24 0.65 RFLP 0.46 0.23 0.69 RFLP 0.23 0.26 0.74 RFLP 0.19 0.16 0.64 RFLP 1.42 0.23 13.71 1.25 0.00 0.00 0.00 0.00 0.00 0.15KUTXAINVER FIM 1.32 1.36 2.34 RFLP 2.85 1.22 2.71 RFLP 0.87 1.69 3.22 RFLP 0.91 1.11 1.81 RFLP 6.06 1.38 18.10 1.75 0.00 0.00 0.00 2.00 0.00 0.20LIBERTY EURO RENTA FIM 0.66 0.99 1.63 RFLP 0.84 1.07 1.73 RFLP 0.01 1.14 1.59 RFLP -0.10 0.81 1.29 RFLP 1.42 1.02 NA 1.50 0.00 0.00 0.00 0.00 0.00 0.10LLOYDS FONDO 1 FIM 0.99 1.49 2.57 RFLP 1.39 1.71 2.35 RFLP -0.06 1.50 2.22 RFLP -0.20 1.17 2.16 RFLP 2.13 1.48 14.64 1.50 0.00 0.00 0.00 1.00 0.00 0.20LUSO RENTA FIM 2.97 4.46 1.98 RFLP 0.46 1.23 1.98 RFLP 0.10 2.47 3.87 RFLP -0.71 2.02 4.00 RFLP 2.83 2.82 9.23 1.50 0.00 0.00 0.00 0.00 0.00 0.13MADRID DEUDA ELECCION FIM NA NA 0.00 RFLP 1.78 2.70 3.30 RFLP -0.09 2.49 0.00 RFLP -0.60 1.90 2.53 RFLP NA 2.39 NA 1.25 0.00 0.00 0.00 3.00 0.00 0.10MADRID DEUDA FT FIM 1.16 2.52 3.67 RFLP 1.27 2.79 3.75 RFLP -0.08 2.81 0.00 RFLP -0.51 1.93 3.79 RFLP 1.85 2.54 15.56 1.25 0.00 0.00 0.00 0.00 0.00 0.10MADRID DEUDA PUBLICA EURO FIM 1.22 2.65 4.18 RFLP 1.62 3.20 4.31 RFLP 0.11 3.02 0.00 RFLP -0.68 2.15 5.60 RFLP 2.27 2.79 18.52 1.40 0.00 0.00 0.00 1.00 0.00 0.04MADRID PREMIERE FIM 1.35 2.00 2.90 RFLP 1.57 2.03 2.76 RFLP 0.18 1.89 0.00 RFLP -0.21 1.59 3.08 RFLP 2.91 1.89 18.64 0.75 0.00 0.00 0.00 2.00 0.00 0.10MADRID RENTABILIDAD TRIENAL FIM 0.44 5.12 0.09 GRF 0.45 1.71 2.83 RFLP -0.05 2.27 0.00 RFLP -0.18 1.80 2.36 RFLP 0.66 1.69 NA 1.00 0.00 0.00 0.00 1.00 0.00 0.10MARCH PREMIER R.F. FIM 0.74 2.48 1.99 RFLP 0.29 1.81 1.76 RFLP 0.17 1.35 1.41 RFLP 0.53 1.17 1.33 RFLP 1.75 1.77 NA 0.90 0.00 0.00 0.00 0.00 0.00 0.10MEDIVALOR FT FIM 0.65 2.81 3.07 RFLP 1.19 2.71 3.15 RFLP -0.04 3.14 3.82 RFLP -0.55 1.63 3.49 RFLP 1.25 2.64 13.74 1.40 0.00 0.00 0.00 0.00 0.00 0.10MORGAN STANLEY AHORRO FIM 0.85 0.86 1.52 RFLP 1.05 0.96 1.51 RFLP 0.23 1.01 1.53 RFLP 0.14 0.77 1.29 RFLP 2.30 0.91 15.79 0.90 0.00 0.00 0.00 0.00 0.00 0.10MORGAN STANLEY EURO DEUDA FIM 1.11 2.77 4.79 RFLP 1.75 3.20 4.77 RFLP -0.17 2.76 4.81 RFLP -0.31 2.15 4.83 RFLP 2.40 2.75 20.04 1.25 0.00 0.00 0.00 0.00 0.00 0.15MORGAN STANLEY FONDO FIM 0.91 0.96 1.64 RFLP 1.21 1.07 1.73 RFLP 0.28 1.11 1.54 RFLP 0.22 0.77 1.34 RFLP 2.65 0.99 17.05 0.55 0.00 2.00 2.00 0.00 0.00 0.10MORGAN STANLEY FT FIM 0.69 0.86 1.36 RFLP 0.72 0.97 1.97 RFLP -0.03 1.27 1.99 RFLP -0.11 0.98 1.98 RFLP 1.26 1.04 11.62 1.40 0.00 0.00 0.00 0.00 0.00 0.05MS CORPORATE QUALITY 1 FIMP NA NA NA NA 0.73 0.02 RFLP 0.55 0.77 1.08 RFLP 0.42 0.83 1.41 RFLP NA 0.79 NA 0.45 0.00 0.00 0.00 0.00 0.00 0.05MS CORPORATE QUALITY FIMS NA NA NA NA 0.73 0.00 RFLP 0.26 0.65 0.00 RFLP 0.14 0.72 0.01 RFLP NA 0.70 NA 0.90 0.00 0.00 0.00 0.00 0.00 0.02MS CORPORATE QUALITY PLUS FIMS NA NA NA NA 0.73 0.00 RFLP 0.38 0.74 0.00 RFLP 0.25 0.79 0.01 RFLP NA 0.76 NA 0.55 0.00 0.00 0.00 0.00 0.00 0.02MUTUAFONDO FIM 1.27 1.18 2.04 RFLP 1.24 1.38 2.14 RFLP 0.19 0.82 2.39 RFLP 0.68 1.01 2.78 RFLP 3.43 1.12 20.80 0.20 0.00 0.00 0.00 0.00 0.00 0.01MUTUAFONDO LP FIM 1.72 2.42 4.50 RFLP 2.03 2.82 4.68 RFLP 0.12 3.22 6.06 RFLP 0.72 2.10 5.27 RFLP 4.66 2.68 21.34 0.25 0.00 0.00 0.00 0.00 0.00 0.06NOVOCAJAS FIM 0.59 0.82 2.53 RFLP 0.97 1.04 2.74 RFLP 0.47 1.41 2.66 RFLP 0.37 1.20 3.14 RFLP 2.42 1.14 11.32 1.40 0.00 0.00 0.00 0.00 0.00 0.14RENTA 4 AHORRO FIM 0.89 1.44 2.44 RFLP 0.17 2.00 2.02 RFLP 0.37 1.60 2.04 RFLP 0.89 1.01 2.27 RFLP 2.34 1.55 14.01 1.50 0.00 0.00 0.00 0.00 0.00 0.13RENTA 4 CUPON 2005 FIM NA 0.90 2.22 RFLP 1.77 1.32 1.98 RFLP 0.23 1.76 1.73 RFLP -0.02 1.12 1.48 RFLP NA 1.38 NA 0.20 0.00 0.00 0.00 0.00 0.00 0.05RENTA 4 CUPON 2008 FIM NA 4.25 4.49 RFLP 1.29 4.22 4.30 RFLP -0.11 4.48 4.05 RFLP -0.71 2.96 2.67 RFLP NA 3.99 NA 0.20 0.00 0.00 0.00 0.00 0.00 0.05RENTA 4 CUPON 2013 FIM NA 11.32 9.21 RFLP 0.87 7.08 8.92 RFLP -0.66 6.95 8.50 RFLP -2.01 6.04 8.52 RFLP NA 7.53 NA 0.20 0.00 0.00 0.00 0.00 0.00 0.05RENTATLANTICO FIM 0.68 1.24 1.26 RFLP 0.52 1.17 1.63 RFLP -0.02 1.83 2.08 RFLP -0.25 1.45 1.80 RFLP 0.93 1.45 11.38 1.50 0.00 0.00 0.00 0.00 0.00 0.20RENTMADRID 2 FIM 1.17 2.17 1.99 RFLP 1.81 2.87 2.22 RFLP 0.34 1.31 0.00 RFLP -1.03 2.19 3.67 RFLP 2.29 2.21 24.23 1.00 0.00 0.00 0.00 1.00 0.00 0.11RIVA Y GARCIA AHORRO FIM 1.11 1.30 2.29 RFLP 1.31 1.23 2.19 RFLP 0.19 1.37 2.36 RFLP 0.13 1.21 2.66 RFLP 2.78 1.28 15.16 1.50 0.00 0.00 0.00 0.00 0.00 0.13RURAL RENTA FIJA 3 FIM 0.52 0.64 1.12 RFLP 0.87 0.54 0.84 RFLP 0.33 0.51 0.91 RFLP 0.20 0.50 1.02 RFLP 1.93 0.55 10.40 1.50 0.00 0.00 0.00 0.00 0.00 0.05RURAL RENTA FIJA 5 FIM 0.76 1.62 3.17 RFLP 1.97 1.98 2.49 RFLP 0.31 1.51 2.71 RFLP -0.09 1.69 2.88 RFLP 2.97 1.72 NA 1.50 0.00 0.00 0.00 0.00 0.00 0.05RURAL RF 3 PLUS FIM 0.82 0.68 1.22 RFLP 0.82 0.66 0.81 RFLP 0.32 0.62 1.04 RFLP 0.28 0.84 1.22 RFLP 2.26 0.71 17.53 1.00 0.00 0.00 0.00 0.00 0.00 0.05RURAL RF 5 PLUS FIM 1.17 1.58 2.90 RFLP 1.99 1.61 1.86 RFLP 0.68 1.60 3.59 RFLP -0.17 1.95 3.37 RFLP 3.71 1.70 16.55 1.00 0.00 0.00 0.00 0.00 0.00 0.05SABADELL BONOS EURO FIMS 1.11 4.14 0.01 RFLP 2.39 3.93 0.01 RFLP -0.73 2.72 0.01 RFLP -0.31 1.53 0.01 RFLP 2.47 3.25 16.52 0.90 0.00 0.00 0.00 0.00 0.00 0.10SABADELL DEUDA EURO FIMP 1.41 4.35 4.16 RFLP 2.76 4.13 5.14 RFLP -0.53 2.86 5.43 RFLP -0.08 1.61 5.79 RFLP 3.57 3.42 NA 0.00 0.00 0.00 0.00 0.00 0.00 0.10SAFEI EUSKOFONDO FIM 0.52 1.55 3.05 RFLP 0.58 1.40 2.60 RFLP 0.27 1.76 1.93 RFLP -0.17 1.27 1.80 RFLP 1.20 1.51 10.75 1.85 0.00 0.00 0.00 1.00 0.00 0.19SAFEI RENTA FIJA FIM 0.62 1.62 1.93 RFLP 1.13 1.33 1.91 RFLP 0.41 1.68 2.22 RFLP 0.34 1.24 1.99 RFLP 2.52 1.48 22.14 1.75 0.00 0.00 0.00 0.00 0.00 0.15SCH BONOS FT RENTA FIM 1.15 2.20 3.47 RFLP 1.14 2.25 2.75 RFLP 0.01 2.34 3.30 RFLP -0.50 2.05 2.98 RFLP 1.79 2.22 13.84 1.50 0.00 0.00 0.00 1.00 0.00 0.00
(Continues over)
(Continued)

256
Annual rep
ort o
n th
e securities m
arket. 2003
A.4.8.Investment in securities. FIM. Yields, volatility and duration
1Q 2Q 3Q 4Q 2003
Yield Vol Dur Yield Vol Dur Yield Vol Dur Yield Vol Dur Yield Vol(1) (2) Type (1) (2) Type (1) (2) Type (1) (2) Type (1)% % % % %
% fees
Management Front end Back endCustody
of assets of yield Max. Min. Max. Min.
Yieldsince1996
Long-term fixed-income FIM(RFLP)
SCH HIGH YIELD PLUS FIM 3.17 3.71 3.79 RFLP 6.69 2.85 4.08 RFLP 1.59 2.25 3.63 RFLP 2.09 1.82 4.30 RFLP 14.16 2.78 NA 1.15 0.00 0.00 0.00 3.00 0.00 0.10SCH RENTA FIJA 1 FIM 1.01 2.14 3.14 RFLP 1.24 2.07 3.16 RFLP 0.14 2.30 3.21 RFLP -0.42 1.75 3.43 RFLP 1.97 2.08 16.56 1.25 0.00 0.00 0.00 1.00 0.00 0.10SCH RENTA FIJA 2 FIM 0.94 2.33 2.99 RFLP 1.01 2.04 3.16 RFLP -0.10 1.98 3.24 RFLP -0.47 1.57 3.85 RFLP 1.38 2.00 11.14 2.00 0.00 0.00 0.00 2.00 0.00 0.15SCH RENTA FIJA EMERGENTES PLUS FIM 3.98 3.50 3.80 RFLP 6.58 5.30 3.74 RFLP 2.35 4.92 4.55 RFLP 4.75 3.09 4.81 RFLP 18.82 4.32 NA 1.15 0.00 0.00 0.00 3.00 0.00 0.10SCH RENTA FIJA PLUS FIM 1.35 3.07 4.19 RFLP 1.73 2.71 4.28 RFLP 0.27 3.00 4.64 RFLP -0.35 2.28 4.58 RFLP 3.02 2.78 21.18 0.75 0.00 0.00 0.00 0.00 0.00 0.10SCH RENTA FIJA PRIVADA FIM 1.62 2.72 3.87 RFLP 3.11 2.80 3.82 RFLP 0.58 3.12 4.07 RFLP 0.07 2.72 4.20 RFLP 5.46 2.86 NA 1.40 0.00 0.00 0.00 3.00 0.00 0.10SEGURFONDO FIM 1.18 1.75 2.93 RFLP 1.35 2.00 2.85 RFLP 0.05 1.87 2.87 RFLP -0.04 1.40 2.41 RFLP 2.55 1.77 16.09 0.65 0.00 0.00 0.00 0.00 0.00 0.15SEGURFONDO LARGO PLAZO FIM 1.80 2.30 4.28 RFLP 2.18 2.72 4.18 RFLP 0.04 2.75 4.08 RFLP 0.22 1.82 3.38 RFLP 4.29 2.43 16.79 0.10 0.00 0.00 0.00 0.00 0.00 0.05SOLBANK BONOS EURO FIMS 1.05 4.14 0.01 RFLP 2.32 3.93 0.01 RFLP -0.80 2.72 0.01 RFLP -0.37 1.53 0.01 RFLP 2.19 3.25 15.01 1.15 0.00 0.00 0.00 0.00 0.00 0.10UNIFOND EUROBONOS FIM NA NA NA NA 3.36 4.42 RFLP -1.06 4.14 4.18 RFLP 0.48 2.67 0.01 RFLP NA 3.46 NA 1.25 0.00 0.00 0.00 0.00 0.00 0.15URQUIJO LIDER FIM 1.17 1.49 1.70 RFLP 0.99 1.96 3.01 RFLP -0.38 2.34 1.99 RFLP -0.18 1.34 2.00 RFLP 1.60 1.84 12.76 1.20 0.00 0.00 0.00 1.00 1.00 0.20VENTURE RENTA FIM NA 0.27 0.65 RFLP 0.68 0.60 0.62 RFLP 0.33 0.99 1.34 RFLP -0.31 1.04 1.54 RFLP NA 0.81 NA 1.25 0.00 0.00 0.00 0.00 0.00 0.12
(Continues over)
(Continued)

257
Annex 4
: Collective in
vestmen
t schem
es and ven
ture cap
ital com
pan
iesA.4.8.Investment in securities. FIM. Yields, volatility and duration
1Q 2Q 3Q 4Q 2003
Yield Vol Dur Yield Vol Dur Yield Vol Dur Yield Vol Dur Yield Vol(1) (2) Type (1) (2) Type (1) (2) Type (1) (2) Type (1)% % % % %
% fees
Management Front end Back endCustody
of assets of yield Max. Min. Max. Min.
Yieldsince1996
Mixed fixed-income FIM (RFM)
30-70 EURO INVERSION FIM 0.59 0.59 0.26 RFM 0.64 0.51 0.27 RFM 0.28 0.35 0.26 RFM 1.21 0.91 0.25 RFM 2.75 0.63 NA 0.70 0.00 0.00 0.00 0.00 0.00 0.10ABA FONDO FIM -0.16 2.81 4.17 RFM 1.89 2.12 3.29 RFM 0.09 2.44 0.30 RFM 3.83 2.35 0.30 RFM 5.72 2.46 5.52 1.50 0.00 0.00 0.00 0.00 0.00 0.13AC EC MIXTO FIM -0.38 6.33 0.05 RFM 3.58 4.40 0.05 RFM -0.06 3.28 0.04 RFM 3.43 2.63 0.05 RFM 6.66 4.39 NA 1.50 0.00 0.00 0.00 1.00 0.00 0.07AC FC MIXT FIM 0.46 3.06 1.89 RFM 2.40 2.17 1.71 RFM 0.09 1.64 1.75 RFM 1.68 1.15 1.57 RFM 4.69 2.13 NA 1.25 0.00 0.00 0.00 1.00 0.00 0.08AC FONDANDALUCIA MIXTO FIM NA NA NA NA 2.36 1.33 RFM -0.25 2.41 2.33 RFM 2.36 1.94 2.44 RFM NA 2.23 NA 1.30 0.00 0.00 0.00 0.00 0.00 0.09AC FT PLUS FIM 0.24 3.81 1.31 RFM 2.79 2.64 1.41 RFM 0.04 1.88 1.39 RFM 1.92 1.33 1.07 RFM 5.05 2.59 10.20 1.35 0.00 0.00 0.00 0.00 0.00 0.07AEGON INVERSION MF FIM -1.40 7.86 1.32 RFM 6.38 5.92 1.07 RFM 0.17 3.43 1.13 RFM 3.33 3.36 0.94 RFM 8.56 5.49 22.13 1.50 0.00 2.00 0.00 2.00 0.00 0.14AHORRO CORPORACION VALOR FIM 0.85 3.31 1.75 RFM 3.48 3.81 1.66 RFM 0.01 2.83 1.45 RFM 2.93 2.10 1.39 RFM 7.41 3.09 16.07 1.60 0.00 0.00 0.00 2.00 0.00 0.05AHORRO VIDA MIXTO FIM -0.17 2.72 3.60 RFM 1.90 1.98 2.71 RFM 0.53 2.75 0.45 RFM 3.43 2.07 0.36 RFM 5.77 2.42 7.09 1.50 0.00 0.00 0.00 0.00 0.00 0.15AHORROFONDO 20 FIM 0.09 5.71 1.88 RFM 4.24 3.82 1.70 RFM 0.04 2.80 1.48 RFM 3.07 2.13 1.46 RFM 7.59 3.87 9.45 1.50 0.00 0.00 0.00 1.00 0.00 0.08AI FONDO FIM -0.07 2.53 1.42 RFM 3.03 1.50 1.30 RFM 1.25 1.55 1.22 RFM 1.84 1.27 1.17 RFM 6.16 1.79 13.57 1.25 0.00 0.00 0.00 0.00 0.00 0.15ALCALA AHORRO FIM 0.71 2.67 0.11 RFM 2.63 2.15 0.05 RFM 0.75 2.09 0.02 RFM 2.98 1.83 0.00 RFM 7.24 2.22 15.63 0.90 0.00 0.00 0.00 0.00 0.00 0.02ALHAMBRA FIMF 1.27 7.51 0.84 RFM 4.04 5.70 0.10 RFM 0.35 3.88 0.09 RFM 2.80 2.39 0.19 RFM 8.70 5.23 -4.41 1.60 0.00 0.00 0.00 0.00 0.00 0.12ALLIANZ CONSERVADOR ESPAÑA FIMF 0.92 1.62 0.00 RFM 0.10 0.36 0.00 RFM -1.25 1.65 0.00 RFM 1.36 1.91 0.01 RFM 1.10 1.53 NA 0.00 0.00 0.00 0.00 1.00 0.00 0.14ALLIANZ CONSERVADOR EUROPA FIMF 0.25 0.59 0.00 RFM 0.23 0.16 0.00 RFM -1.16 2.26 0.00 RFM 1.49 2.08 0.01 RFM 0.80 1.58 NA 0.00 0.00 0.00 0.00 1.00 0.00 0.14ARQUIUNO FIM -0.15 4.66 1.53 RFM 4.11 3.58 0.73 RFM 0.34 4.21 1.99 RFM 3.02 2.25 1.94 RFM 7.45 3.80 2.08 1.50 0.00 0.00 0.00 0.00 0.00 0.20ASTURFONDO MIX-R.F. FIM -1.92 8.02 0.96 RFM 3.53 4.67 0.96 RFM -0.25 4.56 1.15 RFM 4.16 3.65 1.10 RFM 5.51 5.49 -4.05 1.70 0.00 0.00 0.00 2.00 0.00 0.15ATLANTICO MIXTO 2 FIM -1.80 6.31 1.68 RFM 4.25 4.48 1.71 RFM -0.28 3.78 1.57 RFM 2.94 3.09 1.52 RFM 5.10 4.59 -0.42 1.60 0.00 0.00 0.00 2.00 0.00 0.10ATLANTICO PLUS PREMIER FIM 0.31 3.73 1.74 RFM 3.30 2.65 1.70 RFM -0.10 2.29 1.64 RFM 2.59 1.78 1.51 RFM 6.21 2.72 8.06 0.90 0.00 0.00 0.00 2.00 0.00 0.07BANCAJA FONDO DE FONDOS 30 FIMF -2.22 7.92 0.06 RFM 4.32 5.13 0.00 RFM 1.01 4.32 0.00 RFM 2.36 3.41 0.01 RFM 5.47 5.47 NA 0.95 0.00 0.00 0.00 2.00 0.00 0.05BANCAJA RENTA FIJA MIXTA FIM -3.56 10.81 0.28 RFM 4.96 5.74 0.32 RFM 0.45 3.15 0.04 RFM 2.08 2.56 0.06 RFM 3.79 6.45 0.50 1.50 0.00 0.00 0.00 1.00 0.00 0.20BANESTO ESPE. MX RF FIM -1.98 7.86 3.05 RFM 4.36 5.46 3.19 RFM 0.07 4.82 3.60 RFM 2.28 3.40 3.47 RFM 4.69 5.63 -2.91 0.90 0.00 0.00 0.00 0.00 0.00 0.10BANESTO FC MIXT FIM -1.84 5.01 1.96 RFM 3.64 3.95 2.05 RFM -0.07 3.20 2.40 RFM 2.00 2.13 2.29 RFM 3.69 3.74 NA 1.40 0.00 0.00 0.00 0.00 0.00 0.10BANESTO MIX. FIJO 2 FIM -0.77 3.35 3.07 RFM 2.28 2.66 3.23 RFM -0.51 2.82 3.26 RFM 1.03 2.04 3.42 RFM 2.02 2.77 -0.33 1.55 0.00 0.00 0.00 0.00 0.00 0.20BANESTO MIXTO 70/30 FIM -3.56 10.28 3.45 RFM 6.31 7.18 3.57 RFM -0.35 5.72 3.05 RFM 3.97 4.19 2.87 RFM 6.22 7.23 -4.41 1.85 0.00 0.00 0.00 0.00 0.00 0.10BANESTO MIXTO FIJO 85/15 FIM -1.29 4.51 1.59 RFM 3.35 3.59 1.88 RFM -0.75 3.03 1.65 RFM 2.56 2.60 2.57 RFM 3.84 3.52 4.27 1.65 0.00 0.00 0.00 0.00 0.00 0.10BANIF RF CONVERTIBLES FIM 0.47 3.43 1.39 RFM 2.95 2.99 2.67 RFM 0.09 4.18 1.09 RFM 4.07 5.00 1.33 RFM 7.74 3.99 13.87 1.25 0.00 0.00 0.00 0.00 0.00 0.20BANKPYME FC MIXT EURO 15 RV FIM -1.04 4.79 1.99 RFM 5.13 3.59 1.88 RFM 0.17 2.55 0.76 RFM 1.83 2.04 0.59 RFM 6.12 3.43 NA 1.00 0.00 0.00 0.00 0.50 0.00 0.15BANKPYME MULTIFIX 25 RV FIM -2.21 8.41 2.71 RFM 8.85 5.62 2.70 RFM 0.41 3.97 3.06 RFM 0.87 3.61 4.30 RFM 7.81 5.77 5.44 1.35 9.00 0.00 0.00 0.00 0.00 0.20BARCLAYS GESTION 25 FIMF -1.44 7.72 0.01 RFM 5.06 5.08 0.01 RFM 0.17 4.03 0.01 RFM 3.17 3.04 0.01 RFM 7.01 5.27 NA 0.05 0.00 0.00 0.00 2.00 0.00 0.00BARCLAYS MIXTO 25 FIM -0.96 7.92 2.54 RFM 4.59 4.87 2.52 RFM -0.31 4.05 2.42 RFM 2.90 3.07 2.16 RFM 6.26 5.30 -4.41 2.25 0.00 0.00 0.00 2.50 0.00 0.20BBK GESTION ACTIVA 15 FIMF 0.40 0.40 0.20 RFCP 0.13 0.18 0.17 RFCP 0.08 2.48 0.14 RFCP 0.12 0.14 0.08 RFM 0.74 0.23 8.72 1.60 0.00 0.00 0.00 0.00 0.00 0.09BBVA FONDANDALUCIA MIXTO FIM NA 1.45 2.84 RFM 2.08 1.94 2.37 RFM -0.28 1.84 2.06 RFM 0.30 1.06 2.20 RFM NA 1.63 NA 1.45 0.00 0.00 0.00 1.00 0.00 0.05BESTINVER RENTA FIM 1.03 0.99 0.69 RFM 2.35 0.92 0.88 RFM 0.69 0.81 0.60 RFM 1.13 0.64 0.46 RFM 5.30 0.86 22.95 0.50 0.00 0.00 0.00 0.50 0.50 0.05BETA RENTA PLUS FIM 1.17 0.89 0.93 RFM 0.79 0.51 0.84 RFM 0.28 0.63 1.02 RFM 0.15 0.56 0.97 RFM 2.41 0.67 -5.43 1.40 0.00 0.00 0.00 0.00 0.00 0.15BG MIXTO 25 FIM 0.24 3.89 0.10 RFM 3.91 3.03 0.10 RFM 0.18 2.70 0.08 RFM 3.30 2.19 0.14 RFM 7.79 3.03 NA 1.30 0.00 0.00 0.00 1.00 0.00 0.15BI MONETARIO PRIMADO FIM -0.09 2.77 0.01 RFI 0.26 0.18 0.01 RFI -0.13 1.34 0.01 RFI -0.06 0.77 0.01 RFM -0.03 0.78 NA 0.75 0.00 0.00 0.00 0.00 0.00 0.00BK FV MIXTO FIM 1.15 5.21 0.03 RFM 3.13 3.84 0.04 RFM 0.11 2.90 0.03 RFM 3.08 2.50 0.03 RFM 7.65 3.76 NA 1.20 0.00 0.00 0.00 1.00 0.00 0.09BK MIXTO ESPAÑA 30 FIM -0.37 8.24 0.10 RFM 4.98 6.53 0.12 RFM -0.49 4.92 0.12 RFM 4.91 4.04 0.11 RFM 9.18 6.16 NA 1.20 0.00 0.00 0.00 1.00 0.00 0.08BK MIXTO EUROPA 20 FIM -2.73 6.40 0.18 RFM 4.08 5.08 0.53 RFM 0.09 3.84 0.52 RFM 2.58 2.82 0.60 RFM 3.96 4.75 3.27 1.20 0.00 0.00 0.00 1.00 0.00 0.08BNP GLOBAL 15-85 FIM -1.34 5.66 1.93 RFM 4.24 4.25 1.93 RFM 0.85 3.20 1.82 RFM 1.90 2.59 1.83 RFM 5.69 4.11 7.52 1.35 0.00 0.00 0.00 0.00 0.00 0.15BNP PARIBAS FONDO SOLIDARIDAD FIM -2.98 7.29 2.22 RFM 5.76 5.46 2.22 RFM 0.71 4.49 2.11 RFM 2.57 3.74 2.14 RFM 6.00 5.44 NA 1.75 0.00 0.00 0.00 0.00 0.00 0.15BOLFOND FIM 0.24 6.73 1.30 RFM 3.62 3.68 1.32 RFM -0.43 2.70 1.80 RFM 2.93 2.55 0.92 RFM 6.44 4.26 8.56 1.25 0.00 0.00 0.00 0.00 0.00 0.10BOLSINDEX FIM -0.62 7.28 0.61 RFM 3.80 5.06 1.06 RFM -0.01 4.17 0.93 RFM 3.95 3.30 0.82 RFM 7.22 5.17 -0.78 1.18 0.00 0.00 0.00 0.00 0.00 0.15CAHISPA RENTA FIM -5.72 10.60 0.49 RFM 7.57 10.66 0.88 RFM 3.34 6.84 0.84 RFM 4.44 4.87 0.76 RFM 9.46 8.65 6.55 1.60 0.00 0.00 0.00 0.00 0.00 0.10CAI RENTA MIXTO 20 FIM 0.06 5.68 1.72 RFM 4.20 3.76 1.73 RFM 0.06 2.81 1.62 RFM 3.04 2.14 1.53 RFM 7.51 3.84 NA 1.50 0.00 0.00 0.00 1.00 0.00 0.12CAIXA CAT. SOLIDARI FIM -0.90 3.53 0.00 RFM 3.04 2.82 0.00 RFM -0.31 2.70 0.00 RFM 1.15 1.89 0.01 RFM 2.96 2.81 NA 1.35 5.00 0.00 0.00 0.00 0.00 0.20CAIXA CATALUNYA EUROPA MIXT 25 FIM -1.69 6.69 2.43 RFM 4.17 5.22 2.56 RFM -0.62 3.31 2.51 RFM 1.41 2.40 2.10 RFM 3.20 4.72 -0.86 1.50 0.00 0.00 0.00 0.00 0.00 0.20CAIXA GALICIA MIX 25 FIM -0.21 7.22 1.84 RFM 4.68 4.74 1.33 RFM -0.17 3.55 1.22 RFM 3.68 2.73 1.34 RFM 8.12 4.87 NA 2.00 0.00 0.00 0.00 1.00 0.00 0.08CAIXASABAD. 6-MIXT FIM -0.20 8.16 1.70 RFM 5.17 5.15 1.65 RFM -0.08 3.84 1.44 RFM 4.13 2.98 1.63 RFM 9.21 5.41 3.00 1.55 0.00 0.00 0.00 1.00 0.00 0.15
(Continues over)
(Continued)

258
Annual rep
ort o
n th
e securities m
arket. 2003
A.4.8.Investment in securities. FIM. Yields, volatility and duration
1Q 2Q 3Q 4Q 2003
Yield Vol Dur Yield Vol Dur Yield Vol Dur Yield Vol Dur Yield Vol(1) (2) Type (1) (2) Type (1) (2) Type (1) (2) Type (1)% % % % %
% fees
Management Front end Back endCustody
of assets of yield Max. Min. Max. Min.
Yieldsince1996
Mixed fixed-income FIM(RFM)
CAJA BADAJOZ INV. FIM -0.18 7.83 1.48 RFM 5.20 5.15 1.62 RFM 0.00 3.88 1.78 RFM 4.16 3.02 1.51 RFM 9.38 5.30 NA 1.50 0.00 0.00 0.00 1.00 0.00 0.12CAJA INGENIEROS EUROPA 25 FIM -2.38 7.45 2.13 RFM 4.39 5.21 1.99 RFM -0.14 4.06 1.93 RFM 2.33 3.51 1.15 RFM 4.14 5.29 4.05 2.25 0.00 0.00 0.00 0.00 0.00 0.20CAJA LABORAL PATRIMONIO FIM -1.09 9.17 1.78 RFM 6.44 5.38 1.98 RFM 0.00 3.69 1.73 RFM 4.31 3.42 1.60 RFM 9.81 5.89 0.95 2.00 0.00 0.00 0.00 1.00 0.00 0.20CAJABURGOS MIXTO I FIM 0.14 5.71 1.77 RFM 4.18 3.79 1.76 RFM 0.06 2.83 1.38 RFM 3.09 2.15 1.51 RFM 7.62 3.87 NA 1.50 0.00 0.00 0.00 0.00 0.00 0.09CAJASUR MIXTO FIM -2.46 7.25 1.71 RFM 4.73 5.17 1.78 RFM -0.15 3.84 1.07 RFM 3.06 3.26 1.66 RFM 5.12 5.13 1.18 1.75 0.00 0.00 0.00 0.00 0.00 0.20CAM MIXTO 25 FIM 0.17 6.56 2.09 RFM 4.52 4.70 1.74 RFM -0.25 4.26 0.37 RFM 4.07 3.15 0.28 RFM 8.68 4.84 -0.43 1.75 0.00 0.00 0.00 2.00 2.00 0.10CAN DINAMICO PLUS FIMF 0.28 0.03 0.00 GRV 0.61 0.20 0.00 RFM 0.56 0.18 0.00 RFM 0.46 0.22 0.02 RFM 1.93 0.18 5.97 0.20 0.00 0.00 0.00 0.00 0.00 0.05CAN GESTION 30 FIM -0.39 8.97 0.46 RFM 5.12 5.59 0.36 RFM -0.45 4.69 0.39 RFM 4.74 3.44 0.50 RFM 9.18 6.04 NA 1.40 0.00 0.00 0.00 0.00 0.00 0.10CANTABRIA RENTA 20 FIM -2.41 6.16 3.01 RFM 4.71 4.66 2.51 RFM 0.02 3.88 1.90 RFM 2.74 3.02 1.75 RFM 5.00 4.60 -0.67 1.50 0.00 0.00 0.00 1.00 0.00 0.19CASFONDO FIM 0.68 0.38 0.01 RFM 0.12 0.32 0.01 RFM 0.12 1.89 4.85 RFM -0.06 0.78 0.03 RFM 0.87 1.06 6.85 2.00 0.00 0.00 0.00 0.00 0.00 0.10CITIFONDO LIDER FIM -2.53 6.61 3.28 RFM 4.49 4.63 3.44 RFM -0.24 4.12 3.18 RFM 2.83 2.69 3.23 RFM 4.47 4.75 -2.88 1.75 0.00 0.00 0.00 0.00 0.00 0.20CREDIT AGRICOLE MERCAPATRIM. FIM 0.60 0.85 0.17 RFM 0.46 0.20 0.06 RFM 0.32 0.14 0.15 RFM 0.35 0.84 0.39 RFM 1.74 0.61 12.39 1.50 0.00 0.00 0.00 0.00 0.00 0.10CT EUROMIXT 25 FIM -3.07 7.42 1.83 RFM 4.83 5.58 1.77 RFM -0.01 4.43 1.68 RFM 2.87 3.33 1.39 RFM 4.52 5.43 NA 2.00 0.00 0.00 0.00 1.00 1.00 0.10DINFONDO FIM 0.27 3.18 2.11 RFM 1.90 2.02 2.04 RFM -0.09 1.50 1.95 RFM 1.17 1.37 0.58 RFM 3.27 2.14 6.31 1.25 0.00 0.00 0.00 0.00 0.00 0.10DWS CAPITAL I FIM -1.50 4.67 0.33 RFM 3.15 3.44 0.39 RFM 0.43 3.12 0.33 RFM 1.78 2.42 0.33 RFM 3.85 3.52 3.80 1.15 0.00 0.00 0.00 0.00 0.00 0.10DWS EURORENDIMIENTO FIM 0.50 0.76 0.34 RFM 0.54 0.48 0.40 RFM 0.20 0.59 0.35 RFM 0.27 0.33 0.34 RFM 1.51 0.56 8.08 1.30 0.00 0.00 0.00 0.00 0.00 0.10DWS VALOR GLOBAL FIM 0.82 1.61 0.29 RFM 1.02 0.92 0.46 RFM 0.56 1.08 0.32 RFM 0.59 0.56 0.30 RFM 3.02 1.11 12.75 0.55 0.00 0.00 0.00 0.00 0.00 0.00ESPIRITO SANTO MIXTO ESPAÑA 25 FIM 0.49 4.42 0.85 RFM 4.29 4.71 1.08 RFM -0.29 3.20 0.97 RFM 2.76 2.59 0.76 RFM 7.38 3.84 16.17 1.50 0.00 0.00 0.00 0.00 0.00 0.13ESPIRITO SANTO MIXTO EURO 25 FIM -0.15 4.72 0.95 RFM 4.09 5.51 1.24 RFM -0.13 4.12 1.05 RFM 2.22 3.26 0.76 RFM 6.11 4.49 5.25 1.00 0.00 0.00 0.00 0.00 0.00 0.10ESPIRITO SANTO RENTA PLUS FIM 0.39 0.51 0.08 RFM 0.96 1.12 0.51 RFM -0.37 1.64 0.49 RFM 1.08 1.24 0.34 RFM 2.07 1.21 8.25 1.50 0.00 0.00 0.00 0.00 0.00 0.15ESPIRITO SANTO TESORERIA PLUS FIM 0.37 0.15 0.09 RFM 0.57 0.44 0.74 RFM -0.25 1.34 0.52 RFM 0.69 0.75 0.35 RFM 1.39 0.81 24.01 1.25 0.00 0.00 0.00 0.00 0.00 0.10EUROAGENTES RENTA FIM 0.26 4.58 0.03 RFM 0.45 3.15 0.03 RFM 0.32 0.02 0.03 RFM 0.33 0.02 0.04 RFM 1.37 0.03 3.12 0.50 0.00 0.00 0.00 0.00 0.00 0.10EUROVALOR MIXTO-15 FIM 0.08 4.18 0.35 RFM 2.65 2.80 0.37 RFM 0.09 2.07 1.26 RFM 2.01 1.61 1.01 RFM 4.88 2.84 8.60 1.60 0.00 0.00 0.00 0.00 0.00 0.00EUROVALOR MIXTO-30 FIM 0.12 7.89 3.31 RFM 5.76 5.70 3.32 RFM -0.60 4.56 3.14 RFM 4.07 3.28 2.91 RFM 9.54 5.63 11.39 2.00 0.00 0.00 0.00 0.00 0.00 0.00F. VALENCIA FONDO DE FONDOS 30 FIMF -2.31 7.40 0.00 RFM 4.80 4.83 0.00 RFM 1.49 3.52 0.00 RFM 3.02 2.93 0.01 RFM 7.05 4.99 8.78 0.95 0.00 0.00 0.00 2.00 0.00 0.05F.M.C. PORTUARIO DE VALENCIA FIM 0.68 6.64 0.56 RFM 4.24 3.60 0.30 RFM 0.51 2.32 0.31 RFM 2.52 2.01 0.33 RFM 8.15 4.07 29.49 0.80 0.00 0.00 0.00 0.00 0.00 0.15FG MIXTO RENTA FIJA FIM 0.07 2.51 2.82 RFM 2.07 1.97 1.46 RFM -0.12 2.45 0.44 RFM 3.73 2.10 0.41 RFM 5.82 2.29 2.21 1.00 0.00 0.00 0.00 0.00 0.00 0.13FIBANC MIX. RF EUR. FIM -1.50 5.09 3.11 RFM 2.02 4.37 3.28 RFM -0.91 4.34 2.90 RFM 2.86 3.73 2.81 RFM 2.44 4.42 NA 1.50 0.00 0.00 0.00 0.00 0.00 0.10FIDEFONDO FIM 0.86 4.13 0.89 RFM 3.07 2.72 0.86 RFM -0.05 2.17 0.89 RFM 2.83 1.94 0.64 RFM 6.84 2.87 9.75 1.50 0.00 0.00 0.00 0.00 0.00 0.15FIDENZIS FDO DE FDOS L20 FIMF NA NA NA NA 1.78 0.00 RFM 1.17 2.68 0.00 RFM 1.57 2.18 0.00 RFM NA 2.36 NA 1.00 0.00 0.00 0.00 1.50 0.00 0.10FIDENZIS FONDO DE FONDOS C10 FIMF NA NA NA NA 0.79 0.00 RFM 0.61 0.97 0.00 RFM 0.81 0.61 0.00 RFM NA 0.81 NA 0.70 0.00 0.00 0.00 1.50 0.00 0.10FIDENZIS FONDO DE FONDOS C15 FIMF NA NA NA NA 1.46 0.00 RFM 0.44 1.59 0.00 RFM 1.17 1.05 0.00 RFM NA 1.37 NA 0.90 0.00 0.00 0.00 1.50 0.00 0.10FIDENZIS FONDO DE FONDOS C30 FIMF NA NA NA NA 2.34 0.00 RFM 0.75 2.92 0.00 RFM 2.08 2.40 0.00 RFM NA 2.63 NA 1.50 0.00 0.00 0.00 1.50 0.00 0.10FINANCIALFOND FIM 1.19 6.77 1.06 RFM 6.24 5.34 0.91 RFM 1.52 3.72 0.57 RFM 2.86 2.29 1.13 RFM 12.27 4.83 15.93 1.10 0.00 0.00 0.00 0.00 0.00 0.11FINESFONDO FIM -0.03 2.81 3.63 RFM 2.07 2.12 2.02 RFM -0.26 2.46 0.96 RFM 3.85 2.27 0.96 RFM 5.70 2.45 8.68 1.50 0.00 0.00 0.00 0.00 0.00 0.13FOMODI FIM -1.46 5.76 0.85 RFM 2.59 3.80 1.75 RFM 0.30 2.89 0.93 RFM 2.74 2.66 0.86 RFM 4.17 3.97 6.30 1.18 0.00 0.00 0.00 0.00 0.00 0.15FON FINECO AHORRO FIM -3.31 10.05 0.81 RFM 6.43 7.37 0.83 RFM 0.33 5.23 0.97 RFM 3.39 4.26 0.83 RFM 6.74 7.11 8.54 1.50 0.00 0.00 0.00 0.00 0.00 0.20FONBILBAO MIXTO FIM -0.34 8.79 0.10 RFM 4.99 6.64 0.07 RFM -0.41 5.30 0.05 RFM 5.86 4.21 0.09 RFM 10.30 6.48 5.87 1.45 0.00 0.00 0.00 0.00 0.00 0.10FONCAIXA 104 FONDANDALUCIA MIX. FIM NA 0.77 0.85 RFM 0.86 1.97 3.02 RFM -0.30 1.28 1.50 RFM 0.53 1.51 1.56 RFM NA 1.47 NA 1.35 0.00 0.00 0.00 1.00 0.00 0.15FONCAIXA FC MIXT 60 FIM 0.50 1.03 1.92 RFM 0.92 1.96 3.10 RFM -0.20 1.00 1.79 RFM 0.55 1.55 1.79 RFM 1.77 1.44 NA 1.35 0.00 0.00 0.00 1.00 0.00 0.13FONCOLONYA FIM 1.71 3.94 2.09 RFM 3.03 2.95 2.39 RFM 2.69 3.76 0.38 RFM 0.96 1.30 0.39 RFM 8.65 3.16 NA 1.50 0.00 0.00 0.00 0.00 0.00 0.15FONDESPAÑA CATEDRALES FIM -1.29 4.94 2.05 RFM 4.08 3.69 1.93 RFM 0.12 3.19 1.62 RFM 2.55 2.54 1.60 RFM 5.48 3.71 NA 1.30 0.00 0.00 0.00 0.00 0.00 0.15FONDESPAÑA GLOBAL FIM -1.03 4.87 2.42 RFM 4.01 3.42 3.30 RFM 0.41 2.75 3.40 RFM 2.25 2.56 3.47 RFM 5.68 3.53 2.82 1.10 0.00 0.00 0.00 0.00 0.00 0.15FONDIBAS FIM 0.73 6.30 0.91 RFM 3.06 3.06 1.04 RFM 0.82 1.96 0.99 RFM 1.81 1.56 0.94 RFM 6.56 3.71 1.12 1.75 0.00 0.00 0.00 0.00 0.00 0.10FONDIBAS FUTURO FIM 0.65 4.63 0.85 RFM 2.66 2.13 0.82 RFM 0.50 1.30 0.72 RFM 1.50 1.08 0.72 RFM 5.40 2.68 5.34 1.50 0.00 0.00 0.00 0.00 0.00 0.10FONDMAPFRE RENTA MIXTO FIM -0.50 6.50 2.39 RFM 4.68 4.69 2.06 RFM -0.05 3.85 2.64 RFM 3.04 2.73 2.52 RFM 7.26 4.66 3.25 2.00 0.00 0.00 0.00 1.50 0.00 0.20FONDMUSINI III FIM 0.34 4.71 0.19 RFM 3.39 3.35 0.23 RFM 0.28 2.53 0.20 RFM 3.25 2.08 0.19 RFM 7.41 3.33 18.67 1.25 0.00 0.00 0.00 0.00 0.00 0.10FONDMUSINI UNIVERS. FIM 0.38 5.89 0.21 RFM 4.25 4.07 0.18 RFM 0.43 3.06 0.15 RFM 4.00 2.54 0.12 RFM 9.29 4.10 17.56 1.50 0.00 0.00 0.00 0.00 0.00 0.20FONDO VALENCIA EUROPA MIXTO 20 FIM -2.34 7.52 0.00 RFM 3.61 4.48 0.01 RFM 0.10 3.53 0.01 RFM 2.68 2.87 0.01 RFM 4.00 4.94 -0.41 1.50 0.00 0.00 0.00 1.00 0.00 0.20FONDO VALENCIA RENTA FIJA MIXTA FIM 0.07 7.35 0.04 RFM 4.60 4.44 0.04 RFM 0.06 3.11 0.02 RFM 3.03 2.43 0.05 RFM 7.91 4.72 3.77 1.75 0.00 0.00 0.00 1.00 0.00 0.20
(Continues over)
(Continued)

259
Annex 4
: Collective in
vestmen
t schem
es and ven
ture cap
ital com
pan
iesA.4.8.Investment in securities. FIM. Yields, volatility and duration
1Q 2Q 3Q 4Q 2003
Yield Vol Dur Yield Vol Dur Yield Vol Dur Yield Vol Dur Yield Vol(1) (2) Type (1) (2) Type (1) (2) Type (1) (2) Type (1)% % % % %
% fees
Management Front end Back endCustody
of assets of yield Max. Min. Max. Min.
Yieldsince1996
Mixed fixed-income FIM (RFLP)
FONDONORTE FIM -0.23 2.55 1.99 RFM 3.55 1.89 2.01 RFM 0.75 1.89 2.17 RFM 1.93 1.47 2.05 RFM 6.10 2.01 14.88 0.45 0.00 0.00 0.00 0.00 0.00 0.08FONDOSUR FIM -0.10 8.00 1.55 RFM 5.08 5.15 1.60 RFM -0.16 3.84 1.43 RFM 4.03 2.99 1.37 RFM 9.03 5.35 0.07 1.75 0.00 0.00 0.00 0.00 0.00 0.20FONDPUEYO FIM 0.32 4.77 1.02 RFM 3.85 4.40 1.07 RFM 0.51 2.56 0.95 RFM 2.15 1.55 0.54 RFM 6.98 3.58 9.27 1.60 0.00 0.00 0.00 0.00 0.00 0.07FONDTURIA FIM -1.03 4.13 0.63 RFM 5.67 3.62 0.55 RFM -0.25 2.86 0.47 RFM 2.24 1.97 0.56 RFM 6.66 3.28 23.83 1.25 0.00 0.00 0.00 1.00 0.00 0.20FONDUNACSA FIM 0.47 0.21 0.07 RFM 0.47 0.05 0.08 RFM 0.37 7.96 0.13 RFM 0.33 6.27 0.11 RFM 1.66 0.12 NA 0.40 0.00 0.00 0.00 2.00 0.00 0.15FONDUXO FIM -1.18 8.66 1.32 RFM 5.32 5.54 1.29 RFM 0.84 4.09 1.39 RFM 4.32 3.32 1.54 RFM 9.49 5.78 3.54 1.05 0.00 0.00 0.00 1.00 0.00 0.15FONGRUM FIM -0.23 8.14 2.03 RFM 7.65 5.97 2.01 RFM 1.06 5.18 2.01 RFM 3.65 2.69 1.54 RFM 12.51 5.85 10.77 1.50 0.00 0.00 0.00 1.00 0.00 0.20FONLAIETANA 30 FIM -1.51 9.39 1.05 RFM 6.44 6.47 1.40 RFM 0.74 5.59 1.33 RFM 4.42 3.95 1.29 RFM 10.28 6.66 NA 1.50 0.00 0.00 0.00 2.00 0.00 0.20FONLAIETANA FIM -0.20 6.09 2.92 RFM 4.44 4.14 2.82 RFM -0.46 3.03 2.30 RFM 2.46 2.18 2.13 RFM 6.31 4.14 4.19 1.80 0.00 0.00 0.00 2.00 0.10 0.20FONMUTUAL FIM 0.74 6.22 0.99 RFM 4.41 4.25 0.99 RFM -0.17 3.32 0.92 RFM 3.19 2.71 0.87 RFM 8.35 4.34 2.22 1.40 0.00 0.00 0.00 0.00 0.00 0.10FONPASTOR 10 FIM 0.79 1.49 2.90 RFM 2.40 1.88 2.88 RFM -0.01 1.84 2.91 RFM 1.27 1.30 3.69 RFM 4.50 1.65 15.62 1.00 0.00 0.00 0.00 0.00 0.00 0.20FONPASTOR 25 FIM -0.19 4.45 2.87 RFM 4.48 3.44 2.39 RFM -0.06 3.13 2.78 RFM 3.30 2.34 2.90 RFM 7.66 3.44 NA 1.00 0.00 0.00 0.00 0.00 0.00 0.20FONPENEDES MIXT FIM -7.12 15.91 2.65 RFM 7.24 9.17 2.41 RFM 1.73 4.18 2.37 RFM -0.51 2.46 2.41 RFM 0.81 9.51 -17.89 1.90 0.00 0.00 0.00 0.00 0.00 0.00FONSMANLLEU BORSA FIM 0.55 7.76 0.42 RFM 5.07 8.06 0.07 RFM 0.53 3.58 0.39 RFM 2.93 3.18 0.31 RFM 9.32 6.08 3.16 2.00 0.00 0.00 0.00 0.00 0.00 0.20GIROFONS FIM -0.88 5.89 1.58 RFM 4.56 4.57 0.02 RFM -0.15 3.43 1.34 RFM 2.76 2.79 1.42 RFM 6.34 4.34 6.58 0.75 3.00 0.00 0.00 0.00 0.00 0.08IBER FONDO 2000 FIM -1.23 4.60 1.48 RFM 3.51 3.59 1.84 RFM 0.19 3.24 1.71 RFM 2.19 2.02 1.52 RFM 4.69 3.50 5.44 1.25 0.00 0.00 0.00 3.00 0.00 0.10IBERAGENTES POPULAR REND. FIM 1.20 2.10 1.71 RFM 1.74 1.25 1.25 RFM 0.36 0.93 1.00 RFM 0.45 0.62 0.89 RFM 3.80 1.34 11.92 1.50 0.00 0.00 0.00 0.00 0.00IBERCAJA RENTA FIM -0.78 9.87 0.99 RFM 6.24 6.40 0.89 RFM -0.22 4.52 0.91 RFM 4.56 3.56 0.79 RFM 9.98 6.55 -2.76 1.50 0.00 0.00 0.00 2.50 0.00 0.20IM 93 RENTA FIM 0.69 8.93 1.80 RFM 5.27 5.42 2.01 RFM 1.14 4.33 2.53 RFM 3.61 3.67 2.66 RFM 11.08 5.93 -3.72 1.50 0.00 0.00 0.00 0.00 0.00 0.10ING DIRECT NARANJA MIX.EUR. FIMF -2.79 7.46 0.00 RFM 5.52 5.10 0.00 RFM -0.01 4.45 0.00 RFM 2.92 3.37 0.01 RFM 5.56 5.34 NA 0.40 0.00 0.00 0.00 0.00 0.00 0.00INTERMONEY MIXTO EURO FIM -0.12 6.04 0.16 RFM 4.20 4.57 0.17 RFM -0.23 3.61 0.19 RFM 2.73 3.15 0.07 RFM 6.66 4.49 NA 0.85 0.00 0.00 0.00 0.00 0.00 0.10INVERKOA FIM 0.26 5.14 1.31 RFM 3.16 3.42 1.08 RFM -0.18 2.28 1.14 RFM 2.14 1.60 0.88 RFM 5.45 3.39 2.59 2.00 0.00 0.00 0.00 0.00 0.00 0.00INVERMANRESA 2 FIM -0.69 4.40 1.25 RFM 3.58 3.18 1.30 RFM 0.30 2.84 1.35 RFM 2.72 2.42 1.44 RFM 5.97 3.30 16.55 0.90 0.00 0.00 0.00 1.00 0.00 0.10INVERMANRESA FIM -0.08 1.80 1.30 RFM 2.11 1.39 1.37 RFM 0.14 1.21 1.40 RFM 0.99 1.12 1.49 RFM 3.18 1.41 10.61 1.75 0.00 0.00 0.00 1.00 0.00 0.15JPMF EURIBOR PLUS FIMF 0.59 0.40 0.00 RFMI 0.81 0.78 0.00 RFMI 0.25 0.81 0.00 RFMI 0.42 9.33 0.01 RFM 2.10 0.60 15.20 0.29 0.00 0.00 0.00 0.00 0.00 0.10LUSO VALORES FIM 2.55 10.43 2.04 RFM 5.95 5.86 2.12 RFM -0.24 4.20 3.51 RFM 3.91 3.82 3.11 RFM 12.63 6.61 -0.55 1.50 0.00 0.00 0.00 2.00 0.00 0.08MAPFRE AHORRO PROGRESIVO FIM -0.57 6.13 2.39 RFM 4.66 4.47 2.03 RFM -0.17 3.39 2.62 RFM 2.54 2.39 2.53 RFM 6.52 4.33 -1.02 1.75 0.00 0.00 0.00 2.50 0.00 0.20MARCHFONDO FIM -1.14 2.80 2.04 RFM 2.24 2.65 1.77 RFM -0.44 2.99 1.27 RFM 2.63 2.99 1.36 RFM 3.27 2.88 -4.43 2.25 0.00 0.00 0.00 0.00 0.00 0.00MD FOND FIM -3.52 8.99 1.18 RFM 4.99 6.21 1.10 RFM -0.33 4.26 0.93 RFM 3.31 3.33 0.12 RFM 4.30 6.12 -10.27 1.25 0.00 0.00 0.00 0.00 0.00 0.10MEDIFOND FIM -0.66 5.08 3.10 RFM 4.77 3.57 3.13 RFM 0.02 2.98 2.95 RFM 2.54 2.30 2.28 RFM 6.75 3.65 2.93 1.35 9.00 0.00 0.00 0.00 0.00 0.20MIXFOND 2000 FIM 1.67 4.89 2.03 RFM 3.69 2.48 1.08 RFM 0.85 2.66 1.65 RFM 0.99 1.40 2.44 RFM 7.37 3.12 11.85 1.50 0.00 0.00 0.00 0.00 0.00 0.10MULTIGESTORES FIM 1.90 2.26 1.31 RFM 1.04 2.33 1.54 RFM -0.46 2.17 1.36 RFM 2.54 2.48 1.98 RFM 5.10 2.33 3.01 2.00 0.00 0.00 0.00 0.00 0.00 0.06MUTUALFASA 2 FIM 1.53 2.30 3.22 RFM 1.13 1.47 1.47 RFM 0.49 0.84 1.50 RFM 1.40 0.93 1.51 RFM 4.63 1.50 11.23 0.40 0.00 0.00 0.00 0.00 0.00 0.19PATROFONDO FIM -0.41 1.90 4.19 RFM 0.97 1.57 3.36 RFM 0.50 1.61 0.50 RFM 1.65 1.04 0.44 RFM 2.72 1.57 6.48 1.25 0.00 0.00 0.00 2.00 2.00 0.13PENTAFONDO MIXTO FIM -1.94 7.87 1.02 RFM 3.74 4.59 1.10 RFM -0.44 4.34 0.94 RFM 4.06 3.55 0.87 RFM 5.39 5.36 -4.99 1.80 0.00 0.00 0.00 0.00 0.00 0.13PLUSMADRID 15 FIM -1.01 4.78 2.59 RFM 4.07 3.22 2.01 RFM -0.12 2.63 0.00 RFM 1.81 1.83 0.87 RFM 4.76 3.31 13.25 1.00 0.00 0.00 0.00 1.00 0.00 0.10PLUSMADRID 25 FIM -2.89 8.78 3.42 RFM 5.97 5.76 3.58 RFM -0.29 4.51 0.00 RFM 3.33 3.48 3.49 RFM 6.03 5.99 NA 1.50 0.00 0.00 0.00 1.00 0.00 0.08PLUSMADRID AHORRO EURO FIM -2.44 8.86 3.25 RFM 5.88 5.71 3.70 RFM -0.16 4.55 0.00 RFM 3.47 3.48 3.50 RFM 6.70 6.02 20.46 1.00 0.00 0.00 0.00 1.00 0.00 0.08PLUSMADRID AHORRO FIM 0.60 6.36 2.05 RFM 5.16 4.53 1.98 RFM -0.42 3.58 0.00 RFM 3.56 2.65 1.81 RFM 9.10 4.50 7.36 1.00 0.00 0.00 0.00 1.00 0.00 0.08PLUSMADRID FONDANDALUCIA FIM NA NA NA NA 0.58 0.00 RFM -0.46 0.12 0.00 RFM -0.60 0.15 0.01 RFM NA 0.25 NA 1.30 0.00 0.00 0.00 1.00 0.00 0.10PSN PLAN DE AHORRO FIMS -3.49 6.79 0.00 RFMI 3.17 5.33 0.00 RFMI 0.78 4.59 0.00 RFM 1.08 3.93 0.00 RFM 1.43 5.29 -7.28 1.50 0.00 0.00 0.00 0.00 0.00 0.15RENTA 4 GAP FIM 0.68 5.48 0.00 RFM 3.56 2.86 0.00 RFM -2.68 0.35 0.00 RFM 4.48 50.24 0.00 RFM 6.02 25.42 NA 1.25 0.00 0.00 0.00 0.00 0.00 0.08RENTA 4 INDICE FIM 0.17 0.51 0.37 RFM 0.37 0.44 0.31 RFM 0.04 0.32 4.76 RFM 0.84 0.67 5.06 RFM 1.42 0.50 3.35 1.50 0.00 0.00 0.00 0.00 0.00 0.19RENTRIFONDO FIM 1.67 5.72 1.80 RFM 4.25 3.87 1.84 RFM 0.58 2.98 3.19 RFM 3.36 2.46 3.01 RFM 10.19 3.95 18.48 2.00 0.00 0.00 0.00 0.00 0.00 0.20RURAL MIXTO 25 FIM -0.59 4.43 0.95 RFM 5.17 3.67 0.77 RFM 0.00 3.00 0.48 RFM 2.65 2.20 0.80 RFM 7.31 3.45 9.24 1.50 0.00 0.00 0.00 1.50 0.00 0.10RV FOND FIM 0.04 7.41 1.90 RFM 3.86 4.43 1.75 RFM -0.29 3.05 2.19 RFM 2.84 2.55 0.72 RFM 6.54 4.75 -0.90 1.25 0.00 0.00 0.00 0.00 0.00 0.10SAFEI FOMENTO FIM -3.35 8.83 0.32 RFM 4.64 6.18 0.29 RFM -0.37 4.63 0.32 RFM 3.42 3.65 0.25 RFM 4.20 6.16 -10.38 1.75 0.00 0.00 0.00 0.00 0.00 0.15SCH EC MIXTO FIM -2.13 6.18 3.24 RFM 4.60 4.62 3.25 RFM -0.25 4.10 2.97 RFM 2.38 2.67 3.03 RFM 4.54 4.59 NA 1.40 0.00 0.00 0.00 3.00 0.00 0.10SCH ESTRUCTURADO RF MIXTA FIM 0.28 1.45 1.13 RFM -0.14 3.19 0.97 RFM 1.49 2.11 0.64 RFM 0.62 0.92 0.50 RFM 2.27 2.10 NA 1.40 0.00 0.00 0.00 0.00 0.00 0.10SCH FC MIXT FIM -1.79 4.83 4.02 RFM 3.30 3.91 4.53 RFM -0.02 3.32 1.47 RFM 2.30 2.38 1.60 RFM 3.77 3.73 NA 1.40 0.00 0.00 0.00 1.00 0.00 0.10
(Continues over)
(Continued)

260
Annual rep
ort o
n th
e securities m
arket. 2003
A.4.8.Investment in securities. FIM. Yields, volatility and duration
1Q 2Q 3Q 4Q 2003
Yield Vol Dur Yield Vol Dur Yield Vol Dur Yield Vol Dur Yield Vol(1) (2) Type (1) (2) Type (1) (2) Type (1) (2) Type (1)% % % % %
% fees
Management Front end Back endCustody
of assets of yield Max. Min. Max. Min.
Yieldsince1996
Mixed fixed-income FIM (RFLP)
SCH FONDANDALUCIA MIXTO FIM NA 0.96 0.00 RFM -0.22 0.11 0.01 RFM 0.69 2.41 2.91 RFM 1.25 1.67 2.12 RFM NA 1.60 NA 1.40 0.00 0.00 0.00 0.00 0.00 0.10SCH FV MIXTO FIM -2.95 8.41 3.78 RFM 3.84 3.39 3.30 RFM -0.65 4.54 2.44 RFM 3.51 3.47 1.75 RFM 3.64 5.37 2.54 1.15 0.00 0.00 0.00 2.00 0.00 0.10SCH MIXTO EUSKADI FIM -0.77 4.98 3.98 RFM 4.18 3.66 4.44 RFM -0.32 3.27 4.45 RFM 2.83 2.29 4.10 RFM 5.97 3.69 3.10 2.00 0.00 0.00 0.00 3.00 0.00 0.20SCH MIXTO RENTA FIJA 75/25 FIM -2.38 6.49 3.58 RFM 4.43 4.65 4.17 RFM -0.34 4.16 3.80 RFM 3.12 2.85 3.68 RFM 4.75 4.74 4.50 1.60 0.00 0.00 0.00 2.00 0.00 0.20SCH MIXTO RENTA FIJA 90/10 FIM 0.18 1.92 1.69 RFM 2.16 1.82 1.90 RFM -0.38 1.79 1.63 RFM 1.19 1.32 2.40 RFM 3.17 1.74 12.88 1.50 0.00 0.00 0.00 0.00 0.00 0.10SCH MIXTO RENTA FIJA FIM 0.49 3.28 1.18 RFM 2.05 1.36 0.48 RFM -0.07 2.00 0.75 RFM 1.81 1.45 0.20 RFM 4.33 2.16 5.86 1.00 0.00 0.00 0.00 0.00 0.00 0.07SCH RESPONSABILIDAD FIM NA NA NA NA 4.87 0.01 RFM -0.07 1.49 1.28 RFM 0.84 1.16 2.63 RFM NA 1.26 NA 1.49 0.00 0.00 0.00 0.00 0.00 0.10SCH SOLIDARIDAD FIM -2.21 7.13 5.21 RFM 2.02 1.90 1.59 RFM -0.05 1.81 1.39 RFM 1.03 1.15 1.04 RFM 0.73 3.83 NA 1.25 0.00 0.00 0.00 3.00 0.00 0.10SEQUEFONDO FIM 0.32 0.55 0.27 RFM 1.05 0.31 0.28 RFM 0.27 0.33 0.24 RFM 1.38 0.97 0.26 RFM 3.04 0.61 -15.76 0.70 0.00 0.00 0.00 0.00 0.00 0.10UNIFOND MIXTO FONDANDALUCIA FIM 2.62 12.55 0.00 RFM 2.15 3.11 3.39 RFM -0.68 2.58 3.40 RFM 1.73 2.06 3.45 RFM 5.90 6.63 -24.29 1.40 0.00 0.00 0.00 0.00 0.00 0.10URQUIJO AHORRO FIM -1.92 6.52 1.04 RFM 2.98 3.49 1.95 RFM -0.50 2.49 1.36 RFM 2.54 2.27 0.64 RFM 3.05 4.07 -1.06 1.30 0.00 0.00 0.00 1.00 1.00 0.20URQUIJO CAPITAL FIM -2.29 7.53 0.95 RFM 3.21 4.23 1.82 RFM -0.95 2.78 1.40 RFM 2.41 2.67 0.58 RFM 2.29 4.73 -6.66 2.00 0.00 0.00 0.00 0.00 0.00 0.20URQUIJO EURO FIM -2.26 7.70 1.52 RFM 3.21 3.92 1.97 RFM -1.21 2.74 1.59 RFM 2.96 3.36 0.57 RFM 2.61 4.84 -1.24 2.00 0.00 0.00 0.00 0.00 0.00 0.20URQUIJO TESORERIA PLUS FIM NA 0.13 0.11 RFM 0.28 0.18 0.13 RFM -0.46 1.06 0.23 RFM 0.46 0.34 0.19 RFM NA 0.60 NA 1.25 0.00 0.00 0.00 0.00 0.00 0.20VENTURE MIXTO R.FIJA FIMF NA 1.61 0.00 RFMI 2.94 2.04 0.00 RFM 1.06 1.99 0.00 RFM 1.77 2.11 0.01 RFM NA 1.98 NA 1.50 0.00 0.00 0.00 0.00 0.00 0.12ZARAGOZANO DEUDA MIXTA FIM -2.08 6.91 0.57 RFM 4.68 4.71 0.53 RFM 0.31 3.83 0.62 RFM 3.32 3.45 0.55 RFM 6.24 4.93 3.39 1.40 0.00 0.00 0.00 0.00 0.00 0.20ZARAGOZANO SELECCION PLATINUM FIMF NA NA NA NA 3.89 0.00 RFM -0.13 0.89 0.05 RFM 2.11 1.49 0.10 RFM NA 1.10 NA 0.50 0.00 0.00 0.00 5.00 0.00 0.10
(Continues over)
(Continued)

261
Annex 4
: Collective in
vestmen
t schem
es and ven
ture cap
ital com
pan
iesA.4.8.Investment in securities. FIM. Yields, volatility and duration
1Q 2Q 3Q 4Q 2003
Yield Vol Dur Yield Vol Dur Yield Vol Dur Yield Vol Dur Yield Vol(1) (2) Type (1) (2) Type (1) (2) Type (1) (2) Type (1)% % % % %
% fees
Management Front end Back endCustody
of assets of yield Max. Min. Max. Min.
Yieldsince1996
Mixed equity FIM (RVM)
AC EUROMIX FIM -7.05 19.22 1.57 RVM 9.41 11.85 1.48 RVM -0.68 9.81 1.35 RVM 8.05 8.64 1.38 RVM 9.14 13.08 -11.95 2.00 0.00 0.00 0.00 1.00 0.00 0.09AEGON INVERSION MV FIM -6.00 19.54 1.31 RVM 10.32 11.84 1.02 RVM -0.03 10.77 0.77 RVM 8.52 9.03 0.52 RVM 12.50 13.44 -29.28 2.25 0.00 2.00 0.00 2.00 0.00 0.18AF BOLSA QUALITY FIM -1.91 2.87 0.00 RVM -0.46 3.06 0.00 RVM -1.29 1.23 0.00 RVM 0.53 1.40 0.00 RVM -3.11 2.30 -1.05 2.00 0.00 0.00 0.00 0.00 0.00 0.15AF RENTA VARIABLE FIM -1.06 15.53 0.00 RVM 11.19 11.85 0.00 RVM 1.08 8.74 0.00 RVM 3.92 10.02 0.00 RVM 15.56 11.83 -8.28 2.00 0.00 0.00 0.00 0.00 0.00 0.15AFINA PENTOR ESPAÑA FIM 2.41 8.54 1.74 RVM 5.24 6.17 1.75 RVM 0.50 4.99 1.03 RVM 5.80 3.95 0.68 RVM 14.60 6.15 -9.22 2.00 0.00 0.00 0.00 0.00 0.00 0.06AHORROFONDO FIM 0.03 14.29 1.75 RVM 8.63 9.48 1.53 RVM -0.63 7.14 1.26 RVM 7.51 5.74 1.39 RVM 16.08 9.73 -4.75 2.00 0.00 0.00 0.00 1.00 0.00 0.06ALCALA BOLSA FIM 0.62 7.96 0.17 RVM 6.31 7.01 0.10 RVM 0.85 6.92 0.03 RVM 7.19 5.29 0.00 RVM 15.63 6.88 22.73 0.75 7.50 0.00 0.00 0.00 0.00 0.08ALLIANZ EMPRENDEDOR ESPAÑA FIMF -0.83 14.84 0.00 RVM 9.52 10.55 0.00 RVM -0.94 8.13 0.00 RVM 8.52 7.05 0.01 RVM 16.76 10.60 NA 0.00 0.00 0.00 0.00 1.00 0.00 0.14ALLIANZ EMPRENDEDOR EUROPA FIMF -8.43 19.96 0.00 RVM 11.52 13.51 0.00 RVM 0.46 8.64 0.00 RVM 5.91 7.13 0.01 RVM 8.65 13.33 NA 0.00 0.00 0.00 0.00 1.00 0.00 0.14ALLIANZ MIXTO FIM 0.07 8.33 3.25 RVM 6.04 6.32 4.18 RVM -0.78 5.15 3.01 RVM 5.20 4.44 2.68 RVM 10.77 6.25 -0.15 1.50 0.00 0.00 0.00 1.00 0.00 0.14ALLIANZ MODERADO ESPAÑA FIMF -0.02 9.07 0.00 RVM 6.40 6.45 0.00 RVM -0.84 5.40 0.00 RVM 5.46 4.85 0.01 RVM 11.25 6.66 NA 0.00 0.00 0.00 0.00 1.00 0.00 0.14ALLIANZ MODERADO EUROPA FIMF -4.62 12.44 0.00 RVM 7.18 8.52 0.00 RVM 0.41 5.62 0.00 RVM 3.90 4.87 0.01 RVM 6.66 8.43 NA 0.00 0.00 0.00 0.00 1.00 0.00 0.14ARCALIA GLOBAL FIM -4.11 20.58 0.34 RVM 12.73 12.65 0.18 RVM -0.04 8.99 0.00 RVM 8.85 7.31 0.01 RVM 17.62 13.42 -4.85 1.25 0.00 0.00 0.00 0.00 0.00 0.15ASC ESTALVI FIM -2.66 8.54 0.41 RVM 3.63 4.17 0.35 RVM -0.02 2.80 1.98 RVM 2.64 2.57 2.41 RVM 3.52 5.12 NA 1.65 0.00 0.00 0.00 0.00 0.00 0.10ASTURFONDO MIX-RV FIM -5.20 17.59 0.38 RVM 8.98 10.98 0.40 RVM 0.04 9.68 0.18 RVM 7.77 8.25 0.30 RVM 11.38 12.19 NA 2.00 0.00 0.00 0.00 2.00 0.00 0.15ATLANTICO MIXTO 3 FIM -0.13 8.99 1.77 RVM 5.67 5.77 1.57 RVM -0.52 4.56 1.50 RVM 5.44 3.88 1.48 RVM 10.70 6.13 NA 1.50 0.00 0.00 0.00 2.00 0.00 0.09ATLANTICO MIXTO 4 FIM -6.51 17.85 1.36 RVM 8.77 11.51 1.40 RVM -0.61 9.44 1.42 RVM 7.51 8.03 1.53 RVM 8.65 12.33 NA 1.60 0.00 0.00 0.00 2.00 0.00 0.06ATLANTICO MIXTO FIM -0.05 13.75 1.50 RVM 8.01 8.89 1.47 RVM -0.76 6.92 1.43 RVM 8.32 5.98 1.48 RVM 16.04 9.39 -7.57 1.60 0.00 0.00 0.00 2.00 0.00 0.06ATLANTICO MIXTO PREMIER FIM -6.98 19.22 1.44 RVM 10.21 12.77 1.26 RVM -0.34 9.85 1.25 RVM 7.61 8.08 0.94 RVM 9.94 13.21 NA 0.85 0.00 0.00 0.00 2.00 0.00 0.08B.I. EUROMIXTO FIM 0.97 11.37 0.01 RVMI 11.07 7.54 0.01 RVM 1.04 5.59 0.01 RVM 7.10 5.19 0.01 RVM 21.35 7.84 17.18 1.00 0.00 0.00 0.00 0.00 0.00 0.00BANCAJA FONDO DE FONDOS 60 FIMF -5.32 15.28 0.11 RVM 8.29 9.93 0.00 RVM 1.96 8.63 0.00 RVM 4.31 6.95 0.01 RVM 9.04 10.68 NA 1.15 0.00 0.00 0.00 2.00 0.00 0.05BANCAJA RENTA VARIABLE MIXTA FIM -8.80 24.96 0.10 RVM 12.88 14.94 0.10 RVM 0.38 9.94 0.04 RVM 6.60 7.40 0.07 RVM 10.17 15.83 -14.57 2.00 0.00 0.00 0.00 1.00 0.00 0.20BANCOFAR FUTURO FIM -0.34 9.69 0.00 RVM 6.15 6.66 0.00 RVM -0.38 5.06 0.00 RVM 5.50 3.97 0.01 RVM 11.19 6.71 7.58 0.80 0.00 0.00 0.00 0.00 0.00 0.14BANKPYME EUROMIX 60 RV FIM -6.93 23.49 4.58 RVM 21.20 14.65 2.33 RVM 1.22 10.52 3.06 RVM 7.38 8.58 5.37 RVM 22.60 15.49 -2.08 1.35 9.00 0.15 0.15 0.75 0.25 0.20BARCLAYS GESTION 50 FIMF -3.21 13.40 0.01 RVM 8.23 8.92 0.01 RVM 0.44 6.84 0.01 RVM 6.36 5.46 0.01 RVM 11.92 9.18 NA 0.05 0.00 0.00 0.00 2.00 0.00 0.00BARCLAYS MIXTO 50 FIM -4.34 16.57 0.38 RVM 8.16 10.91 0.23 RVM 0.01 8.22 0.53 RVM 6.06 6.67 0.43 RVM 9.75 11.25 -15.60 1.00 9.00 0.00 0.00 2.50 0.00 0.20BASKEPLUS FIM -0.15 11.68 3.81 RVM 6.43 7.99 2.73 RVM 0.57 6.27 2.47 RVM 5.66 5.23 2.12 RVM 12.93 8.17 10.81 1.25 0.00 0.00 0.00 2.00 0.00 0.05BBK GESTION ACTIVA 30 FIMF -2.63 9.24 0.82 RVM 4.57 5.61 0.61 RVM 0.62 5.11 0.37 RVM 3.32 4.37 0.14 RVM 5.85 6.37 -3.48 1.90 0.00 0.00 0.00 0.00 0.00 0.07BBK GESTION ACTIVA 60 FIMF -5.83 18.26 0.03 RVM 9.09 11.22 0.03 RVM 1.08 9.92 0.00 RVM 6.50 8.53 0.04 RVM 10.59 12.57 NA 1.90 0.00 0.00 0.00 0.00 0.00 0.10BBK MIXTO FIM -2.01 15.37 1.46 RVM 9.15 10.12 1.20 RVM -0.42 7.48 1.07 RVM 7.27 5.97 0.62 RVM 14.25 10.38 4.64 0.90 0.00 0.00 0.00 0.00 0.00 0.06BBVA GARANTIA 2 FIM 0.13 2.30 0.86 RVM 0.74 1.60 0.91 RVM 1.53 1.49 0.37 RVM 0.11 1.24 0.16 RVM 2.53 1.70 NA 1.25 0.00 0.00 0.00 0.00 0.00 0.20BBVA GARANTIA FIM -0.06 2.10 1.30 RVM 1.17 1.60 1.34 RVM 1.32 1.49 0.69 RVM 0.13 1.01 0.39 RVM 2.57 1.60 NA 1.40 0.00 0.00 0.00 0.00 0.00 0.10BBVA INDICE MIXTO PLUS FIM -6.69 21.16 0.36 RVM 10.54 14.30 0.90 RVM -0.66 9.51 1.11 RVM 7.13 7.85 0.95 RVM 9.77 14.20 NA 0.80 0.00 1.00 0.00 2.00 0.00 0.20BBVA OPCIONES 1 FIM -0.40 2.08 0.91 RVM 0.78 1.69 0.90 RVM 0.78 1.36 0.06 RVM 0.51 0.59 0.03 RVM 1.68 1.53 28.90 1.60 0.00 0.00 0.00 0.00 0.00 0.10BCN MIXTO FIM -1.57 12.56 1.94 RVM 6.17 8.91 1.67 RVM 1.10 9.60 1.36 RVM 2.94 4.13 0.81 RVM 8.75 9.30 -7.47 0.80 0.00 0.00 0.00 0.00 0.00 0.10BESTINVER MIXTO FIM 1.98 6.04 0.20 RVM 12.76 5.11 0.17 RVM 4.26 4.49 0.07 RVM 5.75 3.42 0.05 RVM 26.79 4.91 65.16 1.50 0.00 0.00 0.00 3.00 3.00 0.13BG EUSKOVALOR FIM 0.67 7.81 0.44 RVM 7.06 6.24 0.38 RVM 1.44 5.26 0.32 RVM 6.52 3.87 0.25 RVM 16.46 5.99 NA 2.25 0.00 0.00 0.00 1.00 0.00 0.20BG IZARBE FIM -5.77 20.85 0.11 RVM 13.78 15.26 0.09 RVM 1.13 11.95 0.09 RVM 9.75 10.11 0.07 RVM 19.00 15.14 -32.40 2.25 0.00 0.00 0.00 1.00 0.00 0.20BG MIXTO 50 FIM -5.11 14.98 0.13 RVM 8.95 10.71 0.10 RVM -0.04 7.99 0.10 RVM 7.03 7.14 0.09 RVM 10.61 10.69 NA 2.25 0.00 0.00 0.00 1.00 0.00 0.19BI MIXTO EUROPA FIM (EN DISOLUCION) -0.09 2.18 0.01 RVM 2.27 5.01 0.01 RVM -0.34 0.12 0.01 RVM -0.24 0.59 0.01 RVM 1.59 2.53 NA 2.00 0.00 0.00 0.00 1.00 0.00 0.00BK MIXTO ESPAÑA 50 FIM -1.03 13.89 0.44 RVM 8.12 11.01 0.41 RVM 0.05 8.11 0.42 RVM 7.37 6.38 0.43 RVM 14.96 10.26 -1.18 1.60 0.00 0.00 0.00 1.00 1.00 0.20BK MIXTO EUROPA 50 FIM -6.88 16.54 0.48 RVM 8.30 12.57 0.44 RVM -0.26 9.54 0.48 RVM 6.42 7.87 0.49 RVM 7.05 12.12 -11.19 1.60 0.00 0.00 0.00 1.00 0.00 0.10BNP GLOBAL 30-70 FIM -3.23 10.08 2.08 RVM 6.82 7.30 2.10 RVM 1.11 6.30 2.03 RVM 3.47 4.82 1.90 RVM 8.15 7.40 NA 1.50 0.00 0.00 0.00 0.00 0.00 0.15BNP GLOBAL 50-50 FIM -5.47 14.91 1.90 RVM 9.61 10.51 1.68 RVM 2.57 8.26 1.59 RVM 3.66 6.07 1.96 RVM 10.15 10.49 -4.18 1.75 0.00 0.00 0.00 0.00 0.00 0.15BNP PARIBAS BOLSA II FIM -7.73 16.40 3.05 RVM 7.47 10.36 2.86 RVM 0.35 7.25 2.97 RVM 4.90 6.02 2.91 RVM 4.38 10.82 -8.45 1.50 0.00 0.00 0.00 0.25 0.00 0.00BNP PARIBAS INSTITUCIONES FIM -5.32 14.20 1.87 RVM 9.20 9.19 1.55 RVM 2.08 7.54 1.92 RVM 3.97 5.34 1.73 RVM 9.74 9.67 -2.30 0.00 0.00 0.00 0.00 0.00 0.00 0.00CAI RENTA MIXTO 40 FIM -5.12 15.10 1.95 RVM 7.98 11.11 1.92 RVM 0.90 8.78 1.52 RVM 4.98 7.21 1.64 RVM 8.52 10.98 NA 1.75 0.00 0.00 0.00 1.00 0.00 0.15CAI RENTA MIXTO FIM -7.05 19.19 1.32 RVM 9.35 11.85 1.29 RVM -0.75 9.80 1.26 RVM 7.95 8.64 1.34 RVM 8.90 13.07 -18.29 2.00 0.00 0.00 0.00 0.00 0.00 0.14CAIXA CATALUNYA EUROPA MIXT 75 FIM -3.04 26.84 2.62 RVM 12.40 15.81 2.20 RVM -2.09 11.05 2.35 RVM 6.12 9.07 1.88 RVM 13.23 17.12 -21.40 1.35 9.00 0.00 0.00 0.00 0.00 0.15CAIXA GALICIA MIX FIM -1.32 15.10 1.69 RVM 8.96 10.13 1.33 RVM -0.59 7.69 1.15 RVM 7.36 6.43 1.29 RVM 14.76 10.39 -7.92 1.85 0.00 0.00 0.00 1.50 0.00 0.20
(Continues over)
(Continued)

262
Annual rep
ort o
n th
e securities m
arket. 2003
A.4.8.Investment in securities. FIM. Yields, volatility and duration
1Q 2Q 3Q 4Q 2003
Yield Vol Dur Yield Vol Dur Yield Vol Dur Yield Vol Dur Yield Vol(1) (2) Type (1) (2) Type (1) (2) Type (1) (2) Type (1)% % % % %
% fees
Management Front end Back endCustody
of assets of yield Max. Min. Max. Min.
Yieldsince1996
Mixed equity FIM (RVM)
CAJA LABORAL CRECIMIENTO FIM -11.07 27.80 2.12 RVM 14.50 16.60 2.02 RVM -0.28 11.48 1.85 RVM 9.63 10.39 1.68 RVM 11.32 18.00 -28.11 2.25 0.00 0.00 0.00 1.00 0.00 0.14CAM MIXTO 50 FIM -0.56 13.13 1.98 RVM 8.77 9.43 1.55 RVM -0.36 7.78 0.87 RVM 7.37 5.59 0.82 RVM 15.72 9.41 -1.38 1.50 0.00 0.00 0.00 2.00 2.00 0.19CAM MIXTO 75 FIM -1.69 20.33 0.20 RVM 12.72 14.18 0.00 RVM -0.54 11.32 0.00 RVM 10.48 10.06 0.01 RVM 21.77 14.54 -8.20 2.00 0.00 0.00 0.00 2.00 2.00 0.11CAM MIXTO VARIABLE EUROPA FIM -5.12 21.06 1.52 RVM 12.08 14.22 1.50 RVM 1.02 15.02 1.74 RVM 10.24 11.60 1.45 RVM 18.43 15.89 -19.15 1.75 0.00 0.00 0.00 2.00 2.00 0.13CAN GESTION 50 FIM -0.98 15.13 0.68 RVM 7.92 9.52 0.60 RVM -1.37 7.98 0.60 RVM 8.04 5.96 0.65 RVM 13.86 10.24 -11.14 2.25 0.00 0.00 0.00 0.00 0.00 0.15CAN INDEXNAVARRA FIM 0.55 9.30 0.00 RVM 5.66 6.72 0.00 RVM 1.82 5.98 0.00 RVM 5.58 5.29 0.20 RVM 14.21 6.98 4.32 1.20 0.00 3.00 0.00 0.00 0.00 0.04CANTABRIA ACCIONES FIM -6.01 14.17 3.10 RVM 8.49 10.23 2.53 RVM 0.73 8.43 1.88 RVM 4.98 6.65 1.65 RVM 7.83 10.29 -10.88 2.00 0.00 0.00 0.00 1.00 0.00 0.17CAPITAL 2.000 FIM 1.30 10.63 1.08 RVM 7.71 7.96 1.02 RVM 0.55 7.22 1.79 RVM 5.93 5.49 4.21 RVM 16.23 8.05 0.04 2.25 0.00 0.00 0.00 0.00 0.00 0.20CITIFONDO AGIL FIM -7.11 18.40 1.66 RVM 9.78 13.07 1.54 RVM -0.66 10.18 1.41 RVM 7.38 8.05 1.39 RVM 8.78 13.05 -13.49 2.25 0.00 0.00 0.00 0.00 0.00 0.20CRV FONDBOLSA FIM -7.46 16.59 0.77 RVM 9.79 12.81 0.87 RVM 0.34 10.72 0.83 RVM 6.75 8.50 0.85 RVM 8.84 12.56 -25.69 2.00 0.00 0.00 0.00 0.00 0.00 0.11CT EUROMIXT 50 FIM -6.87 15.71 2.04 RVM 9.08 11.20 2.23 RVM 0.03 9.00 2.13 RVM 6.02 6.97 2.21 RVM 7.74 11.24 NA 2.00 0.00 0.00 0.00 1.00 1.00 0.10CT EUROMIXT 75 FIM -10.79 24.39 2.65 RVM 13.95 17.25 2.91 RVM -0.14 13.64 2.50 RVM 9.37 10.69 2.44 RVM 11.02 17.33 NA 2.00 0.00 0.00 0.00 1.00 1.00 0.10DINERO ACTIVO II FIM -4.69 11.53 0.00 RVM 6.15 8.27 0.01 RVM -0.17 6.57 0.01 RVM 4.93 5.34 0.02 RVM 5.98 8.29 -6.30 1.50 0.00 0.00 0.00 0.00 0.00 0.07DWS CAPITAL II FIM -2.50 6.94 0.30 RVM 4.56 5.09 0.39 RVM 0.73 4.66 0.34 RVM 2.44 3.62 0.34 RVM 5.21 5.23 -0.52 1.25 0.00 0.00 0.00 0.00 0.00 0.10DWS CAPITAL III FIM -3.33 9.41 0.29 RVM 5.92 6.78 0.37 RVM 0.70 6.25 0.32 RVM 3.18 4.86 0.33 RVM 6.39 7.04 -4.48 1.35 0.00 0.00 0.00 0.00 0.00 0.10DWS CAPITAL IV FIM -4.34 11.91 0.27 RVM 7.33 8.54 0.33 RVM 0.51 7.85 0.29 RVM 4.09 6.10 0.28 RVM 7.42 8.88 -7.84 1.45 0.00 0.00 0.00 0.00 0.00 0.10DWS CRECIMIENTO FIM -2.89 12.02 0.33 RVM 5.74 8.16 0.30 RVM 0.09 7.54 1.46 RVM 5.71 6.53 1.65 RVM 8.64 8.82 12.00 1.00 0.00 0.00 0.00 0.00 0.00 0.00DWS EDELSTAHL FIM -8.59 23.46 1.95 RVM 14.57 16.44 1.83 RVM 1.38 12.45 1.55 RVM 7.03 9.33 2.06 RVM 13.63 16.35 5.96 1.00 0.00 0.00 0.00 0.00 0.00 0.00DWS EUROPA MIXTO FIM -7.90 18.12 1.65 RVM 10.94 14.06 1.82 RVM 0.63 12.07 1.93 RVM 6.67 9.35 1.90 RVM 9.68 13.83 -21.22 2.25 0.00 0.00 0.00 1.00 0.00 0.10DWS FONCREATIVO FIM -2.02 7.20 2.18 RVM 4.88 5.05 2.39 RVM 0.58 5.03 2.61 RVM 3.43 3.78 2.71 RVM 6.91 5.43 10.04 0.40 6.00 0.00 0.00 0.00 0.00 0.00DWS MIXTA FIM -1.17 17.99 1.36 RVM 11.97 12.45 1.53 RVM -0.48 10.29 1.78 RVM 10.47 7.31 1.33 RVM 21.67 12.65 -8.18 1.75 0.00 0.00 0.00 0.00 0.00 0.10DWS MIXTA II FIM -1.08 17.93 1.23 RVM 11.99 12.44 1.23 RVM -0.46 10.24 1.56 RVM 10.50 7.25 1.10 RVM 21.84 12.61 -9.45 1.50 0.00 0.00 0.00 0.00 0.00 0.10DWS RENTA FIM -1.43 6.60 0.29 RVM 3.43 5.31 0.25 RVM -1.23 4.82 1.39 RVM 5.06 5.88 1.37 RVM 5.79 5.72 9.98 1.00 0.00 0.00 0.00 0.00 0.00 0.10ESPIRITO SANTO MIXTO ESPAÑA 75 FIM -2.19 18.11 0.01 RVM 11.82 14.82 0.01 RVM -1.10 11.17 0.01 RVM 9.78 8.71 0.01 RVM 18.74 13.70 -14.47 2.25 0.00 0.00 0.00 0.00 0.00 0.15ESPIRITO SANTO MIXTO EURO 75 FIM -4.57 20.71 0.01 RVM 8.53 16.86 0.01 RVM -1.01 13.60 0.01 RVM 7.88 11.16 0.01 RVM 10.61 16.00 -37.97 1.75 0.00 0.00 0.00 0.00 0.00 0.20ETCHEVERRIA FONDO FIM -2.31 6.91 1.58 RVM 4.97 4.27 1.17 RVM 0.28 3.43 1.32 RVM 2.79 2.31 0.93 RVM 5.70 4.58 -5.77 2.25 0.00 0.00 0.00 0.00 0.00 0.15EUROAGENTES BOLSA FIM 2.79 7.85 0.00 RVM 6.68 5.67 0.00 RVM 3.12 4.85 0.00 RVM 9.18 10.98 0.01 RVM 23.45 7.73 4.02 1.35 0.00 0.00 0.00 0.00 0.00 0.10EUROAGENTES PREVISION FIM 2.86 4.62 0.00 RVM 1.49 0.92 0.00 RVM 0.39 0.91 0.00 RVM 1.16 0.69 0.01 RVM 6.00 2.41 35.80 2.00 0.00 0.00 0.00 0.00 0.00 0.15EUROAGENTES UNIVERSAL FIM 3.17 6.28 0.00 RVM 4.54 2.71 0.00 RVM 2.23 3.33 0.00 RVM 5.57 2.51 0.01 RVM 16.40 4.00 17.06 1.50 0.00 0.00 0.00 0.00 0.00 0.11EUROVALENCIA VCG FIM 2.45 17.86 0.00 RVM 15.57 15.58 0.00 RVM 4.12 11.69 0.00 RVM 8.82 10.20 0.01 RVM 34.15 14.17 -42.09 2.00 0.00 1.00 1.00 1.00 1.00 0.15EUROVALOR MIXTO-50 FIM -0.71 13.73 3.93 RVM 8.85 9.21 3.52 RVM -0.98 7.09 3.22 RVM 6.95 5.48 2.92 RVM 14.46 9.41 -0.72 2.25 0.00 0.00 0.00 0.00 0.00 0.00EUROVALOR MIXTO-70 FIM -9.04 25.83 3.64 RVM 11.68 15.30 3.53 RVM -1.51 12.72 3.16 RVM 9.64 10.24 3.02 RVM 9.69 17.12 -25.87 2.25 0.00 0.00 0.00 0.00 0.00 0.00F. ANDALUCIA 2000 FIM 1.43 5.75 1.55 RVM 3.11 2.90 0.37 RVM 0.08 1.73 0.43 RVM 4.31 2.60 1.50 RVM 9.19 3.58 -28.23 0.90 0.00 0.00 0.00 0.00 0.00 0.07F. VALENCIA FONDO DE FONDOS 60 FIMF -5.65 13.88 0.00 RVM 8.98 9.33 0.00 RVM 3.25 7.12 0.00 RVM 5.43 6.13 0.00 RVM 11.92 9.63 NA 1.15 0.00 0.00 0.00 2.00 0.00 0.05FIBANC CRECIMIENTO FIM -2.40 14.37 2.78 RVM 9.07 9.17 3.46 RVM -0.65 7.76 3.49 RVM 9.24 6.88 3.04 RVM 15.53 10.01 -15.00 2.00 0.00 0.00 0.00 0.00 0.00 0.20FIBANC MIX. RV EUR. FIM -5.68 13.20 2.85 RVM 2.62 10.71 3.03 RVM -2.45 10.66 2.56 RVM 8.21 9.58 2.42 RVM 2.16 11.16 NA 2.00 0.00 0.00 0.00 0.00 0.00 0.10FINGEST MIXTO FIM -1.76 9.55 3.67 RVN 2.67 7.25 1.08 RVN -0.50 8.30 0.74 RVM 10.55 6.27 0.55 RVM 10.94 7.99 -25.62 2.00 0.00 0.00 0.00 0.00 0.00 0.13FINVERBOLSA FIM -1.54 17.45 1.11 RVM 10.22 8.31 0.45 RVM -0.78 7.67 1.34 RVM 6.48 5.57 0.31 RVM 14.65 10.77 -40.55 2.25 0.00 0.00 0.00 0.00 0.00 0.13FINVEREGA INTERNACIONAL FIM -7.02 17.70 1.74 RVM 7.49 10.74 0.41 RVM -0.72 7.37 0.89 RVM 6.34 7.34 0.55 RVM 5.51 11.61 -20.00 2.25 0.00 0.00 0.00 0.00 0.00 0.13FON FINECO EUROLIDER FIM -10.15 30.72 1.08 RVM 16.75 20.30 0.73 RVM -0.67 14.76 0.64 RVM 11.12 12.40 0.44 RVM 15.77 20.82 -4.87 1.25 0.00 3.00 0.00 3.00 0.00 0.10FON FINECO GESTION FIM 0.62 13.66 0.17 RVM 4.37 3.88 0.24 RVM 1.25 4.20 0.49 RVM 2.51 2.28 0.36 RVM 9.01 7.46 NA 0.75 0.00 5.00 0.00 0.00 0.00 0.10FON FINECO I FIM -6.46 25.19 1.03 RVM 13.28 16.18 1.08 RVM 0.77 9.14 1.48 RVM 6.90 5.94 1.31 RVM 14.15 15.93 1.93 1.50 0.00 0.00 0.00 0.00 0.00 0.15FONALCALA FIM 0.03 10.45 0.18 RVM 8.17 8.85 0.12 RVM 0.67 7.79 0.04 RVM 8.58 5.97 0.00 RVM 18.28 8.45 15.08 2.00 0.00 0.00 0.00 0.00 0.00 0.06FONBOLSA PLUS FIM -4.74 13.51 0.01 RVM 6.19 9.51 0.01 RVM -0.51 7.02 0.01 RVM 4.75 6.36 0.01 RVM 5.42 9.54 -11.67 1.50 0.00 0.00 0.00 0.00 0.00 0.15FONBUSA MIXTO FIM 0.49 7.34 1.74 RVM 5.94 5.35 1.63 RVM 0.41 4.44 1.97 RVM 3.71 3.09 1.61 RVM 10.86 5.30 5.03 1.25 0.00 0.00 0.00 0.00 0.00 0.12FONCAFIX FIM -4.36 22.79 1.12 RVM 14.29 13.81 0.29 RVM -0.03 9.44 0.19 RVM 9.25 7.79 0.33 RVM 19.38 14.68 -6.38 1.30 0.00 0.00 0.00 0.00 0.00 0.00FONCAIXA 29 RV MIXTA ESPAÑA FIMS 0.10 6.25 0.00 RVM 2.20 4.86 0.00 RVM -1.92 7.44 0.00 RVM 8.93 7.07 0.00 RVM 9.30 6.54 2.66 1.85 0.00 0.00 0.00 4.00 0.00 0.08FONCAIXA 38 R.V. MIXTA EURO FIMS -5.90 8.95 0.00 RVM 2.93 4.91 0.00 RVM -2.32 9.51 0.00 RVM 8.40 9.96 0.00 RVM 2.57 8.65 -10.13 2.00 0.00 0.00 0.00 4.00 0.00 0.15FONCAIXA 42 R.V. MIXTA ESPAÑA FIMS 0.84 6.95 0.00 RVM 2.18 4.86 0.00 RVM -1.92 7.42 0.00 RVM 8.89 7.06 0.00 RVM 10.03 6.70 -7.15 1.85 0.00 0.00 0.00 4.00 0.00 0.15FONCAIXA 97 RV MIXTA EURO FIMS NA 6.21 0.00 RVM 2.89 4.79 0.00 RVM -2.20 8.91 0.00 RVM 8.06 9.41 0.00 RVM NA 7.82 NA 1.35 9.00 0.00 0.00 4.00 0.00 0.20
(Continues over)
(Continued)

263
Annex 4
: Collective in
vestmen
t schem
es and ven
ture cap
ital com
pan
iesA.4.8.Investment in securities. FIM. Yields, volatility and duration
1Q 2Q 3Q 4Q 2003
Yield Vol Dur Yield Vol Dur Yield Vol Dur Yield Vol Dur Yield Vol(1) (2) Type (1) (2) Type (1) (2) Type (1) (2) Type (1)% % % % %
% fees
Management Front end Back endCustody
of assets of yield Max. Min. Max. Min.
Yieldsince1996
Mixed equity FIM (RVM)
FONCAIXA RV MIXTA ESPAÑA FIMP NA 2.16 1.70 RVM 2.81 5.12 2.21 RVM -1.53 7.83 1.67 RVM 9.96 7.44 1.15 RVM NA 6.34 NA 0.00 0.00 0.00 0.00 0.00 0.00 0.00FONCAIXA RV MIXTA EURO FIMP NA 5.29 1.32 RVM 3.66 5.19 1.97 RVM -1.91 10.11 1.98 RVM 9.50 10.59 1.46 RVM NA 8.45 NA 0.00 0.00 0.00 0.00 0.00 0.00 0.00FONDANETO FIM -1.81 6.58 2.21 RVM 4.37 5.36 0.70 RVM 0.61 4.71 1.40 RVM 5.62 4.32 1.60 RVM 8.90 5.34 -22.29 0.70 0.00 2.00 2.00 3.00 3.00 0.10FONDCHART FIM -2.74 20.35 0.02 RVM 10.09 12.95 0.05 RVM -1.31 8.93 0.02 RVM 8.46 7.18 0.00 RVM 14.60 13.35 -13.15 2.00 0.00 0.00 0.00 0.00 0.00 0.15FONDEGA BOLSA FIM -7.00 18.14 1.31 RVM 8.53 11.16 0.89 RVM -1.18 8.22 0.83 RVM 7.50 7.71 0.81 RVM 7.23 12.08 -23.09 2.25 0.00 0.00 0.00 0.00 0.00 0.13FONDESPAÑA CRECIM. FIM -3.93 14.90 1.31 RVM 8.61 9.25 1.40 RVM 0.28 7.76 1.05 RVM 6.00 6.65 0.97 RVM 10.92 10.17 NA 1.40 0.00 0.00 0.00 0.00 0.00 0.15FONDESPAÑA DINAMICO FIM -5.75 19.73 2.13 RVM 13.15 13.15 2.06 RVM 0.14 10.67 1.74 RVM 8.05 7.45 1.53 RVM 15.38 13.56 NA 1.50 0.00 0.00 0.00 0.00 0.00 0.15FONDGESKOA FIM -0.63 14.51 0.84 RVM 8.69 10.08 0.62 RVM -1.00 7.68 1.02 RVM 8.35 6.17 0.85 RVM 15.84 10.13 3.17 2.25 0.00 0.00 0.00 1.00 0.00 0.00FONDIBAS MIXTO FIM -0.17 10.10 0.77 RVM 6.37 6.52 0.90 RVM 1.01 3.70 0.71 RVM 2.30 3.27 0.57 RVM 9.74 6.49 -1.68 1.50 0.00 0.00 0.00 0.00 0.00 0.10FONDMAPFRE BOLSA FIM -1.50 17.16 2.05 RVM 9.96 11.69 1.75 RVM -0.55 8.89 1.67 RVM 7.78 6.72 1.84 RVM 16.09 11.79 -3.70 2.25 0.00 0.00 0.00 1.50 0.00 0.20FONDMAPFRE DIVERSIFICACION FIM -1.67 10.71 2.33 RVM 6.72 7.78 2.07 RVM -0.53 7.08 2.56 RVM 6.49 6.04 2.52 RVM 11.15 8.11 3.53 1.50 0.00 0.00 0.00 0.00 0.00 0.17FONDMONTECO FIM -2.71 11.01 0.20 RVM 4.37 10.77 0.64 RVM -0.48 8.21 0.11 RVM 4.74 7.12 0.08 RVM 5.84 9.43 -9.68 1.00 0.00 0.00 0.00 0.00 0.00 0.10FONJALON ACCIONES FIM -1.51 16.85 0.00 RVM 13.20 11.50 0.00 RVM -0.04 8.44 0.00 RVM 8.08 6.58 0.01 RVM 20.45 11.54 -3.00 2.00 0.00 0.00 0.00 2.00 0.00 0.14FONJALON II FIM -0.85 10.86 0.35 RVM 9.50 9.34 0.29 RVM -0.81 7.46 0.24 RVM 7.08 6.14 0.16 RVM 15.31 8.67 4.01 2.00 0.00 0.00 0.00 2.00 0.00 0.20FONMUTUAL M.V. FIM 0.54 13.00 0.00 RVM 7.76 8.96 0.00 RVM 0.06 6.59 0.00 RVM 5.43 5.56 0.01 RVM 14.29 8.99 NA 1.80 0.00 0.00 0.00 0.00 0.00 0.10FONPASTOR 50 FIM -1.79 11.07 3.00 RVM 7.68 7.53 3.04 RVM -0.25 6.34 3.14 RVM 6.60 5.30 2.90 RVM 12.45 7.89 NA 1.50 0.00 0.00 0.00 1.00 0.00 0.20FONPASTOR 70 FIM -2.54 18.04 3.11 RVM 12.28 12.38 3.08 RVM -0.38 9.36 3.12 RVM 9.82 9.66 3.17 RVM 19.71 12.87 1.71 1.50 0.00 0.00 0.00 0.00 0.00 0.17FONPENEDES MULTIFONS 25 FIMF NA NA NA NA 5.34 0.00 RVM 1.02 3.61 0.00 RVM 1.56 2.71 0.00 RVM NA 3.88 NA 1.25 0.00 0.00 0.00 1.00 0.00 0.05FONPENEDES VARIABLE MIXT FIM -12.47 32.28 1.58 RVM 17.38 20.33 1.07 RVM 0.89 12.31 1.67 RVM 8.56 9.48 2.29 RVM 12.53 20.64 -21.75 2.00 0.00 0.00 0.00 0.00 0.00 0.00FONQUIVIR FIM 0.63 13.02 0.54 RVM 8.61 8.97 0.59 RVM 0.18 6.74 0.03 RVM 8.27 5.76 0.03 RVM 18.55 9.07 13.45 0.25 0.00 0.00 0.00 1.00 0.00 0.15FONSNOSTRO II FIM -0.21 21.61 1.01 RVM 13.09 14.27 1.06 RVM -0.77 10.85 0.98 RVM 11.36 8.70 0.93 RVM 24.72 14.71 -9.34 1.00 0.00 0.00 0.00 1.00 0.00 0.17GESRIOJA FIM 3.36 33.15 0.96 RVM 11.66 11.47 1.11 RVM 1.63 6.46 1.16 RVM 5.17 5.27 1.10 RVM 23.35 17.94 -29.39 1.50 0.00 0.00 0.00 0.00 0.00 0.13GESTI GLOBAL FIM -3.51 8.23 0.00 RVM 4.28 4.73 0.00 RVM -0.59 4.12 0.00 RVM 3.36 3.57 0.01 RVM 3.38 5.49 -14.94 2.00 0.00 0.00 0.00 0.00 0.00 0.15GLOBAL ASSETS FUND FIM 0.26 2.82 0.19 RVM 2.36 2.24 0.23 RVM -1.23 3.65 0.76 RVM 5.72 4.06 0.78 RVM 7.17 3.32 -20.27 0.60 0.00 0.00 0.00 0.00 0.00 0.03GLOBAL VARIABLE FIM -0.48 1.87 0.76 RVM 0.58 1.29 0.78 RVM -0.07 3.20 0.78 RVM 0.18 1.33 0.68 RVM 0.21 2.07 -6.60 2.00 0.00 0.00 0.00 0.00 0.00 0.20HERRERO CRECIMIENTO FIMS -10.93 20.70 0.01 RVM 8.84 13.73 0.01 RVM -0.28 11.77 0.01 RVM 8.01 10.22 0.01 RVM 4.41 14.72 -21.97 2.25 0.00 0.00 0.00 0.00 0.00 0.10HERRERO FUTURO FIMS -7.33 14.18 0.01 RVM 7.57 9.45 0.01 RVM 0.06 9.00 0.01 RVM 6.81 7.80 0.01 RVM 6.53 10.45 -4.47 1.10 5.00 0.00 0.00 0.00 0.00 0.10HSBC MIXTO ACCIONES FIM -6.03 16.25 0.16 RVM 8.85 10.97 0.19 RVM -0.13 8.79 0.00 RVM 8.85 10.48 0.00 RVM 11.19 12.00 6.39 1.00 9.00 0.00 0.00 0.00 0.00 0.15IBERAG. POPULAR MIXTO 50 EUROPA FIM-8.01 18.31 1.12 RVM 9.19 11.35 8.79 RVM -1.12 9.42 0.83 RVM 7.09 7.23 0.86 RVM 6.35 12.34 NA 2.25 0.00 0.00 0.00 0.00 0.00 0.10IBERCAJA CAPITAL EUROPA FIM -9.30 24.80 0.81 RVM 11.94 15.91 0.44 RVM 0.11 11.45 0.31 RVM 9.09 9.79 0.31 RVM 10.89 16.58 -0.34 1.70 0.00 0.00 0.00 0.00 0.00 0.20IBERCAJA CAPITAL FIM -2.94 27.05 2.05 RVM 18.67 17.30 1.64 RVM 0.55 11.52 1.55 RVM 11.62 9.42 1.39 RVM 29.27 17.71 -15.24 1.50 0.00 0.00 0.00 2.50 0.00 0.20IBERCAJA RENTA EUROPA FIM -4.04 12.60 0.44 RVM 6.79 8.67 0.36 RVM -0.03 6.03 0.49 RVM 4.75 5.07 0.45 RVM 7.31 8.62 1.59 1.70 0.00 0.00 0.00 2.00 0.00 0.20IBERCAJA RENTA PLUS FIM -1.24 22.08 0.37 RVM 15.34 14.73 0.31 RVM 1.06 10.92 0.40 RVM 10.73 9.69 0.31 RVM 27.47 15.16 -6.42 1.50 0.00 0.00 0.00 2.50 0.00 0.20IM 93 MIXTO FIM -9.22 24.58 0.00 RVM 16.02 15.72 0.00 RVM 1.98 11.81 0.00 RVM 9.26 9.85 0.01 RVM 17.36 16.55 -24.73 1.50 0.00 0.00 0.00 0.00 0.00 0.10INBORSA FIM -4.24 13.95 0.74 RVM 8.22 9.67 0.72 RVM -0.09 7.72 0.77 RVM 5.20 6.18 0.82 RVM 8.92 9.84 -0.07 1.75 0.00 0.00 0.00 2.00 0.00 0.15INDOSUEZ BOLSA FIM -5.05 20.46 0.00 RVM 11.47 13.57 0.00 RVM -0.85 10.13 0.00 RVM 11.50 10.53 0.13 RVM 17.01 14.32 -31.69 2.25 0.00 0.00 0.00 0.00 0.00 0.10INDOSUEZ MIXTO FIM -3.76 9.66 0.13 RVM 4.98 6.77 0.10 RVM 1.40 6.66 0.05 RVM 2.73 5.00 0.40 RVM 5.24 7.24 -14.60 1.50 0.00 0.00 0.00 0.00 0.00 0.10INDOSUEZ PATRIMONIO FIM -4.51 10.95 0.44 RVM 5.93 7.55 0.43 RVM 1.19 6.39 0.36 RVM 4.07 4.92 0.45 RVM 6.52 7.80 -14.55 0.50 0.00 0.00 0.00 0.00 0.00 0.10INGENIEROS RENTA FIM -9.60 23.00 1.66 RVM 13.55 16.16 1.52 RVM 0.86 11.84 1.46 RVM 7.57 10.12 1.71 RVM 11.37 16.12 -17.48 2.00 0.00 0.00 0.00 0.00 0.00 0.14INTERMONEY TRADING FIM NA NA NA NA 0.35 0.00 RVM 0.78 0.32 0.00 RVM 0.97 0.32 0.08 RVM NA 0.33 NA 0.90 9.00 0.00 0.00 0.00 0.00 0.10INTERVALOR BOLSA FIM -7.05 18.14 1.42 RVM 15.00 10.97 0.99 RVM 1.96 2.73 0.77 RVM -5.54 9.80 0.36 RVM 2.94 11.84 -27.99 1.35 9.00 0.00 0.00 0.00 0.00 0.15INVERBAN FONBOLSA FIM -1.47 22.25 0.00 RVM 12.23 14.80 0.00 RVM -1.55 11.19 0.00 RVM 11.01 8.84 0.01 RVM 20.85 15.15 -13.91 2.25 0.00 0.00 0.00 0.00 0.00 0.17INVERBANSER FIM -8.66 27.94 2.51 RVM 16.50 13.78 3.42 RVM 1.77 7.99 2.16 RVM 5.36 5.61 2.38 RVM 14.10 16.34 -18.34 0.50 0.00 0.00 0.00 1.00 0.00 0.00INVERSABADELL 50 FIMS -7.49 14.17 0.01 RVM 7.34 9.43 0.01 RVM -0.13 8.95 0.01 RVM 6.82 7.66 0.01 RVM 5.92 10.41 NA 1.90 0.00 0.00 0.00 0.00 0.00 0.10INVERSABADELL 70 FIMS -10.78 20.68 0.01 RVM 8.93 13.71 0.01 RVM -0.16 11.74 0.01 RVM 8.06 10.13 0.01 RVM 4.85 14.69 -25.36 1.90 0.00 0.00 0.00 0.00 0.00 0.10INVERTRES FONDO I FIM -0.48 16.30 6.08 RVM 9.59 10.54 5.29 RVM 1.00 8.96 6.15 RVM 8.73 7.25 5.61 RVM 19.77 11.29 -5.22 0.60 0.00 0.00 0.00 0.00 0.00 0.00INVERTRES FONDO II FIM -1.12 17.79 7.15 RVM 10.07 9.82 5.30 RVM 1.29 7.46 5.51 RVM 7.01 6.37 5.48 RVM 17.96 11.28 -10.83 0.60 0.00 0.00 0.00 0.00 0.00 0.00KUTXAFOND FIM -0.16 11.91 2.23 RVM 7.50 7.10 2.16 RVM -0.73 5.03 2.79 RVM 5.88 4.37 1.72 RVM 12.81 7.70 0.57 2.00 0.00 0.00 0.00 2.00 0.00 0.20MARCH BOLSA FIM -1.42 10.01 2.10 RVM 7.93 7.67 1.57 RVM 0.37 7.31 1.36 RVM 6.85 6.05 1.41 RVM 14.11 7.92 -10.26 2.25 0.00 0.00 0.00 0.00 0.00 0.00MEDIVALOR GLOBAL FIM -2.57 14.44 2.71 RVM 8.97 8.73 3.14 RVM -0.42 7.05 2.86 RVM 8.25 6.15 2.54 RVM 14.44 9.67 -15.19 1.35 9.00 0.00 0.00 0.00 0.00 0.20
(Continues over)
(Continued)
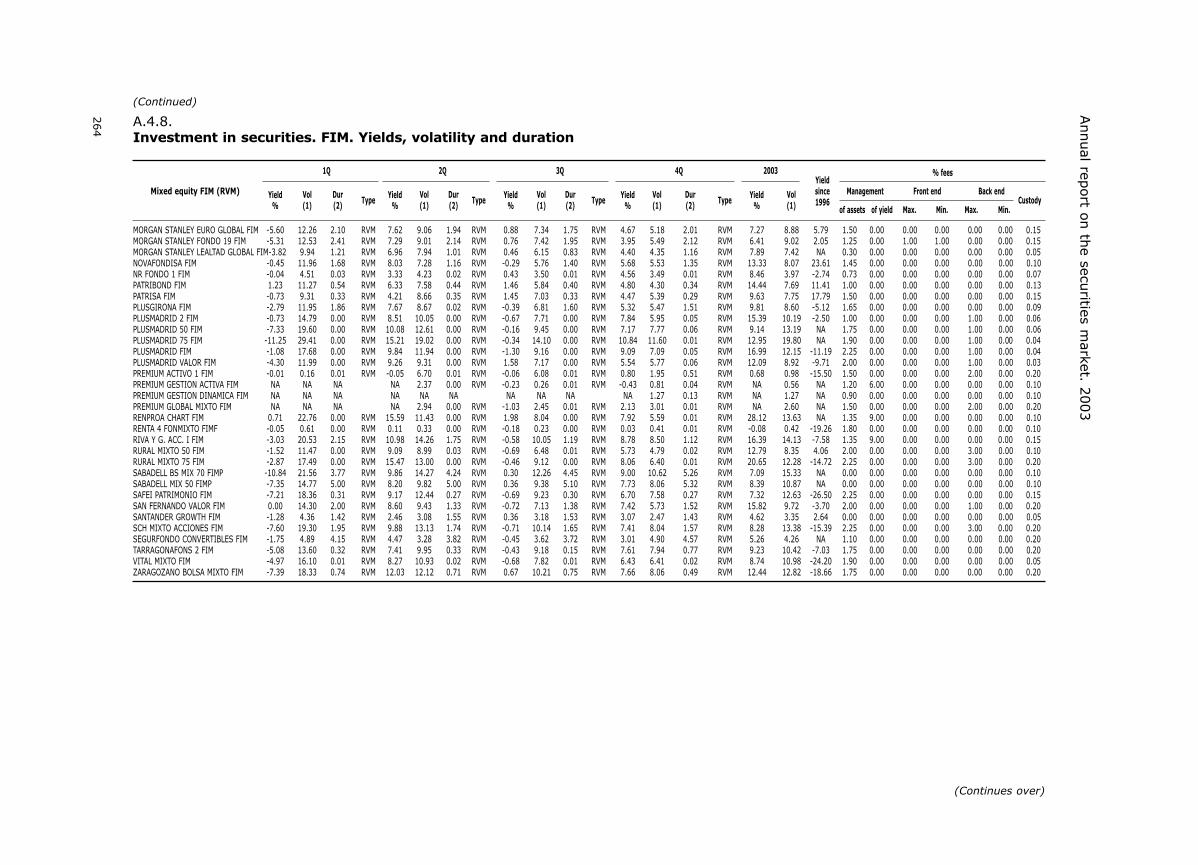
264
Annual rep
ort o
n th
e securities m
arket. 2003
A.4.8.Investment in securities. FIM. Yields, volatility and duration
1Q 2Q 3Q 4Q 2003
Yield Vol Dur Yield Vol Dur Yield Vol Dur Yield Vol Dur Yield Vol(1) (2) Type (1) (2) Type (1) (2) Type (1) (2) Type (1)% % % % %
% fees
Management Front end Back endCustody
of assets of yield Max. Min. Max. Min.
Yieldsince1996
Mixed equity FIM (RVM)
MORGAN STANLEY EURO GLOBAL FIM -5.60 12.26 2.10 RVM 7.62 9.06 1.94 RVM 0.88 7.34 1.75 RVM 4.67 5.18 2.01 RVM 7.27 8.88 5.79 1.50 0.00 0.00 0.00 0.00 0.00 0.15MORGAN STANLEY FONDO 19 FIM -5.31 12.53 2.41 RVM 7.29 9.01 2.14 RVM 0.76 7.42 1.95 RVM 3.95 5.49 2.12 RVM 6.41 9.02 2.05 1.25 0.00 1.00 1.00 0.00 0.00 0.15MORGAN STANLEY LEALTAD GLOBAL FIM-3.82 9.94 1.21 RVM 6.96 7.94 1.01 RVM 0.46 6.15 0.83 RVM 4.40 4.35 1.16 RVM 7.89 7.42 NA 0.30 0.00 0.00 0.00 0.00 0.00 0.05NOVAFONDISA FIM -0.45 11.96 1.68 RVM 8.03 7.28 1.16 RVM -0.29 5.76 1.40 RVM 5.68 5.53 1.35 RVM 13.33 8.07 23.61 1.45 0.00 0.00 0.00 0.00 0.00 0.10NR FONDO 1 FIM -0.04 4.51 0.03 RVM 3.33 4.23 0.02 RVM 0.43 3.50 0.01 RVM 4.56 3.49 0.01 RVM 8.46 3.97 -2.74 0.73 0.00 0.00 0.00 0.00 0.00 0.07PATRIBOND FIM 1.23 11.27 0.54 RVM 6.33 7.58 0.44 RVM 1.46 5.84 0.40 RVM 4.80 4.30 0.34 RVM 14.44 7.69 11.41 1.00 0.00 0.00 0.00 0.00 0.00 0.13PATRISA FIM -0.73 9.31 0.33 RVM 4.21 8.66 0.35 RVM 1.45 7.03 0.33 RVM 4.47 5.39 0.29 RVM 9.63 7.75 17.79 1.50 0.00 0.00 0.00 0.00 0.00 0.15PLUSGIRONA FIM -2.79 11.95 1.86 RVM 7.67 8.67 0.02 RVM -0.39 6.81 1.60 RVM 5.32 5.47 1.51 RVM 9.81 8.60 -5.12 1.65 0.00 0.00 0.00 0.00 0.00 0.09PLUSMADRID 2 FIM -0.73 14.79 0.00 RVM 8.51 10.05 0.00 RVM -0.67 7.71 0.00 RVM 7.84 5.95 0.05 RVM 15.39 10.19 -2.50 1.00 0.00 0.00 0.00 1.00 0.00 0.06PLUSMADRID 50 FIM -7.33 19.60 0.00 RVM 10.08 12.61 0.00 RVM -0.16 9.45 0.00 RVM 7.17 7.77 0.06 RVM 9.14 13.19 NA 1.75 0.00 0.00 0.00 1.00 0.00 0.06PLUSMADRID 75 FIM -11.25 29.41 0.00 RVM 15.21 19.02 0.00 RVM -0.34 14.10 0.00 RVM 10.84 11.60 0.01 RVM 12.95 19.80 NA 1.90 0.00 0.00 0.00 1.00 0.00 0.04PLUSMADRID FIM -1.08 17.68 0.00 RVM 9.84 11.94 0.00 RVM -1.30 9.16 0.00 RVM 9.09 7.09 0.05 RVM 16.99 12.15 -11.19 2.25 0.00 0.00 0.00 1.00 0.00 0.04PLUSMADRID VALOR FIM -4.30 11.99 0.00 RVM 9.26 9.31 0.00 RVM 1.58 7.17 0.00 RVM 5.54 5.77 0.06 RVM 12.09 8.92 -9.71 2.00 0.00 0.00 0.00 1.00 0.00 0.03PREMIUM ACTIVO 1 FIM -0.01 0.16 0.01 RVM -0.05 6.70 0.01 RVM -0.06 6.08 0.01 RVM 0.80 1.95 0.51 RVM 0.68 0.98 -15.50 1.50 0.00 0.00 0.00 2.00 0.00 0.20PREMIUM GESTION ACTIVA FIM NA NA NA NA 2.37 0.00 RVM -0.23 0.26 0.01 RVM -0.43 0.81 0.04 RVM NA 0.56 NA 1.20 6.00 0.00 0.00 0.00 0.00 0.10PREMIUM GESTION DINAMICA FIM NA NA NA NA NA NA NA NA NA NA 1.27 0.13 RVM NA 1.27 NA 0.90 0.00 0.00 0.00 0.00 0.00 0.10PREMIUM GLOBAL MIXTO FIM NA NA NA NA 2.94 0.00 RVM -1.03 2.45 0.01 RVM 2.13 3.01 0.01 RVM NA 2.60 NA 1.50 0.00 0.00 0.00 2.00 0.00 0.20RENPROA CHART FIM 0.71 22.76 0.00 RVM 15.59 11.43 0.00 RVM 1.98 8.04 0.00 RVM 7.92 5.59 0.01 RVM 28.12 13.63 NA 1.35 9.00 0.00 0.00 0.00 0.00 0.10RENTA 4 FONMIXTO FIMF -0.05 0.61 0.00 RVM 0.11 0.33 0.00 RVM -0.18 0.23 0.00 RVM 0.03 0.41 0.01 RVM -0.08 0.42 -19.26 1.80 0.00 0.00 0.00 0.00 0.00 0.10RIVA Y G. ACC. I FIM -3.03 20.53 2.15 RVM 10.98 14.26 1.75 RVM -0.58 10.05 1.19 RVM 8.78 8.50 1.12 RVM 16.39 14.13 -7.58 1.35 9.00 0.00 0.00 0.00 0.00 0.15RURAL MIXTO 50 FIM -1.52 11.47 0.00 RVM 9.09 8.99 0.03 RVM -0.69 6.48 0.01 RVM 5.73 4.79 0.02 RVM 12.79 8.35 4.06 2.00 0.00 0.00 0.00 3.00 0.00 0.10RURAL MIXTO 75 FIM -2.87 17.49 0.00 RVM 15.47 13.00 0.00 RVM -0.46 9.12 0.00 RVM 8.06 6.40 0.01 RVM 20.65 12.28 -14.72 2.25 0.00 0.00 0.00 3.00 0.00 0.20SABADELL BS MIX 70 FIMP -10.84 21.56 3.77 RVM 9.86 14.27 4.24 RVM 0.30 12.26 4.45 RVM 9.00 10.62 5.26 RVM 7.09 15.33 NA 0.00 0.00 0.00 0.00 0.00 0.00 0.10SABADELL MIX 50 FIMP -7.35 14.77 5.00 RVM 8.20 9.82 5.00 RVM 0.36 9.38 5.10 RVM 7.73 8.06 5.32 RVM 8.39 10.87 NA 0.00 0.00 0.00 0.00 0.00 0.00 0.10SAFEI PATRIMONIO FIM -7.21 18.36 0.31 RVM 9.17 12.44 0.27 RVM -0.69 9.23 0.30 RVM 6.70 7.58 0.27 RVM 7.32 12.63 -26.50 2.25 0.00 0.00 0.00 0.00 0.00 0.15SAN FERNANDO VALOR FIM 0.00 14.30 2.00 RVM 8.60 9.43 1.33 RVM -0.72 7.13 1.38 RVM 7.42 5.73 1.52 RVM 15.82 9.72 -3.70 2.00 0.00 0.00 0.00 1.00 0.00 0.20SANTANDER GROWTH FIM -1.28 4.36 1.42 RVM 2.46 3.08 1.55 RVM 0.36 3.18 1.53 RVM 3.07 2.47 1.43 RVM 4.62 3.35 2.64 0.00 0.00 0.00 0.00 0.00 0.00 0.05SCH MIXTO ACCIONES FIM -7.60 19.30 1.95 RVM 9.88 13.13 1.74 RVM -0.71 10.14 1.65 RVM 7.41 8.04 1.57 RVM 8.28 13.38 -15.39 2.25 0.00 0.00 0.00 3.00 0.00 0.20SEGURFONDO CONVERTIBLES FIM -1.75 4.89 4.15 RVM 4.47 3.28 3.82 RVM -0.45 3.62 3.72 RVM 3.01 4.90 4.57 RVM 5.26 4.26 NA 1.10 0.00 0.00 0.00 0.00 0.00 0.20TARRAGONAFONS 2 FIM -5.08 13.60 0.32 RVM 7.41 9.95 0.33 RVM -0.43 9.18 0.15 RVM 7.61 7.94 0.77 RVM 9.23 10.42 -7.03 1.75 0.00 0.00 0.00 0.00 0.00 0.20VITAL MIXTO FIM -4.97 16.10 0.01 RVM 8.27 10.93 0.02 RVM -0.68 7.82 0.01 RVM 6.43 6.41 0.02 RVM 8.74 10.98 -24.20 1.90 0.00 0.00 0.00 0.00 0.00 0.05ZARAGOZANO BOLSA MIXTO FIM -7.39 18.33 0.74 RVM 12.03 12.12 0.71 RVM 0.67 10.21 0.75 RVM 7.66 8.06 0.49 RVM 12.44 12.82 -18.66 1.75 0.00 0.00 0.00 0.00 0.00 0.20
(Continues over)
(Continued)

265
Annex 4
: Collective in
vestmen
t schem
es and ven
ture cap
ital com
pan
iesA.4.8.Investment in securities. FIM. Yields, volatility and duration
1Q 2Q 3Q 4Q 2003
Yield Vol Dur Yield Vol Dur Yield Vol Dur Yield Vol Dur Yield Vol(1) (2) Type (1) (2) Type (1) (2) Type (1) (2) Type (1)% % % % %
% fees
Management Front end Back endCustody
of assets of yield Max. Min. Max. Min.
Yieldsince1996
Spanish equity FIM (RVN)
AC ACCIONES FIM –1.17 29.10 0.01 RVN 16.56 18.49 0.01 RVN –1.22 13.78 0.08 RVN 14.79 11.14 0.02 RVN 30.63 19.39 –22.17 2.00 0.00 0.00 0.00 1.00 0.00 0.04AC IBEX–35 INDICE FIM –1.56 30.60 0.01 RVN 16.15 19.89 0.01 RVN –1.37 14.76 0.00 RVN 15.10 11.36 0.01 RVN 29.80 20.49 NA 1.00 0.00 0.00 0.00 0.00 0.00 0.09ACTIBOLSA FIM 1.03 16.92 0.01 RVE 7.31 8.75 0.00 RVE –0.91 5.29 0.01 RVN 6.74 5.59 0.00 RVN 14.66 10.25 –6.00 1.35 0.00 0.00 0.00 0.00 0.00 0.12ALLIANZ VARIABLE FIM –1.89 22.48 0.00 RVN 14.67 15.94 0.00 RVN –0.92 11.94 0.00 RVN 13.26 10.17 0.01 RVN 26.25 15.88 –22.21 1.50 0.00 0.00 0.00 1.00 0.00 0.14ALMAGRO VALORES FIM –2.27 27.12 0.00 RVN 15.55 18.48 0.00 RVN –1.40 14.17 0.00 RVN 14.81 11.29 0.01 RVN 27.84 18.76 –22.08 2.25 0.00 0.00 0.00 0.00 0.00 0.11ALTAE BOLSA FIM –1.82 29.30 0.00 RVN 16.42 19.39 0.00 RVN –2.19 14.58 0.00 RVN 14.96 11.41 0.01 RVN 28.53 19.87 –15.11 2.00 0.00 0.00 0.00 0.00 0.00 0.03ARCALIA BOLSA FIM –1.22 22.70 0.00 RVE 13.59 15.59 0.00 RVE 0.97 11.46 0.00 RVN 10.34 9.31 0.01 RVN 25.01 15.62 –0.89 2.15 0.00 0.00 0.00 2.00 0.00 0.08ATLANTICO DIVIDENDO FIMS 1.18 11.75 0.00 RVN 13.36 10.67 0.00 RVN 0.73 9.59 0.00 RVN 12.16 7.83 0.00 RVN 29.59 10.12 NA 1.75 0.00 0.00 0.00 2.00 0.00 0.15ATLANTICO DIVIDENDO PLUS FIMP 1.71 12.23 0.00 RVN 14.49 11.11 0.00 RVN 1.23 10.03 0.00 RVN 13.35 8.21 0.01 RVN 33.63 10.56 NA 0.25 0.00 0.00 0.00 0.00 0.00 0.05ATLANTICO INDICE FIM –3.09 30.24 0.00 RVN 16.71 19.99 0.00 RVN –1.77 14.72 0.00 RVN 15.70 11.39 0.01 RVN 28.56 20.39 NA 1.50 0.00 0.00 0.00 2.00 0.00 0.20AVIVA ESPABOLSA FIM –5.02 27.25 0.01 RVN 18.42 16.94 0.01 RVN 0.35 12.13 0.01 RVN 13.25 9.84 0.01 RVN 27.83 17.88 NA 0.45 0.00 0.00 0.00 0.00 0.00 0.11BANCAJA RENTA VARIABLE FIM –1.00 27.39 0.09 RVN 16.27 17.66 0.06 RVN –0.32 12.50 0.02 RVN 12.74 10.03 0.03 RVN 29.34 18.16 –10.47 1.50 0.00 0.00 0.00 1.50 0.00 0.20BANESTO RENTA VARIABLE ESPAÑOLA FIM –2.25 28.64 0.00 RVN 15.43 18.59 0.00 RVN –1.72 14.59 0.00 RVN 14.30 11.15 0.01 RVN 26.76 19.40 –22.76 2.25 0.00 0.00 0.00 0.00 0.00 0.20BANIF ACCIONES ESPAÑOLAS FIM –2.00 28.57 0.00 RVN 15.61 18.69 0.00 RVN –1.62 14.38 0.00 RVN 14.51 11.19 0.01 RVN 27.63 19.36 –21.96 2.00 0.00 0.00 0.00 1.00 0.00 0.20BANIF ALPHA RV ESPAÑA FIM NA NA NA NA NA NA NA 6.72 0.00 RVN 11.10 10.19 0.01 RVN NA 9.80 NA 1.35 9.00 0.00 0.00 0.00 0.00 0.10BANIF RV ESPAÑOLA FIM –2.01 26.56 0.00 RVN 16.72 16.61 0.00 RVN –0.28 13.05 0.00 RVN 13.68 10.01 0.01 RVN 29.66 17.70 –15.60 0.80 0.00 0.00 0.00 1.00 0.00 0.10BANKOA BOLSA FIM –1.61 20.14 0.00 RVN 13.10 14.03 0.00 RVN –1.37 11.01 0.06 RVN 13.06 9.38 0.01 RVN 24.10 14.28 1.39 2.25 0.00 0.00 0.00 1.00 0.00 0.00BARCLAYS BOLSA ESPAÑA FIM –4.30 30.55 0.01 RVN 17.38 20.31 0.01 RVN –0.29 15.67 0.01 RVN 15.12 11.93 0.01 RVN 28.95 20.83 –16.52 2.25 0.00 0.00 0.00 2.50 0.00 0.20BARCLAYS SMALL CAPS ESPAÑA FIM 0.84 10.46 0.01 RVN 14.85 8.94 0.01 RVN 2.25 7.81 0.01 RVN 7.78 4.93 0.01 RVN 27.64 8.34 NA 1.60 0.00 0.00 0.00 2.00 0.00 0.15BBK BOLSA FIM –2.48 30.25 0.05 RVN 16.43 19.44 0.06 RVN –1.52 14.52 0.08 RVN 14.94 11.46 0.03 RVN 28.52 20.23 –15.91 2.15 0.00 0.00 0.00 1.00 0.00 0.04BBVA BOLSA 2 FIM –2.16 30.24 0.01 RVN 16.48 19.48 0.01 RVN –0.80 14.60 0.01 RVN 15.55 11.43 0.01 RVN 30.65 20.24 –20.30 2.25 0.00 0.00 0.00 1.50 0.00 0.20BBVA BOLSA PLUS FIM –0.87 28.96 0.01 RVN 15.93 19.10 0.01 RVN –1.24 14.01 0.01 RVN 15.84 11.37 0.03 RVN 31.47 19.56 –7.52 1.25 0.00 0.00 0.00 2.00 0.00 0.20BBVA INDICE PLUS FIM –2.58 29.99 0.01 RVN 17.56 19.69 0.01 RVN –1.82 14.77 0.01 RVN 15.68 11.51 0.01 RVN 30.07 20.25 –18.27 1.10 0.00 0.60 0.00 2.00 0.00 0.20BESTINFOND FIM 2.55 8.08 0.00 RVN 17.38 6.78 0.00 RVN 5.74 6.15 0.00 RVN 8.58 5.02 0.01 RVN 38.20 6.67 81.36 1.50 0.00 0.00 0.00 3.00 3.00 0.05BESTINVER BOLSA FIM 2.61 8.08 0.00 RVN 17.33 6.71 0.00 RVN 5.78 6.14 0.00 RVN 8.61 5.01 0.01 RVN 38.31 6.65 84.03 1.35 0.00 0.00 0.00 3.00 3.00 0.05BETA ACCIONES FIM –2.35 31.65 0.00 RVN 18.11 21.20 0.00 RVN –2.24 15.37 0.00 RVN 16.36 11.99 0.01 RVN 31.19 21.41 –25.92 2.25 0.00 0.00 0.00 0.00 0.00 0.12BETA ESPAÑA VALOR FIM 2.80 2.34 0.00 RVN 5.41 3.55 0.00 RVN 2.21 5.32 0.00 RVN 7.42 4.11 0.01 RVN 18.96 4.01 NA 2.25 0.00 0.00 0.00 0.00 0.00 0.10BI IBERACCIONES FIM –2.58 28.69 0.01 RVN 17.05 19.23 0.01 RVN –1.48 15.04 0.01 RVN 14.09 11.38 0.01 RVN 28.17 19.69 –23.06 2.00 0.00 0.00 0.00 1.00 0.00 0.00BI SMALL Y MID–CAPS ESPAÑA FIM –0.09 2.18 0.01 RVN 2.95 5.16 0.01 RVN 0.99 7.79 0.01 RVN 6.75 7.31 0.00 RVN 10.88 5.97 NA 2.00 0.00 0.00 0.00 0.00 0.00 0.00BK BOLSA ESPAÑA 2 FIM –2.13 29.71 0.00 RVN 16.88 21.90 0.00 RVN –1.70 17.53 0.01 RVN 16.53 13.34 0.01 RVN 31.04 21.51 –4.55 1.15 0.00 0.00 0.00 1.00 0.00 0.04BK BOLSA ESPAÑA FIM –2.68 29.74 0.00 RVN 16.28 21.92 0.00 RVN –1.59 17.74 0.01 RVN 16.65 13.45 0.01 RVN 29.91 21.59 –15.97 1.15 0.00 0.00 0.00 1.00 0.00 0.03BK FUTURO IBEX FIM –1.55 30.18 0.01 RVN 15.91 19.15 0.01 RVN –0.99 14.87 0.01 RVN 15.18 11.45 0.01 RVN 30.14 20.19 –12.73 0.40 0.07 0.00 0.00 0.00 0.00 0.00BNP BOLSA FIM –3.53 36.36 0.00 RVN 22.01 23.69 0.00 RVN –0.13 17.02 0.00 RVN 13.54 12.81 0.01 RVN 33.45 24.17 –17.39 1.75 0.00 0.00 0.00 0.00 0.00 0.20BNP PARIBAS BOLSA PLUS FIM –1.33 32.32 0.00 RVN 18.60 21.18 0.00 RVN –0.26 15.16 0.00 RVN 13.06 11.66 0.00 RVN 31.96 21.55 6.70 1.00 9.00 0.00 0.00 0.00 0.00 0.00BOLSA 35 INDICE FIM –2.24 29.86 0.00 RVN 16.93 19.80 0.00 RVN –1.26 14.61 0.00 RVN 15.47 11.63 0.00 RVN 30.32 20.22 –24.44 2.25 0.00 0.00 0.00 0.00 0.00 0.03BOLSALIDER FIM –2.49 31.41 0.00 RVN 21.13 18.09 0.01 RVN 1.41 12.17 0.02 RVN 10.56 9.59 0.03 RVN 32.43 19.71 –34.24 2.25 0.00 0.00 0.00 0.00 0.00 0.15BOLSATLANTICO FIM –3.02 23.70 0.00 RVN 12.57 15.34 0.00 RVN –1.82 12.57 0.00 RVN 15.02 10.92 0.01 RVN 23.30 16.42 –31.32 2.25 0.00 0.00 0.00 2.00 0.00 0.20BOLSATLANTICO PREMIER FIM –2.14 25.85 0.00 RVN 14.48 17.31 0.00 RVN –1.13 13.10 0.00 RVN 15.06 11.10 0.01 RVN 27.45 17.79 NA 1.10 0.00 2.00 0.00 0.00 0.00 0.20CAIXA CATALUNYA INDEX FIM –5.58 33.38 0.00 RVN 17.78 21.74 0.00 RVN –3.68 15.78 0.00 RVN 14.62 11.85 0.01 RVN 22.78 22.25 –26.35 2.20 0.00 0.00 0.00 0.00 0.00 0.15CAIXASABADELL 7–RV FIM –0.50 23.10 0.92 RVN 13.63 15.21 0.86 RVN –0.92 11.55 0.85 RVN 13.37 10.21 0.39 RVN 26.99 15.85 –12.36 1.55 0.00 0.00 0.00 1.00 0.00 0.11CAJA LABORAL BOLSA FIM –2.62 27.73 0.02 RVN 16.29 18.07 0.00 RVN –1.32 13.39 0.02 RVN 13.55 10.55 0.04 RVN 26.88 18.63 –17.63 2.25 0.00 0.00 0.00 1.00 0.00 0.16CAJABURGOS BOLSA FIM –1.20 29.10 0.01 RVN 16.50 18.39 0.01 RVN –1.33 13.78 0.07 RVN 14.72 11.16 0.01 RVN 30.29 19.37 –23.03 2.25 0.00 0.00 0.00 0.00 0.00 0.06CAJASUR HISPANIA FIM –1.90 24.75 0.00 RVN 14.57 17.13 0.01 RVN –1.23 13.49 0.06 RVN 15.35 11.09 0.01 RVN 28.06 17.43 NA 1.80 0.00 0.00 0.00 0.00 0.00 0.20CAM BOLSA INDICE FIM –2.42 31.65 0.10 RVN 16.88 20.92 0.06 RVN –1.48 15.60 0.03 RVN 15.71 11.95 0.04 RVN 30.01 21.37 –22.25 1.75 0.00 0.00 0.00 0.00 0.00 0.11CAN ACCIONES FIM –2.33 29.97 0.00 RVN 16.65 19.60 0.18 RVN –1.68 14.77 0.17 RVN 15.29 11.56 0.15 RVN 29.14 20.22 –20.83 1.90 0.00 0.00 0.00 0.00 0.00 0.10CARTERA VARIABLE FIM –3.18 30.50 0.03 RVN 15.82 19.30 0.03 RVN –1.89 13.89 0.01 RVN 13.98 10.98 0.00 RVN 25.40 20.10 –22.94 2.00 0.00 0.00 0.00 0.00 0.00 0.15CATALANA OCC. BOLSA ESPAÑOLA FIM NA 17.39 0.00 RVN 13.99 13.17 0.00 RVN 1.63 9.62 0.00 RVN 10.34 6.61 0.01 RVN NA 11.66 NA 2.25 0.00 0.00 0.00 0.00 0.00 0.10CITIFONDO RV FIM –2.07 28.89 0.00 RVN 15.57 18.72 0.00 RVN –1.67 14.63 0.00 RVN 14.51 11.21 0.01 RVN 27.43 19.53 –19.78 2.25 0.00 0.00 0.00 0.00 0.00 0.20
(Continues over)
(Continued)

266
Annual rep
ort o
n th
e securities m
arket. 2003
A.4.8.Investment in securities. FIM. Yields, volatility and duration
1Q 2Q 3Q 4Q 2003
Yield Vol Dur Yield Vol Dur Yield Vol Dur Yield Vol Dur Yield Vol(1) (2) Type (1) (2) Type (1) (2) Type (1) (2) Type (1)% % % % %
% fees
Management Front end Back endCustody
of assets of yield Max. Min. Max. Min.
Yieldsince1996
Spanish equity FIM (RVN)
CS BOLSA FIM –11.35 31.09 0.00 RVN 5.14 29.43 0.00 RVN 1.02 22.35 0.00 RVN 16.34 17.14 0.01 RVN 9.55 25.66 –6.96 2.00 0.00 0.00 0.00 1.00 0.00 0.00DWS ACCIONES FIM –2.48 30.74 0.00 RVN 19.96 20.05 0.00 RVN –0.56 14.86 0.00 RVN 15.44 11.67 0.01 RVN 34.29 20.66 –13.19 2.25 0.00 0.00 0.00 2.00 0.00 0.10DWS BOLSA INSTITUCIONES FIM –2.27 30.64 0.00 RVN 20.21 20.07 0.00 RVN –0.31 14.82 0.00 RVN 15.54 11.51 0.01 RVN 35.33 20.60 –9.48 1.15 0.00 0.00 0.00 0.00 0.00 0.10EDM INVERSION FIM –3.00 17.89 0.01 RVN 14.14 10.81 0.01 RVN 2.09 9.07 0.01 RVN 10.52 6.36 0.01 RVN 24.95 11.86 7.83 2.25 0.00 0.00 0.00 0.00 0.00 0.16ESPIRITO SANTO BOLSA ESPAÑA FIM –3.59 27.40 0.01 RVN 17.06 21.19 0.01 RVN –1.56 16.35 0.01 RVN 14.17 12.24 0.01 RVN 26.83 20.14 –26.54 2.25 0.00 0.00 0.00 0.00 0.00 0.15ESPIRITO STO B.ESPAÑOLA SELECC. FIM –2.50 20.80 1.02 RVN 12.96 12.01 0.01 RVN 3.49 10.19 0.01 RVN 7.41 6.45 0.01 RVN 22.43 13.44 7.34 1.00 0.00 0.00 0.00 0.00 0.00 0.20EUROVALOR BOLSA ESPAÑOLA FIM 6.04 13.78 0.00 RVN 10.99 8.75 0.00 RVN 0.09 8.76 0.00 RVN 11.13 7.78 0.01 RVN 30.91 10.07 NA 1.50 0.00 0.00 0.00 0.00 0.00 0.00EUROVALOR BOLSA FIM –2.39 28.20 0.00 RVN 16.65 18.44 0.00 RVN –1.80 14.18 0.00 RVN 15.08 11.22 0.01 RVN 28.67 19.14 –19.59 2.25 0.00 0.00 0.00 0.00 0.00 0.00FG ACCIONES FIM –2.78 13.81 0.00 RVN 8.83 11.97 0.00 RVN 0.49 11.27 0.00 RVN 13.51 8.20 0.01 RVN 20.69 11.55 –19.89 2.25 0.00 0.00 0.00 0.00 0.00 0.13FIBANC INDICE FIM –2.26 29.66 0.12 RVN 16.13 19.35 0.10 RVN –1.66 14.52 0.04 RVN 14.85 11.30 0.02 RVN 28.18 19.96 –22.33 2.00 0.00 0.00 0.00 0.00 0.00 0.15FONBILBAO ACCIONES FIM –1.91 20.04 0.01 RVN 13.05 14.13 0.01 RVN –1.13 10.60 0.01 RVN 12.18 8.39 0.01 RVN 22.99 14.03 3.64 1.45 0.00 0.00 0.00 0.00 0.00 0.10FONCAIXA 117 CARTERA BOL.ESPAÑA FIM NA NA NA NA NA NA NA 11.42 0.00 RVN 13.73 10.42 0.01 RVN NA 11.06 NA 0.75 9.00 0.00 0.00 0.00 0.00 0.00FONCAIXA 33 BOLSA GESTION
ESPAÑA. FIMS –1.93 11.93 0.00 RVN 7.50 9.97 0.00 RVN –1.68 10.44 0.00 RVN 13.06 9.94 0.00 RVN 17.19 10.67 –20.84 1.35 9.00 0.00 0.00 4.00 0.00 0.00FONCAIXA 65 BOLSA INDICE ESPAÑA FIM –12.43 33.03 0.00 RVIE 14.51 21.32 0.00 RVIE 0.81 13.92 0.00 RVIE 8.86 11.00 0.00 RVN 10.05 21.59 NA 0.75 7.50 0.00 0.00 4.00 0.00 0.15FONCAIXA BOLSA GESTION ESPAÑA FIMP NA NA NA NA NA NA NA 11.22 0.00 RVN 15.41 11.35 0.01 RVN NA 11.41 NA 0.00 0.00 0.00 0.00 0.00 0.00 0.00FONDESPAÑA BOLSA FIM –2.18 30.42 0.01 RVN 16.82 20.12 0.01 RVN –1.46 15.10 0.01 RVN 15.42 11.71 0.01 RVN 29.96 20.60 –19.67 1.45 0.00 0.00 0.00 0.00 0.00 0.15FONDGALLEGO 21 FIM –1.17 29.08 0.01 RVN 16.56 18.48 0.01 RVN –1.33 13.73 0.08 RVN 14.77 11.14 0.01 RVN 30.46 19.37 –25.27 2.00 0.00 0.00 0.00 2.00 0.00 0.13FONDGUISSONA BOLSA FIM –0.30 17.18 0.00 FGL 18.05 11.79 0.00 FGL 5.38 9.70 0.00 RVN 10.67 7.24 0.00 RVN 37.27 12.09 17.39 0.65 0.00 0.00 0.00 0.00 0.00 0.20FONDO HISPANO LUSO RV FIM –2.06 28.85 1.32 RVN 18.59 18.65 0.14 RVN –0.48 12.84 0.09 RVN 13.54 11.36 0.06 RVN 31.24 19.21 NA 2.25 0.00 0.00 0.00 3.00 0.00 0.01FONDO VALENCIA RENTA VARIABLE FIM –2.05 26.89 0.04 RVN 16.32 17.38 0.05 RVN –0.30 12.70 0.03 RVN 12.12 9.84 0.06 RVN 27.35 17.92 –4.10 1.75 0.00 0.00 0.00 1.00 0.00 0.20FONPASTOR RENTA VARIABLE FIM –3.89 25.49 4.24 RVN 16.09 16.72 0.69 RVN 0.26 13.12 0.44 RVN 13.79 10.31 0.38 RVN 27.28 17.40 NA 1.50 0.00 0.00 0.00 1.00 0.00 0.12FONPENEDES BORSA FIM –4.10 31.72 3.53 RVN 20.90 20.31 0.60 RVN 1.22 13.60 0.87 RVN 12.90 9.66 0.36 RVN 32.49 20.61 –4.03 2.00 0.00 0.00 0.00 0.00 0.00 0.00HSBC SPANISH EQUITIES FIM –8.09 20.82 0.00 RVN 10.04 11.29 0.00 RVN 0.65 8.73 0.00 RVN 8.67 6.74 0.00 RVN 10.63 13.10 –18.66 1.00 9.00 0.00 0.00 0.00 0.00 0.15IBERAGENTES POPULAR AHORRO FIM 1.54 2.33 3.66 RFI 1.65 2.65 3.65 RFI –0.26 2.61 4.01 RFI –0.42 1.90 3.32 RVN 2.51 2.40 13.10 1.50 0.00 0.00 0.00 0.00 0.00 0.10IBERAGENTES POPULAR BOLSA FIM –3.17 28.27 0.00 RVN 15.97 18.19 0.00 RVN –1.18 14.14 0.00 RVN 14.80 11.27 0.00 RVN 27.40 19.10 –18.28 2.25 0.00 0.00 0.00 0.00 0.00 0.10IBERCAJA BOLSA FIM –2.96 32.77 0.01 RVN 19.00 20.95 0.01 RVN –1.16 14.72 0.01 RVN 15.29 12.15 0.01 RVN 31.59 21.67 –22.12 1.50 0.00 0.00 0.00 2.50 0.00 0.20IBERSECURITIES BS BOLSA ACTIVA FIM NA NA NA NA NA NA NA 8.07 0.00 RVN 12.33 7.22 0.01 RVN NA 7.69 NA 2.25 0.00 0.00 0.00 0.00 0.00 0.10ING DIRECT F. NARANJA IBEX 35 FIM –2.19 30.03 0.00 RVN 17.05 19.85 0.00 RVN –1.47 14.81 0.00 RVN 15.61 11.44 0.01 RVN 30.41 20.30 NA 0.99 0.00 0.00 0.00 0.00 0.00 0.10JPM SPAIN RV FIM –2.59 28.47 0.08 RVN 17.40 18.67 0.01 RVN –0.66 14.24 0.03 RVN 15.48 11.00 0.08 RVN 31.20 19.27 –13.94 1.60 0.00 0.00 0.00 0.00 0.00 0.20KUTXAVALOR FIM –2.05 30.57 0.01 RVN 16.60 19.23 0.01 RVN –1.88 14.27 0.01 RVN 15.18 11.43 0.01 RVN 29.08 20.25 –21.99 2.25 0.00 0.00 0.00 2.00 0.00 0.20LIBERTY SPANISH STOCK M. INDEX FIM –2.29 30.71 0.00 RVN 16.37 20.15 0.00 RVN –1.83 15.09 0.00 RVN 15.18 11.60 0.01 RVN 28.57 20.69 NA 2.25 0.00 0.00 0.00 0.00 0.00 0.10LLOYDS BOLSA FIM –2.35 25.81 0.00 RVN 16.84 17.78 0.00 RVN –1.28 13.37 0.00 RVN 13.45 10.38 0.01 RVN 27.77 17.84 –15.20 2.00 0.00 0.00 0.00 1.00 0.00 0.08MADRID BOLSA FIM –2.24 29.89 0.00 RVN 17.34 19.54 0.00 RVN –2.05 14.87 0.00 RVN 15.43 11.64 0.01 RVN 29.71 20.21 –24.62 2.00 0.00 0.00 0.00 2.00 0.00 0.04MADRID BOLSA OPORTUNIDAD
ELECC. FIM NA NA 0.00 RVN 8.21 14.70 0.00 RVN –1.71 14.58 0.00 RVN 14.59 11.37 0.01 RVN NA 13.70 NA 1.25 0.00 0.00 0.00 3.00 0.00 0.04MADRID BOLSA OPORTUNIDAD FIM –2.09 29.48 0.00 RVN 17.51 19.44 0.00 RVN –1.88 14.67 0.00 RVN 15.47 11.48 0.01 RVN 30.36 19.98 –7.27 1.25 0.00 0.00 0.00 4.00 0.00 0.04MARCH VALORES FIM –1.03 19.36 0.01 RVN 13.39 13.28 0.01 RVN 0.39 11.00 0.01 RVN 10.83 8.59 0.01 RVN 24.86 13.68 –8.63 2.25 0.00 0.00 0.00 0.00 0.00 0.20MEDIVALOR R.V. FIM –1.47 28.05 0.01 RVN 17.63 17.53 0.01 RVN 0.31 12.86 0.01 RVN 14.82 10.50 0.01 RVN 33.49 18.52 –16.34 1.35 9.00 0.00 0.00 0.00 0.00 0.08METAVALOR FIM 3.60 22.78 0.00 RVE 11.79 9.61 0.00 RVE 4.26 10.65 0.00 RVE 12.21 6.53 0.00 RVN 35.49 13.82 4.61 2.00 0.00 0.00 0.00 0.00 0.00 0.20MORGAN STANLEY BOLSA FIM –1.95 30.51 0.00 RVN 17.10 20.65 0.00 RVN –1.15 15.02 0.00 RVN 15.65 11.47 0.01 RVN 31.25 20.71 –15.47 2.25 0.00 0.00 0.00 0.00 0.00 0.10PATAGON IBEX 35 FIM –6.83 28.91 0.00 RVN 16.90 20.39 0.00 RVN –1.38 15.23 0.00 RVN 15.30 11.68 0.01 RVN 23.84 20.17 NA 0.99 0.00 0.00 0.00 0.00 0.00 0.10PREMIUM BOLSA FIM NA NA NA NA 2.71 0.00 RVN –0.33 0.13 0.01 RVN 1.58 5.48 0.01 RVN NA 3.65 NA 1.50 0.00 0.00 0.00 2.00 0.00 0.20PRIVANZA BOLSA FIM –2.44 31.76 0.92 RVN 17.29 20.42 0.72 RVN –1.64 15.25 0.65 RVN 15.78 11.74 0.01 RVN 30.30 21.20 –22.64 2.25 0.00 0.00 0.00 3.00 0.00 0.20RENTA 4 BOLSA FIM 0.44 29.87 0.00 RVN 15.80 19.29 0.00 RVN –0.30 14.28 0.00 RVN 12.37 10.37 0.01 RVN 30.31 19.83 –7.49 2.25 0.00 0.00 0.00 0.00 0.00 0.10RENTA 4 IBEX 35 FIM NA NA NA NA 7.64 0.00 RVN 1.01 18.44 0.00 RVN 15.82 12.07 0.01 RVN NA 15.44 NA 0.60 0.00 0.00 0.00 0.00 0.00 0.10RIO TRUEBA RV FIM –4.08 15.04 0.01 RVN 9.92 7.97 0.01 RVN 3.72 7.27 0.01 RVN 9.89 6.19 0.01 RVN 20.17 9.79 –2.31 1.50 0.00 0.00 0.00 0.00 0.00 0.15RURAL INDICE FIM –3.13 26.41 0.00 RVN 21.80 18.37 0.00 RVN 0.16 14.16 0.00 RVN 13.85 10.98 0.01 RVN 34.54 18.46 –19.45 2.25 0.00 0.00 0.00 3.00 0.00 0.20SABADELL ESPAÑA BOLSA FIM –1.91 29.05 0.01 RVN 14.76 18.18 0.01 RVN –1.28 13.96 0.01 RVN 15.05 10.84 0.01 RVN 27.87 19.28 NA 1.75 0.00 0.00 0.00 0.00 0.00 0.10SAFEI BOLSA ACTIVA FIM –4.69 29.02 0.01 RVN 15.88 19.84 0.01 RVN 0.49 15.36 0.01 RVN 14.56 12.35 0.01 RVN 27.15 20.17 –14.51 1.35 9.00 0.00 0.00 0.00 0.00 0.15
(Continues over)
(Continued)

267
Annex 4
: Collective in
vestmen
t schem
es and ven
ture cap
ital com
pan
iesA.4.8.Investment in securities. FIM. Yields, volatility and duration
1Q 2Q 3Q 4Q 2003
Yield Vol Dur Yield Vol Dur Yield Vol Dur Yield Vol Dur Yield Vol(1) (2) Type (1) (2) Type (1) (2) Type (1) (2) Type (1)% % % % %
% fees
Management Front end Back endCustody
of assets of yield Max. Min. Max. Min.
Yieldsince1996
Spanish equity FIM (RVN)
SAFEI BOLSA OPORTUNIDAD FIM –0.73 2.76 0.01 RVIO –0.83 4.24 0.01 RVIO –0.71 0.27 0.01 RVIO 3.69 6.19 0.01 RVN 1.35 3.13 NA 1.35 9.00 0.00 0.00 0.00 0.00 0.15SAFEI FONBOLSA FIM –4.34 29.06 0.01 RVN 17.02 19.57 0.01 RVN –1.42 14.62 0.01 RVN 14.78 11.53 0.01 RVN 26.67 19.86 –32.67 2.25 0.00 0.00 0.00 0.00 0.00 0.15SAN FERNANDO BOLSA FIM –1.21 29.16 0.01 RVN 16.61 18.50 0.01 RVN –1.29 13.76 0.08 RVN 14.68 11.14 0.02 RVN 30.40 19.41 –22.93 2.00 0.00 0.00 0.00 2.50 0.25 0.17SCH ACCIONES ESPAÑOLAS FIM –2.10 28.53 0.00 RVN 15.71 18.75 0.00 RVN –1.68 14.37 0.00 RVN 14.39 11.12 0.01 RVN 27.40 19.35 –23.99 2.25 0.00 0.00 0.00 3.00 0.00 0.20SCH ACCIONES ESPAÑOLAS PLUS FIM –2.53 26.76 0.00 RVN 16.55 19.23 0.00 RVN –1.30 14.45 0.00 RVN 15.38 11.50 0.01 RVN 29.37 18.91 –9.45 1.20 0.00 0.00 0.00 3.00 0.00 0.15SCH INDICE ESPAÑA FIM –2.13 30.42 0.00 RVN 17.02 19.98 0.00 RVN –1.39 14.93 0.00 RVN 15.68 11.66 0.01 RVN 30.66 20.52 –18.13 0.85 0.00 0.00 0.00 1.00 0.00 0.15SCH RENTA VARIABLE ESPAÑOLA 100 FIM –2.45 26.11 0.00 RVN 16.78 16.67 0.00 RVN –0.48 13.03 0.00 RVN 13.47 9.96 0.01 RVN 28.63 17.54 –13.66 1.70 0.00 0.00 0.00 1.00 0.00 0.10SCH TOP 25 ESPAÑA FIM –1.47 26.12 0.01 RVN 16.04 15.82 0.01 RVN –3.56 14.44 0.00 RVN 16.32 11.94 0.01 RVN 28.26 17.96 –19.83 1.50 0.00 0.00 0.00 0.00 0.00 0.07SEGURFONDO RENTA VARIABLE FIM –2.94 23.79 0.01 RVN 13.64 14.65 0.01 RVN 3.05 13.13 0.01 RVN 13.47 10.31 0.01 RVN 28.96 16.29 –26.61 1.25 0.00 0.00 0.00 0.00 0.00 0.20SWISS PATRIMONIO FIM –0.63 4.06 2.62 RFM 3.95 3.23 3.40 RFM –0.12 3.19 3.35 RFM 2.12 2.68 3.48 RVN 5.36 3.34 9.56 1.25 0.00 0.00 0.00 0.00 0.00 0.12UNIFOND RV I FIM 2.40 17.16 0.00 RVN 9.75 10.13 0.61 RVN –1.33 6.75 0.55 RVN 11.54 8.82 0.46 RVN 23.69 11.42 –15.73 1.75 0.00 0.00 0.00 0.00 0.00 0.20UNO–E IBEX 35 FIM –2.14 30.24 0.01 RVN 16.82 19.86 0.01 RVN –1.33 14.80 0.01 RVN 15.57 11.45 0.00 RVN 30.36 20.38 NA 0.40 0.00 0.00 0.00 2.00 0.00 0.10URQUIJO BOLSA FIM –0.06 22.97 0.00 RVN 13.70 14.65 0.00 RVN –1.03 11.57 0.00 RVN 11.21 10.90 0.00 RVN 25.07 15.78 11.88 1.00 9.00 0.00 0.00 0.00 0.00 0.06URQUIJO INDICE FIM –2.53 27.68 0.00 RVN 15.76 18.45 0.00 RVN –1.54 14.18 0.00 RVN 14.52 11.36 0.01 RVN 27.22 18.97 –22.84 2.25 0.00 0.00 0.00 2.00 2.00 0.04
(Continues over)
(Continued)

268
Annual rep
ort o
n th
e securities m
arket. 2003
A.4.8.Investment in securities. FIM. Yields, volatility and duration
1Q 2Q 3Q 4Q 2003
Yield Vol Dur Yield Vol Dur Yield Vol Dur Yield Vol Dur Yield Vol(1) (2) Type (1) (2) Type (1) (2) Type (1) (2) Type (1)% % % % %
% fees
Management Front end Back endCustody
of assets of yield Max. Min. Max. Min.
Yieldsince1996
Foreign fixed-income FIM (RFI)
AC BONOS CORPORATIVOS FIM NA NA NA NA NA NA NA 0.58 0.01 RFI 0.51 0.31 0.44 RFI NA 0.34 NA 0.20 9.00 0.00 0.00 0.00 0.00 0.09AC RENTA FIJA PRIVADA FIM 0.85 1.03 1.67 RFI 0.85 0.72 1.66 RFI 0.54 0.94 1.71 RFI 0.04 0.91 1.66 RFI 2.31 0.91 13.21 1.25 0.00 0.00 0.00 0.00 0.00 0.09AFINA TRADICIONAL FIMF 0.86 0.80 3.34 RFI 1.06 1.21 0.00 RFI –0.48 0.29 0.00 RFI 0.15 0.61 0.00 RFI 1.60 0.81 NA 1.00 0.00 0.00 0.00 0.00 0.00 0.09ATLANTICO DIVISA FIM 0.13 1.48 1.84 RFI 0.61 1.28 1.98 RFI –0.52 2.14 2.60 RFI –1.84 1.85 1.53 RFI –1.62 1.74 13.44 2.00 0.00 0.00 0.00 0.00 0.00 0.20BANCAJA RF INTERNACIONAL FIM –1.37 4.36 5.45 RFI –1.65 4.34 5.62 RFI 0.03 6.08 5.22 RFI –3.82 5.13 5.79 RFI –6.66 5.04 8.52 2.00 0.00 0.00 0.00 1.00 0.00 0.20BANESTO RENTA FIJA U.S.A. FIM –3.51 9.05 3.22 RFI –5.00 10.74 0.10 RFI –1.52 10.61 0.05 RFI –8.99 10.41 0.07 RFI –17.85 10.25 NA 1.65 0.00 0.00 0.00 0.00 0.00 0.10BANIF RF DINAMICA FIMF –1.26 2.57 4.86 RFI –0.24 3.55 6.00 RFI –0.83 2.11 0.00 RFI 1.50 0.84 8.43 RFI –0.83 2.47 5.67 1.00 0.00 0.00 0.00 0.00 0.00 0.20BANKPYME GLOBAL RENT FIM 0.76 1.90 2.50 RFI 1.18 2.69 2.52 RFI 1.00 4.14 2.67 RFI –3.68 4.36 3.43 RFI –0.82 3.46 21.39 0.95 0.00 0.00 0.00 0.15 0.15 0.20BASKEDIVISAS. FIM –1.58 3.27 0.77 RFMI –1.40 3.28 0.73 RFMI –0.68 3.46 0.65 RFI –1.77 2.52 0.66 RFI –5.32 3.15 12.57 1.80 0.00 0.00 0.00 1.00 0.00 0.09BBVA BONOS EMERGENTES FIM 1.03 6.71 3.89 RFI 3.78 3.80 4.10 RFI 1.42 4.25 3.72 RFI 0.39 3.85 3.72 RFI 6.76 4.80 NA 1.65 0.00 0.00 0.00 2.00 0.00 0.15BBVA BONOS INTERNACIONAL FIM –0.40 2.31 3.99 RFI –0.13 2.70 4.31 RFI –0.34 3.05 3.99 RFI –1.72 1.98 3.67 RFI –2.57 2.55 9.27 1.65 0.00 0.00 0.00 2.00 0.00 0.15BBVA BONOS USA FIM –3.60 7.64 3.52 RFI –3.46 9.49 3.11 RFI –2.38 9.71 2.91 RFI –7.86 8.57 2.88 RFI –16.29 8.90 6.58 1.65 0.00 0.00 0.00 2.00 0.00 0.20BBVA DOLAR CASH FIM –4.06 8.90 0.03 RFI –5.33 7.37 0.10 RFI –0.22 9.62 0.15 RFI –7.21 8.11 0.23 RFI –15.91 8.56 6.66 1.00 0.00 0.00 0.00 2.00 0.00 0.10BBVA RENTA LATAM FIM 3.45 2.88 1.89 RFI 2.08 3.36 1.70 RFI 1.60 2.35 0.90 RFI –2.64 4.56 1.75 RFI 4.46 3.42 –13.36 1.65 0.00 0.00 0.00 2.00 0.00 0.15BG EURO YIELD FIM 3.07 2.39 4.47 RFI 4.73 2.20 4.10 RFI 1.98 2.15 4.10 RFI 1.19 1.73 4.24 RFI 11.39 2.15 –6.37 1.80 0.00 0.00 0.00 1.00 0.00 0.20BIPOP PROTECCION FIMF 0.46 0.17 0.01 RFI 0.42 0.14 0.01 RFI 0.22 0.12 0.01 RFI 0.26 0.10 0.01 RFI 1.37 0.14 NA 0.60 9.00 0.00 0.00 0.00 0.00 0.15BIPOP RENDIMIENTO FIMF –0.90 3.40 0.01 RFI 1.01 1.78 0.02 RFI 0.06 0.61 0.01 RFI 0.15 0.43 0.02 RFI 0.30 1.95 NA 1.00 9.00 0.00 0.00 0.00 0.00 0.15BNP PARIBAS BONOS FIM –2.08 6.72 0.86 RFI –2.90 7.47 0.98 RFI –2.23 9.87 1.83 RFI –5.96 6.35 1.53 RFI –12.58 7.74 –13.12 0.50 0.00 0.00 0.00 0.00 0.00 0.00BNP PARIBAS DOLAR FIM –3.18 9.60 1.88 RFI –2.96 9.46 1.78 RFI –2.30 17.77 1.36 RFI –6.07 6.49 1.20 RFI –13.77 11.63 14.49 1.00 0.00 0.00 0.00 0.00 0.00 0.00CAIXA CATALUNYA FONS INTERN. FIM 0.83 2.43 2.19 RFI 1.87 2.27 2.72 RFI 0.18 2.01 2.68 RFI –0.06 1.81 2.01 RFI 2.84 2.15 26.77 2.00 0.00 0.00 0.00 0.00 0.00 0.20CAJA INGENIEROS RF UNIVERSAL FIM –1.06 3.85 1.21 RFI –1.18 2.14 1.53 RFI 0.27 2.39 1.77 RFI –1.19 1.66 1.86 RFI –3.13 2.64 NA 1.75 0.00 0.00 0.00 0.00 0.00 0.20CAM EUROPA BONOS FIM 1.41 2.41 3.17 RFI 1.63 2.33 3.14 RFI 0.13 2.32 3.53 RFI –0.52 2.08 3.50 RFI 2.66 2.29 20.15 1.00 0.00 0.00 0.00 0.00 0.00 0.20CAM HIGH YIELD FIMF 3.12 6.66 0.13 RFI 6.10 2.23 0.00 RFI 1.58 6.30 0.00 RFI 3.54 1.15 0.00 RFI 15.07 4.75 NA 1.75 0.00 0.00 0.00 2.00 2.00 0.10CAM MUNDIAL BONOS FIM 0.64 3.31 3.98 RFI 1.78 2.39 3.94 RFI –0.78 2.76 3.89 RFI –1.08 1.83 4.09 RFI 0.53 2.63 25.34 2.00 0.00 0.00 0.00 2.00 2.00 0.12CANTABRIA RENTA FIJA GLOBAL FIM –0.86 2.39 2.89 RFI –1.19 3.01 3.03 RFI 0.67 4.12 2.68 RFI –3.07 3.38 2.46 RFI –4.40 3.30 NA 1.80 0.00 0.00 0.00 1.00 0.00 0.20CONSULNOR EUROBONO FIM 0.02 3.38 4.08 RFI 0.47 2.93 3.87 RFI –0.55 3.46 3.63 RFI –2.53 3.26 3.59 RFI –2.59 3.27 16.26 1.25 0.00 0.00 0.00 0.00 0.00 0.15DEXIA IBERAG.BONOS ALTO
RENDIM. FIM 2.94 1.18 4.43 RFI 3.95 1.41 4.24 RFI 1.58 1.72 3.80 RFI 2.60 1.33 4.12 RFI 11.52 1.44 NA 2.10 0.00 0.00 0.00 0.00 0.00 0.10EUROVALOR RF INTER. FIM –0.94 3.39 2.15 RFI 0.02 4.59 2.32 RFI –0.24 2.98 2.22 RFI –2.12 2.10 1.84 RFI –3.25 3.39 13.25 2.25 0.00 0.00 0.00 0.00 0.00 0.00FIBANC EUROBOND HY FIM –1.69 3.45 3.46 RFI 4.71 1.95 3.66 RFI 1.50 1.71 3.52 RFI 1.99 1.74 3.68 RFI 6.56 2.37 NA 1.75 0.00 0.00 0.00 0.00 0.00 0.10FIBANC–INT. R.F. FIM 0.25 1.87 2.15 RFI 1.33 1.38 2.25 RFI –0.02 1.84 2.16 RFI –1.82 2.00 2.08 RFI –0.29 1.80 16.26 1.50 0.00 0.00 0.00 0.00 0.00 0.20FONCAIXA 1 RFC DOLAR FIMS –3.49 7.65 0.24 RFI –2.50 8.54 0.53 RFI –2.35 8.94 0.00 RFI –5.60 7.01 0.00 RFI –13.26 8.08 7.87 1.10 0.00 0.00 0.00 4.00 0.00 0.20FONCAIXA 110 CARTERA RFC
DOLAR FIMS NA NA NA NA NA NA NA 9.33 0.00 RFI –5.71 6.99 0.00 RFI NA 8.00 NA 0.30 0.00 0.00 0.00 0.00 0.00 0.20FONCAIXA 111 CARTERA RFL
DOLAR FIMS NA NA NA NA NA NA NA 7.23 0.00 RFI –6.24 5.80 0.00 RFI NA 6.41 NA 0.55 0.00 0.00 0.00 0.00 0.00 0.20FONCAIXA 3 RFL DOLAR FIMS –3.48 7.11 2.52 RFI –1.93 7.15 3.45 RFI –3.16 7.05 0.00 RFI –5.87 5.76 0.00 RFI –13.70 6.80 11.77 1.10 0.00 0.00 0.00 4.00 0.00 0.20FONCAIXA 86 RF INTERNACIONAL FIM 0.27 1.56 1.66 RFI 1.02 2.73 4.05 RFI –0.53 1.34 1.05 RFI –0.06 0.74 1.38 RFI 0.71 1.75 NA 1.50 0.00 0.00 0.00 4.00 0.00 0.15FONCAIXA 87 CESTA RENTA FIJA FIMF 0.46 0.65 0.00 RFI 0.91 1.19 0.00 RFI 0.04 0.69 0.00 RFI 0.14 0.42 0.00 RFI 1.56 0.79 NA 1.50 0.00 0.00 0.00 4.00 0.00 0.15FONCAIXA RF CORTO DOLAR FIMP NA NA NA NA NA NA NA 9.63 0.32 RFI –5.53 7.27 0.30 RFI NA 8.30 NA 0.00 0.00 0.00 0.00 0.00 0.00 0.00FONCAIXA RF LARGO DOLAR FIMP NA NA NA NA NA NA NA 7.47 1.69 RFI –5.79 6.01 1.52 RFI NA 6.64 NA 0.00 0.00 0.00 0.00 0.00 0.00 0.00FONDGALEA FIM 1.48 2.14 2.70 RFI 2.56 1.78 2.95 RFI 0.70 1.91 2.59 RFI 0.24 1.77 2.40 RFI 5.04 1.91 NA 0.50 0.00 0.00 0.00 0.00 0.00 0.15FONPENEDES DOLAR FIM –3.80 8.13 1.15 RFI –5.45 7.92 1.13 RFI 2.08 8.32 1.02 RFI –8.98 12.85 0.97 RFI –15.49 9.58 NA 1.75 0.00 0.00 0.00 0.00 0.00 0.00FONPENEDES MULTIFONS FIX FIMF NA NA NA NA 0.43 0.00 RFI 0.42 0.70 0.00 RFI –0.44 0.69 0.00 RFI NA 0.64 NA 1.00 0.00 0.00 0.00 1.00 0.00 0.05FONSMANLLEU ESTALVI 2 FIM 0.09 0.98 0.45 RFI 0.30 0.55 0.32 RFI 0.24 1.11 0.50 RFI 0.63 0.76 0.45 RFI 1.27 0.88 7.61 1.60 0.00 0.00 0.00 0.00 0.00 0.20HERRERO FONDO INTERNACIONAL FIM 0.76 3.99 5.59 RFI 1.68 4.47 5.30 RFI –3.28 4.17 5.32 RFI –0.95 2.75 5.65 RFI –1.85 3.92 23.80 1.90 0.00 0.00 0.00 0.00 0.00 0.10IBERCAJA HIGH YIELD FIMF 5.98 4.98 3.81 RFI 7.12 3.24 2.90 RFI 2.50 2.88 2.73 RFI 0.91 2.11 2.93 RFI 17.42 3.49 NA 1.90 0.00 0.00 0.00 2.00 0.00 0.20IBERCAJA INTERNACIONAL FIM –1.38 5.78 3.56 RFI –0.78 5.01 3.91 RFI 0.02 5.54 4.11 RFI –2.86 4.19 4.06 RFI –4.93 5.17 4.24 1.80 0.00 0.00 0.00 2.00 0.00 0.20IBERCAJA SELECCION RENTA FIJA FIMF 0.23 0.35 0.01 RFI 0.64 0.60 0.01 RFI 0.35 0.94 0.01 RFI –0.03 0.66 0.00 RFI 1.20 0.67 8.23 1.25 0.00 0.00 0.00 2.00 0.00 0.20INTERDIN FONDO DE SOBERANOS FIM NA NA 0.00 RFI 0.50 0.24 0.00 RFI 0.31 1.14 0.02 RFI 0.31 1.29 0.02 RFI NA 0.14 NA 0.50 6.00 0.00 0.00 0.00 0.00 0.10
(Continues over)
(Continued)

269
Annex 4
: Collective in
vestmen
t schem
es and ven
ture cap
ital com
pan
iesA.4.8.Investment in securities. FIM. Yields, volatility and duration
1Q 2Q 3Q 4Q 2003
Yield Vol Dur Yield Vol Dur Yield Vol Dur Yield Vol Dur Yield Vol(1) (2) Type (1) (2) Type (1) (2) Type (1) (2) Type (1)% % % % %
% fees
Management Front end Back endCustody
of assets of yield Max. Min. Max. Min.
Yieldsince1996
Foreign fixed-income FIM (RFI)
KUTXAINVER2 FIM 0.12 2.63 3.03 RFI 2.68 2.21 3.79 RFI 0.92 3.39 3.94 RFI –0.88 2.87 2.21 RFI 2.83 2.82 NA 2.25 0.00 0.00 0.00 2.00 0.00 0.20MADRID BONOS INTERNACIONAL FIM –0.72 8.87 3.13 RFI 2.02 7.30 3.47 RFI 0.52 7.66 0.00 RFI –2.76 7.59 3.10 RFI –1.01 7.88 19.69 1.40 0.00 0.00 0.00 1.00 0.00 0.09MADRID DOLAR FIM –2.90 9.76 1.46 RFI –3.93 8.43 0.75 RFI –2.19 7.96 0.00 RFI –5.93 6.10 0.39 RFI –14.17 8.16 NA 0.75 0.00 0.00 0.00 0.00 0.00 0.06MADRID RENT FIJA FIM –1.43 5.97 2.57 RFI –1.70 5.79 2.32 RFI –1.27 5.87 0.00 RFI –4.82 5.10 1.75 RFI –8.95 5.70 –2.56 1.60 0.00 0.00 0.00 1.00 0.00 0.08MADRID TRIPLE B FIM 1.67 2.26 3.10 RFI 2.27 2.15 2.95 RFI 0.46 2.53 0.00 RFI –0.37 1.70 3.44 RFI 4.08 2.19 NA 1.50 0.00 0.00 0.00 2.00 0.00 0.11MERCHRENTA FIM 0.31 1.33 1.20 RFI 0.47 1.35 1.31 RFI –0.12 1.54 1.17 RFI –2.12 2.05 1.23 RFI –1.48 1.61 16.40 1.50 0.00 0.00 0.00 0.00 0.00 0.13MORGAN STANLEY DIVISA FIM –0.48 2.38 0.36 RFI 0.31 3.19 0.35 RFI –1.13 6.22 0.35 RFI –2.12 3.97 0.25 RFI –3.40 4.21 20.45 1.50 0.00 0.00 0.00 0.00 0.00 0.10MUTUAFONDO HIGH YIELD FIMF 3.83 3.08 0.00 RFI 5.37 3.35 0.00 RFI 1.94 3.09 0.00 RFI 4.64 2.37 0.00 RFI 16.70 3.01 26.20 0.30 0.00 0.00 0.00 0.00 0.00 0.02RENTA INTERNACIONAL FIM –1.96 3.48 3.23 RFI –1.51 4.44 2.82 RFI 0.76 5.20 2.49 RFI –3.00 3.85 2.68 RFI –5.62 4.31 8.26 1.50 0.00 0.00 0.00 0.00 0.00 0.20RENTACASER FIM 1.12 0.91 1.93 RFI 1.15 0.66 2.10 RFI 0.64 1.04 1.83 RFI 0.31 1.14 1.99 RFI 3.27 0.96 16.71 0.50 0.00 0.00 0.00 0.00 0.00 0.08RURAL RENTA FIJA INTERNACIONAL FIM–3.63 8.38 0.58 RFI –2.84 6.62 0.23 RFI –2.26 6.91 0.09 RFI –3.52 5.67 0.46 RFI –11.71 6.96 NA 1.75 0.00 0.00 0.00 0.00 0.00 0.05SABADELL BS DOLAR FIJO FIM 0.78 4.77 3.45 RFI 1.30 6.77 3.92 RFI –5.66 8.02 3.88 RFI –1.34 4.76 4.47 RFI –4.99 6.27 34.40 1.65 0.00 0.00 0.00 0.00 0.00 0.20SCH DOLAR FIM –2.33 10.51 0.02 RFI –5.00 10.46 0.10 RFI –1.42 10.33 0.07 RFI –7.58 9.63 0.07 RFI –15.46 10.25 NA 1.70 0.00 0.00 0.00 3.00 0.00 0.10SCH RENTA FIJA ACTIVA FIM –0.50 2.53 4.50 RFI 0.85 0.63 1.47 RFI 0.76 0.57 1.92 RFI 0.61 0.68 1.56 RFI 1.72 1.37 16.55 1.50 0.00 0.00 0.00 3.00 0.00 0.10SEGURFONDO ACTIVO DIVISA FIM –0.98 3.02 0.63 RFI –1.52 3.60 0.79 RFI 0.71 4.80 0.84 RFI –3.38 3.90 0.73 RFI –5.12 3.90 12.63 0.75 0.00 0.00 0.00 0.00 0.00 0.15SEGURFONDO DIVISAS FIM –0.86 3.66 3.00 RFI –0.67 3.74 3.29 RFI 0.25 5.40 3.63 RFI –3.66 4.65 3.26 RFI –4.89 4.44 14.30 1.00 0.00 0.00 0.00 0.00 0.00 0.15SEGURFONDO HIGH YIELD FIMF 3.80 2.22 0.00 RFI 5.74 3.05 0.01 RFI 1.81 3.23 0.01 RFI 4.51 2.46 0.00 RFI 16.78 2.79 NA 0.90 0.00 0.00 0.00 0.00 0.00 0.10UNIFOND MONETARIO DINAMICO FIMF NA NA NA NA NA NA NA 0.38 0.00 RFI 0.53 0.33 0.00 RFI NA 0.35 NA 0.60 0.00 0.00 0.00 0.50 0.00 0.05UNIFOND RENTA FIJA GLOBAL FIMF –0.49 2.24 0.00 RFI 1.69 1.40 7.46 RFI –0.85 1.79 6.17 RFI 0.50 1.01 0.81 RFI 0.83 1.68 NA 1.20 0.00 0.00 0.00 0.00 0.00 0.19
(Continues over)
(Continued)

270
Annual rep
ort o
n th
e securities m
arket. 2003
A.4.8.Investment in securities. FIM. Yields, volatility and duration
1Q 2Q 3Q 4Q 2003
Yield Vol Dur Yield Vol Dur Yield Vol Dur Yield Vol Dur Yield Vol(1) (2) Type (1) (2) Type (1) (2) Type (1) (2) Type (1)% % % % %
% fees
Management Front end Back endCustody
of assets of yield Max. Min. Max. Min.
Yieldsince1996
Foreign mixed fixed-income FIM(RFMI)
ABANTE VALOR FIMF –1.29 4.76 0.00 RFMI 3.60 3.71 0.00 RFMI 1.49 3.69 0.00 RFMI 1.29 3.03 0.00 RFMI 5.13 3.86 NA 1.25 0.00 0.00 0.00 0.00 0.00 0.10ABF MONEY PLUS FIMF 0.35 0.85 0.39 RFMI 1.21 1.09 0.17 RFMI 0.29 1.06 0.00 RFMI 0.29 0.81 0.65 RFMI 2.16 0.97 19.43 0.75 0.00 0.00 0.00 0.00 0.00 0.10AC MULTIESTRELLAS SELECCION
20 FIMF –0.67 3.47 0.00 RFMI 3.69 3.14 0.00 RFMI 0.33 3.80 0.00 RFMI 0.26 2.56 0.00 RFMI 3.61 3.29 NA 1.10 0.00 0.00 0.00 1.00 0.00 0.11ALLIANZ CONSERVADOR GLOBAL FIMF 0.53 1.63 0.00 RFMI –0.01 0.51 0.00 RFMI –1.21 2.48 0.00 RFMI 1.19 2.29 0.01 RFMI 0.48 1.90 NA 0.00 0.00 0.00 0.00 1.00 0.00 0.14ALMAGRO DIVISAS FIM –1.41 5.78 0.75 RFMI 2.74 3.31 0.72 RFMI –1.64 3.30 1.62 RFMI –0.90 3.69 1.33 RFMI –1.27 4.16 1.77 2.25 0.00 0.00 0.00 0.00 0.00 0.20APPLE FOND FIM 0.58 6.03 0.71 RFMI 2.48 4.16 1.13 RFMI –0.30 4.81 0.82 RFMI –0.33 4.06 1.14 RFMI 2.42 4.83 NA 1.35 0.00 0.00 0.00 0.00 0.00 0.15ASC PATRIMONI FIM 0.74 0.51 0.84 RFMI 0.50 0.74 0.06 RFMI 0.62 0.60 0.04 RFMI 0.85 0.74 0.02 RFMI 2.74 0.66 8.28 0.70 0.00 0.00 0.00 0.00 0.00 0.10BANESTO GESTION GLOBAL FIM –0.59 3.19 0.05 RFMI 0.31 1.53 0.08 RFMI 0.43 1.18 0.02 RFMI 0.71 0.96 0.04 RFMI 0.86 1.92 NA 1.65 0.00 0.00 0.00 5.00 0.00 0.10BANKPYME GEST.CARTERA
MODERADA FIMF –2.33 7.53 0.00 RFMI 7.61 5.49 0.00 RFMI 1.97 4.35 0.00 RFMI 1.13 3.50 0.00 RFMI 8.37 5.47 NA 0.00 0.00 0.00 0.00 0.00 0.00 0.20BBVA BONOS SELECCION FIM 2.04 3.80 4.44 RFMI 6.54 3.66 4.87 RFMI 1.12 3.25 4.56 RFMI 1.87 3.49 4.25 RFMI 12.00 3.58 –20.56 2.00 0.00 0.00 0.00 2.00 0.00 0.20BBVA MIXTO 25 FIM –0.01 1.21 1.46 RFMI 0.96 1.00 1.33 RFMI 0.01 0.90 0.90 RFMI 0.38 0.89 0.91 RFMI 1.34 1.01 0.89 2.00 0.00 0.00 0.00 2.00 0.00 0.20BBVA SOLIDARIDAD FIM –1.28 3.78 2.19 RFMI 2.86 2.84 2.11 RFMI 0.16 2.72 2.48 RFMI 1.63 1.96 2.04 RFMI 3.36 2.91 NA 1.70 0.00 0.00 0.00 1.00 0.00 0.05BENKERS AHORRO FIMF 0.39 0.27 0.26 RFMI 0.16 0.25 0.14 RFMI 0.39 0.27 0.06 RFMI 0.33 0.36 0.01 RFMI 1.28 0.29 NA 1.35 9.00 0.00 0.00 0.00 0.00 0.10BI CONVERTIBLES INTERNACIONAL FIM –0.16 3.17 3.93 RFMI 4.24 3.21 3.60 RFMI 0.57 2.99 3.33 RFMI –2.40 3.47 2.43 RFMI 2.16 3.25 3.17 2.00 0.00 0.00 0.00 2.00 0.00 0.00BIPOP EQUILIBRADO FIMF –1.34 5.56 0.00 RFMI –0.44 4.71 0.00 RFMI 1.12 5.73 0.00 RFMI –1.45 4.92 0.00 RFMI –2.11 5.25 NA 1.10 9.00 0.00 0.00 0.00 0.00 0.15BNP P.CONSERV.ASSET ALLOCATION
FIMF –0.09 2.61 0.05 RFMI 5.52 4.98 0.10 RFMI –0.22 4.13 1.33 RFMI 3.54 6.35 4.86 RFMI 8.92 4.75 NA 1.25 0.00 0.00 0.00 0.25 0.00 0.00BNP PARIBAS GESTION ACTIVA FIMF –0.88 2.19 0.19 RFMI 3.04 2.01 0.20 RFMI 0.27 1.40 1.40 RFMI 0.82 2.38 0.00 RFMI 3.25 2.05 NA 0.85 9.00 0.00 0.00 0.00 0.00 0.00BNP PARIBAS SELECCION FIMF 0.15 5.53 0.30 RFMI 4.38 4.52 0.60 RFMI 0.49 4.43 4.60 RFMI 2.51 4.74 0.00 RFMI 7.68 4.83 –30.71 1.00 9.00 0.00 0.00 0.00 0.00 0.00CAIXA CAT. SELECCIO ACTIVA 25 FIMF –1.75 4.42 0.00 RFMI 4.36 5.02 0.00 RFMI 0.19 3.46 0.00 RFMI 1.54 2.62 0.01 RFMI 4.31 4.01 NA 1.45 0.00 0.00 0.00 0.00 0.00 0.05CAN GESTION 15 FIM 0.26 4.40 0.44 RFMI 2.39 2.78 0.32 RFMI 0.02 2.40 0.31 RFMI 2.17 1.63 0.48 RFMI 4.89 2.98 NA 1.20 0.00 0.00 0.00 0.00 0.00 0.05CRV FONRENTA FIM –2.29 5.35 3.10 RFMI 4.14 4.70 3.21 RFMI 0.22 4.26 3.06 RFMI 2.68 3.26 2.91 RFMI 4.71 4.48 –0.44 1.50 0.00 0.00 0.00 0.20 0.00 0.13DALMATIAN FIM –0.51 7.39 0.57 RFMI 5.56 5.88 0.75 RFMI 2.00 5.40 0.38 RFMI 4.17 3.87 0.50 RFMI 11.59 5.78 NA 1.00 0.00 0.00 0.00 0.00 0.00 0.10DWS SELECTED FUNDS 25 FIMF –2.24 5.29 0.00 RFMI 4.02 4.17 0.00 RFMI 0.69 4.52 0.00 RFMI 0.06 4.00 0.01 RFMI 2.44 4.54 NA 1.50 0.00 0.00 0.00 0.00 0.00 0.10EL MONTE FONDO SOLIDARIO FIM –1.03 4.26 1.13 RFMI 3.45 3.00 1.03 RFMI 0.54 3.01 1.35 RFMI 2.36 2.65 1.34 RFMI 5.37 3.30 NA 1.75 0.00 0.00 0.00 1.00 0.00 0.13EUROVALOR SELECCION TOP–15 FIMF –0.71 2.31 0.00 RFMI 0.92 3.24 0.00 RFMI 1.06 1.35 0.00 RFMI 1.79 1.27 0.01 RFMI 3.09 2.20 NA 1.60 0.00 0.00 0.00 0.00 0.00 0.00EUROVALOR SELECCION TOP–30 FIMF –0.41 5.25 0.00 RFMI 2.74 5.64 0.00 RFMI 1.44 3.24 0.00 RFMI 2.84 2.49 0.01 RFMI 6.74 4.36 NA 1.80 0.00 0.00 0.00 0.00 0.00 0.00FONBILBAO GLOBAL 10 FIM –0.02 2.68 3.44 RFMI 2.85 2.74 3.47 RFMI –0.03 3.24 3.42 RFMI 0.89 2.19 3.32 RFMI 3.71 2.75 NA 1.75 0.00 0.00 0.00 0.00 0.00 0.13FONBILBAO GLOBAL 30 FIM –1.80 5.47 3.84 RFMI 4.93 4.67 4.10 RFMI 0.19 4.75 3.99 RFMI 1.70 3.66 3.83 RFMI 5.00 4.71 NA 1.75 0.00 0.00 0.00 0.00 0.00 0.13FONCAIXA 25 RFM INTERNACIONAL
FIMS 0.34 1.13 0.00 RFMI 1.01 1.88 0.00 RFMI –0.91 1.23 0.00 RFMI 1.00 1.21 0.00 RFMI 1.44 1.41 5.82 2.00 0.00 0.00 0.00 4.00 0.00 0.00FONCAIXA 26 RFM INTERNACIONAL
FIMS 0.48 1.07 0.00 RFMI 1.07 1.89 0.00 RFMI –0.85 1.23 0.00 RFMI 1.05 1.21 0.00 RFMI 1.75 1.39 5.00 1.75 0.00 0.00 0.00 4.00 0.00 0.00FONCAIXA 28 RFM INTERNACIONAL
FIMS 0.17 1.08 0.00 RFMI 1.02 1.88 0.00 RFMI –0.90 1.23 0.00 RFMI 1.00 1.21 0.00 RFMI 1.28 1.39 5.97 1.85 0.00 0.00 0.00 4.00 0.00 0.12FONCAIXA 48 PATRIMONIO RFMI FIMS 0.61 1.06 0.00 RFMI 1.22 1.89 0.00 RFMI –0.69 1.23 0.00 RFMI 1.21 1.21 0.00 RFMI 2.36 1.39 11.84 1.00 0.00 0.00 0.00 0.00 0.00 0.13FONCAIXA 58 RFM INTERNACIONAL
FIMS 0.55 1.04 0.00 RFMI 1.12 1.74 0.00 RFMI –0.66 1.13 0.00 RFMI 1.06 1.11 0.00 RFMI 2.08 1.29 NA 1.00 9.00 0.00 0.00 4.00 0.00 0.20FONCAIXA 88 CESTA MIXTA 25RV FIMF 0.48 1.08 0.00 RFMI 1.26 1.97 0.00 RFMI –0.71 1.41 0.00 RFMI 1.74 1.83 0.00 RFMI 2.79 1.62 NA 1.50 0.00 0.00 0.00 4.00 0.00 0.15FONCAIXA PATRIMONIO 16 FIM 0.51 1.02 1.96 RFMI 1.27 1.99 3.29 RFMI –0.69 1.26 1.49 RFMI 1.36 1.24 1.61 RFMI 2.46 1.43 13.32 0.75 0.00 0.00 0.00 0.00 0.00 0.13FONCAIXA PATRIMONIO 35 FIM 0.44 1.04 2.06 RFMI 1.26 2.00 3.25 RFMI –0.76 1.28 1.54 RFMI 1.29 1.25 1.71 RFMI 2.23 1.45 10.20 1.00 0.00 0.00 0.00 0.00 0.00 0.16FONCAIXA PATRIMONIO 39 FIM 0.70 1.10 1.71 RFMI 1.20 2.01 3.00 RFMI –0.73 1.27 1.25 RFMI 1.31 1.24 1.33 RFMI 2.49 1.46 13.45 0.75 0.00 0.00 0.00 0.00 0.00 0.13FONCAIXA RFM INTERNACIONAL FIMP NA 1.57 2.13 RFMI 1.56 1.98 3.06 RFMI –0.46 1.29 1.53 RFMI 1.56 1.27 1.77 RFMI NA 1.56 NA 0.00 0.00 0.00 0.00 0.00 0.00 0.00FONDITEL RF MIXTA INTERNACIONAL
FIM NA NA NA NA NA NA NA 2.38 1.66 RFMI 3.48 1.95 1.81 RFMI NA 2.17 NA 1.50 0.00 0.00 0.00 0.00 0.00 0.12FONDO ARTAC FIM –1.05 4.02 2.63 RFMI 3.69 2.71 2.26 RFMI –0.16 3.21 1.90 RFMI 3.17 2.75 1.46 RFMI 5.68 3.24 NA 0.30 6.00 0.00 0.00 3.00 0.00 0.10FONDO BONOS FIM 1.73 4.28 4.31 RFMI 2.25 4.47 4.20 RFMI –0.31 4.55 4.71 RFMI –0.46 3.61 4.62 RFMI 3.23 4.25 24.58 0.35 0.00 0.00 0.00 0.00 0.00 0.10FONDO MUTUALFASA 1 FIM 1.02 1.71 1.99 RFMI 1.14 1.11 1.51 RFMI 0.12 1.28 1.48 RFMI 0.47 0.87 0.80 RFMI 2.77 1.28 –1.70 0.40 0.00 0.00 0.00 0.00 0.00 0.14
(Continues over)
(Continued)

271
Annex 4
: Collective in
vestmen
t schem
es and ven
ture cap
ital com
pan
iesA.4.8.Investment in securities. FIM. Yields, volatility and duration
1Q 2Q 3Q 4Q 2003
Yield Vol Dur Yield Vol Dur Yield Vol Dur Yield Vol Dur Yield Vol(1) (2) Type (1) (2) Type (1) (2) Type (1) (2) Type (1)% % % % %
% fees
Management Front end Back endCustody
of assets of yield Max. Min. Max. Min.
Yieldsince1996
Foreign mixed fixed-income FIM(RFMI)
FONDUERO MIXTO FIM –1.21 3.78 2.21 RFMI 3.42 3.81 1.93 RFMI –0.62 3.59 1.93 RFMI 2.90 3.04 1.97 RFMI 4.48 3.59 6.32 2.00 0.00 0.00 0.00 0.00 0.00 0.10FONEMPORIUM FIM –1.41 6.96 1.84 RFMI 4.61 4.81 6.51 RFMI 0.28 4.16 2.41 RFMI 3.11 3.09 2.24 RFMI 6.64 4.97 3.70 0.61 0.00 0.00 0.00 0.00 0.00 0.08FONENGIN FIM –1.25 4.79 1.86 RFMI 2.73 3.46 1.86 RFMI 0.32 3.42 1.77 RFMI 0.72 2.67 1.83 RFMI 2.49 3.67 –0.34 1.50 0.00 0.00 0.00 1.00 0.00 0.20FONMASTER 1 FIMF 0.76 1.81 2.21 RFMI 2.76 2.03 1.50 RFMI –0.07 1.45 1.37 RFMI –0.61 1.63 1.42 RFMI 2.83 1.76 2.30 0.50 0.00 0.00 0.00 0.00 0.00 0.17FONPENEDES EUROEME. FIM –4.39 5.92 1.13 RFMI 4.84 6.53 0.91 RFMI 4.13 4.94 0.70 RFMI –0.36 3.80 0.60 RFMI 4.00 5.45 NA 2.25 0.00 0.00 0.00 0.00 0.00 0.00HSBC RENTA MIXTA FIM –2.98 8.33 0.51 RFMI 4.42 5.23 0.00 RFMI 0.22 4.06 0.65 RFMI 3.50 4.45 0.72 RFMI 5.09 5.78 1.12 1.00 9.00 0.00 0.00 0.00 0.00 0.10IBERCAJA RENTA INTERNACIONAL FIM –3.38 8.72 1.50 RFMI 2.21 6.68 1.30 RFMI –0.36 6.85 1.10 RFMI –0.28 5.25 0.86 RFMI –1.87 6.99 NA 1.70 0.00 0.00 0.00 2.00 0.00 0.20IBERCAJA SELECCION RENTA 2 FIMF 0.25 5.92 0.00 RFMI 5.32 5.70 0.00 RFMI 1.40 5.39 0.01 RFMI 2.72 4.21 0.01 RFMI 9.97 5.36 NA 1.70 0.00 0.00 0.00 2.00 0.00 0.20INDOSUEZ GLOBAL FIM 0.13 1.35 0.36 RFMI 1.04 0.74 0.28 RFMI 0.26 0.59 0.24 RFMI 0.26 0.50 0.33 RFMI 1.70 0.86 0.75 2.00 0.00 0.00 0.00 0.00 0.00 0.15INDOSUEZ RENDIM.. FIM –0.41 2.68 0.15 RFMI 2.53 1.80 0.20 RFMI 0.82 1.19 0.15 RFMI 0.66 0.95 0.20 RFMI 3.63 1.79 NA 1.10 0.00 0.00 0.00 0.00 0.00 0.10INVERBONOS FIM –1.63 4.66 2.14 RFMI 3.96 4.59 1.89 RFMI –0.62 4.14 1.90 RFMI 3.54 3.55 1.80 RFMI 5.23 4.28 –5.61 1.50 0.00 0.00 0.00 0.00 0.00 0.19INVERSABADELL 10 FIM –2.11 6.29 3.96 RFM 5.88 4.57 4.11 RFM –0.69 3.83 2.64 RFM 2.86 2.96 1.79 RFMI 5.87 4.61 NA 1.75 0.00 0.00 0.00 0.00 0.00 0.10INVERSABADELL 25 FIMS –3.92 5.69 0.01 RFMI 3.63 3.95 0.01 RFMI –0.61 4.55 0.01 RFMI 3.01 3.64 0.01 RFMI 1.94 4.56 –3.28 1.90 0.00 0.00 0.00 0.00 0.00 0.10INVERTECNOCREDIT FIMS –3.93 5.68 0.01 RFMI 3.66 3.95 0.01 RFMI –0.58 4.56 0.01 RFMI 3.05 3.64 0.01 RFMI 2.04 4.56 –2.74 1.70 0.00 0.00 0.00 0.00 0.00 0.10KUTXAMIXTO 2 FIM –2.10 7.66 1.57 RFMI 5.11 4.96 1.61 RFMI –0.10 3.78 1.40 RFMI 2.06 2.95 1.50 RFMI 4.91 5.17 NA 2.05 0.00 0.00 0.00 2.00 0.00 0.17MADRID CRECIM. DINAMICO ELECC. FIMF NA NA 0.00 RFMI 0.41 0.27 0.00 RFMI 0.21 0.19 0.00 RFMI 0.21 0.24 0.01 RFMI NA 0.24 NA 0.20 0.00 0.00 0.00 3.00 0.00 0.00MADRID CRECIMIENTO DINAMICO FIMF NA 0.40 0.00 RFMI 0.48 0.25 0.00 RFMI 0.23 0.19 0.00 RFMI 0.23 0.24 0.01 RFMI NA 0.25 NA 0.20 0.00 0.00 0.00 1.00 0.00 0.00MADRID GESTION ACTIVA 25 FIMF –1.46 5.66 0.00 RFMI 3.62 4.13 0.00 RFMI 0.77 4.50 0.00 RFMI 0.78 3.27 0.01 RFMI 3.70 4.48 NA 1.75 0.00 0.00 0.00 4.00 0.00 0.00MARCH PREMIER 70/30 FIM –0.78 2.86 2.19 RFMI 3.01 2.84 1.76 RFMI 0.38 3.28 1.31 RFMI 2.84 2.58 1.29 RFMI 5.50 2.92 NA 1.00 0.00 0.00 0.00 0.00 0.00 0.10MERCH–FONTEMAR FIM –0.88 7.44 0.24 RFMI 4.87 6.05 0.22 RFMI 1.29 6.86 0.18 RFMI 1.51 5.69 0.16 RFMI 6.88 6.56 21.16 1.50 0.00 0.00 0.00 0.00 0.00 0.16MORGAN STANLEY F. CONSERVADOR FIMF –3.24 7.34 0.00 RFMI 3.73 5.49 0.00 RFMI 1.06 4.82 0.00 RFMI 1.81 3.90 0.00 RFMI 3.27 5.55 NA 1.01 0.00 0.00 0.00 0.00 0.00 0.15MORGAN STANLEY FIVA FIM –3.74 8.21 1.11 RFM 5.42 6.24 1.03 RFM –0.08 5.01 0.90 RFM 3.34 3.68 1.34 RFMI 4.78 6.05 1.61 2.25 0.00 0.00 0.00 0.00 0.00 0.08MORGAN STANLEY FONDO ETICO FIM –3.52 8.96 1.29 RFMI 4.75 6.32 1.11 RFMI 0.54 4.65 1.39 RFMI 2.89 3.64 1.26 RFMI 4.55 6.24 NA 1.75 0.00 0.00 0.00 0.00 0.00 0.10MS MULTIGESTION CONSERVADOR FIMF –0.24 659.38 0.00 RFMI 3.20 4.88 0.00 RFMI 0.21 4.82 0.00 RFMI 1.82 3.79 0.00 RFMI 5.06 327.45 NA 0.00 0.00 0.00 0.00 0.00 0.00 0.10MUTUAFONDO GESTION BONOS FIMF 0.38 2.72 0.00 RFMI 3.22 3.23 0.01 RFMI 2.11 3.96 0.00 RFMI 1.74 2.81 0.00 RFMI 7.64 3.23 NA 1.00 0.00 0.00 0.00 0.00 0.00 0.02NUCLEFON FIM 0.74 0.11 0.84 RFMI 0.73 0.12 0.59 RFMI 1.38 1.12 0.59 RFMI 0.53 0.22 0.42 RFMI 3.43 0.58 NA 0.90 0.00 0.00 0.00 0.00 0.00 0.10OPEN FUND FIM –0.44 7.55 1.34 RFMI 4.22 4.36 1.02 RFMI 0.12 2.98 1.09 RFMI 2.89 2.65 0.00 RFMI 6.88 4.79 –0.77 0.90 0.00 5.00 5.00 1.00 0.00 0.10PERFILADO CONSERVADOR FIMFP –3.27 7.40 0.00 RFMI 3.58 5.49 0.00 RFMI 1.14 4.83 0.00 RFMI 1.47 4.14 0.01 RFMI 2.82 5.61 NA 0.00 0.00 0.00 0.00 0.00 0.00 0.10PLUSMADRID INTERN. 15
ELECCION FIM NA NA 0.00 RFMI 1.28 1.63 0.00 RFMI –0.11 1.80 0.00 RFMI 0.74 1.21 0.01 RFMI NA 1.57 NA 1.50 0.00 0.00 0.00 3.00 0.00 0.08PLUSMADRID INTERNACIONAL 15 FIM 0.89 0.93 1.77 RFMI 1.75 1.60 2.12 RFMI –0.19 2.28 0.00 RFMI –0.10 1.53 2.12 RFMI 2.36 1.67 NA 1.50 0.00 0.00 0.00 1.00 0.00 0.08PREMIUM CRECIMIENTO ACTIVO FIM NA NA NA NA NA NA NA NA NA NA 0.94 0.07 RFMI NA 0.94 NA 0.90 0.00 0.00 0.00 0.00 0.00 0.10RENTA 4 TES–BOL FIM 0.67 0.96 0.24 RFM 0.52 0.74 0.21 RFMI 0.28 0.73 0.33 RFMI 0.57 0.42 1.08 RFMI 2.05 0.74 10.76 1.00 0.00 0.00 0.00 0.00 0.00 0.16RURAL CESTA CONSERVADORA 20 FIMF –2.18 4.02 0.00 RFMI 4.81 3.30 0.00 RFMI –0.17 3.08 0.00 RFMI 2.53 2.30 0.01 RFMI 4.94 3.28 NA 0.00 0.00 0.00 0.00 2.00 0.00 0.10RURAL GES. DINAMICA FIMF 0.18 0.76 0.37 RFMI 1.00 1.01 0.17 RFMI 0.12 0.95 0.00 RFMI 0.20 0.82 0.01 RFMI 1.51 0.90 NA 1.50 0.00 0.00 0.00 0.00 0.00 0.10RURAL MIXTO INTERNACIONAL 25 FIM –1.44 4.86 1.53 RFMI 2.95 3.02 1.54 RFMI 0.24 2.78 1.44 RFMI 1.90 2.32 1.49 RFMI 3.64 3.39 –3.10 1.50 0.00 0.00 0.00 0.75 0.00 0.00SABADELL BS MIX 25 FIMP –3.66 5.91 5.66 RFMI 4.30 4.12 5.20 RFMI –0.14 4.76 5.50 RFMI 3.68 3.82 5.85 RFMI 4.04 4.76 NA 0.00 0.00 0.00 0.00 0.00 0.00 0.10SAFEI GLOBAL RENTA FIMF –2.00 5.27 0.20 RFMI 2.01 3.25 0.29 RFMI 0.57 3.32 0.33 RFMI 0.63 2.85 0.25 RFMI 1.18 3.80 NA 1.50 0.00 0.00 0.00 0.00 0.00 0.15SEGUNDA GENERACION RENTA FIM 0.11 1.81 0.62 RFMI 2.54 1.65 0.57 RFMI 0.29 1.50 0.60 RFMI 2.40 1.67 0.59 RFMI 5.42 1.68 10.96 0.80 5.00 0.00 0.00 0.00 0.00 0.07SOLIDARIO PROUNICEF FIM –0.73 5.06 3.67 RFMI 2.27 3.88 3.92 RFMI –0.20 4.21 0.00 RFMI 0.32 2.92 3.52 RFMI 1.65 4.09 NA 1.75 0.00 0.00 0.00 1.00 0.00 0.08TARRAGONAFONS SELEC 25 FIMF –1.76 3.32 0.01 RFMI 3.18 3.09 0.01 RFMI 0.73 2.96 0.02 RFMI 1.79 2.34 0.19 RFMI 3.94 2.97 NA 1.45 0.00 0.00 0.00 0.00 0.00 0.20VITAL DIVISA FIM –2.51 6.35 1.75 RFMI 3.49 4.24 1.74 RFMI 0.53 3.67 1.23 RFMI 2.18 3.15 1.12 RFMI 3.64 4.53 –4.44 2.00 0.00 0.00 0.00 4.00 4.00 0.27ZARAGOZANO DEUDA MIXTA
GLOBAL FIM 0.40 4.30 0.14 RFMI 2.96 5.07 0.11 RFMI –0.23 4.86 0.21 RFMI 1.76 3.68 0.07 RFMI 4.95 4.52 10.81 1.40 0.00 0.00 0.00 0.50 0.00 0.20
(Continues over)
(Continued)

272
Annual rep
ort o
n th
e securities m
arket. 2003
A.4.8.Investment in securities. FIM. Yields, volatility and duration
1Q 2Q 3Q 4Q 2003
Yield Vol Dur Yield Vol Dur Yield Vol Dur Yield Vol Dur Yield Vol(1) (2) Type (1) (2) Type (1) (2) Type (1) (2) Type (1)% % % % %
% fees
Management Front end Back endCustody
of assets of yield Max. Min. Max. Min.
Yieldsince1996
Foreign mixed equity FIM(RVMI)
ABANTE SELECCION FIMF –5.30 11.72 0.00 RVMI 7.41 9.51 0.00 RVMI 2.64 9.18 0.00 RVMI 2.99 7.39 0.00 RVMI 7.53 9.61 NA 1.25 0.00 0.00 0.00 0.00 0.00 0.10AC MULTIESTRELLAS SELECCION 35 FIMF –2.15 7.22 0.00 RVMI 5.14 5.45 0.00 RVMI 0.99 5.72 0.00 RVMI 1.02 4.40 0.00 RVMI 4.96 5.80 NA 1.15 0.00 0.00 0.00 1.00 0.00 0.11AC MULTIESTRELLAS SELECCION 50 FIMF –3.66 11.14 0.00 RVMI 6.51 8.13 0.00 RVMI 1.63 7.99 0.00 RVMI 1.81 6.55 0.00 RVMI 6.18 8.63 NA 1.20 0.00 0.00 0.00 1.00 0.00 0.11AC MULTIESTRELLAS SELECCION 65 FIMF –5.23 15.11 0.00 RVMI 7.96 10.91 0.00 RVMI 2.18 10.40 0.00 RVMI 2.61 8.84 0.00 RVMI 7.28 11.57 NA 1.30 0.00 0.00 0.00 1.00 0.00 0.11ALCALA GLOBAL FIM –3.30 8.22 0.05 RVMI 3.75 7.27 0.00 RVMI 0.72 7.31 0.00 RVMI 3.89 5.93 0.00 RVMI 4.97 7.25 2.76 1.25 0.00 0.00 0.00 0.00 0.00 0.10ALLIANZ EMPRENDEDOR GLOBAL FIMF –6.46 12.53 0.00 RVMI 3.98 8.26 0.00 RVMI –0.31 10.21 0.00 RVMI 2.59 7.52 0.01 RVMI –0.53 9.85 NA 0.00 0.00 0.00 0.00 1.00 0.00 0.14ALLIANZ MODERADO GLOBAL FIMF –4.83 8.97 0.00 RVMI 2.74 6.83 0.00 RVMI –0.31 8.54 0.00 RVMI 1.26 5.79 0.01 RVMI –1.29 7.66 NA 0.00 0.00 0.00 0.00 1.00 0.00 0.14BANESTO RV MIXTA INTERNACIONAL FIM –5.17 14.56 1.77 RVMI 6.05 9.63 1.53 RVMI 0.70 8.15 1.49 RVMI 3.52 6.37 1.27 RVMI 4.84 10.15 –12.40 2.25 0.00 0.00 0.00 0.00 0.00 0.20BANIF MULTIFONDOS PREMIER FIMF –3.35 10.56 0.00 RVMI 5.21 7.97 0.00 RVMI 2.05 7.85 0.00 RVMI 2.99 6.84 0.01 RVMI 6.87 8.43 NA 1.55 0.00 0.00 0.00 0.00 0.00 0.20BANKPYME GEST. CARTERA CLASICA FIMF –5.50 14.98 0.00 RVMI 11.15 10.55 0.00 RVMI 2.08 8.10 0.00 RVMI 3.33 5.88 0.00 RVMI 10.79 10.48 NA 0.00 0.00 0.00 0.00 0.00 0.00 0.20BANKPYME TOP CLASS 75 RV FIM –7.92 22.97 3.60 RVMI 17.87 15.71 2.38 RVMI 2.21 11.47 3.21 RVMI 5.69 8.24 4.53 RVMI 17.25 15.66 5.63 1.35 9.00 0.25 0.25 1.50 0.50 0.20BAV FONDO DE FONDOS FIMF –2.35 5.35 0.00 RVMI 3.80 4.26 0.00 RVMI 0.40 3.36 0.00 RVMI 3.15 3.13 0.00 RVMI 4.97 4.14 –9.86 1.35 9.00 0.00 0.00 0.00 0.00 0.10BBVA BONOS CONVERTIBLES FIM –0.16 4.93 3.47 RVMI 2.87 3.15 3.25 RVMI –0.70 3.68 3.14 RVMI 0.18 5.07 2.88 RVMI 2.17 4.29 –8.11 2.00 0.00 0.00 0.00 2.00 0.00 0.20BBVA EXITO FIMF –3.20 11.03 0.01 RVMI 5.42 7.60 0.01 RVMI 0.38 6.19 0.01 RVMI 3.20 4.94 0.00 RVMI 5.72 7.79 NA 1.75 0.00 0.00 0.00 2.00 0.00 0.10BBVA MIXTO 50 FIM –4.20 11.80 3.50 RVMI 6.48 8.29 3.58 RVMI 0.52 6.93 3.51 RVMI 4.31 5.55 3.18 RVMI 6.96 8.49 –14.83 2.20 0.00 0.00 0.00 2.00 0.00 0.20BBVA MULTIFONDO EQUILIBRADO FIMF –3.03 6.26 0.00 RVMI 5.99 5.83 0.00 RVMI 2.12 6.01 0.01 RVMI 1.98 5.26 0.00 RVMI 7.03 5.89 1.33 1.20 9.00 0.00 0.00 2.00 0.00 0.05BG FONCARTERA 1 FIMF –3.86 6.62 0.01 RVMI 7.60 5.84 0.01 RVMI 1.91 6.01 0.01 RVMI 3.54 5.47 0.01 RVMI 9.15 6.06 NA 1.50 0.00 0.00 0.00 1.00 0.00 0.10BNP GLOBAL 70–30 INTERNACIONAL FIMF –6.05 14.48 0.00 RVMI 8.84 9.98 0.00 RVMI 3.14 8.84 0.00 RVMI 4.25 8.45 0.00 RVMI 9.95 10.75 –5.85 1.75 0.00 0.00 0.00 0.00 0.00 0.20BNP P. DYNAMIC ASSET ALLOCAT. FIMF –7.51 16.40 0.00 RVMI 8.89 9.94 0.00 RVMI 2.73 8.70 0.00 RVMI 4.35 8.55 0.00 RVMI 7.97 11.40 NA 1.50 0.00 0.00 0.00 0.25 0.00 0.00BNP P. MODERATE ASSET ALLOCAT. FIMF –5.38 12.13 0.00 RVMI 6.72 7.57 0.00 RVMI 1.85 6.40 0.00 RVMI 3.34 6.22 0.01 RVMI 6.28 8.45 NA 1.50 0.00 0.00 0.00 0.25 0.00 0.00BNP PARIBAS GLOBAL II FIM –3.54 8.21 4.91 RVMI 4.05 5.31 3.09 RVMI 0.30 5.91 2.97 RVMI 1.72 4.07 4.52 RVMI 2.41 6.08 –2.57 1.25 0.00 0.00 0.00 0.00 0.00 0.00CAIXA CAT. SELECCIO ACTIVA 50 FIMF –4.58 9.56 0.00 RVMI 6.51 9.87 0.00 RVMI 1.05 6.51 0.00 RVMI 3.03 5.54 0.01 RVMI 5.81 8.12 NA 1.45 0.00 0.00 0.00 0.00 0.00 0.05CAIXANOVA UNIVERSAL FIM –3.53 12.33 1.60 RVMI 4.78 8.34 1.51 RVMI 0.18 7.87 1.53 RVMI 2.77 5.63 1.68 RVMI 4.06 8.88 –10.67 1.50 0.00 0.00 0.00 0.00 0.00 0.08CAJA INGENIEROS MUNDIAL 50 FIM –3.55 10.00 2.98 RVMI 4.80 6.87 2.82 RVMI 0.61 7.07 2.65 RVMI 1.42 5.59 2.67 RVMI 3.15 7.57 –10.26 2.25 0.00 0.00 0.00 0.00 0.00 0.20CAÑADA BLANCH FIM 0.16 0.51 0.33 RVMI 0.58 0.50 0.32 RVMI –0.17 0.61 0.47 RVMI 0.67 0.71 0.50 RVMI 1.24 0.59 NA 1.40 0.00 0.00 0.00 0.00 0.00 0.12DWS SELECTED FUNDS 50 FIMF –4.69 10.10 0.00 RVMI 6.75 7.91 0.00 RVMI 1.97 7.89 0.00 RVMI 1.11 6.63 0.01 RVMI 4.90 8.26 NA 1.60 0.00 0.00 0.00 0.00 0.00 0.10EUROVALOR SELECCION TOP–50 FIMF –1.87 9.82 0.00 RVMI 4.21 8.54 0.00 RVMI 2.11 5.17 0.00 RVMI 4.25 3.96 0.00 RVMI 8.87 7.27 NA 2.00 0.00 0.00 0.00 0.00 0.00 0.00EUROVALOR SELECCION TOP–75 FIMF –3.71 15.31 0.00 RVMI 6.80 12.70 0.00 RVMI 3.00 8.08 0.00 RVMI 5.58 5.93 0.01 RVMI 11.84 11.14 NA 2.25 0.00 0.00 0.00 0.00 0.00 0.00FIBANC–LATINOAM. RV FIM 2.20 17.64 0.05 RVIO 14.36 14.77 0.01 RVIO 7.00 11.97 2.56 RVIO 12.69 11.98 0.76 RVMI 40.93 14.29 9.65 2.25 0.00 0.00 0.00 0.00 0.00 0.20FIMA GLOBAL MARKETS I FIM –1.71 5.93 0.00 RVMI 1.84 4.04 0.00 RVMI 5.73 4.59 0.00 RVMI –2.35 3.76 0.00 RVMI 3.36 4.69 NA 1.35 0.00 0.00 0.00 0.00 0.00 0.09FINVERBOLSA INTERNACIONAL FIM –10.22 24.33 0.02 RVMI 13.72 18.27 0.06 RVMI –0.58 12.31 0.01 RVMI 7.00 8.74 0.00 RVMI 8.61 17.03 NA 2.25 0.00 0.00 0.00 0.00 0.00 0.20FONBILBAO GLOBAL 50 FIM –4.06 10.53 3.87 RVMI 7.24 8.10 4.26 RVMI 0.27 7.47 3.90 RVMI 3.43 6.70 3.78 RVMI 6.71 8.35 NA 1.75 0.00 0.00 0.00 0.00 0.00 0.13FONBUSA FONDOS FIMF –3.38 6.87 0.99 RVMI 6.26 5.56 1.03 RVMI 3.05 5.22 1.00 RVMI 2.97 5.61 1.78 RVMI 8.93 5.89 NA 1.25 0.00 0.00 0.00 0.00 0.00 0.12FONCAIXA 17 RENTA VARIABLE
MIXTA INTERNA –5.17 7.59 0.00 RVMI 3.26 5.22 0.00 RVMI –2.82 9.03 0.00 RVMI 8.58 9.42 0.00 RVMI 3.32 8.07 –12.00 1.75 0.00 0.00 0.00 4.00 0.00 0.00FONCAIXA 18 RENTA VARIABLE
MIXTA INTERNA –5.28 7.59 0.00 RVMI 3.26 5.21 0.00 RVMI –2.82 9.03 0.00 RVMI 8.57 9.42 0.00 RVMI 3.19 8.07 –12.01 1.75 0.00 0.00 0.00 4.00 0.00 0.00FONCAIXA 56 PATRIMONIO RVMI FIMS –4.92 7.50 0.00 RVMI 3.36 5.22 0.00 RVMI –2.70 9.03 0.00 RVMI 8.68 9.42 0.00 RVMI 3.92 8.05 NA 1.25 0.00 0.00 0.00 0.00 0.00 0.09FONCAIXA 89 CESTA MIXTA 50RV FIMF –1.91 3.61 0.00 RVMI 2.59 2.64 0.00 RVMI –1.51 4.04 0.00 RVMI 4.27 3.84 0.00 RVMI 3.35 3.61 NA 1.50 0.00 0.00 0.00 4.00 0.00 0.15FONCAIXA 90 CESTA MIXTA 75RV FIMF –3.85 6.39 0.00 RVMI 3.66 5.11 0.00 RVMI –2.28 7.91 0.00 RVMI 6.94 7.17 0.00 RVMI 4.15 6.79 NA 1.50 0.00 0.00 0.00 4.00 0.00 0.15FONCAIXA COOPERAC. FIM –5.02 8.15 0.68 RVMI 3.41 5.62 2.16 RVMI –2.26 9.85 2.24 RVMI 8.78 9.96 1.35 RVMI 4.43 8.66 NA 2.10 0.00 0.00 0.00 4.00 0.00 0.15FONCAIXA RVM INTERNACIONAL FIMP NA 3.24 1.15 RVMI 3.88 5.50 2.89 RVMI –2.53 9.51 1.52 RVMI 9.53 9.93 1.56 RVMI NA 7.88 NA 0.00 0.00 0.00 0.00 0.00 0.00 0.00FONDESPAÑA GESTION INTERN. FIM –4.75 11.10 5.39 RVMI 3.52 8.20 5.43 RVMI –0.10 9.49 5.21 RVMI –1.32 7.38 4.98 RVMI –2.79 9.17 NA 1.60 0.00 0.00 0.00 0.00 0.00 0.15FONDONORTE DIVISAS FIM –5.81 13.71 1.96 RVMI 4.65 9.51 1.80 RVMI 0.25 8.73 2.06 RVMI 2.34 7.04 2.09 RVMI 1.14 10.06 –17.20 2.00 0.00 0.00 0.00 0.00 0.00 0.08FONDUERO EMERGENTES FIMF –0.44 7.91 0.00 RVMI 9.14 6.98 0.00 RVMI 3.78 5.60 0.00 RVMI 5.06 4.42 0.01 RVMI 18.49 6.40 NA 1.60 0.00 0.00 0.00 0.00 0.00 0.10FONDUERO PLUS FIM –5.28 12.56 1.09 RVMI 7.82 11.81 1.38 RVMI –1.62 9.57 1.48 RVMI 9.20 8.99 1.72 RVMI 9.72 10.90 –29.65 2.00 0.00 0.00 0.00 0.00 0.00 0.10FONPENEDES MULTIFONS 50 FIMF NA NA NA NA 10.36 0.00 RVMI 1.90 7.14 0.00 RVMI 3.55 5.44 0.00 RVMI NA 7.61 NA 1.50 0.00 0.00 0.00 1.00 0.00 0.05GENERAL COMMERCE FIM –2.48 14.38 2.71 RVMI 6.89 8.61 0.99 RVMI 1.05 6.92 3.00 RVMI 3.32 3.05 2.72 RVMI 8.83 9.19 –17.60 2.25 0.00 0.00 0.00 0.00 0.00 0.10HIGH RATE FIM –3.73 6.73 4.78 RVMI 5.99 3.91 2.28 RVMI 2.43 3.40 2.90 RVMI 2.84 3.52 3.23 RVMI 7.47 4.64 –1.41 0.35 0.00 0.00 0.00 0.00 0.00 0.05IBER FONDO 2020 INT.FIM –4.68 14.43 1.85 RVMI 6.41 9.62 1.76 RVMI 1.10 8.08 1.62 RVMI 3.61 6.21 1.28 RVMI 6.24 10.07 –20.06 1.20 0.00 0.00 0.00 3.00 0.00 0.15
(Continues over)
(Continued)
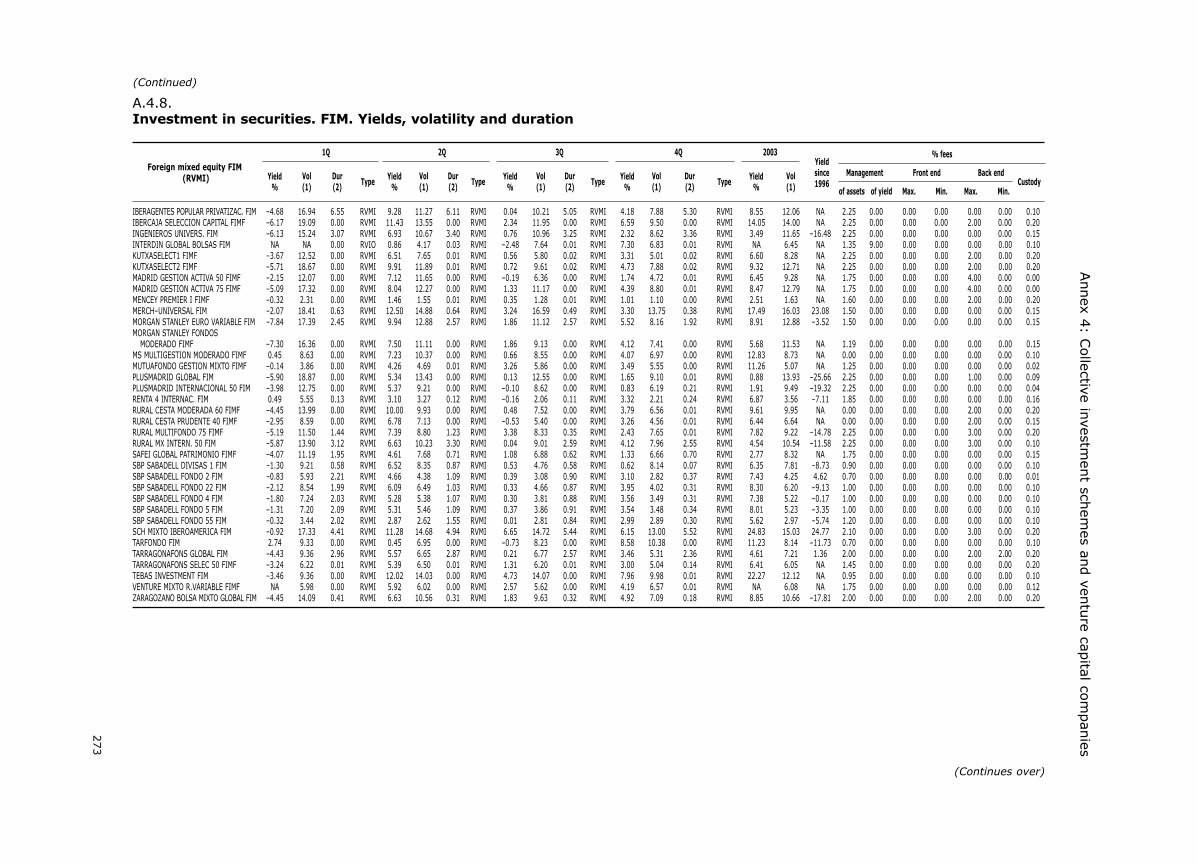
273
Annex 4
: Collective in
vestmen
t schem
es and ven
ture cap
ital com
pan
iesA.4.8.Investment in securities. FIM. Yields, volatility and duration
1Q 2Q 3Q 4Q 2003
Yield Vol Dur Yield Vol Dur Yield Vol Dur Yield Vol Dur Yield Vol(1) (2) Type (1) (2) Type (1) (2) Type (1) (2) Type (1)% % % % %
% fees
Management Front end Back endCustody
of assets of yield Max. Min. Max. Min.
Yieldsince1996
Foreign mixed equity FIM(RVMI)
IBERAGENTES POPULAR PRIVATIZAC. FIM –4.68 16.94 6.55 RVMI 9.28 11.27 6.11 RVMI 0.04 10.21 5.05 RVMI 4.18 7.88 5.30 RVMI 8.55 12.06 NA 2.25 0.00 0.00 0.00 0.00 0.00 0.10IBERCAJA SELECCION CAPITAL FIMF –6.17 19.09 0.00 RVMI 11.43 13.55 0.00 RVMI 2.34 11.95 0.00 RVMI 6.59 9.50 0.00 RVMI 14.05 14.00 NA 2.25 0.00 0.00 0.00 2.00 0.00 0.20INGENIEROS UNIVERS. FIM –6.13 15.24 3.07 RVMI 6.93 10.67 3.40 RVMI 0.76 10.96 3.25 RVMI 2.32 8.62 3.36 RVMI 3.49 11.65 –16.48 2.25 0.00 0.00 0.00 0.00 0.00 0.15INTERDIN GLOBAL BOLSAS FIM NA NA 0.00 RVIO 0.86 4.17 0.03 RVMI –2.48 7.64 0.01 RVMI 7.30 6.83 0.01 RVMI NA 6.45 NA 1.35 9.00 0.00 0.00 0.00 0.00 0.10KUTXASELECT1 FIMF –3.67 12.52 0.00 RVMI 6.51 7.65 0.01 RVMI 0.56 5.80 0.02 RVMI 3.31 5.01 0.02 RVMI 6.60 8.28 NA 2.25 0.00 0.00 0.00 2.00 0.00 0.20KUTXASELECT2 FIMF –5.71 18.67 0.00 RVMI 9.91 11.89 0.01 RVMI 0.72 9.61 0.02 RVMI 4.73 7.88 0.02 RVMI 9.32 12.71 NA 2.25 0.00 0.00 0.00 2.00 0.00 0.20MADRID GESTION ACTIVA 50 FIMF –2.15 12.07 0.00 RVMI 7.12 11.65 0.00 RVMI –0.19 6.36 0.00 RVMI 1.74 4.72 0.01 RVMI 6.45 9.28 NA 1.75 0.00 0.00 0.00 4.00 0.00 0.00MADRID GESTION ACTIVA 75 FIMF –5.09 17.32 0.00 RVMI 8.04 12.27 0.00 RVMI 1.33 11.17 0.00 RVMI 4.39 8.80 0.01 RVMI 8.47 12.79 NA 1.75 0.00 0.00 0.00 4.00 0.00 0.00MENCEY PREMIER I FIMF –0.32 2.31 0.00 RVMI 1.46 1.55 0.01 RVMI 0.35 1.28 0.01 RVMI 1.01 1.10 0.00 RVMI 2.51 1.63 NA 1.60 0.00 0.00 0.00 2.00 0.00 0.20MERCH–UNIVERSAL FIM –2.07 18.41 0.63 RVMI 12.50 14.88 0.64 RVMI 3.24 16.59 0.49 RVMI 3.30 13.75 0.38 RVMI 17.49 16.03 23.08 1.50 0.00 0.00 0.00 0.00 0.00 0.15MORGAN STANLEY EURO VARIABLE FIM –7.84 17.39 2.45 RVMI 9.94 12.88 2.57 RVMI 1.86 11.12 2.57 RVMI 5.52 8.16 1.92 RVMI 8.91 12.88 –3.52 1.50 0.00 0.00 0.00 0.00 0.00 0.15MORGAN STANLEY FONDOS
MODERADO FIMF –7.30 16.36 0.00 RVMI 7.50 11.11 0.00 RVMI 1.86 9.13 0.00 RVMI 4.12 7.41 0.00 RVMI 5.68 11.53 NA 1.19 0.00 0.00 0.00 0.00 0.00 0.15MS MULTIGESTION MODERADO FIMF 0.45 8.63 0.00 RVMI 7.23 10.37 0.00 RVMI 0.66 8.55 0.00 RVMI 4.07 6.97 0.00 RVMI 12.83 8.73 NA 0.00 0.00 0.00 0.00 0.00 0.00 0.10MUTUAFONDO GESTION MIXTO FIMF –0.14 3.86 0.00 RVMI 4.26 4.69 0.01 RVMI 3.26 5.86 0.00 RVMI 3.49 5.55 0.00 RVMI 11.26 5.07 NA 1.25 0.00 0.00 0.00 0.00 0.00 0.02PLUSMADRID GLOBAL FIM –5.90 18.87 0.00 RVMI 5.34 13.43 0.00 RVMI 0.13 12.55 0.00 RVMI 1.65 9.10 0.01 RVMI 0.88 13.93 –25.66 2.25 0.00 0.00 0.00 1.00 0.00 0.09PLUSMADRID INTERNACIONAL 50 FIM –3.98 12.75 0.00 RVMI 5.37 9.21 0.00 RVMI –0.10 8.62 0.00 RVMI 0.83 6.19 0.21 RVMI 1.91 9.49 –19.32 2.25 0.00 0.00 0.00 0.00 0.00 0.04RENTA 4 INTERNAC. FIM 0.49 5.55 0.13 RVMI 3.10 3.27 0.12 RVMI –0.16 2.06 0.11 RVMI 3.32 2.21 0.24 RVMI 6.87 3.56 –7.11 1.85 0.00 0.00 0.00 0.00 0.00 0.16RURAL CESTA MODERADA 60 FIMF –4.45 13.99 0.00 RVMI 10.00 9.93 0.00 RVMI 0.48 7.52 0.00 RVMI 3.79 6.56 0.01 RVMI 9.61 9.95 NA 0.00 0.00 0.00 0.00 2.00 0.00 0.20RURAL CESTA PRUDENTE 40 FIMF –2.95 8.59 0.00 RVMI 6.78 7.13 0.00 RVMI –0.53 5.40 0.00 RVMI 3.26 4.56 0.01 RVMI 6.44 6.64 NA 0.00 0.00 0.00 0.00 2.00 0.00 0.15RURAL MULTIFONDO 75 FIMF –5.19 11.50 1.44 RVMI 7.39 8.80 1.23 RVMI 3.38 8.33 0.35 RVMI 2.43 7.65 0.01 RVMI 7.82 9.22 –14.78 2.25 0.00 0.00 0.00 3.00 0.00 0.20RURAL MX INTERN. 50 FIM –5.87 13.90 3.12 RVMI 6.63 10.23 3.30 RVMI 0.04 9.01 2.59 RVMI 4.12 7.96 2.55 RVMI 4.54 10.54 –11.58 2.25 0.00 0.00 0.00 3.00 0.00 0.10SAFEI GLOBAL PATRIMONIO FIMF –4.07 11.19 1.95 RVMI 4.61 7.68 0.71 RVMI 1.08 6.88 0.62 RVMI 1.33 6.66 0.70 RVMI 2.77 8.32 NA 1.75 0.00 0.00 0.00 0.00 0.00 0.15SBP SABADELL DIVISAS 1 FIM –1.30 9.21 0.58 RVMI 6.52 8.35 0.87 RVMI 0.53 4.76 0.58 RVMI 0.62 8.14 0.07 RVMI 6.35 7.81 –8.73 0.90 0.00 0.00 0.00 0.00 0.00 0.10SBP SABADELL FONDO 2 FIM –0.83 5.93 2.21 RVMI 4.66 4.38 1.09 RVMI 0.39 3.08 0.90 RVMI 3.10 2.82 0.37 RVMI 7.43 4.25 4.62 0.70 0.00 0.00 0.00 0.00 0.00 0.01SBP SABADELL FONDO 22 FIM –2.12 8.54 1.99 RVMI 6.09 6.49 1.03 RVMI 0.33 4.66 0.87 RVMI 3.95 4.02 0.31 RVMI 8.30 6.20 –9.13 1.00 0.00 0.00 0.00 0.00 0.00 0.10SBP SABADELL FONDO 4 FIM –1.80 7.24 2.03 RVMI 5.28 5.38 1.07 RVMI 0.30 3.81 0.88 RVMI 3.56 3.49 0.31 RVMI 7.38 5.22 –0.17 1.00 0.00 0.00 0.00 0.00 0.00 0.10SBP SABADELL FONDO 5 FIM –1.31 7.20 2.09 RVMI 5.31 5.46 1.09 RVMI 0.37 3.86 0.91 RVMI 3.54 3.48 0.34 RVMI 8.01 5.23 –3.35 1.00 0.00 0.00 0.00 0.00 0.00 0.10SBP SABADELL FONDO 55 FIM –0.32 3.44 2.02 RVMI 2.87 2.62 1.55 RVMI 0.01 2.81 0.84 RVMI 2.99 2.89 0.30 RVMI 5.62 2.97 –5.74 1.20 0.00 0.00 0.00 0.00 0.00 0.10SCH MIXTO IBEROAMERICA FIM –0.92 17.33 4.41 RVMI 11.28 14.68 4.94 RVMI 6.65 14.72 5.44 RVMI 6.15 13.00 5.52 RVMI 24.83 15.03 24.77 2.10 0.00 0.00 0.00 3.00 0.00 0.20TARFONDO FIM 2.74 9.33 0.00 RVMI 0.45 6.95 0.00 RVMI –0.73 8.23 0.00 RVMI 8.58 10.38 0.00 RVMI 11.23 8.14 –11.73 0.70 0.00 0.00 0.00 0.00 0.00 0.10TARRAGONAFONS GLOBAL FIM –4.43 9.36 2.96 RVMI 5.57 6.65 2.87 RVMI 0.21 6.77 2.57 RVMI 3.46 5.31 2.36 RVMI 4.61 7.21 1.36 2.00 0.00 0.00 0.00 2.00 2.00 0.20TARRAGONAFONS SELEC 50 FIMF –3.24 6.22 0.01 RVMI 5.39 6.50 0.01 RVMI 1.31 6.20 0.01 RVMI 3.00 5.04 0.14 RVMI 6.41 6.05 NA 1.45 0.00 0.00 0.00 0.00 0.00 0.20TEBAS INVESTMENT FIM –3.46 9.36 0.00 RVMI 12.02 14.03 0.00 RVMI 4.73 14.07 0.00 RVMI 7.96 9.98 0.01 RVMI 22.27 12.12 NA 0.95 0.00 0.00 0.00 0.00 0.00 0.10VENTURE MIXTO R.VARIABLE FIMF NA 5.98 0.00 RVMI 5.92 6.02 0.00 RVMI 2.57 5.62 0.00 RVMI 4.19 6.57 0.01 RVMI NA 6.08 NA 1.75 0.00 0.00 0.00 0.00 0.00 0.12ZARAGOZANO BOLSA MIXTO GLOBAL FIM –4.45 14.09 0.41 RVMI 6.63 10.56 0.31 RVMI 1.83 9.63 0.32 RVMI 4.92 7.09 0.18 RVMI 8.85 10.66 –17.81 2.00 0.00 0.00 0.00 2.00 0.00 0.20
(Continues over)
(Continued)

274
Annual rep
ort o
n th
e securities m
arket. 2003
A.4.8.Investment in securities. FIM. Yields, volatility and duration
1Q 2Q 3Q 4Q 2003
Yield Vol Dur Yield Vol Dur Yield Vol Dur Yield Vol Dur Yield Vol(1) (2) Type (1) (2) Type (1) (2) Type (1) (2) Type (1)% % % % %
% fees
Management Front end Back endCustody
of assets of yield Max. Min. Max. Min.
Yieldsince1996
Euro equity FIM (RVE)
ABF EUROBOLSA FIMF –11.23 29.33 0.00 RVE 14.10 21.26 0.00 RVE 1.06 15.51 0.00 RVE 9.96 13.15 0.01 RVE 12.56 20.81 –40.41 1.25 0.00 0.00 0.00 0.00 0.00 0.10AC EURO STOXX 50 INDICE FIM –13.73 42.16 0.01 RVE 19.32 28.52 0.01 RVE –1.08 20.37 0.00 RVE 14.11 17.94 0.01 RVE 16.18 28.88 NA 1.00 0.00 0.00 0.00 0.00 0.00 0.09AC EUROACCIONES FIM –14.81 38.43 0.01 RVE 18.12 23.48 0.01 RVE –1.72 18.82 0.00 RVE 15.72 16.61 0.01 RVE 14.45 25.85 –35.00 2.00 0.00 0.00 0.00 1.00 0.00 0.09ASTURFONDO BOLSA FIM –8.02 29.06 0.00 RVE 13.85 18.77 0.00 RVE –1.42 15.15 0.00 RVE 13.57 12.35 0.01 RVE 17.25 19.90 –30.76 2.10 0.00 0.00 0.00 2.00 0.00 0.15ATLANTICO BOLSA PREMIER FIM –12.47 33.85 0.00 RVE 16.68 22.28 0.00 RVE –1.19 17.26 0.00 RVE 12.68 14.50 0.01 RVE 13.70 23.24 NA 1.10 0.00 0.00 0.00 2.00 0.00 0.20ATLANTICO EUROACC. FIM –12.25 31.00 0.00 RVE 14.34 19.95 0.00 RVE –1.87 16.83 0.00 RVE 13.03 14.30 0.01 RVE 11.29 21.55 NA 2.25 0.00 0.00 0.00 2.00 0.00 0.20AVIVA EUROBOLSA FIM –15.04 35.58 0.01 RVE 19.45 21.97 0.01 RVE –0.66 14.98 0.01 RVE 13.14 13.03 0.01 RVE 14.06 23.22 NA 0.55 0.00 0.00 0.00 0.00 0.00 0.11BANCAJA CONSTRUCCION FIM –0.90 17.82 0.17 RVE 9.03 11.77 0.22 RVE 3.92 10.34 0.09 RVE 11.25 8.48 0.23 RVE 24.92 12.60 –3.33 1.50 0.00 0.00 0.00 1.50 0.00 0.20BANCAJA ENERGIA Y COMUNICAC. FIM –3.13 24.29 0.00 RVE 11.46 14.76 0.00 RVE –2.09 10.41 0.00 RVE 10.28 8.91 0.01 RVE 16.59 15.78 –30.32 1.50 0.00 0.00 0.00 1.50 0.00 0.20BANCAJA EUROPA FINANCIERO FIM –12.59 30.44 0.00 RVE 19.58 25.05 0.00 RVE 0.36 18.84 0.00 RVE 12.19 14.02 0.01 RVE 17.68 23.03 NA 2.23 0.00 0.00 0.00 1.50 0.00 0.20BANCAJA RENTA VARIABLE EURO FIM –12.34 34.20 0.05 RVE 22.83 21.42 0.14 RVE 3.18 16.33 0.08 RVE 9.99 13.49 0.16 RVE 22.19 22.86 –27.83 2.00 0.00 0.00 0.00 1.50 0.00 0.20BANESTO BOLSAS EUROPEAS FIM –14.44 38.02 0.00 RVE 19.56 24.34 0.00 RVE –1.13 18.10 0.00 RVE 14.22 15.06 0.02 RVE 15.52 25.52 –31.37 2.25 0.00 0.00 0.00 3.00 0.00 0.10BANIF RV EURO FIM –14.46 37.98 0.00 RVE 19.97 23.90 0.00 RVE –1.13 17.75 0.00 RVE 13.86 14.49 0.05 RVE 15.53 25.26 –32.56 1.60 0.00 0.00 0.00 1.00 0.00 0.20BANKPYME EUROPA CRECIMIENTO FIM –11.38 19.07 0.01 RVE 25.76 14.95 0.01 RVE 11.61 12.48 0.00 RVE 8.70 9.29 0.00 RVE 35.19 14.61 –2.04 1.35 9.00 0.25 0.25 1.50 0.50 0.20BANKPYME EUROVALOR FIM –14.90 39.22 0.00 RVE 29.96 24.61 0.00 RVE 0.05 17.25 0.00 RVE 11.87 13.67 0.00 RVE 23.80 25.75 –13.99 1.35 9.00 0.25 0.25 1.50 0.50 0.20BANKPYME IBERBOLSA FIM –2.83 22.72 0.00 RVE 16.18 13.90 0.00 RVE 1.90 10.11 0.00 RVE 13.08 7.72 0.00 RVE 30.10 14.78 18.99 1.35 9.00 0.25 0.25 1.00 0.25 0.20BARCLAYS BOLSA EURO FIM –15.03 40.52 0.01 RVE 20.26 26.18 0.01 RVE –0.73 19.62 0.01 RVE 14.57 16.15 0.01 RVE 16.21 27.32 NA 1.80 0.00 0.00 0.00 2.00 0.00 0.15BBK BOLSA EURO FIM –14.25 43.41 0.07 RVE 20.42 28.65 0.07 RVE –1.22 20.39 0.06 RVE 13.98 18.05 0.05 RVE 16.26 29.39 NA 1.65 0.00 0.00 0.00 0.00 0.00 0.10BBVA INDICE EUROPA PLUS FIM –15.22 39.87 0.00 RVE 20.59 25.67 0.01 RVE –0.77 19.30 0.01 RVE 15.04 15.85 0.01 RVE 16.70 26.87 –27.80 0.80 0.00 0.00 0.00 0.00 0.00 0.20BBVA MIX 80 FIM –8.22 22.50 2.82 RVE 10.59 14.85 2.66 RVE –0.24 11.01 2.89 RVE 7.72 9.68 1.97 RVE 9.08 15.37 –23.97 2.25 0.00 0.00 0.00 2.00 0.00 0.20BESTINVER EUROPA FIM –14.35 37.01 0.00 RVE 19.07 23.86 0.00 RVE –1.06 17.67 0.00 RVE 14.33 15.02 0.01 RVE 15.36 24.95 NA 1.00 0.00 0.00 0.00 3.00 3.00 0.13BETA EURO ACCIONES FIM –12.16 29.95 0.00 RVE 15.37 21.87 0.00 RVE –0.56 17.64 0.00 RVE 13.37 15.76 0.01 RVE 14.24 22.06 –28.10 2.25 0.00 0.00 0.00 0.00 0.00 0.12BG EUROMARKET BOLSA FIM –12.57 32.26 0.01 RVE 17.27 22.26 0.01 RVE –0.57 18.02 0.01 RVE 14.09 15.61 0.00 RVE 16.31 23.01 –37.21 2.25 0.00 0.00 0.00 1.00 0.00 0.20BI EURO ACCIONES FIM –14.94 38.72 0.01 RVE 20.63 25.23 0.01 RVE –0.82 18.98 0.01 RVE 14.45 15.77 0.00 RVE 16.48 26.27 –31.68 2.00 0.00 0.00 0.00 1.00 0.00 0.00BK BOLSA EURIBEX FIM –2.10 27.33 0.11 RVE 14.81 20.17 0.00 RVE –1.81 15.85 0.01 RVE 15.92 12.84 0.01 RVE 27.95 19.83 –15.08 0.85 0.00 0.00 0.00 5.00 0.00 0.15BK BOLSA EUROPA FIM –14.46 34.86 0.00 RVE 20.29 28.15 0.01 RVE –0.58 22.19 0.00 RVE 15.78 18.10 0.01 RVE 18.44 26.68 –28.95 1.75 0.00 0.00 0.00 1.00 1.00 0.15BK INDICE EUROPEO 50 FIM –15.46 38.80 0.01 RVE 20.43 24.88 0.01 RVE –0.87 18.80 0.01 RVE 13.85 14.49 0.01 RVE 14.91 25.99 NA 0.60 0.00 0.00 0.00 0.00 0.00 0.09BK SMALL CAPS FIM –1.57 12.90 0.00 RVE 12.47 11.20 0.00 RVE 7.80 10.92 0.00 RVE 14.34 10.32 0.01 RVE 36.45 11.43 NA 1.40 0.00 0.00 0.00 0.00 0.00 0.10BNP BOLSA EUROPEA FIM –11.65 30.17 0.00 RVE 11.94 20.04 0.00 RVE –0.43 14.73 0.00 RVE 9.47 13.07 0.00 RVE 7.80 20.64 –21.20 1.85 0.00 0.00 0.00 0.00 0.00 0.20BNP PARIBAS EUROPA
CRECIMIENTO FIMF –11.76 19.75 0.00 RVE 15.09 12.70 0.00 RVE 3.91 8.89 0.00 RVE 7.40 9.06 0.00 RVE 13.34 13.46 –7.32 1.25 9.00 0.00 0.00 0.00 0.00 0.00BNP PARIBAS UTILITIES FIM –0.86 20.17 0.00 RVE 13.34 13.10 0.00 RVE –1.26 9.55 0.00 RVE 11.07 8.19 0.00 RVE 23.24 13.59 NA 1.50 0.00 0.00 0.00 0.00 0.00 0.00BOLSACASER FIM –14.50 38.46 0.01 RVE 18.39 23.55 0.01 RVE –1.40 18.83 0.01 RVE 16.05 16.67 0.01 RVE 15.82 25.89 –32.34 0.70 0.00 0.00 0.00 0.00 0.00 0.05CAHISPA SMALL CAPS FIM –13.16 15.18 0.00 RVE 27.09 12.97 0.00 RVE 12.67 12.63 0.00 RVE 11.79 10.96 0.01 RVE 39.01 13.33 NA 2.25 0.00 0.00 0.00 0.00 0.00 0.10CAI BOLSA 10 FIM –14.92 38.39 0.01 RVE 17.98 23.46 0.01 RVE –1.80 18.82 0.00 RVE 15.57 16.62 0.01 RVE 13.92 25.83 –43.12 2.00 0.00 0.00 0.00 0.00 0.00 0.20CAIXA CATALUNYA BORSA
EUROPEA FIM –17.92 41.16 0.00 RVE 22.03 30.71 0.00 RVE –2.13 18.68 0.00 RVE 11.52 16.03 0.01 RVE 9.31 28.56 NA 1.35 9.00 0.00 0.00 0.00 0.00 0.15CAIXA GALICIA EUROBOLSA FIM –13.28 34.62 0.87 RVE 16.43 21.36 0.70 RVE –1.57 17.79 1.10 RVE 14.79 15.78 1.26 RVE 14.08 23.63 –35.49 2.00 0.00 0.00 0.00 1.00 0.00 0.14CAJA LABORAL BOLSAS
EUROPEAS FIMF –9.83 17.68 0.00 RVE 13.94 11.86 0.00 RVE 3.33 8.80 0.00 RVE 7.70 7.64 0.01 RVE 14.33 12.23 NA 2.25 0.00 0.00 0.00 1.00 0.00 0.05CAJASUR BOLSA EURO FIM –13.76 35.67 0.34 RVE 16.74 22.39 0.22 RVE –2.10 18.23 0.17 RVE 15.43 16.69 0.01 RVE 13.76 24.49 –17.13 2.25 0.00 0.00 0.00 1.00 0.00 0.20CAM BOLSA EUROPA FIM –16.30 42.64 0.09 RVE 20.77 28.84 0.04 RVE –0.94 20.66 0.03 RVE 13.96 17.94 0.04 RVE 14.13 29.21 –44.50 1.75 0.00 0.00 0.00 2.00 2.00 0.12CAM EUROPA PYMES FIMF –3.98 7.49 0.12 RVE 13.45 7.54 0.15 RVE 8.64 8.25 0.00 RVE 8.16 7.55 0.00 RVE 28.00 7.82 NA 1.75 0.00 0.00 0.00 2.00 2.00 0.08CAN EURONAVARRA FIM –12.64 32.05 0.00 RVE 15.79 21.17 0.00 RVE –0.52 15.03 0.00 RVE 11.24 12.99 0.02 RVE 11.94 21.67 –23.60 2.25 0.00 0.00 0.00 0.00 0.00 0.15CANTABRIA BOLSA EURO FIM –13.93 33.42 0.00 RVE 18.59 23.25 0.00 RVE 0.76 17.51 0.00 RVE 12.16 13.73 0.00 RVE 15.35 23.27 NA 2.00 0.00 0.00 0.00 2.00 0.00 0.20CAT CAPITAL 2 FIM NA 21.21 0.00 RVE 14.24 16.04 0.00 RVE –2.12 12.35 0.00 RVE 12.36 11.17 0.01 RVE NA 15.41 NA 2.25 0.00 0.00 0.00 1.00 0.00 0.10CORTAL CAPITAL DINAMICO FIMF –3.33 13.43 0.00 RVE 9.49 10.47 0.00 RVE 1.59 9.43 0.00 RVE 5.30 9.46 0.00 RVE 13.23 10.85 NA 1.75 0.00 0.00 0.00 0.00 0.00 0.10EJECUTIVOS EUROFOND FIM –5.53 24.47 1.04 RVE 8.36 13.87 0.36 RVE 0.24 11.64 0.01 RVE 10.15 10.79 0.01 RVE 13.03 16.15 –23.44 2.00 0.00 0.00 0.00 0.00 0.00 0.15ESPIRITO SANTO BOLSA EURO FIM –8.26 31.78 0.01 RVE 15.54 24.84 0.01 RVE –2.18 19.64 0.01 RVE 11.73 15.64 0.01 RVE 15.85 23.79 –37.35 2.25 0.00 0.00 0.00 0.00 0.00 0.20EUROAGENTES PLUS FIM 0.34 16.66 0.00 RVE 13.93 10.27 0.00 RVE –0.10 7.52 0.00 RVE 12.99 6.71 0.01 RVE 29.04 11.05 25.88 0.50 0.00 0.00 0.00 0.00 0.00 0.15
(Continues over)
(Continued)

275
Annex 4
: Collective in
vestmen
t schem
es and ven
ture cap
ital com
pan
iesA.4.8.Investment in securities. FIM. Yields, volatility and duration
1Q 2Q 3Q 4Q 2003
Yield Vol Dur Yield Vol Dur Yield Vol Dur Yield Vol Dur Yield Vol(1) (2) Type (1) (2) Type (1) (2) Type (1) (2) Type (1)% % % % %
% fees
Management Front end Back endCustody
of assets of yield Max. Min. Max. Min.
Yieldsince1996
Euro equity FIM (RVE)
EUROCEM BORSA FIM –13.45 30.29 0.00 RVE 14.04 20.23 0.00 RVE –0.21 15.78 0.00 RVE 10.42 13.89 0.01 RVE 8.75 21.09 –26.64 2.15 0.00 0.00 0.00 2.00 0.00 0.10EUROINDICE 50 FIM –1.54 8.48 0.00 RVE –3.18 1.75 0.00 RVE –9.92 10.53 0.00 RVE –1.99 1.96 0.01 RVE –15.83 6.93 NA 1.25 0.00 0.00 0.00 0.00 0.00 0.10EUROSANFERNANDO RV FIM –14.89 38.42 0.00 RVE 18.42 23.32 0.00 RVE –1.76 18.80 0.00 RVE 15.56 16.63 0.00 RVE 14.43 25.81 NA 2.00 0.00 0.00 0.00 1.00 0.00 0.20EUROV. BOL. EUROPEA FIM –13.29 35.31 0.00 RVE 16.66 22.00 0.00 RVE –2.00 17.99 0.00 RVE 13.84 14.85 0.17 RVE 12.86 23.91 –24.63 2.25 0.00 0.00 0.00 0.00 0.00 0.00F.FINECO EURO ELITE FIM –14.35 43.72 0.15 RVE 20.67 29.44 0.05 RVE –1.73 20.81 0.09 RVE 14.09 18.38 0.07 RVE 15.88 29.83 NA 1.75 0.00 0.00 0.00 0.00 0.00 0.15FIBANC–EUROPA RV FIM –12.78 28.71 0.01 RVE 4.56 21.57 0.01 RVE –4.34 20.36 0.00 RVE 15.37 17.64 0.00 RVE 0.64 22.51 –39.79 2.25 0.00 0.00 0.00 0.00 0.00 0.10FON FINECO VALOR FIM –13.39 33.39 0.00 RVE 21.65 24.13 0.00 RVE 3.18 18.83 0.00 RVE 11.08 13.83 0.01 RVE 20.75 23.76 NA 1.75 0.00 0.00 0.00 0.00 0.00 0.15FONBILBAO EUROBOLSA FIM –13.93 37.00 0.01 RVE 18.59 23.40 0.01 RVE –0.77 18.34 0.01 RVE 14.04 14.79 0.01 RVE 15.49 24.92 –26.73 1.75 0.00 0.00 0.00 0.00 0.00 0.13FONCAIXA 113 CARTERA BOL.
EURO FIMS NA NA NA NA NA NA NA 15.90 0.00 RVE 13.73 14.44 0.00 RVE NA 15.25 NA 0.60 9.00 0.00 0.00 0.00 0.00 0.15FONCAIXA 5 BOLSA EURO FIMS –14.87 38.27 0.00 RVE 18.87 24.08 0.00 RVE –1.01 17.94 0.00 RVE 13.93 14.96 0.00 RVE 14.12 25.51 –19.92 2.25 0.00 0.00 0.00 4.00 0.00 0.00FONCAIXA 52 B. GESTION EURO FIMS –9.18 14.10 0.00 RVE 5.50 10.65 0.00 RVE –2.63 14.60 0.00 RVE 12.02 13.44 0.00 RVE 4.50 13.39 –25.46 1.35 9.00 0.00 0.00 4.00 0.00 0.15FONCAIXA 64 PATR. BOLSA EURO FIMS –14.64 37.87 0.00 RVE 19.04 23.68 0.00 RVE –0.67 16.71 0.00 RVE 13.27 13.88 0.00 RVE 14.33 24.89 NA 0.75 7.50 0.00 0.00 4.00 0.00 0.15FONCAIXA 98 BOLSA EURO FIMS NA 49.87 0.00 RVE 17.58 22.32 0.00 RVE –0.90 16.68 0.00 RVE 13.15 13.94 0.00 RVE NA 22.33 NA 1.35 9.00 0.00 0.00 4.00 0.00 0.00FONCAIXA BOLSA EURO FIMP NA 54.67 0.00 RVE 20.63 25.36 0.00 RVE –0.60 18.94 0.00 RVE 15.40 15.81 0.00 RVE NA 25.01 NA 0.00 0.00 0.00 0.00 0.00 0.00 0.00FONCAIXA BOLSA GESTION EURO FIMP NA NA NA NA NA NA NA 14.25 0.00 RVE 13.99 15.20 0.01 RVE NA 14.88 NA 0.00 0.00 0.00 0.00 0.00 0.00 0.00FONDESPAÑA EUROBOLSA FIM –14.71 40.86 0.01 RVE 20.77 26.70 0.01 RVE –1.36 19.52 0.01 RVE 14.55 16.34 0.01 RVE 16.38 27.58 NA 1.45 0.00 0.00 0.00 0.00 0.00 0.15FONDESPAÑA VALORES FIM –9.20 29.37 0.00 RVE 18.17 18.35 0.00 RVE 1.59 15.02 0.00 RVE 12.90 13.41 0.00 RVE 23.07 20.09 –35.23 1.60 0.00 0.00 0.00 0.00 0.00 0.15FONDO VALENCIA EUROPA FIM –12.11 34.76 0.05 RVE 24.00 22.38 0.12 RVE 4.03 15.75 0.07 RVE 10.72 13.53 0.01 RVE 25.53 23.20 NA 2.00 0.00 0.00 0.00 1.50 0.00 0.11FONDO VALENCIA RENTA FIM –2.05 13.60 0.00 RVE 18.28 10.00 0.00 RVE 4.13 7.80 0.00 RVE 6.99 6.65 0.02 RVE 29.06 9.95 10.55 1.75 0.00 0.00 0.00 1.50 0.00 0.20FONDONORTE EUROBOLSA FIM –12.85 33.12 0.01 RVE 16.62 21.70 0.01 RVE 0.86 16.32 0.01 RVE 11.48 14.20 0.01 RVE 14.27 22.61 –30.92 2.00 0.00 0.00 0.00 0.00 0.00 0.08FONJALON EURO ACCIONES FIM –12.56 32.15 0.00 RVE 19.47 21.63 0.00 RVE –1.15 15.96 0.00 RVE 12.88 13.79 0.01 RVE 16.55 22.14 –27.79 2.25 0.00 0.00 0.00 0.00 0.00 0.14FONLIFE FIM –13.49 30.31 0.14 RVN 16.37 20.00 0.04 RVN –0.53 16.98 0.01 RVN 13.10 14.35 0.01 RVE 13.26 21.37 –31.27 1.80 0.00 0.00 0.00 0.00 0.00 0.17FONPENEDES EUROBORSA 100 FIM –22.64 44.80 3.56 RVE 24.54 30.30 0.91 RVE 1.91 17.32 0.45 RVE 10.18 13.58 0.67 RVE 8.18 29.31 –32.60 2.00 0.00 0.00 0.00 0.00 0.00 0.00FONPROFIT FIM –1.91 11.29 1.71 FGL 7.22 8.07 1.56 FGL 0.18 4.85 1.88 RVE 4.31 3.86 2.15 RVE 9.90 7.61 7.05 0.90 5.00 0.00 0.00 5.00 0.00 0.05GAESCO SMALL CAPS FIM –11.69 15.60 0.00 RVE 26.01 13.86 0.00 RVE 14.46 13.25 0.00 RVE 11.88 10.91 0.01 RVE 42.50 13.77 –22.76 2.25 0.00 0.00 0.00 0.00 0.00 0.10GENERAL BOLSA FIM –6.67 31.18 0.01 RVE 13.64 18.03 0.01 RVE –0.65 13.27 0.01 RVE 6.97 7.52 0.01 RVE 12.71 19.54 –25.21 2.25 0.00 0.00 0.00 0.00 0.00 0.10GREEN FUND FIM –12.59 35.38 0.50 RVE 18.74 21.73 0.11 RVE 0.06 16.34 0.16 RVE 14.33 13.36 0.32 RVE 18.74 23.35 –34.65 1.00 0.00 0.00 0.00 1.00 0.00 0.15HSBC EUROPA ACCIONES FIM –16.76 30.57 0.00 RVE 13.26 18.39 0.00 RVE 0.45 12.84 0.00 RVE 9.24 11.39 0.00 RVE 3.46 19.88 –25.09 2.00 0.00 0.00 0.00 0.00 0.00 0.07IBERAGENTES POPULAR BOL.EUROPA FIM –14.68 37.24 0.00 RVE 17.40 23.67 0.00 RVE –1.55 18.40 0.00 RVE 13.63 14.49 0.00 RVE 12.05 25.04 –23.35 2.25 0.00 0.00 0.00 0.00 0.00 0.10INGENIEROS EUROP.DJ FIM –13.87 42.60 0.04 RVE 19.97 28.79 0.02 RVE –1.61 19.75 0.01 RVE 13.48 17.73 0.06 RVE 15.36 28.97 –22.88 2.25 0.00 0.00 0.00 0.00 0.00 0.20INTERMONEY VARIABLE EURO FIM –7.34 34.52 0.00 RVE 16.67 25.19 0.00 RVE –0.95 19.37 0.00 RVE 14.02 15.00 0.01 RVE 22.11 24.64 NA 0.95 0.00 0.00 0.00 0.00 0.00 0.17INTERVALOR ACC.INT. FIM –9.66 34.13 0.00 RVE 26.92 18.90 0.00 RVE 5.24 5.89 0.00 RVE 1.24 8.98 0.01 RVE 22.15 20.30 –30.11 1.35 9.00 0.00 0.00 0.00 0.00 0.15LAIETANA BOLSA FIM –7.37 32.95 0.45 RVE 22.24 21.69 0.23 RVE 0.19 16.89 0.00 RVE 14.02 13.37 0.00 RVE 29.35 22.52 –37.30 2.00 0.00 0.00 0.00 3.00 0.00 0.02LIBERTY EUROPEAN STOCK
MARKET FIM –15.02 40.58 0.00 RVE 20.33 26.41 0.00 RVE –1.39 19.55 0.00 RVE 14.65 16.34 0.01 RVE 15.60 27.42 NA 2.25 0.00 0.00 0.00 0.00 0.00 0.10LUSO EUROPA FIM –13.14 37.57 1.30 RVE 19.96 24.26 0.19 RVE –0.94 17.41 0.18 RVE 14.55 15.67 0.14 RVE 18.24 25.30 NA 2.25 0.00 0.00 0.00 3.00 0.00 0.03MEDIVALOR EUROPEO FIM –12.30 28.93 0.00 RVE 8.09 21.94 0.01 RVE –3.94 20.36 0.00 RVE 15.77 17.74 0.00 RVE 5.42 22.70 –31.30 2.25 0.00 0.00 0.00 0.00 0.00 0.07MID CAPS EURO INSTITUCIONALES FIMS –8.67 17.48 0.00 RVE 19.88 13.47 0.00 RVE 8.54 11.57 0.00 RVE 7.25 9.42 0.01 RVE 27.45 13.45 52.53 0.30 0.00 0.00 0.00 0.00 0.00 0.00MORGAN STANLEY BOLSAPLUS FIM –14.65 34.51 0.00 RVE 19.71 23.73 0.00 RVE 0.55 18.08 0.00 RVE 13.39 14.56 0.01 RVE 16.49 24.03 –22.87 1.25 0.00 1.00 1.00 0.00 0.00 0.02MORGAN STANLEY EURO INDICE FIM –14.58 39.80 0.00 RVE 20.44 25.22 0.00 RVE –0.95 19.25 0.00 RVE 15.21 15.73 0.00 RVE 17.41 26.70 –12.42 1.00 0.00 0.00 0.00 0.00 0.00 0.10MULTIFONDO EFICIENTE FIMF –4.45 21.00 0.00 RVE 18.58 16.60 0.00 RVE 4.11 11.87 0.00 RVE 10.89 10.80 0.01 RVE 30.80 15.65 46.56 0.75 0.00 3.00 0.00 0.00 0.00 0.10MUTUAFONDO VALORES FIM –1.63 11.94 0.01 RVE 16.74 9.31 0.01 RVE 6.23 9.28 0.01 RVE 11.36 8.04 0.00 RVE 35.84 9.82 25.08 0.30 0.00 0.00 0.00 0.00 0.00 0.06NAVARRA ACCIONES FIM –9.25 32.40 0.00 RVE 15.33 20.54 0.00 RVE 1.57 16.81 0.00 RVE 11.55 13.96 0.01 RVE 18.59 22.09 –31.84 2.00 0.00 0.00 0.00 0.00 0.00 0.12PENTAFONDO VARIABLE FIM –8.07 28.95 0.00 RVE 14.08 18.82 0.00 RVE –1.59 15.34 0.00 RVE 13.70 12.44 0.00 RVE 17.35 19.93 –30.58 2.00 0.00 0.00 0.00 0.00 0.00 0.11PREMIUM GLOBAL DINAMICO EURO FIM NA NA NA NA 2.71 0.00 RVE –0.44 0.13 0.01 RVE 2.20 7.72 0.01 RVE NA 5.14 NA 2.00 0.00 0.00 0.00 2.00 0.00 0.20PREVIBOLSA FIM –13.98 34.15 0.00 RVE 19.73 23.43 0.00 RVE 0.78 17.97 0.00 RVE 13.66 14.49 0.01 RVE 17.97 23.79 –15.80 0.20 0.00 0.00 0.00 0.00 0.00 0.10PROFIT BOLSA FIM NA NA NA NA 4.73 0.00 RVE –1.30 8.58 0.01 RVE 9.32 9.45 0.00 RVE NA 8.33 NA 1.00 5.00 0.00 0.00 0.00 0.00 0.05PRUDFONDO VARIABLE FIM –16.46 30.20 0.00 RVE 17.33 22.73 0.00 RVE 0.41 18.00 0.00 RVE 12.67 14.50 0.00 RVE 10.88 22.27 NA 1.50 0.00 0.00 0.00 0.00 0.00 0.15
(Continues over)
(Continued)

276
Annual rep
ort o
n th
e securities m
arket. 2003
A.4.8.Investment in securities. FIM. Yields, volatility and duration
1Q 2Q 3Q 4Q 2003
Yield Vol Dur Yield Vol Dur Yield Vol Dur Yield Vol Dur Yield Vol(1) (2) Type (1) (2) Type (1) (2) Type (1) (2) Type (1)% % % % %
% fees
Management Front end Back endCustody
of assets of yield Max. Min. Max. Min.
Yieldsince1996
Euro equity FIM (RVE)
RENTA 4 EUROBOLSA FIM –13.04 37.77 0.00 RVE 17.67 26.60 0.00 RVE –0.89 19.45 0.00 RVE 13.26 16.86 0.01 RVE 14.87 26.48 –45.39 1.85 0.00 0.00 0.00 0.00 0.00 0.13RURAL EURO RV FIM –14.16 34.96 0.00 RVE 19.65 22.07 0.00 RVE –1.02 16.32 0.00 RVE 11.13 13.63 0.01 RVE 12.96 23.32 NA 2.25 0.00 0.00 0.00 3.00 0.00 0.20SAFEI BOLSA EURO FIM –14.69 36.54 0.01 RVE 18.17 24.47 0.01 RVE –1.22 18.27 0.01 RVE 14.31 14.92 0.01 RVE 13.83 25.02 –30.76 2.25 0.00 0.00 0.00 0.00 0.00 0.15SCH BOLSA EURO FIM –9.04 32.01 0.01 RVE 15.65 18.79 0.00 RVE –1.45 16.43 0.00 RVE 12.56 12.35 0.01 RVE 16.69 21.24 –41.37 1.50 0.00 0.00 0.00 0.00 0.00 0.07SCH EUROACCIONES 150 FIM –23.51 60.88 0.00 RVE 30.95 40.49 0.00 RVE –2.18 29.30 0.00 RVE 21.85 25.03 0.01 RVE 19.39 41.43 NA 2.00 0.00 0.00 0.00 3.00 0.00 0.10SCH EUROACCIONES FIM –14.41 38.53 0.00 RVE 19.83 24.02 0.00 RVE –1.45 18.06 0.00 RVE 14.03 14.68 0.02 RVE 15.26 25.57 –33.42 2.25 0.00 0.00 0.00 1.00 0.00 0.20SEGURFONDO MID–CAPS FIMF –7.54 10.71 0.01 RVE 10.16 9.42 0.01 RVE 11.85 14.48 0.01 RVE 2.64 11.80 0.01 RVE 16.93 11.87 NA 1.25 0.00 0.00 0.00 0.00 0.00 0.20SGAM MID CAPS EURO FIMP –9.01 18.31 0.00 RVE 20.85 14.02 0.00 RVE 9.00 12.02 0.00 RVE 7.63 9.80 0.01 RVE 29.01 14.03 NA 0.30 0.00 0.00 0.00 0.00 0.00 0.15TARRAGONAFONS 4 FIM –12.68 33.22 3.16 RVE 18.59 22.13 0.73 RVE –0.75 17.01 0.01 RVE 13.71 14.22 0.01 RVE 16.86 22.90 –6.61 1.75 0.00 0.00 0.00 0.00 0.00 0.20UNIFOND EUROBOLSA FIM –10.96 29.18 0.00 RVE 14.31 15.67 7.46 RVE 0.00 8.82 6.69 RVE 10.80 11.16 1.02 RVE 12.77 18.07 NA 2.00 0.00 0.00 0.00 0.00 0.00 0.20URQUIJO CRECIMIENTO FIM –7.31 27.33 0.00 RVE 14.68 17.12 0.00 RVE –0.45 13.67 0.00 RVE 12.22 12.26 0.01 RVE 18.74 18.59 –34.94 2.25 0.00 0.00 0.00 2.00 2.00 0.10URQUIJO DIVIDENDO FIM NA NA NA NA 7.63 0.00 RVE –2.36 5.21 0.00 RVE 10.35 7.30 0.01 RVE NA 6.38 NA 1.75 0.00 0.00 0.00 2.00 2.00 0.20VITAL BOLSA INDICE FIM NA 45.15 0.00 RVE 18.33 24.64 0.00 RVE –1.56 18.42 0.00 RVE 14.04 15.06 0.01 RVE NA 24.10 NA 1.50 0.00 0.00 0.00 0.00 0.00 0.05ZARAGOZANO R.V. FIM –9.87 25.01 1.06 RVE 15.63 16.95 1.23 RVE 0.95 13.64 0.52 RVE 10.19 10.93 0.78 RVE 15.93 17.52 –32.38 2.00 0.00 0.00 0.00 2.00 0.00 0.10
(Continues over)
(Continued)

277
Annex 4
: Collective in
vestmen
t schem
es and ven
ture cap
ital com
pan
iesA.4.8.Investment in securities. FIM. Yields, volatility and duration
1Q 2Q 3Q 4Q 2003
Yield Vol Dur Yield Vol Dur Yield Vol Dur Yield Vol Dur Yield Vol(1) (2) Type (1) (2) Type (1) (2) Type (1) (2) Type (1)% % % % %
% fees
Management Front end Back endCustody
of assets of yield Max. Min. Max. Min.
Yieldsince1996
Foreign equity EuropeFIM (RVIE)
AC EUROFONDO FIM –9.91 26.48 0.00 RVIE 18.09 18.78 0.00 RVIE 2.06 15.79 0.00 RVIE 5.99 14.78 0.00 RVIE 15.08 19.57 –30.50 2.00 0.00 0.00 0.00 1.00 0.00 0.09ALTAE BOLSA ACTIVA FIM –8.99 33.53 0.00 RVIE 21.38 23.14 0.00 RVIE –0.40 15.57 0.00 RVIE 8.63 12.49 0.01 RVIE 19.53 22.72 NA 1.25 0.00 0.00 0.00 0.00 0.00 0.03BANIF ABN AMRO RV EUROPA
CREC. FIM –9.11 16.88 0.00 RVIE 12.31 18.00 0.00 RVIE 1.16 14.58 0.00 RVIE 8.66 13.20 0.01 RVIE 12.21 15.86 –20.72 2.25 0.00 0.00 0.00 1.00 0.00 0.20BANIF DIVIDENDO FIM NA NA NA NA NA NA NA 9.31 0.00 RVIE 10.52 9.66 0.01 RVIE NA 9.58 NA 1.35 9.00 0.00 0.00 0.00 0.00 0.20BANIF GOLDMAN S.RV EUROPA
VALOR FIM –7.38 20.81 0.00 RVM 7.73 16.90 0.00 RVIE 1.51 14.42 0.00 RVIE 10.43 12.17 0.00 RVIE 11.85 16.42 –16.14 2.25 0.00 0.00 0.00 0.00 0.00 0.20BANIF INVESCO RV EUROPA FIM –13.59 28.58 0.00 RVIE 15.58 19.68 0.00 RVIE 0.15 14.82 0.00 RVIE 8.37 12.53 0.00 RVIE 8.39 19.95 NA 2.25 0.00 0.00 0.00 0.00 0.00 0.20BANKPYME EUROTOP FIM –13.70 33.42 0.00 RVIE 15.98 22.17 0.00 RVIE 0.11 14.95 0.00 RVIE 10.29 11.93 0.00 RVIE 10.51 22.27 –25.47 1.35 9.00 0.25 0.25 1.50 0.50 0.20BANKPYME SWISS FIM –14.83 29.93 0.00 RVIE 20.33 20.23 4.57 RVIE 9.38 15.05 3.47 RVIE 11.12 11.93 1.08 RVIE 24.56 20.57 6.04 2.00 0.00 1.00 1.00 1.00 1.00 0.15BARCLAYS BOLSA EUROPA FIM –13.47 35.59 0.00 RVIE 16.83 24.67 0.00 RVIE 1.35 17.67 0.00 RVIE 12.44 14.89 0.01 RVIE 15.19 24.59 –21.21 1.50 0.00 0.00 0.00 2.50 0.00 0.20BBVA BOLSA EUROPA FIM –12.37 32.34 0.01 RVIE 13.85 19.93 0.01 RVIE –0.43 14.65 0.01 RVIE 10.06 13.36 0.00 RVIE 9.33 21.46 –26.09 2.25 0.00 0.00 0.00 2.00 0.00 0.20BBVA CRECIMIENTO EUROPA FIM –12.34 31.10 0.01 RVIE 14.15 20.26 0.01 RVIE –2.01 14.70 0.00 RVIE 11.35 13.10 0.00 RVIE 9.17 21.06 –25.42 2.25 0.00 0.00 0.00 2.00 0.00 0.20BBVA MID CAP EUROPA FIM –11.43 26.20 0.01 RVIE 15.80 18.14 0.01 RVIE 3.59 14.38 0.01 RVIE 9.09 12.00 0.01 RVIE 15.91 18.55 NA 2.25 0.00 0.00 0.00 2.00 0.00 0.20BBVA OPORTUNIDADES EUROPA FIM –11.78 33.41 0.01 RVIE 15.50 20.29 0.01 RVIE 0.17 14.67 0.00 RVIE 10.22 13.03 0.00 RVIE 12.50 21.90 7.62 2.25 0.00 0.00 0.00 2.00 0.00 0.20BBVA SMALL CAPS EUROPA FIM –11.37 14.72 0.00 RVIE 25.59 12.63 0.00 RVIE 11.34 9.43 0.00 RVIE 7.12 7.81 0.00 RVIE 32.75 11.74 NA 2.25 0.00 0.00 0.00 2.00 0.00 0.10BETA EUROPYME ACC. FIM –9.68 15.80 0.00 RVIE 20.94 12.44 0.00 RVIE 9.67 10.65 0.00 RVIE 9.02 10.17 0.01 RVIE 30.60 12.64 17.32 2.25 0.00 0.00 0.00 1.50 1.50 0.12BK DIVIDENDO FIM –2.67 20.50 0.00 RVN 14.39 15.24 0.01 RVN 2.20 12.46 0.01 RVIE 10.31 8.53 0.00 RVIE 25.52 14.86 NA 1.15 0.00 0.00 0.00 1.00 0.00 0.03BK RV EUROPEA FIM –14.90 38.01 0.01 RVIE 21.20 29.93 0.00 RVIE 0.09 23.18 0.01 RVIE 16.84 19.00 0.01 RVIE 20.62 28.54 –14.80 2.00 0.00 0.00 0.00 0.00 0.00 0.05BK SECTOR TELECOMUNICACIONES FIM –8.61 28.62 0.00 RVIE 12.67 18.84 0.00 RVIE 0.86 14.81 0.01 RVIE 11.54 13.89 0.01 RVIE 15.84 19.94 NA 1.15 0.00 0.00 0.00 1.00 1.00 0.01BNP PARIBAS ACCIONES EUROPEAS FIM –13.54 28.91 0.00 RVIE 11.76 18.53 0.00 RVIE 0.14 13.39 0.00 RVIE 8.71 11.30 0.00 RVIE 5.18 19.32 –1.11 1.25 9.00 0.00 0.00 0.00 0.00 0.00CAHISPA EUROVARIABLE FIM –16.08 39.81 0.16 RVIE 23.73 28.53 3.02 RVIE 6.87 19.73 0.20 RVIE 11.59 16.03 2.73 RVIE 23.83 27.67 NA 2.25 0.00 0.00 0.00 0.00 0.00 0.10CAM EUROPA CONVERGENTE FIMF –2.66 5.68 0.01 RVIE 4.70 7.78 0.00 RVIE 13.02 12.58 0.01 RVIE 1.89 10.13 0.01 RVIE 17.36 9.49 NA 1.75 0.00 0.00 0.00 2.00 2.00 0.10DWS EUROPA BOLSA FIM –14.02 33.42 0.00 RVIE 19.82 22.95 0.00 RVIE 1.91 17.09 0.00 RVIE 10.32 13.75 0.01 RVIE 15.82 23.12 –25.65 2.00 0.00 0.00 0.00 0.00 0.00 0.10DWS WINFONDO FIM –11.22 32.43 0.00 RVIE 15.92 20.62 0.00 RVIE 1.34 15.37 0.00 RVIE 10.86 13.90 0.01 RVIE 15.62 21.86 –28.43 2.25 0.00 0.00 0.00 0.00 0.00 0.00EUROVALOR EUROPA FIMF –12.93 23.08 0.00 RVIE 15.70 13.25 0.00 RVIE 3.17 8.37 0.00 RVIE 7.11 8.24 0.00 RVIE 11.33 14.65 NA 1.35 9.00 0.00 0.00 0.00 0.00 0.15FONCAIXA 43 BOLSA EUROPA FIMS –12.61 33.00 0.00 RVIE 13.85 21.46 0.00 RVIE –0.17 15.05 0.00 RVIE 10.28 12.71 0.00 RVIE 9.53 22.04 –23.84 2.25 0.00 0.00 0.00 4.00 0.00 0.15FONCAIXA 66 SUIZA FIM –13.00 32.64 0.00 RVIE 12.77 21.18 0.00 RVIE 5.00 15.16 0.00 RVIE 6.63 11.65 0.01 RVIE 9.85 21.70 NA 2.25 0.00 0.00 0.00 4.00 0.00 0.15FONCAIXA 94 F. BOLSA EUROPA FIMF –14.45 23.79 0.00 RVIE 16.20 18.03 0.00 RVIE 1.65 12.54 0.00 RVIE 9.50 9.83 0.01 RVIE 10.66 17.04 NA 1.35 9.00 0.00 0.00 4.00 0.00 0.15FONCAIXA BOLSA 54 FIM –11.71 30.33 0.00 RVIE 10.18 19.84 0.00 RVIE 1.46 13.99 0.00 RVIE 8.08 12.31 0.00 RVIE 6.68 20.39 –25.92 2.25 0.00 0.00 0.00 4.00 0.00 0.15FONCAIXA BOLSA EUROPA FIMP NA 32.67 0.00 RVIE 15.30 22.66 0.00 RVIE 0.35 15.89 0.00 RVIE 11.54 13.42 0.00 RVIE NA 21.52 NA 0.00 0.00 0.00 0.00 0.00 0.00 0.00FONDMAPFRE BOLSA EUROPA FIM –12.11 32.51 0.00 RVIE 14.21 22.01 0.00 RVIE –0.28 15.61 0.00 RVIE 10.52 12.85 0.00 RVIE 10.62 22.11 –26.83 2.25 0.00 0.00 0.00 1.50 0.00 0.20FONPASTOR ACCIONES EUROPEAS FIM –10.17 25.78 0.01 RVIE 12.64 17.74 0.00 RVIE 1.22 14.81 0.00 RVIE 10.52 13.76 0.00 RVIE 13.20 18.68 NA 1.75 0.00 0.00 0.00 0.00 0.00 0.16IBERCAJA BOLSA EUROPA FIM –13.90 35.20 0.01 RVIE 18.64 23.17 0.01 RVIE 1.02 15.87 0.01 RVIE 12.48 13.72 0.01 RVIE 16.08 23.60 –23.57 1.50 0.00 0.00 0.00 2.00 0.00 0.20IBERCAJA SECTOR INMOBILIARIO FIM 0.01 10.66 0.00 RVIE 9.42 7.64 0.00 RVIE 5.37 7.86 0.00 RVIE 12.19 8.13 0.00 RVIE 29.37 8.70 NA 1.90 0.00 0.00 0.00 2.00 0.00 0.20IBERCAJA UTILITIES FIM –4.46 19.97 0.00 RVIE 14.42 12.97 0.00 RVIE –0.38 9.62 0.00 RVIE 9.71 7.24 0.00 RVIE 19.48 13.39 NA 1.90 0.00 0.00 0.00 2.00 0.00 0.20KUTXAVALOREURO FIM –12.89 34.40 0.01 RVIE 14.66 21.83 0.01 RVIE –0.57 15.40 0.01 RVIE 10.71 13.86 0.01 RVIE 9.94 22.89 –32.83 2.25 0.00 0.00 0.00 2.00 0.00 0.06MADRID BOLSA EUROPEA FIM –12.58 30.40 0.00 RVIE 14.32 20.62 0.00 RVIE –0.26 15.57 0.00 RVIE 11.45 13.61 0.01 RVIE 11.08 21.14 –25.30 1.80 0.00 0.00 0.00 4.00 0.00 0.12MORGAN STANLEY EURO ACCIONES FIM –14.09 31.62 0.00 RVIE 15.75 21.30 0.00 RVIE 1.41 16.18 0.00 RVIE 11.38 13.09 0.01 RVIE 12.31 21.79 –17.93 1.75 0.00 0.00 0.00 0.00 0.00 0.15MORGAN STANLEY EURO SELECCION FIM –7.36 19.19 0.00 RVIE 17.32 15.04 0.00 RVIE 4.75 14.11 0.00 RVIE 10.74 10.49 0.01 RVIE 26.07 15.12 1.03 2.25 0.00 0.00 0.00 0.00 0.00 0.15SABADELL BS ACCIONES EUROPA FIMP –14.85 37.82 0.01 RVIE 16.46 23.64 0.01 RVIE –0.35 18.19 0.01 RVIE 13.46 15.95 0.00 RVIE 12.11 25.42 NA 0.00 0.00 0.00 0.00 0.00 0.00 0.10SABADELL BS EUROPA BOLSA FIMS –14.57 36.10 0.01 RVIE 15.22 22.74 0.01 RVIE –0.81 17.46 0.01 RVIE 12.34 15.32 0.01 RVIE 9.68 24.34 –42.81 1.90 0.00 0.00 0.00 0.00 0.00 0.10SAFEI EUROPA FIMF –11.00 24.75 0.01 RVIE 14.16 16.29 0.01 RVIE 1.24 10.88 0.01 RVIE 8.69 10.06 0.01 RVIE 11.79 16.62 –17.23 1.75 0.00 0.00 0.00 0.00 0.00 0.15SCH ACCIONES EUROPEAS FIM –12.43 32.13 0.00 RVE 15.00 19.85 0.00 RVE 0.98 15.31 0.00 RVE 10.69 12.97 0.01 RVIE 12.56 21.42 –22.41 2.05 0.00 0.00 0.00 1.00 0.00 0.20SCH ACCIONES EUROPEAS PLUS FIM –12.38 31.62 0.00 RVE 16.11 20.44 0.00 RVE 1.14 15.74 0.00 RVE 11.45 13.33 0.01 RVIE 14.68 21.52 NA 1.15 0.00 0.00 0.00 3.00 0.00 0.10SCH CUANTITATIVO EUROPA FIM 3.51 35.22 0.01 RVE 12.64 23.23 0.01 RVE 12.16 21.46 0.00 RVIE 10.52 14.28 0.01 RVIE 44.53 24.66 NA 1.90 0.00 0.00 0.00 0.00 0.00 0.10SCH DIVIDENDO EUROPA FIM –12.29 27.02 0.00 RVIO 12.82 15.02 0.00 RVIE 1.33 10.01 0.00 RVIE 9.74 8.75 0.01 RVIE 10.03 16.88 NA 1.90 0.00 0.00 0.00 3.00 0.00 0.10SCH EUROINDICE FIM –12.94 34.86 0.00 RVIE 15.41 22.79 0.00 RVIE –0.01 16.54 0.00 RVIE 11.35 13.99 0.01 RVIE 11.88 23.51 –18.58 0.90 0.00 0.00 0.00 1.00 0.00 0.10SCH SELECCION FONDOS
EUROPA FIMFP –11.23 21.28 0.00 RVE 16.18 14.01 0.00 RVE 1.19 10.66 0.00 RVE 10.59 9.28 0.01 RVIE 15.40 14.68 NA 0.32 0.00 5.00 5.00 5.00 5.00 0.09
(Continues over)
(Continued)

278
Annual rep
ort o
n th
e securities m
arket. 2003
A.4.8.Investment in securities. FIM. Yields, volatility and duration
1Q 2Q 3Q 4Q 2003
Yield Vol Dur Yield Vol Dur Yield Vol Dur Yield Vol Dur Yield Vol(1) (2) Type (1) (2) Type (1) (2) Type (1) (2) Type (1)% % % % %
% fees
Management Front end Back endCustody
of assets of yield Max. Min. Max. Min.
Yieldsince1996
Foreign equity EuropeFIM (RVIE)
SCH SMALL CAPS EUROPA FIM –7.83 16.68 0.00 RVE 21.41 12.75 0.00 RVE 7.23 10.60 0.00 RVIE 8.12 9.21 0.01 RVIE 29.74 12.77 NA 2.10 0.00 0.00 0.00 3.00 0.00 0.10SCH TOP 25 EUROPA FIM –12.93 35.04 0.00 RVIE 19.81 23.32 0.00 RVIE 1.97 15.88 0.00 RVIE 12.54 12.79 0.01 RVIE 19.71 23.44 NA 1.90 0.00 0.00 0.00 3.00 0.00 0.10SEGURFONDO DINAMICO EUROPA FIM –12.30 29.90 0.01 RVIE 12.98 19.67 0.01 RVIE –0.65 14.70 0.01 RVIE 10.34 12.50 0.01 RVIE 8.62 20.38 NA 1.00 0.00 0.00 0.00 0.00 0.00 0.20URQUIJO EUROBOL. 50 FIM –11.63 32.88 0.00 RVIE 14.35 20.47 0.00 RVIE –0.72 13.50 0.00 RVIE 9.73 12.40 0.00 RVIE 10.08 21.45 –20.60 1.00 9.00 0.00 0.00 0.00 0.00 0.12URQUIJO EUROP. SMALLCOMPANIES FIMF –10.62 11.42 0.00 RVIE 17.12 9.42 0.00 RVIE 6.58 8.63 0.00 RVIE 7.52 6.40 0.01 RVIE 19.97 9.36 NA 1.70 0.00 0.00 0.00 1.00 1.00 0.10VENTURE BOLSA EUROPEA FIM NA 25.24 0.00 RVIE 16.10 19.19 0.00 RVIE 1.70 14.22 0.00 RVIE 10.96 12.27 0.01 RVIE NA 18.19 NA 2.00 0.00 0.00 0.00 0.00 0.00 0.12
(Continues over)
(Continued)

279
Annex 4
: Collective in
vestmen
t schem
es and ven
ture cap
ital com
pan
ies
A.4.8.Investment in securities. FIM. Yields, volatility and duration
1Q 2Q 3Q 4Q 2003
Yield Vol Dur Yield Vol Dur Yield Vol Dur Yield Vol Dur Yield Vol(1) (2) Type (1) (2) Type (1) (2) Type (1) (2) Type (1)% % % % %
% fees
Management Front end Back endCustody
of assets of yield Max. Min. Max. Min.
Yieldsince1996
Foreign equity Japan FIM (RVIJ)
BANCAJA RENTA VARIABLE JAPON FIM –13.35 19.35 0.00 RVIJ 4.83 18.44 0.00 RVIJ 17.65 22.77 0.00 RVIJ 0.68 23.21 0.01 RVIJ 7.60 21.19 NA 2.23 0.00 0.00 0.00 1.50 0.00 0.20BANESTO BOLSA JAPON FIM –12.08 21.82 0.00 RVIJ 5.32 20.32 0.00 RVIJ 18.15 24.04 0.00 RVIJ 0.13 26.21 0.01 RVIJ 9.55 23.33 NA 2.25 0.00 0.00 0.00 3.00 0.00 0.15BANIF JPMORGAN FLEMING RV
JAPON FIM –11.93 20.97 0.00 RVIJ 6.34 20.45 0.00 RVIJ 20.26 23.40 0.00 RVIJ –0.61 25.96 0.01 RVIJ 11.94 22.94 –24.86 2.25 0.00 0.00 0.00 1.00 0.00 0.20BBK BOLSA JAPON FIM –10.07 26.33 0.40 RVIJ 9.07 20.18 0.40 RVIJ 17.96 24.97 0.50 RVIJ –0.11 30.40 0.44 RVIJ 15.58 25.83 NA 1.65 0.00 0.00 0.00 0.00 0.00 0.10BBVA BOLSA JAPON FIM –13.23 20.74 5.91 RVIJ 5.48 20.07 5.99 RVIJ 18.00 24.24 0.00 RVIJ –0.49 27.08 0.00 RVIJ 7.48 23.34 NA 2.25 0.00 0.00 0.00 2.00 0.00 0.20BBVA INDICE JAPON PLUS FIM –5.51 20.84 0.44 RVIJ 15.32 16.82 0.17 RVIJ 13.45 20.23 0.10 RVIJ 3.03 25.94 0.05 RVIJ 27.36 21.29 –43.57 0.80 0.00 1.00 0.00 2.00 0.00 0.20BK INDICE JAPON FIM –4.36 21.51 0.00 RVIJ 14.80 16.45 0.00 RVIJ 12.48 19.31 0.01 RVIJ 1.19 25.40 0.01 RVIJ 24.97 20.99 NA 0.60 0.00 0.00 0.00 2.00 2.00 0.09BNP PARIBAS ACCIONES
JAPONESAS FIM –10.88 21.12 0.00 RVIJ 7.39 19.89 0.00 RVIJ 18.12 21.70 0.00 RVIJ –1.84 24.91 0.00 RVIJ 10.96 22.10 –22.17 1.00 9.00 0.00 0.00 0.00 0.00 0.00CAIXA CATALUNYA BORSA JAPO FIM –11.64 23.19 0.00 RVIJ 13.02 22.08 0.00 RVIJ 19.09 27.28 0.00 RVIJ –4.55 30.33 0.01 RVIJ 13.52 26.08 NA 1.35 9.00 0.00 0.00 0.00 0.00 0.15CAJA LABORAL BOLSA JAPON FIMF –4.75 10.56 0.00 RVIJ 11.11 9.49 0.00 RVIJ 13.14 11.90 0.00 RVIJ 3.53 15.89 0.01 RVIJ 23.96 12.30 NA 2.25 0.00 0.00 0.00 1.00 0.00 0.05DEXIA IBERAG.JAPON FIM –12.30 21.62 0.00 RVIJ 3.91 21.13 0.00 RVIJ 17.67 25.22 0.00 RVIJ –2.15 26.79 0.00 RVIJ 4.92 23.93 NA 2.25 0.00 0.00 0.00 0.00 0.00 0.10EUROVALOR JAPON FIMF –9.26 17.03 0.00 RVIJ 5.97 15.66 0.00 RVIJ 22.66 19.91 0.00 RVIJ –0.21 23.81 0.00 RVIJ 17.71 19.51 NA 1.35 9.00 0.00 0.00 0.00 0.00 0.15FONCAIXA BOLSA 55 FIM –11.28 23.20 0.00 RVIJ 5.73 20.19 0.00 RVIJ 19.09 25.60 0.00 RVIJ –1.23 29.14 0.01 RVIJ 10.34 24.87 –22.81 2.25 0.00 0.00 0.00 4.00 0.00 0.15FONDESPAÑA JAPON FIM –12.21 21.38 0.01 RVIJ 4.88 19.45 0.01 RVIJ 15.39 24.40 0.01 RVIJ –2.48 23.86 0.02 RVIJ 3.61 22.47 NA 1.75 0.00 0.00 0.00 0.00 0.00 0.15FONPENEDES B. JAPO FIM –7.65 23.12 0.00 RVIJ 9.43 20.58 0.01 RVIJ 24.69 26.77 0.01 RVIJ 2.25 28.86 0.02 RVIJ 28.85 25.16 NA 2.25 0.00 0.00 0.00 0.00 0.00 0.00IBERCAJA JAPON FIM –6.20 20.03 0.01 RVIJ 12.30 15.55 0.01 RVIJ 11.22 26.37 0.01 RVIJ 3.96 26.27 0.01 RVIJ 21.78 22.60 NA 1.90 0.00 0.00 0.00 2.00 0.00 0.20KUTXAVALORJAPON FIM –9.97 23.83 1.44 RVIJ 7.97 18.90 1.12 RVIJ 19.26 26.98 1.16 RVIJ –1.30 29.11 0.96 RVIJ 14.42 25.12 NA 2.25 0.00 0.00 0.00 2.00 0.00 0.03MADRID BOLSA JAPONESA FIM –10.33 21.14 0.00 RVIJ 8.28 19.42 0.00 RVIJ 21.66 24.92 0.00 RVIJ –1.75 26.63 0.01 RVIJ 16.06 23.35 NA 2.00 0.00 0.00 0.00 4.00 0.00 0.05RENTA 4 JAPON FIM –6.41 20.26 0.00 RVIJ 13.87 17.13 0.00 RVIJ 10.67 23.70 0.00 RVIJ –1.03 30.50 0.01 RVIJ 16.72 23.52 –9.02 1.35 9.00 0.00 0.00 0.00 0.00 0.13SABADELL BS ACCIONES JAPON FIMP –13.37 23.16 0.01 RVIJ 4.98 20.61 0.01 RVIJ 15.84 24.72 0.01 RVIJ –0.48 26.41 0.01 RVIJ 4.84 23.94 NA 0.00 0.00 0.00 0.00 0.00 0.00 0.15SABADELL BS JAPON BOLSA FIMS –13.19 22.14 0.01 RVIJ 4.31 19.77 0.01 RVIJ 14.68 23.80 0.01 RVIJ –0.88 25.37 0.01 RVIJ 2.92 22.97 NA 1.75 0.00 0.00 0.00 0.00 0.00 0.05SAFEI JAPON FIMF –10.41 13.53 0.01 RVIJ 3.87 13.69 0.01 RVIJ 16.55 18.70 0.01 RVIJ –2.73 20.97 0.01 RVIJ 5.50 17.17 –17.60 1.75 0.00 0.00 0.00 0.00 0.00 0.15SCH JAPON FIM –12.09 21.75 0.00 RVIJ 6.01 20.16 0.00 RVIJ 18.43 24.34 0.00 RVIJ 0.42 26.76 0.01 RVIJ 10.83 23.51 NA 2.25 0.00 0.00 0.00 3.00 0.00 0.15SCH SELECCION JAPON FIMF –12.16 21.73 0.00 RVIJ 7.12 21.09 0.01 RVIJ 17.76 20.87 0.00 RVIJ –0.35 22.98 0.01 RVIJ 10.41 21.80 NA 2.20 0.00 0.00 0.00 3.00 0.00 0.10
(Continues over)
(Continued)

280
Annual rep
ort o
n th
e securities m
arket. 2003
A.4.8.Investment in securities. FIM. Yields, volatility and duration
1Q 2Q 3Q 4Q 2003
Yield Vol Dur Yield Vol Dur Yield Vol Dur Yield Vol Dur Yield Vol(1) (2) Type (1) (2) Type (1) (2) Type (1) (2) Type (1)% % % % %
% fees
Management Front end Back endCustody
of assets of yield Max. Min. Max. Min.
Yieldsince1996
Foreign equity USA FIM (RVIU)
AC USA FIM –6.65 27.13 0.00 RVIU 9.18 18.64 0.00 RVIU 0.12 19.21 0.00 RVIU 2.42 14.08 0.00 RVIU 4.51 20.31 NA 2.25 0.00 0.00 0.00 1.00 0.00 0.09ATLANTICO NORTEAMERICA FIM –2.76 19.21 0.00 RVIU 10.04 13.53 0.00 RVIU 1.81 13.87 0.00 RVIU 5.00 10.49 0.01 RVIU 14.40 14.62 NA 2.00 0.00 0.00 0.00 2.00 0.00 0.20BANCAJA RV ESTADOS UNIDOS FIM –7.67 25.45 0.00 RVIU 8.19 17.53 0.00 RVIU 2.54 19.06 0.00 RVIU 3.92 14.63 0.01 RVIU 6.45 19.58 –28.13 2.23 0.00 0.00 0.00 1.50 0.00 0.20BANESTO BOLSA USA FIM –6.86 28.25 0.01 RVIU 9.16 19.73 0.01 RVIU –3.54 18.59 0.00 RVIU 2.39 15.92 0.01 RVIU 0.41 21.13 NA 2.25 0.00 0.00 0.00 3.00 0.00 0.15BANIF PIONEER RV USA FIM –13.33 28.11 0.01 RVIO 14.72 21.95 0.00 RVIU 0.47 18.10 0.00 RVIU 3.15 15.48 0.00 RVIU 3.04 21.50 –17.18 2.25 0.00 0.00 0.00 0.00 0.00 0.20BANKPYME US AMERICA FIM –7.13 29.12 0.00 RVIU 7.25 20.96 0.00 RVIU –0.08 17.20 0.00 RVIU 2.22 12.09 0.00 RVIU 1.73 20.77 NA 1.35 9.00 0.25 0.25 1.50 0.50 0.20BARCLAYS BOLSA USA 2 FIMS –3.18 21.56 0.00 RVIU 12.47 14.61 0.00 RVIU 2.08 13.31 0.00 RVIU 10.67 10.04 0.00 RVIU 23.02 15.48 NA 1.60 0.00 0.00 0.00 2.00 0.00 0.15BARCLAYS BOLSA USA FIMP –2.78 22.73 0.01 RVIU 14.70 16.14 0.01 RVIU 2.64 13.79 0.01 RVIU 11.63 10.37 0.01 RVIU 27.75 16.41 NA 0.00 0.00 5.00 0.00 0.00 0.00 0.05BBK BOLSA EEUU FIM –6.88 24.46 0.21 RVIU 8.92 16.37 0.35 RVIU 2.06 16.34 0.23 RVIU 5.24 11.30 0.42 RVIU 8.94 17.76 NA 1.65 0.00 0.00 0.00 0.00 0.00 0.10BBK BOLSA NUEVA ECONOMIA FIM –5.72 27.11 0.00 RVIO 13.91 21.02 0.71 RVIU 6.65 27.91 0.49 RVIU 4.62 21.14 0.47 RVIU 19.81 24.54 NA 1.65 0.00 0.00 0.00 0.00 0.00 0.10BBVA BOLSA USA FIM –7.80 27.56 1.96 RVIU 6.11 19.15 0.01 RVIU –0.50 18.64 0.00 RVIU 1.97 15.10 0.00 RVIU –0.73 20.61 4.64 2.25 0.00 0.00 0.00 2.00 0.00 0.20BBVA INDICE NASDAQ PLUS FIM 3.86 32.29 0.01 RVIU 17.87 23.97 0.01 RVIU 8.95 23.81 0.01 RVIU 11.80 19.58 0.01 RVIU 49.11 25.32 NA 0.80 0.00 1.00 0.00 2.00 0.00 0.20BBVA INDICE USA PLUS FIM –3.11 22.71 0.01 RVIU 13.62 16.53 0.01 RVIU 2.56 13.64 0.01 RVIU 11.20 9.95 0.01 RVIU 25.55 16.40 –4.23 0.80 0.00 1.00 0.00 2.00 0.00 0.20BETA USA ACCIONES FIM –6.45 24.61 0.00 RVIU 6.91 17.27 0.00 RVIU –2.29 17.75 0.00 RVIU –1.33 14.03 0.00 RVIU –3.58 18.81 NA 2.25 0.00 0.00 0.00 0.00 0.00 0.12BI AMERICA FIM –6.98 23.96 0.01 RVIU 9.65 15.59 0.00 RVIU 0.79 15.69 0.01 RVIU 2.79 11.78 0.01 RVIU 5.67 17.34 –36.13 1.35 9.00 0.00 0.00 1.00 0.00 0.00BK INDICE AMERICA FIM –3.39 22.54 0.00 RVIU 14.03 15.21 0.00 RVIU 1.47 14.29 0.01 RVIU 10.95 10.57 0.01 RVIU 24.03 16.27 NA 0.60 0.00 0.00 0.00 0.00 0.00 0.08BK INDICE NASDAQ 100 FIM 2.57 30.53 0.00 RVIU 16.07 21.57 0.00 RVIU 6.97 22.41 0.01 RVIU 13.55 20.64 0.01 RVIU 44.61 24.10 NA 1.15 0.00 0.00 0.00 1.00 0.00 0.10CAIXA CATALUNYA BORSA USA FIM –11.22 26.71 0.00 RVIU 12.37 24.35 0.00 RVIU –2.19 18.91 0.00 RVIU 7.54 14.56 0.01 RVIU 4.94 21.70 NA 1.35 9.00 0.00 0.00 0.00 0.00 0.15CAJA LABORAL BOLSA USA FIMF –2.36 14.48 0.00 RVIU 13.01 11.49 0.00 RVIU 3.80 9.71 0.00 RVIU 9.56 7.44 0.01 RVIU 25.47 11.12 NA 2.25 0.00 0.00 0.00 1.00 0.00 0.05CAM RENTA VARIABLE USA FIMF –3.53 13.67 0.01 RVIU 6.05 11.17 0.01 RVIU 2.66 16.63 0.01 RVIU 1.13 15.26 0.01 RVIU 6.21 14.36 NA 1.75 0.00 0.00 0.00 2.00 2.00 0.10CAN NORTEAMERICA FIMF –5.99 17.03 0.00 RVIU 7.35 13.47 0.00 RVIU 1.91 13.29 0.00 RVIU 3.96 11.55 0.00 RVIU 6.91 14.00 NA 2.25 0.00 0.00 0.00 0.00 0.00 0.15DWS NORTEAMERICA BOLSA FIM –6.59 25.00 0.00 RVIU 7.31 18.32 0.00 RVIU 0.87 17.04 0.00 RVIU 3.56 13.48 0.01 RVIU 4.71 18.92 –32.22 2.00 0.00 0.00 0.00 0.00 0.00 0.10ESPIRITO SANTO BOLSA USA FIM –6.35 24.21 0.01 RVIU 17.20 18.79 0.01 RVIU 0.67 18.36 0.01 RVIU 6.16 13.69 0.01 RVIU 17.30 19.18 –30.11 1.60 0.00 0.00 0.00 0.00 0.00 0.15EUROVALOR ESTADOS UNIDOS FIMF –6.45 22.78 0.00 RVIU 8.61 18.09 0.00 RVIU 1.92 15.65 0.00 RVIU 2.79 12.95 0.00 RVIU 6.44 17.74 NA 1.35 9.00 0.00 0.00 0.00 0.00 0.15FONCAIXA 114 CARTERA BOLSA
USA FIMS NA NA NA NA 11.37 0.00 RVIU 1.11 15.61 0.00 RVIU 4.14 11.16 0.00 RVIU NA 13.18 NA 0.60 9.00 0.00 0.00 0.00 0.00 0.15FONCAIXA 53 BOLSA USA FIMS –7.83 25.09 0.00 RVIU 6.86 16.67 0.00 RVIU 1.14 16.85 0.00 RVIU 4.04 11.69 0.00 RVIU 3.65 18.22 –5.60 2.25 0.00 0.00 0.00 4.00 0.00 0.15FONCAIXA 96 FONDOS BOLSA USA FIMF –4.20 18.98 0.00 RVIU 6.50 14.81 0.00 RVIU 1.11 17.09 0.00 RVIU 3.15 13.28 0.01 RVIU 6.41 16.19 NA 1.35 9.00 0.00 0.00 4.00 0.00 0.15FONCAIXA 99 BOLSA USA FIMS NA 26.53 0.00 RVIU 6.54 15.71 0.00 RVIU 1.17 15.68 0.00 RVIU 4.00 10.87 0.00 RVIU NA 16.56 NA 1.35 9.00 0.00 0.00 4.00 0.00 0.20FONCAIXA BOLSA USA FIMP NA 24.47 0.00 RVIU 7.91 17.63 0.00 RVIU 1.75 17.78 0.00 RVIU 4.89 12.34 0.00 RVIU NA 18.04 NA 0.00 0.00 0.00 0.00 0.00 0.00 0.00FONDESPAÑA USA FIM –6.85 24.68 0.01 RVIU 6.58 17.36 0.01 RVIU –0.13 18.37 0.01 RVIU 2.18 11.87 0.02 RVIU 1.30 18.63 NA 1.75 0.00 0.00 0.00 0.00 0.00 0.15FONDMAPFRE BOLSA AMERICA FIM –6.86 25.77 0.00 RVIU 9.74 16.86 0.00 RVIU –0.13 17.46 0.00 RVIU 3.89 13.18 0.00 RVIU 6.04 18.89 –24.45 2.25 0.00 0.00 0.00 1.50 0.00 0.20FONPENEDES BORSA USA FIM –6.16 29.48 0.00 RVIU 10.86 21.39 0.01 RVIU 3.37 15.96 0.00 RVIU 4.09 14.41 0.02 RVIU 11.93 21.13 NA 2.25 0.00 0.00 0.00 0.00 0.00 0.00IBERAG. POPULAR NUEVAS TECNOL. FIM –7.57 29.30 0.00 RVIU 13.88 21.55 0.00 RVIU 3.26 21.21 0.00 RVIJ 2.60 15.42 0.00 RVIU 11.52 22.43 NA 2.25 0.00 0.00 0.00 0.00 0.00 0.10IBERCAJA BOLSA USA FIM –8.01 25.49 0.00 RVIU 8.40 17.75 0.00 RVIU 1.07 18.61 0.00 RVIU 4.00 12.82 0.00 RVIU 4.82 19.21 NA 2.00 0.00 0.00 0.00 2.00 0.00 0.20KUTXAVALOREEUU FIM –7.40 24.14 0.61 RVIU 8.66 16.99 0.40 RVIU 0.17 17.81 0.22 RVIU 2.54 12.70 0.04 RVIU 3.36 18.37 NA 2.25 0.00 0.00 0.00 2.00 0.00 0.03MADRID BOLSA NEW YORK FIM –5.60 26.08 0.00 RVIU 5.95 18.20 0.00 RVIU 0.76 19.50 0.00 RVIU 1.82 14.06 0.01 RVIU 2.61 19.92 –47.93 1.80 0.00 0.00 0.00 4.00 0.00 0.01SABADELL BS DOLAR BOLSA FIM –4.78 23.81 0.01 RVIU 12.41 17.57 0.01 RVIU –2.12 16.36 0.01 RVIU 9.22 11.41 0.01 RVIU 14.44 17.87 –4.47 2.25 0.00 0.00 0.00 0.00 0.00 0.10SAFEI NORTEAMERICA FIMF –5.90 24.46 0.01 RVIU 7.80 17.77 0.00 RVIU 0.13 15.05 0.01 RVIU 1.51 12.97 0.01 RVIU 3.11 18.07 –27.90 1.75 0.00 0.00 0.00 0.00 0.00 0.15SCH NORTEAMERICA FIM –7.55 28.67 0.01 RVIU 9.13 20.55 0.02 RVIU 1.89 18.63 0.00 RVIU 3.78 15.50 0.00 RVIU 6.69 21.39 NA 2.25 0.00 0.00 0.00 3.00 0.00 0.15SCH SELECCION FONDOS USA FIMFP –4.80 19.07 0.00 RVIU 7.71 14.63 0.00 RVIU 1.96 13.32 0.00 RVIU 3.17 11.67 0.01 RVIU 7.86 14.93 NA 0.32 0.00 0.00 0.00 5.00 5.00 0.09SEGURFONDO USA FIM NA NA NA NA NA NA NA 18.09 0.01 RVIU 1.74 13.15 0.01 RVIU NA 14.50 NA 0.00 0.00 0.00 0.00 0.00 0.00 0.00
(Continues over)
(Continued)

281
Annex 4
: Collective in
vestmen
t schem
es and ven
ture cap
ital com
pan
iesA.4.8.Investment in securities. FIM. Yields, volatility and duration
1Q 2Q 3Q 4Q 2003
Yield Vol Dur Yield Vol Dur Yield Vol Dur Yield Vol Dur Yield Vol(1) (2) Type (1) (2) Type (1) (2) Type (1) (2) Type (1)% % % % %
% fees
Management Front end Back endCustody
of assets of yield Max. Min. Max. Min.
Yieldsince1996
Foreign equity emergingcountries FIM (RVIM)
AC IBEROAMERICA FIM –4.94 21.43 0.00 RVIM 15.22 18.45 0.00 RVIM 8.16 17.13 0.00 RVIM 10.00 16.21 0.00 RVIM 30.32 18.45 –5.50 2.25 0.00 0.00 0.00 1.00 0.00 0.09BANCAJA FDO DE FDOS
EMERGENTES FIMF –9.60 19.36 0.00 RVIM 14.83 16.52 0.00 RVIM 10.52 13.84 0.00 RVIM 5.74 12.72 0.00 RVIM 21.32 15.91 NA 1.90 0.00 0.00 0.00 1.50 0.00 0.15BANESTO BOL.IBEROA. FIM –5.01 24.47 0.00 RVIM 16.08 19.57 0.00 RVIM 9.50 18.27 0.00 RVIM 10.19 16.65 0.01 RVIM 33.05 19.99 27.52 2.25 0.00 0.00 0.00 0.00 0.00 0.20BANIF RV SILA FIM –5.29 24.71 0.00 RVIM 16.41 18.86 0.00 RVIM 9.78 18.31 0.00 RVIM 10.26 16.06 0.01 RVIM 33.46 19.78 48.80 2.25 0.00 0.00 0.00 1.00 0.00 0.20BANIF SGAM RV EMERGENTES FIM –10.81 21.01 0.00 RVIM 15.50 20.61 0.00 RVIM 11.99 19.06 0.00 RVIM 7.03 16.27 0.01 RVIM 23.48 19.43 46.80 2.25 0.00 0.00 0.00 1.00 1.00 0.20BARCLAYS LATINOAM. FIM –4.33 25.21 0.00 RVIM 17.37 19.77 0.00 RVIM 8.72 16.51 0.01 RVIM 15.48 14.90 0.01 RVIM 40.97 19.54 NA 1.60 0.00 0.00 0.00 2.00 0.00 0.15BBK BOLSAS EMERG. FIMF –10.58 20.98 0.00 RVIM 15.89 16.27 0.00 RVIM 12.10 16.43 0.00 RVIM 5.96 15.87 0.00 RVIM 23.08 17.62 NA 1.65 0.00 0.00 0.00 0.00 0.00 0.10BBVA BOLSA LATAM FIM –4.94 23.80 0.00 RVIM 16.32 19.58 0.00 RVIM 10.37 17.56 0.00 RVIM 9.90 17.93 0.00 RVIM 34.12 19.91 9.02 2.25 0.00 0.00 0.00 2.00 0.00 0.20BBVA MULTIFONDO BOLSA EMERG. FIMF –7.20 13.22 0.00 RVIM 12.13 11.66 0.00 RVIM 11.24 12.72 0.00 RVIM 6.22 12.84 0.00 RVIM 22.95 12.72 –19.03 1.35 9.00 0.00 0.00 2.00 0.00 0.05BI EMERGENTES FIM –10.44 19.30 0.01 RVIM 13.73 16.15 2.33 RVIM 8.49 17.33 0.00 RVIM 2.43 16.47 0.01 RVIM 13.18 17.45 16.91 2.00 0.00 0.00 0.00 1.00 0.00 0.00CAHISPA EMERGENTES
MULTIFONDO FIMF –6.66 14.88 0.00 RVIM 14.54 12.98 0.00 RVIM 12.67 14.81 0.00 RVIM 9.29 15.11 0.00 RVIM 31.65 14.57 NA 1.50 0.00 0.00 0.00 0.00 0.00 0.10CAIXA CATALUNYA BORSA
EMERGENT FIMF –11.30 12.28 0.00 RVIM 12.39 16.32 0.00 RVIM 16.37 17.74 0.00 RVIM 5.72 16.41 0.01 RVIM 22.65 15.99 NA 1.35 9.00 0.00 0.00 0.00 0.00 0.20CAIXA CATALUNYA CHINA FUND FIMF –0.14 2.41 0.00 RFMI 3.50 3.20 0.00 RFMI –1.65 8.23 0.00 RVIM 11.60 16.24 0.00 RVIM 13.44 9.41 3.46 1.65 0.00 0.00 0.00 0.00 0.00 0.10CAJA LABORAL MERCADOS EMERG. FIMF –5.05 9.58 0.00 RVIM 19.05 9.99 0.00 RVIM 13.05 8.99 0.00 RVIM 14.12 9.87 0.01 RVIM 45.84 9.79 NA 2.25 0.00 0.00 0.00 1.00 0.00 0.04CAM IBEROAMERICA FIMF –1.47 7.74 0.01 RVIM 5.75 6.42 0.01 RVIM 4.36 13.83 0.00 RVIM 11.52 15.32 0.00 RVIM 21.28 11.55 NA 1.75 0.00 0.00 0.00 2.00 2.00 0.10CAN MERCADOS EMERGENTES FIMF –8.71 11.74 0.00 RVIM 13.75 11.73 0.00 RVIM 11.86 13.92 0.00 RVIM 9.91 12.86 0.00 RVIM 27.66 12.74 NA 2.25 0.00 0.00 0.00 0.00 0.00 0.15CAN TECNOLOGIA FIMF –4.94 23.48 0.00 RVIO 12.04 17.12 0.00 RVIO 7.96 17.20 0.00 RVIO 4.45 15.75 0.02 RVIM 20.11 18.65 NA 2.25 0.00 0.00 0.00 0.00 0.00 0.15EURO CONVERGENCE INSTITUC. FIMS –9.91 14.71 0.00 RVIM 5.94 11.68 0.00 RVIM 12.37 16.03 0.00 RVIM 4.67 14.38 0.01 RVIM 12.26 14.39 NA 0.50 0.00 0.00 0.00 0.00 0.00 0.00EUROVALOR ASIA FIMF NA NA NA NA NA NA NA NA NA NA 8.66 0.01 RVIM NA 8.66 NA 1.35 9.00 0.00 0.00 0.00 0.00 0.15EUROVALOR EUROPA DEL ESTE FIMF –6.59 13.13 0.00 RVIM 20.59 12.59 0.00 RVIM 11.11 15.13 0.00 RVIM 0.54 16.77 0.00 RVIM 25.83 14.65 NA 1.35 9.00 0.00 0.00 0.00 0.00 0.15EUROVALOR IBEROAMERICA FIMF –2.36 23.58 0.00 RVIM 16.49 17.94 0.00 RVIM 8.25 17.03 0.00 RVIM 10.81 15.07 0.00 RVIM 36.45 18.69 NA 1.35 9.00 0.00 0.00 0.00 0.00 0.15FONCAIXA 72 BOLSA P.
EMERGENTES FIM –10.58 20.59 0.00 RVIM 16.70 18.45 0.00 RVIM 9.48 16.16 0.00 RVIM 6.06 14.62 0.00 RVIM 21.18 17.70 NA 1.35 9.00 0.00 0.00 4.00 0.00 0.15FONDESPAÑA EMERGENTES FIMF –10.48 19.69 0.00 RVIM 17.50 13.94 0.00 RVIM 10.79 15.83 0.00 RVIM 3.47 15.27 0.00 RVIM 20.58 16.45 NA 1.10 0.00 0.00 0.00 0.00 0.00 0.15GAESCO EMERGENTFOND FIMF –7.84 14.20 0.00 RVIM 14.42 12.62 0.00 RVIM 12.53 14.77 0.00 RVIM 7.79 13.19 0.01 RVIM 27.91 13.84 NA 1.50 0.00 0.00 0.00 0.00 0.00 0.10IBERCAJA EMERGENTES FIMF –8.94 16.37 0.01 RVIM 15.15 14.03 0.01 RVIM 10.23 15.77 0.01 RVIM 5.21 14.02 0.01 RVIM 21.60 15.19 12.47 1.50 0.00 0.00 0.00 2.00 0.00 0.20IBERCAJA LATINOAMERICA FIMF –4.62 20.97 0.00 RVIM 16.20 16.27 0.00 RVIM 8.33 15.41 0.00 RVIM 11.15 14.03 0.00 RVIM 33.45 16.92 NA 2.25 0.00 0.00 0.00 2.00 0.00 0.20KUTXAEMERGENTE FIMF –10.22 17.91 0.00 RVIM 14.30 15.11 0.00 RVIM 10.43 15.11 0.00 RVIM 7.54 14.52 0.00 RVIM 21.87 15.82 NA 2.25 0.00 0.00 0.00 2.00 0.00 0.20MADRID BOLSA LATINOAMERICANA FIM –3.72 24.55 0.00 RVIM 18.14 18.91 0.00 RVIM 11.61 15.35 0.00 RVIM 8.30 15.60 0.01 RVIM 37.48 19.00 NA 2.25 0.00 0.00 0.00 4.00 0.00 0.02MADRID EMERGENTES GLOBAL FIMF –7.14 16.79 0.41 RVIM 14.72 16.00 0.06 RVIM 8.99 15.63 0.00 RVIM 8.57 13.85 0.01 RVIM 26.06 15.68 16.28 1.45 0.00 0.00 0.00 5.00 0.00 0.07MORGAN STANLEY LATINOAMERICA FIM –3.87 25.37 0.00 RVIM 16.07 20.14 0.00 RVIM 8.46 17.17 0.00 RVIM 9.83 16.59 0.01 RVIM 32.93 20.14 20.76 2.25 0.00 0.00 0.00 0.00 0.00 0.20RENTA 4 ASIA FIM –10.74 23.13 0.00 RVIM 15.39 20.24 0.00 RVIM 10.92 19.46 0.00 RVIM 7.06 18.08 0.01 RVIM 22.31 20.40 NA 1.35 9.00 0.00 0.00 0.00 0.00 0.12RENTA 4 EUROPA ESTE FIM –2.82 16.85 0.00 RVIM 20.80 15.86 0.00 RVIM 8.56 20.21 0.00 RVIM 2.21 20.15 0.01 RVIM 30.24 18.47 NA 1.35 9.00 0.00 0.00 0.00 0.00 0.12RENTA 4 LATINOAMER. FIM –3.30 24.21 0.00 RVIM 15.77 22.85 0.00 RVIM 8.07 16.29 0.00 RVIM 10.18 17.32 0.01 RVIM 33.29 20.47 NA 1.35 9.00 0.00 0.00 0.00 0.00 0.12RURAL EMERGENTES RENTA
VARIABLE FIM –7.28 19.11 0.00 RVIM 16.75 16.72 0.00 RVIM 8.40 17.50 0.00 RVIM 4.85 15.36 0.00 RVIM 23.02 17.31 NA 2.25 0.00 0.00 0.00 3.00 0.00 0.00SABADELL BS ACC.AMERICA
LATINA FIMP –0.84 22.38 0.01 RVIM 19.60 17.54 0.01 RVIM 8.42 17.37 0.01 RVIM 16.68 15.61 0.01 RVIM 50.02 18.44 NA 0.00 0.00 0.00 0.00 0.00 0.00 0.15SABADELL BS AMERICA LAT.
BOLSA FIMS –1.14 21.37 0.01 RVIM 18.29 16.84 0.01 RVIM 7.61 16.69 0.01 RVIM 15.36 14.91 0.01 RVIM 45.17 17.66 NA 1.75 0.00 0.00 0.00 0.00 0.00 0.05SAFEI EMERGENTES FIMF –8.24 16.53 0.01 RVIM 13.69 13.81 0.01 RVIM 11.90 15.33 0.01 RVIM 3.98 15.11 0.01 RVIM 21.38 15.32 14.93 1.75 0.00 0.00 0.00 0.00 0.00 0.15SCH ACCIONES IBEROAMERICANAS FIM –5.27 24.07 0.00 RVIM 15.54 18.44 0.00 RVIM 9.80 18.20 0.00 RVIM 9.72 15.66 0.01 RVIM 31.85 19.37 NA 2.25 0.00 0.00 0.00 3.00 0.00 0.10SCH EMERGENTES EUROPA FIM –10.86 14.37 0.00 RVIM 5.81 12.57 0.00 RVIM 12.93 17.45 0.00 RVIM 4.99 15.55 0.01 RVIM 11.83 15.21 NA 2.00 0.00 0.00 0.00 3.00 0.00 0.10SCH IBEROAMERICA PLUS FIM –5.40 23.91 0.00 RVIM 16.54 18.91 0.00 RVIM 10.52 18.14 0.00 RVIM 10.36 16.14 0.01 RVIM 34.46 19.53 NA 1.25 0.00 0.00 0.00 3.00 0.00 0.10SGAM EURO CONVERGENCE FIMP –9.78 14.81 0.00 RVIM 6.31 12.18 0.00 RVIM 13.01 16.66 0.00 RVIM 4.94 14.94 0.01 RVIM 13.75 14.84 NA 0.50 0.00 0.00 0.00 0.00 0.00 0.20URQUIJO F. LATINOAMERICANOS FIMF –0.73 12.21 0.00 RVMI 13.52 10.99 0.00 RVIM 2.75 12.08 0.00 RVIM 12.65 12.24 0.01 RVIM 30.44 11.95 NA 1.70 0.00 0.00 0.00 1.00 1.00 0.10
(Continues over)
(Continued)

282
Annual rep
ort o
n th
e securities m
arket. 2003
A.4.8.Investment in securities. FIM. Yields, volatility and duration
1Q 2Q 3Q 4Q 2003
Yield Vol Dur Yield Vol Dur Yield Vol Dur Yield Vol Dur Yield Vol(1) (2) Type (1) (2) Type (1) (2) Type (1) (2) Type (1)% % % % %
% fees
Management Front end Back endCustody
of assets of yield Max. Min. Max. Min.
Yieldsince1996
Other foreign equity FIM (RVIO)
ABANTE BOLSA FIMF –8.45 19.75 0.00 RVIO 10.77 14.94 0.00 RVIO 3.86 13.84 0.00 RVIO 4.50 11.84 0.00 RVIO 10.06 15.41 NA 1.25 0.00 0.00 0.00 0.00 0.00 0.10ABF ESTRATEGIA 100 FIMF –8.49 22.51 0.00 RVIO 10.74 17.23 0.00 RVIO 4.37 14.51 0.00 RVIO 5.44 13.02 0.00 RVIO 11.51 17.23 NA 1.25 0.00 0.00 0.00 0.00 0.00 0.10AC AUSTRALASIA FIM –11.00 19.99 0.01 RVIO 7.72 16.58 0.01 RVIO 16.68 21.11 0.00 RVIO 0.12 21.22 0.00 RVIO 12.01 19.93 –22.28 2.25 0.00 0.00 0.00 1.00 0.00 0.09AC MULTIESTRELLAS SELECCION
90 FIMF –7.85 21.68 0.00 RVIO 10.35 15.57 0.00 RVIO 3.14 14.43 0.00 RVIO 3.90 12.71 0.00 RVIO 8.98 16.47 NA 1.40 0.00 0.00 0.00 1.00 0.00 0.11ASTURF. INTERBOLSA FIM –11.19 25.67 0.00 RVIO 11.91 17.42 0.00 RVIO 0.82 13.00 0.00 RVIO 8.28 11.26 0.01 RVIO 8.49 17.78 –19.90 2.10 0.00 0.00 0.00 2.00 0.00 0.15ATLANTICO BOLSA GLOBAL FIM –5.62 17.81 0.00 RVIO 12.45 12.83 0.09 RVIO 1.93 11.76 0.02 RVIO 6.16 9.19 0.03 RVIO 14.84 13.31 NA 2.00 0.00 0.00 0.00 2.00 0.00 0.20AVANCE GLOBAL FIM –3.55 27.38 0.01 RVIO 12.37 16.30 0.00 RVIO 9.62 15.86 0.00 RVIO 6.93 11.88 0.00 RVIO 27.03 18.75 NA 0.85 0.00 0.00 0.00 0.00 0.00 0.15BANESTO BOLSA INTERNACIONAL FIM –9.33 24.94 0.01 RVIO 9.98 17.81 0.19 RVIO 1.66 16.03 0.30 RVIO 4.36 12.99 0.14 RVIO 5.79 18.49 –43.82 2.25 0.00 0.00 0.00 3.00 0.00 0.20BANESTO ESPECIAL RV FIM –10.17 24.37 0.18 RVIO 11.00 17.28 0.01 RVIO 1.94 15.13 0.35 RVIO 4.82 12.63 0.14 RVIO 6.56 17.93 –33.89 0.90 9.00 0.00 0.00 0.00 0.00 0.20BANESTO S.FINANCIE. FIM –13.94 29.29 0.00 RVIO 16.43 21.23 0.01 RVIO 2.43 16.50 0.00 RVIO 7.29 14.16 0.01 RVIO 10.13 21.18 NA 2.00 0.00 0.00 0.00 3.00 0.00 0.10BANESTO S.SALUD FIM –4.98 21.79 0.01 RVIO 5.80 18.13 0.01 RVIO –5.18 12.99 0.00 RVIO 1.74 13.24 0.01 RVIO –3.03 16.93 NA 2.00 0.00 0.00 0.00 3.00 0.00 0.10BANESTO S.TECNOLOG. FIM –6.48 31.66 0.63 RVIO 9.96 24.31 1.10 RVIO 9.45 26.69 0.06 RVIO 4.84 21.64 0.77 RVIO 18.00 26.34 NA 2.00 0.00 0.00 0.00 3.00 0.00 0.10BANESTO SELECCION F. GLOBAL FIMS –7.26 15.72 0.00 RVIO 8.05 12.33 0.00 RVIO 3.12 11.99 0.00 RVIO 3.56 10.74 0.01 RVIO 7.01 12.87 –32.84 1.71 0.00 0.00 0.00 3.00 0.00 0.01BANIF INVESCO RV GLOBAL FIM –9.58 24.46 0.00 RVIO 11.12 17.93 0.00 RVIO 1.84 15.93 0.00 RVIO 5.33 14.60 0.00 RVIO 7.78 18.65 NA 2.25 0.00 0.00 0.00 0.00 0.00 0.20BANKPYME COMUNICACIONES FIM –7.73 31.42 0.00 RVIO 14.83 21.75 0.00 RVIO 4.11 19.98 0.00 RVIO 6.09 13.79 0.00 RVIO 17.02 22.64 –29.24 1.35 9.00 0.25 0.25 1.50 0.50 0.20BANKPYME GEST.CARTERA
AVANZADA FIMF –9.75 25.57 0.00 RVIO 16.39 17.09 0.00 RVIO 2.41 13.03 0.00 RVIO 7.01 9.76 0.00 RVIO 15.12 17.45 NA 0.00 0.00 0.00 0.00 0.00 0.00 0.20BANKPYME MULTI TOP FUNDS FIMF –7.81 15.56 0.00 RVIO 13.38 12.60 0.00 RVIO 7.95 11.75 0.00 RVIO 6.63 10.72 0.00 RVIO 20.31 12.87 6.16 1.35 9.00 0.25 0.25 1.50 0.50 0.20BANKPYME MULTIGESTORAS FIMF –9.73 21.17 0.00 RVIO 11.70 16.26 0.00 RVIO 2.78 12.56 0.00 RVIO 4.54 11.26 0.00 RVIO 8.34 15.84 –19.98 1.35 9.00 0.25 0.25 1.50 0.50 0.20BANKPYME MULTIOCIO FIM –11.22 28.70 0.00 RVIO 15.97 20.10 0.00 RVIO 0.52 13.69 0.00 RVIO 5.61 10.38 0.00 RVIO 9.29 19.55 –15.00 1.35 9.00 0.25 0.25 1.50 0.50 0.20BANKPYME MULTISALUD FIM –7.55 22.12 0.01 RVIO 8.83 17.94 0.01 RVIO –2.06 12.10 0.00 RVIO 2.55 11.45 0.00 RVIO 1.04 16.51 –7.66 1.35 9.00 0.25 0.25 1.50 0.50 0.20BANKPYME MUNDIFINANZAS FIM –14.56 30.21 0.00 RVIO 19.94 21.15 0.00 RVIO 3.94 15.56 0.00 RVIO 6.84 12.26 0.00 RVIO 13.80 21.03 –6.05 1.35 9.00 0.25 0.25 1.50 0.50 0.20BARCLAYS BOLSA GLOBAL FIMF –8.68 21.35 0.01 RVIO 11.81 15.85 0.00 RVIO 3.89 14.18 0.00 RVIO 3.97 13.44 0.00 RVIO 10.28 16.54 –21.73 1.50 0.00 0.00 0.00 2.00 0.00 0.20BARCLAYS GESTION 80 FIMF –6.43 21.50 0.01 RVIO 12.54 13.99 0.01 RVIO 1.46 10.68 0.01 RVIO 9.66 8.84 0.01 RVIO 17.16 14.61 NA 0.05 0.00 0.00 0.00 2.00 0.00 0.00BBK FONDO INTERN. FIMF –9.37 19.79 0.00 RVIO 11.01 14.17 0.00 RVIO 3.26 14.21 0.00 RVIO 4.30 11.23 0.00 RVIO 8.34 15.22 –16.49 1.65 0.00 0.00 0.00 0.00 0.00 0.10BBVA BIOFARMA FIM –4.47 22.31 0.00 RVIO 5.99 18.14 0.01 RVIO –4.23 13.19 0.01 RVIO 1.23 13.16 0.00 RVIO –1.84 17.12 NA 2.25 0.00 0.00 0.00 2.00 0.00 0.20BBVA BIOGEN FIM –0.66 17.48 0.00 RVIO 11.21 13.46 0.00 RVIO –2.24 10.18 0.01 RVIO 0.93 12.58 0.00 RVIO 9.01 13.70 NA 2.25 0.00 0.00 0.00 0.00 0.00 0.20BBVA BOLSA CINCO ESTRELLAS FIMF –8.02 15.92 0.00 RVIO 9.58 13.94 0.00 RVIO 4.71 13.50 0.00 RVIO 3.36 12.29 0.00 RVIO 9.09 14.03 –9.94 2.25 0.00 0.00 0.00 2.00 0.00 0.20BBVA BOLSA INTERNACIONAL FIM –8.92 24.17 0.01 RVIO 9.29 16.58 0.01 RVIO 1.62 16.35 0.01 RVIO 4.06 13.74 0.01 RVIO 5.26 18.15 –32.74 2.25 0.00 0.00 0.00 2.00 0.00 0.20BBVA BOLSA MUNDIAL FIM –6.55 22.48 0.01 RVIO 13.07 14.59 0.01 RVIO 1.16 10.19 0.01 RVIO 8.20 9.14 0.01 RVIO 15.65 15.07 NA 2.25 0.00 0.00 0.00 0.00 0.00 0.20BBVA FINANZAS FIM –11.57 26.67 0.01 RVIO 13.79 19.15 0.00 RVIO 1.98 16.02 0.00 RVIO 6.45 13.97 0.00 RVIO 9.24 19.61 2.66 2.25 0.00 0.00 0.00 2.00 0.00 0.20BBVA INDICE INTERNACIONAL
PLUS FIM –9.00 29.21 0.01 RVIO 17.49 19.60 0.01 RVIO 0.99 14.34 0.01 RVIO 13.17 12.15 0.01 RVIO 22.19 19.99 NA 0.80 0.00 1.00 0.00 2.00 0.00 0.20BBVA MID CAP INTERNACIONAL FIM –9.55 20.71 0.01 RVIO 11.85 15.62 0.00 RVIO 3.48 14.65 0.00 RVIO 7.32 12.87 0.01 RVIO 12.36 16.28 10.43 2.25 0.00 0.00 0.00 2.00 0.00 0.20BBVA NUEVAS TECNOLOGIAS FIM –2.80 36.30 0.01 RVIO 20.77 29.59 0.00 RVIO 7.83 32.32 0.00 RVIO 4.00 28.18 0.01 RVIO 31.65 31.77 NA 2.25 0.00 0.00 0.00 2.00 0.00 0.20BBVA OPORTUNIDADES INTERN. FIM –9.57 24.64 0.01 RVIO 9.06 16.71 0.01 RVIO 1.83 16.46 0.00 RVIO 4.72 13.68 0.01 RVIO 5.16 18.35 –46.53 2.25 0.00 0.00 0.00 2.00 0.00 0.20BBVA TELECOMUNICACIONES 2 FIM –9.29 31.91 0.12 RVIO 12.83 21.98 2.54 RVIO 6.66 23.80 2.30 RVIO 4.89 18.77 0.01 RVIO 14.50 24.62 –27.28 2.25 0.00 0.00 0.00 2.00 0.00 0.20BENKERS TECH FIM (EN DISOLUCION) –3.06 28.21 0.00 RVIO 9.20 16.67 0.00 RVIO 11.46 118.07 0.00 RVIO –0.09 8.10 0.00 RVIO 17.88 61.62 NA 1.35 9.00 0.00 0.00 0.00 0.00 0.12BESTINVER INTERNACIONAL FIM –16.79 20.55 0.00 RVIO 30.30 15.59 0.00 RVIO 11.51 10.40 0.00 RVIO 9.76 9.25 0.01 RVIO 32.70 15.00 97.87 1.75 0.00 0.00 0.00 3.00 3.00 0.06BETA ALPHA DINAMICO FIM –11.14 18.87 0.00 RVIO 6.55 17.47 0.00 RVIO 14.13 16.79 0.00 RVIO –0.21 0.08 0.01 RVIO 7.83 15.45 NA 1.00 9.00 0.00 0.00 0.00 0.00 0.12BG BOLSA INTERNACIONAL FIM –9.86 21.39 0.01 RVIO 9.75 15.73 0.01 RVIO 2.02 15.03 0.01 RVIO 4.84 11.71 0.00 RVIO 5.81 16.38 –14.91 2.25 0.00 0.00 0.00 1.00 0.00 0.20BI GLOBAL MUNDIAL FIM –10.76 26.50 0.01 RVIO 13.43 17.51 0.01 RVIO 2.76 14.36 0.01 RVIO 5.47 10.68 0.01 RVIO 9.71 18.26 –32.29 2.00 0.00 0.00 0.00 2.00 0.00 0.00BIOGEN INVESTIGACION FIMP –0.25 18.58 0.00 RVIO 12.40 15.12 0.00 RVIO 0.88 10.59 0.00 RVIO 7.41 11.34 0.00 RVIO 21.49 14.27 NA 0.45 0.00 0.00 0.00 0.00 0.00 0.10BIPOP CRECIMIENTO FIMF –9.53 19.19 0.02 RVIO 9.53 13.27 0.00 RVIO 2.43 11.49 0.01 RVIO 4.11 9.66 0.01 RVIO 5.67 13.91 NA 1.35 9.00 0.00 0.00 0.00 0.00 0.15BIPOP DESARROLLO FIMF –8.40 18.73 0.00 RVIO 8.17 12.77 0.00 RVIO 5.14 12.12 0.01 RVIO 3.54 10.91 0.00 RVIO 7.86 14.00 NA 1.35 9.00 0.00 0.00 0.00 0.00 0.15BIPOP VALOR FIMF –9.02 21.71 0.01 RVIO 10.87 14.77 0.01 RVIO –0.71 11.49 0.01 RVIO 6.92 9.52 0.01 RVIO 7.09 15.14 NA 1.35 9.00 0.00 0.00 0.00 0.00 0.15BK FONDO INTERNET FIM 2.86 26.68 0.00 RVIO 16.35 20.48 0.00 RVIO 5.26 21.11 0.01 RVIO 7.17 21.06 0.01 RVIO 35.00 22.47 NA 2.25 0.00 0.00 0.00 0.00 0.00 0.01BK SECTOR ENERGIA FIM –4.02 24.28 0.00 RVIO 16.25 17.41 0.00 RVIO 2.20 13.24 0.00 RVIO 13.69 9.70 0.00 RVIO 29.64 17.07 NA 1.15 0.00 0.00 0.00 1.00 1.00 0.10BK SECTOR FINANZAS FIM –17.02 44.00 0.00 RVIO 29.34 34.08 0.00 RVIO 2.95 25.73 0.01 RVIO 11.91 17.52 0.01 RVIO 23.64 31.98 NA 1.15 0.00 0.00 0.00 0.00 0.00 0.10
(Continues over)
(Continued)

283
Annex 4
: Collective in
vestmen
t schem
es and ven
ture cap
ital com
pan
iesA.4.8.Investment in securities. FIM. Yields, volatility and duration
1Q 2Q 3Q 4Q 2003
Yield Vol Dur Yield Vol Dur Yield Vol Dur Yield Vol Dur Yield Vol(1) (2) Type (1) (2) Type (1) (2) Type (1) (2) Type (1)% % % % %
% fees
Management Front end Back endCustody
of assets of yield Max. Min. Max. Min.
Yieldsince1996
Other foreign equity FIM (RVIO)
BOLSA INTERNACIONAL FIM –9.33 24.84 0.00 RVIO 11.44 17.30 0.00 RVIO 1.80 15.64 0.00 RVIO 5.03 11.97 0.01 RVIO 8.04 18.08 –29.72 2.25 0.00 0.00 0.00 0.00 0.00 0.15C. INGEN. MERCADOS FIM –8.70 21.39 0.02 RVIO 8.52 14.35 0.02 RVIO 1.16 14.46 0.01 RVIO 3.33 11.63 0.03 RVIO 3.56 15.90 NA 2.25 0.00 0.00 0.00 0.00 0.00 0.04C.MANRESA MUNDIBORS.FIM –9.45 20.11 0.00 RVIO 12.68 12.80 0.00 RVIO 2.53 10.46 0.00 RVIO 6.92 9.30 0.01 RVIO 11.85 13.88 NA 2.25 0.00 0.00 0.00 1.00 0.00 0.15CAHISPA MULTIFONDO FIMF –11.33 17.57 0.00 RVIO 12.84 13.56 0.00 RVIO 6.39 12.39 0.00 RVIO 4.93 10.91 0.01 RVIO 11.70 13.94 NA 1.50 0.00 0.00 0.00 0.00 0.00 0.10CAIXA CAT. MATERIES PRIMERES FIM –12.34 17.37 0.00 RVIO 5.58 13.91 0.00 RVIO 8.30 11.34 0.00 RVIO 16.59 11.61 0.00 RVIO 16.86 13.92 NA 1.35 9.00 0.00 0.00 0.00 0.00 0.15CAIXA CAT. SELECCIO ACTIVA 75 FIMF –11.38 16.77 0.00 RVIO 11.34 16.56 0.00 RVIO 1.87 11.08 0.00 RVIO 7.47 9.43 0.01 RVIO 8.02 13.94 NA 1.45 0.00 0.00 0.00 0.00 0.00 0.05CAIXA CATALUNYA BORSA MUNDIAL FIM –16.77 27.61 0.00 RVIO 16.86 24.97 0.00 RVIO 0.22 19.71 0.00 RVIO 2.89 16.14 0.00 RVIO 0.30 22.66 –39.41 1.35 9.00 0.00 0.00 0.00 0.00 0.15CAIXA CATALUNYA CONSUM FIM –9.55 22.27 0.00 RVIO 13.16 19.54 0.00 RVIO 1.38 15.62 0.00 RVIO 7.38 13.39 0.00 RVIO 11.42 18.09 NA 1.35 9.00 0.00 0.00 0.00 0.00 0.15CAIXA CATALUNYA FINANCER FIM –13.51 23.77 0.00 RVIO 10.10 24.13 0.00 RVIO 4.30 18.53 0.00 RVIO –0.82 15.01 0.01 RVIO –1.49 20.77 NA 1.35 9.00 0.00 0.00 0.00 0.00 0.15CAIXA CATALUNYA S. IMMOBILIARI FIMF –7.81 7.60 0.00 RVIO 9.19 7.34 0.00 RVIO 5.05 5.31 0.00 RVIO 8.93 6.14 0.00 RVIO 15.19 6.81 NA 1.35 9.00 0.00 0.00 0.00 0.00 0.20CAIXA CATALUNYA SANITAT FIM –6.40 18.10 0.00 RVIO 6.58 19.08 0.00 RVIO –5.86 12.61 0.00 RVIO 5.13 12.93 0.01 RVIO –1.26 15.98 NA 1.35 9.00 0.00 0.00 0.00 0.00 0.15CAIXA CATALUNYA TELECOMUNIC. FIM –17.39 27.13 0.00 RVIO 19.53 23.22 0.00 RVIO –2.96 14.12 0.00 RVIO 8.41 12.00 0.01 RVIO 3.88 20.27 NA 1.35 9.00 0.00 0.00 0.00 0.00 0.15CAJA INGENIEROS MULTIFONDO FIMF –7.91 18.84 3.07 RVIO 10.91 13.74 2.90 RVIO 3.25 12.35 0.01 RVIO 4.36 11.65 0.04 RVIO 10.06 14.47 –11.83 2.00 0.00 0.00 0.00 0.00 0.00 0.11CAJA LABORAL BOLSA UNIVERSAL FIMF –3.42 11.95 0.00 RVIO 14.52 10.34 0.00 RVIO 5.55 7.74 0.00 RVIO 9.65 7.27 0.01 RVIO 27.99 9.59 NA 2.25 0.00 0.00 0.00 1.00 0.00 0.04CAM ASIA FIMF –5.88 11.30 0.01 RVIO 6.35 9.39 0.01 RVIO 8.39 15.17 0.00 RVIO 3.80 16.32 0.01 RVIO 12.62 13.41 NA 1.75 0.00 0.00 0.00 2.00 2.00 0.10CAM GLOBAL FIM –0.76 23.59 0.10 RVIO 21.90 19.26 0.05 RVIO 1.63 18.13 0.01 RVIO 15.87 16.91 0.02 RVIO 42.47 19.69 NA 2.00 0.00 0.00 0.00 2.00 2.00 0.11CAM SALUD Y OCIO FIMF –1.48 8.54 0.01 RVIO 2.85 6.29 0.01 RVIO –1.30 13.41 0.00 RVIO 2.92 12.75 0.01 RVIO 2.94 10.70 NA 1.75 0.00 0.00 0.00 2.00 2.00 0.10CAM SECTOR FINANCIERO FIMF –1.96 5.12 0.01 RVIO 5.13 5.32 0.01 RVIO 1.54 11.58 0.01 RVIO 7.91 9.79 0.01 RVIO 12.94 8.49 NA 1.75 0.00 0.00 0.00 2.00 2.00 0.10CAM SECTOR INDUSTRIAL FIMF –1.93 4.17 0.01 RVIO 1.81 3.47 0.01 RVIO –2.02 9.30 0.00 RVIO 6.63 10.24 0.01 RVIO 4.32 7.48 NA 1.75 0.00 0.00 0.00 2.00 2.00 0.10CAM SECTOR TECNOLOGICO FIMF –0.57 12.90 0.01 RVIO 8.69 14.35 0.00 RVIO 5.31 17.80 0.00 RVIO 2.69 16.52 0.01 RVIO 16.86 15.54 NA 1.75 0.00 0.00 0.00 2.00 2.00 0.10CAN GESTION 80 FIM –8.28 23.67 0.00 RVIO 7.89 15.95 0.00 RVIO –0.12 13.50 0.00 RVIO 6.07 11.84 0.02 RVIO 4.84 16.87 –29.07 2.25 0.00 0.00 0.00 0.00 0.00 0.15CANTABRIA BOLSA GLOBAL FIM –9.09 23.61 0.01 RVIO 10.54 16.51 0.00 RVIO 1.57 15.47 0.00 RVIO 4.58 11.65 0.00 RVIO 6.76 17.38 NA 2.25 0.00 0.00 0.00 2.00 0.00 0.20CREDIT SUISSE MUNDIFOND FIMF –7.40 14.74 0.00 RVIO 9.95 11.00 0.00 RVIO 3.62 9.61 0.00 RVIO 6.44 8.96 0.00 RVIO 12.29 11.36 –8.52 1.30 0.00 0.00 0.00 0.00 0.00 0.10CRV FONDO MULTIPLE FIMF –7.86 18.07 0.13 RVIO 9.45 12.64 0.16 RVIO 2.70 11.46 0.22 RVIO 3.75 11.00 0.31 RVIO 7.46 13.63 –12.75 1.75 0.00 0.00 0.00 0.00 0.00 0.05CS EUROCEANICO FIMF –4.76 18.32 0.00 RVIO 12.43 12.65 0.00 RVIO 2.45 12.25 0.00 RVIO 7.14 10.54 0.01 RVIO 17.53 13.79 NA 0.40 0.00 0.00 0.00 0.00 0.00 0.15CT GLOBAL 100 FIM –8.76 23.24 0.04 RVIO 9.93 15.72 0.00 RVIO 1.68 15.29 0.08 RVIO 4.84 11.67 0.00 RVIO 6.91 17.03 NA 2.25 0.00 0.00 0.00 1.00 1.00 0.10DREAM TEAM FONDO FIMF –4.01 11.46 0.00 RVIO 9.59 8.09 0.00 RVIO 3.62 8.17 0.00 RVIO 7.44 8.09 0.01 RVIO 17.11 9.12 3.73 1.60 0.00 0.00 0.00 0.00 0.00 0.09DWS BOLSA UNIVERSAL FIM –10.99 24.35 0.00 RVIO 14.45 18.13 0.00 RVIO 4.09 16.26 0.00 RVIO 6.20 13.10 0.01 RVIO 12.62 18.49 NA 2.00 0.00 0.00 0.00 0.00 0.00 0.10DWS SELECTED FUNDS 75 FIMF –7.72 14.70 0.00 RVIO 9.03 11.81 0.00 RVIO 2.62 11.41 0.00 RVIO 2.62 9.50 0.00 RVIO 5.95 12.05 NA 1.75 0.00 0.00 0.00 0.00 0.00 0.10E–BANKINTER BOLSA. FIM –3.68 25.21 0.00 GRF 13.36 15.22 0.00 RVIO –0.06 12.26 0.00 RVIO 12.26 10.74 0.01 RVIO 22.49 16.84 NA 2.25 0.00 1.00 1.00 0.00 0.00 0.05ESPIRITO SANTO BOLSA GLOBAL FIM –11.54 26.31 0.00 RVIO 13.94 20.23 0.01 RVIO 0.24 16.33 0.01 RVIO 8.09 13.38 0.01 RVIO 9.21 19.72 –40.92 2.25 0.00 0.00 0.00 0.00 0.00 0.15ESPIRITO SANTO PHARMAFUND. FIM –4.69 15.82 0.01 RVIO 10.46 13.29 0.01 RVIO –3.70 9.06 0.01 RVIO 5.15 9.01 0.01 RVIO 6.60 12.19 –0.79 2.25 0.00 0.00 0.00 0.00 0.00 0.20ESPIRITO SANTO TECNOLOGIA FIM 0.50 48.00 0.10 RVIO 21.51 25.25 3.12 RVIO 8.06 28.37 0.14 RVIO 4.33 22.87 0.10 RVIO 37.68 32.62 –76.53 2.25 0.00 0.00 0.00 0.00 0.00 0.20ESPIRITO SANTO TOP RANKING FIMF –8.05 23.58 0.01 RVIO 16.51 17.57 0.01 RVIO 0.34 14.86 0.01 RVIO 6.69 13.62 0.01 RVIO 14.70 17.88 –41.47 2.25 0.00 0.00 0.00 0.00 0.00 0.15EUROVALOR BOLSA INTERNACIONAL FIM –5.84 25.44 0.00 RVIO 8.62 19.61 0.00 RVIO –0.90 19.00 0.00 RVIO 2.92 12.06 0.01 RVIO 4.32 19.60 –35.69 2.25 0.00 0.00 0.00 0.00 0.00 0.00EUROVALOR SEC.INMOB.FIM –3.21 6.05 0.00 RVIO 3.39 6.32 0.00 RVIO 3.36 5.15 0.00 RVIO 10.08 7.24 0.01 RVIO 13.87 6.31 26.83 2.25 0.00 0.00 0.00 0.00 0.00 0.00EUROVALOR SELECCION TOP–100 FIMF –7.63 18.69 0.00 RVIO 9.87 14.33 0.00 RVIO 5.47 8.46 0.00 RVIO 7.07 6.78 0.01 RVIO 14.62 12.99 NA 2.25 0.00 0.00 0.00 0.00 0.00 0.00FIBANC GLOBAL RV FIM –9.23 21.22 0.00 RVIO 12.21 15.37 0.01 RVIO –0.46 15.07 0.00 RVIO 8.04 11.44 0.00 RVIO 9.53 16.22 NA 2.25 0.00 0.00 0.00 0.00 0.00 0.10FIBANC TITANES FIM –8.78 25.25 0.00 RVIO 8.35 17.45 0.00 RVIO –0.26 16.06 0.00 RVIO 2.69 11.56 0.00 RVIO 1.23 18.27 NA 2.00 0.00 0.00 0.00 0.00 0.00 0.10FONBILBAO INTERN. FIM –11.66 25.45 0.01 RVIO 13.18 17.75 0.01 RVIO 2.69 15.13 0.01 RVIO 5.59 10.06 0.01 RVIO 8.40 18.03 –27.86 1.75 0.00 0.00 0.00 0.00 0.00 0.15FONCAIXA 61 TECNOL. FIM –8.73 28.45 0.00 RVIO 9.46 21.64 0.00 RVIO 7.97 24.61 0.00 RVIO 3.30 17.38 0.01 RVIO 11.43 23.40 NA 1.35 9.00 0.00 0.00 4.00 0.00 0.15FONCAIXA 73 BOLSA S. FINANCIERO FIM –9.39 24.14 0.00 RVIO 14.43 16.78 0.00 RVIO 0.22 14.89 0.00 RVIO 4.54 11.44 0.00 RVIO 8.64 17.49 NA 1.35 9.00 0.00 0.00 4.00 0.00 0.15FONCAIXA 74 BOLSA BLUE CHIPS FIM –8.53 24.63 0.00 RVIO 8.87 17.58 0.00 RVIO –0.14 15.35 0.00 RVIO 3.01 11.00 0.00 RVIO 2.44 17.84 NA 1.35 9.00 0.00 0.00 4.00 0.00 0.15FONCAIXA 91 CESTA RV FIMF –7.84 12.11 0.00 RVIO 6.54 10.41 0.00 RVIO –1.66 11.84 0.00 RVIO 10.69 10.13 0.00 RVIO 6.88 11.25 NA 1.50 0.00 0.00 0.00 4.00 0.00 0.15FONCAIXA 93 BOLSAS MUNDIALES FIMF –6.31 14.96 0.00 RVIO 6.20 12.64 0.00 RVIO 3.68 11.69 0.00 RVIO 3.99 9.55 0.01 RVIO 7.28 12.39 NA 1.35 9.00 0.00 0.00 4.00 0.00 0.15FONCAIXA BOLSA 62 FIM –11.13 25.35 0.06 RVIO 12.75 17.91 0.07 RVIO –5.58 13.78 0.07 RVIO 7.30 11.50 0.14 RVIO 1.51 17.99 –52.06 1.35 9.00 0.00 0.00 4.00 0.00 0.15FONCAIXA BOLSA 63 FIM –8.25 24.15 0.00 RVIO 13.04 13.75 0.00 RVIO –2.16 10.02 0.00 RVIO 10.64 7.71 0.01 RVIO 12.28 15.32 –22.33 1.35 9.00 0.00 0.00 4.00 0.00 0.15FONDESPAÑA MULTIFONDOS FIMF –8.86 19.42 0.00 RVIO 9.52 13.32 0.00 RVIO 2.40 14.64 0.00 RVIO 4.26 11.86 0.00 RVIO 6.57 15.12 –23.53 1.10 0.00 0.00 0.00 0.00 0.00 0.15FONDESPAÑA S. CRECIMIENTO FIM –8.44 20.87 0.00 RVIO 6.27 14.15 0.00 RVIO –3.19 13.47 0.00 RVIO 3.19 10.38 0.00 RVIO –2.79 15.22 NA 1.75 0.00 0.00 0.00 0.00 0.00 0.15FONDESPAÑA SECTORIAL VALOR FIM –9.28 24.30 0.00 RVIO 15.61 16.82 0.00 RVIO 0.10 15.03 0.00 RVIO 4.79 9.13 0.00 RVIO 10.02 17.24 NA 1.75 0.00 0.00 0.00 0.00 0.00 0.15
(Continues over)
(Continued)

284
Annual rep
ort o
n th
e securities m
arket. 2003
A.4.8.Investment in securities. FIM. Yields, volatility and duration
1Q 2Q 3Q 4Q 2003
Yield Vol Dur Yield Vol Dur Yield Vol Dur Yield Vol Dur Yield Vol(1) (2) Type (1) (2) Type (1) (2) Type (1) (2) Type (1)% % % % %
% fees
Management Front end Back endCustody
of assets of yield Max. Min. Max. Min.
Yieldsince1996
Other foreign equity FIM (RVIO)
FONDMAPFRE BOLSA ASIA FIMF –10.19 16.95 0.00 RVIO 7.42 10.68 0.00 RVIO 11.23 13.66 0.00 RVIO 2.86 16.52 0.00 RVIO 10.38 14.77 NA 1.75 0.00 0.00 0.00 1.50 0.00 0.20FONDMAPFRE BOLSA GLOBAL FIM –8.09 25.99 0.00 RVIO 10.75 17.39 0.00 RVIO –0.15 13.38 0.00 RVIO 8.28 10.69 0.00 RVIO 10.05 17.84 NA 2.25 0.00 0.00 0.00 1.50 0.00 0.20FONDMAPFRE TECNOLOGIA FIM –2.08 30.96 0.00 RVIO 17.12 23.25 0.00 RVIO 11.34 24.72 0.00 RVIO 7.69 19.96 0.00 RVIO 37.50 25.05 NA 2.25 0.00 0.00 0.00 1.50 0.00 0.20FONDUERO BOLSA FIM –7.47 16.90 0.00 RVIO 10.04 15.47 0.00 RVIO –1.86 12.54 0.00 RVIO 11.85 11.32 0.01 RVIO 11.77 14.31 –39.05 2.00 0.00 0.00 0.00 2.00 0.00 0.00FONDUERO EUROPA FIM –7.54 16.90 0.00 RVIO 9.98 15.49 0.00 RVIO –2.04 12.66 0.00 RVIO 12.64 12.19 0.01 RVIO 12.20 14.53 –29.06 2.00 0.00 0.00 0.00 0.00 0.00 0.10FONDUERO SECTORIAL FIM –5.24 19.12 0.00 RVIO 7.20 14.55 0.00 RVIO –2.02 12.64 0.00 RVIO 14.82 11.75 0.01 RVIO 14.28 14.85 –26.13 2.25 0.00 0.00 0.00 0.00 0.00 0.40FONPASTOR TECNOLOGIA FIMF –1.81 15.00 0.01 RVIO 7.96 9.84 0.01 RVIO 5.16 17.97 0.01 RVIO 3.99 11.00 0.01 RVIO 15.92 13.86 NA 1.50 0.00 0.00 0.00 3.00 0.00 0.20FONPENEDES MULTIFONS 100 FIMF NA NA NA NA 19.14 0.00 RVIO 3.47 13.90 0.00 RVIO 7.55 11.13 0.00 RVIO NA 14.61 NA 2.00 0.00 0.00 0.00 1.00 0.00 0.05FONPENEDES MULTIFONS 75 FIMF NA NA NA NA 15.18 0.00 RVIO 2.64 10.80 0.00 RVIO 5.47 8.12 0.00 RVIO NA 11.32 NA 1.75 0.00 0.00 0.00 1.00 0.00 0.05FONPENEDES TECNOLOGIA FIM –9.45 37.60 0.00 RVIO 29.97 28.12 0.00 RVIO 13.73 19.17 0.00 RVIO 5.66 19.66 0.00 RVIO 41.41 27.26 NA 2.25 0.00 0.00 0.00 0.00 0.00 0.00GAESCO FONDO DE FONDOS FIMF –9.23 16.60 0.00 RVIO 13.08 12.55 0.00 RVIO 6.20 11.94 0.00 RVIO 5.50 10.84 0.01 RVIO 14.99 13.26 –7.69 1.50 0.00 0.00 0.00 0.00 0.00 0.10GAESCO MULTINACIONAL FIM –15.45 35.89 0.00 RVIO 21.23 27.11 0.00 RVIO 3.69 21.63 0.00 RVIO 11.68 16.78 0.01 RVIO 18.70 26.41 NA 2.25 0.00 0.00 0.00 0.00 0.00 0.10GAESCO T.F.T. FIM –5.39 26.81 0.00 RVIO 16.97 21.78 0.00 RVIO 8.41 20.50 0.00 RVIO 7.95 16.50 0.01 RVIO 29.51 21.74 –43.28 2.25 0.00 0.00 0.00 0.00 0.00 0.10GLOBAL BOLSA FIM –8.82 24.25 0.00 RVIO 11.79 12.25 0.00 RVIO –2.15 13.52 0.00 RVIO 11.52 10.04 0.01 RVIO 11.24 16.04 –36.56 1.75 0.00 0.00 0.00 0.00 0.00 0.17HSBC GLOBAL ACCIONES FIM –9.76 25.42 0.00 RVIO 12.52 15.62 0.00 RVIO –0.85 14.09 0.00 RVIO 6.42 10.60 0.00 RVIO 7.13 17.36 –21.45 2.15 0.00 0.00 0.00 0.00 0.00 0.15IBERAG. POPULAR SELECC. VALOR FIMF –7.40 14.48 0.00 RVIO 8.45 11.78 0.00 RVIO 2.34 9.65 0.00 RVIO 3.51 8.16 0.00 RVIO 6.37 11.31 –22.35 2.25 0.00 0.00 0.00 0.00 0.00 0.10IBERAGENTES POPULAR BIOGEN FIMS –0.64 17.81 0.00 RVIO 11.42 14.50 0.00 RVIO 0.39 10.13 0.00 RVIO 6.58 10.86 0.00 RVIO 18.45 13.68 NA 1.80 0.00 0.00 0.00 0.00 0.00 0.03IBERCAJA BOLSA INTERNACIONAL FIM –12.50 25.09 0.01 RVIO 14.13 18.91 0.01 RVIO 2.09 17.14 0.01 RVIO 5.45 13.29 0.01 RVIO 7.51 19.16 –16.84 1.80 0.00 0.00 0.00 2.00 0.00 0.20IBERCAJA FINANCIERO FIM –10.81 27.27 0.00 RVIO 20.19 20.25 0.00 RVIO 2.25 17.08 0.00 RVIO 8.50 13.48 0.00 RVIO 18.92 20.25 NA 1.90 0.00 0.00 0.00 2.00 0.00 0.20IBERCAJA NUEVAS OPORTUNIDADES FIM –8.81 37.99 0.01 RVIO 27.80 25.99 0.00 RVIO 7.37 19.52 0.00 RVIO 14.16 15.07 0.00 RVIO 42.85 26.16 NA 1.90 0.00 0.00 0.00 2.00 0.00 0.20IBERCAJA PETROQUIMICO FIM –8.42 22.07 0.00 RVIO 8.49 13.58 0.00 RVIO –0.72 12.85 0.00 RVIO 9.94 10.89 0.00 RVIO 8.44 15.49 NA 1.90 0.00 0.00 0.00 2.00 0.00 0.20IBERCAJA SANIDAD FIM –4.89 21.40 0.00 RVIO 6.94 16.84 0.00 RVIO –4.35 13.35 0.00 RVIO 1.17 12.55 0.00 RVIO –1.57 16.41 NA 1.90 0.00 0.00 0.00 2.00 0.00 0.20IBERCAJA SELECCION BOLSA FIMF –8.45 26.41 0.00 RVIO 15.51 17.85 0.00 RVIO 2.58 15.02 0.00 RVIO 8.64 11.94 0.00 RVIO 17.85 18.64 NA 2.25 0.00 0.00 0.00 2.00 0.00 0.20IBERCAJA TECNOLOGICO FIM –5.33 30.67 0.01 RVIO 15.67 21.31 0.01 RVIO 4.68 22.10 0.01 RVIO 4.37 17.36 0.01 RVIO 19.65 23.37 NA 1.90 0.00 0.00 0.00 2.00 0.00 0.20ING DIRECT NARANJA RV GLOBAL FIMF –8.84 21.04 0.00 RVIO 9.15 14.87 0.00 RVIO 2.47 13.97 0.00 RVIO 3.40 11.92 0.01 RVIO 5.43 15.85 NA 0.00 0.00 0.00 0.00 0.00 0.00 0.00INGENIEROS BOLSA
MULTISECTORIAL FIM –7.10 26.06 0.01 RVIO 10.02 18.71 0.02 RVIO 1.12 14.44 0.00 RVIO 5.69 12.42 0.05 RVIO 9.22 18.65 NA 2.25 0.00 0.00 0.00 0.00 0.00 0.09INTERVALOR FONDOS FIMF –8.29 14.95 0.00 RVIO 11.61 10.43 0.00 RVIO 2.98 7.47 0.00 RVIO 2.65 6.37 0.01 RVIO 8.20 10.42 –23.35 1.00 9.00 0.00 0.00 0.00 0.00 0.10KUTXACRECIMIENTO FIM –7.73 29.64 0.00 RVIO 12.97 20.68 0.00 RVIO 2.27 20.39 0.00 RVIO 4.45 14.84 0.00 RVIO 11.35 22.04 NA 2.25 0.00 0.00 0.00 2.00 0.00 0.06KUTXAOPPORTUNITIES FIMF –8.92 17.19 0.00 RVIO 15.04 13.56 0.00 RVIO 11.08 14.42 0.00 RVIO 2.41 12.99 0.00 RVIO 19.20 14.74 NA 2.25 0.00 0.00 0.00 2.00 0.00 0.20KUTXARENDIMIENTO FIM –7.04 18.88 0.00 RVIO 12.56 11.89 0.00 RVIO –1.62 9.08 0.00 RVIO 6.73 7.21 0.00 RVIO 9.86 12.62 NA 2.25 0.00 0.00 0.00 2.00 0.00 0.03KUTXAVALORINTER FIM –10.19 23.68 0.01 RVIO 10.45 16.75 0.00 RVIO 1.37 15.19 0.00 RVIO 4.84 12.56 0.00 RVIO 5.42 17.57 –31.01 2.25 0.00 0.00 0.00 2.00 0.00 0.05MADRID FARMACIA GLOBAL FIM –4.51 22.47 0.00 RVIO 6.38 18.25 0.00 RVIO –3.99 15.00 0.00 RVIO 0.37 14.20 0.00 RVIO –2.11 17.77 NA 2.25 0.00 0.00 0.00 3.00 0.00 0.01MADRID GESTION ACTIVA 100 FIMF –7.42 23.31 0.00 RVIO 10.22 16.31 0.00 RVIO 1.44 14.39 0.00 RVIO 8.35 11.37 0.01 RVIO 12.14 16.95 NA 1.75 0.00 0.00 0.00 4.00 0.00 0.00MADRID SECTOR FINANCIERO
GLOBAL FIM –10.34 27.99 0.00 RVIO 14.07 19.58 0.00 RVIO –0.69 15.27 0.00 RVIO 7.98 11.62 0.00 RVIO 9.68 19.63 –26.42 2.20 0.00 0.00 0.00 3.00 0.00 0.09MADRID TECNOLOGICO GLOBAL FIM –5.76 28.03 0.00 RVIO 10.37 20.46 0.00 RVIO 6.92 23.84 0.00 RVIO 4.66 17.58 0.00 RVIO 16.39 22.82 NA 2.25 0.00 0.00 0.00 4.00 0.00 0.02MADRID TELECOMUNIC. GLOBAL FIM –9.45 27.04 0.00 RVIO 13.61 20.10 0.00 RVIO 1.03 18.45 0.00 RVIO 5.50 14.38 0.01 RVIO 9.66 20.54 NA 2.25 0.00 0.00 0.00 3.00 0.00 0.05MARCH GLOBAL FIM –4.45 20.49 0.00 RVIO 10.80 13.98 0.01 RVIO 1.31 12.58 0.01 RVIO 10.34 10.69 0.01 RVIO 18.34 14.92 –28.30 2.25 0.00 0.00 0.00 0.00 0.00 0.20MARCH MULTIFONDO RVI FIMF –10.71 18.09 0.01 RVIO 12.75 11.09 0.01 RVIO 2.83 10.95 0.00 RVIO 8.49 8.84 0.01 RVIO 12.30 12.83 NA 1.75 0.00 0.00 0.00 1.00 1.00 0.10MARCH PREMIER BOLSA FIM –4.92 20.51 0.01 RVIO 11.27 14.04 0.01 RVIO 1.85 12.42 0.01 RVIO 10.41 10.63 0.01 RVIO 18.96 14.90 NA 1.15 0.00 0.00 0.00 0.00 0.00 0.10MORGAN STANLEY F. SECTORIAL FIMF –8.17 19.82 0.00 RVIO 12.10 14.78 0.00 RVIO 2.05 13.65 0.00 RVIO 5.34 10.60 0.02 RVIO 10.66 15.13 NA 0.00 0.00 0.00 0.00 0.00 0.00 0.15MORGAN STANLEY FONDOS
AGRESIVO FIMF –11.26 25.71 0.00 RVIO 12.87 17.87 0.00 RVIO 2.82 14.44 0.00 RVIO 7.14 11.02 0.00 RVIO 10.34 18.15 NA 1.35 0.00 0.00 0.00 0.00 0.00 0.15MORGAN STANLEY FONDOS RV FIMF –8.93 20.17 0.00 RVIO 10.32 15.43 0.00 RVIO 2.50 14.29 0.00 RVIO 4.18 12.95 0.00 RVIO 7.28 15.99 –9.84 0.00 0.00 0.00 0.00 0.00 0.00 0.12MORGAN STANLEY INTERNET FIM –4.48 34.48 0.00 RVIO 20.48 25.20 0.00 RVIO 8.75 26.16 0.00 RVIO 9.54 19.82 0.01 RVIO 37.10 26.94 NA 2.25 0.00 0.00 0.00 0.00 0.00 0.15MS MULTIGESTION AGRESIVO FIMF –1.38 8.84 0.00 RVIO 11.10 16.04 0.00 RVIO 1.31 13.06 0.00 RVIO 6.61 10.39 0.00 RVIO 18.33 12.43 NA 0.00 0.00 0.00 0.00 0.00 0.00 0.10MUTUAFONDO BOLSA FIM –7.63 21.30 0.01 RVIO 12.34 15.01 0.01 RVIO 2.07 13.37 0.01 RVIO 11.53 11.16 0.02 RVIO 18.13 15.72 –19.77 0.30 0.00 0.00 0.00 0.00 0.00 0.02MUTUAFONDO FONDOS FIMF –4.71 20.19 0.00 RVIO 11.43 12.10 0.01 RVIO 5.27 12.22 0.00 RVIO 4.87 12.09 0.00 RVIO 17.23 14.59 NA 0.30 0.00 0.00 0.00 0.00 0.00 0.02MUTUAFONDO GESTION ACCIONES FIMF –5.18 11.32 0.00 RVIO 10.81 11.02 0.00 RVIO 5.76 11.72 0.00 RVIO 4.32 10.34 0.02 RVIO 15.93 11.17 NA 1.50 0.00 0.00 0.00 0.00 0.00 0.02
(Continues over)
(Continued)

285
Annex 4
: Collective in
vestmen
t schem
es and ven
ture cap
ital com
pan
iesA.4.8.Investment in securities. FIM. Yields, volatility and duration
1Q 2Q 3Q 4Q 2003
Yield Vol Dur Yield Vol Dur Yield Vol Dur Yield Vol Dur Yield Vol(1) (2) Type (1) (2) Type (1) (2) Type (1) (2) Type (1)% % % % %
% fees
Management Front end Back endCustody
of assets of yield Max. Min. Max. Min.
Yieldsince1996
Other foreign equity FIM (RVIO)
MUTUAFONDO TECNOLOGICO FIMF –1.98 31.24 0.00 RVIO 15.76 24.82 0.01 RVIO 9.42 22.78 0.00 RVIO 5.19 18.77 0.02 RVIO 30.60 24.81 NA 0.30 0.00 0.00 0.00 0.00 0.00 0.02NAVARRA ACC.SIG.XXI FIM –9.62 31.26 0.00 RVIO 14.84 22.30 0.00 RVIO –0.04 15.27 0.00 RVIO 8.05 13.90 0.01 RVIO 12.10 21.82 NA 1.60 0.00 0.00 0.00 0.00 0.00 0.12NAVARRA ACC.TECNOL. FIM –7.48 38.18 0.00 RVIO 16.87 26.60 0.00 RVIO 5.14 24.34 0.00 RVIO 7.72 20.12 0.00 RVIO 22.46 28.11 NA 1.60 0.00 0.00 0.00 0.00 0.00 0.12NAVARRA ACCION.INT.FIM –11.16 31.36 0.00 RVIO 9.08 21.24 0.00 RVIO 3.75 18.11 0.00 RVIO 8.29 14.44 0.01 RVIO 8.87 22.21 –27.84 2.00 0.00 0.00 0.00 0.00 0.00 0.15PENTAFONDO INTERN.FIM –11.44 25.51 0.00 RVIO 11.61 17.40 0.00 RVIO 0.98 13.17 0.00 RVIO 8.21 11.27 0.01 RVIO 8.01 17.75 –20.64 2.10 0.00 0.00 0.00 0.00 0.00 0.15PERFILADO AGRESIVO FIMFP –11.62 26.14 0.00 RVIO 12.43 17.76 0.00 RVIO 2.61 14.14 0.00 RVIO 6.89 11.13 0.01 RVIO 8.98 18.23 NA 0.00 0.00 0.00 0.00 0.00 0.00 0.10PERFORMANCE FUND FIM –2.01 4.69 0.40 RVIO 3.86 3.70 0.37 RVIO –1.12 6.44 0.47 RVIO 7.44 6.19 0.79 RVIO 8.12 5.44 –31.48 1.35 5.00 0.00 0.00 0.00 0.00 0.12PSN PLAN INVERSION FIMS –10.56 22.91 0.00 RVIO 11.03 16.42 0.00 RVIO 2.07 13.43 0.00 RVIO 6.11 10.45 0.00 RVIO 7.56 16.51 NA 1.75 0.00 0.00 0.00 0.00 0.00 0.05RENTA 4 ECOFONDO FIM –3.79 19.76 0.00 RVIO 5.91 9.65 0.00 RVIO 1.54 6.33 0.00 RVIO 5.16 4.99 0.01 RVIO 8.80 11.68 NA 2.25 0.00 0.00 0.00 0.00 0.00 0.13RENTA 4 TECNOLOGIA FIM 1.69 30.38 0.01 RVIO 11.74 22.40 0.00 RVIO 7.31 25.21 0.00 RVIO 9.09 19.35 0.01 RVIO 33.02 24.65 NA 2.25 0.00 0.00 0.00 0.00 0.00 0.13RURAL CESTA DECIDIDA 80 FIMF –5.87 16.49 0.00 RVIO 13.71 12.86 0.00 RVIO 0.57 9.38 0.00 RVIO 3.88 9.04 0.02 RVIO 11.83 12.37 NA 0.00 0.00 0.00 0.00 2.00 0.00 0.20RURAL RV INTERNAC. FIM –8.23 23.24 0.00 RVIO 8.29 15.32 0.00 RVIO 1.22 14.61 0.00 RVIO 3.32 10.60 0.01 RVIO 3.93 16.60 NA 2.25 0.00 0.00 0.00 3.00 0.00 0.20RURAL TECNOLOGICO RV FIM –8.29 27.73 0.00 RVIO 10.48 20.57 0.00 RVIO 2.15 18.80 0.00 RVIO 3.34 15.00 0.00 RVIO 6.96 21.04 NA 2.25 0.00 0.00 0.00 3.00 0.00 0.00SABADELL SECTOR FINANCIERO FIM –16.73 26.03 0.01 RVIO 10.08 15.31 0.01 RVIO –0.86 14.10 0.00 RVIO 10.07 11.20 0.01 RVIO 0.03 17.69 NA 1.90 0.00 0.00 0.00 0.00 0.00 0.10SAFEI FONDEFON MUNDIAL FIMF –7.76 22.46 0.01 RVIO 8.09 15.73 0.01 RVIO 1.48 13.90 0.01 RVIO 1.82 11.19 0.01 RVIO 3.01 16.36 –35.02 1.35 9.00 0.00 0.00 0.00 0.00 0.15SAFEI GLOBAL INVERSION FIMF –8.17 21.16 0.01 RVIO 8.50 14.97 0.00 RVIO 2.52 12.81 0.01 RVIO 3.01 12.29 0.01 RVIO 5.23 15.73 NA 1.35 9.00 0.00 0.00 0.00 0.00 0.15SBP SABADELL BOLSA 1 FIM –8.32 24.22 0.01 RVIO 15.02 17.90 0.01 RVIO 0.57 12.31 0.01 RVIO 8.98 9.95 0.01 RVIO 15.56 17.06 –27.04 1.50 0.00 0.00 0.00 0.00 0.00 0.20SCH FINANCIERO FIM –13.55 29.37 0.00 RVIO 15.85 21.36 0.01 RVIO 3.01 16.45 0.00 RVIO 7.25 14.26 0.01 RVIO 10.66 21.24 NA 1.90 0.00 0.00 0.00 1.00 0.00 0.10SCH INTERNACIONAL ACCIONES FIM –9.05 25.06 0.01 RVIO 9.95 17.84 0.20 RVIO 1.76 16.00 0.30 RVIO 4.38 13.01 0.13 RVIO 6.22 18.53 –37.61 2.05 0.00 0.00 0.00 3.00 0.00 0.20SCH SALUD FIM –4.44 18.96 0.01 RVIO 6.07 17.22 0.01 RVIO –5.68 13.14 0.00 RVIO 1.85 13.35 0.01 RVIO –2.63 15.87 –37.52 1.90 0.00 0.00 0.00 3.00 0.00 0.10SCH SELECCION FONDOS GLOBAL FIMFP –7.17 16.34 0.00 RVIO 8.91 12.83 0.00 RVIO 3.69 12.48 0.00 RVIO 4.19 11.19 0.01 RVIO 9.22 13.39 NA 0.32 0.00 0.00 0.00 5.00 5.00 0.09SCH SELECCION GLOBAL FIMS –7.32 15.71 0.00 RVIO 8.07 12.32 0.00 RVIO 3.07 11.99 0.00 RVIO 3.54 10.75 0.01 RVIO 6.89 12.86 –29.33 1.88 0.00 0.00 0.00 3.00 0.00 0.01SCH TECNOLOGICO FIM –7.62 31.96 1.21 RVIO 10.39 24.61 1.11 RVIO 9.50 26.66 0.04 RVIO 3.68 21.31 0.69 RVIO 15.76 26.43 –57.81 1.90 0.00 0.00 0.00 3.00 0.00 0.10SEGURFONDO BOLSA FIM –8.47 22.26 0.01 RVIO 8.80 15.03 0.01 RVIO –0.31 14.19 0.01 RVIO 3.87 10.51 0.01 RVIO 3.11 16.09 –13.02 1.50 0.00 0.00 0.00 0.00 0.00 0.20TARRAGONAFONS SELEC 75 FIMF –5.82 10.05 0.01 RVIO 8.15 9.99 0.01 RVIO 1.09 9.98 0.01 RVIO 6.20 9.43 0.01 RVIO 9.36 9.93 NA 1.45 0.00 0.00 0.00 0.00 0.00 0.20UNIFOND BOLSA GLOBAL FIMF –2.24 6.10 0.00 RVIO 6.70 3.71 7.13 RVIO 3.01 3.26 7.05 RVIO 5.98 2.97 6.29 RVIO 13.88 4.25 NA 1.60 0.00 0.00 0.00 0.00 0.00 0.10URQUIJO GLOBAL FIM –5.19 22.36 0.00 RVIO 10.84 15.10 0.00 RVIO –2.52 12.59 0.00 RVIO 5.93 10.89 0.01 RVIO 8.52 15.87 –35.61 2.25 0.00 0.00 0.00 2.00 2.00 0.20VALENCIA INTERNAC. FIM –9.86 19.61 2.18 RVIO 11.00 13.73 0.00 RVIO 6.17 11.19 0.00 RVIO 8.37 9.63 0.01 RVIO 15.11 14.13 –12.82 2.23 0.00 0.00 0.00 1.50 0.00 0.20
(Continues over)
(Continued)

286
Annual rep
ort o
n th
e securities m
arket. 2003
A.4.8.Investment in securities. FIM. Yields, volatility and duration
1Q 2Q 3Q 4Q 2003
Yield Vol Dur Yield Vol Dur Yield Vol Dur Yield Vol Dur Yield Vol(1) (2) Type (1) (2) Type (1) (2) Type (1) (2) Type (1)% % % % %
% fees
Management Front end Back endCustody
of assets of yield Max. Min. Max. Min.
Yieldsince1996
Guaranteed fixed-income FIM(GRF)
ASTURFON. C G GAR.I FIM 0.42 0.10 0.29 GRF 0.42 3.32 0.07 GRF 0.25 2.05 0.00 GRV 0.89 3.20 2.81 GRF 2.00 1.61 17.05 0.95 0.00 5.00 5.00 0.00 0.00 0.20ASTURFONDO PLAZO I FIM 0.67 0.75 0.79 GRF 0.66 0.67 0.56 GRF 0.27 0.32 0.32 GRF 0.33 1.51 0.08 GRF 1.94 0.53 NA 0.50 0.00 3.00 3.00 0.00 0.00 0.15ASTURFONDO PLAZO II FIM 0.80 0.27 0.57 GRF 0.53 0.12 0.34 GRF 0.49 1.58 0.10 GRF 0.44 2.73 0.01 GRF 2.28 0.15 NA 0.75 0.00 3.00 3.00 0.00 0.00 0.15ASTURFONDO PLAZO III FIM 0.60 0.38 0.30 GRF 0.53 1.38 0.07 GRF 0.34 3.06 0.00 GRF 0.16 1.82 0.01 GRF 1.64 0.19 5.81 1.00 0.00 5.00 5.00 0.00 0.00 0.20ASTURFONDO PLAZO IV FIM 0.84 0.36 0.70 GRF 0.64 0.25 0.48 GRF 0.39 0.26 0.25 GRF 0.39 2.02 0.01 GRF 2.28 0.26 6.35 0.40 0.00 3.00 3.00 0.00 0.00 0.10BANCAJA GARANTIZADO RENTA
FIJA FIM 1.32 1.51 2.20 GRF 1.48 1.94 1.97 GRF 0.13 1.58 1.73 GRF 0.10 1.52 1.49 GRF 3.06 1.65 17.39 0.50 0.00 0.00 0.00 0.00 0.00 0.05BANESTO RENTAS DIC2003 FIM 0.56 0.40 0.75 GRF 0.43 0.33 0.53 GRF 0.19 5.28 0.28 GRF 0.19 2.97 0.04 GRF 1.38 0.26 NA 1.07 0.00 2.00 2.00 5.00 0.00 0.10BANKINTER GARANT. 4 FIM 0.53 1.03 1.54 GRF 0.99 0.78 1.30 GRF 0.18 0.52 1.04 GRF 0.26 0.42 0.80 GRF 1.97 0.73 14.50 0.70 0.00 2.00 2.00 5.00 5.00 0.20BARCLAYS INTERES GARANTIZADO
1 FIM 0.73 0.33 0.09 GRF 0.52 0.22 0.08 GRF 0.41 0.14 0.04 GRF 0.25 0.12 0.02 GRF 1.93 0.22 NA 0.60 0.00 0.00 0.00 0.00 0.00 0.10BARCLAYS INTERES GARANTIZADO
2 FIM 1.19 1.54 0.14 GRF 1.34 1.21 0.14 GRF 0.28 1.32 0.14 GRF 0.31 1.22 0.14 GRF 3.15 1.33 NA 0.50 0.00 0.50 0.50 3.00 3.00 0.10BARCLAYS INTERES GARANTIZADO
3 FIM 0.60 5.65 0.07 GRF 1.35 3.48 0.10 GRF –0.09 2.40 0.10 GRF –0.39 4.42 0.17 GRF 1.46 3.07 NA 0.50 0.00 3.00 3.00 0.25 0.25 0.10BARCLAYS INTERES GARANTIZADO
6 FIM 1.18 1.26 1.80 GRF 1.00 1.11 1.56 GRF 0.28 1.12 1.35 GRF 0.16 0.81 1.14 GRF 2.63 1.09 NA 0.65 0.00 0.00 0.00 0.25 0.25 0.10BBK GARANTIZADO 1 FIM 0.86 0.97 1.42 GRF 0.70 0.76 1.20 GRF 0.15 0.55 0.97 GRF 0.13 0.41 0.75 GRF 1.85 0.70 NA 1.18 0.00 5.00 0.00 1.50 0.00 0.10BBK GARANTIZADO 2 FIM 0.96 1.21 1.66 GRF 0.85 1.00 1.45 GRF 0.17 0.84 1.23 GRF 0.06 0.59 0.93 GRF 2.06 0.94 NA 1.05 0.00 5.00 0.00 1.50 0.00 0.10BBK GARANTIZADO 4 FIM 0.57 9.90 0.14 GRF 0.51 2.06 0.01 GRV –0.14 1.56 1.67 GRV 0.36 1.14 1.43 GRF 1.31 0.97 NA 0.40 0.00 5.00 0.00 5.00 0.00 0.10BBVA 100 POR 100 FIM 1.18 0.78 0.84 GRF 0.75 0.34 0.61 GRF 0.28 0.12 0.40 GRF 0.26 4.56 0.23 GRF 2.50 0.43 13.16 1.00 0.00 0.00 0.00 2.00 0.00 0.20BBVA 2005 FIM 1.23 1.84 2.37 GRF 1.15 1.73 2.21 GRF 0.07 1.49 1.65 GRF –0.02 1.06 1.43 GRF 2.45 1.56 NA 1.00 0.00 0.00 0.00 2.00 0.00 0.20BBVA 2007 FIM 2.04 4.05 4.70 GRF 2.19 3.93 4.51 GRF –0.32 3.81 4.17 GRF –0.58 2.98 3.98 GRF 3.35 3.72 17.78 1.10 0.00 0.00 0.00 3.00 0.00 0.15BBVA BONO 2003 FIM 0.67 0.56 0.96 GRF 0.53 0.29 0.57 GRF 0.28 0.14 0.37 GRF 0.21 9.66 0.09 GRF 1.71 0.33 13.47 0.90 0.00 0.00 0.00 3.00 0.00 0.10BBVA BONO 2004 A FIM 0.78 0.94 1.31 GRF 0.64 0.69 1.08 GRF 0.08 0.47 0.79 GRF 0.07 0.32 0.49 GRF 1.57 0.65 14.45 1.30 0.00 2.00 0.00 2.00 0.00 0.10BBVA BONO 2004 B FIM 0.91 0.88 1.22 GRF 0.76 0.60 0.99 GRF 0.26 0.39 0.75 GRF 0.26 0.28 0.45 GRF 2.21 0.58 16.29 0.70 0.00 2.00 0.00 2.00 0.00 0.10BBVA BONO 2004 C FIM 0.92 0.94 1.28 GRF 0.73 0.60 0.97 GRF 0.25 0.38 0.71 GRF 0.26 0.25 0.46 GRF 2.18 0.61 15.83 0.70 0.00 2.00 0.00 2.00 0.00 0.10BBVA BONO 2004 D FIM 0.66 0.79 1.19 GRF 0.51 0.62 0.99 GRF 0.02 0.40 0.72 GRF 0.02 0.21 0.45 GRF 1.22 0.55 13.66 1.60 0.00 2.00 0.00 0.00 0.00 0.10BBVA BONO 2004 FIM 0.92 1.41 1.91 GRF 0.89 1.24 1.65 GRF 0.00 1.00 1.29 GRF –0.05 0.72 1.05 GRF 1.77 1.12 12.46 1.40 0.00 0.00 0.00 3.00 0.00 0.10BBVA BONO 2005 B FIM 1.29 1.92 2.40 GRF 1.24 1.76 2.18 GRF 0.03 1.74 1.89 GRF –0.08 1.27 1.64 GRF 2.49 1.69 NA 1.20 0.00 2.00 0.00 0.00 0.00 0.10BBVA BONO 2005 C FIM 1.32 2.05 2.48 GRF 1.27 1.87 2.27 GRF 0.09 1.87 2.04 GRF –0.06 1.42 1.80 GRF 2.64 1.82 NA 1.20 0.00 2.00 0.00 0.00 0.00 0.10BBVA BONO 2005 D FIM 1.30 2.04 2.51 GRF 1.25 1.89 2.29 GRF 0.06 1.88 2.07 GRF –0.11 1.42 1.81 GRF 2.52 1.83 14.38 1.15 0.00 2.00 0.00 2.00 0.00 0.10BBVA BONO 2005 E FIM 1.39 2.20 2.58 GRF 1.32 2.03 2.39 GRF 0.04 2.02 2.16 GRF –0.11 1.54 1.92 GRF 2.66 1.97 NA 1.20 0.00 2.00 0.00 5.00 0.00 0.10BBVA BONO 2005 FIM 1.29 1.65 2.14 GRF 1.22 1.51 1.93 GRF 0.23 1.54 1.66 GRF 0.01 1.19 1.47 GRF 2.76 1.49 16.34 0.90 0.00 0.00 0.00 3.00 0.00 0.10BBVA BONO 2007 FIM 1.91 3.94 4.80 GRF 2.03 4.05 4.57 GRF –0.34 3.93 4.23 GRF –0.73 3.13 4.01 GRF 2.86 3.79 15.47 1.40 0.00 0.00 0.00 3.00 0.00 0.10BBVA DOBLE–BEX FIM 1.75 3.64 3.72 GRF 1.98 3.88 3.53 GRF –0.32 3.77 3.34 GRF –0.68 2.99 3.05 GRF 2.72 3.59 16.76 1.50 0.00 3.00 0.00 5.00 0.00 0.10BBVA EXTRA TESORERIA FIM 0.69 7.13 0.20 GRF 0.56 4.51 0.44 GRF 0.47 2.85 0.24 GRF 0.48 1.41 0.02 GRF 2.21 0.04 17.26 0.10 0.00 0.00 0.00 0.00 0.00 0.05BBVA FONDPLAZO 2005 B FIM 1.09 0.95 0.01 GRF 1.23 1.63 2.00 GRF 0.22 1.61 1.83 GRF 0.07 1.21 1.58 GRF 2.63 1.38 NA 0.70 0.00 5.00 0.00 5.00 0.00 0.10BBVA FONDPLAZO 2005 FIM 3.01 3.28 2.90 GRF 1.42 2.25 2.60 GRF 0.02 2.25 2.39 GRF –0.17 1.70 2.11 GRF 4.32 2.45 9.61 1.15 0.00 2.00 0.00 3.00 0.00 0.10BBVA FONDPLAZO 2006 FIM 2.33 4.05 2.98 GRF 1.52 2.40 2.76 GRF –0.01 2.48 2.59 GRF –0.22 1.87 2.36 GRF 3.66 2.82 9.20 1.05 0.00 2.00 0.00 5.00 0.00 0.10BBVA PLAN RENTA FIM 1.78 3.56 4.26 GRF 1.94 3.59 4.15 GRF –0.25 3.56 3.96 GRF –0.72 2.87 3.78 GRF 2.75 3.42 16.05 1.40 0.00 0.00 0.00 1.00 0.00 0.10BBVA PLAN RENTAS 10 B FIM 1.78 3.27 3.98 GRF 1.84 3.37 3.79 GRF –0.03 3.39 3.56 GRF –0.54 2.77 3.35 GRF 3.06 3.22 18.86 0.90 0.00 0.00 0.00 3.00 0.00 0.10BBVA PLAN RENTAS 10 FIM 1.56 3.14 3.71 GRF 1.62 3.03 3.49 GRF –0.17 2.95 3.23 GRF –0.53 2.38 3.01 GRF 2.49 2.90 15.77 1.40 0.00 0.00 0.00 1.00 0.00 0.10BBVA RENTA CRECIENTE 2006 FIM 1.45 2.59 2.94 GRF 1.51 2.44 2.72 GRF –0.01 2.50 2.57 GRF –0.21 1.90 2.30 GRF 2.75 2.38 NA 1.20 0.00 2.00 0.00 0.00 0.00 0.10BBVA RENTAS 2006 B FIM 1.48 2.62 2.96 GRF 1.56 2.42 2.77 GRF 0.00 2.54 2.58 GRF –0.23 1.93 2.28 GRF 2.83 2.40 19.46 1.15 0.00 2.00 0.00 2.00 0.00 0.10BBVA RENTAS 2006 C FIM 1.39 2.40 2.95 GRF 1.35 2.30 2.72 GRF –0.01 2.25 2.52 GRF –0.29 1.79 2.28 GRF 2.44 2.20 17.49 1.15 0.00 2.00 0.00 2.00 0.00 0.10BBVA RENTAS 2006 FIM 1.52 2.53 2.92 GRF 1.52 2.37 2.72 GRF 0.00 2.44 2.54 GRF –0.21 1.88 2.32 GRF 2.85 2.32 22.13 1.15 0.00 2.00 0.00 2.00 0.00 0.10BBVA RENTAS CRECIENTE 2005 B FIM 1.50 2.13 2.50 GRF 1.40 1.89 2.26 GRF 0.24 1.88 2.02 GRF 0.10 1.44 1.81 GRF 3.26 1.85 14.64 0.46 0.00 2.00 0.00 0.00 0.00 0.10BBVA RENTAS CRECIENTE 2005 C FIM 1.55 2.18 2.52 GRF 1.43 1.99 2.32 GRF 0.20 2.00 2.09 GRF 0.06 1.49 1.82 GRF 3.28 1.94 8.00 0.55 0.00 2.00 0.00 0.00 0.00 0.10BBVA RENTAS CRECIENTE 2005 FIM 1.25 1.80 2.22 GRF 1.16 1.65 2.00 GRF 0.13 1.62 1.81 GRF –0.04 1.23 1.55 GRF 2.52 1.59 15.56 1.20 0.00 2.00 2.00 0.00 0.00 0.10BBVA RENTAS CRECIENTE 2006 B FIM 2.99 3.15 2.69 GRF 1.45 2.10 2.49 GRF 0.13 2.11 2.28 GRF –0.05 1.60 2.04 GRF 4.58 2.32 20.15 0.75 0.00 2.00 0.00 3.00 0.00 0.10BBVA RENTAS CRECIENTE 2006 C FIM 0.28 0.20 0.01 GRF 1.50 2.31 2.69 GRF 0.07 2.42 2.50 GRF –0.04 1.78 2.28 GRF 1.81 1.90 10.15 0.67 0.00 5.00 0.00 5.00 0.00 0.10
(Continues over)
(Continued)

287
Annex 4
: Collective in
vestmen
t schem
es and ven
ture cap
ital com
pan
iesA.4.8.Investment in securities. FIM. Yields, volatility and duration
1Q 2Q 3Q 4Q 2003
Yield Vol Dur Yield Vol Dur Yield Vol Dur Yield Vol Dur Yield Vol(1) (2) Type (1) (2) Type (1) (2) Type (1) (2) Type (1)% % % % %
% fees
Management Front end Back endCustody
of assets of yield Máx. Min. Max. Min.
Yieldsince1996
Guaranteed fixed-income FIM(GRF)
BBVA TRANQUILIDAD I FIM 1.20 2.78 3.87 GRF 1.93 2.53 3.65 GRF –0.14 2.53 3.42 GRF –0.39 2.11 3.10 GRF 2.60 2.51 13.12 1.40 0.00 2.00 0.00 2.00 0.00 0.10BBVA TRANQUILIDAD II FIM 1.21 2.77 3.86 GRF 1.92 2.54 3.65 GRF –0.14 2.52 3.40 GRF –0.40 2.09 3.14 GRF 2.59 2.50 13.34 1.40 0.00 2.00 0.00 2.00 0.00 0.10BCH 2000–B FIM 0.94 1.17 1.70 GRF 0.77 1.05 1.49 GRF 0.09 0.90 1.26 GRF 0.03 0.66 1.02 GRF 1.85 0.96 18.39 1.27 0.00 2.00 2.00 2.00 0.50 0.10BCH 2004–A FIM 0.70 0.42 0.91 GRF 0.59 0.29 0.69 GRF 0.28 0.23 0.28 GRF 0.29 8.87 0.05 GRF 1.88 0.28 13.55 0.65 0.00 2.00 2.00 2.00 0.00 0.25BCH 4 FIM 1.03 1.25 1.77 GRF 0.85 1.07 1.52 GRF 0.19 0.94 1.29 GRF 0.12 0.67 1.04 GRF 2.21 1.00 19.86 0.94 0.00 2.00 2.00 2.00 0.50 0.10BCH 5 B FIM 0.91 1.24 1.76 GRF 0.75 1.05 1.51 GRF 0.08 0.93 1.28 GRF 0.01 0.66 1.03 GRF 1.77 0.99 18.91 1.39 0.00 2.00 2.00 2.00 0.50 0.10BCH 5–A FIM 0.95 1.17 1.73 GRF 0.79 1.06 1.52 GRF 0.10 0.90 1.24 GRF 0.03 0.67 1.02 GRF 1.87 0.97 18.10 1.27 0.00 2.00 2.00 2.00 0.50 0.10BCH RENTAS 3 C FIM 0.77 0.39 0.64 GRF 0.51 0.53 0.40 GRF 0.64 7.94 0.17 GRF 1.40 1.70 0.05 GRF 3.36 0.92 NA 0.00 0.00 2.00 2.00 2.00 0.00 0.00BCH RENTAS 5 K FIM 0.74 0.41 0.82 GRF 0.54 0.25 0.56 GRF 0.28 6.20 0.32 GRF 0.29 8.37 0.07 GRF 1.86 0.24 NA 0.65 0.00 2.00 2.00 0.50 0.50 0.25BCH RENTAS 5 M FIM 0.79 0.65 1.11 GRF 0.58 0.47 0.88 GRF 0.19 0.29 0.63 GRF 0.18 0.17 0.39 GRF 1.75 0.44 NA 0.90 0.00 2.00 2.00 2.00 0.50 0.25BCH RENTAS 5 N FIM 0.81 0.88 1.36 GRF 0.60 0.69 1.11 GRF 0.12 0.54 0.90 GRF 0.08 0.39 0.66 GRF 1.63 0.65 16.46 1.25 0.00 2.00 2.00 2.00 0.50 0.10BCH RENTAS 5 P FIM 0.97 1.17 1.74 GRF 0.72 1.05 1.46 GRF 0.16 0.91 1.25 GRF 0.04 0.65 1.01 GRF 1.90 0.97 NA 1.25 0.00 2.00 2.00 2.00 0.00 0.10BCH RENTAS 5 R FIM 1.20 1.28 1.90 GRF 1.05 1.16 1.61 GRF 0.32 1.04 1.39 GRF 0.22 0.78 1.17 GRF 2.81 1.08 NA 0.47 0.00 2.00 2.00 2.00 0.50 0.10BCH RENTAS 5 S FIM 1.28 1.41 1.94 GRF 1.07 1.27 1.70 GRF 0.34 1.13 1.44 GRF 0.25 0.84 1.24 GRF 2.97 1.18 22.88 0.36 0.00 2.00 2.00 2.00 0.00 0.10BCH RENTAS 5 T FIM 1.16 1.53 2.12 GRF 1.08 1.49 1.89 GRF 0.21 1.45 1.69 GRF –0.02 1.12 1.47 GRF 2.44 1.41 NA 0.80 0.00 2.00 2.00 2.00 0.50 0.10BK FT GARANTIA FIM 0.86 0.70 1.04 GRF 0.62 0.45 0.79 GRF 0.31 0.25 0.53 GRF 0.34 0.10 0.00 GRF 2.13 0.44 13.54 0.50 0.00 0.00 0.00 0.00 0.00 0.05BSN 2006–1 FIM 1.27 3.42 2.27 GRF 1.27 2.67 2.13 GRF 0.10 2.98 1.98 GRF –0.56 1.90 2.04 GRF 2.07 2.80 20.54 0.73 0.00 3.00 3.00 5.00 0.00 0.20CAIXA CATALUNYA 1 FIM 0.47 0.10 0.21 GRF 0.54 0.22 0.00 GRF 0.25 0.83 0.93 GRF 0.11 0.49 0.74 GRF 1.37 0.50 NA 0.45 0.00 1.00 0.00 1.00 0.00 0.05CAIXA CATALUNYA 1–A FIM 0.77 0.61 0.74 GRF 0.94 0.44 0.78 GRF 0.41 0.26 0.56 GRF 0.21 0.18 0.36 GRF 2.34 0.41 NA 0.45 0.00 1.00 0.00 1.00 0.00 0.05CAIXA CATALUNYA 1–B FIM 0.56 6.36 0.13 GRF 0.71 0.49 0.67 GRF 0.51 0.33 0.60 GRF 0.20 0.27 0.39 GRF 1.99 0.33 NA 0.45 0.00 1.00 0.00 1.00 0.00 0.05CAIXA CATALUNYA 1–C FIM 0.97 0.58 0.93 GRF 0.77 0.57 0.71 GRF 0.36 0.21 0.48 GRF 0.24 0.19 0.23 GRF 2.36 0.43 NA 0.45 0.00 1.00 0.00 1.00 0.00 0.05CAIXA CATALUNYA 1–D FIM NA 0.96 0.02 GRF 1.01 0.53 0.89 GRF 0.49 0.29 0.65 GRF 0.19 0.25 0.46 GRF NA 0.47 NA 0.45 0.00 1.00 0.00 1.00 0.00 0.05CAIXA CATALUNYA 1–E FIM NA NA NA NA NA NA NA 4.57 0.00 GRF 0.38 3.55 0.01 GRF NA 3.87 NA 0.45 0.00 1.00 0.00 1.00 0.00 0.05CAIXA CATALUNYA 3–A FIM 1.32 1.45 1.65 GRF 1.71 1.49 1.53 GRF 0.59 1.06 1.33 GRF –0.41 1.13 1.13 GRF 3.24 1.31 NA 0.95 0.00 3.00 0.00 0.50 0.00 0.10CAIXA CATALUNYA 5 FIM 1.95 1.54 2.01 GRF 1.27 1.50 1.98 GRF 0.23 1.26 1.81 GRF –0.25 1.07 1.41 GRF 3.22 1.37 15.55 0.90 0.00 3.00 0.00 2.00 0.00 0.10CAIXA CATALUNYA 5–A FIM 0.58 1.31 1.71 GRF 0.73 1.06 1.45 GRF –0.02 0.82 1.21 GRF 0.00 0.53 0.98 GRF 1.30 0.97 NA 1.25 0.00 3.00 0.00 0.50 0.00 0.20CAIXA CATALUNYA DOBLE FIM 1.92 1.82 2.37 GRF 1.57 1.73 2.23 GRF 0.25 1.56 2.06 GRF –0.33 1.30 1.75 GRF 3.44 1.62 14.97 0.70 0.00 3.00 0.00 2.00 0.00 0.20CAIXA CATALUNYA PREVISIO FIM 0.07 0.47 0.48 GRF 0.30 0.21 0.44 GRF 0.06 6.95 0.23 GRF 0.94 1.24 0.06 GRF 1.38 0.67 12.31 1.10 0.00 0.00 0.00 0.00 0.00 0.10CAIXA GALICIA BETA GARANTIA FIM 1.18 1.75 3.16 GRF 1.36 1.50 2.87 GRF 0.12 1.51 2.62 GRF –0.03 1.24 2.47 GRF 2.65 1.52 16.87 1.00 0.00 3.00 3.00 3.00 3.00 0.15CAIXAMANRESA GARANTIT 1 FIM 0.97 0.34 0.76 GRF 0.86 0.55 0.54 GRF 0.53 0.14 0.32 GRF 0.53 3.65 0.08 GRF 2.92 0.33 NA 0.40 0.00 3.00 3.00 3.00 3.00 0.10CAIXAMANRESA GARANTIT 2 FIM 0.98 0.32 0.87 GRF 0.70 0.25 0.64 GRF 0.38 0.13 0.48 GRF 0.40 3.47 0.24 GRF 2.48 0.22 NA 0.40 0.00 3.00 3.00 3.00 3.00 0.10CAJA LABORAL RENTA ASEGURADA I FIM 0.57 1.68 2.50 GRF 1.97 1.52 2.30 GRF 0.62 1.39 2.07 GRF 0.29 0.96 1.84 GRF 3.49 1.42 14.13 1.10 0.00 3.00 3.00 2.00 2.00 0.13CAJA LABORAL RENTA FIM 1.55 1.59 1.89 GRF 1.13 1.24 1.63 GRF 0.00 1.44 1.40 GRF 0.02 0.78 1.16 GRF 2.71 1.30 15.56 1.30 0.00 1.00 1.00 1.00 1.00 0.20CAJAINVEST 1 FIM 0.54 0.21 0.50 GRF 0.39 8.31 0.25 GRF 0.33 8.92 0.03 GRF 0.25 1.35 0.01 GRF 1.51 0.11 NA 0.80 0.00 0.00 0.00 0.00 0.00 0.05CAM FUTURO GARANTIZADO 2 FIM 0.93 0.72 0.90 GRF 0.49 0.54 0.66 GRF 0.33 0.12 0.41 GRF 0.41 2.60 0.17 GRF 2.18 0.45 NA 0.45 0.00 5.00 5.00 2.00 2.00 0.05CG DELTA FUTURO FIM NA NA NA NA NA NA NA NA NA NA 2.64 0.02 GRF NA 2.64 NA 0.20 0.00 0.00 0.00 0.00 0.00 0.05COOPVALOR V FIM 1.09 0.70 1.07 GRF 0.77 0.52 0.86 GRF 0.43 0.39 0.64 GRF 0.35 0.16 0.41 GRF 2.67 0.49 16.74 0.70 0.00 2.00 0.00 2.00 0.00 0.00CT CLASSIC 1 FIM 0.55 0.12 0.31 GRF 0.37 0.21 0.03 GRF 0.77 0.85 1.22 GRF 0.25 0.92 1.00 GRF 1.95 0.64 NA 0.30 0.00 5.00 5.00 5.00 5.00 0.10DOBLEMED FIM 0.65 1.18 1.65 GRF 0.88 1.07 1.43 GRF 0.19 1.01 1.22 GRF 0.13 0.54 1.01 GRF 1.86 0.98 15.94 0.90 0.00 2.00 2.00 0.00 0.00 0.09EUROVALOR RENTA AÑO 3 FIM 0.90 0.50 0.95 GRF 0.68 0.42 0.72 GRF 0.37 0.20 0.47 GRF 0.38 1.95 0.23 GRF 2.34 0.34 NA 0.38 0.00 4.00 4.00 4.00 4.00 0.00EUROVALOR RENTA AÑO 4 FIM 1.53 2.02 1.26 GRF 0.85 0.57 1.03 GRF 0.35 0.43 0.80 GRF 0.31 0.29 0.55 GRF 3.08 1.08 NA 0.40 0.00 4.00 4.00 4.00 4.00 0.00EUROVALOR RENTA AÑO 5 FIM NA 6.49 0.00 GRF 0.96 1.81 2.45 GRF 0.06 3.15 2.33 GRF –0.57 1.78 2.07 GRF NA 2.25 NA 0.50 0.00 4.00 4.00 4.00 4.00 0.00F. EXTREMADURA GARANTIZADO II FIM NA NA NA NA 1.76 0.19 GRF 0.75 0.65 0.91 GRF 0.33 0.29 0.68 GRF NA 0.49 NA 0.65 0.00 3.00 3.00 3.00 3.00 0.05F. EXTREMADURA GARANTIZADO III FIM NA NA NA NA NA NA NA 0.22 0.12 GRF 0.67 0.42 0.84 GRF NA 0.40 NA 0.65 0.00 3.00 3.00 3.00 3.00 0.05F. EXTREMADURA GARANTIZADO IV FIM NA NA NA NA NA NA NA NA NA NA 1.89 0.04 GRF NA 1.89 NA 0.65 0.00 0.00 0.00 0.00 0.00 0.05F.VALENCIA GARAN. 2 FIM 1.09 1.15 1.69 GRF 0.87 1.03 1.48 GRF 0.23 1.03 1.24 GRF 0.15 1.14 1.01 GRF 2.36 1.09 22.80 0.80 0.00 2.00 0.00 0.00 0.00 0.10FON FINECO II GARANTIZADO FIM 0.58 0.17 0.30 GRF 0.61 5.88 0.05 GRF 0.45 0.19 0.00 GRF 0.31 1.73 0.01 GRF 1.96 0.13 18.01 0.50 0.00 1.00 0.00 0.00 0.00 0.10FONCAIXA FUTURO 27 FIM 0.78 0.43 0.78 GRF 0.58 0.32 0.55 GRF 0.28 0.11 0.32 GRF 0.29 3.55 0.10 GRF 1.93 0.28 13.33 0.95 0.00 3.00 3.00 0.00 0.00 0.00FOND C.C.M. FIM 1.21 1.68 1.71 GRF 1.21 0.83 1.48 GRF 0.18 0.96 1.24 GRF 0.18 0.71 1.00 GRF 2.80 1.11 13.74 0.60 0.00 0.00 0.00 1.00 1.00 0.15FOND C.C.M. RENTAS FIM 0.94 0.68 0.07 GRF 1.44 0.96 4.06 GRF 0.29 1.04 3.84 GRF 0.28 0.74 3.61 GRF 2.98 0.88 NA 0.67 0.00 0.00 0.00 3.00 3.00 0.13FONDESPAÑA RENTA FIJA 1 FIM NA NA NA NA NA NA NA 0.54 2.88 GRF –0.15 2.07 2.73 GRF NA 1.60 NA 0.40 0.00 5.00 5.00 3.00 3.00 0.10FONDESPAÑA RENTA FIJA 2 FIM NA NA NA NA NA NA NA NA 0.00 GRF 0.42 1.78 2.69 GRF NA 1.78 NA 0.60 0.00 5.00 5.00 3.00 3.00 0.10
(Continues over)
(Continued)

288
Annual rep
ort o
n th
e securities m
arket. 2003
A.4.8.Investment in securities. FIM. Yields, volatility and duration
1Q 2Q 3Q 4Q 2003
Yield Vol Dur Yield Vol Dur Yield Vol Dur Yield Vol Dur Yield Vol(1) (2) Type (1) (2) Type (1) (2) Type (1) (2) Type (1)% % % % %
% fees
Management Front end Back endCustody
of assets of yield Max. Min. Max. Min.
Yieldsince1996
Guaranteed fixed-income FIM(GRF)
FONDESPAÑA RENTA FIJA 3 FIM NA NA NA NA NA NA NA NA NA NA 0.69 0.00 GRF NA 0.69 NA 0.65 0.00 5.00 5.00 3.00 3.00 0.10FONDESPAÑA SEMESTRAL GTZO FIM 0.53 1.93 0.28 GRF 0.56 3.30 0.05 GRF 0.37 2.30 0.32 GRF 0.37 2.17 0.09 GRF 1.84 2.41 13.85 1.10 0.00 5.00 5.00 3.00 3.00 0.15FONDO EXTREMADURA GARANTIZADO
I FIM NA NA NA NA 1.85 0.91 GRF 0.20 0.22 0.67 GRF 0.29 0.14 0.44 GRF NA 1.05 NA 0.65 0.00 3.00 3.00 3.00 3.00 0.05FONDO NUEVO FIM 1.76 1.92 2.42 GRF 2.74 1.89 2.23 GRF 0.96 1.54 2.15 GRF 0.49 1.32 1.92 GRF 6.06 1.69 22.85 0.60 0.00 5.00 0.00 0.00 0.00 0.00FONDUERO INTERES GARANTIZADO
1 FIM 1.85 2.32 1.54 GRF 1.01 1.23 1.31 GRF 0.28 0.96 1.13 GRF 0.18 0.71 0.89 GRF 3.36 1.44 NA 0.55 0.00 5.00 5.00 0.00 0.00 0.10FONDUERO INTERES GARANTIZADO
2 FIM 0.75 0.47 0.81 GRF 0.64 0.37 0.59 GRF 0.27 0.15 0.36 GRF 0.35 1.56 0.12 GRF 2.03 0.31 NA 0.70 0.00 5.00 5.00 3.00 3.00 0.00FONGENERAL RF PRIVADA GTZO FIM NA NA NA NA NA NA NA NA 0.00 GRF 2.34 1.61 2.79 GRF NA 1.61 NA 0.60 0.00 3.00 3.00 3.00 3.00 0.05FONMIX LAIETANA DOS FIM NA NA NA NA NA NA NA 5.01 0.01 GRF 0.63 0.02 0.24 GRF NA 4.31 NA 1.15 0.00 3.00 3.00 3.00 3.00 0.10FONMIX LAIETANA FIM –6.76 12.79 0.00 RVIO 0.39 0.19 0.32 GRF 0.91 2.06 0.12 GRF 0.90 2.03 0.24 GRF –4.69 6.39 –39.93 1.15 0.00 3.00 3.00 3.00 3.00 0.10FONPENEDES GARANTIT FIM 2.50 3.83 4.60 GRF 1.90 3.97 4.38 GRF –0.27 4.14 4.19 GRF –0.99 3.74 3.83 GRF 3.14 3.93 11.55 1.00 0.00 0.00 0.00 0.00 0.00 0.00FONPENEDES INTERES GARANTIT
1 FIM 0.65 0.36 0.48 GRF 0.26 1.88 0.25 GRF 0.29 5.21 0.01 GRF 0.39 0.80 1.17 GRF 1.60 0.44 NA 1.00 0.00 0.00 0.00 0.00 0.00 0.00FONPENEDES INTERES GARANTIT
2 FIM 0.74 0.71 0.91 GRF 0.53 0.38 0.70 GRF 0.23 0.35 0.47 GRF 0.23 7.08 0.24 GRF 1.74 0.44 NA 1.00 0.00 0.00 0.00 0.00 0.00 0.00FONPENEDES INTERES GARANTIT
3 FIM 0.52 4.71 0.01 GRF 0.93 0.67 1.23 GRF 0.22 0.66 0.96 GRF 0.20 0.53 0.72 GRF 1.87 0.55 NA 1.00 0.00 0.00 0.00 0.00 0.00 0.00HERRERO FONPLAZO 2 FIM 1.35 1.49 1.95 GRF 1.29 1.34 1.73 GRF 0.37 1.31 1.64 GRF 0.10 1.07 1.42 GRF 3.14 1.32 22.37 0.80 0.00 3.00 3.00 0.00 0.00 0.10HERRERO FONPLAZO 5 FIM 1.02 1.64 1.54 GRF 0.93 1.00 1.44 GRF 0.28 0.85 1.20 GRF 0.22 0.61 0.88 GRF 2.46 1.10 NA 0.75 0.00 5.00 5.00 2.00 2.00 0.05HERRERO FONPLAZO III FIM 0.76 0.54 0.88 GRF 0.59 0.40 0.72 GRF 0.26 0.20 0.44 GRF 0.31 4.99 0.22 GRF 1.93 0.35 NA 0.73 0.00 5.00 5.00 2.00 2.00 0.05HERRERO FONPLAZO IV FIM 0.78 0.54 0.88 GRF 0.62 0.40 0.72 GRF 0.28 0.20 0.44 GRF 0.33 5.17 0.22 GRF 2.03 0.35 NA 0.63 0.00 5.00 5.00 2.00 2.00 0.05KUTXAGARANTIZADO–2 FIM 0.57 0.39 0.62 GRF 0.38 0.34 0.00 GRF 0.30 4.02 0.04 GRF 0.10 6.89 0.02 GRF 1.35 0.26 18.49 0.55 0.00 0.00 0.00 0.00 0.00 0.20KUTXAINDEX4 FIM 1.26 2.78 3.58 GRF 1.82 2.84 3.37 GRF 0.04 3.11 3.14 GRF –0.29 2.68 2.81 GRF 2.84 2.86 10.79 1.10 0.00 5.00 0.00 5.00 0.00 0.10KUTXASEG1 FIM 0.43 0.24 0.51 GRF 0.33 0.13 0.28 GRF 0.21 4.48 0.04 GRF 0.12 1.75 0.01 GRF 1.09 0.14 14.40 1.10 0.00 0.00 0.00 0.00 0.00 0.20MADRID CRECIMIENTO II FIM 0.94 1.11 1.58 GRF 0.74 0.93 1.38 GRF 0.19 0.75 0.00 GRF 0.13 0.53 0.91 GRF 2.01 0.86 14.79 1.00 0.00 0.00 0.00 1.00 0.00 0.10MADRID FONDLIB.2004.FIM 0.93 1.05 1.51 GRF 0.76 0.88 1.28 GRF 0.20 0.66 0.00 GRF 0.15 0.44 0.81 GRF 2.06 0.79 NA 1.00 0.00 5.00 5.00 1.00 0.00 0.05MADRID FONDLIBRETA 2003 FIM 0.64 0.43 0.80 GRF 0.52 0.25 0.52 GRF 0.20 6.69 0.00 GRF 0.26 1.71 0.01 GRF 1.63 0.25 NA 1.00 0.00 0.00 0.00 1.00 0.00 0.05MADRID FONDLIBRETA 2006 FIM 1.42 2.17 2.79 GRF 1.35 2.06 2.57 GRF 0.05 2.09 0.00 GRF –0.16 1.64 2.16 GRF 2.68 2.00 NA 1.00 0.00 5.00 5.00 1.00 0.00 0.05MADRID FONDLIBRETA 5 FIM 1.60 3.14 3.91 GRF 1.70 3.21 3.75 GRF –0.28 3.26 0.00 GRF –0.55 2.57 3.35 GRF 2.47 3.06 16.02 1.40 0.00 5.00 5.00 1.00 0.00 0.10MORGAN STANLEY FONDGARANT.
2005 FIM 1.03 1.36 1.74 GRF 0.92 1.13 1.44 GRF 0.30 1.00 1.22 GRF 0.15 0.71 1.00 GRF 2.42 1.08 21.54 0.35 0.00 2.00 2.00 0.00 0.00 0.15PASTOR FIJO 10 FIM 0.81 4.84 1.13 GRF 0.68 0.52 0.93 GRF 0.35 0.37 0.72 GRF 0.35 0.28 0.51 GRF 2.22 2.43 NA 0.34 0.00 5.00 5.00 5.00 5.00 0.10PASTOR FIJO 3 FIM 0.50 1.79 0.19 GRF 0.59 5.78 0.01 GRF 0.02 2.03 1.46 GRF 0.15 1.02 1.34 GRF 1.25 1.14 NA 0.40 0.00 5.00 5.00 5.00 5.00 0.10PASTOR FIJO 4 FIM 0.71 0.46 0.80 GRF 0.60 0.24 0.56 GRF 0.33 8.38 0.32 GRF 0.37 1.51 0.08 GRF 2.03 0.26 NA 0.45 0.00 5.00 5.00 5.00 5.00 0.15PASTOR FIJO 5 FIM 0.87 0.50 1.57 GRF 0.58 0.55 1.29 GRF 0.25 0.15 0.42 GRF 0.45 0.64 0.82 GRF 2.17 0.50 NA 0.30 0.00 5.00 5.00 5.00 5.00 0.08PASTOR FIJO 7 FIM 0.65 2.39 0.01 GRF 1.56 2.23 1.84 GRF 0.36 1.09 1.57 GRF 0.24 1.78 1.32 GRF 2.84 1.53 NA 0.17 0.00 5.00 5.00 5.00 5.00 0.15PASTOR FIJO 8 FIM 0.65 0.48 1.46 GRF 0.95 1.31 1.47 GRF 0.48 1.04 1.27 GRF 0.31 0.73 1.06 GRF 2.41 0.94 NA 0.25 0.00 5.00 5.00 5.00 5.00 0.10PASTOR FIJO 9 FIM 0.63 0.29 0.56 GRF 0.41 0.17 0.33 GRF 0.42 1.03 0.10 GRF 0.83 0.86 0.01 GRF 2.31 0.46 NA 0.57 0.00 0.00 0.00 5.00 5.00 0.10PASTOR RENTA GARANTIZADA 1 FIM 1.19 1.67 2.14 GRF 1.14 1.66 1.95 GRF 0.14 1.53 1.66 GRF –0.01 1.23 1.52 GRF 2.48 1.53 17.12 0.88 0.00 5.00 5.00 5.00 5.00 0.15PASTOR RENTA GARANTIZADA 2 FIM 1.02 1.01 1.40 GRF 0.85 0.87 1.20 GRF 0.32 0.67 0.98 GRF 0.23 0.48 0.76 GRF 2.44 0.79 14.74 0.55 0.00 5.00 5.00 5.00 5.00 0.10RURAL GARANTIZADO RENTA FIJA
I FIM 0.86 0.67 1.18 GRF 0.71 0.58 0.96 GRF 0.32 0.42 0.74 GRF 0.32 0.30 0.51 GRF 2.23 0.51 NA 0.65 0.00 3.00 0.00 3.00 0.00 0.00RURAL GARANTIZADO RENTA FIJA
II FIM 0.34 1.29 0.00 GRF 1.34 1.01 1.44 GRF 0.50 0.88 1.21 GRF 0.26 0.74 1.01 GRF 2.45 0.77 9.61 0.60 0.00 3.00 0.00 3.00 0.00 0.04RURAL REN.PERI.5 G. FIM 1.01 1.25 1.92 GRF 1.20 1.45 1.79 GRF –0.01 1.37 1.58 GRF –0.05 0.96 1.39 GRF 2.17 1.28 NA 1.00 0.00 2.00 0.00 1.75 0.00 0.00RURALDEUDA FIM 0.40 0.13 0.31 GRF 0.39 4.36 0.08 GRF 0.26 1.99 0.00 GRF 0.51 1.62 2.57 GRF 1.58 0.81 15.43 0.60 0.00 3.00 0.00 3.00 0.00 0.05SABADELL BS GARANTIA ANUAL 2 FIM 0.58 0.23 0.40 GRF 0.44 1.19 0.20 GRF 0.43 1.35 0.01 GRF 0.78 0.63 2.01 GRF 2.25 0.34 NA 0.54 0.00 5.00 5.00 2.00 2.00 0.05SBD GARANTIA ANUAL 3 FIM 0.77 0.54 0.88 GRF 0.60 0.40 0.72 GRF 0.27 0.20 0.44 GRF 0.31 4.98 0.22 GRF 1.96 0.35 15.41 0.70 0.00 5.00 5.00 2.00 2.00 0.05SBD GARANTIA ANUAL 4 FIM 0.91 0.80 1.10 GRF 0.74 0.55 0.96 GRF 0.30 0.34 0.66 GRF 0.33 0.20 0.44 GRF 2.29 0.53 NA 0.56 0.00 5.00 5.00 2.00 2.00 0.05SBD GARANTIA ANUAL 5 FIM 1.47 1.83 1.40 GRF 1.17 1.27 1.29 GRF 0.29 0.70 0.96 GRF 0.18 0.48 0.74 GRF 3.14 1.19 NA 0.70 0.00 5.00 5.00 2.00 2.00 0.05
(Continues over)
(Continued)

289
Annex 4
: Collective in
vestmen
t schem
es and ven
ture cap
ital com
pan
iesA.4.8.Investment in securities. FIM. Yields, volatility and duration
1Q 2Q 3Q 4Q 2003
Yield Vol Dur Yield Vol Dur Yield Vol Dur Yield Vol Dur Yield Vol(1) (2) Type (1) (2) Type (1) (2) Type (1) (2) Type (1)% % % % %
% fees
Management Front end Back endCustody
of assets of yield Max. Min. Max. Min.
Yieldsince1996
Guaranteed fixed-income FIM(GRF)
SCH RENTAS 3 D FIM 0.92 0.90 1.45 GRF 0.77 0.81 1.24 GRF 0.28 0.60 1.00 GRF 0.19 0.44 0.78 GRF 2.18 0.71 12.59 0.80 0.00 2.00 2.00 1.00 1.00 0.10SCH RENTAS 3 E FIM 1.12 1.42 1.94 GRF 0.92 1.29 1.71 GRF 0.18 1.16 1.49 GRF 0.08 0.89 1.26 GRF 2.31 1.21 15.53 1.00 0.00 2.00 2.00 2.00 0.00 0.10SCH RENTAS 3 F FIM 0.73 2.23 2.73 GRF 1.18 1.95 2.46 GRF 0.03 1.93 2.35 GRF –0.18 1.62 2.11 GRF 1.76 1.95 11.14 1.20 0.00 2.00 2.00 2.00 1.00 0.10SCH RENTAS 4 H FIM 1.29 2.01 2.61 GRF 1.25 2.04 2.42 GRF 0.03 1.71 2.20 GRF –0.12 1.49 1.92 GRF 2.46 1.83 14.29 1.06 0.00 5.00 0.00 5.00 0.00 0.10SCH RENTAS CRECIENTES 1 FIM 1.22 1.69 2.16 GRF 1.16 1.54 1.92 GRF 0.33 1.34 1.70 GRF 0.09 1.11 1.46 GRF 2.83 1.44 17.97 0.47 0.00 2.00 2.00 1.00 0.50 0.10SCH RENTAS CRECIENTES 2 FIM 1.17 1.72 2.34 GRF 1.13 1.67 2.15 GRF 0.13 1.62 1.91 GRF –0.02 1.30 1.69 GRF 2.42 1.59 16.58 1.03 0.00 2.00 2.00 2.00 0.50 0.10SCH RENTAS CRECIENTES 3 FIM 0.68 0.25 0.55 GRF –0.05 1.62 0.31 GRF 0.95 0.65 0.07 GRF 1.39 1.63 3.55 GRF 2.99 1.20 20.04 1.12 0.00 2.00 2.00 2.00 0.00 0.10SCH RENTAS EURIBOR FIM 0.45 0.14 0.41 GRF 0.20 3.86 0.15 GRF 1.60 1.96 3.70 GRF –0.23 3.00 3.23 GRF 2.02 1.81 9.84 1.22 0.00 2.00 2.00 1.00 0.00 0.10SCH SUPERMILLENNIUM 10 FIM 0.57 7.92 0.04 GRF 1.25 1.78 1.24 GRF 0.11 0.61 1.03 GRF 0.08 0.46 0.79 GRF 2.01 0.97 14.09 1.30 0.00 5.00 5.00 5.00 5.00 0.10SCH SUPERMILLENNIUM 11 FIM 0.51 4.74 0.10 GRF 0.41 1.38 0.00 GRF –0.48 2.27 2.45 GRF –0.21 1.76 2.23 GRF 0.23 1.44 15.70 1.01 0.00 5.00 5.00 5.00 5.00 0.10SCH SUPERMILLENNIUM 12 FIM 0.52 0.30 0.49 GRF 0.42 9.58 0.25 GRF 0.24 4.02 0.00 GRF 0.38 1.49 2.22 GRF 1.56 0.76 11.26 1.20 0.00 2.00 2.00 2.00 0.50 0.10SCH SUPERMILLENNIUM 2 FIM 0.60 0.41 0.76 GRF 0.44 0.33 0.52 GRF 0.21 4.81 0.28 GRF 0.21 2.46 0.04 GRF 1.47 0.26 14.25 1.02 0.00 5.00 5.00 5.00 5.00 0.10SCH SUPERMILLENNIUM 3 FIM 0.72 0.57 1.01 GRF 0.56 0.47 0.79 GRF 0.18 0.22 0.55 GRF 0.19 8.94 0.31 GRF 1.65 0.39 12.60 1.00 0.00 2.00 2.00 2.00 0.00 0.10SCH SUPERMILLENNIUM 4 FIM 0.69 0.73 1.15 GRF 0.57 0.55 0.90 GRF 0.14 0.32 0.66 GRF 0.15 0.15 0.43 GRF 1.55 0.49 16.94 1.14 0.00 2.00 2.00 1.00 1.00 0.10SCH SUPERMILLENNIUM 5 FIM 0.64 0.34 0.77 GRF 0.47 0.28 0.53 GRF 0.22 3.93 0.29 GRF 0.23 1.31 0.05 GRF 1.58 0.22 13.82 0.97 0.00 2.00 2.00 2.00 0.50 0.10SCH SUPERMILLENNIUM 6 FIM 0.90 0.96 1.51 GRF 0.72 0.86 1.24 GRF 0.15 0.61 1.02 GRF 0.13 0.45 0.78 GRF 1.91 0.75 17.87 1.15 0.00 5.00 5.00 5.00 5.00 0.10SCH SUPERMILLENNIUM 7 FIM 0.79 1.14 1.51 GRF 0.70 0.92 1.29 GRF 0.12 0.69 1.05 GRF 0.02 0.48 0.79 GRF 1.64 0.85 13.61 1.30 0.00 2.00 2.00 1.00 1.00 0.10SCH SUPERMILLENNIUM 8 FIM 0.99 1.73 2.22 GRF 1.02 1.61 2.00 GRF 0.15 1.40 1.77 GRF –0.13 1.15 1.51 GRF 2.04 1.49 15.21 1.19 0.00 2.50 2.50 5.00 2.50 0.10SCH SUPERMILLENNIUM 9 FIM 1.26 1.81 2.43 GRF 1.13 1.79 2.17 GRF 0.07 1.69 1.93 GRF –0.08 1.33 1.68 GRF 2.40 1.67 12.25 1.22 0.00 5.00 5.00 5.00 5.00 0.10TARRAGONAFONS 11 FIM NA NA NA NA NA NA NA NA NA NA 2.44 3.46 GRF NA 2.44 NA 0.90 0.00 5.00 5.00 0.00 0.00 0.20TARRAGONAFONS 3 FIM 0.84 1.21 2.02 GRF 1.31 1.43 1.83 GRF 0.12 1.37 1.62 GRF 0.09 0.90 1.39 GRF 2.38 1.25 13.97 0.75 0.00 3.00 3.00 0.00 0.00 0.20TARRAGONAFONS 5 FIM 0.85 0.76 1.25 GRF 0.74 0.61 1.02 GRF 0.22 0.44 0.78 GRF 0.38 0.49 0.55 GRF 2.21 0.59 14.55 0.75 0.00 5.00 5.00 0.00 0.00 0.20TARRAGONAFONS 7 FIM 1.06 1.12 1.71 GRF 0.89 1.07 1.50 GRF 0.28 1.03 1.23 GRF 0.25 0.59 1.00 GRF 2.50 0.98 NA 0.80 0.00 3.00 3.00 0.00 0.00 0.20TARRAGONAFONS 9 FIM NA NA NA NA 3.94 4.12 GRF –0.33 4.38 3.52 GRF –0.45 2.89 3.71 GRF NA 3.74 NA 0.75 0.00 5.00 5.00 0.00 0.00 0.20TELEFONICO FIJO FIM 0.68 0.83 6.76 GRF 0.56 0.63 8.18 GRF 0.08 0.44 0.80 GRF 0.11 0.33 0.53 GRF 1.43 0.59 11.37 1.25 0.00 2.00 2.00 5.00 5.00 0.20UNIFOND EURORENTA FIM 1.37 1.34 0.00 GRF 1.30 5.89 4.16 GRF 0.98 5.10 4.00 GRF 0.70 3.12 3.77 GRF 4.41 4.25 13.37 0.75 0.00 0.00 0.00 1.00 1.00 0.05UNIFOND FONDANDALUCIA FIM 0.76 0.66 0.47 GRF 0.98 0.67 0.25 GRF 0.26 0.15 0.33 GRF 0.27 0.03 0.24 GRF 2.29 0.48 13.94 0.95 0.00 5.00 5.00 3.00 3.00 0.05UNIFOND II FIM 1.10 1.37 0.95 GRF 0.70 0.63 0.73 GRF 0.32 0.26 0.51 GRF 0.32 0.12 0.27 GRF 2.46 0.76 15.02 0.94 0.00 5.00 5.00 3.00 3.00 0.05UNIFOND III FIM 1.16 1.34 0.95 GRF 0.76 0.61 0.73 GRF 0.36 0.26 0.51 GRF 0.36 0.12 0.27 GRF 2.67 0.75 16.15 0.79 0.00 5.00 5.00 3.00 3.00 0.05UNIFOND IV FIM 0.43 0.19 0.01 GRF 1.00 2.26 2.42 GRF 0.29 2.62 2.05 GRF 0.42 1.57 2.03 GRF 2.16 1.91 10.26 1.05 0.00 5.00 5.00 3.00 1.00 0.05UNIFOND V FIM 0.59 0.26 0.00 GRF 1.46 5.07 4.28 GRF 0.54 4.90 4.14 GRF 0.55 3.32 3.90 GRF 3.17 3.91 12.78 0.80 0.00 0.00 0.00 1.00 0.50 0.05UNIFOND VII FIM 0.51 0.02 0.07 GRV 0.34 0.10 0.00 GRF 3.22 5.42 4.16 GRF 0.27 3.53 3.96 GRF 4.39 3.25 13.27 1.05 0.00 0.00 0.00 1.00 0.50 0.05UNIFOND VIII FIM 0.72 0.34 0.71 GRF 0.47 0.26 0.48 GRF 0.37 0.11 0.25 GRF 0.38 2.31 0.13 GRF 1.96 0.22 15.44 0.87 0.00 5.00 5.00 3.00 3.00 0.05UNIFOND X FIM 0.79 0.44 0.87 GRF 0.75 0.52 0.65 GRF 0.30 0.22 0.44 GRF 0.41 6.10 0.20 GRF 2.27 0.36 10.79 0.75 0.00 5.00 5.00 3.00 3.00 0.05UNIFOND XI FIM 0.50 4.53 0.03 GRF 0.20 0.30 0.18 GRF 0.37 0.23 0.00 GRF 0.60 0.35 1.37 GRF 1.69 0.26 10.65 1.00 0.00 5.00 5.00 3.00 3.00 0.05UNIFOND XII FIM 0.51 0.15 0.24 GRF 0.50 3.07 0.05 GRF 0.40 0.21 0.00 GRF 0.21 5.08 4.72 GRF 1.63 2.55 13.37 1.10 0.00 5.00 5.00 0.50 0.50 0.05UNIFOND XIV FIM 0.47 0.39 0.46 GRF 0.36 0.12 0.24 GRF 0.34 1.42 0.05 GRF 0.66 0.79 1.20 GRF 1.85 0.44 18.98 0.82 0.00 0.00 0.00 3.00 3.00 0.05UNIFOND XIX FIM 0.44 0.01 0.00 GRF 4.56 4.56 3.69 GRF 0.07 4.30 3.48 GRF 0.64 2.79 3.30 GRF 5.77 3.46 NA 0.80 0.00 0.00 0.00 1.00 1.00 0.05UNIFOND XV FIM 1.05 0.66 1.11 GRF 1.08 0.78 0.91 GRF 0.39 0.44 0.69 GRF 0.30 0.22 0.49 GRF 2.84 0.57 NA 0.89 0.00 5.00 5.00 3.00 3.00 0.05UNIFOND XVI FIM 0.52 0.46 0.52 GRF 0.37 0.13 0.30 GRF 0.31 2.15 0.09 GRF 1.15 1.78 4.60 GRF 2.37 0.92 NA 0.76 0.00 5.00 5.00 0.50 0.50 0.05UNIFOND XVIII FIM 0.86 0.79 1.06 GRF 0.83 0.64 0.84 GRF 0.38 0.38 0.61 GRF 0.39 0.17 0.37 GRF 2.49 0.55 NA 0.95 0.00 5.00 5.00 3.00 3.00 0.05UNIFOND XX FIM 0.38 4.21 0.02 GRF 0.53 0.62 1.13 GRF 0.29 0.53 0.87 GRF 0.32 0.30 0.66 GRF 1.52 0.44 NA 1.00 0.00 5.00 5.00 3.00 3.00 0.05UNIFOND XXI FIM 0.57 0.39 0.32 GRV 0.47 0.14 0.13 GRV 0.35 0.02 0.03 GRF 0.30 1.11 0.97 GRF 1.69 0.59 NA 0.88 0.00 5.00 5.00 3.00 3.00 0.05VITAL G3 FIM 0.97 0.52 0.96 GRF 0.77 0.38 0.74 GRF 0.46 0.23 0.51 GRF 0.36 0.07 0.28 GRF 2.59 0.34 28.25 0.75 0.00 3.00 3.00 3.00 3.00 0.00ZARAGOZANO RENTA FIJA I GTZO FIM 0.79 0.66 1.06 GRF 0.70 0.55 0.85 GRF 0.23 0.43 0.65 GRF 0.36 0.98 0.43 GRF 2.09 0.69 NA 0.90 0.00 5.00 0.00 2.50 0.00 0.10ZARAGOZANO RENTA FIJA III
GTZDO FIM 0.49 9.99 0.29 GRF 0.47 5.96 0.00 GRF 0.46 0.26 0.00 GRF –0.14 0.46 0.02 GRF 1.29 0.28 NA 0.60 0.00 0.00 0.00 0.00 0.00 0.10ZARAGOZANO RENTA FIJA V GTZO FIM 0.97 1.15 1.44 GRF 0.79 0.87 1.22 GRF 0.28 0.76 0.98 GRF 0.15 0.62 0.77 GRF 2.20 0.88 15.85 0.85 0.00 5.00 0.00 5.00 0.00 0.10ZARAGOZANO RENTA FIJA VI
GTZO FIM NA NA 0.00 GRF 0.33 2.05 2.90 GRF 1.57 1.38 2.92 GRF –0.16 2.29 2.53 GRF NA 1.55 NA 0.75 0.00 5.00 0.00 3.00 0.00 0.10ZARAGOZANO RF VII GARANTIZADO
FIM 0.81 0.37 0.00 GRV 0.29 0.10 2.11 GRF 1.06 0.67 1.94 GRF 0.11 1.43 1.71 GRF 2.29 0.82 NA 0.65 0.00 5.00 0.00 5.00 0.00 0.10
(Continues over)
(Continued)

290
Annual rep
ort o
n th
e securities m
arket. 2003
A.4.8.Investment in securities. FIM. Yields, volatility and duration
1Q 2Q 3Q 4Q 2003
Yield Vol Dur Yield Vol Dur Yield Vol Dur Yield Vol Dur Yield Vol(1) (2) Type (1) (2) Type (1) (2) Type (1) (2) Type (1)% % % % %
% fees
Management Front end Back endCustody
of assets of yield Max. Min. Max. Min.
Yieldsince1996
Guaranteed equity FIM (GRV)
AC CAPITAL 1 FIM 0.46 0.20 1.14 GRV 0.35 0.16 0.93 GRV 0.16 1.52 0.69 GRV 0.19 3.89 0.13 GRV 1.17 0.13 4.62 1.30 0.00 0.00 0.00 0.00 0.00 0.05AC CAPITAL 2 FIM 0.45 0.20 1.12 GRV 0.34 0.16 0.90 GRV 0.15 1.45 0.67 GRV 0.15 1.70 0.01 GRV 1.09 0.13 10.12 1.30 0.00 0.00 0.00 0.00 0.00 0.05AC CAPITAL 3 FIM 0.67 0.68 1.20 GRV 0.57 0.42 0.98 GRV 0.06 0.21 0.75 GRV 0.15 0.14 0.51 GRV 1.45 0.42 3.92 1.30 0.00 5.00 5.00 5.00 5.00 0.04AC CAPITAL 4 FIM 0.75 0.97 1.63 GRV 0.83 0.72 1.40 GRV –0.06 0.63 1.18 GRV 0.14 0.31 0.95 GRV 1.67 0.70 0.14 1.30 0.00 5.00 5.00 5.00 5.00 0.05AC CAPITAL 5 FIM 0.84 1.44 2.17 GRV 1.62 1.13 1.94 GRV –0.10 1.69 1.72 GRV –0.21 1.22 1.45 GRV 2.16 1.40 4.46 1.30 0.00 5.00 5.00 5.00 5.00 0.05AC CAPITAL 6 FIM 0.47 0.38 0.40 GRV 0.29 0.06 0.17 GRV 0.21 7.03 0.19 GRV –0.01 2.71 0.23 GRV 0.96 1.37 3.58 1.30 0.00 4.00 4.00 4.00 4.00 0.04AC CAPITAL 7 FIM 0.71 0.81 1.24 GRV 0.73 0.56 1.00 GRV –0.06 0.32 0.76 GRV 0.17 0.16 0.54 GRV 1.57 0.52 NA 1.30 0.00 5.00 5.00 5.00 5.00 0.05AC CAPITAL 8 FIM 0.67 0.67 1.20 GRV 0.57 0.42 0.99 GRV 0.07 0.21 0.75 GRV 0.15 0.13 0.52 GRV 1.46 0.42 5.06 1.30 0.00 5.00 5.00 5.00 5.00 0.05AC EUROINVERSION FIM 0.88 1.32 2.14 GRV 1.70 1.16 1.93 GRV –0.26 1.58 1.71 GRV 0.30 1.75 1.48 GRV 2.64 1.48 7.67 1.30 0.00 5.00 5.00 5.00 5.00 0.05AC SELECCION GARANTIZADO FIM 0.41 1.20 0.01 GRF 0.35 1.63 0.07 GRV –0.89 3.40 2.81 GRV 1.99 2.23 2.59 GRV 1.85 2.05 NA 0.85 0.00 3.00 3.00 3.00 3.00 0.05ALTAE CESTA ESPAÑOLA FIM 0.93 2.39 1.96 GRV 2.92 2.70 1.77 GRV –0.81 4.11 0.00 GRV 4.66 4.33 1.32 GRV 7.83 3.52 NA 1.40 0.00 5.00 5.00 3.00 3.00 0.10ALTAE CESTA EUROPEA FIM 0.41 3.76 2.27 GRV 2.46 2.66 2.04 GRV 0.11 5.97 0.00 GRV 1.32 5.92 1.58 GRV 4.35 4.81 NA 1.40 0.00 5.00 5.00 0.00 0.00 0.10ALTAE DOBLE GARANTIA FIM NA NA NA NA 4.10 2.86 GRV –0.43 2.34 0.00 GRV 0.41 1.89 2.45 GRV NA 2.88 NA 1.00 0.00 5.00 5.00 3.00 3.00 0.10ARAGON PATRIMONIOS FIMF –2.18 3.90 0.00 GRV 2.88 2.35 0.00 GRV 1.20 2.96 0.00 GRV 1.03 2.44 0.01 GRV 2.89 3.00 –10.97 1.65 0.00 2.50 0.00 2.50 0.00 0.12ASTURFONDO EUROBOLSA GTZO FIM 0.78 1.05 1.38 GRV 0.57 0.84 1.16 GRV 0.06 0.62 0.94 GRV 0.00 0.45 0.73 GRV 1.42 0.78 7.15 1.40 0.00 5.00 5.00 5.00 5.00 0.20ASTURFONDO EUROBOLSA II FIM 0.87 9.13 1.71 GRV 0.74 1.82 1.50 GRV 0.03 0.97 1.27 GRV 0.02 0.76 1.01 GRV 1.67 4.66 10.70 1.40 0.00 5.00 5.00 5.00 5.00 0.20ASTURFONDO IBEX GARANTIZADO FIM 0.72 0.73 1.03 GRV 0.53 0.56 0.84 GRV 0.10 0.41 0.64 GRV 0.08 0.34 0.45 GRV 1.43 0.53 5.67 1.30 0.00 5.00 5.00 0.00 0.00 0.20ATLANTICO CUPON GARANTIZADO FIM 0.59 0.53 2.45 GRV 2.54 2.79 2.43 GRV 0.77 4.04 2.20 GRV 1.29 2.29 1.96 GRV 5.29 2.73 NA 0.77 0.00 5.00 5.00 5.00 5.00 0.10ATLANTICO GARANTIA ALTERNATIVA FIM –0.02 1.09 2.51 GRV 0.89 1.84 2.29 GRV 0.19 2.39 2.08 GRV 0.33 2.07 1.85 GRV 1.39 1.92 1.28 0.80 0.00 5.00 5.00 5.00 5.00 0.10ATLANTICO LIDER 2 FIM 0.55 0.19 0.00 GRV 1.12 2.24 3.00 GRV 0.10 3.35 2.76 GRV 1.33 3.67 2.52 GRV 3.13 2.74 NA 2.15 0.00 5.00 5.00 5.00 5.00 0.10ATLANTICO LIDER FIM –1.09 3.11 2.43 GRV 2.18 2.33 2.22 GRV 0.25 3.62 1.96 GRV 2.31 3.06 1.72 GRV 3.66 3.08 NA 1.77 0.00 5.00 5.00 5.00 5.00 0.10ATLANTICO MUNDIBOLSA 2 FIM 0.81 1.18 1.23 GRV 0.65 0.78 1.01 GRV 0.17 0.59 0.80 GRV 0.27 0.33 0.55 GRV 1.91 0.78 17.85 0.92 0.00 5.00 5.00 5.00 5.00 0.08ATLANTICO PLUS FIM 1.13 2.51 2.19 GRV 1.24 1.62 1.97 GRV 0.20 1.47 1.73 GRV 0.07 1.38 1.49 GRV 2.65 1.80 20.01 0.63 0.00 5.00 5.00 5.00 5.00 0.10BANCAJA GARANTIZADO JAPONEURO FIM 0.83 2.00 1.23 GRV 0.77 0.76 1.01 GRV 0.09 0.95 0.79 GRV 0.27 1.36 0.55 GRV 1.97 1.35 NA 1.05 0.00 0.00 0.00 0.00 0.00 0.15BANCAJA GARANTIZADO RV 3 FIM 1.51 1.83 3.10 GRV 3.85 2.84 2.91 GRV 0.91 3.04 2.70 GRV 0.15 2.18 2.06 GRV 6.54 2.54 5.93 0.60 0.00 0.00 0.00 0.00 0.00 0.05BANCAJA GARANTIZADO RV FIM 0.70 2.41 3.03 GRV 1.73 2.20 2.86 GRV –0.34 2.43 2.66 GRV –0.11 1.50 2.30 GRV 1.97 2.17 –2.09 1.05 0.00 0.00 0.00 0.00 0.00 0.15BANCAJA GTZO RENTA VARIABLE 2 FIM 0.92 2.75 2.75 GRV 3.05 2.67 2.54 GRV 0.07 2.40 2.29 GRV 1.61 1.89 1.94 GRV 5.75 2.46 13.39 0.65 0.00 0.00 0.00 0.00 0.00 0.05BANCAJA GTZO RENTA VARIABLE 4 FIM NA 0.10 0.00 GRV 0.73 3.40 3.44 GRV 0.90 4.48 3.25 GRV 1.33 3.19 3.04 GRV NA 3.58 NA 1.45 0.00 0.00 0.00 0.00 0.00 0.05BANCAJA TOP GARANTIZADO FIM 0.67 2.04 1.24 GRV 0.76 0.76 1.02 GRV 0.08 0.91 0.80 GRV 0.23 1.33 0.56 GRV 1.75 1.35 NA 1.05 0.00 0.00 0.00 0.00 0.00 0.15BANESTO CAPITAL 105 FIM 0.81 1.31 3.91 GRV 1.73 3.25 3.61 GRV –0.21 2.96 3.37 GRV –0.37 2.53 3.13 GRV 1.96 2.63 NA 1.61 0.00 5.00 5.00 3.00 3.00 0.10BANESTO CAPITAL 95 FIM NA 5.39 3.90 GRV 5.04 9.23 3.63 GRV 0.56 7.55 3.42 GRV 3.41 7.21 3.18 GRV NA 7.57 NA 2.20 0.00 0.00 0.00 0.00 0.00 0.10BANESTO G PREMIUM GLOBAL FIM 0.77 2.32 2.39 GRV 0.02 2.40 2.17 GRV –0.33 2.20 1.94 GRV –0.43 1.33 1.60 GRV 0.03 2.10 5.63 2.25 0.00 5.00 5.00 5.00 5.00 0.10BANESTO G. PREMIUM ACTIVO
LIDER FIM 0.32 1.02 1.29 GRV 0.41 0.75 1.04 GRV –0.05 0.45 0.80 GRV 0.00 0.28 0.55 GRV 0.69 0.69 NA 1.58 0.00 5.00 5.00 5.00 5.00 0.10BANESTO G.PART.CRECIENTE FIM NA NA NA NA NA NA NA 2.03 0.00 GRV –0.20 3.48 3.67 GRV NA 3.00 NA 1.47 0.00 0.00 0.00 0.00 0.00 0.10BANESTO GARANTIZADO OCASION FIM 1.48 3.68 2.38 GRV 3.22 3.89 2.16 GRV –0.31 3.39 1.99 GRV 2.85 4.24 1.75 GRV 7.39 3.82 NA 1.90 0.00 0.00 0.00 0.00 0.00 0.10BANESTO GARANTIZADO PODIUM FIM –0.95 3.96 2.40 GRV 3.04 3.12 2.16 GRV 0.15 3.01 1.93 GRV 1.52 2.54 1.69 GRV 3.77 3.21 NA 0.86 0.00 5.00 5.00 0.00 0.00 0.10BANESTO GTZO BOLSA EUROPEA 4 FIM 0.57 0.58 1.03 GRV 0.41 0.47 0.79 GRV 0.04 0.22 0.55 GRV 0.04 8.82 0.31 GRV 1.06 0.39 15.77 1.60 0.00 5.00 5.00 5.00 5.00 0.10BANESTO GTZO BOLSA EUROPEA 5 FIM 0.74 0.94 1.48 GRV 0.60 1.11 1.23 GRV 0.03 0.56 0.99 GRV 0.01 0.43 0.76 GRV 1.38 0.81 –1.05 1.57 0.00 5.00 5.00 5.00 5.00 0.10BANESTO GTZO BOLSA EUROPEA 6 FIM 0.77 0.98 1.51 GRV 0.62 0.87 1.29 GRV 0.03 0.60 1.04 GRV 0.00 0.46 0.79 GRV 1.41 0.76 –2.63 1.58 0.00 5.00 0.00 0.00 0.00 0.10BANESTO GTZO BOLSA EUROPEA 7 FIM 0.25 2.33 2.25 GRV 0.89 1.72 2.00 GRV –0.13 1.45 1.76 GRV –0.29 1.25 1.52 GRV 0.72 1.74 NA 2.04 0.00 5.00 5.00 0.00 0.00 0.10BANESTO GTZO CONOCIMIENTO FIM –0.64 0.56 0.03 RFCP 0.58 2.05 2.42 GRV –0.29 1.96 2.18 GRV 0.57 1.79 1.93 GRV 0.22 1.70 NA 1.67 0.00 0.00 0.00 0.00 0.00 0.10BANESTO GTZO OCASION 2 FIM 0.41 0.26 0.54 GRV 0.14 0.17 0.31 GRV 0.16 1.13 0.07 GRV 0.86 1.65 3.50 GRV 1.59 0.84 8.77 1.72 0.00 5.00 5.00 5.00 5.00 0.10BANESTO GTZO OCASION 3 FIM 0.53 0.25 0.54 GRV 0.29 0.15 0.33 GRV 0.28 1.07 0.09 GRV 0.21 1.60 0.01 GRV 1.31 0.14 7.68 1.10 0.00 5.00 5.00 5.00 5.00 0.10BANESTO GTZO PREMIUM
MUNDIAL FIM 0.71 1.59 2.00 GRV 0.70 1.38 1.75 GRV –0.05 1.20 1.52 GRV –0.20 0.91 1.28 GRV 1.17 1.29 4.67 1.80 0.00 3.50 3.50 0.00 0.00 0.20BANESTO GTZO PREMIUM MUNDIAL
II FIM 0.92 1.57 1.99 GRV 0.70 1.36 1.75 GRV –0.04 1.20 1.52 GRV –0.15 1.27 1.28 GRV 1.43 1.36 –7.25 1.90 0.00 5.00 5.00 0.00 0.00 0.10BANESTO PREMIUM EUROPA 2 FIM 0.54 0.61 1.03 GRV 0.39 0.47 0.79 GRV 0.02 0.21 0.55 GRV 0.02 9.01 0.31 GRV 0.98 0.40 15.47 1.70 0.00 5.00 5.00 5.00 5.00 0.10BANESTO PREMIUM EUROPA FIM 0.52 0.42 0.79 GRV 0.35 0.48 0.56 GRV 0.10 5.62 0.32 GRV –0.08 0.19 0.08 GRV 0.88 0.34 NA 1.44 0.00 5.00 5.00 5.00 5.00 0.10BANESTO RENTABILIDAD ASEG.
PLUS FIM NA NA NA NA 3.44 0.00 GRV –3.01 6.93 3.59 GRV –0.07 3.09 3.36 GRV NA 5.30 NA 0.92 0.00 0.00 0.00 0.00 0.00 0.10
(Continues over)
(Continued)

291
Annex 4
: Collective in
vestmen
t schem
es and ven
ture cap
ital com
pan
iesA.4.8.Investment in securities. FIM. Yields, volatility and duration
1Q 2Q 3Q 4Q 2003
Yield Vol Dur Yield Vol Dur Yield Vol Dur Yield Vol Dur Yield Vol(1) (2) Type (1) (2) Type (1) (2) Type (1) (2) Type (1)% % % % %
% fees
Management Front end Back endCustody
of assets of yield Max. Min. Max. Min.
Yieldsince1996
Guaranteed equity FIM (GRV)
BANESTO RENTABILIDADASEGURADA FIM –0.68 0.78 0.00 GRV 1.54 2.61 3.66 GRV –0.27 3.58 3.43 GRV 1.18 4.06 3.19 GRV 1.76 3.05 –0.83 1.56 0.00 0.00 0.00 0.00 0.00 0.10
BANESTO SUPER GTZO EUROPA FIM 0.65 1.64 1.98 GRV 0.85 1.37 1.75 GRV –0.21 1.21 1.51 GRV –0.14 0.91 1.28 GRV 1.15 1.31 NA 1.90 0.00 5.00 5.00 0.00 0.00 0.10BANIF 6 PLUS FIM 0.49 0.60 0.55 GRV 0.24 2.55 0.30 GRV 0.04 0.40 0.07 GRV 0.67 3.58 0.00 GRV 1.45 2.23 3.17 1.27 0.00 5.00 5.00 5.00 5.00 0.10BANIF BOLSA GARANTIZADO FIM 0.42 3.75 1.49 GRV 1.20 2.41 1.26 GRV 0.04 3.28 1.03 GRV 3.79 3.30 0.79 GRV 5.53 3.23 14.56 1.20 0.00 5.00 5.00 5.00 5.00 0.10BANIF GLOBALIZACION
GARANTIZADO FIM –0.04 1.09 0.77 GRV 1.02 0.63 0.55 GRV 0.25 0.36 0.30 GRV –0.45 1.18 0.06 GRV 0.77 0.88 13.17 1.20 0.00 5.00 5.00 5.00 5.00 0.10BANIF SELECCION I FIM –2.37 3.89 0.85 GRV 4.56 5.53 0.59 GRV 2.95 6.91 0.38 GRV 9.76 7.53 0.14 GRV 15.36 6.20 10.78 1.30 0.00 5.00 5.00 5.00 5.00 0.10BANIF USA 95% PLUS FIM 0.38 0.21 0.07 GRV 0.35 0.16 0.00 GRV 0.05 0.97 0.97 GRV 3.07 5.53 0.73 GRV 3.87 2.83 10.18 1.09 0.00 5.00 5.00 5.00 5.00 0.10BANKOA EUROBANCA GARANTIZADO
FIM 0.46 0.23 0.57 GRV 0.32 0.13 0.16 GRV 0.20 1.03 0.15 GRV 0.16 0.00 0.00 GRV 1.15 0.13 8.16 1.30 0.00 0.00 0.00 0.00 0.00 0.00BANKOA GARANTIZADO 50 FIM 0.75 0.79 1.23 GRV 0.55 0.60 1.01 GRV 0.11 0.35 0.78 GRV 0.08 0.23 0.55 GRV 1.49 0.54 5.34 1.35 0.00 5.00 5.00 5.00 5.00 0.00BANKOA IBEX 106 GARANTIZADO FIM 0.26 4.68 2.80 GRV 3.45 4.30 2.60 GRV –0.85 4.12 2.35 GRV 3.33 3.08 2.12 GRV 6.26 4.10 22.80 1.20 0.00 5.00 5.00 5.00 1.00 0.00BANKOA IBEX GARANTIZADO FIM 1.13 1.67 2.19 GRV 1.06 1.64 1.95 GRV 0.05 1.52 1.72 GRV –0.12 1.18 1.48 GRV 2.13 1.52 5.60 1.30 0.00 5.00 5.00 5.00 1.00 0.00BANKOA PODIUM GARANTIZADO FIM 0.40 1.29 0.12 GRV 0.52 2.20 2.90 GRV –0.38 2.47 2.68 GRV 1.46 1.87 2.45 GRV 2.01 1.91 NA 0.92 0.00 5.00 5.00 5.00 1.00 0.00BANKOA SELECCION GARANTIZADO FIM 0.46 0.26 0.60 GRV 0.29 0.14 0.13 GRV 0.20 9.76 0.02 GRV 0.79 1.75 2.82 GRV 1.75 0.89 13.83 1.60 0.00 5.00 5.00 5.00 1.00 0.00BARCLAYS GARANTIZADO 1 FIM 1.28 1.93 2.46 GRV 1.24 1.78 2.20 GRV 0.04 1.60 1.99 GRV –0.03 1.35 1.76 GRV 2.54 1.68 9.77 1.10 0.00 5.00 5.00 3.00 3.00 0.12BARCLAYS GARANTIZADO 10 FIM 0.52 9.65 0.01 FGL 1.03 4.65 0.00 FGL 0.36 0.14 0.01 GRV 1.16 1.21 0.11 GRV 3.10 2.40 –9.80 1.15 0.00 5.00 5.00 3.00 0.00 0.10BARCLAYS GARANTIZADO 2 FIM 0.98 1.13 1.57 GRV 0.83 0.96 1.39 GRV 0.17 0.92 1.18 GRV 0.06 0.68 0.97 GRV 2.06 0.94 NA 1.10 0.00 5.00 5.00 3.00 3.00 0.13BARCLAYS GARANTIZADO 3 FIM 1.20 7.79 3.80 GRV 6.10 8.64 3.50 GRV –0.33 6.47 3.29 GRV 3.59 6.12 3.08 GRV 10.86 7.34 12.83 1.10 0.00 5.00 5.00 3.00 3.00 0.15BARCLAYS GARANTIZADO 4 FIM 0.80 0.49 0.93 GRV 0.57 0.30 0.72 GRV 0.19 0.16 0.49 GRV 0.25 2.72 0.26 GRV 1.82 0.30 10.15 0.90 0.00 5.00 5.00 3.00 3.00 0.07BARCLAYS GARANTIZADO 5 FIM 0.53 0.27 0.18 GRV 1.50 2.23 3.52 GRV –0.04 6.20 3.28 GRV 1.40 6.16 3.05 GRV 3.43 4.53 10.70 1.10 0.00 5.00 5.00 3.00 0.00 0.14BARCLAYS GARANTIZADO 6 FIM 0.90 0.91 1.47 GRV 0.75 0.77 1.26 GRV 0.13 0.59 1.03 GRV 0.12 0.45 0.82 GRV 1.92 0.70 NA 1.10 0.00 5.00 5.00 3.00 3.00 0.15BARCLAYS GARANTIZADO 7 FIM –0.70 5.27 2.35 GRV 3.81 6.59 2.15 GRV –0.02 5.33 1.94 GRV 3.64 5.31 1.71 GRV 6.82 5.67 NA 1.20 0.00 5.00 5.00 3.00 3.00 0.15BARCLAYS GARANTIZADO 8 FIM 0.77 0.61 1.06 GRV 0.57 0.45 0.86 GRV 0.16 0.28 0.64 GRV 0.16 0.18 0.43 GRV 1.67 0.42 7.50 1.10 0.00 5.00 5.00 3.00 3.00 0.15BARCLAYS GARANTIZADO 9 FIM 1.83 4.74 1.02 GRV 4.06 5.19 0.83 GRV –3.57 6.56 0.61 GRV 3.22 5.02 0.41 GRV 5.47 5.47 55.78 1.10 0.00 5.00 5.00 3.00 3.00 0.14BBK GARANTIZADO 3 FIM 0.66 0.68 1.96 GRV 1.86 1.29 1.75 GRV 0.43 1.78 1.51 GRV 0.81 1.36 1.30 GRV 3.82 1.34 NA 0.95 0.00 5.00 0.00 5.00 0.00 0.10BBK GARANTIZADO 5 FIM 0.97 1.45 1.35 GRV 1.45 1.01 2.33 GRV 0.39 3.00 2.10 GRV 1.35 2.47 1.86 GRV 4.22 2.14 NA 1.34 0.00 5.00 0.00 5.00 0.00 0.10BBK GARANTIZADO 6 FIM NA NA NA NA NA NA NA NA NA NA 0.60 1.44 GRV NA 0.60 NA 1.28 0.00 5.00 0.00 5.00 0.00 0.10BBVA 5X5 EXTRAGARANTIZADO FIM NA NA NA NA NA NA NA 3.72 0.89 GRV –0.16 3.28 0.67 GRV NA 3.51 NA 1.75 0.00 5.00 0.00 3.00 0.00 0.15BBVA BOLPLAZO FIM 1.20 1.93 2.41 GRV 1.15 1.82 2.16 GRV 0.02 1.75 1.98 GRV –0.19 1.38 1.72 GRV 2.19 1.73 NA 1.50 0.00 2.00 0.00 5.00 0.00 0.10BBVA EUROINDICES 2
GARANTIZADO FIM 0.71 0.75 1.13 GRV 0.59 0.56 0.78 GRV 0.07 0.21 0.55 GRV 0.14 7.97 0.29 GRV 1.52 0.48 12.79 1.40 0.00 2.00 0.00 2.00 0.00 0.10BBVA EUROINDICES 4
GARANTIZADO FIM 0.71 0.75 1.13 GRV 0.59 0.56 0.79 GRV 0.07 0.21 0.54 GRV 0.14 8.46 0.29 GRV 1.51 0.48 1.86 1.40 0.00 2.00 0.00 2.00 0.00 0.10BBVA EUROINDICES 5
GARANTIZADO FIM 0.81 1.04 1.43 GRV 0.70 0.84 1.20 GRV 0.09 0.63 0.97 GRV 0.07 0.42 0.74 GRV 1.67 0.77 NA 1.40 0.00 2.00 0.00 2.00 0.00 0.10BBVA EUROINDICES 6
GARANTIZADO FIM 0.85 1.35 1.77 GRV 0.76 1.16 1.55 GRV –0.02 0.90 1.20 GRV –0.09 0.65 0.98 GRV 1.49 1.05 NA 1.90 0.00 5.00 0.00 5.00 0.00 0.10BBVA EUROINDICES 7
GARANTIZADO FIM 1.33 1.80 2.28 GRV 1.41 1.64 2.07 GRV 0.16 1.62 1.86 GRV –0.04 1.26 1.53 GRV 2.88 1.60 12.04 1.25 0.00 2.00 0.00 2.00 0.00 0.10BBVA EUROINDICES 8
GARANTIZADO FIM 1.28 1.75 2.28 GRV 1.48 1.62 2.07 GRV 0.19 1.58 1.84 GRV –0.02 1.23 1.51 GRV 2.95 1.56 3.63 1.25 0.00 2.00 0.00 2.00 0.00 0.10BBVA EXTRA 5 GARANTIZADO FIM NA NA NA NA NA NA NA 9.54 0.01 GRV 0.68 3.50 0.77 GRV NA 2.72 NA 2.25 0.00 5.00 0.00 5.00 0.00 0.20BBVA EXTRA 5 II GARANTIZADO FIM NA NA NA NA NA NA NA NA NA NA 2.29 0.01 GRV NA 2.29 NA 1.50 0.00 0.00 0.00 5.00 0.00 0.20BBVA FONDBOLSA C FIM 1.01 1.39 1.87 GRV 1.02 1.24 1.45 GRV 0.13 0.89 1.21 GRV 0.06 0.64 0.98 GRV 2.24 1.08 9.54 1.20 0.00 2.00 0.00 2.00 0.00 0.10BBVA FONDBOLSA INTERNACIONAL
D FIM 0.50 0.42 0.76 GRV 0.28 0.24 0.53 GRV 0.09 8.16 0.27 GRV 0.08 7.05 0.14 GRV 0.96 0.25 13.18 1.60 0.00 2.00 0.00 2.00 0.00 0.10BBVA FONDBOLSA INTERNACIONAL
E FIM 0.50 0.42 0.73 GRV 0.28 0.23 0.52 GRV 0.08 7.11 0.27 GRV 0.05 5.34 0.13 GRV 0.91 0.24 6.57 1.60 0.00 2.00 0.00 2.00 0.00 0.10BBVA FONDBOLSA INTERNACIONAL
F FIM 0.52 0.43 0.75 GRV 0.29 0.26 0.53 GRV 0.09 7.14 0.23 GRV 0.09 0.05 0.05 GRV 0.99 0.26 13.70 1.60 0.00 2.00 0.00 2.00 0.00 0.10
(Continues over)
(Continued)

292
Annual rep
ort o
n th
e securities m
arket. 2003
A.4.8.Investment in securities. FIM. Yields, volatility and duration
1Q 2Q 3Q 4Q 2003
Yield Vol Dur Yield Vol Dur Yield Vol Dur Yield Vol Dur Yield Vol(1) (2) Type (1) (2) Type (1) (2) Type (1) (2) Type (1)% % % % %
% fees
Management Front end Back endCustody
of assets of yield Max. Min. Max. Min.
Yieldsince1996
Guaranteed equity FIM (GRV)
BBVA FONDBOLSA INTERNACIONALG FIM 0.51 0.44 0.81 GRV 0.33 0.26 0.53 GRV 0.06 9.15 0.31 GRV 0.10 8.78 0.07 GRV 0.99 0.26 7.54 1.60 0.00 2.00 0.00 2.00 0.00 0.10
BBVA FONDBOLSA INTERNACIONALH FIM 0.69 0.86 1.21 GRV 0.52 0.63 0.97 GRV 0.01 0.35 0.75 GRV 0.01 0.25 0.48 GRV 1.22 0.57 6.54 1.60 0.00 2.00 0.00 2.00 0.00 0.10
BBVA FONDBOLSA INTERNACIONALI FIM 0.68 0.85 1.19 GRV 0.52 0.61 0.96 GRV 0.01 0.34 0.74 GRV 0.01 0.24 0.47 GRV 1.22 0.56 25.25 1.60 0.00 2.00 0.00 2.00 0.00 0.10
BBVA FONDBOLSA JAPON 2 FIM 0.88 1.35 1.82 GRV 0.77 1.20 1.58 GRV 0.01 1.07 1.38 GRV –0.11 0.77 1.12 GRV 1.55 1.12 4.90 1.60 0.00 2.00 0.00 3.00 0.00 0.10BBVA FONDBOLSA JAPON 3 FIM 0.88 1.32 1.77 GRV 0.77 1.14 1.55 GRV 0.03 1.01 1.33 GRV –0.09 0.73 1.09 GRV 1.58 1.07 3.23 1.60 0.00 2.00 0.00 3.00 0.00 0.10BBVA FONDBOLSA JAPON 4 FIM 0.87 1.33 1.78 GRV 0.78 1.13 1.56 GRV 0.01 1.03 1.34 GRV –0.11 0.75 1.10 GRV 1.55 1.08 10.15 1.60 0.00 2.00 0.00 3.00 0.00 0.10BBVA FONDBOLSA–D FIM 0.96 1.27 1.74 GRV 0.88 1.13 1.51 GRV 0.11 0.97 1.29 GRV 0.04 0.70 1.07 GRV 1.99 1.04 9.46 1.20 0.00 2.00 0.00 2.00 0.00 0.10BBVA GARANTIZADO
DOBLE 6–2006 FIM NA 3.72 3.14 GRV 0.90 2.58 2.90 GRV –0.33 2.71 2.76 GRV 1.70 2.73 2.61 GRV NA 2.94 NA 0.60 0.00 5.00 0.00 5.00 0.00 0.10BBVA GARANTIZADO FLEXIBLE FIM 0.75 0.76 1.17 GRV 0.56 0.57 0.89 GRV 0.06 0.25 0.58 GRV 0.12 0.10 0.33 GRV 1.50 0.49 NA 1.40 0.00 5.00 0.00 5.00 0.00 0.10BBVA GARANTIZADO FLEXIBLE II FIM 0.99 1.32 1.72 GRV 0.89 1.10 1.42 GRV 0.14 0.93 1.22 GRV 0.08 0.67 1.00 GRV 2.10 1.03 7.73 1.15 0.00 5.00 0.00 5.00 0.00 0.10BBVA GARANTIZADO FLEXIBLE III FIM 1.05 1.43 1.84 GRV 0.98 1.23 1.44 GRV 0.14 0.90 1.22 GRV 0.08 0.64 0.98 GRV 2.27 1.09 10.39 1.15 0.00 5.00 0.00 5.00 0.00 0.10BBVA GARANTIZADO FLEXIBLE IV FIM 1.25 1.63 2.28 GRV 1.19 1.58 1.85 GRV 0.10 1.39 1.64 GRV –0.02 1.05 1.40 GRV 2.55 1.44 NA 1.20 0.00 5.00 0.00 5.00 0.00 0.10BBVA IBEX 9 FIM 0.18 4.81 2.14 GRV 3.07 3.98 1.93 GRV –1.03 3.32 1.73 GRV 4.51 3.06 1.49 GRV 6.80 3.87 7.52 1.10 0.00 2.00 0.00 2.00 0.00 0.10BBVA MUNDIBOLSA 2 FIM 0.93 1.39 1.84 GRV 0.86 1.16 1.47 GRV 0.05 0.92 1.25 GRV –0.02 0.67 1.03 GRV 1.82 1.07 10.07 1.50 0.00 2.00 0.00 2.00 0.00 0.10BBVA MUNDIBOLSA 5 FIM 0.92 1.38 1.87 GRV 0.79 1.19 1.56 GRV 0.03 1.03 1.30 GRV –0.04 0.77 0.89 GRV 1.70 1.12 9.69 1.50 0.00 2.00 0.00 2.00 0.00 0.10BBVA MUNDIBOLSA GARANTIZADO
2 FIM –1.07 3.08 1.79 GRV 1.97 2.45 1.55 GRV 0.13 3.35 1.19 GRV 2.52 3.02 0.97 GRV 3.55 3.01 10.12 1.60 0.00 2.00 0.00 2.00 0.00 0.10BBVA MUNDIBOLSA GARANTIZADO
3 FIM –1.34 4.22 2.72 GRV 3.64 3.60 2.52 GRV 0.12 5.15 2.30 GRV 3.25 3.66 2.08 GRV 5.71 4.23 8.57 1.25 0.00 2.00 0.00 0.00 0.00 0.10BBVA MUNDIBOLSA GARANTIZADO
4 FIM 2.04 5.78 3.03 GRV 5.52 4.67 2.82 GRV 0.31 4.31 2.64 GRV 4.34 3.42 2.38 GRV 12.70 4.63 18.77 1.40 0.00 3.00 0.00 5.00 0.00 0.10BBVA MUNDIBOLSA GARANTIZADO
5 FIM –0.19 1.00 0.01 GRV 3.05 3.55 3.26 GRV 0.13 3.83 3.06 GRV 2.77 3.00 2.83 GRV 5.83 3.07 NA 1.15 0.00 0.00 0.00 0.00 0.00 0.10BBVA MUNDIBOLSA GARANTIZADO
6 FIM 0.35 2.15 0.04 GRV –0.53 3.48 3.36 GRV 0.37 5.06 3.12 GRV 3.90 3.09 2.93 GRV 4.09 3.46 6.04 1.15 0.00 5.00 0.00 5.00 0.00 0.10BBVA MUNDIBOLSA GARANTIZADO
FIM 1.00 1.65 2.26 GRV 1.04 1.63 2.08 GRV 0.03 1.42 1.70 GRV –0.13 1.06 1.43 GRV 1.94 1.46 1.93 1.60 0.00 2.00 0.00 2.00 0.00 0.10BBVA RANKING GARANTIZADO FIM NA 4.98 0.01 GRV 1.26 4.26 3.36 GRV –0.78 4.24 3.16 GRV 1.51 4.08 2.92 GRV NA 3.96 NA 1.55 0.00 5.00 0.00 5.00 0.00 0.15BBVA RANKING II GARANTIZADO FIM NA NA NA NA 0.58 0.01 GRV –0.76 3.71 3.24 GRV 1.24 4.00 3.06 GRV NA 3.35 NA 1.65 0.00 5.00 0.00 5.00 0.00 0.15BBVA RENOVE III FIM 0.97 1.61 2.05 GRV 0.87 1.45 1.83 GRV –0.05 1.17 1.47 GRV –0.17 0.87 1.22 GRV 1.63 1.31 19.54 1.90 0.00 3.00 0.00 5.00 0.00 0.10BBVA RENOVE IV FIM 0.90 1.58 2.05 GRV 0.86 1.44 1.82 GRV –0.05 1.20 1.46 GRV –0.19 0.87 1.20 GRV 1.52 1.30 8.33 1.90 0.00 3.00 0.00 5.00 0.00 0.10BCH GTZO ACCION TELEFONICA FIM 0.48 0.41 0.81 GRV 0.32 0.33 0.59 GRV 0.09 4.81 0.33 GRV 0.08 1.01 0.08 GRV 0.97 0.26 17.46 1.52 0.00 5.00 5.00 3.00 3.00 0.10BG CAPITAL ASEGUR. FIM 0.60 0.94 1.43 GRV 0.58 0.79 1.21 GRV 0.05 0.64 0.97 GRV –0.02 0.42 0.76 GRV 1.20 0.73 9.04 1.50 0.00 5.00 5.00 5.00 5.00 0.15BG VALOR ASEGURADO FIM 2.80 5.69 2.88 GRV 4.62 6.95 2.66 GRV –2.06 5.51 2.44 GRV 5.02 4.19 2.21 GRV 10.62 5.70 19.50 1.30 0.00 5.00 5.00 5.00 5.00 0.10BI MULTINDICES 1 FIM 1.04 1.40 2.01 GRV 0.93 1.30 1.72 GRV 0.14 1.20 1.49 GRV –0.28 1.18 1.25 GRV 1.84 1.28 5.61 1.20 0.00 5.00 5.00 5.00 5.00 0.00BI OPORTUNIDAD ESPAÑA 2005 FIM 0.98 1.36 2.00 GRV 0.97 1.29 1.69 GRV 0.10 1.20 1.47 GRV 0.10 0.91 1.23 GRV 2.16 1.20 10.04 1.10 0.00 5.00 5.00 5.00 5.00 0.00BK CUPON 4 GARANTIA FIM –0.34 2.86 3.05 GRV 2.58 1.86 2.78 GRV –0.38 1.94 2.56 GRV 1.77 1.72 2.32 GRV 3.65 2.16 4.83 1.15 0.00 5.00 0.00 3.00 0.00 0.10BK CUPON GARANTIA LIQUIDEZ FIM 0.92 0.61 0.01 GRV 3.07 3.70 3.60 GRV –0.24 3.87 3.41 GRV 1.87 3.55 3.14 GRV 5.70 3.24 15.81 1.68 0.00 5.00 5.00 3.00 3.00 0.10BK CUPON VARIABLE ESPAÑA FIM –1.42 4.15 3.08 GRV 4.15 3.79 2.80 GRV –1.05 4.02 2.57 GRV 5.39 4.09 2.28 GRV 7.06 4.07 9.45 1.40 0.00 5.00 5.00 3.00 3.00 0.10BK EURO GARANTIA 6–II FIM 1.01 2.03 2.40 GRV 1.38 1.90 2.17 GRV –0.10 1.81 1.91 GRV 0.68 1.88 0.00 GRV 2.99 1.91 NA 1.75 0.00 5.00 5.00 5.00 5.00 0.10BK EURO–GARANTIA 1 FIM 0.24 1.34 1.52 GRV 0.80 1.39 1.28 GRV –0.22 2.04 1.04 GRV 0.99 1.93 0.00 GRV 1.82 1.71 5.27 2.10 0.00 5.00 5.00 5.00 5.00 0.10BK EURO–GARANTIA 2 FIM 0.27 1.57 1.54 GRV 0.98 1.58 1.30 GRV –0.26 2.15 1.05 GRV 1.02 1.96 0.00 GRV 2.02 1.84 2.99 2.10 0.00 5.00 5.00 5.00 5.00 0.10BK EURO–GARANTIA 6 FIM 0.92 1.63 2.00 GRV 0.89 1.46 1.76 GRV 0.05 1.13 1.50 GRV 0.04 0.88 0.00 GRV 1.90 1.31 NA 1.40 0.00 5.00 5.00 5.00 5.00 0.10BK G. CONSOLIDACION
EURO–JAPON FIM 0.73 0.75 1.30 GRV 0.58 0.66 1.08 GRV –0.02 0.41 0.85 GRV –0.03 0.30 0.62 GRV 1.27 0.56 5.08 1.85 0.00 5.00 0.00 5.00 0.00 0.09BK GARANTIA CUPON 20
NOVIEMBRE FIM 0.39 0.57 1.00 GRV 0.30 0.45 0.75 GRV –0.48 0.38 0.50 GRV –0.30 0.20 0.22 GRV –0.11 0.43 NA 2.00 0.00 5.00 5.00 5.00 5.00 0.10BK GARANTIA CUPON 20 OCTUBRE FIM 0.39 0.57 1.00 GRV 0.30 0.44 0.75 GRV –0.48 0.38 0.51 GRV –0.30 0.20 0.22 GRV –0.10 0.43 8.95 2.00 0.00 5.00 5.00 5.00 5.00 0.10
(Continues over)
(Continued)

293
Annex 4
: Collective in
vestmen
t schem
es and ven
ture cap
ital com
pan
iesA.4.8.Investment in securities. FIM. Yields, volatility and duration
1Q 2Q 3Q 4Q 2003
Yield Vol Dur Yield Vol Dur Yield Vol Dur Yield Vol Dur Yield Vol(1) (2) Type (1) (2) Type (1) (2) Type (1) (2) Type (1)% % % % %
% fees
Management Front end Back endCustody
of assets of yield Max. Min. Max. Min.
Yieldsince1996
Guaranteed equity FIM (GRV)
BK GARANTIA CUPON GANADOR FIM NA NA 0.00 GRV NA 3.58 1.78 GRV 0.00 2.22 1.52 GRV 0.93 2.87 0.00 GRV NA 2.94 NA 1.55 0.00 5.00 0.00 3.00 0.00 0.10BK GARANTIA CUPON GANADOR II FIM 0.31 4.75 0.17 GRV 1.00 1.46 1.85 GRV 1.23 1.69 1.57 GRV 2.46 2.39 0.00 GRV 5.08 1.65 7.07 1.20 0.00 5.00 0.00 3.00 0.00 0.10BK GARANTIA CUPON GANADOR
III FIM 0.28 0.14 0.22 GRV 0.46 0.67 0.01 GRV –0.55 2.93 1.85 GRV 1.24 1.95 1.63 GRV 1.43 1.81 27.87 1.67 0.00 5.00 5.00 5.00 5.00 0.11BK GARANTIA DIVERSIFICACION FIM 0.44 2.06 1.28 GRV 3.13 2.38 1.03 GRV –0.23 1.61 0.80 GRV 1.48 1.16 0.56 GRV 4.87 1.87 –1.39 1.80 0.00 5.00 5.00 5.00 5.00 0.10BK GARANTIA DOBLE CUPON FIM 1.38 22.57 0.55 GRV 3.00 2.29 0.32 GRV –0.15 1.91 0.43 GRV 2.01 2.41 0.31 GRV 6.36 11.37 NA 1.30 0.00 5.00 0.00 2.00 0.00 0.10BK GARANTIA F. INTERNACIONALES FIM 0.53 0.77 1.04 GRV 0.38 0.46 0.80 GRV 0.02 0.25 0.54 GRV 0.03 9.44 0.31 GRV 0.96 0.47 11.07 1.65 0.00 5.00 5.00 5.00 5.00 0.10BK GARANTIA INDICE ESPAÑA FIM 0.68 3.27 2.29 GRV 4.26 2.80 2.00 GRV 0.23 2.69 1.82 GRV 4.01 3.92 1.55 GRV 9.43 3.23 16.46 1.10 0.00 5.00 0.00 5.00 0.00 0.10BK GARANTIA INDICE ESPAÑA II FIM 0.79 4.04 2.96 GRV 3.45 2.33 2.72 GRV 0.26 2.00 2.44 GRV 0.67 1.77 2.17 GRV 5.24 2.69 10.04 1.50 0.00 5.00 5.00 5.00 5.00 0.10BK GARANTIA RECORD FIM 0.53 0.27 0.41 GRF 0.41 0.11 0.15 GRF 0.29 2.86 0.04 GRV –0.69 2.83 1.75 GRV 0.54 1.43 11.37 1.83 0.00 5.00 5.00 3.00 3.00 0.10BK GARANTIA RECORD II FIM 0.23 0.10 0.31 GRV 0.27 0.16 0.08 GRV 0.05 0.16 0.01 GRV –0.26 3.73 1.74 GRV 0.30 1.88 10.31 1.35 0.00 5.00 0.00 3.00 0.00 0.10BK INDICES GARANTIA FIM 0.45 0.17 0.46 GRV 0.33 4.87 0.22 GRV 0.25 0.10 0.03 GRV 0.78 0.91 0.95 GRV 1.82 0.47 19.69 1.95 0.00 5.00 0.00 5.00 0.00 0.10BK INDICES GARANTIA II FIM 0.50 0.31 0.67 GRV 0.40 0.21 0.44 GRV 0.15 0.12 0.36 GRV 0.58 0.98 0.01 GRV 1.65 0.53 16.24 1.35 0.00 5.00 5.00 5.00 5.00 0.09BK REVALORIZACION
INTERNACIONAL FIM –1.63 2.58 2.98 GRV 3.32 2.45 2.75 GRV 0.14 2.69 2.48 GRV 2.13 2.30 0.00 GRV 3.95 2.54 0.74 0.72 0.00 5.00 5.00 3.00 3.00 0.05BK TRIPLE GARANTIA FIM 0.74 1.42 1.80 GRV 0.60 1.22 1.59 GRV –0.16 1.00 1.34 GRV –0.21 0.84 1.07 GRV 0.96 1.14 10.54 2.25 0.00 5.00 5.00 5.00 5.00 0.10BM–BOLSA SUPERGARANTIA FIM 1.06 0.69 1.13 GRV 0.94 0.54 0.96 GRV 0.35 0.34 0.73 GRV 0.26 0.27 0.51 GRV 2.64 0.49 10.02 1.25 0.00 0.00 0.00 0.00 0.00 0.05BSN BANIF CUPON 2004 FIM 0.95 1.11 1.50 GRV 0.96 1.80 1.25 GRV 0.07 0.63 1.03 GRV 0.22 0.50 0.79 GRV 2.22 1.13 12.61 0.90 0.00 5.00 5.00 5.00 5.00 0.10BSN BANIF VALOR MAXIMO GTZO FIM –0.73 5.28 2.41 GRV 4.63 4.49 2.14 GRV 1.12 3.71 1.91 GRV 1.97 2.81 1.68 GRV 7.10 4.18 13.56 1.04 0.00 5.00 5.00 5.00 5.00 0.10C.C.M. ANIVERSARIO I FIM NA NA NA NA 5.33 3.99 GRV 1.44 4.88 3.77 GRV 2.03 2.03 3.56 GRV NA 4.28 NA 0.95 0.00 2.00 2.00 2.00 2.00 0.05CAI GARANTIZADO FIM –0.03 2.05 2.94 GRV 1.64 1.99 2.70 GRV –0.09 2.37 2.47 GRV 1.49 1.63 2.20 GRV 3.03 2.04 6.24 1.00 0.00 5.00 5.00 5.00 5.00 0.10CAIXA CATALUNYA BORSA 1 FIM 0.09 1.40 0.17 GRV 1.12 0.67 0.18 GRV 0.42 0.27 0.20 GRV 0.22 9.58 0.01 GRV 1.86 0.79 8.00 0.90 0.00 3.00 0.00 3.00 0.00 0.09CAIXA CATALUNYA BORSA 10 FIM –2.19 4.60 0.19 GRV 2.67 3.50 0.20 GRV –0.34 3.60 0.35 GRV 2.00 2.95 0.32 GRV 2.09 3.73 NA 1.35 0.00 3.00 0.00 3.00 0.00 0.10CAIXA CATALUNYA BORSA 11 FIM NA 7.49 0.06 GRV 0.01 4.51 1.54 GRV 0.49 2.11 0.07 GRV 1.03 1.54 0.06 GRV NA 2.91 NA 0.90 0.00 3.00 0.00 3.00 0.00 0.05CAIXA CATALUNYA BORSA 12 FIM NA NA NA NA NA NA NA 0.11 0.00 GRF 1.61 2.97 0.10 GRV NA 2.64 NA 1.25 0.00 3.00 0.00 3.00 0.00 0.10CAIXA CATALUNYA BORSA 2 FIM 1.24 1.35 0.09 GRV 1.43 1.54 0.09 GRV 0.29 1.74 0.09 GRV 0.28 0.91 0.09 GRV 3.27 1.42 NA 1.35 0.00 3.00 0.00 3.00 0.00 0.15CAIXA CATALUNYA BORSA 3 FIM 0.81 1.27 0.65 GRV 2.14 1.48 0.60 GRV –0.12 1.40 0.47 GRV 0.94 1.10 0.33 GRV 3.80 1.33 NA 1.35 0.00 3.00 0.00 3.00 0.00 0.10CAIXA CATALUNYA BORSA 4 FIM –0.58 0.51 0.05 GRV 1.21 2.37 0.16 GRV 0.37 2.92 0.17 GRV 0.88 2.14 0.09 GRV 1.89 2.19 NA 1.05 0.00 3.00 0.00 3.00 0.00 0.05CAIXA CATALUNYA BORSA 5 FIM –0.45 0.62 0.02 GRV –0.30 0.41 0.07 GRV –1.59 3.11 0.16 GRV 2.36 2.66 0.17 GRV –0.02 2.11 NA 1.15 0.00 3.00 0.00 3.00 0.00 0.10CAIXA CATALUNYA BORSA 6 FIM 0.87 0.63 0.15 GRV 0.51 0.60 0.12 GRV 0.22 0.19 0.12 GRV –1.01 0.36 0.08 GRV 0.58 0.50 NA 1.35 0.00 0.00 0.00 0.00 0.00 0.15CAIXA CATALUNYA BORSA 7 FIM 0.67 0.79 0.06 GRV 0.71 0.47 0.05 GRV 0.18 0.30 0.04 GRV –0.30 0.41 0.05 GRV 1.27 0.53 NA 1.35 0.00 0.00 0.00 0.00 0.00 0.15CAIXA CATALUNYA BORSA 8 FIM 0.81 0.93 0.22 GRV 0.97 0.79 0.16 GRV 0.24 0.50 0.14 GRV –0.29 1.13 0.11 GRV 1.73 0.87 NA 1.35 0.00 0.00 0.00 0.00 0.00 0.10CAIXA CATALUNYA BORSA 9 FIM 1.08 1.21 0.09 GRV 0.97 1.03 0.13 GRV 0.24 0.87 0.13 GRV 0.08 0.68 0.11 GRV 2.38 0.97 NA 1.35 0.00 0.00 0.00 0.00 0.00 0.10CAIXA CATALUNYA CREIXEMENT FIM 1.41 2.48 0.06 GRV 2.13 2.77 0.06 GRV –0.51 2.92 0.06 GRV 0.12 1.88 0.06 GRV 3.17 2.55 1.47 1.45 0.00 3.00 0.00 3.00 0.00 0.10CAIXA CATALUNYA FONCLIQUET II FIM –0.42 2.75 0.10 GRV 0.62 1.47 0.07 GRV 0.02 1.47 0.06 GRV –0.12 0.96 0.09 GRV 0.10 1.79 NA 1.35 0.00 3.00 0.00 3.00 0.00 0.10CAIXA GALICIA ALFA GARANTIA FIM 0.42 1.88 0.07 GRV 1.65 2.36 3.90 GRV 0.56 3.11 3.70 GRV 0.85 2.78 3.49 GRV 3.51 2.40 14.24 1.00 0.00 3.00 3.00 5.00 5.00 0.14CAIXAMANRESA GARANTIT 3 FIM 0.61 4.14 0.01 GRF 3.07 4.38 2.86 GRV –0.80 4.52 2.75 GRV 2.66 3.62 2.47 GRV 5.61 3.65 NA 0.40 0.00 5.00 5.00 5.00 5.00 0.10CAJA INGENIEROS AMERICA GTZO FIM 0.96 5.70 2.82 GRV 3.72 5.10 2.62 GRV –1.34 4.09 2.40 GRV 2.58 4.29 2.17 GRV 5.97 4.85 NA 1.60 0.00 5.00 0.00 5.00 0.00 0.20CAJA INGENIEROS MULTICESTA
GTZO FIM NA NA NA NA NA NA NA NA NA NA 4.00 0.03 GRV NA 4.00 NA 1.80 0.00 0.00 0.00 0.00 0.00 0.20CAJA LABORAL BOLSA
GARANTIZADO FIM 0.61 0.60 0.99 GRV 0.63 0.45 0.59 GRV 0.07 0.29 0.48 GRV 0.12 0.24 0.33 GRV 1.43 0.42 9.16 1.60 0.00 2.00 2.00 2.00 2.00 0.12CAJA LABORAL BOLSA GTZO II FIM 0.61 0.67 1.12 GRV 0.47 0.54 0.86 GRV –0.03 0.40 0.70 GRV –0.01 0.30 0.51 GRV 1.04 0.50 9.00 1.75 0.00 2.00 2.00 2.00 2.00 0.13CAJA LABORAL BOLSA GTZO III FIM 0.79 1.62 1.66 GRV 1.21 1.83 1.45 GRV –0.33 1.82 1.20 GRV 1.35 1.46 0.99 GRV 3.05 1.69 7.93 1.35 0.00 2.00 2.00 2.00 2.00 0.09CAJA LABORAL BOLSA GTZO IV FIM 1.81 3.11 1.95 GRV 3.18 3.69 1.74 GRV –1.15 4.31 1.50 GRV 5.97 3.66 1.26 GRV 10.04 3.76 6.08 1.35 0.00 2.00 2.00 2.00 2.00 0.13CAJA LABORAL BOLSA GTZO IX FIM –0.90 2.30 2.22 GRV 4.40 3.47 1.97 GRV 0.13 4.07 1.74 GRV 2.25 2.70 1.49 GRV 5.92 3.24 NA 1.35 0.00 2.00 2.00 2.00 2.00 0.14CAJA LABORAL BOLSA GTZO V FIM –0.46 1.70 2.38 GRV 2.15 1.65 2.22 GRV 0.77 2.69 2.03 GRV 1.74 2.91 1.84 GRV 4.25 2.32 9.95 1.35 0.00 2.00 2.00 2.00 2.00 0.13CAJA LABORAL BOLSA GTZO VI FIM –0.32 2.47 1.24 GRV 2.66 2.37 1.09 GRV 0.27 2.50 0.86 GRV 2.94 2.62 0.66 GRV 5.64 2.51 9.98 1.35 0.00 2.00 2.00 2.00 2.00 0.13CAJA LABORAL BOLSA GTZO VII FIM –1.06 2.91 0.03 GRV 2.12 2.25 1.76 GRV –0.44 2.39 1.54 GRV 2.87 2.24 1.32 GRV 3.49 2.48 8.61 1.35 0.00 2.00 2.00 2.00 2.00 0.13CAJA LABORAL BOLSA GTZO VIII FIM –0.47 2.57 1.63 GRV 2.61 1.80 0.89 GRV 0.31 1.62 0.66 GRV 1.09 1.61 0.46 GRV 3.55 1.95 7.71 1.35 0.00 2.00 2.00 2.00 2.00 0.14CAJA LABORAL BOLSA GTZO X FIM 0.36 1.69 0.05 GRV 0.71 1.47 2.37 GRV 1.56 4.32 2.15 GRV 1.31 2.55 1.93 GRV 3.99 2.62 NA 1.35 0.00 2.00 2.00 2.00 2.00 0.14CAJA MURCIA GARANT. FIM 0.53 0.17 1.19 GRV 0.42 0.14 0.98 GRV 0.25 0.01 0.74 GRV 0.26 4.14 0.23 GRV 1.46 0.11 6.15 1.15 0.00 5.00 5.00 5.00 5.00 0.10
(Continues over)
(Continued)

294
Annual rep
ort o
n th
e securities m
arket. 2003
A.4.8.Investment in securities. FIM. Yields, volatility and duration
1Q 2Q 3Q 4Q 2003
Yield Vol Dur Yield Vol Dur Yield Vol Dur Yield Vol Dur Yield Vol(1) (2) Type (1) (2) Type (1) (2) Type (1) (2) Type (1)% % % % %
% fees
Management Front end Back endCustody
of assets of yield Max. Min. Max. Min.
Yieldsince1996
Guaranteed equity FIM (GRV)
CAJABURGOS EUROBOLSAS FIM 0.81 1.33 2.09 GRV 1.49 1.08 1.90 GRV –0.13 1.58 1.67 GRV –0.22 1.18 1.44 GRV 1.97 1.32 5.31 1.35 0.00 5.00 5.00 5.00 5.00 0.15CAJABURGOS EUROCUPON FIM 0.65 0.12 0.41 GRF 0.45 1.00 0.19 GRF 0.42 0.23 0.00 GRV 0.01 1.56 2.69 GRV 1.54 0.79 18.50 0.80 0.00 3.00 3.00 3.00 3.00 0.10CAJABURGOS EUROPA FIM 0.82 0.99 1.66 GRV 0.85 0.74 1.40 GRV –0.06 0.63 1.18 GRV 0.16 0.31 0.95 GRV 1.79 0.71 14.75 1.20 0.00 5.00 5.00 5.00 5.00 0.10CAJABURGOS EUROTOP FIM 0.82 1.33 2.11 GRV 1.50 1.10 1.90 GRV –0.13 1.58 1.68 GRV –0.21 1.19 1.45 GRV 1.99 1.32 7.46 1.35 0.00 5.00 5.00 5.00 5.00 0.13CAJABURGOS GLOBAL FIM 0.82 1.34 2.11 GRV 1.52 1.09 1.90 GRV –0.12 1.59 1.67 GRV –0.21 1.19 1.44 GRV 2.01 1.33 6.28 1.35 0.00 5.00 5.00 5.00 5.00 0.14CAJABURGOS VALOR FIM –1.03 2.00 3.28 GRV 3.83 3.02 3.08 GRV 1.17 4.08 2.84 GRV 2.44 3.84 2.60 GRV 6.49 3.36 13.22 1.10 0.00 5.00 5.00 5.00 5.00 0.15CAJACANARIAS EUROPA
GARANTIZADO FIM NA NA NA NA 3.41 3.02 GRV –0.07 2.03 2.82 GRV –0.42 1.73 2.66 GRV NA 2.46 NA 0.80 0.00 5.00 5.00 5.00 5.00 0.05CAJACANARIAS EUROPA GTZO 2 FIM NA NA NA NA NA NA NA NA NA NA 1.95 0.07 GRV NA 1.95 NA 1.20 0.00 0.00 0.00 0.00 0.00 0.05CAJASTUR VALOR GARANTIZADO FIM NA NA NA NA 1.43 3.02 GRV –0.16 2.56 2.80 GRV 0.19 2.43 2.58 GRV NA 2.22 NA 0.95 0.00 5.00 5.00 5.00 5.00 0.20CAM CESTA FONDOS
GARANTIZADO FIM –0.09 2.03 1.58 GRV 1.28 2.08 1.39 GRV 0.87 3.03 1.17 GRV 1.74 2.19 0.96 GRV 3.84 2.37 NA 0.95 0.00 5.00 0.00 3.00 0.00 0.05CAM FUTURO 10 GARANTIZADO FIM 0.44 1.67 0.01 GRV 1.25 3.71 3.94 GRV 0.95 4.50 3.42 GRV 1.66 4.08 3.22 GRV 4.36 3.57 12.26 1.40 0.00 5.00 5.00 5.00 5.00 0.05CAM FUTURO 11 GARANTIZADO FIM 0.38 1.85 0.01 GRV 0.27 1.66 0.01 GRV 0.17 2.66 0.01 GRV –0.40 5.18 0.81 GRV 0.42 2.60 5.16 1.20 0.00 5.00 5.00 5.00 5.00 0.05CAM FUTURO 3 GARANTIZADO FIM 0.10 2.68 2.19 GRV 1.17 2.38 1.98 GRV 0.15 1.42 1.74 GRV –0.14 1.32 1.52 GRV 1.28 2.03 1.05 0.95 0.00 5.00 5.00 2.00 2.00 0.05CAM FUTURO 4 GARANTIZADO FIM –0.49 2.47 2.22 GRV 1.87 2.44 2.02 GRV 0.14 2.58 1.78 GRV 1.54 1.92 1.54 GRV 3.08 2.37 8.70 0.95 0.00 5.00 0.00 2.00 0.00 0.05CAM FUTURO 5 GARANTIZADO FIM 0.25 7.41 2.07 GRV 3.68 5.95 1.87 GRV –0.77 4.53 1.65 GRV 3.56 3.56 1.44 GRV 6.80 5.56 18.02 1.30 0.00 5.00 5.00 2.00 2.00 0.10CAM FUTURO 6 GARANTIZADO FIM –0.24 4.86 2.16 GRV 3.48 3.94 1.96 GRV –0.79 2.97 1.73 GRV 3.47 2.84 1.51 GRV 5.96 3.76 15.36 1.30 0.00 5.00 5.00 2.00 2.00 0.10CAM FUTURO 7 GARANTIZADO FIM 0.21 4.16 2.55 GRV 3.15 3.30 2.35 GRV –0.93 2.83 2.13 GRV 3.07 2.80 1.92 GRV 5.55 3.33 7.77 1.30 0.00 5.00 5.00 2.00 2.00 0.10CAM FUTURO 8 GARANTIZADO FIM 0.33 5.39 2.64 GRV 3.15 4.07 2.43 GRV –1.06 4.10 2.23 GRV 3.74 3.17 2.00 GRV 6.22 4.27 3.56 0.80 0.00 5.00 5.00 2.00 2.00 0.10CAM FUTURO 9 GARANTIZADO FIM 0.42 2.75 0.01 GRV 2.61 4.04 3.29 GRV 1.39 4.99 3.09 GRV 2.40 4.45 2.87 GRV 6.98 3.92 14.72 1.00 0.00 5.00 5.00 5.00 5.00 0.05CAM FUTURO GARANTIZADO FIM 0.96 1.34 1.75 GRV 0.95 1.04 1.53 GRV 0.29 0.94 1.30 GRV 0.23 0.68 1.07 GRV 2.45 1.03 NA 0.70 0.00 5.00 5.00 2.00 2.00 0.05CRV BOLSA MUNDIAL GARANTIZADO FIM 0.93 0.63 0.75 GRV 0.46 0.28 0.53 GRV 0.17 6.22 0.24 GRV 0.19 2.71 0.08 GRV 1.77 0.35 7.70 1.10 0.00 0.00 0.00 0.00 0.00 0.15CRV COMBIBOLSA GARANTIZADO FIM 1.24 1.39 2.10 GRV 1.28 1.58 1.89 GRV 0.00 1.39 1.67 GRV –0.04 1.04 1.45 GRV 2.50 1.37 NA 0.90 0.00 5.00 5.00 2.00 2.00 0.10CRV EUROBOLSA GAR. FIM 0.94 1.26 1.46 GRV 1.00 1.05 1.24 GRV 0.13 0.64 0.98 GRV 0.24 0.83 0.77 GRV 2.33 0.97 15.86 0.90 0.00 2.50 2.50 2.50 2.50 0.10DINERO ACTIVO III FIM 0.78 0.31 0.29 GRF 0.54 6.49 0.08 RFCP 0.37 3.17 0.05 RFCP 0.25 0.82 1.06 GRV 1.94 0.44 NA 0.75 0.00 5.00 5.00 5.00 5.00 0.00DINERO ACTIVO IV FIM NA 1.30 0.01 GRV 1.80 4.70 2.88 GRV –0.96 5.11 2.64 GRV 3.66 3.63 2.41 GRV NA 4.28 NA 1.00 0.00 3.00 3.00 3.00 3.00 0.00DWS GLOBALFLEX GARANTIZADO FIM 0.59 2.63 2.57 GRV 1.76 2.20 2.38 GRV –0.17 3.16 2.12 GRV 0.06 2.18 1.66 GRV 2.25 2.58 9.94 1.25 0.00 4.50 0.00 4.50 0.00 0.10DWS MULTIFONDO GARANTIZADO FIM 0.91 1.48 1.37 GRV 1.27 1.33 1.16 GRV 0.57 1.94 0.84 GRV 0.22 1.26 0.52 GRV 2.99 1.53 12.13 1.45 0.00 4.50 0.00 4.50 0.00 0.05DWS MULTIGESTION ACTIVA GTZO FIM 0.01 1.97 1.80 GRV 1.38 1.61 1.60 GRV 0.12 1.74 1.37 GRV 0.19 1.17 1.16 GRV 1.70 1.65 9.05 1.25 0.00 4.50 0.00 4.50 0.00 0.07DWS SECTORIAL 2001 FIM 0.57 0.48 0.88 GRV 0.36 0.36 0.65 GRV –0.17 0.22 0.39 GRV –0.12 0.12 0.17 GRV 0.63 0.33 6.07 1.65 0.00 4.50 0.00 4.50 0.00 0.10DWS SELECTOR GARANTIZADO FIM –1.52 10.94 1.58 RVM 7.51 10.55 1.39 RVM 1.45 4.81 0.00 GRV 0.69 3.14 4.60 GRV 8.16 8.12 8.05 1.25 0.00 4.50 0.00 4.50 0.00 0.10DWS TRIPLE BENEFICIO GTZO FIM 0.40 4.25 2.97 GRV 1.94 2.25 2.77 GRV –0.20 2.11 2.55 GRV 0.97 1.70 2.36 GRV 3.14 2.75 NA 1.15 0.00 4.50 0.00 4.50 0.00 0.05EUROBOLSA ATLANTICO PLUS FIM 0.70 2.33 2.08 GRV 0.79 1.55 1.86 GRV –0.20 1.40 1.69 GRV –0.36 1.34 1.45 GRV 0.93 1.70 5.39 2.25 0.00 5.00 5.00 5.00 5.00 0.20EUROV.IBEX35 ASEG.B FIM 0.73 0.90 1.41 GRV 0.73 0.81 1.19 GRV 0.02 0.61 0.97 GRV 0.09 0.53 0.77 GRV 1.58 0.73 3.35 1.50 0.00 4.00 4.00 4.00 4.00 0.00EUROVALOR CESTA GLOBAL FIM 0.72 0.90 0.94 GRV 0.54 0.48 0.73 GRV 0.11 0.27 0.50 GRV 0.15 0.11 0.26 GRV 1.53 0.53 –3.65 1.37 0.00 4.00 4.00 4.00 4.00 0.00EUROVALOR CUPON MULTIPLE
OPORT. FIM 0.36 0.14 0.31 GRV 0.34 0.10 0.08 GRV 0.27 0.11 0.00 GRV 2.55 3.69 2.66 GRV 3.54 1.86 9.43 1.25 0.00 4.00 4.00 4.00 4.00 0.00EUROVALOR DOBLE BENEFICIO FIM 0.40 6.39 0.08 GRV 0.41 0.21 0.00 GRV 0.77 2.76 2.76 GRV 1.35 2.11 2.54 GRV 2.95 1.75 6.33 1.25 0.00 4.00 4.00 4.00 4.00 0.00EUROVALOR EUROPA GARANTIZADO
2 FIM 0.98 1.63 2.10 GRV 0.88 1.47 1.88 GRV 0.05 1.38 1.66 GRV 0.06 1.03 1.43 GRV 1.99 1.40 8.38 1.50 0.00 4.00 4.00 4.00 4.00 0.00EUROVALOR EUROPA
GARANTIZADO. FIM 0.44 0.64 0.77 GRV 0.44 0.42 0.54 GRV 0.17 0.19 0.31 GRV 0.21 0.15 0.09 GRV 1.27 0.40 10.26 1.25 0.00 4.00 4.00 4.00 4.00 0.00EUROVALOR EUROPA GTZO 2 B FIM 0.99 1.64 2.10 GRV 0.89 1.47 1.89 GRV 0.04 1.39 1.66 GRV 0.07 1.04 1.45 GRV 1.99 1.40 1.84 1.50 0.00 4.00 4.00 4.00 4.00 0.00EUROVALOR EUROPA MAXIMO
GTZO FIM NA NA NA NA NA NA NA NA NA NA 8.73 0.01 GRV NA 8.73 NA 1.25 0.00 0.00 0.00 0.00 0.00 0.00EUROVALOR FORMULA 25 FIM 0.78 1.24 1.65 GRV 2.34 3.05 1.43 GRV –0.05 3.16 1.22 GRV 3.72 2.87 0.99 GRV 6.92 2.72 14.27 1.50 0.00 4.00 4.00 4.00 4.00 0.00EUROVALOR FORMULA 25–2 FIM 0.40 2.11 0.00 GRV 2.09 3.06 2.48 GRV 1.63 3.71 2.31 GRV 2.19 3.10 2.08 GRV 6.45 2.87 9.07 1.25 0.00 4.00 4.00 4.00 4.00 0.00EUROVALOR FORMULA 40 FIM –0.05 3.46 2.11 GRV 5.10 4.14 1.89 GRV 2.24 5.67 1.67 GRV 4.97 5.45 1.45 GRV 12.73 4.80 13.77 1.48 0.00 4.00 4.00 4.00 4.00 0.00EUROVALOR GARANTIZADO
IBEX–1 FIM 0.39 3.67 2.77 GRV 4.07 5.94 2.56 GRV –1.12 4.70 2.33 GRV 3.99 3.96 2.10 GRV 7.43 4.67 NA 1.25 0.00 4.00 4.00 4.00 4.00 0.00EUROVALOR GLOBAL ASEGURADO FIM 0.77 0.75 1.23 GRV 0.64 0.57 1.00 GRV 0.14 0.43 0.77 GRV 0.10 0.32 0.55 GRV 1.66 0.54 16.40 1.25 0.00 4.00 4.00 4.00 4.00 0.00
(Continues over)
(Continued)

295
Annex 4
: Collective in
vestmen
t schem
es and ven
ture cap
ital com
pan
iesA.4.8.Investment in securities. FIM. Yields, volatility and duration
1Q 2Q 3Q 4Q 2003
Yield Vol Dur Yield Vol Dur Yield Vol Dur Yield Vol Dur Yield Vol(1) (2) Type (1) (2) Type (1) (2) Type (1) (2) Type (1)% % % % %
% fees
Management Front end Back endCustody
of assets of yield Max. Min. Max. Min.
Yieldsince1996
Guaranteed equity FIM (GRV)
EUROVALOR INDICE MAXIMO FIM NA NA NA NA NA NA NA 7.73 0.00 GRV –1.04 4.34 2.88 GRV NA 4.22 NA 1.25 0.00 0.00 0.00 0.00 0.00 0.00EUROVALOR PLUS 2 FIM 0.87 4.61 1.66 GRV 0.74 1.04 1.44 GRV 0.07 0.87 1.22 GRV –0.02 0.68 1.00 GRV 1.67 2.41 NA 1.65 0.00 4.00 4.00 4.00 4.00 0.00EUROVALOR PLUS FIM 0.61 1.25 1.64 GRV 0.51 0.95 1.43 GRV –0.12 0.79 1.22 GRV –0.18 0.63 0.99 GRV 0.81 0.93 NA 2.18 0.00 4.00 4.00 4.00 4.00 0.20EUROVALOR POPULAR 1 FIM 0.43 3.66 2.26 GRV 2.41 4.22 2.05 GRV –1.32 2.92 1.83 GRV 1.13 2.84 1.61 GRV 2.65 3.46 NA 1.25 0.00 4.00 4.00 4.00 4.00 0.00EUROVALOR RENTABILIDAD
PROTEG. FIM 0.41 4.26 0.08 GRF 0.38 0.16 0.00 GRV 0.64 3.11 2.76 GRV –0.64 2.18 2.53 GRV 0.79 1.91 NA 1.25 0.00 4.00 4.00 4.00 4.00 0.00F.GTZO CONFIANZA II CAJA MURCIA FIM NA NA NA NA 8.95 0.01 GRV 0.16 2.75 2.64 GRV 1.56 1.50 2.48 GRV NA 1.90 NA 0.95 0.00 5.00 5.00 5.00 5.00 0.05FIBANC EUROPA GARANTIZADO FIM 0.75 1.06 1.48 GRV 0.78 0.79 1.27 GRV 0.13 0.64 1.02 GRV 0.22 0.47 0.80 GRV 1.89 0.77 14.29 1.30 0.00 5.00 5.00 5.00 5.00 0.10FIBANC MULTIBOLSAS GARANTIZADO FIM 1.46 2.06 2.68 GRV 1.25 1.88 2.44 GRV –0.06 1.76 2.19 GRV –0.24 1.48 1.95 GRV 2.41 1.81 4.28 1.40 0.00 5.00 5.00 5.00 5.00 0.09FON FINECO EUROINVERSION FIM 0.45 0.41 0.00 GRV 0.29 6.39 0.00 GRV –0.03 5.15 0.00 GRV –0.01 1.71 0.01 GRV 0.71 0.21 NA 0.50 5.00 5.00 5.00 0.00 0.00 0.14FON FINECO JAPON FIM 0.69 0.53 0.83 GRV 0.65 0.39 0.88 GRV 0.26 8.08 0.00 GRV 0.20 9.09 0.01 GRV 1.81 0.33 NA 0.50 5.00 5.00 5.00 0.00 0.00 0.14FON FINECO OPTIM. G FIM 0.79 0.15 0.00 GRV 0.48 4.28 0.00 GRV –0.69 6.39 0.67 GRV 5.99 8.21 0.65 GRV 6.60 5.25 NA 1.05 3.00 5.00 5.00 5.00 0.00 0.05FON FINECO TECNOLOGIA FIM 0.62 0.34 0.54 GRV 0.50 0.22 0.36 GRV 0.36 5.29 0.11 GRV 1.05 0.56 0.01 GRV 2.54 0.35 NA 0.50 5.00 5.00 5.00 0.00 0.00 0.14FONCAIXA 15 G. CUPON PLUS
BOLSA FIM –0.01 1.54 3.13 GRV 0.76 2.58 2.90 GRV –0.20 2.54 2.66 GRV 1.31 1.72 2.53 GRV 1.87 2.15 13.32 1.05 0.00 4.00 4.00 4.00 4.00 0.00FONCAIXA 20 GARANTIZADO MIXTO FIM 1.27 1.87 2.32 GRV 0.79 1.80 2.14 GRV 0.31 1.88 1.90 GRV 0.49 1.81 1.74 GRV 2.88 1.84 –28.75 1.10 0.00 4.00 4.00 4.00 4.00 0.00FONCAIXA 21 GARANTIZADO MIXTO FIM 1.85 2.27 2.48 GRV 0.73 2.02 2.33 GRV 0.13 6.31 2.09 GRV –0.21 1.75 1.87 GRV 2.52 3.62 –10.27 1.15 0.00 4.00 4.00 4.00 4.00 0.00FONCAIXA 68 G.EURO FIM 0.87 1.40 1.82 GRV 0.86 1.28 1.62 GRV 0.10 1.20 1.39 GRV 0.00 0.87 1.14 GRV 1.83 1.21 NA 1.50 0.00 3.00 3.00 3.00 3.00 0.00FONCAIXA 69 G.JAPON FIM 0.81 1.47 1.73 GRV 0.79 1.24 1.53 GRV 0.09 1.11 1.29 GRV 0.00 0.76 1.05 GRV 1.69 1.17 NA 1.50 0.00 3.00 3.00 3.00 3.00 0.00FONCAIXA 70 G.MUND. FIM 0.95 1.47 1.76 GRV 0.82 1.24 1.56 GRV 0.11 1.16 1.34 GRV –0.01 0.82 1.10 GRV 1.87 1.20 NA 1.50 0.00 3.00 3.00 3.00 3.00 0.00FONCAIXA 71 GARANTIZADO MIXTO FIM 0.67 0.62 0.91 GRV 0.63 0.93 1.52 GRV 0.11 1.06 1.28 GRV 0.03 1.22 1.04 GRV 1.45 0.99 NA 1.40 0.00 3.00 3.00 3.00 3.00 0.00FONCAIXA 76 GARANTIZADO MIXTO FIM 0.44 0.79 1.10 GRV 0.42 0.98 1.82 GRV –0.02 1.55 1.59 GRV –0.14 1.10 1.35 GRV 0.71 1.14 NA 1.90 0.00 3.00 3.00 3.00 3.00 0.00FONCAIXA 78 G.EURO FIM 0.99 1.57 2.13 GRV 1.26 1.48 1.95 GRV 0.10 1.45 1.70 GRV –0.03 1.05 1.50 GRV 2.32 1.40 NA 1.50 0.00 3.00 3.00 3.00 3.00 0.00FONCAIXA 79 G.JAPON FIM 0.81 1.71 2.09 GRV 1.20 1.45 1.92 GRV 0.13 1.42 1.67 GRV –0.04 1.03 1.48 GRV 2.12 1.42 NA 1.50 0.00 3.00 3.00 3.00 3.00 0.00FONCAIXA 80 G.MUND.FIM 1.25 1.88 2.22 GRV 1.22 1.63 2.04 GRV 0.04 1.58 1.81 GRV –0.04 1.16 1.59 GRV 2.48 1.59 NA 1.50 0.00 3.00 3.00 3.00 3.00 0.00FONCAIXA 85 GARANTIZADO
IBEX–35 FIM 0.43 4.71 2.36 GRV 2.80 3.51 2.21 GRV –0.87 3.11 1.97 GRV 2.99 2.43 1.76 GRV 5.42 3.55 NA 1.50 0.00 3.00 3.00 3.00 3.00 0.00FONCAIXA 92 G. IND. MUNDIALES FIM 0.69 0.60 1.06 GRV 0.55 0.46 0.84 GRV 0.13 0.28 0.61 GRV 0.12 0.15 0.37 GRV 1.50 0.41 NA 1.50 0.00 3.00 3.00 3.00 3.00 0.00FONCAIXA FUTURO 14 FIM 1.07 1.66 2.04 GRV 1.03 1.55 1.83 GRV 0.09 1.49 1.62 GRV –0.02 1.15 1.38 GRV 2.18 1.48 5.10 1.40 0.00 3.00 3.00 0.00 0.00 0.00FONCAIXA FUTURO 22 FIM 0.97 1.55 2.00 GRV 1.20 1.47 1.79 GRV 0.37 1.48 1.57 GRV 0.19 1.06 1.32 GRV 2.75 1.41 11.58 0.70 0.00 3.00 3.00 0.00 0.00 0.00FONCAIXA FUTURO 23 FIM 0.94 1.57 2.00 GRV 1.08 1.48 1.76 GRV 0.20 1.40 1.54 GRV 0.11 1.00 1.29 GRV 2.36 1.38 10.73 1.00 0.00 3.00 3.00 0.00 0.00 0.00FONCAIXA FUTURO 24 FIM 1.01 1.31 1.64 GRV 0.92 1.11 1.43 GRV 0.27 0.95 1.21 GRV 0.16 0.70 0.98 GRV 2.37 1.04 –15.27 1.00 0.00 3.00 3.00 0.00 0.00 0.00FONCAIXA FUTURO 40 FIM 2.21 7.82 0.89 GRV 4.88 6.43 0.59 GRV 1.47 6.90 0.35 GRV 3.61 4.85 0.12 GRV 12.70 6.59 50.20 1.50 0.00 3.00 3.00 0.00 0.00 0.00FONCAIXA FUTURO 49 FIM 0.47 1.06 1.47 GRV 0.77 0.88 1.26 GRV 0.24 1.27 1.02 GRV 0.17 0.96 0.80 GRV 1.66 1.05 0.78 1.50 0.00 3.00 3.00 0.00 0.00 0.00FONCAIXA FUTURO 50 FIM 1.03 1.29 1.65 GRV 0.92 1.13 1.44 GRV 0.25 0.96 1.20 GRV 0.16 0.74 0.98 GRV 2.36 1.05 –1.41 1.00 0.00 3.00 3.00 0.00 0.00 0.00FONCAIXA G.MIX.LARGO
EUROVA.106 FIM NA 0.19 0.00 GRV 2.42 4.16 4.29 GRV –0.31 3.93 4.03 GRV 1.78 2.50 3.81 GRV NA 3.55 NA 1.20 0.00 4.00 4.00 4.00 4.00 0.00FONCAIXA GARAN.CUPON
MEMORIA 51 FIM 0.32 6.43 0.28 GRV 0.31 1.31 0.05 GRV –0.38 1.84 3.44 GRV 1.49 3.04 3.36 GRV 1.73 1.79 0.94 1.50 0.00 4.00 4.00 4.00 4.00 0.00FONCAIXA GTZO CUPON
MEMORIA 116 FIM NA NA NA NA 3.11 0.01 GRV 0.37 3.58 3.33 GRV 4.86 3.60 3.12 GRV NA 3.30 NA 1.45 0.00 4.00 4.00 4.00 4.00 0.00FONCAIXA GTZO CUPON
MEMORIA 83 FIM 0.44 4.69 0.00 GRV 0.14 5.42 0.00 RFLP –0.32 1.02 3.51 GRV 1.44 2.92 3.36 GRV 1.71 1.56 NA 1.45 0.00 4.00 4.00 4.00 4.00 0.00FONCAIXA GTZO EUROVALORES
100 FIM NA 4.18 2.55 GRV 4.22 2.76 2.39 GRV 0.15 3.24 2.17 GRV 3.65 2.60 1.97 GRV NA 3.23 NA 1.45 0.00 4.00 4.00 4.00 4.00 0.00FONCAIXA GTZO EUROVALORES 44 FIM –1.31 3.85 3.16 GRV 3.71 2.78 2.90 GRV 0.00 2.90 2.66 GRV 2.83 2.31 2.52 GRV 5.25 3.04 –5.59 1.55 0.00 4.00 4.00 4.00 4.00 0.00FONCAIXA GTZO MIXTO
EUROVAL. 41 FIM 0.37 1.65 0.04 GRV 1.72 2.78 3.05 GRV –0.08 2.54 2.80 GRV 0.74 1.80 2.57 GRV 2.76 2.10 2.42 1.30 0.00 4.00 4.00 4.00 4.00 0.00FONCAIXA GTZO MIXTO
EUROVAL. 45 FIM 0.21 1.91 3.15 GRV 2.41 2.38 2.90 GRV –0.01 2.36 2.65 GRV 0.93 1.67 2.44 GRV 3.57 2.11 10.91 1.20 0.00 4.00 4.00 4.00 4.00 0.00FONCAIXA GTZO MIXTO
EUROVAL. 82 FIM 0.44 4.86 0.00 GRV 0.06 0.13 0.00 RFCP –1.36 3.24 3.44 GRV –0.18 2.67 3.26 GRV –1.05 2.12 NA 1.25 0.00 4.00 4.00 4.00 4.00 0.00
(Continues over)
(Continued)

296
Annual rep
ort o
n th
e securities m
arket. 2003
A.4.8.Investment in securities. FIM. Yields, volatility and duration
1Q 2Q 3Q 4Q 2003
Yield Vol Dur Yield Vol Dur Yield Vol Dur Yield Vol Dur Yield Vol(1) (2) Type (1) (2) Type (1) (2) Type (1) (2) Type (1)% % % % %
% fees
Management Front end Back endCustody
of assets of yield Max. Min. Max. Min.
Yieldsince1996
Guaranteed equity FIM (GRV)
FONCAIXA GTZO MIXTOEUROVAL.101 FIM NA 4.41 2.57 GRV 2.30 1.81 2.47 GRV 0.06 2.06 2.18 GRV 1.32 1.37 1.98 GRV NA 2.59 NA 1.20 0.00 0.00 0.00 4.00 4.00 0.00
FONCAIXA GTZO MIXTOEUROVAL.105 FIM NA 5.87 0.00 GRV 1.62 2.80 2.91 GRV –0.12 2.57 2.64 GRV 0.81 1.73 2.43 GRV NA 2.37 NA 1.10 0.00 4.00 4.00 4.00 4.00 0.00
FONCAIXA GTZO MIXTOEUROVAL.115 FIM NA NA NA NA 2.50 0.01 GRV 1.09 2.37 2.92 GRV 0.65 1.95 2.66 GRV NA 1.98 NA 1.25 0.00 4.00 4.00 4.00 4.00 0.00
FONCAIXA GTZO MIXTOGLOBAL 112 FIM NA NA NA NA NA NA NA 9.85 0.00 RVN 3.66 6.60 0.02 GRV NA 8.30 NA 1.45 0.00 0.00 0.00 0.00 0.00 0.00
FONDAVILA GARANT. 3 FIM 0.42 0.17 1.20 GRV 0.31 0.13 0.98 GRV 0.14 1.61 0.00 GRV 0.14 1.13 0.23 GRV 1.01 0.11 5.84 1.40 0.00 5.00 5.00 5.00 5.00 0.20FONDESPAÑA INT. II FIM 0.61 0.58 0.01 RFCP –0.13 0.75 0.22 GRV 0.66 3.62 0.22 GRV 0.71 2.36 0.22 GRV 1.86 2.22 7.75 0.95 0.00 5.00 5.00 5.00 5.00 0.15FONDESPAÑA INT. III FIM 0.51 0.78 1.21 GRV 0.59 0.72 0.94 GRV –0.11 0.43 0.75 GRV 0.20 0.24 0.50 GRV 1.19 0.58 NA 1.20 0.00 5.00 5.00 5.00 5.00 0.15FONDESPAÑA INT.GAR. FIM 0.10 6.10 0.20 GRV 6.41 6.83 0.21 GRV 2.25 7.47 0.20 GRV 4.65 7.49 0.19 GRV 13.98 7.02 11.73 0.90 0.00 5.00 5.00 5.00 2.00 0.15FONDESPAÑA INT.IV FIM 0.70 3.04 0.20 GRV 4.04 3.64 0.21 GRV 1.01 4.16 0.21 GRV 2.47 3.96 0.20 GRV 8.42 3.74 NA 1.00 0.00 5.00 5.00 5.00 2.00 0.15FONDESPAÑA INTERNACIONAL 7 FIM –1.77 4.25 0.08 GRV 3.39 3.69 0.08 GRV 1.10 6.19 0.08 GRV 2.78 6.11 0.08 GRV 5.53 5.21 17.59 1.10 0.00 5.00 5.00 3.00 3.00 0.15FONDESPAÑA INTERNACIONAL V FIM 0.71 1.14 1.24 GRV 0.61 0.76 0.93 GRV 0.13 0.44 0.78 GRV 0.15 0.29 0.50 GRV 1.60 0.73 NA 1.10 0.00 5.00 5.00 5.00 5.00 0.15FONDESPAÑA INTERNACIONAL VI FIM 1.33 1.88 0.09 GRV 0.90 2.09 0.09 GRV 0.00 1.83 0.10 GRV –0.16 1.68 0.10 GRV 2.07 1.88 5.47 1.50 0.00 5.00 5.00 2.50 1.00 0.15FONDESPAÑA MULTIBOLSA
GTZO 1 FIM 0.02 2.32 0.16 GRV 2.92 2.95 0.16 GRV 0.62 3.80 0.16 GRV 1.11 3.25 0.15 GRV 4.74 3.14 NA 1.45 0.00 5.00 5.00 5.00 2.00 0.15FONDESPAÑA RENTA VARIABLE FIM 0.94 2.22 0.05 GRV 1.77 2.30 0.06 GRV –0.02 2.32 0.06 GRV 0.04 1.69 0.05 GRV 2.74 2.15 7.30 1.10 0.00 5.00 5.00 2.00 0.50 0.15FONDMAPFRE B. GARAN.FIM 0.86 1.22 1.91 GRV 1.08 1.19 1.69 GRV –0.10 1.14 1.47 GRV –0.10 0.77 1.02 GRV 1.76 1.10 8.30 1.10 0.00 5.00 5.00 5.00 5.00 0.20FONDMAPFRE BOL. GIV FIM 0.68 0.56 0.99 GRV 0.46 0.43 0.75 GRV 0.12 0.25 0.52 GRV 0.08 8.13 0.27 GRV 1.35 0.38 NA 1.45 0.00 5.00 5.00 5.00 5.00 0.20FONDMAPFRE BOLSA
GARANTIZADO II FIM –1.92 5.28 3.48 GRV 3.74 5.00 3.32 GRV –0.16 4.33 3.09 GRV 1.51 2.78 2.87 GRV 3.12 4.47 4.34 1.25 0.00 5.00 5.00 5.00 5.00 0.20FONDMAPFRE BOLSA GIX FIM –0.57 2.36 0.95 RFI –0.63 1.54 0.00 GRV 0.10 4.38 3.65 GRV 2.55 4.93 3.44 GRV 1.43 3.61 22.44 1.25 0.00 5.00 5.00 4.00 4.00 0.20FONDMAPFRE BOLSA GV FIM 0.61 0.42 0.83 GRV 0.41 0.35 0.61 GRV 0.10 0.13 0.39 GRV 0.07 9.48 0.18 GRV 1.20 0.29 NA 1.40 0.00 5.00 5.00 5.00 5.00 0.19FONDMAPFRE BOLSA GVI FIM 0.62 0.53 0.72 GRV 0.33 0.23 0.47 GRV 0.17 9.43 0.25 GRV 0.10 6.89 0.00 GRV 1.23 0.29 NA 1.45 0.00 0.00 0.00 0.00 0.00 0.19FONDMAPFRE BOLSA GVII FIM 0.87 0.72 1.21 GRV 0.53 0.61 0.99 GRV 0.11 0.50 0.77 GRV 0.14 0.27 0.51 GRV 1.65 0.55 NA 1.45 0.00 5.00 5.00 5.00 5.00 0.17FONDMAPFRE BOLSA GVIII FIM 0.98 1.83 2.69 GRV 1.36 1.95 2.50 GRV 0.17 1.94 2.28 GRV –0.20 1.39 1.84 GRV 2.32 1.80 NA 1.35 0.00 5.00 5.00 5.00 5.00 0.20FONDMAPFRE BOLSA GX FIM –0.13 1.06 0.86 GRV 0.71 1.36 0.16 GRV 0.53 0.55 0.00 GRV 2.44 4.50 3.75 GRV 3.58 2.44 NA 1.30 0.00 5.00 5.00 4.00 4.00 0.20FONDMAPFRE INT.GIII FIM 2.03 5.66 3.80 GRV 7.96 7.05 3.62 GRV 0.57 5.39 3.41 GRV 5.07 4.29 3.19 GRV 16.38 5.71 NA 1.40 0.00 5.00 5.00 5.00 5.00 0.20FONDMAPFRE INTERN.
GARANTIA II FIM 0.89 2.02 3.34 GRV 1.83 2.58 3.15 GRV –0.16 2.63 2.92 GRV –0.25 1.90 2.69 GRV 2.32 2.31 11.26 1.25 0.00 5.00 5.00 5.00 5.00 0.20FONDMAPFRE INTERNACIONAL
GTZO FIM 0.89 1.98 2.60 GRV 1.47 1.92 2.39 GRV 0.09 1.89 2.17 GRV –0.12 1.44 1.79 GRV 2.34 1.82 11.81 1.20 0.00 5.00 5.00 5.00 5.00 0.20FONDO CONFIANZA GARANTIZADO FIM NA 1.84 0.01 GRV 2.55 4.05 2.53 GRV –0.12 2.62 2.32 GRV 1.97 2.81 2.11 GRV NA 2.87 NA 0.90 0.00 5.00 5.00 5.00 5.00 0.10FONDO GTD 2 FIM –0.05 2.38 2.45 GRV 2.86 2.46 2.16 GRV 0.54 2.19 1.95 GRV 2.52 1.90 1.69 GRV 5.97 2.25 25.18 1.42 0.00 5.00 5.00 5.00 5.00 0.10FONDO SUPER 100 2 FIM NA NA NA NA NA NA NA 1.13 0.00 GRV 0.92 4.86 4.37 GRV NA 3.67 NA 1.50 0.00 0.00 0.00 0.00 0.00 0.10FONDO SUPER 100 FIM NA NA NA NA 3.25 0.00 GRV 1.19 3.91 4.41 GRV 0.37 4.25 4.09 GRV NA 3.65 NA 1.42 0.00 0.00 0.00 0.00 0.00 0.10FONDO SUPER 120 FIM NA NA NA NA NA NA NA NA NA NA 1.34 4.50 GRV NA 1.34 NA 1.54 0.00 0.00 0.00 0.00 0.00 0.10FONDO SUPERSATISFACCION FIM 1.11 1.49 2.02 GRV 0.37 1.41 1.80 GRV –0.12 1.66 1.65 GRV 2.62 1.85 1.41 GRV 4.02 1.63 NA 1.41 0.00 0.00 0.00 3.00 0.00 0.10FONDO SUPERSELECCION 2 FIM –5.66 16.66 0.00 GRV 1.02 4.84 4.12 GRV 0.95 4.48 3.88 GRV 1.48 3.66 3.56 GRV –2.37 9.12 NA 1.49 0.00 0.00 0.00 0.00 0.00 0.10FONDO SUPERSELECCION FIM NA 0.23 0.00 GRV 4.63 4.41 3.26 GRV 0.91 3.92 3.16 GRV 2.12 2.79 2.77 GRV NA 3.35 NA 1.15 0.00 0.00 0.00 0.00 0.00 0.10FONDO VALENCIA GARANTIZADO
RV 2 FIM NA 5.54 2.67 GRV 5.76 7.11 2.47 GRV –1.01 6.04 2.27 GRV 1.46 3.64 2.04 GRV NA 5.75 NA 0.65 0.00 0.00 0.00 0.00 0.00 0.05FONDO VALENCIA GARANTIZADO
RV 3 FIM NA NA NA NA 2.84 3.13 GRV –1.12 5.01 2.91 GRV 2.88 4.18 2.66 GRV NA 4.17 NA 0.85 0.00 0.00 0.00 0.00 0.00 0.05FONDUERO CAPITAL GARANT. 2 FIM 0.09 1.17 0.00 FGL 0.02 1.56 0.00 FGL –2.34 4.87 3.68 GRV 2.29 2.40 3.43 GRV 0.00 2.75 NA 1.47 0.00 5.00 5.00 5.00 5.00 0.20FONDUERO CAPITAL GARANTIZADO
1 FIM NA NA NA NA 4.93 0.11 GRV 0.34 3.75 0.00 GRV 0.40 2.07 0.23 GRV NA 2.70 NA 1.40 0.00 5.00 5.00 5.00 5.00 0.20FONDUERO COMBINADO FIM 2.40 3.06 2.39 GRV 1.75 4.11 2.16 GRV –1.01 3.12 2.00 GRV 1.67 2.05 1.77 GRV 4.86 3.18 NA 1.20 0.00 5.00 5.00 5.00 5.00 0.10FONDUERO GARANTIZADO FIM 1.05 1.54 3.28 GRV 1.52 2.39 3.06 GRV –0.87 2.42 2.83 GRV 0.75 2.12 2.59 GRV 2.45 2.16 10.73 1.15 0.00 5.00 5.00 5.00 5.00 0.10FONDUERO INDICE FIM 0.39 1.63 0.00 GRV 1.14 3.38 0.07 GRV –0.60 3.99 0.31 GRV 0.48 2.29 0.07 GRV 1.41 2.86 6.85 1.15 0.00 5.00 5.00 5.00 5.00 0.10
(Continues over)
(Continued)

297
Annex 4
: Collective in
vestmen
t schem
es and ven
ture cap
ital com
pan
iesA.4.8.Investment in securities. FIM. Yields, volatility and duration
1Q 2Q 3Q 4Q 2003
Yield Vol Dur Yield Vol Dur Yield Vol Dur Yield Vol Dur Yield Vol(1) (2) Type (1) (2) Type (1) (2) Type (1) (2) Type (1)% % % % %
% fees
Management Front end Back endCustody
of assets of yield Max. Min. Max. Min.
Yieldsince1996
Guaranteed equity FIM (GRV)
FONPENEDES G.INT. MES BORSA II FIM NA NA NA NA NA NA NA 5.26 0.01 GRV –0.37 3.15 2.66 GRV NA 2.71 NA 1.30 0.00 5.00 5.00 5.00 5.00 0.05FONPENEDES G.INTERES M.
BORSA I FIM NA NA NA NA 0.69 0.02 GRV –0.97 2.68 2.67 GRV 1.43 2.12 2.44 GRV NA 2.28 NA 0.79 0.00 5.00 5.00 5.00 5.00 0.05GARANTIA PLUS 4 FIM 0.64 1.16 1.72 GRV 0.74 1.02 1.48 GRV –0.26 0.97 1.25 GRV 0.00 0.76 0.98 GRV 1.12 0.99 11.01 2.00 0.00 5.00 5.00 5.00 5.00 0.10GARANTIZADO TOP MARKETS FIM 0.20 0.16 0.06 GRV 0.03 0.50 0.06 GRV 0.55 1.84 3.62 GRV 0.67 5.34 3.36 GRV 1.46 2.85 2.23 1.50 0.00 0.00 0.00 0.00 0.00 0.10GAREXMED FIM 0.37 0.25 0.32 GRV 0.39 1.22 0.08 GRV 0.32 1.58 0.33 GRV 0.29 1.23 0.09 GRV 1.37 0.12 9.96 0.90 0.00 5.00 5.00 3.00 3.00 0.10HERRERO BS GAANTIA DOBLE 1 FIM NA NA NA NA 1.90 1.85 GRV –0.26 1.40 1.50 GRV 0.99 1.01 1.28 GRV NA 1.47 NA 1.20 0.00 5.00 5.00 5.00 5.00 0.10HERRERO FONDO 125 (SERIE 1) FIM –0.83 2.32 1.29 GRV 1.05 1.68 1.16 GRV 0.01 1.61 0.86 GRV 1.63 2.05 1.52 GRV 1.85 1.94 13.56 1.40 0.00 5.00 5.00 5.00 5.00 0.10IBERCAJA INDEX 3 FIM 0.42 0.32 0.55 GRV 0.17 0.17 0.31 GRV 0.19 1.27 0.07 GRV 0.39 0.69 3.85 GRV 1.17 0.39 5.15 1.40 0.00 5.00 0.00 5.00 0.00 0.20IBERCAJA INDEX 4 FIM 0.64 0.91 1.77 GRV 0.90 1.25 1.54 GRV 0.17 1.17 1.29 GRV 0.19 0.61 1.05 GRV 1.92 1.02 7.99 1.00 0.00 5.00 0.00 5.00 0.00 0.00IBERCAJA INDEX 6 FIM 0.40 2.89 2.31 GRV 3.12 2.87 2.07 GRV –0.15 3.12 1.84 GRV 2.44 1.84 1.69 GRV 5.91 2.74 NA 0.85 0.00 5.00 0.00 5.00 0.00 0.15IBERCAJA PATRIMONIO FIM 0.57 0.47 2.87 GRV 4.00 5.43 2.73 GRV –0.19 3.16 2.48 GRV 3.27 3.27 2.24 GRV 7.81 3.57 13.34 0.85 0.00 5.00 0.00 5.00 0.00 0.15IBERCAJA PT III FIM 0.66 1.62 1.29 GRV 0.54 1.84 1.06 GRV 0.05 0.54 0.81 GRV 0.08 0.30 0.56 GRV 1.33 1.26 4.50 1.30 0.00 5.00 0.00 5.00 0.00 0.20IBERCAJA RENTA MUNDIAL FIM NA NA NA NA 7.37 0.01 GRV 1.66 6.66 2.95 GRV 1.10 2.23 2.72 GRV NA 4.38 NA 0.85 0.00 5.00 0.00 5.00 0.00 0.15INGENIEROS EUROB.G. FIM 0.78 2.74 1.48 GRV 0.88 0.71 1.27 GRV 0.25 0.72 1.03 GRV 0.14 1.36 0.80 GRV 2.07 1.61 17.04 0.90 0.00 5.00 0.00 5.00 0.00 0.15INVERDUERO 2000 FIM 0.99 4.95 1.24 GRV 3.15 3.96 1.02 GRV –0.02 4.19 0.81 GRV 4.74 3.83 0.56 GRV 9.08 4.27 17.03 1.20 0.00 5.00 5.00 5.00 5.00 0.19KUTXAGARANTIZADO–4 FIM 0.69 0.13 0.25 RFCP 0.58 0.13 0.05 RFCP 0.37 0.18 0.01 GRV 2.16 6.50 2.61 GRV 3.86 3.27 NA 1.35 0.00 5.00 0.00 5.00 0.00 0.15KUTXAGARANTIZADO–5 FIM 0.28 0.31 0.20 GRV 0.24 2.56 0.08 GRV 0.02 0.40 0.01 GRV –0.25 3.30 2.73 GRV 0.30 1.67 NA 1.30 0.00 5.00 0.00 5.00 0.00 0.15KUTXAINDEX FIM 0.54 0.89 1.24 GRV 0.72 0.75 1.02 GRV 0.21 0.43 0.78 GRV 0.09 0.36 0.55 GRV 1.57 0.65 5.00 1.30 0.00 5.00 0.00 5.00 0.00 0.20KUTXAINDEX2 FIM 0.53 0.89 1.26 GRV 0.74 0.76 0.94 GRV 0.22 0.44 0.79 GRV 0.08 0.38 0.56 GRV 1.58 0.65 7.93 1.30 0.00 5.00 0.00 5.00 0.00 0.20KUTXAINDEX3 FIM 1.06 1.82 2.27 GRV 1.06 1.64 2.06 GRV 0.06 1.56 1.81 GRV –0.14 1.38 1.58 GRV 2.05 1.61 3.83 1.30 0.00 5.00 0.00 5.00 0.00 0.17KUTXAINDEX5 FIM 0.61 0.53 0.01 GRV –0.89 2.42 3.66 GRV 0.09 3.28 3.41 GRV –0.09 3.42 3.31 GRV –0.29 2.68 0.75 1.15 0.00 5.00 0.00 5.00 0.00 0.19KUTXAINDEX7 FIM 0.67 0.76 1.14 GRV 0.55 0.60 0.95 GRV 0.01 0.67 0.69 GRV 0.03 0.15 0.46 GRV 1.26 0.60 NA 1.35 0.00 5.00 0.00 5.00 0.00 0.17KUTXAINDEX8 FIM 0.05 2.74 2.87 GRV 3.45 2.82 2.65 GRV 0.82 3.36 2.42 GRV 2.60 3.03 2.18 GRV 7.07 3.01 NA 1.10 0.00 5.00 0.00 5.00 0.00 0.10LUSO GARANTIZADO 2004 FIM 0.57 0.76 0.80 GRV 0.55 1.14 0.56 GRV 0.33 0.33 0.32 GRV 0.26 7.50 0.08 GRV 1.73 0.70 3.41 0.75 0.00 3.00 3.00 5.00 5.00 0.05MADRID ACCIONES GLOBAL 100 G FIM 1.03 1.49 2.01 GRV 0.93 1.37 1.80 GRV 0.04 1.30 0.00 GRV –0.09 0.94 1.33 GRV 1.91 1.29 8.50 1.50 0.00 5.00 5.00 3.00 3.00 0.08MADRID BOLSA 100 FIM 0.57 0.45 0.83 GRV 0.43 0.32 0.59 GRV 0.16 0.18 0.00 GRV 0.19 7.13 0.12 GRV 1.36 0.29 7.97 1.30 0.00 5.00 5.00 3.00 3.00 0.10MADRID BOLSA 50 FIM 0.58 0.45 0.83 GRV 0.43 0.32 0.59 GRV 0.16 0.18 0.00 GRV 0.20 7.59 0.12 GRV 1.37 0.29 6.00 1.30 0.00 5.00 5.00 3.00 3.00 0.10MADRID BOLSA ACTIVA FIM 1.00 1.48 1.99 GRV 0.91 1.36 1.77 GRV 0.03 1.28 0.00 GRV –0.08 0.92 1.32 GRV 1.87 1.28 6.32 1.50 0.00 5.00 5.00 3.00 3.00 0.08MADRID BOLSA EXTRA FIM 0.95 1.51 2.11 GRV 0.74 1.43 1.87 GRV 0.04 1.41 0.00 GRV –0.11 1.01 1.40 GRV 1.63 1.36 3.90 1.50 0.00 5.00 5.00 3.00 3.00 0.08MADRID CESTA EURO–AMERICANA FIM –0.19 2.38 2.25 GRV 1.80 2.22 2.02 GRV 0.01 2.07 0.00 GRV 1.37 2.02 1.57 GRV 3.01 2.18 17.64 1.50 0.00 5.00 5.00 3.00 3.00 0.10MADRID CESTA EUROPEA FIM 0.96 1.52 2.10 GRV 0.96 1.47 1.87 GRV 0.04 1.41 0.00 GRV –0.10 1.02 1.41 GRV 1.87 1.37 9.17 1.50 0.00 5.00 5.00 3.00 3.00 0.08MADRID CESTA MUNDIAL FIM 0.46 0.58 0.99 GRV 0.31 0.37 0.76 GRV –0.06 0.21 0.00 GRV –0.03 6.57 0.28 GRV 0.67 0.36 NA 2.00 0.00 5.00 5.00 3.00 3.00 0.10MADRID EURO JAPON FIM 0.51 0.55 0.94 GRV 0.41 0.35 0.70 GRV 0.03 0.16 0.00 GRV 0.13 0.02 0.23 GRV 1.08 0.34 NA 1.50 0.00 5.00 5.00 3.00 3.00 0.10MADRID EUROACCION G FIM 0.65 2.18 3.12 GRV 1.49 2.28 2.88 GRV –0.19 2.30 0.00 GRV –0.01 1.83 2.50 GRV 1.95 2.16 16.84 1.40 0.00 5.00 5.00 3.00 3.00 0.08MADRID EUROAMERICA FIM 1.00 1.48 1.98 GRV 0.90 1.36 1.76 GRV 0.04 1.28 0.00 GRV –0.08 0.92 1.32 GRV 1.87 1.28 13.74 1.50 0.00 5.00 5.00 3.00 3.00 0.08MADRID GARANTIA IBEX FIM 0.96 1.40 1.98 GRV 0.89 1.33 1.77 GRV 0.04 1.28 0.00 GRV –0.09 0.92 1.31 GRV 1.81 1.25 –1.21 1.50 0.00 5.00 5.00 3.00 3.00 0.10MADRID GARANTIA MIXTA FIM 0.61 0.74 1.09 GRV 0.61 1.03 1.77 GRV 0.04 1.34 0.00 GRV –0.11 0.98 1.35 GRV 1.16 1.05 NA 1.50 0.00 5.00 5.00 3.00 3.00 0.10MADRID NUEVA ECONOMIA FIM 0.63 0.73 1.18 GRV 0.47 0.56 0.94 GRV 0.12 0.40 0.00 GRV 0.05 0.20 0.47 GRV 1.27 0.51 NA 1.50 0.00 5.00 5.00 3.00 3.00 0.10MADRID RENTABILIDAD DUAL I FIM 0.46 2.36 3.11 GRV 1.89 2.27 2.88 GRV –0.21 2.19 0.00 GRV 0.37 1.73 2.46 GRV 2.52 2.15 7.93 1.50 0.00 5.00 5.00 3.00 3.00 0.08MADRID RENTABILIDAD DUAL II FIM 1.58 2.90 3.12 GRV 2.15 2.30 2.89 GRV –0.08 2.22 0.00 GRV 0.69 1.77 2.49 GRV 4.40 2.33 6.14 1.50 0.00 5.00 5.00 3.00 3.00 0.08MADRID VALORES PREMIUM 100 FIM NA NA NA NA NA NA NA 3.26 0.00 GRV 0.59 2.56 2.92 GRV NA 2.46 NA 1.50 0.00 5.00 5.00 3.00 3.00 0.10MADRID VALORES PREMIUM 95 FIM NA NA NA NA NA NA NA 3.16 0.00 GRV 0.03 4.19 2.91 GRV NA 4.02 NA 1.50 0.00 5.00 5.00 3.00 3.00 0.10MADRID VALORES PREMIUM III FIM 0.56 0.35 0.65 GRF 0.38 0.13 0.35 GRF 0.29 1.36 0.00 GRF 0.04 1.35 3.35 GRV 1.27 0.70 16.45 1.50 0.00 5.00 5.00 3.00 3.00 0.10MARCH BOLSAS INTERN. GTZDO FIM 0.70 1.31 1.27 GRV 0.64 0.66 1.05 GRV 0.12 0.45 0.81 GRV 0.12 0.29 0.56 GRV 1.59 0.78 NA 1.10 0.00 0.00 0.00 0.00 0.00 0.20MARCH EUROBOLSA GARANTIZADO FIM –0.70 3.72 2.15 GRV 1.63 3.31 1.95 GRV 0.01 3.37 1.73 GRV 1.81 3.50 1.48 GRV 2.76 3.49 7.85 1.30 0.00 3.00 3.00 3.00 3.00 0.20MARCH EUROTOP GARANTIZADO FIM –1.79 6.88 2.65 GRV 3.47 6.30 2.45 GRV –0.43 4.40 2.20 GRV 1.91 3.42 1.93 GRV 3.11 5.44 13.15 1.10 0.00 3.00 3.00 3.00 3.00 0.20MARCH IBEX GARANT. FIM 0.32 9.02 0.30 GRV 0.34 8.61 0.08 GRV 0.16 8.63 0.01 GRV –0.18 2.48 2.24 GRV 0.63 1.25 9.46 1.30 0.00 3.00 3.00 3.00 3.00 0.20MARCH MULTIFONDO
GARANTIZADO FIM NA 8.61 0.01 GRV 2.69 6.03 2.42 GRV 1.69 3.81 1.98 GRV 3.48 2.33 2.05 GRV NA 4.20 NA 1.30 0.00 3.00 3.00 3.00 3.00 0.20MARCH USA GARANTIZADO FIM 0.27 1.70 1.53 GRV 0.74 1.00 1.27 GRV –0.02 1.07 1.04 GRV 0.45 0.86 0.78 GRV 1.45 1.20 NA 1.30 0.00 3.00 3.00 3.00 3.00 0.20MORGAN STANLEY EURO FONDO 1 FIM –0.65 2.74 3.32 GRV 3.99 2.75 2.99 GRV 1.12 3.38 2.90 GRV 2.75 2.28 2.68 GRV 7.34 2.84 15.93 1.25 0.00 2.00 2.00 2.00 2.00 0.05
(Continues over)
(Continued)

298
Annual rep
ort o
n th
e securities m
arket. 2003
A.4.8.Investment in securities. FIM. Yields, volatility and duration
1Q 2Q 3Q 4Q 2003
Yield Vol Dur Yield Vol Dur Yield Vol Dur Yield Vol Dur Yield Vol(1) (2) Type (1) (2) Type (1) (2) Type (1) (2) Type (1)% % % % %
% fees
Management Front end Back endCustody
of assets of yield Max. Min. Max. Min.
Yieldsince1996
Guaranteed equity FIM (GRV)
MORGAN STANLEY GRANSELECCION FIM –11.15 14.03 4.36 GRV 8.88 7.97 4.20 GRV 8.53 13.62 3.99 GRV 11.49 11.89 3.76 GRV 17.06 12.27 NA 1.35 0.00 3.00 3.00 2.00 2.00 0.05
MORGAN STANLEY USAGARANTIZADO FIM 0.09 1.47 1.69 GRV 1.25 1.55 1.48 GRV 0.28 1.78 1.25 GRV 0.86 1.50 1.02 GRV 2.51 1.58 4.04 1.25 0.00 2.00 2.00 2.00 2.00 0.05
MS TRIPLE OPORTUNIDAD FIM 0.39 0.01 0.07 GRV –0.09 1.41 0.41 GRV –0.85 4.54 0.00 GRV 3.63 5.15 0.30 GRV 3.05 3.53 –21.84 1.25 0.00 2.00 2.00 2.00 2.00 0.02MS TRIPLE OPORTUNIDAD II FIM 0.38 1.35 0.07 GRV 0.22 2.79 0.00 GRV –0.10 0.29 0.00 GRV –1.17 5.04 0.79 GRV –0.67 2.54 –1.16 1.25 0.00 2.00 2.00 2.00 2.00 0.02MULTIBOLSA DUERO FIM 1.06 1.36 2.07 GRV 1.26 1.48 1.85 GRV –0.06 1.40 1.67 GRV –0.43 1.03 1.44 GRV 1.83 1.34 2.88 1.15 0.00 5.00 5.00 5.00 5.00 0.10PASTOR DOBLE GARANTIA FIM 0.59 0.18 0.01 GRF 4.03 11.56 0.00 GRV 0.02 2.27 2.03 GRV 2.47 2.88 1.88 GRV 7.25 6.07 NA 1.00 0.00 5.00 5.00 5.00 5.00 0.10PASTOR EUROBOLSA
GARANTIZADO 1 FIM 0.76 1.50 1.86 GRV 0.86 0.92 1.59 GRV 0.06 0.81 1.34 GRV 0.12 0.54 1.07 GRV 1.82 1.00 8.96 1.00 0.00 5.00 5.00 5.00 5.00 0.15PASTOR FIJO 2 FIM 0.94 2.50 2.30 GRV 2.36 2.36 2.13 GRV 0.51 2.76 1.92 GRV 1.49 2.09 1.23 GRV 5.39 2.44 11.48 0.83 0.00 5.00 5.00 5.00 5.00 0.10PBP ETERNUM FIM –0.10 3.25 2.58 GRV 1.95 2.85 61.54 GRV –0.13 3.86 2.27 GRV 3.67 4.32 2.05 GRV 5.44 3.63 13.06 0.92 0.00 5.00 0.00 0.00 0.00 0.15RENTA 4 BOLSA PLUS FIM 0.19 4.20 1.88 GRV 1.62 1.46 1.74 GRV –0.14 1.88 1.61 GRV 0.15 1.17 1.37 GRV 1.82 2.48 –37.27 1.80 0.00 2.50 0.00 2.50 0.00 0.10RENTADUERO FIM 0.73 0.84 1.25 GRV 0.60 0.68 1.02 GRV 0.12 0.46 0.79 GRV 0.51 0.52 0.54 GRV 1.97 0.64 7.80 1.15 0.00 5.00 5.00 5.00 5.00 0.10RURAL AHORRO II FIM 0.35 0.16 0.13 GRV 0.30 1.60 0.00 GRV –0.38 3.16 2.15 GRV 2.02 2.61 1.94 GRV 2.29 2.07 9.63 0.60 0.00 3.00 0.00 3.00 0.00 0.05RURAL CESTA DE INDICES GTZO FIM 0.36 1.28 1.20 GRV 1.19 1.09 1.00 GRV 0.00 1.09 1.62 GRV 1.50 1.61 1.33 GRV 3.07 1.29 NA 0.70 0.00 3.00 0.00 3.00 0.00 0.00RURAL EUROINDICE FIM 1.14 0.67 1.08 GRV 0.93 0.54 0.89 GRV 0.39 0.42 0.71 GRV 0.34 0.26 0.50 GRV 2.84 0.50 14.75 0.60 0.00 3.00 0.00 3.00 0.00 0.00RURAL GARANTIZADO RV III FIM 0.53 0.43 0.00 GRF 1.21 1.63 1.64 GRV –0.02 2.04 1.47 GRV 1.99 1.48 1.32 GRV 3.75 1.53 14.66 0.60 0.00 3.00 0.00 3.00 0.00 0.05RURAL GARANTIZADO
TECNOLOGIA FIM 0.60 0.61 0.91 GRV 0.83 0.58 0.70 GRV 0.18 0.49 0.49 GRV 0.28 0.65 0.02 GRV 1.90 0.59 NA 1.00 0.00 0.00 0.00 0.00 0.00 0.00RURAL VALOR FIM 0.58 0.91 0.41 GRV 0.06 1.52 0.20 GRV 0.45 1.10 0.07 GRV 0.23 7.31 0.01 GRV 1.32 0.88 5.97 1.00 0.00 0.00 0.00 0.00 0.00 0.00RURAL VALOR III FIM 0.53 1.74 1.19 GRV 1.53 1.59 0.99 GRV 0.09 1.39 0.79 GRV 1.38 1.01 1.02 GRV 3.58 1.46 14.84 0.80 0.00 0.00 0.00 3.00 0.00 0.00RURAL VALOR IV FIM 0.72 0.51 0.90 GRV 0.59 0.44 0.69 GRV 0.37 0.80 1.15 GRV 0.17 0.57 0.94 GRV 1.87 0.60 2.98 0.75 0.00 3.00 0.00 3.00 0.00 0.00SABADELL BS GARANTIA DOBLE 2 FIM 0.55 0.11 0.29 GRV 0.48 3.12 0.09 GRV 0.37 2.58 0.01 GRV 1.19 1.79 1.31 GRV 2.61 0.90 NA 0.92 0.00 5.00 5.00 5.00 5.00 0.10SABADELL BS GARANTIA DOBLE 3 FIM NA NA NA NA NA NA NA NA NA NA 1.97 0.01 GRV NA 1.97 NA 1.03 0.00 0.00 0.00 0.00 0.00 0.10SABADELL BS GARANTIA EXTRA 1 FIM 0.57 0.29 0.52 GRV 0.32 0.10 0.30 GRV 0.34 1.28 0.07 GRV 0.24 0.02 0.01 GRV 1.47 0.15 NA 1.30 0.00 5.00 5.00 5.00 5.00 0.10SABADELL BS GARANTIA
INTERN. 2 FIM 0.43 7.18 0.01 GRV 3.37 5.05 2.59 GRV –0.56 2.77 2.36 GRV 2.40 2.16 2.02 GRV 5.71 3.09 14.21 1.40 0.00 5.00 5.00 5.00 5.00 0.10SABADELL BS GARANTIA
SUPERIOR 1 FIM NA NA NA NA 2.89 2.78 GRV –0.12 3.39 2.39 GRV 2.65 2.64 2.20 GRV NA 3.02 NA 1.56 0.00 5.00 5.00 5.00 5.00 0.10SABADELL BS GARANTIA
SUPERIOR 2 FIM NA NA NA NA 1.70 0.01 GRV –1.54 5.25 2.55 GRV 1.97 2.40 2.35 GRV NA 3.95 NA 1.10 0.00 5.00 5.00 5.00 5.00 0.10SABADELL GARANTIA INTERN. 1 FIM –0.09 1.88 2.62 GRV 4.91 4.01 2.58 GRV 0.56 3.19 2.20 GRV 2.89 3.27 2.01 GRV 8.45 3.21 14.45 1.40 0.00 5.00 5.00 5.00 5.00 0.10SABADELL GARANTIA INTERN. 3 FIM –0.38 1.85 1.81 GRV 2.60 2.32 1.69 GRV 0.13 2.66 1.37 GRV 1.52 1.79 1.17 GRV 3.91 2.20 NA 1.35 0.00 5.00 5.00 5.00 5.00 0.04SABADELL GLOBAL FIM 2.06 2.88 3.35 GRV 1.99 3.05 3.48 GRV 0.10 3.00 2.92 GRV –0.14 2.41 2.72 GRV 4.05 2.85 –45.54 0.15 0.00 5.00 5.00 0.00 0.00 0.10SANTANDER BEST 2 FIM 0.53 0.42 0.77 GRV 0.38 0.33 0.51 GRV 0.14 4.84 0.28 GRV 0.14 0.06 0.04 GRV 1.20 0.27 7.99 1.31 0.00 5.00 5.00 5.00 5.00 0.10SANTANDER BEST FIM 2.43 2.81 0.55 GRV 3.10 7.08 0.30 GRV 1.53 4.36 0.07 GRV 2.41 3.28 0.01 GRV 9.80 4.68 NA 1.22 0.00 5.00 5.00 5.00 5.00 0.10SANTANDER EUROSTOXX
GARANTIZADO FIM 0.50 0.44 0.76 GRV 0.40 0.34 0.52 GRV 0.16 4.92 0.28 GRV 0.16 6.10 0.04 GRV 1.23 0.28 7.32 1.23 0.00 5.00 5.00 5.00 5.00 0.10SANTANDER GARANTIZADO
ACCION FIM 0.57 0.66 1.02 GRV 0.53 0.47 0.77 GRV 0.41 0.44 0.54 GRV 0.19 8.96 0.29 GRV 1.70 0.46 0.20 1.08 0.00 5.00 5.00 5.00 5.00 0.10SANTANDER GARANTIZADO MIXTO FIM 1.09 2.58 1.04 GRV 2.71 4.08 0.77 GRV 0.51 3.97 0.55 GRV 4.92 4.02 0.31 GRV 9.49 3.74 19.43 1.52 0.00 5.00 5.00 5.00 5.00 0.10SANTANDER SEGURIDAD 2000 FIM 0.64 0.67 1.04 GRV 0.59 0.47 0.78 GRV 0.22 0.21 0.55 GRV 0.22 9.09 0.31 GRV 1.69 0.42 NA 0.88 0.00 5.00 5.00 5.00 5.00 0.10SANTANDER SELECCION
GARANTIZADO FIM 0.67 0.37 0.76 GRV 0.46 0.51 0.52 GRV 0.20 6.44 0.28 GRV 0.14 0.18 0.04 GRV 1.48 0.33 NA 0.98 0.00 5.00 5.00 5.00 5.00 0.10SANTANDER SELECCION GTZO 2 FIM 0.63 0.61 1.04 GRV 0.52 0.47 0.78 GRV 0.15 0.22 0.54 GRV 0.08 0.14 0.31 GRV 1.38 0.41 15.01 1.20 0.00 5.00 5.00 5.00 5.00 0.10SBD EURO GARANTIA FIM –0.83 1.90 1.59 GRV 0.69 1.76 1.47 GRV –0.20 1.22 1.16 GRV 0.01 0.63 0.96 GRV –0.34 1.47 7.99 1.94 0.00 5.00 5.00 5.00 5.00 0.10SBD GARANTIA DOBLE 1 FIM –0.08 1.22 1.38 GRV 0.91 0.97 1.27 GRV 0.06 0.98 0.95 GRV 0.44 0.65 0.74 GRV 1.34 0.98 NA 1.00 0.00 5.00 5.00 5.00 5.00 0.08SBD IBEX 2 FIM 0.15 1.18 1.39 GRV 1.00 1.27 1.24 GRV 0.07 0.64 0.96 GRV 0.02 0.46 0.74 GRV 1.24 0.95 7.21 1.35 0.00 5.00 5.00 5.00 5.00 0.10SBD INTERNACIONAL 5 GARANTIA FIM 0.65 0.45 0.70 GRV 0.49 0.30 0.52 GRV 0.20 5.98 0.25 GRV 0.23 1.86 0.04 GRV 1.58 0.27 9.33 1.05 0.00 5.00 5.00 5.00 5.00 0.05SBD INTERNACIONAL 6 GARANTIA FIM 0.40 1.09 1.39 GRV 0.98 1.25 1.24 GRV 0.12 0.68 0.96 GRV 0.01 0.46 0.74 GRV 1.52 0.93 8.24 1.36 0.00 5.00 5.00 5.00 5.00 0.10SBD INTERNACIONAL 7 GARANTIA FIM 0.40 1.09 1.39 GRV 0.98 1.25 1.24 GRV 0.12 0.68 0.96 GRV 0.01 0.46 0.74 GRV 1.52 0.93 8.55 1.36 0.00 5.00 5.00 5.00 5.00 0.10
(Continues over)
(Continued)

299
Annex 4
: Collective in
vestmen
t schem
es and ven
ture cap
ital com
pan
iesA.4.8.Investment in securities. FIM. Yields, volatility and duration
1Q 2Q 3Q 4Q 2003
Yield Vol Dur Yield Vol Dur Yield Vol Dur Yield Vol Dur Yield Vol(1) (2) Type (1) (2) Type (1) (2) Type (1) (2) Type (1)% % % % %
% fees
Management Front end Back endCustody
of assets of yield Max. Min. Max. Min.
Yieldsince1996
Guaranteed equity FIM (GRV)
SBD INTERNACIONAL 8 GARANTIA FIM 0.72 1.32 1.59 GRV 0.62 0.93 1.47 GRV 0.03 0.94 1.16 GRV –0.06 0.65 0.96 GRV 1.31 0.99 NA 1.76 0.00 5.00 5.00 5.00 5.00 0.10SBD VALOR GARANTIZADO FIM 0.63 0.57 0.93 GRV 0.47 0.40 0.77 GRV 0.11 0.19 0.49 GRV 0.11 8.75 0.28 GRV 1.33 0.37 5.45 1.35 0.00 5.00 5.00 5.00 5.00 0.10SCH BOLSA ESPAÑOLA
ASEGURADO FIM 0.42 4.56 0.07 GRV 0.63 2.39 3.78 GRV –1.26 3.84 3.38 GRV 1.80 3.55 3.07 GRV 1.57 2.89 7.71 1.54 0.00 5.00 5.00 5.00 5.00 0.10SCH BOLSA EURO ASEGURADO FIM –0.08 3.25 2.96 GRV 2.81 3.19 2.61 GRV 0.01 2.85 2.48 GRV 1.77 2.58 2.24 GRV 4.55 2.99 –8.46 1.55 0.00 5.00 5.00 0.00 0.00 0.10SCH BOLSA GARANTIZADO FIM –0.31 2.87 2.67 GRV 2.58 3.17 2.40 GRV 0.51 3.12 2.14 GRV 2.72 3.09 1.86 GRV 5.57 3.08 10.14 1.70 0.00 5.00 5.00 5.00 5.00 0.10SCH EUROINDICE GARANTIZADO FIM 0.91 1.31 1.76 GRV 0.75 1.25 1.53 GRV 0.10 0.97 1.30 GRV 0.02 0.68 1.05 GRV 1.79 1.08 1.55 1.30 0.00 5.00 5.00 5.00 5.00 0.10SCH GLOBAL INDICES ASEGURADO FIM 0.35 0.17 0.00 GRV 0.28 1.05 0.00 GRV 0.34 1.92 3.88 GRV 1.58 4.23 3.40 GRV 2.58 2.33 4.05 1.60 0.00 5.00 5.00 5.00 5.00 0.10SCH RENTABILIDAD EUROPA FIM 0.86 1.57 1.94 GRV 0.85 1.27 1.68 GRV 0.11 1.21 1.49 GRV 0.00 0.90 1.24 GRV 1.83 1.26 0.55 1.33 0.00 5.00 5.00 5.00 5.00 0.10SCH RENTABILIDAD USA FIM 0.43 2.42 1.92 GRV 0.87 2.10 1.76 GRV 0.02 1.21 1.51 GRV –0.02 0.91 1.27 GRV 1.30 1.77 NA 1.50 0.00 5.00 5.00 0.00 0.00 0.10SCH SECTOR BANCOS
GARANTIZADO FIM 0.78 0.97 1.51 GRV 0.69 0.86 1.27 GRV 0.11 0.60 1.04 GRV –0.06 0.49 0.79 GRV 1.52 0.76 20.76 1.26 0.00 5.00 5.00 5.00 5.00 0.10SCH SEGURIDAD EUROPA FIM –0.22 3.04 2.08 GRV 0.80 2.15 1.90 GRV –0.13 1.64 1.62 GRV 0.09 1.47 1.39 GRV 0.53 2.16 NA 1.55 0.00 5.00 5.00 0.00 0.00 0.10SCH SELECCION GARANTIZADO 3 FIM 0.84 0.98 1.51 GRV 0.69 0.87 1.25 GRV 0.11 0.61 1.03 GRV 0.06 0.46 0.79 GRV 1.71 0.76 15.86 1.35 0.00 5.00 5.00 5.00 5.00 0.10SCH SELECCION GARANTIZADO 4 FIM 0.74 1.48 1.78 GRV 0.71 1.34 1.49 GRV 0.07 0.98 1.29 GRV –0.17 0.74 1.05 GRV 1.35 1.17 14.04 1.49 0.00 5.00 5.00 5.00 5.00 0.10SCH SELECCION GARANTIZADO 5 FIM –1.18 3.72 2.42 GRV 2.60 3.39 2.13 GRV 0.84 2.81 1.92 GRV 1.08 2.73 1.67 GRV 3.35 3.20 19.94 1.46 0.00 5.00 5.00 5.00 5.00 0.10UNIFOND BOLSA I FIM 0.66 0.77 0.22 GRV 0.71 0.20 0.06 GRV 0.26 1.52 0.00 GRV –0.46 6.94 0.89 GRV 1.16 3.50 10.41 0.90 0.00 5.00 5.00 1.00 1.00 0.05UNIFOND BOLSA II FIM 0.09 0.67 0.58 GRV 0.42 0.57 0.37 GRV 0.08 0.27 0.17 GRV 0.29 0.35 0.06 GRV 0.88 0.49 0.67 0.95 0.00 0.00 0.00 0.00 0.00 0.05UNIFOND BOLSA III FIM 0.59 0.70 1.18 GRV 0.61 0.71 0.97 GRV 0.10 0.50 0.77 GRV 0.12 0.26 0.55 GRV 1.43 0.57 1.54 1.65 0.00 5.00 5.00 3.00 3.00 0.05UNIFOND BOLSA VIII FIM –2.80 6.04 2.44 GRV 4.14 3.88 2.27 GRV 0.86 7.16 1.81 GRV 3.14 3.59 1.81 GRV 5.29 5.40 NA 0.63 0.00 5.00 5.00 3.00 3.00 0.05UNIFOND XVII FIM 0.62 0.36 0.49 GRF 0.46 0.14 0.27 GRF 0.41 2.34 0.08 GRF 0.42 0.27 0.01 GRV 1.91 0.24 NA 1.20 0.00 0.00 0.00 5.00 5.00 0.05URQUIJO GARANT. 3 FIM 0.66 3.25 3.57 GRV 3.21 3.67 3.40 GRV –0.19 3.52 3.20 GRV 1.71 4.45 3.01 GRV 5.46 3.76 15.13 0.90 0.00 5.00 5.00 5.00 5.00 0.20URQUIJO GTZO ACCIONES
INTERNAC. FIM NA NA NA NA NA NA NA NA NA NA 0.00 0.01 GRV NA 0.00 NA 1.40 0.00 0.00 0.00 0.00 0.00 0.20VALENCIA GTZO RENTA VARIABLE FIM –1.93 5.87 2.47 GRV 2.11 4.01 2.25 GRV –0.33 3.84 2.05 GRV 1.46 3.32 1.80 GRV 1.28 4.37 NA 1.05 0.00 0.00 0.00 0.00 0.00 0.15VITAL EURO INDICES FIM 0.66 0.39 1.01 GRV 0.51 0.27 0.72 GRV 0.22 0.12 0.54 GRV 0.18 6.99 0.38 GRV 1.58 0.25 8.38 1.50 0.00 3.00 3.00 3.00 3.00 0.06VITAL EURO PLUS FIM 0.84 0.39 0.98 GRV 0.70 0.27 0.77 GRV 0.43 0.15 0.59 GRV 0.37 8.03 0.41 GRV 2.36 0.25 10.49 0.75 0.00 3.00 3.00 3.00 3.00 0.07VITAL INDICES I FIM 1.29 1.79 1.98 GRV 1.81 6.51 1.76 GRV 0.48 6.69 1.56 GRV 3.90 5.12 1.34 GRV 7.66 5.41 19.15 0.75 0.00 3.00 3.00 3.00 3.00 0.09ZARAG. GTZO CINCO ESTRELLAS
II FIM –0.18 3.96 0.19 GRV 0.44 4.19 0.20 GRV 1.11 4.44 0.20 GRV 1.43 3.76 0.20 GRV 2.82 4.10 NA 1.25 0.00 0.00 0.00 5.00 0.00 0.15ZARAGOZANO GARANTIZADO
BOLSA 8 FIM NA NA NA NA 2.03 0.00 GRV –0.80 4.64 0.19 GRV –0.62 2.49 0.40 GRV NA 3.09 NA 1.85 0.00 5.00 0.00 3.00 0.00 0.10ZARAGOZANO GARANTIZADO
BOLSA IV FIM 0.75 0.84 0.93 GRV 0.54 0.64 0.71 GRV 0.20 1.28 0.49 GRV 0.06 8.31 0.00 GRV 1.56 0.83 4.83 0.90 0.00 0.00 0.00 0.00 0.00 0.15ZARAGOZANO GARANTIZADO
BOLSA V FIM 0.17 1.73 0.24 GRV 1.18 1.41 0.11 GRV 0.06 1.85 0.26 GRV 0.02 1.16 0.12 GRV 1.42 1.56 20.75 1.20 0.00 0.00 0.00 5.00 0.00 0.10ZARAGOZANO GARANTIZADO
BOLSA VI FIM 0.86 5.98 0.20 GRV 2.60 5.73 0.20 GRV 2.54 7.02 0.20 GRV 2.05 5.69 0.21 GRV 8.29 6.13 NA 1.45 0.00 5.00 0.00 5.00 0.00 0.10ZARAGOZANO GARANTIZADO
MIXTO I FIM 1.30 1.78 0.07 GRV 0.31 2.46 0.07 GRV –0.07 2.09 0.07 GRV –0.02 1.27 0.07 GRV 1.53 1.95 14.36 1.45 0.00 0.00 0.00 5.00 0.00 0.10ZARAGOZANO GARANTIZADO
MIXTO II FIM 1.36 1.72 0.06 GRV 0.17 1.86 0.07 GRV 0.05 2.05 0.07 GRV 0.05 1.02 0.07 GRV 1.63 1.71 13.68 1.45 0.00 0.00 0.00 5.00 0.00 0.10ZARAGOZANO GTZO BOLSA VII FIM –0.45 2.61 0.17 GRV 2.36 3.86 0.36 GRV –1.07 3.77 0.17 GRV 2.26 2.76 0.38 GRV 3.10 3.32 NA 1.40 0.00 5.00 0.00 5.00 0.00 0.10ZARAGOZANO GTZO CINCO
ESTRELLAS FIM –0.18 3.96 0.19 GRV 0.44 4.19 0.20 GRV 1.10 4.44 0.20 GRV 1.45 4.00 0.20 GRV 2.83 4.16 –3.16 1.25 0.00 0.00 0.00 5.00 0.00 0.15ZARAGOZANO GTZO MIXTO III FIM 0.76 3.24 0.06 GRV 1.65 2.95 0.06 GRV 1.29 3.26 0.07 GRV 1.36 4.18 0.07 GRV 5.17 3.44 0.70 1.30 0.00 5.00 0.00 5.00 0.00 0.10ZARAGOZANO GTZO PRIMERA
CLASE FIM 1.84 3.08 0.89 GRV –0.67 3.18 0.83 GRV –0.21 2.85 0.76 GRV –0.25 1.82 0.71 GRV 0.70 2.79 NA 1.00 0.00 0.00 0.00 5.00 0.00 0.12ZARAGOZANO GTZO PRIVILEGIO FIM 1.03 0.85 1.21 GRV 0.67 0.73 1.00 GRV 0.23 0.74 0.79 GRV 0.02 0.58 0.57 GRV 1.97 0.74 NA 0.90 0.00 5.00 0.00 2.50 0.00 0.10ZARAGOZANO GTZO RF
EMERGENTE FIM 0.32 9.98 0.07 GRV 1.31 0.67 0.02 GRV 0.09 0.03 0.00 GRV –0.88 2.93 0.21 GRV 0.83 1.52 1.81 1.30 0.00 5.00 0.00 5.00 0.00 0.10
(Continues over)
(Continued)

300
Annual rep
ort o
n th
e securities m
arket. 2003
A.4.8.Investment in securities. FIM. Yields, volatility and duration
1Q 2Q 3Q 4Q 2003
Yield Vol Dur Yield Vol Dur Yield Vol Dur Yield Vol Dur Yield Vol(1) (2) Type (1) (2) Type (1) (2) Type (1) (2) Type (1)% % % % %
% fees
Management Front end Back endCustody
of assets of yield Max. Min. Max. Min.
Yieldsince1996
Global funds (FGL)
A&G MULTISELECTION FUND FIMF –7.07 8.31 0.00 FGL 3.97 7.85 0.00 FGL 4.39 7.55 0.00 FGL –0.05 2.51 0.01 FGL 0.82 7.02 NA 1.00 0.00 0.00 0.00 0.00 0.00 0.12ABANTE ASESORES GLOBAL FIMF –3.97 9.08 0.00 FGL 5.78 7.36 0.00 FGL 3.14 8.06 0.00 FGL 2.27 7.58 0.00 FGL 7.15 8.08 NA 1.00 0.00 0.00 0.00 0.00 0.00 0.10ABANTE PATRIMONIO GLOBAL FIMF NA NA NA NA NA NA NA NA NA NA 2.05 0.00 FGL NA 2.05 NA 1.00 0.00 0.00 0.00 0.00 0.00 0.10ABANTE RENTABILIDAD ABSOLUTA FIMF NA NA NA NA 2.43 0.00 FGL 0.81 0.96 0.00 FGL 0.40 0.74 0.00 FGL NA 0.80 NA 1.25 0.00 0.00 0.00 0.00 0.00 0.10AC BIENESTAR FIM –6.52 23.81 0.00 FGL 7.67 17.66 0.00 FGL –2.10 14.75 0.00 FGL 1.96 11.58 0.00 FGL 0.47 17.53 NA 2.25 0.00 0.00 0.00 1.00 0.00 0.09AC DIVISA FIM –7.91 25.11 0.00 FGL 7.94 17.18 0.00 FGL 0.04 15.66 0.26 FGL 5.40 11.08 0.01 FGL 4.81 17.99 –31.36 2.00 0.00 0.00 0.00 1.00 0.00 0.09AC EMERGENTES FIM –10.45 19.58 0.00 FGL 16.36 17.03 0.00 FGL 9.37 17.83 0.00 FGL 6.78 15.47 0.00 FGL 21.70 17.65 –35.69 2.25 0.00 0.00 0.00 1.00 0.00 0.09AC GESTION DINAMICA FIM NA NA NA NA NA NA NA 0.59 0.01 FGL –0.36 1.06 0.02 FGL NA 1.04 NA 1.00 9.00 0.00 0.00 0.00 0.00 0.09AC PROTECCION ACTIVA 95 FIM NA 0.21 0.11 FGL 1.74 1.78 0.01 FGL –0.02 1.45 0.15 FGL 0.87 1.37 0.02 FGL NA 1.51 NA 0.50 9.00 0.00 0.00 1.00 1.00 0.05AC TECNOLOGICO FIM 1.99 34.34 0.00 FGL 11.30 24.43 0.00 FGL 6.29 27.36 0.00 FGL 5.13 22.47 0.01 FGL 26.84 27.50 NA 2.25 0.00 0.00 0.00 1.00 0.00 0.09AFINA ESTRATEGICO FIM –5.72 11.89 0.00 RVIO 0.78 1.41 0.00 RVIO 2.65 10.11 0.00 FGL –3.97 7.40 0.00 FGL –6.34 8.68 NA 1.35 0.00 0.00 0.00 0.00 0.00 0.09ARCALIA COYUNTURA FIM 0.90 14.11 0.25 FGL 10.51 9.45 0.15 FGL –0.20 6.80 0.10 FGL 6.88 5.85 0.05 FGL 18.93 9.61 –14.83 1.75 0.00 0.00 0.00 0.00 0.00 0.15ARCALIA SELECCION FIM –3.81 21.17 0.00 RVE 12.64 11.70 0.00 RVE 1.06 8.47 0.00 RVE 9.24 7.46 0.01 FGL 19.61 13.36 –8.38 0.75 0.00 0.00 0.00 0.00 0.00 0.10ARTE FINANCIERO FIM –1.27 4.53 0.01 FGL –0.17 9.17 0.01 FGL –0.28 0.14 0.01 FGL –0.32 0.12 0.01 FGL –2.03 2.25 –11.73 1.25 9.00 0.00 0.00 1.25 0.00 0.00ASTURFONDO GLOBAL FIM –4.24 12.15 0.00 FGL 7.24 8.81 0.00 FGL –0.25 9.65 0.40 FGL 7.15 9.23 0.39 FGL 9.76 10.09 NA 2.10 0.00 0.00 0.00 2.00 0.00 0.15ATLANTICO EVOLUCION FIMF –0.41 1.10 0.11 GRV 2.30 3.64 0.00 GRV 0.41 2.48 0.00 GRV 0.44 1.33 0.01 FGL 2.75 2.02 8.85 1.35 9.00 0.00 0.00 2.00 0.00 0.10ATLANTICO GESTION DINAMICA FIMF 0.32 0.44 0.02 FGL 0.80 0.44 0.02 FGL 0.52 0.40 0.02 FGL 0.28 0.46 0.02 FGL 1.92 0.44 11.72 1.00 9.00 0.00 0.00 2.00 0.00 0.10ATLANTICO MULTIFONDO AZUL 2 FIMF –0.72 2.66 0.00 FGL 3.87 3.39 0.00 FGL 1.48 2.69 0.00 FGL 2.84 2.62 0.01 FGL 7.63 2.88 NA 1.20 0.00 0.00 0.00 2.00 0.00 0.10ATLANTICO MULTIFONDO AZUL 3 FIMF –3.12 7.13 0.00 FGL 8.34 6.36 0.00 FGL 3.69 5.70 0.00 FGL 6.37 5.83 0.01 FGL 15.76 6.34 NA 1.30 0.00 0.00 0.00 2.00 0.00 0.10ATLANTICO MULTIFONDO AZUL FIMF –3.50 6.45 0.00 FGL 6.88 5.00 0.00 FGL 3.13 4.70 0.00 FGL 4.50 4.16 0.01 FGL 11.15 5.20 NA 1.25 0.00 0.00 0.00 2.00 0.00 0.10ATLANTICO MULTIG. ALTERNATIVA FIMF 0.51 0.93 0.00 FGL 0.90 0.53 0.00 FGL 0.31 0.35 0.00 FGL 0.26 0.31 0.01 FGL 1.99 0.58 9.38 1.35 9.00 0.00 0.00 2.00 0.00 0.10AVIVA GESTION GLOBAL FIM –8.34 30.84 0.01 FGL 17.33 17.15 0.01 FGL 0.68 10.75 1.64 FGL 9.87 10.01 3.44 FGL 18.96 19.13 NA 1.90 0.00 0.00 0.00 0.00 0.00 0.11AZPELAN FIM –2.92 8.08 1.76 FGL 4.19 5.94 0.52 FGL –0.95 5.71 0.45 FGL 6.78 6.99 0.44 FGL 6.98 6.79 NA 1.50 0.00 0.00 0.00 2.00 0.00 0.10BANCAJA FDO DE FDOS 90
GLOBAL FIMF –8.21 22.55 0.00 FGL 12.76 14.83 0.00 FGL 3.01 12.73 0.00 FGL 6.44 10.35 0.01 FGL 13.48 15.83 NA 1.55 0.00 0.00 0.00 2.00 0.00 0.05BANCAJA FDO DE FDOS INTERN. FIMF –7.03 20.11 0.00 FGL 10.20 14.42 0.00 FGL 6.28 15.05 0.00 FGL 3.78 14.30 0.01 FGL 13.01 16.19 –18.15 1.50 0.00 0.00 0.00 1.50 0.00 0.20BANESTO GARANTIZADO
DINAMICO FIMF NA NA NA NA NA NA NA 0.17 0.00 FGL 0.27 0.20 0.01 FGL NA 0.19 NA 1.10 0.00 0.00 0.00 0.00 0.00 0.10BANESTO GESTION DINAMICA 1 FIMF 1.65 2.34 0.36 FGL 1.73 0.81 0.06 FGL 0.10 0.68 0.20 FGL 0.84 0.73 4.69 FGL 4.38 1.33 NA 1.50 0.00 0.00 0.00 3.00 0.00 0.10BANESTO GESTION DINAMICA 2 FIMF 0.11 5.00 0.61 FGL 3.60 2.05 0.05 FGL 0.26 2.07 0.01 FGL 2.41 2.66 8.76 FGL 6.48 3.19 NA 1.50 0.00 0.00 0.00 3.00 0.00 0.10BANESTO GESTION DINAMICA 3 FIMF –1.80 7.85 0.49 RVMI 5.88 5.29 0.07 FGL 0.42 4.29 0.13 FGL 4.12 4.42 12.83 FGL 8.72 5.67 NA 1.50 0.00 0.00 0.00 3.00 0.00 0.10BANESTO GTZO DINAMICO PLUS FIMF NA NA NA NA NA NA NA NA NA NA 9.15 0.01 FGL NA 9.15 NA 1.35 9.00 0.00 0.00 0.00 0.00 0.20BANIF GLOBAL 3–98 FIMF –1.75 4.47 0.00 RVMI 1.67 5.47 0.00 RVMI 1.84 3.63 1.14 FGL 2.49 4.56 7.62 FGL 4.26 4.59 –19.19 0.70 9.00 0.00 0.00 0.00 0.00 0.10BANIF GLOBAL UNIVERSAL FIM NA NA NA NA NA NA NA 1.80 0.00 FGL 11.99 13.05 0.01 FGL NA 11.98 NA 0.70 9.00 0.00 0.00 0.00 0.00 0.10BANIF RENDIMIENTO PLUS FIMF 0.71 0.72 0.00 FGL 0.49 0.32 0.00 FGL 0.38 0.44 0.00 FGL 0.73 0.62 0.01 FGL 2.32 0.55 NA 0.55 0.00 0.00 0.00 0.00 0.00 0.10BANIF RIESGO ABIERTO FIM –0.08 3.38 0.00 FGL 0.51 3.12 0.03 FGL 0.30 2.66 0.01 FGL 1.44 2.33 0.07 FGL 2.18 2.90 23.17 1.00 9.00 0.00 0.00 0.00 0.00 0.20BANKINTER LONG SHORT. FIM NA 1.00 0.01 FGL 1.96 3.55 0.01 FGL 2.10 2.20 0.00 FGL 0.88 0.82 0.01 FGL NA 2.39 NA 2.00 0.10 0.00 0.00 3.00 3.00 0.00BARCLAYS GESTION TOTAL FIMF –7.89 21.91 0.01 FGL 13.59 15.07 0.01 FGL 2.33 12.36 0.00 FGL 10.81 10.23 0.00 FGL 18.64 15.58 NA 0.00 0.00 0.00 0.00 2.00 0.00 0.05BBVA AGRO ALTERNATIVO FIM NA NA NA NA NA NA NA 2.00 0.01 FGL –0.55 1.91 0.01 FGL NA 3.04 NA 1.70 0.00 0.00 0.00 2.00 0.00 0.20BBVA BOLSA ACTIVA FIM –0.30 1.19 0.06 FGL 0.48 0.71 0.09 FGL 0.84 1.53 0.90 FGL –0.27 1.70 0.92 FGL 0.74 1.34 NA 1.30 9.00 5.00 0.00 2.00 0.00 0.20BBVA GESTION ACTIVA FIM –0.16 1.81 0.08 FGL 0.91 1.49 0.09 FGL 1.13 1.32 0.44 FGL 0.04 0.88 0.35 FGL 1.92 1.42 NA 1.20 9.00 0.00 0.00 2.00 0.00 0.10BBVA MIXTO GLOBAL FIM –3.44 9.52 4.84 FGL 4.96 5.96 5.27 FGL 0.20 4.94 4.73 FGL 2.61 3.53 2.54 FGL 4.19 6.39 –11.92 2.00 0.00 0.00 0.00 2.00 0.00 0.20BBVA MULTIFONDO ALTERNATIVO FIMF –0.48 2.20 0.00 FGL 1.45 1.46 0.00 FGL 0.20 1.10 0.00 FGL 0.78 1.00 0.02 FGL 1.96 1.52 NA 1.35 9.00 0.00 0.00 2.00 0.00 0.10BBVA MULTIFONDO DINAMICO FIMF –6.91 14.19 0.01 FGL 9.95 12.04 0.00 FGL 6.26 12.04 0.01 FGL 3.75 11.24 0.00 FGL 12.84 12.49 –4.14 1.35 9.00 0.00 0.00 2.00 0.00 0.05BCH SAYPLUS FIM –1.74 4.25 0.60 FGL 2.24 1.91 0.67 FGL –1.24 3.60 0.78 FGL 6.00 5.18 1.14 FGL 5.17 3.97 –16.95 1.75 0.00 0.00 0.00 1.00 0.00 0.20BELGRAVIA EPSILON FIM NA NA 0.00 FGL 0.18 0.31 0.00 RFCP 0.09 1.40 0.00 RFCP 0.49 3.69 0.01 FGL NA 2.14 NA 1.00 9.00 0.00 0.00 0.00 0.00 0.10BETA ACTIVOS FIM 0.53 6.38 0.39 FGL 0.48 7.42 0.00 FGL 0.33 0.09 0.34 FGL 0.32 8.67 0.22 FGL 1.68 8.29 12.01 0.70 0.00 0.00 0.00 0.00 0.00 0.09BETA CRECIMIENTO FIM –9.55 22.25 0.00 FGL 13.91 16.52 0.00 FGL 1.16 15.10 0.00 FGL 5.99 12.65 0.00 FGL 10.46 17.06 –39.10 2.25 0.00 0.00 0.00 0.00 0.00 0.12BETA STOCKS TRADING FIM 2.22 3.79 0.00 FGL 2.18 3.73 0.00 FGL 1.13 2.14 0.00 FGL 0.92 1.35 0.07 FGL 6.60 2.94 NA 1.00 9.00 0.00 0.00 0.00 0.00 0.12BETA VALOR FIM –3.22 9.91 0.00 FGL 4.58 7.03 0.01 FGL –0.41 7.62 0.01 FGL 6.44 5.62 0.02 FGL 7.28 7.73 –19.93 1.65 0.00 0.00 0.00 0.00 0.00 0.10BG RENTA ALTERNATIVA FIMF 0.56 0.11 0.35 GRF 0.46 6.46 0.16 GRF 0.27 0.04 0.01 GRF 0.25 0.38 0.00 FGL 1.56 0.20 17.38 1.15 0.00 0.00 0.00 1.00 0.00 0.10BK MULTIFONDOS DINAMICO FIMF –4.28 12.61 0.00 FGL 11.86 11.62 0.00 FGL 4.04 10.16 0.01 FGL 9.43 8.93 0.01 FGL 21.91 10.98 –0.74 1.00 0.00 0.00 0.00 1.00 1.00 0.07
(Continues over)
(Continued)

301
Annex 4
: Collective in
vestmen
t schem
es and ven
ture cap
ital com
pan
iesA.4.8.Investment in securities. FIM. Yields, volatility and duration
1Q 2Q 3Q 4Q 2003
Yield Vol Dur Yield Vol Dur Yield Vol Dur Yield Vol Dur Yield Vol(1) (2) Type (1) (2) Type (1) (2) Type (1) (2) Type (1)% % % % %
% fees
Management Front end Back endCustody
of assets of yield Max. Min. Max. Min.
Yieldsince1996
Global funds (FGL)
BK MULTIFONDOS EQUILIBRADO FIMF –1.27 5.98 0.00 FGL 6.37 5.61 0.00 FGL 1.49 6.35 0.01 FGL 4.66 5.59 0.01 FGL 11.54 5.92 NA 1.00 0.00 0.00 0.00 0.00 0.00 0.07BNP PARIBAS GLOB.ASSET
ALLOCAT.FIMF –0.86 3.41 0.24 FGL 2.45 2.84 0.37 FGL 0.63 2.13 0.34 FGL 1.03 1.93 1.53 FGL 3.27 2.65 19.98 1.00 0.00 0.00 0.00 0.00 0.00 0.00BNP PARIBAS GLOBAL DIVISA FIM 0.60 3.68 0.00 FGL 0.22 1.26 0.00 FGL 0.30 1.47 0.00 FGL 1.65 1.62 0.01 FGL 2.79 2.23 –11.11 1.00 9.00 0.00 0.00 0.00 0.00 0.00BNP PARIBAS GLOBAL III FIMF –1.18 5.62 0.34 FGL 5.20 4.30 0.28 FGL 0.63 3.81 0.61 FGL 2.59 3.57 1.75 FGL 7.31 4.42 –1.10 0.70 0.00 0.00 0.00 0.00 0.00 0.00BNP PARIBAS INVERSION I FIMF –3.22 10.64 0.00 FGL 9.53 8.64 0.00 FGL 2.96 7.33 0.00 FGL 4.08 7.99 0.00 FGL 13.59 8.78 6.86 1.00 0.00 0.00 0.00 0.00 0.00 0.00BNP PARIBAS INVERSION II FIMF –5.32 11.16 0.48 FGL 5.89 6.09 0.52 FGL 2.42 5.46 0.51 FGL 3.62 5.02 1.81 FGL 6.39 7.39 –17.14 0.85 0.00 0.00 0.00 0.00 0.00 0.00BNP PARIBAS MANAGEMENT
FUND FIMF –1.86 3.97 0.00 FGL 4.28 3.49 0.00 FGL 1.25 3.23 1.37 FGL 0.41 4.13 4.00 FGL 4.04 3.75 NA 0.80 0.00 0.00 0.00 0.00 0.00 0.00BNP PARIBAS SELEC. ALTERNATIVA
FIMF –0.05 2.36 0.00 FGL 3.73 4.17 0.00 FGL 0.70 1.12 0.00 FGL 1.71 1.19 0.01 FGL 6.19 2.55 14.34 1.35 9.00 0.00 0.00 0.00 0.00 0.00BOMERBE FIM –12.29 31.73 0.00 FGL 15.94 20.21 0.00 FGL 1.93 15.52 0.00 FGL 11.93 13.30 0.01 FGL 16.03 21.46 NA 0.25 0.00 0.00 0.00 0.00 0.00 0.05BONA–RENDA FIM –4.47 20.66 0.17 FGL 12.38 13.81 0.10 FGL 0.70 10.68 0.02 FGL 8.08 8.45 0.01 FGL 16.83 14.19 –26.61 1.50 0.00 0.00 0.00 0.00 0.00 0.20CAIXA CAT.DINAMICO FIMF –0.09 3.85 0.00 FGL 7.68 7.47 0.00 FGL 6.45 9.76 0.00 FGL 6.09 8.26 0.00 FGL 21.50 7.69 NA 0.45 9.00 0.00 0.00 0.00 0.00 0.05CAIXA CAT.EQUILIB. FIMF 0.02 2.89 0.00 FGL 6.10 4.51 0.00 FGL 4.25 5.23 0.00 FGL 3.66 4.82 0.01 FGL 14.68 4.48 NA 0.45 9.00 0.00 0.00 0.00 0.00 0.05CAIXA CATALUNYA DINAMICO 2 FIMF NA NA NA NA NA NA NA NA NA NA 0.49 0.01 FGL NA 0.49 NA 1.05 9.00 0.00 0.00 0.00 0.00 0.05CAIXA CATALUNYA EQUILIBRIO 2 FIMF NA NA NA NA NA NA NA NA NA NA 0.25 0.01 FGL NA 0.25 NA 1.05 9.00 0.00 0.00 0.00 0.00 0.05CAIXAGIRONA DIMANIC FIMF NA NA NA NA 0.67 0.00 RFCP 0.86 0.74 0.01 FGL 0.13 0.69 0.01 FGL NA 0.71 NA 1.00 0.00 0.00 0.00 0.00 0.00 0.10CAIXAGIRONA EMERGENT FIMF –5.51 13.45 0.00 FGL 16.51 10.77 0.00 FGL 10.78 11.96 0.00 FGL 5.88 12.62 0.00 FGL 29.12 12.34 NA 1.75 0.00 0.00 0.00 0.00 0.00 0.15CAIXAGIRONA GLOBAL FIMF –9.24 18.51 0.00 FGL 12.04 13.82 0.00 FGL 3.18 12.43 0.00 FGL 4.70 10.31 0.00 FGL 9.85 14.16 NA 1.75 0.00 0.00 0.00 0.00 0.00 0.15CAIXAGIRONA TELENET FIMF –1.65 20.77 0.00 FGL 14.81 15.80 0.00 FGL 7.55 20.76 0.00 FGL 3.29 16.71 0.00 FGL 25.44 18.68 NA 1.75 0.00 0.00 0.00 0.00 0.00 0.15CAIXAMANRESA OPORTUNITATS
GLOB. FIM –11.52 20.20 0.00 FGL 5.60 10.84 0.01 FGL 2.42 10.71 0.01 FGL 8.05 10.36 0.01 FGL 3.40 13.73 NA 2.25 0.00 0.00 0.00 1.00 0.00 0.15CAJAMAR DINAMIFONDO 1 FIMF NA NA NA NA NA NA NA NA NA NA 0.36 0.01 FGL NA 0.36 NA 1.20 0.00 0.00 0.00 0.00 0.00 0.10CAJAMAR DINAMIFONDO 2 FIMF NA NA NA NA NA NA NA NA NA NA 0.55 1.02 FGL NA 0.55 NA 1.50 0.00 0.00 0.00 0.00 0.00 0.10CAJASUR GLOBAL FIMF –7.58 17.49 0.00 RVIO 10.34 13.98 0.00 RVIO 3.85 14.49 0.00 FGL 3.83 13.55 0.00 FGL 9.96 15.00 NA 1.80 0.00 0.00 0.00 2.00 0.00 0.15CAM EMERGENTE FIMF –3.41 8.25 0.11 FGL 6.04 19.11 0.08 FGL 4.39 10.95 0.08 FGL 0.61 8.68 0.07 FGL 7.57 12.55 NA 2.00 0.00 0.00 0.00 2.00 2.00 0.04CAN SELECCION FIMF 0.41 0.48 0.53 RFCP 0.66 0.51 0.89 FGL –0.30 1.02 1.45 FGL 0.46 0.97 2.57 FGL 1.24 0.79 7.81 1.50 0.00 0.00 0.00 0.00 0.00 0.10CAT CAPITAL 1 FIM NA 14.75 0.00 FGL 11.97 10.67 0.00 FGL –0.66 7.76 0.00 FGL 9.60 7.50 0.55 FGL NA 10.38 NA 2.25 0.00 0.00 0.00 1.00 0.00 0.10CATALANA OCCIDENTE PATRIMONIO FIM NA 16.05 0.00 FGL 11.21 11.97 0.00 FGL 0.31 9.06 0.00 FGL 9.33 8.25 1.09 FGL NA 11.14 NA 2.25 0.00 0.00 0.00 0.00 0.00 0.10CATALUNYA FONS FIM –0.86 12.11 1.73 FGL 12.48 9.90 3.36 FGL 1.72 7.77 6.59 FGL 7.02 6.02 8.64 FGL 21.39 9.27 3.16 2.25 0.00 0.00 0.00 0.00 0.00 0.20CEM DINAMIC FIMF NA NA NA NA NA NA NA 0.03 0.01 FGL 0.29 1.67 0.02 FGL NA 1.26 NA 1.45 0.00 0.00 0.00 1.00 0.00 0.15COMPOSITUM GESTION FIM –0.35 8.92 1.40 RVMI 5.75 5.79 1.12 RVMI –0.54 6.17 1.19 FGL 6.88 6.27 1.41 FGL 12.03 6.93 NA 0.50 0.00 0.00 0.00 0.00 0.00 0.10CORDOBA RURAL RENTAB.
ABSOLUTA FIM –0.43 5.11 0.40 RFM 3.39 3.49 0.34 RFM 0.06 2.74 0.35 RFM 2.27 2.06 0.40 FGL 5.35 3.54 NA 1.00 9.00 0.00 0.00 0.00 0.00 0.20CREACION DE CULTURA EN
ESPAÑOL FIMF NA NA NA NA NA NA NA NA NA NA 5.89 0.01 FGL NA 5.89 NA 0.00 0.00 0.00 0.00 0.00 0.00 0.00DINVALOR GLOBAL FIMF 1.05 0.24 0.08 FGL 1.03 0.42 0.19 FGL 0.29 0.33 0.12 FGL 0.44 0.54 0.64 FGL 2.84 0.41 14.67 1.00 0.00 0.00 0.00 0.00 0.00 0.10DWS SELECCION ALTERNATIVA FIMF –4.32 10.88 0.00 RVM 6.62 7.62 0.00 RVM 1.67 6.68 0.00 RVM 0.44 0.49 0.01 FGL 4.16 7.46 –6.49 1.50 0.00 0.00 0.00 0.00 0.00 0.00EDM VALORES UNO FIM NA NA NA NA NA NA NA 1.50 0.00 FGL 1.34 1.80 0.75 FGL NA 1.71 NA 0.50 0.00 0.00 0.00 0.00 0.00 0.13ESPINOSA PART. INV. FIM –0.55 16.70 0.00 FGL 12.21 13.70 0.00 FGL 3.45 13.18 0.00 FGL 8.78 9.06 0.01 FGL 25.58 13.45 7.22 2.00 0.00 0.00 0.00 0.00 0.00 0.10ESPIRITO SANTO CARTERA GLOBAL FIM –4.01 14.13 1.34 FGL 10.09 12.36 1.32 FGL 0.77 9.55 0.98 FGL 3.63 8.48 0.82 FGL 10.36 11.38 –27.22 1.50 0.00 0.00 0.00 0.00 0.00 0.12ESTUBROKER GAC I FIM NA NA NA NA 7.12 0.00 FGL –0.41 7.18 0.00 FGL 10.49 6.63 0.01 FGL NA 7.02 NA 2.25 0.00 0.00 0.00 1.00 0.00 0.10EUROFONDO FIM –8.33 30.62 0.01 FGL 21.85 19.57 0.01 FGL 2.55 14.08 0.01 FGL 12.01 11.53 0.04 FGL 28.30 20.37 –44.00 2.25 0.00 0.00 0.00 0.00 0.00 0.15EUROVALENCIA AHORRO FIM 2.63 6.96 0.00 FGL 0.81 1.80 0.00 FGL 1.11 2.93 0.00 FGL 1.24 1.83 0.01 FGL 5.90 3.97 13.84 2.00 0.00 0.00 0.00 0.00 0.00 0.15EUROVALOR GESTION ALTERNATIVA
FIMF NA NA NA NA NA NA NA NA NA NA 1.84 0.01 FGL NA 1.84 NA 1.35 0.00 0.00 0.00 0.00 0.00 0.15EUROVALOR SELECCION FLEXIBLE
FIMF –1.37 6.59 0.00 FGL 3.06 5.86 0.00 FGL 2.84 3.67 0.00 FGL 3.85 2.94 0.01 FGL 8.56 5.00 NA 2.25 0.00 0.00 0.00 0.00 0.00 0.00EXTRAFONDO BANESTO FIMF 0.53 1.25 0.00 RFLP 0.47 1.40 0.00 RFLP 0.38 1.24 0.00 RFLP 0.33 0.30 0.01 FGL 1.72 0.15 13.25 0.50 0.00 0.00 0.00 0.00 0.00 0.00FIBANC EXCELLENT FIM –2.15 8.23 0.48 FGL 5.49 6.25 0.63 FGL 0.57 5.83 0.66 FGL 3.87 5.08 0.54 FGL 7.83 6.47 NA 0.50 3.00 0.00 0.00 0.00 0.00 0.04FIDENZIS F.DE FDOS L100 GLOBAL FIMF NA NA NA NA 6.76 0.00 FGL 2.57 10.40 0.00 FGL 6.22 9.17 0.00 FGL NA 9.43 NA 2.20 0.00 0.00 0.00 1.50 0.00 0.10
(Continues over)
(Continued)

302
Annual rep
ort o
n th
e securities m
arket. 2003
A.4.8.Investment in securities. FIM. Yields, volatility and duration
1Q 2Q 3Q 4Q 2003
Yield Vol Dur Yield Vol Dur Yield Vol Dur Yield Vol Dur Yield Vol(1) (2) Type (1) (2) Type (1) (2) Type (1) (2) Type (1)% % % % %
% fees
Management Front end Back endCustody
of assets of yield Max. Min. Max. Min.
Yieldsince1996
Global funds (FGL)
FIDENZIS F.DE FDOS L35 GLOBAL FIMF NA NA NA NA 2.61 0.00 FGL 0.89 4.17 0.00 FGL 2.66 3.70 0.00 FGL NA 3.78 NA 1.50 0.00 0.00 0.00 1.50 0.00 0.10FIMA MARKET NEUTRAL I FIM –4.56 4.27 0.01 FGL 1.04 3.85 0.01 FGL –0.35 2.41 0.01 FGL 0.09 0.40 0.01 FGL –3.82 3.15 NA 1.35 9.00 0.00 0.00 0.00 0.00 0.10FLEXIBLE ASSET ALLOCATION FIM –5.87 13.87 3.52 FGL 6.86 10.26 3.90 FGL 1.55 11.61 4.55 FGL 1.97 8.62 4.56 FGL 4.17 11.28 NA 0.65 0.00 0.00 0.00 0.00 0.00 0.15FONCAIXA 75 GLOBAL FIM 0.24 1.69 1.77 FGL 0.91 2.93 4.28 FGL –1.20 1.87 1.81 FGL 0.88 1.73 1.94 FGL 0.82 2.12 NA 1.35 9.00 0.00 0.00 4.00 0.00 0.15FONCANARIAS INTERNACIONAL FIM –2.67 15.08 0.51 FGL 5.72 8.40 0.45 FGL 0.09 6.82 0.96 FGL 6.34 5.93 0.81 FGL 9.52 9.74 NA 0.85 0.00 3.00 3.00 3.00 0.00 0.10FONDCOYUNTURA FIM 1.21 12.49 0.01 FGL 10.62 8.61 0.01 FGL 0.72 7.42 0.02 FGL 8.77 5.44 0.01 FGL 22.65 8.89 34.96 2.00 0.00 0.00 0.00 1.00 0.00 0.10FONDEGA GLOBAL FIM –13.03 31.50 2.95 FGL 13.24 19.22 0.00 FGL –0.79 13.42 0.00 FGL 9.47 11.73 0.01 FGL 6.96 20.53 –42.17 2.25 0.00 0.00 0.00 0.00 0.00 0.13FONDESPAÑA AUDAZ FIMF –4.59 14.88 0.00 FGL 6.27 7.81 0.00 FGL –0.21 7.01 0.00 FGL 5.76 7.49 0.00 FGL 7.00 9.86 NA 0.50 0.00 0.00 0.00 0.00 0.00 0.05FONDESPAÑA CONSERVADOR FIMF NA NA NA NA 1.89 0.00 FGL 0.12 1.12 0.01 FGL 0.59 0.99 0.01 FGL NA 0.96 NA 0.50 0.00 0.00 0.00 0.00 0.00 0.05FONDESPAÑA EMPRENDEDOR FIMF –2.92 9.98 0.00 FGL 4.52 5.12 0.00 FGL 0.46 4.74 0.00 FGL 2.86 5.42 0.00 FGL 4.84 6.67 NA 0.50 0.00 0.00 0.00 0.00 0.00 0.05FONDESPAÑA MODERADO FIMF –0.62 5.14 0.00 FGL 2.53 2.71 0.00 FGL –0.22 2.37 0.00 FGL 1.74 2.12 0.01 FGL 3.43 3.31 NA 0.50 0.00 0.00 0.00 0.00 0.00 0.05FONDGESTION GLOBAL FIM 0.88 0.61 0.01 FGL 0.15 4.17 0.01 FGL 0.27 0.52 0.01 FGL –0.12 0.68 0.01 FGL 1.19 0.53 20.69 1.35 9.00 0.00 0.00 3.00 0.00 0.10FONDITEL ALBATROS FIM NA NA NA NA NA NA NA 4.53 1.12 FGL 10.61 6.60 0.41 FGL NA 5.84 NA 1.35 6.00 0.00 0.00 0.00 0.00 0.12FONDITEL VELOCIRAPTOR FIM NA NA NA NA NA NA NA 4.03 0.61 FGL 12.68 6.61 0.44 FGL NA 5.71 NA 1.35 9.00 0.00 0.00 0.00 0.00 0.12FONDMAPFRE MULTISELECCION FIMF –5.76 15.65 0.00 FGL 6.65 11.48 0.00 FGL 1.87 10.26 0.00 FGL 3.98 9.55 0.00 FGL 6.46 11.99 NA 1.75 0.00 0.00 0.00 1.50 0.00 0.20FONDO JALON FIM NA NA NA NA NA NA NA 7.85 0.06 FGL 0.47 0.14 0.08 FGL NA 0.13 NA 0.20 0.00 0.00 0.00 0.00 0.00 0.05FONDO LEVANTE FIMF –2.10 13.10 0.75 FGL 8.78 9.27 1.40 FGL 3.51 9.07 1.77 FGL 7.40 8.53 3.29 FGL 18.39 10.17 –26.13 0.85 0.00 0.00 0.00 4.00 0.00 0.00FONDO PERMANENCIA FIM –2.23 7.33 1.54 RVM 4.93 5.14 1.43 RVM 0.53 4.31 1.33 FGL 2.80 3.34 1.22 FGL 6.02 5.26 4.11 0.70 0.00 5.00 0.00 0.00 0.00 0.05FONDO SUPERGESTION FIMF NA NA NA NA NA NA NA NA NA NA 0.00 0.00 FGL NA 0.00 NA 1.35 9.00 0.00 0.00 0.00 0.00 0.10FONDOGAESCO FIM 0.45 0.22 0.69 FGL 0.73 0.23 0.75 FGL 0.23 0.26 1.32 FGL 0.49 0.51 1.77 FGL 1.91 0.33 7.79 1.50 0.00 0.00 0.00 0.00 0.00 0.15FONGAUDI FIM 0.42 0.91 0.04 FGL 0.18 0.55 0.18 FGL 0.43 1.34 0.17 FGL 2.25 1.46 0.19 FGL 3.30 1.14 –17.54 0.70 5.00 0.00 0.00 0.00 0.00 0.12FONHUESCA 2000 FIM 0.04 14.75 0.63 RVM 9.97 9.38 0.47 FGL 1.01 6.25 0.43 FGL 6.70 4.66 0.35 FGL 18.57 9.57 –0.08 0.75 0.00 0.00 0.00 0.00 0.00 0.10FONJARAMA FIM 2.96 3.36 0.51 FGL 3.42 2.02 0.53 FGL 0.10 2.86 0.93 FGL 5.50 4.12 0.90 FGL 12.45 3.21 NA 1.00 0.00 0.00 0.00 0.00 0.00 0.13FONSGLOBAL RENTA FIM –1.11 10.02 2.12 FGL 6.09 7.10 1.09 FGL 0.82 6.11 2.05 FGL 4.42 4.54 1.89 FGL 10.44 7.23 10.00 1.00 0.00 0.00 0.00 0.00 0.00 0.10FONSVALLADOLID FIM 1.41 5.59 0.01 FGL 4.06 3.97 0.01 FGL –0.82 4.17 0.01 FGL 4.34 3.87 0.02 FGL 9.20 4.47 1.40 0.80 0.00 0.00 0.00 0.00 0.00 0.10FONTALENTO FIM –2.92 21.75 0.93 FGL 12.65 18.79 1.16 FGL 6.42 16.43 0.98 FGL 2.33 7.59 0.87 FGL 19.09 16.98 2.82 1.50 0.00 0.00 0.00 0.00 0.00 0.19FONTIBREFONDO FIMF –4.11 14.13 0.00 FGL 15.05 9.49 0.00 FGL 5.31 10.34 0.00 FGL 11.14 9.37 0.00 FGL 29.12 11.08 –41.85 1.10 0.00 0.00 0.00 0.00 0.00 0.08FONVALCEM FIM 0.39 16.03 0.28 FGL 10.55 10.75 0.29 FGL 0.48 8.48 0.18 FGL 8.15 6.91 0.16 FGL 20.61 11.10 –11.52 0.50 0.00 0.00 0.00 0.00 0.00 0.15GAESCOQUANT FIM –16.80 40.64 0.16 FGL 26.64 30.61 3.02 FGL 7.83 21.23 0.09 FGL 12.65 17.90 2.73 FGL 27.98 29.08 –43.56 2.25 0.00 0.00 0.00 0.00 0.00 0.10GENERAL PLUSFONDO FIM –1.53 15.93 0.06 FGL 11.86 10.16 0.03 FGL 0.66 8.40 0.03 FGL 8.34 6.56 0.01 FGL 20.12 10.87 7.51 2.25 0.00 0.00 0.00 0.00 0.00 0.10GESCAFONDO FIM –2.08 56.05 0.71 FGL 8.57 10.24 1.30 FGL 2.25 6.45 1.11 FGL 1.20 2.70 1.28 FGL 10.01 28.52 6.12 0.85 0.00 0.00 0.00 0.00 0.00 0.10GESDIVISA FIM –2.45 59.61 1.02 FGL 14.58 13.24 1.24 FGL 2.43 9.56 1.26 FGL 6.95 6.03 1.23 FGL 22.44 30.86 20.80 0.75 0.00 0.00 0.00 0.00 0.00 0.10GIROBORSA FIM –12.52 32.80 0.01 FGL 17.16 21.92 0.00 FGL –0.09 16.14 0.00 FGL 10.62 14.37 0.00 FGL 13.28 22.54 –45.71 2.25 0.00 0.00 0.00 0.00 0.00 0.15GLOBAL FINANCIAL TRADING FIM –0.50 1.29 0.01 FGL 0.21 0.87 0.15 FGL 1.09 2.42 0.11 FGL –0.01 1.04 0.06 FGL 0.78 1.54 NA 2.25 0.00 0.00 0.00 0.00 0.00 0.20GOACO MIXTO FIM –3.50 8.74 1.38 FGL 4.45 5.13 1.08 FGL –0.91 5.33 1.01 FGL 6.57 7.05 1.12 FGL 6.43 6.77 NA 1.50 0.00 0.00 0.00 2.00 0.00 0.10HERMES GLOBAL FIM 0.62 6.77 0.00 FGL 1.76 4.27 0.00 FGL 1.05 3.10 0.00 FGL 1.18 3.04 0.01 FGL 4.68 4.54 NA 0.00 0.00 0.00 0.00 0.00 0.00 0.00HSBC RENTA NEUTRAL FIM –0.86 6.83 0.61 RVM 4.87 5.65 0.65 RVM 1.39 5.17 0.61 RVM 5.36 3.86 0.59 FGL 11.05 5.50 19.46 1.35 0.00 0.00 0.00 0.00 0.00 0.20IBERAG.POPULAR MULTIG.
ALTERNAT.FIMF 0.41 1.37 0.00 FGL 1.10 1.14 0.00 FGL 0.08 0.99 0.00 FGL –0.01 0.92 0.00 FGL 1.58 1.12 NA 0.50 9.00 0.00 0.00 0.00 0.00 0.06IBERSECURITIES GLOBAL FIM NA NA NA NA NA NA NA 1.96 0.13 FGL 4.01 3.00 0.34 FGL NA 2.71 NA 1.10 0.00 0.00 0.00 0.00 0.00 0.15INTERDIN GESTION ALTERNATIVA FIM NA NA NA NA NA NA NA 1.64 0.00 FGL –0.77 2.80 0.01 FGL NA 2.34 NA 1.35 9.00 0.00 0.00 0.00 0.00 0.10INTERDIN GLOBAL FONDOS FIMF –1.13 2.38 0.00 FGL 0.52 2.50 0.03 FGL 1.75 3.91 0.00 FGL 3.33 6.24 0.01 FGL 4.49 4.09 NA 1.00 9.00 0.00 0.00 0.00 0.00 0.10INVERACTIVO GLOBAL FIM 1.40 3.68 0.00 FGL –0.71 3.25 0.00 FGL 0.39 2.03 0.00 FGL 0.45 1.32 0.01 FGL 1.53 2.73 NA 2.00 0.00 0.00 0.00 3.00 0.00 0.10KUTXADINAMICO FIMF NA NA NA NA NA NA NA NA NA NA 1.38 0.00 FGL NA 1.38 NA 1.00 9.00 0.00 0.00 2.00 0.00 0.20LAREDO FONDO FIM 1.72 12.17 0.42 FGL 4.01 3.64 0.19 FGL –0.49 2.98 1.14 FGL 3.95 2.42 0.89 FGL 9.44 6.61 –29.65 0.85 0.00 0.00 0.00 0.00 0.00 0.05LEALTAD MUNDIAL FIM –3.70 7.47 3.83 RVIO 3.44 3.89 2.78 RVIO 2.56 4.67 2.08 FGL 1.69 3.22 1.87 FGL 3.89 5.10 NA 1.00 0.00 0.00 0.00 0.00 0.00 0.15MADRID GESTION ALTERNATIVA FIM 2.46 1.63 0.00 FGL 0.76 0.54 0.00 FGL –0.06 0.23 0.00 FGL –0.69 1.54 0.01 FGL 2.47 1.18 –1.22 2.00 0.00 0.00 0.00 1.50 0.00 0.10MADRID GESTION DINAMICA FIM 1.19 2.34 0.00 FGL 0.27 1.26 0.00 FGL 0.63 1.24 0.00 FGL 0.20 1.33 0.01 FGL 2.32 1.61 –6.05 0.00 0.00 0.00 0.00 1.00 0.00 0.10MADRID MULTIGESTION
DINAMICA FIMF 1.44 1.89 0.00 RFI 3.54 2.19 0.00 RFI –0.52 2.81 0.00 FGL –0.16 1.27 0.01 FGL 4.33 2.14 NA 1.25 0.00 0.00 0.00 2.00 0.00 0.10MERCHFONDO FIM 0.29 28.81 0.00 FGL 16.38 20.54 0.00 FGL 3.97 21.63 0.00 FGL 5.86 18.83 0.00 FGL 28.46 22.77 –0.56 1.35 9.00 0.00 0.00 1.00 1.00 0.13MERCH–OPORTUNIDADES FIM NA NA NA NA NA NA NA NA NA NA 6.34 0.01 FGL NA 6.34 NA 1.25 7.00 0.00 0.00 1.00 1.00 0.20
(Continues over)
(Continued)
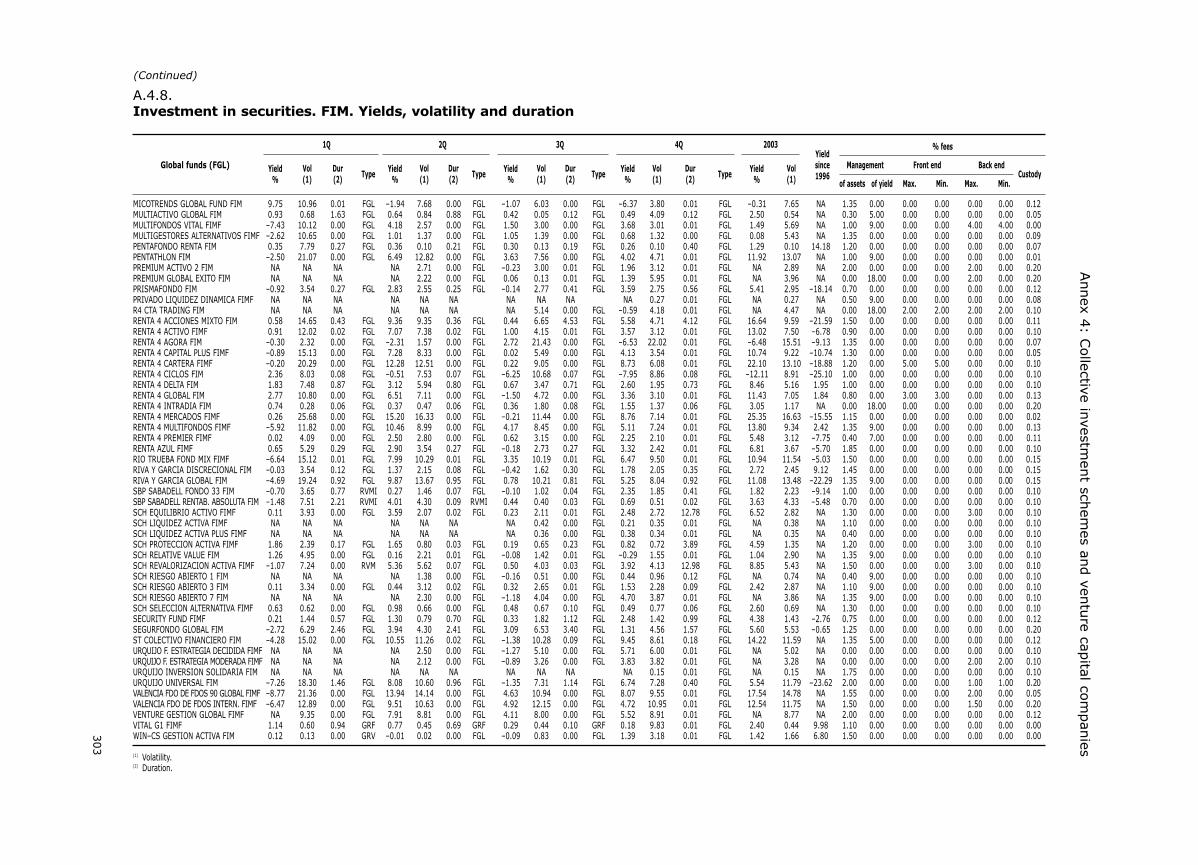
303
Annex 4
: Collective in
vestmen
t schem
es and ven
ture cap
ital com
pan
iesA.4.8.Investment in securities. FIM. Yields, volatility and duration
1Q 2Q 3Q 4Q 2003
Yield Vol Dur Yield Vol Dur Yield Vol Dur Yield Vol Dur Yield Vol(1) (2) Type (1) (2) Type (1) (2) Type (1) (2) Type (1)% % % % %
% fees
Management Front end Back endCustody
of assets of yield Max. Min. Max. Min.
Yieldsince1996
Global funds (FGL)
MICOTRENDS GLOBAL FUND FIM 9.75 10.96 0.01 FGL –1.94 7.68 0.00 FGL –1.07 6.03 0.00 FGL –6.37 3.80 0.01 FGL –0.31 7.65 NA 1.35 0.00 0.00 0.00 0.00 0.00 0.12MULTIACTIVO GLOBAL FIM 0.93 0.68 1.63 FGL 0.64 0.84 0.88 FGL 0.42 0.05 0.12 FGL 0.49 4.09 0.12 FGL 2.50 0.54 NA 0.30 5.00 0.00 0.00 0.00 0.00 0.05MULTIFONDOS VITAL FIMF –7.43 10.12 0.00 FGL 4.18 2.57 0.00 FGL 1.50 3.00 0.00 FGL 3.68 3.01 0.01 FGL 1.49 5.69 NA 1.00 9.00 0.00 0.00 4.00 4.00 0.00MULTIGESTORES ALTERNATIVOS FIMF –2.62 10.65 0.00 FGL 1.01 1.37 0.00 FGL 1.05 1.39 0.00 FGL 0.68 1.32 0.00 FGL 0.08 5.43 NA 1.35 0.00 0.00 0.00 0.00 0.00 0.09PENTAFONDO RENTA FIM 0.35 7.79 0.27 FGL 0.36 0.10 0.21 FGL 0.30 0.13 0.19 FGL 0.26 0.10 0.40 FGL 1.29 0.10 14.18 1.20 0.00 0.00 0.00 0.00 0.00 0.07PENTATHLON FIM –2.50 21.07 0.00 FGL 6.49 12.82 0.00 FGL 3.63 7.56 0.00 FGL 4.02 4.71 0.01 FGL 11.92 13.07 NA 1.00 9.00 0.00 0.00 0.00 0.00 0.01PREMIUM ACTIVO 2 FIM NA NA NA NA 2.71 0.00 FGL –0.23 3.00 0.01 FGL 1.96 3.12 0.01 FGL NA 2.89 NA 2.00 0.00 0.00 0.00 2.00 0.00 0.20PREMIUM GLOBAL EXITO FIM NA NA NA NA 2.22 0.00 FGL 0.06 0.13 0.01 FGL 1.39 5.95 0.01 FGL NA 3.96 NA 0.00 18.00 0.00 0.00 2.00 0.00 0.20PRISMAFONDO FIM –0.92 3.54 0.27 FGL 2.83 2.55 0.25 FGL –0.14 2.77 0.41 FGL 3.59 2.75 0.56 FGL 5.41 2.95 –18.14 0.70 0.00 0.00 0.00 0.00 0.00 0.12PRIVADO LIQUIDEZ DINAMICA FIMF NA NA NA NA NA NA NA NA NA NA 0.27 0.01 FGL NA 0.27 NA 0.50 9.00 0.00 0.00 0.00 0.00 0.08R4 CTA TRADING FIM NA NA NA NA NA NA NA 5.14 0.00 FGL –0.59 4.18 0.01 FGL NA 4.47 NA 0.00 18.00 2.00 2.00 2.00 2.00 0.10RENTA 4 ACCIONES MIXTO FIM 0.58 14.65 0.43 FGL 9.36 9.35 0.36 FGL 0.44 6.65 4.53 FGL 5.58 4.71 4.12 FGL 16.64 9.59 –21.59 1.50 0.00 0.00 0.00 0.00 0.00 0.11RENTA 4 ACTIVO FIMF 0.91 12.02 0.02 FGL 7.07 7.38 0.02 FGL 1.00 4.15 0.01 FGL 3.57 3.12 0.01 FGL 13.02 7.50 –6.78 0.90 0.00 0.00 0.00 0.00 0.00 0.10RENTA 4 AGORA FIM –0.30 2.32 0.00 FGL –2.31 1.57 0.00 FGL 2.72 21.43 0.00 FGL –6.53 22.02 0.01 FGL –6.48 15.51 –9.13 1.35 0.00 0.00 0.00 0.00 0.00 0.07RENTA 4 CAPITAL PLUS FIMF –0.89 15.13 0.00 FGL 7.28 8.33 0.00 FGL 0.02 5.49 0.00 FGL 4.13 3.54 0.01 FGL 10.74 9.22 –10.74 1.30 0.00 0.00 0.00 0.00 0.00 0.05RENTA 4 CARTERA FIMF –0.20 20.29 0.00 FGL 12.28 12.51 0.00 FGL 0.22 9.05 0.00 FGL 8.73 6.08 0.01 FGL 22.10 13.10 –18.88 1.20 0.00 5.00 5.00 0.00 0.00 0.10RENTA 4 CICLOS FIM 2.36 8.03 0.08 FGL –0.51 7.53 0.07 FGL –6.25 10.68 0.07 FGL –7.95 8.86 0.08 FGL –12.11 8.91 –25.10 1.00 0.00 0.00 0.00 0.00 0.00 0.10RENTA 4 DELTA FIM 1.83 7.48 0.87 FGL 3.12 5.94 0.80 FGL 0.67 3.47 0.71 FGL 2.60 1.95 0.73 FGL 8.46 5.16 1.95 1.00 0.00 0.00 0.00 0.00 0.00 0.10RENTA 4 GLOBAL FIM 2.77 10.80 0.00 FGL 6.51 7.11 0.00 FGL –1.50 4.72 0.00 FGL 3.36 3.10 0.01 FGL 11.43 7.05 1.84 0.80 0.00 3.00 3.00 0.00 0.00 0.13RENTA 4 INTRADIA FIM 0.74 0.28 0.06 FGL 0.37 0.47 0.06 FGL 0.36 1.80 0.08 FGL 1.55 1.37 0.06 FGL 3.05 1.17 NA 0.00 18.00 0.00 0.00 0.00 0.00 0.20RENTA 4 MERCADOS FIMF 0.26 25.68 0.00 FGL 15.20 16.33 0.00 FGL –0.21 11.44 0.00 FGL 8.76 7.14 0.01 FGL 25.35 16.63 –15.55 1.15 0.00 0.00 0.00 0.00 0.00 0.02RENTA 4 MULTIFONDOS FIMF –5.92 11.82 0.00 FGL 10.46 8.99 0.00 FGL 4.17 8.45 0.00 FGL 5.11 7.24 0.01 FGL 13.80 9.34 2.42 1.35 9.00 0.00 0.00 0.00 0.00 0.13RENTA 4 PREMIER FIMF 0.02 4.09 0.00 FGL 2.50 2.80 0.00 FGL 0.62 3.15 0.00 FGL 2.25 2.10 0.01 FGL 5.48 3.12 –7.75 0.40 7.00 0.00 0.00 0.00 0.00 0.11RENTA AZUL FIMF 0.65 5.29 0.29 FGL 2.90 3.54 0.27 FGL –0.18 2.73 0.27 FGL 3.32 2.42 0.01 FGL 6.81 3.67 –5.70 1.85 0.00 0.00 0.00 0.00 0.00 0.10RIO TRUEBA FOND MIX FIMF –6.64 15.12 0.01 FGL 7.99 10.29 0.01 FGL 3.35 10.19 0.01 FGL 6.47 9.50 0.01 FGL 10.94 11.54 –5.03 1.50 0.00 0.00 0.00 0.00 0.00 0.15RIVA Y GARCIA DISCRECIONAL FIM –0.03 3.54 0.12 FGL 1.37 2.15 0.08 FGL –0.42 1.62 0.30 FGL 1.78 2.05 0.35 FGL 2.72 2.45 9.12 1.45 0.00 0.00 0.00 0.00 0.00 0.15RIVA Y GARCIA GLOBAL FIM –4.69 19.24 0.92 FGL 9.87 13.67 0.95 FGL 0.78 10.21 0.81 FGL 5.25 8.04 0.92 FGL 11.08 13.48 –22.29 1.35 9.00 0.00 0.00 0.00 0.00 0.15SBP SABADELL FONDO 33 FIM –0.70 3.65 0.77 RVMI 0.27 1.46 0.07 FGL –0.10 1.02 0.04 FGL 2.35 1.85 0.41 FGL 1.82 2.23 –9.14 1.00 0.00 0.00 0.00 0.00 0.00 0.10SBP SABADELL RENTAB. ABSOLUTA FIM –1.48 7.51 2.21 RVMI 4.01 4.30 0.09 RVMI 0.44 0.40 0.03 FGL 0.69 0.51 0.02 FGL 3.63 4.33 –5.48 0.70 0.00 0.00 0.00 0.00 0.00 0.10SCH EQUILIBRIO ACTIVO FIMF 0.11 3.93 0.00 FGL 3.59 2.07 0.02 FGL 0.23 2.11 0.01 FGL 2.48 2.72 12.78 FGL 6.52 2.82 NA 1.30 0.00 0.00 0.00 3.00 0.00 0.10SCH LIQUIDEZ ACTIVA FIMF NA NA NA NA NA NA NA 0.42 0.00 FGL 0.21 0.35 0.01 FGL NA 0.38 NA 1.10 0.00 0.00 0.00 0.00 0.00 0.10SCH LIQUIDEZ ACTIVA PLUS FIMF NA NA NA NA NA NA NA 0.36 0.00 FGL 0.38 0.34 0.01 FGL NA 0.35 NA 0.40 0.00 0.00 0.00 0.00 0.00 0.10SCH PROTECCION ACTIVA FIMF 1.86 2.39 0.17 FGL 1.65 0.80 0.03 FGL 0.19 0.65 0.23 FGL 0.82 0.72 3.89 FGL 4.59 1.35 NA 1.20 0.00 0.00 0.00 3.00 0.00 0.10SCH RELATIVE VALUE FIM 1.26 4.95 0.00 FGL 0.16 2.21 0.01 FGL –0.08 1.42 0.01 FGL –0.29 1.55 0.01 FGL 1.04 2.90 NA 1.35 9.00 0.00 0.00 0.00 0.00 0.10SCH REVALORIZACION ACTIVA FIMF –1.07 7.24 0.00 RVM 5.36 5.62 0.07 FGL 0.50 4.03 0.03 FGL 3.92 4.13 12.98 FGL 8.85 5.43 NA 1.50 0.00 0.00 0.00 3.00 0.00 0.10SCH RIESGO ABIERTO 1 FIM NA NA NA NA 1.38 0.00 FGL –0.16 0.51 0.00 FGL 0.44 0.96 0.12 FGL NA 0.74 NA 0.40 9.00 0.00 0.00 0.00 0.00 0.10SCH RIESGO ABIERTO 3 FIM 0.11 3.34 0.00 FGL 0.44 3.12 0.02 FGL 0.32 2.65 0.01 FGL 1.53 2.28 0.09 FGL 2.42 2.87 NA 1.10 9.00 0.00 0.00 0.00 0.00 0.10SCH RIESGO ABIERTO 7 FIM NA NA NA NA 2.30 0.00 FGL –1.18 4.04 0.00 FGL 4.70 3.87 0.01 FGL NA 3.86 NA 1.35 9.00 0.00 0.00 0.00 0.00 0.10SCH SELECCION ALTERNATIVA FIMF 0.63 0.62 0.00 FGL 0.98 0.66 0.00 FGL 0.48 0.67 0.10 FGL 0.49 0.77 0.06 FGL 2.60 0.69 NA 1.30 0.00 0.00 0.00 0.00 0.00 0.10SECURITY FUND FIMF 0.21 1.44 0.57 FGL 1.30 0.79 0.70 FGL 0.33 1.82 1.12 FGL 2.48 1.42 0.99 FGL 4.38 1.43 –2.76 0.75 0.00 0.00 0.00 0.00 0.00 0.12SEGURFONDO GLOBAL FIM –2.72 6.29 2.46 FGL 3.94 4.30 2.41 FGL 3.09 6.53 3.40 FGL 1.31 4.56 1.57 FGL 5.60 5.53 –0.65 1.25 0.00 0.00 0.00 0.00 0.00 0.20ST COLECTIVO FINANCIERO FIM –4.28 15.02 0.00 FGL 10.55 11.26 0.02 FGL –1.38 10.28 0.09 FGL 9.45 8.61 0.18 FGL 14.22 11.59 NA 1.35 5.00 0.00 0.00 0.00 0.00 0.12URQUIJO F. ESTRATEGIA DECIDIDA FIMF NA NA NA NA 2.50 0.00 FGL –1.27 5.10 0.00 FGL 5.71 6.00 0.01 FGL NA 5.02 NA 0.00 0.00 0.00 0.00 0.00 0.00 0.10URQUIJO F. ESTRATEGIA MODERADA FIMF NA NA NA NA 2.12 0.00 FGL –0.89 3.26 0.00 FGL 3.83 3.82 0.01 FGL NA 3.28 NA 0.00 0.00 0.00 0.00 2.00 2.00 0.10URQUIJO INVERSION SOLIDARIA FIM NA NA NA NA NA NA NA NA NA NA 0.15 0.01 FGL NA 0.15 NA 1.75 0.00 0.00 0.00 0.00 0.00 0.10URQUIJO UNIVERSAL FIM –7.26 18.30 1.46 FGL 8.08 10.60 0.96 FGL –1.35 7.31 1.14 FGL 6.74 7.28 0.40 FGL 5.54 11.79 –23.62 2.00 0.00 0.00 0.00 1.00 1.00 0.20VALENCIA FDO DE FDOS 90 GLOBAL FIMF –8.77 21.36 0.00 FGL 13.94 14.14 0.00 FGL 4.63 10.94 0.00 FGL 8.07 9.55 0.01 FGL 17.54 14.78 NA 1.55 0.00 0.00 0.00 2.00 0.00 0.05VALENCIA FDO DE FDOS INTERN. FIMF –6.47 12.89 0.00 FGL 9.51 10.63 0.00 FGL 4.92 12.15 0.00 FGL 4.72 10.95 0.01 FGL 12.54 11.75 NA 1.50 0.00 0.00 0.00 1.50 0.00 0.20VENTURE GESTION GLOBAL FIMF NA 9.35 0.00 FGL 7.91 8.81 0.00 FGL 4.11 8.00 0.00 FGL 5.52 8.91 0.01 FGL NA 8.77 NA 2.00 0.00 0.00 0.00 0.00 0.00 0.12VITAL G1 FIMF 1.14 0.60 0.94 GRF 0.77 0.45 0.69 GRF 0.29 0.44 0.10 GRF 0.18 9.83 0.01 FGL 2.40 0.44 9.98 1.10 0.00 0.00 0.00 0.00 0.00 0.00WIN–CS GESTION ACTIVA FIM 0.12 0.13 0.00 GRV –0.01 0.02 0.00 FGL –0.09 0.83 0.00 FGL 1.39 3.18 0.01 FGL 1.42 1.66 6.80 1.50 0.00 0.00 0.00 0.00 0.00 0.00
(1) Volatility.(2) Duration.
(Continued)

304
Annual rep
ort o
n th
e securities m
arket. 2003
12/31/2002 12/31/2003 Change
Amount % of assets Amount % of assets Amount %
1. Assets 53,366,474 100.00 58,054,417 100.00 4,687,943 8.782. Cash and cash equivalents 1,323,577 2.48 1,741,524 3.00 417,947 31.583. Portfolio investments 52,084,668 97.60 56,366,443 97.09 4,281,775 8.22
3.1. Domestic portfolio 28,051,510 52.56 29,405,407 50.65 1,353,897 4.833.1.1. Shares 0 0.00 0 0.00 0 –3.1.2. Units in mutual funds 0 0.00 0 0.00 0 –3.1.3. Treasury bills 5,094,855 9.55 4,982,764 8.58 –112,091 –2.203.1.4. Other public fixed-income securities 914,418 1.71 474,935 0.82 –439,483 –48.063.1.5. Private money market assets 5,636,877 10.56 7,176,912 12.36 1,540,035 27.323.1.6. Other private fixed-income 1,537,758 2.88 2,945,814 5.07 1,408,056 91.573.1.7. Purchased Spanish warrants and options 0 0.00 0 0.00 0 –3.1.8. Reverse repos 14,867,602 27.86 13,824,982 23.81 –1,042,620 –7.013.1.9. Unlisted portfolio 0 0.00 0 0.00 0 –
3.2. Foreign portfolio 24,033,158 45.03 26,961,036 46.44 2,927,878 12.183.2.1. Euros 24,000,174 44.97 26,959,909 46.44 2,959,735 12.33
3.2.1.1. Shares 0 0.00 0 0.00 0 –3.2.1.2. Units in mutual funds 0 0.00 0 0.00 0 –3.2.1.3. Fixed-income 24,000,174 44.97 26,959,800 46.44 2,959,626 12.333.2.1.4. Purchased foreign warrants and options 0 0.00 109 0.00 109 –3.2.1.5. Unlisted portfolio 0 0.00 0 0.00 0 –
3.2.2. Other 32,984 0.06 1,127 0.00 –31,857 –96.583.2.2.1. Shares 0 0.00 0 0.00 0 –3.2.2.2. Units in mutual funds 0 0.00 0 0.00 0 –3.2.2.3. Fixed-income 32,984 0.06 1,127 0.00 –31,857 –96.583.2.2.4. Purchased foreign warrants and options 0 0.00 0 0.00 0 –3.2.2.5. Unlisted portfolio 0 0.00 0 0.00 0 –
4. Net balance (debtors-creditors) –41,771 –0.08 –53,550 –0.09 –11,779 –28.20
A.4.9.Investment in securities. FIAMM. Breakdown of assets at market value
Amounts in thousands of euros

305
Annex 4: Collective investment schemes and venture capital companies
Committed nominal amount
12/31/2002 12/31/2003
Amount % of assets Amount % of assets
Forward purchases 11,667 0.02 89,876 0.15Spot purchases 1,469,229 2.75 300,355 0.52Purchased futures 0 0.00 0 0.00Options and warrants (call purchase, put sale) 0 0.00 0 0.00Financial swaps. Collection rights 0 0.00 0 0.00Other purchase commitments 0 0.00 0 0.00Forward sales 0 0.00 0 0.00Spot sales 1,010 0.00 0 0.00Sold futures 196,766 0.37 734,266 1.26Options and warrants (call sale, put purchase) 0 0.00 943,200 1.62Financial swaps. Payment obligations 0 0.00 0 0.00Other sale commitments 0 0.00 0 0.00
Total 1,678,672 3.15 2,067,697 3.56
A.4.10.Investment in securities. FIAMM. Transactions in derivatives.
Amounts in thousands of euros

306
Annual rep
ort o
n th
e securities m
arket. 2003
A.4.11.Investment in securities. FIAMM. Breakdown of change in assets
Amount in thousands of euros
2003 Accumulated
1Q 2Q 3Q 4Q 2003 2002
% of % of % of % of % of % ofAmount average Amount average Amount average Amount average Amount average Amount average
daily assets daily assets daily assets daily assets daily assets daily assets
Change in assets 2,031,553 3.71 1,860,609 3.31 1,368,496 2.34 –572,715 –0.98 4,687,943 8.29 9,544,756 19.34
Net subscriptions andreimbursements 1,767,014 3.23 1,618,574 2.88 1,191,605 2.04 –734,083 –1.26 3,843,110 6.80 8,356,368 16.93
Gross distributed profits –787 0.00 –716 0.00 –612 0.00 –555 0.00 –2,670 0.00 –3880 –0.01
Net yields 265,326 0.48 242,750 0.43 177,504 0.30 161,923 0.28 847,503 1.50 1,192,255 2,42
Total yields 403,327 0.74 386,325 0.69 326,371 0.56 308,680 0.53 1,424,703 2.52 1,707,574 3.46Interest 444,671 0.81 427,134 0.76 368,218 0.63 369,044 0.63 1,609,067 2.85 1,866,970 3.78Total changes in price of fixed-income (whether realisedor not) –35,227 –0.06 –36,126 –0.06 –39,320 –0.07 –60,101 –0.10 –170,774 –0.30 –143,255 –0.29
Total changes in price ofequities (whether realisedor not) –14 0.00 21 0.00 20 0.00 –2 0.00 25 0.00 –3 0.00
Results on derivatives –3,993 –0.01 –2,438 0.00 –890 0.00 1,175 0.00 –6,146 –0.01 –9,782 –0.02Other yields –2,106 0.00 –2,265 0.00 –1,648 0.00 –1,438 0.00 –7,457 –0.01 –6,547 –0.01Foreign exchange differences –4 0.00 –1 0.00 –9 0.00 2 0.00 –12 0.00 191 0.00
Total expenses 138,001 0.25 143,575 0.26 148,867 0.25 146,757 0.25 577,200 1.02 515,319 1.04Management fees 121,805 0.22 126,262 0.22 130,866 0.22 129,287 0.22 508,220 0.90 454,174 0.92Custody fees 15,141 0.03 16,656 0.03 16,885 0.03 16,663 0.03 65,345 0.12 55,591 0.11Other operating costs 1,055 0.00 657 0.00 1,116 0.00 807 0.00 3,635 0.01 5,554 0.01

307
Annex 4
: Collective in
vestmen
t schem
es and ven
ture cap
ital com
pan
iesA.4.12.Investment in securities. FIAMM. Yields, volatility and duration
1Q 2Q 3Q 4Q 2003
Yield Vol Dur Yield Vol Dur Yield Vol Dur Yield Vol Dur Yield Vol(1) (2) Type (1) (2) Type (1) (2) Type (1) (2) Type (1)% % % % %
% fees
Management Front end Back endCustody
of assets of yield Max. Min. Max. Min.
Yieldsince1996
ABANTE TESORERIA FIAMM 0.60 1.60 0.00 FIAMM 0.54 1.49 0.00 FIAMM 0.45 1.08 0.00 FIAMM 0.44 1.17 0.00 FIAMM 2.05 1.99 NA 0.10 0.00 0.00 0.00 0.00 0.00 0.05AC CUENTA FT FIAMM 0.44 1.35 0.13 FIAMM 0.35 1.78 0.18 FIAMM 0.30 2.01 0.12 FIAMM 0.27 1.80 0.10 FIAMM 1.37 0.02 12.41 1.00 0.00 0.00 0.00 0.00 0.00 0.06AC DINERO FIAMM 0.51 4.37 0.17 FIAMM 0.41 5.47 0.18 FIAMM 0.34 2.38 0.17 FIAMM 0.31 3.79 0.19 FIAMM 1.57 4.47 12.93 1.00 0.00 0.00 0.00 0.00 0.00 0.05AHORRO ACTIVO FT FIAMM 0.40 5.76 0.01 FIAMM 0.31 1.16 0.01 FIAMM 0.22 9.15 0.00 FIAMM 0.21 9.03 0.01 FIAMM 1.14 0.03 11.13 1.00 0.00 0.00 0.00 0.00 0.00 0.10ALCALA DINERO FIAMM 0.44 0.44 0.28 FIAMM 0.28 0.47 0.33 FIAMM 0.35 0.10 0.19 FIAMM 0.34 6.07 0.28 FIAMM 1.41 0.33 12.95 0.90 0.00 0.00 0.00 0.00 0.00 0.02ALTAE DINERO FIAMM 0.53 6.65 0.27 FIAMM 0.45 0.10 0.25 FIAMM 0.29 9.98 0.00 FIAMM 0.26 4.66 0.19 FIAMM 1.54 8.75 13.12 0.90 0.00 0.00 0.00 0.00 0.00 0.10ASTURFONDO DINERO FIAMM 0.42 2.76 0.18 FIAMM 0.35 7.07 0.17 FIAMM 0.27 7.03 0.18 FIAMM 0.25 3.91 0.19 FIAMM 1.30 2.06 11.92 1.00 0.00 0.00 0.00 0.00 0.00 0.07ATLANT. DINERFOND FIAMM 0.53 6.43 0.16 FIAMM 0.44 5.26 0.18 FIAMM 0.39 6.56 0.20 FIAMM 0.35 8.42 0.15 FIAMM 1.71 1.65 13.99 0.60 0.00 0.00 0.00 0.00 0.00 0.15ATLANTICO AZUL PREMIER FIAMM 0.59 6.35 0.13 FIAMM 0.50 5.61 0.00 FIAMM 0.45 1.06 0.00 FIAMM 0.41 1.27 0.17 FIAMM 1.98 1.76 NA 0.40 0.00 0.00 0.00 0.00 0.00 0.10ATLAS RENTA FIAMM 0.37 7.72 0.04 FIAMM 0.31 1.75 0.02 FIAMM 0.24 2.61 0.28 FIAMM 0.19 0.12 0.27 FIAMM 1.12 6.79 11.15 1.00 0.00 0.00 0.00 0.00 0.00 0.10BANCAJA DINERO FIAMM 0.42 2.88 0.12 FIAMM 0.34 9.34 0.10 FIAMM 0.25 9.96 0.08 FIAMM 0.23 1.16 0.11 FIAMM 1.25 2.33 11.11 0.98 0.00 0.00 0.00 0.00 0.00 0.15BANCAJA DINERO PLUS FIAMM 0.51 2.87 0.12 FIAMM 0.44 9.34 0.11 FIAMM 0.35 9.10 0.08 FIAMM 0.33 1.22 0.11 FIAMM 1.64 2.33 14.03 0.70 0.00 0.00 0.00 0.00 0.00 0.05BANESTO MONETARIO FIAMM 0.45 0.13 0.46 FIAMM 0.44 0.12 0.37 FIAMM 0.25 0.08 0.41 FIAMM 0.24 8.28 0.39 FIAMM 1.39 0.11 11.33 1.00 0.00 0.00 0.00 0.00 0.00 0.15BANIF DINERO FIAMM 0.56 0.11 0.45 FIAMM 0.48 0.10 0.38 FIAMM 0.33 8.38 0.42 FIAMM 0.31 0.08 0.39 FIAMM 1.69 0.10 14.14 0.75 0.00 0.00 0.00 0.00 0.00 0.15BANIF TESORERIA FT FIAMM 0.43 5.82 0.27 FIAMM 0.34 3.08 0.19 FIAMM 0.24 3.54 0.24 FIAMM 0.21 3.02 0.22 FIAMM 1.22 4.45 11.83 1.00 0.00 0.00 0.00 0.00 0.00 0.15BANKINTER DINERO 1 FIAMM NA 0.11 0.29 FIAMM 0.41 4.49 0.30 FIAMM 0.33 0.02 0.34 FIAMM 0.32 2.02 0.25 FIAMM NA 6.07 NA 0.70 0.00 0.00 0.00 0.00 0.00 0.05BANKINTER DINERO 2 FIAMM 0.60 0.01 0.42 FIAMM 0.53 4.33 0.33 FIAMM 0.41 2.41 0.30 FIAMM 0.39 5.68 0.23 FIAMM 1.95 4.27 15.68 0.35 0.00 0.00 0.00 0.00 0.00 0.15BANKINTER DINERO 3 FIAMM NA 0.08 0.29 FIAMM 0.54 5.20 0.32 FIAMM 0.46 2.45 0.30 FIAMM 0.44 6.34 0.22 FIAMM NA 6.13 NA 0.25 0.00 0.00 0.00 0.00 0.00 0.05BANKINTER DINERO 4 FIAMM 0.68 1.26 0.55 FIAMM 0.63 5.17 0.32 FIAMM 0.51 2.33 0.30 FIAMM 0.48 6.39 0.23 FIAMM 2.32 4.70 NA 0.10 0.00 0.00 0.00 0.00 0.00 0.05BANKOA TESORERIA FIAMM 0.53 3.04 0.31 FIAMM 0.45 2.38 0.42 FIAMM 0.38 4.43 0.49 FIAMM 0.33 0.10 0.56 FIAMM 1.70 6.22 13.90 0.75 0.00 0.00 0.00 0.00 0.00 0.00BANKPYME FV FIAMM 0.51 4.72 0.20 FIAMM 0.41 4.87 0.18 FIAMM 0.30 1.72 0.12 FIAMM 0.28 6.85 0.10 FIAMM 1.50 4.01 12.94 0.75 0.00 0.00 0.00 0.00 0.00 0.15BANKPYME MULTIDINERO FIAMM 0.56 7.09 0.28 FIAMM 0.61 4.97 0.47 FIAMM 0.47 8.47 0.43 FIAMM 0.43 7.89 1.56 FIAMM 2.07 0.07 12.33 0.25 0.00 0.00 0.00 0.00 0.00 0.10BARCLAYS DINERO FIAMM 0.53 0.21 0.51 FIAMM 0.43 0.17 0.51 FIAMM 0.28 0.18 0.55 FIAMM 0.23 0.22 0.52 FIAMM 1.48 0.20 12.07 1.00 0.00 0.00 0.00 1.00 0.00 0.14BARCLAYS EUROCASH FIAMM 0.49 0.10 0.19 FIAMM 0.37 0.06 0.10 FIAMM 0.31 6.60 0.17 FIAMM 0.28 1.36 0.11 FIAMM 1.46 7.19 25.43 0.90 0.00 0.00 0.00 0.00 0.00 0.10BBK FONDINERO FIAMM 0.51 1.61 0.20 FIAMM 0.43 9.57 0.17 FIAMM 0.36 2.01 0.22 FIAMM 0.36 9.19 0.35 FIAMM 1.68 5.01 14.28 0.65 0.00 0.00 0.00 0.00 0.00 0.09BBVA ACTIVOS FT FIAMM 0.49 8.07 0.45 FIAMM 0.40 9.75 0.45 FIAMM 0.29 8.75 0.35 FIAMM 0.25 9.87 0.36 FIAMM 1.44 9.36 11.60 1.00 0.00 0.00 0.00 0.00 0.00 0.00BBVA DINERO FIAMM 0.47 9.42 0.44 FIAMM 0.39 0.11 0.40 FIAMM 0.28 8.14 0.28 FIAMM 0.26 9.44 0.34 FIAMM 1.42 0.09 12.60 1.00 0.00 0.00 0.00 0.00 0.00 0.10BBVA DINERO II FIAMM NA 0.10 0.34 FIAMM 0.43 0.11 0.39 FIAMM 0.37 9.68 0.34 FIAMM 0.33 9.21 0.34 FIAMM NA 0.10 NA 0.65 0.00 0.00 0.00 0.00 0.00 0.10BBVA DINERO III FIAMM 0.59 9.51 0.45 FIAMM 0.51 0.10 0.40 FIAMM 0.41 8.36 0.32 FIAMM 0.38 9.13 0.32 FIAMM 1.91 9.66 16.03 0.50 0.00 0.00 0.00 0.00 0.00 0.10BBVA DINERO IV FIAMM NA 0.11 0.41 FIAMM 0.54 0.10 0.38 FIAMM 0.47 9.20 0.34 FIAMM 0.44 9.23 0.32 FIAMM NA 0.10 NA 0.25 0.00 0.00 0.00 0.00 0.00 0.05BBVA LIQUIDEZ FIAMM NA 9.59 0.45 FIAMM 0.55 0.14 0.34 FIAMM 0.46 0.10 0.33 FIAMM 0.48 0.11 0.29 FIAMM NA 0.11 NA 0.15 0.00 0.00 0.00 0.00 0.00 0.05BCH FONDIMO 1 FIAMM 0.49 0.11 0.46 FIAMM 0.43 0.10 0.39 FIAMM 0.28 8.38 0.41 FIAMM 0.26 8.50 0.40 FIAMM 1.46 9.97 13.09 1.00 0.00 0.00 0.00 0.00 0.00 0.10BCH FONDIMO 2 FIAMM 0.49 0.12 0.44 FIAMM 0.44 0.12 0.37 FIAMM 0.27 0.10 0.44 FIAMM 0.25 8.38 0.39 FIAMM 1.46 0.11 12.89 1.00 0.00 0.00 0.00 0.00 0.00 0.10BETA DINERO FIAMM 0.56 6.19 0.11 FIAMM 0.46 0.11 0.10 FIAMM 0.31 4.40 0.14 FIAMM 0.31 3.91 0.14 FIAMM 1.65 7.35 13.03 0.90 0.00 0.00 0.00 0.00 0.00 0.07BG DINERO FIAMM 0.44 2.23 0.08 FIAMM 0.38 1.86 0.09 FIAMM 0.27 1.13 0.07 FIAMM 0.25 9.98 0.11 FIAMM 1.35 2.32 11.39 1.00 0.00 0.00 0.00 0.00 0.00 0.15BG MONETARIO FIAMM 0.49 2.58 0.09 FIAMM 0.43 2.01 0.09 FIAMM 0.32 0.01 0.08 FIAMM 0.30 1.00 0.10 FIAMM 1.56 2.51 12.88 0.85 0.00 0.00 0.00 0.00 0.00 0.09BI EURO DINERO FIAMM 0.57 0.23 0.20 FIAMM 0.49 0.13 0.39 FIAMM 0.47 0.08 0.23 FIAMM 0.36 7.88 0.41 FIAMM 1.90 0.14 14.01 0.50 0.00 0.00 0.00 0.00 0.00 0.00BIZKAIFONDO FIAMM 0.47 3.08 0.19 FIAMM 0.36 1.48 0.17 FIAMM 0.28 1.52 0.21 FIAMM 0.27 7.25 0.31 FIAMM 1.38 4.46 11.95 1.00 0.00 0.00 0.00 0.00 0.00 0.09BK DINERO 95 FIAMM 0.49 0.01 0.52 FIAMM 0.40 5.19 0.32 FIAMM 0.30 2.80 0.30 FIAMM 0.28 4.44 0.18 FIAMM 1.48 4.19 12.64 0.85 0.00 0.00 0.00 0.00 0.00 0.15BK DINERO 96 FIAMM 0.49 2.49 0.62 FIAMM 0.41 3.49 0.32 FIAMM 0.29 3.05 0.28 FIAMM 0.27 5.01 0.22 FIAMM 1.47 4.13 12.85 0.85 0.00 0.00 0.00 0.00 0.00 0.15BK DINERO 97 FIAMM 0.49 1.44 0.53 FIAMM 0.44 4.20 0.32 FIAMM 0.28 3.34 0.30 FIAMM 0.27 3.69 0.20 FIAMM 1.49 3.93 12.86 0.85 0.00 0.00 0.00 0.00 0.00 0.15BK DINERO FIAMM 0.52 0.04 0.29 FIAMM 0.39 0.03 0.33 FIAMM 0.28 3.30 0.30 FIAMM 0.27 2.61 0.22 FIAMM 1.46 4.38 12.62 0.85 0.00 0.00 0.00 0.00 0.00 0.15BK MONETARIO FIAMM 0.45 1.56 0.49 FIAMM 0.40 0.06 0.33 FIAMM 0.22 5.15 0.30 FIAMM 0.24 6.80 0.23 FIAMM 1.32 0.05 10.92 1.00 0.00 0.00 0.00 0.00 0.00 0.15BNP CASH FIAMM 0.56 6.27 0.24 FIAMM 0.57 6.58 0.48 FIAMM 0.42 6.49 0.50 FIAMM 0.38 7.64 0.00 FIAMM 1.95 0.07 15.44 0.45 0.00 0.00 0.00 0.00 0.00 0.10BROKERDINER FIAMM 0.43 0.08 0.21 FIAMM 0.34 4.67 0.18 FIAMM 0.20 4.73 0.00 FIAMM 0.21 3.33 0.20 FIAMM 1.18 5.95 11.05 1.00 0.00 0.00 0.00 0.00 0.00 0.15CAI DINERO FIAMM 0.48 4.48 0.15 FIAMM 0.37 6.01 0.21 FIAMM 0.31 0.02 0.16 FIAMM 0.28 3.92 0.19 FIAMM 1.45 0.04 12.35 1.00 0.00 0.00 0.00 0.00 0.00 0.14CAIXA GALICIA DR FIAMM 0.49 4.65 0.16 FIAMM 0.39 6.15 0.21 FIAMM 0.32 2.42 0.17 FIAMM 0.29 0.03 0.17 FIAMM 1.49 4.75 12.04 1.00 0.00 0.00 0.00 0.00 0.00 0.15CAIXASAB. 1-DINER FIAMM 0.49 5.21 0.17 FIAMM 0.38 6.62 0.22 FIAMM 0.32 2.69 0.17 FIAMM 0.29 4.16 0.18 FIAMM 1.48 5.16 11.66 1.00 0.00 0.00 0.00 0.00 0.00 0.14CAJA EXTREMADURA FIAMM NA NA NA NA 0.10 0.11 FIAMM 0.38 1.72 0.10 FIAMM 0.38 3.68 0.17 FIAMM NA 6.46 NA 0.65 0.00 0.00 0.00 0.00 0.00 0.05CAJA INGENIEROS TESORERIA FIAMM NA NA NA NA 3.41 0.14 FIAMM 0.36 3.30 0.15 FIAMM 0.39 4.53 0.31 FIAMM NA 3.91 NA 0.45 0.00 0.00 0.00 0.00 0.00 0.15CAJA LABORAL AHORRO FIAMM 0.50 8.17 0.45 FIAMM 0.48 0.11 0.48 FIAMM 0.23 0.21 0.49 FIAMM 0.21 0.22 0.37 FIAMM 1.43 0.17 12.94 1.00 0.00 0.00 0.00 1.00 0.00 0.15CAJA LABORAL DR FIAMM 0.46 5.08 0.34 FIAMM 0.46 8.75 0.31 FIAMM 0.23 9.75 0.21 FIAMM 0.24 1.42 0.15 FIAMM 1.40 5.66 11.82 1.00 0.00 0.00 0.00 1.00 0.00 0.15
(Continues over)
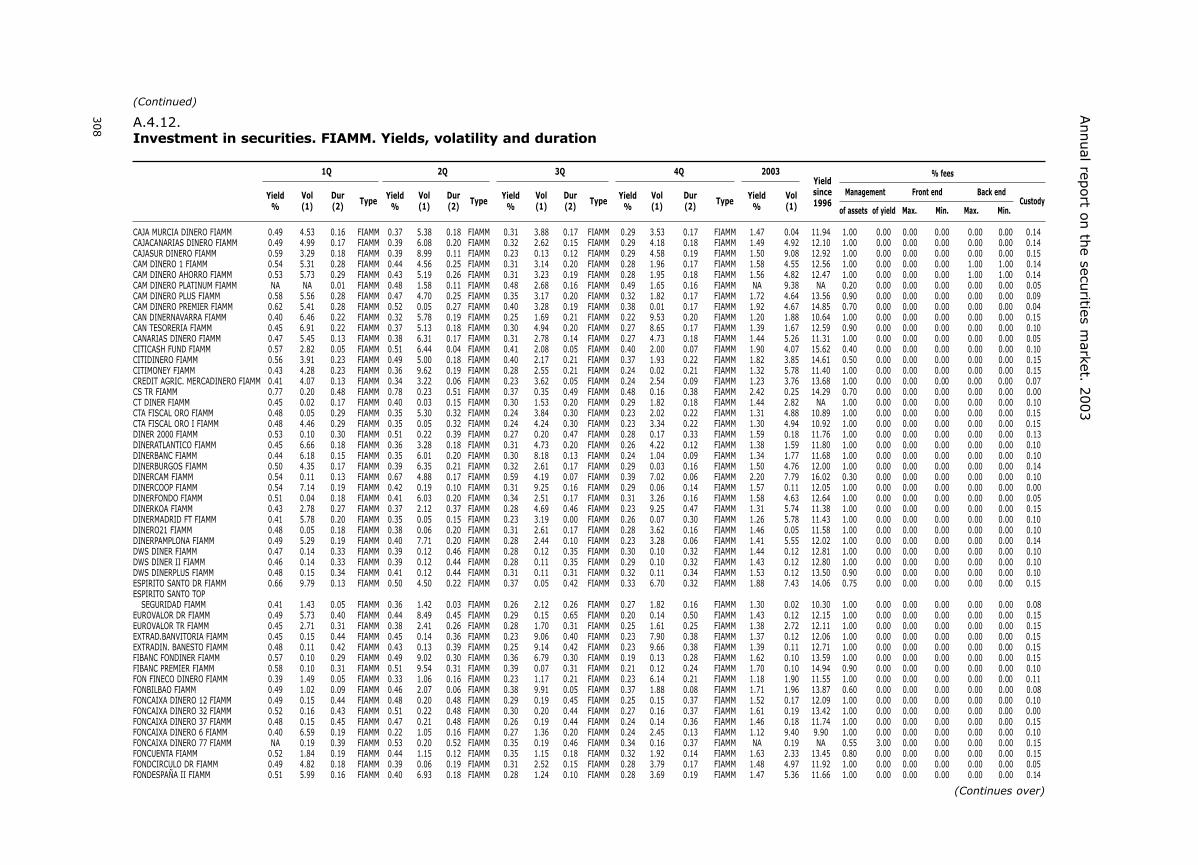
308
Annual rep
ort o
n th
e securities m
arket. 2003
CAJA MURCIA DINERO FIAMM 0.49 4.53 0.16 FIAMM 0.37 5.38 0.18 FIAMM 0.31 3.88 0.17 FIAMM 0.29 3.53 0.17 FIAMM 1.47 0.04 11.94 1.00 0.00 0.00 0.00 0.00 0.00 0.14CAJACANARIAS DINERO FIAMM 0.49 4.99 0.17 FIAMM 0.39 6.08 0.20 FIAMM 0.32 2.62 0.15 FIAMM 0.29 4.18 0.18 FIAMM 1.49 4.92 12.10 1.00 0.00 0.00 0.00 0.00 0.00 0.14CAJASUR DINERO FIAMM 0.59 3.29 0.18 FIAMM 0.39 8.99 0.11 FIAMM 0.23 0.13 0.12 FIAMM 0.29 4.58 0.19 FIAMM 1.50 9.08 12.92 1.00 0.00 0.00 0.00 0.00 0.00 0.15CAM DINERO 1 FIAMM 0.54 5.31 0.28 FIAMM 0.44 4.56 0.25 FIAMM 0.31 3.14 0.20 FIAMM 0.28 1.96 0.17 FIAMM 1.58 4.55 12.56 1.00 0.00 0.00 0.00 1.00 1.00 0.14CAM DINERO AHORRO FIAMM 0.53 5.73 0.29 FIAMM 0.43 5.19 0.26 FIAMM 0.31 3.23 0.19 FIAMM 0.28 1.95 0.18 FIAMM 1.56 4.82 12.47 1.00 0.00 0.00 0.00 1.00 1.00 0.14CAM DINERO PLATINUM FIAMM NA NA 0.01 FIAMM 0.48 1.58 0.11 FIAMM 0.48 2.68 0.16 FIAMM 0.49 1.65 0.16 FIAMM NA 9.38 NA 0.20 0.00 0.00 0.00 0.00 0.00 0.05CAM DINERO PLUS FIAMM 0.58 5.56 0.28 FIAMM 0.47 4.70 0.25 FIAMM 0.35 3.17 0.20 FIAMM 0.32 1.82 0.17 FIAMM 1.72 4.64 13.56 0.90 0.00 0.00 0.00 0.00 0.00 0.09CAM DINERO PREMIER FIAMM 0.62 5.41 0.28 FIAMM 0.52 0.05 0.27 FIAMM 0.40 3.28 0.19 FIAMM 0.38 0.01 0.17 FIAMM 1.92 4.67 14.85 0.70 0.00 0.00 0.00 0.00 0.00 0.04CAN DINERNAVARRA FIAMM 0.40 6.46 0.22 FIAMM 0.32 5.78 0.19 FIAMM 0.25 1.69 0.21 FIAMM 0.22 9.53 0.20 FIAMM 1.20 1.88 10.64 1.00 0.00 0.00 0.00 0.00 0.00 0.15CAN TESORERIA FIAMM 0.45 6.91 0.22 FIAMM 0.37 5.13 0.18 FIAMM 0.30 4.94 0.20 FIAMM 0.27 8.65 0.17 FIAMM 1.39 1.67 12.59 0.90 0.00 0.00 0.00 0.00 0.00 0.10CANARIAS DINERO FIAMM 0.47 5.45 0.13 FIAMM 0.38 6.31 0.17 FIAMM 0.31 2.78 0.14 FIAMM 0.27 4.73 0.18 FIAMM 1.44 5.26 11.31 1.00 0.00 0.00 0.00 0.00 0.00 0.05CITICASH FUND FIAMM 0.57 2.82 0.05 FIAMM 0.51 6.44 0.04 FIAMM 0.41 2.08 0.05 FIAMM 0.40 2.00 0.07 FIAMM 1.90 4.07 15.62 0.40 0.00 0.00 0.00 0.00 0.00 0.10CITIDINERO FIAMM 0.56 3.91 0.23 FIAMM 0.49 5.00 0.18 FIAMM 0.40 2.17 0.21 FIAMM 0.37 1.93 0.22 FIAMM 1.82 3.85 14.61 0.50 0.00 0.00 0.00 0.00 0.00 0.15CITIMONEY FIAMM 0.43 4.28 0.23 FIAMM 0.36 9.62 0.19 FIAMM 0.28 2.55 0.21 FIAMM 0.24 0.02 0.21 FIAMM 1.32 5.78 11.40 1.00 0.00 0.00 0.00 0.00 0.00 0.15CREDIT AGRIC. MERCADINERO FIAMM 0.41 4.07 0.13 FIAMM 0.34 3.22 0.06 FIAMM 0.23 3.62 0.05 FIAMM 0.24 2.54 0.09 FIAMM 1.23 3.76 13.68 1.00 0.00 0.00 0.00 0.00 0.00 0.07CS TR FIAMM 0.77 0.20 0.48 FIAMM 0.78 0.23 0.51 FIAMM 0.37 0.35 0.49 FIAMM 0.48 0.16 0.38 FIAMM 2.42 0.25 14.29 0.70 0.00 0.00 0.00 0.00 0.00 0.00CT DINER FIAMM 0.45 0.02 0.17 FIAMM 0.40 0.03 0.15 FIAMM 0.30 1.53 0.20 FIAMM 0.29 1.82 0.18 FIAMM 1.44 2.82 NA 1.00 0.00 0.00 0.00 0.00 0.00 0.10CTA FISCAL ORO FIAMM 0.48 0.05 0.29 FIAMM 0.35 5.30 0.32 FIAMM 0.24 3.84 0.30 FIAMM 0.23 2.02 0.22 FIAMM 1.31 4.88 10.89 1.00 0.00 0.00 0.00 0.00 0.00 0.15CTA FISCAL ORO I FIAMM 0.48 4.46 0.29 FIAMM 0.35 0.05 0.32 FIAMM 0.24 4.24 0.30 FIAMM 0.23 3.34 0.22 FIAMM 1.30 4.94 10.92 1.00 0.00 0.00 0.00 0.00 0.00 0.15DINER 2000 FIAMM 0.53 0.10 0.30 FIAMM 0.51 0.22 0.39 FIAMM 0.27 0.20 0.47 FIAMM 0.28 0.17 0.33 FIAMM 1.59 0.18 11.76 1.00 0.00 0.00 0.00 0.00 0.00 0.13DINERATLANTICO FIAMM 0.45 6.66 0.18 FIAMM 0.36 3.28 0.18 FIAMM 0.31 4.73 0.20 FIAMM 0.26 4.22 0.12 FIAMM 1.38 1.59 11.80 1.00 0.00 0.00 0.00 0.00 0.00 0.10DINERBANC FIAMM 0.44 6.18 0.15 FIAMM 0.35 6.01 0.20 FIAMM 0.30 8.18 0.13 FIAMM 0.24 1.04 0.09 FIAMM 1.34 1.77 11.68 1.00 0.00 0.00 0.00 0.00 0.00 0.10DINERBURGOS FIAMM 0.50 4.35 0.17 FIAMM 0.39 6.35 0.21 FIAMM 0.32 2.61 0.17 FIAMM 0.29 0.03 0.16 FIAMM 1.50 4.76 12.00 1.00 0.00 0.00 0.00 0.00 0.00 0.14DINERCAM FIAMM 0.54 0.11 0.13 FIAMM 0.67 4.88 0.17 FIAMM 0.59 4.19 0.07 FIAMM 0.39 7.02 0.06 FIAMM 2.20 7.79 16.02 0.30 0.00 0.00 0.00 0.00 0.00 0.10DINERCOOP FIAMM 0.54 7.14 0.19 FIAMM 0.42 0.19 0.10 FIAMM 0.31 9.25 0.16 FIAMM 0.29 0.06 0.14 FIAMM 1.57 0.11 12.05 1.00 0.00 0.00 0.00 0.00 0.00 0.00DINERFONDO FIAMM 0.51 0.04 0.18 FIAMM 0.41 6.03 0.20 FIAMM 0.34 2.51 0.17 FIAMM 0.31 3.26 0.16 FIAMM 1.58 4.63 12.64 1.00 0.00 0.00 0.00 0.00 0.00 0.05DINERKOA FIAMM 0.43 2.78 0.27 FIAMM 0.37 2.12 0.37 FIAMM 0.28 4.69 0.46 FIAMM 0.23 9.25 0.47 FIAMM 1.31 5.74 11.38 1.00 0.00 0.00 0.00 0.00 0.00 0.15DINERMADRID FT FIAMM 0.41 5.78 0.20 FIAMM 0.35 0.05 0.15 FIAMM 0.23 3.19 0.00 FIAMM 0.26 0.07 0.30 FIAMM 1.26 5.78 11.43 1.00 0.00 0.00 0.00 0.00 0.00 0.10DINERO21 FIAMM 0.48 0.05 0.18 FIAMM 0.38 0.06 0.20 FIAMM 0.31 2.61 0.17 FIAMM 0.28 3.62 0.16 FIAMM 1.46 0.05 11.58 1.00 0.00 0.00 0.00 0.00 0.00 0.10DINERPAMPLONA FIAMM 0.49 5.29 0.19 FIAMM 0.40 7.71 0.20 FIAMM 0.28 2.44 0.10 FIAMM 0.23 3.28 0.06 FIAMM 1.41 5.55 12.02 1.00 0.00 0.00 0.00 0.00 0.00 0.14DWS DINER FIAMM 0.47 0.14 0.33 FIAMM 0.39 0.12 0.46 FIAMM 0.28 0.12 0.35 FIAMM 0.30 0.10 0.32 FIAMM 1.44 0.12 12.81 1.00 0.00 0.00 0.00 0.00 0.00 0.10DWS DINER II FIAMM 0.46 0.14 0.33 FIAMM 0.39 0.12 0.44 FIAMM 0.28 0.11 0.35 FIAMM 0.29 0.10 0.32 FIAMM 1.43 0.12 12.80 1.00 0.00 0.00 0.00 0.00 0.00 0.10DWS DINERPLUS FIAMM 0.48 0.15 0.34 FIAMM 0.41 0.12 0.44 FIAMM 0.31 0.11 0.31 FIAMM 0.32 0.11 0.34 FIAMM 1.53 0.12 13.50 0.90 0.00 0.00 0.00 0.00 0.00 0.10ESPIRITO SANTO DR FIAMM 0.66 9.79 0.13 FIAMM 0.50 4.50 0.22 FIAMM 0.37 0.05 0.42 FIAMM 0.33 6.70 0.32 FIAMM 1.88 7.43 14.06 0.75 0.00 0.00 0.00 0.00 0.00 0.15ESPIRITO SANTO TOP
SEGURIDAD FIAMM 0.41 1.43 0.05 FIAMM 0.36 1.42 0.03 FIAMM 0.26 2.12 0.26 FIAMM 0.27 1.82 0.16 FIAMM 1.30 0.02 10.30 1.00 0.00 0.00 0.00 0.00 0.00 0.08EUROVALOR DR FIAMM 0.49 5.73 0.40 FIAMM 0.44 8.49 0.45 FIAMM 0.29 0.15 0.65 FIAMM 0.20 0.14 0.50 FIAMM 1.43 0.12 12.15 1.00 0.00 0.00 0.00 0.00 0.00 0.15EUROVALOR TR FIAMM 0.45 2.71 0.31 FIAMM 0.38 2.41 0.26 FIAMM 0.28 1.70 0.31 FIAMM 0.25 1.61 0.25 FIAMM 1.38 2.72 12.11 1.00 0.00 0.00 0.00 0.00 0.00 0.15EXTRAD.BANVITORIA FIAMM 0.45 0.15 0.44 FIAMM 0.45 0.14 0.36 FIAMM 0.23 9.06 0.40 FIAMM 0.23 7.90 0.38 FIAMM 1.37 0.12 12.06 1.00 0.00 0.00 0.00 0.00 0.00 0.15EXTRADIN. BANESTO FIAMM 0.48 0.11 0.42 FIAMM 0.43 0.13 0.39 FIAMM 0.25 9.14 0.42 FIAMM 0.23 9.66 0.38 FIAMM 1.39 0.11 12.71 1.00 0.00 0.00 0.00 0.00 0.00 0.15FIBANC FONDINER FIAMM 0.57 0.10 0.29 FIAMM 0.49 9.02 0.30 FIAMM 0.36 6.79 0.30 FIAMM 0.19 0.13 0.28 FIAMM 1.62 0.10 13.59 1.00 0.00 0.00 0.00 0.00 0.00 0.15FIBANC PREMIER FIAMM 0.58 0.10 0.31 FIAMM 0.51 9.54 0.31 FIAMM 0.39 0.07 0.31 FIAMM 0.21 0.12 0.24 FIAMM 1.70 0.10 14.94 0.90 0.00 0.00 0.00 0.00 0.00 0.10FON FINECO DINERO FIAMM 0.39 1.49 0.05 FIAMM 0.33 1.06 0.16 FIAMM 0.23 1.17 0.21 FIAMM 0.23 6.14 0.21 FIAMM 1.18 1.90 11.55 1.00 0.00 0.00 0.00 0.00 0.00 0.11FONBILBAO FIAMM 0.49 1.02 0.09 FIAMM 0.46 2.07 0.06 FIAMM 0.38 9.91 0.05 FIAMM 0.37 1.88 0.08 FIAMM 1.71 1.96 13.87 0.60 0.00 0.00 0.00 0.00 0.00 0.08FONCAIXA DINERO 12 FIAMM 0.49 0.15 0.44 FIAMM 0.48 0.20 0.48 FIAMM 0.29 0.19 0.45 FIAMM 0.25 0.15 0.37 FIAMM 1.52 0.17 12.09 1.00 0.00 0.00 0.00 0.00 0.00 0.10FONCAIXA DINERO 32 FIAMM 0.52 0.16 0.43 FIAMM 0.51 0.22 0.48 FIAMM 0.30 0.20 0.44 FIAMM 0.27 0.16 0.37 FIAMM 1.61 0.19 13.42 1.00 0.00 0.00 0.00 0.00 0.00 0.00FONCAIXA DINERO 37 FIAMM 0.48 0.15 0.45 FIAMM 0.47 0.21 0.48 FIAMM 0.26 0.19 0.44 FIAMM 0.24 0.14 0.36 FIAMM 1.46 0.18 11.74 1.00 0.00 0.00 0.00 0.00 0.00 0.15FONCAIXA DINERO 6 FIAMM 0.40 6.59 0.19 FIAMM 0.22 1.05 0.16 FIAMM 0.27 1.36 0.20 FIAMM 0.24 2.45 0.13 FIAMM 1.12 9.40 9.90 1.00 0.00 0.00 0.00 0.00 0.00 0.10FONCAIXA DINERO 77 FIAMM NA 0.19 0.39 FIAMM 0.53 0.20 0.52 FIAMM 0.35 0.19 0.46 FIAMM 0.34 0.16 0.37 FIAMM NA 0.19 NA 0.55 3.00 0.00 0.00 0.00 0.00 0.15FONCUENTA FIAMM 0.52 1.84 0.19 FIAMM 0.44 1.15 0.12 FIAMM 0.35 1.15 0.18 FIAMM 0.32 1.92 0.14 FIAMM 1.63 2.33 13.45 0.80 0.00 0.00 0.00 0.00 0.00 0.15FONDCIRCULO DR FIAMM 0.49 4.82 0.18 FIAMM 0.39 0.06 0.19 FIAMM 0.31 2.52 0.15 FIAMM 0.28 3.79 0.17 FIAMM 1.48 4.97 11.92 1.00 0.00 0.00 0.00 0.00 0.00 0.05FONDESPAÑA II FIAMM 0.51 5.99 0.16 FIAMM 0.40 6.93 0.18 FIAMM 0.28 1.24 0.10 FIAMM 0.28 3.69 0.19 FIAMM 1.47 5.36 11.66 1.00 0.00 0.00 0.00 0.00 0.00 0.14
A.4.12.Investment in securities. FIAMM. Yields, volatility and duration
1Q 2Q 3Q 4Q 2003
Yield Vol Dur Yield Vol Dur Yield Vol Dur Yield Vol Dur Yield Vol(1) (2) Type (1) (2) Type (1) (2) Type (1) (2) Type (1)% % % % %
% fees
Management Front end Back endCustody
of assets of yield Max. Min. Max. Min.
Yieldsince1996
(Continues over)
(Continued)

309
Annex 4
: Collective in
vestmen
t schem
es and ven
ture cap
ital com
pan
ies
FONDESPAÑA TR FIAMM 0.56 7.00 0.17 FIAMM 0.51 4.09 0.15 FIAMM 0.42 8.25 0.28 FIAMM 0.34 7.46 0.23 FIAMM 1.84 7.13 15.00 0.55 0.00 0.00 0.00 0.00 0.00 0.15FONDINERO FIAMM 0.49 4.00 0.18 FIAMM 0.38 6.14 0.20 FIAMM 0.32 2.48 0.15 FIAMM 0.30 3.55 0.17 FIAMM 1.50 0.04 12.07 1.00 0.00 0.00 0.00 0.00 0.00 0.09FONDINERO GALLEGO FIAMM 0.64 6.22 0.13 FIAMM 0.52 6.51 0.17 FIAMM 0.46 3.99 0.16 FIAMM 0.44 5.11 0.15 FIAMM 2.07 5.80 16.76 0.15 0.00 0.00 0.00 0.00 0.00 0.10FONDITEL DINERO FIAMM NA NA NA NA NA NA NA 0.13 0.00 FIAMM 0.42 0.10 0.07 FIAMM NA 0.12 NA 0.10 0.00 0.00 0.00 0.00 0.00 0.07FONDJOVER FIAMM 0.48 0.16 0.45 FIAMM 0.41 0.17 0.46 FIAMM 0.26 9.34 0.00 FIAMM 0.24 5.73 0.23 FIAMM 1.39 0.13 12.43 1.00 0.00 0.00 0.00 0.00 0.00 0.10FONDMADRID FIAMM 0.46 9.63 0.27 FIAMM 0.42 8.86 0.26 FIAMM 0.21 8.34 0.00 FIAMM 0.20 6.41 0.20 FIAMM 1.30 8.75 11.40 1.00 0.00 0.00 0.00 0.00 0.00 0.10FONDMAPFRE DINERO FIAMM 0.45 4.12 0.10 FIAMM 0.37 2.55 0.12 FIAMM 0.26 1.82 0.13 FIAMM 0.26 5.31 0.21 FIAMM 1.34 4.08 12.00 1.00 0.00 0.00 0.00 0.00 0.00 0.12FONDO 111 FIAMM 0.47 0.07 0.16 FIAMM 0.40 4.04 0.17 FIAMM 0.30 7.95 0.26 FIAMM 0.23 6.81 0.21 FIAMM 1.41 6.91 12.28 1.00 0.00 0.00 0.00 0.00 0.00 0.15FONDO ACTIVO LUSO ESPAÑOL FIAMM 0.51 8.33 0.80 FIAMM 0.37 6.04 0.71 FIAMM 0.27 3.96 0.65 FIAMM 0.25 9.58 0.67 FIAMM 1.39 7.63 12.63 1.00 0.00 0.00 0.00 0.00 0.00 0.13FONDO VALENCIA DINERO FIAMM 0.41 1.01 0.13 FIAMM 0.33 7.62 0.11 FIAMM 0.25 3.96 0.08 FIAMM 0.23 1.28 0.12 FIAMM 1.24 1.80 11.07 0.98 0.00 0.00 0.00 0.00 0.00 0.15FONDO VALENCIA ORO FIAMM 0.51 2.52 0.14 FIAMM 0.43 8.29 0.12 FIAMM 0.35 5.92 0.09 FIAMM 0.33 1.10 0.11 FIAMM 1.63 2.16 14.04 0.70 0.00 0.00 0.00 0.00 0.00 0.05FONDUERO DINERO FIAMM 0.46 1.66 0.09 FIAMM 0.42 7.55 0.26 FIAMM 0.33 0.23 0.66 FIAMM 0.25 0.28 0.54 FIAMM 1.47 0.19 13.34 0.75 0.00 0.00 0.00 0.00 0.00 0.14FONGENERAL DINERO FIAMM 0.50 0.05 0.17 FIAMM 0.40 6.92 0.20 FIAMM 0.31 2.72 0.16 FIAMM 0.28 3.75 0.16 FIAMM 1.50 5.24 12.13 1.00 0.00 0.00 0.00 0.00 0.00 0.15FONMANRESA FIAMM 0.55 6.18 0.28 FIAMM 0.47 6.57 0.26 FIAMM 0.34 6.94 0.31 FIAMM 0.31 8.01 0.51 FIAMM 1.67 7.28 12.53 1.00 0.00 0.00 0.00 0.00 0.00 0.10FONPENEDES DINER FIAMM 0.51 0.18 0.19 FIAMM 0.39 0.17 0.11 FIAMM 0.28 8.41 0.33 FIAMM 0.24 8.44 0.86 FIAMM 1.43 0.14 12.63 1.00 0.00 0.00 0.00 0.00 0.00 0.15FONPENEDES RENDES GARANTIT FIAMM 0.45 1.33 0.01 FIAMM 0.38 1.23 0.01 FIAMM 0.30 1.25 0.01 FIAMM 0.31 1.46 0.01 FIAMM 1.46 1.90 13.09 0.75 0.00 0.00 0.00 1.00 1.00 0.00FONSCATALONIA 2 FIAMM 0.39 3.85 0.06 FIAMM 0.32 1.05 0.01 FIAMM 0.23 2.09 0.02 FIAMM 0.25 3.25 0.17 FIAMM 1.20 2.19 11.75 1.00 0.00 0.00 0.00 0.00 0.00 0.13GAESCO FONDO FT FIAMM 0.44 9.45 0.04 FIAMM 0.37 7.48 0.08 FIAMM 0.28 1.94 0.10 FIAMM 0.28 1.38 0.07 FIAMM 1.37 1.99 12.51 0.80 0.00 0.00 0.00 0.00 0.00 0.10GESTI ALMAGRO FIAMM 0.48 5.08 0.25 FIAMM 0.35 1.45 0.17 FIAMM 0.28 2.16 0.24 FIAMM 0.26 6.64 0.27 FIAMM 1.37 4.77 11.76 1.00 0.00 0.00 0.00 0.00 0.00 0.09HISPAMER DINERO 1 FIAMM 0.48 0.10 0.44 FIAMM 0.44 0.10 0.35 FIAMM 0.27 9.20 0.41 FIAMM 0.25 9.02 0.39 FIAMM 1.44 0.10 12.73 1.00 0.00 0.00 0.00 0.00 0.00 0.10IBERAGENTES POPULAR DINERO
FT FIAMM 0.41 6.49 0.25 FIAMM 0.38 8.63 0.21 FIAMM 0.25 0.12 0.29 FIAMM 0.22 0.12 0.29 FIAMM 1.25 0.10 11.35 1.00 0.00 0.00 0.00 0.00 0.00 0.08IBERCAJA DINERO FIAMM 0.53 6.54 0.17 FIAMM 0.45 5.06 0.16 FIAMM 0.32 8.98 0.30 FIAMM 0.30 6.70 0.26 FIAMM 1.62 7.27 12.04 1.00 0.00 0.00 0.00 0.00 0.00 0.15IBERCAJA DINERO II FT RENTA FIAMM 0.41 7.63 0.05 FIAMM 0.33 6.93 0.07 FIAMM 0.24 8.09 0.16 FIAMM 0.24 9.55 0.18 FIAMM 1.21 0.01 11.57 1.00 0.00 0.00 0.00 0.00 0.00 0.15INDOSUEZ ORO FIAMM 0.48 1.62 0.18 FIAMM 0.41 2.18 0.19 FIAMM 0.32 8.79 0.16 FIAMM 0.31 5.53 0.13 FIAMM 1.52 0.04 13.24 0.75 0.00 0.00 0.00 0.00 0.00 0.10INDOSUEZ TR FIAMM 0.41 5.25 0.23 FIAMM 0.33 6.13 0.26 FIAMM 0.26 1.31 0.19 FIAMM 0.22 6.49 0.14 FIAMM 1.24 5.45 10.64 1.00 0.00 0.00 0.00 0.00 0.00 0.15INVERDINER FIAMM 0.52 5.19 0.19 FIAMM 0.42 6.65 0.21 FIAMM 0.34 2.71 0.18 FIAMM 0.31 3.78 0.17 FIAMM 1.60 5.11 12.19 1.00 0.00 0.00 0.00 0.00 0.00 0.05JP MORGAN DINERO FIAMM 0.43 5.26 0.21 FIAMM 0.35 3.99 0.19 FIAMM 0.25 3.17 0.14 FIAMM 0.21 2.06 0.20 FIAMM 1.24 4.23 11.67 1.00 0.00 0.00 0.00 0.00 0.00 0.06KUTXADINERO FIAMM 0.54 0.16 0.30 FIAMM 0.66 0.19 0.23 FIAMM 0.41 0.27 0.22 FIAMM 0.29 0.16 0.20 FIAMM 1.91 0.20 13.03 1.00 0.00 0.00 0.00 0.00 0.00 0.15KUTXAMONETARIO FIAMM 0.60 0.13 0.22 FIAMM 0.62 0.13 0.22 FIAMM 0.44 0.17 0.31 FIAMM 0.38 0.11 0.27 FIAMM 2.05 0.14 NA 0.60 0.00 0.00 0.00 0.00 0.00 0.00KUTXAPLUS FIAMM 0.55 0.11 0.26 FIAMM 0.63 0.15 0.20 FIAMM 0.38 0.15 0.30 FIAMM 0.31 0.10 0.28 FIAMM 1.88 0.13 13.83 1.00 0.00 0.00 0.00 0.00 0.00 0.00KUTXARENT FIAMM 0.53 0.11 0.27 FIAMM 0.60 0.13 0.23 FIAMM 0.35 0.13 0.19 FIAMM 0.28 0.10 0.16 FIAMM 1.78 0.12 12.39 1.00 0.00 0.00 0.00 0.00 0.00 0.15KUTXARENT2 FIAMM 0.51 0.12 0.27 FIAMM 0.60 0.14 0.22 FIAMM 0.35 0.15 0.29 FIAMM 0.27 0.10 0.27 FIAMM 1.75 0.13 12.25 1.00 0.00 0.00 0.00 0.00 0.00 0.15LAIDINER FIAMM 0.65 1.39 0.28 FIAMM 0.65 3.99 0.07 FIAMM 0.67 1.32 0.19 FIAMM 0.68 2.13 0.05 FIAMM 2.67 7.48 13.28 1.00 0.00 0.00 0.00 1.00 0.00 0.15LLOYDS MONEY MARKET FIAMM 0.44 7.00 0.22 FIAMM 0.35 5.45 0.20 FIAMM 0.25 3.59 0.16 FIAMM 0.23 1.86 0.13 FIAMM 1.27 0.05 11.16 1.00 0.00 0.00 0.00 0.00 0.00 0.15LLOYDS TESORERIA FIAMM 0.48 7.23 0.20 FIAMM 0.39 4.86 0.21 FIAMM 0.29 2.21 0.16 FIAMM 0.28 1.31 0.16 FIAMM 1.45 4.86 12.59 0.80 0.00 0.00 0.00 0.00 0.00 0.15LUSO DINERO FIAMM 0.54 0.05 0.53 FIAMM 0.44 3.86 0.59 FIAMM 0.37 3.27 0.58 FIAMM 0.34 5.81 0.55 FIAMM 1.70 5.08 15.29 0.72 0.00 0.00 0.00 0.00 0.00 0.06MADRID FOND MONET.FIAMM 0.51 0.21 0.25 FIAMM 0.44 6.77 0.19 FIAMM 0.28 0.05 0.00 FIAMM 0.25 3.77 0.14 FIAMM 1.50 0.11 11.87 1.00 0.00 0.00 0.00 0.00 0.00 0.09MADRID FOND ORO FIAMM 0.57 0.09 0.27 FIAMM 0.56 9.33 0.26 FIAMM 0.39 0.10 0.00 FIAMM 0.35 8.80 0.24 FIAMM 1.89 9.83 14.84 0.50 0.00 0.00 0.00 0.00 0.00 0.10MARCH DINERO FIAMM 0.57 3.15 0.19 FIAMM 0.41 4.14 0.16 FIAMM 0.31 2.13 0.13 FIAMM 0.32 2.23 0.14 FIAMM 1.62 3.73 12.09 1.00 0.00 0.00 0.00 0.00 0.00 0.15MEDINER FIAMM 0.53 8.92 0.28 FIAMM 0.50 9.86 0.31 FIAMM 0.35 7.10 0.28 FIAMM 0.21 0.10 0.23 FIAMM 1.60 9.55 13.09 1.00 0.00 0.00 0.00 0.00 0.00 0.10MERCHBANC FT FIAMM 0.49 6.28 0.02 FIAMM 0.42 8.38 0.02 FIAMM 0.34 6.49 0.02 FIAMM 0.33 4.54 0.02 FIAMM 1.58 6.71 13.74 0.60 3.33 0.00 0.00 0.00 0.00 0.07MORGAN STANLEY DINERPLUS FIAMM 0.50 3.79 0.12 FIAMM 0.41 3.10 0.10 FIAMM 0.28 1.82 0.12 FIAMM 0.28 2.50 0.11 FIAMM 1.47 3.51 11.91 1.00 0.00 0.00 0.00 0.00 0.00 0.07MORGAN STANLEY FONDO 25 FIAMM 0.57 3.37 0.12 FIAMM 0.48 2.70 0.11 FIAMM 0.36 2.40 0.13 FIAMM 0.37 3.00 0.17 FIAMM 1.80 3.44 14.70 0.75 0.00 0.00 0.00 0.00 0.00 0.00MULTIF. 2 PASTOR FIAMM 0.54 8.42 0.26 FIAMM 0.47 7.82 0.26 FIAMM 0.38 9.20 0.20 FIAMM 0.34 8.19 0.26 FIAMM 1.74 8.60 13.91 0.75 0.00 0.00 0.00 0.00 0.00 0.14MULTIFONDO PASTOR FIAMM 0.49 8.19 0.24 FIAMM 0.41 7.91 0.23 FIAMM 0.32 8.68 0.24 FIAMM 0.28 0.08 0.26 FIAMM 1.50 8.44 12.31 1.00 0.00 0.00 0.00 0.00 0.00 0.14MUTUAFONDO DINERO FIAMM 0.72 2.98 0.12 FIAMM 0.62 0.03 0.00 FIAMM 0.56 2.59 0.11 FIAMM 0.53 3.10 0.11 FIAMM 2.45 3.45 18.46 0.10 0.00 0.00 0.00 0.00 0.00 0.04PRIVANZA DINERO FIAMM 0.52 0.16 0.24 FIAMM 0.58 0.20 0.31 FIAMM 0.31 0.11 0.44 FIAMM 0.31 0.17 0.40 FIAMM 1.73 0.17 12.97 1.00 0.00 0.00 0.00 0.00 0.00 0.00PROFIT DINERO FIAMM 0.64 1.09 0.53 FIAMM 0.57 1.63 0.51 FIAMM 0.50 6.89 0.61 FIAMM 0.48 1.69 0.74 FIAMM 2.22 1.98 15.85 0.25 2.50 0.00 0.00 0.00 0.00 0.05RURAL DINER PLUS FIAMM NA NA NA NA 7.40 0.12 FIAMM 0.39 0.12 0.30 FIAMM 0.42 0.14 0.35 FIAMM NA 0.12 NA 0.50 0.00 0.00 0.00 0.00 0.00 0.05RURAL DINERO FIAMM 0.54 0.13 0.44 FIAMM 0.51 0.12 0.27 FIAMM 0.36 0.13 0.39 FIAMM 0.31 0.13 0.40 FIAMM 1.74 0.13 13.10 1.00 0.00 0.00 0.00 0.00 0.00 0.00RURALRENTA FV FIAMM 0.36 0.02 0.08 FIAMM 0.30 2.41 0.00 FIAMM 0.20 2.55 0.07 FIAMM 0.21 9.05 0.15 FIAMM 1.08 5.19 11.06 1.00 0.00 0.00 0.00 0.00 0.00 0.15
A.4.12.Investment in securities. FIAMM. Yields, volatility and duration
1Q 2Q 3Q 4Q 2003
Yield Vol Dur Yield Vol Dur Yield Vol Dur Yield Vol Dur Yield Vol(1) (2) Type (1) (2) Type (1) (2) Type (1) (2) Type (1)% % % % %
% fees
Management Front end Back endCustody
of assets of yield Max. Min. Max. Min.
Yieldsince1996
(Continues over)
(Continued)

310
Annual rep
ort o
n th
e securities m
arket. 2003
SAFEI EFECTIVO FT FIAMM 0.39 0.13 0.32 FIAMM 0.40 0.11 0.28 FIAMM 0.24 0.10 0.23 FIAMM 0.22 0.10 0.23 FIAMM 1.25 0.11 12.23 1.00 0.00 0.00 0.00 0.00 0.00 0.15SCH MONETARIO FIAMM 0.44 6.50 0.24 FIAMM 0.39 0.03 0.20 FIAMM 0.27 1.89 0.20 FIAMM 0.25 2.39 0.21 FIAMM 1.36 4.42 11.98 1.00 0.00 0.00 0.00 1.00 0.00 0.15SCH MONETARIO FT RENTA FIAMM 0.43 0.06 0.24 FIAMM 0.34 4.21 0.20 FIAMM 0.24 3.90 0.23 FIAMM 0.20 4.17 0.22 FIAMM 1.21 5.04 11.09 1.00 0.00 0.00 0.00 0.00 0.00 0.15SCH TESORERIA FIAMM 0.51 0.11 0.46 FIAMM 0.46 0.10 0.37 FIAMM 0.30 9.05 0.42 FIAMM 0.28 8.71 0.39 FIAMM 1.57 0.10 13.48 0.85 0.00 0.00 0.00 0.00 0.00 0.15SGAM EURIBOR FIAMM 0.58 1.72 0.00 FIAMM 0.50 1.12 0.00 FIAMM 0.41 1.51 0.00 FIAMM 0.38 2.45 0.01 FIAMM 1.88 2.49 16.37 0.25 0.00 0.00 0.00 0.00 0.00 0.10TARRAGONAFONS 1 FIAMM 0.50 0.12 0.32 FIAMM 0.43 7.60 0.27 FIAMM 0.28 3.45 0.26 FIAMM 0.30 0.05 0.26 FIAMM 1.52 8.08 11.36 1.00 0.00 0.00 0.00 0.00 0.00 0.14TIBESTFOND FIAMM 0.52 5.88 0.15 FIAMM 0.62 0.21 0.67 FIAMM 0.29 0.31 0.52 FIAMM 0.24 0.36 0.39 FIAMM 1.68 0.26 14.15 0.50 0.00 0.00 0.00 0.25 0.25 0.06UNIFOND DINERO FIAMM 0.55 0.25 0.59 FIAMM 0.50 0.25 0.52 FIAMM 0.29 0.14 0.36 FIAMM 0.30 0.16 0.16 FIAMM 1.65 0.21 12.27 1.00 0.00 0.00 0.00 0.00 0.00 0.15UNIFOND PATRIMONIO FIAMM 0.69 0.27 0.61 FIAMM 0.70 0.33 0.57 FIAMM 0.51 0.12 0.47 FIAMM 0.48 0.12 0.25 FIAMM 2.40 0.23 NA 0.25 0.00 0.00 0.00 0.00 0.00 0.05URQUIJO DINERO FIAMM 0.45 4.72 0.21 FIAMM 0.34 1.34 0.18 FIAMM 0.28 3.38 0.23 FIAMM 0.25 6.93 0.29 FIAMM 1.32 4.85 10.32 1.00 0.00 0.00 0.00 0.00 0.00 0.15URQUIJO MONETARIO FIAMM 0.42 9.52 0.11 FIAMM 0.35 0.01 0.14 FIAMM 0.26 2.23 0.19 FIAMM 0.27 1.12 0.20 FIAMM 1.29 2.05 11.27 1.00 0.00 0.00 0.00 0.00 0.00 0.10VITALDINERO FIAMM 0.46 7.89 0.23 FIAMM 0.45 0.12 0.18 FIAMM 0.28 3.77 0.34 FIAMM 0.28 3.63 0.11 FIAMM 1.47 7.89 12.34 1.00 0.00 0.00 0.00 0.00 0.00 0.15ZARAGOZANO DINERO FIAMM 0.52 0.22 0.23 FIAMM 0.34 0.14 0.17 FIAMM 0.35 5.31 0.19 FIAMM 0.32 6.69 0.14 FIAMM 1.55 0.14 11.64 1.00 0.00 0.00 0.00 0.00 0.00 0.15ZARAGOZANO TESORERIA FIAMM 0.67 0.13 0.20 FIAMM 0.60 0.10 0.14 FIAMM 0.46 8.64 0.15 FIAMM 0.46 6.42 0.17 FIAMM 2.22 0.10 NA 0.50 0.00 0.00 0.00 0.00 0.00 0.00
(1) Volatility.(2) Duration.
A.4.12.Investment in securities. FIAMM. Yields, volatility and duration
1Q 2Q 3Q 4Q 2003
Yield Vol Dur Yield Vol Dur Yield Vol Dur Yield Vol Dur Yield Vol(1) (2) Type (1) (2) Type (1) (2) Type (1) (2) Type (1)% % % % %
% fees
Management Front end Back endCustody
of assets of yield Max. Min. Max. Min.
Yieldsince1996
(Continued)

311
Annex 4
: Collective in
vestmen
t schem
es and ven
ture cap
ital com
pan
ies
12/31/2002 12/31/2003 Change
Amount % Amount % Amount %
1. Assets 36,684,193 100.00 49,230,784 100.00 12,546,591 34.202. Cash and cash equivalents 948,063 3.20 1,752,029 3.20 803,966 84.803. Portfolio investments 36,076,095 97.36 48,395,853 97.36 12,319,758 34.15
3.1 Domestic portfolio 12,846,560 48.47 14,992,386 48.47 2,145,826 16.703.1.1 Shares 0 0.04 0 0.04 0 –3.1.2 Unlisted shares 0 0.00 0 0.00 0 –3.1.3 Units in mutual funds 3,004 0.00 2,654 0.00 –350 –11.653.1.4 Private in mutual funds 588,384 5.19 653,879 5.19 65,495 11.133.1.5 Unlisted fixed-income 0 0.00 0 0.00 0 –3.1.6 Government bonds 8,111,942 28.41 7,760,225 28.41 –351,717 –4.343.1.7 Treasury bills 283,078 0.72 338,510 0.72 55,432 19.583.1.8 Other government securities 254,426 1.58 223,968 1.58 –30,458 –11.973.1.9 Reverse repos 2,964,748 8.83 4,876,071 8.83 1,911,323 64.473.1.10 Private money market assets 635,787 3.39 1,101,392 3.39 465,605 73.233.1.11 Warrants and options 5,191 0.31 35,687 0.31 30,496 587.48
3.2 Foreign portfolio 23,229,535 48.89 33,403,467 48.89 10,173,932 43.803.2.1 Shares 18 0.00 0 0.00 –18 –100.003.2.2 Unlisted shares 0 0.00 0 0.00 0 –3.2.3 Units in mutual funds 260 0.00 45 0.00 –215 –82.693.2.4 Bonds 22,056,712 43.61 31,312,986 43.61 9,256,274 41.973.2.5 Unlisted fixed-income 0 0.00 0 0.00 0 –3.2.6 Money market assets 743,407 1.47 438,165 1.47 –305,242 –41.063.2.7 Warrants and options 429,138 3.75 1,652,271 3.75 1,223,133 285.023.2.8 Reverse repos 0 0.07 0 0.07 0 –
4. Net balance (debtors-creditors) –339,965 –0.57 –917,098 –0.57 –577,133 –169.76
A.4.13.Investment in securities. Guaranteed funds. Breakdown of assets
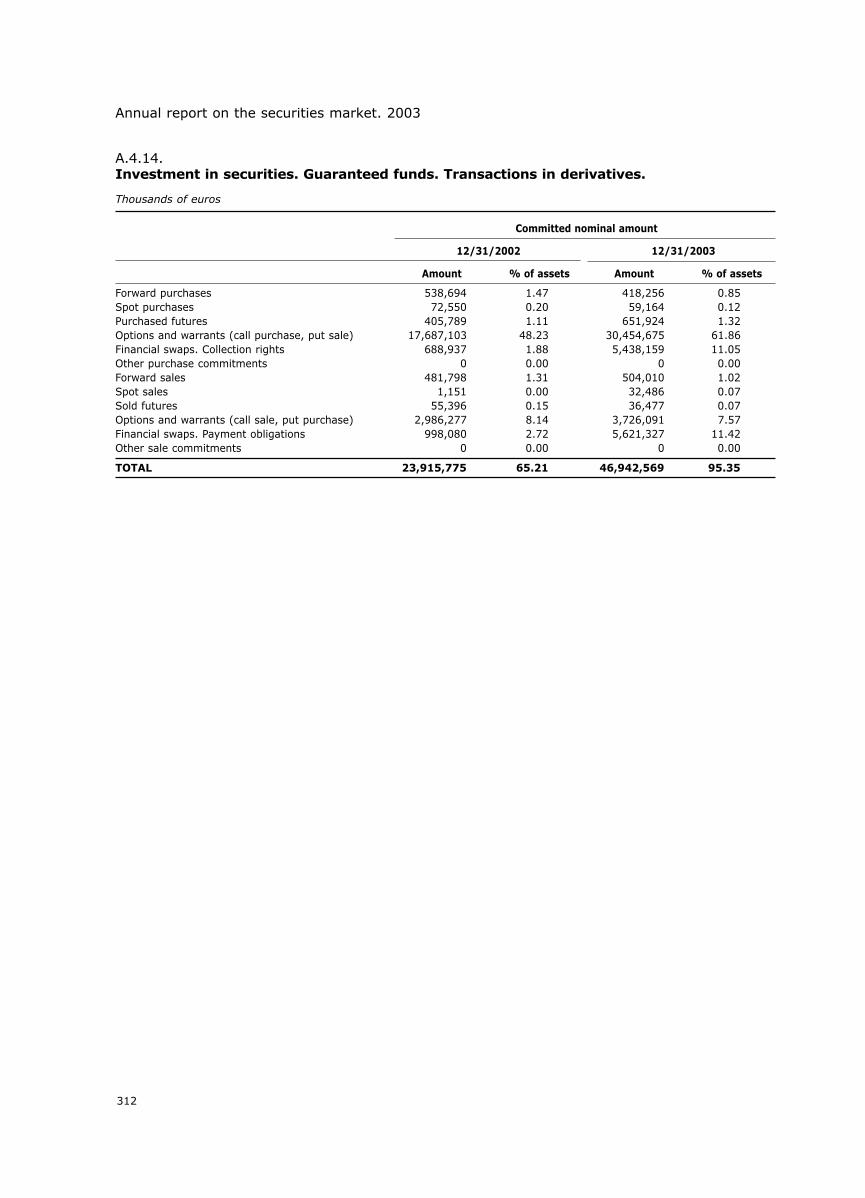
312
Annual report on the securities market. 2003
Committed nominal amount
12/31/2002 12/31/2003
Amount % of assets Amount % of assets
Forward purchases 538,694 1.47 418,256 0.85Spot purchases 72,550 0.20 59,164 0.12Purchased futures 405,789 1.11 651,924 1.32Options and warrants (call purchase, put sale) 17,687,103 48.23 30,454,675 61.86Financial swaps. Collection rights 688,937 1.88 5,438,159 11.05Other purchase commitments 0 0.00 0 0.00Forward sales 481,798 1.31 504,010 1.02Spot sales 1,151 0.00 32,486 0.07Sold futures 55,396 0.15 36,477 0.07Options and warrants (call sale, put purchase) 2,986,277 8.14 3,726,091 7.57Financial swaps. Payment obligations 998,080 2.72 5,621,327 11.42Other sale commitments 0 0.00 0 0.00
TOTAL 23,915,775 65.21 46,942,569 95.35
A.4.14.Investment in securities. Guaranteed funds. Transactions in derivatives.
Thousands of euros
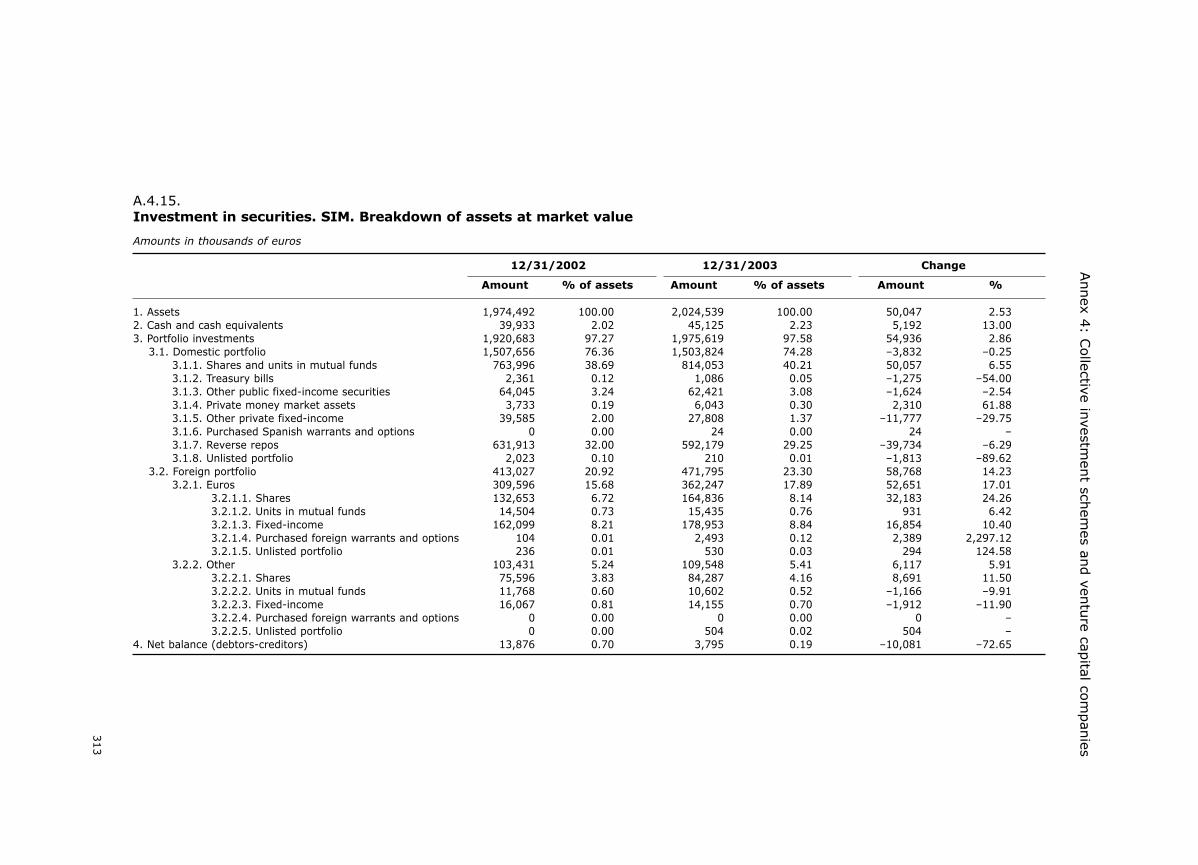
313
Annex 4
: Collective in
vestmen
t schem
es and ven
ture cap
ital com
pan
ies
12/31/2002 12/31/2003 Change
Amount % of assets Amount % of assets Amount %
1. Assets 1,974,492 100.00 2,024,539 100.00 50,047 2.532. Cash and cash equivalents 39,933 2.02 45,125 2.23 5,192 13.003. Portfolio investments 1,920,683 97.27 1,975,619 97.58 54,936 2.86
3.1. Domestic portfolio 1,507,656 76.36 1,503,824 74.28 –3,832 –0.253.1.1. Shares and units in mutual funds 763,996 38.69 814,053 40.21 50,057 6.553.1.2. Treasury bills 2,361 0.12 1,086 0.05 –1,275 –54.003.1.3. Other public fixed-income securities 64,045 3.24 62,421 3.08 –1,624 –2.543.1.4. Private money market assets 3,733 0.19 6,043 0.30 2,310 61.883.1.5. Other private fixed-income 39,585 2.00 27,808 1.37 –11,777 –29.753.1.6. Purchased Spanish warrants and options 0 0.00 24 0.00 24 –3.1.7. Reverse repos 631,913 32.00 592,179 29.25 –39,734 –6.293.1.8. Unlisted portfolio 2,023 0.10 210 0.01 –1,813 –89.62
3.2. Foreign portfolio 413,027 20.92 471,795 23.30 58,768 14.233.2.1. Euros 309,596 15.68 362,247 17.89 52,651 17.01
3.2.1.1. Shares 132,653 6.72 164,836 8.14 32,183 24.263.2.1.2. Units in mutual funds 14,504 0.73 15,435 0.76 931 6.423.2.1.3. Fixed-income 162,099 8.21 178,953 8.84 16,854 10.403.2.1.4. Purchased foreign warrants and options 104 0.01 2,493 0.12 2,389 2,297.123.2.1.5. Unlisted portfolio 236 0.01 530 0.03 294 124.58
3.2.2. Other 103,431 5.24 109,548 5.41 6,117 5.913.2.2.1. Shares 75,596 3.83 84,287 4.16 8,691 11.503.2.2.2. Units in mutual funds 11,768 0.60 10,602 0.52 –1,166 –9.913.2.2.3. Fixed-income 16,067 0.81 14,155 0.70 –1,912 –11.903.2.2.4. Purchased foreign warrants and options 0 0.00 0 0.00 0 –3.2.2.5. Unlisted portfolio 0 0.00 504 0.02 504 –
4. Net balance (debtors-creditors) 13,876 0.70 3,795 0.19 –10,081 –72.65
A.4.15.Investment in securities. SIM. Breakdown of assets at market value
Amounts in thousands of euros

314
Annual report on the securities market. 2003
Committed nominal amount
12/31/2002 12/31/2003
Amount % of assets Amount % of assets
Forward purchases 324 0.02 250 0.01Spot purchases 0 0.00 0 0.00Purchased futures 15,866 0.80 21,985 1.09Options and warrants (call purchase, put sale) 6,076 0.31 18,872 0.93Financial swaps. Collection rights 0 0.00 0 0.00Other purchase commitments 0 0.00 0 0.00Forward sales 9,877 0.50 6,792 0.34Spot sales 281 0.01 0 0.00Sold futures 9,623 0.49 6,337 0.31Options and warrants (call sale, put purchase) 1,151 0.06 13,485 0.67Financial swaps. Payment obligations 0 0.00 0 0.00Other sale commitments 0 0.00 0 0.00
Total 43,198 2.19 67,721 3.35
A.4.16.Investment in securities. SIM. Transactions in derivatives.
Thousands of euros

315
Annex 4
: Collective in
vestmen
t schem
es and ven
ture cap
ital com
pan
ies
12/31/2002 12/31/2003 Variación
Amount % of assets Amount % of assets Amount %
1. Assets 16,925,915 100.00 20,163,057 100.00 3,237,142 19.132. Cash and cash equivalents 485,774 2.87 683,320 3.39 197,546 40.673. Portfolio investments 16,324,173 96.44 19,320,524 95.82 2,996,351 18.36
3.1. Domestic portfolio 9,712,941 57.39 10,489,785 52.02 776,844 8.003.1.1. Shares and units in mutual funds 2,598,649 15.35 3,692,673 18.31 1,094,024 42.103.1.2. Treasury bills 153,058 0.90 63,232 0.31 –89,826 –58.693.1.3. Other public fixed-income securities 881,135 5.21 857,414 4.25 –23,721 –2.693.1.4. Private money market assets 194,674 1.15 143,893 0.71 –50,781 –26.093.1.5. Other private fixed-income 131,780 0.78 245,119 1.22 113,339 86.013.1.6. Purchased Spanish warrants and options 2,260 0.01 2,891 0.01 631 27.923.1.7. Reverse repos 5,751,239 33.98 5,483,929 27.20 –267,310 –4.653.1.8. Unlisted portfolio 146 0.00 634 0.00 488 334.25
3.2. Foreign portfolio 6,611,232 39.06 8,830,739 43.80 2,219,507 33.573.2.1. Euros 4,313,054 25.48 5,989,052 29.70 1,675,998 38.86
3.2.1.1. Shares 1,325,309 7.83 1,746,168 8.66 420,859 31.763.2.1.2. Units in mutual funds 1,053,352 6.22 1,557,393 7.72 504,041 47.853.2.1.3. Fixed-income 1,924,915 11.37 2,590,742 12.85 665,827 34.593.2.1.4. Purchased foreign warrants and options 8,784 0.05 94,462 0.47 85,678 975.393.2.1.5. Unlisted portfolio 694 0.00 287 0.00 –407 –58.65
3.2.2. Other 2,298,178 13.58 2,841,687 14.09 543,509 23.653.2.2.1. Shares 1,520,692 8.98 1,801,277 8.93 280,585 18.453.2.2.2. Units in mutual funds 553,820 3.27 810,390 4.02 256,570 46.333.2.2.3. Fixed-income 223,134 1.32 227,297 1.13 4,163 1.873.2.2.4. Purchased foreign warrants and options 352 0.00 2,723 0.01 2,371 673.583.2.2.5. Unlisted portfolio 180 0.00 0 0.00 –180 –100.00
4. Net balance (debtors-creditors) 115,968 0.69 159,213 0.79 43,245 37.29
A.4.17.Investment in securities. SIMCAV. Breakdown of assets at market value
Importes en miles de euros

316
Annual report on the securities market. 2003
A.4.19.Investment in securities. Foreign collective investment schemes marketed in Spain
Change12/31/2002 12/31/2003
Absolute %
Investment (thousands of euros) 6,538,012 9,158,738 2,620,726 40.1Funds 895,432 1,709,815 814,383 90.9Companies 5,642,580 7,448,923 1,806,343 32.0
of which guaranteed 73,481 24,149 -49,332 -67.1
Number of investors 200,758 225,214 24,456 12.2Funds 16,962 30,577 13,615 80.3Companies 183,796 194,637 10,841 5.9
of which guaranteed 1,708 365 -1,343 -78.6
No. of schemes (*) 218 233 15 6.9Funds 82 97 15 18.3Companies 136 136 0 0.0
Home countryLuxembourg 157 165 8 5.1Ireland 28 32 4 14.3France 19 21 2 10.5Germany 9 10 1 11.1UK 4 4 0 0.0The Netherlands 1 1 0 0.0
(*) Many of these schemes are structured into sub-funds (compartments). Ocassionally, it is the sub-funds which are guaranteed.
Committed nominal amount
12/31/2002 12/31/2003
Amount % of assets Amount % of assets
Forward purchases 131,806 0.78 76,469 0.38Spot purchases 4,315 0.03 7,396 0.04Purchased futures 279,011 1.65 437,146 2.17Options and warrants (call purchase, put sale) 385,909 2.28 1,071,915 5.32Financial swaps. Collection rights 0 0.00 0 0.00Other purchase commitments 0 0.00 0 0.00Forward sales 951,317 5.62 958,532 4.75Spot sales 10,638 0.06 5,309 0.03Sold futures 110,745 0.65 269,879 1.34Options and warrants (call sale, put purchase) 102,040 0.60 747,417 3.71Financial swaps. Payment obligations 0 0.00 0 0.00Other sale commitments 0 0.00 0 0.00
Total 1,975,781 11.67 3,574,063 17.73
A.4.18.Investment in securities. SIMCAV. Transactions in derivatives.
Thousands of euros

317
Annex 4: Collective investment schemes and venture capital companies
A.4.20.Investment in real estate. FII. Number, assets and investors
Year Assets No. of investors No. of FII funds Yield
1995 71,557 1,897 4 nd1996 85,091 2,174 4 2.701997 131,874 4,617 4 6.911998 396,193 14,250 5 6.091999 871,113 33,042 5 7.972000 1,215,822 43,200 5 7.732001 1,520,472 52,752 5 7.492002 2,112,569 70,506 5 7.872002 2,840,700 88,501 5 6.89
Amounts in thousands of euros
A.4.21.Investment in real estate. FII. Breakdown of assets
12/31/2002 12/31/2003 Change
Amount % of assets Amount % of assets Amount %
1. Assets 2,112,569 100.0 2,840,700 100.0 728,131 34.52. Cash and cash equivalents 9,181 0.4 32,147 1.1 22,966 250.13. Securities 634,890 30.1 635,635 22.4 745 0.14. Homes 611,604 29.0 971,779 34.2 360,175 58.95. Other property 948,820 44.9 1,306,286 46.0 357,466 37.76. Other items -91,926 -4.4 -105,147 -3.7 -13,221 -14.4
Pro memoria:Leased property 1,028,163 48.7 1,665,038 58.6 636,874 61.9
Amounts in thousands of euros
A.4.22.Number of venture capital institutions(1)
Year Venture capital companies Venture capital funds Total
1986 0 0 01987 2 0 21988 5 1 61989 7 4 111990 10 6 161991 11 6 171992 12 6 181993 15 7 221994 14 7 211995 14 8 221996 16 10 261997 17 10 271998 19 12 311999 23 19 422000 40 25 652001 51 31 822002 59 33 922003 65 35 100
(1) Data at period close.Source: CNMV.

318
Annual report on the securities market. 2003
A.4.23.Breakdown of funds raised by venture capital institutions,by type of investor
2002 2003
Amount % Amount %
Financial institutions 353.7 41.1 439.0 42.1Pension funds 114.4 13.3 89.9 8.6Insurance companies 23.4 2.7 40.1 3.8Funds of funds 70.9 8.2 101.9 9.8Non-financial companies 69.4 8.1 154.9 14.9Individuals 48.9 5.7 28.1 2.7Public investors 124.0 14.4 148.1 14.2Academic institutions 0.0 0.0 4.1 0.4Securities markets 22.8 2.6 5.9 0.6Other 0.0 0.0 29.3 2.8Capital gains for reinvestments 32.6 3.8 1.1 0.1
Total 860.0 100.0 1,042.4 100.0
Source: ASCRI/webcapitalriesgo.
Amounts in millions of euros
A.4.24.Breakdown of investment by venture capital institutions,by phase of development
Phase of development2002 2003
Amount % Amount %
Seed 13.0 1.3 7.0 0.5Start-up 93.1 9.6 49.2 3.7Expansion 594.3 61.4 882.0 66.0Substitution 0.4 0.0 25.0 1.9MBO/MBI(1) 238.4 24.6 368.8 27.6Other 29.0 3.0 5.0 0.4
Total 968 100.0 1,336.9 100.0(1) Management Buy-Out / Management Buy-In.Source: ASCRI/webcapitalriesgo.
Amounts in millions of euros

319
Annex 4: Collective investment schemes and venture capital companies
A.4.25.Breakdown of investments by venture capital institutions,by sector
Sector2002 2003
Amount % Amount %
Communications 25.6 2.6 69.2 5.2IT 38.6 4.0 18.2 1.4Other electronic 9.0 0.9 5.9 0.4Biotechnology 8.1 0.8 5.6 0.4Healthcare/Medicine 25.9 2.7 32.5 2.4Energy 70.5 7.3 110.8 8.3Consumer products 235.9 24.4 373.4 27.9Industrial products and services 99.0 10.2 150.4 11.2Chemical & plastics 103.2 10.7 12.6 0.9Robotics 0.3 0.0 6.4 0.5Other production 35.0 3.6 39.4 2.9Transport 31.0 3.2 68.2 5.1Financial services 1.9 0.2 3.8 0.3Hospitality/Leisure 91.9 9.5 271 20.3Other services 99.5 10.3 41.9 3.1Agriculture 25.1 2.6 31.4 2.3Construction 15.4 1.6 42.4 3.2Other 52.2 5.4 54.1 4.0
Investment in the year 968.2 100.0 1336.9 100.0
Source: ASCRI/webcapitalriesgo.
Amounts in millions of euros

ANNEX 5
SECURITIES FIRMS AND FUNDMANAGEMENT COMPANIES

Annex 5: Securities firms and fund management companies
323
Number of firms Number of branches Number of agents
12/31/02 12/31/03 12/31/02 12/31/03 12/31/02 12/31/03
Number of institutions
Owned by domestic Owned by foreign financialfinancial institutions institutions
Total > 50% 10-50% < 10% Total > 50% 10-50% < 10%
OtherTotal
Broker-dealers 45 46 96 98 6,335 6,111Stock exchange members 37 37 94 96 711 591Non-members 8 9 2 2 5,624 5,520
Brokers 65 59 18 18 513 322Stock exchange members 18 14 8 6 68 57Non-members 47 45 10 12 445 265
Total 110 105 114 116 6,848 6,433Stock exchange members 55 51 102 102 779 648Non-members 55 54 12 14 6,069 5,785
Foreign branches 19 19Investment services from
with free provision 763 743
Spanish financial institutions
Insurance OtherTotal Banks Thrifts financialcompanies
intermediaries
Other Non-residents residents% Total
Broker-dealers 46 20 18 2 0 18 17 1 0 8Stock exchange members 37 15 14 1 0 15 14 1 0 7Non-members 9 5 4 1 0 3 3 0 0 1
Brokers 59 12 10 2 0 20 16 4 0 27Stock exchange members 14 1 1 0 0 3 2 1 0 10Non-members 45 11 9 2 0 17 14 3 0 17
TOTAL 105 32 28 4 0 38 33 5 0 35Stock exchange members 51 16 15 1 0 18 16 2 0 17Non-members 54 16 13 3 0 20 17 3 0 18
Broker-dealers 100.0 45.7 10.9 22.2 12.6 0.0 16.8 37.5Stock exchange members 100.0 39.5 12.4 25.1 2.1 0.0 19.7 40.8Non-members 100.0 79.0 3.1 7.2 68.8 0.0 1.0 20.0
Brokers 100.0 26.7 13.3 12.4 0.0 1.0 55.5 17.8Stock exchange members 100.0 7.2 7.2 0.0 0.0 0.0 76.2 16.5Non-members 100.0 29.7 14.3 14.2 0.0 1.2 52.4 18.0
TOTAL 100.0 41.8 11.4 20.2 10.0 0.2 41.6 16.6Stock exchange members 100.0 38.2 12.2 24.1 2.0 0.0 21.9 39.9Non-members 100.0 61.9 9.6 11.3 33.9 7.0 19.3 18.8
A.5.1.Securities firms. Number, branches and agents
A.5.2.1.Securities firms. Ownership by financial institutions
Data at 12/31/2003
A.5.2.2.Securities firms. Ownership by financial institutionsPercentage of share capitalData at 12/31/2003

Annual rep
ort o
n th
e securities m
arket. 2003
324
Annual average (*)Total broker-dealersand brokers
12/31/02 12/31/03
Total Broker-dealers Brokers
2002 2003 2002 2003 2002 2003
(*) Averages of montly balances.
1. Cash 3,142 15,636 5,854 7,803 4,634 6,050 1,220 1,753
2. Financial intermediariesDirect investment 1,609,180 2,590,615 2,185,682 2,255,722 1,975,985 1,968,425 209,697 287,2982.1. Demand deposits 718,414 756,891 730,030 681,473 637,755 595,938 92,276 85,5352.2. Other balances 890,766 1,833,724 1,455,652 1,574,250 1,338,230 1,372,487 117,422 201,763
3. Trading portfolio 9,679,806 7,200,035 6,832,025 7,104,619 6,745,857 7,019,166 86,168 85,4533.1. Equities 610,601 1,535,515 790,269 880,297 767,256 855,851 23,013 24,4463.2. Fixed-income 7,480,390 5,425,582 5,626,967 5,270,873 5,561,930 5,208,575 65,037 62,298
3.2.1. To maturity 130,627 217,120 153,857 151,006 144,229 145,285 9,628 5,7203.2.2. Reverse repos 7,349,763 5,208,462 5,473,111 5,119,868 5,417,702 5,063,290 55,409 56,578
3.3. Options purchased 1,602,309 244,510 430,571 962,829 430,570 962,829 1 03.4. Less, provision for valuation –13,494 –5,572 –15,783 –9,380 –13,899 –8,088 –1,883 –1,292
4. Credit to individual clients 126,609 80,805 137,271 115,108 129,541 103,595 7,730 11,513
5. Permanent equity portfolio (net) 123,433 144,646 160,435 175,115 151,154 134,327 9,281 40,788
6. Doubtful investments, in default 6,054 4,744 4,035 6,072 3,296 5,603 739 469or in litigation (net)
7. Expired investments 4,585 11 766 31 667 18 98 13
8. Tangible fixed assets 91,182 79,172 103,741 86,452 81,642 67,326 22,099 19,126
9. Sundry accounts 289,817 533,119 268,666 316,161 241,392 287,006 27,275 29,155
TOTAL ASSETS 11,933,808 10,648,783 9,698,474 10,067,083 9,334,167 9,591,514 364,307 475,568
A.5.3.1.Securities firms. Aggregate balance sheet. Assets
In thousands of euros
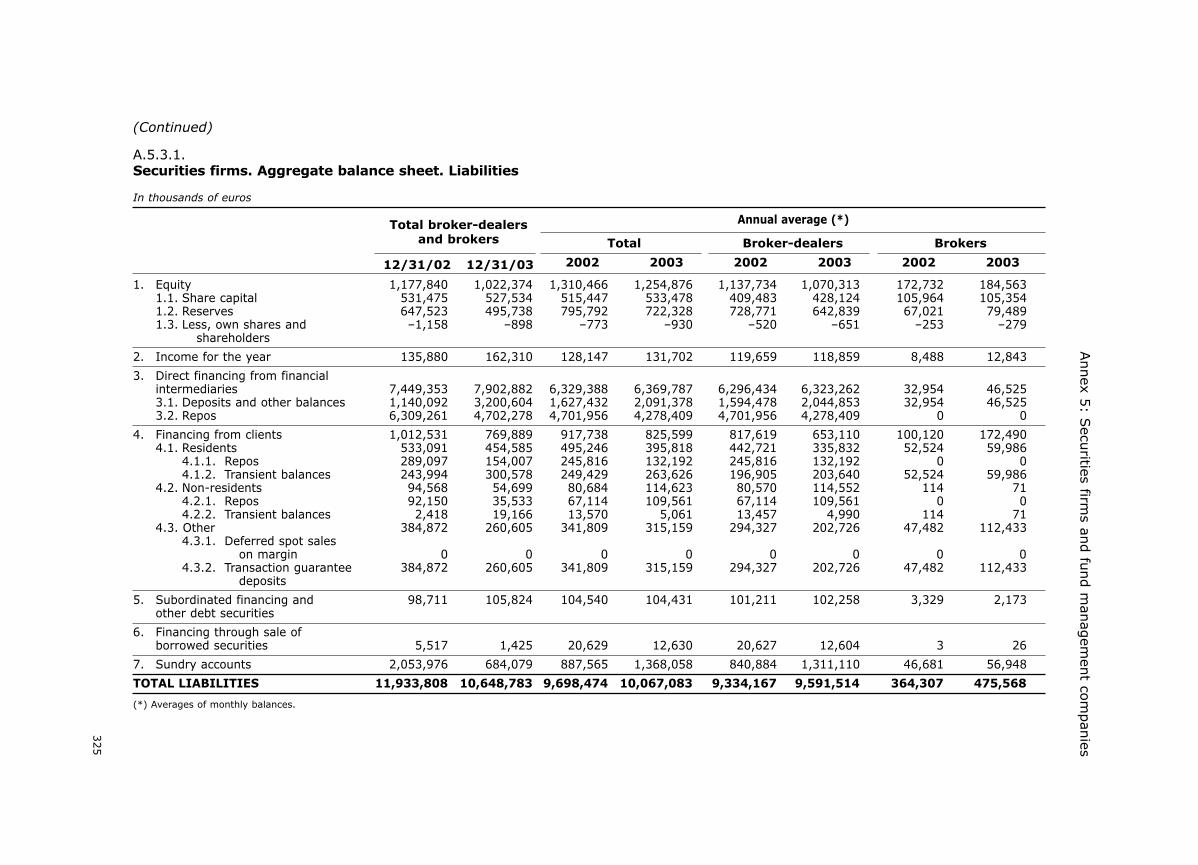
Annex 5
: Secu
rities firms an
d fu
nd m
anag
emen
t com
pan
ies
325
Annual average (*)Total broker-dealersand brokers
12/31/02 12/31/03
Total Broker-dealers Brokers
2002 2003 2002 2003 2002 2003
(*) Averages of monthly balances.
(Continued)
1. Equity 1,177,840 1,022,374 1,310,466 1,254,876 1,137,734 1,070,313 172,732 184,5631.1. Share capital 531,475 527,534 515,447 533,478 409,483 428,124 105,964 105,3541.2. Reserves 647,523 495,738 795,792 722,328 728,771 642,839 67,021 79,4891.3. Less, own shares and –1,158 –898 –773 –930 –520 –651 –253 –279
shareholders
2. Income for the year 135,880 162,310 128,147 131,702 119,659 118,859 8,488 12,843
3. Direct financing from financialintermediaries 7,449,353 7,902,882 6,329,388 6,369,787 6,296,434 6,323,262 32,954 46,5253.1. Deposits and other balances 1,140,092 3,200,604 1,627,432 2,091,378 1,594,478 2,044,853 32,954 46,5253.2. Repos 6,309,261 4,702,278 4,701,956 4,278,409 4,701,956 4,278,409 0 0
4. Financing from clients 1,012,531 769,889 917,738 825,599 817,619 653,110 100,120 172,4904.1. Residents 533,091 454,585 495,246 395,818 442,721 335,832 52,524 59,986
4.1.1. Repos 289,097 154,007 245,816 132,192 245,816 132,192 0 04.1.2. Transient balances 243,994 300,578 249,429 263,626 196,905 203,640 52,524 59,986
4.2. Non-residents 94,568 54,699 80,684 114,623 80,570 114,552 114 714.2.1. Repos 92,150 35,533 67,114 109,561 67,114 109,561 0 04.2.2. Transient balances 2,418 19,166 13,570 5,061 13,457 4,990 114 71
4.3. Other 384,872 260,605 341,809 315,159 294,327 202,726 47,482 112,4334.3.1. Deferred spot sales
on margin 0 0 0 0 0 0 0 04.3.2. Transaction guarantee 384,872 260,605 341,809 315,159 294,327 202,726 47,482 112,433
deposits
5. Subordinated financing and 98,711 105,824 104,540 104,431 101,211 102,258 3,329 2,173other debt securities
6. Financing through sale ofborrowed securities 5,517 1,425 20,629 12,630 20,627 12,604 3 26
7. Sundry accounts 2,053,976 684,079 887,565 1,368,058 840,884 1,311,110 46,681 56,948
TOTAL LIABILITIES 11,933,808 10,648,783 9,698,474 10,067,083 9,334,167 9,591,514 364,307 475,568
A.5.3.1.Securities firms. Aggregate balance sheet. Liabilities
In thousands of euros

Annual rep
ort o
n th
e securities m
arket. 2003
326
Annual average (*)Totalbroker-dealers
12/31/02 12/31/03
Total Stock exchange members Non-members
2002 2003 2002 2003 2002 2003
(*) Averages of montly balances.
1. Cash 2,208 14,971 4,634 6,050 4,603 6,001 31 50
2. Financial intermediariesDirect investment 1,341,660 2,304,691 1,975,985 1,968,425 1,870,463 1,836,822 105,522 131,6032.1. Demand deposits 631,151 662,700 637,755 595,938 586,891 535,346 50,863 60,5922.2. Other balances 710,509 1,641,991 1,338,230 1,372,487 1,283,571 1,301,475 54,659 71,011
3. Trading portfolio 9,563,230 7,117,168 6,745,857 7,019,166 5,539,622 5,098,252 1,206,235 1,920,9143.1. Equities 584,367 1,510,629 767,256 855,851 648,993 715,905 118,264 139,9463.2. Fixed-income 7,387,652 5,366,882 5,561,930 5,208,575 4,802,233 4,343,984 759,697 864,591
3.2.1. To maturity 119,116 215,619 144,229 145,285 93,147 118,475 51,082 26,8103.2.2. Reverse repos 7,268,536 5,151,263 5,417,702 5,063,290 4,709,086 4,225,509 708,616 837,780
3.3. Options purchased 1,602,309 244,510 430,570 962,829 97,960 45,059 332,609 917,7693.4. Less, provision for valuation –11,098 –4,853 –13,899 –8,088 –9,564 –6,697 –4,336 –1,391
4. Credit to individual clients 118,220 69,137 129,541 103,595 122,489 103,085 7,052 510
5. Permanent equity portfolio (net) 113,692 130,903 151,154 134,327 132,752 117,298 18,403 17,029
6. Doubtful investments, in default orin litigation (net) 5,972 4,091 3,296 5,603 3,272 5,557 24 46
7. Expired investments 4,582 11 667 18 394 18 273 0
8. Tangible fixed assets 73,115 61,082 81,642 67,326 79,360 65,332 2,282 1,993
9. Sundry accounts 260,746 477,032 241,392 287,006 227,773 273,467 13,619 13,539
TOTAL ASSETS 11,483,425 10,179,086 9,334,167 9,591,514 7,980,727 7,505,831 1,353,440 2,085,683
A.5.3.2.Securities firms. Broker-dealers. Aggregate balance sheet. Assets
In thousands of euros

Annex 5
: Secu
rities firms an
d fu
nd m
anag
emen
t com
pan
ies
327
Annual average (*)Totalbroker-dealers
12/31/02 12/31/03
Total Stock exchange members Non-members
2002 2003 2002 2003 2002 2003
(*) Averages of monthly balances.
1. Equity 980,590 849,368 1,137,734 1,070,313 994,442 918,869 143,292 151,4441.1. Share capital 414,017 428,563 409,483 428,124 342,609 359,876 66,875 68,2481.2. Reserves 567,093 421,547 728,771 642,839 652,353 559,643 76,418 83,1961.3. Less, own shares and –520 –742 –520 –651 –520 –651 0 0
sahreholders
2. Income for the year 131,721 146,394 119,659 118,859 102,598 105,084 17,061 13,775
3. Direct financing from financialintermediaries 7,408,815 7,856,778 6,296,434 6,323,262 5,572,918 5,359,490 723,517 963,7713.1. Deposits and other balances 1,099,554 3,154,500 1,594,478 2,044,853 1,487,970 1,770,123 106,508 274,7303.2. Repos 6,309,261 4,702,278 4,701,956 4,278,409 4,084,948 3,589,368 617,008 689,041
4. Financing from clients 873,498 593,168 817,619 653,110 701,510 631,706 116,109 21,4044.1. Residents 482,061 384,307 442,721 335,832 421,426 324,100 21,296 11,732
4.1.1. Repos 289,097 154,007 245,816 132,192 236,463 123,723 9,353 8,4704.1.2. Transient balances 192,964 230,300 196,905 203,640 184,962 200,378 11,943 3,263
4.2. Non-residents 94,485 54,596 80,570 114,552 77,435 114,550 3,136 24.2.1. Repos 92,150 35,533 67,114 109,561 64,061 109,561 3,053 04.2.2. Transient balances 2,335 19,063 13,457 4,990 13,374 4,988 83 2
4.3. Other 296,952 154,265 294,327 202,726 202,650 193,056 91,677 9,6704.3.1. Deferred spot sales
on margin 0 0 0 0 0 0 0 04.3.2. Transaction guarantee 296,952 154,265 294,327 202,726 202,650 193,056 91,677 9,670
deposits
5. Subordinated financing and other 96,211 103,704 101,211 102,258 101,211 102,258 0 0debt securities
6. Financing through sale of borrowedsecurities 5,517 1,425 20,627 12,604 20,627 12,604 0 0
7. Sundry accounts 1,987,073 628,249 840,884 1,311,110 487,422 375,821 353,462 935,289
TOTAL LIABILITIES 11,483,425 10,179,086 9,334,167 9,591,514 7,980,727 7,505,831 1,353,440 2,085,683
(Continued)
A.5.3.2.Securities firms. Broker-dealers. Aggregate balance sheet. Liabilities
In thousands of euros

Annual rep
ort o
n th
e securities m
arket. 2003
328
Annual average (*)Totalbrokers
12/31/02 12/31/03
Total Stock exchange members Non-members
2002 2003 2002 2003 2002 2003
(*) Averages of monthly balances.
1. Cash 934 665 1.220 1.753 356 106 864 1.647
2. Financial intermediariesDirect investment 267,520 285,924 209,697 287,298 70,162 60,488 139,536 226,8092.1. Demand deposits 87,263 94,191 92,276 85,535 49,499 44,285 42,777 41,2492.2. Other balances 180,257 191,733 117,422 201,763 20,663 16,203 96,759 185,560
3. Trading portfolio 116,576 82,867 86,168 85,453 26,548 28,281 59,620 57,1723.1. Equities 26,234 24,886 23,013 24,446 5,671 4,737 17,342 19,7093.2. Fixed-income 92,738 58,700 65,037 62,298 21,069 23,559 43,968 38,739
3.2.1. To maturity 11,511 1,501 9,628 5,720 1,578 258 8,051 5,4623.2.2. Reverse repos 81,227 57,199 55,409 56,578 19,492 23,301 35,917 33,277
3.3. Options purchased 0 0 1 0 1 0 0 03.4. Less, provision for valuation –2,396 –719 –1,883 –1,292 –193 –16 –1,690 –1,276
4. Credit to individual clients 8,389 11,668 7,730 11,513 3,846 5,018 3,884 6,495
5. Permanent equity portfolio (net) 9,741 13,743 9,281 40,788 7,422 6,747 1,859 34,041
6. Doubtful investments, in defaultor in litigation (net) 82 653 739 469 210 46 530 424
7. Expired investments 3 0 98 13 0 2 98 12
8. Tangible fixed assets 18,067 18,090 22,099 19,126 9,382 7,392 12,717 11,735
9. Sundry accounts 29,071 56,087 27,275 29,155 6,618 4,877 20,657 24,278
TOTAL ASSETS 450,383 469,697 364,307 475,568 124,543 112,957 239,764 362,612
A.5.3.3.Securities firms. Brokers. Aggregate balance sheet. Assets
In thousands of euros
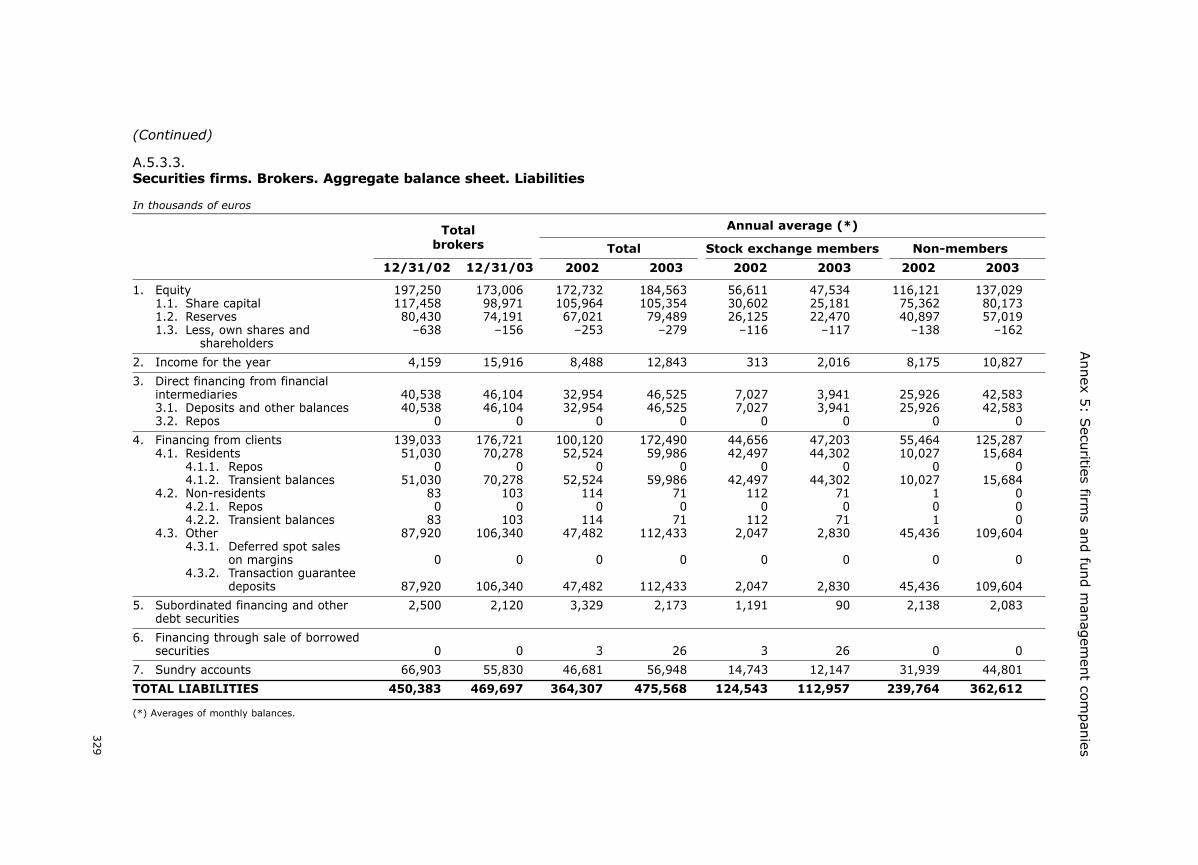
Annex 5
: Secu
rities firms an
d fu
nd m
anag
emen
t com
pan
ies
329
Annual average (*)Totalbrokers
12/31/02 12/31/03
Total Stock exchange members Non-members
2002 2003 2002 2003 2002 2003
(*) Averages of monthly balances.
1. Equity 197,250 173,006 172,732 184,563 56,611 47,534 116,121 137,0291.1. Share capital 117,458 98,971 105,964 105,354 30,602 25,181 75,362 80,1731.2. Reserves 80,430 74,191 67,021 79,489 26,125 22,470 40,897 57,0191.3. Less, own shares and –638 –156 –253 –279 –116 –117 –138 –162
shareholders
2. Income for the year 4,159 15,916 8,488 12,843 313 2,016 8,175 10,827
3. Direct financing from financialintermediaries 40,538 46,104 32,954 46,525 7,027 3,941 25,926 42,5833.1. Deposits and other balances 40,538 46,104 32,954 46,525 7,027 3,941 25,926 42,5833.2. Repos 0 0 0 0 0 0 0 0
4. Financing from clients 139,033 176,721 100,120 172,490 44,656 47,203 55,464 125,2874.1. Residents 51,030 70,278 52,524 59,986 42,497 44,302 10,027 15,684
4.1.1. Repos 0 0 0 0 0 0 0 04.1.2. Transient balances 51,030 70,278 52,524 59,986 42,497 44,302 10,027 15,684
4.2. Non-residents 83 103 114 71 112 71 1 04.2.1. Repos 0 0 0 0 0 0 0 04.2.2. Transient balances 83 103 114 71 112 71 1 0
4.3. Other 87,920 106,340 47,482 112,433 2,047 2,830 45,436 109,6044.3.1. Deferred spot sales
on margins 0 0 0 0 0 0 0 04.3.2. Transaction guarantee
deposits 87,920 106,340 47,482 112,433 2,047 2,830 45,436 109,604
5. Subordinated financing and other 2,500 2,120 3,329 2,173 1,191 90 2,138 2,083debt securities
6. Financing through sale of borrowedsecurities 0 0 3 26 3 26 0 0
7. Sundry accounts 66,903 55,830 46,681 56,948 14,743 12,147 31,939 44,801
TOTAL LIABILITIES 450,383 469,697 364,307 475,568 124,543 112,957 239,764 362,612
(Continued)
A.5.3.3.Securities firms. Brokers. Aggregate balance sheet. Liabilities
In thousands of euros

Annual rep
ort o
n th
e securities m
arket. 2003
330
Total Broker-dealers Brokers
2002 2003 Chg. (%) 2002 2003 Chg. (%) 2002 2003 Chg. (%)
Financial income 79,564 54,426 –31.6 73,050 47,728 –34.7 6,514 6,698 2.8Financial revenues 237,646 170,149 –28.4 224,841 158,115 –29.7 12,805 12,034 –6.0Financial costs 158,082 115,723 –26.8 151,791 110,387 –27.3 6,291 5,336 –15.2
Net income from securities trading 18,916 25,542 35.0 19,430 24,017 23.6 –514 1,525 396.7Gains on securities 1,801,209 878,003 –51.3 1,798,271 875,869 –51.3 2,938 2,134 –27.4Losses on securities 1,782,293 852,461 –52.2 1,778,841 851,852 –52.1 3,452 609 –82.4
Net commission revenues 684,994 631,405 –7.8 542,958 495,762 –8.7 142,036 135,643 –4.5Commission revenues 851,467 830,621 –2.4 667,195 666,046 –0.2 184,272 164,575 –10.7
Brokering 533,901 467,762 –12.4 418,617 382,583 –8.6 115,284 85,179 –26.1Placement and underwriting 49,287 91,890 86.4 46,920 89,296 90.3 2,367 2,594 9.6IIC subscription & reimbursement 121,224 116,477 –3.9 108,091 98,629 –8.8 13,133 17,848 35.9Portfolio management 17,530 19,465 11.0 7,027 7,711 9.7 10,503 11,754 11.9Other 129,525 135,027 4.2 86,540 87,827 1.5 42,985 47,200 9.8
Comission expenses 166,473 199,216 19.7 124,237 170,284 37.1 42,236 28,932 –31.5
Total net revenues 783,474 711,373 –9.2 635,438 567,507 –10.7 148,036 143,866 –2.8
Operating expenses 543,168 484,446 –10.8 384,503 357,026 –7.1 158,665 127,420 –19.7Personnel 333,232 296,309 –11.1 237,014 219,914 –7.2 96,218 76,395 –20.6General 209,936 188,137 –10.4 147,489 137,112 –7.0 62,447 51,025 –18.3
Operating income 240,306 226,927 –5.6 250,935 210,481 –16.1 –10,629 16,446 —
Depreciation and other charges 57,348 45,521 –20.6 48,306 39,246 –18.8 9,042 6,275 –30.6Depreciation 39,089 35,942 –8.1 31,203 27,657 –11.4 7,886 8,285 5.1Other charges 18,259 9,579 –47.5 17,103 11,589 –32.2 1,156 –2,010 –273.9
Other gains and losses 34,326 68,247 98.8 –376 52,204 13,984.0 34,702 16,043 –53.8
Earnings before taxes 217,284 249,653 14.9 202,253 223,439 10.5 15,031 26,214 74.4
Corporate income tax 81,404 87,343 7.3 70,532 77,045 9.2 10,872 10,298 –5.3
EARNINGS AFTER TAXES 135,880 162,310 19.5 131,721 146,394 11.1 4,159 15,916 282.7
A.5.4.1.Securities firms. Aggregate income statement
In thousands of euros

Annex 5
: Secu
rities firms an
d fu
nd m
anag
emen
t com
pan
ies
331
Total Stock exchange members Non-members
2002 2003 Var. (%) 2002 2003 Var. (%) 2002 2003 Var. (%)
Financial income 73,050 47,728 –34.7 69,387 44,170 –36.3 3,663 3,558 –2.9Financial revenues 224,841 158,115 –29.7 193,790 132,313 –31.7 31,051 25,802 –16.9Financial costs 151,791 110,387 –27.3 124,403 88,143 –29.1 27,388 22,244 –18.8
Net income from securities trading 19,430 24,017 23.6 20,285 21,843 7.7 –855 2,174 —Gains on securities 1,798,271 875,869 –51.3 1,458,368 689,023 –52.8 339,903 186,846 –45.0Losses on securities 1,778,841 851,852 –52.1 1,438,083 667,180 –53.6 340,758 184,672 –45.8
Net commission revenues 542,958 495,762 –8.7 493,985 449,407 –9.0 48,973 46,355 –5.3Commission revenues 667,195 666,046 –0.2 603,555 602,984 –0.1 63,640 63,062 –0.9
Brokering 418,617 382,583 –8.6 407,443 368,279 –9.6 11,174 14,304 28.0Placement and underwriting 46,920 89,296 90.3 44,146 89,296 102.3 2,774 0 –100.0IIC subscription & reimbursement 108,091 98,629 –8.8 67,422 59,506 –11.7 40,669 39,123 –3.8Portfolio management 7,027 7,711 9.7 6,303 6,792 7.8 724 919 26.9Other 86,540 87,827 1.5 78,241 79,111 1.1 8,299 8,716 5.0
Comission expenses 124,237 170,284 37.1 109,570 153,577 40.2 14,667 16,707 13.9
Total net revenues 635,438 567,507 –10.7 583,657 515,420 –11.7 51,781 52,087 0.6
Operating expenses 384,503 357,026 –7.1 364,335 333,140 –8.6 20,168 23,886 18.4Personnel 237,014 219,914 –7.2 224,370 205,383 –8.5 12,644 14,531 14.9General 147,489 137,112 –7.0 139,965 127,757 –8.7 7,524 9,355 24.3
Operating income 250,935 210,481 –16.1 219,322 182,280 –16.9 31,613 28,201 –10.8
Depreciation and other charges 48,306 39,246 –18.8 47,510 38,285 –19.4 796 961 20.7Depreciation 31,203 27,657 –11.4 30,368 26,762 –11.9 835 895 7.2Other charges 17,103 11,589 –32.2 17,142 11,523 –32.8 –39 66 269.2
Other gains and losses –376 52,204 — –986 51,761 — 610 443 –27.4
Earnings before taxes 202,253 223,439 10.5 170,826 195,756 14.6 31,427 27,683 –11.9
Corporate income tax 70,532 77,045 9.2 59,414 67,570 13.7 11,118 9,475 –14.8
EARNINGS AFTER TAXES 131,721 146,394 11.1 111,412 128,186 15.1 20,309 18,208 –10.3
A.5.4.2.Securities firms. Broker-dealers. Aggregate income statement
In thousands of euros

Annual rep
ort o
n th
e securities m
arket. 2003
332
Total Stock exchange members Non-members
2002 2003 Var. (%) 2002 2003 Var. (%) 2002 2003 Var. (%)
Financial income 6,514 6,698 2.8 2,542 2,082 –18.1 3,972 4,616 16.2Financial revenues 12,805 12,034 –6.0 2,911 2,238 –23.1 9,894 9,796 –1.0Financial costs 6,291 5,336 –15.2 369 156 –57.7 5,922 5,180 –12.5
Net income from securities trading –514 1,525 396.7 336 1,343 299.7 –850 182 121.4Gains on securities 2,938 2,134 –27.4 577 1,441 149.7 2,361 693 –70.6Losses on securities 3,452 609 –82.4 241 98 –59.3 3,211 511 –84.1
Net commission revenues 142,036 135,643 –4.5 39,421 27,973 –29.0 102,615 107,670 4.9Commission revenues 184,272 164,575 –10.7 55,432 33,866 –38.9 128,840 130,709 1.5
Brokering 115,284 85,179 –26.1 45,537 25,663 –43.6 69,747 59,516 –14.7Placement and underwriting 2,367 2,594 9.6 19 88 363.2 2,348 2,506 6.7IIC subscription & reimbursement 13,133 17,848 35.9 1,015 1,167 15.0 12,118 16,681 37.7Portfolio management 10,503 11,754 11.9 521 669 28.4 9,982 11,085 11.0Other 42,985 47,200 9.8 8,340 6,279 –24.7 34,645 40,921 18.1
Commission expenses 42,236 28,932 –31.5 16,011 5,893 –63.2 26,225 23,039 –12.1
Total net revenues 148,036 143,866 –2.8 42,299 31,398 –25.8 105,737 112,468 6.4
Operating expenses 158,665 127,420 –19.7 40,565 25,318 –37.6 118,100 102,102 –13.5Personnel 96,218 76,395 –20.6 22,368 14,663 –34.4 73,850 61,732 –16.4General 62,447 51,025 –18.3 18,197 10,655 –41.4 44,250 40,370 –8.8
Operating income –10,629 16,446 – 1,734 6,080 250.6 –12,363 10,366 183.8
Depreciation and other charges 9,042 6,275 –30.6 3,185 959 –69.9 5,857 5,316 –9.2Depreciation 7,886 8,285 5.1 2,021 1,051 –48.0 5,865 7,234 23.3Other charges 1,156 –2,010 –273.9 1,164 –92 –107.9 –8 –1,918 —
Other gains and losses 34,702 16,043 –53.8 1,645 850 –48.3 33,057 15,193 –54.0
Earnings before taxes 15,031 26,214 74.4 194 5,971 2,977.8 14,837 20,243 36.4
Corporate income tax 10,872 10,298 –5.3 1,099 2,050 86.5 9,773 8,248 –15.6
EARNINGS AFTER TAXES 4,159 15,916 282.7 –905 3,921 — 5,064 11,995 136.9
A.5.4.3.Securities firms. Brokers. Aggregate income statement
In thousands of euros

Annex 5
: Secu
rities firms an
d fu
nd m
anag
emen
t com
pan
ies
333
Quarter2002 2003
1Q02 2Q02 3Q02 4Q02 1Q03 2Q03 3Q03 4Q03
Financial income 79,564 54,426 11,064 24,146 13,708 30,646 18,084 22,091 12,012 2,239Financial revenues 237,646 170,149 50,231 61,923 52,926 72,566 55,021 51,876 35,863 27,389Financial costs 158,082 115,723 39,167 37,777 39,218 41,920 36,937 29,785 23,851 25,150
Net income from securities trading 18,916 25,542 7,002 –308 –2,431 14,653 13,035 8,800 –2,214 5,921Gains on securities 1,801,209 878,003 502,088 296,951 585,797 416,373 293,000 213,201 155,938 215,864Losses on securities 1,782,293 852,461 495,086 297,259 588,228 401,720 279,965 204,401 158,152 209,943
Net commission revenues 684,994 631,405 173,202 204,570 154,256 152,966 165,320 174,556 161,056 130,473Commission revenues 851,467 830,621 217,718 247,815 193,782 192,152 230,376 222,271 201,111 176,863
Brokering 533,901 467,762 143,567 148,830 122,814 118,690 125,151 122,324 125,700 94,587Placement and underwriting 49,287 91,890 8,517 27,351 5,565 7,854 46,775 37,493 5,524 2,098IIC subscription & reimbursement 121,224 116,477 34,282 29,062 30,271 27,609 27,006 27,285 27,836 34,350Portfolio management 17,530 19,465 4,519 4,525 4,624 3,862 3,857 4,729 3,993 6,886Other 129,525 135,027 26,833 38,047 30,508 34,137 27,587 30,440 38,058 38,942
Comission expenses 166,473 199,216 44,516 43,245 39,526 39,186 65,056 47,715 40,055 46,390
Total net revenues 783,474 711,373 191,268 228,408 165,533 198,265 196,439 205,447 170,854 138,633
Operating expenses 543,168 484,446 136,538 129,014 127,333 150,283 123,803 127,507 122,645 110,491Personnel 333,232 296,309 83,007 80,596 75,883 93,746 75,097 81,064 73,942 66,206General 209,936 188,137 53,531 48,418 51,450 56,537 48,706 46,443 48,703 44,285
Operating income 240,306 226,927 54,730 99,394 38,200 47,982 72,636 77,940 48,209 28,142
Depreciation and other charges 57,348 45,521 9,896 11,898 9,749 25,805 9,721 9,985 16,253 9,562Depreciation 39,089 35,942 9,318 9,048 9,697 11,026 9,337 9,426 9,457 7,722Other charges 18,259 9,579 578 2,850 52 14,779 384 559 6,796 1,840
Other gains and losses 34,326 68,247 8,435 8,880 6,089 10,922 7,715 13,281 10,681 36,570
Earnings before taxes 217,284 249,653 53,269 96,376 34,540 33,099 70,630 81,236 42,637 55,150
Corporate income tax 81,404 87,343 0 42 0 81,362 0 0 0 87,343
EARNINGS AFTER TAXES 135,880 162,310 53,269 96,334 34,540 –48,263 70,630 81,236 42,637 –32,193
A.5.5.1.Securities firms. Aggregate income statement.Quarterly performance
In thousands of euros

Annual rep
ort o
n th
e securities m
arket. 2003
334
Quarter2002 2003
1Q02 2Q02 3Q02 4Q02 1Q03 2Q03 3Q03 4Q03
Financial income 73,050 47,728 9,527 21,927 12,216 29,380 15,979 20,333 10,865 551Financial revenues 224,841 158,115 47,122 58,255 49,882 69,582 51,206 48,713 33,645 24,551Financial costs 151,791 110,387 37,595 36,328 37,666 40,202 35,227 28,380 22,780 24,000
Net income from securities trading 19,430 24,017 7,038 682 –2,471 14,181 13,265 8,464 –2,241 4,529Gains on securities 1,798,271 875,869 501,849 296,699 584,461 415,262 292,759 212,670 156,206 214,234Losses on securities 1,778,841 851,852 494,811 296,017 586,932 401,081 279,494 204,206 158,447 209,705
Net commission revenues 542,958 495,762 138,617 167,385 118,438 118,518 128,206 141,903 130,705 94,948Commission revenues 667,195 666,046 172,960 199,442 146,844 147,949 184,115 182,954 165,071 133,906
Brokering 418,617 382,583 114,944 117,805 94,013 91,855 97,758 101,592 106,596 76,637Placement and underwriting 46,920 89,296 7,958 26,836 5,086 7,040 46,226 36,679 5,147 1,244IIC subscription & reimbursement 108,091 98,629 30,987 25,831 26,816 24,457 24,031 23,436 24,622 26,540Portfolio management 7,027 7,711 2,071 2,175 1,476 1,305 1,479 1,580 1,428 3,224Other 86,540 87,827 17,000 26,795 19,453 23,292 14,621 19,667 27,278 26,261
Comission expenses 124,237 170,284 34,343 32,057 28,406 29,431 55,909 41,051 34,366 38,958
Total net revenues 635,438 567,507 155,182 189,994 128,183 162,079 157,450 170,700 139,329 100,028
Operating expenses 384,503 357,026 100,673 91,368 90,259 102,203 90,488 93,039 91,303 82,196Personnel 237,014 219,914 61,817 57,879 54,998 62,320 55,713 58,792 54,783 50,626General 147,489 137,112 38,856 33,489 35,261 39,883 34,775 34,247 36,520 31,570
Operating income 250,935 210,481 54,509 98,626 37,924 59,876 66,962 77,661 48,026 17,832
Depreciation and other charges 48,306 39,246 8,064 9,815 7,414 23,013 7,893 10,157 14,643 6,553Depreciation 31,203 27,657 7,410 7,088 7,722 8,983 7,578 7,672 8,005 4,402Other charges 17,103 11,589 654 2,727 –308 14,030 315 2,485 6,638 2,151
Other gains and losses –376 52,204 2,662 3,719 858 –7,615 3,770 6,867 6,815 34,752
Earnings before taxes 202,253 223,439 49,107 92,530 31,368 29,248 62,839 74,371 40,198 46,031
Corporate income tax 70,532 77,045 0 42 0 70,490 0 0 0 77,045
EARNINGS AFTER TAXES 131,721 146,394 49,107 92,488 31,368 –41,242 62,839 74,371 40,198 –31,014
A.5.5.2.Securities firms. Broker-dealers. Aggregate income statement.Quarterly performance
In thousands of euros

Annex 5
: Secu
rities firms an
d fu
nd m
anag
emen
t com
pan
ies
335
Quarter2002 2003
1Q02 2Q02 3Q02 4Q02 1Q03 2Q03 3Q03 4Q03
Financial income 6,514 6,698 1,537 2,219 1,492 1,266 2,105 1,758 1,147 1,688Financial revenues 12,805 12,034 3,109 3,668 3,044 2,984 3,815 3,163 2,218 2,838Financial costs 6,291 5,336 1,572 1,449 1,552 1,718 1,710 1,405 1,071 1,150
Net income from securities trading –514 1,525 –36 –990 40 472 –230 336 27 1,392Gains on securities 2,938 2,134 239 252 1,336 1,111 241 531 –268 1,630Losses on securities 3,452 609 275 1,242 1,296 639 471 195 –295 238
Net commission revenues 142,036 135,643 34,585 37,185 35,818 34,448 37,114 32,653 30,351 35,525Commission revenues 184,272 164,575 44,758 48,373 46,938 44,203 46,261 39,317 36,040 42,957
Brokering 115,284 85,179 28,623 31,025 28,801 26,835 27,393 20,732 19,104 17,950Placement and underwriting 2,367 2,594 559 515 479 814 549 814 377 854IIC subscription & reimbursement 13,133 17,848 3,295 3,231 3,455 3,152 2,975 3,849 3,214 7,810Portfolio management 10,503 11,754 2,448 2,350 3,148 2,557 2,378 3,149 2,565 3,662Other 42,985 47,200 9,833 11,252 11,055 10,845 12,966 10,773 10,780 12,681
Comission expenses 42,236 28,932 10,173 11,188 11,120 9,755 9,147 6,664 5,689 7,432
Total net revenues 148,036 143,866 36,086 38,414 37,350 36,186 38,989 34,747 31,525 38,605
Operating expenses 158,665 127,420 35,865 37,646 37,074 48,080 33,315 34,468 31,342 28,295Personnel 96,218 76,395 21,190 22,717 20,885 31,426 19,384 22,272 19,159 15,580General 62,447 51,025 14,675 14,929 16,189 16,654 13,931 12,196 12,183 12,715
Operating income –10,629 16,446 221 768 276 –11,894 5,674 279 183 10,310
Depreciation and other charges 9,042 6,275 1,832 2,083 2,335 2,792 1,828 –172 1,610 3,009Depreciation 7,886 8,285 1,908 1,960 1,975 2,043 1,759 1,754 1,452 3,320Other charges 1,156 –2,010 –76 123 360 749 69 –1,926 158 –311
Other gains and losses 34,702 16,043 5,773 5,161 5,231 18,537 3,945 6,414 3,866 1,818
Earnings before taxes 15,031 26,214 4,162 3,846 3,172 3,851 7,791 6,865 2,439 9,119
Corporate income tax 10,872 10,298 0 0 0 10,872 0 0 0 10,298
EARNINGS AFTER TAXES 4,159 15,916 4,162 3,846 3,172 –7,021 7,791 6,865 2,439 –1,179
A.5.5.3.Securities firms. Brokers. Aggregate income statement.Quarterly performance
In thousands of euros

Annual report on the securities market. 2003
336
No. of firms, by ROE bracket
Loss 0-15% 16-30% 31-45% 46-60% 61-75% 76-100% > 100%Average(2)
(%)
(1) ROE=earnings before taxes/(equity + interin dividend) expressed as a percentage. Equity is calculated in accordance with the public balan-ce sheet and the reserved balance sheet established in Annex 2 of CNMV Circular 5/1990 regarding the accounting standards for broker-dealers and brokers. Since this item is presented net of the interim dividend without including income for the year, the dividend is addedback to calculate ROE.
(2) Equity-weighted average.
Broker-dealers 24.40 5 17 11 9 1 0 0 3Stock exchange members 25.52 4 14 8 8 0 0 0 3Non-members 18.62 1 3 3 1 1 0 0 0
Agencias de Valores 15.06 22 18 7 5 3 2 0 2Stock exchange members 14.71 4 6 1 2 1 0 0 0Non-members 15.17 18 12 6 3 2 2 0 2
Total 22.88 27 35 18 14 4 2 0 5Stock exchange members 24.98 8 20 9 10 1 0 0 3Non-members 16.96 19 15 9 4 3 2 0 2
No. of firms, by ROE bracket
Loss 0-15% 16-30% 31-45% 46-60% 61-75% 76-100% > 100%Average(2)
(%)
(1) ROE=earnings before taxes/(equity + interin dividend) expressed as a percentage. Equity is calculated in accordance with the public balan-ce sheet and the reserved balance sheet established in Annex 2 of CNMV Circular 5/1990 regarding the accounting standards for broker-dealers and brokers. Since this item is presented net of the interim dividend without including income for the year, the dividend is addedback to calculate ROE.
(2) Equity-weighted average.
Broker-dealers 15.99 5 22 15 1 0 1 0 2Stock exchange members 16.71 4 18 12 0 0 1 0 2Non-members 12.25 1 4 3 1 0 0 0 0
Brokers 9.33 22 21 7 5 1 1 1 1Stock exchange members 9.67 4 6 3 0 1 0 0 0Non-members 9.23 18 15 4 5 0 1 1 1
Total 14.90 27 43 22 6 1 2 1 3Stock exchange members 16.36 8 24 15 0 1 1 0 2Non-members 10.79 19 19 7 6 0 1 1 1
A.5.6.1.Securities firms. Return on equity (ROE) before taxes(1) in 2003
A.5.6.2.Securities firms. Return on equity (ROE) after taxes(1) in 2003
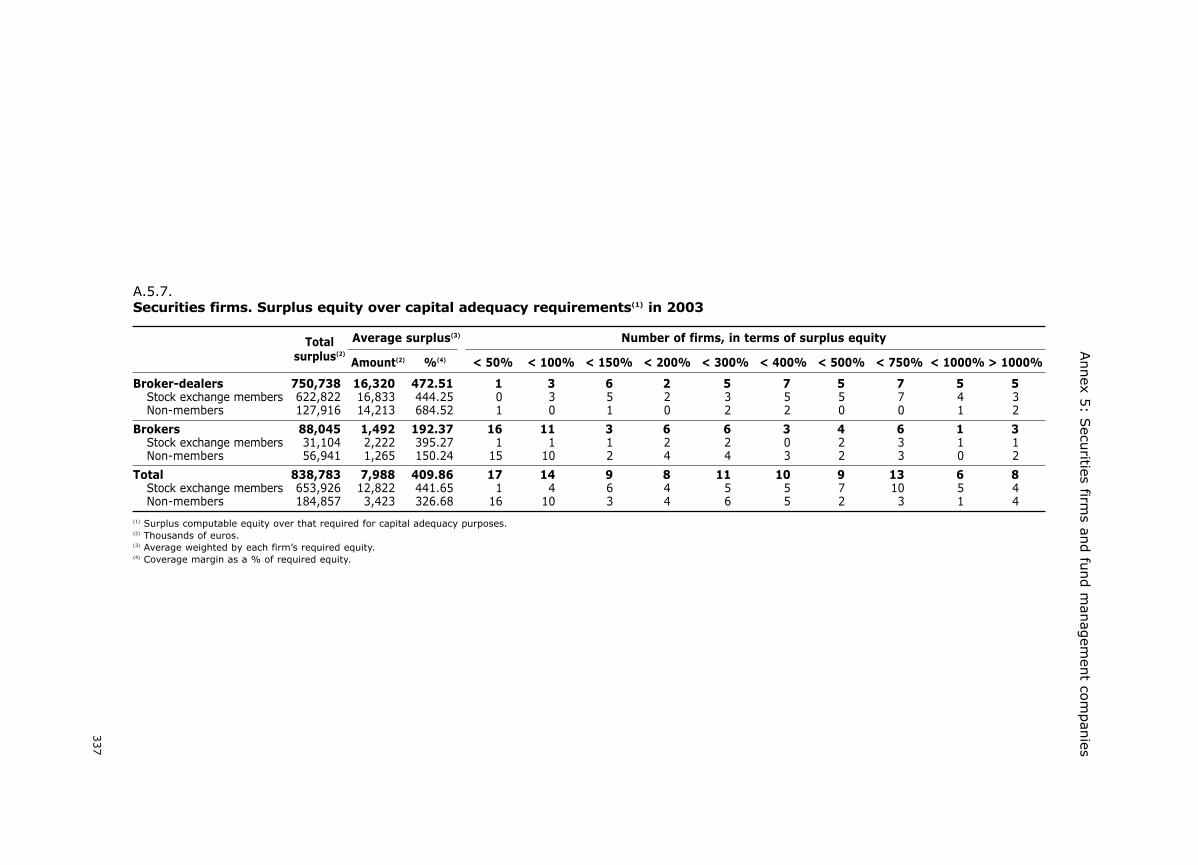
Annex 5
: Secu
rities firms an
d fu
nd m
anag
emen
t com
pan
ies
337
(1) Surplus computable equity over that required for capital adequacy purposes.(2) Thousands of euros.(3) Average weighted by each firm’s required equity.(4) Coverage margin as a % of required equity.
Average surplus(3) Number of firms, in terms of surplus equityTotalsurplus(2)
Amount(2) %(4) < 50% < 100% < 150% < 200% < 300% < 400% < 500% < 750% < 1000% > 1000%
Broker-dealers 750,738 16,320 472.51 1 3 6 2 5 7 5 7 5 5Stock exchange members 622,822 16,833 444.25 0 3 5 2 3 5 5 7 4 3Non-members 127,916 14,213 684.52 1 0 1 0 2 2 0 0 1 2
Brokers 88,045 1,492 192.37 16 11 3 6 6 3 4 6 1 3Stock exchange members 31,104 2,222 395.27 1 1 1 2 2 0 2 3 1 1Non-members 56,941 1,265 150.24 15 10 2 4 4 3 2 3 0 2
Total 838,783 7,988 409.86 17 14 9 8 11 10 9 13 6 8Stock exchange members 653,926 12,822 441.65 1 4 6 4 5 5 7 10 5 4Non-members 184,857 3,423 326.68 16 10 3 4 6 5 2 3 1 4
A.5.7.Securities firms. Surplus equity over capital adequacy requirements(1) in 2003

Annual rep
ort o
n th
e securities m
arket. 2003
338
Total Trading for third parties Proprietary trading
2002 2003 Chg. (%) 2002 2003 Chg. (%) 2002 2003 Chg. (%)
Breakdown by instrumentMoney market & government bonds 8,827.4 16,424.4 86.06 8,596.9 16,210.6 88.56 230.5 213.8 –7.27
Domestic stock markets 60.7 44.0 –27.62 60.7 43.5 –28.22 0.1 0.4 542.16Other domestic markets 8,118.1 14,805.1 82.37 7,890.3 14,596.4 84.99 227.8 208.7 –8.36Foreign markets 648.6 1,575.3 142.86 646.0 1,570.7 143.15 2.7 4.6 72.53
Other fixed-income 125.0 137.0 9.55 91.9 106.6 15.94 33.1 30.4 –8.17Domestic stock markets 6.8 5.3 –21.75 6.1 5.2 –14.32 0.7 0.1 –82.66Other domestic markets 79.5 98.7 24.10 69.9 86.6 23.79 9.6 12.1 26.38Foreign markets 38.7 33.0 –14.84 15.9 14.8 –7.07 22.8 18.2 –20.26
Equities 853.4 892.2 4.54 717.5 763.3 6.39 136.0 128.9 –5.21Domestic stock markets 824.9 857.1 3.90 692.5 738.8 6.68 132.4 118.2 –10.68Other domestic markets 1.7 2.2 29.46 1.4 1.9 35.19 0.3 0.3 5.53Foreign markets 26.8 32.9 22.79 23.5 22.6 –3.91 3.3 10.3 215.08
Derivatives 3,675.6 3,760.9 2.32 3,492.1 3,688.7 5.63 183.5 72.2 –60.67Domestic stock markets 13.4 19.1 42.80 12.3 19.0 54.56 1.1 0.1 –92.48Other domestic markets 1,630.4 1,782.2 9.31 1,477.5 1,723.1 16.62 152.9 59.1 –61.33Foreign markets 2,031.8 1,959.6 –3.55 2,002.3 1,946.6 –2.78 29.5 13.0 –56.09
TOTAL 13,481.5 21,214.4 57.36 12,898.4 20,769.2 61.02 583.1 445.2 –23.65
Domestic stock markets 905.8 925.4 2.16 771.6 806.6 4.54 134.2 118.8 –11.47Other domestic markets 9,829.7 16,688.2 69.77 9,439.1 16,407.9 73.83 390.6 280.3 –28.23Foreign markets 2,745.9 3,600.8 31.13 2,687.7 3,554.7 32.26 58.3 46.1 –20.96
Breakdown by type of fundStock exchange members 3,711.5 3,488.3 –6.01 3,153.7 3,059.3 –2.99 557.8 429.0 –23.09
Broker-dealers 2,007.4 2,037.4 1.50 1,450.7 1,610.2 10.99 556.7 427.2 –23.25Brokers 1,704.2 1,450.9 –14.86 1,703.0 1,449.1 –14.91 1.2 1.8 54.13
Non-members 9,770.0 17,726.1 81.43 9,744.7 17,709.9 81.74 25.3 16.2 –35.99Broker-dealers 66.9 57.1 –14.57 42.2 41.5 –1.50 24.7 15.6 –36.87Brokers 9,703.1 17,668.9 82.10 9,702.5 17,668.4 82.10 0.6 0.6 1.91
TOTAL 13,481.5 21,214.4 57.36 12,898.4 20,769.2 61.02 583.1 445.2 –23.65
A.5.8.Securities firms. Volume traded
Amounts in billions of euros

Annex 5
: Secu
rities firms an
d fu
nd m
anag
emen
t com
pan
ies
339
Total Financial income Securities portfolio Other provisions
2002 2003 2002 2003 2002 2003 2002 2003
(*) Adjustments arising from the valuation of derivatives used in hedges.
Breakdown by instrumentMoney market & government bonds 5,206 –11,105 5,634 5,809 –428 –16,914 0 0Other fixed-income securities 20,076 38,579 2,682 3,690 17,394 34,889 0 0
Domestic portfolio 15,683 35,826 1,905 2,788 13,778 33,038 0 0Foreign portfolio 4,393 2,753 777 902 3,616 1,851 0 0
Equities –68,695 96,456 24,589 17,891 –93,284 78,565 0 0Domestic portfolio –75,143 82,579 17,028 9,929 –92,171 72,650 0 0Foreign portfolio 6,448 13,877 7,561 7,962 –1,113 5,915 0 0
Derivatives 96,219 –70,452 0 0 96,219 –70,452 0 0Repos 18,136 13,447 18,136 13,447 0 0 0 0Market credit transactions 1,703 0 1,703 0 0 0 0 0Deposits and other transactions with financial
intermediaries 229 –2,039 229 –2,039 0 0 0 0Other transactions 7,347 5,503 26,591 15,628 –985 –546 –18,259 –9,579
TOTAL 80,221 70,389 79,564 54,426 18,916 25,542 –18,259 –9,579
Breakdown by type of firmStock exchange members 74,244 58,007 71,929 46,252 20,621 23,186 –18,306 –11,431
Broker-dealers 72,530 54,490 69,387 44,170 20,285 21,843 –17,142 –11,523Brokers 1,714 3,517 2,542 2,082 336 1,343 –1,164 92
Non-members 5,977 12,382 7,635 8,174 –1,705 2,356 47 1,852Broker-dealers 2,847 5,666 3,663 3,558 –855 2,174 39 –66Brokers 3,130 6,716 3,972 4,616 –850 182 8 1,918
TOTAL 80,221 70,389 79,564 54,426 18,916 25,542 –18,259 –9,579
A.5.9.Securities firms. Results of propietary trading
Amounts in thousands of euros

Annual report on the securities market. 2003
340
2002 2003 Change(%) 2002 2003
Structure (%)
Breakdown by type of service
Brokering 533,901 467,762 –12.39 62.70 56.31
Money market and fixed-income assets 54,517 47,909 –12.12 6.40 5.77Domestic official secondary markets 31,325 30,730 –1.90 3.68 3.70Other domestic markets 13,994 10,850 –22.47 1.64 1.31Foreign markets 9,198 6,329 –31.19 1.08 0.76
Equities 377,497 331,023 –12.31 44.33 39.85Domestic official secondary markets 327,885 288,753 –11.93 38.51 34.76Other domestic markets 2,956 2,739 –7.34 0.35 0.33Foreign markets 46,656 39,531 –15.27 5.48 4.76
Derivatives 101,887 88,830 –12.82 11.97 10.69Domestic official secondary markets 57,259 47,376 –17.26 6.72 5.70Other domestic markets 21,114 16,213 –23.21 2.48 1.95Foreign markets 23,514 25,241 7.34 2.76 3.04
IIC subscription & reimbursement 121,224 116,477 –3.92 14.24 14.02Placement and underwriting 49,287 91,890 86.44 5.79 11.06Corporate 18,685 34,660 85.50 2.19 4.17Portfolio management and securities custody 32,462 34,624 6.66 3.81 4.17Other 95,908 85,208 –11.16 11.26 10.26
TOTAL 851,467 830,621 –2.45 100.00 100.00
Breakdown by type of firm
Stock exchange members 658,987 636,850 –3.36 77.39 76.67Broker-dealers 603,555 602,984 –0.09 70.88 72.59Brokers 55,432 33,866 –38.91 6.51 4.08
Non-members 192,480 193,771 0.67 22.61 23.33Broker-dealers 63,640 63,062 –0.91 7.47 7.59Brokers 128,840 130,709 1.45 15.13 15.74
TOTAL 851,467 830,621 –2.45 100.00 100.00
Pro memoria:Breakdown of brokering commissionsby type of firmStock exchange members 452,980 393,942 –13.03 84.84 84.22
Broker-dealers 407,443 368,279 –9.61 76.31 78.73Brokers 45,537 25,663 –43.64 8.53 5.49
Non-members 80,921 73,820 –8.78 15.16 15.78Broker-dealers 11,174 14,304 28.01 2.09 3.06Brokers 69,747 59,516 –14.67 13.06 12.72
TOTAL 533,901 467,762 –12.39 100.00 100.00
Comission expenses 166,473 199,216 19.67 – –
Amounts in thousands of euros
A.5.10.Securities firms. Commission revenues

Annex 5: Securities firms and fund management companies
341
Groups constituted around:
Number of
A.5.11.Securities firms. Consolidable groups.
Groups
2002 2003 2002 2003
Firms
Non-resident credit institutions (Title I of R.D. 1343/92) 11 12 58 123Broker-dealers and brokers (Title II of R.D. 1343/92) 19 18 147 258Other financial institutions (Title IV of R.D. 1343/92) 27 23 172 133
TOTAL 57 53 377 514
Types, as defined in Royal Decree 1343/92
(*) Marketing of pension and retirement plans, marketing of insurance, currency brokers, SIM, companies with no activity or in liquidation.
Groups comprising:
Number of
Groups
2002 2003 2002 2003
Firms
Five or more firms 27 30 289 424Less than five firms 30 23 88 90
TOTAL 57 53 377 514
Concentration
Type of firm2002
Number % Number %
2003
Agents of broker-dealers and brokers 76 20.2 110 21.4IIC and FTH operators 53 14.1 66 12.8Brokers 48 12.7 56 10.9Broker-dealers 25 6.6 29 5.6Holding companies 28 7.4 33 6.4Instrumental companies 14 3.7 30 5.8Advisory and consulting services 10 2.7 14 2.7Portfolio managers 8 2.1 7 1.4Pension fund managers 14 3.7 19 3.7Computer services 9 2.4 5 1.0Real estate holding companies 4 1.1 1 0.2Other financial institutions (*) 29 7.7 42 8.2Other institutions 59 15.6 102 19.8
TOTAL 377 100.0 514 100
Composition

Annual rep
ort o
n th
e securities m
arket. 2003
342
A.5.12.Securities firms. Consolidable groups. Aggregate balance sheet. Assets
Fixed assets 229,633 225,221 126,614 135,104 103,019 44.86 90,117 40.01Tangible fixed assets 169,929 141,386 91,182 79,172 78,747 46.34 62,214 44.00Intangibles 59,704 83,835 35,432 55,932 24,272 40.65 27,903 33.28
Goodwill in consolidation 171,830 142,911 0 0 171,830 100.00 142,911 100.00Permanent portfolio (net) 103,474 153,486 123,433 144,646 –19,959 –19.29 8,840 5.76Doubtful investments, in default or
in litigation (net) 7,727 5,312 6,054 4,744 1,673 21.65 568 10.69Trading portfolio (net) 9,919,040 9,091,045 9,679,806 7,200,035 239,234 2.41 1,891,010 20.80Credit to individual clients 1,289,617 88,452 126,609 80,805 1,163,008 90.18 7,647 8.65Financial intermediaries 1,828,002 2,670,877 1,609,180 2,590,615 218,822 11.97 80,262 3.01Cash 6,610 18,696 3,142 15,636 3,468 52.47 3,060 16.37Sundry accounts 383,964 638,046 258,970 477,198 124,994 32.55 160,848 25.21
TOTAL ASSETS 13,939,897 13,034,046 11,933,808 10,648,783 2,006,089 14.39 2,385,263 18.30
12/31/02 12/31/03
Amounts in thousands of euros
Total consolidated Securities firms Difference
12/31/02 12/31/03 12/31/02 % %12/31/03

Annex 5
: Secu
rities firms an
d fu
nd m
anag
emen
t com
pan
ies
343
A.5.12.Securities firms. Consolidable groups. Aggregate balance sheet. Liabilities
Equity 1,823,285 1,673,771 1,177,840 1,022,374 645,445 35.40 651,397 38.92Capital 916,935 917,470 531,475 527,534 385,460 42.04 389,936 42.50Reserves 744,855 569,028 737,727 566,707 7,128 0.96 2,321 0.41(–) Ow shares, shareholders and
interim dividends –51,447 –29,770 –91,362 –71,867 39,915 –77.58 42,097 –141.41Reserves at consolidated companies 212,942 217,043 0 0 212,942 100.00 217,043 100.00
Income for the year 139,527 193,435 135,880 162,310 3,647 2.61 31,125 16.09Minority interests 39,977 42,803 0 0 39,977 100.00 42,803 100.00Negative differences in consolidation 6,817 6,805 0 0 6,817 100.00 6,805 100.00Subordinated financing and other debt
securities 104,759 114,979 98,711 105,824 6,048 5.77 9,155 7.96Financing from financial intermediaries 7,479,025 9,295,792 7,449,353 7,902,882 29,672 0.40 1,392,910 14.98Financing from clients 2,143,107 832,329 1,018,048 771,314 1,125,059 52.50 61,015 7.33Special allowances 16,217 16,789 35,596 36,485 –19,379 –119.50 –19,696 –117.31Sundry accounts 2,187,246 857,343 2,018,380 647,594 168,866 7.72 209,749 24.47
TOTAL LIABILITIES 13,939,960 13,034,046 11,933,808 10,648,783 2,006,152 14.39 2,385,263 18.30
12/31/02 12/31/03
Amounts in thousands of euros
(Continued)
Total consolidated Securities firms Difference
12/31/02 12/31/03 12/31/02 % %12/31/03

Annual rep
ort o
n th
e securities m
arket. 2003
344
A.5.13.Securities firms. Consolidable groups. Aggregate income statement
Financial income 78,396 67,591 79,564 54,426 –1,168 –1.49 13,165 19.48Interest and dividends from investments 235,821 180,931 237,646 170,149 –1,825 –0.77 10,782 5.96Interest on liabilities 157,425 113,340 158,082 115,723 –657 –0.42 –2,383 –2.10
Net income from securities trading 16,025 37,835 18,916 25,542 –2,891 –18.04 12,293 32.49Gain on trading portfolio 1,876,573 959,989 1,801,209 878,003 75,364 4.02 81,986 8.54Loss on trading portfolio 1,860,548 922,154 1,782,293 852,461 78,255 4.21 69,693 7.56
Net commission revenues 939,123 910,552 684,994 631,405 254,129 27.06 279,147 30.66Commission revenues 1,434,705 1,445,032 851,467 830,621 583,238 40.65 614,411 42.52Brokering fees and commissions paid 495,582 534,480 166,473 199,216 329,109 66.41 335,264 62.73
Total net revenues 1,033,544 1,015,978 783,474 711,373 250,070 24.20 304,605 29.98
Operating expenses 813,812 751,208 600,516 529,967 213,296 26.21 221,241 29.45Personnel expenses 443,003 413,068 333,232 296,309 109,771 24.78 116,759 28.27General expenses, depreciation and other
provisions 370,809 338,140 267,284 233,658 103,525 27.92 104,482 30.90
Other gains and losses 53,608 70,727 34,326 68,247 19,282 35.97 2,480 3.51
Earnings before taxes 273,340 335,497 217,284 249,653 56,056 20.51 85,844 25.59
Corporate income tax 107,072 121,810 81,404 87,343 25,668 23.97 34,467 28.30
Earnings after taxes 166,268 213,687 135,880 162,310 30,388 18.28 51,377 24.04
Minority interests –282 3,943 0 0 –282 100.00 3,943 100.00
CONSOLIDATED SECTOR EARNINGS 166,550 209,744 135,880 162,310 30,670 18.41 47,434 22.62
12/31/02 12/31/03
Amounts in thousands of euros
Total consolidated Securities firms Difference
12/31/02 12/31/03 12/31/02 % %12/31/03

Annex 5
: Secu
rities firms an
d fu
nd m
anag
emen
t com
pan
ies
345
A.5.14.Securities firms. Consolidable groups. Commission revenues and expenses. 2003
Commission revenues 1,445,170 100.0 830,621 100.0 614,549 100.0 42.5Brokering 537,700 37.2 467,762 56.3 69,938 11.4 13.0Subscription, reimbursement & mgmt. of IIC
& pension funds 619,117 42.8 116,477 14.0 502,640 81.8 81.2Underwriting, search and placement 91,891 6.4 91,890 11.1 1 0.0 0.0Portfolio management 23,730 1.6 19,465 2.3 4,265 0.7 18.0Advisory services 70,123 4.9 34,660 4.2 35,463 5.8 50.6Custody and registration of securities 15,372 1.1 15,159 1.8 213 0.0 1.4Other revenues from securities transactions 45,873 3.2 36,154 4.4 9,719 1.6 21.2Computer services 4,251 0.3 0 0.0 4,251 0.7 100.0Property rental 198 0.0 0 0.0 198 0.0 100.0Other revenues not related to securities 36,916 2,6 49.054 5,9 –12.138 –2,0 –32.9
Commission expenses 533,302 100.0 199,216 100.0 334,086 100.0 62.6Securities transactions 469,345 88.0 160,831 80.7 308,514 92.3 65.7Transactions not related to securities 63,957 12.0 38,385 19.3 25,572 7.7 40.0
TOTAL NET COMMISSION REVENUES 911,868 – 631,405 – 280,463 – 30.8
Breakdown by type of serviceAmount Amount Amount Contribution (%)Structure (%) Structure (%) Structure (%)
Amounts in thousands of euros
Total consolidated (1) Securities firms (2) Difference (3)
Broker-dealers and brokers 749,699 51.9 175,134 32.8 574,564 63.0IIC and FTH operators 609,140 42.2 345,389 64.8 263,751 28.9Advisory and consulting services 19,796 1.4 16 0.0 19,780 2.2Holding companies 5,713 0.4 1,794 0.3 3,919 0.4Portfolio managers 3,413 0.2 262 0.0 3,151 0.3Agents of broker-dealers and brokers 211 0.0 3,798 0.7 –3,587 –0.4Pension fund managers 17,817 1.2 5,763 1.1 12,054 1.3Real estate holding companies 3,275 0.2 0 0.0 3,275 0.4Instrumental companies 823 0.1 0 0.0 823 0.1Other financial firms 35,283 2.4 1,145 0.2 34,138 3.7
TOTAL 1,445,170 100.0 533,302 100.0 911,868 100.0
Breakdown of commission revenues by type of firmAmount Structure (%)
Revenues Expenses Net commissions
Amount Structure (%) Amount Structure (%)
(1) Consolidable groups plus independent broker-dealers and brokers.(2) Total broker-dealers and brokers.(3) Difference between (1) and (2).

Annual report on the securities market. 2003
346
Amount Structure (%)
Eliminated
A.5.15.Securities firms. Consolidable groups.Detail of items eliminated in the 2003 income statement
Revenues 171,061 100.0 3,192,506Commission revenues 112,126 65.5 1,442,170Interest and dividends from investments 35,478 20.7 180,723Other revenues 21,203 12.4 597,972Gains on trading portfolio 2,254 1.3 971,641
Expenses 136,823 100.0 2,550,881Commission expenses 105,651 77.2 534,473Interest on liabilities 3,507 2.6 113,339General expenses and provisions 18,156 13.3 372,920Other expenses 6,945 5.1 197,013Personnel expenses 1,751 1.3 410,983Loss on trading portfolio 813 0.6 922,153
Net income 34,237 – 641,625
Amounts in thousands of euros
Balance inconsolidation
12/31/02 12/31/03 Chg. (%)
SGIIC SGC
A.5.16.Collective investment scheme management companies (SGIIC) and portfolio manage-ment companies (SGC). Number of companies and assets under management or advice
Number of companies 124 119 –4.0 31 24 –29.2Assets under management or adviceTotalNumber of portfolios 5,110 5,323 4.2 4,926 4,956 0.6Assets 192,981,621 232,915,327 20.7 6,917,489 6,022,311 –14.9Breakdown by portfolio typeIIC
Number 5,110 5,323 4.2 37 46 19.6Assets 192,981,621 232,915,327 20.7 176,397 229,617 23.2
FIAMMNumber 165 168 1.8 – – –Assets 53,366,474 58,054,417 8.8 – – –
FIMNumber 2,373 2,386 0.5 – – –Assets 121,368,392 152,572,747 25.7 – – –
SIMNumber 95 85 –10.5 0 0 0.0Assets 903,767 1,457,762 61.3 0 0 0.0
SIMCAVNumber 2,471 2,678 8.4 37 46 19.6Assets 15,221,345 17,980,283 18.1 176,397 229,617 23.2
Real estate mutual fundsNumber 5 5 0.0 – – –Assets 2,112,569 2,840,700 34.5 – – –
Real estate investment companiesNumber 1 1 0.0 – – –Assets 9,074 9,418 3.8 – – –
Other managed portfoliosNumber – – – 3,337 4,511 26.0Assets – – – 1,848,817 2,246,363 17.7
Advisory service contracts – – –Number – – – 1,552 399 –289.0Assets – – – 4,892,275 3,546,331 –38.0
Amounts in thousands of euros
12/31/02 12/31/03 Chg. (%)

Annex 5
: Secu
rities firms an
d fu
nd m
anag
emen
t com
pan
ies
347
A.5.17.Collective investment scheme management companies (SGIIC) and portfolio management companies (SGC). Aggregatebalance sheet. Assets
1. Uncalled capital 601 0.0 301 0.0 –49.9 0 0.0 0 0.0 –2. Fixed assets 105,925 5.5 97,473 5.5 –8.0 4,232 8.0 1,912 4.1 –54.83. Deferred charges 24 0.0 1,798 0.1 7,391.7 97 0.2 68 0.1 –29.94. Current assets 1,687,912 94.5 1,678,199 94.4 –0.6 48,307 91.8 44,648 95.8 –7.6
4.1. Accounts receivable 288,249 16.9 282,841 15.9 –1.9 11,645 30.0 7,797 16.7 –33.04.2. Securities portfolio 1,074,467 63.6 1,180,621 66.4 9.9 28,009 48.8 32,232 69.1 15.1
4.2.1. Government funds 794,767 48.8 707,425 39.8 –11.0 22,198 35.1 24,962 53.5 12.54.2.2. Listed securities 243,019 11.1 277,948 15.6 14.4 4,270 13.0 2,985 6.4 –30.14.2.3. Other securities 48,004 4.3 196,961 11.1 310.3 1,927 1.1 4,284 9.2 122.34.2.4. Interest 3,595 0.2 2,792 0.2 –22.3 38 0.2 8 0.0 –78.94.2.5. Provisions –14,918 –0.8 –4,505 –0.3 69.8 –424 –0.6 –7 0.0 98.3
4.3. Own shares 0 0.0 0 0.0 – 0 0.0 0 0.0 –4.4. Cash 320,953 13.8 203,710 11.5 –36.5 4,558 12.0 4,196 9.0 –7.94.5. Accrual adjustments 4,243 0.1 11,027 0.6 159.9 397 1.0 423 0.9 6.5
TOTAL ASSETS 1,794,462 100.0 1,777,771 100.0 –0.9 46,892 100.0 46,628 100.0 –0.6
12/31/02
Amount % Amount %
12/31/03 Chg.(%)
Amounts in thousands of euros
SGIIC SGC
12/31/02
Amount % Amount %
12/31/03 Chg.(%)

Annual rep
ort o
n th
e securities m
arket. 2003
348
(Continued)
A.5.17.Collective investment scheme management companies (SGIIC) and portfolio management companies (SGC). Aggregatebalance sheet. Liabilities
1. Equity 1,036,745 56.7 1,024,366 57.6 –1.2 38,026 71.4 32,587 69.9 –14.31.1. Capital stock 291,473 14.5 278,872 15.7 –4.3 17,846 40.7 16,323 35.0 –8.51.2. Reserves 613,595 33.3 609,342 34.3 –0.7 17,873 43.0 14,739 31.6 –17.51.3. Prior years’ income 7,684 0.5 1,411 0.1 –81.6 –1,161 –9.0 –811 –1.7 –30.11.4. Income for the year 289,636 23.0 291,119 16.4 0.5 3,899 –2.2 2,360 5.1 –39.51.5. Interim dividend –165,643 –14.5 –156,378 –8.8 5.6 –431 –1.2 –24 –0.1 –94.4
2. Deferred revenues 12 0.0 0 0.0 –100.0 0 0.0 0 0.0 –
3. Provisions for contingencies and expenses 44,455 2.3 22,873 1.3 –48.5 146 4.6 42 0.1 –71.2
4. Long-term liabilities 90,368 3.2 120,975 6.8 33.9 4,235 3.4 5,318 11.4 25.6
5. Current liabilities 622,882 37.8 609,557 34.3 –2.1 4,485 20.6 8,681 18.6 93.6
TOTAL LIABILITIES 1,794,462 100.0 1,777,771 100.0 –0.9 46,892 100.0 46,628 100.0 –0.6
12/31/02
Amount % Amount %
12/31/03 Chg.(%)
Amounts in thousands of euros
SGIIC SGC
12/31/02
Amount % Amount %
12/31/03 Chg.(%)
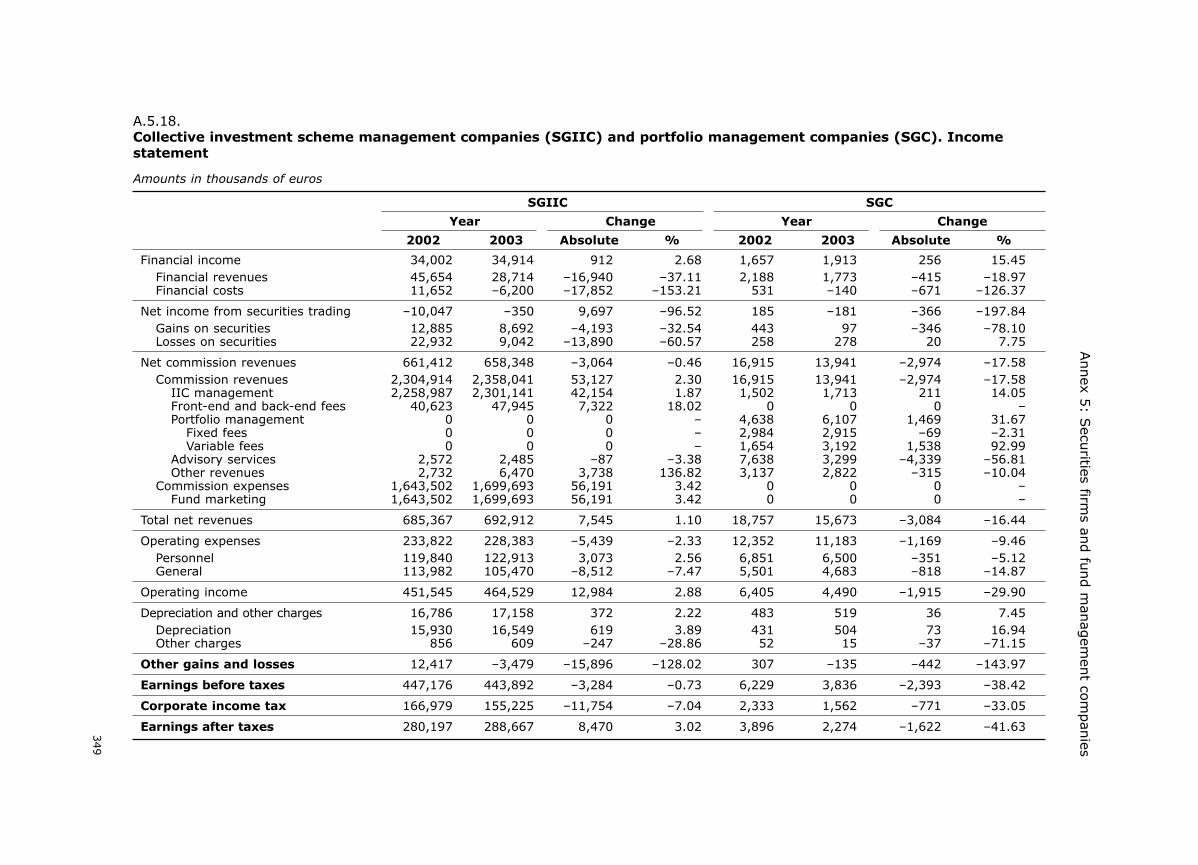
Annex 5
: Secu
rities firms an
d fu
nd m
anag
emen
t com
pan
ies
349
A.5.18.Collective investment scheme management companies (SGIIC) and portfolio management companies (SGC). Incomestatement
Financial income 34,002 34,914 912 2.68 1,657 1,913 256 15.45Financial revenues 45,654 28,714 –16,940 –37.11 2,188 1,773 –415 –18.97Financial costs 11,652 –6,200 –17,852 –153.21 531 –140 –671 –126.37
Net income from securities trading –10,047 –350 9,697 –96.52 185 –181 –366 –197.84Gains on securities 12,885 8,692 –4,193 –32.54 443 97 –346 –78.10Losses on securities 22,932 9,042 –13,890 –60.57 258 278 20 7.75
Net commission revenues 661,412 658,348 –3,064 –0.46 16,915 13,941 –2,974 –17.58Commission revenues 2,304,914 2,358,041 53,127 2.30 16,915 13,941 –2,974 –17.58
IIC management 2,258,987 2,301,141 42,154 1.87 1,502 1,713 211 14.05Front-end and back-end fees 40,623 47,945 7,322 18.02 0 0 0 –Portfolio management 0 0 0 – 4,638 6,107 1,469 31.67
Fixed fees 0 0 0 – 2,984 2,915 –69 –2.31Variable fees 0 0 0 – 1,654 3,192 1,538 92.99
Advisory services 2,572 2,485 –87 –3.38 7,638 3,299 –4,339 –56.81Other revenues 2,732 6,470 3,738 136.82 3,137 2,822 –315 –10.04
Commission expenses 1,643,502 1,699,693 56,191 3.42 0 0 0 –Fund marketing 1,643,502 1,699,693 56,191 3.42 0 0 0 –
Total net revenues 685,367 692,912 7,545 1.10 18,757 15,673 –3,084 –16.44
Operating expenses 233,822 228,383 –5,439 –2.33 12,352 11,183 –1,169 –9.46Personnel 119,840 122,913 3,073 2.56 6,851 6,500 –351 –5.12General 113,982 105,470 –8,512 –7.47 5,501 4,683 –818 –14.87
Operating income 451,545 464,529 12,984 2.88 6,405 4,490 –1,915 –29.90
Depreciation and other charges 16,786 17,158 372 2.22 483 519 36 7.45Depreciation 15,930 16,549 619 3.89 431 504 73 16.94Other charges 856 609 –247 –28.86 52 15 –37 –71.15
Other gains and losses 12,417 –3,479 –15,896 –128.02 307 –135 –442 –143.97
Earnings before taxes 447,176 443,892 –3,284 –0.73 6,229 3,836 –2,393 –38.42
Corporate income tax 166,979 155,225 –11,754 –7.04 2,333 1,562 –771 –33.05
Earnings after taxes 280,197 288,667 8,470 3.02 3,896 2,274 –1,622 –41.63
Year Change Year Change
2002 2003 Absolute 2002 Absolute% 2003 %
Amounts in thousands of euros
SGIIC SGC

ANNEX 6
COMPOSITIONOF THE CNMV BOARD

Annex 6
Composition of the CNMV Board
President: Blas Calzada Terrados
Vice-president: Juan Jesús Roldan Fernández
Commissioners: Belén Romana García1
Gonzalo Gil GarcíaSoledad Plaza y JabatJuan Junquera GonzálezLuis Perezagua Clamagirand
Secretary: José María Garrido García
353
Annex 6: Composition of the CNMV Board
1 Replaces Gloria Hernández García as Director General of Treasury and Finance Policy, appointed by Royal Decree910/2003, dated 11 July.

ANNEX 7
COMPOSITION OF THE CNMVEXECUTIVE COMMITTEE

Annex 7
Composition of the CNMV Executive Committee(2)
President: Blas Calzada Terrados
Vice-president: Juan Jesús Roldan Fernández
Commissioners: Soledad Plaza y JabatJuan Junquera GonzálezLuis Perezagua Clamagirand
Secretary: José María Garrido García
357
Annex 7: Composition of the CNMV Executive Committee
2 The creation, constitution and functions of the Executive Committee are regulated by Article 18 of Securities Market Law24/1988, dated 28 July, as amended by Law 44/2002, dated 22 November, on Measures to Reform the Financial System.

ANNEX 8
COMPOSITION OF THE CNMVADVISORY COMMITTEE

Annex 8
Composition of the CNMV Advisory Committee(3)
President: Juan Jesús Roldán Fernández
Secretary: José María Garrido García
Representatives
Issuers: Jesús López-Brea y López de RodasJavier López MadridCarlos Cerón Bombín
Investors: Enrique Goñi Beltrán de GarizurietaJavier Tribó Boixareu
Stock exchange members:
Sebastián Albella AmigoGregorio Arranz PumarJorge Bergareche BusquetIgnacio Gómez Sancha
Consumers and users council:
Jorge Caminero Rodríguez
Autonomous regions:
Valencian government:
José Manuel Uncio Lacasa
Catalan government:
Sadurní Anfosso i Borrell
Basque government:
Juan Miguel Bilbao Garai
Alternative representatives
Issuers: David Herrero GarcíaLuis Felipe Marcos García
Investors: Luis Munárriz MorenoJosé Palomeras Pagés
361
Annex 8: Composition of the CNMV Advisory Committee
3 CNMV Board resolution dated 25 March 2002.

Stock exchange members:
Juan Luis Muñoz PardoJosé María Ramírez Núñez de PradoJaime Aguilar Fernández-HontoriaJosé Antonio de Bonilla y Moreno
Consumers and users council:
Manuel Pardos Vicente
Autonomous regions:
Valencian government:
Javier Gomar Parra
Catalan government:
Josep María Sánchez i Pascual4
Basque government:
Miguel Bengoechea Romero
362
Annual report on the securities markets. 2003
4 Replaces Jaume Piera i Llovera. Notification from the Department of Economy and Finance of the Catalan Government on18 December 2002.

ANNEX 9
CNMV DIRECTORS

Annex 9
CNMV Directors
Directorate-General of Markets and Investors: Angel Benito Benito
Primary Markets: Carlos Lázaro RecachaSecondary Markets: Antonio Mas SirventInvestors Affairs: Elena Brito Alonso
Directorate-General of Securities MarketsParticipants Sol Hernández Olmo
Authorisation and Registration: Antonio Moreno EspejoSupervision: Mª José Gómez Yubero
Directorate-General of Legal Affairsand Secretary to the Board: José María Garrido García
Legal Counsel andDeputy Secretary to the Board: Javier Rodríguez PelliteroLitigation andEnforcement: Silvia García Malsipica5
Directorates:
Director attached to the President: Rafael Sánchez de la PeñaResearch and Statistics: Mª Nieves García SantosInternational Relations: Juan Carlos Recoder CassoInformation Systems: Javier Nozal MillánGeneral Secretariat: Salvador Meca GómezInternal Control: Margarita García Muñoz
365
Annex 9: CNMV Directors
5 Appointed, at the proposal of the President of the CNMV, by Board resolution dated 31 March 2004.