ANNUAL REPORT - Central Bank of Eswatini
216
UMNTSHOLI WEMASWATI ANNUAL REPORT APRIL 2016 - MARCH 2017 CENTRAL BANK OF SWAZILAND UMNTSHOLI WEMASWATI
-
Upload
khangminh22 -
Category
Documents
-
view
0 -
download
0
Transcript of ANNUAL REPORT - Central Bank of Eswatini

CENTRAL BANK OF SWAZILAND 2016/2017 ANNUAL REPORT
i
UMNTSHOLI WEMASWATI
ANNUAL REPORTAPRIL 2016 - MARCH 2017
CENTRAL BANK OF SWAZILANDUMNTSHOLI WEMASWATI
CENTRAL BANK OF SWAZILAND 2016/2017 ANNUAL REPORT
ii
VISION, MISSION AND VALUES
VISION STATEMENT
MISSION STATEMENT
MANDATEThe Bank seeks to achieve this mission by among other things: � Achieving price stability through sound monetary policy.� Achievingasoundandefficientfinancialsystemandfinancialstability.� Issuing and redeeming currency (notes and coins) for Swaziland.� Holding and managing foreign exchange reserves of Swaziland.� Be the Bank of and advisor to Government.� Facilitatingthedevelopmentandoperationofanefficientnationalpayment
system.� Beingthelenderoflastresorttofinancialinstitutionsandfacilitatethe
developmentofdomesticfinancialmarkets.� Researchingonmonetary,financialandeconomicmattersthatwillsupport
monetary policy formulation.
“WefosterfinancialsectorstabilityconducivetoeconomicdevelopmentinSwaziland”.
“TobeamongstthetopfiveleadingCentralBanksintheEasternandSouthernAfrican region”.
� PERFORMANCE DRIVEN We are performance driven, delivering timely services beyond expected
standards, and maintaining good relations with stakeholders. � ACCOUNTABILITY We take ownership of all our actions to respond in a transparent manner. � INTEGRITY Our actions are integrity driven. We are honest, respectful, upright, ethical
and consistent in our decision-making. � OPEN COMMUNICATION We believe in open communication in the timely delegation and delivery of
our tasks, taking constructive criticism and ideas.
VALUES
CENTRAL BANK OF SWAZILAND 2016/2017 ANNUAL REPORT
1
EXECUTIVE BOARD MEMBERS
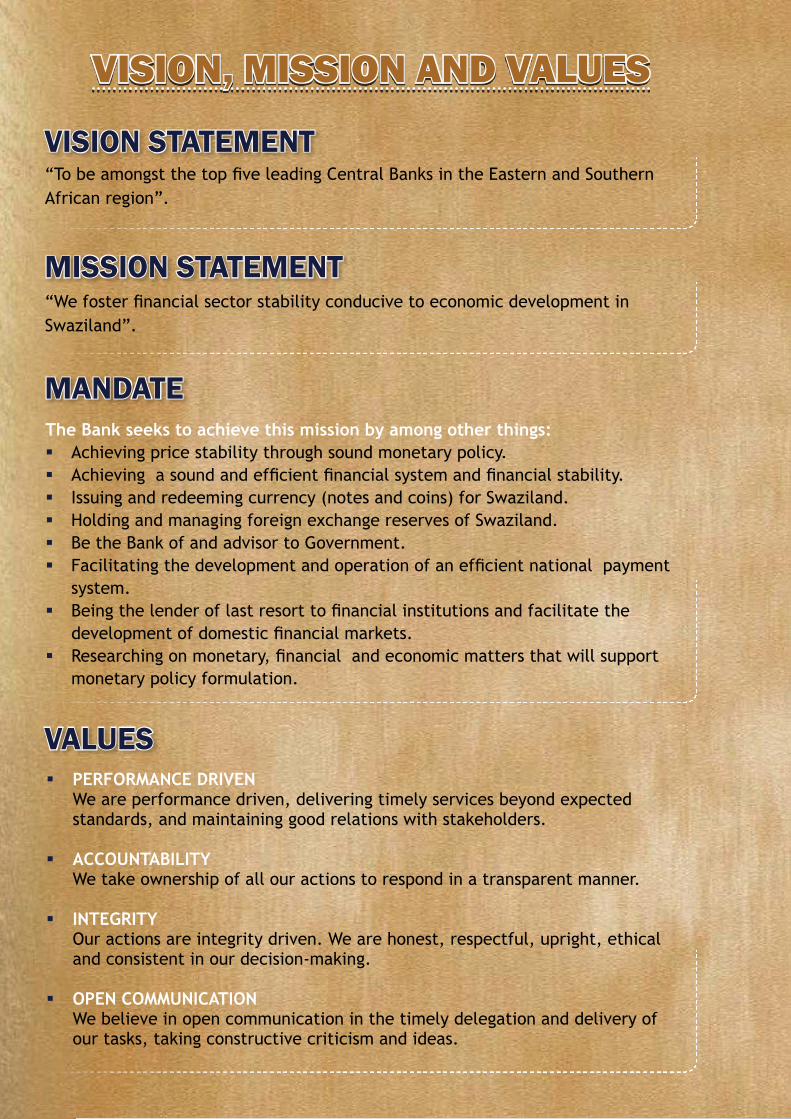
Mr. Majozi V. SitholeGovernor and Chairman
MrSitholeistheGovernoroftheCentralBankofSwaziland,aposition he has held since November 2013. Prior to this current position he held the political positions of: Minister for Finance (2001–2013); Minister of Economic Planning and Development(1998-2001); Elected Member of Parliament for MafutseniInkhundla (1998 – 2008); Appointed Member of Parliament (2008–2013).
Prior to engaging in a political career he was an academician and held the following positions: Research Assistant at University of Swaziland (UNISWA) 1981–1983, Research Fellow at UNISWA (1986–1994); Lecturer in Economics Department (1986–1998);Research Associate in Women and Law in Southern Africa. Majozi is a Fulbright Scholar (Iowa State University 1996/97) and holds academic qualifications which include a B.A. Social SciencesinEconomicsandAccountingfromUNISWA,1981andanM.Sc.AgriculturalEconomicsfromtheUniversityofAlberta,Canada,1986; and a few post graduate diplomas. He has attended many LeadershipTrainingPrograms,EmotionalIntelligenceWorkshopsand Strategy Formulation Workshops both locally and externally. He has done consultancy work while working at UNISWA. His area ofspecializationisTransportationEconomics,ProjectEvaluation,andAgriculturalEconomics.
Mr Sithole has an extensive administration experience including being Head of the Department of Economics at UNISWA,ChairmanandSecretaryGeneraloftheAssociationofLecturersand Academic Personnel of the UNISWA, Governor of IMF/WB and Governorof theAfricanDevelopmentBank. Hehasproducedover 40 papers, some of which have been published in research journals,referredjournalsandforspecificconferencepapers.
He is currently a board member of the Swaziland Revenue Authority,SwazilandEconomicPolicyandResearchCentreandalso serves as an Executive Committee Member of the MEFMISecretariat.
Mr. Mhlabuhlangene P. DlaminiDeputy Governor
Mr Dlamini is the Deputy Governor of the Central Bank ofSwaziland, a position he has held since November, 2015. Prior to this current position he has held the following:-BoardSecretaryandHeadLegalattheCentralBankofSwazilandfrom2008–2015;LegalOfficerattheCentralBankofSwazilandfrom 2007 – 2008; Partner at Magagula & Hlophe Attorneys; ManagerLegalComplianceStandardBank(Swaziland)Limited;CompanySecretary,Stanlib(Swaziland)andCandidateAttorneyatMillin&CurrieAttorneys.Mr Dlamini was a part-time Law Lecturer at the Universityof Swaziland Distance Education Unit. He holds professionaladmissionasanAttorneyoftheSupremeCourtofSwazilandandthefollowingacademicqualifications:• ABritishScheveningScholar;• MasterofLawsinBankingandFinancialRegulation(Kings
College–UniversityofLondon)–(Non-degreed);• MasterofLawsMerchantileLaw(StellenboschUniversity)–
(Degreed);• BachelorofLaws(RhodesUniversity-(Degreed);• BachelorofArtsinLaw–UniversityofSwaziland–(Degreed,
1994; Currently, he is a board member of the Swaziland RevenueAuthority;SwazilandPostandTelecommunicationsCorporation;and Lomati Mine (Pty) Ltd.

CENTRAL BANK OF SWAZILAND 2016/2017 ANNUAL REPORT
2
Ms. Refiloe M. Mamogobo Board Secretary
Ms Mamogobo is the Head Legal and Secretary to the Board of DirectorsoftheCentralBankofSwaziland.SheholdsaBachelorof LawsDegree (LLB) awarded in 2000andaBachelor ofArtsDegree(B.ALaw)awardedin1998.
She was admitted and enrolled as an attorney of the High CourtofSwazilandinOctober,2001.ShewasalsoadmittedandenrolledasaConveyancerJune,2006andfurtheradmittedandenrolled as a Notary Public in March, 2011.
She has served in several boards and including being President of theMalkernsTownBoardEvaluationCourt,MatsaphaTownBoardEvaluationCourtandNgwenyaTownBoardEvaluationCourt.
She has also served as a board member of the Swaziland Railways, RoyalSwaziNationalAirwaysCorporationandthePrinceLindaniFoundation.
ShehasalsoservedasProBonoCounselfortheSavetheChildrenFund and prosecutor for the Premier League of Swaziland. Ms MamogobowasfurtherappointedtotheCommissionofEnquirytolookintotheaffairsoftheMunicipalCouncilofMbabaneandservedasanExecutiveMemberoftheCounciloftheLawSocietyof Swaziland – 2001/2002 : 2004/2005 and 2007/ 2008.
ABRIDGED PROFILE OF BOARD MEMBERS
Mr. Bheki S. BhembeEx-Officio Member, Principal Secretary Ministry of FinanceNon-Executive Board Director
Mr Bhembe has been the Principal Secretary for the Ministry of Finance since 2014. Prior to his appointment as the Principal Secretary, he held the position of Budget Director within theMinistry of Finance between 2009 and 2014. Mr Bhembe is an economist by profession with extensive experience in the public sector having served over seven years as a planning officer oreconomist in various departments of the Ministry of EconomicPlanningandDevelopment.Hehasalsoworkedasaneconomistand statistician for the Central Bank of Swaziland and theSwaziland Railway respectively.
HeholdsaMasterofArtsdegreeinDevelopmentEconomicsfromWilliamsCollege,MA,USA,completedinJune2005.Hecompletedhis Bachelor of Arts’ Degree in 1997 from the University ofSwaziland.MrBhembecurrentlyservesasanAlternateExecutiveDirectorintheAfricanDevelopmentBankrepresentingLesotho,Swaziland and South Africa in the Board and as an ExecutiveCommitteeMemberoftheMEFMISecretariat.Healsohasservedin various boards within the country such as the Swaziland Development and Savings Bank, Swaziland Revenue Authority,NationalEmergencyResponseCouncilonHIV/AIDS,UniversityofSwazilandandSwazilandEnvironmentAuthority.

CENTRAL BANK OF SWAZILAND 2016/2017 ANNUAL REPORT
3
Mr. Daniel M. ShabanguNon-Executive Board Director
Mr Shabangu began his career as an Investment Analyst with BakerWilliams&AssociatesinCapeTown,whereheacquiredallroundskillsincorporatefinanceadvisory,dealingprimarilywithlisted companies. He has been exposed to the practical aspects ofpublicfinance,handlingSOEsatthePEU,MinistryofFinance.HewasHead of loans& Equities at SIDCwith responsibilitiesin origination, structuring and execution of project financetransactions.
Mr Shabangu holds a BSc (Maths & Physics) from UNISWA and a BBusSci(Finance)fromtheUniversityofCapeTown(UCT)andanMBA(finance)fromMaastrict,Holland.HewonaCASHPrizeineconomicsatUCTandhisMBAwasawardedwithdistinction.HeisanAlumniofINSEADBusinessSchoolinParis,France.
He has served in a number of Boards of companies locally, including Swazican, then Protea Hotel, Swaziland Water Services Corporation,Swaprop,SwaziPlazaProperties,tonameafew. MrShabanguhasadvisedbroadlyongreenfieldtransactionsacrossvarious industries including telecommunications, pulp & paper, insuranceandWaterreticulation(SD),oil&gas(Mozambique),mining(Zimbabwe)andOilRefining(Namibia).HeispresentlyaDirectorofSalueloCapital,aspecialistprojectFinanceadvisorycompany focusing on the origination, preparation and capital raisingforimpactfulgreenfieldprojectsregionally.
Mrs. Adelaide S. DlaminiNon-Executive Board Director
Mrs Dlamini is recently retired from the employ of TibiyoTakaNgwane having served the organization and its affiliatedcompanies for thirty years, entering at grass-roots level and culminating in the management cadre. She serves in various companies’BoardsofDirectors,rangingfromagriculture,leisure,propertyandfinanceindustries.SheoftensitsintheRemCoandAuditSub-Committeesofthese,mainly,asChairmanormember.She has a robust knowledge of retirement funds having served as a Trustee for both pension and provident funds for over twenty years.
SheholdsaBachelor’sDegreeinAccountingwhichsheobtainedin1976fromCuttingtonUniversityinLiberia,anMBAinCorporateFinance in 1986 from the Adelphi University, Long Island, New York and a Chartered Global Management Accountant (CGMA)obtainedin2010fromCIMA,UnitedKingdom.
She received with honour His Majesty’s 45th Anniversary Medal for Good National Service bestowed at the Lozitha Royal Residence in 2014byHisMajestyKingMswatiIII.
ABRIDGED PROFILE OF BOARD MEMBERS

CENTRAL BANK OF SWAZILAND 2016/2017 ANNUAL REPORT
4
Dr. Khanyisile D. DlaminiNon-Executive Board Director
Dr. Dlamini is passionate in nurturing small businesses andentrepreneurs to reach their full potential. She is the founder and director of TOWAK Consultancy, a financial andbusiness management consulting firm that has footprintsin Swaziland and South Africa. She specializes in designing funding models, conducting financial due diligence, financialwellness, training on managing finance, mentorship, as wellas conducting commissioned market surveys. She mainly works with government departments, private companies, non-governmental organisations and micro small and medium enterprises. Previously, she was a lecturer at the University of SwazilandandUniversityofDerby,UKandhasbeenavisitinglecturer at California State Polytechnic University, Pomona,USA.
Dr Dlamini completed her Bachelor of Commerce Degree in1990 from the University of Swaziland and a Master of Business Administration from De Montfort University, Leicester, UK in1994.ShefurtherobtainedaGraduateDiplomainMarketingin1995fromTheCharteredInstituteofMarketing,London,UK.In2006shecompletedaDegreeofDoctorofPhilosophyinSMEandEconomicDevelopmentfromAstonUniversity,Birmingham,UK.Dr Dlamini sits in several boards including, Central Bank ofSwaziland, Greystone Partners Limited, Central TransportOrganisation and a Trustee for the Swaziland Royal Insurance Corporation Preservation Provident Fund and Swaziland RoyalInsurance Pension Fund.
ABRIDGED PROFILE OF BOARD MEMBERS
Professor Mike S. MatsebulaNon-Executive Board Director
Professor Matsebula is an independent economist, having retired fromthepositionofCEOattheSwazilandSugarAssociationwhereheservedfor19years.Previously,hewasanEconomicsProfessorat the University of Swaziland. He completed his Bachelor’s Degreein1972atthethenUniversityofBotswana,LesothoandSwaziland (now National University of Lesotho); completed his Master’s Degree in Economics at theUniversity ofManitoba inWinnipeg,Canadain1975;andcompletedhisDoctorateDegreeinEconomicsatQueen’sUniversity,Ontario,Canadain1981.
Professor Matsebula has published extensively on various issues related to the Swazi economy, regional economic integration as well as international economic relations. He has made several presentations at national and international conferences. He subscribes to the King Code of Corporate Governance and hasbeen involved with its application in a few enterprises. He is a non-executive director of a few companies.
Professor Matsebula has been decorated twice with national honours in recognition of his meritorious efforts. These are the Royal Order of Sobhuza II, Chief Counsellor (awarded in 1992)and the Order of Eswatini, Rank of Commander (awarded inSeptember 2008).
CENTRAL BANK OF SWAZILAND 2016/2017 ANNUAL REPORT
5
ABRIDGED PROFILE OF BOARD MEMBERS
Dr. Sikhomba C. Gumbi Non-Executive Board Director
DrGumbiistheChiefExecutiveofREDI,aleadingmanagementconsulting services company based in Swaziland but with a regional footprint. He specializes in Leadership, Strategy and Governance.HeisaCertifiedProjectManagerandAccreditedCorporate Governance Facilitator. He has served as ProjectDirectorforlongtermassignmentsfortheAfDB,COMESAandUSAfricanDevelopmentFoundation.InadditiontoseveralDiplomacertificates mainly in management and human resources, heholdsaBachelorofScience inAgricultureEducation,aMasterof Science (UNISWA), and aDoctor of Philosophy in EducationManagement (Walden). He has studied Quality ManagementProgrammes at the University Sians Malaysia, the World Bank Institute,UniversityofIllinois,Urbana-Champaign,USAandtheAsia Institute of Technology in Bangkok, Thailand. He has also done short term training in Finance and Strategy at Wits Business School and the Gordon Institute of Business Studies (GIBS). DrGumbi’spreviousboards’appointmentsincludeSwazilandPostandTelecommunicationsCorporation,ConciliationMediationandArbitrationCommission,theUniversityofSwaziland,SwazilandStandards Authority, the Scholarship Selection Board as well as Boards of Non-Governmental Organisations: SHAPE, CitizenEmpowermentCentreandGoneRuralBoMake.HeisaRotarianandpastPresidentof theMbabane-MbuluziRotaryClubwherehe is a Paul Harris Fellow. He was honoured for exceptional nationalservicebyHisMajestyKingMswatiIIIandbestowedwithHis Majesty’s 45th Anniversary Medal in 2014.

CENTRAL BANK OF SWAZILAND 2016/2017 ANNUAL REPORT
6
CENTRAL BANK OF SWAZILAND UMNTSHOLI WEMASWATI
OfficeoftheGovernorMahlokohla Street Tel: (+268) 2408 2111P.O.Box546 Telex:2029WD:MONASMbabane, Swaziland Fax: (+268) 2404-0013
10th August, 2017
SenatorMartinG.DlaminiHonourable MinisterMinistry of FinanceP.O. Box 443MBABANEH100
DearMinister
InaccordancewithSection52(1)oftheCentralBankOrderof1974,Ihavethehonourtotransmit:-
(i). A copy of the Financial Statements for the year ended 31stMarch,2017certifiedbyAuditors;and
(ii). AreportoftheCentralBankoperationsandactivitiesincludingcoverageofeconomicdevelopmentsduringthefinancialyear2016/17.
Yours faithfully
MajoziV.SitholeGovernor

CENTRAL BANK OF SWAZILAND 2016/2017 ANNUAL REPORT
7
DEPARTMENT MANAGEMENT
EXECUTIVE COMMITTEEGovernor
DeputyGovernorAssistant Governor
GM, Financial MarketsGM, Finance
GM, OperationsGM,EconomicPolicyResearch&Stats
GM, Financial Regulation Head of Internal Audit
Head of Risk Head of HR & Administration
Secretary to the Board & Head of Legal
M.V. SitholeM.P. DlaminiM.E. Dlamini M.M. Khomo P. NxumaloL.G. Dlamini S.S. DlaminiM.T. NkambuleR.T. Manyathi J.S. DlaminiVacantR.M. Mamogobo
HeadofICTHeadofStrategy&Communication
Head, Internal Affairs & SecurityManager, Statistics & Publications
Manager, BOP & International Affairs Manager, PRAMA
Manager, Settlements Manager,Compliance&Risk
Manager,Investments&DomesticMarketsManager, National Payments Systems
Manager,CurrencyManager, Banking
Manager, Bank Supervision Manager,Policy&Enforcement
Manager,ExchangeControlManager,ICT(Systems)
Manager, IT Infrastructure & Security Manager, Facilities
Manager, Human Resources Manager,Learning&OD
Manager, Financial Accounting Manager, Management Accounting
Manager,SupplyChain Manager, Financial Stability
Manager,Compliance&EthicsManager, Security & Protection Services
DeputyHeadofLegal
S.N. DlaminiZ.M. GinaS.G. FakudzeA.M. DlaminiJ.C. DlaminiP.B. NdzinisaS.M. NxumaloO.Z. MakhanyaN.I. MthethwaM.L. DlaminiZ.F. NkambuleR.M. MambaB.A. DlaminiM.A. MathunjwaB. N. GilbertS. K. GamaL. D. SacoloS. N. MotsaG.C. DlaminiP. K. Mthupha S.M. ManyatsiQ.T. JeleB.O. MotsaW.L. MotsaZ.N. SimelaneN.J. HlatshwayoS. N. Jele
CENTRAL BANK OF SWAZILAND 2016/2017 ANNUAL REPORT
8
TABLE OF CONTENTS
Acronyms & Abbreviations .............................................................................................. 12
1. Governor’s Statement .............................................................................................. 15
PART A - REVIEW OF THE ECONOMY ................................................................................... 19
2. Global Economic Developments ................................................................................. 202.1 Overview ........................................................................................................ 202.2 IndustrializedCountries ...................................................................................... 212.3 EmergingMarkets&DevelopingEconomies ............................................................... 232.4 EconomicDevelopmentsinSouthAfrica ................................................................... 252.5 RegionalDevelopments ....................................................................................... 26
2.5.1 Common Monetary Area ............................................................................. 262.5.2 Southern African Customs Union .................................................................. 262.5.3 Southern African Development Community ...................................................... 272.5.4 Common Market for Eastern and Southern Africa ............................................. 272.5.5 Other Regional & International Arrangements .................................................. 27
3. Domestic Economy .................................................................................................. 293.1 AnnualRealGDPDevelopments ............................................................................ 29
3.1.1 Maize .................................................................................................. 303.1.2 Cotton .................................................................................................. 313.1.3 Livestock ............................................................................................... 323.1.4 Milk/Dairy Production ............................................................................... 343.1.5 Mining and Quarrying ................................................................................ 353.1.6 Sugar ................................................................................................... 363.1.7 Other Manufacturing ................................................................................ 373.1.8 Construction .......................................................................................... 383.1.9 Electricity Consumption ............................................................................. 393.1.10 Water Consumption .................................................................................. 40
3.2 Prices ............................................................................................................ 41
4. Balance of Payments ............................................................................................... 434.1 ChangesintheBalanceofPaymentsandInternationalInvestmentPositionMethodology ........ 444.2CurrentAccount ................................................................................................ 45 4.2.1 Trade Account......................................................................................... 46
4.2.2 Services Account ...................................................................................... 464.2.3 Primary Income ....................................................................................... 464.2.4 Secondary Income .................................................................................... 46
4.3 Financial Account ............................................................................................. 474.4 International Investment Position ........................................................................... 484.5 ExchangeRateDevelopments ................................................................................ 48
5. Monetary Developments ........................................................................................... 515.1 Overview ........................................................................................................ 51 5.2 Interest Rates .................................................................................................. 51 5.3 Statutory Reserve and Liquidity Requirements ............................................................ 525.4 DepositoryCorporationsSurvey ............................................................................ 53
5.4.1 Net Foreign Assets ................................................................................... 535.4.2 Domestic Claims (Net) ............................................................................... 535.4.3 Money .................................................................................................. 55
6. Public Finance ...................................................................................................... 576.1 The 2017/18 Government Budget Review and Analysis ................................................. 57
6.1.1 Introduction ........................................................................................... 576.1.2 Summary of Budget Estimates ..................................................................... 576.1.3 Revenue ................................................................................................ 586.1.4 Expenditure ........................................................................................... 60
6.2 BudgetDeficitFinancing ...................................................................................... 61
7. Public Debt......... .................................................................................................. 617.1 Overview ....................................................................................................... 617.2 PublicExternalDebt .......................................................................................... 62
7.2.1 Debt Service ........................................................................................... 627.2.2 Disbursements ........................................................................................ 63
7.3 DomesticDebt ................................................................................................. 637.3.1 Domestic Debt Portfolio Review ................................................................... 63
CENTRAL BANK OF SWAZILAND 2016/2017 ANNUAL REPORT
9
TABLE OF CONTENTSPART B - REPORT ON OPERATIONS ..................................................................................... 64 8. Corporate Governance ............................................................................................. 65
8.1 TheGoverningLegalEnvironment ......................................................................... 658.2 The Board ....................................................................................................... 658.3 TheBoardSub-Committees .................................................................................. 668.4 Board Statement on Risk Management ..................................................................... 668.5 MonetaryPolicyConsultativeCommittee .................................................................. 678.6 ConcludingStatement ......................................................................................... 67
9. Corporate Strategy and Communication ....................................................................... 689.1 Strategy Implementation ..................................................................................... 689.2 Performance Indicators ....................................................................................... 689.3 Progress Made................................................................................................... 68
9.3.1 SWOT Analysis ........................................................................................ 689.3.2 Excellence & Organizational Transformation .................................................... 689.3.3 Innovation & High Performance .................................................................... 689.3.4 Top 10 Risks ........................................................................................... 689.3.5 Performance Standards ............................................................................. 68
9.4 Branding and Image ............................................................................................ 68 10. Financial Markets Department ................................................................................... 69
10.1 Reserves Management ......................................................................................... 6910.2DomesticDebtMarketDevelopments ....................................................................... 69
10.2.1 Treasury Bills Portfolio .............................................................................. 6910.2.2 Treasury Bonds Portfolio ............................................................................ 6910.2.3 Private Placement Portfolio ........................................................................ 7010.2.4 Medium to Long-Term Auction Performance for the Fiscal Year 2016/17 ................... 7010.2.5 BondsMaturityProfile ............................................................................... 7110.2.6 Government Bonds Issuance Plan for 2017/18 ................................................... 72
11. Operations Department ........................................................................................... 7211.1BankingDivision ................................................................................................ 72
11.1.1 BackOffice-ClearingSection ...................................................................... 7211.1.2 FrontOffice-Cash&ForexSection ............................................................... 72
11.2CurrencyDivision .............................................................................................. 7311.2.1 Emalangeni Notes Issued .......................................................................... 7311.2.2 Coins Issued ......................................................................................... 7311.2.3 Rands Notes Issued ................................................................................. 7311.2.4 Deposited Currency and Notes Processed ...................................................... 7311.2.5 Shredded and Destroyed Notes ................................................................... 7311.2.6 Rands Deposited, Processed and Repatriated ................................................... 7311.2.7 Currency in Circulation ............................................................................. 7411.2.8 New Coins Series .................................................................................... 7411.2.9 Old Coins Series ..................................................................................... 7511.2.10 Coin Destruction .................................................................................... 7511.2.11 Commemorative Coins ............................................................................. 7511.2.12 New Notes ........................................................................................... 75
11.3DevelopmentFinanceDivision ............................................................................... 75 11.3.1 Overview ............................................................................................... 75
11.3.2 Small Scale Enterprise Loan Guarantee Scheme ................................................ 75 11.3.3 Export Credit Guarantee Scheme .................................................................. 7611.4Information&CommunicationTechnologyDivision ...................................................... 76 11.4.1 SAP Enterprise Resource Planning Update ....................................................... 76
12. Report on National Payments & Settlements Systems.............. ......................................... 7712.1 Introduction .................................................................................................... 7712.2CentralBankOversightofPaymentSystems .............................................................. 7712.3 Operational Activities ......................................................................................... 7812.4Cross-BorderPayments ....................................................................................... 7812.5FutureDevelopments ......................................................................................... 78
13. Bank Supervision .................................................................................................... 7813.1 Introduction .................................................................................................... 7813.2 Overview of the Banking System ............................................................................ 7813.3 Performance of the Banking Sector ........................................................................ 79
13.3.1 Balance Sheet Structure ............................................................................ 7913.3.2 Capital Adequacy ..................................................................................... 8013.3.3 Earnings Performance ............................................................................... 8013.3.4 Assets Quality ........................................................................................ 80
CENTRAL BANK OF SWAZILAND 2016/2017 ANNUAL REPORT
10
TABLE OF CONTENTS13.3.5 Liquidity Management ............................................................................... 80
13.4 Off-site Surveillance........................................................................................... 8013.5 On-site Inspection Supervision ............................................................................... 8113.6RegulatoryDevelopments .................................................................................... 81
13.6.1 Legal Notice on Bank Charges ...................................................................... 8113.6.2 Basel II Implementation ............................................................................. 8113.6.3 IFRS 9 Implementation .............................................................................. 81
14. Exchange Control and Anti-Money Laundering ................................................................ 8114.1ExchangeControl .............................................................................................. 81
14.1.1 Applications Approved ............................................................................... 8114.1.2 Out-Payments ......................................................................................... 8114.1.3 Import Permits Granted & Out Payments ........................................................ 8214.1.4 Analysis of Import Permits Granted ............................................................... 8214.1.5 Total In-Payment ..................................................................................... 82
14.2 Anti-Money Laundering ........................................................................................ 8214.2.1 Introduction ........................................................................................... 8214.2.2 Overview of the Regulated Industry .............................................................. 8214.2.3 Regulatory Developments ........................................................................... 8314.2.4 National Risk Assessment ........................................................................... 8414.2.5 Challenges ............................................................................................. 8414.2.6 Future Outlook ....................................................................................... 84
15. Internal Audit ........................................................................................................ 85
15.1OverviewandAuditCoverage ................................................................................ 8515.2 Achievements ................................................................................................... 85
15.2.1 Audits Covered ....................................................................................... 8515.2.2 Continuous Internal Assessments .................................................................. 8515.2.3 Anti-fraud & Logs Monitoring System ............................................................. 85
15.3 Future Outlook ................................................................................................ 8515.3.1 Combined Assurance Audit .......................................................................... 8515.2.2 Anti Fraud & Lock Monitoring System............................................................. 8515.2.3 Upgrade of TeamMate ............................................................................... 85
16. Risk Management Function ....................................................................................... 8616.1 Risk Management Framework ................................................................................ 8616.2 Top 10 Risks ..................................................................................................... 8616.3Safety,Health,Risk&Quality..... ........................................................................... 86
16.3.1 Compliance with the Occupational Safety and Health Act of 2001 ......................... 8716.3.2 Environmental Survey ............................................................................... 8716.3.3 Stakeholder Engagement ............................................................................ 87
16.4BusinessContinuityManagement ............................................................................ 87
17. Economic Policy Research and Statistics Department....... ................................................ 8717.1 Major Highlights ................................................................................................ 87
17.1.1 Monetary Policy Framework ........................................................................ 8717.1.2 Research Bulletin ..................................................................................... 8717.1.3 FinancialSectorDevelopmentImplementationPlan ........................................... 8817.1.4 Post Budget Seminar ................................................................................. 88
17.2ActivitiesEarnmarkedfor2017/18.......................................................................... 88
18. Human Resource Management ................................................................................... 8818.1HumanResourceDivision ..................................................................................... 88
18.1.1 Staff Compliment .................................................................................... 8818.1.2 Induction ............................................................................................... 8818.1.3 Salary Review ......................................................................................... 8818.1.4 Talent Management Strategy ....................................................................... 88
18.2LearningandOrganisationalDevelopment ................................................................ 8818.2.1 Specialized Training .................................................................................. 8818.2.2 General Training ...................................................................................... 8818.2.3 Change Management ................................................................................. 89
18.3 Facilities......................................................................................................... 8918.4EmployeeAssistanceProgramme ............................................................................ 89
PART C - FINANCIAL STATEMENTS ..................................................................................... 90CentralBankofSwaziland ................................................................................................ 90CapitalInvestmentSpecialFund ........................................................................................ 169ExportCreditGuaranteeScheme ....................................................................................... 184SmallScaleEnterpriseLoanGuaranteeScheme ...................................................................... 198
CENTRAL BANK OF SWAZILAND 2016/2017 ANNUAL REPORT
11
LIST OF FIGURESFigure 1: WorldEconomicOutlook–GDPProjections(revised):2015-2018 .................................... 20Figure 2: ConsumerPriceInflationforGoodsandServices ........................................................ 41Figure 3: ContributiontoAnnualConsumerInflationbyCOICOPCategory ..................................... 42Figure 4: OverallInflationversusCoreInflation ..................................................................... 42Figure 5: CurrentAccount .............................................................................................. 45Figure 6: Financial Account ............................................................................................. 47Figure 7: ForeignDirectInvestmentComponents,2016 ........................................................... 47Figure 8: MonthlyLilangeni’sExchangeRate-2016 ................................................................ 49Figure 9: NominalEffectiveandRealEffectiveExchangeRateIndices ......................................... 50Figure 10: NetForeignAssets&GrossOfficialReserves ............................................................. 53Figure 11: PrivateSectorLoansandDeposits ......................................................................... 55Figure 12: Loans by Type of Business ................................................................................... 55Figure 13: Money Supply .................................................................................................. 56Figure 14: MoneySupply:AnnualChanges ............................................................................. 56Figure 15: ComparativeBudgetSummary ............................................................................. 58Figure 16: GovernmentRevenueMajorComponents ................................................................. 59Figure 17: TotalPublicDebtTrend ...................................................................................... 61Figure 18: GovernmentBondsMaturityProfile ........................................................................ 71Figure 19: LoansDisbursedandGuaranteesOutstanding ........................................................... 76
LIST OF TABLESTable 1: Maize Production ............................................................................................. 31Table 2: CottonProduction ............................................................................................ 32Table 3: LivestockProduction-Cattle ............................................................................... 32Table 4: BeefExports ................................................................................................... 33Table 5: Other Livestock – Pigs, Goats, Sheep and Poultry ....................................................... 33Table 6: DairyProductioninMillions–LiquidMilkEquivalent(LME) ............................................ 34Table 7: Minerals - Production and Sales ............................................................................ 35Table 8: Sugar Production and Sales ................................................................................. 37Table 9: ConstructionIndicators ...................................................................................... 39Table 10: ElectricityConsumption ..................................................................................... 40Table 11: TreatedWaterConsumption ................................................................................ 40Table 12: Bank Liquidity ................................................................................................. 52Table 13: TotalClaimsonOtherSectors(PrivateSector)byCategoryofBorrower ........................... 54Table 14: Business: Loans and Advances by Type of Industry ...................................................... 54Table 15: OwnershipofDepositswithOtherDepositoryCorporationsinSwaziland ........................... 57Table 16: Budget Summary .............................................................................................. 58Table 17: CentralGovernmentRevenue .............................................................................. 59Table 18: CentralGovernmentRecurrentExpenditure ............................................................. 60Table 19: CentralGovernmentCapitalExpenditure ................................................................ 60Table 20: PublicDebtIndicators ....................................................................................... 62Table 21: PublicExternalDebtbyHolderCategory ................................................................. 62Table 22: DomesticDebtPortfoliobyInstrument ................................................................... 63Table 23: DomesticDebtPortfoliobyHolder ........................................................................ 63Table 24: Frequency and Attendance of Board Meetings ........................................................... 65Table 25: FrequencyandAttendanceofRemunerationCommitteeMeetings ................................... 66Table 26: FrequencyandAttendanceofCapitalProjectsCommitteeMeetings ................................ 66Table 27: FrequencyandAttendanceofRisk&ITCommitteeMeetings ......................................... 66Table 28: FrequencyandAttendanceofAuditCommitteeMeetings ............................................. 66Table 29: FrequencyandAttendanceofMPCCCommitteeMeetings ............................................. 67Table 30: AssetClassComposition ..................................................................................... 69Table 31: Treasury Bills Portfolio by Tenor ........................................................................... 69Table 32: Treasury Bills Auction Performance for 2016/17 ......................................................... 69Table 33: Treasury Bonds Portfolio Listed on SSX .................................................................... 70Table 34: Private Placement Portfolio By Tenor ..................................................................... 70Table 35: Government Bonds Auction Performance for 2016/17 .................................................. 70Table 36: 2017/2018IssuanceCalendar;NormalBondIssuanceProgramme.................................... 72Table 37: 2017/2018IssuanceCalendar;InfrastructureBondProgramme ...................................... 72Table 38: ScheduleofNotesandCoinConsumptionfor2016/17 ................................................. 73Table 39: RandsDepositedandRepatriated .......................................................................... 74Table 40: Banks’ Shareholdings ......................................................................................... 78Table 41: RegulatedEntities ............................................................................................ 82Table 42: Top 10 Risks ................................................................................................... 86
LIST OF FIGURES AND TABLES
CENTRAL BANK OF SWAZILAND 2016/2017 ANNUAL REPORT
12
ACRONYMS AND ABBREVIATIONS
AACB - AssociationofAfricanCentralBanks
ACH - AutomatedClearingHouse
AfDB - AfricanDevelopmentBank
AGOA - African Growth Opportunity Act
AIDS - AcquiredImmuneDeficiencySyndrome
AU – African Union
AML - Anti-Money Laundering
BCM - BusinessContinuityManagement
BOE – BankofEngland
BOJ - BankofJapan
BOP - Balance of Payments
BPM - Balance of Payments Manual
BRC - BoardRiskCommittee
BRICS - Brazil,Russia,India,ChinaandSouthAfrica
BSD – BankSupervisionDivision
CAATS - ComputerAssistedAuditTechniques
CBS - CentralBankofSwaziland
CCBG - CommitteeofCentralBankGovernors(SADC)
CFT - CombatingFinancingofTerrorism
CFTA - ContinentalFreeTradeArea
CIEA - CompositeIndicatorforEconomicActivity
CMA - CommonMonetaryArea
COMESA - CommonMarketforEasternandSouthernAfrica
COMSEC - CommonwealthSecretariat
CPI - ConsumerPriceIndex
CSO - CentralStatisticalOffice
EAC - EastAfricanCommunity
ECB - EuropeanCentralBank
ECGS - ExportCreditGuaranteeScheme
EFT - ElectronicFundsTransfers
EFTA - EuropeanFreeTradeAssociation
EPA - EconomicPartnershipAgreement
EPRS - EconomicPolicyResearchandStatisticsDepartment
ERM - EnterpriseRiskManagement
EU - EuropeanUnion
FDI - ForeignDirectInvestment
FIP - Finance and Investment Protocol
FOMC - FederalOpenMarketCommittee
FSC - FinancialStabilityCommittee
FSDIP - FinancialSectorDevelopmentImplementationPlan
FSRA – Financial Services Regulatory Authority
FSU - Financial Stability Unit
FTA - Free Trade Area
GBP - Great Britain Pound
GDP - GrossDomesticProduct
CENTRAL BANK OF SWAZILAND 2016/2017 ANNUAL REPORT
13
ACRONYMS AND ABBREVIATIONS
GM - GeneticallyModified
GSP - Generalised System of Preferences
HIV - HumanImmunoVirus
IAA - Internal Audit Activity
ICCFISH - InternationalConventionCentreandFiveStarHotel
IBRD - InternationalBankforConstruction&Development
ICT – InformationandCommunicationTechnology
IFRS - International Financial Reporting Standards
IIP - International Investment Position
IMF - International Monetary Fund
IPPs - Individual Power Producers
IT - Information Technology
JPY - JapaneseYen
LME - LiquidMilkEquivalent
LUSIP - Lower Usuthu Smallholders Irrigation Project
M2 - Broad Money Supply
MEPD - MinistryofEconomicPlanning&Development
MEFMI - MacroeconomicandFinancialManagementInstituteofEastern
MMA - Multilateral Monetary Agreement
MMT - Mobile Money Transfer
MPC – MonetaryPolicyCommittee
MPCC - MonetaryPolicyConsultativeCommittee
Mt - Metric Tonnes
NAMBOARD - National Agricultural Marketing Board
NBFIs – Non–Bank Financial Institutions
NCDs - Non-CommunicableDiseases
NEER - NominalEffectiveExchangeRate
NMC - NationalMaizeCorporation
NPSS - National Payments and Settlements System
OHS - Occupational Health and Safety
PAYE – PayAsYouEarnTax/PersonalIncomeTax
PBOC - People’sBankofChina
PPI - Producer Price Index
PPPs - Private-Public Partnerships
PRAMA - Policy Research and Macroeconomic Analysis
PTA – Preferential Trade Agreement
RBIA - Risk Based Internal Audit
REC – RegionalEconomicCommunity
REER - RealEffectiveExchangeRate
RISDP - RegionalIndicativeStrategicDevelopmentPlan
RSA - Republic of South Africa
RSF – Revenue Sharing Formula
RTGS - Real Time Gross Settlement
SACU - SouthernAfricanCustomsUnion
SADC - SouthernAfricanDevelopmentCommunity
CENTRAL BANK OF SWAZILAND 2016/2017 ANNUAL REPORT
14
SARB - South African Reserve Bank
SCB - SwazilandCottonBoard
SEC - SwazilandElectricityCompany
SG - Swaziland Government
SIDC – SwazilandIndustrialDevelopmentCompany
SIRESS – SADCIntegratedRegionalElectronicSettlementSystem
SMEs – SmallandMediumEnterprises
SMI - Swaziland Meat Industries
SNHB – Swaziland National Housing Board
SNL – Swazi Nation Land
SRA - Swaziland Revenue Authority
SSA - Swaziland Sugar Association
SSELGS - SmallScaleEnterpriseLoanGuaranteeScheme
SSX - SwazilandStockExchange
STA - Swaziland Tourism Authority
SWIPSS - Swaziland Inter-Bank Payment and Settlement System
SWSC – SwazilandWaterServicesCorporation
TFTA - Tripartite Free Trade Area
TIDCA – Trade,InvestmentandDevelopmentCooperationAgreement
TLC - TechnicalLiaisonCommittees
UCT - UniversityofCapeTown
UNISWA - University of Swaziland
UK - UnitedKingdom
USA/US - United States of America
USD - UnitedStatesDollar
VAT - ValueAddedTax
WCO - WorldCustomsOrganisation
WEO – WorldEconomicOutlook
ACRONYMS AND ABBREVIATIONS

CENTRAL BANK OF SWAZILAND 2016/2017 ANNUAL REPORT
15
1. GOVERNOR’S STATEMENT
� Mr. Majozi SitholeGovernor
According to the IMF April 2017 World Economic Outlook, global growth wassubdued in 2016, with the world economy
advancing by a lower 3.1 per cent compared to3.2percentrecordedin2015.Contributingto the lagging growth in the global economy was a slump in private consumption mostly in the advanced economies as well as sluggish performance in commodity markets, which in turn also affected emerging markets, who have been the anchor of positive and higher source of growth in previous years. Advanced economies grew by a paltry 1.7 per cent in 2016 compared to 2.1 per cent in 2015, whilst emerging market economies grew by 4.1 per cent in 2016 unchanged from the previous year. However, going forward there seems to be optimism with the buoyant financial marketscombined with a recovery in manufacturing and a pick-up in global trade. Synchronised growth in world output is expected to persist in 2017 withconfidencesurveysandmarketssignallingbetter prospects for global expansion. Global growth is expected to rise to 3.5 per cent in 2017 and 3.6 per cent in 2018. Risks, however, to the global outlook still remains a heightened possibility with political uncertainty playing a big part especially given the developments in theUSandEurope.
On the other hand, monetary policy conditions changed in 2016 with global consumer price
inflation increasing as the retail prices ofgasoline and other energy related products slightly rose. The uptick has been especially strong for advanced economies, where 12-month consumer price inflation in the year stoodslightly above 2 per cent - more than double the averageannualinflationrateof0.8percentin2016. In many emerging market and developing economies headline inflation picked up dueto higher commodity prices. Annual headline inflationin2016forEMDEswasrecordedat4.4per cent in 2016 and is expected to edge up to4.7percentin2017(IMFWEOReport,April2017).
The sluggish global growth and commodity markets negatively affected Swaziland’s leading trading partner, South Africa, in 2016; and this combined with rising prices. Again according to the International Monetary Fund’s April 2017 World Economic Outlook Report,South African national output declined by 0.3 percentin2016comparedtoaGDPgrowthof1.3 per cent in 2015. South Africa experienced atechnicalrecessionforthefirsttimeineightyears after recording two consecutive quarterly economic growth contractions in the period 2016 to first quarter of 2017. However, goingforward a modest recovery is expected in 2017, with growth rising to 0.8 per cent as commodity prices rebound, drought conditions ease, and electricity capacity expands; for 2018, GDP
A tight monetary policy stance was pursued by the Bank during the financial year ended March 2017. The broad objective of the stance was to contain rapidly intensifying inflationary pressures while cautious not to further weaken economic growth prospects.
“
“
CENTRAL BANK OF SWAZILAND 2016/2017 ANNUAL REPORT
16
growth is projected at 1.6 per cent. This glossy outlook though is likely to be affected by sovereign credit ratings downgrade on domestic private sectorgrossfixedcapital formation inparticular(IMFWEOReport,April2017).
The South African Reserve Bank (SARB) weighed in to assist the situation by loosening its monetary policy to shore up economic growth in mid-2016. However, the Bank found itself having to backtrack after its hand was forced by rising consumer prices, taking CPI outsidethe target range especially in the latter part of2016.Inthefirstquarterof2017,theSARBincreased the benchmark repo rate, taking it back to 7 per cent where it was early in 2016. However, inflation pressures are expected toimprove with headline inflation expected toreturn to within the target range during the second quarter of 2017 (South African Reserve Bank,27June2017).
In Swaziland, revised estimates indicate that the economy grew by 1.3 per cent in 2016, an upward revision from the September 2016 estimate of -0.6 per cent, but remained marginally lower than the revised estimate of 1.5 per cent growth in 2015. The improvement in economic performance (relative to the previous projection) mainly benefited frombetter output in the secondary sector due to lower-than-anticipated effects of the ElNino induced drought on food manufacturing, electricity generation and water supply.
The real output of the secondary sector contracted by 0.8 per cent in 2016 compared to a growth of 2.8 per cent in 2015. The reduction in output for the secondary sector was accounted for by the manufacturing sector whose output declined by 1.3 per cent in 2016 compared to a growth of 2.5 per cent in 2015. The tertiary sector grew by 3.7 per cent in 2016 compared to a slower pace of 1.3 per cent the previous year, mainly supported by an expansionary fiscal policy (following theimplementation of a salary review exercise) in the second half of 2016. Other sectors that recorded growth include ‘wholesale and retail’,
‘tourism’, ‘financial services’, ‘transport’,‘communication’ and ‘real estate’ subsectors. The primary sector shrank by 2.4 per cent in 2016 compared to another contraction of 3.5 per cent in 2015. The performance of the primary sector was mainly affected by the negativeeffectsoftheElNinoinduceddroughtparticularly the growing of crops both for rain-fed crops and irrigated farms.
Swaziland’s headline consumer inflationincreased from an average of 5.0 per cent in 2015 to an average of 7.8 per cent in 2016, with a peak of 8.7 per cent reached in December2016. The rise in overall consumer inflationmainly benefitted from a notable growth infoodinflationlargelydrivenbyasevereElNinophenomenon that affected the entire Southern Africa region. However, inflationary pressuressubsided in the opening months of 2017, with headline inflation slowing to 7.1 per cent inApril 2017, as favourable weather conditions reversed the effects of the drought that prevailed in the 2015/16 season.
Swaziland’sinflationoutlookisexpectedtobecontained in the short to medium term due to a combination of factors that include declining food prices, a relatively stronger Rand/Lilangeni against major trading partners and containedinternationaloilprices.TheCentralBank inflation forecasts reflect that inflationwill close the year on a downward trajectory with an average of 7.0 per cent in 2017. The mediumtermforecastsalsoshowthatinflationwill average 5.8 per cent in 2018 and 5.6 per cent in 2019.
A tight monetary policy stance was pursued by the Bank during the financial year endedMarch 2017. The broad objective of the stance wastocontainrapidlyintensifyinginflationarypressures while cautious not to further weaken economic growth prospects. The policy (bank) rate increased by 75 basis points from 6.50 per cent in March 2016 to 7.25 per cent at the endofMarch2017.Correspondingly,theprimelending rate increased from 10.00 per cent in March 2016 to 10.75 per cent in March 2017.
Revised estimates for GDP growth indicate that the economy grew by 1.3 per cent in 2016, an upward revision from the September 2016 estimate of -0.6 per cent, but remained
marginally lower than the revised estimate of 1.5 per cent growth in 2015.
GOVERNOR’S STATEMENT (Continued)
CENTRAL BANK OF SWAZILAND 2016/2017 ANNUAL REPORT
17
GOVERNOR’S STATEMENT (Continued)
International reserves reached 3.4 months of imports of goods and services at the end of March 2017, notably lower than the level of 3.9 months at the end of March 2016. The deterioration in reserves was largely attributed totheconsiderabledeclineinSACUreceiptsforthefiscalyear2016-17.Theshorttomedium-term prospects for the country’s reserves remainpositivewitharecoveryinSACUreceiptsfor 2017/18 expected to improve the reserves level. The Bank will thus continue to monitor and provide appropriate advice to government to ensure that the reserves are sustained at a healthy position. This would go a long way in safeguarding the market’s confidence in thecountry’s ability to meet its external obligations and to withstand external shocks.
With the new balance of payments compilation format of BPM6 the preliminary data indicate that in 2016, the current account recorded a E5.923billionsurplus,downfromasurplusofE9.379billioninthepreviousyear.Thedeclinewas a turnaround from the 52.9 per cent increase in the surplus reported in 2015. The current account in 2016 was equivalent to 10.8 percentofGDPfrom17.9percentin2015.Thebalance in the current account was explained by a narrow trade balance and a reduction in the net receipts posted in the secondary income account.
The financial account resulted in a netacquisition of foreign assets of E5.066 billionreflecting a net outflow, though moderatingrelativetothenetoutflowofE7.391billionin2015.The net outflow depicts that Swazilandwas a net lender to the rest of the world during this period. This result was the interplay of net foreign assets acquired in the ‘other investment’ sub-account as well as incurrence of liabilities in direct investment and other investment.
The international investment position (IIP) for Swaziland indicates that external financialassets continued to surpass external financial
liabilities. At the end of 2016, Swaziland’s IIP recorded a net asset position amounting to E21.698 billion, an increase of 21.7 per centfrom the net asset position posted in 2015. The net position in the IIP was sustained by a 21.6 per cent increase in foreign assets while liabilities grew 21.4 per cent.
The Minister of Finance presented the 2017/18 National Budget to Parliament under the theme: “Rising Above Adversity to Create Prosperity for All”. The Budget was in line with His Majesty’s Speech from the Throne when opening the 4th session of the 10th Parliament. The key objectives of this Budget were highlighted as reducing reliance on SACUreceipts,fiscalconsolidationandinfrastructuredevelopment to build Government’s preparedness and resilience against future adversities.
Thebudgetshowedadeficitof8.2percentofGDP (E4.8billion) for 2017/18 compared to adeficitof12.3percentestimatedfor2016/17.The improvement in the budget deficit willbenefitfromacombinationofalowerincreasein expenditure coupled with a surge in revenues for2017/18fiscalyear.Overthemediumtolongterm,Government’saimistobringthedeficitback to levels less than 3 per cent, in line with SADC Macroeconomic Convergence targets,supported by improved revenue collection.
The Minister indicated in previous budgets that to avoid an increase in relatively expensive external borrowing and reduce the fiscalburden of debt payments over the medium term, a larger share of the fiscal deficit willbe financed through domestic borrowing.Externalborrowingwillbeconsideredonlyforthefinancingofhighlyproductivefixedcapitalinvestments.
The Swaziland banking sector was stable, financially sound and conformed to statutory
In line with the Bank’s mandate of promoting a sound and safe banking system and ensuring confidence in the domestic banking sector, the Central Bank increased the
minimum liquidity requirement for commercial banks with effect from 1st July 2016 while the reserve requirement remained unaltered. The liquidity requirement for all banks
went up from 20 per cent to 25 per cent of domestic liabilities while for the Swazi Bank it was increased from 17 per cent to 22 per cent of domestic liabilities.
The reserve requirement remained unchanged at 6 per cent.
CENTRAL BANK OF SWAZILAND 2016/2017 ANNUAL REPORT
18
prudential requirements in terms of capital adequacy and liquidity. The asset quality of banks deteriorated notably during the year with non-performing loans and advances expressed as a percentage of gross loans at 10.25 per cent inMarch2017, representinga significantincrease from the 5.0 per cent recorded in March 2016. Furthermore, their profitability showedsignificantdeteriorationwhencomparedtotheprevious year, mainly due to the severe drought that impacted negatively on economic growth, the volatile exchange rate market and increased cost of borrowing which resulted in low credit extension and high non-performing loans The banking sector assets grew by 5.0 per cent to E17.9billionduringtheyearendedMarch2017fromE17.0billionattheendofMarch2017.Netloans and advances consisted of 62.0 per cent of the banking sector assets, rising marginally from 61.0 per cent reported at the end of March 2016.
In line with the Bank’s mandate of promoting a sound and safe banking system and ensuring confidenceinthedomesticbankingsector,theCentral Bank increased theminimum liquidityrequirement for commercial banks with effect from 1stJuly2016whilethereserverequirementremained unaltered. The liquidity requirement for all banks went up from 20 per cent to 25 per cent of domestic liabilities while for the Swazi Bank it was increased from 17 per cent to 22 per cent of domestic liabilities. The reserve requirement remained unchanged at 6 per cent.
TostrengthenthefinancialsectorinSwazilandtheMinistryofFinance, theCentralBankandFinancial Services Regulatory Authority have collaborated to develop Swaziland’s Financial Sector Development Implementation Plan(FSDIP). The FSDIP was formulated with the
To strengthen the financial sector in Swaziland, the Ministry of Finance, the Central Bank and Financial Services Regulatory Authority have collaborated to develop Swaziland’s
Financial Sector Development Implementation Plan (FSDIP). The FSDIP was formulated with the support of the World Bank which provided the expertise and assisted in ensuring it has latest international best practice in financial sector development.
GOVERNOR’S STATEMENT
support of the World Bank which provided the expertise and assisted in ensuring it has latest international best practice in financial sectordevelopment. This is a three-year strategy which will be implemented from 2017 to 2019.
The objective of the strategy is to have a stable, diversified, modern and competitive financialsystem that provides quality, affordable and accessible financial services to all people inthe economy in an effort to support economic growth. This national strategy was launched byHis Excellency theRightHonourablePrimeMinister Dr. Barnabas Sibusiso Dlamini on13th April 2017. The Bank is on course with the implementation of its own strategy and continues to be guided by best practice in corporate governance.
In an endeavour to foster cooperation and monetary integration at the regional level, the Bank continues to participate in the meetings of theCommitteeofCentralBankGovernorsintheCMA,SADC,COMESAandAfricaasacontinent.
I would like to extend my sincere thanks to theMinisterofFinanceandhisOfficials,Boardof Directors, all staff of the Central Bank ofSwazilandaswell asfinancial institutions andother key stakeholders for their cooperation, commitment and dedication to the attainment offinancialstabilityinSwaziland.
..................................M.V.SitholeGovernor

CENTRAL BANK OF SWAZILAND 2016/2017 ANNUAL REPORT
19
PART A
CENTRAL BANK OF SWAZILAND
REVIEW OF THE ECONOMY
CENTRAL BANK OF SWAZILAND 2016/2017 ANNUAL REPORT
20
2. GLOBAL ECONOMIC DEVELOPMENTS
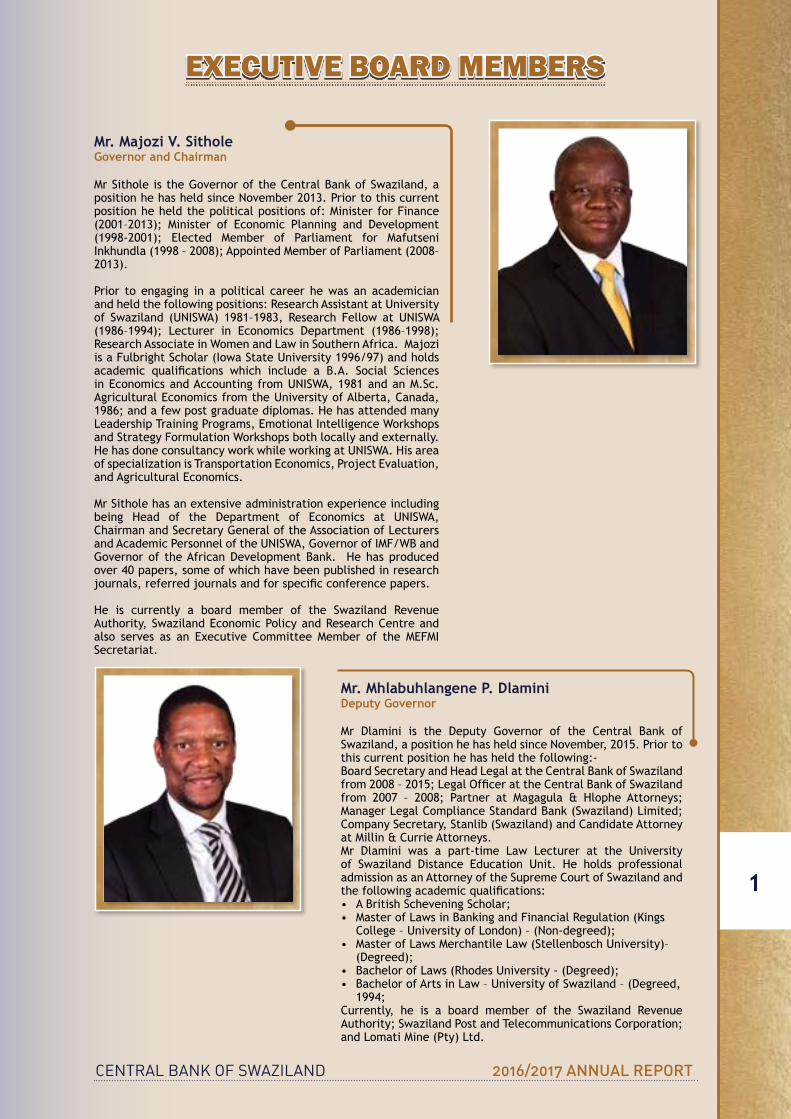
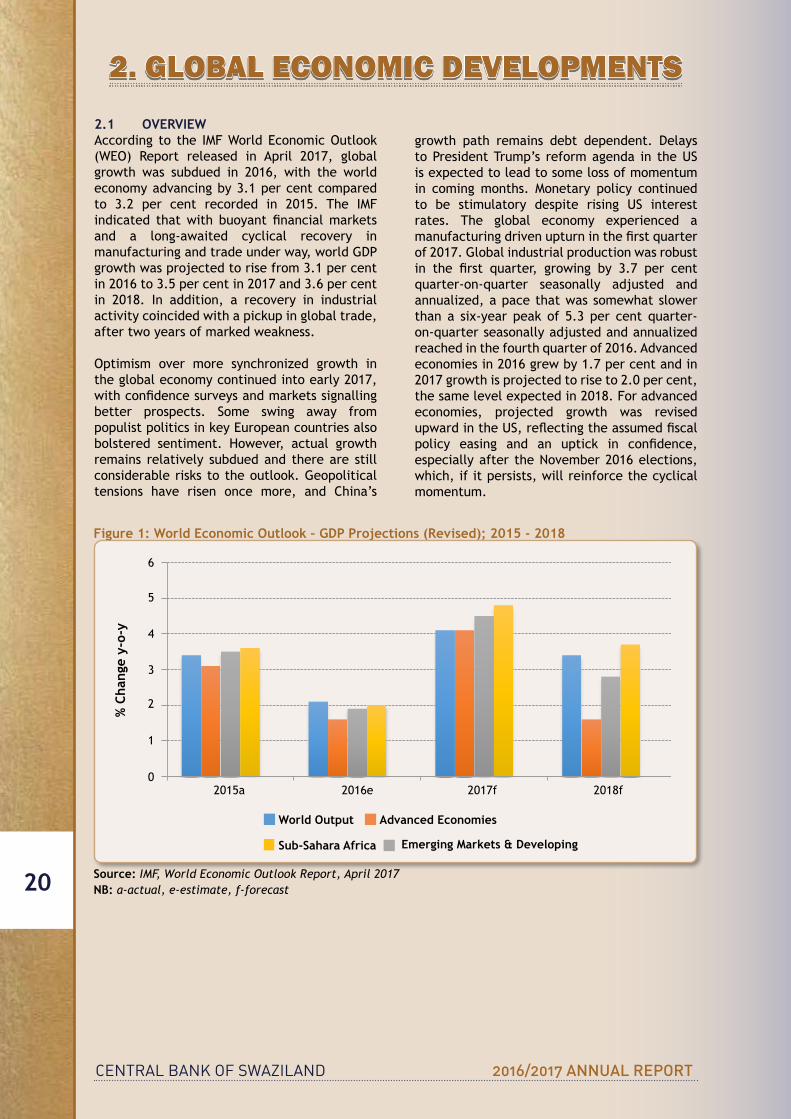
Figure 1: World Economic Outlook – GDP Projections (Revised); 2015 - 2018
0.0
1.0
2.0
3.0
4.0
5.0
6.0
1 2 3 4 5 2015a
% C
hang
e y-
o-y
6
5
4
3
2
1
02016e 2017f 2018f
World Output Advanced Economies
Emerging Markets & DevelopingSub-Sahara Africa
Source: IMF, World Economic Outlook Report, April 2017NB: a-actual, e-estimate, f-forecast
2.1 OVERVIEWAccording to the IMFWorldEconomicOutlook(WEO) Report released in April 2017, globalgrowth was subdued in 2016, with the world economy advancing by 3.1 per cent compared to 3.2 per cent recorded in 2015. The IMF indicated thatwith buoyant financialmarketsand a long-awaited cyclical recovery in manufacturingandtradeunderway,worldGDPgrowth was projected to rise from 3.1 per cent in 2016 to 3.5 per cent in 2017 and 3.6 per cent in 2018. In addition, a recovery in industrial activity coincided with a pickup in global trade, after two years of marked weakness.
Optimism over more synchronized growth in the global economy continued into early 2017, withconfidencesurveysandmarketssignallingbetter prospects. Some swing away from populistpoliticsinkeyEuropeancountriesalsobolstered sentiment. However, actual growth remains relatively subdued and there are still considerable risks to the outlook. Geopolitical tensions have risen once more, and China’s
growth path remains debt dependent. Delaysto President Trump’s reform agenda in the US is expected to lead to some loss of momentum in coming months. Monetary policy continued to be stimulatory despite rising US interest rates. The global economy experienced a manufacturingdrivenupturninthefirstquarterof 2017. Global industrial production was robust in the first quarter, growing by 3.7 per centquarter-on-quarter seasonally adjusted and annualized, a pace that was somewhat slower than a six-year peak of 5.3 per cent quarter-on-quarter seasonally adjusted and annualized reached in the fourth quarter of 2016. Advanced economies in 2016 grew by 1.7 per cent and in 2017 growth is projected to rise to 2.0 per cent, the same level expected in 2018. For advanced economies, projected growth was revised upwardintheUS,reflectingtheassumedfiscalpolicy easing and an uptick in confidence,especially after the November 2016 elections, which, if it persists, will reinforce the cyclical momentum.
CENTRAL BANK OF SWAZILAND 2016/2017 ANNUAL REPORT
21
TheoutlookhasalsoimprovedforEuropeandJapan based on a cyclical recovery in globalmanufacturing and trade that started in the second half of 2016. The main forces shaping the outlook differ, to some extent, between advanced economies and emerging market and developing economies. Among the advanced economies group, the US economy is projected togathersteambecauseofexpansionaryfiscalpolicy. Elsewhere, especially in Europe, thecyclical recovery from the crises of 2008/09 and 2011/12 will help keep growth modestly above potential over the next few years. Looking to the medium term, however, demographic headwinds and weak trend productivity are likely to restrain growth. Risks to the global outlook remain tilted to the downside. These include increased trade protectionism, elevated economic policy uncertainty, the possibility offinancialmarket disruptions, and, over thelongerterm,weakerpotentialgrowth(IMFWEOReport, April 2017).
2.2 INDUSTRIALISED COUNTRIES Growth in major advanced economies strengthened, and their short-term outlook has improved, despite elevated policy uncertainty. A modest recovery should continue, with output gaps narrowing and inflation graduallyconverging toward central bank targets. US monetary policy normalization is expected to proceed at a measured pace. China’s policyguided gradual transition to slower but more sustainable growth continues as expected.
Advanced economies started the year on a solid note, with investment and exports regaining momentum after subdued growth in 2016. Private consumption decelerated somewhat in early 2017, but has been supported by labour market improvements. Import demand has strengthened, further contributing to a recovery in global trade.
Advanced economies consumer price inflationhas ticked up as the retail prices of gasoline and other energy related products have increased. Consumerinflationadvancedto0.8percentin2016 up from 0.3 per cent in 2015.The uptick is expected to continue in 2018, where it will reach 2.0 per cent before remaining somewhat steady at 1.9 per cent in 2018. The world also needs a renewed multilateral effort to tackle a number of common challenges in an integrated global economy. Many of the challenges that the global economy confronts call for individual country actions to be supported by multilateral cooperation. Key areas for collective action
include preserving an open trading system, safeguarding global financial stability,achieving equitable tax systems, continuing to support low-income countries as they pursue their development goals, and mitigating and adapting to climate change (IMFWEOReport,April 2017).
In the United States:In2016,USGDPexpandedby 1.6 per cent after growing by 2.6 per cent in 2015, the lowest since 2011. This was due toaslumpinprivateinvestment,thefirsttimesince 2009, dragged down by structures and equipment.For2017,projectedUSGDPgrowthbytheIMFassumesafiscalstimulusthatleadsgrowth to rise to 2.3 per cent and further advanceby2.5percentin2018.Thefiscalpolicyeasingandanuptick inconfidence,especiallyafter the November 2016 US elections, which, if it persists, will reinforce the observed cyclical momentum(IMFWEOReport,April2017).
TheUSFederalReserve(USFED)raisedinterestratesby25basispointstwiceinearly2017,firstin Januaryand inMarch respectively. Interestrates were raised from a range of between 0.25 per cent and 0.5 per cent in December 2016to a range of 0.75 per cent to 1.00 per cent in March2017.Thismarkedoneof theUSFED’smost convincing steps yet in the effort to return monetary policy to a more normal stance (US Federal Reserve, April 2017).
USinflationforthefullyearof2016ranatthefastestpace infiveyears,climbingto2.1percent,propelledbyfivestraightmonthsofcostof living increase compared to 0.1 per cent in 2015. For the period ending March 2017, US consumer prices increased by 2.4 per cent year-on-year, lower than 2.7 per cent in February and below market expectations of 2.6 per cent. This was the lowest inflation rate in threemonthsdue to a slowdown in energy and services cost (USBureauofEconomicAnalysis,April2017).
According to the US Bureau of Labour Statistics, US unemployment rate in 2016 averaged 4.9per cent, and in thefirstquarter of 2017unemployment declined rapidly. As at end March 2017 US unemployment was recorded at 4.5 per cent from 4.7 per cent in the previous month, as the number of unemployed persons declined.
In the Eurozone: According to the IMF World EconomicOutlook,over thewhole year2016,EurozoneGDPadvancedby1.7percentaftergrowing by 2 per cent in 2015. The IMF projected
GLOBAL ECONOMIC DEVELOPMENTS (Continued)
CENTRAL BANK OF SWAZILAND 2016/2017 ANNUAL REPORT
22
thatEurozoneGDPin2017and2018willgrowby1.7 per cent and 1.6 per cent, respectively. In thefirstquarterof2017theEurozoneeconomyexpanded by 0.6 per cent, following a 0.5 per cent advance in the previous quarter. This was thestrongestgrowthratesincethefirstquarterof 2015, mainly boosted by fixed investmentand household consumption. Growth picked up in Germany, Spain, Italy and Finland but slowed in France.
Following the European Central Bank’s (ECB)decision to lower its benchmark-refinancingrate to 0.0 per cent and increase its asset purchase programme to €80 billion a month in March 2016, the ECBmaintained the samepolicy stance until end of March 2017. Both the deposit rate and the lending rate were also left steady at -0.4 per cent and 0.25 per cent, respectively.ECBpolicymakersconfirmedthatthe monthly asset purchases will run at the current monthly pace of €80 billion until March 2018, and from April 2018, they are intended to continue at a monthly pace of €60 billion until the end of the year 2018 (European CentralBank, April 2017).
Eurozone inflation rate rose to 1.1 per centyear-on-year in December 2016, compared to0.2 per cent in December 2015. The surge ininflation was the highest in more than threeyears, driven by increased prices for energy, food, alcohol and tobacco. In the three months toMarch2017,consumerpricesintheEurozonerose by 1.5 per cent year-on-year, easing from a 2 per cent increase in February and below marketexpectationsof1.8percent(Eurostat,April 2017).
Eurozone unemployment rate averaged 10per cent in 2016 and has been steadily on a downward trend. The unemployment rate came in at 9.5 per cent in March 2017, unchanged from the previous month and was the lowest unemploymentratesinceApril2009(Eurostat,April 2017).
In the United Kingdom: Looking at 2016 as a whole,UKGDPgrowthslowedto1.8percentfrom 2.2 per cent in 2015. Fixed investment and government spending went up at a slower pace while household consumption grew further. In the first quarter of 2017, the UKeconomy grew by only 2.2 per cent, the lowest quarter-on-quarter growth in a year, after expanding by 0.7 per cent in the fourth quarter of 2016. The slowdown was mainly driven by
the service sector on weak performances of consumer-focused industries, such as retail and accommodation(IMFWorldEconomicOutlook,April 2017).
The Bank of England cut its interest rates to0.25 per cent from 0.5 per cent in August 2016 and introduced a package of measures designed to provide additional monetary stimulus. The Bank of England has kept interest rates atrecord low for the whole of 2016 and including thefirstquarterof2017,inordertomeetits2percentinflationtarget.TheBank’sobjectiveis to achieve sustainable economic growth and fullemployment(BankofEngland,April2017).
UK inflation averaged 0.67 per cent in 2016compared to 0.2 per cent in 2015. The Bank ofEnglandexpects inflation to riseabove the2 per cent target over the short-term, before peaking at around 2.75 per cent in early 2018 and drifting gradually back down towards the target thereafter. The projected overshoot reflectstheexpectedeffectsofthedropinthevalue of the Pound Sterling. Wages and salary growth remained subdued, while measures of inflationexpectationsremainatlevelsbroadlyconsistentwiththeachievementoftheinflationtarget(Eurostat,April2017).
Average annual unemployment rate in the UK was recorded at 4.9 per cent in 2016and has been on a declining trend since. UKunemployment rate fell to 4.6 per cent in the three months to March 2017 from 4.7 per cent inthepreviousperiod(Eurostat,April2017).
In Japan:Japan’sGDPgrewby1.0percentin2016 compared to 0.5 per cent in 2015. The growth momentum, fuelled by stronger-than-expected net exports in 2016, will continue into 2017, with growth forecast at 1.2 per cent. The pace of expansion is expected to weaken thereafter to 0.6 per cent in 2018, with the assumed withdrawal of fiscal support and arecovery of imports offsetting the impact of stronger anticipated foreign demand and Tokyo Olympics–relatedprivateinvestment(IMFWEOReport, April 2017).
FollowingtheBankofJapan’sdecisiontoadopta negative interest rate policy, the Bank has maintained this rate for the whole of 2016. Further, the Bank of Japan left its key short-term interest rate unchanged at -0.1 per cent at its March 2017 meeting. Policymakers also decided to keep its 10-years government
GLOBAL ECONOMIC DEVELOPMENTS (Continued)

CENTRAL BANK OF SWAZILAND 2016/2017 ANNUAL REPORT
23
bond yield target around zero per cent and maintaining their upbeat economic view (Bank ofJapan,April2017).
Japanconsumerinflationin2016averaged-0.1per cent following 0.2 per cent recorded in 2015. Higher energy prices, the recent weakening in the yen, and slowly building wage-price pressuresareexpectedtoliftinflationinJapan.However,withinflationexpectationsrisingonlyslowly,theincreaseininflationisprojectedtobequite subdued,with inflation rates stayingwellbelowtheBankofJapan’spricestabilitytarget of 2 per cent throughout the forecast horizon(StatisticsBureauofJapan,April2017).On an average basis the unemployment rate in Japan was recorded at 3.1 per cent in 2016,declining from 3.3 per cent recorded in 2015. The unemployment rate at the end of March 2017 stood at 2.8 per cent, the same as in February2017.Thefigurecameslightlybelowmarket consensus of 2.9 per cent (Statistics BureauofJapan,April2017).
2.3 EMERGING MARKET AND DEVELOPING ECONOMIES
Economicperformanceacrossemergingmarketand developing economies (EMDEs) remainedmixed. Economic growth in these economiesin 2016 was recorded at 4.1 per cent, and is projected to edge up to 4.5 per cent and 4.8 per cent in 2017 and 2018, respectively. Whereas China’s growth remained strong, reflectingcontinued policy support, activity slowed in India because of the impact of the currency exchange initiative (country’s two highest-denomination notes, the 500 and 1000 rupee - worth roughly $7.50 and $15.00 would no longer be legal tender), as well as in Brazil, which has been mired in a deep recession. Activity remained weak in fuel and non-fuel commodity exporters more generally, while geopolitical factors held back growth in parts of the Middle East and Turkey. Obstacles to growth amongcommodity exporters are gradually diminishing, while activity in commodity importers remains generally robust. Headline inflation pickedup in many emerging market and developing economies due to higher commodity prices. Annualheadlineinflationin2016forEMDEswasrecorded at 4.4 per cent in 2016 and is expected to edge up to 4.7 per cent in 2017. However, in a number of cases, it has receded as pass-through from the sharp currency depreciations in 2015 and early 2016 continues to fade (IMF WEOReport,April2017).
According to the IMF, renewed risk appetite has supportedEMDEsfinancialmarketsandledtoanarrowing of corporate bond spreads globally. Capital inflows to EMDEs were robust in thefirstquarterof2017,partlyinareboundfroma late 2016 weakness. Over time, however, a gradual tightening of international financingconditions may weigh on capital flows toEMDEs. Commodity prices have continuedto rise moderately, although prospects for increased US shale oil production are weighing on the outlook for oil prices. Windfalls from the recent decline in commodity prices is waning, but accommodative policies are supporting domestic demand and export growth bolstered byarecoveryinglobaltrade(IMFWEOReport,April 2017).
The IMF highlighted that a policy priority for EMDEs is to rebuildmonetaryandfiscal spacethat could be drawn on were such risks to materialise. Over the longer term, structural policies that support investment and trade are critical to boost productivity and potential growth.Globalfinancingconditionshavebeenbenign and benefited from improving marketexpectations about growth prospects. Financial market volatility has been low despite elevated policy uncertainty, reflecting investor riskappetite and, perhaps, some level of market complacency.
Brazil: Brazil is currently going through a deep recession. The country’s growth rate decelerated steadily since the beginning of this decade, from an average annual growth of 4.5 per cent between 2006 and 2010 to 2.1 per cent between 2011 and 2014. GDP contracted by3.8 per cent in 2015, and in 2016 the economy further contracted by 3.6 per cent. According to the IMF, the country’s GDP is expected torecover in 2017 and 2018, growing by 0.2 per cent and 1.7 per cent, respectively. The economic crisis, a result of the fall in commodity prices and an inability to make the necessary policy adjustments, coupled with the political crisis faced by the country has contributed to undermining theconfidenceofconsumersandinvestors over the year (IMF World EconomicOutlook, April 2017).
The Central Bank of Brazil lowered itsbenchmark Selic rate to 13.75 per cent on 30 November 2016, its lowest in over a year. The decision was because of policymakers’ aim to bring inflation back to target amid a deep
GLOBAL ECONOMIC DEVELOPMENTS (Continued)
CENTRAL BANK OF SWAZILAND 2016/2017 ANNUAL REPORT
24
economic recession and a new political scandal. In February 2017, the Bank continued with its easing cycle, cutting its key Selic rate by 75 basis points to 12.25 per cent. This was the fourth straight rate decline, bringing borrowing costs to the lowest levels in nearly 2 years amid slowinginflationandastickycontraction.Itfollowsa75basispointscutinJanuary2017(TradingEconomics,April2017).
Averageinflationin2016wasrecordedat8.77per cent compared to 10.67 per cent reached in2015.Consumerpriceswentupby4.57percent year-on-year in March 2017, easing from a 4.76 per cent rise in February and compared to market expectations of a 4.54 per cent increase. The inflation rate slowed for theseventh month to the lowest since August 2010, remainingslightlyabovecentralbank’sofficialtargetof4.5percent(TradingEconomics,April2017).
The unemployment rate in Latin America’s largest economy hit 7.0 per cent at the end of 2015andfinished2016at8.0percentnearlydouble the record low of 4.3 per cent at the end of 2014. The unemployment rate in Brazil rose to 13.6 per cent in the three months to April 2017 from 12.6 per cent recorded in the three months to January 2017 (Trading Economics,April 2017).
Russia: In Russia, where activity appears to have bottomed out and higher oil prices bolsteringtherecovery,GDPgrowthcontractedby a lesser 0.8 per cent in 2016 compared to a 3.7 per cent contraction in 2015 (World DataAtlas–RussiaFederation,June2017).
TheCentralBankofRussialowereditsbenchmarkone-week repo rate by 25 basis points to 9.75 per cent in March 2017. Policymakers signalled the possibility of further cuts in the second and third quarter of 2017, as inflation outcomesslowdown and economic activity recovers. The Bank took into consideration the oil market uncertainty and indicated it will pursue a conservative approach to the forecast, which assumes an oil price reduction to $40 per barrel by the end of 2017 and it’s further staying near thislevel(CentralBankofRussia,April2017).
The average annual inflation in 2016 wasrecorded at 7.07 per cent compared to a higher 15.55 per cent rise in 2015. Consumer pricesincreased by 4.3 per cent year-on-year in the quarter ended March 2017, easing from a 4.6 per cent rise in February. The Bank forecasts
that the annual consumer price growth will decline to 4 per cent by the end of 2017 and remain within this target range in 2018-2019. In 2016 the unemployment rate was recorded at 6 per cent and declined to 5.4 per cent in March 2017 from 5.6 per cent in the previous month. Unemployment is expected to remain steady at 6 per cent in 2017 and 2018 respectively (World Data Atlas-knoema.com – Russia Federation,June2017).
India: The Indian economy grew by 6.8 per cent in 2016 compared to 7.6 per cent in 2015. The growth forecast for 2017 was downwardly revised by 0.4 percentage point to 7.2 per cent, primarily because of the temporary negative consumption shock induced by cash shortages and payment disruptions from the recent currency exchange initiative. Medium-term growth prospects are favourable, with growth forecast to rise to about 8 per cent over the medium term due to the implementation of key reforms, loosening of supply-side bottlenecks, and appropriate fiscal and monetary policies(IMFWEOReport,April2017).
Following a 25 basis point rate cut to 6.5 per cent by the Bank of India in April 2016, the Bank maintained the benchmark rate at that level until October 2016. The Bank rate was cut to 6.25 per cent and has been maintained at sameleveluntiltheendofthefirstquarterof2017. Policymakers in February 2017 decided to change the stance from accommodative to neutral while assessing the effects of demonetisation on inflation and growth. Theaverageinflationin2016wasrecordedat4.97per cent, lower than 5.88 per cent rise in 2015 (Reserve Bank of India, April 2017).
China: In2016,GDPexpandedbya lower6.7per cent compared to a 6.9 per cent expansion in 2015, and the weakest growth in 26 years. The Chinese economy advanced by 1.3 percent in the first quarter of 2017, following a1.7 per cent growth in the last quarter of 2016, as investment and the property market gained momentum in the latest sign of stabilisation in theworld’s second-largesteconomy (IMFWEOReport, April 2017).
ThePeople’sBankofChinaraisedtheinterestrate it charges on short-term open-market operations by 10 basis points in March 2017, due to strengthening market expectations for higher funding costs in light of rising domestic inflation and property prices following theFederal Reserve’s rate increase in March 2017.
GLOBAL ECONOMIC DEVELOPMENTS (Continued)
CENTRAL BANK OF SWAZILAND 2016/2017 ANNUAL REPORT
25
It was the second adjustment in short-term interest rates since early February 2017. The benchmark lending rate was left unchanged at 4.35 per cent. It was last cut by 25 basis points in October 2015 (The Peoples Bank of China,April 2017).
Chinese consumer prices averaged 2.0 percent in 2016 compared to 1.4 per cent in 2015. Consumerpricesroseby0.9percentyear-on-year in the quarter ended March 2017, following a 0.8 per cent rise in February. Notably, China’s producer prices have emerged fromdeflation,reflectinghigherrawmaterialpricesas well as efforts to reduce excess industrial capacity and recovering real estate investment. Unemployment rate in China decreased to3.97percentinthefirstquarterof2017from4.02 per cent in the fourth quarter 2016. UnemploymentrateinChinaaveraged4.12percent from 2002 until 2017 (National Bureau of StatisticsofChina,May2017).
2.4 ECONOMIC DEVELOPMENTS IN SOUTH AFRICA
The South African economy unexpectedly contracted by an annualized 0.7 per cent quarter-on-quarter in the first three monthsof 2017, following a 0.3 per cent drop in the previous period and compared to market expectations of a 0.9 per cent expansion. This is thefirst recession since2009asboth tradeand manufacturing recorded negative growth rates. The largest negative contribution came from trade, catering and accommodation which contracted by 5.9 per cent, following a 2.1 per cent rise in the previous period. Manufacturing also dragged down theGDP figure, falling forthe third straight quarter (-3.7 per cent from -3.1 per cent), as production of petroleum, chemical products, rubber and plastic products decreased (Statistics South Africa, 27 June2017).
The domestic growth outlook has deteriorated amidweakbusinessandconsumerconfidence.The South African Reserve Bank’s forecast for GDP growth has been revised down for theentire forecast period, by 0.2 percentage points for 2017 and 2018, and by 0.3 percentage points in 2019. Annual growth rates of 1.0 per cent for 2017, 1.5 per cent for 2018 and 1.7 per cent in 2019 are now expected. This downward revision is due in part to the expected impact of the sovereign credit ratings downgrade on domestic private sector gross fixed capital formation
in particular. The downgrade is also likely to weigh on public sector investment through higher fundingcostsandmoredifficultaccesstofunding(SouthAfricanReserveBank,27June2017).
The Rand remains a key upside risk to the forecast. The Rand however, has been surprisingly resilient in the face of recent domestic developments. This is partly due to offsetting factors, particularly positive sentiment towards emerging markets and the improved current account balance. Following twobankratehikesinJanuaryandMarch2016,the South African Reserve Bank (SARB) has thereafteruntiltheendofDecember2016keptthe Bank repo rate on hold at 7 per cent. As at March 2017 the Bank continued to keep the benchmark repo rate on hold at 7 per cent. The Bankhighlightedthattheinflationoutlookhasimproved although the exchange rate became a risk due to recent political uncertainties. In addition, the Bank stated that the end of the tightening cycle has been reached (South AfricanReserveBank,June2017).
The SARB in March 2017 highlighted that the inflation forecast of the Bank has improved,with headline inflation expected to return towithin the target range of between 3 - 6 per cent during the second quarter of 2017. Consumerprice inflation is expected to average5.9percent in 2017, compared with 6.2 per cent in the previous forecast, while the forecast for 2018 has moderated from an average of 5.5 per cent to 5.4 per cent.
Consumerprices inSouthAfrica increased6.1per cent year-on-year in March 2017, lower than a 6.3 per cent rise in February and below market expectations of 6.3 per cent. It is the lowest inflationrateinsixmonthsduetoaslowdownin food inflation.Annual core inflation,whichexcludes cost of food, non-alcoholic beverages, petrol and energy, fell to 4.9 per cent in March from 5.2 per cent in February 2017. It is the lowest rate since January of 2013April(Statistics South Africa, April 2017).
The unemployment rate in South Africa increasedto27.7percentinthefirstquarterof2017 from 26.5 per cent in the previous period. It is the highest jobless rate since the firstquarter of 2004 as unemployment rose faster than employment (Statistics South Africa, April 2017).
GLOBAL ECONOMIC DEVELOPMENTS (Continued)

CENTRAL BANK OF SWAZILAND 2016/2017 ANNUAL REPORT
26
2.5 REGIONAL DEVELOPMENTS
Swaziland is party to a number of regional and international trade agreements that allow for improved market access for her products as well as harmonised policy actions and procedures aimed at achieving integration goals. 2016 was a momentous year for the Kingdom when itwas her turn to take the leadership role of two key regional organizations that is the Southern AfricanCustomsUnion(SACU)andtheSouthernAfrican Development Community (SADC).Whilst the loss of the AGOA three years ago was expected to have major negative repercussions for the country it would seem that the effects were not as severe as it was initially envisaged. Switching to regional markets seems to have softened the loss of AGOA and presented an alternative opportunity for expansion. However, regaining the lucrative market offered by the AGOA arrangement remained the key objective for the government.
Following is a brief update on activities Swaziland took part in during the reporting periodoneachRegionalEconomicCommunity(REC):
2.5.1 Common Monetary Area (CMA)CMA comprises of four members, namelyLesotho, Namibia, South Africa and Swaziland. It is premised on the CMAAgreement (knownas the Multilateral Monetary Agreement – MMA) which allows the South African Rand to circulate freely in all three-member states alongside national currencies. The MMA broadly definesthe overall framework in which the contracting four member states conducts monetary arrangements among themselves.
CMAcontinuedtomeetonaquarterlybasistolook at progress in their economies, exchange views on issues of common interest and work onprojectsthatarebeneficialtothearea.Aspart of the standard discussions during these meetings were the impact of global economic developments on theCMAaswell as progresson the revision of the MMA to ensure that it is updated and covered all the pertinent areas.
A couple of new issues have emerged during the year and these are on the table for discussion. One of these issues is the development of guiding principles for membership of the CMA to assist in case of expansion of theCMA membership as some countries havingindicated interest in joining the area. However, a decision on the expansion is not imminent
but will likely be made in the medium to long term after comprehensive analysis and lengthy discussions.Another issue on the CMA agendais the establishment of a consultative group on deposit insurance and stress testing. The main objective of establishing a deposit insurance scheme (DIS) for the CMA is to protect lessfinancially sophisticated depositors in theevent of a bank failure, thereby contributing to customer protection and enhancement of the stability of the CMA financial system. Byprotecting the covered deposits in all banks, the DIScanalsocontributetothedevelopmentofa less concentrated banking sector and support financial inclusion and transformation of thesector. On stress testing, the CMA Governorswant todoa stress testing ofCMAbanks andmooted was a crisis simulation exercise to be doneintheCMAwiththeassistanceoftheIMF.
2.5.2 Southern African Customs Union (SACU)
Swaziland took the Chairmanship of SACU inJune 2016 and this was for a period of oneyear. SACU currently represents the largestmarket for Swaziland’s export products. Trade initiatives pursued under SACU include tradefacilitation, development of common policies, establishment of SACU institutions, unifiedengagement in trade negotiations and trade in services. The Union has also embarked on the review of the revenue sharing formula.
TheCustomsUnioniscurrentlyengagedinthereview of the current Revenue Sharing Formula (RSF), which will result in the amendment of the2002SACUAgreement.Otherareasincludethe trade facilitation, establishment of SACUInstitutions, trade in services, Common tradepolicies, Common Negotiating Mechanism,CompetitionPolicy,IndustrialPolicyandUnfairTrade Practices Annex.
SACU is working on reviving the TechnicalLiaison Committees (TLC) and an agreementwith the World Customs Organization (WCO).The TLCwere suspended in favour of ad hoctechnical experts’ task teams, which have risen exponentially in the last couple of years. The problemisthatfinancingofthistaskteamhastobe undertaken by the Secretariat and there are procedural challenges in hosting of these task teams since they are not governed by rules of proceduresliketheTLCs.Onthetaskteamsandtechnical committees, the SACU Commissionagreed that once the terms of reference for the Ministerial Task Teams and Work Programmes are approved, the commission will then assess
GLOBAL ECONOMIC DEVELOPMENTS (Continued)
CENTRAL BANK OF SWAZILAND 2016/2017 ANNUAL REPORT
27
the institutions required to support the Work Program;andconsiderthefinancialimplicationsand how the Technical Committee meetingsare arranged. In the interim, the Secretariat was directed to continue to fund prioritized meetingsoftheTechnicalCommittees.
SACUandWCOarestillyettoagreeonthetextof the provisions in the cooperation agreement, relating to ownership of intellectual property rights on the deliverables of the Project. Once the issue is resolved, this will pave the way for the signature of the Agreement, during the second half of 2017. The Secretariat was directed to ensure that ownership and intellectual property rights on the deliverables are preserved and that SACU and its MemberStates are able to utilize the outcomes of the project without restrictions.
2.5.3 Southern African Development Community (SADC)
Swaziland ascended to the chairmanship of SADC inAugust 2016 as per the Community’srotational schedule and immediately hosted key institutional meetings as per the dictum of procedure. A retreat and extra ordinary summit meetings were held and key decisions were made.
Firstly, it approved the costed action plan for the industrialisation strategy and roadmap. The Action Plan focuses on the actions and policy interventions embodied in the goals and objectivesoftheStrategyforfirstfifteenyears(2016-2030) of implementation. Major actions include getting the macroeconomic policy environment right, positioning industrialisation at the centre of development, building capabilities to underpin transformation and strengthening competitive production set-ups, removal of infrastructural impediments to industrialisation and regional integration and value chain development.
Secondly, it considered and approved the new organizational structure of the Secretariat. The new structure aims at delivering on the objectives of the revised Regional Indicative Strategic and Development Plan (RISDP), theStrategic Indicative Plan of the Organ (SIPO) and the Industrialization Strategy and Roadmap; andaddressingtheidentifiedweaknesses.
SADC has concluded negotiating an EconomicPartnership Agreement with the EuropeanUnion. Six SADC Member States namelyBotswana, Lesotho, Mozambique, Namibia,
SouthAfricaandSwazilandsignedanEconomicPartnership Agreement with the EU on June2016. The Agreement came into force on 10 October2016followingtheratificationbythefiveSADCEPAmemberstatesnamelyBotswana,Lesotho, Namibia, South Africa and Swaziland. Mozambique is in the process of ratifying the Agreement while Angola did not sign however, with both participating as observers.
The Agreement has entered into force and preparation for the implementation of the Agreement are underway as two studies have been undertaken on market access and trade facilitation and technical barriers to trade and sanitary and phyto sanitary measures to identify opportunitiesandbenefits.
2.5.4 Common Market for Eastern and Southern Africa (COMESA)
Swaziland is a founder member of the PreferentialTradeAreaofEasternandSouthernAfrica, the predecessor to COMESA, whosemain objective is to strengthen the process of regional integration that was initiated under the Preferential Trade Agreement (PTA) to help Member States achieve sustainable economic growth.COMESAlauncheditsCustomsUnionin2009andSwazilandcontinuestotradeinCOMESAunder a derogation which allows her goods to preferentiallyentertheCOMESAmarketwithoutobligation to reciprocate. Over the years the derogation had been subjected to an annual review until a decision by Summit to link it to the conclusion of the COMESA-EAC-SADC FreeTradeAgreement.TheotherCOMESAmembersareBurundi,Comoros,D.R.C.,Djibouti,Egypt,Eritrea, Ethiopia, Kenya, Libya, Madagascar,Malawi, Mauritius, Rwanda, Seychelles Sudan, Uganda, Zambia and Zimbabwe.
Since Swaziland is trading under a derogation inCOMESAandthederogationhasbeenlinkedto the conclusion of the Tripartite FTA, if negotiations are not concluded in the agreed timeframe there is a possibility that discussions can be re-opened on the derogation.
2.5.5 Other Regional and International Arrangements
2.5.5.1 COMESA-SADC-EAC Tripartite Free Trade Area
AccordingtoanupdatefromaSACUreportonthe Tripartite Free Trade Area (TFTA), Ministerial meetings were held in 28-30 October 2016. The objective of the meetings was to consider the outstanding Phase I issues on Tariff Offers,
GLOBAL ECONOMIC DEVELOPMENTS (Continued)
CENTRAL BANK OF SWAZILAND 2016/2017 ANNUAL REPORT
28
Rules of Origin and Trade Remedies. In addition, the meetings considered the legal scrubbing of Tripartite Annexes, Phase II negotiations, Movement of Business Persons, ContinentalFreeTradeArea(CFTA),IndustrialDevelopmentPillar, Infrastructure Development Pillar andfunding of the Tripartite Programme.
With regard to Trade Integration Pillar, eighteen Member States have already signed the Tripartite Agreement on Free Trade Area. Most AnnexesoftheAgreementhavebeenfinalisedand are undergoing legal scrubbing. However, two critical annexes are still under discussion: Rules of Origin and Trade Remedies. These two Annexes are critical to operationalize the Agreement(SACUupdatereport,April2017).
InOctober2016,TripartiteCouncilreceivedthedraftTripartiteFrameworkforCooperationandthe draft Tripartite Work Programme/Roadmap for the Tripartite Industrial DevelopmentCooperation and noted the need for speedyimplementation of the Work Programme/Roadmap. The Tripartite Council approvedthe Draft Framework for Cooperation andWork Programme/Roadmap of the Industrial Development Pillar; and urged the TripartiteTask Force (TTF) to mobilize resources for the implementation of the Work Programme/Roadmap of the Industrial Development Pillar(SACUupdatereport,April2017).
The Tripartite work programmes had been supported by donor funds from the EuropeanDevelopment Fund through EU-IRCC as wellas theAfrican Development Bank (AfDB). ThelevelofEUfundingcurrentlyavailablefortheTripartiteisUS$100,000.TheAfDBhadagreedto extend its US$7.5 million support line from November 2016 to November 2018 with US$5 million available for the extension period. The meeting also noted that the Tripartite Task ForcehadbeendiscussingwithUNECAforthelatter to support the funding of studies on Phase II issues and a consultative meeting of Member/Partner States on these issues, for an estimated totalcostofUS$180,000(SACUupdatereport,April 2017).
2.5.5.2 Proposed Continental Free Trade Area The African Union Summit endorsed an African Union Commission proposal for theestablishment of a continental Free Trade Area covering all the members of the African Union by an indicative date of 2017. The Conference of African Ministers of Trade,through an AU Summit directive, have adopted
the work plan, modalities and principles of the CFTA negotiations and was launched in 2015.Negotiations have been scheduled to commence by April 2016 and be completed by the same time in 2017. Phase I issues are trade in goods, trade in services and movement of business persons. Phase II negotiations will focus on investment, intellectual property rights and competition policy (Ministry of Commerce &Industry Update Report on trade negotiations, May 2017).
Preparatory work ahead of the commencement oftheContinentalFreeTradeAreanegotiationsis on-going mainly through the work of the ContinentalFreeTradeAreaNegotiationForum(CFTA-NF). Terms of Reference have beenfinalized for all the variousTechnicalWorkingGroups to be constituted to provide expert input into the negotiations, namely: on Rules of Origin; Sanitary and Phyto-sanitary measures; Customs Procedures and Trade Facilitation;Non-Tariff Barriers and Technical Barriers to Trade; Legal and Institutional Affairs; Trade Remedies; and Trade in Services. The Tariff and Trade in Services Negotiation Modalities are beingdevelopedandexpected tobefinalizedandapprovedinJune2017.
2.5.5.3 Generalised System of Preference (GSP)
The countries that grant GSP include some of the EU member states, US, Canada, Japan,Australia, Russia and New Zealand. A wide range of export products from Swaziland enjoys market access through the GSP scheme. The scheme affords access of Swazi products at reduced custom duties in advanced economies (Ministry of Commerce & Industry UpdateReport on trade negotiations, May 2017).
TheEuropeanUnionhassincerevieweditsGSPand the possible implication could be that some products that were receiving preference under the previous regime might be subjected to customs duties.
2.5.5.4 SACU-EFTA FTASwazilandispartytoSACU-EFTA(EuropeanFreeTrade Association), which comprises Norway, Switzerland, Iceland and Liechtenstein. The EFTAagreementhasbeenratifiedbyallmemberstates and became operational in May 2008. Furthermore, both Parties have engaged on a process to review the Agreement with an aim to improve market access on both agricultural and industrial products.
GLOBAL ECONOMIC DEVELOPMENTS
CENTRAL BANK OF SWAZILAND 2016/2017 ANNUAL REPORT
29
3. DOMESTIC ECONOMY3.1 ANNUAL REAL GDP DEVELOPMENTSRevised estimates for GDP growth indicatethat the economy grew by 1.3 per cent in 2016, an upward revision from the September 2016 estimate of -0.6 per cent, but remained marginally lower than the revised estimate of 1.5 per cent growth in 2015. The improvement in economic performance (relative to the previous projection) mainly benefited from betteroutput in the secondary sector due to lower-than-anticipatedeffectsoftheElNinoinduceddrought on food manufacturing, electricity generation and water supply. Furthermore, demand driven growth was boosted by an expansionary fiscal policy particularly in thesecond half of the year which improved the performance of most sub-sectors in the tertiary sector.
The real output of the secondary sector decreased by 0.8 per cent in 2016 compared to a growth of 2.8 per cent in 2015. The decrease in output relative to 2015, was mainly accounted for by the negative effects of the El Nino induced drought on food processing,electricity supply and water supply. However, the decrease observed in these subsectors was notably lower than previously anticipated. Sugar production which is the main component of food processing in Swaziland decreased by 15 per cent in 2016, lower than the previously projected growth of -25 per cent. The better-than-expected sugar production emanated from good weather conditions in the last quarter of 2016 which resulted in improved yields from sugarcane. Manufacturing output contracted by 1.3 per cent in 2016 compared to growth of
Under this Agreement the review of the entire Agreement, which might result in reduction duties of the requested tariff lines, should the request be considered favourably requested by both Parties, commenced in 2016. The EFTAsubmitted as part of the review of the Annex on the Rules of Origin. It desires to amend the “whole owned” article to cover products obtained from cell cultures and fermentation. These cell cultures are technological methods of extraction and cultivation of human cells, animal cells and plant cells under controlled conditions. The scope of the EFTA proposalcovers a wide range of products from chapter 29 to 39 of the Harmonised System (HS) of product classification. However, noting thecomplexities in managing and controlling such processes in view of the Rules of Origin and noting that the same treatment would have to be offered to the European Union (EU) SACUexpertsarerecommendingthatSACUshouldnotagreetotherequestfromtheEFTA(MinistryofCommerce& IndustryUpdateReportontradenegotiations, May 2017).
2.5.5.5 SACU-MERCOSUR PTASACU negotiated and successfully concludeda Preferential Trade Agreement (PTA) with MERCOSUR (Common Market of the South)comprising Brazil, Argentina, Uruguay and Paraguay. The Agreement was signed in 2008 and ratification processes commencedimmediately after. Both Parties have completed anddepositedtheirinstrumentsofratificationand the Agreement came into force on 1st April 2016.
Subsequently South Africa has offered to train the BLNS countries on the implementation of Rules of Origin.
The entry into force of the SACU-MERCOSURPTA necessitated comprehensive training on the Rules of Origin to ensure standardization in the tariff treatment processes undertaken by customs authorities at the entry points into the custom union. Therefore, each new trade agreement requires SACU to have a commonunderstanding on the procedures and to deploy a common approach. This training would be aiming at providing additional capacity to Member States to complement what is already available. The training was deemed to be very important and Member States were urged to utilize the training opportunities being offered; the training would be undertaken once the member states indicated their readiness (Ministry of Commerce & Industry UpdateReport on trade negotiations, May 2017).
2.2.5.6 SACU-India PTASACU-India,negotiationsstalledandareyettoresume with new tariff offers already prepared by both Parties. Exchange of offers will bedoneonceameetinghasbeenconfirmed.SACUtechnical experts are in the process of improving the SACUoffer to India and once the list hasbeenfinaliseditwillbesubmittedtotheSACUCommission for clearance before shared withIndia through a negotiations session (Ministry of Commerce& IndustryUpdateReportontradenegotiations, May 2017).
CENTRAL BANK OF SWAZILAND 2016/2017 ANNUAL REPORT
30
2.5 per cent in 2015. Above average rains in the last quarter of 2016 also led to an improvement in hydro-power generation and water supply, partially reversing the impact of the severe droughtonthesesubsectors.Electricitysupplyrecorded a modest decline of 5 per cent in 2016 compared to 22 per cent projected previously while water supply decreased by 7 per cent broadly in line with the previous projection.
The secondary sector further benefitted fromincreased activity in the construction sector. Despite facing cash-flow challenges, theGovernment was able to implement 73 per cent of her capital programme in the 2016/17 fiscal year. This, coupled with other privatesector projects, supported increased activity in the construction sector. As a result, indicators used to measure construction activity such as imports of construction material and quarried stone production recorded notable increases in 2016.
Developmentsintheprimarysectorweremainlydominated by the negative effects of the ElNino induced drought particularly the growing of crops both for rain-fed crops and irrigated farms. Sugarcane which is predominantly irrigated fell approximately by 10 per cent while maize and cotton, which are predominantly rain-fed crops decreased by 60 and 90 per cent respectively. The output of the livestock sector was affected by the negative effects of the drought which manifested through low birth rates, high mortality rates and high feeding costs, a development that would potentially affect the performance of this subsector in the medium term. On a positive note, the primary sector was boosted by positive performance in the ‘forestry’ and ‘mining and quarrying’ subsectors. The overall primary sector is estimated to have contracted by 2.4 per cent in 2016 following another contraction of 3.5 per cent the previous year.
Anexpansionaryfiscalpolicyinthesecondhalfof 2016 supported growth in the tertiary sector. Theaboveinflationaverageincreaseinpublicsector wages following the implementation of a salary review supported growth in the ‘wholesale and retail’ subsector. This subsector is estimated to have grown by 6.7 per cent in 2016 after contracting by 7.5 per cent in 2015, accounting for approximately 1 percentage point of the overall growth outcome in 2016. Public administration rose by 2.8 per cent in 2016 in line with an increase in public sector payroll numbers (excluding teachers and
healthcare workers) which rose by a similar magnitude.
Other sectors that recorded growth include ‘tourism’, ‘financial services’, ‘transport’,‘communication’ and ‘real estate’ subsectors. Tourism activities mainly benefited fromSwaziland’s chairmanship over SADC whichresultedinanincreaseinnumberofSADCeventshostedbythecountry.Eventhoughinternationalarrivals rose marginally by 1.8 per cent in 2016, thenumberofbed-nightssoldrosesignificantlyby16percentreflectinganincreasedusageofaccommodation services in the country in the period under review. The real value added for financial and insurance activities grew by 4.8per cent in 2016 compared with growth of 3.7 per cent in 2015. This growth was broadly in line with increase in credit extended to the private sector which resulted in a more 30 per cent increase in net interest incomes for the banking sector. All other subsectors in the tertiary sector reflectedpositivegrowth ratesexcept ‘professional, administrative and other support services’. As a result, the tertiary sector is estimated to have rose by 3.7 per cent in 2016 up from 1.3 per cent the previous year. The notable increase in the tertiary sector was the main driver that offset the negative growth rates observed in the primary and secondary sectors.
3.1.1 MaizeThe 2015/16 season was characterised by below long-term average rains over most parts of the countryasaconsequenceofanElNinoinduceddrought that affected the entire Southern African region. The impact of the drought was evident in most parts of the country as most of thefieldsremaineduncultivatedandunplanted.Other fields experienced poor germinationrates due to lack of moisture caused by a combination of extremely high temperatures and dry weather conditions resulting in crop failure in the 2015/16 season. Consequently,totalareaundermaizecultivationsignificantlydeclined by 65 per cent to 46.0 thousand hectares in 2015/16 compared to 87.2 thousand hectares in the 2014/15 season. In line with the significantdecreaseinareaplanted,totalmaizeproduction shrank by 58.9 per cent to 33,460 metric tonnes in the 2015/16 season from 81,623 metric tonnes in the previous season. This occurred despite government’s assistance through the provision of input subsidies through the Indian loan to farmers in the high maize producing areas.
DOMESTIC ECONOMY (Continued)
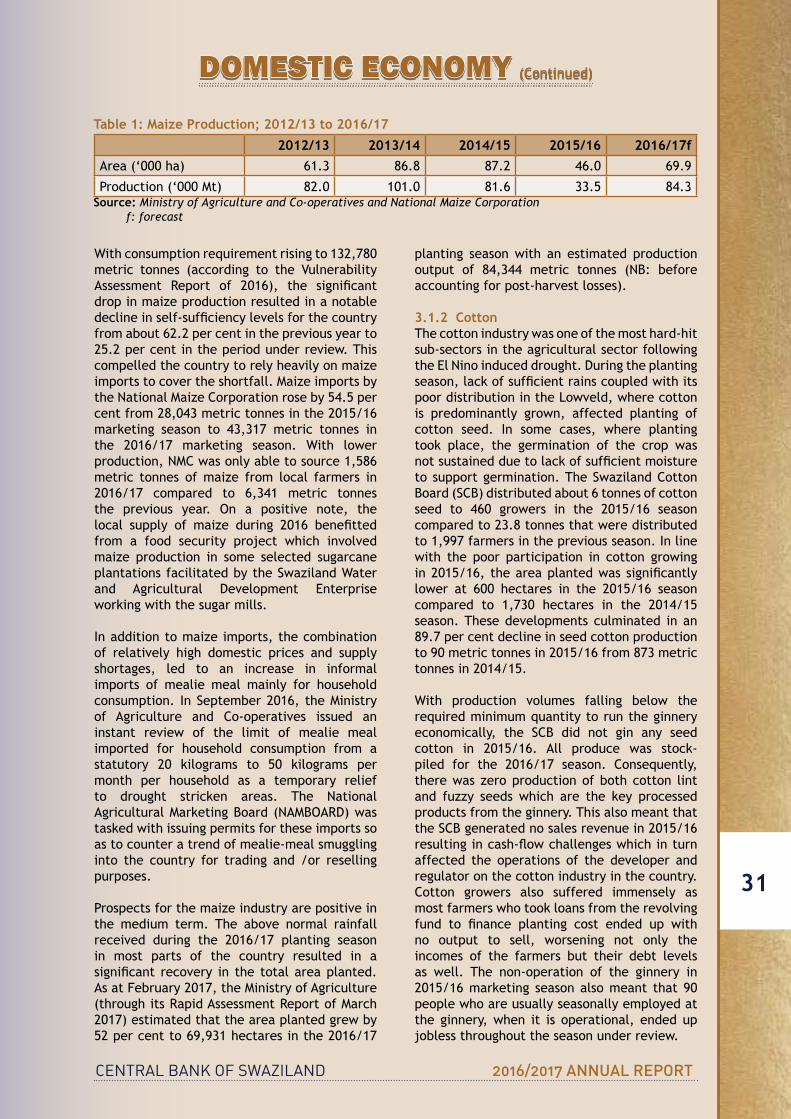
CENTRAL BANK OF SWAZILAND 2016/2017 ANNUAL REPORT
31
DOMESTIC ECONOMY (Continued)
With consumption requirement rising to 132,780 metric tonnes (according to the VulnerabilityAssessment Report of 2016), the significantdrop in maize production resulted in a notable declineinself-sufficiencylevelsforthecountryfrom about 62.2 per cent in the previous year to 25.2 per cent in the period under review. This compelled the country to rely heavily on maize imports to cover the shortfall. Maize imports by theNationalMaizeCorporationroseby54.5percent from 28,043 metric tonnes in the 2015/16 marketing season to 43,317 metric tonnes in the 2016/17 marketing season. With lower production,NMCwasonlyabletosource1,586metric tonnes of maize from local farmers in 2016/17 compared to 6,341 metric tonnes the previous year. On a positive note, the local supply of maize during 2016 benefittedfrom a food security project which involved maize production in some selected sugarcane plantations facilitated by the Swaziland Water and Agricultural Development Enterpriseworking with the sugar mills.
In addition to maize imports, the combination of relatively high domestic prices and supply shortages, led to an increase in informal imports of mealie meal mainly for household consumption. In September 2016, the Ministry of Agriculture and Co-operatives issued aninstant review of the limit of mealie meal imported for household consumption from a statutory 20 kilograms to 50 kilograms per month per household as a temporary relief to drought stricken areas. The National AgriculturalMarketingBoard(NAMBOARD)wastasked with issuing permits for these imports so as to counter a trend of mealie-meal smuggling into the country for trading and /or reselling purposes. Prospects for the maize industry are positive in the medium term. The above normal rainfall received during the 2016/17 planting season in most parts of the country resulted in a significant recovery in the totalareaplanted.As at February 2017, the Ministry of Agriculture (through its Rapid Assessment Report of March 2017) estimated that the area planted grew by 52 per cent to 69,931 hectares in the 2016/17
planting season with an estimated production output of 84,344 metric tonnes (NB: before accounting for post-harvest losses).
3.1.2 CottonThe cotton industry was one of the most hard-hit sub-sectors in the agricultural sector following theElNinoinduceddrought.Duringtheplantingseason,lackofsufficientrainscoupledwithitspoor distribution in the Lowveld, where cotton is predominantly grown, affected planting of cotton seed. In some cases, where planting took place, the germination of the crop was notsustainedduetolackofsufficientmoisturetosupportgermination.TheSwazilandCottonBoard(SCB)distributedabout6tonnesofcottonseed to 460 growers in the 2015/16 season compared to 23.8 tonnes that were distributed to 1,997 farmers in the previous season. In line with the poor participation in cotton growing in2015/16,theareaplantedwassignificantlylower at 600 hectares in the 2015/16 season compared to 1,730 hectares in the 2014/15 season. These developments culminated in an 89.7 per cent decline in seed cotton production to 90 metric tonnes in 2015/16 from 873 metric tonnes in 2014/15.
With production volumes falling below the required minimum quantity to run the ginnery economically, the SCB did not gin any seedcotton in 2015/16. All produce was stock-piled for the 2016/17 season. Consequently,there was zero production of both cotton lint and fuzzy seeds which are the key processed products from the ginnery. This also meant that theSCBgeneratednosalesrevenuein2015/16resultingincash-flowchallengeswhichinturnaffected the operations of the developer and regulator on the cotton industry in the country. Cotton growers also suffered immensely asmost farmers who took loans from the revolving fund to finance planting cost ended up withno output to sell, worsening not only the incomes of the farmers but their debt levels as well. The non-operation of the ginnery in 2015/16 marketing season also meant that 90 people who are usually seasonally employed at the ginnery, when it is operational, ended up jobless throughout the season under review.
Table 1: Maize Production; 2012/13 to 2016/17
2012/13 2013/14 2014/15 2015/16 2016/17fArea (‘000 ha) 61.3 86.8 87.2 46.0 69.9
Production (‘000 Mt) 82.0 101.0 81.6 33.5 84.3Source: Ministry of Agriculture and Co-operatives and National Maize Corporation f: forecast

CENTRAL BANK OF SWAZILAND 2016/2017 ANNUAL REPORT
32
The outlook for cotton production for the 2016/17 season indicates signs of recovery from the worst season of 2015/16 largely on the back of an improvement in weather conditions coupled with better distribution of rains during the planting season. The SCB distributed 16tonnes of cotton seed in the 2016/17 planting season. The cotton seed was distributed free of charge to the farmers to encourage them to return to cotton production following the worst performance in more than 30 years. Based on the cotton seed distributed, the area planted for 2016/17 season is estimated at 1,600 hectares with a yield of 800 metric tonnes of seed cotton. This output combined with accumulated stock is projected to yield about 320 tonnes of lint and 448 tonnes of fuzzy seed. Revenues for the growers are projected to reachE6millionin2016/17whilsttheSCBwillrealise an estimated E7.9 million in revenuefrom processed products (lint and fuzzy seeds).Apart from erratic weather conditions, cotton production in the medium term would be highly dependent on whether the growing of Genetically Modified (GM) cotton wouldeventually get a green light in Swaziland. Trials on GM cotton seed compared to the conventional non-GM cotton seed were conducted in 2014/15 season which revealed that the GM cotton seed yielded far better results than the conventional non-GM cotton in termsofbothproductivityandprofitmargins.
Table 2: Cotton Production; 2012/13 to 2016/17
2012/13 2013/14 2014/15 2015/16 2016/17fProduction (Mt) 2,485 1,820 873 89 800
Area (‘000 ha) 3.0 2.3 1.7 0.6 1.6
ValuetoGrowers(E’m) 13.2 10.3 4.4 0.5 6.0
AveragePrice(E/kg) 5.30 5.70 5.15 6.0 6.0
Planting Seed Sales (Mt) 50.9 36.7 23.8 6.0 16Source: Swaziland Cotton Boardf: forecast
Table 3: Livestock Production - Cattle; 2013 to 2016
2013 2014 2015 2016Total Population 627,486 620,032 594,240 531,450
CalvesBirth 102,418 85,784 80,602 66,437
Total Slaughters 59,971 50,041 55,842 60,760
CommercialSlaughters 32,642 23,789 28,345 31,866
HomeConsumptionSlaughter 27,329 26,252 27,497 28,894
Deaths 35,096 38,899 57,796 46,123
Mortality Rate % 5.6 6.3 9.7 8.6Source: Ministry of Agriculture & Co-operatives
However, the growing of GM cotton continues to be hindered by the Bio-Safety Act of 2012 which has clauses that prohibits the growing of GM cotton. If successfully reviewed, opening up for GMcottonprovidesasignificantopportunitytorevive the cotton industry in the medium term as it has a potential to attract other large scale growers who have ceased producing cotton under the prevailing circumstances.
3.1.3 LivestockErratic weather conditions characterised bybelow long-term average rains over most parts of the country severely affected the livestock subsector particularly in terms of depletion of animal stock levels.According tofigures fromthe annual livestock census conducted by the MinistryofAgricultureandCo-operatives,totalcattle population declined by 10.6 per cent to 531,450 in 2016 from 594,240 in 2015. The persistent drought resulted in unfavourable livestock breeding conditions and deteriorating cattle well-being due to the depletion of grazing areas with most parts of the country, particularly the Lowveld region, exposed to prolonged dryness. Calf births remainedsuppressed falling by 17.6 per cent in 2016 following a cumulative decline of 22 per cent intheprevioustwoyears.Cattlemortalityrateremained at elevated levels of 8.6 per cent in 2016 but was slightly lower than the peak of 9.7 per cent observed in 2015.
DOMESTIC ECONOMY (Continued)
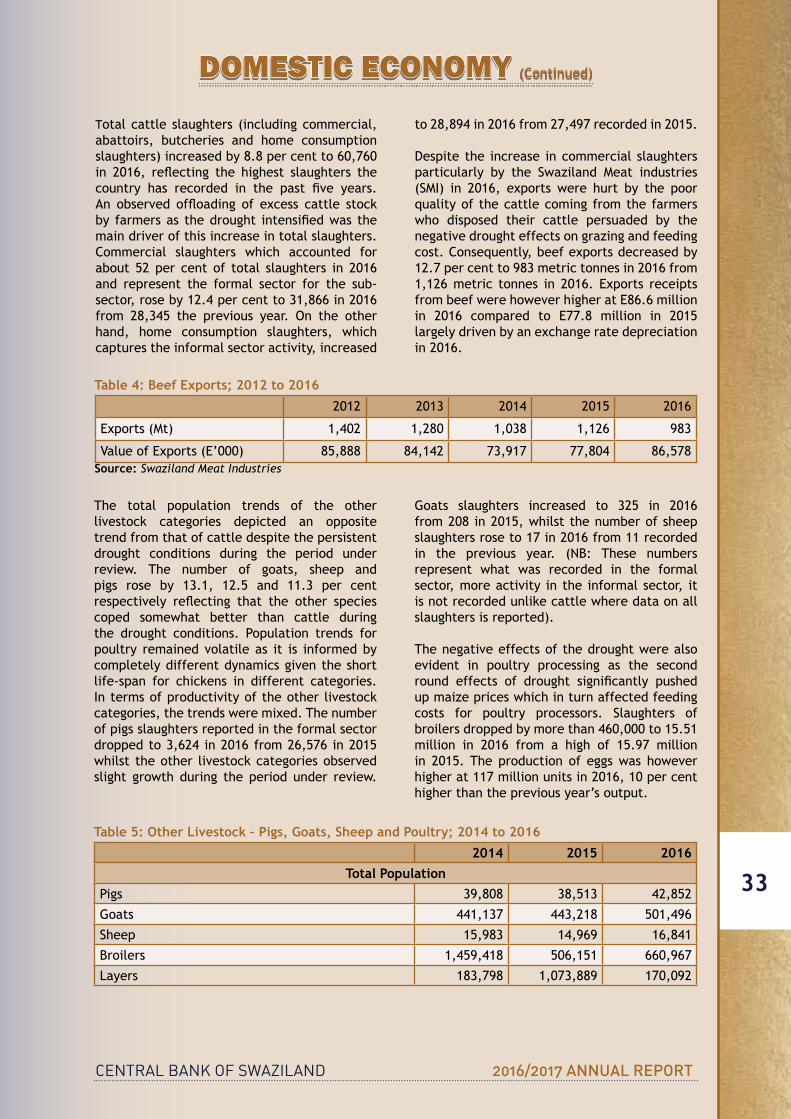
CENTRAL BANK OF SWAZILAND 2016/2017 ANNUAL REPORT
33
Table 4: Beef Exports; 2012 to 2016
2012 2013 2014 2015 2016
Exports(Mt) 1,402 1,280 1,038 1,126 983
ValueofExports(E’000) 85,888 84,142 73,917 77,804 86,578Source: Swaziland Meat Industries
The total population trends of the other livestock categories depicted an opposite trend from that of cattle despite the persistent drought conditions during the period under review. The number of goats, sheep and pigs rose by 13.1, 12.5 and 11.3 per cent respectively reflecting that the other speciescoped somewhat better than cattle during the drought conditions. Population trends for poultry remained volatile as it is informed by completely different dynamics given the short life-span for chickens in different categories. In terms of productivity of the other livestock categories, the trends were mixed. The number of pigs slaughters reported in the formal sector dropped to 3,624 in 2016 from 26,576 in 2015 whilst the other livestock categories observed slight growth during the period under review.
Goats slaughters increased to 325 in 2016 from 208 in 2015, whilst the number of sheep slaughters rose to 17 in 2016 from 11 recorded in the previous year. (NB: These numbers represent what was recorded in the formal sector, more activity in the informal sector, it is not recorded unlike cattle where data on all slaughters is reported).
The negative effects of the drought were also evident in poultry processing as the second round effects of drought significantly pushedup maize prices which in turn affected feeding costs for poultry processors. Slaughters of broilers dropped by more than 460,000 to 15.51 million in 2016 from a high of 15.97 million in 2015. The production of eggs was however higher at 117 million units in 2016, 10 per cent higher than the previous year’s output.
Table 5: Other Livestock – Pigs, Goats, Sheep and Poultry; 2014 to 2016
2014 2015 2016Total Population
Pigs 39,808 38,513 42,852
Goats 441,137 443,218 501,496
Sheep 15,983 14,969 16,841
Broilers 1,459,418 506,151 660,967
Layers 183,798 1,073,889 170,092
Total cattle slaughters (including commercial, abattoirs, butcheries and home consumption slaughters) increased by 8.8 per cent to 60,760 in 2016, reflecting the highest slaughters thecountry has recorded in the past five years.An observed offloading of excess cattle stockby farmersas thedrought intensifiedwasthemain driver of this increase in total slaughters. Commercial slaughters which accounted forabout 52 per cent of total slaughters in 2016 and represent the formal sector for the sub-sector, rose by 12.4 per cent to 31,866 in 2016 from 28,345 the previous year. On the other hand, home consumption slaughters, which captures the informal sector activity, increased
to 28,894 in 2016 from 27,497 recorded in 2015.
Despitethe increase incommercial slaughtersparticularly by the Swaziland Meat industries (SMI) in 2016, exports were hurt by the poor quality of the cattle coming from the farmers who disposed their cattle persuaded by the negative drought effects on grazing and feeding cost.Consequently,beefexportsdecreasedby12.7 per cent to 983 metric tonnes in 2016 from 1,126metric tonnes in 2016. Exports receiptsfrombeefwerehoweverhigheratE86.6millionin 2016 compared to E77.8 million in 2015largely driven by an exchange rate depreciation in 2016.
DOMESTIC ECONOMY (Continued)

CENTRAL BANK OF SWAZILAND 2016/2017 ANNUAL REPORT
34
2014 2015 2016Total Formal Slaughters/Productivity
Pigs Slaughters 13,176 26,576 3,624
Goats Slaughters 344 208 325
Sheep Slaughters 76 11 17
Broilers 12,697,600 15,967,743 15,506,535
EggProduction(in‘000units) 98,822.3 106,468.3 117,331.2Source: Ministry of Agriculture & Co-operatives
Prospects for the livestock sector are mixed. On the positive side, the good rains received in last quarterof2016andfirstquarterof2017wouldimprove rangelands and aid an improvement in cattle calves’ births which have been significantlyaffectedduringthedroughtperiodin the past 2 years. This would allow farmers to restock their livestock which was severely depleted during the drought years. However, the rebuilding of stocks would negatively affect production because less animals would be available for commercial slaughters and this will hamper export volumes. Beef exports receipts would further be dampened by a relatively stronger Lilangeni/Rand exchange rate against major trading currencies.
3.1.4 Milk/Dairy ProductionThe dairy sector performed well in 2016 despite challenges presented by the El Nino induceddrought which increased mortality rates and feeding costs for the dairy farmers. The sector largely benefitted from the first phase of theimplementation of a large scale dairy project facilitated by Old Mutual. Under this project
600 dairy cows were brought into the country in 2016 and this aided an increase in the total number of dairy cows from 5,477 in 2015 to 6,276 in 2016. The increase in the number of dairy cows led to a 35.8 per cent increase in domestic milk production from 12.02 million litres in 2015 to 16.65 million litres in 2016.
The country’s demand for dairy products (milk and milk products) remained sustainably higher at 82.24 million litres in terms of liquid milk equivalence (LME) in 2016 compared to 81.67million litres the previous year. Thus, the increase in local milk production only covered 17.7 per cent of the total demand. Though the increase in local milk production still fell significantly short of total demand (for dairyproducts), it did reflect good strides towardsself-sufficiency. Dairy imports fell by about 5percentfrom69.02millionlitres(LME)in2015to65.65millionlitres(LME)in2016.UHTmilk,margarine and yoghurt are amongst the top 5 dairy products that are imported in higher quantities.
Table 6: Dairy Production in Millions – Liquid Milk Equivalent (LME); 2013 to 2016
2013 2014 2015 2016DomesticDemand 60.24 68.94 81.67 82.24
DomesticProduction 9.76 10.64 12.02 16.65
Imports 50.48 58.30 69.02 65.65Source: Swaziland Dairy Board
In terms of local processing, there are 5 main products namely; dairy juice, emasi, yoghurt, freshcreamandfreshmilk.Emasiandyoghurtare the leading products in terms of volumes and revenuesfordairyprocessing.Dairyprocessingyielded E115.3 million in 2016 compared toE99.7millionthepreviousyearreflectinggainsmade from improved domestic milk production. The Swaziland Dairy Board (SDB), as per itsdevelopment mandate, continued to provide support, training and advisory services to milk producers. Services to farmers included;
resource assessment for starting dairy businesses, procurement of dairy cattle, perennial and winter pasture establishment and management, artificial insemination,production and handling of clean milk, and the construction of dairy structures. In an endeavour to stimulate local milk production anddairy farmingatgrass-root level, theSDBcontinued to support the Indigenous DairyingInitiative by encouraging farmers to venture into dairy farming as an enterprise. Through this initiative, the SDB distributed its cooling
DOMESTIC ECONOMY (Continued)

CENTRAL BANK OF SWAZILAND 2016/2017 ANNUAL REPORT
35
milk tanks to communities for farmers to take milk from their indigenous beef cattle to the collection centres where it can be stored and sold in bulk to dairy processors. Ata largescale,theOldMutualDairyProjectwhich started in 2016 is earmarked to deliver broader positive prospects for the dairy industry. The three-year project (2016-2018) is targeting to bring in 3,500 dairy cattle during the project period and produce about 2 million litres per month at full scale production. Though the project has had some unanticipated delays in its scope of implementation, it is expected that at its completion, the proportion of dairy imports would be reduced substantially and the prospects of attracting more processors into the country would be enhanced. Another aspect of dairy production is goat milk production and consumption. The demand for goat milk has been consistently on the upward trend reaching 35,870 litres in 2016 from 33,035 litres in2015.Domesticgoatdairyproductionstood at 28,250 in 2016 compared to 24,800 the previous year. In line with the increase in domestic production, goat dairy imports were lower at 7,350 in 2016 from 8,235 the previous year.TheSDBisactivelyinvolvedinsupportingand promoting production and consumption of dairy goat.The SDBoperates a goatbreedingprogramme in one of its farms to help boost availability of dairy goats given their scarcity even at region level. The Board also conducts
technical trainings to equip farmers on how to manage dairy goats’ projects.
3.1.5 Mining and QuarryingThe ‘mining and quarrying’ subsector continued to be dominated by anthracite coal and quarried stone production. The sector depicted signs of recovery in 2016 with output and revenues for both coal and quarried stone recording increases from levels realised the previous year. Sales revenues, which represent the output value forthesector, roseby9.2percenttoE236.9millionin2016fromE216.9millionin2015.Atthis level, however, the mining output remained more than two-thirds lower than what it was when there was active production in the iron-ore mine that was terminated in August 2014.
Coal production increased by 12 per cent to158,418 metric tonnes in 2016 from 141,733 metric tonnes produced in 2015. The increase inproductionvolumesofcoalbenefittedfroman improvement in coal yields which came through accessing of new mining grounds with a higher yield. International price developments for coal were broadly unfavourable remaining depressed for most part of 2016. Prices rebounded in the last quarter of 2016 following adecisionbyChina,thelargestcoalproducer,to reduce harmful emissions, triggering higher demand of coal and causing coal prices to soar. Sales revenue from coal output rose slightly fromE177.6million in 2015 to E188.1millionin 2016.
Table 7: Minerals - Production and Sales; 2014 to 2016
2014 2015 2016Production
Coal(Mt) 177 930 141 733 158 418
QuarriedStone(M³) 310 659 396 046 419 642
Iron Ore (Mt) 603 251 - -
Sales Value (E’ 000)Coal 210.3 177.6 188.1
QuarriedStone 36.8 39.3 48.8
Iron Ore 381.2 - -
Total Sales 628.3 216.9 236.9Source: Ministry of Natural Resources & Energy, Mining DepartmentNotes: Mt= Metric Tonnes, M³= Cubic Metres
Quarried stone production maintained anupward trend rising by 6 per cent from 396,046 cubic metres in 2015 to 419,642 cubic meters in 2016. The increase in quarried stone production mainly benefitted from
continuous implementation of public works projects particularly road infrastructure (such as Nhlangano – Sicunusa road and Mbandlane – Manzini road which were under construction during the period under review). In line with
DOMESTIC ECONOMY (Continued)
CENTRAL BANK OF SWAZILAND 2016/2017 ANNUAL REPORT
36
the higher volumes produced and sold, revenue fromquarriedstonesincreasedtoE48.8millionin2016fromE39.3millionin2015. Prospects in the mining and quarrying sector are positive.Duringthecourseof2016,therewasacommencement of gold mining at Lufafa, albeit at a small scale. Small quantities of extracted goldoreweresenttoDubai forconversiontoa bullion which weighed 1 kilogram and was worth about E1 million. There is scope forintensifying gold production and the Swaziland Mining Department has issued more licensesfor scooping in areas between Bulembu and Piggs Peak where there is a prospect for more minerals’ extraction. Prospects for coal production are also positive particularly after the official renewal of themining licence forMaloma Colliery which had expired in June2013. Increases in coal production would also benefit from planned thermal powerproduction at Lubhuku area. The anticipated positive prospects in the mining sector would also present opportunities for processing of raw minerals to enhance value addition in this sub-sector. In quarrying, the on-going road and building projects are expected to have a positive impact on quarry output in the short to medium term.
3.1.6 SugarThe sugar industry was not spared from the drasticeffectsoftheElNinoinduceddrought.Lack of consistent rains negatively affected the flowofriversanddamlevels,severelydisruptingirrigation activities as some dam levels fell below required levels to support effective irrigation of sugar cane. For example, in the northern region, the Umjoli dam fell below 10 per cent whilst in the southern region, the Ingwavuma river and some parts of Lusushwana river ran dry formostpartoftheseason.Consistentsupplyin the south only came from the Lubovane dam in the Lower Usuthu Smallholder Irrigation Scheme (LUSIP) areas. Thus, even though there was a continuous increase in area under sugarcane production, the drastic effects of the drought resulted in area harvested falling by more than 1,200 hectares in the 2016/17 harvesting season and some of the harvested cane was of a poor quality. The poor quality of thecanewasreflectedinsucroseyieldswhichfell by 12 per cent from 14.2 tonnes/hectare in the 2015/16 season to 12.5 tonnes/hectare in 2016/17 season.
The developments at agricultural level filteredthroughtothemanufacturingofsugar
particularly the significant drop in sucroseproduction. Sugar production fell by 15.7 per cent from 695,410 metric tonnes in 2015/16 season to 586,085 metric tonnes in 2016/17. However, sugar production volumes were slightly better than previously anticipated where it was estimated that output might fall by 25 per cent. This improvement mainly resulted from better weather conditions in the last quarter of 2016 which partially improved yields of the harvested crop.
Thesignificantdropinsugarproductionresultedin lower sugar sales volumes in 2016/17. Total sugar sales volumes fell by 11.3 per cent to 621,164 metric tonnes in 2016/17 marketing season from 700,017 metric tonnes in 2015/16. The drop in total sales was relatively lower than the fall in production due to high inventory stock from the 2015/16 season which was a record year in terms of production. Export sales destinedoutside the SACU market – predominantly tothe European Union (EU) decreased by 20.8per cent from 299 936 metric tonnes in the 2015/16 marketing season to 237 582 metric tonnes in 2016/17. This decline resulted from the combination of lower volumes available for sale (due to the drop in sugar production) as well as the continuous market diversificationaway from the EUmarket undertaken by theSwaziland Sugar Association (SSA) in light of the erosion of preferential access to this market. In line with the fall in volume shipments, exportsreceiptsfromoutsidetheSACUmarketdecreasedby3.7percenttoE1.646billioninthe period under review with moderate gains from the exchange rate depreciation.
Thesignificantfallinsugarproduction,coupledwith a surge in imports also affected sales to the domestic SACU market even though theSSA strategically pushed more volumes to the SACUmarketwheretherewasadeficitinsugarsupply caused by the negative effects of the drought. Volume sugar sales into the SACUmarket dropped by 4.1 per cent to 383,582 metric tonnes in the period under review from 400,081 metric tonnes in the previous season. With theSACUmarket slightlyprotectedbyasugar tariff, the shortfall in sugar supply in the Southern region pushed prices upwards by more than 25 per cent in the period under review. Henceforth,sugarsalesrevenuefromtheSACUmarketrosesignificantlyfromE2.573billionin2015/16marketing season toE3.009billion inthe period under review.
In line with sugar production, molasses which is a by-product for sugar production and a
DOMESTIC ECONOMY (Continued)
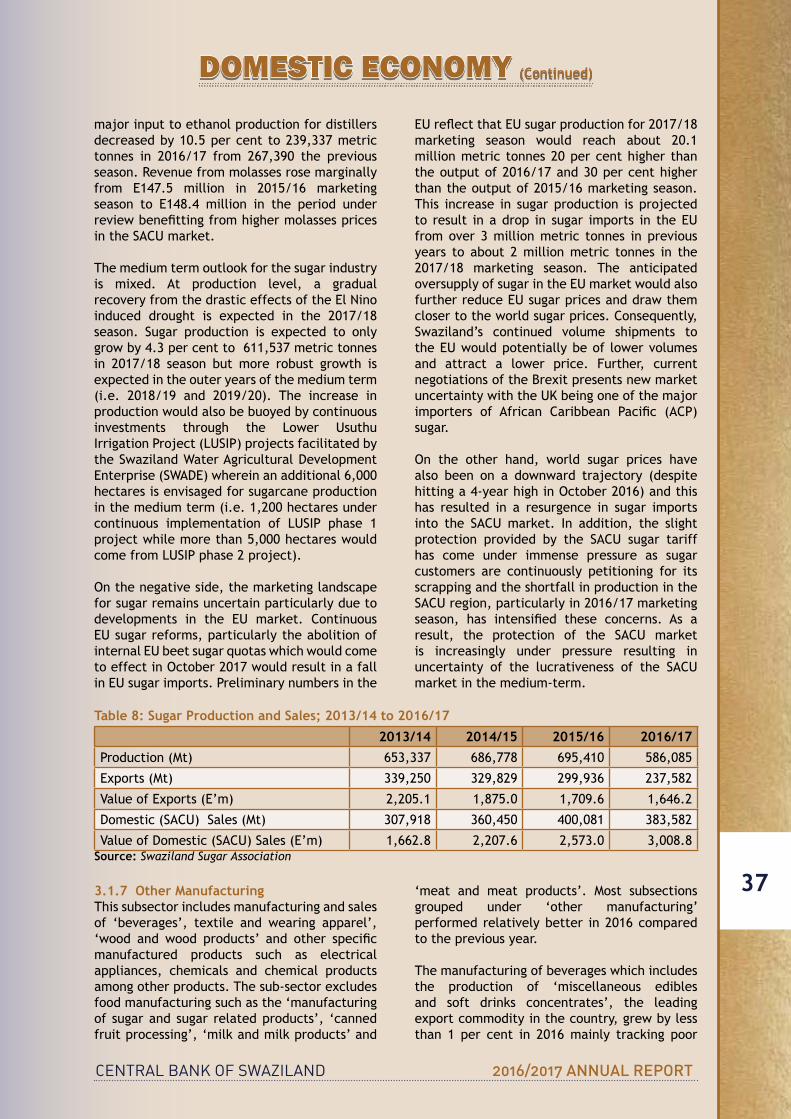
CENTRAL BANK OF SWAZILAND 2016/2017 ANNUAL REPORT
37
Table 8: Sugar Production and Sales; 2013/14 to 2016/17
2013/14 2014/15 2015/16 2016/17Production (Mt) 653,337 686,778 695,410 586,085
Exports(Mt) 339,250 329,829 299,936 237,582
ValueofExports(E’m) 2,205.1 1,875.0 1,709.6 1,646.2
Domestic(SACU)Sales(Mt) 307,918 360,450 400,081 383,582
ValueofDomestic(SACU)Sales(E’m) 1,662.8 2,207.6 2,573.0 3,008.8Source: Swaziland Sugar Association
3.1.7 Other ManufacturingThis subsector includes manufacturing and sales of ‘beverages’, textile and wearing apparel’, ‘wood and wood products’ and other specificmanufactured products such as electrical appliances, chemicals and chemical products among other products. The sub-sector excludes food manufacturing such as the ‘manufacturing of sugar and sugar related products’, ‘canned fruit processing’, ‘milk and milk products’ and
‘meat and meat products’. Most subsections grouped under ‘other manufacturing’ performed relatively better in 2016 compared to the previous year.
The manufacturing of beverages which includes the production of ‘miscellaneous edibles and soft drinks concentrates’, the leading export commodity in the country, grew by less than 1 per cent in 2016 mainly tracking poor
major input to ethanol production for distillers decreased by 10.5 per cent to 239,337 metric tonnes in 2016/17 from 267,390 the previous season. Revenue from molasses rose marginally from E147.5 million in 2015/16 marketingseason to E148.4 million in the period underreviewbenefittingfromhighermolassespricesintheSACUmarket.
The medium term outlook for the sugar industry is mixed. At production level, a gradual recoveryfromthedrasticeffectsoftheElNinoinduced drought is expected in the 2017/18 season. Sugar production is expected to only grow by 4.3 per cent to 611,537 metric tonnes in 2017/18 season but more robust growth is expected in the outer years of the medium term (i.e. 2018/19 and 2019/20). The increase in production would also be buoyed by continuous investments through the Lower Usuthu Irrigation Project (LUSIP) projects facilitated by theSwazilandWaterAgriculturalDevelopmentEnterprise(SWADE)whereinanadditional6,000hectares is envisaged for sugarcane production in the medium term (i.e. 1,200 hectares under continuous implementation of LUSIP phase 1 project while more than 5,000 hectares would come from LUSIP phase 2 project).
On the negative side, the marketing landscape for sugar remains uncertain particularly due to developments in the EU market. ContinuousEUsugarreforms,particularlytheabolitionofinternalEUbeetsugarquotaswhichwouldcometo effect in October 2017 would result in a fall inEUsugarimports.Preliminarynumbersinthe
EUreflectthatEUsugarproductionfor2017/18marketing season would reach about 20.1 million metric tonnes 20 per cent higher than the output of 2016/17 and 30 per cent higher than the output of 2015/16 marketing season. This increase in sugar production is projected to result inadrop in sugar imports in theEUfrom over 3 million metric tonnes in previous years to about 2 million metric tonnes in the 2017/18 marketing season. The anticipated oversupplyofsugarintheEUmarketwouldalsofurtherreduceEUsugarpricesanddrawthemclosertotheworldsugarprices.Consequently,Swaziland’s continued volume shipments to theEUwouldpotentiallybeof lowervolumesand attract a lower price. Further, current negotiations of the Brexit presents new market uncertaintywiththeUKbeingoneofthemajorimporters of African Caribbean Pacific (ACP)sugar.
On the other hand, world sugar prices have also been on a downward trajectory (despite hitting a 4-year high in October 2016) and this has resulted in a resurgence in sugar imports into the SACUmarket. In addition, the slightprotection provided by the SACU sugar tariffhas come under immense pressure as sugar customers are continuously petitioning for its scrapping and the shortfall in production in the SACUregion,particularlyin2016/17marketingseason, has intensified these concerns. As aresult, the protection of the SACU marketis increasingly under pressure resulting in uncertainty of the lucrativeness of the SACUmarket in the medium-term.
DOMESTIC ECONOMY (Continued)

CENTRAL BANK OF SWAZILAND 2016/2017 ANNUAL REPORT
38
developments in the South African market. Significantpositivegrowthwasobservedinthemanufacturing of ‘wood and wood products’ mainly benefiting from investments made byforestrycompaniesinsellingdiversifiedforestryproducts. The textile sector also performed well with an estimated growth of about 6 per cent aided by the continuous penetration of the regional markets which have partially offset earlier anticipated negative effects of the loss of the US market following Swaziland’s removal from the benefits of the African Growth andOpportunity Act (AGOA). Most textile companies have expanded their operations to maximize returns from the regional markets.
Subsectors that recorded negative performance included ‘manufacture of construction material (such as cement and concretes)’, ‘manufacture of paper and paper products’, ‘manufacture of electrical appliances’ and ‘other manufacturing non-elsewhere-classified’. The manufacturersof construction material recorded negative growth largely due to the effect of increased competition from imports. The other subsectors recorded negative growth due to scaling down of operations partly due to deterioration in market conditions and other internal challenges.
3.1.8 ConstructionThe construction sector registered a steady performance in 2016 on account of developments in various public projects in the country. The public infrastructure development benefitted from the 42 per cent increase incapitalexpenditure;E5.29billionwasallocatedin 2016/17 fiscal year against E3.72 billionallocated in 2015/16. The implementation rate remained relatively higher at 73 per cent in 2016/17 but slightly lower than the 80 per cent recorded the previous year. Some of the major on-going capital projects implemented in 2016 included: the InternationalConventionCentreandFiveStarHotel (ICCFISH)atEzulwini, theBiotechnology themed park at Nokwane and Information Technology (IT) Park at Phocweni and Nhlangano-Sicunusa road, and Manzini-Mbhadlane road.
Indicators linked to construction activity reflected positive activity in the constructionsector. Imports of construction material rose by 24 per cent in real terms in 2016 compared to 16percent thepreviousyear.Quarried stoneproduction increased by 6 per cent in 2016 from396,046cubicmeters in2015, reflectingthat there was notable growth in construction activity particularly road infrastructure which
uses relatively more quantities of quarried stone. Private sector construction activity was however on the downside. Statistics from the country’s municipalities which broadly track private sector related construction activity exhibited negative growth in 2016. The total number of buildings completed decreased from 178 units in 2015 to 166 units in 2016. The number of residential completed buildings contracted from 148 units in 2015 to 134 units in 2016. The number of completed commercial buildings also decreased from 26 units in 2015 to 24 units in 2016 while ‘other buildings’ completed increased to 8 units from 6 units over the same period.
Prospects for the construction sector are mixed with numbers of building plans approved by municipalities showing slower construction activity for the urban areas. The total number of building plans approved decreased by 6 per cent from 879 units in 2015 to 829 units in 2016. Residential building plans approved stood at 643 units in 2016 compared to 683 units in 2015 while commercial building plans approved were also lower at 112 units from 130 units over the same period. The number of building plans approved for ‘other’ buildings was higher at 77 units in 2016 compared with 66 units in 2015. In line with the decline in the number of units approved, the value of the total building plans approved was also lower at E845.2million in2016comparedtoE1.23billionin2015.
On a positive note, estimates for Government budget show growth in funds allocated for capital expenditure that mainly caters for infrastructure development in the country. On-going and new construction projects in the public sector, if fully implemented, are expected to continue to drive activity in this sector. The InternationalConventionCentreandFiveStarHotel (ICCFISH)atEzulwiniandBiotechnologythemed park at Nokwane and Information Technology (IT) Park at Phocweni remain the major on-going capital projects expected to finish in the short-term. Upcoming projectsinclude the construction of the Mkhondvo and Nondvo dams, the National Referral Hospital at Siteki aswell as the Strategic Fuel Depot.Road construction projects include the on-going construction of Nhlangano-Sicunusa road and Manzini-Mbhadlane road. The construction of Sikhuphe link roads, Bulembu-Piggs Peak road, Lukhula Big-Bend road and Motshane-Matsamo road are upcoming in the short to medium-
DOMESTIC ECONOMY (Continued)

CENTRAL BANK OF SWAZILAND 2016/2017 ANNUAL REPORT
39
Table 9: Construction Indicators; 2013 to 2016
Approved Building Plans Completed Buildings
No. of Plans E’ million No. of Buildings E’ million
2013 728 656.3 147 144.2
2014 768 1 747.3 141 100.9
2015# 879 1 245.9 178 159.4
2016 829 845.2 166 142.1Source: All Municipalities
3.1.9 Electricity Consumption Persistent drought conditions experienced over the past two years severely depleted water levels in dams and reservoirs, severely affecting local hydro-power generation. Consequently,hydro-power generation remained on a down-trend falling by 3.6 per cent to 118.9 GWh in the2016/17financialyearfrom123.3GWhin2015/16. In line with decline in sugar production, complementary electricity from the Ubombo Sugar cogeneration plant fell from 55 GWh in 2015/16 to 52 GWh in 2016/17 resulting in a 4.2 per cent drop in overall power generation. On a positive side, through Individual Power Producers (IPPs) arrangements, there was an additional 0.11 GWh power produced through a solar plant in the Lubombo region in 2016/17. Total electricity consumption, measured in volume unit sales, dropped by 2.4 per cent to 1,058.4 GWh in the 2016/17 from 1,084.1 GWh in 2015/16. The decline was due to the severe drought that affected dam levels used for irrigation purposes, which, in turn, resulted in the demand for electricity by the ‘bulk power and irrigation’ customers falling by 7.9 per cent in 2016/17. Furthermore, the negative drought effects on hydro-power generation prompted the Swaziland Electricity Company (SEC) toundertake load-shedding in a bid to reduce imports. Despite the fall in local generation,electricity imports were slightly lower at 1,063.7 GWh in 2016/17 from 1,077.1 GWh in 2015/16.
The prospects for electricity generation are broadly positive in the medium term. A weak and short-lived LaNina weather phenomenon in the last quarter of 2016 and first quarterof 2017, resulted in above-normal rainfall during this period and restored most dams and reservoirs to pre-drought levels. This, coupled with investments made by SEC during thedrought period, which included the dredging oftheEdwaleniheadpondinordertoincreasethe water holding capacity of the dam, would facilitate an increase in hydro-power generation. As a result, electricity generation is forecasted to increase by 30 per cent in the 2017/18financialyear.Powergenerationwouldalso be impacted positively by collaboration betweenSECandIPPs.Plannedprojectsincludesolar energy stations and more hydro-power stations. Sugar and forestry companies have also registered interest to partake in renewable energy supply. On a longer term though, SECplans hinges on the proposed thermal power plant envisaged for production of about 300 MW. OnthisprojectSEChascompletedinitialstagesthat include prospecting the availability and quality of the coal at Lubhuku where the plant is to be constructed. If all prospective projects are fully implemented, then the production capacity for the country will grow beyond the local demand of about 220 MW and will enable the country not only to self-sustain itself but also to export some of its power to the region.
term. The construction of the 146 kilometres railway connecting Lothair in South Africa and
SidvokodvovaluedataboutE16billion,willalsobenefitthesectorinthemedium-term.
DOMESTIC ECONOMY (Continued)
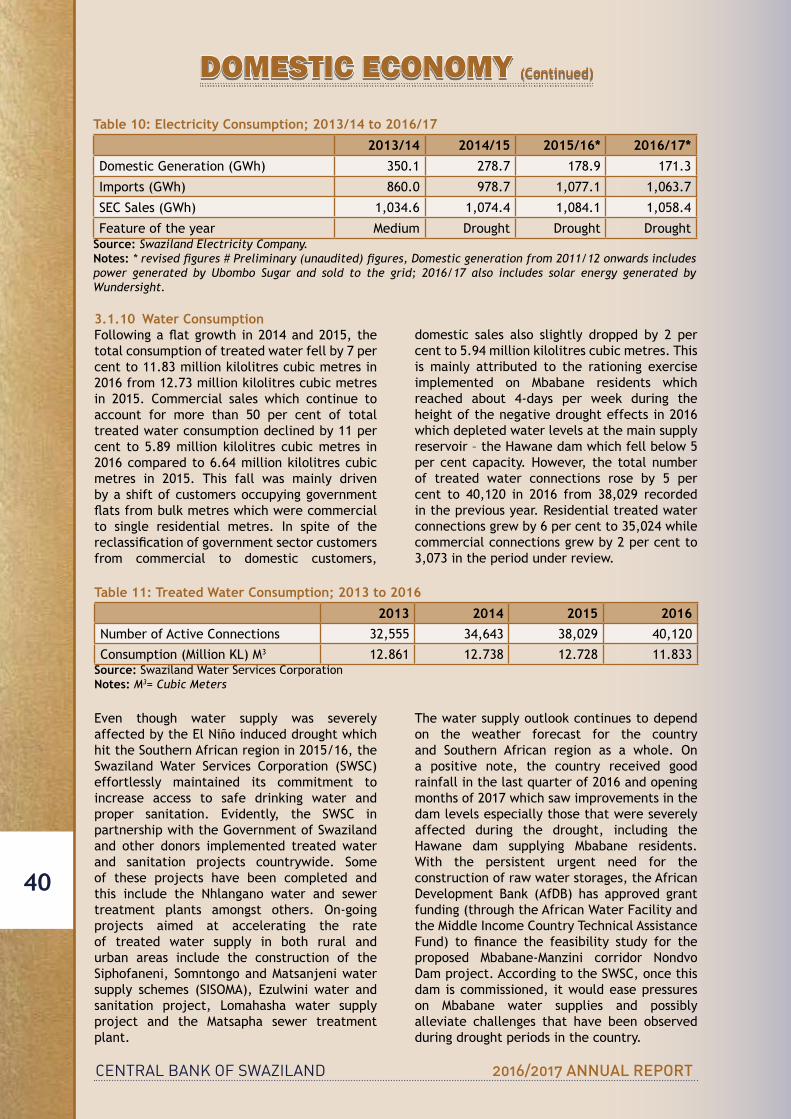
CENTRAL BANK OF SWAZILAND 2016/2017 ANNUAL REPORT
40
3.1.10 Water Consumption Followingaflatgrowth in2014and2015, thetotal consumption of treated water fell by 7 per cent to 11.83 million kilolitres cubic metres in 2016 from 12.73 million kilolitres cubic metres in 2015. Commercial sales which continue toaccount for more than 50 per cent of total treated water consumption declined by 11 per cent to 5.89 million kilolitres cubic metres in 2016 compared to 6.64 million kilolitres cubic metres in 2015. This fall was mainly driven by a shift of customers occupying government flatsfrombulkmetreswhichwerecommercialto single residential metres. In spite of the reclassificationofgovernmentsectorcustomersfrom commercial to domestic customers,
domestic sales also slightly dropped by 2 per cent to 5.94 million kilolitres cubic metres. This is mainly attributed to the rationing exercise implemented on Mbabane residents which reached about 4-days per week during the height of the negative drought effects in 2016 which depleted water levels at the main supply reservoir – the Hawane dam which fell below 5 per cent capacity. However, the total number of treated water connections rose by 5 per cent to 40,120 in 2016 from 38,029 recorded in the previous year. Residential treated water connections grew by 6 per cent to 35,024 while commercial connections grew by 2 per cent to 3,073 in the period under review.
Table 11: Treated Water Consumption; 2013 to 2016
2013 2014 2015 2016NumberofActiveConnections 32,555 34,643 38,029 40,120
Consumption(MillionKL)M3 12.861 12.738 12.728 11.833Source: SwazilandWaterServicesCorporationNotes: M3= Cubic Meters
Even though water supply was severelyaffectedbytheElNiñoinduceddroughtwhichhit the Southern African region in 2015/16, the Swaziland Water Services Corporation (SWSC)effortlessly maintained its commitment to increase access to safe drinking water and proper sanitation. Evidently, the SWSC inpartnership with the Government of Swaziland and other donors implemented treated water and sanitation projects countrywide. Some of these projects have been completed and this include the Nhlangano water and sewer treatment plants amongst others. On-going projects aimed at accelerating the rate of treated water supply in both rural and urban areas include the construction of the Siphofaneni, Somntongo and Matsanjeni water supply schemes (SISOMA), Ezulwini water andsanitation project, Lomahasha water supply project and the Matsapha sewer treatment plant.
The water supply outlook continues to depend on the weather forecast for the country and Southern African region as a whole. On a positive note, the country received good rainfall in the last quarter of 2016 and opening months of 2017 which saw improvements in the dam levels especially those that were severely affected during the drought, including the Hawane dam supplying Mbabane residents. With the persistent urgent need for the construction of raw water storages, the African Development Bank (AfDB) has approved grantfunding (through the African Water Facility and theMiddleIncomeCountryTechnicalAssistanceFund) to finance the feasibility study for theproposed Mbabane-Manzini corridor Nondvo Damproject.AccordingtotheSWSC,oncethisdam is commissioned, it would ease pressures on Mbabane water supplies and possibly alleviate challenges that have been observed during drought periods in the country.
Table 10: Electricity Consumption; 2013/14 to 2016/17
2013/14 2014/15 2015/16* 2016/17*DomesticGeneration(GWh) 350.1 278.7 178.9 171.3
Imports (GWh) 860.0 978.7 1,077.1 1,063.7
SECSales(GWh) 1,034.6 1,074.4 1,084.1 1,058.4
Feature of the year Medium Drought Drought DroughtSource: Swaziland Electricity Company. Notes:*revisedfigures#Preliminary(unaudited)figures,Domesticgenerationfrom2011/12onwardsincludespower generated by Ubombo Sugar and sold to the grid; 2016/17 also includes solar energy generated by Wundersight.
DOMESTIC ECONOMY (Continued)
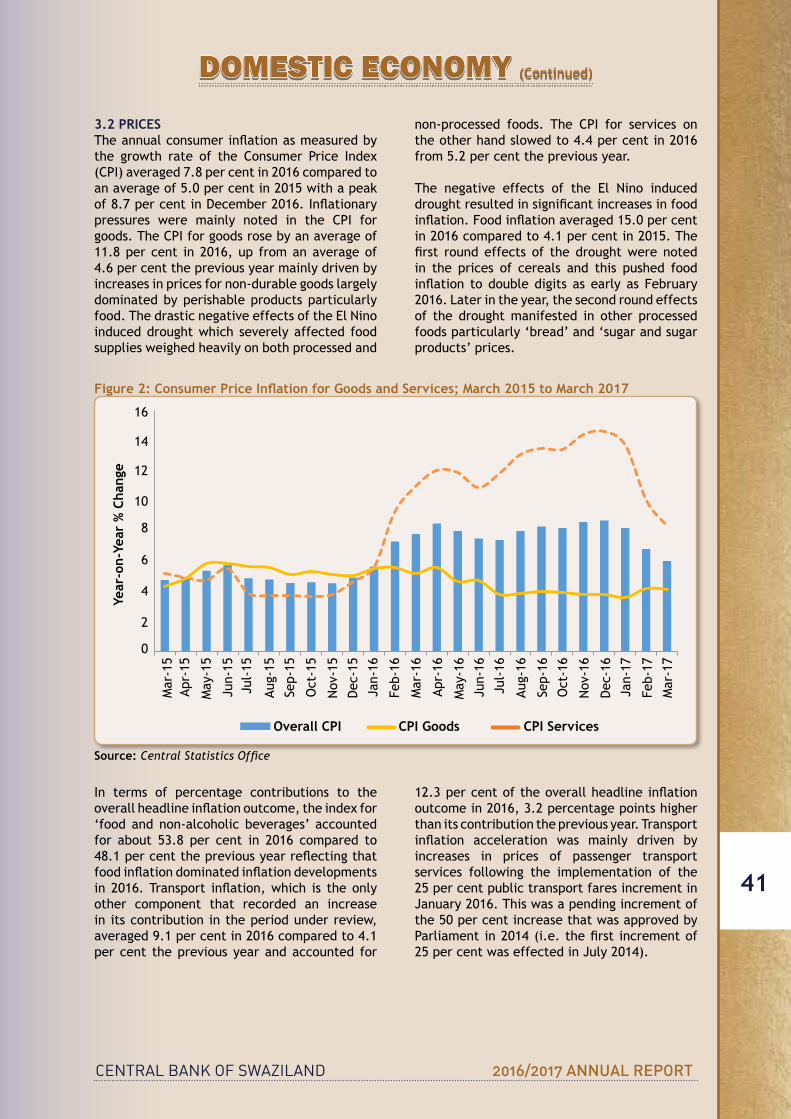
CENTRAL BANK OF SWAZILAND 2016/2017 ANNUAL REPORT
41
3.2 PRICESTheannualconsumerinflationasmeasuredbythe growth rate of the Consumer Price Index(CPI)averaged7.8percentin2016comparedtoan average of 5.0 per cent in 2015 with a peak of8.7percentinDecember2016.Inflationarypressures were mainly noted in the CPI forgoods.TheCPIforgoodsrosebyanaverageof11.8 per cent in 2016, up from an average of 4.6 per cent the previous year mainly driven by increases in prices for non-durable goods largely dominated by perishable products particularly food.ThedrasticnegativeeffectsoftheElNinoinduced drought which severely affected food supplies weighed heavily on both processed and
non-processed foods. The CPI for services onthe other hand slowed to 4.4 per cent in 2016 from 5.2 per cent the previous year.
The negative effects of the El Nino induceddroughtresultedinsignificantincreasesinfoodinflation.Foodinflationaveraged15.0percentin 2016 compared to 4.1 per cent in 2015. The first roundeffects of the droughtwere notedin the prices of cereals and this pushed food inflation todoubledigits as early as February2016. Later in the year, the second round effects of the drought manifested in other processed foods particularly ‘bread’ and ‘sugar and sugar products’ prices.
Figure 2: Consumer Price Inflation for Goods and Services; March 2015 to March 2017
0
2
4
6
8
10
12
14
16
Mar
-15
Apr-1
5 M
ay-1
5 Ju
n-15
Ju
l-15
Aug-
15
Sep-
15
Oct-1
5 No
v-15
De
c-15
Ja
n-16
Fe
b-16
M
ar-1
6 Ap
r-16
May
-16
Jun-
16
Jul-1
6 Au
g-16
Se
p-16
Oc
t-16
Nov-
16
Dec-
16
Jan-
17
Feb-
17
Mar
-17
year
-on-
year
% ch
ange
Overall CPI CPI Goods CPI Services
Mar
-15
Year
-on-
Year
% C
hang
e
16
14
12
10
8
6
4
2
0
Nov
-15
Jun-16
Jul-15
Mar
-16
Oct
-16
Apr-
15
Dec-15
Jul-16
Aug-
15
Apr-
16
Nov
-16
May
-15
Jan-16
Aug-
16
Sep-
15
May
-16
Dec-16
Feb-
17
Jun-15
Feb-
16
Sep-
16
Oct
-15
Jan-17
Mar
-17
Overall CPI CPI Goods CPI Services
Source:CentralStatisticsOffice
In terms of percentage contributions to the overallheadlineinflationoutcome,theindexfor‘food and non-alcoholic beverages’ accounted for about 53.8 per cent in 2016 compared to 48.1percentthepreviousyearreflectingthatfoodinflationdominatedinflationdevelopmentsin2016.Transport inflation,which is theonlyother component that recorded an increase in its contribution in the period under review, averaged 9.1 per cent in 2016 compared to 4.1 per cent the previous year and accounted for
12.3percentoftheoverallheadlineinflationoutcome in 2016, 3.2 percentage points higher than its contribution the previous year. Transport inflation acceleration was mainly driven byincreases in prices of passenger transport services following the implementation of the 25 per cent public transport fares increment in January2016.Thiswasapendingincrementofthe 50 per cent increase that was approved by Parliament in2014(i.e.thefirst incrementof25percentwaseffectedinJuly2014).
DOMESTIC ECONOMY (Continued)
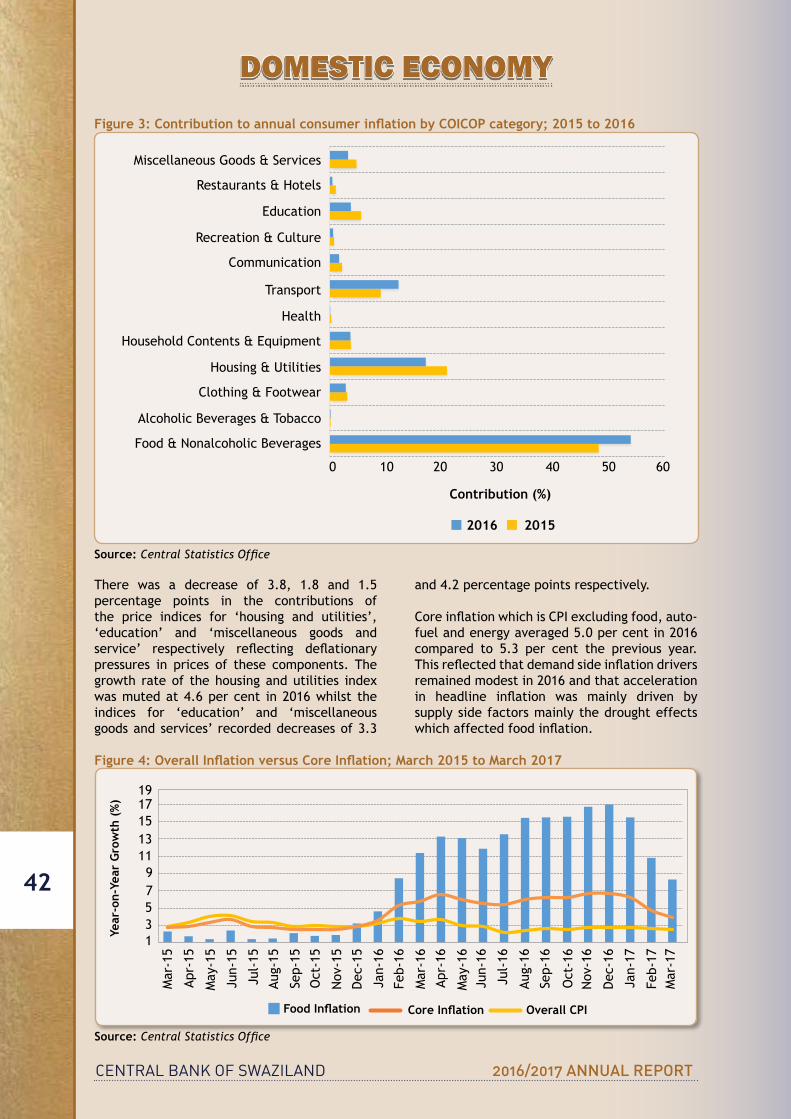
CENTRAL BANK OF SWAZILAND 2016/2017 ANNUAL REPORT
42
Figure 3: Contribution to annual consumer inflation by COICOP category; 2015 to 2016
0 10 20 30 40 50 60
Food & Nonalcoholic Beverages
Alcoholic Beverages & Tobacco
Clothing & Footwear
Housing & Utilities
Household Contents & Equipment
Health
Transport
Communication
Recreation & Culture
Education
Restaurants & Hotels
Miscellaneous Goods & Services
2016 2015
Miscellaneous Goods & Services
Restaurants & Hotels
Education
Recreation&Culture
Communication
Transport
Health
HouseholdContents&Equipment
Housing & Utilities
Clothing&Footwear
Alcoholic Beverages & Tobacco
Food & Nonalcoholic Beverages
0
2016 2015
10 20 30 40 50 60
Contribution (%)
Source:CentralStatisticsOffice
There was a decrease of 3.8, 1.8 and 1.5 percentage points in the contributions of the price indices for ‘housing and utilities’, ‘education’ and ‘miscellaneous goods and service’ respectively reflecting deflationarypressures in prices of these components. The growth rate of the housing and utilities index was muted at 4.6 per cent in 2016 whilst the indices for ‘education’ and ‘miscellaneous goods and services’ recorded decreases of 3.3
and 4.2 percentage points respectively.
CoreinflationwhichisCPIexcludingfood,auto-fuel and energy averaged 5.0 per cent in 2016 compared to 5.3 per cent the previous year. Thisreflectedthatdemandsideinflationdriversremained modest in 2016 and that acceleration in headline inflation was mainly driven bysupply side factors mainly the drought effects whichaffectedfoodinflation.
Figure 4: Overall Inflation versus Core Inflation; March 2015 to March 2017
3
5
7
9
11
13
15
17
19
year
-on-
year
grow
th (%
)
Chart Title
Mar
-15
191715131197531
Food Inflation
Year
-on-
Year
Gro
wth
(%
)
Core Inflation Overall CPI
Apr-
15
May
-15
Jun-15
Jul-15
Aug-
15
Sep-
15
Mar
-16
Sep-
16
Oct
-15
Apr-
16
Oct
-16
Nov
-15
May
-16
Nov
-16
Dec-15
Jun-16
Dec-16
Jan-16
Jul-16
Jan-17
Feb-
16
Aug-
16
Feb-
17M
ar-1
7
Source:CentralStatisticsOffice
DOMESTIC ECONOMY
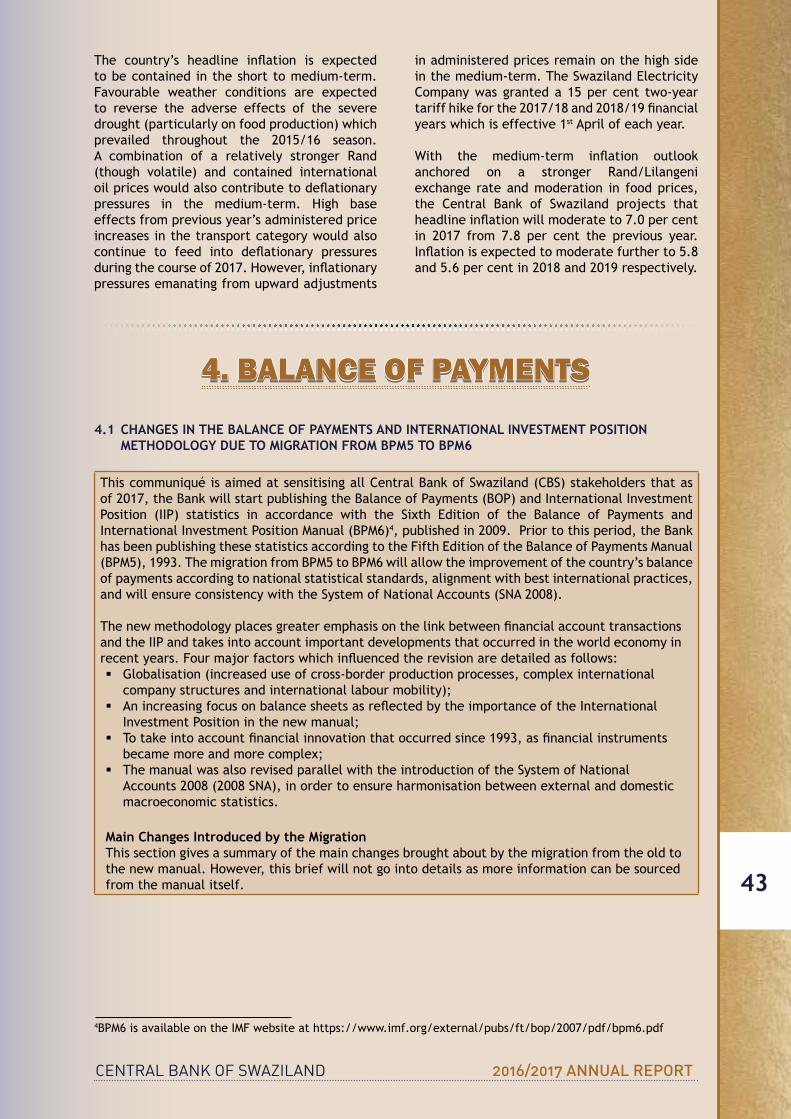
CENTRAL BANK OF SWAZILAND 2016/2017 ANNUAL REPORT
43
The country’s headline inflation is expectedto be contained in the short to medium-term. Favourable weather conditions are expected to reverse the adverse effects of the severe drought (particularly on food production) which prevailed throughout the 2015/16 season. A combination of a relatively stronger Rand (though volatile) and contained international oilpriceswouldalsocontributetodeflationarypressures in the medium-term. High base effects from previous year’s administered price increases in the transport category would also continue to feed into deflationary pressuresduringthecourseof2017.However,inflationarypressures emanating from upward adjustments
in administered prices remain on the high side inthemedium-term.TheSwazilandElectricityCompanywas granteda15per cent two-yeartariffhikeforthe2017/18and2018/19financialyears which is effective 1st April of each year.
With the medium-term inflation outlookanchored on a stronger Rand/Lilangeni exchange rate and moderation in food prices, the Central Bank of Swaziland projects thatheadlineinflationwillmoderateto7.0percentin 2017 from 7.8 per cent the previous year. Inflationisexpectedtomoderatefurtherto5.8and 5.6 per cent in 2018 and 2019 respectively.
4.1 CHANGES IN THE BALANCE OF PAYMENTS AND INTERNATIONAL INVESTMENT POSITION METHODOLOGY DUE TO MIGRATION FROM BPM5 TO BPM6
ThiscommuniquéisaimedatsensitisingallCentralBankofSwaziland(CBS)stakeholdersthatasof 2017, the Bank will start publishing the Balance of Payments (BOP) and International Investment Position (IIP) statistics in accordance with the Sixth Edition of the Balance of Payments andInternational Investment Position Manual (BPM6)4, published in 2009. Prior to this period, the Bank hasbeenpublishingthesestatisticsaccordingtotheFifthEditionoftheBalanceofPaymentsManual(BPM5), 1993. The migration from BPM5 to BPM6 will allow the improvement of the country’s balance of payments according to national statistical standards, alignment with best international practices, and will ensure consistency with the System of National Accounts (SNA 2008).
Thenewmethodologyplacesgreateremphasisonthelinkbetweenfinancialaccounttransactionsand the IIP and takes into account important developments that occurred in the world economy in recentyears.Fourmajorfactorswhichinfluencedtherevisionaredetailedasfollows:
� Globalisation (increased use of cross-border production processes, complex international company structures and international labour mobility);
� AnincreasingfocusonbalancesheetsasreflectedbytheimportanceoftheInternationalInvestment Position in the new manual;
� Totakeintoaccountfinancialinnovationthatoccurredsince1993,asfinancialinstrumentsbecame more and more complex;
� The manual was also revised parallel with the introduction of the System of National Accounts 2008 (2008 SNA), in order to ensure harmonisation between external and domestic macroeconomic statistics.
Main Changes Introduced by the MigrationThis section gives a summary of the main changes brought about by the migration from the old to the new manual. However, this brief will not go into details as more information can be sourced from the manual itself.
4BPM6 is available on the IMF website at https://www.imf.org/external/pubs/ft/bop/2007/pdf/bpm6.pdf
4. BALANCE OF PAYMENTS
CENTRAL BANK OF SWAZILAND 2016/2017 ANNUAL REPORT
44
Current and Capital Accounts � Under BPM6, both credit and debit entries in the current and capital accounts are shown with an
implied positive sign (even though some exceptions can occur especially in the primary income account);
� The net balance of the current account is the difference between credit and debit entries. According to the previous methodology (BPM5), debit entries were shown with a minus sign and the net balance was the sum of credit and debit entries;
� The primary income and secondary income accounts replace the income and current transfer’s accounts respectively, to be consistent with the SNA 2008;
� “Merchanting”wasreclassifiedfromservicesinBPM5togoodsinBPM6; � “Manufacturing services on physical inputs owned by others” (“goods for processing” in BPM5) and“maintenance and repair services” (“repairs on goods” in BPM5)were reclassified fromgoods to services in BPM6. The adoption of the BPM6 treatment of goods for processing might result in increases in imports and/or exports of services (equivalent to the amounts received or paid for manufacturing services), and larger reductions in gross goods imports and exports (due to the elimination of imputed transactions in goods that do not change ownership);
� “Migrants’ transfers” is no longer recorded as a balance of payments transaction in “other capital transfers”, in the capital account in BPM6.
Financial Account � InBPM6,thefinancialaccountisnowconsistentwiththeSNAandtheGFS(GovernmentFinance
Statistics) presentations and, furthermore, eliminates the balance of payments practice of presenting an increase in assets as a negative entry (debit);
� Theheadingsofthefinancialaccounthavebeenchangedfrom“creditsanddebits”to“netacquisitionoffinancialassets”and“netincurrenceofliabilities”,i.e.,allchangesduetocreditanddebitentriesarerecordedonanetbasisseparatelyforfinancialassetsandliabilities;
� Apositive balance of the total financial account, aswell as positive net values of financialaccount items, mean an increase in our claims on non-residents and/or a decrease in our liabilitiestonon-residents,i.e.capitaloutflowfromSwaziland,whileanegativebalanceofthefinancialaccountindicateschangestowardsareductioninourclaims,i.e.capitalinflowintoSwaziland.ThisistheoppositeoftheBPM5versionwhereapositivebalanceofthefinancialaccountdenotedcapitalinflow,whileanegativebalancemeantcapitaloutflow;
� Thenetbalanceofthefinancialaccountisthedifferencebetweenassetsandliabilities(i.e.assets minus liabilities), while in BPM5 it was calculated as change in assets plus change in liabilities.
4.2 CURRENT ACCOUNTIn 2016, preliminary data shows that the current accountrecordedaE5.923billionsurplus,downfromasurplusofE9.379billioninthepreviousyear. The decline was a turnaround from the 52.9 per cent increase in the surplus reported
in 2015. The current account in 2016 was equivalent to10.8percentofGDP from17.9per cent in 2015. The balance in the current account was explained by a narrow trade balance and a reduction in the net receipts posted in the secondary income account.
BALANCE OF PAYMENTS (Continued)

CENTRAL BANK OF SWAZILAND 2016/2017 ANNUAL REPORT
45
Figure 5: Current Account; 2011 to 2016
-5000.0
0.0
5000.0
10000.0
15000.0
20000.0
25000.0
30000.0
E'M
illio
n Current Account
Export of goods & services Import of goods & services
Primary Income Secondary Income
Trade balance Current account balance
30,000
25,000
20,000
15,000
10,000
5,000
02011 2012 2013 2014 2015 2016
Export of Goods & Services Secondary Income
Primary Income Import of Goods & Services
Trade Balance (Goods & Services)
E’M
illio
n
Current Account Balance
-5,000
Source: Central Bank of Swaziland
4.2.1 Trade AccountAtradesurplusofE2.527billionwasrecordedin2016, a 24.8 per cent decline from the surplus registered in the preceding year as exports rose faster than imports. In 2015, the country’s merchandise imports declined by 2.9 per cent, however, in 2016, imports rose by a wide 17.1 per cent signifying a turnaround in economic activity.Exportsreceipts,mainlydrivenbytheexport of sugar and miscellaneous edibles, grew by10.9percenttoE23.209billiononaccountof a weaker Lilangeni against major world currencies and calculated efforts to increase volumes in new and existing markets. This comes after a 7.5 per cent increase in exports in 2015 from the previous year. The South African market remains the major contributor to Swaziland’s export receipts contributing 66 per cent to total merchandise exports.
Export earnings from miscellaneous edibles,in 2016, maintained stable growth posting the previousyear’s8.4percentincreasetoE12.023billion. Receipts from the South African market, however,roseby9.5percenttoE6.729billionwhile maintaining a 55 per cent share of the exports for these goods. The performance of miscellaneous edibles exports was partially affected by persistent macroeconomic pressures in emerging and developing markets during the period. Sugar and sugar confectionery exports made notable returns amounting to E5.115billion in 2016, a 13.7 per cent increase from the previous year. The sugar sector was sustained
by implementation of industry plans that were put in place to mitigate the adverse effects of the drought season that was experienced during the period. The share of earnings received for the export of sugar and sugar confectionery into South Africa remained around 66 per cent in 2016. Receipts from South Africa, however, declined by 15.2 per cent in the reporting period from 23.6 per cent a year earlier.
Textiles and articles of textiles grew considerablyby13.6percenttoE2.616billionin 2016. The textile sector continues to post persistent growth in the face of tough global economic conditions and growing competition. Proceeds from the export of wood and wood productsgrewawide38.1percenttoE1.274billion in the review period. The forestry sector in Swaziland specializes in the planting of timber and processing it into finishedproducts. In 2016, most companies under this sector invested extensively in their forestry operations and extended plantations, thus the impressive export performance. Wood products from Swaziland are sold to countries as far as EuropeandAsiathroughsalesagentsbasedinSouth Africa. The total merchandise imports bill in 2016 jumpedawide17.1percenttoE20.682billionfrom the previous year. Accounting for the spike in imports during the period was a 17 per cent year-on-year increase in imports of machinery,
BALANCE OF PAYMENTS (Continued)

CENTRAL BANK OF SWAZILAND 2016/2017 ANNUAL REPORT
46
appliances and electrical materials to E2.300billion. These were directed to the high value construction projects that have been ongoing in the country since 2014. Also contributing to the bill were products of chemical or allied industrieswhichroseby6.3percenttoE2.948billion during the period. Vehicles and othertransportmeansgrewtoE1.659billionin2016,a 23.6 per cent hike from 2015. 4.2.2 Services AccountThe services account recorded a significantlyhigherdeficitin2016.Ayear-on-yearcomparisonrevealsa23.2percentincreaseinthedeficittoE3.059billion.Thecombinedeffectsofhigherimports of services of 12.6 per cent coupled with a 4.8 per cent decline of exported services resulted in the deterioration observed in the account.
Trade in services exports amounted toE1.451billion in theyear.These inflowsweremainlysupported by export activity in transport, travel andconstruction services.Exportof transportservices amounted to E578.7 million in 2016compared to E574.9 million in the previousyear. Travel service exports displayed a 7.3 percentyear-on-yeargrowthtoE191.6millionin the year under review. In 2016, the export of construction services increased to E379.6millionfromE322.9millioninthepreviousyear.Construction services contributed significantlyto export service proceeds in the review period.
Imports of services were reported at E4.509billion in 2016,higher than theE4.005billionservices import bill in the preceding year. Still dominating the services imported is transport services which registered an increase of 9.1 per cent toE2.119billion in theyear.The importoftravelservicesfelltoE514.0millionin2016fromE689.6millioninthepreviousyear.Otherbusinessservicesoutflows,however,increasedby73.0percenttoE831.0millionin2016withcharges for the use of intellectual property registering E256.7 million worth of outflows.These increases in outflows from importedservicesresultedintheworseningofthedeficitin the services account.
4.2.3 Primary IncomeIn 2016, the primary income account recorded a deficitofE326.1million,aturnaroundfromthesurplusofE497.0millionin2015.Thenegativeturnaround is largely explained by a E1.139billion net income payable recorded in the other primary income sub-account in 2016 from aE72.6millioninflowintheprecedingyear.
Compensationofemployees’inflowsin2016fellby5.1percenttoE417.3millionandoutflowsincreasedtoE178.4millionfromE64.2millionin2015.InvestmentincomerecordedaE574.8millionnetincomereceivableduetoasignificantreductioninoutflows.Thisdeclineinoutflowswas as a result of a slowdown in payments of reinvested earnings to E82.8 million in 2016from E523.9 million in the previous year dueto resident companies paying more dividends than the net earnings made during the year. Outflowsduetodividendpay-outsinthereviewperiodalsorecordedadeclinetoE260.5millionfromE350.4million.Investmentincomeinflowson the other hand, were comparatively on the higher side despite a 7.7 per cent year-on-yeardeclinetoE1.110billionin2016.Interestearned, including interest with respect to loans, forms a large part of these inflows. Interestearnings grew from E1.071 billion in 2015 toE1.069billionin2016.
Other primary income includes rent, taxes and subsidies. Inflows from this subcategorydominated by taxes on products and production which include income tax were recorded at E410.3 million while other primary incomeoutflows declined by 5.5 per cent to E1.550billion in 2016. The net income payable in this accountcontributedsignificantlytotheoveralldeficitintheprimaryincomeaccount.
4.2.4 Secondary IncomeDespite the continued surplus trajectory, thesecondary income account recorded a surplus ofE6.781billionin2016,lowerthantheE8.003billion surplus in 2015. This decline is a result ofreducedSACUrevenuereceiptsinthefiscalyear 2016/17 compared to 2015/16. As a result, general government registered a 20.9 per cent lower net inflow of E5.633 in 2016 from theprevious year.
The surplus was supported by a 39.2 per cent upsurgeintransfersfromnon-profitinstitutionsserving households (NPISHs), financial andnonfinancial corporations, and personaltransfersinflowstoE2.068billion. SecondaryincomeoutflowsdecreasedtoE476.9million in theyear fromE521.0million in thepreceding year. Government subscriptions to international organisations and social contributions by NPISHs account for most of the outflows recorded in theaccount.Preliminarydata still shows that the country is still a net receiver of transfers in all the functional categories of the secondary income account.
BALANCE OF PAYMENTS (Continued)
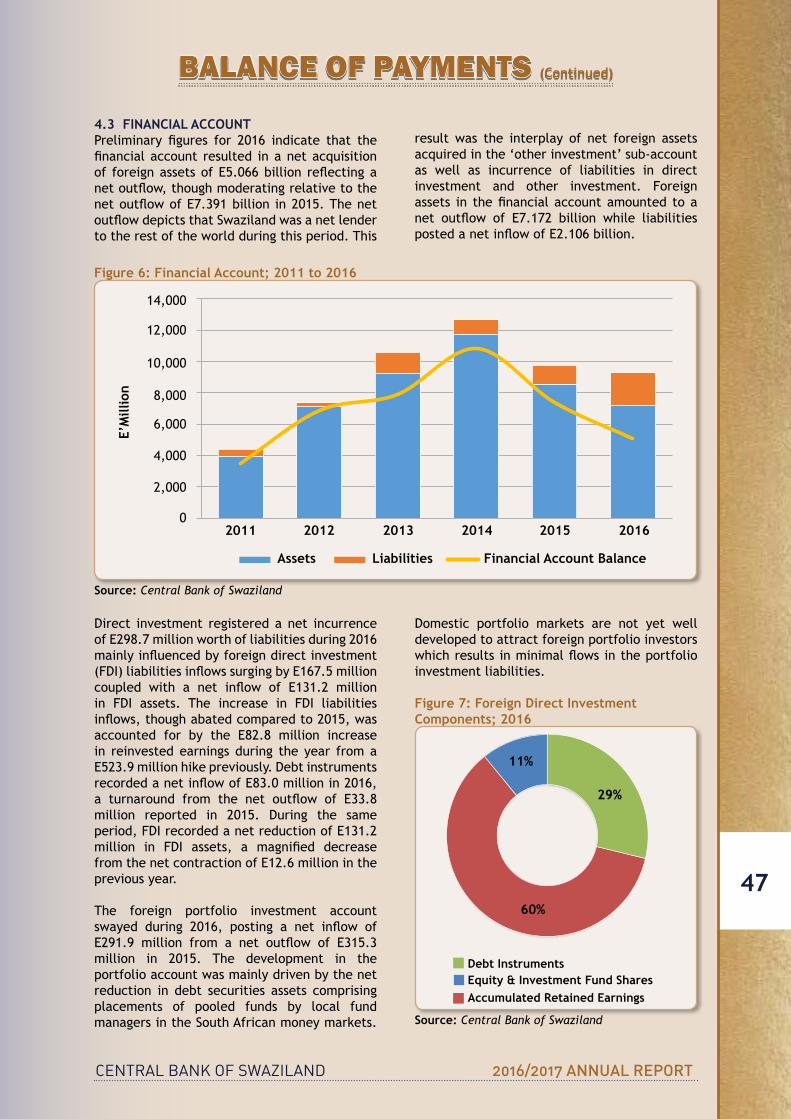
CENTRAL BANK OF SWAZILAND 2016/2017 ANNUAL REPORT
47
4.3 FINANCIAL ACCOUNTPreliminary figures for 2016 indicate that thefinancialaccount resulted inanetacquisitionof foreignassetsofE5.066billion reflectinganetoutflow,thoughmoderatingrelativetothenetoutflowofE7.391billion in2015.ThenetoutflowdepictsthatSwazilandwasanetlenderto the rest of the world during this period. This
result was the interplay of net foreign assets acquired in the ‘other investment’ sub-account as well as incurrence of liabilities in direct investment and other investment. Foreign assets in thefinancialaccountamounted toanet outflow of E7.172 billion while liabilitiespostedanetinflowofE2.106billion.
Figure 6: Financial Account; 2011 to 2016
13352.49
0.0
2000.0
4000.0
6000.0
8000.0
10000.0
12000.0
14000.0
2011 2012 2013 2014 2015 2016
E'M
illio
n
Financial Account
Assets Liabilities Financial Account Balance
2011
Assets
E’M
illio
n
Liabilities Financial Account Balance
14,000
12,000
10,000
8,000
6,000
4,000
2,000
02012 2013 2014 2015 2016
Source: Central Bank of Swaziland
Direct investment registeredanet incurrenceofE298.7millionworthofliabilitiesduring2016mainlyinfluencedbyforeigndirectinvestment(FDI)liabilitiesinflowssurgingbyE167.5millioncoupled with a net inflow of E131.2 millionin FDI assets. The increase in FDI liabilitiesinflows,thoughabatedcomparedto2015,wasaccounted for by the E82.8 million increasein reinvested earnings during the year from a E523.9millionhikepreviously.DebtinstrumentsrecordedanetinflowofE83.0millionin2016,a turnaround from the net outflow of E33.8million reported in 2015. During the sameperiod,FDIrecordedanetreductionofE131.2million in FDI assets, a magnified decreasefromthenetcontractionofE12.6millionintheprevious year.
The foreign portfolio investment account swayed during 2016, posting a net inflow ofE291.9 million from a net outflow of E315.3million in 2015. The development in the portfolio account was mainly driven by the net reduction in debt securities assets comprising placements of pooled funds by local fund managers in the South African money markets.
Domestic portfolio markets are not yet welldeveloped to attract foreign portfolio investors whichresultsinminimalflowsintheportfolioinvestment liabilities.
Figure 7: Foreign Direct Investment Components; 2016 FDI Components 2016
29%
Debt InstrumentsEquity & Investment Fund SharesAccumulated Retained Earnings
11%
60%
Source: Central Bank of Swaziland
BALANCE OF PAYMENTS (Continued)

CENTRAL BANK OF SWAZILAND 2016/2017 ANNUAL REPORT
48
Thenetoutflowin‘otherinvestment’accountnarrowed to E6.036 billion during 2016emanatingfromaE1.938billionnetincurrenceof liabilities coupled with a slight increase of E7.974 billion in net assets acquired. Theacquisition of assets edged up in 2016 on a net basiswhencomparedtotheE7.648billionnetincrease in assets acquired in the preceding year, while the liabilities side registered an uptickfromtheE94.4millionincreaseincurredpreviously. Attributable to the net acquisition of financialassetsweretradecreditsandadvancesby other sectors alongside currency and deposits assets by deposit-taking corporations.
Investment liabilities incurred, on a net basis, increasedduring2016fromanetinflowofE94.4million toanet inflowofE1.938billion. Thenet increase was underpinned by increases in currency and deposits as well as loans towards general government. During 2016 governmentdrawdownsamountedtoE1.618billionagainstrepaymentsofE393.8millionresultingtoanetincurrence of E1.224 billion liabilities. During2016, the country’s reserve assets declined byE597.2millionexcludingvaluationchangesfromaE263.5million rise in2015, leading toa net depletion in reserves during the period under review. The decline in reserve assets derivesfromadropofE999.7millioninforeignsecurities assets in 2016 against the previous year’sE388.1millionoutflow.
4.4 INTERNATIONAL INVESTMENT POSITIONThe international investment position (IIP) for Swaziland indicates that external financialassets continued to surpass external financialliabilities. At the end of 2016, Swaziland’s IIP recorded a net asset position amounting to E21.698 billion, an increase of 21.7 per centfrom the net asset position posted in 2015. The net position in the IIP was sustained by a 21.6 per cent increase in foreign assets while liabilities grew 21.4 per cent.
The stock of financial assets amounted toE41.269billioninDecember2016comparedtothe stock of E33.940 billion in the precedingyear, mainly on account of portfolio investment assets as well as other investment assets. Portfolio investment assets recorded a growth of 3.5 per cent to E16.867 billion in 2016accounting for 40.9 per cent of the country’s foreign assets. These assets were driven by equityand investment fund sharesofE12.237billion from E12.172 billion in 2015 alongsidedebt securities assets amounting to E4.630billionfromE4.130billioninthepreviousyear.
OtherinvestmentassetswereE15.141billionin2016 posting a growth of 69.7 per cent from the stock of 2015, mainly on account of currency and deposits assets and trade credits and advances. These assets closed the year 2016 at E8.591 billion and E6.450 billion respectively.ThestockofreserveassetsamountedtoE7.748billion in 2016, declining by 8.1 per cent when compared to the E8.432 billion reported in2015.OutwardFDIstockwasE1.513billion in2016fromE281millioninthepreviousyear.
The international investment position (IIP) is a statistical statement that shows at a point in time the value of financial assets of residents of an economy that are claims on non-residents and the financial liabilities of residents of an economy to non-residents. The difference between the total assets and liabilities is the net position in the IIP and represents either a net claim on or a net liability to the rest of the world.
Swaziland’s stock of financial liabilitiesamounted to E19.571 billion in 2016 fromE16.116 billion the previous year. FDI stockwhich constituted 53.5 per cent of the country’s external financial liabilities, registered anannual increase of 29.3 per cent in 2016. The growthinFDIstockliabilitieswassupportedbyequity and reinvested earnings as well as debt instruments. Equity and reinvested earningsaccounted for 71.4 per cent of the total FDIstock in 2016. Other investment liabilities surgedby13.5percenttoE9.104billionin2016.The composition of these liabilities was mainly loansamountingtoE4.769billionwithashareof 52.4 per cent while currency and deposits registered E2.907 billion accounting for 31.9percent.SDRsandtradecreditandadvancesweretheleastcontributorswithE888.2millionandE539.6millionrespectively.
4.5 EXCHANGE RATE DEVELOPMENTSThe exchange rate of the Lilangeni/Rand was volatile during the year 2016, but generally weakened against the major currencies. The depreciationwasmorepronouncedinthefirstquarter of 2016 with the local unit ending theperiodunder review justabove theE13.5markagainst theUnitedStates (US)Dollaronaverage,whichwashigher thantheE10markrecorded in the previous period. Although the Lilangeni on average depreciated against major currencies in 2016 compared to 2015, there were recoveries in the second quarter to the fourthquarterof2016.Duringthisperiod,the
BALANCE OF PAYMENTS (Continued)
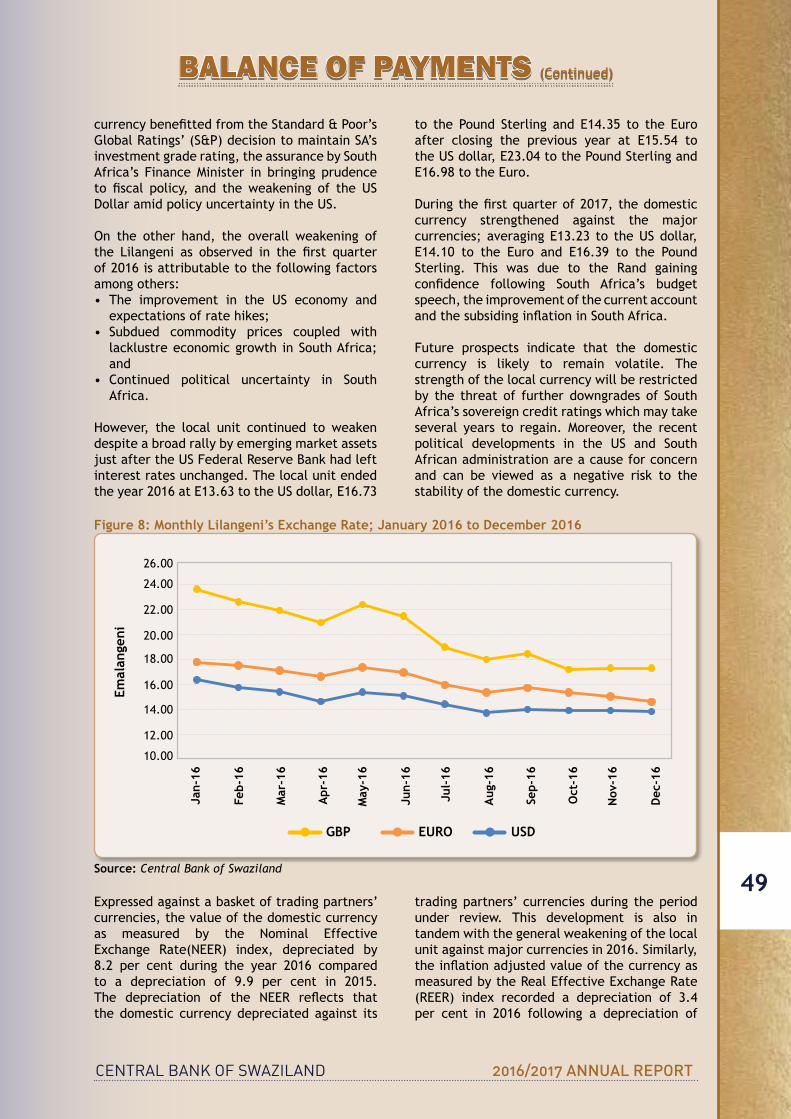
CENTRAL BANK OF SWAZILAND 2016/2017 ANNUAL REPORT
49
currencybenefittedfromtheStandard&Poor’sGlobal Ratings’ (S&P) decision to maintain SA’s investment grade rating, the assurance by South Africa’s Finance Minister in bringing prudence to fiscal policy, and theweakening of the USDollaramidpolicyuncertaintyintheUS.
On the other hand, the overall weakening of the Lilangeni as observed in the first quarterof 2016 is attributable to the following factors among others:• The improvement in the US economy and
expectations of rate hikes; • Subdued commodity prices coupled with
lacklustre economic growth in South Africa; and
• Continued political uncertainty in SouthAfrica.
However, the local unit continued to weaken despite a broad rally by emerging market assets just after the US Federal Reserve Bank had left interest rates unchanged. The local unit ended theyear2016atE13.63totheUSdollar,E16.73
to the Pound Sterling and E14.35 to the Euroafter closing the previous year at E15.54 totheUSdollar,E23.04tothePoundSterlingandE16.98totheEuro.
Duringthefirstquarterof2017,thedomesticcurrency strengthened against the major currencies;averagingE13.23 to theUSdollar,E14.10 to the Euro and E16.39 to the PoundSterling. This was due to the Rand gaining confidence following South Africa’s budgetspeech, the improvement of the current account andthesubsidinginflationinSouthAfrica.
Future prospects indicate that the domestic currency is likely to remain volatile. The strength of the local currency will be restricted by the threat of further downgrades of South Africa’s sovereign credit ratings which may take several years to regain. Moreover, the recent political developments in the US and South African administration are a cause for concern and can be viewed as a negative risk to the stability of the domestic currency.
Figure 8: Monthly Lilangeni’s Exchange Rate; January 2016 to December 2016
10.00
12.00
14.00
16.00
18.00
20.00
22.00
24.00
26.00
Jan-
16
Feb-
16
Mar
-16
Apr
-16
May
-16
Jun-
16
Jul-1
6
Aug
-16
Sep-
16
Oct
-16
Nov
-16
Dec
-16
Emal
ange
ni
USD GBP Euro
Jan-
16
Emal
ange
ni
26.00
16.00
24.00
14.00
22.00
12.00
20.00
10.00
GBP EURO USD
18.00
Jul-
16
Feb-
16
Aug
-16
Mar
-16
Sep-
16
Apr
-16
Oct
-16
May
-16
Nov
-16
Jun-
16
Dec
-16
Source: Central Bank of Swaziland
Expressedagainstabasketoftradingpartners’currencies, the value of the domestic currency as measured by the Nominal EffectiveExchange Rate(NEER) index, depreciated by8.2 per cent during the year 2016 compared to a depreciation of 9.9 per cent in 2015. The depreciation of the NEER reflects thatthe domestic currency depreciated against its
trading partners’ currencies during the period under review. This development is also in tandem with the general weakening of the local unit against major currencies in 2016. Similarly, theinflationadjustedvalueofthecurrencyasmeasuredbytheRealEffectiveExchangeRate(REER) index recorded a depreciation of 3.4per cent in 2016 following a depreciation of
BALANCE OF PAYMENTS (Continued)
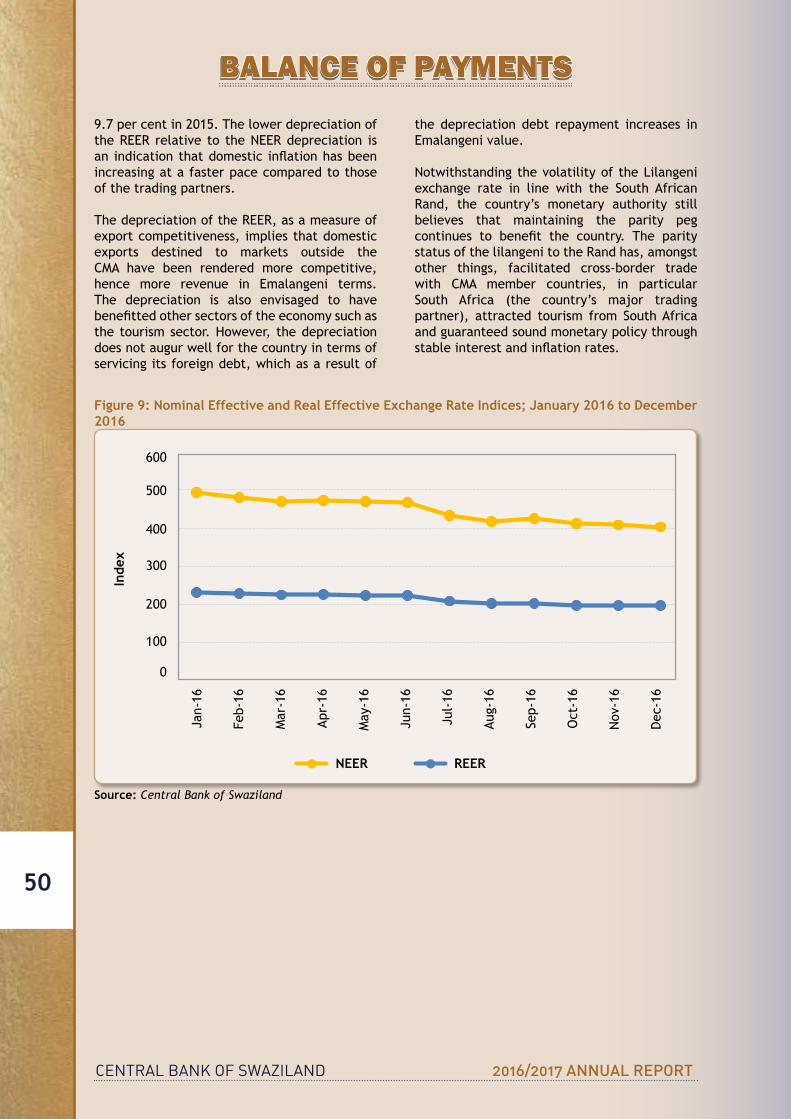
CENTRAL BANK OF SWAZILAND 2016/2017 ANNUAL REPORT
50
9.7 per cent in 2015. The lower depreciation of theREER relative to theNEERdepreciation isan indicationthatdomestic inflationhasbeenincreasing at a faster pace compared to those of the trading partners.
ThedepreciationoftheREER,asameasureofexport competitiveness, implies that domestic exports destined to markets outside the CMA have been rendered more competitive,hence more revenue in Emalangeni terms.The depreciation is also envisaged to have benefittedothersectorsoftheeconomysuchasthe tourism sector. However, the depreciation does not augur well for the country in terms of servicing its foreign debt, which as a result of
the depreciation debt repayment increases in Emalangenivalue.
Notwithstanding the volatility of the Lilangeni exchange rate in line with the South African Rand, the country’s monetary authority still believes that maintaining the parity peg continues to benefit the country. The paritystatus of the lilangeni to the Rand has, amongst other things, facilitated cross-border trade with CMA member countries, in particularSouth Africa (the country’s major trading partner), attracted tourism from South Africa and guaranteed sound monetary policy through stableinterestandinflationrates.
Figure 9: Nominal Effective and Real Effective Exchange Rate Indices; January 2016 to December 2016Figure 9: Nominal Effective and Real Effective Exchange Rate Indices
0
100
200
300
400
500
600
Jan-
16
Feb-
16
Mar
-16
Apr
-16
May
-16
Jun-
16
Jul-1
6
Aug
-16
Sep-
16
Oct
-16
Nov
-16
Dec
-16
Inde
x
REER NEER
Jan-16
Inde
x
600
300
500
200
400
100
0
Feb-
16
Mar
-16
Apr-
16
May
-16
Jun-16
Jul-16
Aug-
16
Sep-
16
Oct
-16
Nov
-16
Dec-16
NEER REER
Source: Central Bank of Swaziland
BALANCE OF PAYMENTS

CENTRAL BANK OF SWAZILAND 2016/2017 ANNUAL REPORT
51
5.1 OVERVIEWDuringtheyearendedMarch2017,thestanceof monetary policy was partly restrictive and steady, characterized by efforts to safeguard price stability while cautious not to restrain economic growth. As economic growth weakened notably, threats to price stability were mostly fuelled by the severe drought-induced elevated food price inflation. Consequently, over theyear under review, the policy (discount) rate increased twice in May 2017 and in January2017 and remained unchanged in the remaining months. Overall, the policy rate went up by a cumulative 75 basis points to 7.25 per cent at the end of March 2017.The banks’ prime lending rate increased by a similar margin to reach 10.75 per cent at the end of Mach 2017. Having aligned the local discount rate to the South African repo rate since May 2016, the differential between the two resurfaced in January2017.Unlikeinthepastwherethelocalrate was lower, this time, the discount rate was 25 basis points higher than the repo rate. This has indirectly implied a reduced incentive for capitalflighttoSouthAfricanmoneymarkets.Nonetheless, this continues to be temporal with the view of aligning the two rates at an appropriate instance.
A notable development on the structure of deposit interest rates as at the end of March 2017 was the tendency to encourage longer term deposits than shorter term deposits. This was evidenced by the comparatively higher growth in the remuneration of longer term depositors compared to shorter term and savings depositors. Additionally, the spread between the local and South African rates narrowed somewhat; indicating improvement from the widening spread registered the previous year. However, treasury bill rates increased by a higher margin owing to the greater risk premium attached to government securities amid the fiscalcashflowchallenges.
Over the year, credit extended to the private sector continued to grow but at a slightly slower pace compared to the previous year. The growth was underpinned by renewed demand for credit from the business sector, consistent with the dissipating drought condition during the year under review. Subsequently, credit to the business sector turned around from the negative growth rates recorded since 2015 to register positive and even double digit growth rates since November 2016. However, household credit growth decelerated notably from double
to single digit levels and credit to Other residual (mainly other financial corporations, localgovernment and public enterprises) sectors fell substantially. The double-digit growth rates in broad money supply (M2) which began in 2015 persisted during the year under review predominantly enhanced by growth in private sector credit extension. However, the growth in M2 was slightly lower than recorded in the previous year owing somewhat to the notable fall in the country’s net foreign assets. The rise in broad money supply was discernible in its components namely; quasi and narrow money supply. This was evidence of depositors’ preference to hoard money for both investment and transactions motives.
The country’s net foreign assets declined markedly; in line with the plunge in SACUrevenueduringthe2016/17fiscalyearcombinedwith the strengthening of the external value of the local currency over the year under review. Consistently, the country’s external reserveswent down as the government made drawdowns tomitigatetheresultantcashflowchallenges.However, the reserves were maintained above the internationally recommended import cover threshold of three months. Notably, the import cover of the reserves fluctuated between 3.4and 4.4 months throughout the year under review.
Domestic liquid assets of the banking systemrose persistently over the year under review. The increase was to a large extent reinforced by banks’ investment in government securities as they sought to meet the higher statutory liquidity requirement introduced in July 2016as well as to absorb the competitively priced securities offered by the government under its auction calendar.
5.2 INTEREST RATESDuring the year under review, the structureof Interest rates was revised upwards on two occasions; following the tight monetary policy stance pursued by the Bank. Therefore, in May 2017, the policy (discount) rate increased by 50 basis points from 6.5 per cent in April 2016 to 7.0 percentandinJanuary2017byanadditional25 basis points to 7.25 per cent at the end of March 2017. Similarly, the prime lending rate increased from 10.0 per cent in March 2016 to 10.5 per cent and further to 10.75 per cent in March 2017.
5. MONETARY DEVELOPMENTS
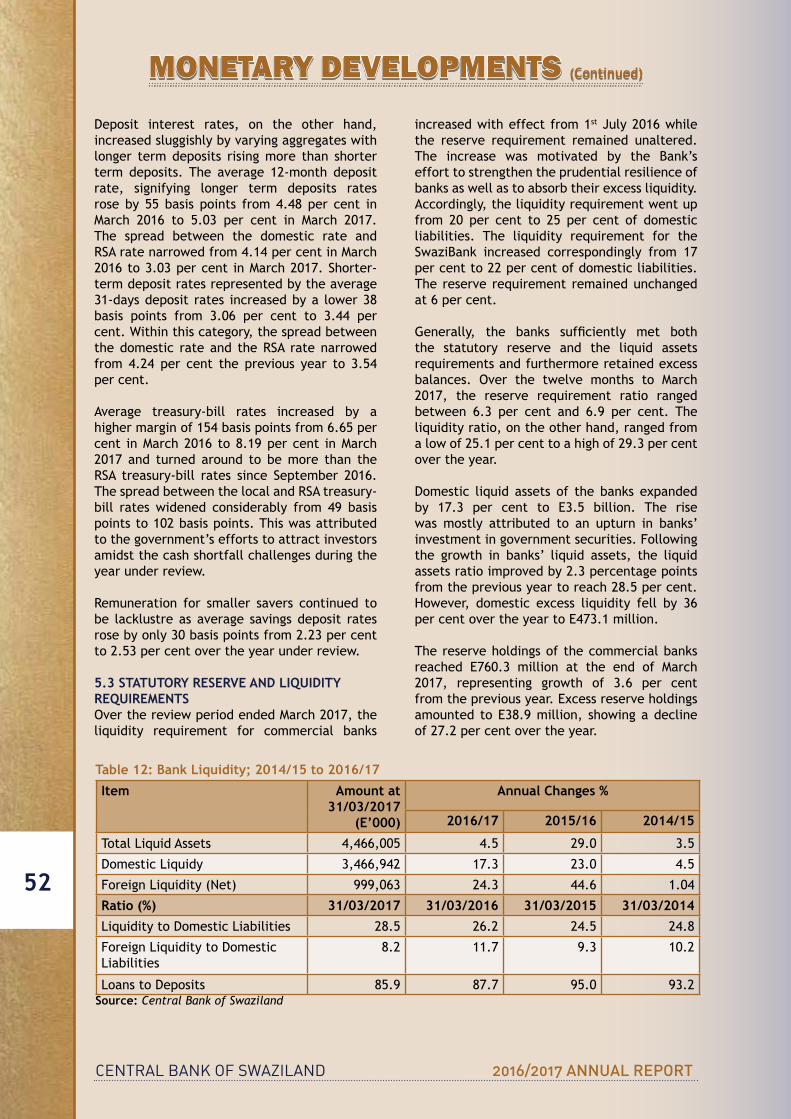
CENTRAL BANK OF SWAZILAND 2016/2017 ANNUAL REPORT
52
Deposit interest rates, on the other hand,increased sluggishly by varying aggregates with longer term deposits rising more than shorter term deposits. The average 12-month deposit rate, signifying longer term deposits rates rose by 55 basis points from 4.48 per cent in March 2016 to 5.03 per cent in March 2017. The spread between the domestic rate and RSA rate narrowed from 4.14 per cent in March 2016 to 3.03 per cent in March 2017. Shorter-term deposit rates represented by the average 31-days deposit rates increased by a lower 38 basis points from 3.06 per cent to 3.44 per cent. Within this category, the spread between the domestic rate and the RSA rate narrowed from 4.24 per cent the previous year to 3.54 per cent.
Average treasury-bill rates increased by a higher margin of 154 basis points from 6.65 per cent in March 2016 to 8.19 per cent in March 2017 and turned around to be more than the RSA treasury-bill rates since September 2016. The spread between the local and RSA treasury-bill rates widened considerably from 49 basis points to 102 basis points. This was attributed to the government’s efforts to attract investors amidst the cash shortfall challenges during the year under review.
Remuneration for smaller savers continued to be lacklustre as average savings deposit rates rose by only 30 basis points from 2.23 per cent to 2.53 per cent over the year under review.
5.3 STATUTORY RESERVE AND LIQUIDITY REQUIREMENTSOver the review period ended March 2017, the liquidity requirement for commercial banks
increased with effect from 1stJuly2016whilethe reserve requirement remained unaltered. The increase was motivated by the Bank’s effort to strengthen the prudential resilience of banks as well as to absorb their excess liquidity. Accordingly, the liquidity requirement went up from 20 per cent to 25 per cent of domestic liabilities. The liquidity requirement for the SwaziBank increased correspondingly from 17 per cent to 22 per cent of domestic liabilities. The reserve requirement remained unchanged at 6 per cent.
Generally, the banks sufficiently met boththe statutory reserve and the liquid assets requirements and furthermore retained excess balances. Over the twelve months to March 2017, the reserve requirement ratio ranged between 6.3 per cent and 6.9 per cent. The liquidity ratio, on the other hand, ranged from a low of 25.1 per cent to a high of 29.3 per cent over the year.
Domestic liquid assets of the banks expandedby 17.3 per cent to E3.5 billion. The risewas mostly attributed to an upturn in banks’ investment in government securities. Following the growth in banks’ liquid assets, the liquid assets ratio improved by 2.3 percentage points from the previous year to reach 28.5 per cent. However, domestic excess liquidity fell by 36 percentovertheyeartoE473.1million.
The reserve holdings of the commercial banks reached E760.3 million at the end of March2017, representing growth of 3.6 per cent fromthepreviousyear.Excessreserveholdingsamounted toE38.9million, showingadeclineof 27.2 per cent over the year.
Table 12: Bank Liquidity; 2014/15 to 2016/17
Item Amount at 31/03/2017
(E’000)
Annual Changes %
2016/17 2015/16 2014/15
Total Liquid Assets 4,466,005 4.5 29.0 3.5
DomesticLiquidy 3,466,942 17.3 23.0 4.5
Foreign Liquidity (Net) 999,063 24.3 44.6 1.04
Ratio (%) 31/03/2017 31/03/2016 31/03/2015 31/03/2014LiquiditytoDomesticLiabilities 28.5 26.2 24.5 24.8
ForeignLiquiditytoDomesticLiabilities
8.2 11.7 9.3 10.2
LoanstoDeposits 85.9 87.7 95.0 93.2Source: Central Bank of Swaziland
MONETARY DEVELOPMENTS (Continued)

CENTRAL BANK OF SWAZILAND 2016/2017 ANNUAL REPORT
53
5.4 DEPOSITORY CORPORATIONS SURVEY
5.4.1 Net Foreign AssetsOver the twelve months ended March 2017, the country’s net foreign assets tumbled by 17.3 percenttoreachE7.2billion.Thiswascontraryto the growth of 6.6 per cent recorded a year ago. Contributing to the fall in net foreignassets was a decrease in net foreign holdings of thebankingsystemaswellastheofficialsectorcombined with revaluation losses from the significant appreciation of the lilangeni/randexchange rate against major trading currencies over the year.
Net foreign assets of the banking sector dropped by 25.1 per cent over the year to reach E1.0billion.Thiswaspartlya result ofbanks
drawing down on their foreign balances to meet the higher domestic liquid assets requirement.Additionally,netofficialassetsrecededby15.9per cent to reach E6.2 billion; a significantreduction from the 1.4 per cent growth recorded thepreviousyear.Almostsimilarly,grossofficialreserves contracted by 13.7 per cent over the yeartoE7.3billion.Intermsofimportsofgoodsand services, the reserves were sufficient tocover 3.4 months in March 2017, substantially lower than the 3.9 months covered the previous year. The deterioration in reserves was largely attributedtotheconsiderabledeclineinSACUreceiptsforthefiscalyear2016/17.However,the somewhat recovery in SACU receipts for2017/18 is expected to improve the reserves level.
Figure 10: Net Foreign Assets & Gross Official Reserves; 2014 Q1 to 2017 Q1
0
100
200
300
400
500
600
0
2,000
4,000
6,000
8,000
10,000
12,000
2014
Q1 Q3
2015
Q1 Q3
2016
Q1 Q3
2017
Q1
SDR'
Mill
ion
E'M
illio
n
Gross Official (E) Net Foreign Ass (E) Bank Holdings (E) Gross Official (SDR) Net Foreign Ass (SDR)
2014
Q1
Gross Official (E)
Net Foreign Assets (E)
Net Foreign Assets (E)Gross Official (SDR)
Net Foreign Assets (SDR)
E’M
illio
n
SDR’
Mill
ion
12,000
10,000
8,000
6,000
4,000
2,000
0
Q2
Q2
Q2
Q3
Q3
Q3
Q4
Q4
Q4
600
500
400
300
200
100
0
2015
Q1
2016
Q1
2017
Q1
Source: Central Bank of Swaziland
5.4.2 Domestic Claims (Net)Net domestic claims registered moderate growthof31.8percentovertheyeartoE11.6billion. The rise was buoyed by growth in credit extended to the private sector combined with a fall in government net balances with other depository corporations. Government net balances with other depository corporations declined markedly by 71.1 per cent over the yeartocloseatE808.3million,primarilyasa
result of lower government revenue vis-à-vis accelerating expenditure.
CreditextendedtotheprivatesectorreachedE12.5 billion at the end of March 2017indicating a year-on-year expansion of 7.0 per cent compared to that of 9.3 per cent recorded the previous year. The increase was mostly discernible in the business sector and to a lesser extent in the household sector. Weighing down
MONETARY DEVELOPMENTS (Continued)
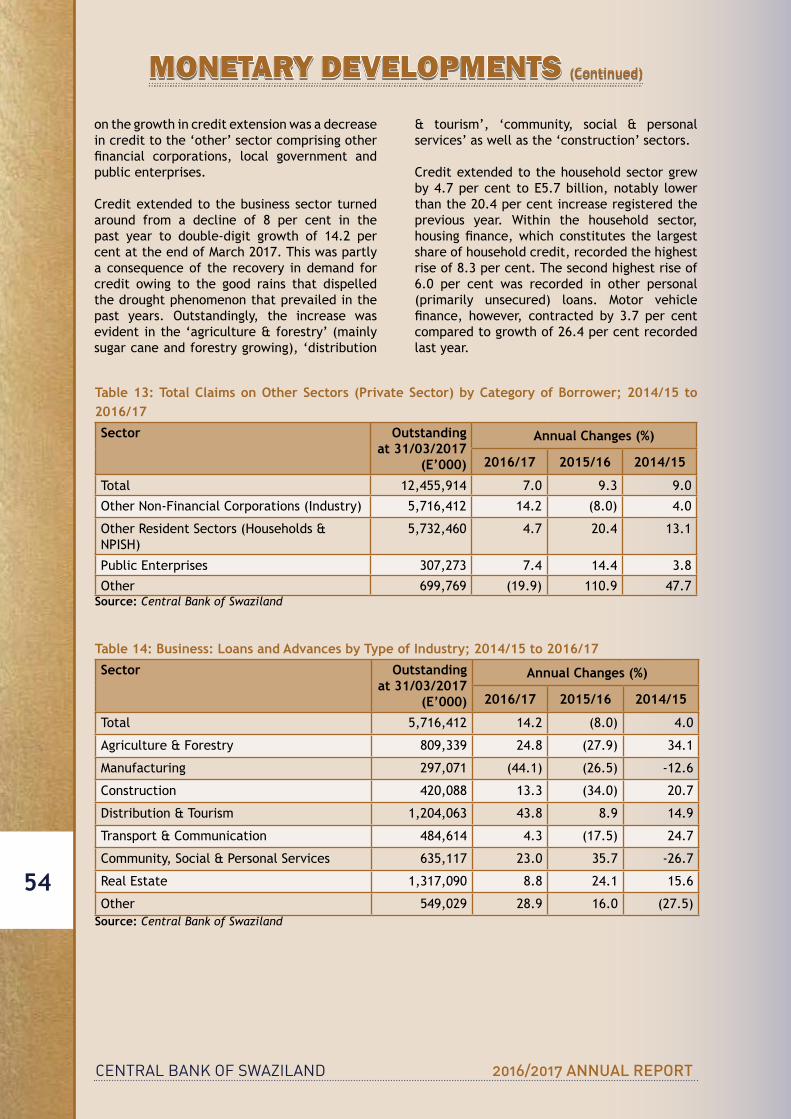
CENTRAL BANK OF SWAZILAND 2016/2017 ANNUAL REPORT
54
on the growth in credit extension was a decrease in credit to the ‘other’ sector comprising other financial corporations, local government andpublic enterprises.
Creditextendedtothebusinesssectorturnedaround from a decline of 8 per cent in the past year to double-digit growth of 14.2 per cent at the end of March 2017. This was partly a consequence of the recovery in demand for credit owing to the good rains that dispelled the drought phenomenon that prevailed in the past years. Outstandingly, the increase was evident in the ‘agriculture & forestry’ (mainly sugar cane and forestry growing), ‘distribution
& tourism’, ‘community, social & personal services’ as well as the ‘construction’ sectors.
Creditextendedtothehouseholdsectorgrewby4.7percent toE5.7billion,notably lowerthan the 20.4 per cent increase registered the previous year. Within the household sector, housingfinance,whichconstitutes the largestshare of household credit, recorded the highest rise of 8.3 per cent. The second highest rise of 6.0 per cent was recorded in other personal (primarily unsecured) loans. Motor vehicle finance, however, contracted by 3.7 per centcompared to growth of 26.4 per cent recorded last year.
Table 13: Total Claims on Other Sectors (Private Sector) by Category of Borrower; 2014/15 to 2016/17
Sector Outstanding at 31/03/2017
(E’000)
Annual Changes (%)
2016/17 2015/16 2014/15
Total 12,455,914 7.0 9.3 9.0
OtherNon-FinancialCorporations(Industry) 5,716,412 14.2 (8.0) 4.0
Other Resident Sectors (Households & NPISH)
5,732,460 4.7 20.4 13.1
PublicEnterprises 307,273 7.4 14.4 3.8
Other 699,769 (19.9) 110.9 47.7 Source: Central Bank of Swaziland
Table 14: Business: Loans and Advances by Type of Industry; 2014/15 to 2016/17
Sector Outstanding at 31/03/2017
(E’000)
Annual Changes (%)
2016/17 2015/16 2014/15
Total 5,716,412 14.2 (8.0) 4.0
Agriculture & Forestry 809,339 24.8 (27.9) 34.1
Manufacturing 297,071 (44.1) (26.5) -12.6
Construction 420,088 13.3 (34.0) 20.7
Distribution&Tourism 1,204,063 43.8 8.9 14.9
Transport&Communication 484,614 4.3 (17.5) 24.7
Community,Social&PersonalServices 635,117 23.0 35.7 -26.7
RealEstate 1,317,090 8.8 24.1 15.6
Other 549,029 28.9 16.0 (27.5)Source: Central Bank of Swaziland
MONETARY DEVELOPMENTS (Continued)
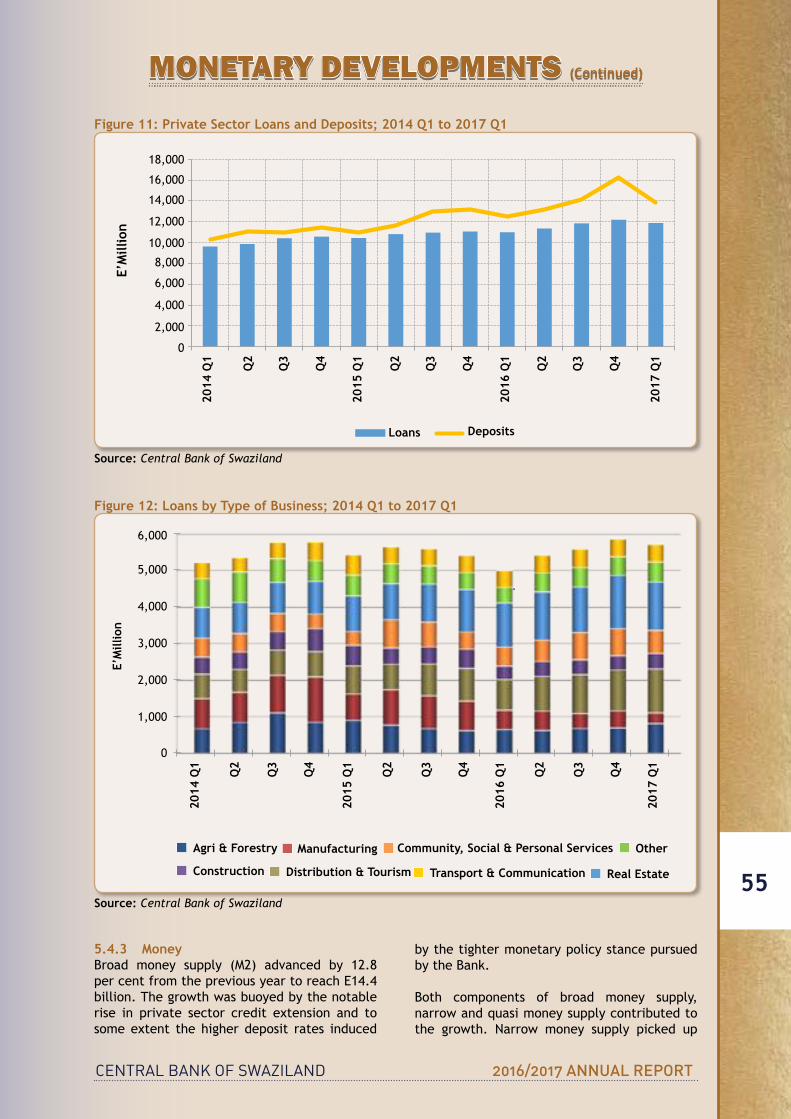
CENTRAL BANK OF SWAZILAND 2016/2017 ANNUAL REPORT
55
Figure 11: Private Sector Loans and Deposits; 2014 Q1 to 2017 Q1
0 2,000 4,000 6,000 8,000
10,000 12,000 14,000 16,000 18,000
2014
Q1
Q2
Q3
Q4
2015
Q1
Q2
Q3
Q4
2016
Q1
Q2
Q3 Q4
2017
Q1
E'M
illio
n
Loans Deposits
2014
Q1
E’M
illio
n
18,000
16,000
14,000
12,000
10,000
8,000
6,000
4,000
2,000
0
Q2
Q2
Q2
Q3
Q3
Q3
Q4
Q4
Q4
2015
Q1
2016
Q1
2017
Q1
Loans Deposits
Source: Central Bank of Swaziland
Figure 12: Loans by Type of Business; 2014 Q1 to 2017 Q1
-
0
1,000
2,000
3,000
4,000
5,000
6,000
2014
Q1 Q2
Q3
Q4
2015
Q1 Q2
Q3
Q4
2016
Q1
Q2
Q3
Q4
2017
Q1
Agri&forestry Manufacturing Distribution &Tourism Construction Community, Social & Personal Services Real Estate Other Transport & Communication
2014
Q1
E’M
illio
n
6,000
5,000
4,000
3,000
2,000
1,000
Agri & Forestry Manufacturing
Construction
Other
Distribution & Tourism Transport & Communication
Community, Social & Personal Services
Real Estate
0
Q2
Q3
Q4
Q2
Q2
Q3
Q3
Q4
Q4
2015
Q1
2016
Q1
2017
Q1
Source: Central Bank of Swaziland
5.4.3 Money Broad money supply (M2) advanced by 12.8 percentfromthepreviousyeartoreachE14.4billion. The growth was buoyed by the notable rise in private sector credit extension and to some extent the higher deposit rates induced
by the tighter monetary policy stance pursued by the Bank.
Both components of broad money supply, narrow and quasi money supply contributed to the growth. Narrow money supply picked up
MONETARY DEVELOPMENTS (Continued)
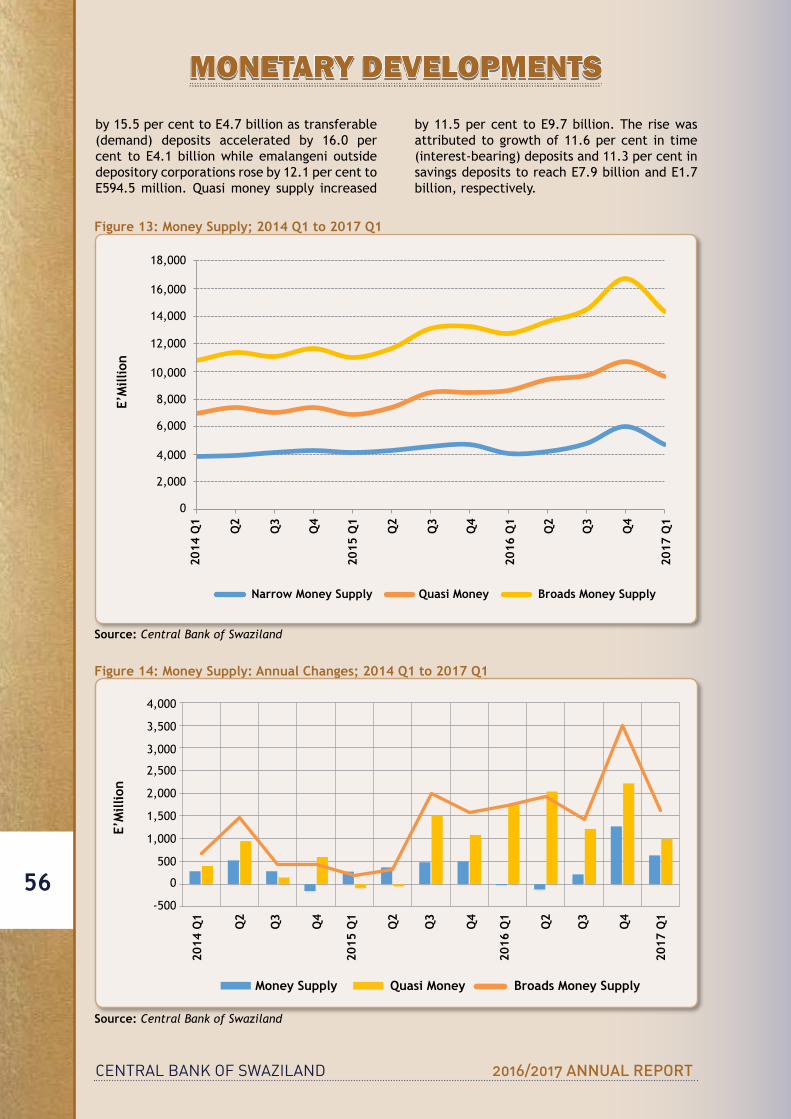
CENTRAL BANK OF SWAZILAND 2016/2017 ANNUAL REPORT
56
by15.5percenttoE4.7billionastransferable(demand) deposits accelerated by 16.0 per cent to E4.1 billionwhile emalangeni outsidedepository corporations rose by 12.1 per cent to E594.5million.Quasimoney supply increased
by11.5percent toE9.7billion.Therisewasattributed to growth of 11.6 per cent in time (interest-bearing) deposits and 11.3 per cent in savingsdepositstoreachE7.9billionandE1.7billion, respectively.
Figure 13: Money Supply; 2014 Q1 to 2017 Q1
0
2,000
4,000
6,000
8,000
10,000
12,000
14,000
16,000
18,000
2014
Q1 Q2
Q3
Q4
2015
Q1 Q2
Q3
Q4
2016
Q1
Q2
Q3
Q4
2017
Q1
E' M
illio
n
Narrow Money Supply Quasi Money Broad Money Supply
2014
Q1
E’M
illio
n
18,000
12,000
6,000
16,000
10,000
4,000
Narrow Money Supply Quasi Money Broads Money Supply
14,000
8,000
2,000
0
Q2
Q2
Q2
Q3
Q3
Q3
Q4
Q4
Q4
2015
Q1
2016
Q1
2017
Q1
Source: Central Bank of Swaziland
Figure 14: Money Supply: Annual Changes; 2014 Q1 to 2017 Q1
-500
0
500
1,000
1,500
2,000
2,500
3,000
3,500
4,000
E'M
illio
n
Money Supply Quasi Money Broad Money Supply
2014
Q1
2015
Q1
2016
Q1
2017
Q1
E’M
illio
n
2,500
4,000
1,000
2,000
3,500
500
Money Supply Quasi Money Broads Money Supply
1,500
3,000
0
-500
Q2
Q2
Q2
Q3
Q3
Q3
Q4
Q4
Q4
Source: Central Bank of Swaziland
MONETARY DEVELOPMENTS

CENTRAL BANK OF SWAZILAND 2016/2017 ANNUAL REPORT
57
As at the end of March 2017, other depository corporations’ deposits amounted to E13.8billion, registering an increase of 10.3 per cent fromthepreviousyear.Whenclassifiedintermsof ownership, deposits by the other resident sector (households and NPISH), constituting the second largest share of deposits, accelerated
by36.5percenttoE4.6billion.Depositsbythelocalgovernment,otherfinancialcorporationsand public enterprises grew by 15.5 per cent to E2.7billion.However,corporatesectordeposits(constituting the largest share of deposits) contractedby3.2percenttoE6.1billion.
Table 15: Ownership of Deposits with Other Depository Corporations in Swaziland; 2015/16 to 2016/17 Sector Outstanding at
31/03/2017(E’000)
% Distribution
Annual Changes (%)
2016/17 2015/16
CentralGovernment 378,162 2.7 (15.8) (4.8)
LocalGovt,PublicEnterprises&PrivateFinancialCorporations
2,707,689 19.6 15.5 14.0
Other Resident Sectors 4,647,077 33.6 36.5 12.8
OtherNon-FinancialCorporations 6,086,455 44.1 (3.9) 16.2
Total 13,819,383 100.0 10.3 13.9 Source: Central Bank of Swaziland
6. PUBLIC FINANCE
6.1.1 IntroductionOn 24th February 2017, the Minister of Finance presented the 2017/18 National Budget to Parliament on the backdrop of devastating effects of severe drought over the last two years and the resultant low economic growth. The theme of the Budget was in line with His Majesty’s Speech from the Throne when opening the 4th Session of the 10th Parliament, being: “Rising Above Adversity to Create Prosperity for All”. His Majesty’s Speech from the Throne emphasised that more resources should be channelled to infrastructure that will yield to economic growth while at the same time, efforts should be made to decrease the budget deficit. His Majesty pointed out thata fall in SACU revenue coupledwith a rise inGovernment spending has put pressure on ability to meet commitments to suppliers. Also
highlighted is Government’s commitment to ensure that the private sector does not suffer.
The key objectives of this Budget were highlighted as reducing reliance on SACUreceipts,fiscalconsolidationandinfrastructuredevelopment to build Government’s preparedness and resilience against future adversities.
6.1.2 Summary of Budget EstimatesThe actual outturn for 2015/16 shows a budget deficit of E2.5 billion or 4.8 per cent ofGDP.On the other hand, the estimated outturn for 2016/17 indicates a budget deficit of E6.8billion,anequivalentof12.3percentofGDP.Therisingdeficitwasmainlyattributabletoa23percentdeclineinSACUreceiptsandincreasesin Government expenditure.
6.1 2017/18 GOVERNMENT BUDGET REVIEW AND ANALYSIS

CENTRAL BANK OF SWAZILAND 2016/2017 ANNUAL REPORT
58
Figure 15: Comparative Budget Summary; 2014/15 to 2017/18
-14
-12
-10
-8
-6
-4
-2
0
-10
-5
0
5
10
15
20
25
2014/15 2015/16 2016/17 2017/18
% o
f G
DP
E' B
illi
on
Total Revenue and Grants Total Expenditure Overall Balance Overall Balance (% of GDP)
2014/15
E’Bi
llion
% o
f G
DP
2016/172015/16
Total Revenue and Grants Total ExpenditureOverall BalanceOverall Balance (% of GDP
2017/18
25 0
10 -6
20 -2
5 -8
-5 -12
15 -4
0 -10
-10 -14
Source: 2017/18 Estimates Book, Ministry of Finance
Estimatesfor2017/18indicatethatGovernmentwillrunadeficitofE4.8billion,correspondingto 8.2 per cent of GDP. The improvement ismainly attributed to a 36.7 per cent projected increase in SACU receipts coupled with amarginal increase in Government expenditure.
Over the medium to long term, Government’s aimistobringthedeficitbacktolevelslessthan3 per cent, in linewith SADCMacroeconomicConvergence targets, supported by improvedrevenuecollectionandfiscalconsolidation.
Table 16: Budget Summary (E’ Million); 2014/15 to 2017/18
Item 2014/15 2015/16 2016/17* 2017/18**Total Revenue & Grants 14,731 14,452 14,352 16,894TotalExpenditure 15,304 16,998 21,194 21,734
o/wCurrentExpenditure 11,694 13,273 15,898 16,186
o/wCapitalExpenditure 3,610 3,725 5,296 5,548
Fiscal Balance -573 -2,546 -6,842 -4,840FiscalBalanceas%ofGDP -1.2 -4.8 -12.3 -8.2
Source: 2017/18 Estimates Book, Ministry of Finance* Revised Estimate**Budget Estimate
6.1.3 RevenueTotal revenue and grants are projected to increase by 17.4 per cent from E14.4 billionthepreviousfiscalyeartoreachE16.9billionin2017/18. SACU receipts and several proposedpolicy measures targeted to increase revenue
underpin the projected increase in revenue.
SACUreceipts,whichconstitute42.1percentof total revenue, is projected to increase by 36.7percenttoreachE7.1billionin2017/18.
PUBLIC FINANCE (Continued)
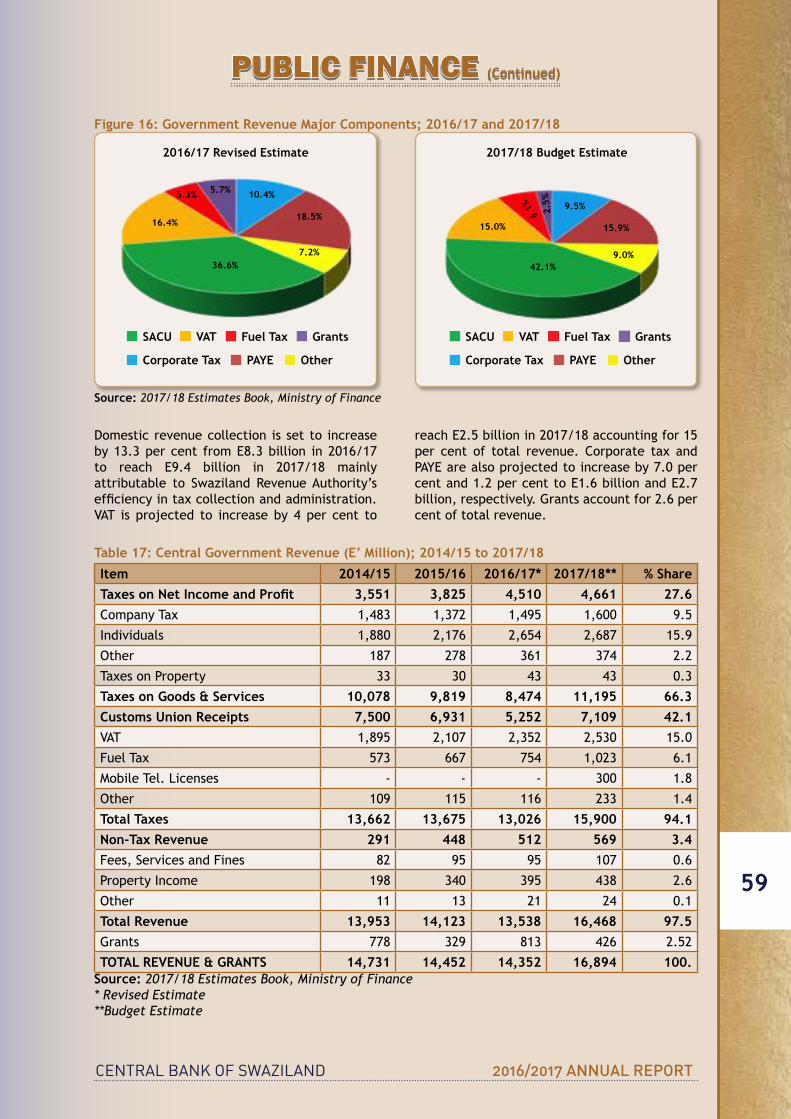
CENTRAL BANK OF SWAZILAND 2016/2017 ANNUAL REPORT
59
Figure 16: Government Revenue Major Components; 2016/17 and 2017/18
2016/17 Revised Budget
2016/17 Revised Budget
36.6% 42.1%9.0%
15.9%
9.5%
6.1% 2.5%
15.0%
SACU SACU
Corporate Tax Corporate Tax
VAT VATFuel Tax Fuel Tax
2016/17 Revised Estimate 2017/18 Budget Estimate
PAYE PAYE
Grants Grants
Other Other
7.2%
18.5%16.4%
10.4%5.3% 5.7%
Source: 2017/18 Estimates Book, Ministry of Finance
Domesticrevenuecollectionissetto increaseby13.3percent fromE8.3billion in2016/17to reach E9.4 billion in 2017/18 mainlyattributable to Swaziland Revenue Authority’s efficiencyintaxcollectionandadministration.VAT is projected to increaseby 4 per cent to
reachE2.5billionin2017/18accountingfor15per cent of total revenue. Corporate tax andPAYEarealsoprojectedtoincreaseby7.0percentand1.2percenttoE1.6billionandE2.7billion, respectively. Grants account for 2.6 per cent of total revenue.
Table 17: Central Government Revenue (E’ Million); 2014/15 to 2017/18
Item 2014/15 2015/16 2016/17* 2017/18** % ShareTaxes on Net Income and Profit 3,551 3,825 4,510 4,661 27.6CompanyTax 1,483 1,372 1,495 1,600 9.5
Individuals 1,880 2,176 2,654 2,687 15.9
Other 187 278 361 374 2.2
Taxes on Property 33 30 43 43 0.3
Taxes on Goods & Services 10,078 9,819 8,474 11,195 66.3Customs Union Receipts 7,500 6,931 5,252 7,109 42.1VAT 1,895 2,107 2,352 2,530 15.0
Fuel Tax 573 667 754 1,023 6.1
Mobile Tel. Licenses - - - 300 1.8
Other 109 115 116 233 1.4
Total Taxes 13,662 13,675 13,026 15,900 94.1Non-Tax Revenue 291 448 512 569 3.4Fees, Services and Fines 82 95 95 107 0.6
Property Income 198 340 395 438 2.6
Other 11 13 21 24 0.1
Total Revenue 13,953 14,123 13,538 16,468 97.5Grants 778 329 813 426 2.52
TOTAL REVENUE & GRANTS 14,731 14,452 14,352 16,894 100.Source: 2017/18 Estimates Book, Ministry of Finance* Revised Estimate**Budget Estimate
PUBLIC FINANCE (Continued)
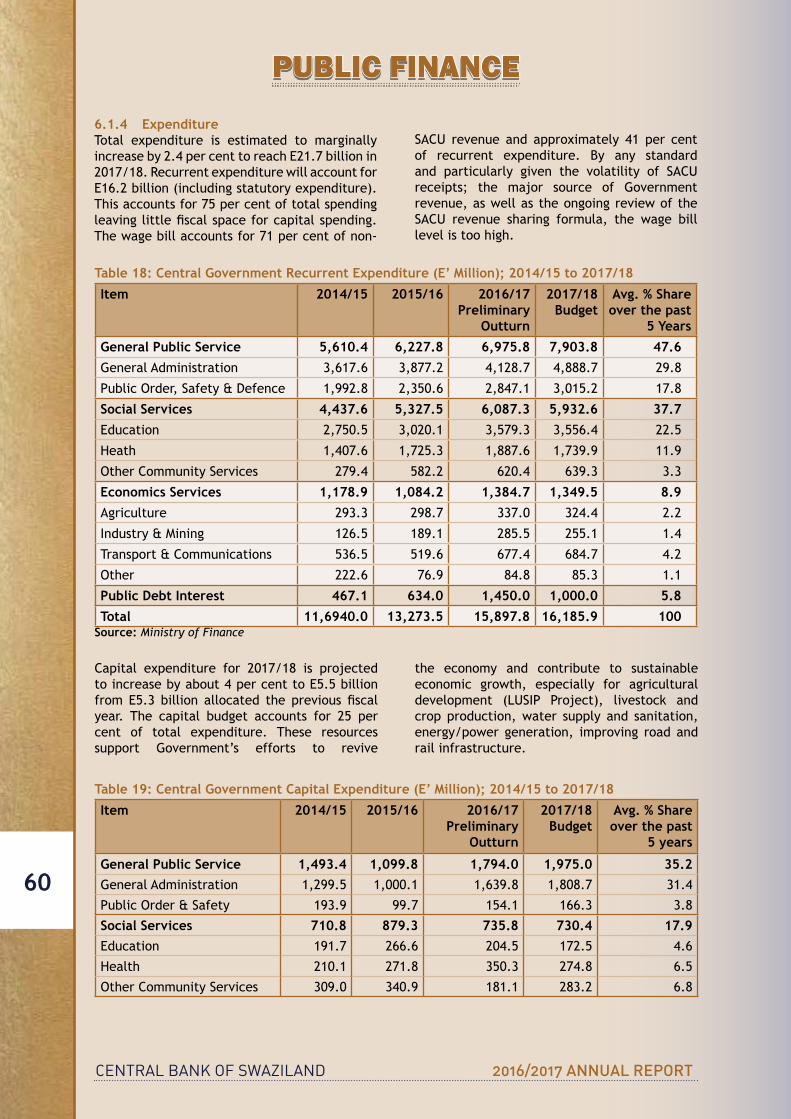
CENTRAL BANK OF SWAZILAND 2016/2017 ANNUAL REPORT
60
6.1.4 ExpenditureTotal expenditure is estimated to marginally increaseby2.4percenttoreachE21.7billionin2017/18. Recurrent expenditure will account for E16.2billion(includingstatutoryexpenditure).This accounts for 75 per cent of total spending leavinglittlefiscalspaceforcapitalspending.The wage bill accounts for 71 per cent of non-
SACU revenue and approximately 41 per centof recurrent expenditure. By any standard and particularly given the volatility of SACUreceipts; the major source of Government revenue, as well as the ongoing review of the SACU revenue sharing formula, the wage billlevel is too high.
Table 18: Central Government Recurrent Expenditure (E’ Million); 2014/15 to 2017/18
Item 2014/15 2015/16 2016/17Preliminary
Outturn
2017/18Budget
Avg. % Share over the past
5 Years
General Public Service 5,610.4 6,227.8 6,975.8 7,903.8 47.6General Administration 3,617.6 3,877.2 4,128.7 4,888.7 29.8
PublicOrder,Safety&Defence 1,992.8 2,350.6 2,847.1 3,015.2 17.8
Social Services 4,437.6 5,327.5 6,087.3 5,932.6 37.7Education 2,750.5 3,020.1 3,579.3 3,556.4 22.5
Heath 1,407.6 1,725.3 1,887.6 1,739.9 11.9
OtherCommunityServices 279.4 582.2 620.4 639.3 3.3
Economics Services 1,178.9 1,084.2 1,384.7 1,349.5 8.9Agriculture 293.3 298.7 337.0 324.4 2.2
Industry & Mining 126.5 189.1 285.5 255.1 1.4
Transport&Communications 536.5 519.6 677.4 684.7 4.2
Other 222.6 76.9 84.8 85.3 1.1
Public Debt Interest 467.1 634.0 1,450.0 1,000.0 5.8Total 11,6940.0 13,273.5 15,897.8 16,185.9 100
Source: Ministry of Finance
Capital expenditure for 2017/18 is projectedtoincreasebyabout4percenttoE5.5billionfromE5.3 billion allocated the previous fiscalyear. The capital budget accounts for 25 per cent of total expenditure. These resources support Government’s efforts to revive
the economy and contribute to sustainable economic growth, especially for agricultural development (LUSIP Project), livestock and crop production, water supply and sanitation, energy/power generation, improving road and rail infrastructure.
Table 19: Central Government Capital Expenditure (E’ Million); 2014/15 to 2017/18
Item 2014/15 2015/16 2016/17Preliminary
Outturn
2017/18Budget
Avg. % Share over the past
5 years
General Public Service 1,493.4 1,099.8 1,794.0 1,975.0 35.2General Administration 1,299.5 1,000.1 1,639.8 1,808.7 31.4
Public Order & Safety 193.9 99.7 154.1 166.3 3.8
Social Services 710.8 879.3 735.8 730.4 17.9Education 191.7 266.6 204.5 172.5 4.6
Health 210.1 271.8 350.3 274.8 6.5
OtherCommunityServices 309.0 340.9 181.1 283.2 6.8
PUBLIC FINANCE
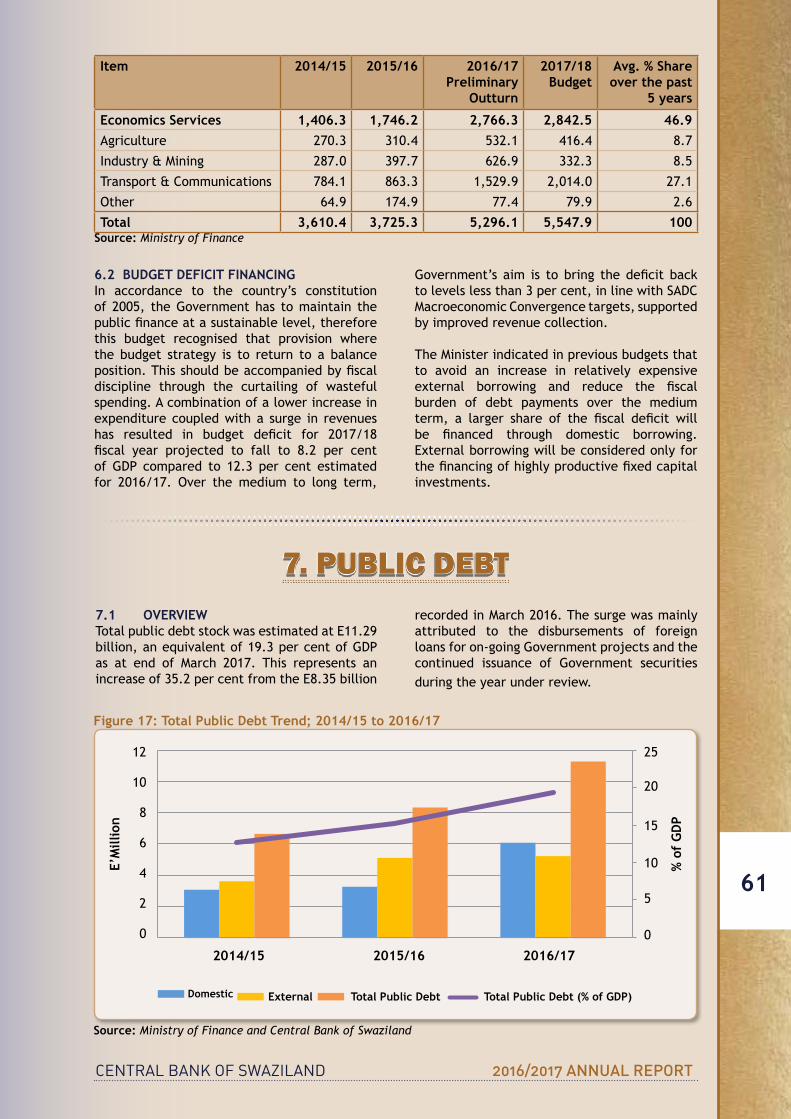
CENTRAL BANK OF SWAZILAND 2016/2017 ANNUAL REPORT
61
Item 2014/15 2015/16 2016/17Preliminary
Outturn
2017/18Budget
Avg. % Share over the past
5 years
Economics Services 1,406.3 1,746.2 2,766.3 2,842.5 46.9Agriculture 270.3 310.4 532.1 416.4 8.7
Industry & Mining 287.0 397.7 626.9 332.3 8.5
Transport&Communications 784.1 863.3 1,529.9 2,014.0 27.1
Other 64.9 174.9 77.4 79.9 2.6
Total 3,610.4 3,725.3 5,296.1 5,547.9 100Source: Ministry of Finance
6.2 BUDGET DEFICIT FINANCING In accordance to the country’s constitution of 2005, the Government has to maintain the publicfinanceatasustainablelevel,thereforethis budget recognised that provision where the budget strategy is to return to a balance position.Thisshouldbeaccompaniedbyfiscaldiscipline through the curtailing of wasteful spending. A combination of a lower increase in expenditure coupled with a surge in revenues has resulted in budget deficit for 2017/18fiscal year projected to fall to 8.2 per centof GDP compared to 12.3 per cent estimatedfor 2016/17. Over the medium to long term,
Government’s aim is tobring thedeficit backtolevelslessthan3percent,inlinewithSADCMacroeconomicConvergencetargets,supportedby improved revenue collection.
The Minister indicated in previous budgets that to avoid an increase in relatively expensive external borrowing and reduce the fiscalburden of debt payments over the medium term, a larger share of the fiscal deficit willbe financed through domestic borrowing.Externalborrowingwillbeconsideredonlyforthefinancingofhighlyproductivefixedcapitalinvestments.
7. PUBLIC DEBT7.1 OVERVIEWTotalpublicdebtstockwasestimatedatE11.29billion,anequivalentof19.3percentofGDPas at end of March 2017. This represents an increaseof35.2percentfromtheE8.35billion
recorded in March 2016. The surge was mainly attributed to the disbursements of foreign loans for on-going Government projects and the continued issuance of Government securities during the year under review.
Figure 17: Total Public Debt Trend; 2014/15 to 2016/17
0
5
10
15
20
25
0
2
4
6
8
10
12
2014/15 2015/16 2016/17
% o
f GDP
Chart Title
Domestic
External
Total Public Debt
Total Public Debt (% of GDP)
2014/15
12 25
20
15
10
5
0
% o
f G
DP
E’M
illio
n
10
8
6
4
2
0
2015/16 2016/17
Domestic External Total Public Debt Total Public Debt (% of GDP)
Source: Ministry of Finance and Central Bank of Swaziland
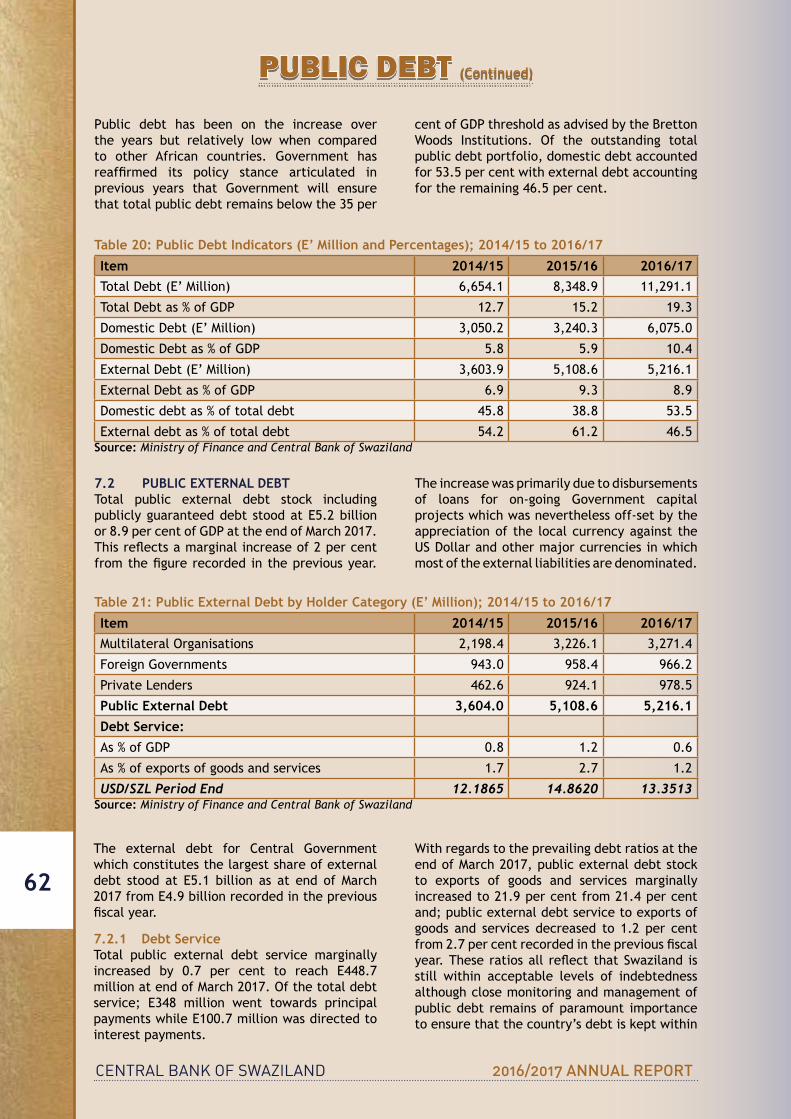
CENTRAL BANK OF SWAZILAND 2016/2017 ANNUAL REPORT
62
Public debt has been on the increase over the years but relatively low when compared to other African countries. Government has reaffirmed its policy stance articulated inprevious years that Government will ensure that total public debt remains below the 35 per
centofGDPthresholdasadvisedbytheBrettonWoods Institutions. Of the outstanding total public debt portfolio, domestic debt accounted for 53.5 per cent with external debt accounting for the remaining 46.5 per cent.
Table 20: Public Debt Indicators (E’ Million and Percentages); 2014/15 to 2016/17
Item 2014/15 2015/16 2016/17TotalDebt(E’Million) 6,654.1 8,348.9 11,291.1
TotalDebtas%ofGDP 12.7 15.2 19.3
DomesticDebt(E’Million) 3,050.2 3,240.3 6,075.0
DomesticDebtas%ofGDP 5.8 5.9 10.4
ExternalDebt(E’Million) 3,603.9 5,108.6 5,216.1
ExternalDebtas%ofGDP 6.9 9.3 8.9
Domesticdebtas%oftotaldebt 45.8 38.8 53.5
Externaldebtas%oftotaldebt 54.2 61.2 46.5Source: Ministry of Finance and Central Bank of Swaziland
7.2 PUBLIC EXTERNAL DEBTTotal public external debt stock including publiclyguaranteeddebtstoodatE5.2billionor8.9percentofGDPattheendofMarch2017.Thisreflectsamarginalincreaseof2percentfromthefigurerecordedinthepreviousyear.
The increase was primarily due to disbursements of loans for on-going Government capital projects which was nevertheless off-set by the appreciation of the local currency against the USDollarandothermajorcurrenciesinwhichmost of the external liabilities are denominated.
Table 21: Public External Debt by Holder Category (E’ Million); 2014/15 to 2016/17
Item 2014/15 2015/16 2016/17Multilateral Organisations 2,198.4 3,226.1 3,271.4
Foreign Governments 943.0 958.4 966.2
Private Lenders 462.6 924.1 978.5
Public External Debt 3,604.0 5,108.6 5,216.1Debt Service:As%ofGDP 0.8 1.2 0.6
As % of exports of goods and services 1.7 2.7 1.2
USD/SZL Period End 12.1865 14.8620 13.3513Source: Ministry of Finance and Central Bank of Swaziland
The external debt for Central Governmentwhich constitutes the largest share of external debt stood at E5.1 billion as at end ofMarch2017fromE4.9billionrecordedinthepreviousfiscalyear.
7.2.1 Debt ServiceTotal public external debt service marginally increased by 0.7 per cent to reach E448.7million at end of March 2017. Of the total debt service; E348 million went towards principalpaymentswhileE100.7millionwasdirectedtointerest payments.
With regards to the prevailing debt ratios at the end of March 2017, public external debt stock to exports of goods and services marginally increased to 21.9 per cent from 21.4 per cent and; public external debt service to exports of goods and services decreased to 1.2 per cent from2.7percentrecordedinthepreviousfiscalyear.Theseratiosall reflectthatSwaziland isstill within acceptable levels of indebtedness although close monitoring and management of public debt remains of paramount importance to ensure that the country’s debt is kept within
PUBLIC DEBT (Continued)
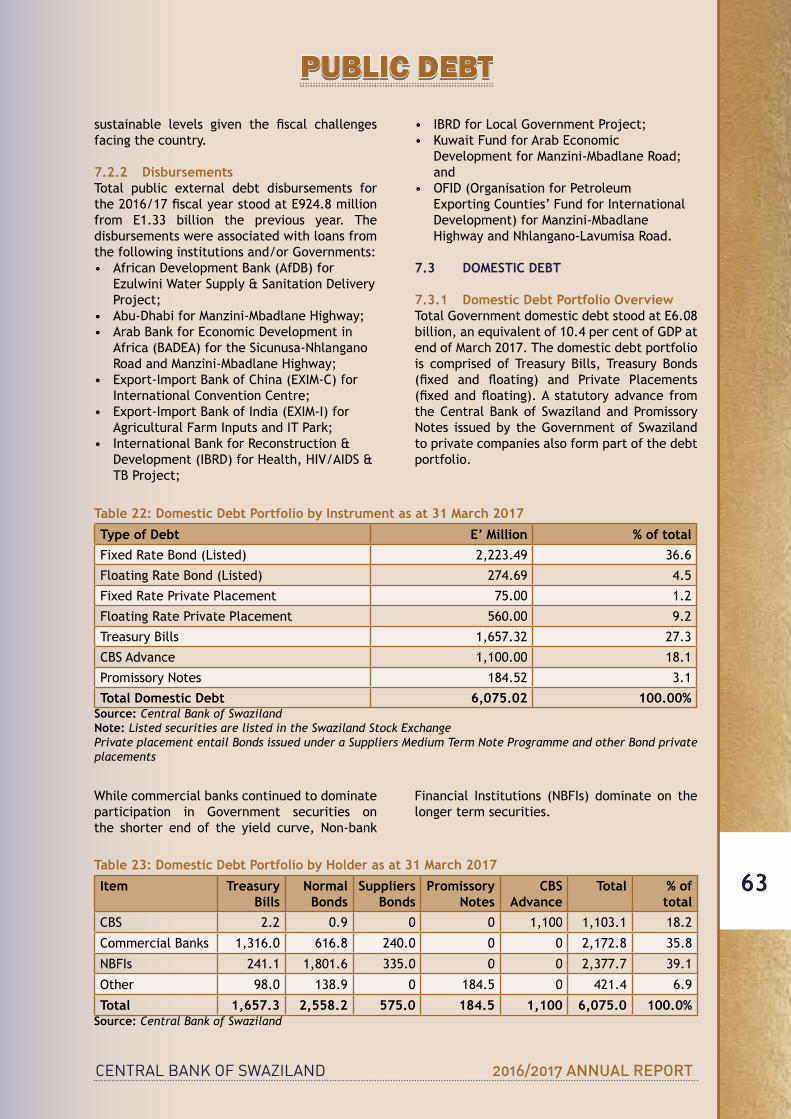
CENTRAL BANK OF SWAZILAND 2016/2017 ANNUAL REPORT
63
sustainable levels given the fiscal challengesfacing the country.
7.2.2 DisbursementsTotal public external debt disbursements for the2016/17fiscalyearstoodatE924.8millionfrom E1.33 billion the previous year. Thedisbursements were associated with loans from the following institutions and/or Governments:• AfricanDevelopmentBank(AfDB)for
EzulwiniWaterSupply&SanitationDeliveryProject;
• Abu-DhabiforManzini-MbadlaneHighway;• ArabBankforEconomicDevelopmentin
Africa(BADEA)fortheSicunusa-NhlanganoRoad and Manzini-Mbadlane Highway;
• Export-ImportBankofChina(EXIM-C)forInternationalConventionCentre;
• Export-ImportBankofIndia(EXIM-I)forAgricultural Farm Inputs and IT Park;
• InternationalBankforReconstruction&Development(IBRD)forHealth,HIV/AIDS&TB Project;
• IBRDforLocalGovernmentProject;• KuwaitFundforArabEconomic
DevelopmentforManzini-MbadlaneRoad;and
• OFID(OrganisationforPetroleumExportingCounties’FundforInternationalDevelopment)forManzini-MbadlaneHighway and Nhlangano-Lavumisa Road.
7.3 DOMESTIC DEBT
7.3.1 Domestic Debt Portfolio OverviewTotalGovernmentdomesticdebtstoodatE6.08billion,anequivalentof10.4percentofGDPatend of March 2017. The domestic debt portfolio is comprised of Treasury Bills, Treasury Bonds (fixed and floating) and Private Placements(fixedandfloating).A statutoryadvance fromtheCentralBankof SwazilandandPromissoryNotes issued by the Government of Swaziland to private companies also form part of the debt portfolio.
Table 22: Domestic Debt Portfolio by Instrument as at 31 March 2017
Type of Debt E’ Million % of totalFixed Rate Bond (Listed) 2,223.49 36.6
Floating Rate Bond (Listed) 274.69 4.5
Fixed Rate Private Placement 75.00 1.2
Floating Rate Private Placement 560.00 9.2
Treasury Bills 1,657.32 27.3
CBSAdvance 1,100.00 18.1
Promissory Notes 184.52 3.1
Total Domestic Debt 6,075.02 100.00%Source: Central Bank of SwazilandNote: Listed securities are listed in the Swaziland Stock ExchangePrivate placement entail Bonds issued under a Suppliers Medium Term Note Programme and other Bond private placements
While commercial banks continued to dominate participation in Government securities on the shorter end of the yield curve, Non-bank
Financial Institutions (NBFIs) dominate on the longer term securities.
Table 23: Domestic Debt Portfolio by Holder as at 31 March 2017
Item Treasury Bills
Normal Bonds
Suppliers Bonds
Promissory Notes
CBS Advance
Total % of total
CBS 2.2 0.9 0 0 1,100 1,103.1 18.2
CommercialBanks 1,316.0 616.8 240.0 0 0 2,172.8 35.8
NBFIs 241.1 1,801.6 335.0 0 0 2,377.7 39.1
Other 98.0 138.9 0 184.5 0 421.4 6.9
Total 1,657.3 2,558.2 575.0 184.5 1,100 6,075.0 100.0%Source: Central Bank of Swaziland
PUBLIC DEBT
CENTRAL BANK OF SWAZILAND 2016/2017 ANNUAL REPORT
64
PART B
CENTRAL BANK OF SWAZILAND
REPORT ON OPERATIONS
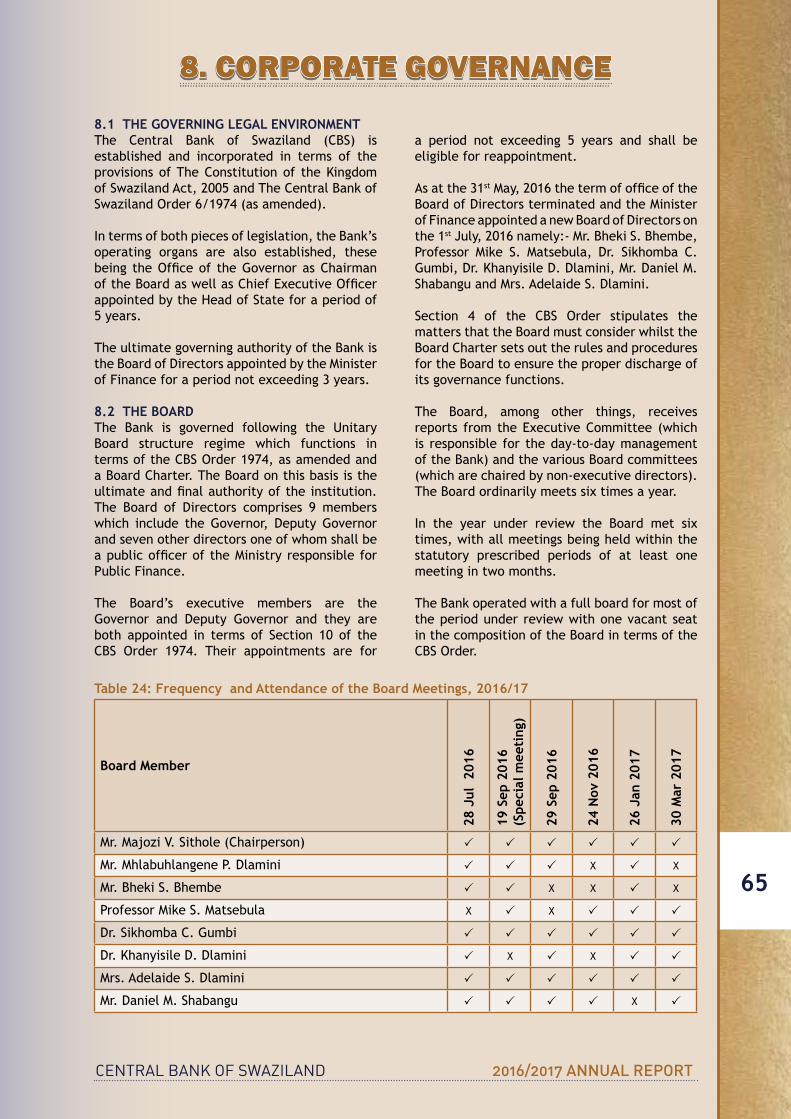
CENTRAL BANK OF SWAZILAND 2016/2017 ANNUAL REPORT
65
8.1 THE GOVERNING LEGAL ENVIRONMENTThe Central Bank of Swaziland (CBS) isestablished and incorporated in terms of the provisionsofTheConstitutionof theKingdomofSwazilandAct,2005andTheCentralBankofSwaziland Order 6/1974 (as amended).
In terms of both pieces of legislation, the Bank’s operating organs are also established, these being theOfficeof theGovernorasChairmanoftheBoardaswellasChiefExecutiveOfficerappointed by the Head of State for a period of 5 years.
The ultimate governing authority of the Bank is theBoardofDirectorsappointedbytheMinisterof Finance for a period not exceeding 3 years.
8.2 THE BOARDThe Bank is governed following the Unitary Board structure regime which functions in termsoftheCBSOrder1974,asamendedandaBoardCharter.TheBoardonthisbasisistheultimateandfinalauthorityoftheinstitution.The Board of Directors comprises 9 memberswhich include theGovernor, DeputyGovernorand seven other directors one of whom shall be apublicofficeroftheMinistryresponsibleforPublic Finance.
The Board’s executive members are the Governor and Deputy Governor and they areboth appointed in terms of Section 10 of the CBS Order 1974. Their appointments are for
a period not exceeding 5 years and shall be eligible for reappointment.
As at the 31stMay,2016thetermofofficeoftheBoardofDirectorsterminatedandtheMinisterofFinanceappointedanewBoardofDirectorsonthe 1stJuly,2016namely:-Mr.BhekiS.Bhembe,Professor Mike S. Matsebula, Dr. Sikhomba C.Gumbi,Dr.KhanyisileD.Dlamini,Mr.DanielM.ShabanguandMrs.AdelaideS.Dlamini.
Section 4 of the CBS Order stipulates thematters that the Board must consider whilst the BoardChartersetsouttherulesandproceduresfor the Board to ensure the proper discharge of its governance functions.
The Board, among other things, receives reports fromtheExecutiveCommittee (whichis responsible for the day-to-day management of the Bank) and the various Board committees (which are chaired by non-executive directors). The Board ordinarily meets six times a year.
In the year under review the Board met six times, with all meetings being held within the statutory prescribed periods of at least one meeting in two months.
The Bank operated with a full board for most of the period under review with one vacant seat in the composition of the Board in terms of the CBSOrder.
8. CORPORATE GOVERNANCE
Table 24: Frequency and Attendance of the Board Meetings, 2016/17
Board Member
28 J
ul 2
016
19 S
ep 2
016
(Spe
cial
mee
ting
)
29 S
ep 2
016
24 N
ov 2
016
26 J
an 2
017
30 M
ar 2
017
Mr.MajoziV.Sithole(Chairperson) � � � � � �
Mr.MhlabuhlangeneP.Dlamini � � � X � X
Mr. Bheki S. Bhembe � � X X � X
Professor Mike S. Matsebula X � X � � �
Dr.SikhombaC.Gumbi � � � � � �
Dr.KhanyisileD.Dlamini � X � X � �
Mrs.AdelaideS.Dlamini � � � � � �
Mr.DanielM.Shabangu � � � � X �
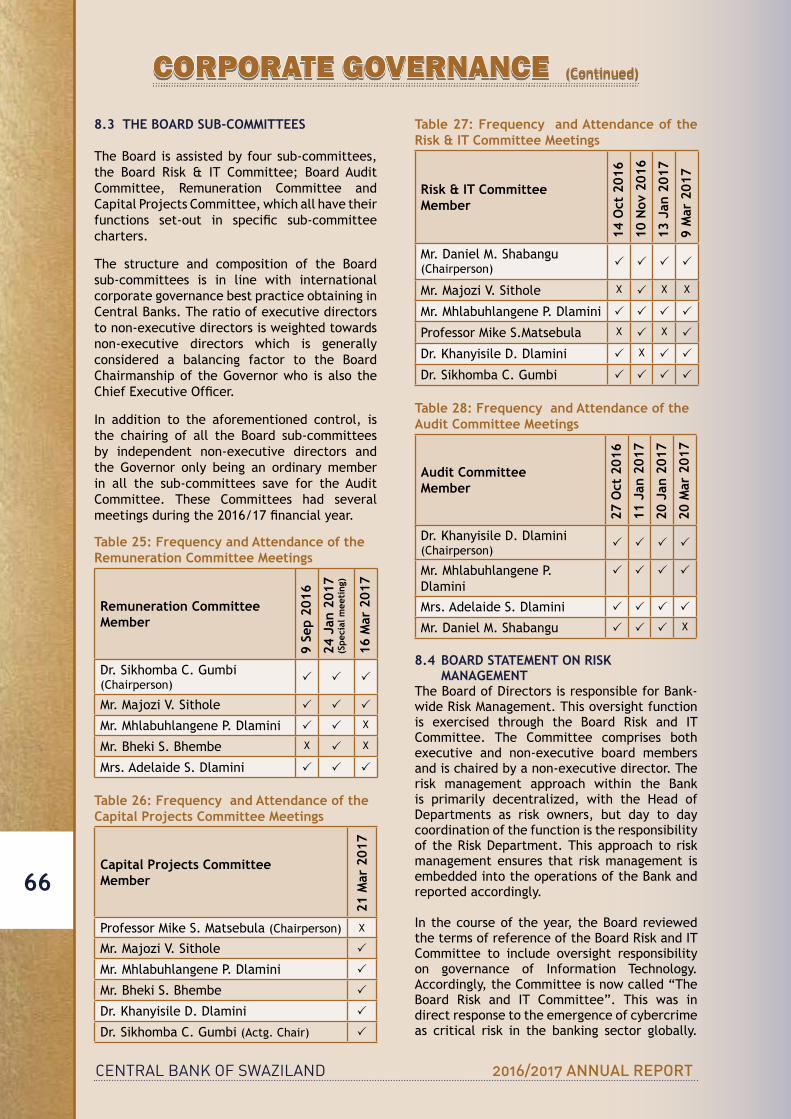
CENTRAL BANK OF SWAZILAND 2016/2017 ANNUAL REPORT
66
8.3 THE BOARD SUB-COMMITTEES
The Board is assisted by four sub-committees, the Board Risk & IT Committee; Board AuditCommittee, Remuneration Committee andCapitalProjectsCommittee,whichallhavetheirfunctions set-out in specific sub-committeecharters.
The structure and composition of the Board sub-committees is in line with international corporate governance best practice obtaining in CentralBanks.Theratioofexecutivedirectorsto non-executive directors is weighted towards non-executive directors which is generally considered a balancing factor to the Board Chairmanshipof theGovernorwho isalso theChiefExecutiveOfficer.
In addition to the aforementioned control, is the chairing of all the Board sub-committees by independent non-executive directors and the Governor only being an ordinary member in all the sub-committees save for the Audit Committee. These Committees had severalmeetingsduringthe2016/17financialyear.
Table 25: Frequency and Attendance of the Remuneration Committee Meetings
Remuneration Committee Member
9 Se
p 20
16
24 J
an 2
017
(Spe
cial
mee
ting
)
16 M
ar 2
017
Dr.SikhombaC.Gumbi(Chairperson) � � �
Mr.MajoziV.Sithole � � �
Mr.MhlabuhlangeneP.Dlamini � � X
Mr. Bheki S. Bhembe X � X
Mrs.AdelaideS.Dlamini � � �
Table 26: Frequency and Attendance of the Capital Projects Committee Meetings
Capital Projects Committee Member
21 M
ar 2
017
Professor Mike S. Matsebula (Chairperson) X
Mr.MajoziV.Sithole �
Mr.MhlabuhlangeneP.Dlamini �
Mr. Bheki S. Bhembe �
Dr.KhanyisileD.Dlamini �
Dr.SikhombaC.Gumbi(Actg.Chair) �
Table 27: Frequency and Attendance of the Risk & IT Committee Meetings
Risk & IT Committee Member
14 O
ct 2
016
10 N
ov 2
016
13 J
an 2
017
9 M
ar 2
017
Mr.DanielM.Shabangu(Chairperson) � � � �
Mr.MajoziV.Sithole X � X X
Mr.MhlabuhlangeneP.Dlamini � � � �
Professor Mike S.Matsebula X � X �
Dr.KhanyisileD.Dlamini � X � �
Dr.SikhombaC.Gumbi � � � �
Table 28: Frequency and Attendance of the Audit Committee Meetings
Audit Committee Member
27 O
ct 2
016
11 J
an 2
017
20 J
an 2
017
20 M
ar 2
017
Dr.KhanyisileD.Dlamini(Chairperson) � � � �
Mr. Mhlabuhlangene P. Dlamini
� � � �
Mrs.AdelaideS.Dlamini � � � �
Mr.DanielM.Shabangu � � � X
8.4 BOARD STATEMENT ON RISK MANAGEMENT TheBoardofDirectorsisresponsibleforBank-wide Risk Management. This oversight function is exercised through the Board Risk and IT Committee. The Committee comprises bothexecutive and non-executive board members and is chaired by a non-executive director. The risk management approach within the Bank is primarily decentralized, with the Head of Departments as risk owners, but day to daycoordination of the function is the responsibility of theRiskDepartment.Thisapproachto riskmanagement ensures that risk management is embedded into the operations of the Bank and reported accordingly.
In the course of the year, the Board reviewed the terms of reference of the Board Risk and IT Committee to include oversight responsibilityon governance of Information Technology. Accordingly,theCommitteeisnowcalled“TheBoard Risk and IT Committee”. This was indirect response to the emergence of cybercrime as critical risk in the banking sector globally.
CORPORATE GOVERNANCE (Continued)
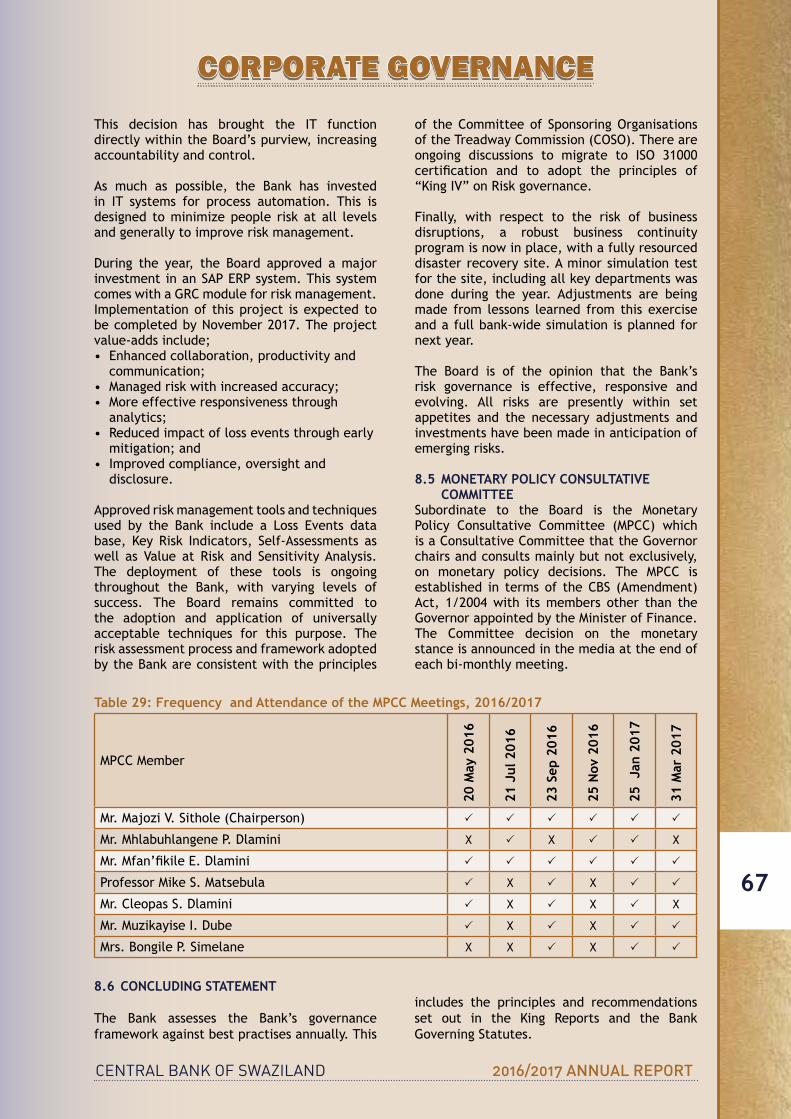
CENTRAL BANK OF SWAZILAND 2016/2017 ANNUAL REPORT
67
CORPORATE GOVERNANCE
This decision has brought the IT function directly within the Board’s purview, increasing accountability and control.
As much as possible, the Bank has invested in IT systems for process automation. This is designed to minimize people risk at all levels and generally to improve risk management.
During the year, the Board approved amajorinvestmentinanSAPERPsystem.ThissystemcomeswithaGRCmoduleforriskmanagement.Implementation of this project is expected to be completed by November 2017. The project value-adds include;• Enhancedcollaboration,productivityand
communication;• Managedriskwithincreasedaccuracy;• Moreeffectiveresponsivenessthrough
analytics;• Reducedimpactoflosseventsthroughearly
mitigation; and • Improvedcompliance,oversightand
disclosure.
Approved risk management tools and techniques used by the Bank include a Loss Events database, Key Risk Indicators, Self-Assessments aswell as Value at Risk and SensitivityAnalysis.The deployment of these tools is ongoing throughout the Bank, with varying levels of success. The Board remains committed to the adoption and application of universally acceptable techniques for this purpose. The risk assessment process and framework adopted by the Bank are consistent with the principles
of theCommitteeof SponsoringOrganisationsoftheTreadwayCommission(COSO).Thereareongoing discussions to migrate to ISO 31000 certification and to adopt the principles of“KingIV”onRiskgovernance.
Finally, with respect to the risk of business disruptions, a robust business continuity program is now in place, with a fully resourced disaster recovery site. A minor simulation test for the site, including all key departments was done during the year. Adjustments are being made from lessons learned from this exercise and a full bank-wide simulation is planned for next year.
The Board is of the opinion that the Bank’s risk governance is effective, responsive and evolving. All risks are presently within set appetites and the necessary adjustments and investments have been made in anticipation of emerging risks.
8.5 MONETARY POLICY CONSULTATIVE COMMITTEE
Subordinate to the Board is the Monetary Policy Consultative Committee (MPCC) whichisaConsultativeCommitteethattheGovernorchairs and consults mainly but not exclusively, on monetary policy decisions. The MPCC isestablished in termsof theCBS (Amendment)Act, 1/2004 with its members other than the Governor appointed by the Minister of Finance.The Committee decision on the monetarystance is announced in the media at the end of each bi-monthly meeting.
Table 29: Frequency and Attendance of the MPCC Meetings, 2016/2017
MPCCMember
20 M
ay 2
016
21 J
ul 2
016
23 S
ep 2
016
25 N
ov 2
016
25 J
an 2
017
31 M
ar 2
017
Mr.MajoziV.Sithole(Chairperson) � � � � � �
Mr.MhlabuhlangeneP.Dlamini X � X � � X
Mr.Mfan’fikileE.Dlamini � � � � � �
Professor Mike S. Matsebula � X � X � �
Mr.CleopasS.Dlamini � X � X � X
Mr.MuzikayiseI.Dube � X � X � �
Mrs. Bongile P. Simelane X X � X � �
8.6 CONCLUDING STATEMENT
The Bank assesses the Bank’s governance framework against best practises annually. This
includes the principles and recommendations set out in the King Reports and the BankGoverning Statutes.
CENTRAL BANK OF SWAZILAND 2016/2017 ANNUAL REPORT
68
9.1 STRATEGY IMPLEMENTATIONThe2016/17financialyearmarkedthesecondyear of execution of the Bank’s three year projects-based corporate strategic plan. The latest end-of-year performance review which was conducted in the last quarter of the year ended 31st March 2017 gave the Bank good indicators on whether positive progress was achieved whilst executing the Bank’s strategic plan.
9.2 PERFORMANCE INDICATORS In order to assess progress made in the implementation of the strategy over the past twelve months the Bank considered five (5)indicators that would provide a solid guide. These were variations in the SWOT analysis position that had been determined at the beginning of the year; how well the Bank has achieved excellence and organizational transformation in its processes; strived for innovation and high performance; the top ten (10)risksthatwouldmakeitdifficulttoachievethe aspirations of the strategy and finally,benchmarks for measuring performance in the various areas of operation.
9.3 PROGRESS MADE
9.3.1 SWOT AnalysisThe Bank remained in a good position to influence the financial sector in a positivemanner as a regulator and was still sitting at theapexofthefinancial sector.Thiswasstilla major strength for the Bank even during the year under review. The list of internal weaknesses was shorter though, with most of the remaining items adequately covered in the recommendations and plan of action for the 2017/18financialyear.Therewerealsononewthreats facing the business, save for the obvious consequences of unpredictable global economic dynamics. The Bank noted an opportunity to continue enhancing its legislative regulatory space and be more innovative in dealing with new developments like financial technology,among many other opportunities.
9.3.2 Excellence and Organizational Transformation
Having properly defined the meaning ofexcellence and transformation in the context of, the execution of strategic projects and processes, it was noted that the Bank was on the right direction. The ultimate targets have not yet been met, but plans are in place for implementing outstanding actions in the finalyear.
9.3.3 Innovation and High PerformanceSince the formulation of the strategy in 2015 the Bank introduced a number of programmes aimed at enhancing a culture of high performance, the main one being the Sishingishane Performance Management System. The Bank was able to introduce innovative products for stakeholders during the year under review, particularly in the currency portfolio. More initiatives are in the pipeline for further innovative services and products across all functions of the Bank. 9.3.4 Top 10 Risks Topten (10) riskswere identified.Thepropermanagement of these is critical in order for the execution of the strategy to be successful. These weregenerallyclassifiedintofour(4)typesofrisks being strategy risk (risks that affect or are created by an organization’s business strategy and strategic objectives); operational risk (major risks that affect an organization’s ability toexecuteitsstrategicplan;financialrisk(areassuchasfinancialreporting,valuation,market,liquidity and credit risks) and compliance risk (legal and regulatory compliance). Out of these fourclasses,thetoptenriskswereidentified,and converted into actionable plans.
9.3.5 Performance StandardsFinally, the Bank was able to adopt internationally recognised performance standards for all functions. This will further enhance the culture of excellence and high performance which is key in the vision of the Bank.
9.4 BRANDING AND IMAGEAll initiatives across all functions of the Bank are designed such that the functions complement each other in fulfilling the mission of theBank (i.e. fostering financial sector stabilityconducive to economic development within the KingdomofSwaziland).
As the various functions pursued their initiatives under the new performance culture, the quality of products and services provided by the Bank to stakeholders improved. A public perception survey undertaken during the period under review indicated satisfactory levels by stakeholders in terms of their appreciation of the Bank’s operations. This performance culture also impacted the level of publicity that the Bank received over the period, with the Bank attracting more positive publicity in the media compared to previous years.
9. CORPORATE STRATEGY AND COMMUNICATION
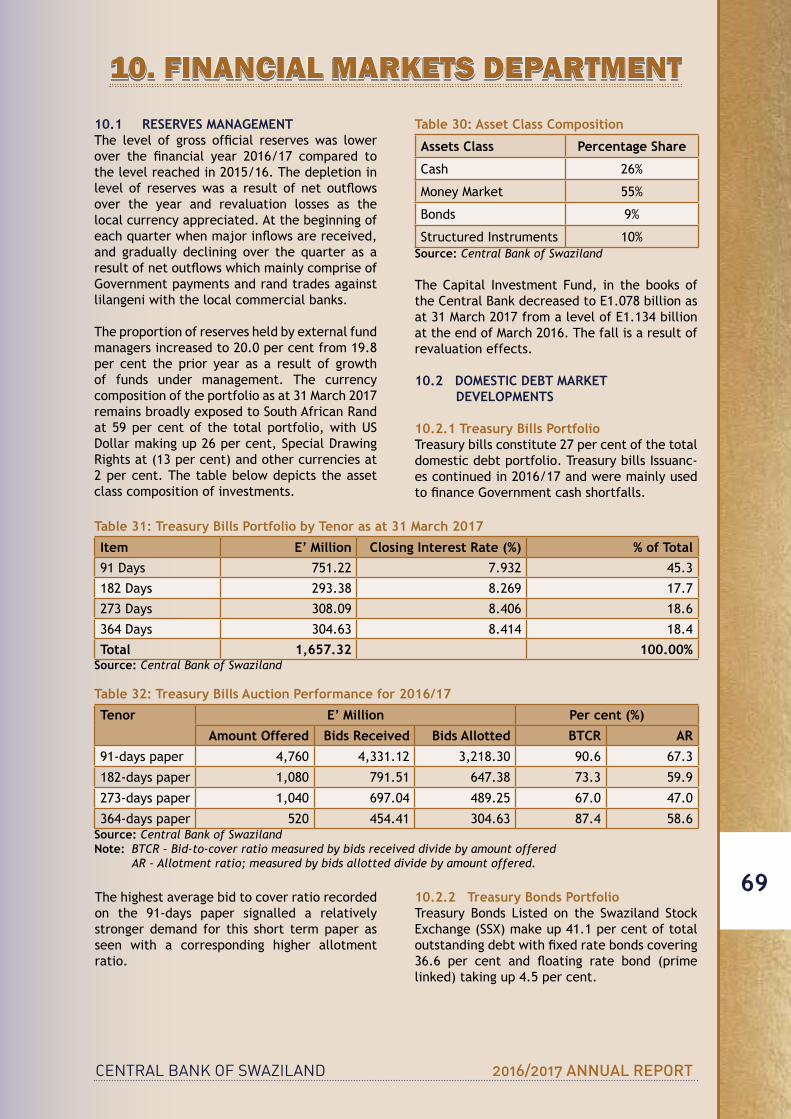
CENTRAL BANK OF SWAZILAND 2016/2017 ANNUAL REPORT
69
10. FINANCIAL MARKETS DEPARTMENT10.1 RESERVES MANAGEMENTThe level of gross official reserves was lowerover the financial year 2016/17 compared tothe level reached in 2015/16. The depletion in level of reserveswas a result of net outflowsover the year and revaluation losses as the local currency appreciated. At the beginning of eachquarterwhenmajorinflowsarereceived,and gradually declining over the quarter as a resultofnetoutflowswhichmainlycompriseofGovernment payments and rand trades against lilangeni with the local commercial banks. The proportion of reserves held by external fund managers increased to 20.0 per cent from 19.8 per cent the prior year as a result of growth of funds under management. The currency composition of the portfolio as at 31 March 2017 remains broadly exposed to South African Rand at 59 per cent of the total portfolio, with US Dollarmakingup26percent,SpecialDrawingRights at (13 per cent) and other currencies at 2 per cent. The table below depicts the asset class composition of investments.
Table 30: Asset Class Composition
Assets Class Percentage Share
Cash 26%
Money Market 55%
Bonds 9%
Structured Instruments 10%Source: Central Bank of Swaziland
TheCapital Investment Fund, in the books oftheCentralBankdecreasedtoE1.078billionasat31March2017fromalevelofE1.134billionat the end of March 2016. The fall is a result of revaluation effects.
10.2 DOMESTIC DEBT MARKET DEVELOPMENTS
10.2.1 Treasury Bills PortfolioTreasury bills constitute 27 per cent of the total domestic debt portfolio. Treasury bills Issuanc-es continued in 2016/17 and were mainly used tofinanceGovernmentcashshortfalls.
Table 31: Treasury Bills Portfolio by Tenor as at 31 March 2017
Item E’ Million Closing Interest Rate (%) % of Total91Days 751.22 7.932 45.3
182Days 293.38 8.269 17.7
273Days 308.09 8.406 18.6
364Days 304.63 8.414 18.4
Total 1,657.32 100.00%Source: Central Bank of Swaziland
Table 32: Treasury Bills Auction Performance for 2016/17
Tenor E’ Million Per cent (%)Amount Offered Bids Received Bids Allotted BTCR AR
91-days paper 4,760 4,331.12 3,218.30 90.6 67.3
182-days paper 1,080 791.51 647.38 73.3 59.9
273-days paper 1,040 697.04 489.25 67.0 47.0
364-days paper 520 454.41 304.63 87.4 58.6Source: Central Bank of SwazilandNote: BTCR – Bid-to-cover ratio measured by bids received divide by amount offered AR - Allotment ratio; measured by bids allotted divide by amount offered.
The highest average bid to cover ratio recorded on the 91-days paper signalled a relatively stronger demand for this short term paper as seen with a corresponding higher allotment ratio.
10.2.2 Treasury Bonds PortfolioTreasury Bonds Listed on the Swaziland Stock Exchange(SSX)makeup41.1percentoftotaloutstandingdebtwithfixedratebondscovering36.6 per cent and floating rate bond (primelinked) taking up 4.5 per cent.
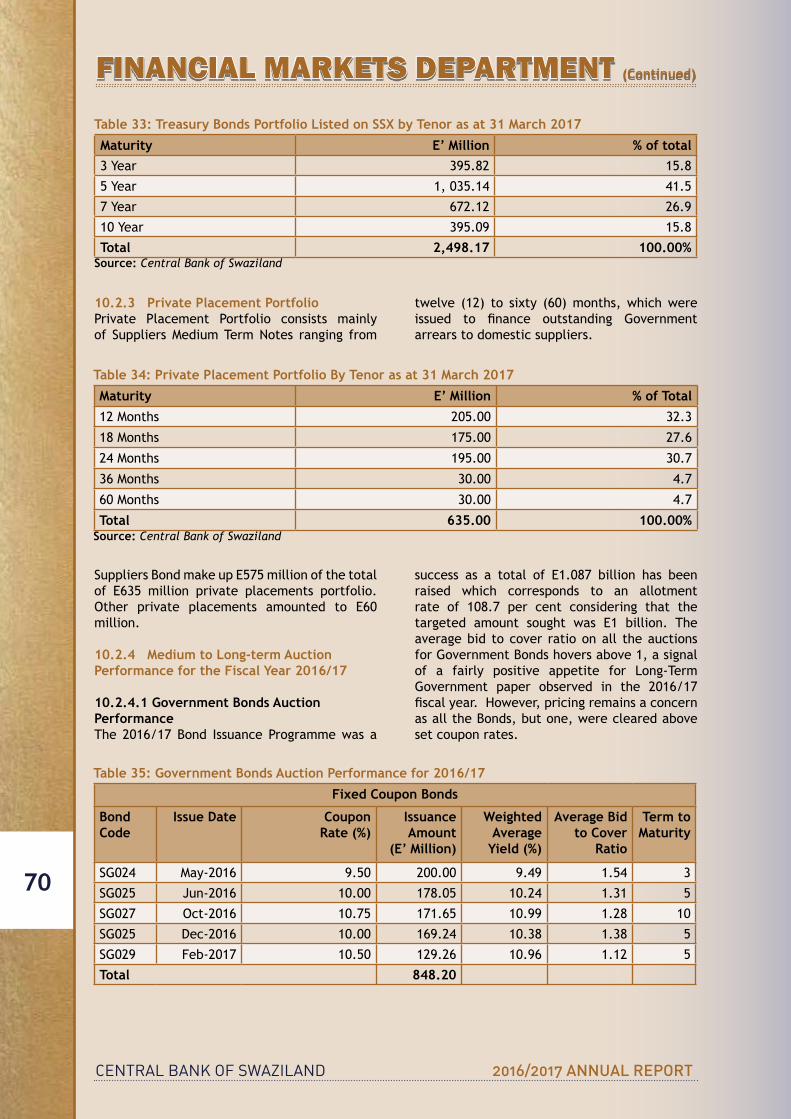
CENTRAL BANK OF SWAZILAND 2016/2017 ANNUAL REPORT
70
Table 33: Treasury Bonds Portfolio Listed on SSX by Tenor as at 31 March 2017
Maturity E’ Million % of total3 Year 395.82 15.8
5 Year 1, 035.14 41.5
7 Year 672.12 26.9
10 Year 395.09 15.8
Total 2,498.17 100.00%Source: Central Bank of Swaziland
10.2.3 Private Placement PortfolioPrivate Placement Portfolio consists mainly of Suppliers Medium Term Notes ranging from
twelve (12) to sixty (60) months, which were issued to finance outstanding Governmentarrears to domestic suppliers.
Table 34: Private Placement Portfolio By Tenor as at 31 March 2017
Maturity E’ Million % of Total12 Months 205.00 32.3
18 Months 175.00 27.6
24 Months 195.00 30.7
36 Months 30.00 4.7
60 Months 30.00 4.7
Total 635.00 100.00%Source: Central Bank of Swaziland
SuppliersBondmakeupE575millionofthetotalof E635 million private placements portfolio.Other private placements amounted to E60million.
10.2.4 Medium to Long-term Auction Performance for the Fiscal Year 2016/17
10.2.4.1 Government Bonds Auction PerformanceThe 2016/17 Bond Issuance Programme was a
success as a total of E1.087 billion has beenraised which corresponds to an allotment rate of 108.7 per cent considering that the targeted amount sought was E1 billion. Theaverage bid to cover ratio on all the auctions for Government Bonds hovers above 1, a signal of a fairly positive appetite for Long-Term Government paper observed in the 2016/17 fiscalyear.However,pricingremainsaconcernas all the Bonds, but one, were cleared above set coupon rates.
Table 35: Government Bonds Auction Performance for 2016/17
Fixed Coupon Bonds
Bond Code
Issue Date CouponRate (%)
Issuance Amount
(E’ Million)
Weighted Average
Yield (%)
Average Bid to Cover
Ratio
Term to Maturity
SG024 May-2016 9.50 200.00 9.49 1.54 3
SG025 Jun-2016 10.00 178.05 10.24 1.31 5
SG027 Oct-2016 10.75 171.65 10.99 1.28 10
SG025 Dec-2016 10.00 169.24 10.38 1.38 5
SG029 Feb-2017 10.50 129.26 10.96 1.12 5
Total 848.20
FINANCIAL MARKETS DEPARTMENT (Continued)
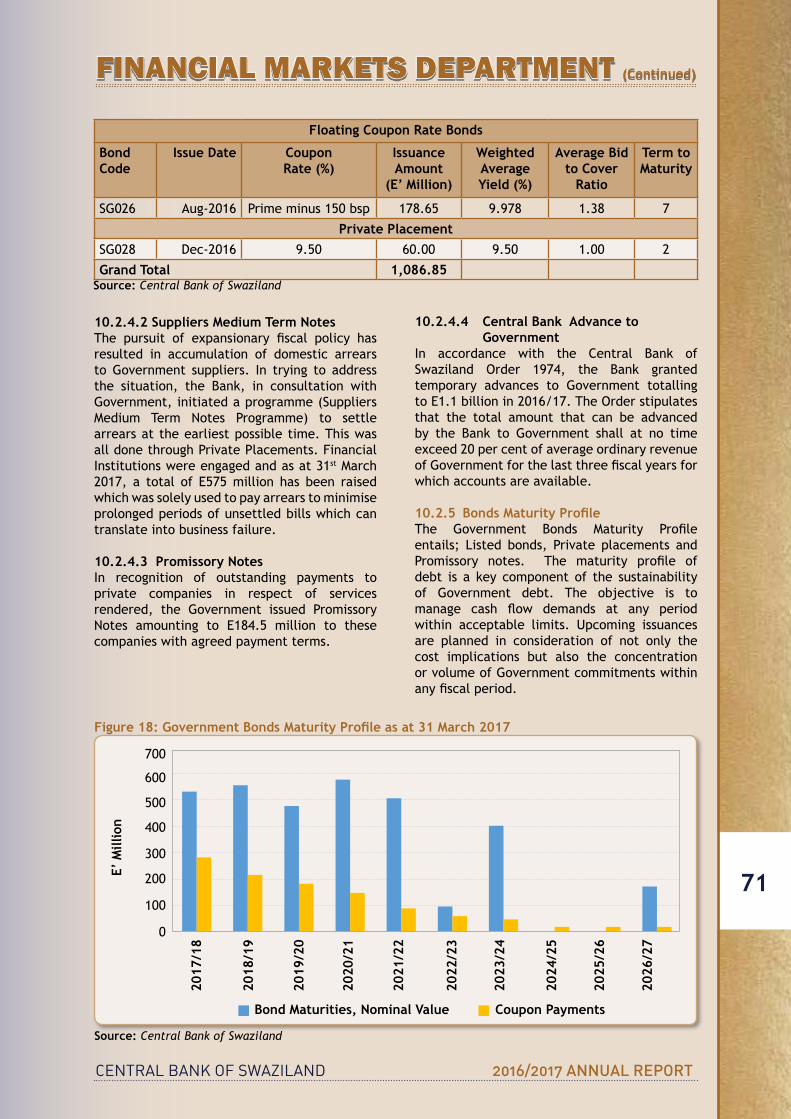
CENTRAL BANK OF SWAZILAND 2016/2017 ANNUAL REPORT
71
Floating Coupon Rate Bonds
Bond Code
Issue Date CouponRate (%)
Issuance Amount
(E’ Million)
Weighted Average Yield (%)
Average Bid to Cover
Ratio
Term to Maturity
SG026 Aug-2016 Prime minus 150 bsp 178.65 9.978 1.38 7
Private PlacementSG028 Dec-2016 9.50 60.00 9.50 1.00 2
Grand Total 1,086.85Source: Central Bank of Swaziland
FINANCIAL MARKETS DEPARTMENT (Continued)
10.2.4.2 Suppliers Medium Term Notes The pursuit of expansionary fiscal policy hasresulted in accumulation of domestic arrears to Government suppliers. In trying to address the situation, the Bank, in consultation with Government, initiated a programme (Suppliers Medium Term Notes Programme) to settle arrears at the earliest possible time. This was all done through Private Placements. Financial Institutions were engaged and as at 31st March 2017, a total of E575million has been raisedwhich was solely used to pay arrears to minimise prolonged periods of unsettled bills which can translate into business failure. 10.2.4.3 Promissory NotesIn recognition of outstanding payments to private companies in respect of services rendered, the Government issued Promissory Notes amounting to E184.5 million to thesecompanies with agreed payment terms.
10.2.4.4 Central Bank Advance to Government
In accordance with the Central Bank ofSwaziland Order 1974, the Bank granted temporary advances to Government totalling toE1.1billionin2016/17.TheOrderstipulatesthat the total amount that can be advanced by the Bank to Government shall at no time exceed 20 per cent of average ordinary revenue ofGovernmentforthelastthreefiscalyearsforwhich accounts are available.
10.2.5 Bonds Maturity ProfileThe Government Bonds Maturity Profileentails; Listed bonds, Private placements and Promissory notes. The maturity profile ofdebt is a key component of the sustainability of Government debt. The objective is to manage cash flow demands at any periodwithin acceptable limits. Upcoming issuances are planned in consideration of not only the cost implications but also the concentration or volume of Government commitments within anyfiscalperiod.
Figure 18: Government Bonds Maturity Profile as at 31 March 2017
-
100
200
300
400
500
600
700
2017/18 2018/19 2019/20 2020/21 2021/22 2022/23 2023/24 2024/25 2025/26 2026/27
E' M
illio
n
Bonds Maturities, Nominal Value Coupon Payments
2017
/18
E’ M
illio
n
700
400
600
300
500
200
Bond Maturities, Nominal Value Coupon Payments
100
0
2021
/22
2018
/19
2022
/23
2024
/25
2019
/20
2023
/24
2025
/26
2020
/21
2026
/27
Source: Central Bank of Swaziland
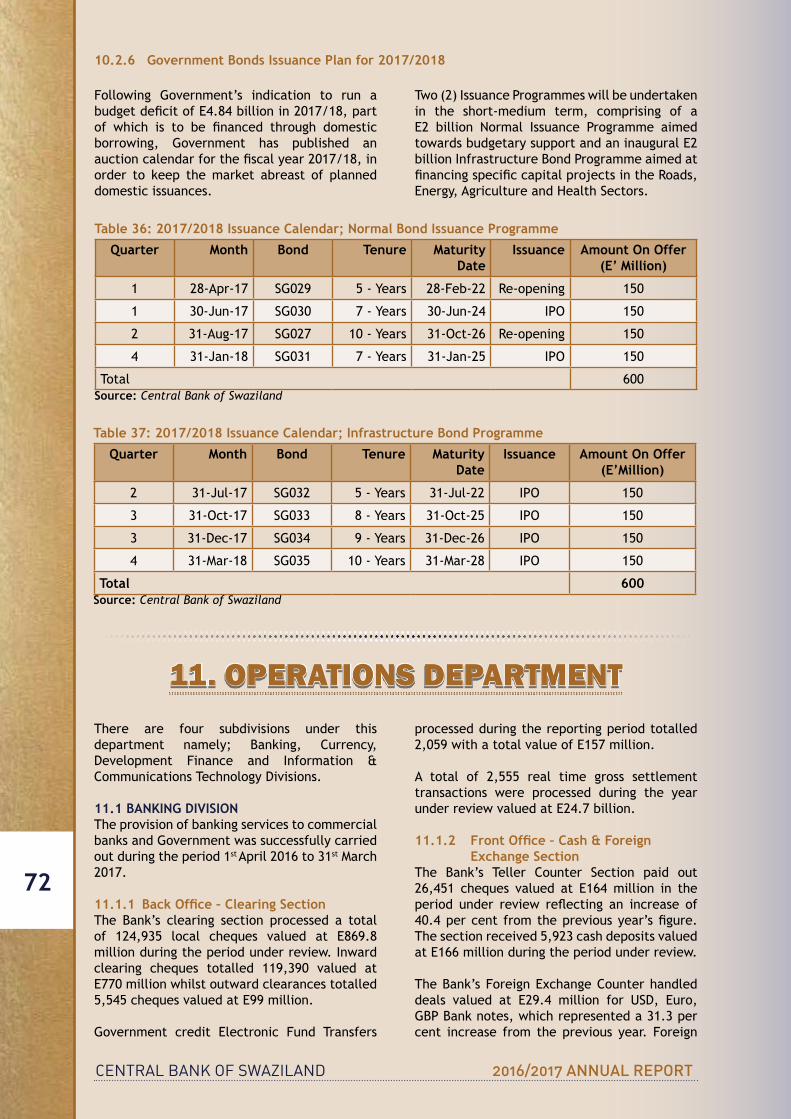
CENTRAL BANK OF SWAZILAND 2016/2017 ANNUAL REPORT
72
Following Government’s indication to run a budgetdeficitofE4.84billionin2017/18,partof which is to be financed through domesticborrowing, Government has published an auctioncalendarforthefiscalyear2017/18,inorder to keep the market abreast of planned domestic issuances.
Two (2) Issuance Programmes will be undertaken in the short-medium term, comprising of a E2 billion Normal Issuance Programme aimedtowardsbudgetarysupportandaninauguralE2billion Infrastructure Bond Programme aimed at financingspecificcapitalprojectsintheRoads,Energy,AgricultureandHealthSectors.
Table 36: 2017/2018 Issuance Calendar; Normal Bond Issuance Programme
Quarter Month Bond Tenure Maturity Date
Issuance Amount On Offer (E’ Million)
1 28-Apr-17 SG029 5 - Years 28-Feb-22 Re-opening 150
1 30-Jun-17 SG030 7 - Years 30-Jun-24 IPO 150
2 31-Aug-17 SG027 10 - Years 31-Oct-26 Re-opening 150
4 31-Jan-18 SG031 7 - Years 31-Jan-25 IPO 150
Total 600Source: Central Bank of Swaziland
Table 37: 2017/2018 Issuance Calendar; Infrastructure Bond Programme
Quarter Month Bond Tenure Maturity Date
Issuance Amount On Offer (E’Million)
2 31-Jul-17 SG032 5 - Years 31-Jul-22 IPO 150
3 31-Oct-17 SG033 8 - Years 31-Oct-25 IPO 150
3 31-Dec-17 SG034 9 - Years 31-Dec-26 IPO 150
4 31-Mar-18 SG035 10 - Years 31-Mar-28 IPO 150
Total 600Source: Central Bank of Swaziland
11. OPERATIONS DEPARTMENTThere are four subdivisions under this department namely; Banking, Currency,Development Finance and Information &CommunicationsTechnologyDivisions.
11.1 BANKING DIVISIONThe provision of banking services to commercial banks and Government was successfully carried out during the period 1st April 2016 to 31st March 2017.
11.1.1 Back Office – Clearing SectionThe Bank’s clearing section processed a total of 124,935 local cheques valued at E869.8million during the period under review. Inward clearing cheques totalled 119,390 valued at E770millionwhilstoutwardclearancestotalled5,545chequesvaluedatE99million.
Government credit Electronic Fund Transfers
processed during the reporting period totalled 2,059withatotalvalueofE157million.
A total of 2,555 real time gross settlement transactions were processed during the year underreviewvaluedatE24.7billion.
11.1.2 Front Office – Cash & Foreign Exchange Section
The Bank’s Teller Counter Section paid out26,451 cheques valued at E164million in theperiod under review reflecting an increase of40.4percent fromthepreviousyear’sfigure.The section received 5,923 cash deposits valued atE166millionduringtheperiodunderreview.
TheBank’sForeignExchangeCounterhandleddeals valued at E29.4 million for USD, Euro,GBP Bank notes, which represented a 31.3 per cent increase from the previous year. Foreign
10.2.6 Government Bonds Issuance Plan for 2017/2018
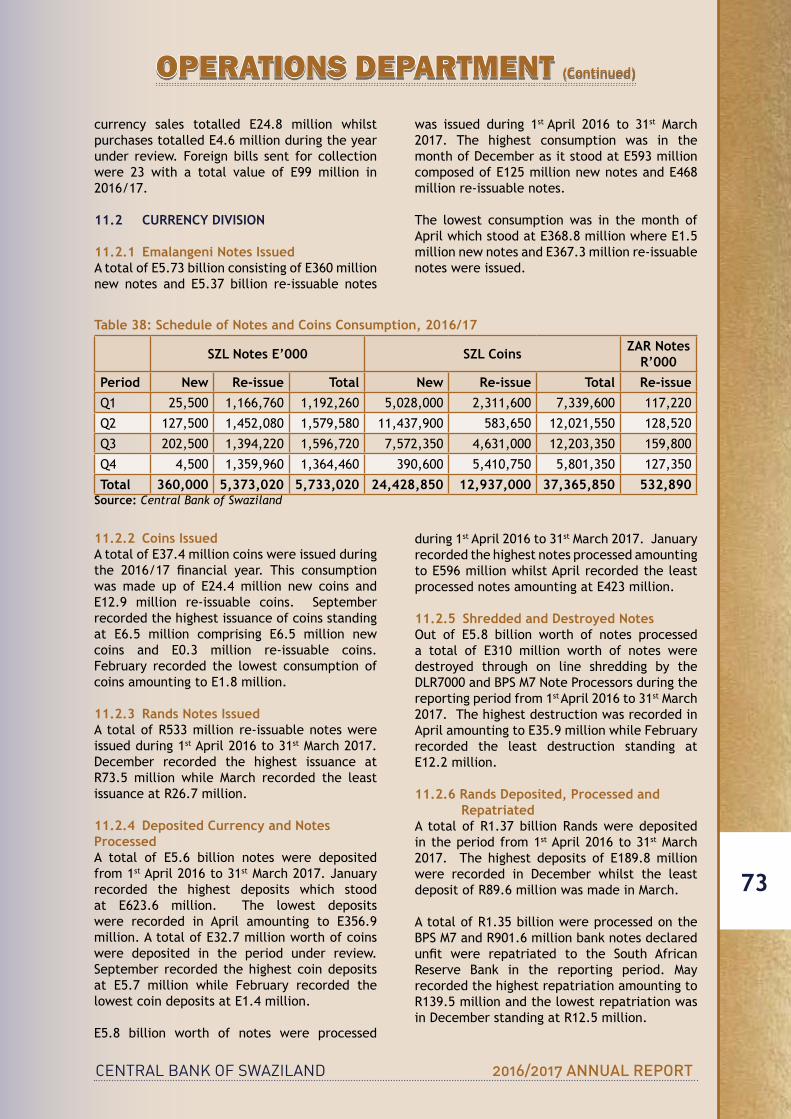
CENTRAL BANK OF SWAZILAND 2016/2017 ANNUAL REPORT
73
OPERATIONS DEPARTMENT (Continued)
11.2.2 Coins IssuedAtotalofE37.4millioncoinswereissuedduringthe 2016/17 financial year. This consumptionwasmade up of E24.4million new coins andE12.9 million re-issuable coins. Septemberrecorded the highest issuance of coins standing at E6.5 million comprising E6.5 million newcoins and E0.3 million re-issuable coins.February recorded the lowest consumption of coinsamountingtoE1.8million.
11.2.3 Rands Notes IssuedA total of R533 million re-issuable notes were issued during 1st April 2016 to 31st March 2017. December recorded the highest issuance atR73.5 million while March recorded the least issuance at R26.7 million.
11.2.4 Deposited Currency and Notes ProcessedA total of E5.6 billion notes were depositedfrom 1st April 2016 to 31stMarch2017.Januaryrecorded the highest deposits which stood at E623.6 million. The lowest depositswere recorded in April amounting to E356.9million.AtotalofE32.7millionworthofcoinswere deposited in the period under review. September recorded the highest coin deposits at E5.7 million while February recorded thelowestcoindepositsatE1.4million.
E5.8 billion worth of notes were processed
during 1st April 2016 to 31stMarch2017.Januaryrecorded the highest notes processed amounting toE596millionwhilstAprilrecordedtheleastprocessednotesamountingatE423million.
11.2.5 Shredded and Destroyed NotesOut of E5.8 billion worth of notes processeda total of E310 million worth of notes weredestroyed through on line shredding by the DLR7000andBPSM7NoteProcessorsduringthereporting period from 1st April 2016 to 31st March 2017. The highest destruction was recorded in AprilamountingtoE35.9millionwhileFebruaryrecorded the least destruction standing at E12.2million. 11.2.6 Rands Deposited, Processed and
RepatriatedA total of R1.37 billion Rands were deposited in the period from 1st April 2016 to 31st March 2017. The highest deposits of E189.8millionwere recorded in December whilst the leastdeposit of R89.6 million was made in March.
A total of R1.35 billion were processed on the BPS M7 and R901.6 million bank notes declared unfit were repatriated to the South AfricanReserve Bank in the reporting period. May recorded the highest repatriation amounting to R139.5 million and the lowest repatriation was inDecemberstandingatR12.5million.
currency sales totalled E24.8 million whilstpurchasestotalledE4.6millionduringtheyearunder review. Foreign bills sent for collection were 23 with a total value of E99 million in2016/17.
11.2 CURRENCY DIVISION
11.2.1 Emalangeni Notes IssuedAtotalofE5.73billionconsistingofE360millionnew notes and E5.37 billion re-issuable notes
was issued during 1st April 2016 to 31st March 2017. The highest consumption was in the monthofDecemberasitstoodatE593millioncomposedofE125millionnewnotesandE468million re-issuable notes.
The lowest consumption was in the month of AprilwhichstoodatE368.8millionwhereE1.5millionnewnotesandE367.3millionre-issuablenotes were issued.
Table 38: Schedule of Notes and Coins Consumption, 2016/17
SZL Notes E’000 SZL Coins ZAR NotesR’000
Period New Re-issue Total New Re-issue Total Re-issueQ1 25,500 1,166,760 1,192,260 5,028,000 2,311,600 7,339,600 117,220
Q2 127,500 1,452,080 1,579,580 11,437,900 583,650 12,021,550 128,520
Q3 202,500 1,394,220 1,596,720 7,572,350 4,631,000 12,203,350 159,800
Q4 4,500 1,359,960 1,364,460 390,600 5,410,750 5,801,350 127,350
Total 360,000 5,373,020 5,733,020 24,428,850 12,937,000 37,365,850 532,890Source: Central Bank of Swaziland

CENTRAL BANK OF SWAZILAND 2016/2017 ANNUAL REPORT
74
OPERATIONS DEPARTMENT (Continued)
Table 39: Rands Deposited and Repatriated (ZAR’000), 2016/17
Deposits RepatriationPeriod 2015/16 2016/17 2015/16 2016/17
Q1 250,990 330,530 249,000 260,500
Q2 265,120 302,160 157,450 207,600
Q3 262,480 456,242 260,000 143,500
Q4 266,340 279,246 280,000 290,000
Total 1,044,930 1,368,178 946,450 901,600Source: Central Bank of Swaziland
11.2.7 Currency in Circulation (By Denomination)
DENOMINATION 31/03/2016 31/03/2017NOTES (E’000)E200 538 770 589 806
E100 97 113 80 922
E50 75 854 76 947
E20 41 670 46 217
E10 22 739 23 649
E5 1 249 1 249
E2 1 184 1 184
E1 342 342
TOTAL NOTES 778 921 820 316COINS
E5 17 447 17 950
E2 14 996 16 382
E1 13 655 14 523
50c 4 418 4 653
20c 4 338 4 364
10c 4 131 4 476
5c 5 994 5 857
2c 230 230
1c 685 685
TOTAL COINS 65 894 69 120 TOTAL NOTES & COINS 844 815 889 436
Source: Central Bank of Swaziland
11.2.8 New Coins SeriesAs part of its mandate, the Bank rolled out new series of coins in February 2016. The Bank issued out two Legal Notices which came into force from 1st September 2016.
Legal Notice No. 147 of 2016 “The Withdrawal ofCurrency(Coins)Notice2016”,stipulatestheold coin series shall cease to be legal tender in theKingdomofSwazilandfrom1stSeptember2017. The Legal Notice further stipulates that all withdrawn coins shall be exchanged on
demand without any charge for note and coins equivalentattheCentralBankofSwazilandorany other local agencies approved by the Ministry of Finance with effect from 1st September 2016 to 31st August 2021. The Legal Notice further states that 5c is excluded from the recall and shall continue in circulation and remain legal tenderintheKingdomofSwaziland.
Legal Notice No. 148 of 2016 “The Manufacture and Characteristics of New Currency (Coins)Notice 2016” stipulates the characteristics of
CENTRAL BANK OF SWAZILAND 2016/2017 ANNUAL REPORT
75
OPERATIONS DEPARTMENT (Continued)
the new coin series, dimension, size, material, and features.
11.2.9 Old Coin Series The Bank engaged in the Old Coin SeriesCollectionProjectafterthereleaseofthenewcoin series in February 2016. The Bank sent out notices to the public and commercial banks stipulating that the coin series (dated 2013 and backwards) of the 10c, 20c, 50c, E1, E2 andE5 denominations shall cease to be issued asmedium of exchange effective 1st September 2016, as these have been replaced by the new series of the same denominations dated 2015. The communications also clearly stated that 5c is excluded from the recall and shall continue in circulation and remain legal tender in the KingdomofSwaziland.
To expedite the old coin collection exercise, the Central Bank of Swaziland signed aMemorandum of Understanding with Swaziland Post & Telecoms Corporation (SPTC) for theusage of their Post Offices countrywide ascollection points for the old coins.
11.2.10 Coin DestructionFollowing the withdrawal of the old coin series from circulation, the Bank has commenced a coin destruction project. The Project will be completedwithinthe2017/18financialyear.
11.2.11 Commemorative Coins The Bank has implemented a commemorative coins’ project for the country’s 50th Independence Anniversary which will be celebrated in 2018. The official launch forthe commemorative coin design competition was conducted in November 2016 and this was targeting school going children from the ages of 6 – 16 years.
11.2.12 New NotesThe Bank has completed the approval process of thenewE100andE200and thenewnoteswill be launched by end of 2017. These new notes come with a different design, colour and additional security features. With respect tothenewE10,thereleaseintocirculationisplanned for August 2017.
11.3 DEVELOPMENT FINANCE
11.3.1 OverviewDuring the year, participation of individualcommercial banks under the Small Scale
Enterprise Loan Guarantee Scheme (SSELGS)declined significantly when compared to theprevious year. The Export Credit GuaranteeScheme (ECGS) however continued to bestagnant over the year.
The Bank participated in various promotional campaigns like the International Trade Fair and workshops to disseminate information on how toaccessfinanceundertheguaranteeschemes. During the year there were numerousconsultative meetings between Government, the Micro Finance Unit, the Bank as well as other small and medium enterprises stakeholders. One of the major issues discussed was, how best can the schemes be managed and utilized for better performance and effective impact in the development of Swaziland’s economy.
Duringtheyear,theGovernmentofSwazilandrecapitalized the SSELGS to the tune of E5.0million to ensure that the scheme continues to facilitate granting of loans by the participating financialinstitutionsthroughissuanceofcreditguarantees. The Bank in collaboration with theMinistryofCommerce,Tradeand Industrycontinued to monitor the performance of the schemesovertheyear,inparticulartheSSELGS.
The operational activities of the two schemes presently administered by Central Bank aresummarized below.
11.3.2 Small Scale Enterprise Loan Guarantee SchemeTheoverallperformanceoftheSSELGSdeclinedover the year when compared to the year ended 31st March 2016. This is indicated by the huge decrease of guarantees issued from 79 valued E12.6million to35amounting toE5.5millionas at 31st March 2017. This can be attributed to the low number of applications for guarantees submitted by the participating financialinstitutions. Cumulatively, from inception to31st March 2017, the SSELGS facilitated theapproval and disbursement of 1,201 loans amountingE100.8million.Asat31st March 2016 the total loans were 1,166 valued at E95.3million thus signifying growth year on year. The guarantees issued by the scheme to facilitate the disbursement by financialinstitutionsofthe35newloansvaluedatE5.5millionamountedtoE4.8millionforthewholeyear. At the end of March 2017, the SSELGScommitment to financial institutions stood at261guaranteesamountingtoE30.7million.
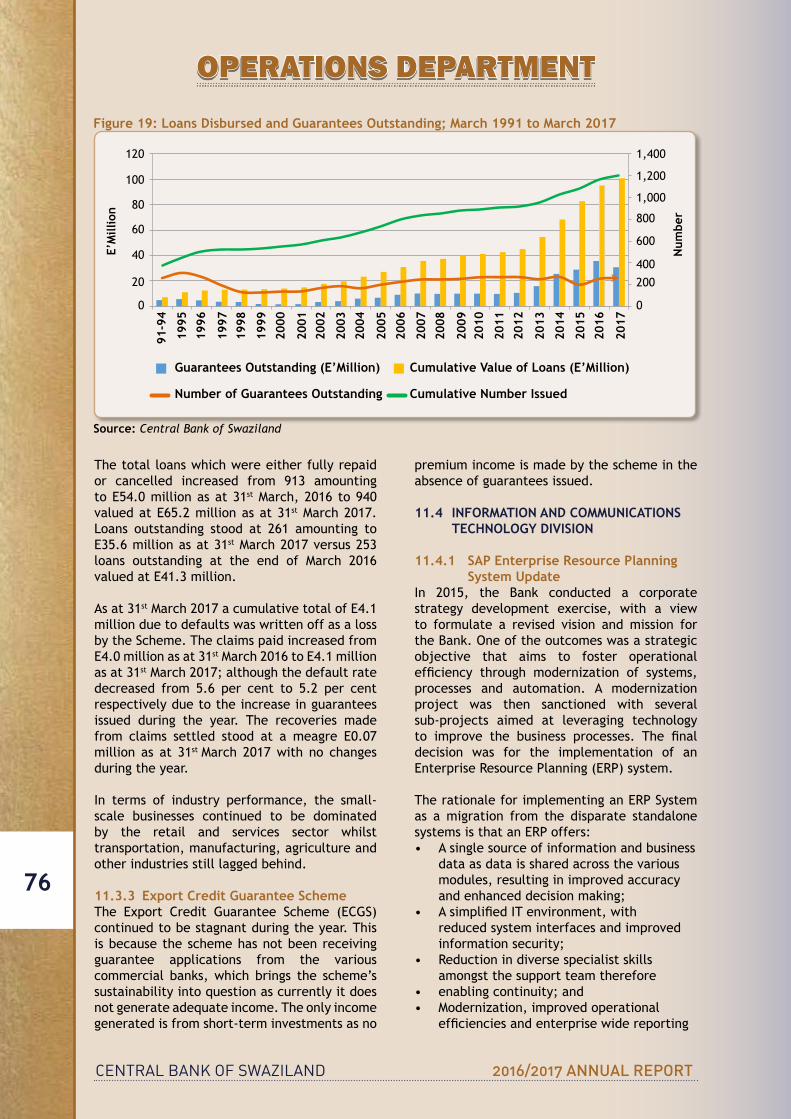
CENTRAL BANK OF SWAZILAND 2016/2017 ANNUAL REPORT
76
OPERATIONS DEPARTMENTFigure 19: Loans Disbursed and Guarantees Outstanding; March 1991 to March 2017
Num
ber
E’M
illio
n
0
200
400
600
800
1,000
1,200
1,400
0
20
40
60
80
100
120 91
-94
1995
1996
1997
1998
1999
2000
2001
2002
2003
2004
2005
2006
2007
2008
2009
2010
2011
2012
2013
2014
2015
2016
2017
Num
ber
E' M
illio
n
Guarantees Outstanding (E' Million) Cumulative Value of Loans (E' Million) Number of Gurantees Outstanding Cumulative Number Issued
2017
1,400
1,200
1,000
800
600
400
200
120
100
80
60
40
20
0 0
2013
2009
2005
2001
1997
2016
2012
2008
2004
2000
1996
2015
2011
2007
2003
1999
1995
2014
2010
2006
2002
1998
91-9
4
Guarantees Outstanding (E’Million)
Number of Guarantees Outstanding
Cumulative Value of Loans (E’Million)
Cumulative Number Issued
Source: Central Bank of Swaziland
The total loans which were either fully repaid or cancelled increased from 913 amounting toE54.0millionasat31st March, 2016 to 940 valuedatE65.2millionasat31st March 2017.Loans outstanding stood at 261 amounting to E35.6millionasat31st March 2017 versus 253 loans outstanding at the end of March 2016 valuedatE41.3million.
As at 31stMarch2017acumulativetotalofE4.1million due to defaults was written off as a loss by the Scheme. The claims paid increased from E4.0millionasat31stMarch2016toE4.1millionas at 31st March 2017; although the default rate decreased from 5.6 per cent to 5.2 per cent respectively due to the increase in guarantees issued during the year. The recoveries made from claims settled stood at a meagre E0.07million as at 31st March 2017 with no changes during the year.
In terms of industry performance, the small-scale businesses continued to be dominated by the retail and services sector whilst transportation, manufacturing, agriculture and other industries still lagged behind.
11.3.3 Export Credit Guarantee Scheme The Export Credit Guarantee Scheme (ECGS)continued to be stagnant during the year. This is because the scheme has not been receiving guarantee applications from the various commercial banks, which brings the scheme’s sustainability into question as currently it does not generate adequate income. The only income generated is from short-term investments as no
premium income is made by the scheme in the absence of guarantees issued.
11.4 INFORMATION AND COMMUNICATIONS TECHNOLOGY DIVISION
11.4.1 SAP Enterprise Resource Planning System Update
In 2015, the Bank conducted a corporate strategy development exercise, with a view to formulate a revised vision and mission for the Bank. One of the outcomes was a strategic objective that aims to foster operational efficiency through modernization of systems,processes and automation. A modernization project was then sanctioned with several sub-projects aimed at leveraging technology to improve the business processes. The finaldecision was for the implementation of an EnterpriseResourcePlanning(ERP)system.
TherationaleforimplementinganERPSystemas a migration from the disparate standalone systemsisthatanERPoffers:• A single source of information and business
data as data is shared across the various modules, resulting in improved accuracy and enhanced decision making;
• AsimplifiedITenvironment,withreduced system interfaces and improved information security;
• Reduction in diverse specialist skills amongst the support team therefore
• enabling continuity; and• Modernization, improved operational
efficienciesandenterprisewidereporting
CENTRAL BANK OF SWAZILAND 2016/2017 ANNUAL REPORT
77
due to the end-to- end business processes coveredbytheERP.
In September 2016, the Board approved Management’s recommendation for the selection of SAP as the technology of choice fordeliveryoftheERPobjective.Theprimarydrivers for the SAP selection were; SAP’s impressive global and regional track record and lowertotalcostofownership(TCO)forsuchabest-in-classERP.
In the third quarter of the reporting period, the SAP ERP implementation project commencedwith Ernest & Young (EY) as the Bank’simplementation partner. This project is now referred to as #Insika within the Bank. The approved project plan set very aggressive timelines with a go-live date set for 1st November 2017.
AsatthecloseofthefinancialyearendedMarch2017, the #Insika Project status was on track, wherein the detailed scope of the project had been defined, the physical ICT infrastructureand SAP software was being installed and a committed team comprising the Bank staff and EYteamweredefiningandconfiguringSAPforthe Bank’s environment.
The SAP launch took place on 12th April, 2017 and was headlined with its official name andcatch phrase ‘INSIKA…. Connected, Faster,Safer.
With a dedicated ERP Project SteeringCommittee driving the project governance,commitment from staff and the implementation partner, there is high confidence that theproject will be delivered successfully.
12. REPORT ON NATIONAL PAYMENTS AND SETTLEMENTS SYSTEMS
12.1 INTRODUCTIONTheBankisresponsibleforsupportingfinancialstability and to facilitate economic activity through safe, efficient and effective paymentsystems. Safety and efficiency in paymentsystems requires that payments are carried out timely, securely and effectively. The role of the Bank is executed through promotion, regulation and supervision of payment systems with the prime aim of mitigating risks associated with operations of domestic and cross border payment systems.
The main payment systems during the period under review were the Swaziland Interbank Payment & Settlement System (SWIPSS/Masheshisa) operated by the Central Bank ofSwaziland(CBS)thatisinternationallyreferredto as the “Real Time Gross Settlement System” (RTGS), the cheque and Electronic FundsTransfers(EFTs)processingsystemoperatedbythe Swaziland Automated Electronic ClearingHouse, the Mobile Money Transfer System operatedbySwaziMTNLimitedandtheSADCIntegrated Regional Electronic SettlementSystem (SIRESS) presently operated by theSouth African Reserve Bank.
12.2 CENTRAL BANK OVERSIGHT OF PAYMENT SYSTEMS
According to the mandate of the CBS and inorder to ensure that systems comply not only with applicable domestic rules and procedures and also with international standards and best practice, oversight of payment systems is imperative. In this regard, the Bank continued to monitor and conduct inspections on designated payment systems during the period under review.
No issues were reported from the payment system oversight function. The inspections are conducted to satisfy public policy objectives of ensuring safety and efficiency not only inthepayment systemsbutalso in thefinancialsystem as a whole. As disruptions in payment systems have a potential to permeate through to other areas of the national economy including thefinancialsystem,itremainedimportanttosafeguardbothpaymentandfinancialsystemsfrom systemic disturbances and risk.
The Bank also conducted inspection of operations under the Mobile Money Transfer (MMT) system during the period under review.
CENTRAL BANK OF SWAZILAND 2016/2017 ANNUAL REPORT
78
The operations of the MMT System were found compliant to the terms and conditions issued by theCentralBankofSwaziland.Riskmitigationmeasures and operational rules and procedures were found satisfactory during the reporting period.
12.3 OPERATIONAL ACTIVITIESThe Automated Clearing House (ACH) andSwaziland Interbank Payment and Settlement System (SWIPSS) continued to operate smoothly during the period under review. In line with international best practice, large value items continued to be characterized by low volumes inSWIPSSwhileactivitiesattheACHcontinuedto record high volumes of low value items.
Usage of the Mobile Money Transfer System also continued to rise during the period under review.TheBankviewsmobilefinancialservicesas products that can change the payment systems landscape in Swaziland particularly in view of the potential to facilitate access to financialsystemsfortheunbankedandunder-banked users.
12.4 CROSS-BORDER PAYMENTS During the period under review, the SADCIntegrated Regional Electronic SettlementSystem(SIRESS)continuedtooperatesmoothly.By the end of March 2017, there were 83 participants made up of 7 Central Banksand 76 Commercial Banks from 14 MemberStates. Madagascar has indicated interest and has started working on the requirements to facilitate systems connectivity. The Central
13.1 INTRODUCTIONDuringtheyear2016/17,theSouthernAfricanregion experienced one of the worst drought ever and Swaziland in particular was not spared from the effects of the drought. The agricultural sector which was hit the hardest saw a significant decline in its annual outputand this had a ripple effect on the banking sector as the agricultural sector is one of the main contributors to Swaziland’s GDP. TheCentralBankofSwaziland,whichistaskedwiththe responsibility of overseeing the prudential management of banking institutions in order to protect the stability and soundness of the financialsystem,continuedtocloselymonitorthe situation to ensure that it has minimal impact on the banking industry. The Bank remains committed to constantly improving the
level of banking supervision to cope with global and domestic changes in the banking sector.
13.2 OVERVIEW OF THE BANKING SYSTEMAs at 31st March 2017, the banking sector of the country remained with the four (4) commercial banks, three (3) of which are subsidiaries of South African holding companies and one (1) which is fully owned by the Swaziland Government. The commercial banks are Standard Bank Swaziland Limited, Nedbank (Swaziland) Limited, First National Bank of Swaziland and Swaziland Development and Savings Bank. SwazilandBuildingSocietyisalsoasignificantdepositoryinstitution in the domestic banking sector due to its product offering and will be included in this paper albeit classified as a Non-BankFinancial Institution.
13. BANK SUPERVISION
Bank of Swaziland and all four (4) commercial banks are active participants in the SADCregional payment system.
12.5 FUTURE DEVELOPMENTSTheCentral Bank of Swaziland in conjunctionwith commercial banks are working on settlement of cross-border retail payment streams in the SADC region. This wouldbe facilitated through channelling these transactions through a Regional Clearing andSettlement Operator. Priority had been given to LowValueCross-borderCreditElectronicFundsTransfers and scheduled for full implementation by July 2018, that is, data capture, clearing,batching and channelled to SIRESS forsettlement. Presently, these transactions are processed through correspondent arrangements and processed as domestic transactions in the South African jurisdiction. In this way, transparency and reporting has been the main challenge that required redress henceforth the need for reform.
On another front, the Bank continues to monitor and encourage innovation in the payment systems space that are expected to come with new products and financial services to meetclient needs and to grow financial inclusionin the payment systems landscape. These developments include and extend government payments and cross border remittances. Inevitably, the Bank is cognizant that these developments would require proportionate review of supporting legal framework.
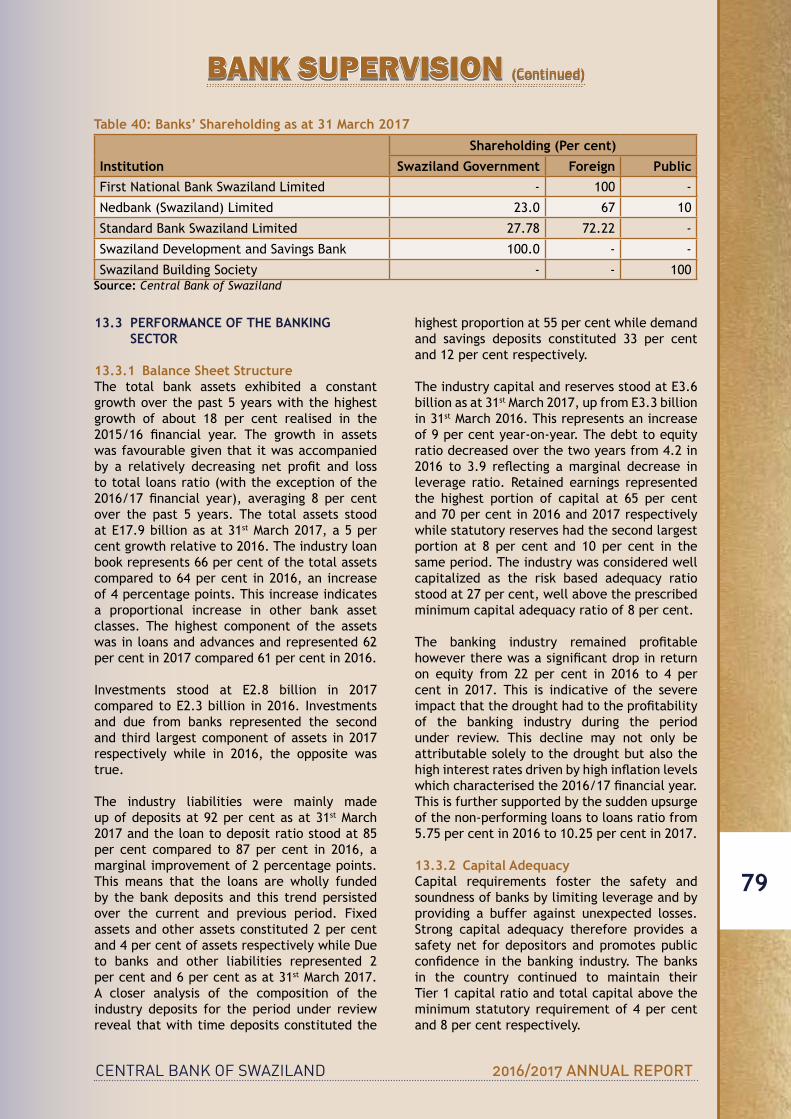
CENTRAL BANK OF SWAZILAND 2016/2017 ANNUAL REPORT
79
Table 40: Banks’ Shareholding as at 31 March 2017
InstitutionShareholding (Per cent)
Swaziland Government Foreign PublicFirst National Bank Swaziland Limited - 100 -
Nedbank (Swaziland) Limited 23.0 67 10
Standard Bank Swaziland Limited 27.78 72.22 -
SwazilandDevelopmentandSavingsBank 100.0 - -
Swaziland Building Society - - 100Source: Central Bank of Swaziland
13.3 PERFORMANCE OF THE BANKING SECTOR
13.3.1 Balance Sheet StructureThe total bank assets exhibited a constant growth over the past 5 years with the highest growth of about 18 per cent realised in the 2015/16 financial year. The growth in assetswas favourable given that it was accompanied by a relatively decreasing net profit and lossto total loans ratio (with the exception of the 2016/17 financial year), averaging 8 per centover the past 5 years. The total assets stood atE17.9billionasat31st March 2017, a 5 per cent growth relative to 2016. The industry loan book represents 66 per cent of the total assets compared to 64 per cent in 2016, an increase of 4 percentage points. This increase indicates a proportional increase in other bank asset classes. The highest component of the assets was in loans and advances and represented 62 per cent in 2017 compared 61 per cent in 2016. Investments stood at E2.8 billion in 2017comparedtoE2.3billion in2016. Investmentsand due from banks represented the second and third largest component of assets in 2017 respectively while in 2016, the opposite was true.
The industry liabilities were mainly made up of deposits at 92 per cent as at 31st March 2017 and the loan to deposit ratio stood at 85 per cent compared to 87 per cent in 2016, a marginal improvement of 2 percentage points. This means that the loans are wholly funded by the bank deposits and this trend persisted over the current and previous period. Fixed assets and other assets constituted 2 per cent and4percentofassetsrespectivelywhileDueto banks and other liabilities represented 2 per cent and 6 per cent as at 31st March 2017. A closer analysis of the composition of the industry deposits for the period under review reveal that with time deposits constituted the
highest proportion at 55 per cent while demand and savings deposits constituted 33 per cent and 12 per cent respectively.
TheindustrycapitalandreservesstoodatE3.6billion as at 31stMarch2017,upfromE3.3billionin 31st March 2016. This represents an increase of 9 per cent year-on-year. The debt to equity ratio decreased over the two years from 4.2 in 2016 to 3.9 reflecting amarginal decrease inleverage ratio. Retained earnings represented the highest portion of capital at 65 per cent and 70 per cent in 2016 and 2017 respectively while statutory reserves had the second largest portion at 8 per cent and 10 per cent in the same period. The industry was considered well capitalized as the risk based adequacy ratio stood at 27 per cent, well above the prescribed minimum capital adequacy ratio of 8 per cent.
The banking industry remained profitablehowevertherewasasignificantdropinreturnon equity from 22 per cent in 2016 to 4 per cent in 2017. This is indicative of the severe impactthatthedroughthadtotheprofitabilityof the banking industry during the period under review. This decline may not only be attributable solely to the drought but also the highinterestratesdrivenbyhighinflationlevelswhichcharacterisedthe2016/17financialyear.This is further supported by the sudden upsurge of the non-performing loans to loans ratio from 5.75 per cent in 2016 to 10.25 per cent in 2017.
13.3.2 Capital AdequacyCapital requirements foster the safety andsoundness of banks by limiting leverage and by providing a buffer against unexpected losses. Strong capital adequacy therefore provides a safety net for depositors and promotes public confidence in thebanking industry.Thebanksin the country continued to maintain their Tier 1 capital ratio and total capital above the minimum statutory requirement of 4 per cent and 8 per cent respectively.
BANK SUPERVISION (Continued)
CENTRAL BANK OF SWAZILAND 2016/2017 ANNUAL REPORT
80
BANK SUPERVISION
As at 31st March 2017, capital and reserves held by the banking sector amounted to E3.6billion, up from E3.3 billion as at 31st March 2016 showing an increase of 9 per cent. The total capital ratio of the industry stood at 27 per cent at 31st March 2017 from 26 per cent at 31st March 2016 indicating a marginal increase of 1 percentage point. Tier 1 capital stood at 25 per cent as at 31st March 2017, up from 23 per cent at 31st March 2016.
13.3.3 Earnings Performance Thecontinuedviabilityofafinancialinstitutiondepends on its ability to generate appropriate return on its assets and capital. Good earnings performance enables a financial institution tofund its expansion, remain competitive and augmentitscapitalbase.Earningsarethereforethe primary source of any increases in capital.
Net income before tax decreased drastically by 72 per cent during the year under review from E492million in 2016 to E139million in 2017.This can be attributable to the severe drought that had an effect on economic growth, the high volatility that characterised the foreign exchangemarket,high inflation levels leadingto high interest rates which sometimes result in defaultsoncreditandhighNPLs.Consequently,the return on equity dropped from 22 per cent in 2016 to 4 per cent in 2017 while cost to income ratio increased from 54.9 per cent to 72 per cent during the period under review. The bank is still to assess the impact of Legal Notice no. 62 of 2016 to see it is already a factor in the decline in earnings within the banking sector.
13.3.4 Asset QualityDeteriorationofassetqualitymayresultinanupsurge in the volume of non-performing loans and advances which could cause a decline in interest income. A review of asset quality dwells much on the assessment of loans and advances as they form a major portion of the asset structure. Also, loans and advances present the greatest credit risk and potential loss to banks. The quality of banks assets is also assessed by tracking the levels, trends and compositions of accounts in arrears, provisions and credit concentrations.
Total gross loans in the banking industry amounted to E11.8 billion in the year underreview from E11.0 billion the previous yearrepresenting a growth rate of 7 per cent. General provisions and specific provisionsstood at 1.3 per cent and 1.8 per cent during
the year under review. Non-performing loans and advances expressed as a percentage of gross loans was recorded at 10.25 per cent as at 31st March 2017 representing a significantdeterioration relative to 5.75 per cent recorded at 31st March 2016.
13.3.5 Liquidity Management Liquidity is one of the fundamental aspects used to determine the soundness of the banks. Several indicators show that the Swaziland bankingsectorhadsufficientliquidassetsandthat these are continuously maintained at healthy levels with liquid assets to deposits higher than the minimum statutory requirement of 25 per cent. The liquidity ratio for 31st March 2017 stood at 27.26 per cent from 26.26 per cent at 31st March 2016, well above the prescribed statutory minimum liquidity ratio.
In line with the Bank’s mandate of promoting a sound and safe banking system and ensuring confidenceinthedomesticbankingsector,theCentral Bank increased theminimum liquidityrequirement for the banking system, effective 1st July 2016 to 22 per cent for DevelopmentBanks and 25 per cent for all other banks. The banking sector remains compliant with the new requirements and maintain sufficient buffersto protect themselves in times of financialdistress.
13.4 OFF-SITE SURVEILLANCEAreliableandfinanciallysoundbankingsectoris an essential prerequisite for a country’s financialstabilityandeconomicgrowth.Forthisreason, continual monitoring and examining the financialconditionofbanksisofgreatinterestto regulatory authorities throughout the world. Since on-site examinations require substantial amounts of time and resources and thus cannot be carried out very frequently, off-site analyses play a major role in the supervision process.
The main purpose of the off-site monitoring function is to study and analyse the financialdata of each of the banking institutions to ensure the soundness of their financialpositions and to monitor phenomena or trends whose emergence calls for issuing relevant recommendations and or remedial actions. The Bank continues to receive financial and non-financialinformationfrombanksonafrequentbasis through Bank Supervision Application and then prepares periodic reports on the trends in thefinancialpositionandresultsofactivitiesofeach bank and on a consolidated basis.
CENTRAL BANK OF SWAZILAND 2016/2017 ANNUAL REPORT
81
13.5 ON-SITE SUPERVISIONThe Bank is mandated with the responsibility to supervise the operations of the domestic banking sector. Apart from its off-site work, the Bank, pursuant to section 39 of the Financial Institutions Act, 2005 conducts routine examinations in order to gain full understanding of the operations taking place and assess operational procedures and processes, to identify key risks that banks are faced with and the risk management systems in place to mitigatetheidentifiedrisks.
Based on the Risk Based Supervision approach, the Bank conducted two targeted on-site inspections for Standard Bank and Nedbank during the period under review.
13.6 REGULATORY DEVELOPMENTSThe Bank continued to strive for better ways of improving its supervisory oversight and a numberofsignificantmilestoneswereachievedand some still underway. The following is a list of the activities and policy changes that were initiated by the Bank during the year;
13.6.1 Legal Notice on Bank ChargesThe Bank issued Legal Notice No. 62, 2016 which came into force on 1stJuly2016.Theregulationamong other things prescribed for the capping at zeroof cashdeposit fees, cappingat E100the penalty fee for dishonoured payments and compelling banks to post their banking
fees and charges in their respective websites and banking halls and further publish same semi-annually in one of the widely circulating newspapers in the country. The intervention on the market disclosure regime is aimed at fostering market discipline in the industry. The CentralBankcontinuestomonitorcomplianceand the policy implications of the Legal Notice on an on-going basis.
13.6.2 Basel II Implementation The Bank has taken a strategic direction to migrate to Basel II and is currently doing preparatory work for the full implementation of Basel II which is scheduled for 1stJanuary2018.TheBankhasfinalizedadraftguidelineonPillar1 (minimum capital computation). Further, the Bank is currently meeting with various key strategic stakeholders, including banks, to discuss in detail the fundamental aspects of Basel II implementation in Swaziland.
13.6.3 IFRS 9 Implementation In order to align its regulatory and supervisory practices with other regimes like the new accounting standard, IFRS 9, which outlines the treatment of financial assets, the Bankthrough the Policy and Enforcement Divisionhas developed industry guidelines which set out the Bank’s policy in terms of IFRS 9. The new standard will be effective on or after 1st January2018.
14. EXCHANGE CONTROL AND ANTI-MONEY LAUNDERING
14.1 EXCHANGE CONTROL
14.1.1 Applications Approved During the period from 1st April, 2016 to 31st March 2017, the Bank approved a total of 71 applications for foreign exchange transactions with countries outside the CommonMonetaryArea (CMA). The number of applicationsapproved decreased by 2.7 per cent from a total of 73 approved in 2015/16. The amount of foreignexchange involvedwasE13.449billionreflecting a decrease of 20.8 per cent whencompared with E16.983 billion approved in2015/16. The monthly average for the period wasE1.121billioncomparedwithE1.415billionin 2015/16.
Dividend plus profit transactions accountedforE4.900billionor31.8percentofthetotalamountofE15.419billionapprovedbytheBankforremittanceoutsidetheCMA.
14.1.2 Out Payments Out payments totalling E11.807 billion weremade through the banking system and include remittances for transactions approved by the Bank. This figure shows an increase of 155.4per cent when compared with E4.623 billiontransferred in 2015/16 period. The monthly averagefortheperiodunderreviewwasE983.9million compared with E385.2 million the previous year.

CENTRAL BANK OF SWAZILAND 2016/2017 ANNUAL REPORT
82
Table 41: Regulated Entities as at 31 March 2017
Authorized Dealers Forex Bureaus Money Remittance Service Providers
First National Bank Interchange MTN
Standard Bank Swaziland Building Society Shoprite
SwaziDevelopmentandSavingsBank
NedbankSource: Central Bank of Swaziland
EXCHANGE CONTROL ANDANTI-MONEY LAUNDERING
Payments for invisible goods/services accounted forE4.472billionor37.9percentoftotaloutpayments, a decrease of 53.6 per cent when comparedwith E2.910 billion remitted duringthe 2015/16 period.
Payments for imports amounted to E7.336billiondenotingasignificantincreasefromtheE1.712 billion recorded during the 2015/16financialperiod.
14.1.3 Import Permits Granted and Out Payments
A total limit of E338.5 million was grantedfor imports of goods covered in the country’s negative list during the year under view, denoting an increase of 55.4 per cent when comparedwithE217.8millionrecordedduringthe2015/16financialperiod.
Out payments for imports totalled E7.336billion. The variance between import permit granted and actual payments was caused by imports, which do not require an import permit for importation into the country.
14.1.4 Analysis of Import Permits Granted This section covers breakdown of import permits granted by the Ministry of Finance for the period under review. The highest allocation was for machinery and transport equipment whichrecordedE234.1millionor69.2percentof the total limit, followed by miscellaneous manufactureswhichaddeduptoE103.9millionand clothing totalling to 0.5 million.
14.1.5 Total in-Payment Total receipts of foreign exchange from outside theCMAwere E11.483 billion during the year
under review, reflecting a decrease of 32.1per centwhen comparedwith E16.924 billionreceived in 2015/16. The monthly average for theperiodunderreviewwasE956.9million.
Income from exports totalled E8.440 billionreflecting a decrease of 5.1 per cent whencomparedwithE8.895billionreceivedfromthe2015/16 period.
The monthly average of export receipts for the period under review was E703.3 millioncomparedwithE741.3millionin2015/16.
14.2 ANTI–MONEY LAUNDERING
14.2.1 IntroductionThe Bank, continued with its objective of maintainingtheintegrityofthefinancialsystem.Identificationoftheinherentmoneylaunderingand terrorist financing risks in the financialindustry topped the agenda list in the year underreview.Tofacilitatetheidentificationofthe money laundering and terrorist financingrisks in the industry, the Bank phased in a risk based approach to supervision. It is through theidentificationandassessmentofrisksthatappropriate controls can be implemented and adequate resources allocated to detecting and deterring money laundering and terrorist financingintheindustry.
14.2.2 Overview of the Regulated IndustryOn the anti-money laundering and combatting ofterroristfinancingfront,theBankregulatesthe players in the banking financial industry.These include banks, forex bureaus and money remittance service providers.
CENTRAL BANK OF SWAZILAND 2016/2017 ANNUAL REPORT
83
EXCHANGE CONTROL AND ANTI-MONEY LAUNDERING (Continued)
14.2.3 Regulatory Developments
14.2.3.1 Risk Based Approach The Bank phased in the risk based approach to supervision by directing financial institutionsto conduct money laundering and terrorist financing risk assessments. As part of theexercise, banks were expected to develop money laundering and terrorist financing riskmanagement frameworks and thereafter submit quarterly risk assessment reports beginning from the quarter that ended on 30thJune2016.As at 31st March 2017, only one bank had managed to meet full compliance by developing a risk assessment framework and conducting a satisfactory risk assessment.
The Bank continues to provide guidance to the financialinstitutionstoensurecompliancewiththe directive to conduct risk assessments and steady progress has been noted. Preliminary risk assessments have been conducted and the development of risk management framework byfinancialinstitutionsisongoing.Ittranspiredthat the preparatory phase of adopting Risk Based Approach was more intensive than originally envisaged which therefore led to the extension of the implementation deadline.
14.2.3.2 Inspections In the year under review, the Bank strategically halted all onsite inspections to allow the phasing in of the risk based approach. Offsite inspections continued nonetheless and were conductedonall four(4)financial institutionsthrough the quarterly risk assessments. Areas of specificconcernwerecoveredthroughtargetedad-hoc onsite inspections. The Bank also reviewed Post Inspection Remedial Action Plans of two (2) banks on which onsite inspections had been conducted in the previous year. This ensures effective implementation of post-inspection recommendations.
Another area of dedicated focus was on new players in the market on which close offsite monitoring and guidance was ensured. Offsite inspections enable the Bank to monitor the adequacy and implementation of compliance programmesdevelopedbyfinancialinstitutions.
14.2.3.3 Money Laundering and Terrorist Financing (Prevention) Bill, 2015. The Bank welcomed the promulgation of the Bill to an Act in September 2016. The amendments to the Money Laundering and Terrorist
Financing (Prevention) Act, 2011, in relevant part, introduced the risk based approach in the implementation of anti-money laundering and countering of terrorist financing controland empowered supervisory authorities to issue administrative sanctions. The Amendment Act entrenched the Bank’s strategic objective of implementing a risk based approach and also enhanced the enforcement powers of the Bank.
14.2.3.4 Anti-Money Laundering (United Nations Security Council Resolutions) Regulations, 2016 The Regulations enacted in August 2016 establish the structures for the implementation of the United Nations Security Council Resolutions1267, 1373 and ancillary resolutions. There Resolutions require financial institutions tofreeze without delay assets of prescribed entities and individuals involved in financingterrorist activities. The Regulations will guide financial institutions as they thrive to complywiththeResolutionsandjointhefightagainstterroristfinancing.
14.2.3.5 Administrative Sanctions In the year under review, the Bank imposed two (2) administrative sanctions on one bank. The bank was fined for failure to submit anapplication for approval for the preferred candidate to assume the position of money launderingcomplianceofficerandforfailuretoadequatelyconductafitandproperassessmentduring the appointment of the compliance officer.
Theroleofacomplianceofficeriscrucialinacompliance programme as the function requires independence, competence and integrity from thepersonoccupyingtheposition.Thefitnessand probity of the candidate needs to be vetted using robust structures as the candidate is the pillar of the function over and above the policies implemented.
14.2.3.6 Domestic Cooperation The Bank is proud to have operationalized the Memorandum of Understanding between the Bank and the Financial Services Regulatory Authority on anti-money laundering and countering terrorist financing matters. Atechnical working group between the two supervisors was established and Terms of Reference guiding its operation have been drafted. They are yet to be tabled before the principals of the two supervisors for approval.

CENTRAL BANK OF SWAZILAND 2016/2017 ANNUAL REPORT
84
We look forward to a good working relationship on matters of common interest with the Financial Services Regulatory Authority.
14.2.4 National Risk AssessmentThe country is conducting a National Risk Assessment of the money laundering and terroristfinancingriskstowhichthecountryisexposed. The unit is pleased to participate in the exercise as the leader of the Banking sector. It is moreexcitingtohavethefinancialinstitutionsparticipate in the project as it gives them hands-onexperienceintheidentificationoftherisk exposures of the sector and understanding the national threats and vulnerabilities. The project, which is expected to take 18 months, will allow the Bank to understand the risks to which the banking sector is exposed and how they relate to the risk exposure of the country.
The results will guide the country as it formulates policy and allocate resources appropriately in thefightagainstmoneylaunderingandterroristfinancing.Fromafinancialsectorperspective,the Bank will understand the risk exposures, develop the appropriate supervisory tools, give appropriate guidance to financial institutionsbased on the risk in the banking sector and allocate adequate resources in implementing the supervisory tools developed. Through this exercise, the banks will appreciate the risks from a national level which will inform their risk assessments and guide development of mitigation controls.
Conducting a national risk assessment alsopositions the country for the 2019 mutual evaluation exercise through which the country will be assessed on the new methodology. This is the peer review exercise through which the country’s compliance to the FATF 40 Recommendations is assessed through an assessment of all stakeholders as well all underlying legislations. The last mutual evaluation exercise was conducted in 2010.
14.2.5 ChallengesIn the year under review, the Bank also faced some obstacles as it rendered its service as indicated below: 14.2.5.1 Supervisory ToolsWith the phasing in of a new system of operation, it follows that new supervisory tools need to be developed. In the year under review, the Bank
had a challenge in implementing the risk based approach as a risk based supervisory framework is yet to be developed. The Bank nonetheless persevered despite the crippling challenge.
14.2.5.2 Identification and Verification of Ultimate Beneficial OwnerIn the year under review, the Bank noted that financial institutions had difficulty inimplementing the requirement to identify and verifytheultimatebeneficialowner,especiallyfor legal persons. This was because there is a growing trend of complex ownership structures that has been noted yet there is no proper guidance in legislation on the threshold to apply in the ownership percentages to be considered in identifying the ultimate beneficial owner.Further compounding the problem was the unavailability of formal government structures for verifying the authenticity of identificationdocuments.
14.2.5.3 Voluntary Industry Compliance The Bank supervises commercial institutions thatareprofitdriven.Compliance,notclearlyunderstood, may be deemed to be depleting resources than contributing to the profits ofan organization. Yet the converse is true, compliance, effectively carried out, contributes to the profits of an organization by guidingbusiness operation towards meeting compliance standard and thereby avoiding steep regulatory fines.
The Bank is still trying to embed a voluntary culture of compliance as opposed to the tick box culture of compliance. The dangers of the tick box compliance culture are that institutions do the bare minimum to comply and they disregard the effectiveness of the controls employed. The Bank is hopeful that the risk based approach tosupervisionwillenablefinancialinstitutionsto understand that the controls implemented should be commensurate with the risk exposures and appropriate to effectively mitigate the risks.
14.2.6 Future OutlookThe Bank is optimistic about the ongoing National Risk Assessment as the process is a learning curve in understanding the principles of money laundering and terrorist financingriskidentificationandassessment.TheBankisdetermined to make a meaningful contribution in leading the banking sector.
EXCHANGE CONTROL AND ANTI-MONEY LAUNDERING
CENTRAL BANK OF SWAZILAND 2016/2017 ANNUAL REPORT
85
The development of supervisory tools to implement the risk based approach is a chief strategic objective in the next financial year.The Bank will be receiving technical assistance from international partners to develop a robust and effective regulatory framework that conforms to international standards.
The Bank is concerned about the increasing trend of complex ownership structures of legal
persons. Without the knowledge of the natural persons behind these structures, it opens room for criminals to use and control the legal personstolaundermoneyandfinanceterroristactivities. The Bank hopes to amend the AML/CFTGuidelines forFinancial Institutions,2016in thenextfinancial year to give guidance tofinancialinstitutionsonthethresholdstoapplyinidentifyingtheultimatebeneficialowneroflegal persons.
15. INTERNAL AUDIT15.1 OVERVIEW AND AUDIT COVERAGEThe Bank has maintained the provision of independent, objective assurance and consulting services designed to add value and improve the Bank’s Operations. The Bank has followed the Risk Based Internal Auditing (RBIA) methodology in performing audits with emphasis placed on high risk auditable units /areas.
The Bank endeavours to cover a wide range of auditable units with high risks, emphasis beingplacedonCBScorebusinessareaswhichencompass the Bank’s mandate as espoused in theCBSOrder(asamended).Inthatvein,theBank has maintained a three sectional approach to its audits which are: Core & ContinuousAudits; IS Applications, Strategic Performance &ChangeAudits;andQAR,Training&FindingsAssurance. This has ensured broader audit coverage of the Bank’s activities and instilled adherence to international auditing standards.The Bank reported on a wide range of audit issues to the Board Audit Committee (BAC)which needed management attention and were of significant importance. These issuesranged from policy formulation / updating to control issues. Most of the issues were resolved within acceptable time limits, and those that remained at year end were being attended to in a satisfactory manner.
15.2 ACHIEVEMENTS
15.2.1 Audits CoveredThe Bank continued to focus on integrated business audits (IBAs) of critical CBSdepartments, continuous audits including cash management audits as well as audit of two of the Bank’s strategic objectives – Project Perform and Project Reform.The Bank has alsoconductedthe InternalFinancialControlsReview to determine if financial controls areadequate and effective.
15.2.2 Continuous Internal AssessmentsThe Bank has periodically conducted internal assessments of audit projects to ensure compliance to international auditing standards in execution of audits. Further, the Bank has continued with its monthly Quality Circle(QCS)meetingsasperthedictatesoftheauditmethodology. This is a way of assisting each audit team manage / resolve challenges encountered whilst conducting quarterly audits.
15.2.3 Anti-fraud and Logs Monitoring System (AFLMS)The Bank has procured and put in place the AFLMS as at 31st March 2017. The system has an audit analytics module which is basically a ComputerAssistedAuditingTool(CAAT).
15.3 FUTURE OUTLOOK
15.3.1 Combined Assurance AuditThe Bank with other assurance providers are mulling on how would this important activity be tackled. A formal initiation of this is yet tobedone.The intent is to ensure sufficientuse of all assurance providers within the Bank. This will ensure that audit resources are then focused on key areas of the Bank with high risk.
15.3.2 Anti-fraud and Logs Monitoring SystemThe Bank staff are now expected to start using the AFLMS. The AFLMS will be used for effective data mining, analysis and interrogation thus adding value in the operations of the Bank. Specific training (user training) on the use ofthis acquired tool is an absolute necessity to equip all the available audit staff.
15.3.3 Upgrade of TeamMateThe Bank has been using an older version of teammate. An upgrade to the latest version of teammate – R12 will be done. This will come with user / refresher training of the audit staff thus enhance utilization of the system.

CENTRAL BANK OF SWAZILAND 2016/2017 ANNUAL REPORT
86
16.1 Risk Management FrameworkThe Bank’s risk management framework is closely integrated with the strategic and business planning processes. Improvements to the framework over the past year resulted in a numberofrelativelyhighrisksbeingidentifiedearly, monitored and controlled.
During 2016/17 the Risk Committee workedclosely with the other governance committees to ensure overlapping coverage of risk
management in linewith the EnterpriseWideRisk Management Framework.
16.2 Top 10 RisksThrough the collaborated effort, the Bank managed to come up with Top Ten Risks, which made the basis for strategic focus. Of the 17 Risk classes as informed by the Bank’s risk universe, the 2016/17 reporting period risk assessment indicated a high exposure on the following;
16. RISK MANAGEMENT FUNCTION
Table 42: Top 10 Risks
Rank Risk Class Risk Description1 IT Risk CBSITenvironment(ITSystems,InfrastructureandSecurity)weakness
against the increasing cyber threats.
2 Financial Risk Failure to maintain adequate FX reserves thus undermining the Bank’s ability to fulfil itsmandate in the view of adverse financialmarkets developments, dwindling reserves, limited revenue base and government liquidity challenges.
3 Procurement Risk Ineffective procurement policy and procedures exposing the Bank to procurement fraud and poor service delivery.
4 ExternalEnvironmentRisk
Ineffective monitoring and response to external environment (Political, economic, social, technological, environmental and legal) developments due to the inadequate tools and data resulting in uneconomic responses and inappropriate policy direction.
5 People Risk Inappropriate organizational culture due to ineffective HR policies, structures and disengaged/demotivated staff leading to poor performance and loss of key talent.
6 Strategic Risk Ineffective strategy planning and execution process resulting in the non-delivery/sub-standard delivery of strategic projects thus compromisingthefulfilmentofthemandateoftheBank.
7 Fraud Risk Failing to effectively prevent, detect, monitor, investigate and respond to fraud leading to operational disruptions,financial lossesand reputational damage.
8 Processes Risk Poor process, risk and continuity management due to undocumented processflows,disintegratedrolesandpoorriskandbusinesscontinuitycultureresultinginineffectiveandinefficientdeliveryonobjectives.
9 Regulatory ComplianceRisk
Absence of a bank-wide regulatory compliance universe leading to inadequate compliance to regulatory and good governance practices andcompliancebreachessomeofwhichattractpenaltieswithfinancialand reputational implications.
10 Reputational Risk LackofstakeholderconfidenceintheBankduetoineffectivestakeholder engagement leading to poor stakeholder cooperation and ineffective implementation of the monetary policy.
In ensuring effective management of risk, the Bank continued to make effective use of the three lines of defence, which are business units, risk and audit functions. To the extent that the Internal Audit function was able to map internal controls against strategic and operational risks to help better coordinate and provide coverage of assurance activities.
16.3 SAFETY, HEALTH, ENVIRONMENT RISK AND QUALITY
TheRe-LaunchingoftheSafety,HealthQuality,and Risk section during the reporting period is a reflectionoftheBank’scommitmenttoprovinga safe and conducive working environment to its employees in compliance with the Occupational, Safety and Health Act of 2001.
CENTRAL BANK OF SWAZILAND 2016/2017 ANNUAL REPORT
87
16.3.1 Compliance with the Occupational Safety and Health Act of 2001In compliance with Section 16 of the Occupational Health and Safety Act of 2001, the Bank appointed“theHealthandSafetyCommittee”.In support of this statutory structure was the appointment of Safety Representatives, Fire ChampionsandFirstAiders.
16.3.2 Environmental SurveyDuring the reporting period, the Banksuccessfully commissioned an environmental survey through technical assistance for the Bank Premises, in particular the vaults, banking hall and the Matsapha Cash Centre. This wasdonetoscientificallyassesstheenvironmentalconditions of the workplaces in order to provide timely interventions. The outcome of the survey was a source of information which assisted the Bank on the type and nature of protective equipment to be used, and the medical surveillance to be afforded on the staff in those work areas.
16.3.3 Stakeholder Engagement• Re-LaunchofSHERQfunctionandcelebration
of the World Occupational Health and Safety Daywasheldonthe13th May 2016, wherein the Ministry of Labour and Social Services was represented.
• Engaginginternalstakeholdersonstandardsinuse in theBank.The ideawastodefineand discuss standards with a view to collate an inventory of all standards in use at the Bank.
• Engaging internal stakeholders on safehousekeeping in the Bank. A Housekeeping Plan was adopted running from 1st June2016for review in February 2017. The purpose of this is exercise was to:- Identify, eliminate and or mitigate unsafe
acts and conditions; and- Allow for needs assessment of each
division / department that would inform their planning and budget cycle.
• Engaged all stakeholders (staff inoperations, audit, risk and cash centre) on theEnvironmentalSurveyreport.
• FacilitatedappointmentandtrainingofFirstAiders and Fire Marshalls.
16.4 BUSINESS CONTINUITY MANAGEMENTThe Bank had reviewed its approach in addressing its resilience to respond and be able to operate in case of business disruptions to its critical process.
During the period under review, activities onBusiness Continuity Management (BCM) hadimproved significantly as a consequence ofappointingadedicatedBCMSpecialist.BusinessContinuityPlanshadbeenrevisedinlinewiththe new organizational structure. A minor simulation had been successfully conducted at the Disaster Recovery Site on all criticalprocesses to ensure that the Bank can continue to operate its critical business processes during a disaster. Major Bank-wide simulation exercise is planned to be conducted in 2017/18 reporting period.
17. ECONOMIC POLICY RESEARCHAND STATISTICS DEPARTMENT
17.1 MAJOR HIGHLIGHTS
17.1.1 Monetary Policy FrameworkThe year 2016 has been tough for monetary policy implementation. Various developmentsat global, regional and domestic economy have tested the operational efficacy of the policytools the Bank has at its disposal to ensure price andfinancialsectorstability.TheyearhadtheBank thinking on how best to respond to supply-sideinflation.Partofthatprocessyieldedthedocumentation of a Monetary Policy Framework (MPF). The MPF would guide monetary policy implementation going forward. It outlines the monetary policy transmission channels and
targets, in broad terms. The Framework was disseminated to all stakeholders during the presentation of the 2017 Governor’s Annual Monetary Policy Statement.
17.1.2 Research BulletinAs part of knowledge management and information dissemination, the Bank introduced a Research Bulletin in which all research papers produced by the Bank during the reporting year were compiled. This is aimed at helping the public to easily access the published papers from the Bank’s website and understand the policy dynamics faced by economy.
CENTRAL BANK OF SWAZILAND 2016/2017 ANNUAL REPORT
88
17.1.3 Financial Sector Development Implementation PlanTo further strengthen the financial sector inSwaziland, the Ministry of Finance, the Bank and the Financial Services Regulatory Authority (FSRA) are working on a Financial Sector Development Implementation Plan (FSDIP) incollaboration with the World Bank and IMF. The objective of the FSDIP is to develop,strengthen, deepen and modernize the entire financialsectorinSwaziland.TheFSDIPtakesacomprehensiveapproachtothefinancialsectorcovering both Non-Bank Financial Institutions and the domestic commercial banks. Further, the FSDIP addresses Payments Systems andinfrastructureandissuesoffinancialinclusion.This is a three-year strategy which will be implemented from 2017 to 2019 with the Bank providing Secretariat services.
17.1.4 Post Budget SeminarThe Bank, in collaboration with Ministry of Finance, also hosted the 2017 Post Budget Seminar. The purpose of the Seminar was to bring together stakeholders from all sectors of the society to deliberate and brainstorm on the 2017/18 Budget presented by the Minister
of Finance and thereby assist the Ministry of Finance and the whole Government on how to effectively execute the budget. 17.2 ACTIVITIES EARNMARKED FOR 2017/18Going forward, the Bank aims to continue refiningtheMPFandimplementingittoensureprice and financial sector stability. To ensuretransparency and open communication, the Bank’s decision on the appropriate monetary policy stance taken in consultation with the MonetaryPolicyConsultativeCommittee(MPCC)is immediately disseminated to the public through a Press Release. Secondly, the Bank in collaborationwith the Swaziland EconomicPolicy Analysis and Research Centre (SEPARC)and the University of Swaziland (UNISWA), will host the first ever Swaziland EconomicConference in October 2017. The Conferenceis conceived as a knowledge sharing platform wherein research work will be presented. Thirdly, the Bank will host a Governor’s lecture. The lecture is a stakeholder engagement platform for which the Bank can interact with students, researchers and other policymakers on monetary policy implementation and other related issues.
18. HUMAN RESOURCE MANAGEMENT18.1 HUMAN RESOURCE DIVISION
18.1.1 Staff Compliment As a result of the Restructuring process and increased departmental requirements/ needs, anumberofvacancieswerefilledacrossvariouslevelsintheBank’sDepartments.Inthatregard,29positionswerefilledduringtheyearbringingthe total staff compliment to 291 at end of March 2017. Staff turn over was recorded at 2.7 per cent during the period under review.
18.1.2 Induction All new staff and Graduate Trainees recruited at all levels were inducted to be acquainted with the Banks mandate, operations, strategy, performance management drive and values.
18.1.3 Salary Review The Bank has embarked on a Salary Review Exercisewhichisconductedeverythreeyears.It is expected that the exercise will be concluded inthe2017/18financialyear.
18.1.4 Talent Management StrategyTalent Management Strategy is being rolled out in adherence to the nine pillars:• TalentIdentificationandAcquisition
• SuccessionManagement• PerformanceManagement• DevelopmentandLearning• WorkforcePlanning• LeadershipDevelopment• TalentRetention• CompensationandBenefits• Offboarding
18.2 LEARNING AND ORGANISATIONAL DEVELOPMENT
18.2.1 Specialized TrainingIn the year under review, the Bank continued to expose its management team to a variety of training programmes to enhance effectiveness.
18.2.1.1 Corporate Governance and Induction for the Board of DirectorsIt was provided by the Institute of Board of Directors. The course content includedcustomized induction, introduction to CorporateGovernance,principlesofCorporateGovernance, Increasing Board’s effectiveness and value add, the Board’s role in Strategy and Risk.AnoverviewoftheChairman’sProgrammeformed part of the training.
CENTRAL BANK OF SWAZILAND 2016/2017 ANNUAL REPORT
89
18.2.1.2 Emotional Intelligence TrainingThetrainingtargetedbothExecutiveCommitteeand Management. This short course provided Management with an understanding of and practice in assertive Communication, definingAssertiveness,non-verbalCommunication,self-image and developing and managing effective Relationships. As the Bank experiences some changes, especially in adopting the high performance culture, the ability to relate to people and makegooddecisions influences individualandorganisational performance, hence the training onEmotionalIntelligence.ThiswasprovidedbyMaccauvlei.
18.2.1.3 High Performance Culture Programme The Programme was attended by ExecutiveCommitteeMembers.
18.2.2 General TrainingThe Generic training for the Bank consists of the following:• EmotionalIntelligenceandtargetgroupwas
theLineManagersandExecutiveTeam.• Retire in Dignity – target group consists of
employees who are 55 years and above.• Introductory, intermediate and advanced
excel for Departments that use excel themost.
• Customer Care for the front-liners of theBank.
• FireMarshalandFirstAidTraining.• VoiceProjectionandPresentationSkills.
18.2.3 Change ManagementThe Bank continues to execute the change ManagementconceptusingtheADKARapproach:
A - Awareness of the need to change. This awareness tries to explain issues that have created the need and what it will address in terms of business, customer and competitor needs.
D - Desiretoparticipateandsupportthechange
K - Knowledge of how to change (andwhat the change looks like)
A - Ability to implement the change on a day-to-day basis
R - Reinforcement to keep the change in place
18.3 FACILITIESTo ensure safe environment for employees, during the year 2016/17, the Bank implemented the following: • Installationofanewsecondarygate.• Refurbishment of the Boundary fence and
painting in the parking premises at Mbabane.• ContinuetosupporttoBankbyprovisionof
Facelift maintenance to three Bank Flats.• Continuetoprovidecanteenservices.
18.4 EMPLOYEE ASSISTANCE PROGRAMMEIn its consideration of the wellness of its employees to be of strategic importance, the Bank has continued to invest in programmes and projects that create awareness on how staff can improve their wellbeing. On 16thJune2016, the Employee Assistance Programmewas relaunched as a Comprehensive WellnessProgramme. The essence of the relaunch was to sensitise members of staff that the Bank continues to consider their wellness as a priority and that the focus has shifted from theemphasisofinterventionsonHIVandAIDSgiven that the burden of disease for business has significantly increased as result of non-communicable diseases (NCDs). These NCDshave also become known as lifestyle diseases due their causation being the lifestyle.
Asoneof the interventions forfightingNDCs,the Bank hosted a Wellness Aerobathon, which was a national event that attracted over 300 participants from all over the country. The aim of the aerobathon was mainly to challenge members of staff first and general publicsecondly to engage their bodies in physical activity for development of a healthy lifestyle.
HUMAN RESOURCE MANAGEMENT

CENTRAL BANK OF SWAZILAND 2016/2017 ANNUAL REPORT
Central Bank of Swaziland Annual Financial Statements
90
PART C
CENTRAL BANK OF SWAZILAND
FINANCIAL STATEMENTSfor the year ended 31 March 2017

CENTRAL BANK OF SWAZILAND 2016/2017 ANNUAL REPORT
Central Bank of Swaziland Annual Financial Statements
91
STATEMENT OF DIRECTOR’S RESPONSIBILITYfor the year ended 31 March 2017
The directors are responsible for the maintenance of adequate accounting records and the preparation andintegrityofthefinancialstatementsandtherelatedinformation.Theauditorsareresponsibleforreportingonthefairpresentationofthefinancialstatements.Thefinancialstatementshavebeenprepared in accordance with International Financial Reporting Standards and in the manner required bytheCentralBankOrderof1974,asamended.
The directors are also responsible for the Bank’s system of internal financial control. These aredesigned to provide reasonable, but not absolute, assurance as to the reliability of the financialstatements, and to adequately safeguard, verify and maintain accountability of the assets, and to prevent and detect misstatement and loss. Nothing has come to the attention of the directors to indicate that any material breakdown in the functioning of these controls, procedures and systems has occurred during the year under review.
Thegoingconcernbasishasbeenadoptedinpreparingthefinancialstatements.Thedirectorshaveno reason to believe that the Bank will not be a going concern in the foreseeable future based on forecastsandavailablecashresources.ThesefinancialstatementssupporttheviabilityoftheBank.
The financial statements have been audited by the independent accounting firm,PricewaterhouseCoopers,whichwas given unrestricted access to all financial records and relateddata, including minutes of the board of directors and committees of the board. The directors believe that all representations made to the independent auditors during their audit are valid and appropriate. PricewaterhouseCoopers’auditreportispresentedonpages97to98.
Theannualfinancialstatementswhichappearonpages96to215havebeenapprovedbytheboardof
directors on and are signed on its behalf by:
GOVERNOR DIRECTOR
CENTRAL BANK OF SWAZILAND 2016/2017 ANNUAL REPORT
Central Bank of Swaziland Annual Financial Statements
92
INDEPENDENT AUDITOR’S REPORTTotheShareholder’sofCentralBankofSwaziland
Our OpinionInouropinion,thefinancialstatementspresentfairly,inallmaterialrespects,thefinancialpositionofCentralBankofSwaziland(theBank)asat31March2017,anditsfinancialperformanceandcashflowsfortheyearthenendedinaccordancewithInternationalFinancialReportingStandardsandtherequirementsoftheCentralBankOrderof1974.
What we have auditedCentralBankofSwaziland’sfinancialstatementssetoutonpages97to215comprise:• thestatementoffinancialpositionasat31March2017;• thestatementofcomprehensiveincomefortheyearthenended;• thestatementofchangesinequityfortheyearthenended;• thestatementofcashflowsfortheyearthenended;and• thenotestothefinancialstatements,whichincludeasummaryofsignificantaccountingpolicies.
Basis for OpinionWe conducted our audit in accordance with International Standards on Auditing (ISAs). Our responsibilities under those standards are further described in the Auditor’s responsibilities for the auditofthefinancialstatements section of our report.
Webelievethattheauditevidencewehaveobtainedissufficientandappropriatetoprovideabasisfor our opinion.
IndependenceWe are independent of the Company in accordance with the requirements of the InternationalFederationofAccountants’(IFAC)CodeofEthicsforProfessionalAccountantsWehavefulfilledourethicalresponsibilitiesinaccordancewiththeIFACCode. Other InformationThedirectorsareresponsiblefortheotherinformation.TheotherinformationcomprisestheDirectors’Reportandthestatementofdirector’sresponsibility.Otherinformationdoesnotincludethefinancialstatements and our auditor’s report thereon.
Ouropiniononthefinancialstatementsdoesnotcovertheotherinformationandwedonotexpressan audit opinion or any form of assurance conclusion thereon.
In connection with our audit of the financial statements, our responsibility is to read the otherinformationidentifiedaboveand,indoingso,considerwhethertheotherinformationismateriallyinconsistent with the financial statements or our knowledge obtained in the audit, or otherwiseappears to be materially misstated.
If, based on the work we have performed, we conclude that there is a material misstatement of this other information, we are required to report that fact. We have nothing to report in this regard.
Responsibilities of the Directors for the Financial StatementsThedirectorsareresponsibleforthepreparationandfairpresentationofthefinancialstatementsinaccordancewithInternationalFinancialReportingStandardsandtherequirementsoftheCentralBank Order of 1974 and for such internal control as the directors determine is necessary to enable the preparationoffinancialstatementsthatarefreefrommaterialmisstatement,whetherduetofraudor error.

CENTRAL BANK OF SWAZILAND 2016/2017 ANNUAL REPORT
Central Bank of Swaziland Annual Financial Statements
93
INDEPENDENT AUDITOR’S REPORTTotheShareholder’sofCentralBankofSwaziland
Inpreparingthefinancialstatements,thedirectorsareresponsibleforassessingtheBank’sabilitytocontinue as a going concern, disclosing, as applicable, matters related to going concern and using the going concern basis of accounting unless the directors either intend to liquidate the Bank or to cease operations, or have no realistic alternative but to do so.
Auditor’s Responsibilities for the Audit of the Financial StatementsOurobjectivesaretoobtainreasonableassuranceaboutwhetherthefinancialstatementsasawholeare free from material misstatement, whether due to fraud or error, and to issue an auditor’s report that includes our opinion. Reasonable assurance is a high level of assurance, but is not a guarantee that an audit conducted in accordance with ISAs will always detect a material misstatement when it exists. Misstatements can arise from fraud or error and are considered material if, individually or in theaggregate,theycouldreasonablybeexpectedtoinfluencetheeconomicdecisionsofuserstakenonthebasisofthesefinancialstatements.
As part of an audit in accordance with ISAs, we exercise professional judgement and maintain professional scepticism throughout the audit. We also:• Identifyandassesstherisksofmaterialmisstatementofthefinancialstatements,whetherdue
to fraud or error, design and perform audit procedures responsive to those risks, and obtain audit evidence that is sufficient and appropriate to provide a basis for our opinion.The risk of notdetecting a material misstatement resulting from fraud is higher than for one resulting from error, as fraud may involve collusion, forgery, intentional omissions, misrepresentations, or the override of internal control.
• Obtainanunderstandingofinternalcontrolrelevanttotheauditinordertodesignauditproceduresthat are appropriate in the circumstances, but not for the purpose of expressing an opinion on the effectiveness of the Bank’s internal control.
• Evaluatetheappropriatenessofaccountingpoliciesusedandthereasonablenessofaccountingestimates and related disclosures made by the directors.
• Concludeontheappropriatenessofthedirectors’useofthegoingconcernbasisofaccountingand,based on the audit evidence obtained, whether a material uncertainty exists related to events or conditionsthatmaycastsignificantdoubtontheBank’sabilitytocontinueasagoingconcern.Ifwe conclude that a material uncertainty exists, we are required to draw attention in our auditor’s reporttotherelateddisclosuresinthefinancialstatementsor,ifsuchdisclosuresareinadequate,to modify our opinion. Our conclusions are based on the audit evidence obtained up to the date of our auditor’s report. However, future events or conditions may cause the Bank to cease to continue as a going concern.
• Evaluate theoverallpresentation, structureandcontentof thefinancial statements, includingthedisclosures,andwhetherthefinancialstatementsrepresenttheunderlyingtransactionsandevents in a manner that achieves fair presentation.
We communicate with the directors regarding, among other matters, the planned scope and timing of theauditandsignificantauditfindings,includinganysignificantdeficienciesininternalcontrolthatwe identify during our audit.
PricewaterhouseCoopersPartner: Theo MasonCharteredAccountant(Swaziland)P.O Box 569 MbabaneDate:
CENTRAL BANK OF SWAZILAND 2016/2017 ANNUAL REPORT
Central Bank of Swaziland Annual Financial Statements
94
DIRECTOR’S REPORTfor the year ended 31 March 2017
IntroductionThe Board of Directors (“Directors”) present their report of the Central Bank of Swaziland (“theBank”)fortheyearended31March2017.ThisreportintermsofSection52(1)oftheCentralBankofSwazilandOrder,1974coversthefinancialperformanceoftheBankintermsoftherelevantstatutoryrequirements.
Nature of Business and OperationsTheBank is theCentralBankof theKingdomofSwazilandand is regulated in termsofanActofParliament.TheprimaryobjectiveoftheBankistheachievementandmaintenanceoffinancialandmonetary stability.
Financial ResultsThe results of the Bank and the state of its affairs at 31 March 2017 are set out in the attached financialstatements.
DirectorsTheDirectorsareappointedbytheMinisterforFinance.ThefollowingDirectorsservedontheBoardduring the year:
M.Sithole Governor,ChairmanM.Dlamini DeputyGovernorD.Masilela Member(expired31/05/2016)P.N.Joubert Member(expired31/05/2016)HRHPrinceDavidDlamini Member(expired31/05/2016)C.Muir Member(expired31/05/2016)K.Dlamini MemberS. Gumbi MemberD.Shabangu MemberA.SDlamini MemberM. Matsebula MemberB. Bhembe Member
SecretaryR. Mamogobo
Business Address Postal AddressMahlokohla Street P O Box 546Mbabane Mbabane
AuditorsPricewaterhouseCoopersRhusOfficePark,KalGrantStreet,Mbabane
CENTRAL BANK OF SWAZILAND 2016/2017 ANNUAL REPORT
Central Bank of Swaziland Annual Financial Statements
95
DIRECTOR’S REPORTfor the year ended 31 March 2017
ContractsTherewerenocontractsenteredintoduringtheyearinwhichdirectorsorofficersoftheBankhadintereststhatsignificantlyaffectedtheaffairsorbusinessoftheBank.
Post Balance Sheet EventsThere are no events which have occurred between the balance sheet date and the date of this report whichhaveamaterialimpactonthesefinancialstatements.
Expenditure on Capital ProjectsThe bank completed drilling of the borehole system and network infrastructure for the seventh and eight floors of Umntsholi building following the relocation of the US Embassy. Other investmentsundertaken included purchasing of an armoured vehicle, two SUVs, ERP hardware, planning andscoping expenses. As at 31 March 2017 the total cost incurred towards capital project amounts to E20.244million(2016:E41Million).
Director’s approval of the Annual Financial StatementsThe Directors are responsible for maintaining adequate accounting records and preparing annualfinancialstatementswhichfairlypresentsthestateofaffairsoftheBankattheendofthefinancialyear, and the results of operations, cash flows and changes in equity for the year, in conformitywith International Financial Reporting Standards. The Board is also responsible for the total risk management process within the Bank. Management is accountable to the Board and has established asystemofinternalcontroltomanagesignificantrisksfacedbytheBank.ThissystemsupportstheBoard in discharging its responsibility for ensuring that the wide range of risks associated with the Bank’s operations are effectively managed. The system of internal control, which is embedded in all key operations, provides reasonable assurance, rather than absolute assurance, that the Bank’s businessobjectiveswillbeachievedwithintherisktolerancelevelsdefinedbytheBoard.
The Board also subscribes to the principles of corporate governance and has maintained and operated an audit committee, executive committee, budget committee and remuneration committee throughout the year.
In preparing the financial statements reflected on pages 96 to 215, the Bank has complied withInternational Financial Reporting Standards and has used appropriate accounting policies supported by reasonable andprudent judgments andestimates.TheDirectors areof theopinion that thesefinancialstatementsfairlypresentthefinancialpositionoftheBankat31March2017,andtheresultsofoperations,cashflowinformationandchangesinequityfortheyearthenended.
TheDirectorshave reviewed theBank’s3-year corporate strategyandbudget for theyearended31March2017.Onthebasisofthisreview,andinlightofthecurrentfinancialpositionandexistingborrowingfacilities,theDirectorsaresatisfiedthattheCentralBankofSwazilandisagoingconcernandhavecontinuedtoadoptthegoingconcernbasisinpreparingthesefinancialstatements.
The external auditors, PricewaterhouseCoopers, are responsible for independently auditing andreporting on the financial statements in conformity with International Auditing Standards. Theirunqualifiedreportonthesefinancialstatementsappearsonpage97.
Theannualfinancialstatementsfortheyearended31March2017,assetoutinpages96to215,were
approvedbytheBoardofDirectorson and are signed on its behalf by:
Governor Director DeputyGovernor
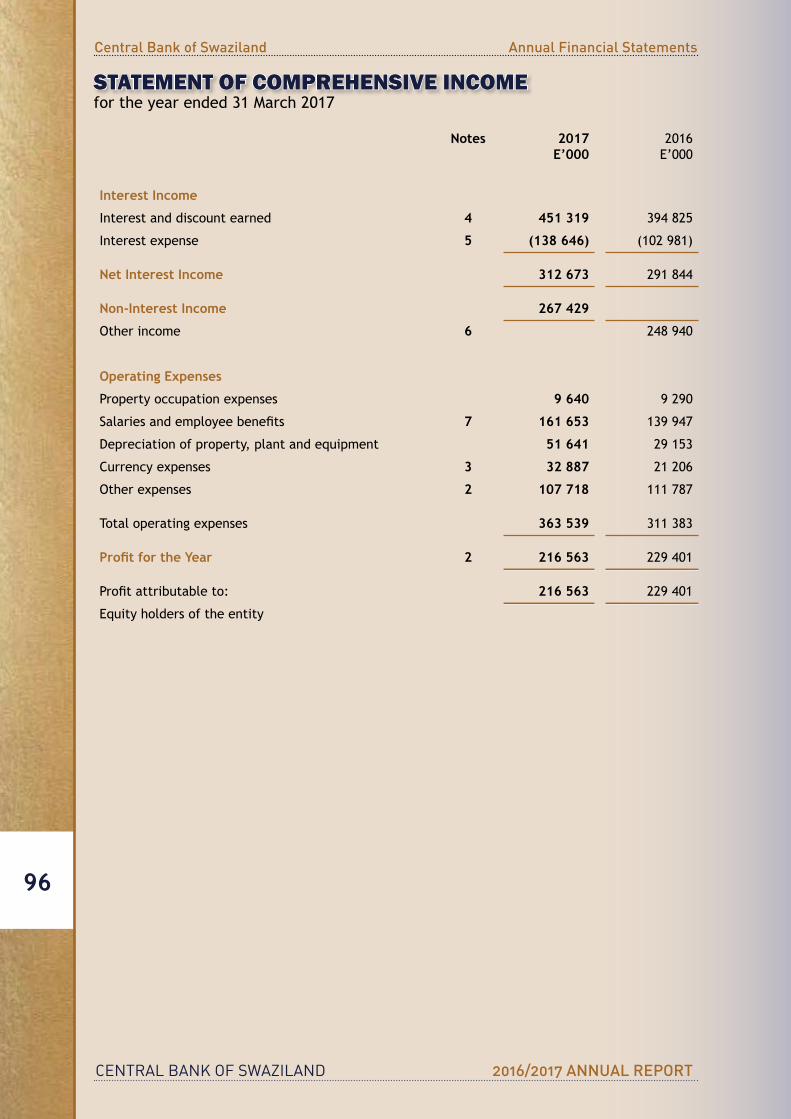
CENTRAL BANK OF SWAZILAND 2016/2017 ANNUAL REPORT
Central Bank of Swaziland Annual Financial Statements
96
STATEMENT OF COMPREHENSIVE INCOMEfor the year ended 31 March 2017
Notes 2017E’000
2016E’000
Interest Income
Interest and discount earned 4 451 319 394 825
Interest expense 5 (138 646) (102 981)
Net Interest Income 312 673 291 844
Non-Interest Income 267 429
Other income 6 248 940
Operating Expenses
Property occupation expenses 9 640 9 290
Salariesandemployeebenefits 7 161 653 139 947
Depreciationofproperty,plantandequipment 51 641 29 153
Currencyexpenses 3 32 887 21 206
Other expenses 2 107 718 111 787
Total operating expenses 363 539 311 383
Profit for the Year 2 216 563 229 401
Profitattributableto: 216 563 229 401
Equityholdersoftheentity
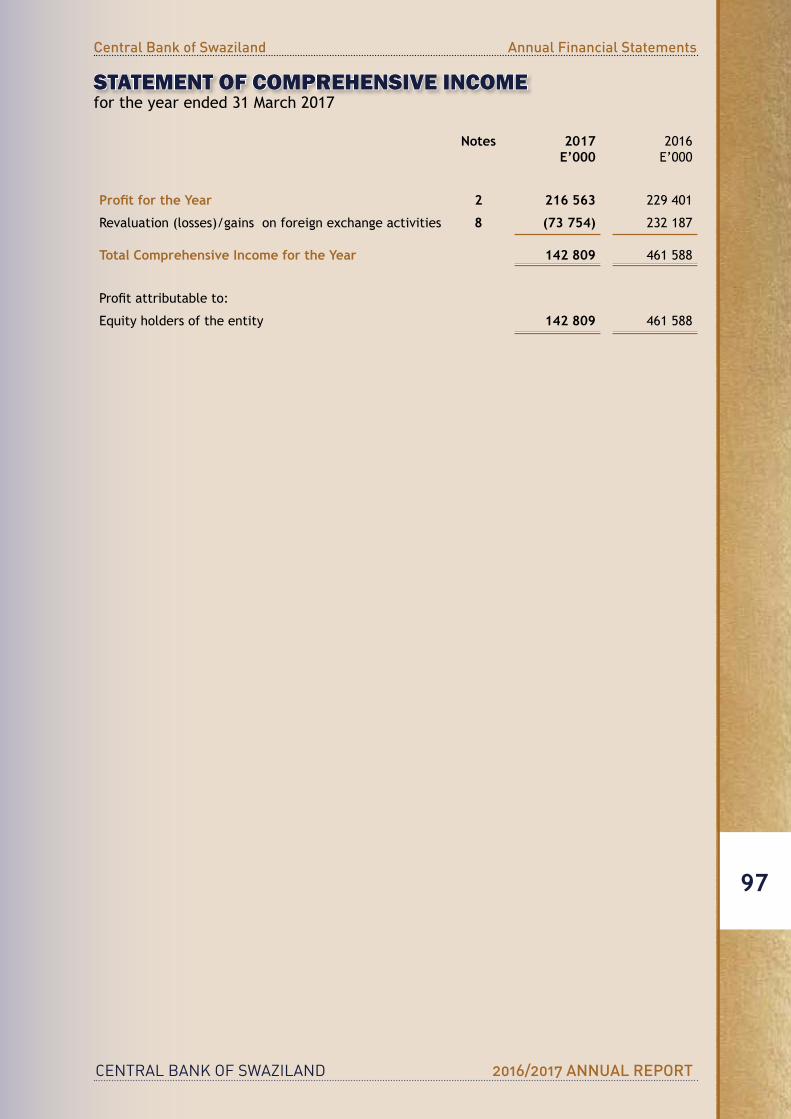
CENTRAL BANK OF SWAZILAND 2016/2017 ANNUAL REPORT
Central Bank of Swaziland Annual Financial Statements
97
STATEMENT OF COMPREHENSIVE INCOMEfor the year ended 31 March 2017
Notes 2017E’000
2016E’000
Profit for the Year 2 216 563 229 401
Revaluation (losses)/gains on foreign exchange activities 8 (73 754) 232 187
Total Comprehensive Income for the Year 142 809 461 588
Profitattributableto:
Equityholdersoftheentity 142 809 461 588
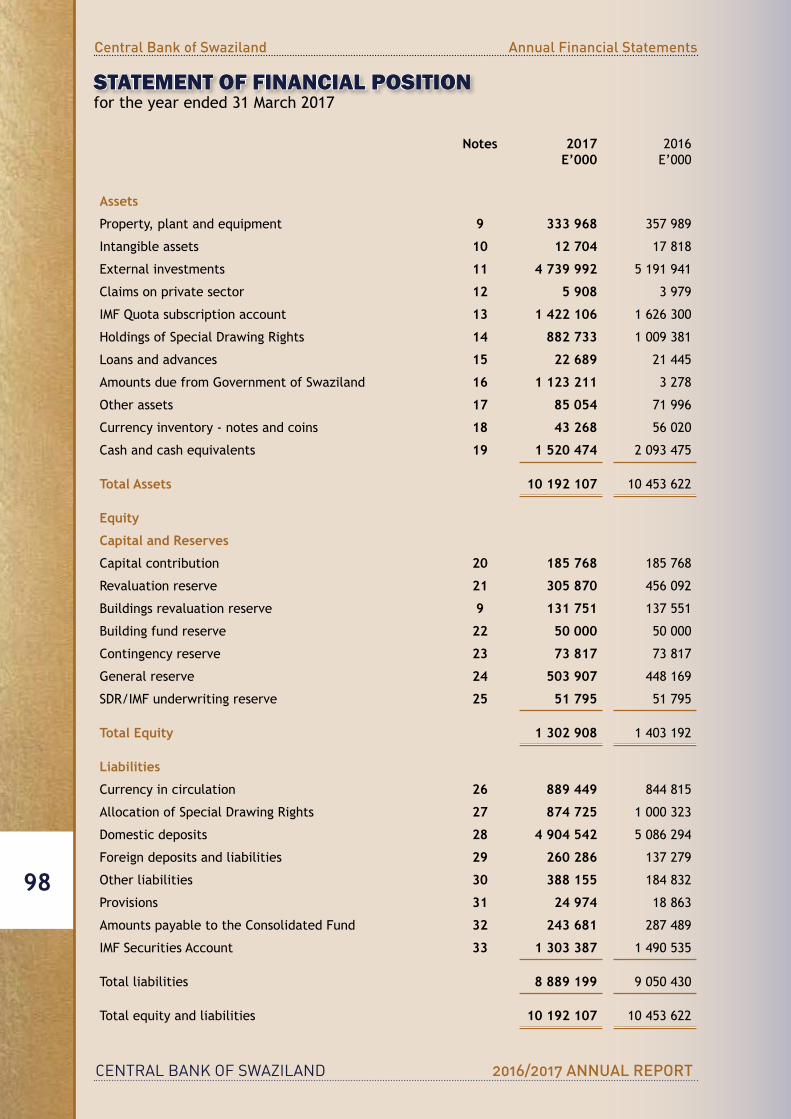
CENTRAL BANK OF SWAZILAND 2016/2017 ANNUAL REPORT
Central Bank of Swaziland Annual Financial Statements
98
STATEMENT OF FINANCIAL POSITIONfor the year ended 31 March 2017
Notes 2017E’000
2016E’000
Assets
Property, plant and equipment 9 333 968 357 989
Intangible assets 10 12 704 17 818
Externalinvestments 11 4 739 992 5 191 941
Claimsonprivatesector 12 5 908 3 979
IMFQuotasubscriptionaccount 13 1 422 106 1 626 300
HoldingsofSpecialDrawingRights 14 882 733 1 009 381
Loans and advances 15 22 689 21 445
Amounts due from Government of Swaziland 16 1 123 211 3 278
Other assets 17 85 054 71 996
Currencyinventory-notesandcoins 18 43 268 56 020
Cashandcashequivalents 19 1 520 474 2 093 475
Total Assets 10 192 107 10 453 622
Equity
Capital and Reserves
Capitalcontribution 20 185 768 185 768
Revaluation reserve 21 305 870 456 092
Buildings revaluation reserve 9 131 751 137 551
Building fund reserve 22 50 000 50 000
Contingencyreserve 23 73 817 73 817
General reserve 24 503 907 448 169
SDR/IMFunderwritingreserve 25 51 795 51 795
Total Equity 1 302 908 1 403 192
Liabilities
Currencyincirculation 26 889 449 844 815
AllocationofSpecialDrawingRights 27 874 725 1 000 323
Domesticdeposits 28 4 904 542 5 086 294
Foreign deposits and liabilities 29 260 286 137 279
Other liabilities 30 388 155 184 832
Provisions 31 24 974 18 863
AmountspayabletotheConsolidatedFund 32 243 681 287 489
IMF Securities Account 33 1 303 387 1 490 535
Total liabilities 8 889 199 9 050 430
Total equity and liabilities 10 192 107 10 453 622

CENTRAL BANK OF SWAZILAND 2016/2017 ANNUAL REPORT
Central Bank of Swaziland Annual Financial Statements
99
STATEMENT OF CASH FLOWfor the year ended 31 March 2017
Notes 2017E’000
2016E’000
Cash flows from Operating Activities
Operatingprofit 142 809 461 588
Adjusted for:
Depreciationandamortizationandimpairment 9,10 51 641 28 805
Loss on disposal of property plant and equipment 2 268 52
Adjusted for unrealized gains on IMF Accounts: 18 097 (27 411)
IMFQuotasubscriptionaccount 204 194 (774 464)
HoldingsofSpecialDrawingRights 126 649 (190 751)
IMF securities account (187 148) 748 803
AllocationofSpecialDrawingRights (125 598) 189 001
Netcashinflowfromoperatingactivities 214 815 463 034
Increase in external liabilities 123 007 49 005
Decreaseinotherliabilitiesandprovisions 209 431 179 740
Decrease/(increase)/inclaimsonprivatesectorandloans and advances (3 173) (5 647)
Decreaseinotherassets (13 058) (18 327)
Increase/(decrease) in notes and coins 12 752 (15 673)
Net increase in operating assets and liabilities 328 959 189 098
Netcashinflowsfromoperatingactivities 543 774 652 132
Cash flows from Investing Activities
Purchase of property, plant and equipment and software equipment 9,10 (24 764) (40 954)
Proceeds from disposal of property, plant and equipment 577 -
Decreaseinexternalinvestments 451 949 606 877
Increase in amounts due from Government (1 119 933) (480)
Amounts paid to the Government through the consolidated fund 32 (287 489) (245 276)
Netcash(outflows)/inflowsfrominvestingactivities (979 660) 320 167
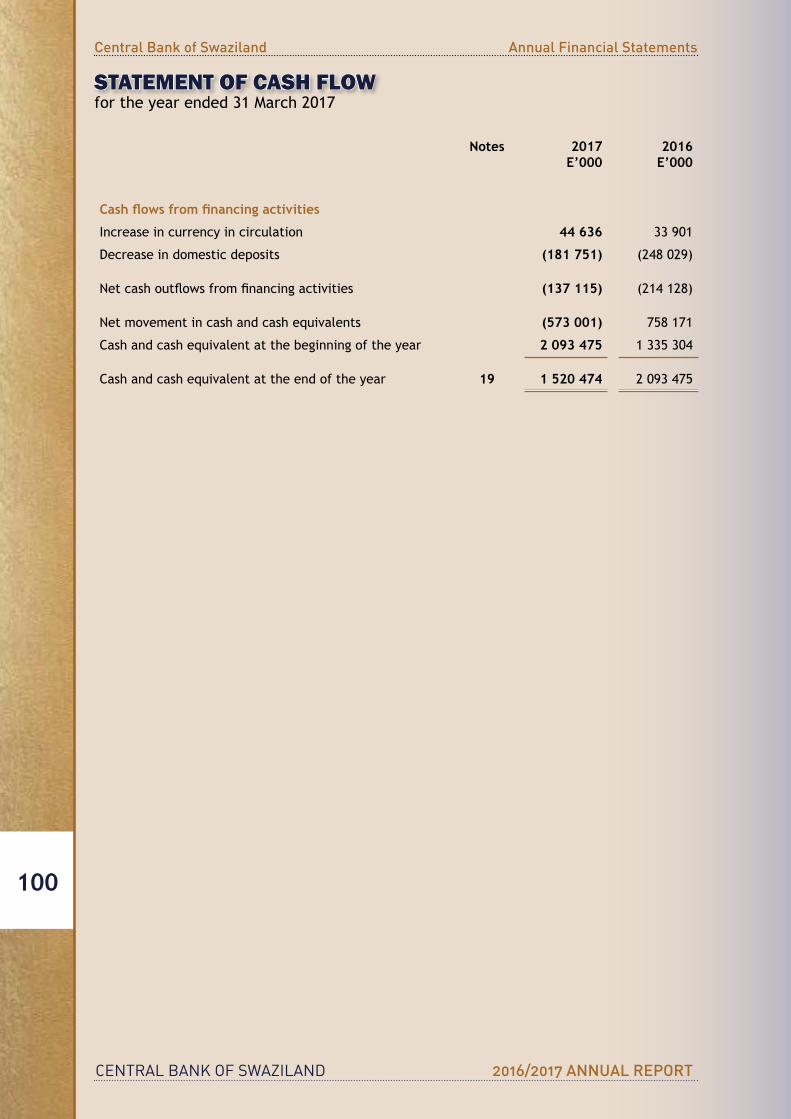
CENTRAL BANK OF SWAZILAND 2016/2017 ANNUAL REPORT
Central Bank of Swaziland Annual Financial Statements
100
STATEMENT OF CASH FLOWfor the year ended 31 March 2017
Notes 2017E’000
2016E’000
Cash flows from financing activities
Increase in currency in circulation 44 636 33 901
Decreaseindomesticdeposits (181 751) (248 029)
Netcashoutflowsfromfinancingactivities (137 115) (214 128)
Net movement in cash and cash equivalents (573 001) 758 171
Cashandcashequivalentatthebeginningoftheyear 2 093 475 1 335 304
Cashandcashequivalentattheendoftheyear 19 1 520 474 2 093 475
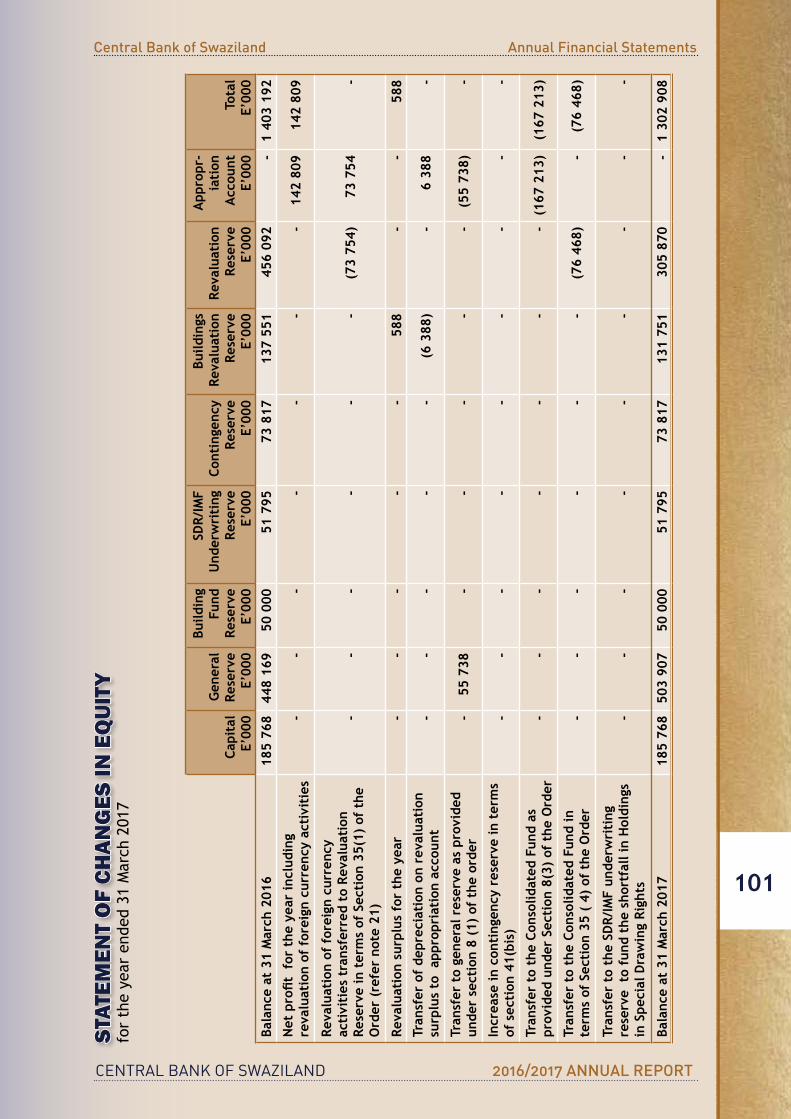
CENTRAL BANK OF SWAZILAND 2016/2017 ANNUAL REPORT
Central Bank of Swaziland Annual Financial Statements
101
STAT
EMEN
T O
F CH
ANG
ES IN
EQ
UIT
Yfo
r th
e ye
ar e
nded
31
Mar
ch 2
017
Capi
tal
E’00
0
Gen
eral
Rese
rve
E’00
0
Build
ing
Fund
Rese
rve
E’00
0
SDR/
IMF
Und
erw
riti
ngRe
serv
eE’
000
Cont
inge
ncy
Rese
rve
E’00
0
Build
ings
Reva
luat
ion
Rese
rve
E’00
0
Reva
luat
ion
Rese
rve
E’00
0
App
ropr
-ia
tion
Acc
ount
E’00
0To
tal
E’00
0Ba
lanc
e at
31
Mar
ch 2
016
185
768
448
169
50 0
0051
795
73 8
1713
7 55
145
6 09
2-
1 40
3 19
2
Net
pro
fit f
or t
he y
ear
incl
udin
g re
valu
atio
n of
for
eign
cur
renc
y ac
tivi
ties
--
--
--
-14
2 80
914
2 80
9
Reva
luat
ion
of f
orei
gn c
urre
ncy
acti
viti
es t
rans
ferr
ed t
o Re
valu
atio
n Re
serv
e in
ter
ms
of S
ecti
on 3
5(1)
of
the
Ord
er (
refe
r no
te 2
1)
--
--
--
(73
754)
73 7
54-
Reva
luat
ion
surp
lus
for
the
year
--
--
-58
8-
-58
8
Tran
sfer
of
depr
ecia
tion
on
reva
luat
ion
surp
lus
to a
ppro
pria
tion
acc
ount
--
--
-(6
388
)-
6 38
8-
Tran
sfer
to
gene
ral r
eser
ve a
s pr
ovid
ed
unde
r se
ctio
n 8
(1)
of t
he o
rder
-55
738
--
--
-(5
5 73
8)-
Incr
ease
in c
onti
ngen
cy r
eser
ve in
ter
ms
of s
ecti
on 4
1(bi
s)
--
--
--
--
-
Tran
sfer
to
the
Cons
olid
ated
Fun
d as
pr
ovid
ed u
nder
Sec
tion
8(3
) of
the
Ord
er-
--
--
--
(167
213
)(1
67 2
13)
Tran
sfer
to
the
Cons
olid
ated
Fun
d in
te
rms
of S
ecti
on 3
5 (
4) o
f th
e O
rder
--
--
--
(76
468)
-(7
6 46
8)
Tran
sfer
to
the
SDR/
IMF
unde
rwri
ting
re
serv
e t
o fu
nd t
he s
hort
fall
in H
oldi
ngs
in S
peci
al D
raw
ing
Righ
ts-
--
--
--
--
Bala
nce
at 3
1 M
arch
201
718
5 76
850
3 90
750
000
51 7
9573
817
131
751
305
870
-1
302
908
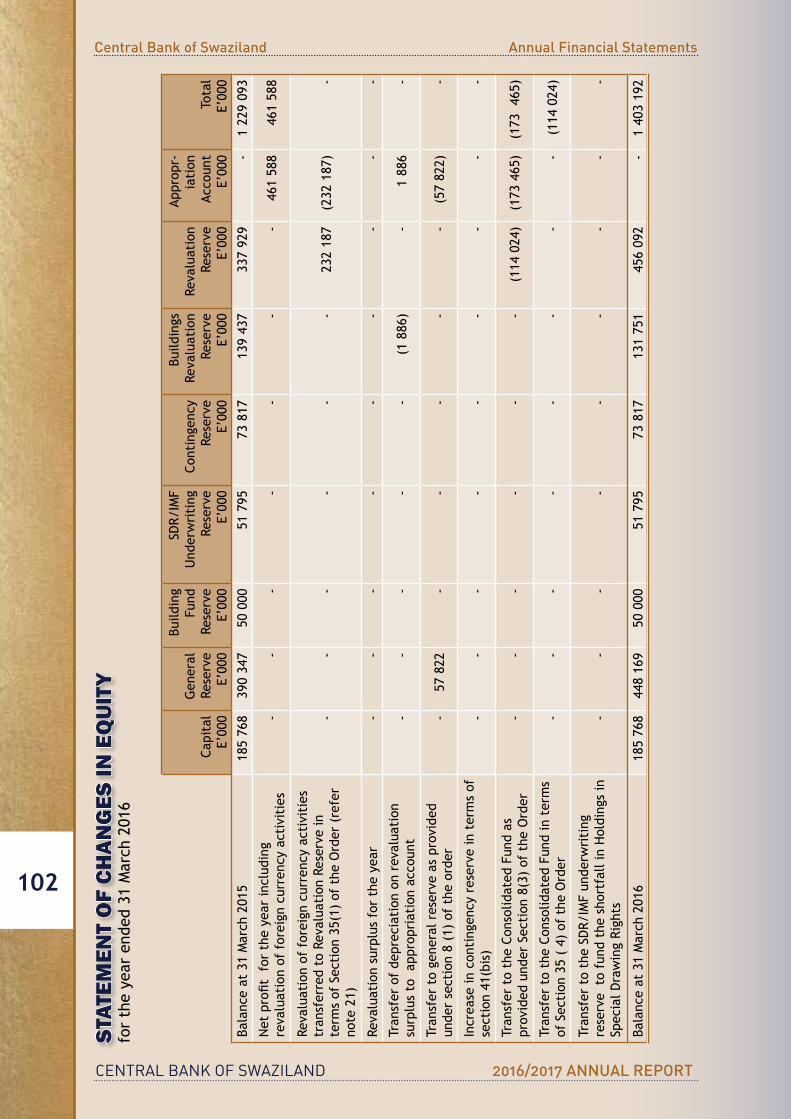
CENTRAL BANK OF SWAZILAND 2016/2017 ANNUAL REPORT
Central Bank of Swaziland Annual Financial Statements
102
STAT
EMEN
T O
F CH
ANG
ES IN
EQ
UIT
Yfo
r th
e ye
ar e
nded
31
Mar
ch 2
016
Capital
E’000
Gen
eral
Rese
rve
E’000
Build
ing
Fund
Rese
rve
E’000
SDR/
IMF
Und
erw
riti
ngRe
serv
eE’000
Contingency
Rese
rve
E’000
Build
ings
Reva
luat
ion
Rese
rve
E’000
Reva
luat
ion
Rese
rve
E’000
Appr
opr-
iati
onAc
coun
tE’000
Tota
lE’000
Bala
nce
at 3
1 M
arch
201
518
5 76
839
0 34
750
000
51 7
9573
817
139
437
337
929
-1
229
093
Netprofitforthe
yea
rinclud
ing
reva
luat
ion
of f
orei
gn c
urre
ncy
acti
viti
es-
--
--
--
461
588
461
588
Reva
luat
ion
of f
orei
gn c
urre
ncy
acti
viti
es
tran
sfer
red
to R
eval
uati
on R
eser
ve in
te
rms
of S
ecti
on 3
5(1)
of
the
Ord
er (
refe
r no
te 2
1)
--
--
--
232
187
(232
187
)-
Reva
luat
ion
surp
lus
for
the
year
--
--
--
--
-
Tran
sfer
of
depr
ecia
tion
on
reva
luat
ion
surp
lus
to a
ppro
pria
tion
acc
ount
--
--
-(1
886
)-
1 88
6-
Tran
sfer
to
gene
ral r
eser
ve a
s pr
ovid
ed
unde
r se
ctio
n 8
(1)
of t
he o
rder
-57
822
--
--
-(5
7 82
2)-
Incr
ease
in c
onti
ngen
cy r
eser
ve in
ter
ms
of
sect
ion
41(b
is)
--
--
--
--
-
Tran
sfertotheCo
nsolidated
Fun
das
prov
ided
und
er S
ecti
on 8
(3)
of t
he O
rder
--
--
--
(114
024
)(1
73 4
65)
(173
465
)
Tran
sfertotheCo
nsolidated
Fun
dinterms
of S
ecti
on 3
5 (
4) o
f th
e O
rder
--
--
--
--
(114
024
)
Tran
sfertotheSD
R/IMFun
derw
riting
rese
rve
to
fund
the
sho
rtfa
ll in
Hol
ding
s in
SpecialD
rawingRights
--
--
--
--
-
Bala
nce
at 3
1 M
arch
201
618
5 76
844
8 16
950
000
51 7
9573
817
131
751
456
092
-1
403
192
CENTRAL BANK OF SWAZILAND 2016/2017 ANNUAL REPORT
Central Bank of Swaziland Annual Financial Statements
103
NOTES TO THE FINANCIAL STATEMENT for the year ended 31 March 2017
1. GENERAL INFORMATION
TheBankistheCentralBankoftheKingdomofSwazilandandisregulatedintermsofanActofParliament.TheprimaryobjectiveoftheBankistheachievementandmaintenanceoffinancialand monetary stability.
TheBoardofDirectors(“Directors”)presenttheirreportoftheCentralBankofSwaziland(“theBank”)fortheyearended31March2017.ThisreportintermsofSection52(1)oftheCentralBankof SwazilandOrder, 1974 covers thefinancial performanceof theBank in termsof therelevant statutory requirements.
1.1 Summary of Significant Accounting Policies
Theprincipalaccountingpoliciesappliedinthepreparationoftheseconsolidatedfinancialstatements are set out below. These policies have been consistently applied to all the years presented, unless otherwise stated.
1.1.0 Statement of compliance and basis of preparation
ThefinancialstatementsoftheBankhavebeenpreparedinaccordancewiththeInternationalFinancialReportingStandards(IFRS).Thefinancialstatementshavebeenpreparedunderthehistoricalcostconventionasmodifiedbytherevaluationoffinancialassetsandfinancialliabilitiesheld-for-tradingatfairvaluethroughtheprofitorloss.
The financial statements comprise the income statement and statement ofcomprehensive income showing as two statements, the statement of financialpositions, the statementofchanges inequity, thecashflowstatementand thenotes.
ThepreparationoffinancialstatementsinconformitywithIFRSrequirestheuseof certain critical accounting estimates. It also requires management to exercise its judgment in the process of applying the Bank’s accounting policies. The areas involving a higher degree of judgment or complexity, or areas where assumptions andestimatesaresignificanttothefinancialstatementsarediscussedinnote1.13of these accounting policies.
1.1.1 Going–concern basis
The bank meets its day-to-day working capital requirements through its investments. The bank’s forecasts and projections, taking account of reasonably possible changes in trading performance, show that the bank should be able operate within the level of its current facilities. After making enquiries, the directors have a reasonable expectation that the bank has adequate resources to continue in operational existence for the foreseeable future. The bank therefore continues to adoptthegoingconcernbasisinpreparingitsfinancialstatements.
CENTRAL BANK OF SWAZILAND 2016/2017 ANNUAL REPORT
Central Bank of Swaziland Annual Financial Statements
104
NOTES TO THE FINANCIAL STATEMENT (continued)for the year ended 31 March 2017
1.1.2 Changes in accounting policy and disclosures
(a) New and amended standards adopted by the bank
Thefollowingstandardshavebeenadoptedbythebankforthefirsttimeforthefinancialyearbeginningonorafter1April2016:
• Amendment to IAS 32, ‘Financial instruments Presentation’ on offsettingfinancial assets and financial liabilities. This amendment clarifies that theright of set-off must not be contingent on a future event. It must also be legally enforceable for all counterparties in the normal course of business, as well as in the event of default, insolvency or bankruptcy. The amendment also considerssettlementmechanisms.Theamendmentdidnothaveasignificanteffectonthebankfinancialstatements.
• Amendments to IAS36, ‘Impairmentofassets’,on the recoverableamountdisclosures for non-financial assets. This amendment removed certaindisclosuresoftherecoverableamountofCGUswhichhadbeenincludedinIAS36 by the issue of IFRS 13.
• AmendmenttoIAS39,‘Financialinstruments:Recognitionandmeasurement’on the novation of derivatives and the continuation of hedge accounting. This amendment considers legislative changes to ‘over-the-counter’ derivatives and the establishment of central counterparties. Under IAS 39 novation of derivatives to central counterparties would result in discontinuance of hedge accounting.
The amendment provides relief from discontinuing hedge accounting when novation of a hedging instrument meets specified criteria. The bank hasappliedtheamendmentandtherehasbeennosignificantimpactonthebank’sfinancialstatementsasaresult.
• IFRIC21,‘Levies’,setsouttheaccountingforanobligationtopayalevyifthatliability is within the scope of IAS 37 ‘Provisions’. The interpretation addresses what the obligating event is that gives rise to pay a levy and when a liability shouldberecognised.Thebankisnotcurrentlysubjectedtosignificantleviesso the impact on the bank is not material.
Other standards, amendments and interpretations which are effective for the financialyearbeginningon1April2014arenotmaterialtothebank.
(b) New standards, amendments and interpretations issued but not effective for thefinancialyearunderreviewandnotearlyadopted
• IFRS9‘Financialinstruments’addressestheclassification,measurementandrecognitionoffinancialassetsandfinancialliabilities.ThecompleteversionofIFRSwasissuedinJuly2015.ItreplacestheguidanceinIAS39thatrelatetotheclassificationandmeasurementoffinancialinstruments.
IFRS 9 requires financial assets to be classified into two measurementcategories: those measured as at fair value and those measured at amortised cost. The determination is made at initial recognition. The classificationdependsontheentity’sbusinessmodelformanagingitsfinancialinstrumentsandthecontractualcashflowcharacteristicsoftheinstrument.Investmentsinequityinstrumentsarerequiredtobemeasuredatfairvaluethroughprofitor loss with the irrevocable option at inception to present changes in fair value inOCInotrecycling.Thereisnowanewexpectedcreditlossesmodelthatreplaces the incurred loss impairment model used in IAS 39.
CENTRAL BANK OF SWAZILAND 2016/2017 ANNUAL REPORT
Central Bank of Swaziland Annual Financial Statements
105
1.1.2 Changes in accounting policy and disclosures (continued)
(b) New standards, amendments and interpretations issued but not effective for thefinancialyearunderreviewandnotearlyadopted.
Forfinancialliabilities,thestandardretainsmostoftheIAS39requirements.Themainchangeisthat,incaseswherethefairvalueoptionistakenforfinancialliabilities, the part of a fair value change due to an entity’s own credit risk is recorded in other comprehensive income rather than the income statement, unless this creates an accounting mismatch. IFRS 9 relaxes the requirements for hedge effectiveness by replacing the bright line hedge effectiveness tests. It requires an economic relationship between the hedged item and hedging instrument and for the ‘hedged ratio’ to be the same as the one management actuallyuseforriskmanagementpurposes.Contemporaneousdocumentationis still required but is different to that currently prepared under IAS 39. The standardiseffectiveforaccountingperiodsbeginningonorafter1January2018. Early adoption is permitted. The group is yet to assess IFRS 9’s fullimpact. The bank is yet to assess IFRS 9’s full impact and intends to adopt IFRS 9nolaterthanthereportingperiodbeginningonorafter1January2015.
• IFRS 13 ‘Fair valuemeasurement’ aims to improve consistency and reducecomplexitybyprovidingaprecisedefinitionoffairvalueandasinglesourceof fair value measurement and disclosure requirements for use across IFRSs. The bank is yet to assess IFRS13’s full impact and intends to adopt IFRS 13 no laterthantheaccountingperiodbeginningonorafter1January2013.
• IFRS 15, ‘Revenue from contracts with customers’ deals with revenuerecognition and establishes principles for reporting useful information to users offinancialstatementsaboutthenature,amount,timinganduncertaintyofrevenue and cash flows arising from an entity’s contracts with customers.Revenue is recognised when a customer obtains control of a good or service andthushastheabilitytodirecttheuseandobtainthebenefitsfromthegoodor service.
ThestandardreplacesIAS18‘Revenue’andIAS11‘Constructioncontracts’andrelated interpretations. The standard is effective for annual periods beginning onorafter1January2017andearlierapplicationispermitted.Thebankisassessing the impact of IFRS 15.
Therearenoother IFRSsor IFRICinterpretationsthatarenotyeteffectivethat would be expected to have a material impact on the bank.
Therearenoother IFRSsor IFRICinterpretationsthatarenotyeteffectivethat would be expected to have a material impact on the bank.
1.2 Foreign Currency Activities and Revaluation Reserve
TheRevaluationreservehasbeencreated inaccordancewithSection35oftheCentralBankOrder,1974,asamended,andisusedtoaccommodateanynetgainorlossesinanyfinancialyearof the Bank arising from any change in the book value or realized value of the Bank’s assets or liabilities denominated in currencies or units other than the domestic currency, such as special drawing rights and foreign currencies. Any change in the value of such currencies or units of account in terms of the currency on Swaziland, shall be credited to the Revaluation Reserve account before any appropriation to any other reserve.
NOTES TO THE FINANCIAL STATEMENT (continued)for the year ended 31 March 2017
CENTRAL BANK OF SWAZILAND 2016/2017 ANNUAL REPORT
Central Bank of Swaziland Annual Financial Statements
106
1.2 Foreign Currency Activities and Revaluation Reserve (continued)
AssetsandliabilitiesinforeigncurrenciesaretranslatedtoEmalangeniatyearendexchangerates. In termsof section35of theCentralBankofSwazilandorder,1974,asamended, theexchange gains and losses of the Bank are for the account of the Government and are consequently transferredtotheRevaluationReserveAccountbeforeappropriationofprofits.
1.3 Financial Instruments
TheBankclassifiesitsfinancialassetsinthefollowingcategories:atfairvaluethroughprofitorloss,loansandreceivablesandavailableforsale.Theclassificationdependsonthepurposeforwhichthefinancialassetswereacquired.Managementdeterminestheclassificationoffinancialassets at initial recognition.
(a) Financialassetsatfairvaluethroughprofitandloss Financialassetsatfairvaluethroughprofitandlossarefinancialassetsheldfortrading.
A financial asset is classified in this category if acquired principally for the purpose ofsellingintheshortterm.Derivativesarealsocategorisedasheldfortradingunlesstheyaredesignatedashedges.Assetsinthiscategoryareclassifiedascurrentassets.
(b) Loans and Receivables Loans and receivables are non-derivative financial assets with fixed or determinable
payments that are not quoted in an active market. They are included in current assets, except for maturities greater than 12 months after the balance sheet date.
Theseareclassifiedasnon-currentassets.TheBank’sloansandreceivablescompriseamountsdue from the Government of Swaziland, claims on private sector, external investments, and ‘cashandcashequivalents’inthestatementoffinancialposition(accountingpolicies16,12,11 and 19).
(c) Available for Sale Financial Assets Available for sale financial assets are non-derivatives that are either designated in this
categoryornotclassifiedinanyoftheothercategories.Theyareincludedinnon-currentassets unless management intends to dispose of the investment within 12 months of the balancesheetdate.TheBank’savailableforsalefinancialassetscomprisesofsecurities.
Regularpurchasesandsalesoffinancialassetsarerecognisedonthetrade-date–thedateonwhich the Bank commits to purchase or sell the asset. Investments are initially recognised at fairvalueplustransactioncostsforallfinancialassetsnotcarriedatfairvaluethroughprofitorloss.Financialassetscarriedatfairvaluethroughprofitorlossareinitiallyrecognisedat fair value and transaction costs are expensed in the income statement. Financial assets arederecognisedwhentherightstoreceivecashflowsfromtheinvestmentshaveexpiredor have been transferred and the Bank has transferred substantially all risks and rewards ofownership.Available-for-salefinancialassetsandfinancialassetsatfairvaluethroughprofitorlossaresubsequentlycarriedatfairvalue.Loansandreceivablesarecarriedatamortised cost using the effective interest method.
Gainsorlossesarisingfromchangesinthefairvalueofthe‘financialassetsatfairvaluethrough profit or loss’ category are presented in the income statement within ‘other(losses)/gains–net’intheperiodinwhichtheyarise.Dividendincomefromfinancialassetsatfairvaluethroughprofitorlossisrecognisedintheincomestatementaspartofotherincome when the Bank’s right to receive payments is established.
Changes in the fairvalueofmonetary securitiesdenominated ina foreigncurrencyandclassifiedasavailable-for-saleareanalysedbetweentranslationdifferencesresultingfromchanges in amortised cost of the security and other changes in the carrying amount of the security.Thetranslationdifferencesonmonetarysecuritiesarerecognisedinprofitorloss,while translation differences on non-monetary securities are recognised in equity.
NOTES TO THE FINANCIAL STATEMENT (continued)for the year ended 31 March 2017

CENTRAL BANK OF SWAZILAND 2016/2017 ANNUAL REPORT
Central Bank of Swaziland Annual Financial Statements
107
1.3 Financial Instruments (continued)
(c) Availableforsalefinancialassets(continued) Changesinthefairvalueofmonetaryandnonmonetarysecuritiesclassifiedasavailable-
for-sale are recognised in equity.
Whensecuritiesclassifiedasavailableforsalearesoldorimpaired,theaccumulatedfairvalue adjustments recognised in equity are included in the income statement as ‘gains and losses from investment securities’.
Interest on available-for-sale securities calculated using the effective interest method is recognisedintheincomestatementaspartofotherincome.Dividendsonavailable-for-saleequity instruments are recognised in the income statement as part of other income when the Bank’s right to receive payments is established.
The fair values of quoted investments are based on current bid prices. If the market for afinancialassetisnotactive(andforunlistedsecurities),theBankestablishesfairvalueby using valuation techniques. These include the use of recent arm’s length transactions, reference to other instruments that are substantially the same, discounted cash flowanalysis, and option pricing models making maximum use of market inputs and relying as littleaspossibleonentity-specificinputs.TheBankassessesateachbalancesheetdatewhether there is objective evidence that a financial asset or a bank of financial assetsis impaired. In thecaseofequity securitiesclassifiedasavailable for sale,a significantor prolonged decline in the fair value of the security below its cost is considered as an indicator that the securities are impaired.
If any such evidence exists for available-for-sale financial assets, the cumulative loss –measured as the difference between the acquisition cost and the current fair value, less any impairmentlossonthatfinancialassetpreviouslyrecognisedinprofitorloss–isremovedfrom equity and recognised in the income statement. Impairment losses recognised in the income statement on equity instruments are not reversed through the income statement.
1.4 Impairment and non-collectability of Financial Assets
An assessment is made at each balance sheet date to determine whether there is objective evidencethatafinancialassetorbankoffinancialassetsmaybeimpaired.Ifsuchevidenceexists, the estimated recoverable amount of that asset is determined and any impairment loss recognised for the difference between the recoverable amount and the carrying amount as follows:
• Forfinancialassetsatamortisedcost - thecarryingamountof theasset is reduced to itsestimated recoverable amount either directly or through the use of an allowance account and theamountofthelossisincludedinthenetprofitandlossfortheperiod;and
• Forfinancialassetsatfairvalue-thecarryingamountoftheassetisreducedtoitsestimatedrecoverable amount either directly or through the use of an allowance accounts and the amountofthelossisincludedinthenetprofitandlossfortheperiod.
1.5 Property, Plant and Equipment
All property, plant and equipment other than land and buildings are stated at cost less accumulated depreciation and amortisation.
Land and buildings are stated at market value based on valuations performed by an external independent valuer. Increases in the carrying value of land and buildings arising from the revaluation are credited directly to a non-distributable revaluation surplus reserve.
NOTES TO THE FINANCIAL STATEMENT (continued)for the year ended 31 March 2017
CENTRAL BANK OF SWAZILAND 2016/2017 ANNUAL REPORT
Central Bank of Swaziland Annual Financial Statements
108
1.5 Property, Plant and Equipment (continued)
Eachyearthedifferencebetweendepreciationbasedontherevaluedcarryingamountoftheasset and depreciation based on the asset’s original cost is transferred from the non-distributable revaluation surplus reserve to retained earnings. On disposal of the previously revalued property, any amount relating to that asset remaining in the non- distributable revaluation surplus reserve is transferred to retained earnings.
Depreciationiscomputedonastraight-linebasisovertheestimatedusefullifeoftheasset,aftertaking into consideration the estimated residual value of the asset, as follows:
Buildings 20-50 Years MotorVehicles 3-13Years OfficeEquipment 5-22Years Furniture and Fittings 5 -23 Years Household Furniture 5-22 Years
The remaining useful lives of assets are reassessed annually.
Land is not depreciated.
Repairsandmaintenancearechargedtotheincomestatementduringthefinancialperiodinwhichthey are incurred. The cost of major renovations is included in the carrying amount of the asset whenitisprobablethatfutureeconomicbenefitsinexcessoftheoriginallyassessedstandardofperformanceoftheexistingassetwillflowtotheBank.Majorrenovationsaredepreciatedoverthe remaining useful life of the related asset.
Gains or losses on disposals are determined by reference to the carrying amount of the asset and the net proceeds received, and are recorded in the income statement on disposal.
1.6 Intangible Assets
Computer Software Costsassociatedwithmaintainingcomputersoftwareprogrammesarerecognisedasanexpense
as incurred. Development costs that are directly attributable to the design and testing ofidentifiableanduniquesoftwareproductscontrolledbythebankarerecognisedasintangibleassets when the following criteria are met:
� it is technically feasible to complete the software product so that it will be available for use; � management intends to complete the software product and use or sell it; � there is an ability to use or sell the software product;
� it can be demonstrated how the software product will generate probable future economic benefits;
� adequatetechnical,financialandotherresourcestocompletethedevelopmentand
� to use or sell the software product are available; and
� the expenditure attributable to the software product during its development can be reliably measured.
Directly attributable costs that are capitalised as part of the software product include thesoftware development employee costs and an appropriate portion of relevant overheads.
NOTES TO THE FINANCIAL STATEMENT (continued)for the year ended 31 March 2017
CENTRAL BANK OF SWAZILAND 2016/2017 ANNUAL REPORT
Central Bank of Swaziland Annual Financial Statements
109
1.6 Intangible Assets (continued)
Other development expenditures that do not meet these criteria are recognised as an expense asincurred.Developmentcostspreviouslyrecognisedasanexpensearenotrecognisedasanasset in a subsequent period
Computersoftwaredevelopmentcostsrecognisedasassetsareamortisedovertheirestimateduseful lives, which does not exceed three years
1.7 Stock of New Notes and Coins
The cost of new notes and coins purchased in bulk are treated as stock and expensed to the incomestatementastheyareissuedtothecommercialbanks.Costcomprisesofprintingandminting costs, carriage insurance and freight landed at the Bank’s premises. The carrying value ofthenewnotesandcoinsisthecostofnotesdeterminedonthefirst-infirst-outbasis.
1.8 Currency in Circulation
CurrencyincirculationrepresentsSwazilandcurrencythathasbeenissuedintotheSwazilandeconomybytheBanksinceinception.Currencyincirculationismeasuredatthefacevalueofnotes and coins issued. Issued notes and coins held by the Bank are netted off against currency in circulation.
1.9 Provisions
Provisions are recognised when the Bank has a present legal or constructive obligation as a resultofpastevents;itismorelikelythannotthatanoutflowofresourceswillberequiredto settle the obligation; and the amount has been reliably estimated. Restructuring provisions comprise lease termination penalties and employee termination payments. Provisions are not recognised for future operating losses.
Wherethereareanumberofsimilarobligations,thelikelihoodthatanoutflowwillberequired
in settlement is determined by considering the class of obligations as a whole. A provision is recognisedevenifthelikelihoodofanoutflowwithrespecttooneitemincludedintheclassmay be small.
Provisions are measured at the present value of the expenditures expected to be required to settletheobligationusingapre-taxratethatreflectscurrentmarketassessmentsofthetimevalueofmoneyandtherisksspecifictotheobligation.Theincreaseintheprovisionduetothepassage of time is recognised as an interest expense.
1.10 Revenues Recognition
Interest income is recognized on a time proportioned basis, taking account of the principal outstanding and the effective interest rate over the period to maturity. The effective interest rate takes into account all directly attributable external costs, discounts or premiums on the financialassets.
NOTES TO THE FINANCIAL STATEMENT (continued)for the year ended 31 March 2017
CENTRAL BANK OF SWAZILAND 2016/2017 ANNUAL REPORT
Central Bank of Swaziland Annual Financial Statements
110
1.10 Revenues Recognition (continued)
The bank accounts for rental income on a straight line basis under the term of the lease. Fees, commission and other income is recognized on an accrual basis. Rand compensation income is received from the South African Government as compensation for Rand circulation in Swaziland. The Bank accounts for this income on an accrual basis.
Interest income is recognized on a time proportioned basis, taking account of the principal outstanding and the effective interest rate over the period to maturity. The effective interest rate takes into account all directly attributable external costs, discounts or premiums on the financialassets.
The bank accounts for rental income on a straight line basis under the term of the lease. Fees, commission and other income is recognized on an accrual basis. Rand compensation income is received from the South African Government as compensation for Rand circulation in Swaziland. The Bank accounts for this income on an accrual basis.
1.11 Employee Benefits
a) Pension and Retirement Funds
Theexpectedcostsofpost-retirementbenefitsunderthedefinedbenefitanddefinedcontribution scheme are charged to income over the expected service lives of the employeesentitledtothesebenefitsaccordingtotheprojectedunitbenefitmethod.Costsareactuariallyassessedandexpenseadjustmentsandpast-servicecostsresultingfrom plan amendments are amortised over the expected average remaining service lives of the employees participating in the plans.
TheBankoperatesadefinedcontributionplan.Thepensionplanisgenerallyfundedbypayments from employees and the Bank taking into account the recommendations of independentqualifiedactuaries.Forthedefinedbenefitplans,thepensionaccountingcosts are assessed using the projected unit credit method. Under this method the cost of providing pensions is charged to the income statement to spread regular cost over the service lives of employees. Actuarial gains and losses are recognised as they arise.
B) ShortTermBenefits
Shorttermbenefitsconsistofsalaries,accumulatedleavepayments,bonusesandanynon-monetarybenefitssuchasmedicalandcontributionandfreeservices.Itexcludesterminationbenefits.Shorttermbenefitsarefullypayablein12monthsaftertheendofa period in which the employee rendered his or her services.
1.12 Fair Value Estimation
Thefairvalueoffinancial liabilitiesfordisclosurepurposes isestimatedbydiscountingthefuturecontractualcashflowsat thecurrentmarket interest rateavailable to theBank forsimilarfinancialinstruments.
NOTES TO THE FINANCIAL STATEMENT (continued)for the year ended 31 March 2017

CENTRAL BANK OF SWAZILAND 2016/2017 ANNUAL REPORT
Central Bank of Swaziland Annual Financial Statements
111
NOTES TO THE FINANCIAL STATEMENT (continued)for the year ended 31 March 2017
1.13 Critical Accounting Estimates and Assumptions
The Bank makes estimates and assumptions that affect the reported amounts of assets and liabilitieswithinthefinancialyear.Estimatesandjudgmentsarecontinuallyevaluatedandarebased on historical experience and other factors, including expectations of future events that arebelievedtobereasonableunderthecircumstances.Estimateshavebeenmadeprimarilyin property plant and equipment, intangible assets and provisions and are disclosed in notes 9, 10 and 31 respectively.
1.14 Cash and Cash Equivalents
Cashandcashequivalentsincludescashinhand,depositsheldatcallwithbanks,othershort-term highly liquid investments with original maturities of three months or less, and bank overdrafts. Bank overdrafts are shown within borrowings in current liabilities on the balance sheet.
1.15 Special Drawing Rights
a) Gross Method of Presenting General Resources Account Position The bank present their positions in the GRA by reporting their quota subscriptions as
assetsinthebalancesheet,andincludingtheFund’sholdingsoftheEmalangeniintheSecurities Account, No.1 Account, and the No. 2 Account in the Liabilities to Non-Residents section of the balance sheet. Under this method of reporting, neither the member’s reserve tranche position in the Fund nor its use of GRA credit is disclosed on the face of the central bank balance sheet, but both are disclosed in an explanatory footnote to the financialstatements.
b) Quota Subscriptions Membership in theFund is reflectedasanassetequal toamember’squota.Quota is
determined upon admission to membership and is increased periodically under General QuotasReviewsoradhoc increases.Thequota subscriptionand subsequent increasesare paid in local currency (75 percent) and in reserve assets (25 percent), except for the 1978 increase which was paid entirely in local currencies. The quota is denominated inSDRsbutisexpressedinlocalcurrencyonthebooksofthedepository.TheIMFNo.1Account, the IMF No. 2 Account, and the IMF Securities Account are the property of the Fund, even though the Fund’s holdings of a member’s currency are maintained in the accounts of the depository. Initially, the quota subscriptions are recorded at the local currency value based on historical cost. Whenever the Fund revalues its holdings of the member’scurrencytoreflectcurrentexchangerates,andat leastonceayearat theFund’sfinancialyear-end(April30),themember’ssubscriptionintheFundshouldalsoberevalued at the same rate of exchange.
1.16 Comparatives
Where necessary comparatives have been adjusted to conform with changes in presentation in the current year.
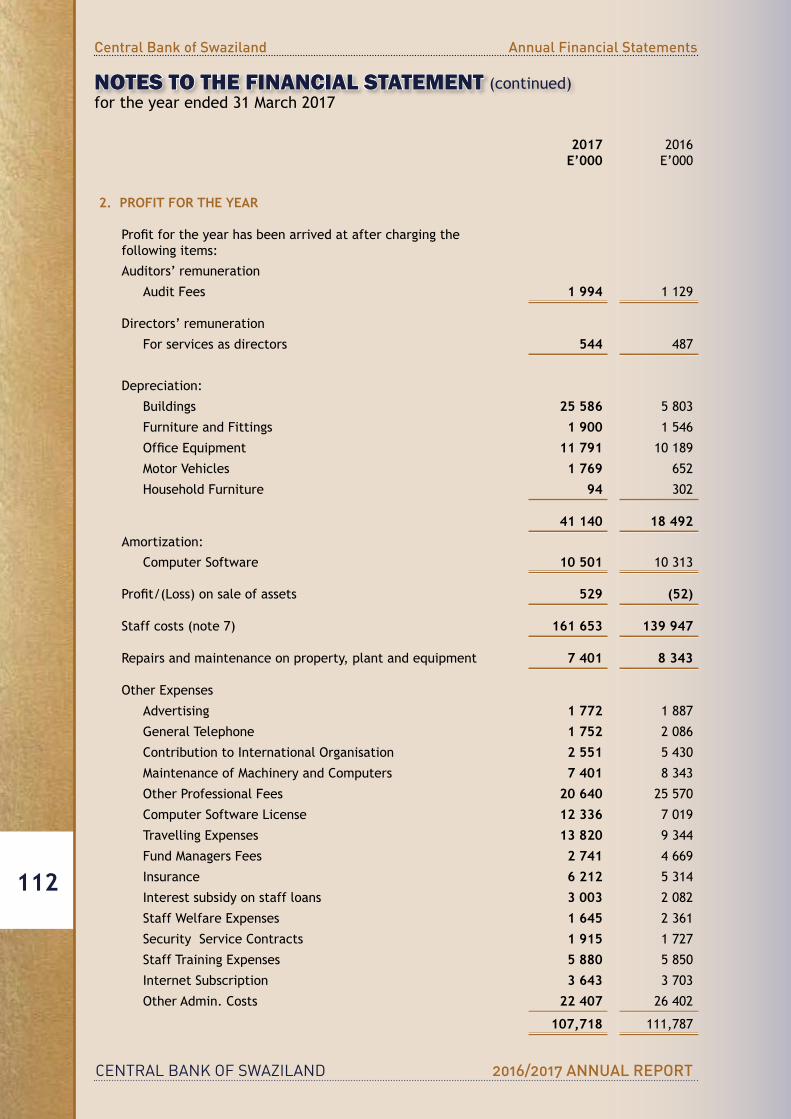
CENTRAL BANK OF SWAZILAND 2016/2017 ANNUAL REPORT
Central Bank of Swaziland Annual Financial Statements
112
NOTES TO THE FINANCIAL STATEMENT (continued)for the year ended 31 March 2017
2017E’000
2016E’000
2. PROFIT FOR THE YEAR
Profitfortheyearhasbeenarrivedatafterchargingthefollowing items:
Auditors’ remuneration
Audit Fees 1 994 1 129
Directors’remuneration
For services as directors 544 487
Depreciation:
Buildings 25 586 5 803
Furniture and Fittings 1 900 1 546
OfficeEquipment 11 791 10 189
MotorVehicles 1 769 652
Household Furniture 94 302
41 140 18 492Amortization:
ComputerSoftware 10 501 10 313
Profit/(Loss)onsaleofassets 529 (52)
Staff costs (note 7) 161 653 139 947
Repairs and maintenance on property, plant and equipment 7 401 8 343
OtherExpenses
Advertising 1 772 1 887
General Telephone 1 752 2 086
ContributiontoInternationalOrganisation 2 551 5 430
MaintenanceofMachineryandComputers 7 401 8 343
Other Professional Fees 20 640 25 570
ComputerSoftwareLicense 12 336 7 019
TravellingExpenses 13 820 9 344
Fund Managers Fees 2 741 4 669
Insurance 6 212 5 314
Interest subsidy on staff loans 3 003 2 082
StaffWelfareExpenses 1 645 2 361
SecurityServiceContracts 1 915 1 727
StaffTrainingExpenses 5 880 5 850
Internet Subscription 3 643 3 703
OtherAdmin.Costs 22 407 26 402
107,718 111,787
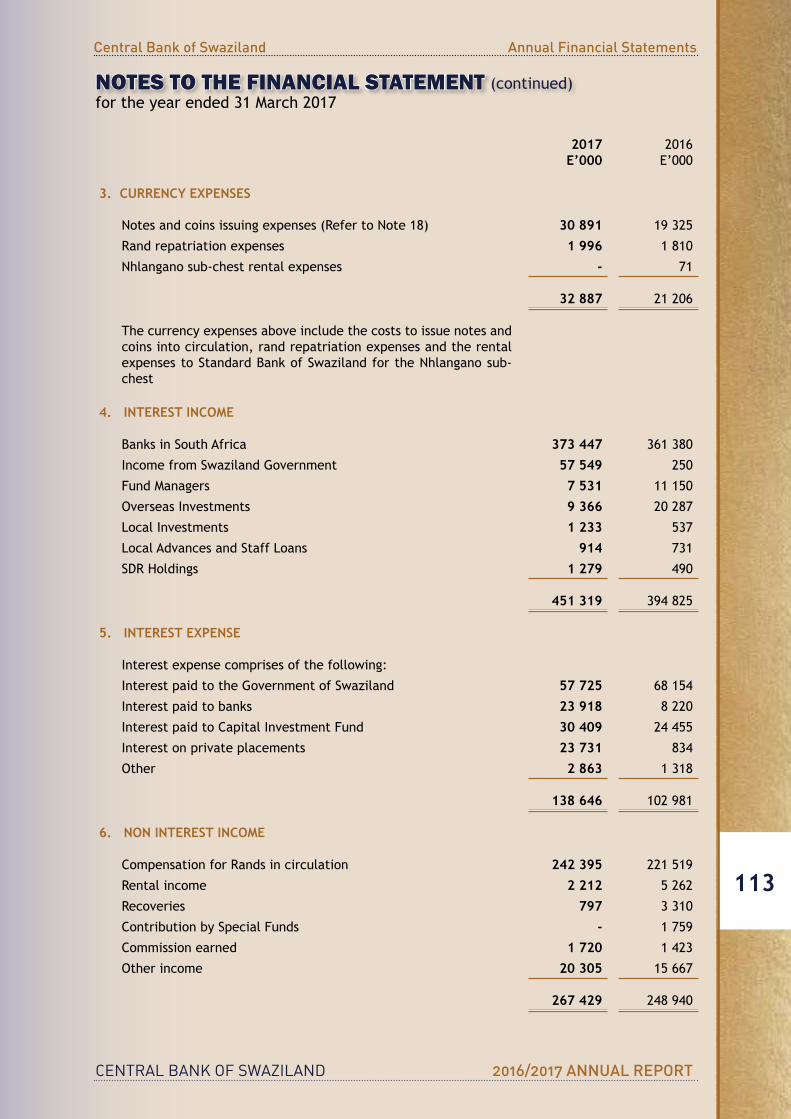
CENTRAL BANK OF SWAZILAND 2016/2017 ANNUAL REPORT
Central Bank of Swaziland Annual Financial Statements
113
NOTES TO THE FINANCIAL STATEMENT (continued)for the year ended 31 March 2017
2017E’000
2016E’000
3. CURRENCY EXPENSES
Notes and coins issuing expenses (Refer to Note 18) 30 891 19 325
Rand repatriation expenses 1 996 1 810
Nhlangano sub-chest rental expenses - 71
32 887 21 206
The currency expenses above include the costs to issue notes and coins into circulation, rand repatriation expenses and the rental expenses to Standard Bank of Swaziland for the Nhlangano sub-chest
4. INTEREST INCOME
Banks in South Africa 373 447 361 380
Income from Swaziland Government 57 549 250
Fund Managers 7 531 11 150
Overseas Investments 9 366 20 287
Local Investments 1 233 537
Local Advances and Staff Loans 914 731
SDRHoldings 1 279 490
451 319 394 825
5. INTEREST EXPENSE
Interest expense comprises of the following:
Interest paid to the Government of Swaziland 57 725 68 154
Interest paid to banks 23 918 8 220
InterestpaidtoCapitalInvestmentFund 30 409 24 455
Interest on private placements 23 731 834
Other 2 863 1 318
138 646 102 981
6. NON INTEREST INCOME
CompensationforRandsincirculation 242 395 221 519
Rental income 2 212 5 262
Recoveries 797 3 310
ContributionbySpecialFunds - 1 759
Commissionearned 1 720 1 423
Other income 20 305 15 667
267 429 248 940

CENTRAL BANK OF SWAZILAND 2016/2017 ANNUAL REPORT
Central Bank of Swaziland Annual Financial Statements
114
NOTES TO THE FINANCIAL STATEMENT (continued)for the year ended 31 March 2017
6. NON INTEREST INCOME (continued)
On 4March 2004, the Declaration of Legal Tender Notice, 2004was legislated and deemedto have come into force on 19 September 2003. Under this declaration, South African Rand notes were declared legal tender in Swaziland. In terms of the Bilateral Monetary Agreement between the Government of Swaziland and the Government of Republic of South Africa, the CentralBankofSwazilandiscompensatedbytheGovernmentofRepublicofSouthAfricanforRands in circulation in Swaziland on a calendar year basis with effect from 19 September 2003. CompensationofE267429283(2016:E221517862)duefortheperiodfrom1April2016to31March 2017 has been included in Other Income in the Income Statement.
2017E’000
2016E’000
7. STAFF COSTSWages and Salaries 132 519 113 443
TerminationBenefits 9 434 6 438
DefinedContributionPlanContributions 12 135 11 171
Leave Pay Provision 7 435 6 644
StaffUniformExpenses 130 2 251
161 653 139 947
8. REVALUATION GAINS/LOSSES ON FOREIGN EXCHANGE ACTIVITIESForeign exchange (losses)/gains on translation of foreign currency balances (73 754) 232 187
IntermsofSection35(1)oftheCentralBankofSwazilandOrder1974,revaluationofforeignexchange transactions are to be transferred to the Revaluation Reserve. Total gains and losses for the year havebeendisclosedon the Statement ofComprehensive Income to reflect thefinancialperformanceoftheBank.

CENTRAL BANK OF SWAZILAND 2016/2017 ANNUAL REPORT
Central Bank of Swaziland Annual Financial Statements
115
NOTES TO THE FINANCIAL STATEMENT (continued)for the year ended 31 March 2017
9. PROPERTY, PLANT AND EQUIPMENT
2017E’000
2016E’000
Cost/Revalued
CostAccumulated Depreciation
Carrying Value
Cost/Revalued
CostAccumulated Depreciation
CarryingValue
Buildings 249 077 (52 063) 197 014 254 350 (27 030) 227 320
Land 40 957 - 40 957 38 265 - 38 265
Furniture and Fittings 19 512 (11 773) 7 739 17 387 (10 844) 6 543
OfficeEquipment 135 026 (59 362) 75 664 129 340 (48 519) 80 821
MotorVehicles 11 736 (7 897) 3 839 11 451 (7 519) 3 932
Household Furniture 1 846 (1 025) 821 1 769 (958) 811
Work in Progress 7 934 - 7 934 297 - 297
Total 466 088 (132 120) 333 968 452 859 (94 870) 357 989
31 March 2017
Carrying value at
beginningof year Additions Transfers Disposals Depreciation
Carrying value at
end of year
Buildings 227 320 (2 104) 183 - (2 798) (25 586)Land 38 265 2 691 - - - -Furniture and Fittings
OfficeEquipment 80 821 - 6 665 - (31) (11 791)MotorVehicles 3 932 - 1 676 - - (1 769)Household Furniture 811 - 104 - - (94)Work in Progress* 297 - 7 934 (297) - -Total 357 989 587 19 674 (297) (2 845) (41 140)
The carrying amounts of property, plant and equipment can be reconciled as follows:31 March 2016
Carryingvalue at
beginningof year
Revalu-ation
surplus Additions Transfers Disposal Depreciation
Carryingvalue at
end of year
Buildings 227 585 - 4 933 605 - (5 803) 227 320
Land 38 224 - 41 - - - 38 265
Furniture and Fittings 7 720 - 369 - - (1 546) 6 543
OfficeEquipment 61 576 - 5 984 23 502 (52) (10 189) 80 821
MotorVehicles 2 058 - 2 526 - - (652) 3 932
Household Furniture 998 - 115 - - (302) 811
Work in Progress* 16 512 - 16 452 (32 667) - - 297
Total 354 673 - 30 420 (8 560) (52) (18 492) 357 989
*Asat31March2017thebankhadworkinprogressofE7.934million(2016:E0.297million)relatingto the installation of the new accounting system
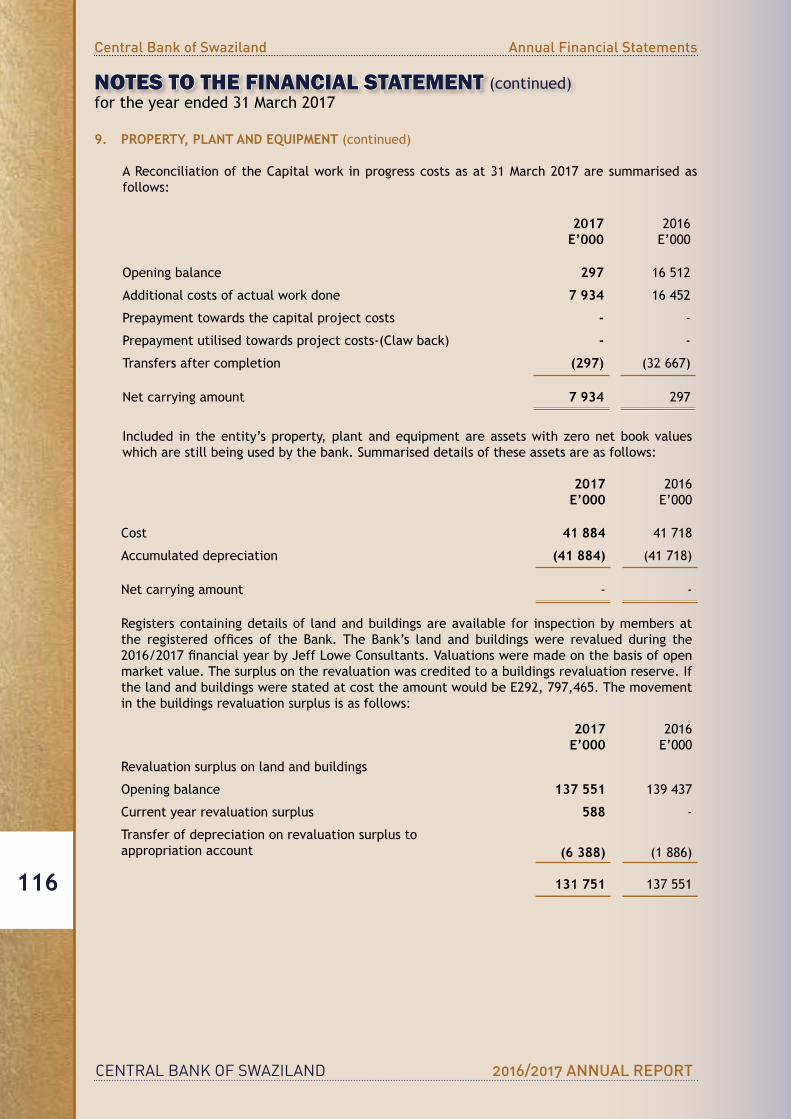
CENTRAL BANK OF SWAZILAND 2016/2017 ANNUAL REPORT
Central Bank of Swaziland Annual Financial Statements
116
NOTES TO THE FINANCIAL STATEMENT (continued)for the year ended 31 March 2017
9. PROPERTY, PLANT AND EQUIPMENT (continued)
AReconciliationoftheCapitalwork inprogresscostsasat31March2017aresummarisedasfollows:
2017E’000
2016E’000
Opening balance 297 16 512
Additional costs of actual work done 7 934 16 452
Prepayment towards the capital project costs - -
Prepaymentutilisedtowardsprojectcosts-(Clawback) - -
Transfers after completion (297) (32 667)
Net carrying amount 7 934 297
Included in the entity’s property, plant and equipment are assets with zero net book values which are still being used by the bank. Summarised details of these assets are as follows:
2017 E’000
2016 E’000
Cost 41 884 41 718
Accumulated depreciation (41 884) (41 718)
Net carrying amount - -
Registers containing details of land and buildings are available for inspection by members at the registered offices of the Bank. The Bank’s land and buildings were revalued during the2016/2017financialyearbyJeffLoweConsultants.Valuationsweremadeonthebasisofopenmarket value. The surplus on the revaluation was credited to a buildings revaluation reserve. If thelandandbuildingswerestatedatcosttheamountwouldbeE292,797,465.Themovementin the buildings revaluation surplus is as follows:
2017 E’000
2016 E’000
Revaluation surplus on land and buildings
Opening balance 137 551 139 437
Currentyearrevaluationsurplus 588 -
Transfer of depreciation on revaluation surplus to appropriation account (6 388) (1 886)
131 751 137 551
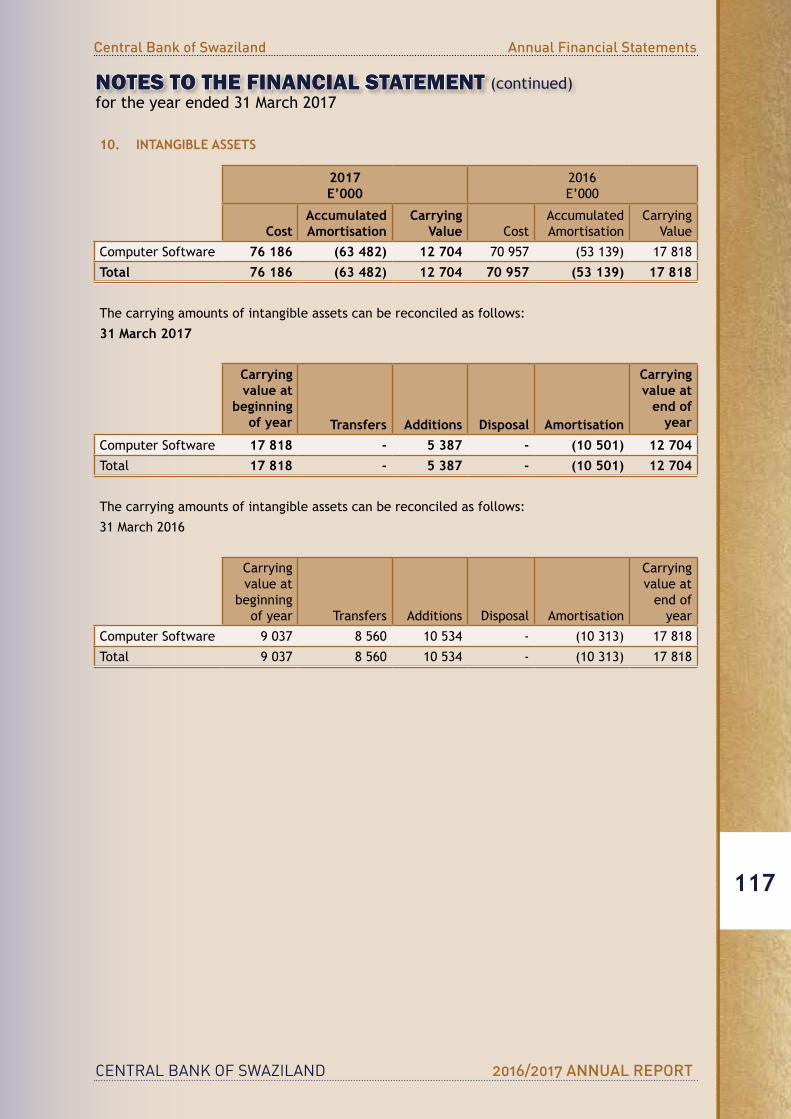
CENTRAL BANK OF SWAZILAND 2016/2017 ANNUAL REPORT
Central Bank of Swaziland Annual Financial Statements
117
NOTES TO THE FINANCIAL STATEMENT (continued)for the year ended 31 March 2017
10. INTANGIBLE ASSETS
2017E’000
2016E’000
CostAccumulatedAmortisation
CarryingValue Cost
AccumulatedAmortisation
CarryingValue
ComputerSoftware 76 186 (63 482) 12 704 70 957 (53 139) 17 818
Total 76 186 (63 482) 12 704 70 957 (53 139) 17 818
The carrying amounts of intangible assets can be reconciled as follows:
31 March 2017
Carryingvalue at
beginningof year Transfers Additions Disposal Amortisation
Carryingvalue at
end of year
ComputerSoftware 17 818 - 5 387 - (10 501) 12 704Total 17 818 - 5 387 - (10 501) 12 704
The carrying amounts of intangible assets can be reconciled as follows:
31 March 2016
Carryingvalue at
beginningof year Transfers Additions Disposal Amortisation
Carryingvalue at
end of year
ComputerSoftware 9 037 8 560 10 534 - (10 313) 17 818
Total 9 037 8 560 10 534 - (10 313) 17 818
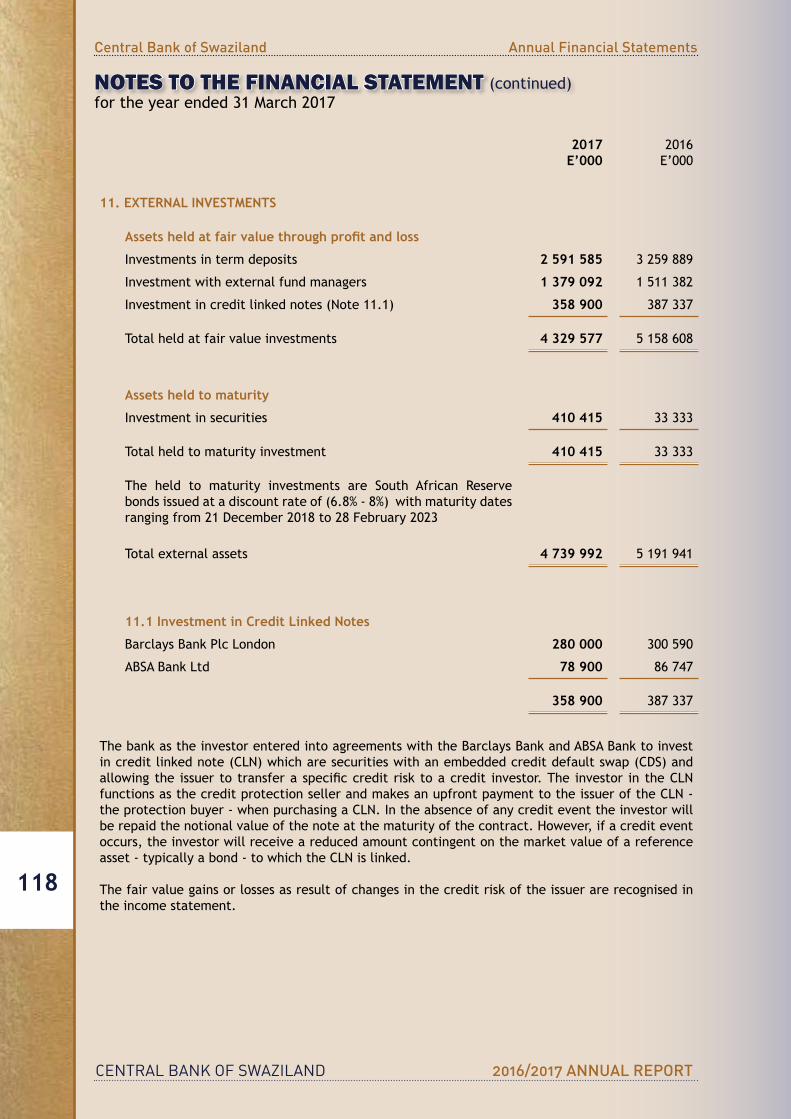
CENTRAL BANK OF SWAZILAND 2016/2017 ANNUAL REPORT
Central Bank of Swaziland Annual Financial Statements
118
NOTES TO THE FINANCIAL STATEMENT (continued)for the year ended 31 March 2017
2017 E’000
2016 E’000
11. EXTERNAL INVESTMENTS
Assets held at fair value through profit and loss
Investments in term deposits 2 591 585 3 259 889
Investment with external fund managers 1 379 092 1 511 382
Investment in credit linked notes (Note 11.1) 358 900 387 337
Total held at fair value investments 4 329 577 5 158 608
Assets held to maturity
Investment in securities 410 415 33 333
Total held to maturity investment 410 415 33 333
The held to maturity investments are South African Reserve bonds issued at a discount rate of (6.8% - 8%) with maturity dates rangingfrom21December2018to28February2023
Total external assets 4 739 992 5 191 941
11.1 Investment in Credit Linked Notes
Barclays Bank Plc London 280 000 300 590
ABSA Bank Ltd 78 900 86 747
358 900 387 337
The bank as the investor entered into agreements with the Barclays Bank and ABSA Bank to invest increditlinkednote(CLN)whicharesecuritieswithanembeddedcreditdefaultswap(CDS)andallowingthe issuertotransferaspecificcreditrisktoacredit investor.The investor intheCLNfunctionsasthecreditprotectionsellerandmakesanupfrontpaymenttotheissueroftheCLN-theprotectionbuyer-whenpurchasingaCLN.Intheabsenceofanycrediteventtheinvestorwillbe repaid the notional value of the note at the maturity of the contract. However, if a credit event occurs, the investor will receive a reduced amount contingent on the market value of a reference asset-typicallyabond-towhichtheCLNislinked.
The fair value gains or losses as result of changes in the credit risk of the issuer are recognised in the income statement.
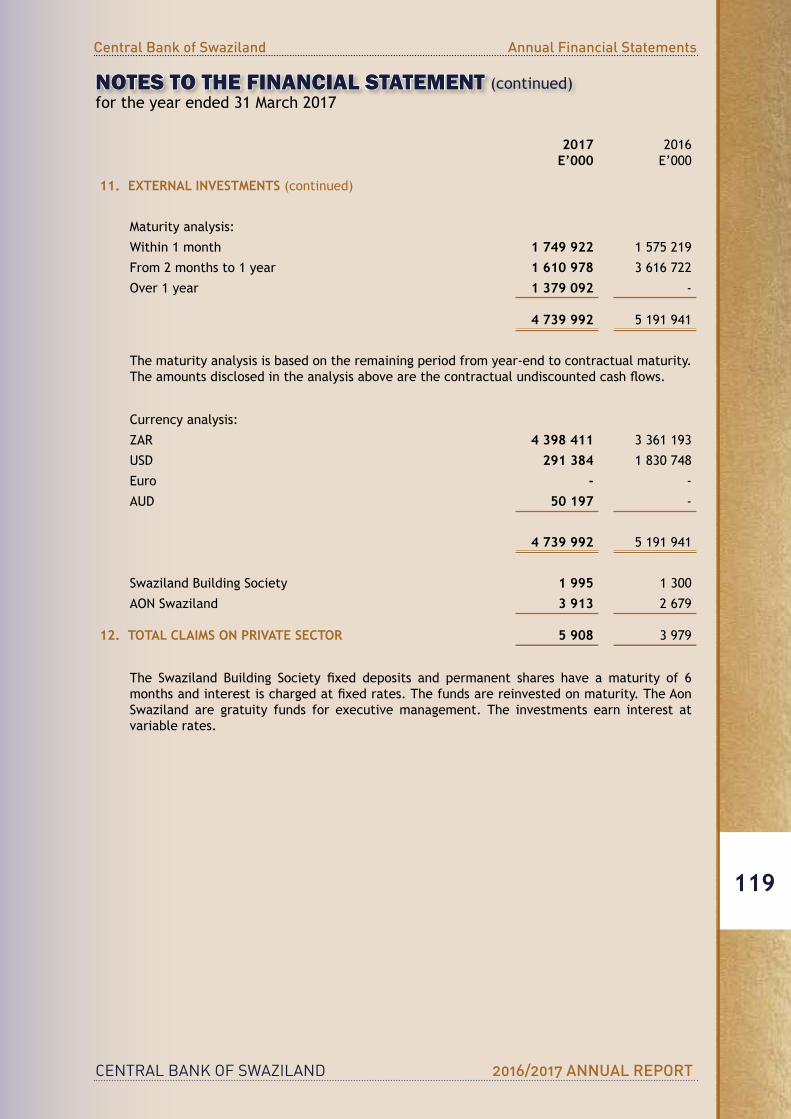
CENTRAL BANK OF SWAZILAND 2016/2017 ANNUAL REPORT
Central Bank of Swaziland Annual Financial Statements
119
2017E’000
2016E’000
11. EXTERNAL INVESTMENTS (continued)
Maturity analysis:
Within 1 month 1 749 922 1 575 219
From 2 months to 1 year 1 610 978 3 616 722
Over 1 year 1 379 092 -
4 739 992 5 191 941
The maturity analysis is based on the remaining period from year-end to contractual maturity. Theamountsdisclosedintheanalysisabovearethecontractualundiscountedcashflows.
Currencyanalysis:
ZAR 4 398 411 3 361 193
USD 291 384 1 830 748
Euro - -
AUD 50 197 -
4 739 992 5 191 941
Swaziland Building Society 1 995 1 300
AON Swaziland 3 913 2 679
12. TOTAL CLAIMS ON PRIVATE SECTOR 5 908 3 979
The Swaziland Building Society fixed deposits and permanent shares have amaturity of 6monthsandinterestischargedatfixedrates.Thefundsarereinvestedonmaturity.TheAonSwaziland are gratuity funds for executive management. The investments earn interest at variable rates.
NOTES TO THE FINANCIAL STATEMENT (continued)for the year ended 31 March 2017
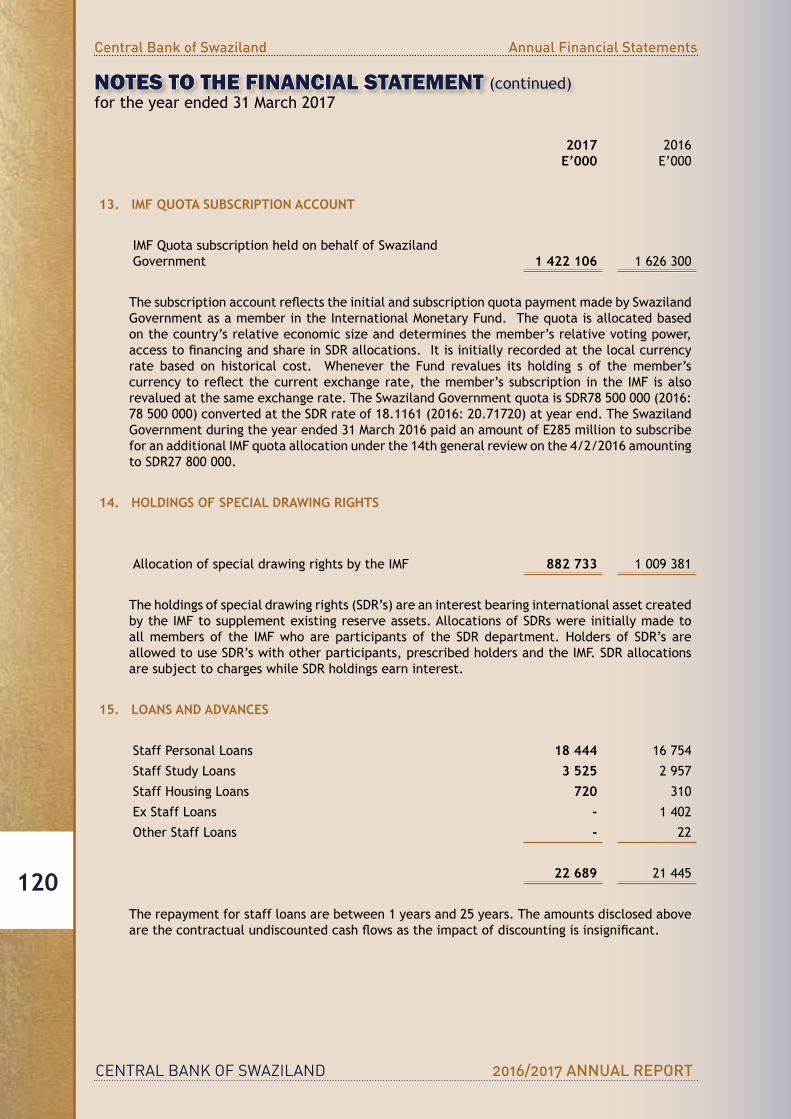
CENTRAL BANK OF SWAZILAND 2016/2017 ANNUAL REPORT
Central Bank of Swaziland Annual Financial Statements
120
NOTES TO THE FINANCIAL STATEMENT (continued)for the year ended 31 March 2017
2017E’000
2016E’000
13. IMF QUOTA SUBSCRIPTION ACCOUNT
IMFQuotasubscriptionheldonbehalfofSwazilandGovernment 1 422 106 1 626 300
ThesubscriptionaccountreflectstheinitialandsubscriptionquotapaymentmadebySwazilandGovernment as a member in the International Monetary Fund. The quota is allocated based on the country’s relative economic size and determines the member’s relative voting power, accesstofinancingandshareinSDRallocations.Itisinitiallyrecordedatthelocalcurrencyrate based on historical cost. Whenever the Fund revalues its holding s of the member’s currencytoreflectthecurrentexchangerate,themember’ssubscription inthe IMF isalsorevaluedatthesameexchangerate.TheSwazilandGovernmentquotaisSDR78500000(2016:78500000)convertedattheSDRrateof18.1161(2016:20.71720)atyearend.TheSwazilandGovernmentduringtheyearended31March2016paidanamountofE285milliontosubscribefor an additional IMF quota allocation under the 14th general review on the 4/2/2016 amounting toSDR27800000.
14. HOLDINGS OF SPECIAL DRAWING RIGHTS
Allocation of special drawing rights by the IMF 882 733 1 009 381
Theholdingsofspecialdrawingrights(SDR’s)areaninterestbearinginternationalassetcreatedbytheIMFtosupplementexistingreserveassets.AllocationsofSDRswereinitiallymadetoallmembers of the IMFwho are participants of the SDRdepartment.Holders of SDR’s areallowedtouseSDR’swithotherparticipants,prescribedholdersandtheIMF.SDRallocationsaresubjecttochargeswhileSDRholdingsearninterest.
15. LOANS AND ADVANCES
Staff Personal Loans 18 444 16 754
Staff Study Loans 3 525 2 957
Staff Housing Loans 720 310
ExStaffLoans - 1 402
Other Staff Loans - 22
22 689 21 445
The repayment for staff loans are between 1 years and 25 years. The amounts disclosed above arethecontractualundiscountedcashflowsastheimpactofdiscountingisinsignificant.

CENTRAL BANK OF SWAZILAND 2016/2017 ANNUAL REPORT
Central Bank of Swaziland Annual Financial Statements
121
NOTES TO THE FINANCIAL STATEMENT (continued)for the year ended 31 March 2017
2017E’000
2016E’000
16. AMOUNTS DUE FROM GOVERNMENT OF SWAZILAND
Treasury Bills (16.1) 3 324 3 278
Advances to the Swaziland Government (refer to 16.2) 1 119 887
Opening balance - -
Advance 1 100 000 -
Repayments - -
Interest accrued 19 887 -
1 123 211 3 278
16.1 The bank purchased the Swaziland Government Treasury Bills with an interest rate of 6.501% per annum payable in 182 days.
16.2 InaccordancewithpartVIIsection45oftheCentralBankorderof1974,asamendedthebankadvancedE1.1billiontotheSwazilandGovernment.Theadvancesarematuringon 8 May 2017 and 17 August 2017 at an interest rate of 6.5% to7.25% per annum.
Maturity analysis:
From 1 month to 6 months 1 123 211 3 278
Over 12 months - -
1 123 211 3 278
17. OTHER ASSETS
CompensationforRandsincirculation 60 599 55 380
Uncleared effects 77 2 867
Prepayments 20 852 6 012
Sundry debtors 3 526 7 737
85 054 71 996
CompensationforRandscirculatinginSwazilandisduefromtheGovernmentofRepublicofSouthAfrica(refernote5).ThisamountrepresentsanaccrualfortheperiodfromJanuarytoMarch 2016 and will be settled within one year. Uncleared effects relate to items in course of collection between local and foreign banks and to the expatriation of notes and coins with South Africa. Sundry debtors consist of prepayments and miscellaneous debtors. The advance to standard bank was an overnight loan made to the commercial bank to comply with the regulatory requirements by the central bank of Swaziland. The overnight advance was settled by standard bank on the next working day.
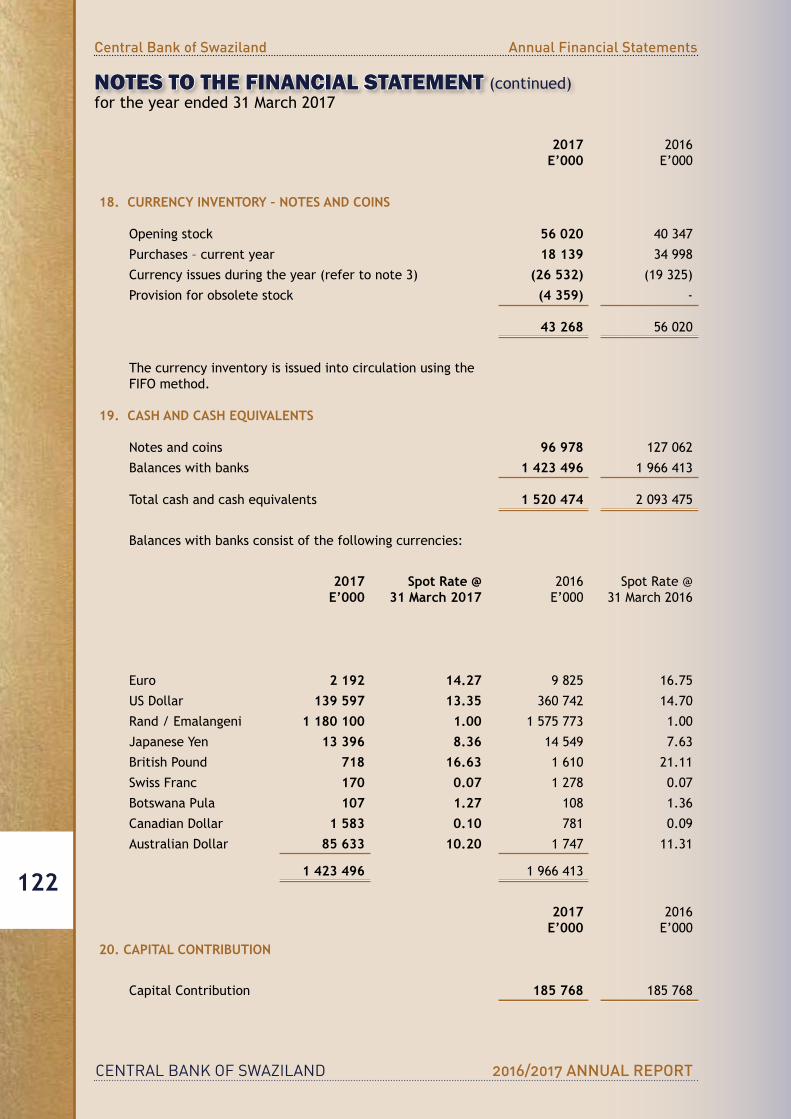
CENTRAL BANK OF SWAZILAND 2016/2017 ANNUAL REPORT
Central Bank of Swaziland Annual Financial Statements
122
NOTES TO THE FINANCIAL STATEMENT (continued)for the year ended 31 March 2017
2017E’000
2016E’000
18. CURRENCY INVENTORY – NOTES AND COINS
Opening stock 56 020 40 347
Purchases – current year 18 139 34 998
Currencyissuesduringtheyear(refertonote3) (26 532) (19 325)
Provision for obsolete stock (4 359) -
43 268 56 020
The currency inventory is issued into circulation using the FIFO method.
19. CASH AND CASH EQUIVALENTS
Notes and coins 96 978 127 062
Balances with banks 1 423 496 1 966 413
Total cash and cash equivalents 1 520 474 2 093 475
Balances with banks consist of the following currencies:
2017E’000
Spot Rate @31 March 2017
2016E’000
Spot Rate @31 March 2016
Euro 2 192 14.27 9 825 16.75
USDollar 139 597 13.35 360 742 14.70
Rand/Emalangeni 1 180 100 1.00 1 575 773 1.00
JapaneseYen 13 396 8.36 14 549 7.63
British Pound 718 16.63 1 610 21.11
Swiss Franc 170 0.07 1 278 0.07
Botswana Pula 107 1.27 108 1.36
CanadianDollar 1 583 0.10 781 0.09
AustralianDollar 85 633 10.20 1 747 11.31
1 423 496 1 966 413
2017E’000
2016E’000
20. CAPITAL CONTRIBUTION
CapitalContribution 185 768 185 768
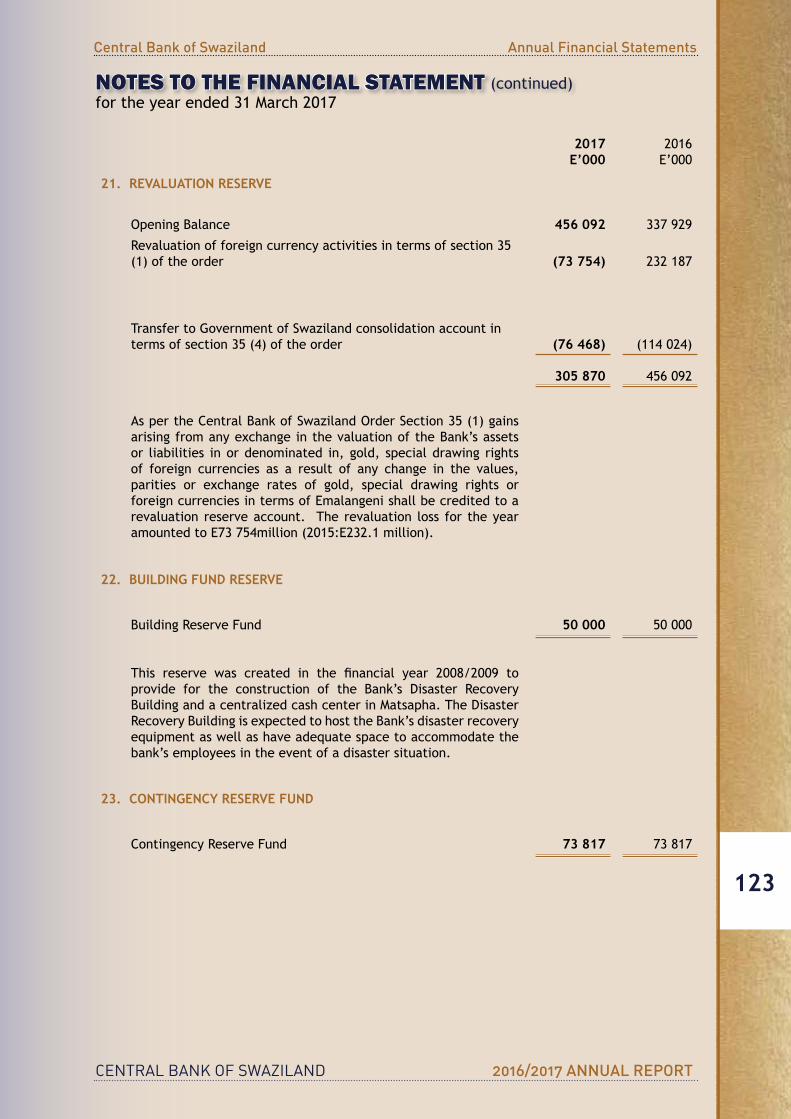
CENTRAL BANK OF SWAZILAND 2016/2017 ANNUAL REPORT
Central Bank of Swaziland Annual Financial Statements
123
NOTES TO THE FINANCIAL STATEMENT (continued)for the year ended 31 March 2017
2017E’000
2016E’000
21. REVALUATION RESERVE
Opening Balance 456 092 337 929
Revaluation of foreign currency activities in terms of section 35 (1) of the order (73 754) 232 187
Transfer to Government of Swaziland consolidation account in terms of section 35 (4) of the order (76 468) (114 024)
305 870 456 092
AspertheCentralBankofSwazilandOrderSection35(1)gainsarising from any exchange in the valuation of the Bank’s assets or liabilities in or denominated in, gold, special drawing rights of foreign currencies as a result of any change in the values, parities or exchange rates of gold, special drawing rights or foreigncurrenciesintermsofEmalangenishallbecreditedtoarevaluation reserve account. The revaluation loss for the year amountedtoE73754million(2015:E232.1million).
22. BUILDING FUND RESERVE
Building Reserve Fund 50 000 50 000
This reserve was created in the financial year 2008/2009 toprovide for the construction of the Bank’s Disaster RecoveryBuildingandacentralizedcashcenterinMatsapha.TheDisasterRecovery Building is expected to host the Bank’s disaster recovery equipment as well as have adequate space to accommodate the bank’s employees in the event of a disaster situation.
23. CONTINGENCY RESERVE FUND
ContingencyReserveFund 73 817 73 817
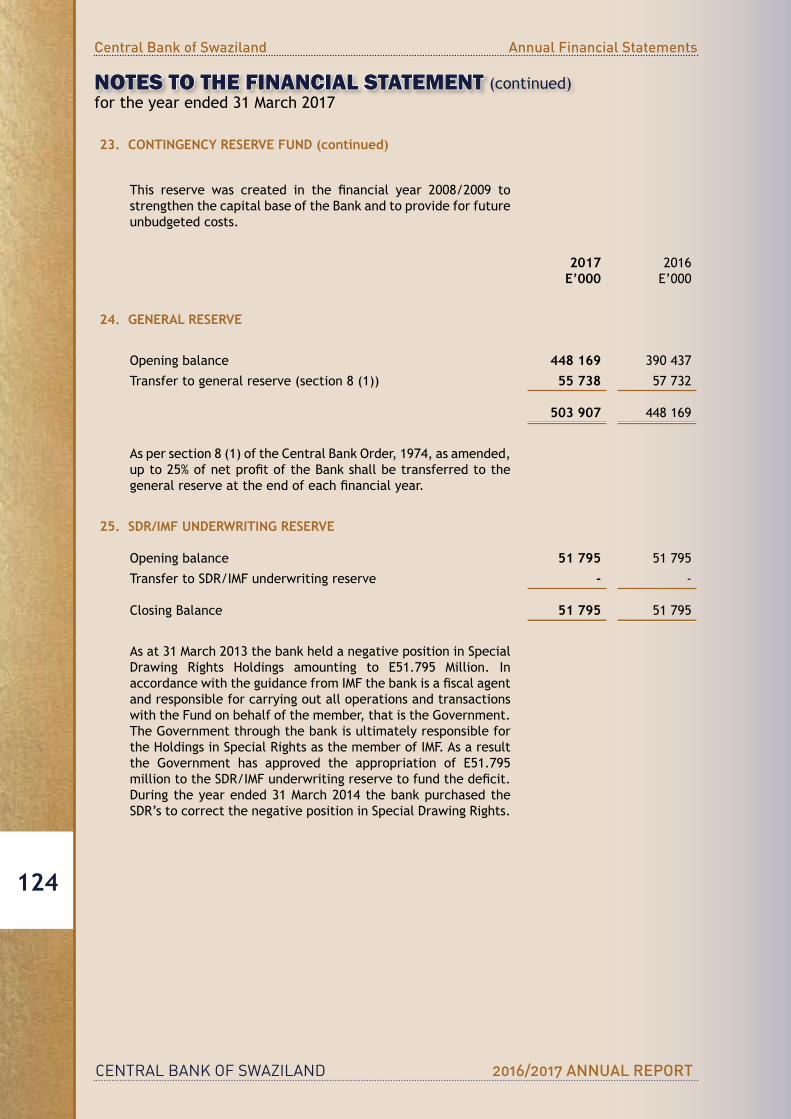
CENTRAL BANK OF SWAZILAND 2016/2017 ANNUAL REPORT
Central Bank of Swaziland Annual Financial Statements
124
NOTES TO THE FINANCIAL STATEMENT (continued)for the year ended 31 March 2017
23. CONTINGENCY RESERVE FUND (continued)
This reserve was created in the financial year 2008/2009 tostrengthen the capital base of the Bank and to provide for future unbudgeted costs.
2017E’000
2016E’000
24. GENERAL RESERVE
Opening balance 448 169 390 437
Transfer to general reserve (section 8 (1)) 55 738 57 732
503 907 448 169
Aspersection8(1)oftheCentralBankOrder,1974,asamended,upto25%ofnetprofitoftheBankshallbetransferredtothegeneralreserveattheendofeachfinancialyear.
25. SDR/IMF UNDERWRITING RESERVE
Opening balance 51 795 51 795
TransfertoSDR/IMFunderwritingreserve - -
ClosingBalance 51 795 51 795
As at 31 March 2013 the bank held a negative position in Special Drawing Rights Holdings amounting to E51.795 Million. InaccordancewiththeguidancefromIMFthebankisafiscalagentand responsible for carrying out all operations and transactions with the Fund on behalf of the member, that is the Government. The Government through the bank is ultimately responsible for the Holdings in Special Rights as the member of IMF. As a result the Government has approved the appropriation of E51.795milliontotheSDR/IMFunderwritingreservetofundthedeficit.Duringtheyearended31March2014thebankpurchasedtheSDR’stocorrectthenegativepositioninSpecialDrawingRights.
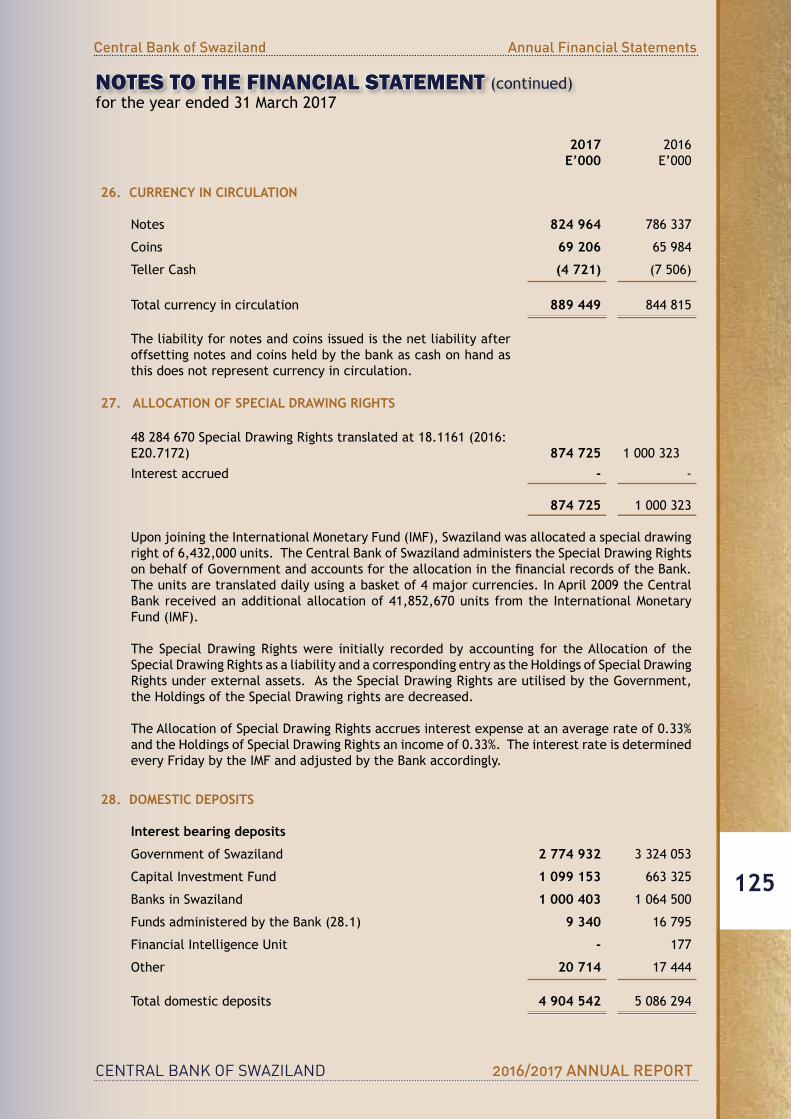
CENTRAL BANK OF SWAZILAND 2016/2017 ANNUAL REPORT
Central Bank of Swaziland Annual Financial Statements
125
NOTES TO THE FINANCIAL STATEMENT (continued)for the year ended 31 March 2017
2017E’000
2016E’000
26. CURRENCY IN CIRCULATION
Notes 824 964 786 337
Coins 69 206 65 984
TellerCash (4 721) (7 506)
Total currency in circulation 889 449 844 815
The liability for notes and coins issued is the net liability after offsetting notes and coins held by the bank as cash on hand as this does not represent currency in circulation.
27. ALLOCATION OF SPECIAL DRAWING RIGHTS
48284670SpecialDrawingRightstranslatedat18.1161(2016:E20.7172) 874 725 1 000 323
Interest accrued - -
874 725 1 000 323
Upon joining the International Monetary Fund (IMF), Swaziland was allocated a special drawing rightof6,432,000units.TheCentralBankofSwazilandadministerstheSpecialDrawingRightsonbehalfofGovernmentandaccountsfortheallocationinthefinancialrecordsoftheBank.Theunitsaretranslateddailyusingabasketof4majorcurrencies.InApril2009theCentralBank received an additional allocation of 41,852,670 units from the International Monetary Fund (IMF).
The Special DrawingRightswere initially recordedby accounting for theAllocation of theSpecialDrawingRightsasaliabilityandacorrespondingentryastheHoldingsofSpecialDrawingRightsunderexternalassets.AstheSpecialDrawingRightsareutilisedbytheGovernment,theHoldingsoftheSpecialDrawingrightsaredecreased.
TheAllocationofSpecialDrawingRightsaccruesinterestexpenseatanaveragerateof0.33%andtheHoldingsofSpecialDrawingRightsanincomeof0.33%.Theinterestrateisdeterminedevery Friday by the IMF and adjusted by the Bank accordingly.
28. DOMESTIC DEPOSITS
Interest bearing deposits
Government of Swaziland 2 774 932 3 324 053
CapitalInvestmentFund 1 099 153 663 325
Banks in Swaziland 1 000 403 1 064 500
Funds administered by the Bank (28.1) 9 340 16 795
Financial Intelligence Unit - 177
Other 20 714 17 444
Total domestic deposits 4 904 542 5 086 294

CENTRAL BANK OF SWAZILAND 2016/2017 ANNUAL REPORT
Central Bank of Swaziland Annual Financial Statements
126
NOTES TO THE FINANCIAL STATEMENT (continued)for the year ended 31 March 2017
28. DOMESTIC DEPOSITS (continued)
28.1FundsadministeredbytheBankaredepositsmadebytheSmallScaleEnterpriseLoanGuarantee Scheme and Export Credit Guarantee Scheme (refer note 34). Other domesticdeposits consist of deposits by Swaziland Building Society and other miscellaneous deposits.
2017E’000
2016E’000
Maturity analysis:
On demand 1 000 403 1 064 500
From 1 month to 6 months 3 894 054 4 021 794
4 894 457 5 086 294
The maturity analysis is based on the remaining period from year-end to contractual maturity.
Domesticdepositsbalancesincludethefollowingbalancesin foreign currencies;
2017E’000
Spot Rate @31 March 2017
2016E’000
Spot Rate @31 March 2016
Euro 237 053 14.27 287 888 16.75
USDollar 545 361 13.34 603 445 14.70
782 414 891 333
2017E’000
2016E’000
29. FOREIGN DEPOSITS AND LIABILITIES
SwazilandGovernmentDebtservice 16 966 65 438
SwazilandGovernmentIFADaccount 2 723 3 332
Public Finance Management 96 2 046
SwazilandGovernmentADBGrantaccount-NerchaandHIVand TB projects
18 118
InternationalBankofReconstructionandDevelopment 10 598 10 528
ABSA 1 089 3 683
Other 7 505 22 672
Swaziland Government Road construction projects 201 323SwazilandGovernmentPigIndustryEnhancement 1 868
260 286 137 279
Analyses of currency composition and maturity structure is set out in note 39.2.

CENTRAL BANK OF SWAZILAND 2016/2017 ANNUAL REPORT
Central Bank of Swaziland Annual Financial Statements
127
NOTES TO THE FINANCIAL STATEMENT (continued)for the year ended 31 March 2017
2017E’000
2016E’000
30. OTHER LIABILITIES
Financial LiabilitiesDisbursements 13 519 33 998
Stanlib Swaziland (30.1, 30.2, 30.3) 272 692 150 834
African Alliance Swaziland (30.4) 101 944 -
388 155 184 832
Maturity analysis:
On demand
From 1 month to 6 months 10 894 5 057
From 7 months to 12 months 207 261 179 775
Over 12 months 170 000 -
388 155 184 832 The maturity analysis is based on the remaining period from year end to contractual maturity. The amountsdisclosedintheanalysisabovearethecontractualundiscountedcashflows. 30.1 To protect the country’s reserves the Central Bank entered into an agreementwith Stanlib
SwazilandtoissueaprivateplacementofE150million.TheamountearnsaninterestofPrimeless 2.5%. Interest is payable quarterly in arrears on 06 June 2016, 05 September 2016, 5December2016and06March2017.Theprincipalamountisre-payableon06March2017.
30.2To protect the country’s reserves theCentral Bank entered into an agreementwith StanlibSwazilandtoissueaprivateplacementofE100million.TheamountearnsaninterestofPrimeless2.5%.Interestispayablequarterlyinarrearson14July2016,14October2016,16January2017 and 13 April 2017. The principal amount is re-payable on 13 April 2017.
30.3 To protect the country’s reserves the Central Bank entered into an agreementwith StanlibSwazilandtoissueaprivateplacementofE170million.TheamountearnsaninterestofPrimeless1.75%.Interestispayablequarterlyinarrearson7June2017,7September2017,and7December2017.Theprincipalamountisre-payableon7March2018.
30.4 Toprotect the country’s reserves theCentral Bank entered into an agreementwithAfricanAllianceSwazilandtoissueaprivateplacementofE100million.TheamountearnsaninterestofPrimeless1.4%.Interestispayablequarterlyinarrearson10January,10April2016,1oJulyand 10 October. The principal amount is re-payable on 10 October 2017.
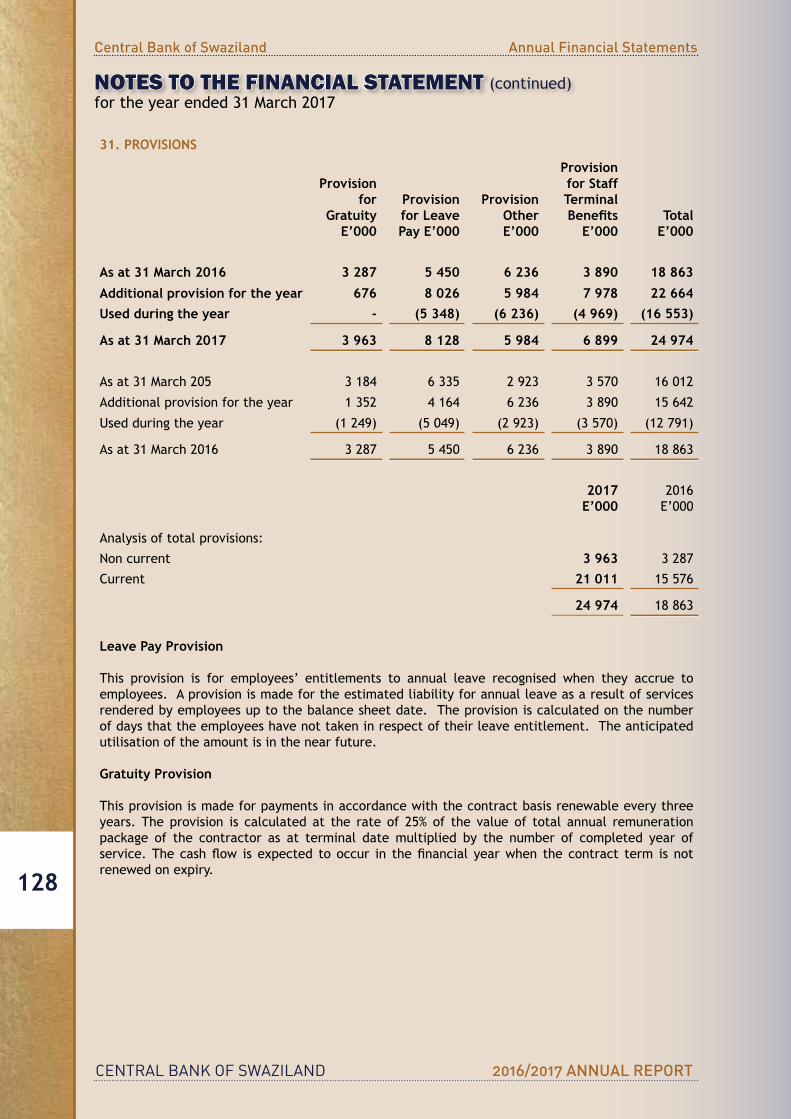
CENTRAL BANK OF SWAZILAND 2016/2017 ANNUAL REPORT
Central Bank of Swaziland Annual Financial Statements
128
NOTES TO THE FINANCIAL STATEMENT (continued)for the year ended 31 March 2017
31. PROVISIONS
Provision for
GratuityE’000
Provision for Leave Pay E’000
ProvisionOtherE’000
Provision for Staff TerminalBenefits
E’000Total
E’000
As at 31 March 2016 3 287 5 450 6 236 3 890 18 863
Additional provision for the year 676 8 026 5 984 7 978 22 664Used during the year - (5 348) (6 236) (4 969) (16 553)
As at 31 March 2017 3 963 8 128 5 984 6 899 24 974
As at 31 March 205 3 184 6 335 2 923 3 570 16 012
Additional provision for the year 1 352 4 164 6 236 3 890 15 642
Used during the year (1 249) (5 049) (2 923) (3 570) (12 791)
As at 31 March 2016 3 287 5 450 6 236 3 890 18 863
2017E’000
2016E’000
Analysis of total provisions:
Non current 3 963 3 287
Current 21 011 15 576
24 974 18 863
Leave Pay Provision
This provision is for employees’ entitlements to annual leave recognised when they accrue to employees. A provision is made for the estimated liability for annual leave as a result of services rendered by employees up to the balance sheet date. The provision is calculated on the number of days that the employees have not taken in respect of their leave entitlement. The anticipated utilisation of the amount is in the near future.
Gratuity Provision
This provision is made for payments in accordance with the contract basis renewable every three years. The provision is calculated at the rate of 25% of the value of total annual remuneration package of the contractor as at terminal date multiplied by the number of completed year of service.Thecashflow isexpected tooccur in thefinancial yearwhen thecontract term isnotrenewed on expiry.
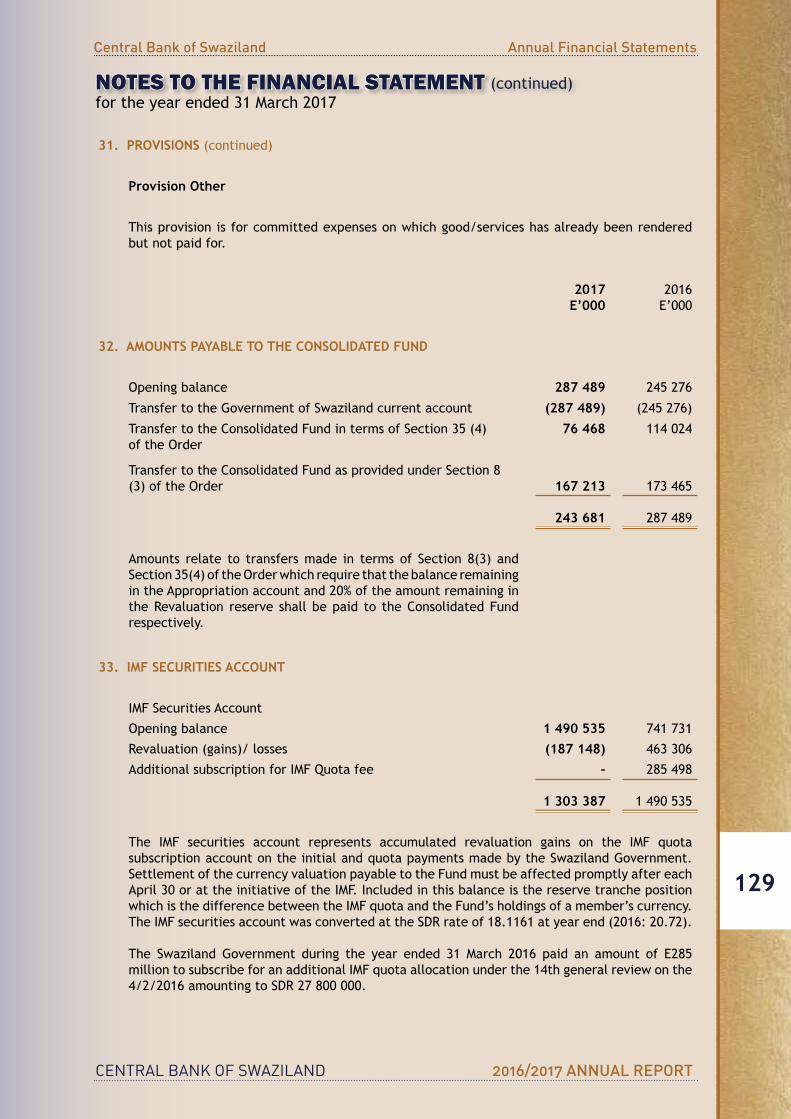
CENTRAL BANK OF SWAZILAND 2016/2017 ANNUAL REPORT
Central Bank of Swaziland Annual Financial Statements
129
31. PROVISIONS (continued)
Provision Other
This provision is for committed expenses on which good/services has already been rendered but not paid for.
2017E’000
2016E’000
32. AMOUNTS PAYABLE TO THE CONSOLIDATED FUND
Opening balance 287 489 245 276
Transfer to the Government of Swaziland current account (287 489) (245 276)
TransfertotheConsolidatedFundintermsofSection35(4)of the Order
76 468 114 024
TransfertotheConsolidatedFundasprovidedunderSection8(3) of the Order 167 213 173 465
243 681 287 489
Amounts relate to transfers made in terms of Section 8(3) and Section 35(4) of the Order which require that the balance remaining in the Appropriation account and 20% of the amount remaining in theRevaluation reserve shallbepaid to theConsolidatedFundrespectively.
33. IMF SECURITIES ACCOUNT
IMF Securities Account
Opening balance 1 490 535 741 731
Revaluation (gains)/ losses (187 148) 463 306
AdditionalsubscriptionforIMFQuotafee - 285 498
1 303 387 1 490 535
The IMF securities account represents accumulated revaluation gains on the IMF quota subscription account on the initial and quota payments made by the Swaziland Government. Settlement of the currency valuation payable to the Fund must be affected promptly after each April 30 or at the initiative of the IMF. Included in this balance is the reserve tranche position which is the difference between the IMF quota and the Fund’s holdings of a member’s currency. TheIMFsecuritiesaccountwasconvertedattheSDRrateof18.1161atyearend(2016:20.72).
The Swaziland Government during the year ended 31 March 2016 paid an amount of E285million to subscribe for an additional IMF quota allocation under the 14th general review on the 4/2/2016amountingtoSDR27800000.
NOTES TO THE FINANCIAL STATEMENT (continued)for the year ended 31 March 2017
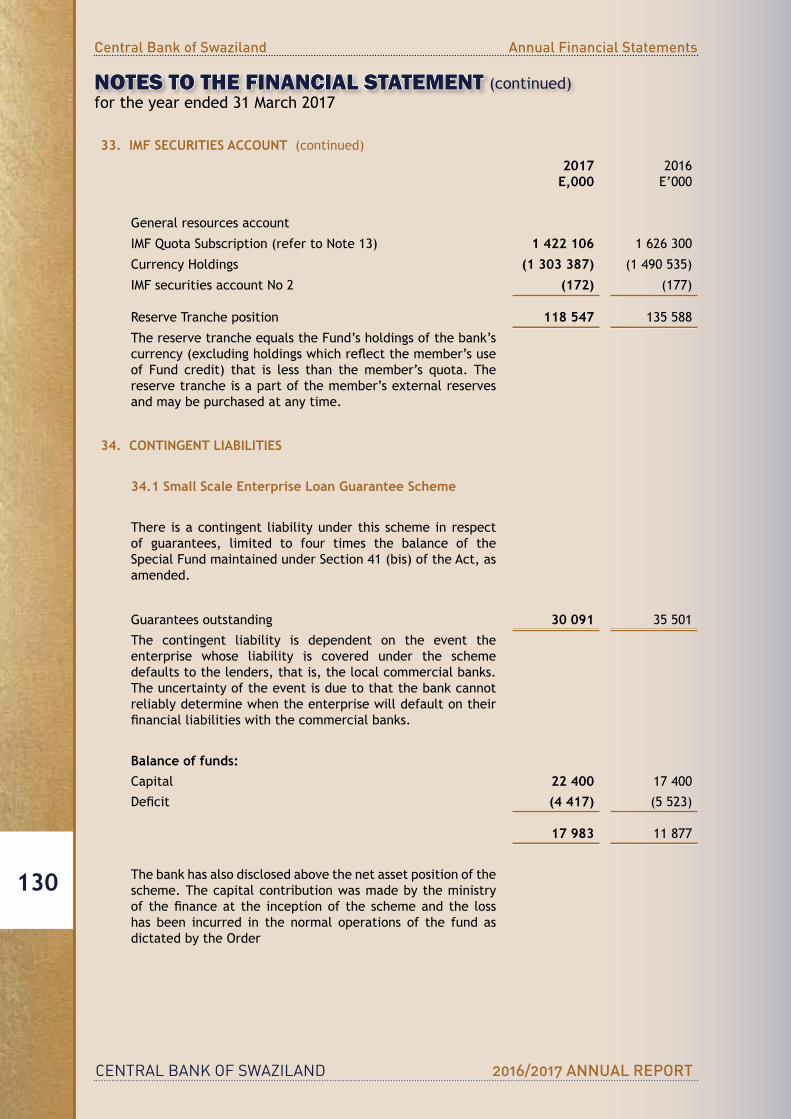
CENTRAL BANK OF SWAZILAND 2016/2017 ANNUAL REPORT
Central Bank of Swaziland Annual Financial Statements
130
33. IMF SECURITIES ACCOUNT (continued)
2017E,000
2016E’000
General resources account
IMFQuotaSubscription(refertoNote13) 1 422 106 1 626 300
CurrencyHoldings (1 303 387) (1 490 535)
IMF securities account No 2 (172) (177)
Reserve Tranche position 118 547 135 588
The reserve tranche equals the Fund’s holdings of the bank’s currency(excludingholdingswhichreflectthemember’suseof Fund credit) that is less than the member’s quota. The reserve tranche is a part of the member’s external reserves and may be purchased at any time.
34. CONTINGENT LIABILITIES
34.1 Small Scale Enterprise Loan Guarantee Scheme
There is a contingent liability under this scheme in respect of guarantees, limited to four times the balance of the Special Fund maintained under Section 41 (bis) of the Act, as amended.
Guarantees outstanding 30 091 35 501
The contingent liability is dependent on the event the enterprise whose liability is covered under the scheme defaults to the lenders, that is, the local commercial banks. The uncertainty of the event is due to that the bank cannot reliably determine when the enterprise will default on their financialliabilitieswiththecommercialbanks.
Balance of funds:Capital 22 400 17 400
Deficit (4 417) (5 523)
17 983 11 877
The bank has also disclosed above the net asset position of the scheme. The capital contribution was made by the ministry of thefinanceat the inceptionof the schemeand the losshas been incurred in the normal operations of the fund as dictated by the Order
NOTES TO THE FINANCIAL STATEMENT (continued)for the year ended 31 March 2017
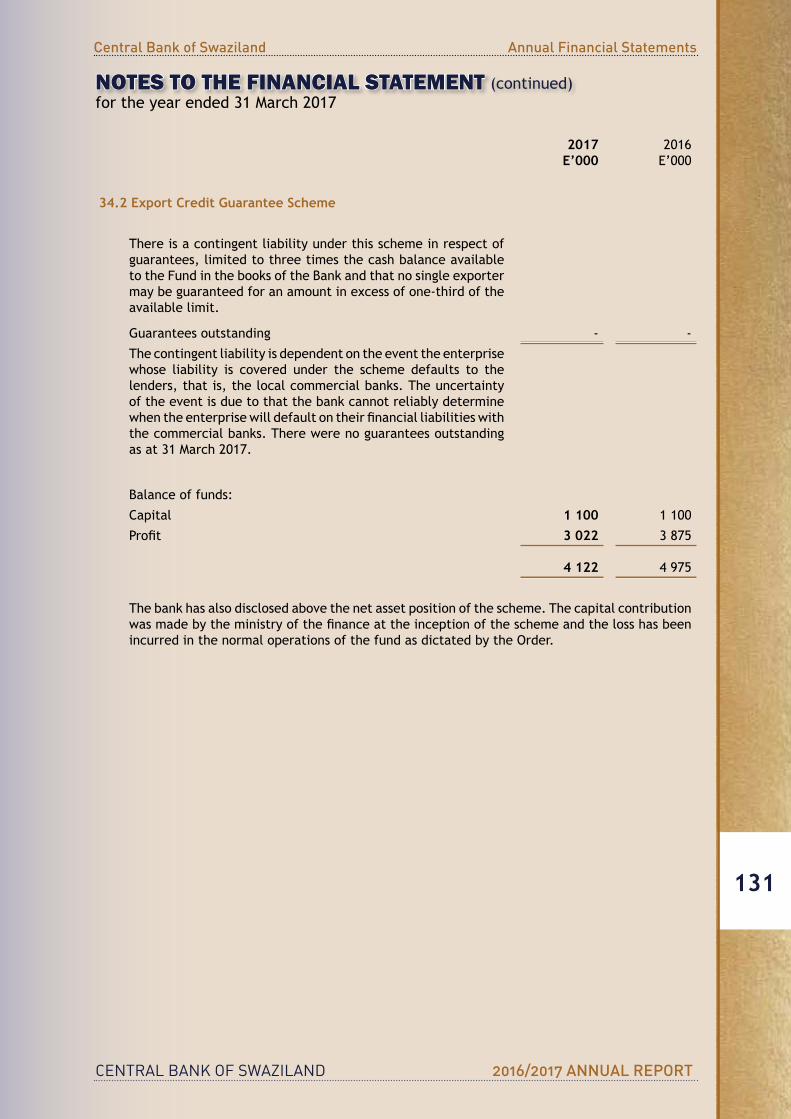
CENTRAL BANK OF SWAZILAND 2016/2017 ANNUAL REPORT
Central Bank of Swaziland Annual Financial Statements
131
2017E’000
2016E’000
34.2 Export Credit Guarantee Scheme
There is a contingent liability under this scheme in respect of guarantees, limited to three times the cash balance available to the Fund in the books of the Bank and that no single exporter may be guaranteed for an amount in excess of one-third of the available limit.
Guarantees outstanding - -
The contingent liability is dependent on the event the enterprise whose liability is covered under the scheme defaults to the lenders, that is, the local commercial banks. The uncertainty of the event is due to that the bank cannot reliably determine whentheenterprisewilldefaultontheirfinancialliabilitieswiththe commercial banks. There were no guarantees outstanding as at 31 March 2017.
Balance of funds:
Capital 1 100 1 100
Profit 3 022 3 875
4 122 4 975
The bank has also disclosed above the net asset position of the scheme. The capital contribution wasmadebytheministryofthefinanceattheinceptionoftheschemeandthelosshasbeenincurred in the normal operations of the fund as dictated by the Order.
NOTES TO THE FINANCIAL STATEMENT (continued)for the year ended 31 March 2017
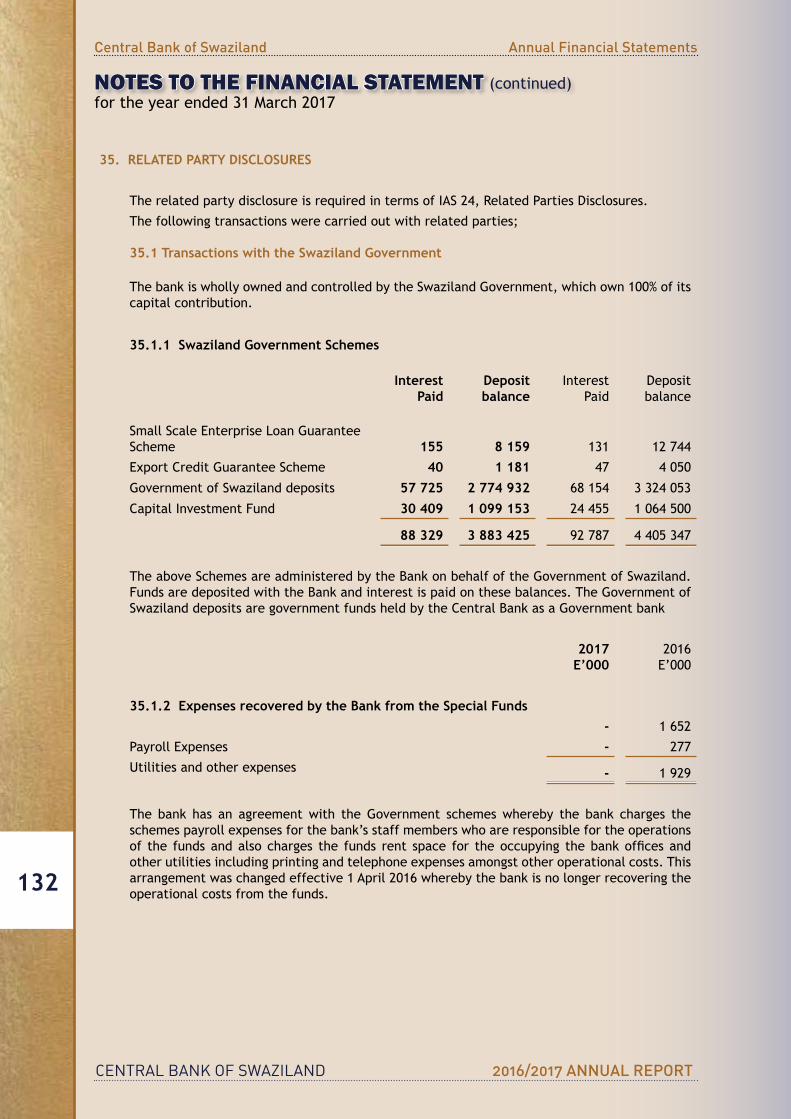
CENTRAL BANK OF SWAZILAND 2016/2017 ANNUAL REPORT
Central Bank of Swaziland Annual Financial Statements
132
NOTES TO THE FINANCIAL STATEMENT (continued)for the year ended 31 March 2017
35. RELATED PARTY DISCLOSURES
TherelatedpartydisclosureisrequiredintermsofIAS24,RelatedPartiesDisclosures.
The following transactions were carried out with related parties;
35.1 Transactions with the Swaziland Government
The bank is wholly owned and controlled by the Swaziland Government, which own 100% of its capital contribution.
35.1.1 Swaziland Government Schemes
InterestPaid
Depositbalance
InterestPaid
Depositbalance
SmallScaleEnterpriseLoanGuaranteeScheme 155 8 159 131 12 744
ExportCreditGuaranteeScheme 40 1 181 47 4 050
Government of Swaziland deposits 57 725 2 774 932 68 154 3 324 053
CapitalInvestmentFund 30 409 1 099 153 24 455 1 064 500
88 329 3 883 425 92 787 4 405 347
The above Schemes are administered by the Bank on behalf of the Government of Swaziland. Funds are deposited with the Bank and interest is paid on these balances. The Government of SwazilanddepositsaregovernmentfundsheldbytheCentralBankasaGovernmentbank
2017E’000
2016E’000
35.1.2 Expenses recovered by the Bank from the Special Funds- 1 652
PayrollExpenses - 277
Utilities and other expenses - 1 929
The bank has an agreement with the Government schemes whereby the bank charges the schemes payroll expenses for the bank’s staff members who are responsible for the operations of the fundsandalsocharges the funds rent space for theoccupying thebankofficesandother utilities including printing and telephone expenses amongst other operational costs. This arrangement was changed effective 1 April 2016 whereby the bank is no longer recovering the operational costs from the funds.
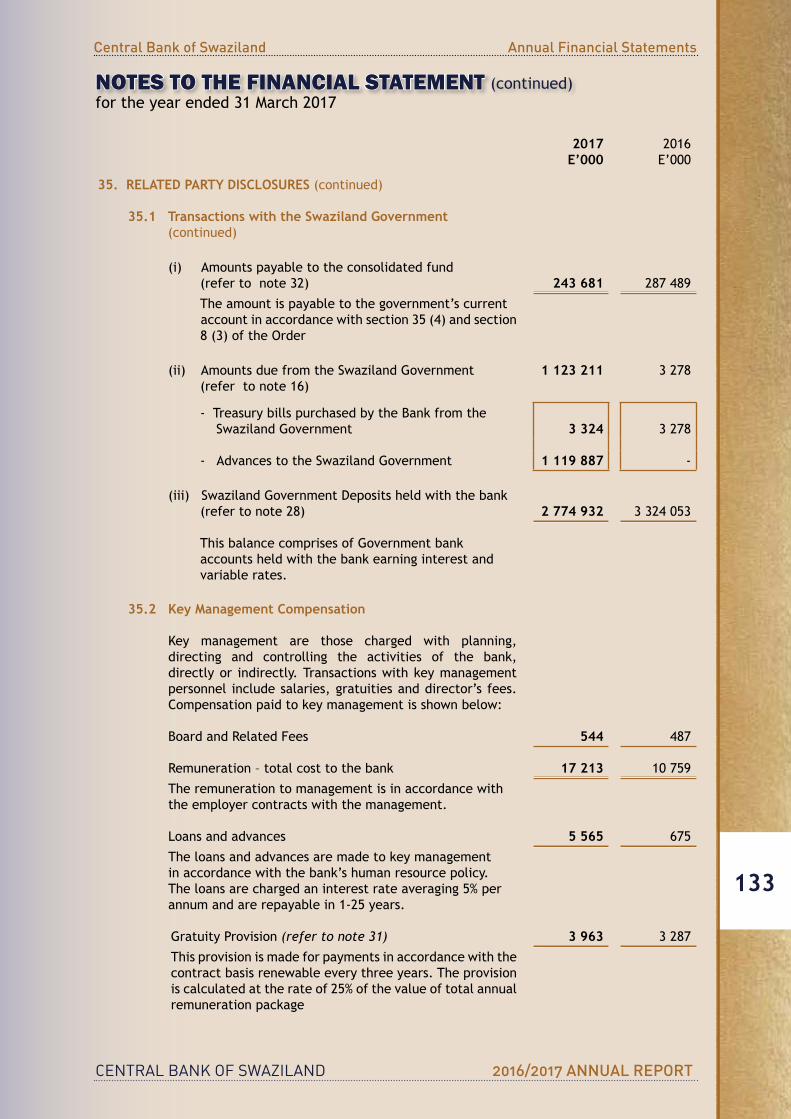
CENTRAL BANK OF SWAZILAND 2016/2017 ANNUAL REPORT
Central Bank of Swaziland Annual Financial Statements
133
NOTES TO THE FINANCIAL STATEMENT (continued)for the year ended 31 March 2017
2017E’000
2016E’000
35. RELATED PARTY DISCLOSURES (continued)
35.1 Transactions with the Swaziland Government (continued)
(i) Amounts payable to the consolidated fund (refer to note 32) 243 681 287 489
The amount is payable to the government’s current account in accordance with section 35 (4) and section 8 (3) of the Order
(ii) Amounts due from the Swaziland Government (refer to note 16)
1 123 211 3 278
- Treasury bills purchased by the Bank from the Swaziland Government 3 324 3 278
- Advances to the Swaziland Government 1 119 887 -
(iii)SwazilandGovernmentDepositsheldwiththebank (refer to note 28) 2 774 932 3 324 053
This balance comprises of Government bank accounts held with the bank earning interest and variable rates.
35.2 Key Management Compensation
Key management are those charged with planning,directing and controlling the activities of the bank, directly or indirectly. Transactions with key management personnel include salaries, gratuities and director’s fees. Compensationpaidtokeymanagementisshownbelow:
Board and Related Fees 544 487
Remuneration – total cost to the bank 17 213 10 759
The remuneration to management is in accordance with the employer contracts with the management.
Loans and advances 5 565 675
The loans and advances are made to key management in accordance with the bank’s human resource policy. The loans are charged an interest rate averaging 5% per annum and are repayable in 1-25 years.
Gratuity Provision (refer to note 31) 3 963 3 287
This provision is made for payments in accordance with the contract basis renewable every three years. The provision is calculated at the rate of 25% of the value of total annual remuneration package

CENTRAL BANK OF SWAZILAND 2016/2017 ANNUAL REPORT
Central Bank of Swaziland Annual Financial Statements
134
NOTES TO THE FINANCIAL STATEMENT (continued)for the year ended 31 March 2017
36. EMPLOYEE RETIREMENT BENEFITS OBLIGATION
2017E’000
2016E’000
Employeecontributionstodefinedcontributionplan 12 135 11 171
TheBankmakescontributions toadefinedcontributionplanthatprovidespensionbenefitsforpermanentemployeesuponretirement.
37. TAXATION
In terms of Section 56 of the Order, the Bank is exempt from taxationinrespectofitsprofitsandoperations.
38. CAPITAL COMMITMENTS 2017 2016
E’000 E’000
Contracted - -
Not contracted - -
- -
39. FINANCIAL INSTRUMENTS AND RISK MANAGEMENT
Thebank’sactivitiesexposeittoavarietyoffinancialrisks:marketrisk(includingcurrencyrisk,fairvalueinterestrateriskandcashflowinterestraterisk,creditriskandliquidityrisk.
TheBank’soverallriskmanagementprogrammefocusesontheunpredictabilityoffinancialmarketsandseekstominimisepotentialadverseeffectsonthefinancialperformanceoftheBank.
Risk Management at the Central Bank of Swaziland, forms an integral part of reservesmanagement within the governance structures of the bank starting from the level of the Board. RiskmanagementiscarriedoutunderpoliciesapprovedbytheBoardofDirectorsoftheBankthe Board defines the investment guidelines and the Bank’s strategic asset allocation.TheInvestment committee formulates the investment mandate and monitors compliance with the Investment guidelines. The Board provides written principles for overall risk management, aswellasforspecificareassuchasforeignexchangerisk,interestraterisk,creditrisk,useofderivativefinancialinstruments,andinvestingexcessliquidity.Thetypesofriskthattheforeign currency reserves are exposed to and the Bank’s risk management approaches are stated below.

CENTRAL BANK OF SWAZILAND 2016/2017 ANNUAL REPORT
Central Bank of Swaziland Annual Financial Statements
135
NOTES TO THE FINANCIAL STATEMENT (continued)for the year ended 31 March 2017
39. FINANCIAL INSTRUMENTS AND RISK MANAGEMENT (continued)
39.1 Market Risk
Market price risk is the risk of loss resulting from changes in market conditions and prices. The Bank follows a passive investment strategy, whereby the bank tracts a customised benchmark.TheBank’sinstrumentsaremarktomarketandthustheportfolioreflectsmarket value at time of reporting.
39.1.1 Interest Rate Risks
Sinceforeigncurrencyreservesareinvestedinfixedincomeinstruments,TheBank isexposed to interest rate risk, which is the risk that the market value of securities will decline due to changes in market interest rate. The Bank uses the investment benchmark’s target duration as means of managing interest rate risk. Asat31March2017theweighteddurationforZARUSDandAUDportfolioswere4.04, 0.36 and 0.03 months, respectively.
The sensitivity analysis tables below measure the impact of a 25 basis points increase in interest rates on both USD andAUD portfolios. It also shows thesensitivity analysis table with the impact of a 50 basis points increase in the ZAR portfolio as compares with portfolio holdings in 2017.
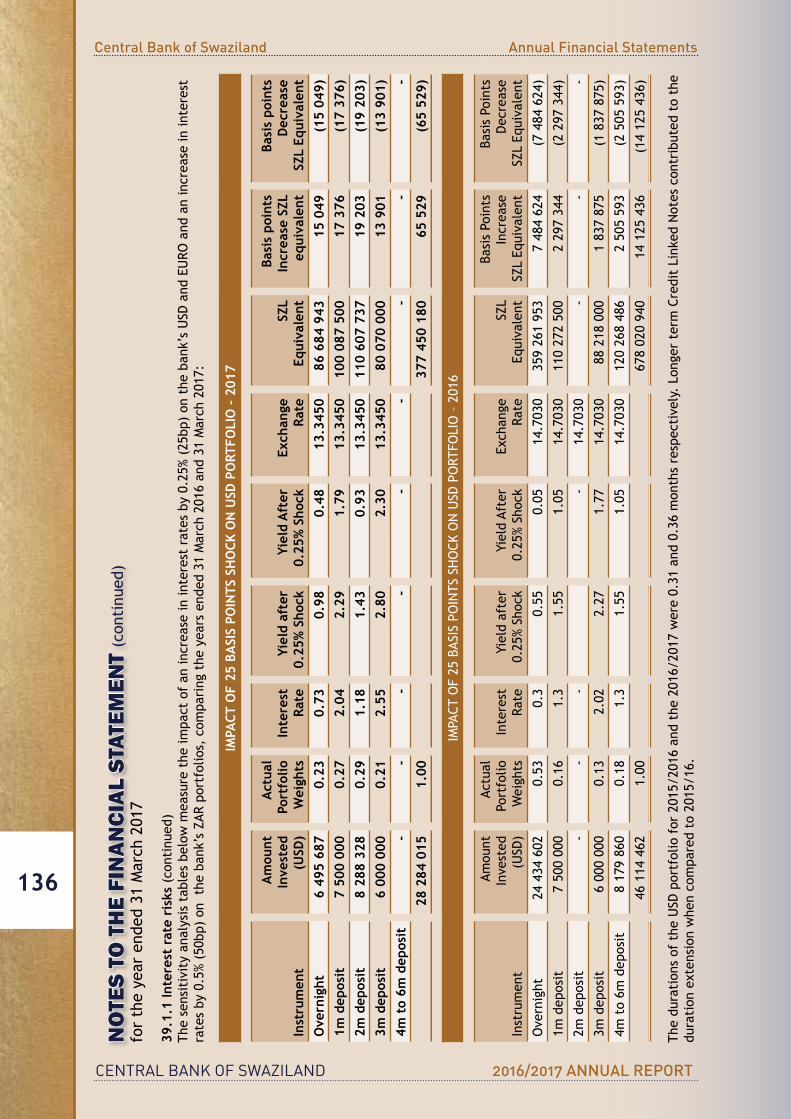
CENTRAL BANK OF SWAZILAND 2016/2017 ANNUAL REPORT
Central Bank of Swaziland Annual Financial Statements
136
NO
TES
TO T
HE
FIN
ANCI
AL S
TATE
MEN
T (c
onti
nued
)fo
r th
e ye
ar e
nded
31
Mar
ch 2
017
39.1
.1 In
tere
st r
ate
risk
s (c
onti
nued
)Th
esensitivityan
alysistab
lesbe
lowm
easurethe
impa
ctofan
increa
sein
interestratesby0.25%(25b
p)ontheba
nk’sUSD
and
EURO
and
anincrea
sein
interest
rate
s by
0.5
% (5
0bp)
on
the
ban
k’s
ZAR
port
folio
s, c
ompa
ring
the
yea
rs e
nded
31
Mar
ch 2
016
and
31 M
arch
201
7:
IMPA
CT O
F 25
BA
SIS
POIN
TS S
HO
CK O
N U
SD P
ORT
FOLI
O –
201
7
Inst
rum
ent
Am
ount
Inve
sted
(U
SD)
Act
ual
Por
tfol
io W
eigh
tsIn
tere
stRa
teYi
eld
afte
r0.
25%
Sho
ckYi
eld
Aft
er
0.25
% S
hock
Exch
ange
Rate
SZL
Equi
vale
nt
Basi
s po
ints
Inc
reas
e SZ
L eq
uiva
lent
Basi
s po
ints
Dec
reas
eSZ
L Eq
uiva
lent
Ove
rnig
ht
6 49
5 68
70.
230.
730.
980.
4813
.345
086
684
943
15 0
49(1
5 04
9)1m
dep
osit
7 50
0 00
00.
272.
042.
291.
7913
.345
010
0 08
7 50
017
376
(17
376)
2m d
epos
it8
288
328
0.29
1.18
1.43
0.93
13.3
450
110
607
737
19 2
03(1
9 20
3)3m
dep
osit
6 00
0 00
00.
212.
552.
802.
3013
.345
080
070
000
13 9
01(1
3 90
1)4m
to
6m d
epos
it-
--
--
--
--
28 2
84 0
151.
0037
7 45
0 18
065
529
(65
529)
IMPACT
OF25BAS
ISPOINTS
SHOCK
ONUSD
PORT
FOLIO–2016
Inst
rum
ent
Amou
nt In
vest
ed(USD
)
Actu
al P
ortf
olio
Wei
ghts
Inte
rest
Rate
Yiel
d af
ter
0.25
% Sh
ock
Yiel
d Af
ter
0.25
% Sh
ock
Exchan
geRa
teSZ
L Eq
uivalent
Basi
s Po
ints
Inc
reas
eSZLEq
uivalent
Basi
s Po
ints
Decrease
SZLEq
uivalent
Ove
rnig
ht
24 4
34 6
020.
530.
30.
550.
0514
.703
035
9 26
1 95
37
484
624
(7 4
84 6
24)
1m d
epos
it7
500
000
0.16
1.3
1.55
1.05
14.7
030
110
272
500
2 29
7 34
4(2
297
344
)
2m d
epos
it-
--
-14
.703
0-
--
3m d
epos
it6
000
000
0.13
2.02
2.27
1.77
14.7
030
88 2
18 0
001
837
875
(1 8
37 8
75)
4m t
o 6m
dep
osit
8 17
9 86
00.
181.
31.
551.
0514
.703
012
0 26
8 48
62
505
593
(2 5
05 5
93)
46 1
14 4
621.
0067
8 02
0 94
014
125
436
(14
125
436)
Thedu
ration
softhe
USD
portfoliofor2015/2016and
the
2016/2017were0.31and
0.36mon
thsrespectively.LongertermCreditLink
edNotescon
tributed
tothe
dura
tion
ext
ensi
on w
hen
com
pare
d to
201
5/16
.

CENTRAL BANK OF SWAZILAND 2016/2017 ANNUAL REPORT
Central Bank of Swaziland Annual Financial Statements
137
NO
TES
TO T
HE
FIN
ANCI
AL S
TATE
MEN
T (c
onti
nued
)fo
r th
e ye
ar e
nded
31
Mar
ch 2
017
39.1
.1 In
tere
st r
ate
risk
s (c
onti
nued
)
IMPA
CT O
F 25
BA
SIS
POIN
TS S
HO
CK O
N U
SD P
ORT
FOLI
O –
201
7
Inst
rum
ent
Am
ount
Inve
sted
(U
SD)
Act
ual
Por
tfol
io W
eigh
tsIn
tere
stRa
teYi
eld
afte
r0.
25%
Sho
ckYi
eld
Aft
er
0.25
% S
hock
Exch
ange
Rate
SZL
Equi
vale
nt
Basi
s po
ints
Inc
reas
e SZ
L eq
uiva
lent
Basi
s po
ints
Dec
reas
eSZ
L Eq
uiva
lent
Ove
rnig
ht
--
--
--
--
-1m
dep
osit
--
--
--
--
-4m
to
6m d
epos
it-
--
--
--
--
7m t
o 12
m d
epos
it-
--
--
--
--
--
--
--
--
-
IMPACT
OF25BAS
ISPOINTS
SHOCK
ONUSD
PORT
FOLIO–2016
Inst
rum
ent
Am
ount
Inve
sted
(U
SD)
Act
ual
Por
tfol
io W
eigh
tsIn
tere
stRa
teYi
eld
afte
r0.
25%
Sho
ckYi
eld
Aft
er
0.25
% S
hock
Exch
ange
Rate
SZL
Equi
vale
nt
Basi
s Po
ints
Inc
reas
e SZ
L Eq
uiva
lent
Basi
s Po
ints
Dec
reas
eSZ
L Eq
uiva
lent
Ove
rnig
ht
486
978
1.00
1.5
1.75
1.25
16.7
460
8 15
4 92
81
699
(1 6
99)
1m d
epos
it-
--
--
--
--
4m t
o 6m
dep
osit
--
--
--
--
-
7m t
o 12
m d
epos
it-
--
--
--
--
486
978
1.00
1.5
1.75
1.25
16.7
460
1 69
9(1
699
)
Thedu
ration
oftheEU
Rpo
rtfolio
sfor2015/2016an
d2016/2017were0.38and
0.00mon
thsrespectively.Th
eassetsw
erefully
investedinthe
mon
eym
arke
tin
stru
men
ts.
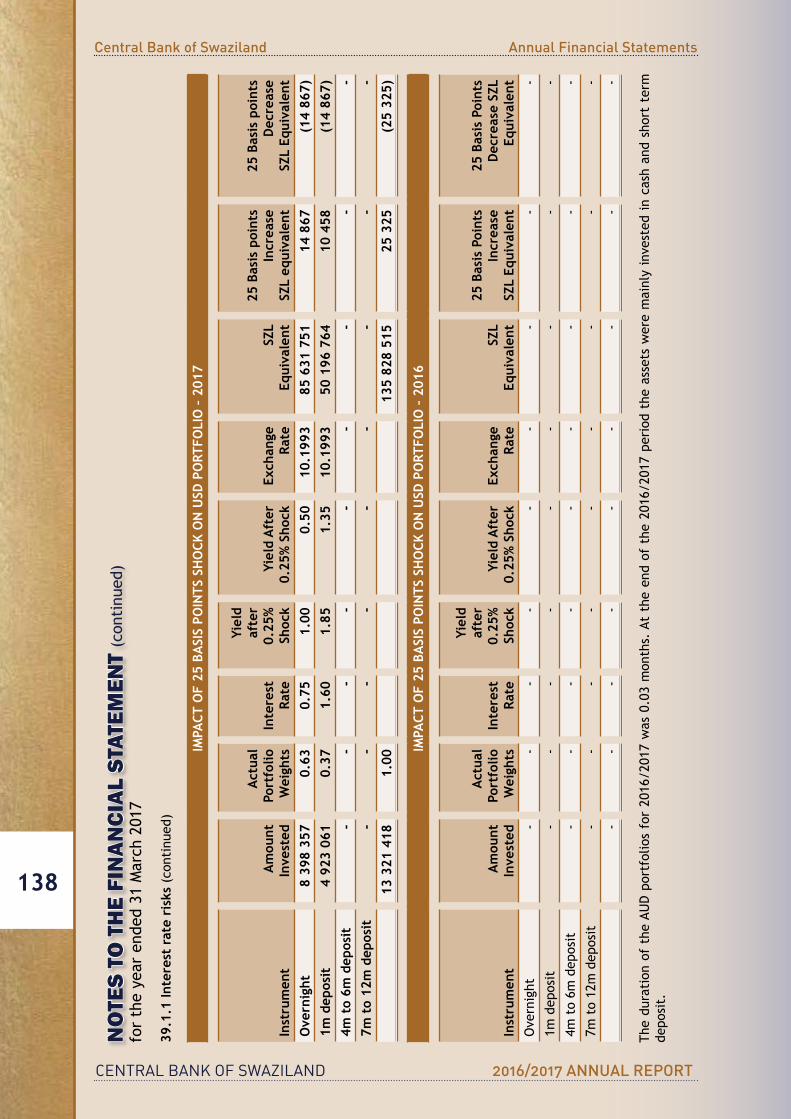
CENTRAL BANK OF SWAZILAND 2016/2017 ANNUAL REPORT
Central Bank of Swaziland Annual Financial Statements
138
NO
TES
TO T
HE
FIN
ANCI
AL S
TATE
MEN
T (c
onti
nued
)fo
r th
e ye
ar e
nded
31
Mar
ch 2
017
39.1
.1 In
tere
st r
ate
risk
s (c
onti
nued
)
IMPA
CT O
F 25
BA
SIS
POIN
TS S
HO
CK O
N U
SD P
ORT
FOLI
O –
201
7
Inst
rum
ent
Am
ount
Inve
sted
Act
ual
Por
tfol
io W
eigh
tsIn
tere
stRa
te
Yiel
d af
ter
0.25
%
Shoc
kYi
eld
Aft
er
0.25
% S
hock
Exch
ange
Rate
SZL
Equi
vale
nt
25 B
asis
poi
nts
Inc
reas
e SZ
L eq
uiva
lent
25 B
asis
poi
nts
Dec
reas
e S
ZL E
quiv
alen
tO
vern
ight
8
398
357
0.63
0.75
1.00
0.50
10.1
993
85 6
31 7
5114
867
(14
867)
1m d
epos
it4
923
061
0.37
1.60
1.85
1.35
10.1
993
50 1
96 7
6410
458
(14
867)
4m t
o 6m
dep
osit
--
--
--
--
-7m
to
12m
dep
osit
--
--
--
--
-13
321
418
1.00
135
828
515
25 3
25(2
5 32
5)
IMPA
CT O
F 25
BA
SIS
POIN
TS S
HO
CK O
N U
SD P
ORT
FOLI
O –
201
6
Inst
rum
ent
Am
ount
Inve
sted
Act
ual
Por
tfol
io W
eigh
tsIn
tere
stRa
te
Yiel
d af
ter
0.25
%
Shoc
kYi
eld
Aft
er
0.25
% S
hock
Exch
ange
Rate
SZL
Equi
vale
nt
25 B
asis
Poi
nts
Inc
reas
eSZ
L Eq
uiva
lent
25 B
asis
Poi
nts
Dec
reas
e SZ
L Eq
uiva
lent
Ove
rnig
ht
--
--
--
--
-
1m d
epos
it-
--
--
--
--
4m t
o 6m
dep
osit
--
--
--
--
-
7m t
o 12
m d
epos
it-
--
--
--
--
--
--
--
--
-
Thedu
ration
oftheAU
Dportfoliosfor2016/2017was0.03mon
ths.Attheen
dofthe
2016/2017periodtheassetsw
eremainlyinvested
incashand
sho
rtterm
depo
sit.
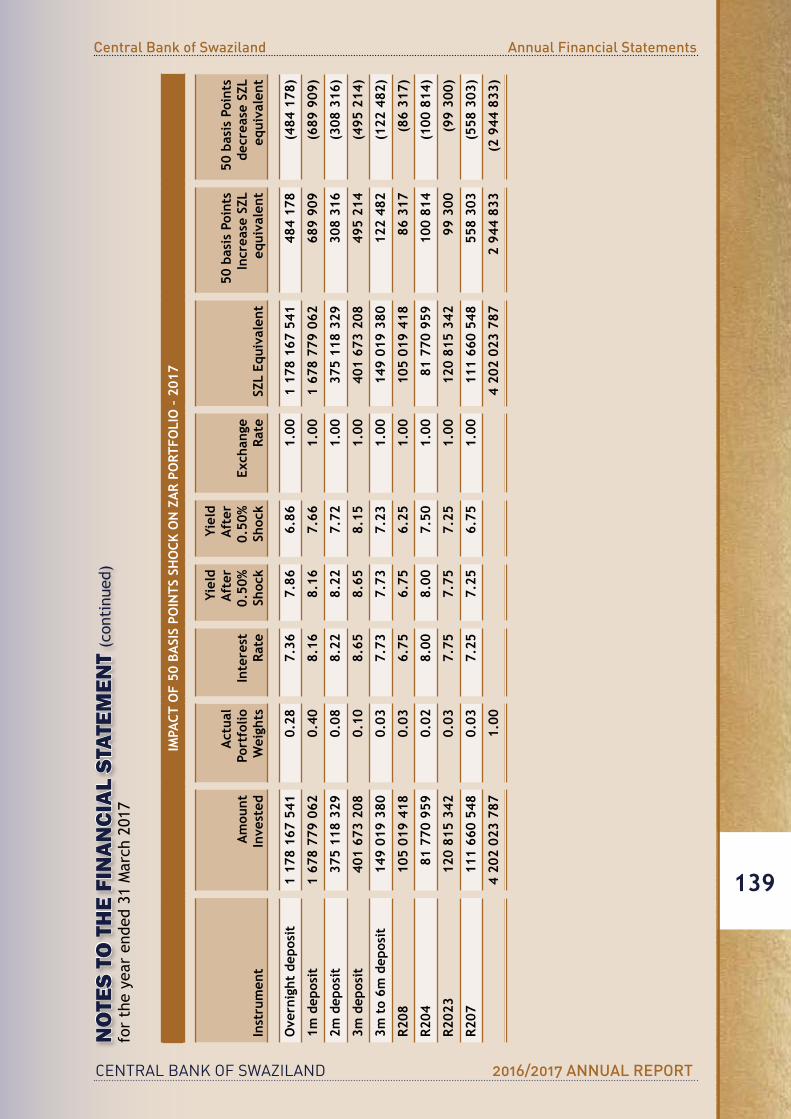
CENTRAL BANK OF SWAZILAND 2016/2017 ANNUAL REPORT
Central Bank of Swaziland Annual Financial Statements
139
NO
TES
TO T
HE
FIN
ANCI
AL S
TATE
MEN
T (c
onti
nued
)fo
r th
e ye
ar e
nded
31
Mar
ch 2
017
IMPA
CT O
F 50
BA
SIS
POIN
TS S
HO
CK O
N Z
AR
PORT
FOLI
O –
201
7
Inst
rum
ent
Am
ount
Inve
sted
Act
ual
Por
tfol
io W
eigh
tsIn
tere
stRa
te
Yiel
d A
fter
0.50
%
Shoc
k
Yiel
d A
fter
0.
50%
Sh
ock
Exch
ange
Rate
SZL
Equi
vale
nt
50 b
asis
Poi
nts
Incr
ease
SZL
equ
ival
ent
50 b
asis
Poi
nts
dec
reas
e SZ
L e
quiv
alen
t
Ove
rnig
ht d
epos
it1
178
167
541
0.28
7.36
7.86
6.86
1.00
1 17
8 16
7 54
148
4 17
8(4
84 1
78)
1m d
epos
it1
678
779
062
0.40
8.16
8.16
7.66
1.00
1 67
8 77
9 06
268
9 90
9(6
89 9
09)
2m d
epos
it37
5 11
8 32
90.
088.
228.
227.
721.
0037
5 11
8 32
930
8 31
6(3
08 3
16)
3m d
epos
it40
1 67
3 20
80.
108.
658.
658.
151.
0040
1 67
3 20
849
5 21
4(4
95 2
14)
3m t
o 6m
dep
osit
149
019
380
0.03
7.73
7.73
7.23
1.00
149
019
380
122
482
(122
482
)
R208
105
019
418
0.03
6.75
6.75
6.25
1.00
105
019
418
86 3
17(8
6 31
7)
R204
81 7
70 9
590.
028.
008.
007.
501.
0081
770
959
100
814
(100
814
)
R202
312
0 81
5 34
20.
037.
757.
757.
251.
0012
0 81
5 34
299
300
(99
300)
R207
111
660
548
0.03
7.25
7.25
6.75
1.00
111
660
548
558
303
(558
303
)
4
202
023
787
1.00
4 20
2 02
3 78
72
944
833
(2 9
44 8
33)
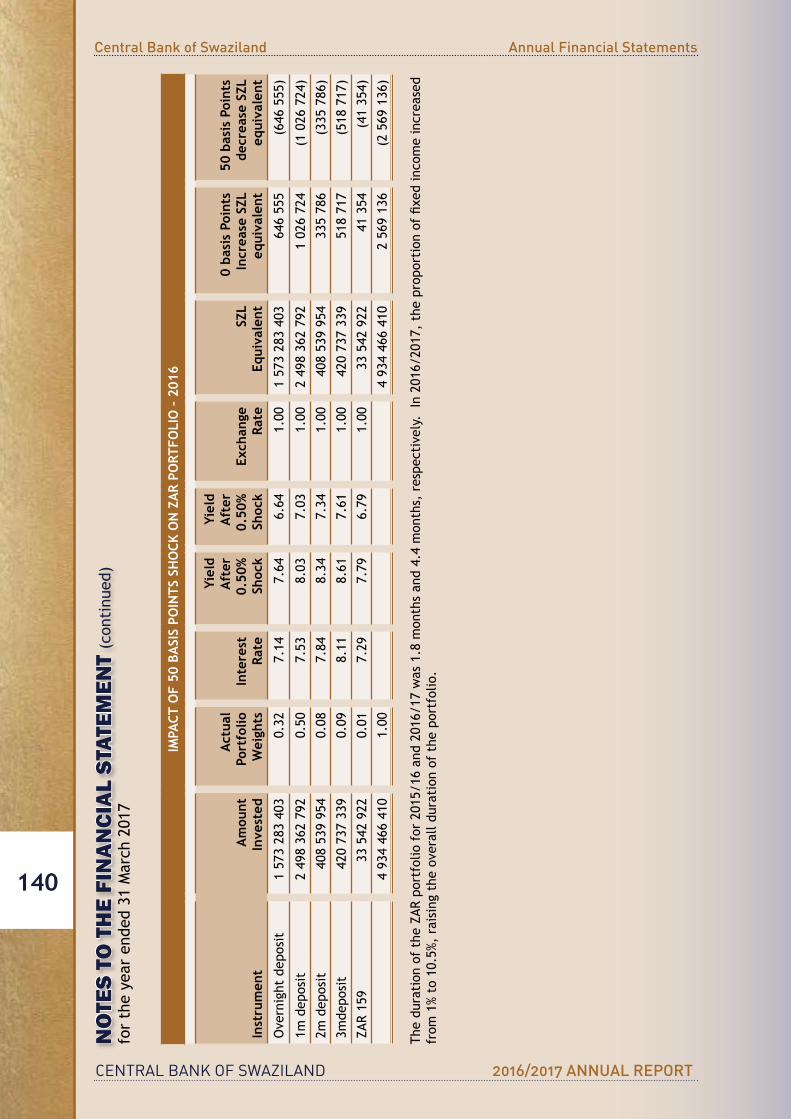
CENTRAL BANK OF SWAZILAND 2016/2017 ANNUAL REPORT
Central Bank of Swaziland Annual Financial Statements
140
NO
TES
TO T
HE
FIN
ANCI
AL S
TATE
MEN
T (c
onti
nued
)fo
r th
e ye
ar e
nded
31
Mar
ch 2
017
IMPA
CT O
F 50
BA
SIS
POIN
TS S
HO
CK O
N Z
AR
PORT
FOLI
O –
201
6
Inst
rum
ent
Am
ount
Inve
sted
Act
ual
Por
tfol
io W
eigh
tsIn
tere
stRa
te
Yiel
d A
fter
0.50
%
Shoc
k
Yiel
d A
fter
0.
50%
Sh
ock
Exch
ange
Rate
SZL
Equi
vale
nt
0 ba
sis
Poin
ts In
crea
se S
ZL e
quiv
alen
t
50 b
asis
Poi
nts
dec
reas
e SZ
L e
quiv
alen
t
Ove
rnig
ht d
epos
it1
573
283
403
0.32
7.14
7.64
6.64
1.00
1 57
3 28
3 40
364
6 55
5(6
46 5
55)
1m d
epos
it2
498
362
792
0.50
7.53
8.03
7.03
1.00
2 49
8 36
2 79
21
026
724
(1 0
26 7
24)
2m d
epos
it40
8 53
9 95
40.
087.
848.
347.
341.
0040
8 53
9 95
433
5 78
6(3
35 7
86)
3mde
posi
t42
0 73
7 33
90.
098.
118.
617.
611.
0042
0 73
7 33
951
8 71
7(5
18 7
17)
ZAR
159
33 5
42 9
220.
017.
297.
796.
791.
0033
542
922
41 3
54(4
1 35
4)
4
934
466
410
1.00
4 93
4 46
6 41
02
569
136
(2 5
69 1
36)
Thedu
ration
oftheZA
Rpo
rtfolio
for2015/16and
2016/17was1.8m
onthsan
d4.4mon
ths,respe
ctively.In2016/2017,the
propo
rtionoffixedincomeincrea
sed
from
1%
to 1
0.5%
, ra
isin
g th
e ov
eral
l dur
atio
n of
the
por
tfol
io.

CENTRAL BANK OF SWAZILAND 2016/2017 ANNUAL REPORT
Central Bank of Swaziland Annual Financial Statements
141
NOTES TO THE FINANCIAL STATEMENT (continued)for the year ended 31 March 2017
39.1.2 Currency Risk
Currency Risk
The country’s FX reserves are held in two major currencies: being the South African Rand, and US dollar. This by implication means that there is an exposure to currency risk arising from adverse movements in foreign exchange rates. By assessing the pattern of Government short and long-term debt as well as general expenditure a currency composition was formulated to act as a natural hedge against currency risk as it matches the liabilities against the assets. The bank usually holds about ZAR 2 billion in its liquidity tranche at the beginning of each quarter for liquidity and working capital purposes with the remainder of the reserves (core portfolio) split according to the currency composition. The currencycompositionisafollows:74%inZAR,21%inUSD,3%inEURand2%other;thisisdonewitha permissible deviation of 5% to the downside and topside.
Asof31stMarch2017thestrategiccurrencycompositionstoodasfollows:30%inUSD,0%inEUR,68%in ZAR and 2% in other currencies.
Our ZAR portfolio is trenched into three; the working capital, liquidity and core portfolio and the working capital and the liquidity portfolios are fully invested in the money market, while the core portfolio invested in bonds. The working capital portfolio has a time horizon of zero to three months inaccordancewithourprojectedcashoutflowasdemandedbythelocalbanksaswellasGovernmentfor her general spending. This is done to match short-term liabilities versus short-term assets and eliminate in the process any currency risk that may arise from mismatched positions, forcing us to buyorsellhardcurrencies(EUR,GBPandUSD)inordertomeetshorttermobligations.Theliquidityportfolio has a time horizon of three to twelve months, and is used to replenish any shortages or shortfalls in the working capital portfolio. The core portfolio’s sole mandate on the other hand is to grow reserves through enhanced return; following that, the core portfolio has a longer investment time horizon of three months to three years.
Dependingondevelopmentsinthemarketstheseinvestmenttimehorizonsareadheredto,butatthemoment the market is undergoing a period of decreasing interest rates in South Africa, and hence, goingforwardintothenewfinancialyear2016/2017,theportfolio,especiallythecoreportfolio,willbe re-priced and the duration will be kept medium term to twelve months and invested in the money market and overweight SA government bonds. Short term will be done away with so as to avoid reinvestment risk. Because the South African rand is at par with the local Lilangeni no currency risk arises from these portfolios.
Cash Balances
TheBankhasaboutsevenmajorNostroaccountsusedformakinggovernmentpaymentsaswellasCBSpayments. These accounts are purely operational and hence balances are always kept at the most minimal levels possibly achievable. These accounts also form a negligible percentage of the whole portfolio and hence they are not taken as part of the investment portfolio. The stipulated balances to be held in these accounts are contained in the investment policy guidelines. The risk that arises on theseaccountsarerelatedtoforeignexchangemovementsleadingtoeitherrevaluationlossorprofit,which is also minimal considering the weight of these accounts on total assets.
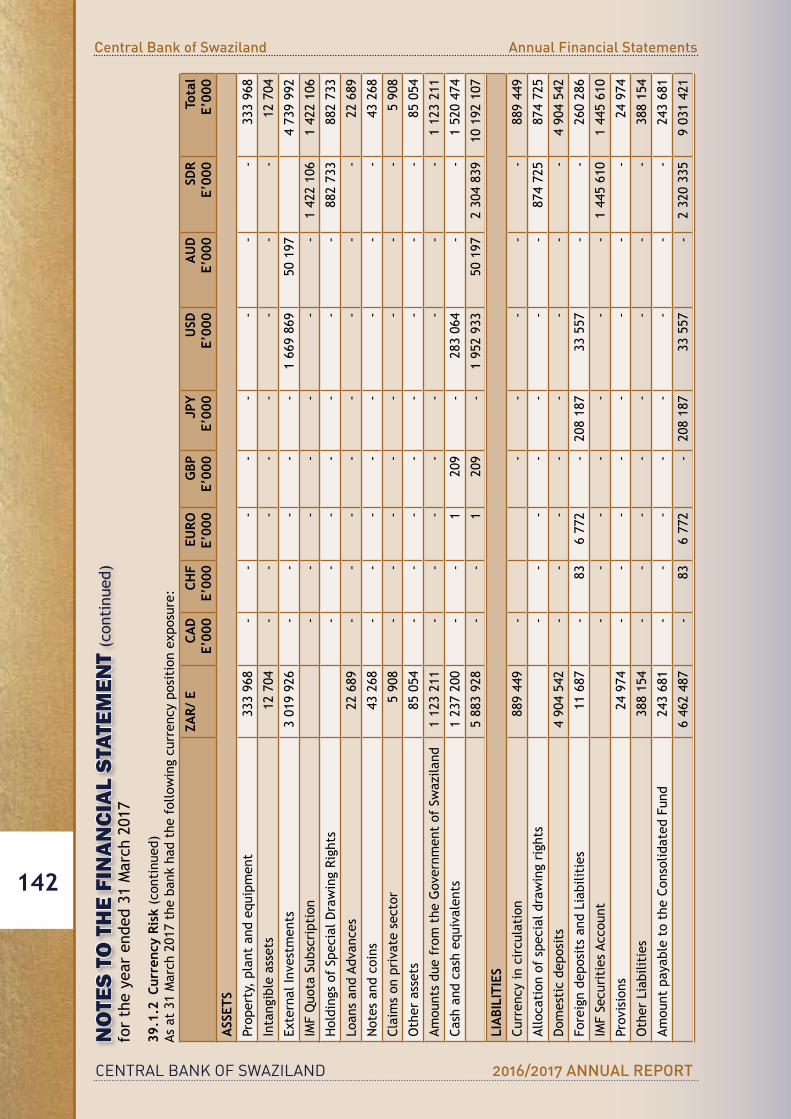
CENTRAL BANK OF SWAZILAND 2016/2017 ANNUAL REPORT
Central Bank of Swaziland Annual Financial Statements
142
NO
TES
TO T
HE
FIN
ANCI
AL S
TATE
MEN
T (c
onti
nued
)fo
r th
e ye
ar e
nded
31
Mar
ch 2
017
39.1
.2 C
urre
ncy
Risk
(co
ntin
ued)
As a
t 31
Mar
ch 2
017
the
bank
had
the
fol
low
ing
curr
ency
pos
itio
n ex
posu
re:
ZAR/
ECA
DE’
000
CHF
E’00
0EU
ROE’
000
GBP
E’00
0JP
YE’
000
USD
E’00
0A
UD
E’00
0SD
RE’
000
Tota
lE’
000
ASS
ETS
Prop
erty
, pl
ant
and
equi
pmen
t33
3 96
8 -
--
--
--
-33
3 96
8
Inta
ngib
le a
sset
s12
704
--
--
--
--
12 7
04
ExternalIn
vestmen
ts3
019
926
--
--
-1
669
869
50 1
974
739
992
IMFQuo
taSub
scription
--
--
--
-1
422
106
1 42
2 10
6
HoldingsofSpe
cialDrawingRights
--
--
--
-88
2 73
388
2 73
3
Loan
s an
d Ad
vanc
es22
689
--
--
--
--
22 6
89
Not
es a
nd c
oins
43 2
68-
--
--
--
-43
268
Claimson
privatesector
5 90
8-
--
--
--
-5
908
Oth
er a
sset
s 85
054
--
--
--
--
85 0
54
Amou
nts
due
from
the
Gov
ernm
ent
of S
waz
iland
1 12
3 21
1-
--
--
--
-1
123
211
Cashand
casheq
uivalents
1 23
7 20
0-
-1
209
-28
3 06
4-
-1
520
474
5 88
3 92
8-
-1
209
-1
952
933
50 1
972
304
839
10 1
92 1
07
LIA
BILI
TIES
Curren
cyin
circulation
88
9 44
9-
--
--
-88
9 44
9
Allo
cati
on o
f sp
ecia
l dra
win
g ri
ghts
--
--
--
-87
4 72
5 87
4 72
5
Dom
esticde
posits
4 90
4 54
2-
--
--
--
-4
904
542
Fore
ign
depo
sits
and
Lia
bilit
ies
11 6
87-
836
772
-20
8 18
733
557
--
260
286
IMF
Secu
riti
es A
ccou
nt-
--
--
--
1 44
5 61
01
445
610
Prov
isio
ns24
974
--
--
--
--
24 9
74
Oth
er L
iabi
litie
s38
8 15
4-
--
--
--
-38
8 15
4
Amou
ntpayab
letotheCo
nsolidated
Fun
d24
3 68
1-
--
--
--
-24
3 68
1
6 46
2 48
7-
836
772
-20
8 18
733
557
-2
320
335
9 03
1 42
1
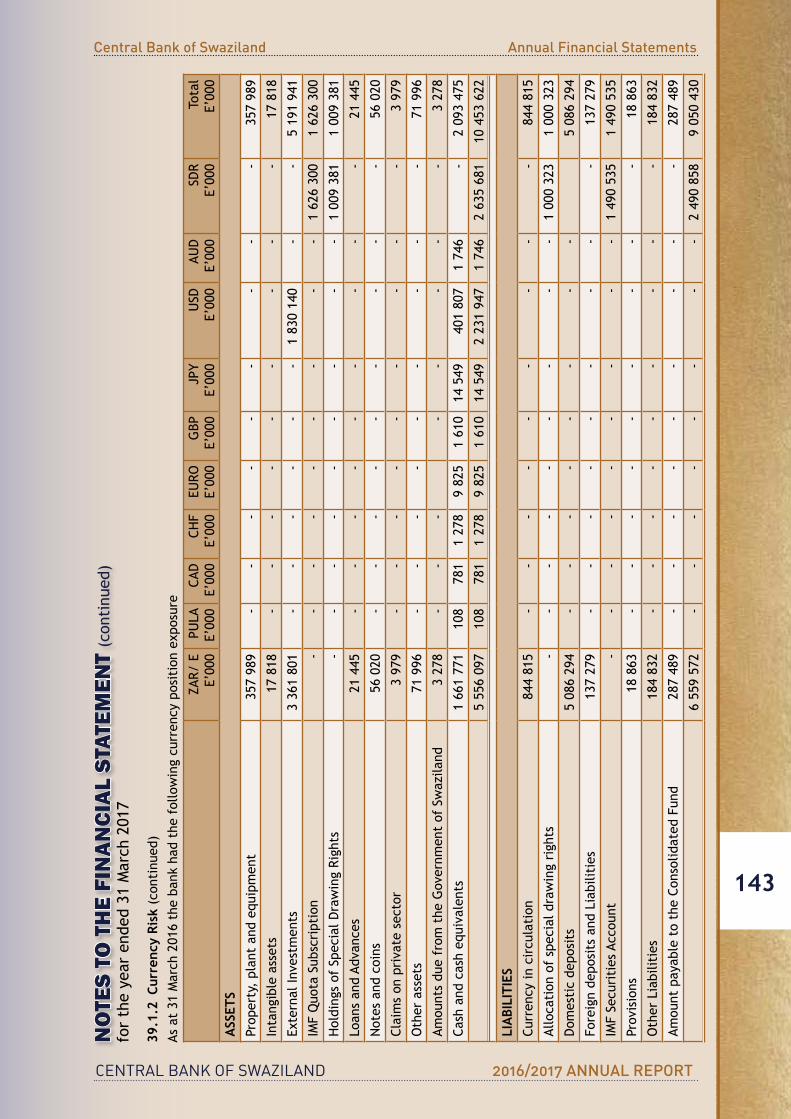
CENTRAL BANK OF SWAZILAND 2016/2017 ANNUAL REPORT
Central Bank of Swaziland Annual Financial Statements
143
NO
TES
TO T
HE
FIN
ANCI
AL S
TATE
MEN
T (c
onti
nued
)fo
r th
e ye
ar e
nded
31
Mar
ch 2
017
39.1
.2 C
urre
ncy
Risk
(co
ntin
ued)
As a
t 31
Mar
ch 2
016
the
bank
had
the
fol
low
ing
curr
ency
pos
itio
n ex
posu
re
ZAR/
E
E’000
PULA
E’000
CAD
E’000
CHF
E’000
EURO
E’000
GBP
E’000
JPY
E’000
USD
E’000
AUD
E’000
SDR
E’000
Tota
l E’000
ASS
ETS
Prop
erty
, pl
ant
and
equi
pmen
t35
7 98
9-
--
--
--
--
357
989
Inta
ngib
le a
sset
s17
818
--
--
--
--
-17
818
ExternalIn
vestmen
ts3
361
801
--
--
--
1 83
0 14
0-
-5
191
941
IMFQuo
taSub
scription
--
--
--
--
-1
626
300
1 62
6 30
0
HoldingsofSpe
cialDrawingRights
--
--
--
--
-1
009
381
1 00
9 38
1
Loan
s an
d Ad
vanc
es21
445
--
--
--
--
-21
445
Not
es a
nd c
oins
56 0
20-
--
--
--
--
56 0
20
Claimson
privatesector
3 97
9-
--
--
--
--
3 97
9
Oth
er a
sset
s 71
996
--
--
--
--
-71
996
Amou
nts
due
from
the
Gov
ernm
ent
of S
waz
iland
3 27
8-
--
--
--
-3
278
Cashand
casheq
uivalents
1 66
1 77
110
878
11
278
9 82
51
610
14 5
4940
1 80
71
746
-2
093
475
5 55
6 09
710
878
11
278
9 82
51
610
14 5
492
231
947
1 74
62
635
681
10 4
53 6
22
LIA
BILI
TIES
Curren
cyin
circulation
84
4 81
5-
--
--
--
--
844
815
Allo
cati
on o
f sp
ecia
l dra
win
g ri
ghts
--
--
--
--
-1
000
323
1 00
0 32
3
Dom
esticde
posits
5 08
6 29
4-
--
--
--
-5
086
294
Fore
ign
depo
sits
and
Lia
bilit
ies
137
279
--
--
--
--
-13
7 27
9
IMF
Secu
riti
es A
ccou
nt-
--
--
--
--
1 49
0 53
51
490
535
Prov
isio
ns18
863
--
--
--
--
-18
863
Oth
er L
iabi
litie
s18
4 83
2-
--
--
--
--
184
832
Amou
ntpayab
letotheCo
nsolidated
Fun
d28
7 48
9-
--
--
--
--
287
489
6 55
9 57
2-
--
--
--
-2
490
858
9 05
0 43
0
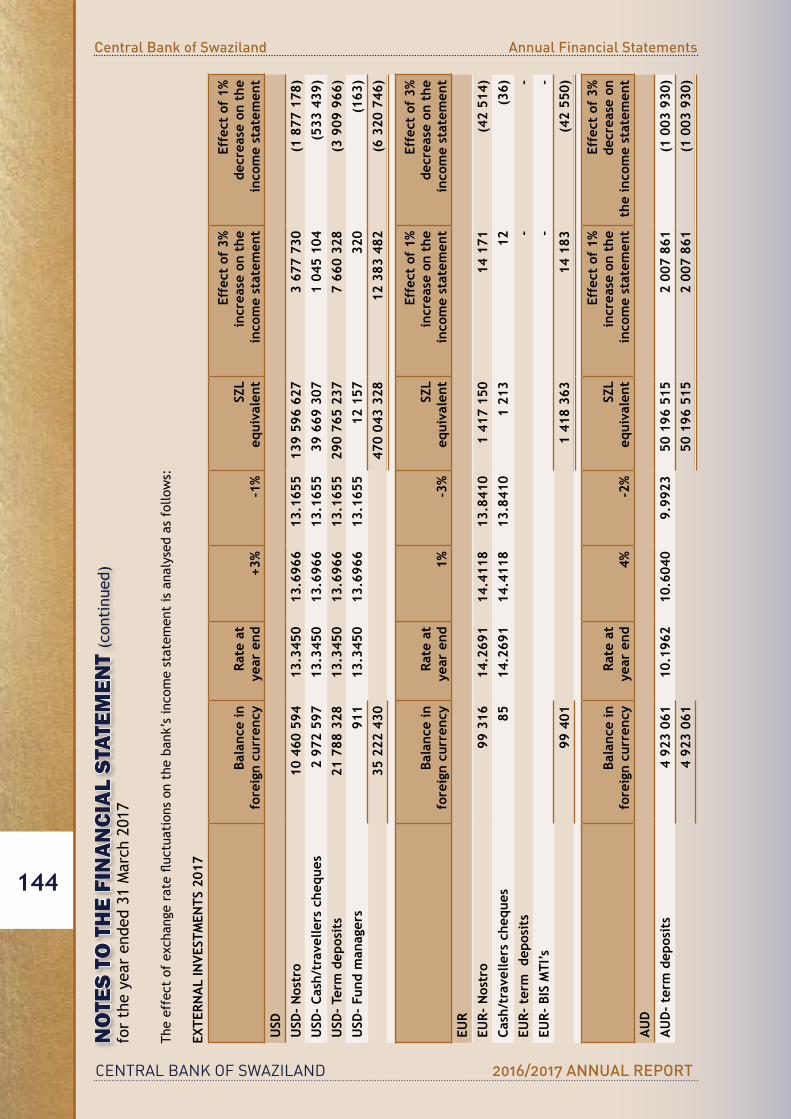
CENTRAL BANK OF SWAZILAND 2016/2017 ANNUAL REPORT
Central Bank of Swaziland Annual Financial Statements
144
NO
TES
TO T
HE
FIN
ANCI
AL S
TATE
MEN
T (c
onti
nued
)fo
r th
e ye
ar e
nded
31
Mar
ch 2
017
Theeffectofexchan
gerateflu
ctua
tion
son
the
ban
k’sincomestatem
entisana
lysedasfollows:
EXTE
RNA
L IN
VEST
MEN
TS 2
017
Bala
nce
info
reig
n cu
rren
cyRa
te a
t y
ear
end
+3%
-1%
SZL
equi
vale
nt
Effe
ct o
f 3%
incr
ease
on
the
inco
me
stat
emen
t
Effe
ct o
f 1%
dec
reas
e on
the
in
com
e st
atem
ent
USD
USD
- N
ostr
o10
460
594
13.3
450
13.6
966
13.1
655
139
596
627
3 67
7 73
0(1
877
178
)U
SD-
Cash
/tra
velle
rs c
hequ
es2
972
597
13.3
450
13.6
966
13.1
655
39 6
69 3
071
045
104
(533
439
)U
SD-
Term
dep
osit
s21
788
328
13.3
450
13.6
966
13.1
655
290
765
237
7 66
0 32
8(3
909
966
)U
SD-
Fund
man
ager
s91
113
.345
013
.696
613
.165
512
157
320
(163
)35
222
430
470
043
328
12 3
83 4
82(6
320
746
)
Bala
nce
info
reig
n cu
rren
cyRa
te a
t ye
ar e
nd1%
-3%
SZL
equi
vale
nt
Effe
ct o
f 1%
incr
ease
on
the
inco
me
stat
emen
t
Effe
ct o
f 3%
dec
reas
e on
the
in
com
e st
atem
ent
EUR
EUR-
Nos
tro
99 3
1614
.269
114
.411
813
.841
01
417
150
14 1
71(4
2 51
4)Ca
sh/t
rave
llers
che
ques
8514
.269
114
.411
813
.841
01
213
12(3
6)EU
R- t
erm
dep
osit
s-
-EU
R- B
IS M
TI’s
--
99 4
011
418
363
14 1
83(4
2 55
0)
Bala
nce
info
reig
n cu
rren
cyRa
te a
t ye
ar e
nd4%
-2%
SZL
equi
vale
nt
Effe
ct o
f 1%
incr
ease
on
the
inco
me
stat
emen
t
Effe
ct o
f 3%
dec
reas
e on
th
e in
com
e st
atem
ent
AU
DA
UD
- te
rm d
epos
its
4 92
3 06
110
.196
210
.604
09.
9923
50 1
96 5
152
007
861
(1 0
03 9
30)
4 92
3 06
150
196
515
2 00
7 86
1(1
003
930
)

CENTRAL BANK OF SWAZILAND 2016/2017 ANNUAL REPORT
Central Bank of Swaziland Annual Financial Statements
145
NO
TES
TO T
HE
FIN
ANCI
AL S
TATE
MEN
T (c
onti
nued
)fo
r th
e ye
ar e
nded
31
Mar
ch 2
017
EXTE
RNA
L IN
VEST
MEN
TS 2
017
Bala
nce
in
Fore
ign
Curr
ency
Rate
at
the
end
3%-1
%SZ
L eq
uiva
lent
Effe
ct o
f 3%
incr
ease
on
the
inco
me
stat
emen
t
Effe
ct o
f 1%
dec
reas
e on
the
in
com
e st
atem
ent
GBP
Nos
tro
42 4
4916
.634
517
.133
516
.468
270
6 11
821
183
(7 0
61)
Cash
/tra
velle
rs c
hequ
es12
590
16.6
345
17.1
335
16.4
682
209
428
6 28
3(2
094
)55
039
915
546
27 4
66(9
155
)
DEP
OSI
TS A
ND
EXT
ERN
AL
LIA
BILI
TIES
201
7
Bala
nce
in
Fore
ign
Curr
ency
Rate
at
the
end
1%-3
%SZ
L eq
uiva
lent
Effe
ct o
f 1%
incr
ease
on
the
inco
me
stat
emen
Effe
ct o
f 1%
dec
reas
e on
the
in
com
e st
atem
ent
Eur
o Cl
imat
e Sm
art
Agr
ic.
Fund
-Ca
pita
l inv
estm
ent
fund
12 4
83 9
5114
.269
114
.411
813
.841
017
8 13
4 74
51
781
348
(5 3
44 0
43)
Repl
enis
hmen
t on
gov
ernm
ent
rese
rves
4 12
9 06
914
.269
114
.411
813
.841
058
918
098
589
181
(1 7
67 5
43)
Swd
Gov
t D
ebt
Serv
ice
236
162
14.2
691
14.4
118
13.8
410
3 36
9 81
933
698
(101
095
)SI
DC
1 88
314
.269
114
.411
813
.841
026
876
269
(806
)Re
gion
al In
ter
Impl
em S
uppo
rt P
roje
ct23
6 49
414
.269
114
.411
813
.841
03
374
557
33 7
46(1
01 2
37)
17 0
87 5
5924
3 82
4 09
52
438
242
(7 3
14 7
24)
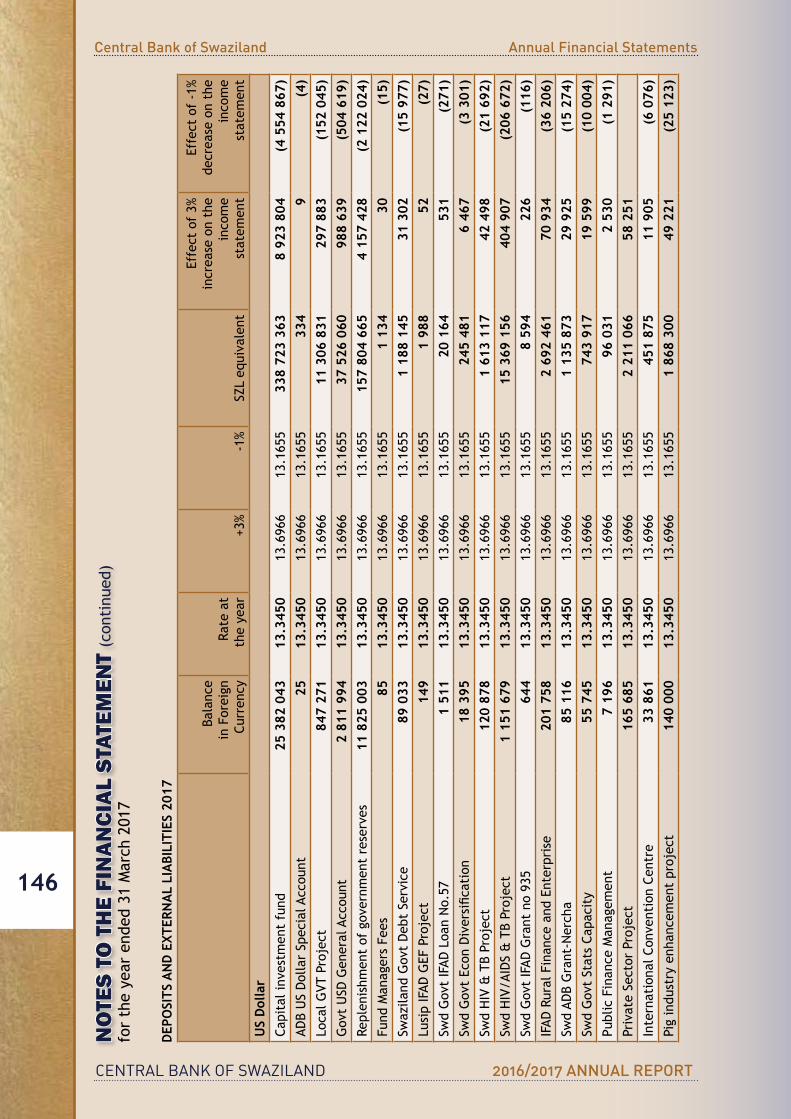
CENTRAL BANK OF SWAZILAND 2016/2017 ANNUAL REPORT
Central Bank of Swaziland Annual Financial Statements
146
NO
TES
TO T
HE
FIN
ANCI
AL S
TATE
MEN
T (c
onti
nued
)fo
r th
e ye
ar e
nded
31
Mar
ch 2
017
DEP
OSI
TS A
ND
EXT
ERN
AL
LIA
BILI
TIES
201
7
Bala
nce
in F
orei
gn
Curren
cyRa
te a
tth
e ye
ar+3
%-1
%SZ
L eq
uiva
lent
Effectof3%
incr
ease
on
the
inco
me
stat
emen
t
Effectof-1%
decr
ease
on
the
inco
me
stat
emen
t
US
Dol
lar
Capitalinvestm
entfund
25 3
82 0
4313
.345
013
.696
613
.165
533
8 72
3 36
38
923
804
(4 5
54 8
67)
ADBUSDollarSpecialA
ccou
nt25
13.3
450
13.6
966
13.1
655
334
9(4
)LocalG
VTProject
847
271
13.3
450
13.6
966
13.1
655
11 3
06 8
3129
7 88
3(1
52 0
45)
GovtUSD
Gen
eralAccou
nt2
811
994
13.3
450
13.6
966
13.1
655
37 5
26 0
6098
8 63
9(5
04 6
19)
Repl
enis
hmen
t of
gov
ernm
ent
rese
rves
11 8
25 0
0313
.345
013
.696
613
.165
515
7 80
4 66
54
157
428
(2 1
22 0
24)
Fund
Man
ager
s Fe
es
8513
.345
013
.696
613
.165
51
134
30(1
5)Sw
azila
ndGovtDeb
tService
89 0
3313
.345
013
.696
613
.165
51
188
145
31 3
02(1
5 97
7)Lu
sipIFAD
GEF
Project
149
13.3
450
13.6
966
13.1
655
1 98
852
(27)
SwdGovtIFAD
Loa
nNo.57
1 51
113
.345
013
.696
613
.165
520
164
531
(271
)Sw
dGovtEcon
Diversific
ation
18 3
9513
.345
013
.696
613
.165
524
5 48
16
467
(3 3
01)
SwdHIV&TBProject
120
878
13.3
450
13.6
966
13.1
655
1 61
3 11
742
498
(21
692)
SwdHIV/A
IDS&TBProject
1 15
1 67
913
.345
013
.696
613
.165
515
369
156
404
907
(206
672
)Sw
dGovtIFAD
Grantno935
644
13.3
450
13.6
966
13.1
655
8 59
422
6(1
16)
IFAD
RuralFinan
ceand
Enterprise
201
758
13.3
450
13.6
966
13.1
655
2 69
2 46
170
934
(36
206)
SwdAD
BGrant-Nercha
85 1
1613
.345
013
.696
613
.165
51
135
873
29 9
25(1
5 27
4)Sw
dGovtStatsCa
pacity
55 7
4513
.345
013
.696
613
.165
574
3 91
719
599
(10
004)
Publ
ic F
inan
ce M
anag
emen
t7
196
13.3
450
13.6
966
13.1
655
96 0
312
530
(1 2
91)
Priv
ate
Sect
or P
roje
ct16
5 68
513
.345
013
.696
613
.165
52
211
066
58 2
51Internationa
lCon
ventionCe
ntre
33 8
6113
.345
013
.696
613
.165
545
1 87
511
905
(6 0
76)
Pig
indu
stry
enh
ance
men
t pr
ojec
t 14
0 00
013
.345
013
.696
613
.165
51
868
300
49 2
21(2
5 12
3)

CENTRAL BANK OF SWAZILAND 2016/2017 ANNUAL REPORT
Central Bank of Swaziland Annual Financial Statements
147
NO
TES
TO T
HE
FIN
ANCI
AL S
TATE
MEN
T (c
onti
nued
)fo
r th
e ye
ar e
nded
31
Mar
ch 2
017
DEP
OSI
TS A
ND
EXT
ERN
AL
LIA
BILI
TIES
201
7 (
cont
inue
d)
Bala
nce
in F
orei
gn
Curren
cyRa
te a
tth
e ye
ar+3
%-1
%SZ
L eq
uiva
lent
Effectof3%
incr
ease
on
the
inco
me
stat
emen
t
Effectof-1%
decr
ease
on
the
inco
me
stat
emen
t
US
Dol
lar
Electron
icDocum
entrecordMan
agem
ent
syst
em38
413
.345
013
.696
613
.165
55
124
135
(69)
SADC/
HRD
Extdep
non
interestearn
1 08
413
.345
013
.696
613
.165
514
466
381
(195
)SA
DC/
HRD
Extdep
non
interestearn
5 89
213
.345
013
.696
613
.165
578
629
2 07
2(1
057
)AD
BMan
zini-Mba
bane
Highw
ayproject
ADBMan
zini-Mbh
adlane
Highw
ayproject
160
612
13.3
450
13.6
966
13.1
655
2 14
3 36
756
468
(28
822)
248
522
13.3
450
13.6
966
13.1
655
3 31
6 52
687
375
(44
598)
43 3
54 5
6557
8 56
6 66
715
242
572
(7 7
50 3
45)
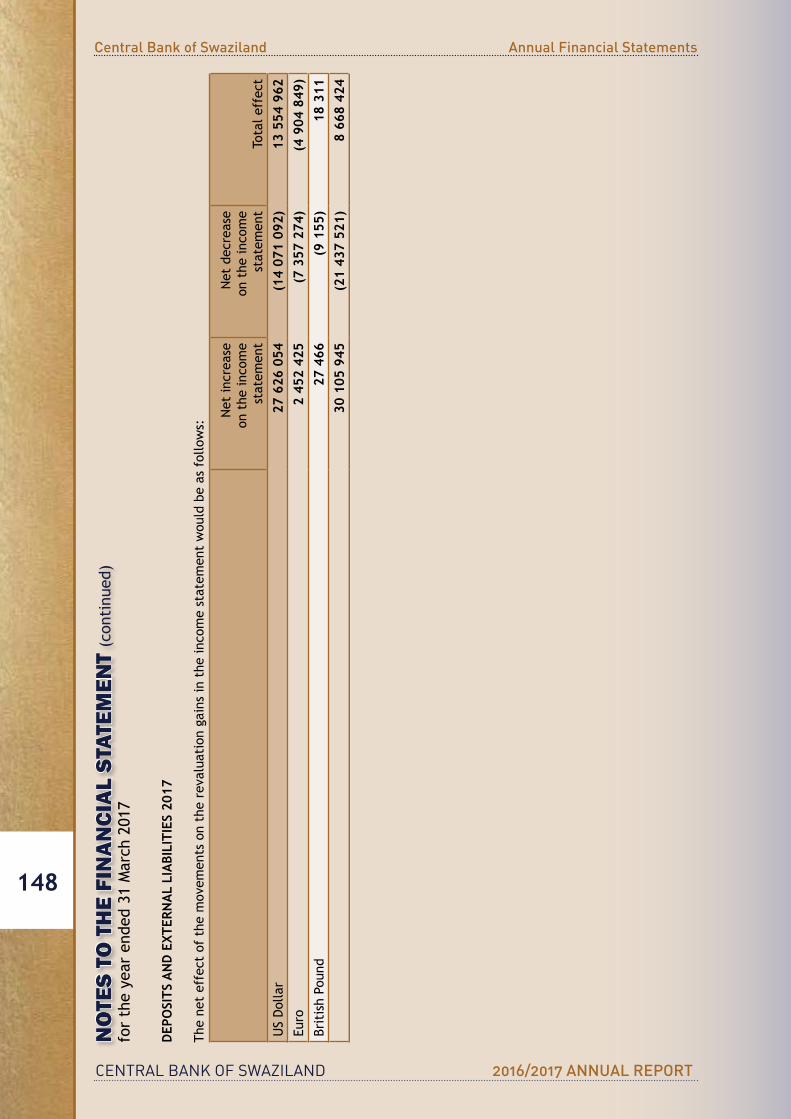
CENTRAL BANK OF SWAZILAND 2016/2017 ANNUAL REPORT
Central Bank of Swaziland Annual Financial Statements
148
NO
TES
TO T
HE
FIN
ANCI
AL S
TATE
MEN
T (c
onti
nued
)fo
r th
e ye
ar e
nded
31
Mar
ch 2
017
DEP
OSI
TS A
ND
EXT
ERN
AL
LIA
BILI
TIES
201
7
The
net
effe
ct o
f th
e m
ovem
ents
on
the
reva
luat
ion
gain
s in
the
inco
me
stat
emen
t w
ould
be
as f
ollo
ws:
Net
incr
ease
on t
he in
com
est
atem
ent
Net
dec
reas
eon
the
inco
me
sta
tem
ent
Tota
l eff
ect
USDollar
27 6
26 0
54(1
4 07
1 09
2)13
554
962
Euro
2 45
2 42
5(7
357
274
)(4
904
849
)Br
itis
h Po
und
27 4
66(9
155
)18
311
30 1
05 9
45(2
1 43
7 52
1)8
668
424
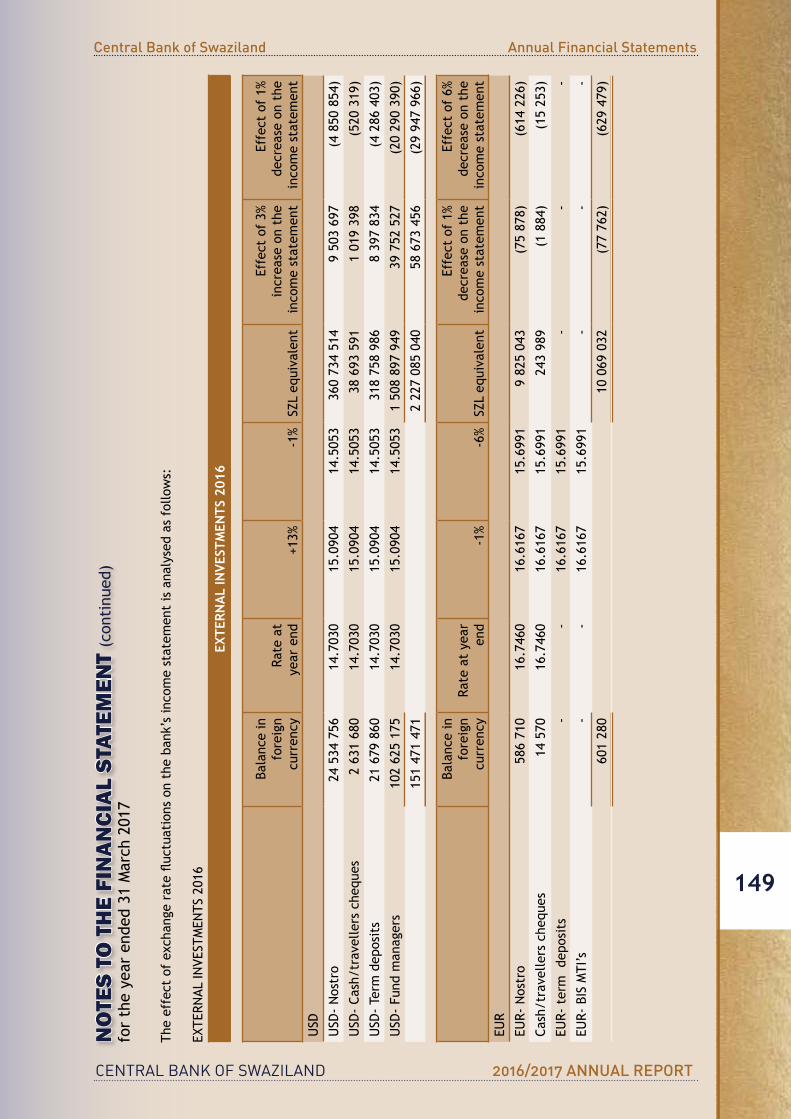
CENTRAL BANK OF SWAZILAND 2016/2017 ANNUAL REPORT
Central Bank of Swaziland Annual Financial Statements
149
NO
TES
TO T
HE
FIN
ANCI
AL S
TATE
MEN
T (c
onti
nued
)fo
r th
e ye
ar e
nded
31
Mar
ch 2
017
Theeffectofexchan
gerateflu
ctua
tion
son
the
ban
k’sincomestatem
entisana
lysedasfollows:
EXTE
RNAL
INVE
STMEN
TS2016
EXTE
RNA
L IN
VEST
MEN
TS 2
016
Bala
nce
info
reig
n c
urre
ncy
Rate
at
year
end
+13%
-1%
SZL
equi
vale
nt
Effectof3%
incr
ease
on
the
inco
me
stat
emen
t
Effectof1%
dec
reas
e on
the
inco
me
stat
emen
t
USD
USD
-Nostro
24 5
34 7
5614
.703
015
.090
414
.505
336
0 73
4 51
49
503
697
(4 8
50 8
54)
USD
-Ca
sh/travelle
rsche
ques
2 63
1 68
014
.703
015
.090
414
.505
338
693
591
1 01
9 39
8(5
20 3
19)
USD
-Term
dep
osits
21 6
79 8
6014
.703
015
.090
414
.505
331
8 75
8 98
68
397
834
(4 2
86 4
03)
USD
-Fu
ndm
anagers
102
625
175
14.7
030
15.0
904
14.5
053
1 50
8 89
7 94
939
752
527
(20
290
390)
151
471
471
2 22
7 08
5 04
058
673
456
(29
947
966)
Bala
nce
info
reig
n cu
rren
cyRa
te a
t ye
ar
end
-1%
-6%
SZL
equi
vale
nt
Effectof1%
dec
reas
e on
the
inco
me
stat
emen
t
Effectof6%
dec
reas
e on
the
inco
me
stat
emen
t
EUR
EUR-Nostro
586
710
16.7
460
16.6
167
15.6
991
9 82
5 04
3(7
5 87
8)(6
14 2
26)
Cash/travelle
rsche
ques
14 5
7016
.746
016
.616
715
.699
124
3 98
9(1
884
)(1
5 25
3)
EUR-termd
eposits
--
16.6
167
15.6
991
--
-
EUR-BISMTI’s
--
16.6
167
15.6
991
--
-
601
280
10 0
69 0
32(7
7 76
2)(6
29 4
79)
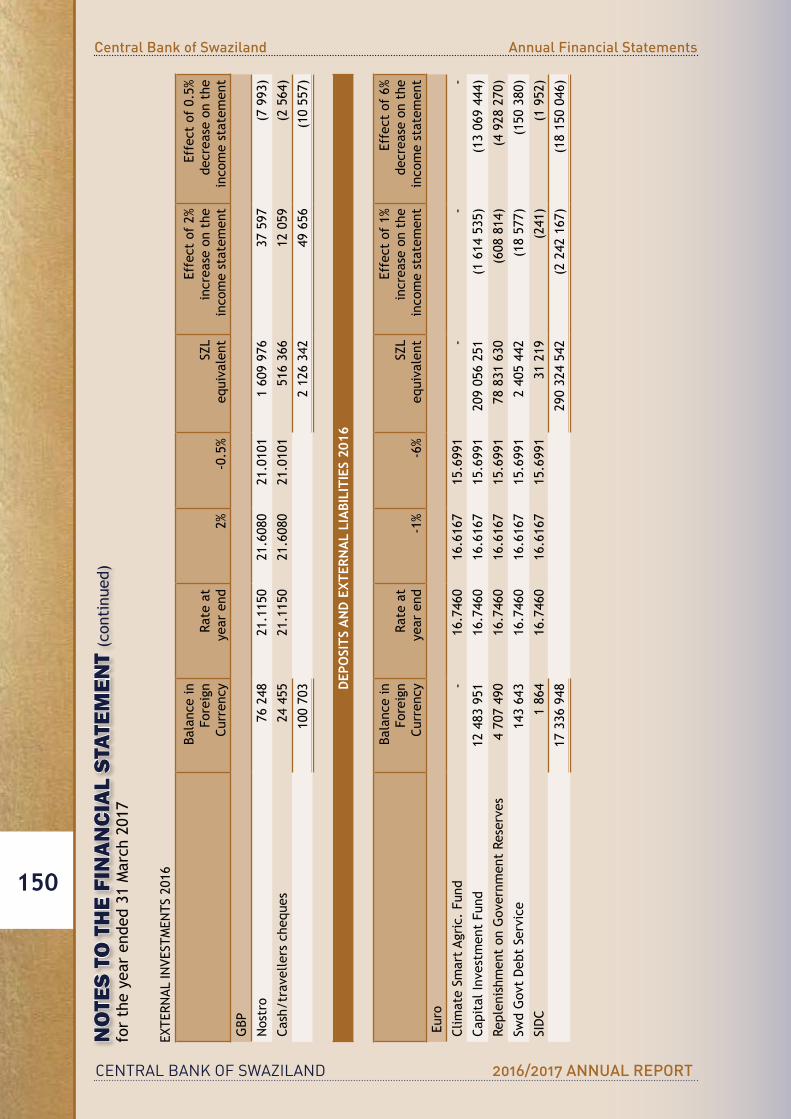
CENTRAL BANK OF SWAZILAND 2016/2017 ANNUAL REPORT
Central Bank of Swaziland Annual Financial Statements
150
NO
TES
TO T
HE
FIN
ANCI
AL S
TATE
MEN
T (c
onti
nued
)fo
r th
e ye
ar e
nded
31
Mar
ch 2
017
EXTE
RNAL
INVE
STMEN
TS2016
Bala
nce
in
Fore
ign
Curren
cyRa
te a
t ye
ar e
nd2%
-0.5
%SZ
L eq
uiva
lent
Effectof2%
incr
ease
on
the
inco
me
stat
emen
t
Effectof0.5%
dec
reas
e on
the
inco
me
stat
emen
t
GBP
Nos
tro
76 2
4821
.115
021
.608
021
.010
11
609
976
37 5
97(7
993
)
Cash/travelle
rsche
ques
24 4
5521
.115
021
.608
021
.010
151
6 36
612
059
(2 5
64)
100
703
2 12
6 34
249
656
(10
557)
DEP
OSI
TS A
ND
EXT
ERN
AL
LIA
BILI
TIES
201
6
Bala
nce
in
Fore
ign
Curren
cyRa
te a
t ye
ar e
nd-1
%-6
%SZ
L eq
uiva
lent
Effectof1%
incr
ease
on
the
inco
me
stat
emen
t
Effectof6%
dec
reas
e on
the
inco
me
stat
emen
t
Euro
Clim
ateSm
artAg
ric.Fun
d-
16.7
460
16.6
167
15.6
991
--
-
CapitalInvestm
entFu
nd12
483
951
16.7
460
16.6
167
15.6
991
209
056
251
(1 6
14 5
35)
(13
069
444)
Repl
enis
hmen
t on
Gov
ernm
ent
Rese
rves
4 70
7 49
016
.746
016
.616
715
.699
178
831
630
(608
814
)(4
928
270
)
SwdGovtDeb
tService
143
643
16.7
460
16.6
167
15.6
991
2 40
5 44
2(1
8 57
7)(1
50 3
80)
SIDC
1 86
416
.746
016
.616
715
.699
131
219
(241
)(1
952
)
17 3
36 9
4829
0 32
4 54
2(2
242
167
)(1
8 15
0 04
6)

CENTRAL BANK OF SWAZILAND 2016/2017 ANNUAL REPORT
Central Bank of Swaziland Annual Financial Statements
151
NO
TES
TO T
HE
FIN
ANCI
AL S
TATE
MEN
T (c
onti
nued
)fo
r th
e ye
ar e
nded
31
Mar
ch 2
017
EXTE
RNAL
INVE
STMEN
TS2016
Bala
nce
in
Fore
ign
Curren
cyRa
te a
t ye
ar e
nd2%
-0.5
%SZ
L eq
uiva
lent
Effectof2%
incr
ease
on
the
inco
me
stat
emen
t
Effectof0.5%
dec
reas
e on
the
inco
me
stat
emen
t
GBP
Nos
tro
76 2
4821
.115
021
.608
021
.010
11
609
976
37 5
97(7
993
)
Cash/travelle
rsche
ques
24 4
5521
.115
021
.608
021
.010
151
6 36
612
059
(2 5
64)
100
703
2 12
6 34
249
656
(10
557)
DEP
OSI
TS A
ND
EXT
ERN
AL
LIA
BILI
TIES
201
6
Bala
nce
in
Fore
ign
Curren
cyRa
te a
t ye
ar e
nd-1
%-6
%SZ
L eq
uiva
lent
Effectof1%
incr
ease
on
the
inco
me
stat
emen
t
Effectof6%
dec
reas
e on
the
inco
me
stat
emen
t
Euro
Clim
ateSm
artAg
ric.Fun
d-
16.7
460
16.6
167
15.6
991
--
-
CapitalInvestm
entFu
nd12
483
951
16.7
460
16.6
167
15.6
991
209
056
251
(1 6
14 5
35)
(13
069
444)
Repl
enis
hmen
t on
Gov
ernm
ent
Rese
rves
4 70
7 49
016
.746
016
.616
715
.699
178
831
630
(608
814
)(4
928
270
)
SwdGovtDeb
tService
143
643
16.7
460
16.6
167
15.6
991
2 40
5 44
2(1
8 57
7)(1
50 3
80)
SIDC
1 86
416
.746
016
.616
715
.699
131
219
(241
)(1
952
)
17 3
36 9
4829
0 32
4 54
2(2
242
167
)(1
8 15
0 04
6)
NO
TES
TO T
HE
FIN
ANCI
AL S
TATE
MEN
T (c
onti
nued
)fo
r th
e ye
ar e
nded
31
Mar
ch 2
017
DEP
OSI
TS A
ND
EXT
ERN
AL
LIA
BILI
TIES
201
6 (c
onti
nued
) Bala
nce
in
Fore
ign
Curren
cyRa
te a
t ye
ar e
nd+
3%-1
%SZ
L eq
uiva
lent
Effectof3%
Incr
ease
on
the
Inco
me
Stat
emen
t
Effectof1%
Decreaseon
the
Inco
me
Stat
emen
t
US
Dol
lar
Capitalinvestm
entfund
25 2
93 8
3514
.703
015
.090
414
.505
337
1 89
5 26
09
797
731
(5 0
00 9
35)
ADBUSDollarSpecialA
ccou
nt25
14.7
030.
15.0
904
14.5
053
368
10(5
)
LocalG
VTProject
71 8
9114
.703
015
.090
414
.505
31
057
012
27 8
47(1
4 21
4)
GovtUSD
Gen
eralAccou
nt2
811
994
14.7
030
15.0
904
14.5
053
41 3
44 7
511
089
244
(555
969
)
Repl
enis
hmen
t of
Gov
ernm
ent
Rese
rves
12 8
62 4
9914
.703
015
.090
414
.505
318
9 11
7 31
84
982
372
(2 5
43 0
91)
Fund
Man
ager
s Fe
es
8514
.703
015
.090
414
.505
31
250
33(1
7)
Swazila
ndGovtDeb
tService
3 37
2 21
114
.703
015
.090
414
.505
349
581
621
1 30
6 24
8(6
66 7
32)
LusipIFAD
GEF
Project
149
14.7
030
15.0
904
14.5
053
2 18
958
(29)
SwdGovtIFAD
Loa
nNo.57
1 51
114
.703
015
.090
414
.505
322
217
585
(299
)
SwdGovtEcon
Diversific
ation
18 3
9514
.703
015
.090
414
.505
327
0 45
97
125
(3 6
37)
SwdHIV&TBProject
228
611
14.7
030
15.0
904
14.5
053
3 36
1 26
588
554
(45
199)
SwdHIV/A
IDS&TBProject
1 69
8 13
714
.703
015
.090
414
.505
324
967
715
657
785
(335
745
)
SwdGovtIFAD
GrantNo935
644
14.7
030
15.0
904
14.5
053
9 46
824
9(1
27)
IFAD
RuralFinan
ceand
Enterprise
224
315
14.7
030
15.0
904
14.5
053
3 29
8 11
186
890
(44
350)
SwdAD
BGrant-Nercha
85 1
1614
.703
015
.090
414
.505
31
251
467
32 9
70(1
6 82
9)
SwdGovtStatsCa
pacity
117
455
14.7
030
15.0
904
14.5
053
1 72
6 94
445
497
(23
222)
Publ
ic F
inan
ce M
anag
emen
t13
9 14
914
.703
015
.090
414
.505
32
045
909
53 9
00(2
7 51
2)
Priv
ate
Sect
or P
roje
ct16
5 68
514
.703
015
.090
414
.505
32
436
067
64 1
79(3
2 75
8)
Internationa
lCon
ventionCe
ntre
1 20
2 59
714
.703
015
.090
414
.505
317
681
789
465
834
(237
770
)
48 2
94 3
0471
0 07
1 18
018
707
111
(9 5
48 4
40)
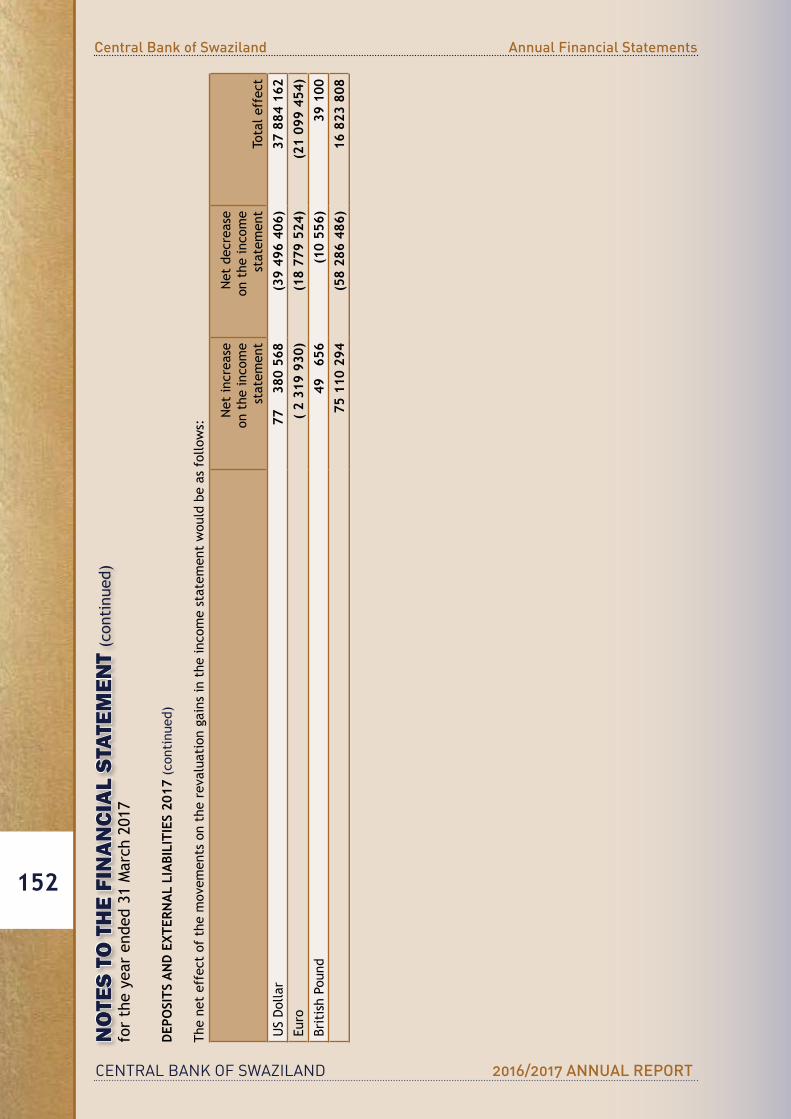
CENTRAL BANK OF SWAZILAND 2016/2017 ANNUAL REPORT
Central Bank of Swaziland Annual Financial Statements
152
NO
TES
TO T
HE
FIN
ANCI
AL S
TATE
MEN
T (c
onti
nued
)fo
r th
e ye
ar e
nded
31
Mar
ch 2
017
DEP
OSI
TS A
ND
EXT
ERN
AL
LIA
BILI
TIES
201
7 (c
onti
nued
)
The
net
effe
ct o
f th
e m
ovem
ents
on
the
reva
luat
ion
gain
s in
the
inco
me
stat
emen
t w
ould
be
as f
ollo
ws:
Net
incr
ease
on t
he in
com
est
atem
ent
Net
dec
reas
eon
the
inco
me
sta
tem
ent
Tota
l eff
ect
USDollar
77
380
568
(39
496
406)
37 8
84 1
62Eu
ro(
2 31
9 93
0)(1
8 77
9 52
4)(2
1 09
9 45
4)Br
itis
h Po
und
49
656
(10
556)
39 1
0075
110
294
(58
286
486)
16 8
23 8
08

CENTRAL BANK OF SWAZILAND 2016/2017 ANNUAL REPORT
Central Bank of Swaziland Annual Financial Statements
153
NO
TES
TO T
HE
FIN
ANCI
AL S
TATE
MEN
T (c
onti
nued
)fo
r th
e ye
ar e
nded
31
Mar
ch 2
017
39.2
Li
quid
ity
Risk
Liqu
idit
y An
alys
isLiqu
idityRiskin
volvesorinclud
esthe
inab
ilitytoman
ageun
plan
nedchan
gesinfun
dingresou
rces.Inthe
caseofthe
Cen
tralBan
kofSwazila
nd,itwou
ldbeinab
ility
to m
eet
or h
onou
r fo
reig
n ex
chan
ge o
blig
atio
ns a
s th
ey f
all d
ue. A
noth
er d
imen
sion
wou
ld t
he p
roba
bilit
y th
at t
he B
ank
incu
r ca
pita
l los
ses
whe
n it
dis
pose
s of
f it
s securitiesinthesecond
arymarke
t.Th
eam
ountsinclud
edinthetablearethecontractua
ldiscou
nted
cashflo
ws.Asaresult,theseam
ountswillnotrecon
cileto
theam
ountsdisclosedon
the
statemen
toffina
ncialpo
sition
excep
tforshort-term
payab
lesan
dreceivab
lestobesettledwithin12m
onthswhe
rediscoun
tingis
not
appl
ied.
The
Liqu
idit
y Ri
sk A
naly
sis
stat
emen
t as
at
31 M
arch
201
7 is
as
follo
ws:
On
Dem
and
E’00
01
Mon
thE’
000
2-6
Mon
ths
E’00
07-
12 M
onth
sE’
000
Ove
r 12
Mon
ths
E’00
0To
tal
E’00
0A
SSET
SExternalIn
vestmen
ts-
1 82
9 45
0 1
121
022
-1
789
520
4 73
9 99
2Claimson
privatesector
--
5 90
85
908
Loan
s an
d ad
vanc
es-
1 59
721
092
22
689
Amou
nts
due
from
the
Gov
ernm
ent
of S
waz
iland
-1
123
211
--
1 12
3 21
1
Oth
er a
sset
s 1
256
23 1
9960
599
-85
054
Cashand
casheq
uivalents
1 52
0 47
4-
-1
520
474
1 52
1 73
01
829
450
2 26
7 43
262
196
1 81
6 52
07
497
328
LIA
BILI
TIES
Curren
cyin
circulation
88
9 44
9-
--
-88
9 44
9Dom
esticde
posits
2 49
3 59
4-
1 69
5 98
1-
714
967
4 90
4 54
2Fo
reig
n de
posi
ts a
nd li
abili
ties
231
633
-18
055
10 5
9826
0 28
6O
ther
Lia
bilit
ies
-20
3 58
718
3 40
31
165
-38
8 15
5Pr
ovis
ions
376
3 52
214
110
3 67
93
287
24 9
74Am
ountpayab
letotheCo
nsolidated
Fun
d-
-24
3 68
1-
-24
3 68
13
615
052
207
109
2 15
5 23
015
442
718
254
6 71
1 08
7Li
quid
ity
sens
itiv
ity
gap
(2 0
93 3
22)
1 62
2 34
111
2 20
246
754
1 09
8 26
678
6 24
1Cu
mulativeliq
uiditysen
sitivitygap
(2 0
93 3
22)
(470
981
)(3
58 7
79)
(312
025
)78
6 24
11
572
482
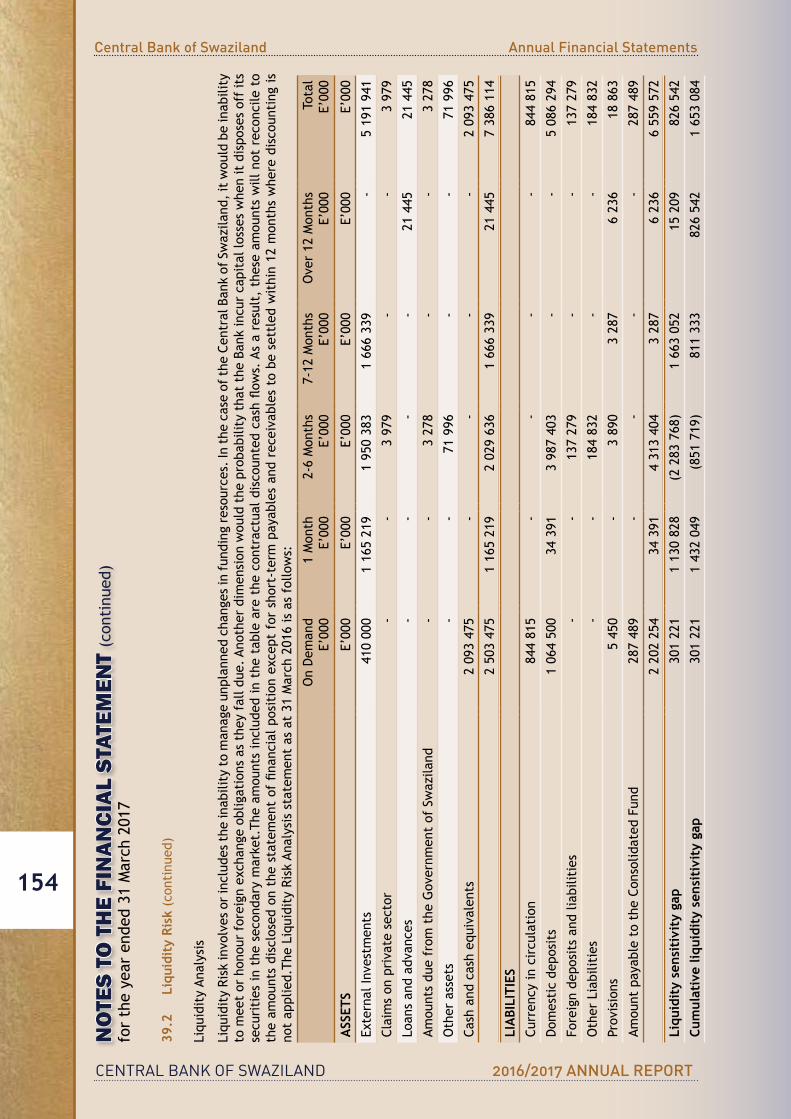
CENTRAL BANK OF SWAZILAND 2016/2017 ANNUAL REPORT
Central Bank of Swaziland Annual Financial Statements
154
NO
TES
TO T
HE
FIN
ANCI
AL S
TATE
MEN
T (c
onti
nued
)fo
r th
e ye
ar e
nded
31
Mar
ch 2
017
39.2
Li
quid
ity
Risk
(co
ntin
ued)
Liqu
idit
y An
alys
is
Liqu
idityRiskin
volvesorinclud
esthe
inab
ilitytoman
ageun
plan
nedchan
gesinfun
dingresou
rces.Inthe
caseofthe
Cen
tralBan
kofSwazila
nd,itwou
ldbeinab
ility
to m
eet
or h
onou
r fo
reig
n ex
chan
ge o
blig
atio
ns a
s th
ey f
all d
ue. A
noth
er d
imen
sion
wou
ld t
he p
roba
bilit
y th
at t
he B
ank
incu
r ca
pita
l los
ses
whe
n it
dis
pose
s of
f it
s securitiesinthesecond
arymarke
t.Th
eam
ountsinclud
edinthetablearethecontractua
ldiscou
nted
cashflo
ws.Asaresult,theseam
ountswillnotrecon
cileto
theam
ountsdisclosedon
the
statemen
toffina
ncialpo
sition
excep
tforshort-term
payab
lesan
dreceivab
lestobesettledwithin12m
onthswhe
rediscoun
tingis
not
appl
ied.
The
Liqu
idit
y Ri
sk A
naly
sis
stat
emen
t as
at
31 M
arch
201
6 is
as
follo
ws:
OnDem
and
E’000
1 M
onth
E’000
2-6
Mon
ths
E’000
7-12
Mon
ths
E’000
Ove
r 12
Mon
ths
E’000
Tota
lE’000
ASS
ETS
E’000
E’000
E’000
E’000
E’000
E’000
ExternalIn
vestmen
ts41
0 00
01
165
219
1 95
0 38
31
666
339
-5
191
941
Claimson
privatesector
--
3 97
9-
-3
979
Loan
s an
d ad
vanc
es-
--
-21
445
21 4
45
Amou
nts
due
from
the
Gov
ernm
ent
of S
waz
iland
--
3 27
8-
-3
278
Oth
er a
sset
s -
-71
996
--
71 9
96
Cashand
casheq
uivalents
2 09
3 47
5-
--
-2
093
475
2 50
3 47
51
165
219
2 02
9 63
61
666
339
21 4
457
386
114
LIA
BILI
TIES
Curren
cyin
circulation
84
4 81
5-
--
-84
4 81
5
Dom
esticde
posits
1 06
4 50
034
391
3 98
7 40
3-
-5
086
294
Fore
ign
depo
sits
and
liab
iliti
es-
-13
7 27
9-
-13
7 27
9
Oth
er L
iabi
litie
s-
-18
4 83
2-
-18
4 83
2
Prov
isio
ns5
450
-3
890
3 28
76
236
18 8
63
Amou
ntpayab
letotheCo
nsolidated
Fun
d28
7 48
9-
--
-28
7 48
9
2 20
2 25
434
391
4 31
3 40
43
287
6 23
66
559
572
Liqu
idit
y se
nsit
ivit
y ga
p30
1 22
11
130
828
(2 2
83 7
68)
1 66
3 05
215
209
826
542
Cum
ulat
ive
liqui
dity
sen
siti
vity
gap
301
221
1 43
2 04
9(8
51 7
19)
811
333
826
542
1 65
3 08
4

CENTRAL BANK OF SWAZILAND 2016/2017 ANNUAL REPORT
Central Bank of Swaziland Annual Financial Statements
155
NO
TES
TO T
HE
FIN
ANCI
AL S
TATE
MEN
T (c
onti
nued
)fo
r th
e ye
ar e
nded
31
Mar
ch 2
017
39.3
Cr
edit
Ris
kTh
is is
the
ris
k th
at t
he b
ank’
s co
unte
rpar
ties
will
def
ault
on
thei
r ob
ligat
ions
as
they
fal
l due
. Th
e ba
nk m
itig
ates
thi
s ri
sk b
y in
vest
ing
wit
h re
puta
ble
inst
itut
ions
w
hich
are
rat
ed b
y Fi
tch,
Moo
dy’s
and
Sta
ndar
d &
Poo
rs r
atin
g ag
enci
es.
The
bank
als
o m
inim
izes
thi
s ri
sk b
y in
vest
ing
in m
oney
mar
ket
inst
rum
ents
iss
ued
by
coun
terp
arti
es w
ith
shor
t-te
rm m
inim
um r
atin
g of
F1+
and
long
ter
m r
atin
g of
A,
wit
h th
e ex
cept
ion
of t
he m
ajor
Sou
th A
fric
an b
anks
. Th
e co
unte
rpar
ties
for
deb
t is
suer
s m
ust
have
a s
hort
-ter
m r
atin
g of
F1+
and
a lo
ng t
erm
rat
ing
of A
A, w
ith
the
exce
ptio
n of
the
Rep
ublic
of
Sout
h Af
rica
.
Coun
terpartiesaregroup
intothreecategoriestode
term
inelim
itsinrespe
ctofinvestmen
ts,an
daresetataneq
uivalenceofE750,E550an
dE3
50m
illionfor
Category1,2an
d3,respe
ctively
Detailedbe
lowisatab
lewhichprovide
sratingin
form
ationon
institutionswhe
rethe
Ban
kinvestsitsfund
s:
Coun
terp
arty
Corr
espo
nden
ce B
ank
Shor
t Te
rm R
atin
gLo
ng T
erm
Rat
ing
Bots
wan
aBa
nk o
f Bo
tsw
ana
F1A-
Cana
daBa
nkofCa
nada
F1+
AAA
RoyalB
ankofCan
ada
F1+
AA
Bank
of
Mon
trea
lF1
+AA
-
Fran
ceBa
nque
de
Fran
ceF1
+AA
Banq
ue N
atio
nal d
e Pa
ris
F1A+
Cred
itAgricole
F1A
Soci
ete
Gen
eral
eF1
A
Ger
man
Deu
tche
Bun
desban
kF1
+AA
A
Deu
tche
Ban
k-Fran
kfurt
F1A-
Commerzban
kF2
BBB+
Aust
ralia
Rese
rve
bank
of
Aust
ralia
F1+
AA-
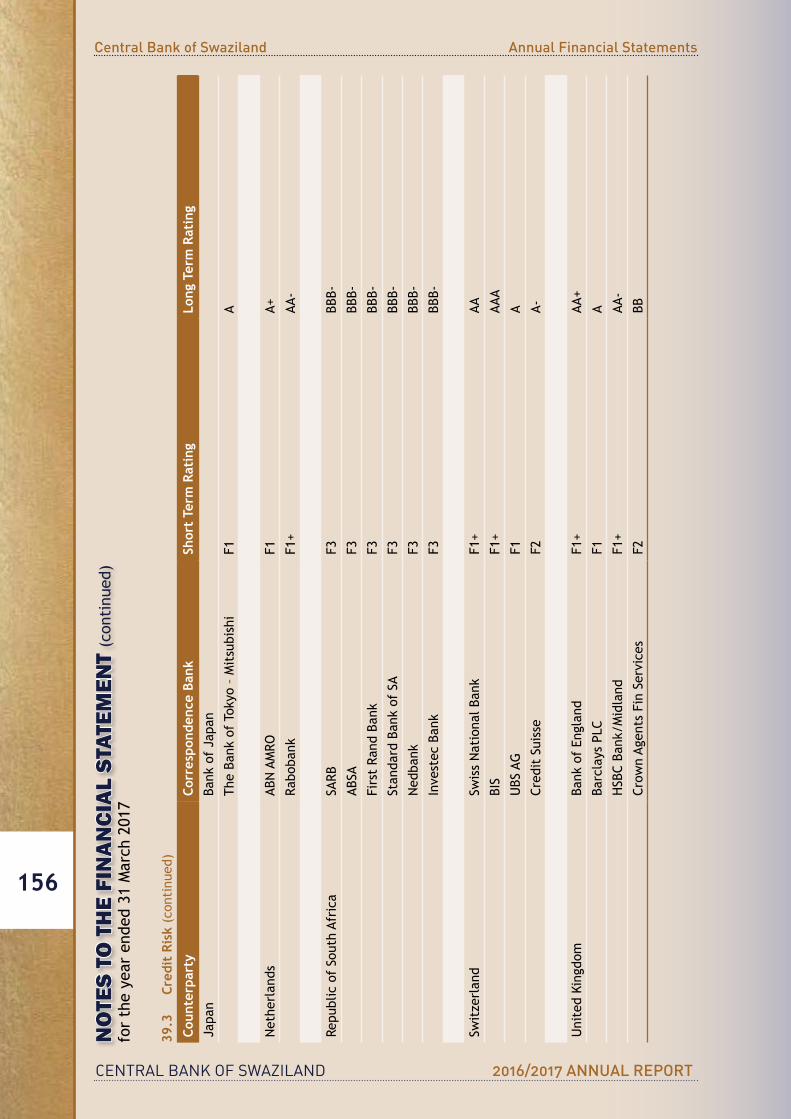
CENTRAL BANK OF SWAZILAND 2016/2017 ANNUAL REPORT
Central Bank of Swaziland Annual Financial Statements
156
NO
TES
TO T
HE
FIN
ANCI
AL S
TATE
MEN
T (c
onti
nued
)fo
r th
e ye
ar e
nded
31
Mar
ch 2
017
39.3
Cr
edit
Ris
k (c
onti
nued
)
Coun
terp
arty
Corr
espo
nden
ce B
ank
Shor
t Te
rm R
atin
gLo
ng T
erm
Rat
ing
Japa
nBa
nkofJapa
n
The
Bank
of
Toky
o –
Mit
subi
shi
F1A
Net
herl
ands
ABN
AM
ROF1
A+
Rabo
bank
F1+
AA-
Repu
blic
of
Sout
h Af
rica
SARB
F3BB
B-
ABSA
F3BB
B-
Firs
t Ra
nd B
ank
F3BB
B-
Stan
dard
Ban
k of
SA
F3BB
B-
Ned
bank
F3BB
B-
Inve
stec
Ban
kF3
BBB-
Swit
zerl
and
Swis
s N
atio
nal B
ank
F1+
AA
BIS
F1+
AAA
UBS
AG
F1A
Cred
itSuisse
F2A-
UnitedKingdo
mBa
nkofEn
glan
dF1
+AA
+
BarclaysPLC
F1A
HSBCBa
nk/M
idland
F1+
AA-
Crow
nAg
entsFinServices
F2BB

CENTRAL BANK OF SWAZILAND 2016/2017 ANNUAL REPORT
Central Bank of Swaziland Annual Financial Statements
157
NO
TES
TO T
HE
FIN
ANCI
AL S
TATE
MEN
T (c
onti
nued
)fo
r th
e ye
ar e
nded
31
Mar
ch 2
017
39.3
Cr
edit
Ris
k (c
onti
nued
)
Coun
terp
arty
Corr
espo
nden
ce B
ank
Shor
t Te
rm R
atin
gLo
ng T
erm
Rat
ing
Japa
nBa
nkofJapa
n
The
Bank
of
Toky
o –
Mit
subi
shi
F1A
Net
herl
ands
ABN
AM
ROF1
A+
Rabo
bank
F1+
AA-
Repu
blic
of
Sout
h Af
rica
SARB
F3BB
B-
ABSA
F3BB
B-
Firs
t Ra
nd B
ank
F3BB
B-
Stan
dard
Ban
k of
SA
F3BB
B-
Ned
bank
F3BB
B-
Inve
stec
Ban
kF3
BBB-
Swit
zerl
and
Swis
s N
atio
nal B
ank
F1+
AA
BIS
F1+
AAA
UBS
AG
F1A
Cred
itSuisse
F2A-
UnitedKingdo
mBa
nkofEn
glan
dF1
+AA
+
BarclaysPLC
F1A
HSBCBa
nk/M
idland
F1+
AA-
Crow
nAg
entsFinServices
F2BB
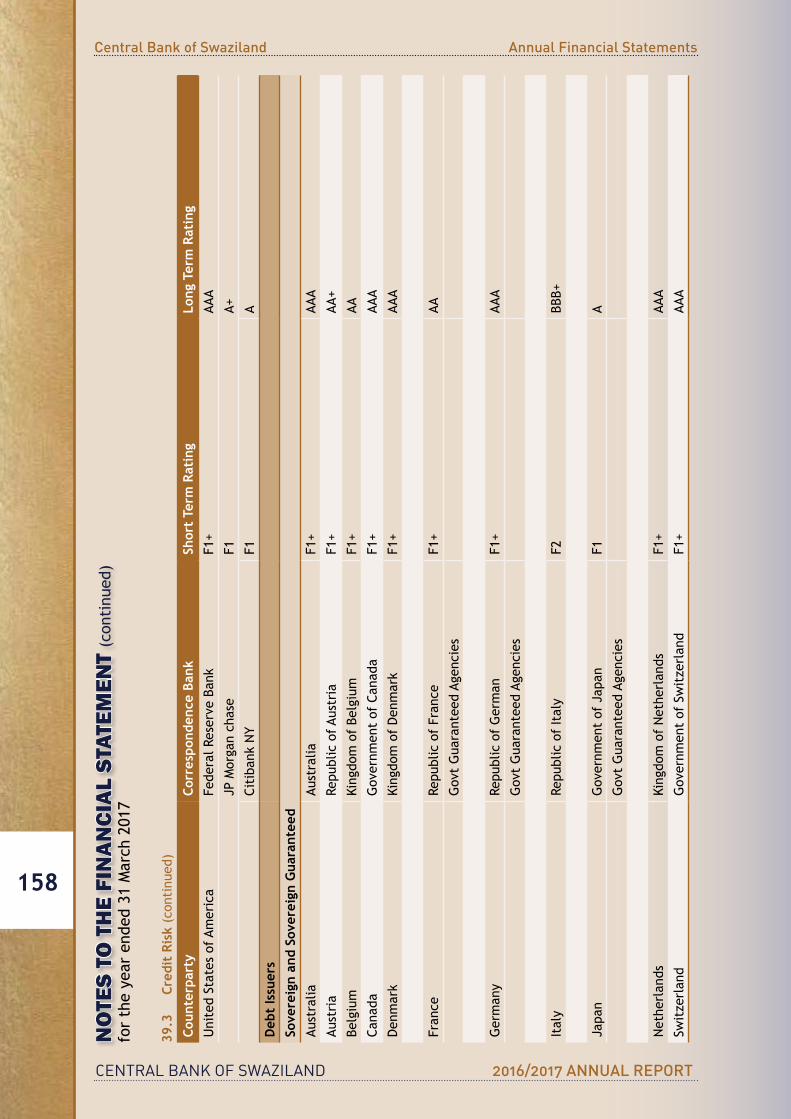
CENTRAL BANK OF SWAZILAND 2016/2017 ANNUAL REPORT
Central Bank of Swaziland Annual Financial Statements
158
NO
TES
TO T
HE
FIN
ANCI
AL S
TATE
MEN
T (c
onti
nued
)fo
r th
e ye
ar e
nded
31
Mar
ch 2
017
39.3
Cr
edit
Ris
k (c
onti
nued
)
Coun
terp
arty
Corr
espo
nden
ce B
ank
Shor
t Te
rm R
atin
gLo
ng T
erm
Rat
ing
Uni
ted
Stat
es o
f Am
eric
aFe
dera
l Res
erve
Ban
kF1
+AA
A
JPMorganchase
F1A+
Citiba
nkNY
F1A
Deb
t Is
suer
sSo
vere
ign
and
Sove
reig
n G
uara
ntee
dAu
stra
liaAu
stra
liaF1
+AA
A
Aust
ria
Repu
blic
of
Aust
ria
F1+
AA+
Belg
ium
Kingdo
mofBe
lgium
F1+
AA
Cana
daGovernm
entofCan
ada
F1+
AAA
Den
mark
Kingdo
mofDen
mark
F1+
AAA
Fran
ceRe
publ
ic o
f Fr
ance
F1+
AA
Gov
t G
uara
ntee
d Ag
enci
es
Ger
man
yRe
publ
ic o
f G
erm
anF1
+AA
A
Gov
t G
uara
ntee
d Ag
enci
es
Ital
yRe
publ
ic o
f It
aly
F2BB
B+
Japa
nGovernm
entofJap
anF1
A
Gov
t G
uara
ntee
d Ag
enci
es
Net
herl
ands
Kingdo
mofNethe
rlan
dsF1
+AA
A
Swit
zerl
and
Gov
ernm
ent
of S
wit
zerl
and
F1+
AAA
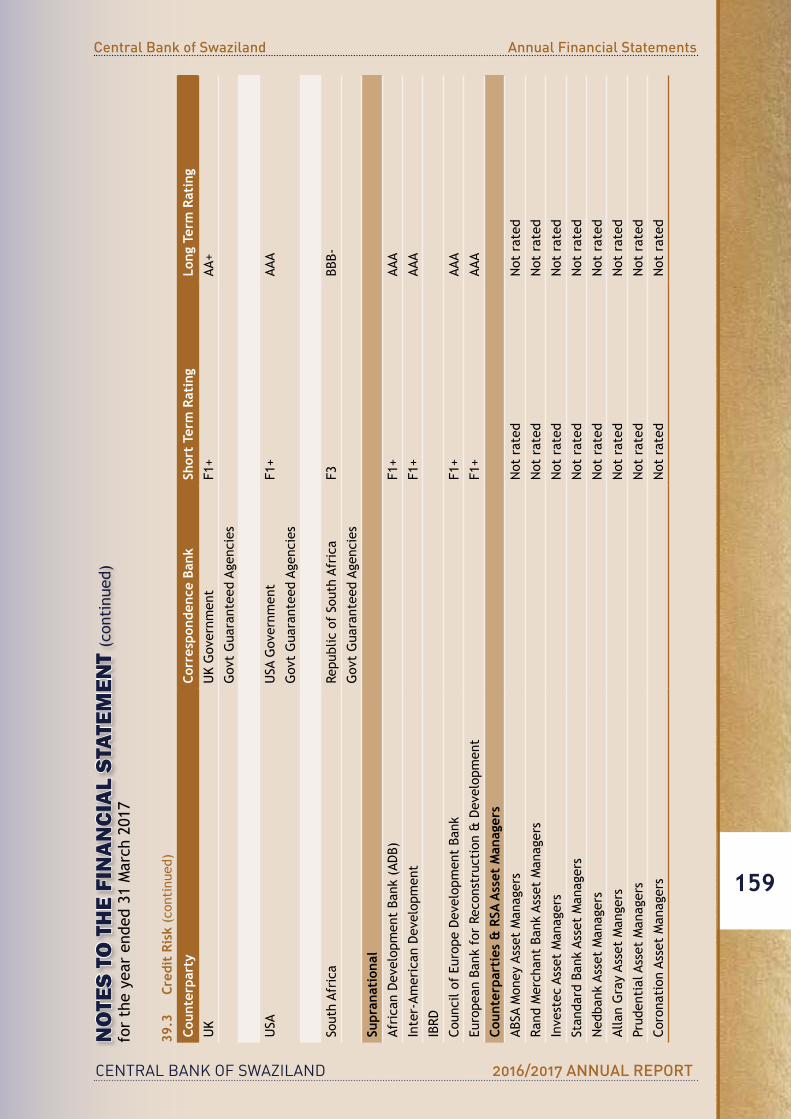
CENTRAL BANK OF SWAZILAND 2016/2017 ANNUAL REPORT
Central Bank of Swaziland Annual Financial Statements
159
NO
TES
TO T
HE
FIN
ANCI
AL S
TATE
MEN
T (c
onti
nued
)fo
r th
e ye
ar e
nded
31
Mar
ch 2
017
39.3
Cr
edit
Ris
k (c
onti
nued
)
Coun
terp
arty
Corr
espo
nden
ce B
ank
Shor
t Te
rm R
atin
gLo
ng T
erm
Rat
ing
UK
UKGovernm
ent
F1+
AA+
Gov
t G
uara
ntee
d Ag
enci
es
USA
USA
Gov
ernm
ent
F1+
AAA
Gov
t G
uara
ntee
d Ag
enci
es
Sout
h Af
rica
Repu
blic
of
Sout
h Af
rica
F3BB
B-
Gov
t G
uara
ntee
d Ag
enci
es
Supr
anat
iona
lAfricanDevelop
men
tBa
nk(AD
B)F1
+AA
A
Inter-Am
erican
Develop
men
tF1
+AA
A
IBRD
Coun
cilo
fEu
rope
Develop
men
tBa
nkF1
+AA
A
Europe
anBan
kforRe
construction
&Develop
men
tF1
+AA
A
Coun
terp
arti
es &
RSA
Ass
et M
anag
ers
ABSA
Mon
ey A
sset
Man
ager
sN
ot r
ated
Not
rat
ed
Rand
Mer
chan
t Ba
nk A
sset
Man
ager
sN
ot r
ated
Not
rat
ed
Inve
stec
Ass
et M
anag
ers
Not
rat
edN
ot r
ated
Stan
dard
Ban
k As
set
Man
ager
sN
ot r
ated
Not
rat
ed
Ned
bank
Ass
et M
anag
ers
Not
rat
edN
ot r
ated
Alla
n G
ray
Asse
t M
ange
rsN
ot r
ated
Not
rat
ed
Prud
enti
al A
sset
Man
ager
sN
ot r
ated
Not
rat
ed
Corona
tion
AssetMan
agers
Not
rat
edN
ot r
ated
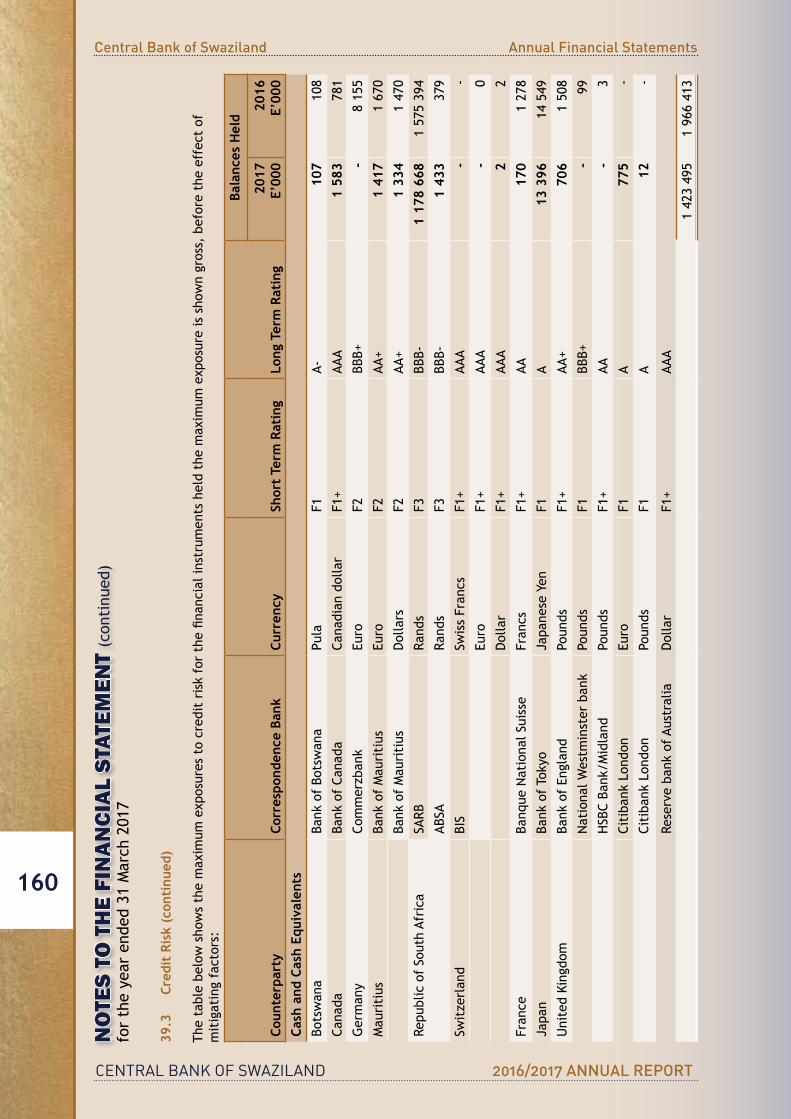
CENTRAL BANK OF SWAZILAND 2016/2017 ANNUAL REPORT
Central Bank of Swaziland Annual Financial Statements
160
NO
TES
TO T
HE
FIN
ANCI
AL S
TATE
MEN
T (c
onti
nued
)fo
r th
e ye
ar e
nded
31
Mar
ch 2
017
39.3
Cr
edit
Ris
k (c
onti
nued
)
Thetablebe
lowsho
wsthemaxim
umexp
osurestocred
itriskforthefin
ancialin
strumen
tsheldthemaxim
umexp
osureissho
wngross,beforetheeffectof
mit
igat
ing
fact
ors:
Coun
terp
arty
Corr
espo
nden
ce B
ank
Curr
ency
Shor
t Te
rm R
atin
gLo
ng T
erm
Rat
ing
Bala
nces
Hel
d
2017
E’00
020
16E’
000
Cash
and
Cas
h Eq
uiva
lent
sBo
tsw
ana
Bank
of
Bots
wan
aPu
laF1
A-10
710
8
Cana
daBa
nkofCa
nada
Cana
dian
dollar
F1+
AAA
1 58
378
1
Ger
man
y Co
mmerzban
kEu
roF2
BBB+
-8
155
Mau
riti
usBa
nk o
f M
auri
tius
Euro
F2AA
+1
417
1 67
0
Bank
of
Mau
riti
usDollars
F2AA
+1
334
1 47
0
Repu
blic
of
Sout
h Af
rica
SARB
Rand
sF3
BBB-
1 17
8 66
81
575
394
ABSA
Ra
nds
F3BB
B-1
433
379
Swit
zerl
and
BIS
Swis
s Fr
ancs
F1+
AAA
- -
Euro
F1+
AAA
- 0
Dollar
F1+
AAA
2 2
Fran
ceBa
nque
Nat
iona
l Sui
sse
Fran
csF1
+AA
170
1 27
8
Japa
nBa
nk o
f To
kyo
Japa
neseYen
F1A
13 3
9614
549
UnitedKingdo
mBa
nkofEn
glan
dPo
unds
F1+
AA+
706
1 50
8
Nat
iona
l Wes
tmin
ster
ban
kPo
unds
F1BB
B+-
99
HSBCBa
nk/M
idland
Poun
dsF1
+AA
- 3
Citiba
nkLon
don
Euro
F1A
775
-
Citiba
nkLon
don
Poun
dsF1
A12
-
Rese
rve
bank
of
Aust
ralia
Dollar
F1+
AAA
1 42
3 49
51
966
413
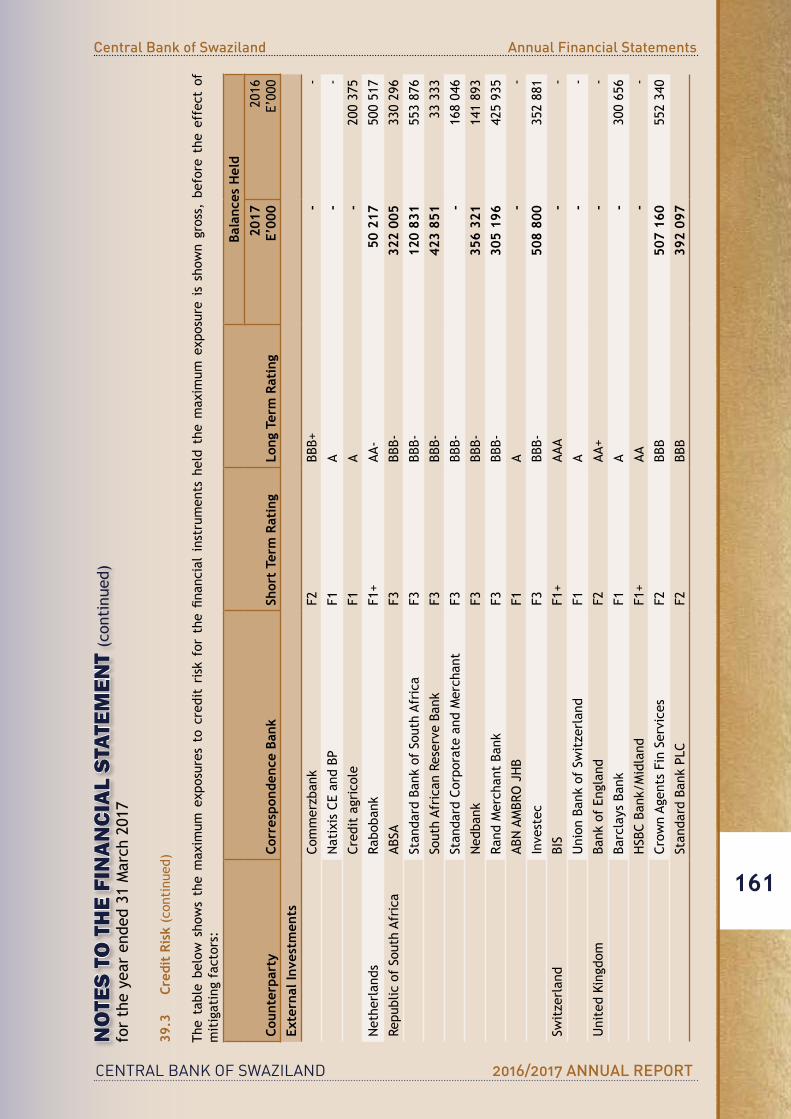
CENTRAL BANK OF SWAZILAND 2016/2017 ANNUAL REPORT
Central Bank of Swaziland Annual Financial Statements
161
NO
TES
TO T
HE
FIN
ANCI
AL S
TATE
MEN
T (c
onti
nued
)fo
r th
e ye
ar e
nded
31
Mar
ch 2
017
39.3
Cr
edit
Ris
k (c
onti
nued
)
Thetablebe
lowsho
wsthemaxim
umexp
osurestocred
itriskforthefin
ancialinstrum
entsheldthemaxim
umexp
osureissho
wngross,beforetheeffectof
mit
igat
ing
fact
ors:
Coun
terp
arty
Corr
espo
nden
ce B
ank
Shor
t Te
rm R
atin
gLo
ng T
erm
Rat
ing
Bala
nces
Hel
d
2017
E’00
020
16E’000
Exte
rnal
Inve
stm
ents
Commerzban
kF2
BBB+
--
NatixisCEan
dBP
F1A
--
Cred
itagricole
F1A
-20
0 37
5
Net
herl
ands
Rabo
bank
F1+
AA-
50 2
1750
0 51
7
Repu
blic
of
Sout
h Af
rica
ABSA
F3BB
B-32
2 00
533
0 29
6
Stan
dard
Ban
k of
Sou
th A
fric
aF3
BBB-
120
831
553
876
Sout
h Af
rica
n Re
serv
e Ba
nkF3
BBB-
423
851
33 3
33
Stan
dardCorpo
rateand
Merchan
tF3
BBB-
-16
8 04
6
Ned
bank
F3BB
B-35
6 32
114
1 89
3
Rand
Mer
chan
t Ba
nkF3
BB
B-30
5 19
642
5 93
5
ABNAMBR
OJHB
F1A
--
Inve
stec
F3BB
B-50
8 80
035
2 88
1
Swit
zerl
and
BIS
F1+
AAA
--
Uni
on B
ank
of S
wit
zerl
and
F1A
--
UnitedKingdo
mBa
nkofEn
glan
dF2
AA+
--
Barc
lays
Ban
kF1
A-
300
656
HSBCBa
nk/M
idland
F1+
AA-
-
Crow
nAg
entsFinServices
F2BB
B50
7 16
055
2 34
0
Stan
dardBan
kPL
CF2
BBB
392
097
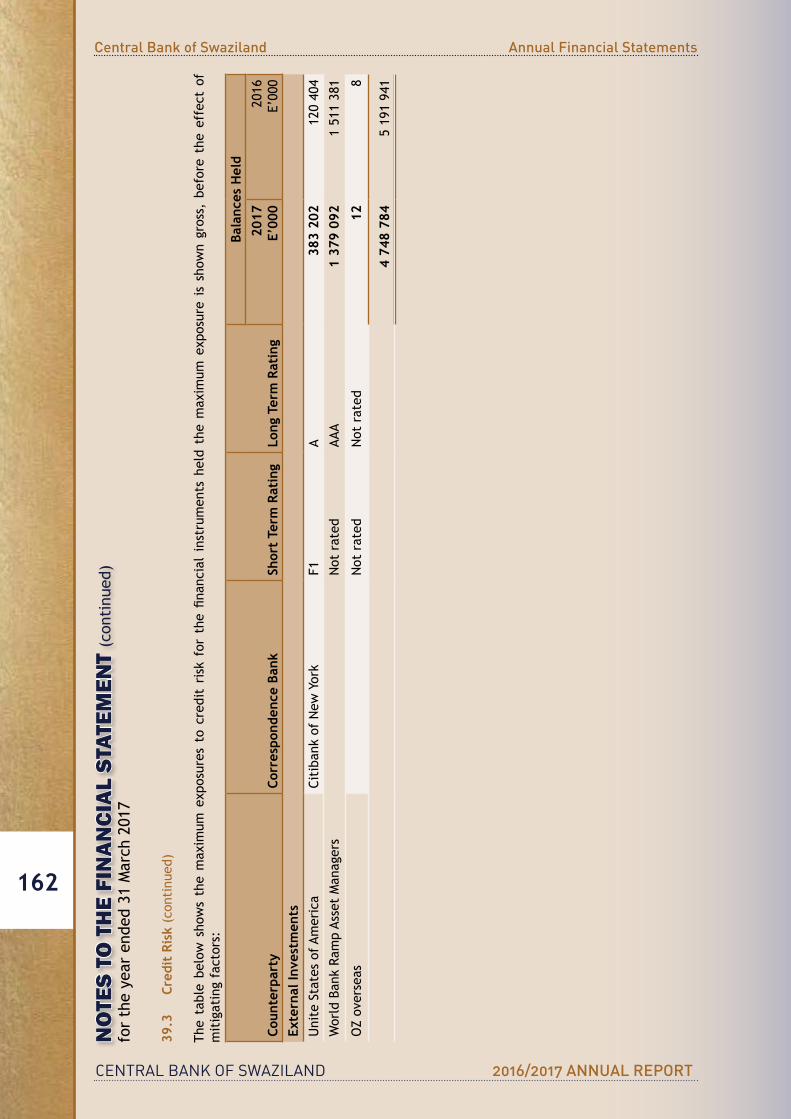
CENTRAL BANK OF SWAZILAND 2016/2017 ANNUAL REPORT
Central Bank of Swaziland Annual Financial Statements
162
NO
TES
TO T
HE
FIN
ANCI
AL S
TATE
MEN
T (c
onti
nued
)fo
r th
e ye
ar e
nded
31
Mar
ch 2
017
39.3
Cr
edit
Ris
k (c
onti
nued
)
Thetablebe
lowsho
wsthemaxim
umexp
osurestocred
itriskforthefin
ancialinstrum
entsheldthemaxim
umexp
osureissho
wngross,beforetheeffectof
mit
igat
ing
fact
ors:
Coun
terp
arty
Corr
espo
nden
ce B
ank
Shor
t Te
rm R
atin
gLo
ng T
erm
Rat
ing
Bala
nces
Hel
d
2017
E’00
020
16E’000
Exte
rnal
Inve
stm
ents
Uni
te S
tate
s of
Am
eric
aCitiba
nkofNew
York
F1A
383
202
120
404
Wor
ld B
ank
Ram
p As
set
Man
ager
sN
ot r
ated
AAA
1 37
9 09
21
511
381
OZ
over
seas
Not
rat
edN
ot r
ated
128
4 74
8 78
45
191
941
CENTRAL BANK OF SWAZILAND 2016/2017 ANNUAL REPORT
Central Bank of Swaziland Annual Financial Statements
163
NOTES TO THE FINANCIAL STATEMENT (continued)for the year ended 31 March 2017
39. 4 Settlement Risk
This is the risk that the Bank is exposed to when settling or clearing transactions. In its day to day operationsinfinancialmarkets,theBankisexposedtotheriskthatoneofthepartiestoadealmayfail to honor its part in the contract. Settlement risk is present in the case of all trades where the exchangeofcashorsecuritiesisnotimmediate.Thisriskisofparticularofsignificanceasforeignexchange transactions are settled only two days after the deal date, and uncertain events within these two days could have a negative impact on the Bank
To mitigate settlement risk, the Bank implemented a policy of dealing only with reputable counterparties that are highly rated by professional rating agencies, currently Fitch Rating. The ratings are monitored by the Bank very closely and total trades with each counterparty are within set limits. To diminish the risk of failure to deliver on the Bank’s part, all effort is made to comply with international practice and internal procedures.
39.5 Operational Risk ThisisariskoffinanciallossesoradamagetotheBank’sreputationasaresultofnon-financialfactorsrelating to itsbusiness.Thenon-financialoroperational risk factors include systemsbreakdowns,human factors, fraud, and natural disasters.
As part of the Bank’s overall risk management program to minimize the occurrence and effect of unpleasant factors associated with operational risk, there are internal controls, policies and procedures inplace.Currentmeasurestomitigatetheriskfactorsareasfollows:
• Systems breakdown: daily backup of all systems and data, as a part of a bank-wide BusinessContinuityPlan(BCP)
• Human factors: insufficient personnel, lack of knowledge, skills and experiences, inadequatetraining and development, inadequate supervision, loss of key personnel, inadequate succession planning or lack of integrity or ethical standards.
• Fraud:segregationofdutiesinalloperations,coupledwithcontrolledaccesstoallsensitiveareasand systems
• Naturaldisasters:DisasterRecoveryPlan (DRP)/BCPand insurancepoliciescovering livesandproperty
• Externalevents:theoccurrenceofaneventhavinganadverse impactontheBankoutsideitscontrol.
The operational risk at the Bank is managed by having a suitable operational organizational structure withclearsegregationofdutiesaswellasdefinedbuilt–insystematiccontrols.Bankwideoperationmanuals are in place to be followed by staff.
In as far the treasury operations are concerned the Bank ensures that the dealers are well trained in instruments in which they are trading and that the systems they need to operate on is in place. The bankalsomakessurethatallinvestmentofficersareawareofproceduresinplaceandhaveaccessto relevant documents.

CENTRAL BANK OF SWAZILAND 2016/2017 ANNUAL REPORT
Central Bank of Swaziland Annual Financial Statements
164
NOTES TO THE FINANCIAL STATEMENT (continued)for the year ended 31 March 2017
39.6 Financial Instruments by Category
Financial assets and financial liabilities aremeasured on an ongoing basis either at fair value oramortisedcost.ThesummaryofaccountingpoliciesinNote4describeshowtheclassesoffinancialinstruments are measured and how income and expenses, including fair value gains are recognised. Thefollowingtableanalysesthecarryingamountsofthefinancialassetsandliabilitiesbycategory:
Loans and
receivablesE’000
At fair value
through profit
and lossE’000
Availablefor sale
E’000
FinancialLiabilities
atAmortised
costE’000
Total E’000
2016
Financial AssetsExternalInvestments - 4 739 992 - - 4 739 992
ClaimsonPrivateSector 5 908 - - - 5 908
Loans and advances 22 689 - - - 22 689
Amounts due from the Government of Swaziland 1 123 211 - - - 1 123 211
CashandCashEquivalents 1 520 474 - - - 1 520 474
2 672 282 4 739 992 - - 7 412 274
Financial LiabilitiesDomesticDeposits - - - 4 904 542 4 904 542
ForeignDepositsandLiabilities - - - 260 286 260 286
Other Liabilities - - - 388 155 388 155
Amounts payable to the consolidated fund - - - 243 681 243 681
- - - 5 796 664 5 796 664
2015
Financial AssetsExternalInvestments - 5 191 941 - - 5 191 941
ClaimsonPrivateSector 3 979 - - - 3 979
Loans and advances 21 445 - - - 21 445
Amounts due from the Government of Swaziland 3 278 - - - 3 278
CashandCashEquivalents 2 093 475 - - - 2 093 475
2 122 177 5 191 941 - - 7 314 118
Financial LiabilitiesDomesticDeposits - - - 5 086 294 5 086 294
ForeignDepositsandLiabilities - - - 137 279 137 279
Other Liabilities - - - 184 832 184 832
Amounts payable to the consolidated fund - - - 287 489 287 489
- - - 5 695 894 5 695 894
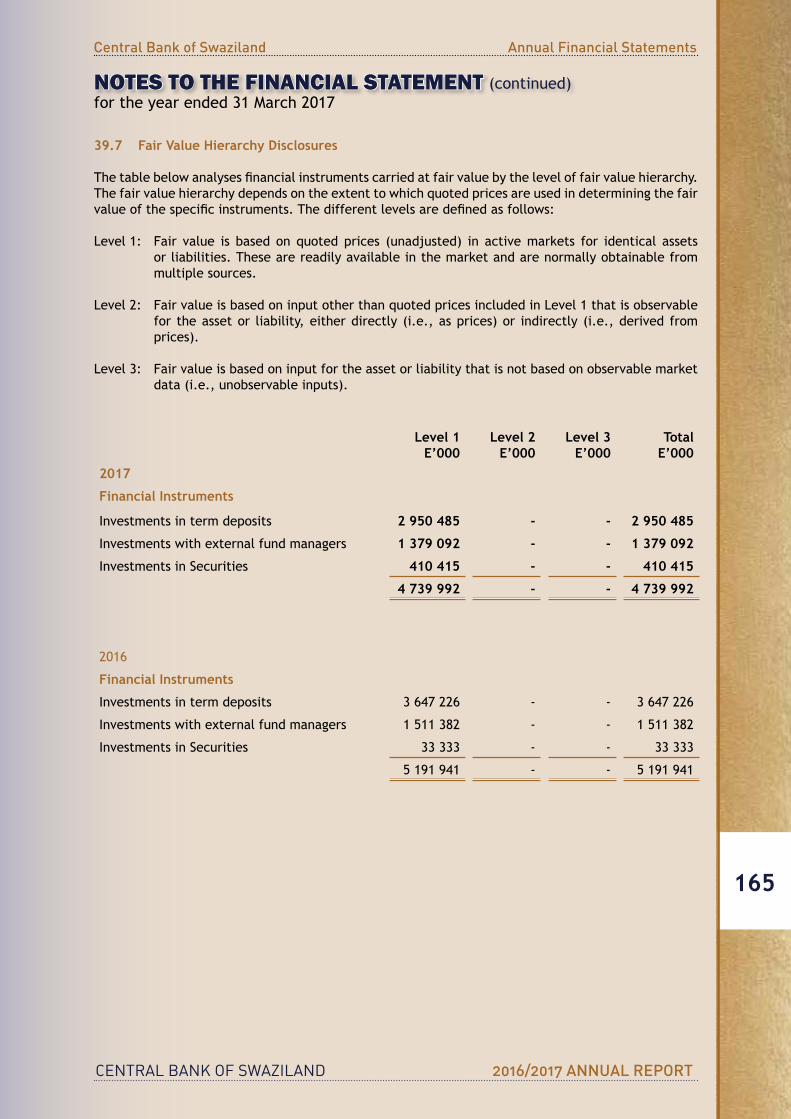
CENTRAL BANK OF SWAZILAND 2016/2017 ANNUAL REPORT
Central Bank of Swaziland Annual Financial Statements
165
NOTES TO THE FINANCIAL STATEMENT (continued)for the year ended 31 March 2017
39.7 Fair Value Hierarchy Disclosures
Thetablebelowanalysesfinancialinstrumentscarriedatfairvaluebytheleveloffairvaluehierarchy.The fair value hierarchy depends on the extent to which quoted prices are used in determining the fair valueofthespecificinstruments.Thedifferentlevelsaredefinedasfollows:
Level 1: Fair value is based on quoted prices (unadjusted) in active markets for identical assets or liabilities. These are readily available in the market and are normally obtainable from multiple sources.
Level 2: Fair value is based on input other than quoted prices included in Level 1 that is observable for the asset or liability, either directly (i.e., as prices) or indirectly (i.e., derived from prices).
Level 3: Fair value is based on input for the asset or liability that is not based on observable market data (i.e., unobservable inputs).
Level 1 E’000
Level 2 E’000
Level 3 E’000
Total E’000
2017
Financial Instruments
Investments in term deposits 2 950 485 - - 2 950 485
Investments with external fund managers 1 379 092 - - 1 379 092
Investments in Securities 410 415 - - 410 415
4 739 992 - - 4 739 992
2016
Financial Instruments
Investments in term deposits 3 647 226 - - 3 647 226
Investments with external fund managers 1 511 382 - - 1 511 382
Investments in Securities 33 333 - - 33 333
5 191 941 - - 5 191 941
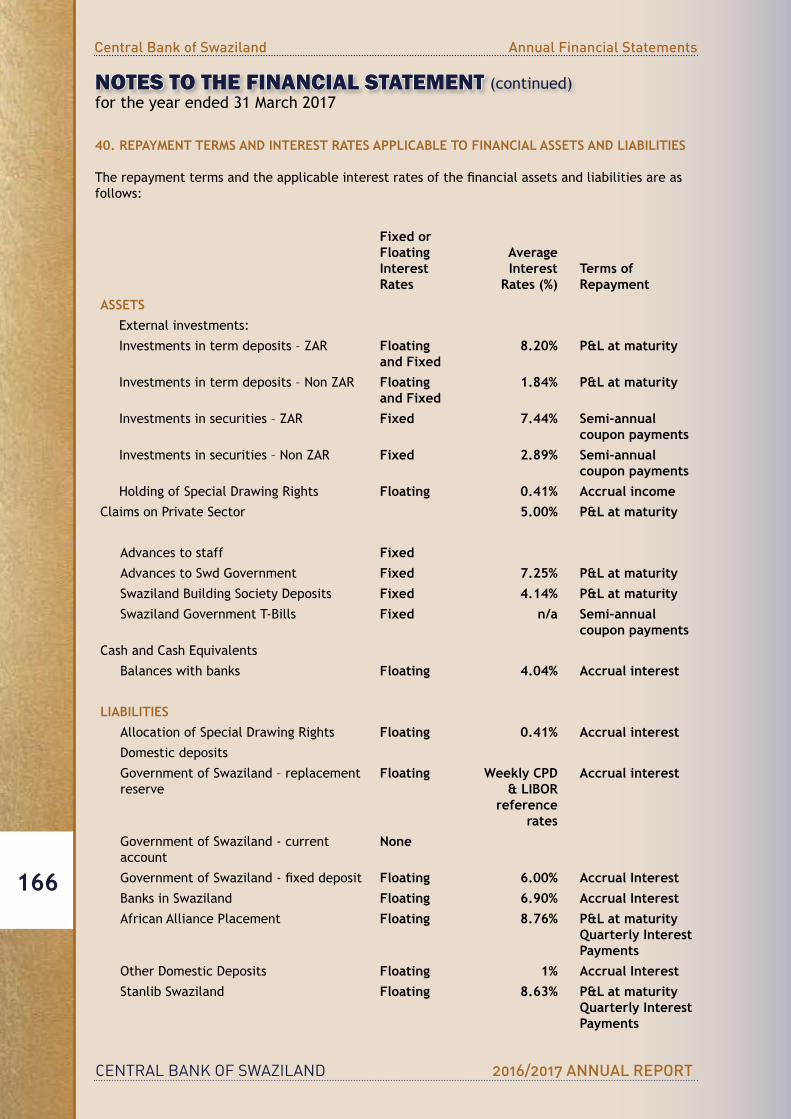
CENTRAL BANK OF SWAZILAND 2016/2017 ANNUAL REPORT
Central Bank of Swaziland Annual Financial Statements
166
NOTES TO THE FINANCIAL STATEMENT (continued)for the year ended 31 March 2017
40. REPAYMENT TERMS AND INTEREST RATES APPLICABLE TO FINANCIAL ASSETS AND LIABILITIES
Therepaymenttermsandtheapplicableinterestratesofthefinancialassetsandliabilitiesareasfollows:
Fixed orFloatingInterest Rates
AverageInterest
Rates (%)Terms ofRepayment
ASSETSExternalinvestments:
Investments in term deposits – ZAR Floating and Fixed
8.20% P&L at maturity
Investments in term deposits – Non ZAR Floating and Fixed
1.84% P&L at maturity
Investments in securities – ZAR Fixed 7.44% Semi-annual coupon payments
Investments in securities – Non ZAR Fixed 2.89% Semi-annual coupon payments
HoldingofSpecialDrawingRights Floating 0.41% Accrual incomeClaimsonPrivateSector 5.00% P&L at maturity
Advances to staff FixedAdvances to Swd Government Fixed 7.25% P&L at maturitySwazilandBuildingSocietyDeposits Fixed 4.14% P&L at maturitySwaziland Government T-Bills Fixed n/a Semi-annual
coupon paymentsCashandCashEquivalents
Balances with banks Floating 4.04% Accrual interest
LIABILITIESAllocationofSpecialDrawingRights Floating 0.41% Accrual interestDomesticdeposits
Government of Swaziland – replacement reserve
Floating Weekly CPD & LIBOR
reference rates
Accrual interest
Government of Swaziland - current account
None
GovernmentofSwaziland-fixeddeposit Floating 6.00% Accrual InterestBanks in Swaziland Floating 6.90% Accrual InterestAfrican Alliance Placement Floating 8.76% P&L at maturity
Quarterly Interest Payments
OtherDomesticDeposits Floating 1% Accrual InterestStanlib Swaziland Floating 8.63% P&L at maturity
Quarterly Interest Payments
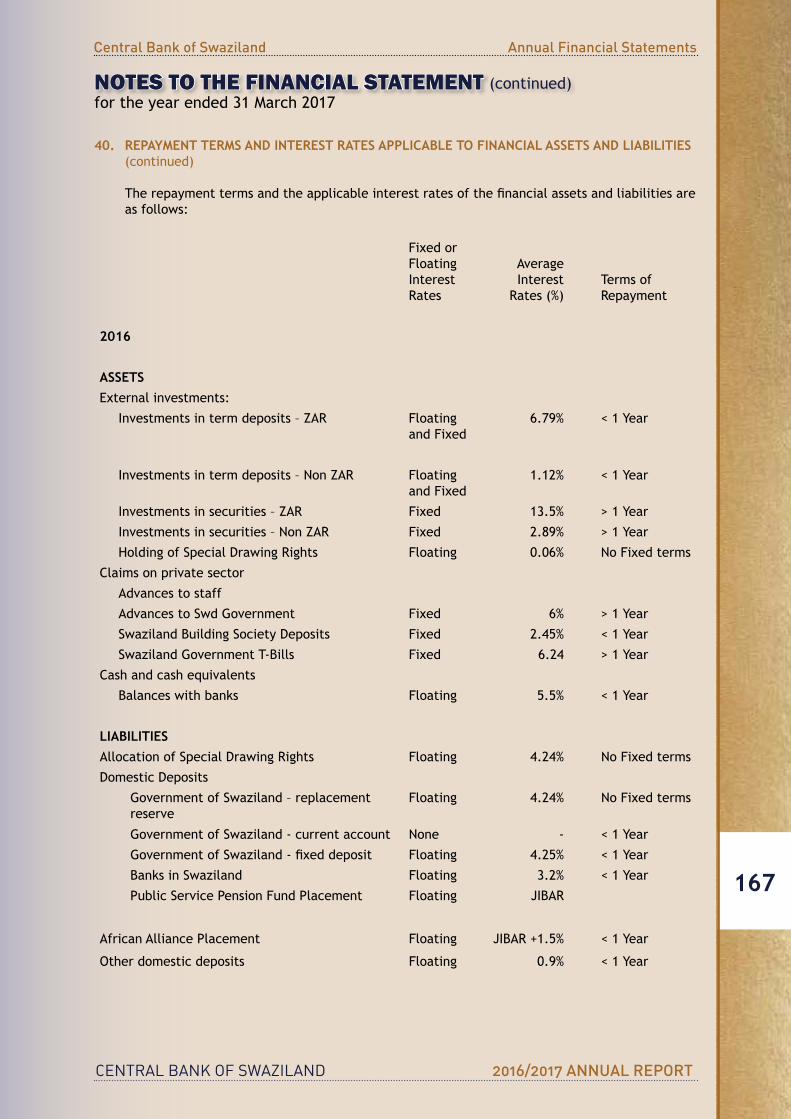
CENTRAL BANK OF SWAZILAND 2016/2017 ANNUAL REPORT
Central Bank of Swaziland Annual Financial Statements
167
NOTES TO THE FINANCIAL STATEMENT (continued)for the year ended 31 March 2017
40. REPAYMENT TERMS AND INTEREST RATES APPLICABLE TO FINANCIAL ASSETS AND LIABILITIES (continued)
Therepaymenttermsandtheapplicableinterestratesofthefinancialassetsandliabilitiesareas follows:
Fixed orFloatingInterest Rates
AverageInterest
Rates (%)Terms ofRepayment
2016
ASSETSExternalinvestments:
Investments in term deposits – ZAR Floating and Fixed
6.79% < 1 Year
Investments in term deposits – Non ZAR Floating and Fixed
1.12% < 1 Year
Investments in securities – ZAR Fixed 13.5% > 1 Year
Investments in securities – Non ZAR Fixed 2.89% > 1 Year
HoldingofSpecialDrawingRights Floating 0.06% No Fixed terms
Claimsonprivatesector
Advances to staff
Advances to Swd Government Fixed 6% > 1 Year
SwazilandBuildingSocietyDeposits Fixed 2.45% < 1 Year
Swaziland Government T-Bills Fixed 6.24 > 1 Year
Cashandcashequivalents
Balances with banks Floating 5.5% < 1 Year
LIABILITIESAllocationofSpecialDrawingRights Floating 4.24% No Fixed terms
DomesticDeposits
Government of Swaziland – replacement reserve
Floating 4.24% No Fixed terms
Government of Swaziland - current account None - < 1 Year
GovernmentofSwaziland-fixeddeposit Floating 4.25% < 1 Year
Banks in Swaziland Floating 3.2% < 1 Year
Public Service Pension Fund Placement Floating JIBAR
African Alliance Placement Floating JIBAR+1.5% < 1 Year
Other domestic deposits Floating 0.9% < 1 Year
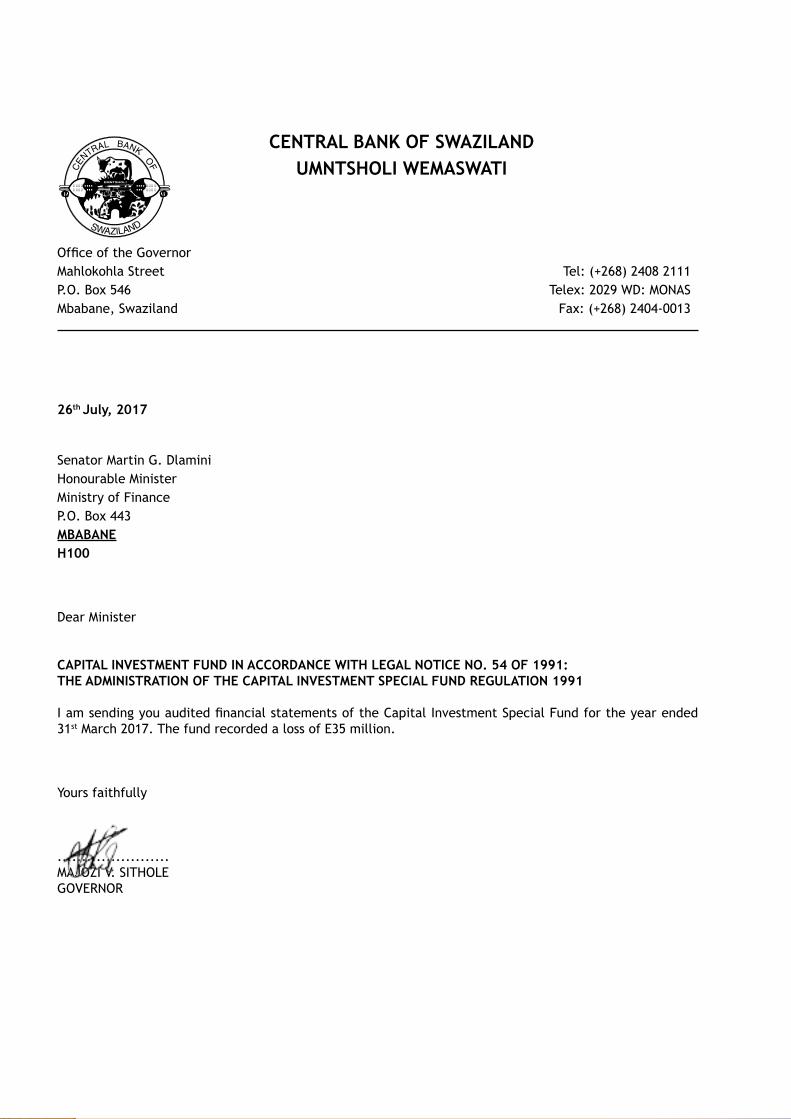
CENTRAL BANK OF SWAZILAND 2016/2017 ANNUAL REPORT
Capital Investment Special Fund Annual Financial Statements
168
CENTRAL BANK OF SWAZILAND UMNTSHOLI WEMASWATI
OfficeoftheGovernorMahlokohla Street Tel: (+268) 2408 2111P.O.Box546 Telex:2029WD:MONASMbabane, Swaziland Fax: (+268) 2404-0013
26th July, 2017
SenatorMartinG.DlaminiHonourable MinisterMinistry of FinanceP.O. Box 443MBABANEH100
DearMinister
CAPITAL INVESTMENT FUND IN ACCORDANCE WITH LEGAL NOTICE NO. 54 OF 1991:THE ADMINISTRATION OF THE CAPITAL INVESTMENT SPECIAL FUND REGULATION 1991
IamsendingyouauditedfinancialstatementsoftheCapitalInvestmentSpecialFundfortheyearended31stMarch2017.ThefundrecordedalossofE35million.
Yours faithfully
.......................MAJOZIV.SITHOLEGOVERNOR

CENTRAL BANK OF SWAZILAND 2016/2017 ANNUAL REPORT
Capital Investment Special Fund Annual Financial Statements
169
CAPITAL INVESTMENTSPECIAL FUND
FINANCIAL STATEMENTSfor the year ended 31 March 2017

CENTRAL BANK OF SWAZILAND 2016/2017 ANNUAL REPORT
Capital Investment Special Fund Annual Financial Statements
170
STATEMENT OF FUND ADMINISTRATORS’ RESPONSIBILITYfor the year ended 31 March 2017
The Fund Administrators are responsible for the maintenance of adequate accounting records and thepreparationandintegrityofthefinancialstatementsandtherelatedinformation.Theauditorsare responsible for reporting on the fair presentation of the financial statements. The financialstatements have been prepared in accordance with International Financial Reporting Standards.
The FundAdministrators are also responsible for the fund’s system of internal financial control.These are designed to provide reasonable, but not absolute assurance as to the reliability of the financialstatements,andtoadequatelysafeguard,verifyandmaintainaccountabilityoftheassets,and to prevent and detect misstatement and loss. Nothing has come to the attention of the Fund’s Administrators to indicate that any material breakdown in the functioning of these controls, procedures and system has occurred during the year under review.
The going concern basis has been adopted in preparing the financial statements. The Fund’sAdministrators have no reason to believe that the fund will not be a going concern in the foreseeable future based on forecasts and available cash resources. These financial statements support theviability of the fund.
The financial statements have been audited by the independent accounting firm,PricewaterhouseCoopers,whichwas given unrestricted access to all financial records and relateddata. The Fund Administrators believe that all representations made to the independent auditors duringtheirauditarevalidandappropriate.PricewaterhouseCoopers’auditreportispresentedonpage 176 to 177.
TheFundAdministratorsconfirmthattheannualfinancialstatementssetoutonpages175to187were approved by the Fund Administrators and are signed on its behalf by:
GOVERNOR DATE
ASSISTANTGOVERNOR DATE
GENERALMANAGERFINANCE DATE

CENTRAL BANK OF SWAZILAND 2016/2017 ANNUAL REPORT
Capital Investment Special Fund Annual Financial Statements
171
INDEPENDENT AUDITOR’S REPORTTo the Minister of Finance
Independent Auditor’s ReportTo the Minister of Finance
Our opinionInouropinion,thefinancialstatementspresentfairly,inallmaterialrespects,thefinancialpositionofCapitalInvestmentSpecialFund(thefund)asat31March2017,anditsfinancialperformanceandcashflowsfortheyearthenendedinaccordancewithInternationalFinancialReportingStandardsandtherequirementoftheCentralBankOrderof1974.
What we have auditedCapitalInvestmentSpecialFund’sfinancialstatementssetoutonpages175to187comprise:
• thestatementoffinancialpositionasat31March2017;• thestatementofcomprehensiveincomefortheyearthenended;• thestatementofchangesinequityfortheyearthenended;• thestatementofcashflowsfortheyearthenended;and• thenotestothefinancialstatements,whichincludeasummaryofsignificantaccounting policies.
Basis for OpinionWe conducted our audit in accordance with International Standards on Auditing (ISAs). Our responsibilities under those standards are further described in the Auditor’s responsibilities for the auditofthefinancialstatements section of our report.
Webelievethattheauditevidencewehaveobtainedissufficientandappropriatetoprovideabasisfor our opinion.
IndependenceWe are independent of the Company in accordance with the requirements of the InternationalFederationofAccountants’(IFAC)CodeofEthicsforProfessionalAccountantsWehavefulfilledourethicalresponsibilitiesinaccordancewiththeIFACCode.
Other InformationThedirectorsareresponsiblefortheotherinformation.TheotherinformationcomprisestheDirectors’Report as required by theCentral BankOrder of 1974 and the statement of fund administrators’responsibility.Otherinformationdoesnotincludethefinancialstatementsandourauditor’sreportthereon.
Ouropiniononthefinancialstatementsdoesnotcovertheotherinformationandwedonotandwillnot express an audit opinion or any form of assurance conclusion thereon.
In connection with our audit of the financial statements, our responsibility is to read the otherinformationidentifiedaboveand,indoingso,considerwhethertheotherinformationismateriallyinconsistent with the financial statements or our knowledge obtained in the audit, or otherwiseappears to be materially misstated.
If, based on the work we have performed, we conclude that there is a material misstatement of this other information, we are required to report that fact. We have nothing to report in this regard.
CENTRAL BANK OF SWAZILAND 2016/2017 ANNUAL REPORT
Capital Investment Special Fund Annual Financial Statements
172
INDEPENDENT AUDITOR’S REPORTTo the Minister of Finance
ResponsibilitiesofthedirectorsforthefinancialstatementsThedirectorsareresponsibleforthepreparationandfairpresentationofthefinancialstatementsin accordance with International Financial Reporting Standards and in the manner required by the CentralBankOrderof1974andforsuchinternalcontrolasthedirectorsdetermineisnecessarytoenablethepreparationoffinancialstatementsthatarefreefrommaterialmisstatement,whetherdue to fraud or error.
Inpreparingthefinancialstatements,thedirectorsareresponsibleforassessingthefund’sabilitytocontinue as a going concern, disclosing, as applicable, matters related to going concern and using the going concern basis of accounting unless the directors either intend to liquidate the fund or to cease operations, or have no realistic alternative but to do so.
Auditor’sresponsibilitiesfortheauditofthefinancialstatementsOurobjectivesaretoobtainreasonableassuranceaboutwhetherthefinancialstatementsasawholeare free from material misstatement, whether due to fraud or error, and to issue an auditor’s report that includes our opinion. Reasonable assurance is a high level of assurance, but is not a guarantee that an audit conducted in accordance with ISAs will always detect a material misstatement when it exists. Misstatements can arise from fraud or error and are considered material if, individually or in theaggregate,theycouldreasonablybeexpectedtoinfluencetheeconomicdecisionsofuserstakenonthebasisofthesefinancialstatements.
As part of an audit in accordance with ISAs, we exercise professional judgement and maintain professional scepticism throughout the audit. We also:• Identifyandassesstherisksofmaterialmisstatementofthefinancialstatements,whetherdue
to fraud or error, design and perform audit procedures responsive to those risks, and obtain audit evidence that is sufficient and appropriate to provide a basis for our opinion.The risk of notdetecting a material misstatement resulting from fraud is higher than for one resulting from error, as fraud may involve collusion, forgery, intentional omissions, misrepresentations, or the override of internal control.
• Obtainanunderstandingofinternalcontrolrelevanttotheauditinordertodesignauditproceduresthat are appropriate in the circumstances, but not for the purpose of expressing an opinion on the effectiveness of the fund’s internal control.
• Evaluatetheappropriatenessofaccountingpoliciesusedandthereasonablenessofaccountingestimates and related disclosures made by the directors.
• Concludeontheappropriatenessofthedirectors’useofthegoingconcernbasisofaccountingand,based on the audit evidence obtained, whether a material uncertainty exists related to events or conditionsthatmaycastsignificantdoubtonthefund’sabilitytocontinueasagoingconcern.Ifwe conclude that a material uncertainty exists, we are required to draw attention in our auditor’s reporttotherelateddisclosuresinthefinancialstatementsor,ifsuchdisclosuresareinadequate,to modify our opinion. Our conclusions are based on the audit evidence obtained up to the date of our auditor’s report. However, future events or conditions may cause the fund to cease to continue as a going concern.
• Evaluate theoverallpresentation, structureandcontentof thefinancial statements, includingthedisclosures,andwhetherthefinancialstatementsrepresenttheunderlyingtransactionsandevents in a manner that achieves fair presentation.
We communicate with the directors regarding, among other matters, the planned scope and timing of theauditandsignificantauditfindings,includinganysignificantdeficienciesininternalcontrolthatwe identify during our audit.
PricewaterhouseCoopersPartner: Theo MasonCharteredAccountant(Swaziland)P.O Box 569 MbabaneDate:
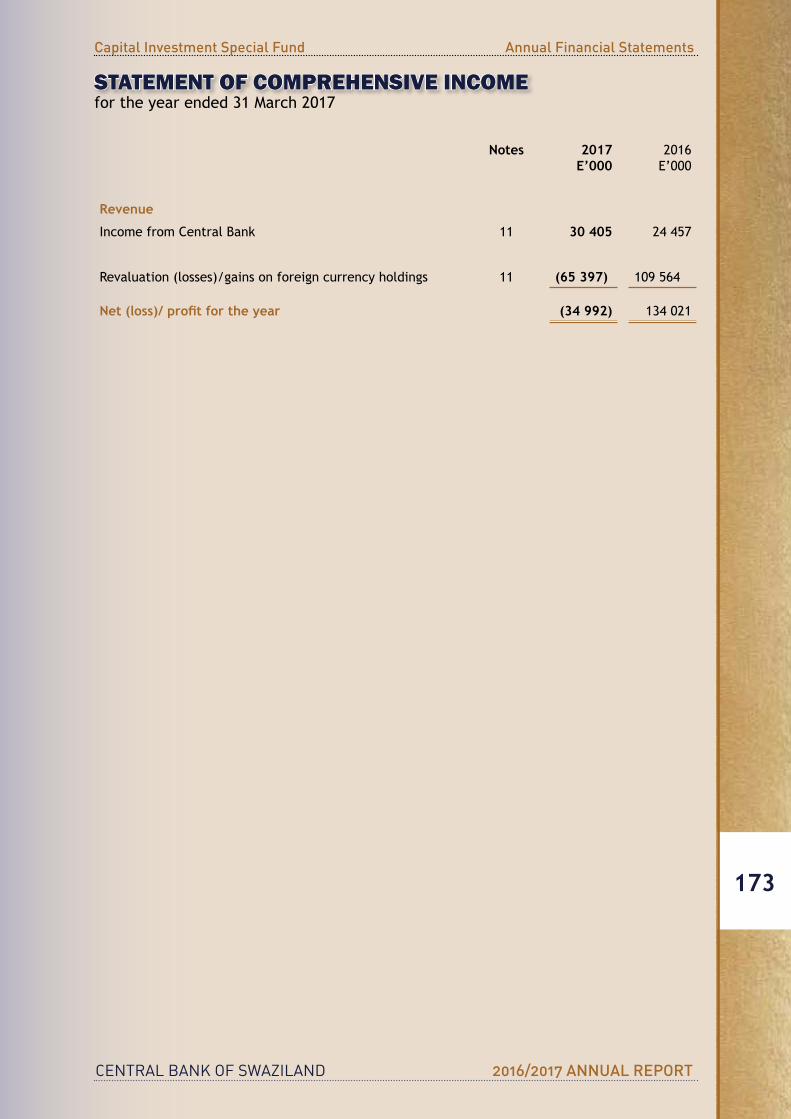
CENTRAL BANK OF SWAZILAND 2016/2017 ANNUAL REPORT
Capital Investment Special Fund Annual Financial Statements
173
STATEMENT OF COMPREHENSIVE INCOMEfor the year ended 31 March 2017
Notes 2017E’000
2016E’000
Revenue
IncomefromCentralBank 11 30 405 24 457
Revaluation (losses)/gains on foreign currency holdings 11 (65 397) 109 564
Net (loss)/ profit for the year (34 992) 134 021
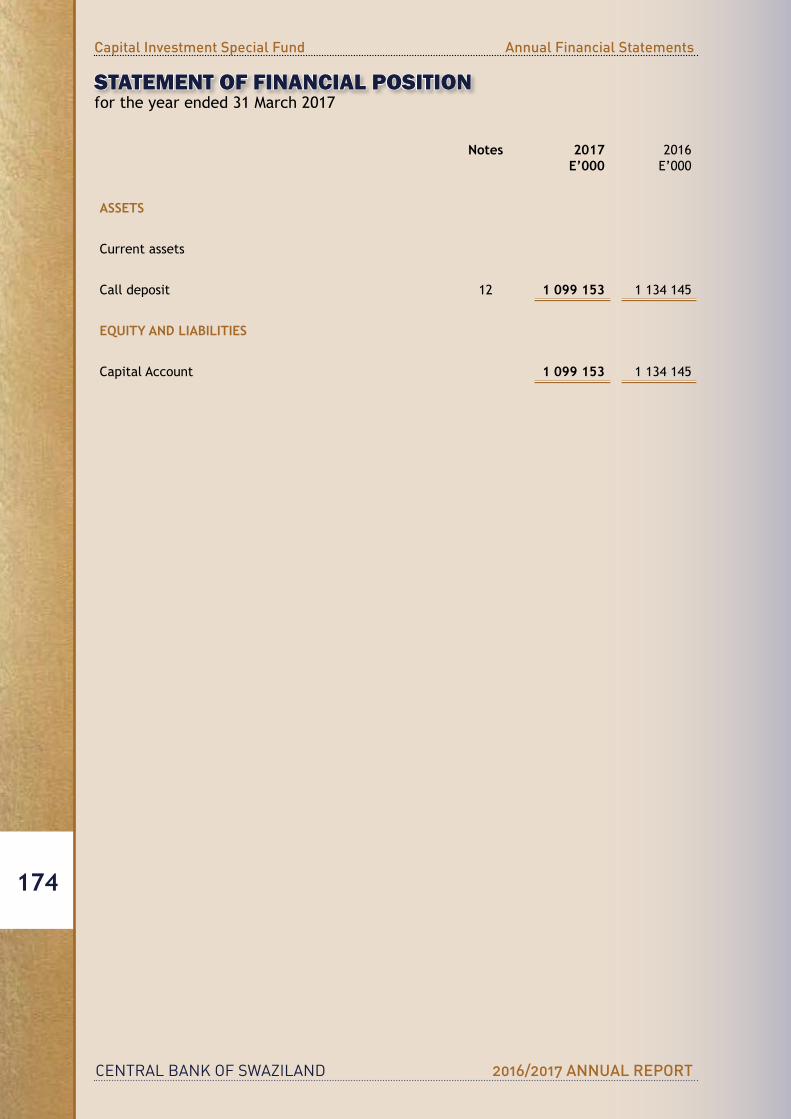
CENTRAL BANK OF SWAZILAND 2016/2017 ANNUAL REPORT
Capital Investment Special Fund Annual Financial Statements
174
STATEMENT OF FINANCIAL POSITIONfor the year ended 31 March 2017
Notes 2017E’000
2016E’000
ASSETS
Currentassets
Calldeposit 12 1 099 153 1 134 145
EQUITY AND LIABILITIES
CapitalAccount 1 099 153 1 134 145
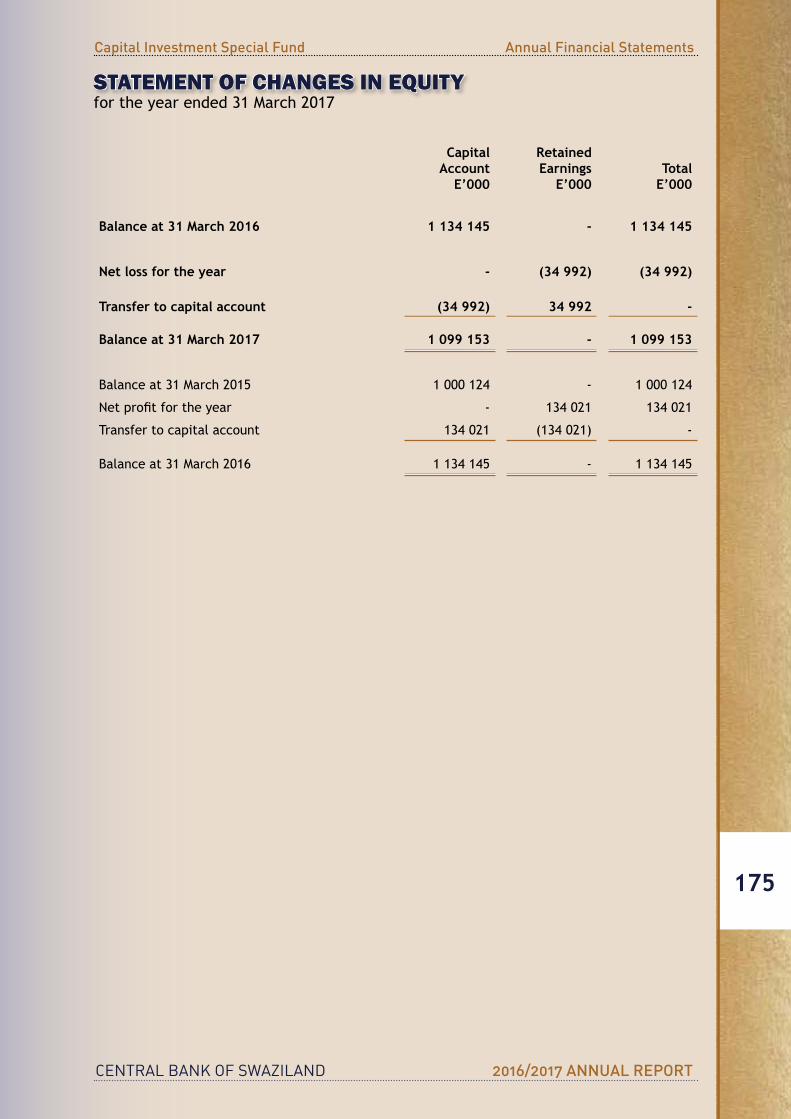
CENTRAL BANK OF SWAZILAND 2016/2017 ANNUAL REPORT
Capital Investment Special Fund Annual Financial Statements
175
STATEMENT OF CHANGES IN EQUITYfor the year ended 31 March 2017
CapitalAccount
E’000
RetainedEarnings
E’000Total
E’000
Balance at 31 March 2016 1 134 145 - 1 134 145
Net loss for the year - (34 992) (34 992)
Transfer to capital account (34 992) 34 992 -
Balance at 31 March 2017 1 099 153 - 1 099 153
Balance at 31 March 2015 1 000 124 - 1 000 124
Netprofitfortheyear - 134 021 134 021
Transfer to capital account 134 021 (134 021) -
Balance at 31 March 2016 1 134 145 - 1 134 145
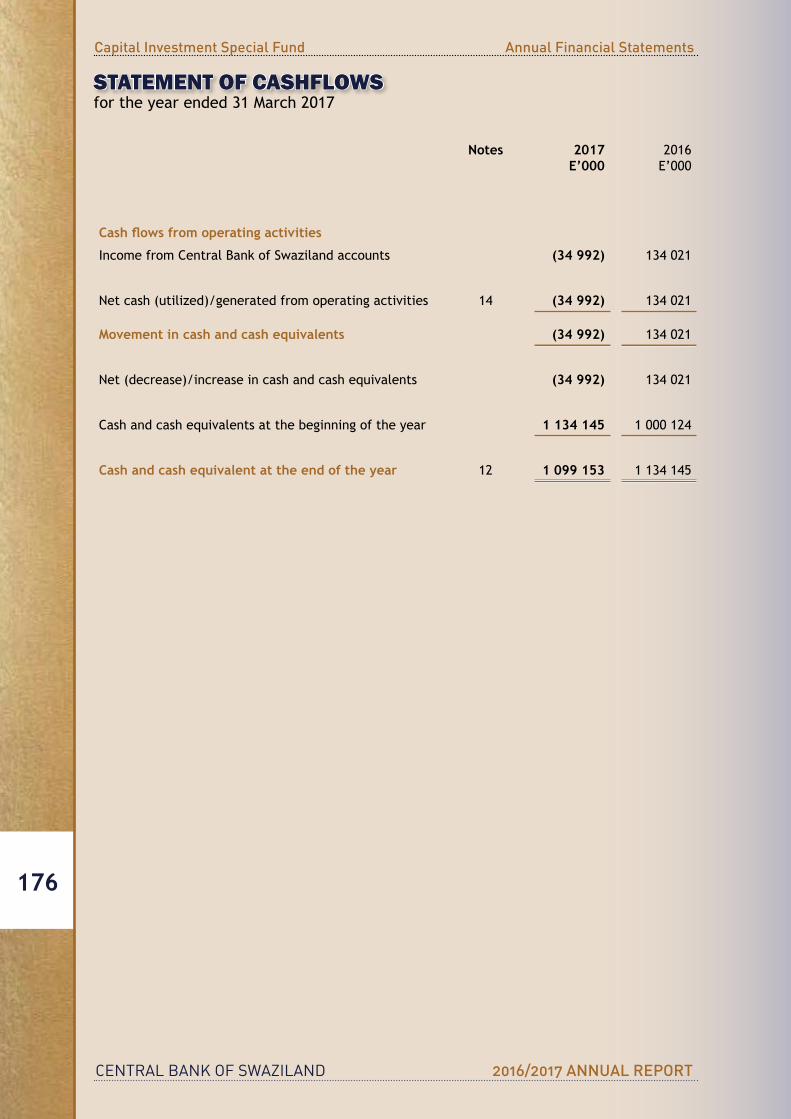
CENTRAL BANK OF SWAZILAND 2016/2017 ANNUAL REPORT
Capital Investment Special Fund Annual Financial Statements
176
STATEMENT OF CASHFLOWSfor the year ended 31 March 2017
Notes 2017E’000
2016 E’000
Cash flows from operating activities
IncomefromCentralBankofSwazilandaccounts (34 992) 134 021
Net cash (utilized)/generated from operating activities 14 (34 992) 134 021
Movement in cash and cash equivalents (34 992) 134 021
Net (decrease)/increase in cash and cash equivalents (34 992) 134 021
Cashandcashequivalentsatthebeginningoftheyear 1 134 145 1 000 124
Cash and cash equivalent at the end of the year 12 1 099 153 1 134 145
CENTRAL BANK OF SWAZILAND 2016/2017 ANNUAL REPORT
Capital Investment Special Fund Annual Financial Statements
177
NOTES TO THE FINANCIAL STATEMENT for the year ended 31 March 2017
1. GENERAL INFORMATION
TheFundisregulatedintermsoftheCentralBankofSwazilandOrder,1974.Theprimaryobjectiveof the fund is to generate interest income.
2. BASIS OF PREPARATION
ThefinancialstatementsoftheCapitalInvestmentSpecialFundhavebeenpreparedinaccordancewith International Financial Reporting Standards (IFRS). The financial statements have beenpreparedunderthehistoricalcostconventionasmodifiedbytherevaluationoffinancialassetsandfinancialliabilitiesheld-for-tradingatfairvaluethroughtheprofitorloss.
ThepreparationoffinancialstatementsinconformitywithIFRSrequirestheuseofcertaincritical accounting estimates. It also requires management to exercise its judgment in the process of
applying the Fund’s accounting policies.
2.1.1 Going–concern Basis
The investmentwill still earn interest, as the investmentswill still yield thebenefitsexpected by the Fund. After making enquiries, the fund administrator has a reasonable expectation that the fund has adequate resources to continue in operational existence for the foreseeable future. The fund therefore continues to adopt the going concern basis in preparingitsfinancialstatements.
2.1.2 Changes in Accounting Policy and Disclosures
(a) New and amended standards adopted by the scheme
TherearenoIFRSsorIFRICinterpretationsthatareeffectiveforthefirsttimeforthefinancialyearbeginningonorafter1April2016thatwouldbeexpectedtohaveamaterialimpact on the scheme.
3. FOREIGN CURRENCY ACTIVITIES
Foreign currency transactions are recorded at the exchange rate ruling on the transaction date. Monetary assets and liabilities designated in foreign currencies are translated at the rates of exchange ruling at the balance sheet date. Any gain or loss on revaluation is transferred to the Income Statement.

CENTRAL BANK OF SWAZILAND 2016/2017 ANNUAL REPORT
Capital Investment Special Fund Annual Financial Statements
178
NOTES TO THE FINANCIAL STATEMENT (continued)for the year ended 31 March 2017
4. FINANCIAL INSTRUMENTS
TheFundclassifiesitsfinancialassetsinthefollowingcategories:atfairvaluethroughprofitorloss,loansandreceivablesandavailableforsale.Theclassificationdependsonthepurposeforwhichthefinancialassetswereacquired.Managementdeterminestheclassificationoffinancialassets at initial recognition.
(a) Financialassetsatfairvaluethroughprofitandloss Financialassetsatfairvaluethroughprofitandlossarefinancialassetsheldfortrading.A
financialassetisclassifiedinthiscategoryifacquiredprincipallyforthepurposeofsellingintheshortterm.Derivativesarealsocategorisedasheldfortradingunlesstheyaredesignatedashedges.Assetsinthiscategoryareclassifiedascurrentassets.TheFundcurrentlydoesnothave assets in this category.
(b) Loans and receivables Loansandreceivablesarenon-derivativefinancialassetswithfixedordeterminablepayments
that are not quoted in an active market. They are included in current assets, except for maturitiesgreaterthan12monthsafterthebalancesheetdate.Theseareclassifiedasnon-current assets.
(c) Available for Sale Financial Assets Available for sale financial assets are non-derivatives that are either designated in this
categoryornotclassifiedinanyoftheothercategories.Theyareincludedinnon-currentassets unless management intends to dispose of the investment within 12 months of the balancesheetdate.TheFund’savailableforsalefinancialassetscomprisesofsecurities.
Regular purchases and sales of financial assets are recognised on the trade-date–the date onwhich the Fund commits to purchase or sell the asset. Investments are initially recognised at fair valueplustransactioncostsforallfinancialassetsnotcarriedatfairvaluethroughprofitorloss.Financialassetscarriedatfairvaluethroughprofitorlossareinitiallyrecognisedatfairvalueand transaction costs are expensed in the income statement. Financial assets are derecognised whentherightstoreceivecashflowsfromtheinvestmentshaveexpiredorhavebeentransferredand the Fund has transferred substantially all risks and rewards of ownership. Available-for-sale financialassetsandfinancialassetsatfairvaluethroughprofitorlossaresubsequentlycarriedat fair value. Loans and receivables are carried at amortised cost using the effective interest method.
Gainsorlossesarisingfromchangesinthefairvalueofthe‘financialassetsatfairvaluethroughprofitorloss’categoryarepresentedintheincomestatementwithin‘other(losses)/gains–net’intheperiod inwhichtheyarise.Dividend incomefromfinancialassetsat fairvaluethroughprofitorlossisrecognisedintheincomestatementaspartofotherincomewhentheFund’srightto receive payments is established.
Changesinthefairvalueofmonetarysecuritiesdenominatedinaforeigncurrencyandclassifiedas available-for-sale are analysed between translation differences resulting from changes in amortised cost of the security and other changes in the carrying amount of the security. The translationdifferencesonmonetarysecuritiesarerecognisedinprofitorloss,whiletranslationdifferences on non-monetary securities are recognised in equity.

CENTRAL BANK OF SWAZILAND 2016/2017 ANNUAL REPORT
Capital Investment Special Fund Annual Financial Statements
179
NOTES TO THE FINANCIAL STATEMENT (continued)for the year ended 31 March 2017
4. FINANCIAL INSTRUMENTS (continued)
(c) Available for Sale Financial Assets (continued) Changesinthefairvalueofmonetaryandnonmonetarysecuritiesclassifiedasavailable-for-
sale are recognised in equity.
Whensecuritiesclassifiedasavailableforsalearesoldorimpaired,theaccumulatedfairvalue adjustments recognised in equity are included in the income statement as ‘gains and losses from investment securities’.
Interest on available-for-sale securities calculated using the effective interest method is recognisedintheincomestatementaspartofotherincome.Dividendsonavailable-for-saleequity instruments are recognised in the income statement as part of other income when the Fund’s right to receive payments is established.
The fair values of quoted investments are based on current bid prices. If the market for afinancialassetisnotactive(andforunlistedsecurities),theFundestablishesfairvalueby using valuation techniques. These include the use of recent arm’s length transactions, referencetootherinstrumentsthataresubstantiallythesame,discountedcashflowanalysis,and option pricing models making maximum use of market inputs and relying as little as possibleonentity-specificinputs.
The Fund assesses at each balance sheet date whether there is objective evidence that afinancialassetoraFundoffinancialassets is impaired. Inthecaseofequitysecuritiesclassifiedasavailable for sale,a significantorprolongeddecline in the fair valueof thesecurity below its cost is considered as an indicator that the securities are impaired. If any suchevidenceexistsforavailable-for-salefinancialassets,thecumulativeloss–measuredasthe difference between the acquisition cost and the current fair value, less any impairment lossonthatfinancialassetpreviouslyrecognisedinprofitorloss–isremovedfromequityandrecognised in the income statement. Impairment losses recognised in the income statement on equity instruments are not reversed through the income statement.
5. IMPAIRMENT AND NON-COLLECTABILITY OF FINANCIAL ASSETS
An assessment is made at each balance sheet date to determine whether there is objective evidencethatafinancialassetorFundoffinancialassetsmaybeimpaired.Ifsuchevidenceexists,the estimated recoverable amount of that asset is determined and any impairment loss recognised for the difference between the recoverable amount and the carrying amount as follows:
• Forfinancialassetsatamortisedcost-thecarryingamountoftheassetisreducedtoitsestimated recoverable amount either directly or through the use of an allowance account andtheamountofthelossisincludedinthenetprofitandlossfortheperiod;and
• Forfinancialassetsatfairvalue-thecarryingamountoftheassetisreducedtoitsestimatedrecoverable amount either directly or through the use of an allowance accounts and the amountofthelossisincludedinthenetprofitandlossfortheperiod.
CENTRAL BANK OF SWAZILAND 2016/2017 ANNUAL REPORT
Capital Investment Special Fund Annual Financial Statements
180
NOTES TO THE FINANCIAL STATEMENT (continued)for the year ended 31 March 2017
6. REVENUES RECOGNITION
Interest income is recognized on a time proportioned basis, taking account of the principal outstanding and the effective interest rate over the period to maturity. The effective interest rate takes into account all directly attributable external costs, discounts or premiums on the financialassets.
7. FAIR VALUE ESTIMATION
The fair value of financial liabilities for disclosure purposes is estimated by discounting thefuturecontractualcashflowsatthecurrentmarketinterestrateavailabletotheFundforsimilarfinancialinstruments.
8. CRITICAL ACCOUNTING ESTIMATES AND ASSUMPTIONS
The Fund makes estimates and assumptions that affect the reported amounts of assets and liabilitieswithinthefinancialyear.Estimatesandjudgmentsarecontinuallyevaluatedandarebased on historical experience and other factors, including expectations of future events that are believed to be reasonable under the circumstances.
9. CASH AND CASH EQUIVALENTS
Cashandcashequivalentsincludescashinhand,depositsheldatcallwithFunds,othershort-termhighly liquid investments with original maturities of three months or less, and Fund overdrafts. Fund overdrafts are shown within borrowings in current liabilities on the balance sheet
10. COMPARATIVES
Where necessary comparatives have been adjusted to conform with changes in presentation in the current year.

CENTRAL BANK OF SWAZILAND 2016/2017 ANNUAL REPORT
Capital Investment Special Fund Annual Financial Statements
181
NOTES TO THE FINANCIAL STATEMENT (continued)for the year ended 31 March 2017
2017E’000
2016E’000
11. OPERATING PROFIT
Operatingprofitisarrivedatafter
Interest income 30 405 24 457
Revaluation losses on foreign currency holdings (65 397) 109 564
12. CALL DEPOSITS
Calldeposits 1 099 153 1 134 145
On9December2005,oninstructionbytheMinistryofFinancePrincipalSecretaryallbalancesofthefundweretransferredtothebooksoftheCentralFundofSwazilandwhereintheyareheldascall deposits.
12.1 Maturity and Interest Rates The repayments terms and applicable interest rates are as follows:
Fixed orFloating
Terms ofRepayment
Calldeposits Floating On demand
Spot rate @31 March 2017
2017E’000
Spot rate @31 March 2016
2016E’000
Euro 14.27 178 135 16.75 209 056
USDollar 13.35 338 723 14.70 371 977
Rand/Emalangeni 1 582 295 1 553 112
1 099 153 1 134 145
2017E’000
2016E’000
1 099 153 1 134 145

CENTRAL BANK OF SWAZILAND 2016/2017 ANNUAL REPORT
Capital Investment Special Fund Annual Financial Statements
182
NOTES TO THE FINANCIAL STATEMENT (continued)for the year ended 31 March 2017
13. FINANCIAL INSTRUMENTS
13.1 Fair Values
Thecarryingamountsoffinancialassetsapproximatetheirfairvalue.
14. RECONCILIATION OF CASH FLOWS TO CASH GENERATED FROM OPERATIONS
2017E’000
2016E’000
Operating(loss)/profit (34 992) 134 021
Netcashflowsfromoperations (34 992) 134 021

CENTRAL BANK OF SWAZILAND 2016/2017 ANNUAL REPORT
Capital Investment Special Fund Annual Financial Statements
183
CENTRAL BANK OF SWAZILAND UMNTSHOLI WEMASWATI
OfficeoftheGovernorMahlokohla Street Tel: (+268) 2408 2111P.O.Box546 Telex:2029WD:MONASMbabane, Swaziland Fax: (+268) 2404-0013
26th July, 2017
MrJabulaniMabuza(MP)Honourable MinisterMinisterofCommerce,IndustryandTradeP.O. Box 451MBABANEH100
DearMinister
EXPORT CREDIT GUARANTEE SCHEME AND SMALL SCALE ENTERPRISE LOAN GUARANTEE SCHEME
In terms of Section 41(bis) of the Central Bank of SwazilandAct, I have the honour to submit auditedfinancialaccountsoftheoperationsoftheExportCreditGuaranteeSchemeandSmallScaleEnterpriseLoanGuaranteeSchemeforthefiscalyearended31st March 2017.
Yours faithfully
.......................MAJOZIV.SITHOLEGOVERNOR

CENTRAL BANK OF SWAZILAND 2016/2017 ANNUAL REPORT
Export Credit Guarantee Scheme Annual Financial Statements
184
EXPORT CREDITGUARANTEE SCHEME
FINANCIAL STATEMENTSfor the year ended 31 March 2017
CENTRAL BANK OF SWAZILAND 2016/2017 ANNUAL REPORT
Export Credit Guarantee Scheme Annual Financial Statements
185
STATEMENT OF SCHEME ADMINISTRATORS’ RESPONSIBILITYfor the year ended 31 March 2017
The Scheme Administrators are responsible for the preparation, integrity and fair presentation of the financialstatementsoftheExportCreditGuaranteeScheme.Thefinancialstatementspresentedonpages 190 to 202 have been prepared in accordance with International Financial Reporting Standards, and include amounts based on judgment and estimates made by management.
TheSchemeAdministratorsarealsoresponsibleforthescheme’ssystemofinternalfinancialcontrol.These are designed to provide reasonable, but not absolute assurance as to the reliability of the financialstatements,andtoadequatelysafeguard,verifyandmaintainaccountabilityoftheassets,and to prevent and detect misstatement and loss. Nothing has come to the attention of the Scheme’s Administrators to indicate that any material breakdown in the functioning of these controls, procedures and system has occurred during the year under review.
The going concern basis has been adopted in preparing the financial statements. The SchemeAdministrators have no reason to believe that the scheme will not be a going concern in the foreseeable future based on forecasts and available cash resources. These financial statements support theviability of the scheme.
The financial statements have been audited by the independent accounting firm,PricewaterhouseCoopers,whichwas given unrestricted access to all financial records and relateddata, including minutes of all meetings of the Scheme Administrators. The Scheme Administrators believe that all representations made to the independent auditors during their audit are valid and appropriate.PricewaterhouseCoopers’auditreportispresentedonpage191to193.
TheSchemeAdministratorsconfirmthattheannualfinancialstatementssetoutonpages190to202were approved by the Scheme Administrators and are signed on its behalf by:
GOVERNOR DATE
ASSISTANTGOVERNOR DATE
GENERALMANAGEROPERATIONS DATE
CENTRAL BANK OF SWAZILAND 2016/2017 ANNUAL REPORT
Export Credit Guarantee Scheme Annual Financial Statements
186
Our OpinionInouropinion,thefinancialstatementspresentfairly,inallmaterialrespects,thefinancialpositionofExportCreditGuaranteeScheme(thescheme)asat31March2017,anditsfinancialperformanceandcashflowsfortheyearthenendedinaccordancewithInternationalFinancialReportingandtherequirementsoftheCentralBankOrderof1974,asamended.
What we have auditedExportCreditGuaranteeScheme’sfinancialstatementssetoutonpages190to202comprise:• thestatementoffinancialpositionasat31March2017;• thestatementofcomprehensiveincomefortheyearthenended;• thestatementofchangesinequityfortheyearthenended;• thestatementofcashflowsfortheyearthenended;and• thenotestothefinancialstatements,whichincludeasummaryofsignificantaccountingpolicies.
Basis for OpinionWe conducted our audit in accordance with International Standards on Auditing (ISAs). Our responsibilities under those standards are further described in the Auditor’s responsibilities for the auditofthefinancialstatements section of our report.
Webelievethattheauditevidencewehaveobtainedissufficientandappropriatetoprovideabasisfor our opinion.
IndependenceWe are independent of the Company in accordance with the requirements of the InternationalFederationofAccountants’(IFAC)CodeofEthicsforProfessionalAccountants.WehavefulfilledourethicalresponsibilitiesinaccordancewiththeIFACCode.
Other InformationThe Scheme Administrators are responsible for the other information. The other information comprises theSchemeAdministrators’ReportasrequiredbytheCentralBankOrderof1974,asamendedandthestatementofschemeadministrators’responsibility.Otherinformationdoesnotincludethefinancialstatements and our auditor’s report thereon.
Ouropiniononthefinancialstatementsdoesnotcovertheotherinformationandwedonotandwillnot express an audit opinion or any form of assurance conclusion thereon.
In connection with our audit of the financial statements, our responsibility is to read the otherinformationidentifiedaboveand,indoingso,considerwhethertheotherinformationismateriallyinconsistent with the financial statements or our knowledge obtained in the audit, or otherwiseappears to be materially misstated.
If, based on the work we have performed, we conclude that there is a material misstatement of this other information, we are required to report that fact. We have nothing to report in this regard.
INDEPENDENT AUDITOR’S REPORTTotheMinisterofCommerce,IndustryandTrade

CENTRAL BANK OF SWAZILAND 2016/2017 ANNUAL REPORT
Export Credit Guarantee Scheme Annual Financial Statements
187
ResponsibilitiesoftheSchemeAdministratorsforthefinancialstatementsTheSchemeAdministratorsareresponsibleforthepreparationandfairpresentationofthefinancialstatements in accordance with International Financial Reporting Standards and the requirements of theCentralBankOrderof1974,asamendedandforsuchinternalcontrolastheSchemeAdministratorsdetermineisnecessarytoenablethepreparationoffinancialstatementsthatarefreefrommaterialmisstatement, whether due to fraud or error.
Inpreparingthefinancialstatements,theSchemeAdministratorsareresponsibleforassessingthescheme’s ability to continue as a going concern, disclosing, as applicable, matters related to going concern and using the going concern basis of accounting unless the Scheme Administrators either intend to liquidate the scheme or to cease operations, or have no realistic alternative but to do so.
Auditor’sresponsibilitiesfortheauditofthefinancialstatementsOurobjectivesaretoobtainreasonableassuranceaboutwhetherthefinancialstatementsasawholeare free from material misstatement, whether due to fraud or error, and to issue an auditor’s report that includes our opinion. Reasonable assurance is a high level of assurance, but is not a guarantee that an audit conducted in accordance with ISAs will always detect a material misstatement when it exists. Misstatements can arise from fraud or error and are considered material if, individually or in theaggregate,theycouldreasonablybeexpectedtoinfluencetheeconomicdecisionsofuserstakenonthebasisofthesefinancialstatements.
As part of an audit in accordance with ISAs, we exercise professional judgement and maintain professional scepticism throughout the audit. We also:• Identifyandassesstherisksofmaterialmisstatementofthefinancialstatements,whetherdue
to fraud or error, design and perform audit procedures responsive to those risks, and obtain audit evidence that is sufficient and appropriate to provide a basis for our opinion.The risk of notdetecting a material misstatement resulting from fraud is higher than for one resulting from error, as fraud may involve collusion, forgery, intentional omissions, misrepresentations, or the override of internal control.
• Obtainanunderstandingofinternalcontrolrelevanttotheauditinordertodesignauditproceduresthat are appropriate in the circumstances, but not for the purpose of expressing an opinion on the effectiveness of the scheme’s internal control.
• Evaluatetheappropriatenessofaccountingpoliciesusedandthereasonablenessofaccounting
estimates and related disclosures made by the Scheme Administrators.
INDEPENDENT AUDITOR’S REPORTTotheMinisterofCommerce,IndustryandTrade
CENTRAL BANK OF SWAZILAND 2016/2017 ANNUAL REPORT
Export Credit Guarantee Scheme Annual Financial Statements
188
INDEPENDENT AUDITOR’S REPORTTotheMinisterofCommerce,IndustryandTrade
• Concludeontheappropriatenessof theSchemeAdministrators’useof thegoingconcernbasisof accounting and, based on the audit evidence obtained, whether a material uncertainty exists relatedtoeventsorconditionsthatmaycastsignificantdoubtonthescheme’sabilitytocontinueas a going concern. If we conclude that a material uncertainty exists, we are required to draw attentioninourauditor’sreporttotherelateddisclosuresinthefinancialstatementsor,ifsuchdisclosures are inadequate, to modify our opinion. Our conclusions are based on the audit evidence obtained up to the date of our auditor’s report. However, future events or conditions may cause the scheme to cease to continue as a going concern.
• Evaluate theoverallpresentation, structureandcontentof thefinancial statements, includingthedisclosures,andwhetherthefinancialstatementsrepresenttheunderlyingtransactionsandevents in a manner that achieves fair presentation.
We communicate with the Scheme Administrators regarding, among other matters, the planned scopeandtimingoftheauditandsignificantauditfindings,includinganysignificantdeficienciesin internal control that we identify during our audit.
PricewaterhouseCoopersPartner: Theo MasonCharteredAccountant(Swaziland)P.O Box 569 MbabaneDate:
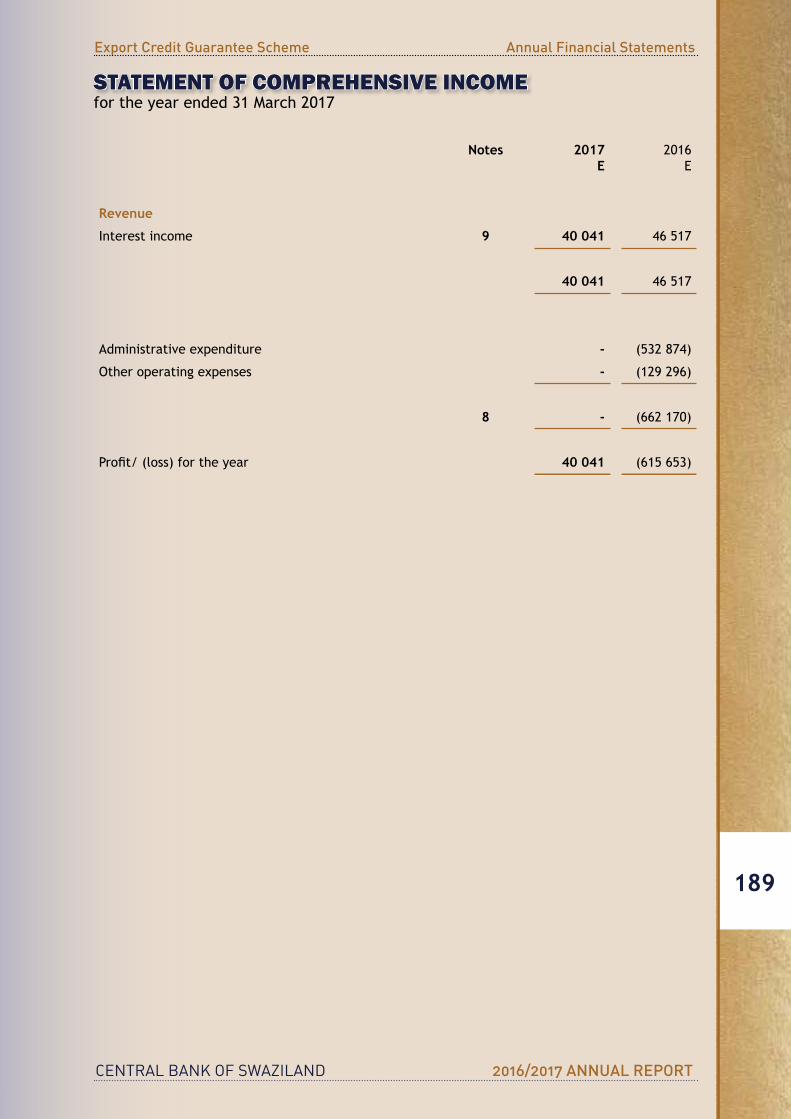
CENTRAL BANK OF SWAZILAND 2016/2017 ANNUAL REPORT
Export Credit Guarantee Scheme Annual Financial Statements
189
STATEMENT OF COMPREHENSIVE INCOMEfor the year ended 31 March 2017
Notes 2017E
2016E
Revenue
Interest income 9 40 041 46 517
40 041 46 517
Administrative expenditure - (532 874)
Other operating expenses - (129 296)
8 - (662 170)
Profit/(loss)fortheyear 40 041 (615 653)
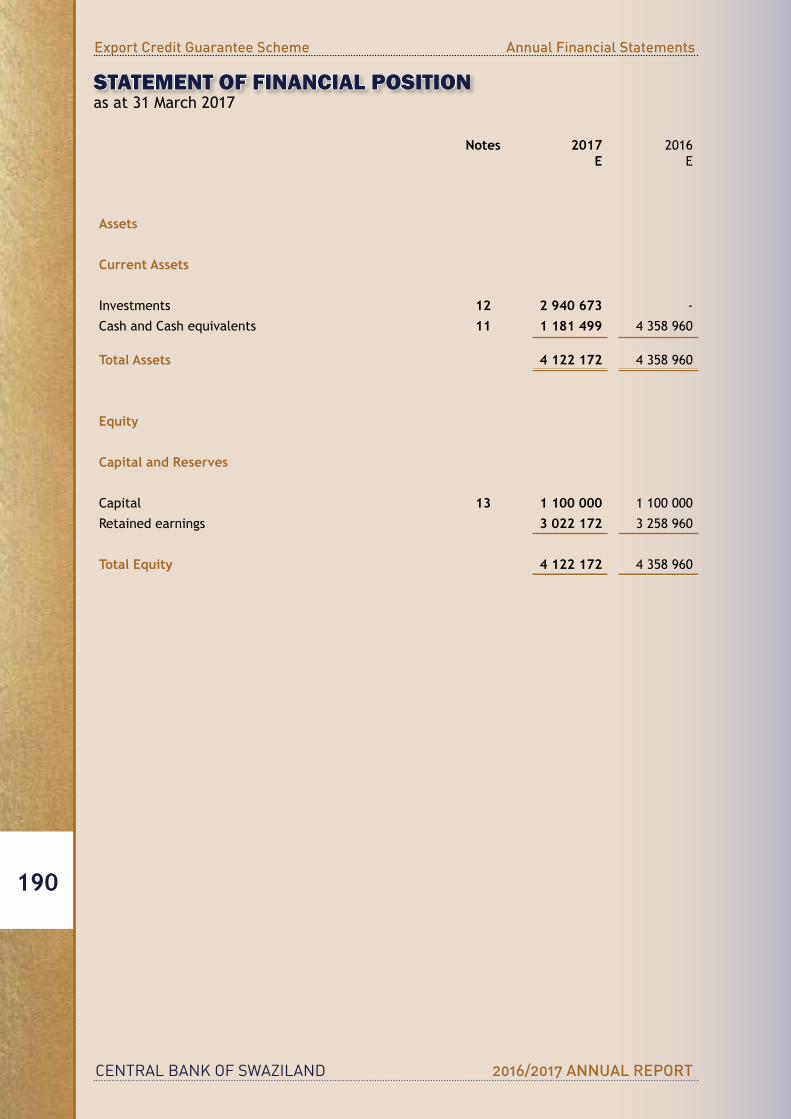
CENTRAL BANK OF SWAZILAND 2016/2017 ANNUAL REPORT
Export Credit Guarantee Scheme Annual Financial Statements
190
STATEMENT OF FINANCIAL POSITIONas at 31 March 2017
Notes 2017E
2016E
Assets
Current Assets
Investments 12 2 940 673 -
CashandCashequivalents 11 1 181 499 4 358 960
Total Assets 4 122 172 4 358 960
Equity
Capital and Reserves
Capital 13 1 100 000 1 100 000
Retained earnings 3 022 172 3 258 960
Total Equity 4 122 172 4 358 960
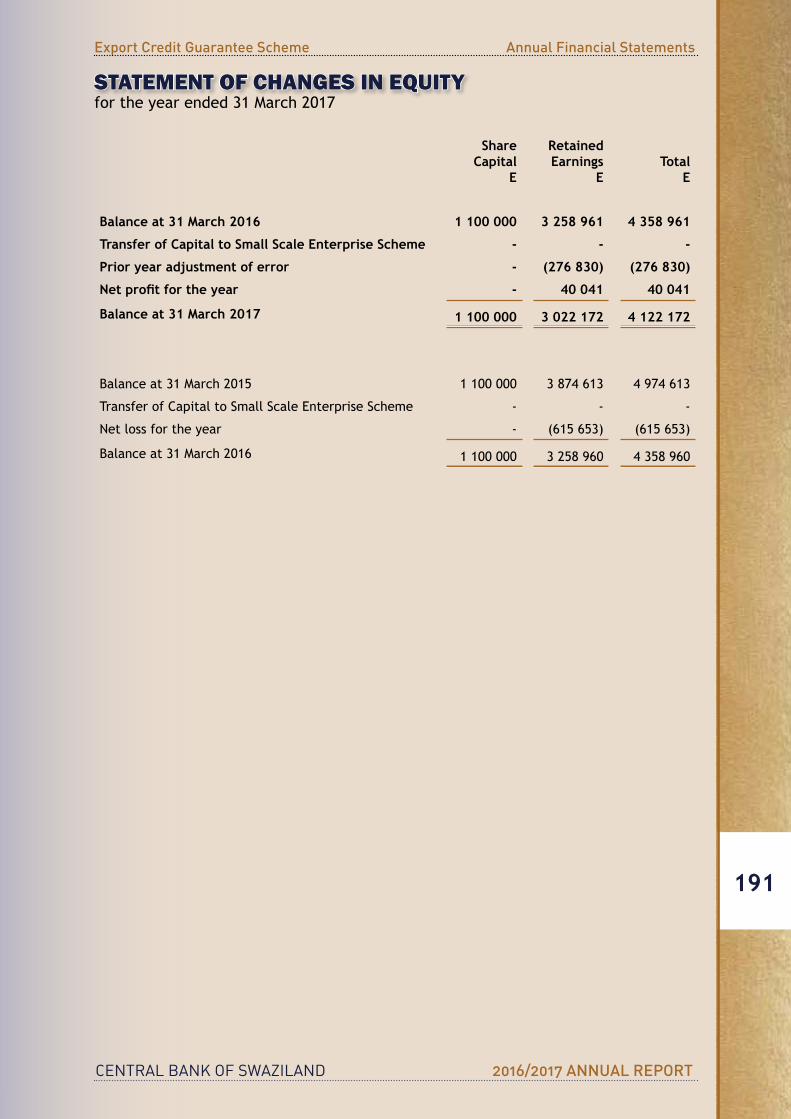
CENTRAL BANK OF SWAZILAND 2016/2017 ANNUAL REPORT
Export Credit Guarantee Scheme Annual Financial Statements
191
STATEMENT OF CHANGES IN EQUITYfor the year ended 31 March 2017
ShareCapital
E
RetainedEarnings
ETotal
E
Balance at 31 March 2016 1 100 000 3 258 961 4 358 961
Transfer of Capital to Small Scale Enterprise Scheme - - -
Prior year adjustment of error - (276 830) (276 830)
Net profit for the year - 40 041 40 041
Balance at 31 March 2017 1 100 000 3 022 172 4 122 172
Balance at 31 March 2015 1 100 000 3 874 613 4 974 613
TransferofCapitaltoSmallScaleEnterpriseScheme - - -
Net loss for the year - (615 653) (615 653)
Balance at 31 March 2016 1 100 000 3 258 960 4 358 960
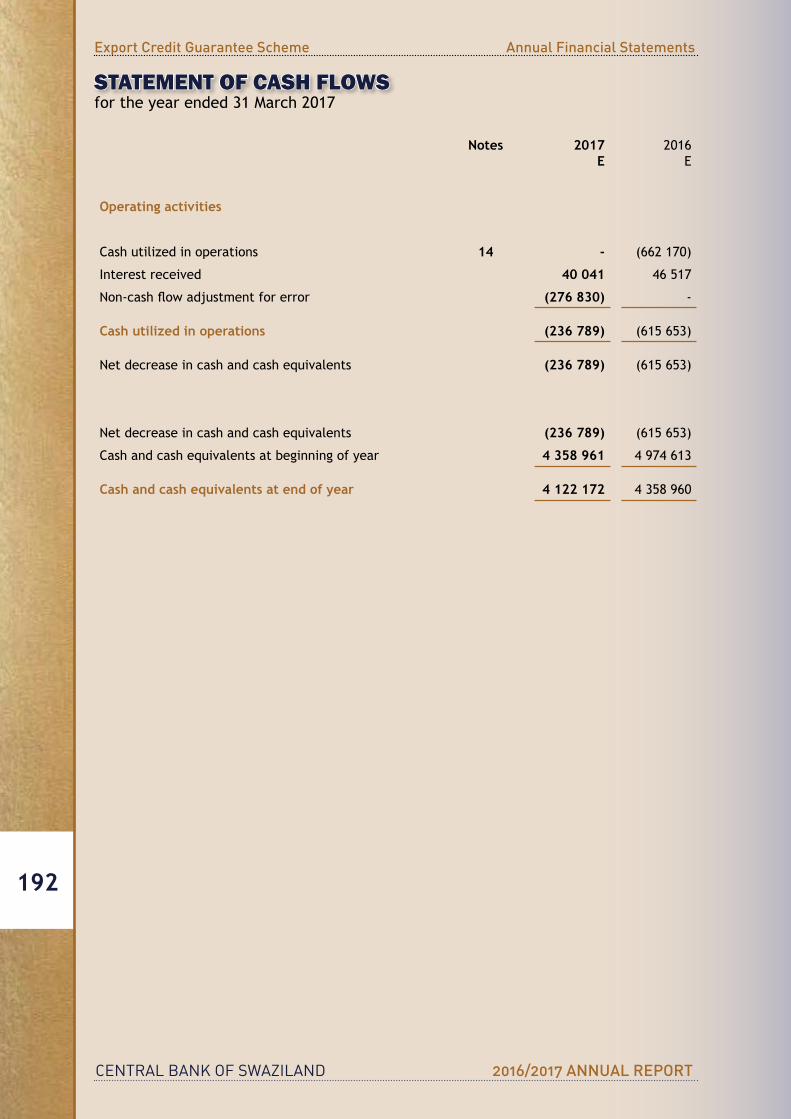
CENTRAL BANK OF SWAZILAND 2016/2017 ANNUAL REPORT
Export Credit Guarantee Scheme Annual Financial Statements
192
STATEMENT OF CASH FLOWSfor the year ended 31 March 2017
Notes 2017E
2016E
Operating activities
Cashutilizedinoperations 14 - (662 170)
Interest received 40 041 46 517
Non-cashflowadjustmentforerror (276 830) -
Cash utilized in operations (236 789) (615 653)
Net decrease in cash and cash equivalents (236 789) (615 653)
Net decrease in cash and cash equivalents (236 789) (615 653)
Cashandcashequivalentsatbeginningofyear 4 358 961 4 974 613
Cash and cash equivalents at end of year 4 122 172 4 358 960
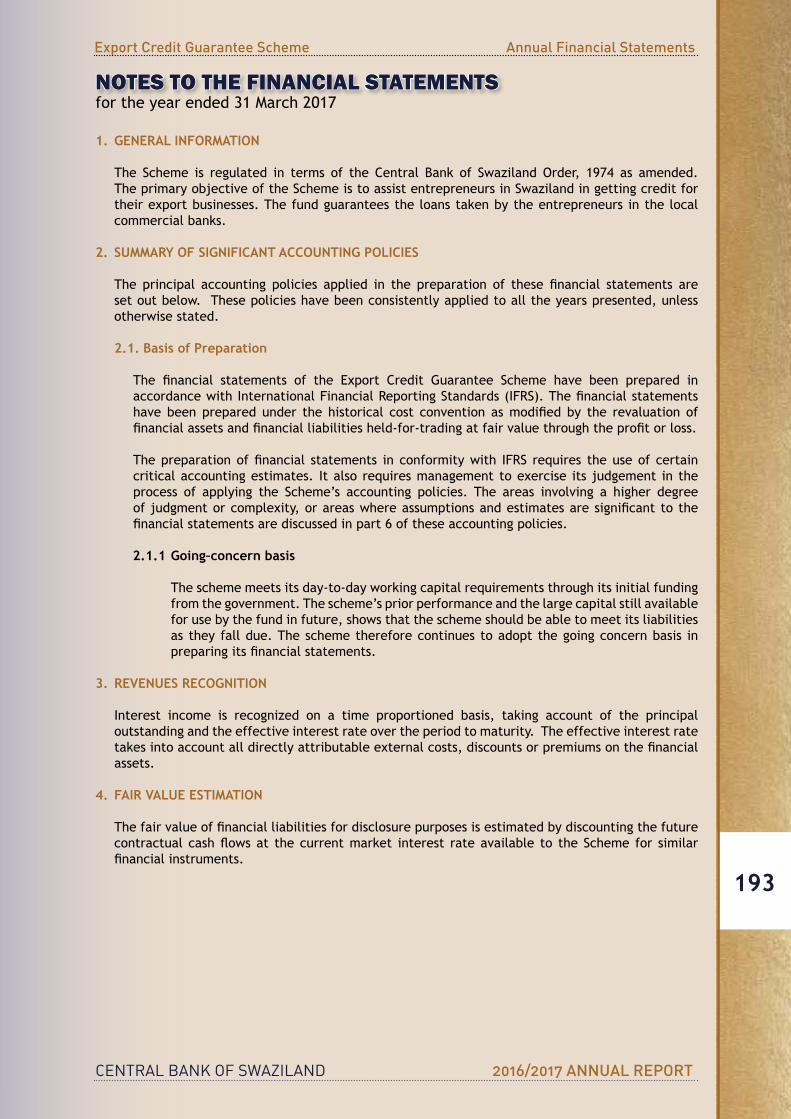
CENTRAL BANK OF SWAZILAND 2016/2017 ANNUAL REPORT
Export Credit Guarantee Scheme Annual Financial Statements
193
NOTES TO THE FINANCIAL STATEMENTSfor the year ended 31 March 2017
1. GENERAL INFORMATION
The Scheme is regulated in terms of the Central Bank of Swaziland Order, 1974 as amended.The primary objective of the Scheme is to assist entrepreneurs in Swaziland in getting credit for their export businesses. The fund guarantees the loans taken by the entrepreneurs in the local commercial banks.
2. SUMMARY OF SIGNIFICANT ACCOUNTING POLICIES
The principal accounting policies applied in the preparation of these financial statements areset out below. These policies have been consistently applied to all the years presented, unless otherwise stated.
2.1. Basis of Preparation
The financial statements of the Export Credit Guarantee Scheme have been prepared inaccordancewithInternationalFinancialReportingStandards(IFRS).Thefinancialstatementshave beenprepared under the historical cost convention asmodifiedby the revaluation offinancialassetsandfinancialliabilitiesheld-for-tradingatfairvaluethroughtheprofitorloss.
Thepreparationoffinancial statements inconformitywith IFRS requires theuseofcertaincritical accounting estimates. It also requires management to exercise its judgement in the process of applying the Scheme’s accounting policies. The areas involving a higher degree ofjudgmentorcomplexity,orareaswhereassumptionsandestimatesaresignificanttothefinancialstatementsarediscussedinpart6oftheseaccountingpolicies.
2.1.1 Going–concern basis
The scheme meets its day-to-day working capital requirements through its initial funding from the government. The scheme’s prior performance and the large capital still available for use by the fund in future, shows that the scheme should be able to meet its liabilities as they fall due. The scheme therefore continues to adopt the going concern basis in preparingitsfinancialstatements.
3. REVENUES RECOGNITION
Interest income is recognized on a time proportioned basis, taking account of the principal outstanding and the effective interest rate over the period to maturity. The effective interest rate takesintoaccountalldirectlyattributableexternalcosts,discountsorpremiumsonthefinancialassets.
4. FAIR VALUE ESTIMATION
Thefairvalueoffinancialliabilitiesfordisclosurepurposesisestimatedbydiscountingthefuturecontractual cashflowsat thecurrentmarket interest rateavailable to theScheme for similarfinancialinstruments.
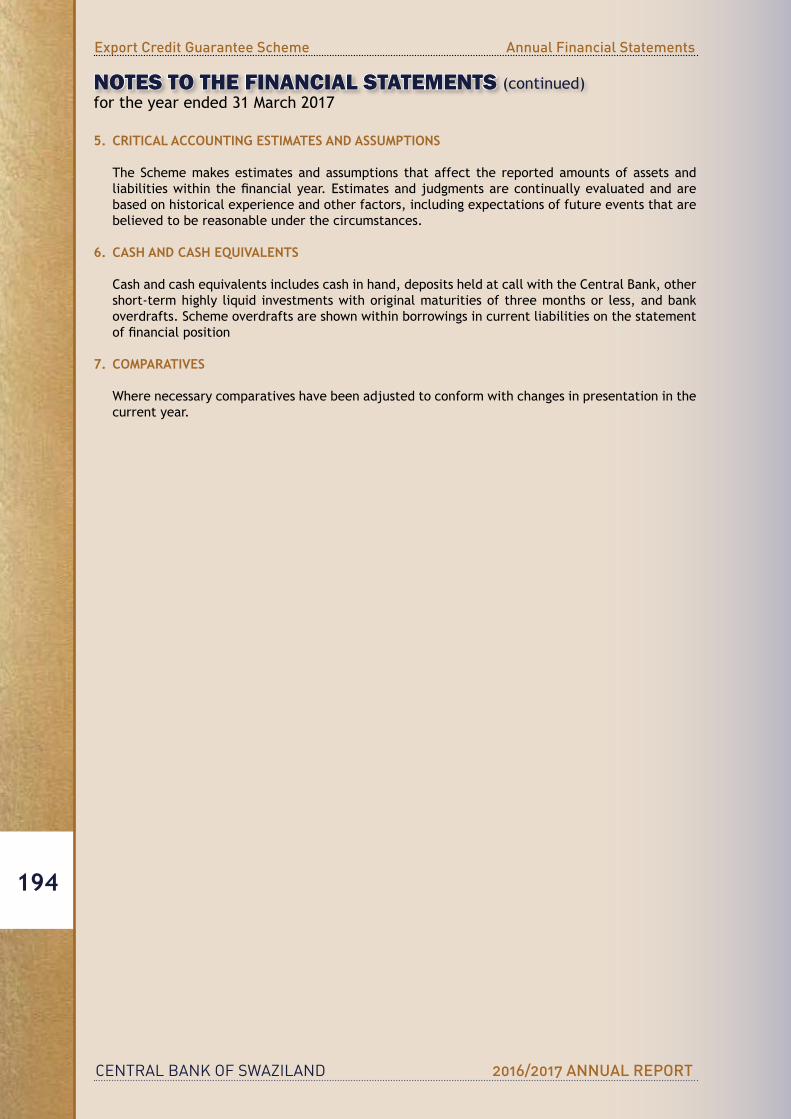
CENTRAL BANK OF SWAZILAND 2016/2017 ANNUAL REPORT
Export Credit Guarantee Scheme Annual Financial Statements
194
NOTES TO THE FINANCIAL STATEMENTS (continued)for the year ended 31 March 2017
5. CRITICAL ACCOUNTING ESTIMATES AND ASSUMPTIONS
The Scheme makes estimates and assumptions that affect the reported amounts of assets and liabilitieswithinthefinancialyear.Estimatesandjudgmentsarecontinuallyevaluatedandarebased on historical experience and other factors, including expectations of future events that are believed to be reasonable under the circumstances.
6. CASH AND CASH EQUIVALENTS
Cashandcashequivalentsincludescashinhand,depositsheldatcallwiththeCentralBank,othershort-term highly liquid investments with original maturities of three months or less, and bank overdrafts. Scheme overdrafts are shown within borrowings in current liabilities on the statement offinancialposition
7. COMPARATIVES
Where necessary comparatives have been adjusted to conform with changes in presentation in the current year.
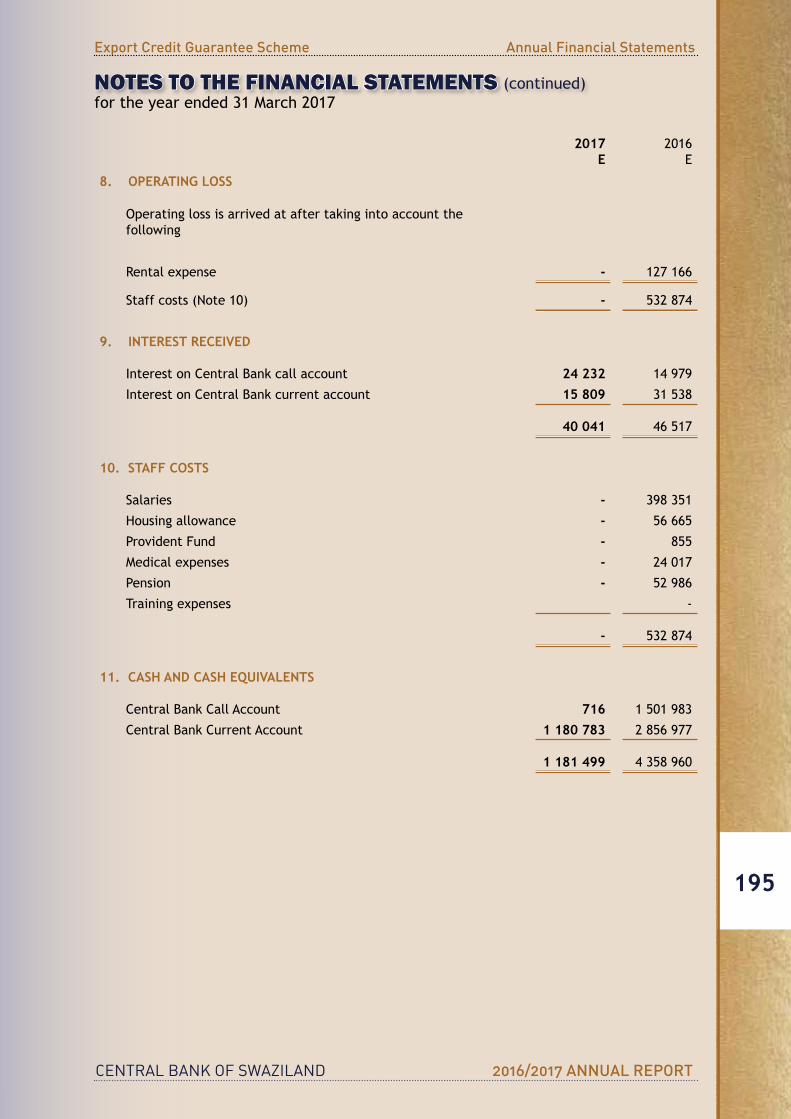
CENTRAL BANK OF SWAZILAND 2016/2017 ANNUAL REPORT
Export Credit Guarantee Scheme Annual Financial Statements
195
NOTES TO THE FINANCIAL STATEMENTS (continued)for the year ended 31 March 2017
2017E
2016E
8. OPERATING LOSS
Operating loss is arrived at after taking into account the following
Rental expense - 127 166
Staff costs (Note 10) - 532 874
9. INTEREST RECEIVED
InterestonCentralBankcallaccount 24 232 14 979
InterestonCentralBankcurrentaccount 15 809 31 538
40 041 46 517
10. STAFF COSTS
Salaries - 398 351
Housing allowance - 56 665
Provident Fund - 855
Medical expenses - 24 017
Pension - 52 986
Training expenses -
- 532 874
11. CASH AND CASH EQUIVALENTS
CentralBankCallAccount 716 1 501 983
CentralBankCurrentAccount 1 180 783 2 856 977
1 181 499 4 358 960
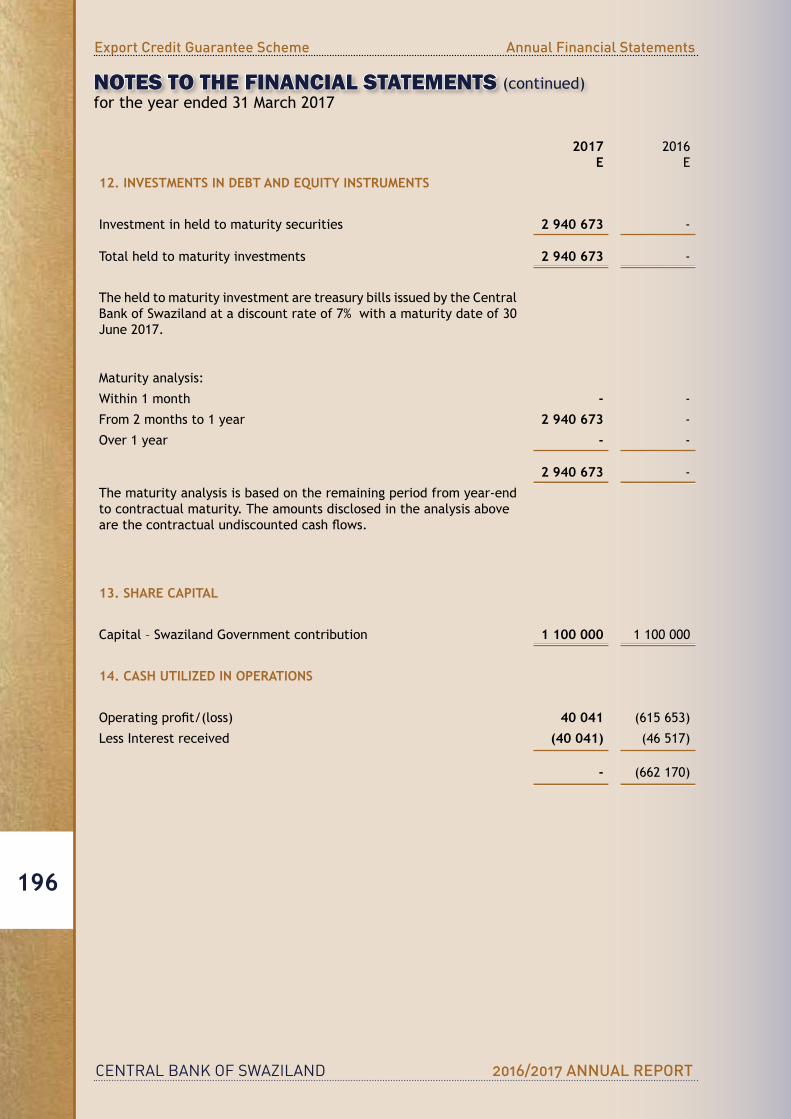
CENTRAL BANK OF SWAZILAND 2016/2017 ANNUAL REPORT
Export Credit Guarantee Scheme Annual Financial Statements
196
NOTES TO THE FINANCIAL STATEMENTS (continued)for the year ended 31 March 2017
2017E
2016E
12. INVESTMENTS IN DEBT AND EQUITY INSTRUMENTS
Investment in held to maturity securities 2 940 673 -
Total held to maturity investments 2 940 673 -
TheheldtomaturityinvestmentaretreasurybillsissuedbytheCentralBank of Swaziland at a discount rate of 7% with a maturity date of 30 June2017.
Maturity analysis:
Within 1 month - -
From 2 months to 1 year 2 940 673 -
Over 1 year - -
2 940 673 -
The maturity analysis is based on the remaining period from year-end to contractual maturity. The amounts disclosed in the analysis above arethecontractualundiscountedcashflows.
13. SHARE CAPITAL
Capital–SwazilandGovernmentcontribution 1 100 000 1 100 000
14. CASH UTILIZED IN OPERATIONS
Operatingprofit/(loss) 40 041 (615 653)
Less Interest received (40 041) (46 517)
- (662 170)
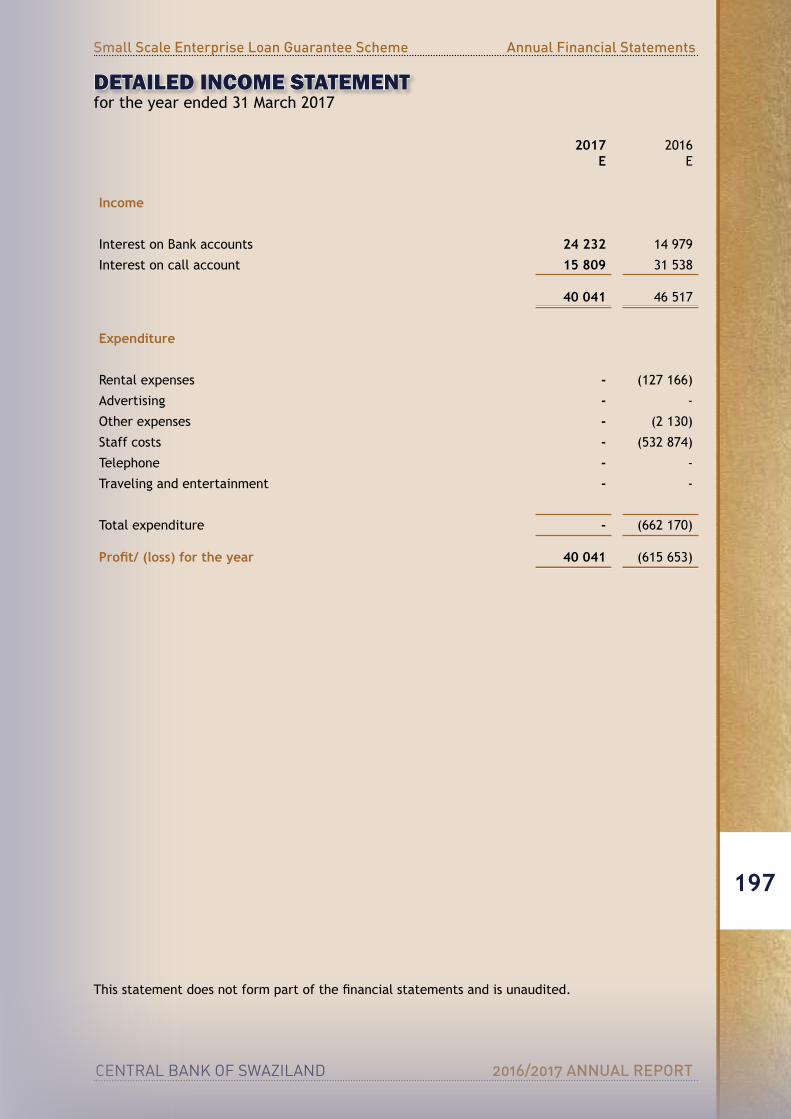
CENTRAL BANK OF SWAZILAND 2016/2017 ANNUAL REPORT
Small Scale Enterprise Loan Guarantee Scheme Annual Financial Statements
197
DETAILED INCOME STATEMENTfor the year ended 31 March 2017
2017E
2016E
Income
Interest on Bank accounts 24 232 14 979
Interest on call account 15 809 31 538
40 041 46 517
Expenditure
Rental expenses - (127 166)
Advertising - -
Other expenses - (2 130)
Staff costs - (532 874)
Telephone - -
Traveling and entertainment - -
Total expenditure - (662 170)
Profit/ (loss) for the year 40 041 (615 653)
Thisstatementdoesnotformpartofthefinancialstatementsandisunaudited.
CENTRAL BANK OF SWAZILAND 2016/2017 ANNUAL REPORT
Small Scale Enterprise Loan Guarantee Scheme Annual Financial Statements
198
SMALL SCALE ENTERPRISE LOAN GUARANTEE SCHEME
FINANCIAL STATEMENTSfor the year ended 31 March 2017
CENTRAL BANK OF SWAZILAND 2016/2017 ANNUAL REPORT
Small Scale Enterprise Loan Guarantee Scheme Annual Financial Statements
199
STATEMENT OF SCHEME ADMINISTRATOR’S RESPONSIBILITYfor the year ended 31 March 2017
The Scheme Administrators are responsible for the preparation, integrity and fair presentation of the financialstatementsoftheSmallScaleEnterpriseLoanGuaranteeScheme.Thefinancialstatementspresented on pages 204 to 216 have been prepared in accordance with International Financial Reporting Standards, and include amounts based on judgment and estimates made by management.
TheSchemeAdministratorsarealsoresponsibleforthescheme’ssystemofinternalfinancialcontrol.These are designed to provide reasonable, but not absolute assurance as to the reliability of the financialstatements,andtoadequatelysafeguard,verifyandmaintainaccountabilityoftheassets,and to prevent and detect misstatement and loss. Nothing has come to the attention of the Scheme Administrators to indicate that any material breakdown in the functioning of these controls, procedures and system has occurred during the year under review.
The going concern basis has been adopted in preparing the financial statements. The SchemeAdministrators have no reason to believe that the scheme will not be a going concern in the foreseeable future based on forecasts and available cash resources. These financial statements support theviability of the scheme.
The financial statements have been audited by the independent accounting firm,PricewaterhouseCoopers,whichwas given unrestricted access to all financial records and relateddata, including minutes of all meetings of the Scheme Administrators. The Scheme Administrators believe that all representations made to the independent auditors during their audit are valid and appropriate.PricewaterhouseCoopers’auditreportispresentedonpage205to206.
TheSchemeAdministratorsconfirmthattheannualfinancialstatementssetoutonpages204to216were approved by the Scheme Administrators and are signed on its behalf by:
GOVERNOR DATE
ASSISTANTGOVERNOR DATE
GENERALMANAGEROPERATIONS DATE
CENTRAL BANK OF SWAZILAND 2016/2017 ANNUAL REPORT
Small Scale Enterprise Loan Guarantee Scheme Annual Financial Statements
200
Our OpinionInouropinion,thefinancialstatementspresentfairly,inallmaterialrespects,thefinancialpositionofSmallScaleEnterpriseLoanGuaranteeScheme(thefund)asat31March2017,anditsfinancialperformance and cash flows for the year then ended in accordance with International FinancialReportingStandardsandinthemannerrequiredbytheCentralBankOrderof1974,asamended.
What we have auditedSmallScaleEnterpriseLoanGuaranteeScheme’sfinancialstatementssetoutonpages204to216comprise:• thestatementoffinancialpositionasat31March2017;• thestatementofcomprehensiveincomefortheyearthenended;• thestatementofchangesinequityfortheyearthenended;• thestatementofcashflowsfortheyearthenended;and• thenotestothefinancialstatements,whichincludeasummaryofsignificantaccountingpolicies.
Basis for OpinionWe conducted our audit in accordance with International Standards on Auditing (ISAs). Our responsibilities under those standards are further described in the Auditor’s responsibilities for the auditofthefinancialstatements section of our report.
Webelievethattheauditevidencewehaveobtainedissufficientandappropriatetoprovideabasisfor our opinion.
IndependenceWe are independent of the Company in accordance with the requirements of the InternationalFederationofAccountants’(IFAC)CodeofEthicsforProfessionalAccountants.WehavefulfilledourethicalresponsibilitiesinaccordancewiththeIFACCode.
Other InformationThe Scheme Administrators are responsible for the other information. The other information comprises theSchemeAdministrators’ReportasrequiredbytheCentralBankOrderof1974,asamendedandthestatementofschemeadministrators’responsibility.Otherinformationdoesnotincludethefinancialstatements and our auditor’s report thereon.
Ouropiniononthefinancialstatementsdoesnotcovertheotherinformationandwedonotandwillnot express an audit opinion or any form of assurance conclusion thereon.
In connection with our audit of the financial statements, our responsibility is to read the otherinformationidentifiedaboveand,indoingso,considerwhethertheotherinformationismateriallyinconsistent with the financial statements or our knowledge obtained in the audit, or otherwiseappears to be materially misstated.
If, based on the work we have performed, we conclude that there is a material misstatement of this other information, we are required to report that fact. We have nothing to report in this regard.
ResponsibilitiesoftheSchemeAdministratorsforthefinancialstatementsTheSchemeAdministratorsareresponsibleforthepreparationandfairpresentationofthefinancialstatements in accordance with International Financial Reporting Standards and the requirements of theCentralBankOrderof1974,asamendedandforsuchinternalcontrolastheSchemeAdministratorsdetermineisnecessarytoenablethepreparationoffinancialstatementsthatarefreefrommaterialmisstatement, whether due to fraud or error.
INDEPENDENT AUDITOR’S REPORTTotheMinisterofCommerce,IndustryandTrade
CENTRAL BANK OF SWAZILAND 2016/2017 ANNUAL REPORT
Small Scale Enterprise Loan Guarantee Scheme Annual Financial Statements
201
INDEPENDENT AUDITOR’S REPORTTotheMinisterofCommerce,IndustryandTrade
Inpreparingthefinancialstatements,theSchemeAdministratorsareresponsibleforassessingthefund’s ability to continue as a going concern, disclosing, as applicable, matters related to going concern and using the going concern basis of accounting unless the Scheme Administrators either intend to liquidate the fund or to cease operations, or have no realistic alternative but to do so.
Auditor’sresponsibilitiesfortheauditofthefinancialstatementsOurobjectivesaretoobtainreasonableassuranceaboutwhetherthefinancialstatementsasawholeare free from material misstatement, whether due to fraud or error, and to issue an auditor’s report that includes our opinion. Reasonable assurance is a high level of assurance, but is not a guarantee that an audit conducted in accordance with ISAs will always detect a material misstatement when it exists. Misstatements can arise from fraud or error and are considered material if, individually or in theaggregate,theycouldreasonablybeexpectedtoinfluencetheeconomicdecisionsofuserstakenonthebasisofthesefinancialstatements.
As part of an audit in accordance with ISAs, we exercise professional judgement and maintain professional scepticism throughout the audit. We also:• Identifyandassesstherisksofmaterialmisstatementofthefinancialstatements,whetherdue
to fraud or error, design and perform audit procedures responsive to those risks, and obtain audit evidence that is sufficient and appropriate to provide a basis for our opinion.The risk of notdetecting a material misstatement resulting from fraud is higher than for one resulting from error, as fraud may involve collusion, forgery, intentional omissions, misrepresentations, or the override of internal control.
• Obtainanunderstandingofinternalcontrolrelevanttotheauditinordertodesignauditproceduresthat are appropriate in the circumstances, but not for the purpose of expressing an opinion on the effectiveness of the fund’s internal control.
• Evaluatetheappropriatenessofaccountingpoliciesusedandthereasonablenessofaccountingestimates and related disclosures made by the Scheme Administrators.
• Concludeontheappropriatenessof theSchemeAdministrators’useof thegoingconcernbasisof accounting and, based on the audit evidence obtained, whether a material uncertainty exists relatedtoeventsorconditionsthatmaycastsignificantdoubtonthefund’sabilitytocontinueas a going concern. If we conclude that a material uncertainty exists, we are required to draw attentioninourauditor’sreporttotherelateddisclosuresinthefinancialstatementsor,ifsuchdisclosures are inadequate, to modify our opinion. Our conclusions are based on the audit evidence obtained up to the date of our auditor’s report. However, future events or conditions may cause the fund to cease to continue as a going concern.
• Evaluate theoverallpresentation, structureandcontentof thefinancial statements, includingthedisclosures,andwhetherthefinancialstatementsrepresenttheunderlyingtransactionsandevents in a manner that achieves fair presentation.
We communicate with the Scheme Administrators regarding, among other matters, the planned scope andtimingoftheauditandsignificantauditfindings,includinganysignificantdeficienciesininternalcontrol that we identify during our audit.
PricewaterhouseCoopersPartner: Theo MasonCharteredAccountant(Swaziland)P.O Box 569 MbabaneDate:
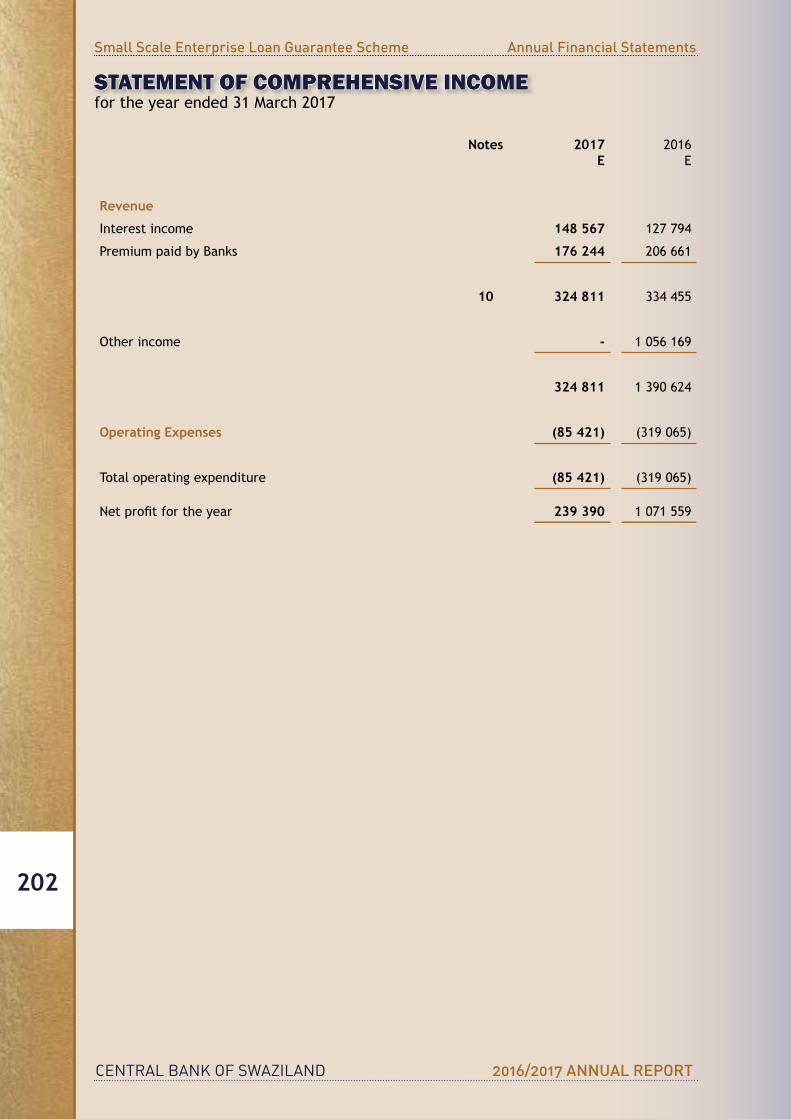
CENTRAL BANK OF SWAZILAND 2016/2017 ANNUAL REPORT
Small Scale Enterprise Loan Guarantee Scheme Annual Financial Statements
202
Notes 2017E
2016E
Revenue
Interest income 148 567 127 794
Premium paid by Banks 176 244 206 661
10 324 811 334 455
Other income - 1 056 169
324 811 1 390 624
Operating Expenses (85 421) (319 065)
Total operating expenditure (85 421) (319 065)
Netprofitfortheyear 239 390 1 071 559
STATEMENT OF COMPREHENSIVE INCOMEfor the year ended 31 March 2017
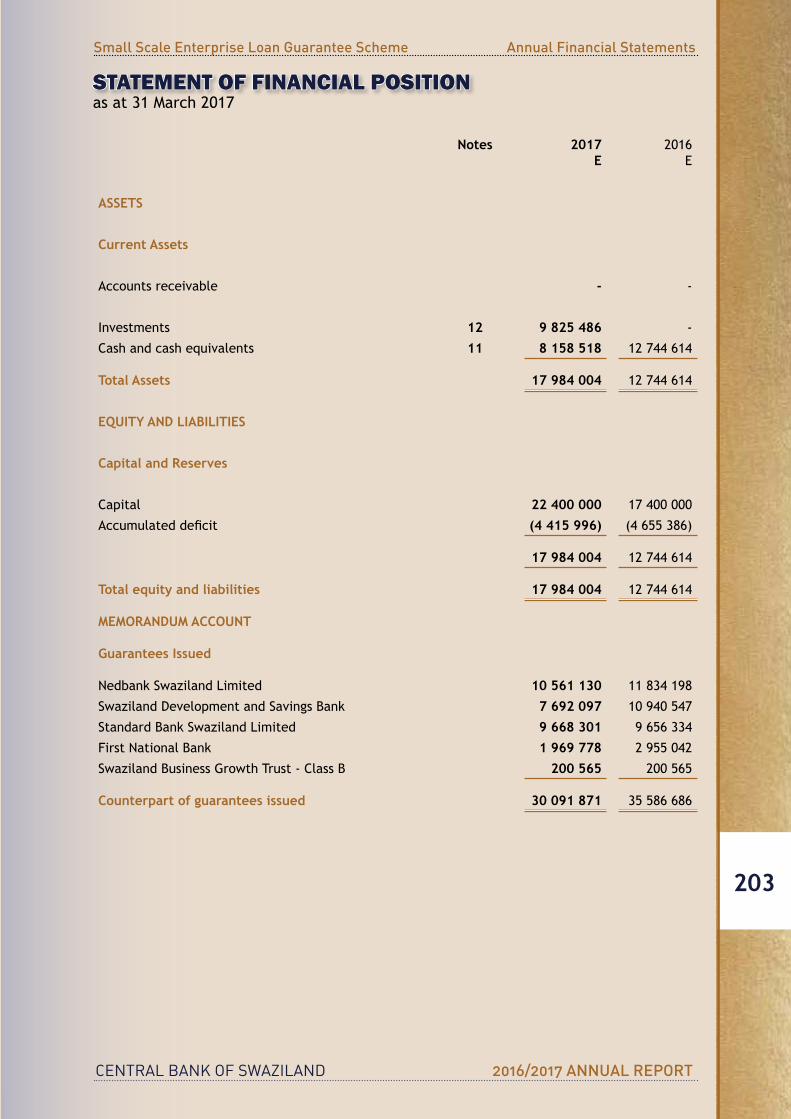
CENTRAL BANK OF SWAZILAND 2016/2017 ANNUAL REPORT
Small Scale Enterprise Loan Guarantee Scheme Annual Financial Statements
203
Notes 2017E
2016E
ASSETS
Current Assets
Accounts receivable - -
Investments 12 9 825 486 -
Cashandcashequivalents 11 8 158 518 12 744 614
Total Assets 17 984 004 12 744 614
EQUITY AND LIABILITIES
Capital and Reserves
Capital 22 400 000 17 400 000
Accumulateddeficit (4 415 996) (4 655 386)
17 984 004 12 744 614
Total equity and liabilities 17 984 004 12 744 614
MEMORANDUM ACCOUNT
Guarantees Issued
Nedbank Swaziland Limited 10 561 130 11 834 198
SwazilandDevelopmentandSavingsBank 7 692 097 10 940 547
Standard Bank Swaziland Limited 9 668 301 9 656 334
First National Bank 1 969 778 2 955 042
SwazilandBusinessGrowthTrust-ClassB 200 565 200 565
Counterpart of guarantees issued 30 091 871 35 586 686
STATEMENT OF FINANCIAL POSITIONas at 31 March 2017
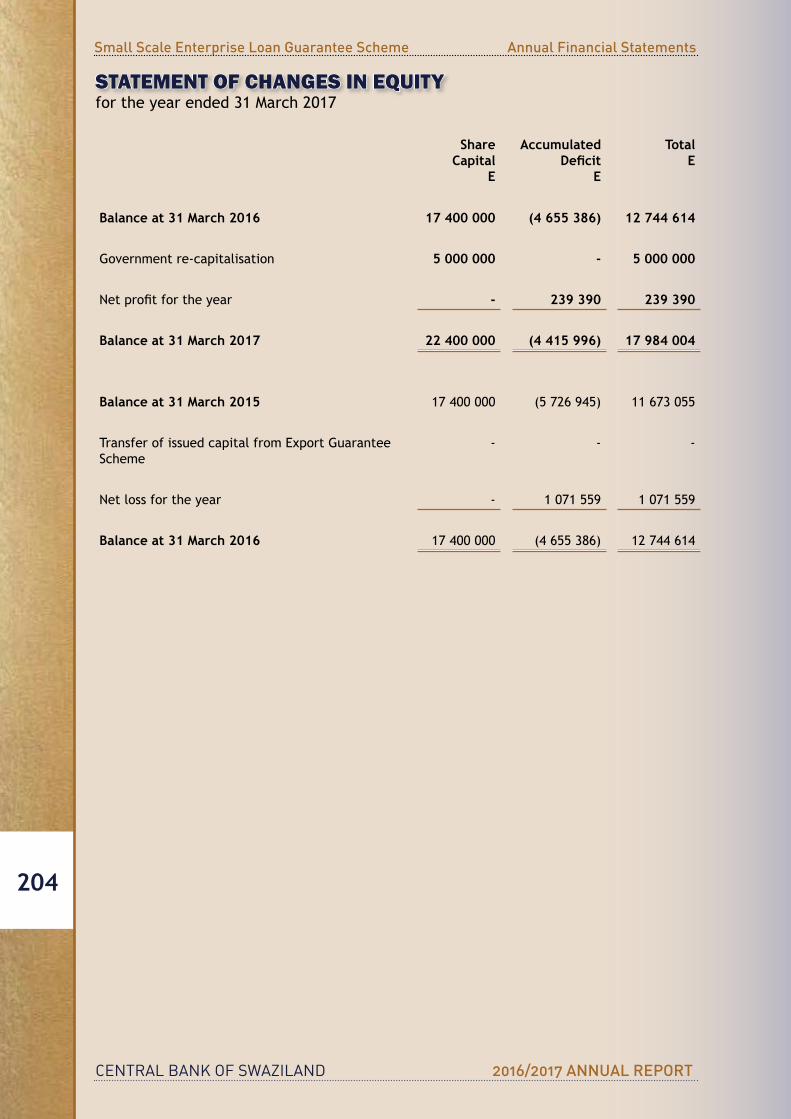
CENTRAL BANK OF SWAZILAND 2016/2017 ANNUAL REPORT
Small Scale Enterprise Loan Guarantee Scheme Annual Financial Statements
204
Share Capital
E
AccumulatedDeficit
E
TotalE
Balance at 31 March 2016 17 400 000 (4 655 386) 12 744 614
Government re-capitalisation 5 000 000 - 5 000 000
Netprofitfortheyear - 239 390 239 390
Balance at 31 March 2017 22 400 000 (4 415 996) 17 984 004
Balance at 31 March 2015 17 400 000 (5 726 945) 11 673 055
TransferofissuedcapitalfromExportGuaranteeScheme
- - -
Net loss for the year - 1 071 559 1 071 559
Balance at 31 March 2016 17 400 000 (4 655 386) 12 744 614
STATEMENT OF CHANGES IN EQUITYfor the year ended 31 March 2017
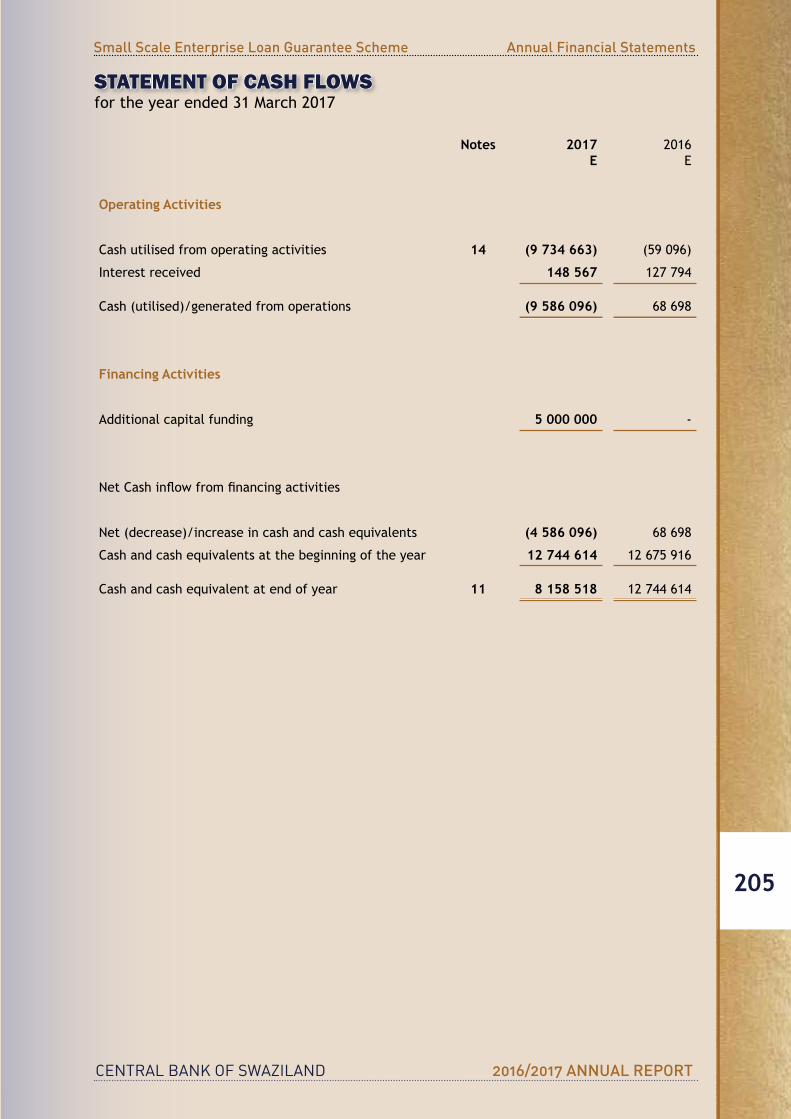
CENTRAL BANK OF SWAZILAND 2016/2017 ANNUAL REPORT
Small Scale Enterprise Loan Guarantee Scheme Annual Financial Statements
205
Notes 2017 E
2016E
Operating Activities
Cashutilisedfromoperatingactivities 14 (9 734 663) (59 096)
Interest received 148 567 127 794
Cash(utilised)/generatedfromoperations (9 586 096) 68 698
Financing Activities
Additional capital funding 5 000 000 -
NetCashinflowfromfinancingactivities
Net (decrease)/increase in cash and cash equivalents (4 586 096) 68 698
Cashandcashequivalentsatthebeginningoftheyear 12 744 614 12 675 916
Cashandcashequivalentatendofyear 11 8 158 518 12 744 614
STATEMENT OF CASH FLOWS for the year ended 31 March 2017

CENTRAL BANK OF SWAZILAND 2016/2017 ANNUAL REPORT
Small Scale Enterprise Loan Guarantee Scheme Annual Financial Statements
206
1. GENERAL INFORMATION
TheSchemeisregulatedintermsoftheCentralBankofSwazilandOrder,1974,asamendedTheprimary objective of the Scheme is to assist small scale entrepreneurs in Swaziland in getting credit for their businesses. The Bank guarantees the loans taken by the entrepreneurs from the local commercial banks.
2. SUMMARY OF SIGNIFICANT ACCOUNTING POLICIES
Theprincipalaccountingpoliciesapplied in thepreparationof thesefinancial statementsareset out below. These policies have been consistently applied to all the years presented, unless otherwise stated.
2.1 Basis of Preparation
ThefinancialstatementsoftheSmallScaleEnterpriseLoanSchemehavebeenpreparedinaccordancewithInternationalFinancialReportingStandards(IFRS).Thefinancialstatementshavebeenpreparedunderthehistoricalcostconventionasmodifiedbytherevaluationoffinancialassetsandfinancial liabilitiesheld-for-tradingat fair value through theprofitorloss.
ThepreparationoffinancialstatementsinconformitywithIFRSrequirestheuseofcertaincritical accounting estimates. It also requires management to exercise its judgement in the process of applying the Scheme’s accounting policies. The areas involving a higher degree ofjudgmentorcomplexity,orareaswhereassumptionsandestimatesaresignificanttothefinancialstatementsarediscussedinpart7oftheseaccountingpolicies.
2.1.1 Going–concern Basis The scheme meets its day-to-day working capital requirements through its funding
from the government. The scheme’s prior performance and the large capital still available for use by the fund in future, shows that the scheme should be able operate within the level of its current facilities. After making enquiries, the scheme administrator has a reasonable expectation that the scheme has adequate resources to continue in operational existence for the foreseeable future. The scheme therefore continuestoadoptthegoingconcernbasisinpreparingitsfinancialstatements.
2.1.2 Changes in accounting policy and disclosures
(a) New and amended standards adopted by the scheme
TherearenoIFRSorIFRICinterpretationsthatareeffectiveforthefirsttimeforthefinancialyearbeginningonorafter1April2016thatwouldbeexpectedtohaveamaterial impact on the scheme.
(b) New standards, amendments and interpretations issued but not effective for the financialyearbeginning1April2016andnotearlyadopted
IFRS9,‘Financialinstruments’,addressestheclassification,measurementandrecognitionoffinancialassetsandfinancialliabilities.IFRS9wasissuedinNovember2009andOctober2010.ItreplacesthepartsofIAS39thatrelatetotheclassificationandmeasurementoffinancialinstruments.
NOTES TO THE FINANCIAL STATEMENTSfor the year ended 31 March 2017
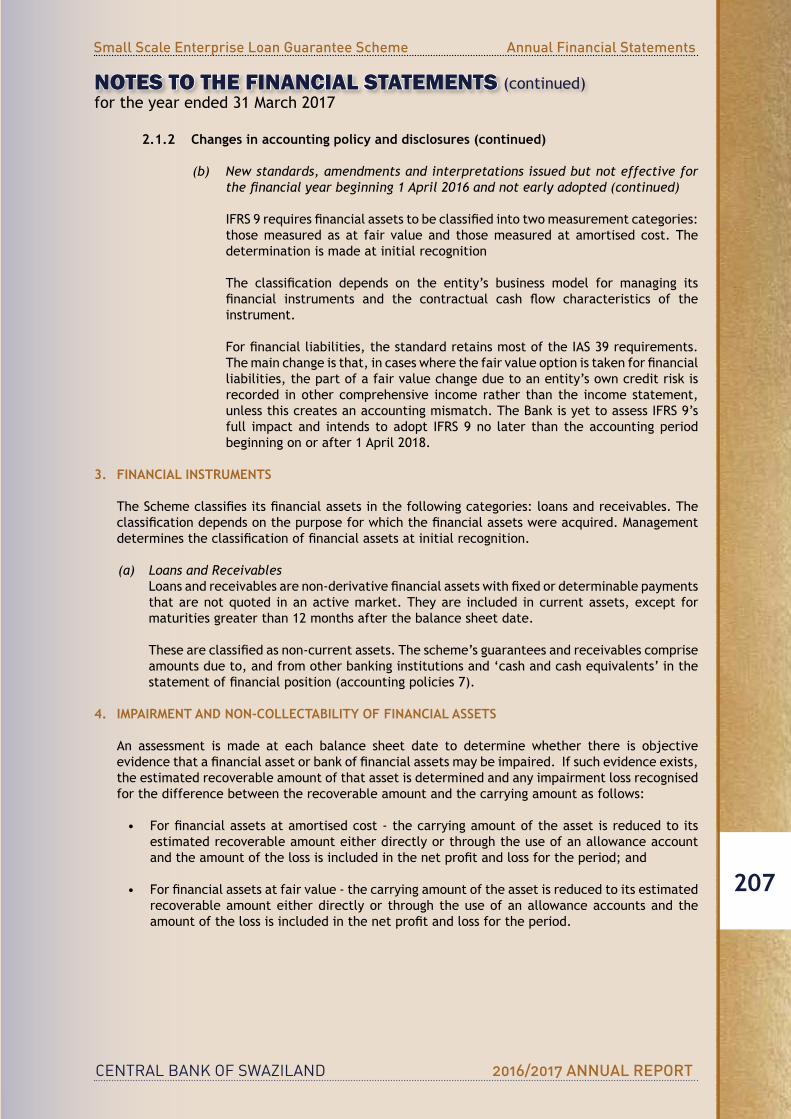
CENTRAL BANK OF SWAZILAND 2016/2017 ANNUAL REPORT
Small Scale Enterprise Loan Guarantee Scheme Annual Financial Statements
207
2.1.2 Changes in accounting policy and disclosures (continued)
(b) New standards, amendments and interpretations issued but not effective for thefinancialyearbeginning1April2016andnotearlyadopted(continued)
IFRS9requiresfinancialassetstobeclassifiedintotwomeasurementcategories:those measured as at fair value and those measured at amortised cost. The determination is made at initial recognition
The classification depends on the entity’s business model for managing itsfinancial instruments and the contractual cash flow characteristics of theinstrument.
Forfinancialliabilities,thestandardretainsmostoftheIAS39requirements.Themainchangeisthat,incaseswherethefairvalueoptionistakenforfinancialliabilities, the part of a fair value change due to an entity’s own credit risk is recorded in other comprehensive income rather than the income statement, unless this creates an accounting mismatch. The Bank is yet to assess IFRS 9’s full impact and intends to adopt IFRS 9 no later than the accounting period beginning on or after 1 April 2018.
3. FINANCIAL INSTRUMENTS
TheSchemeclassifiesitsfinancialassetsinthefollowingcategories:loansandreceivables.Theclassificationdependsonthepurposeforwhichthefinancialassetswereacquired.Managementdeterminestheclassificationoffinancialassetsatinitialrecognition.
(a) Loans and Receivables Loansandreceivablesarenon-derivativefinancialassetswithfixedordeterminablepayments
that are not quoted in an active market. They are included in current assets, except for maturities greater than 12 months after the balance sheet date.
Theseareclassifiedasnon-currentassets.Thescheme’sguaranteesandreceivablescompriseamounts due to, and from other banking institutions and ‘cash and cash equivalents’ in the statementoffinancialposition(accountingpolicies7).
4. IMPAIRMENT AND NON-COLLECTABILITY OF FINANCIAL ASSETS
An assessment is made at each balance sheet date to determine whether there is objective evidencethatafinancialassetorbankoffinancialassetsmaybeimpaired.Ifsuchevidenceexists,the estimated recoverable amount of that asset is determined and any impairment loss recognised for the difference between the recoverable amount and the carrying amount as follows:
• Forfinancialassetsatamortisedcost-thecarryingamountoftheassetisreducedtoits
estimated recoverable amount either directly or through the use of an allowance account andtheamountofthelossisincludedinthenetprofitandlossfortheperiod;and
• Forfinancialassetsatfairvalue-thecarryingamountoftheassetisreducedtoitsestimatedrecoverable amount either directly or through the use of an allowance accounts and the amountofthelossisincludedinthenetprofitandlossfortheperiod.
NOTES TO THE FINANCIAL STATEMENTS (continued)for the year ended 31 March 2017
CENTRAL BANK OF SWAZILAND 2016/2017 ANNUAL REPORT
Small Scale Enterprise Loan Guarantee Scheme Annual Financial Statements
208
5. PROVISIONS
Provisions are recognised when the Scheme has a present legal or constructive obligation as a resultofpastevents;itismorelikelythannotthatanoutflowofresourceswillberequiredtosettle the obligation; and the amount has been reliably estimated.
Restructuring provisions comprise lease termination penalties and employee termination payments. Provisions are not recognised for future operating losses.
Wherethereareanumberofsimilarobligations,thelikelihoodthatanoutflowwillberequiredin settlement is determined by considering the class of obligations as a whole. A provision is recognisedevenifthelikelihoodofanoutflowwithrespecttooneitemincludedintheclassmaybe small.
Provisions are measured at the present value of the expenditures expected to be required to settletheobligationusingapre-taxratethatreflectscurrentmarketassessmentsofthetimevalueofmoneyandtherisksspecifictotheobligation.Theincreaseintheprovisionduetothepassage of time is recognised as an interest expense.
6. REVENUES RECOGNITION
Interest income is recognized on a time proportioned basis, taking account of the principal outstanding and the effective interest rate over the period to maturity. The effective interest rate takes into account all directly attributable external costs, discounts or premiums on the financialassets.
7. CASH AND CASH EQUIVALENTS
Cashandcashequivalentsincludescashinhand,depositsheldatcallwithCentralBank,othershort-term highly liquid investments with original maturities of three months or less, and bank overdrafts. Bank overdrafts are shown within borrowings in current liabilities on the statement of financialposition.
8. COMPARATIVES
Where necessary comparatives have been adjusted to conform with changes in presentation in the current year.
NOTES TO THE FINANCIAL STATEMENTS (continued)for the year ended 31 March 2017

CENTRAL BANK OF SWAZILAND 2016/2017 ANNUAL REPORT
Small Scale Enterprise Loan Guarantee Scheme Annual Financial Statements
209
2017E
2016E
9. OPERATING LOSSThe following items have been taken into account in arriving at the operating loss for the year.
Loss on guarantee claims 85 421 319 065
10. REVENUEInterest received 148 567 127 794
Premium paid by Banks 176 244 206 661
324 811 334 455
11. CASH AND CASH EQUIVALENTSCentralBankCallAccount 3 590 1 120 280
CentralBankCurrentAccount 8 154 928 11 624 334
8 158 518 12 744 614
12. INVESTMENTS IN DEBT AND EQUITY INSTRUMENTSInvestment in held to maturity securities 9 825 486 -
Total held to maturity investments 9 825 486 -
The held to maturity investment are treasury bills issued by the CentralBankofSwazilandatadiscountrateof7.932%withamaturitydateof30June2017.
Maturity analysis:
Within 1 month - -
From 2 months to 1 year 9 825 486 -
Over 1 year - -
9 825 486 -
The maturity analysis is based on the remaining period from year-end to contractual maturity. The amounts disclosed in the analysisabovearethecontractualundiscountedcashflows.
13. ACCOUNTS PAYABLEPROVISIONS FOR DOUBTFUL GUARANTEES:Opening balance - 1 002 860
Additional provision for the year 1 224 53 309
Utilised (1 224) (1 056 169)
Closingbalance - -
NOTES TO THE FINANCIAL STATEMENTS (continued)for the year ended 31 March 2017
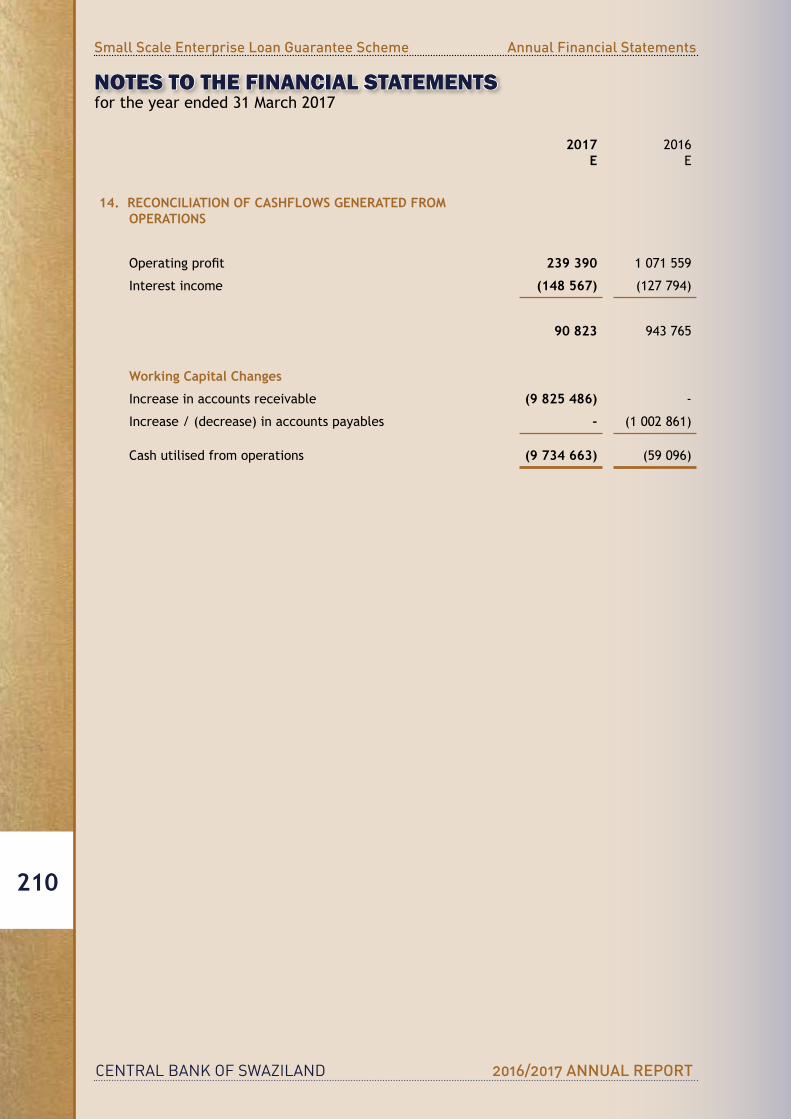
CENTRAL BANK OF SWAZILAND 2016/2017 ANNUAL REPORT
Small Scale Enterprise Loan Guarantee Scheme Annual Financial Statements
210
NOTES TO THE FINANCIAL STATEMENTS for the year ended 31 March 2017
2017E
2016E
14. RECONCILIATION OF CASHFLOWS GENERATED FROM OPERATIONS
Operatingprofit 239 390 1 071 559
Interest income (148 567) (127 794)
90 823 943 765
Working Capital Changes
Increase in accounts receivable (9 825 486) -
Increase / (decrease) in accounts payables - (1 002 861)
Cashutilisedfromoperations (9 734 663) (59 096)
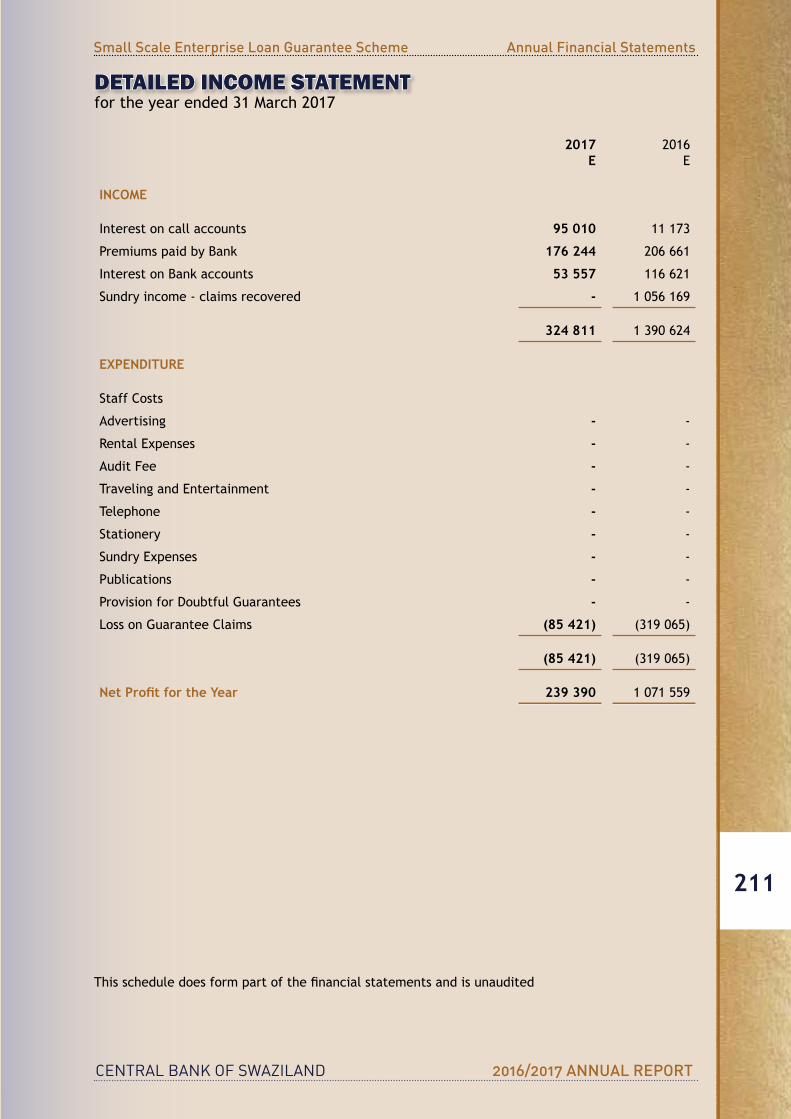
CENTRAL BANK OF SWAZILAND 2016/2017 ANNUAL REPORT
Small Scale Enterprise Loan Guarantee Scheme Annual Financial Statements
211
DETAILED INCOME STATEMENTfor the year ended 31 March 2017
2017E
2016E
INCOME
Interest on call accounts 95 010 11 173
Premiums paid by Bank 176 244 206 661
Interest on Bank accounts 53 557 116 621
Sundry income - claims recovered - 1 056 169
324 811 1 390 624
EXPENDITURE
StaffCosts
Advertising - -
RentalExpenses - -
Audit Fee - -
TravelingandEntertainment - -
Telephone - -
Stationery - -
SundryExpenses - -
Publications - -
ProvisionforDoubtfulGuarantees - -
LossonGuaranteeClaims (85 421) (319 065)
(85 421) (319 065)
Net Profit for the Year 239 390 1 071 559
Thisscheduledoesformpartofthefinancialstatementsandisunaudited

CENTRAL BANK OF SWAZILAND 2016/2017 ANNUAL REPORT
Small Scale Enterprise Loan Guarantee Scheme Annual Financial Statements
212
CENTRAL BANK OF SWAZILAND 2016/2017 ANNUAL REPORT
212
NOTES

CENTRAL BANK OF SWAZILAND 2016/2017 ANNUAL REPORT
Small Scale Enterprise Loan Guarantee Scheme Annual Financial Statements
213
CENTRAL BANK OF SWAZILAND 2016/2017 ANNUAL REPORT
Small Scale Enterprise Loan Guarantee Scheme Annual Financial Statements
214
Central Bank of Swaziland
Postal Address: P .O .Box 546, MbabanePhysical Address: Umntsholi Building, Mahlokohla Street, Mbabane
Phone: (+268) 2408 2244E-mail: [email protected]
For enquires, contactEconomic Policy
Research and Statistics
UMNTSHOLI WEMASWATI