
Report-June 2004 - Central Bank of Kenya
79
FOREWORD Ensuring the liquidity, solvency and proper functioning of a stable market based financial system is one of the two principal objectives of the Central Bank of Kenya. The Financial Institutions Supervision Department carries out the Central Bank’s responsibility for the soundness and stability of the financial system by undertaking the supervision of banks, non-bank financial institutions, building societies and foreign exchange bureaus. In line with its core responsibility, the Department, during the year proposed various amendments to the Banking Act and revised a number of Prudential Regulations as a cogent basis for ensuring and sustaining the stability and soundness of the Kenyan financial sector. Similarly, in tandem with global supervisory focus, the Department’s effort was directed towards the implementation of Risk Based Supervision (RBS). The RBS approach emphasises on the understanding and assessing of the adequacy of each institution’s risk management system. It is a proactive supervisory approach that focuses on risk mitigation, rather than risk avoidance. As a prelude to the implementation of Risk Based Supervision, the Department conducted a survey to establish the Risk Management practices and processes in the Kenyan Banking sector. In pursuit of its role, the Department will continue to place emphasis on compliance with the requirements of the Banking Act and Prudential Regulations. In particular, attention will be directed towards strengthening corporate governance practices in the banking sector, both at the board of directors and shareholders level, as well as improvement in Risk Management practices of the financial institutions. Also, in conjunction with other government agencies, the Department will endeavour to formulate relevant legislations and regulations to combat money laundering and terrorist financing such that the Kenyan financial system shall not serve as a conduit for these international criminal vices. Foreword
-
Upload
khangminh22 -
Category
Documents
-
view
3 -
download
0
Transcript of Report-June 2004 - Central Bank of Kenya
FOREWORD
Ensuring the liquidity, solvency and proper functioning of a stable market based
financial system is one of the two principal objectives of the Central Bank of
Kenya. The Financial Institutions Supervision Department carries out the Central
Bank’s responsibility for the soundness and stability of the financial system by
undertaking the supervision of banks, non-bank financial institutions, building societies
and foreign exchange bureaus.
In line with its core responsibility, the Department, during the year proposed
various amendments to the Banking Act and revised a number of Prudential
Regulations as a cogent basis for ensuring and sustaining the stability and soundness
of the Kenyan financial sector. Similarly, in tandem with global supervisory focus,
the Department’s effort was directed towards the implementation of Risk Based
Supervision (RBS). The RBS approach emphasises on the understanding and
assessing of the adequacy of each institution’s risk management system. It is a
proactive supervisory approach that focuses on risk mitigation, rather than risk
avoidance. As a prelude to the implementation of Risk Based Supervision, the
Department conducted a survey to establish the Risk Management practices and
processes in the Kenyan Banking sector.
In pursuit of its role, the Department will continue to place emphasis on compliance
with the requirements of the Banking Act and Prudential Regulations. In particular,
attention will be directed towards strengthening corporate governance practices
in the banking sector, both at the board of directors and shareholders level, as
well as improvement in Risk Management practices of the financial institutions.
Also, in conjunction with other government agencies, the Department will
endeavour to formulate relevant legislations and regulations to combat money
laundering and terrorist financing such that the Kenyan financial system shall not
serve as a conduit for these international criminal vices.
Foreword
Table of Contents
Page
Foreword i
Chapter 1
Developments in the Banking Industry
1.1 Overview 1
1.2 Structure of the Banking Sector 1
1.3 Foreign Exchange Bureaus 2
1.4 Information Communications Technology (ICT) 3
1.5 Customer Service Trends 4
1.6 Employment and Training in the Banking Industry 5
1.7 Supervisory Enforcement Action 6
1.8 Highlights of Amendments to Banking Legislation 7
1.9 Outlook 8
Chapter 2
Banking Sector performance and macro-economic developments
2.1 Overview 10
2.2 Macro-economic Conditions during 2004 10
2.3 Balance sheet analysis 11
2.4 Profitability 17
2.5 Market Share 20
2.6 Year End Performance Rating 21
Chapter 3
Developments in Regulatory Framework
3.1 Overview 22
3.2 Amendments to Legislation 22
Table of Contents
3.3 Revision of Prudential Regulation 25
3.4 Legal framework for Anti-Money Laundering and Combating 26
Financing of Terrorism
3.5 Micro Finance Bill 28
Chapter 4
Current Supervisory Issues
4.1 Overview 30
4.2 Risk Based Supervision (RBS) 30
4.3 International Financial Reporting Standards (IFRS) 32
4.4 Corporate Governance in the Banking Sector 33
4.5 International Covergence of Capital Measurement and 34
Capital Standards
4.6 Anti-Money Laundering (AML) and Combating Financing 35
of Terrorism (CFT) initiatives in Kenya
4.7 Banking Sector Reforms: Financial and Legal Sector Technical 37
Assistance Project (FLSTAP) and Financial Sector Reform
Credit (FSRC)
4.8 International and regional supervisory initiatives 38
4.9 Deployment of the Bank Supervision Application (BSA) System 40
Tables
1.1 Regional Distribution of Financial Institutions Branch Network 2
1.2 Distribution of Foreign Exchange Bureaus 3
1.3 Employment in the Banking Industry 5
1.4 Progress on compliance 6
1.5 Trend of Non-Compliance 7
2.1 Balance Sheet Analysis 13
2.2 Asset Quality 16
2.3 Capital Adequacy 17
2.4 Income and expenditure items as percentage of total income 19
Table of Contents
2.5 Ranking by Assets and Deposits as at December, 2004 20
2.6 Year end overall Performance rating 21
4.1 Salient features of FLSTAP & FSRC 37
Charts
1 Balance Sheet Movements (Assets) 14
2 Balance Sheet Movements (Liabilities) 14
3 Structure of Deposits 15
4 Risk Classification of Loans 16
5 Income as a Percentage of Total Income 19
6 Expenses as a Percentage of Total Income 20
Appendices
1 Audited Banking Sector Balance Sheet as at December 2003/2004 42
2 Audited Banking Sector Profit & Loss as at December 2003/2004 43
3 Market Share: (Net Assets, Net Advances, Deposits, Capital 44
& Profits) December 2004
4 Non-Performing Loans & Provisions - December 2004 46
5 Profitability of Banking Institutions for the year 2004 48
6 Capital and Risk Weighted Assets - December 2004 50
7 Classification of Loans 52
8 Proposed Changes to the Prudential Regulations 53
9 Financial Institutions Supervision Circulars Issued in 2004 57
10 Institutions Operating in Kenya as at December 2004 58
11 Directory of Foreign Exchange Bureaus as at December 2004 66
Table of Contents

1Financial Institutions Supervision Annual Report 2004
FISD Annual Report, 2004
Chapter OneChapter OneChapter OneChapter OneChapter One
Developments in the Banking IndustryDevelopments in the Banking IndustryDevelopments in the Banking IndustryDevelopments in the Banking IndustryDevelopments in the Banking Industry
1.1 Overview
The number of banking institutions increased marginally from 43 as atDecember 2003 to 44 as at December 2004 following the conversion ofone building society into a commercial bank. Following the lifting of themoratorium placed on the licensing of foreign exchange bureaus, the numberof bureaus increased to 89 as at December 2004 from 80 as at December2003. Financial institutions continue to embrace latest Information andCommunication Technology (ICT) as integral to the sector’s capacity andability to enhance institutional productivity and operational efficiency throughbranch interconnectivity and improved service delivery.
As a result of enhanced supervisory enforcement actions, and introductionof penalties as deterrence measure, there was a marked improvement inthe level of compliance with the requirements of the Banking Act and theCentral Bank Prudential Regulations. During 2004, the Central Bank proposedvarious amendments to the Banking Act aimed at promoting stability andsoundness of the banking sector. The Central Bank will continue to improveits supervisory process in line with the best international practices and wherenecessary propose amendments to the Banking Act and review the existingPrudential Regulations, to further enhance efficiency and competitiveness ofthe banking sector.
1.2 Structure of the Banking Sector
The banking sector comprised 51 financial institutions with 44 commercialbanks, two non-bank financial institutions, two mortgage finance companiesand three building societies, with a total of 532 branches across the country.The number of commercial banks increased to 44 in December 2004 from43 in December 2003 following the conversion of Equity Building Societyinto a fully fledged commercial bank. The sector comprised six locallyincorporated foreign banks and four branches of foreign owned institutions.Devna finance, a non-bank financial institution is in the process of self-
liquidation, and Daima Bank Limited is still under statutory management.The decline in the number of building societies to 3 in 2004 from 4 in 2003was attributed to conversion of Equity Building Society to a commercial bank.
There was markedimprovement in thelevel of complianceas a result ofsupervisoryenforcement actions
The banking sectorcomprised 51financial institutions
2Financial Institutions Supervision Annual Report 2004
FISD Annual Report, 2004
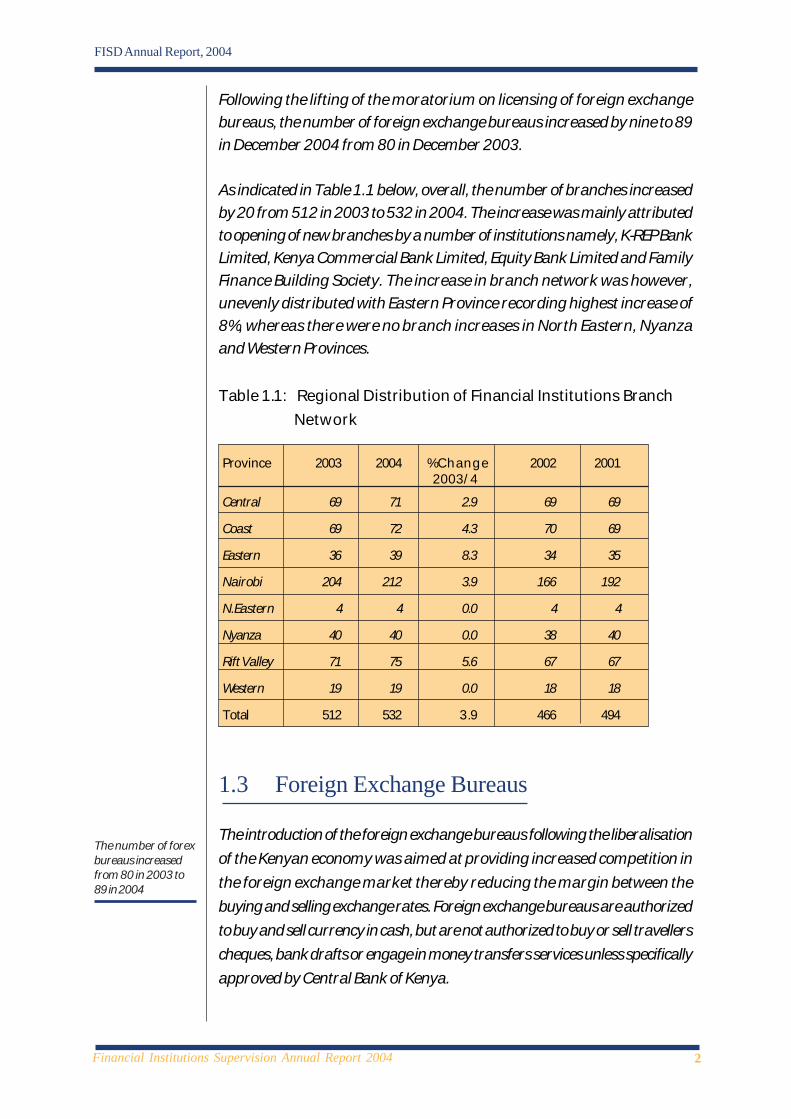
Following the lifting of the moratorium on licensing of foreign exchangebureaus, the number of foreign exchange bureaus increased by nine to 89in December 2004 from 80 in December 2003.
As indicated in Table 1.1 below, overall, the number of branches increasedby 20 from 512 in 2003 to 532 in 2004. The increase was mainly attributedto opening of new branches by a number of institutions namely, K-REP BankLimited, Kenya Commercial Bank Limited, Equity Bank Limited and FamilyFinance Building Society. The increase in branch network was however,unevenly distributed with Eastern Province recording highest increase of8%, whereas there were no branch increases in North Eastern, Nyanzaand Western Provinces.
Table 1.1: Regional Distribution of Financial Institutions Branch
Network
Province 2003 2004 %Change 2002 2001 2003/4
Central 69 71 2.9 69 69
Coast 69 72 4.3 70 69
Eastern 36 39 8.3 34 35
Nairobi 204 212 3.9 166 192
N.Eastern 4 4 0.0 4 4
Nyanza 40 40 0.0 38 40
Rift Valley 71 75 5.6 67 67
Western 19 19 0.0 18 18
Total 512 532 3.9 466 494
1.3 Foreign Exchange Bureaus
The introduction of the foreign exchange bureaus following the liberalisation
of the Kenyan economy was aimed at providing increased competition in
the foreign exchange market thereby reducing the margin between the
buying and selling exchange rates. Foreign exchange bureaus are authorized
to buy and sell currency in cash, but are not authorized to buy or sell travellers
cheques, bank drafts or engage in money transfers services unless specifically
approved by Central Bank of Kenya.
The number of forexbureaus increasedfrom 80 in 2003 to89 in 2004

3Financial Institutions Supervision Annual Report 2004
FISD Annual Report, 2004
As at end of 2004, there were 89 licensed and operational bureaus as shown
in the Table 1.2 below,with total assets of Ksh. 1.2 bn. Inspection of most
bureaus was conducted for the year ended December 2004. Out of 89
operating foreign exchange bureaus 70 or 79% are located in Nairobi and
12 in Mombasa.
Table 1.2: Distribution of Foreign Exchange Bureaus
Location December 2004 December 2003
Nairobi 70 64
Mombasa 12 11
Nakuru 2 1
Kisumu 1 1
Eldoret 2 1
Malindi 1 1
Namanga 1 1
Narok 1 1
Total 89 80
1.4 Information Communications Technology(ICT)
Information and Communications Technology (ICT) has become an integral
part of banking operations. Developments in ICT are, however accompanied
by various inherent risks that affect confidentiality, integrity and availability of
information, as well as complexity of banking products and services. In order
to minimise such risks, financial institutions have formulated security policies
to uphold confidentiality and integrity of information. This is critical given the
enormous resources committed to ICT and the potential risk of ICT systems
failing to meet the needs of bank business.
A major concern among financial institutions is the possibility of business
disruptions due to increased dependence on ICT, which may ultimately impact
adversely on banks’ operations. Thus, to minimise this risk, by 2004, most
institutions had developed detailed disaster recovery and business continuity
plans, which outline well defined strategy for quick resumption of critical
business systems after disruptions.
ICT is integral tobanking sector’scapacity to enhanceoperationalefficiency and qualityof customer service

4Financial Institutions Supervision Annual Report 2004
FISD Annual Report, 2004
In addition, financial institutions continue to utilise ICT as a tool to enhance
operational efficiency, support newly developed products and improve the
quality of customer service. For example, some financial institutions are
focusing on branch interconnectivity to facilitate branchless banking. Similarly,
with the growth in the out-of-city centre supermarkets and retail parks, and
emerging widespread convenience culture, there has been substantial growth
in off-site ATMs particularly in Nairobi, installed in places other than bank
premises. As a security measure, banks have put in place cameras in most
new ATMs to deter criminals.
1.5 Customer Service Trends
In today’s competitive banking environment, exemplary customer service is
one of the distinguishing characteristics that banks can exploit to establish a
competitive edge. Since most banks offer comparable products and services,
they continually search for a competitive advantage that will attract new
customers and help them retain existing ones. Banks therefore, must
endeavour to develop innovative programs and initiatives to maintain superior
customer service levels while remaining profitable.
In order to address customer concerns and remain competitive, institutions
are increasingly turning to ICT solutions to enhance service delivery, as a
tool to maintain and expand clientele. Financial Institutions are increasingly
embracing E-banking and provision of ATMs to reduce long queues in banking
hall. In addition, some of the banks with the large customer base have launched
mobile phone banking services. Mobile phone banking services provides
several account enquiry tools, including account balances, thereby, minimising
the need for customers to visit banking halls.
Over the years, customers have expressed concerns regarding the high
charges imposed by banks for the provision of services. In response to the
concerns, the Central Bank publishes on weekly basis, selected bank charges
levied by all financial institutions so as to foster transparency and enhance
competitiveness in the industry.
Central Bankintroduced weeklypublication ofselected bankcharges to fostertransparency andenhancecompetitiveness inthe industry
5Financial Institutions Supervision Annual Report 2004
FISD Annual Report, 2004
1.6 Employment and Training in the BankingIndustry
The general employment levels in the banking industry increased marginally
by 5.4% during year 2004. While most institutions over the past years
experienced a reduction in employment levels due to restructuring and staff
rationalisation,over the last two years, the employment levels in the banking
industry have stabilised .
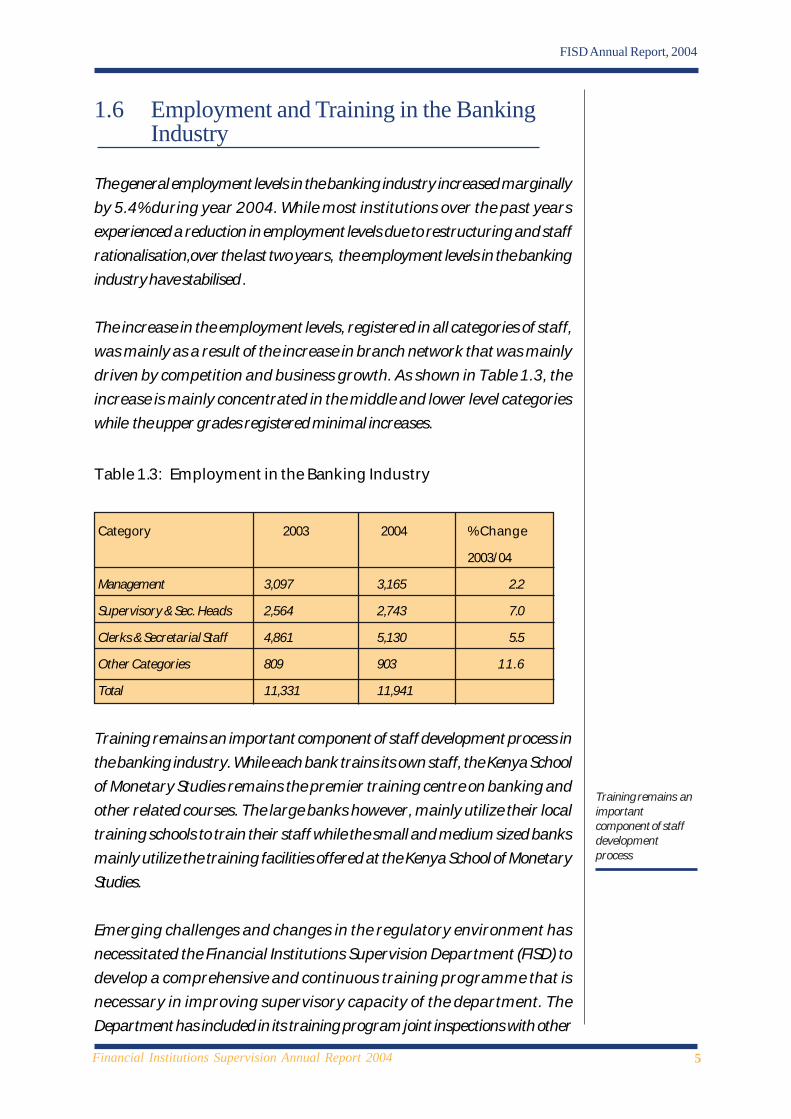
The increase in the employment levels, registered in all categories of staff,
was mainly as a result of the increase in branch network that was mainly
driven by competition and business growth. As shown in Table 1.3, the
increase is mainly concentrated in the middle and lower level categories
while the upper grades registered minimal increases.
Table 1.3: Employment in the Banking Industry
Category 2003 2004 % Change
2003/04
Management 3,097 3,165 2.2
Supervisory & Sec. Heads 2,564 2,743 7.0
Clerks & Secretarial Staff 4,861 5,130 5.5
Other Categories 809 903 11.6
Total 11,331 11,941
Training remains an important component of staff development process in
the banking industry. While each bank trains its own staff, the Kenya School
of Monetary Studies remains the premier training centre on banking and
other related courses. The large banks however, mainly utilize their local
training schools to train their staff while the small and medium sized banks
mainly utilize the training facilities offered at the Kenya School of Monetary
Studies.
Emerging challenges and changes in the regulatory environment has
necessitated the Financial Institutions Supervision Department (FISD) to
develop a comprehensive and continuous training programme that is
necessary in improving supervisory capacity of the department. The
Department has included in its training program joint inspections with other
Training remains animportantcomponent of staffdevelopmentprocess

6Financial Institutions Supervision Annual Report 2004
FISD Annual Report, 2004
East African Central Banks, as well as in-house and external training
opportunities thereby strengthening the Department’s regulatory capacity.
1.7 Supervisory Enforcement Action
The Central Bank’s enforcement of compliance requirements particularly
through introduction of penalties resulted in reduced incidences of non-
compliance. As shown in Table 1.4, the incidence of non-compliance reduced
from 31 in December 2003 to 19 in December 2004. Similarly, the number
of institutions that were non-compliant declined from 12 in December 2003
to 8 as at end of December 2004.
In addition to the penalties, enforcement action also included withholding of
corporate approvals for institutions that did not comply with the requirements
of the Banking Act and Central Bank Prudential Regulations. Consequently,
the Department reviewed banking licence applications for year 2005 from
all institutions and forwarded recommendations to the Minister for Finance
to grant approval only to those institutions that were fully compliant.
Conditional licences were however, granted to the institutions that were
non-compliant. Some of these institutions are undergoing restructuring in
order to address structural problems associated with non-compliance. The
Central Bank will continue to monitor the level of compliance in the banking
sector on a daily basis with a view to ensuring that all institutions are fully
compliant.
Table 1.4: Progress on compliance
December 2003 December 2004
No. of institutions 12 8
not in compliance
Incidence of non- 31 16
compliance
Positive progressnoted in the level ofcompliance
7Financial Institutions Supervision Annual Report 2004
FISD Annual Report, 2004
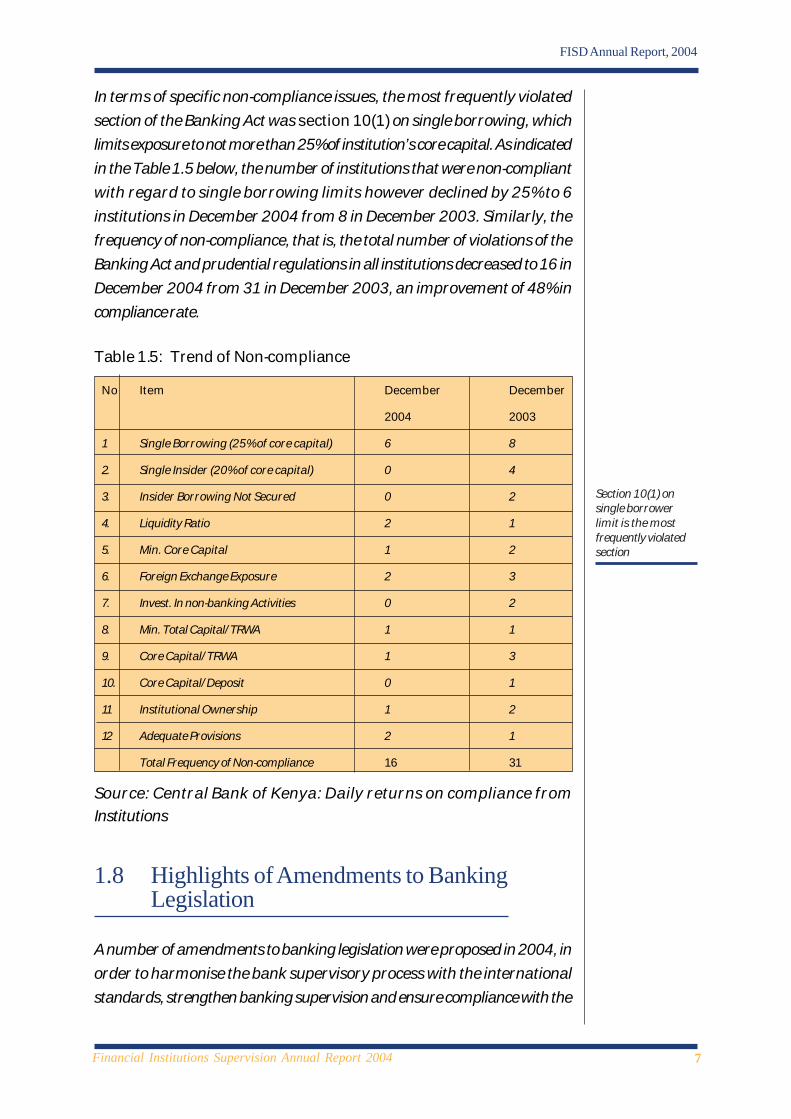
In terms of specific non-compliance issues, the most frequently violated
section of the Banking Act was section 10(1) on single borrowing, which
limits exposure to not more than 25% of institution’s core capital. As indicated
in the Table 1.5 below, the number of institutions that were non-compliant
with regard to single borrowing limits however declined by 25% to 6
institutions in December 2004 from 8 in December 2003. Similarly, the
frequency of non-compliance, that is, the total number of violations of the
Banking Act and prudential regulations in all institutions decreased to 16 in
December 2004 from 31 in December 2003, an improvement of 48% in
compliance rate.
Table 1.5: Trend of Non-compliance
No Item December December
2004 2003
1 Single Borrowing (25% of core capital) 6 8
2. Single Insider (20% of core capital) 0 4
3. Insider Borrowing Not Secured 0 2
4. Liquidity Ratio 2 1
5. Min. Core Capital 1 2
6. Foreign Exchange Exposure 2 3
7. Invest. In non-banking Activities 0 2
8. Min. Total Capital/TRWA 1 1
9. Core Capital/TRWA 1 3
10. Core Capital/Deposit 0 1
11 Institutional Ownership 1 2
12 Adequate Provisions 2 1
Total Frequency of Non-compliance 16 31
Source: Central Bank of Kenya: Daily returns on compliance from
Institutions
1.8 Highlights of Amendments to BankingLegislation
A number of amendments to banking legislation were proposed in 2004, in
order to harmonise the bank supervisory process with the international
standards, strengthen banking supervision and ensure compliance with the
Section 10(1) onsingle borrowerlimit is the mostfrequently violatedsection
8Financial Institutions Supervision Annual Report 2004
FISD Annual Report, 2004
Basle Core Principles for Effective Banking Supervision and other corporate
governance requirements. Highlights of the proposed amendments to the
Banking Act and Central Bank of Kenya Act were:
• Transfer of Supervisory and Regulatory powers to the Central Bank. The
proposed amendments aim at ceding from the Minister for Finance most
of the powers related to supervision and regulation of financial institutions.
• Repeal of Section 39 of the Central Bank of Kenya Act, which regulate
interest rates.
• Repeal of section 44 of the Banking Act, which requires financial institutions
to obtain approval of the Minister for Finance before increasing their
rates of banking or other charges.
• Introduction of a new section 44 A of the Banking Act on the in-duplum
rule, which limits the total interest an institution can recover on a non-
performing loan to a maximum of the amount of outstanding at the time
the loan became non-performing.
• Introduction of vetting of significant shareholders, who are defined as
persons, other than the Government or a public entity, who hold, directly
or indirectly, or otherwise have beneficial interest in, more than five
percent of the share capital of an institution.
1.9 Outlook
The Department continues to improve supervisory measures to enhance
stability and soundness of the banking sector. In summary, some of these
measures are:
• Enforcement of compliance with the banking laws and prudential
regulations. Penalties shall continue to be imposed as a deterrence
mechanism.
• Full implementation of Risk Based Supervision by the end of 2005. This
is being done with the technical assistance from IMF - East Afritac. The
department will issue risk management guidelines to the sector in the
Regulatoryamendmentsproposed to transfersupervisory andRegulatory powersto the Central Bank
Stringentsupervisory andregulatoryenforcementmeasures pursuedto enhance stabilityand soundness of thebanking sector
9Financial Institutions Supervision Annual Report 2004
FISD Annual Report, 2004
second quarter of 2005, and conduct pilot Risk Based Examinations in
July 2005.
• Introduction of more advanced inspection techniques. The Central
Bank Supervisors are currently embracing the use of Computer
Assisted Audit Techniques – CAATs. The bank examiners use Audit
Command Language –ACL to interrogate computer files in the banking
institutions and produce exception reports.
• The parallel run of the Banking Supervision Application (BSA) system
currently in progress is expected to be completed in year 2005. With
full implementation of the system, it is expected that data processing
will be timelier.
• Implementation of the remaining Basle Core Principles for Effective
Banking Supervision in order to enhance supervisory oversight and
ensure compliance with international best practice.
• Strengthening the inspection follow up process to ensure that financial
institutions rectify deficiencies observed during on-site examination
promptly.
• Continued publication of bank charges to increase customer awareness
of products and services available and their associated costs with a
view to increasing competition in the sector.
• Working closely with other Governmental agencies in addressing the
problem of Non-Performing Loans (NPL) affecting five public sector
institutions, which also constitute the largest proportion of the sector’s
NPL.
Pilot Risk BasedSupervision (RBS)conducted in July2005, and fullimplementation ofRBS expected byend of the year
10Financial Institutions Supervision Annual Report 2004
FISD Annual Report, 2004
Chapter TChapter TChapter TChapter TChapter Twwwwwooooo
Banking sector performance and macroeconomic developments
2.1 Overview
The Kenya economy exhibited improved growth and stability in the banking
sector attributed mainly to the favourable macroeconomic environment.
The banking system remained sound with positive developments recorded
in all key financial indicators. With net non-performing loans maintaining a
downward trend and profitability improving, capital adequacy ratios were
sustained at high levels throughout the year, thus providing the banking system
with sufficient buffer to absorb any unexpected shocks.The continued
enforcement of prudential and legislative supervisory requirements also
supported the stability of the sector. While the reduction in net non-performing
loans impacted favourably on earnings, thus contributing positively to the
overall financial performance, the strengthened balance sheet enabled the
banking system to expand credit thereby supporting the country’s economic
activities.
2.2 Macro-economic Conditions during 2004
The economic recovery process that began in 2003 continued into 2004
with Gross Domestic Product (GDP) expanding by 4.3% during the year,
the fastest growth since 1994 compared with 2.7% in 2003 and 0.4% in
2002. The improvement in the economy was reflected in positive growth
across all sectors complemented by strong macro economic fundamentals.
The Debt Restructuring Strategy pursued by the Central Bank since 2002,
which substituted short term domestic instrument with long term instruments
resulted in the reduction in general interest rates. The debt restructuring
strategy together with ample liquidity in the system, led to a decline of the
average interest rate on loans and advances from 13.47% in December 2003
to 11.25% by the end of 2004.
Similarly, the monetary policy stance remained supportive of domestic
economic activity. The monetary policy pursued in 2004 ensured that
The Banking systemremained sound andstable
Gross DomesticProduct (GDP)expanded by 4.3%
11Financial Institutions Supervision Annual Report 2004
FISD Annual Report, 2004
inflationary pressures were contained while monetary expansion at 9.5%
facilitated, the availability of credit. Total domestic credit therefore increased
by 14.2% of which private sector credit increased by 14.7% while credit to
the public sector declined by 6%. The monetary policy stance was
complemented by a process of fiscal consolidation as the Government
strengthened its fiscal position by efficiently utilizing the existing resources
and enhanced revenue collection. Moreover, public policy continued to be
pursued with the objective of allocating increased resources to private sector
activity and restating the private sector as the engine of economic growth.
2.3 Balance sheet analysis
2.3.1 Analysis of Assets and Liabilities
In response to improved economic environment, the banking sector
expanded in terms of asset size by 12% or Ksh. 61.8 bn from Ksh. 515.8 bn
as at December 2003 to Ksh. 577.6 bn as at December 2004. As a proportion
of GDP, total assets remained at 45% of GDP which was the same as at the
end of 2003. The assets growth was mainly funded by increases in local
currency and foreign currency deposits, fresh capital injection and retained
profits.
Total deposits increased by Ksh. 49.7 bn during the year out of which local
currency deposits expanded by Ksh. 29.1bn from Ksh. 356 bn in 2003 to
Ksh. 385.1bn in 2004. Foreign currency deposits also rose by Ksh. 20.5bn
from Ksh. 58.9 bn to Ksh. 79.4 bn over the same period.
Total shareholders funds, over the year increased by Ksh. 7.8 bn from Ksh.
61bn in 2003 to Ksh 68.8 bn in December 2004. Paid up capital in the sector
rose by Ksh. 3.5 bn while reserves rose by Ksh. 4.3 bn during the year,
reflecting strengthened capital position of the institutions. The improved capital
position has enhanced the instititions’ capacity to absorb losses, expand their
operations and therefore the scope of financial intermediation.
While loans at 52% and government securities at 20% continue to constitute
a major portion of their investments, the financial institutions substantially
reduced investments in Government securities during the year as a result of
declining interest rates. Investments in Government securities declined by
Ksh. 27 bn from Ksh. 143 bn in December 2003 to Ksh. 116 bn in December
The banking sectorexpanded due toimproved economicenvironment

12Financial Institutions Supervision Annual Report 2004
FISD Annual Report, 2004
2004. Changes in the composition of other assets and liabilities remained
relatively stable during the year.
Total credit to the private sector increased by Ksh. 64 bn from Ksh. 266 bn in
2003 to Ksh. 330 bn in 2004. The highest credit growth was registered in the
private households sector, in which credit increased by Ksh. 13.4 bn over
the year, followed by the manufacturing sector that registered a growth of
Ksh. 10.6 bn. This upward trend in credit to these sectors was in response
to financial institutions’ efforts to increase personal lendings, and in particular
the upgrading of factories and manufacturing firms to take advantage of the
improved business environment.
In terms of sectoral credit, most of the private sector credit was directed to
finance, insurance and business services sector, which accounted for 22% of
the total private sector credit. This was followed by the Manufacturing and
Tourism (Trade and Hotels) sectors with 19% and 14.5% respectively.
During the year, the off balance sheet items increased substantially by Ksh.
23.5 bn or 36%, mainly comprising of letters of credit, guarantees and
acceptances. This increase reflected a deliberate strategy by most institutions
to increase their share of non-fund based business in order to diversify sources
of their income.
Investment inGovernmentsecurities declined
Substantial growth ofoff balance sheetitems
13Financial Institutions Supervision Annual Report 2004
FISD Annual Report, 2004
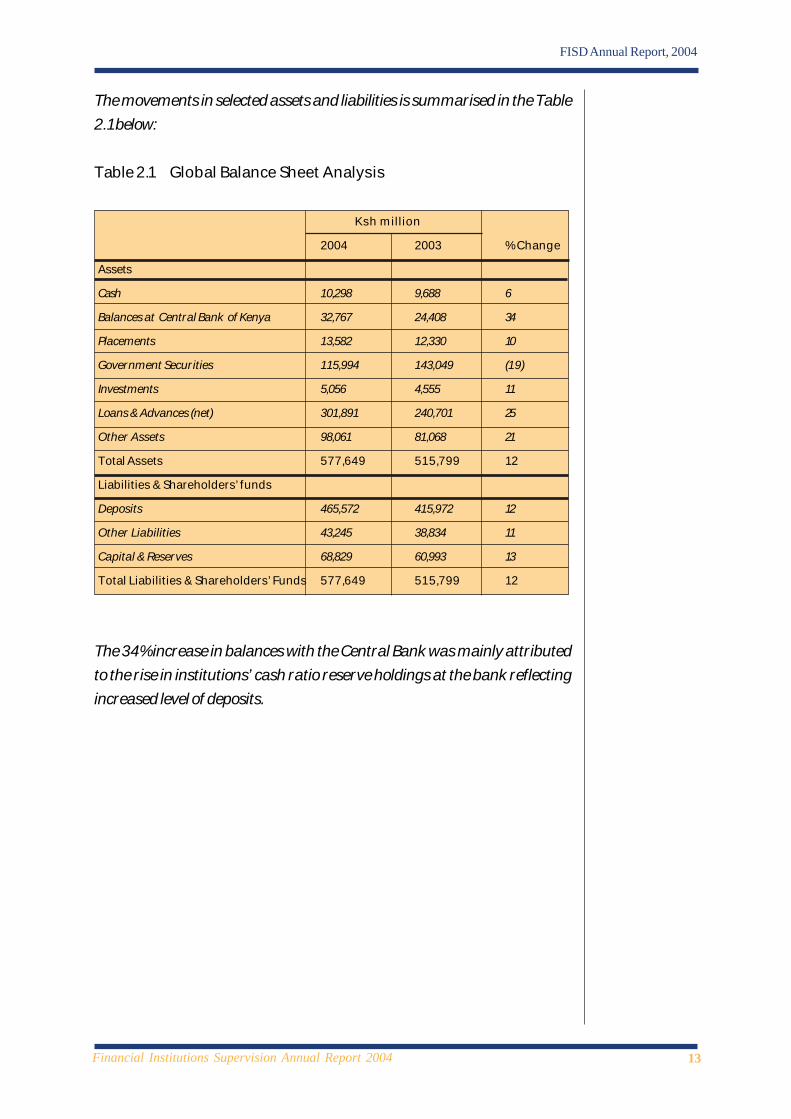
The movements in selected assets and liabilities is summarised in the Table
2.1below:
Table 2.1 Global Balance Sheet Analysis
Ksh million
2004 2003 % Change
Assets
Cash 10,298 9,688 6
Balances at Central Bank of Kenya 32,767 24,408 34
Placements 13,582 12,330 10
Government Securities 115,994 143,049 (19)
Investments 5,056 4,555 11
Loans & Advances (net) 301,891 240,701 25
Other Assets 98,061 81,068 21
Total Assets 577,649 515,799 12
Liabilities & Shareholders’ funds
Deposits 465,572 415,972 12
Other Liabilities 43,245 38,834 11
Capital & Reserves 68,829 60,993 13
Total Liabilities & Shareholders’ Funds 577,649 515,799 12
The 34% increase in balances with the Central Bank was mainly attributed
to the rise in institutions’ cash ratio reserve holdings at the bank reflecting
increased level of deposits.
14Financial Institutions Supervision Annual Report 2004
FISD Annual Report, 2004
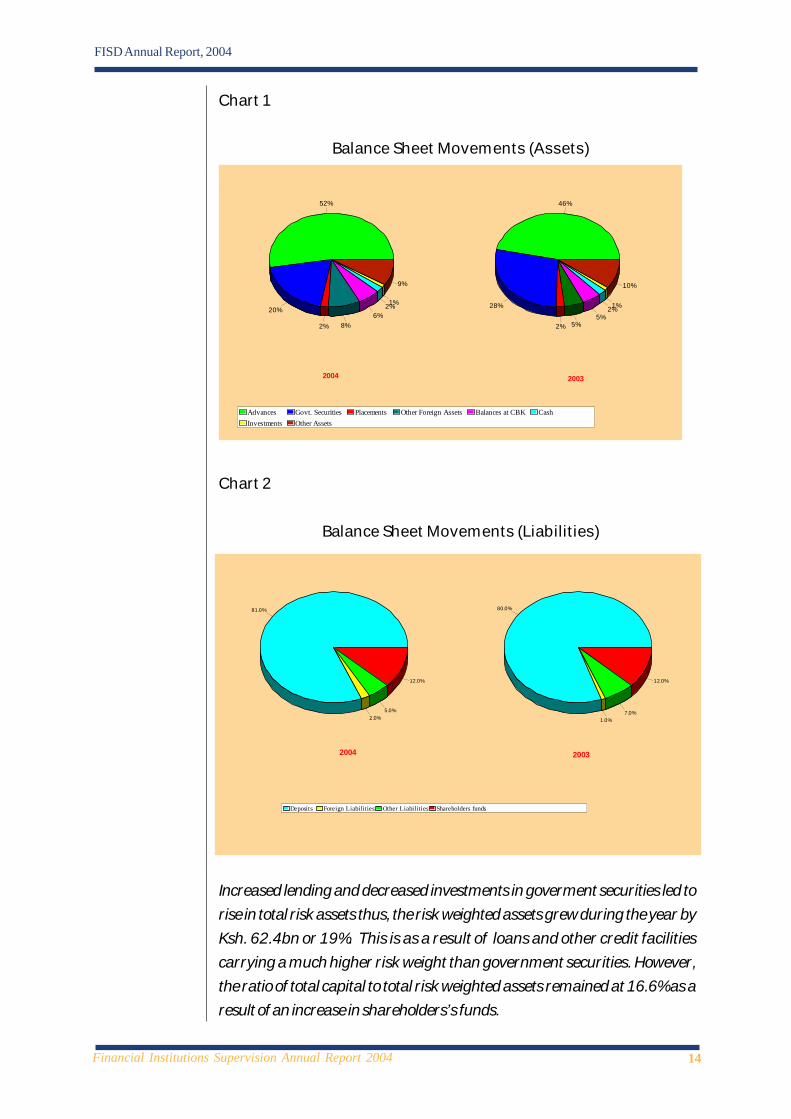
Chart 1
Balance Sheet Movements (Assets)
Chart 2
Balance Sheet Movements (Liabilities)
Increased lending and decreased investments in goverment securities led to
rise in total risk assets thus, the risk weighted assets grew during the year by
Ksh. 62.4bn or 19%. This is as a result of loans and other credit facilities
carrying a much higher risk weight than government securities. However,
the ratio of total capital to total risk weighted assets remained at 16.6% as a
result of an increase in shareholders’s funds.
52%
20%
2% 8%6%
2%1%
9%
46%
28%
2% 5%5%
2%1%
10%
Advances Govt. Securities Placements Other Foreign Assets Balances at CBK CashInvestments Other Assets
20032004
81.0%
2.0%5.0%
12.0%
80.0%
1.0%7.0%
12.0%
Deposits Foreign Liabilities Other Liabilities Shareholders funds
20032004

15Financial Institutions Supervision Annual Report 2004
FISD Annual Report, 2004
The structure of deposits remained unchanged in terms of type and sources.
Demand and call deposits continue to be the dominant type of deposits
accounting for 51% of total deposits. The Non-Profit Institutions and
individuals were the largest source of deposits, with 63% of total deposits.
The percentage of demand deposits to total deposits however, increased
from 45% in 2003 to 46% in 2004.
Chart 3
Structure of Deposits
The government and parastatals continued to have significant deposits in the
sector. Government and parastatal deposits amount to Ksh 40bn or 10% of
total deposits, an increase of Ksh. 2 bn from Ksh 38bn in 2003.
2.3.2 Asset QualityArising from the improved economic performance, net non-performing loans
of the banking system declined in 2004 to Ksh. 70.8 bn from Ksh. 73.9 bn in
2003. Similarly, as shown in Table 2.2, the gross non-performing loans as a
ratio of total loans declined to 29.0% in 2004 from 35.0 % in 2003. Recoveries
and improved provisioning supported by reduced levels of new non-
performing loans during the year contributed to the decline in net non-
performing loans.
46%
5%
29%
20%
45%
6%
28%21%
Demand Call Time Savings
20032004
Non-profitinstitutions andindividuals accountfor 63% of totaldeposites

16Financial Institutions Supervision Annual Report 2004
FISD Annual Report, 2004
Table 2.2: Asset Quality
Asset Quality
Ksh. Million 2004 2003
Total Assets 577,648 515,799
Gross Loans 382,290 315,321
Gross Non-Performing Loans 111,889 109,898
Interest in suspense 39,309 38,588
Net Non-Performing Loans 72,580 71,310
Specific provisions 37,940 33,435
Net Non-Performing Loans 34,640 37,875
Gross Loan over total assets (%) 66 61
Gross NPLs/Gross Loans (%) 29 35
Total NPLs/Total Loans (%) 21 26
* Total Loans = Gross Loans net of interest in suspense
Chart 4:
Risk Classification of loans
2.3.4 Capital Adequacy
The banking system remained well capitalised with the capital base increasing
by Ksh. 8 billion from Ksh. 61 bn as at the end of 2003 to Ksh.69bn as at the
end of 2004. The overall rating of the banking sector’s capital strength was
satisfactory same rating as in the previous year. The improved capital base
59.3%
11.4%3.0% 12.4%
13.9%
50.9%
14.3%
3.9%15.2%
15.7%
Normal Watch Sub-standardDoubtful Loss
20032004
The banking systemremained adequatelycapitalised at Ksh. 69bn
17Financial Institutions Supervision Annual Report 2004
FISD Annual Report, 2004
was attributed to retention of current year’s profit and additional injection
of capital by institutions. As shown in Table 2.3 below, the risk weighted
assets to core-capital ratio of the banking system was 16.2% the same level
as at the end of 2003 since the rate of increase in risk weighted assets was
matched by expansion in the capital base.
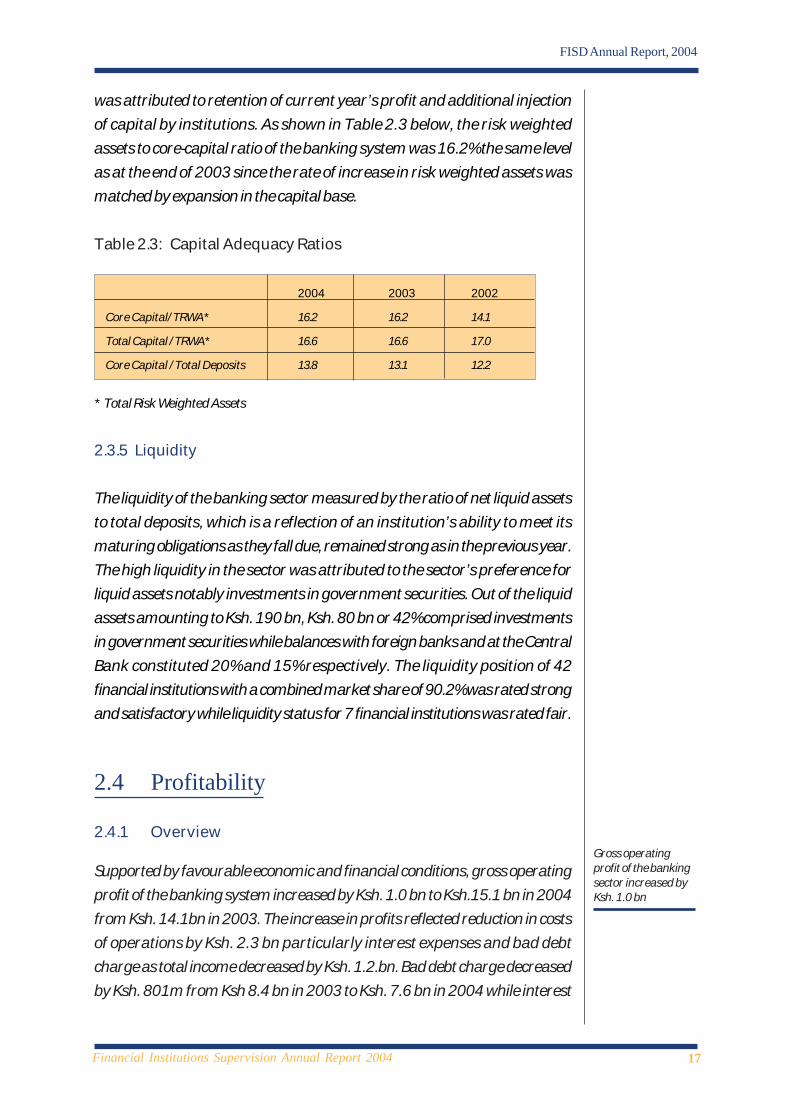
Table 2.3: Capital Adequacy Ratios
2004 2003 2002
Core Capital/TRWA* 16.2 16.2 14.1
Total Capital /TRWA* 16.6 16.6 17.0
Core Capital /Total Deposits 13.8 13.1 12.2
* Total Risk Weighted Assets
2.3.5 Liquidity
The liquidity of the banking sector measured by the ratio of net liquid assets
to total deposits, which is a reflection of an institution’s ability to meet its
maturing obligations as they fall due, remained strong as in the previous year.
The high liquidity in the sector was attributed to the sector’s preference for
liquid assets notably investments in government securities. Out of the liquid
assets amounting to Ksh. 190 bn, Ksh. 80 bn or 42% comprised investments
in government securities while balances with foreign banks and at the Central
Bank constituted 20% and 15% respectively. The liquidity position of 42
financial institutions with a combined market share of 90.2% was rated strong
and satisfactory while liquidity status for 7 financial institutions was rated fair.
2.4 Profitability
2.4.1 Overview
Supported by favourable economic and financial conditions, gross operating
profit of the banking system increased by Ksh. 1.0 bn to Ksh.15.1 bn in 2004
from Ksh. 14.1bn in 2003. The increase in profits reflected reduction in costs
of operations by Ksh. 2.3 bn particularly interest expenses and bad debt
charge as total income decreased by Ksh. 1.2.bn. Bad debt charge decreased
by Ksh. 801m from Ksh 8.4 bn in 2003 to Ksh. 7.6 bn in 2004 while interest
Gross operatingprofit of the bankingsector increased byKsh. 1.0 bn

18Financial Institutions Supervision Annual Report 2004
FISD Annual Report, 2004
expenses decreased by Ksh. 3.1bn from Ksh9.6 bn in 2003 to Ksh. 6.5 bn in
2004. The decline in bad debt charge was partly attributable to the improved
credit administration by banks.
Commercial banks profits constitituted 97.3% of the sector’s total profits
while non-bank financial institutions and building societies combined
contributed 2.7%. Out of 49 financial institutions that were operating, 41
made an aggregate profit of Ksh. 15.9 bn while the remaining 8 made an
aggregate loss of Ksh. 0.8 bn. Although the general performance of the banking
sector has continued to improve over the years, the distribution of profits
was still skewed with two major banks contributing 53.5% of the total pre-
tax profits.
2.4.2 Income
Total income of the banking system declined marginally by 1.9% from Ksh
63.9 bn in 2003 to Ksh. 62.7 bn in 2004. The fall in income was mainly
attributed to reduction in interest income from Ksh. 39.2 bn in 2003 to Ksh.
38.0 bn in 2004 following the general decline in interest rates during the year.
Interest income however remained the major source of income at Ksh.
38.0 bn or 61% of total income out of which income from advances was
Ksh. 25.5 bn while income from government securities was Ksh. 7.6 bn.
In tandem with efforts by institutions to diversify sources of income, income
from fees, commissions and foreign exchange transaction increased marginally
from Ksh 24.7 bn in 2003 to Ksh 24.8 bn in 2004. Thus, the contribution of
non-interest income to total income increased from 39% in 2003 to 40% in
2004 reflecting the strategy by banking institutions to shift away from
traditional sources of income to non funded income as general interest rates
remained low.
2.4.3 Expenses
Total expenses decreased by 4.5% from Ksh. 49.8 bn in 2003 to Ksh. 47.5
bn in 2004. The decrease in expenses was attributable to the decline in interest
expenses and bad debt charge, which declined by Ksh. 3.1bn and Ksh. 0.8 bn
respectively.
Contribution of non-interest incomeincreased from 37%to 38% in 2004.
Interest expense ondeposits declined

19Financial Institutions Supervision Annual Report 2004
FISD Annual Report, 2004
Interest expense on deposits accounted for 14% of the total expenses having
declined from 17% in the year 2003. The decline in interest expenses on
deposits was due to lower interest rates offered by banking institutions
following relatively high liquidity of the banking system. As a percentage of
total income, interest expense fell from 13.3% in 2003 to 10.4% in 2004.
Staff related expenses such as salaries and wages increased marginally by
0.6% from Ksh. 14.8 bn in 2003 to Ksh. 14.9 bn in 2004 mainly owing to
increase in the number of employees from 11,331in 2003 to 11,941in 2004
Table 2.4 Income and expenditure items as percentage of total
income.
Ksh. billion
2004 2003 2002
Ksh. % Ksh % Ksh. %
Income
Interest on advances 25.5 41 27.9 44 28.7 45
Interest on government securities 7.6 12 10.3 16 11.8 19
Interest on placement 4.9 8 1.0 2 1.3 2
Other income 24.8 39 24.7 38 21.7 34
Total income 62.7 100 63.9 100 63.5 100
Expenses
Interest expenses 6.5 10.4 8.5 13.3 13.0 20.5
Bad debts charge 7.6 12.2 8.4 13.2 11.1 17.5
Salaries& wages 14.9 23.8 14.8 23.2 15.9 25.0
Other expenses 18.5 29.5 18.1 28.3 17.5 27.6
Total expenses 47.5 75.9 49.8 78.0 57.5 90.6
Profit before tax 15.1 24.1 14.1 22.0 6.0 9.4

20Financial Institutions Supervision Annual Report 2004
FISD Annual Report, 2004
Chart 5
Income as a Percentage of Total Income
Chart 6
Expenses as a Percentage of Total Income
2.5 Market Share
The banking sector continued to be dominated by a few banks as shown in
Table 2.5 below with 13 largest institutions out of the 49 institutions accounting
for 77% of total net assets and 78% of the total deposits. Similarly, the 13
institutions contributed 82.8% of the total pre-tax profits compared with
94% in the previous year.
41%
12%
8%
39%
44%
16%
2%
38%
Interest on Advances Interest on Govt. SecuritiesInterest on Placements Other Income
20032004
Banking sector wasdominated by a fewbanks, 13 banksaccounted for 77%of total net assets
10%
12%24%
30% 24%
13%
13%
23%
28%22%
Interest expenses Bad Debts Charge Salaries & Wages Other Expenses Profit before TAx
20032004

21Financial Institutions Supervision Annual Report 2004
FISD Annual Report, 2004
Table 2.5: Ranking by Assets and Deposits as at December, 2004
Peer Asset No. of Net Assets Deposits Pre-Tax
Group Range Inst. Shs’ Market Shs’ Market Shs’ Shs’
shs’ billion Billion Share billion share million Share
1 Over 10 13 445.0 77.1% 361.8 77.9% 12.5 82.8%
2 5-10 11 67.1 11.6% 54.8 11.8% 0.9 6.0%
3 3-5 11 40.5 7.0% 32.6 7.0% 0.7 4.6%
4 0-3 14 25.0 4.3% 15.3 3.3% 1.0 6.6%
TOTAL 49 577.6 100.0% 464.5 100.0% 15.1 100.0%
2.6 Year End Performance Rating
The overall performance of the banking sector based on CAMEL rating
framework of Capital Adequacy (C) Asset Quality (A) Management (M)
Earnings (E) and Liquidity (L) was satisfactory, the same composite rating as
in the previous year
As shown in Table 2.6 below, four institutions with a combined market share
of Ksh.12.6bn or 2.2% were rated strong compared to nine institutions in
the previous year while twenty-three institutions were rated satisfactory.
Seventeen institutions were rated fair compared to 13 in year 2003 while no
institution was rated unsatisfactory. Five institutions were rated marginal.
Table 2.6: Year end overall Performance rating
2004 2003
No. of Net Asset No. of Net Assts
CATEGORY INST. Shs. Billion % INST. Shs. Billion %
STRONG 4 12.6 2.2 9 44.5 8.6
SATISFACTORY 23 357.8 62.0 23 298.8 57.9
FAIR 17 186.0 32.2 13 124.9 24.2
MARGINAL 5 21.1 3.7 5 47.5 9.2
UNSATISFACTORY 0 0 0.0 0 0 0.0
TOTALS 49 577.6 100.0 50 515.8 100.0
OVERALL SATISFACTORY SATISFACTORY
Overall the bankingsector was ratedsatisfactory.
22Financial Institutions Supervision Annual Report 2004
FISD Annual Report, 2004
Chapter ThreeChapter ThreeChapter ThreeChapter ThreeChapter Three
Developments in RegulatoryDevelopments in RegulatoryDevelopments in RegulatoryDevelopments in RegulatoryDevelopments in RegulatoryF r a m e w o r kF r a m e w o r kF r a m e w o r kF r a m e w o r kF r a m e w o r k
3.1 Overview
One of the principal objectives of the Central Bank of Kenya is to foster the
liquidity, solvency and proper functioning of a stable market-based financial
system as spelt out in Section 4 (2) of the Central Bank of Kenya Act. In
addition, section 33B of the Act specifies the legal basis for licensing of foreign
exchange bureaus. The Banking Act, which provides the legislative framework
for regulating banking business, empowers the Central Bank to issue guidelines
to be followed by institutions in order to maintain a stable and efficient financial
system.
The Central Bank continued to review the relevant legislations and regulations
in 2004 in order to put in place up-to-date regulatory framework that meets
international standards. These measures include: amendments to the Central
Bank of Kenya Act and Banking Act, reviewing the Prudential Guidelines, and
introduction of Risk Management Guidelines. The Central Bank also
participated in the preparation of the micro-finance and anti money laundering
bills.
3.2. Amendments to legislation
3.2.1 Overview
The Central Bank continued to enhance and develop the current regulatory
framework in order to strengthen and ensure the stability and soundness of
the banking system. Thus, in 2004 various amendments to the Banking Act,
and Central Bank of Kenya Act were introduced. In addition, the ongoing
process of the revision of current prudential guidelines is expected to be
completed by end of 2005.
3.2.2 Amendments to the Central Bank of Kenya Act
The Central Bankcontinued to reviewlegislations andregulatons
23Financial Institutions Supervision Annual Report 2004
FISD Annual Report, 2004
In 2004, The Central Bank of Kenya Act was amended on three specific
areas. These included introduction of: a new section 4D that provided for
creation of a Monetary Policy Advisory Committee, section 36 (4) dealing
with the Central bank rate, and deletion of sections 39 and 39A on the
regulation of interest rates.
3.2.3 Amendments to the Banking Act
• Ceding of Supervisory and Regulatory Powers to the Central Bank
Numerous sections of the Banking Act grant the Minister for Finance powers
to make decisions related to supervision and regulation of financial institutions.
This is not in tandem with the Basle core principles for Effective Banking
Supervision which requires that supervisory authorities be fully independent
in discharging their functions. The Banking (Amendment) Bill, 2004 proposed
various amendments aimed at transferring most of these powers from the
Minister to the Central Bank. These include powers to;
• Restrict institutions undertaking banking business.
• Authorise licenses;
• Revoke licenses;
• Approve location of places of business;
• Approve mergers and acquisitions;
• Determine minimum capital requirements
• Certify as fit and proper persons appointed to manage and control
institutions;
• Place loan limitations by mortgage finance companies;
• Restrict trading and investments of institutions
• Interven in management of troubled institutions; and
• Approve voluntary liquidations.
• Section 44The Banking (Amendment) Bill, 2004 contained a proposal to delete section
44 of the Banking Act which requires financial institutions to obtain approval
of the Minister for Finance before increasing their rates of banking or other
charges. To replace Section 44 a new Section 44 (A) was introduced in
order to provide for the introduction of the induplum rule. This is a common
Variousamendments to theBanking Actproposed.
24Financial Institutions Supervision Annual Report 2004
FISD Annual Report, 2004
law principle that limits the total interest an institution can recover on a non-
performing loan. The total interest charged cannot exceed the amount of
outstanding principal at the time the loan becomes non-performing. The
limitation does not apply to interest accruing under a court order after the
order is made. The section also clarified that, for loans that became non-
performing before the new section comes into operation, the principal applied
is the total principal and interest owing at the time the section comes into
operation.
• Subjecting significant shareholders and senior officers to the fitand proper criteria
Currently, vetting by the Central Bank is limited to directors and chief
executives of institutions. It has been established however, that significant
shareholders can influence management decision and exercise control on
institutions. Unsuitable shareholders may therefore, exert adverse influence,
thus exposing depositors and undermine stability of financial institutions.
Accordingly, the following amendments to the Banking Act were proposed
in the Banking (Amendment) Bill, 2004 in order to introduce vetting of
significant shareholders and senior officers:
• Section 2A definition of significant shareholder was introduced, to mean a person,
other than the Government or a public entity, who holds, directly or indirectly,
or otherwise has beneficial interest in, more than five percent of the share
capital of an institution.
• Section 4This section was amended to categorise significant shareholders among
persons who manage and control institutions, and who therefore must be
vetted.
• Section 11Significant shareholders were included in the definition of ‘insiders’. This means
that the existing limitations on advances to insiders would also apply to
shareholders with more than 5% shareholding.
Vetting of significantshareholders andsenior managers offinancial institutionproposed.

25Financial Institutions Supervision Annual Report 2004
FISD Annual Report, 2004
• First Schedule of the Banking ActThe First Schedule, which provides the criteria for vetting persons proposed
to manage or control institutions, was expanded to provide criteria for vetting
a significant shareholder that is a corporation.
The amendments were part of the Banking (Amendment) Bill, 2004 that
were referred back to Parliament in December 2004 for further review.
3.3 Revision of Prudential Regulations
The Financial Institutions Supervision Department (FISD) is in the process of
revising the current Prudential Regulations in order to incorporate various
amendments made to the Banking Act, and new developments in the
international supervisory standards and practices. Details of the proposed
changes are contained in Appendix 9.
The revised Prudential Regulations are to be submitted to the Kenya Bankers
Association (KBA) and the Institute of Certified Public Accountants of Kenya
(ICPAK) for comments. The comments received from these stakeholders
will be taken into account in the revised Prudential Regulations.
Among the proposals is to revise the Guidelines on Risk Classification and
Provisioning which is scheduled to be issued to the industry in the course of
2005/06. The key changes in the revised guidelines are: -
1. Besides the credit risk classification, the other assets other than loans
will be evaluated and provisioned accordingly.
2. Discounting of collaterals for non-performing advances over a 5 year
period.
3. Allocate specific rates in providing for the advances portfolio.
4. Enhanced provisioning for non-performing assets.
Revision ofPrudentialRegulations.

26Financial Institutions Supervision Annual Report 2004
FISD Annual Report, 2004
3.3.1 Introduction of Risk Management GuidelinesAs a prerequisite for the adoption of the Risk Based Supervisory framework,
the Financial Institutions Supervision Department is developing Risk
Management Guidelines for the banking sector. These guidelines are intended
to provide minimum requirements for sound risk management. While the
types and degree of risks an organization may be exposed to depends upon
a number of factors such as its size, complexity of business activities, volume
etc, the guidelines cover the most common risks in financial institutions,
namely;
• Strategic Risk,
• Credit Risk,
• Liquidity Risk,
• Interest Rate Risk,
• Foreign Exchange Risk,
• Price Risk,
• Operational Risk,
• Reputational Risk and Compliance/Regulatory Risks.
In order to effectively manage these risks, banks will be required to put in
place risk management processes that cover the four critical aspects of
management oversight, policies and procedures, measurement and internal
controls. The guideline details the pre-requisites for an institution’s risk
management system. The financial institutions will therefore put up the
necessary structures that place strong emphasis on understanding and
assessing the adequacy of each institution’s risk management systems to
identify, measure, monitor and control risk in an appropriate and timely
manner.
3.4 Legal framework for Anti-MoneyLaundering and Combating Financing ofTerrorism
The Kenya Government continues to develop the national Anti-Money
Laundering and Combating the Financing of Terrorism regime by strengthening
the legislative framework, improving the domestic and international
cooperation and upgrading the capacity of regulatory and enforcement
personnel.
National Task Forceestablished to draft acomprehensive anti-Money Launderinglegislation.
Risk ManagmentGuildeline is beingdeveloped for thebanking sector.
27Financial Institutions Supervision Annual Report 2004
FISD Annual Report, 2004
One of the measures taken by the Government to deter money laundering
and terrorism financing was the formation of a National Task Force on Anti-
Money Laundering whose main mandate was to draft specific and
comprehensive Anti-Money Laundering Legislation. Once enacted by
Parliament, the Anti-Money Laundering law will criminalize all forms of money
laundering, and establish the necessary institutional arrangements to ensure
the enforcement of the act and regulation therein. The National Task Force
has drafted The Proceeds of Crime and Money Laundering (Prevention)
Bill, 2005, which will soon be presented to National Assembly of Kenya for
enactment.
The Objective of the draft legislation is to develop a legal framework on
anti-money laundering and provide for institutional arrangements, and policy
strategy on anti-money laundering. The draft Bill criminalises money
laundering and establishes a Financial Intelligence Unit (FIU), whose main
mandate will be to collect and collate information on suspicious transactions
reports (STR), and to analyze and transfer such information to the law
enforcement agencies for action. However, the FIU will not be a law
enforcement agency itself as it’s role will be restricted to providing the
necessary information.
The draft Bill meets the Financial Action Task Force’s (FATF)1 40
Recommendations. The draft Bill further extends the definition of money
laundering beyond the realm of drug trafficking to include all indictable
offences. It contains extensive forfeiture and seizure provisions. The Bill
also seeks to establish a special fund where proceeds obtained from money
launders shall be kept and may be applied to support the operations of the
Financial Intelligence Unit and the anti-money laundering law enforcement
agencies.
In addition, the draft Bill places a duty on financial institutions or persons
engaged in relevant business activies to report suspicious unusual transactions
to the FIU. It also provides for money laundering to be included as one of
the offences extraditable under the Extradition Act and it enables the
The Draft Anti-Money Launderingbill criminalisesmoney laundering
1 FATF is an Inter governmental, multi disciplinary body whose task is to develop and promote policiesboth at national and internal levels, to combat money laundering. FATF has issued forty recommendationson money laundering and nine on combating financing of Terrorism (CFT). These recommendations aredesigned as minimum standard/best practices in creating effective AML/CFT regime. Their domesticationshould be subject to local risk, vulnerabilities and local circumstances and constitution.
28Financial Institutions Supervision Annual Report 2004
FISD Annual Report, 2004
extradition of fugitives to countries even, with which Kenya does not have
Extradition Treaties.
The following provisions are included in the draft bill:
• Synchronized modalities of tracing, seizing and freezing suspected
money laundering accounts.
• Confiscation of the proceeds of crime, including proceeds of money
laundering once the crime has been established.
• Introduction of mandatory Know Your Customer (KYC) policies for
the financial sector in the following areas:
• Identification
• Financial status
• Nature of Business
• Penalise institutions for non-compliance with the KYC
requirements.
• Declaration of the source of funds.
• Outlaw the maintenance of anonymous bank accounts.
• Require banks to store financial records for a minimum of 5 years.
• Introduce mandatory reporting for any suspicious transactions, after
amending the banks secrecy laws to protect the reporting banks from
liability.
• Strengthen the declaration procedure for cash transactions across
boarders.
• Require banks to co-operate with the law enforcement and the
prosecuting authorities in money laundering cases.
3.5 Micro Finance Bill
During the year, the development of a legal and regulatory framework for
the microfinance institutions, especially deposit-taking remained the central
focus. As a result, the refinement of the proposed Deposit-Taking
Microfinance Bill continued, in close consultation with stakeholders.
A Bill has therefore been drafted for debate by Parliament for enactment of
legislation to regulate the micro finance sector. Once enacted by Parliament,
the Act shall be cited as the Deposit-taking Microfinance Act 2005. It shall
apply to deposit-taking microfinance business, as well as empower the Minister
A bill drafted toregulate the microfinance sector.
29Financial Institutions Supervision Annual Report 2004
FISD Annual Report, 2004
for Finance to issue regulations for the conduct of credit by microfinance
institutions.
The Bill shall, among others;
• Define qualifications for carrying out deposit taking microfinance
business.
• Provide procedures for applying for licensing to carry out deposit-
taking microfinance business.
• Set out requirements for licensing of deposit-taking microfinance
institutions.
• Grant the Minister for Finance the powers to regulate and set out
categories of deposit-taking microfinance businesses.
• Grant the Governor of the Central Bank of Kenya powers, to revoke
a license of a licensee.
• Specify the minimum capital requirements to operate a microfinance
business.
• Specify the minimum liquid assets an institution shall maintain to be
allowed to carry out a deposit-taking microfinance business.
• Determine prohibited activities for the licensed microfinance
institutions.
• Specify limits on loans and advances in aggregate to core capital.
• Provide for ownership and corporate governance, including ‘fit and
proper’ test for the owners and directors of the microfinance
institutions.
• Provide for inspection and control of the deposit-taking microfinance
institutions.
• Provide for deposit protection for customers of microfinance
institutions.
It is anticipated that, when the Bill becomes law, a number of credit-only
micro finance institutions (few initially) will be licensed under the new
legislation.
In addition to the microfinance issues, during the year, the Central Bank was
part of the Task Force formed to develop regulatory framework for savings
and credit cooperatives, which culminated in the draft SACCO Regulatory
Bill. The proposed Bill is aimed at establishing an authority to regulate SACCO
societies, and especially to establish prudential regulation for SACCO societies
with Front Office Services (FOSA).
A task force formedto developregulatoryframework forSaving and CreditCooperatives(SACCOs)
30Financial Institutions Supervision Annual Report 2004
FISD Annual Report, 2004
Chapter 4Chapter 4Chapter 4Chapter 4Chapter 4
Current Supervisory IssuesCurrent Supervisory IssuesCurrent Supervisory IssuesCurrent Supervisory IssuesCurrent Supervisory Issues
4.1 Overview
The supervisory activities in 2004 continued to be directed at the promotion
of a sound and stable banking system. These activities included on-site
examination, off-site surveillance and enforcement of the requirements of
the Banking Act and Central Bank Prudential Regulations. Significant progress
was also achieved in implementing a number of initiatives to further promote
the stability of the banking system. These included the implementation of
the Bank Supervision Application (BSA), the Risk Based Supervision (RBS)
and developing the framework for the implementation of Basel II Capital
Accord. In addition, another important area of supervisory focus has been
the monitoring of anti-money laundering measures taken by banking
institutions.
Efforts have been undertaken to intensify reforms in the banking sector in
order to promote competition and improve efficiency. These reforms are
aimed at restructuring and privatizing the state owned bank, reforming the
judiciary and the resolution of the non performing loans in the banking sector.
In addition, recognizing the increasing challenges of banking supervision, the
Central Bank is engaged in a number of international and regional cooperation
initiatives to facilitate information exchange and closer cooperation with
other regulatory and supervisory organizations and international bodies.
4.2 Risk Based Supervision (RBS)
Risk Based Supervision (RBS) is an approach that places strong emphasis on
understanding and assessing the adequacy of each banks’ risk management
systems. RBS is a proactive supervisory approach as opposed to the
traditional supervisory approach, which focuses on banks’ historical financial
performance. Most regulators across the world have embraced RBS. The
global move towards adoption of RBS has been motivated by: -
Central Bank is inthe process ofimplementing RiskBased Supervision(RBS)

31Financial Institutions Supervision Annual Report 2004
FISD Annual Report, 2004
• Competition in the Banking industry that has led to the development
of new products by banks.
• Expansion by banks across borders.
• Banks have embraced technological developments, which have
increased their reliance on Information, and Communication
Technology (ICT) leading to an increase in the attendant risk from
technological failure.
• The need for Supervisory Authorities to focus their resources on banks
that pose higher risk to the stability of the financial system.
As a prerequisite to the implementation of RBS, the Central Bank conducted
a survey in 2004 through a questionnaire sent to 48 financial institutions. The
survey sought to establish the Risk Management practices and processes in
the Kenyan Banking Sector. The Key findings of the survey were the followings:
1. Ninety-four percent (94%) of institutions reported having clearly
defined Risk management guidelines.
2. Institutions place their greatest emphasis on credit risk, with 97% of
the respondents indicating credit risk as a principal risk covered in their
risk management policies and procedures.
3. A number of other risks are considered relatively important by many
institutions, such as Liquidity, Market and Operational Risks.
The major gaps identified by the survey were: -
1. Inadequate risk management policies and procedures, particularly for
non-credit risks.
2. Not all institutions have functions and personnel dedicated for risk
management
3. Several institutions have not developed their own risk management
reports and are relying only on Central Bank of Kenya prudential returns
to monitor risks.
4. Not all institutions utilize independent review of their risk management
function.
5. A number of institutions have not set aside specific budgetary allocations
to fund risk management activities.
Central Bankconducted RiskManagment survey
32Financial Institutions Supervision Annual Report 2004
FISD Annual Report, 2004
In cognisance of these gaps, the Central Bank is developing Risk Management
Guidelines for the Banking Sector. The guidelines will stipulate the minimum
standards for risk management frameworks to be established by banks. Based
on the guidelines, banks will be required to develop Risk Management
Programs (RMP) that will address the principal risks that they face. In addition,
the Central Bank is reviewing its supervisory procedures and processes with
the aim of aligning them to the RBS approach.
4.3 International Financial ReportingStandards (IFRS)
Kenya adopted International Financial Reporting Standards (IFRS) in 1998.
The current Prudential Guidelines are being reviewed partially in response
to changes in IFRS. The major changes proposed in the guidelines are the
following:
1. IFRS 40 on Investment Property which requires that investment
property be revalued every year and that the gains or losses be passed
through the profit and loss account. It has been proposed that these
gains and losses be excluded from the computation of core capital.
This is intended to shield core capital from the fluctuations inherent in
periodic revaluation of property.
2. New disclosure requirements are to be incorporated in the Regulation
on Publication of Accounts to take account of: -
(a) IFRS 17 on leases, which requires that leasehold land be disclosed
separately from fixed assets.
(b) IFRS 32 on Financial Instruments, which requires that investments
in commercial paper and corporate bonds be reported under
loans and advances.
In the financial year ending 31st December 2003, banks in Kenya started
implementing IFRS 39, which deals with recognition, measurement and
disclosure of financial instruments. With regard to provisioning, IFRS 39
requires that financial assets such as loans to be impaired (provided for) when
PrudentialGuidelines beingreviewed in linewith changes in IFRS
33Financial Institutions Supervision Annual Report 2004
FISD Annual Report, 2004
their realizable value is less than their carrying (book value). The realizable
value is derived by discounting the expected future cash flows from the
financial assets. The estimation of the future cashflows and the discount rate
are subjective and may lead to fluctuations in the amount of impairment
losses/provisions. This may lead to fluctuations in the levels of capital. Banks
are using both IFRS 39 and the Central Bank provisioning guideline, which
largely follows objective criteria for the determining of loan loss provisioning.
4.4 Corporate Governance in the BankingSector
As part of its supervisory activities the Central Bank evaluates the
performance of directors and various board committees in banking institutions
and continues to place emphasis on the importance of embedding strong
corporate governance culture in all aspects of banking operations. The roles
and functions performed by board members either individually or collectively
are assessed during the inspection process. The Central Bank’s approach to
corporate governance in the banking sector is primarily designed to achieve
public confidence through enhanced levels of transparency and accountability
in board action.
To further strengthen corporate governance practices in the banking sector,
the Department continues to review and propose amendments to the
Banking Act and the Prudential Regulations. In this regard, some aspects of
the Banking Act (Amendments) Bill 2004 were primarily aimed at enhancing
the governance culture in the Banking sector. These include vetting and
certification of significant shareholders as ‘fit and proper’.
4.4.1 The Board of Directors and ManagementThe role of the Board of directors in each banking institution remains in
focus as the financial sector embraces the Risk Based Supervision framework.
The boards mandate is to ensure the implementation of policies and systems
which strike a good prudential balance between risks and returns. These
involve identification, measurement, monitoring and control of risks posed
by its lending, investing, trading and other significant activities by institutions.
Banking Act (Amendment) Bill, 2004, extended the net of ‘senior officers’ to
be certified as ‘fit and proper’. The Chief Executive Officer, Deputy Chief
Executive Officer, Chief Operations Officer, Chief Financial Officer, Secretary
Corporategovernance gearedtowards enhancedtransparency andaccountability inboard actions.
34Financial Institutions Supervision Annual Report 2004
FISD Annual Report, 2004
to the Board of Directors, Treasurer, Chief Internal Auditor or Manager of a
significant unit of an institution or a person with a similar level of position or
responsibilities as persons described shall be required to be vetted as ‘fit and
proper’.
Sustained progress has been observed in corporate governance practices
and the Central Bank will continue to foster good corporate governance in
the financial sector in line with international best governance practices.
4.5 International Convergence of CapitalMeasurement and Capital Standards
The Basel Committee on Banking Supervision released the International
Convergence of Capital Measurement and Capital Standards (also referred
to as Basel II Capital Accord) in June 2004. The framework provides a more
risk sensitive approach to the measurement of capital adequacy in financial
institutions, and for supervisors to review such assessments to ensure banks
have adequate capital to support their risk. It also seeks to strengthen market
discipline by enhancing transparency in financial reporting. It is anticipated
that, subject to specific country circumstances, various supervisory and
regulatory jurisdictions across the world will adopt the framework.
The Central Bank has, since the release of the final version of the Basle II
Capital Accord, participated in various forums organized to consider the
most appropriate implementation plan for the East African Region. Following
resolutions arising from those deliberations, the Financial Institutions
Supervision Department undertook an internal diagnosis of Pillar 1 of the
Capital Accord. It sought to identify possible implementation challenges and
determine corresponding strategies that may be necessary for each of the
approaches available for computing capital charges for credit risk, operational
risk and market risk.
Due to complexity of Basle II Capital Accord, banks and supervisors alike
will have to re-engineer their processes and tailor their organizations to meet
the Basel II standards. Consequently, the Central Bank has examined the
pre-requisites of effective implementation of Basel II and decided that the
following be put in place:
• Implementation of Basel I by adopting the Market Risk component
35Financial Institutions Supervision Annual Report 2004
FISD Annual Report, 2004
• Compliance with the Basel Core Principles for Effective Banking
Supervision
• Implementation of Risk Based Supervision
• Sensitization of stakeholders
• Liaison of regional regulatory agencies to keep abreast of developments
in Basel II.
4.6 Anti-Money Laundering (AML) andCombating Financing of Terrorism (CFT)initiatives in Kenya
Kenya is committed to the fight against money laundering and terrorism. In
line with the government commitment to combating financing of terrorism,
Kenya under the auspices of Eastern and Southern Africa Anti-Money
Laundering Group (ESAAMLG) hosted a regional workshop on counter
terrorism in November 2004.
As part of efforts to ensure the implementation of a comprehensive anti-
money laundering system, a National Task Force (NTF) on Anti-money
laundering was established in 2003. The Task Force which is chaired by the
Ministry of Finance comprises of fourteen government agencies with the
Central Bank as the Secretariat. The NTF has three distinct working sub-
groups that correspond to the ESAAMLG working groups, namely Finance,
Legal, and Law Enforcement. Kenya in collaboration with ESAAMLG hosted
a regional workshop on counter terrorism in November 2004.
The NTF has prepared draft legislation on anti-money laundering based on
the United Nations (UN) model. The draft Proceeds of Crime and Money
Laundering (Prevention) Bill will be the focal point of Kenya’s AML regulatory
regime and has the following broad objectives:
• Enable institutions and law enforcement agencies to identify, trace,
seize, freeze, confiscate, forfeit, proceeds of crime following criminal
or civil recovery proceedings.
• Establishing criminal assets recovery account and unit to deal with the
process.
• Establishing mechanism for international assistance on investigations
and mutual legal assistance.
Kenya hosted aregional workshopon counterterrorism inNovember 2004.
36Financial Institutions Supervision Annual Report 2004
FISD Annual Report, 2004
Like most developing countries, Kenya has characteristics which may
accommodate money laundering and financing of terrorism. These include
prevalent of cash based transactions, lack of requisite legal framework,
existence of alternative remittance avenues, illegal migration and most
importantly inadequate capacity to deter criminals and other fraudsters. The
overall broad objective of the National Task Force is therefore to work on
the remaining weaknesses that render Kenya and the region vulnerable to
money laundering and financing of terrorist activities. Some of the major
challenges include:
• Lack of policy and legislative framework to fight AML.
• Existence of predominantly cash based economy.
• Existence of porous boarders and political instability in neighbouring
countries
• Lack of training, technical and institutional capacity to deal with the
new issues of AML.
Additional measures initiated by the government to combating money
laundering and terrorism financing include:
• Signing and ratifying all the United Nations conventions on combating
money laundering and the financing of terrorism.
• Criminalising money laundering in relation to drug trafficking;
• Establishment of an independent Anti-Corruption Commission;
• Enactment of Public Officers’ Service Code of Ethics to minimize
corruption among the public servants;
• Enactment of Anti-Corruption and Economic Crimes Act;
• Strengthening the Anti-Terrorism units within the Police Force;
• Issuing of Prudential Regulation on money laundering by the Central
Bank;
• Amendments to the Banking Act and removal of Secrecy laws;
• Drafting of Witness Protection Bill 2005; and
• Strengthening the revenue collection system.
Similarly, the Central Bank during its on-site inspection process ensures that
banking institutions abide by prudential requirements and implement adequate
controls that allows them to ‘know’ their customers. The main requirements
of the Know Your Customer (KYC) principles are geared towards designing
and implementation of appropriate policies and procedures for customer
identification and for effective transactions monitoring particularly of high
risk accounts by financial institutions.
The Kenyagovernment hasintiated additionalmeasures to combatmoney launderingand terrorismfinancing
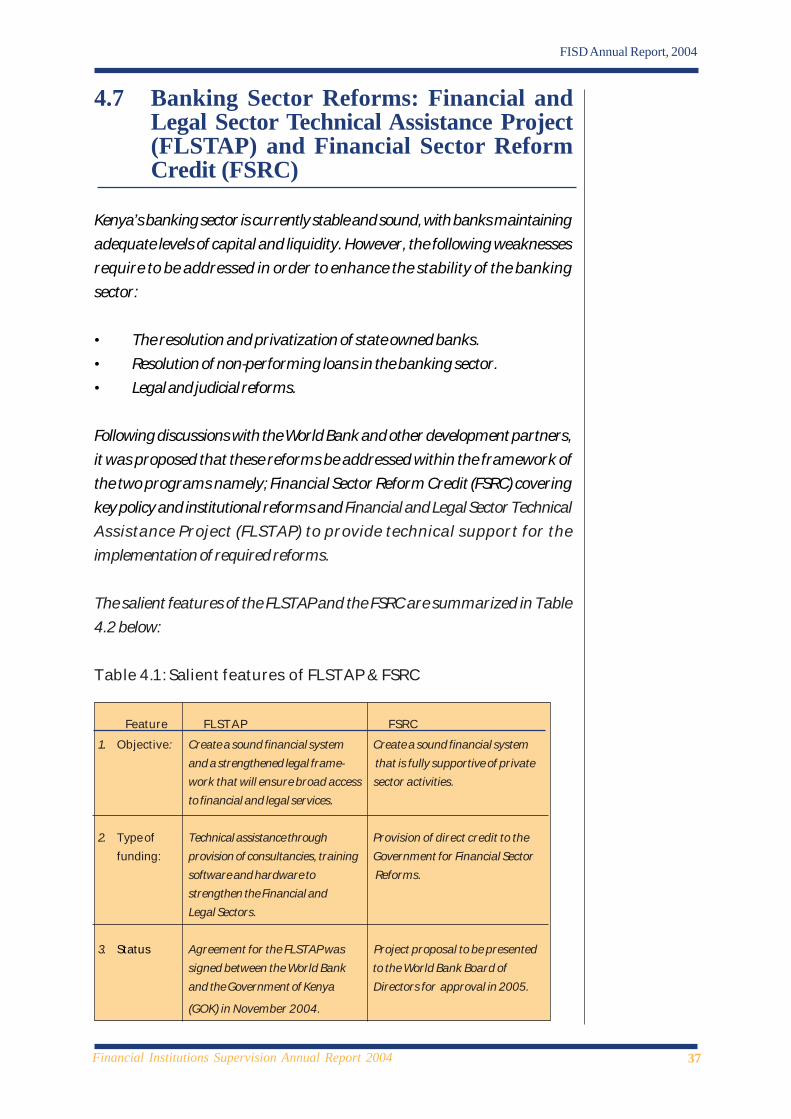
37Financial Institutions Supervision Annual Report 2004
FISD Annual Report, 2004
4.7 Banking Sector Reforms: Financial andLegal Sector Technical Assistance Project(FLSTAP) and Financial Sector ReformCredit (FSRC)
Kenya’s banking sector is currently stable and sound, with banks maintaining
adequate levels of capital and liquidity. However, the following weaknesses
require to be addressed in order to enhance the stability of the banking
sector:
• The resolution and privatization of state owned banks.
• Resolution of non-performing loans in the banking sector.
• Legal and judicial reforms.
Following discussions with the World Bank and other development partners,
it was proposed that these reforms be addressed within the framework of
the two programs namely; Financial Sector Reform Credit (FSRC) covering
key policy and institutional reforms and Financial and Legal Sector Technical
Assistance Project (FLSTAP) to provide technical support for the
implementation of required reforms.
The salient features of the FLSTAP and the FSRC are summarized in Table
4.2 below:
Table 4.1: Salient features of FLSTAP & FSRC
Feature FLSTAP FSRC
1. Objective: Create a sound financial system Create a sound financial system
and a strengthened legal frame- that is fully supportive of private
work that will ensure broad access sector activities.
to financial and legal services.
2. Type of Technical assistance through Provision of direct credit to the
funding: provision of consultancies, training Government for Financial Sector
software and hardware to Reforms.
strengthen the Financial and
Legal Sectors.
3. Status Agreement for the FLSTAP was Project proposal to be presented
signed between the World Bank to the World Bank Board of
and the Government of Kenya Directors for approval in 2005.
(GOK) in November 2004.
38Financial Institutions Supervision Annual Report 2004
FISD Annual Report, 2004
4.8 International and Regional SupervisoryInitiatives
The Central Bank continued to participate in international and regional
supervisory initiatives that impact on supervisory policies and practices.
4.8.1 World Bank and IMFThe report of the joint IMF/World Bank Financial Sector Assessment Program
(FSAP) carried out in October 2003 was formally released in early 2004 and
the Central Bank continued to address issues highlighted in the report. The
issues included the following:
• Amendments to the Banking Act to allow for independence of the
Central Bank and vetting of significant shareholders;
• Introduction of Risk Based Supervision;
• Revision of prudential guidelines on asset classification;
• Capacity building for staff involved in supervision of financial institution;
• Enhancing enforcement actions on banks that fail to comply with legal
and prudential guidelines
• Continuation of efforts to introduce Anti Money Laundering legislative
framework
4.8.2 The Basel Committee on Banking Supervision
• International Convergence of Capital Measurement and Capital
Standards (Basel II)
In June 2004, the Governor attended, under observer status, the G10 Central
Bank Governors’ forum under the auspices of the Bank for International
Settlements (BIS). The forum endorsed the revised framework on
International Convergence of Capital Measurement and Capital Standards,
leading to its issuance on June 26, 2004.
• FSI Connect
The Financial Stability Institute, which operates under the auspices of the
BIS, launched an e-learning tool referred to as FSI Connect. The tool has
been designed to provide bank supervisors with effective skills development
Report on FinancialSector AssessmentProgram released
Central Banksubscribes for fivepilot users for e-learning tool, FSI(Financial StabilityInstitute)E-connect
39Financial Institutions Supervision Annual Report 2004
FISD Annual Report, 2004
on the Basel II framework. During the year the bank implemented a pilot
subscription for five users.
4.8.3 The Macroeconomic and Financial Management Institute of
Eastern and Southern Africa (MEFMI)
MEFMI is a regionally owned institute with 12 member countries currently:
Angola, Botswana, Kenya, Lesotho, Malawi, Mozambique, Namibia,
Swaziland, Tanzania, Uganda, Zambia and Zimbabwe. Its main objectives
include:
• Building sustainable capacity in identified key areas in Central Banks,
Ministries of Finance and Economic Planning
• Fostering best practices
• Bringing emerging risks and opportunities to the fore among
executive level officials.
MEFMI has since its formation in 1997 dedicated itself to its mandate of
capacity building in debt management, macroeconomic management, and
financial management. Kenya joined MEFMI in 2003 and first participated in
its training programmes in 2004. Four members of staff are pursuing the
MEFMI fellowship program.
4.8.4 The Common Market for East and Southern Africa (COMESA)In November 2004, Committee of COMESA Central Bank Governors
meeting in Lusaka, Zambia, resolved to fast-track the process to have a
Monetary Union in place by 2018. Among the convergence criteria adopted
was the implementation of the 25 Basel Core Principles for Effective Banking
Supervision.
4.8.5 The Monetary Affairs Committee (MAC) of the East AfricanCommunity
The Governors of the three East African Central Banks met in Tanzania,
Arusha in March 2004 within the framework of the Monetary Affairs
Committee (MAC), and made the following decisions relating to the
harmonization of banking supervision within the three East African countries:
• Monitoring progress in performance of commercial courts;
• Speeding up of the development of anti-money laundering legislation;
• Draft legislation on regulation of microfinance institutions;
Central Bankpaticipated inMEFMI in 2004
Harmonisation ofbanking supervisiondiscussed within theframework ofMonetary AffairsCommittee (MAC)
40Financial Institutions Supervision Annual Report 2004
FISD Annual Report, 2004
• Promotion of Credit Reference Bureaus;
• Reviewing the proposal for a policy towards a consolidated financial
services regulatory framework
• Defining the role of Central Bank in licensing and revocation of licences
of financial institutions
• Reviewing best practices in recovery of NPLs
• Revising the best approach towards implementation of the New Basle
Capital Accord.
Efforts were made during the year to promote harmonisation in these areas.
This included a regional workshop on implementation of Basel II held in
Bagamoyo, Tanzania in July 2004.
4.9 Deployment of the Bank SupervisionApplication (BSA)
The Banking Supervision Application (BSA) System, is an Information and
Communication Technology (ICT) solution developed to automate banking
supervision workflows and risk analysis within the East and Southern African
Central banks. The system was deployed by the Central Bank of Kenya
between November 2004 and January 2005 and was the 9th central bank
within the region to deploy the solution.
The benefits of the BSA solution are as follows:
• The BSA is an intergrated ICT solution that automates all supervisory
processes and risk analysis and thus greatly reduces the time taken to
conduct analysis and produce management reports. The system does
not require collecting of information from individual computers.
• The BSA has a facility for automated data capturing and validation from
financial institutions that ensures timely and accurate data.
• The BSA provides powerful analysis tools for reports and graphs that
enable supervisors to spend more time on data analysis rather than
data preparation.
• The BSA is based on a powerful database management system that is
unlikely to become unstable with data growth.
Central Bankdeployed BSA inNovember 2004

41Financial Institutions Supervision Annual Report 2004
FISD Annual Report, 2004
• The system is built on a workflow concept that provides a mechanism
for tracking tasks and is therefore a useful management tool.
• The shared cost of the BSA enabled all participarting central banks to
acquire the solution at a minimal cost.
• Above all, the BSA provides the basis for the implementation of
harmonised banking supervision in the East Africa and SADC region
that is a powerful tool in minimising systemic risks within the central
banks in the region.
The BSA deployment process kicked off on November 1, 2004 with a
Stakeholders Meeting and the User Requirements Definition Workshop which
was attended by delegates from Uganda. During the User Requirements
Workshop, staff from the Financial Institutions Supervision Department
defined supervision workflows and identified the relevant approval levels
and proccesses to facilitate mapping of the workflows in the system. This
was followed by the installation of servers, setting up of client machines,
configuration of returns and reports, benchmarks and training of both system
users and administrators. A test environment was set up and and the system
was rolled out to users in January 2005. Currently the system is under testing
and operated on a parallel-run basis in preparation for going live once users
are fully conversant with it and other operational handcups have been
resolved.
Bank staff have been trained to provide first level support under the general
guidance of the BSA Support Office in South Africa.
Future enhancements to the system will be discussed by users and system
administrators drawn from member central banks that have deployed the
solution. The BSA User Group has been mandated to oversee and co-
ordinate all BSA user activities to effectively apply and upgrade the solution
at the central banks that have deployed the solution. The BSA User Group is
scheduled to meet bi-annually and advise on the new change requests and
enhancements for the application.

42Financial Institutions Supervision Annual Report 2004
FISD Annual Report, 2004
Appendix 1
Audited Banking Sector Balance Sheet As at December 2003 & December 2004
Ksh. mn
Banks NBFIS Sub % BLD Total % Growth Banks NBFIS Sub BLD TotalTotal Society Total Society
A. ASSETS1. Cash 10,164 70 10,234 2% 64 10,298 2% 6% 9,373 65 9,438 250 9,6882. Balances at CBK 32,653 114 32,767 6% - 32,767 6% 34% 24,292 116 24,408 0 24,4083. Placements 10,932 1,427 12,359 2% 1,223 13,582 2% 10% 7,334 2,431 9,765 2,565 12,3304. Government Securities 110,617 3,371 113,988 20% 2,006 115,994 20% -19% 137,030 3,497 140,527 2,522 143,0495. Investments 4,480 124 4,604 1% 452 5,056 1% 11% 3,948 94 4,042 513 4,5556. Advances(net) 242,714 9,879 252,593 44% 2,120 254,713 44% 29% 184,111 10,118 194,229 3,285 197,5147. Foreign Loans 47,144 34 47,178 8% - 47,178 8% 9% 43,187 - 43,187 0 43,1877.(b) Other foreign Assets 42,679 63 42,742 8% - 42,742 7% 59% 26,692 63 26,755 120 26,8758. Fixed Assets 16,483 336 16,819 3% 1,142 17,961 3% 5% 15,395 335 15,730 1,403 17,1339. Other Assets 35,842 635 36,477 6% 881 37,358 6% 1% 35,662 734 36,396 664 37,060
10. Total Assets 553,708 16,053 569,761 100% 7,888 577,649 100% 12% 487,024 17,453 504,477 11,322 515,799
B. LIABILITIES11. Local Currency Deposits 365,804 12,947 378,751 66% 6,353 385,104 67% 8% 332,146 14,452 346,598 9,359 355,95712. Foreign Currency Deposits 79,429 - 79,429 14% - 79,429 14% 35% 58,884 - 58,884 0 58,88413. Accrued Interest 929 57 986 0% 53 1,039 0% -8% 983 83 1,066 65 1,13114. Foreign Liabilities 11,225 - 11,225 2% - 11,225 2% 135% 4,772 - 4,772 0 4,77215. Other Liabilities 30,928 732 31,660 6% 363 32,023 6% -6% 32,951 711 33,662 400 34,062
16. Total Liabilities 488,315 13,736 502,051 88% 6,769 508,820 88% 12% 429,736 15,246 444,982 9,824 454,806 17. Net Assets/(Liabilities) 65,393 2,317 67,710 12% 1,119 68,829 12% 13% 57,288 2,207 59,495 1,498 60,993
C. CAPITAL & RESERVES18. Paid up/Assigned Capital 40,472 1,475 41,947 7% 350 42,297 7% 9% 36,859 1,531 38,390 413 38,80319. Shareholders Loans/Grants 746 - 746 0% - 746 0% -34% 1,127 - 1,127 0 1,12720. Reserves 20,497 463 20,960 4% 680 21,640 4% 51% 13,035 383 13,418 950 14,36821. P & L Account 3,678 379 4,057 1% 89 4,146 1% -38% 6,267 293 6,560 135 6,69522. Total Shareholders' Funds 65,393 2,317 67,710 12% 1,119 68,829 12% 13% 57,288 2,207 59,495 1,498 60,993
23. Contingent Liabilities 89,413 3 89,416 - 89,416 36% 65,898 7 65,905 2 65,907 24. Gross Loans 364,405 14,758 379,163 3,127 382,290 21% 295,830 15,302 311,132 4,189 315,32125. Total Loans 329,521 10,723 340,244 2,737 342,981 24% 261,949 10,903 272,852 3,881 276,733 26. Gross Non-Performing Loans 101,971 8,416 110,387 1,502 111,889 2% 98,887 9,283 108,170 1728 109,898 27. Total Non-performing loans 67,087 4,381 71,468 1,112 72,580 2% 65,006 4,884 69,890 1,420 71,31028. Interest in suspense 34,884 4,035 38,919 390 39,309 2% 33,881 4,399 38,280 308 38,588 29. Specific Provisions 36,593 749 37,342 598 37,940 13% 32,145 725 32,870 565 33,435 30. General Provisions 3,070 61 3,131 19 3,150 21% 2,506 60 2,566 31 2,597 31. Total Provisions 39,663 810 40,473 617 41,090 14% 34,651 785 35,436 596 36,032 32. Gross Provisions 74,547 4,845 79,392 1,007 80,399 8% 68,532 5,184 73,716 904 74,620 33. Accum. Depreciation 16,087 336 16,423 218 16,641 14% 13,991 423 14,414 218 14,632
Dec-03Dec-04
35. Total Capital 65,077 2,316 67,393 705 65,782 19% 54,549 2,186 56,735 937 55,486 36. Total Risk Weighted Assets 380,639 11,538 392,177 4,679 396,857 19% 316,290 11,784 328,074 6,405 334,480 D. PERFORMANCE INDICATORS
37. Capital/Deposits Ratio 14.7% 17.8% 14.7% 17.5% 14.8% 14.6% 15.2% 14.6% 15.9% 14.7%
38. Capital/Assets Ratio (Unweighted) 10.2% 14.4% 10.3% 14.2% 10.3% 10.4% 12.6% 10.4% 13.2% 10.5%
39. Core Capital/TRWA 16.2% 18.7% 16.2% 13.2% 16.2% 16.2% 17.2% 16.3% 13.5% 16.2%
40. Total Capital/TRWA 17.1% 20.1% 17.2% 15.1% 16.6% 17.2% 18.6% 17.3% 14.6% 16.6%
41. Core Capital/Total Depoists 13.8% 16.7% 13.9% 9.7% 13.8% 13.1% 14.0% 13.2% 9.2% 13.1%
42. Liquidity Ratio 42.4% 36.3% 50.6% 47.8% 48.2% 49.2% 39.4% 48.8% 47.8% 48.2%43. Gross Prov/Gross Non-perf Loans 73.1% 57.6% 71.9% 67.0% 71.9% 69.3% 55.8% 68.1% 52.3% 67.9%44. Gross Non-perf.Adv/Gross Loans 28.0% 57.0% 29.1% 48.0% 29.3% 33.4% 60.7% 34.8% 41.3% 34.9%45. Total NPLs/Total Loans (27/25) 20.4% 40.9% 21.0% 40.6% 21.2% 24.8% 44.8% 25.6% 36.6% 25.8%46. (Total NPLs-S/Prov.)/Net Loans 7.5% 24.2% 8.2% 15.8% 8.2% 10.3% 26.8% 11.1% 19.7% 11.2%47. Gross Loans/Deposits Ratio 81.7% 113.5% 82.6% 48.8% 82.1% 75.5% 105.3% 76.5% 44.5% 75.8%48. Gross Provisions/Gross Loans 20.5% 32.8% 20.9% 32.2% 21.0% 23.2% 33.9% 23.7% 21.6% 23.7%49. Total Provisions/Total Loans 12.0% 7.6% 11.9% 22.5% 12.0% 13.2% 7.2% 13.0% 15.4% 13.0%50. Total NPL's/Total Assets 12.1% 27.3% 12.5% 14.1% 12.6% 13.3% 28.0% 13.9% 12.5% 13.8%
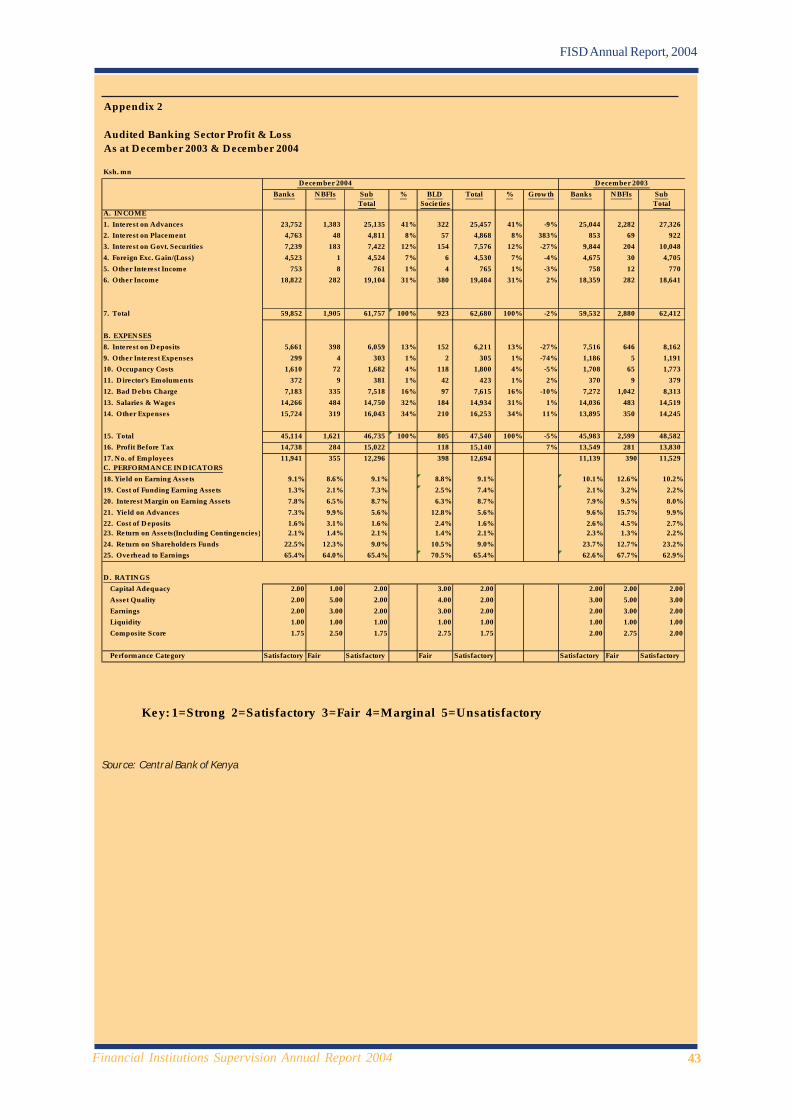
43Financial Institutions Supervision Annual Report 2004
FISD Annual Report, 2004
Appendix 2
Audited Banking Sector Profit & Loss As at December 2003 & December 2004
Ksh. mn December 2004 December 2003
Banks NBFIs Sub % BLD Total % Growth Banks NBFIs SubTotal Societies Total
A. INCOME1. Interest on Advances 23,752 1,383 25,135 41% 322 25,457 41% -9% 25,044 2,282 27,326 2. Interest on Placement 4,763 48 4,811 8% 57 4,868 8% 383% 853 69 922 3. Interest on Govt. Securities 7,239 183 7,422 12% 154 7,576 12% -27% 9,844 204 10,048 4. Foreign Exc. Gain/(Loss) 4,523 1 4,524 7% 6 4,530 7% -4% 4,675 30 4,705 5. Other Interest Income 753 8 761 1% 4 765 1% -3% 758 12 770 6. Other Income 18,822 282 19,104 31% 380 19,484 31% 2% 18,359 282 18,641
7. Total 59,852 1,905 61,757 100% 923 62,680 100% -2% 59,532 2,880 62,412
B. EXPENSES8. Interest on Deposits 5,661 398 6,059 13% 152 6,211 13% -27% 7,516 646 8,162 9. Other Interest Expenses 299 4 303 1% 2 305 1% -74% 1,186 5 1,191 10. Occupancy Costs 1,610 72 1,682 4% 118 1,800 4% -5% 1,708 65 1,773 11. Director's Emoluments 372 9 381 1% 42 423 1% 2% 370 9 379 12. Bad Debts Charge 7,183 335 7,518 16% 97 7,615 16% -10% 7,272 1,042 8,313 13. Salaries & Wages 14,266 484 14,750 32% 184 14,934 31% 1% 14,036 483 14,519 14. Other Expenses 15,724 319 16,043 34% 210 16,253 34% 11% 13,895 350 14,245
15. Total 45,114 1,621 46,735 100% 805 47,540 100% -5% 45,983 2,599 48,582 16. Profit Before Tax 14,738 284 15,022 118 15,140 7% 13,549 281 13,830 17. No. of Employees 11,941 355 12,296 398 12,694 11,139 390 11,529 C. PERFORMANCE INDICATORS18. Yield on Earning Assets 9.1% 8.6% 9.1% 8.8% 9.1% 10.1% 12.6% 10.2%19. Cost of Funding Earning Assets 1.3% 2.1% 7.3% 2.5% 7.4% 2.1% 3.2% 2.2%20. Interest Margin on Earning Assets 7.8% 6.5% 8.7% 6.3% 8.7% 7.9% 9.5% 8.0%21. Yield on Advances 7.3% 9.9% 5.6% 12.8% 5.6% 9.6% 15.7% 9.9%22. Cost of Deposits 1.6% 3.1% 1.6% 2.4% 1.6% 2.6% 4.5% 2.7%23. Return on Assets(Including Contingencies) 2.1% 1.4% 2.1% 1.4% 2.1% 2.3% 1.3% 2.2%24. Return on Shareholders Funds 22.5% 12.3% 9.0% 10.5% 9.0% 23.7% 12.7% 23.2%25. Overhead to Earnings 65.4% 64.0% 65.4% 70.5% 65.4% 62.6% 67.7% 62.9%
D. RATINGS Capital Adequacy 2.00 1.00 2.00 3.00 2.00 2.00 2.00 2.00 Asset Quality 2.00 5.00 2.00 4.00 2.00 3.00 5.00 3.00 Earnings 2.00 3.00 2.00 3.00 2.00 2.00 3.00 2.00 Liquidity 1.00 1.00 1.00 1.00 1.00 1.00 1.00 1.00 Composite Score 1.75 2.50 1.75 2.75 1.75 2.00 2.75 2.00
Performance Category Satisfactory Fair Satisfactory Fair Satisfactory Satisfactory Fair Satisfactory
Key: 1=Strong 2=Satisfactory 3=Fair 4=Marginal 5=Unsatisfactory
Source: Central Bank of Kenya

44Financial Institutions Supervision Annual Report 2004
FISD Annual Report, 2004
Appendix 3
Market Share: ( Net Assets, Net Advances, Deposits, Capital & Profits). Dec. 2004
Ksh.Mn.No Name of Total Net Market Net Market Total Market Capital & Market Pre-Tax Market
Institution Assets Share Advamces Share Deposits Share Reserves Share Pre-Tax Share
1 Barclays Bank of Kenya Ltd 107,530 19.4 63,187 21.8 82,583 18.6 12,485 19.1 5,413 36.7
2 Standard Chartered Bank Ltd 67,306 12.2 26,557 9.2 56,971 12.8 5,419 8.3 2,691 18.3
3 Kenya Commercial Bank Ltd 66,536 12.0 33,644 11.6 54,560 12.3 7,978 12.2 1,076 7.3
4 Co-operative Bank of Kenya 46,476 8.4 27,009 9.3 39,486 8.9 3,299 5.0 354 2.4
5 National Bank of Kenya Ltd 30,594 5.5 22,302 7.7 25,470 5.7 2,625 4.0 743 5.0
6 Citibank, N.A. 25,129 4.5 9,595 3.3 20,001 4.5 3,510 5.4 356 2.4
7 Commercial Bank of Africa 20,176 3.6 5,305 1.8 17,774 4.0 1,812 2.8 416 2.8
8 CFC Bank Limited 17,727 3.2 10,940 3.8 14,268 3.2 1,702 2.6 354 2.4
9 National Industrial Credit Bank 16,636 3.0 11,307 3.9 12,788 2.9 2,644 4.0 373 2.5
10 Investment & Mortgages Bank 14,912 2.7 8,198 2.8 12,554 2.8 1,721 2.6 372 2.5
11 Stanbic Bank Kenya Limited 11,479 2.1 6,991 2.4 8,092 1.8 1,771 2.7 154 1.0
12 Diamond Trust Bank Kenya 11,037 2.0 7,137 2.5 9,203 2.1 1,223 1.9 193 1.3
13 First American Bank Limited 8,928 1.6 5,088 1.8 7,500 1.7 1,325 2.0 214 1.5
14 Bank of Baroda 8,355 1.5 2,692 0.9 7,130 1.6 969 1.5 65 0.4
15 Equity Bank Limited 6,707 1.2 2,874 1.0 5,074 1.1 1,271 1.9 218 1.5
16 Bank of India 6,138 1.1 1,522 0.5 4,935 1.1 959 1.5 123 0.8
17 Fina Bank Limited 5,948 1.1 2,718 0.9 5,021 1.1 786 1.2 -51 -0.3
18 Imperial Bank Limited 5,814 1.1 3,870 1.3 4,662 1.1 876 1.3 268 1.8
19 Prime Bank Limited 5,709 1.0 2,612 0.9 4,737 1.1 670 1.0 103 0.7
20 Bank of Africa 4,945 0.9 3,053 1.1 3,964 0.9 649 1.0 -32 -0.2
21 Giro Commercial Bank 4,744 0.9 3,027 1.0 4,137 0.9 431 0.7 14 0.1
22 Habib AG Zurich 4,453 0.8 1,039 0.4 3,763 0.9 448 0.7 56 0.4
23 Akiba Bank Ltd 4,210 0.8 2,541 0.9 3,169 0.7 604 0.9 -62 -0.4
24 African Banking Corporation 4,188 0.8 2,065 0.7 3,446 0.8 504 0.8 114 0.8
25 Guardian Bank 4,112 0.7 2,876 1.0 3,261 0.7 715 1.1 119 0.8
26 Middle East Bank of Kenya 3,983 0.7 1,608 0.6 3,146 0.7 713 1.1 36 0.2
27 Southern Credit Banking Corp. 3,848 0.7 1,972 0.7 3,203 0.7 504 0.8 61 0.4
28 Victoria Commercial Bank Ltd 3,620 0.7 1,877 0.7 3,049 0.7 507 0.8 45 0.3
29 Charterhouse Bank Limited 3,407 0.6 1,751 0.6 2,820 0.6 503 0.8 43 0.3
30 Habib Bank Limited 3,368 0.6 872 0.3 2,767 0.6 413 0.6 92 0.6
31 Equatorial Commercial Bank 2,873 0.5 1,750 0.6 2,294 0.5 508 0.8 103 0.7
32 Consolidated Bank of Kenya 2,767 0.5 1,129 0.4 1,907 0.4 565 0.9 -71 -0.5
33 K-REP BANK 2,710 0.5 2,044 0.7 1,602 0.4 757 1.2 110 0.7
34 Credit Bank Limited 2,708 0.5 1,352 0.5 2,252 0.5 419 0.6 47 0.3
35 Development Bank of Kenya 2,391 0.4 647 0.2 620 0.1 934 1.4 94 0.6

45Financial Institutions Supervision Annual Report 2004
FISD Annual Report, 2004
36 Transnational Bank Limited 2,342 0.4 867 0.3 1,229 0.3 1,009 1.5 1,035 7.0
37 Chase Bank Limited 2,086 0.4 1,280 0.4 1,452 0.3 526 0.8 -92 -0.6
38 Oriental Commercial Bank 1,630 0.3 544 0.2 638 0.1 388 0.6 -369 -2.5
39 Fidelity Commercial Bank 1,587 0.3 1,087 0.4 1,277 0.3 262 0.4 2 0.0
40 Industrial Development Bank 1,398 0.3 1,092 0.4 212 0.1 184 0.3 -90 -0.6
41 Paramount-Universal Bank 1,328 0.2 758 0.3 997 0.2 292 0.5 12 0.1
42 Dubai Bank Limited 926 0.2 550 0.2 475 0.1 373 0.6 31 0.2
43 City Finance Bank 543 0.1 308 0.1 74 0.0 417 0.6 11 0.1
44 Daima Bank Limited 403 0.1 218 0.1 669 0.2 -276 -0.4 -3 0.0TOTAL 553,707 100.0 289,855 100.0 445,232 100.0 65,394 100.0 14,739 100.0
NBFI's
1 Housing Finance Co. of Kenya 9,489 59.1 6,617 66.8 8,012 61.9 1,080 46.6 99 40.7
2 Savings & Loan (K) Ltd 3,858 24.0 1,982 20.0 2,984 23.1 533 23.0 19 7.7
3 Prime Capital and Credit Ltd. 2,704 16.9 1,313 13.3 1,950 15.1 704 30.4 125 51.6
TOTAL 16,051 100.0 9,912 100.0 12,946 100.0 2,317 100.0 242 100.0
BUILDING SOCIETIES
1 East African Building Society 5,610 72.2 1,142 53.9 4,514 71.1 751 74.6 18.0 16.5
2 Family Finance Building Society 2,193 27.6 978 46.1 1,839 28.9 285 25.4 90.9 83.5
TOTAL 7,803 99.8 2,120 100.0 6,353 100.0 1,036 100.0 109.0 100.0
Cont...
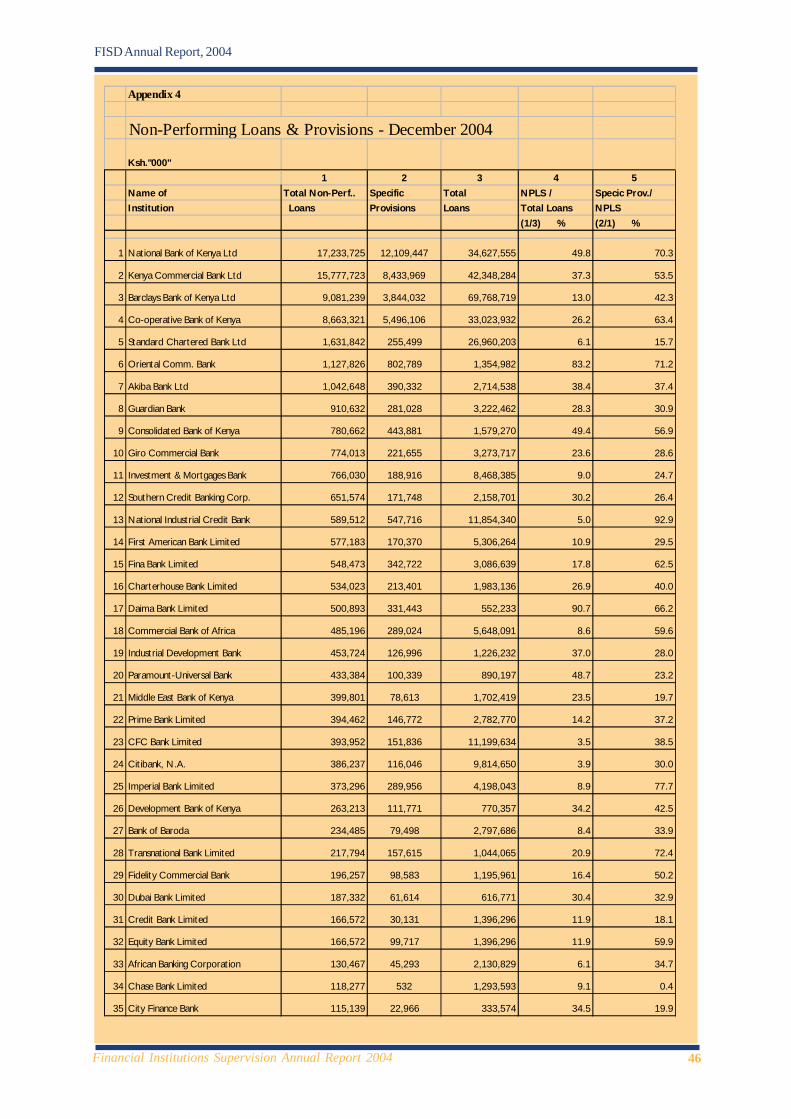
46Financial Institutions Supervision Annual Report 2004
FISD Annual Report, 2004
Appendix 4
Non-Performing Loans & Provisions - December 2004
Ksh."000"1 2 3 4 5
Name of Total Non-Perf.. Specific Total NPLS / Specic Prov./Institution Loans Provisions Loans Total Loans NPLS
(1/3) % (2/1) %
1 National Bank of Kenya Ltd 17,233,725 12,109,447 34,627,555 49.8 70.3
2 Kenya Commercial Bank Ltd 15,777,723 8,433,969 42,348,284 37.3 53.5
3 Barclays Bank of Kenya Ltd 9,081,239 3,844,032 69,768,719 13.0 42.3
4 Co-operative Bank of Kenya 8,663,321 5,496,106 33,023,932 26.2 63.4
5 Standard Chartered Bank Ltd 1,631,842 255,499 26,960,203 6.1 15.7
6 Oriental Comm. Bank 1,127,826 802,789 1,354,982 83.2 71.2
7 Akiba Bank Ltd 1,042,648 390,332 2,714,538 38.4 37.4
8 Guardian Bank 910,632 281,028 3,222,462 28.3 30.9
9 Consolidated Bank of Kenya 780,662 443,881 1,579,270 49.4 56.9
10 Giro Commercial Bank 774,013 221,655 3,273,717 23.6 28.6
11 Investment & Mortgages Bank 766,030 188,916 8,468,385 9.0 24.7
12 Southern Credit Banking Corp. 651,574 171,748 2,158,701 30.2 26.4
13 National Industrial Credit Bank 589,512 547,716 11,854,340 5.0 92.9
14 First American Bank Limited 577,183 170,370 5,306,264 10.9 29.5
15 Fina Bank Limited 548,473 342,722 3,086,639 17.8 62.5
16 Charterhouse Bank Limited 534,023 213,401 1,983,136 26.9 40.0
17 Daima Bank Limited 500,893 331,443 552,233 90.7 66.2
18 Commercial Bank of Africa 485,196 289,024 5,648,091 8.6 59.6
19 Industrial Development Bank 453,724 126,996 1,226,232 37.0 28.0
20 Paramount-Universal Bank 433,384 100,339 890,197 48.7 23.2
21 Middle East Bank of Kenya 399,801 78,613 1,702,419 23.5 19.7
22 Prime Bank Limited 394,462 146,772 2,782,770 14.2 37.2
23 CFC Bank Limited 393,952 151,836 11,199,634 3.5 38.5
24 Citibank, N.A. 386,237 116,046 9,814,650 3.9 30.0
25 Imperial Bank Limited 373,296 289,956 4,198,043 8.9 77.7
26 Development Bank of Kenya 263,213 111,771 770,357 34.2 42.5
27 Bank of Baroda 234,485 79,498 2,797,686 8.4 33.9
28 Transnational Bank Limited 217,794 157,615 1,044,065 20.9 72.4
29 Fidelity Commercial Bank 196,257 98,583 1,195,961 16.4 50.2
30 Dubai Bank Limited 187,332 61,614 616,771 30.4 32.9
31 Credit Bank Limited 166,572 30,131 1,396,296 11.9 18.1
32 Equity Bank Limited 166,572 99,717 1,396,296 11.9 59.9
33 African Banking Corporation 130,467 45,293 2,130,829 6.1 34.7
34 Chase Bank Limited 118,277 532 1,293,593 9.1 0.4
35 City Finance Bank 115,139 22,966 333,574 34.5 19.9
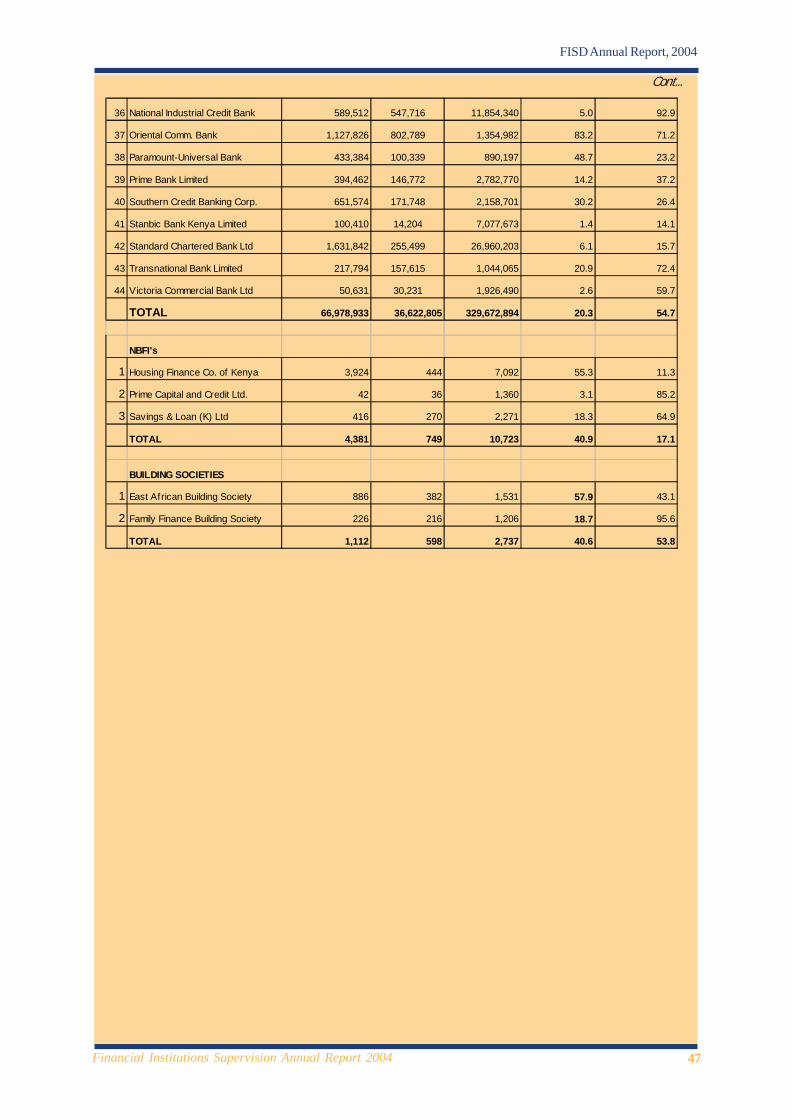
47Financial Institutions Supervision Annual Report 2004
FISD Annual Report, 2004
36 National Industrial Credit Bank 589,512 547,716 11,854,340 5.0 92.9
37 Oriental Comm. Bank 1,127,826 802,789 1,354,982 83.2 71.2
38 Paramount-Universal Bank 433,384 100,339 890,197 48.7 23.2
39 Prime Bank Limited 394,462 146,772 2,782,770 14.2 37.2
40 Southern Credit Banking Corp. 651,574 171,748 2,158,701 30.2 26.4
41 Stanbic Bank Kenya Limited 100,410 14,204 7,077,673 1.4 14.1
42 Standard Chartered Bank Ltd 1,631,842 255,499 26,960,203 6.1 15.7
43 Transnational Bank Limited 217,794 157,615 1,044,065 20.9 72.4
44 Victoria Commercial Bank Ltd 50,631 30,231 1,926,490 2.6 59.7
TOTAL 66,978,933 36,622,805 329,672,894 20.3 54.7
NBFI's
1 Housing Finance Co. of Kenya 3,924 444 7,092 55.3 11.3
2 Prime Capital and Credit Ltd. 42 36 1,360 3.1 85.2
3 Savings & Loan (K) Ltd 416 270 2,271 18.3 64.9
TOTAL 4,381 749 10,723 40.9 17.1
BUILDING SOCIETIES
1 East African Building Society 886 382 1,531 57.9 43.1
2 Family Finance Building Society 226 216 1,206 18.7 95.6
TOTAL 1,112 598 2,737 40.6 53.8
Cont...

48Financial Institutions Supervision Annual Report 2004
FISD Annual Report, 2004
Appendix 5
PROFITABILITY OF BANKING INSTITUTIONS FOR THE YEAR 2004Ksh.Mn.
1 2 3 4 5
PROFIT BEFORE RETURN ON ASSETS RETURN ON EQUITY
NO BANKS TAX TOTAL ASSETS RETURN ON SHAREHOLDERS RETURN ONASSETS EQUITY EQUITY( 1/2 ) % ( 1/4 ) %
1 Barclays Bank of Kenya Ltd 5,413 115,800 4.67% 12,485 43.36
2 Standard Chartered Bank Ltd 2,691 70,310 3.83% 5,419 49.66
3 Kenya Commercial Bank Ltd 1,076 81,797 1.32% 7,978 13.49
4 Transnational Bank Ltd. 1,035 2,832 36.54% 1,009 102.57
5 National Bank of Kenya Ltd 743 59,727 1.24% 2,625 28.32
6 Commercial Bank of Africa Ltd. 416 21,394 1.94% 1,812 22.95
7 National Industrial Credit Bank Ltd. 373 17,549 2.12% 2,644 14.09
8 Investment & Mortgages Bank Ltd. 372 15,664 2.37% 1,721 21.61
9 Citibank, N.A. 356 26,043 1.37% 3,510 10.14
10 CFC Bank Ltd. 354 18,474 1.91% 1,702 20.77
11 Co-operative Bank of Kenya Ltd. 354 62,088 0.57% 3,299 10.72
12 Bank of Baroda 274 8,654 3.17% 969 28.28
13 Imperial Bank Ltd. 268 6,286 4.26% 876 30.56
14 Equity Bank Ltd. 218 7,161 3.05% 1,271 17.17
15 First American Bank Ltd. 214 9,630 2.23% 1,325 16.18
16 Diamond Trust Bank Kenya Ltd. 193 11,691 1.65% 1,223 15.77
17 Stanbic Bank Kenya Ltd. 154 11,959 1.29% 1,771 8.70
18 Bank of India 123 6,342 1.94% 959 12.82
19 Guardian Bank Ltd. 119 4,851 2.44% 715 16.58
20 African Banking Corporation Ltd. 114 4,321 2.64% 504 22.60
21 K-Rep Bank Ltd. 110 2,851 3.87% 757 14.57
22 Equatorial Commercial Bank Ltd. 103 3,023 3.42% 508 20.34
23 Prime Bank Ltd. 103 6,006 1.71% 670 15.33
24 Development Bank of Kenya Ltd. 94 2,780 3.36% 934 10.02
25 Habib Bank Ltd. 92 3,453 2.65% 413 22.17
26 Southern Credit Banking Corp. Ltd. 61 4,453 1.37% 504 12.07
27 Habib AG Zurich 56 4,596 1.22% 448 12.50
28 Credit Bank Ltd. 47 2,708 1.74% 419 11.24
29 Victoria Commercial Bank Ltd 45 3,750 1.21% 507 8.92
30 Charterhouse Bank Ltd. 43 3,773 1.14% 503 8.57
31 Middle East Bank of Kenya Ltd. 36 4,366 0.81% 713 4.98
32 Dubai Bank Ltd. 31 1,146 2.70% 373 8.28
33 Giro Commercial Bank Ltd. 14 5,166 0.27% 431 3.25
34 Paramount-Universal Bank Ltd. 12 2,048 0.58% 292 4.06

49Financial Institutions Supervision Annual Report 2004
FISD Annual Report, 2004
Cont...
35 City Finance Bank Ltd. 11 624 1.77% 417 2.64
36 Fidelity Commercial Bank Ltd. 2 1,776 0.10% 262 0.65
37 Daima Bank Ltd. -3 1,060 -0.24% -276 0.91
38 Bank of A f rica -32 5,188 -0.62% 649 (4.95)
39 Fina Bank Ltd. -51 6,564 -0.78% 786 (6.49)
40 Akiba Bank Ltd -62 5,009 -1.24% 604 (10.30)
41 Consolidated Bank of Kenya ltd. -71 4,579 -1.55% 565 (12.57)
42 Industrial Development Bank Ltd. -90 1,844 -4.86% 184 (48.74)
43 Chase Bank Ltd. -92 2,128 -4.31% 526 (17.42)
44 Oriental Commercial Bank -369 2,874 -12.83% 388 (95.07)
SUB-TOTAL 14,948 644,338 2.32% 65,394 22.86
NBFI'S
1 Prime Capital & Credit Ltd. 122 2,810 4.33% 704 17.27%
2 Housing Fin. Co. of Kenya Ltd. 99 14,084 0.70% 1,080 9.13%
3 Savings and Loan (K) Ltd. 63 4,429 1.43% 533 11.85%
SUB-TOTAL 283 21,323 1.33% 2,317 12.23%
BUILDING SOCIETIES
1 Family Finace Building Society 91 2,531 3.58% 285 31.81%
2 East A f rican Building Society 27 6,582 0.42% 835 3.29%
SUB-TOTAL 118 9,113 1.30% 1,120 10.55%
GRAND TOTAL 15,350 674,774 2.27% 68,831 22.30%
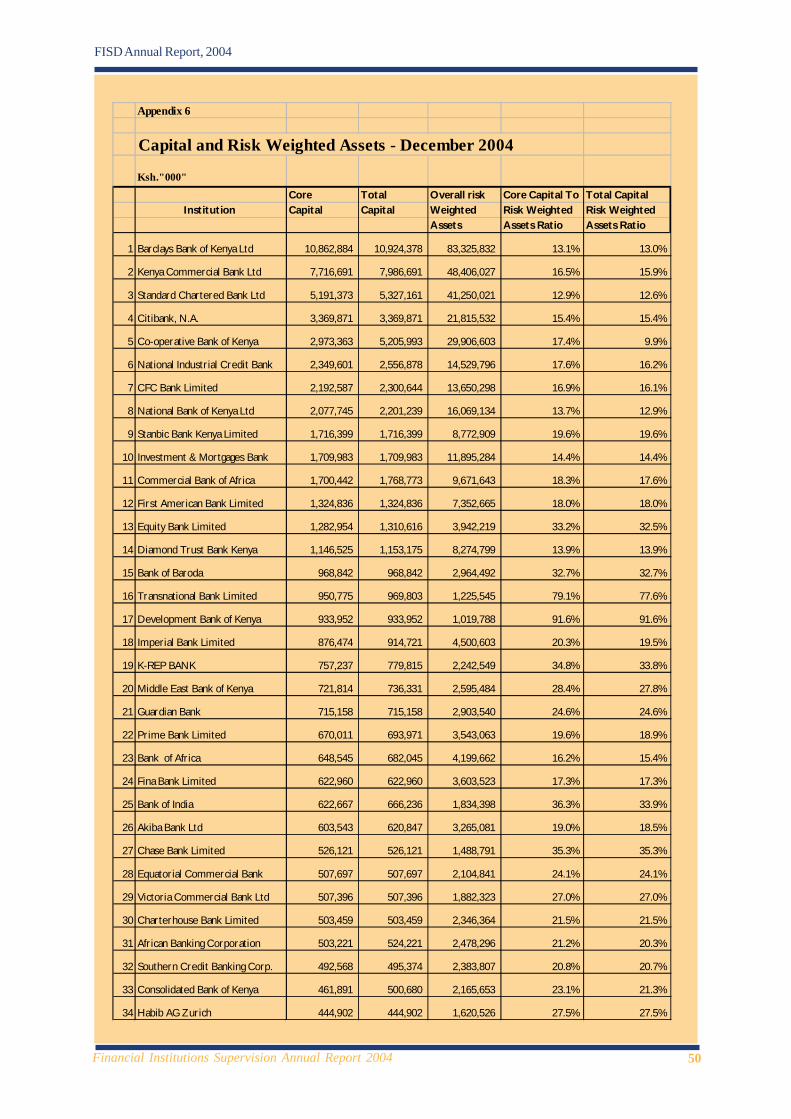
50Financial Institutions Supervision Annual Report 2004
FISD Annual Report, 2004
Appendix 6
Capital and Risk Weighted Assets - December 2004
Ksh."000"
Core Total Overall risk Core Capital To Total Capital Institution Capital Capital Weighted Risk Weighted Risk Weighted
Assets Assets Ratio Assets Ratio
1 Barclays Bank of Kenya Ltd 10,862,884 10,924,378 83,325,832 13.1% 13.0%
2 Kenya Commercial Bank Ltd 7,716,691 7,986,691 48,406,027 16.5% 15.9%
3 Standard Chartered Bank Ltd 5,191,373 5,327,161 41,250,021 12.9% 12.6%
4 Citibank, N.A. 3,369,871 3,369,871 21,815,532 15.4% 15.4%
5 Co-operative Bank of Kenya 2,973,363 5,205,993 29,906,603 17.4% 9.9%
6 National Industrial Credit Bank 2,349,601 2,556,878 14,529,796 17.6% 16.2%
7 CFC Bank Limited 2,192,587 2,300,644 13,650,298 16.9% 16.1%
8 National Bank of Kenya Ltd 2,077,745 2,201,239 16,069,134 13.7% 12.9%
9 Stanbic Bank Kenya Limited 1,716,399 1,716,399 8,772,909 19.6% 19.6%
10 Investment & Mortgages Bank 1,709,983 1,709,983 11,895,284 14.4% 14.4%
11 Commercial Bank of Africa 1,700,442 1,768,773 9,671,643 18.3% 17.6%
12 First American Bank Limited 1,324,836 1,324,836 7,352,665 18.0% 18.0%
13 Equity Bank Limited 1,282,954 1,310,616 3,942,219 33.2% 32.5%
14 Diamond Trust Bank Kenya 1,146,525 1,153,175 8,274,799 13.9% 13.9%
15 Bank of Baroda 968,842 968,842 2,964,492 32.7% 32.7%
16 Transnational Bank Limited 950,775 969,803 1,225,545 79.1% 77.6%
17 Development Bank of Kenya 933,952 933,952 1,019,788 91.6% 91.6%
18 Imperial Bank Limited 876,474 914,721 4,500,603 20.3% 19.5%
19 K-REP BANK 757,237 779,815 2,242,549 34.8% 33.8%
20 Middle East Bank of Kenya 721,814 736,331 2,595,484 28.4% 27.8%
21 Guardian Bank 715,158 715,158 2,903,540 24.6% 24.6%
22 Prime Bank Limited 670,011 693,971 3,543,063 19.6% 18.9%
23 Bank of Africa 648,545 682,045 4,199,662 16.2% 15.4%
24 Fina Bank Limited 622,960 622,960 3,603,523 17.3% 17.3%
25 Bank of India 622,667 666,236 1,834,398 36.3% 33.9%
26 Akiba Bank Ltd 603,543 620,847 3,265,081 19.0% 18.5%
27 Chase Bank Limited 526,121 526,121 1,488,791 35.3% 35.3%
28 Equatorial Commercial Bank 507,697 507,697 2,104,841 24.1% 24.1%
29 Victoria Commercial Bank Ltd 507,396 507,396 1,882,323 27.0% 27.0%
30 Charterhouse Bank Limited 503,459 503,459 2,346,364 21.5% 21.5%
31 African Banking Corporation 503,221 524,221 2,478,296 21.2% 20.3%
32 Southern Credit Banking Corp. 492,568 495,374 2,383,807 20.8% 20.7%
33 Consolidated Bank of Kenya 461,891 500,680 2,165,653 23.1% 21.3%
34 Habib AG Zurich 444,902 444,902 1,620,526 27.5% 27.5%

51Financial Institutions Supervision Annual Report 2004
FISD Annual Report, 2004
Cont...
35 Giro Commercial Bank 426,101 426,101 2,734,507 15.6% 15.6%
36 Credit Bank Limited 419,041 432,541 1,439,587 30.0% 29.1%
37 City Finance Bank 416,605 416,605 498,410 83.6% 83.6%
38 Habib Bank Limited 413,139 413,139 891,241 46.4% 46.4%
39 Oriental comm bank 375,677 384,098 1,226,593 31.3% 30.6%
40 Dubai Bank Limited 372,674 372,674 873,194 42.7% 42.7%
41 Paramount-Universal Bank 281,919 288,174 837,757 34.4% 33.7%
42 Fidelity Commercial Bank 263,077 263,077 1,241,442 21.2% 21.2%
43 Industrial Development Bank 185,360 185,360 1,428,202 13.0% 13.0%
44 Daima Bank Limited (276,057) (276,057) 237,150 -116.4% -116.4%
TOTAL 61,532,023 65,076,880 380,639,174 16.2 17.1
NBFI's
1 Housing Finance Co. of Kenya 979,455 1,055,312 7,618,720 12.9 13.9
2 Prime Capital and Credit Ltd. 702,416 713,739 1,638,164 42.9 43.6
3 Savings & Loan (K) Ltd 474,715 546,670 2,281,303 20.8 24.0
TOTAL 2,156,586 2,315,721 11,538,187 18.7 20.1
BUILDING SOCIETIES
East Afr ican Building Society 265,415 349,207 3,278,325 8.1 10.7
Family Finance Building Society 253,325 265,438 1,450,109 17.5 18.3
TOTAL 518,740 614,645 4,728,434 11.0 13.0
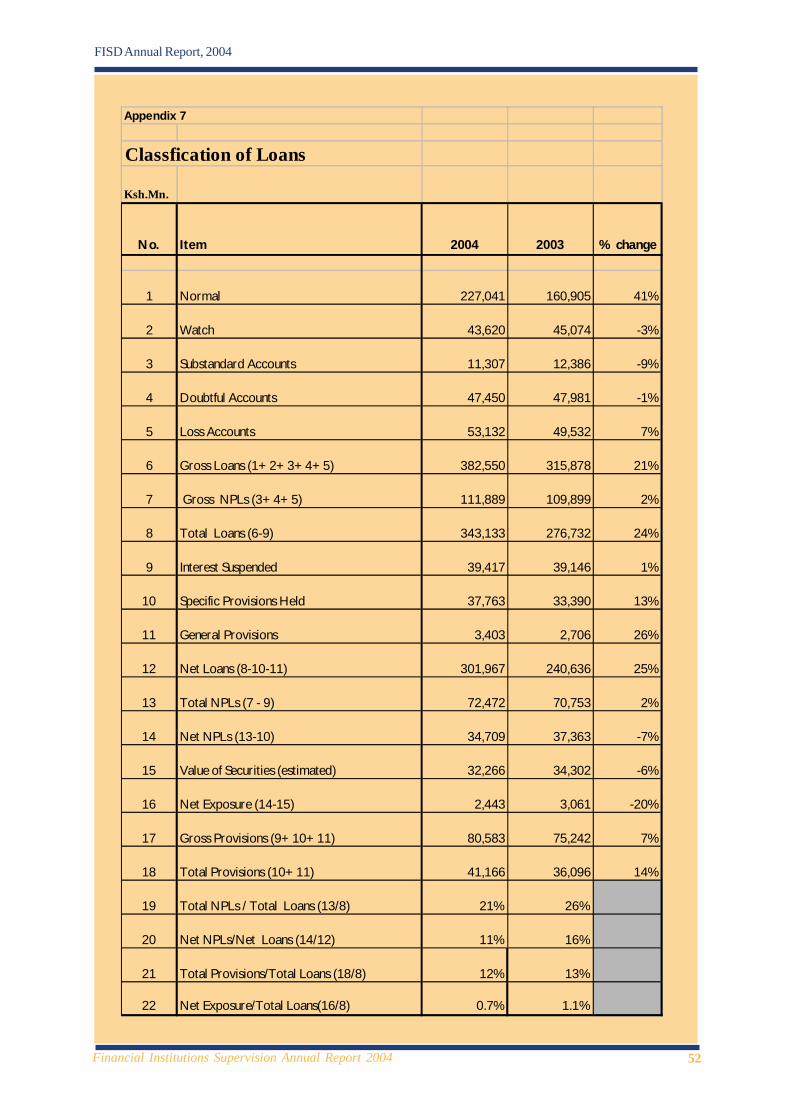
52Financial Institutions Supervision Annual Report 2004
FISD Annual Report, 2004
Appendix 7
Classfication of Loans
Ksh.Mn.
No. Item 2004 2003 % change
1 Normal 227,041 160,905 41%
2 Watch 43,620 45,074 -3%
3 Substandard Accounts 11,307 12,386 -9%
4 Doubtful Accounts 47,450 47,981 -1%
5 Loss Accounts 53,132 49,532 7%
6 Gross Loans (1+ 2+ 3+ 4+ 5) 382,550 315,878 21%
7 Gross NPLs (3+ 4+ 5) 111,889 109,899 2%
8 Total Loans (6-9) 343,133 276,732 24%
9 Interest Suspended 39,417 39,146 1%
10 Specific Provisions Held 37,763 33,390 13%
11 General Provisions 3,403 2,706 26%
12 Net Loans (8-10-11) 301,967 240,636 25%
13 Total NPLs (7 - 9) 72,472 70,753 2%
14 Net NPLs (13-10) 34,709 37,363 -7%
15 Value of Securities (estimated) 32,266 34,302 -6%
16 Net Exposure (14-15) 2,443 3,061 -20%
17 Gross Provisions (9+ 10+ 11) 80,583 75,242 7%
18 Total Provisions (10+ 11) 41,166 36,096 14%
19 Total NPLs / Total Loans (13/8) 21% 26%
20 Net NPLs/Net Loans (14/12) 11% 16%
21 Total Provisions/Total Loans (18/8) 12% 13%
22 Net Exposure/Total Loans(16/8) 0.7% 1.1%
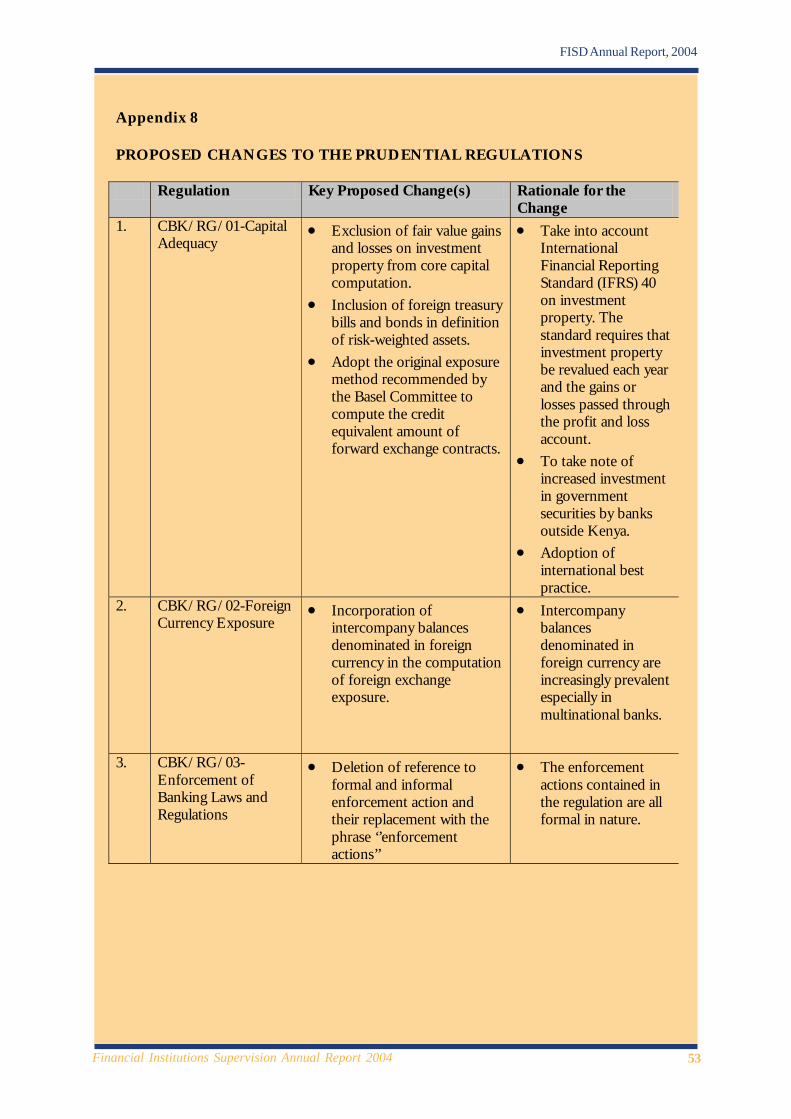
53Financial Institutions Supervision Annual Report 2004
FISD Annual Report, 2004
Appendix 8 PROPOSED CHANGES TO THE PRUDENTIAL REGULATIONS Regulation Key Proposed Change(s) Rationale for the
Change 1. CBK/RG/01-Capital
Adequacy • Exclusion of fair value gains
and losses on investment property from core capital computation.
• Inclusion of foreign treasury bills and bonds in definition of risk-weighted assets.
• Adopt the original exposure method recommended by the Basel Committee to compute the credit equivalent amount of forward exchange contracts.
• Take into account International Financial Reporting Standard (IFRS) 40 on investment property. The standard requires that investment property be revalued each year and the gains or losses passed through the profit and loss account.
• To take note of increased investment in government securities by banks outside Kenya.
• Adoption of international best practice.
2. CBK/RG/02-Foreign Currency Exposure
• Incorporation of intercompany balances denominated in foreign currency in the computation of foreign exchange exposure.
• Intercompany balances denominated in foreign currency are increasingly prevalent especially in multinational banks.
3. CBK/RG/03-Enforcement of Banking Laws and Regulations
• Deletion of reference to formal and informal enforcement action and their replacement with the phrase ‘’enforcement actions’’
• The enforcement actions contained in the regulation are all formal in nature.
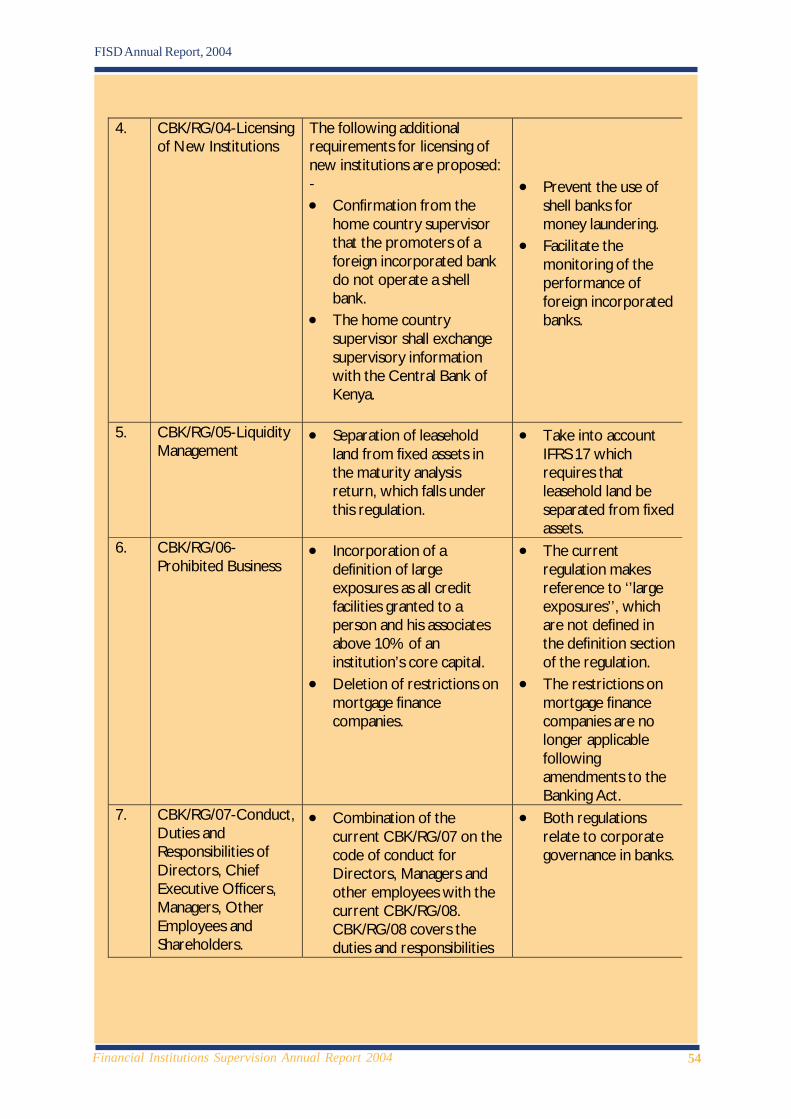
54Financial Institutions Supervision Annual Report 2004
FISD Annual Report, 2004
4. CBK/RG/04-Licensing of New Institutions
The following additional requirements for licensing of new institutions are proposed: - • Confirmation from the
home country supervisor that the promoters of a foreign incorporated bank do not operate a shell bank.
• The home country supervisor shall exchange supervisory information with the Central Bank of Kenya.
• Prevent the use of
shell banks for money laundering.
• Facilitate the monitoring of the performance of foreign incorporated banks.
5. CBK/RG/05-Liquidity Management
• Separation of leasehold land from fixed assets in the maturity analysis return, which falls under this regulation.
• Take into account IFRS 17 which requires that leasehold land be separated from fixed assets.
6. CBK/RG/06-Prohibited Business
• Incorporation of a definition of large exposures as all credit facilities granted to a person and his associates above 10% of an institution’s core capital.
• Deletion of restrictions on mortgage finance companies.
• The current regulation makes reference to ‘’large exposures’’, which are not defined in the definition section of the regulation.
• The restrictions on mortgage finance companies are no longer applicable following amendments to the Banking Act.
7. CBK/RG/07-Conduct, Duties and Responsibilities of Directors, Chief Executive Officers, Managers, Other Employees and Shareholders.
• Combination of the current CBK/RG/07 on the code of conduct for Directors, Managers and other employees with the current CBK/RG/08. CBK/RG/08 covers the duties and responsibilities
• Both regulations relate to corporate governance in banks.
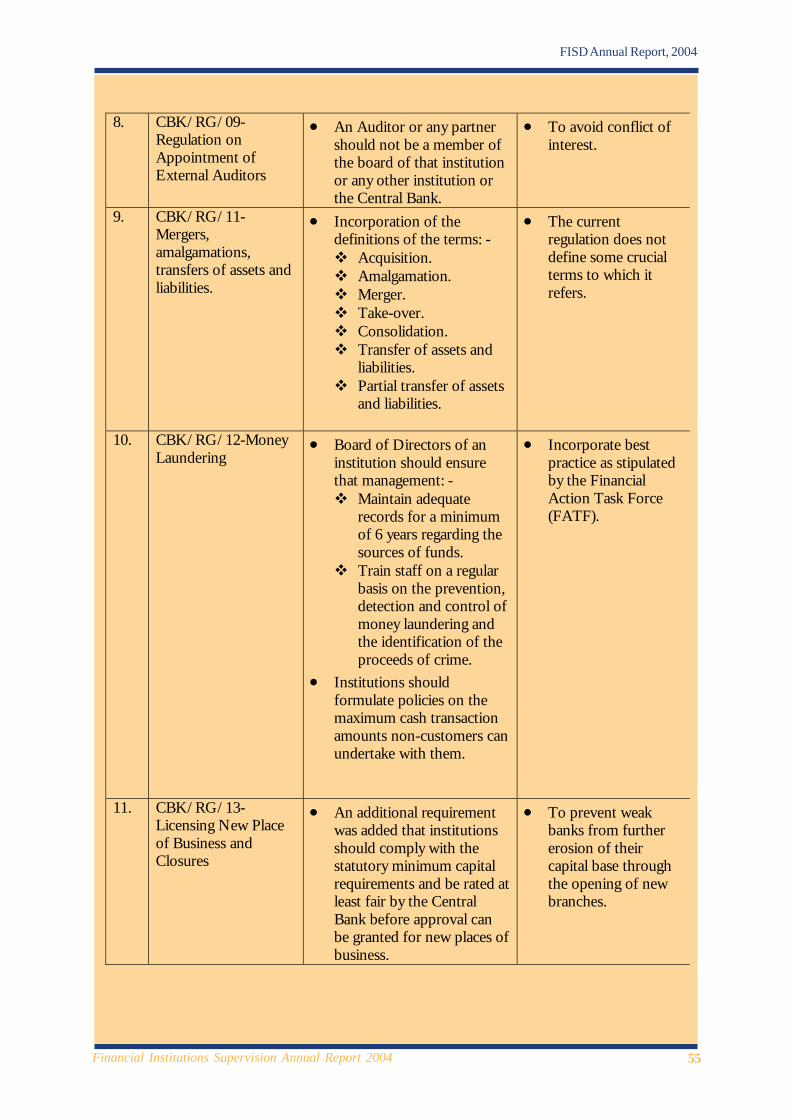
55Financial Institutions Supervision Annual Report 2004
FISD Annual Report, 2004
8. CBK/RG/09-Regulation on Appointment of External Auditors
• An Auditor or any partner should not be a member of the board of that institution or any other institution or the Central Bank.
• To avoid conflict of interest.
9. CBK/RG/11-Mergers, amalgamations, transfers of assets and liabilities.
• Incorporation of the definitions of the terms: - ! Acquisition. ! Amalgamation. ! Merger. ! Take-over. ! Consolidation. ! Transfer of assets and
liabilities. ! Partial transfer of assets
and liabilities.
• The current regulation does not define some crucial terms to which it refers.
10. CBK/RG/12-Money Laundering
• Board of Directors of an institution should ensure that management: - ! Maintain adequate
records for a minimum of 6 years regarding the sources of funds.
! Train staff on a regular basis on the prevention, detection and control of money laundering and the identification of the proceeds of crime.
• Institutions should formulate policies on the maximum cash transaction amounts non-customers can undertake with them.
• Incorporate best practice as stipulated by the Financial Action Task Force (FATF).
11. CBK/RG/13-Licensing New Place of Business and Closures
• An additional requirement was added that institutions should comply with the statutory minimum capital requirements and be rated at least fair by the Central Bank before approval can be granted for new places of business.
• To prevent weak banks from further erosion of their capital base through the opening of new branches.

56Financial Institutions Supervision Annual Report 2004
FISD Annual Report, 2004
12. CBK/RG/13-Publication of Accounts.
• Reporting of assets and liabilities gross of interest.
• Separate disclosure of leasehold land from fixed assets.
• Disclosures of investments in commercial paper and corporate bonds under loans and advances.
• Incorporate new disclosure requirements stipulated by various International Financial Reporting Standards (IFRS).
13. Proposed CBK/RG/14-Dormant Accounts
• Segregation of dormant accounts from active accounts.
• Submission to the Central Bank of a dormant accounts return on an annual basis.
• Protection of the interests of dormant account holders.
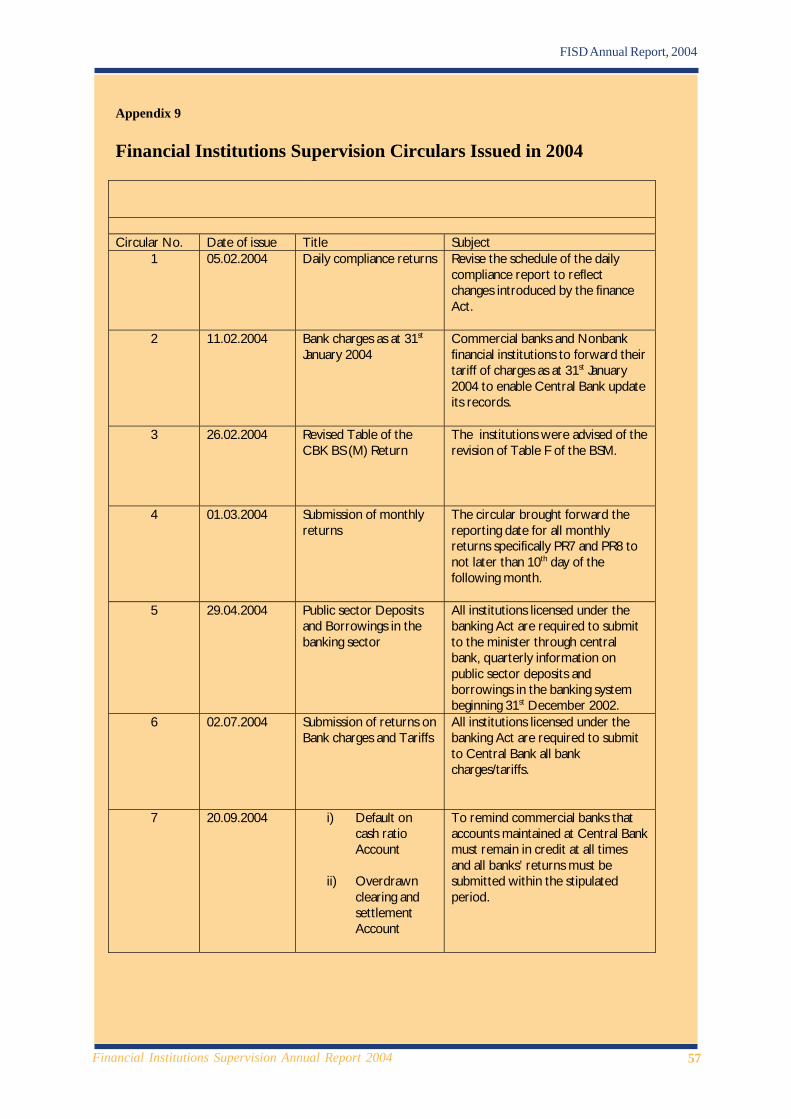
57Financial Institutions Supervision Annual Report 2004
FISD Annual Report, 2004
Appendix 9 Financial Institutions Supervision Circulars Issued in 2004
Circular No. Date of issue Title Subject
1 05.02.2004 Daily compliance returns
Revise the schedule of the daily compliance report to reflect changes introduced by the finance Act.
2 11.02.2004 Bank charges as at 31st January 2004
Commercial banks and Nonbank financial institutions to forward their tariff of charges as at 31st January 2004 to enable Central Bank update its records.
3 26.02.2004 Revised Table of the CBK BS (M) Return
The institutions were advised of the revision of Table F of the BSM.
4 01.03.2004 Submission of monthly returns
The circular brought forward the reporting date for all monthly returns specifically PR7 and PR8 to not later than 10th day of the following month.
5 29.04.2004 Public sector Deposits and Borrowings in the banking sector
All institutions licensed under the banking Act are required to submit to the minister through central bank, quarterly information on public sector deposits and borrowings in the banking system beginning 31st December 2002.
6 02.07.2004 Submission of returns on Bank charges and Tariffs
All institutions licensed under the banking Act are required to submit to Central Bank all bank charges/tariffs.
7 20.09.2004 i) Default on cash ratio Account
ii) Overdrawn
clearing and settlement Account
To remind commercial banks that accounts maintained at Central Bank must remain in credit at all times and all banks’ returns must be submitted within the stipulated period.

58Financial Institutions Supervision Annual Report 2004
FISD Annual Report, 2004
App
endi
x-10
INST
ITU
TIO
NS
OPE
RATI
NG
IN K
ENYA
AS
AT D
ECEM
BER
200
4
A).
COM
MER
CIAL
BAN
KS
NA
ME
PHYS
ICA
LD
ATE
BRA
NCH
ESA
GENC
IES
AD
DRE
SS O
FLI
CEN
SED
A
NDH
EAD
OFF
ICE
FULL
SUB
OTH
ERS
1. A
FRIC
AN B
AN
KIN
G C
ORP
. LTD
ABC
Ban
k1.
5.19
848
--
Mez
zani
ne F
loor
Koin
ange
Str
eet
2. A
KIB
A B
ANK
LTD
.Fe
dha
Tow
ers
1972
5M
uind
i Mbi
ngu
st.
Nai
robi
3. B
AN
K O
F AF
RICA
KEN
YA
LTD
Plaz
a
Taifa
Roa
d4.
BA
NK
OF
BARO
DA
(K)
LTD
.Ba
nk o
f Bar
oda
Build
ing
Baro
da h
ouse
1.7.
1953
6-
-Ko
inan
ge S
tree
t
5. B
AN
K O
F IN
DIA
Keny
atta
5.6.
1953
2-
-Av
enue
6. B
ARC
LAYS
BA
NK
OF
KEN
YA L
TD.
Barc
lays
Pla
za19
6646
38
Loita
Str
eet
7. C
FC B
AN
K LI
MIT
EDC
FC C
entr
e14
.05.
555
Chi
rom
o ro
adW
estla
nds
8. C
HAS
E BA
NK
(KEN
YA) L
TD.
Prud
entia
l Ass
.1.
4.19
911
-1
Build
ing
6th
Floo
r.W
aber
a St
reet

59Financial Institutions Supervision Annual Report 2004
FISD Annual Report, 2004
NAM
EPH
YSIC
ALD
ATE
AGE
NCIE
SAD
DRE
SS O
FLI
CEN
SED
A
NDH
EAD
OFF
ICE
FULL
SUB
OTH
ERS
9. C
HAR
TERH
OU
SE
BAN
K LT
D.
Long
onot
Pla
ce11
.11.
962
9. C
HAR
TERH
OU
SE
BAN
K LT
D.
Long
onot
Pla
ce6t
h. F
loor
Kija
beSt
reet
10. C
ITIB
ANK
N.A
.C
itiba
nk H
ouse
1.7.
1974
31
11
. CIT
Y FI
NAN
CE B
ANK
LTD
.U
nity
Hou
se10
.09.
1984
1Ko
inan
ge S
t. 12
. CO
MM
ERCI
AL B
ANK
OF
AFRI
CA L
TD.
Wab
era
01.0
1.19
676
8
Stre
et
13. C
ON
SOLI
DAT
ED B
ANK
OF
KEN
YA L
TD.
Con
solid
ated
18.1
2.19
8912
--
Bank
Hse
.
Ko
inan
ge S
tree
t
N
ew L
ocat
ion-
(H.Q
)14
. CO
-OPE
RATI
VE B
ANK
OF
KEN
YA L
TD.
CO
-OPE
RATI
VE H
OU
SE19
6530
015
15. C
RED
IT B
ANK
LIM
ITED
Gro
und
Floo
r14
.5.1
986
Mer
cant
ile H
se3
--
Koin
ange
st.
16. D
AIM
A BA
NK
LTD
. U
talii
Hou
se1.
9.19
922
--
(Cur
rent
ly in
liqu
idat
ion)
Off
Uhu
ruH
ighw
ay17
. DEV
ELO
PMEN
T BA
NK
OF
KEN
YA L
TD.
Fina
nce
Hou
se19
731
--
Loita
Str
eet
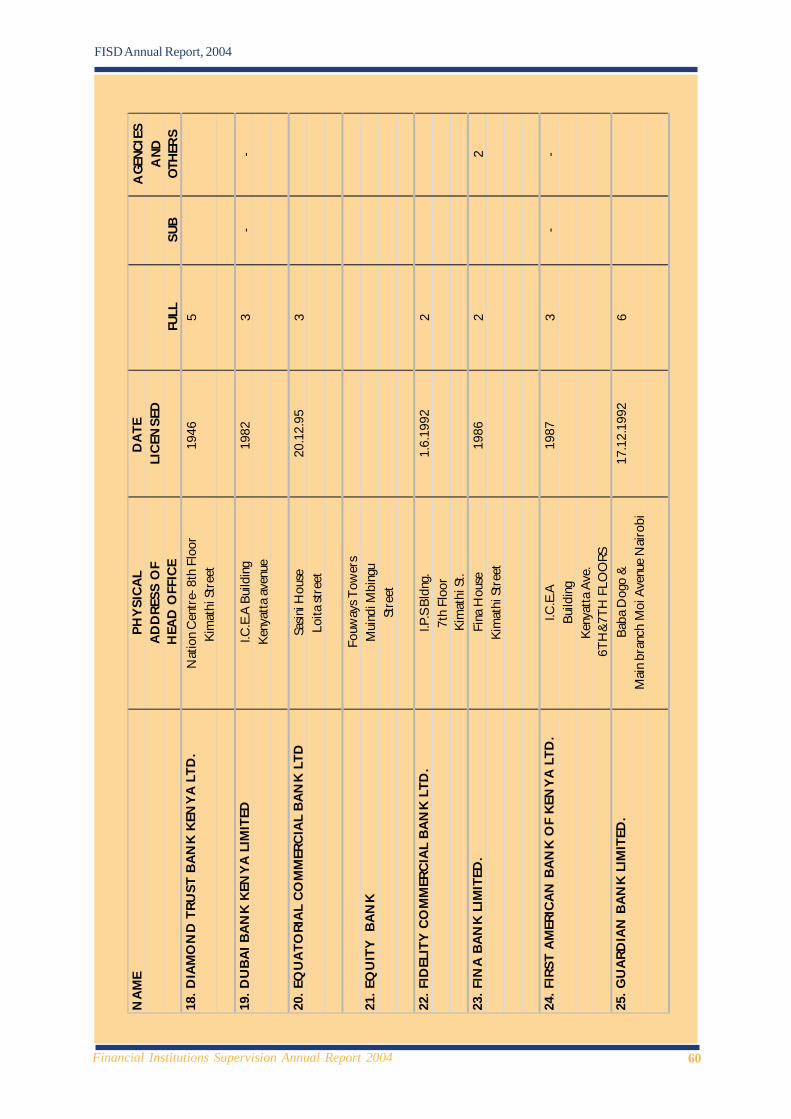
60Financial Institutions Supervision Annual Report 2004
FISD Annual Report, 2004
NA
ME
PHYS
ICAL
DA
TE
AGE
NCIE
SAD
DRE
SS O
FLI
CEN
SED
A
NDH
EAD
OFF
ICE
FULL
SUB
OTH
ERS
18. D
IAM
ON
D T
RUST
BAN
K K
ENYA
LTD
.N
atio
n C
entr
e- 8
th F
loor
1946
5Ki
mat
hi S
tree
t
19. D
UBA
I BA
NK
KEN
YA L
IMIT
EDI.C
.E.A
Bui
ldin
g19
823
--
Keny
atta
ave
nue
20. E
QU
ATO
RIAL
CO
MM
ERC
IAL
BAN
K L
TDSa
sini H
ouse
20.1
2.95
3Lo
ita st
reet
Fouw
ays T
ower
s21
. EQ
UIT
Y B
ANK
Mui
ndi M
bing
uSt
reet
22. F
IDEL
ITY
COM
MER
CIAL
BAN
K LT
D.
I.P.S
Bld
ng.
1.6.
1992
2
7th
Floo
rKi
mat
hi S
t.23
. FIN
A B
ANK
LIM
ITED
.Fi
na H
ouse
1986
22
Kim
athi
Str
eet
24. F
IRST
AM
ERIC
AN B
ANK
OF
KEN
YA L
TD.
I.C.E
.A19
873
--
Build
ing
Keny
atta
Ave
.6T
H&7
TH F
LOO
RS25
. GU
ARD
IAN
BAN
K L
IMIT
ED.
Baba
Dog
o &
17.1
2.19
926
Mai
n br
anch
Moi
Ave
nue
Nai
robi
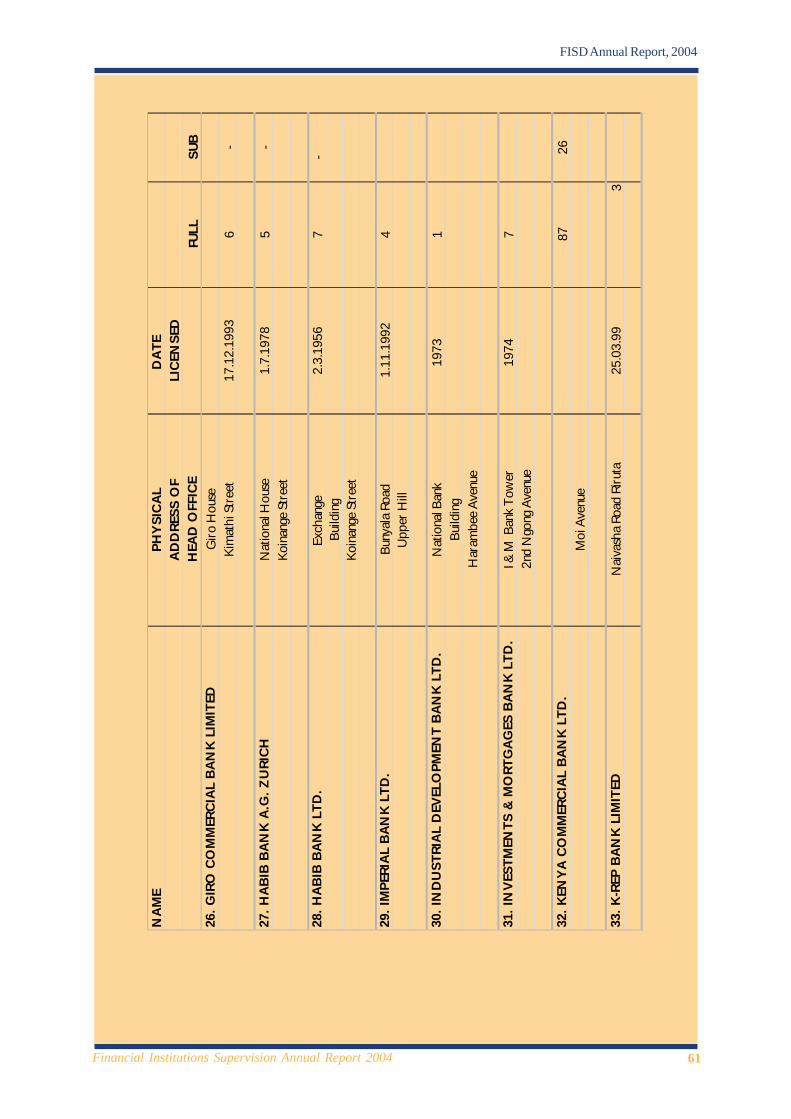
61Financial Institutions Supervision Annual Report 2004
FISD Annual Report, 2004
NA
ME
PHY
SIC
ALD
ATE
ADD
RESS
OF
LICE
NSE
D
HEA
D O
FFIC
EFU
LLSU
B26
. GIR
O C
OM
MER
CIAL
BAN
K LI
MIT
EDG
iro H
ouse
Kim
athi
Str
eet
17.1
2.19
936
-
27. H
ABIB
BAN
K A.
G. Z
URI
CHN
atio
nal H
ouse
1.7.
1978
5-
Koin
ange
Str
eet
28
. HAB
IB B
ANK
LTD
.Ex
chan
ge
2.3.
1956
7
-Bu
ildin
gKo
inan
ge S
tree
t
29. I
MPE
RIAL
BAN
K LT
D.
Buny
ala
Road
1.11
.199
24
Upp
er H
ill
30. I
ND
UST
RIA
L D
EVEL
OPM
ENT
BAN
K L
TD.
Nat
iona
l Ban
k19
731
Build
ing
Har
ambe
e Av
enue
31. I
NVE
STM
ENTS
& M
ORT
GAG
ES B
AN
K L
TD.
I & M
Ban
k To
wer
1974
72n
d N
gong
Ave
nue
32. K
ENYA
CO
MM
ERCI
AL B
ANK
LTD
.
8726
Moi
Ave
nue
33. K
-REP
BAN
K LI
MIT
EDN
aiva
sha
Road
Riru
ta25
.03.
993
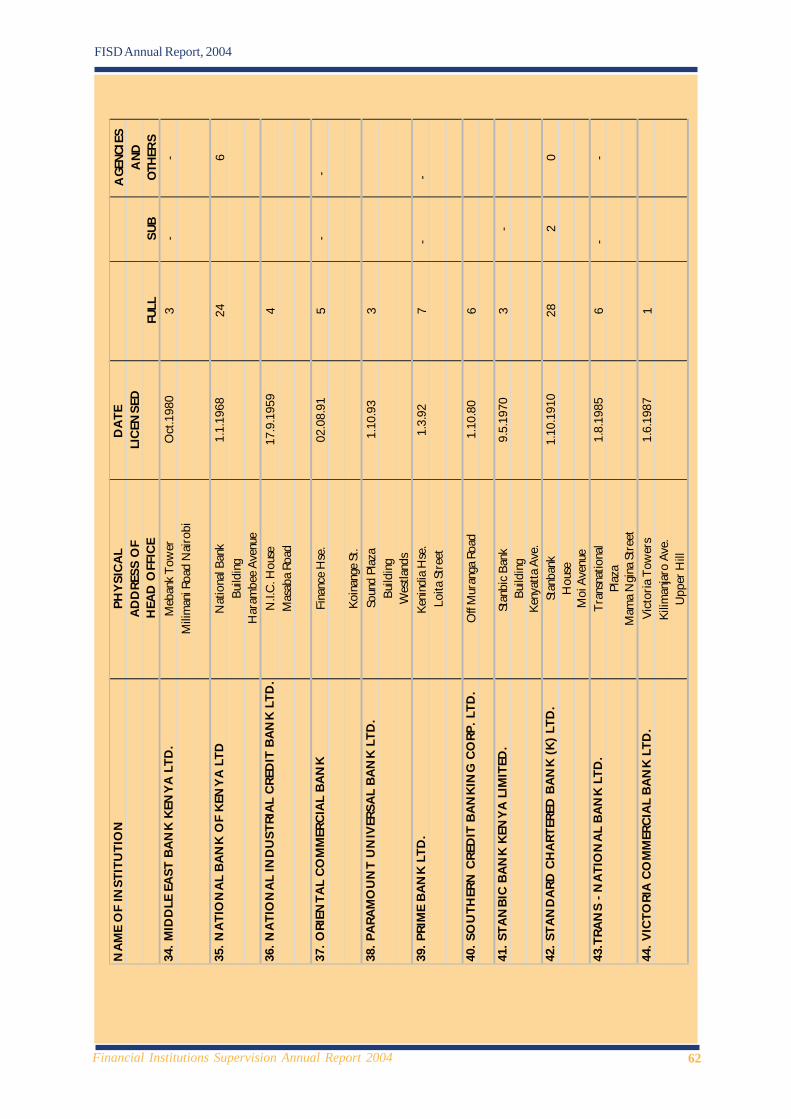
62Financial Institutions Supervision Annual Report 2004
FISD Annual Report, 2004
NA
ME
OF
INST
ITU
TIO
N
PHY
SIC
AL
DA
TE
AGE
NCIE
SA
DD
RESS
OF
LIC
ENSE
D
AND
HEA
D O
FFIC
EFU
LLSU
BO
THER
S34
. MID
DLE
EA
ST B
AN
K K
ENYA
LTD
.M
eban
k To
wer
Oct
.198
03
-
-M
ilim
ani R
oad
Nai
robi
35. N
ATI
ON
AL
BA
NK
OF
KEN
YA
LTD
Nat
iona
l Ban
k1.
1.19
6824
6
Build
ing
Har
ambe
e Av
enue
36. N
ATI
ON
AL
IND
UST
RIAL
CRE
DIT
BAN
K L
TD.
N.I.
C. H
ouse
17.9
.195
94
Mas
aba
Road
37. O
RIEN
TAL
CO
MM
ERC
IAL
BAN
KFi
nanc
e H
se.
02.0
8.91
5
-
-
Koin
ange
St.
38. P
ARA
MO
UN
T U
NIV
ERSA
L BA
NK
LTD
.So
und
Plaz
a1.
10.9
33
Build
ing
Wes
tland
s 39
. PRI
ME
BAN
K L
TD.
Keni
ndia
Hse
. 1.
3.92
7
-
-Lo
ita S
tree
t
40. S
OU
THER
N C
RED
IT B
AN
KIN
G C
ORP
. LTD
.O
ff M
uran
ga R
oad
1.10
.80
6
41. S
TAN
BIC
BA
NK
KEN
YA
LIM
ITED
.St
anbi
c Ba
nk
9.5.
1970
3-
Build
ing
Ke
nyat
ta A
ve.
42. S
TAN
DA
RD C
HA
RTER
ED B
ANK
(K)
LTD
.St
anba
nk1.
10.1
910
282
0H
ouse
Moi
Ave
nue
43.T
RAN
S - N
ATI
ON
AL
BA
NK
LTD
.Tr
ansn
atio
nal
1.8.
1985
6
--
Plaz
aM
ama
Ngi
na S
tree
t44
. VIC
TORI
A C
OM
MER
CIA
L B
AN
K L
TD.
Vict
oria
Tow
ers
1.6.
1987
1Ki
liman
jaro
Ave
. U
pper
Hill
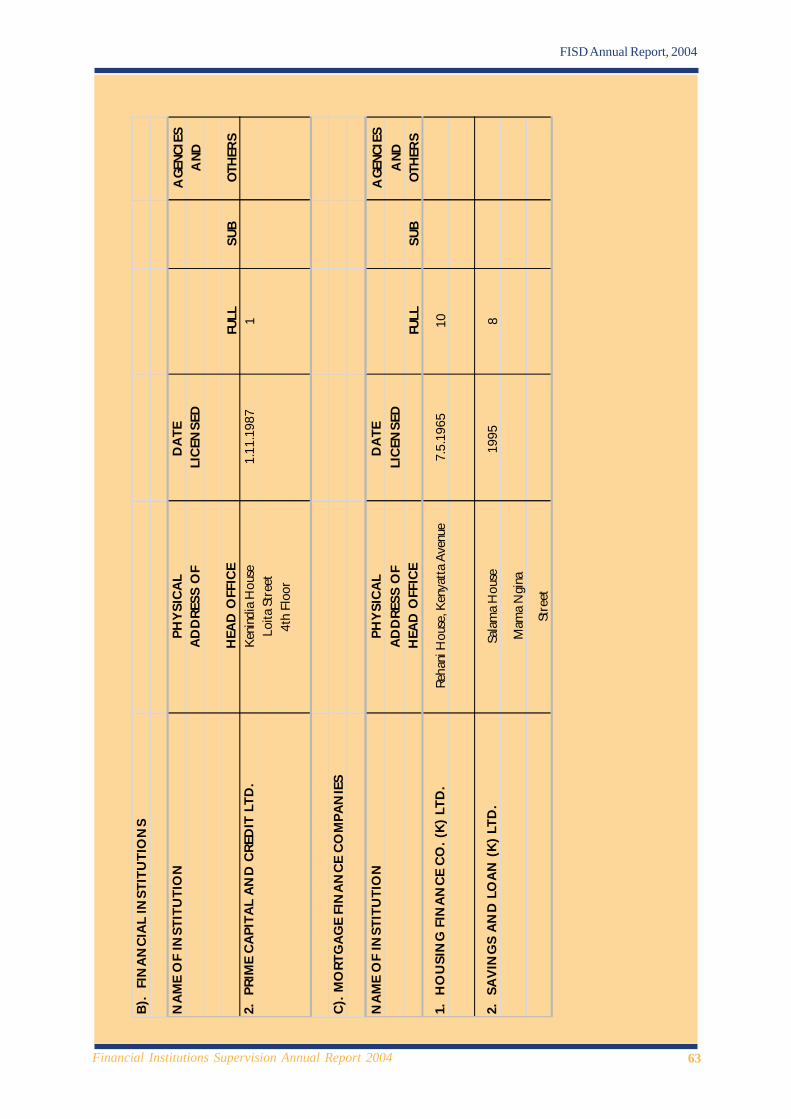
63Financial Institutions Supervision Annual Report 2004
FISD Annual Report, 2004
B).
FIN
AN
CIA
L IN
STIT
UTI
ON
S
NA
ME
OF
INST
ITU
TIO
N
PHYS
ICAL
DA
TE
AGE
NCIE
SAD
DRE
SS O
FLI
CEN
SED
A
ND
HEA
D O
FFIC
EFU
LLSU
BO
THER
S2.
PRI
ME
CAPI
TAL
AND
CRE
DIT
LTD
.Ke
nind
ia H
ouse
1.11
.198
71
Loita
Str
eet
4th
Floo
r
C). M
ORT
GAG
E FI
NA
NCE
CO
MPA
NIE
S
NA
ME
OF
INST
ITU
TIO
N
PHYS
ICAL
DA
TE
AGE
NCIE
SAD
DRE
SS O
FLI
CEN
SED
A
NDH
EAD
OFF
ICE
FULL
SUB
OTH
ERS
1. H
OU
SIN
G F
INAN
CE C
O. (
K) L
TD.
Reha
ni H
ouse
, Ken
yatta
Ave
nue
7.5.
1965
10
2. S
AVI
NG
S AN
D L
OA
N (K
) LTD
.Sa
lam
a H
ouse
1995
8
Mam
a N
gina
Stre
et
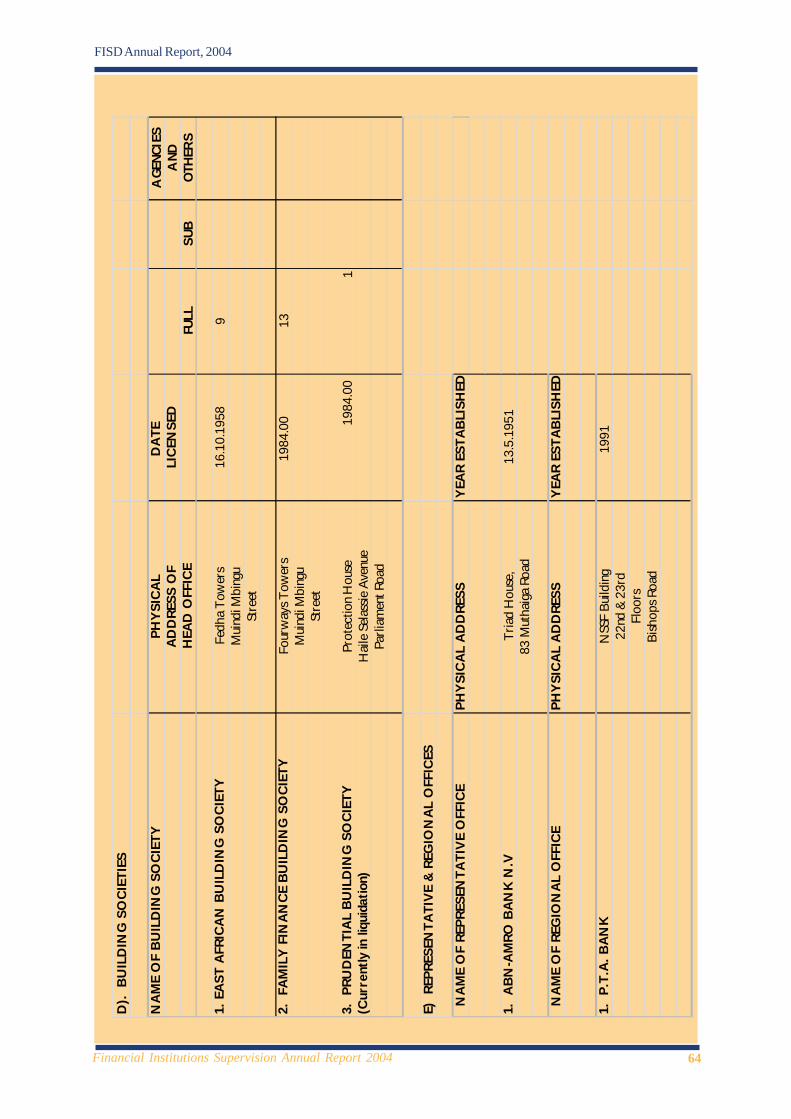
64Financial Institutions Supervision Annual Report 2004
FISD Annual Report, 2004
D).
BU
ILD
ING
SO
CIET
IES
NA
ME
OF
BU
ILD
ING
SO
CIET
Y PH
YSIC
A LD
ATE
A
GENC
IES
ADD
RESS
OF
LICE
NSE
D
AND
HEA
D O
FFIC
EFU
LLSU
BO
THER
S
1. E
AST
AFRI
CAN
BU
ILD
ING
SO
CIE
TYFe
dha
Tow
ers
16.1
0.19
589
Mui
ndi M
bing
uSt
reet
2. F
AMIL
Y FI
NAN
CE B
UIL
DIN
G S
OCI
ETY
Four
way
s Tow
ers
1984
.00
13M
uind
i Mbi
ngu
Stre
et
3. P
RUD
ENTI
AL
BUIL
DIN
G S
OCI
ETY
Prot
ectio
n H
ouse
1984
.00
1(C
urre
ntly
in li
quid
atio
n)H
aile
Sel
assie
Ave
nue
Parli
amen
t Roa
d
E) R
EPRE
SEN
TATI
VE &
REG
ION
AL O
FFIC
ES
NA
ME
OF
REPR
ESEN
TATI
VE O
FFIC
EPH
YSIC
AL A
DD
RESS
YEAR
EST
ABLI
SHED
1. A
BN-A
MRO
BAN
K N
.VTr
iad
Hou
se,
13.5
.195
1
83 M
utha
iga
Road
NA
ME
OF
REG
ION
AL O
FFIC
EPH
YSIC
AL A
DD
RESS
YEAR
EST
ABLI
SHED
1. P
.T.A
. BAN
KN
SSF
Build
ing
1991
22nd
& 2
3rd
Floo
rsBi
shop
s Roa
d
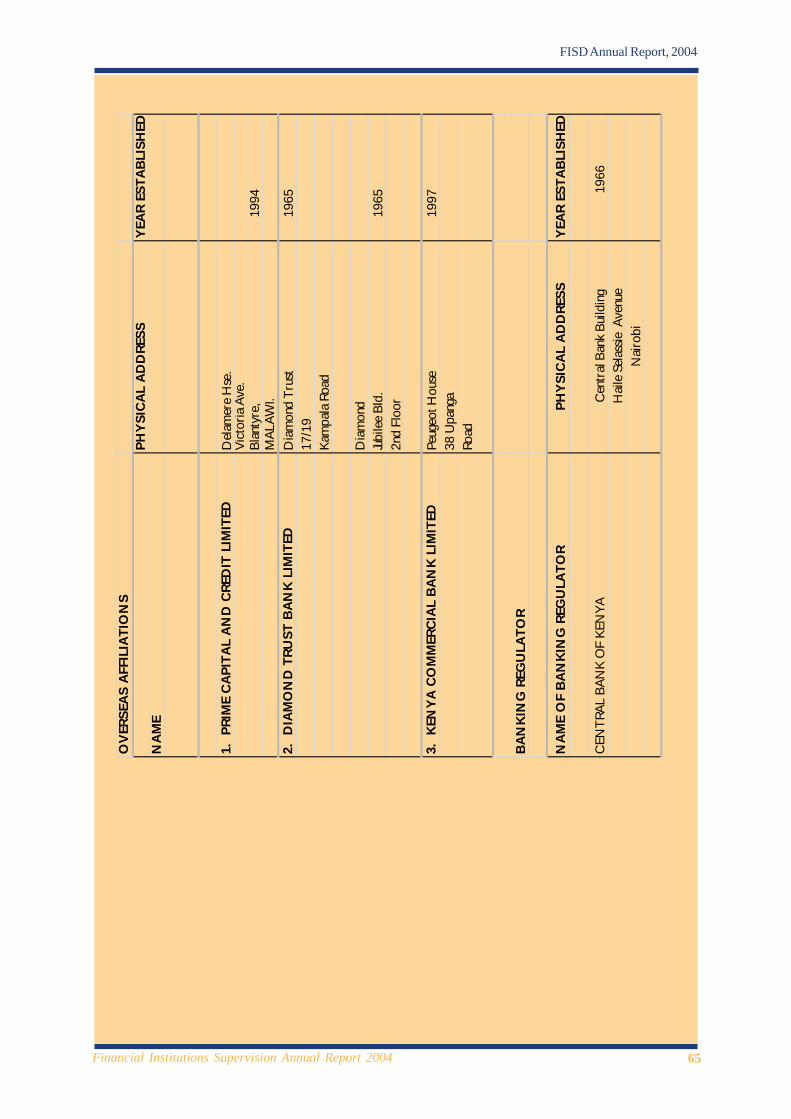
65Financial Institutions Supervision Annual Report 2004
FISD Annual Report, 2004
OV
ERSE
AS A
FFIL
IATI
ON
SPH
YSIC
AL A
DD
RESS
YEAR
EST
ABLI
SHED
NA
ME
1. P
RIM
E C
APIT
AL A
ND
CRE
DIT
LIM
ITED
Del
amer
e H
se.
Vict
oria
Ave
.Bl
anty
re,
199
4M
ALAW
I.2.
DIA
MO
ND
TRU
ST B
ANK
LIM
ITED
Dia
mon
d Tr
ust
196
517
/19
Kam
pala
Roa
d
Dia
mon
d Ju
bile
e Bl
d.
1
965
2nd
Floo
r
3. K
ENYA
CO
MM
ERCI
AL B
ANK
LIM
ITED
Peug
eot H
ouse
199
738
Upa
nga
Road
BAN
KIN
G R
EGU
LATO
R
NA
ME
OF
BAN
KIN
G R
EGU
LATO
RPH
YSIC
AL A
DD
RESS
YEAR
EST
ABLI
SHED
CEN
TRAL
BAN
K O
F KE
NYA
Cen
tral
Ban
k Bu
ildin
g19
66H
aile
Sel
assie
Ave
nue
Nai
robi
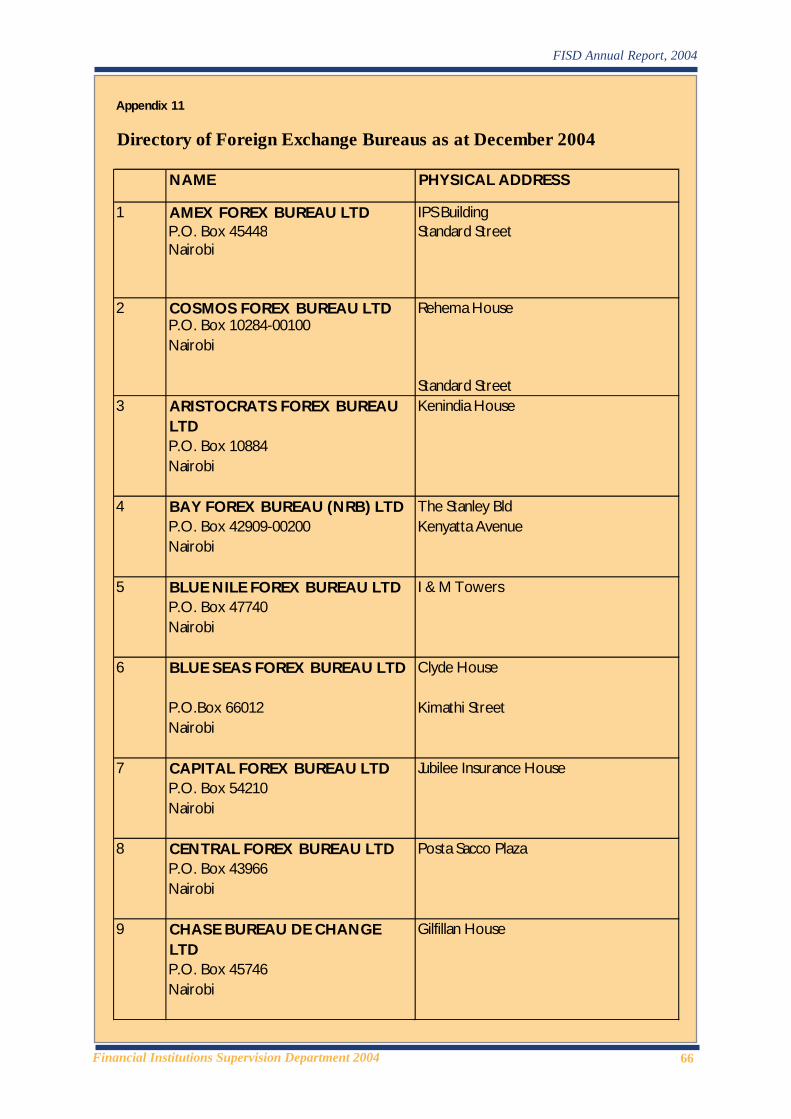
66Financial Institutions Supervision Department 2004
FISD Annual Report, 2004
Appendix 11
Directory of Foreign Exchange Bureaus as at December 2004
AMEX FOREX BUREAU LTD IPS BuildingP.O. Box 45448 Standard StreetNairobi
COSMOS FOREX BUREAU LTDP.O. Box 10284-00100Nairobi
Standard StreetARISTOCRATS FOREX BUREAU LTDP.O. Box 10884Nairobi
BAY FOREX BUREAU (NRB) LTD The Stanley BldP.O. Box 42909-00200 Kenyatta AvenueNairobi
BLUE NILE FOREX BUREAU LTDP.O. Box 47740Nairobi
BLUE SEAS FOREX BUREAU LTD Clyde House
P.O.Box 66012 Kimathi StreetNairobi
CAPITAL FOREX BUREAU LTDP.O. Box 54210Nairobi
CENTRAL FOREX BUREAU LTDP.O. Box 43966Nairobi
CHASE BUREAU DE CHANGE LTDP.O. Box 45746Nairobi
8
PHYSICAL ADDRESS
3
1
NAME
2
7
5
4
6
Gilfillan House
Rehema House
I & M Towers
Kenindia House
Posta Sacco Plaza
Jubilee Insurance House
9
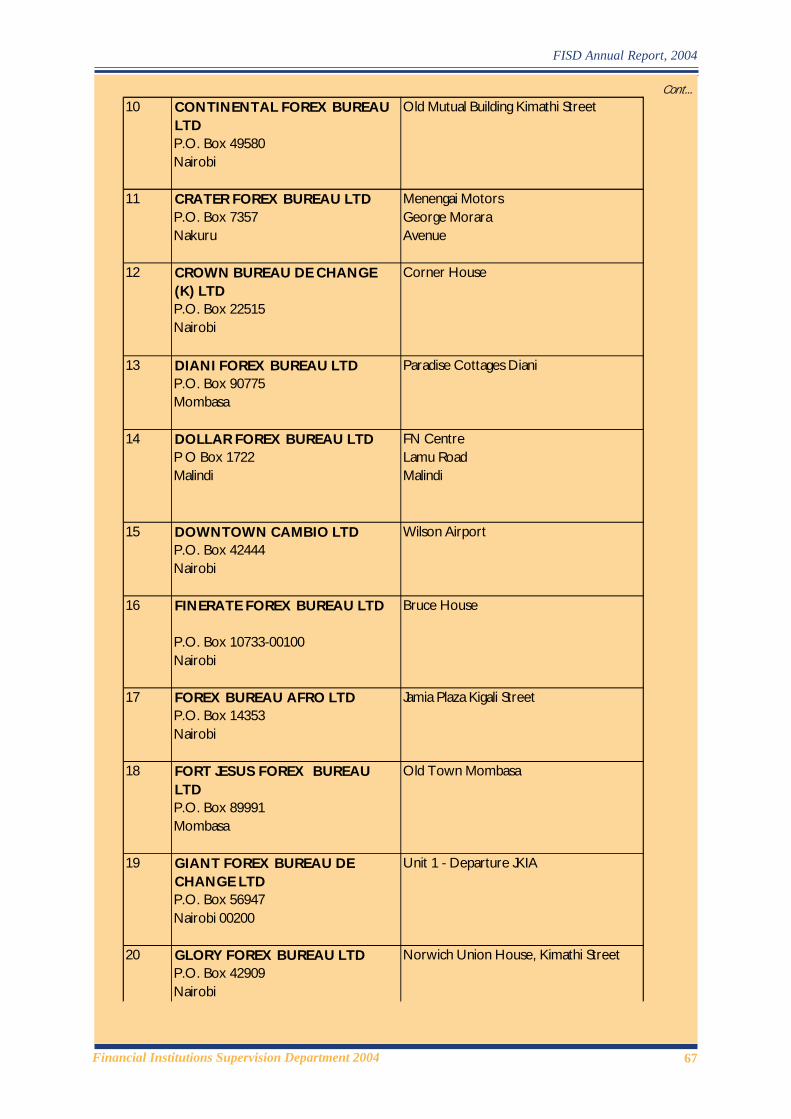
67Financial Institutions Supervision Department 2004
FISD Annual Report, 2004
Cont...
CONTINENTAL FOREX BUREAU LTDP.O. Box 49580Nairobi
CRATER FOREX BUREAU LTD Menengai MotorsP.O. Box 7357 George MoraraNakuru Avenue
CROWN BUREAU DE CHANGE (K) LTDP.O. Box 22515Nairobi
DIANI FOREX BUREAU LTDP.O. Box 90775Mombasa
14 DOLLAR FOREX BUREAU LTD FN Centre P O Box 1722 Lamu RoadMalindi Malindi
DOWNTOWN CAMBIO LTDP.O. Box 42444Nairobi
FINERATE FOREX BUREAU LTD
P.O. Box 10733-00100Nairobi
FOREX BUREAU AFRO LTDP.O. Box 14353Nairobi
FORT JESUS FOREX BUREAU LTDP.O. Box 89991Mombasa
GIANT FOREX BUREAU DE CHANGE LTDP.O. Box 56947Nairobi 00200
GLORY FOREX BUREAU LTDP.O. Box 42909Nairobi
19 Unit 1 - Departure JKIA
20 Norwich Union House, Kimathi Street
16 Bruce House
18 Old Town Mombasa
17 Jamia Plaza Kigali Street
12 Corner House
15 Wilson Airport
13 Paradise Cottages Diani
Old Mutual Building Kimathi Street
11
10
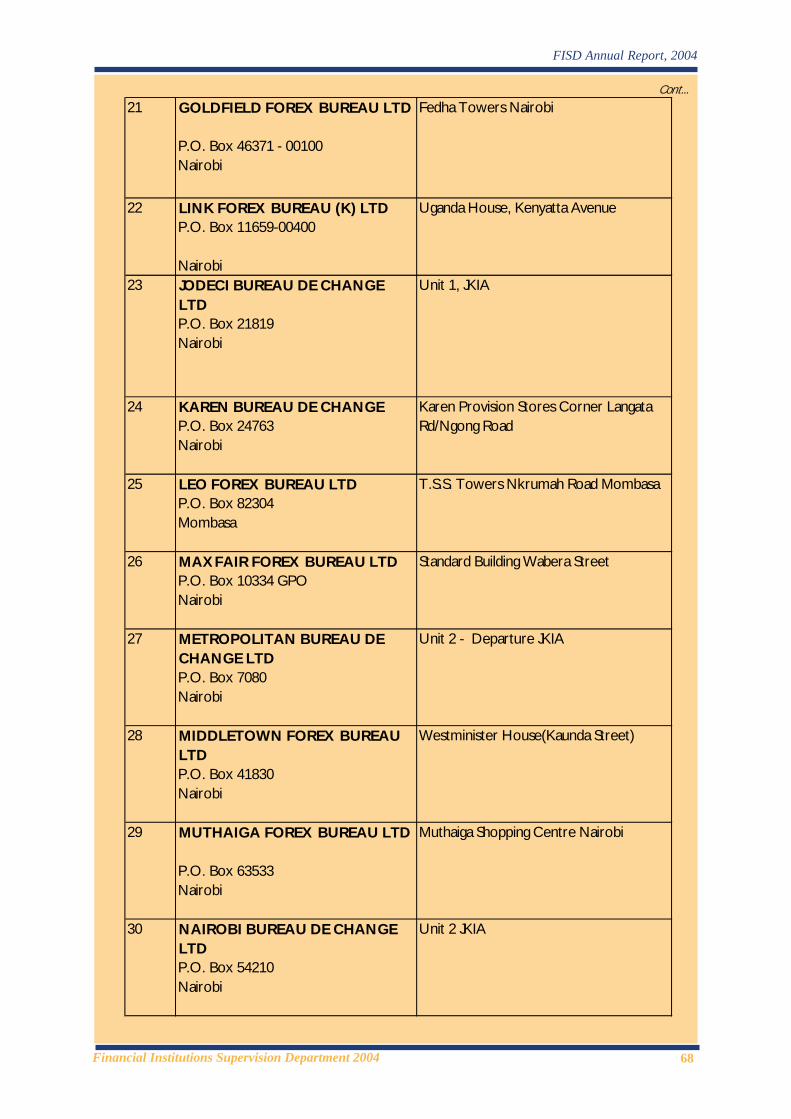
68Financial Institutions Supervision Department 2004
FISD Annual Report, 2004
Cont...
GOLDFIELD FOREX BUREAU LTD
P.O. Box 46371 - 00100Nairobi
LINK FOREX BUREAU (K) LTDP.O. Box 11659-00400
NairobiJODECI BUREAU DE CHANGE LTDP.O. Box 21819Nairobi
KAREN BUREAU DE CHANGE P.O. Box 24763Nairobi
LEO FOREX BUREAU LTDP.O. Box 82304Mombasa
MAX FAIR FOREX BUREAU LTDP.O. Box 10334 GPONairobi
METROPOLITAN BUREAU DE CHANGE LTDP.O. Box 7080Nairobi
MIDDLETOWN FOREX BUREAU LTDP.O. Box 41830Nairobi
MUTHAIGA FOREX BUREAU LTD
P.O. Box 63533Nairobi
NAIROBI BUREAU DE CHANGE LTDP.O. Box 54210Nairobi
Uganda House, Kenyatta Avenue
Unit 1, JKIA
24
Standard Building Wabera Street
28
Karen Provision Stores Corner Langata Rd/Ngong Road
T.S.S. Towers Nkrumah Road Mombasa
21 Fedha Towers Nairobi
Unit 2 - Departure JKIA
Westminister House(Kaunda Street)
Unit 2 JKIA
Muthaiga Shopping Centre Nairobi
26
27
25
30
29
23
22

69Financial Institutions Supervision Department 2004
FISD Annual Report, 2004
Cont...
NAIROBI FOREX BUREAU LTDP.O. Box 73194Nairobi
LANGATA FOREX BUREAU LTD Mercantile HouseP.O. Box 13580 Loita StreetNairobiOVERSEAS FOREX BUREAU LTD View Park Towers
P.O. Box 66864 00800 Monrovia/Utalii St.NairobiPEARL FOREX BUREAU LTDP.O. Box 58059 00200NairobiPEL FOREX BUREAU LTDKisumu P O Box 957PINNACLE FOREX BUREAU LTD
P.O. Box 10020Nairobi
PWANI FOREX BUREAU LTDP.O. Box 87200Mombasa
ABC PlaceFOREX BUREAU LTDP.O. Box 63533 - 00619 MuthaigaNairobi
SOLID EX CHANGE BUREAU LTD
P.O. Box 19257Nairobi
SPEEDY FOREX BUREAU LTDP.O. Box 45888Nairobi
STERLING FOREX BUREAU LTDP.O. Box 43673Nairobi
TAIPAN FOREX BUREAU LTD* P. O. Box 42909Nairobi
TRADE BUREAU DE CHANGE LTD
Cotts House
P.O. Box 7080 City Hall WayNairobi Transnational Bank Nairobi
40 Jubilee Insurance Exchange Kaunda Street
Stanley Hotel Building
Laxmi Plaza Biashara Street
42
38 ABC, PLACE, Wayiaki Way
39 JKIA
Hurlingham Shopping Centre
37 Mombasa Block 404 XVII/MI Abdel Nasseiz
Allmran Plaza, Oginga Odinga Road, Kisumu
36 Corner House, Kimathi Street
35
33
32
34
Gujarat House, Muindi Mbingu St.31
41
43
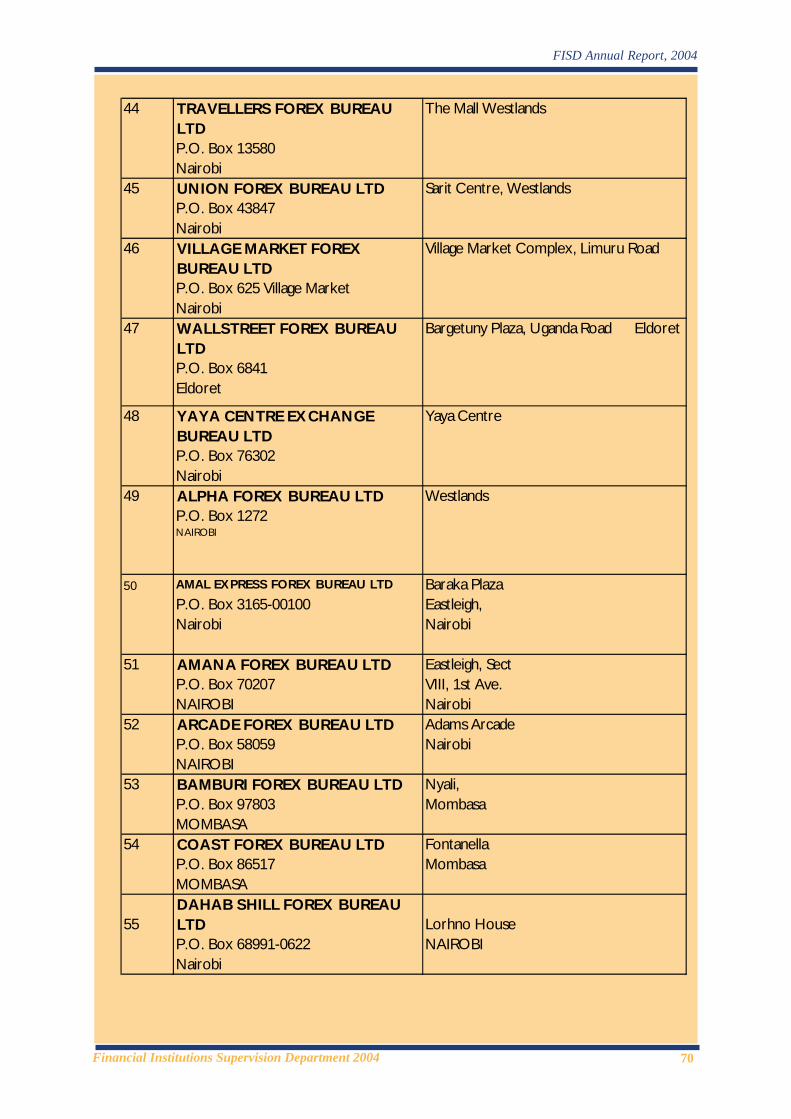
70Financial Institutions Supervision Department 2004
FISD Annual Report, 2004
TRAVELLERS FOREX BUREAU LTDP.O. Box 13580NairobiUNION FOREX BUREAU LTDP.O. Box 43847NairobiVILLAGE MARKET FOREX BUREAU LTDP.O. Box 625 Village MarketNairobiWALLSTREET FOREX BUREAU LTD P.O. Box 6841Eldoret
YAYA CENTRE EX CHANGE BUREAU LTDP.O. Box 76302Nairobi
49 ALPHA FOREX BUREAU LTD WestlandsP.O. Box 1272NAIROBI
50 AMAL EXPRESS FOREX BUREAU LTD Baraka PlazaP.O. Box 3165-00100 Eastleigh, Nairobi Nairobi
51 AMANA FOREX BUREAU LTD Eastleigh, SectP.O. Box 70207 VIII, 1st Ave. NAIROBI Nairobi
52 ARCADE FOREX BUREAU LTD Adams ArcadeP.O. Box 58059 NairobiNAIROBI
53 BAMBURI FOREX BUREAU LTD Nyali,P.O. Box 97803 MombasaMOMBASA
54 COAST FOREX BUREAU LTD FontanellaP.O. Box 86517 MombasaMOMBASA
55DAHAB SHILL FOREX BUREAU LTD Lorhno HouseP.O. Box 68991-0622 NAIROBINairobi
Yaya Centre
Village Market Complex, Limuru Road
Bargetuny Plaza, Uganda Road Eldoret
Sarit Centre, Westlands
44 The Mall Westlands
48
47
46
45
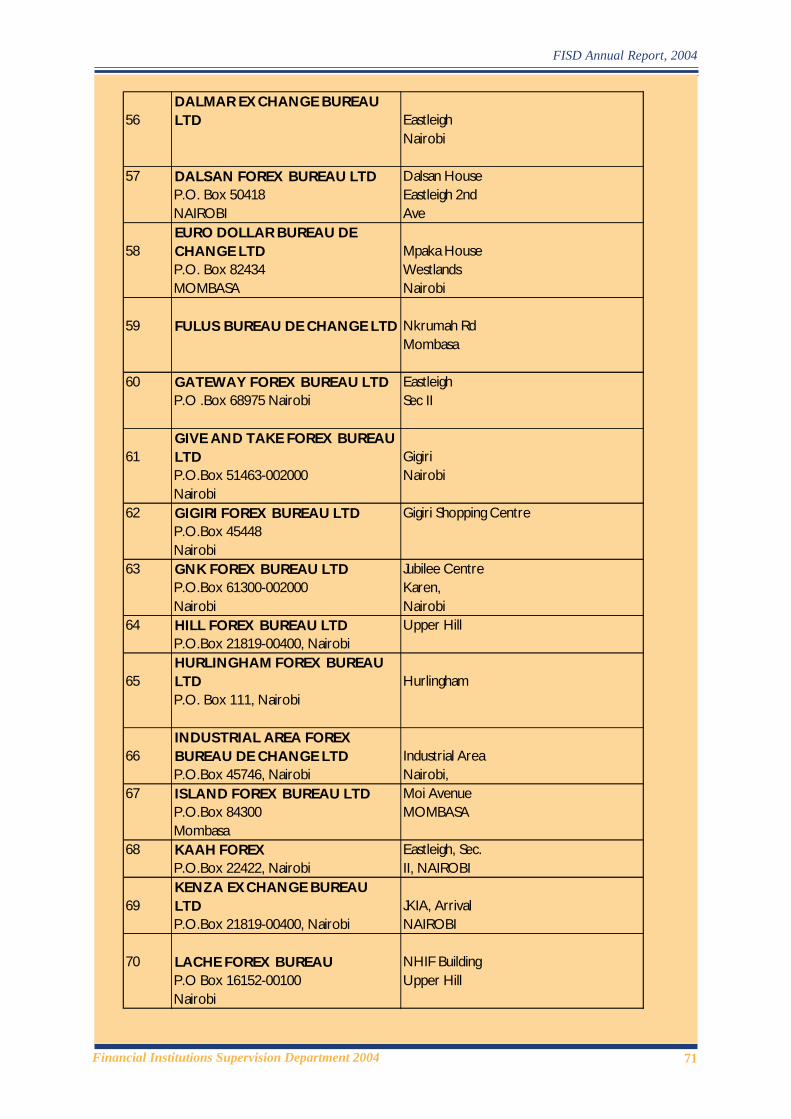
71Financial Institutions Supervision Department 2004
FISD Annual Report, 2004
56DALMAR EX CHANGE BUREAU LTD Eastleigh
Nairobi
57 DALSAN FOREX BUREAU LTD Dalsan HouseP.O. Box 50418 Eastleigh 2nd NAIROBI Ave
58EURO DOLLAR BUREAU DE CHANGE LTD Mpaka HouseP.O. Box 82434 WestlandsMOMBASA Nairobi
59 FULUS BUREAU DE CHANGE LTD Nkrumah RdMombasa
60 GATEWAY FOREX BUREAU LTD EastleighP.O .Box 68975 Nairobi Sec II
61GIVE AND TAKE FOREX BUREAU LTD GigiriP.O.Box 51463-002000 NairobiNairobi
62 GIGIRI FOREX BUREAU LTD Gigiri Shopping CentreP.O.Box 45448Nairobi
63 GNK FOREX BUREAU LTD Jubilee CentreP.O.Box 61300-002000 Karen,Nairobi Nairobi
64 HILL FOREX BUREAU LTD Upper HillP.O.Box 21819-00400, Nairobi
65HURLINGHAM FOREX BUREAU LTD HurlinghamP.O. Box 111, Nairobi
66INDUSTRIAL AREA FOREX BUREAU DE CHANGE LTD Industrial AreaP.O.Box 45746, Nairobi Nairobi,
67 ISLAND FOREX BUREAU LTD Moi AvenueP.O.Box 84300 MOMBASAMombasa
68 KAAH FOREX Eastleigh, Sec.P.O.Box 22422, Nairobi II, NAIROBI
69KENZA EXCHANGE BUREAU LTD JKIA, ArrivalP.O.Box 21819-00400, Nairobi NAIROBI
70 LACHE FOREX BUREAU NHIF Building P.O Box 16152-00100 Upper HillNairobi
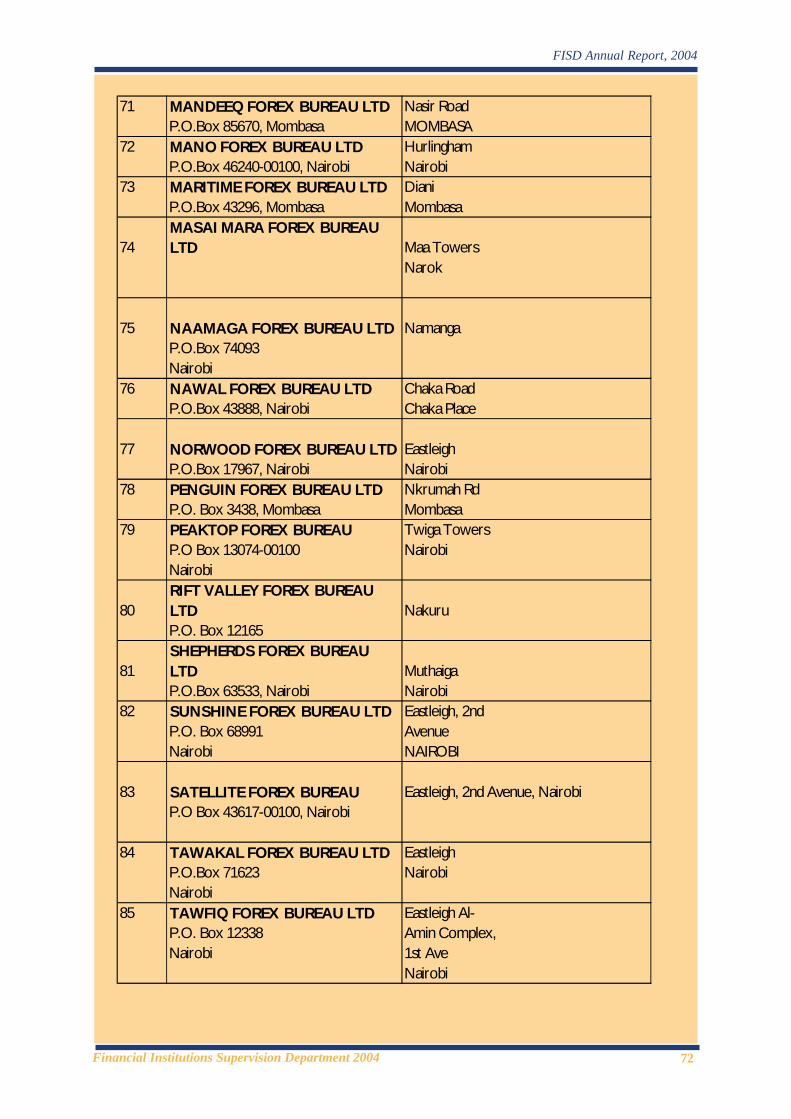
72Financial Institutions Supervision Department 2004
FISD Annual Report, 2004
71 MANDEEQ FOREX BUREAU LTD Nasir RoadP.O.Box 85670, Mombasa MOMBASA
72 MANO FOREX BUREAU LTD HurlinghamP.O.Box 46240-00100, Nairobi Nairobi
73 MARITIME FOREX BUREAU LTD DianiP.O.Box 43296, Mombasa Mombasa
74MASAI MARA FOREX BUREAU LTD Maa Towers
Narok
75 NAAMAGA FOREX BUREAU LTD NamangaP.O.Box 74093Nairobi
76 NAWAL FOREX BUREAU LTD Chaka RoadP.O.Box 43888, Nairobi Chaka Place
77 NORWOOD FOREX BUREAU LTD EastleighP.O.Box 17967, Nairobi Nairobi
78 PENGUIN FOREX BUREAU LTD Nkrumah RdP.O. Box 3438, Mombasa Mombasa
79 PEAKTOP FOREX BUREAU Twiga Towers P.O Box 13074-00100 NairobiNairobi
80RIFT VALLEY FOREX BUREAU LTD NakuruP.O. Box 12165
81SHEPHERDS FOREX BUREAU LTD MuthaigaP.O.Box 63533, Nairobi Nairobi
82 SUNSHINE FOREX BUREAU LTD Eastleigh, 2ndP.O. Box 68991 AvenueNairobi NAIROBI
83 SATELLITE FOREX BUREAU Eastleigh, 2nd Avenue, NairobiP.O Box 43617-00100, Nairobi
84 TAWAKAL FOREX BUREAU LTD EastleighP.O.Box 71623 NairobiNairobi
85 TAWFIQ FOREX BUREAU LTD Eastleigh Al-P.O. Box 12338 Amin Complex,Nairobi 1st Ave
Nairobi
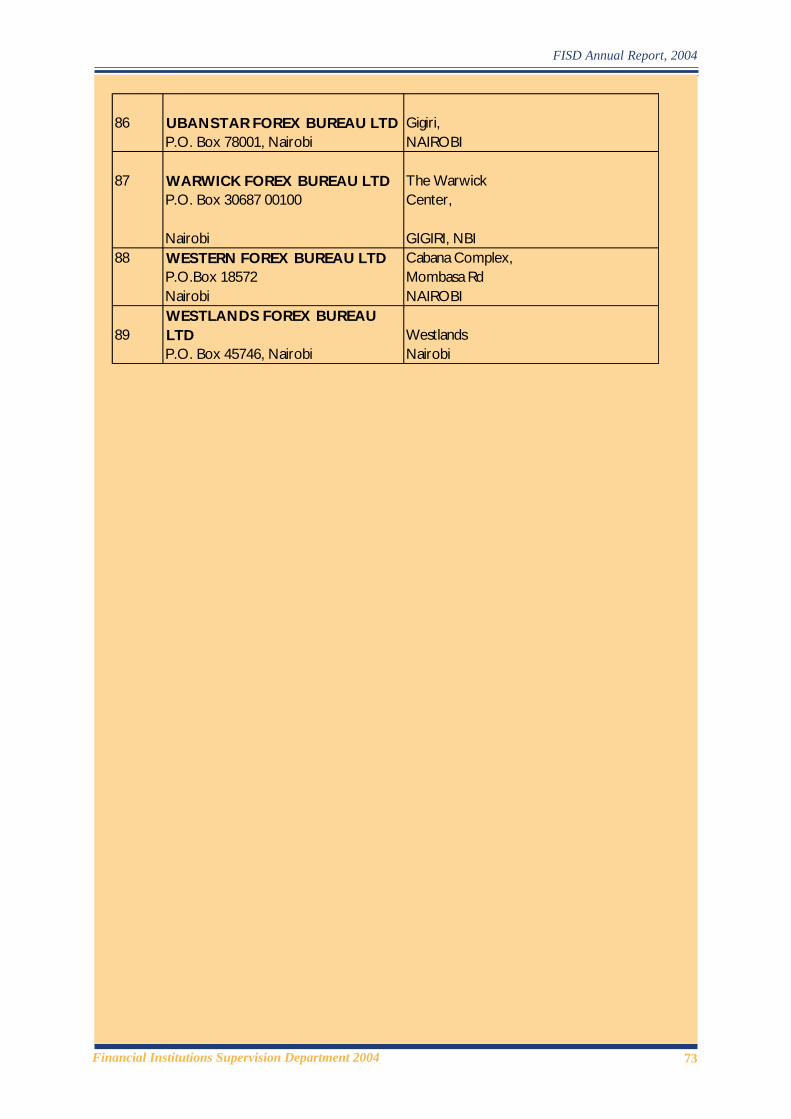
73Financial Institutions Supervision Department 2004
FISD Annual Report, 2004
86 UBANSTAR FOREX BUREAU LTD Gigiri,P.O. Box 78001, Nairobi NAIROBI
87 WARWICK FOREX BUREAU LTD The WarwickP.O. Box 30687 00100 Center,
Nairobi GIGIRI, NBI88 WESTERN FOREX BUREAU LTD Cabana Complex,
P.O.Box 18572 Mombasa RdNairobi NAIROBI
89WESTLANDS FOREX BUREAU LTD WestlandsP.O. Box 45746, Nairobi Nairobi

74Financial Institutions Supervision Department 2004
FISD Annual Report, 2004
Financial Institutions Supervision Annual Report, prepared by theCentral Bank of Kenya, is available on the internet:
http://wwww.centralbank.go.ke
75Financial Institutions Supervision Department 2004
FISD Annual Report, 2004
CENTRAL BANK OF KENYA
Financial InstitutionsSupervisionAnnual Report(Eleventh Edition )2004