Annual Report - Amundi LU
145
$QQXDO 5HSRUW 'HFHPEHU $XGLWHG $PXQGL 6) $ /X[HPERXUJ ,QYHVWPHQW )XQG )RQGV &RPPXQ GH 3ODFHPHQW Amundi ASSET MANAGEMENT
-
Upload
khangminh22 -
Category
Documents
-
view
1 -
download
0
Transcript of Annual Report - Amundi LU

Amundi ASSET MANAGEMENT

Amundi S.F.Audited annual report
R.C.S. Luxembourg K 651
For the year ended as at 31/12/20
No subscriptions can be received on the basis of these financial statements. Subscriptions are only valid if made on the basis of the current prospectus and the Key Investor Information Document(“KIID”), accompanied by a copy of the latest annual report including audited financial statements and a copy of the latest semi-annual report, if published thereafter.

Table of Contents
Page
Organisation 4
Board of Directors’ Report 6
Portfolios details as at 31/12/20:
Bond Sub-FundsAmundi S.F. - Diversified Short-Term Bond 8
Amundi S.F. - Emerging Markets Bond 2024 10
Amundi S.F. - Emerging Markets Bond 2025 13
Amundi S.F. - Euro Curve 1-3year 17
Amundi S.F. - Euro Curve 3-5year 18
Amundi S.F. - Euro Curve 7-10year 19
Amundi S.F. - Euro Curve 10+year 20
Amundi S.F. - Global High Yield Opportunities 2025 21
Amundi S.F. - High Yield & Emerging Markets Bond Opportunities 2021 25
Equity Sub-FundsAmundi S.F. - European Equity Market Plus 26
Amundi S.F. - European Equity Optimal Volatility 30
Amundi S.F. - European Research 31
Absolute Return Sub-FundsAmundi S.F. - Absolute Return Multi-Strategy Control 33
Amundi S.F. - Saving Box I 44
Amundi S.F. - Saving Box II 47
Amundi S.F. - Saving Box III 51
Multi-Asset Sub-FundsAmundi S.F. - Amundi Target Trend 2024 54
Amundi S.F. - Diversified Target Income 11/2021 55
Amundi S.F. - Diversified Target Income 11/2022 60
Commodities Sub-FundsAmundi S.F. - EUR Commodities 66
Capital Guaranteed Sub-FundsAmundi S.F. - SMBC Amundi Protect Fund USD Step 201803 67
Amundi S.F. - SMBC Amundi Protect Fund USD Step 201809 68
Accounts:Statement of Net Assets 69
Statement of Unit Statistics 81
Statement of Operations and Changes in Net Assets 87
Notes to the Financial Statements as at 31/12/20 1001 Introduction 1002 Principal Accounting Conventions 1013 Exchange Rates used as of 31 December 2020 1024 Management, Investment Management and Distribution Fees 1025 Performance Fee 1036 Depositary and Paying Agent, Administrator, Registrar and Transfer Agent 1047 Taxation of the Fund - Taxe d’abonnement 1048 Open Positions on Futures Contracts 1059 Open Positions on Forward Foreign Exchange Contracts 11010 Other Income 11511 Other Charges 11512 Statement of Portfolio Movements 11513 Dividends 11514 Options 11615 Swaps 12616 Collateral 13917 Transaction Costs 13918 Proxy Voting Policy 13919 Class Action 13920 Liquidated Sub-Funds 139
Report of the Réviseur d’entreprises agréé 140
Additional Information (unaudited) 142
(1) This Sub-Fund has been launched on 16 January 2018.(2) This Sub-Fund has been launched on 12 April 2018.
--

4
Organisation
MANAGEMENT COMPANY, Amundi Luxembourg S.A.DOMICILIARY AGENT AND DISTRIBUTOR 5, Allée Scheffer
L-2520 LuxembourgGrand Duchy of Luxembourg
BOARD OF DIRECTORS OF THEMANAGEMENT COMPANY
Chairman David Joseph HARTEDeputy Head of the Operations, Services and Technology Division, Head of Ireland Amundi Ireland Limitedresiding in Ireland
Members Jeanne DUVOUXChief Executive Officer and Managing Director, Amundi Luxembourg S.A.,residing in Luxembourg
Claude KREMERPartner, Arendt & Medernach S.A. and Independent Director,residing in Luxembourg
Christian PELLISGlobal Head of Distribution, Amundi Asset Management S.A.S,residing in France
Enrico TURCHIDeputy Chief Executive Officer and Managing Director of Amundi Luxembourg S.A.,residing in Luxembourg
François VEVERKAIndependent Director,residing in France
CONDUCTING OFFICERS OF Jeanne DUVOUXTHE MANAGEMENT COMPANY Chief Executive Officer and Managing Director, Amundi Luxembourg S.A.
Enrico TURCHIDeputy Chief Executive Officer and Managing Director, Amundi Luxembourg S.A.
Pierre BOSIOChief Operating Officer, Amundi Luxembourg S.A.
Charles GIRALDEZDeputy Chief Executive Officer, Amundi Luxembourg S.A.
Benjamin LAUNAYReal Estate Portfolio Manager, Amundi Luxembourg S.A.
ADMINISTRATOR, REGISTRAR Société Générale LuxembourgAND TRANSFER AGENT (formely Société Générale Bank & Trust)
(Operational center)28-32, Place de la gareL-1616 LuxembourgGrand Duchy of Luxembourg
DEPOSITARY AND PAYING AGENT Société Générale Luxembourg(formely Société Générale Bank & Trust)11, Avenue Emile ReuterL-2420 LuxembourgGrand Duchy of Luxembourg
INVESTMENT MANAGERS Amundi Ireland Limited1, George’s Quay PlazaGeorge’s QuayDublin 2Ireland
Amundi (UK) Limited41, LothburyLondon EC2R 7HFUnited Kingdom

5
Organisation
Amundi Deutschland GmbHArnulfstraße 124 -126D-80636 MunichGermany
Amundi SGR S.p.A.Via Cernaia 8/1020121 MilanoItaly
Amundi Asset Management90, Boulevard Pasteur75015 ParisFrance
Amundi Pioneer Asset Management, Inc.60, State StreetBoston, MA 02109-1820U.S.A.
Amundi Singapore Ltd168, Robinson Road #24-01, Capital TowerSingapore 068912, Singapore
AUDITOR / CABINET DE RÉVISION AGRÉÉ Deloitte Audit, Société à responsabilité limitée20, boulevard de Kockelscheuer L-1821 LuxembourgGrand Duchy of Luxembourg
LEGAL ADVISOR Arendt & Medernach S.A.41A, avenue J.F. KennedyL-2082 LuxembourgGrand Duchy of Luxembourg
6
Board of Directors’ Report
� OverviewAt the beginning of the year, economic figures were positive yet moderate overall in the United States and in the Eurozone, with the COVID-19 pandemic largely limitedto China. Starting from the middle of the quarter, the global spread of the pandemic had major consequences for the global economy. Lockdown measures adopted bya number of governments caused many sectors to come to a near standstill. Faced with this crisis, governments and central banks announced very wide-rangingsupport measures. Equity markets and bond yields fell sharply.In the second quarter, global economic activity was severely constrained by the travel-restriction measures adopted by the authorities in response to the COVID-19pandemic. There were signs of improvement at the end of April, albeit at different rates from country to country. Equity markets recovered significantly after their collapsein quarter one, while bond yields in the major countries remained at very low levels. While the start of quarter three saw an upturn in economic activity, at the end of the quarter a slowdown recurred, particularly in the Eurozone. Central banks andgovernments continued to work very actively in order to support the recovery. Equity markets recovered much of the ground that they had lost since the beginning ofthe year, while some have even reached new highs. During quarter four, the second wave of the pandemic led to further lockdown restrictions, which took a heavy toll on economic activity in Europe. In the United States,which imposed its own restrictions later, the slowdown was less significant. In China, which has largely been spared from the new wave of the epidemic, economicrecovery was robust. The end of the year saw the election of Joe Biden as President of the United States and positive news on vaccine developments. Finally, equitymarkets closed the year with substantial growth.
� United StatesA slowdown in economic activity was noticeable at the beginning of 2020, with signs of weakening consumption and investment, and moderation in retail sales and capitalgoods orders. Corporate sentiment in Manufacturing sector, while signs from the Services sector were more moderate. With the labour market remaining quite buoyant,consumer sentiment remained broadly positive. The economic backdrop was then completely altered by the spread of the COVID-19 pandemic, which led the USPresident to declare a State of Emergency on 13 March 2020. Lockdown measures for the US population began at the end of the first quarter. PMI indicators fellsharply and initial unemployment claims reached a historic high of 3.3 million in the week of 21 March. The response from public institutions was unprecedented: theUS Federal Reserve reduced its key rate by 150 basis points, to 0-0.25%. It also announced a new purchasing programme for assets of unlimited duration and size,and introduced several programmes aimed at supporting credit to businesses. Moreover, there was a very large budgetary response, with the announcement, on 27March, of a plan to support the economy totalling over 2 billion dollars, made up of a number of measures to assist households and businesses.The US experienced a very sharp economic slowdown from April onwards. The lockdown measures implemented in many US regions to halt the epidemic paralysedseveral economic sectors. The negative effects on consumption were spectacular, whilst inflation fell sharply. Pressures on the US labour market intensified, withunemployment claims reaching historic highs in April 2020. In May, economic activity began to recover as lockdown measures were relaxed. June data confirmed agradual economic recovery, mainly based on domestic demand, while the pandemic continued to disrupt international trade. Inflation remained moderate, while asignificant improvement was seen in the labour market. During quarter three of 2020, as the spread of the virus slowed in the United States, the economic recovery continued, buoyed by the recovery in domestic and foreigndemand. Sales figures confirmed a continued increase in activity in the private sector, with the Services and Industry sectors signalling an improvement in the businessclimate. Retail sales grew 2.6% year-on-year in August, while industrial production growth was more moderate. The US unemployment rate was 8.4% in August, withcompanies reporting increases in the size of their workforces. However, pressure on the labour market remained high due to pandemic uncertainty. Inflation rosemoderately to 1.3% over 12 months in August (compared to 1.0% over 12 months in July). In August, the Federal Reserve confirmed its intention to maintain a veryaccommodating attitude for the foreseeable future. The campaigning around the presidential election intensified, with the two candidates Donald Trump and Joe Bidenholding their first presidential debate on 29 September 2020.Despite the resurgence of COVID-19 cases in the United States during quarter four, economic activity continued to grow at a rapid pace, buoyed in particular by healthydomestic demand. Economic surveys and production and consumption figures confirmed the continued recovery and the improved business climate in both the Industrialand Service sectors. Retail sales grew 5.7% year-on-year in October, while industrial production had a more moderate rise than expected (1.1% month-on-month and-5.34% year-on-year). The unemployment rate stood at 6.7% in November 2020, with companies reporting increases in the size of their workforces, despite the labourmarket remaining very weak compared to the period before the crisis. Inflation remained very moderate. It settled at 1.2% over 12 months in October, slightly downfrom 1.4% in September. The Federal Reserve confirmed that it would be continuing its very expansive monetary policy, while a new budgetary-support plan wasapproved by Congress. Finally, Joe Biden was elected 46th President of the United States and assumed his role in January 2021.
� EurozoneThe economy in the Eurozone started the first quarter of 2020 on a very moderate note. During the first two months of the year, domestic demand, buoyed by a dynamiclabour market, was the main driver of growth. Investment remained weak and the Manufacturing sector remained under considerable pressure, particularly in Germanyand Italy. In March, the spread of the COVID-19 in Europe significantly impacted the Eurozone economy. Lockdown measures completely or partially halted theoperations of many Services and disrupted the Manufacturing sector. Eurozone PMI indicators fell to record lows of 31.4 and 28.4 for Industry and Services respectively.European institutions decided to establish a joint response to support the Eurozone economy. The European Central Bank kept its key interest rates unchanged butannounced new emergency asset purchase programmes totalling EUR 870 billion, as well as liquidity to enable banks to continue lending to businesses. Europeangovernments, in turn, adopted significant measures to support the economy, covering, in particular, medical expenses, increased unemployment compensation andbusiness loans or business-loan guarantees. In addition to announcing their own support programmes, European institutions lifted constraints on governments' budgetsand their opportunities to help businesses. Finally, year-on-year inflation was 0.7% in March 2020, down from the 1.2% rate seen in February.The impact of the COVID-19 pandemic on the Eurozone economy intensified in April, as strict lockdown measures were adopted and many companies were forced toclose their doors. Consumption and investment collapsed, while companies experienced their sharpest drop in business ever. Pressure on the labour market increasedas job cuts reached record highs. However, governments announced unprecedented fiscal-stimulus measures to support recovery, with EU institutions also providingsupport. Pressure on economic activity began to lessen in May, as lockdown measures were eased. In June, the Eurozone economic recovery was mainly based ondomestic demand, as global demand remained weak. Inflation remained very moderate after its fall during April, with very strong divergence between products andservices. In order to support and stimulate recovery, the European Commission proposed the creation of a significant stimulus fund (EUR 750 billion), which was stillbeing negotiated at the end of June.However, economic recovery slowed significantly in the Eurozone in September following the major upturn over the quarter, as the rise in COVID-19 cases led to newrestrictions. PMI indicators showed a loss of momentum in the Service sector, while the business climate remained positive in the Manufacturing sector. Economic dataconfirmed this slowdown in the recovery, with retail sales only improving moderately in August by 0.4% over 12 months, while industrial production fell by 7.7% over 12months in July. Pressure on the labour market remained high despite the extension of employment-protection schemes, which limited the rise in the unemployment rate(8.1% compared with 7.4% in January). Inflation remained slightly negative, at -0.3% over 12 months in September, slightly down on its August rate of -0.2%. The EUstimulus fund and the SURE programme (support for partial unemployment schemes) were approved in order to support the Eurozone economy. The ECB continuedits asset purchasing programmes and governments announced sizeable domestic stimulus plans.Economic activity slowed down considerably in the Eurozone during quarter four as the second wave of COVID-19 led new restrictions. However, the contraction ineconomic activity was less severe than in the spring, due to the less stringent measures and companies' abilities to adapt their operations. Business-climate surveysand production and consumption figures confirmed this trend. Retail sales grew 4.3% year-on-year in October. Industrial production fell 6.8% year-on-year in September,far below the level at the end of 2019. The labour market was still very weak, although the employment-protection schemes were extended (the unemployment ratewas at 8.4% in October, compared with 7.4% in January). Inflation remained slightly negative over 12 months in November. National governments started to introducereform programmes in order to obtain support from the European stimulus fund. On the political front, difficult Brexit negotiations finally led to an agreement at the endof December.

7
Board of Directors’ Report
� Emerging marketsThe outbreak of a global pandemic dominated news at the start of the year, first with the spread of COVID-19 in China and then outside the country. Faced with thispandemic, most countries adopted lockdown measures. Governments announced a number of budgetary measures, firstly to combat the virus and secondly to limitthe negative impact of the pandemic on the economy. Central banks also greatly relaxed their monetary policy. The responses from public authorities naturally differedfrom country to country, depending on their room for manoeuvre. Against a backdrop of major uncertainty about the duration of the pandemic and the impact on globalgrowth, assets from emerging markets were heavily affected and capital outflows reached historic highs. Meanwhile, another crisis loomed: the oil price crisis. It wasbrought about by a trade war between producer countries and a sharp fall in demand. The oil price hit lows not seen for 20 years, reaching $21 per barrel for WTI andfor $23 for Brent. While growth forecasts were revised downwards and the massive rise in government deficits took a heavy toll on the most vulnerable countries, ratingagencies started to lower ratings for some sovereigns, thus increasing the risks to external financing. The IMF announced the opening of credit lines for the most fragilecountries. In quarter two of 2020, the COVID-19 health crisis continued to have a negative impact on growth in emerging countries. The IMF updated its outlook for the globaleconomy in 2020, which included a further downward revision of the global contraction, to -4.9% year-on-year in 2020 and a downward revision for 2021 to 5.4%. Themajor economic contraction, combined with the exceptional budgetary policy measures that were implemented, led to a deterioration in the budgetary situation in allregions. In order to limit the negative impact of this crisis on the economy, central banks continued to ease their monetary policy with quantitative easing and interestrate cuts. This was true, in particular, for Mexico, Brazil, India, Colombia, Indonesia and Russia. Overall, the recovery in emerging economies was robust during quarter three, reflecting the easing of lockdown measures between May and June 2020. The economicrecovery was driven both by domestic demand and exports, boosted by simultaneous improvements in developed economies, as well as extremely accommodatingmonetary policies and targeted budgetary-support programmes. In quarter three inflation rose slightly, but the cost of living did not significantly exceed central-banktargets, with rare exceptions, such as Turkey and India. Monetary authorities maintained a very expansionary position while reducing their easing measures. In somecases, they implemented non-conventional policies, such as in Indonesia, Poland and the Philippines. Budgetary support was increasingly limited and targeted, due toconcerns about pre-existing frailties and some operational issues in rolling out these programmes.
The Board of DirectorsAmundi Luxembourg S.A.
Luxembourg, April 15, 2021
The figures stated in this report are historical and not necessarily indicative of future performance.

8
The accompanying notes form an integral part of these financial statements
% o
f NaV
Market V
alue
Quan
tity
EUR
98.001,050,502,177Long positions
85.72918,912,517Transferable securities admitted to an official stock exchangelisting and/or dealt in on another regulated market
84.32903,948,067Bonds1.0411,191,207Australia
0.485,099,150AUSTRALIA NEW ZEALAND BANKING GROUPLTD VAR 21/11/2029
5,000,000
0.566,092,057BHP BILLITON FINANCE LTD VAR 22/10/20775,000,000
1.1011,841,600Austria
0.576,143,200OMV AG VAR PERPETUAL EUR (ISINXS1294343337)
5,000,000
0.535,698,400VIENNA INSURANCE GROUP AG WIENERVERSICHERUNG GRUPPE VAR 09/10/2043
5,000,000
0.939,956,600Belgium
0.939,956,600KBC GROUP SA/NV VAR 03/12/202910,000,000
1.0010,706,300British Virgin Islands
0.495,201,700GLOBAL SWITCH HOLDING 1.50% 31/01/20245,000,0000.515,504,600GLOBAL SWITCH HOLDING 2.25% 31/05/20275,000,000
0.485,127,150Czech Republic
0.485,127,150CEZ AS 0.875% 02/12/20265,000,000
0.464,944,700Finland
0.464,944,700SBB TREASURY OYJ 0.75% 14/12/20285,000,000
17.83191,074,091France
2.1022,422,400AXA SA VAR PERPETUAL20,000,0000.838,946,181BNP PARIBAS SA VAR REGS PERPETUAL USD
(ISIN USF1R15XK938)10,000,000
0.9510,160,900BNP PARIBAS SA VAR 15/07/202510,000,0000.475,079,900BPCE SA 0.50% 15/09/20275,000,0001.0711,502,200CNP ASSURANCES VAR 05/06/204510,000,0000.859,119,694CREDIT AGRICOLE SA VAR REGS PERPETUAL10,000,0000.495,223,100CREDIT AGRICOLE SA VAR 05/06/20305,000,0000.9710,411,400CREDIT AGRICOLE SA VAR 22/04/202610,000,0000.828,822,688ELECTRICITE DE FRANCE SA VAR 144A
PERPETUAL10,000,000
0.485,134,050ENGIE SA VAR PERPETUAL EUR (ISINFR0013431244)
5,000,000
0.9910,616,600JC DECAUX SA 2.00% 24/10/202410,000,0000.08809,328LA MONDIALE SOCIETE D ASSURANCE A FORME
MUTUELLE 0.75% 20/04/2026800,000
0.9910,570,800ORANGE SA VAR PERPETUAL EUR (ISINFR0013413887)
10,000,000
1.4815,767,100PEUGEOT SA 2.375% 14/04/202315,000,0000.475,018,200SOCIETE GENERALE SA FRANCE VAR 24/11/20305,000,0001.0311,071,500SOLVAY FINANCE VAR PERPETUAL10,000,0000.9810,539,800THALES 1.00% 15/05/202810,000,0001.4415,439,800TOTAL SA VAR PERPETUAL EUR (ISIN
XS1974787480)15,000,000
0.889,435,000UNIBAIL-RODAMCO SE VAR PERPETUAL10,000,0000.464,983,450UNIBAIL-RODAMCO SE 0.625% 04/05/20275,000,000
% o
f NaV
Market V
alue
Quan
tity
EUR
3.6138,697,218Germany
1.1812,531,568ALLIANZ SE VAR REGS PERPETUAL15,000,0000.485,178,550BERTELSMANN SE & CO VAR 23/04/20755,000,0000.515,461,100COMMERZBANK AG VAR 05/12/20305,000,0000.485,165,050DEUTSCHE BANK AG VAR 03/09/20265,000,0000.485,197,900INFINEON TECHNOLOGIES AG VAR PERPETUAL5,000,0000.485,163,050ZF FINANCE GMBH 3.00% 21/09/20255,000,000
5.9964,201,239Italy
0.535,627,950ASSICURAZIONI GENERALI SPA VARPERPETUAL
5,000,000
0.899,563,810ENEL SPA VAR 24/09/207310,000,0000.495,229,750ENI S P A VAR PERPETUAL EUR (ISIN
XS2242929532)5,000,000
0.475,057,300FCA BANK SPA 0.50% 13/09/20245,000,0000.515,446,200INTESA SANPAOLO SPA VAR PERPETUAL EUR
(ISIN XS1614415542)5,000,000
0.475,029,300POSTE ITALIANE SPA 0.50% 10/12/20285,000,0000.495,254,368UNICREDIT SPA VAR PERPETUAL EUR (ISIN
XS1539597499)4,800,000
0.495,270,450UNICREDIT SPA VAR PERPETUAL EUR (ISINXS1619015719)
5,000,000
0.485,180,000UNICREDIT SPA VAR 03/07/20255,000,0001.1712,542,111UNICREDIT SPA 2.569% 144A 22/09/202615,000,000
1.2813,764,588Japan
0.495,213,650NISSAN MOTOR CO LTD 1.94% REGS 15/09/20235,000,0000.798,550,938NISSAN MOTOR CO LTD 3.043% REGS 15/09/202310,000,000
3.3235,576,100Luxembourg
0.464,903,600AROUNDTOWN SA 0% 16/07/20265,000,0000.495,267,300CK HUTCHISON GROUP TELECOM FIN SA
1.125% 17/10/20285,000,000
0.485,125,050EUROFINS SCIENTIFIC BONDS VAR PERPETUAL5,000,0000.464,943,700GRAND CITY PROPERTIES S A VAR PERPETUAL5,000,0000.9510,209,800LOGICOR FINANCING SARL 0.75% 15/07/202410,000,0000.485,126,650SES S.A. VAR PERPETUAL5,000,000
1.0711,457,400Mexico
1.0711,457,400AMERICA MOVIL SAB DE CV VAR 06/09/207310,000,000
11.69125,364,153Netherlands
1.0411,196,500AIRBUS SE 2.00% 07/04/202810,000,0000.879,281,190ARGENTUM NETHERLAND BV VAR 15/08/205010,000,0000.808,535,001AT SECURITIES BV VAR PERPETUAL10,000,0000.515,470,100COOPERATIEVE RABOBANK UA VAR
PERPETUAL EUR (ISIN XS1877860533)5,000,000
1.5817,049,450FIAT CHRYSLER AUTOMOBILES N.V. 3.875%05/01/2026
15,000,000
0.485,159,600IBERDROLA INTERNATIONAL BV VARPERPETUAL EUR (ISIN XS2244941063)
5,000,000
0.475,001,750ING GROUP NV VAR 18/02/20295,000,0000.404,294,062KONINKLIJKE KPN NV VAR REGS 28/03/20735,000,0001.0511,257,000NN GROUP NV VAR 08/04/204410,000,0001.0210,961,900REPSOL INTERNATIONAL FINANCE BV VAR
25/03/207510,000,000
Amundi S.F. - Diversified Short-Term Bond
31/12/20Securities Portfolio as at
Bond Sub-Funds
Portfolios details as at 31/12/20:

9
The accompanying notes form an integral part of these financial statements
% o
f NaV
Market V
alue
Quan
tity
EUR
0.9610,256,300TELEFONICA EUROPE BV VAR PERPETUAL EUR(ISIN XS1795406575)
10,000,000
1.5616,686,300VOLKSWAGEN INTERNATIONAL FINANCE NVVAR PERPETUAL EUR (ISIN XS1048428442)
15,000,000
0.9510,215,000WINTERSHALL DEA FINANCE BV 0.84%25/09/2025
10,000,000
0.778,265,375Norway
0.778,265,375DNB BANK ASA 1.127% REGS 16/09/202610,000,000
5.8863,064,650Spain
0.9810,482,500BANCO BILBAO VIZCAYA ARGENTARIA SA VARPERPETUAL
10,000,000
0.9810,464,900BANCO SANTANDER SA VAR PERPETUAL EUR(ISIN XS1692931121)
10,000,000
1.4815,915,600BANCO SANTANDER SA 1.375% 05/01/202615,000,0000.9810,463,100CAIXABANK S.A VAR 14/07/202810,000,0000.475,055,600FERROVIAL EMISIONES SA 0.54% 12/11/20285,000,0000.495,295,900IMMOBILIARIA COLONIAL SOCIMI SA 1.625%
28/11/20255,000,000
0.505,387,050IMMOBILIARIA COLONIAL SOCIMI SA 2.00%17/04/2026
5,000,000
1.8219,557,422Sweden
0.9910,607,400AKELIUS RESIDENTIAL PROPERTY VAR05/10/2078
10,000,000
0.838,950,022SVENSKA HANDELSBANKEN AB VARPERPETUAL
10,000,000
1.1912,736,913Switzerland
0.818,630,215CREDIT SUISSE GRP AG VAR PERPETUAL10,000,0000.384,106,698UBS GROUP FUNDING SWITZERLAND INC VAR
PERPETUAL USD (ISIN CH0400441280)5,000,000
9.2198,756,931United Kingdom
1.9120,459,000BARCLAYS PLC VAR 07/02/202820,000,0001.4916,016,250BP CAPITAL MARKETS PLC VAR PERPETUAL15,000,0000.545,835,900BP CAPITAL MARKETS PLC 2.519% 07/04/20285,000,0001.4215,190,200LLOYDS BANKING GRP PLC VAR 12/11/202515,000,0000.414,374,321NATWEST GROUP PLC VAR 01/11/20295,000,0002.5927,803,250NATWEST MARKETS PLC 2.75% 02/04/202525,000,0000.859,078,010VODAFONE GROUP PLC VAR 03/10/2078 USD10,000,000
15.65167,664,430United States of America
1.1512,375,383BANCO BILBAO VIZCAYA ARG USA BRANCH1.125% 18/09/2025
15,000,000
0.778,239,467BANCO BILBAO VIZCAYA ARG 0.875% 18/09/202310,000,0001.7318,399,248BMW US CAPITAL LLC 3.90% 144A 09/04/202520,000,0001.3013,969,106BOEING CO 4.875% 01/05/202515,000,0000.9910,631,900CITIGROUP INC USA VAR 24/07/202610,000,0000.788,357,648CK HUTCHISON CAPITAL SECURITIES (17) LTD
VAR REGS PERPETUAL10,000,000
0.495,254,600FORD MOTOR CREDIT CO LLC 3.25% 15/09/20255,000,0000.485,150,850GENERAL ELECTRIC CO 0.875% 17/05/20255,000,0001.4215,113,850GENERAL MOTORS FINANCIAL CO 0.85%
26/02/202615,000,000
1.0611,398,800GOLDMAN SACHS GROUP INC. 3.375%27/03/2025
10,000,000
% o
f NaV
Market V
alue
Quan
tity
EUR
0.475,078,400HARLEY DAVIDSON FINANCIAL SERVICES INC0.90% 19/11/2024
5,000,000
0.9810,527,900JPMORGAN CHASE & CO VAR 11/03/202710,000,0000.434,640,391SANTANDER HOLDINGS USA 4.50% 17/07/20255,000,0000.849,033,550SIMON PROPERTY GROUP LP 3.50% 01/09/202510,000,0000.818,660,537WE FIN WST UK NOTES WESTFIELD UK EUROPE
FINANCE PLC 3.75% 144A 17/09/202410,000,000
1.9520,832,800WELLS FARGO & CO VAR 04/05/202520,000,000
1.4014,964,450Convertible bonds1.4014,964,450Italy
1.4014,964,450TELECOM ITALIA SPA 1.125% 26/03/2022 CV15,000,000
8.0886,581,510Share/Units of UCITS/UCIS
8.0886,581,510Share/Units in investment funds6.5570,154,170France
2.1322,814,351AMUNDI CASH INST SRI I C1050.798,513,388AMUNDI FRN CREDIT EURO VALUE FACTOR FCP8,0000.454,815,591AMUNDI MULTI FACTOR OPPORTUNITY CREDIT
FCP EUR450
2.6728,559,875AMUNDI TRESO COURT TERME PART I C1,5400.515,450,965EUROPEAN HIGH YIELD SRI SICAV5,000
1.5316,427,340Luxembourg
0.555,907,100AMUNDI FUNDS EURO HIGH YIELD SHORT TERMBOND - O EUR (C)
5,000
0.9810,520,240PI SOLUTIONS - EUROPEAN CREDITCONTINUUM - J2 (C)
2,000
4.2045,008,150Money market instrument
4.2045,008,150Bonds4.2045,008,150France
1.8720,001,400FRANCE BTF 0% 06/01/202120,000,0002.3325,006,750FRANCE BTF 0% 13/01/202125,000,000
98.001,050,502,177Total securities portfolio
Amundi S.F. - Diversified Short-Term Bond
31/12/20Securities Portfolio as at

10
The accompanying notes form an integral part of these financial statements
% o
f NaV
Market V
alue
Quan
tity
EUR
93.66147,851,400Long positions
93.66147,851,400Transferable securities admitted to an official stock exchangelisting and/or dealt in on another regulated market
93.66147,851,400Bonds2.664,205,795Argentina
0.42670,483AES ARGENTINA GENERACION SA 7.75% REGS02/02/2024
1,000,000
0.15233,419PROVINCIA DE BUENOS AIRES 0% REGS16/03/2024
700,000
0.29463,313PROVINCIA DE BUENOS AIRES 5.375% REGS20/01/2023
1,250,000
1.802,838,580YPF SOCIEDAD ANONIMA 8.50% REGS28/07/2025
4,500,000
0.37585,096Austria
0.37585,096SAPPI PAPIER HOLDING GMBH 3.125% REGS15/04/2026
600,000
1.973,116,644Bahrain
1.392,201,038BBK 5.50% 09/07/20242,600,0000.58915,606OIL GAS HOLDING 7.625% REGS 07/11/20241,000,000
0.11165,876Belarus
0.11165,876DEVELOPMENT BANK OF BELARUS 6.75% REGS02/05/2024
200,000
1.071,694,021Bermuda
1.071,694,021GEOPARK LTD 6.50% REGS 21/09/20242,000,000
1.522,396,528Brazil
1.141,797,139AEGEA FINANCE SARL 5.75% REGS 10/10/20242,100,0000.11173,449BANCO VOTORANTIM 4.50% REGS 24/09/2024200,0000.27425,940CEMIG GERACAO E TRANSMISSAO SA 9.25%
REGS 05/12/2024450,000
2.343,699,017British Virgin Islands
0.14221,678ENN CLEAN ENERGY INTERNATIONALINVESTMENT LTD 7.50% 27/02/2021
270,000
1.672,648,019FORTUNE STAR BVI LTD 6.85% 02/07/20243,050,0000.53829,320HUARONG FINANCE II CO LTD 5.50% 16/01/2025900,000
2.483,910,631Canada
0.58922,389FIRST QUANTUM MINERALS LTD 6.50% REGS01/03/2024
1,100,000
0.981,542,266FRONTERA ENERGY CORPORATION 9.70%REGS 25/06/2023
2,000,000
0.921,445,976HUDBAY MINERALS INC 7.625% 144A 15/01/20251,700,000
13.7121,644,466Cayman Islands
0.55875,101BANCO BTG PACTUAL LUX 4.50% REGS10/01/2025
1,000,000
3.054,808,344BANK OF SHARJAH FUNDING LTD 4.00%18/09/2024
5,600,000
1.712,691,481BRASKEM FINANCE 6.45% 03/02/20243,000,0000.10165,337CENTRAL CHN REAL ESTATE 6.75% 08/11/2021200,0000.941,482,767CHINA EVERGRANDE GROUP 10.50% 11/04/20242,000,000
% o
f NaV
Market V
alue
Quan
tity
EUR
0.55868,522CHINA SCE PROPERTY HOLDINGS LTD 7.375%09/04/2024
1,000,000
1.001,586,122KAISA GROUP 9.375% 30/06/20242,000,0000.51802,844LAMAR FUNDING LTD 3.958% REGS 07/05/20251,000,0000.17267,223MAF GLOBAL SECURITIES LTD 4.75% 07/05/2024300,0000.821,298,088NAGACORP LTD 7.95% 06/07/20241,526,0000.18284,565RED SUN PROPERTIES GRP 9.70% 16/04/2023330,0000.781,226,247RONSHINE CHINA HOLDINGS LTD 6.75%
05/08/20241,500,000
0.781,226,933SUNAC CHINA HOLDINGS LTD 6.65% 03/08/20241,450,0001.081,703,372SUNRISE CAYMAN LTD 5.25% 11/03/20242,000,0000.58917,181UPCB FINANCE IV LTD 4.00% REGS 15/01/20271,000,0000.801,269,891ZHENRO PROPERTIES GROUP LIMITED 7.35%
05/02/20251,500,000
0.11170,448ZHENRO PROPERTIES GROUP LIMITED 7.875%14/04/2024
200,000
0.11178,136Colombia
0.11178,136ECOPETROL SA 4.125% 16/01/2025200,000
0.17268,819Cyprus
0.17268,819MHP SE 7.75% REGS 10/05/2024300,000
2.433,829,169Egypt
0.781,229,444AFRICAN EXPORT IMPORT BANK AFREXIMBANK4.125% 20/06/2024
1,400,000
1.652,599,725EGYPT 4.75% REGS 11/04/20252,500,000
2.994,725,048France
0.31490,175ALTICE FRANCE SA 2.50% REGS 15/01/2025500,0001.241,953,460CASINO GUICHARD PERRACHON SA VAR
07/03/20242,000,000
1.261,992,700CMA CGM 5.25% REGS 15/01/20252,000,0000.11174,100NOVAFIVES 5.00% REGS 15/06/2025200,0000.07114,613ORANO SA 4.875% 23/09/2024100,000
1.832,885,894Georgia
1.832,885,894TBC BANK JSC 5.75% REGS 19/06/20243,400,000
0.951,499,783Germany
0.47748,875NIDDA HEALTHCARE HOLDING AG 3.50% REGS30/09/2024
750,000
0.48750,908THYSSENKRUPP AG 2.50% 25/02/2025750,000
0.26406,440Hungary
0.26406,440OTP BANK PLC VAR 15/07/2029400,000
4.416,962,790India
1.542,447,266ADANI GREEN ENERGY UP LTD 6.25% REGS10/12/2024
2,700,000
0.53829,611GMR HYDERABAD INTERNATIONAL AIRPORTLTD 5.375% REGS 10/04/2024
1,000,000
0.941,477,406INDIABULLS HOUSING FINANCE LTD 6.375%28/05/2022
2,000,000
0.11180,895OIL INDIA LTD 5.375% 17/04/2024200,0000.11178,677ONGC VIDESH 4.625% 15/07/2024200,0000.19292,479POWER FINANCE CORPORATION 3.25%
16/09/2024343,000
Amundi S.F. - Emerging Markets Bond 2024
31/12/20Securities Portfolio as at

11
The accompanying notes form an integral part of these financial statements
% o
f NaV
Market V
alue
Quan
tity
EUR
0.32497,756RENEW CLEAN ENERGY PVT LTD 6.67% REGS12/03/2024
577,000
0.41640,462RURAL ELECTRIFICATION CORP LTD 3.375%25/07/2024
750,000
0.26418,238SHRIRAM TRANSPORT FINANCE LTD 5.95%REGS 24/10/2022
500,000
2.944,635,819Indonesia
0.19293,020BK TABUNGAN NEGARA 4.20% 23/01/2025353,0002.233,519,196PELABUHAN INDONESIA III 4.875% REGS
01/10/20243,900,000
0.52823,603PT CHANDRA ASRI PETROCHEMICAL TBK 4.95%REGS 08/11/2024
1,000,000
1.862,942,320Ireland
0.45703,579ARAGVI FINANCE INTERNATIONAL 12.00% REGS09/04/2024
800,000
0.36562,978ASG FINANCE DAC 7.875% REGS 03/12/2024800,0001.051,675,763CBOM FINANCE PLC 4.70% REGS 29/01/20252,000,000
1.742,748,168Italy
1.742,748,168ITALY BTP 3.75% 01/09/20242,400,000
2.333,681,926Kenya
2.333,681,926EASTERN AND SOUTHERN AFRICAN TRADE ANDDEV BANK 4.875% 23/05/2024
4,270,000
4.757,490,613Luxembourg
0.06102,439CONTOURGLOBAL POWER HOLDINGS 4.125%REGS 01/08/2025
100,000
0.641,005,680CRYSTAL ALMOND S A R L 4.25% REGS15/10/2024
1,000,000
0.26410,552GARFUNKELUX HOLDCO 3 SA 6.75% REGS01/11/2025
400,000
0.28440,579GOL FINANCE SA 7.00% REGS 31/01/2025600,0000.63989,307HIRDROVIAS INTERNATIONAL FINANCE SARL
5.95% REGS 24/01/20251,150,000
0.16256,879INTRALOT CAPITAL LUXEMBOURG SA 5.25%REGS 15/09/2024
700,000
0.841,329,386KENBOURNE INVEST SA 6.875% REGS26/11/2024
1,500,000
0.771,218,107PUMA INTERNATIONAL FINANCING SA 5.125%REGS 06/10/2024
1,500,000
0.17261,444STEEL CAPITAL SA 3.15% REGS 16/09/2024306,0000.941,476,240VIVION INVESTMENTS SARL 3.00% 08/08/20241,600,000
1.682,646,837Mauritius
0.45703,585HTA GROUP LTD 7.00% REGS 18/12/2025800,0001.231,943,252MTN MAURITIUS INVESTMENTS 4.755% REGS
11/11/20242,250,000
7.0811,174,741Mexico
0.57906,264ALPHA HOLDINGS SA DE CV 9.00% REGS10/02/2025
1,500,000
0.47741,896CREDITO REAL SAB DE CV SOFOM ER 5.00%REGS 01/02/2027
800,000
0.56890,074CREDITO REAL SAB DE CV SOFOM ER 9.50%REGS 07/02/2026
1,000,000
% o
f NaV
Market V
alue
Quan
tity
EUR
0.44700,029GRUPO POSADAS SAB DE CV 0% REGS30/06/2022 DEFAULTED
2,000,000
0.11169,281NEMAK SAB DE CV 4.75% REGS 23/01/2025200,0004.316,803,208PETROLEOS MEXICANOS PEMEX 4.25%
15/01/20258,200,000
0.12181,765TRUST F/1401 5.25% REGS 15/12/2024200,0000.50782,224UNIFIN FINANCIERA SAB DE CV SOFOM ENR
7.00% REGS 15/01/20251,000,000
8.3613,193,522Netherlands
0.63993,646BHARTI AIRTEL INTERNATIONAL NETHERLANDSB.V. 5.35% REGS 20/05/2024
1,100,000
0.861,354,860DTEK RENEWABLES FINANCE B.V. 8.50% REGS12/11/2024
1,500,000
1.121,763,557IHS NETHERLANDS HOLDCO BV 8.00% REGS18/09/2027
2,000,000
0.45713,284JABABEKA INTERNATIONAL B.V. 6.50% REGS05/10/2023
900,000
1.151,820,770METINVEST BV 5.625% REGS 17/06/20251,750,0000.21332,475NOSTRUM OIL&GAS FIN BV 0% REGS 16/02/20251,800,0000.48752,621PPF ARENA 1 BV 3.50% 20/05/2024710,0000.39622,500SUNSHINE MID BV 6.50% REGS 15/05/2026600,0001.322,085,863TEVA PHARMACEUTICAL FINANCE
NETHERLANDS II BV 1.125% 15/10/20242,250,000
1.101,732,696TEVA PHARMACEUTICAL FINANCENETHERLANDS III BV 6.00% 15/04/2024
2,000,000
0.651,021,250UNITED GROUP B V 4.875% REGS 01/07/20241,000,000
1.983,123,420Nigeria
0.811,276,474ACCESS BANK NIGERIA 10.50% REGS 19/10/20211,500,0000.851,346,443SEPLAT PETROLEUM DEVELOPMENT COMPANY
PLC 9.25% REGS 01/04/20231,600,000
0.32500,503UNITED BANK FOR AFRICA PLC 7.75% REGS08/06/2022
600,000
0.11177,745Pakistan
0.11177,745PAKISTAN 8.25% REGS 15/04/2024200,000
0.27424,704Panama
0.27424,704CARNIVAL CORPORATION 7.625% REGS01/03/2026 EUR
400,000
0.11174,133Paraguay
0.11174,133TELEFONICA CELULAR DEL PARAGUAY 5.875%REGS 15/04/2027
200,000
0.34534,025Philippines
0.34534,025RIZAL COMMERICAL BANKING 3.00% 11/09/2024625,000
0.28449,642Senegal
0.28449,642SENEGAL 6.25% REGS 30/07/2024500,000
1.732,724,542Singapore
0.58921,293ABJA INVESTMENT CO 5.95% 31/07/20241,050,0001.151,803,249MEDCO PLATINUM ROAD PTE LTD 6.75% REGS
30/01/20252,100,000
Amundi S.F. - Emerging Markets Bond 2024
31/12/20Securities Portfolio as at

12
The accompanying notes form an integral part of these financial statements
% o
f NaV
Market V
alue
Quan
tity
EUR
0.701,097,884Spain
0.47727,664EL CORTE INGLES 3.625% REGS 15/03/2024700,0000.23370,220MASARIA INVESTMENTS SAU VAR REGS
15/09/2024400,000
0.31491,880Sri Lanka
0.31491,880SRI LANKA 6.35% REGS 28/06/20241,000,000
0.32500,000Sweden
0.32500,000INTRUM JUSTITIA AB 3.125% REGS 15/07/2024500,000
1.392,195,762Togo
1.392,195,762ECOBANK TRANSPORATIONAL INCORPORATED9.50% REGS 18/04/2024
2,500,000
0.44693,128Tunisia
0.44693,128BANQUE CENTRALE DE TUNISIE 5.625%17/02/2024
750,000
5.128,085,246Turkey
1.302,069,593AKBANK T A S 5.125% REGS 31/03/20252,500,0001.131,782,649FINANSBANK AS 6.875% REGS 07/09/20242,000,0000.43676,942TURK TELEKOMUNIKASYON A.S. 4.875% REGS
19/06/2024800,000
0.37585,842TURK TELEKOMUNIKASYON A.S. 6.875% REGS28/02/2025
650,000
0.791,239,862TURKEY 5.60% 14/11/20241,450,0000.53833,795TURKIYE IS BANKASI A S 6.125% REGS
25/04/20241,000,000
0.57896,563YAPI VE KREDIT BANKASI AS 8.25% REGS15/10/2024
1,000,000
1.151,814,393Ukraine
1.151,814,393UKRAINE 7.75% REGS 01/09/20242,000,000
6.7210,611,607United Kingdom
0.711,117,127ARROW GLOBAL FINANCE PLC 5.125% REGS15/09/2024
1,000,000
0.711,127,338BOPARAN FINANCE PLC 7.625% REGS30/11/2025
1,000,000
0.18280,728ELLAKTOR VALUE PLC 6.375% REGS 15/12/2024300,0000.38592,146INEOS FINANCE PLC 2.125% REGS 15/11/2025600,0000.26406,812JAGUAR LAND ROVER PLC 5.875% REGS
15/11/2024400,000
0.13197,945KCA DEUTAG UK FINANCE PLC 0% REGS15/05/2021
500,000
1.312,076,340KONDOR FINANCE PLC 7.125% 19/07/20242,000,0000.911,439,251MARB BONDCO PLC 6.875% REGS 19/01/20251,700,0000.53840,064MARB BONDCO PLC 7.00% REGS 15/03/20241,000,0000.41648,397NMG FINCO PLC 5.00% REGS 01/08/2022600,0001.191,885,459TULLOW OIL PLC 7.00% REGS 01/03/20253,500,000
1.001,585,371United States of America
0.19307,071COGENT COMMUNICATIONS GROUP INC 4.375%REGS 30/06/2024
300,000
0.61956,633SASOL FIANCNING USA LLC 5.875% 27/03/20241,100,000
% o
f NaV
Market V
alue
Quan
tity
EUR
0.20321,667UNITED AIRLINES HLODINGS INC 4.875%15/01/2025
400,000
1.572,479,819Uzbekistan
1.572,479,819UZBEK INDUSTRIAL AND CONSTRUCTION BANKJOINT STOCK COMMERCIAL BK 5.75% 02/12/2024
2,900,000
93.66147,851,400Total securities portfolio
Amundi S.F. - Emerging Markets Bond 2024
31/12/20Securities Portfolio as at

13
The accompanying notes form an integral part of these financial statements
% o
f NaV
Market V
alue
Quan
tity
EUR
92.67235,051,475Long positions
92.67235,051,475Transferable securities admitted to an official stock exchangelisting and/or dealt in on another regulated market
92.67235,051,475Bonds2.616,624,592Argentina
0.17435,814AES ARGENTINA GENERACION SA 7.75% REGS02/02/2024
650,000
0.23588,015ARGENTINA VAR 09/07/20301,782,3990.0113,802ARGENTINA 1.00% 09/07/202939,0630.20497,824CAPEX NOTES 6.875% REGS 15/05/2024700,0000.14348,334PAMPA ENERGIA SA 7.375% REGS 21/07/2023450,0000.11288,018PAMPA ENERGIA SA 7.50% REGS 24/01/2027400,0000.07185,325PROVINCIA DE BUENOS AIRES 5.375% REGS
20/01/2023500,000
0.601,528,339TELECOM ARGENTINA SA 8.50% REGS06/08/2025
2,000,000
0.38972,894TRANSPORTADORA DE GAS DEL SUR SA TGS6.75% REGS 02/05/2025
1,300,000
0.701,766,227YPF SOCIEDAD ANONIMA 8.50% REGS28/07/2025
2,800,000
0.481,218,950Austria
0.481,218,950SAPPI PAPIER HOLDING GMBH 3.125% REGS15/04/2026
1,250,000
0.25627,114Bahrain
0.07169,311BBK 5.50% 09/07/2024200,0000.18457,803OIL GAS HOLDING 7.625% REGS 07/11/2024500,000
0.621,575,825Belarus
0.621,575,825DEVELOPMENT BANK OF BELARUS 6.75% REGS02/05/2024
1,900,000
0.872,202,228Bermuda
0.872,202,228GEOPARK LTD 6.50% REGS 21/09/20242,600,000
0.802,040,907Brazil
0.802,040,907CENTRAIS ELECTRICAS BRASILEIRAS S.A3.625% REGS 04/02/2025
2,400,000
3.228,169,257British Virgin Islands
0.12295,570ENN CLEAN ENERGY INTERNATIONALINVESTMENT LTD 7.50% 27/02/2021
360,000
0.511,284,676FORTUNE STAR BVI LTD 5.95% 19/10/20251,500,0001.042,648,020FORTUNE STAR BVI LTD 6.85% 02/07/20243,050,0001.553,940,991HUARONG FINANCE 2019 CO LTD FRN
24/02/20255,000,000
2.045,181,427Canada
0.23595,476FIRST QUANTUM MINERALS LTD 7.50% REGS01/04/2025
700,000
0.741,889,276FRONTERA ENERGY CORPORATION 9.70%REGS 25/06/2023
2,450,000
0.842,126,436HUDBAY MINERALS INC 7.625% REGS 15/01/20252,500,0000.17425,287HUDBAY MINERALS INC 7.625% 144A 15/01/2025500,000
% o
f NaV
Market V
alue
Quan
tity
EUR
0.06144,952STONEWAY CAPITAL CORPORATION 0% REGS01/03/2027
500,000
8.9522,673,194Cayman Islands
0.34875,101BANCO BTG PACTUAL LUX 4.50% REGS10/01/2025
1,000,000
1.152,919,351BANK OF SHARJAH FUNDING LTD 4.00%18/09/2024
3,400,000
0.531,345,740BRASKEM FINANCE 6.45% 03/02/20241,500,0000.12297,918BRIGHT SCHOLAR EDUCATION HLDG 7.45%
31/07/2022350,000
0.07165,337CENTRAL CHN REAL ESTATE 6.75% 08/11/2021200,0000.401,015,815CHINA EVERGRANDE GROUP 8.75% 28/06/20251,500,0000.411,042,226CHINA SCE PROPERTY HOLDINGS LTD 7.375%
09/04/20241,200,000
0.28699,205CIFI HOLDINGS LTD 6.55% 28/03/2024800,0000.511,284,198COUNTRY GARDEN HOLDINGS CO LTD 5.125%
17/01/20251,500,000
0.12303,183COUNTRY GARDEN HOLDINGS CO LTD 7.25%08/04/2026
330,000
0.07175,126FIBRIA OVERSEAS FINANCE 4.00% 14/01/2025200,0000.972,455,094KAISA GROUP 10.50% 15/01/20253,000,0000.31798,962KAISA GROUP 9.95% 23/07/20251,000,0000.471,204,266LAMAR FUNDING LTD 3.958% REGS 07/05/20251,500,0000.18447,441NAGACORP LTD 7.95% 06/07/2024526,0000.11284,565RED SUN PROPERTIES GRP 9.70% 16/04/2023330,0000.34862,498SHIMAO PROPERTY HOLDINGS LIMITED 5.20%
30/01/20251,000,000
0.32799,575SUNAC CHINA HOLDINGS LTD 6.50% 10/01/2025950,0000.671,703,371SUNRISE CAYMAN LTD 5.25% 11/03/20242,000,0000.22550,309UPCB FINANCE IV LTD 4.00% REGS 15/01/2027600,0000.691,750,725YUZHOU GROUP HOLDINGS COMPANY LIMITED
7.70% 20/02/20252,000,000
0.671,693,188ZHENRO PROPERTIES GROUP LIMITED 7.35%05/02/2025
2,000,000
1.443,662,621Chile
1.443,662,621CENCOSUD SA 5.15% REGS 12/02/20254,000,000
0.421,065,674Colombia
0.24620,335BANCO BILBAO VIZCAYA ARGENTINA COLOMBIASA 4.875% REGS 21/04/2025
700,000
0.18445,339ECOPETROL SA 4.125% 16/01/2025500,000
0.26672,049Cyprus
0.26672,049MHP SE 7.75% REGS 10/05/2024750,000
1.293,282,613Egypt
0.21526,905AFRICAN EXPORT IMPORT BANK AFREXIMBANK4.125% 20/06/2024
600,000
1.082,755,708EGYPT 4.75% REGS 11/04/20252,650,000
3.238,193,080France
0.461,176,420ALTICE FRANCE SA 2.50% REGS 15/01/20251,200,0001.243,150,455CASINO GUICHARD PERRACHON SA VAR
07/02/20253,500,000
0.791,992,700CMA CGM 5.25% REGS 15/01/20252,000,0000.671,699,405LOXAM 3.25% 14/01/20251,700,000
Amundi S.F. - Emerging Markets Bond 2025
31/12/20Securities Portfolio as at

14
The accompanying notes form an integral part of these financial statements
% o
f NaV
Market V
alue
Quan
tity
EUR
0.07174,100NOVAFIVES 5.00% REGS 15/06/2025200,000
0.17438,270Gabon
0.17438,270GABON 6.95% REGS 16/06/2025500,000
1.002,546,377Georgia
1.002,546,377TBC BANK JSC 5.75% REGS 19/06/20243,000,000
0.591,501,815Germany
0.591,501,815THYSSENKRUPP AG 2.50% 25/02/20251,500,000
0.872,197,907Hong Kong (China)
0.33825,058FAR EAST HORIZON LTD 3.375% 18/02/20251,000,0000.11282,572LENOVO GROUP LTD 5.875% 24/04/2025300,0000.431,090,277YANGO JUSTICE INTERNATIONAL LIMITED 7.50%
17/02/20251,300,000
4.8712,344,050India
0.892,265,988ADANI GREEN ENERGY UP LTD 6.25% REGS10/12/2024
2,500,000
0.651,647,484BHARTI AIRTEL LTD 4.375% REGS 10/06/20251,850,0000.511,292,730INDIABULLS HOUSING FINANCE LTD 6.375%
28/05/20221,750,000
0.15390,953JSW STEEL LTD 5.95% 18/04/2024450,0000.23584,957POWER FINANCE CORPORATION 3.25%
16/09/2024686,000
0.852,149,754RENEW CLEAN ENERGY PVT LTD 6.67% REGS12/03/2024
2,492,000
0.34849,986RENEW POWER LTD 6.45% REGS 27/09/20221,000,0000.922,325,722RURAL ELECTRIFICATION CORP LTD 3.50%
12/12/20242,700,000
0.33836,476SHRIRAM TRANSPORT FINANCE LTD 5.95%REGS 24/10/2022
1,000,000
1.634,137,316Indonesia
1.152,905,296BK TABUNGAN NEGARA 4.20% 23/01/20253,500,0000.29741,243PT CHANDRA ASRI PETROCHEMICAL TBK 4.95%
REGS 08/11/2024900,000
0.19490,777PT PELABUHAN INDONESIA II 4.25% REGS05/05/2025
550,000
1.383,510,829Ireland
0.23571,658ARAGVI FINANCE INTERNATIONAL 12.00% REGS09/04/2024
650,000
0.33844,467ASG FINANCE DAC 7.875% REGS 03/12/20241,200,0000.822,094,704CBOM FINANCE PLC 4.70% REGS 29/01/20252,500,000
1.293,268,877Italy
0.28715,778INTESA SANPAOLO SPA VAR PERPETUAL EUR(ISIN XS2124979753)
750,000
0.972,448,419ITALY BTP 1.45% 15/11/20242,300,0000.04104,680TELECOM ITALIA SPA 2.75% 15/04/2025100,000
0.34862,278Kenya
0.34862,278EASTERN AND SOUTHERN AFRICAN TRADE ANDDEV BANK 4.875% 23/05/2024
1,000,000
% o
f NaV
Market V
alue
Quan
tity
EUR
5.3913,669,643Luxembourg
0.08205,266AROUNDTOWN SA VAR PERPETUAL EUR (ISINXS2027946610)
200,000
0.401,005,680CRYSTAL ALMOND S A R L 4.25% REGS15/10/2024
1,000,000
0.24615,828GARFUNKELUX HOLDCO 3 SA 6.75% REGS01/11/2025
600,000
0.431,101,447GOL FINANCE SA 7.00% REGS 31/01/20251,500,0001.042,647,042HIRDROVIAS INTERNATIONAL FINANCE SARL
5.95% REGS 24/01/20253,077,000
0.07168,843JBS USA LUX S.A./JBS USA FINANCE 5.75%REGS 15/06/2025
200,000
0.922,321,994KENBOURNE INVEST SA 6.875% REGS26/11/2024
2,620,000
0.07171,753MINERVA LUXEMBOURG SA 6.50% REGS20/09/2026
200,000
1.062,696,889PUMA INTERNATIONAL FINANCING SA 5.125%REGS 06/10/2024
3,321,000
0.34863,961RUMO LUXEMBOURG S.A.R.L 5.875% REGS18/01/2025
1,000,000
0.741,870,940VIVION INVESTMENTS SARL 3.50% 01/11/20252,000,000
0.37927,576Malta
0.37927,576VISTAJET MALTA FINANCE PLC 10.50% REGS01/06/2024
1,100,000
2.907,365,615Mauritius
0.14349,181AZURE POWER SOLAR ENERGY PRIVATELIMITED 5.65% REGS 24/12/2024
400,000
1.393,542,788GREENKO SOLAR 5.55% REGS 29/01/20254,200,0000.421,055,378HTA GROUP LTD 7.00% REGS 18/12/20251,200,0000.952,418,268MTN MAURITIUS INVESTMENTS 4.755% REGS
11/11/20242,800,000
10.2626,000,896Mexico
0.15382,819AEROVIAS DE MEXICO SA DE CV AEROMEX 0%REGS 05/02/2025 DEFAULTED
1,170,000
0.601,510,441ALPHA HOLDINGS SA DE CV 9.00% REGS10/02/2025
2,500,000
0.35887,042BANCO MERCAN DEL NORTE SA BANORTE VARREGS PERPETUAL
1,000,000
0.16406,720CEMEX SAB DE CV 3.125% REGS 19/03/2026395,0001.142,874,847CREDITO REAL SAB DE CV SOFOM ER 5.00%
REGS 01/02/20273,100,000
0.541,379,615CREDITO REAL SAB DE CV SOFOM ER 9.50%REGS 07/02/2026
1,550,000
0.26658,998EL PUERTO DE LIVERPOOL SAB DE CV 3.95%REGS 02/10/2024
750,000
0.33828,908ELEMENTIA SA DE CV 5.50% REGS 15/01/20251,000,0000.832,116,015NEMAK SAB DE CV 4.75% REGS 23/01/20252,500,0002.466,222,446PETROLEOS MEXICANOS PEMEX 4.25%
15/01/20257,500,000
1.082,732,100PETROLEOS MEXICANOS PEMEX 5.50% REGS24/02/2025
2,500,000
0.641,627,281TOTAL PLAY TELECOMUICATIONS 7.50% REGS12/11/2025
2,000,000
0.641,635,881TRUST F/1401 5.25% REGS 15/12/20241,800,000
Amundi S.F. - Emerging Markets Bond 2025
31/12/20Securities Portfolio as at

15
The accompanying notes form an integral part of these financial statements
% o
f NaV
Market V
alue
Quan
tity
EUR
1.082,737,783UNIFIN FINANCIERA SAB DE CV SOFOM ENR7.00% REGS 15/01/2025
3,500,000
0.07180,910Morocco
0.07180,910OFFICE CHERIFIEN DES PHOSPHATES SA5.625% REGS 25/04/2024
200,000
0.28702,095Namibia
0.28702,095NAMIBIA 5.25% REGS 29/10/2025800,000
7.5919,216,254Netherlands
1.072,709,720DTEK RENEWABLES FINANCE B.V. 8.50% REGS12/11/2024
3,000,000
1.162,920,435IHS NETHERLANDS HOLDCO BV 7.125% REGS18/03/2025
3,400,000
0.701,763,557IHS NETHERLANDS HOLDCO BV 8.00% REGS18/09/2027
2,000,000
1.032,601,100METINVEST BV 5.625% REGS 17/06/20252,500,0000.36921,852NE PROPERTY COOPERATIEF U.A. 1.75%
23/11/2024900,000
0.0492,354NOSTRUM OIL&GAS FIN BV 0% REGS 16/02/2025500,0000.24608,328OI EUROPEAN GROUP BV 2.875% REGS
15/02/2025600,000
0.12310,041TEVA PHARMACEUTICAL FINANCENETHERLANDS II BV 4.50% 01/03/2025
300,000
0.17434,284TEVA PHARMACEUTICAL FINANCENETHERLANDS II BV 6.00% 31/01/2025
400,000
0.892,257,488TEVA PHARMACEUTICAL FINANCENETHERLANDS III BV 7.125% 31/01/2025
2,500,000
0.16399,972UNITED GROUP B V VAR REGS 15/05/2025400,0000.771,956,020UNITED GROUP B V 3.125% REGS 15/02/20262,000,0000.29732,508VOLKSWAGEN INTERNATIONAL FINANCE NV
VAR PERPETUAL EUR (ISIN XS1799938995)700,000
0.591,508,595ZIGGO BOND COMPANY BV 3.375% REGS28/02/2030
1,500,000
1.193,017,145Nigeria
0.631,593,905NIGERIA 7.625% REGS 21/11/20251,700,0000.23589,069SEPLAT PETROLEUM DEVELOPMENT COMPANY
PLC 9.25% REGS 01/04/2023700,000
0.33834,171UNITED BANK FOR AFRICA PLC 7.75% REGS08/06/2022
1,000,000
1.102,786,230Oman
0.33829,251NATIONAL BANK OF OMAN 5.625% 25/09/20231,000,0000.771,956,979OMAN 4.875% REGS 01/02/20252,350,000
0.07179,458Pakistan
0.07179,458PAKISTAN 8.25% REGS 30/09/2025200,000
0.25637,056Panama
0.25637,056CARNIVAL CORPORATION 7.625% REGS01/03/2026 EUR
600,000
0.531,348,927Senegal
0.531,348,927SENEGAL 6.25% REGS 30/07/20241,500,000
% o
f NaV
Market V
alue
Quan
tity
EUR
2.225,643,639Singapore
0.14350,969ABJA INVESTMENT CO 5.95% 31/07/2024400,0001.694,293,450MEDCO PLATINUM ROAD PTE LTD 6.75% REGS
30/01/20255,000,000
0.39999,220THEA CAPITAL PTE LTD 8.125% 22/01/20251,210,000
0.771,957,623South Africa
0.37935,287SOUTH AFRICA 5.875% 16/09/20251,000,0000.401,022,336STANDARD BANK GP LTD VAR 31/05/20291,200,000
0.671,698,802Spain
0.451,143,472EL CORTE INGLES 3.625% REGS 15/03/20241,100,0000.22555,330MASARIA INVESTMENTS SAU VAR REGS
15/09/2024600,000
0.39985,975Sri Lanka
0.19491,880SRI LANKA 6.35% REGS 28/06/20241,000,0000.20494,095SRI LANKA 6.85% REGS 14/03/20241,000,000
0.932,371,423Togo
0.932,371,423ECOBANK TRANSPORATIONAL INCORPORATED9.50% REGS 18/04/2024
2,700,000
0.531,340,047Tunisia
0.531,340,047BANQUE CENTRALE DE TUNISIE 5.625%17/02/2024
1,450,000
6.1515,612,220Turkey
0.621,572,890AKBANK T A S 5.125% REGS 31/03/20251,900,0001.874,731,801TURK TELEKOMUNIKASYON A.S. 6.875% REGS
28/02/20255,250,000
0.721,832,993TURKCELL ILETISIM HIZMETLERI A.S. 5.75%REGS 15/10/2025
2,100,000
2.115,370,493TURKEY 7.375% 05/02/20255,900,0000.12291,828TURKIYE IS BANKASI A S 6.125% REGS
25/04/2024350,000
0.711,812,215TURKIYE SINAI KALKINA BANKASI AS 6.00%REGS 23/01/2025
2,200,000
0.07182,896Ukraine
0.07182,896UKRAINE 7.75% REGS 01/09/2025200,000
8.4421,389,375United Kingdom
0.441,117,127ARROW GLOBAL FINANCE PLC 5.125% REGS15/09/2024
1,000,000
0.671,691,007BOPARAN FINANCE PLC 7.625% REGS30/11/2025
1,500,000
0.461,175,894DTEK FINANCE PLC 0% 31/12/2024 DEFAULTED2,300,0000.581,474,245EG GLOBAL FINANCE PLC 4.375% REGS
07/02/20251,500,000
0.18467,880ELLAKTOR VALUE PLC 6.375% REGS 15/12/2024500,0000.27690,837INEOS FINANCE PLC 2.125% REGS 15/11/2025700,0000.401,017,030JAGUAR LAND ROVER PLC 5.875% REGS
15/11/20241,000,000
0.822,076,340KONDOR FINANCE PLC 7.125% 19/07/20242,000,0000.33834,498LIQUID TELECOMMUNICATIONS FINANCING PLC
8.50% REGS 13/07/20221,000,000
Amundi S.F. - Emerging Markets Bond 2025
31/12/20Securities Portfolio as at

16
The accompanying notes form an integral part of these financial statements
% o
f NaV
Market V
alue
Quan
tity
EUR
1.002,539,854MARB BONDCO PLC 6.875% REGS 19/01/20253,000,0000.741,869,378MARKS AND SPENCER PLC 4.75% 12/06/20251,500,0000.21521,265MATALAN FINANCE PLC 6.75% REGS 31/01/2023600,0000.30756,463NMG FINCO PLC 5.00% REGS 01/08/2022700,0000.34862,278PHOENIX GROUP HOLDINGS PLC VAR
PERPETUAL USD1,000,000
0.441,105,943PINNACLE BIDCO PLC 6.375% REGS 15/02/20251,000,0000.07170,223RAIL CAP MARKETS PLC 8.25% 09/07/2024200,0000.992,504,968TULLOW OIL PLC 7.00% REGS 01/03/20254,650,0000.20514,145VFU FUNDING PLC 6.20% REGS 11/02/2025600,000
1.744,415,525United States of America
0.07169,678AMERICAN AXLE AND MANUFCTURNG INC 6.25%01/04/2025
200,000
0.07172,078COMMSCOPE FINANCE LLC 6.00% 144A01/03/2026
200,000
0.09217,229COMMSCOPE TECHNOLOGIES FINANCE LLC6.00% 144A 15/06/2025
260,000
0.912,331,832PANTHER BF AGGREGATOR 4.375% REGS15/05/2026
2,250,000
0.34869,666SASOL FIANCNING USA LLC 5.875% 27/03/20241,000,0000.07172,541STILLWATER MINING CO 7.125% REGS
27/06/2025200,000
0.19482,501UNITED AIRLINES HLODINGS INC 4.875%15/01/2025
600,000
1.383,493,218Uzbekistan
0.671,697,487NATIONAL BANK FOR FOREIGN ECONOMIC ACTIREP OF UZBEKISTAN 4.85% 21/10/2025
2,000,000
0.711,795,731UZBEK INDUSTRIAL AND CONSTRUCTION BANKJOINT STOCK COMMERCIAL BK 5.75% 02/12/2024
2,100,000
0.761,931,677Viet Nam
0.761,931,677VIETNAM PROSPER JOINT STOCK COMMERCIALBANK 6.25% 17/07/2022
2,300,000
92.67235,051,475Total securities portfolio
Amundi S.F. - Emerging Markets Bond 2025
31/12/20Securities Portfolio as at

17
The accompanying notes form an integral part of these financial statements
% o
f NaV
Market V
alue
Quan
tity
EUR
98.4923,652,742Long positions
92.7522,273,366Transferable securities admitted to an official stock exchangelisting and/or dealt in on another regulated market
92.7522,273,366Bonds3.51841,719Austria
0.49116,854AUSTRIA 0% 20/04/2023115,0000.78188,267AUSTRIA 0% 20/09/2022186,0001.09261,949AUSTRIA 3.40% 22/11/2022243,0001.15274,649AUSTRIA 3.65% 20/04/2022260,000
1.94465,326Belgium
1.94465,326BELGIUM 4.25% 28/09/2021449,000
20.614,948,924France
1.47352,884FRANCE OAT 0% 25/02/2022350,0004.03968,667FRANCE OAT 0% 25/03/2023953,0003.19765,610FRANCE OAT 0% 25/05/2022758,0004.411,059,890FRANCE OAT 1.75% 25/05/20231,000,0004.06974,377FRANCE OAT 2.25% 25/10/2022924,0003.45827,496FRANCE OAT 3.25% 25/10/2021802,000
21.105,067,001Germany
7.041,690,672FEDERAL REPUBLIC OF GERMANY 0%15/08/2030
1,600,000
12.683,045,402GERMANY BUND 0% 11/04/20252,949,0001.38330,927GERMANY BUNDI 0.10% 15/04/2046209,000
2.56615,405Ireland
0.64152,670IRELAND 0.80% 15/03/2022150,0001.92462,735IRELAND 3.90% 20/03/2023420,000
24.675,927,725Italy
1.78428,041ITALY BTP 0.05% 15/01/2023424,0001.34320,866ITALY BTP 0.60% 15/06/2023313,0001.78426,937ITALY BTP 0.90% 01/08/2022418,0001.98474,558ITALY BTP 0.95% 01/03/2023461,0001.72412,012ITALY BTP 0.95% 15/03/2023400,0002.13511,265ITALY BTP 1.00% 15/07/2022500,0002.75662,642ITALY BTP 1.20% 01/04/2022649,0001.75419,512ITALY BTP 1.35% 15/04/2022410,0002.02485,270ITALY BTP 1.45% 15/09/2022470,0002.14515,084ITALY BTP 4.50% 01/05/2023462,0002.92704,150ITALY BTP 5.50% 01/09/2022641,0002.36567,388ITALY BTP 5.50% 01/11/2022512,000
2.91698,008Netherlands
1.53366,650NETHERLANDS 0% 15/01/2022364,0000.45108,081NETHERLANDS 3.75% 15/01/202399,0000.93223,277NETHERLANDS 7.50% 15/01/2023191,000
3.71890,669Portugal
3.71890,669PORTUGAL 2.20% 17/10/2022846,000
% o
f NaV
Market V
alue
Quan
tity
EUR
11.742,818,589Spain
1.43344,583SPAIN 0% 30/04/2023340,0002.30552,965SPAIN 0.05% 31/10/2021550,0001.39334,671SPAIN 0.35% 30/07/2023327,0002.11506,840SPAIN 0.40% 30/04/2022500,0002.05492,182SPAIN 0.45% 31/10/2022483,0002.46587,348SPAIN 5.85% 31/01/2022549,000
5.741,379,376Share/Units of UCITS/UCIS
5.741,379,376Share/Units in investment funds5.741,379,376France
5.741,379,376AMUNDI 3 M FCP1
98.4923,652,742Total securities portfolio
Amundi S.F. - Euro Curve 1-3year
31/12/20Securities Portfolio as at

18
The accompanying notes form an integral part of these financial statements
% o
f NaV
Market V
alue
Quan
tity
EUR
99.1756,107,289Long positions
93.2652,763,062Transferable securities admitted to an official stock exchangelisting and/or dealt in on another regulated market
93.2652,763,062Bonds2.351,331,252Austria
2.351,331,252AUSTRIA 1.65% 21/10/20241,220,000
8.344,718,660Belgium
2.221,255,932BELGIUM 0.50% 22/10/20241,200,0001.891,067,530BELGIUM 0.80% 22/06/20251,000,0004.232,395,198BELGIUM 2.25% 22/06/20232,230,000
2.071,168,818Finland
1.34755,007FINLAND 0% 15/09/2023740,0000.73413,811FINLAND 4.00% 04/07/2025340,000
21.0111,884,691France
9.525,383,663FRANCE OAT 0% 25/03/20245,260,0004.282,420,635FRANCE OAT 0.50% 25/05/20252,300,0003.511,986,156FRANCE OAT 1.00% 25/05/20271,800,0003.702,094,237FRANCE OAT 2.25% 25/05/20241,900,000
21.4312,122,238Germany
2.991,690,672FEDERAL REPUBLIC OF GERMANY 0%15/08/2030
1,600,000
11.326,404,743GERMANY BUND 0% 11/04/20256,202,0005.893,330,134GERMANY BUND 1.50% 15/02/20233,176,7601.23696,689GERMANY BUNDI 0.10% 15/04/2046440,000
1.09617,165Ireland
1.09617,165IRELAND 5.40% 13/03/2025492,000
14.878,413,653Italy
2.171,226,580ITALY BTP 0.35% 01/02/20251,200,0008.404,754,393ITALY BTP 1.85% 01/07/20254,368,0004.302,432,680ITALY BTP 5.00% 01/03/20252,000,000
3.371,908,108Netherlands
1.63920,133NETHERLANDS 0% 15/01/2024900,0001.74987,975NETHERLANDS 2.00% 15/07/2024900,000
4.072,303,294Portugal
0.56319,461PORTUGAL 0.70% 15/10/2027300,0003.511,983,833PORTUGAL 5.65% 15/02/20241,660,000
14.668,295,183Spain
5.082,874,043SPAIN 0.25% 30/07/20242,795,0002.311,309,320SPAIN 1.60% 30/04/20251,200,0000.61345,074SPAIN 3.45% 30/07/2066190,0001.53865,564SPAIN 4.65% 30/07/2025700,0005.132,901,182SPAIN 4.80% 31/01/20242,488,000
% o
f NaV
Market V
alue
Quan
tity
EUR
5.913,344,227Share/Units of UCITS/UCIS
5.913,344,227Share/Units in investment funds5.913,344,227France
5.913,344,227AMUNDI 3 M FCP3
99.1756,107,289Total securities portfolio
Amundi S.F. - Euro Curve 3-5year
31/12/20Securities Portfolio as at

19
The accompanying notes form an integral part of these financial statements
% o
f NaV
Market V
alue
Quan
tity
EUR
99.38125,859,938Long positions
92.61117,280,234Transferable securities admitted to an official stock exchangelisting and/or dealt in on another regulated market
92.61117,280,234Bonds2.723,448,124Austria
1.291,637,444AUSTRIA 0.50% 20/02/20291,510,0000.28350,870AUSTRIA 0.75% 20/02/2028320,0001.151,459,810AUSTRIA 6.25% 15/07/20271,000,000
7.119,008,353Belgium
1.151,458,514BELGIUM 0.80% 22/06/20271,335,0002.503,163,429BELGIUM 0.90% 22/06/20292,832,0003.464,386,410BELGIUM 5.50% 28/03/20283,030,000
0.56703,108Canada
0.56703,108ONTARIO TEACHERS’ FINANCE TRUST 0.05%25/11/2030
700,000
2.152,719,491Finland
0.64800,270FINLAND 0.50% 15/09/2027743,0000.48606,738FINLAND 0.50% 15/09/2028560,0000.52664,150FINLAND 0.50% 15/09/2029610,0000.51648,333FINLAND 2.75% 04/07/2028516,000
16.6321,059,955France
1.962,477,232FRANCE OAT 0% 25/02/20262,400,0003.504,442,618FRANCE OAT 0% 25/11/20294,282,0001.662,102,640FRANCE OAT 0.25% 25/11/20262,000,0002.583,269,198FRANCE OAT 0.75% 25/11/20282,970,0001.181,489,617FRANCE OAT 1.00% 25/05/20271,350,0001.722,172,362FRANCE OAT 2.50% 25/05/20301,700,0003.384,288,104FRANCE OAT 5.50% 25/04/20292,838,0000.65818,184SOCIETE DE FINANCEMENT LOCAL 0%
23/11/2028800,000
13.6017,223,120Germany
8.0510,194,752FEDERAL REPUBLIC OF GERMANY 0%15/08/2030
9,648,000
4.565,779,079GERMANY BUND 0.50% 15/08/20275,338,0000.991,249,289GERMANY BUNDI 0.10% 15/04/2046789,000
2.042,589,882Ireland
0.54683,768IRELAND 0.20% 18/10/2030650,0001.501,906,114IRELAND 0.90% 15/05/20281,730,000
17.7722,508,190Italy
5.246,634,581ITALY BTP 1.35% 01/04/20306,126,0000.43544,063ITALY BTP 2.45% 01/09/2050435,0001.782,259,627ITALY BTP 3.00% 01/08/20291,850,0005.917,479,899ITALY BTP 3.50% 01/03/20305,863,0001.481,877,726ITALY BTP 5.25% 01/11/20291,320,0002.933,712,294ITALY BTP 6.50% 01/11/20272,603,000
6.398,093,462Netherlands
3.073,880,044NETHERLANDS 0.75% 15/07/20273,550,000
% o
f NaV
Market V
alue
Quan
tity
EUR
1.732,196,900NETHERLANDS 0.75% 15/07/20281,990,0001.592,016,518NETHERLANDS 5.50% 15/01/20281,400,000
3.884,913,228Portugal
1.862,348,707PORTUGAL 0.475% 18/10/20302,250,0000.46585,679PORTUGAL 0.70% 15/10/2027550,0001.561,978,842PORTUGAL 3.875% 15/02/20301,459,000
19.7625,013,321Spain
1.061,341,864SPAIN 1.25% 31/10/20301,200,0001.652,092,601SPAIN 1.40% 30/04/20281,871,0000.941,187,224SPAIN 1.40% 30/07/20281,059,00012.1815,417,974SPAIN 1.45% 30/04/202913,640,0001.912,421,330SPAIN 1.45% 31/10/20272,168,0002.022,552,328SPAIN 5.15% 31/10/20281,800,000
6.778,579,704Share/Units of UCITS/UCIS
6.778,579,704Share/Units in investment funds6.778,579,704France
0.00761AMUNDI TRESO COURT TERME PART I C0.0416.778,578,943AMUNDI 3 M FCP8
99.38125,859,938Total securities portfolio
Amundi S.F. - Euro Curve 7-10year
31/12/20Securities Portfolio as at

20
The accompanying notes form an integral part of these financial statements
% o
f NaV
Market V
alue
Quan
tity
EUR
98.85112,539,591Long positions
91.96104,695,896Transferable securities admitted to an official stock exchangelisting and/or dealt in on another regulated market
91.96104,695,896Bonds3.694,200,989Austria
0.32369,003AUSTRIA 0.85% 30/06/2120279,0000.47532,311AUSTRIA 2.10% 20/09/2117237,0000.38429,755AUSTRIA 2.40% 23/05/2034315,0000.951,082,964AUSTRIA 3.15% 20/06/2044617,0000.73832,163AUSTRIA 3.80% 26/01/2062341,0000.84954,793AUSTRIA 4.15% 15/03/2037557,000
6.877,817,622Belgium
1.761,997,086BELGIUM 0.40% 22/06/20401,890,0000.40456,720BELGIUM 1.00% 22/06/2031400,0000.0226,699BELGIUM 1.60% 22/06/204720,0000.44498,870BELGIUM 1.70% 22/06/2050360,0000.35398,886BELGIUM 1.90% 22/06/2038300,0000.931,054,353BELGIUM 2.15% 22/06/2066623,0000.46521,830BELGIUM 2.25% 22/06/2057320,0000.19220,636BELGIUM 3.75% 22/06/2045120,0001.221,385,868BELGIUM 4.25% 28/03/2041760,0001.101,256,674BELGIUM 5.00% 28/03/2035720,000
0.53602,664Canada
0.53602,664ONTARIO TEACHERS’ FINANCE TRUST 0.05%25/11/2030
600,000
1.671,905,665Finland
0.981,124,300FINLAND 0.75% 15/04/20311,000,0000.41462,653FINLAND 1.125% 15/04/2034390,0000.28318,712FINLAND 2.625% 04/07/2042200,000
18.6821,268,550France
2.092,374,014FRANCE OAT 0% 25/02/20262,300,0001.711,943,352FRANCE OAT 0.50% 25/05/20401,800,0001.461,657,210FRANCE OAT 1.25% 25/05/20341,391,0000.79902,618FRANCE OAT 1.25% 25/05/2036750,0002.602,965,125FRANCE OAT 1.50% 25/05/20502,224,0002.062,346,436FRANCE OAT 1.75% 25/05/20661,540,0001.391,586,556FRANCE OAT 1.75% 25/06/20391,200,0000.44500,080FRANCE OAT 2.00% 25/05/2048343,0001.121,280,271FRANCE OAT 4.00% 25/04/2055590,0001.531,747,453FRANCE OAT 4.00% 25/04/2060760,0001.972,239,185FRANCE OAT 4.00% 25/10/20381,300,0001.521,726,250FRANCE OAT 5.75% 25/10/20321,000,000
23.6126,884,149Germany
6.026,851,035FEDERAL REPUBLIC OF GERMANY 0%15/08/2030
6,483,610
0.74845,960GERMANY BUND 0% 15/05/2035800,0000.43493,112GERMANY BUND 1.25% 15/08/2048350,0001.241,412,897GERMANY BUND 2.50% 04/07/2044841,0003.794,314,482GERMANY BUND 3.25% 04/07/20422,398,000
% o
f NaV
Market V
alue
Quan
tity
EUR
5.135,843,609GERMANY BUND 4.00% 04/01/20373,372,0006.267,123,054GERMANY BUND 6.25% 04/01/20304,335,000
2.212,517,648Ireland
0.62705,858IRELAND 0.20% 18/10/2030671,0000.10118,860IRELAND 1.30% 15/05/2033100,0000.47537,420IRELAND 1.50% 15/05/2050400,0001.021,155,510IRELAND 1.70% 15/05/2037900,000
16.7219,036,265Italy
0.80905,412ITALY BTP 1.70% 01/09/2051850,0000.931,063,112ITALY BTP 2.45% 01/09/2050850,0001.952,221,268ITALY BTP 2.80% 01/03/20671,653,0002.052,335,861ITALY BTP 2.95% 01/09/20381,788,0000.74838,349ITALY BTP 3.10% 01/03/2040627,0000.73833,269ITALY BTP 3.35% 01/03/2035625,0002.112,405,024ITALY BTP 3.45% 01/03/20481,631,0001.541,756,042ITALY BTP 3.85% 01/09/20491,110,0002.232,527,454ITALY BTP 4.75% 01/09/20441,478,0001.741,986,186ITALY BTP 5.00% 01/09/20401,183,0001.902,164,288ITALY BTP 6.00% 01/05/20311,400,000
0.64723,548Luxembourg
0.64723,548LUXEMBOURG 0% 14/09/2032700,000
5.306,035,361Netherlands
0.71804,517NETHERLANDS 0.50% 15/01/2040700,0000.83939,325NETHERLANDS 2.50% 15/01/2033690,0001.601,831,962NETHERLANDS 2.75% 15/01/20471,025,0001.171,326,812NETHERLANDS 3.75% 15/01/2042710,0000.991,132,745NETHERLANDS 4.00% 15/01/2037660,000
1.271,442,511Portugal
0.28313,161PORTUGAL 0.475% 18/10/2030300,0000.15170,683PORTUGAL 0.90% 12/10/2035159,0000.84958,667PORTUGAL 4.10% 15/02/2045550,000
10.7712,260,924Spain
0.40455,836KINGDOM OF SPAIN 2.70% 31/10/2048310,0000.54609,890SPAIN 1.20% 31/10/2040550,0000.57654,421SPAIN 1.85% 30/07/2035540,0000.87989,954SPAIN 2.90% 31/10/2046660,0003.453,937,477SPAIN 3.45% 30/07/20662,168,0000.76862,105SPAIN 4.20% 31/01/2037541,0001.451,646,268SPAIN 4.70% 30/07/2041918,0001.431,628,892SPAIN 4.90% 30/07/2040900,0000.961,087,922SPAIN 5.15% 31/10/2044550,0000.34388,159SPAIN 5.75% 30/07/2032236,000
6.897,843,695Share/Units of UCITS/UCIS
6.897,843,695Share/Units in investment funds6.897,843,695France
6.897,843,695AMUNDI 3 M FCP7
98.85112,539,591Total securities portfolio
Amundi S.F. - Euro Curve 10+year
31/12/20Securities Portfolio as at

21
The accompanying notes form an integral part of these financial statements
% o
f NaV
Market V
alue
Quan
tity
EUR
93.39585,246,428Long positions
93.39585,246,428Transferable securities admitted to an official stock exchangelisting and/or dealt in on another regulated market
0.0020,807Shares0.0020,807United States of America
0.0020,807AMC ENTERTAINMENT HLDS-CL A11,625
93.39585,225,621Bonds0.714,439,438Australia
0.714,439,438TRONOX LTD 6.50% 144A 01/05/20255,075,000
1.016,332,004Bermuda
0.452,831,171FLY LEASING LTD 5.25% 15/10/20243,640,0000.563,500,833VIKING CRUISES LTD 6.25% 144A 15/05/20254,350,000
1.016,338,083Brazil
0.362,267,993BANCO VOTORANTIM 4.375% 144A 29/07/20252,605,0000.654,070,090CEMIG GERACAO E TRANSMISSAO SA 9.25%
REGS 05/12/20244,300,000
0.734,558,950British Virgin Islands
0.734,558,950FORTUNE STAR BVI LTD 4.35% 06/05/20234,500,000
6.5440,995,380Canada
1.026,380,262BAUSCH HEALTH COMPANIES INC 6.125% 144A15/04/2025
7,600,000
0.483,003,079BOMBARDIER INC 7.5% 15/03/20253,942,0000.352,192,894CENOVUS ENERGY 3.00% 15/08/20222,635,0000.10630,773CENOVUS ENERGY 5.375% 15/07/2025685,0000.04268,658FIRST QUANTUM MINERALS LTD 7.25% 144A
01/04/2023320,000
0.885,503,902FIRST QUANTUM MINERALS LTD 7.50% 144A01/04/2025
6,470,000
0.654,094,407GARDA WORLD SECURITY CORP 8.75% 144A15/05/2025
4,800,000
0.805,020,357MDC PARTNERS INC 6.50% 144A 01/05/20246,060,0000.503,133,255MEG ENEGRY CORP 7.00% 144A 31/03/20243,796,0000.774,796,835NOVA CHEMICALS CORP 4.875% 144A 01/06/20245,621,0000.201,255,098PRIMO WATER CORPORATION 3.875% REGS
31/10/20281,225,000
0.392,463,591SEVEN GENERATIONS ENERGY LTD 5.375%144A 30/09/2025
2,939,000
0.362,252,269TERVITA CORP. 11.00% 144A 01/12/20252,560,000
1.469,133,891Cayman Islands
0.905,592,799GLOBAL AIRCRAFTS LEASING CO LTD 6.50%144A 15/09/2024
7,668,250
0.322,025,230SHELF DRILL HOLD LTD 8.25% 144A 15/02/20255,500,0000.241,515,862SKYMILES IP LIMITED DELTA AIR LINE
INCORPOTAION 4.50% 144A 20/10/20251,730,000
0.321,976,332Ecuador
0.13785,362ECUADOR VAR 144A 31/07/20301,500,0000.181,099,554ECUADOR VAR 144A 31/07/20352,476,5000.0191,416ECUADOR 0% 144A 31/07/2030236,200
% o
f NaV
Market V
alue
Quan
tity
EUR
0.684,251,210Egypt
0.684,251,210EGYPT 5.875% 144A 11/06/20254,800,000
1.348,397,467France
0.754,700,423LOXAM 6.00% REGS 15/04/20254,700,0000.593,697,044QUATRIM SASU 5.875% REGS 15/01/20243,564,000
1.016,360,486Germany
0.764,762,886NIDDA BONDCO GMBH 7.25% 144A 30/09/20254,600,0000.251,597,600NIDDA HEALTHCARE HOLDING AG 3.50% REGS
30/09/20241,600,000
1.398,715,935India
0.503,156,975ADANI GREEN ENERGY UP LTD 6.25% 144A10/12/2024
3,483,000
0.895,558,960MUTHOOT FINANCE 4.40% REGS 02/09/20236,670,000
1.449,027,571Ireland
0.201,281,866ARDAGH PKG FIN/HLDGS USA 5.25% 30/04/20251,485,0000.563,531,281ASG FINANCE DAC 7.875% 144A 03/12/20245,018,0000.684,214,424ENDO LTD / ENDO FINANCE LLC / ENDO FINCO
INC 5.875% 144A 15/10/20245,100,000
1.7610,999,595Italy
0.794,979,040INTERNATIONAL DESIGN GROUP SPA 6.50%REGS 15/11/2025
4,800,000
0.976,020,555INTESA SANPAOLO SPA VAR PERPETUAL USD6,500,000
0.513,203,076Jersey
0.513,203,076AVIS BUDGET FINANCE PLC 4.50% REGS15/05/2025
3,276,000
0.251,559,100Liberia
0.201,230,241ROYAL CARIBBEAN CRUISES LTD 11.50% 144A01/06/2025
1,287,000
0.05328,859ROYAL CARIBBEAN CRUISES LTD 9.125% 144A15/06/2023
370,000
9.5359,699,045Luxembourg
1.046,562,934ALTICE FRANCE HOLDING SA 2.125% 144A15/02/2025
6,810,000
0.804,990,200CIRSA FINANCE INTERNATIONAL S A R I 6.25%REGS 20/12/2023
5,000,000
0.332,092,948CODERE FINANCE 2 SA 6.75% REGS 01/11/20213,197,0000.643,984,024DANA FINANCING LUXEMBOURG S A R L 5.75%
144A 15/04/20254,700,000
0.744,617,968FAGE 5.625% 144A 15/08/20265,500,0000.412,539,077GOL EQUITY FINANCE SA 8.00% 30/06/20263,150,0000.472,937,191GOL FINANCE SA 7.00% REGS 31/01/20254,000,0000.804,989,550HIRDROVIAS INTERNATIONAL FINANCE SARL
5.95% REGS 24/01/20255,800,000
0.633,967,813JBS USA LUX S.A./JBS USA FINANCE 5.75% 144A15/06/2025
4,700,000
0.794,927,590KENBOURNE INVEST SA 6.875% 144A 26/11/20245,560,0000.573,599,380KERNEL HOLDING SA 6.50% 144A 17/10/20244,150,0000.784,894,952MINERVA LUXEMBOURG SA 6.50% 144A
20/09/20265,700,000
Amundi S.F. - Global High Yield Opportunities 2025
31/12/20Securities Portfolio as at

22
The accompanying notes form an integral part of these financial statements
% o
f NaV
Market V
alue
Quan
tity
EUR
0.855,330,850ROSSINI SARL 6.75% 144A 30/10/20255,000,0000.684,264,568TRINSEO MATERIALS OPERATING SCA 5.375%
144A 01/09/20255,100,000
0.825,143,832Malta
0.825,143,832VISTAJET MALTA FINANCE PLC 10.50% 144A01/06/2024
6,100,000
0.925,783,801Mauritius
0.281,741,374HTA GROUP LTD 7.00% 144A 18/12/20251,980,0000.644,042,427MTN MAURITIUS INVESTMENTS 5.373% 144A
13/02/20224,800,000
0.845,239,336Mexico
0.07462,982AEROVIAS DE MEXICO SA DE CV AEROMEX 0%144A 05/02/2025 DEFAULTED
1,415,000
0.14865,235GRUPO POSADAS SAB DE CV 0% 144A30/06/2022 DEFAULTED
2,472,000
0.633,911,119UNIFIN FINANCIERA SAB DE CV SOFOM ENR7.00% 144A 15/01/2025
5,000,000
3.8323,986,050Netherlands
0.664,122,967IHS NETHERLANDS HOLDCO BV 7.125% REGS18/03/2025
4,800,000
0.603,774,703INTERTRUST GROUP BV 3.375% REGS15/11/2025
3,700,000
0.875,462,310METINVEST BV 5.625% REGS 17/06/20255,250,0000.14847,886OCI N V 3.125% 144A 01/11/2024825,0000.04276,001OCI N V 4.625% 144A 15/10/2025325,0000.11698,534OCI N V 5.25% 144A 01/11/2024825,0000.311,930,051OI EUROPEAN GROUP BV 4.00% 144A 15/03/20232,307,0001.106,873,598TEVA PHARMACEUTICAL FINANCE
NETHERLANDS III BV 2.80% 21/07/20238,496,000
0.583,618,565Nigeria
0.583,618,565SEPLAT PETROLEUM DEVELOPMENT COMPANYPLC 9.25% 144A 01/04/2023
4,300,000
0.12767,791Poland
0.12767,791CANPACK SA 3.125% 144A 01/11/2025930,000
0.442,775,669Portugal
0.442,775,669TAP TRANSPORTIES AEREOS PORTUGUESESSGPS SA 5.625% REGS 02/12/2024
3,900,000
1.338,353,182Spain
0.311,943,902EL CORTE INGLES 3.625% REGS 15/03/20241,870,0001.026,409,280GRIFOLS SA 1.625% REGS 15/02/20256,400,000
0.623,900,000Sweden
0.623,900,000INTRUM JUSTITIA AB 3.125% REGS 15/07/20243,900,000
1.9912,466,475Turkey
0.825,169,842AKBANK T A S 5.125% 144A 31/03/20256,245,0000.503,109,469TURK TELEKOMUNIKASYON A.S. 6.875% REGS
28/02/20253,450,000
0.674,187,164TURKEY 7.375% 05/02/20254,600,000
% o
f NaV
Market V
alue
Quan
tity
EUR
0.694,297,472Ukraine
0.694,297,472UKRAINE 7.75% 144A 01/09/20254,700,000
2.8117,588,869United Kingdom
0.352,172,189INEOS FINANCE PLC 2.125% REGS 15/11/20252,201,0000.835,217,765INTERNATIONAL GAME TECHNOLOGY PLC
3.50% REGS 15/07/20245,010,000
0.976,080,032NEPTUNE ENERGY BONDCO PLC 6.625% 144A15/05/2025
7,720,000
0.13810,562PINNACLE BIDCO PLC 5.50% REGS 15/02/2025820,0000.12722,547SYNTHOMER PLC 3.875% 144A 01/07/2025690,0000.412,585,774TULLOW OIL PLC 7.00% 144A 01/03/20254,800,000
48.71305,317,016United States of America
0.06365,634ADIENT US LLC 9% 15/04/2025400,0000.221,359,326ALBERTSONS COS LLC SAFEW 3.50% 144A
15/02/20231,624,000
0.654,047,260ALLIANCE DATA SYSTEMS CO 4.75% 15/12/20244,898,0000.13798,565AMC ENTERTAINMENT HOLDINGS INC 10.50%
144A 24/04/20261,441,000
0.11715,206AMC ENTERTAINMENT HOLDINGS INC 12.00%144A 15/06/2026
4,004,440
0.694,326,799AMERICAN AXLE AND MANUFCTURNG INC 6.25%01/04/2025
5,100,000
0.845,253,939AMERICAN MIDSTREAM PTR/F VAR 15/12/20216,450,0000.472,940,919APX GROUP INC 7.875 01/12/20223,591,0000.664,133,718ARCHROCK PARTNERS LP FIN 6.875% 144A
01/04/20274,700,000
0.05319,033ASBURY AUTOMOTIVE GROUP 4.75% 01/03/2030365,0000.603,749,318AZUL INVESTMENTS LLP 5.875% REGS
26/10/20244,900,000
1.056,623,973BEACON ESCROW CORP 4.875% 01/11/20257,922,0001.046,581,743BEAZER HOMES USA 6.75% 15/03/20257,738,0000.472,952,532BELDEN INC 2.875% REGS 15/09/20252,930,0000.301,884,380BELDEN INC 2.875% 144A 15/09/20251,870,0000.03209,758BLUE CUBE SPINCO INC 9.75% 15/10/2023250,0000.221,396,025BOEING CO 4.508% 01/05/20231,585,0000.171,071,591BOYD GAMING CORP 8.625% 144A 01/06/20251,180,0000.161,022,098BPCE CYCLE MERGER SUB II 10.625%
15/07/20271,135,000
1.026,435,512CARDTRONICS INC/USA 5.50% 144A 01/05/20257,604,0000.10619,308CBS OUT AMER CAP LLC/COR 5.625% 15/02/2024748,0000.342,147,571CD AND R SMOKEY BUYER INC 6.75% 144A
15/07/20252,455,000
0.493,041,869CLEAR CHANNEL WORLDWIDE HOLDING 9.25%15/02/2024
3,680,000
0.654,045,330CLEARWAY ENERGY OPERATING LLC 5.75%15/10/2025
4,700,000
0.815,056,128CLEVELAND CLIFFS INC 5.75% 01/03/20256,092,0000.06356,558CLEVELAND CLIFFS INC 6.75% 144A 15/03/2026405,0000.04278,668CLEVELAND CLIFFS INC 9.875% 144A 17/10/2025290,0000.462,876,232COGENT COMMUNICATIONS GROUP INC 4.375%
144A 30/06/20242,810,000
0.191,170,558COLT MERGER SUB INC 6.25% 144A 01/07/20251,345,0000.513,215,969COMMERCIAL METALS CO 6.50% 2017 5.375%
15/07/20273,731,000
Amundi S.F. - Global High Yield Opportunities 2025
31/12/20Securities Portfolio as at

23
The accompanying notes form an integral part of these financial statements
% o
f NaV
Market V
alue
Quan
tity
EUR
0.955,966,270COMMSCOPE TECHNOLOGIES FINANCE LLC6.00% 144A 15/06/2025
7,141,000
0.482,987,270COVANTA HOLDING CORP 5.00% 01/09/20303,415,0000.352,186,446CROWNROCK FINANCE 5.625% 144A 15/10/20252,622,0000.684,243,554DAE FUNDING LLC 5.00% 144A 01/08/20245,000,0000.976,053,346DCP MIDSTREAM LLC VAR 144A 21/05/20438,540,0000.05335,447DEALER TIRE LIC DT ISSUER LIC 8.00% 144A
01/02/2028390,000
0.372,291,621DELEK LOGISTICS PARTNERS LP 6.75%15/05/2025
2,854,000
0.11683,746DELL INTERNATIONAL LLC EMC CORP 5.85%144A 15/07/2025
700,000
0.603,739,094DELTA AIR LINES INC DE 7.00% 144A 01/05/20253,950,0000.503,123,913DIAMOND SPORTS GROUP LLC 6.625% 144A
15/08/20276,318,000
0.05323,459DIEBOLD NIXDORF INC 9.375% 144A 15/07/2025355,0000.352,200,957ENDEAVOR ENERGY RESOURCES LP 6.625%
144A 15/07/20252,513,000
0.553,470,481ENERGY TRANSFER PARTNERS LP VARPERPETUAL
5,300,000
0.322,033,643ENLINK MIDSTREAM PARTNERS LP 4.15%01/06/2025
2,555,000
1.036,498,237ENTERPRISE DEVELOPMENT AUTHORITY12.00% 144A 15/07/2024
7,053,000
0.08502,368EXPEDIA GROUP INC 6.25% 144A 01/05/2025530,0000.04237,700EXPEDIA GROUP INC 7.00% 144A 01/05/2025265,0000.543,408,810EXTERRAN ENERGY SOLUTIONS LP/ EES
FINANCE CORP 8.125% 01/05/20255,000,000
0.332,047,765FORD MOTOR CO 4.134% 04/08/20252,393,0000.513,177,267FORD MOTOR CREDIT CO LLC FRN 15/02/20234,027,0000.281,730,227FORD MOTOR CREDIT CO LLC 3.37% 17/11/20232,075,0000.07428,356FORTERRA FIN LLC FRTA FI 6.50% 144A
15/07/2025485,000
0.493,056,792FREEDOM MORTGAGE CO 8.25% 144A15/04/2025
3,576,000
0.432,692,883GENESIS ENERGY LP/GENESIS ENERGYFINANCE CORP 6.50% 01/10/2025
3,390,000
0.352,219,306GOODYEAR TIRE & RUBBER CO 9.50%31/05/2025
2,400,000
0.15929,428HEXION INC 7.875% 144A 15/07/20271,061,0000.10603,583HILLENBRAND INDUSTRIES INC 5.75%
15/06/2025680,000
0.362,285,799HYATT HOTELS CORP 5.375% 23/04/20252,465,0001.036,434,822I STAR INC 4.75% 01/10/20247,753,0000.14847,131IRB HOLDING CORP 7.00% 144A 15/06/2025950,0000.664,106,781JELD-WEN INC 4.625% 144A 15/12/20254,900,0000.12722,651JOSEPH T RYERSON AND SON INC 8.50% 144A
01/08/2028780,000
0.664,131,410KOPPERS INC 6.00% 144A 15/02/20254,900,0000.513,189,629KRATON POLYMERS LLC/ CAP CORP 7.00% 144A
15/04/20253,708,000
0.12772,880LIFEPOINT HEALTH INC 6.75% 144A 15/04/2025880,0000.865,386,284LUMEN TECHNOLOGIES INC 5.625% 01/04/20256,069,0000.714,442,200MERCER INTERNATIUONAL INC 7.375%
15/01/20255,225,000
0.352,179,811MERITAGE HOMES CORP 6.00% 01/06/20252,355,0000.754,669,340MICHAELS STORIES INC 8.00% 144A 15/07/20275,280,0000.623,913,164MURPHY OIL CORP 5.75% 15/08/20254,800,000
% o
f NaV
Market V
alue
Quan
tity
EUR
0.181,110,405NAVISTAR INTERNATIONAL CORP 9.50% 144A01/05/2025
1,210,000
0.02145,410NCR CORP 8.125% 144A 15/04/2025160,0000.754,703,363NETFLIX INC 5.875% 15/02/20255,000,0000.865,367,844NOVELIS INC 5.875% 144A 30/09/20266,270,0000.12738,178OLIN CORP 9.50% 144A 01/06/2025725,0000.493,076,401OUTFRONT MEDIA CAPITAL LLC/CORPORATION
6.25% 144A 15/06/20253,551,000
0.372,288,629OWENS BROCKWAY GLASS CONTAINER INC5.375% 144A 15/01/2025
2,600,000
0.654,081,579PARSLEY ENERGY LLC FINANCE 5.25% 144A15/08/2025
4,800,000
0.643,993,294PBF HOLDING COMPANY LLC 7.25% 15/06/20257,540,0000.03161,098PBF HOLDING COMPANY LLC 9.25% 144A
15/05/2025200,000
0.201,267,886PENSKE AUTOMOTIVE GROUP 3.50% 01/09/20251,525,0000.422,626,161PETSMART INC 5.875% 144A 01/06/20253,136,0000.352,173,229PL DEVELOPMENT LLC PLD FINANCE CORP
7.75% 144A 15/11/20252,470,000
0.774,804,555POINDEXTER JB INC 7.125% 144A 15/04/20265,541,0000.472,929,952POWER TEAM SERVICES LLC 9.033% 144A
04/12/20253,225,000
1.066,702,832PRIME SECURITY SERVICES BORROWER LLC5.25% 144A 15/04/2024
7,679,000
0.674,219,676PROVIDENT FUNDING ASSOCIATES LP PFGFINANCE CORP 6.375% 144A 15/06/2025
5,100,000
0.684,239,517RAIN CII CARBON LLC 7.25% 144A 01/04/20255,100,0000.825,151,256SCHWEITZER MAUDUIT INTERNATIONAL INC
6.875% 144A 01/10/20265,946,000
0.674,219,787SCIENTIFIC GAMES INTERNATIONAL INC 8.25%144A 15/03/2026
4,800,000
0.07421,640SEAWORLD PARKS & ENTERTAINMENT INC9.50% 144A 01/08/2025
475,000
1.056,650,575SIMMONS FOODS INC 5.75% 144A 01/11/20247,963,0000.271,720,536SOTHEBY S 7.375% 144A 15/10/20271,970,0001.016,340,053SP FINCO LLC 6.75% 144A 01/07/20257,614,0000.583,648,701SPIRIT AEROSYSTEMS INC 5.50% 144A
15/01/20254,235,000
0.231,432,469STATION CASINOS LLC 5.00% 144A 01/10/20251,730,0000.714,452,323SUNCOKE ENERGY PARTNERS LP SUNCODE
ENERGY PARTNERS 7.50% 144A 15/06/20255,500,000
0.462,908,167TENET HEALTHCARE CORP 6.75% 15/06/20233,315,0000.644,041,564TEREX CORP 5.625% 144A 01/02/20254,800,0000.221,363,637THE BRINKS CO 5.5% 15/07/20251,565,0000.12735,842TRIUMPH GROUP INC 7.75% 15/08/2025983,0000.07412,630TRIUMPH GROUP INC 8.875% 144A 01/06/2024460,0000.603,779,591UNITED AIRLINES HLODINGS INC 4.875%
15/01/20254,700,000
0.724,521,418UNITI GROUP INC 7.875% 144A 15/02/20255,150,0000.291,824,084VERSCEND ESCROW CORP 9.75% 144A
15/08/20262,053,000
0.14906,685WESCO DISTRIBUTION INC 7.125% 144A15/06/2025
1,010,000
0.402,481,973WEST STREET MERGER SUB 6.375% 144A01/09/2025
2,950,000
0.613,835,763WESTERN GLOBAL AIRLINES 10.375% 144A15/08/2025
4,200,000
Amundi S.F. - Global High Yield Opportunities 2025
31/12/20Securities Portfolio as at
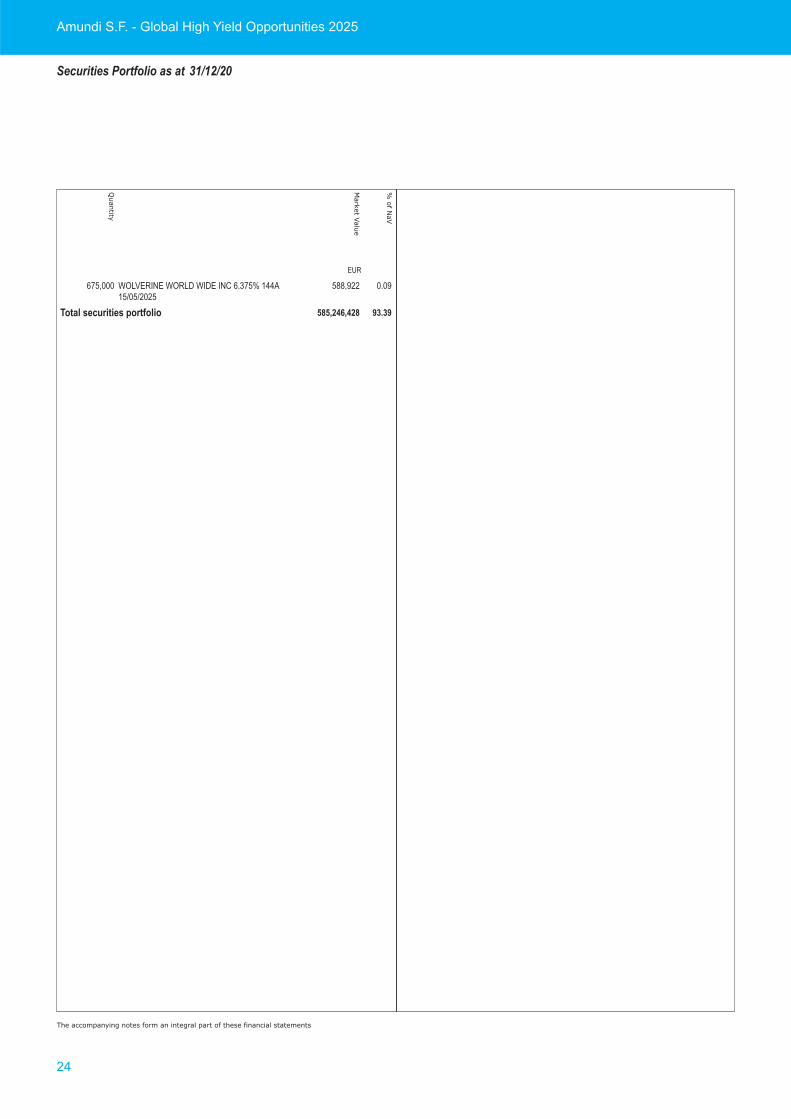
24
The accompanying notes form an integral part of these financial statements
% o
f NaV
Market V
alue
Quan
tity
EUR
0.09588,922WOLVERINE WORLD WIDE INC 6.375% 144A15/05/2025
675,000
93.39585,246,428Total securities portfolio
Amundi S.F. - Global High Yield Opportunities 2025
31/12/20Securities Portfolio as at

25
The accompanying notes form an integral part of these financial statements
% o
f NaV
Market V
alue
Quan
tity
EUR
95.1723,096,744Long positions
95.1723,096,744Transferable securities admitted to an official stock exchangelisting and/or dealt in on another regulated market
95.1723,096,744Bonds1.15278,853Argentina
1.15278,853YPF SOCIEDAD ANONIMA 8.50% REGS23/03/2025
416,000
1.35327,303Bahrain
1.35327,303BAHRAIN 5.875% REGS 26/01/2021400,000
8.602,087,842Cayman Islands
1.06256,771BANCO DO BRASIL SA GRAND CAYMAN BRANCH5.875% REGS 26/01/2022
300,000
0.82198,609CHINA EVERGRANDE GROUP 6.25% 28/06/2021250,0001.05254,505COUNTRY GARDEN HOLDINGS CO LTD 7.125%
27/01/2022300,000
1.18287,332FUFENG GROUP LTD 5.875% 28/08/2021343,0002.11513,919GRUPO AVAL LTD 4.75% REGS 26/09/2022600,0001.53371,394KAISA GROUP 7.875% 09/06/2021450,0000.85205,312YUZHOU GROUP HOLDINGS COMPANY LIMITED
6.375% 06/03/2021250,000
4.761,155,654Egypt
4.761,155,654AFRICAN EXPORT IMPORT BANK AFREXIMBANK4.00% 24/05/2021
1,400,000
0.83201,612Ireland
0.83201,612RYANAIR DAC 1.875% 17/06/2021200,000
4.171,012,156Kenya
4.171,012,156EASTERN AND SOUTHERN AFRICAN TRADE ANDDEV BANK 5.375% 14/03/2022
1,200,000
3.44834,923Luxembourg
3.44834,923SBERBANK LUX 5.717% 16/06/20211,000,000
4.161,010,607Mauritius
4.161,010,607MTN MAURITIUS INVESTMENTS 5.373% REGS13/02/2022
1,200,000
9.872,394,811Mexico
0.87210,009GRUPO POSADAS SAB DE CV 0% REGS30/06/2022 DEFAULTED
600,000
9.002,184,802PETROLEOS MEXICANOS PEMEX 4.875%24/01/2022
2,600,000
2.07501,680Montenegro
2.07501,680MONTENEGRO 5.75% REGS 10/03/2021500,000
1.38334,371Namibia
1.38334,371NAMIBIA 5.50% REGS 03/11/2021400,000
0.1638,380Netherlands
0.1638,380NOSTRUM OIL&GAS FIN BV 8.00% REGS25/07/2022
200,000
% o
f NaV
Market V
alue
Quan
tity
EUR
4.06985,233Nigeria
2.10510,590ACCESS BANK NIGERIA 10.50% REGS 19/10/2021600,0001.96474,643UNITED BANK FOR AFRICA PLC 7.75% REGS
08/06/2022569,000
5.461,326,188Oman
4.11999,313BANK MUSCAT SAOG 3.75% 03/05/20211,225,0001.35326,875OMAN 3.625% REGS 15/06/2021400,000
4.691,138,960Panama
3.20776,921GLOBAL BANK CORP 4.50% REGS 20/10/2021927,0001.49362,039MULTIBANK INC 4.375% REGS 09/11/2022429,000
4.311,046,473Senegal
4.311,046,473REPUBLIC OF SENEGAL 8.75% REGS 13/05/20211,250,000
1.36330,308South Africa
1.36330,308TRANSNET SOC LTD 4.00% REGS 26/07/2022400,000
2.09506,035Sweden
2.09506,035VOLVO CAR AB 3.25% 18/05/2021500,000
7.801,893,145Turkey
2.38578,531TURKIYE GARANIT BANKSAI 6.25% REGS20/04/2021
700,000
5.421,314,614TURKIYE IS BANKASI A S 5.00% REGS 25/06/20211,600,000
2.62635,191Ukraine
2.62635,191UKRAINE 7.75% REGS 01/09/2021750,000
5.081,232,635United Arab Emirates
5.081,232,635AXIS BANK / DUBAI BRANCH 2.875% REGS01/06/2021
1,500,000
6.191,501,855United Kingdom
4.121,000,390FCE BANK PLC 1.875% 24/06/20211,000,0002.07501,465ROLLS ROYCE PLC 2.125% 18/06/2021500,000
9.572,322,529United States of America
3.40825,434BBVA BANCOMER SA TEXAS AGENCY 6.50%REGS 10/03/2021
1,000,000
2.05496,665FORD MOTOR CREDIT CO LLC VAR 14/05/2021500,0004.121,000,430GENERAL MOTORS FINANCIAL CO FRN
10/05/20211,000,000
95.1723,096,744Total securities portfolio
Amundi S.F. - High Yield & Emerging Markets Bond Opportunities 2021
31/12/20Securities Portfolio as at

26
The accompanying notes form an integral part of these financial statements
% o
f NaV
Market V
alue
Quan
tity
EUR
98.15102,334,671Long positions
97.56101,718,005Transferable securities admitted to an official stock exchangelisting and/or dealt in on another regulated market
97.53101,691,014Shares0.20206,303Austria
0.15156,288OMV AG4,7360.0550,015VOESTALPINE AG1,707
2.212,306,442Belgium
0.24247,229AGEAS NV5,6730.64668,898ANHEUSER BUSCH INBEV SA/NV11,7330.54561,879GROUPE BRUXELLES LAMBERT6,8090.15160,842KBC GROUPE2,8080.19197,811PROXIMUS12,2030.20212,167SOLVAY2,1900.21220,022TELENET GROUP HOLDING6,2720.0437,594UCB SA445
3.944,105,366Denmark
0.36370,767A.P. MOELLER-MAERSK B2030.31324,916CARLSBERG B2,4800.46482,693COLOPLAST B3,8650.17173,484DSV PANALPINA A/S1,2660.11119,784GENMAB3621.421,478,598NOVO NORDISK25,7960.0332,821NOVOZYMES AS-B6990.25256,269ORSTED SH1,5340.28290,114PANDORA AB3,1710.55575,920VESTAS WIND SYSTEMS A/S2,978
1.731,806,578Finland
0.13140,422FORTUM OYJ7,1280.0328,113KONE B4230.17182,098METSO OUTOTEC OYI22,2750.0774,726NELES CORPORATION6,8840.20205,699NESTE CORPORATION3,4770.24253,498NOKIA OYJ80,4500.0331,443NOKIAN RENKAAT OYJ1,0910.15157,288ORION NEW B4,1910.10102,350STORA ENSO OYJ-R6,5420.47489,530UPM KYMMENE OYJ16,0660.14141,411WARTSILA OYJ17,351
16.1916,878,120France
0.0223,739ACCOR SA8020.28287,564AIR LIQUIDE2,1420.0445,628ARKEMA4880.19199,139ATOS SE2,6630.58607,604AXA31,1400.15151,289BIOMERIEUX SA1,3111.031,077,668BNP PARIBAS25,0010.42434,657BOUYGUES12,9170.22231,790CAP GEMINI SE1,828
% o
f NaV
Market V
alue
Quan
tity
EUR
0.15157,633CNP ASSURANCES11,9600.35367,500COMPAGNIE DE SAINT-GOBAIN SA9,8000.0438,127COVIVIO SA REIT5060.27284,275CREDIT AGRICOLE SA27,5460.56585,823DANONE SA10,8970.0223,322DASSAULT AVIATION260.0773,771DASSAULT SYSTEMES4440.20213,541ELECTRICITE DE FRANCE SA16,5600.0994,601ENGIE SA7,5560.28293,748ESSILOR LUXOTTICA SA2,3030.19202,206GECINA ACT1,6010.0215,773IMERYS SA4080.0222,000IPSEN3240.39407,758KERING6860.10100,042KLEPIERRE REITS5,4400.30309,666LEGRAND4,2421.091,140,325L’OREAL SA3,6691.491,547,006LVMH MOET HENNESSY LOUIS VUITTON SE3,0280.33346,335MICHELIN (CGDE)-SA3,3000.0878,293NATIXIS28,0720.18187,603ORANGE19,2730.37385,414PERNOD RICARD2,4580.50520,170PEUGEOT SA23,2530.17176,205PUBLICIS GROUPE4,3230.0549,650REMY COINTREAU3260.17176,654RENAULT SA4,9400.38395,505SAFRAN3,4111.011,055,288SANOFI13,4090.32334,298SARTORIUS STEDIM BIOTECH1,1481.141,175,311SCHNEIDER ELECTRIC SA9,9350.35366,569SOCIETE GENERALE A21,5350.0332,894SUEZ SA ACT2,0280.35364,085TELEPERFORMANCE SE1,3420.0879,918THALES SA1,0671.101,148,556TOTAL SA32,5370.17178,967UBISOFT ENTERTAINMENT2,2700.29298,553UNIBAIL RODAMCO SE REITS4,6230.13136,544VALEO SA4,2300.17179,724VINCI SA2,2090.13135,461VIVENDI5,1350.13139,928WORLDLINE1,769
14.0214,618,098Germany
0.0215,9841&1 DRILLISCH AKTIENGESELLCHAFT7820.64662,232ADIDAS NOM2,2230.73762,057ALLIANZ SE-NOM3,7970.66690,432BASF SE10,6680.43443,315BAYER AG9,2060.0997,005BAYERISCHE MOTORENWERKE1,3430.0883,957BEIERSDORF8890.13138,525BRENNTAG AG2,1870.25258,529CARL ZEISS MEDITEC2,3740.26271,820COMMERZBANK51,6180.0326,433CONTINENTAL AG218
Amundi S.F. - European Equity Market Plus
31/12/20Securities Portfolio as at
Equity Sub-Funds

27
The accompanying notes form an integral part of these financial statements
% o
f NaV
Market V
alue
Quan
tity
EUR
0.38400,004COVESTRO AG7,9240.33340,441DAIMLER5,8910.0994,107DELIVERY HERO AG7410.19200,726DEUTSCHE BANK AG-NOM22,4300.51531,517DEUTSCHE BOERSE AG3,8170.96998,851DEUTSCHE POST AG-NOM24,6630.33348,511DEUTSCHE TELEKOM AG-NOM23,3040.0990,438DEUTSCHE WOHNEN AG REIT2,0700.14141,244E.ON SE15,5830.49510,949EVONIK INDUSTRIES AG19,1510.0777,339FRESENIUS MEDICAL CARE AG & CO1,1340.0333,613GEA GROUP AG1,1480.40421,010HEIDELBERGCEMENT AG6,8770.18186,723HENKEL KGAA VZ PFD2,0230.24246,287HOCHTIEF3,0960.21221,708INFINEON TECHNOLOGIES AG-NOM7,0630.0990,587KION GROUP1,2730.15160,931KNORR BREMSE AG1,4410.0441,684MERCK KGAA2970.18192,700MTU AERO ENGINES HLDG AG9030.28287,961MUENCHENER RUECKVERSICHERUNGS AG-
NOM1,186
0.40421,534PORSCHE AUTOMOBIL HOLDING SE7,4740.35368,289PUMA AG3,9910.37390,434RWE AG11,2941.311,370,271SAP SE12,7800.39404,074SARTORIUS VZ PFD1,1760.93973,300SIEMENS AG-NOM8,2820.11110,250SIEMENS ENERGY AG3,6750.0329,810SYMRISE2750.40417,481TEAMVIEWER AG9,5250.33344,767TELEFONICA DEUTSCHLAND HOLDING AG152,8900.0768,087UNIPER SE2,4110.0439,123VOLKSWAGEN AG2300.18185,648VOLKSWAGEN AG PFD1,2180.26267,964VONOVIA SE NAMEN AKT REIT4,4840.15159,446ZALANDO1,751
1.171,219,111Ireland
0.0223,117BANK OF IRELAND GROUP PLC7,0050.0221,571DALATA HOTEL5,6990.0554,551DCC PLC9430.45463,314FLUTTER ENTMT RG2,7760.20212,115KERRY GROUP A1,7900.15156,013KINGSPAN GROUP PLC2,7180.0438,127LINDE PLC1790.24250,303SMURFIT KAPPA6,580
0.24252,305Isle of Man
0.24252,305ENTAIN PLC19,924
2.412,517,877Italy
0.17179,115DIASORIN SPA1,0531.261,309,974ENEL SPA158,2860.24248,951ENI SPA29,124
% o
f NaV
Market V
alue
Quan
tity
EUR
0.0557,315LEONARDO AZIONE POST RAGGRUPPAMENTO9,6980.10106,322MEDIOBANCA SPA14,1010.0548,084MONCLER SPA9590.0549,821NEXI SPA3,0490.0555,710PIRELLI C SPA12,5670.0329,345POSTE ITALIANE SPA3,5270.0443,940PRYSMIAN SPA1,5110.11113,875SNAM RETE GAS24,7500.10107,502TELECOM ITALIA SPA284,8490.11115,018UNICREDIT SPA15,0390.0552,905UNIPOLSAI AZ24,380
0.79826,330Jersey
0.13134,305EXPERIAN PLC4,3290.55581,316FERGUSON PLC5,8570.11110,709WPP PLC12,387
0.27276,876Luxembourg
0.24249,424ARCELORMITTAL SA13,2110.0327,452EUROFINS SCIENTIFIC SE400
9.109,485,929Netherlands
0.0222,536ABN AMRO GROUP N.V.2,8100.60626,745ADYEN BV3290.24249,406AEGON NV77,0960.27284,154AIRBUS BR BEARER SHS3,1650.23240,209AKZO NOBEL NV2,7340.14143,990ARGEN-X N V5952.142,221,510ASML HOLDING N.V.5,5880.25261,945FIAT CHRYSLER AUTOMOBILES NV17,8680.58607,160HEINEKEN NV6,6560.44457,948ING GROUP NV59,9330.20205,775JUST EAT TAKEAWAY COM N V2,2270.65672,940KONINKLIJKE AHOLD DELHAIZE29,1190.62646,835KONINKLIJKE DSM NV4,5940.40419,763KONINKLIJKE PHILIPS N.V.9,5880.81845,507NN GROUP NV23,7970.32335,591PROSUS N V3,7980.0550,346QIAGEN NV1,1860.30314,116RANDSTAD HOLDING NV5,9000.42438,091STMICROELECTRONICS NV14,4680.42441,362WOLTERS KLUWER CVA6,391
0.84872,057Norway
0.0438,818ADEVINTA ASA RG REGISTERED SHS2,8240.0888,581EQUINOR ASA6,4020.28292,936MOWI ASA16,0670.12121,969NORSK HYDRO ASA32,0560.25260,327ORKLA ASA31,3470.0769,426YARA INTERNATIONAL ASA2,043
0.10103,709Portugal
0.10103,709GALP ENERGIA SGPS SA-B11,847
Amundi S.F. - European Equity Market Plus
31/12/20Securities Portfolio as at

28
The accompanying notes form an integral part of these financial statements
% o
f NaV
Market V
alue
Quan
tity
EUR
3.793,949,734Spain
0.0662,689ACS2,3090.17179,871AMADEUS IT GROUP SA3,0200.66693,069BANCO BILBAO VIZCAYA ARGENTA171,7640.38399,220BANCO SANTANDER SA157,2970.19201,824CAIXABANK96,0610.0992,502ENAGAS5,1490.30307,581ENDESA13,7620.64668,877IBERDROLA SA57,1690.39402,448INDITEX15,4550.0880,584MAFPRE SA50,5860.18190,643NATURGY ENERGY GROUP SA10,0550.17173,084RED ELECTRICA CORPORACION SA10,3180.37385,407REPSOL46,7160.0878,820SIEMENS GAMESA RENEWABLE ENERGY SA2,3820.0333,115TELEFONICA SA10,205
5.005,213,050Sweden
0.0552,315AB INDUSTRIVAERDEN C1,9800.15159,989ASSA ABLOY AB7,9390.55587,608ATLAS COPCO B16,0320.18186,669BOLIDEN AB6,4370.17175,211ELECTROLUX B9,2010.015,637ELECTROLUX PROFESSIONAL AB1,2160.29305,403EPIROC AKTIEBOLAG SEK (ISIN SE0011166941)22,0780.0665,768EQT AB3,1410.35360,389ERICSSON LM-B SHS37,0890.30307,603ESSITY AB11,6860.32333,471EVOLUTION AB4,0140.25264,201HENNES & MAURITZ AB-B SHS15,4350.0552,158HEXAGON AB6990.27277,355HUSQVARNA AB26,1690.16163,526ICA GRUPPEN AB3,9990.51533,994INVESTOR B8,9550.24253,720KINNEVIK AB6,1360.0331,525LUNDIN ENERGY AB1,4250.0336,153NIBE INDUSTRIER AB SHS B1,3470.24245,603SANDVIK12,2600.11119,849SKANSKA AB-B SHS5,7430.26269,816SKF AB-B SHS12,7050.0327,294SWEDBANK A SHS A1,9030.12121,239TELE2 B11,2180.0546,929TELIA COMPANY SHS13,8860.22229,625VOLVO AB-B SHS11,906
15.2415,887,616Switzerland
0.11114,897ABB LTD-NOM5,0290.0546,932ADECCO GROUP INC8580.30313,429ALCON INC5,8000.0333,071BARRY CALLEBAUT N170.38397,679CIE FINANCIERE RICHEMONT SA5,3710.25265,637COCA COLA HBC10,0030.0113,358COCA COLA HBC GBP5030.0996,772CREDIT SUISSE GROUP AG-NOM9,181
% o
f NaV
Market V
alue
Quan
tity
EUR
0.54564,679GEBERIT AG-NOM1,1020.16168,989GIVAUDAN N490.71728,156KUEHNE UND NAGEL INTERNATIONAL AG-NOM3,9220.39403,147LAFARGEHOLCIM LTD8,9680.42442,966LOGITECH INTERNATIONAL NOM5,5760.59613,739LONZA GROUP AG N1,1673.693,841,585NESTLE SA39,8511.972,048,344NOVARTIS AG-NOM26,4840.51536,563PARTNERS GROUP HOLDING N5582.782,889,295ROCHE HOLDING LTD10,1130.29303,648SGS SA-NOM1230.18190,256SIKA LTD8510.27280,070SONOVA HOLDING AG1,3170.0775,344STRAUMANN HOLDING (NAMEN)790.44458,792SWISS RE AG5,9540.51533,322SWISSCOM N1,2090.0998,037UBS GROUP INC NAMEN AKT8,5030.41428,909ZURICH INSURANCE GROUP AG1,242
20.2921,165,513United Kingdom
0.43443,6133I GROUP34,2900.19195,021ADMIRAL GROUP6,0070.0552,656ANGLO AMERICAN PLC1,9440.0438,044ANTOFAGASTA PLC2,3640.41422,616ASHTEAD GROUP11,0030.21219,773ASSOCIATED BRITISH FOODS8,6891.341,407,278ASTRAZENECA PLC17,1990.0441,568AVEVA GROUP1,1620.20211,992AVIVA PLC58,3500.30316,923BARCLAYS PLC193,3990.13131,612BARRATT DEVELOPMENTS17,5830.16162,799BERKELEY GROUP HOLDINGS UNITS3,0730.64665,631BHP GROUP PLC30,9510.41429,531BP PLC150,8920.11110,043BRITISH LAND CO REIT20,1430.0883,081BT GROUP PLC56,2310.15154,451BUNZL5,6590.12123,232BURBERRY GROUP6,1640.31327,830COCA COLA EUROPEAN PARTNERS PLC8,3100.13138,767COMPASS GROUP PLC9,1130.0446,646CRODA INTERNATIONAL PLC6330.71736,300DIAGEO22,9000.29297,866DIRECT LINE INSURANCE GROUP PLC83,5800.19200,094EVRAZ PLC37,9780.67699,111GLAXOSMITHKLINE PLC46,6300.0329,275HALMA PLC1,0700.0330,088HARGREAVES LANSDOWN1,7661.091,140,584HSBC HOLDINGS PLC269,4830.15152,764INFORMA PLC24,9070.13136,988INTERTEK GROUP2,1710.0219,887INVESTEC9,5040.13134,539JD SPORTS FASHION PLC14,0030.0550,174JOHNSON MATTHEY PLC1,8520.26267,086KINGFISHER88,413
Amundi S.F. - European Equity Market Plus
31/12/20Securities Portfolio as at

29
The accompanying notes form an integral part of these financial statements
% o
f NaV
Market V
alue
Quan
tity
EUR
0.17180,874LAND SECURITIES GROUP PLC R E I T24,0280.32336,067LEGAL & GENERAL GROUP113,0030.30315,410LLOYDS BANKING GROUP PLC774,7630.0768,831MEGGITT PLC13,2070.18192,247MELROSE INDUSTRIES SHS96,6470.13137,254M&G PLC62,0640.38399,168MONDI PLC20,7790.45471,928NATIONAL GRID PLC48,8350.15155,120NATWEST GROUP PLC82,8200.0547,024NEXT PLC5940.0112,168NINETY ONE PLC4,7520.15152,279OCADO GROUP5,9600.0664,133PEARSON8,4370.22229,218PERSIMMON PLC7,4150.0225,363QUILTER PLC14,7800.40419,007RECKITT BENCKISER GROUP PLC5,7330.13136,785RELX PLC6,8290.0331,961RELX PLC1,5960.0436,909RENTOKIL INITIAL6,4831.181,240,054RIO TINTO PLC20,2921.011,053,594ROYAL DUTCH SHELL A SHARES72,6670.25264,557ROYAL DUTCH SHELL B SHARES18,8030.22228,928ROYAL DUTCH SHELL PLC-A15,6650.0439,504RSA INSURANCE GROUP PLC5,2200.32338,582SAGE GRP52,0730.23237,645SAINSBURY(J)94,3310.14149,943SCHRODERS LTD4,0220.24251,377SEGRO PLC REIT23,7450.24250,699SMITH & NEPHEW14,8610.10107,690SMITHS GROUP6,4070.16161,772SPIRAX-SARCO ENGINEERING PLC1,2820.24246,559SSE PLC14,7130.34353,670STANDARD CHARTERED67,9480.46476,918STANDARD LIFE ABERDEEN PLC151,7560.22225,330TATE & LYLE PLC29,9070.12125,073TAYLOR WINPEY PLC67,5230.64668,344UNILEVER13,6210.90934,251UNILEVER PLC18,8490.0554,864UNITED UTILITIES GROUP PLC5,4870.65679,823VODAFONE GROUP503,1500.0446,727WILLIAM HILL PLC15,485
0.0326,991Warrants, Rights0.0214,972Spain
0.0213,114REPSOL SA RIGHTS 08/01/202146,7160.001,858TELEFONICA RIGHTS 28/12/2010,205
0.002,284Switzerland
0.002,284COMPAGNIE FINANCIERE RICHEMONT SAWARRANT 22/11/2023
10,742
0.019,735United Kingdom
0.019,735AVEVA GROUP RIGHTS 09/12/2020903
% o
f NaV
Market V
alue
Quan
tity
EUR
0.59616,666Share/Units of UCITS/UCIS
0.59616,666Share/Units in investment funds0.59616,666Luxembourg
0.59616,666AMUNDI FUND ABSOLUTE RETURN FOREX - XEUR (C)
636
98.15102,334,671Total securities portfolio
Amundi S.F. - European Equity Market Plus
31/12/20Securities Portfolio as at

30
The accompanying notes form an integral part of these financial statements
% o
f NaV
Market V
alue
Quan
tity
EUR
89.7463,664,199Long positions
86.8761,626,616Transferable securities admitted to an official stock exchangelisting and/or dealt in on another regulated market
86.8761,626,616Shares3.912,772,964Belgium
0.76538,459ANHEUSER BUSCH INBEV SA/NV9,4451.32936,700KBC GROUPE16,3531.831,297,805SOLVAY13,396
0.80570,231Denmark
0.80570,231GN GREAT NORDIC8,712
15.2210,797,206France
1.681,193,750BNP PARIBAS27,6942.401,705,587CAP GEMINI SE13,4511.28911,178DANONE SA16,9491.521,077,053KERING1,8122.661,882,156LVMH MOET HENNESSY LOUIS VUITTON SE3,6841.551,101,131PUBLICIS GROUPE27,0152.361,672,375SANOFI21,2501.771,253,976THALES SA16,742
13.279,415,411Germany
1.641,164,789ADIDAS NOM3,9102.221,576,298ALLIANZ SE-NOM7,8541.411,000,929DEUTSCHE BOERSE AG7,1881.541,090,544DEUTSCHE POST AG-NOM26,9271.701,203,085FRESENIUS SE & CO KGAA31,7941.40990,820SAP SE9,2413.362,388,946SIEMENS AG-NOM20,328
3.752,659,163Ireland
2.631,863,718CRH PLC54,7831.12795,445FLUTTER ENTMT RG4,766
4.393,113,772Italy
1.701,207,585ENEL SPA145,9140.85599,851FINECOBANK44,7651.05747,485MEDIOBANCA SPA99,1360.79558,851SNAM RETE GAS121,463
12.578,919,146Netherlands
2.601,846,775AIRBUS BR BEARER SHS20,5703.402,408,315FIAT CHRYSLER AUTOMOBILES NV164,2781.621,152,095ING GROUP NV150,7780.88625,733JUST EAT TAKEAWAY COM N V6,7720.83587,653KONINKLIJKE KPN NV236,2901.851,312,831KONINKLIJKE PHILIPS N.V.29,9871.39985,744PROSUS N V11,156
2.491,763,973Spain
1.781,263,541IBERDROLA SA107,9950.71500,432RED ELECTRICA CORPORACION SA29,832
% o
f NaV
Market V
alue
Quan
tity
EUR
2.471,755,286Sweden
1.451,031,538LUNDIN ENERGY AB46,6281.02723,748SWEDBANK A SHS A50,462
9.196,521,567Switzerland
1.16822,000LONZA GROUP AG N1,5634.853,445,385NESTLE SA35,7413.182,254,182ROCHE HOLDING LTD7,890
18.8113,337,897United Kingdom
2.571,818,522ASTRAZENECA PLC22,2251.641,161,581BHP GROUP PLC54,0120.83590,650M&G PLC267,0831.35955,812PRUDENTIAL PLC63,5150.91646,234RECKITT BENCKISER GROUP PLC8,8421.15813,419ROYAL DUTCH SHELL A SHARES56,1021.24879,118ROYAL DUTCH SHELL B SHARES62,4820.29207,606ROYAL DUTCH SHELL PLC-A14,2061.781,265,471SMITHS GROUP75,2890.96682,813STANDARD CHARTERED131,1842.111,496,106UNILEVER30,4911.721,219,200UNILEVER PLC24,5982.261,601,365VODAFONE GROUP1,185,201
2.872,037,583Derivative instruments
2.872,037,583Options1.951,384,500Germany
0.81576,000EURO STOXX 600 TRAVEL - 200 - 19.03.21 CALL4001.14808,500DJ EURO STOXX 50 EUR - 3,500 - 19.03.21 CALL500
0.92653,083Sweden
0.92653,083OMX 30 - 1,680 - 19.03.21 PUT2,500-0.84-599,000Short positions
-0.84-599,000Derivative instruments
-0.84-599,000Options-0.84-599,000Germany
-0.13-90,000EURO STOXX 600 TRAVEL - 240 - 19.03.21 CALL-400-0.71-509,000DJ EURO STOXX 50 EUR - 3,600 - 19.03.21 CALL-500
88.9063,065,199Total securities portfolio
Amundi S.F. - European Equity Optimal Volatility
31/12/20Securities Portfolio as at

31
The accompanying notes form an integral part of these financial statements
% o
f NaV
Market V
alue
Quan
tity
EUR
101.0440,840,337Long positions
100.6640,687,482Transferable securities admitted to an official stock exchangelisting and/or dealt in on another regulated market
100.6640,687,482Shares1.15464,956Austria
0.50203,060AMS11,3440.65261,896BAWAG GROUP AG6,892
3.711,500,579Belgium
0.71286,361ANHEUSER BUSCH INBEV SA/NV5,0231.27514,260KBC GROUPE8,9781.73699,958SOLVAY7,225
0.89358,877Bermuda
0.89358,877HISCOX LTD32,317
0.95384,374Canada
0.95384,374LUNDIN MINING52,720
2.491,007,211Denmark
0.57229,846FLSMIDTH & CO B7,3490.75305,144GN GREAT NORDIC4,6621.17472,221ROCKWOOL INTERNATIONAL B1,543
0.53214,892Finland
0.53214,892HUHTAMAKI OYJ5,085
14.565,885,763France
1.62655,325BNP PARIBAS15,2032.32936,418CAP GEMINI SE7,3851.24500,237DANONE SA9,3051.41570,624KERING9602.501,012,093LVMH MOET HENNESSY LOUIS VUITTON SE1,9811.50604,471PUBLICIS GROUPE14,8302.27918,114SANOFI11,6661.70688,481THALES SA9,192
12.815,178,228Germany
1.58640,187ADIDAS NOM2,1492.15865,418ALLIANZ SE-NOM4,3121.35545,442DEUTSCHE BOERSE AG3,9171.46591,989DEUTSCHE POST AG-NOM14,6170.53215,864DWS GROUP GMBH CO KGAA6,2031.63660,422FRESENIUS SE & CO KGAA17,4530.86347,500SAP SE3,2413.251,311,406SIEMENS AG-NOM11,159
4.821,947,895Ireland
2.531,023,016CRH PLC30,0711.10443,286FLUTTER ENTMT RG2,6561.19481,593LINDE PLC2,261
7.402,991,161Italy
0.51206,447CERVED GROUP SPA AZ NOMINATIVA27,711
% o
f NaV
Market V
alue
Quan
tity
EUR
1.89764,198ENEL SPA92,3390.79319,952FINECOBANK23,8771.24499,578MEDIOBANCA SPA66,2572.23902,915NEXI SPA55,2580.74298,071SNAM RETE GAS64,784
0.52208,291Luxembourg
0.52208,291B&M EUROPEAN VALUE RETAIL SA.36,118
13.895,614,903Netherlands
2.511,013,796AIRBUS BR BEARER SHS11,2920.83336,351ASR NEDERLAND N.V10,2390.65260,790BASIC FIT N.V.8,6933.571,442,456FIAT CHRYSLER AUTOMOBILES NV98,3941.56632,369ING GROUP NV82,7600.84339,478JUST EAT TAKEAWAY COM N V3,6740.81327,707KONINKLIJKE KPN NV131,7681.78720,663KONINKLIJKE PHILIPS N.V.16,4611.34541,293PROSUS N V6,126
3.171,280,787Spain
1.51610,611IBERDROLA SA52,1891.00403,235INTERNATIONAL CONSOLIDATED AIRLINES
GROUP SA225,145
0.66266,941RED ELECTRICA CORPORACION SA15,913
2.36952,286Sweden
1.40566,231LUNDIN ENERGY AB25,5950.96386,055SWEDBANK A SHS A26,917
8.833,570,429Switzerland
1.09441,240LONZA GROUP AG N8394.681,891,246NESTLE SA19,6193.061,237,943ROCHE HOLDING LTD4,333
22.589,126,850United Kingdom
2.47998,326ASTRAZENECA PLC12,2011.58637,609BHP GROUP PLC29,6480.50201,080DECHRA PHARMACEUTICALS5,2171.10443,055ITV371,3281.83738,353MEGGITT PLC141,6720.78315,028M&G PLC142,4511.26509,816PRUDENTIAL PLC33,8780.85343,654RECKITT BENCKISER GROUP PLC4,7021.21488,745ROYAL DUTCH SHELL A SHARES33,7091.40564,612ROYAL DUTCH SHELL B SHARES40,1290.1871,346ROYAL DUTCH SHELL PLC-A4,8821.96791,665SMITHS GROUP47,1000.90364,189STANDARD CHARTERED69,9690.0727,183UNILEVER5543.601,460,333UNILEVER PLC29,4630.72292,923VISTRY GROUP PLC27,9082.17878,933VODAFONE GROUP650,515
Amundi S.F. - European Research
31/12/20Securities Portfolio as at

32
The accompanying notes form an integral part of these financial statements
% o
f NaV
Market V
alue
Quan
tity
EUR
0.38152,855Share/Units of UCITS/UCIS
0.38152,855Share/Units in investment funds0.38152,855France
0.38152,855AMUNDI CASH CORPORATE0.658
101.0440,840,337Total securities portfolio
Amundi S.F. - European Research
31/12/20Securities Portfolio as at

33
The accompanying notes form an integral part of these financial statements
% o
f NaV
Market V
alue
Quan
tity
EUR
89.91121,085,571Long positions
76.46102,968,026Transferable securities admitted to an official stock exchangelisting and/or dealt in on another regulated market
7.4310,003,026Shares0.12162,274Belgium
0.12162,274SOLVAY1,675
0.28374,524Canada
0.0687,170BARRICK GOLD CORP4,6920.12156,443CANADIAN SOLAR3,7010.10130,911SHOPIFY INC141
0.68915,887Cayman Islands
0.09117,253ALIBABA GROUP HOLDING-SP ADR6170.13173,180GEELY AUTOMOBILE HOLDINGS LTD62,0000.10134,754PINDUODUO INC ADR9420.08107,007TENCENT HOLDINGS LTD1,8000.13178,787WUXI BIOLOGICS INC16,5000.15204,906XINYI SOLAR HOLDINGS LTD96,000
0.36478,962China
0.12160,637BYD CO LTD-H7,5000.14187,549CHINA LONGYUAN POWER GROUP-H229,0000.10130,776FLAT GLASS GROUP CO LTD38,000
0.21286,454Denmark
0.08107,760A.P. MOELLER-MAERSK B590.13178,694VESTAS WIND SYSTEMS A/S924
0.20266,844France
0.10130,558MICHELIN (CGDE)-SA1,2440.10136,286VALEO SA4,222
0.64866,765Germany
0.0795,833BRENNTAG AG1,5130.10135,337COVESTRO AG2,6810.08109,796DEUTSCHE POST AG-NOM2,7110.0788,325ENCAVIS AG4,1370.14190,617SIEMENS AG-NOM1,6220.10136,948WACKER CHEMIE1,1730.08109,909ZALANDO1,207
0.24327,301Ireland
0.12164,436LINDE PLC7720.0111,453NVENT ELECTRIC6090.11151,412RYANAIR HOLDINGS PLC9,196
0.0679,545Israel
0.0679,545JFROG LTD1,554
0.0111,283Italy
0.0111,283PRYSMIAN SPA388
% o
f NaV
Market V
alue
Quan
tity
EUR
0.38514,614Japan
0.10116,263ADVANTEST1,9000.08112,877RECRUIT HOLDING CO LTD3,3000.0458,112SBI HOLDINGS3,0000.08113,983SONY CORP1,4000.08113,379TOYOTA MOTOR CORP1,800
0.08110,216Jersey
0.08110,216APTIV REGISTERED SHS1,034
0.10131,443Luxembourg
0.10131,443ARCELORMITTAL SA6,962
0.47627,132Spain
0.19255,474EDP RENOVAVEIS11,2050.16212,537SIEMENS GAMESA RENEWABLE ENERGY SA6,4230.12159,121SOLARIA ENERGIA Y MEDIO AMBIENTE SA6,731
0.0790,035Switzerland
0.0790,035CIE FINANCIERE RICHEMONT SA1,216
3.534,759,747United States of America
0.11146,181AMAZON.COM INC550.08114,170APPLE INC1,0570.0794,189BALL CORP1,2580.09117,824BILL.COM HOLDINGS INC1,0580.08106,439CLOUDFLARE INC1,7100.08107,926CROWDSTRIKE HOLDINGS INC6310.10128,053DEERE & CO5860.08107,627ENPHASE ENERGY7550.11146,974FIRST SOLAR INC1,8010.11149,950GENERAC HOLDINGS8070.10138,397LEAR CORP1,0610.13180,718MICRON TECHNOLOGY INC2,9400.07100,889MODERNA INC1,1580.07100,495NETFLIX INC2270.08102,773NEWMONT CORPORTAION2,1120.08107,135NIKE INC -B-9310.09120,004PAYPAL HOLDINGS INC6350.08111,029PINTEREST INC2,0410.11150,240PLUG POWER5,4290.10137,980QORVO INC SHS1,0150.11146,326ROKU-A RG5350.08108,405ROSS STORES INC1,0810.10135,156SERVICENOW INC3040.08112,596SNAP INC2,7460.08103,533SNOWFLAKE INC4380.15189,897SOLAREDGE TECHNOLOGIES INC7280.10131,150STARBUCKS1,5120.08111,120SUNNOVA ENERGY INTERNATIONAL INC3,0180.18235,386TESLA INC4030.08104,268THE TRADE DEESK INC1590.11148,795TJX COMPANIES INC2,6640.08104,167TWILIO INC373
Amundi S.F. - Absolute Return Multi-Strategy Control
31/12/20Securities Portfolio as at Absolute Return Sub-Funds

34
The accompanying notes form an integral part of these financial statements
% o
f NaV
Market V
alue
Quan
tity
EUR
0.08110,936ULTA BEAUTY INC.4760.0567,079UNIVERSAL DISPLAY3570.08107,122VERISK ANALYTICS INC6370.11151,440WALT DISNEY CO/THE1,0190.08113,402WORKDAY INC5760.08109,976XPO LOGISTICS INC1,125
67.2190,516,549Bonds1.922,585,864Australia
0.22300,558AUSTRALIA 1.75% 21/06/2051500,0000.44594,490AUSTRALIA 2.75% 21/05/2041800,0000.29388,897AUSTRALIA 3.00% 21/03/2047500,0000.47635,781NEW SOUTH WALES TREASURY CRP 1.50%
20/02/20321,000,000
0.50666,138QUEENSLAND TREASURY CORP 1.25%10/03/2031
1,050,000
0.891,201,340Austria
0.0566,130AUSTRIA 0.85% 30/06/212050,0000.16224,604AUSTRIA 2.10% 20/09/2117100,0000.15199,514ERSTE GROUP BANK AG VAR 16/11/2028200,0000.16209,444IMMOFINANZ AG 2.50% 15/10/2027200,0000.15204,870PIERER INDUSTRIE AG 2.50% 22/04/2028200,0000.15199,262RAIFFEISEN BANK INTERNATIONAL AG VAR
PERPETUAL EUR (ISIN XS1756703275)200,000
0.0797,516SAPPI PAPIER HOLDING GMBH 3.125% REGS15/04/2026
100,000
0.08101,782Belgium
0.08101,782COFINIMMO SA 0.875% 02/12/2030100,000
0.13174,200Brazil
0.13174,200BRAZIL 4.75% 14/01/2050200,000
2.222,996,137Canada
1.241,670,211CANADA GOVERNMENT I 4.25% 01/12/20211,500,0000.58783,849CANADA 2.25% 01/03/20241,150,0000.14193,625CANADA 2.75% 01/12/2048220,0000.18245,995CANADIAN IMPERIAL BANK OF COMMERCE
0.50% 14/12/2023300,000
0.08102,457PRIMO WATER CORPORATION 3.875% REGS31/10/2028
100,000
0.46616,722Cayman Islands
0.12168,068AGILE GROUP HOLDINGS LTD 5.75% 02/01/2025200,0000.14176,580COUNTRY GARDEN HOLDINGS CO LTD 4.80%
06/08/2030200,000
0.12168,067TENCENT HOLDINGS LIM 2.39% REGS 03/06/2030200,0000.08104,007UPCB FINANCE VII LTD 3.625% REGS 15/06/2029100,000
0.901,214,591Denmark
0.07100,756DANSKE BANK AS VAR 27/08/2025100,0000.12164,180DANSKE BANK AS 1.171% REGS 08/12/2023200,0000.56749,477DENMARK 1.75% 15/11/20255,000,0000.15200,178NYKREDIT REALKREDIT AS 0.25% 13/01/2026200,000
% o
f NaV
Market V
alue
Quan
tity
EUR
0.24317,195Dominican Republic
0.24317,195DOMINICAN REPUBLIC 4.875% REGS 23/09/2032350,000
0.13173,685Egypt
0.13173,685EGYPT 5.25% REGS 06/10/2025200,000
0.22294,907Finland
0.08102,757SATO OYJ 1.375% 24/02/2028100,0000.0798,894SBB TREASURY OYJ 0.75% 14/12/2028100,0000.0793,256TVO POWER CO 1.125% 09/03/2026100,000
3.364,525,136France
0.08101,982ALTICE FRANCE SA 4.125% REGS 15/01/2029100,0000.12164,585BNP PARIBAS SA VAR REGS PERPETUAL USD
(ISIN USF1R15XL274)200,000
0.15199,206BNP PARIBAS SA 0.125% 04/09/2026200,0000.08101,979CARMILA SAS 1.625% 30/05/2027100,0000.08101,051CASINO GUICHARD PERRACHON SA 6.625%
15/01/2026100,000
0.0799,871CNP ASSURANCES 0.375% 08/03/2028100,0000.10135,704CREDIT LOGEMENT VAR PERPETUAL150,0000.15217,952ELECTRICITE DE FRANCE SA VAR PERPETUAL
EUR (ISIN FR0013534336)200,000
0.09127,603ELECTRICITE DE FRANCE SA VAR PERPETUALGBP
100,000
0.0796,314FFP 1.875% 30/10/2026100,0000.08109,137GECINA 1.375% 30/06/2027100,0000.08103,361GETLINK SE 3.50% 30/10/2025100,0000.08102,893ICADE SANTE SAS 0.875% 04/11/2029100,0000.15204,252LA BANQUE POSTALE VAR PERPETUAL200,0000.08102,688LOUVRE BIDCO SAS 6.50% REGS 30/09/2024100,0000.08104,948ORANO SA 2.75% 08/03/2028100,0000.08104,066PARTS EUROPE SA 6.50% REGS 16/07/2025100,0000.0799,793PICARD GROUPE VAR REGS 30/11/2023100,0000.15196,934QUADIENT SA 2.25% 03/02/2025200,0000.08101,287RCI BANQUE SA VAR 18/02/2030100,0000.08110,097RCI BANQUE SA 0.25% 08/03/2023110,0000.14188,472RENAULT SA 1.125% 04/10/2027200,0000.08101,431RENAULT SA 2.375% 25/05/2026100,0000.08106,518RUBIS TERMINAL INFRA SAS 5.625% REGS
15/05/2025100,000
0.13173,193SOCIETE GENERALE SA FRANCE VAR REGSPERPETUAL
200,000
0.12164,984SOCIETE GENERALE SA FRANCE VAR REGS14/12/2026
200,000
0.07100,364SOCIETE GENERALE SA FRANCE VAR 24/11/2030100,0000.08101,719SPCM SA 2.00% REGS 01/02/2026100,0000.08103,036SPCM SA 2.625% REGS 01/02/2029100,0000.0799,691TELEPERFORMANCE SE 0.25% 26/11/2027100,0000.07100,452UBISOFT ENTERTAINMENT 0.878% 24/11/2027100,0000.0794,350UNIBAIL-RODAMCO SE VAR PERPETUAL100,0000.0799,669UNIBAIL-RODAMCO SE 0.625% 04/05/2027100,0000.07100,812UNIBAIL-RODAMCO SE 1.375% 04/12/2031100,0000.08102,066VEOLIA ENVIRONMENT SA VAR PERPETUAL100,000
Amundi S.F. - Absolute Return Multi-Strategy Control
31/12/20Securities Portfolio as at

35
The accompanying notes form an integral part of these financial statements
% o
f NaV
Market V
alue
Quan
tity
EUR
0.15202,676VEOLIA ENVIRONMENT SA VAR PERPETUAL EUR(ISIN FR00140007L3)
200,000
7.9710,727,658Germany
0.15206,058ALLIANZ SE VAR PERPETUAL EUR (ISINDE000A289FK7)
200,000
0.12167,088ALLIANZ SE VAR REGS PERPETUAL200,0000.08102,832CHEPLAPHARM 4.375% REGS 15/01/2028100,0000.08101,651DEUTSCHE BANK AG VAR 19/11/2025100,0000.08105,154DEUTSCHE BANK AG VAR 19/11/2030100,0000.07100,049DEUTSCHE LUFTHANSA AG 3.00% 29/05/2026100,0003.244,376,697GERMANY BUND 0.25% 15/08/20284,080,0001.471,979,490GERMANY BUND 1.25% 15/08/20481,405,0002.072,784,087GERMANY BUNDI 0.10% 15/04/20232,500,0000.08105,816SCHAEFFLER AG 2.75% 12/10/2025100,0000.08101,804SIXT SE 1.75% 09/12/2024100,0000.10129,769THYSSENKRUPP AG 1.875% 06/03/2023130,0000.11151,173THYSSENKRUPP AG 2.875% 22/02/2024150,0000.08111,015VOLKSWAGEN FINANCIAL SERVICES AG 0.625%
01/04/2022110,000
0.08101,714ZF FINANCE GMBH 2.75% 25/05/2027100,0000.08103,261ZF FINANCE GMBH 3.00% 21/09/2025100,000
0.13173,536Ghana
0.13173,536GHANA 8.125% REGS 26/03/2032200,000
0.11154,660Hong Kong (China)
0.11154,660CNAC HK FIBRIDGE COMPANY LIMITED 3.00%22/09/2030
200,000
0.33444,317Indonesia
0.18242,539INDONESIA 1.40% 30/10/2031235,0000.15201,778PT PERTAMINA 5.625% REGS 20/05/2043200,000
0.30401,231Ireland
0.16200,232FCA BANK S.P.A IRISH BRANCH VAR 17/06/2021200,0000.0799,994FCA BANK S.P.A IRISH BRANCH 0.125%
16/11/2023100,000
0.07101,005FCA BANK S.P.A IRISH BRANCH 0.50% 18/09/2023100,000
0.15205,035Isle of Man
0.08101,717PLAYTECH PLC 3.75% 12/10/2023100,0000.07103,318PLAYTECH PLC 4.25% 07/03/2026100,000
22.2429,964,201Italy
0.13180,302AEROPORTI DI ROMA SPA 5.441% 20/02/2023150,0000.11148,649ATLANTIA S.P.A 1.875% 13/07/2027150,0000.37502,985AUTOSTRADE PER ITALIA SPA 2.00% 04/12/2028500,0000.15195,464BANCA IFIS SPA 1.75% 25/06/2024200,0000.0799,612BANCA MONTE DEI PASCHI DI SIENA 1.875%
09/01/2026100,000
0.15200,646BANCO BPM SPA VAR PERPETUAL200,0000.22298,572BANCO BPM SPA VAR 14/01/2031300,0000.18248,425BANCO BPM SPA 1.625% 18/02/2025250,0000.08113,186BPER BANCA SPA 1.875% 07/07/2025110,0000.07100,319CASSA CENTRALE RAIFFEISEN DELL ALTO
ADIGE SPA 1.00% 01/12/2025100,000
% o
f NaV
Market V
alue
Quan
tity
EUR
0.15199,263CASSA DI RIS ASTI VAR PERPETUAL200,0000.08103,481CENTURION BIDCO SPA 5.875% REGS 30/09/2026100,0000.08111,261FCA BANK SPA 0.50% 13/09/2024110,0000.16213,054FINECOBANK SPA VAR PERPETUAL200,0000.07100,525HERA SPA 0.25% 03/12/2030100,0000.21286,263ICCREA BANCA SPA VAR 28/11/2029300,0000.15203,630ILLIMITY BANK SPA 3.375% 11/12/2023200,0000.09123,373IMMOBILIARE GRANDE DISTRIBUZIONE
SOCIETE 2.125% 28/11/2024130,000
0.11148,463IMMOBILIARE GRANDE DISTRIBUZIONESOCIETE 2.65% 21/04/2022
150,000
0.08102,815INFRASTRUTTURE WIRELESS ITALINAE SPA1.625% 21/10/2028
100,000
0.0793,775INTER MEDIA AND COMMUNICATION S.P.A4.875% REGS 31/12/2022
100,000
0.22300,660INTESA SANPAOLO SPA VAR PERPETUAL EUR(ISIN XS1346815787)
300,000
0.16217,848INTESA SANPAOLO SPA VAR PERPETUAL EUR(ISIN XS1614415542)
200,000
0.18237,570INTESA SANPAOLO SPA VAR PERPETUAL EUR(ISIN XS2124980256)
250,000
0.20266,525INTESA SANPAOLO SPA VAR PERPETUAL EUR(ISIN XS2223762381)
250,000
0.24316,803INTESA SANPAOLO SPA 2.925% 14/10/2030 EUR(ISIN XS2243298069)
300,000
0.16219,476INTESA SANPAOLO VITA S P A VAR PERPETUAL200,0000.15197,794IREN S.P.A 0.25% 17/01/2031200,0005.998,047,680ITALY BTP 0% 30/05/20228,000,0000.16213,038ITALY BTP 1.70% 01/09/2051200,0000.41553,690ITALY BTP 1.80% 01/03/2041500,0002.142,885,095ITALY BTP 2.80% 01/03/20672,147,0001.592,136,000ITALY BTPI 0.10% 15/05/20222,000,0000.23315,547ITALY BTPI 0.10% 15/05/2023300,0000.32429,658ITALY BTPI 0.40% 15/05/2030400,0002.273,044,909ITALY BTPI 0.50% 20/04/20233,000,0000.911,228,022ITALY BTPI 0.55% 21/05/20261,200,0000.31411,550ITALY BTPI 0.65% 28/10/2027400,0000.63847,730ITALY BTPI 1.40% 26/05/2025800,0000.10140,927KEDRION SPA 3.00% 12/07/2022141,0000.08104,077LEONARDO SPA 2.375% 08/01/2026100,0000.0799,735LIMACORPORATE SPA VAR REGS 15/08/2023100,0000.07100,658MEDIOBANCA BANCA DI CREDITO FINANZIARIO
S P A FRN 18/05/2022100,000
0.0334,766OFFICINE MACCAFERRI SPA 0% REGS01/06/2021
100,000
0.0799,933POSTE ITALIANE SPA 0% 10/12/2024100,0000.15205,108PRYSMIAN SPA 2.50% 11/04/2022200,0000.0799,495SNAM SPA 0% 07/12/2028100,0000.07100,847SOFIMA HOLDING SPA VAR REGS 15/01/2028100,0000.08101,427SOFIMA HOLDING SPA 3.75% REGS 15/01/2028100,0000.07100,108TEAMSYSTEM SPA VAR REGS 15/04/2023100,0000.15204,068UNICREDIT SPA VAR PERPETUAL EUR (ISIN
XS1107890847)200,000
0.16218,932UNICREDIT SPA VAR PERPETUAL EUR (ISINXS1539597499)
200,000
0.27359,484UNICREDIT SPA VAR PERPETUAL EUR (ISINXS2121441856)
400,000
Amundi S.F. - Absolute Return Multi-Strategy Control
31/12/20Securities Portfolio as at

36
The accompanying notes form an integral part of these financial statements
% o
f NaV
Market V
alue
Quan
tity
EUR
0.29385,356UNICREDIT SPA VAR REGS 02/04/2034390,0000.13179,427UNICREDIT SPA VAR REGS 30/06/2035200,0000.22292,649UNICREDIT SPA 2.569% REGS 22/09/2026350,0000.16214,176UNIONE DI BANCHE ITALIAN VAR PERPETUAL200,0000.12162,534UNIONE DI BANCHE ITALIAN 0.75% 17/10/2022160,0000.12157,470UNIONE DI BANCHE ITALIAN 1.50% 10/04/2024150,0000.08106,306UNIPOL GRUPPO SPA 3.25% 23/09/2030 EUR
(ISIN XS2237434803)100,000
0.16211,686UNIPOL GRUPPO SPA 3.25% 23/09/2030 EUR(ISIN XS2264177028)
200,000
0.08107,930UNIPOL GRUPPO SPA 3.50% 29/11/2027100,0000.08108,514UNIPOLSAI SPA VAR PERPETUAL100,0000.16217,842UNIPOLSAI SPA VAR PERPETUAL EUR (ISIN
XS2249600771)200,000
0.15207,088WEBUILD SPA 5.875% 15/12/2025200,000
0.08102,957Ivory Coast
0.08102,957IVORY COAST 4.875% REGS 30/01/2032100,000
1.111,492,472Japan
0.17232,231JAPAN JGB 0.10% 20/09/202929,000,0000.47626,914JAPAN JGB 0.40% 20/06/204984,000,0000.08105,870NISSAN MOTOR CO LTD 2.652% REGS 17/03/2026100,0000.08108,665NISSAN MOTOR CO LTD 3.201% REGS 17/09/2028100,0000.13179,842NISSAN MOTOR CO LTD 4.345% REGS 17/09/2027200,0000.18238,950NISSAN MOTOR CO LTD 4.81% REGS 17/09/2030260,000
0.29389,470Jersey
0.09117,131CPUK FINANCE LTD 6.50% 28/08/2026100,0000.08102,336EURO DM SECURITIES 0% 08/04/2021200,0000.12170,003GALAXY PIPELINE ASSETS 2.625% REGS
31/03/2036200,000
1.111,500,246Luxembourg
0.11151,528ARCELORMITTAL SA 1.00% 19/05/2023150,0000.10134,160ARCELORMITTAL SA 1.75% 19/11/2025130,0000.0798,072AROUNDTOWN SA 0% 16/07/2026100,0000.0799,912CNH INDUSTRIAL FINANCE EUROPE S A 0%
01/04/2024100,000
0.0799,790CONTOURGLOBAL POWER HOLDINGS 2.75%REGS 01/01/2026
100,000
0.24306,510CROMWELL EREIT LUX FINCO 2.125% 19/11/2025300,0000.07100,553GARFUNKELUX HOLDCO 3 SA FRN REGS
01/05/2026100,000
0.08102,638GARFUNKELUX HOLDCO 3 SA 6.75% REGS01/11/2025
100,000
0.09115,003GARFUNKELUX HOLDCO 3 SA 7.75% REGS01/11/2025
100,000
0.0798,874GRAND CITY PROPERTIES S A VAR PERPETUAL100,0000.07100,519HOLCIM FINANCE 0.50% 23/04/2031100,0000.0792,687VIVION INVESTMENTS SARL 3.00% 08/08/2024100,000
0.0459,028Malta
0.0459,028VISTAJET MALTA FINANCE PLC 10.50% 144A01/06/2024
70,000
% o
f NaV
Market V
alue
Quan
tity
EUR
0.29386,799Mexico
0.13170,031MEXICO 3.771% 24/05/2061200,0000.12163,011PETROLEOS MEXICANOS PEMEX 5.95%
28/01/2031200,000
0.0453,757PETROLEOS MEXICANOS PEMEX 6.875% REGS16/10/2025
60,000
0.12163,787Morocco
0.12163,787MOROCCO 2.375% REGS 15/12/2027200,000
3.044,089,447Netherlands
0.08103,718ABERTIS INFRSESTRUCTURAS FINANCE BV VARPERPETUAL
100,000
0.13168,676BRASKEM NETHERLANDS 4.50% REGS31/01/2030
200,000
0.33454,842COOPERATIEVE RABOBANK UA 0% 28/10/2026894,0000.07100,842CTP BV 0.625% 27/11/2023100,0000.25331,122EXOR N.V 2.25% 29/04/2030300,0000.08103,095FE NEW NV 1.50% 27/05/2025100,0000.08103,192IBERDROLA INTERNATIONAL BV VAR
PERPETUAL EUR (ISIN XS2244941063)100,000
0.08105,270IBERDROLA INTERNATIONAL BV VARPERPETUAL EUR (ISIN XS2244941147)
100,000
0.22300,105ING GROUP NV VAR 18/02/2029300,0000.08103,241IPD 3 BV 5.50% REGS 01/12/2025100,0000.32441,588NETHERLANDS 0.75% 15/07/2028400,0000.14187,866PETROBRAS GLOBAL FINANCE BV 5.60%
03/01/2031200,000
0.14183,717PPF ARENA 1 BV 2.125% 31/01/2025180,0000.16215,532PPF ARENA 1 BV 3.25% 29/09/2027200,0000.08103,289PROSUS NV 1.539% 03/08/2028100,0000.12160,477PROSUS NV 3.832% REGS 08/02/2051200,0000.07100,965REPSOL INTERNATIONAL FINANCE BV 0.25%
02/08/2027100,000
0.08104,669SAIPEM FINANCE INTERNATIONAL BV 3.375%15/07/2026
100,000
0.0799,871UNITED GROUP B V 4.00% REGS 15/11/2027100,0000.08102,632UPC HOLDINGS BV 3.875% REGS 15/06/2029100,0000.08112,914VOLKSWAGEN FINANCIAL SERVICES NV 1.125%
18/09/2023100,000
0.08103,623VOLKSWAGEN INTERNATIONAL FINANCE NV0.875% 22/09/2028
100,000
0.15199,400VZ VENDOR FINANCING BV 2.875% REGS15/01/2029
200,000
0.0798,801ZF EUROPE FINANCE BV 2.00% 23/02/2026100,000
3.404,580,624New Zealand
0.54733,039NEW ZEALAND 0.25% 15/05/20281,290,0001.572,120,078NEW ZEALAND 2.75% 15/04/20253,275,0001.111,490,988NEW ZEALAND 3.00% 20/04/20292,155,0000.18236,519NZ LOCAL GOVT FUND AGENCY 2.00%
15/04/2037400,000
0.08106,135Norway
0.08106,135NORSK HYDRO ASA 2.00% 11/04/2029100,000
Amundi S.F. - Absolute Return Multi-Strategy Control
31/12/20Securities Portfolio as at

37
The accompanying notes form an integral part of these financial statements
% o
f NaV
Market V
alue
Quan
tity
EUR
0.0344,388Panama
0.0344,388CARNIVAL CORPORATION 7.625% REGS01/03/2026 USD
50,000
0.36485,263Portugal
0.14192,612BANCO COMERCIAL PORTUGUES SA VAR27/03/2030
200,000
0.11150,309REGIAO AUTONOMA DA MADEIRA 1.141%04/12/2034
150,000
0.11142,342TAP TRANSPORTIES AEREOS PORTUGUESESSGPS SA 5.625% REGS 02/12/2024
200,000
0.16212,491Romania
0.0451,014ROMANIA 1.375% REGS 02/12/202950,0000.12161,477ROMANIA 3.375% REGS 28/01/2050140,000
2.533,407,039Spain
0.08102,600ABERTIS INFRAESTRUCTURAS SA 0.625%15/07/2025
100,000
0.15203,702ABERTIS INFRAESTRUCTURAS SA 1.125%26/03/2028
200,000
0.16212,046ABERTIS INFRAESTRUCTURAS SA 1.875%26/03/2032
200,000
0.22299,841BANCO BILBAO VIZCAYA ARGENTARIA SA VAR16/01/2030
300,000
0.15196,874BANCO DE SABADELL SA VAR PERPETUAL EUR(ISIN XS1720572848)
200,000
0.22292,464BANCO DE SABADELL SA VAR 17/01/2030300,0000.32423,664BANCO SANTANDER SA VAR PERPETUAL EUR
(ISIN XS1602466424)400,000
0.08104,779BANCO SANTANDER SA 1.625% 22/10/2030100,0000.17232,466BANCO SANTANDER SA 1.75% 17/02/2027200,0000.15206,472BANKIA S.A. VAR PERPETUAL EUR (ISIN
XS1645651909)200,000
0.16220,464BANKINTER SA VAR PERPETUAL200,0000.15204,842CAIXABANK S.A VAR PERPETUAL200,0000.08102,495CRITERIA CAIXA SA 0.875% 28/10/2027100,0000.15207,000IBERCAJA BANCO SAU VAR PERPETUAL200,0000.0797,045IBERCAJA BANCO SAU VAR 23/07/2030100,0000.15207,106IMMOBILIARIA COLONIAL SOCIMI SA 1.35%
14/10/2028200,000
0.0793,179INTERNATIONAL CONSOLIDATED AIRLINESGROUP SA 0.50% 04/07/2023
100,000
0.48649,843Sweden
0.15200,024HOIST FINANCE AB 3.375% 27/11/2024200,0000.19249,782INTRUM JUSTITIA AB 3.00% REGS 15/09/2027260,0000.07100,358MOLNLYCKE HOLDING AB 0.625% 15/01/2031100,0000.0799,679SAMHALLSBYGGNADSBOLAGET I NORDEN AB
VAR PERPETUAL EUR (ISIN XS2272358024)100,000
0.69923,066Switzerland
0.13173,203CREDIT SUISSE GRP AG VAR REGS PERPETUALUSD (ISIN USH3698DDA93)
200,000
0.44584,708SWITZERLAND 0% 22/06/2029600,0000.12165,155UBS GROUP INC VAR REGS 30/07/2024200,000
% o
f NaV
Market V
alue
Quan
tity
EUR
0.13169,384Ukraine
0.13169,384UKRAINE 7.75% REGS 01/09/2021200,000
2.973,997,201United Kingdom
0.12162,666ASTRAZENECA PLC 0.70% 08/04/2026200,0000.0793,350BARCLAYS BANK PLC LONDON VAR PERPETUAL
EUR100,000
0.17225,807COVENTRY BUILDING SOCIETY 1.00% 21/09/2025200,0000.12167,514HSBC HOLDINGS PLC VAR 22/09/2028200,0000.08102,983INEOS FINANCE PLC 3.375% REGS 31/03/2026100,0000.07100,480INFORMA PLC 1.25% 22/04/2028100,0000.08105,515INFORMA PLC 2.125% 06/10/2025100,0000.16213,169INTERNATIONAL PERSONAL FINANCE PLC 9.75%
12/11/2025220,000
0.11153,239JAGUAR LAND ROVER PLC 4.50% REGS01/10/2027
200,000
0.12165,185JAGUAR LAND ROVER PLC 5.875% REGS15/01/2028
200,000
0.16215,518LLOYDS BANKING GRP PLC VAR PERPETUALEUR
200,000
0.12166,524LLOYDS BANKING GRP PLC VAR 03/12/2035142,0000.08102,680NATIONAL GRID PLC 0.553% 18/09/2029100,0000.08101,071NATIONWIDE BUILDING SOCIETY 0.25%
22/07/2025100,000
0.0798,849PINNACLE BIDCO PLC 5.50% REGS 15/02/2025100,0000.08111,306RAC BOND CO 5.00% REGS 06/11/2022100,0000.08108,006ROLLS ROYCE GROUP PLC 4.625% REGS
16/02/2026100,000
0.13171,185SHAWBROOK GROUP PLC VAR PERPETUAL200,0000.09116,584SMITH AND NEPHEW PLC 2.032% 14/10/2030140,0000.08112,823SOUTHERN GAS NETWORK PLC 1.25%
02/12/2031100,000
0.20256,522STANDARD CHARTERED PLC VAR REGS18/12/2036
300,000
0.15207,422STANDARD CHARTERED PLC VAR 27/01/2028200,0000.08104,940STANDARD CHARTERED PLC 0.90% 02/07/2027100,0000.08113,168THAMES WATER KEMBLE FINANCE PLC 4.625%
19/05/2026100,000
0.15200,958THAMES WATER UTILITIES FINANCE PLC 0.19%23/10/2023
200,000
0.15205,228VMED O2 UK FINANCING I PLC 3.25% REGS31/01/2031
200,000
0.09114,509VMED O2 UK FINANCING I PLC 4.00% REGS31/01/2029
100,000
8.5211,484,712United States of America
0.0685,078AIR LEASE CORP 3.125% 01/12/2030100,0000.08112,314AMERICAN HONDA FINANCE CORP 0.75%
25/11/2026100,000
0.0565,455AMERICAN TOWER CORP 0.60% 15/01/202480,0000.0682,312AMERICAN TOWER CORP 1.50% 31/01/2028100,0000.08102,355AVANTOR FUNDING INC 2.625% REGS 01/11/2025100,0000.0449,390BP CAP MARKETS AMERICA 1.749% 10/08/203060,0000.07100,304CATALENT PHARMA SOLUTIONS INC 2.375%
144A 01/03/2028100,000
0.12165,430CBOE GLOBAL MARKETS INC 1.625% 15/12/2030200,000
Amundi S.F. - Absolute Return Multi-Strategy Control
31/12/20Securities Portfolio as at

38
The accompanying notes form an integral part of these financial statements
% o
f NaV
Market V
alue
Quan
tity
EUR
0.0451,565CHARLES SCHWAB CORP VAR PERPETUAL USD(ISIN US808513BJ38)
60,000
0.0681,701CHARTER COMMUNICATIONS OPERATING LLC/CAPITAL CORP 2.30% 01/02/2032
100,000
0.0797,679CSX CORP 2.50% 15/05/2051120,0000.0791,126CVS HEALTH CORP 1.875% 28/02/2031110,0000.09126,146DEUTSCHE BANK AG NY VAR 18/09/2024150,0000.12167,326DEUTSCHE BANK AG NY VAR 24/11/2026200,0000.0341,007DUKE ENERGY CORP 0.90% 15/09/202550,0000.07100,430ENCORE CAPITAL GROUP INC VAR REGS
15/01/2028100,000
0.08103,520ENCORE CAPITAL GROUP INC 4.875% REGS15/10/2025
100,000
0.17227,054ENCORE CAPITAL GROUP INC 5.375% REGS15/02/2026
200,000
0.17226,870ENERGY TRANSFER OPERATING LP VARPERPETUAL
300,000
0.17234,684ENERGY TRANSFER PARTNERS LP VARPERPETUAL USD (ISIN US29278NAT00)
300,000
0.10136,013EXPEDIA GROUP INC 3.25% 15/02/2030160,0000.08101,135FORD MOTOR CREDIT CO LLC FRN 01/12/2024109,0000.0799,751FORD MOTOR CREDIT CO LLC 1.744% 19/07/2024100,0000.08111,774FORD MOTOR CREDIT CO LLC 2.748% 14/06/2024100,0000.08105,092FORD MOTOR CREDIT CO LLC 3.25% 15/09/2025100,0000.13170,872FORD MOTOR CREDIT CO LLC 4.125% 17/08/2027200,0000.09124,551FRESENIUS MEDICAL CARE 2.375% REGS
16/02/2031150,000
0.11150,435GENERAL MOTORS FINANCIAL CO 0.20%02/09/2022
150,000
0.07100,759GENERAL MOTORS FINANCIAL CO 0.85%26/02/2026
100,000
0.0341,013GILEAD SCIENCES INC 1.65% 01/10/203050,0000.11141,747GOLDMAN SACHS GROUP INC. FRN 27/07/2021141,0000.0341,060GOLDMAN SACHS GROUP INC. VAR 17/11/202350,0000.39516,410INTERNATIONAL BANK FOR RECONSTRUCTION
& DEVELOPMENT IBRD 0% 28/10/20241,000,000
0.18247,410JPMORGAN CHASE & CO VAR 19/11/2031300,0000.0449,015LEVEL 3 FINANCING INC 3.625% REGS
15/01/202960,000
0.0798,903LOWES COMPANIES INC 1.30% 15/04/2028120,0000.0341,584LUMEN TECHNOLOGIES INC 4.50% 144A
15/01/202950,000
0.09115,048MCKESSON CORP 0.90% 03/12/2025140,0000.0790,205MORGAN STANLEY VAR 20/01/2023110,0000.08101,810MORGAN STANLEY VAR 26/10/2029100,0000.0450,668MPT OPERATING PARTNERSHIP LP / MPT
FINANCE CORP 3.50% 15/03/203160,000
0.0565,465NASDAQ INC 0.445% 21/12/202280,0000.18243,080NASDAQ INC 1.65% 15/01/2031300,0000.17234,527NASDAQ INC 2.50% 21/12/2040290,0000.12162,594NESTLE HOLDING INC 0.625% REGS 15/01/2026200,0000.09127,406NRG ENERGY INC 2.00% 144A 02/12/2025150,0000.0675,830NUTRITION BIOSCIENCES 2.30% REGS
01/11/203090,000
0.0798,198ROSS STORES INC 0.875% 15/04/2026120,0000.0342,991T-MOBILE USA INC 2.55% 144A 15/02/203150,0000.0573,296UDR INC REIT 1.90% 15/03/203390,000
% o
f NaV
Market V
alue
Quan
tity
EUR
3.704,964,869USA T-BONDS 2.00% 31/08/20216,000,0000.0680,405VERIZON COMMUNICATIONS INC 1.50%
18/09/2030100,000
0.09122,467VERIZON COMMUNICATIONS INC 1.75%20/01/2031
150,000
0.0681,589VISA INC 0.75% 15/08/2027100,0000.12164,994VOLKSWAGEN GROUP OF AMERICA FINANCE
1.25% 144A 24/11/2025200,000
0.15202,024Convertible bonds0.15202,024Italy
0.08102,261PRYSMIAN SPA 0% 17/01/2022 CV100,0000.0799,763TELECOM ITALIA SPA 1.125% 26/03/2022 CV100,000
1.672,246,427Warrants, Rights1.672,246,427Ireland
1.672,246,427AMUNDI PHYSICAL GOLD ETC36,481
10.8814,657,084Share/Units of UCITS/UCIS
10.8814,657,084Share/Units in investment funds6.538,809,078France
6.168,311,315AMUNDI 3 MI FCP8400.37497,763LYXOR NEW ENERGY (DR) UCITS ETF11,979
0.871,170,212Ireland
0.0345,391INVESCO MARKETS PLC-MORNINGSTAR USENER INFRA MLP UCITS ETF
2,030
0.29389,595ISHARES IV PLC ISHARES AUTOMATION ROBUCITS ETF
40,100
0.55735,226ISHARES SP GLOB.CLEAN ENERGY55,233
0.14187,368Italy
0.0551,405ALPHA IMMOBILIARE SGR690.003,135AMUNDI RE EUROPA (D)570.0231,584AMUNDI RE ITALIA (D)570.0334,008ATLANTIC FONDO COMUNE DI INVESTMENTO
IMMOBILIARE CHUSO183
0.00891QF EUROPA IMMOBILIARE 1360.0229,520QF IMMOBILIUM 2001240.00-QF INVEST REAL SEC650.001,477QF POLIS390.006,158QF VALORE IMM GLOBAL150.0227,189SOCRATE - FONDO DI INVESTIMENTO
IMMOBILIARE DI TIPO159
0.002,001UNICREDITO IMMOBILIARE UNO - A80
1.261,693,892Jersey
0.11145,875ETFS METAL SECURITIES LTD7,2130.0341,900WISDOM TREE COMMODITY SECURITIES
LIMITED ETF EUR5,945
0.13172,609WISDOM TREE COMMODITY SECURITIESLIMITED ETF USD (ISIN GB00B15KXQ89)
6,711
0.24330,318WISDOM TREE COMMODITY SECURITIESLIMITED ETF USD (ISIN GB00B15KXV33)
94,408
0.17227,443WISDOM TREE COMMODITY SECURITIESLIMITED ETF USD (ISIN GB00B15KY211)
17,782
Amundi S.F. - Absolute Return Multi-Strategy Control
31/12/20Securities Portfolio as at

39
The accompanying notes form an integral part of these financial statements
% o
f NaV
Market V
alue
Quan
tity
EUR
0.20272,295WISDOM TREE METAL SECURITIES LIMITED13,5470.16212,969WISDOM TREE METAL SECURITIES LTD1,1660.0221,977WISDOMTREE COMMODITY SECURITIES
LIMITED ETF9,445
0.20268,506WISDOMTREE METAL SECURITIES LIMITED3,256
2.082,796,534Luxembourg
0.14188,525AMUNDI MSCI EUROPE QUALITY FACTOR UCITSETF - EUR (C)
2,296
0.21279,023AMUNDI SMART CITY UCITS ETF (C)4,7550.28383,519AMUNDI SMART FACTORY UCITS ETF - EUR (C)5,4200.29384,786AMUNDI STOXX GLOBAL ARTIFICIAL
INTELLIGENCE UCITS ETF (C)5,727
1.161,560,681MULTI UNITS LUXEMBOURG LYXORCOMMODITIES TR UCITS ETF SICAV
120,983
2.573,460,461Derivative instruments
2.573,460,461Options0.0223,753Australia
0.002,043SPI 200 INDEX - 5,975 - 21.01.21 PUT180.001,896SPI 200 INDEX - 6,275 - 21.01.21 PUT90.002,032SPI 200 INDEX - 6,300 - 21.01.21 PUT90.002,361SPI 200 INDEX - 6,350 - 21.01.21 PUT90.003,321SPI 200 INDEX - 6,450 - 21.01.21 PUT90.013,644SPI 200 INDEX - 6,475 - 21.01.21 PUT90.016,242SPI 200 INDEX - 6,500 - 21.01.21 PUT140.002,214SPI 200 INDEX - 6,750 - 21.01.21 CALL9
0.15205,934Germany
0.00752MSCI WORLD NET TOTAL - 7,000 - 15.01.21 PUT230.001,363MSCI WORLD NET TOTAL - 7,450 - 15.01.21 PUT120.003,534MSCI WORLD NET TOTAL - 7,550 - 15.01.21 PUT23
0.0113,596DJ EURO STOXX 50 EUR - 1,500 - 17.06.22 PUT660.0895,742DJ EURO STOXX 50 EUR - 3,050 - 19.03.21 CALL180.001,188DJ EURO STOXX 50 EUR - 3,125 - 15.01.21 PUT220.002,838DJ EURO STOXX 50 EUR - 3,325 - 15.01.21 PUT220.003,108DJ EURO STOXX 50 EUR - 3,350 - 15.01.21 PUT210.005,424DJ EURO STOXX 50 EUR - 3,425 - 15.01.21 PUT240.0227,764DJ EURO STOXX 50 EUR - 3,625 - 19.02.21 CALL440.018,745DOW JONES EURO STOXX OIL & GAS - 220 -
19.02.21 PUT33
0.0021EURO STOXX 50 DIVID - 120 - 17.12.21 CALL210.0221,063EURO STOXX 50 DIVID - 90 - 16.12.22 CALL170.0057MSCI EM INDEX - 1,130 - 15.01.21 PUT140.0120,138MSCI EM INDEX - 1,130 - 17.12.21 PUT80.00601MSCI EM INDEX - 1,225 - 15.01.21 PUT7
0.0676,775Italy
0.001,575MINI FTSE / MIB INDEX - 16,000 - 19.03.21 PUT100.004,375MINI FTSE / MIB INDEX - 18,500 - 19.03.21 PUT100.0552,100MINI FTSE / MIB INDEX - 20,500 - 19.03.21 CALL100.0118,725MINI FTSE / MIB INDEX - 22,500 - 19.03.21 CALL10
0.0791,541Japan
0.0212,349NIKKEI 225 - 15,000 - 10.06.22 PUT6
% o
f NaV
Market V
alue
Quan
tity
EUR
0.002,422NIKKEI 225 - 20,750 - 12.03.21 PUT60.00285NIKKEI 225 - 22,500 - 12.02.21 PUT10.002,153NIKKEI 225 - 23,875 - 12.02.21 PUT40.00317NIKKEI 225 - 24,375 - 08.01.21 PUT40.00443NIKKEI 225 - 25,125 - 08.01.21 PUT40.00427NIKKEI 225 - 25,500 - 08.01.21 PUT30.005,343NIKKEI 225 - 25,875 - 12.02.21 PUT30.004,473NIKKEI 225 - 27,000 - 08.01.21 CALL10.0220,067NIKKEI 225 - 27,125 - 12.02.21 CALL30.006,016NIKKEI 225 - 27,250 - 08.01.21 CALL20.004,750NIKKEI 225 - 27,375 - 08.01.21 CALL20.003,800NIKKEI 225 - 27,500 - 08.01.21 CALL20.004,631NIKKEI 225 - 27,625 - 08.01.21 CALL30.0322,759NIKKEI 225 - 27,625 - 12.02.21 CALL50.001,306NIKKEI 225 - 31,000 - 12.03.21 CALL3
1.852,489,110Luxembourg
0.0455,615CALL CDX OPTION - ITRAXX EUROPECROSSOVER SERIES 34 INDEX - 250.00 -17.02.21
5,000,000
0.19249,510CALL CDX OPTION - ITRAXX EUROPECROSSOVER SERIES 34 INDEX - 325.00 -20.01.21
6,000,000
0.0120,138CALL CDX OPTION - ITRAXX EUROPE SERIES 34INDEX - 50.00 - 17.02.21
8,000,000
0.00814EXO FX OPTION - PUT EUR / CALL USD - 1.19 -05.02.21
1,500,000
0.00369FX OPTION - CALL EUR / PUT CHF - 1.11 -21.01.21
1,200,000
0.00180FX OPTION - CALL EUR / PUT SEK - 10.60 -21.01.21
1,200,000
0.0112,034FX OPTION - CALL EUR / PUT USD - 1.23 -11.01.21
2,200,000
0.0110,557FX OPTION - CALL EUR / PUT USD - 1.24 -27.01.21
2,200,000
0.0070FX OPTION - CALL USD / PUT CAD - 1.33 -22.01.21
400,000
0.0035FX OPTION - CALL USD / PUT CAD - 1.36 -22.01.21
1,200,000
0.00256FX OPTION - CALL USD / PUT INR - 79.00 -23.02.21
1,500,000
0.0223,511FX OPTION - CALL USD / PUT JPY - 100.00 -24.09.26
500,000
0.0115,707FX OPTION - CALL USD / PUT JPY - 104.00 -07.10.26
500,000
0.0112,048FX OPTION - CALL USD / PUT JPY - 104.50 -14.10.26
400,000
0.0115,448FX OPTION - CALL USD / PUT JPY - 105.00 -24.09.26
500,000
0.0114,112FX OPTION - CALL USD / PUT JPY - 105.25 -15.10.26
500,000
0.0222,070FX OPTION - CALL USD / PUT JPY - 98.00 -14.10.26
400,000
0.0226,531FX OPTION - CALL USD / PUT JPY - 98.50 -15.10.26
500,000
0.0224,013FX OPTION - CALL USD / PUT JPY - 99.00 -07.10.26
500,000
Amundi S.F. - Absolute Return Multi-Strategy Control
31/12/20Securities Portfolio as at

40
The accompanying notes form an integral part of these financial statements
% o
f NaV
Market V
alue
Quan
tity
EUR
0.00270FX OPTION - CALL USD / PUT KRW - 1,125.00 -22.02.21
100,000
0.00912FX OPTION - CALL USD / PUT TWD - 28.90 -26.04.21
1,000,000
0.0070FX OPTION - PUT AUD / CALL JPY - 71.00 -21.01.21
1,800,000
0.00148FX OPTION - PUT AUD / CALL JPY - 73.50 -17.02.21
200,000
0.005,964FX OPTION - PUT EUR / CALL CAD - 1.55 -02.11.21
400,000
0.00172FX OPTION - PUT EUR / CALL CHF - 1.055 -21.01.21
1,200,000
0.0230,279FX OPTION - PUT EUR / CALL CNH - 8.33 -10.02.21
800,000
0.00-FX OPTION - PUT EUR / CALL INR - 84.00 -15.01.21
600,000
0.001FX OPTION - PUT EUR / CALL MXN - 21.00 -18.02.21
600,000
0.001FX OPTION - PUT EUR / CALL MXN - 22.50 -14.01.21
600,000
0.00-FX OPTION - PUT EUR / CALL USD - 1.1025 -12.01.21
1,700,000
0.00-FX OPTION - PUT EUR / CALL USD - 1.105 -12.01.21
1,700,000
0.0081FX OPTION - PUT EUR / CALL USD - 1.14 -18.02.21
900,000
0.002,755FX OPTION - PUT EUR / CALL USD - 1.19 -05.03.21
1,500,000
0.00225FX OPTION - PUT EUR / CALL USD - 1.195 -11.01.21
1,500,000
0.0114,688FX OPTION - PUT USD / CALL INR - 77.30 -24.11.21
500,000
0.0226,209FX OPTION - PUT USD / CALL INR - 82.00 -07.06.22
450,000
0.0222,021FX OPTION - PUT USD / CALL JPY - 102.00 -15.06.21
1,900,000
0.002,272PUT CDX OPTION - CDX NA HY 35 INDEX - 104.00- 20.01.21
2,400,000
0.0230,337PUT CDX OPTION - CDX NA HY 35 INDEX - 105.00- 17.03.21
5,000,000
0.0339,823PUT CDX OPTION - CDX NA HY 35 INDEX - 108.00- 17.02.21
5,000,000
0.0674,408PUT CDX OPTION - CDX NA HY 35 INDEX - 109.00- 17.03.21
5,000,000
0.001,287PUT CDX OPTION - CDX NA IG 35 INDEX - 62.50 -20.01.21
4,500,000
0.0117,373PUT CDX OPTION - ITRAXX EUROPECROSSOVER SERIES 34 INDEX - 287.50 -17.02.21
3,500,000
0.004,849PUT CDX OPTION - ITRAXX EUROPECROSSOVER SERIES 34 INDEX - 325.00 -20.01.21
5,000,000
0.004,359PUT CDX OPTION - ITRAXX EUROPECROSSOVER SERIES 34 INDEX - 350.00 -20.01.21
6,000,000
0.005,763PUT CDX OPTION - ITRAXX EUROPECROSSOVER SERIES 34 INDEX - 387.50 -17.02.21
3,500,000
% o
f NaV
Market V
alue
Quan
tity
EUR
0.00290PUT CDX OPTION - ITRAXX EUROPECROSSOVER SERIES 34 INDEX - 425.00 -20.01.21
700,000
0.001,230PUT CDX OPTION - ITRAXX EUROPECROSSOVER SERIES 34 INDEX - 525.00 -20.01.21
5,000,000
0.019,804PUT CDX OPTION - ITRAXX EUROPE SERIES 34INDEX - 55.00 - 17.03.21
5,000,000
0.003,561PUT CDX OPTION - ITRAXX EUROPE SERIES 34INDEX - 55.00 - 20.01.21
6,000,000
0.004,904PUT CDX OPTION - ITRAXX EUROPE SERIES 34INDEX - 60.00 - 17.02.21
5,000,000
0.001,030PUT CDX OPTION - ITRAXX EUROPE SERIES 34INDEX - 65.00 - 20.01.21
4,000,000
0.00773PUT CDX OPTION - ITRAXX EUROPE SERIES 34INDEX - 85.00 - 20.01.21
6,000,000
0.017,820SWAP OPTION - PAY BBSW 3M / REC 0.300% -19.11.21
3,400,000
0.0111,407SWAP OPTION - PAY BBSW 3M / REC 0.500% -21.11.22
3,400,000
0.0338,020SWAP OPTION - PAY BBSW 3M / REC 1.250% -18.11.25
6,500,000
0.16210,755SWAP OPTION - PAY BBSW 6M / REC 2.900% -25.07.22
6,500,000
0.0221,634SWAP OPTION - PAY EURIBOR 6M / REC -0.120%- 08.08.22
1,000,000
0.0112,234SWAP OPTION - PAY KIKRW 3M / REC 1.250% -16.02.21
2,200,000,000
0.0346,091SWAP OPTION - PAY LIBOR 3M / REC 2.000% -05.12.29
800,000
0.017,248SWAP OPTION - PAY LIBOR 6M / REC 0.000% -14.10.25
164,000,000
0.0340,039SWAP OPTION - PAY LIBOR 6M / REC 0.500% -05.12.29
170,000,000
0.0113,812SWAP OPTION - PAY LIBOR 6M / REC 0.500% -13.11.28
100,000,000
0.0335,779SWAP OPTION - PAY LIBOR 6M / REC 0.600% -29.01.21
2,900,000
0.0120,036SWAP OPTION - PAY STIBOR 3M / REC 0.350% -27.01.23
36,300,000
0.002,379SWAP OPTION - PAY 0.000% / REC EURIBOR 6M -19.11.21
2,700,000
0.0338,693SWAP OPTION - PAY 0.010% / REC EURIBOR 6M -03.11.22
500,000
0.00692SWAP OPTION - PAY -0.300% / REC EURIBOR 6M- 12.08.21
3,400,000
0.002SWAP OPTION - PAY -0.300% / REC EURIBOR 6M- 15.01.21
3,400,000
0.00520SWAP OPTION - PAY -0.300% / REC EURIBOR 6M- 16.07.21
3,400,000
0.001,928SWAP OPTION - PAY 0.500% / REC LIBOR 3M -16.12.21
7,700,000
0.0340,186SWAP OPTION - PAY 0.500% / REC LIBOR 6M -05.12.29
170,000,000
0.0110,130SWAP OPTION - PAY 0.840% / REC LIBOR 6M -12.04.28
325,000,000
0.001,411SWAP OPTION - PAY 0.900% / REC EURIBOR 6M -26.07.21
700,000
0.019,074SWAP OPTION - PAY 1.200% / REC EURIBOR 6M -08.11.22
1,200,000
Amundi S.F. - Absolute Return Multi-Strategy Control
31/12/20Securities Portfolio as at

41
The accompanying notes form an integral part of these financial statements
% o
f NaV
Market V
alue
Quan
tity
EUR
0.0456,018SWAP OPTION - PAY 1.250% / REC BBSW 3M -18.11.25
6,500,000
0.001SWAP OPTION - PAY 1.250% / REC LIBOR 3M -27.08.21
4,000,000
0.0338,382SWAP OPTION - PAY 1.400% / REC EURIBOR 6M -08.02.39
1,000,000
0.001,461SWAP OPTION - PAY 1.500% / REC LIBOR 6M -13.11.28
100,000,000
0.0336,368SWAP OPTION - PAY 1.500% / REC LIBOR 6M -21.04.27
500,000
0.018,863SWAP OPTION - PAY 2.000% / REC EURIBOR 6M -12.04.28
6,000,000
0.0119,777SWAP OPTION - PAY 2.000% / REC EURIBOR 6M -23.02.33
750,000
0.00553SWAP OPTION - PAY 2.000% / REC EURIBOR 6M -31.10.23
2,500,000
0.0233,200SWAP OPTION - PAY 2.000% / REC LIBOR 3M -05.12.29
800,000
0.00584SWAP OPTION - PAY 2.060% / REC STIBOR 3M -14.04.25
42,500,000
0.00985SWAP OPTION - PAY 2.500% / REC LIBOR 3M -12.09.22
1,700,000
0.0110,658SWAP OPTION - PAY 2.750% / REC LIBOR 3M -07.11.22
1,200,000
0.0336,193SWAP OPTION - PAY 2.800% / REC LIBOR 3M -08.02.39
1,300,000
0.001,597SWAP OPTION - PAY 2.900% / REC BBSW 6M -25.07.22
6,500,000
0.019,742SWAP OPTION - PAY 3.060% / REC LIBOR 3M -15.02.23
1,600,000
0.0231,661SWAP OPTION - PAY 3.180% / REC LIBOR 3M -29.10.38
1,400,000
0.00423SWAP OPTION - PAY 3.210% / REC LIBOR 3M -29.11.21
450,000
0.019,501SWAP OPTION - PAY 3.800% / REC LIBOR 3M -26.10.28
1,050,000
0.005,909SWAP OPTION - PAY 4.000% / REC LIBOR 3M -29.01.30
450,000
0.018,490SWAP OPTION - PAY 4.000% / REC LIBOR 3M -30.01.35
450,000
0.002,509SWAP OPTION - PAY 4.500% / REC LIBOR 3M -04.12.29
300,000
0.12165,873SWAP OPTION - REC EURIBOR 6M / PAY 1.000% -31.10.23
2,500,000
0.20255,157SWAP OPTION - REC EURIBOR 6M / PAY 2.000% -12.04.28
6,000,000
0.08111,999SWAP OPTION - REC LIBOR 3M / PAY 3.000% -26.10.28
1,050,000
0.14182,662SWAP OPTION - REC LIBOR 3M / PAY 3.020% -24.01.29
1,700,000
0.0681,777SWAP OPTION - REC LIBOR 6M / PAY 0.840% -12.04.28
325,000,000
0.003,483Sweden
0.003,483OMX 30 - 1,860 - 15.01.21 PUT20
0.0118,406Switzerland
0.001,561SMI (ZURICH) - 10,100 - 15.01.21 PUT80.001,702SMI (ZURICH) - 10,200 - 15.01.21 PUT70.002,189SMI (ZURICH) - 10,250 - 15.01.21 PUT8
% o
f NaV
Market V
alue
Quan
tity
EUR
0.019,135SMI (ZURICH) - 10,750 - 15.01.21 CALL80.003,819SMI (ZURICH) - 9,900 - 19.02.21 PUT7
0.0680,349United Kingdom
0.001,106FOOTSIE 100 - 58 - 15.01.21 PUT110.005,139FOOTSIE 100 - 62 - 15.01.21 PUT100.001,955FOOTSIE 100 - 62 - 15.01.21 PUT70.017,999FOOTSIE 100 - 62 - 19.02.21 PUT80.005,039FOOTSIE 100 - 6,200 - 15.01.21 PUT110.017,061FOOTSIE 100 - 64 - 15.01.21 PUT80.0112,820FOOTSIE 100 - 6,475 - 15.01.21 PUT150.0112,535FOOTSIE 100 - 65 - 15.01.21 CALL110.0226,695FOOTSIE 100 - 68 - 17.12.21 CALL9
0.35471,110United States of America
0.0019210YR US TREASRY NOTE - 135.00 - 19.02.21 PUT30.0080510YR US TREASRY NOTE - 136.00 - 22.01.21 PUT210.004,34210YR US TREASRY NOTE - 136.50 - 19.02.21 PUT200.001,34110YR US TREASRY NOTE - 136.50 - 22.01.21 PUT210.0112,64310YR US TREASRY NOTE - 137.00 - 19.02.21 PUT450.0221,07110YR US TREASRY NOTE - 138.00 - 22.01.21
CALL50
0.0015310YR US TREASRY NOTE - 140.50 - 19.02.21CALL
3
0.0011510YR US TREASRY NOTE - 141.00 - 19.02.21CALL
3
0.004,348CBOE S&P VOL INDEX - 30 - 20.01.21 CALL380.002,873CBOE S&P VOL INDEX - 35 - 20.01.21 CALL380.001,941CBOE S&P VOL INDEX - 40 - 20.01.21 CALL380.0225,369NASDAQ 100 - 12,500 - 31.12.20 CALL10.0057NASDAQ 100 - 13,000 - 31.12.20 CALL10.0675,126RUSSELL 2000 INDEX - 1,750 - 15.01.21 CALL40.0897,489RUSSELL 2000 MINI - 1,680 - 31.12.20 CALL40.00744S&P 500 INDEX - 3,300 - 15.01.21 PUT20.008S&P 500 INDEX - 3,410 - 31.12.20 PUT20.0020S&P 500 INDEX - 3,500 - 30.12.20 PUT50.001,962S&P 500 INDEX - 3,505 - 08.01.21 PUT40.0016S&P 500 INDEX - 3,575 - 31.12.20 PUT40.002,190S&P 500 INDEX - 3,610 - 08.01.21 PUT20.001,197S&P 500 INDEX - 3,620 - 08.01.21 PUT10.006,232S&P 500 INDEX - 3,625 - 08.01.21 PUT50.0228,491S&P 500 INDEX - 3,750 - 19.03.21 CALL30.004,242S&P 500 INDEX - 3,800 - 15.01.21 CALL30.00100S&P 500 INDEX - 3,825 - 04.01.21 CALL70.0029S&P 500 INDEX - 3,825 - 31.12.20 CALL70.001,667S&P 500 INDEX - 3,850 - 15.01.21 CALL30.09102,831S&P 500 INDEX - 3,850 - 17.12.21 CALL60.003,204S&P 500 INDEX - 3,850 - 19.02.21 CALL10.0341,094S&P 500 INDEX - 4,000 - 16.12.22 CALL20.004,086T BOND - 170.00 - 22.01.21 PUT100.0221,646T BOND - 172.00 - 19.02.21 PUT150.00345T BOND - 183.00 - 19.02.21 CALL30.001,047US 5YR T-NOTES - 125.50 - 22.01.21 PUT410.002,094US 5YR T-NOTES - 125.75 - 22.01.21 PUT41
Amundi S.F. - Absolute Return Multi-Strategy Control
31/12/20Securities Portfolio as at

42
The accompanying notes form an integral part of these financial statements
% o
f NaV
Market V
alue
Quan
tity
EUR
-1.32-1,782,990Short positions
-1.32-1,782,990Derivative instruments
-1.32-1,782,990Options0.00-5,786Australia
0.00-931SPI 200 INDEX - 5,900 - 21.01.21 PUT-90.00-988SPI 200 INDEX - 5,950 - 21.01.21 PUT-90.00-1,322SPI 200 INDEX - 6,125 - 21.01.21 PUT-90.00-2,295SPI 200 INDEX - 6,175 - 21.01.21 PUT-140.00-250SPI 200 INDEX - 7,000 - 21.01.21 CALL-9
-0.19-256,469Germany
0.00-2,744DAX INDEX - 10,700 - 19.03.21 PUT-8-0.01-8,224DAX INDEX - 12,400 - 19.03.21 PUT-8-0.02-22,848DAX INDEX - 13,700 - 19.03.21 CALL-80.00-3,400DAX INDEX - 15,000 - 19.03.21 CALL-80.00-1,738DJ EURO STOXX 50 EUR - 2,775 - 19.02.21 PUT-220.00-1,298DJ EURO STOXX 50 EUR - 3,150 - 15.01.21 PUT-220.00-1,365DJ EURO STOXX 50 EUR - 3,175 - 15.01.21 PUT-210.00-2,100DJ EURO STOXX 50 EUR - 3,275 - 15.01.21 PUT-210.00-339DJ EURO STOXX 50 EUR - 3,300 - 15.01.21 PUT-3-0.05-56,142DJ EURO STOXX 50 EUR - 3,300 - 19.03.21 CALL-18-0.05-59,730DJ EURO STOXX 50 EUR - 3,325 - 19.02.21 CALL-220.00-4,455DOW JONES EURO STOXX OIL & GAS - 205 -
19.02.21 PUT-33
0.00-6,105DOW JONES EURO STOXX OIL & GAS - 255 -19.02.21 CALL
-33
-0.01-10,115EURO STOXX 50 DIVID - 100 - 16.12.22 CALL-170.00-2,941EURO STOXX 50 DIVID - 70 - 16.12.22 PUT-17-0.02-24,213EURO STOXX 50 DIVID - 95 - 17.12.21 PUT-21-0.01-15,463MSCI EM INDEX - 1,060 - 17.12.21 PUT-8-0.02-33,249MSCI EM INDEX - 1,300 - 17.12.21 CALL-8
-0.03-35,424Japan
0.00-2,256NIKKEI 225 - 24,500 - 12.02.21 PUT-30.00-6,412NIKKEI 225 - 25,000 - 12.03.21 PUT-3-0.01-9,736NIKKEI 225 - 28,000 - 12.02.21 CALL-3-0.01-8,708NIKKEI 225 - 28,625 - 12.02.21 CALL-5-0.01-8,312NIKKEI 225 - 28,750 - 12.03.21 CALL-3
-0.90-1,212,370Luxembourg
-0.23-293,405CALL CDX OPTION - ITRAXX EUROPECROSSOVER SERIES 34 INDEX - 287.50 -20.01.21
-12,000,000
0.00-518FX OPTION - CALL EUR / PUT CHF - 1.095 -21.01.21
-400,000
0.00-247FX OPTION - CALL EUR / PUT SEK - 10.40 -21.01.21
-400,000
0.00-70FX OPTION - CALL USD / PUT CAD - 1.33 -22.01.21
-400,000
0.00-376FX OPTION - CALL USD / PUT INR - 76.65 -23.02.21
-500,000
-0.01-16,724FX OPTION - CALL USD / PUT JPY - 100.00 -22.09.21
-500,000
% o
f NaV
Market V
alue
Quan
tity
EUR
-0.01-18,506FX OPTION - CALL USD / PUT JPY - 98.00 -14.10.21
-400,000
-0.02-21,536FX OPTION - CALL USD / PUT JPY - 98.50 -14.10.21
-500,000
-0.01-19,898FX OPTION - CALL USD / PUT JPY - 99.00 -07.10.21
-500,000
0.00-116FX OPTION - CALL USD / PUT TWD - 30.10 -26.04.21
-1,000,000
0.00-34FX OPTION - PUT AUD / CALL JPY - 71.50 -17.02.21
-100,000
0.00-100FX OPTION - PUT AUD / CALL JPY - 73.75 -21.01.21
-600,000
0.00-1,032FX OPTION - PUT EUR / CALL CAD - 1.45 -02.11.21
-400,000
0.00-228FX OPTION - PUT EUR / CALL CHF - 1.0675 -21.01.21
-400,000
-0.01-15,104FX OPTION - PUT EUR / CALL CNH - 8.15 -10.02.21
-800,000
0.00-FX OPTION - PUT EUR / CALL INR - 79.00 -15.01.21
-900,000
0.00-FX OPTION - PUT EUR / CALL MXN - 20.00 -18.02.21
-600,000
0.00-FX OPTION - PUT EUR / CALL MXN - 21.00 -14.01.21
-900,000
0.00-1,054FX OPTION - PUT EUR / CALL USD - 1.17 -05.03.21
-1,500,000
0.00-5,579FX OPTION - PUT USD / CALL INR - 74.15 -21.05.21
-500,000
0.00-5,969FX OPTION - PUT USD / CALL INR - 75.00 -07.06.22
-450,000
0.00-4,048FX OPTION - PUT USD / CALL JPY - 95.00 -15.06.21
-1,900,000
-0.01-16,729PUT CDX OPTION - CDX NA HY 35 INDEX - 101.00- 17.03.21
-5,000,000
-0.01-17,710PUT CDX OPTION - CDX NA HY 35 INDEX - 105.00- 17.02.21
-5,000,000
-0.03-45,689PUT CDX OPTION - CDX NA HY 35 INDEX - 107.00- 17.03.21
-5,000,000
0.00-4,314PUT CDX OPTION - ITRAXX EUROPE SERIES 34INDEX - 75.00 - 17.03.21
-5,000,000
0.00-1,643PUT CDX OPTION - ITRAXX EUROPE SERIES 34INDEX - 90.00 - 17.02.21
-5,000,000
-0.02-30,885SWAP OPTION - PAY EURIBOR 6M / REC -0.090%- 03.11.22
-1,500,000
-0.01-8,335SWAP OPTION - PAY EURIBOR 6M / REC 0.300% -08.11.21
-400,000
0.00-518SWAP OPTION - PAY EURIBOR 6M / REC 0.500% -19.11.21
-2,700,000
-0.04-54,063SWAP OPTION - PAY EURIBOR 6M / REC 0.850% -05.12.29
-1,400,000
0.00-2,889SWAP OPTION - PAY EURIBOR 6M / REC 1.500% -08.02.24
-1,000,000
0.00-SWAP OPTION - PAY LIBOR 3M / REC 1.500% -27.08.21
-4,000,000
0.00-SWAP OPTION - PAY LIBOR 3M / REC 1.600% -15.01.21
-3,900,000
-0.01-12,609SWAP OPTION - PAY LIBOR 3M / REC 1.650% -08.11.21
-400,000
0.00-15SWAP OPTION - PAY LIBOR 3M / REC 1.750% -19.11.21
-2,600,000
Amundi S.F. - Absolute Return Multi-Strategy Control
31/12/20Securities Portfolio as at

43
The accompanying notes form an integral part of these financial statements
% o
f NaV
Market V
alue
Quan
tity
EUR
0.00-SWAP OPTION - PAY LIBOR 3M / REC 1.750% -27.08.21
-4,000,000
-0.01-7,687SWAP OPTION - PAY LIBOR 3M / REC 2.900% -08.02.24
-1,300,000
0.00-83SWAP OPTION - PAY LIBOR 3M / REC 3.160% -29.11.21
-2,000,000
-0.01-9,089SWAP OPTION - PAY LIBOR 3M / REC 5.000% -24.01.29
-1,700,000
0.00-2,589SWAP OPTION - PAY LIBOR 3M / REC 6.000% -04.12.29
-600,000
0.00-313SWAP OPTION - PAY LIBOR 6M / REC 0.550% -16.07.21
-2,900,000
0.00-225SWAP OPTION - PAY LIBOR 6M / REC 0.700% -12.08.21
-2,900,000
0.00-2,156SWAP OPTION - PAY 0.150% / REC BBSW 3M -19.11.21
-3,400,000
0.00-805SWAP OPTION - PAY 0.150% / REC BBSW 3M -21.11.22
-3,400,000
-0.02-33,022SWAP OPTION - PAY 0.250% / REC EURIBOR 6M -27.01.23
-250,000
-0.08-95,670SWAP OPTION - PAY 0.400% / REC EURIBOR 6M -26.07.21
-700,000
-0.01-12,623SWAP OPTION - PAY -0.500% / REC EURIBOR 6M- 14.10.25
-1,300,000
-0.01-14,020SWAP OPTION - PAY 0.500% / REC LIBOR 6M -21.04.21
-500,000
-0.01-9,807SWAP OPTION - PAY 0.550% / REC LIBOR 6M -29.01.21
-600,000
-0.01-19,396SWAP OPTION - PAY -0.650% / REC EURIBOR 6M- 07.08.25
-350,000
-0.11-138,478SWAP OPTION - PAY 0.850% / REC EURIBOR 6M -05.12.29
-1,400,000
-0.02-32,670SWAP OPTION - PAY 1.250% / REC LIBOR 3M -16.02.21
-1,900,000
-0.07-84,245SWAP OPTION - PAY 2.000% / REC LIBOR 3M -12.09.22
-1,700,000
0.00-3,210SWAP OPTION - REC LIBOR 3M / PAY 3.330% -15.02.23
-7,000,000
-0.09-105,737SWAP OPTION - REC 0.500% / PAY EURIBOR 6M -31.10.23
-2,500,000
-0.03-40,602SWAP OPTION - REC 1.500% / PAY LIBOR 3M -26.10.28
-1,050,000
0.00-736Sweden
0.00-736OMX 30 - 1,770 - 15.01.21 PUT-20
0.00-3,838Switzerland
0.00-2,285SMI (ZURICH) - 9,500 - 19.02.21 PUT-70.00-732SMI (ZURICH) - 9,600 - 15.01.21 PUT-80.00-821SMI (ZURICH) - 9,700 - 15.01.21 PUT-8
-0.03-34,493United Kingdom
0.00-6,636FOOTSIE 100 - 41 - 17.12.21 PUT-90.00-1,352FOOTSIE 100 - 5,875 - 15.01.21 PUT-110.00-1,564FOOTSIE 100 - 59 - 15.01.21 PUT-100.00-4,067FOOTSIE 100 - 59 - 19.02.21 PUT-80.00-2,592FOOTSIE 100 - 61 - 15.01.21 PUT-8-0.01-7,541FOOTSIE 100 - 6,250 - 15.01.21 PUT-150.00-2,949FOOTSIE 100 - 6,700 - 15.01.21 CALL-11
% o
f NaV
Market V
alue
Quan
tity
EUR
-0.02-7,792FOOTSIE 100 - 75 - 17.12.21 CALL-9
-0.17-233,874United States of America
0.00-2,29910YR US TREASRY NOTE - 134.50 - 19.02.21 PUT-450.00-2,14510YR US TREASRY NOTE - 135.50 - 19.02.21 PUT-210.00-24310YR US TREASRY NOTE - 139.00 - 19.02.21
CALL-1
0.00-14010YR US TREASRY NOTE - 139.50 - 19.02.21CALL
-1
0.00-2,55410YR US TREASRY NOTE - 139.50 - 22.01.21CALL
-50
0.00-776CBOE S&P VOL INDEX - 19 - 20.01.21 PUT-380.00-1,765CBOE S&P VOL INDEX - 21 - 17.02.21 PUT-18-0.01-10,715CBOE S&P VOL INDEX - 22 - 20.01.21 CALL-38-0.03-34,065RUSSELL 2000 INDEX - 1,890 - 15.01.21 CALL-4-0.08-114,036RUSSELL 2000 MINI - 1,800 - 31.12.20 CALL-80.00-1,925S&P 500 INDEX - 1,500 - 16.12.22 PUT-10.00-5,529S&P 500 INDEX - 2,600 - 17.12.21 PUT-10.00-621S&P 500 INDEX - 3,430 - 08.01.21 PUT-20.00-388S&P 500 INDEX - 3,470 - 08.01.21 PUT-10.00-2,064S&P 500 INDEX - 3,480 - 08.01.21 PUT-5-0.01-11,033S&P 500 INDEX - 3,900 - 19.03.21 CALL-3-0.03-34,228S&P 500 INDEX - 4,200 - 17.12.21 CALL-60.00-1,149T BOND - 167.00 - 22.01.21 PUT-10-0.01-7,854T BOND - 168.00 - 19.02.21 PUT-150.00-345T BOND - 179.00 - 19.02.21 CALL-1
88.59119,302,581Total securities portfolio
Amundi S.F. - Absolute Return Multi-Strategy Control
31/12/20Securities Portfolio as at

44
The accompanying notes form an integral part of these financial statements
% o
f NaV
Market V
alue
Quan
tity
EUR
92.5629,105,069Long positions
62.4719,642,984Transferable securities admitted to an official stock exchangelisting and/or dealt in on another regulated market
61.8319,441,180Bonds2.45768,922Australia
0.1959,838AUSTRALIA 1.75% 21/06/2051100,0000.47148,099AUSTRALIA 2.75% 21/05/2041200,0000.81254,871NEW SOUTH WALES TREASURY CRP 1.50%
20/02/2032400,000
0.98306,114QUEENSLAND TREASURY CORP 1.25%10/03/2031
485,000
1.59499,464Austria
0.2165,554AUSTRIA 0.85% 30/06/212050,0001.06334,288AUSTRIA 2.10% 20/09/2117150,0000.3299,622ERSTE GROUP BANK AG VAR 16/11/2028100,000
0.52163,997Canada
0.52163,997CANADIAN IMPERIAL BANK OF COMMERCE0.50% 14/12/2023
200,000
0.61191,778Finland
0.3198,894SBB TREASURY OYJ 0.75% 14/12/2028100,0000.3092,884TVO POWER CO 1.125% 09/03/2026100,000
4.371,373,589France
0.32101,982ALTICE FRANCE SA 4.125% REGS 15/01/2029100,0000.32100,723CASINO GUICHARD PERRACHON SA 6.625%
15/01/2026100,000
0.3299,792CNP ASSURANCES 0.375% 08/03/2028100,0000.33102,703ICADE SANTE SAS 0.875% 04/11/2029100,0000.33104,066PARTS EUROPE SA 6.50% REGS 16/07/2025100,0000.3198,121QUADIENT SA 2.25% 03/02/2025100,0000.32100,877RCI BANQUE SA VAR 18/02/2030100,0000.2269,971RCI BANQUE SA 0.25% 08/03/202370,0000.3093,815RENAULT SA 1.125% 04/10/2027100,0000.32101,181RENAULT SA 2.375% 25/05/2026100,0000.34106,518RUBIS TERMINAL INFRA SAS 5.625% REGS
15/05/2025100,000
0.32100,250SOCIETE GENERALE SA FRANCE VAR 24/11/2030100,0000.3094,047UNIBAIL-RODAMCO SE VAR PERPETUAL100,0000.3299,543UNIBAIL-RODAMCO SE 0.625% 04/05/2027100,000
1.64514,973Germany
0.33102,441CHEPLAPHARM 4.375% REGS 15/01/2028100,0000.32101,634DEUTSCHE BANK AG VAR 19/11/2025100,0000.33105,033DEUTSCHE BANK AG VAR 19/11/2030100,0000.32100,049DEUTSCHE LUFTHANSA AG 3.00% 29/05/2026100,0000.34105,816SCHAEFFLER AG 2.75% 12/10/2025100,000
0.32100,949Ireland
0.32100,949FCA BANK S.P.A IRISH BRANCH 0.50% 18/09/2023100,000
22.287,004,244Italy
0.38119,895AEROPORTI DI ROMA SPA 5.441% 20/02/2023100,000
% o
f NaV
Market V
alue
Quan
tity
EUR
0.47147,783ATLANTIA S.P.A 1.875% 13/07/2027150,0000.64201,194AUTOSTRADE PER ITALIA SPA 2.00% 04/12/2028200,0000.3197,422BANCA IFIS SPA 1.75% 25/06/2024100,0000.63198,600BANCA MONTE DEI PASCHI DI SIENA 1.875%
09/01/2026200,000
0.63198,668BANCO BPM SPA VAR 14/01/2031200,0000.32101,065FCA BANK SPA 0.50% 13/09/2024100,0000.32100,407HERA SPA 0.25% 03/12/2030100,0000.60188,128ICCREA BANCA SPA VAR 28/11/2029200,0000.3198,172IMMOBILIARE GRANDE DISTRIBUZIONE
SOCIETE 2.65% 21/04/2022100,000
0.75236,673INTESA SANPAOLO SPA VAR PERPETUAL EUR(ISIN XS2124980256)
250,000
0.63197,566IREN S.P.A 0.25% 17/01/2031200,0000.82258,118ITALY BTP 1.45% 01/03/2036240,0000.53166,055ITALY BTP 1.80% 01/03/2041150,0001.96617,623ITALY BTP 2.80% 01/03/2067460,0001.00315,429ITALY BTPI 0.10% 15/05/2023300,0001.62507,873ITALY BTPI 0.45% 22/05/2023500,0003.231,014,212ITALY BTPI 0.50% 20/04/20231,000,0000.78246,691ITALY BTPI 0.65% 28/10/2027240,0001.00314,348ITALY BTPI 1.40% 26/05/2025297,0000.45140,927KEDRION SPA 3.00% 12/07/2022141,0000.33104,077LEONARDO SPA 2.375% 08/01/2026100,0000.3299,529LIMACORPORATE SPA VAR REGS 15/08/2023100,0000.1134,766OFFICINE MACCAFERRI SPA 0% REGS
01/06/2021100,000
0.3299,881POSTE ITALIANE SPA 0% 10/12/2024100,0000.33102,554PRYSMIAN SPA 2.50% 11/04/2022100,0000.3299,406SNAM SPA 0% 07/12/2028100,0000.32101,427SOFIMA HOLDING SPA 3.75% REGS 15/01/2028100,0000.57179,742UNICREDIT SPA VAR PERPETUAL EUR (ISIN
XS2121441856)200,000
0.93291,825UNICREDIT SPA 2.569% REGS 22/09/2026350,0000.69217,842UNIPOLSAI SPA VAR PERPETUAL EUR (ISIN
XS2249600771)200,000
0.66206,346WEBUILD SPA 5.875% 15/12/2025200,000
0.68214,286Japan
0.34105,750NISSAN MOTOR CO LTD 2.652% REGS 17/03/2026100,0000.34108,536NISSAN MOTOR CO LTD 3.201% REGS 17/09/2028100,000
0.1651,162Jersey
0.1651,162EURO DM SECURITIES 0% 08/04/2021100,000
2.19689,186Luxembourg
0.3197,997AROUNDTOWN SA 0% 16/07/2026100,0000.3299,556CONTOURGLOBAL POWER HOLDINGS 2.75%
REGS 01/01/2026100,000
0.64200,314GARFUNKELUX HOLDCO 3 SA FRN REGS01/05/2026
200,000
0.3198,642GRAND CITY PROPERTIES S A VAR PERPETUAL100,0000.32100,412HOLCIM FINANCE 0.50% 23/04/2031100,0000.2992,265VIVION INVESTMENTS SARL 3.00% 08/08/2024100,000
Amundi S.F. - Saving Box I
31/12/20Securities Portfolio as at

45
The accompanying notes form an integral part of these financial statements
% o
f NaV
Market V
alue
Quan
tity
EUR
0.1342,163Malta
0.1342,163VISTAJET MALTA FINANCE PLC 10.50% 144A01/06/2024
50,000
3.921,231,349Netherlands
1.78557,669COOPERATIEVE RABOBANK UA 0% 28/10/20261,100,0000.68215,148PPF ARENA 1 BV 3.25% 29/09/2027200,0000.51160,160PROSUS NV 3.832% REGS 08/02/2051200,0000.3299,871UNITED GROUP B V 4.00% REGS 15/11/2027100,0000.3299,700VZ VENDOR FINANCING BV 2.875% REGS
15/01/2029100,000
0.3198,801ZF EUROPE FINANCE BV 2.00% 23/02/2026100,000
0.1444,388Panama
0.1444,388CARNIVAL CORPORATION 7.625% REGS01/03/2026 USD
50,000
0.48149,930Portugal
0.48149,930REGIAO AUTONOMA DA MADEIRA 1.141%04/12/2034
150,000
3.881,218,784Spain
0.33102,392ABERTIS INFRAESTRUCTURAS SA 0.625%15/07/2025
100,000
0.65203,266ABERTIS INFRAESTRUCTURAS SA 1.125%26/03/2028
200,000
0.3299,836BANCO BILBAO VIZCAYA ARGENTARIA SA VAR16/01/2030
100,000
0.62194,028BANCO DE SABADELL SA VAR 17/01/2030200,0000.66211,152BANCO SANTANDER SA VAR PERPETUAL EUR
(ISIN XS1602466424)200,000
0.33104,593BANCO SANTANDER SA 1.625% 22/10/2030100,0000.66206,472BANKIA S.A. VAR PERPETUAL EUR (ISIN
XS1645651909)200,000
0.3197,045IBERCAJA BANCO SAU VAR 23/07/2030100,000
1.18372,312Sweden
0.3299,857HOIST FINANCE AB 3.375% 27/11/2024100,0000.54172,926INTRUM JUSTITIA AB 3.00% REGS 15/09/2027180,0000.3299,529SAMHALLSBYGGNADSBOLAGET I NORDEN AB
VAR PERPETUAL EUR (ISIN XS2272358024)100,000
4.661,466,071United Kingdom
0.34105,371INFORMA PLC 2.125% 06/10/2025100,0000.3196,895INTERNATIONAL PERSONAL FINANCE PLC 9.75%
12/11/2025100,000
0.49153,239JAGUAR LAND ROVER PLC 4.50% REGS01/10/2027
200,000
0.53165,185JAGUAR LAND ROVER PLC 5.875% REGS15/01/2028
200,000
0.33102,528NATIONAL GRID PLC 0.553% 18/09/2029100,0000.3198,849PINNACLE BIDCO PLC 5.50% REGS 15/02/2025100,0000.35111,306RAC BOND CO 5.00% REGS 06/11/2022100,0000.34108,006ROLLS ROYCE GROUP PLC 4.625% REGS
16/02/2026100,000
0.65206,900STANDARD CHARTERED PLC VAR 27/01/2028200,0000.33104,688STANDARD CHARTERED PLC 0.90% 02/07/2027100,000
% o
f NaV
Market V
alue
Quan
tity
EUR
0.36113,063THAMES WATER KEMBLE FINANCE PLC 4.625%19/05/2026
100,000
0.32100,041THAMES WATER UTILITIES FINANCE PLC 0.19%23/10/2023
100,000
10.633,343,633United States of America
0.36112,187AMERICAN HONDA FINANCE CORP 0.75%25/11/2026
100,000
0.53165,194CBOE GLOBAL MARKETS INC 1.625% 15/12/2030200,0000.1651,496CHARLES SCHWAB CORP VAR PERPETUAL USD
(ISIN US808513BJ38)60,000
0.2681,599CHARTER COMMUNICATIONS OPERATING LLC/CAPITAL CORP 2.30% 01/02/2032
100,000
0.3197,470CSX CORP 2.50% 15/05/2051120,0000.1857,901CVS HEALTH CORP 1.875% 28/02/203170,0000.32100,430ENCORE CAPITAL GROUP INC VAR REGS
15/01/2028100,000
0.36113,527ENCORE CAPITAL GROUP INC 5.375% REGS15/02/2026
100,000
0.3093,197EXPEDIA GROUP INC 3.25% 15/02/2030110,0000.3299,330FORD MOTOR CREDIT CO LLC 1.744% 19/07/2024100,0000.36111,774FORD MOTOR CREDIT CO LLC 2.748% 14/06/2024100,0000.33105,092FORD MOTOR CREDIT CO LLC 3.25% 15/09/2025100,0000.32100,718GENERAL MOTORS FINANCIAL CO 0.85%
26/02/2026100,000
0.1340,948GILEAD SCIENCES INC 1.65% 01/10/203050,0000.1341,054GOLDMAN SACHS GROUP INC. VAR 17/11/202350,0001.65516,165INTERNATIONAL BANK FOR RECONSTRUCTION
& DEVELOPMENT IBRD 0% 28/10/20241,000,000
0.52164,716JPMORGAN CHASE & CO VAR 19/11/2031200,0000.1340,846LEVEL 3 FINANCING INC 3.625% REGS
15/01/202950,000
0.1341,584LUMEN TECHNOLOGIES INC 4.50% 144A15/01/2029
50,000
0.37114,984MCKESSON CORP 0.90% 03/12/2025140,0000.32101,671MORGAN STANLEY VAR 26/10/2029100,0000.1650,668MPT OPERATING PARTNERSHIP LP / MPT
FINANCE CORP 3.50% 15/03/203160,000
0.1340,902NASDAQ INC 0.445% 21/12/202250,0000.51161,888NASDAQ INC 1.65% 15/01/2031200,0000.51161,419NASDAQ INC 2.50% 21/12/2040200,0000.2475,630NUTRITION BIOSCIENCES 2.30% REGS
01/11/203090,000
0.3198,068ROSS STORES INC 0.875% 15/04/2026120,0000.1442,928T-MOBILE USA INC 2.55% 144A 15/02/203150,0000.2373,121UDR INC REIT 1.90% 15/03/203390,0000.39122,247VERIZON COMMUNICATIONS INC 1.75%
20/01/2031150,000
0.52164,879VOLKSWAGEN GROUP OF AMERICA FINANCE1.25% 144A 24/11/2025
200,000
0.64201,804Convertible bonds0.64201,804Italy
0.32102,075PRYSMIAN SPA 0% 17/01/2022 CV100,0000.3299,729TELECOM ITALIA SPA 1.125% 26/03/2022 CV100,000
Amundi S.F. - Saving Box I
31/12/20Securities Portfolio as at

46
The accompanying notes form an integral part of these financial statements
% o
f NaV
Market V
alue
Quan
tity
EUR
29.609,306,669Share/Units of UCITS/UCIS
29.609,306,669Share/Units in investment funds4.411,385,219France
4.411,385,219AMUNDI 3 MI FCP140
0.014,212Italy
0.00618QF EUROPA IMMOBILIARE 1250.00-QF INVEST REAL SEC450.00720QF POLIS190.012,874QF VALORE IMM GLOBAL7
0.87275,120Jersey
0.2475,678ETFS METAL SECURITIES LTD3,7420.45141,304WISDMTREE METAL SECURITIES LIMITED9630.1858,138WISDOMTREE METAL SECURITIES LIMITED705
24.317,642,118Luxembourg
5.171,625,314AMUNDI INVESTMENT FUNDS OPTIMISER - M (C)81019.015,976,608AMUNDI S.F. ABSOLUTE RETURN MULTI-
STRATEGY CONTROL - H (C)5,731
0.1340,196MULTI UNITS LUXEMBOURG LYXORCOMMODITIES TR UCITS ETF SICAV
3,116
0.49155,416Derivative instruments
0.49155,416Options0.41129,939Luxembourg
0.0516,684CALL CDX OPTION - ITRAXX EUROPECROSSOVER SERIES 34 INDEX - 250.00 -17.02.21
1,500,000
0.1441,585CALL CDX OPTION - ITRAXX EUROPECROSSOVER SERIES 34 INDEX - 325.00 -20.01.21
1,000,000
0.013,776CALL CDX OPTION - ITRAXX EUROPE SERIES 34INDEX - 50.00 - 17.02.21
1,500,000
0.00379PUT CDX OPTION - CDX NA HY 35 INDEX - 104.00- 20.01.21
400,000
0.027,281PUT CDX OPTION - CDX NA HY 35 INDEX - 105.00- 17.03.21
1,200,000
0.037,965PUT CDX OPTION - CDX NA HY 35 INDEX - 108.00- 17.02.21
1,000,000
0.0617,858PUT CDX OPTION - CDX NA HY 35 INDEX - 109.00- 18.03.21
1,200,000
0.00143PUT CDX OPTION - CDX NA IG 35 INDEX - 62.50 -20.01.21
500,000
0.012,978PUT CDX OPTION - ITRAXX EUROPECROSSOVER SERIES 34 INDEX - 287.50 -17.02.21
600,000
0.00970PUT CDX OPTION - ITRAXX EUROPECROSSOVER SERIES 34 INDEX - 325.00 -20.01.21
1,000,000
0.00726PUT CDX OPTION - ITRAXX EUROPECROSSOVER SERIES 34 INDEX - 350.00 -20.01.21
1,000,000
% o
f NaV
Market V
alue
Quan
tity
EUR
0.00988PUT CDX OPTION - ITRAXX EUROPECROSSOVER SERIES 34 INDEX - 387.50 -17.02.21
600,000
0.00246PUT CDX OPTION - ITRAXX EUROPECROSSOVER SERIES 34 INDEX - 525.00 -20.01.21
1,000,000
0.012,941PUT CDX OPTION - ITRAXX EUROPE SERIES 34INDEX - 55.00 - 17.03.21
1,500,000
0.001,187PUT CDX OPTION - ITRAXX EUROPE SERIES 34INDEX - 55.00 - 20.01.21
2,000,000
0.001,471PUT CDX OPTION - ITRAXX EUROPE SERIES 34INDEX - 60.00 - 17.02.21
1,500,000
0.00103PUT CDX OPTION - ITRAXX EUROPE SERIES 34INDEX - 65.00 - 20.01.21
400,000
0.00258PUT CDX OPTION - ITRAXX EUROPE SERIES 34INDEX - 85.00 - 20.01.21
2,000,000
0.0821,821SWAP OPTION - PAY 1.500% / REC LIBOR 6M -21.04.27
300,000
0.00579SWAP OPTION - PAY 2.500% / REC LIBOR 3M -12.09.22
1,000,000
0.0825,477United States of America
0.025,61910YR US TREASRY NOTE - 137.00 - 19.02.21 PUT200.0412,64310YR US TREASRY NOTE - 138.00 - 22.01.21
CALL30
0.027,215T BOND - 172.00 - 19.02.21 PUT5-0.42-132,349Short positions
-0.42-132,349Derivative instruments
-0.42-132,349Options-0.40-127,177Luxembourg
-0.16-48,901CALL CDX OPTION - ITRAXX EUROPECROSSOVER SERIES 34 INDEX - 287.50 -20.01.21
-2,000,000
-0.01-4,015PUT CDX OPTION - CDX NA HY 35 INDEX - 101.00- 17.03.21
-1,200,000
-0.01-3,542PUT CDX OPTION - CDX NA HY 35 INDEX - 105.00- 17.02.21
-1,000,000
-0.03-10,965PUT CDX OPTION - CDX NA HY 35 INDEX - 107.00- 17.03.21
-1,200,000
0.00-1,294PUT CDX OPTION - ITRAXX EUROPE SERIES 34INDEX - 75.00 - 17.03.21
-1,500,000
0.00-493PUT CDX OPTION - ITRAXX EUROPE SERIES 34INDEX - 90.00 - 17.02.21
-1,500,000
-0.03-8,412SWAP OPTION - PAY 0.500% / REC LIBOR 6M -21.04.21
-300,000
-0.16-49,555SWAP OPTION - PAY 2.000% / REC LIBOR 3M -12.09.22
-1,000,000
-0.02-5,172United States of America
0.00-1,02210YR US TREASRY NOTE - 134.50 - 19.02.21 PUT-200.00-1,53210YR US TREASRY NOTE - 139.50 - 22.01.21
CALL-30
-0.02-2,618T BOND - 168.00 - 19.02.21 PUT-5
92.1428,972,720Total securities portfolio
Amundi S.F. - Saving Box I
31/12/20Securities Portfolio as at

47
The accompanying notes form an integral part of these financial statements
% o
f NaV
Market V
alue
Quan
tity
EUR
90.7662,993,183Long positions
60.3041,857,801Transferable securities admitted to an official stock exchangelisting and/or dealt in on another regulated market
59.7241,454,193Bonds1.841,278,343Australia
0.26179,514AUSTRALIA 1.75% 21/06/2051300,0000.43296,198AUSTRALIA 2.75% 21/05/2041400,0000.64446,025NEW SOUTH WALES TREASURY CRP 1.50%
20/02/2032700,000
0.51356,606QUEENSLAND TREASURY CORP 1.25%10/03/2031
565,000
0.66454,892Austria
0.0965,554AUSTRIA 0.85% 30/06/212050,0000.43289,716AUSTRIA 2.10% 20/09/2117130,0000.1499,622ERSTE GROUP BANK AG VAR 16/11/2028100,000
0.15101,611Belgium
0.15101,611COFINIMMO SA 0.875% 02/12/2030100,000
0.24163,997Canada
0.24163,997CANADIAN IMPERIAL BANK OF COMMERCE0.50% 14/12/2023
200,000
0.19130,906Denmark
0.19130,906DANSKE BANK AS VAR 27/08/2025130,000
0.32219,643Finland
0.1498,894SBB TREASURY OYJ 0.75% 14/12/2028100,0000.18120,749TVO POWER CO 1.125% 09/03/2026130,000
3.202,221,862France
0.15101,982ALTICE FRANCE SA 4.125% REGS 15/01/2029100,0000.28199,012BNP PARIBAS SA 0.125% 04/09/2026200,0000.15100,723CASINO GUICHARD PERRACHON SA 6.625%
15/01/2026100,000
0.1499,792CNP ASSURANCES 0.375% 08/03/2028100,0000.16108,083ELECTRICITE DE FRANCE SA VAR PERPETUAL
EUR (ISIN FR0013367612)100,000
0.15103,361GETLINK SE 3.50% 30/10/2025100,0000.15102,703ICADE SANTE SAS 0.875% 04/11/2029100,0000.15104,066PARTS EUROPE SA 6.50% REGS 16/07/2025100,0000.1498,121QUADIENT SA 2.25% 03/02/2025100,0000.15100,877RCI BANQUE SA VAR 18/02/2030100,0000.16109,955RCI BANQUE SA 0.25% 08/03/2023110,0000.27187,630RENAULT SA 1.125% 04/10/2027200,0000.15101,181RENAULT SA 2.375% 25/05/2026100,0000.15106,518RUBIS TERMINAL INFRA SAS 5.625% REGS
15/05/2025100,000
0.14100,250SOCIETE GENERALE SA FRANCE VAR 24/11/2030100,0000.1494,047UNIBAIL-RODAMCO SE VAR PERPETUAL100,0000.1499,543UNIBAIL-RODAMCO SE 0.625% 04/05/2027100,0000.15101,828VEOLIA ENVIRONMENT SA VAR PERPETUAL100,0000.28202,190VEOLIA ENVIRONMENT SA VAR PERPETUAL EUR
(ISIN FR00140007L3)200,000
% o
f NaV
Market V
alue
Quan
tity
EUR
5.543,854,514Germany
0.15102,441CHEPLAPHARM 4.375% REGS 15/01/2028100,0000.15101,634DEUTSCHE BANK AG VAR 19/11/2025100,0000.15105,033DEUTSCHE BANK AG VAR 19/11/2030100,0000.14100,049DEUTSCHE LUFTHANSA AG 3.00% 29/05/2026100,0004.803,339,541GERMANY BUNDI 0.10% 15/04/20233,000,0000.15105,816SCHAEFFLER AG 2.75% 12/10/2025100,000
0.15100,949Ireland
0.15100,949FCA BANK S.P.A IRISH BRANCH 0.50% 18/09/2023100,000
25.4817,689,776Italy
0.17119,895AEROPORTI DI ROMA SPA 5.441% 20/02/2023100,0000.28197,044ATLANTIA S.P.A 1.875% 13/07/2027200,0000.58402,388AUTOSTRADE PER ITALIA SPA 2.00% 04/12/2028400,0000.22155,875BANCA IFIS SPA 1.75% 25/06/2024160,0000.29198,600BANCA MONTE DEI PASCHI DI SIENA 1.875%
09/01/2026200,000
0.43298,002BANCO BPM SPA VAR 14/01/2031300,0000.36247,815BANCO BPM SPA 1.625% 18/02/2025250,0000.19131,385FCA BANK SPA 0.50% 13/09/2024130,0000.14100,407HERA SPA 0.25% 03/12/2030100,0000.41282,192ICCREA BANCA SPA VAR 28/11/2029300,0000.29203,630ILLIMITY BANK SPA 3.375% 11/12/2023200,0000.28196,344IMMOBILIARE GRANDE DISTRIBUZIONE
SOCIETE 2.65% 21/04/2022200,000
0.15102,661INFRASTRUTTURE WIRELESS ITALINAE SPA1.625% 21/10/2028
100,000
0.34236,673INTESA SANPAOLO SPA VAR PERPETUAL EUR(ISIN XS2124980256)
250,000
0.28197,566IREN S.P.A 0.25% 17/01/2031200,0003.622,514,650ITALY BTP 0% 30/05/20222,500,0000.73505,480ITALY BTP 1.45% 01/03/2036470,0000.48332,109ITALY BTP 1.80% 01/03/2041300,0001.691,174,828ITALY BTP 2.80% 01/03/2067875,0002.311,601,447ITALY BTPI 0.10% 15/05/20221,500,0000.98683,430ITALY BTPI 0.10% 15/05/2023650,0005.864,056,852ITALY BTPI 0.50% 20/04/20234,000,0000.74513,940ITALY BTPI 0.65% 28/10/2027500,0000.91635,047ITALY BTPI 1.40% 26/05/2025600,0000.41281,853KEDRION SPA 3.00% 12/07/2022282,0000.15104,077LEONARDO SPA 2.375% 08/01/2026100,0000.29199,058LIMACORPORATE SPA VAR REGS 15/08/2023200,0000.1069,532OFFICINE MACCAFERRI SPA 0% REGS
01/06/2021200,000
0.1499,881POSTE ITALIANE SPA 0% 10/12/2024100,0000.37256,385PRYSMIAN SPA 2.50% 11/04/2022250,0000.1499,406SNAM SPA 0% 07/12/2028100,0000.15101,427SOFIMA HOLDING SPA 3.75% REGS 15/01/2028100,0000.52359,484UNICREDIT SPA VAR PERPETUAL EUR (ISIN
XS2121441856)400,000
0.42291,825UNICREDIT SPA 2.569% REGS 22/09/2026350,0000.45314,400UNIONE DI BANCHE ITALIAN 1.50% 10/04/2024300,0000.31217,842UNIPOLSAI SPA VAR PERPETUAL EUR (ISIN
XS2249600771)200,000
Amundi S.F. - Saving Box II
31/12/20Securities Portfolio as at

48
The accompanying notes form an integral part of these financial statements
% o
f NaV
Market V
alue
Quan
tity
EUR
0.30206,346WEBUILD SPA 5.875% 15/12/2025200,000
0.31214,286Japan
0.15105,750NISSAN MOTOR CO LTD 2.652% REGS 17/03/2026100,0000.16108,536NISSAN MOTOR CO LTD 3.201% REGS 17/09/2028100,000
0.15102,324Jersey
0.15102,324EURO DM SECURITIES 0% 08/04/2021200,000
0.85589,029Luxembourg
0.1497,997AROUNDTOWN SA 0% 16/07/2026100,0000.1499,556CONTOURGLOBAL POWER HOLDINGS 2.75%
REGS 01/01/2026100,000
0.15100,157GARFUNKELUX HOLDCO 3 SA FRN REGS01/05/2026
100,000
0.1498,642GRAND CITY PROPERTIES S A VAR PERPETUAL100,0000.15100,412HOLCIM FINANCE 0.50% 23/04/2031100,0000.1392,265VIVION INVESTMENTS SARL 3.00% 08/08/2024100,000
0.1284,325Malta
0.1284,325VISTAJET MALTA FINANCE PLC 10.50% 144A01/06/2024
100,000
3.312,297,882Netherlands
1.451,000,255COOPERATIEVE RABOBANK UA 0% 28/10/20261,973,0000.15103,000IBERDROLA INTERNATIONAL BV VAR
PERPETUAL EUR (ISIN XS2244941063)100,000
0.15105,038IBERDROLA INTERNATIONAL BV VARPERPETUAL EUR (ISIN XS2244941147)
100,000
0.29199,818ING GROUP NV VAR 18/02/2029200,0000.15103,241IPD 3 BV 5.50% REGS 01/12/2025100,0000.31215,148PPF ARENA 1 BV 3.25% 29/09/2027200,0000.23160,160PROSUS NV 3.832% REGS 08/02/2051200,0000.1499,871UNITED GROUP B V 4.00% REGS 15/11/2027100,0000.16112,850VOLKSWAGEN FINANCIAL SERVICES NV 1.125%
18/09/2023100,000
0.1499,700VZ VENDOR FINANCING BV 2.875% REGS15/01/2029
100,000
0.1498,801ZF EUROPE FINANCE BV 2.00% 23/02/2026100,000
0.0644,388Panama
0.0644,388CARNIVAL CORPORATION 7.625% REGS01/03/2026 USD
50,000
0.22149,930Portugal
0.22149,930REGIAO AUTONOMA DA MADEIRA 1.141%04/12/2034
150,000
2.521,748,492Spain
0.15102,392ABERTIS INFRAESTRUCTURAS SA 0.625%15/07/2025
100,000
0.29203,266ABERTIS INFRAESTRUCTURAS SA 1.125%26/03/2028
200,000
0.1499,836BANCO BILBAO VIZCAYA ARGENTARIA SA VAR16/01/2030
100,000
0.28196,874BANCO DE SABADELL SA VAR PERPETUAL EUR(ISIN XS1720572848)
200,000
0.28194,028BANCO DE SABADELL SA VAR 17/01/2030200,000
% o
f NaV
Market V
alue
Quan
tity
EUR
0.30211,152BANCO SANTANDER SA VAR PERPETUAL EUR(ISIN XS1602466424)
200,000
0.15104,593BANCO SANTANDER SA 1.625% 22/10/2030100,0000.34232,117BANCO SANTANDER SA 1.75% 17/02/2027200,0000.30206,472BANKIA S.A. VAR PERPETUAL EUR (ISIN
XS1645651909)200,000
0.1497,045IBERCAJA BANCO SAU VAR 23/07/2030100,0000.15100,717UNICAJA BANCO SA VAR 13/11/2029100,000
0.79549,433Sweden
0.1499,857HOIST FINANCE AB 3.375% 27/11/2024100,0000.37249,782INTRUM JUSTITIA AB 3.00% REGS 15/09/2027260,0000.14100,265MOLNLYCKE HOLDING AB 0.625% 15/01/2031100,0000.1499,529SAMHALLSBYGGNADSBOLAGET I NORDEN AB
VAR PERPETUAL EUR (ISIN XS2272358024)100,000
0.25173,203Switzerland
0.25173,203CREDIT SUISSE GRP AG VAR REGS PERPETUALUSD (ISIN USH3698DDA93)
200,000
3.352,323,140United Kingdom
0.24167,297HSBC HOLDINGS PLC VAR 22/09/2028200,0000.30205,966INEOS FINANCE PLC 3.375% REGS 31/03/2026200,0000.15105,371INFORMA PLC 2.125% 06/10/2025100,0000.28193,790INTERNATIONAL PERSONAL FINANCE PLC 9.75%
12/11/2025200,000
0.47329,465JAGUAR LAND ROVER PLC 4.50% REGS01/10/2027
430,000
0.24165,185JAGUAR LAND ROVER PLC 5.875% REGS15/01/2028
200,000
0.15102,528NATIONAL GRID PLC 0.553% 18/09/2029100,0000.1498,849PINNACLE BIDCO PLC 5.50% REGS 15/02/2025100,0000.30211,481RAC BOND CO 5.00% REGS 06/11/2022190,0000.16108,006ROLLS ROYCE GROUP PLC 4.625% REGS
16/02/2026100,000
0.30206,900STANDARD CHARTERED PLC VAR 27/01/2028200,0000.17115,157STANDARD CHARTERED PLC 0.90% 02/07/2027110,0000.16113,063THAMES WATER KEMBLE FINANCE PLC 4.625%
19/05/2026100,000
0.29200,082THAMES WATER UTILITIES FINANCE PLC 0.19%23/10/2023
200,000
10.026,961,268United States of America
0.16112,187AMERICAN HONDA FINANCE CORP 0.75%25/11/2026
100,000
0.14100,304CATALENT PHARMA SOLUTIONS INC 2.375%144A 01/03/2028
100,000
0.24165,193CBOE GLOBAL MARKETS INC 1.625% 15/12/2030200,0000.0751,496CHARLES SCHWAB CORP VAR PERPETUAL USD
(ISIN US808513BJ38)60,000
0.1281,599CHARTER COMMUNICATIONS OPERATING LLC/CAPITAL CORP 2.30% 01/02/2032
100,000
0.1497,470CSX CORP 2.50% 15/05/2051120,0000.0857,901CVS HEALTH CORP 1.875% 28/02/203170,0000.24167,249DEUTSCHE BANK AG NY VAR 24/11/2026200,0000.14100,430ENCORE CAPITAL GROUP INC VAR REGS
15/01/2028100,000
Amundi S.F. - Saving Box II
31/12/20Securities Portfolio as at

49
The accompanying notes form an integral part of these financial statements
% o
f NaV
Market V
alue
Quan
tity
EUR
0.16113,527ENCORE CAPITAL GROUP INC 5.375% REGS15/02/2026
100,000
0.33226,871ENERGY TRANSFER OPERATING LP VARPERPETUAL
300,000
0.34234,685ENERGY TRANSFER PARTNERS LP VARPERPETUAL USD (ISIN US29278NAT00)
300,000
0.1393,197EXPEDIA GROUP INC 3.25% 15/02/2030110,0000.1499,330FORD MOTOR CREDIT CO LLC 1.744% 19/07/2024100,0000.16111,774FORD MOTOR CREDIT CO LLC 2.748% 14/06/2024100,0000.15105,092FORD MOTOR CREDIT CO LLC 3.25% 15/09/2025100,0000.18124,370FRESENIUS MEDICAL CARE 2.375% REGS
16/02/2031150,000
0.22150,359GENERAL MOTORS FINANCIAL CO 0.20%02/09/2022
150,000
0.15100,718GENERAL MOTORS FINANCIAL CO 0.85%26/02/2026
100,000
0.0640,948GILEAD SCIENCES INC 1.65% 01/10/203050,0000.0641,054GOLDMAN SACHS GROUP INC. VAR 17/11/202350,0000.74516,165INTERNATIONAL BANK FOR RECONSTRUCTION
& DEVELOPMENT IBRD 0% 28/10/20241,000,000
0.24164,716JPMORGAN CHASE & CO VAR 19/11/2031200,0000.0640,846LEVEL 3 FINANCING INC 3.625% REGS
15/01/202950,000
0.1498,759LOWES COMPANIES INC 1.30% 15/04/2028120,0000.0641,584LUMEN TECHNOLOGIES INC 4.50% 144A
15/01/202950,000
0.17114,984MCKESSON CORP 0.90% 03/12/2025140,0000.1390,186MORGAN STANLEY VAR 20/01/2023110,0000.15101,671MORGAN STANLEY VAR 26/10/2029100,0000.0750,668MPT OPERATING PARTNERSHIP LP / MPT
FINANCE CORP 3.50% 15/03/203160,000
0.0640,902NASDAQ INC 0.445% 21/12/202250,0000.23161,888NASDAQ INC 1.65% 15/01/2031200,0000.23161,419NASDAQ INC 2.50% 21/12/2040200,0000.1284,690NRG ENERGY INC 2.00% 144A 02/12/2025100,0000.1175,630NUTRITION BIOSCIENCES 2.30% REGS
01/11/203090,000
0.1498,068ROSS STORES INC 0.875% 15/04/2026120,0000.0642,928T-MOBILE USA INC 2.55% 144A 15/02/203150,0000.1173,121UDR INC REIT 1.90% 15/03/203390,0003.252,259,942USA T-BONDSI 0.50% 15/04/20242,500,0000.1280,221VERIZON COMMUNICATIONS INC 1.50%
18/09/2030100,000
0.18122,247VERIZON COMMUNICATIONS INC 1.75%20/01/2031
150,000
0.24164,879VOLKSWAGEN GROUP OF AMERICA FINANCE1.25% 144A 24/11/2025
200,000
0.58403,608Convertible bonds0.58403,608Italy
0.29204,150PRYSMIAN SPA 0% 17/01/2022 CV200,0000.29199,458TELECOM ITALIA SPA 1.125% 26/03/2022 CV200,000
% o
f NaV
Market V
alue
Quan
tity
EUR
29.9920,812,459Share/Units of UCITS/UCIS
29.9920,812,459Share/Units in investment funds4.703,265,160France
4.703,265,160AMUNDI 3 MI FCP330
0.018,475Italy
0.001,212QF EUROPA IMMOBILIARE 1490.00-QF INVEST REAL SEC900.001,515QF POLIS400.015,748QF VALORE IMM GLOBAL14
0.82568,248Jersey
0.22155,684ETFS METAL SECURITIES LTD7,6980.38256,782ETFS PHYSICAL GOLD1,7500.0537,857WISDMTREE METAL SECURITIES LIMITED2580.17117,925WISDOMTREE METAL SECURITIES LIMITED1,430
24.4616,970,576Luxembourg
5.313,686,051AMUNDI INVESTMENT FUNDS OPTIMISER - M (C)1,83719.0313,201,243AMUNDI S.F. ABSOLUTE RETURN MULTI-
STRATEGY CONTROL - H (C)12,660
0.1283,282MULTI UNITS LUXEMBOURG LYXORCOMMODITIES TR UCITS ETF SICAV
6,456
0.47322,923Derivative instruments
0.47322,923Options0.39270,565Luxembourg
0.0533,369CALL CDX OPTION - ITRAXX EUROPECROSSOVER SERIES 34 INDEX - 250.00 -17.02.21
3,000,000
0.1383,170CALL CDX OPTION - ITRAXX EUROPECROSSOVER SERIES 34 INDEX - 325.00 -20.01.21
2,000,000
0.0110,069CALL CDX OPTION - ITRAXX EUROPE SERIES 34INDEX - 50.00 - 17.02.21
4,000,000
0.00663PUT CDX OPTION - CDX NA HY 35 INDEX - 104.00- 20.01.21
700,000
0.0215,169PUT CDX OPTION - CDX NA HY 35 INDEX - 105.00- 17.03.21
2,500,000
0.0319,911PUT CDX OPTION - CDX NA HY 35 INDEX - 108.00- 17.02.21
2,500,000
0.0637,204PUT CDX OPTION - CDX NA HY 35 INDEX - 109.00- 17.03.21
2,500,000
0.00315PUT CDX OPTION - CDX NA IG 35 INDEX - 62.50 -20.01.21
1,100,000
0.016,453PUT CDX OPTION - ITRAXX EUROPECROSSOVER SERIES 34 INDEX - 287.50 -17.02.21
1,300,000
0.002,424PUT CDX OPTION - ITRAXX EUROPECROSSOVER SERIES 34 INDEX - 325.00 -20.01.21
2,500,000
0.001,453PUT CDX OPTION - ITRAXX EUROPECROSSOVER SERIES 34 INDEX - 350.00 -20.01.21
2,000,000
Amundi S.F. - Saving Box II
31/12/20Securities Portfolio as at

50
The accompanying notes form an integral part of these financial statements
% o
f NaV
Market V
alue
Quan
tity
EUR
0.002,141PUT CDX OPTION - ITRAXX EUROPECROSSOVER SERIES 34 INDEX - 387.50 -17.02.21
1,300,000
0.00615PUT CDX OPTION - ITRAXX EUROPECROSSOVER SERIES 34 INDEX - 525.00 -20.01.21
2,500,000
0.015,882PUT CDX OPTION - ITRAXX EUROPE SERIES 34INDEX - 55.00 - 17.03.21
3,000,000
0.002,968PUT CDX OPTION - ITRAXX EUROPE SERIES 34INDEX - 55.00 - 20.01.21
5,000,000
0.002,942PUT CDX OPTION - ITRAXX EUROPE SERIES 34INDEX - 60.00 - 17.02.21
3,000,000
0.00257PUT CDX OPTION - ITRAXX EUROPE SERIES 34INDEX - 65.00 - 20.01.21
1,000,000
0.00645PUT CDX OPTION - ITRAXX EUROPE SERIES 34INDEX - 85.00 - 20.01.21
5,000,000
0.0743,641SWAP OPTION - PAY 1.500% / REC LIBOR 6M -21.04.27
600,000
0.001,274SWAP OPTION - PAY 2.500% / REC LIBOR 3M -12.09.22
2,200,000
0.0852,358United States of America
0.0212,64310YR US TREASRY NOTE - 137.00 - 19.02.21 PUT450.0425,28510YR US TREASRY NOTE - 138.00 - 22.01.21
CALL60
0.0214,430T BOND - 172.00 - 19.02.21 PUT10-0.40-277,885Short positions
-0.40-277,885Derivative instruments
-0.40-277,885Options-0.38-267,286Luxembourg
-0.14-97,801CALL CDX OPTION - ITRAXX EUROPECROSSOVER SERIES 34 INDEX - 287.50 -20.01.21
-4,000,000
-0.01-8,364PUT CDX OPTION - CDX NA HY 35 INDEX - 101.00- 17.03.21
-2,500,000
-0.01-8,855PUT CDX OPTION - CDX NA HY 35 INDEX - 105.00- 17.02.21
-2,500,000
-0.03-22,845PUT CDX OPTION - CDX NA HY 35 INDEX - 107.00- 17.03.21
-2,500,000
0.00-2,588PUT CDX OPTION - ITRAXX EUROPE SERIES 34INDEX - 75.00 - 17.03.21
-3,000,000
0.00-986PUT CDX OPTION - ITRAXX EUROPE SERIES 34INDEX - 90.00 - 17.02.21
-3,000,000
-0.02-16,824SWAP OPTION - PAY 0.500% / REC LIBOR 6M -21.04.21
-600,000
-0.17-109,023SWAP OPTION - PAY 2.000% / REC LIBOR 3M -12.09.22
-2,200,000
-0.02-10,599United States of America
0.00-2,29910YR US TREASRY NOTE - 134.50 - 19.02.21 PUT-450.00-3,06510YR US TREASRY NOTE - 139.50 - 22.01.21
CALL-60
-0.02-5,235T BOND - 168.00 - 19.02.21 PUT-10
90.3662,715,298Total securities portfolio
Amundi S.F. - Saving Box II
31/12/20Securities Portfolio as at

51
The accompanying notes form an integral part of these financial statements
% o
f NaV
Market V
alue
Quan
tity
EUR
89.6326,206,827Long positions
59.8717,504,312Transferable securities admitted to an official stock exchangelisting and/or dealt in on another regulated market
59.1817,302,508Bonds1.71501,339Australia
0.2059,838AUSTRALIA 1.75% 21/06/2051100,0000.51148,099AUSTRALIA 2.75% 21/05/2041200,0000.65191,154NEW SOUTH WALES TREASURY CRP 1.50%
20/02/2032300,000
0.35102,248QUEENSLAND TREASURY CORP 1.25%10/03/2031
162,000
0.95276,605Austria
0.2265,554AUSTRIA 0.85% 30/06/212050,0000.39111,429AUSTRIA 2.10% 20/09/211750,0000.3499,622ERSTE GROUP BANK AG VAR 16/11/2028100,000
0.56163,997Canada
0.56163,997CANADIAN IMPERIAL BANK OF COMMERCE0.50% 14/12/2023
200,000
0.66191,778Finland
0.3498,894SBB TREASURY OYJ 0.75% 14/12/2028100,0000.3292,884TVO POWER CO 1.125% 09/03/2026100,000
4.701,373,589France
0.35101,982ALTICE FRANCE SA 4.125% REGS 15/01/2029100,0000.34100,723CASINO GUICHARD PERRACHON SA 6.625%
15/01/2026100,000
0.3499,792CNP ASSURANCES 0.375% 08/03/2028100,0000.35102,703ICADE SANTE SAS 0.875% 04/11/2029100,0000.36104,066PARTS EUROPE SA 6.50% REGS 16/07/2025100,0000.3498,121QUADIENT SA 2.25% 03/02/2025100,0000.34100,877RCI BANQUE SA VAR 18/02/2030100,0000.2469,971RCI BANQUE SA 0.25% 08/03/202370,0000.3293,815RENAULT SA 1.125% 04/10/2027100,0000.35101,181RENAULT SA 2.375% 25/05/2026100,0000.37106,518RUBIS TERMINAL INFRA SAS 5.625% REGS
15/05/2025100,000
0.34100,250SOCIETE GENERALE SA FRANCE VAR 24/11/2030100,0000.3294,047UNIBAIL-RODAMCO SE VAR PERPETUAL100,0000.3499,543UNIBAIL-RODAMCO SE 0.625% 04/05/2027100,000
1.76514,973Germany
0.35102,441CHEPLAPHARM 4.375% REGS 15/01/2028100,0000.35101,634DEUTSCHE BANK AG VAR 19/11/2025100,0000.36105,033DEUTSCHE BANK AG VAR 19/11/2030100,0000.34100,049DEUTSCHE LUFTHANSA AG 3.00% 29/05/2026100,0000.36105,816SCHAEFFLER AG 2.75% 12/10/2025100,000
0.35100,949Ireland
0.35100,949FCA BANK S.P.A IRISH BRANCH 0.50% 18/09/2023100,000
19.595,724,194Italy
0.2159,948AEROPORTI DI ROMA SPA 5.441% 20/02/202350,000
% o
f NaV
Market V
alue
Quan
tity
EUR
0.3498,522ATLANTIA S.P.A 1.875% 13/07/2027100,0000.69201,194AUTOSTRADE PER ITALIA SPA 2.00% 04/12/2028200,0000.3397,422BANCA IFIS SPA 1.75% 25/06/2024100,0000.3499,300BANCA MONTE DEI PASCHI DI SIENA 1.875%
09/01/2026100,000
0.68198,668BANCO BPM SPA VAR 14/01/2031200,0000.35101,065FCA BANK SPA 0.50% 13/09/2024100,0000.34100,407HERA SPA 0.25% 03/12/2030100,0000.64188,128ICCREA BANCA SPA VAR 28/11/2029200,0000.3498,172IMMOBILIARE GRANDE DISTRIBUZIONE
SOCIETE 2.65% 21/04/2022100,000
0.81236,673INTESA SANPAOLO SPA VAR PERPETUAL EUR(ISIN XS2124980256)
250,000
0.68197,566IREN S.P.A 0.25% 17/01/2031200,0000.59172,078ITALY BTP 1.45% 01/03/2036160,0000.57166,055ITALY BTP 1.80% 01/03/2041150,0001.43417,567ITALY BTP 2.80% 01/03/2067311,0000.90262,858ITALY BTPI 0.10% 15/05/2023250,0002.78812,595ITALY BTPI 0.45% 22/05/2023800,0001.04304,264ITALY BTPI 0.50% 20/04/2023300,0000.84246,691ITALY BTPI 0.65% 28/10/2027240,0000.77224,383ITALY BTPI 1.40% 26/05/2025212,0000.36105,945KEDRION SPA 3.00% 12/07/2022106,0000.36104,077LEONARDO SPA 2.375% 08/01/2026100,0000.1234,766OFFICINE MACCAFERRI SPA 0% REGS
01/06/2021100,000
0.3499,881POSTE ITALIANE SPA 0% 10/12/2024100,0000.35102,554PRYSMIAN SPA 2.50% 11/04/2022100,0000.3499,406SNAM SPA 0% 07/12/2028100,0000.35101,427SOFIMA HOLDING SPA 3.75% REGS 15/01/2028100,0000.61179,742UNICREDIT SPA VAR PERPETUAL EUR (ISIN
XS2121441856)200,000
1.00291,825UNICREDIT SPA 2.569% REGS 22/09/2026350,0000.74217,842UNIPOLSAI SPA VAR PERPETUAL EUR (ISIN
XS2249600771)200,000
0.35103,173WEBUILD SPA 5.875% 15/12/2025100,000
0.73214,286Japan
0.36105,750NISSAN MOTOR CO LTD 2.652% REGS 17/03/2026100,0000.37108,536NISSAN MOTOR CO LTD 3.201% REGS 17/09/2028100,000
2.01589,029Luxembourg
0.3497,997AROUNDTOWN SA 0% 16/07/2026100,0000.3499,556CONTOURGLOBAL POWER HOLDINGS 2.75%
REGS 01/01/2026100,000
0.34100,157GARFUNKELUX HOLDCO 3 SA FRN REGS01/05/2026
100,000
0.3498,642GRAND CITY PROPERTIES S A VAR PERPETUAL100,0000.33100,412HOLCIM FINANCE 0.50% 23/04/2031100,0000.3292,265VIVION INVESTMENTS SARL 3.00% 08/08/2024100,000
0.1442,163Malta
0.1442,163VISTAJET MALTA FINANCE PLC 10.50% 144A01/06/2024
50,000
3.34977,863Netherlands
1.03304,183COOPERATIEVE RABOBANK UA 0% 28/10/2026600,000
Amundi S.F. - Saving Box III
31/12/20Securities Portfolio as at

52
The accompanying notes form an integral part of these financial statements
% o
f NaV
Market V
alue
Quan
tity
EUR
0.74215,148PPF ARENA 1 BV 3.25% 29/09/2027200,0000.55160,160PROSUS NV 3.832% REGS 08/02/2051200,0000.3499,871UNITED GROUP B V 4.00% REGS 15/11/2027100,0000.3499,700VZ VENDOR FINANCING BV 2.875% REGS
15/01/2029100,000
0.3498,801ZF EUROPE FINANCE BV 2.00% 23/02/2026100,000
0.1544,388Panama
0.1544,388CARNIVAL CORPORATION 7.625% REGS01/03/2026 USD
50,000
0.51149,930Portugal
0.51149,930REGIAO AUTONOMA DA MADEIRA 1.141%04/12/2034
150,000
4.511,319,501Spain
0.35102,392ABERTIS INFRAESTRUCTURAS SA 0.625%15/07/2025
100,000
0.70203,266ABERTIS INFRAESTRUCTURAS SA 1.125%26/03/2028
200,000
0.3499,836BANCO BILBAO VIZCAYA ARGENTARIA SA VAR16/01/2030
100,000
0.66194,028BANCO DE SABADELL SA VAR 17/01/2030200,0000.72211,152BANCO SANTANDER SA VAR PERPETUAL EUR
(ISIN XS1602466424)200,000
0.36104,593BANCO SANTANDER SA 1.625% 22/10/2030100,0000.71206,472BANKIA S.A. VAR PERPETUAL EUR (ISIN
XS1645651909)200,000
0.3397,045IBERCAJA BANCO SAU VAR 23/07/2030100,0000.34100,717UNICAJA BANCO SA VAR 13/11/2029100,000
1.61472,169Sweden
0.68199,714HOIST FINANCE AB 3.375% 27/11/2024200,0000.59172,926INTRUM JUSTITIA AB 3.00% REGS 15/09/2027180,0000.3499,529SAMHALLSBYGGNADSBOLAGET I NORDEN AB
VAR PERPETUAL EUR (ISIN XS2272358024)100,000
5.361,566,331United Kingdom
0.34100,259INFORMA PLC 1.25% 22/04/2028100,0000.36105,371INFORMA PLC 2.125% 06/10/2025100,0000.3396,895INTERNATIONAL PERSONAL FINANCE PLC 9.75%
12/11/2025100,000
0.52153,239JAGUAR LAND ROVER PLC 4.50% REGS01/10/2027
200,000
0.56165,186JAGUAR LAND ROVER PLC 5.875% REGS15/01/2028
200,000
0.35102,528NATIONAL GRID PLC 0.553% 18/09/2029100,0000.3498,849PINNACLE BIDCO PLC 5.50% REGS 15/02/2025100,0000.38111,306RAC BOND CO 5.00% REGS 06/11/2022100,0000.37108,006ROLLS ROYCE GROUP PLC 4.625% REGS
16/02/2026100,000
0.72206,900STANDARD CHARTERED PLC VAR 27/01/2028200,0000.36104,688STANDARD CHARTERED PLC 0.90% 02/07/2027100,0000.39113,063THAMES WATER KEMBLE FINANCE PLC 4.625%
19/05/2026100,000
0.34100,041THAMES WATER UTILITIES FINANCE PLC 0.19%23/10/2023
100,000
% o
f NaV
Market V
alue
Quan
tity
EUR
10.543,079,424United States of America
0.38112,187AMERICAN HONDA FINANCE CORP 0.75%25/11/2026
100,000
0.57165,194CBOE GLOBAL MARKETS INC 1.625% 15/12/2030200,0000.1851,496CHARLES SCHWAB CORP VAR PERPETUAL USD
(ISIN US808513BJ38)60,000
0.2881,599CHARTER COMMUNICATIONS OPERATING LLC/CAPITAL CORP 2.30% 01/02/2032
100,000
0.3397,470CSX CORP 2.50% 15/05/2051120,0000.2057,901CVS HEALTH CORP 1.875% 28/02/203170,0000.34100,430ENCORE CAPITAL GROUP INC VAR REGS
15/01/2028100,000
0.39113,527ENCORE CAPITAL GROUP INC 5.375% REGS15/02/2026
100,000
0.3293,197EXPEDIA GROUP INC 3.25% 15/02/2030110,0000.38111,774FORD MOTOR CREDIT CO LLC 2.748% 14/06/2024100,0000.36105,092FORD MOTOR CREDIT CO LLC 3.25% 15/09/2025100,0000.34100,718GENERAL MOTORS FINANCIAL CO 0.85%
26/02/2026100,000
0.1440,948GILEAD SCIENCES INC 1.65% 01/10/203050,0000.1441,054GOLDMAN SACHS GROUP INC. VAR 17/11/202350,0001.78516,165INTERNATIONAL BANK FOR RECONSTRUCTION
& DEVELOPMENT IBRD 0% 28/10/20241,000,000
0.56164,716JPMORGAN CHASE & CO VAR 19/11/2031200,0000.1440,846LEVEL 3 FINANCING INC 3.625% REGS
15/01/202950,000
0.1441,584LUMEN TECHNOLOGIES INC 4.50% 144A15/01/2029
50,000
0.39114,984MCKESSON CORP 0.90% 03/12/2025140,0000.35101,671MORGAN STANLEY VAR 26/10/2029100,0000.1750,668MPT OPERATING PARTNERSHIP LP / MPT
FINANCE CORP 3.50% 15/03/203160,000
0.1440,902NASDAQ INC 0.445% 21/12/202250,0000.55161,888NASDAQ INC 1.65% 15/01/2031200,0000.55161,419NASDAQ INC 2.50% 21/12/2040200,0000.2675,630NUTRITION BIOSCIENCES 2.30% REGS
01/11/203090,000
0.3498,068ROSS STORES INC 0.875% 15/04/2026120,0000.1542,928T-MOBILE USA INC 2.55% 144A 15/02/203150,0000.2573,121UDR INC REIT 1.90% 15/03/203390,0000.42122,247VERIZON COMMUNICATIONS INC 1.75%
20/01/2031150,000
0.69201,804Convertible bonds0.69201,804Italy
0.35102,075PRYSMIAN SPA 0% 17/01/2022 CV100,0000.3499,729TELECOM ITALIA SPA 1.125% 26/03/2022 CV100,000
29.308,566,875Share/Units of UCITS/UCIS
29.308,566,875Share/Units in investment funds4.401,286,275France
4.401,286,275AMUNDI 3 MI FCP130
0.012,468Italy
0.00371QF EUROPA IMMOBILIARE 115
Amundi S.F. - Saving Box III
31/12/20Securities Portfolio as at

53
The accompanying notes form an integral part of these financial statements
% o
f NaV
Market V
alue
Quan
tity
EUR
0.00-QF INVEST REAL SEC270.00455QF POLIS120.011,642QF VALORE IMM GLOBAL4
0.69200,961Jersey
0.1954,402ETFS METAL SECURITIES LTD2,6900.1543,726ETFS PHYSICAL GOLD2980.2161,188WISDMTREE METAL SECURITIES LIMITED4170.1441,645WISDOMTREE METAL SECURITIES LIMITED505
24.207,077,171Luxembourg
5.241,533,012AMUNDI INVESTMENT FUNDS OPTIMISER - M (C)76418.865,515,263AMUNDI S.F. ABSOLUTE RETURN MULTI-
STRATEGY CONTROL - H (C)5,289
0.1028,896MULTI UNITS LUXEMBOURG LYXORCOMMODITIES TR UCITS ETF SICAV
2,240
0.46135,640Derivative instruments
0.46135,640Options0.38112,832Luxembourg
0.0514,460CALL CDX OPTION - ITRAXX EUROPECROSSOVER SERIES 34 INDEX - 250.00 -17.02.21
1,300,000
0.1233,268CALL CDX OPTION - ITRAXX EUROPECROSSOVER SERIES 34 INDEX - 325.00 -20.01.21
800,000
0.024,531CALL CDX OPTION - ITRAXX EUROPE SERIES 34INDEX - 50.00 - 17.02.21
1,800,000
0.00379PUT CDX OPTION - CDX NA HY 35 INDEX - 104.00- 20.01.21
400,000
0.027,281PUT CDX OPTION - CDX NA HY 35 INDEX - 105.00- 17.03.21
1,200,000
0.037,965PUT CDX OPTION - CDX NA HY 35 INDEX - 108.00- 17.02.21
1,000,000
0.0617,858PUT CDX OPTION - CDX NA HY 35 INDEX - 109.00- 17.03.21
1,200,000
0.00143PUT CDX OPTION - CDX NA IG 35 INDEX - 62.50 -20.01.21
500,000
0.012,978PUT CDX OPTION - ITRAXX EUROPECROSSOVER SERIES 34 INDEX - 287.50 -17.02.21
600,000
0.001,164PUT CDX OPTION - ITRAXX EUROPECROSSOVER SERIES 34 INDEX - 325.00 -20.01.21
1,200,000
0.00581PUT CDX OPTION - ITRAXX EUROPECROSSOVER SERIES 34 INDEX - 350.00 -20.01.21
800,000
0.00988PUT CDX OPTION - ITRAXX EUROPECROSSOVER SERIES 34 INDEX - 387.50 -17.02.21
600,000
0.00295PUT CDX OPTION - ITRAXX EUROPECROSSOVER SERIES 34 INDEX - 525.00 -20.01.21
1,200,000
0.012,941PUT CDX OPTION - ITRAXX EUROPE SERIES 34INDEX - 55.00 - 17.03.21
1,500,000
0.001,187PUT CDX OPTION - ITRAXX EUROPE SERIES 34INDEX - 55.00 - 20.01.21
2,000,000
% o
f NaV
Market V
alue
Quan
tity
EUR
0.011,471PUT CDX OPTION - ITRAXX EUROPE SERIES 34INDEX - 60.00 - 17.02.21
1,500,000
0.00103PUT CDX OPTION - ITRAXX EUROPE SERIES 34INDEX - 65.00 - 20.01.21
400,000
0.00258PUT CDX OPTION - ITRAXX EUROPE SERIES 34INDEX - 85.00 - 20.01.21
2,000,000
0.0514,547SWAP OPTION - PAY 1.500% / REC LIBOR 6M -21.04.27
200,000
0.00434SWAP OPTION - PAY 2.500% / REC LIBOR 3M -12.09.22
750,000
0.0822,808United States of America
0.025,05710YR US TREASRY NOTE - 137.00 - 19.02.21 PUT180.0410,53610YR US TREASRY NOTE - 138.00 - 22.01.21
CALL25
0.027,215T BOND - 172.00 - 19.02.21 PUT5-0.37-107,019Short positions
-0.37-107,019Derivative instruments
-0.37-107,019Options-0.35-102,205Luxembourg
-0.14-39,121CALL CDX OPTION - ITRAXX EUROPECROSSOVER SERIES 34 INDEX - 287.50 -20.01.21
-1,600,000
-0.01-4,015PUT CDX OPTION - CDX NA HY 35 INDEX - 101.00- 17.03.21
-1,200,000
-0.01-3,542PUT CDX OPTION - CDX NA HY 35 INDEX - 105.00- 17.02.21
-1,000,000
-0.04-10,965PUT CDX OPTION - CDX NA HY 35 INDEX - 107.00- 17.03.21
-1,200,000
0.00-1,294PUT CDX OPTION - ITRAXX EUROPE SERIES 34INDEX - 75.00 - 17.03.21
-1,500,000
0.00-493PUT CDX OPTION - ITRAXX EUROPE SERIES 34INDEX - 90.00 - 17.02.21
-1,500,000
-0.02-5,608SWAP OPTION - PAY 0.500% / REC LIBOR 6M -21.04.21
-200,000
-0.13-37,167SWAP OPTION - PAY 2.000% / REC LIBOR 3M -12.09.22
-750,000
-0.02-4,814United States of America
0.00-91910YR US TREASRY NOTE - 134.50 - 19.02.21 PUT-180.00-1,27710YR US TREASRY NOTE - 139.50 - 22.01.21
CALL-25
-0.02-2,618T BOND - 168.00 - 19.02.21 PUT-5
89.2626,099,808Total securities portfolio
Amundi S.F. - Saving Box III
31/12/20Securities Portfolio as at

54
The accompanying notes form an integral part of these financial statements
% o
f NaV
Market V
alue
Quan
tity
EUR
96.5420,769,997Long positions
1.00215,215Transferable securities admitted to an official stock exchangelisting and/or dealt in on another regulated market
1.00215,215Warrants, Rights1.00215,215Ireland
1.00215,215AMUNDI PHYSICAL GOLD ETC3,495
95.5420,554,782Share/Units of UCITS/UCIS
95.5420,554,782Share/Units in investment funds17.573,780,124France
6.041,298,923AMUNDI BBB EURO CORPORATE INVESTMENTGRADE UCITS ETF - EUR (C)
78,499
11.532,481,201AMUNDI 3 M FCP2
23.124,974,464Ireland
2.06443,323ALGEBRIS FINANC.CRD ACC.I EUR2,3690.80173,019CONCEPT FUND SOLUTIONS PLC DB X
TRACKERS MSCI WORLD ETF6,555
2.04439,836ISHARES ETF EUR CORPORATE BOND FUND3,0972.51538,520ISHARES III PLC ISHARES CORE MSCI WORLD
UCITS ETF87,166
1.06227,705ISHARES III PLC ISHARES EUR AGGREGATEBOND UCITS ETF
1,745
0.83178,660ISHARES IV PLC ISHARES AUTOMATION ROBUCITS ETF
18,389
0.71151,726ISHARES IV PLC ISHARES DIGITALISATIONUCITS ETF
18,420
0.71153,048ISHARES IV PLC ISHARES HEALTHCAREINNOVATION UCITS ETF
18,194
1.02218,459PIMCO GIS GLOBAL BOND I EUR H CAP7,3530.81174,363POLAR CAPITAL FUNDS PLC-I3,3391.85398,374POLAR GLOBAL TECHNOLOGY- CLASS I DIST5,5933.27702,452S SGA SPDR ETFS EUROPE I PLC BLOOMBERG
BARCLAYS EMLM UCITS E24,848
0.4086,615SPDR S&P GLOBAL DIVIDEND ARISTOCRATSETF
3,396
0.51110,399SSGA SPDR EUROPE II PLC MSCI USA SMALL CACALUE WEIGHTED ETF
3,196
1.19256,710TRELIGGA PLC ARDEVORA GLOBAL EQUITYFUND
213,237
0.61132,256UBS ETF PLC MSCI USA QUALITY UCITS ETF4,6750.72154,766UBS IRL ETF MSCI USA V2,3111.52326,869WELLINGTON MANAGEMENT GLOBAL BOND
FUND PLC24,363
0.50107,364XTRACKERS IE PLC XTRACKERS MSCI WORLDUCTIS ETF
2,755
54.8511,800,194Luxembourg
2.52541,425ACMB EUROP.INC.PTF I2 EUR D.3D36,8570.72155,194AMUNDI FUNDS EUROPEAN EQUITY VALUE - M2
EUR (C)95
1.05225,356AMUNDI FUNDS POLEN CAPITAL GLOBALGROWTH - I2 USD (C)
11,038
1.52326,714AMUNDI FUNDS VOLATILITY WORLD - O USD (C)3860.4086,788AMUNDI INDEX BARCLAYS GLOBAL AGG 500M
UCITS ETF DR (C)1,666
% o
f NaV
Market V
alue
Quan
tity
EUR
0.78167,885AMUNDI INDEX MSCI EUROPE SRI - UCITS ETFDR (C)
2,756
0.75162,393AMUNDI INDEX MSCI USA SRI UCITS ETF DR (C)2,3921.00216,074AMUNDI INDEX MSCI WORLD SRI UCITS ETF DR
(C)3,328
0.3575,163AMUNDI MSCI EUROPE HIGH DIVIDEND FACTORUCITS ETF - EUR (C)
617
0.4290,896AMUNDI MSCI EUROPE QUALITY FACTOR UCITSETF - EUR (C)
1,107
1.05226,327AMUNDI MSCI EUROPE UCITS ETF - EUR (C)9540.50106,786AMUNDI MSCI EUROPE VALUE FACTOR UCITS
ETF - EUR (C)529
1.00215,947AMUNDI NASDAQ-100 UCITS ETF - DAILYHEDGED EUR (C)
672
1.02220,092AMUNDI SMART CITY UCITS ETF (C)3,7631.71367,250AMUNDI STOXX GLOBAL ARTIFICIAL
INTELLIGENCE UCITS ETF (C)5,466
4.62994,357BLACK ROCK GLOBAL FUNDS SICAV - EUROCORPORATE BOND FUND
83,983
2.61561,074BLACKROCK GLOBAL FUND EUR BOND I235,3323.16679,113BLUEBAY INV GRADE EURO AGGR BD SICAV3,5161.43308,074CPR INVEST SICAV GLOBAL DISRUPTIVE
OPPORTUNITIES2,018
0.3575,820DB X-TRACKERS SICAV MSCI EUROPE SMALLCAP INDEX UCITS ETF
1,480
0.95204,187HSBC GIF EURO H.Y.BD I C.3DEC3,9834.891,051,639JANUS HENDERSON HORIZON FUND SICAV
EURO CORPORATE BOND FUND8,457
2.54545,493JPMF EMERG MKTS EQ I EUR CAP C SICAV18,7650.73156,782MFS EUROP.EQ.I1 C.5655.611,204,246MFS MER EMG MK DEB I15,3371.07229,764MIROVA FUNDS SICAV MIROVA GLOBAL
SUSTAINABLE EQUITY FD SICAV2,079
0.80172,976MORGAN STANLEY INVESTMENT FUNDS SICAVZH EUR
5,603
2.52541,710MS INVF EURO STRAT BD Z USD11,4071.13243,056MSI AM FRANCHISE Z CAP C1,5911.00215,794MULTI UNITS LUXEMBOURG LYXOR SHS -DAILY
HEDGED D-EUR- ETF1,072
3.17682,951NORDEA 1 EURP HY BD BI EUR C17,4311.70365,004SCHRODER INTERNATIONAL SELECTION FUND
SICAV6,769
1.78383,864SCHRODER INTL CHINA OPPORT PART C763
96.5420,769,997Total securities portfolio
Amundi S.F. - Amundi Target Trend 2024
31/12/20Securities Portfolio as at
Multi-Asset Sub-Funds

55
The accompanying notes form an integral part of these financial statements
% o
f NaV
Market V
alue
Quan
tity
EUR
89.1633,583,019Long positions
81.3930,655,674Transferable securities admitted to an official stock exchangelisting and/or dealt in on another regulated market
23.618,892,824Shares0.44164,657Belgium
0.1765,333ANHEUSER BUSCH INBEV SA/NV1,1460.2799,324KBC GROUPE1,734
0.27103,576Canada
0.1140,380AGNICO EAGLE MINES7000.1663,196LUNDIN MINING8,664
0.37138,829Denmark
0.1243,497CARLSBERG B3320.1454,629ORSTED SH3270.1140,703ROCKWOOL INTERNATIONAL B133
0.1348,172Finland
0.1348,172NOKIA OYJ15,288
2.34880,828France
0.1139,648AXA2,0320.1141,120BOUYGUES1,2220.1972,276CAP GEMINI SE5700.28109,617DANONE SA2,0390.1453,954ESSILOR LUXOTTICA SA4230.1140,715L’OREAL SA1310.2490,429LVMH MOET HENNESSY LOUIS VUITTON SE1770.1243,869MICHELIN (CGDE)-SA4180.1453,151PUBLICIS GROUPE1,3040.1866,187SANOFI8410.1971,441SOCIETE GENERALE A4,1970.1139,997THALES SA5340.2595,451TOTAL SA2,7040.1140,761VINCI SA5010.0622,212VIVENDI842
1.41530,060Germany
0.1244,555ALLIANZ SE-NOM2220.1244,978DEUTSCHE BOERSE AG3230.1244,753DWS GROUP GMBH CO KGAA1,2860.1764,517FRESENIUS SE & CO KGAA1,7050.1867,158HEIDELBERGCEMENT AG1,0970.2177,282INFINEON TECHNOLOGIES AG-NOM2,4620.1246,533SAP SE4340.2389,434SIEMENS AG-NOM7610.1450,850SIEMENS ENERGY AG1,695
0.69260,020Ireland
0.1867,871CRH PLC1,9950.1659,084EATON CORP6040.1868,586LINDE PLC3220.1764,479MEDTRONIC PLC680
% o
f NaV
Market V
alue
Quan
tity
EUR
0.95358,850Italy
0.2286,509ENEL SPA10,4530.1244,270ENI SPA5,1790.1036,502FINECOBANK2,7240.1350,661MEDIOBANCA SPA6,7190.1659,837NEXI SPA3,6620.1036,699PRYSMIAN SPA1,2620.1244,372SNAM RETE GAS9,644
0.2387,512Jersey
0.2387,512APTIV REGISTERED SHS821
0.1765,910Luxembourg
0.1765,910ARCELORMITTAL SA3,491
1.52572,853Netherlands
0.1556,561AIRBUS BR BEARER SHS6300.1246,286ASR NEDERLAND N.V1,4090.2073,741CNH INDUSTRIAL N.V7,1420.1452,067FERRARI NV2760.2492,343FIAT CHRYSLER AUTOMOBILES NV6,2990.1245,739ING GROUP NV5,9860.0620,769KONINKLIJKE KPN NV8,3510.26100,345KONINKLIJKE PHILIPS N.V.2,2920.2385,002PROSUS N V962
0.56209,150Spain
0.1142,235BANCO SANTANDER SA16,6410.1862,700IBERDROLA SA5,3590.1453,956INTERNATIONAL CONSOLIDATED AIRLINES
GROUP SA30,126
0.1350,259REPSOL6,092
0.1036,724Sweden
0.1036,724LUNDIN ENERGY AB1,660
0.97365,660Switzerland
0.1558,123CIE FINANCIERE RICHEMONT SA7850.0935,236LONZA GROUP AG N670.2592,446NESTLE SA9590.37137,137ROCHE HOLDING LTD4800.1142,718UBS GROUP INC NAMEN AKT3,705
2.57969,883United Kingdom
0.42154,825ANGLO AMERICAN PLC5,7160.27101,052ASTRAZENECA PLC1,2350.29110,571BARCLAYS PLC67,4750.2284,691BHP GROUP PLC3,9380.1143,149DIAGEO1,3420.1762,431MEGGITT PLC11,9790.1245,868PRUDENTIAL PLC3,0480.0724,489ROYAL DUTCH SHELL A SHARES1,6890.1142,907ROYAL DUTCH SHELL PLC-A2,9360.1659,635SMITHS GROUP3,5480.1660,898SSE PLC3,634
Amundi S.F. - Diversified Target Income 11/2021
31/12/20Securities Portfolio as at

56
The accompanying notes form an integral part of these financial statements
% o
f NaV
Market V
alue
Quan
tity
EUR
0.0934,919VODAFONE GROUP25,8440.27101,642WEIR GROUP4,5730.1142,806WHITBREAD1,236
10.894,100,140United States of America
0.1556,120ABBVIE INC6430.28104,507ADOBE INC2580.1972,216ALIGN TECHNOLOGY1660.48180,049ALPHABET INC SHS C1260.2595,682AMAZON.COM INC360.2595,854AMPHENOL CORPORATION-A9030.1347,853ANTHEM INC1850.51189,131APPLE INC1,7510.1452,783AUTODESK INC2140.40150,536BANK OF AMERICA CORP6,1040.34126,466BOOKING HOLDINGS INC700.2178,446CATERPILLAR INC5300.1764,075CDW CORP6020.0935,683CENTENE7380.1868,449CHARLES SCHWAB CORP1,5910.1037,546CME GROUP INC2560.1971,333COGNIZANT TECH SO-A1,0750.28103,873COMCAST CLASS A2,4460.1243,595CROWN HOLDINGS5340.2179,916DUPONT DE NEMOURS INC1,3770.1038,305ELANCO ANIMAL HEALTH INC1,5550.1349,922ELI LILLY & CO3660.1037,477FEDEX CORP1770.1039,122FMC CORP4170.2595,546FREEPORT MCMORAN INC4,4740.027,588GOOD WORKS ACQUISITION CORP9340.0830,854HESS CORP7150.1139,930HOME DEPOT INC1850.2284,134HONEYWELL INTERNATIONAL INC4870.1037,415ILLINOIS TOOL WORKS INC2270.31117,124JP MORGAN CHASE & CO1,1370.2284,284LAM RESEARCH CORP2210.34127,096MERCK AND CO INC1,9270.29110,213MICRON TECHNOLOGY INC1,7930.36134,433MICROSOFT CORP7480.2180,437MOTOROLA SOLUTIONS INC5860.1244,152NETAPP INC8220.1556,623NEXTERA ENERGY INC9140.1141,331NORFOLK SOUTHERN CORP2140.1348,647NUANCE COMMUNICATIONS1,3630.2697,203PEPSICO INC8100.1972,815PIONEER NATURAL RES7860.31117,010QUALCOMM INC9460.1868,603ROCKWELL AUTOMATION INC3380.0830,706S&P GLOBAL INC1160.0520,219STANLEY BLACK AND DECKER INC.1390.28103,827STARBUCKS1,1970.1557,083TJX COMPANIES INC1,0220.0932,267VERIZON COMMUNICATIONS INC679
% o
f NaV
Market V
alue
Quan
tity
EUR
0.1347,352VF CORP6770.1867,921VISA INC-A3840.41156,196WALT DISNEY CO/THE1,0510.1867,305WELLS FARGO & CO2,7350.1243,723WEYERHAEUSER CO REIT1,6070.1659,164ZIMMER BIOMET HOLDINGS INC476
55.2520,811,709Bonds0.1764,439Argentina
0.0622,599ARGENTINA VAR 09/07/203068,5010.1037,296ARGENTINA VAR 09/07/2035125,4980.014,544ARGENTINA 1.00% 09/07/202912,862
1.28481,973Australia
0.2075,522AUSTRALIA 3.25% 21/04/2029100,0000.53198,851AUSTRALIA 4.75% 21/04/2027250,0000.27101,192BHP BILLITON FINANCE LTD VAR 22/04/2076100,0000.28106,408TELSTRA CORPORATION LTD 3.50% 21/09/2022100,000
0.42157,164Austria
0.1452,768AUSTRIA 3.65% 20/04/202250,0000.28104,396OMV AG VAR PERPETUAL EUR (ISIN
XS1294342792)100,000
0.29109,395Bermuda
0.29109,395FIDELITY WORLDWIDE INVESTMENT 2.50%04/11/2026
100,000
0.68255,672Brazil
0.52196,206BRAZIL 6.00% 07/04/2026200,0000.1659,466BRAZIL 8.25% 20/01/203450,000
0.62232,658Canada
0.2799,745CANADA 2.75% 01/06/2022150,0000.1350,679CANADA 5.75% 01/06/203350,0000.1038,041CANADA 8.00% 01/06/202350,0000.1244,193CANADA 9.00% 01/06/202550,000
0.28103,618Cayman Islands
0.28103,618UPCB FINANCE VII LTD 3.625% REGS 15/06/2029100,000
1.05396,742Colombia
0.45168,588BANCOLOMBIA SA VAR 18/10/2027200,0000.60228,154COLOMBIA 3.875% 22/03/2026200,000
0.28105,919Czech Republic
0.28105,919CZECH REPUBLIC 3.875% 24/05/2022100,000
0.27100,452Finland
0.27100,452NORDEA MORTGAGE BANK PLC 4.00%10/02/2021
100,000
5.352,013,436France
0.46171,926ALTICE FRANCE SA 7.375% REGS 01/05/2026200,0000.29107,642BNP PARIBAS SA 2.375% 17/02/2025100,0000.46178,025BNP PARIBAS 3.8% 10/01/2024200,000
Amundi S.F. - Diversified Target Income 11/2021
31/12/20Securities Portfolio as at

57
The accompanying notes form an integral part of these financial statements
% o
f NaV
Market V
alue
Quan
tity
EUR
0.30111,517BPCE SA 4.625% 18/07/2023100,0000.27102,442BUREAU VERITAS REGISTRE INTL DE
CLASSIFICA DE NAVIRES ET D’AERONEFS SA1.125% 18/01/2027
100,000
0.29108,083ELECTRICITE DE FRANCE SA VAR PERPETUALEUR (ISIN FR0013367612)
100,000
0.41152,609ELECTRICITE DE FRANCE SA 6.25% 30/05/2028100,0000.29109,630ENGIE SA VAR PERPETUAL100,0000.27102,750FAURECIA SA 3.125% 15/06/2026100,0000.2385,673FRANCE OAT 4.75% 25/04/203550,0000.46172,469FRANCE OAT 5.75% 25/10/2032100,0000.35132,702FRANCE OAT 6.00% 25/10/2025100,0000.32121,419FRANCE OAT 8.50% 25/04/2023100,0000.1141,907ORANGE SA 4.125% 14/09/202150,0000.28106,317PEUGEOT SA 2.00% 20/03/2025100,0000.28103,733QUATRIM SASU 5.875% REGS 15/01/2024100,0000.28104,592TOTAL SA VAR PERPETUAL EUR (ISIN
XS1501167164)100,000
2.57968,951Germany
0.30111,750ALLIANZ SE VAR PERPETUAL EUR (ISINDE000A1YCQ29)
100,000
0.43165,065ALLIANZ SE 3.875% PERPETUAL200,0000.34132,509BASF SE 3.00% 07/02/2033100,0000.27101,125ENBW ENERGIE BADEN-WUERTTEMBERG VAR
05/08/2079100,000
0.30112,415FRESENIUS SE CO KGAA 4.00% REGS 01/02/2024100,0000.1451,379GERMANY BUND 2.00% 04/01/202250,0000.2386,709GERMANY BUND 4.75% 04/07/203450,0000.2281,515GERMANY BUND 5.50% 04/01/203150,0000.2074,164GERMANY BUND 6.50% 04/07/202750,0000.1452,320HEIDELBERGCEMENT AG 2.25% 30/03/202350,000
0.49186,342Hungary
0.49186,342HUNGARY 5.75% 22/11/2023200,000
1.14429,625Indonesia
0.64241,860INDONESIA 3.75% REGS 14/06/2028200,0000.50187,765INDONESIA 5.875% REGS 15/01/2024200,000
2.791,051,921Italy
0.30112,310INTESA SANPAOLO SPA 3.928% 15/09/2026100,0000.44164,744INTESA SANPAOLO SPA 6.50% 24/02/2021200,0000.62237,723ITALY BTP 5.75% 01/02/2033150,0000.38142,587ITALY BTP 6.50% 01/11/2027100,0000.1763,309ITALY BTP 9.00% 01/11/202350,0000.28106,587TELECOM ITALIA SPA 3.00% 30/09/2025100,0000.30113,434UNICREDIT SPA 5.25% 30/04/2023100,0000.30111,227UNICREDIT SPA 6.95% 31/10/2022100,000
1.96740,103Luxembourg
0.46172,080ALTICE FINANCING SA 7.5% 15/05/2026200,0000.2696,656ALTICE FINCO S.A 4.75% REGS 15/01/2028100,0000.28104,201ARCELORMITTAL SA 2.25% 17/01/2024100,0000.70267,672EUROPEAN INVESTMENT BANK (EIB) 3.25%
29/01/2024300,000
% o
f NaV
Market V
alue
Quan
tity
EUR
0.2699,494TELECOM ITALIA CAPITAL SA 6.00% 30/09/2034100,000
1.82686,258Mexico
0.52194,320MEXICO 4.75% 08/03/2044200,0000.81310,077MEXICO 8.30% 15/08/2031250,0000.27100,248PETROLEOS MEXICANOS PEMEX 2.50%
21/08/2021100,000
0.1764,497PETROLEOS MEXICANOS PEMEX 4.50%23/01/2026
79,000
0.0517,116PETROLEOS MEXICANOS PEMEX 5.95%28/01/2031
21,000
5.542,088,509Netherlands
0.29107,953ABN AMRO BANK NV 2.50% 29/11/2023100,0000.27101,211ABN AMRO BANK NV 4.25% 06/04/2021100,0000.27101,061BHARTI AIRTEL INTERNATIONAL NETHERLANDS
B.V. 3.375% REGS 20/05/2021100,000
0.2489,206CNH INDUSTRIAL NV 4.50% 15/08/2023100,0000.58221,074COOPERATIEVE RABOBANK UA VAR
PERPETUAL EUR (ISIN XS2202900424)200,000
0.2384,954COOPERATIEVE RABOBANK UA 3.875%08/02/2022
100,000
0.47182,239DEUTSCHE TELEKOM INTERNATIONAL FINANCEBV 7.50% 24/01/2033
100,000
0.28105,637EDP FINANCE BV 2.375% 23/03/2023100,0000.28106,847ENEL FINANCE INTERNATIONAL NV 1.50%
21/07/2025100,000
0.1866,094ENEL FINANCE INTERNATIONAL NV 5.625%14/08/2024
50,000
0.29109,489IBERDROLA INTERNATIONAL BV VARPERPETUAL EUR (ISIN XS1890845875)
100,000
0.45171,763KONINKLIJKE KPN NV VAR REGS 28/03/2073200,0000.32118,703KONINKLIJKE KPN NV 5.625% 30/09/2024100,0000.28105,385NATURGY FINANCE BV VAR PERPETUAL EUR
(ISIN XS1139494493)100,000
0.28106,003NATURGY FINANCE BV 1.25% 19/04/2026100,0000.28104,155TENNET HOLDING BV VAR PERPETUAL EUR
(ISIN XS2207430120)100,000
0.27102,091VOLKSWAGEN INTERNATIONAL FINANCE NVVAR PERPETUAL EUR (ISIN XS1629658755)
100,000
0.28104,644VOLKSWAGEN INTERNATIONAL FINANCE NVVAR PERPETUAL EUR (ISIN XS1799938995)
100,000
0.47175,852Nigeria
0.47175,852NIGERIA 7.143% REGS 23/02/2030200,000
0.48180,738Panama
0.48180,738PANAMA 4.00% 22/09/2024200,000
0.56209,163Peru
0.56209,163PERU 8.75% 21/11/2033150,000
0.64241,084Philippines
0.46173,771PHILIPPINES 10.625% 16/03/2025150,0000.1867,313PHILIPPINES 9.50% 02/02/203050,000
0.2386,232Poland
0.2386,232POLAND 5.00% 23/03/2022100,000
Amundi S.F. - Diversified Target Income 11/2021
31/12/20Securities Portfolio as at

58
The accompanying notes form an integral part of these financial statements
% o
f NaV
Market V
alue
Quan
tity
EUR
0.46172,893Romania
0.46172,893ROMANIA 6.125% REGS 22/01/2044150,000
0.1969,879Russia
0.1969,879RUSSIA 12.75% REGS 24/06/202850,000
0.34129,310Slovenia
0.34129,310SLOVENIA 5.125% 30/03/2026100,000
1.51569,027Spain
0.28105,012CELLNEX TELECOM SA 2.375% 16/01/2024100,0000.27101,432FERROVIAL EMISIONES SA 3.375% 07/06/2021100,0000.2698,835SPAIN 5.15% 31/10/204450,0000.1453,489SPAIN 5.85% 31/01/202250,0000.36135,359SPAIN 5.90% 30/07/2026100,0000.2074,900SPAIN 6.00% 31/01/202950,000
0.58218,147Sweden
0.0310,002INTRUM JUSTITIA AB 2.75% REGS 15/07/2022100,0000.28105,117TELIA COMPANY AB VAR 04/04/2078100,0000.27103,028VOLVO CAR AB 2.125% 02/04/2024100,000
0.68254,931Switzerland
0.28104,083CREDIT SUISSE GRP AG VAR 17/07/2025100,0000.40150,848UBS INC VAR 12/02/2026150,000
0.40148,882Tunisia
0.40148,882BANQUE CENTRALE DE TUNISIE 5.75% REGS30/01/2025
200,000
0.36136,538Turkey
0.36136,538TURKEY 7.375% 05/02/2025150,000
0.44166,355United Arab Emirates
0.44166,355UNITED ARAB EMIRATES 4.00% REGS 28/07/2050200,000
5.822,194,284United Kingdom
0.30114,266AVIVA PLC VAR 05/07/2043100,0000.27102,237BARCLAYS PLC VAR 07/02/2028100,0000.33124,487BARCLAYS PLC 3.25% 12/02/2027100,0000.59222,962HSBC HOLDINGS PLC VAR PERPETUAL EUR200,0000.35133,127HSBC HOLDINGS PLC 6.50% 20/05/2024100,0000.36136,721LLOYDS BANK GR PLC 7.50% 15/04/2024100,0000.35131,762NATIONWIDE BUILDING SOCIETY 3.25%
20/01/2028100,000
0.2490,407SANTANDER UK PLC 4.00% 13/03/2024100,0000.1659,392TESCO PLC 6.125% 24/02/202250,0000.28106,453TESCO PLC 6.15% REGS 15/11/2037100,0001.16431,566UK GILT 4.50% 07/09/2034250,0000.2180,841UK GILT 4.75% 07/12/203050,0000.1867,788UK GILT 5.00% 07/03/202550,0000.43163,749UK GILT 6.00% 07/12/2028100,0000.28103,615VODAFONE GROUP PLC VAR 03/01/2079100,0000.33124,911WM MORRISON SUPERMARKETS PLC 4.625%
08/12/2023100,000
% o
f NaV
Market V
alue
Quan
tity
EUR
14.735,550,142United States of America
0.1453,021ANHEUSER BUSCH CO NBEV 4.9% 01/02/204650,0000.2492,070APPLE INC 3% 20/06/2027100,0000.34126,534AT&T INC 3.15% 04/09/2036100,0000.2593,227BALL CORP 5.25% 01/07/2025100,0000.31115,605BANK OF AMERICA CORP VAR 07/02/2030120,0000.2386,693BANK OF AMERICA CORP 3.30% 11/01/2023100,0000.2491,624BANK OF AMERICA CORP 4.20% 26/08/2024100,0000.47178,487BAYER US FINANCE LLC 3.375% REGS
08/10/2024200,000
0.36135,563CITIGROUP INC USA 3.75% 16/06/2024150,0000.36137,120CITIGROUP INC USA 5.15% 21/05/2026100,0000.27102,451EXPEDIA GROUP INC 2.50% 03/06/2022100,0000.1244,517EXPEDIA GROUP INC 4.50% 15/08/202450,0000.31118,493FORD MOTOR CREDIT CO LLC 4.535% 06/03/2025100,0000.67251,771FREDDIE MAC 6.75% 15/03/2031200,0000.2489,983GENERAL MOTORS FINANCIAL CO 4.00%
15/01/2025100,000
0.1661,606GOLDMAN SACHS GROUP INC. 1.625%27/07/2026
57,000
0.28107,141GOLDMAN SACHS GROUP INC. 3.25% 01/02/2023100,0000.0933,496GOODYEAR TIRE & RUBBER CO 5.00%
31/05/202640,000
1.12423,064INTERNATIONAL BANK FOR RECONSTRUCTION& DEVELOPMENT IBRD 7.625% 19/01/2023
450,000
0.27100,935JPMORGAN CHASE & CO 2.625% 23/04/2021100,0000.32120,403JPMORGAN CHASE & CO 2.875% 24/05/2028100,0000.2490,707JPMORGAN CHASE & CO 2.95% 01/10/2026100,0000.2489,410JPMORGAN CHASE & CO 3.125% 23/01/2025100,0000.29109,028LASMO (USA) INC 7.30% 15/11/2027100,0000.0518,280MORGAN STANLEY 3.125% 27/07/202620,0000.2388,129MORGAN STANLEY 4.875% 01/11/2022100,0000.30114,619ORACLE CORP 3.125% 10/07/2025100,0000.2284,440POST HOLDINGS INC 5.00% 144A 15/08/2026100,0000.27101,444SPRINT CORPORATION 7.625% 01/03/2026100,0000.2386,187THERMO FISHER SCIENTIFIC INC 3.00%
15/04/2023100,000
0.2282,798T-MOBILE USA INC 6.00% 15/04/2024100,0001.87703,556USA T-BONDS 5.00% 15/05/2037550,0001.99744,094USA T-BONDS 7.625% 15/02/2025700,0001.25471,197USA T-BONDS 8.125% 15/08/2021550,0000.2696,129VERIZON COMMUNICATIONS INC 3.875%
08/02/2029100,000
0.28106,320WELLS FARGO & CO 1.375% 26/10/2026100,000
0.36135,075Uruguay
0.36135,075URUGUAY 4.50% 14/08/2024150,000
2.53951,141Warrants, Rights2.24839,369Ireland
2.24839,369AMUNDI PHYSICAL GOLD ETC13,631
0.001,710Spain
0.001,710REPSOL SA RIGHTS 08/01/20216,092
Amundi S.F. - Diversified Target Income 11/2021
31/12/20Securities Portfolio as at

59
The accompanying notes form an integral part of these financial statements
% o
f NaV
Market V
alue
Quan
tity
EUR
0.00334Switzerland
0.00334COMPAGNIE FINANCIERE RICHEMONT SAWARRANT 22/11/2023
1,570
0.29109,406United Kingdom
0.026,895UBS AG CERTIFICATE ETC190.1762,680UBS AG LONDON CERTIFICATE4390.0311,388UBS ETC ON CMCI ALU USD2590.0312,776UBS ETC ON CMCI HEAT OIL USD ETC2930.0415,667UBS ETC ON COMCI CORN USD326
0.00322United States of America
0.00322GOOD WORKS ACQUISITION CORP WARRANT22/10/2025
353
7.002,636,260Share/Units of UCITS/UCIS
7.002,636,260Share/Units in investment funds7.002,636,260Luxembourg
0.50187,636AMUNDI FUNDS EMERGING MARKETSCORPORATE BOND - Z EUR QD (D)
200
3.171,197,425AMUNDI FUNDS REAL ASSETS TARGET INCOME- Z USD QTI (D)
1,450
0.49184,111AMUNDI INDEX MSCI PACIFIC EX JAPAN SRIUCITS ETF DR - EUR (C)
339
2.40902,303AMUNDI INVESTMENT FUNDS EMERGINGMARKETS EQUITY ENGAGEMENT - M QD (D)
949
0.44164,785AMUNDI S.F. EUR COMMODITIES - I (C)391
0.77291,085Derivative instruments
0.77291,085Options0.0935,569Germany
0.001,121DJ EURO STOXX 50 EUR - 3,150 - 15.01.21 PUT190.0521,098DJ EURO STOXX 50 EUR - 3,450 - 19.03.21 PUT220.0413,350EURO STOXX BANKS - 75 - 19.03.21 CALL60
0.00119Japan
0.00119NIKKEI 225 - 22,750 - 08.01.21 PUT3
0.44163,911Luxembourg
0.001,056FX OPTION - CALL EUR / PUT RUB - 97.00 -04.02.21
200,000
0.00199FX OPTION - PUT AUD / CALL USD - 0.71 -12.02.21
430,000
0.00405FX OPTION - PUT AUD / CALL USD - 0.71 -12.02.21
874,000
0.014,207FX OPTION - PUT EUR / CALL USD - 1.20 -08.03.21
1,350,000
0.0310,995SWAP OPTION - PAY 1.860% / REC EURIBOR 6M -19.05.27
750,000
0.40147,049SWAP OPTION - REC EURIBOR 6M / PAY 1.860% -19.05.27
400,000
0.2491,486United States of America
0.0069BARRICK GOLD (US) - 28.00 - 15.01.21 CALL280.0830,289NASDAQ 100 E-MINI - 12,500 - 19.03.21 PUT4
% o
f NaV
Market V
alue
Quan
tity
EUR
0.0936,983RUSSELL 2000 INDEX - 1,990 - 19.03.21 CALL50.0622,083S&P 500 INDEX - 3,450 - 19.03.21 PUT40.012,062US 5YR T-NOTES - 126.00 - 22.01.21 PUT19
-0.28-106,880Short positions
-0.28-106,880Derivative instruments
-0.28-106,880Options-0.03-12,900Germany
-0.01-5,250EURO STOXX BANKS - 65 - 19.03.21 PUT-60-0.02-7,650EURO STOXX BANKS - 80 - 19.03.21 CALL-60
-0.04-15,278Japan
-0.02-6,491NIKKEI 225 - 25,000 - 09.04.21 PUT-2-0.02-8,787NIKKEI 225 - 25,750 - 09.04.21 PUT-2
-0.02-7,526Luxembourg
-0.01-2,338FX OPTION - CALL EUR / PUT RUB - 94.00 -04.02.21
-200,000
0.00-1,056FX OPTION - CALL EUR / PUT RUB - 97.00 -04.02.21
-200,000
-0.01-4,132FX OPTION - CALL EUR / PUT USD - 1.25 -08.03.21
-675,000
-0.19-71,176United States of America
-0.07-27,737S&P 500 EMIN - 3,730 - 19.03.21 PUT-5-0.03-13,158S&P 500 INDEX - 3,250 - 19.03.21 PUT-4-0.09-30,281S&P 500 INDEX - 3,645 - 19.03.21 CALL-2
88.8833,476,139Total securities portfolio
Amundi S.F. - Diversified Target Income 11/2021
31/12/20Securities Portfolio as at

60
The accompanying notes form an integral part of these financial statements
% o
f NaV
Market V
alue
Quan
tity
EUR
90.6939,546,275Long positions
82.6136,023,561Transferable securities admitted to an official stock exchangelisting and/or dealt in on another regulated market
23.5010,245,306Shares0.44192,899Belgium
0.1876,849ANHEUSER BUSCH INBEV SA/NV1,3480.26116,050KBC GROUPE2,026
0.27117,220Canada
0.1045,687AGNICO EAGLE MINES7920.1771,533LUNDIN MINING9,807
0.37160,776Denmark
0.1250,441CARLSBERG B3850.1463,817ORSTED SH3820.1146,518ROCKWOOL INTERNATIONAL B152
0.1358,227Finland
0.1358,227NOKIA OYJ18,479
2.361,030,384France
0.1146,829AXA2,4000.1147,177BOUYGUES1,4020.1984,829CAP GEMINI SE6690.28125,798DANONE SA2,3400.1563,265ESSILOR LUXOTTICA SA4960.1044,444L’OREAL SA1430.25108,822LVMH MOET HENNESSY LOUIS VUITTON SE2130.1251,426MICHELIN (CGDE)-SA4900.1462,974PUBLICIS GROUPE1,5450.1877,598SANOFI9860.1983,476SOCIETE GENERALE A4,9040.1147,262THALES SA6310.26112,607TOTAL SA3,1900.1147,840VINCI SA5880.0626,037VIVENDI987
1.42618,348Germany
0.1252,784ALLIANZ SE-NOM2630.1252,776DEUTSCHE BOERSE AG3790.1252,304DWS GROUP GMBH CO KGAA1,5030.1877,231FRESENIUS SE & CO KGAA2,0410.1878,484HEIDELBERGCEMENT AG1,2820.2190,309INFINEON TECHNOLOGIES AG-NOM2,8770.1354,575SAP SE5090.22100,245SIEMENS AG-NOM8530.1459,640SIEMENS ENERGY AG1,988
0.68298,530Ireland
0.1878,519CRH PLC2,3080.1566,910EATON CORP6840.1880,088LINDE PLC3760.1773,013MEDTRONIC PLC770
% o
f NaV
Market V
alue
Quan
tity
EUR
0.96420,762Italy
0.2299,395ENEL SPA12,0100.1252,245ENI SPA6,1120.1042,880FINECOBANK3,2000.1459,649MEDIOBANCA SPA7,9110.1671,095NEXI SPA4,3510.1043,649PRYSMIAN SPA1,5010.1251,849SNAM RETE GAS11,269
0.2399,130Jersey
0.2399,130APTIV REGISTERED SHS930
0.1877,012Luxembourg
0.1877,012ARCELORMITTAL SA4,079
1.55674,444Netherlands
0.1566,258AIRBUS BR BEARER SHS7380.1254,301ASR NEDERLAND N.V1,6530.2086,172CNH INDUSTRIAL N.V8,3460.1462,066FERRARI NV3290.24106,666FIAT CHRYSLER AUTOMOBILES NV7,2760.1354,763ING GROUP NV7,1670.0523,577KONINKLIJKE KPN NV9,4800.29120,176KONINKLIJKE PHILIPS N.V.2,7450.23100,465PROSUS N V1,137
0.56244,607Spain
0.1149,351BANCO SANTANDER SA19,4450.1773,640IBERDROLA SA6,2940.1461,143INTERNATIONAL CONSOLIDATED AIRLINES
GROUP SA34,139
0.1460,473REPSOL7,330
0.1041,635Sweden
0.1041,635LUNDIN ENERGY AB1,882
0.97425,084Switzerland
0.1668,711CIE FINANCIERE RICHEMONT SA9280.0939,443LONZA GROUP AG N750.25108,352NESTLE SA1,1240.36158,850ROCHE HOLDING LTD5560.1149,728UBS GROUP INC NAMEN AKT4,313
2.621,144,167United Kingdom
0.40178,688ANGLO AMERICAN PLC6,5970.28119,953ASTRAZENECA PLC1,4660.29129,111BARCLAYS PLC78,7890.2399,551BHP GROUP PLC4,6290.1251,155DIAGEO1,5910.1773,522MEGGITT PLC14,1070.1253,799PRUDENTIAL PLC3,5750.1880,187ROYAL DUTCH SHELL PLC-A5,4870.1671,721SMITHS GROUP4,2670.1772,930SSE PLC4,3520.1041,654VODAFONE GROUP30,829
Amundi S.F. - Diversified Target Income 11/2022
31/12/20Securities Portfolio as at

61
The accompanying notes form an integral part of these financial statements
% o
f NaV
Market V
alue
Quan
tity
EUR
0.28121,713WEIR GROUP5,4760.1250,183WHITBREAD1,449
10.664,642,081United States of America
0.1563,539ABBVIE INC7280.27118,280ADOBE INC2920.1981,787ALIGN TECHNOLOGY1880.47204,341ALPHABET INC SHS C1430.25108,971AMAZON.COM INC410.25108,485AMPHENOL CORPORATION-A1,0220.1254,061ANTHEM INC2090.50214,082APPLE INC1,9820.1459,936AUTODESK INC2430.39170,389BANK OF AMERICA CORP6,9090.33142,726BOOKING HOLDINGS INC790.2088,807CATERPILLAR INC6000.1772,483CDW CORP6810.0940,373CENTENE8350.1877,483CHARLES SCHWAB CORP1,8010.1042,532CME GROUP INC2900.1980,755COGNIZANT TECH SO-A1,2170.27117,590COMCAST CLASS A2,7690.1149,310CROWN HOLDINGS6040.2190,478DUPONT DE NEMOURS INC1,5590.1043,355ELANCO ANIMAL HEALTH INC1,7600.1356,469ELI LILLY & CO4140.1042,559FEDEX CORP2010.1044,282FMC CORP4720.25108,146FREEPORT MCMORAN INC5,0640.016,020GOOD WORKS ACQUISITION CORP7410.0834,954HESS CORP8100.1045,110HOME DEPOT INC2090.2295,191HONEYWELL INTERNATIONAL INC5510.1042,360ILLINOIS TOOL WORKS INC2570.30132,576JP MORGAN CHASE & CO1,2870.2295,343LAM RESEARCH CORP2500.33143,849MERCK AND CO INC2,1810.29124,781MICRON TECHNOLOGY INC2,0300.35152,225MICROSOFT CORP8470.2191,006MOTOROLA SOLUTIONS INC6630.1149,953NETAPP INC9300.1567,155NEXTERA ENERGY INC1,0840.1146,739NORFOLK SOUTHERN CORP2420.1355,072NUANCE COMMUNICATIONS1,5430.25110,043PEPSICO INC9170.1982,450PIONEER NATURAL RES8900.30132,348QUALCOMM INC1,0700.1877,533ROCKWELL AUTOMATION INC3820.0834,676S&P GLOBAL INC1310.0522,838STANLEY BLACK AND DECKER INC.1570.27117,532STARBUCKS1,3550.1564,623TJX COMPANIES INC1,1570.0836,544VERIZON COMMUNICATIONS INC7690.1253,647VF CORP767
% o
f NaV
Market V
alue
Quan
tity
EUR
0.1876,765VISA INC-A4340.41176,854WALT DISNEY CO/THE1,1900.1776,189WELLS FARGO & CO3,0960.1149,491WEYERHAEUSER CO REIT1,8190.1566,995ZIMMER BIOMET HOLDINGS INC539
56.4724,626,975Bonds0.1564,439Argentina
0.0522,599ARGENTINA VAR 09/07/203068,5010.0937,296ARGENTINA VAR 09/07/2035125,4980.014,544ARGENTINA 1.00% 09/07/202912,862
1.18515,047Australia
0.0937,761AUSTRALIA 3.25% 21/04/202950,0000.46198,850AUSTRALIA 4.75% 21/04/2027250,0000.1670,836AUSTRALIA 5.50% 21/04/2023100,0000.23101,192BHP BILLITON FINANCE LTD VAR 22/04/2076100,0000.24106,408TELSTRA CORPORATION LTD 3.50% 21/09/2022100,000
0.24104,396Austria
0.24104,396OMV AG VAR PERPETUAL EUR (ISINXS1294342792)
100,000
0.1356,736Belgium
0.1356,736ANHEUSER-BUSCH INBEV SA/NV 2.00%17/03/2028
50,000
0.41178,398Brazil
0.41178,398BRAZIL 8.25% 20/01/2034150,000
0.73316,585Canada
0.31132,993CANADA 2.75% 01/06/2022200,0000.23101,358CANADA 5.75% 01/06/2033100,0000.0938,041CANADA 8.00% 01/06/202350,0000.1044,193CANADA 9.00% 01/06/202550,000
0.24103,618Cayman Islands
0.24103,618UPCB FINANCE VII LTD 3.625% REGS 15/06/2029100,000
0.26113,823Chile
0.26113,823CHILE 1.875% 27/05/2030100,000
0.72312,464China
0.72312,464EXPORT IMPORT BANK OF CHINA 3.625% REGS31/07/2024
350,000
0.92400,166Colombia
0.39168,588BANCOLOMBIA SA VAR 18/10/2027200,0000.53231,578COLOMBIA 4.50% 28/01/2026250,000
0.24105,919Czech Republic
0.24105,919CZECH REPUBLIC 3.875% 24/05/2022100,000
0.24104,300Denmark
0.24104,300NYKREDIT REALKREDIT AS VAR 17/11/2027100,000
Amundi S.F. - Diversified Target Income 11/2022
31/12/20Securities Portfolio as at

62
The accompanying notes form an integral part of these financial statements
% o
f NaV
Market V
alue
Quan
tity
EUR
0.42184,838Egypt
0.42184,838EGYPT 8.50% REGS 31/01/2047200,000
0.23100,452Finland
0.23100,452NORDEA MORTGAGE BANK PLC 4.00%10/02/2021
100,000
5.102,225,760France
0.39171,926ALTICE FRANCE SA 7.375% REGS 01/05/2026200,0000.25109,472BANQUE FEDERATIVE DU CREDIT MUTUEL
3.00% 28/11/2023100,000
0.25107,642BNP PARIBAS SA 2.375% 17/02/2025100,0000.40178,025BNP PARIBAS 3.8% 10/01/2024200,0000.26111,517BPCE SA 4.625% 18/07/2023100,0000.23102,442BUREAU VERITAS REGISTRE INTL DE
CLASSIFICA DE NAVIRES ET D’AERONEFS SA1.125% 18/01/2027
100,000
0.25108,083ELECTRICITE DE FRANCE SA VAR PERPETUALEUR (ISIN FR0013367612)
100,000
0.35152,609ELECTRICITE DE FRANCE SA 6.25% 30/05/2028100,0000.25109,630ENGIE SA VAR PERPETUAL100,0000.24102,750FAURECIA SA 3.125% 15/06/2026100,0000.2085,673FRANCE OAT 4.75% 25/04/203550,0000.35151,025FRANCE OAT 5.50% 25/04/2029100,0000.45199,053FRANCE OAT 6.00% 25/10/2025150,0000.28121,419FRANCE OAT 8.50% 25/04/2023100,0000.1041,907ORANGE SA 4.125% 14/09/202150,0000.1357,945ORANGE SA 5.375% 13/01/204250,0000.24106,317PEUGEOT SA 2.00% 20/03/2025100,0000.24103,733QUATRIM SASU 5.875% REGS 15/01/2024100,0000.24104,592TOTAL SA VAR PERPETUAL EUR (ISIN
XS1501167164)100,000
2.661,158,096Germany
0.26111,750ALLIANZ SE VAR PERPETUAL EUR (ISINDE000A1YCQ29)
100,000
0.38165,065ALLIANZ SE 3.875% PERPETUAL200,0000.30132,509BASF SE 3.00% 07/02/2033100,0000.23100,021DEUTSCHE BANK AG 0.375% 18/01/2021100,0000.23101,125ENBW ENERGIE BADEN-WUERTTEMBERG VAR
05/08/2079100,000
0.26112,415FRESENIUS SE CO KGAA 4.00% REGS 01/02/2024100,0000.23101,958GERMANY BUND 2.25% 04/09/2021100,0000.2086,709GERMANY BUND 4.75% 04/07/203450,0000.1772,860GERMANY BUND 5.625% 04/01/202850,0000.28121,364GERMANY BUND 6.25% 04/01/2024100,0000.1252,320HEIDELBERGCEMENT AG 2.25% 30/03/202350,000
0.41178,988Hungary
0.41178,988HUNGARY 5.375% 21/02/2023200,000
1.09476,566Indonesia
0.55241,860INDONESIA 3.75% REGS 14/06/2028200,0000.54234,706INDONESIA 5.875% REGS 15/01/2024250,000
% o
f NaV
Market V
alue
Quan
tity
EUR
0.53230,998Ireland
0.29124,989GE CAPITAL EUROPEAN FUNDING UNLIMITEDCOMPANY 4.625% 22/02/2027
100,000
0.24106,009SMURFIT KAPPA ACQUISITIONS UNLIMITEDCOMPAGNY 2.375% REGS 01/02/2024
100,000
2.791,218,551Italy
0.26112,310INTESA SANPAOLO SPA 3.928% 15/09/2026100,0000.37164,744INTESA SANPAOLO SPA 6.50% 24/02/2021200,0000.36158,482ITALY BTP 5.75% 01/02/2033100,0000.1877,281ITALY BTP 6.00% 01/05/203150,0000.33142,587ITALY BTP 6.50% 01/11/2027100,0000.29126,618ITALY BTP 9.00% 01/11/2023100,0000.24106,587TELECOM ITALIA SPA 3.00% 30/09/2025100,0000.24105,281TELECOM ITALIA SPA 3.25% 16/01/2023100,0000.26113,434UNICREDIT SPA 5.25% 30/04/2023100,0000.26111,227UNICREDIT SPA 6.95% 31/10/2022100,000
0.60263,324Kazakhstan
0.60263,324KAZAKHSTAN 6.50% REGS 21/07/2045200,000
1.77769,686Luxembourg
0.39172,080ALTICE FINANCING SA 7.5% 15/05/2026200,0000.2296,656ALTICE FINCO S.A 4.75% REGS 15/01/2028100,0000.24104,201ARCELORMITTAL SA 2.25% 17/01/2024100,0000.25107,012CNH INDUSTRIAL FINANCE EUROPE S A 1.875%
19/01/2026100,000
0.32137,457EUROPEAN INVESTMENT BANK (EIB) 5.50%15/04/2025
100,000
0.24102,533SES S.A. VAR PERPETUAL100,0000.1149,747TELECOM ITALIA CAPITAL SA 6.00% 30/09/203450,000
1.52664,697Mexico
0.53229,970MEXICO 3.75% 11/01/2028250,0000.43188,739MEXICO 4.15% 28/03/2027200,0000.33145,740MEXICO 4.75% 08/03/2044150,0000.23100,248PETROLEOS MEXICANOS PEMEX 2.50%
21/08/2021100,000
5.032,193,420Netherlands
0.25107,953ABN AMRO BANK NV 2.50% 29/11/2023100,0000.23101,211ABN AMRO BANK NV 4.25% 06/04/2021100,0000.24104,014ATF NETHERLANDS BV VAR PERPETUAL100,0000.23101,061BHARTI AIRTEL INTERNATIONAL NETHERLANDS
B.V. 3.375% REGS 20/05/2021100,000
0.2089,206CNH INDUSTRIAL NV 4.50% 15/08/2023100,0000.52221,074COOPERATIEVE RABOBANK UA VAR
PERPETUAL EUR (ISIN XS2202900424)200,000
0.1984,954COOPERATIEVE RABOBANK UA 3.875%08/02/2022
100,000
0.28120,625DEUTSCHE TELEKOM INTERNATIONAL FINANCEBV 6.50% 08/04/2022
100,000
0.42182,239DEUTSCHE TELEKOM INTERNATIONAL FINANCEBV 7.50% 24/01/2033
100,000
0.24105,637EDP FINANCE BV 2.375% 23/03/2023100,000
Amundi S.F. - Diversified Target Income 11/2022
31/12/20Securities Portfolio as at

63
The accompanying notes form an integral part of these financial statements
% o
f NaV
Market V
alue
Quan
tity
EUR
0.25106,847ENEL FINANCE INTERNATIONAL NV 1.50%21/07/2025
100,000
0.1566,094ENEL FINANCE INTERNATIONAL NV 5.625%14/08/2024
50,000
0.25109,489IBERDROLA INTERNATIONAL BV VARPERPETUAL EUR (ISIN XS1890845875)
100,000
0.1252,035INNOGY FINANCE BV 6.50% 10/08/202150,0000.27118,703KONINKLIJKE KPN NV 5.625% 30/09/2024100,0000.24105,385NATURGY FINANCE BV VAR PERPETUAL EUR
(ISIN XS1139494493)100,000
0.24106,003NATURGY FINANCE BV 1.25% 19/04/2026100,0000.24104,155TENNET HOLDING BV VAR PERPETUAL EUR
(ISIN XS2207430120)100,000
0.23102,091VOLKSWAGEN INTERNATIONAL FINANCE NVVAR PERPETUAL EUR (ISIN XS1629658755)
100,000
0.24104,644VOLKSWAGEN INTERNATIONAL FINANCE NVVAR PERPETUAL EUR (ISIN XS1799938995)
100,000
0.40175,852Nigeria
0.40175,852NIGERIA 7.143% REGS 23/02/2030200,000
0.38166,267Oman
0.38166,267OMAN 5.375% REGS 08/03/2027200,000
0.67292,550Peru
0.2190,843BANCO INTERNATIONAL DEL PERU VAR REGS19/03/2029
100,000
0.1044,765BBVA BANCO CONTIENTAL VAR REGS 22/09/202950,0000.36156,942PERU 7.35% 21/07/2025150,000
0.57250,474Philippines
0.27115,847PHILIPPINES 10.625% 16/03/2025100,0000.30134,627PHILIPPINES 9.50% 02/02/2030100,000
0.2086,232Poland
0.2086,232POLAND 5.00% 23/03/2022100,000
0.32138,848Qatar
0.32138,848QATAR 9.75% REGS 15/06/2030100,000
0.53230,524Romania
0.53230,524ROMANIA 6.125% REGS 22/01/2044200,000
0.1669,879Russia
0.1669,879RUSSIA 12.75% REGS 24/06/202850,000
0.30129,310Slovenia
0.30129,310SLOVENIA 5.125% 30/03/2026100,000
1.03450,967Spain
0.24105,012CELLNEX TELECOM SA 2.375% 16/01/2024100,0000.1982,207SPAIN 5.75% 30/07/203250,0000.1253,489SPAIN 5.85% 31/01/202250,0000.31135,359SPAIN 5.90% 30/07/2026100,0000.1774,900SPAIN 6.00% 31/01/202950,000
% o
f NaV
Market V
alue
Quan
tity
EUR
0.2296,737Sri Lanka
0.2296,737SRI LANKA 6.85% REGS 03/11/2025200,000
0.48208,145Sweden
0.24105,117TELIA COMPANY AB VAR 04/04/2078100,0000.24103,028VOLVO CAR AB 2.125% 02/04/2024100,000
0.85372,633Switzerland
0.24104,083CREDIT SUISSE GRP AG VAR 17/07/2025100,0000.38167,985UBS GROUP FUNDING SWITZERLAND INC VAR
PERPETUAL USD (ISIN CH0331455318)200,000
0.23100,565UBS INC VAR 12/02/2026100,000
0.27118,713Turkey
0.27118,713TURKEY 11.875% 15/01/2030100,000
0.38166,355United Arab Emirates
0.38166,355UNITED ARAB EMIRATES 4.00% REGS 28/07/2050200,000
5.602,442,317United Kingdom
0.24106,300ANGLO AMERICAN CAPITAL PLC 1.625%18/09/2025
100,000
0.26114,266AVIVA PLC VAR 05/07/2043100,0000.23102,237BARCLAYS PLC VAR 07/02/2028100,0000.29124,487BARCLAYS PLC 3.25% 12/02/2027100,0000.51222,962HSBC HOLDINGS PLC VAR PERPETUAL EUR200,0000.27119,033HSBC HOLDINGS PLC VAR 13/11/2026100,0000.1566,564HSBC HOLDINGS PLC 6.50% 20/05/202450,0000.31136,721LLOYDS BANK GR PLC 7.50% 15/04/2024100,0000.30131,762NATIONWIDE BUILDING SOCIETY 3.25%
20/01/2028100,000
0.32139,863NATWEST GROUP PLC 6.00% 19/12/2023150,0000.2190,407SANTANDER UK PLC 4.00% 13/03/2024100,0000.26111,399SKY PLC 2.25% 17/11/2025100,0000.1459,392TESCO PLC 6.125% 24/02/202250,0000.1358,577UK GILT 4.00% 07/03/202250,0000.1880,644UK GILT 4.25% 07/06/203250,0001.00431,565UK GILT 4.50% 07/09/2034250,0000.56242,523UK GILT 4.75% 07/12/2030150,0000.24103,615VODAFONE GROUP PLC VAR 03/01/2079100,000
16.507,189,905United States of America
0.1253,021ANHEUSER BUSCH CO NBEV 4.9% 01/02/204650,0000.2192,070APPLE INC 3% 20/06/2027100,0000.29126,534AT&T INC 3.15% 04/09/2036100,0000.2193,227BALL CORP 5.25% 01/07/2025100,0000.27115,605BANK OF AMERICA CORP VAR 07/02/2030120,0000.25108,400BANK OF AMERICA CORP 2.375% 19/06/2024100,0000.2086,693BANK OF AMERICA CORP 3.30% 11/01/2023100,0000.2191,624BANK OF AMERICA CORP 4.20% 26/08/2024100,0000.27118,973BANK OF AMERICA CORP 6.11% 29/01/2037100,0000.1146,446BOOKING HOLDING INC 3.60% 01/06/202650,0000.31135,563CITIGROUP INC USA 3.75% 16/06/2024150,0000.31137,120CITIGROUP INC USA 5.15% 21/05/2026100,0000.2088,776COCA COLA CO 2.25% 01/09/2026100,000
Amundi S.F. - Diversified Target Income 11/2022
31/12/20Securities Portfolio as at

64
The accompanying notes form an integral part of these financial statements
% o
f NaV
Market V
alue
Quan
tity
EUR
0.23102,451EXPEDIA GROUP INC 2.50% 03/06/2022100,0000.1044,517EXPEDIA GROUP INC 4.50% 15/08/202450,0000.58251,630FEDERAL HOME LOAN BANK SYSTEM 5.50%
15/07/2036200,000
0.72312,096FEDERAL NATIONAL MORTGAGE ASSOCIATION7.125% 15/01/2030
250,000
0.27118,493FORD MOTOR CREDIT CO LLC 4.535% 06/03/2025100,0000.2189,983GENERAL MOTORS FINANCIAL CO 4.00%
15/01/2025100,000
0.25108,081GOLDMAN SACHS GROUP INC. 1.625%27/07/2026
100,000
0.25107,141GOLDMAN SACHS GROUP INC. 3.25% 01/02/2023100,0000.23100,935JPMORGAN CHASE & CO 2.625% 23/04/2021100,0000.28120,403JPMORGAN CHASE & CO 2.875% 24/05/2028100,0000.2190,707JPMORGAN CHASE & CO 2.95% 01/10/2026100,0000.2189,410JPMORGAN CHASE & CO 3.125% 23/01/2025100,0000.25109,028LASMO (USA) INC 7.30% 15/11/2027100,0000.2191,400MORGAN STANLEY 3.125% 27/07/2026100,0000.2088,129MORGAN STANLEY 4.875% 01/11/2022100,0000.2189,485ORACLE CORP 2.65% 15/07/2026100,0000.26114,619ORACLE CORP 3.125% 10/07/2025100,0000.1984,440POST HOLDINGS INC 5.00% 144A 15/08/2026100,0000.1042,457SPRINT CORPORATION 7.25% 15/09/202150,0000.23101,444SPRINT CORPORATION 7.625% 01/03/2026100,0000.2086,187THERMO FISHER SCIENTIFIC INC 3.00%
15/04/2023100,000
0.28124,198T-MOBILE USA INC 6.00% 15/04/2024150,0001.61703,556USA T-BONDS 5.00% 15/05/2037550,0000.1459,139USA T-BONDS 6.125% 15/08/202950,0002.811,222,441USA T-BONDS 7.625% 15/02/20251,150,0002.461,070,902USA T-BONDS 8.125% 15/08/20211,250,0000.2296,129VERIZON COMMUNICATIONS INC 3.875%
08/02/2029100,000
0.1252,061VERIZON COMMUNICATIONS INC 4.329%21/09/2028
53,000
0.24106,320WELLS FARGO & CO 1.375% 26/10/2026100,0000.27118,071WELLS FARGO & CO 2.00% 28/07/2025100,000
2.641,151,280Warrants, Rights2.341,019,854Ireland
2.341,019,854AMUNDI PHYSICAL GOLD ETC16,562
0.002,058Spain
0.002,058REPSOL SA RIGHTS 08/01/20217,330
0.00281Switzerland
0.00281COMPAGNIE FINANCIERE RICHEMONT SAWARRANT 22/11/2023
1,320
0.30128,832United Kingdom
0.027,983UBS AG CERTIFICATE ETC220.1874,961UBS AG LONDON CERTIFICATE5250.0313,015UBS ETC ON CMCI ALU USD2960.0314,563UBS ETC ON CMCI HEAT OIL USD ETC3340.0418,310UBS ETC ON COMCI CORN USD381
% o
f NaV
Market V
alue
Quan
tity
EUR
0.00255United States of America
0.00255GOOD WORKS ACQUISITION CORP WARRANT22/10/2025
280
7.313,186,560Share/Units of UCITS/UCIS
7.313,186,560Share/Units in investment funds7.313,186,560Luxembourg
0.52225,163AMUNDI FUNDS EMERGING MARKETSCORPORATE BOND - Z EUR QD (D)
240
3.331,451,774AMUNDI FUNDS REAL ASSETS TARGET INCOME- Z USD QTI (D)
1,758
0.50218,326AMUNDI INDEX MSCI PACIFIC EX JAPAN SRIUCITS ETF DR - EUR (C)
402
2.511,096,180AMUNDI INVESTMENT FUNDS EMERGINGMARKETS EQUITY ENGAGEMENT - M QD (D)
1,152
0.45195,117AMUNDI S.F. EUR COMMODITIES - I (C)463
0.77336,154Derivative instruments
0.77336,154Options0.1042,475Germany
0.001,298DJ EURO STOXX 50 EUR - 3,150 - 15.01.21 PUT220.0624,934DJ EURO STOXX 50 EUR - 3,450 - 19.03.21 PUT260.0416,243EURO STOXX BANKS - 75 - 19.03.21 CALL73
0.00119Japan
0.00119NIKKEI 225 - 22,750 - 08.01.21 PUT3
0.45195,562Luxembourg
0.001,056FX OPTION - CALL EUR / PUT RUB - 97.00 -04.02.21
200,000
0.00241FX OPTION - PUT AUD / CALL USD - 0.71 -12.02.21
520,000
0.00492FX OPTION - PUT AUD / CALL USD - 0.71 -12.02.21
1,062,000
0.015,086FX OPTION - PUT EUR / CALL USD - 1.20 -08.03.21
1,632,000
0.001,856PUT CDX OPTION - CDX NA HY 35 INDEX - 101.00- 20.01.21
2,600,000
0.028,949PUT CDX OPTION - CDX NA HY 35 INDEX - 106.00- 17.02.21
2,000,000
0.00724PUT CDX OPTION - CDX NA IG 35 INDEX - 60.00 -20.01.21
2,000,000
0.0311,728SWAP OPTION - PAY 1.860% / REC EURIBOR 6M -19.05.27
800,000
0.39165,430SWAP OPTION - REC EURIBOR 6M / PAY 1.860% -19.05.27
450,000
0.2297,998United States of America
0.0083BARRICK GOLD (US) - 28.00 - 15.01.21 CALL340.0730,289NASDAQ 100 E-MINI - 12,500 - 19.03.21 PUT40.0836,983RUSSELL 2000 INDEX - 1,990 - 19.03.21 CALL50.0627,604S&P 500 INDEX - 3,450 - 19.03.21 PUT50.013,039US 5YR T-NOTES - 126.00 - 22.01.21 PUT28
Amundi S.F. - Diversified Target Income 11/2022
31/12/20Securities Portfolio as at

65
The accompanying notes form an integral part of these financial statements
% o
f NaV
Market V
alue
Quan
tity
EUR
-0.32-137,953Short positions
-0.32-137,953Derivative instruments
-0.32-137,953Options-0.04-15,695Germany
-0.01-6,388EURO STOXX BANKS - 65 - 19.03.21 PUT-73-0.03-9,307EURO STOXX BANKS - 80 - 19.03.21 CALL-73
-0.04-15,278Japan
-0.01-6,491NIKKEI 225 - 25,000 - 09.04.21 PUT-2-0.03-8,787NIKKEI 225 - 25,750 - 09.04.21 PUT-2
-0.03-11,827Luxembourg
-0.01-2,338FX OPTION - CALL EUR / PUT RUB - 94.00 -04.02.21
-200,000
0.00-1,056FX OPTION - CALL EUR / PUT RUB - 97.00 -04.02.21
-200,000
-0.01-4,995FX OPTION - CALL EUR / PUT USD - 1.25 -08.03.21
-816,000
-0.01-3,438PUT CDX OPTION - CDX NA HY 35 INDEX - 100.00- 17.02.21
-2,000,000
-0.21-95,153United States of America
-0.08-33,284S&P 500 EMIN - 3,730 - 19.03.21 PUT-6-0.04-16,448S&P 500 INDEX - 3,250 - 19.03.21 PUT-5-0.09-45,421S&P 500 INDEX - 3,645 - 19.03.21 CALL-3
90.3739,408,322Total securities portfolio
Amundi S.F. - Diversified Target Income 11/2022
31/12/20Securities Portfolio as at

66
The accompanying notes form an integral part of these financial statements
% o
f NaV
Market V
alue
Quan
tity
EUR
84.6881,698,550Long positions
53.8551,951,728Transferable securities admitted to an official stock exchangelisting and/or dealt in on another regulated market
53.8551,951,728Bonds53.8551,951,728Governments
2.492,402,424BERLIN LAND 1.50% 21/01/20212,400,0004.164,022,166BRANDENBURG (LAND) 3.50% 15/06/20213,950,0001.511,452,088BUNDESLANDER BUNDESREP.DEUTSCH 1.50%
29/01/20211,450,000
1.471,416,436FINLAND 3.50% 15/04/20211,400,0002.802,703,321FRANCE OAT 0% 25/02/20212,700,0004.984,812,864FRANCE OAT 0% 25/05/20214,800,0001.371,317,771FRANCE OAT 3.75% 25/04/20211,300,0000.10100,088FREE HANSEATIC CITY OF BREMEN 0%
02/03/2021100,000
2.542,450,588FREE HANSEATIC CITY OF BREMEN 0%19/01/2021
2,450,000
3.343,219,808FREE HANSEATIC CITY OF BREMEN 1.375%28/04/2021
3,200,000
1.041,000,640FREE HANSEATIC CITY OF HAMBURG 0%12/02/2021
1,000,000
1.361,309,438FREE HANSEATIC CITY OF HAMBURG 1.00%18/06/2021
1,300,000
3.223,102,077LAND NORDRHEIN WESTFALEN 0% 16/02/20213,100,0003.473,351,976LAND NORDRHEIN WESTFALEN 1.50%
14/01/20213,350,000
4.414,260,795STATE OF HESSEN 0% 10/06/20214,250,0000.37354,015STATE OF HESSEN 0.375% 10/03/2022350,0001.00961,163STATE OF HESSEN 3.75% 12/04/2021950,0004.924,754,275STATE OF LOWER SAXONY 0% 01/03/20214,750,0001.821,754,498STATE OF LOWER SAXONY 0% 14/06/20211,750,0000.79759,180STATE OF LOWER SAXONY 1.625% 23/07/2021750,0000.78750,135STATE OF RHINELAND PALATINATE 0%
15/01/2021750,000
1.041,002,290STATE OF RHINELAND PALATINATE 0%31/05/2021
1,000,000
1.671,610,112STATE OF RHINELAND PALATINATE 3.50%01/03/2021
1,600,000
3.203,083,580STATE OF SAXONY ANHALT 3.75% 06/04/20213,050,000
30.8329,746,822Money market instrument
30.8329,746,822Bonds30.8329,746,822Governments
4.113,959,836BELGIUM 0% 13/05/20213,950,0000.88850,238BELGIUM 0% 14/01/2021850,0002.752,653,498FRANCE BTF 0% 10/03/20212,650,0000.46444,446FRANCE BTF 0% 16/06/2021650,0004.113,960,072FRANCE BTF 0% 19/05/20213,950,0003.793,654,161FRANCE BTF 0% 24/02/20213,650,0003.893,756,075FRANCE BTF 0% 24/03/20213,750,0001.141,100,649FRANCE BTF 0% 27/01/20211,100,0003.633,505,670FREE HANSEATIC CITY OF BREMEN 0%
20/04/20213,500,000
3.423,304,059NETHERLANDS 0% 25/02/20213,300,000
% o
f NaV
Market V
alue
Quan
tity
EUR
1.771,706,290NETHERLANDS 0% 29/06/20211,700,0000.88851,828NETHERLANDS 0% 30/03/2021850,000
84.6881,698,550Total securities portfolio
Amundi S.F. - EUR Commodities
31/12/20Securities Portfolio as at
Commodities Sub-Funds

67
The accompanying notes form an integral part of these financial statements
% o
f NaV
Market V
alue
Quan
tity
USD
99.51437,145,240Long positions
99.51437,145,240Transferable securities admitted to an official stock exchangelisting and/or dealt in on another regulated market
99.51437,145,240Bonds99.51437,145,240United States of America
29.42129,248,444USA T-BONDS 0% 15/02/2024 USD (ISINUS912820L473)
130,000,000
29.39129,116,403USA T-BONDS 0% 15/02/2024 USD (ISINUS912833LQ14)
130,000,000
0.001,060USA T-BONDS 2.00% 30/04/20241,00028.65125,846,785USA T-BONDS 2.125% 29/02/2024118,601,0000.001,062USA T-BONDS 2.125% 31/03/20241,00012.0552,931,486USA T-BONDS 2.75% 15/02/202449,000,000
99.51437,145,240Total securities portfolio
Amundi S.F. - SMBC Amundi Protect Fund USD Step 201803
31/12/20Securities Portfolio as at
Capital Guaranteed Sub-Funds

68
The accompanying notes form an integral part of these financial statements
% o
f NaV
Market V
alue
Quan
tity
USD
98.8757,776,428Long positions
89.9852,578,685Transferable securities admitted to an official stock exchangelisting and/or dealt in on another regulated market
89.9852,578,685Bonds89.9852,578,685United States of America
29.3617,154,032USA T-BONDS 0% 15/08/2024 USD (ISINUS912820P847)
17,300,000
29.1517,029,343USA T-BONDS 0% 15/08/2024 USD (ISINUS912833LS79)
17,200,000
25.9415,159,117USA T-BONDS 1.875% 31/08/202414,300,0000.001,070USA T-BONDS 2.125% 30/09/20241,0000.001,076USA T-BONDS 2.25% 31/10/20241,0005.533,234,047USA T-BONDS 2.375% 15/08/20243,001,000
8.895,197,743Share/Units of UCITS/UCIS
8.895,197,743Share/Units in investment funds8.895,197,743Luxembourg
2.211,294,328AMUNDI GOVT BOND LOWEST RATE EUROMTSINVESTMENT GRADE UCITS ETF -EUR (C)
3,997
2.221,300,077AMUNDI INDEX EURO AGG CORPORATE SRIUCITS ETF DR (C)
19,319
3.401,985,978AMUNDI INDEX US CORP SRI UCITS ETF DR (C)31,4830.28163,975AMUNDI MSCI EM LATIN AMERICA UCITS ETF -
EUR (C)11,478
0.26150,417AMUNDI MSCI EUROPE VALUE FACTOR UCITSETF - EUR (C)
609
0.52302,968AMUNDI S&P 500 ESG UCITS ETF DR (C)3,074
98.8757,776,428Total securities portfolio
Amundi S.F. - SMBC Amundi Protect Fund USD Step 201809
31/12/20Securities Portfolio as at
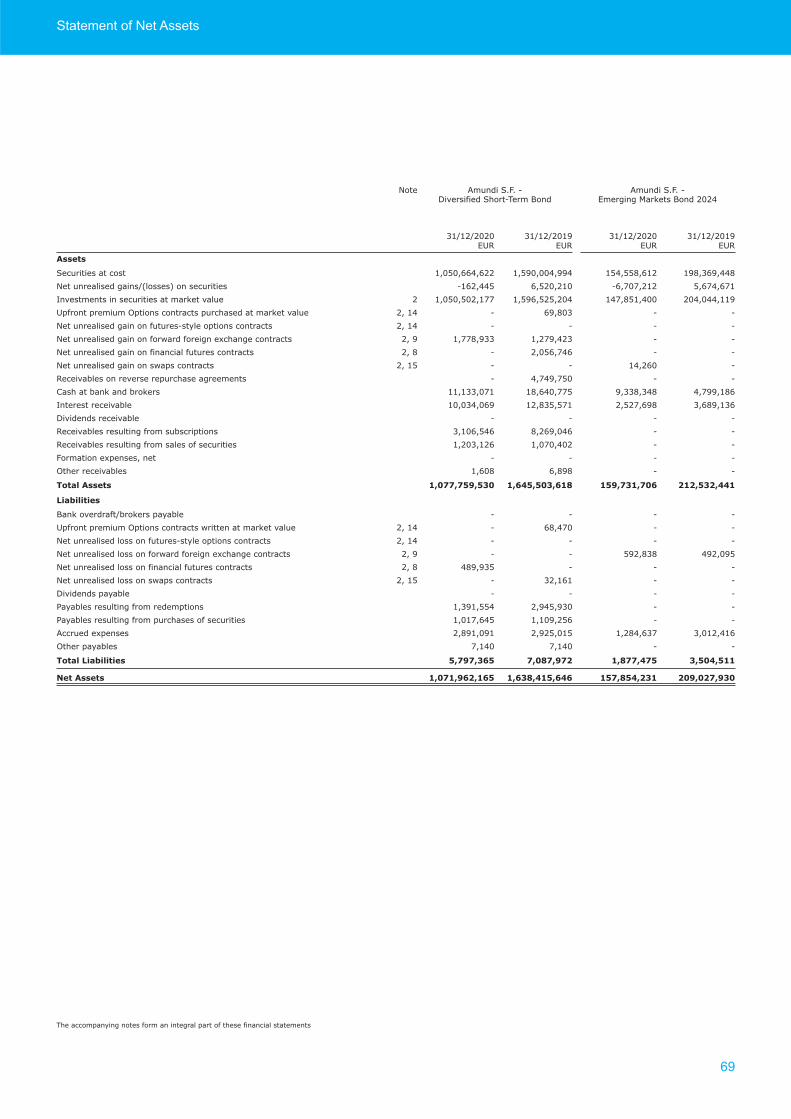
69
The accompanying notes form an integral part of these financial statements
Statement of Net Assets
Amundi S.F. - Emerging Markets Bond 2024
Amundi S.F. - Diversified Short-Term Bond
Note
31/12/201931/12/202031/12/201931/12/2020EUREUREUREUR
Assets
198,369,448154,558,6121,590,004,9941,050,664,622Securities at cost
5,674,671-6,707,2126,520,210-162,445Net unrealised gains/(losses) on securities
204,044,119147,851,4001,596,525,2041,050,502,177Investments in securities at market value
--69,803-Upfront premium Options contracts purchased at market value
----Net unrealised gain on futures-style options contracts
--1,279,4231,778,933Net unrealised gain on forward foreign exchange contracts
--2,056,746-Net unrealised gain on financial futures contracts
-14,260--Net unrealised gain on swaps contracts
--4,749,750-Receivables on reverse repurchase agreements
4,799,1869,338,34818,640,77511,133,071Cash at bank and brokers
3,689,1362,527,69812,835,57110,034,069Interest receivable
----Dividends receivable
--8,269,0463,106,546Receivables resulting from subscriptions
--1,070,4021,203,126Receivables resulting from sales of securities
----Formation expenses, net
--6,8981,608Other receivables
1 5 441159 7 1 7061 645 50 6181 077 759 5 0Total Assets
Liabilities
----Bank overdraft/brokers payable
--68,470-Upfront premium Options contracts written at market value
----Net unrealised loss on futures-style options contracts
492,095592,838--Net unrealised loss on forward foreign exchange contracts
---489,935Net unrealised loss on financial futures contracts
--32,161-Net unrealised loss on swaps contracts
----Dividends payable
--2,945,9301,391,554Payables resulting from redemptions
--1,109,2561,017,645Payables resulting from purchases of securities
3,012,4161,284,6372,925,0152,891,091Accrued expenses
--7,1407,140Other payables
504 5111 877 4757 087 975 797 65Total Liabilities
09 0 7 9 0157 854 11 6 8 415 6461 071 96 165Net Assets
Accounts:
2
2, 14
2, 14
2, 9
2, 8
2, 15
2, 14
2, 14
2, 9
2, 8
2, 15

70
The accompanying notes form an integral part of these financial statements
Statement of Net Assets
Amundi S.F. - Euro Curve 1-3year
Amundi S.F. - Emerging Markets Bond 2025
Note
31/12/201931/12/202031/12/201931/12/2020EUREUREUREUR
Assets
53,008,54123,834,195293,778,572246,276,619Securities at cost
-473,734-181,4533,326,951-11,225,144Net unrealised gains/(losses) on securities
52,534,80723,652,742297,105,523235,051,475Investments in securities at market value
----Upfront premium Options contracts purchased at market value
----Net unrealised gain on futures-style options contracts
----Net unrealised gain on forward foreign exchange contracts
33,260---Net unrealised gain on financial futures contracts
---37,077Net unrealised gain on swaps contracts
----Receivables on reverse repurchase agreements
325,281335,1766,393,22716,371,067Cash at bank and brokers
576,986129,9355,231,9814,202,882Interest receivable
----Dividends receivable
52,073---Receivables resulting from subscriptions
----Receivables resulting from sales of securities
----Formation expenses, net
1,747---Other receivables
5 5 4 1544 117 8508 7 0 7 155 66 501Total Assets
Liabilities
3535--Bank overdraft/brokers payable
----Upfront premium Options contracts written at market value
----Net unrealised loss on futures-style options contracts
--672,8281,100,307Net unrealised loss on forward foreign exchange contracts
-3,415--Net unrealised loss on financial futures contracts
-12,530--Net unrealised loss on swaps contracts
----Dividends payable
115,6279,324--Payables resulting from redemptions
----Payables resulting from purchases of securities
136,88277,2741,740,704906,309Accrued expenses
-544--Other payables
5 54410 141 5006 616Total Liabilities
5 71 6104 014 7 106 17 1995 655 885Net Assets
2
2, 14
2, 14
2, 9
2, 8
2, 15
2, 14
2, 14
2, 9
2, 8
2, 15

71
The accompanying notes form an integral part of these financial statements
Statement of Net Assets
Amundi S.F. - Euro Curve 7-10year
Amundi S.F. - Euro Curve 3-5year
Note
31/12/201931/12/202031/12/201931/12/2020EUREUREUREUR
Assets
128,933,927124,051,07375,902,225Securities at cost
-494,7941,808,865-273,419Net unrealised gains/(losses) on securities
128,439,133125,859,93875,628,806Investments in securities at market value
---Upfront premium Options contracts purchased at market value
---Net unrealised gain on futures-style options contracts
---Net unrealised gain on forward foreign exchange contracts
19,150-31,470Net unrealised gain on financial futures contracts
---Net unrealised gain on swaps contracts
---Receivables on reverse repurchase agreements
174,160316,273109,273Cash at bank and brokers
1,574,276837,9721,256,514Interest receivable
---Dividends receivable
35,060105,0458,299Receivables resulting from subscriptions
---Receivables resulting from sales of securities
---Formation expenses, net
---Other receivables
1 0 41 7791 7 119 877 0 4 6Total Assets
Liabilities
---Bank overdraft/brokers payable
---Upfront premium Options contracts written at market value
---Net unrealised loss on futures-style options contracts
---Net unrealised loss on forward foreign exchange contracts
-20,040-Net unrealised loss on financial futures contracts
-71,512-Net unrealised loss on swaps contracts
---Dividends payable
11,09239,05656,450Payables resulting from redemptions
---Payables resulting from purchases of securities
298,476337,013247,240Accrued expenses
-3,116-Other payables
09 568470 7 70 690Total Liabilities
1 9 9 111 6 648 49176 7 0 67Net Assets
2
2, 14
2, 14
2, 9
2, 8
2, 15
2, 14
2, 14
2, 9
2, 8
2, 15
56,251,134
-143,845
56,107,289
-
-
-
1,580
-
-
250,827
457,013
-
132
-
-
-
56 816 841
-
-
-
-
-
31,324
-
6,782
-
201,176
1,361
40 64
56 576 198

72
The accompanying notes form an integral part of these financial statements
Statement of Net Assets
Amundi S.F. - Global High Yield Opportunities 2025
Amundi S.F. - Euro Curve 10+year
Note
31/12/201931/12/202031/12/201931/12/2020EUREUREUREUR
Assets
714,855,074635,268,10474,421,047108,696,032Securities at cost
-3,828,069-50,021,676499,9763,843,559Net unrealised gains/(losses) on securities
711,027,005585,246,42874,921,023112,539,591Investments in securities at market value
----Upfront premium Options contracts purchased at market value
----Net unrealised gain on futures-style options contracts
2,693,7481,097,180--Net unrealised gain on forward foreign exchange contracts
---10,625Net unrealised gain on financial futures contracts
1,290,8851,131,231--Net unrealised gain on swaps contracts
----Receivables on reverse repurchase agreements
24,273,54332,930,454494,474505,411Cash at bank and brokers
10,459,0428,601,327798,8761,109,777Interest receivable
----Dividends receivable
--8736,354Receivables resulting from subscriptions
----Receivables resulting from sales of securities
----Formation expenses, net
----Other receivables
749 7446 9 006 6 076 14 460114 01 758Total Assets
Liabilities
18,127,48372,909-7,450Bank overdraft/brokers payable
----Upfront premium Options contracts written at market value
----Net unrealised loss on futures-style options contracts
----Net unrealised loss on forward foreign exchange contracts
--157,910-Net unrealised loss on financial futures contracts
---62,648Net unrealised loss on swaps contracts
----Dividends payable
--4,0406,160Payables resulting from redemptions
----Payables resulting from purchases of securities
3,063,6562,264,528197,473270,233Accrued expenses
---2,722Other payables
1 191 1 97 4 759 449 1Total Liabilities
7 8 55 0846 6 669 1875 855 0 711 85 545Net Assets
2
2, 14
2, 14
2, 9
2, 8
2, 15
2, 14
2, 14
2, 9
2, 8
2, 15

73
The accompanying notes form an integral part of these financial statements
Statement of Net Assets
Amundi S.F. - European Equity Market Plus
Amundi S.F. - High Yield &
Emerging Markets Bond Opportunities 2021
Note
31/12/201931/12/202031/12/201931/12/2020EUREUREUREUR
Assets
99,821,01090,393,97533,274,349Securities at cost
17,433,72411,940,696-190,632Net unrealised gains/(losses) on securities
117,254,734102,334,67133,083,717Investments in securities at market value
---Upfront premium Options contracts purchased at market value
---Net unrealised gain on futures-style options contracts
---Net unrealised gain on forward foreign exchange contracts
1,16632,870-Net unrealised gain on financial futures contracts
---Net unrealised gain on swaps contracts
---Receivables on reverse repurchase agreements
3,032,5343,746,962685,345Cash at bank and brokers
552-481,205Interest receivable
95,11070,304-Dividends receivable
49,337371-Receivables resulting from subscriptions
---Receivables resulting from sales of securities
---Formation expenses, net
---Other receivables
1 0 4 4106 185 1784 50 67Total Assets
Liabilities
925,7081,734,208-Bank overdraft/brokers payable
---Upfront premium Options contracts written at market value
---Net unrealised loss on futures-style options contracts
--9,740Net unrealised loss on forward foreign exchange contracts
---Net unrealised loss on financial futures contracts
---Net unrealised loss on swaps contracts
---Dividends payable
401,3968,402-Payables resulting from redemptions
---Payables resulting from purchases of securities
157,055179,437664,728Accrued expenses
---Other payables
1 484 1591 9 047674 468Total Liabilities
118 949 74104 6 1 1575 799Net Assets
2
2, 14
2, 14
2, 9
2, 8
2, 15
2, 14
2, 14
2, 9
2, 8
2, 15
25,153,571
-2,056,827
23,096,744
-
-
-
-
-
-
1,403,865
293,917
-
-
-
-
-
4 794 5 6
197,255
-
-
66,305
-
-
-
-
-
261,607
-
5 5 167
4 69 59

74
The accompanying notes form an integral part of these financial statements
Statement of Net Assets
Amundi S.F. - European Research
Amundi S.F. - European Equity Optimal Volatility
Note
31/12/201931/12/202031/12/201931/12/2020EUREUREUREUR
Assets
233,779,64538,253,39375,524,81657,160,963Securities at cost
22,290,6672,586,9446,882,6544,465,653Net unrealised gains/(losses) on securities
256,070,31240,840,33782,407,47061,626,616Investments in securities at market value
--215,0002,037,583Upfront premium Options contracts purchased at market value
----Net unrealised gain on futures-style options contracts
----Net unrealised gain on forward foreign exchange contracts
13,620---Net unrealised gain on financial futures contracts
----Net unrealised gain on swaps contracts
----Receivables on reverse repurchase agreements
1,286,295131,87812,800,8129,157,379Cash at bank and brokers
66-16-Interest receivable
233,31834,571102,081115,027Dividends receivable
111,3951,3183,2531,245Receivables resulting from subscriptions
----Receivables resulting from sales of securities
----Formation expenses, net
-14--Other receivables
57 715 00641 008 11895 5 8 67 9 7 850Total Assets
Liabilities
----Bank overdraft/brokers payable
--71,500599,000Upfront premium Options contracts written at market value
----Net unrealised loss on futures-style options contracts
----Net unrealised loss on forward foreign exchange contracts
--1,946,000803,682Net unrealised loss on financial futures contracts
----Net unrealised loss on swaps contracts
----Dividends payable
790,9266,422142,220205,725Payables resulting from redemptions
----Payables resulting from purchases of securities
839,928582,122420,464391,986Accrued expenses
-947--Other payables
1 6 0 854589 491580 184000 9Total Liabilities
56 084 1540 418 6 79 948 44870 9 7 457Net Assets
2
2, 14
2, 14
2, 9
2, 8
2, 15
2, 14
2, 14
2, 9
2, 8
2, 15

75
The accompanying notes form an integral part of these financial statements
Statement of Net Assets
Amundi S.F. - Saving Box I
Amundi S.F. - Absolute Return Multi-Strategy
Control
Note
31/12/201931/12/202031/12/201931/12/2020EUREUREUREUR
Assets
46,328,245137,738,727Securities at cost
-278,482942,073Net unrealised gains/(losses) on securities
46,049,763138,680,800Investments in securities at market value
53,3712,708,870Upfront premium Options contracts purchased at market value
-12,909Net unrealised gain on futures-style options contracts
28,860282,215Net unrealised gain on forward foreign exchange contracts
89,268303,729Net unrealised gain on financial futures contracts
--Net unrealised gain on swaps contracts
--Receivables on reverse repurchase agreements
3,677,8849,971,757Cash at bank and brokers
109,246572,594Interest receivable
-1,843Dividends receivable
-39,444Receivables resulting from subscriptions
179,960216,180Receivables resulting from sales of securities
--Formation expenses, net
25,322-Other receivables
50 1 67415 790 41Total Assets
Liabilities
-57,486Bank overdraft/brokers payable
27,7081,264,708Upfront premium Options contracts written at market value
1,670-Net unrealised loss on futures-style options contracts
--Net unrealised loss on forward foreign exchange contracts
--Net unrealised loss on financial futures contracts
103,615233,354Net unrealised loss on swaps contracts
--Dividends payable
409,908-Payables resulting from redemptions
120,259833,020Payables resulting from purchases of securities
151,397318,649Accrued expenses
--Other payables
814 557707 17Total Liabilities
49 99 117150 08 1 4Net Assets
2
2, 14
2, 14
2, 9
2, 8
2, 15
2, 14
2, 14
2, 9
2, 8
2, 15
28,042,716
906,937
28,949,653
155,416
-
-
-
-
-
3,678,435
91,322
-
-
-
-
8,693
88 519
5,103
132,349
3,560
19,565
42,342
979,707
-
-
101,784
119,680
36,272
1 440 6
1 44 157
113,981,391
3,643,719
117,625,110
3,460,461
-
148,378
199,261
-
-
17,383,269
433,586
255
-
245,486
-
-
1 9 495 806
53,199
1,782,990
29,725
-
-
1,616,708
-
-
943,202
372,255
24,310
4 8 89
1 4 67 417
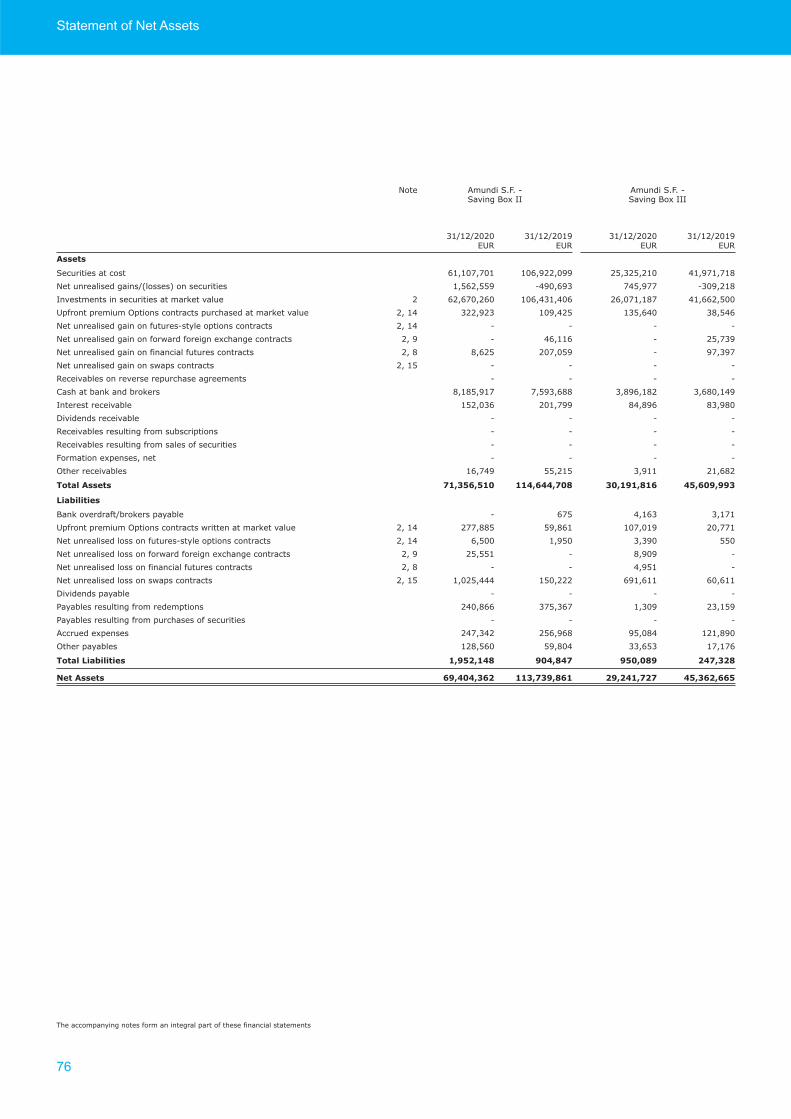
76
The accompanying notes form an integral part of these financial statements
Statement of Net Assets
Amundi S.F. - Saving Box III
Amundi S.F. - Saving Box II
Note
31/12/201931/12/202031/12/201931/12/2020EUREUREUREUR
Assets
41,971,71825,325,210106,922,09961,107,701Securities at cost
-309,218745,977-490,6931,562,559Net unrealised gains/(losses) on securities
41,662,50026,071,187106,431,40662,670,260Investments in securities at market value
38,546135,640109,425322,923Upfront premium Options contracts purchased at market value
----Net unrealised gain on futures-style options contracts
25,739-46,116-Net unrealised gain on forward foreign exchange contracts
97,397-207,0598,625Net unrealised gain on financial futures contracts
----Net unrealised gain on swaps contracts
----Receivables on reverse repurchase agreements
3,680,1493,896,1827,593,6888,185,917Cash at bank and brokers
83,98084,896201,799152,036Interest receivable
----Dividends receivable
----Receivables resulting from subscriptions
----Receivables resulting from sales of securities
----Formation expenses, net
21,6823,91155,21516,749Other receivables
45 609 990 191 816114 644 70871 56 510Total Assets
Liabilities
3,1714,163675-Bank overdraft/brokers payable
20,771107,01959,861277,885Upfront premium Options contracts written at market value
5503,3901,9506,500Net unrealised loss on futures-style options contracts
-8,909-25,551Net unrealised loss on forward foreign exchange contracts
-4,951--Net unrealised loss on financial futures contracts
60,611691,611150,2221,025,444Net unrealised loss on swaps contracts
----Dividends payable
23,1591,309375,367240,866Payables resulting from redemptions
----Payables resulting from purchases of securities
121,89095,084256,968247,342Accrued expenses
17,17633,65359,804128,560Other payables
47 8950 089904 8471 95 148Total Liabilities
45 6 6659 41 7 711 7 9 86169 404 6Net Assets
2
2, 14
2, 14
2, 9
2, 8
2, 15
2, 14
2, 14
2, 9
2, 8
2, 15

77
The accompanying notes form an integral part of these financial statements
Statement of Net Assets
Amundi S.F. - Diversified Target Income 11/2021
Amundi S.F. - Amundi Target Trend 2024
Note
31/12/201931/12/202031/12/201931/12/2020EUREUREUREUR
Assets
36,283,36932,465,50528,005,76219,844,626Securities at cost
1,257,642826,4291,337,475925,371Net unrealised gains/(losses) on securities
37,541,01133,291,93429,343,23720,769,997Investments in securities at market value
199,605291,085--Upfront premium Options contracts purchased at market value
14,566---Net unrealised gain on futures-style options contracts
297,221---Net unrealised gain on forward foreign exchange contracts
33,64972,176-46,869Net unrealised gain on financial futures contracts
225,734457,003--Net unrealised gain on swaps contracts
----Receivables on reverse repurchase agreements
1,247,3183,627,573964,050692,287Cash at bank and brokers
392,486340,910127-Interest receivable
5,8754,487--Dividends receivable
----Receivables resulting from subscriptions
-888-823,505Receivables resulting from sales of securities
----Formation expenses, net
19,0295,9789693,217Other receivables
9 976 4948 09 0 40 08 85 875Total Assets
Liabilities
39,336---Bank overdraft/brokers payable
130,184106,880--Upfront premium Options contracts written at market value
----Net unrealised loss on futures-style options contracts
-8,584--Net unrealised loss on forward foreign exchange contracts
----Net unrealised loss on financial futures contracts
----Net unrealised loss on swaps contracts
----Dividends payable
-21,895-25,162Payables resulting from redemptions
180,780153,171-731,846Payables resulting from purchases of securities
127,524134,02088,64163,675Accrued expenses
-1,163--Other payables
477 8 44 5 7188 6418 0 68Total Liabilities
9 498 6707 666 10 19 741 515 19Net Assets
2
2, 14
2, 14
2, 9
2, 8
2, 15
2, 14
2, 14
2, 9
2, 8
2, 15

78
The accompanying notes form an integral part of these financial statements
Statement of Net Assets
Amundi S.F. - EUR Commodities
Amundi S.F. - Diversified Target Income
11/2022
Note
31/12/201931/12/202031/12/201931/12/2020EUREUREUREUR
Assets
151,062,90682,110,07040,766,34238,695,264Securities at cost
-458,912-411,5201,187,174514,857Net unrealised gains/(losses) on securities
150,603,99481,698,55041,953,51639,210,121Investments in securities at market value
--221,101336,154Upfront premium Options contracts purchased at market value
--16,390-Net unrealised gain on futures-style options contracts
--360,845-Net unrealised gain on forward foreign exchange contracts
--25,867112,919Net unrealised gain on financial futures contracts
7,648,5633,714,389246,930657,142Net unrealised gain on swaps contracts
----Receivables on reverse repurchase agreements
27,958,59411,042,5375,201,7873,329,875Cash at bank and brokers
653,107445,911451,015424,447Interest receivable
--6,8107,105Dividends receivable
71,95848,270--Receivables resulting from subscriptions
---953Receivables resulting from sales of securities
----Formation expenses, net
--21,9076,851Other receivables
186 9 6 1696 949 65748 506 16844 085 567Total Assets
Liabilities
----Bank overdraft/brokers payable
--140,077137,953Upfront premium Options contracts written at market value
----Net unrealised loss on futures-style options contracts
206,25763,044-9,362Net unrealised loss on forward foreign exchange contracts
----Net unrealised loss on financial futures contracts
----Net unrealised loss on swaps contracts
--1,207,411-Dividends payable
135,910138,700--Payables resulting from redemptions
--807,149167,252Payables resulting from purchases of securities
326,387265,597153,483164,901Accrued expenses
10,2405,4794,338-Other payables
678 79447 8 01 458479 468Total Liabilities
186 57 496 476 8 746 19 7104 606 099Net Assets
2
2, 14
2, 14
2, 9
2, 8
2, 15
2, 14
2, 14
2, 9
2, 8
2, 15

79
The accompanying notes form an integral part of these financial statements
Statement of Net Assets
Amundi S.F. - SMBC Amundi Protect Fund USD Step
201809
Amundi S.F. - SMBC Amundi Protect Fund USD Step 201803
Note
31/12/201931/12/202031/12/201931/12/2020USDUSDUSDUSD
Assets
59,357,14052,356,437469,617,438398,908,808Securities at cost
4,276,0655,419,99134,963,01238,236,432Net unrealised gains/(losses) on securities
63,633,20557,776,428504,580,450437,145,240Investments in securities at market value
75,703-613,374-Upfront premium Options contracts purchased at market value
----Net unrealised gain on futures-style options contracts
----Net unrealised gain on forward foreign exchange contracts
72,115-611,27116,766Net unrealised gain on financial futures contracts
----Net unrealised gain on swaps contracts
----Receivables on reverse repurchase agreements
1,748,625976,41613,241,6243,103,856Cash at bank and brokers
34,336117,099208,1421,354,694Interest receivable
----Dividends receivable
-506--Receivables resulting from subscriptions
----Receivables resulting from sales of securities
46,76014,463--Formation expenses, net
----Other receivables
65 610 74458 884 91519 54 861441 6 0 556Total Assets
Liabilities
----Bank overdraft/brokers payable
24,862-201,546-Upfront premium Options contracts written at market value
----Net unrealised loss on futures-style options contracts
57,27074,649439,966-Net unrealised loss on forward foreign exchange contracts
----Net unrealised loss on financial futures contracts
----Net unrealised loss on swaps contracts
----Dividends payable
32,679105,338333,158350,013Payables resulting from redemptions
258,957-2,061,658-Payables resulting from purchases of securities
251,913265,4371,982,6551,989,008Accrued expenses
----Other payables
6 5 681445 4 45 018 989 0 1Total Liabilities
64 985 0658 4 9 488514 5 8784 9 81 5 5Net Assets
2
2, 14
2, 14
2, 9
2, 8
2, 15
2, 14
2, 14
2, 9
2, 8
2, 15

80
The accompanying notes form an integral part of these financial statements
Statement of Net Assets
CombinedNote
31/12/201931/12/2020EUREUR
Assets
4,697,776,610Securities at cost
100,156,978Net unrealised gains/(losses) on securities
4,797,933,588Investments in securities at market value
4,299,724Upfront premium Options contracts purchased at market value
43,865Net unrealised gain on futures-style options contracts
5,169,219Net unrealised gain on forward foreign exchange contracts
3,557,146Net unrealised gain on financial futures contracts
9,412,112Net unrealised gain on swaps contracts
4,749,750Receivables on reverse repurchase agreements
149,512,992Cash at bank and brokers
39,747,819Interest receivable
458,327Dividends receivable
8,679,942Receivables resulting from subscriptions
1,466,542Receivables resulting from sales of securities
41,657Formation expenses, net
152,769Other receivables
5 0 5 5 45Total Assets
Liabilities
19,328,719Bank overdraft/brokers payable
2,002,230Upfront premium Options contracts written at market value
4,170Net unrealised loss on futures-style options contracts
1,823,893Net unrealised loss on forward foreign exchange contracts
2,103,910Net unrealised loss on financial futures contracts
579,963Net unrealised loss on swaps contracts
1,207,411Dividends payable
5,821,347Payables resulting from redemptions
5,128,783Payables resulting from purchases of securities
17,609,835Accrued expenses
98,698Other payables
55 708 959Total Liabilities
4 969 516 49Net Assets
2
2, 14
2, 14
2, 9
2, 8
2, 15
2, 14
2, 14
2, 9
2, 8
2, 15
3,380,949,348
-1,458,598
3,379,490,750
6,739,262
-
3,024,491
498,628
6,011,102
-
140,791,552
31,370,580
231,749
3,299,695
2,273,958
11,820
47,021
57 790 608
2,074,322
3,144,076
43,175
1,955,475
1,364,365
4,491,484
-
2,473,511
3,114,900
12,952,502
245,267
1 859 077
541 9 1 5 1

81
The accompanying notes form an integral part of these financial statements
Statement of Unit Statistics
Amundi S.F. - Diversified Short-Term Bond
31/12/1831/12/1931/12/2031/12/20
NAV per unitNAV per unitNAV per unit
Currency
Number of units
IsIN
48.8450.0850.29EUR42,638.689LU1706854152Class A Non - Distributing
-5.0445.035EUR1,011.380LU1706854236Class E Distributing Quarterly
4.9425.0685.089EUR181,402,642.419LU1499628912Class E Non - Distributing
5.6505.6896.226USD181,402,642.419LU1706854319Class E Non - Distributing
991.641,009.671,009.73EUR28,730.934LU1889052269Class H Distributing Quarterly
995.711,023.921,030.87EUR80,797.979LU1503126044Class H Non - Distributing
979.501,008.081,015.73EUR33,873.910LU1706854400Class I Non - Distributing
1,918,128,3391,638,415,6461,071,962,165EURTotal Net Assets
Amundi S.F. - Emerging Markets Bond 2024
31/12/1831/12/1931/12/2031/12/20
NAV per unitNAV per unitNAV per unit
Currency
Number of units
IsIN
-1,094.661,066.17CZK358,026.335LU1920531610Class A Hedged Non - Distributing
-5.4355.089EUR28,164,885.541LU1920531701Class E Distributing Annually
-209,027,930157,854,231EURTotal Net Assets
Amundi S.F. - Emerging Markets Bond 2025
31/12/1831/12/1931/12/2031/12/20
NAV per unitNAV per unitNAV per unit
Currency
Number of units
IsIN
-5.1694.795EUR52,897,306.754LU1984707163Class E Distributing Annually
-306,317,199253,655,885EURTotal Net Assets
Amundi S.F. - Euro Curve 1-3year
31/12/1831/12/1931/12/2031/12/20
NAV per unitNAV per unitNAV per unit
Currency
Number of units
IsIN
473.04472.37468.22EUR7,284.748LU0271690827Class A Distributing Annually
61.6661.5761.03EUR22,994.154LU0271690744Class A Non - Distributing
5.8085.7925.732EUR1,142,066.100LU0271690660Class E Non - Distributing
5.5655.5285.451EUR1,190,039.317LU0279958614Class F Non - Distributing
1,037.591,037.641,030.10EUR82.751LU0271691122Class H Distributing Annually
1,185.011,184.921,176.39EUR4,184.042LU0332132637Class H Non - Distributing
1,107.491,110.271,104.87EUR1,041.088LU0433266359Class I Non - Distributing
49.5449.6349.36EUR100.000LU1706854749Class R Distributing Annually
49.5949.6949.41EUR101.003LU1706853691Class R Non - Distributing
647,260,91853,271,61024,014,731EURTotal Net Assets
Amundi S.F. - Euro Curve 3-5year
31/12/1831/12/1931/12/2031/12/20
NAV per unitNAV per unitNAV per unit
Currency
Number of units
IsIN
65.6366.5767.33EUR56,049.078LU0281584838Class A Distributing Annually
69.0170.0070.79EUR35,818.721LU0367809836Class A Non - Distributing
6.5966.6606.703EUR5,160,179.955LU0271691478Class E Non - Distributing

82
The accompanying notes form an integral part of these financial statements
Statement of Unit Statistics
31/12/1831/12/1931/12/2031/12/20
NAV per unitNAV per unitNAV per unit
Currency
Number of units
IsIN
Amundi S.F. - Euro Curve 3-5year
6.2826.3086.314EUR1,248,076.328LU0279958887Class F Non - Distributing
1,389.621,410.481,427.13EUR3,428.758LU0332132553Class H Non - Distributing
1,314.171,336.251,354.61EUR2,028.562LU0400221809Class I Non - Distributing
49.4850.3150.97EUR3,018.107LU1706853774Class R Non - Distributing
214,613,89476,730,67256,576,198EURTotal Net Assets
Amundi S.F. - Euro Curve 5-7year
31/12/1831/12/1912/11/2012/11/20
NAV per unitNAV per unitNAV per unit
Currency
Number of units
IsIN
5.3335.4595.573EUR222,734.802LU0859096066Class E Distributing Quarterly Target
6.586.786.94EUR159,086.781LU0551379273Class E Non - Distributing
1,362.241,411.661,451.41EUR4,236.211LU0551376923Class H Non - Distributing
9,743,9728,415,0298,494,236EURTotal Net Assets
Amundi S.F. - Euro Curve 7-10year
31/12/1831/12/1931/12/2031/12/20
NAV per unitNAV per unitNAV per unit
Currency
Number of units
IsIN
71.1975.5179.50EUR1,810.654LU0536711285Class A Distributing
75.2479.7083.92EUR210,017.503LU0536711103Class A Distributing Annually
85.6090.8595.66EUR159,106.286LU0367810172Class A Non - Distributing
69.7773.1175.98EUR386.630LU0536711442Class C Non - Distributing
5.6005.8976.173EUR333,020.158LU0857391824Class E Distributing Quarterly Target
8.1698.6319.045EUR3,176,894.700LU0271693920Class E Non - Distributing
7.5987.9828.320EUR390,667.984LU0271694654Class F Non - Distributing
1,712.291,818.251,915.42EUR29,226.747LU0332132041Class H Non - Distributing
1,561.171,660.961,753.15EUR1,974.224LU0433266433Class I Non - Distributing
49.8652.9455.86EUR100.437LU1706854665Class R Distributing
50.2153.5456.49EUR2,475.000LU1706853857Class R Non - Distributing
210,527,064129,932,211126,648,491EURTotal Net Assets
Amundi S.F. - Euro Curve 10+year
31/12/1831/12/1931/12/2031/12/20
NAV per unitNAV per unitNAV per unit
Currency
Number of units
IsIN
93.16107.54120.50EUR4,329.173LU0281585215Class A Distributing Annually
6.0806.8847.671EUR197,649.620LU0857391741Class E Distributing Quarterly Target
8.78110.08611.288EUR247,101.168LU0271691981Class E Non - Distributing
8.1679.33210.386EUR153,561.582LU0271692013Class F Non - Distributing
1,962.422,266.222,549.43EUR31,686.952LU0332132397Class H Non - Distributing
1,862.852,155.572,429.39EUR10,968.517LU0433266516Class I Non - Distributing
116,694,79475,855,037113,852,545EURTotal Net Assets

83
The accompanying notes form an integral part of these financial statements
Statement of Unit Statistics
Amundi S.F. - Global High Yield Opportunities 2025
31/12/1831/12/1931/12/2031/12/20
NAV per unitNAV per unitNAV per unit
Currency
Number of units
IsIN
-5.0034.341EUR63,214,126.630LU2035036107Class B Distributing Annually
-5.0814.840EUR63,949,267.585LU2035036016Class B Hedged Distributing Annually
-5.0054.344EUR9,848,616.905LU2035036362Class E Distributing Annually
-728,553,084626,669,183EURTotal Net Assets
Amundi S.F. - High Yield & Emerging Markets Bond Opportunities 2021
31/12/1831/12/1931/12/2031/12/20
NAV per unitNAV per unitNAV per unit
Currency
Number of units
IsIN
5.0695.4294.981EUR4,872,172.079LU1410362625Class E Distributing Annually
44,385,91833,575,79924,269,359EURTotal Net Assets
Amundi S.F. - European Equity Market Plus
31/12/1831/12/1931/12/2031/12/20
NAV per unitNAV per unitNAV per unit
Currency
Number of units
IsIN
113.02138.17133.32CHF104,288.982LU0536711871Class A Non - Distributing
100.29127.11123.27EUR104,288.982LU0380935170Class A Non - Distributing
11.03013.96113.518EUR643,998.943LU0285097662Class E Non - Distributing
2,026.432,571.912,497.86EUR33,106.930LU0383420295Class H Non - Distributing
895.941,139.161,108.21EUR5.000LU1619842302Class I Non - Distributing
149,842,566118,949,274104,263,131EURTotal Net Assets
Amundi S.F. - European Equity Optimal Volatility
31/12/1831/12/1931/12/2031/12/20
NAV per unitNAV per unitNAV per unit
Currency
Number of units
IsIN
-40.8837.57EUR1,419,161.683LU1920531883Class A Non - Distributing
-45.8945.97USD1,419,161.683LU1920531966Class A Non - Distributing
-43.0339.15EUR4,209.364LU1920532345Class C Non - Distributing
-48.3047.90USD4,209.364LU1920532261Class C Non - Distributing
-4.0843.753EUR3,900,952.845LU1920532428Class E Non - Distributing
-4.3323.950EUR574,438.854LU1920532691Class F Non - Distributing
-4.2653.900EUR5,239.381LU1920532774Class G Non - Distributing
-839.12776.63EUR665.862LU1920532857Class H Non - Distributing
-849.20788.37EUR5.000LU1920533079Class I Non - Distributing
-953.22964.62USD5.000LU1920532931Class I Non - Distributing
-44.3741.12EUR100.000LU1920533152Class R Non - Distributing
-92,948,44870,937,457EURTotal Net Assets
Amundi S.F. - European Research
31/12/1831/12/1931/12/2031/12/20
NAV per unitNAV per unitNAV per unit
Currency
Number of units
IsIN
-6.916.56EUR1,794,284.281LU1920533400Class A Non - Distributing
-7.768.03USD1,794,284.281LU1920533236Class A Non - Distributing

84
The accompanying notes form an integral part of these financial statements
Statement of Unit Statistics
31/12/1831/12/1931/12/2031/12/20
NAV per unitNAV per unitNAV per unit
Currency
Number of units
IsIN
Amundi S.F. - European Research
-5.425.10EUR6,319.115LU1920533582Class B Non - Distributing
-6.096.24USD6,319.115LU1920533665Class B Non - Distributing
-4.954.66EUR60,901.813LU1920533749Class C Non - Distributing
-7.1416.782EUR1,752,043.056LU1920533822Class E Non - Distributing
-6.0485.700EUR859,363.437LU1920534044Class F Non - Distributing
-5.0874.807EUR12,487.401LU1920534127Class G Non - Distributing
-1,498.781,434.49EUR1,789.238LU1920534390Class H Non - Distributing
-8.317.96EUR1,119,192.660LU1920534473Class I Non - Distributing
-9.339.74USD1,119,192.660LU1920534556Class I Non - Distributing
-53.0050.75EUR100.000LU1920534630Class R Non - Distributing
-50.51-EUR-LU1920534713Class U Non - Distributing
-56.69-USD-LU1920534804Class U Non - Distributing
-256,084,15240,418,627EURTotal Net Assets
Amundi S.F. - Absolute Return Multi-Strategy Control
31/12/1831/12/1931/12/2031/12/20
NAV per unitNAV per unitNAV per unit
Currency
Number of units
IsIN
48.4349.8451.13EUR102.208LU1410363276Class A Non - Distributing
4.8404.9775.105EUR22,169.730LU1410363359Class E Non - Distributing
978.551,009.931,043.10EUR128,990.576LU1410363433Class H Non - Distributing
48.5350.0551.44EUR100.000LU1706854822Class R Non - Distributing
164,203,098150,083,124134,673,417EURTotal Net Assets
Amundi S.F. - Saving Box I
31/12/1831/12/1931/12/2031/12/20
NAV per unitNAV per unitNAV per unit
Currency
Number of units
IsIN
4.9015.0355.107EUR686,760.822LU1390435458Class E Non - Distributing
48.8850.1850.84EUR549,447.205LU1390435888Class U Non - Distributing
93,644,38649,399,11731,443,157EURTotal Net Assets
Amundi S.F. - Saving Box II
31/12/1831/12/1931/12/2031/12/20
NAV per unitNAV per unitNAV per unit
Currency
Number of units
IsIN
4.8975.0125.097EUR2,738,479.067LU1428820432Class E Non - Distributing
48.9250.0450.87EUR1,090,040.359LU1428824004Class U Non - Distributing
196,340,205113,739,86169,404,362EURTotal Net Assets

85
The accompanying notes form an integral part of these financial statements
Statement of Unit Statistics
Amundi S.F. - Saving Box III
31/12/1831/12/1931/12/2031/12/20
NAV per unitNAV per unitNAV per unit
Currency
Number of units
IsIN
4.8855.0335.167EUR614,459.716LU1467376098Class E Non - Distributing
4.8805.0255.157EUR5,054,649.647LU1490758445Class F Non - Distributing
69,746,74145,362,66529,241,727EURTotal Net Assets
Amundi S.F. - Amundi Target Trend 2024
31/12/1831/12/1931/12/2031/12/20
NAV per unitNAV per unitNAV per unit
Currency
Number of units
IsIN
46.4450.2950.43EUR74,619.000LU1681511959Class A Distributing Annually
46.4350.2650.40EUR352,249.705LU1664216329Class W Distributing Annually
32,974,63330,219,74221,515,192EURTotal Net Assets
Amundi S.F. - Equity Plan 60
31/12/1831/12/1920/11/2020/11/20
NAV per unitNAV per unitNAV per unit
Currency
Number of units
IsIN
5.0815.7545.951EUR6,889,747.188LU1322782373Class E Non - Distributing
107,148,13464,675,53241,000,395EURTotal Net Assets
Amundi S.F. - Diversified Target Income 11/2021
31/12/1831/12/1931/12/2031/12/20
NAV per unitNAV per unitNAV per unit
Currency
Number of units
IsIN
44.8547.6248.95EUR769,411.252LU1272945004Class U Distributing Annually
41,347,30439,498,67037,666,321EURTotal Net Assets
Amundi S.F. - Diversified Target Income 11/2022
31/12/1831/12/1931/12/2031/12/20
NAV per unitNAV per unitNAV per unit
Currency
Number of units
IsIN
45.1947.9449.18EUR886,618.312LU1467375017Class W Distributing Annually
46,520,49046,193,71043,606,099EURTotal Net Assets
Amundi S.F. - EUR Commodities
31/12/1831/12/1931/12/2031/12/20
NAV per unitNAV per unitNAV per unit
Currency
Number of units
IsIN
29.5330.3628.77CHF5,057.130LU1694769693Class A Hedged Non - Distributing
29.6731.5030.41USD200,175.323LU1694769859Class A Hedged Non - Distributing
22.0322.7421.62EUR1,359,617.687LU0271695388Class A Non - Distributing
28.3829.7028.25USD473.130LU1694769933Class B Hedged Non - Distributing
33.6535.4133.83USD12,335.977LU1694770196Class C Hedged Non - Distributing
12.9813.2712.49EUR18,097.635LU0372625102Class C Non - Distributing
1.9752.0391.938EUR3,385,474.735LU0273973874Class E Non - Distributing
1.8071.8521.747EUR2,654,244.804LU0273974336Class F Non - Distributing

86
The accompanying notes form an integral part of these financial statements
Statement of Unit Statistics
31/12/1831/12/1931/12/2031/12/20
NAV per unitNAV per unitNAV per unit
Currency
Number of units
IsIN
Amundi S.F. - EUR Commodities
575.31596.68570.12EUR4.000LU0484923635Class H Distributing Annually
884.21942.91913.48USD803.596LU1772191695Class H Hedged Non - Distributing
416.96432.44412.97EUR6,395.808LU0271872185Class H Non - Distributing
398.80414.39396.48EUR4,670.000LU1694770352Class I Distributing Annually
669.51715.56694.70USD5,778.207LU0419230916Class I Hedged Non - Distributing
426.50443.17424.00EUR97,873.769LU0271695461Class I Non - Distributing
39.3441.9840.67USD3,529.488LU1706854582Class R Hedged Non - Distributing
44.4046.0543.98EUR4,614.443LU1706853931Class R Non - Distributing
189,362,301186,257,42296,476,837EURTotal Net Assets
Amundi S.F. - SMBC Amundi Protect Fund USD Step 201803
31/12/1831/12/1931/12/2031/12/20
NAV per unitNAV per unitNAV per unit
Currency
Number of units
IsIN
98.53108.26108.66USD4,042,700.000LU1744900314Class W1 Non - Distributing
500,661,498514,235,878439,281,535UsDTotal Net Assets
Amundi S.F. - SMBC Amundi Protect Fund USD Step 201809
31/12/1831/12/1931/12/2031/12/20
NAV per unitNAV per unitNAV per unit
Currency
Number of units
IsIN
99.18109.01110.38USD529,460.000LU1845134714Class W1 Non - Distributing
61,366,16364,985,06358,439,488UsDTotal Net Assets

87
The accompanying notes form an integral part of these financial statements
Statement of Operations and Changes in Net Assets
Amundi S.F. - Emerging Markets Bond 2024
Amundi S.F. - Diversified Short-Term Bond
Note
31/12/201931/12/202031/12/201931/12/2020EUREUREUREUR
Income
----Dividends, net
9,887,9499,853,56539,920,38532,973,630Interest on securities
255,31810,23052,44133,821Interest on bank accounts
3967,186378,58211,257,892Interest on swaps contracts
--14,33110,468Income on reverse repurchase agreements
437,0722,222,628251,915604,084Other income
10 580 7 51 09 60940 617 65444 879 895Total Income
Expenses
1,933,2521,679,7639,975,0427,167,848Management fees
----Distribution fees
106,740111,524901,536757,806Depositary & administration fees
114,87278,587834,655598,499“Taxe d’abonnement”
6,3176,72576,40653,147Professional fees
5,3173,36352,80526,573Printing & publishing fees
2,313,988262,65858,417-Performance fee
--243,990128,382Transaction costs
86,17477,738-690,343Reception and transmission of orders fees
-5,0691,294,50211,177,821Interest on swaps contracts
--40,4025,266Expenses on Repos
63,51862,731621,790558,283Other charges
4 6 0 17888 15814 099 5451 16 968Total Expenses
-09 0 7 9 01 918 1 8 91 6 8 415 646Net asset value at the beginning of the year
5 950 5579 805 4516 518 109715 9 7Net Operational Income/(Loss)
4,865,251-1,616,7005,183,443-18,771,299Net realised gain/(loss) on sales of securities
969,798-783,1594,923,1674,246,109Net realised gain/(loss) on foreign exchange
2,792,709-1,738,166-16,450,68414,155,043Net realised gain/(loss) on forward foreign exchange contracts
---8,300,335-12,071,524Net realised gain/(loss) on financial futures contracts
---549,524-7,193,325Net realised gain/(loss) on options contracts
--14,656-1,507,1781,386,917Net realised gain/(loss) on swaps contracts
8 6 7 758-4 15 681-16 701 111-18 48 079Net Realised Gain/(Loss)
5,674,670-12,381,88232,040,140-6,682,654Net change in unrealised gain/(loss) on securities
-492,095-100,7421,211,277499,510Net change in unrealised gain/(loss) on forward foreign exchange contracts
--2,387,341-2,546,682Net change in unrealised gain/(loss) on financial futures contracts
---77,86777,867Net change in unrealised gain/(loss) on options contracts
-14,260-40,63332,161Net change in unrealised gain/(loss) on swaps contracts
5 18 575-1 468 645 5 0 58-8 619 798Net Change in Unrealised Gain/(Loss) for the Year
19 760 890-6 815 59445 7 56- 151 950Net Increase/(Decrease) in Net Assets as a Result of Operations
189,267,040-38,806,574-323,547,013-562,211,066Net subscriptions/(redemptions)
--5,551,531-1,502,936-1,090,465Dividend declared
----Reevaluation of consolidated Net Assets
09 0 7 9 0157 854 11 6 8 415 6461 071 96 165Net Asset Value at Year End
2
2
2
2
2
10, 19
4
4
6
7
5
17
11, 19
13

88
The accompanying notes form an integral part of these financial statements
Statement of Operations and Changes in Net Assets
Amundi S.F. - Euro Curve 1-3year
Amundi S.F. - Emerging Markets Bond 2025
Note
31/12/201931/12/202031/12/201931/12/2020EUREUREUREUR
Income
----Dividends, net
2,622,603553,5716,927,89815,288,150Interest on securities
12,646-184,99611,963Interest on bank accounts
-1,061-18,298Interest on swaps contracts
----Income on reverse repurchase agreements
1,7473,73861,2861,069,373Other income
6 6 996558 707 174 18016 87 784Total Income
Expenses
934,113214,7221,367,3112,641,718Management fees
----Distribution fees
70,66916,58799,287186,008Depositary & administration fees
39,78312,92577,249126,284“Taxe d’abonnement”
4,315-9,61910,593Professional fees
5,1216316195,296Printing & publishing fees
--753,947-Performance fee
6,6034,322--Transaction costs
-5,840102,574114,448Reception and transmission of orders fees
-1,754-13,181Interest on swaps contracts
----Expenses on Repos
86,06421,82956,941101,445Other charges
1 146 66878 610467 547198 97Total Expenses
647 60 9185 71 610-06 17 199Net asset value at the beginning of the year
1 490 879 7604 706 61 188 811Net Operational Income/(Loss)
-7,888,691-1,085,099740,758-7,457,481Net realised gain/(loss) on sales of securities
14,277-1,587118,164-896,951Net realised gain/(loss) on foreign exchange
--979,097-3,276,812Net realised gain/(loss) on forward foreign exchange contracts
-1,128,10648,435--Net realised gain/(loss) on financial futures contracts
-121,480-28,663--Net realised gain/(loss) on options contracts
-35,948--38,103Net realised gain/(loss) on swaps contracts
-9 1 4 000-1 0 0 9661 8 8 019-11 669 47Net Realised Gain/(Loss)
6,311,341292,2813,326,951-14,552,095Net change in unrealised gain/(loss) on securities
---672,828-427,479Net change in unrealised gain/(loss) on forward foreign exchange contracts
221,925-36,675--Net change in unrealised gain/(loss) on financial futures contracts
33,650---Net change in unrealised gain/(loss) on options contracts
--12,530-37,077Net change in unrealised gain/(loss) on swaps contracts
6 566 9164 076654 1-14 94 497Net Change in Unrealised Gain/(Loss) for the Year
-1 066 756-508 1 09 198 775-1 4 0Net Increase/(Decrease) in Net Assets as a Result of Operations
-592,922,552-28,748,749297,118,424-31,053,593Net subscriptions/(redemptions)
----8,184,688Dividend declared
----Reevaluation of consolidated Net Assets
5 71 6104 014 7 106 17 1995 655 885Net Asset Value at Year End
2
2
2
2
2
10, 19
4
4
6
7
5
17
11, 19
13

89
The accompanying notes form an integral part of these financial statements
Statement of Operations and Changes in Net Assets
Amundi S.F. - Euro Curve 5-7year
Amundi S.F. - Euro Curve 3-5year
Note
31/12/201912/11/202031/12/201931/12/2020EUREUREUREUR
Income
----Dividends, net
176,991138,4833,007,6811,471,118Interest on securities
11-1,282216Interest on bank accounts
-16--Interest on swaps contracts
----Income on reverse repurchase agreements
67---Other income
177 0691 8 499008 961 471 4Total Income
Expenses
92,56857,7661,065,381666,403Management fees
----Distribution fees
6,9496,84155,22438,080Depositary & administration fees
4,6423,51748,16431,254“Taxe d’abonnement”
6333,0463,4462,677Professional fees
-1583,4461,339Printing & publishing fees
----Performance fee
3338098,94511,659Transaction costs
-5,574-20,682Reception and transmission of orders fees
-860-7,268Interest on swaps contracts
----Expenses on Repos
3,38711,25842,40021,969Other charges
108 5189 8 91 7 006801 1Total Expenses
9 74 978 415 0 914 61 89476 7 0 67Net asset value at the beginning of the year
68 55748 6701 781 957670 00Net Operational Income/(Loss)
250,985132,726-306,686-394,992Net realised gain/(loss) on sales of securities
--91,827-507Net realised gain/(loss) on foreign exchange
---687Net realised gain/(loss) on forward foreign exchange contracts
-27,39276,005-177,003102,270Net realised gain/(loss) on financial futures contracts
-5,830-3,155-83,570-29,807Net realised gain/(loss) on options contracts
-489-18,241Net realised gain/(loss) on swaps contracts
17 7606 056-565 4- 04 108Net Realised Gain/(Loss)
23,672-57,429155,622129,574Net change in unrealised gain/(loss) on securities
----Net change in unrealised gain/(loss) on forward foreign exchange contracts
4,020-2,53036,530-29,890Net change in unrealised gain/(loss) on financial futures contracts
530-9,910-Net change in unrealised gain/(loss) on options contracts
----31,324Net change in unrealised gain/(loss) on swaps contracts
8-59 9590 0668 60Net Change in Unrealised Gain/(Loss) for the Year
14 54194 7671 418 5874 4 55Net Increase/(Decrease) in Net Assets as a Result of Operations
-1,622,155-8,603,605-139,301,809-20,588,729Net subscriptions/(redemptions)
-21,330-6,191--Dividend declared
----Reevaluation of consolidated Net Assets
8 415 0 9-76 7 0 6756 576 198Net Asset Value at Year End
2
2
2
2
2
10, 19
4
4
6
7
5
17
11, 19
13

90
The accompanying notes form an integral part of these financial statements
Statement of Operations and Changes in Net Assets
Amundi S.F. - Euro Curve 10+year
Amundi S.F. - Euro Curve 7-10year
Note
31/12/201931/12/202031/12/201931/12/2020EUREUREUREUR
Income
----Dividends, net
2,992,4841,760,3382,449,1582,012,690Interest on securities
3,63983381232Interest on bank accounts
----Interest on swaps contracts
----Income on reverse repurchase agreements
----Other income
996 11 761 171449 901 9Total Income
Expenses
881,979582,2541,309,200890,586Management fees
--7277Distribution fees
56,79360,72780,08475,535Depositary & administration fees
47,27342,66772,89660,079“Taxe d’abonnement”
3,7404,3265,7125,200Professional fees
3,7402,1634,1122,600Printing & publishing fees
----Performance fee
9,26222,36310,08320,180Transaction costs
-47,221-40,564Reception and transmission of orders fees
-12,239-13,947Interest on swaps contracts
----Expenses on Repos
51,93928,72779,75827,998Other charges
1 054 7 680 6871 561 9171 1 6 766Total Expenses
116 694 79475 855 0 710 5 7 0641 9 9 11Net asset value at the beginning of the year
1 941 97958 484887876 156Net Operational Income/(Loss)
15,680,8661,726,01310,154,1453,149,921Net realised gain/(loss) on sales of securities
5,178-14,265-70-745Net realised gain/(loss) on foreign exchange
---2,271Net realised gain/(loss) on forward foreign exchange contracts
1,414,4401,258,445114,089332,105Net realised gain/(loss) on financial futures contracts
-60,170-47,543-70,170-84,958Net realised gain/(loss) on options contracts
-29,388-33,442Net realised gain/(loss) on swaps contracts
17 040 1495 0 810 197 9944 0 6Net Realised Gain/(Loss)
1,167,7153,343,583-1,263,5052,303,660Net change in unrealised gain/(loss) on securities
----Net change in unrealised gain/(loss) on forward foreign exchange contracts
-377,580168,535-55,350-39,190Net change in unrealised gain/(loss) on financial futures contracts
4,600-7,220-Net change in unrealised gain/(loss) on options contracts
--62,648--71,512Net change in unrealised gain/(loss) on swaps contracts
794 7 5449 470-1 11 6 519 958Net Change in Unrealised Gain/(Loss) for the Year
19 776 4467 59 999 77 6816 501 150Net Increase/(Decrease) in Net Assets as a Result of Operations
-60,585,65930,645,050-90,332,815-9,782,987Net subscriptions/(redemptions)
-30,544-7,534-35,719-1,883Dividend declared
----Reevaluation of consolidated Net Assets
75 855 0 711 85 5451 9 9 111 6 648 491Net Asset Value at Year End
2
2
2
2
2
10, 19
4
4
6
7
5
17
11, 19
13

91
The accompanying notes form an integral part of these financial statements
Statement of Operations and Changes in Net Assets
Amundi S.F. - High Yield & Emerging Markets Bond
Opportunities 2021
Amundi S.F. - Global High Yield Opportunities 2025
Note
31/12/201931/12/202031/12/201931/12/2020EUREUREUREUR
Income
----Dividends, net
2,392,0211,481,25110,033,73640,190,528Interest on securities
16,9301,021119,00513,206Interest on bank accounts
2,683-465,143341,462Interest on swaps contracts
----Income on reverse repurchase agreements
206,720519,27315,685943,761Other income
618 54001 54510 6 56941 488 957Total Income
Expenses
394,770285,7632,226,0877,575,270Management fees
----Distribution fees
34,76824,614144,910462,983Depositary & administration fees
19,24513,555181,414308,086“Taxe d’abonnement”
1,1891,1435,63625,633Professional fees
1,1895725,63612,817Printing & publishing fees
522,84442,788605,0665,786Performance fee
---1,083Transaction costs
-2,781--Reception and transmission of orders fees
--293,681168,538Interest on swaps contracts
----Expenses on Repos
15,20310,356124,184504,805Other charges
989 0881 57586 6149 065 001Total Expenses
44 85 918575 799-7 8 55 084Net asset value at the beginning of the year
1 6 9 1461 619 977 046 9554 956Net Operational Income/(Loss)
-1,785,772-1,188,497-274,788-50,116,577Net realised gain/(loss) on sales of securities
86,282-108,885-2,452,820-1,781,744Net realised gain/(loss) on foreign exchange
158,220-282,0751,850,95017,605,498Net realised gain/(loss) on forward foreign exchange contracts
----Net realised gain/(loss) on financial futures contracts
----Net realised gain/(loss) on options contracts
-14--675,575-469,356Net realised gain/(loss) on swaps contracts
-1 541 84-1 579 457-1 55- 4 76 179Net Realised Gain/(Loss)
3,624,993-1,866,195-3,828,069-46,193,607Net change in unrealised gain/(loss) on securities
2,530-56,5652,693,748-1,596,568Net change in unrealised gain/(loss) on forward foreign exchange contracts
----Net change in unrealised gain/(loss) on financial futures contracts
----Net change in unrealised gain/(loss) on options contracts
-1,118-1,290,885-159,654Net change in unrealised gain/(loss) on swaps contracts
6 6 405-1 9 760156 564-47 949 8 9Net Change in Unrealised Gain/(Loss) for the Year
714 67-1 88 445 651 86-50 88 05Net Increase/(Decrease) in Net Assets as a Result of Operations
-13,780,013-6,879,492722,901,798-33,910,554Net subscriptions/(redemptions)
-744,373-544,704--17,685,295Dividend declared
----Reevaluation of consolidated Net Assets
575 7994 69 597 8 55 0846 6 669 18Net Asset Value at Year End
2
2
2
2
2
10, 19
4
4
6
7
5
17
11, 19
13

92
The accompanying notes form an integral part of these financial statements
Statement of Operations and Changes in Net Assets
Amundi S.F. - European Equity Optimal Volatility
Amundi S.F. - European Equity Market Plus
Note
31/12/201931/12/202031/12/201931/12/2020EUREUREUREUR
Income
2,222,4141,435,3435,709,0002,407,607Dividends, net
---81,822Interest on securities
3,47686220,8213,392Interest on bank accounts
----Interest on swaps contracts
----Income on reverse repurchase agreements
-27,783--Other income
5 8901 46 9885 7 9 8 149 8 1Total Income
Expenses
1,196,9681,236,116809,487403,552Management fees
2,8212,506--Distribution fees
75,923111,81890,32571,594Depositary & administration fees
38,42039,20869,22547,976“Taxe d’abonnement”
2,3693,2485,9854,325Professional fees
2,3691,6244,3222,021Printing & publishing fees
3---Performance fee
429,269513,873161,41051,866Transaction costs
-61,911-28,213Reception and transmission of orders fees
----Interest on swaps contracts
----Expenses on Repos
99,161114,99956,52830,407Other charges
1 847 0085 01 197 86 9 954Total Expenses
-9 948 448149 84 566118 949 74Net asset value at the beginning of the year
78 587-6 1 154 5 5 91 85 867Net Operational Income/(Loss)
2,708,240-1,719,4519,418,761-754,038Net realised gain/(loss) on sales of securities
21,923-34,991185,536-7,115Net realised gain/(loss) on foreign exchange
----Net realised gain/(loss) on forward foreign exchange contracts
-8,925,450-1,439,647881,349120,131Net realised gain/(loss) on financial futures contracts
-1,971,278-2,803,949--Net realised gain/(loss) on options contracts
----Net realised gain/(loss) on swaps contracts
-8 166 565-5 998 0 810 485 646-641 0Net Realised Gain/(Loss)
6,882,654-2,417,00120,678,941-5,493,028Net change in unrealised gain/(loss) on securities
----Net change in unrealised gain/(loss) on forward foreign exchange contracts
-1,946,0001,142,318148,76531,704Net change in unrealised gain/(loss) on financial futures contracts
-92,000925,186--Net change in unrealised gain/(loss) on options contracts
----Net change in unrealised gain/(loss) on swaps contracts
4 844 654- 49 4970 8 7 706-5 461 4Net Change in Unrealised Gain/(Loss) for the Year
- 94 4-6 968 8505 845 891-4 49 479Net Increase/(Decrease) in Net Assets as a Result of Operations
95,891,772-15,042,141-66,739,183-10,436,664Net subscriptions/(redemptions)
----Dividend declared
----Reevaluation of consolidated Net Assets
9 948 44870 9 7 457118 949 74104 6 1 1Net Asset Value at Year End
2
2
2
2
2
10, 19
4
4
6
7
5
17
11, 19
13

93
The accompanying notes form an integral part of these financial statements
Statement of Operations and Changes in Net Assets
Amundi S.F. - Absolute Return Multi-Strategy
Control
Amundi S.F. - European Research
Note
31/12/201931/12/202031/12/201931/12/2020EUREUREUREUR
Income
269,6028,794,1253,379,039Dividends, net
2,335,580-157,793Interest on securities
45,4967,874297Interest on bank accounts
790,285--Interest on swaps contracts
---Income on reverse repurchase agreements
-938,965Other income
440 968 80 09546 094Total Income
Expenses
860,8343,126,7931,765,568Management fees
-4,0363,403Distribution fees
92,942140,211114,920Depositary & administration fees
75,906105,42665,806“Taxe d’abonnement”
5,0427,3187,059Professional fees
4,2427,3183,530Printing & publishing fees
-26,169-Performance fee
90,806316,916292,188Transaction costs
--114,713Reception and transmission of orders fees
1,201,032--Interest on swaps contracts
---Expenses on Repos
165,71657,86643,350Other charges
496 5 079 05410 5 7Total Expenses
164 0 098-56 084 15Net asset value at the beginning of the year
944 445 010 0 91 1 5 557Net Operational Income/(Loss)
3,915,0518,560,041-398,430Net realised gain/(loss) on sales of securities
420,105-191,354-182,000Net realised gain/(loss) on foreign exchange
-1,867,589--Net realised gain/(loss) on forward foreign exchange contracts
-3,947,238599,509272,190Net realised gain/(loss) on financial futures contracts
-569,630--Net realised gain/(loss) on options contracts
292,532--Net realised gain/(loss) on swaps contracts
-1 756 7698 968 196- 08 40Net Realised Gain/(Loss)
4,785,01322,290,667-19,703,723Net change in unrealised gain/(loss) on securities
-131,370--Net change in unrealised gain/(loss) on forward foreign exchange contracts
287,51413,620-13,620Net change in unrealised gain/(loss) on financial futures contracts
-22,072--Net change in unrealised gain/(loss) on options contracts
536,129--Net change in unrealised gain/(loss) on swaps contracts
5 455 1404 87-19 717 4Net Change in Unrealised Gain/(Loss) for the Year
4 64 8886 8 5-18 890 0 6Net Increase/(Decrease) in Net Assets as a Result of Operations
-18,762,862219,801,630-196,775,499Net subscriptions/(redemptions)
---Dividend declared
---Reevaluation of consolidated Net Assets
150 08 1 456 084 1540 418 6 7Net Asset Value at Year End
2
2
2
2
2
10, 19
4
4
6
7
5
17
11, 19
13
199,373
1,646,382
21,331
1,836,361
-
-
70 447
700,986
-
89,807
67,523
5,594
2,797
338
248,330
74,328
2,056,694
-
170,965
417 6
150 08 1 4
86 085
2,493,303
372,305
1,020,798
-3,097,037
2,030,512
550,054
69 9 5
2,701,646
-133,837
-104,469
-394,048
-1,383,354
685 9 8
4 41 958
-19,751,665
-
-
1 4 67 417

94
The accompanying notes form an integral part of these financial statements
Statement of Operations and Changes in Net Assets
Amundi S.F. - Saving Box II
Amundi S.F. - Saving Box I
Note
31/12/201931/12/202031/12/201931/12/2020EUREUREUREUR
Income
20,4249,119Dividends, net
1,598,508755,271Interest on securities
32,85416,214Interest on bank accounts
365,477193,177Interest on swaps contracts
--Income on reverse repurchase agreements
87,82554,575Other income
105 0881 0 8 56Total Income
Expenses
780,013422,408Management fees
--Distribution fees
90,01041,888Depositary & administration fees
57,09325,424“Taxe d’abonnement”
4,7712,159Professional fees
4,7712,159Printing & publishing fees
--Performance fee
4,5973,941Transaction costs
--Reception and transmission of orders fees
637,934366,787Interest on swaps contracts
--Expenses on Repos
99,68143,321Other charges
1 678 870908 087Total Expenses
196 40 059 644 86Net asset value at the beginning of the year
4 6 181 0 69Net Operational Income/(Loss)
1,817,2451,054,199Net realised gain/(loss) on sales of securities
122,13971,498Net realised gain/(loss) on foreign exchange
-907,830-585,920Net realised gain/(loss) on forward foreign exchange contracts
-1,355,128-943,606Net realised gain/(loss) on financial futures contracts
-52,187-27,767Net realised gain/(loss) on options contracts
-447,776-233,859Net realised gain/(loss) on swaps contracts
-8 5 7-665 455Net Realised Gain/(Loss)
2,993,0461,698,705Net change in unrealised gain/(loss) on securities
-175,048-94,588Net change in unrealised gain/(loss) on forward foreign exchange contracts
449,571320,466Net change in unrealised gain/(loss) on financial futures contracts
-69,850-29,538Net change in unrealised gain/(loss) on options contracts
436,841254,278Net change in unrealised gain/(loss) on swaps contracts
6 4 560149Net Change in Unrealised Gain/(Loss) for the Year
7 411 604 1 7Net Increase/(Decrease) in Net Assets as a Result of Operations
-85,837,585-45,849,406Net subscriptions/(redemptions)
--Dividend declared
--Reevaluation of consolidated Net Assets
11 7 9 86149 99 117Net Asset Value at Year End
2
2
2
2
2
10, 19
4
4
6
7
5
17
11, 19
13
2,1351,026
727,938447,591
6,1664,788
811,436403,042
--
23,14711,262
1 570 8867 709
423,714225,352
--
52,45523,787
30,57513,577
3,4501,529
1,725764
--
57,61229,864
38,01024,155
758,672429,923
--
75,24430,288
1 441 457779 9
11 7 9 86149 99 117
1 9 6588 470
310,168298,270
28,2927,897
399,251165,025
-626,772-642,745
-418,260-212,492
200,257344,606
-107 064- 9 4 9
2,053,2521,185,419
-71,667-48,425
-198,435-131,610
-226,282-106,750
-875,222-876,092
681 64654
70 94771 57
-45,039,446-18,027,533
--
--
69 404 61 44 157

95
The accompanying notes form an integral part of these financial statements
Statement of Operations and Changes in Net Assets
Amundi S.F. - Amundi Target Trend 2024
Amundi S.F. - Saving Box III
Note
31/12/201931/12/202031/12/201931/12/2020EUREUREUREUR
Income
25,48919,2675,682Dividends, net
--659,735Interest on securities
29,80855111,604Interest on bank accounts
--121,828Interest on swaps contracts
---Income on reverse repurchase agreements
8,2684,80031,573Other income
6 5654 6188 0 4Total Income
Expenses
318,441240,162286,484Management fees
---Distribution fees
20,09016,00834,378Depositary & administration fees
5,4344,40320,954“Taxe d’abonnement”
9559581,734Professional fees
9554791,734Printing & publishing fees
---Performance fee
13,28310,6652,417Transaction costs
-190-Reception and transmission of orders fees
--215,968Interest on swaps contracts
---Expenses on Repos
16,35245,90251,399Other charges
75 51018 767615 068Total Expenses
974 60 19 7469 746 741Net asset value at the beginning of the year
- 11 945- 94 14915 54Net Operational Income/(Loss)
446,173815,9041,271,698Net realised gain/(loss) on sales of securities
18,8368,09460,221Net realised gain/(loss) on foreign exchange
---456,106Net realised gain/(loss) on forward foreign exchange contracts
-248,025-588,474Net realised gain/(loss) on financial futures contracts
---20,073Net realised gain/(loss) on options contracts
---178,852Net realised gain/(loss) on swaps contracts
465 0091 07 088 414Net Realised Gain/(Loss)
2,745,246-412,1041,014,607Net change in unrealised gain/(loss) on securities
---55,619Net change in unrealised gain/(loss) on forward foreign exchange contracts
-46,869190,154Net change in unrealised gain/(loss) on financial futures contracts
---27,101Net change in unrealised gain/(loss) on options contracts
--153,737Net change in unrealised gain/(loss) on swaps contracts
745 46- 65 51 75 778Net Change in Unrealised Gain/(Loss) for the Year
898 1041 6 91 579 546Net Increase/(Decrease) in Net Assets as a Result of Operations
-5,300,168-8,523,690-25,963,622Net subscriptions/(redemptions)
-353,033-593,499-Dividend declared
---Reevaluation of consolidated Net Assets
0 19 741 515 1945 6 665Net Asset Value at Year End
2
2
2
2
2
10, 19
4
4
6
7
5
17
11, 19
13
642
389,940
4,321
298,179
-
11,807
704 889
173,805
-
21,737
12,478
1,400
700
-
23,464
23,313
302,834
-
32,151
591 88
45 6 665
11 007
272,785
14,842
154,865
-187,548
-183,954
284,069
55 059
1,055,194
-34,647
-102,348
-90,128
-631,000
197 071
665 1 7
-16,786,075
-
-
9 41 7 7

96
The accompanying notes form an integral part of these financial statements
Statement of Operations and Changes in Net Assets
Amundi S.F. - Diversified Target Income 11/2021
Amundi S.F. - Equity Plan 60
Note
31/12/201931/12/202031/12/201920/11/2020EUREUREUREUR
Income
361,812210,739663,635246,292Dividends, net
1,135,160979,418733,016299,492Interest on securities
34,1098,93510,3504,890Interest on bank accounts
119,732335,919--Interest on swaps contracts
----Income on reverse repurchase agreements
52,53418,76327-Other income
1 70 471 55 7741 407 0 8550 674Total Income
Expenses
413,795374,7891,411,414730,984Management fees
----Distribution fees
27,94724,34173,18957,671Depositary & administration fees
19,02217,17436,11418,281“Taxe d’abonnement”
1,2411,4962,4891,714Professional fees
1,2417482,489857Printing & publishing fees
---18,963Performance fee
41,49248,79063,43935,990Transaction costs
-10,091--Reception and transmission of orders fees
99,195243,924--Interest on swaps contracts
----Expenses on Repos
32,74522,72851,92366,080Other charges
6 6 678744 0811 641 0579 0 540Total Expenses
41 47 049 498 670107 148 1 464 675 5Net asset value at the beginning of the year
1 066 669809 69- 4 0 9- 79 866Net Operational Income/(Loss)
-148,061-293,2973,766,6891,313,289Net realised gain/(loss) on sales of securities
120,036-11,60062,3074,067,904Net realised gain/(loss) on foreign exchange
-893,2561,162,609162,478235,626Net realised gain/(loss) on forward foreign exchange contracts
-54,3481,973,933380,619-95,854Net realised gain/(loss) on financial futures contracts
117,728-602,089-281,455152,304Net realised gain/(loss) on options contracts
-476,808-612,421-12,792-Net realised gain/(loss) on swaps contracts
-1 4 7091 617 1 54 077 8465 67 69Net Realised Gain/(Loss)
3,975,107-431,2136,503,535-4,587,368Net change in unrealised gain/(loss) on securities
-96,106-305,805129,048-155,052Net change in unrealised gain/(loss) on forward foreign exchange contracts
165,83238,527225,003-33,427Net change in unrealised gain/(loss) on financial futures contracts
-385,83633,344-85,29413,033Net change in unrealised gain/(loss) on options contracts
217,139231,269--Net change in unrealised gain/(loss) on swaps contracts
876 1 6-4 8786 77 9-4 76 814Net Change in Unrealised Gain/(Loss) for the Year
608 0961 99 95010 616 1095 0 589Net Increase/(Decrease) in Net Assets as a Result of Operations
-4,339,610-2,807,697-53,088,711-65,206,121Net subscriptions/(redemptions)
-1,117,120-1,017,602--Dividend declared
----Reevaluation of consolidated Net Assets
9 498 6707 666 164 675 5-Net Asset Value at Year End
2
2
2
2
2
10, 19
4
4
6
7
5
17
11, 19
13

97
The accompanying notes form an integral part of these financial statements
Statement of Operations and Changes in Net Assets
Amundi S.F. -EUR Commodities
Amundi S.F. - Diversified Target Income
11/2022
Note
31/12/201931/12/202031/12/201931/12/2020EUREUREUREUR
Income
--424,140274,114Dividends, net
756,163585,5131,321,3901,143,070Interest on securities
31,4235,23435,83813,712Interest on bank accounts
756844139,203438,894Interest on swaps contracts
----Income on reverse repurchase agreements
35,8712029,5807,383Other income
8 4 1591 6111 950 1511 877 17Total Income
Expenses
1,148,066761,225476,200439,928Management fees
8,6606,253--Distribution fees
113,71965,73931,72527,537Depositary & administration fees
44,34228,90121,96120,026“Taxe d’abonnement”
11,0654,5191,4291,756Professional fees
2,0652,2601,429878Printing & publishing fees
----Performance fee
-51,71649,64166,007Transaction costs
-18,872-16,309Reception and transmission of orders fees
125,45430,816117,854337,349Interest on swaps contracts
----Expenses on Repos
145,896100,90639,61638,266Other charges
1 599 671 071 077 9 855948 056Total Expenses
189 6 01186 57 446 5 0 49046 19 710Net asset value at the beginning of the year
-775 054-479 5961 10 969 9 117Net Operational Income/(Loss)
-1,750,652-1,400,101-203,101-851,791Net realised gain/(loss) on sales of securities
22,058-121,59362,685-19,473Net realised gain/(loss) on foreign exchange
923,479-464,043-1,094,4511,353,398Net realised gain/(loss) on forward foreign exchange contracts
---15,8612,480,691Net realised gain/(loss) on financial futures contracts
--119,836-350,247Net realised gain/(loss) on options contracts
-11,512,757-11,366,188-555,918-780,355Net realised gain/(loss) on swaps contracts
-1 17 87-1 51 9 5-1 686 8101 8Net Realised Gain/(Loss)
68,38147,3914,513,870-672,318Net change in unrealised gain/(loss) on securities
29,798143,21339,143-370,207Net change in unrealised gain/(loss) on forward foreign exchange contracts
--157,53387,052Net change in unrealised gain/(loss) on financial futures contracts
---440,920-38,258Net change in unrealised gain/(loss) on options contracts
20,998,501-3,934,173235,068410,213Net change in unrealised gain/(loss) on swaps contracts
1 096 680- 74 5694 504 694-58 518Net Change in Unrealised Gain/(Loss) for the Year
8 00 754-17 575 0904 0 8 180177 8Net Increase/(Decrease) in Net Assets as a Result of Operations
-11,108,633-72,205,495-3,147,549-3,654,838Net subscriptions/(redemptions)
---1,207,411-1,110,595Dividend declared
----Reevaluation of consolidated Net Assets
186 57 496 476 8 746 19 7104 606 099Net Asset Value at Year End
2
2
2
2
2
10, 19
4
4
6
7
5
17
11, 19
13

98
The accompanying notes form an integral part of these financial statements
Statement of Operations and Changes in Net Assets
Amundi S.F. - SMBC Amundi Protect Fund USD Step
201809
Amundi S.F. - SMBC Amundi Protect Fund USD Step 201803
Note
31/12/201931/12/202031/12/201931/12/2020USDUSDUSDUSD
Income
----Dividends, net
76,153363,798696,5913,253,125Interest on securities
18,6473,842111,59717,476Interest on bank accounts
----Interest on swaps contracts
----Income on reverse repurchase agreements
918-5,132-Other income
95 71867 64081 070 601Total Income
Expenses
167,418163,0251,341,4541,269,924Management fees
244,689238,2671,960,5881,856,047Distribution fees
38,59423,489236,896246,220Depositary & administration fees
22,98729,002182,189232,739“Taxe d’abonnement”
66,43265,082531,461506,886Professional fees
4,3551,25115,4799,748Printing & publishing fees
----Performance fee
6,7212,42449,12812,506Transaction costs
----Reception and transmission of orders fees
----Interest on swaps contracts
----Expenses on Repos
448,214414,6573,102,2892,860,789Other charges
999 4109 7 1977 419 4846 994 859Total Expenses
61 66 1664 985 06500 661 498514 5 878Net asset value at the beginning of the year
-90 69-569 557-6 606 164- 7 4 58Net Operational Income/(Loss)
770,296525,200-891,3502,852,581Net realised gain/(loss) on sales of securities
41,71566,895169,438800,097Net realised gain/(loss) on foreign exchange
444,333-119,0623,567,130-918,126Net realised gain/(loss) on forward foreign exchange contracts
1,085,41424,5008,490,7421,302,060Net realised gain/(loss) on financial futures contracts
-50,316-160,645-351,053-1,277,000Net realised gain/(loss) on options contracts
----Net realised gain/(loss) on swaps contracts
91 446 88810 984 907759 61Net Realised Gain/(Loss)
4,714,5391,143,92544,414,9403,273,421Net change in unrealised gain/(loss) on securities
-32,482-17,378-231,000439,966Net change in unrealised gain/(loss) on forward foreign exchange contracts
-52,089-72,115-381,731-594,505Net change in unrealised gain/(loss) on financial futures contracts
12,875-12,875104,791-104,791Net change in unrealised gain/(loss) on options contracts
----Net change in unrealised gain/(loss) on swaps contracts
4 64 841 041 5574 907 000014 091Net Change in Unrealised Gain/(Loss) for the Year
6 0 0 59808 88848 85 74049 445Net Increase/(Decrease) in Net Assets as a Result of Operations
-2,411,693-7,354,463-34,711,363-77,003,788Net subscriptions/(redemptions)
----Dividend declared
----Reevaluation of consolidated Net Assets
64 985 0658 4 9 488514 5 8784 9 81 5 5Net Asset Value at Year End
2
2
2
2
2
10, 19
4
4
6
7
5
17
11, 19
13

99
The accompanying notes form an integral part of these financial statements
Statement of Operations and Changes in Net Assets
CombinedNote
31/12/201931/12/2020EUREUR
Income
18,517,716Dividends, net
97,309,760Interest on securities
1,214,642Interest on bank accounts
2,579,530Interest on swaps contracts
14,331Income on reverse repurchase agreements
1,642,099Other income
1 1 78 078Total Income
Expenses
34,123,010Management fees
1,980,204Distribution fees
2,804,391Depositary & administration fees
2,202,147“Taxe d’abonnement”
700,266Professional fees
138,800Printing & publishing fees
4,338,740Performance fee
1,506,254Transaction costs
188,748Reception and transmission of orders fees
4,352,407Interest on swaps contracts
40,402Expenses on Repos
5,217,949Other charges
57 59 18Total Expenses
4 994 869 84Net asset value at the beginning of the year
6 684 760Net Operational Income/(Loss)
64,090,084Net realised gain/(loss) on sales of securities
4,957,023Net realised gain/(loss) on foreign exchange
-15,189,201Net realised gain/(loss) on forward foreign exchange contracts
-13,541,825Net realised gain/(loss) on financial futures contracts
-3,933,138Net realised gain/(loss) on options contracts
-15,306,452Net realised gain/(loss) on swaps contracts
1 076 491Net Realised Gain/(Loss)
167,710,382Net change in unrealised gain/(loss) on securities
-48,851Net change in unrealised gain/(loss) on forward foreign exchange contracts
1,842,867Net change in unrealised gain/(loss) on financial futures contracts
-1,069,743Net change in unrealised gain/(loss) on options contracts
24,079,453Net change in unrealised gain/(loss) on swaps contracts
19 514 108Net Change in Unrealised Gain/(Loss) for the Year
77 75 59Net Increase/(Decrease) in Net Assets as a Result of Operations
-306,659,267Net subscriptions/(redemptions)
-5,012,466Dividend declared
( ) 9 04 0 4Reevaluation of consolidated Net Assets
4 969 516 49Net Asset Value at Year End
(1) The caption "Reevaluation of consolidated Net Assets" amounting to EUR -42,619,077 in the Combined Statement of Operations and Changes in Net Assets as at 31 December2020 includes: the result of the movements in exchange rates between 31 December 2019 and 31 December 2020 used to convert the "net asset value at the beginning of theyear" for sub-funds denominated in a currency other than the consolidated currency.
(2) The caption "Reevaluation of consolidated Net Assets" amounting to EUR 9,043,024 in the Combined Statement of Operations and Changes in Net Assets as at 31 December2019 includes: the result of the movements in exchange rates between 31 December 2018 and 31 December 2019 used to convert the "net asset value at the beginning of theyear" for sub-funds denominated in a currency other than the consolidated currency.
2
2
2
2
2
10, 19
4
4
6
7
5
17
11, 19
13
8,175,577
115,138,358
163,424
15,750,590
10,468
5,476,787
144 715 04
30,409,409
1,723,901
2,638,549
1,855,299
617,002
82,884
330,533
1,631,365
1,415,296
15,560,889
5,266
4,797,676
61 068 069
4 969 516 49
8 647 1 5
-72,774,747
5,489,403
29,646,292
-10,164,713
-10,950,599
-10,397,668
-69 15 0
-98,728,364
-2,312,894
-2,268,693
97,797
-7,312,529
-110 5 4 68
-96 0 9 580
-1,253,142,318
-35,793,987
(1) -4 619 077
541 9 1 5 1

100
1 INTRODUCTIONAmundi S.F. (the “Fund”) is organised as a Fonds Commun de Placement (FCP) with several separate Sub-Funds (individually the “Sub-Fund” and collectively the “Sub-Funds”). The Fund is an Undertaking for Collective Investment in Transferable Securities (UCITS) created 06 June 2003 and qualifies under Part I of the Luxembourgamended law of 17 December 2010 relating to Undertakings for Collective Investment. It is governed by the Management Regulations effective as at year-end, andupdated for the last time on 29 June 2018 and published in the Recueil Electronique des Sociétés et Associations (“RESA”) on 16 July 2018.
The Fund is an unincorporated co-proprietorship of its securities and other assets, managed by Amundi Luxembourg S.A. (the “Management Company”) a companyorganised in the form of a public limited company (“société anonyme”) under chapter 15 of the Law of 17 December 2010 as amended, wholly owned subsidiary ofAmundi Asset Management S.A.S, registered with the Trade and Companies Register under number B 57.255 and having its registered office in Luxembourg. It wasincorporated on 20 December 1996 for an unlimited period of time. Its Articles of Incorporation are published in the Mémorial on 28 January 1997 and have beenamended for the last time on 1 January 2018.
The assets of the different Sub-Funds are separately invested in accordance with their respective investment policies and objectives. All Sub-Funds are denominatedin EUR or in USD (the “Base Currency”) and all assets and liabilities of each Sub-Fund are valued in the Base Currency of such Sub-Fund.The unitholders are allowed to subscribe in Euros, US dollars and in Swiss francs or such other freely convertible currency upon a decision of the Board of Directorsof the Management Company. Net Asset Value (“NAV”) per unit in currency different to the euro represents the daily conversion of the NAV per unit in euro.
As of January 27, 2020, Société Générale Bank & Trust’s name has been changed into Société Générale Luxembourg.
The following Sub-Fund has been merged:Amundi S.F. - Equity Plan 60 into Amundi Funds Global Multi-Asset on 20 November 2020.
The following Sub-Fund has been liquidated:Amundi S.F. - Euro Curve 5-7year on 12 November 2020.
As at 31 December 2020, 22 Sub-Funds were active as detailed below:
Bond Sub-FundsAmundi S.F. - Diversified Short-Term BondAmundi S.F. - Emerging Markets Bond 2024Amundi S.F. - Emerging Markets Bond 2025Amundi S.F. - Euro Curve 1-3yearAmundi S.F. - Euro Curve 3-5yearAmundi S.F. - Euro Curve 7-10yearAmundi S.F. - Euro Curve 10+yearAmundi S.F. - Global High Yield Opportunities 2025 Amundi S.F. - High Yield & Emerging Markets Bond Opportunities 2021
Equity Sub-FundsAmundi S.F. - European Equity Market Plus Amundi S.F. - European Equity Optimal VolatilityAmundi S.F. - European Research
Absolute Return Sub-FundsAmundi S.F. - Absolute Return Multi-Strategy ControlAmundi S.F. - Saving Box IAmundi S.F. - Saving Box IIAmundi S.F. - Saving Box III
Multi-Asset Sub-FundsAmundi S.F. - Amundi Target Trend 2024Amundi S.F. - Diversified Target Income 11/2021Amundi S.F. - Diversified Target Income 11/2022
Commodities Sub-FundsAmundi S.F. - EUR Commodities
Capital Guaranteed Sub-FundsAmundi S.F. - SMBC Amundi Protect Fund USD Step 201803Amundi S.F. - SMBC Amundi Protect Fund USD Step 201809
Detailed Units Classes active as at 31 December 2020 are listed in the “Statement of Unit Statistics” and description of Units Classes are disclosed in the latestprospectus.
Notes to the Financial Statements as at 31/12/20

101
Notes to the Financial Statements as at 31/12/20
2 PRINCIPAL ACCOUNTING CONVENTIONS� PRESENTATION OF FINANCIAL STATEMENTSThese financial statements are prepared in accordance with Luxembourg legal and regulatory requirements relating to undertakings for collective investment intransferable securities and generally accepted accounting principles in Luxembourg.The financial statements reflect the Net Asset Values (“NAV”) as calculated on the last business day of the year based on latest available market prices of the investments.
Valuation of investments and other investmentsThe following pricing policy applies:
� Valuation of investments - Investments which are quoted or dealt in on a stock exchange or on a Regulated Market or any Other Regulated Market are valued atthe last available price at 6.00 p.m. Luxembourg time of the relevant Valuation Day except for the Amundi S.F.- European Equity Optimal Volatility Sub-Fund wherethe investments are valued at the last available prices at 10.00 p.m. Luxembourg time. Pricing rules (Bid/Mid/Ask) of each Sub-Fund are regularly reviewed by theBoard of Directors of the Management Company of the Fund, and may be adapted either to the investment cycle and/or to the investment objective of each Sub-Fund. In the event that any assets held in a Sub-Fund’s portfolio on the relevant day are not quoted or dealt in on any stock exchange or on any Regulated Market,or on any Other Regulated Market or if, with respect of assets quoted or dealt in on any stock exchange or dealt in on any such markets, the last available price(as determined pursuant to the previous paragraph) is not representative of the fair market value of the relevant assets, the value of such assets is based on areasonably foreseeable sales price determined prudently and in good faith by the Board of Directors of the Management Company.
� Open-ended and closed-ended UCIs - Units or shares of open-ended UCIs are valued at their last determined and available Net Asset Value or, if such price isnot representative of the fair market value of such assets, then the price is determined prudently and in good faith by the Board of Directors of the ManagementCompany. Units or shares of a closed-ended UCI are valued at their last available market value.
� Forward foreign exchange contracts - Forward foreign exchange contracts are valued at the forward rate applicable at the “Statement of Net Assets” date forthe period until their maturity. Net unrealised gain and loss on forward foreign exchange contracts are recorded in the “Statement of Net Assets”; net realised andnet change in unrealised gain/(loss) on forward foreign exchange contracts are recorded in the “Statement of Operations and Changes in Net Assets”. The Fundalso offers Hedged Unit Classes. All gain/(loss) on forward foreign exchange contracts used for Hedged Unit Classes are allocated solely to the relevant Unit Class.
� Financial futures contracts - Financial futures contracts are valued at the quoted price available on an official stock exchange (following the pricing policy asdescribed above under “Valuation of investments”). Initial margin deposits are made in cash upon entering into futures contracts. Subsequent payments, referredto as variation margins, are made or received by the Sub-Fund periodically and are based on changes in the market value of open futures contracts. Net unrealisedgain and loss on financial futures contracts are recorded in the “Statement of Net Assets”; net realised and net change in unrealised gain/(loss) on financial futurescontracts are recorded in the “Statement of Operations and Changes in Net Assets”. When the contract is closed, the concerned Sub-Fund records a realised gainor loss equal to the difference between the proceeds from (or cost of) the closing transaction and the opening transaction.
� Upfront premium Options contracts - When the Sub-Fund purchases an options contract with an upfront premium, it pays a premium and an amount equal tothat premium is recorded as an asset. When the Sub-Fund writes an option with an upfront premium, it receives a premium and an amount equal to that premiumis recorded as a liability.The asset or liability is adjusted daily to reflect the current market value of the options contracts.Options contracts which are quoted or dealt in on a stock exchange or on a Regulated Market or any Other Regulated Market are valued at the exchange quotedprice (following the pricing policy described above under “Valuation of investments”). OTC options are marked-to-market based upon daily prices calculated by thirdparty agents and verified against the value received from the counterparty.If the last known prices are not representative, the valuation will be based on the potential realisation value estimated by the Board of Directors of the ManagementCompany with prudence and in good faith.If an option expires unexercised, the Sub-Fund realises a gain or loss to the extent of the premium received or paid. Premiums received or paid, net unrealisedgain and loss from options contracts are recorded in the “Statement of Net Assets” under the account balances “Upfront premium Options contracts purchased atmarket value” or “Upfront premium Options contracts written at market value”.Net realised and net change in unrealised gain/(loss) on options contracts are recorded in the “Statement of Operations and Changes in Net Assets”.
� Futures-style options contracts - Futures-style options contracts are valued at the quoted price available on an official stock exchange (following the pricingpolicy as described above under “Valuation of Investments”). Initial margin deposits are paid in cash upon entering into the contract. Subsequent positive or negativecash-flows, referred to as variation margins, are paid or received by the Sub-Fund periodically and are based on changes in the market value of open optioncontracts. When the contract is closed, the concerned Sub-Fund records a realised gain or loss equal to the difference between the proceeds from (or cost of) theclosing transaction and the opening transaction.Net unrealised gain and loss on futures-style options contracts are recorded in the “Statement of Net Assets”.Net realised and net change in unrealised gain/(loss) on futures-style options contracts are recorded in the “Statement of Operations and Changes in Net Assets”.
� Swaps Contracts - Sub-Funds may enter into different types of swaps agreements such as interest rate swaps, swaptions, inflation-linked swaps, credit defaultswaps and total return swaps. Net unrealised gain and loss on swaps contracts are recorded in the “Statement of Net Assets”. Net realised and net change inunrealised gain/(loss) on swap contracts are recorded in the “Statement of Operations and Changes in Net Assets”. Swaps contracts are valued at fair market valueas determined prudently and in good faith pursuant to procedures established by the Board of Directors of the Management Company.Swaps contracts are marked-to-market at each Net Asset Valuation calculation date. The market value is based on the valuation of elements laid down in thecontract, and it is obtained from third party agents, market makers or internal models, pursuant to the procedures established by the Board of Directors of theManagement Company.Effective interest expense/income on swaps is booked in full in the “Statement of Operations and Changes in Net Assets”. Accrued expense/income on swapsare netted on each Net Asset Valuation calculation date for each swap contract and the resulting net balance is posted per swap, either as interest expense on swapor interest income on swap, in the “Statement of Operations and Changes in Net Assets”.
� Income - Interest income is accrued on a daily basis. Dividends are shown net of withholding taxes deducted at source, and are recorded as income on the ex-dividend date.
� Net realised gain and loss - Net Realised gain and loss comprise the gain or loss arising on the trading of securities and other investments, financial futurescontracts, forward foreign exchange contracts, options, CFDs, swaps and other investments during the year, and differences arising on the revaluation of other assetsand liabilities denominated in foreign currencies at year end. Net realised gains or losses are determined on the basis of weighted average cost of the investmentssold except for future contracts and CFDs, where the First-In First-Out (“FIFO”) methodology is applied.
� Combined financial statements - The figures of each Sub-Fund are presented in their respective Base Currency. The combined financial statements are expressedin euros and the sum of the Sub-Funds’ net assets which are in another currency are converted in euros at the exchange rates prevailing at year end. The combinedfinancial statements are presented for information purposes only.At year-end, the value of investments made by Sub-Funds in other Sub-Funds of the same umbrella amounts to EUR 25,053,017 representing 0.70% of theCombined Net Assets and therefore the total Combined Net Assets at year-end without cross Sub-Fund investment would amount to EUR 3,516,878,514.
� Securities Lending - Sub-Funds may lend securities in their portfolios to a borrower. To guarantee this transaction, the Sub-Fund receives collateral. Securitieson loan are delivered to a third party broker and these assets continue to be valued as part of the portfolio of the Sub-Fund. Upon termination of a loan, the Sub-Fund is required to return to the borrower the collateral received. Loans can be terminated by the parties at any time. Securities lending generates additional incomefor the Sub-Fund according to the contractual arrangements. This remuneration is accounted in the “Statement of Operations and Changes in Net Assets”.

102
Notes to the Financial Statements as at 31/12/20
3 EXCHANGE RATES USED AS OF 31 DECEMBER 2020Assets and liabilities expressed in currencies other than the Base Currency of the relevant Sub-Fund are converted at exchange rates prevailing as at 31 December2020. Profit and losses arising on foreign exchange operations are recorded in the “Statement of Operations and Changes in Net Assets”. Transactions in foreigncurrencies are converted into the Base Currency of the relevant Sub-Fund at exchange rates prevailing on the transaction dates.
The exchange rates used as at 31 December 2020 are as follows:
4 MANAGEMENT, INVESTMENT MANAGEMENT AND DISTRIBUTION FEESThe management fee is a percentage of the Net Asset Value of each Sub-Fund, which ranges, according to the prospectus, from 0.25% to 2.25% p.a, depending onthe relevant Sub-Fund and unit class.For Class X Units, the management fees are charged and collected by the Management Company directly from the Unitholder and will not be charged to the Sub-Fundsor reflected in the Net Asset Value.
The management fee rates effectively applied as at 31 December 2020 are as follows:
1 EUR =1 EUR =
KRW1,329.14240AUD1.58560MXN24.37985BRL6.35535MYR4.92175CAD1.55880NOK10.47600CHF1.08155NZD1.69940CLP869.33240PHP58.75915CNH7.94900PLN4.55895CNY8.00180RON4.86745COP4,185.15300RUB90.49915CZK26.26200SAR4.59030DEM1.95583SEK10.04850DKK7.44345SGD1.61710GBP0.89510THB36.65755HKD9.48725TRY9.09405HUF362.68500
TWD34.37930IDR17,190.87900USD1.22355ILS3.92860ZAR17.97245INR89.40175
JPY126.32545
Class W1Class WClass UClass RClass PClass IClass HClass GClass FClass EClass CClass BClass ASub-Fund *****0.30%0.35%**0.60%**0.60%Amundi S.F. - Diversified Short-Term
Bond*********1.00%**1.00%Amundi S.F. - Emerging Markets Bond
2024*********1.00%***Amundi S.F. - Emerging Markets Bond
2025***0.30%*0.25%0.45%*1.10%0.75%**0.60%Amundi S.F. - Euro Curve 1-3year***0.40%*0.40%0.55%*1.60%1.05%**0.60%Amundi S.F. - Euro Curve 3-5year***0.40%*0.40%0.55%*1.60%1.05%0.90%*0.60%Amundi S.F. - Euro Curve 7-10year*****0.40%0.55%*1.60%1.05%**0.60%Amundi S.F. - Euro Curve 10+year*********1.00%*1.20%*Amundi S.F. - Global High Yield
Opportunities 2025*********1.00%***Amundi S.F. - High Yield & Emerging
Markets Bond Opportunities 2021*****0.25%0.35%**0.65%**0.50%Amundi S.F. - European Equity Market
Plus***0.75%*0.60%0.80%1.50%2.25%1.50%1.50%1.50%1.50%Amundi S.F. - European Equity Optimal
Volatility**1.50%0.75%*0.65%0.80%1.50%2.25%1.50%1.50%1.50%1.50%Amundi S.F. - European Research***0.60%**0.50%**0.90%**0.90%Amundi S.F. - Absolute Return Multi-
Strategy Control**0.60%******0.50%***Amundi S.F. - Saving Box I**0.50%******0.45%***Amundi S.F. - Saving Box II********0.50%0.45%***Amundi S.F. - Saving Box III*1.00%**********1.00%Amundi S.F. - Amundi Target Trend 2024**1.00%**********Amundi S.F. - Diversified Target Income
11/2021*1.00%***********Amundi S.F. - Diversified Target Income
11/2022***0.55%*0.40%0.55%*1.75%1.00%1.00%1.00%1.00%Amundi S.F. - EUR Commodities
0.26%************Amundi S.F. - SMBC Amundi ProtectFund USD Step 201803
0.26%************Amundi S.F. - SMBC Amundi ProtectFund USD Step 201809
*Not launched and/or applicable

103
Notes to the Financial Statements as at 31/12/20
The distribution fee, when applicable, is a percentage of the Net Asset Value of each Sub-Fund, which ranges, according to the prospectus, from 0.00% to max 1.50%p.a, depending on the relevant unit class.
The distribution fee rates effectively applied as at 31 December 2020 are as follows:
Both management fee and distribution fee are calculated and accrued on each Valuation Day on the basis of the Net Asset Value of the Sub-Fund and unit class andare payable monthly in arrears.The Investment Managers are paid by the Management Company out of the management fee payable to it in accordance with the Management Regulations of the Fund.
5 PERFORMANCE FEEThe Management Company may earn a performance fee for certain Classes of Units within certain Sub-Funds where the Net Asset Value per Unit of the Classoutperforms its benchmark or performance hurdle during its performance period as reported in the prospectus.The performance period is a calendar year ending except for High Yield & Emerging Markets Bond Opportunities 2021, Saving Box I, Saving Box II and Saving Box IIISub-Funds where the performance period is from the Launch Date until the Maturity Date.The performance fee, set up at a maximum rate of 25% (where applicable and depending on the Unit Class), is calculated by reference to the increase in the Class’sassets over and above the increase in the benchmark or performance hurdle as adjusted for subscriptions into and redemptions out of the relevant Classes of Unitsduring the Performance Period. The calculation is as follows:1) where the benchmark or performance returns are positive, the Management Company earns a performance fee equal to the percentage listed in Appendix I of theProspectus of the outperformance the relevant Classes of Units achieved over its respective benchmark subject, where applicable, to the High Watermark Principle (asdefined below) during the Performance Period.2) where the Sub-Fund’s benchmark or performance hurdle declines over the Performance Period, the Management Company earns a performance fee equal to thepercentage listed in Appendix I of the Prospectus of the positive performance that the relevant Classes of Units achieved subject, where applicable, to the HighWatermark Principle during the Performance Period.3) where a Class performance exceeds the High Watermark and the benchmark or performance hurdle, but the excess performance against the High Watermark isless than the excess performance against benchmark or performance hurdle, then the performance fee is calculated by reference to the portion of the excessperformance over the High Watermark and not the benchmark or performance hurdle.As defined in the prospectus, the High Watermark principle establishes a Net Asset Value per Unit below which performance fees is not paid.It is set at the Net Asset Value per Unit of the relevant Classes at which the last performance fee was paid or, if no performance fee has ever been paid on that Class,at the Net Asset Value per Unit at which the Class was launched or, where a performance fee is introduced to that Class for the first time, at the Net Asset Value perUnit of the Class on the Business Day immediately preceding the date of introduction of the performance fee on that Class.The benchmarks or performance hurdles are calculated gross of management and other fees and charges based on a Total Return index unless otherwise specified.In respect of the Class F Units (other than Bond Sub-Funds), the performance calculation is performed on a “Price Index”, i.e., the calculation of the performance ofthe benchmark or performance hurdle is net of dividends.In respect of the Class X Units, performance fee, if any, are charged and collected by the Management Company directly from the Unitholders and are not, therefore,reflected in the Net Asset Value.
Class W1Class WClass UClass RClass PClass KClass IClass HClass GClass FClass EClass CClass BClass ASub-Fund **************Amundi S.F. - Diversified Short-Term
Bond**************Amundi S.F. - Emerging Markets Bond
2024**************Amundi S.F. - Emerging Markets Bond
2025**************Amundi S.F. - Euro Curve 1-3year**************Amundi S.F. - Euro Curve 3-5year***********1.00%**Amundi S.F. - Euro Curve 7-10year**************Amundi S.F. - Euro Curve 10+year**************Amundi S.F. - Global High Yield
Opportunities 2025**************Amundi S.F. - High Yield & Emerging
Markets Bond Opportunities 2021**************Amundi S.F. - European Equity Market
Plus********0.50%**1.00%1.00%*Amundi S.F. - European Equity Optimal
Volatility**1.00%*****0.50%**1.00%1.00%*Amundi S.F. - European Research**************Amundi S.F. - Absolute Return Multi-
Strategy Control**************Amundi S.F. - Saving Box I**************Amundi S.F. - Saving Box II**************Amundi S.F. - Saving Box III**************Amundi S.F. - Amundi Target Trend 2024**************Amundi S.F. - Diversified Target Income
11/2021**************Amundi S.F. - Diversified Target Income
11/2022***********1.00%1.50%*Amundi S.F. - EUR Commodities
0.75%*************Amundi S.F. - SMBC Amundi ProtectFund USD Step 201803
0.75%*************Amundi S.F. - SMBC Amundi ProtectFund USD Step 201809
*Not launched and/or applicable

104
Notes to the Financial Statements as at 31/12/20
6 DEPOSITARY AND PAYING AGENT, ADMINISTRATOR, REGISTRAR AND TRANSFER AGENTThe Depositary and Paying Agent, the Administrator and the Registrar and Transfer Agent receive out of the assets of the relevant Sub-Fund, a fee for their servicesas detailed below.
� Depositary and Paying Agent: The fee is a percentage of portfolio value at each month end of each Sub-Fund. It ranges from 0.003% to 0.50% p.a. dependingon where the assets of the relevant Sub-Fund are held. The fee is calculated and accrued on each Valuation Day and is payable monthly in arrears.
� Administrator: The fee for the main services provided, amounts to an annual rate of 0.01%, is calculated and accrued on each Valuation Day on the basis of theNet Asset Value of the relevant Sub-Fund. It is payable monthly in arrears.
� Registrar and Transfer Agent: The main components of the compensation for the services provided are the number of the existing active Unit Classes, the numberof clients’ accounts and the number of transactions processed.
7 TAXATION OF THE FUND - TAXE D’ABONNEMENTIn accordance with the legislation currently prevailing in Luxembourg, the Fund is not subject to any taxes on income or capital gains. The Fund is subject to a subscriptiontax Taxe d’abonnement, which amounts to an annual rate of 0.05% based on the Net Asset Value of each Sub-Fund at the end of each calendar quarter, calculatedand paid quarterly. However, this tax is reduced to 0.01% for Net Asset Value related to units classes only aimed at eligible institutional investors and for Sub-Fundswhose sole object is collective investment in money market instruments and in deposits with credit institutions.Pursuant to Article 175 (a) of the amended law of 17 December 2010, the net asset invested in UCIs already subject to Taxe d’abonnement is exempted from this tax.Interest and dividend income received by the Fund may be subject to non-recoverable withholding tax in the countries of origin.

105
Notes to the Financial Statements as at 31/12/20
8 OPEN POSITIONS ON FUTURES CONTRACTSAs at 31 December 2020, certain Sub-Funds had the following positions on futures contracts.The broker of all the futures listed is SOCIETE GENERALE.
� Amundi S.F. - Diversified Short-Term Bond
in EURUnrealised appreciation / depreciation
EURCommitment inCurrencyMaturitydateDescription
Number of contractsPurchase/Sale
-315,720.00-262,231,848.00EUR03-2021EURO BOBL-2,531-40,520.00-36,131,958.00EUR03-2021EURO BUND-342251,020.00-275,616,072.00EUR03-2021EURO SCHATZ-2,718-64,665.60-73,518,718.48USD04-2021US 2 YR NOTE FUTURE-437
-320,049.80-103,671,113.87USD04-2021US 5 YR NOTE FUTURE-1,271-489,935.40Total :
� Amundi S.F. - Euro Curve 1-3year
in EURUnrealised appreciation / depreciation
EURCommitment inCurrencyMaturitydateDescription
Number of contractsPurchase/Sale
-2,100.00-1,346,904.00EUR03-2021EURO BOBL-132,970.00-845,192.00EUR03-2021EURO BUND-8
-3,520.00-344,758.00EUR03-2021EURO BUXL-2-1,235.001,318,252.00EUR03-2021EURO SCHATZ13
-760.00-382,548.00EUR03-2021EURO-BTP FUTURE-3-90.00127,782.00EUR03-2021EURO-OAT FUTURES1
1,320.004,017,078.00EUR03-2021SHORT EURO BTP39-3,415.00Total :
� Amundi S.F. - Euro Curve 3-5year
in EURUnrealised appreciation / depreciation
EURCommitment inCurrencyMaturitydateDescription
Number of contractsPurchase/Sale
4,160.003,315,456.00EUR03-2021EURO BOBL326,830.00-1,373,437.00EUR03-2021EURO BUND-13
-12,200.00-1,034,274.00EUR03-2021EURO BUXL-6-410.00-382,548.00EUR03-2021EURO-BTP FUTURE-3
-1,140.00-383,346.00EUR03-2021EURO-OAT FUTURES-34,340.0011,433,222.00EUR03-2021SHORT EURO BTP1111,580.00Total :
� Amundi S.F. - Euro Curve 7-10year
in EURUnrealised appreciation / depreciation
EURCommitment inCurrencyMaturitydateDescription
Number of contractsPurchase/Sale
-14,140.00-10,464,408.00EUR03-2021EURO BOBL-10112,540.005,388,099.00EUR03-2021EURO BUND51
-19,940.00-1,551,411.00EUR03-2021EURO BUXL-9-930.00-892,612.00EUR03-2021EURO-BTP FUTURE-7
2,630.005,494,626.00EUR03-2021EURO-OAT FUTURES43-200.0015,553,302.00EUR03-2021SHORT EURO BTP151
-20,040.00Total :
� Amundi S.F. - Euro Curve 10+year
in EURUnrealised appreciation / depreciation
EURCommitment inCurrencyMaturitydateDescription
Number of contractsPurchase/Sale
-16,800.00-14,505,120.00EUR03-2021EURO BOBL-1407,940.005,282,450.00EUR03-2021EURO BUND50
-1,960.00517,137.00EUR03-2021EURO BUXL3-95.00101,404.00EUR03-2021EURO SCHATZ1
18,900.003,442,932.00EUR03-2021EURO-BTP FUTURE274,980.003,450,114.00EUR03-2021EURO-OAT FUTURES27
-2,340.0013,905,270.00EUR03-2021SHORT EURO BTP13510,625.00Total :

106
Notes to the Financial Statements as at 31/12/20
� Amundi S.F. - European Equity Market Plus
in EURUnrealised appreciation / depreciation
EURCommitment inCurrencyMaturitydateDescription
Number of contractsPurchase/Sale
14,645.001,035,761.10EUR03-2021EURO STOXX 5029-9,216.85732,412.02GBP03-2021FTSE 100 INDEX1027,442.10692,751.79CHF03-2021SWISS MKT INDEX FUT732,870.25Total :
� Amundi S.F. - European Equity Optimal Volatility
in EURUnrealised appreciation / depreciation
EURCommitment inCurrencyMaturitydateDescription
Number of contractsPurchase/Sale
-803,682.00-66,049,200.00EUR03-2021MSCI EUROPE-2,800-803,682.00Total :
� Amundi S.F. - Absolute Return Multi-Strategy Control
in EURUnrealised appreciation / depreciation
EURCommitment inCurrencyMaturitydateDescription
Number of contractsPurchase/Sale
1,500.00401,400.00EUR12-2022ALLIANZ SE SSDF24,482.00874,454.00EUR01-2021AMSTERDAM INDEX74,001.505,703,031.03AUD03-2021AUST 3YR BOND FUT775,712.00312,192.00EUR12-2022AXA16
-7,150.00529,705.00EUR12-2022BAYER DIVIDENDS116,600.00577,840.00EUR12-2022BAYERIS MOTOREN AG83,946.5488,148.33TRY02-2021BIST 30 FUTURES49
-2,865.00222,056.40EUR01-2021CAC 4042,687.97582,037.46CAD03-2021CAN 10YR BOND FUT83,087.50685,939.00EUR03-2021DAX INDEX2
19,200.00634,200.00EUR03-2021DJ STOXX 600 AUTO24810.0060,625.00EUR03-2021DJ STOXX 600 FINANCI2
4,525.00-463,950.00EUR03-2021DJ STOXX 600 TELECOM-458,455.00293,930.00EUR03-2021DJ STOXX 600 TRVL26
98.0855,151.93USD03-2021EMINI RUSS 1000 VALU1-3,146.58-99,209.88USD03-2021EMINI RUSSELL 1000-189,552.942,501,757.39USD03-2021EMINI RUSSELL 200031-4,689.22-362,980.67USD03-2021EMINI S&P REESTATE-10-1,757.18219,004.54USD03-2021E-MINI XAI INDUSTRIA3-8,344.57-214,444.85USD03-2021E-MINI XAK TECHNO-2-1,814.39-103,987.58USD03-2021E-MINI XAU UTILITIES-2
420.00239,344.00EUR12-2022ENI SPA283,660.00-10,049,976.00EUR03-2021EURO BOBL-976,600.00-7,712,377.00EUR03-2021EURO BUND-73
-72,780.00-4,998,991.00EUR03-2021EURO BUXL-29-20,620.0025,351,000.00EUR03-2021EURO SCHATZ250
-3,690.00151,228.50EUR03-2021EURO STOXX BANKS412,030.00-500,022.60EUR03-2021EURO STOXX 50-14
18,360.00846.00EUR12-2023EURO STOXX 50 DIV18-18,240.00-1,786.00EUR12-2021EURO STOXX 50 DIV-38-14,530.00-4,080,512.00EUR03-2021EURO-BTP FUTURE-32-13,170.00-4,472,370.00EUR03-2021EURO-OAT FUTURES-3518,729.76448,619.44USD01-2021FTSE CHINA A5031
2,084.1083,413.02USD01-2021FTSE TAIWAN INDEX2-4,993.861,025,376.83GBP03-2021FTSE 100 INDEX1418,603.51732,460.73GBP03-2021FTSE 250 INDEX16
96.81-30,257.19ZAR03-2021FTSE/JSE TOP 40-1-3,630.00-221,290.00EUR03-2021FTSE/MIB IDX FUT-218,667.16574,057.39HKD01-2021HANG SENG INDEX4
-10,540.46-451,173.94HKD01-2021HSCEI FUTURES-8-10,512.00-322,948.00EUR01-2021IBEX 35 INDEX FUTURE-4
5,040.00275,076.00EUR12-2022ING GROEP NV36-3,245.592,406,118.48JPY03-2021JAPANESE 10Y BOND3
518.11-49,592.42MYR01-2021KL COMPOSITE IDX-34,344.9173,195.69KRW03-2021KOSPI 200 INDEX1

107
Notes to the Financial Statements as at 31/12/20
in EURUnrealised appreciation / depreciation
EURCommitment inCurrencyMaturitydateDescription
Number of contractsPurchase/Sale
-78.20323,043.91GBP03-2021LONG GILT25,870.00153,981.30EUR03-2021MDAX INDEX FUT1
182.5372,300.49MXN03-2021MEXICAN BOLSA IDX442,017.081,632,950.43USD03-2021MINI MSCI EMG MKT31
4,367.29165,386.29USD03-2021MSCI BRAZIL IX FU4-6,019.37-192,865.02USD03-2021MSCI CHINA FREE-4-4,540.07143,758.33USD03-2021MSCI INDONESIA11
260.51159,188.43USD03-2021MSCI RUSSIA5-82.86-120,359.90SGD01-2021MSCI SING IX ETS-6
2,950.00485,600.00EUR12-2022MUENCHENER RUECKVER25,455.44632,010.79USD03-2021NASDAQ 100 E-MINI3
115,891.143,258,745.96JPY03-2021NIKKEI 225 (SGX)30-2,859.23-1,324,640.89SEK01-2021OMXS30 INDEX FUTURE-714,050.001,183,000.00EUR12-2022SCHNEIDER ELECTRIC S10
-1,554.39-119,215.82THB03-2021SET 50 FUTURES-243,523.35137,126.39USD01-2021SGX CNX NIFTY6-600.00-5,871,114.00EUR03-2021SHORT EURO BTP-57-240.00705,120.00EUR12-2022SIEMENS DIVIDEND6-858.16214,478.36USD03-2021S&P EMINI COM SERV3
-26,772.51-4,422,751.83USD03-2021S&P 500 EMINI-29-12,786.961,038,580.98AUD03-2021SPI 200 FUTURES10
3,015.14-663,819.60CAD03-2021S&P/TSE 60 IX FUT-5-4,410.00-315,592.00EUR03-2021STOXX EURO LARGE 200-169,830.00314,174.50EUR03-2021STOXX EURO SMALL 20019
-1,980.00-179,563.50EUR03-2021STOXX EUROP 600 FUT-9-4,780.00221,830.50EUR03-2021STOXX 600 BANK41
-665.00370,125.00EUR03-2021STOXX 600 BASIC RES15-6,085.00-321,718.50EUR03-2021STOXX 600 FOOD BEV-9-1,450.00-348,280.00EUR03-2021STOXX 600 HEALTH-81,580.00188,670.00EUR03-2021STOXX 600 INDUS6
-7,920.00520,058.00EUR03-2021STOXX 600 OIL & GAS44-9,450.00-180,990.00EUR03-2021STOXX 600 TECHNO-612,480.00307,216.00EUR03-2021STOXX 600 UTIL16-2,182.05-494,822.71CHF03-2021SWISS MKT INDEX FUT-52,790.00317,700.00EUR12-2022TOTAL SA SSDF91,787.83-1,664,112.62USD03-2021US LONG BOND-13
-24,627.362,030,362.47USD03-2021US ULTRA BOND CBT19-8,619.90-8,977,440.24USD03-2021US 10 YR NOTE FUTURE-997,815.441,354,339.03USD03-2021US 10YR ULTRA T NOTE17
23,677.0822,543,497.20USD04-2021US 2 YR NOTE FUTURE134-5,606.17-1,957,597.74USD04-2021US 5 YR NOTE FUTURE-242,741.86148,560.52PLN03-2021WIG20 INDEX FUT172,615.34188,113.28USD03-2021XAB MATERIALS37,036.90-97,474.56USD03-2021XAE ENERGY-39,838.18519,929.71USD03-2021XAF FINANCIAL7-457.68-111,326.88USD03-2021XAP CONS STAPLES-2809.1293,827.80USD03-2021XAV HEALTH CARE1
15,207.213,621,323.16AUD03-202110Y AUSTRALIAN BOND39199,260.57Total :
� Amundi S.F. - Saving Box I
in EURUnrealised appreciation / depreciation
EURCommitment inCurrencyMaturitydateDescription
Number of contractsPurchase/Sale
-240.00-1,479,086.00EUR03-2021EURO BUND-14-7,740.00-517,137.00EUR03-2021EURO BUXL-3-4,380.00-1,020,128.00EUR03-2021EURO-BTP FUTURE-8-1,686.96-161,521.95GBP03-2021LONG GILT-1-2,298.64256,017.33USD03-2021US LONG BOND2
-12,961.781,068,611.83USD03-2021US ULTRA BOND CBT10-4,009.85-3,627,248.58USD03-2021US 10 YR NOTE FUTURE-40
510.80-159,334.00USD03-2021US 10YR ULTRA T NOTE-2536.37504,705.16USD04-2021US 2 YR NOTE FUTURE3
-15,286.08-5,138,694.08USD04-2021US 5 YR NOTE FUTURE-635,213.901,114,253.28AUD03-202110Y AUSTRALIAN BOND12
-42,342.24Total :

108
Notes to the Financial Statements as at 31/12/20
108
� Amundi S.F. - Saving Box II
in EURUnrealised appreciation / depreciation
EURCommitment inCurrencyMaturitydateDescription
Number of contractsPurchase/Sale
-1,800.00-3,697,715.00EUR03-2021EURO BUND-35-2,580.00-172,379.00EUR03-2021EURO BUXL-1-6,240.00-1,530,192.00EUR03-2021EURO-BTP FUTURE-1210,121.77969,131.72GBP03-2021LONG GILT6
-980.00-1,545,030.00EUR03-2021SHORT EURO BTP-159,092.40-1,792,121.29USD03-2021US LONG BOND-14
-5,184.71427,444.73USD03-2021US ULTRA BOND CBT4-1,883.61-2,720,436.43USD03-2021US 10 YR NOTE FUTURE-301,277.01-398,335.01USD03-2021US 10YR ULTRA T NOTE-5
357.58336,470.11USD04-2021US 2 YR NOTE FUTURE2-4,852.72-1,631,331.45USD04-2021US 5 YR NOTE FUTURE-2011,296.782,414,215.44AUD03-202110Y AUSTRALIAN BOND268,624.50Total :
� Amundi S.F. - Saving Box III
in EURUnrealised appreciation / depreciation
EURCommitment inCurrencyMaturitydateDescription
Number of contractsPurchase/Sale
-1,080.00-2,218,629.00EUR03-2021EURO BUND-21-5,160.00-344,758.00EUR03-2021EURO BUXL-2-5,060.89-484,565.86GBP03-2021LONG GILT-32,247.56-512,034.65USD03-2021US LONG BOND-4
-51.08-90,681.21USD03-2021US 10 YR NOTE FUTURE-1255.40-79,667.00USD03-2021US 10YR ULTRA T NOTE-1
1,251.541,177,645.38USD04-2021US 2 YR NOTE FUTURE7-1,698.45-570,966.01USD04-2021US 5 YR NOTE FUTURE-74,344.92928,544.40AUD03-202110Y AUSTRALIAN BOND10-4,951.00Total :
� Amundi S.F. - Amundi Target Trend 2024
in EURUnrealised appreciation / depreciation
EURCommitment inCurrencyMaturitydateDescription
Number of contractsPurchase/Sale
44,828.573,677,822.73USD03-2021EURO FX362,040.00382,548.00EUR03-2021EURO-BTP FUTURE346,868.57Total :
� Amundi S.F. - Diversified Target Income 11/2021
in EURUnrealised appreciation / depreciation
EURCommitment inCurrencyMaturitydateDescription
Number of contractsPurchase/Sale
1,878.122,962,613.52AUD03-2021AUST 3YR BOND FUT40-962.281,091,320.25CAD03-2021CAN 10YR BOND FUT15
8,679.66242,105.55USD03-2021EMINI RUSSELL 200031,590.00-2,175,768.00EUR03-2021EURO BOBL-215,700.002,007,331.00EUR03-2021EURO BUND19
-10,400.00-689,516.00EUR03-2021EURO BUXL-41,530.00-1,825,272.00EUR03-2021EURO SCHATZ-18
-30,090.00-1,892,942.70EUR03-2021EURO STOXX 50-53-9,600.00-1,530,192.00EUR03-2021EURO-BTP FUTURE-121,980.00383,346.00EUR03-2021EURO-OAT FUTURES3
16,938.58390,733.06USD01-2021FTSE CHINA A50275,463.08-439,447.21GBP03-2021FTSE 100 INDEX-66,399.28183,115.18GBP03-2021FTSE 250 INDEX4
712.45-802,039.49JPY03-2021JAPANESE 10Y BOND-1-12,691.32-1,292,175.62GBP03-2021LONG GILT-8-2,533.61-385,730.05USD03-2021MSCI CHINA FREE-812,080.00523,106.10EUR03-2021MSCI EM NTR INDEX1135,521.231,053,351.31USD03-2021NASDAQ 100 E-MINI537,700.241,086,248.65JPY03-2021NIKKEI 225 OSE5

109
Notes to the Financial Statements as at 31/12/20
in EURUnrealised appreciation / depreciation
EURCommitment inCurrencyMaturitydateDescription
Number of contractsPurchase/Sale
80.00103,002.00EUR03-2021SHORT EURO BTP11,297.45152,508.68USD03-2021S&P 500 EMINI1
-2,223.13207,716.20AUD03-2021SPI 200 FUTURES2-11,497.39-296,893.62CHF03-2021SWISS MKT INDEX FUT-3-1,481.35-256,017.33USD03-2021US LONG BOND-2-3,575.66213,722.37USD03-2021US ULTRA BOND CBT2-2,911.61-2,176,349.15USD03-2021US 10 YR NOTE FUTURE-241,162.151,274,672.03USD03-2021US 10YR ULTRA T NOTE16
12,770.8813,458,804.30USD03-2021US 2 YR NOTE FUTURE80268.1881,566.57USD03-2021US 5 YR NOTE FUTURE1
8,391.021,857,088.80AUD03-202110Y AUSTRALIAN BOND2072,175.97Total :
� Amundi S.F. - Diversified Target Income 11/2022
in EURUnrealised appreciation / depreciation
EURCommitment inCurrencyMaturitydateDescription
Number of contractsPurchase/Sale
2,355.963,777,332.24AUD03-2021AUST 3YR BOND FUT51-1,090.581,236,829.61CAD03-2021CAN 10YR BOND FUT17
-570.00-1,968,552.00EUR03-2021EURO BOBL-198,070.002,641,225.00EUR03-2021EURO BUND25
-10,400.00-689,516.00EUR03-2021EURO BUXL-42,125.00-2,535,100.00EUR03-2021EURO SCHATZ-25
-32,630.00-2,000,090.40EUR03-2021EURO STOXX 50-56-9,360.00-1,530,192.00EUR03-2021EURO-BTP FUTURE-121,980.00383,346.00EUR03-2021EURO-OAT FUTURES3
20,075.35463,091.04USD01-2021FTSE CHINA A50324,552.56-366,206.01GBP03-2021FTSE 100 INDEX-59,598.93274,672.77GBP03-2021FTSE 250 INDEX6
-19,036.98-1,938,263.43GBP03-2021LONG GILT-12-2,850.31-433,946.30USD03-2021MSCI CHINA FREE-919,770.00855,991.80EUR03-2021MSCI EM NTR INDEX1849,724.981,474,691.84USD03-2021NASDAQ 100 E-MINI752,780.341,520,748.12JPY03-2021NIKKEI 225 OSE7
480.00618,012.00EUR03-2021SHORT EURO BTP610,972.171,067,560.79USD03-2021S&P 500 EMINI7-2,223.13207,716.20AUD03-2021SPI 200 FUTURES2
-15,329.85-395,858.17CHF03-2021SWISS MKT INDEX FUT-4-1,481.35-256,017.33USD03-2021US LONG BOND-2-5,440.11320,583.55USD03-2021US ULTRA BOND CBT3-3,147.86-2,629,755.22USD03-2021US 10 YR NOTE FUTURE-29
676.921,832,341.04USD03-2021US 10YR ULTRA T NOTE2320,322.7320,188,206.45USD03-2021US 2 YR NOTE FUTURE120
804.53244,699.72USD03-2021US 5 YR NOTE FUTURE312,189.382,692,778.76AUD03-202110Y AUSTRALIAN BOND29112,918.68Total :
� Amundi S.F. - SMBC Amundi Protect Fund USD Step 201803
in USDUnrealised appreciation / depreciation
USDCommitment inCurrencyMaturitydateDescription
Number of contractsPurchase/Sale
16,765.786,287,449.14USD04-2021US 5 YR NOTE FUTURE6316,765.78Total :

110
Notes to the Financial Statements as at 31/12/20
9 OPEN POSITIONS ON FORWARD FOREIGN EXCHANGE CONTRACTSAs at 31 December 2020, certain Sub-Funds had the following open positions on forward foreign exchange contracts:
� Amundi S.F. - Diversified Short-Term Bond
EURAmount inCurrency227,752,891.09EURCurrency receivable227,752,891.09Total :
5,361,608.46GBPCurrency payable220,612,349.90USD225,973,958.36Total :1,778,932.73Total :
The final expiry date for all open contracts will be 15 January 2021. The counterparty of the forwards is CITIGROUP.
� Amundi S.F. - Emerging Markets Bond 2024
EURAmount inCurrency14,497,118.82CZKCurrency receivable36,728,073.19USD51,225,192.01Total :48,634,027.77EURCurrency payable
3,184,001.79GBP51,818,029.56Total :-592,837.55Total :
The maximal final expiry date for the open contracts will be 03 March 2021. The counterparties of the forwards are BANK OF AMERICA, BNP PARIBAS, HSBC and SOCIETE GENERALE.
� Amundi S.F. - Emerging Markets Bond 2025
EURAmount inCurrency60,847,609.26USDCurrency receivable60,847,609.26Total :54,485,063.13EURCurrency payable
7,462,853.31GBP61,947,916.44Total :-1,100,307.18Total :
The final expiry date for all open contracts will be 03 March 2021. The counterparties of the forwards are BANK OF AMERICA, BNP PARIBAS, CITIGROUP and HSBC.
� Amundi S.F. - Global High Yield Opportunities 2025
EURAmount inCurrency312,623,589.12EURCurrency receivable
586,725.70GBP89,242,223.84USD402,452,538.66Total :
90,639,252.39EURCurrency payable310,716,106.10USD401,355,358.49Total :1,097,180.17Total :
The maximal final expiry date for the open contracts will be 26 March 2021. The counterparties of the forwards are BANK OF AMERICA, GOLDMAN SACHS, JP MORGAN, SOCIETE GENERALE and STATE STREET.
� Amundi S.F. - High Yield & Emerging Markets Bond Opportunities 2021
EURAmount inCurrency4,525,288.62USDCurrency receivable4,525,288.62Total :4,591,594.07EURCurrency payable4,591,594.07Total :-66,305.45Total :
The final expiry date for all open contracts will be 03 March 2021. The counterparties of the forwards are BANK OF AMERICA and BNP PARIBAS.

111
Notes to the Financial Statements as at 31/12/20
� Amundi S.F. - Absolute Return Multi-Strategy Control
EURAmount inCurrency2,306,541.89AUDCurrency receivable1,859,360.08BRL1,527,360.00CAD3,492,530.43CHF1,390,705.68CLP1,828,520.08CNH
697,043.97COP190,358.46CZK396,981.80DKK
54,463,559.71EUR1,982,345.01GBP
849,032.87HUF2,199,591.57IDR
341,165.59ILS1,743,281.00INR6,433,808.89JPY1,643,192.10KRW
816,699.62MXN41,023.41MYR
3,223,137.96NOK896,284.91NZD939,177.15PHP872,570.12PLN219,652.11RON495,739.45RUB
1,855,333.82SEK587,474.29SGD791,910.54THB586,024.78TRY
1,928,718.36TWD16,893,959.60USD
826,563.77ZAR114,319,649.02Total :
3,704,843.03AUDCurrency payable1,459,111.36BRL4,000,596.59CAD1,776,554.23CHF1,157,164.54CLP
377,405.96CNH742,551.58COP425,616.02CZK
16,400,092.07EUR2,216,178.43GBP1,214,577.46HKD1,346,011.26HUF
800,015.42IDR221,452.93ILS
1,625,935.88INR4,777,698.64JPY2,127,867.58KRW
225,596.14MXN41,326.76MYR
1,155,617.12NOK5,765,711.02NZD
856,864.43PHP1,443,729.73PLN
749,280.58RON322,654.98RUB522,466.04SEK538,000.12SGD392,824.95THB252,912.62TRY
1,338,969.24TWD55,868,928.31USD
322,716.17ZAR114,171,271.19Total :
148,377.83Total :
The counterparties of the forwards are BANK OF AMERICA, BNP PARIBAS, CITIGROUP, CREDIT AGRICOLE, CREDIT SUISSE, DEUTSCHE BANK, GOLDMANSACHS, HSBC, JP MORGAN, MORGAN STANLEY, ROYAL BANK OF CANADA, SOCIETE GENERALE and UBS.
The maximal final expiry date for the open contracts will be 16 March 2021.

112
Notes to the Financial Statements as at 31/12/20
� Amundi S.F. - Saving Box I
EURAmount inCurrency22,448.51CADCurrency receivable
4,257,186.35EUR564,085.89GBP144,726.87JPY717,398.68USD
5,705,846.30Total :810,305.07AUDCurrency payable
64,726.34CHF1,443,810.64EUR1,211,946.91GBP
33,401.00NOK35,300.90NZD35,822.61SEK
2,090,097.75USD5,725,411.22Total :-19,564.92Total :
The final expiry date for all open contracts will be 15 January 2021. The counterparties of the forwards are BANK OF AMERICA, BARCLAYS BANK, CITIGROUP, DEUTSCHE BANK, HSBC, MORGAN STANLEY and UBS.
� Amundi S.F. - Saving Box II
EURAmount inCurrency12,827.72CADCurrency receivable
7,119,238.81EUR437,864.69GBP338,329.24JPY480,444.67USD
8,388,705.13Total :1,226,492.89AUDCurrency payable
129,452.68CHF1,264,975.70EUR1,401,837.21GBP
85,411.14NOK76,485.29NZD70,650.14SEK
4,158,951.34USD8,414,256.39Total :-25,551.26Total :
The final expiry date for all open contracts will be 15 January 2021. The counterparties of the forwards are BANK OF AMERICA, BARCLAYS BANK, CITIGROUP, DEUTSCHE BANK, HSBC, MORGAN STANLEY and UBS.
� Amundi S.F. - Saving Box III
EURAmount inCurrency4,078,514.38EURCurrency receivable
560,734.88GBP145,874.56JPY832,607.35USD
5,617,731.17Total :527,171.24AUDCurrency payable
35,276.23CAD87,842.89CHF
1,534,814.00EUR977,376.54GBP
37,695.42NOK29,417.42NZD25,871.88SEK
2,371,174.22USD5,626,639.84Total :
-8,908.67Total :
The final expiry date for all open contracts will be 15 January 2021. The counterparties of the forwards are BANK OF AMERICA, BNP PARIBAS, CITIGROUP, DEUTSCHE BANK, HSBC, MORGAN STANLEY and UBS.

113
Notes to the Financial Statements as at 31/12/20
� Amundi S.F. - Diversified Target Income 11/2021
EURAmount inCurrency283,076.95BRLCurrency receivable
1,075,169.95CLP751,131.95CNY272,561.93COP
19,324,000.61EUR344,445.14IDR381,796.70ILS220,493.20INR957,644.60JPY195,422.04KRW524,400.60MXN381,783.46NOK352,986.87NZD
66,251.91RUB368,200.05SEK185,405.31THB146,510.97TWD
1,513,774.51USD27,345,056.75Total :
126,107.58AUDCurrency payable462,327.62CHF714,801.38CLP
72,613.83COP147,778.55DKK
3,196,903.77EUR2,569,229.56GBP
347,725.56HKD407,249.81ILS111,854.63INR31,657.67JPY
376,182.41KRW360,525.42MXN
19,089.17NOK352,986.87NZD212,670.80THB319,959.97TWD
17,468,415.74USD55,560.12ZAR
27,353,640.46Total :-8,583.71Total :
The counterparties of the forwards are BANK OF AMERICA, CITIGROUP, CREDIT AGRICOLE, GOLDMAN SACHS, HSBC, JP MORGAN, MORGAN STANLEY,SOCIETE GENERALE, UBS and UNICREDIT.
The maximal final expiry date for the open contracts will be 24 March 2021.
� Amundi S.F. - Diversified Target Income 11/2022
EURAmount inCurrency330,256.45BRLCurrency receivable
1,291,170.09CLP913,877.21CNY328,797.66COP121,781.37CZK
23,649,561.77EUR414,501.78IDR432,702.92ILS220,493.20INR
1,195,077.15JPY285,616.84KRW630,919.48MXN448,595.57NOK411,818.01NZD88,335.88RUB
437,859.52SEK223,576.99THB146,510.97TWD
1,780,655.56USD33,352,108.42Total :

114
Notes to the Financial Statements as at 31/12/20
126,107.58AUDCurrency payable554,793.14CHF857,324.54CLP
87,953.77COP174,647.38DKK
3,965,481.93EUR3,016,052.10GBP
474,171.22HKD458,156.04ILS
39,572.09JPY526,655.37KRW438,366.14MXN470,649.16NZD261,748.68THB407,221.78TWD
21,435,897.42USD66,672.15ZAR
33,361,470.49Total :-9,362.07Total :
The counterparties of the forwards are BANK OF AMERICA, CITIGROUP, CREDIT AGRICOLE, GOLDMAN SACHS, HSBC, JP MORGAN, MORGAN STANLEY,SOCIETE GENERALE and UBS.
The maximal final expiry date for the open contracts will be 24 March 2021.
� Amundi S.F. - EUR Commodities
EURAmount inCurrency133,603.41CHFCurrency receivable
2,467,729.85EUR9,257,831.63USD11,859,164.89Total :9,458,565.55EURCurrency payable2,463,642.95USD11,922,208.50Total :
-63,043.61Total :
The maximal final expiry date for the open contracts will be 12 January 2021. The counterparties of the forwards are CITIGROUP and SOCIETE GENERALE.
� Amundi S.F. - SMBC Amundi Protect Fund USD Step 201809
USDAmount inCurrency2,802,382.99USDCurrency receivable2,802,382.99Total :2,877,031.56EURCurrency payable2,877,031.56Total :-74,648.57Total :
The final expiry date for all open contracts will be 29 January 2021. The counterparty of the forwards is HSBC.

115
Notes to the Financial Statements as at 31/12/20
10 Other IncOmeAmounts of other income in the Statement of Operations and Changes in Net Assets mainly include revenues from withholding tax reclaim and class action, rebate feesand redemptions fees.
11 Other chargesBalances for other charges in the Statement of Operations and Changes in Net Assets include other taxes and interest and bank charges.
12 statement Of POrtfOlIO mOvementsA list of changes in the portfolio for the year ended 31 December 2020 is available free of charge at the registered office of the Management Company of the Fund.All details relating to the Outstanding Derivatives Contracts as at 31 December 2020 are presented within the Notes to the Financial Statements.
13 DIvIDenDs
� Distributing classes: these classes distribute on a daily basis an amount based on the net income generated; daily amounts are cumulated and paid monthly.� Distributing annually: these classes distribute on an annual basis an amount based on the income generated in the previous year or a dividend based on an annual
target yield defined at the launch date/beginning of the year. Depending on the Sub-Fund the income distributed could be net or gross of fees.
� Distributing Quarterly target: these classes aim to distribute on a quarterly basis a dividend based on an annual target yield defined at the beginning of the year.� Quarterly Distributing: these classes distribute on a quarterly basis an amount based on the net income generated on the same quarter.Dividend Distribution policy is described in the prospectus of the Fund for further details. No distribution other than those described in the prospectus have been doneduring the year.

116
Notes to the Financial Statements as at 31/12/20
14 OPtIOnsPlease refer to the note 16 for detailed collateral information.
As at 31 December 2020, certain Sub-Funds had the following open positions:
UPfrOnt PremIUm OPtIOns cOntracts
� amundi s.f. - european equity Optimal volatility
currency eUrtotal
commitment in number of
optionsmaturity
datestrikecontract
EUR -40019/03/21200STOXX EURO 600 TRAVL /CALLEUR -1,247,052.40-40019/03/21240STOXX EURO 600 TRAVL /CALL
EUR -8,553,958.05-50019/03/213,600DJ EURO STOXX 50 EUR /CALLEUR -50019/03/213,500DJ EURO STOXX 50 EUR /CALLSEK -2,50019/03/211,680OMX 30 /PUT
-9,801,010.45total :
As at 31 December 2020, the total net market value on Upfront Premium Options Contracts purchased amounted to EUR 2,037,582.55.As at 31 December 2020, the total net market value on Upfront Premium Options Contracts sold amounted to EUR 599,000.00.The counterparty of these options is SOCIETE GENERALE.
� amundi s.f. - absolute return multi-strategy control
currency eUrtotal
commitment in number of
optionsmaturity
datestrikecontract
EUR -12,000,000.00-12,000,00020/01/21287.50CALL CDX OPTION - ITRAXX EUROPE CROSSOVERSERIES 34 INDEX
EUR -6,000,00020/01/21325.00CALL CDX OPTION - ITRAXX EUROPE CROSSOVERSERIES 34 INDEX
EUR -5,000,00017/02/21250.00CALL CDX OPTION - ITRAXX EUROPE CROSSOVERSERIES 34 INDEX
EUR -8,000,00017/02/2150.00CALL CDX OPTION - ITRAXX EUROPE SERIES 34 INDEXUSD -45,855.13-3820/01/2122CBOE S&P VOL INDEX /CALLUSD -3820/01/2130CBOE S&P VOL INDEX /CALLUSD -3820/01/2135CBOE S&P VOL INDEX /CALLUSD -3820/01/2140CBOE S&P VOL INDEX /CALLUSD 8,337.30-3820/01/2119CBOE S&P VOL INDEX /PUTUSD 7,496.87-1817/02/2121CBOE S&P VOL INDEX /PUTEUR -292,484.39-819/03/2113,700DAX INDEX /CALLEUR -82,861.43-819/03/2115,000DAX INDEX /CALLEUR 34,022.57-819/03/2110,700DAX INDEX /PUTEUR 107,555.24-819/03/2112,400DAX INDEX /PUTEUR -4419/02/213,625DJ EURO STOXX 50 EUR /CALLEUR -599,238.00-2219/02/213,325DJ EURO STOXX 50 EUR /CALLEUR -1819/03/213,050DJ EURO STOXX 50 EUR /CALLEUR -487,307.74-1819/03/213,300DJ EURO STOXX 50 EUR /CALLEUR 63,752.88-2115/01/213,275DJ EURO STOXX 50 EUR /PUTEUR 38,251.73-2115/01/213,175DJ EURO STOXX 50 EUR /PUTEUR 36,930.24-2215/01/213,150DJ EURO STOXX 50 EUR /PUTEUR -2115/01/213,350DJ EURO STOXX 50 EUR /PUTEUR -2415/01/213,425DJ EURO STOXX 50 EUR /PUTEUR -2215/01/213,325DJ EURO STOXX 50 EUR /PUTEUR -2215/01/213,125DJ EURO STOXX 50 EUR /PUTEUR 10,607.62-315/01/213,300DJ EURO STOXX 50 EUR /PUTEUR 28,605.86-2219/02/212,775DJ EURO STOXX 50 EUR /PUTEUR -6617/06/221,500DJ EURO STOXX 50 EUR /PUTEUR -95,950.70-3319/02/21255DOW JONES EURO STOXX OIL & GAS /CALLEUR -3319/02/21220DOW JONES EURO STOXX OIL & GAS /PUTEUR 58,506.53-3319/02/21205DOW JONES EURO STOXX OIL & GAS /PUTEUR -2117/12/21120EURO STOXX 50 DIVID /CALLEUR -76,386.78-1716/12/22100EURO STOXX 50 DIVID /CALLEUR -1716/12/2290EURO STOXX 50 DIVID /CALLEUR 140,772.24-2117/12/2195EURO STOXX 50 DIVID /PUTEUR 17,455.26-1716/12/2270EURO STOXX 50 DIVID /PUTEUR -1,500,00005/02/211.19EXO FX OPTION - PUT EUR / CALL USDGBP -129,730.07-1115/01/216,700FOOTSIE 100 /CALL

117
Notes to the Financial Statements as at 31/12/20
currency eUrtotal
commitment in number of
optionsmaturity
datestrikecontract
GBP -1115/01/2165FOOTSIE 100 /CALLGBP -86,395.29-917/12/2175FOOTSIE 100 /CALLGBP -917/12/2168FOOTSIE 100 /CALLGBP -1115/01/216,200FOOTSIE 100 /PUTGBP 60,339.57-1115/01/215,875FOOTSIE 100 /PUTGBP 83,147.35-815/01/2161FOOTSIE 100 /PUTGBP 54,132.39-1015/01/2159FOOTSIE 100 /PUTGBP -1015/01/2162FOOTSIE 100 /PUTGBP -815/01/2164FOOTSIE 100 /PUTGBP -1115/01/2158FOOTSIE 100 /PUTGBP -715/01/2162FOOTSIE 100 /PUTGBP -1515/01/216,475FOOTSIE 100 /PUTGBP 251,174.28-1515/01/216,250FOOTSIE 100 /PUTGBP 93,021.09-819/02/2159FOOTSIE 100 /PUTGBP -819/02/2162FOOTSIE 100 /PUTGBP 41,573.67-917/12/2141FOOTSIE 100 /PUTEUR -1,200,00021/01/211.11FX OPTION - CALL EUR / PUT CHFEUR -400,000.00-400,00021/01/211.095FX OPTION - CALL EUR / PUT CHFEUR -1,200,00021/01/2110.60FX OPTION - CALL EUR / PUT SEKEUR -400,000.00-400,00021/01/2110.40FX OPTION - CALL EUR / PUT SEKEUR -2,200,00011/01/211.23FX OPTION - CALL EUR / PUT USDEUR -2,200,00027/01/211.24FX OPTION - CALL EUR / PUT USDUSD -1,200,00022/01/211.36FX OPTION - CALL USD / PUT CADUSD -326,917.58-400,00022/01/211.33FX OPTION - CALL USD / PUT CADUSD -400,00022/01/211.33FX OPTION - CALL USD / PUT CADUSD -1,500,00023/02/2179.00FX OPTION - CALL USD / PUT INRUSD -408,646.97-500,00023/02/2176.65FX OPTION - CALL USD / PUT INRUSD -408,646.97-500,00022/09/21100.00FX OPTION - CALL USD / PUT JPYUSD -408,646.97-500,00007/10/2199.00FX OPTION - CALL USD / PUT JPYUSD -326,917.58-400,00014/10/2198.00FX OPTION - CALL USD / PUT JPYUSD -408,646.97-500,00014/10/2198.50FX OPTION - CALL USD / PUT JPYUSD -500,00024/09/26105.00FX OPTION - CALL USD / PUT JPYUSD -500,00024/09/26100.00FX OPTION - CALL USD / PUT JPYUSD -500,00007/10/2699.00FX OPTION - CALL USD / PUT JPYUSD -500,00007/10/26104.00FX OPTION - CALL USD / PUT JPYUSD -400,00014/10/2698.00FX OPTION - CALL USD / PUT JPYUSD -400,00014/10/26104.50FX OPTION - CALL USD / PUT JPYUSD -500,00015/10/26105.25FX OPTION - CALL USD / PUT JPYUSD -500,00015/10/2698.50FX OPTION - CALL USD / PUT JPYUSD -100,00022/02/211,125.00FX OPTION - CALL USD / PUT KRWUSD -817,293.94-1,000,00026/04/2130.10FX OPTION - CALL USD / PUT TWDUSD -1,000,00026/04/2128.90FX OPTION - CALL USD / PUT TWDAUD -1,800,00021/01/2171.00FX OPTION - PUT AUD / CALL JPYAUD 378,405.65-600,00021/01/2173.75FX OPTION - PUT AUD / CALL JPYAUD -200,00017/02/2173.50FX OPTION - PUT AUD / CALL JPYAUD 63,067.61-100,00017/02/2171.50FX OPTION - PUT AUD / CALL JPYEUR 400,000.00-400,00002/11/211.45FX OPTION - PUT EUR / CALL CADEUR -400,00002/11/211.55FX OPTION - PUT EUR / CALL CADEUR -1,200,00021/01/211.055FX OPTION - PUT EUR / CALL CHFEUR 400,000.00-400,00021/01/211.0675FX OPTION - PUT EUR / CALL CHFEUR -800,00010/02/218.33FX OPTION - PUT EUR / CALL CNHEUR 800,000.00-800,00010/02/218.15FX OPTION - PUT EUR / CALL CNHEUR -600,00015/01/2184.00FX OPTION - PUT EUR / CALL INREUR 900,000.00-900,00015/01/2179.00FX OPTION - PUT EUR / CALL INREUR -600,00014/01/2122.50FX OPTION - PUT EUR / CALL MXNEUR 900,000.00-900,00014/01/2121.00FX OPTION - PUT EUR / CALL MXNEUR -600,00018/02/2121.00FX OPTION - PUT EUR / CALL MXNEUR 600,000.00-600,00018/02/2120.00FX OPTION - PUT EUR / CALL MXNEUR -1,500,00011/01/211.195FX OPTION - PUT EUR / CALL USDEUR -1,700,00012/01/211.1025FX OPTION - PUT EUR / CALL USDEUR -1,700,00012/01/211.105FX OPTION - PUT EUR / CALL USDEUR -900,00018/02/211.14FX OPTION - PUT EUR / CALL USDEUR -1,500,00005/03/211.19FX OPTION - PUT EUR / CALL USDEUR 1,500,000.00-1,500,00005/03/211.17FX OPTION - PUT EUR / CALL USDUSD 408,646.97-500,00021/05/2174.15FX OPTION - PUT USD / CALL INRUSD -500,00024/11/2177.30FX OPTION - PUT USD / CALL INRUSD 367,782.27-450,00007/06/2275.00FX OPTION - PUT USD / CALL INRUSD -450,00007/06/2282.00FX OPTION - PUT USD / CALL INR

118
Notes to the Financial Statements as at 31/12/20
currency eUrtotal
commitment in number of
optionsmaturity
datestrikecontract
USD -1,900,00015/06/21102.00FX OPTION - PUT USD / CALL JPYUSD 1,552,858.49-1,900,00015/06/2195.00FX OPTION - PUT USD / CALL JPYEUR -1019/03/2122,500MINI FTSE / MIB INDEX /CALLEUR -1019/03/2120,500MINI FTSE / MIB INDEX /CALLEUR -1019/03/2116,000MINI FTSE / MIB INDEX /PUTEUR -1019/03/2118,500MINI FTSE / MIB INDEX /PUTUSD -224,154.00-817/12/211,300MSCI EM INDEX /CALLUSD -1415/01/211,130MSCI EM INDEX /PUTUSD -715/01/211,225MSCI EM INDEX /PUTUSD 84,427.12-817/12/211,060MSCI EM INDEX /PUTUSD -817/12/211,130MSCI EM INDEX /PUT
USD -131/12/2012,500NASDAQ 100 /CALLUSD -131/12/2013,000NASDAQ 100 /CALLJPY -108/01/2127,000NIKKEI 225 /CALLJPY -208/01/2127,250NIKKEI 225 /CALLJPY -208/01/2127,375NIKKEI 225 /CALLJPY -208/01/2127,500NIKKEI 225 /CALLJPY -308/01/2127,625NIKKEI 225 /CALLJPY -651,749.19-312/02/2128,000NIKKEI 225 /CALLJPY -312/02/2127,125NIKKEI 225 /CALLJPY -512/02/2127,625NIKKEI 225 /CALLJPY -1,086,248.65-512/02/2128,625NIKKEI 225 /CALLJPY -312/03/2131,000NIKKEI 225 /CALLJPY -651,749.19-312/03/2128,750NIKKEI 225 /CALLJPY -408/01/2124,375NIKKEI 225 /PUTJPY -408/01/2125,125NIKKEI 225 /PUTJPY -308/01/2125,500NIKKEI 225 /PUTJPY -112/02/2122,500NIKKEI 225 /PUTJPY -312/02/2125,875NIKKEI 225 /PUTJPY 651,749.19-312/02/2124,500NIKKEI 225 /PUTJPY -412/02/2123,875NIKKEI 225 /PUTJPY 651,749.19-312/03/2125,000NIKKEI 225 /PUTJPY -612/03/2120,750NIKKEI 225 /PUTJPY -610/06/2215,000NIKKEI 225 /PUTSEK 31,343.62-2015/01/211,770OMX 30 /PUTSEK -2015/01/211,860OMX 30 /PUTUSD -2,400,00020/01/21104.00PUT CDX OPTION - CDX NA HY 35 INDEXUSD 4,086,469.70-5,000,00017/02/21105.00PUT CDX OPTION - CDX NA HY 35 INDEXUSD -5,000,00017/02/21108.00PUT CDX OPTION - CDX NA HY 35 INDEXUSD 4,086,469.70-5,000,00017/03/21107.00PUT CDX OPTION - CDX NA HY 35 INDEXUSD -5,000,00017/03/21105.00PUT CDX OPTION - CDX NA HY 35 INDEXUSD 4,086,469.70-5,000,00017/03/21101.00PUT CDX OPTION - CDX NA HY 35 INDEXUSD -5,000,00017/03/21109.00PUT CDX OPTION - CDX NA HY 35 INDEXUSD -4,500,00020/01/2162.50PUT CDX OPTION - CDX NA IG 35 INDEXEUR -700,00020/01/21425.00PUT CDX OPTION - ITRAXX EUROPE CROSSOVER SERIES
34 INDEXEUR -6,000,00020/01/21350.00PUT CDX OPTION - ITRAXX EUROPE CROSSOVER SERIES
34 INDEXEUR -5,000,00020/01/21525.00PUT CDX OPTION - ITRAXX EUROPE CROSSOVER SERIES
34 INDEXEUR -5,000,00020/01/21325.00PUT CDX OPTION - ITRAXX EUROPE CROSSOVER SERIES
34 INDEXEUR -3,500,00017/02/21387.50PUT CDX OPTION - ITRAXX EUROPE CROSSOVER SERIES
34 INDEXEUR -3,500,00017/02/21287.50PUT CDX OPTION - ITRAXX EUROPE CROSSOVER SERIES
34 INDEXEUR -4,000,00020/01/2165.00PUT CDX OPTION - ITRAXX EUROPE SERIES 34 INDEXEUR -6,000,00020/01/2155.00PUT CDX OPTION - ITRAXX EUROPE SERIES 34 INDEXEUR -6,000,00020/01/2185.00PUT CDX OPTION - ITRAXX EUROPE SERIES 34 INDEXEUR 5,000,000.00-5,000,00017/02/2190.00PUT CDX OPTION - ITRAXX EUROPE SERIES 34 INDEXEUR -5,000,00017/02/2160.00PUT CDX OPTION - ITRAXX EUROPE SERIES 34 INDEXEUR 5,000,000.00-5,000,00017/03/2175.00PUT CDX OPTION - ITRAXX EUROPE SERIES 34 INDEXEUR -5,000,00017/03/2155.00PUT CDX OPTION - ITRAXX EUROPE SERIES 34 INDEXUSD -490,667.26-415/01/211,890RUSSELL 2000 INDEX /CALLUSD -415/01/211,750RUSSELL 2000 INDEX /CALL
USD -2315/01/217,000MSCI WORLD INDEX /PUTUSD -1215/01/217,450MSCI WORLD INDEX /PUTUSD -2315/01/217,550MSCI WORLD INDEX /PUT

119
Notes to the Financial Statements as at 31/12/20
currency eUrtotal
commitment in number of
optionsmaturity
datestrikecontract
USD -431/12/201,680RUSSELL 2000 MINI /CALLUSD -1,291,229.62-831/12/201,800RUSSELL 2000 MINI /CALLCHF -815/01/2110,750SMI (ZURICH) /CALLCHF 29,293.50-815/01/219,600SMI (ZURICH) /PUTCHF 30,876.94-815/01/219,700SMI (ZURICH) /PUTCHF -815/01/2110,250SMI (ZURICH) /PUTCHF -815/01/2110,100SMI (ZURICH) /PUTCHF -715/01/2110,200SMI (ZURICH) /PUTCHF 52,164.21-719/02/219,500SMI (ZURICH) /PUTCHF -719/02/219,900SMI (ZURICH) /PUTUSD -731/12/203,825S&P 500 INDEX /CALLUSD -704/01/213,825S&P 500 INDEX /CALLUSD -315/01/213,850S&P 500 INDEX /CALLUSD -315/01/213,800S&P 500 INDEX /CALLUSD -119/02/213,850S&P 500 INDEX /CALLUSD -319/03/213,750S&P 500 INDEX /CALLUSD -274,515.63-319/03/213,900S&P 500 INDEX /CALLUSD -617/12/213,850S&P 500 INDEX /CALLUSD -433,734.70-617/12/214,200S&P 500 INDEX /CALLUSD -216/12/224,000S&P 500 INDEX /CALLUSD -530/12/203,500S&P 500 INDEX /PUTUSD -231/12/203,410S&P 500 INDEX /PUTUSD -431/12/203,575S&P 500 INDEX /PUTUSD 19,521.11-208/01/213,430S&P 500 INDEX /PUTUSD -208/01/213,610S&P 500 INDEX /PUTUSD -408/01/213,505S&P 500 INDEX /PUTUSD -108/01/213,620S&P 500 INDEX /PUTUSD 12,200.69-108/01/213,470S&P 500 INDEX /PUTUSD -508/01/213,625S&P 500 INDEX /PUTUSD 67,103.82-508/01/213,480S&P 500 INDEX /PUTUSD -215/01/213,300S&P 500 INDEX /PUTUSD 30,501.74-117/12/212,600S&P 500 INDEX /PUTUSD 8,235.47-116/12/221,500S&P 500 INDEX /PUTAUD -921/01/216,750SPI 200 INDEX /CALLAUD -373,889.15-921/01/217,000SPI 200 INDEX /CALLAUD 373,889.15-921/01/216,125SPI 200 INDEX /PUTAUD -921/01/216,475SPI 200 INDEX /PUTAUD -921/01/216,300SPI 200 INDEX /PUTAUD 373,889.15-921/01/215,900SPI 200 INDEX /PUTAUD 373,889.15-921/01/215,950SPI 200 INDEX /PUTAUD -921/01/216,275SPI 200 INDEX /PUTAUD -921/01/216,350SPI 200 INDEX /PUTAUD -1421/01/216,500SPI 200 INDEX /PUTAUD 581,605.35-1421/01/216,175SPI 200 INDEX /PUTAUD -1821/01/215,975SPI 200 INDEX /PUTAUD -921/01/216,450SPI 200 INDEX /PUTAUD -3,400,00019/11/210.30SWAP OPTION - PAY BBSW 3M / REC 0.300%AUD -3,400,00021/11/220.50SWAP OPTION - PAY BBSW 3M / REC 0.500%AUD -6,500,00018/11/251.25SWAP OPTION - PAY BBSW 3M / REC 1.250%AUD -6,500,00025/07/222.90SWAP OPTION - PAY BBSW 6M / REC 2.900%EUR -1,500,000.00-1,500,00003/11/22-0.09SWAP OPTION - PAY EURIBOR 6M / REC -0.090%EUR -1,000,00008/08/22-0.12SWAP OPTION - PAY EURIBOR 6M / REC -0.120%EUR -400,000.00-400,00008/11/210.30SWAP OPTION - PAY EURIBOR 6M / REC 0.300%EUR -2,700,000.00-2,700,00019/11/210.50SWAP OPTION - PAY EURIBOR 6M / REC 0.500%EUR -1,400,000.00-1,400,00005/12/290.85SWAP OPTION - PAY EURIBOR 6M / REC 0.850%EUR -1,000,000.00-1,000,00008/02/241.50SWAP OPTION - PAY EURIBOR 6M / REC 1.500%KRW -2,200,000,00016/02/211.25SWAP OPTION - PAY KIKRW 3M / REC 1.250%USD -3,269,175.76-4,000,00027/08/211.50SWAP OPTION - PAY LIBOR 3M / REC 1.500%USD -3,187,446.37-3,900,00015/01/211.60SWAP OPTION - PAY LIBOR 3M / REC 1.600%USD -326,917.58-400,00008/11/211.65SWAP OPTION - PAY LIBOR 3M / REC 1.650%USD -3,269,175.76-4,000,00027/08/211.75SWAP OPTION - PAY LIBOR 3M / REC 1.750%USD -2,124,964.24-2,600,00019/11/211.75SWAP OPTION - PAY LIBOR 3M / REC 1.750%USD -800,00005/12/292.00SWAP OPTION - PAY LIBOR 3M / REC 2.000%USD -1,062,482.12-1,300,00008/02/242.90SWAP OPTION - PAY LIBOR 3M / REC 2.900%USD -1,634,587.88-2,000,00029/11/213.16SWAP OPTION - PAY LIBOR 3M / REC 3.160%USD 1,389,399.70-1,700,00024/01/295.00SWAP OPTION - PAY LIBOR 3M / REC 5.000%USD -490,376.36-600,00004/12/296.00SWAP OPTION - PAY LIBOR 3M / REC 6.000%JPY -164,000,00014/10/250.00SWAP OPTION - PAY LIBOR 6M / REC 0.000%

120
Notes to the Financial Statements as at 31/12/20
currency eUrtotal
commitment in number of
optionsmaturity
datestrikecontract
JPY -100,000,00013/11/280.50SWAP OPTION - PAY LIBOR 6M / REC 0.500%JPY -170,000,00005/12/290.50SWAP OPTION - PAY LIBOR 6M / REC 0.500%GBP -3,239,861.47-2,900,00016/07/210.55SWAP OPTION - PAY LIBOR 6M / REC 0.550%GBP -2,900,00029/01/210.60SWAP OPTION - PAY LIBOR 6M / REC 0.600%GBP -3,239,861.47-2,900,00012/08/210.70SWAP OPTION - PAY LIBOR 6M / REC 0.700%SEK -36,300,00027/01/230.35SWAP OPTION - PAY STIBOR 3M / REC 0.350%EUR -2,700,00019/11/210.00SWAP OPTION - PAY 0.000% / REC EURIBOR 6MEUR -500,00003/11/220.01SWAP OPTION - PAY 0.010% / REC EURIBOR 6MAUD 2,144,298.69-3,400,00019/11/210.15SWAP OPTION - PAY 0.150% / REC BBSW 3MAUD 2,144,298.69-3,400,00021/11/220.15SWAP OPTION - PAY 0.150% / REC BBSW 3MEUR 250,000.00-250,00027/01/230.25SWAP OPTION - PAY 0.250% / REC EURIBOR 6MEUR -3,400,00015/01/21-0.30SWAP OPTION - PAY -0.300% / REC EURIBOR 6MEUR -3,400,00016/07/21-0.30SWAP OPTION - PAY -0.300% / REC EURIBOR 6MEUR -3,400,00012/08/21-0.30SWAP OPTION - PAY -0.300% / REC EURIBOR 6MEUR 700,000.00-700,00026/07/210.40SWAP OPTION - PAY 0.400% / REC EURIBOR 6MEUR 1,300,000.00-1,300,00014/10/25-0.50SWAP OPTION - PAY -0.500% / REC EURIBOR 6MUSD -7,700,00016/12/210.50SWAP OPTION - PAY 0.500% / REC LIBOR 3MGBP 558,596.80-500,00021/04/210.50SWAP OPTION - PAY 0.500% / REC LIBOR 6MJPY -170,000,00005/12/290.50SWAP OPTION - PAY 0.500% / REC LIBOR 6MGBP -670,316.17-600,00029/01/210.55SWAP OPTION - PAY 0.550% / REC LIBOR 6MEUR 350,000.00-350,00007/08/25-0.65SWAP OPTION - PAY -0.650% / REC EURIBOR 6MJPY -325,000,00012/04/280.84SWAP OPTION - PAY 0.840% / REC LIBOR 6MEUR 1,400,000.00-1,400,00005/12/290.85SWAP OPTION - PAY 0.850% / REC EURIBOR 6MEUR -700,00026/07/210.90SWAP OPTION - PAY 0.900% / REC EURIBOR 6MEUR -1,200,00008/11/221.20SWAP OPTION - PAY 1.200% / REC EURIBOR 6MAUD -6,500,00018/11/251.25SWAP OPTION - PAY 1.250% / REC BBSW 3MUSD -1,552,858.49-1,900,00016/02/211.25SWAP OPTION - PAY 1.250% / REC LIBOR 3MUSD -4,000,00027/08/211.25SWAP OPTION - PAY 1.250% / REC LIBOR 3MEUR -1,000,00008/02/391.40SWAP OPTION - PAY 1.400% / REC EURIBOR 6MGBP -500,00021/04/271.50SWAP OPTION - PAY 1.500% / REC LIBOR 6MJPY -100,000,00013/11/281.50SWAP OPTION - PAY 1.500% / REC LIBOR 6MEUR -2,500,00031/10/232.00SWAP OPTION - PAY 2.000% / REC EURIBOR 6MEUR -6,000,00012/04/282.00SWAP OPTION - PAY 2.000% / REC EURIBOR 6MEUR -750,00023/02/332.00SWAP OPTION - PAY 2.000% / REC EURIBOR 6MUSD 1,389,399.70-1,700,00012/09/222.00SWAP OPTION - PAY 2.000% / REC LIBOR 3MUSD -800,00005/12/292.00SWAP OPTION - PAY 2.000% / REC LIBOR 3MSEK -42,500,00014/04/252.06SWAP OPTION - PAY 2.060% / REC STIBOR 3MUSD -1,700,00012/09/222.50SWAP OPTION - PAY 2.500% / REC LIBOR 3MUSD -1,200,00007/11/222.75SWAP OPTION - PAY 2.750% / REC LIBOR 3MUSD -1,300,00008/02/392.80SWAP OPTION - PAY 2.800% / REC LIBOR 3MAUD -6,500,00025/07/222.90SWAP OPTION - PAY 2.900% / REC BBSW 6MUSD -1,600,00015/02/233.06SWAP OPTION - PAY 3.060% / REC LIBOR 3MUSD -1,400,00029/10/383.18SWAP OPTION - PAY 3.180% / REC LIBOR 3MUSD -450,00029/11/213.21SWAP OPTION - PAY 3.210% / REC LIBOR 3MUSD -1,050,00026/10/283.80SWAP OPTION - PAY 3.800% / REC LIBOR 3MUSD -450,00029/01/304.00SWAP OPTION - PAY 4.000% / REC LIBOR 3MUSD -450,00030/01/354.00SWAP OPTION - PAY 4.000% / REC LIBOR 3MUSD -300,00004/12/294.50SWAP OPTION - PAY 4.500% / REC LIBOR 3MEUR -2,500,00031/10/231.00SWAP OPTION - REC EURIBOR 6M / PAY 1.000%EUR -6,000,00012/04/282.00SWAP OPTION - REC EURIBOR 6M / PAY 2.000%USD -1,050,00026/10/283.00SWAP OPTION - REC LIBOR 3M / PAY 3.000%USD -1,700,00024/01/293.02SWAP OPTION - REC LIBOR 3M / PAY 3.020%USD 5,721,057.58-7,000,00015/02/233.33SWAP OPTION - REC LIBOR 3M / PAY 3.330%JPY -325,000,00012/04/280.84SWAP OPTION - REC LIBOR 6M / PAY 0.840%EUR 2,500,000.00-2,500,00031/10/230.50SWAP OPTION - REC 0.500% / PAY EURIBOR 6MUSD 858,158.64-1,050,00026/10/281.50SWAP OPTION - REC 1.500% / PAY LIBOR 3MUSD -319/02/21183.00T BOND /CALLUSD -21,373.31-119/02/21179.00T BOND /CALLUSD 97,099.93-1022/01/21167.00T BOND /PUTUSD -1022/01/21170.00T BOND /PUTUSD 408,286.82-1519/02/21168.00T BOND /PUTUSD -1519/02/21172.00T BOND /PUTUSD -4122/01/21125.50US 5YR T-NOTES /PUTUSD -4122/01/21125.75US 5YR T-NOTES /PUTUSD -5022/01/21138.0010YR US TREASRY NOTE /CALLUSD -560,866.56-5022/01/21139.5010YR US TREASRY NOTE /CALLUSD -32,726.62-119/02/21139.0010YR US TREASRY NOTE /CALLUSD -319/02/21141.0010YR US TREASRY NOTE /CALL
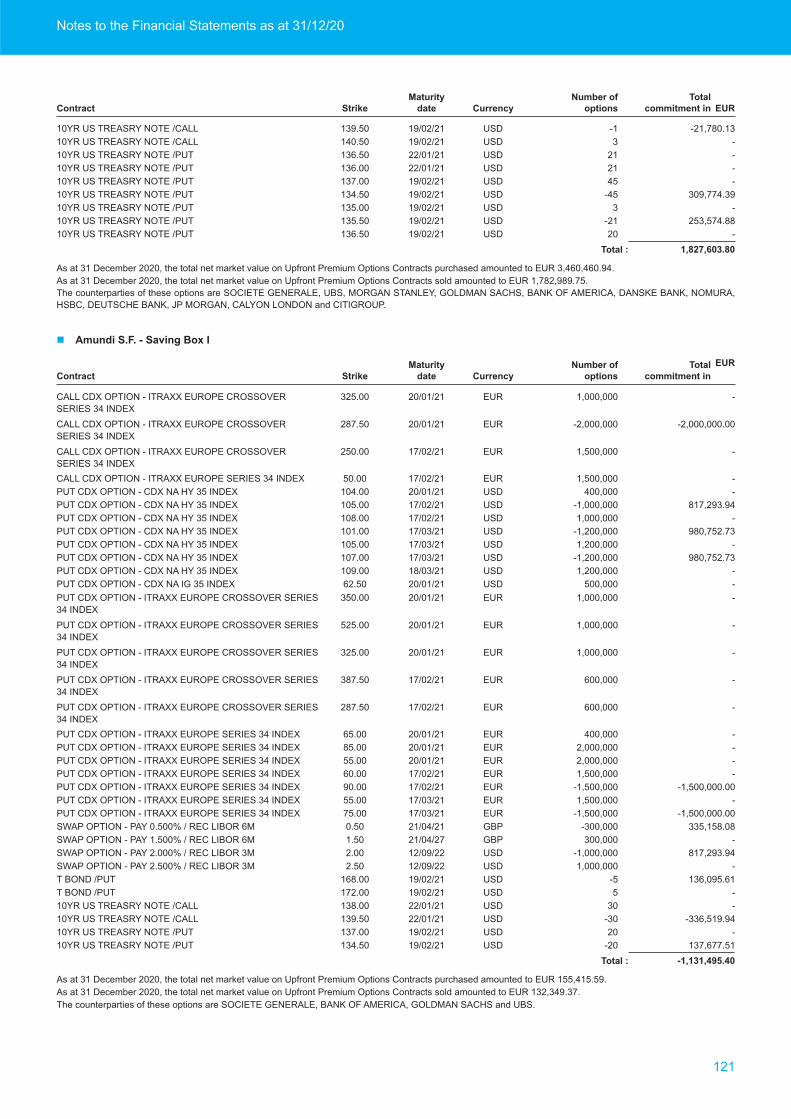
121
Notes to the Financial Statements as at 31/12/20
currency eUrtotal
commitment in number of
optionsmaturity
datestrikecontract
USD -21,780.13-119/02/21139.5010YR US TREASRY NOTE /CALLUSD -319/02/21140.5010YR US TREASRY NOTE /CALLUSD -2122/01/21136.5010YR US TREASRY NOTE /PUTUSD -2122/01/21136.0010YR US TREASRY NOTE /PUTUSD -4519/02/21137.0010YR US TREASRY NOTE /PUTUSD 309,774.39-4519/02/21134.5010YR US TREASRY NOTE /PUTUSD -319/02/21135.0010YR US TREASRY NOTE /PUTUSD 253,574.88-2119/02/21135.5010YR US TREASRY NOTE /PUTUSD -2019/02/21136.5010YR US TREASRY NOTE /PUT
1,827,603.80total :
As at 31 December 2020, the total net market value on Upfront Premium Options Contracts purchased amounted to EUR 3,460,460.94.As at 31 December 2020, the total net market value on Upfront Premium Options Contracts sold amounted to EUR 1,782,989.75.The counterparties of these options are SOCIETE GENERALE, UBS, MORGAN STANLEY, GOLDMAN SACHS, BANK OF AMERICA, DANSKE BANK, NOMURA,HSBC, DEUTSCHE BANK, JP MORGAN, CALYON LONDON and CITIGROUP.
� amundi s.f. - saving Box I
currencyeUrtotal
commitment in number of
optionsmaturity
datestrikecontract
EUR -1,000,00020/01/21325.00CALL CDX OPTION - ITRAXX EUROPE CROSSOVERSERIES 34 INDEX
EUR -2,000,000.00-2,000,00020/01/21287.50CALL CDX OPTION - ITRAXX EUROPE CROSSOVERSERIES 34 INDEX
EUR -1,500,00017/02/21250.00CALL CDX OPTION - ITRAXX EUROPE CROSSOVERSERIES 34 INDEX
EUR -1,500,00017/02/2150.00CALL CDX OPTION - ITRAXX EUROPE SERIES 34 INDEXUSD -400,00020/01/21104.00PUT CDX OPTION - CDX NA HY 35 INDEXUSD 817,293.94-1,000,00017/02/21105.00PUT CDX OPTION - CDX NA HY 35 INDEXUSD -1,000,00017/02/21108.00PUT CDX OPTION - CDX NA HY 35 INDEXUSD 980,752.73-1,200,00017/03/21101.00PUT CDX OPTION - CDX NA HY 35 INDEXUSD -1,200,00017/03/21105.00PUT CDX OPTION - CDX NA HY 35 INDEXUSD 980,752.73-1,200,00017/03/21107.00PUT CDX OPTION - CDX NA HY 35 INDEXUSD -1,200,00018/03/21109.00PUT CDX OPTION - CDX NA HY 35 INDEXUSD -500,00020/01/2162.50PUT CDX OPTION - CDX NA IG 35 INDEXEUR -1,000,00020/01/21350.00PUT CDX OPTION - ITRAXX EUROPE CROSSOVER SERIES
34 INDEXEUR -1,000,00020/01/21525.00PUT CDX OPTION - ITRAXX EUROPE CROSSOVER SERIES
34 INDEXEUR -1,000,00020/01/21325.00PUT CDX OPTION - ITRAXX EUROPE CROSSOVER SERIES
34 INDEXEUR -600,00017/02/21387.50PUT CDX OPTION - ITRAXX EUROPE CROSSOVER SERIES
34 INDEXEUR -600,00017/02/21287.50PUT CDX OPTION - ITRAXX EUROPE CROSSOVER SERIES
34 INDEXEUR -400,00020/01/2165.00PUT CDX OPTION - ITRAXX EUROPE SERIES 34 INDEXEUR -2,000,00020/01/2185.00PUT CDX OPTION - ITRAXX EUROPE SERIES 34 INDEXEUR -2,000,00020/01/2155.00PUT CDX OPTION - ITRAXX EUROPE SERIES 34 INDEXEUR -1,500,00017/02/2160.00PUT CDX OPTION - ITRAXX EUROPE SERIES 34 INDEXEUR -1,500,000.00-1,500,00017/02/2190.00PUT CDX OPTION - ITRAXX EUROPE SERIES 34 INDEXEUR -1,500,00017/03/2155.00PUT CDX OPTION - ITRAXX EUROPE SERIES 34 INDEXEUR -1,500,000.00-1,500,00017/03/2175.00PUT CDX OPTION - ITRAXX EUROPE SERIES 34 INDEXGBP 335,158.08-300,00021/04/210.50SWAP OPTION - PAY 0.500% / REC LIBOR 6MGBP -300,00021/04/271.50SWAP OPTION - PAY 1.500% / REC LIBOR 6MUSD 817,293.94-1,000,00012/09/222.00SWAP OPTION - PAY 2.000% / REC LIBOR 3MUSD -1,000,00012/09/222.50SWAP OPTION - PAY 2.500% / REC LIBOR 3MUSD 136,095.61-519/02/21168.00T BOND /PUTUSD -519/02/21172.00T BOND /PUTUSD -3022/01/21138.0010YR US TREASRY NOTE /CALLUSD -336,519.94-3022/01/21139.5010YR US TREASRY NOTE /CALLUSD -2019/02/21137.0010YR US TREASRY NOTE /PUTUSD 137,677.51-2019/02/21134.5010YR US TREASRY NOTE /PUT
-1,131,495.40total :
As at 31 December 2020, the total net market value on Upfront Premium Options Contracts purchased amounted to EUR 155,415.59.As at 31 December 2020, the total net market value on Upfront Premium Options Contracts sold amounted to EUR 132,349.37.The counterparties of these options are SOCIETE GENERALE, BANK OF AMERICA, GOLDMAN SACHS and UBS.

122
Notes to the Financial Statements as at 31/12/20
� amundi s.f. - saving Box II
currency eUrtotal
commitment in number of
optionsmaturity
datestrikecontract
EUR -4,000,000.00-4,000,00020/01/21287.50CALL CDX OPTION - ITRAXX EUROPE CROSSOVERSERIES 34 INDEX
EUR -2,000,00020/01/21325.00CALL CDX OPTION - ITRAXX EUROPE CROSSOVERSERIES 34 INDEX
EUR -3,000,00017/02/21250.00CALL CDX OPTION - ITRAXX EUROPE CROSSOVERSERIES 34 INDEX
EUR -4,000,00017/02/2150.00CALL CDX OPTION - ITRAXX EUROPE SERIES 34 INDEXUSD -700,00020/01/21104.00PUT CDX OPTION - CDX NA HY 35 INDEXUSD 2,043,234.85-2,500,00017/02/21105.00PUT CDX OPTION - CDX NA HY 35 INDEXUSD -2,500,00017/02/21108.00PUT CDX OPTION - CDX NA HY 35 INDEXUSD -2,500,00017/03/21109.00PUT CDX OPTION - CDX NA HY 35 INDEXUSD 2,043,234.85-2,500,00017/03/21101.00PUT CDX OPTION - CDX NA HY 35 INDEXUSD 2,043,234.85-2,500,00017/03/21107.00PUT CDX OPTION - CDX NA HY 35 INDEXUSD -2,500,00017/03/21105.00PUT CDX OPTION - CDX NA HY 35 INDEXUSD -1,100,00020/01/2162.50PUT CDX OPTION - CDX NA IG 35 INDEXEUR -2,000,00020/01/21350.00PUT CDX OPTION - ITRAXX EUROPE CROSSOVER SERIES
34 INDEXEUR -2,500,00020/01/21525.00PUT CDX OPTION - ITRAXX EUROPE CROSSOVER SERIES
34 INDEXEUR -2,500,00020/01/21325.00PUT CDX OPTION - ITRAXX EUROPE CROSSOVER SERIES
34 INDEXEUR -1,300,00017/02/21387.50PUT CDX OPTION - ITRAXX EUROPE CROSSOVER SERIES
34 INDEXEUR -1,300,00017/02/21287.50PUT CDX OPTION - ITRAXX EUROPE CROSSOVER SERIES
34 INDEXEUR -1,000,00020/01/2165.00PUT CDX OPTION - ITRAXX EUROPE SERIES 34 INDEXEUR -5,000,00020/01/2185.00PUT CDX OPTION - ITRAXX EUROPE SERIES 34 INDEXEUR -5,000,00020/01/2155.00PUT CDX OPTION - ITRAXX EUROPE SERIES 34 INDEXEUR -3,000,000.00-3,000,00017/02/2190.00PUT CDX OPTION - ITRAXX EUROPE SERIES 34 INDEXEUR -3,000,00017/02/2160.00PUT CDX OPTION - ITRAXX EUROPE SERIES 34 INDEXEUR -3,000,000.00-3,000,00017/03/2175.00PUT CDX OPTION - ITRAXX EUROPE SERIES 34 INDEXEUR -3,000,00017/03/2155.00PUT CDX OPTION - ITRAXX EUROPE SERIES 34 INDEXGBP 670,316.17-600,00021/04/210.50SWAP OPTION - PAY 0.500% / REC LIBOR 6MGBP -600,00021/04/271.50SWAP OPTION - PAY 1.500% / REC LIBOR 6MUSD 1,798,046.67-2,200,00012/09/222.00SWAP OPTION - PAY 2.000% / REC LIBOR 3MUSD -2,200,00012/09/222.50SWAP OPTION - PAY 2.500% / REC LIBOR 3MUSD 272,191.22-1019/02/21168.00T BOND /PUTUSD -1019/02/21172.00T BOND /PUTUSD -6022/01/21138.0010YR US TREASRY NOTE /CALLUSD -673,039.87-6022/01/21139.5010YR US TREASRY NOTE /CALLUSD -4519/02/21137.0010YR US TREASRY NOTE /PUTUSD 309,774.39-4519/02/21134.5010YR US TREASRY NOTE /PUT
-1,493,006.87total :
As at 31 December 2020, the total net market value on Upfront Premium Options Contracts purchased amounted to EUR 322,922.93.As at 31 December 2020, the total net market value on Upfront Premium Options Contracts sold amounted to EUR 277,884.55.The counterparties of these options are SOCIETE GENERALE, BANK OF AMERICA, UBS and GOLDMAN SACHS.
� amundi s.f. - saving Box III
currency eUrtotal
commitment in number of
optionsmaturity
datestrikecontract
EUR -1,600,000.00-1,600,00020/01/21287.50CALL CDX OPTION - ITRAXX EUROPE CROSSOVERSERIES 34 INDEX
EUR -800,00020/01/21325.00CALL CDX OPTION - ITRAXX EUROPE CROSSOVERSERIES 34 INDEX
EUR -1,300,00017/02/21250.00CALL CDX OPTION - ITRAXX EUROPE CROSSOVERSERIES 34 INDEX
EUR -1,800,00017/02/2150.00CALL CDX OPTION - ITRAXX EUROPE SERIES 34 INDEXUSD -400,00020/01/21104.00PUT CDX OPTION - CDX NA HY 35 INDEXUSD -1,000,00017/02/21108.00PUT CDX OPTION - CDX NA HY 35 INDEX
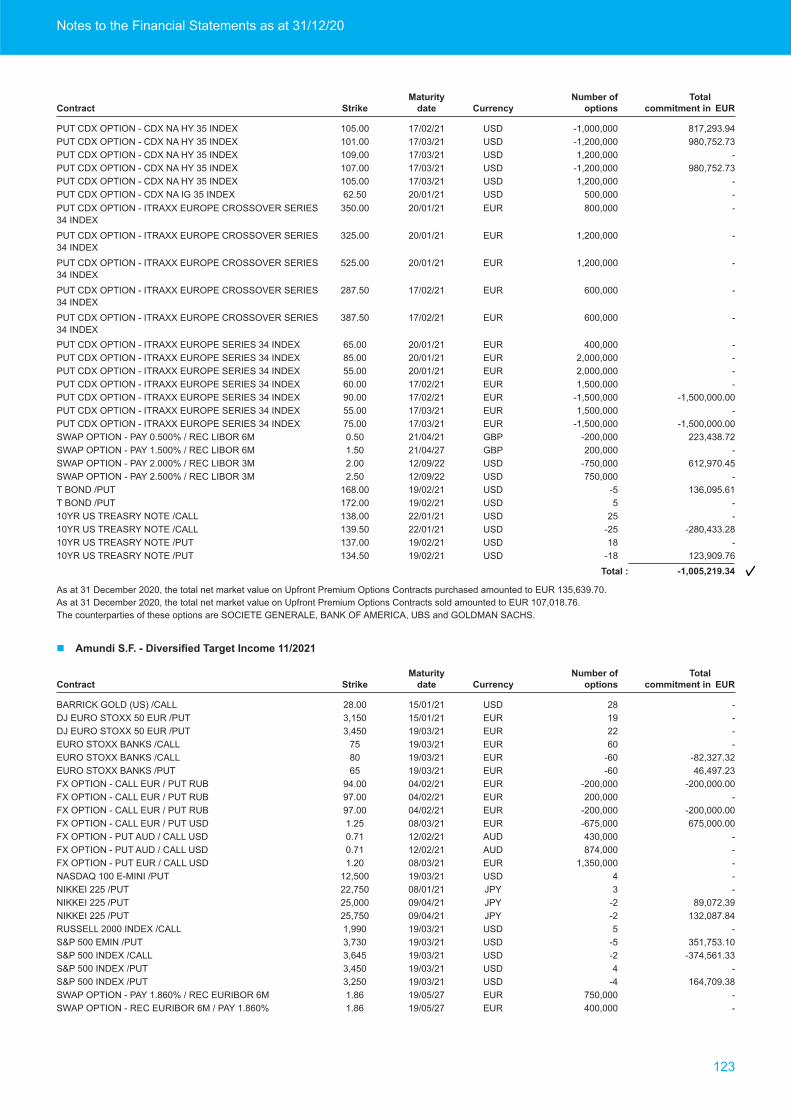
123
Notes to the Financial Statements as at 31/12/20
currency eUrtotal
commitment in number of
optionsmaturity
datestrikecontract
USD 817,293.94-1,000,00017/02/21105.00PUT CDX OPTION - CDX NA HY 35 INDEXUSD 980,752.73-1,200,00017/03/21101.00PUT CDX OPTION - CDX NA HY 35 INDEXUSD -1,200,00017/03/21109.00PUT CDX OPTION - CDX NA HY 35 INDEXUSD 980,752.73-1,200,00017/03/21107.00PUT CDX OPTION - CDX NA HY 35 INDEXUSD -1,200,00017/03/21105.00PUT CDX OPTION - CDX NA HY 35 INDEXUSD -500,00020/01/2162.50PUT CDX OPTION - CDX NA IG 35 INDEXEUR -800,00020/01/21350.00PUT CDX OPTION - ITRAXX EUROPE CROSSOVER SERIES
34 INDEXEUR -1,200,00020/01/21325.00PUT CDX OPTION - ITRAXX EUROPE CROSSOVER SERIES
34 INDEXEUR -1,200,00020/01/21525.00PUT CDX OPTION - ITRAXX EUROPE CROSSOVER SERIES
34 INDEXEUR -600,00017/02/21287.50PUT CDX OPTION - ITRAXX EUROPE CROSSOVER SERIES
34 INDEXEUR -600,00017/02/21387.50PUT CDX OPTION - ITRAXX EUROPE CROSSOVER SERIES
34 INDEXEUR -400,00020/01/2165.00PUT CDX OPTION - ITRAXX EUROPE SERIES 34 INDEXEUR -2,000,00020/01/2185.00PUT CDX OPTION - ITRAXX EUROPE SERIES 34 INDEXEUR -2,000,00020/01/2155.00PUT CDX OPTION - ITRAXX EUROPE SERIES 34 INDEXEUR -1,500,00017/02/2160.00PUT CDX OPTION - ITRAXX EUROPE SERIES 34 INDEXEUR -1,500,000.00-1,500,00017/02/2190.00PUT CDX OPTION - ITRAXX EUROPE SERIES 34 INDEXEUR -1,500,00017/03/2155.00PUT CDX OPTION - ITRAXX EUROPE SERIES 34 INDEXEUR -1,500,000.00-1,500,00017/03/2175.00PUT CDX OPTION - ITRAXX EUROPE SERIES 34 INDEXGBP 223,438.72-200,00021/04/210.50SWAP OPTION - PAY 0.500% / REC LIBOR 6MGBP -200,00021/04/271.50SWAP OPTION - PAY 1.500% / REC LIBOR 6MUSD 612,970.45-750,00012/09/222.00SWAP OPTION - PAY 2.000% / REC LIBOR 3MUSD -750,00012/09/222.50SWAP OPTION - PAY 2.500% / REC LIBOR 3MUSD 136,095.61-519/02/21168.00T BOND /PUTUSD -519/02/21172.00T BOND /PUTUSD -2522/01/21138.0010YR US TREASRY NOTE /CALLUSD -280,433.28-2522/01/21139.5010YR US TREASRY NOTE /CALLUSD -1819/02/21137.0010YR US TREASRY NOTE /PUTUSD 123,909.76-1819/02/21134.5010YR US TREASRY NOTE /PUT
-1,005,219.34total :
As at 31 December 2020, the total net market value on Upfront Premium Options Contracts purchased amounted to EUR 135,639.70.As at 31 December 2020, the total net market value on Upfront Premium Options Contracts sold amounted to EUR 107,018.76.The counterparties of these options are SOCIETE GENERALE, BANK OF AMERICA, UBS and GOLDMAN SACHS.
� amundi s.f. - Diversified target Income 11/2021
currency eUrtotal
commitment in number of
optionsmaturity
datestrikecontract
USD -2815/01/2128.00BARRICK GOLD (US) /CALLEUR -1915/01/213,150DJ EURO STOXX 50 EUR /PUTEUR -2219/03/213,450DJ EURO STOXX 50 EUR /PUTEUR -6019/03/2175EURO STOXX BANKS /CALLEUR -82,327.32-6019/03/2180EURO STOXX BANKS /CALLEUR 46,497.23-6019/03/2165EURO STOXX BANKS /PUTEUR -200,000.00-200,00004/02/2194.00FX OPTION - CALL EUR / PUT RUBEUR -200,00004/02/2197.00FX OPTION - CALL EUR / PUT RUBEUR -200,000.00-200,00004/02/2197.00FX OPTION - CALL EUR / PUT RUBEUR 675,000.00-675,00008/03/211.25FX OPTION - CALL EUR / PUT USDAUD -430,00012/02/210.71FX OPTION - PUT AUD / CALL USDAUD -874,00012/02/210.71FX OPTION - PUT AUD / CALL USDEUR -1,350,00008/03/211.20FX OPTION - PUT EUR / CALL USDUSD -419/03/2112,500NASDAQ 100 E-MINI /PUTJPY -308/01/2122,750NIKKEI 225 /PUTJPY 89,072.39-209/04/2125,000NIKKEI 225 /PUTJPY 132,087.84-209/04/2125,750NIKKEI 225 /PUTUSD -519/03/211,990RUSSELL 2000 INDEX /CALLUSD 351,753.10-519/03/213,730S&P 500 EMIN /PUTUSD -374,561.33-219/03/213,645S&P 500 INDEX /CALLUSD -419/03/213,450S&P 500 INDEX /PUTUSD 164,709.38-419/03/213,250S&P 500 INDEX /PUTEUR -750,00019/05/271.86SWAP OPTION - PAY 1.860% / REC EURIBOR 6MEUR -400,00019/05/271.86SWAP OPTION - REC EURIBOR 6M / PAY 1.860%

124
Notes to the Financial Statements as at 31/12/20
currency eUrtotal
commitment in number of
optionsmaturity
datestrikecontract
USD -1922/01/21126.00US 5YR T-NOTES /PUT602,231.29total :
As at 31 December 2020, the total net market value on Upfront Premium Options Contracts purchased amounted to EUR 291,085.47.As at 31 December 2020, the total net market value on Upfront Premium Options Contracts sold amounted to EUR 106,879.97.The counterparties of these options are SOCIETE GENERALE, GOLDMAN SACHS, MORGAN STANLEY, JP MORGAN, UNICREDIT and CALYON LONDON.
� amundi s.f. - Diversified target Income 11/2022
currency eUrtotal
commitment in number of
optionsmaturity
datestrikecontract
USD -3415/01/2128.00BARRICK GOLD (US) /CALLEUR -2215/01/213,150DJ EURO STOXX 50 EUR /PUTEUR -2619/03/213,450DJ EURO STOXX 50 EUR /PUTEUR -7319/03/2175EURO STOXX BANKS /CALLEUR -100,164.91-7319/03/2180EURO STOXX BANKS /CALLEUR 56,571.63-7319/03/2165EURO STOXX BANKS /PUTEUR -200,000.00-200,00004/02/2194.00FX OPTION - CALL EUR / PUT RUBEUR -200,00004/02/2197.00FX OPTION - CALL EUR / PUT RUBEUR -200,000.00-200,00004/02/2197.00FX OPTION - CALL EUR / PUT RUBEUR -816,000.00-816,00008/03/211.25FX OPTION - CALL EUR / PUT USDAUD -520,00012/02/210.71FX OPTION - PUT AUD / CALL USDAUD -1,062,00012/02/210.71FX OPTION - PUT AUD / CALL USDEUR -1,632,00008/03/211.20FX OPTION - PUT EUR / CALL USDUSD -419/03/2112,500NASDAQ 100 E-MINI /PUTJPY -308/01/2122,750NIKKEI 225 /PUTJPY 89,072.39-209/04/2125,000NIKKEI 225 /PUTJPY 132,087.84-209/04/2125,750NIKKEI 225 /PUTUSD -2,600,00020/01/21101.00PUT CDX OPTION - CDX NA HY 35 INDEXUSD 1,634,587.88-2,000,00017/02/21100.00PUT CDX OPTION - CDX NA HY 35 INDEXUSD -2,000,00017/02/21106.00PUT CDX OPTION - CDX NA HY 35 INDEXUSD -2,000,00020/01/2160.00PUT CDX OPTION - CDX NA IG 35 INDEXUSD -519/03/211,990RUSSELL 2000 INDEX /CALLUSD 422,103.71-619/03/213,730S&P 500 EMIN /PUTUSD -561,841.99-319/03/213,645S&P 500 INDEX /CALLUSD -519/03/213,450S&P 500 INDEX /PUTUSD 205,886.72-519/03/213,250S&P 500 INDEX /PUTEUR -800,00019/05/271.86SWAP OPTION - PAY 1.860% / REC EURIBOR 6MEUR -450,00019/05/271.86SWAP OPTION - REC EURIBOR 6M / PAY 1.860%USD -2822/01/21126.00US 5YR T-NOTES /PUT
662,303.27total :
As at 31 December 2020, the total net market value on Upfront Premium Options Contracts purchased amounted to EUR 336,154.18.As at 31 December 2020, the total net market value on Upfront Premium Options Contracts sold amounted to EUR 137,953.29.The counterparties of these options are GOLDMAN SACHS, MORGAN STANLEY, BANK OF AMERICA, JP MORGAN, UNICREDIT and CALYON LONDON.
fUtUres-stYle OPtIOns cOntracts
� amundi s.f. - absolute return multi-strategy control
currency eUrtotal
commitment in number of
optionsmaturity
datestrikecontract
EUR -3422/01/21135.00BOBL EUREX /PUTEUR -1622/01/21134.75BOBL EUREX /PUTEUR -1022/01/21177.00EURO BUND FUTURE /PUTEUR -1222/01/21178.00EURO BUND FUTURE /PUTEUR 562,763.52-1222/01/21176.50EURO BUND FUTURE /PUTEUR 199,312.08-1719/02/21173.00EURO BUND FUTURE /PUTEUR -1719/02/21175.00EURO BUND FUTURE /PUTEUR -2519/02/21176.50EURO BUND FUTURE /PUTHKD -728/01/219,900HANG SENG CHINA ENT INDEX /PUTHKD -1428/01/219,400HANG SENG CHINA ENT INDEX /PUTHKD -528/01/2127,400HANG SENG INDEX /CALLHKD -717,571.74-528/01/2128,200HANG SENG INDEX /CALLHKD -430,543.04-328/01/2127,800HANG SENG INDEX /CALLHKD 717,571.74-528/01/2124,800HANG SENG INDEX /PUT

125
Notes to the Financial Statements as at 31/12/20
currency eUrtotal
commitment in number of
optionsmaturity
datestrikecontract
HKD -528/01/2126,200HANG SENG INDEX /PUTHKD -328/01/2125,000HANG SENG INDEX /PUTHKD -328/01/2125,200HANG SENG INDEX /PUTHKD 430,543.04-328/01/2123,400HANG SENG INDEX /PUTHKD -528/01/21238HANG SENG INDEX /PUTHKD -328/01/2126,000HANG SENG INDEX /PUTEUR -51,283.27-3520/01/2122VSTOXX INDEX /CALLEUR -3520/01/2130VSTOXX INDEX /CALLEUR -3520/01/2139VSTOXX INDEX /CALLEUR -3520/01/2134VSTOXX INDEX /CALLEUR 7,197.65-3520/01/2118VSTOXX INDEX /PUT
717,989.98total :
As at 31 December 2020, the total net unrealised depreciation on Futures-Style options contracts amounted to EUR 29,725.24.The counterparty of these options is SOCIETE GENERALE.
� amundi s.f. - saving Box I
currency eUrtotal
commitment in number of
optionsmaturity
datestrikecontract
EUR -322/01/21177.00EURO BUND FUTURE /PUTEUR -1019/02/21176.50EURO BUND FUTURE /PUT
-total :
As at 31 December 2020, the total net unrealised depreciation on Futures-Style options contracts amounted to EUR 3,560.00.The counterparty of these options is SOCIETE GENERALE.
� amundi s.f. - saving Box II
currency eUrtotal
commitment in number of
optionsmaturity
datestrikecontract
EUR -522/01/21177.00EURO BUND FUTURE /PUTEUR -2019/02/21176.50EURO BUND FUTURE /PUT
-total :
As at 31 December 2020, the total net unrealised depreciation on Futures-Style options contracts amounted to EUR 6,500.00.The counterparty of these options is SOCIETE GENERALE.
� amundi s.f. - saving Box III
currency eUrtotal
commitment in number of
optionsmaturity
datestrikecontract
EUR -322/01/21177.00EURO BUND FUTURE /PUTEUR -919/02/21176.50EURO BUND FUTURE /PUT
-total :
As at 31 December 2020, the total net unrealised depreciation on Futures-Style options contracts amounted to EUR 3,390.00.The counterparty of these options is SOCIETE GENERALE.

126
Notes to the Financial Statements as at 31/12/20
15 SWAPSPlease refer to the note 16 for detailed collateral information.
� Amundi S.F. - Diversified Short-Term Bond
Unrealised Gain/(Loss) (inSub-Fund Ccy)NominalCounterpartyCurrencyPaid Rate
Received RateUnderlyingContract
Maturity Date
-5,318,537.7448,000,500BNP PARIBASEUR5.000%-iTraxx EuropeCrossover Series32 Index
Credit Default Swap Buyer20-Dec-24
-5,318,537.7448,000,500JP MORGANEUR5.000%-iTraxx EuropeCrossover Series32 Index
Credit Default Swap Buyer20-Dec-24
10,637,075.4796,001,000BNP PARIBASEUR-5.000%iTraxx EuropeCrossover Series32 Index
Credit Default Swap Seller20-Dec-24
-0.01Total:
� Amundi S.F. - Emerging Markets Bond 2024
Unrealised Gain/(Loss) (inSub-Fund Ccy)NominalCounterpartyCurrencyPaid Rate
Received RateUnderlyingContract
Maturity Date
14,260.24500,000JP MORGANEUR-5.000%Cma Cgm SACredit Default Swap Seller20-Dec-21
14,260.24Total:
� Amundi S.F. - Emerging Markets Bond 2025
Unrealised Gain/(Loss) (inSub-Fund Ccy)NominalCounterpartyCurrencyPaid Rate
Received RateUnderlyingContract
Maturity Date
37,076.621,300,000JP MORGANEUR-5.000%Cma Cgm SACredit Default Swap Seller20-Dec-21
37,076.62Total:
� Amundi S.F. - Euro Curve 1-3year
Unrealised Gain/(Loss) (inSub-Fund Ccy)NominalCounterpartyCurrencyPaid Rate
Received RateUnderlyingContract
Maturity Date
-10,637.431,200,000JP MORGANEUR1M CPTFEMUIndex
0.674%-Inflation Swap15-Oct-25
-1,892.091,200,000JP MORGANEUR1M CPTFEMUIndex
0.920%-Inflation Swap15-Nov-25
-12,529.52Total:
� Amundi S.F. - Euro Curve 3-5year
Unrealised Gain/(Loss) (inSub-Fund Ccy)NominalCounterpartyCurrencyPaid Rate
Received RateUnderlyingContract
Maturity Date
-4,730.233,000,000JP MORGANEUR1M CPTFEMUIndex
0.920%-Inflation Swap15-Nov-25
-26,593.563,000,000JP MORGANEUR1M CPTFEMUIndex
0.674%-Inflation Swap15-Oct-25
-31,323.79Total:
� Amundi S.F. - Euro Curve 7-10year
Unrealised Gain/(Loss) (inSub-Fund Ccy)NominalCounterpartyCurrencyPaid Rate
Received RateUnderlyingContract
Maturity Date
-9,460.486,000,000JP MORGANEUR1M CPTFEMUIndex
0.920%-Inflation Swap15-Nov-25
-62,051.647,000,000JP MORGANEUR1M CPTFEMUIndex
0.674%-Inflation Swap15-Oct-25
-71,512.12Total:

127
Notes to the Financial Statements as at 31/12/20
� Amundi S.F. - Euro Curve 10+year
Unrealised Gain/(Loss) (inSub-Fund Ccy)NominalCounterpartyCurrencyPaid Rate
Received RateUnderlyingContract
Maturity Date
-9,460.486,000,000JP MORGANEUR1M CPTFEMUIndex
0.920%-Inflation Swap15-Nov-25
-53,187.116,000,000JP MORGANEUR1M CPTFEMUIndex
0.674%-Inflation Swap15-Oct-25
-62,647.59Total:
� Amundi S.F. - Global High Yield Opportunities 2025
Unrealised Gain/(Loss) (inSub-Fund Ccy)NominalCounterpartyCurrencyPaid Rate
Received RateUnderlyingContract
Maturity Date
1,131,231.3315,000,000JP MORGANUSD-5.000%CDX NA HY 35Index
Credit Default Swap Seller20-Dec-25
1,131,231.33Total:
� Amundi S.F. - Absolute Return Multi-Strategy Control
Unrealised Gain/(Loss) (inSub-Fund Ccy)NominalCounterpartyCurrencyPaid Rate
Received RateUnderlyingContract
Maturity Date
-3,943.72100,000MORGANSTANLEY
USD5.000%-Advanced MicroDevices
Credit Default Swap Buyer20-Dec-21
-753.37100,000MORGANSTANLEY
EUR1.000%-Anheuser BuschInBev NV SA
Credit Default Swap Buyer20-Dec-21
-9,377.03200,000MORGANSTANLEY
EUR5.000%-Ardagh PackagingFinance PLC
Credit Default Swap Buyer20-Dec-21
-4,759.46200,000GOLDMANSACHS
USD1.000%-Arrow ElectronicsInc
Credit Default Swap Buyer20-Jun-25
-4,079.79350,000CITIGROUPUSD1.000%-Aust & NZ BankingGroup
Credit Default Swap Buyer20-Jun-22
-5,541.91200,000GOLDMANSACHS
USD1.000%-Autozone IncCredit Default Swap Buyer20-Jun-25
-3,088.98200,000GOLDMANSACHS
USD1.000%-Avnet IncCredit Default Swap Buyer20-Jun-25
-2,350.80150,000MORGANSTANLEY
USD1.000%-Avnet IncCredit Default Swap Buyer20-Dec-23
-5,040.07200,000GOLDMANSACHS
USD1.000%-Barrick GoldCorporation
Credit Default Swap Buyer20-Jun-25
-16,256.11150,000MORGANSTANLEY
USD5.000%-Block Financial LLCCredit Default Swap Buyer20-Dec-23
-5,103.85200,000GOLDMANSACHS
USD1.000%-Boston ScientificCorp
Credit Default Swap Buyer20-Jun-25
-4,860.12200,000GOLDMANSACHS
USD1.000%-Campbell Soup CoCredit Default Swap Buyer20-Jun-25
-4,210.29200,000GOLDMANSACHS
USD1.000%-Cardinal Health IncCredit Default Swap Buyer20-Jun-25
-3,824.43100,000MORGANSTANLEY
USD5.000%-Cco Holdings LLCCredit Default Swap Buyer20-Dec-21
-188,538.562,500,000GOLDMANSACHS
USD5.000%-CDX NA HY 35Index
Credit Default Swap Buyer20-Dec-25
-3,346.31500,000BANK OFAMERICA
USD1.000%-ColombiaCredit Default Swap Buyer20-Dec-25
-4,073.57350,000CITIGROUPUSD1.000%-CommonwealthBank Aust.
Credit Default Swap Buyer20-Jun-22
-4,751.09200,000GOLDMANSACHS
USD1.000%-Conagra Brands IncCredit Default Swap Buyer20-Jun-25
-3,850.60200,000GOLDMANSACHS
USD1.000%-Conoco PhillipsCredit Default Swap Buyer20-Jun-25

128
Notes to the Financial Statements as at 31/12/20
-4,785.33200,000GOLDMANSACHS
USD1.000%-CoxCommunicationsInc
Credit Default Swap Buyer20-Jun-25
-746.04100,000MORGANSTANLEY
USD1.000%-CoxCommunicationsInc
Credit Default Swap Buyer20-Dec-21
-7,053.14200,000MORGANSTANLEY
USD5.000%-Csc Holdings LLCCredit Default Swap Buyer20-Dec-21
-6,085.20200,000GOLDMANSACHS
USD1.000%-CSX CorporationCredit Default Swap Buyer20-Jun-25
-4,161.46200,000GOLDMANSACHS
USD1.000%-CVS HealthCorporation
Credit Default Swap Buyer20-Jun-25
-2,146.47150,000MORGANSTANLEY
USD1.000%-Darden RestaurantsInc
Credit Default Swap Buyer20-Dec-23
-5,075.73200,000GOLDMANSACHS
USD1.000%-Dominion EnergyInc
Credit Default Swap Buyer20-Jun-25
-2,924.47150,000MORGANSTANLEY
USD1.000%-Dominion EnergyInc
Credit Default Swap Buyer20-Dec-23
-2,316.02200,000GOLDMANSACHS
USD1.000%-Domtar CorpCredit Default Swap Buyer20-Jun-25
-2,236.11150,000MORGANSTANLEY
USD1.000%-Domtar CorpCredit Default Swap Buyer20-Dec-23
-4,757.68200,000GOLDMANSACHS
USD1.000%-D.R. Horton IncCredit Default Swap Buyer20-Jun-25
-2,478.75150,000MORGANSTANLEY
USD1.000%-Eastman ChemicalCredit Default Swap Buyer20-Dec-23
-487.0590,000CITIGROUPUSD1.000%-Enbridge IncCredit Default Swap Buyer20-Dec-21-541.17100,000MORGAN
STANLEYUSD1.000%-Enbridge IncCredit Default Swap Buyer20-Dec-21
-467.74100,000MORGANSTANLEY
USD1.000%-Energy TransferOperating
Credit Default Swap Buyer20-Dec-21
-5,713.85200,000GOLDMANSACHS
USD1.000%-Exelon CorporationCredit Default Swap Buyer20-Jun-25
-432.17100,000BNP PARIBASUSD1.000%-Firstenergy CorpCredit Default Swap Buyer20-Jun-22
-367.06200,000GOLDMANSACHS
USD1.000%-Firstenergy CorpCredit Default Swap Buyer20-Jun-25
-1,055.79200,000MORGANSTANLEY
USD1.000%-General Electric CoCredit Default Swap Buyer20-Dec-21
-5,664.52200,000GOLDMANSACHS
USD1.000%-General Mills IncCredit Default Swap Buyer20-Jun-25
-750.17100,000MORGANSTANLEY
USD1.000%-General Mills IncCredit Default Swap Buyer20-Dec-21
-4,568.22200,000GOLDMANSACHS
USD1.000%-HP IncCredit Default Swap Buyer20-Jun-25
-8,309.02300,000MORGANSTANLEY
EUR1.000%-HSBC HoldingsPLC
Credit Default Swap Buyer20-Jun-25
-6,860.38500,000GOLDMANSACHS
EUR1.000%-HSBC HoldingsPLC
Credit Default Swap Buyer20-Jun-25
-8,205.42200,000MORGANSTANLEY
EUR5.000%-Ineos GroupHoldings SA
Credit Default Swap Buyer20-Dec-21
-4,937.13200,000GOLDMANSACHS
USD1.000%-Intl Paper CoCredit Default Swap Buyer20-Jun-25
-303,181.572,500,000BANK OFAMERICA
EUR5.000%-iTraxx EuropeCrossover Series34 Index
Credit Default Swap Buyer20-Dec-25
-79,299.284,300,000BANK OFAMERICA
EUR1.000%-iTraxx EuropeSeries 33 Index
Credit Default Swap Buyer20-Jun-23
-402,435.2917,000,000JP MORGANEUR1.000%-iTraxx EuropeSeries 33 Index
Credit Default Swap Buyer20-Jun-25
-118,363.325,000,000CITIGROUPEUR1.000%-iTraxx EuropeSeries 33 Index
Credit Default Swap Buyer20-Jun-25
-5,070.67200,000GOLDMANSACHS
USD1.000%-Johnson ControlsInternational PLC
Credit Default Swap Buyer20-Jun-25
-7,156.41200,000MORGANSTANLEY
USD5.000%-Kb HomeCredit Default Swap Buyer20-Dec-21
Unrealised Gain/(Loss) (inSub-Fund Ccy)NominalCounterpartyCurrencyPaid Rate
Received RateUnderlyingContract
Maturity Date

129
Notes to the Financial Statements as at 31/12/20
-1,828.75150,000MORGANSTANLEY
USD1.000%-Kinder Morgan IncCredit Default Swap Buyer20-Dec-23
-846.15100,000MORGANSTANLEY
USD1.000%-Kinder Morgan IncCredit Default Swap Buyer20-Jun-22
-573.47100,000MORGANSTANLEY
USD1.000%-Kraft Heinz FoodsCompany
Credit Default Swap Buyer20-Dec-21
-4,212.93200,000GOLDMANSACHS
USD1.000%-Kroger CoCredit Default Swap Buyer20-Jun-25
-5,565.36200,000GOLDMANSACHS
USD1.000%-Lowe’s CompaniesInc
Credit Default Swap Buyer20-Jun-25
-3,136.43150,000MORGANSTANLEY
USD1.000%-Lowe’s CompaniesInc
Credit Default Swap Buyer20-Dec-23
-3,984.03350,000CITIGROUPUSD1.000%-Macquarie Bank LtdCredit Default Swap Buyer20-Jun-22
-5,909.46200,000GOLDMANSACHS
USD1.000%-Marsh & MclennanCos Inc
Credit Default Swap Buyer20-Jun-25
-820.18200,000MORGANSTANLEY
USD1.000%-Mattel IncCredit Default Swap Buyer20-Dec-21
-5,772.42200,000GOLDMANSACHS
USD1.000%-McDonald’s CorpCredit Default Swap Buyer20-Jun-25
-5,005.77200,000GOLDMANSACHS
USD1.000%-Mckesson HNOCInc
Credit Default Swap Buyer20-Jun-25
-9,497.781,000,000GOLDMANSACHS
USD1.000%-MexicoCredit Default Swap Buyer20-Dec-25
-8,859.32800,000CITIGROUPUSD1.000%-Michigan STCredit Default Swap Buyer20-Jun-22-5,050.13200,000GOLDMAN
SACHSUSD1.000%-Mondelez
International IncCredit Default Swap Buyer20-Jun-25
-4,021.38350,000CITIGROUPUSD1.000%-National AustraliaBank
Credit Default Swap Buyer20-Jun-22
-7,043.75300,000MORGANSTANLEY
EUR1.000%-Natwest Group PLCCredit Default Swap Buyer20-Jun-25
-3,240.19150,000MORGANSTANLEY
USD1.000%-Newmont MiningCorp
Credit Default Swap Buyer20-Dec-23
-5,762.60200,000GOLDMANSACHS
USD1.000%-Newmont MiningCorp
Credit Default Swap Buyer20-Jun-25
-1,143.01100,000CITIGROUPUSD1.000%-Newmont MiningCorp
Credit Default Swap Buyer20-Jun-22
-6,079.54200,000GOLDMANSACHS
USD1.000%-Norfolk SouthernCorp
Credit Default Swap Buyer20-Jun-25
-2,781.49150,000MORGANSTANLEY
USD1.000%-Omnicom Group IncCredit Default Swap Buyer20-Dec-23
-4,600.45200,000GOLDMANSACHS
USD1.000%-Omnicom Group IncCredit Default Swap Buyer20-Jun-25
-87,465.75500,000BARCLAYSBANK
EUR5.000%-Peugeot SACredit Default Swap Buyer20-Jun-25
-5,678.91200,000GOLDMANSACHS
USD1.000%-Quest DiagnosticInc
Credit Default Swap Buyer20-Jun-25
-4,525.96300,000MORGANSTANLEY
EUR1.000%-Repsol Intl FinanceCredit Default Swap Buyer20-Jun-25
-3,605.10500,000GOLDMANSACHS
USD1.000%-Russian FederationCredit Default Swap Buyer20-Dec-25
-574.7185,000BNP PARIBASUSD1.000%-Ryder System IncCredit Default Swap Buyer20-Dec-21
-4,573.40200,000GOLDMANSACHS
USD1.000%-Sempra EnergyCredit Default Swap Buyer20-Jun-25
-4,406.58200,000GOLDMANSACHS
USD1.000%-Sherwin WilliamsCO
Credit Default Swap Buyer20-Jun-25
-686.36100,000MORGANSTANLEY
EUR1.000%-Telefonica SACredit Default Swap Buyer20-Dec-21
-9,256.80300,000MORGANSTANLEY
EUR1.000%-Total Capital SACredit Default Swap Buyer20-Jun-25
-7,200.05200,000GOLDMANSACHS
USD1.000%-Trane TechnologiesCompany LLC
Credit Default Swap Buyer20-Jun-25
-4,677.66200,000GOLDMANSACHS
USD1.000%-Tyson Foods IncCredit Default Swap Buyer20-Jun-25
-3,195.61150,000MORGANSTANLEY
USD1.000%-United ParcelService
Credit Default Swap Buyer20-Dec-23
Unrealised Gain/(Loss) (inSub-Fund Ccy)NominalCounterpartyCurrencyPaid Rate
Received RateUnderlyingContract
Maturity Date

130
Notes to the Financial Statements as at 31/12/20
-2,506.84150,000MORGANSTANLEY
USD1.000%-VerizonCommunications
Credit Default Swap Buyer20-Dec-23
-684.24100,000MORGANSTANLEY
USD1.000%-Viacom IncCredit Default Swap Buyer20-Dec-21
-3,979.31350,000CITIGROUPUSD1.000%-Westpac BankCredit Default Swap Buyer20-Jun-22-5,346.10200,000GOLDMAN
SACHSUSD1.000%-Weyerhaeuser COCredit Default Swap Buyer20-Jun-25
-923.59200,000MORGANSTANLEY
USD1.000%-Xerox CorporationCredit Default Swap Buyer20-Dec-21
27,179.60300,000JP MORGANEUR-5.000%Altice FranceCredit Default Swap Seller20-Dec-256,256.39300,000MORGAN
STANLEYEUR-1.000%BP PLCCredit Default Swap Seller20-Jun-25
52,509.114,600,000GOLDMANSACHS
USD-1.000%CDX NA IG 34Index
Credit Default Swap Seller20-Jun-23
32,405.122,500,000BANK OFAMERICA
USD-1.000%CDX NA IG 34Index
Credit Default Swap Seller20-Jun-25
71,291.275,500,000MORGANSTANLEY
USD-1.000%CDX NA IG 34Index
Credit Default Swap Seller20-Jun-25
19,405.541,700,000MORGANSTANLEY
USD-1.000%CDX NA IG 34Index
Credit Default Swap Seller20-Jun-23
84,475.20500,000BARCLAYSBANK
EUR-5.000%Fiat ChryslerAutomobiles
Credit Default Swap Seller20-Jun-25
242,545.262,000,000JP MORGANEUR-5.000%iTraxx EuropeCrossover Series34 Index
Credit Default Swap Seller20-Dec-25
15,188.321,500,000BANK OFAMERICA
EUR-1.000%iTraxx EuropeSeries 33 Index
Credit Default Swap Seller20-Jun-30
30,011.06150,000,000GOLDMANSACHS
JPY-1.000%iTraxx Japan Series33 Index
Credit Default Swap Seller20-Jun-25
28,649.57150,000,000GOLDMANSACHS
JPY-1.000%iTraxx Japan Series34 Index
Credit Default Swap Seller20-Dec-25
14,324.7875,000,000BNP PARIBASJPY-1.000%iTraxx Japan Series34 Index
Credit Default Swap Seller20-Dec-25
9,549.8650,000,000GOLDMANSACHS
JPY-1.000%iTraxx Japan Series34 Index
Credit Default Swap Seller20-Dec-25
7,089.43300,000MORGANSTANLEY
EUR-1.000%Natwest MarketsPLC
Credit Default Swap Seller20-Jun-25
34,260.40300,000JP MORGANEUR-5.000%Virgin MediaFinance PLC
Credit Default Swap Seller20-Dec-25
34,010.991,150,000JP MORGANUSDLibor 3M+0.75%
-J P Morgan EmbiGlobal Core
Index Equity Swap13-Jan-21
-24,241.90500,000JP MORGANUSD-Libor 3M+0.45%
J P Morgan EmbiGlobal Core
Index Equity Swap13-Jan-21
-28,888.571,500,000GOLDMANSACHS
EUR1.132%1M CPTFEMUIndex
-Inflation Swap15-Dec-29
-2,849.04950,000CITIGROUPEUR1.028%1M CPTFEMUIndex
-Inflation Swap06-Sep-26
1,973.423,000,000GOLDMANSACHS
EUR0.824%1M CPTFEMUIndex
-Inflation Swap15-Aug-24
-19,270.813,000,000JP MORGANEUR1.100%1M TCPI Index-Inflation Swap11-Jan-22-20,556.672,900,000UBSEUR1.364%1M FRCPXTOB
Index-Inflation Swap08-Feb-22
31,249.915,400,000GOLDMANSACHS
EUR0.229%1M CPTFEMUIndex
-Inflation Swap15-Jun-22
19,320.543,000,000GOLDMANSACHS
EUR0.518%1M CPTFEMUIndex
-Inflation Swap15-Sep-23
21,558.671,700,000BANK OFAMERICA
GBP1M UKRPI Index3.311%-Inflation Swap21-May-30
-13,784.834,300,000BANK OFAMERICA
GBP2.535%1M UKRPIIndex
-Inflation Swap21-May-22
43,730.64200,000BANK OFAMERICA
GBP2.719%1M UKRPIIndex
-Inflation Swap21-May-60
-28,094.4487,000,000GOLDMANSACHS
JPY0.230%1M JCPNGENFIndex
-Inflation Swap20-Jan-30
-11,677.7640,600,000BARCLAYSBANK
JPY0.620%1M JCPNGENFIndex
-Inflation Swap25-Jan-27
Unrealised Gain/(Loss) (inSub-Fund Ccy)NominalCounterpartyCurrencyPaid Rate
Received RateUnderlyingContract
Maturity Date

131
Notes to the Financial Statements as at 31/12/20
-22,840.8479,400,000BARCLAYSBANK
JPY0.620%1M JCPNGENFIndex
-Inflation Swap26-Jan-27
-1,477.644,000,000BARCLAYSBANK
USD1.700%1D CPURNSAIndex
-Inflation Swap05-Jun-22
-41,436.551,300,000BANK OFAMERICA
USD1D CPURNSAIndex
1.850%-Inflation Swap12-Aug-30
37,152.06800,000GOLDMANSACHS
USD1.885%1D CPURNSAIndex
-Inflation Swap12-Aug-35
3,400.863,800,000JP MORGANUSD1.441%1D CPURNSAIndex
-Inflation Swap31-Jan-22
-31,689.75600,000BANK OFAMERICA
USD1D CPURNSAIndex
1.405%-Inflation Swap09-Apr-30
37,783.34400,000BANK OFAMERICA
USD1.898%1D CPURNSAIndex
-Inflation Swap12-Aug-50
-23,568.981,800,000CITIGROUPUSD2.168%1M CPURNSAIndex
-Inflation Swap16-Oct-27
-43,132.24550,000UBSUSD2.338%1M CPURNSAIndex
-Inflation Swap23-Jan-47
48,445.143,400,000BANK OFAMERICA
USD0.190%1D CPURNSAIndex
-Inflation Swap09-Apr-22
-44,928.353,800,000GOLDMANSACHS
USD1D CPURNSAIndex
1.683%-Inflation Swap12-Aug-23
-69,181.756,000,000GOLDMANSACHS
USD1D CPURNSAIndex
1.228%-Inflation Swap26-Jun-22
1,158.82750,000JP MORGANUSD1.531%1M CPURNSAIndex
-Inflation Swap01-Sep-21
-160,712.871,400,000CITIGROUPAUD3.000%BBSW 6M -Interest Rate Swap26-Jul-2928,612.418,682,211BANK OF
AMERICABRL0.000%4.860%-Interest Rate Swap03-Jan-22
7,312.271,800,000CITIGROUPCADCdor 3M 1.749%-Interest Rate Swap28-Jun-2146,142.875,100,000GOLDMAN
SACHSCADCdor 3M 1.743%-Interest Rate Swap07-Feb-22
15,974.98305,000,000GOLDMANSACHS
CLPClibo 1D 3.315%-Interest Rate Swap12-Sep-22
3,265.8455,000,000CITIGROUPCNYChina IRS 1W 2.713%-Interest Rate Swap09-Mar-2127,078.387,500,000GOLDMAN
SACHSCNYChina IRS 1W 3.963%-Interest Rate Swap09-Jan-23
44,709.8113,750,000GOLDMANSACHS
CNYChina IRS 1W 3.683%-Interest Rate Swap16-Apr-23
11,264.0711,500,000CITIGROUPCNYChina IRS 1W 2.830%-Interest Rate Swap04-Sep-249,709.00500,000BANK OF
AMERICAEUR-0.087%Euribor 6M -Interest Rate Swap20-Oct-50
-29,018.433,200,000JP MORGANEUR0.330%Euribor 6M -Interest Rate Swap23-Jan-22-59,971.815,300,000NOMURAEUR0.223%Euribor 6M -Interest Rate Swap30-Jun-22-6,055.37150,000MORGAN
STANLEYEUR0.476%Euribor 6M -Interest Rate Swap01-Mar-25
-18,126.83300,000BANK OFAMERICA
EUR-0.022%Euribor 6M -Interest Rate Swap26-Jun-70
-42,895.42150,000MORGANSTANLEY
EUR0.930%Euribor 6M -Interest Rate Swap19-Jul-50
-57,212.562,100,000MORGANSTANLEY
EUR0.455%Euribor 6M -Interest Rate Swap18-Oct-23
-7,940.884,000,000BANK OFAMERICA
EUR-0.390%Euribor 6M -Interest Rate Swap10-Jun-22
2,194.22300,000BANK OFAMERICA
EUR-0.155%Euribor 6M -Interest Rate Swap02-Jun-70
-8,288.15150,000MORGANSTANLEY
EUR0.662%Euribor 6M -Interest Rate Swap25-Oct-25
119,678.761,050,000MORGANSTANLEY
EUREuribor 6M 1.066%-Interest Rate Swap18-Oct-28
-3,172.992,000,000GOLDMANSACHS
EUR-0.440%Euribor 6M -Interest Rate Swap13-Mar-25
-2,935.56200,000BANK OFAMERICA
EUR-0.113%Euribor 6M -Interest Rate Swap24-Sep-70
-15,624.26500,000BANK OFAMERICA
EUREonia 1D -0.150%-Interest Rate Swap20-Oct-50
Unrealised Gain/(Loss) (inSub-Fund Ccy)NominalCounterpartyCurrencyPaid Rate
Received RateUnderlyingContract
Maturity Date

132
Notes to the Financial Statements as at 31/12/20
-10,886.372,000,000GOLDMANSACHS
EUREonia 1D -0.630%-Interest Rate Swap13-Mar-25
12,105.623,200,000BNP PARIBASGBPLibor 6M 0.894%-Interest Rate Swap28-May-21-9,617.69100,000BANK OF
AMERICAGBP0.890%Libor 6M -Interest Rate Swap14-Feb-51
-88.15100,000GOLDMANSACHS
GBP0.408%Libor 6M -Interest Rate Swap01-Oct-30
69,765.79700,000JP MORGANGBPLibor 6M 1.430%-Interest Rate Swap15-Mar-29-42,393.361,300,000BNP PARIBASGBP0.986%Libor 6M -Interest Rate Swap30-May-24
392.31100,000BANK OFAMERICA
GBPLibor 6M 0.273%-Interest Rate Swap03-Dec-25
29,365.65127,000,000NOMURAINRIndian OIS 1D 5.030%-Interest Rate Swap23-Sep-2418,381.6764,000,000GOLDMAN
SACHSINRIndian OIS 1D 5.186%-Interest Rate Swap06-Feb-25
-11,716.0555,000,000CITIGROUPJPY0.350%Libor 6M -Interest Rate Swap26-Jul-28-11,222.0055,000,000UBSJPY0.335%Libor 6M -Interest Rate Swap27-Jul-28-3,323.6665,000,000UBSJPY0.080%Libor 6M -Interest Rate Swap13-Oct-2610,069.391,900,000,000BANK OF
AMERICAKRWKikrw 3M 1.250%-Interest Rate Swap30-Oct-25
18,669.571,800,000,000BANK OFAMERICA
KRWKikrw 3M 1.390%-Interest Rate Swap06-Nov-24
95,427.0911,500,000GOLDMANSACHS
MXNTIIE 1M 8.100%-Interest Rate Swap21-May-29
-111,778.2522,500,000DANSKE BANKNOK2.400%Nibor 6M -Interest Rate Swap19-Oct-27-27,354.818,600,000GOLDMAN
SACHSNOK1.737%Nibor 6M -Interest Rate Swap17-Jun-24
44,414.9550,000,000DANSKE BANKNOKNibor 6M 1.620%-Interest Rate Swap21-Oct-2129,116.308,600,000CITIGROUPNOKNibor 6M 1.800%-Interest Rate Swap17-Jun-245,319.116,900,000CITIGROUPNOK0.768%Nibor 6M -Interest Rate Swap19-Nov-25
-25,468.651,300,000GOLDMANSACHS
NZD1.269%BKBM 3M -Interest Rate Swap17-Feb-25
19,087.663,100,000GOLDMANSACHS
NZDBKBM 3M 1.175%-Interest Rate Swap17-Feb-22
-7,951.892,000,000JP MORGANSEK0.785%Stibor 3M -Interest Rate Swap14-May-294,238.796,800,000BNP PARIBASSEK0.306%Stibor 3M -Interest Rate Swap30-Sep-30
-41,216.618,000,000DANSKE BANKSEK0.929%Stibor 3M -Interest Rate Swap19-Mar-2947,188.431,400,000GOLDMAN
SACHSSGDSibor 6M 1.985%-Interest Rate Swap20-Mar-24
59,219.964,400,000NOMURASGDSibor 6M 1.543%-Interest Rate Swap15-Aug-22120,093.451,600,000UBSSGDSibor 6M 2.590%-Interest Rate Swap03-Mar-27-1,721.991,000,000GOLDMAN
SACHSSGD0.425%Sibor 6M -Interest Rate Swap26-Nov-24
-2,867.021,000,000GOLDMANSACHS
SGDSibor 6M 0.848%-Interest Rate Swap04-Nov-30
-126,671.51550,000HSBCUSD2.570%Libor 3M -Interest Rate Swap14-Jan-49-131,191.306,500,000CREDIT
AGRICOLEUSD2.731%Libor 3M -Interest Rate Swap20-Dec-21
-44,375.733,800,000GOLDMANSACHS
USD1.470%Libor 3M -Interest Rate Swap11-Feb-22
-18,328.92850,000GOLDMANSACHS
USD2.079%Libor 3M -Interest Rate Swap20-Jul-31
-21,991.09200,000GOLDMANSACHS
USD1.965%Libor 3M -Interest Rate Swap24-Sep-48
-175,102.881,400,000UBSUSD2.680%Libor 3M -Interest Rate Swap13-Jan-32167,646.116,300,000CITIGROUPUSDLibor 3M 2.893%-Interest Rate Swap12-Mar-22-125,242.791,000,000CITIGROUPUSD2.690%Libor 3M -Interest Rate Swap21-Feb-29-91,587.094,100,000CITIGROUPUSD1.980%Libor 3M -Interest Rate Swap19-Jun-25-8,881.03400,000MORGAN
STANLEYUSD2.095%Libor 3M -Interest Rate Swap20-Jul-31
9,926.03400,000MORGANSTANLEY
USDLibor 3M 1.403%-Interest Rate Swap20-Jul-23
2,976.45700,000CITIGROUPUSDLibor 3M 1.068%-Interest Rate Swap02-Aug-21115,201.712,600,000UBSUSDLibor 3M 2.165%-Interest Rate Swap18-Oct-23
Unrealised Gain/(Loss) (inSub-Fund Ccy)NominalCounterpartyCurrencyPaid Rate
Received RateUnderlyingContract
Maturity Date

133
Notes to the Financial Statements as at 31/12/20
11,685.28200,000GOLDMANSACHS
USDLibor 3M 1.702%-Interest Rate Swap18-Feb-51
4,135.76750,000JP MORGANUSDLibor 3M 1.195%-Interest Rate Swap01-Sep-21-76,750.942,400,000BNP PARIBASUSD2.655%Libor 3M -Interest Rate Swap07-Feb-52-143,013.201,400,000UBSUSD2.371%Libor 3M -Interest Rate Swap18-Oct-28-88,872.75900,000CITIGROUPUSD2.412%Libor 3M -Interest Rate Swap21-Dec-2768,799.483,600,000MORGAN
STANLEYUSDLibor 3M 2.377%-Interest Rate Swap23-Jan-22
98,649.044,100,000CITIGROUPUSDLibor 3M 1.834%-Interest Rate Swap17-Jun-24-269,936.196,300,000CITIGROUPUSD2.930%Libor 3M -Interest Rate Swap14-Mar-2451,080.1610,000,000CITIGROUPZARJibar 3M 7.545%-Interest Rate Swap19-Sep-29
-1,616,707.75Total:
� Amundi S.F. - Saving Box I
Unrealised Gain/(Loss) (inSub-Fund Ccy)NominalCounterpartyCurrencyPaid Rate
Received RateUnderlyingContract
Maturity Date
-2,331.31200,000CITIGROUPUSD1.000%-Aust & NZ BankingGroup
Credit Default Swap Buyer20-Jun-22
-52,790.80700,000GOLDMANSACHS
USD5.000%-CDX NA HY 35Index
Credit Default Swap Buyer20-Dec-25
-2,327.76200,000CITIGROUPUSD1.000%-CommonwealthBank Aust.
Credit Default Swap Buyer20-Jun-22
-324.7060,000CITIGROUPUSD1.000%-Enbridge IncCredit Default Swap Buyer20-Dec-21-121,272.631,000,000BANK OF
AMERICAEUR5.000%-iTraxx Europe
Crossover Series34 Index
Credit Default Swap Buyer20-Dec-25
-121,272.631,000,000BANK OFAMERICA
EUR5.000%-iTraxx EuropeCrossover Series34 Index
Credit Default Swap Buyer20-Dec-25
-71,017.993,000,000JP MORGANEUR1.000%-iTraxx EuropeSeries 33 Index
Credit Default Swap Buyer20-Jun-25
-92,193.503,500,000JP MORGANEUR1.000%-iTraxx EuropeSeries 34 Index
Credit Default Swap Buyer20-Dec-25
-39,511.501,500,000BANK OFAMERICA
EUR1.000%-iTraxx EuropeSeries 34 Index
Credit Default Swap Buyer20-Dec-25
-2,276.59200,000CITIGROUPUSD1.000%-Macquarie Bank LtdCredit Default Swap Buyer20-Jun-22
-2,297.93200,000CITIGROUPUSD1.000%-National AustraliaBank
Credit Default Swap Buyer20-Jun-22
-405.6860,000BNP PARIBASUSD1.000%-Ryder System IncCredit Default Swap Buyer20-Dec-21
-2,273.90200,000CITIGROUPUSD1.000%-Westpac BankCredit Default Swap Buyer20-Jun-2260,636.31500,000JP MORGANEUR-5.000%iTraxx Europe
Crossover Series34 Index
Credit Default Swap Seller20-Dec-25
1,909.9710,000,000GOLDMANSACHS
JPY-1.000%iTraxx Japan Series34 Index
Credit Default Swap Seller20-Dec-25
7,639.8940,000,000GOLDMANSACHS
JPY-1.000%iTraxx Japan Series34 Index
Credit Default Swap Seller20-Dec-25
-11,562.491,800,000JP MORGANEUR1.100%1M TCPI Index-Inflation Swap11-Jan-22-6,597.762,200,000CITIGROUPEUR1.028%1M CPTFEMU
Index-Inflation Swap06-Sep-26
-13,468.151,900,000UBSEUR1.364%1M FRCPXTOBIndex
-Inflation Swap08-Feb-22
-14,268.3449,600,000BARCLAYSBANK
JPY0.620%1M JCPNGENFIndex
-Inflation Swap26-Jan-27
-7,305.8025,400,000BARCLAYSBANK
JPY0.620%1M JCPNGENFIndex
-Inflation Swap25-Jan-27
2,626.651,700,000JP MORGANUSD1.531%1M CPURNSAIndex
-Inflation Swap01-Sep-21
-14,403.281,100,000CITIGROUPUSD2.168%1M CPURNSAIndex
-Inflation Swap16-Oct-27
Unrealised Gain/(Loss) (inSub-Fund Ccy)NominalCounterpartyCurrencyPaid Rate
Received RateUnderlyingContract
Maturity Date

134
Notes to the Financial Statements as at 31/12/20
-31,368.90400,000UBSUSD2.338%1M CPURNSAIndex
-Inflation Swap23-Jan-47
9,951.63190,000,000GOLDMANSACHS
CLPClibo 1D 3.315%-Interest Rate Swap12-Sep-22
10,831.363,000,000GOLDMANSACHS
CNYChina IRS 1W 3.963%-Interest Rate Swap09-Jan-23
-45,261.734,000,000NOMURAEUR0.223%Euribor 6M -Interest Rate Swap30-Jun-2268,387.87600,000MORGAN
STANLEYEUREuribor 6M 1.066%-Interest Rate Swap18-Oct-28
-19,950.162,200,000JP MORGANEUR0.330%Euribor 6M -Interest Rate Swap23-Jan-22-32,692.901,200,000MORGAN
STANLEYEUR0.455%Euribor 6M -Interest Rate Swap18-Oct-23
-85,790.72300,000MORGANSTANLEY
EUR0.930%Euribor 6M -Interest Rate Swap19-Jul-50
-63,589.4112,800,000DANSKE BANKNOK2.400%Nibor 6M -Interest Rate Swap19-Oct-2724,872.3728,000,000DANSKE BANKNOKNibor 6M 1.620%-Interest Rate Swap21-Oct-2175,058.421,000,000UBSSGDSibor 6M 2.590%-Interest Rate Swap03-Mar-2729,778.051,200,000MORGAN
STANLEYUSDLibor 3M 1.403%-Interest Rate Swap20-Jul-23
66,462.511,500,000UBSUSDLibor 3M 2.165%-Interest Rate Swap18-Oct-23-43,126.792,000,000GOLDMAN
SACHSUSD2.079%Libor 3M -Interest Rate Swap20-Jul-31
-81,721.81800,000UBSUSD2.371%Libor 3M -Interest Rate Swap18-Oct-28-43,982.02400,000GOLDMAN
SACHSUSD1.965%Libor 3M -Interest Rate Swap24-Sep-48
-85,694.042,000,000CITIGROUPUSD2.930%Libor 3M -Interest Rate Swap14-Mar-247,228.521,700,000CITIGROUPUSDLibor 3M 1.068%-Interest Rate Swap02-Aug-219,374.361,700,000JP MORGANUSDLibor 3M 1.195%-Interest Rate Swap01-Sep-21
-26,643.141,200,000MORGANSTANLEY
USD2.095%Libor 3M -Interest Rate Swap20-Jul-31
-125,073.511,000,000UBSUSD2.680%Libor 3M -Interest Rate Swap13-Jan-3247,777.442,500,000MORGAN
STANLEYUSDLibor 3M 2.377%-Interest Rate Swap23-Jan-22
-51,167.301,600,000BNP PARIBASUSD2.655%Libor 3M -Interest Rate Swap07-Feb-52-92,124.72400,000HSBCUSD2.570%Libor 3M -Interest Rate Swap14-Jan-49-49,373.73500,000CITIGROUPUSD2.412%Libor 3M -Interest Rate Swap21-Dec-2753,220.982,000,000CITIGROUPUSDLibor 3M 2.893%-Interest Rate Swap12-Mar-22
-979,707.29Total:
� Amundi S.F. - Saving Box II
Unrealised Gain/(Loss) (inSub-Fund Ccy)NominalCounterpartyCurrencyPaid Rate
Received RateUnderlyingContract
Maturity Date
-5,245.44450,000CITIGROUPUSD1.000%-Aust & NZ BankingGroup
Credit Default Swap Buyer20-Jun-22
-113,123.131,500,000GOLDMANSACHS
USD5.000%-CDX NA HY 35Index
Credit Default Swap Buyer20-Dec-25
-5,237.44450,000CITIGROUPUSD1.000%-CommonwealthBank Aust.
Credit Default Swap Buyer20-Jun-22
-649.40120,000CITIGROUPUSD1.000%-Enbridge IncCredit Default Swap Buyer20-Dec-21-181,908.941,500,000BANK OF
AMERICAEUR5.000%-iTraxx Europe
Crossover Series34 Index
Credit Default Swap Buyer20-Dec-25
-71,017.993,000,000JP MORGANEUR1.000%-iTraxx EuropeSeries 33 Index
Credit Default Swap Buyer20-Jun-25
-79,023.003,000,000BANK OFAMERICA
EUR1.000%-iTraxx EuropeSeries 34 Index
Credit Default Swap Buyer20-Dec-25
-5,122.32450,000CITIGROUPUSD1.000%-Macquarie Bank LtdCredit Default Swap Buyer20-Jun-22
-5,170.34450,000CITIGROUPUSD1.000%-National AustraliaBank
Credit Default Swap Buyer20-Jun-22
-777.55115,000BNP PARIBASUSD1.000%-Ryder System IncCredit Default Swap Buyer20-Dec-21
Unrealised Gain/(Loss) (inSub-Fund Ccy)NominalCounterpartyCurrencyPaid Rate
Received RateUnderlyingContract
Maturity Date

135
Notes to the Financial Statements as at 31/12/20
-5,116.25450,000CITIGROUPUSD1.000%-Westpac BankCredit Default Swap Buyer20-Jun-22157,654.421,300,000JP MORGANEUR-5.000%iTraxx Europe
Crossover Series34 Index
Credit Default Swap Seller20-Dec-25
4,774.9225,000,000GOLDMANSACHS
JPY-1.000%iTraxx Japan Series34 Index
Credit Default Swap Seller20-Dec-25
14,324.7875,000,000GOLDMANSACHS
JPY-1.000%iTraxx Japan Series34 Index
Credit Default Swap Seller20-Dec-25
-26,936.353,800,000UBSEUR1.364%1M FRCPXTOBIndex
-Inflation Swap08-Feb-22
-21,840.243,400,000JP MORGANEUR1.100%1M TCPI Index-Inflation Swap11-Jan-22-15,100.5852,500,000BARCLAYS
BANKJPY0.620%1M JCPNGENF
Index-Inflation Swap25-Jan-27
-29,485.97102,500,000BARCLAYSBANK
JPY0.620%1M JCPNGENFIndex
-Inflation Swap26-Jan-27
-58,816.69750,000UBSUSD2.338%1M CPURNSAIndex
-Inflation Swap23-Jan-47
-28,806.532,200,000CITIGROUPUSD2.168%1M CPURNSAIndex
-Inflation Swap16-Oct-27
20,427.02390,000,000GOLDMANSACHS
CLPClibo 1D 3.315%-Interest Rate Swap12-Sep-22
25,273.157,000,000GOLDMANSACHS
CNYChina IRS 1W 3.963%-Interest Rate Swap09-Jan-23
-68,110.192,500,000MORGANSTANLEY
EUR0.455%Euribor 6M -Interest Rate Swap18-Oct-23
-38,993.504,300,000JP MORGANEUR0.330%Euribor 6M -Interest Rate Swap23-Jan-22-90,523.488,000,000NOMURAEUR0.223%Euribor 6M -Interest Rate Swap30-Jun-22142,474.711,250,000MORGAN
STANLEYEUREuribor 6M 1.066%-Interest Rate Swap18-Oct-28
-8,437.16165,000,000UBSJPY0.080%Libor 6M -Interest Rate Swap13-Oct-26-134,133.9027,000,000DANSKE BANKNOK2.400%Nibor 6M -Interest Rate Swap19-Oct-2753,297.9460,000,000DANSKE BANKNOKNibor 6M 1.620%-Interest Rate Swap21-Oct-21150,116.802,000,000UBSSGDSibor 6M 2.590%-Interest Rate Swap03-Mar-27-98,747.471,000,000CITIGROUPUSD2.412%Libor 3M -Interest Rate Swap21-Dec-27106,441.984,000,000CITIGROUPUSDLibor 3M 2.893%-Interest Rate Swap12-Mar-2295,554.845,000,000MORGAN
STANLEYUSDLibor 3M 2.377%-Interest Rate Swap23-Jan-22
-225,132.331,800,000UBSUSD2.680%Libor 3M -Interest Rate Swap13-Jan-32-173,658.891,700,000UBSUSD2.371%Libor 3M -Interest Rate Swap18-Oct-28-172,733.84750,000HSBCUSD2.570%Libor 3M -Interest Rate Swap14-Jan-49-102,334.623,200,000BNP PARIBASUSD2.655%Libor 3M -Interest Rate Swap07-Feb-52141,786.723,200,000UBSUSDLibor 3M 2.165%-Interest Rate Swap18-Oct-23-171,388.054,000,000CITIGROUPUSD2.930%Libor 3M -Interest Rate Swap14-Mar-24
-1,025,444.31Total:
� Amundi S.F. - Saving Box III
Unrealised Gain/(Loss) (inSub-Fund Ccy)NominalCounterpartyCurrencyPaid Rate
Received RateUnderlyingContract
Maturity Date
-1,748.48150,000CITIGROUPUSD1.000%-Aust & NZ BankingGroup
Credit Default Swap Buyer20-Jun-22
-52,790.80700,000GOLDMANSACHS
USD5.000%-CDX NA HY 35Index
Credit Default Swap Buyer20-Dec-25
-1,745.81150,000CITIGROUPUSD1.000%-CommonwealthBank Aust.
Credit Default Swap Buyer20-Jun-22
-189.4135,000CITIGROUPUSD1.000%-Enbridge IncCredit Default Swap Buyer20-Dec-21-121,272.631,000,000BANK OF
AMERICAEUR5.000%-iTraxx Europe
Crossover Series34 Index
Credit Default Swap Buyer20-Dec-25
-97,018.10800,000BANK OFAMERICA
EUR5.000%-iTraxx EuropeCrossover Series34 Index
Credit Default Swap Buyer20-Dec-25
Unrealised Gain/(Loss) (inSub-Fund Ccy)NominalCounterpartyCurrencyPaid Rate
Received RateUnderlyingContract
Maturity Date

136
Notes to the Financial Statements as at 31/12/20
-59,181.662,500,000JP MORGANEUR1.000%-iTraxx EuropeSeries 33 Index
Credit Default Swap Buyer20-Jun-25
-92,193.503,500,000JP MORGANEUR1.000%-iTraxx EuropeSeries 34 Index
Credit Default Swap Buyer20-Dec-25
-52,682.002,000,000BANK OFAMERICA
EUR1.000%-iTraxx EuropeSeries 34 Index
Credit Default Swap Buyer20-Dec-25
-1,707.44150,000CITIGROUPUSD1.000%-Macquarie Bank LtdCredit Default Swap Buyer20-Jun-22
-1,723.44150,000CITIGROUPUSD1.000%-National AustraliaBank
Credit Default Swap Buyer20-Jun-22
-236.6535,000BNP PARIBASUSD1.000%-Ryder System IncCredit Default Swap Buyer20-Dec-21
-1,705.41150,000CITIGROUPUSD1.000%-Westpac BankCredit Default Swap Buyer20-Jun-2260,636.31500,000JP MORGANEUR-5.000%iTraxx Europe
Crossover Series34 Index
Credit Default Swap Seller20-Dec-25
3,819.9420,000,000GOLDMANSACHS
JPY-1.000%iTraxx Japan Series34 Index
Credit Default Swap Seller20-Dec-25
1,527.988,000,000GOLDMANSACHS
JPY-1.000%iTraxx Japan Series34 Index
Credit Default Swap Seller20-Dec-25
-7,065.961,100,000JP MORGANEUR1.100%1M TCPI Index-Inflation Swap11-Jan-22-8,151.781,150,000UBSEUR1.364%1M FRCPXTOB
Index-Inflation Swap08-Feb-22
-19,605.56250,000UBSUSD2.338%1M CPURNSAIndex
-Inflation Swap23-Jan-47
-9,820.42750,000CITIGROUPUSD2.168%1M CPURNSAIndex
-Inflation Swap16-Oct-27
7,070.89135,000,000GOLDMANSACHS
CLPClibo 1D 3.315%-Interest Rate Swap12-Sep-22
9,026.132,500,000GOLDMANSACHS
CNYChina IRS 1W 3.963%-Interest Rate Swap09-Jan-23
51,290.89450,000MORGANSTANLEY
EUREuribor 6M 1.066%-Interest Rate Swap18-Oct-28
-28,970.57400,000JP MORGANEUR0.757%Euribor 6M -Interest Rate Swap21-Dec-26-11,788.711,300,000JP MORGANEUR0.330%Euribor 6M -Interest Rate Swap23-Jan-22-24,519.68900,000MORGAN
STANLEYEUR0.455%Euribor 6M -Interest Rate Swap18-Oct-23
-31,683.222,800,000NOMURAEUR0.223%Euribor 6M -Interest Rate Swap30-Jun-22-7,384.1351,000,000NOMURAJPY0.275%Libor 6M -Interest Rate Swap21-Dec-26-47,195.269,500,000DANSKE BANKNOK2.400%Nibor 6M -Interest Rate Swap19-Oct-2717,765.9820,000,000DANSKE BANKNOKNibor 6M 1.620%-Interest Rate Swap21-Oct-2145,035.04600,000UBSSGDSibor 6M 2.590%-Interest Rate Swap03-Mar-27-61,291.39600,000UBSUSD2.371%Libor 3M -Interest Rate Swap18-Oct-28-57,577.94250,000HSBCUSD2.570%Libor 3M -Interest Rate Swap14-Jan-49-75,044.12600,000UBSUSD2.680%Libor 3M -Interest Rate Swap13-Jan-3248,739.191,100,000UBSUSDLibor 3M 2.165%-Interest Rate Swap18-Oct-2328,666.451,500,000MORGAN
STANLEYUSDLibor 3M 2.377%-Interest Rate Swap23-Jan-22
-31,979.561,000,000BNP PARIBASUSD2.655%Libor 3M -Interest Rate Swap07-Feb-52-64,270.521,500,000CITIGROUPUSD2.930%Libor 3M -Interest Rate Swap14-Mar-24-34,561.68350,000CITIGROUPUSD2.412%Libor 3M -Interest Rate Swap21-Dec-2739,915.731,500,000CITIGROUPUSDLibor 3M 2.893%-Interest Rate Swap12-Mar-22
-691,611.30Total:
� Amundi S.F. - Diversified Target Income 11/2021
Unrealised Gain/(Loss) (inSub-Fund Ccy)NominalCounterpartyCurrencyPaid Rate
Received RateUnderlyingContract
Maturity Date
4,033.91200,000GOLDMANSACHS
USD1.000%-CDX EM 34 IndexCredit Default Swap Buyer20-Dec-25
8,067.84400,000GOLDMANSACHS
USD1.000%-CDX EM 34 IndexCredit Default Swap Buyer20-Dec-25
Unrealised Gain/(Loss) (inSub-Fund Ccy)NominalCounterpartyCurrencyPaid Rate
Received RateUnderlyingContract
Maturity Date
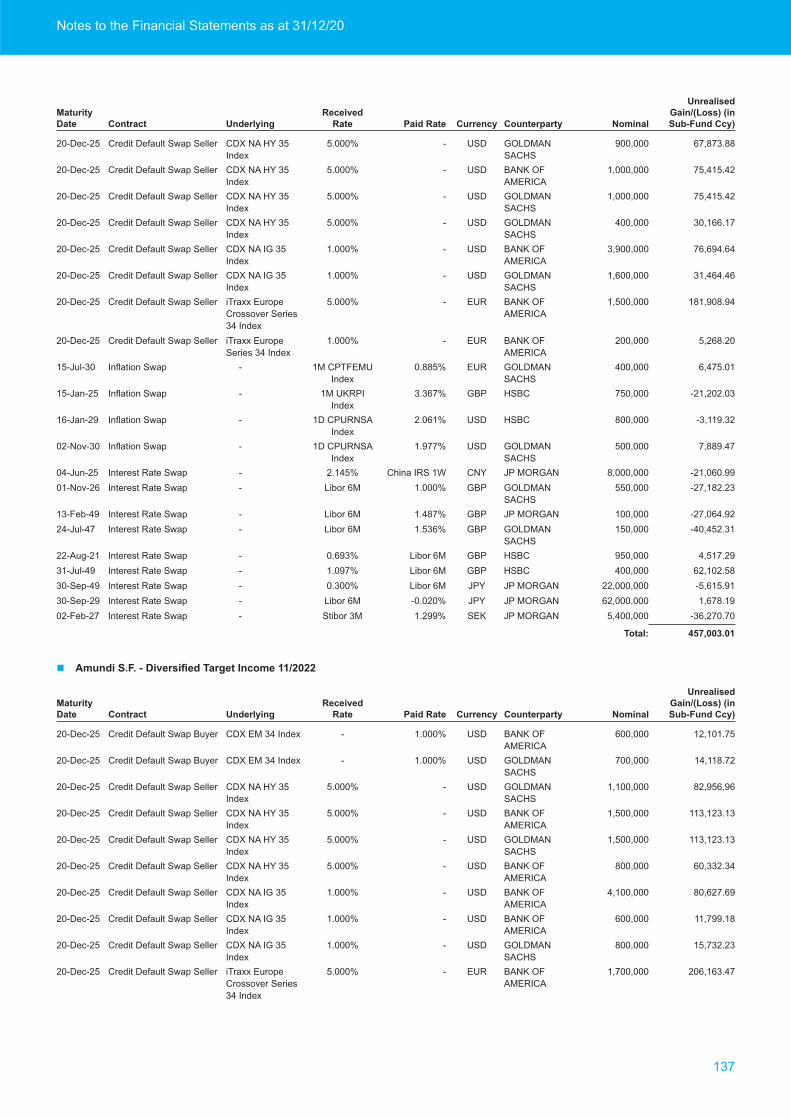
137
Notes to the Financial Statements as at 31/12/20
67,873.88900,000GOLDMANSACHS
USD-5.000%CDX NA HY 35Index
Credit Default Swap Seller20-Dec-25
75,415.421,000,000BANK OFAMERICA
USD-5.000%CDX NA HY 35Index
Credit Default Swap Seller20-Dec-25
75,415.421,000,000GOLDMANSACHS
USD-5.000%CDX NA HY 35Index
Credit Default Swap Seller20-Dec-25
30,166.17400,000GOLDMANSACHS
USD-5.000%CDX NA HY 35Index
Credit Default Swap Seller20-Dec-25
76,694.643,900,000BANK OFAMERICA
USD-1.000%CDX NA IG 35Index
Credit Default Swap Seller20-Dec-25
31,464.461,600,000GOLDMANSACHS
USD-1.000%CDX NA IG 35Index
Credit Default Swap Seller20-Dec-25
181,908.941,500,000BANK OFAMERICA
EUR-5.000%iTraxx EuropeCrossover Series34 Index
Credit Default Swap Seller20-Dec-25
5,268.20200,000BANK OFAMERICA
EUR-1.000%iTraxx EuropeSeries 34 Index
Credit Default Swap Seller20-Dec-25
6,475.01400,000GOLDMANSACHS
EUR0.885%1M CPTFEMUIndex
-Inflation Swap15-Jul-30
-21,202.03750,000HSBCGBP3.367%1M UKRPIIndex
-Inflation Swap15-Jan-25
-3,119.32800,000HSBCUSD2.061%1D CPURNSAIndex
-Inflation Swap16-Jan-29
7,889.47500,000GOLDMANSACHS
USD1.977%1D CPURNSAIndex
-Inflation Swap02-Nov-30
-21,060.998,000,000JP MORGANCNYChina IRS 1W 2.145%-Interest Rate Swap04-Jun-25-27,182.23550,000GOLDMAN
SACHSGBP1.000%Libor 6M -Interest Rate Swap01-Nov-26
-27,064.92100,000JP MORGANGBP1.487%Libor 6M -Interest Rate Swap13-Feb-49-40,452.31150,000GOLDMAN
SACHSGBP1.536%Libor 6M -Interest Rate Swap24-Jul-47
4,517.29950,000HSBCGBPLibor 6M 0.693%-Interest Rate Swap22-Aug-2162,102.58400,000HSBCGBPLibor 6M 1.097%-Interest Rate Swap31-Jul-49-5,615.9122,000,000JP MORGANJPYLibor 6M 0.300%-Interest Rate Swap30-Sep-491,678.1962,000,000JP MORGANJPY-0.020%Libor 6M -Interest Rate Swap30-Sep-29
-36,270.705,400,000JP MORGANSEK1.299%Stibor 3M -Interest Rate Swap02-Feb-27
457,003.01Total:
� Amundi S.F. - Diversified Target Income 11/2022
Unrealised Gain/(Loss) (inSub-Fund Ccy)NominalCounterpartyCurrencyPaid Rate
Received RateUnderlyingContract
Maturity Date
12,101.75600,000BANK OFAMERICA
USD1.000%-CDX EM 34 IndexCredit Default Swap Buyer20-Dec-25
14,118.72700,000GOLDMANSACHS
USD1.000%-CDX EM 34 IndexCredit Default Swap Buyer20-Dec-25
82,956.961,100,000GOLDMANSACHS
USD-5.000%CDX NA HY 35Index
Credit Default Swap Seller20-Dec-25
113,123.131,500,000BANK OFAMERICA
USD-5.000%CDX NA HY 35Index
Credit Default Swap Seller20-Dec-25
113,123.131,500,000GOLDMANSACHS
USD-5.000%CDX NA HY 35Index
Credit Default Swap Seller20-Dec-25
60,332.34800,000BANK OFAMERICA
USD-5.000%CDX NA HY 35Index
Credit Default Swap Seller20-Dec-25
80,627.694,100,000BANK OFAMERICA
USD-1.000%CDX NA IG 35Index
Credit Default Swap Seller20-Dec-25
11,799.18600,000BANK OFAMERICA
USD-1.000%CDX NA IG 35Index
Credit Default Swap Seller20-Dec-25
15,732.23800,000GOLDMANSACHS
USD-1.000%CDX NA IG 35Index
Credit Default Swap Seller20-Dec-25
206,163.471,700,000BANK OFAMERICA
EUR-5.000%iTraxx EuropeCrossover Series34 Index
Credit Default Swap Seller20-Dec-25
Unrealised Gain/(Loss) (inSub-Fund Ccy)NominalCounterpartyCurrencyPaid Rate
Received RateUnderlyingContract
Maturity Date

138
Notes to the Financial Statements as at 31/12/20
48,509.05400,000JP MORGANEUR-5.000%iTraxx EuropeCrossover Series34 Index
Credit Default Swap Seller20-Dec-25
8,343.49400,000GOLDMANSACHS
EUR-1.000%iTraxx EuropeSenior Fin. Series34 Index
Credit Default Swap Seller20-Dec-25
2,634.10100,000BANK OFAMERICA
EUR-1.000%iTraxx EuropeSeries 34 Index
Credit Default Swap Seller20-Dec-25
21,072.80800,000BANK OFAMERICA
EUR-1.000%iTraxx EuropeSeries 34 Index
Credit Default Swap Seller20-Dec-25
8,093.75500,000GOLDMANSACHS
EUR0.885%1M CPTFEMUIndex
-Inflation Swap15-Jul-30
-2,215.56200,000NOMURAGBP3.469%1M UKRPIIndex
-Inflation Swap15-Nov-25
-24,028.97850,000HSBCGBP3.367%1M UKRPIIndex
-Inflation Swap15-Jan-25
-7,501.651,100,000HSBCUSD2.061%1D CPURNSAIndex
-Inflation Swap16-Jan-29
7,889.47500,000GOLDMANSACHS
USD1.977%1D CPURNSAIndex
-Inflation Swap02-Nov-30
-23,693.629,000,000JP MORGANCNYChina IRS 1W 2.145%-Interest Rate Swap04-Jun-25-41,015.29150,000JP MORGANGBP1.549%Libor 6M -Interest Rate Swap25-Jul-47-34,354.75500,000GOLDMAN
SACHSGBP1.269%Libor 6M -Interest Rate Swap12-Jan-27
-27,064.92100,000JP MORGANGBP1.487%Libor 6M -Interest Rate Swap13-Feb-494,273.751,100,000HSBCGBPLibor 6M 0.715%-Interest Rate Swap04-Jul-2147,107.00500,000NOMURAGBPLibor 6M 0.898%-Interest Rate Swap05-Aug-49-6,381.7025,000,000JP MORGANJPYLibor 6M 0.300%-Interest Rate Swap30-Sep-491,976.0573,000,000JP MORGANJPY-0.020%Libor 6M -Interest Rate Swap30-Sep-29
-37,278.225,550,000JP MORGANSEK1.299%Stibor 3M -Interest Rate Swap02-Feb-27698.851,650,000MORGAN
STANLEYSEK0.335%Stibor 3M -Interest Rate Swap26-Nov-30
657,142.23Total:
� Amundi S.F. - EUR Commodities
Unrealised Gain/(Loss) (inSub-Fund Ccy)NominalCounterpartyCurrencyPaid Rate
Received RateUnderlyingContract
Maturity Date
506,885.7414,000,000JP MORGANUSD0.08%-BBG CommodityCommodity Index Swap08-Jan-21380,181.9310,500,000SOCIETE
GENERALEUSD0.065%-BBG CommodityCommodity Index Swap08-Jan-21
1,194,857.5033,000,000MACQUARIEUSD0.065%-BBG CommodityCommodity Index Swap08-Jan-2120,329.421,000,000JP MORGANUSD0.08%-BBG CommodityCommodity Index Swap08-Jan-2133,780.032,000,000SOCIETE
GENERALEUSD0.065%-BBG CommodityCommodity Index Swap08-Jan-21
7,787.651,000,000JP MORGANUSD0.08%-BBG CommodityCommodity Index Swap08-Jan-2133,780.032,000,000MACQUARIEUSD0.065%-BBG CommodityCommodity Index Swap08-Jan-21574,406.1815,000,000JP MORGANUSD0.10%-BBG Comodity 3M
FwdCommodity Index Swap08-Jan-21
7,078.021,000,000JP MORGANUSD0.10%-BBG Comodity 3MFwd
Commodity Index Swap08-Jan-21
31,316.262,000,000MACQUARIEUSD0.105%-BBG Comodity 3MFwd
Commodity Index Swap08-Jan-21
904,908.1130,000,000SOCIETEGENERALE
USD0.115%-BBG Comodity 6MFwd
Commodity Index Swap08-Jan-21
19,078.512,000,000SOCIETEGENERALE
USD0.115%-BBG Comodity 6MFwd
Commodity Index Swap08-Jan-21
3,714,389.38Total:
Unrealised Gain/(Loss) (inSub-Fund Ccy)NominalCounterpartyCurrencyPaid Rate
Received RateUnderlyingContract
Maturity Date

139
Notes to the Financial Statements as at 31/12/20
16 COLLATERALAs at 31 December 2020, the collateral received or paid from/by brokers and counterparties for the purpose of transacting in OTC derivatives are as follows:
17 TRANSACTION COSTSThe transaction costs the Sub-Funds incurred in the year 2020 related to purchase or sale of financial instruments are disclosed in a specific expenses line of the“Statement of Operations and Changes in Net Assets”. Transaction costs include costs directly linked to the acquisition or sale of financial instruments, to the extentthat such costs are shown separately on transaction confirmations.For some asset classes, transaction costs are usually incorporated in dealing prices and are not reported separately.Depending on the nature of the investments of the Sub-Fund, this may result in no data being reported in the transaction costs section for some Sub-Funds.Transactions relating to securities lending and their associated costs are not included in these figures.
18 PROXY VOTING POLICYThe Management Company has implemented a Proxy Voting Policy to enable the exercise of voting rights attached to the portfolio securities. The ManagementCompany aims to cast proxy votes in a manner consistent with the best interest of the Fund. In voting proxies, consideration is given to the economic effect of the proposalon the value of portfolio holdings on both the short and long-term impact. In general, the Management Company believes that supporting the company’s strategy andvoting “for” management’s proposals builds portfolio value. In some cases, however, proposals set forth by management may have a negative effect on that value, andconsideration of this may affect the votes cast by the Management Company.The Management Company exercises voting rights and, where it has authorised delegated investment managers to vote on portfolio securities, it requires that they doso in accordance with the Proxy Voting Policy or another authorized policy. Together, the Management Company and/or the Investment Managers may engage theservices of an independent third party to assist in analysing proxies, Shareholder meeting recommendations, record keeping and voting services provided that the serviceprovider provides its services in accordance with the Proxy Voting Policy.
19 CLASS ACTIONA class action is an action that allows to a group of investors to claim from a company or public institution to obtain financial compensation in the event of losses.The Management Company has engaged the services of two independent companies to assist in the class action activities and ensure a global coverage.Costs paid upfront for the services related to the portfolio analysis, the collection of the depositary data and the assistance in the other activities related to class actionsare booked in the financial statements under “Other charges”.The amounts received when the class action are settled, are booked in the financial statements under “Other income”.During the year 2020, the SICAV has received a total of USD 2,986 as a result of class actions.
20 LIQUIDATED SUB-FUNDSThe following Sub-Fund has been liquidated during the year and as at 31 December 2020 presents the following cash balance at custody level.
Sub-FundSub-Fund Currency Counterparty
Type ofcollateral
Collateral AmountReceived
(In Sub-Funds ccy)
Collateral AmountPaid (In Sub-Funds ccy)
Amundi S.F. - Diversified Short-Term Bond EUR BNP Paribas, Citigroup,Goldman Sachs, JP Morgan
Cash 7,110,000 6,010,000
Amundi S.F. - Emerging Markets Bond 2024 EUR Bank of America Cash - 600,000
Amundi S.F. - Emerging Markets Bond 2025 EUR Citigroup Cash - 690,000
Amundi S.F. - Global High Yield Opportunities 2025 EUR Goldman Sachs Cash - 874,505
Amundi S.F. - Absolute Return Multi-Strategy Control
EUR Morgan Stanley, BarclaysBank, Bank of America, Citigroup, Nomura, UBS
Cash 240,000 1,150,000
Amundi S.F. - Saving Box I EUR Bank of America, Citigroup, UBS
Cash - 860,000
Amundi S.F. - Saving Box II EUR Morgan Stanley, Bank ofAmerica, Citigroup, HSBC,Nomura, UBS
Cash 260,000 1,380,000
Amundi S.F. - Saving Box III EUR Bank of America, Citigroup, Nomura, UBS
Cash - 670,000
Amundi S.F. - Diversified Target Income 11/2021 EUR Bank of America, HSBC Cash 610,000 -
Amundi S.F. - Diversified Target Income 11/2022 EUR Bank of America, Goldman Sachs
Cash 780,000 -
Amundi S.F. - EUR Commodities EUR JP Morgan, Société Générale
Cash 2,040,000 -
Sub-FundDate of Liquidation Currency
Cash Amount
Amundi S.F. - Euro Curve 5-7year 12/11/2020 EUR 18,480

140
Audit Report
Deloitte AuditSoc été à respo sab l té l tée20, Boulevard de KockelscheuerL-1821 LuxembourgTel: +352 451 451www.deloitte.lu
To the Unitholders of Amundi S.F.5, Allée SchefferL-2520 Luxembourg Grand Duchy of Luxembourg
REPORT OF THE REVISEUR D’ENTREPRISES AGREE
OpinionWe have audited the financial statements of Amundi S.F. (the “Fund”) and of each of its sub-funds, which comprise the statement of net assets and the statement of investments and other net assets as at December 31, 2020 and the statement of operations and changes in net assets for the year then ended, and notes to the financial statements, including a summary of significant accounting policies.In our opinion, the accompanying financial statements give a true and fair view of the financial position of the Fund and of each of its sub-funds as at December 31, 2020, and of the results of their operations and changes in their net assets for the year then ended in accordance with Luxembourg legal and regulatory requirements relating to the preparation and presentation of the financial statements.
Basis for OpinionWe conducted our audit in accordance with the Law of 23 July 2016 on the audit profession (Law of 23 July 2016) and with International Standards on Auditing (ISAs) as adopted for Luxembourg by the “Commission de Surveillance du Secteur Financier” (CSSF). Our responsibilities under the Law of 23 July 2016 and ISAs as adopted for Luxembourg by the CSSF are further described in the “Responsibilities of the “réviseur d’entreprises agréé” for the Audit of the Financial Statements” section of our report. We are also independent of the Fund in accordance with the International Code of Ethics for Professional Accountants, including International Independence Standards, issued by the International Ethics Standards Board for Accountants (IESBA Code) as adopted for Luxembourg by the CSSF together with the ethical requirements that are relevant to our audit of the financial statements, and have fulfilled our other ethical responsibilities under those ethical requirements. We believe that the audit evidence we have obtained is sufficient and appropriate to provide a basis for our opinion.
Other InformationThe Board of Directors of the Fund’s Management Company is responsible for the other information. The other information comprises the information stated in the annual report but does not include the financial statements and our report of the “réviseur d’entreprises agréé” thereon.
Our opinion on the financial statements does not cover the other information and we do not express any form of assurance conclusion thereon.In connection with our audit of the financial statements, our responsibility is to read the other information and, in doing so, consider whether the other information is materially inconsistent with the financial statements or our knowledge obtained in the audit or otherwise appears to be materially misstated. If, based on the work we have performed, we conclude that there is a material misstatement of this other information, we are required to report this fact. We have nothing to report in this regard.
Responsibilities of the Board of Directors of the Fund’s Management Company for the Financial StatementsThe Board of Directors of the Fund’s Management Company is responsible for the preparation and fair presentation of the financial statements in accordance with Luxembourg legal and regulatory requirements relating to the preparation and presentation of the financial statements, and for such internal control as the Board of Directors of the Fund’s Management Company determines is necessary to enable the preparation of financial statements that are free from material misstatement, whether due to fraud or error.In preparing the financial statements, the Board of Directors of the Fund’s Management Company is responsible for assessing the Fund’s ability to continue as a going concern, disclosing, as applicable, matters related to going concern and using the going concern basis of accounting unless the Board of Directors of the Fund’s Management Company either intends to liquidate the Fund or to cease operations, or has no realistic alternative but to do so.
Report of the Réviseur d’entreprises agréé
Société à responsabilité limitée au capital de 360.000 € RCS Luxembourg B 67.895 Autorisation d’établissement 10022179
© Deloitte Audit, SARL
Deloitte.

141
Audit Report
Responsibilities of the “réviseur d’entreprises agréé” for the Audit of the Financial StatementsThe objectives of our audit are to obtain reasonable assurance about whether the financial statements as a whole are free from material misstatement, whether due tofraud or error, and to issue a report of the “réviseur d’entreprises agréé” that includes our opinion. Reasonable assurance is a high level of assurance, but is not aguarantee that an audit conducted in accordance with the Law dated 23 July 2016 and with ISAs as adopted for Luxembourg by the CSSF will always detect a materialmisstatement when it exists. Misstatements can arise from fraud or error and are considered material if, individually or in the aggregate, they could reasonably beexpected to influence the economic decisions of users taken on the basis of these financial statements.
As part of an audit in accordance with the Law dated 23 July 2016 and with ISAs as adopted for Luxembourg by the CSSF, we exercise professional judgment andmaintain professional skepticism throughout the audit. We also:
• Identify and assess the risks of material misstatement of the financial statements, whether due to fraud or error, design and perform audit procedures responsive tothose risks, and obtain audit evidence that is sufficient and appropriate to provide a basis for our opinion. The risk of not detecting a material misstatement resultingfrom fraud is higher than for one resulting from error, as fraud may involve collusion, forgery, intentional omissions, misrepresentations, or the override of internal control.
• Obtain an understanding of internal control relevant to the audit in order to design audit procedures that are appropriate in the circumstances, but not for the purposeof expressing an opinion on the effectiveness of the Fund’s internal control.
• Evaluate the appropriateness of accounting policies used and the reasonableness of accounting estimates and related disclosures made by the Board of Directors ofthe Fund’s Management Company.
• Conclude on the appropriateness of the Board of Directors of the Fund’s Management Company use of the going concern basis of accounting and, based on the auditevidence obtained, whether a material uncertainty exists related to events or conditions that may cast significant doubt on the Fund’s ability to continue as a goingconcern. If we conclude that a material uncertainty exists, we are required to draw attention in our report of the “réviseur d’entreprises agréé” to the related disclosuresin the financial statements or, if such disclosures are inadequate, to modify our opinion. Our conclusions are based on the audit evidence obtained up to the date ofour report of the “réviseur d’entreprises agréé”. However, future events or conditions may cause the Fund to cease to continue as a going concern.
• Evaluate the overall presentation, structure and content of the financial statements, including the disclosures, and whether the financial statements represent theunderlying transactions and events in a manner that achieves fair presentation.
We communicate with those charged with governance regarding, among other matters, the planned scope and timing of the audit and significant audit findings, includingany significant deficiencies in internal control that we identify during our audit.
For Deloitte Audit, Cabinet de révision agréé
Yann Mérillou, Réviseur d'entreprises agrééPartner
Luxembourg, April 15, 2021

142
Additional Information (unaudited)
*The Sub-Fund was liquidated on 2 March 2018
SFT REGULATIONFollowing the Regulation 2015/2365 of the European Parliament and of the Council of 25 November 2015 on transparency of securities financing transactions and ofreuse, transactions on total return swaps were subject to this Regulation as at 31 December 2020.
� Total Return SwapsAmundi S.F. -
Absolute Return Multi-Strategy
ControlAmundi S.F. -
EUR CommoditiesAmount of Total Return Swaps expressed in absolute amount (in the currency of the Sub-Fund ) 58,252.89 3,714,389.38
Proportion of AUM 0.04% 3.85%
Maturity tenor of the Total Return Swaps broken down in the following maturity buckets
less than one day - -
one day to one week - -
one week to one month 58,252.89 3,714,389.38
one month to three months - -
three months to one year - -
above one year - -
open maturity - -
Total 58,252.89 3,714,389.38
Counterparty
Name of counterparty, Country of domicile of the counterparty and Gross volume of outstanding transactions
JP MORGAN (GB) EUR 58,252.89
SOCIETE GENERALE (FR)
EUR 1,337,948.58
MACQUARIE GROUP (AU)
EUR 1,259,953.79
JP MORGAN (GB)EUR 1,116,487.01
Data of collateral
Type of collateral:
Cash See note 16 See note 16
Securities - -
Quality of collateral:
Rating - -
Maturity tenor of the collateral broken down in the following maturitybuckets (in Sub-Fund 's currency)
less than one day - -
one day to one week - -
one week to one month - -
one month to three months - -
three months to one year - -
above one year - -
open maturity - -
Total - -
Safekeeping of collateral received by the Sub-Fund as part of Total Return Swaps
Name of custodian SOCIETE GENERALE SOCIETE GENERALE
Cash - -
Securities - -
Safekeeping of collateral granted by the Sub-Fund as part of Total Return Swaps
Proportion of collateral held - -
Data on returns and costs of Total Return Swaps
Returns and costs generated by Total Retun Swaps during the year (in Sub-Fund's currency) 4,195.55 - 3,916,531.81
Data on returns and costs of Total Return Swaps are as follow for Sub-Funds which did not hold TRS as at December 31, 2020 (in Sub-Fund's currency):
Amundi S.F. - Diversified Target Income 11/2021 : - 53 573,69
All transaction are bilateral transactions.ISDA Master Agreement applies to all OTC derivative transactions including total return swap transactions entered by the Sub-Funds. An ISDA Master Agreement is a bilateral agreement established by the Sub-Fund and a counterparty, which governs OTC derivative transactions, including total return swaps. The overall OTC derivative exposures under ISDA Master Agreement are netted and collateralized together. Forthis reason for collateral information on total return swaps we make reference to the note 16 to the financial statements which includes and reflects the overall OTC derivative transactions entered by the Sub-Funds.The collateral received is held in custody and it is not reused.

143
Additional Information (unaudited)
REMUNERATION POLICY AND PRACTICESAmundi Luxembourg remuneration policy is compliant with the requirements detailed in the European Directive 2014/91/EU that come into force on 18 March 2016,and was transposed into Luxembourg Law of 10 May 2016. The remuneration policy is based on Amundi group remuneration framework, and it is reviewed annually and approved by the Board of Amundi Luxembourg. The policyis subject to independent review by the internal Compliance function.In 2020 there were no material changes to the remuneration policy adopted for previous years. The policy applicable for 2020 was approved by Amundi Luxembourg Board on September 28, 2020.Amundi group Remuneration Committee reviews on an annual basis the group remuneration policy. The 2020 review took place on February 11, 2020.The remuneration policy and practices objectives are consistent with and promote sound and effective risk management, aligning remuneration with long-termperformance and risks in order to avoid conflicts of interest. Fixed remuneration components are linked to the roles covered, the professional services rendered andthe scope of responsibilities, reflecting the level of academic qualification, market pay levels, experience and skills required for each position, as well as the level ofexcellence demonstrated. Variable remuneration is designed to promote a sustainable long-term development of the Management Company and a solid and effectiverisk management system. Variable remuneration awards consider the performance of the employee, her/his business unit and Amundi group as a whole, and it is basedon both financial and non-financial criteria.Amundi Luxembourg and Amundi group have defined all identified staff having authority or influence on the funds Amundi manages, and who consequently are likelyto have an impact on the performance or the risk profile of our the funds.
� AMOUNTS OF REMUNERATION AWARDEDAmundi Luxembourg, the Management Company acts as of December 31, 2020 as Management Company or AIFM for several umbrella and standalone UCITS andAIFs.The total remuneration expressed in Euro paid by Amundi Luxembourg to its staff during the calendar year 2020 is as follows:
Amundi S.F. represented as of December 31, 2020 around 2.01% of the Total Net Assets under Management of Amundi Luxembourg S.A.. The total remuneration figuresshown above refer to activities in respect of all funds managed.Amundi Luxembourg S.A. and Amundi group employees who are appointed to the Board of Directors of the Management Company waive the right to any remunerationin respect of all funds managed. No employee of the Management Company receives any amount, including carried interest and performance fees, paid directly by the UCITS or AIFs managed.
� REMUNERATION OF DELEGATESWhen made available to the Management Company, the 2020 remuneration data in respect of the Investment Managers are detailed below.- Amundi Asset Management managed EUR 912.18 billion AuM, out of which EUR 1.87 billion represented by the Sub-Funds in the umbrella (respectively 0.21% ofthe total assets managed by the Investment Manager and 52.8% of the total umbrella's AuM). The pro-rata portion of the identified staff total remuneration attributableto the management of these Sub-Funds was EUR 90,980, out of which EUR 27,826 in fixed remuneration and EUR 63,154 in variable one. The pro-rata portion of stafftotal remuneration attributable to the management of these Sub-Funds was EUR 365,317, out of which EUR 231,945 in fixed remuneration and EUR 133,372 in variableone. Amundi Asset Management had a total of 66 identified staff out of a total of 1414 staff in 2020.
- Amundi Deutschland GmbH managed EUR 20.95 billion AuM, out of which EUR 0.18 billion represented by the Sub-Funds in the umbrella (respectively 0.86% of thetotal assets managed by the Investment Manager and 5.02% of the total umbrella's AuM). The pro-rata portion of the identified staff total remuneration attributable tothe management of these Sub-Funds was EUR 31,914, out of which EUR 15,781 in fixed remuneration and EUR 16,133 in variable one. The pro-rata portion of stafftotal remuneration attributable to the management of these Sub-Funds was EUR 141,436, out of which EUR 94,988 in fixed remuneration and EUR 46,448 in variableone. Amundi Deutschland GmbH had a total of 13 identified staff out of a total of 117 staff in 2020.
- Amundi Ireland Limited. managed EUR 32.16 billion AuM, out of which EUR 0.14 billion represented by the Sub-Funds in the umbrella (respectively 0.44% of the totalassets managed by the Investment Manager and 4.09% of the total umbrella's AuM). The pro-rata portion of the identified staff total remuneration attributable to themanagement of these Sub-Funds was EUR 32,380, out of which EUR 10,216 in fixed remuneration and EUR 22,164 in variable one. The pro-rata portion of staff totalremuneration attributable to the management of these Sub-Funds was EUR 186,380, out of which EUR 122,343 in fixed remuneration and EUR 64,037 in variable one.Amundi Ireland Limited. had a total of 11 identified staff out of a total of 318 staff in 2020.
- Amundi Pioneer Asset Management Inc. managed EUR 76.69 billion AuM, out of which EUR 0.63 billion represented by the Sub-Funds in the umbrella (respectively0.82% of the total assets managed by the Investment Manager and 17.7% of the total umbrella's AuM). The pro-rata portion of the identified staff total remunerationattributable to the management of these Sub-Funds was EUR 287,158, out of which EUR 89,937 in fixed remuneration and EUR 197,221 in variable one. The pro-rataportion of staff total remuneration attributable to the management of these Sub-Funds was EUR 424,433, out of which EUR 188,078 in fixed remuneration and EUR236,355 in variable one. Amundi Pioneer Asset Management Inc. had a total of 49 identified staff out of a total of 155 staff in 2020.
- Amundi SGR S.p.A. managed EUR 104.1 billion AuM, out of which EUR 0.29 billion represented by the Sub-Funds in the umbrella (respectively 0.28% of the totalassets managed by the Investment Manager and 8.09% of the total umbrella's AuM). The pro-rata portion of the identified staff total remuneration attributable to themanagement of these Sub-Funds was EUR 36,882, out of which EUR 16,441 in fixed remuneration and EUR 20,441 in variable one. The pro-rata portion of staff totalremuneration attributable to the management of these Sub-Funds was EUR 116,183, out of which EUR 77,130 in fixed remuneration and EUR 39,053 in variable one.Amundi SGR S.p.A. had a total of 40 identified staff out of a total of 353 staff in 2020.
- Amundi UK Limited. managed EUR 51.09 billion AuM, out of which EUR 0.44 billion represented by the Sub-Funds in the umbrella (respectively 0.86% of the totalassets managed by the Investment Manager and 12.31% of the total umbrella's AuM). The pro-rata portion of the identified staff total remuneration attributable to themanagement of these Sub-Funds was EUR 109,403, out of which EUR 42,521 in fixed remuneration and EUR 66,882 in variable one. The pro-rata portion of staff totalremuneration attributable to the management of these Sub-Funds was EUR 322,244, out of which EUR 179,214 in fixed remuneration and EUR 143,030 in variableone. Amundi UK Limited. had a total of 25 identified staff out of a total of 156 staff in 2020.
Nr. of beneficiaries Fixed remunerationVariable
remuneration TotalStaff 83 6,873,004 1,181,500 8,054,504
Out of which- Identified staff 7 1,192,117 279,600 1,471,717
- All other staff 76 5,680,887 901,900 6,582,787

144
Additional Information (unaudited)
GLOBAL EXPOSURE
� THE COMMITMENT APPROACHThe following Sub-Funds use the commitment approach in order to monitor and measure the global exposure. Amundi S.F. - Emerging Markets Bond 2024Amundi S.F. - Emerging Markets Bond 2025Amundi S.F. - European Equity Market PlusAmundi S.F. - European ResearchAmundi S.F. - SMBC Amundi Protect Fund USD Step 201803Amundi S.F. - SMBC Amundi Protect Fund USD Step 201809
� THE ABSOLUTE VAR APPROACH:The following Sub-Funds use the absolute Value-at-Risk (VaR) approach (99% confidence level, 1 month holding period) in order to monitor and measure the globalexposure. The length of data history is one year (Historical).
� THE RELATIVE VAR APPROACH:The following Sub-Funds use the relative Value-at-Risk (VaR) approach (99% confidence level, 1 month holding period) in order to monitor and measure the globalexposure. The length of data history is one year (Historical).
* The Sub-Fund’s VaR increased significantly since March 2020 due to a general increase of volatility in financial markets caused by the CORONA virus crisis, including the main risk factors of the sub-fund. To ensure that the fund’srisk profile remains in line with the investment policy and the best interest of investors, a detailed analysis of any breach in regulatory VaR is regularly performed and updated. All VaR breaches satisfied these criteria and were thereforeclassified as passive from their start up to 31 December 2020.
Sub-FundVaR Model Reference Portfolio
VaRLimit
LowestVaR
HighestVaR
VaR31.12.2020
AverageVaR
AverageLeverage
Amundi S.F. - Global High Yield Opportunities 2025
Historical N/A 20% 2.41% 14.59% 11.57% 10.95% 14.02%
Amundi S.F. - European Equity Optimal Volatility
Historical N/A 20% 1.28% 5.53% 4.14% 3.02% 169.30%
Amundi S.F. - Absolute Return Multi-Strategy Control
Historical N/A 20% 0.67% 9.76% 9.42% 5.38% 508.36%
Amundi S.F. - Saving Box I Historical N/A 20% 0.80% 11.72% 9.85% 8.00% 225.03%
Amundi S.F. - Saving Box II Historical N/A 20% 0.54% 9.09% 7.91% 6.13% 157.21%
Amundi S.F. - Saving Box III Historical N/A 20% 0.70% 10.63% 8.59% 7.30% 160.35%
Amundi S.F. - Amundi TargetTrend 2024
Historical N/A 20% 3.07% 13.18% 11.35% 9.37% 14.63%
Sub-FundVaR Model Reference Portfolio
VaRLimit
LowestVaR
HighestVaR
VaR31.12.2020
AverageVaR
AverageLeverage
Amundi S.F. - Diversified Short-Term Bond
Historical 25% ICE BofA ML Euro Non-Financial HighYield Constrained BB Index / 25% ICE BofAML Euro Subordinated Financial Index / 50%ICE BofA ML Euro Corporate Large Cap 1-3Yrs Index
200% 35.28% 118.74% 92.38% 92.44% 118.50%
Amundi S.F. - Euro Curve 1-3year Historical 100% JP Morgan GBI EMU 1-3 Index 200% 59.79% 441.41%* 108.08% 195.28% 45.63%
Amundi S.F. - Euro Curve 3-5year Historical 100% JP Morgan GBI EMU 3-5 Index 200% 77.69% 231.1%* 106.99% 148.12% 35.71%
Amundi S.F. - Euro Curve 5-7year Historical 100% JP Morgan GBI EMU 5-7 Index 200% 91.69% 151.47% 98.59% 117.08% 21.42%
Amundi S.F. - Euro Curve 10+year Historical 100% JP Morgan GBI EMU 10+ Index 200% 75.96% 124.11% 98.96% 106.30% 34.64%
Amundi S.F. - High Yield & Emerging Markets Bond Opportunities 2021
Historical 35% JP Morgan CEMBI Broad DiversifiedIndex / 15% JP Morgan GBI-EM Global Diversified Index / 50% ICE BofA ML GlobalHigh Yield Index
200% 56.22% 102.63% 62.87% 67.09% 10.83%
Amundi S.F. - Diversified TargetIncome 11/2021
Historical 35% MSCI AC World Index (hedged to EUR) /15% ICE BofA ML Global High Yield Index(hedged to EUR) / 40% Bloomberg BarclaysGlobal Aggregate Corporate Index (hedged toEUR) / 10% JPMorgan EMBI GlobalDiversified Index (hedged to EUR)
200% 37.50% 97.54% 91.09% 76.51% 301.34%
Amundi S.F. - Diversified TargetIncome 11/2022
Historical 35% MSCI AC World Index (hedged to EUR) /15% ICE BofA ML Global High Yield Index(hedged to EUR) / 40% Bloomberg BarclaysGlobal Aggregate Corporate Index (hedged toEUR) / 10% JPMorgan EMBI GlobalDiversified Index (hedged to EUR)
200% 33.65% 98.41% 95.62% 74.56% 300.85%
Amundi S.F. - EUR Commodities Historical 100% Bloomberg Commodity Total Return Index 200% 83.72% 107.90% 92.48% 92.49% 98.74%

Contact Information Amundi S.F. Amundi Luxembourg S.A. 5, Allée Sche�er, L-2520 Luxembourg
Tel.: 352 2686 8080
www.amundi.lu/amundi-funds
REF-1912
Amundi ASSET MANAGEMENT