Annual Report 2020 | BankTrack
308
Erste Group Annual Report 2020
-
Upload
khangminh22 -
Category
Documents
-
view
0 -
download
0
Transcript of Annual Report 2020 | BankTrack

Erste Group
Annual Report 2020

Extensive presence in Central and Eastern Europe
AustriaBranches: 845Customers: 3.8 millionEmployees: 15,942
SlovakiaBranches: 206 Customers: 2.2 millionEmployees: 3,770
CroatiaBranches: 139 Customers: 1.3 millionEmployees: 3,252
HungaryBranches: 107 Customers: 0.9 millionEmployees: 3,227
SerbiaBranches: 88 Customers: 0.5 millionEmployees: 1,198
Czech Republic Branches: 438Customers: 4.5 million Employees: 9,820
Romania Branches: 370 Customers: 2.9 millionEmployees: 5,645
Majority ownership
Minority ownership

Income statement (in EUR million) 2016 2017 2018 2019 2020
Net interest income 4,374.5 4,353.2 4,582.0 4,746.8 4,774.8
Net fee and commission income 1,783.0 1,851.6 1,908.4 2,000.1 1,976.8 Net trading result and gains/losses from financial instruments at FVPL 272.3 210.5 193.7 293.8 199.5 Operating income 6,691.2 6,669.0 6,915.6 7,255.9 7,155.1 Operating expenses -4,028.2 -4,158.2 -4,181.1 -4,283.3 -4,220.5 Operating result 2,663.0 2,510.8 2,734.6 2,972.7 2,934.6
Impairment result from financial instruments -195.7 -132.0 59.3 -39.2 -1,294.8
Other operating result -665.0 -457.4 -304.5 -628.2 -278.3 Pre-tax result from continuing operations 1,950.4 2,077.8 2,495.0 2,329.7 1,368.0 Net result attributable to owners of the parent 1,264.7 1,316.2 1,793.4 1,470.1 783.1
Net interest margin (on average interest-bearing assets) 2.51% 2.40% 2.30% 2.18% 2.08% Cost/income ratio 60.2% 62.4% 60.5% 59.0% 59.0% Provisioning ratio (on average gross customer loans) 0.15% 0.09% -0.03% 0.02% 0.78% Tax rate 21.2% 19.7% 13.3% 18.0% 25.0% Return on tangible equity 12.3% 11.5% 15.2% 11.2% 5.1% Earnings per share (in EUR) 2.93 2.94 4.02 3.23 1.57
Balance sheet (in EUR million) Dec 16 Dec 17 Dec 18 Dec 19 Dec 20
Cash and cash balances 18,353 21,796 17,549 10,693 35,839 Trading, financial assets 48,320 42,752 43,930 44,295 46,849 Loans and advances to banks 3,469 9,126 19,103 23,055 21,466 Loans and advances to customers 130,654 139,532 149,321 160,270 166,050 Intangible assets 1,390 1,524 1,507 1,368 1,359 Miscellaneous assets 6,775 5,929 5,382 6,012 5,830 Total assets 208,227 220,659 236,792 245,693 277,394 Financial liabilities held for trading 4,762 3,423 2,508 2,421 2,625 Deposits from banks 14,631 16,349 17,658 13,141 24,771 Deposits from customers 138,013 150,969 162,638 173,846 191,070 Debt securities issued 27,192 25,095 29,738 30,371 30,676 Miscellaneous liabilities 7,027 6,535 5,381 5,437 5,840 Total equity 16,602 18,288 18,869 20,477 22,410 Total liabilities and equity 208,227 220,659 236,792 245,693 277,394
Loan/deposit ratio 94.7% 92.4% 91.8% 92.2% 86.9% NPL ratio 4.9% 4.0% 3.2% 2.5% 2.7% NPL coverage ratio (based on AC loans, ex collateral) 69.1% 68.8% 73.4% 77.1% 88.6% Texas ratio 34.6% 29.2% 24.5% 19.9% 20.3% Total own funds (CRR final, in EUR million) 18,893 20,337 20,891 21,961 23,643 CET1 capital ratio (CRR final) 12.8% 12.9% 13.5% 13.7% 14.2% Total capital ratio (CRR final) 18.2% 18.2% 18.1% 18.5% 19.7%
About the share 2016 2017 2018 2019 2020
Shares outstanding at the end of the period 429,800,000 429,800,000 429,800,000 429,800,000 429,800,000 Weighted average number of outstanding shares 426,668,132 426,679,572 426,696,221 426,565,097 426,324,725 Market capitalisation (in EUR billion) 12.0 15.5 12.5 14.4 10.7 High (in EUR) 29.59 37.99 42.38 37.07 35.6 Low (in EUR) 18.87 27.46 28.10 28.23 15.34 Closing price (in EUR) 27.82 36.105 29.05 33.56 24.94 Price/earnings ratio 9.5 11.8 7.0 9.8 13.7 Dividend per share (in EUR) 1.00 1.20 1.40 0.00 0.50 Payout ratio 34.0% 39.2% 33.6% 0.0% 27.4% Dividend yield 3.6% 3.3% 4.8% 0.0% 2.0% Book value per share 27.8 30.0 31.1 32.9 34.0 Price/book ratio 1.0 1.2 0.9 1.0 0.7
Additional information Dec 16 Dec 17 Dec 18 Dec 19 Dec 20
Employees (full-time equivalents) 47,034 47,702 47,397 47,284 45,690 Branches 2,648 2,565 2,507 2,373 2,193 Customers (in million) 15.9 16.1 16.2 16.6 16.1
CRR: Capital Requirements Regulation Shares outstanding include Erste Group shares held by savings banks that are members of the Haftungsverbund (cross-guarantee system). Dividend 2020: The management board proposes to the annual general meeting in May – in line with ECB recommendation – a dividend for 2020 of EUR 0.5 per share. An additional EUR 1 per share has been reserved for a potential later payment.
Key financial and operating data

Financial data
1 Syndicated savings banks foundations, own holdings of savings banks, Erste Employees Foundation2 Other parties to the shareholder agreement of ERSTE Foundation, savings banks and CaixaBank* Unidentified institutional and retail investors** Incl. market makers, prime brokerage, proprietary trading, collateral and stock lending; position reported through custodian banklists
0
1
2
3
4
5
20202019201820172016
1.57
2.93 2.94
4.02
3.23
0
5
10
15
20
20202019201820172016
5.1
12.3 11.5
15.2
11.2
by region
18.15% North America
18.54% UK & Ireland22.68%
Continental Europe
1.27%Rest of world
9.14%Unidentified
2.52%Identified trading**
Austria 27.70%
by investors
9.92% CaixaBank
1.67% Savings banks foundations1
3.08% Other syndicated2
0.79% Employees
4.00% Retail investors
Institutional investors 44.02%
T. Rowe Price 4.12%
BlackRock, Inc. 4.24%
Unidentified* 9.14%
Identified trading** 2.52% 5.90% ERSTE Foundation direct
10.60% Sparkassen Beteiligungs GmbH & Co KG
in € in %
Financial data
Shareholder structureas of 31 December 2020
Return on tangible equity, ROTEEarnings per share

The financial calendar is subject to change.The latest updated version is available on Erste Group’s website (www.erstegroup.com/investorrelations).
Fitch
Long-term A
Short-term F1
Outlook Negative
Moody´s
Long-term A2
Short-term P-1
Outlook Stable
Standard & Poor´s
Long-term A
Short-term A-1
Outlook Stable
30 April Results for the first quarter 2021
9 May Record date Annual General Meeting
19 May Annual General Meeting
25 May Ex-dividend day
26 May Record date dividend
27 May Dividend payment
30 July Half-year financial report 2021
2 November Results for the first three quarters 2021
0
10
20
30
40
50
60
70
80
20202019201820172016
60.2 62.4 60.5 59.059.0
0,0
0,5
1,0
1,5
2,0
2,5
3,0
20202019201820172016
2.51 2.40 2.30 2.18 2.08
in % in %
Ratingsas of 31 December 2020
Financial calendar
Cost/income ratio Net interest margin

Non-financial data
Social Banking until 2020
Share of women in 2020in %
0
10
20
30
40
50
60
70
80
SerbiaCroatiaHungaryRomaniaSlovakiaCzech RepublicAustriaErste Group
62
25
53
19
68
14
70
23
74
39
62
24
68
39
73
38
female employees Topmanagement
26,00026,000clients received education and mentoring
380 mln €380 mln €disbursed loans(at almost 20,000 disbursed loans)
36,00036,000clients supported

Total data (Erste Group) include data of direct and indirect holdings of Erste Group outside its core markets.CO2e: CO2-equivalents are the sum of all greenhouse gas emissions, e.g. carbon dioxide, methane and nitrogen oxide Scope 1: Direct greenhouse gas emissions from burnt natural resources (e.g. heating oil, petrol)Scope 2: Indirect greenhouse gas emissions from energy production (e.g. electric energy, district heating)
Copy paper consumption in 2020in tonnes
Energy consumption in 2020in GWh
Greenhouse gas emissions in 2020in tonnes CO2e
Heating, warm water and district cooling CarpoolElectricity
Austria
121
Romania
72
Czech Republic
69
Slovakia
26
Hungary
17
Croatia
19
Serbia
5
Erste Group
340
Austria
502
Romania
311
Czech Republic
158
Slovakia
72
Hungary
84
Croatia
76
Serbia
22
Erste Group
1,295
Non-recycled paperRecycled paper
Scope 2 (indirect)Scope 1 (direct)
Austria
9,968
Romania
18,693
Czech Republic
10,976
Slovakia
6,144
Hungary
4,659
Croatia
1,800
Serbia
648
Erste Group
57,492

Your Notes

1
Highlights
Solid result in 2020 _ Net result of EUR 783.1 million
despite significant risk provisioning due to Covid-19 pandemic and related measures
_ Local banks in all core markets remain profitable Operating result impacted by lockdowns
_ Operating revenues down by 1.4% _ Net interest income grows by 0.6% despite further rate cuts
in CEE _ Efficiency efforts support improvement in expenses by 1.5% _ Operating result declined by 1.3% _ Cost/income ratio stable at 59.0%
Loan growth continues
_ Net loans increase by 3.6%, organic growth supported by state guarantees and moratoria across the region
_ NPL ratio only moderately up to 2.7% _ NPL provision coverage at 88.6% _ risk provisioning on updated risk parameters with
forward looking information results in 78 basis points (on average gross customer loans)
Favourable capitalisation
_ CET1 ratio (CRR final) increases to 14.2%, exceeding regulatory requirements and internal target
_ Two successful AT1 issuances Excellent funding and liquidity position
_ Strong retail deposit base in all core countries is key trust indicator and competitive advantage
_ Loan-to-deposit ratio at 86.9% _ Successful issuance of various asset classes by Holding and
subsidiaries, e.g. first Non-Preferred Senior (NPS) issuance in Slovakia
Table of contents
TO OUR SHAREHOLDERS
2 Letter from the CEO
4 Report of the supervisory board
6 Report of the audit committee
7 Erste Group on the capital markets
ERSTE GROUP
10 Strategy
17 Financial and operating performance
25 Segments
25 Geographical segmentation – operating segments
26 Austria
27 Erste Bank Oesterreich & Subsidiaries
29 Savings Banks
30 Other Austria
31 Central and Eastern Europe
31 Czech Republic
34 Slovakia
37 Romania
40 Hungary
42 Croatia
45 Serbia
48 Other
49 Business segments
49 Retail
50 Corporates
51 Group Markets
51 Asset/Liability Management & Local Corporate Center
51 Savings Banks
52 Group Corporate Center
53 (Consolidated) non-financial report
55 Materiality analysis
58 Commitment to society
61 Our customers
67 Suppliers and supply chain
68 Compliance and anti-corruption
70 Employees
75 Environment
80 GRI content index
83 Independent assurance report
85 (Consolidated) corporate governance report
AUDITED FINANCIAL REPORTING
100 Auditor’s report
108 Management report
118 Consolidated financial statements
292 Glossary
297 Statement of all members of the management board
298 ADDRESSES
Editorial deadline: 26 February 2021, unless stated otherwise
2
Dear shareholders, in 2020, a year in which the Covid-19 pandemic was the central theme worldwide and hence also in our core markets, Erste Group posted a net profit of EUR 783.1 million. The fact that our local subsidiaries remained profitable is validation of Erste Group’s strategy and a testament to the fundamental strength of the CEE region. Given the challenging environment, the operat-ing result came in better than expected at EUR 2.9 billion. Alt-hough asset quality had hardly deteriorated by the end of the year – at 2.7%, the NPL ratio was barely above the lowest level seen in more than two decades – we had already set aside significant risk provisions of EUR 1.3 billion to brace for potential credit losses going forward. Against the backdrop of a sharp economic downturn, we again registered growth in customer loans and deposits across all core markets in 2020. Another point in our favour is Erste Group’s solid capitalisation, with a common equity tier 1 ratio of 14.2% at the end of December. In line with current ECB recommendations, the management board will there-fore propose to pay a dividend of EUR 0.5 per share at the annual general meeting. In addition, we have set aside EUR 1 per share for a potential additional dividend to be paid once restrictions have been lifted. Unexpected change in fundamentals As the coronavirus was spreading world-wide in 2020, the eco-nomic environment changed significantly both globally and regionally. The governments of the CEE region had been quick in implementing sweeping measures to contain the outbreak, but the abrupt temporary lockdown of public life resulted in a significant decline in economic activity. To mitigate the at times dramatic adverse consequences, all governments launched and – later in the year – extended and/or modified substantial relief pro-grammes. Central banks provided support by easing their mone-tary policies. Regulators and supervisory authorities implemented measures allowing banks more flexibility in terms of capital and liquidity. After a recovery in the third quarter, autumn saw a second wave of the virus. Additional political measures were taken and are still in place to differing degrees. These sometimes vary substantially from region to region, but have one thing in common: to minimise the economic and social consequences as far as possible. Maintaining the maximum of possible economic activity is deemed essential. The restrictions are designed to slow down mobility and social life while keeping up industrial produc-tion, a key driver of the economies of our core markets. The tourist industry and the service sector have been hit particularly hard by the lockdowns, though. Overall, the measures taken to contain the Covid-19 pandemic in our core markets led to a significant decline in economic output of between 1.1% in Serbia and 8.8% in Croatia. Unemployment rates also rose in CEE but remained relatively low compared with many western European countries. Employment benefited from government support pro-grammes, including in particular the widely used short-time
working schemes. On the back of lower revenues and higher expenses fiscal deficits widened across the region. CEE curren-cies were weak throughout the year, inflation remained relatively moderate. Many central banks of the region lowered their policy rates in the course of the year, most prominently the Czech Na-tional Bank, which cut its rates in three steps from 2.25% to 0.25%. Growth despite headwinds In this environment, which proved challenging for all of us, we continued to serve our customers without interruptions, support-ing them with help and advice, seeking to find individual solu-tions whenever necessary. This most certainly contributed to net loan growth of 3.6% to EUR 166.1 billion in a year that wit-nessed such an extraordinary economic slump. Key momentum came from “genuine” demand for loans from retail and corporate clients, while government measures such as loan moratoria and guaranteed loans boosted volume less strongly than initially anticipated. Our clients’ trust in Erste Group was also reflected on the deposit side, with customer deposits rising again, by 9.9%, to EUR 191.1 billion. This resulted in a loan-to-deposit ratio of 86.9%. Other growth aspects were less unexpected: use of Erste Group’s digital channels has intensified, and the number of users of our digital platform George as well as digital transactions have been rising steadily. In an interest rate environment that was unfavour-able for savers, interest in investment products increased. Our prosperity advice offering has proved very popular. Clients are happy to use our advisory services not only online but, despite the restrictions due to the pandemic, also face-to-face at the branches. Operating result better than expected How did this change in the environment impact the performance of Erste Group in detail? In 2020, net interest income – tradition-ally the most important income component of Erste Group – improved moderately to EUR 4,774.8 million despite significant-ly lower interest rates in the Czech Republic. Loan growth as well as access to more favourable ECB funding (TLTRO) were posi-tive drivers. The slowdown of the economy due to Covid-19 reduced net fee and commission income to EUR 1,976.8 million, however, even though substantial growth was recorded in the securities business and in asset management. Cost discipline supported the reduction of operating expenses to EUR 4,220.5 million, even though no cuts were made in rolling out and devel-oping George, our popular digital platform. Considering the business environment, the operating result of EUR 2,934.6 mil-lion was better than expected, but slightly lower than in the pre-vious year. Regulatory costs (banking and transaction levies, contributions to resolution funds and deposit insurance systems) rose by 11.5% to EUR 343.4 million.
Letter from the CEO

Management board | Supervisory board | Capital markets | Strategy | Financial and operating performance | Segments | Non-financial report | Corporate governance report | Audited financial reporting
3
Focus on risk costs Unsurprisingly, the most important bottom-line driver was the development of risk costs. Although the NPL ratio remained low at 2.7%, we pursued a forward-looking approach and factored in the expected deterioration in asset quality as far as possible at this stage. Accordingly, provisions of EUR 1.3 billion were set aside in 2020. With a provisioning rate of 78 basis points of average gross customer loans, risk costs remained within the forecast range. Solid capitalisation and dividend proposal I would particularly like to highlight the strong capitalisation of Erste Group: at the end of December 2020, the common equity tier 1 ratio (final) was again at an excellent level of 14.2%, and thus substantially above our target of 13.5% and far above the regulatory minimum requirement. In addition to sustainable profitability, a strong capital base is important as it is the precon-dition for the bank’s ability to fund growth and pay dividends. In 2020, recommendations issued by the European Central Bank (ECB) prevented the distribution of a dividend. In line with the ECB’s current recommendation, the management board and the supervisory board will propose the distribution of a cash dividend of EUR 0.5 per share for the fiscal year 2020 to the annual general meeting, which will be held on 19 May 2021. In addition, EUR 1 per share has been set aside for potential payout at a later date. Erste Group’s response to Covid-19 We have basically continued what have been doing for 200 years, since the foundation of Erste Bank: steadily maintaining our busi-ness operations while adapting them to the current environment. We have been looking after our retail and corporate clients, civil society and the economy in the region in which we operate. We have, of course, taken extensive measures to protect the health of customers and employees. In this context, I wish to specially highlight our Health Centre in Austria, which, for example, has added a dedicated Covid-19 helpline to its already wide range of physical and mental health services for employees. In all of our seven core markets – Austria, the Czech Republic, Slovakia, Ro-mania, Hungary, Croatia and Serbia – we leveraged the organisa-tions and strong market positions of our local banks to implement government support programmes ranging from moratoria to state-guaranteed loans. At the same time, we expanded our portfolio of products and services and, where desired or required, developed customised solutions to meet our clients’ financial needs. Usage of our digital channels soared during the lockdown periods even though we kept branch operations going everywhere, as far as possible. Within a very short time span, we transferred employees from headquarter offices to working from home. True to the
purpose of Erste Group – creating and spreading prosperity – our efforts were not confined exclusively to our banking business, as the coronavirus and the measures taken to contain it not only triggered a quite abrupt plunge in economic activity but also had psychosocial and societal impacts. Through financial and in-kind donations, we supported a large number of initiatives in the healthcare sector itself as well as indirectly by cooperating with social and cultural institutions that are important to us. Responsibility and stability Hesitating was not an option for us as we, as Erste Bank, are committed to our core region for the long term. Our purpose – to create and secure prosperity in our region – requires us to deal responsibly not only with our customers, employees and inves-tors, but also with the environment and civil society. To provide you with easy access to information about Erste Group’s numer-ous sustainability-related initiatives, we have again incorporated the non-financial report into the Annual Report. Going forward, we are planning to brief you in even more detail on the ecologi-cal, social and governance topics that are of relevance to us. As vaccines become more readily available and economies open up again, opportunities for growth are presenting themselves. With our local banks well positioned, the economic recovery will also offer opportunities for increased action on behalf of the environment and decisive advances in digitalisation. The EU is set to invest major portions of its EUR 700 billion Recovery Fund in climate-friendly and digital projects. As a bank, we wish to support this transformation. We view ourselves as supporters of the businesses and economies in our region. It was in fact with this in mind that changes were made to the management board in 2020. As Chief Platform Officer, Maurizio Poletto will be advancing the ongoing development of our success-ful digital platform George, while Thomas Schaufler will be focus-ing on shaping the retail strategy in the CEE markets. The respon-sibilities of the other members of my team are unchanged: Chief Risk Officer Alexandra Habeler-Drabek is responsible for risk-related matters, Ingo Bleier for Corporate Banking & Markets, Stefan Dörfler serves as Chief Financial Officer and David O’Mahony as Chief Operating Officer. After a year like 2020, it is very important to me to thank the em-ployees of Erste Group for their personal commitment. Our common dedication and conviction to support our clients even in times of crisis have helped us to strengthen our position in the CEE region. Bernhard Spalt mp

4
Dear shareholders, In the 2020 financial year, the key theme world-wide was the Covid-19 pandemic, which posed health as well as economic challenges to many people – including in our core markets. We, as Erste Group, believe that we are not just a financial institution. We see ourselves as an enterprise that wants to make a positive contribution to the development of society. We did this in the past financial year by processing government relief packages, imple-menting debt moratoria, guarantees and bridge financing as well as individual agreements. We wish to continue on this path as we are committed to supporting our customers also in economically challenging times. The supervisory board was impressed by the professionalism, the swiftness and flexibility with which Erste Group’s management board and employees responded to these challenges. With support from our health centre team, a work environment was created that enabled us to continue operations with just some minor re-strictions in a fundamentally different environment. The supervi-sory board was likewise able to continue its work as usual despite the obstacles to in-person meetings. The communication flow among its members and with the management board was not only maintained, but even intensified. All meetings that had been planned or had to be scheduled ad hoc were held virtually or in hybrid format. The topics that needed to be addressed were dealt with in-depth and the required resolutions passed. In the financial year ended, there were a number of changes in the management board: After more than 25 years with our banking group, Peter Bosek resigned from the management board as of 31 December 2020 to pursue new challenges abroad. The super-visory board thanks him very cordially for his many years of successful service for Erste Group, to whose development he contributed significantly as one of the fathers of our digital plat-form George. My heartfelt thanks for his work for Erste Group likewise go to Ara Abrahamyan, who also resigned from the management board as of 31 December 2020. On 15 October 2020, the supervisory board extended the management board mandate of Alexandra Habeler-Drabek until 31 December 2023. In October 2020, the supervisory board appointed Thomas Schau-fler and Maurizio Poletto as additional management board mem-bers for terms from 1 January 2021 to 31 December 2023. In the 2020 financial year, the composition of the supervisory board changed as follows: the supervisory board mandates of Maximilian Hardegg, Gunter Griss and Wilhelm Rasinger expired on 10 November 2020, the date of the annual general meeting. The mandate of Maximilian Hardegg was extended. Gunter Griss was no longer eligible for re-election due to the age limit for supervisory board members set in the articles of association. We are pleased to welcome two new and highly experienced members to our team: Friedrich Santner and András Simor, who were elected to the super-visory board at the annual general meeting of 10 November 2020.
In December 2020, Wilhelm Rasinger passed away after serious illness shortly after the end of his term. He had been a member of Erste Group Bank AG’s supervisory board for more than 15 years and will be remembered for the way he always made valuable contributions to the supervisory board’s work through his expertise, far-sightedness and pithy comments. As regards the composition and independence of the supervisory board, the criteria for its independence, its working procedures, the number and types of committees and their decision-making powers, the meetings of the supervisory board and the main focus of its activities, please refer to the (consolidated) corporate gov-ernance report drawn up by the management board and reviewed by the supervisory board. As regards the activities of the audit committee, please also refer to the separate report of the audit committee. In the course of 43 supervisory board and committee meetings, the management board promptly and comprehensively informed the supervisory board. This allowed us to act in accord-ance with the mandate laid down in the law, the articles of associ-ation and the Austrian Code of Corporate Governance, as well as to ascertain the proper conduct of business. At its meeting of 15 October 2020, the supervisory board consid-ered the management board’s proposal to the annual general meet-ing regarding the appropriation of profit for the 2019 financial year, taking special note of the ECB’s recommendation of 27 July 2020 to refrain from the distribution of dividends until January 2021, for the time being. This was followed by another recommendation issued by the ECB on 15 December 2020 to refrain from or limit dividends based on specified criteria until 30 September 2021. Paying a dividend for the 2019 financial year in the amount ap-proved by the annual general meeting on 10 November 2020 would have contravened the ECB’s recommendation. The supervisory board’s executive committee therefore, at its meeting of 8 February 2021, endorsed the management board’s statement that the condi-tion for distributing dividends for the 2019 financial year has not been met and that, therefore, Erste Group will refrain from paying a dividend for the 2019 financial year in February 2021, and that the profit will be carried forward to new account. The financial statements (consisting of the balance sheet, income statement and notes) and the management report as well as the consolidated financial statements and the group management report for 2020 were audited by Sparkassen-Prüfungsverband, the legally mandated auditor, and by PwC Wirtschaftsprüfung GmbH, the elected supplementary auditor, and received an unqualified audit opinion. Representatives of both auditors attended the finan-cial statements review meetings of the audit committee and the supervisory board and presented their comments on the audits they had conducted. Based upon its own review, the supervisory board endorsed the findings of these audits and agreed to the proposal for appropriation of the profit of the 2020 financial year.
Report of the supervisory board

Management board | Supervisory board | Capital markets | Strategy | Financial and operating performance | Segments | Non-financial report | Corporate governance report | Audited financial reporting
5
PwC Wirtschaftsprüfung GmbH was also mandated with the voluntary audit of the (consolidated) corporate governance report for 2020. Deloitte Audit Wirtschaftsprüfungs GmbH was contract-ed to perform an audit of the (consolidated) non-financial report for 2020. The supervisory board has approved the financial state-ments, and these have thereby been duly endorsed in accordance with section 96 para 4 of the Austrian Stock Corporation Act (Aktiengesetz). The management report, consolidated financial statements, group management report, (consolidated) corporate governance report and the (consolidated) non-financial report have also been reviewed by the supervisory board and accepted on the basis of the audit reports received by the supervisory board. We thank the management board and all employees of Erste Group for their great dedication and impressive commitment in providing our customers with the best support possible in the Pandemic Year 2020. For the supervisory board, Friedrich Rödler mp, Chairman of the supervisory board
6
Dear shareholders, The audit committee is one of six committees established by Erste Group Bank AG’s supervisory board. Its mandate is derived from the law, the rules of the Austrian Code of Corporate Governance (CCG) and its internal rules. The audit committee currently com-prises six shareholder representatives and three members delegat-ed by the employees’ council. The audit committee held seven meetings in 2020 and, in addition, held one informal meeting to prepare for the meeting on the audit of the (consolidated) financial statements. The meetings were attended by those management board members responsible for accounting, controlling and risk management as well as the repre-sentatives of Erste Group Bank AG’s auditors and, as required, representatives of the auditors of key (foreign) subsidiaries. Re-sponsible division heads were also invited to attend as permanent guests or to attend as guests in discussions on specific agenda items. The chairman of the audit committee, also the financial expert, regularly conducted one-on-one meetings with, amongst others, the auditors (Sparkassen-Prüfungsverband as the legally mandated bank auditor and PwC as additional auditor elected by the annual general meeting), members of the management board, the head of internal audit, the head of group compliance and with other division heads as required. The chairman of the audit com-mittee informed the supervisory board on the committee’s activi-ties and the subject matters of its meetings and discussions at the respective subsequent supervisory board meetings. In 2020, the Covid-19 pandemic also affected the work of the audit committee. In its meetings, the audit committee dealt in depth with current developments in Erste Group and in the markets in which it operates. Special attention was paid in particular to the new rules and regulations and the potential impacts of their implementation on the 2020 unconsolidated and consolidated financial statements, but also social aspects that were seen in these generally challenging months. Many decisions of the audit committee were taken using modern video conferencing tools; debates could thus be continued in this manner during lockdown periods. In 2020, the audit committee also considered the following topics: After receipt of the auditors’ report on the (Group) financial state-ments for 2019, the audit committee held the final discussion, reviewed the (Group) financial statements and the (Group) man-agement report, the (consolidated) non-financial report as well as the (consolidated) corporate governance report and recommended to the supervisory board the approval of the annual financial statements, setting out how the annual audit had strengthened the reliability of financial reporting and describing the role played by the audit committee.
The decision on the recommendation of a dividend proposal to the supervisory board was passed in October 2020 after extensive deliberations and in line with the recommendation issued by the European Central Bank. Furthermore, the additional report of the auditors pursuant to Article 11 of Regulation (EU) 537/2014 was taken note of. Key audit matters were discussed with the auditors in the course of audit planning and are covered in the auditors’ report. The findings and status of the annual audit were discussed with representatives of the auditors in an ongoing process. Key audit matters relating to subsidiaries were likewise discussed in depth and commented on with regard to their impact on the consolidated financial state-ments. The findings of the review of the half-year financial statements were taken note of. The exchange of views between the audit committee and the (Group) auditors in the absence of the management board (Rule 81a Austrian CCG) was conducted in December 2020. The auditors’ report on the assessment of the effectiveness of risk management was delivered. The auditors’ observations and recommendations (management letter) and the respective views of the management board were discussed comprehensively. To monitor the auditor’s independ-ence, group accounting regularly reported to the audit committee, and non-audit services rendered by the auditors were approved in advance after careful review. In December 2020, it was decided to recommend to the supervisory board to propose at the annual general meeting the renewal of the audit mandate of PwC Wirtschaftsprüfung GmbH as additional (Group) auditor for the 2022 financial year. The annual report of group regulatory compli-ance was taken note of. The audit committee was presented with reports on the current status of major projects on data manage-ment, credit risk models and IT matters of relevance to the audit committee in an ongoing process. After on-site inspections conducted by supervisory authorities, the audit committee acknowledged the audit report and the report on the contents of the plan to address the supervisory authorities’ findings and, where necessary, requested to be briefed on the current status of implementation. Internal audit submitted a report on the result of the (internal) quality assurance programme. The joint supervisory team of the regulatory authorities was informed about the audit committee’s work in a meeting with the chairman of the audit committee and the supervisory board. Further information on the activities of the audit committee and its composition is contained in the (consolidated) corporate gov-ernance report prepared by the management board and reviewed by the supervisory board. For the audit committee, Friedrich Rödler mp
Report of the audit committee

Management board | Supervisory board | Capital markets | Strategy | Financial and operating performance | Segments | Non-financial report | Corporate governance report | Audited financial reporting
7
In the past year, international financial markets were dominated by the Covid-19 induced crisis and measures taken to contain the virus. Geopolitical risks such as uncertainty over the outcome of the US presidential elections and the drawn-out Brexit negotia-tions between the European Union and the United Kingdom were, by comparison, relegated to the background. As the coronavirus started spreading worldwide, the first quarter saw a global sell-off in stock markets after an initially promising start to the year. Lockdowns imposing restrictions on social and economic activi-ties in almost all countries slowed the outbreak of the corona-virus, but fears of a world-wide economic downturn of an un-quantifiable degree sent share prices plummeting. Massive sup-port measures initiated by policy-makers, central banks and regu-lators in an effort to cushion adverse impacts on the future devel-opment of the economy eased tensions in the markets. The flow of alternately positive and negative news, however, mostly in connection with the Covid-19 pandemic, fuelled volatility. The optimistic outlook on economic growth from 2021 onwards along with lower-than-expected declines in 2020 corporate earnings were offset by a continuing rise in Covid-19 infection rates. These resulted in further lockdowns in the fourth quarter, albeit, in a number of countries, less strict ones than at the beginning of the pandemic. Reports about successful clinical studies of vac-cines against Covid-19, the start of vaccinations and the ebbing off of political risks after the United Kingdom’s exit from the EU single market boosted share prices significantly, but failed to make up for the losses previously sustained in most of the stock markets covered. EQUITY MARKET REVIEW Covid-19 was the predominant theme After a number of stock markets had still been marking new highs up to mid-February of the past year, the first quarter saw sell-offs with prices sliding by more than 20% in most of the stock markets covered. Against the backdrop of rising Covid-19 infection numbers, most governments around the globe imposed restrictions to slow the pandemic, including social distancing orders and business lockdowns. Policy-makers, central banks and regulators took wide-ranging measures – among them multi-billion support programmes for the social and business sectors, rate cuts, loan moratoria and providing additional liquidity by expanding central banks’ balance sheets – to cushion the adverse effects of the lockdowns. While this eased strains on the financial markets, supported by better-than-expected corporate results, volatility remained very high. The US indices hit new highs on the back of the technology and health care sectors while Europe-an stock market indices were trailing behind, posting similar double-digit gains only in the last quarter of the year on the back of positive news on Covid-19 vaccines, the US elections and the successful conclusion of Brexit negotiations. The Dow Jones Industrial Average Index rose beyond the 30,000 mark and, at 30,606.48 points, was 7.2% higher year on year. The broader Standard & Poor’s 500 Index, which reached a historic high in the fourth quarter, advanced 16.3% to 3,756.07 points at the end
of the year. The European Euro Stoxx 600 index closed the re-porting period at 399.03 points, down 4.0%. Central bank support In response to the crisis, the central banks had significantly eased their policies back in the spring and provided additional liquidity to the financial markets by massively expanding their balance sheets. The US central bank (Fed) cut its policy rates by one percentage point to 0.0% - 0.25%, purchased bonds at a monthly rate of USD 120 billion and launched lending programmes to support the economy. The European Central Bank (ECB) expand-ed its purchasing programme in two steps to EUR 1,850 billion and extended it until March 2022. Regardless of the beginning of Covid-19 vaccinations and the resulting confidence in the im-provement of the economic environment, the central banks, in their final meetings in December 2020, announced they would continue to provide generous liquidity and leave policy rates unchanged for an extended period of time. Return to growth expected in 2021 The restrictive measures taken to contain the pandemic triggered the biggest economic shock in decades. As a result of the eco-nomic stimulus measures and monetary policy support, economic activity is expected to decline less sharply than initially feared. From 2021 onwards, global economic output should rise again. The International Monetary Fund (IMF) forecasts for 2020 a contraction of the global economy by 3.5%, followed by a 5.5% growth in 2021. The euro zone countries are expected to grow by 4.2% after a decline by 7.2% in 2020, while the US is expected to expand by 5.1% after a contraction of 3.4%. Banks are among the hardest hit industries The significant deterioration of the economic environment due to measures induced by Covid-19 and the impacts expected, such as lower operating income and higher risk costs for banks, prompted the ECB to recommend that euro zone banks suspend dividend payouts for the fiscal year 2019. Instead, banks should preserve their lending capacity by strengthening their capital positions. In view of continuing state support for the economy, most notably state-guaranteed loans and loan moratoria, and the resulting significant postponement of negative impacts on bank balance sheets, the general ban on dividends was lifted in December, but the ECB still recommends to refrain from dividends and share buy-backs until the end of September 2021 or to meet strict limits on profit distribution. In the year ended, the Dow Jones Euro Stoxx Banks Index, which is composed of the leading European bank shares, declined by 23.7% to 73.77 points. ATX down by double-digits in 2020 As international stock markets plunged in the first quarter of the year ended, the Austrian Traded Index (ATX) lost nearly 27% of its market capitalisation within just one trading week in mid-March. It dropped to its annual low at 1,630.4 points on 18 March. Due to its cyclical composition with a strong weighting of bank and oil shares, which were hit by the slump in
Erste Group on the capital markets

8
oil prices, the leading Austrian index fluctuated more visibly than other indices. As international stock markets rallied significantly in November and December, the ATX likewise recovered some of the ground lost in the first quarter and closed the year at EUR 2,780.44 points, down by 12.8%. ERSTE GROUP SHARE Volatile price performance in lockstep with the European banking index The start into the year was promising, and the Erste Group share reached its highest closing price at EUR 35.60 on 12 February. As international equity markets and, in particular, bank shares slipped in the first quarter due to the Coved-19 induced crisis, the Erste Group share likewise suffered a setback by more than 50%. The lowest closing price of the Erste Group share in 2020 was at EUR 15.34 on 3 April. The share then recovered half of the losses previously sustained but recorded renewed setbacks in the third quarter. The gains of the two final trading months of the year offset only part of the losses posted previously. The Erste Group share closed the year at a price of EUR 24.94, down 25.7% from year-end 2019. The focus of market participants was on the im-pacts of the declining economic activity in Central and Eastern Europe amid the pandemic, above all on the development of lending volumes and operating income as well as risk provisions. Covid-19-related factors (including in particular fiscal policy support measures, moratoria on loan repayments, subsidised and guaranteed loans, interest rate cuts, quantitative easing, re-strictions on dividend payments, easing of capital requirements) were generally among the key issues of the year.
Performance of the Erste Group share versus indices
Erste Group
share ATX
DJ Euro Stoxx Banks
Index
Since IPO (Dec 1997) 125.0% 113.1% -
Since SPO (Sep 2000) 112.3% 137.9% -79.0%
Since SPO (Jul 2002) 43.1% 128.0% -70.6%
Since SPO (Jan 2006) -44.6% -28.6% -80.5%
Since SPO (Nov 2009) -14.0% 6.7% -67.6%
2020 -25.7% -12.8% -23.7%
IPO … initial public offering, SPO … secondary public offering.
Number of shares, market capitalisation and trading volume In the year ended, the number of shares of Erste Group Bank AG remained unchanged at 429,800,000. At year-end 2020, Erste Group’s market capitalisation stood at EUR 10.7 billion, 25.7% down on year-end 2019 (EUR 14.4 billion). In the reporting year, trading volume on the three stock exchang-es (Vienna, Prague, Bucharest) on which the Erste Group share is listed averaged 1,231,504 shares per day and accounted for about 66% of the total trading volume in Erste Group shares. Sustainability indices and ratings The Erste Group share has been part of VÖNIX, the Vienna Stock Exchange’s sustainability index, since its launch in 2008. Since 2011, the Erste Group share has been included in the STOXX Global ESG Leaders Index, which represents the best sustainable companies world-wide on the basis of the STOXX Global 1800. Since 2016, the Erste Group share has been included in the FTSE4Good Index Series, since 2017 in the Euronext Vigeo Index: Eurozone 120. In addition, Erste Group has held prime status in the ISS ESG corporate ratings since 2018. MSCI has rated Erste Group with AA. As the sole Austrian and one of only three companies in the CEE region, Erste Group was again listed in Bloomberg’s Gender Equality Index (GEI) in 2020. DIVIDEND Erste Group’s dividend policy is guided by the bank’s profitabil-ity, growth outlook and capital requirements. Due to the Covid-19 induced restrictions, the annual general meeting originally sched-uled for 13 May was postponed to 10 November 2020 and held virtually. On 10 November 2020, the annual general meeting resolved to pay a dividend of EUR 0.75 per share for the fiscal year 2019, conditional upon no regulatory recommendation to refrain from such payments or no other legal restrictions being in force prohibiting such distributions on 8 February 2021. On 15 December 2020, the ECB asked banks to refrain from or limit dividends until 30 September 2021. As the conditions to pay the dividend were not met, no dividend for the fiscal year 2019 was paid out. The management board proposes to the annual general meeting in May – in line with ECB recommendation – a dividend for 2020 of EUR 0.5 per share. An additional EUR 1 per share has been reserved for a potential later payment.
Performance of the Erste Group share and major indices (indexed)
Erste Group Share Austrian Traded Index (ATX) DJ Euro Stoxx Banks
31 December 20201 January 20200
150
100
50

Management board | Supervisory board | Capital markets | Strategy | Financial and operating performance | Segments | Non-financial report | Corporate governance report | Audited financial reporting
9
RATINGS OF ERSTE GROUP BANK AG Following the changed economic conditions due to the Covid-19 induced crisis rating agencies downgraded their ratings in many cases around the globe. Erste Group’s ratings were affirmed, however the outlook was changed. Fitch kept its rating at A/F1 with a negative outlook, Standard & Poor’s and Moody’s left their ratings unchanged at A/A-1 and A2/P-1, respectively, each with a stable outlook. FUNDING ACTIVITIES Regarding capital market activity, 2020 turned out to be one of the most active years in the recent past. Through seven benchmark-sized transactions across various seniorities, EUR 4.5bn were raised in total. Pre-funding activity for 2021 started early with two senior preferred notes in September and November 2020. Erste Group started with a EUR 750 million 10-year mortgage covered bond at MS+3bp followed by a EUR 500 million (AT1) note (CRD IV-/CRR-compliant Additional Tier 1) with a coupon of 3.375%, representing the second-lowest coupon for a EUR-denominated AT1 at the time of issuance. In May, Erste Group proved its access to capital markets amidst the Covid-19-crisis by placing a EUR 750 million senior preferred note at MS+115bp. September led to further attractive issuance opportunities that were realised with a EUR 500 million Tier 2 instrument at MS+210bp, succeeded by another EUR 500 million 5y senior preferred note issued at MS+52bp. Erste Group was again very active in the fourth quarter by issuing two further benchmarks in November. Its inaugural callable senior preferred note (EUR 750 million at MS+52) – the first of an Austrian issuer – supports the eligibility of outstanding instruments and a diversification of the investor base. Finally, a EUR 750 million AT1 note with a 4.25% coupon was issued mid-November and concluded the funding-year for Erste Group. INVESTOR RELATIONS Open and regular communication with investors and analysts Communication by Erste Group’s investor relations team also changed in the past year. Against the backdrop of the Covid-19 induced restrictions, banking and investor conferences were held as virtual rather than in-person events. A large number of confer-ences organised by the Vienna Stock Exchange, UBS, Goldman Sachs, Deutsche Bank, Citigroup, Morgan Stanley, JP Morgan, Bank of America Merrill Lynch, Autonomous, PKO, mBank and
Wood were conducted as phone or video conferences, as were the spring and autumn road shows with investors from the United States and Europe after the releases of first and third quarter 2020 results. The management and the investor relations team met with investors in a total of 218 one-on-one and group meetings, in which Erste Group’s strategy was presented against the backdrop of the current environment and questions raised by investors and analysts were answered. The dialogue with bond investors was further intensified with a total of 67 meetings held via phone and video. A large number of meetings with analysts and portfolio managers were held at conferences, virtual road shows and inves-tors’ days hosted by UBS, Bank of America Merrill Lynch, Goldman Sachs, HSBC, JP Morgan, ING, Citigroup, Danske Bank and the European Covered Bond Council. The website http://www.erstegroup.com/ir provides comprehen-sive information on Erste Group and the Erste Group share. In-vestors and the broader public can follow the investor relations team on the social media platform Twitter at http://twitter.com/ErsteGroupIR and on Slideshare at http://de.slideshare.net/Erste_Group. These sites provide users with the latest news on Erste Group on the social web. As an additional service for investors and analysts, Erste Group offers an Investor Relations app. This free-of-charge app enables users to access and download Erste Group Bank AG share price infor-mation, the latest investor news, multimedia files, financial re-ports and presentations as well as an interactive financial calendar and contact details for the investor relations team. More details on the Investor Relations app, social media channels, the news/reports subscription and reminder service are available at https://www.erstegroup.com/de/investoren/ir-service. Analyst recommendations In 2020, 21 analysts regularly released research reports about Erste Group. The Erste Group Bank AG share was covered by financial analysts at the following national and international firms: Autonomous, Bank of America Merrill Lynch, Citigroup, Commerzbank, Concorde, Deutsche Bank, Exane BNP Paribas, Goldman Sachs, HSBC,JP Morgan, JT Banka, KBW, Kepler Cheuvreux, mBank, Mediobanca, Morgan Stanley, PKO, RBI, SocGen, UBS and Wood. As of the end of the year, 15 analysts had issued buy recommen-dations and six had rated the Erste Group share neutral. The average year-end target price stood at EUR 26.70. The latest updates on analysts’ estimates for the Erste Group share are posted at https://www.erstegroup.com/en/investors/share/analyst-estimates

10
Erste Group strives to be the leading retail and corporate bank in the eastern part of the European Union, including Austria. To achieve this goal, Erste Group aims to support its retail, corporate and public sector customers in realising their ambitions and en-suring financial health by offering excellent financial advice and solutions, lending responsibly and providing a safe harbour for deposits. Erste Group’s business activities will continue to con-tribute to economic growth and financial stability and thus to prosperity in its region. Erste Group’s strategy is based on three pillars:
_ Efficiency _ Digital transformation _ Growth
In all of its core markets in the eastern part of the European Union, Erste Group pursues a balanced business model focused on providing the best banking services to each of its customers. In this respect, digital innovations are playing an increasingly important role. Sustainability of the business model is reflected in the bank’s ability to fund customer loans by customer depos-its, with most customer deposits being stable retail deposits. Sustainability of the bank’s strategy is reflected in long-term client trust, which underpins strong market shares in almost all of Erste Group’s core markets. However, market leadership is not an end in itself. Market leadership creates value only when it goes hand in hand with positive economies of scale and contrib-utes to the long-term success of the company. The banking business, however, should not only be run profitably, but should also reflect its corporate responsibility towards all material stakeholders, in particular customers, employees, society and the environment. Therefore, Erste Group pursues the banking business in a socially responsible manner and aims to earn an adequate premium on the cost of capital. Long-standing tradition in customer banking Erste Group has been active in the retail business since 1819. This is where the largest part of Erste Group’s capital is tied up, where Erste Group generates most of its income and where it funds the overwhelming part of its core activities by drawing on its customers’ deposits. The retail business represents Erste Group’s strength and is its top priority when developing prod-ucts such as modern digital banking that enable it to meet customers’ expectations more effectively. Offering attractive, easy-to-understand products and services that meet the individual needs and objectives of bank customers is important in building and maintaining strong long-term cus-tomer relationships. Today, Erste Group serves a total of more than 16 million customers in seven core markets. The bank’s core activities also include advisory services and support for its corporate customers with regard to financing, investment, hedging activities and access to international capital markets. Public sector funding includes providing finance for
infrastructure projects and acquiring sovereign bonds issued in the region. To meet the short-term liquidity management needs of the custom-er business, Erste Group also operates in the interbank market. Core markets in the eastern part of the European Union When Erste Group went public as an Austrian savings bank with no meaningful foreign presence in 1997, it defined its target region as consisting of Austria and the part of Central and Eastern Europe that had realistic prospects of joining the European Union. The aim was to benefit from the attractive growth pro-spects in these countries. Against the backdrop of emerging Eu-ropean integration and limited potential for growth in Austria, Erste Group acquired savings banks and financial institutions in countries adjacent to Austria from the late 1990s onwards. While the financial and economic crisis has slowed the economic catch-up process across the countries of Central and Eastern Europe, the underlying convergence trend continues unabated. This part of Europe offered, and still offers, the best structural, and there-fore long-term, growth prospects. Today, Erste Group has an extensive presence in the following core markets: Austria, the Czech Republic, Slovakia, Romania, Hungary and Croatia – all of which are members of the European Union. Following significant investments in its subsidiaries, Erste Group holds considerable market positions in these countries. In Serbia, which has been assigned European Union candidate status, Erste Group maintains a minor market presence but one that may be expanded through acquisitions or organic growth as the country makes progress towards European Union integration. In addition to its core markets, Erste Group also holds direct and indirect majority and minority banking participations in Slovenia, Monte-negro, Bosnia and Herzegovina, North Macedonia and Moldova. Growing importance of innovation and digitalisation The pace of digital transformation has accelerated considerably as a result of technological changes, demographic developments and also regulatory interventions in recent years. As a result, customer behaviour and customer expectations towards financial products have also changed significantly. Erste Group is convinced that the digital banking business will continue to gain in importance and will be essential for the economic success in the long term and therefore fosters digital innovation. Intra-group, interdisciplinary teams develop innovative solutions. Erste Group’s digital strategy is based on its own digital ecosys-tem. It aims at providing customers access to personalised prod-ucts from Erste Group and also third-party suppliers through application programming interfaces (APIs) in the secure IT envi-ronment of a financial platform. APIs enable a wide range of co-operations, whether with fintechs or across industries, and can therefore help open up new markets.
Strategy

Management board | Supervisory board | Capital markets | Strategy | Financial and operating performance | Segments | Non-financial report | Corporate governance report | Audited financial reporting
11
The digital platform George was implemented in Austria in 2015. In the meantime, it is also running in the Czech Republic, Slo-vakia, Romania, Croatia and Hungary. It will also be rolled out in Serbia. The range of digitally available products and services is being constantly expanded. Customers can activate applications of Erste Group or third parties via plug-ins and use them to man-age their finances. The omni-channel approach of Erste Group integrates the various sales and communication channels. Customers decide on how, when and where they do their banking business. Contact centers serve as interfaces between digital banking and traditional branch business. These contact centers offer advice and sales, thus going far beyond the traditional help desk function. Focus on sustainability and profitability Acting responsibly and earning a premium on the cost of capital is a key prerequisite for the long-term survival of any company and the creation of value for customers, investors and employees. Only a bank that operates in a sustainable manner – balancing the social, ecological and economic consequences of its business activities – and profitably can achieve the following: provide products and services to customers that support them in achieving their financial ambitions; deliver the foundation for share price appreciation as well as dividend and coupon payments to investors; create a stable and rewarding work environment for employees and be a reliable contributor of tax revenues to society at large.
The management board adopted a Statement of Purpose to reaf-firm and state in more detail the purpose of Erste Group to pro-mote and secure prosperity across the region. Building on this statement of purpose, a Code of Conduct defines binding rules of the day-to-day business for employees and members of both the management and supervisory boards. At the same time, the Code of Conduct underlines that in pursuing its business activities, Erste Group values responsibility, respect and sustainability. The Code of Conduct is an important tool for preserving the reputa-tion of Erste Group and strengthening stakeholder confidence. Sustainability in this context means to operate the core business both in a socially and environmentally responsible manner and economically successfully. Through a combination of stable revenues, low loan loss provi-sions, and cost efficiency, profits can be achieved in the long term. This is helped by a strong retail-based funding profile. When growth opportunities are elusive, as they will be from time to time, or the market environment is less favourable as a result of factors including high taxation, increased regulation or low interest rates, there will be a stronger focus on cost cutting. When the operating environment improves, more time will be devoted to capturing growth in a responsible way. Irrespective of the environment, Erste Group should benefit materially from operat-ing in the region of Europe that offers the best structural growth opportunities for some time to come.
Customer banking in Central and Eastern Europe
Erste Groupʼs strategy
Focus on CEE, limited exposure to other countriesEastern part of the EU
Retail banking Corporate banking Capital markets Interbank business Public sector
Focus on local currency mortgage and consumer loansfunded by local deposits
FX loans (in Euro) only where funded by local FX deposits (Croatia and Serbia)
Savings products, asset management and pension products
Expansion of digital banking offering
SME and local corporate banking
Advisory services, with focus on providing access to capital markets and corporate finance
Transaction banking services (trade finance, factoring, leasing)
Commercial Real Estate business
Focus on customer business, incl. customer-based trading activities
In addition to core markets, presences in Poland, Germany, New York and Hongkong with institutional client focus and selected product mix
Building debt and equity capital markets in CEE
Financing sovereigns and municipalities with focus on infrastructure development in core markets
Any sovereign holdings are held for market-making, liquidity or balance sheet management reasons
Focus on banks that operate in the core markets
Any bank exposure is only held for liquidity or balance sheet man-agement reasons or to support client business

12
THE STRATEGY IN DETAIL The basis of Erste Group’s banking operations is the retail and corporate customer business in the eastern part of the European Union, including Austria. The capital markets and interbank activities as well as the public sector business are defined more broadly to be able to meet the bank’s customer needs as effec-tively as possible. Retail business Erste Group’s key business is the retail business, covering the entire spectrum from lending, deposit and investment products to current accounts and credit cards. Erste Group’s core compe-tence in retail banking has historical roots. In 1819, wealthy Viennese citizens donated funds to establish Erste Group’s predecessor, the first savings bank in Central Europe. It was their aim to bring basic banking services such as safe savings accounts and mortgage loans to wide sections of the popula-tion. Today, the bank serves a total of more than 16 million customers in its markets and operates about 2,350 branches. Wealthy private clients, trusts and foundations are served by the bank’s private banking staff and benefit from services that are tailored to the needs of this target group. In addition, the bank uses and promotes digital distribution channels such as internet and mobile banking not only to meet the increasing importance of digital banking but to actively shape the digital future. This has already become visible through the activities of fintech companies, which offer financial ser-vices online and typically operate without a banking licence. George, Erste Group’s digital platform, is already available in Austria, the Czech Republic, Slovakia, Romania and Croatia and has been available in Hungary since early 2021. It will also be rolled out in Serbia. Retail banking is attractive to Erste Group for a number of rea-sons: It offers a compelling business case that is built on market leadership, an attractive risk-reward profile and the principle of self-funding. In addition, it benefits from a comprehensive range of products that are simple and easy to understand and provide substantial cross-selling potential. Erste Group takes advantage of these factors in all core markets and makes best use of its resulting position of strength by pursuing an omni-channel strategy. In addition to the expansion of digital sales channels, the branch network remains an important component of the business strategy. Only a retail bank that offers modern digital services and operates an extensive distribution network is able to fund loans in local currency mainly from deposits made in the same currency. In short, Erste Group’s retail banking model supports sustainable and deposit-funded growth even in economically more challenging times. Another positive factor is the diversification of the retail business across countries that are at differing stages of economic development, such as Austria, the Czech Republic, Romania, Slovakia, Hungary, Croatia and Serbia.
Corporate business The second main business line, which also contributes signifi-cantly to Erste Group’s earnings, is business with small and medium-sized enterprises, regional and multi-national groups and real estate companies. Erste Group’s goal is to enhance relationships with its clients beyond pure lending business. Specifically, the bank’s goal is for SMEs and large corporate customers to choose Erste Group as their principal bank and also route their payment transfers through the Group’s banking enti-ties and, in fact, regard Erste Group as their first point of contact for any kind of banking service. Catering to their different requirements, Erste Group serves small and medium-sized enterprises locally in branches or separate commercial centres, while multinational groups are serviced by the Group Corporates’ units. This approach permits Erste Group to combine industry-specific and product expertise with an un-derstanding of regional needs and the experience of the bank’s local customer relationship managers. In view of regulatory interventions, advising and supporting corporate customers in capital market transactions is becoming increasingly important. Capital markets business Client-driven capital markets activities are also part of the com-prehensive portfolio of products and services that Erste Group offers to its retail and corporate customers. The strategic signifi-cance of the bank’s centrally governed and locally rooted capital markets operations consists in supporting all other business areas in their dealings with the capital markets and, hence, in providing the bank’s customers with professional access to the financial markets. Erste Group, therefore, views its capital markets busi-ness as a link between financial markets and its customers. As a key capital markets player in the region, Erste Group also per-forms important functions such as market-making, capital market research and product structuring. The capital markets business serves the needs of Erste Group’s retail and corporate customers as well as those of government entities and financial institutions. Due to Erste Group’s strong network in the eastern part of the European Union, the bank has a thorough understanding of local markets and customer needs. In Erste Group’s capital markets business, too, the bank concen-trates on core markets of the retail, SME and large corporate business: Austria, the Czech Republic, Slovakia, Romania, Hun-gary, Croatia and Serbia. For institutional customers, specialised teams have been established in Germany and Poland as well as in London, Hong Kong and New York that offer these customers a tailor-made range of products. In many countries where Erste Group operates, the local capital markets are not yet as highly developed as in Western Europe or in the United States of America. That means Erste Group’s bank-ing subsidiaries are pioneers in some of these markets. Therefore, building more efficient capital markets in the region is another strategic objective of Erste Group’s capital markets activities.
Management board | Supervisory board | Capital markets | Strategy | Financial and operating performance | Segments | Non-financial report | Corporate governance report | Audited financial reporting
13
Public sector business Solid deposit business is one of the key pillars of Erste Group’s business model. Customer deposits surpass lending volume in many of its geographic markets. Erste Group’s banking entities make a significant part of this liquidity available as financing to the region’s public sector entities. In this way, the bank facilitates essential public sector investment. Erste Group’s public sector customers are primarily municipalities, regional entities and sovereigns that the bank additionally supports and advises in capital market issuance, infrastructure financing and project financing. Furthermore, Erste Group cooperates with supranational institutions. In terms of sovereign bond investments, Erste Group focuses on Central and Eastern Europe equally. Adequate transport and energy infrastructure and municipal ser-vices are absolute key prerequisites for sustainable economic growth in the long term. Therefore, Erste Group views infrastruc-ture finance and all associated financial services to be of extreme importance. Between 2021 and 2027, the European Union has earmarked EUR 95 billion in funding for the Czech Republic, Slovakia, Croatia, Hungary and Romania through the European Structural and Investment Funds. The share for these five CEE countries is well above their 11% share of the population. Three quarters of the funds for CEE are available for regional develop-ment (EFRE, 57% of the funds) and for the Cohesion Fund (19% of the funds). When using EFRE funds, at least 50% of the projects are concentrated on thematic priority areas (research and innova-tion, digital agenda, support for small and medium-sized enterpris-es (SMEs) and low-carbon economy). In addition to the classic cohesion policy, a further EUR 36 billion in grants will be availa-ble for the region as part of the European Corona Development Plan (Next Generation EU). This temporary economic stimulus package will focus on the areas of digitalisation, climate policy and strengthening resilience. Interbank business Interbank business is an integral part of Erste Group’s business model that performs the strategic function to ensure that the liquidity needs of the bank’s customer business are met. This involves, in particular, short-term borrowing and lending of liquid funds in the interbank market. REGULATORY CHANGES IN BANKING In recent years, regulation of the financial sector has been tight-ened substantially to strengthen the resilience of banks and pre-vent or at least minimise the adverse impact of any new crises on economies and market participants. The ultimate aim of these reforms has been to largely rule out reliance on state guarantees and taxpayers’ money to absorb banks’ losses. A banking union has been established as a regulatory framework consisting of a European banking supervision mechanism, a bank-ing resolution mechanism and common standards for deposit
insurance. Implementing the requirements defined by the Basel Committee on Banking Supervision, the European Commission adopted and published the revised risk reduction measure package (RRM-Package) in June 2019 consisting of amended Capital Requirements Regulation (CRR 2), Capital Requirements Di-rective (CRD 5), Single Resolution Mechanism Regulation (SRMR 2) and Bank Recovery and Resolution Directive (BRRD 2). While CRR 2 became partially applicable in June 2019, the majority of the amended provisions will be applicable as of June 2021. Both directives entered into force 20 days after their publi-cation in the Official Journal of the European Union and had to be transposed by the end of 2020 when SRMR 2 became applicable. At the beginning of December 2017, the Basel Committee on Banking Supervision presented the final part of the Basel 3 reform package, which is designed to achieve a transparent and compara-ble calculation of the capital requirements of each institution. The standardised approaches for the individual risk categories have been revised, and the use of internal models for calculating capital requirements will be restricted in the future. An output floor has been introduced to ensure that banks’ calculations of risk-weighted assets (RWAs) generated by internal models cannot, in aggregate, fall below a certain percentage threshold of the risk-weighted assets computed by the standardised approaches; the output floor will be gradually raised to 72.5%. In January 2019, the Basel Committee furthermore released the revised version of the new market risk standard (Fundamental Review of the Trading Book, FRTB). Due to the outbreak of the Covid-19 pandemic, the Basel Committee on Banking Supervision decided to postpone the implementation of the final part of the Basel 3 reform package by one year. An EU legislative proposal for the implementation of Basel 3 is now expected in 2021. For the same reasons, the pack-age is scheduled for implementation by 1 January 2023 instead of 1 January 2022 and will be fully applicable after a transition period of up to five years. As the Covid-19 pandemic has led to a sharp economic down-turn, EU regulators and supervisors have taken measures to support the immediate ability of banks to continue lending and absorb losses related to the pandemic. In particular, the European Commission Covid-19 banking package included an Interpreta-tive Communication on the Union’s accounting and prudential frameworks as well as targeted quick-fix amendments to EU banking prudential rules (CRR). Member states have also taken decisive action, with support schemes typically involving public guarantee schemes and/or payment deferrals (moratoria) to alle-viate liquidity difficulties affecting households and businesses. In this respect, the European Banking Authority (EBA) has pub-lished guidelines on legislative and non-legislative moratoria. The European Commission has also adopted a temporary frame-work to enable member states to use the full flexibility foreseen under state aid rules to support the economy in the context of the Covid-19 outbreak.

14
In December 2020, the European Commission has published a new version of the Action Plan on Non-performing Loans (NPLs) as a response to the Covid-19 crisis and the expected surge in NPLs on banks’ balance sheets. The plan focuses on further developing secondary markets for NPLs as well as estab-lishing a central data hub at EU level. It also puts forward the idea of developing national private or partly publicly funded Asset-Management Companies (AMCs) to buy off bad loans from banks’ balance sheets, as well as setting up a cross-border European network of national AMCs. Furthermore, an insolven-cy law reform is put forward as a priority and how to use state aid in the context of NPLs. The new resolution framework allows for a multiple-point-of-entry (MPE) or a single-point-of-entry (SPE) resolution strategy. The minimum requirement for own funds and eligible liabilities (MREL) should reflect the resolution strategy that is appropriate to a banking group (in case of MPE with different resolution groups and therefore different points of entries) in accordance with the resolution planning. Under the MPE strategy, more than one group entity may be resolved. Under the SPE strategy, only one group entity, usually the parent undertaking, is the point of entry with the aim to apply resolution actions and tools on this entry level, whereas other group entities, usually operating sub-sidiaries, are not subject to resolution actions and tools, but upstream their losses and recapitalisation needs (downstream of capital) to the point of entry. Erste Group received the joint decision signed by the Single Resolution Board (SRB) as Group Resolution Authority, the Croatian Resolution Authority, the Czech Resolution Authority, the Hungarian Resolution Authority and the Romanian Resolu-tion Authority acting within the resolution college upon the MPE approach forming separate resolution groups with Erste Group’s core CEE subsidiaries but with SPE approaches on country level (on resolution group level). In 2020, Erste Group received its MREL target based on BRRD 1 and the SRB MREL 2018 Policy. In the course of 2021, Erste Group will receive a new MREL target, based on BRRD 2 and the SRB MREL Policy. A transitional period is foreseen for the compliance with the final MREL target until 1 January 2024 with two intermediate targets in 2022 and 2023 ensuring a linear MREL build-up. As of 14 September 2019, the Delegated Regulation (EU) 2018/389 of 27 November 2017 supplementing Directive (EU) 2015/2366, with regard to regulatory technical standards for strong customer authentication and common and secure open standards of communication, became effective. Since that date, account servicing payment service providers (within the Europe-an Union) have to provide a standardised interface that enables certain third party providers to offer payment services to custom-ers of banks. These have to comply with particularly strict re-quirements regarding the safe exchange of data between banks
and third-party providers. With the EBA Opinion from 16 Octo-ber 2019, national competent authorities have applied superviso-ry flexibility as regards the requirement for the application of a strong customer authentication for card-based e-commerce trans-actions. This initial extension of the implementation period ended on 31 December 2020. The ESA Review (amendments to the founding regulations of the European Supervisory Authorities – EBA, EIOPA and ESMA) was formally adopted in April 2019 and is applicable since the beginning of 2020. This has strengthened the ESAs’ supervisory powers. EBA has been given the mandate of coordinating and overseeing the national supervisory authorities with regard to measures aimed at preventing and combating money laundering and terrorist financing. As regards sustainability matters, ESAs will strongly integrate environmental, social and governance (ESG) criteria into their work (such as guidelines) and further strengthen proportionality. In 2020, the systemic risk buffers defined by FMA on the basis of the Capital Buffer Regulation and buffers for Other Systemically Important Institutions (O-SIIs) amounted to 2% of RWA for Erste Group. Since 2018, Erste Group Bank AG has been obliged to hold the systemic risk buffer also at single-entity level. The amendments to the Financial Markets Anti-Money Launder-ing Act (FM-GwG, Finanzmarkt-Geldwäschegesetz) and the Beneficial Owners Register Act (WiEReG, Wirtschaftliche Ei-gentümer Registergesetz) were adopted in July 2019, thereby implementing the 5th Money Laundering Directive while at the same time including a compliance package. The new rules en-tered into force on 10 January 2020, while the provisions of the compliance package took effect on 10 November 2020. The compliance package facilitates the identification of beneficial owners. On 21 January 2021, the Austrian National Council (Nationalrat) concluded amendments to the Account Register Act (KontRegG, Kontenregistergesetz) and FM-GwG, with which, amongst oth-ers, lockers (Schließfächer) are included in the account register (reporting date is 1 January 2021). In addition, an exchange of information between parties subject to money laundering provi-sions was introduced as well as transaction monitoring based on artificial intelligence. In WiEReG, a regulation has now been included, according to which companies from third countries that acquire land in Austria are subject to the WiEReG reporting obligations. The changes to FM-GwG and WiEReG entered into force on 1 March 2021. The European Commission presented the proposal for a Capital Markets Recovery Package in July 2020, which includes (i) a short-form prospectus to facilitate new funding in a short time period, (ii) alleviations to the MiFID II framework to encourage investments in the real economy and free up resources for inves-tors and firms and (iii) improvements to securitisation rules to

Management board | Supervisory board | Capital markets | Strategy | Financial and operating performance | Segments | Non-financial report | Corporate governance report | Audited financial reporting
15
support SME lending and management of NPLs. Additionally, amendments to the Benchmark Regulation to, among others, facilitate the transition from LIBORs to new risk-free rates are part of the package. Amendments to the Prospectus Regulation, MiFID II and the Benchmark Regulation were published in the Official Journal in February 2021, amendments to the securitisa-tion framework will be published between March and June 2021. Regulation (EU) 2019/2088 on sustainability-related disclosures in the financial services sector were published in the Official Journal in December 2019. Among others, financial market participants are required – mostly as of March 2021 – to provide comprehensive information on their management of sustainabil-ity risks and strategies in addition to existing disclosure obliga-tions. On 22 June 2020, Regulation (EU) 2020/852 on the estab-lishment of a framework to facilitate sustainable investment (Taxonomy Regulation) was published in the Official Journal. This regulation, designed to govern the concept of sustainability in finance, introduces a classification system for determining whether an economic activity qualifies as environmentally sus-tainable for the purpose of establishing the degree to which an investment is environmentally sustainable. In addition, on 27 November 2020, ECB published its guide on climate-related and environmental risks. The guide outlines how ECB expects banks to safely and prudently manage and disclose such risks under the current prudential framework. It is expected that additional ex-tensive legislative measures will be adopted in the years ahead with the aim of strengthening sustainability in the financial and banking sector. LONG-TERM GROWTH TRENDS IN CENTRAL AND EASTERN EUROPE The economic catch-up process across the countries of Central and Eastern Europe and the underlying convergence trend con-tinues. This is on the one hand due to the fact that the region has to make up for almost half a century of communist mismanage-ment of the economy, and on the other hand, due to the fact that banking activities were largely non-existent during that time. With the exception of deposit-taking, modern banking services were largely unknown in these countries after the fall of com-munism. On the lending side, this was due to high nominal and real interest rates and also to disposable incomes that did not support household credit growth. In addition, a healthy competi-tive environment was lacking due to extensive state ownership. All this has changed. Disposable income has risen strongly on the back of growing gross domestic products. Most formerly state-owned banks have been sold to strategic investors that have fostered product innovation and competition. Economic growth, which temporarily declined substantially in some coun-tries in CEE following the economic and financial crisis, recov-ered again. Despite such economic slowdowns and potential temporary negative impacts on the banking markets in Central and Eastern Europe, these factors will remain the driving force behind future development.
In addition, most countries of Central and Eastern Europe have human resources that are at least equivalent to those of Western European countries but do not need to struggle with the unaf-fordable costs in the long term of the western welfare states and have labour markets that are considerably more flexible. These advantages are complemented by – on average – highly compet-itive export industries that benefit from wage costs that are low relative to workforce productivity and from investor-friendly tax and welfare systems. A comparison of per capita private debt levels in Central and Eastern Europe with those of advanced economies reveals that even today an enormous gap exists between these markets. Countries such as the Czech Republic and Slovakia, but also Croatia and Hungary, are many years away from reaching Austrian or Western European levels of loans per capita; also in relative terms, these countries differ substantially regarding debt levels common in the West. The contrast to Serbia or Romania is even more pronounced – pri-vate debt levels, and particularly household debt, are substan-tially lower than in the advanced economies. Even though the developments of very recent years will probably lead to a reas-sessment of what constitutes acceptable debt levels and to only a gradual rise in lending in Central and Eastern Europe, Erste Group still firmly believes that credit expansion accompanied by economic growth in this region will prove to be a lasting trend rather than a short-term process that has already peaked.
Source: Local central banks, Erste Group
Over the upcoming 15 to 20 years, on average, the countries of the eastern part of the European Union are therefore expected to experience higher growth rates than the countries of Western Europe, even though periods of expansion may alternate with times of economic stagnation or even setbacks on this long-term path of sustainable growth.
0
8
16
24
32
40
48
56
Austria Slovakia HungaryCzech Rep Croatia SerbiaRomania
Customer loans/capita in CEE (2020) in EUR thousand
42.5
12.8 12.3
8.9
5.73.5 3.3

16
BUILDING A STRONG BRAND Slightly more than 200 years ago, our founding fathers wrote: “No age, gender, social class, or nationality shall be excluded from the benefits that a savings bank offers every depositor.” With this founding principle – which was revolutionary at the time – Erste Österreichische Spar-Casse contributed substantially to more democracy in finance in our region. Erste Group was founded to give everyone access to financial services and has developed into an institution that has an impact on the prosperity and the future of a region. Today, it is one of the largest banking groups and employers in Central and Eastern Europe. The trust that Erste Group and its local banks have been enjoying stems from the fact that they have actually been putting the founding principle into practice. A brand is a consistent promise. It is more than a logo – it is about the perception of people when they think or hear of an organisation, its products and services. Brands have an important identification and differentiation function, which in turn deter-mines whether a customer chooses one brand over another. Ulti-mately, companies with strong brands benefit from emotional relationships with their customers. Only a few businesses were founded with the aspiration of achieving more than just making profit. Erste Group is one of these and has been benefitting from a high degree of brand awareness and trustworthiness. Over the last four years, Erste Group has transformed its brand communication from being category- and product-driven to having a purpose-driven approach. To this end, Erste Group has established a statement of purpose as the main group-wide pillar of its brand communication: “Our region needs people who believe in themselves and a bank that believes in them.”
More than 200 years ago, a success story started that continues until the present day. The savings banks were founded on this basis of personal trust and the belief in ideas, plans for the future, and people’s capabilities and potential. Whether it is in any indi-vidual’s own life, in a business start-up or a long-established enterprise, in business or in society at large – trust and confi-dence in the future, believing in oneself and others, the belief in ideas and entrepreneurship are the key prerequisites for personal growth and social well-being. Therefore, it is not products and services that mark the beginning of the relationship between Erste Group and its customers, but ideas, goals, needs, dreams and plans. It all starts with people who believe in their ability to attain prosperity and shape the future. The future is created by people who believe in themselves and their ideas – their visions of the future. “Our region needs people who believe in themselves. And a bank that believes in them” is the key sentence that stands for the ap-proach to which Erste Group has been firmly committed for 200 years. #believeinyourself is more than a lead narrative. It encour-ages people to pursue their aspirations, to create something, and embodies Erste Group’s promise to assist them along the way.
Management board | Supervisory board | Capital markets | Strategy | Financial and operating performance | Segments | Non-financial report | Corporate governance report | Audited financial reporting
17
ECONOMIC ENVIRONMENT In 2020, Covid-19 has triggered the deepest global recession in decades. The pandemic induced crisis, which drastically im-pacted both advanced and emerging markets, has led to an unprecedented contraction in economic activity as more than 85 percent of the countries around the globe experienced shrinking economies. Policy makers have taken extraordinary measures to protect people and national health systems, the economy, and the financial system. To prevent the virus from spreading uncontrollably, most countries imposed stringent lockdown measures in the first half of the year, and with rising infection rates in autumn and winter, further lockdowns fol-lowed in the last quarter. To contain the immediate economic damage governments introduced various measures including state guaranteed loans, payment moratoria for private individu-als and corporates or subsidies from hardship funds. Central banks have eased monetary policies across the globe, with a balance sheet expansion in the G10 countries of nearly EUR 6.5 trillion, and with more than 20 emerging market central banks deploying asset purchases for the first time. In addition, a fiscal policy response of EUR 10.5 trillion globally has pro-vided substantial support to households and corporates. Most economies faced a substantial slump in economic activi-ty. With its real GDP declining by 3.4%, the United States outperformed both Japan and the European Union. Leading European economies like Italy and France recorded a double-digit decline in their GDP. Among emerging and developing regions, China outperformed other major economies. Follow-ing a sharp output contraction in the first quarter of 2020, China’s economic activity rebounded stronger than in most other countries following the relaxation of the initial lock-downs. Overall, China’s GDP increased by 2.3%. All other major emerging markets’ economies, such as India, Brazil, Russia and Turkey declined substantially. India’s economy particularly suffered and fell into its first recession in 40 years. In addition to the Covid-19 crisis, the Russian economy was negatively impacted by lower oil prices. Central and Eastern European economies were similarly hit by the virus induced crisis. Overall, global real GDP declined by 3.5%. The economic development in the United States was mainly characterised by the Covid-19 outbreak, increasing tension between the US and China and the presidential elections in November. The economy plummeted in April and May as a result of the coronavirus induced crisis, and the unemploy-ment rate rose temporarily above 14% in April. The economy, however, recovered quickly mainly due to robust domestic demand, improving labour market, a very accommodative monetary policy and a large fiscal stimulus. Consequently, the unemployment rate stood at 6.7% at the end of the year. Core inflation remained below the Federal Reserve’s 2% target. In March 2020, the Fed reduced its benchmark interest rate to zero and launched a new round of quantitative easing. The
programme entailed USD 700 billion worth of asset purchases of Treasuries and mortgage-backed securities as a response to the slowing economy. Overall, the US economy contracted by 3.4% in 2020. The euro area was also significantly impacted. At 7.2%, eco-nomic decline in the euro zone was deeper than in other ad-vanced regions of the world. Government measures imple-mented as a response to the Covid-19 pandemic – such as nationwide lockdowns, school closures and border restrictions – significantly disrupted domestic economic activity. Tourism, a sector that was virtually shut down completely for many months during the year, suffered significantly. Italy, France and Spain with their very important tourist industries, performed poorly with their real GDP declining by double-digit figures. The biggest economy of the euro zone, Germany, on the other hand, posted a markedly better performance mainly due to its prudent crisis management and stronger production output. Unemployment rates rose across countries. Most euro area governments launched large programmes of public loan guar-antees to preserve access to bank loans for businesses. The European Central Bank (ECB) introduced a new Pandemic Emergency Purchase Programme (PEPP) to counter the serious risks to the monetary policy transmission mechanism and the outlook for the euro area. The programme amounted to EUR 1.85 trillion and was extended until March 2022. ECB also increased its targeted longer-term refinancing operations (TLTROs) to provide low interest rate loans to credit institu-tions. Overall, EUR 1.7 trillion were taken up by 388 banks. ECB kept its discount rate at zero. Against this backdrop, Austria’s economy was also hit hard. Reflecting the containment measures and the lockdown in spring, a sharp decline in private consumption led to a fall in GDP. Investments also fell significantly. A solid economic rebound began in the third quarter. The easing of travel re-strictions, but most importantly strong domestic summer tour-ism, led to a partial recovery in the economically important tourism sector, with overnight stays in July and August down 15% from 2019 levels, compared to a decline of 60% to 90% in May and June. The unemployment rate increased visibly in the first half of the year, reaching 6.2% in June. In 2020, it stood on average at 5.3%. Short-time work schemes helped to miti-gate the effect of the economic downturn on the labour market. The Covid-19 induced crisis has put an abrupt end to the fa-vourable development of Austria’s public finances. A crisis management fund launched in March has been covering finan-cial support, such as to strengthen health care services, fixed cost subsidies or short-time work schemes. Tax deferrals and public guarantees for loans also helped companies to avoid liquidity constraints. The general government deficit stood at 8.9% of GDP. Public debt as a percentage of GDP significantly increased to 84.8%. With the sharp economic downturn and the decrease in energy prices, inflation fell from over 2% in the beginning of the year to 1.2% at year end. Overall, average
Financial and operating performance

18
inflation stood at 1.4% in 2020. Real GDP declined by 7.2%, with GDP per capita falling to EUR 42,000 at year-end. Central and Eastern European economies struggled as well. Consumption and investments fell visibly, exports and imports posted a double-digit contraction. The large exposure of CEE economies to manufacturing and exports contributed signifi-cantly to the economic decline in the spring lockdown. After an unprecedented decline in economic activity, the CEE region saw a very fast economic rebound. The second wave of lock-downs in autumn impacted the regional economies to a much lesser extent, underlying the resilience of CEE industrial pro-duction. This time, production was not halted, and foreign demand held up well. Serbia proved to be the best performer, with its GDP contracting only moderately in 2020. Croatia experienced the deepest GDP decline due to the country’s heavy dependency on the tourism sector. Unemployment rates in CEE increased but remained still low compared to many Western European countries. The labour markets benefited from government support programmes and widely used short-time work schemes. As a result of lower revenues and higher expenses, public deficits in the region widened. CEE currencies remained weak during the year, with the Hungarian forint testing all-time lows throughout the year. Despite the FX im-pact, inflation remained relatively moderate. Many of the region’s central banks, cut their key rates in the course of the year. The most pronounced were the interest rate cuts of the Czech National Bank. Hungary, Romania, and Serbia also cut their policy rates. Overall, CEE economies shrank between 8.8% in Croatia and 1.1% in Serbia in 2020. PERFORMANCE IN 2020 P&L data of 2020 is compared with data of 2019, balance sheet data as of 31 December 2020 is compared to data as of 31 December 2019. Acquisitions and disposals in Erste Group in 2020 did not have any significant impact and therefore had no effect on the rates of change stated below. Details are provided in the notes to the consolidated financial statements. Overview Net interest income increased – mainly in Austria, but also in Romania and Hungary – to EUR 4,774.8 million (+0.6%; EUR 4,746.8 million). Net fee and commission income de-creased to EUR 1,976.8 million (-1.2%; EUR 2,000.1 million). Higher income from the securities business and asset manage-ment did not fully compensate for the declines in other fee and commission income categories – most notably in payment services (thereof EUR 19 million attributable to the impact of the SEPA Payment Services Directive). While net trading
result declined significantly to EUR 137.6 million (EUR 318.3 million), the line item gains/losses from financial instru-
ments measured at fair value through profit or loss im-
proved to EUR 62.0 million (EUR -24.5 million). The devel-opment of both line items was driven by valuation effects due to market volatility amid the Covid-19 pandemic. Operating
income decreased to EUR 7,155.1 million (-1.4%; EUR 7,255.9 million). General administrative expenses declined to EUR 4,220.5 million (-1.5%; EUR 4,283.3 million), person-nel expenses were slightly lower at EUR 2,520.7 million (-0.6%; EUR 2,537.1 million). Other administrative expenses were reduced to EUR 1,158.9 million (-3.8%; EUR 1,205.1 million). Payments into deposit insurance schemes included in other administrative expenses rose to EUR 132.2 million (EUR 104.8 million). Depreciation and amortisation was un-changed at EUR 540.9 million (EUR 541.0 million). Overall, the operating result declined to EUR 2,934.6 million (-1.3%; EUR 2,972.7 million). The cost/income ratio was unchanged at 59.0% (59.0%).
Due to net allocations, the impairment result from financial
instruments amounted to EUR -1,294.8 million or 78 basis points of average gross customers loans (EUR -39.2 million or 7 basis points). Allocations to provisions for loans as well as for commitments and guarantees given went up in all core markets. The marked rise in allocations to provisions for loans was primarily driven by the deterioration in the macroeconom-ic outlook due to Covid-19. A positive contribution came from high income from the recovery of loans already written off, primarily in Romania and Hungary. The NPL ratio based on gross customer loans deteriorated to 2.7% (2.5%), the NPL coverage ratio rose to 88.6% (77.1%). Other operating result improved to EUR -278.3 million (EUR -628.2 million). The expenses for the annual contribu-tions to resolution funds included in this line item rose – in particular in Austria – to EUR 93.5 million (EUR 75.3 million). The decline in banking and transaction taxes to EUR 117.7 million (EUR 128.0 million) is primarily attributable to the
Operating income and operating expensesin EUR million
General administrative expenses Operating income
2019 2020
0
2,500
5,000
7,500
10,000
4,181 4,283
6,916
4,028
6,691 6,669
4,158
2016
7,256
20182017
7,155
4,220

Management board | Supervisory board | Capital markets | Strategy | Financial and operating performance | Segments | Non-financial report | Corporate governance report | Audited financial reporting
19
abolition of banking tax in Romania. In the previous year, other operating result included allocations to a provision in the amount of EUR 153.3 million set aside for losses expected from a supreme court decision concerning the business activi-ties of a Romanian subsidiary as well as the write-off of good-will in Slovakia in the amount of EUR 165.0 million. Taxes on income declined to EUR 342.5 million (EUR 418.7 million). The minority charge fell to EUR 242.3 million (EUR 440.9 million) due to significantly lower earnings con-tribution of the savings banks. The net result attributable to
owners of the parent declined to EUR 783.1 million (-46.7%; EUR 1,470.1 million).
Cash earnings per share (see glossary for definition) amounted to EUR 1.59 (reported EPS: EUR 1.57) versus EUR 3.25 (reported EPS: 3.23) in the previous year.
Cash return on equity (see glossary for definition), i.e. return on equity adjusted for non-cash expenses such as goodwill impairment and straight-line amortisation of customer relation-ships, stood at 4.7% (reported ROE: 4.7%) versus 10.1% (reported ROE: 10.1%) in the previous year. Total assets rose to EUR 277.4 billion (EUR 245.7 billion). On the asset side, cash and cash balances increased, primarily in Austria, to EUR 35.8 billion (EUR 10.7 billion), loans and advances to banks decreased to EUR 21.5 billion (EUR 23.1 billion). Loans and advances to customers increased to EUR 166.1 billion (+3.6%; EUR 160.3 billion). On the liability side, deposits from banks grew significantly to EUR 24.8 billion (EUR 13.1 billion) on the back of increased ECB refi-nancing (TLTROs). Customer deposits rose again – in all core markets, primarily in Austria and the Czech Republic – to EUR 191.1 billion (+9.9%; EUR 173.8 billion). The loan-to-
deposit ratio stood at 86.9% (92.2%). The common equity tier 1 ratio (CET 1, CRR final, see glossary for definition) stood at 14.2% (13.7%), the total
capital ratio (see glossary for definition) at 19.7% (18.5%). Dividend In the reporting period, Erste Group Bank AG posted a post-tax loss of EUR 118.4 million under the Austrian accounting regula-tions, which increased its distributable capital accordingly (2019 post-tax profit: EUR 1,327.1 million). The equity decreased (2019: increased) accordingly. On 15 December 2020 the European Central Bank (ECB) has issued a recommendation in respect of dividend payouts. The management board of Erste Group will propose a 2020 dividend, in line with the ECB recommendation, of EUR 0.5 per share to the 2021 AGM for payment in May 2021. Fur-thermore, an additional reserve of EUR 1.0 per share was created, for payment once the ECB recommendation is with-drawn and subject to profitability and capital performance. On 10 November 2020, the annual general meeting resolved to pay a dividend of EUR 0.75 per share for the fiscal year 2019 (appropriation of net profit), conditional upon no regulatory ECB recommendation to refrain from such payments or no other legal restrictions being in force prohibiting such distribu-tions on 8 February 2021. Based on the ECB recommenda-tions, conditions to pay a dividend of EUR 0.75 per share had not been met as of 8 February 2021, and no dividend was distributed. As a payout is not possible, the dividend is allocat-ed to retained earnings according to the resolution taken at the annual general meeting on 10 November 2020.
Operating result and net profit/loss for the year attributable to owners of the parentin EUR million
Net profit for the year attributable to the owners of the parent
Operating result
0
2,000
4,000
20202016 2019
1,470
2,973 2,935
2,6632,511
1,265
2,735
783
1,793
1,316
20182017
Key profitability ratios in %
2016 2018 20202019
Cost/income ratio Return on equity
65 20
45 0
60
50
55
4.7
10.010.1
59.0
60.2
62.4
10.8
59.0
60.5
13.4
10
2017

20
Outlook Erste Group’s goal for 2021 is to increase net profit. Among the factors that will support achievement of this goal are a recovery of the economies of all core markets – the Czech Republic, Slovakia, Hungary, Romania, Croatia, Serbia and Austria – and, on this basis, a reduction of risk costs and an improvement in the operating result. A continuation or further escalation of Covid-19 measures by governments as well as potential – and as yet unquantifiable – political, regulatory or economic risks may render meeting this goal more challenging. In 2021, the positive development of the economy should be reflected in growth rates (real GDP growth) of between 3% and close to 6% in Erste Group’s CEE core markets. The develop-ment of other economic indicators should vary depending on Covid-19 policy measures imposed by authorities and/or the phasing out of state support. Unemployment rates are expected to rise but, in the Czech Republic and Hungary, should remain among the lowest in the EU. Inflation rates are forecast to decline in the Czech Republic and Slovakia while the other core markets are likely to see a slight acceleration. In most countries, sustained competitiveness should again result in solid and, in Slovakia and Romania, stronger current account balances. The fiscal situation should likewise improve again after the significant budget deficits posted in the year 2020. Public debt is projected to remain largely stable, albeit at a significantly elevated level. Against this backdrop, Erste Group expects net loan growth in the low to mid-single digit range. This performance should keep net interest income stable despite negative interest rates in the euro zone. The second most important income component – net fee and commission income – is expected to rise in low single digits. As in 2020, positive momentum should again come from fund management, the securities business and in-surance brokerage. Given the average result seen in 2020, the net trading and fair value result is expected to come in higher. This, however, will depend substantially on the financial mar-ket environment. The remaining income components are fore-cast to remain, by and large, stable. Overall, operating income should increase again in 2021. Operating expenses are ex-pected to rise slightly in 2021, partly due to re-emerging wage pressure across all Erste Group markets. In addition, Erste Group will continue to invest in IT in 2021 and thus strengthen its competitive position, with a focus on progressive IT mod-ernisation, back-office digitalisation and expansion of the digital platform George. The rollout of George in Hungary and Croatia should be completed in 2021, as a result of which customers will be able to access George in the six largest core markets. Though faced with more challenges in a largely un-predictable environment, Erste Group is striving to make oper-ating income grow faster than costs. This leads Erste Group to project a rise in the operating result in 2021.
Based on the scenario described above, risks costs should decline again in 2021. While precise forecasting is hard in the current Covid-19 environment, Erste Group believes that in 2021 risk costs will not exceed 65 basis points of average gross customer loans. Due to the expected expiry of state support schemes a rise of the NPL ratio to 3 - 4% is expected though. Other operating result is expected to remain unchanged in the absence of significant one-off effects. Assuming a tax rate of below 25% and a similar level of minority charges as in the previous year, Erste Group aims to achieve an improvement in net profit. Erste Group’s CET1 ratio is expected to remain strong. The management board proposes to the annual general meeting in May – in line with ECB recommendation – a divi-dend for 2020 of EUR 0.5 per share. An additional EUR 1/share has been reserved for a potential later payment. Potential risks to the guidance are besides other than expected (geo)political, economic (monetary and fiscal policies) and regulatory measures and developments also global health risks and changes to the competitive environment. In addition, given the Covid-19 governmental measures and their impact on the economic development, financial forecasts are still subject to an elevated level of uncertainty. Erste Group is moreover ex-posed to non-financial and legal risks that may materialise regardless of the economic environment. Worse than expected economic development may put goodwill at risk. ANALYSIS OF PERFORMANCE Net interest income Net interest income increased to EUR 4,774.8 million (EUR 4,746.8 million). While in Austria (Holding) positive impacts came from more favourable ECB refinancing and lower nega-tive interest on deposits with the ECB, net interest income in the Czech Republic declined significantly due to lower interest rates. Included in net interest income are modification losses in the amount of EUR 49.5 million mainly resulting from morato-ria on loan re-payments due to Covid-19.
Net interest margin in %
AustriaCentral and Eastern Europe Overall group
0
1
2
3
20202016 2018 2019
2.492.30
3.16
2.88
2.18 2.08
2.512.30
1.51 1.481.58
2.63
2.40
1.78
4
1.64
2017

Management board | Supervisory board | Capital markets | Strategy | Financial and operating performance | Segments | Non-financial report | Corporate governance report | Audited financial reporting
21
The net interest margin (calculated as the annualised sum of net interest income, dividend income and net result from equity method investments over average interest-bearing assets) stood at 2.08% (2.18%). Net fee and commission income Net fee and commission income decreased to EUR 1,976.8 million (EUR 2,000.1 million). Declines were recorded in pay-ment services (thereof EUR 19 million attributable to SEPA, the payment-integration initiative of the European Union) but also in lending business and insurance brokerage commission in-come. Significant growth was recorded, however – primarily in Austria – in the securities business and in asset management.
Net trading result & gains/losses from financial instruments measured at fair value through profit or loss Valuation effects have a substantial impact on both positions –net trading result & gains/losses from financial instruments measured at fair value through profit or loss. Debt securities issued measured at FV through profit or loss are particularly impacted – related valuation results are shown in the line gains/losses from financial instruments measured at fair value through profit or loss, while valuation results of corresponding hedges are shown in net trading result – as are financial assets in the fair value and trading portfolios. Due to valuation effects resulting from interest rate developments, net trading result decreased significantly to EUR 137.6 million (EUR 318.3 mil-lion), despite strong income from the foreign exchange busi-ness. Conversely, gains/losses from financial instruments meas-ured at fair value through profit or loss improved to EUR 62.0 million (EUR -24.5 million). In addition to gains from the valu-ation of debt securities in issue due to the development of inter-est rates, the valuation result of financial assets in the fair value portfolio was, overall, likewise positive. Gains from the valua-tion of the securities portfolio were significantly higher than the valuation losses in the loan portfolio measured at fair value.
General administrative expenses General administrative expenses decreased to EUR 4,220.5 million (EUR 4,283.3 million).
Personnel expenses declined to EUR 2,520.7 million (EUR 2,537.1 million). While personnel expenses were up in Slo-vakia as a result of a one-off payment agreed through collective bargaining, they declined in all other core markets, in the Czech Republic and Hungary also due to positive currency effects. Other administrative expenses decreased to EUR 1,158.9 million (EUR 1,205.1 million) on the back of a marked reduction of marketing and consulting costs. Contributions to deposit insurance systems rose to EUR 132.2 million (EUR 104.8 million). In Austria, contributions increased substantially to EUR 95.0 million (EUR 58.4 million), driven by a one-off effect as well as continuing strong deposit growth, but declined in Romania to EUR 4.4 million (EUR 12.7 million). IT ex-penditure was likewise up. Amortisation and depreciation amounted to EUR 540.9 million (EUR 541.0 million).
Net fee and commission income, structure and trendin EUR million
1,977
1,7831,852
1,9082,000
0
500
1,000
1,500
2,000
20202018 20192016 2017
Securities business Other
Payment business
Lending business
Customer resources distributed Asset management
Employees as of 31 December 2020
Česká spořitelna
Slovenská sporitel’ňa
Erste Bank Serbia
Erste Bank Croatia
Other
Erste Bank Hungary
2,8363,252
3,227
Erste Group in Austria
8,847
3,770
Cross-guarantee savings banks
7,095
Banca Comercială Română
5,645
1,198
9,820
General administrative expenses,structure and trend, in EUR million
0
750
1,500
2,250
3,000
3,750
4,5004,283 4,220
4,0284,158
20202016 2017 2018 2019
4,181
Personnel expenses Other administrativeexpenses
Depreciation and amortisation

22
Operating result Due to the significant decline of the net trading and fair value result, operating income decreased to EUR 7,155.1 million (-1.4%; EUR 7,255.9 million). General administrative expenses were reduced to EUR 4,220.5 million (-1.5%; EUR 4,283.3 million). The operating result declined to EUR 2,934.6 million (-1.3%; EUR 2,972.7 million). The cost/income ratio was unchanged at 59.0% (59.0%). Gains/losses from derecognition of financial instruments not measured at fair value through profit or loss Gains from derecognition of financial instruments not meas-ured at fair value through profit or loss amounted to EUR 6.5 million (EUR 23.5 million). This line item includes primarily gains/losses from derecognition of loans and the sale of secu-rities. Impairment result from financial instruments Due to net allocations, the impairment result from financial instruments amounted to EUR -1,294.8 million (EUR -39.2 million). Net allocations to provisions for commitments and guarantees given amounted to EUR -159.2 million (net releases of EUR 70.0 million). The significant rise in allocations to provisions was primarily driven by updated risk parameters with forward-looking information as well as experts’ estimates on the impacts of the Covid-19 pandemic. Positive contribu-tions came from continued high income from the recovery of loans already written off – primarily in Romania and Hungary – in the amount of EUR 140.4 million (EUR 154.0 million). Other operating result Other operating result improved to EUR -278.3 million (EUR -628.2 million). Levies on banking activities declined to EUR 117.7 million (EUR 128.0 million). Banking tax payable in Austria increased moderately to EUR 25.5 million (EUR 24.3 million). Levies in Slovakia, where they were charged for the last time in the first half of the year, rose to EUR 33.8 million (EUR 32.5 million). Hungarian banking tax increased to EUR 14.5 million (EUR 12.6 million). Together with the financial transaction tax of EUR 44.0 million (EUR 47.6 million), bank-ing levies in Hungary were slightly down, totalling EUR 58.5 million (EUR 60.2 million). The negative balance of allocations/releases of other provisions decreased markedly to EUR -18.4 million (EUR -207.0 mil-lion). The comparative period was negatively impacted by extraordinary effects – a provision in the amount of EUR 153.3 million had been set aside for losses expected from a supreme court decision concerning the business activities of a Romanian subsidiary. Furthermore, goodwill in Slovakia in the amount of EUR 165.0 million had been written down. Other operating result also reflects the annual contributions to resolution funds in the amount of EUR 93.5 million (EUR 75.3 million).
Increases were recorded across all core markets, but above all in Austria, to EUR 43.6 million (EUR 33.4 million). Profit/loss for the year The pre-tax result from continuing operations amounted to EUR 1,368.0 million (EUR 2,329.7 million). Taxes on income declined to EUR 342.5 million (EUR 418.7 million). The mi-nority charge decreased to EUR 242.3 million (EUR 440.9 million) due to substantially lower earnings contributions of savings banks. The net result attributable to owners of the parent amounted to EUR 783.1 million (EUR 1,470.1 million). Tax situation Pursuant to section 9 of the Austrian Corporate Tax Act (KStG), Erste Group Bank AG and its main domestic subsidiaries consti-tute a tax group. Due to the high proportion of tax-exempt income – particularly income from participating interests – and tax payments for the permanent establishments abroad, no Aus-trian corporate income tax was payable for the fiscal year 2020. The current tax loss carried forward increased in 2020. Taxes on income are made up of current taxes on income calcu-lated in each of the Group companies based on the results re-ported for tax purposes, corrections to taxes on income for previous years, and the change in deferred taxes. The reported total income tax expense amounted to EUR 342.5 million (EUR 418.7 million). Balance sheet development The rise in cash and cash balances to EUR 35.8 billion (EUR 10.7 billion) was primarily due to large cash balances held at central banks, not least due to increased TLTRO III funds. Trading and investment securities held in various catego-ries of financial assets increased to EUR 46.8 billion (EUR 44.3 billion). Loans and advances to banks (net), including demand deposits other than overnight deposits, declined primarily in Austria to EUR 21.5 billion (EUR 23.1 billion). Loans and advances to customers (net) rose – most nota-bly in Austria – to EUR 166.1 billion (EUR 160.3 billion) driven by loan growth in the corporate and retail segments. In subsidiaries outside the euro zone, the effect of growth in local currency was offset by the depreciation of the local currencies.

Management board | Supervisory board | Capital markets | Strategy | Financial and operating performance | Segments | Non-financial report | Corporate governance report | Audited financial reporting
23
Loan loss allowances for loans to customers rose to EUR 4.0 billion (EUR 3.2 billion). The increase reflected the deteri-oration in the macroeconomic outlook due to Covid-19. The NPL ratio (non–performing loans as a percentage of gross customer loans) deteriorated to 2.7% (2.5%). The NPL cover-
age ratio (based on gross customer loans) rose to 88.6% (77.1%). Intangible assets remained unchanged at EUR 1.4 billion (EUR 1.4 billion). Miscellaneous assets amounted to EUR 5.8 billion (EUR 6.0 billion).
Financial liabilities – held for trading increased to EUR 2.6 billion (EUR 2.4 billion).
Deposits from banks, primarily in the form of term deposits, rose to EUR 24.8 billion (EUR 13.1 billion), including EUR 14.1 billion in TLTRO III funds as of the end of December 2020. Deposits from customers increased to EUR 191.1 billion (EUR 173.8 billion) due to strong growth in overnight deposits (the leasing liabilities of EUR 0.6 billion were not included in this position). The loan-to-deposit ratio stood at 86.9% (92.2%). Debt securities in issue increased slightly to EUR 30.7 billion (EUR 30.4 billion). Miscellaneous liabilities amounted to EUR 5.8 billion (EUR 5.4 billion). Total assets grew to EUR 277.4 billion (+12.9%; EUR 245.7 billion). Total equity increased to EUR 22.4 billion (+9.4%; EUR 20.5 billion) including additional tier 1 (AT1) instruments in the amount of EUR 2,733.0 million from five issuances (June 2016, April 2017, March 2019, January 2020 and No-vember 2020). After regulatory deductions and filtering according to the Capital Requirements Regulation (CRR), common equity tier
1 capital (CET1, CRR final) rose to EUR 17.1 billion (EUR 16.3 billion). Total own funds (CRR final) went up to EUR 23.6 billion (EUR 22.0 billion) supported by AT 1 issuances. Total risk (risk-weighted assets including credit, market and operational risk, CRR final) rose to EUR 120.2 billion (+1.3%; EUR 118.6 billion) benefitting from a positive impact of the application of the SME support factor in an amount of EUR 4.5 billion.
Consolidated regulatory capital is calculated in accordance with CRR, taking into consideration transitional provisions as defined in the Austrian CRR Supplementary Regulation and the Regulation (EU) 2016/445 of the European Central Bank on the exercise of options and discretions available in Union law. These transitional provisions define the percentages applicable
Loans and advances to customers, structure and trend, in EUR million
130,654
166,050160,270
139,532
0
50,000
100,000
150,000
200,000
20202018 2019
149,321
Public sector Commercial customers Private customers and others
2016 2017
Balance sheet structure/liabilities and total equityin EUR million
0
245,693
277,394
208,227220,659
20202018 2019
50,000
100,000
300,000
200,000
150,000
236,792
Debts securities in issue Total equity and other liabilities
Customer accountsDeposits by banks
2016 2017
250,000
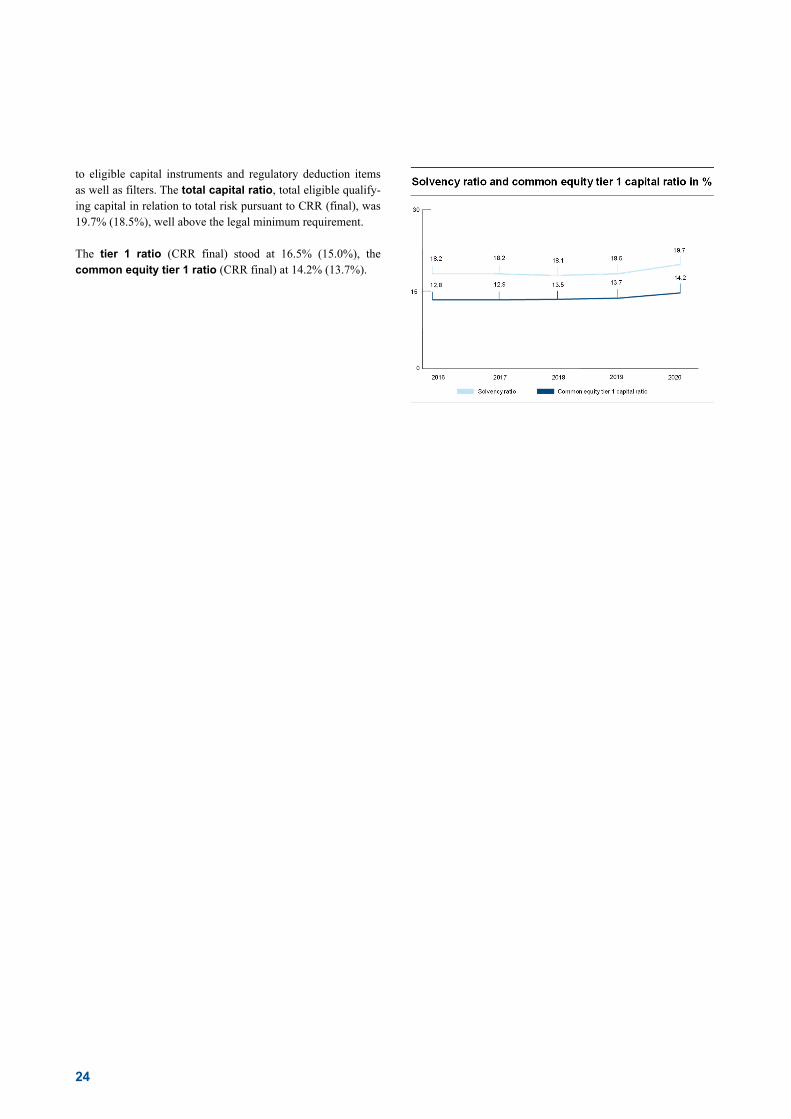
24
to eligible capital instruments and regulatory deduction items as well as filters. The total capital ratio, total eligible qualify-ing capital in relation to total risk pursuant to CRR (final), was 19.7% (18.5%), well above the legal minimum requirement. The tier 1 ratio (CRR final) stood at 16.5% (15.0%), the common equity tier 1 ratio (CRR final) at 14.2% (13.7%).

Management board | Supervisory board | Capital markets | Strategy | Financial and operating performance | Segments | Non-financial report | Corporate governance report | Audited financial reporting
25
Erste Group’s segment reporting is based on IFRS 8 Operating Segments, which adopts the management approach. Accordingly, segment information is prepared on the basis of internal man-agement reporting that is regularly reviewed by the chief operat-ing decision maker to assess the performance of the segments and make decisions regarding the allocation of resources. Within Erste Group, the function of the chief operating decision maker is exercised by the management board. Erste Group uses a matrix organisational structure with geograph-ical segmentation and business segments. Since the chief operat-ing decision maker performs the steering primarily based on geographical segments, those are defined as operating segments according to IFRS 8. In order to provide more comprehensive information, the performance of the business segments is reported additionally. The tables and information below provide a brief overview and focus on selected and summarised items. For more details, please see Note 1. Additional information is available in Excel format at www.erstegroup.com/investorrelations. Operating income consists of net interest income, net fee and commission income, net trading result, gains/losses from finan-cial instruments measured at fair value through profit or loss, dividend income, net result from equity method investments, and rental income from investment properties and other operating leases. The latter three listed items are not disclosed in the tables below. Net trading result and gains/losses from financial instru-ments measured at fair value through profit or loss are summa-rized under one position. Operating expenses correspond to the position general administrative expenses. Operating result is the
net amount of operating income and operating expenses. Risk provisions for loans and receivables as well as impairments and provisions for commitments and guarantees given are included in the position impairment result from financial instruments. Other result summarises the positions other operating result and gains/losses from financial instruments not measured at fair value through profit or loss, net. The cost/income ratio is calculated as operating expenses in relation to operating income. The return on allocated capital is defined as the net result after tax/before mi-norities in relation to the average allocated capital.
Geographical segmentation – operating segments
For the purpose of segment reporting, geographical segments are defined as operating segments, for which the information is pre-sented on the basis of the booking entity’s location (not the coun-try of risk). In case of information regarding a partial group, the allocation is based on the location of the respective parent entity according to the local management responsibility. Geographical areas are defined according to the core markets in which Erste Group operates. Based on the locations of the bank-ing and other financial institution participations, the geographical areas consist of two core markets, Austria and Central and East-ern Europe and a residual segment Other that comprises the remaining business activities of Erste Group outside its core markets as well as the reconciliation to the consolidated account-ing result.
The geographical area Austria consists of the following three operating segments:
_ The Erste Bank Oesterreich & Subsidiaries (EBOe & Subsidiaries) segment comprises Erste Bank der oester-reichischen Sparkassen AG (Erste Bank Oesterreich) and its main subsidiaries (e.g. sBausparkasse, Salzburger Sparkasse, Tiroler Sparkasse, Sparkasse Hainburg).
_ The Savings Banks segment includes those savings banks that are members of the Haftungsverbund (cross-guarantee system) of the Austrian savings banks sector and in which Erste Group does not hold a majority stake but which are ful-
ly controlled according to IFRS 10. The fully or majority-owned Erste Bank Oesterreich, Tiroler Sparkasse, Salzburger Sparkasse, and Sparkasse Hainburg are not part of the Sav-ings Banks segment.
_ The Other Austria segment comprises Erste Group Bank AG (Holding) with its Corporates and Group Markets business, Erste Group Immorent GmbH, Erste Asset Management GmbH and Intermarket Bank AG.
Erste Group – geographical segmentation - operating segments
Austria Central and Eastern Europe Other
EBOe & Subsidiaries
SavingsBanks
OtherAustria
Czech Republic
Slovakia Romania Hungary Croatia Serbia
Segments

26
The geographical area Central and Eastern Europe (CEE) con-sists of the following six operating segments covering Erste Group’s banking subsidiaries located in the respective CEE countries:
_ Czech Republic (comprising Česká spořitelna Group) _ Slovakia (comprising Slovenská sporiteľňa Group) _ Romania (comprising Banca Comercială Română Group) _ Hungary (comprising Erste Bank Hungary Group) _ Croatia (comprising Erste Bank Croatia Group) and _ Serbia (comprising Erste Bank Serbia Group)
The residual segment Other covers mainly centrally managed activities and items that are not directly allocated to other seg-ments. It comprises the corporate center of Erste Group Bank AG (and thus dividends and the refinancing costs from participations, general administrative expenses), internal service providers (facili-ty management, IT, procurement), the banking tax of Erste Group Bank AG as well as free capital of Erste Group (defined as the difference of the total average IFRS equity and the average eco-nomical equity allocated to the segments). Asset/Liability Man-agement of Erste Group Bank AG as well as the reconciliation to the consolidated accounting result (e.g. intercompany elimina-tions, dividend eliminations) are also part of the segment Other.
Austria
Economic review Austria is a well-diversified, developed and open economy, bene-fitting from a well-educated workforce. In 2020, the country’s strong tourism and service sector were particularly hard hit by the Covid-19 containment measures . Despite a solid summer season, mainly attributable to strong domestic tourism, the tourism sector suffered from lockdowns and travel restrictions. Private consump-tion of services and durable goods as well as exports and invest-ment fell sharply and contributed to the significant drop in GDP. Although short-time work schemes helped to mitigate the effect of the economic downturn on the labour market, the unemployment rate increased strongly in the first half of 2020, reaching 6.2% in June. On average, it amounted to 5.3%. Overall, real GDP de-clined by 7.2%, with GDP per capita falling to EUR 42,000.
The Covid-19 induced crisis has put an abrupt end to the favour-able development of Austria's public finances. The crisis man-agement fund launched in March 2020 provided financial support to strengthen health care services, and included funding for fixed cost subsidies as well as short-time work schemes. Tax deferrals, reduced advance tax payments and state guarantees for loans also helped companies to avoid liquidity shortages. With declining revenues and rising expenses, the general government deficit stood at 9.8% of GDP. Public debt as a percentage of GDP signif-icantly increased to 84.8%. With the sharp economic downturn and the decrease in energy prices, inflation fell from over 2% in the beginning of the year to 1.1% in the second quarter before rising again to 1.5% in the third quarter. Inflation in services remained especially high, leading to a core inflation rate of 1.8% and 2.2% in the second and third quarters, respectively. Overall, inflation remained almost un-changed at 1.4% in 2020. As Austria is part of the euro zone, its monetary policy is set by the European Central Bank (ECB), which kept its discount rate at zero in 2020. The ECB introduced its new Pandemic Emergency Purchase Programme (PEPP) to counter serious risks to the monetary policy transmission mecha-nism and the outlook for the euro area and increased its targeted longer-term refinancing operations (TLTRO) to provide low interest rate loans to credit institutions. In addition, ECB recom-mended banks to refrain from or limit dividend payments until 30 September 2021. The three main rating agencies affirmed their credit ratings for Austria. Standard & Poor’s credit rating for Austria stood at AA+ with a stable outlook. Moody’s credit rating for Austria was at Aa1 also with stable outlook. Fitch’s credit rating stood at AA+ while the outlook was revised from positive to stable in May 2020. The outlook change reflected the significant impact of the global coronavirus pandemic on Austria's economy and public finances.
Key economic indicators – Austria 2017 2018 2019 2020e
Population (ave, million) 8.8 8.8 8.9 8.9
GDP (nominal, EUR billion) 369.3 385.4 397.6 374.1
GDP/capita (in EUR thousand) 42.0 43.6 44.8 42.0
Real GDP growth 2.4 2.6 1.4 -7.2
Private consumption growth 1.6 1.1 0.8 -8.8
Exports (share of GDP) 41.1 42.1 42.7 39.9
Imports (share of GDP) 43.1 44.1 44.6 41.9
Unemployment (Eurostat definition) 5.5 4.9 4.5 5.3
Consumer price inflation (ave) 2.2 2.1 1.5 1.4
Short term interest rate (3 months average) -0.3 -0.3 -0.4 -0.4
EUR FX rate (ave) 1.0 1.0 1.0 1.0
EUR FX rate (eop) 1.0 1.0 1.0 1.0
Current account balance (share of GDP) 1.4 1.3 2.8 2.4
General government balance (share of GDP) -0.8 0.2 0.7 -9.8
Source: Erste Group

Management board | Supervisory board | Capital markets | Strategy | Financial and operating performance | Segments | Non-financial report | Corporate governance report | Audited financial reporting
27
Market review The developed and highly competitive Austrian banking sector entered the Covid-19 induced crisis with solid financial funda-mentals. Capitalisation has strengthened significantly in the last decade, and asset quality has improved substantially. Compared with levels before the global financial crisis that started in 2008, the Austrian banking sector has more than doubled its capital ratio in line with tighter prudential requirements. In 2020, banks managed to keep their capital ratios stable, partly due to regulato-ry relief measures and regulators’ recommendations to refrain from or limit dividend payments. The Systemic Risk (SRB) and the Other Systemically Important Institutions (OSII) buffers were recalibrated to 1% as of December 2020. Starting with 2021, these buffers are cumulative. The Financial Market Stability Board recommended to keep the countercyclical capital buffer at a rate of 0%. Stress test results confirmed that the domestic bank-ing sector’s risk-bearing capacity was adequate.
Source: Oesterreichische Nationalbank, Erste Group
The banking sectors’ profitability was negatively impacted by the pandemic and its implications. On the back of very low interest rates lending activity was healthy with customer loans growing by 3.9% in 2020. The Austrian government adopted a legislative moratorium on credit and interest payments between 1 April 2020 and 31 January 2021, deferring such payments by debtors suffer-ing from income losses in connection with the Covid-19 crisis for a period of ten months and extending loan tenors by the length of the moratorium. Banks were instrumental in paying out state guaranteed loans and, in case of liquidity shortages, bridging loans were made available by the government. Therefore, the impact of the crisis on asset quality was muted in 2020: The ratio of nonperforming loans remained low at year-end. On the savings side, customer deposits grew by 8.6%, driven mainly by the corporate sector. The banking system’s loan-to deposit-ratio ratio stood at 91% at the end of the year. Digital financial services and products have continuously been improved and digital penetra-tion increased further. The banking tax remained nearly un-
changed in 2020. Overall, the Austrian banking system remained profitable in 2020.
Source: Oesterreichische Nationalbank, Erste Group
Erste Bank Oesterreich and the savings banks succeeded in fur-ther increasing their combined market shares to between 20% and 23% in both retail and corporate business, benefitting from their balanced business model. George, the digital banking platform of Erste Group, proved its reliability during the lockdowns. It has defended its position as the country’s most modern and popular banking platform. With 1.9 million users in the country more than a third of the Austrian online banking customers use George. In 2020, George’s product range was again widened. ERSTE BANK OESTERREICH & SUBSIDIARIES Business review 2020 – three questions to Gerda Holzinger-Burgstaller, CEO of Erste Bank Oesterreich How did your bank cope with the Covid-19 induced crisis,
and how did you support customers and employees?
We put all our efforts into ensuring to stay in touch with our clients via all available channels to help them through these turbulent times. Making sure that we are fully operative and maintain our services was the first and foremost priority. We were permanently challenged to swiftly adapt to changing situations, be that our face-to-face client service in branches or different regulations related to government programmes to keep the econ-omy running, while guiding our clients through these extraordi-nary times. Looking ahead, we know that significant challenges will remain. The strong economic downturn will, despite substan-tial state support, take its toll, and companies as well as private individuals will be impacted. It is key that we ensure to keep on servicing our clients, providing solutions to overcome the eco-nomic challenges induced by the crisis and to support them on their way back to financial health. We have developed a wide range of initiatives not only to directly support our clients, but
142 141
154
90 92101
96 96
111
0
40
80
120
160
2018 2019 2020e
Domestic assets Domestic loans Domestic deposits
Financial intermediation – Austria (in % of GDP)Retail loans Corporate loans Retail deposits
2021 21
22 2223
2021
22
0
5
10
15
20
25
2018 2019 2020
Market shares – Austria (in %)
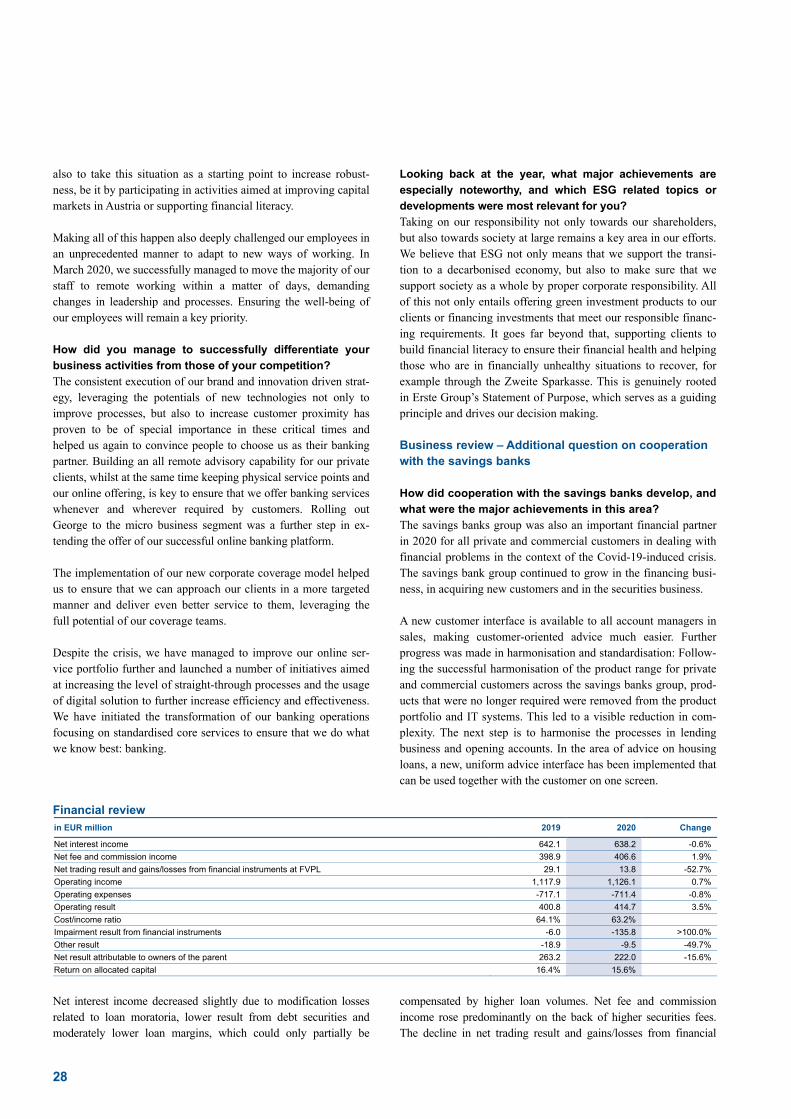
28
also to take this situation as a starting point to increase robust-ness, be it by participating in activities aimed at improving capital markets in Austria or supporting financial literacy. Making all of this happen also deeply challenged our employees in an unprecedented manner to adapt to new ways of working. In March 2020, we successfully managed to move the majority of our staff to remote working within a matter of days, demanding changes in leadership and processes. Ensuring the well-being of our employees will remain a key priority. How did you manage to successfully differentiate your
business activities from those of your competition?
The consistent execution of our brand and innovation driven strat-egy, leveraging the potentials of new technologies not only to improve processes, but also to increase customer proximity has proven to be of special importance in these critical times and helped us again to convince people to choose us as their banking partner. Building an all remote advisory capability for our private clients, whilst at the same time keeping physical service points and our online offering, is key to ensure that we offer banking services whenever and wherever required by customers. Rolling out George to the micro business segment was a further step in ex-tending the offer of our successful online banking platform. The implementation of our new corporate coverage model helped us to ensure that we can approach our clients in a more targeted manner and deliver even better service to them, leveraging the full potential of our coverage teams. Despite the crisis, we have managed to improve our online ser-vice portfolio further and launched a number of initiatives aimed at increasing the level of straight-through processes and the usage of digital solution to further increase efficiency and effectiveness. We have initiated the transformation of our banking operations focusing on standardised core services to ensure that we do what we know best: banking.
Looking back at the year, what major achievements are
especially noteworthy, and which ESG related topics or
developments were most relevant for you?
Taking on our responsibility not only towards our shareholders, but also towards society at large remains a key area in our efforts. We believe that ESG not only means that we support the transi-tion to a decarbonised economy, but also to make sure that we support society as a whole by proper corporate responsibility. All of this not only entails offering green investment products to our clients or financing investments that meet our responsible financ-ing requirements. It goes far beyond that, supporting clients to build financial literacy to ensure their financial health and helping those who are in financially unhealthy situations to recover, for example through the Zweite Sparkasse. This is genuinely rooted in Erste Group’s Statement of Purpose, which serves as a guiding principle and drives our decision making. Business review – Additional question on cooperation with the savings banks How did cooperation with the savings banks develop, and
what were the major achievements in this area?
The savings banks group was also an important financial partner in 2020 for all private and commercial customers in dealing with financial problems in the context of the Covid-19-induced crisis. The savings bank group continued to grow in the financing busi-ness, in acquiring new customers and in the securities business. A new customer interface is available to all account managers in sales, making customer-oriented advice much easier. Further progress was made in harmonisation and standardisation: Follow-ing the successful harmonisation of the product range for private and commercial customers across the savings banks group, prod-ucts that were no longer required were removed from the product portfolio and IT systems. This led to a visible reduction in com-plexity. The next step is to harmonise the processes in lending business and opening accounts. In the area of advice on housing loans, a new, uniform advice interface has been implemented that can be used together with the customer on one screen.
Financial review in EUR million 2019 2020 Change
Net interest income 642.1 638.2 -0.6%
Net fee and commission income 398.9 406.6 1.9%
Net trading result and gains/losses from financial instruments at FVPL 29.1 13.8 -52.7%
Operating income 1,117.9 1,126.1 0.7%
Operating expenses -717.1 -711.4 -0.8%
Operating result 400.8 414.7 3.5%
Cost/income ratio 64.1% 63.2%
Impairment result from financial instruments -6.0 -135.8 >100.0%
Other result -18.9 -9.5 -49.7%
Net result attributable to owners of the parent 263.2 222.0 -15.6%
Return on allocated capital 16.4% 15.6%
Net interest income decreased slightly due to modification losses related to loan moratoria, lower result from debt securities and moderately lower loan margins, which could only partially be
compensated by higher loan volumes. Net fee and commission income rose predominantly on the back of higher securities fees. The decline in net trading result and gains/losses from financial
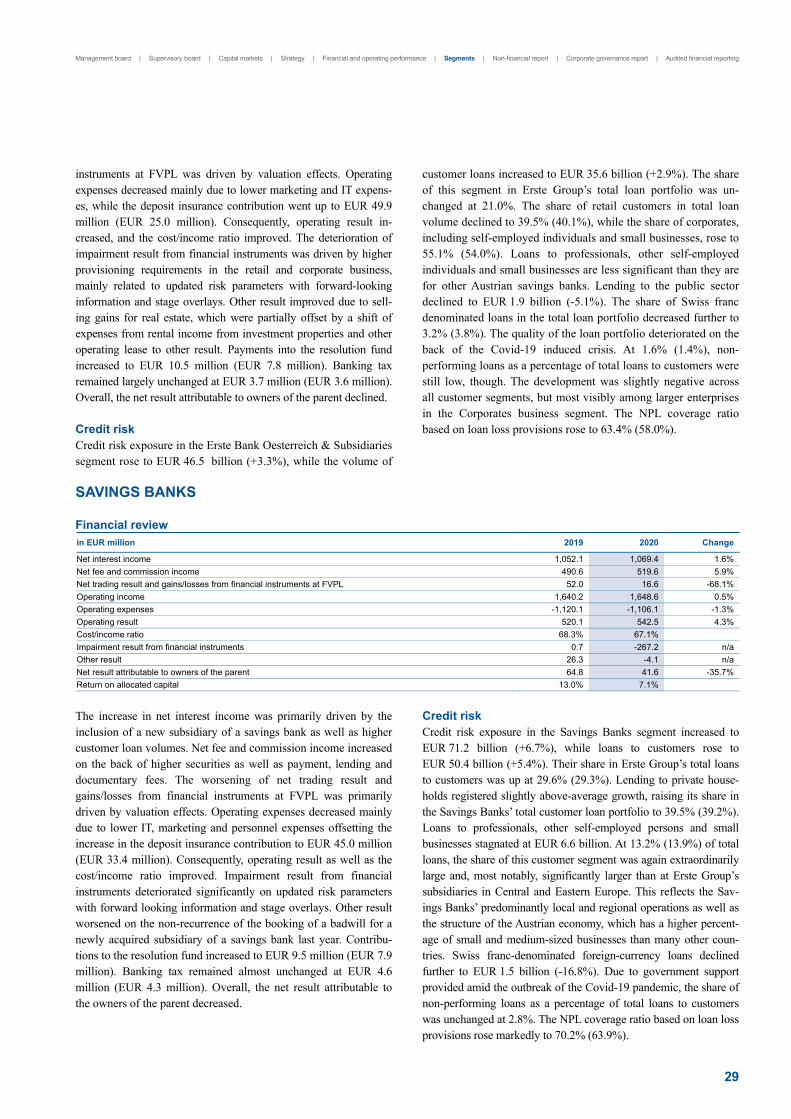
Management board | Supervisory board | Capital markets | Strategy | Financial and operating performance | Segments | Non-financial report | Corporate governance report | Audited financial reporting
29
instruments at FVPL was driven by valuation effects. Operating expenses decreased mainly due to lower marketing and IT expens-es, while the deposit insurance contribution went up to EUR 49.9 million (EUR 25.0 million). Consequently, operating result in-creased, and the cost/income ratio improved. The deterioration of impairment result from financial instruments was driven by higher provisioning requirements in the retail and corporate business, mainly related to updated risk parameters with forward-looking information and stage overlays. Other result improved due to sell-ing gains for real estate, which were partially offset by a shift of expenses from rental income from investment properties and other operating lease to other result. Payments into the resolution fund increased to EUR 10.5 million (EUR 7.8 million). Banking tax remained largely unchanged at EUR 3.7 million (EUR 3.6 million). Overall, the net result attributable to owners of the parent declined. Credit risk Credit risk exposure in the Erste Bank Oesterreich & Subsidiaries segment rose to EUR 46.5 billion (+3.3%), while the volume of
customer loans increased to EUR 35.6 billion (+2.9%). The share of this segment in Erste Group’s total loan portfolio was un-changed at 21.0%. The share of retail customers in total loan volume declined to 39.5% (40.1%), while the share of corporates, including self-employed individuals and small businesses, rose to 55.1% (54.0%). Loans to professionals, other self-employed individuals and small businesses are less significant than they are for other Austrian savings banks. Lending to the public sector declined to EUR 1.9 billion (-5.1%). The share of Swiss franc denominated loans in the total loan portfolio decreased further to 3.2% (3.8%). The quality of the loan portfolio deteriorated on the back of the Covid-19 induced crisis. At 1.6% (1.4%), non-performing loans as a percentage of total loans to customers were still low, though. The development was slightly negative across all customer segments, but most visibly among larger enterprises in the Corporates business segment. The NPL coverage ratio based on loan loss provisions rose to 63.4% (58.0%).
SAVINGS BANKS Financial review in EUR million 2019 2020 Change
Net interest income 1,052.1 1,069.4 1.6%
Net fee and commission income 490.6 519.6 5.9%
Net trading result and gains/losses from financial instruments at FVPL 52.0 16.6 -68.1%
Operating income 1,640.2 1,648.6 0.5%
Operating expenses -1,120.1 -1,106.1 -1.3%
Operating result 520.1 542.5 4.3%
Cost/income ratio 68.3% 67.1%
Impairment result from financial instruments 0.7 -267.2 n/a
Other result 26.3 -4.1 n/a
Net result attributable to owners of the parent 64.8 41.6 -35.7%
Return on allocated capital 13.0% 7.1%
The increase in net interest income was primarily driven by the inclusion of a new subsidiary of a savings bank as well as higher customer loan volumes. Net fee and commission income increased on the back of higher securities as well as payment, lending and documentary fees. The worsening of net trading result and gains/losses from financial instruments at FVPL was primarily driven by valuation effects. Operating expenses decreased mainly due to lower IT, marketing and personnel expenses offsetting the increase in the deposit insurance contribution to EUR 45.0 million (EUR 33.4 million). Consequently, operating result as well as the cost/income ratio improved. Impairment result from financial instruments deteriorated significantly on updated risk parameters with forward looking information and stage overlays. Other result worsened on the non-recurrence of the booking of a badwill for a newly acquired subsidiary of a savings bank last year. Contribu-tions to the resolution fund increased to EUR 9.5 million (EUR 7.9 million). Banking tax remained almost unchanged at EUR 4.6 million (EUR 4.3 million). Overall, the net result attributable to the owners of the parent decreased.
Credit risk Credit risk exposure in the Savings Banks segment increased to EUR 71.2 billion (+6.7%), while loans to customers rose to EUR 50.4 billion (+5.4%). Their share in Erste Group’s total loans to customers was up at 29.6% (29.3%). Lending to private house-holds registered slightly above-average growth, raising its share in the Savings Banks’ total customer loan portfolio to 39.5% (39.2%). Loans to professionals, other self-employed persons and small businesses stagnated at EUR 6.6 billion. At 13.2% (13.9%) of total loans, the share of this customer segment was again extraordinarily large and, most notably, significantly larger than at Erste Group’s subsidiaries in Central and Eastern Europe. This reflects the Sav-ings Banks’ predominantly local and regional operations as well as the structure of the Austrian economy, which has a higher percent-age of small and medium-sized businesses than many other coun-tries. Swiss franc-denominated foreign-currency loans declined further to EUR 1.5 billion (-16.8%). Due to government support provided amid the outbreak of the Covid-19 pandemic, the share of non-performing loans as a percentage of total loans to customers was unchanged at 2.8%. The NPL coverage ratio based on loan loss provisions rose markedly to 70.2% (63.9%).

30
OTHER AUSTRIA Business review 2020 – three questions to Ingo Bleier, Chief Corporates and Markets Officer How did your teams cope with the Covid-19 induced crisis,
and how did you support customers and employees?
Proactive communication via various channels (be it online contact, our call center or calls by relationship managers) ena-bled us to explore our clients’ needs and show our clients alter-natives specifically tailored to their individual business require-ments. We helped them to choose the most suitable solution to service them not only in accessing the various state support measures with minimal effort. The basis for that was to keep all banking services accessible, uninterrupted and functional as well as an excellent collaboration with risk management. While real estate was less affected by the public moratoria as most of our clients were able to meet their financial obligations, capital markets business was hit hard in March 2020. Neverthe-less, we constantly kept our doors open and provided our cus-tomers with liquidity and quick and competitive pricing, which was extremely appreciated. How did you manage to successfully differentiate your
business activities from those of your competition?
The main differentiator in 2020 was our prompt, unbureaucratic and individual client approach. Erste Group clearly proved that we have the expertise to manage a crisis situation by acting in a trust-worthy and authentic way. Our underwriting standards and risk policies allowed us to show stability in a very challenging situa-tion, and we were able to quickly take up new business opportuni-ties after the first lockdowns. In the markets area, this is reflected
in debt and equity origination mandates of almost EUR 107 billion in volume and in the execution of up to 12,000 orders per day by our clients. In Austria, 50% of our FX deals are traded digitally. Another success factor was the close cooperation between all departments, front-, back- and mid-office, as well as with our asset management company, which was able to rapidly regain volume by acting as a reliable partner and very successful portfolio man-ager. Looking back at the year, what major achievements are
especially noteworthy, and which ESG related topics or
developments were most relevant for you?
We merged the large corporate and the real estate businesses of the Holding and Erste Bank Oesterreich in Austria. In addition, we managed to strengthen relationships to our corporate and institutional clients, and we were able to grow our loan volumes on top of the Covid-19 related liquidity needs. On the corporate digital side, we improved the offering towards a multifunctional frontend for guarantees and letter of credits and we launched the first fully digital onboarding process for corpo-rates in Austria, which allows opening accounts remotely for new customers to the bank. We implemented a dedicated, cross-functional ESG team within the large corporates department and, thus, included the increas-ingly important topics of environment, social affairs and govern-ance in our strategic dialogue with clients. Furthermore, we in-troduced ESG minimum standards for the underlying selection of our entire retail structured investment product range and continu-ously trained and certified our sales team to increase the aware-ness in ESG related matters.
Financial review in EUR million 2019 2020 Change
Net interest income 406.9 451.0 10.8%
Net fee and commission income 240.7 249.9 3.8%
Net trading result and gains/losses from financial instruments at FVPL -13.0 -23.9 83.2%
Operating income 689.7 721.8 4.7%
Operating expenses -378.1 -367.2 -2.9%
Operating result 311.6 354.5 13.8%
Cost/income ratio 54.8% 50.9%
Impairment result from financial instruments -7.3 -202.3 >100.0%
Other result 47.4 -14.4 n/a
Net result attributable to owners of the parent 278.3 103.2 -62.9%
Return on allocated capital 13.3% 5.2%
Net interest income increased primarily due to growth of corpo-rate lending volumes in the Holding. Net fee and commission income increased, backed by increased securities transactions, origination and sales activities in the market business of Holding as well as by increased asset under management volumes and performance of managed funds in Erste Asset Management. Net trading result and gains/losses from financial instruments at FVPL went down due to lower valuation results of interest rate derivatives as well as a decrease in market prices of fair value securities and lower valuation of FV loans portfolio. Overall,
operating income improved. Operating expenses decreased, mostly due to lower IT related costs and depreciation. Thus, operating result and the cost/income ratio improved. The impair-ment result from financial instruments deteriorated significantly due to an increased provisioning level in corporate business, mainly related to updated risk parameters with forward-looking information and stage overlays. Other result deteriorated primari-ly due to the non-recurrence of last year’s selling gains. Other result included also the resolution fund contribution of EUR 9.6
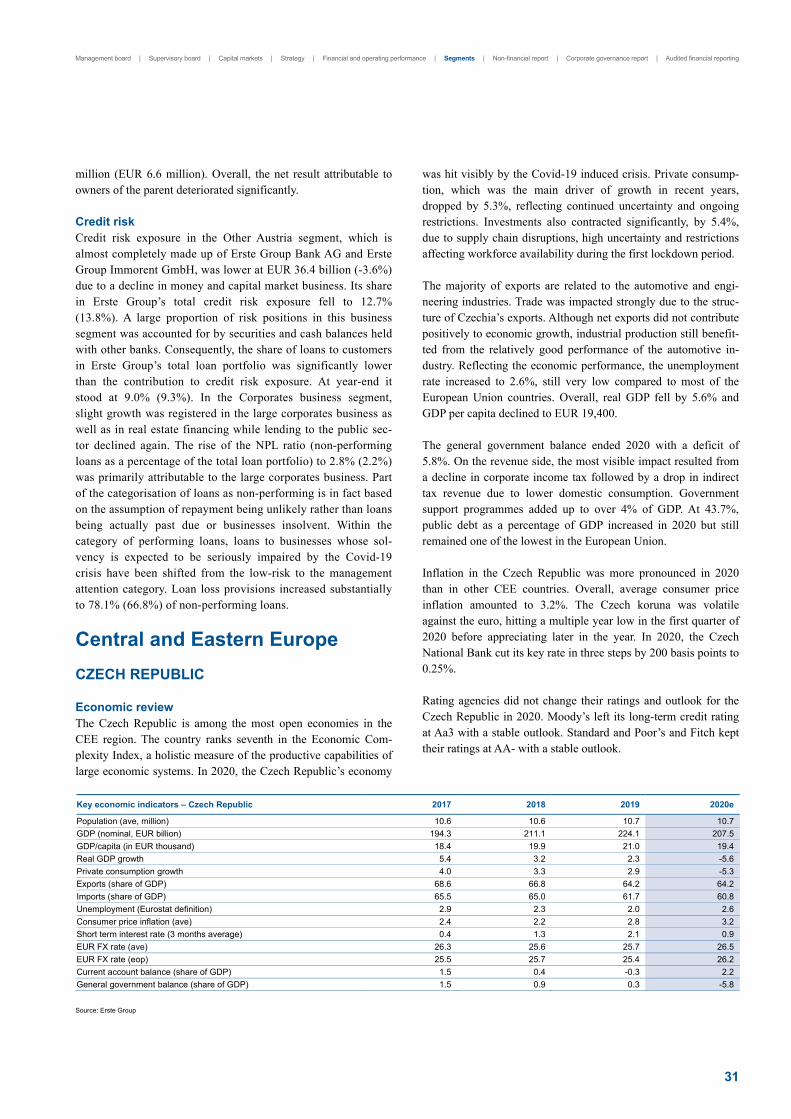
Management board | Supervisory board | Capital markets | Strategy | Financial and operating performance | Segments | Non-financial report | Corporate governance report | Audited financial reporting
31
million (EUR 6.6 million). Overall, the net result attributable to owners of the parent deteriorated significantly. Credit risk Credit risk exposure in the Other Austria segment, which is almost completely made up of Erste Group Bank AG and Erste Group Immorent GmbH, was lower at EUR 36.4 billion (-3.6%) due to a decline in money and capital market business. Its share in Erste Group’s total credit risk exposure fell to 12.7% (13.8%). A large proportion of risk positions in this business segment was accounted for by securities and cash balances held with other banks. Consequently, the share of loans to customers in Erste Group’s total loan portfolio was significantly lower than the contribution to credit risk exposure. At year-end it stood at 9.0% (9.3%). In the Corporates business segment, slight growth was registered in the large corporates business as well as in real estate financing while lending to the public sec-tor declined again. The rise of the NPL ratio (non-performing loans as a percentage of the total loan portfolio) to 2.8% (2.2%) was primarily attributable to the large corporates business. Part of the categorisation of loans as non-performing is in fact based on the assumption of repayment being unlikely rather than loans being actually past due or businesses insolvent. Within the category of performing loans, loans to businesses whose sol-vency is expected to be seriously impaired by the Covid-19 crisis have been shifted from the low-risk to the management attention category. Loan loss provisions increased substantially to 78.1% (66.8%) of non-performing loans.
Central and Eastern Europe
CZECH REPUBLIC Economic review The Czech Republic is among the most open economies in the CEE region. The country ranks seventh in the Economic Com-plexity Index, a holistic measure of the productive capabilities of large economic systems. In 2020, the Czech Republic’s economy
was hit visibly by the Covid-19 induced crisis. Private consump-tion, which was the main driver of growth in recent years, dropped by 5.3%, reflecting continued uncertainty and ongoing restrictions. Investments also contracted significantly, by 5.4%, due to supply chain disruptions, high uncertainty and restrictions affecting workforce availability during the first lockdown period. The majority of exports are related to the automotive and engi-neering industries. Trade was impacted strongly due to the struc-ture of Czechia’s exports. Although net exports did not contribute positively to economic growth, industrial production still benefit-ted from the relatively good performance of the automotive in-dustry. Reflecting the economic performance, the unemployment rate increased to 2.6%, still very low compared to most of the European Union countries. Overall, real GDP fell by 5.6% and GDP per capita declined to EUR 19,400. The general government balance ended 2020 with a deficit of 5.8%. On the revenue side, the most visible impact resulted from a decline in corporate income tax followed by a drop in indirect tax revenue due to lower domestic consumption. Government support programmes added up to over 4% of GDP. At 43.7%, public debt as a percentage of GDP increased in 2020 but still remained one of the lowest in the European Union. Inflation in the Czech Republic was more pronounced in 2020 than in other CEE countries. Overall, average consumer price inflation amounted to 3.2%. The Czech koruna was volatile against the euro, hitting a multiple year low in the first quarter of 2020 before appreciating later in the year. In 2020, the Czech National Bank cut its key rate in three steps by 200 basis points to 0.25%. Rating agencies did not change their ratings and outlook for the Czech Republic in 2020. Moody’s left its long-term credit rating at Aa3 with a stable outlook. Standard and Poor’s and Fitch kept their ratings at AA- with a stable outlook.
Key economic indicators – Czech Republic 2017 2018 2019 2020e
Population (ave, million) 10.6 10.6 10.7 10.7
GDP (nominal, EUR billion) 194.3 211.1 224.1 207.5
GDP/capita (in EUR thousand) 18.4 19.9 21.0 19.4
Real GDP growth 5.4 3.2 2.3 -5.6
Private consumption growth 4.0 3.3 2.9 -5.3
Exports (share of GDP) 68.6 66.8 64.2 64.2
Imports (share of GDP) 65.5 65.0 61.7 60.8
Unemployment (Eurostat definition) 2.9 2.3 2.0 2.6
Consumer price inflation (ave) 2.4 2.2 2.8 3.2
Short term interest rate (3 months average) 0.4 1.3 2.1 0.9
EUR FX rate (ave) 26.3 25.6 25.7 26.5
EUR FX rate (eop) 25.5 25.7 25.4 26.2
Current account balance (share of GDP) 1.5 0.4 -0.3 2.2
General government balance (share of GDP) 1.5 0.9 0.3 -5.8
Source: Erste Group
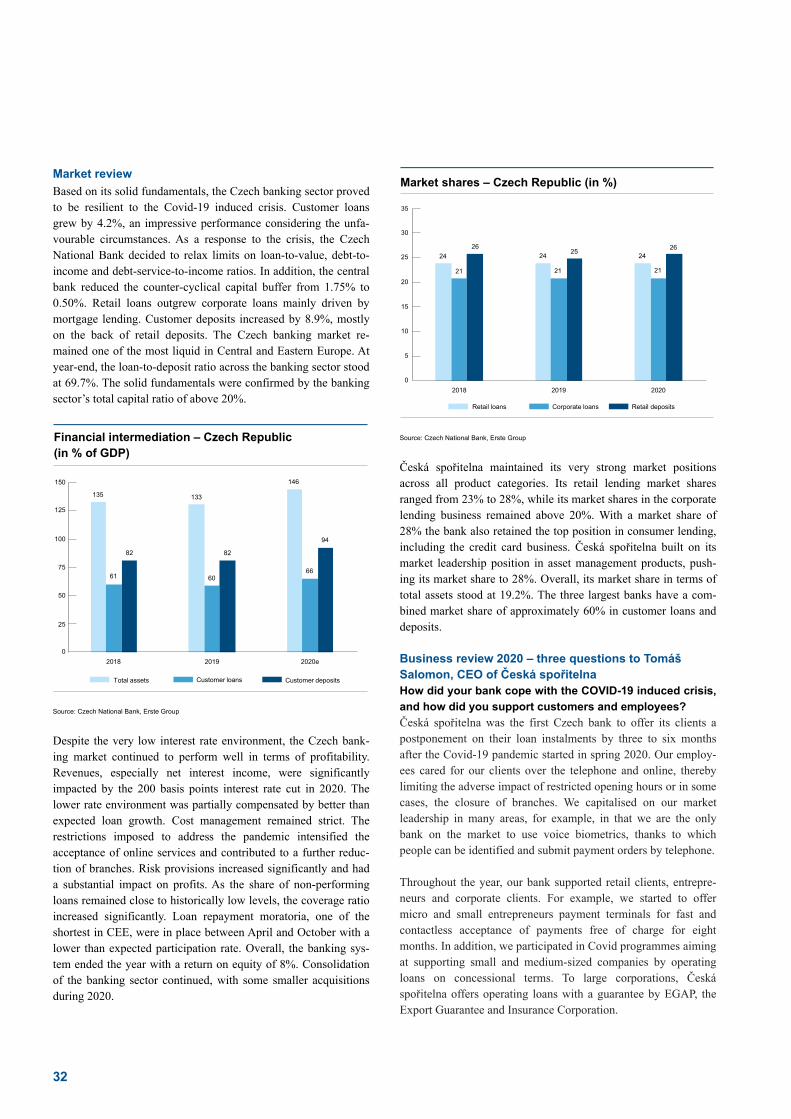
32
Market review
Based on its solid fundamentals, the Czech banking sector proved to be resilient to the Covid-19 induced crisis. Customer loans grew by 4.2%, an impressive performance considering the unfa-vourable circumstances. As a response to the crisis, the Czech National Bank decided to relax limits on loan-to-value, debt-to-income and debt-service-to-income ratios. In addition, the central bank reduced the counter-cyclical capital buffer from 1.75% to 0.50%. Retail loans outgrew corporate loans mainly driven by mortgage lending. Customer deposits increased by 8.9%, mostly on the back of retail deposits. The Czech banking market re-mained one of the most liquid in Central and Eastern Europe. At year-end, the loan-to-deposit ratio across the banking sector stood at 69.7%. The solid fundamentals were confirmed by the banking sector’s total capital ratio of above 20%.
Source: Czech National Bank, Erste Group
Despite the very low interest rate environment, the Czech bank-ing market continued to perform well in terms of profitability. Revenues, especially net interest income, were significantly impacted by the 200 basis points interest rate cut in 2020. The lower rate environment was partially compensated by better than expected loan growth. Cost management remained strict. The restrictions imposed to address the pandemic intensified the acceptance of online services and contributed to a further reduc-tion of branches. Risk provisions increased significantly and had a substantial impact on profits. As the share of non-performing loans remained close to historically low levels, the coverage ratio increased significantly. Loan repayment moratoria, one of the shortest in CEE, were in place between April and October with a lower than expected participation rate. Overall, the banking sys-tem ended the year with a return on equity of 8%. Consolidation of the banking sector continued, with some smaller acquisitions during 2020.
Source: Czech National Bank, Erste Group
Česká spořitelna maintained its very strong market positions across all product categories. Its retail lending market shares ranged from 23% to 28%, while its market shares in the corporate lending business remained above 20%. With a market share of 28% the bank also retained the top position in consumer lending, including the credit card business. Česká spořitelna built on its market leadership position in asset management products, push-ing its market share to 28%. Overall, its market share in terms of total assets stood at 19.2%. The three largest banks have a com-bined market share of approximately 60% in customer loans and deposits. Business review 2020 – three questions to Tomáš Salomon, CEO of Česká spořitelna How did your bank cope with the COVID-19 induced crisis,
and how did you support customers and employees?
Česká spořitelna was the first Czech bank to offer its clients a postponement on their loan instalments by three to six months after the Covid-19 pandemic started in spring 2020. Our employ-ees cared for our clients over the telephone and online, thereby limiting the adverse impact of restricted opening hours or in some cases, the closure of branches. We capitalised on our market leadership in many areas, for example, in that we are the only bank on the market to use voice biometrics, thanks to which people can be identified and submit payment orders by telephone. Throughout the year, our bank supported retail clients, entrepre-neurs and corporate clients. For example, we started to offer micro and small entrepreneurs payment terminals for fast and contactless acceptance of payments free of charge for eight months. In addition, we participated in Covid programmes aiming at supporting small and medium-sized companies by operating loans on concessional terms. To large corporations, Česká spořitelna offers operating loans with a guarantee by EGAP, the Export Guarantee and Insurance Corporation.
Customer loans Customer depositsTotal assets
135 133
146
61 6066
82 82
94
0
25
50
75
100
125
150
2018 2019 2020e
Financial intermediation – Czech Republic (in % of GDP)
35
Retail loans Corporate loans Retail deposits
24 24 24
21 21 21
2625
26
0
5
10
15
20
25
30
2018 2019 2020
Market shares – Czech Republic (in %)

Management board | Supervisory board | Capital markets | Strategy | Financial and operating performance | Segments | Non-financial report | Corporate governance report | Audited financial reporting
33
To alleviate the challenging situations of vulnerable clients we did not hesitate to temporarily cancel some fees. Our bank also offered its facilities to the government. In co-operation with the Ministry of Health and public health stations, Česká spořitelna has formed a specialised tracking team at its client centre, comprised of experienced operators. The team has joined the efforts against the spreading of the Coronavirus, help-ing public health authorities to track infected persons. Most re-cently, Česká spořitelna launched a special phone line for seniors over 80, to help them to register for the Covid-19 vaccination. It goes without saying that Česká spořitelna also paid special attention to its employees. The bank enabled its employees to work from home to the greatest possible extent. How did you manage to successfully differentiate your
business activities from those of your competition?
Česká spořitelna further boosted its market leadership in many fields. After 12 years, Česká spořitelna ranked top in the mort-gage market in terms of new sales (plus CZK 66 billion, approx-imately EUR 2.6 billion, in 2020). Our mortgage portfolio reached CZK 300 billion (approximately EUR 11.4 billion). We strengthened our leading position in asset and wealth man-agement. In autumn 2020, the volume of assets under manage-ment of retail investors reached CZK 200 billion (ca. EUR 7.6 billion). Our share on the mutual funds market grew to 27.6%. The efforts targeted at further improving our digital solutions were equally successful. The number of mobile George users
grew to almost 1 million. Thanks to our initiatives, our overall net promoter score increased by 7 points to 28. Looking back at the year, what major achievements are
especially noteworthy, and which ESG related topics or
developments were most relevant for you?
Our bank once again confirmed its position as responsible corpo-rate citizen of the Czech Republic that significantly contributes to the country’s growth and prosperity. Apart from the above men-tioned efforts targeted to help the government to deal with the Covid-19 induced crisis, we kept on striving to enhance E-government, a modern and efficient administration. Together with ČSOB and Komerční banka, we made it possible for our clients to start using their bank ID for registering to e-government ser-vices as of 1 January 2021. Later on, the use of the bank ID as a universal identification tool will be further extended to commer-cial services providers. We also initiated the launch of the National Development Fund that is intended to help to finance significant infrastructural pro-jects in the Czech Republic. We were among the initiators of the ESG platform of the Czech Banking Association. The ambition is to formulate ESG standards for banks and financial institutions operating on the Czech market. Thanks to our innovation efforts, we won the Bank of the Year trophy awarded by the British magazine The Banker in the Czech Republic.
Financial review in EUR million 2019 2020 Change
Net interest income 1,141.1 1,049.0 -8.1%
Net fee and commission income 334.7 311.6 -6.9%
Net trading result and gains/losses from financial instruments at FVPL 109.7 94.7 -13.7%
Operating income 1,600.5 1,466.6 -8.4%
Operating expenses -753.9 -722.4 -4.2%
Operating result 846.6 744.2 -12.1%
Cost/income ratio 47.1% 49.3%
Impairment result from financial instruments 6.2 -299.8 n/a
Other result -27.6 -25.6 -7.1%
Net result attributable to owners of the parent 666.5 334.7 -49.8%
Return on allocated capital 26.6% 12.9%
The segment analysis is done on a constant currency basis. The CZK depreciated by 3.1% against the EUR in the reporting period. Net interest income in the Czech Republic segment (comprising Česká spořitelna Group) de-creased primarily due to significantly lower interest rates as well as a loan repayment moratorium lead-ing to modification losses. Net fee and commission income de-creased due to lower maintenance fees for current accounts in the retail segment as well as lower payment fees on the back of the euro cross border payments regulation SEPA and the Covid-19 impact. These developments were partially offset by an increase in securities fees. The lower result from net trading and from
gains/losses from financial instruments at FVPL was attributable to negative valuation effects. Personnel costs decreased, and to-gether with lower travel, training and marketing costs, led to a de-cline in operating expenses, while IT costs and depreciation in-creased. The deposit insurance contribution amounted to EUR 10.1 million (EUR 10.4 million). Overall, operating result de-clined, the cost/income ratio worsened. Impairment result from financial instruments deteriorated as a consequence of updates of risk parameters with forward looking information and stage over-lays. The other result improved slightly. Contributions to the reso-lution fund amounted to EUR 29.1 million (EUR 26.6 million).

34
Altogether, these developments led to a decrease in the net result attributable to the owners of the parent. Credit risk Credit risk exposure in the Czech Republic segment rose to EUR 62.0 billion (+3.5%). Compared with previous years, loans to customers grew more slowly and amounted to EUR 29.6 billion (+1.4%), which was largely due to the depreciation of the Czech koruna against the euro. While the retail business posted marginal growth, loans to corporate customers were slightly down. Customer loan volume as a percentage of Erste Group’s total loans to custom-ers fell to 17.4% (17.9%). In terms of business volume, the Czech Republic is still by far the second most important market for Erste Group after Austria. Despite a slight downward trend, the quality of customer loans was again better than in Erste Group’s other core markets in Central and Eastern Europe. Non-performing loans as a percentage of total loans to customers rose to 2.2% (1.8%). In addi-tion to overdue payments and insolvencies, a major part of defaults in both the Retail and the Corporates business segments was at-tributable to a critical review of future debt servicing ability against the backdrop of the Covid-19 induced crisis. Loan loss provisions increased significantly to 115.1% (96.3%) of non-performing loans. SLOVAKIA Economic review Slovakia is an open economy characterised by strong automotive, electronics and services sectors. The Covid-19 induced crisis pushed the country’s economy into a broad-based recession in 2020. Investment, private consumption and net exports contracted significantly. In the second quarter of 2020, Slovakia saw a his-toric decline in GDP, followed by a very strong recovery in the third quarter predominantly on the back of a strong export per-formance. The latter benefited from the traditionally strong car
industry. Services related to tourism, accommodation, restaurants and culture were severely hit, while the industry sector performed relatively well. The country’s labour market, despite being nega-tively affected, showed signs of resilience. The unemployment rate rose moderately to 6.8% as government measures protected jobs and mitigated negative impacts. Overall, real GDP fell by 5.2%, and GDP per capita declined to EUR 16,600. Public finances deteriorated significantly against the backdrop of declining revenues and sizeable fiscal support measures cushion-ing the economic impact of the pandemic. Revenues were nega-tively impacted by weak tax revenues and social contributions. The main measures encompassed employment support, sickness and nursing benefits as well as rent subsidies. Consequently, the fiscal deficit deteriorated to 8.0%. The country’s public debt as a percentage of GDP increased to 60%. Inflation slowed down in 2020. Average consumer price inflation eased to 1.9%, mainly driven by lower energy prices. Wage growth was less pronounced than previously expected. As Slo-vakia is part of the euro zone, its monetary policy is set by the European Central Bank which kept its discount rate at zero in 2020. In the context of the pandemic, the European Central Bank introduced the Pandemic Emergency Purchase Programme and long-term refinancing operations (TLTRO) as important compo-nents of its monetary policy. Moody’s kept its long-term credit rating of A2 with a stable out-look for Slovakia. Standard & Poor’s also left its rating un-changed at A+ but changed its outlook from stable to negative in July 2020. Fitch downgraded Slovakia’s long-term credit rating from A+ to A in May and changed its outlook in another step from stable to negative in November.
Key economic indicators – Slovakia 2017 2018 2019 2020e
Population (ave, million) 5.4 5.5 5.5 5.5
GDP (nominal, EUR billion) 84.5 89.5 93.9 90.8
GDP/capita (in EUR thousand) 15.5 16.4 17.2 16.6
Real GDP growth 3.0 3.8 2.3 -5.2
Private consumption growth 4.5 4.2 2.2 -0.7
Exports (share of GDP) 83.4 84.0 80.6 72.5
Imports (share of GDP) 82.7 84.2 81.6 73.0
Unemployment (Eurostat definition) 8.1 6.5 5.8 6.8
Consumer price inflation (ave) 1.3 2.5 2.7 1.9
Short term interest rate (3 months average) -0.3 -0.3 -0.4 0.0
Current account balance (share of GDP) -1.9 -2.2 -2.7 -2.7
General government balance (share of GDP) -0.9 -1.0 -1.4 -8.0
Source: Erste Group
Market review Market loan and deposit growth continued at a solid pace in 2020. Customer loans increased by 5.1%, driven by housing loans, which grew by 9.2%. Consumer loans, on the other hand, de-clined by 8.2% mainly due to the impact from the Covid-19 induced measures and stricter debt-service-to-income (DSTI) limits from the beginning of 2020. Corporate loans grew by
1.7%, with state guarantees and payment deferrals providing liquidity. At 6.3%, customer deposits rose faster than customer loans, resulting in a system loan-to-deposit ratio of 101.4%. Asset management continued its positive development, with an annual growth rate of 6.0%. Consolidation in the Slovak banking market continued, with KBC acquiring OTP’s Slovak subsidiary in Feb-ruary 2020.

Management board | Supervisory board | Capital markets | Strategy | Financial and operating performance | Segments | Non-financial report | Corporate governance report | Audited financial reporting
35
Source: National Bank of Slovakia, Erste Group
The Slovak banking sector remained profitable in 2020. The very low interest rate environment continued to weigh on net interest income. Fee and commission income benefitted from asset man-agement and insurance brokerage business. Banks started to increase fees for cash transactions. Expenses remained under control, financial institutions reduced their number of branches and employees. Risk provisions increased significantly and be-came a main factor in reducing the banking sector’s profitability. The NPL ratio decreased further to 2.5%, with the rate of default-ed clients in moratoria staying at lower than expected levels. Banking tax, based on total liabilities, excluding equity and sub-ordinated debt, was discontinued after the second quarter of 2020. The banking sector remained well capitalised. Overall, the sec-tor’s return on equity stood at 5.4%.
Source: National Bank of Slovakia, Erste Group
Slovenská sporiteľňa remained the country’s largest bank. It continues to control approximately one fifth of the country’s banking market in terms of total assets and led the market in retail
loans and deposits. In 2020, the bank continued to benefit from its very strong asset management business, holding a 26.4% market share. Slovenská sporiteľňa continued to have significant-ly higher market shares in the retail sector than in the corporate sector. In the retail loan business, the bank’s market share amounted to 25.4%, while for corporate lending it stood at 17.3%. At 11.9%, its market share in corporate deposits was also significantly lower than in retail deposits at 28.4%. Business review 2020 – three questions to Peter Krutil, CEO of Slovenská sporiteľňa How did your bank cope with the Covid-19 induced crisis,
and how did you support customers and employees? We responded swiftly, and extraordinary measures were taken to save the most precious thing there is – human life. We provided protection equipment in the branch network and the headquarters. Most of the employees worked from home. Together with Slov-enská sporiteľňa Foundation, we set up a fund of over EUR 1 million to help fight the pandemic. Half of this amount was ear-marked for a specialised testing device that increased the national testing capacity significantly. Starting in the last quarter of 2020, colleagues from the client centre have been helping as operators for state-organised Covid-19 help lines. To preserve financial health we granted free accounts and fee discounts for six months to vulnerable clients. We participated actively in the state loan moratoria, providing clients with the option to apply for the deferral digitally through George from the first day the moratoria were allowed. The automated process shortened the waiting period significantly. Our help for corporate clients included, among others, an individual approach in case of any difficulties on top of the state moratoria and the First Aid Package with a free-of-charge current account and point of sale terminal for one year. We implemented a variety of useful digital solutions to minimise the need for a visit to a branch or a corpo-rate centre. How did you manage to successfully differentiate your
business activities from those of your competition?
In addition to our exceptional response to the pandemic, confirm-ing our role as a responsible and innovative leader, we focused on business. We rolled out the new Financial Plan enabling clients to see all their assets on a tablet screen, while the branch advisor can easily model optimal allocations to many possible products, e.g. savings account, investments in mutual funds, life and pension insurance. These can be easily set up during the client’s visit. Thanks to the Financial Plan the demand for mutual fund invest-ments increased, our market share in this area rose by almost 2 percentage points. Clients also appreciated the various types of insurance products offered. Over the last years, with more than 650,000 active George users and with the successful corporate banking application Busi-ness24, Slovenská sporiteľňa became the digital leader in Slo-vakia. We introduced new features to support our omnichannel
Customer loans Customer depositsTotal assets
89 90
101
68 68
74
67 6773
0
20
40
60
80
100
2018 2019 2020e
Financial intermediation – Slovakia (in % of GDP)
Retail loans Corporate loans Retail deposits
27
25
26
1416
17
28 28 28
0
5
10
15
20
25
30
35
40
2018 2019 2020
Market shares – Slovakia (in %)

36
approach, enabling clients to interact with us in any way they feel comfortable with, seamlessly switching between the preferred channels. Yet, we remain the bank with the broadest physical distribution network in Slovakia, while we continuously improve our digital solutions. Looking back at the year, what major achievements are
especially noteworthy, and which ESG related topics or
developments were most relevant for you?
The new situation made a new way of working necessary. How-ever, we were on the right path already, with activities focused on an agile approach and on digitalisation. Since April 2020, labs and self-steering teams have been a fully integrated part of the organisational structure. The crisis did not force us to change the path, it just pushed us to follow it faster. We managed to deliver new digital solutions quickly, and the whole bank was able to switch to online working without any significant difficulties. Although the financial results of 2020 were affected by the Covid-19 induced recession, they were significantly better com-
pared to the initial forecasts made in the first weeks of the pan-demic. Operating profit was only slightly lower than a year ago and the net profit was dragged down solely due to prudent provi-sioning. The continued growth in the corporate segment was a real success as we proved that Slovenská sporiteľňa has become the bank of choice not only for retail, but also for corporate cus-tomers. Our balance sheet management contributed to the posi-tive results. We made right investment decisions amid tumbling financial markets and utilised the advantageous TLTRO III fund-ing. In retail banking, the most successful areas were asset man-agement and bancassurance. We have devoted significant attention to optimising the bank’s processes for reducing consumption of energy and paper. We strive for the possibility to issue green bonds already in 2021. Our bank, together with Slovenská sporiteľňa Foundation, supports many initiatives helping Slovakia to become a modern and re-sponsible country. Art and culture, financial education, environ-mental and social responsibility are the main areas of our spon-soring activities.
Financial review in EUR million 2019 2020 Change
Net interest income 433.6 438.4 1.1%
Net fee and commission income 145.2 147.1 1.4%
Net trading result and gains/losses from financial instruments at FVPL 18.8 11.8 -37.3%
Operating income 605.7 601.2 -0.7%
Operating expenses -288.7 -287.1 -0.6%
Operating result 317.0 314.1 -0.9%
Cost/income ratio 47.7% 47.8%
Impairment result from financial instruments -42.7 -107.9 >100.0%
Other result -39.1 -49.3 26.1%
Net result attributable to owners of the parent 187.7 115.8 -38.3%
Return on allocated capital 17.6% 10.5%
Net interest income in the Slovakia segment (comprising Slov-enská sporitel’ňa Group) increased mainly due to the changed disclosure of prepayment fees resulting in a shift from the line item net fee and commission income. As a consequence, net fee and commission income increased only slightly despite higher fees for securities and insurance brokerage. Net trading result and gains/losses from financial instruments at FVPL declined due to valuation effects. Operating expenses decreased on the back of lower depreciation, which offset higher personnel and IT expens-es. Deposit insurance contribution amounted to EUR 1.1 million (EUR 1.0 million). Overall, operating result decreased moderate-ly, and the cost/income ratio remained largely stable. Impairment result from financial instruments deteriorated primarily due to higher provisions in retail and corporate business, mainly caused by updated risk parameters and stage overlays as well as new defaults in corporate business. Other result deteriorated mainly due to the impairment of a participation. Banking tax was charged for the last time in the first half of the year and increased slightly to EUR 33.8 million (EUR 32.5 million). Payment into the reso-lution fund rose to EUR 4.0 million (EUR 3.1 million). Overall, the net result attributable to the owners of the parent decreased.
Credit risk Credit risk exposure in the Slovakia segment amounted to EUR 21.0 billion (+5.8%), while loans to customers rose to EUR 15.3 billion (+5.9%). On the back of slightly above-average growth rates, their share in Erste Group’s total loan portfolio rose to 9.0% (8.8%). As in the previous year, growth was mainly driven by strong demand for loans in the Corporates business segment, especially by large corporates. Despite the increasing proportion of loans to corporate customers, the share of loans to private households was again significantly larger in the Slovakia segment than in other core markets and accounted for 67.2% (68.8%) of total loans to customers. This customer mix with a substantial proportion of retail mortgage loans also explains the large share of secured business of 58.7% (60.0%) in the entire loan portfolio, which exceeds that of other Central and Eastern European core markets. In contrast to the general trend in Erste Group, the quality of the loan portfolio improved significantly. The NPL ratio declined to 2.4% (3.0%). The positive trend was particularly notable in the Retail business segment. Loan loss provisions exceeded non-performing loans. The NPL coverage ratio rose to 107.4% (80.8%).
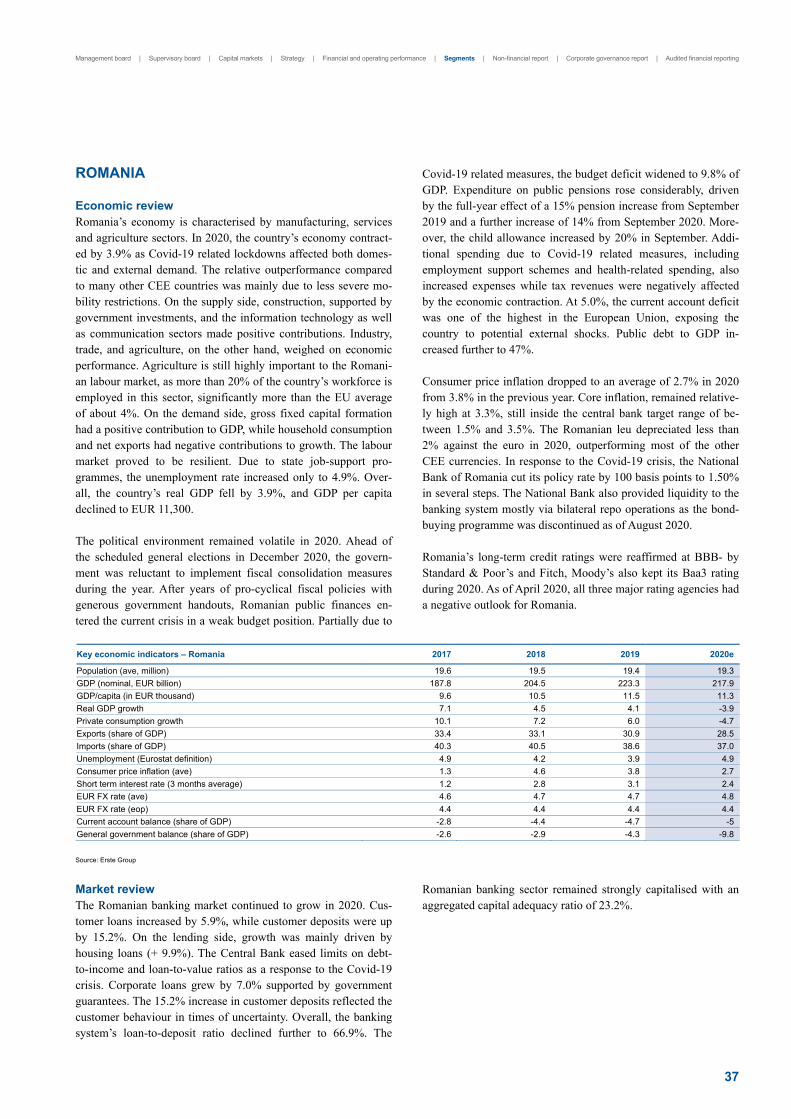
Management board | Supervisory board | Capital markets | Strategy | Financial and operating performance | Segments | Non-financial report | Corporate governance report | Audited financial reporting
37
ROMANIA Economic review Romania’s economy is characterised by manufacturing, services and agriculture sectors. In 2020, the country’s economy contract-ed by 3.9% as Covid-19 related lockdowns affected both domes-tic and external demand. The relative outperformance compared to many other CEE countries was mainly due to less severe mo-bility restrictions. On the supply side, construction, supported by government investments, and the information technology as well as communication sectors made positive contributions. Industry, trade, and agriculture, on the other hand, weighed on economic performance. Agriculture is still highly important to the Romani-an labour market, as more than 20% of the country’s workforce is employed in this sector, significantly more than the EU average of about 4%. On the demand side, gross fixed capital formation had a positive contribution to GDP, while household consumption and net exports had negative contributions to growth. The labour market proved to be resilient. Due to state job-support pro-grammes, the unemployment rate increased only to 4.9%. Over-all, the country’s real GDP fell by 3.9%, and GDP per capita declined to EUR 11,300. The political environment remained volatile in 2020. Ahead of the scheduled general elections in December 2020, the govern-ment was reluctant to implement fiscal consolidation measures during the year. After years of pro-cyclical fiscal policies with generous government handouts, Romanian public finances en-tered the current crisis in a weak budget position. Partially due to
Covid-19 related measures, the budget deficit widened to 9.8% of GDP. Expenditure on public pensions rose considerably, driven by the full-year effect of a 15% pension increase from September 2019 and a further increase of 14% from September 2020. More-over, the child allowance increased by 20% in September. Addi-tional spending due to Covid-19 related measures, including employment support schemes and health-related spending, also increased expenses while tax revenues were negatively affected by the economic contraction. At 5.0%, the current account deficit was one of the highest in the European Union, exposing the country to potential external shocks. Public debt to GDP in-creased further to 47%. Consumer price inflation dropped to an average of 2.7% in 2020 from 3.8% in the previous year. Core inflation, remained relative-ly high at 3.3%, still inside the central bank target range of be-tween 1.5% and 3.5%. The Romanian leu depreciated less than 2% against the euro in 2020, outperforming most of the other CEE currencies. In response to the Covid-19 crisis, the National Bank of Romania cut its policy rate by 100 basis points to 1.50% in several steps. The National Bank also provided liquidity to the banking system mostly via bilateral repo operations as the bond-buying programme was discontinued as of August 2020. Romania’s long-term credit ratings were reaffirmed at BBB- by Standard & Poor’s and Fitch, Moody’s also kept its Baa3 rating during 2020. As of April 2020, all three major rating agencies had a negative outlook for Romania.
Key economic indicators – Romania 2017 2018 2019 2020e
Population (ave, million) 19.6 19.5 19.4 19.3
GDP (nominal, EUR billion) 187.8 204.5 223.3 217.9
GDP/capita (in EUR thousand) 9.6 10.5 11.5 11.3
Real GDP growth 7.1 4.5 4.1 -3.9
Private consumption growth 10.1 7.2 6.0 -4.7
Exports (share of GDP) 33.4 33.1 30.9 28.5
Imports (share of GDP) 40.3 40.5 38.6 37.0
Unemployment (Eurostat definition) 4.9 4.2 3.9 4.9
Consumer price inflation (ave) 1.3 4.6 3.8 2.7
Short term interest rate (3 months average) 1.2 2.8 3.1 2.4
EUR FX rate (ave) 4.6 4.7 4.7 4.8
EUR FX rate (eop) 4.4 4.4 4.4 4.4
Current account balance (share of GDP) -2.8 -4.4 -4.7 -5
General government balance (share of GDP) -2.6 -2.9 -4.3 -9.8
Source: Erste Group
Market review The Romanian banking market continued to grow in 2020. Cus-tomer loans increased by 5.9%, while customer deposits were up by 15.2%. On the lending side, growth was mainly driven by housing loans (+ 9.9%). The Central Bank eased limits on debt-to-income and loan-to-value ratios as a response to the Covid-19 crisis. Corporate loans grew by 7.0% supported by government guarantees. The 15.2% increase in customer deposits reflected the customer behaviour in times of uncertainty. Overall, the banking system’s loan-to-deposit ratio declined further to 66.9%. The
Romanian banking sector remained strongly capitalised with an aggregated capital adequacy ratio of 23.2%.

38
Source: National Bank of Romania, Erste Group
Consolidation of the Romanian banking sector was halted due to the uncertainties related to the pandemic. The banking sector remained profitable despite the low interest rate environment and the significant amount of forward-looking risk provisions. Asset quality did not deteriorate. Moratoria for retail and corporate clients were in place between April and December. Cost control remained strict. The banking levy was cancelled. Overall, the Romanian banking sector achieved a return on equity of 8.9% in 2020.
Source: National Bank of Romania, Erste Group
Banca Comercială Română regained its leading market position in terms of customer loans in 2020, and it remained the second largest bank of the country based on its total asset market share and customer deposits The bank kept its market leader position in asset management and in mortgage lending. The bank’s customer loan market share increased to 15.1%. Its retail loan market share amounted to 17.1%, while in the corporate sector it increased to 12.9%. Banca Comercială Română’s customer deposit market
share remained broadly stable at 14.3%. In terms of total assets, Banca Comercială Română had a market share of 14.2% in 2020. Business review 2020 – three questions to Sergiu Manea, CEO of Banca Comercială Română How did your bank cope with the Covid-19 induced crisis,
and how did you support customers and employees? We managed to adapt rapidly to the new reality. Being well aware of our customers’ concerns – uncertainty, health, business and job losses – we primarily aimed to remain accessible for our custom-ers and help save as many jobs as possible. The strategy imple-mented in the past years, which included fast digitalisation and caution in risk assessment, fully proved its validity. Most of the banking operations can now be done 100% online. Thanks to the fast digitalisation process, our colleagues focused more on one-on-one consulting, accelerating our financial and entrepreneurial education initiatives. We introduced simplified flows to swiftly and remotely address both retail and corporate clients’ needs for payment deferrals, also offering short-term prolongations of revolving facilities and emergency working capital financing to support businesses. Through such measures, we supported and assisted companies that employ more than 300,000 people. Over 4,800 companies were supported through new loans, including the SME Invest programme. We deferred instalments for about 41,000 loans for individuals and 500 loans for companies. We also took measures to protect our employees and ensure a safe working environment in both headquarters and the branch net-work. While our colleagues in headquarters have been working mainly from home, branch network staff has worked in shifts to stay close to our customers. We implemented strict rules regard-ing for working in the office. To ensure further protection and proper traceability branch visits have only been allowed on prior appointment since October. We also had an active role in supporting the impacted communi-ties. EUR 1.7 million were donated for the national health care system, education and NGOs by our bank. How did you manage to successfully differentiate your
business activities from those of your competition?
We adopted a new way of working based on agile principles. We embraced new technologies and developed new skills and capa-bilities. George, our banking platform, is one of the most evolved digital banking ecosystems in the market. We reached 1.8 million users for internet and mobile banking, over 1 million are active George users. As a result, the number of digital transactions more than doubled. In addition, all new sav-ings accounts were opened via George, and 1/3 of the new cash loans were granted end-to-end digitally.
Customer loans Customer depositsTotal assets
47 47
53
27 26 28
36 36
42
0
20
40
60
80
2018 2019 2020e
Financial intermediation – Romania (in % of GDP)
35
Retail loans Corporate loans Retail deposits
17 17 17
1112
13
15 15 15
0
5
10
15
20
25
30
2018 2019 2020
Market shares – Romania (in %)

Management board | Supervisory board | Capital markets | Strategy | Financial and operating performance | Segments | Non-financial report | Corporate governance report | Audited financial reporting
39
We initiated seven digital labs with dedicated internal teams to develop new digital solutions, an agile working mindset and to better understand customers’ needs by analysing their data. Products and services that were usually launched in months or years, have been implemented in a few weeks. As a result, cus-tomers’ perception towards Banca Comercială Română has significantly improved. On the corporate side, we launched dedicated manuals for entrepreneurs to access state grants (SME Invest, non-reimbursable grants). Looking back at the year, what major achievements are
especially noteworthy, and which ESG related topics or
developments were most relevant for you?
We achieved a mid-single digit increase in operating performance and a good bottom line result despite significant forward-looking risk provisioning. As we managed to keep costs stable, our bank was one of the most efficient ones in the country. We continued to be a leader in local currency lending to private individuals. Banca Comercială Română accounts for about 20%
of the mortgage lending in Romania. We also gained market share in consumer and corporate lending. We transformed George by adding new local features, thus achieving substantial customer experience improvements. Nine out of ten users prefer the mobile version, and George received the best app score among all local banks. About 50,000 people were reached last year through mobile offices and online workshops in the context of our newly launched financial advisory programme. Our bank is now recognised as a leader in financial education in Romania. Our Money School programme has been running for four years. More than 430,000 people were trained in offline and online workshops. In addition, we launched Business School, a financial education online platform for entrepreneurs offering free access to online courses in February 2020. So far, about 10,000 people have en-rolled and attended dedicated online sessions. Last but not least, our bank’s InnovX business accelerator pro-gramme successfully supported tech start-ups and entrepreneurs.
Financial review in EUR million 2019 2020 Change
Net interest income 428.0 435.7 1.8%
Net fee and commission income 164.5 146.8 -10.8%
Net trading result and gains/losses from financial instruments at FVPL 74.2 73.7 -0.6%
Operating income 688.0 678.6 -1.4%
Operating expenses -359.0 -344.9 -3.9%
Operating result 329.0 333.7 1.4%
Cost/income ratio 52.2% 50.8%
Impairment result from financial instruments 13.0 -107.7 n/a
Other result -200.8 -60.2 -70.0%
Net result attributable to owners of the parent 85.0 122.4 44.1%
Return on allocated capital 5.9% 8.7%
The segment analysis is done on a constant currency basis. The RON depreciated by 1.9% against the EUR in the reporting peri-od. Net interest income in the Romania segment (comprising Banca Comercială Română Group) improved on the back of in-creasing customer loan volumes in retail and corporate business. Net fee and commission income declined due to lower payment fees – affected among others by euro cross border payments regu-lation SEPA – and lending fees partially mitigated by higher doc-umentary and securities fees. Net trading result and gains/losses from financial instruments at FVPL decreased marginally. Operat-ing expenses decreased mainly due to a lower deposit insurance contribution of EUR 4.4 million (EUR 12.7 million) as well as lower depreciation, legal and consultancy expenses. Overall, operating result increased, and the cost/income ratio improved. Impairment result from financial instruments deteriorated, driven by updated risk parameters and stage overlays. The non-recurrence of a provision in the amount of EUR 153.3 million as a result of a Romanian High Court decision in relation to business activities of the local building society subsidiary led to an improvement of the other result. The resolution fund contribution amounted to EUR 7.7 million (EUR 6.6 million). The net result attributable to the owners of the parent increased considerably.
Credit risk Credit risk exposure in the Romania segment increased to EUR 18.0 billion (+9.9%). A key contribution to growth came from loans to customers, which rose by EUR 544 million to EUR 9.3 billion. On the back of slightly above-average growth, their share in Erste Group’s total loan portfolio rose to 5.5% (5.4%). An expansion of lending volume was seen mostly in the Retail business segment. In the Corporate business segment, growth was registered mostly in loans to small and medium-sized businesses. The share of foreign currency loans decreased further to 34.2% (37.6%) and was almost completely denominated in euro. Non-performing loans rose to 419 million (+16.5%), driven largely by defaults expected to occur amid the Covid-19 crisis rather than actually overdue payments and insolvencies. A break-down by customer segment shows that asset quality deteriorated primarily in the Corporates segment. As a result of this develop-ment, non-performing loans as a percentage of total loans to customers rose to 4.5% (4.1%). Loan loss provisions increased to 122.5% (116.3%) of non-performing loans.

40
HUNGARY Economic review Hungary is an open economy, ranking ninth in the Economic Complexity Index, a holistic measure of the productive capabili-ties of large economic systems. The Covid-19 crisis interrupted a period of strong economic growth. Although the policy measures to mitigate the first wave of infections were less stringent than the EU average, the country’s economy was significantly impacted due to its large exposure to highly cyclical industries, such as the automotive industry and tourism. The recession in the second quarter proved deeper than expected with services, industry, and construction declining by double digit figures. In the second half of the year, economic activity rebounded as the lockdown measures were eased and international supply chains were re-stored. Economic activity also benefitted from the government’s support measures such as the short-time work programme, the extended SME funding scheme, tax incentives, administrative simplifications, and favourable lending conditions for consumer loans. The unemployment rate increased from the third lowest level in the EU to 4.2% in 2020, still low compared to many other European countries. Overall, real GDP fell by 5.1%, GDP per capita decreased to EUR 13,700. In line with the EU-trend general government deficit rose to 8.7% of GDP in 2020. Revenues, in particular indirect tax receipts and
social security contributions, were severely impacted both by the contraction of the tax base and some tax cuts, notably temporary reductions granted to the most affected sectors and a general 2%-point cut of employers’ social contributions as of July 2020. On the expenditure side, measures to contain the economic im-pact of the pandemic, such as a short-time work scheme and other measures aimed at protecting employment, temporary support to specific sectors and a one-off bonus for health workers, resulted in massive spending. The public debt to GDP deteriorated to 79.3% in 2020. Inflation reached the upper level of the National Bank’s target range of 2% and 4% during the summer. It slowed significantly in the second half of the year. Overall, average consumer prices rose by 3.3% in 2020. The Hungarian central bank reduced its policy rate to 0.6% to support economic activity. The forint exchange rate remained volatile, the Hungarian forint reached an all-time low against the euro in the second half of the year. Rating agencies reacted to the economic developments. Standard & Poor’s left the country’s long-term credit rating at BBB but revised the outlook from positive to stable in April 2020. Fitch affirmed its long-term credit ratings of BBB with a stable out-look. Moody’s kept its long-term credit ratings of Baa3 un-changed but improved the country’s outlook from stable to posi-tive in September 2020.
Key economic indicators – Hungary 2017 2018 2019 2020e
Population (ave, million) 9.8 9.8 9.8 9.7
GDP (nominal, EUR billion) 126.9 135.9 146.0 133.5
GDP/capita (in EUR thousand) 13.0 13.9 15.0 13.7
Real GDP growth 4.3 5.4 4.6 -5.1
Private consumption growth 4.4 4.5 4.2 -2.2
Exports (share of GDP) 67.2 65.2 63.7 65.9
Imports (share of GDP) 65.9 66.5 65.8 66.1
Unemployment (Eurostat definition) 4.2 3.7 3.4 4.2
Consumer price inflation (ave) 2.4 2.8 3.4 3.3
Short term interest rate (3 months average) 0.1 0.1 0.2 0.7
EUR FX rate (ave) 309.2 318.9 325.4 351.2
EUR FX rate (eop) 310.1 321.5 330.5 365.1
Current account balance (share of GDP) 2.0 0.3 -0.2 0.4
General government balance (share of GDP) -2.5 -2.1 -2.0 -8.7
Source: Erste Group
Market review Despite the deteriorated macroeconomic environment, Hungary’s banking market performed relatively well in 2020. At 13.4%, loan growth was among the strongest in CEE. Retail loans rose by 14.0%, mainly driven by the increase of consumer lending, large-ly attributable to the very popular baby-loan programme and to the interest rate cap of the central bank of the key rate plus 5%-points for any unsecured loans. Mortgage lending growth stood at 10.0% The National Bank extended its Funding for Growth scheme for small and medium-sized enterprises in April 2020. To mitigate the impact of the coronavirus pandemic on the national economy, the Hungarian government introduced an opt-out loan moratorium as of March 2020. The initial expiration date of the
moratorium was extended from December 2020 to June 2021. In addition, the Hungarian Development Bank introduced guarantee, loan and capital programmes as a response to the pandemic. Corporate loan growth amounted to 12.8%. Overall, the banking system’s loan-to-deposit ratio stood at 64% at year-end.

Management board | Supervisory board | Capital markets | Strategy | Financial and operating performance | Segments | Non-financial report | Corporate governance report | Audited financial reporting
41
Source: National Bank of Hungary, Erste Group
Hungary’s banking market remained profitable in 2020. Although the very low interest rate environment weighed further on reve-nues, this was partially compensated by the relatively strong loan growth. Administrative expenses remained under control, the increase of personnel expenses was limited. Risk costs increased significantly with forward looking provisioning on expected credit losses. In addition, banks booked front-loaded modification losses in relation to the moratorium. In addition to the annual banking levy, an extra banking tax contribution to the Pandemic Defence Fund was introduced and paid in three instalments in 2020. This extra tax will be deductible from the regular banking tax in equal instalments over the next five years. Overall, the banking sector’s return on equity was 6.5%. The Hungarian banking sector continued to be well capitalised, with a capital adequacy ratio of around 18.7%.
Source: National Bank of Hungary, Erste Group
Consolidation of the Hungarian banking market continued with the merger of MKB Bank, Takarék Bank and Budapest Bank.
Based on its asset size, the new entity, called the Magyar Bank-holding Zrt., has become the second largest bank after OTP. Erste Bank Hungary remained one of the major market players in the country and increased its market shares in most product cate-gories. Erste Bank Hungary’s market share in customer loans increased slightly to 9.8%, with the retail business remaining more important than the corporate business. The customer deposit market share remained unchanged at 8.3%. In terms of total assets, Erste Bank Hungary’s market share went up to 6.7%. Business review 2020 – three questions to Radován Jelasity, CEO of Erste Bank Hungary, How did your bank cope with the Covid-19 induced crisis,
and how did you support customers and employees? We have undertaken substantial efforts to ensure accessibility and to improve customer satisfaction. All our branches remained open during the pandemic, and we reshuffled our resources to cover the increased incoming calls in the call center. As a result of our proactive customer approach the opt-out ratio of the retail mora-torium amounted to 60%, well above the market average of 35%. In corporate business we focused on offering all new products introduced by the National Bank, the Hungarian Development Bank and the Hungarian Export-Import Bank to mitigate the negative effects of the coronavirus-induced crisis and to help our customers to improve their financial situation. When the morato-rium was announced we individually provided our corporate customers with all the necessary information which resulted in a 72% opt-out ratio. The market average stood at 30%. We successfully switched to remote working quickly: 90% of our headquarters staff have been working from home since the begin-ning of the pandemic. We encouraged colleagues to take some of the necessary infrastructure home from the bank. To avoid the use of public transportation, we offered a shuttle bus service for employees who had to maintain the key infrastructure of the bank at branches or the headquarters. In addition, Erste Bank Hungary donated more than 30,000 pulse oximeters, thermometers and the like in the amount of HUF 50 million (ca. EUR 140,000) to 39 healthcare centers. How did you manage to successfully differentiate your
business activities from those of your competition?
We speeded up our digitalisation efforts, reaching an impressive share of 54% digitally active clients. We doubled the number of active mobile customers, and 20% of new personal loans were already end-to-end digital. Our tablet based advisory tool was installed in the branches, and we completed the development of George. It was launched in the beginning of 2021 and provides us a competitive advantage in the Hungarian banking market. Managing the payment moratorium was our largest Prosperity Advisor action so far. We reached 220,000 customers proactively
150
Financial intermediation – Hungary (in % of GDP)
Customer loans Customer depositsTotal assets
93 93
115
35 3744
52 52
68
0
30
60
90
120
2018 2019 2020e
12 12 12
78 8
9
1011
0
4
8
12
16
20
2018 2019 2020
Market shares – Hungary (in %)
Retail loans Corporate loans Retail deposits

42
with data-driven personalised advice, and we will continue to work on new solutions for our clients. Looking back at the year, what major achievements are
especially noteworthy, and which ESG related topics or
developments were most relevant for you?
New retail lending improved on the back of new housing loans and the excellent performance in the baby-loans programme. Our retail loan volume exceeded HUF 1,000 billion (ca. EUR 2.7 billion) and assets under management surpassed HUF 2,200 billion (ca. EUR 6.0 billion). We are proud of the additional 9 percentage-point increase of the Employee Engagement Index, which reached 78% at the end of
2020. We also successfully raised the Customer Satisfaction Index (CXI) in each of our segments, ranking top in the micro and SME segments and second in the private individuals seg-ment. Our efforts were rewarded by numerous awards. Erste Bank Hungary not only won the Golden Prize in the best retail savings product of the year category for the Erste Future Investment Programme, but also the Bronze Prize in the best bank of the year category as well as the Bronze Prize in the best private banking service of the year category by Mastercard. Our private banking segment won further awards, such as The Private Bank of the Year by Blochamps Capital.
Financial review in EUR million 2019 2020 Change
Net interest income 213.5 217.9 2.1%
Net fee and commission income 188.3 181.1 -3.8%
Net trading result and gains/losses from financial instruments at FVPL 36.9 24.7 -33.1%
Operating income 445.8 431.4 -3.2%
Operating expenses -216.9 -213.3 -1.6%
Operating result 229.0 218.1 -4.7%
Cost/income ratio 48.6% 49.4%
Impairment result from financial instruments 18.2 -78.0 n/a
Other result -61.2 -65.5 6.9%
Net result attributable to owners of the parent 173.2 56.1 -67.6%
Return on allocated capital 17.7% 5.8%
The segment analysis is done on a constant currency basis. The HUF depreciated by 8.0% against the EUR in the reporting period. Net interest income in the Hungary segment (comprising Erste Bank Hungary Group) increased (also in EUR) driven by higher customer loan and deposit volumes despite the negative effect of loan moratoria leading to modification losses. Net fee and commission income rose in local currency terms predomi-nantly due to higher securities fees. Net trading result and gains/losses from financial instruments at FVPL decreased on a lower valuation result as well as lower result from foreign cur-rency transactions. Operating expenses went up in local currency terms on the back of higher IT expenses and depreciation. De-posit insurance contribution amounted to EUR 5.8 million (EUR 6.0 million). Overall, the operating result and the cost/income ratio deteriorated. Significantly higher risk costs (reflected in the impairment result from financial instruments) were caused by updated risk parameters and stage overlays. Other result deterio-rated on lower securities selling gains. This line item also in-cluded the banking tax of EUR 14.5 million (EUR 12.6 million), the transaction tax of EUR 44.0 million (EUR 47.6 million) and the contribution to the resolution fund of EUR 3.5 million (EUR 2.8 million). Overall, the net result attributable to the owners of the parent decreased. Credit risk Credit risk exposure in the Hungary segment rose to EUR 10.5 billion (+11.7%). This solid growth was mainly attributable to increased investments in the Group Markets business segment.
Loans to customers were up slightly at EUR 4.9 billion (+2.4%). The share of the Hungary segment in Erste Group's total loans to customers declined marginally to 2.9% (3.0%). While loans to private households increased to 2.7 billion (+6.6%), loans to corpo-rates declined to EUR 2.2 billion (-2.5%). The share of loans de-nominated in Hungarian forint was nearly unchanged at 73.7% (73.3%). The quality of the loan portfolio showed a negative trend due to the outbreak of the Covid-19 pandemic. In many cases, particularly in the Corporates segment, loans categorised as non-performing had not yet actually defaulted but were expected to default with high probability. Non-performing loans as a percentage of total loans to customers increased to 3.0% (2.6%). The NPL coverage ratio based on loan loss provisions rose to 111.4% (93.8%). CROATIA Economic review Due to the country’s high exposure to the tourism industry, the Croatian economy was among the hardest hit in CEE in 2020 due to the Covid-19 induced crisis. Croatia’s well-developed tourism industry, accounting for approximately one fifth of the country’s economy, was severely impacted by travel restrictions and rec-orded one of its worst years in recent history. Domestic demand fell as well as households deferred or cancelled spending. In-vestments, on the other hand, benefitted from projects financed by EU funds. Following severe earthquakes, the European Union offered financial and other support for a quick recovery in 2021.

Management board | Supervisory board | Capital markets | Strategy | Financial and operating performance | Segments | Non-financial report | Corporate governance report | Audited financial reporting
43
Reflecting the economic performance, the unemployment rate increased to 7.7%. Overall, real GDP declined by 8.8%, and GDP per capita fell to EUR 12,000. Public finances deteriorated in 2020. As a result of the economic contraction and measures aimed at preserving employment and businesses the general government deficit rose to 8.0%. The most significant among these measures, collectively adding up to approximately 3% of GDP, relate to subsidies for employee wag-es. Tax revenues, especially VAT related income, contracted strongly as household and tourist consumption decreased. The drop in personal income tax revenues was less pronounced, as government measures have protected employment and wages. Wage subsidies and the public wage bill led to growing expendi-ture, while previously agreed collective agreements were also
implemented. The public debt as a percentage of GDP increased to 87.5%. Average consumer prices did not change significantly in 2020. Core inflation excluding food and energy remained close to 1%. The Croatian kuna remained broadly stable against the euro at around 7.4 to 7.6 throughout the year. Given the country’s very high use of the euro, the Croatian National Bank’s objective to preserve nominal exchange rate stability remained unchanged, and it kept its accommodative monetary stance throughout the year. Moody’s upgraded Croatia's long-term credit rating to Ba1 with a stable outlook in July. Fitch affirmed its rating at BBB- but re-vised its outlook from positive to stable in April. Standard & Poor’s left its long-term credit rating unchanged at BBB- with a stable outlook.
Key economic indicators – Croatia 2017 2018 2019 2020e
Population (ave, million) 4.1 4.1 4.1 4.1
GDP (nominal, EUR billion) 49.3 52.0 54.2 48.8
GDP/capita (in EUR thousand) 11.9 12.7 13.3 12.0
Real GDP growth 3.4 2.8 2.9 -8.8
Private consumption growth 3.2 3.3 3.6 -7.0
Exports (share of GDP) 23.8 23.5 23.8 24.3
Imports (share of GDP) 40.9 42.1 43.1 40.7
Unemployment (Eurostat definition) 11.3 8.4 6.6 7.7
Consumer price inflation (ave) 1.2 1.5 0.8 0.1
Short term interest rate (3 months average) 0.5 0.5 0.5 0.0
EUR FX rate (ave) 7.5 7.4 7.4 7.5
EUR FX rate (eop) 7.5 7.4 7.4 7.6
Current account balance (share of GDP) 3.5 1.8 2.7 -1.8
General government balance (share of GDP) 0.8 0.2 0.4 -8.0
Source: Erste Group
Market review By entering the Exchange Rate Mechanism II in July 2020, Croa-tia has committed itself to join the Banking Union. On 1 October 2020, the European Central Bank became the direct supervisor for significant financial institutions in Croatia. Similar to other sectors, Croatia’s banking sector was significant-ly impacted by the pandemic and the associated government measures. In response to Covid-19, banks offered households and corporates the possibility of a 6-month opt-in moratorium, with 12 months for the hardest-hit tourism industry. To support the corporate sector, liquidity financing and guarantee schemes were made available through the Croatian Bank for Reconstruction and Development and the Croatian Agency for SMEs, Innovation and Investments. The Croatian National Bank reduced its minimum reserve requirement.
Source: National Bank of Croatia, Erste Group
Customer loans Customer depositsTotal assets
108 108
126
65 65
7579 78
93
0
30
60
90
120
150
2018 2019 2020e
Financial intermediation – Croatia (in % of GDP)

44
At 5.9%, customer loan growth remained solid, with corporate loans increasing more than retail loans. Retail loans benefitted from the growth in housing loans, which were backed by the government’s subsidised loans scheme. The corporate sector volume growth was mainly due to the public sector. Customer deposits increased by 8.4%, mainly driven by corporate deposits. The banking system’s loan-to-deposit ratio declined to 80.8% at the end of the year. Profitability of the Croatian banking system declined significant-ly in 2020, reflecting higher forward-looking risk provisions and limited revenue growth. Non-performing loans as a percentage of total customer loans remained flat at around 5.4%, while the coverage ratio on NPLs declined slightly to 64%. The capital adequacy ratio of the banking system remained robust at 24.9%. Overall, the country’s banking sector achieved a mid-single digit return on equity.
Source: National Bank of Croatia, Erste Group
Erste Bank Croatia benefited from its strong brand throughout the crisis. The bank improved its market shares in both the lending and savings businesses. George, the digital banking platform of Erste Group, was introduced in Croatia in the last quarter of 2020. The bank’s customer loans and customer deposits market shares stood at 17.3% and 15.7%, respectively. The bank’s loan-to-deposit ratio amounted to 88.7%. In terms of total assets, Erste Bank Croatia affirmed its top three market position with a market share of 15.7%. Business review 2020 – three questions to Christoph Schöfböck, CEO of Erste Bank Croatia, How did your bank cope with the Covid-19 induced crisis,
and how did you support customers and employees? As a systemically relevant institution, we have taken a proactive and socially responsible approach from the very beginning of the crisis, investing maximum efforts to ensure that our stakeholders, clients, individuals and companies, are affected as little as possible.
There were three key phases: temporarily suspending the activation of forced collection measures, enabling deferred repayment for up to six months (or up to 12 months for clients from industries most affected by the crisis, such as tourism) and granting loans aiming to preserve the liquidity of business entities in cooperation with insti-tutions such as the Croatian Agency for SMEs, Innovations and Investments (HAMAG) and the Croatian Bank for Reconstruction and Development (HBOR) while ensuring adequate guarantee schemes and favourable financing conditions. The transparent, clear and timely communication with the general public, clients, business partners and employees through all avail-able channels has marked our communication strategy. We quick-ly adapted to the new circumstances, ensured business continuity and implemented the recommendations given by the authorities, as well as the availability of all services to clients, with a special emphasis on vulnerable groups. How did you manage to successfully differentiate your
business activities from those of your competition?
Due to the impact of the Covid situation on the economy and a significant rise in risk costs, our financial result in 2020 was un-derstandably reduced. However, it is important to stress that our business operations have remained completely stable. Despite challenging times, we maintained the continuity of regular lending activities and a steadily growing deposit base. We have put a strong emphasis on the further development of our digital solu-tions. We have implemented George, Erste Group’s modern pan-European digital platform. In addition to better user experience in mobile and internet banking, it also fosters innovation through which new functionalities will be continuously introduced in the future. Thus, we have managed to fulfil one of our strategic goals – to always be a frontrunner in digital innovations on the Croatian market. We have further improved our very successful and highly recognisable KEKS Pay app, which has been complemented with numerous new functionalities as well. At this moment, the app has 175,000 users, of which more than 75% are not clients of our bank. Looking back at the year, what major achievements are
especially noteworthy, and which ESG related topics or
developments were most relevant for you?
As a responsible business entity, we have continued to successfully monitor and manage our loan portfolio in line with all regulatory rules, our business policies and highest standards in the segment of credit risk management and adopting a balanced approach focusing on our clients’ needs. We have continued to meet all financial needs of retail and corporate customers through our regular lending ac-tivities. We have remained a consistent partner to our clients, offer-ing them adequate financial and advisory support. Our commitment to support society at large is also reflected by various sponsoring activities. Through initiatives to healthcare institutions, Erste Bank Croatia donated in total HRK 2.5 million (ca. EUR 330,000).
14 14 14
1920
22
1514
15
0
5
10
15
20
25
2018 2019 2020
Market shares – Croatia (in %)
Retail loans Corporate loans Retail deposits

Management board | Supervisory board | Capital markets | Strategy | Financial and operating performance | Segments | Non-financial report | Corporate governance report | Audited financial reporting
45
Fitch Ratings affirmed our credit rating at BBB+ with a stable outlook. This investment grade ranking is the best rating of any bank on the Croatian market and two notches above the credit rating currently held by the Republic of Croatia. Last but not least, we also received our seventh Zlatna Kuna award, which is presented by the Croatian Chamber of Economy
to the most successful bank on the Croatian market. We perceive the award as a significant recognition, not just of the quality of our business, but also of our active role in the development of Croa-tia’s economy and fostering the prosperity of the entire communi-ty. That is why we will in future continue to be an active partici-pant in seeking and finding adequate solutions, which will ensure the fastest possible recovery of the Croatian economy.
Financial review in EUR million 2019 2020 Change
Net interest income 275.1 270.8 -1.6%
Net fee and commission income 108.2 92.0 -15.0%
Net trading result and gains/losses from financial instruments at FVPL 32.7 26.2 -20.1%
Operating income 430.3 401.5 -6.7%
Operating expenses -223.1 -214.6 -3.8%
Operating result 207.2 187.0 -9.7%
Cost/income ratio 51.9% 53.4%
Impairment result from financial instruments -5.8 -104.2 >100.0%
Other result -38.2 -16.7 -56.2%
Net result attributable to owners of the parent 90.3 43.9 -51.4%
Return on allocated capital 16.8% 7.2%
The segment analysis is done on a constant currency basis. The HRK depreciated by 1.6% against the EUR in the reporting peri-od. Net interest income in the Croatia segment (comprising Erste Bank Croatia Group) decreased, driven by the negative impact from modification losses related to loan moratoria. Net fee and commission income decreased on the back of lower payment fees in retail and corporate business driven by the SEPA regulation on cross border payments and the Covid-19 impact. Net trading result and gains/losses from financial instruments at FVPL declined due to a lower result from foreign exchange transactions and valuation effects. Operating expenses decreased mainly due to lower per-sonnel, travel, training and marketing expenses, while the deposit insurance contribution went up EUR 12.3 million (EUR 11.6 million). Overall, operating result decreased, the cost/income ratio went up. The deterioration of impairment result from financial instruments was predominantly driven by updated risk parameters and stage overlays. Other result improved mainly due to signifi-cantly lower provisions for legal expenses. This line item included a resolution fund contribution in the amount of EUR 5.7 million (EUR 2.9 million). Overall, the net result attributable to the own-ers of the parent decreased. Credit risk In the Croatia segment, credit risk exposure rose to EUR 11.4 billion (+7.6%), while loans to customers grew at a similar pace to EUR 7.5 billion (+7.3%). Customer loan volume as a percent-age of Erste Group’s total loans to customers was slightly up at 4.4% (4.3%). The composition of the loan portfolio by business segment shifted further from Retail to Corporates. The share of local currency loans rose to 38.1% (36.3%) of total loans to cus-tomers. Most loans were still denominated in euro. The volume of Swiss franc-denominated loans has practically become irrelevant in the course of recent years. The share of foreign currency loans is still high due to the widespread use of the euro in Croatia. Euro loans are usually matched by corresponding income or deposits in
euro. Against the general trend, loan quality improved again. The NPL ratio decreased to 6.7% (7.0%). The NPL coverage ratio based on loan loss provisions rose to 89.7% (79.7%). SERBIA Economic review The Serbian economy was one of the best performers in CEE in 2020. Real GDP contracted only moderately due to the significant policy support to mitigate the Covid-19 crisis impact and very stringent containment measures, resulting in their relatively short duration. The Serbian government introduced a fiscal package of approximately 13% of GDP that significantly limited the adverse impact of the pandemic on the country’s private sector. Neverthe-less, private consumption and investments were a drag on GDP. Public spending supported growth while the net export contribu-tion was neutral to the economic performance. The country’s unemployment rate declined further to 8.8% at the end of the year. Overall, real GDP declined by 1.1%, and GDP per capita amounted to EUR 6,700. The general government deficit equalled 8.1% of GDP in 2020, mostly as a result of a large package of discretionary fiscal sup-port measures including deferred tax payments, wage subsidies, one-off payments and liquidity-enhancing loan guarantees. Public debt as a percentage of GDP deteriorated to 57.6%. Inflation remained well under control, with average consumer prices increasing by only 1.6%. As opposed to most of the other CEE currencies, the Serbian dinar remained broadly stable against the euro throughout the year. The National Bank of Serbia cut the key rate in four steps from 2.25% to 1.00% in 2020. Rating agencies did not change their ratings for Serbia in 2020. Fitch kept the country’s long-term credit rating at BB+ with a

46
stable outlook, Moody’s left its credit rating unchanged at Ba3 with a positive outlook, and Standard & Poor’s also kept its credit
rating at BB+. Standard & Poor’s, however, revised the country’s outlook to stable from positive.
Key economic indicators – Serbia 2017 2018 2019 2020e
Population (ave, million) 7.0 7.0 6.9 6.9
GDP (nominal, EUR billion) 39.2 42.9 46.1 46.2
GDP/capita (in EUR thousand) 5.6 6.2 6.6 6.7
Real GDP growth 2.1 4.5 4.2 -1.1
Private consumption growth 2.2 3.1 3.5 -2.0
Exports (share of GDP) 38.4 38.0 38.0 36.7
Imports (share of GDP) 49.5 51.1 51.8 49.6
Unemployment (Eurostat definition) 13.5 12.7 10.4 8.8
Consumer price inflation (ave) 3.2 2.0 1.9 1.6
Short term interest rate (3 months average) 3.4 3.0 2.5 1.2
EUR FX rate (ave) 121.3 118.3 117.9 117.6
EUR FX rate (eop) 118.2 118.3 117.6 117.6
Current account balance (share of GDP) -5.2 -4.8 -6.8 -5.6
General government balance (share of GDP) 1.1 0.6 -0.2 -8.1
Source: Erste Group
Market review
Considering the pandemic and its economic and social conse-quences, Serbia’s banking market performed relatively well in 2020. The banking system’s lending activity remained strong with retail loans growing by double digit figures. Corporate loans also grew impressively. At 13.9%, consumer loans outgrew housing loans which increased by 12.5%. The currency structure of cus-tomer loans changed further in favour of loans denominated in Serbian dinar due to supportive lending programmes that were introduced in 2020. On the savings side, corporate deposits grew by 25.2%, while total retail deposits increased 12.4%. Overall, the banking system’s loan to deposit ratio stood at 88.7% in 2020.
Source: National Bank of Serbia, Erste Group
The consolidation of Serbia’s banking market continued, with the number of banks declining further to 24 by the end of the year. Nova Ljubljanska Banka d.d., the Slovenian parent bank of NLB Group obtained all required regulatory approvals in relation to the acquisition of Komercijalna Banka a.d. The transaction was con-
cluded in late December 2020 and created the third largest bank of the country, with a total asset market share of approximately 12%. The country’s banking system remained profitable despite signifi-cantly higher risk provisions. Rising revenues and cost control supported the banking sectors’ profitability. The NPL ratio re-mained relatively low at 3.7%, while the coverage ratio declined slightly to 58.5%. The banking system experienced a significantly increased usage of digital channels. Digitalisation was boosted by the banks’ continuous effort to migrate customers to digital chan-nels. Capital adequacy remained strong at 22.4% in 2020.
Source: National Bank of Serbia, Erste Group
Erste Bank Serbia further strengthened its market position in 2020. It is the sixth largest bank in the country in terms of total assets. Erste Bank Serbia continued to gain market share in both retail and corporate business. Its customer loan market share increased to 7.1%, with the retail and corporate lending market shares amounting to 7.4% and 6.8%, respectively. The bank’s customer deposit market share increased to 6.0% at the end of the year.
Customer loans Customer depositsTotal assets
78 79
89
44 454947 48
56
0
20
40
60
80
100
2018 2019 2020e
Financial intermediation – Serbia (in % of GDP)

Management board | Supervisory board | Capital markets | Strategy | Financial and operating performance | Segments | Non-financial report | Corporate governance report | Audited financial reporting
47
Business review 2020 – three questions to Slavko Carić, CEO of Erste Bank Serbia How your bank cope with the Covid-19 induced crisis, and
how did you support customers and employees? With the first confirmed coronavirus cases in Serbia we imple-mented crisis management teams to handle the situation, prepare preventive measures and to establish continuous communication with employees, clients and partners. Quickly our bank was well prepared for approximately 70% remote working regime in the headquarters and working in shifts in the retail network. Even during the most severe waves that hit Serbia, we succeeded in keeping the business fully up and running, while taking measures to secure the health of our customers and employees. Their safety always comes first. So, one of our priorities was to further improve our e-banking services and to raise the capacity of our contact center to provide the support needed. We quickly introduced all measures of the Central Bank with special emphasis on the moratoria. To further enable our custom-ers to ease their monthly obligations, we offered the opportunity to consolidate their loan liabilities with a longer tenor of up to nine years. For the micro segment, we participated in the respec-tive state programmes. Our relationship managers strictly followed the recommenda-tions, moving as much as possible to the digital sphere. Face-to-face meetings were reduced to the absolute minimum. At the beginning, this was a little bit strange to everyone but soon all parties realised that this is the right way to go. How did you manage to successfully differentiate your
business activities from those of your competition?
Our corporate department has always been driven by the idea that we are selling solutions to our clients, not products. Following this approach is reflected in customer proximity, and we believe that this differentiates us from the competition. Our environmentally conscious lending is a positive differentia-tor. We are the largest bank in this segment with a significant part of the portfolio invested in wind, solar, hydro and biogas. We are planning not only to keep our leading position, but to build on it as much as possible. In addition, we are working on the imple-mentation of an environmental social management system .
Having further improvement in customer satisfaction in mind, we specifically focused on upgrading our processes and capacity of our contact center. In the unsecured lending business we put special emphasis on less risky segments. In secured lending, we were recognised as the bank of choice due to our competent staff and excellent service. We acquired new customers in the private individual segment thanks to the high results in the customer satisfaction index, among the best on the market. Our marketing campaign in July, addressing the mass affluent segment, resulted in a significant increase of FX deposits. Our loan/deposit ratio is now below 100%. Looking back at the year, what major achievements are
especially noteworthy, and which ESG related topics or
developments were most relevant for you?
We achieved extraordinary growth of more than 50% in corporate deposits due to customer acquisitions of several big retailers and the effects of our SME deposits campaign from the end of 2019 and beginning of 2020. In addition, we acted as agent bank in one of the first corporate bond issuances for privately owned compa-nies in Serbia (Energoprojekt). We were also successful in our retail business: more than EUR 230 million of new loans were disbursed, pushing our market share further up. We achieved the best customer satisfaction index results, and more than 40,000 new private individuals decided to become clients of our bank. In light of the crisis, we decided to support domestic companies. We created a TV and online advertising support campaign that lasted a month and a half, aiming to inform the general public about these companies and their products. Owing to the cam-paign, their visibility has increased, sales have improved, and they have expanded and preserved their business in spite of the crises. Last but not least, we should not forget financial literacy which is significantly growing in importance. Erste Bank Serbia therefore launched a comprehensive, free-of-charge financial education programme called #ErsteZnali. Our programme has been recognised by domestic and international relevant institu-tions. That is something that we are especially proud of and that inspires us to develop it even more in the future.
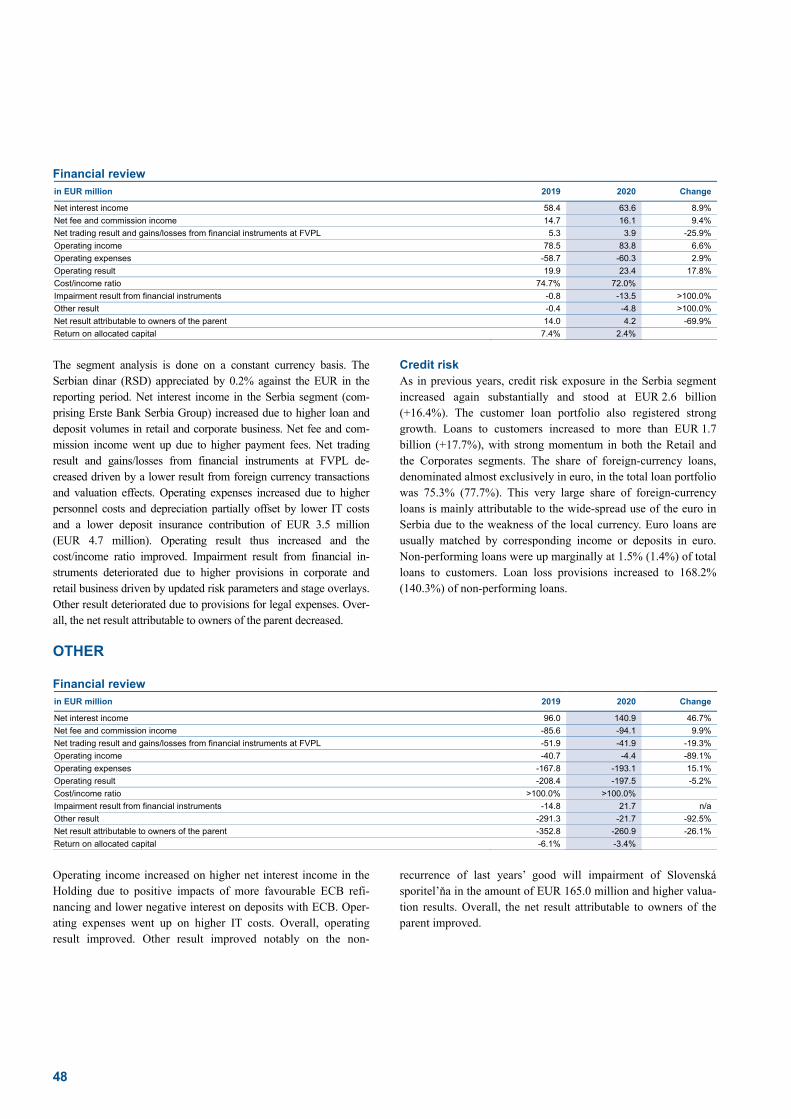
48
Financial review in EUR million 2019 2020 Change
Net interest income 58.4 63.6 8.9%
Net fee and commission income 14.7 16.1 9.4%
Net trading result and gains/losses from financial instruments at FVPL 5.3 3.9 -25.9%
Operating income 78.5 83.8 6.6%
Operating expenses -58.7 -60.3 2.9%
Operating result 19.9 23.4 17.8%
Cost/income ratio 74.7% 72.0%
Impairment result from financial instruments -0.8 -13.5 >100.0%
Other result -0.4 -4.8 >100.0%
Net result attributable to owners of the parent 14.0 4.2 -69.9%
Return on allocated capital 7.4% 2.4%
The segment analysis is done on a constant currency basis. The Serbian dinar (RSD) appreciated by 0.2% against the EUR in the reporting period. Net interest income in the Serbia segment (com-prising Erste Bank Serbia Group) increased due to higher loan and deposit volumes in retail and corporate business. Net fee and com-mission income went up due to higher payment fees. Net trading result and gains/losses from financial instruments at FVPL de-creased driven by a lower result from foreign currency transactions and valuation effects. Operating expenses increased due to higher personnel costs and depreciation partially offset by lower IT costs and a lower deposit insurance contribution of EUR 3.5 million (EUR 4.7 million). Operating result thus increased and the cost/income ratio improved. Impairment result from financial in-struments deteriorated due to higher provisions in corporate and retail business driven by updated risk parameters and stage overlays. Other result deteriorated due to provisions for legal expenses. Over-all, the net result attributable to owners of the parent decreased.
Credit risk As in previous years, credit risk exposure in the Serbia segment increased again substantially and stood at EUR 2.6 billion (+16.4%). The customer loan portfolio also registered strong growth. Loans to customers increased to more than EUR 1.7 billion (+17.7%), with strong momentum in both the Retail and the Corporates segments. The share of foreign-currency loans, denominated almost exclusively in euro, in the total loan portfolio was 75.3% (77.7%). This very large share of foreign-currency loans is mainly attributable to the wide-spread use of the euro in Serbia due to the weakness of the local currency. Euro loans are usually matched by corresponding income or deposits in euro. Non-performing loans were up marginally at 1.5% (1.4%) of total loans to customers. Loan loss provisions increased to 168.2% (140.3%) of non-performing loans.
OTHER Financial review in EUR million 2019 2020 Change
Net interest income 96.0 140.9 46.7%
Net fee and commission income -85.6 -94.1 9.9%
Net trading result and gains/losses from financial instruments at FVPL -51.9 -41.9 -19.3%
Operating income -40.7 -4.4 -89.1%
Operating expenses -167.8 -193.1 15.1%
Operating result -208.4 -197.5 -5.2%
Cost/income ratio >100.0% >100.0%
Impairment result from financial instruments -14.8 21.7 n/a
Other result -291.3 -21.7 -92.5%
Net result attributable to owners of the parent -352.8 -260.9 -26.1%
Return on allocated capital -6.1% -3.4%
Operating income increased on higher net interest income in the Holding due to positive impacts of more favourable ECB refi-nancing and lower negative interest on deposits with ECB. Oper-ating expenses went up on higher IT costs. Overall, operating result improved. Other result improved notably on the non-
recurrence of last years’ good will impairment of Slovenská sporitel’ňa in the amount of EUR 165.0 million and higher valua-tion results. Overall, the net result attributable to owners of the parent improved.

Management board | Supervisory board | Capital markets | Strategy | Financial and operating performance | Segments | Non-financial report | Corporate governance report | Audited financial reporting
49
Business segments
Retail. The Retail segment comprises the business with private individuals, micros and free professionals within the responsibility of account managers in the retail network. This business is operat-ed by the local banks in cooperation with their subsidiaries such as leasing and asset management companies with a focus on simple products ranging from mortgage and consumer loans, investment products, current accounts, savings products to credit cards and cross selling products such as leasing, insurance and building society products. Corporates. The Corporates segment comprises business done with corporate customers of various turnover size (small and medium-sized enterprises and Large Corporate customers) as well as commercial real estate and public sector business. Group Markets. The Group Markets (GM) segment comprises trading and markets services as well as customer business with financial institutions. It includes all activities related to the trad-ing books of Erste Group, including the execution of trade, mar-ket making and short-term liquidity management. In addition, it comprises business connected with servicing financial institutions as clients. Asset/Liability Management & Local Corporate Center. The Asset/Liability Management & Local Corporate Center (ALM & LCC) segment includes all asset/liability management functions – local and of Erste Group Bank AG (Holding) – as well as the local corporate centers which comprise all non-core banking business activities such as internal service providers and reconciliation
items to local entity results. The corporate center of Erste Group Bank AG is included in the Group Corporate Center segment. Savings Banks. The Savings Banks segment is identical to the operating segment Savings banks. Group Corporate Center. The Group Corporate Center (GCC) segment covers mainly centrally managed activities and items that are not directly allocated to other segments. It comprises the corporate center of Erste Group Bank AG (and thus dividends and refinancing costs from participations, general administrative expenses), internal service providers (facility management, IT, procurement), the banking tax of Erste Group Bank AG as well as free capital of Erste Group (defined as the difference of the total average IFRS equity and the average economical equity allocated to the segments). Intragroup Elimination. Intragroup Elimination (IC) is not defined as a segment, but is the reconciliation to the consolidated accounting result. It includes intragroup eliminations between participations of Erste Group (e.g. intragroup funding, internal cost charges). Intragroup eliminations within partial groups are disclosed in the respective segments. Dividend elimination between Erste Group Bank AG and its fully consolidated subsidiaries is performed in Group Corporate Cen-ter. Consolidation differences arising between the segments, which are eliminated over the lifespan of the underlying transac-tion, are part of Group Corporate Center.
RETAIL Financial review in EUR million 2019 2020 Change
Net interest income 2,290.1 2,083.7 -9.0%
Net fee and commission income 1,094.5 1,047.9 -4.3%
Net trading result and gains/losses from financial instruments at FVPL 112.5 89.4 -20.6%
Operating income 3,529.7 3,248.8 -8.0%
Operating expenses -2,096.2 -2,067.7 -1.4%
Operating result 1,433.5 1,181.2 -17.6%
Cost/income ratio 59.4% 63.6%
Impairment result from financial instruments -74.6 -392.2 >100.0%
Other result -226.4 -68.9 -69.6%
Net result attributable to owners of the parent 866.4 583.9 -32.6%
Return on allocated capital 26.4% 18.4%
Retail
Erste Group – business segments
CorporatesGroup
Markets
Asset/LiabilityManagement &Local Corporate
Center
Savings Banks
Group CorporateCenter
IntragroupElimination

50
The decrease in net interest income was primarily driven by a change of transfer prices that led to a negative impact in the retail segment and a corresponding positive effect in ALM & Local Corporate Center. Lending business in the Czech Republic declined primarily on the depreciation of the Czech koruna against the euro and the negative impact of loan repayment moratoria leading to modification losses. These negative effects were partially mitigated by the growth of customer loan volumes in almost all core markets. Net fee and commission income decreased mainly due to lower fees from payments in all core markets as well as lower fees from lending business, mostly on changed disclosure of the fees charged for early loan repayment. Higher fees from securities business in Austria, the Czech Republic, Hungary and Romania and improved fees from insurance brokerage in the Czech Republic and Slovakia could not fully mitigate these developments. Net trading result and gains/losses from financial instruments FVPL decreased due to lower foreign currency transactions in the Czech Republic and negative valuation effects in Hungary. Operating expenses de-creased in several core markets, mainly in the Czech Republic, helped by FX translation effects and lower variable remuneration. Consequently, operating result declined, and the cost/income ratio worsened. The deterioration of impairment result from financial instruments was primarily driven by updated risk parameters with forward-looking information and stage overlays. The non-recurrence of a provision in the amount of EUR 153.3 million in
Romania as a result of a Romanian High Court decision in relation to business activities of the local building society subsidiary led to an improvement of the other result. Overall, the net result attributa-ble to the owners of the parent decreased. Credit risk Credit risk exposure in the Retail business segment rose to EUR 69.8 billion (+1.8%). The customer loan portfolio increased to EUR 61.0 billion (+2.7%). The share of the retail business in Erste Group’s total customer loans was down marginally at 35.9% (36.4%). The collateralisation ratio, which reflects the ratio of collateral to loan volume, stood at 65.9% (64.9%). The quality of the retail customer loan portfolio was stable. Non-performing loans increased by EUR 41 million to nearly EUR 1.5 billion but, as a percentage of total retail customer loans, were unchanged at2.4%. In terms of the NPL ratio (non-performing loans as a percentage of total loans), loan quality was thus again very high in the Retail segment and above the average loan quality within Erste Group. The share of low-risk loans as a percentage of total retail customer loans was high at 86.0% (84.7%). As the volume of non-performing loans is expected to go up in the future, particularly due to the Covid-19 crisis, loan loss provisions were strongly increased to 98.2% (82.8%) of the total non-performing loan portfolio.
CORPORATES Financial review in EUR million 2019 2020 Change
Net interest income 1,098.7 1,109.4 1.0%
Net fee and commission income 301.1 282.3 -6.2%
Net trading result and gains/losses from financial instruments at FVPL 101.0 64.1 -36.5%
Operating income 1,603.1 1,561.3 -2.6%
Operating expenses -575.3 -535.7 -6.9%
Operating result 1,027.8 1,025.6 -0.2%
Cost/income ratio 35.9% 34.3%
Impairment result from financial instruments 32.9 -656.0 n/a
Other result -2.3 -65.5 >100.0%
Net result attributable to owners of the parent 814.9 193.7 -76.2%
Return on allocated capital 18.7% 5.1%
Net interest income increased primarily due to higher loan vol-umes in Austria and positive contributions from lending business in Slovakia, Hungary and Croatia. Net fee and commission in-come went down as a result of lower payment and lending fees mainly in Romania, the Czech Republic and Croatia. Net trading result and gains/losses from financial instruments at FVPL de-creased due to negative valuation effects mainly in the Holding, the Czech Republic and Slovakia. Overall, operating income declined. Operating expenses decreased in the majority of core markets. Operating result thus remained almost unchanged and cost/income ratio improved. The significant increase of risk provisions (line item impairment result from financial instru-ments) across all core markets resulted from the updated risk parameters with forward-looking information and stage overlays. Other result worsened primarily due to the non-recurrence of
selling gains. The net result attributable to the owners of the parent decreased significantly. Credit risk Credit risk exposure in the Corporates segment rose to EUR 83.0 billion (+6.5%). Loans to customers increased to EUR 57.6 bil-lion (+5.0%). As a percentage of Erste Group’s total loans to customers they stood at 33.9% (33.6%). The big difference be-tween credit risk exposure and the customer loan portfolio in the Corporates segment is primarily due to a large volume of guaran-tees and unused loan commitments. The outbreak of the Covid-19 crisis and its serious economic consequences led to deterioration in asset quality; the NPL ratio rose to 2.8% (2.3%). A significant proportion of growth in non-performing loans resulted from a review of borrowers’ expected future solvency. Where repayment

Management board | Supervisory board | Capital markets | Strategy | Financial and operating performance | Segments | Non-financial report | Corporate governance report | Audited financial reporting
51
appears unlikely, customers are categorised as defaulted even if they were not insolvent nor payments past due for more than 90 days. In view of an expected rise in loan losses, loan loss provi-
sions were also increased substantially and amounted to 94.8% (85.7%) of non-performing loans in the Corporates segment.
GROUP MARKETS Financial review in EUR million 2019 2020 Change
Net interest income 257.2 252.2 -2.0%
Net fee and commission income 228.3 240.9 5.5%
Net trading result and gains/losses from financial instruments at FVPL 48.4 38.5 -20.4%
Operating income 536.9 529.7 -1.4%
Operating expenses -240.2 -232.0 -3.4%
Operating result 296.7 297.7 0.3%
Cost/income ratio 44.7% 43.8%
Impairment result from financial instruments 5.1 -0.8 n/a
Other result -18.4 -25.7 39.5%
Net result attributable to owners of the parent 224.6 211.0 -6.1%
Return on allocated capital 24.1% 24.4%
Net interest income went down mainly due to lower result from repurchase operations as well as decreased contribution of the business with institutional clients in the Czech Republic. Net fee and commission income increased mostly due to higher securities fees driven by increased securities transactions, origination and business with institutional clients in Austria. Net trading result and gains/losses from financial instruments at FVPL decreased due to valuation results of interest rate derivatives as well as a significant decrease in market prices of fair value securities.
Overall, operating income decreased. Operating expenses went down, leading to a moderate increase in operating result. Cost/income ratio improved. Impairment result from financial instruments deteriorated due to risk provisioning in several CEE core markets. Other result deteriorated mainly on the back of higher resolution fund contribution and non-recurrence of selling gains in Austria. Overall, the net result attributable to the owners of the parent declined.
ASSET/LIABILITY MANAGEMENT & LOCAL CORPORATE CENTER Financial review in EUR million 2019 2020 Change
Net interest income -104.3 86.2 n/a
Net fee and commission income -84.5 -79.3 -6.2%
Net trading result and gains/losses from financial instruments at FVPL 38.6 13.2 -65.8%
Operating income -107.1 58.0 n/a
Operating expenses -110.9 -107.4 -3.1%
Operating result -218.0 -49.4 -77.3%
Cost/income ratio >100% >100%
Impairment result from financial instruments 13.0 -3.0 n/a
Other result -90.0 -111.8 24.2%
Net result attributable to owners of the parent -237.3 -112.7 -52.5%
Return on allocated capital -8.2% -3.6%
Net interest income improved primarily due to a change of trans-fer prices that led to a negative impact in the retail and corporate segment and a corresponding positive effect in ALM & LCC as well as a higher contribution from balance sheet management in the Czech Republic. Net fee and commission income improved mainly due to a better result in the Czech Republic. Net trading result and gains/losses from financial instruments at FVPL dete-riorated due to valuation results in the Holding. Operating ex-
penses declined mainly on methodological changes resulting in cost allocations to the other business segments in Erste Bank Oesterreich and Slovakia. Overall, operating result improved. Other result worsened mainly due to higher allocations of pay-ment into resolution funds and lower real estate selling gains. The net result attributable to the owners of the parent improved.
SAVINGS BANKS The business segment Savings Banks is identical to the operating segment Savings Banks (see page 29).
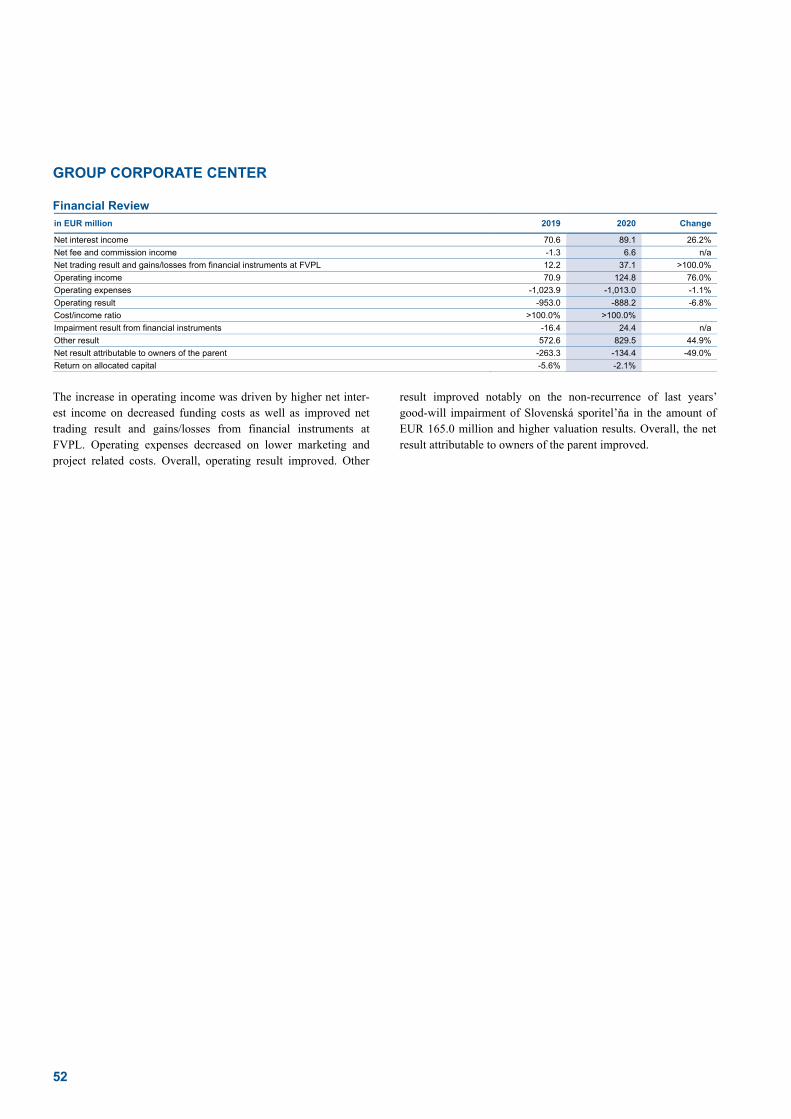
52
GROUP CORPORATE CENTER Financial Review in EUR million 2019 2020 Change
Net interest income 70.6 89.1 26.2%
Net fee and commission income -1.3 6.6 n/a
Net trading result and gains/losses from financial instruments at FVPL 12.2 37.1 >100.0%
Operating income 70.9 124.8 76.0%
Operating expenses -1,023.9 -1,013.0 -1.1%
Operating result -953.0 -888.2 -6.8%
Cost/income ratio >100.0% >100.0%
Impairment result from financial instruments -16.4 24.4 n/a
Other result 572.6 829.5 44.9%
Net result attributable to owners of the parent -263.3 -134.4 -49.0%
Return on allocated capital -5.6% -2.1%
The increase in operating income was driven by higher net inter-est income on decreased funding costs as well as improved net trading result and gains/losses from financial instruments at FVPL. Operating expenses decreased on lower marketing and project related costs. Overall, operating result improved. Other
result improved notably on the non-recurrence of last years’ good-will impairment of Slovenská sporitel’ňa in the amount of EUR 165.0 million and higher valuation results. Overall, the net result attributable to owners of the parent improved.

Management board | Supervisory board | Capital markets | Strategy | Financial and operating performance | Segments | Non-financial report | Corporate governance report | Audited financial reporting
53
2020 was not only characterised by the Covid-19 induced crisis but also by several initiatives to address environmental topics mostly to curb global warming. On 15 January 2020, the World Economic Forum listed in its Global Risk Report climate change and related environmental risks as the five most likely risks events. While infectious diseases did not make Top 10 in terms of likelihood they ranked tenth in terms of impact. At that time hardly anyone could have imagined how soon such a risk in the form of a new coronavirus would spread worldwide and that in order to protect healthcare systems significant social restrictions and economic lockdowns were to be implemented on a global scale. The Covid-19 induced crisis resulted in significant adverse economic impacts, but it also demonstrated how much can be achieved if policymakers focus on common goals. Through all the difficulties of 2020, the European Commission adopted several environmentally relevant declarations, including the European Industry Strategy aiming to help Europe’s industry in the transition towards climate neutrality and digital leadership, the New Consumer Agenda that plans, among other things, issues such as consumer rights to enable consumers to play their part in the green transition by providing them with information on prod-uct sustainability, promoting repair and banning fake green claims. As part of the European Green Deal the Commission proposed in September 2020 to raise the net greenhouse gas emission reduc-tion target to at least 55% compared to 1990. In addition, plans to earmark substantial funds to support the vision of a European Union becoming climate-neutral by 2050 were announced, and it was decided that 30% of the combined EU Budget MFF 2021-2027 and the EU Next Generation funds are to be allocated to climate-related expenditure. Erste Group believes that the aspira-tions of the European Commission will have a profound trans-formative impact on European economies and societies in the years to come and that this transformation is necessary and the right thing to do. Such a transition should be executed in a socially fair manner, and equally high attention needs to be paid to envi-ronmental, social and governance objectives. For Erste Group, considering the impact of its entrepreneurial activities on society or the environment is nothing new. On the contrary, looking beyond financial performance is very much in line with the principles to which Erste österreichische Spar-Casse committed itself when it was founded more than 200 years ago. The Management Board adopted a Statement of Purpose to reaf-firm and state in more detail the purpose of Erste Group to pro-mote and secure prosperity across the region. It defines the follo-wing tasks and principles: Disseminating and securing prosperity Accessibility, independence and innovation Profitability Financial literacy It is about people Serving civil society Transparency, stability, simplicity
Two key questions must be answered every time a business deci-sion is taken: “Is it profitable?” and “Is it legal?” For Erste Group, this has never been enough. Answering the “third ques-tion” that arises from the Statement of Purpose is an expression of its corporate social responsibility: “Is it the right thing to do?” Erste Group pays particular attention to this third question. There-fore, this is the question every employee has to answer whenever they take a business decision. This awareness and the mindset behind it are firmly embedded at Erste Group. Building on this Statement of Purpose, a Code of Conduct defines binding rules of the daily business for employees and members of both the Management Board and Supervisory Board. At the same time, the Code of Conduct underlines that in pursuing its business activities, Erste Group values responsibility, respect and sustaina-bility. The Code of Conduct is an important tool to preserve the reputation of Erste Group and to strengthen stakeholder confi-dence. Implementation of the reporting obligation as a combined non-financial report To meet the statutory requirement of disclosing non-financial information, Erste Group has decided to include the (consolidat-ed) non-financial report in its annual report, thus fulfilling its obligations under sections 243b and 267a of the Austrian Com-mercial Code (UGB). Erste Group has drawn up this non-financial report in conformity with the Global Reporting Initiative (GRI standard: core option). Non-financial reporting is not sub-ject to the audit of the consolidated financial statements. This non-financial report was subject to an independent audit by Deloitte Audit Wirtschaftsprüfungs GmbH in accordance with the GRI standards: Option core and sections 234b and 267a of the Austrian Commercial Code (UGB) to achieve limited assurance. This audit report is available at the end of this non-financial report. The reporting obligation under UGB covers as a minimum envi-ronmental, social and employee matters, respect for human rights and measures against corruption and bribery. The non-financial report must be prepared for the same scope of consolidation that is covered by financial reporting. The calcula-tion of non-financial data, such as energy consumption per em-ployee (full-time equivalent; FTE), is based on all material Erste Group entities that have at least one employee. For the 2020 non-financial report, human resources data was captured at single-entity level. Environmental data of all premises used for banking operations was captured for all entities in the scope of consolidation except one entity with less than 1% of group-wide FTEs. In 2020, the data of all Austrian savings banks in the Haftungsverbund (cross-guarantee system) was included.
(Consolidated) non-financial report
54
Sustainability at Erste Group The founding concept of Erste österreichische Spar-Casse, the predecessor of Erste Group, was simple and revolutionary: “No age, no gender, no social class or nationality” shall be excluded from the benefits that the Spar-Casse offers every depositor.” This excerpt from the founding charter of 1819 expresses the underlying idea that has been valid ever since. Erste Group is built on the inclusive and non-discriminatory belief in people, their ideas and plans for their future as well as their capabilities and their potential for personal growth and a promise for a pros-perous society. Resolving the conflicting targets of profitability and the ecologi-cal and social impact of its business is therefore a key element for the management of Erste Group. Acting responsibly and earning a premium on the cost of capital is a key prerequisite for the long-term survival of any company and the creation of value for cus-tomers, investors and employees. Only a bank that operates in a sustainable manner – balancing the social, ecological and eco-nomic consequences of its business activities – and profitably, can achieve the following: provide products and services to cus-tomers that support them in achieving their financial ambitions; deliver the foundation for share price appreciation as well as dividend and coupon payments to investors; create a stable and rewarding work environment for employees and be a reliable contributor of tax revenues to society at large. Sustainability in this context means to operate the core business both in a socially and environmentally responsible manner and economically suc-cessfully. Today, Erste Group has an extensive presence in the following core markets: Austria, the Czech Republic, Slovakia, Romania, Hungary and Croatia – all of which are members of the European Union. Following significant investments in its subsidiaries, Erste Group holds considerable market positions in these countries. In Serbia, which has been assigned European Union candidate sta-tus, Erste Group maintains a minor market presence but one that may be expanded through acquisitions or organic growth as the country makes progress towards European Union integration. In addition to its core markets, Erste Group also holds direct and indirect majority and minority banking participations in Slovenia, Montenegro, Bosnia and Herzegovina, North Macedonia and Moldova. Erste Group’s business is firmly embedded in the real economy, servicing private individuals, corporate customers ranging from SMEs to large corporations, the public sector and NGOs. The bank offers its services through an extensive branch network and digital channels. In addition, Erste Group takes care of persons that do not or no longer have access to traditional banking ser-vices and offers them their first, or in some cases second, oppor-tunity to bank. As one of the leading banks in Austria and the eastern part of the European Union, Erste Group is also an im-portant employer, taxpayer and customer of local suppliers.
The Group Sustainability Office reports directly to the Chief Executive Officer and is responsible for developing and imple-menting group-wide policies regarding environmental topics, corporate volunteering and corporate social responsibility as well as implementing the group-wide Code of Conduct, CSR ratings and drawing up the non-financial report. Sustainability objectives Against the backdrop of the increasing importance of overarching societal challenges to cope with social imbalances and climate change, Erste Group has reinforced its commitment and formu-lated a transparent set of the sustainability objectives and their relation to the 17 UN Sustainable Development Goals (SDGs). These sustainability objectives are an elementary and clear value set to be consistently activated in Erste Group’s business strate-gies, products and services and, consequently, also in its sustaina-bility risk management principles and in the supplier management principles. Erste Group’s environmental objectives Clean energy & energy security (SDG 7, 13) Resource & energy efficient buildings (SDG 13) Smart mobility and transportation (SDG 9, 13) Resource depletion & waste management (SDG 6, 12) Pollution prevention, preservation of water and maritime
resources (SDG 14) Protective land use, forestry (SDG 15) Protection of biodiversity (SDG 14, 15) Animal welfare (SDG 14, 15)
Erste Group’s social objectives Human rights (SDG 1) Healthcare, education and job safety (SDG 3, 4) Diversity and equal opportunity (SDG 5, 10) Employee attraction, relations and retention, employee rights
(SDG 8) Customer engagement & financial literacy (SDG 1, 4) Product integrity safety and liability (SDG 12) Advertising & marketing ethics (SDG 12)
Erste Group’s governance objectives Management and ownership structure (SDG 16) Corporate governance procedures (SDG 16) Executive and employee compensation (SDG 16) Supply chain standards (SDG 12) Anti-competitive practices (SDG 16) Bribery, corruption & ethics (SDG 16) Political lobbying & donations (SDG 16) Tax & Financial transparency (SDG 16)

Management board | Supervisory board | Capital markets | Strategy | Financial and operating performance | Segments | Non-financial report | Corporate governance report | Audited financial reporting
55
Materiality analysis
The starting point of non-financial reporting is a materiality analysis conforming to GRI Standards (GRI 101) to identify those non-financial material topics that have social and ecological impacts of relevance to both Erste Group and its stakeholders. The first materiality analysis according to GRI was performed in 2016. As a result of internal discussions, the following stakehold-ers were identified as being relevant to Erste Group: employees, customers, governance bodies (supervisory board, management board), investors, society, environment and suppliers. Then, in agreement with in-house experts and in consultation with an external consultant, material non-financial topics of particular relevance to Erste Group were identified. These topics were defined specifically on the basis of the follow-ing principles: Materiality for the bank’s business operations Involvement/inclusion of stakeholder groups Inclusion of sustainability in the business strategy
In 2017, the validity of material topics was re-evaluated in a group-wide survey. To review the topics of material relevance, a survey was conducted in autumn 2017 among management board and supervisory board members and employees as proxies of other relevant stakeholders. In 2019, another group-wide survey was conducted. On this occasion, the stakeholders taking part in this process were given the opportunity to name additional topics. Overall, 1,173 employees and members of the management and supervisory boards as well as 1,676 customers from Erste Group’s seven core countries took part. No further surveys were conducted among representatives of other stakeholders. The aim of the survey was to identify activities that are of particular relevance for Erste Group’s long-term economic performance and for society at large. The target groups surveyed confirmed the validity of the material aspects proposed. The 2019 results were assumed to be equally valid for 2020. These topics therefore represent the material aspects for the non-financial report, no additional topics were included. The following table presents the result of the survey (ranked by relevance): Material topics For employees For customers
Anti-corruption measures 1 3
Data security 2 1
Customer satisfaction 3 2
Ethical conduct of employees in banking operations 4 4
Employee health & work-life balance 5 5
Diversity and equal opportunity 6 6
Ecological impact of banking operations 7 7
Responsible financing 8 8
Financial literacy 9 9
Responsible investment 10 10
Social commitment 11 11
Social banking 12 12
To make the context of the material matters more visible, they have been categorised by higher-level topic areas. Further infor-mation on how Erste Group reflects these topics in its strategy and business activities is provided in the sections discussing commitment to society, our customers, suppliers and supply chain, compliance and anti-corruption measures, employees and environment of the non-financial report. Material topics for Erste Group Social responsibility Ethically correct conduct of business by employees in their daily work (relates to all SDGs to which Erste Group makes notable contributions). The values and attitudes demonstrated by employ-ees in their work determine how Erste Group is perceived in public. This way, appreciation and reputation may be earned, but in the case of misconduct, may also be lost again. Erste Group encourages a culture of fair and mutually respectful interaction. Respecting human rights and zero tolerance for child labour and discrimination are fundamental principles of Erste Group. Financial literacy (SDG 1, 4, 8). For Erste Group, financial literacy is a key factor in creating equal opportunities, economic prosperity and social inclusion. In most cases, a lack of financial literacy means fewer opportunities in many spheres of life. Social commitment (SDs 4, 5, 10). Erste Group aims to be not only commercially successful but also to act in a socially respon-sible manner. It pursues a multitude of activities that contribute to the cultural and social development of society and also encour-ages its employees’ individual social involvement. Governance and anti-corruption measures Anti-corruption measures (SDG 16). Corruption and bribery may be a problem in many parts of the economy. Erste Group employees are required to attend a customised training pro-gramme enabling them to recognise and prevent fraud and cor-ruption. Conflicts of interest between customers, Erste Group and its employees are governed by clear rules such as provisions on employee transactions, the gift policy and research disclaimers. Employees Diversity and equal opportunity (SDG 5, 10). For Erste Group, diversity and equal opportunity are key elements of its human resources strategy. It therefore seeks to offer a work envi-ronment that is free of discrimination and that values the work of each and every person regardless of gender, age, disability, mari-tal status, sexual orientation, skin colour, religious or political affiliation, ethnic background, nationality or any other aspect unrelated to their employment. Employee health and work-life balance (SDG 3, 5). Erste Group is convinced that employees perform better and are more motivated when their work and private lives are well balanced and the company contributes to their good health. The focus of

56
Erste Group is on fostering an awareness of the importance of a healthy lifestyle and promoting preventive health care as a com-plementary service to the public healthcare system. Our customers Customer satisfaction (SDG 8). High levels of customer satis-faction and the resulting customer loyalty safeguard the bank’s long-term success. It is therefore vital to continually adapt prod-ucts and services to customers’ expectations and needs and to ensure high service quality. Responsible investment and finance (SDG 8, 1, 13). Public interest in the indirect impacts of bank products on the environ-ment and society has been growing significantly. When taking business decisions, social and/or ecological criteria are increas-ingly taken into account in addition to the traditional financial risk aspects. Erste Group is steadily expanding its range of re-sponsible investment and finance products. Social banking (SDG 1, 8). For a variety of reasons, even today many people do not have access to financial services from com-mercial banks. In accordance with its founding principles, Erste Group’s social banking programmes help people to help them-selves and contribute to a positive economic development of the excluded parts of society. Data security (not assigned to a specific SDG). The security of customer data is a key prerequisite for long-term success in the banking industry and of fundamental importance to Erste Group. Erste Group therefore applies the highest standards in its IT infra-structure and provides ongoing training to its employees to offer maximum protection against the misuse or loss of customer data. The danger of cyber-attacks requires ongoing investment to maintain and improve data security. Environment Ecological impact of banking operations (SDG 13). Protect-ing the environment and the climate are currently among the most significant global challenges. Erste Group aims to minimise its ecological footprint, specifically its consumption of energy and paper, and to use natural resources responsibly. Suppliers and supply chain Responsible criteria in the supply chain (SDGs 10/13). Against the backdrop of interrelated economic activities, companies must consider not only the ecological and social impacts of their own operations, but also those of their entire supply chain. Through its supply-chain management, Erste Group is making every effort to avoid an undesirable indirect impact on the environment and human rights. Erste Group’s view of climate risk “A decade left” is a clear message of the Global Risk Report 2020 and it is linked to the risk assessment of the Global Risk Percep-tion Survey of the World Economic Forum. Extreme weather,
natural disasters and failure in climate action were assigned as most prominent threats in the past years. Correlating to these perceptions, a season of the most destructive and longest wild-fires and a record number of severe hurricanes resulted in an estimated bill on global natural disaster damages of EUR 175 billion for 2020, making it the fifth costliest year since 1970 for the insurance industry. Yet, although the need for a combined effort to address global warming is less and less questioned, the world of multilateral policies and the reliance on old economic and production structures are still preventing meaningful actions. The European Commission took a leading position in these global efforts. The European Green Deal presents an ambitious trans-formation with a well-framed agenda of fundamental changes in industrial as well as individual behaviour. The aim is clear, to prevent a further increase in global warming, environmental degradation and to protect biodiversity. More than 30% of the combined EU budget of EUR 1.8 trillion shall be allocated to climate aligned activities in the coming years. These funds, com-bined with private investments, shall provide the basis for the annual funding in the amount of EUR 260 billion for the trans-formation. The mobilisation of sustainable finance in this scale is both a substantial opportunity and challenge. Erste Group, as a leading financial institution in CEE, plays an essential role to prepare regional financing solutions for transforming energy and power generation towards low-carbon grids combined with efficient energy storage, the renovation of largely energy inefficient build-ing stocks, the reinvention of mobility and transportation on the basis of hydrogen-powered and electric vehicle solutions, the directional shift of the food chain towards a largely organic and local production format, the conceptual change in product design and industrial production in the spirit of resource efficiency and circular economy, and finally investments into care and restora-tion of our natural environment. Opportunities and risks arising from material topics Consideration of the identified material topics opens up opportu-nities for improving customer relationships, attracting new cus-tomers, improving the ecological footprint as well as maintaining and increasing attractiveness as an employer. Ignoring non-financial matters may adversely affect Erste Group’s stakehold-ers. In addition, Erste Group may become exposed to a variety of risks, some of which are interconnected. Reputation risk exists in all of these matters. In addition, further specific risks may arise. Commitment to society encompasses a broad range of activities, from financial inclusion of low-income or disadvantaged persons to supporting social initiatives, finan-cial literacy as well as art and culture. Reducing the level of involvement in these areas may, for instance, result in financial gaps at co-operation partners and, consequently, the suspension of initiatives or activities. This may harm reputation and, as a consequence, may have a negative impact on customer retention,
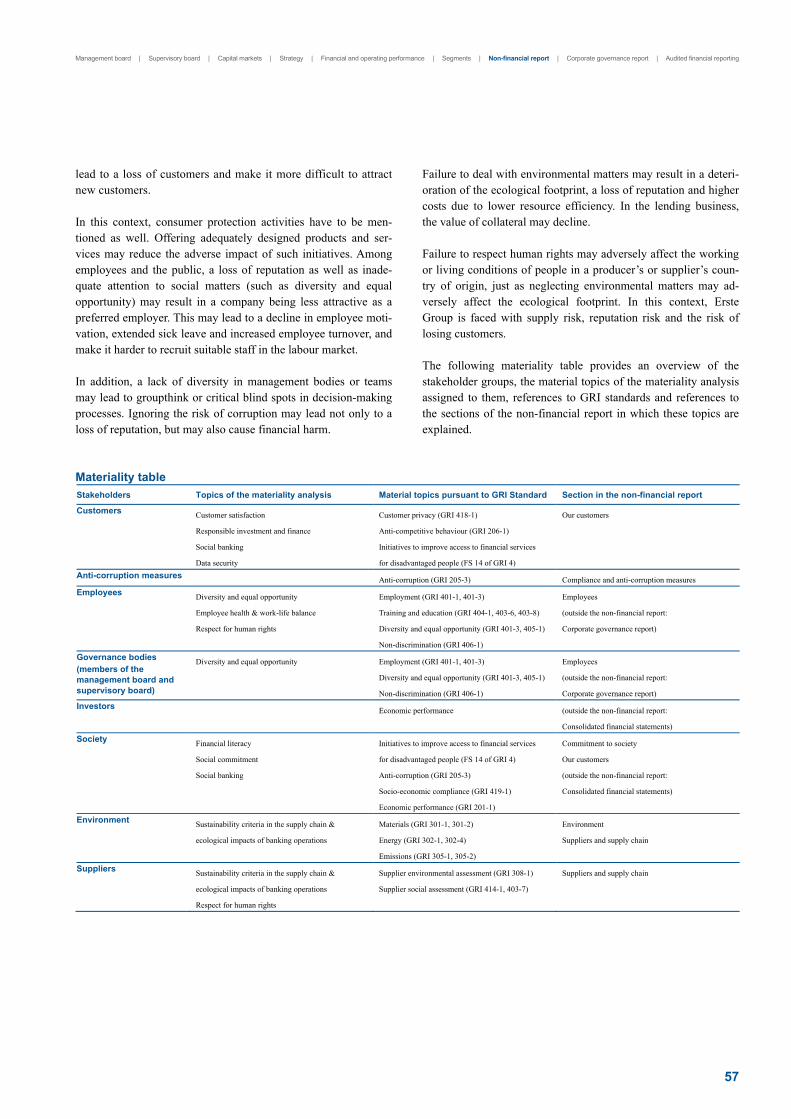
Management board | Supervisory board | Capital markets | Strategy | Financial and operating performance | Segments | Non-financial report | Corporate governance report | Audited financial reporting
57
lead to a loss of customers and make it more difficult to attract new customers. In this context, consumer protection activities have to be men-tioned as well. Offering adequately designed products and ser-vices may reduce the adverse impact of such initiatives. Among employees and the public, a loss of reputation as well as inade-quate attention to social matters (such as diversity and equal opportunity) may result in a company being less attractive as a preferred employer. This may lead to a decline in employee moti-vation, extended sick leave and increased employee turnover, and make it harder to recruit suitable staff in the labour market. In addition, a lack of diversity in management bodies or teams may lead to groupthink or critical blind spots in decision-making processes. Ignoring the risk of corruption may lead not only to a loss of reputation, but may also cause financial harm.
Failure to deal with environmental matters may result in a deteri-oration of the ecological footprint, a loss of reputation and higher costs due to lower resource efficiency. In the lending business, the value of collateral may decline. Failure to respect human rights may adversely affect the working or living conditions of people in a producer’s or supplier’s coun-try of origin, just as neglecting environmental matters may ad-versely affect the ecological footprint. In this context, Erste Group is faced with supply risk, reputation risk and the risk of losing customers. The following materiality table provides an overview of the stakeholder groups, the material topics of the materiality analysis assigned to them, references to GRI standards and references to the sections of the non-financial report in which these topics are explained.
Materiality table
Stakeholders Topics of the materiality analysis Material topics pursuant to GRI Standard Section in the non-financial report
Customers Customer satisfaction
Responsible investment and finance
Social banking
Data security
Customer privacy (GRI 418-1)
Anti-competitive behaviour (GRI 206-1)
Initiatives to improve access to financial services
for disadvantaged people (FS 14 of GRI 4)
Our customers
Anti-corruption measures Anti-corruption (GRI 205-3) Compliance and anti-corruption measures
Employees Diversity and equal opportunity
Employee health & work-life balance
Respect for human rights
Employment (GRI 401-1, 401-3)
Training and education (GRI 404-1, 403-6, 403-8)
Diversity and equal opportunity (GRI 401-3, 405-1)
Non-discrimination (GRI 406-1)
Employees
(outside the non-financial report:
Corporate governance report)
Governance bodies (members of the management board and supervisory board)
Diversity and equal opportunity Employment (GRI 401-1, 401-3)
Diversity and equal opportunity (GRI 401-3, 405-1)
Non-discrimination (GRI 406-1)
Employees
(outside the non-financial report:
Corporate governance report)
Investors Economic performance
(outside the non-financial report:
Consolidated financial statements)
Society Financial literacy
Social commitment
Social banking
Initiatives to improve access to financial services
for disadvantaged people (FS 14 of GRI 4)
Anti-corruption (GRI 205-3)
Socio-economic compliance (GRI 419-1)
Economic performance (GRI 201-1)
Commitment to society
Our customers
(outside the non-financial report:
Consolidated financial statements)
Environment Sustainability criteria in the supply chain &
ecological impacts of banking operations
Materials (GRI 301-1, 301-2)
Energy (GRI 302-1, 302-4)
Emissions (GRI 305-1, 305-2)
Environment
Suppliers and supply chain
Suppliers Sustainability criteria in the supply chain &
ecological impacts of banking operations
Respect for human rights
Supplier environmental assessment (GRI 308-1)
Supplier social assessment (GRI 414-1, 403-7)
Suppliers and supply chain

58
Commitment to society
Erste Group’s commitment to society has never been limited to business activities. This is also reflected in Erste Group’s Code of Conduct: We consider financial literacy, community involvement and corporate volunteering as areas where we can generate signif-icant impact on society and contribute to the UN Sustainable Development Goals (SDG). Consequently, by providing funding or in some cases manpower and expertise Erste Group supports institutions, initiatives and projects in the areas of social affairs, art, sports, culture, education and the environment. At Erste Group Bank AG, the Community Affairs and Sponsoring department is independent of Marketing and forms part of the CEO’s division. As needs and interests in the areas of social affairs, sports, culture and education vary greatly across Erste Group’s markets, depending on local circumstances, specific project sponsorships and initiatives are determined and managed locally. Social and sponsoring activities are combined group-wide under the umbrella of the ExtraVALUE programme. Regional focus, cross-thematic initiatives and cooperation within related fields characterise the programme. The guiding principle is sup-porting personal development and helping people to meet their social and cultural needs. Erste Group’s ExtraVALUE pro-gramme is a visible sign of the bank’s commitment to its respon-sibility towards society and the individual. Erste Group believes that this commitment creates far-reaching opportunities for individuals and society at large and, indirectly, also for the bank while not harbouring any significant risks. As a financial institution Erste Group sets a particular focus on finan-cial literacy initiatives to enable people to build up knowledge to make competent financial decisions in all areas of life, thus im-proving the financial situation of individuals and indirectly socie-ty. Assuming societal and social responsibility is in line with Erste Group’s strategy and brand. Opportunities include the trans-fer of a positive image to the brand, emotional branding and getting employees to identify with the brand. Potential risks may arise from the choice of partners (e.g. reputation risk, conflicts of interest, inadequate transparency or inadequate awareness of compliance requirements on the part of a partner) or in contract-ing (e.g. inadequate specification of services). Due to the multitude of social and educational initiatives, sponsoring of art and culture, and corporate volunteering, only a few selected projects are highlighted in this non-financial report. More detailed information on various Erste Group initiatives is available at https://www.erstegroup.com/en/about-us/ responsibility and on the websites of Erste Group’s banking subsidiaries in the respective local language and in some cases in English.
Erste Group’s support during the Covid-19 induced crisis Flexibility and strong determination were needed in 2020 to launch initiatives in areas such as sponsoring, financial literacy and corporate volunteering in the face of Covid-19 induced re-strictions and lockdowns. Cooperation partners in the fields of culture, sports and the third sector (the non-profit sector compris-ing associations, foundations and other types of non-profit organ-isations) were forced to cancel numerous events. Erste Group continued its long-standing partnerships, adapting or completely re-designing agreements and activation strategies. Erste Group has been actively pursuing initiatives to support communities and non-profit organisations in all core markets. These included donations to various health care institutions such as the Austrian Red Cross or Croatian and Romanian hospitals, call centers helping with contact tracing in the Czech Republic, educational webinars in Slovakia, or a special loan programme and donations to health care workers in Hungary. References to some of those activities are provided in the following pages. SOCIAL AND EDUCATIONAL ACTIVITIES Erste Group’s long tradition of cooperating with established local and international organisations reflects its commitment to the promotion of social welfare and education. The focus of social activities is on providing practical and swift assistance to people in difficult life situations and on support for initiatives creating new opportunities for disadvantaged people. In all its core mar-kets, Erste Group also supports various educational initiatives. Erste Bank Oesterreich has supported annual domestic aid cam-paigns, the youngCaritas initiative for children and Kulturbuddy (a platform coordinating volunteers) for many years as a partner of Caritas. Erste Bank Oesterreich has also been sponsoring Hilfswerk Österreich, one of the largest non-profit providers of healthcare, social and family services in Austria, for many years. In addition, the bank cooperates with a variety of smaller Austrian NGOs. Banca Comercială Română supported the Emergency Fund for hospitals, the fundraising campaign launched by Save the Children to support Romanian doctors with equipment and protec-tion materials in their efforts against the coronavirus epidemic. The bank also provided funds to the health system in Romania to buy equipment and protection materials for hospitals. Likewise, Erste Bank Hungary supported local hospitals. Activities in Hun-gary also included cooperations with several social organisations, e.g. to provide housing for homeless people or enable crowdfund-ing campaigns. Erste Bank Croatia focused on projects aiming at strengthening and developing society, such as SOS Children’s Villages. In a year in which the country was not only negatively impacted by the Covid-19 pandemic but also strong earthquakes in Zagreb, Erste Bank Croatia donated funds for the Zagreb chil-dren’s hospital as well as for the university hospital for infectious diseases in Zagreb. The bank also supported various fund raising activities such as Fond 5.5. for earthquake victims. Česká spořitelna enables the Dokážeme víc (We Can Do More) grant

Management board | Supervisory board | Capital markets | Strategy | Financial and operating performance | Segments | Non-financial report | Corporate governance report | Audited financial reporting
59
programme which encourages citizens, including its own employ-ees, to be active. The bank is also a partner of Festival svobody (Freedom festival) – a platform associating citizen initiatives endorsing the legacy of Czech’s state holiday on 17 November. FINANCIAL LITERACY Financial literacy is essential for creating equal opportunities, economic well-being and social inclusion. In almost all spheres of life, financial illiteracy limits what people can achieve. In line with its mission to foster prosperity, Erste Group is involved in a wide variety of financial education activities, helping people of all ages to acquire the skills and abilities they need to make in-formed and appropriate financial decisions. In accordance with a recommendation of the Organisation for Economic Cooperation and Development (OECD) that financial education should start as early as possible, Erste Group places particular emphasis on financial education projects for children and young people. Erste Group empowers young people to participate in economic life actively and with self-confidence and to understand how the financial system works. The Innovation Hub (Erste HUB) is responsible for the financial literacy strategy and the Financial Life Park (FLiP). Since the beginning of 2020, this unit has been reporting to the Chief Plat-form Officer’s division (previously to the Group Retail division). Erste Group’s FLiP at Erste Campus is one of the largest financial education facilities in Europe. Since it opened in October 2016, more than 50,000 visitors have taken part in more than 2,700 (free-of-charge) tours conducted at FLiP. As a result of Covid-19-induced restrictions, FLiP was open for only 15 weeks in 2020, resulting in about 20,000 fewer visitors (about minus 80%) and 900 tours. Since 2019, a mobile FLiP version – FLiP2Go – has been on tour across all federal states of Austria with support from Erste Bank Oesterreich and regional savings banks. Here again, educational content is provided at interactive stations and de-signed for two target groups: an easy-to-understand format for 10-to-14-year-old children and a more complex one for those aged 15 or older. Visits to both FLiP at Erste Campus and FLiP2Go are free of charge. From April 2019 to March 2020, FLiP2Go attracted more than 11,000 visitors. Because of the Covid-19 pandemic, the bus was not allowed to operate from the beginning of March to the end of the year. During lockdown, demand for FLiP’s digital offerings was sub-stantial, though, with visitor numbers more than doubling. FLiP Challenges offer the option of a digital experience of FliP con-tent. With Financial Life Challenge, teachers can assess the fi-nancial literacy of their pupils and obtain an automated evalua-tion of class performance. Investment Challenge helps users to build knowledge about the capital market and the important role it plays. While enjoying the game, users learn about the impacts that the current interest rate and inflation environment has on savings and why investing in the capital markets is a sensible
alternative. In September 2020, a third Challenge was released, the FLiP Entrepreneurship Challenge, in which only the first part is played in the web browser. Then, the innovation method De-sign Thinking is presented by means of an app that guides users through the entire process (www.flipchallenge.at). Several successful financial education formats were continued in 2020, among them Geld im Griff (Money under Control): Work-ing with the association The Connection, FLiP develops teaching resources for German language courses specifically for young migrants with the aim of building the financial, consumer and language skills they need for coping with daily challenges in their leisure time, at the workplace and in dealing with authorities. The books are designed for all organisations and, in particular, for NGOs that offer German language courses for migrants. Two parts of a five-volume series have already been released as a teaching and learning resource with a print run of 3,000 copies and made available for download (in German only, https://www.financiallifepark.at/de/fuerlehrer/unterrichtsmaterialen/geld-im-griff). In all of Erste Group’s core markets, the subsidiary banks are committed to promoting financial literacy and pursue this mission by means of a wide variety of initiatives and projects. Already in 2018, the Slovenská sporiteľňa foundation launched a three-year programme called Financial literacy for schools up to 2020 in cooperation with the Slovak Ministry of Education. Its aim is to bring financial education to primary and secondary schools to strengthen the financial literacy of Slovak children and young people by investing in teacher training and in teaching resources and methods. The offer made to Slovak school classes to book FLiP for three days per month is very popular. Overall, more than 3,100 Slovak pupils have already visited FLiP, guided by employees of Slovenská sporiteľňa. In 2020, these visits were possible only in the months of January and February due to vari-ous Covid-19 restrictions. Erste Bank Serbia continued its workshops in kindergartens and schools. The children taking part learn what banks do and how banks, the economy and businesses work together. The internet platform #Erste-Znali offers a wide range of financial literacy resources – from text to videos and a quiz. This initiative received multiple awards in 2020. Banca Comercială Română continued its financial literacy pro-gramme even during the pandemic. About 33,000 people were taught online, of which some 20,000 took part in the online ver-sion of FLiP. In addition to setting up a new digital teaching platform called Money School, a children’s book was published to advance financial literacy. Working with the non-profit consultancy SIMPACT, Erste Bank Hungary (Social Banking) organised training events for NGOs on cash flow planning to help them to better overcome the crisis.

60
The bank also organised financial literacy workshops for disadvan-taged people and persons with disabilities in cooperation with other NGOs (Salva, Káva, Köz-Pont, Romaversitas, Nemadomfel). ART AND CULTURE Another important activity is sponsorship of art and culture. As part of its ExtraVALUE sponsoring programme, Erste Bank Oesterreich is the principal sponsor of Jeunesse, whose focus is on the promotion of young artists by giving them opportunities to perform professionally on stage as well as on the development of new concepts for teaching music appreciation. Erste Group also supports the Gustav Mahler Youth Orchestra, Jazz at the Kon-zerthaus, Secession, the ZOOM Children’s Museum, Wiener Festwochen, the International Children’s Film Festival and the Hunger auf Kunst und Kultur (Hunger for Art and Culture) cam-paign. Erste Bank Oesterreich also has a long-standing partner-ship with Viennale, Austria’s largest international film festival. Every year, the bank awards the ExtraVALUE Film Prize and the ExtraVALUE Design Prize for social design as part of the Vienna Design Week as well as the Erste Bank ExtraVALUE Art Prize in collaboration with the art association das weisse haus. Working with Klangforum Wien and the Wien Modern festival, Erste Bank has also been sponsoring the Erste Composition Prize for many years. Slovenská sporiteľňa went on supporting the museum of modern arts Danubiana. Erste Bank Croatia supported RIJEKA 2020 European Capital of Culture project. During the Croatian EU presidency, Rijeka, as the largest Croatian port, became the centre of a significant and extensive culture and arts programme and the host city for the best and most interesting artists from the global, Croatian and European cultural scenes. For the 16th time in a row, Erste Bank Croatia organised Erste Fragmenti, a competition for emerging Croatian artists and art students. The bank buys art-work, organises an exhibition and awards an art scholarship. In 2020, it was the only contest like this in the country as similar projects were cancelled in this challenging time. Erste Bank Serbia’s cultural sponsorship focused on the Guitar Art Festival and the Belgrade Dance Festival. The bank also supported the 54th Belgrade International Theatre Festival. Banca Comercială Română supported the Bucharest Art Pavilion – Art Safari, the largest event dedicated to Romanian art. De-signed as a temporary museum, this event unfolds annually and brings to the public heritage art, contemporary art, performances, workshops for children and guided tours. This year the exhibition took place in former headquarters of the bank. Česká spořitelna continued its support for cultural institutions and events in 2020, however, the whole year looked completely different due to Covid-19. One example were four benefit concerts of the Czech Philharmonic Orchestra, of which it is a partner. Proceeds went to hospitals fighting Covid-19 as well as to others in need. The bank is the general partner of the largest multi-genre festival Colours of Ostrava and partner of Meltingpot, a discussion forum that is
part of the festival. Furthermore, it is a long-term partner of the Smetanova Litomyšl classical music festival. The bank has al-ways supported visual art – primarily design – and has operated its own gallery. Although several festivals such as the Bánkitó civil festival and the Művészetek Völgye Fesztivál (Valley of Arts) – the biggest underground arts festival in Hungary – were cancelled, Erste Bank Hungary as main sponsor provided funds to avoid their bankruptcy and to ensure 2021 planning. CORPORATE VOLUNTEERING Erste Group funds, supports and encourages employees to active-ly contribute to non-profit initiatives and engage in volunteering. Employees and managers of Erste Group prove their commitment by donating their time and expertise and making contributions in kind to partner organisations. This is done on the basis of our code of conduct: With Erste Group’s volunteering programmes, employees can make a contri-bution to the development of society. We support this by building relationships between Erste Group and social welfare organisa-tions and give employees time off for volunteering. The Time Bank, the electronic volunteering platform of Erste Bank and the savings banks, was founded in 2010. The Time Bank matches employees who want to donate their free time and skills with more than 60 partner organisations. In 2020, on aver-age, more than 1,200 employees of Erste Group in Austria were registered on this platform. Partner organisations are selected with particular care. Agreements are entered into exclusively with legal entities, not with private individuals. Cooperation agree-ments are reviewed by the legal department. In addition, the “Know your partner” compliance questionnaire forms part of the cooperation agreement. All of Erste Group’s local banks (except in Austria) give their employees an extra one or two days off each year for volunteer-ing at social welfare institutions. Erste Group thus makes an important contribution to the development of a non-profit sector in the Central and East European region. Another focus of volun-teering in all core markets is on financial literacy. As well as volunteering, donations in kind also remain important. Despite wide-spread prosperity, people on the fringes of society lack items we take for granted such as toys, clothes and sports equipment for children. The Time Bank therefore provides long-term support to its partner organisations by organising regular collection and swap activities. This way, the Time Bank integrates social and societal commitment and supports the sensible and sustainable management of resources and thus the United Na-tions’ Sustainable Development Goals.
Management board | Supervisory board | Capital markets | Strategy | Financial and operating performance | Segments | Non-financial report | Corporate governance report | Audited financial reporting
61
In 2020, three additional campaigns were carried out to collect donations in kind: in addition to collecting men’s clothing for people affected by poverty, the Time Bank launched an eyeglass-es collection campaign. The prescription glasses and sunglasses donated were passed on to the Archdiocese Vienna’s charity for the blind; the glasses were measured and handed out to people in need. In addition, the Time Bank set up a permanent drop-off point for private mobile phones. The proceeds went to the emer-gency relief fund run by Licht ins Dunkel (Light into the dark) and the emergency help service of Caritas. Activities to collect donations in kind were also organised in CEE countries. Erste Bank Croatia and Erste Bank Hungary donated used furniture (chairs, tables, cupboards) and IT equipment to public institutions such as schools and kindergartens as well as to disadvantaged families. SPONSORING SPORTS In addition to numerous activities promoting amateur and profes-sional sport, Erste Group supports professional athletes, teams or events focusing on running, tennis, soccer and handball, water polo and e-sports. With more than 220 running events each year, Erste Bank Spar-kasse Running is Austria’s biggest running initiative and sponsors events from small runs in rural areas to the Vienna City Marathon – Austria’s biggest sports event with more than 40,000 partici-pants. The Vienna City Marathon had to be cancelled in 2020. Other major running events – such as the erste bank vienna night run – were held in a different format, with virtual running races organised for the first time under the umbrella of Erste Bank Sparkasse Running. In 2020, Erste Bank Oesterreich also spon-sored the Erste Bank Open in Vienna, an ATP World Tour 500 tournament and the most important tennis event in Austria. As one of the leading brands with a focus on Central and Eastern Europe, Erste Group has also recognised the growing popularity of e-sports and was the main sponsor of the finals of the League of Legends European Championship (LEC). Attracting more than 100 million players per months, the Riot Game League of Leg-ends, a team-based strategy game, is the leading game in the e-sports sector. This sponsorship is a joint project of the local banks in all of Erste Group's core markets. In addition to group-wide projects, local banks run local sport initiatives. In 2020, Erste Bank Croatia established Erste First League, a new platform to engage and support children in sport. The platform now gathers Erste handball league for children between the age of 7 and 12, and Erste Blue league, an athletic competition for school children across Croatia. In addition, the bank supports the water polo club Primorje Erste Bank based in Rijeka, the football club Rijeka and the basketball club Cibona Zagreb. In June 2020, it backed a fundraising tennis tournament in Osijek featuring the best current Croatian players as well as
famous tennis veterans. Money raised through the event was donated to Croatian scientists working on coronavirus research. Erste Bank Hungary prolonged its involvement in ice hockey sponsorship by sponsoring the Ice Hockey League until 2021/22. Česká spořitelna introduced a sports umbrella programme called Sports with Spořk which consists of 11 separate projects and partnerships focused on health and immunity protection. Current-ly, nearly one million citizens of the Czech Republic benefit from this programme. The partnerships with Bike for Life (the largest cycling tour) and the Czech Athletics Federation have been part of the sponsoring portfolio for more than 20 years. Other partner-ships with Sokol (the oldest Czech sports club) started in Novem-ber 2019 with a new focus on teaching children and students at over 1,500 kindergartens and schools to enjoy sports via the projects With Sokol into Life, PE online and Coaches in schools. The latest additions were Šlappeto (a mobile cycling application for families) and Healthy player which is designed to make e-sports players combine their gaming with physical activity to support their wellbeing. The central project of this programme is Sports with Spořk in cities in which Česká spořitelna organises sports competitions amongst cities in cooperation with local municipal authorities. Slovenská sporiteľňa was again the official partner of Slovakia’s national soccer team and also continued its partnership with the Slovak Olympic Committee. In November 2017, Banca Comer-cială Română and the Romanian Olympic Committee signed a three-year partnership to support sport and the development of education through sport in Romania. This sponsorship represents a strategic initiative that stands as a benchmark for sport in-volvement in Romania, anchoring Banca Comercială Română in national aspirations and creating extraordinary content to support Erste Group’s claim #believeinyourself.
Our customers
FOCUS ON CUSTOMER RELATIONS Erste Group puts customers and their needs at the centre of its business activities. In conformity with its founding principle, Erste Group aims to offer its customers advice, products and services that help them to achieve and maintain prosperity. Only a bank that understands the motives of its customers’ financial needs can offer the right solutions at the right time. Special atten-tion is devoted to approaching customers proactively, handling customers’ requests quickly and with professional care and offer-ing exactly those solutions that meet customers’ needs at an ap-propriate level of risk. This is a key factor in building and main-taining long-term customer relations. Erste Group ensures high-quality advisory services by continuously training its employees, focusing on the relationship with the customer.

62
Prosperity advice – the Erste Group’s approach Erste Group’s retail business reflects its customer-centred ap-proach that aims to support its customers in building and maintain-ing prosperity. Only a bank that understands its customers’ needs and motives is able to develop appropriate solutions for them. Customer behaviour is changing, with online and mobile channels increasing in importance. This development has been further accelerated by the Covid-19 induced crisis. Erste Group therefore offers advice not only face-to-face, but also via chat, audio and video communication and is steadily expanding these services. The advisory concept is supported by a sales incentive scheme that emphasises quality criteria such as the quality of customer relationships and the active use of digital channels rather than product-driven targets. Products and processes Product development is likewise driven by customers’ needs and the ways customers carry out their banking activities. Products and services are designed for flexibility, life-cycle changes, sim-plicity, security, transparency and ease of use. Erste Group focus-es on simplifying its current product portfolios and develops new products and services to meet customers’ needs in the best possi-ble manner. OMNI-CHANNEL APPROACH Erste Group allows its customers to choose between new and traditional sales and communication channels. It is especially basic financial needs such as money transfers and the acquisition of products of low complexity that customers increasingly wish to handle through digital channels. Erste Group therefore invests in building sales and servicing capabilities to offer end-to-end digital banking. At the same time, for more complex needs, most customers prefer a seamless switch between different channels, with personal contact and advisory services in branches remaining essential touch-points. Branches Direct contact with customers through branches remains a sub-stantial asset, especially for more complex customer needs. Con-fidence and trust in highly qualified advisors form the basis for successful business relations. Branch interiors and infrastructure also have to meet the changed expectations of customers and must enable them to handle their banking business in the branch-es quickly and easily. The roll-out of this new branch concept was continued. In total, Erste Group has refurbished or newly opened more than 230 branches in its seven core markets: Austria, the Czech Republic, Slovakia, Romania, Hungary, Croatia and Serbia.
Digital banking Not only internet-savvy but also traditional customers expect an ever-widening range of digital banking services. Digital banking is more than being able to transfer cash by computer or a mobile device. It also includes competent advice and simpler handling of all banking transactions as well as tools providing a quick over-view of all transactions done. Under the George digital banking brand, Erste Group offers a unique digital experience spanning multiple markets and compris-ing a wide range of services. George enables customers to access products and services of the Bank and third parties in a secure IT environment and use the platform for managing their finances. Following the successful roll-out in Austria, Slovakia, the Czech Republic, Romania and Croatia, George already serves more than six million users. George has been available in Hungary since February 2021. The implementation in Serbia will follow next. Contact Center Customers expect easy service interactions when they need assis-tance with digital banking. Their first point of contact is Erste Group’s contact center, which is available around the clock. Qualified employees not only answer questions regarding prod-ucts and services and assist users of self-service terminals, but also help customers navigate the digital product acquisition pro-cesses. In addition, they handle customer complaints or respond to emergencies such as requests to block credit cards and debit cards. The contact center has become an integral touch-point facilitating a seamless omni-channel journey. It not only takes an increasingly active part in advisory and sales processes, but, where regulations permit, also supports end-to-end digital banking services such as unsecured loans, insurance, credit cards and online banking. Customers may also contact Erste Group's contact center by email or via chats, with voice recognition systems and chat-bots completing the services on offer. ACCESSIBILITY Erste Group defines accessibility as designing the real-word and digital environments as well as information and product offerings in such a way that they can also be used by people with disabili-ties without any additional support. Programmes to this effect are being implemented in all countries. In addition to barrier-free access for the blind and visually im-paired (e.g. cash dispensers equipped to provide audio instruc-tions), Erste Group also offers a variety of functions on its digital platform, the George Go app: zoom, contrast adjustment, very large fonts and speech output. The barrier-free functions were developed in cooperation with blind persons and persons with a variety of visual impairments.

Management board | Supervisory board | Capital markets | Strategy | Financial and operating performance | Segments | Non-financial report | Corporate governance report | Audited financial reporting
63
2020 was an exceptional challenge due to the restrictions im-posed in response to the Covid-19 induced crisis. As part of the essential infrastructure, Erste Group branches remained open during the lockdown periods. In consultation with the bank’s crisis management team, measures were taken to protect people while maintaining the possibility of face-to-face contact – includ-ing the free-of-charge provision of face masks, hand sanitiser dispensers and Plexiglas screens in areas with busy customer traffic. In addition, the capacities of the contact center were substantially expanded. The comprehensive banking offering via George also ensured that the customers of Erste Group could conduct their banking transactions through various channels during the Covid-19 induced crisis and lockdowns. In general, measures were taken to ensure a safe working environment. Wherever possible and practicable, employees were asked to work from home. DATA SECURITY The security of customer data is a key prerequisite for long-term success in the banking industry. This requires adequate protection of personal data as it is the personal details that are a significant factor in providing financial advice. Maintaining and improving data security is therefore of vital importance to Erste Group. Erste Group applies the highest standards in its IT infrastructure, pro-vides ongoing training to its employees and has common guide-lines in place throughout the Group to offer maximum protection against the misuse of personal data. By sharing and specifying best practices in an ongoing process covering all markets, the Group Data Protection Office ensures that a consistently high level of data protection is implemented across Erste Group. The development of the Union of Data Pro-tection Officers network and the continuous enhancement of data protection compliance may be regarded as the biggest success stories over the past two years. It is the aim to not only maintain the high level of security achieved, but to also implement addi-tional technical and organisational measures in response to mounting challenges to preserve customers’ trust as the process of digitalisation continues. Trust is also earned through transparency: in the event that a loss, change or unauthorised disclosure or access to personal data occurs despite these precautions and if such a breach of data security places the rights and freedoms of the natural persons affected at risk, a notification must be submitted to the competent data protection authority. In 2020, 20 such notifications were sent to the authorities (thereof one for the Holding). If a breach in-volves a high risk, the persons affected have to be notified as well. In 2020, three such notifications were issued (thereof none for the Holding).
CUSTOMER SATISFACTION The quality of customer relations depends ultimately on the cus-tomers’ experiences in their day-to-day dealings with the bank. To maintain its market-leading position, Erste Group is committed to fully aligning employees, partners, processes, policies and tech-nologies around customers. The bank approaches this challenge in a holistic way and uses a system of interdependent, self-reinforcing elements defined in the Group’s Customer Experience “CX” Framework, ranging from customer experience strategies to process design and corporate governance. As they had done in recent years, Erste Group’s banking subsidi-aries again launched various initiatives against the backdrop of their local environments to provide the best customer experiences possible in a consistent manner. The success of these activities is measured by the CXI (Customer Experience Index). The CXI is determined by the Group Customer Experience department, which is part of the Brand Strategy & Communications division, which reports to the Chief Executive Officer. The CXI replaces the Net Promoter Score (NPS) as it measures not only the cus-tomers’ willingness to recommend the bank, but also satisfaction, readiness to switch to another bank, customer loyalty and cus-tomer effort and thus provides a more comprehensive picture. The CXI is considered, for example, in calculating the internal bonus assessments of Erste Group’s and local banks’ management board members and also helps to determine the market positions as well as the strengths and weaknesses of local banks relative to the market leaders (top three competitors) in each country. Despite the coronavirus crisis, customer satisfaction of the entire Erste Group developed positively in 2020 and is now at the highest level since the measurement began in 2015. Individual subsidiary banks either show growth in both the retail and the SME segment, or can at least keep the high level. In the retail business, Česká spořitelna, Erste Bank Hungary and Banca Comercială Română stand out for their positive development. In the SME business, Česká spořitelna achieved a significant improvement, both in absolute terms and in relation to the top three banks in the country. RESPONSIBLE FINANCE AND INVESTMENT In January 2020, the European Sustainable Investment Plan was presented as the investment pillar of the European Green Deal. To achieve the goals set out by the European Commission, a mini-mum of EUR 1 trillion in sustainable investments will be mobi-lised over the next decade to support a just and green transition. In parallel, the legal and regulatory framework was expanded. In July 2020, the Taxonomy Regulation establishing a common language of climate aligned and environmentally friendly activi-ties entered into force. Early on, the European Commission made it clear that the financial sector is expected to play a key role in reaching the objectives of the Green Deal. The efforts of the European banking authorities complemented to the finance initia-

64
tives. The European Central Bank published a guidance on cli-mate-related and environmental risk management and the Euro-pean Banking Authority issued an action plan on sustainable finance and a discussion paper on the integration of ESG risks into the regulatory and supervisory framework. True to its role as a leading financial institution in CEE, Erste Group is fully committed to take a major share in the transition process towards a sustainable and low carbon economy. Since its foundation, Erste Group has promoted social values and an inclu-sive banking concept. As early as in 2001, it started to offer ethi-cally and environmentally responsible investment products. Against the backdrop of the rising importance of sustainable fi-nance, the bank has extended its service offering, such as ESG structured investment products or specific corporate advisory and financing solutions. In line with its Statement of Purpose, Erste Group has defined exclusion criteria to ensure the ecologically and socially respon-sible conduct of business in its Responsible Financing Policy. Restrictions apply to the critical part of energy and defence sec-tors. The financing of nuclear and of coal power plants, coal mining and fracking are excluded. Erste Group joined the institu-tions aligned with the Paris Agreement and is committed to pro-gressively reduce its coal financing down to achieve a net zero exposure by 2030. Naturally, it is a complex commitment balanc-ing social and energy security with the urgency of climate action. The Responsible Financing Policy is available on Erste Group’s website (https://www.erstegroup.com/en/about-us/sustainability). Erste Group’s approach in developing sustainable finance reflects its cross-functional view towards sustainability. The Group Sus-tainability Office is responsible for aligning the key principles and priorities in all involved areas. In 2020, Erste Group’s corpo-rate division established an ESG advisory team to develop and promote corporate ESG values and banking solutions and to direct the flow of funds towards a sustainable and low-carbon economy across the CEE region. The debt capital markets and treasury departments aim at providing adequate sustainable fund-ing and refinancing instruments and risk management formed complementary teams fitting to the ESG business initiatives and ensuring a sound implementation of the increasing regulatory requirements. Erste Group’s key investment and lending decisions have to pass several layers of screening to ensure compliance with the internal Responsible Financing Policy and the Code of Conduct. In pro-ject finance, Erste Group applies the international standards of the International Finance Corporation and the European Bank for Reconstruction and Development. Corporate sustainable financing Erste Group believes that sustainable finance benefits from public and entrepreneurial awareness, commitment and specific knowledge. For historical reasons, some CEE markets are still
somewhat lagging behind in terms of pronounced public aware-ness and consequently prevailing support toward sustainable objectives. Erste Group’s corporate ESG advisory team is dedi-cated to the mission of building the entrepreneurial understanding of enviro-social equity, long-term risk perspectives and advocat-ing sustainable finance and sustainable debt capital markets. Erste Group’s main goal in the region is to support its clients to start and progress in their transition process while ensuring private funding or co-funding means. Erste Group sees major opportunities in the CEE region arising from the energy sector transformation towards low-carbon grids. In general, life-cycle costs of renewable energy have become comparable with market level, making them increasingly afforda-ble. However, in some countries, the transition will also require modernisation of the transmission infrastructure and further legislative changes though. In 2020, Erste Group participated in or arranged transactions of EUR 1,183 million for renewable energy projects regarding wind-power, photovoltaic, small hydro power and biomass/ biogas across Erste Group’s markets in CEE. Erste Group’s Sustainable Finance Corporates team supports a dedicated dialogue with Corporate clients. This typically starts with an industry- and client-specific assessment of ESG issues and leads to the identification of sustainable finance instruments that match the clients’ sustainability and funding strategy. To date, Erste Group has participated in sustainable financings with environmentally or socially beneficial impacts through green or sustainability linked loans, SSDs (Schuldscheindarlehen) and bonds granted or placed with a total volume in excess of EUR 1,500 million. Green bonds Green bonds are a relatively new and fast-growing asset class. They were created to fund projects that have positive environmen-tal and/or climate benefits. The rising demand for this asset class mirrors the increased public awareness about climate change. Erste Group is about to finalise its internal framework for green or social bond issuances and plans to issue inaugural green or social bonds in 2021. Cross-functional teams comprising debt capital markets, asset/liability management and the Group Sustainability Office ensure that the requirements of all material stakeholders are met. The eligibility criteria are closely linked to the EU taxonomy, and Erste Group’s guiding principles are in line with the ICMA (International Capital Markets Association) green and social bond recommendations and the recommendation of the EU technical expert group on the European green bond standard. Erste Group believes that there will be a discount for green in-struments (green premium) both on the primary and secondary markets and that there will be an increasing shift of private funds into the low-carbon economy transformation.

Management board | Supervisory board | Capital markets | Strategy | Financial and operating performance | Segments | Non-financial report | Corporate governance report | Audited financial reporting
65
Asset management Erste Asset Management (Erste AM) is the asset manager of Erste Group. All Erste AM entities are PRI Signatories (Principles of Responsible Investment) and are committed to the principles of responsible investment. For years, Erste AM has been offering investors an extensive range of sustainable funds enabling them to consider ecological, social and ethical aspects in their investment decisions. Actively managed mutual funds and asset management portfolios are not allowed to invest in companies involved in banned weapons such as land mines, nuclear weapons or cluster bombs and are likewise banned from investing in companies earning more than 30% of total revenues from coal mining, coal trading or the production of coal-based fuels. Furthermore, mutual funds are not allowed to engage in food speculation. The applica-ble guidelines, including further restrictions are available on the website of Erste AM under sustainability (http://www.erste-am.com). By the end of February 2020, Erste AM took the next step by managing a large number of funds on the basis of integrat-ed ESG criteria. The Ethics Advisory Board, a body of five external experts, supplements the expertise of the experts at Erste AM in the field of ethical assessment. Erste AM is an active member of the following institutions: Eurosif, FNG (forum for sustainable investments) and CRIC (association for the promotion of ethics and sustainability in investments). Erste AM is a leading provider of sustainable investment funds in Austria and the CEE region. At year-end 2020, Erste AM man-aged assets worth approximately EUR 68.2 billion. The assets of sustainably managed investment funds, categorised as ESG Im-pact, ESG Responsible and ESG Integration, including sustaina-ble real estate assets, amounted to EUR 15.6 billion, held in a total of 78 investment funds that are divided into mutual funds and special funds or individual mandates. Erste AM believes that a sustainable investment process creates most added value when it combines all available tools and meth-ods. Against this backdrop and to meet strict customer require-ments, Erste AM has developed the integrated sustainable ap-proach for its sustainable funds. This approach combines exclu-sion criteria, positive screening, a best-in-class approach based on the ESG analysis, engagement and voting as well as the design of the investment decisions in line with the desired impact and the assessment of the sustainable yield thus achieved. Furthermore, Erste AM offers tailor-made solutions to its institutional clients. The managed sustainable retail funds include eight bond funds among them a globally oriented, sustainable emerging market corporate bond fund and a global high-yield fund launched in May 2020, four regional equity funds, a global equity fund fol-lowing a dividend strategy, a real estate fund, a microfinance fund of funds, a theme fund in the areas of environment and climate protection (in cooperation with WWF Austria), an asset allocation fund of funds as well as Erste Green Invest, launched in August
2020, whose investment decisions focus on measurable positive effects on the environment and society. In 2020, 13 sustainable funds were awarded the FNG label: four funds were awarded three stars and nine funds received two stars. The FNG label is the quality standard for sustainable investments in German-speaking countries and was first awarded by Forum Nachhaltige Geldanlagen (FNG) in 2015. Moreover, eleven of the sustainable funds, most of them for many years, have been awarded the Aus-trian Ecolabel for sustainable financial products. Cooperation with other international asset managers (organized by PRI and Sustainalytics) continued in 2020. As a founding member of the Climate Action 100+ investor initiative, Erste AM has supported the five-year active dialogue with the world’s 100 largest emitters of greenhouse gases from sectors such as oil and gas, electricity, transport and chemical industry since November 2017. The aim is to make these companies reduce emissions, improve climate-related reporting and to promote measures to combat climate change. In addition to its discussions with com-panies on controversial topics in the field of sustainability and environmental protection, Erste AM also represented the interests of its customers and fund shareholders at numerous annual gen-eral meetings. The regularly published online blog of the Responsible Invest-ment team of Erste AM (https://blog.de.erste-am.com/dossier-overview/) remained popular in 2020. In addition, brief sustaina-bility profiles (fact sheets) on the investment universe and the sustainability funds are published regularly. Customers are pro-vided with additional details on the selection criteria and their influence on sustainability-relevant key data (such as the funds’ CO2 footprints). In 2015, Erste AM was the first Austrian capital investment company to sign the Montreal Carbon Pledge. Erste AM thus undertakes to measure the CO2 emissions of its invest-ments and to publish the CO2 footprint annually. In early 2020, cooperating with the University of Natural Resources and Life Sciences (Universität für Bodenkultur; BOKU) in Vienna and applying international standards, Erste AM was among the first entities in the financial sector to conduct a comprehensive calcu-lation of greenhouse gases emitted by its operations. Calculations were performed for its offices in Austria for 2018 and 2019 and certified by staff of the BOKU CO2 compensation system. In 2020, the water footprint for ERSTE RESPONSIBLE equity funds was calculated for the third time. Structured investment products and advisory Erste Group has already issued several sustainable retail struc-tured investment products in some of its CEE markets. Having long-standing experience in developing structured investment products for its retail clients, Erste Group regards the integration of ESG factors in its product development and offering a com-mitment to enable its retail clients to invest according to their sustainability-related preferences.
66
Business responsibility for the development and management of the group-wide sustainability policy for retail structured investment products lies within the central product management unit, which aligns all ESG related topics with the Group Sustainability Office. In 2020, Erste Group launched a group-wide initiative to introduce a unified Group Markets Retail Responsible Investment Policy for its retail structured investment products. This policy ensures a common understanding of sustainable retail structured investment products and financial advisory services. In addition, it provides transparency on the applied ESG characteristics. The policy has been available on Erste Group’s website since March 2021. Erste Group aims to build-up a client preference-oriented sustain-able retail structured investment product offering based on a harmonised ESG methodology and aligned disclosure standards between its entire asset management and advisory universe. To foster the sustainability knowledge of the financial advisors, a growing range of dedicated ESG training sessions and webinars will be available. SOCIAL BANKING Offering basic banking services to the unbanked part of the popu-lation was one of the main reasons for the foundation of Erste österreichische Spar-Casse in 1819. Since then, the founding principle – to make financial products and services accessible for all people and to disseminate prosperity – has not changed. For a variety of reasons more than 14 million people in Erste Group’s core markets (Austria, Czech Republic, Slovakia, Romania, Hungary, Croatia and Serbia) are still at risk of poverty or social exclusion and even today, some segments of the population do not have access to basic financial services. Erste Group’s social banking initiatives focus on financially ex-cluded or vulnerable private individuals (people at risk of poverty or social exclusion) and social organisations (non-profit sector, non-governmental organisations and social enterprises) by offering them fair access to financial products, sound financial advice and business training and mentoring. Social banking was rolled out across all of Erste Group’s local banks and was implemented in partnership with ERSTE Foundation and local social sector organ-isations. Since the launch, 36,000 clients have been supported, loans of EUR 380 million have been granted and, additionally, educational support has been provided to 26,000 clients. A specific social banking risk policy sets out the key require-ments for managing credit risk of social banking in Erste Group. This policy applies to social banking activities to private individ-uals, micro clients/starting entrepreneurs, social organisations and special projects. The policy provides a framework that is adapted according to local needs and local legal regulations. The respon-sibility for each transaction lies with the associated local bank of Erste Group.
Financial inclusion empowers people to cope with unexpected financial shock. Since its foundation in 2006, Zweite Sparkasse has helped a total of 20,500 people in financial difficulties in Austria and currently serves about 8,600 customers. In Slovakia, Slovenská sporiteľňa’s social banking continued its debt advisory programme supporting approximately 730 low-income clients in taking control of their debts and improving their household finan-cial management skills. One of the most difficult tasks for starting entrepreneurs is raising financing to start their business. Erste Group believes that small entrepreneurs provide not only income for themselves and their families, but they often expand their businesses in their communi-ties and, consequently, create new jobs. Erste Group offers access to start-up micro loans, business training, e-learning tools, men-toring sessions and networking to these customers. In Austria, the Mikrokredit initiative of Erste Bank Oesterreich and the Austrian Federal Ministry of Social Affairs, Health, Care and Consumer Protection targeting unemployed people starting their own busi-ness was extended by adding mentoring support. Overall, Erste Group financed 520 starting entrepreneurs with a total volume of EUR 23 million in 2020. Very often, even a small working capital loan can be sufficient to scale micro business and successfully fight poverty. BCR social finance (formerly good.bee Credit) is a non-banking financing institution established in 2009 with a clear social inclusion mis-sion and reinvesting all earned profits back into the company. It provides tailored financial and non-financial products for micro-businesses, small agricultural producers and individual enterpris-es, in both rural and urban areas of Romania. In 2020, BCR social finance approved 1,400 loans and disbursed EUR 15 million to Romanian micro-businesses. Non-profit organisations and social enterprises often deal with some of the most challenging issues in society such as youth unemployment, social integration and poverty reduction. The Covid-19-induced crisis has triggered funding constraints for many of these organisations. In addition, the current economic downturn might result in declining future aid budgets, social programmes and donations. In May 2020, Erste Group Social Banking with the support of ERSTE Foundation started to provide emergency working capital loans with a zero interest rate in 2020 to non-profit organisations in the CEE markets aiming to support the social sector to cover immediate needs and current expendi-ture. Additional consultation is provided to find suitable financing. Erste Group’s social banking experts and mentors offer innova-tive advice and dynamic perspectives to support social enterprises and starting entrepreneurs. For these clients, Erste Group offers a bundle of working capital loans, bridge loans and investment loans. Erste Group Social Banking benefits from the social entre-preneurship guarantee umbrella under the EU Programme for Employment and Social Innovation (EaSI). In 2020, Erste Group

Management board | Supervisory board | Capital markets | Strategy | Financial and operating performance | Segments | Non-financial report | Corporate governance report | Audited financial reporting
67
financed 110 social organisations, NGOs and social entrepreneurs with a total volume of EUR 14 million. Social Impact Bond Erste Social Finance Holding and ERSTE Foundation teamed up with atempo, an experienced social enterprise in the field of social inclusion, to contribute to solving issues of unemployment of low-skilled women and social exclusion of people with disabil-ities in a social impact bond scheme initiated by the Austrian Federal Ministry of Social Affairs, Health, Care and Consumer Protection. The goal of this project is to support independence and the quality of life of people with disabilities, and at the same time to empower unemployed women with professional, targeted education and mentoring to enable their re-entry into employ-ment. Pre-financing of the private investor is guaranteed by the Federal Ministry of Social Affairs, Health, Care and Consumer Protection. The initiative is planned to run from May 2020 until December 2023 and will be realised in Vienna, Styria, and Lower and Upper Austria. For more information and details about Erste Group’s social banking or to read some client stories, please visit: https://www.erstegroup.com/en/about-us/social-banking.
Suppliers and supply chain
Erste Group views suppliers as partners in shaping its business to be more sustainable. Procurement decisions include assessments of the suppliers’ social and environmental impact. Covering the entire supply chain, Erste Group Procurement is the sourcing and procurement company of Erste Group. Its basic objective is to ensure clear and fair sourcing and procurement activities and contracts. This includes, most importantly, meeting all the needs of Erste Group’s entities for goods and services on time and in accordance with all quality requirements with the best possible terms (e.g. price, terms of payment, guarantees and liability) by purchasing locally or across borders. Erste Group’s suppliers must meet defined standards of business ethics, envi-ronmental protection and human rights. In fulfilling their contractual obligations, suppliers of materials, equipment and services selected as group partners are required to: Comply with national and local laws, decrees and regulations Fulfil all their legal obligations regarding the health and safe-
ty of their employees and their contractors Strictly comply with environmental legislation Respect and implement the basic principles of corporate so-
cial responsibility These principles are also reflected in the supplier code of con-duct, which is publicly available on the website of Erste Group Procurement. Erste Group Procurement holds the CIPS Corporate
Ethics Mark, a certification awarded by the Chartered Institute of Procurement and Supply (CIPS). This certificate distinguishes institutions that have committed to high standards in procurement and provide relevant courses in-house. Currently, 100% of all employees of Erste Group Procurement have obtained individual certification on ethical behaviour in procurement. SUPPLY CHAIN Erste Group’s supply chain mainly involves indirect expenses that support the group’s core business. In 2020, the total amount paid to companies outside Erste Group was slightly above EUR 1.15 billion, mostly linked to IT (43% of total spending), followed by expenses for services, operations and marketing (36%) and facility management (21%). Out of a total of 20,556 suppliers at group level, 693 suppliers accounted for 80% of total third party ex-penditure. 90.7% of suppliers (reflecting 94% of third party expenditure) are located in the European Union, highlighting Erste Group’s focus on its markets in Central and Eastern Europe including Austria. 8.6% of suppliers are located in other European countries, 0.5% in North America and the rest (0.2%) are based on other continents. Only 14% of Erste Group’s purchases were made across borders. The focus on local procurement strengthens the local economies of the countries where Erste Group operates and underlines its commitment to support these regions. SUPPLIER SELECTION PROCESS Compliance with sustainability criteria in selecting suppliers is guaranteed at both the strategic and the operational levels. Strate-gies have been developed for selected groups of goods to help in supplier selection. In addition to group standards for social re-sponsibility, these strategies also include defined technical speci-fications. Since 2016, sustainability criteria drafted with the Group Sustainability Office of Erste Group have been a mandato-ry element of the selection process. To ensure that Erste Group’s suppliers meet the group’s corporate responsibility standards, audit questionnaires must be completed for any purchase worth more than EUR 100,000, and regular supplier business reviews have to be performed. The supplier audit questionnaire is IT-based and an integral part of Erste Group Procurement's supply chain. This ensures full transparency and allows a timely assessment of suppliers and risks before entering into contracts with suppliers. The results of the audits form the basis for supplier classification. To ensure correct procedures, all relevant steps have been inte-grated into an electronic tendering system. The IT application blocks the entry of further data, and thus collaboration with a supplier, if there is not enough information available or a supplier

68
classified as critical has not been explicitly approved. Any non-compliance with the supplier code of conduct is brought forward to compliance delegates, who decide on further action, if re-quired. In addition to the initial evaluation, follow-up reviews are performed regularly on the most important suppliers or those having the most significant risk profile. Environmental aspects As part of Erste Group's efforts in environmental protection, ecological aspects are also included in Erste Group Procurement’s supplier selection process. The supplier audit questionnaire spe-cifically addresses the following topics: Existence of an environmental management system Existence of a written environmental policy Method for measuring CO2-emissions Existence of environmental targets Information on fines or charges for environmental infringe-
ments Description of the supplier’s supply chain
In the procurement of goods, tender documents include additional questions relating to potentially hazardous chemicals, recycling capabilities of products, return policies for products at the end of their useful lives and compliance with ENERGY STAR or similar standards. A supplier sustainability scorecard was introduced in 2017. Sup-pliers are required to disclose their ecological footprint (energy consumption, waste and emissions) for the previous two years, either at an aggregate level or related to their activities for Erste Group. In 2020, 66 suppliers with resource-intensive operations such as data centres and transport services were selected to pro-vide scorecard data. As these criteria are relevant to the supplier selection process, developments are continuously monitored and assessed. In 2020, 20,556 contracts with suppliers were concluded or re-newed. Of these, 1,808 suppliers were screened according to environmental standards. No supplier was subject to any envi-ronmental impact assessment beyond the standard audit question-naire, nor was any supplier identified as having had a significant actual or potentially negative environmental impact. No actual or potentially negative environmental impact was identified in the supply chain. Finally, no supplier contract had to be terminated as a result of a significant actual or potentially negative environmen-tal impact. Social aspects As the supplier selection process also encompasses social aspects, the supplier audit questionnaire also comprises relevant criteria such as: Effective abolition of child labour Elimination of all forms of forced or compulsory labour Elimination of discrimination with respect to employment Freedom of association and the right to collective bargaining
Reasonable working hours and fair remuneration Health protection Occupational health and safety Job restructuring Remuneration Fair working conditions Other social criteria in the supply chain
In 2020, Erste Group co-operated with 20,556 suppliers, of which 1,808 suppliers had a current supplier audit questionnaire on file. No supplier was subject to any specific labour practices or human rights impact assessment beyond the standard audit questionnaire, nor was any supplier identified as having had a significant actual or potentially negative impact on labour practices or human rights. There was no actual or potentially negative impact on labour practices or human rights identified in the supply chain and no supplier contract had to be terminated as a result of a significant actual or potentially negative impact on labour prac-tices or human rights. Furthermore, no supplier was found to be in violation or at risk of violating the right to exercise freedom of association and collec-tive bargaining, nor was any supplier found to have a significant risk of child labour, young workers exposed to hazardous work, or material risk of incidents of forced or compulsory labour.
Compliance and anti-corruption
Erste Group is committed to the highest standards of corporate governance and responsible behaviour of every individual and conducts its business in compliance with applicable laws and regulations. In addition, Erste Group has introduced various policies and guidelines defining rules and principles for its em-ployees. Compliance with external and in-house standards pro-vides the basis for long-term trust in Erste Group. Erste Group’s compliance programme has laid the basis for a common understanding of values within the Group. The Code of Conduct provides guidance for Erste Group’s employees. The rules it sets out for dealing with the day-to-day business create the basis for compliance awareness and for the compliance man-agement system that ensures conduct in conformity with laws and policies. The Compliance department is responsible for the compliance programme and thus for compliance matters within Erste Group. In organisational terms, Compliance is assigned to the Chief Risk Officer’s division but reports directly to the entire management board. The compliance programme of Erste Group is based on relevant legislation such as the Market Abuse Regulation and the Securities Supervision Act, the Criminal Code and the Financial Markets Anti-Money Laundering Act as well as international practices and standards.

Management board | Supervisory board | Capital markets | Strategy | Financial and operating performance | Segments | Non-financial report | Corporate governance report | Audited financial reporting
69
Conflicts of interest between customers, Erste Group and employees are governed by clear rules. The most frequent types of conflicts of interest have been defined. Policies and organisational measures have been implemented to manage such conflicts of interest, includ-ing information barriers and rules on accepting and giving benefits. Additional standards apply, for example, with regard to employee transactions and research disclaimers. Among the key issues are also the establishment and coordination of processes and measures to prevent money laundering and terrorist financing, to comply with financial sanctions and embargoes and to prevent financial crime. In this area, substantial investments are being made on an ongoing basis to strengthen the monitoring systems. To ensure compliance with all laws and regulations, standards, policies and processes are continuously evaluated and reviewed across the Group. Mandatory compliance training for all new employees includes awareness building and an introduction to the prevention of cor-ruption. For employees in selected business areas, regular com-pliance training is mandatory. ANTI-CORRUPTION Based on international anti-bribery and anti-corruption initiatives (e.g. the OECD Anti-Bribery Convention, the United Nations Convention against Corruption), local authorities in many coun-tries have adopted laws and regulations that generally prohibit offering public officials benefits for the purpose of obtaining or retaining business or otherwise securing improper advantages. Offering improper payments or other inducements for the benefit of a public official, even if made indirectly through an intermedi-ary, is prohibited. Erste Group under no circumstances offers anything of value to a public official nor to members of a public official’s family or any charitable organisation suggested by a public official for the purpose of influencing the recipient to take or refrain from taking any official action or to induce the recipient to conduct business with Erste Group. This also includes facilitat-ing payments. All of Erste Group’s businesses are subject to the laws and regulations in the countries in which Erste Group oper-ates. Preventing and combating corruption is fundamental to Erste Group. The following measures are taken to comprehensively raise awareness among and provide information to employees: Policy. By rolling out a group-wide policy on conflicts of interest and anti-corruption, Compliance educates employees about key national rules as well as the rules of the UK Bribery Act and the US Foreign Corrupt Practices Act (FCPA). This ensures that every employee of Erste Group is familiar with the relevant rules and knows how to apply them. This policy is a minimum standard for the entire banking group.
Training. New employees are systematically instructed in the essence and processes of Erste Group’s corruption prevention efforts. Regular releases of intranet news on key themes of anti-corruption efforts such as the proper handling of benefits around Christmas or of monetary or non-monetary benefits help to raise awareness of the anti-corruption agenda. Reporting. Every employee of Erste Group must refrain from any conduct that might give rise to a suspicion of corruption. In addition, various reporting duties have to be met, including in particular reporting any acceptance or giving of certain benefits in the public and the private sector as well as any benefits they receive from third parties within the meaning of MiFID II or give to such third parties. With all topics arising in connection with corruption prevention, Erste Group’s employees may contact Compliance through various channels such as e-mail, reporting tools or, anonymously, by whistle-blowing. Group steering. Under a comprehensive communication scheme, Erste Group entities share information intensively at the expert and division head levels (e.g. regular expert calls, annual division head conferences). Local compliance officers and Erste Group’s Com-pliance department hold regular phone conferences to discuss key issues such as ways of providing advice and creating awareness specifically on matters such as benefits and side-line activities. Surveillance. All suspicious cases are reviewed and disciplinary action is taken, if required. The group-wide survey of corruption risks did not reveal any significant corruption risks for Erste Group. Activities in 2020 Continued optimisation of the compliance strategy with an
increased strategic focus on improvements in anti-money laundering, financial sanctions and the uniform establishment of group-wide standards
Improvement of the monitoring system to combat money laundering
Annual or periodic reviews of policies including the group-wide AML, KYC, CTF, FATCA and CSR policies, the Finan-cial Sanctions and Embargoes Policy, the Securities Compli-ance Manual, and the Anti-Corruption and Conflicts of Inter-est Policy
Regular compliance and anti-corruption training Update of the reporting tool for conflicts of interest (benefits
and side-line activities) Activities continuing in 2021 Increased process and technical improvements in anti-money
laundering, financial sanctions and data analyses to combat financial crime
Further improvement of the monitoring system to combat money laundering
Campaigns to strengthen awareness regarding conflicts of interest and anti-corruption

70
Employees
Erste Group is convinced that current and future staff-related goals can be achieved by focusing on the following three pillars of its human resources strategy: Culture Competence Competitiveness
Human capital is the key element for successful organisational, corporate cultural and competence building. Modern organisa-tions enable people to work in a more flexible, adaptive and customer-centric way. Attracting, retaining and engaging highly qualified employees is crucial to business success, and Erste Group strives to be the employer-of-choice in the region, both in the financial and in the IT sectors, by offering various learning and development opportunities, diverse and international teams and challenging tasks in a flexible organisation. Developing future leaders and experts in a systematic way is what motivates high-potential employees. Talent management is driven by honest feedback, a fair and transparent assessment of individ-ual potential and quality development activities in partnership with internationally renowned institutions In the next few years, Erste Group expects that a significant part of today’s competenc-es will either become obsolete or will be replaced with different skillsets, more relevant for an agile and digital workforce. Build-ing future-fit competence is thus an essential element of Erste Group’s day-to-day human resources work. Learning initiatives go well beyond banking knowledge and also cover the broad economic and social issues facing the region. Erste Group’s cultural transformation aims at linking perfor-mance management and rewards to qualitative aspects. This involves moving away from incentive schemes with predomi-nantly sales-driven key performance indicators towards a remu-neration philosophy that is more purpose-driven, collaborative and team-oriented, thus taking the prosperity and satisfaction of customers into account. Erste Group contributes to the implementation of the UN Sus-tainable Development Goals and Agenda 2030. Its diversity strategy and activities support good health and well-being (Goal 3), gender equality (Goal 5), decent work & economic growth (Goal 8) and reduced inequalities (Goal 10). Erste Group’s response to Covid-19 At the end of January 2020, a Covid-19 Coordination Team was established to assess risks for the company with the accelerated spreading of the coronavirus and to coordinate necessary measures. The aim was to ensure a maximum of safety for both employees and customers as well as to protect the business inter-ests of Erste Group while supporting governmental efforts.
Starting with the first lockdown in mid-March the share of em-ployees of central buildings working from home rose to over 90% within 36 hours. It proved to be advantageous that employees had already been equipped with laptops and softphones, and in most cases, with mobile phones, for several years to accommodate working in modern open-space working environments and from home in general. As banking was defined as a part of critical infrastructure, Erste Group’s branches were kept open even during complete shut-downs in all of its core markets. In some branches, opening hours were reduced, and a two-team system was introduced for several months to ensure the safe and stable provision of services. Due to the strict containment and safety measures no infection clusters were identified in branches or central buildings during 2020. So far, Erste Group Bank AG has not made use of any govern-ment subsidies, such as tax deferrals, compensation of wage costs or short-time work in connection with Covid-19. DIVERSITY AND EQUAL OPPORTUNITY Erste Group defines diversity and inclusion as an integral part of its corporate strategy. Owing to its diversity principles, Erste Group benefits from highly motivated employees, innovative teams and higher customer satisfaction. Erste Group is convinced that diversity promotes operating excellence, as diverse teams achieve better results. The code of conduct also emphasises the respect for human rights and non-discrimination. Erste Group strives to create the best possible work environment, free of discrimination, harassment and intimidation. It values the work of each and every person regardless of gender, age, marital status, family obligations, religion, political conviction, sexual orientation, nationality, social or ethnic background, disability physical appearance and any other aspects unrelated to the bank’s business. Diversity and inclusion In 2020, Erste Group’s Diversity and Inclusion Policy was re-newed, defining measures to increase the share of women in management positions. This policy focuses on the following four areas: HR processes including recruitment, retention and promotion The reconciliation of private and professional lives Culture and communication A new set of targets and ways to effectively monitor them
Erste Group did not reach the 35% target for women in top man-agement positions by year-end 2019. Following an in-depth analysis of the process, the management together with experts in the fields of human resources and diversity set the objective to

Management board | Supervisory board | Capital markets | Strategy | Financial and operating performance | Segments | Non-financial report | Corporate governance report | Audited financial reporting
71
reach a share of 37% women in top management positions (i.e. board and board-1) and 40% women in other management posi-tions (i.e. B-2 and B-3) by the end of 2025. Specific targets were defined for each of the local banks, supplemented with an effec-tive monitoring and reporting system. As of year-end 2020, the banking subsidiaries of Erste Group hold a share of women in top management of 26.6% (2019: 27.4%), with Banca Comercială Română as the best-performer with 41.9% (41.2%), followed by Erste Bank Serbia with 40.0% (38.1%) and Erste Bank Croatia with 33.3% (26.7%). In addition, Erste Group focused on the group-wide implementa-tion of the following initiatives: Establishment of new communication formats to raise aware-
ness for diversity and equal opportunity among executives, to make existing offers more visible and to provide best practice examples
Establishment of a strategic interim management system for persons on parental leave that addresses career disruptions with flexibility and a clear focus on the development oppor-tunities for women and men
As the sole Austrian and one of only three companies in the CEE region, Erste Group was again listed in Bloomberg’s Gender Equality Index (GEI). This index measures disclosure and per-formance in promoting gender equality in five areas: female leadership and talent pipeline, equal pay and gender pay parity, inclusive culture, sexual harassment policies, and pro-women brand. Another prestigious international benchmark is Erste Group’s participation in the EU Diversity Charter platform. All local banks (with the exception of Erste Bank Serbia because it is headquartered in a non-EU member state) are signatories to their national diversity charters in which members commit themselves to establish an inclusive working culture for their employees regardless of gender, ethnicity, religion, age, disability and sexual orientation. In 2020, Erste Group was for the first time a main partner of the United Nations initiative Orange the World. The purpose of the campaign is to raise awareness for violence against women and support women globally to lead a life free from all forms of violence. Antidiscrimination A company agreement on preventing discrimination and promot-ing respectful behaviour in the workplace was concluded for Austria in 2015 to protect against all forms of discrimination, bullying and harassment. An independent anti-discrimination officer advises and mediates in matters concerning harassment and discrimination and works with management on awareness and prevention. In 2020, this company agreement was revised and expanded in the direction of active conflict management, as Erste Group set itself the goal of dealing with conflicts in the Code of Conduct.
Advice for employees is confidential and is accompanied in a structured solution process if required. Experience obtained from such conflict situations are perceived as an opportunity to work on the continuous development of the corporate culture. This development focuses primarily on raising awareness and improving processes, behaviour and organisational matters for management and employees. Following its successful implementation in Austria, a Group Policy will be drawn up in 2021 that will also offer Erste Group’s subsidiaries outside Austria a framework for conflict management and processes to address and deal with discrimination, bullying and harassment. LEARNING, TALENT MANAGEMENT, LEADERSHIP AND COMPETENCE DEVELOPMENT Erste Group is committed to developing its employees’ profes-sional and interpersonal skills to ensure that they are well pre-pared to perform professionally and in a socially responsible manner. Erste Group continuously develops and aligns group-wide training programmes for senior experts and managers. Erste Group’s employees benefitted from the expanding offer of digital learning formats. Deploying the latest digital learning platforms with continuously updated content, Erste Group was able to quickly amend the learning content structure to reflect rapidly changing needs of managers and professionals in the unprecedented workplace situation due to Covid-19. Erste School of Banking and Finance, representing the group’s key learning programmes framework, switched most of its pro-fessional and leadership training, customised executive training, and personal development training courses as well as business area-specific programmes, to blended or fully virtual formats. This allowed Erste Group to keep its 2020 focus on job-specific competence building as well as on identifying and developing group-wide pools of high potential leaders, continuing its cooper-ation with renowned institutions such as IESE Business School, IMD Lausanne, WU Executive Academy in Vienna and Ashridge Executive Education. Erste School of Banking and Finance offers colleges for specific business areas. The Corporates & Markets College focuses on specific product knowledge, corporate analysis and corporate sales abilities. The Finance College covers topics of the four key areas of controlling, asset/liability management, accounting and data excellence. The offering of the Risk Management College reflects the changes in the regulatory framework and helps to acquire knowledge in the various areas of risk management. The Business Transformation College provides training on project management and business analysis, enterprise architecture and the broad integration of agile methods.

72
Erste Group’s international leadership development initiatives are structured into a comprehensive roadmap called Erste Leadership Evolution Centre (ELEC), addressing the full range of leadership development. ELEC also includes development programmes for Erste Group’s talent pools that aim at developing internationally mobile, high-potential leaders across three seniority levels. The International Talent Pool targets high-performing professionals up to board minus 3 management levels. The next level, the Group Key Positions Pool, aims at preparing managerial talents for roles at division head level. The Executive Pool identifies and develops top executive level talent. Attracting new generations of workforce through comprehensive development opportunities remains a steady priority across Erste Group. The aim of the annual Group Graduate Programme for university graduates is to attract top international graduates and provide them with fundamental banking and risk management knowledge. In the current Graduate Programme, 50% of the participants are women. In 2020, each employee of Erste Group had on average 21.5 training hours for professional development (women 21.4 and men 21.7 training hours). Employees in managerial positions had on average 26.0 training hours. Each employee of the Holding had on average 20.2 training hours for professional development (19.6 hours for women and 20.8 hours for men). In 2021, Erste Group plans to further expand its digital learning offering for employees and managers. Based on the experience during the pandemic, Erste Group decided to continue expanding digital learning formats. In many training courses, online formats proved to add substantial value. The focus will be both on the development of new formats and on the education of internal trainers who need to master a professional approach to the new media. REMUNERATION AND PEOPLE PERFORMANCE MANAGEMENT Erste Group’s remuneration policy is geared towards an appropri-ate balance in rewarding performance, competencies and respon-sibility of its employees. As a signatory of the Austrian Diversity Charter, Erste Group committed itself to the principles of equal opportunity and transparency, especially in remuneration. Conse-quently, one of the key strategic priorities is to ensure that all reward schemes are transparent, market-driven and linked to performance and personal development. Erste Group’s general remuneration philosophy is to neither fall short nor lead the mar-ket but to offer competitive remuneration packages. Therefore, its remuneration policy aims to: Create an environment where employees can perform, develop
and be involved Reward at the right level to attract and retain employees with
the required competence and skills
Be cost-competitive and cost-flexible for a sustainable busi-ness
Support leadership and employee behaviour that creates an engaging and unique customer experience and effective risk management practices
All remuneration schemes are designed to meet the respective European and national regulatory requirements on remuneration, as well as the local banks’ national remuneration practices and business line needs. The supervisory boards or, where established remuneration committees, review remuneration policies and practices annually on Group as well as on local level, to ensure compliance with respective international and national legislation. Erste Group’s remuneration packages comprise fixed and variable components, benefits and benefits in kind and other individually agreed terms and conditions. Fixed remuneration is the core component of any employee’s remuneration and is based on job complexity, individual contribution and local market conditions. The fixed salary represents a sufficiently high proportion of the total remuneration to cover the employees’ basic cost of living and allows Erste Group to operate a flexible remuneration policy. Variable components of remuneration are designed in such a way that they do not promote excessive risk-taking. Variable remuner-ation components may be offered to all employees and are based on company, individual and business line performance. Specific sales incentive schemes are offered to employees working in the retail and corporate business lines and are also based on company, individual and business line performance. Sales incentive schemes are based on quantitative and qualitative criteria. On all these levels, Erste Group uses a balance between financial and business growth, risk, customer satisfaction and cost indicators. The overall performance evaluation also includes the employee’s social and business competence. Benefits (in kind) are provided as a means to stimulate well-being in the work environment and to support an appropriate work-life balance. The benefits offered include flexible working time, study leave, parental leave as well as health centre expertise. Pension and insurance schemes aim at ensuring that employees have an appropriate standard of living after retirement. Pension and insur-ance provisions are according to local laws, regulations and market practice. EMPLOYEE HEALTH & WORK-LIFE BALANCE Respecting and promoting work-life balance has been a long-standing priority of Erste Group, and it offers a wide variety of family-friendly measures and evaluates them on a regular basis to ensure that they meet the employees’ needs. These measures differ from country to country and include flexible work ar-rangements, a company kindergarten, short sabbaticals and regu-lar meetings for employees on parental leave.

Management board | Supervisory board | Capital markets | Strategy | Financial and operating performance | Segments | Non-financial report | Corporate governance report | Audited financial reporting
73
One of the priority measures ensuing from the Career and Family (Beruf & Familie) Certification Audit in Austria is to develop effective interim management models for persons on parental leave that address career disruptions with flexibility and a clear focus on the development opportunities for women and men on parental leave. In 2020, Erste Group fostered its initiative on encouraging more men to take full advantage of parental leave options. The development of health literacy, embedded in the UN Sustain-able Development Goals (SDG 3), is essential for dealing with illnesses, guaranteeing equal access to health care, and supporting social policies in this area. The workplace offers an ideal setting and infrastructure to support and promote health issues to large groups of people, thus making occupational health an important contributor to public health. Erste Group is committed to a proac-tive approach to helping its employees to identify and manage health risks. Health promotion activities and topics in Erste Group include lifestyle habits, work-life balance, mental health, stress prevention and nutrition counselling. A multi-professional team of occupational physicians, work-place psychologists and physiotherapists assists Erste Group’s employees in any matters of health and well-being. The requirements for occupational safety in Austria are regulated by law (Occupational Health and Safety Act). Erste Group en-sures compliance with all legal requirements with its own health centre and covers support for the Holding, Erste Bank Oesterreich and almost 30 subsidiaries. In 2020, in the course of the Covid-19 pandemic, almost 7,000 employees received medical treatment in the context of occupational health measures. To set effective measures for employees within the scope of Covid-19 and to maintain continuous banking operations, the health centre initiated and supervised several very successful approaches: a hotline operating 7 days a week for inquiries from employees regarding related health issues, immediate testing in case of suspected infection, participation in a study led by Medi-
cal University of Vienna regarding the immunity situation of employed persons with various demographic factors and em-ployments as well as immediate individual and team support for all employees. Erste Group’s Vienna based health centre focuses on the preven-tion of chronic diseases, which account for 50-80% of all global health costs. Erste Group has implemented a wide variety of measures to prevent or at least minimise the impact of chronic illness. These measures include preventive medical examinations, melanoma screenings, colon cancer prevention and early detec-tion measures, the prevention of cardio-vascular diseases through nutrition consultation, fitness offers, and blood pressure and other screenings. Through close cooperation with local health services providers such as rehabilitation centres, employees are ensured quick access to treatment. A company agreement on re-integration ensures that employees can gradually return to work after an extended sick leave. Erste Group is one of only a few companies with such an agreement, which has resulted in a significant decline in long-term sick leaves over the past years. As mental health is increasingly important for the labour market, the health centre has made it one of its priorities. Employees have access to work-place psychologists, as well as to an external service that provides support for situations concerning children, school, problems at home and outside the home, and caring for older dependent family members. Employees on Erste Campus also have access to a hotline free of charge where they can anon-ymously seek advice from qualified professionals. Staff indicators Staff indicators refer to the end of the reporting period. Total data (48,516 employees; headcount) include data from direct and indirect holdings of Erste Group outside its below-mentioned core markets.

74
Overview and age structure 2020
Total <30 years 30-50 years >50 years
Women Men Number in % Number in % Number in %
Erste Group 30,271 18,245 7,812 16.1% 29,097 60.0% 11,607 23.9%
thereof Holding 924 1,016 213 11.0% 1,184 61.0% 543 28.0%
Austria incl. Holding 9,873 8,822 3,131 16.7% 9,738 52.1% 5,826 31.2%
Czech Republic 6,894 3,320 1,858 18.2% 6,051 59.2% 2,305 22.6%
Slovakia 2,705 1,149 574 14.9% 2,490 64.6% 790 20.5%
Romania 4,301 1,541 871 14.9% 3,724 63.7% 1,247 21.3%
Hungary 2,086 1,284 558 16.6% 2,352 69.8% 460 13.6%
Croatia 2,201 1,040 394 12.2% 2,360 72.8% 487 15.0%
Serbia 923 340 194 15.4% 875 69.3% 194 15.4%
Mode of employment
Full-time employees Part-time employees
2020 2019 2020 2019
Women Men Women Men Women Men Women Men
Erste Group 24,166 17,200 24,773 17,927 6,105 1,045 6,444 1,101
thereof Holding 612 921 639 991 312 95 329 104
Austria incl. Holding 5,106 8,037 5,217 8,271 4,765 787 4,872 817
Czech Republic 6,118 3,227 6,024 3,032 777 92 925 108
Slovakia 2,624 1,133 2,883 1,180 81 16 96 15
Romania 4,114 1,488 4,508 2,138 188 52 271 75
Hungary 1,873 1,200 1,873 1,159 213 84 197 79
Croatia 2,147 1,038 2,218 1,058 54 2 55 0
Serbia 918 338 820 326 5 2 3 1
Selected indicators
Share of women in executive
positions Share of women in other
managerial positions Average number of sick leave
days per employee Number of employees with
health disability
2020 2019 2020 2019 2020 2019 2020 2019
Erste Group 25.1% 23.4% 43.5% 41.2% 10 9 679 677
thereof Holding 25.5% 22.5% 28.4% 25.2% 4 6 17 15
Austria incl. Holding 19.3% 16.8% 25.6% 24.6% 7 8 338 330
Czech Republic 14.0% 14.4% 54.5% 56.8% 20 13 118 128
Slovakia 22.5% 19.4% 57.6% 58.4% 13 9 164 154
Romania 39.2% 38.6% 55.4% 55.3% 8 8 32 34
Hungary 24.1% 24.4% 48.6% 41.9% 3 9 10 9
Croatia 38.6% 35.7% 64.7% 60.4% 4 5 15 14
Serbia 37.5% 34.8% 53.2% 50.9% 9 10 0 1
Executive positions cover all board and board-1 positions. Other managerial positions cover all the board-2, board-3 and board-4 positions.
Governance bodies: Detailed information about the members of the management board and the supervisory board of the Holding is presented in the (consolidated) Corporate Governance Report. As of year-end 2020, one woman
and six men were members of the management board, two of them were between 30 and 50 years old, and five of them were older than 50 years. 39% of the members of the supervisory board were women, 61% were men.
Parental leave (return to work after parental leave)
2020 2019
Women Men Women Men
Number in % Number in % Number in % Number in %
Erste Group 1,013 80.3% 120 96.0% 1,009 77.7% 139 97.9%
thereof Holding 22 100% 7 100% 37 94.9% 16 94.1%
Austria incl. Holding 268 91.4% 81 99.0% 300 89.6% 82 97.6%
Czech Republic 151 67.4% 0 n.a. 131 44.4% 1 100.0%
Slovakia 94 77.0% 15 93.8% 80 96.4% 25 100.0%
Romania 194 84.0% 11 100% 244 97.2% 22 95.7%
Hungary 80 61.1% 0 0.0% 51 46.4% 0 n.a.
Croatia 123 83.7% 12 100% 109 87.2% 6 100%
Serbia 46 93.9% 0 n.a. 36 94.7% 0 n.a.
Every employee in a permanent employment contract is eligible to take parental leave. The ratio (in %) shows the return rate after parental leave has ended.

Management board | Supervisory board | Capital markets | Strategy | Financial and operating performance | Segments | Non-financial report | Corporate governance report | Audited financial reporting
75
New hires in 2020
Women Men <30 years 30-50 years >50 years
Number in % Number in % Number in % Number in % Number in %
Erste Group 2,978 63.4% 1,722 36.6% 2,202 46.9% 1,918 40.8% 580 12.3%
thereof Holding 38 48.1% 41 51.9% 22 27.8% 46 58.2% 11 13.9%
Austria incl. Holding 745 57.8% 545 42.2% 665 51.6% 520 40.3% 105 8.1%
Czech Republic 945 63.2% 551 36.8% 591 39.5% 487 32.6% 418 27.9%
Slovakia 216 67.5% 104 32.5% 167 52.2% 147 45.9% 6 1.9%
Romania 446 71.4% 179 28.6% 339 54.2% 267 42.7% 19 3.0%
Hungary 234 57.9% 170 42.1% 176 43.6% 210 52.0% 18 4.5%
Croatia 130 68.4% 60 31.6% 90 47.4% 94 49.5% 6 3.2%
Serbia 126 71.6% 50 28.4% 84 47.7% 88 50.0% 4 2.3%
The calculation methodology was changed in 2020. The percentages refer to the total of newly hired employees. In 2019, the percentages referred to the total headcount.
Fluctuation in 2020
Women Men <30 years 30-50 years >50 years
Number in % Number in % Number in % Number in % Number in %
Erste Group 3,645 10.8% 1,844 9.3% 1,502 14.5% 2,737 9.8% 1,250 8.2%
thereof Holding 59 5.9% 75 6.7% 27 9.4% 61 4.6% 46 8.9%
Austria incl. Holding 808 7.6% 785 8.2% 395 10.3% 568 5.4% 630 10.8%
Czech Republic 887 11.3% 339 9.3% 340 12.9% 657 22.0% 229 3.9%
Slovakia 512 16.0% 153 11.8% 137 15.9% 368 13.1% 160 19.3%
Romania 720 14.4% 194 11.4% 342 27.4% 465 11.3% 107 8.0%
Hungary 330 14.2% 190 13.4% 143 21.8% 327 12.6% 50 10.1%
Croatia 229 9.6% 81 7.7% 83 14.4% 170 7.1% 57 12.2%
Serbia 77 7.6% 36 9.5% 26 9.6% 75 8.1% 12 6.1%
This table presents the number of employees who left Erste Group (including retirement) during the financial year and it does not include employees on parental leave, internal transfers within Erste Group or departing trainees
and interns. The fluctuation is calculated pursuant to the Schlüter formula. For Erste Group (total of men and women), fluctuation stood at 10.2% (2019: 12.1%).
Environment
In recent years, ecological sustainability has developed from a marginal topic into a major one that is of relevance not only to experts and environmental activists. Stakeholders – employees, customers and last, but not least, investors – are increasingly taking a closer look at the ecological footprint of every company, including banks. The Paris Agreement of 2015, the United Nations’ Sustainable Development Goals and the Special Report of the Intergovern-mental Panel on Climate Change of October 2018 have one thing in common: they call for accelerated and more decisive action to reduce greenhouse gases and transition to a low-CO2 climate-neutral economy. The European Commission estimates that up to 2030, additional annual funding of approx. EUR 260 billion will be needed for a significant transition of the economy to renewa-ble energy sources. This means that banks, insurers and other financial institutions will also play a key role in combating cli-mate change. Under the EU Action Plan on Sustainable Finance, the European Commission aims to create a legal framework under which as-pects such as the environment, social responsibility and govern-ance are to become key decision criteria for the financial system.
Banks are service providers whose business operations have only a modest direct impact on the environment, mostly through their consumption of energy and paper. A bank may, however, have a substantial indirect impact on the environment through its business operations. Becoming aware of this impact and taking appropriate action are among the main challenges financial institutions are facing. Erste Group has therefore already been pursuing ecological goals for many years and understands sustainability as part of its corporate responsibility, building on its 200-year history. Consequently, Erste Group has set ecological targets to minimise its operational environmental footprint. Its direct environmental impact is limited to energy and paper consumption. Since 2016, Erste Group’s published data show a total reduction of more than 21% in Scope 1 and Scope 2 emissions even though the scope of reported entities increased significantly. ENVIRONMENTAL STRATEGY Erste Group's environmental strategy is based on four pillars: Establishment of environmental management systems Inclusion of ecological criteria in banking products and ser-
vices Establishing a supply chain management system for all pur-
chased products and services Cooperation with non-governmental organizations active in
the environmental sector

76
Ecological targets For 2019 to 2021, targets for the use of energy and other re-sources have been agreed individually for each of the local sub-sidiary banks. Following absolute targets set for 2012 to 2016 (e.g. reduction of the total consumption of electrical energy), this time, relative targets (e.g. consumption of electrical energy per m2) were agreed. Relative targets enable comparability between local subsidiary banks. In the past, comparability was limited due to the increasing number of companies included in the non-financial reports and the continuous reduction in the number of branches. The six key indicators for the ecological targets are: Average electricity consumption in kWh/m2 Average heating energy consumption in kWh/m2 Share of hybrid/e-cars in the carpool in % Copy paper consumption in kg/employee (FTE) Share of recycled copy paper in % CO2e emissions (Scope 1 + Scope 2) in tonnes/employee
(FTE) The starting points for the individual targets for each core market were the respective values from 2018. One year after having introduced the ecological targets, Erste Group’s subsidiaries in Serbia, Croatia and the Czech Republic already met their targets on Scope 1 and Scope 2 emissions per FTE in 2020. With regard to the share of hybrid/e-cars in the carpool, the entities in Roma-nia, the Czech Republic and in Austria met the set goals in the course of 2020. In addition, the target on the share of recycled copy paper was reached across Erste Group except in Austria due to the increased scope of entities, i.e. the Austrian savings banks that were not part of the non-financial report in 2019. Nonethe-less, paper consumption per FTE declined due to the shift to-wards a higher rate of persons working from home. The individual environmental targets as well as the environmental data for the reporting period are presented in a table at the end of this section. Scope 3 emissions associated with Erste Group’s investments and financing significantly contribute to total greenhouse gas emis-sions. For this reason, Erste Group started an initiative to develop a methodology to calculate the point-in-time carbon footprint of its credit portfolio in 2020 and to report it in 2021. CO2e Scope 3 emissions caused by mobility (e.g. kilometers travelled by air, train or rental car for business purposes) are not reported as they are immaterial compared to emissions due to investment and finance activities. Overall, Erste Group’s reported total CO2e emissions (Scope 1 + Scope 2) were reduced by 7,518 tonnes (-11.6%), which was mainly attributable to efficiency measures in Romania (-5,401 tonnes CO2) and Hungary (-1,810 tonnes CO2). The increase in emissions in Austria (+20.2%) was due to the expanded scope of entities.
Ecological footprint 2019 2020
Electricity consumption 175 GWh 165 GWh
Heating/cooling energy consumption 138 GWh 137 GWh
Fuel consumption 46 GWh 37 GWh
Total energy consumption 359 GWh 340 GWh
CO2e-emissions (Scope 1 and 2) 64,834 t 57,492 t
Copy paper consumption 1,615 t 1,295 t
Scope of consolidation In 2020, the reporting scope of environmental data covers the whole consolidation scope of Erste Group entities except one minor operational entity that accounts for less than 1% of total FTEs. In 2020, the environmental data of all Austrian savings banks of Erste Group were taken into account, while in 2019 only those with more than 150 employees were covered. The extension of the reporting scope by 30 Austrian savings banks led to the fol-lowing increases in environmental data: total energy consumption 17,226 MWh (thereof consumption of electrical energy: 6,596 MWh, consumption of heating energy 7,577 MWh), copy paper consumption 55 t (of which 9.4 t recycled paper), CO2e emissions 2,054 t. Environmental management systems Certifications according to ISO 14001 and/or ISO 50001 have been completed in Erste Group’s subsidiaries in Croatia, Slovakia and Hungary. Erste Bank Croatia introduced energy management standard ISO 50001 in addition to the ISO 14001 certification that has been in place since 2017. Česká spořitelna is considering the introduction of an EMAS certification in 2021. Of the Austri-an savings banks Steiermärkische Sparkasse (ISO 14001) and Allgemeine Sparkasse Oberösterreich (ISO 50001) are already certified. Steiermärkische Sparkasse plans to audit its environ-mental management system at the beginning of 2021. Dornbirner Sparkasse has been certified ÖKOPROFIT every year since 2012 PRIORITIES Improving energy efficiency For banks, the most effective approach to cutting CO2 emissions is to switch to electricity from renewable energy sources. Erste Group has completed this change fully in Austria and Croatia and has completed it partially in Hungary and the Czech Republic. The reduction in energy consumption for electrical energy and for heating and hot water preparation is predominately ensured by new, energy-efficient headquarter administrative buildings. How-ever, branches are mostly located in rented premises and therefore are limited in their choice of heating systems efficiency measures that can lead to improvements. The following newly constructed Erste Group headquarters
meet strict ecological criteria and thus contribute substantially to reduced consumption of resources: Erste Campus in Vienna
Management board | Supervisory board | Capital markets | Strategy | Financial and operating performance | Segments | Non-financial report | Corporate governance report | Audited financial reporting
77
is certified on platinum level by DGBN/ÖGNI Österreichische Gesellschaft für Nachhaltige Immobilienwirtschaft.
The Bridge, the headquarters of Banca Comercială Română in Bucharest, holds LEED Platinum (Leadership in Energy and Environmental Design) certification. Office space in the LED technology equipped building was reduced from 21,000 m² of floor area to 14,000 m² compared to the old premises.
Erste Campus, for example, is supplied exclusively with non-fossil energy (district heating and cooling and green electricity). In 2020, the use of district cooling was reduced significantly by 39.2% (2019: 27.7%) to 1.0 GWh (2019: 1.7 GWh) through improved use of cold groundwater for cooling. The construction of a photovoltaic system on the roof of the Erste Campus began in December 2020. The 764 modules covering roughly 2,000 m2 will supply approximately 250,000 kWh per year, which is rough-ly equivalent to the consumption of 5 branches or 125 house-holds. This installation is an important step to make the main building of Erste Group even more climate-friendly, in addition to measures already taken, such as the use of 100% green electricity and the use of rainwater and district cooling. Česká spořitelna’s energy management focus was on the imple-mentation of remote monitoring and control of technical building management, e.g. a facility management system enabling digitali-sation and technology passporting, control of cleaning and waste management and corresponding documentation of systems. The bank cooperated in this area with the Centre for Energy Efficient Buildings and the Faculty of Mechanical Engineering of the Czech Technical University. Slovenská sporiteľňa achieved a further 10% reduction in electricity consumption by reducing the CO2 footprint of its branches and optimising data server functions. At the beginning of 2020, Erste Campus as well the branches of Erste Bank Oesterreich and some savings banks switched to Verbund as their electricity provider. Verbund is Austria’s leading electricity company and one of Europe‘s largest producers of electricity from hydropower, making up almost 100% of their electricity generation. Several savings banks joined the effort and invested both in ener-gy savings and innovation. Kärntner Sparkasse piloted an eco-protective local concept. For the wooden construction of a new branch, wood was sourced locally in the Gurktal region and owing to an innovative heat pump the building's CO2 emissions are kept at minimum levels. When Wiener Neustädter Sparkasse planned the renovation of both their customer center and the main headquarters, a special emphasis was placed on state-of-the-art technology for ventilation, cooling, heating and lighting. A project aiming at the transition to sustainable energy and the vision of operating in a climate-neutral manner launched in 2019 by Allgemeine Sparkasse Oberösterreich, with support from OÖ Energiesparverband, proved successful in 2020. The conversion to energy sourcing with zero-carbon electricity led to a reduction
of the CO2 emissions of 59%. Technical monitoring of selected branches is an important part of this project. Automatic meter readings facilitate energy consumption and trend reports. In addition to the main locations of Promenade, sBC and Wels, six additional branches will be integrated into the system in 2020. The project also includes an analysis of the mobility behaviour of employees on their way to work. Use of electric and hybrid vehicles An additional measure to reduce CO2e emissions is the replace-ment of fossil fuel-powered company cars with e-cars or hybrid cars. Given the cost-efficiency focus in 2020, Erste Group gener-ally did not invest into car-fleet renewals, and its policy was focused mainly towards reduction, phase out or essential re-placements. Still, Erste Group made progress towards its goal and increased the share from 1.4% to 3.2% in 2020. Austria reached 9.1% in 2020 (2019: 6.6). Banca Comercială Română improved its share from 0.1% to 3.8% as the net increase of its carpool was fully covered with eco-friendly vehicles. Other entities achieved a reduction of emissions through a decrease of their combustion engine car park – Česká spořitelna by 4.9% and Erste Bank Croa-tia by 8.9%. A further increase of the share of e-cars or hybrid cars will also depend on the charging station network availability in CEE countries, which is still only a fraction of that in Austria. E-car charging stations were put in place at various sites includ-ing Erste Campus in Vienna and several savings banks branches. Reduction of paper consumption To minimise its environmental impact, Erste Group preferably buys recycled copy paper and continuously runs paper-saving initiatives in its banking operations. The trend towards digitalisa-tion helps to reduce paper consumption. On the online platform George, customers may choose to waive printouts of account statements as Erste Group's mobile banking offers an easy-to-use archive of all account transactions. Current efforts aim at processing all standard banking transactions electronically whenever possible, which will accelerate back-office procedures and make customer service more efficient. This improves not only the customer experience but also reduces paper consumption. sDG Dienstleistungsgesellschaft mbH – with 187 tonnes the main consumer of printed paper across Erste Group in Austria – reduced its consumption by 37.5 tonnes in 2020. Other paper reduction initiatives in 2020 include Erste Bank Croatia introducing electronic delivery of invoices and Česká spořitelna’s ongoing Low-paper office operation project with topics such as cashless banking, biometrics and robotics. Other environmental initiatives One element of Erste Group's environmental strategy is coopera-tion with environmental NGOs. They offer access to their local and international expertise and provide Erste Group with valuable support in its efforts to improve its ecological sustainability. An example of this is the close cooperation between Erste Asset

78
Management and WWF in the area of ecologically particularly sustainable investment funds. With an increase in value of 77% in 2020, the ERSTE WWF Stock Environment Fund underlined that sustainability and financial performance can be combined. Česká spořitelna is a member of Společenská odpovědnost (the Association of Social Responsibility), the largest Czech CSR initiative, and a founding member of the Změna k lepšímu (Change for the better) initiative. The bank supported the Founda-tion Partnerství and their project Greenways: 4,200 kilometers of cycling and hiking trails were built. Erste Bank Serbia encourages its employees to take an active part in environmental initiatives and raises awareness, for example by cleaning the Petrovaradin fortress with the help of volunteers. In 2020, Erste Bank Restau-rantbetriebe switched to a reusable system for coffee cups at all restaurants it operates at Erste Campus. This initiative will save at least 85,000 disposable coffee to-go cups per year. Slovenská sporiteľňa and Allgemeine Sparkasse Oberösterreich keep bee hives on the rooftops of their headquarters, following the example of Erste Campus in Vienna. In addition to producing excellent honey, these bee hives also serve as a visible symbol of the need for nature conservation.
Details on ecological criteria for purchasing are presented in the section on suppliers and supply chain. Environmental data acquisition Erste Group uses a software program from CRedit360 (cr360) to collect environmental data group-wide. With this tool, the energy consumption of approx. 3,000 business locations is individually recorded and evaluated. For the conversion to greenhouse gas equivalents (CO2e), cr360 uses emission factors from DEFRA (UK Department for Environment, Food & Rural Affairs) and the IEA (International Energy Agency). Environmental indicators Total figures for Erste Group shown in the following tables also include data of direct and indirect holdings of Erste Group out-side its core markets. A separate presentation of Holding data is not provided, as a meaningful segregation of environmental indicators is not possible due to the shared use of the location (Erste Campus in Vienna) with other entities. The environmental indicators for 2020 relate to 45,435.27 full-time equivalents (FTEs), that is 99% of all FTEs in Erste Group. Further details on Erste Group's environmental data are available on the Erste Group website https://www.erstegroup.com/en/ about-us/sustainability.
Environmental targets for 2021 Measure AT CZ SK RO HU HR RS
Average electricity consumption per m² kWh/m² 104 103 85 79 125 163 106
Average heating energy usage per m² kWh/m² 60 95 81 85 60 60 77
Share of hybrid/e-cars in carpool % 5% 3% 1% 0% 10% 1% 3%
Copy paper consumption per employee kg/FTE 34 23 25 59 30 33 46
Share recycled copy paper % 90% 95% 100% 95% 100% 95% 100%
Scope 1 and 2 per employee tCO2e/FTE 0.53 1.40 1.50 2.55 1.20 0.75 1.95
Environmental data 2020 Measure Erste Group AT CZ SK RO HU HR RS
Full-time equivalents (FTE) Number 45,435 16,635 9,933 3,821 5,803 3,286 3,067 1,199
Net floor area m² 1,654,020 663,089 301,533 143,199 356,830 61,617 67,709 23,093
Total energy consumption MWh 339,588 121,495 69,317 26,478 72,270 16,945 18,628 4,867
Electricity total consumption (with ATM and own electricity production) MWh 165,356 65,953 32,145 12,328 25,457 8,232 12,353 2,283
Heating, warm water and district cooling total consumption MWh 137,449 47,015 31,875 12,502 31,244 6,433 4,598 1,895
Total diesel consumption for electricity generation MWh 254 177 47 20 5 3 - -
Carpool consumption total (converted to kWh) MWh 36,528 8,350 5,251 1,628 15,564 2,277 1,677 690
Share of hybrid/e-cars in carpool % 3.2% 9.1% 0.4% 1.1% 3.8% 1.0% 0.0% 0.0%
Average electricity consumption per m² kWh/m² 100.0 99.5 106.6 86.1 71.3 133.6 182.4 98.9
Average heating energy usage per m² kWh/m² 83.1 70.9 105.7 87.3 87.6 104.4 67.9 82.1
Total paper usage t 1,295 502 158 72 311 84 76 22
Paper consumption per employee kg/FTE 28.5 30.2 16.0 18.8 53.6 25.5 24.7 18.4
Non-recycled copy paper t 402 334 3 1 3 0 0 0
Recycled copy paper t 892 169 155 71 308 84 76 22
Share recycled copy paper % 68.9% 33.6% 97.9% 98.9% 99.1% 99.7% 100.0% 99.5%
Emissions Scope 1 and 2 tCO2e 57,492 9,968 10,976 6,144 18,693 4,659 1,800 648
Scope 1-emissions tCO2e 24,929 6,785 2,160 2,931 9,636 1,603 1,221 212
Scope 2-emissions tCO2e 32,562 3,183 8,816 3,214 9,057 3,056 579 436
Scope 1 and 2 per employee tCO2e/FTE 1.27 0.60 1.10 1.61 3.22 1.42 0.59 0.54

Management board | Supervisory board | Capital markets | Strategy | Financial and operating performance | Segments | Non-financial report | Corporate governance | Audited financial reporting
79
2019 Measure Erste Group AT CZ SK RO HU HR RS
Full-time equivalents (FTE) Number 44,315 14,962 9,780 4,133 6,795 3,230 3,134 1,136
Net floor area m² 1,591,455 573,036 301,629 155,036 376,953 68,192 68,133 24,226
Total energy consumption MWh 358,563 109,096 73,466 27,979 96,959 16,985 20,352 5,598
Electricity total consumption (with ATM and own electricity production) MWh 174,588 63,419 32,928 13,272 35,244 8,767 13,059 2,638
Heating, warm water and district cooling total consumption MWh 138,361 38,407 32,756 12,495 41,677 4,937 4,472 1,838
Total diesel consumption for electricity generation MWh 301 192 41 20 16 22 5 4
Carpool consumption total (converted to kWh) MWh 45,313 7,078 7,740 2,193 20,022 3,258 2,815 1,118
Share of hybrid/e-cars in carpool % 1.4% 6.6% 0.3% 1.1% 0.1% 1.0% 0.0% 0.0%
Average electricity consumption per m² kWh/m² 109.7 110.7 109.2 85.6 93.5 128.6 191.7 108.9
Average heating energy usage per m² kWh/m² 86.9 67.0 108.6 80.6 110.6 72.4 65.6 75.9
Total paper usage t 1,615 575 211 101 397 102 102 69
Paper consumption per employee kg/FTE 37 38 22 25 59 31 33 60
Non-recycled copy paper t 432 360 12 1 3 1 5 -
Recycled copy paper t 1,184 215 199 100 394 101 97 69
Share recycled copy paper % 73.3% 37.5% 94.4% 98.9% 99.1% 99.0% 95.2% 99.9%
Emissions Scope 1 and 2 tCO2e 64,834 8,120 12,015 6,177 24,094 6,469 2,271 1,224
Scope 1 - Emissions tCO2e 29,950 5,799 2,813 3,155 12,899 2,738 1,561 582
Scope 2 - Emissions tCO2e 34,884 2,321 9,203 3,021 11,195 3,731 710 643
Scope 1 and 2 per employee tCO2e/FTE 1.46 0.54 1.23 1.49 3.55 2.00 0.72 1.08
FTE: full-time equivalent, defined as an employee times his/her employment factor.
The CO2 equivalents (CO2e) are the sum of all greenhouse gas emissions, i.e. carbon dioxide, methane and nitrogen oxide.
Management board
Bernhard Spalt mp, Chairman
Ingo Bleier mp, Member Stefan Dörfler mp, Member
Alexandra Habeler-Drabek mp, Member David O’Mahony mp, Member
Maurizio Poletto mp, Member Thomas Schaufler mp, Member
Vienna, 10 March 2021

80
GRI Standard Number
GRI+ Standard Title Disclosure Number
Disclosure Titel Reference to Annual Report 2020
Comments / Reasons for omission
GRI 102 General Disclosures 2016
1. Organisational profile
GRI 102 General Disclosures 102-1 Name of the organisation Erste Group Bank AG
GRI 102 General Disclosures 102-2 Activities, brands, products, and services
p. 10 et seq. Strategy
GRI 102 General Disclosures 102-3 Location of headquarters Erste Campus, Am Belvedere 1, 1100 Vienna
GRI 102 General Disclosures 102-4 Location of operations p. 54
GRI 102 General Disclosures 102-5 Ownership and legal form p. 85 (consolidated) corporate governance report
GRI 102 General Disclosures 102-6 Markets served Note 1 Group consolidated financial statements: Note 1 (segment reporting)
GRI 102 General Disclosures 102-7 Scale of the organisation Note 1 Group consolidated financial statements: Note 1 (segment reporting)
GRI 102 General Disclosures 102-8 Information on employees and other workers
p. 75 et seq.
Workers who are not employees do not perform a significant portion of organization’s activities. Therefore does not apply. There are no significant variations in the reported numbers in Disclosures 102-8a, 102-8b and 102-8c. In the initial phase of preparation for HR data collection for the non-financial report, the scope and the reporting categories are based on GRI standards. The data are collected using an Excel template which is sent to those responsible in each institution. Once the completed template has been returned and the data quality has been checked, the data are consolidated and prepared for publication.
GRI 102 General Disclosures 102-9 Supply chain p. 67
GRI 102 General Disclosures 102-10 Significant changes to the organisation and its supply chain
No significant changes in the organisation (neither in terms of size, structure nor ownership) nor in the supply chain.
GRI 102 General Disclosures 102-11 Precautionary principle or approach
p. 53 The precautionary principle is reflected in both Erste Group's code of conduct and the statement of purpose.
GRI 102 General Disclosures 102-12 External initiatives p. 64 et seq., 75
(consolidated) non-financial report: our customers, environment; Erste Asset Management: UN Principles of Responsible Investment, Bangladesh Memorandum, Montreal Carbon Pledge Erste Group: Nestor Gold Charta, Austrian Diversity Charter
GRI 102 General Disclosures 102-13 Membership of associations
Erste Group Bank AG has the following significant memberships: WSBI (World Savings Banks Institute), ESBG (European Savings Banks Group), Österreichischer Sparkassenverband, WKO (Austrian Economic Chambers, Industry Sector: Banking and Insurance), OEVFA (Österreichische Vereinigung für Finanzanalyse und Asset Management), BWG (Bankwissen-schaftliche Gesellschaft Österreich), WIFO (Wirtschaftsforschungsinstitut Österreich), Österreichische Industriellenvereinigung, respACT (Austrian Business Council for Sustainable Development) Erste Group’s banking subsidiaries in CEE have following important memberships: Erste Bank Croatia: Croatia Green Building Council (CGBC), Croatian Association of Accountants and Financial Experts (CAAFE); Erste Bank Serbia: Association of Banks of Serbia, Chamber of Commerce Serbia; Slovenská sporiteľňa: Slovak Banking Association, Central European Corporate Governance Association; Erste Bank Hungary: Hungarian Banking Association, Budapest Chamber of Commerce and industry; Banca Comercială Română: Romanian Banking Association, Financial Markets Association; Česká spořitelna: Czech Banking Association, Economic chamber of the Czech Republic
2. Strategy
GRI 102 General Disclosures 102-14 Statement from senior decision maker
p. 2 et seqq.
GRI 102 General Disclosures 102-15 Key impacts, risks and opportunities
p. 56 et seq.
3. Ethics and integrity
GRI 102 General Disclosures 102-16 Values, principles, standards, and norms of behaviour
p. 53, 85 et seqq.
Reference made to the code of conduct and the statement of purpose), (consolidated) non-financial report, (consolidated) corporate governance report (reference made to the Austrian Code of Corporate Governance and internal guidelines)
4. Governance
GRI 102 General Disclosures 102-18 Governance structure p. 85 et seqq.
5. Stakeholder engagement
GRI 102 General Disclosures 102-40 List of stakeholder groups p. 57
GRI 102 General Disclosures 102-41 Collective bargaining agreements
Collective agreements apply to a total of 87.9% of all employees. In Hungary, there is no collective agreement as a salary basis. In the other core markets, 90-100% of employees are included in collective agreements (Holding: 90.4%)
GRI 102 General Disclosures 102-42 Identifying and selecting stakeholders
p. 55 et seqq.
GRI 102 General Disclosures 102-43 Approach to stakeholder engagement
p. 55 et seqq.
GRI 102 General Disclosures 102-44 Key topics and concerns raised p. 55 et seqq.
GRI Content Index

Management board | Supervisory board | Capital markets | Strategy | Financial and operating performance | Segments | Non-financial report | Corporate governance report | Audited financial reporting
81
GRI Standard Number
GRI+ Standard Title Disclosure Number
Disclosure Titel Reference to Annual Report 2020
Comments / Reasons for omission
6. Reporting practice
GRI 102 General Disclosures 102-45 Entities included in the consolidated financial statements
p. 53
GRI 102 General Disclosures 102-46 Defining report content and topic boundaries
p. 55 et seqq.
GRI 102 General Disclosures 102-47 List of material topics p. 55 et seqq.
GRI 102 General Disclosures 102-49 Changes in reporting p. 53 Additional 30 Savings Banks from the scope of consolidation were included in the non-financial reporting in 2020.
GRI 102 General Disclosures 102-50 Reporting period From 1 January 2020 to 31 December 2020
GRI 102 General Disclosures 102-51 Date of most recent report Annual report 2019
GRI 102 General Disclosures 102-52 Reporting cycle Annual
GRI 102 General Disclosures 102-53 Contact point for questions regarding the report
p. 298
GRI 102 General Disclosures 102-54 Claims of reporting in accordance with GRI Standards
p. 53 This report has been prepared in accordance with the requirements of the Global Reporting Initiative (GRI Standard Option: Core).
GRI 102 General Disclosures 102-55 GRI content index p. 80 et seqq.
GRI 102 General Disclosures 102-56 External assurance p. 83 et seq
GRI 103 Management Approach 2016
GRI 103 Management Approach
103-1 Explanation of the material topic and its boundary
p. 55 et seqq.
GRI 103 Management Approach
103-2 The management approach and its components
p. 55 et seqq.
GRI 103 Management Approach
103-3 Evaluation of the management approach
p. 55 et seqq., 83
GRI 201 Economic Performance 2016
GRI 201 Economic Performance
201-1 Direct economic value generated and distributed
Note 1, Note 56
Outside the non-financial report. Consolidated financial statements.
Social commitment and social banking (FS 14 Indirect Economic Impacts 2016)
FS 14 Indirect Economic Effects
FS14 of GRI G4
Initiatives to improve access to financial services for disadvantages peoples
p. 62 et seq., 66 et seq.
Anti-corruption and compliance (GRI 205 Anti-corruption 2016)
GRI 205 Anti-Corruption 205-3 Confirmed incidents of corruption and actions taken
In 2020, Erste Group did not discover or record any incident of corruption.
GRI 206 Anti-competitive behaviour 2016
GRI 206 Anti-competitive behaviour
206-1
Legal actions for anti-competitive behaviour, anti-trust and monopoly practices
Note 43
Group consolidated financial statements: Note 43 (contingent liabilities); No legal actions for anti-competitive behavior, anti-trust, or monopoly practices have been initiated against Erste Group Bank AG. During the reporting period, subsidiaries of Erste Group Bank AG were directly or indirectly involved in five such cases. As one of these cases got resolved in 2020, there remain only four pending cases. We do not expect these cases to lead to any fines or sanctions that would have a material effect on Erste Group.
Responsible criteria in the supply chain and ecological impacts on banking operations (GRI 301 Materials 2016)
GRI 301 Materials 301-1 Materials used by weight and volume
p. 78
GRI 301 Materials 301-2 Recycled input materials used p. 78
Responsible criteria in the supply chain and ecological impacts on banking operations (GRI 302 Energy 2016)
GRI 302 Energy 302-1 Energy consumption within the organisation
p. 76, 78
(consolidated) non-financial report: environment; In terms of energy consumption, there is no separate presentation of renewable / non-renewable energy sources. It is included in the determination of the CO2e-emissions.
GRI 302 Energy 302-4 Reduction of energy consumption
p. 76, 78 et seq.
Responsible criteria in the supply chain and ecological impacts on banking operations (GRI 305 Emissions 2016)
GRI 305 Emissions 305-1 Direct (Scope 1) GHG emissions p. 78 GRI 305-1c There are no biogenic CO2 emissions to report.
GRI 305 Emissions 305-2 Energy indirect (Scope 2) GHG emissions
p. 78 Gross market based: 32,562t; Gross location-based:57,514t or 177% of reported value of 32,562t.
Responsible criteria in the supply chain and ecological impacts on banking operations (GRI 308 Supplier Environmental Assessment 2016)
GRI 308 Supplier Environmental Assessment
308-1 New suppliers that were screened using environmental criteria
p. 68

82
GRI Standard Number
GRI+ Standard Title Disclosure Number
Disclosure Titel Reference to Annual Report 2020
Comments / Reasons for omission
Diversity and equal opportunity (GRI 401 Employment 2016)
GRI 401 Employment 401-1 New employee hires and employee turnover
p. 75 Pursuant to Schlüter formula: (total of employees leaving) / (number of employees at the beginning of the year + total of newly hired employees)
GRI 401 Employment 401-3 Parental leave p. 74 401-3a) All employees (women and men) are entitled to take parental leave;401-3d) No information available due to data that could not be clearly distinguished.
Employee health & work-life balance (GRI 403 Occupational Health and Safety 2018)
GRI 403 Occupational Health and Safety
403-1 Occupational health and safety management systems
Data not completely available. Group-wide data collection is under development.
GRI 403 Occupational Health and Safety
403-2 Hazard identification, risk assessment and incident investigation
Data not completely available. Group-wide data collection is under development.
GRI 403 Occupational Health and Safety
403-3 Occupational health services Data not completely available. Group-wide data collection is under development
GRI 403 Occupational Health and Safety
403-4 Worker participation, consultation and communication occupational health and safety
Data not completely available. Group-wide data collection is under development.
GRI 403 Occupational Health and Safety
403-5 Worker training on occupational health and safety
Data not completely available. Group-wide data collection is under development.
GRI 403 Occupational Health and Safety
403-6 Promotion of worker health Data not completely available. Group-wide data collection is under development
GRI 403 Occupational Health and Safety
403-7
Prevention and mitigation of occupational health and safety impacts directly linked by business relationships
Data not completely available. Group-wide data collection is under development
GRI 403 Occupational Health and Safety
403-8 Workers covered by an occupational health and safety management system.
Data not completely available. Group-wide data collection is under development
Diversity and equal opportunity (GRI 404 Training and Education 2016)
GRI 404 Training and Education
404-1 Average hours of training per year per employee
p. 72
Diversity and equal opportunity (GRI 405 Diversity and Equal Opportunity 2016)
GRI 405 Diversity and Equal Opportunity
405-1 Diversity of governance bodies and employees
p. 74, 85 et seqq.
At Erste Group Bank AG, the parent company of Erste Group, employees represent more than 50 different nationalities.
Diversity and equal opportunity (GRI 406 Non-Discrimination 2016)
GRI 406 Non-Discrimination 406-1 Incidents of discrimination and corrective actions taken
.
In 2020, one significant incident was submitted to the anti-discrimination officer. The responsible HR and Compliance unit reviewed the incident.. According to their assessment the incident was not qualified as discrimination but rather unprofessional behaviour. In order to solve the conflict a set of recommendations were made to all involved parties. (conflict mediation by HR and compliance), coaching for all involved parties.
Responsible criteria in the supply chain and ecological impacts on banking operations (GRI 414 Supplier Social Assessment 2016)
GRI 414 Supplier Social Assessment
414-1 New suppliers that were screened using social criteria
p. 68
GRI 418 Customer Privacy 2016
GRI 418 Customer Privacy 418-1
Substantiated complaints concerning breaches of customer privacy and losses of customer data
p. 63
GRI 419 Socioeconomic Compliance 2016
GRI 419 Socioeconomic compliance
419-1 Non-compliance with laws and regulations in the social and economic area
In 2020, there were neither significant fines nor non-monetary sanctions for non-compliance with laws and/or regulations in the social and economic area.
Material topic: Financial education
GRI G4 Sector Disclosures Financial Service
Information on Erste Group's engagement to improve financial literacy
GRI G4-DMA (former FS16)
Initiatives to enhance financial literacy by type of beneficiary
p. 59 et seq.
Material topic: Customer satisfaction
Information on customer satisfaction
p. 63
Material topic: Responsible investment and finance
Information on responsible investment and financing
p. 63et seqq.
GRI 103 Management Approach
103-2 The management approach and its components
p. 55 et seq., 63 et seq.
GRI 103 Management Approach
103-3 Evaluation of the management approach
p. 55 et seq., 63 et seqq.
Materiality analysis; compliance with the existing exclusion criteria for investments and financing is the responsibility of the respective business units. The exclusion criteria are evaluated on a regular basis to see whether they fulfil the envisaged social and ecological responsibility.

Management board | Supervisory board | Capital markets | Strategy | Financial and operating performance | Segments | Non-financial report | Corporate governance report | Audited financial reporting
83
Independent Assurance Report
To the Management Board of Erste Group Bank AG COURTESY TRANSLATION OF THE AUDIT REPORT OF THE INDEPENDENT ASSURANCE ON NON-FINANCIAL REPORTING Attention: This letter has been translated from German to English for referencing purposes only. Please refer to the officially legally binding version as written and signed in German. Only the German version is the legally binding version. Introduction We performed procedures to obtain limited assurance, if the (consolidated) non-financial report as at December 31, 2020 was prepared in accordance with the reporting criteria. The reporting criteria include the Sustainability Reporting Standards (GRI Standards: Core option) issued by the Global Sustainability Standards Board (GSSB) and the reporting requirements mentioned in §§ 243b and 267a UGB. Responsibility of the management The preparation of the report in accordance with the reporting criteria as well as the selection of the scope of the engagement is the re-sponsibility of the management of Erste Group Bank AG. The reporting criteria include the Sustainability Reporting Standards (GRI Standards: Core option) issued by the Global Sustainability Standards Board (GSSB) and the reporting requirements mentioned in §§ 243b and 267a UGB. This responsibility includes the selection and application of appropriate methods for preparing the report, making assumptions and esti-mates of individual non-financial disclosures that are plausible under the given circumstances. The responsibility of the management includes further designing, implementing and maintaining internal controls, which have been determined as necessary by management for the preparation of the report free from misstatement, whether due to fraud or error. Responsibility of the auditor Our responsibility is to express a limited assurance opinion on the (consolidated) non-financial report based on our review, whether all the reporting requirements mentioned in the Sustainability Reporting Standards (GRI Standards: Core option) issued by the Global Sustaina-bility Standards Board (GSSB) and §§ 243b and 267a UGB are met. We conducted our engagement in accordance with the International Standard on Assurance Engagements ISAE 3000 (Revised), “Assur-ance Engagements Other Than Audits or Reviews of Historical Financial Information” issued by the International Auditing and Assurance Standards Board (IAASB) in order to obtain limited assurance on the subject matters. ISAE 3000 (Revised) requires us to plan and perform the engagement in a way that enables us to obtain limited assurance that nothing has come to our attention that causes us to believe that the (consolidated) non-financial report has not, in any material aspect been prepared in accordance with the reporting criteria of GRI Standards: Core option and §§ 243b and 267a UGB. In a limited assurance engagement, the evidence-gathering procedures are more limited than in a reasonable assurance engagement and therefore, less assurance can be obtained. The choice of audit procedures lies in the due discretion of the auditor. As part of our audit, we have performed, inter alia, the following audit procedures and other activities as far as they are relevant to the limited assurance engagement:
_ Interview of the employees named by Erste Group Bank AG regarding the sustainability strategy, the sustainability principles and the sustainability management
_ Interviewing employees of Erste Group Bank AG to assess the methods of data collection, data processing and internal controls _ Video conference with responsible parties for non-financial data of Slovenska sporitelna, a. s. and Dornbirner Sparkasse Bank AG _ Matching the non-financial disclosures shown in the report with the calculation documents provided _ Furthermore, we conducted procedures with regard to whether the reporting requirements of §§ 243b and 267a UGB are met with the
(consolidated) nonfinancial report. We performed the audit mainly at our premises in Vienna using electronic forms of communication.

84
Summarised Conclusion Based on our work, nothing has come to our attention that causes us to believe that the (consolidated) non-financial report has not, in any material aspects, been prepared in accordance with the reporting criteria of the Sustainability Reporting Standards (GRI Standards: Core option) issued by the Global Sustainability Board (GSSB). Furthermore, nothing has come to our attention that causes us to believe that the reporting requirements of §§ 243b and 267a UGB are not met with the (consolidated) non-financial report. Engagement approach The basis for this engagement are the “General Conditions of Contract for the Public Accounting Professions”, as issued by the Chamber of Tax Advisers and Auditors in Austria (refer to appendix). In accordance with chapter 7, our liability shall be limited to intent and gross negligence. In cases of gross negligence, the maximum liability is limited to a maximum of five times the fee. This amount constitutes a total maximum liability cap, which may only be utilized once up to this maximum amount, even if there is more than one claimant or more than one claim has been asserted. Vienna, 10 March 2021
Deloitte Audit Wirtschaftsprüfungs GmbH
Gerhard Marterbauer m.p. Austrian Certified Public Accountant
Christof Wolf m.p. Austrian Certified Public Accountant

Management board | Supervisory board | Capital markets | Strategy | Financial and operating performance | Segments | Non-financial report | Corporate governance report | Audited financial reporting
85
Erste Group Bank AG is a stock corporation established according to Austrian law and since 2003 has declared its commitment to complying with the rules of the Austrian Code of Corporate Gov-ernance (Austrian CCG – see www.corporate-governance.at) with the objective of ensuring responsible and transparent corporate governance. In addition, the management board adopted a State-ment of Purpose in 2015. This statement reaffirms and states in more detail the purpose of Erste Group Bank AG to promote and secure prosperity throughout the region in which Erste Group is active. Building on this Statement of Purpose, a Code of Conduct defines binding rules for day-to-day business. Erste Group values responsibility, respect and sustainability in pursuing its business activities. The Code of Conduct therefore helps to protect the repu-tation of Erste Group and to strengthen stakeholder confidence. The Corporate Governance Report has been prepared in accordance with sections 243c and 267b of the Austrian Commercial Code and Rules 60 et seq. of the Austrian CCG and combines the corporate governance report of Erste Group Bank AG, the parent, and the consolidated corporate governance report in one single report. The management board has also prepared a (consolidated) non-financial report in accordance with sections 243b and 267a of the Austrian Commercial Code, which is released as part of the annual report. As from the 2020 financial year, information on the total remunera-tion of individual members of the management board or the super-visory board and on the principles governing the remuneration policy is no longer required to be disclosed in this consolidated corporate governance report, but instead in a separate remuneration report pursuant to section 78e Austrian Stock Corporation Act. In the 2020 financial year, Erste Group Bank AG complied with all L-Rules (Legal Requirements – mandatory legal norms) and R-Rules (Recommendations – these rules are more similar to recommendations; non-compliance does not need to be disclosed or explained) as well as – with five exceptions – all C-Rules (Comply-or-Explain – deviations are permitted but must be ex-plained) of the Austrian CCG. The deviations are described and explained below:
_ Pursuant to C-Rule 2 of the Austrian CCG, shares are to be construed in accordance with the principle of one share – one vote, i.e. investors have one vote per share and no right to nominate members to the supervisory board. Under Erste Group Bank AG’s articles of association (Art. 15.1), DIE ERSTE österreichische Spar-Casse Privatstiftung is, however, granted the right to nominate up to one third of the members of the supervisory board to be elected by the shareholder meeting as long as it is liable for all present and future liabili-ties of Erste Group Bank AG in case of its insolvency accord-ing to section 92 para 9 of the Austrian Banking Act. The Privatstiftung has not exercised this right to date.
_ Pursuant to C-Rule 52a of the Austrian CCG, the number of supervisory board members (without employees’ representa-tives) shall be ten at most. In 2020, the supervisory board of Erste Group Bank AG comprised twelve members elected by the annual general meeting. The deviation from C-Rule 52a
of the Austrian CCG is due to the size of Erste Group and its market position in seven core markets in Central and Eastern Europe as well as to the fact that the supervisory board must perform a multitude of financial market related and prudential review and oversight duties. Moreover, the supervisory board must meet various criteria to comply with diversity require-ments.
_ Pursuant to C-Rules 30, 31 and 51 of the Austrian CCG, spe-cifically the principles governing the management board’s variable remuneration and the ratio of the management board’s fixed and variable remuneration have to be stated in the consolidated corporate governance report, and the fixed and variable remuneration of the management board granted in the financial year and the remuneration of the supervisory board members in the reporting period have to be disclosed. Deviations from these rules are attributable to the mandatory application of sections 78a et seq. Austrian Stock Corporation Act. This information is now covered by the remuneration policy pursuant to section 78a Austrian Stock Corporation Act and disclosed in the remuneration report pursuant to sec-tion 78e Austrian Stock Corporation Act.
The management board is responsible for managing the company as required for the benefit of the company taking into account the interests of the shareholders and the employees as well as public interest. The management board takes its decisions in compliance with the articles of association and its internal rules as well as the Statement of Purpose. Selection and assessment of members of management bodies The qualification requirements for members of the management bodies (management board and supervisory board) of Erste Group Bank AG are governed by the internal guidelines for the selection and assessment of members of the management and supervisory boards (Suitability Policy). These guidelines define, in accordance with applicable legal provisions, the internal framework for the selection and assessment of members of the management bodies. The assessment of proposed and appointed members of manage-ment bodies is based on the following criteria: personal reputation, professional qualifications and required experience as well as poten-tial conflicts of interest, independence, time availability, overall composition of the management or supervisory board and diversity. Training and development To maintain an appropriate level of professional qualification of members of the management bodies, Erste Group regularly or-ganises events and seminars for members of the management board and supervisory board and facilitates their participation in external training events. The in-house training programme cov-ered the following matters, for example: legal principles defined in the law on banking supervision and the application of acts of law of relevance to banks, cyber-security and other IT matters, and the application of artificial intelligence in financial services.
(Consolidated) corporate governance report

86
MANAGEMENT BOARD In 2020, the management board consisted of seven members.
Management board member Year of birth Date of initial appointment
End of currentperiod of office
Bernhard Spalt (Chairman) 1968 1 July 2019 30 June 2023
Ara Abrahamyan 1972 1 January 2020 31 December 2020
Ingo Bleier 1970 1 July 2019 30 June 2022
Peter Bosek 1968 1 January 2015 31 December 2020
Stefan Dörfler 1971 1 July 2019 31 December 2023
Alexandra Habeler-Drabek 1970 1 July 2019 31 December 2023
David O'Mahony 1965 1 January 2020 31 December 2022
On 15 October 2020, the supervisory board extended Alexandra Habeler-Drabek’s management board mandate until 31 December 2023. Peter Bosek and Ara Abrahamyan resigned from the man-agement board as of 31 December 2020.
Thomas Schaufler and Maurizio Poletto were appointed by the supervisory board as additional members of the management board in October 2020 with effect from 1 January 2021 to 31 December 2023.
Management board member Areas of responsibility
Starting with 1 January 2020
Bernhard Spalt (Chairman) Group Strategy, Group Secretariat, Brand Management and Company Transformation, Group Investor Relations, Group Human Resources, Human Resources, Group Audit, Group Board Support & Corporate Affairs, Social Banking Development
Ara Abrahamyan Group Portfolio Management, Group Architecture, Digital Initiatives
Ingo Bleier Group Corporates, GCRE & Leasing, Group Markets, Group Product and Business Management C. and M., Group Research
Peter Bosek Erste Hub, Digital Governance, Group Retail Strategy
Stefan Dörfler Group ALM, Group Data Management and Reporting, Group Accounting and Group Controlling
Alexandra Habeler-Drabek Group Liquidity and Market Risk Management, Enterprise wide Risk Management, Credit Risk Models, Group Compliance, Group Credit Risk Management, Group Legal
David O'Mahony Holding Banking Operations, CIO Group Functions, Governance and Steering
Starting with 1 January 2021
Bernhard Spalt (Chairman) Group Human Resources, Human Resources, Group Secretariat, Group Audit, Brand Strategy & Communications, Group Investor Relations, Group Strategy, Group Board Support & Corporate Affairs, Group Sustainability Office, Social Banking Development
Ingo Bleier Group Corporates, Group Commercial Real Estate, Group Markets, Group Product and Business Management C. and M., Group Research
Stefan Dörfler Group ALM, Group Portfolio Management & Governance, Group Data Management and Reporting, Group Accounting and Group Controlling
Alexandra Habeler-Drabek Group Compliance, Credit Risk Methods, Retail Risk Management, Credit Risk Portfolio, Group Legal, Corporate Risk Management, EnterpriseWide Risk Management, Group Liquidity and Market Risk Management
David O'Mahony CIO Group Functions, Group Architecture, Banking Services, Group Security, Governance and Steering
Maurizio Poletto Innovation Hub (Erste Hub), Platform Governance
Thomas Schaufler Group Retail Strategy
Supervisory board mandates and similar functions As of 31 December 2020, the management board members held the following supervisory board mandates or similar functions in domestic or foreign companies or material subsidiaries of Erste Group Bank AG (the latter are marked with *). Bernhard Spalt Česká spořitelna, a.s.*, Vice Chair Banca Comercială Română S.A.*, Member Ara Abrahamyan Erste Bank Hungary Zrt.*, Member Erste Group IT International GmbH*, Member (both mandates until 31 December 2020)
Ingo Bleier Erste Bank der oesterreichischen Sparkassen AG*, Member Erste & Steiermärkische Bank d.d.* (Erste Bank Croatia), Member Erste Bank a.d. Novi Sad*, Chair Oesterreichische Kontrollbank Aktiengesellschaft, Member Peter Bosek Wiener Städtische Versicherung AG Vienna Insurance Group, 2nd Vice Chair Sparkassen IT Holding AG*, Member Wien 3420 Aspern Development AG, Member s IT Solutions AT Spardat GmbH*, Chair (all mandates until 31 December 2020)

Management board | Supervisory board | Capital markets | Strategy | Financial and operating performance | Segments | Non-financial report | Corporate governance report | Audited financial reporting
87
Stefan Dörfler Česká spořitelna, a.s.*, Member Erste Group IT International GmbH*, Vice Chair Slovenská sporiteľňa, a.s.*, Chair Sparkassen-Haftungs GmbH*, Member Wiener Börse AG, Member Alexandra Habeler-Drabek Prvá stavebná sporiteľňa, a.s.*, Vice Chair Banca Comercială Română S.A.*, Vice Chair (until 1 February 2021) David O’Mahony s IT Solutions AT Spardat GmbH*, 2nd Vice Chair Erste Group IT International GmbH*, Chair Erste Bank a.d. Novi Sad*, Member
On 1 January 2021, the following mandates were assumed by new members of the management board: Thomas Schaufler Bausparkasse der österreichischen Sparkassen Aktiengesell-schaft*, Chair Erste Asset Management GmbH*, Vice Chair Kärntner Sparkasse Aktiengesellschaft*, Member Salzburger Sparkasse Bank Aktiengesellschaft*, Chair Steiermärkische Bank und Sparkassen Aktiengesellschaft*, Member Management positions in subsidiaries Peter Bosek was a member of the management board of Erste Group Bank AG and of Erste Bank Oesterreich in 2020. Since 1 January 2021, Alexandra Habeler-Drabek and Thomas Schaufler each hold a mandate on the management board of Erste Group Bank AG and on the management board of Erste Bank Oesterreich.
SUPERVISORY BOARD In the 2020 financial year, the following persons were members of the supervisory board:
Position Name Year of birth Occupation
Date of initial appointment
End of the current period of office
Chairman Friedrich Rödler 1950 Auditor and tax advisor 4 May 2004 AGM 2022
1st Vice Chairman Jan Homan 1947 General Manager, ret. 4 May 2004 AGM 2022
2nd Vice Chairman Maximilian Hardegg 1966 Entrepreneur 12 May 2015 AGM 2025
Member Matthias Bulach 1976 Head of Financial Accounting, Control and Capital, CaixaBank 15 May 2019 AGM 2022
Member Henrietta Egerth-Stadlhuber 1971 Managing Director 26 June 2019 AGM 2022
Member Gunter Griss 1945 Lawyer 21 May 2014 AGM 2020
Member Jordi Gual Solé 1957 Chairman, CaixaBank 17 May 2017 AGM 2022
Member Marion Khüny 1969 Consultant 17 May 2017 AGM 2022
Member Elisabeth Krainer Senger-Weiss 1972 Lawyer 21 May 2014 AGM 2024
Member Wilhelm Rasinger 1948 Consultant 11 May 2005 AGM 2020
Member Friedrich Santner 1960 Managing Director 10. November 2020 AGM 2023
Member András Simor 1954 Senior Vice President, EBRD, ret. 10. November 2020 AGM 2023
Member John James Stack 1946 CEO, ret. 31 May 2007 AGM 2021
Member Michèle F. Sutter-Rüdisser 1979 Adjunct Professor, University of St. Gallen 15 May 2019 AGM 2022
Delegated by the employees' council
Member Martin Grießer 1969 26 June 2019 21 January 2020
Member Markus Haag 1980 21 November 2011 until further notice
Member Regina Haberhauer 1965 12 May 2015 until further notice
Member Andreas Lachs 1964 9 August 2008 until further notice
Member Barbara Pichler 1969 9 August 2008 until further notice
Member Jozef Pinter 1974 25 June 2015 until further notice
Member Karin Zeisel 1961 9 August 2008 until further notice
In the 2020 financial year, the composition of the supervisory board changed as follows: the supervisory board mandates of Maximilian Hardegg, Gunter Griss and Wilhelm Rasinger expired as of the end of the annual general meeting on 10 November 2020. Maximilian Hardegg was re-elected. Friedrich Santner und András Simor were elected to the supervisory board at the annual
general meeting with immediate effect. Following the death of the then supervisory board member Brian D. O’Neill in Decem-ber 2019, Martin Grießer’s delegation to the supervisory board was revoked pursuant to section 110 of the Labour Relations Act (ArbVG) on 21 January 2020.

88
Membership in supervisory board committees Committee membership since 10 November 2020:
Executive
committee Nomination committee
Audit committee
Risk committee
Remuneration committee
ITcommittee
Chairman Friedrich Rödler Friedrich Rödler Friedrich Rödler(financial expert)
Maximilian Hardegg Friedrich Rödler (remuneration expert)
Maximilian Hardegg
Vice Chairman Jan Homan Jan Homan Maximilian Hardegg Jan Homan Jan Homan Friedrich Rödler
Member Maximilian Hardegg Maximilian Hardegg Matthias Bulach Henrietta Egerth-Stadlhuber
Jordi Gual Solé Henrietta Egerth-Stadlhuber
Member Elisabeth Krainer Senger-Weiss
Elisabeth Krainer Senger-Weiss
Jan Homan Marion Khüny Maximilian Hardegg Marion Khüny
Member Barbara Pichler Barbara Pichler Friedrich Santner Elisabeth Krainer Senger-Weiss
András Simor Andreas Lachs
Member Karin Zeisel Karin Zeisel Michèle F. Sutter-Rüdisser
Friedrich Rödler John James Stack Karin Zeisel
Member Regina Haberhauer Markus Haag Andreas Lachs
Member Barbara Pichler Andreas Lachs Barbara Pichler
Member Jozef Pinter Jozef Pinter Karin Zeisel
Substitute Andreas Lachs Andreas Lachs Marion Khüny Regina Haberhauer Friedrich Santner Elisabeth Krainer Senger-Weiss
Substitute Jozef Pinter Jozef Pinter Andreas Lachs Karin Zeisel Markus Haag Barbara Pichler
Substitute Karin Zeisel Jozef Pinter Jozef Pinter
Mandates on supervisory boards or similar functions As of 31 December 2020, supervisory board members held the following additional supervisory board mandates or similar func-tions in domestic or foreign companies. Material subsidiaries of Erste Group Bank AG are marked with *, listed companies are marked with **. Friedrich Rödler Erste Bank der oesterreichischen Sparkassen AG*, Chair Erste Bank Hungary Zrt.*, Member Sparkassen-Prüfungsverband, Chair Audit Oversight Body of Austria, Member Jan Homan Erste Bank der oesterreichischen Sparkassen AG*, Vice Chair FRAPAG Beteiligungsholding AG, Vice Chair Slovenská sporiteľňa, a.s.*, 1st Vice Chair Loparex International Holding B.V., Member Maximilian Hardegg DIE ERSTE österreichische Spar-Casse Privatstiftung, Member Česká spořitelna, a.s.*, Member TIROLER SPARKASSE Bankaktiengesellschaft Innsbruck*, Member Matthias Bulach CaixaBank Payments & Consumer Finance E.F.C., S.A.U., Member CaixaBank Asset Management SGIIC, S.A.U., Member BuildingCenter, S.A.U., Member Henrietta Egerth-Stadlhuber NÖ Kulturwirtschaft GesmbH., Member Jordi Gual Solé CaixaBank, S.A.**, Chair Telefónica S.A.**, Member
Marion Khüny KA Finanz AG, Member Elisabeth Krainer Senger-Weiss Gebrüder Weiss Holding AG, Vice Chair Gebrüder Weiss Gesellschaft m.b.H., Vice Chair Banca Comercială Română S.A.*, Member Friedrich Santner Steiermärkische Bank und Sparkassen Aktiengesellschaft*, Chair Styria Media Group AG, Chair Styria Media Immobilien AG, Chair John James Stack Ally Bank, Member Ally Financial Inc.**, Member Česká spořitelna, a.s.*, Chair Mutual of America Capital Management, Member Michèle F. Sutter-Rüdisser Spital Thurgau AG, Member Helsana Versicherungen AG, Member Graubündner Kantonalbank AG**, Member András Simor did not hold any mandates on supervisory boards or similar functions in domestic or foreign companies as of 31 December 2020. Members of the supervisory board retiring after the 2020 annual general meeting: Gunter Griss AVL List GmbH, Chair Wilhelm Rasinger Gebrüder Ulmer Holding GmbH, Member

Management board | Supervisory board | Capital markets | Strategy | Financial and operating performance | Segments | Non-financial report | Corporate governance report | Audited financial reporting
89
Delegated by the employees’ council: Regina Haberhauer Erste Asset Management GmbH*, Member Andreas Lachs VBV-Pensionskasse Aktiengesellschaft, Member Barbara Pichler DIE ERSTE österreichische Spar-Casse Privatstiftung, Member Martin Grießer (until 21 January 2020), Markus Haag, Jozef Pinter and Karin Zeisel did not hold any mandates on supervisory boards or similar functions in domestic or foreign companies. Mechanism for shareholders and employees to provide recommendations and direction to the supervisory board In accordance with the law and the articles of association, the employees’ council has the right to delegate one member from among its ranks for every two members appointed by the annual general meeting (statutory one-third parity rule). If the number of shareholder representatives is an odd number, then one more member is appointed as an employee representative. Measures to avoid conflicts of interest Every year, the members of the supervisory board are obligated to consider the regulations of the Austrian CCG regarding con-flicts of interest. Furthermore, new members of the supervisory board receive comprehensive information regarding the avoid-ance of conflicts of interest when taking up their supervisory board functions. Independence of the supervisory board Pursuant to C-Rule 53 of the Austrian CCG, the majority of the members of the supervisory board elected by the annual general meeting or delegated by shareholders in accordance with the articles of association shall be independent of the company and its management board. A member of the supervisory board is deemed to be independent if such person does not have any busi-ness or personal relations with the company or its management that would constitute a material conflict of interest and, therefore, might influence the member’s conduct. The supervisory board adheres to the independence criteria guidelines as set out in An-nex I of the Austrian CCG. _ The supervisory board member shall not have been a member
of the management board or a managing employee of the com-pany or of a subsidiary of the company in the past five years.
_ The supervisory board member shall not have or not have had in the past year any business relations with the company or a subsidiary of the company to an extent of significance for the supervisory board member. This shall also apply to business relations with companies in which the supervisory board mem-ber has a significant economic interest but not to positions held in the Group’s managing bodies. The approval of individual
transactions by the supervisory board pursuant to L-Rule 48 does not automatically qualify the respective supervisory board member as not being independent.
_ The supervisory board member shall not have served as auditor for the company or been involved in an audit or worked as an employee of the audit firm that audited the company in the past three years.
_ The supervisory board member shall not serve as a management board member at another company in which a member of the company’s management board is a supervisory board member.
_ The supervisory board member shall not serve on the superviso-ry board for more than 15 years. This shall not apply to members of the supervisory board that hold investments with a business interest or that represent the interests of such a shareholder.
_ The supervisory board member shall not be a close family mem-ber (child, spouse, life partner, parent, uncle, aunt, sibling, niece, nephew) of a member of the management board or of persons holding one of the positions described in the points above.
Based on the above criteria, all supervisory board members have declared their independence with the exception of Friedrich Rödler and Jan Homan. Friedrich Rödler and Jan Homan have been serving on the supervisory board for more than 15 years. No member of the supervisory board holds directly or indirectly more than 10% of the shares of Erste Group Bank AG. In 2020, two members of the supervisory board (Maximilian Hardegg and Barbara Pichler) served on a management body of DIE ERSTE österreichische Spar-Casse Privatstiftung, which holds more than 10% of the shares of Erste Group Bank AG. Self-evaluation of the supervisory board At its meetings of 22 January 2020 and 11 March 2020, the nomi-nation committee performed an evaluation of the activities of the supervisory board and its committees for 2019. It discussed, for example, the supervisory board members’ attendance at superviso-ry board and committee meetings in 2019, assessed the efficiency of the supervisory board’s activities, organisation and working practice and undertook a critical review of the composition of committees. Potential conflicts of interest of management board and supervisory board members as well as the requirements of section 29 no 6 and no 7 of the Austrian Banking Act were consid-ered, and the number of mandates and secondary activities of management and supervisory board members were reviewed. The supervisory board discussed afterwards the results of this evaluation pursuant to C-Rule 36 of the Austrian CCG at its meet-ing of 26 March 2020 and concluded the evaluation for 2019 with a positive assessment. At its meeting of 20 January 2021, the nomination committee considered, among other things, potential conflicts of interest of supervisory board members and evaluated the supervisory board’s attendance at supervisory board and com-mittee meetings in 2020. The supervisory board’s self-evaluation for 2020 will be continued with support from an external consult-ant and completed in the course of the year.

90
Contracts subject to approval (C-Rule 49 Austrian CCG) In 2019, „Am Klimtpark“ LiegenschaftsverwaltungsgmbH, an entity in which Wilhelm Rasinger has a significant economic interest, signed a loan agreement with Erste Group for the amount of EUR 18 million. SUPERVISORY BOARD COMMITTEES AND THEIR DECISION-MAKING POWERS The supervisory board has set up six committees: the risk commit-tee, the executive committee, the audit committee, the nomination committee, the remuneration committee and the IT committee. Some of these committees are required by law and support the supervisory board in preparing and stating its position on all mat-ters that the supervisory board is required to deal with. The super-visory board moreover has the right, within its statutory remit, to transfer decision-making powers to committees or to withdraw powers from the committees. Risk committee The risk committee advises the management board with regard to the bank’s current and future risk appetite and risk strategy and monitors the implementation of this risk strategy. The committee also reviews whether the services and products offered are ade-quately priced in accordance with the bank’s business model and risk strategy. Without prejudice to the duties of the remuneration committee, the risk committee is also responsible for reviewing whether the incentives offered by the internal remuneration system adequately take into account risk, capital, liquidity and the proba-bility and timing of profit realisation. The risk committee is re-sponsible for granting approval in all those cases in which loans and exposures or large exposures reach an amount exceeding the approval authority of the management board defined in the ap-proval authority regulation. The approval of the risk committee is required for large loans as defined in section 28b of the Austrian Banking Act. In addition, it may grant advance approvals to the extent permitted by law. The risk committee is responsible for monitoring the risk management of Erste Group Bank AG. The supervisory board has delegated to the risk committee the right to approve the establishment and closure of branches and to grant special statutory power of attorney (Prokura) or commercial power (Handlungsvollmacht) for all business operations. The committee is responsible for monitoring the Group’s portfolio of participa-tions except in cases where this is the responsibility of the audit committee. The tasks of the risk committee include the acknowl-edgement of reports on legal disputes as well as on important audits of subsidiaries conducted by regulatory authorities. In addition, the risk committee is responsible for reviewing potential stress scenarios in order to assess how the bank’s risk profile reacts to external and internal events. Furthermore, the risk com-mittee assesses recommendations of internal and external auditors and monitors the appropriate implementation of measures taken that are not covered by reports of other committees. It also advises and supports the supervisory board in monitoring current and future risk appetite and the risk strategy and submits recommenda-
tions on required adjustments to the risk strategy to the superviso-ry board. Executive committee The executive committee meets on an ad hoc basis at the supervi-sory board’s request for the purpose of preparing specific topics for meetings or for circular resolutions. The committee may also be assigned the power to take final decisions. In case of imminent danger and to prevent significant damage, the executive commit-tee may be convened by its chairperson in order to take action in the interest of the company even without a specific mandate from the supervisory board. Audit committee The audit committee is responsible for overseeing the accounting process; monitoring the effectiveness of the company’s internal control system, internal audit system and risk management system; overseeing the annual audit of single-entity and consolidated financial statements; reviewing and supervising the independence of the auditor (Group auditor), in particular with respect to the additional services rendered to the audited company and the group companies; submitting a report on the results of the annual audit to the supervisory board and explaining how the annual audit has affected the reliability of financial reporting and the role of the audit committee in doing so; reviewing the annual financial state-ments and preparing its approval; reviewing the proposal for the allocation of profits, the management report and the (consolidated) corporate governance report as well as the (consolidated) non-financial report and submitting a report on the results of the review to the supervisory board; reviewing the consolidated financial statements of the group and the group management report and submitting the report on the results of the review to the superviso-ry board; carrying out the procedure for the selection of the auditor (group auditor), taking into account the appropriateness of the fees and recommending the appointment of the auditor (group auditor) to the supervisory board; recommending the renewal of the audi-tor’s (group auditor’s) mandate to the supervisory board; acknowl-edging the additional report of the auditor and discussing this report; acknowledging timely information on the focal points of the audit and submitting proposals for additional focal points of the audit; taking note of the annual financial statements of material subsidiaries and of the participations report; acknowledging the audit plan of the company’s internal audit function; acknowledg-ing information on current matters relevant to the internal audit of the Group and on the efficiency and effectiveness of the internal audit; acknowledging the internal auditors’ report on the audit areas and material audit findings and the activity report pursuant to Article 25 (3) in conjunction with Article 24 of the Delegated Regulation (EU) 2017/565; in the case of on-site inspection con-ducted by supervisory authorities acknowledging the inspection report, the report on the contents of the plan to address identified findings and/or the result of administrative proceedings initiated on the basis of the identified findings; acknowledging immediate information on material findings of the auditor, the internal audit function or an audit conducted by a regulatory authority; acknowl-

Management board | Supervisory board | Capital markets | Strategy | Financial and operating performance | Segments | Non-financial report | Corporate governance report | Audited financial reporting
91
edging immediate information on loss events that could exceed 5% of consolidated equity or 10% of the budgeted net result; acknowledging reports of the management board on current de-velopments and compliance regarding corporate governance and anti-money laundering rules; acknowledging the compliance activity report pursuant to Article 25 (3) in conjunction with Arti-cle 22 of the Delegated Regulation (EU) 2017/565. The audit committee is also responsible for preparing supervisory board decisions concerning the approval of the conclusion of a material transaction pursuant to section 95a of the Austrian Stock Corpora-tion Act (AktG) and overseeing its execution as well as oversee-ing and periodically (re-)assessing this material transaction; taking note of cases of damage or loss at Erste Group that are reported to the audit committee by internal audit as part of signif-icant audit findings provided they exceed thresholds previously defined by the audit committee; pre-consenting to the removal of the head of internal audit from their position and involvement in the process of filling the position of head of internal audit. Pursu-ant to the – no legally binding – Expectations for Banks docu-ment published by the Single Resolution Board (SRB) on 1 April 2020, the audit committee is tasked with monitoring the effec-tiveness of Erste Group Bank AG’s internal quality control with regard to resolution-relevant information, including rules ensur-ing the completeness and accuracy of data, by regularly receiv-ing, reviewing and taking into account audit reports on this theme. Nomination committee Meetings of the nomination committee are held as needed (at least once a year) or when a member of the committee or of the manage-ment board requests a meeting. The nomination committee submits proposals to the supervisory board for filling management board mandates that become vacant and deals with issues of succession planning. The committee decides on the employment contracts for members of the management board. It deals with and decides on relationships between the company and the members of the man-agement board except for resolutions to appoint members to the management board or revoke such appointments and on the granting of company stock options. Furthermore, the nomination committee supports the supervisory board in making proposals to the annual general meeting for filling supervisory board mandates that have become vacant. In filling vacant management board and supervisory board mandates, the focus is in particular on the members’ personal and professional qualifications, but also a well-balanced board composition in terms of expertise, a well-balanced and broad range of knowledge, skills and experience of the members on each body (collective suitability) and on aspects of diversity. The nomination committee also defines a target quota for the underrepresented gender and develops a strategy to achieve this target. The nomina-tion committee furthermore adopts the internal policy for dealing with conflicts of interest for the management board and the su-pervisory board, monitors compliance with it and regularly re-ports to the supervisory board on existing conflicts of interest and the measures taken to control them. The nomination committee must ensure that the management board’s and the supervisory
board’s decision-making processes are not dominated by one single person or a small group of persons. The nomination committee periodically assesses the management board’s and the supervisory board’s structure, size, composition and performance and submits proposals for changes to the supervisory board, if necessary. In addition, the nomination committee must conduct periodic assess-ments of the expertise, skills and experience of both the manage-ment board members and the individual members of the supervisory board as well as of each body in its entirety and report its findings to the supervisory board. As regards the selection for senior man-agement positions, the nomination committee must review ac-tions taken by the management board and supports the superviso-ry board in making recommendations to the management board. Remuneration committee The remuneration committee prepares resolutions on remuneration matters, including resolutions that have an impact on the bank’s risk and risk management and must be passed by the supervisory board. The remuneration committee approves the general princi-ples of remuneration policy, reviews them regularly and is also responsible for their implementation. The committee monitors remuneration policy, remuneration practices and remuneration-linked incentive programmes in relation to the control, monitoring and containment of risks, the capital base and liquidity, with due regard to the long-term interests of the bank’s shareholders, inves-tors and employees as well as the national interest in a well-functioning banking system and financial market stability. The committee approves exceptions from the application of the remu-neration policy to individual staff members of the company and monitors the payment of variable remuneration to members of the management board and to the company’s second management level as well as to management board members of major subsidiar-ies. It furthermore reviews the (variable) remuneration of senior managers of the company performing independent control func-tions such as risk management and compliance and of staff mem-bers having a significant impact on the company’s risk profile. In addition, it approves the identification of employees having a significant impact on the company’s risk profile and reviews the criteria on which the management board’s decision is based as well as the procedure used in taking such decisions. The commit-tee also ensures that information on the remuneration policy and practices provided to shareholders is appropriate. Once a year, the committee is presented with a comprehensive report on the remu-neration system including key performance indicators as well as a report on the situation regarding personnel and management in the Group. For the very first time, the nomination committee also prepared for 2020 the principles for the remuneration of manage-ment and supervisory board members pursuant to sections 78a and 98a of the Austrian Stock Corporation Act (Remuneration Policy according to Austrian Stock Corporation Act). In addition, it is responsible for preparing the report on the remuneration of man-agement and supervisory board pursuant to sections 78a and 98a of the Austrian Stock Corporation Act (Remuneration Report according to Austrian Stock Corporation Act).

92
IT committee The IT committee monitors and supervises IT-related issues and IT strategy in general. In addition, the IT committee is also re-sponsible for taking note of IT reports, of reports on the IT out-sourcing strategy and on the outsourcing of IT-related functions; taking note of the Group IT budget; of reports on the status of the IT support function and on the development of key IT initiatives and projects; monitoring the capacity and performance of sys-tems, operating continuity and crisis management, data security, computer and network security and taking note of critical changes in the organisational structure and responsibilities of the IT de-partment. MEETINGS OF THE SUPERVISORY BOARD AND REPORT ON PRINCIPAL ACTIVITIES Seven meetings of the supervisory board were held in the 2020 financial year. At the ordinary meetings of the supervisory board, the respective monthly developments of the balance sheet and the income state-ment were presented and reports were given on individual risk types and the bank’s total risk; the status of individual bank subsid-iaries in Central and Eastern Europe was discussed, and quarterly reports were delivered on the areas audited and on the internal audit department’s material audit findings pursuant to section 42 para 3 of the Austrian Banking Act. The chairpersons of the committees reported on the main topics dealt with by the committees since the last supervisory board meeting. Recurring topics at supervisory board meetings in 2020 were reports on Erste Group’s view on the Covid-19 evolution as well as current regulatory developments in the banking environment and their impacts on Erste Group. The management board regularly presented proposals to the supervisory board that required its approval under the law, the articles of asso-ciation and internal rules. At the meeting of 26 March 2020, the financial statements and the 2019 management report, the consolidated financial statements and consolidated management report as well as the 2019 (consolidated) corporate governance report and the 2019 (consolidated) non-financial report were extensively discussed and reviewed; the auditors’ reports as well as the report of the audit committee pursu-ant to section 63a para 4 (5) of BWG were discussed, and subse-quently the financial statements for 2019 were adopted by circular resolution in accordance with the recommendation of the audit committee. It was also decided – by circular resolution – to propose PwC Wirtschaftsprüfung GmbH to the annual general meeting in 2020 as an additional auditor of the (consolidated) financial state-ments for the 2021 financial year and to approve the Remuneration Policy according to the Austrian Stock Corporation Act. The fur-ther approach to the 2020 annual general meeting was discussed. In addition, the annual report of the supervisory board on loans to board members pursuant to section 28 para 4 of the Austrian Bank-ing Act was discussed and then approved by circular resolution. The supervisory board performed a self-evaluation pursuant to
C-Rule 36 of the Austrian CCG and took note of an evaluation of the management board performed by the nomination committee pursuant to section 29 of the Austrian Banking Act. Reports were delivered on the issuance of additional core capital (additional tier 1 bonds), the new organisation of the Risk Management division, and applications were approved by circular resolution. At the meeting of 23 April 2020, note was taken of the annual report of Group Compliance, the report on the collective suitability of the supervisory board and the annual report on conflicts of inter-est. The variable remuneration of members of the management board for the 2019 financial year was adopted subsequently by circular resolution. The report on the assessment of the effective-ness of the risk management was submitted to the supervisory board by the chairman of the audit committee, and the list pre-pared pursuant to the C-Rule 82a of the Austrian CCG was taken note of. Applications were discussed and subsequently approved by circular resolution, among them, for instance, the postpone-ment of the annual general meeting to 10 November 2020 and a change to the internal rules of the management board.
At the meeting of 25 June 2020, which was also attended by members of the supervisory authorities’ Joint Supervisory Team, who gave presentations and answered questions raised by super-visory board members, note was taken of reports delivered by the management board of Erste Group Bank AG as well as by man-agement board members of Erste Bank Hungary, Česká spořitelna and Banca Comercială Română, with a special focus on the Covid-19 situation. Also discussed were Peter Bosek’s conflicts of interest due to his dual role as CEO of Erste Bank Oesterreich, and note was taken of the result of the re-evaluation by the nomi-nation committee as well as the reorganisation of the internal audit functions of Erste Group Bank AG and Erste Bank Oester-reich. Framework plans were adopted for the issuance of certifi-cates and warrants, and it was decided that in the future the Group Sustainability Office will report to the Chief Executive Officer. At the meeting of 17 September 2020, the supervisory board approved the resolutions proposed for the 2020 annual general meeting and discussed in depth the supervisory board’s supple-mentary report pursuant to section 96 Austria Stock Corporation Act. Reports were also presented on the half-year results and the closure of the London branch. The changes to the remuneration policy pursuant to section 78a Austrian Stock Corporation Act and the new structure of the strategic risk functions of Erste Group Bank AG and Erste Bank Oesterreich were approved. The supervisory board was informed about the change in the IT com-mittee’s external consultant. At the meeting of 15 October 2020, the supervisory board adopted the recommendation to the 2020 annual general meeting on the appropriation of profit after extensive debate and consultations with the auditor and outside legal advisors. In addition, the issu-ance of additional core capital (additional tier 1 bonds) was ap-proved, the resignations of Peter Bosek and Ara Abrahamyan from
Management board | Supervisory board | Capital markets | Strategy | Financial and operating performance | Segments | Non-financial report | Corporate governance report | Audited financial reporting
93
the management board were taken note of, and Maurizio Poletto, Thomas Schaufler and Alexandra Habeler-Drabek were newly appointed or their terms renewed upon consideration of the nomi-nation committee's recommendations and the discussion of poten-tial conflicts of interest. At the constituent meeting of 10 November 2020 held after the annual general meeting, Friedrich Rödler, Jan Homan and Maxi-milian Hardegg were re-elected to their positions, and the mem-bers of the supervisory board were elected to the respective su-pervisory board committees, and the committees was thus newly formed. In addition, a capital increase of a subsidiary was ap-proved. At the meeting of 10 December 2020, a report on new measures and targets regarding women in management positions was dis-cussed and taken note of. The budget and the capital plan for the 2021 to 2025 financial years, new representation rules for the management board and a new allocation of responsibilities were adopted. In addition, an anticipatory resolution pursuant to sec-tion 95 para 5 no 12 of the Austrian Stock Corporation Act as well as a resolution on long-term funding activities in the 2021 financial year were adopted, and a change to the internal rules of the audit committee was approved. At a strategy retreat held on 10 and 11 December 2020, the su-pervisory board considered strategic topics of Erste Group com-prehensively and in great depth. The management board and other experts were invited to join in more detailed debates. MEETINGS OF THE COMMITTEES AND REPORT ON ACTIVITIES The risk committee held sixteen meetings in 2020, at which it regularly took decisions on exposures and loans exceeding the powers of the management board, was briefed on loans granted within the scope of authorisation of the management board and approved the granting of statutory powers of attorney (Prokuren). The committee was regularly informed on the risk strategy, risk appetite, the monitoring required to comply with these limits, individual risk types, risk-bearing capacity and large exposures. Furthermore, reports were given on current regulatory risk topics, the situation of specific sectors and industries, including the real estate and automotive industries and the resulting impacts on the risk strategy. Further items on the agenda were audits by supervi-sory authorities, internal risk models and various legal disputes. Reports were regularly delivered on risk development in individ-ual countries and subsidiaries. Without prejudice to the duties of the remuneration committee, the risk committee members were also informed on whether the incentives offered by the internal remuneration system adequately account for risk, capital, liquidi-ty and the probability and timing of profit realisation. Also on the agenda were reports on stress tests. In addition, the members of the risk committee were informed about developments in the corporate workout portfolio in general and major workout cases
in particular. Special attention was given to the economic effects of the Covid-19 pandemic and its impact on Erste Group. The executive committee held one meeting in 2020 to discuss the potential acquisition of a bank. On 8 February 2021, a meeting was held in which the executive committee discussed the fulfil-ment of conditions for the pay-out of the dividend for the finan-cial year 2019 as decided by the annual general meeting on 10 November 2020. The audit committee met seven times in 2020 and, in addition, held one informal meeting to prepare the meeting on the review of the (consolidated) financial statements. The external auditors were present at all meetings. Among other things, the auditors reported on the audit of the single-entity and consolidated financial state-ments for 2019 and the audit committee subsequently conducted the final discussion. The financial statements and the management report, the consolidated financial statements and the management report as well as the (consolidated) corporate governance report and the (consolidated) non-financial report were reviewed and the financial statements recommended for approval by the supervisory board. The additional report of the auditors pursuant to Article 11 of EU Regulation 2014/537 was taken note of. The head of the inter-nal audit department reported on the audit subjects and material audit findings for the year 2019 and, on an ongoing basis, about audit-relevant matters in the group and explained the audit plan for 2020. The internal audit department presented its reports pursuant to section 42 para 3 of the Austrian Banking Act and to the quality assurance programme as well as – jointly with the compliance department – a report pursuant to Article 25 (3) in conjunction with Article 24 of the Delegated Regulation (EU) 2017/565. In addition, a report was delivered on the assessment of the functionality of the risk management system pursuant to Rule 83 of the Austrian CCG and on the effectiveness of the internal control system. Based on these reports, the audit committee monitored the effectiveness of the internal control system, the internal audit system and the risk management system pursuant to section 63a para 4 no 2 of the Austrian Banking Act. The audit committee also discussed its work plan for 2021 and defined agenda topics for the meetings. It was decided to recommend the renewal of the audit mandate of PwC Wirtschaftsprüfung GmbH as additional auditor of the (consolidat-ed) financial statements for the 2022 financial year to the supervi-sory board. The auditors provided information about the prelimi-nary audit of the single-entity and consolidated financial statements for 2020. In addition, discussions were held on the reports on the development of participations, on the half-year report as of 30 June 2020, as well as on the 2019 management letter. Audit reports on on-site inspections conducted by supervisory authorities were taken note of, as were reports on the contents of the plan to ad-dress the findings made. The audit committee continuously re-viewed and monitored the independence of the auditors of the (consolidated) financial statements with a particular focus on non-audit services rendered for Erste Group pursuant to section 63a para 4 (4) of the Austrian Banking Act. Among other things, the audit committee thus gave pre-approval to permissible non-audit

94
services rendered by the (group) auditor, received reports on their current status. The audit committee’s report on activities included in the 2019 annual report was discussed and approved. The ex-change of views between the audit committee and the auditors in the absence of the management board pursuant to C-Rule 81a of the Austrian CCG was conducted in December 2020. Also, the head of internal audit was evaluated by the audit committee. The annual report of Group Regulatory Compliance was taken note of. The impact of the Covid-19 pandemic on Erste Group was discussed regularly, taking into account in particular the account-ing perspective. The nomination committee hold four meetings in 2020. At one meeting, the nomination committee assessed the qualifications of Maurizio Poletto and Thomas Schaufler for their appointment as members of the management board of Erste Group Bank AG and recommended that the supervisory board approve their appoint-ments. The review of whether the requirements for the extension of the contract and early re-appointment of Alexandra Habeler-Drabek were met ended with a positive result, and hence a rec-ommendation to this effect was made to the supervisory board. The nomination committee furthermore conducted fit and proper assessments of Friedrich Santner, András Simor and Maximilian Hardegg for the elections to the supervisory board at the annual general meeting of Erste Group Bank AG on 10 November 2020. In addition, the nomination committee reviewed the evaluation of the supervisory board and the management board pursuant to C-Rule 36 of the Austrian CCG as well as pursuant to section 29 no 6 and 7 of the Austrian Banking Act and considered, in particular, the possible conflicts of interest and the attendance at meetings by supervisory board members. The collective suitability of the management board was likewise established, and the report on the collective suitability of the management board and the supervisory board was discussed, with a special focus on members’ time avail-ability. The report on the selection of senior management pursuant to section 28 of the Austrian Banking Act was taken note of. The remuneration committee met four times in 2020. The super-visory board’s resolution on the management board’s variable remuneration was prepared and adopted in line with the ECB recommendation. In addition, various remuneration topics relat-ing to Erste Group Bank AG were discussed and approved, in-cluding the structure of key performance indicators, the bonus policy, including the requirements for the payment of variable remuneration components, and remuneration rules for Material Risk Takers and the question of which employees are subject to these rules. In addition, changes to the internal remuneration policy of Erste Group Bank AG and Erste Group and the remu-
neration policy pursuant to section 78a Austrian Stock Corpora-tion Act were approved, and a report was presented on the current status of the 2020 remuneration report being drawn up pursuant to section 78e Austrian Stock Corporation Act. Reports were delivered on the remuneration of directors in countries in which Erste Group operates and on the review of the internal remunera-tion policy by internal audit. The IT committee met four times in 2020. The main topics were periodic updates on IT projects of Erste Group Bank AG and within Erste Group, priorities of IT activities in 2020, the timeline set for their implementation and impacts on ongoing processes. Also presented were a George update and news on the entities s IT Solutions AT Spardat GmbH and Erste Group IT Internation-al GmbH. The implementation of requirements regarding IT set by the supervisory authorities was also discussed in consultation with the auditor. The IT project portfolio and IT governance for Erste Group as well as IT risk management were considered on an ongoing basis. Reports were also delivered on IT security, outsourcing governance, on the strategy concerning use of data while handling data and digitalisation, on the current status of various infrastructure projects and on IT strategy. In addition, the IT budget and IT costs were discussed, and the impact of the Covid-19 pandemic explained from an IT perspective, with a special focus on customer behaviour, the increase in working from home arrangements and potential security aspects. Attendance of supervisory board meetings In 2020, all members of the supervisory board attended more than half of the supervisory board and committee meetings that took place after their election or delegation to the supervisory board or before their resignation from their mandate or revocation of their delegation. Furthermore, in 2020, the ordinary members of the supervisory board or their substitutes, if applicable, attended in person, by videoconferencing or teleconferencing more than half of the committee meetings held after their election or delegation to the supervisory board or before resigning from their mandate or their delegation being revoked. The following table shows the attendance of meetings by ordi-nary members without accounting for the attendance of substitute members. In the exceptional circumstances caused by Covid-19 in 2020, members attending virtual meetings only via acoustic channels are still considered to be in regular attendance in all regards under an ordinance issued by the Federal Ministry of Justice.
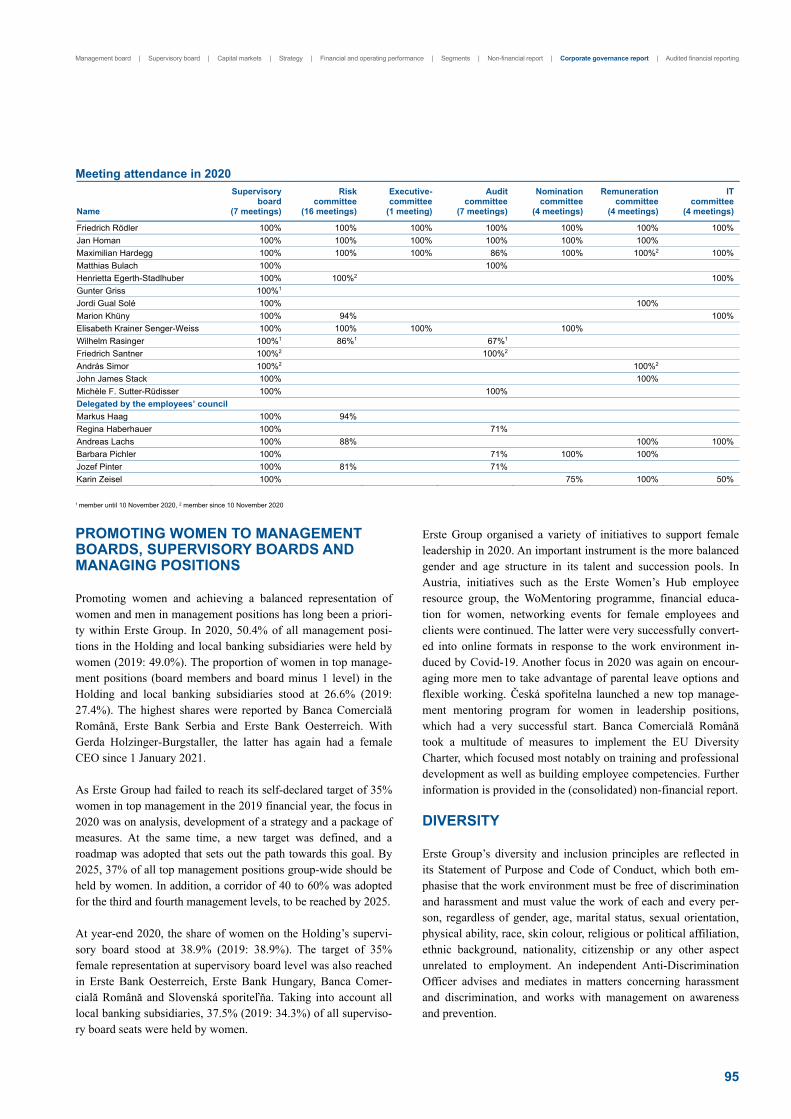
Management board | Supervisory board | Capital markets | Strategy | Financial and operating performance | Segments | Non-financial report | Corporate governance report | Audited financial reporting
95
Meeting attendance in 2020
Name
Supervisory board
(7 meetings)
Risk committee
(16 meetings)
Executive-committee
(1 meeting)
Audit committee
(7 meetings)
Nomination committee
(4 meetings)
Remuneration committee
(4 meetings)
ITcommittee
(4 meetings)
Friedrich Rödler 100% 100% 100% 100% 100% 100% 100%
Jan Homan 100% 100% 100% 100% 100% 100%
Maximilian Hardegg 100% 100% 100% 86% 100% 100%2 100%
Matthias Bulach 100% 100%
Henrietta Egerth-Stadlhuber 100% 100%2 100%
Gunter Griss 100%1
Jordi Gual Solé 100% 100%
Marion Khüny 100% 94% 100%
Elisabeth Krainer Senger-Weiss 100% 100% 100% 100%
Wilhelm Rasinger 100%1 86%1 67%1
Friedrich Santner 100%2 100%2
András Simor 100%2 100%2
John James Stack 100% 100%
Michèle F. Sutter-Rüdisser 100% 100%
Delegated by the employees’ council
Markus Haag 100% 94%
Regina Haberhauer 100% 71%
Andreas Lachs 100% 88% 100% 100%
Barbara Pichler 100% 71% 100% 100%
Jozef Pinter 100% 81% 71%
Karin Zeisel 100% 75% 100% 50%
1 member until 10 November 2020, 2 member since 10 November 2020
PROMOTING WOMEN TO MANAGEMENT BOARDS, SUPERVISORY BOARDS AND MANAGING POSITIONS Promoting women and achieving a balanced representation of women and men in management positions has long been a priori-ty within Erste Group. In 2020, 50.4% of all management posi-tions in the Holding and local banking subsidiaries were held by women (2019: 49.0%). The proportion of women in top manage-ment positions (board members and board minus 1 level) in the Holding and local banking subsidiaries stood at 26.6% (2019: 27.4%). The highest shares were reported by Banca Comercială Română, Erste Bank Serbia and Erste Bank Oesterreich. With Gerda Holzinger-Burgstaller, the latter has again had a female CEO since 1 January 2021. As Erste Group had failed to reach its self-declared target of 35% women in top management in the 2019 financial year, the focus in 2020 was on analysis, development of a strategy and a package of measures. At the same time, a new target was defined, and a roadmap was adopted that sets out the path towards this goal. By 2025, 37% of all top management positions group-wide should be held by women. In addition, a corridor of 40 to 60% was adopted for the third and fourth management levels, to be reached by 2025. At year-end 2020, the share of women on the Holding’s supervi-sory board stood at 38.9% (2019: 38.9%). The target of 35% female representation at supervisory board level was also reached in Erste Bank Oesterreich, Erste Bank Hungary, Banca Comer-cială Română and Slovenská sporiteľňa. Taking into account all local banking subsidiaries, 37.5% (2019: 34.3%) of all superviso-ry board seats were held by women.
Erste Group organised a variety of initiatives to support female leadership in 2020. An important instrument is the more balanced gender and age structure in its talent and succession pools. In Austria, initiatives such as the Erste Women’s Hub employee resource group, the WoMentoring programme, financial educa-tion for women, networking events for female employees and clients were continued. The latter were very successfully convert-ed into online formats in response to the work environment in-duced by Covid-19. Another focus in 2020 was again on encour-aging more men to take advantage of parental leave options and flexible working. Česká spořitelna launched a new top manage-ment mentoring program for women in leadership positions, which had a very successful start. Banca Comercială Română took a multitude of measures to implement the EU Diversity Charter, which focused most notably on training and professional development as well as building employee competencies. Further information is provided in the (consolidated) non-financial report. DIVERSITY Erste Group’s diversity and inclusion principles are reflected in its Statement of Purpose and Code of Conduct, which both em-phasise that the work environment must be free of discrimination and harassment and must value the work of each and every per-son, regardless of gender, age, marital status, sexual orientation, physical ability, race, skin colour, religious or political affiliation, ethnic background, nationality, citizenship or any other aspect unrelated to employment. An independent Anti-Discrimination Officer advises and mediates in matters concerning harassment and discrimination, and works with management on awareness and prevention.

96
Erste Group’s Diversity and Inclusion Policy provides the frame-work for local diversity managers to define priorities and initia-tives that support the group diversity strategy. The Policy also defines the diversity concepts applicable in appointing manage-ment board and supervisory board members with regard to age, gender, education and professional career. In addition to setting group-wide targets for the share of women in top management and on the supervisory board, it also requires that all positions, includ-ing management positions, have to be advertised internally (unless candidates from a succession pool are already available for a position). Selection processes and criteria must be transparent, and job offers have to be worded in a gender-neutral manner: Talent pools and programmes must be open to suitable employees of any age group, gender or origin; when filling top management posi-tions, at least one candidate per gender must be short-listed; when filling supervisory board mandates, the nomination committees (Holding and local banks) must consider female candidates.
In 2020, Erste Group pursued the following diversity priorities: more networking and best-practice sharing within the group as well as the joint development of a group-wide diversity strategy; further increasing the number of women in management posi-tions; developing and encouraging more initiatives for LGBT+ inclusion in the CEE region; and implementing local initiatives promoting diversity in CEE. Further information is provided in the (consolidated) non-financial report. DIRECTORS’ AND OFFICERS’ LIABILITY INSURANCE Erste Group Bank AG has directors’ and officers’ liability insur-ance. Unless otherwise provided by local law, the insurance policy covers former, current and future members of the management board or managing directors, of the supervisory board, of the administrative board and of the advisory board as well as senior management, holders of statutory powers of attorney (Prokuristen) and management staff of Erste Group Bank AG and the subsidiar-ies in which Erste Group Bank AG holds more than 50% of the shares or voting rights either directly or indirectly through one or more subsidiaries. The costs are borne by the company. EXTERNAL EVALUATION Erste Group Bank AG commissioned an external evaluation of compliance with the Austrian Code of Corporate Governance in accordance with C-Rule 62 of the Austrian CCG at least every three years, most recently for the 2020 fiscal year. All evaluations reached the conclusion that Erste Group Bank AG had met all requirements of the Code. The deviations from C-Rules were described and explained. Summary reports on these evaluations are available on the website of Erste Group Bank AG.
SHAREHOLDERS’ RIGHTS Erste Group Bank AG has no rights arising from its own shares. Neither a subsidiary nor a third party holding shares on behalf of Erste Group Bank AG or of a subsidiary may exercise its voting rights and its rights for subscription of these shares. Voting rights Each share of Erste Group Bank AG entitles its holder to one vote at the annual general meeting. In general, shareholders may pass resolutions at an annual general meeting by a simple majority of the votes cast or, in the event that the majority of the share capital present is required to approve a measure, by a simple majority of the share capital present, unless Austrian law or the articles of association require a qualified majority vote. The articles of association differ from the statutory majority requirements in three cases: First, the appointment of supervisory board members can be revoked before the end of their respective term by a resolution of the annual general meeting that requires a majority of 75% of the votes cast and a majority of 75% of the share capital present at such meeting. Second, the articles of association may be amended by a resolution of the annual general meeting. Provided that such amendment does not concern the business purpose, this requires a simple majority of the votes cast and a simple majority of the share capital present at such meeting. Third, any provision regulating increased majority requirements can only be amended with the same increased majority. Dividend rights Each shareholder is entitled to receive dividends if and to the extent the distribution of dividends is resolved by the annual general meeting. Liquidation proceeds In case of dissolution of Erste Group Bank AG, the assets remaining after the discharge of liabilities and repayment of supplementary capital as well as additional tier 1 capital will be distributed pro rata to the shareholders. The dissolution of Erste Group Bank AG re-quires a majority of at least 75% of the share capital present at an annual general meeting. Subscription rights All holders of shares have subscription rights allowing them to subscribe to any newly issued shares to maintain their existing share in the share capital of Erste Group Bank AG. Such subscrip-tion rights are in proportion to the number of shares held by such shareholders prior to the issue of the new shares. The said subscrip-tion rights do not apply if the respective shareholder does not exer-cise these subscription rights or subscription rights are excluded in certain cases by a resolution of the annual general meeting or by a resolution of the management board and the supervisory board. The Austrian Stock Corporation Act contains provisions that protect the rights of individual shareholders. In particular, all shareholders must be treated equally under equal circumstances

Management board | Supervisory board | Capital markets | Strategy | Financial and operating performance | Segments | Non-financial report | Corporate governance report | Audited financial reporting
97
unless the shareholders affected have consented to unequal treat-ment. Furthermore, measures affecting shareholders’ rights, such as capital increases and the exclusion of subscription rights, generally require a shareholders’ resolution. The articles of association of Erste Group Bank AG do not con-tain any provisions regarding a change in the share capital, the rights associated with the shares or the exercise of the sharehold-ers’ rights that differ from statutory requirements.
Stock corporations such as Erste Group Bank AG must hold at least one annual general meeting (ordinary shareholders’ meeting) per year, which must be held within the first eight months of any financial year and cover at least the following items:
_ Presentation of certain documents _ Appropriation of profit _ Discharge of the members of the management board and the
supervisory board for the financial year ended. At annual general meetings, shareholders may ask for infor-mation about the company’s affairs to the extent that this is required for the proper assessment of an agenda item.
Management Board
Bernhard Spalt mp, Chairman
Ingo Bleier mp, Member Stefan Dörfler mp, Member
Alexandra Habeler-Drabek mp, Member David O‘Mahony mp, Member
Maurizio Poletto mp, Member Thomas Schaufler mp, Member
Vienna, 26 February 2021

98
Your Notes

99
26 February 2021 AUDITOR’S REPORT
Management report
Consolidated financial statements
AUDITED FINANCIAL REPORTING

100
AUDITOR’S REPORT AUDIT OPINION Report on the Consolidated Financial Statements Audit Opinion Sparkassen-Prüfungsverband (Prüfungsstelle) and PwC Wirtschaftsprüfung GmbH, Vienna, – hereinafter referred to as ‘we’ – have audited the group consolidated financial statements of Erste Group Bank AG, Vienna, and its subsidiaries (the Group), which comprise the consol-idated balance sheet as at December 31, 2020, the consolidated statement of income, the consolidated statement of comprehensive income, the consolidated statement of changes in equity and the consolidated statement of cash flows for the fiscal year then ended, and the notes to the group financial statements of Erste Group. In our opinion, the accompanying consolidated financial statements comply with legal requirements and give a true and fair view of the financial position of the Group as at December 31, 2020, and of its financial performance and cash flows for the year then ended in accord-ance with the International Financial Reporting Standards (IFRSs) as adopted by the EU and the additional requirements under Section 59a Austrian Banking Act (BWG) in conjunction with Section 245a Austrian Company Code (UGB). Basis for Opinion We conducted our audit in accordance with Regulation (EU) No. 537/2014 (hereinafter EU Regulation) and Austrian generally accepted auditing standards. Those standards require the application of the International Standards on Auditing (ISAs). Our responsibilities under those provisions and standards are further described in the ‘Auditor’s Responsibilities for the Audit of the Consolidated Financial Statements’ section of our report. We are independent of the Group in accordance with Austrian Generally Accepted Accounting Principles, the provisions of the Austrian Banking Act and professional requirements and we have fulfilled our other ethical responsibilities in accordance with these requirements. We believe that the audit evidence we have obtained until the date of this auditor’s report is sufficient and appropriate to provide a basis for our opinion by this date. Key Audit Matters Key audit matters are those matters that, in our professional judgment, were of most significance in our audit of the consolidated financial statements of the fiscal year. These matters were addressed in the context of our audit of the consolidated financial statements as a whole, and in forming our opinion thereon, and we do not provide a separate opinion on these matters. We have structured key audit matters as follows:
_ Description _ Audit approach _ Reference to related disclosures
1. Loss allowances for Loans and Advances to Customers (expected credit losses)
Description Loss allowances represent management's best estimate of the credit losses expected with respect to the loan portfolio at balance sheet date. For loans and advances to customers in the amount of EUR 164 billion, measured at amortised cost, Erste Group Bank AG has recognised credit loss allowances in the amount of EUR 3.8 billion. Due to the underlying assumptions and estimates, determining of expected credit losses is inherently subject to substantial judgement applied by management. Erste Group Bank AG has implemented internal guidelines and specific processes to identify significant increases in credit risk and loss events. These processes rely significantly on quantitative criteria and involve management judgement. The following methods are applied to determine the level of loss allowances using scenario-based discounted cash flow methods as required by IFRS 9:
_ For non-defaulted loans, loss allowances are generally determined collectively and measured at an amount equal to 12-month expected credit loss. If a significant increase in credit risk has occurred, loss allowances are measured as lifetime expected credit losses. Similarly, the lifetime expected credit losses are measured for those non-defaulted loans and advances whose credit risk at initial recognition could not be determined due to missing data at IFRS 9 first-time adoption.
_ For defaulted loans with a comparable risk profile that are considered not to be individually significant, expected credit losses are collectively assessed as well.
_ The collectively measured loss allowances are calculated considering the probability of default, the impact of forward-looking infor-mation and parameters that reflect the expected cash flows as well as the expected proceeds from the realisation of collateral. The applied parameters are estimated based on statistical models.

101
_ For defaulted loans considered to be significant at customer level, loss allowances are determined on a case-by-case basis. These loss allowances are calculated considering scenario probabilities, expected cash flows as well as expected proceeds from the realisation of collateral. This process involves significant judgement and management estimates.
The models used for determining loss allowances are specific to the types of loan portfolios. There are country-specific features both with regard to products and economic environment that are relevant to the respective loss estimate resulting in heightened complexity of models and input factors. The uncertainty which is inherent to estimating expected credit losses significantly increased due to the imponderability of economic con-sequences of the Covid-19 pandemic. To reduce the adverse economic consequences of the Covid-19 pandemic, numerous states have introduced relief programs in a variety of forms (e.g. moratoria, deferral options, support programs, hardship funds etc.). Those programs complicate a timely reflection of a potential deterioration of the loan portfolio and result in artificially low observed default rates. This has a negative effect on the predictive power of statistically determined default rates and the perceptibility of a significant increase in credit risk. Erste Group Bank AG therefore introduced additional criteria on the basis of which customer groups were identified that potentially were specifically affected by the economic consequences of the pandemic, and individually assessed the customers within those groups as to whether a significant increase in credit risk occurred (Post Model Adjustment). Method and impacts of this portfolio stage transfer due to the Covid-19 pandemic are presented in note 34 of the consolidated financial statements. With respect to the forward-looking information used for modelling expected credit losses, the heightened uncertainty about the future economic developments that results from the pandemic was reflected by using up-to-date macroeconomic assumptions and adapting the relative weight of the scenarios applied. In addition to the adjustment of forward looking information, further adjustments to the methodology applied for estimating credit risk parameters were required in Erste Group Bank AG’s view with respect to the Covid-19 pandemic and the state relief packages, which are described in note 34 of the consolidated financial statements. Due to
_ the substantial judgement to be applied by management in defining the Post Model Adjustments and determining and weighting macro-economic future scenarios,
_ a high degree of uncertainty due to the economic impact of the Covid-19 pandemic which led to a high degree of the auditor judgement, _ the complexity of models and interdependent assumptions and the resulting audit effort and _ the significance of credit loss allowances
we identified this area to be a key audit matter. Audit Approach To assess the appropriateness of the expected credit losses, we:
_ updated our understanding of the Expected Credit Loss calculation methodology applied by Erste Group Bank AG based on policies, documentation and interviews and re-assessed its compliance with the requirements of IFRS 9. We focused on adjustements to methods and processes made in order to capture the increased uncertainties of the present and future environment due to the Covid-19 pandemic in expected credit losses.
_ evaluated and critically assessed the control activities in credit risk management and lending business processes and tested key controls, notably with respect to the approval of loans, ongoing monitoring and early warning, especially the changes of processes made by management with respect to the early identification of defaults as well as the assessment of unlikeness to pay.
_ evaluated control activities and tested key controls in the area of rating models and collateral valuation. _ evaluated model governance and validation processes and critically reviewed the information brought to the attention of the management.
With the help of our credit risk modelling experts, we evaluated the results of back-testing and model validations. _ evaluated the adequacy of credit risk parameters and models taking into consideration possible distortions of currently observed data
due to state or private relief programs (e.g. low default rates due to payment moratoria) and local specifics , and critically assessed the plausibility of expectations and estimates that have been introduced due to aforementioned distortions in order to identify significant increases in credit risk of single customers or customer groups.
_ assessed the correctness of the stage allocation for a sample of loans based on applicable policies. _ analyzed impacts of IFRS 9 specific model aspects. _ evaluated whether key components of the ECL calculation are correctly incorporated in the models by performing walkthroughs and
reviewing steering tables. _ evaluated the adequacy and plausibility of forward-looking information integrated into the estimates. In this context, we specifically
compared the underlying macro-economic forecasts with external sources of information and critically assessed the individual weights attribute to scenarios.

102
_ tested, on a sample basis, whether default events have been identified in accordance with applicable policies and evaluated whether events occurred that significantly affect the borrower’s ability to repay loans and advances. Furthermore, we tested, on a sample basis, the adequacy of individual loan loss allowances assessing the scenarios adopted and the estimates of expected cash flows made by the Group.
Reference to related disclosures For further details regarding the process of determining loss allowances as well as regarding the design of the models involved we refer to the management board’s disclosures in section Significant accounting policies; b) Covid-19 disclosures and Note 34. Credit Risk in the Notes to the consolidated financial statements.
2. Recoverability of goodwill for Česká Spořitelna a.s Description The balance sheet item ‘Intangible assets’ includes goodwill in the amount of EUR 544 million for the subsidiary Česká Spořitelna a.s., Prague, (‘CS’). In the Group, goodwill is subject to an annual impairment test in performed in month of November each year. Additionally, management determined that the significant economic impact of the Covid-19 pandemic in the first and second quarter is an indication that goodwill may be impaired and therefore performed additional impairment tests. No impairment of goodwill resulted from these tests. Ac-cordingly, when compared to the prior year, the goodwill for CS remains unchanged as of December 31, 2020. To test for impairment, the recoverable amount of CS was determined and compared to the carrying amount of CS's net assets. The recov-erable amount was determined using the dividend discount method (‘DDM’). Under the DDM, expected future dividends that are available for the distribution to shareholders (‘flows-to-equity’) are capitalized in compliance with capital requirements. The determination of future distributions by CS was based on the current business plan prepared by CS management which also reflected the expected impact of the Covid-19 pandemic. The business plan comprises income statements, balance sheet and equity projections for the years 2021 to 2025. The perpetuity for the period not covered by the business plan was derived by assuming a constant growth rate. The flows-to-equity were discounted with the group-specific cost of equity for the business activities of the Group in the Czech Republic, taking into account group wide capital requirements. Management has to make a large number of assumptions and judgments when preparing a business plan, selecting a discount rate and the assumed growth rate; in this context, he uncertainties inherent in management's expectations regarding the future economic development are much higher than usual due to the Covid-19 pandemic. Due to
_ the subjectiveness of the assessments and future expectations that the management must take into account when determining a recover-able amount,
_ the high degree of auditor judgment required when assessing management’s determination of the recoverable amount, and _ the potential impact of an impairment loss on the Group's consolidated financial statements,
we have identified this area as a key audit matter. Audit approach In order to assess the appropriateness of the carrying amount of goodwill for CS, we have, with the support of valuation specialists with the necessary industry knowledge and regional expertise,
_ examined the key business processes for determining recoverable amounts. _ identified and evaluated the internal process for approval and review of the valuation model parameters (e.g. risk-free interest rate,
market risk premium, beta factors) as well as the valuation results _ tested, on a sample basis, the valuation method used with regard to its technical and mathematical correctness in order to determine
whether the valuation method used is in line with the business model of CS as well as that of the Group. _ performed, on a sample basis, with respect to the aggregation of planning data for the three budget scenarios (base, best and worst case)
that were used as a basis for estimating the value _ followed and assessed the steps taken to ensure the mathematical accuracy of budget data, _ analyzed the key assumptions in the business plan and
_ verified the plausibility of the derivation of key value drivers (by means of benchmarking), _ compared the macroeconomic assumptions for the future used with independent macroeconomic forecasts, _ reviewed the planning accuracy for past planning periods by comparing plan vs. actual values and interviewing employees respon-
sible for variance analyses. _ critically assessed probability weighting of the three scenarios.
_ examined how key valuation model parameters were derived as well as whether they are up-to-date and checked their appropriateness using our own independently determined benchmarks by making an independent estimate of the base interest rate, the beta factor, the market risk premium, the country risk premium and the inflation differential.
103
_ compared, on a sample basis, the appropriateness of planning figures and model parameters used in the valuation model with the ap-proved budget figures and model parameters. Our focus here was particularly on the assumptions related to the perpetuity (especially growth rate and retention).
_ evaluated the appropriateness and accuracy of the presentations and explanations in the notes. Reference to related disclosures We refer to the management board’s disclosure in section Significant accounting policies; b) Covid-19 disclosures and Note 39. Intangible assets in the Notes to the consolidated financial statements.
3. Recoverability of assets within the scope of IAS 36 Description The market capitalization of Erste Group Bank AG was below the carrying amount of net assets both during the financial year and at the balance sheet date. According to IAS 36.12 (d), this is an indication that one or more assets may be impaired. Assets within the scope of IAS 36 account for approximately 2% of the Group's total assets. The vast majority of these assets are property, plant and equipment, investment property or intangible assets. To determine whether these assets are impaired, the Group calculated the 'recoverable amount', i.e. the higher of fair value less costs to sell and value in use, and compared it to the carrying amount of the asset. Based on these tests, no impairment losses were recognized. The recoverable amount was determined either at the level of individual assets or, if no cash flows were identified for an individual asset that are largely independent of those of other assets or groups of assets, at the level of cash-generating units (‘CGUs’). The recoverable amount of individual assets was verified by means of additional information such as valuation reports or replacement values. The recoverable amount of a CGU was determined using the dividend discount method (‘DDM’). Under the DDM, expected future divi-dends available for distribution to shareholders (‘flows-to-equity’) are capitalized in compliance with capital requirements. The determination of future distributions is based on current business plans prepared by the management that also reflect the expected impact of the Covid-19 pandemic. The business plans comprise income statements, balance sheets and equity projections for the years 2021 to 2025. The perpetuity for the period not covered by the respective business plan was derived assuming a constant growth rate. The flows-to-equity were discounted taking into account group wide capital requirements with the specific cost of equity. Where the recoverable amount of an individual CGU did not cover the carrying amount of the net assets, the recoverability of the significant individual assets in the respective CGU was tested separately. The determination of the respective recoverable amounts, both for individual assets and for the CGUs, requires numerous assumptions and estimates, in particular with regard to future earnings expectations and discount factors. These are subject to inherent uncertainties regarding the economic development. Due to
_ the subjectiveness of the assessments and future expectations that the management must take into account when determining a recover-able amount, and
_ the high degree of auditor judgment required when assessing management’s determination of the recoverable amount, we have identified this area as a key audit matter. Audit Approach In order to assess the appropriateness of the carrying amounts of assets within the scope of IAS 36, we, used valuation specialists with the required industry knowledge and regional expertise and:
_ assessed the appropriateness of the definition of CGUs. _ examined the key business processes for determining recoverable amounts. _ identified and evaluated the internal process for approval and review of the valuation model parameters (e.g. risk-free interest rate,
market risk premium, beta factors) as well as the valuation results. _ tested, on a sample basis, the valuation method used with regard to its technical and mathematical correctness to determine whether the
valuation method used is in line with the business model of the CGU as well as with information available to the Group. _ performed, on a sample basis, with respect to the aggregation of planning data for the three budget scenarios (base, best and worst case)
that were used as a basis for the calculation of the appraised value, the following: _ followed and assessed the steps taken to ensure the mathematical accuracy of budget data, _ analyzed the key assumptions in the business plan and

104
_ verified the plausibility of the derivation of key value drivers (by means of benchmarking), _ compared the macroeconomic assumptions for the future used with independent macroeconomic forecasts, _ reviewed the planning accuracy for past planning periods by comparing plan vs. actual values and interviewing employees respon-
sible for variance analyses. _ critically assessed probability weighting of the three scenarios.
_ examined how the key valuation model parameters were derived as well as whether they are up-to-date and checked their appropriate-ness using our own independently determined benchmarks by making an independent estimate of the base interest rate, the beta factor, the market risk premium, the country risk premium and the inflation differential,
_ compared, on a sample basis, the appropriateness of planning figures and model parameters used in the valuation model with the ap-proved budget figures and model parameters. Our focus here was particularly on the assumptions related to the perpetuity (especially growth rate and retention).
_ reviewed documentation to determine whether an individual impairment trigger exists for significant assets within the scope of IAS 36. _ assessed and validated the methodology, basic data, and parameters used in the documentation received to determine whether individual
assets are impaired. Reference to related disclosure We refer to the management board’s disclosure in the section Significant accounting policies; b) Covid-19 disclosures and Note 39. Intan-gible assets in the Notes to the consolidated financial statements.
4. Total recoverability of deferred tax assets Description Erste Group Bank AG, together with its major domestic subsidiaries, forms a corporate tax group in accordance with Section 9 of the Corporate Income Tax Act (KStG). The deferred tax assets as of December 31, 2020 consist of deferred tax assets for future claims from tax loss carry-forwards and temporary differences. To determine the value of deferred tax assets, which is largely based on assumptions and estimates for the future development of the corporate tax group's tax results, tax planning calculations are prepared together with the entities in the group. The assumptions and estimates made in the context of preparing the budget are determined by future developments. The uncertainties inherent in the estimates when determining the recoverability of the deferred tax assets have increased significantly due to the uncertainties of the economic implications of the Covid-19 pandemic. Due to
_ management’s discretion in determining which future scenarios flow into the budget, _ the complexity of determining the tax results at the level of the Austrian corporate tax group and the manual steps and adjustments
involved, and _ the high level of uncertainty due to the economic effects of the Covid-19 pandemic, which involves a high degree of auditor judgment,
we have identified this area as a key audit matter. Audit approach In order to assess the appropriateness of the recognition of deferred tax assets of Erste Group Bank AG, we have used tax specialists with the necessary industry knowledge and
_ verified the changes (additions and disposals) of group members in the tax group. _ assessed the completeness of the main group members in the summarized tax plan. _ identified and assessed the process for determining the temporary differences between the corporate and tax balance sheets, from which
the deferred tax assets / liabilities arise. _ analyzed the timing of the reversal of the identified temporary differences. _ reconciled the profit-and-loss forecasts on which the above-mentioned impairment considerations are based for all material companies
in the corporate tax group with budgets approved by the responsible oversight bodies and analyzed the assumptions and significant influencing factors regarding future developments underlying these forecasts, by means of benchmarking in order to judge the appro-priateness and feasibility of the budget.
_ reviewed the process and the documentation for reviewing historical adherence to budgets and the resulting adjustments of future budg-ets for selected companies.
_ analyzed, understood and critically assessed the adjustments made to the budget for tax planning. _ retraced book-to-tax calculation between the planned UGB and tax results. _ analyzed the recognition of losses incurred before the tax group was established for individual group members. _ critically assessed and reconciled the determination of the recoverable deferred tax assets with the calculation documents. _ inquired about the process for splitting impairments into income-related and non-income-related tax deferrals. _ reconciled the determined recoverable deferred tax assets with the posted values. Particular attention was paid to the correct breakdown
into income and non-income tax deferrals. _ assessed the appropriateness and accuracy of the presentations and explanations of deferred taxes in the notes.

105
Reference to further information We refer to the management board’s disclosure in Note 13. Income taxes in the notes to the consolidated financial statements. Other Information Management is responsible for other information. Other information comprises any information included in the annual report, but does not include the consolidated financial statements, the management report for the Group and the auditor’s report. We obtained the consolidated corporate governance report in accordance with Section 267b UGB prior to the date of this auditor`s report, the rest of the annual report is expected to be made available to us after that date. Our opinion on the consolidated financial statements does not cover other information and we will not express any form of assurance thereon. In connection with our audit of the consolidated financial statements, our responsibility is to read other information identified above when it becomes available and, in doing so, consider whether the other information is materially inconsistent with the consolidated financial statements or our knowledge obtained in the audit, or otherwise appears to be materially misstated. If, based on the work we have performed on the other information that we obtained prior to the date of this auditor’s report, we conclude that there is a material misstatement of this other information, we are required to report that fact. We have nothing to report in this regard. Responsibilities of Management and the Audit Committee for the Consolidated Financial Statements Management is responsible for the preparation and fair presentation of these consolidated financial statements in accordance with Interna-tional Financial Reporting Standards (IFRSs) as adopted by the EU, and the additional requirements under Section 59a BWG in conjunction with Section 245a UGB, and for such internal control as management determines is necessary to enable the preparation of consolidated financial statements that are free from material misstatement, whether due to fraud or error. In preparing the consolidated financial statements, management is responsible for assessing the Group’s ability to continue as a going concern, disclosing, as applicable, matters related to going concern and using the going concern basis of accounting unless management either intends to liquidate the Group or to cease operations, or has no realistic alternative but to do so. The audit committee is responsible for overseeing the Group’s financial reporting process. Auditor’s Responsibilities for the Audit of the Consolidated Financial Statements Our objectives are to obtain reasonable assurance about whether the consolidated financial statements as a whole are free from material misstatement, whether due to fraud or error, and to issue an auditor’s report that includes our opinion. Reasonable assurance is a high level of assurance, but is not a guarantee that an audit conducted in accordance with the EU Regulation and with Austrian generally accepted auditing standards, which require the application of ISAs, will always detect a material misstatement when it exists. Misstatements can arise from fraud or error and are considered material if, individually or in the aggregate, they could reasonably be expected to influence the economic decisions of users taken on the basis of these consolidated financial statements. As part of an audit in accordance with the EU Regulation and with Austrian generally accepted auditing standards, which require the application of ISAs, we exercise professional judgment and maintain professional skepticism throughout the audit. We also:
_ identify and assess the risks of material misstatement of the consolidated financial statements, whether due to fraud or error, design and perform audit procedures responsive to those risks, and obtain audit evidence that is sufficient and appropriate to provide a basis for our opinion. The risks of not detecting a material misstatement resulting from fraud is higher than for one resulting from error, as fraud may involve collusion, forgery, intentional omissions, misrepresentations, or the override of internal control.
_ obtain an understanding of internal control relevant to the audit in order to design audit procedures that are appropriate in the circum-stances, but not for the purpose of expressing an opinion on the effectiveness of the Group’s internal control.
_ evaluate the appropriateness of accounting policies used and the reasonableness of accounting estimates and related disclosures made by management.
_ conclude on the appropriateness of management’s use of the going concern basis of accounting and, based on the audit evidence ob-tained, whether a material uncertainty exists related to events or conditions that may cast significant doubt on the Group’s ability to continue as a going concern. If we conclude that a material uncertainty exists, we are required to draw attention in our auditor’s report to the related disclosures in the consolidated financial statements or, if such disclosures are inadequate, to modify our opinion. Our conclusions are based on the audit evidence obtained up to the date of our auditor’s report. However, future events or conditions may cause the Group to cease to continue as a going concern.
_ evaluate the overall presentation, structure and content of the consolidated financial statements, including the disclosures, and whether the consolidated financial statements represent the underlying transactions and events in a manner that achieves fair presentation.

106
_ obtain sufficient appropriate audit evidence regarding the financial information of the entities or business activities within the Group to express an opinion on the consolidated financial statements. We are responsible for the direction, supervision and performance of the group audit. We remain solely responsible for our audit opinion.
We communicate with the audit committee regarding, among other matters, the planned scope and timing of the audit and significant audit findings, including any significant deficiencies in internal control that we identify during our audit. We also provide the audit committee with a statement that we have complied with all relevant ethical requirements regarding independence, and to communicate with them all relationships and other matters that may reasonably be thought to bear on our independence, and where applicable, related safeguards. From the matters communicated to the audit committee, we determine those matters that were of most significance in the audit of the consolidated financial statements of the current period and are therefore the key audit matters. We describe these matters in our auditor’s report unless law or regulation precludes public disclosure about the matter or when, in extremely rare circumstances, we determine that a matter should not be communicated in our report because the adverse consequences of doing so would reasonably be expected to outweigh the public interest benefits of such communication. Report on Other Legal and Regulatory Requirements COMMENTS ON THE MANAGEMENT REPORT FOR THE GROUP Pursuant to the Austrian Company Code, the management report for the Group is to be audited as to whether it is consistent with the consolidated financial statements and as to whether the management report for the Group was prepared in accordance with the applicable legal requirements. Management is responsible for the preparation of the management report for the Group in accordance with the Austrian Company Code and the special legal requirements. We conducted our audit in accordance with Austrian Standards on Auditing for the audit of the management report for the Group. Opinion In our opinion, the management report for the Group was prepared in accordance with the applicable legal requirements, includes accurate disclosures pursuant to Section 243a UGB and is consistent with the consolidated financial statements. Statement Based on the findings during the audit of the consolidated financial statements and the obtained understanding concerning the Group and its circumstances no material misstatements in the management report for the Group came to our attention. Additional Information in accordance with Article 10 of the EU Regulation Pursuant to Sections 23 and 24 Austrian Savings Bank Act (SpG), Sparkassen-Prüfungsverband (Prüfungsstelle) is the statutory auditor of Erste Group Bank AG, Vienna. In accordance with Section 23 (3) SpG in conjunction with Sections 60 and 61 BWG, the Company is subject to an audit, the consolidated financial statements are also subject to a statutory audit. At the ordinary general meeting dated May 15, 2019 and pursuant to Section 1 (1) of the Auditing Rules for Savings Banks, Annex to Section 24 SpG, PwC Wirtschaftsprüfung GmbH, Vienna, was appointed as additional auditor for the financial year 2020 and, subsequently, was engaged by the supervisory board. At the ordinary general meeting dated November 10, 2020 PwC Wirtschaftsprüfung GmbH, Vienna, was appointed as additional auditor for the financial year 2021 and was engaged by the Supervisory Board on November 10, 2020. Since 2017 PwC Wirtschaftsprüfung GmbH, Vienna, has constantly been appointed as additional auditor. We confirm that the audit opinion in the ‘Report on the Consolidated Financial Statements’ section is consistent with the additional report to the audit committee referred to in Article 11 of the EU Regulation. We declare that we did not provide any prohibited non-audit services (Article 5 (1) of the EU Regulation) and that we remained independent of the audited company in conducting the audit.

107
Responsible Engagement Partner Responsible for the proper performance of the engagement are Mr. Gerhard Margetich, Austrian Certified Public Accountant (Sparkassen-Prüfungsverband), and Ms. Dorotea-E. Rebmann, Austrian Certified Public Accountant (PwC Wirtschaftsprüfung GmbH, Vienna). We draw attention to the fact that the English translation of this auditor’s report according to Section 274 of the Austrian Commercial Code (UGB) is presented for the convenience of the reader only and that the German wording is the only legally binding version.
Vienna, 26 February 2021
Sparkassen-Prüfungsverband
(Prüfungsstelle)
(Bank Auditor)
Gerhard Margetich Stephan Lugitsch
Austrian Certified Public Accountant Austrian Certified Public Accountant
PwC Wirtschaftsprüfung GmbH
Timo Steinmetz Dorotea-E. Rebmann
Austrian Certified Public Accountant Austrian Certified Public Accountant
This report is a translation of the original report in German, which is solely valid. Publication and sharing with third parties of the consoli-dated financial statements together with our auditor’s opinion is only allowed if the consolidated financial statements and the management report for the Group are identical with the German audited version. This audit opinion is only applicable to the German and complete consolidated financial statements with the management report for the Group. For deviating versions, the provisions of Section 281 (2) UGB apply.
108
ECONOMIC ENVIRONMENT In 2020, Covid-19 has triggered the deepest global recession in decades. The pandemic induced crisis, which drastically impacted both advanced and emerging markets, has led to an unprecedented contraction in economic activity as more than 85 percent of the countries around the globe experienced shrinking economies. Pol-icy makers have taken extraordinary measures to protect people and national health systems, the economy, and the financial system. To prevent the virus from spreading uncontrollably, most countries imposed stringent lockdown measures in the first half of the year, and with rising infection rates in autumn and winter further lock-downs followed in the last quarter. To contain the immediate eco-nomic damage governments introduced various measures including state guaranteed loans, payment moratoria for private in-dividuals and corporates or subsidies from hardship funds. Central banks have eased monetary policies across the globe, with a bal-ance sheet expansion in the G10 countries of nearly EUR 6.5 tril-lion 1 , and with more than 20 emerging market central banks deploying asset purchases for the first time. In addition, a fiscal policy response of EUR 10.5 trillion2 globally has provided sub-stantial support to households and corporates. Most economies faced a substantial slump in economic activity. With its real GDP declining by 3.4%3, the United States outper-formed both Japan and the European Union. Leading European economies like Italy and France recorded a double-digit decline in their GDP. Among emerging and developing regions, China out-performed other major economies. Following a sharp output con-traction in the first quarter 2020, China’s economic activity rebounded stronger than in most other countries following the re-laxation of the initial lockdowns. Overall, China’s GDP increased by 2.3%4. All other major emerging markets’ economies, such as India, Brazil, Russia or Turkey declined substantially. India’s econ-omy particularly suffered and fell into its first recession in 40 years. In addition to the Covid-19 crisis, the Russian economy was nega-tively impacted by lower oil prices. Central and Eastern European economies were similarly hit by the virus induced crisis. Overall, global real GDP declined by 3.5%5. The economic development in the United States was mainly char-acterised by the Covid-19 outbreak, increasing tension between the US and China and the presidential elections in November. The economy plummeted in April and May as a result of the corona-virus induced crisis, and the unemployment rate rose temporarily above 14% in April6. The economy, however, recovered quickly mainly due to robust domestic demand, improving labour market,
1 IMF: https://www.imf.org/-/media/Files/Publications/GFSR/2020/October/English/foreword.ashx
(Download on 19 February 2021, applied exchange rate: 1 EUR=1,147 USD)
2 IMF: https://www.imf.org/-/media/Files/Publications/GFSR/2020/October/English/foreword.ashx
(Download on 19 February 2021, applied exchange rate: 1 EUR=1,147 USD)
3 IMF: https://www.imf.org/en/Publications/WEO/Issues/2021/01/26/2021-world-economic-outlook-update
(Download on 19 February 2021)
4 IMF: https://www.imf.org/en/Publications/WEO/Issues/2021/01/26/2021-world-economic-outlook-update
(Download on 19. February 2021)
5 IMF: https://www.imf.org/en/Publications/WEO/Issues/2021/01/26/2021-world-economic-outlook-update
(Download on 19. February 2021)
6 US Labor Statistics: https://www.bls.gov/news.release/pdf/empsit.pdf (Download on 19 February 2021), page 1
a very accommodative monetary policy and a large fiscal stimulus. Consequently, the unemployment rate stood at 6.7%7 at the end of the year. Core inflation remained below the Federal Reserve’s 2% target. In March 2020, the Fed reduced its benchmark interest rate to zero and launched a new round of quantitative easing. The pro-gramme entailed USD 700 billion worth of asset purchases of Treasury’s and mortgage-backed securities as a response to the slowing economy. Overall, the US economy contracted by 3.4%8 in 2020. The euro area was also significantly impacted. At 7.2%9, economic decline in the euro zone was deeper than in other advanced regions of the world. Government measures implemented as a response to the Covid-19 pandemic – such as nationwide lockdowns, school closures or border restrictions – significantly disrupted domestic economic activity. Tourism, a sector that was virtually shut down completely for many months during the year, suffered significantly. Italy, France and Spain with their very important tourist industries performed poorly with their real GDP declining by double digit figures. The biggest economy of the euro zone, Germany, on the other hand, posted a markedly better performance mainly due to its prudent crisis management and stronger production output. Unem-ployment rates rose across countries. Most euro area governments launched large programmes of public loan guarantees to preserve access to bank loans for businesses. The European Central Bank (ECB) introduced a new Pandemic Emergency Purchase Pro-gramme (PEPP) to counter the serious risks to the monetary policy transmission mechanism and the outlook for the euro area. The pro-gramme amounted to EUR 1.85 trillion10 and was extended until March 2022. The ECB also increased its targeted longer-term refi-nancing operations (TLTROs) to provide low interest rate loans to credit institutions. Overall, EUR 1.7 trillion11 were taken up by 388 banks. The ECB kept its discount rate at zero. Against this backdrop, Austria’s economy was also hit hard. Re-flecting the containment measures and the lockdown in spring, a sharp decline in private consumption led to a fall in GDP. Invest-ments also fell significantly. A solid economic rebound began in the third quarter. The easing of travel restrictions, but most im-portantly a strong domestic Summer tourism led to a partial recov-ery in the economically important tourism sector, with overnight stays in July and August down 15% from 2019 levels, compared to a decline of 60% to 90% in May and June. The unemployment rate increased visibly in the first half of the year, reaching 6.2% in June. In 2020, it stood on average at 5.3%12. Short-time work schemes helped to mitigate the effect of the economic downturn on the la-bour market. The Covid-19 induced crisis has put an abrupt end to
7 US Labor Statistics: https://www.bls.gov/news.release/pdf/empsit.pdf (Download on 19 February 2021), page 9
8 IMF: https://www.imf.org/en/Publications/WEO/Issues/2021/01/26/2021-world-economic-outlook-update
(Download on 19 February 2021)
9 IMF: https://www.imf.org/en/Publications/WEO/Issues/2021/01/26/2021-world-economic-outlook-update
(Download on 19 February 2021)
10 ECB: https://www.ecb.europa.eu/mopo/implement/pepp/html/index.en.html
(Download am 19 February 2021)
11 Euromoney: https://www.euromoney.com/article/280nvn47uuu2gasjb5534/banking/european-banks-head-for-a-funding-cliff-
thanks-to-tltro-iii (Download on 19 February 2021)
12 Statistik Austria: http://www.statistik.at/wcm/idc/idcplg?IdcService=GET_PDF_FILE&RevisionSelectionMethod=LatestRe-
leased&dDocName=055370 (Download on 19 February 2021)
Management report

109
the favourable development of Austria’s public finances. A crisis management fund launched in March has been covering financial support e.g. to strengthen health care services, fixed cost subsidies or short-time work schemes. Tax deferrals and public guarantees for loans also helped companies to avoid liquidity constraints. The general government deficit stood at 8.9%13 of GDP. Public debt as a percentage of GDP significantly increased to 84.8%14. With the sharp economic downturn and the decrease in energy prices, infla-tion fell from over 2% in the beginning of the year to 1.2%15 at year end. Overall, average inflation stood at 1.4%16 in 2020. Real GDP declined by 7.2%17, with GDP per capita falling to EUR 42,00018 at year-end. Central and Eastern European economies struggled as well. Con-sumption and investments fell visibly, exports and imports posted a double-digit contraction. The large exposure of CEE economies to manufacturing and exports contributed significantly to the eco-nomic decline in the spring lockdown. After an unprecedented de-cline in economic activity, the CEE region saw a very fast economic rebound. The second wave of lockdowns in autumn im-pacted the regional economies to a much lesser extent, underlying the resilience of CEE industrial production. This time, production was not halted and foreign demand held up well. Serbia proved to be the best performer with its GDP contracting only moderately in 2020. Croatia experienced the deepest GDP decline due to the country’s heavy dependency on the tourism sector. Unemployment rates in CEE increased but remained still low compared to many Western European countries. The labour markets benefited from government support programmes and widely used short-time work schemes. As a result of lower revenues and higher expenses, public deficits in the region widened. CEE currencies remained weak dur-ing the year with the Hungarian forint testing all-time lows throughout the year. Despite the FX impact, inflation remained rel-atively moderate. Many of the region’s central banks, cut their key rates in the course of the year. The most pronounced were the in-terest rate cuts of the Czech National Bank. Hungary, Romania, and Serbia also cut their policy rates. Overall, CEE economies shrank between 8.8%19 in Croatia and 1.1%20 in Serbia in 2020.
13 OeNB: https://www.oenb.at/dam/jcr:370f2792-c563-4471-93d7-f6530d6c29e0/facts-on-austria_oct-2020.pdf
(Download on 19 February 2021), page 4
14 OeNB: https://www.oenb.at/dam/jcr:370f2792-c563-4471-93d7-f6530d6c29e0/facts-on-austria_oct-2020.pdf
(Download on 19 February 2021), page 4
15 Statistik Austria: http://www.statistik.at/wcm/idc/idcplg?IdcService=GET_PDF_FILE&RevisionSelectionMethod=LatestRe-
leased&dDocName=022832 (Download on 19 February 2021)
16 Statistik Austria: http://www.statistik.at/wcm/idc/idcplg?IdcService=GET_PDF_FILE&RevisionSelectionMethod=LatestRe-
leased&dDocName=022832 (Download on 19 February 2021)
PERFORMANCE IN 2020 P&L data of 2020 is compared with data of 2019, balance sheet data as of 31 December 2020 is compared to data as of 31 Decem-ber 2019. Acquisitions and disposals in Erste Group in 2020 did not have any significant impact and therefore had no effect on the rates of change stated below. Details are provided in the notes to the con-solidated financial statements. Overview Net interest income increased – mainly in Austria, but also in Ro-mania and Hungary – to EUR 4,774.8 million (+0.6%; EUR 4,746.8 million). Net fee and commission income decreased to EUR 1,976.8 million (-1.2%; EUR 2,000.1 million). Higher income from the securities business and asset management did not fully compensate for the declines in other fee and commission income categories – most notably in payment services (thereof EUR 19 mil-lion attributable to the impact of the SEPA Payment Services Di-rective). While net trading result declined significantly to EUR 137.6 million (EUR 318.3 million), the line item gains/losses
from financial instruments measured at fair value through
profit or loss improved to EUR 62.0 million (EUR -24.5 million). The development of both line items was driven by valuation effects due to market volatility amid the Covid-19 pandemic. Operating
income decreased to EUR 7,155.1 million (-1.4%; EUR 7,255.9 million). General administrative expenses declined to EUR 4,220.5 million (-1.5%; EUR 4,283.3 million), personnel expenses were slightly lower at EUR 2,520.7 million (-0.6%; EUR 2,537.1 million). Other administrative expenses were reduced to EUR 1,158.9 million (-3.8%; EUR 1,205.1 million). Payments into de-posit insurance schemes included in other administrative expenses rose to EUR 132.2 million (EUR 104.8 million). Depreciation and amortisation was unchanged at EUR 540.9 million (EUR 541.0 mil-lion). Overall, the operating result declined to EUR 2,934.6 mil-lion (-1.3%; EUR 2,972.7 million). The cost/income ratio was unchanged at 59.0% (59.0%). Due to net allocations, the impairment result from financial in-
struments amounted to EUR -1,294.8 million or 78 basis points of average gross customers loans (EUR -39.2 million or 7 basis points). Allocations to provisions for loans as well as for commitments and guarantees given went up in all core markets. The marked rise in allocations to provisions for loans was primarily driven by the dete-rioration in the macroeconomic outlook due to Covid-19. A positive contribution came from high income from the recovery of loans al-ready written off, primarily in Romania and Hungary. The NPL ratio based on gross customer loans deteriorated to 2.7% (2.5%), the NPL coverage ratio rose to 88.6% (77.1%).
17 OeNB: https://www.oenb.at/dam/jcr:370f2792-c563-4471-93d7-f6530d6c29e0/facts-on-austria_oct-2020.pdf
(Download on 19 February 2021), page 4
18 OeNB: https://www.oenb.at/dam/jcr:370f2792-c563-4471-93d7-f6530d6c29e0/facts-on-austria_oct-2020.pdf
(Download on 19 February 2021) and Statistik Austria: https://statcube.at/statistik.at/ext/statcube/jsf/tableView/tableView.xhtml
(Download on 19 February 2021)
19 European Commission: https://ec.europa.eu/eurostat/databrowser/view/NAMQ_10_GDP__custom_589433/default/table?lang=en
(Download on 19. February 2019), calculation based on Q1-Q3 2020 data
20 Statistical Office of the Republic of Serbia: https://www.stat.gov.rs/en-US/vesti/20201230-ekonomska-kretanja-2020
(Download on 19. February 2021)

110
Other operating result improved to EUR -278.3 million (EUR -628.2 million). The expenses for the annual contributions to reso-lution funds included in this line item rose – in particular in Austria – to EUR 93.5 million (EUR 75.3 million). The decline in banking and transaction taxes to EUR 117.7 million (EUR 128.0 million) is primarily attributable to the abolition of banking tax in Romania. In the previous year, other operating result included allocations to a provision in the amount of EUR 153.3 million set aside for losses expected from a supreme court decision concerning the business activities of a Romanian subsidiary as well as the write-off of good-will in Slovakia in the amount of EUR 165.0 million. Taxes on income declined to EUR 342.5 million (EUR 418.7 mil-lion). The minority charge fell to EUR 242.3 million (EUR 440.9 million) due to significantly lower earnings contribution of the sav-ings banks. The net result attributable to owners of the parent declined to EUR 783.1 million (-46.7%; EUR 1,470.1 million). Cash earnings per share (see glossary for definition) amounted to EUR 1.59 (reported EPS: EUR 1.57) versus EUR 3.25 (reported EPS: 3.23) in the previous year. Cash return on equity (see glossary for definition), i.e. return on equity adjusted for non-cash expenses such as goodwill impair-ment and straight-line amortisation of customer relationships, stood at 4.7% (reported ROE: 4.7%) versus 10.1% (reported ROE: 10.1%) in the previous year. Total assets rose to EUR 277.4 billion (EUR 245.7 billion). On the asset side, cash and cash balances increased, primarily in Aus-tria, to EUR 35.8 billion (EUR 10.7 billion), loans and advances to banks decreased to EUR 21.5 billion (EUR 23.1 billion). Loans
and advances to customers increased to EUR 166.1 billion (+3.6%; EUR 160.3 billion). On the liability side, deposits from banks grew significantly to EUR 24.8 billion (EUR 13.1 billion) on the back of increased ECB refinancing (TLTROs). Customer
deposits rose again – in all core markets, primarily in Austria and the Czech Republic – to EUR 191.1 billion (+9.9%; EUR 173.8 billion). The loan-to-deposit ratio stood at 86.9% (92.2%). The common equity tier 1 ratio (CET 1, CRR final, see glossary for definition) stood at 14.2% (13.7%), the total capital ratio (see glossary for definition) at 19.7% (18.5%). Dividend In the reporting period, Erste Group Bank AG posted a post-tax loss of EUR 118.4 million under the Austrian accounting regulations, which increased its distributable capital accordingly (2019 post-tax profit: EUR 1,327.1 million). The equity decreased (2019: in-creased) accordingly. On 15 December 2020 the European Central Bank (ECB) has is-sued a recommendation in respect of dividend payouts. The man-agement board of Erste Group will propose a 2020 dividend, in line with the ECB recommendation, of EUR 0.5 per share to the 2021 AGM for payment in May 2021. Furthermore, an additional re-serve of EUR 1.0 per share was created, for payment once the ECB recommendation is withdrawn and subject to profitability and cap-ital performance.
On 10 November 2020 the annual general meeting resolved to pay a dividend of EUR 0.75 per share for the business year of 2019 (appropriation of net profit), conditional upon no regulatory ECB recommendation to refrain from such payments or no other legal restrictions being in force prohibiting such distributions on 8 February 2021. Based on the ECB recommendations conditions to pay dividend ofd EUR 0.75 per share have not been met as of 8 February 2021 and no dividend was distributed. As a pay out is not possible, the dividend is allocated to retained earnings accord-ing to the resolution taken on the annual general meeting on 10 November 2020. Outlook Erste Group’s goal for 2021 is to increase net profit. Among the factors that will support achievement of this goal are a recovery of the economies of all core markets – the Czech Republic, Slovakia, Hungary, Romania, Croatia, Serbia and Austria – and, on this basis, a reduction of risk costs and an improvement in the operating result. A continuation or further escalation of Covid-19 measures by gov-ernments as well as potential – and as yet unquantifiable – political, regulatory or economic risks may render meeting this goal more challenging. In 2021, the positive development of the economy should be reflected in growth rates (real GDP growth) of between 3% and close to 6% in Erste Group’s CEE core markets. The de-velopment of other economic indicators should vary depending on Covid-19 policy measures imposed by authorities and/or the phas-ing out of state support. Unemployment rates are expected to rise but, in the Czech Republic and Hungary, should remain among the lowest in the EU. Inflation rates are forecast to decline in the Czech Republic and Slovakia while the other core markets are likely to see a slight acceleration. In most countries, sustained competitive-ness should again result in solid and, in Slovakia and Romania, stronger current account balances. The fiscal situation should like-wise improve again after the significant budget deficits posted in the year 2020. Public debt is projected to remain largely stable, al-beit at a significantly elevated level. Against this backdrop, Erste Group expects net loan growth in the low to mid-single digit range. This performance should keep net interest income stable despite negative interest rates in the euro zone. The second most important income component – net fee and commission income – is expected to rise in low single digits. As in 2020, positive momentum should again come from fund manage-ment, the securities business and insurance brokerage. Given the average result seen in 2020, the net trading and fair value result is expected to come in higher. This, however, will depend substan-tially on the financial market environment. The remaining income components are forecast to remain, by and large, stable. Overall, operating income should increase again in 2021. Operating ex-penses are expected to rise slightly in 2021, partly due to re-emerg-ing wage pressure across all Erste Group markets. In addition, Erste Group will continue to invest in IT in 2021, and thus strengthen its competitive position, with a focus on progressive IT modernisation, back-office digitalisation and expansion of the dig-ital platform George. The rollout of George in Hungary and Croatia should be completed in 2021, as a result of which customers will be able to access George in the six largest core markets. Though faced with more challenges in a largely unpredictable environment, Erste Group is striving to make operating income grow faster than costs. This leads Erste Group to project a rise in the operating result in 2021.

111
Based on the scenario described above, risks costs should decline again in 2021. While precise forecasting is hard in the current Covid-19 environment, Erste Group believes that in 2021 risk costs will not exceed 65 basis points of average gross customer loans. Due to the expected expiry of state support schemes a rise of the NPL ratio to 3-4% is expected though. Other operating result is expected to remain unchanged in the ab-sence of significant one-off effects. Assuming a tax rate of below 25% and a similar level of minority charges as in the previous year, Erste Group aims to achieve an improvement in net profit. Erste Group’s CET1 ratio is expected to remain strong. The management board proposes to the annual general meeting in May – in line with ECB recommendation – a dividend for 2020 of EUR 0.5 per share. An additional EUR 1/share has been reserved for a potential later payment. Potential risks to the guidance are besides other than expected (geo)political, economic (monetary and fiscal policies) und regu-latory measures and developments also global health risks or changes to the competitive environment. In addition, given the Covid-19 governmental measures and their impact on the eco-nomic development, financial forecasts are still subject to an ele-vated level of uncertainty. Erste Group is moreover exposed to non-financial and legal risks that may materialise regardless of the eco-nomic environment. Worse than expected economic development may put goodwill at risk. ANALYSIS OF PERFORMANCE Net interest income Net interest income increased to EUR 4,774.8 million (EUR 4,746.8 million). While in Austria (Holding) positive impacts came from more favourable ECB refinancing and lower negative interest on deposits with the ECB, net interest income in the Czech Repub-lic declined significantly due to lower interest rates. Included in net interest income are modification losses in the amount of EUR 49.5 million mainly resulting from moratoria on loan re-payments due to Covid-19. The net interest margin (calculated as the annualised sum of net interest income, dividend income and net result from equity method investments over average interest-bearing assets) stood at 2.08% (2.18%). Net fee and commission income Net fee and commission income decreased to EUR 1,976.8 million (EUR 2,000.1 million). Declines were recorded in payment ser-vices (thereof EUR 19 million attributable to SEPA, the payment-integration initiative of the European Union) but also in the lending business and insurance brokerage commission income. Significant growth was recorded, however –primarily in Austria –in the secu-rities business and in asset management. Net trading result & gains/losses from financial instruments measured at fair value through profit or loss Valuation effects have a substantial impact on both positions – net trading result & gains/losses from financial instruments measured at fair value through profit or loss. Debt securities issued measured at FV through profit or loss are particularly impacted – related val-uation results are shown in the line gains/losses from financial in-struments measured at fair value through profit or loss while
valuation results of corresponding hedges are shown in net trading result – as are financial assets in the fair value and trading portfolios. Due to valuation effects resulting from interest rate developments, net trading result decreased significantly to EUR 137.6 million (EUR 318.3 million), despite strong income from the foreign ex-change business. Conversely, gains/losses from financial instru-ments measured at fair value through profit or loss improved to EUR 62.0 million (EUR -24.5 million). In addition to gains from the valuation of debt securities in issue due to the development of interest rates, the valuation result of financial assets in the fair value portfolio was, overall, likewise positive. Gains from the val-uation of the securities portfolio were significantly higher than the valuation losses in the loan portfolio measured at fair value. General administrative expenses General administrative expenses decreased to EUR 4,220.5 million (EUR 4,283.3 million). Personnel expenses declined to EUR 2,520.7 million (EUR 2,537.1 million). While personnel expenses were up in Slovakia as a result of a one-off payment agreed through collective bargaining, they declined in all other core markets, in the Czech Republic and Hungary also due to positive currency effects. Other administrative expenses decreased to EUR 1,158.9 mil-lion (EUR 1,205.1 million) on the back of a marked reduction of marketing and consulting costs. Contributions to deposit insurance systems rose to EUR 132.2 million (EUR 104.8 million). In Austria, contributions increased substantially to EUR 95.0 million (EUR 58.4 million), driven by a one-off effect as well as continuing strong deposit growth, but declined in Romania to EUR 4.4 million (EUR 12.7 million). IT expenditure was likewise up. Amortisa-
tion and depreciation amounted to EUR 540.9 million (EUR 541.0 million). Operating result Due to the significant decline of the net trading and fair value result, operating income decreased to EUR 7,155.1 million (-1.4%; EUR 7,255.9 million). General administrative expenses were reduced to EUR 4,220.5 million (-1.5%; EUR 4,283.3 million). The operating result declined to EUR 2,934.6 million (-1.3%; EUR 2,972.7 mil-lion). The cost/income ratio was unchanged at 59.0% (59.0%). Gains/losses from derecognition of financial instruments not measured at fair value through profit or loss Gains from derecognition of financial instruments not measured at fair value through profit or loss amounted to EUR 6.5 million (EUR 23.5 million). This line item includes primarily gains/losses from the derecognition of loans and the sale of securities. Impairment result from financial instruments Due to net allocations, the impairment result from financial instru-ments amounted to EUR -1,294.8 million (EUR -39.2 million). Net allocations to provisions for commitments and guarantees given amounted to EUR -159.2 million (net releases of EUR 70.0 mil-lion). The significant rise in allocations to provisions was primarily driven by updated risk parameters with forward-looking infor-mation as well as experts’ estimates on the impacts of the Covid-19 pandemic. Positive contributions came from continued high in-come from the recovery of loans already written off – primarily in Romania and Hungary – in the amount of EUR 140.4 million (EUR 154.0 million).

112
Other operating result Other operating result improved to EUR -278.3 million (EUR -628.2 million). Levies on banking activities declined to EUR 117.7 million (EUR 128.0 million). Banking tax payable in Austria increased moderately to EUR 25.5 million (EUR 24.3 million). Levies in Slovakia, where they were charged for the last time in the first half of the year, rose to EUR 33.8 million (EUR 32.5 million). Hungarian banking tax increased to EUR 14.5 million (EUR 12.6 million). Together with the financial transaction tax of EUR 44.0 million (EUR 47.6 million), banking levies in Hungary were slightly down, totalling EUR 58.5 million (EUR 60.2 million). The negative balance of allocations/releases of other provisions de-creased markedly to EUR -18.4 million (EUR -207.0 million). The comparative period was negatively impacted by extraordinary effects – a provision in the amount of EUR 153.3 million had been set aside for losses expected from a supreme court decision con-cerning the business activities of a Romanian subsidiary. Further-more, goodwill in Slovakia in the amount of EUR 165.0 million had been written down. Other operating result also reflects the an-nual contributions to resolution funds in the amount of EUR 93.5 million (EUR 75.3 million). Increases were recorded across all core markets, but above all in Austria, to EUR 43.6 million (EUR 33.4 million). Profit/loss for the year The pre-tax result from continuing operations amounted to EUR 1,368.0 million (EUR 2,329.7 million). Taxes on income declined to EUR 342.5 million (EUR 418.7 million). The minority charge decreased to EUR 242.3 million (EUR 440.9 million) due to sub-stantially lower earnings contributions of savings banks. The net result attributable to owners of the parent amounted to EUR 783.1 million (EUR 1,470.1 million). Tax situation Pursuant to section 9 of the Austrian Corporate Tax Act (KStG), Erste Group Bank AG and its main domestic subsidiaries constitute a tax group. Due to the high proportion of tax-exempt income – par-ticularly income from participating interests – and tax payments for the permanent establishments abroad, no Austrian corporate income tax was payable for the financial year 2020. The current tax loss carried forward increased in 2020. Taxes on income are made up of current taxes on income calculated in each of the Group companies based on the results reported for tax purposes, corrections to taxes on income for previous years, and the change in deferred taxes. The reported total income tax expense amounted to EUR 342.5 million (EUR 418.7 million). Balance sheet development The rise in cash and cash balances to EUR 35.8 billion (EUR 10.7 billion) was primarily due to large cash balances held at cen-tral banks, not least due to increased TLTRO III funds. Trading and investment securities held in various categories of financial assets increased to EUR 46.8 billion (EUR 44.3 billion). Loans and advances to banks (net), including demand deposits other than overnight deposits, declined primarily in Austria to EUR 21.5 billion (EUR 23.1 billion).
Loans and advances to customers (net) rose –most notably in Austria –to EUR 166.1 billion (EUR 160,3 billion) driven by loan growth in the corporate and retail segments. In subsidiaries outside the euro zone, the effect of growth in local currency was offset by the depreciation of the local currencies. Loan loss allowances for loans to customers rose to EUR 4.0 billion (EUR 3.2 billion). The increase reflected the deterioration in the macroeconomic outlook due to Covid-19. The NPL ratio (non–performing loans as a percentage of gross customer loans) deteriorated to 2.7% (2.5%). The NPL coverage ratio (based on gross customer loans) rose to 88.6% (77.1%). Intangible assets remained unchanged at EUR 1.4 billion (EUR 1.4 billion). Miscellaneous assets amounted to EUR 5.8 billion (EUR 6.0 billion).
Financial liabilities –held for trading increased to EUR 2.6 bil-lion (EUR 2.4 billion).
Deposits from banks, primarily in the form of term deposits, rose to EUR 24.8 billion (EUR 13.1 billion), including EUR 14.1 billion in TLTRO III funds as of the end of December 2020. Deposits
from customers increased to EUR 191.1 billion (EUR 173.8 bil-lion) due to strong growth in overnight deposits (the leasing liabil-ities of EUR 0.6 billion were not included in this position). The loan-to-deposit ratio stood at 86.9% (92.2%). Debt securities in issue increased slightly to EUR 30.7 billion (EUR 30.4 billion). Miscellaneous liabilities amounted to EUR 5.8 billion (EUR 5.4 billion). Total assets grew to EUR 277.4 billion (+12.9%; EUR 245.7 bil-lion). Total equity increased to EUR 22.4 billion (+9.4%; EUR 20.5 billion) including additional tier 1 (AT1) instruments in the amount of EUR 2,733.0 million from five issuances (June 2016, April 2017, March 2019, January 2020 and November 2020). After regulatory deductions and filtering according to the Capital Re-quirements Regulation (CRR) common equity tier 1 capital (CET1, CRR final) rose to EUR 17.1 billion (EUR 16.3 billion). Total own funds (CRR final) went up to EUR 23.6 billion (EUR 22.0 billion) supported by AT 1 issuances. Total risk (risk-
weighted assets including credit, market and operational risk, CRR final) rose to EUR 120.2 billion (+1.3%; EUR 118.6 billion) benefitting from a positive impact of the application of the SME support factor in an amount of EUR 4.5 billion. Consolidated regulatory capital is calculated in accordance with CRR taking into consideration transitional provisions as defined in the Austrian CRR Supplementary Regulation and the Regulation (EU) 2016/445 of the European Central Bank on the exercise of options and discretions available in Union law. These transitional provisions define the percentages applicable to eligible capital in-struments and regulatory deduction items as well as filters. The to-
tal capital ratio, total eligible qualifying capital in relation to total risk pursuant to CRR (final), was 19.7% (18.5%), well above the legal minimum requirement. The tier 1 ratio (CRR final) stood at 16.5% (15.0%), the common equity tier 1 ratio (CRR final) at 14.2% (13.7%).

113
RISK MANAGEMENT Comments on the risk profile of Erste Group
In light of the business strategy of Erste Group Bank AG, besides participation risk, the main risks included credit risk, market risk, interest-change risk in the banking book, liquidity risk and non-financial risks. In addition, a risk materiality assessment is under-taken on an annual basis. It is ensured that all relevant material risks are covered by Erste Group Bank AG’s control and risk man-agement framework. This entails a set of different tools and gov-ernance to ensure adequate oversight of the overall risk profile and sound execution of the risk strategy, including appropriate moni-toring and escalation of issues that could materially impact the risk profile of the group. The main types of risk can be summarised as follows:
_ Credit risk: is the risk of loss from the potential collapse of counterparties, particularly of borrowers in the conventional lending business, and any related credit losses.
_ Market risk: describes the risk of loss from unfavourable price changes in marketable and traded products, such as shares, fixed-income securities and derivatives, as well as from inter-est and foreign exchange volatility and fluctuations in raw ma-terial prices.
_ Liquidity risk: describes the risk of the bank’s insufficient li-quidity or inability to make funds available in a timely manner to service its debts.
_ Non financial risk: includes operational risks and other busi-ness risks. Operational risks are losses as a result of error or malfunction of internal procedures, humans and systems or ex-ternal events. Major sub-categories of other business risks are strategic risks, reputational risks and compliance risks.
With respect to the explanations on substantial financial and non-financial risks at Erste Group as well as the goals and methods of risk management, we would like to draw the reader’s attention to the information in Notes 27, 32, 34, 35, 36, 37 and 43 to the con-solidated financial statements. RESEARCH AND DEVELOPMENT Erste Group does not engage in any research activities pursuant to section 243 (3) no. 3 UGB, but in 2020 development costs in the amount of EUR 70 million (EUR 76 million) were capitalised in connection with software developed in-house. In order to drive improvements for retail customers and in the on-going services, Erste Group launched the Innovation Hub. Its pur-pose is to initiate and coordinate across-the-board initiatives with a strong focus on customer experiences. As a multi-disciplinary team consisting of marketing, product and IT as well as design experts, the Innovation Hub is tasked with creating innovations and manag-ing new programme initiatives. BRANCHES Erste Group Bank AG maintains branches in London, New York, Hong Kong and Germany (Berlin and Stuttgart) that provide com-mercial lending to foreign banks, leasing companies and sovereign debtors as well as institutional sales. The London branch is ex-pected to be closed in the financial year 2021.
CAPITAL, SHARE, VOTING AND CONTROL RIGHTS Investor information pursuant to section 243a (1) of the Austrian Commercial Code (‘UGB’)With regard to the statutory disclosure requirements related to the composition of the capital as well as the class of shares, special ref-erence is made to Note 44 in the consolidated financial statements. The interests disclosed in the paragraph below relate to shares in capital. This is different to the ones presented in the Consolidated Financial Statements 2019, in which shares in voting rights have been presented. Therefore comparative figures are slightly differ-ent. As of 31 December 2020, together with its syndicate partners, DIE ERSTE oesterreichische Spar-Casse Privatstiftung (ERSTE Stiftung), a foundation, controls approx. 31.17% (prior year: 30.39%) of the shares in Erste Group Bank AG and with 16.50% (prior year: 15.96%) is the main shareholder. The ERSTE Stiftung holds 5.90% (prior year: 6.37%) of the shares directly; the indirect participation of the ERSTE Stiftung amounts to around 10.60% (prior year: 9.59%) of the shares held by Sparkassen Beteiligungs GmbH & Co KG, which is an affiliated undertaking of the ERSTE Stiftung. 1.67% (prior year: 1.43%) are held directly by savings bank foundations (Sparkassenstiftungen) respectively saving banks foundations acting together with the ERSTE Stiftung and af-filiated with Erste Group Bank AG through the joint liability scheme/IPS fund. 9.92% (prior year: 9.92%) of the subscribed cap-ital is controlled by the ERSTE Stiftung on the basis of a share-holder agreement with Caixabank S.A. 3.08% (prior year: 3.08%) are held by other partners to the shareholder agreement. It should also be noted that in addition to the joint liability scheme in place since 2001, from 1.1.2014 onwards Erste Group Bank AG has formed a recognised institutional protection scheme (IPS) in accordance with article 113 (7) CRR together with the Austrian savings banks. The joint liability scheme complies with the re-quirements of article 4 (1) Z 127 CRR, whereby the required indi-vidual services of the individual members of the scheme are subject to an individual and general ceiling. Furthermore, starting in 2014 an IPS ex-ante fund was established and endowed for the following 10 years. The payments of the individual members are recognised in the balance sheet as a share in IPS GesbR, which manages the ex-ante fund and are accounted for as revenue reserve. Due to the contractual terms, this revenue reserve represents a blocked re-serve. The writing off of this blocked reserve may only take place as a result of the mobilisation of the ex-ante fund due to a claim. This reserve can therefore not be utilised internally to cover losses and on member level does not qualify as capital according to the CRR; on a consolidated level, the ex-ante fund does qualify, how-ever. Additional disclosures pursuant to section 243a (1) UGB All restrictions on voting rights or the transfer of shares, even if they are included in agreements between shareholders, insofar as they are known to the Management Board pursuant to section 243a (1) no. 2 UGB:

114
In shareholder agreements ERSTE Stiftung agreed with its partners the following: concerning the appointment of the members of the supervisory board the partners are obliged to vote as required by ERSTE Stiftung. The partners can dispose of shares according to a predefined sale procedure and can purchase shares only within the quotas agreed with ERSTE Stiftung (of a maximum of 2% within 12 months in total); with this regulation an unwanted creeping-in according to takeover law shall be prevented. In addition, the part-ners have committed themselves not to make a hostile takeover bid, nor to participate in a hostile takeover bid nor to act together with a hostile bidder in any other way. The Articles of Association contain no restrictions in respect of vot-ing rights or the transfer of shares. Pursuant to section 243a (1) no. 6 UGB not directly prescribed by the law regarding the appointment and dismissal of members of management and supervisory boards as well as on the amendment of the Articles of Association: This concerns:
_ Art. 15.1 of the Articles of Association, which provides that ERSTE Stiftung will be granted the right to nominate up to one third of the members of the Supervisory Board to be elected by the shareholders’ meeting, as long as ERSTE Stiftung is liable or all present and future liabilities of the company in the case of its insolvency pursuant to Section 92 (9) Banking Act and
_ Art. 15.4 of the Articles of Association, which provides that a three-quarter majority of valid votes cast and a three-quarter majority of the subscribed capital represented at the meeting considering the proposal are required to pass a motion for re-moval of Supervisory Board members
_ Art. 19.9 of the Articles of Association, which provides that the Articles of Association, in so far as they do not alter the busi-ness purpose, may be passed by simple majority of votes cast and simple majority of the subscribed capital represented at the meeting considering the amendment. Where higher majority votes are required by individual provisions of the Articles of Association, these provisions can only be amended with the same higher majority vote. Moreover, amendments to Art. 19.9 require a three-quarter majority of the votes cast and a three-quarter majority of the subscribed capital represented at the meeting considering the proposal.
Pursuant to section 243a (1) no. 7 UGB, members of the Manage-ment Board have the right to issue or repurchase shares, where such a right is not prescribed by statutory law: As per decision of the Annual General Meeting of 15 May 2019:
_ the Management Board is entitled to purchase up to 10% of the subscribed capital in treasury shares for trading purposes ac-cording to section 65 (1) no. 7 Austrian Stock Corporation Act (AktG). However, the trading portfolio of these shares may not exceed 5% of the subscribed capital at the end of any calendar day. The consideration for the shares to be purchased must not be less than 50% of the closing price at the Vienna Stock Ex-change on the last trading day prior to the purchase and must not exceed 20% of the closing price at the Vienna Stock Ex-change on the last trading day prior to the purchase. This au-thorisation is valid for a period of 30 months, i.e. until 14 November 2021.
_ the Management Board is entitled, pursuant to section 65 (1) no. 8 as well as (1a) and (1b) Stock Exchange Act and for a period
of 30 months from the date of the resolution, i.e. until 14 No-vember 2021, to acquire own shares of up to 10% of the sub-scribed capital, subject to approval by the Supervisory Board, with the option of making repeated use of the 10% limit, either at the stock exchange or over the counter, likewise to the exclu-sion of the shareholders’ right to tender proportional payment. The authorization may be exercised in whole or in part or in several instalments and in pursuit of one or several purposes. The market price per share must not be below EUR 2.00 or above EUR 120.00. Pursuant to section 65 (1b) in conjunction with sec. 171 Stock Corporation Act, the Management Board is authorised, from the date of the resolution, i.e. until 14 May 2024, on approval by the Supervisory Board, to sell or use the company’s own shares, also by means other than the stock ex-change or a public offering for any purpose allowed by the law, particularly as consideration for the acquisition and financing of the acquisition of companies, businesses, business divisions or shares in one or several businesses in Austria or abroad to the exclusion of the shareholders’ proportional purchase option.
_ The Management Board is authorised to redeem shares without further resolution at the Annual General Meeting with the ap-proval of the Supervisory Board.
_ According to section 65 (1) Z 4 as well as (1a) and (1b) Stock Exchange Act, the Management Board is authorised for the du-ration of 30 months following the date of resolution, hence un-til 14 November 2021, and with the approval of the Supervisory Board to purchase own shares at an amount equal-ling up to 10% of share capital of the company also under re-peated utilisation of the 10% limit both via the stock market as well as off-market under exclusion of the pro rata tender rights of shareholders for the purpose of granting shares for free or at concessionary terms to Erste Mitarbeiterbeteiligung Privatstif-tung, their beneficiaries, employees, executive employees and members of the board at Erste Group Bank AG as well as affil-iated group companies or other companies according to section 4d (5) Z 1 Income Tax Act. The authorisation may be exercised in whole or in part or in several installments and in pursuit of one or several purposes. The value per share may neither be lower than the floor value of two Euros nor higher than the ceiling of EUR 120.
All sales and purchases were carried out as authorised at the An-nual General Meeting. According to section 8.3 of the Articles of Association, the Manage-ment Board is authorized, until 24 May 2023 and with the approval of the Supervisory Board, to issue convertible bonds (including con-ditional compulsory convertible bonds according to section 26 Aus-trian Banking Act (BWG)), which grant subscription or conversion rights to the acquisition of company shares, while paying due con-sideration or excluding the subscription right of shareholders. The terms of issue can also set out a conversion obligation at the end of the term or at another point in time in addition or instead of sub-scription or conversion rights. The issue of convertible bonds may only take place to the extent that guarantees the fulfilment of agreed conversion or subscription rights and, in the case of a conversion obligation set out in the conditions of issue, the fulfilment of the corresponding conversion obligations from the conditional capital increase. The issue amount, conditions or issue and the exclusion of shareholders’ subscription rights are to be determined by the Man-agement Board with consent of the Supervisory Board.

115
Significant agreements to which the company is party, and which become effective, are amended or are rendered ineffective when there is a change in the control of the company as a result of a take-over bid, as well as their effects [section 243a (1) no. 8 UGB]: Agreement in principle of the joint liability scheme The agreement in principle of the joint liability scheme provides for the possibility of early cancellation for good cause. Good cause allowing the respective other contracting parties to cancel the agreement is deemed to exist if:
_ one contracting party grossly harms the duties resulting from the present agreement
_ the ownership structure of a party to the contract changes in such a way – particularly by transfer or capital increase – that one or more third parties from outside the savings bank sector directly and/or indirectly gain a majority of the equity capital or voting rights in the contracting party or
_ one contracting party resigns from the savings bank sector ir-respective of the reason.
The joint liability scheme’s agreement in principle and supplemen-tary agreement expire if and as soon as any entity that is not a mem-ber of the savings bank sector association acquires more than 25% of the voting power or equity capital of Erste Group Bank AG in any manner whatsoever and a member savings bank notifies the joint liability scheme’s steering company and Erste Group Bank AG by registered letter within twelve weeks from the change of control that it intends to withdraw from the joint liability scheme. Directors and Officers Insurance Changes in control In the event that any of the following transactions or processes oc-cur during the term of the insurance policy (each constituting a ‘change in control’) in respect of the insured:
_ the insured ceases to exist as a result of a merger or consolida-tion, unless the merger or consolidation occurs between two insured parties, or
_ another company, person or group of companies or persons act-ing in consent, who are not insured parties, acquire more than 50% of the insured’s outstanding equity or more than 50% of its voting power (resulting in the right to control the voting power represented by the shares, and the right to appoint the Management Board members of the insured),
then the insurance cover under this policy remains in full force and effect for claims relating to unlawful acts committed or alleged to have been committed before this change in control took effect. However, no insurance cover is provided for claims relating to un-lawful acts committed or allegedly committed after that time (un-less the insured and insurer agree otherwise). The premium for this insurance cover is deemed to be completely earned. In the event that a subsidiary ceases to be a subsidiary during the insurance period, the insurance cover under this policy shall remain in full force and effect for that entity for the remainder of the in-surance period or (if applicable) until the end of the extended dis-covery period, but only in respect of claims brought against an insured in relation to unlawful acts committed or alleged to have been committed by the insured during the existence of this entity as a subsidiary. No insurance cover is provided for claims brought against an insured in relation to unlawful acts committed or alleg-edly committed after this entity ceased to exist.
Cooperation between Erste Group Bank AG and Vienna Insurance Group (VIG) Erste Group Bank and VIENNA INSURANCE GROUP AG Wie-ner Versicherung Gruppe (VIG) are parties to a general distribution agreement (the ‘Agreement’) concerning the framework of the co-operation of Erste Group and VIG in Austria and CEE with respect to bank and insurance products. Originally concluded in 2008 (be-tween Erste Group Oesterreich and WIENER STÄDTISCHE Ver-sicherung AG Vienna Insurance Group), the Agreement was renewed and extended in 2018 until the end of 2033. The objective for the renewal and extension was in particular to adapt the Agree-ment to the corporate restructuring of the original parties, to amend some commercial parameters and to align the Agreement with re-cent developments in the legal framework. Already in the original Agreement the parties stipulated that both parties have the right to terminate the Agreement in case of a change of control of one of the parties. A change of control is defined, with respect to Erste Group Bank, as the acquisition of Erste Group Bank by any per-son/entity other than DIE ERSTE österreichische Spar-Casse Privatstiftung or Austrian savings banks of 50% plus one share of Erste Group Bank’s voting shares, and with respect to VIG, as the acquisition of VIG by any person/entity other than Wiener Städ-tische Wechselseitiger Versicherungsverein – Vermögensverwal-tung – Vienna Insurance Group of 50% plus one share of VIG’s voting shares. Apart from this regulation on the termination of the Agreement, the parties agreed in the renewal and extension of the Agreement for an additional termination for cause if based on new legal or regulatory provisions, the continuation of the Agreement is unreasonable for each or both of the parties. Erste Group Bank and VIG are furthermore parties to an asset man-agement agreement, pursuant to which Erste Group undertakes to manage certain parts of VIG’s and its group companies’ securities assets. In case of a change of control (as described above), each party has the termination right. The asset management agreement has been renewed and extended until 2033 concurrently with the renewal and extension of the Agreement outlined above. INTERNAL CONTROL AND RISK MANAGEMENT SYSTEM FOR THE GROUP FINANCIAL REPORTING PROCEDURES Control environment The management board is responsible for the establishment, struc-ture and application of an appropriate internal control and risk management system that meets the company’s needs in its group accounting procedures. The management in each group unit is responsible for implementing group-wide instructions. Compliance with group rules is monitored as part of the audits performed by internal and local auditors. Consolidated financial statements are prepared by the Group Con-solidation department. The assignment of powers, the process de-scription and the necessary control procedure are defined in the operating instructions. Risks relating to the financial reporting procedures The main risk in the financial reporting procedures is that errors or deliberate action (fraud) prevent facts from adequately reflecting the

116
company’s financial position and performance. This is the case whenever the data provided in the financial statements and notes is essentially inconsistent with the correct figures, i.e. whenever, alone or in aggregate, they are apt to influence the decisions made by the users of financial statements. Such a decision may incur serious damage, such as financial loss, the imposition of sanctions by the banking supervisor or reputational harm. Furthermore, especially estimates for the determination of the fair value of financial instruments for which no reliable market value is available, estimates for the accounting of risk provisions for loans and advances and for provisions, complex measurement re-quirements for accounting as well as a difficult business environ-ment bear the risk of significant financial reporting errors. Controls Group Accounting and Group Performance Management are respon-sible for group reporting and report to Erste Group’s CFO. Erste Group issues group policies used for preparation of consolidated financial statements in accordance with IFRS. A summary descrip-tion of the accounting process is provided in Erste Group’s IFRS Accounting Manual. All transactions have to be recorded, posted and accounted for in accordance with the accounting and measurement methods set out in this manual. The management of each subsidiary is responsible for the implementation of group policies. The basic components of the internal control system (ICS) at Erste Group are:
_ Controlling as a permanent financial/business analysis (e.g. comparison of target and actual data between Accounting and Controlling) and control of the company and/or individual cor-porate divisions.
_ Systemic, automatic control systems and measures in the for-mal procedure and structure, e.g. programmed controls during data processing.
_ Principles of functional separation and checks performed by a second person (the four-eye principle).
_ Internal Audit, as a separate organisational unit, is charged with monitoring all corporate divisions in an independent yet proxi-mate manner, particularly with regard to the effectiveness of the components of the internal control system. The Internal Audit unit is monitored and/or checked by the management board, the audit committee/supervisory board, by external parties (bank supervisor, in individual cases also by an external auditor) as well as through audit’s internal quality assurance measures (self-assessments, peer reviews).
Group Consolidation The data provided by the group entities is checked for plausibility by the Group Consolidation department. The subsequent consoli-dation steps are then performed using the consolidation system (TAGETIK). These include consolidation of capital, expense and income consolidation, and debt consolidation. Lastly, possible in-tragroup gains are eliminated. At the end of the consolidation pro-cess, the notes to the financial statements are prepared in accordance with IFRS, BWG and UGB. The consolidated financial statements and the group management report are reviewed by the audit committee of the supervisory board and are also presented to the supervisory board for approval. They are published as part of the annual report, on Erste Group’s
website and in the Official Journal of Wiener Zeitung and finally filed with the Commercial Register. Information and communication Each year, the annual report shows the consolidated results in the form of a complete set of consolidated financial statements. In ad-dition, the management summary provides verbal comments on the consolidated results in accordance with the statutory requirements. Throughout the year, the group produces consolidated monthly re-ports for group management. Statutory interim reports are pro-duced that conform to the provisions of IAS 34 and are also published quarterly in accordance with the Austrian Stock Corpo-ration Act. Before publication, the consolidated financial state-ments are presented to senior managers and the Chief Financial Officer for final approval and then submitted to the supervisory board’s audit committee. Reporting is almost fully automated, based on source systems and automated interfaces, and guarantees up-to-date data for control-ling, segment reporting and other analyses. Accounting infor-mation is derived from the same data source and is reconciled monthly for reporting purposes. Close collaboration between ac-counting and controlling permits continual target/actual compari-sons for control and reconciliation purposes. Monthly and quarterly reports to the management board and the supervisory board ensure a regular flow of financial information and monitor-ing of the internal control system. Responsibilities of Internal Audit Internal Audit is in charge of auditing and evaluating all areas of the bank based on risk-oriented audit areas (according to the annual audit plan as approved by the management board and reported to the audit committee). The main focus of audit reviews is to monitor the completeness and functionality of the internal control system. Internal Audit has the duty of reporting its findings to the group’s management board, supervisory board and audit committee several times within one year. According to section 42 BWG, Internal Audit is a control body that is directly subordinate to the management board. Its sole purpose is to comprehensively verify the lawfulness, propriety and expedi-ency of the banking business and banking operation on an on-going basis. The mandate of Internal Audit is therefore to support the management board in its efforts to secure the bank’s assets and pro-mote economic and operational performance and thus in the man-agement board’s pursuit of its business and operating policy. The activities of Internal Audit are governed in particular by the cur-rently applicable Rules of Procedure, which were drawn up under the authority of all management board members and approved as well as implemented by them. The Rules of Procedure are reviewed on a regular basis and whenever required and adapted should the need arise. Audit activities of Internal Audit In its auditing activities, Internal Audit puts a special focus on:
_ operating and business areas of the bank; _ operating and business processes of the bank; _ internal bank standards (policies, guidelines, operating in-
structions), also with regard to their compliance and up-to-dateness;

117
_ audit areas stipulated by the law as they inter alia result from the rules of the Austrian Banking Act (BWG) and the Capital Requirements Regulation (CRR).
Internal Audit performs its responsibilities based on its own discre-tion and in compliance with the annual audit plan as approved by the management board. Once approved, the audit plan is also re-ported to the audit committee. CORPORATE GOVERNANCE The (consolidated) corporate governance report is part of the an-nual report of Erste Group (www.erstegroup.com/investor-relations).
(CONSOLIDATED) NON-FINANCIAL DECLARATION Erste Group decided to prepare and publish a separate non-finan-cial report – integrated in the annual report– in line with an option provided for in the Austrian Sustainability and Diversity Improve-ment Act (NaDiVeG). With regard to non-financial risks related to the topics environment, social and employee matters, respect for human rights and measures against corruption and bribery, reference is made to the respective sections in the non-financial report; these are summa-rised under opportunities and risks arising from material topics. Upcoming new regulations on sustainability disclosures and risk management obligations: the EU Taxonomy Regulation (EC 2020/852), Sustainability Disclosure Regulation (EC 2019/2088), EBA Guideline on Loan Origination and Monitoring, ECB Guide on climate-related and Environmental Risks are properly taken into account and will be integrated with due care into the business model of Erste Group.
Management Board
Bernhard Spalt mp, Chairman
Ingo Bleier mp, Member Stefan Dörfler mp, Member
Alexandra Habeler-Drabek mp, Member David O‘Mahony mp, Member
Maurizio Poletto mp, Member Thomas Schaufler mp, Member
Vienna, 26 February 2021

118
Management report .............................................................................................................................................. 99
Consolidated financial statements ..................................................................................................................... 99
Consolidated statement of income ................................................................................................................... 120
Consolidated statement of comprehensive income ....................................................................................... 121
Consolidated balance sheet .............................................................................................................................. 122
Consolidated statement of changes in equity ................................................................................................. 123
Consolidated statement of cash flows ............................................................................................................. 125
Notes to the group financial statements of Erste Group ................................................................................ 126
General information ............................................................................................................................................ 126
Significant accounting policies ......................................................................................................................... 126 a) Basis of preparation .................................................................................................................................................................... 126 b) Covid-19 disclosures ................................................................................................................................................................... 126 c) Accounting and measurement methods ...................................................................................................................................... 127 d) Significant accounting judgements, assumptions and estimates ................................................................................................ 128 e) Application of amended and new IFRS/IAS ................................................................................................................................ 129
PERFORMANCE / RETURN ................................................................................................................................ 131 1. Segment reporting ................................................................................................................................................................. 131 2. Net interest income ................................................................................................................................................................ 139 3. Net fee and commission income ............................................................................................................................................ 140 4. Dividend income ..................................................................................................................................................................... 141 5. Net trading result .................................................................................................................................................................... 141 6. Gains/losses from financial instruments measured at fair value through profit or loss ......................................................... 141 7. Rental income from investment properties & other operating leases .................................................................................... 141 8. General administrative expenses .......................................................................................................................................... 142 9. Gains/losses from derecognition of financial assets measured at amortised cost ................................................................ 143 10. Other gains/losses from derecognition of financial instruments not measured at fair value through profit or loss ............... 143 11. Impairment result from financial instruments ......................................................................................................................... 143 12. Other operating result ............................................................................................................................................................ 144 13. Taxes on income .................................................................................................................................................................... 145 14. Appropriation of profit ............................................................................................................................................................. 148
Financial instruments – Significant accounting policies ............................................................................... 149
Financial instruments held at amortised cost ................................................................................................. 154 15. Cash and cash balances ........................................................................................................................................................ 154 16. Financial assets at amortised cost ......................................................................................................................................... 154 17. Debt instruments subject to contractual modifications .......................................................................................................... 159 18. Trade and other receivables .................................................................................................................................................. 159 19. Financial liabilities at amortised costs .................................................................................................................................... 160
Financial instruments at fair value .................................................................................................................... 163 20. Derivative financial instruments ............................................................................................................................................. 164 21. Other financial assets held for trading ................................................................................................................................... 165 22. Non-trading financial assets at fair value through profit or loss ............................................................................................. 165 23. Other financial liabilities held for trading ................................................................................................................................ 165 24. Financial liabilities at fair value through profit or loss ............................................................................................................ 166 25. Financial assets at fair value through other comprehensive income ..................................................................................... 168
Financial instruments – other disclosure matters .......................................................................................... 170 26. Fair value of financial instruments ......................................................................................................................................... 170 27. Hedge accounting .................................................................................................................................................................. 180 28. Offsetting of financial instruments .......................................................................................................................................... 185 29. Transfers of financial assets – repurchase transactions and securities lending ................................................................... 186 30. Collaterals .............................................................................................................................................................................. 188 31. Securities ............................................................................................................................................................................... 188
Risk and capital management ........................................................................................................................... 189 32. Risk management .................................................................................................................................................................. 189 33. Own funds and capital requirements ..................................................................................................................................... 196 34. Credit risk ............................................................................................................................................................................... 200 35. Market risk .............................................................................................................................................................................. 235 36. Liquidity risk ........................................................................................................................................................................... 238 37. Operational risk ...................................................................................................................................................................... 241
Non-current assets and other investments ..................................................................................................... 243 38. Property, equipment and investment properties .................................................................................................................... 243 39. Intangible assets .................................................................................................................................................................... 246
Group Consolidated Financial Statements 2020 (IFRS)

119
40. Other assets ........................................................................................................................................................................... 250
Leases .................................................................................................................................................................. 251
Accruals, provisions, contingent liabilities and legal proceedings .............................................................. 255 41. Other liabilities ....................................................................................................................................................................... 255 42. Provisions .............................................................................................................................................................................. 255 43. Contingent liabilities ............................................................................................................................................................... 261
Capital instruments, equity and reserves ........................................................................................................ 263 44. Total equity ............................................................................................................................................................................. 263 45. Non controlling interest .......................................................................................................................................................... 265
Scope of consolidation ...................................................................................................................................... 266 46. Subsidiaries ........................................................................................................................................................................... 267 47. Investments in associates and joint ventures ........................................................................................................................ 269 48. Unconsolidated structured entities ........................................................................................................................................ 270
Other disclosure matters ................................................................................................................................... 273 49. Related-party transactions and principal shareholders ......................................................................................................... 273 50. Share-based payments .......................................................................................................................................................... 275 51. Audit fees and tax consultancy fees ...................................................................................................................................... 276 52. Assets held for sale and liabilities associated with assets held for sale ............................................................................... 276 53. Assets and liabilities denominated in foreign currencies and outside Austria and return on assets ..................................... 277 54. Analysis of remaining maturities ............................................................................................................................................ 278 55. Events after the balance sheet date ...................................................................................................................................... 278 56. Country by country reporting ................................................................................................................................................. 279 57. Details of the companies wholly or partly owned by Erste Group as of 31 December 2020 ................................................ 280
Additional information ....................................................................................................................................... 292
STATEMENT OF ALL MEMBERS OF THE MANAGEMENT BOARD .............................................................. 297
Glossary
Abbreviations

120
Consolidated statement of income
in EUR million Notes 1-12 19 1-12 20
Net interest income 2 4,746.8 4,774.8
Interest income 2 5,544.0 5,107.9
Other similar income 2 1,655.2 1,461.7
Interest expenses 2 -1,054.9 -621.2
Other similar expenses 2 -1,397.5 -1,173.6
Net fee and commission income 3 2,000.1 1,976.8
Fee and commission income 3 2,373.5 2,354.5
Fee and commission expenses 3 -373.4 -377.7
Dividend income 4 27.9 19.9
Net trading result 5 318.3 137.6
Gains/losses from financial instruments measured at fair value through profit or loss 6 -24.5 62.0
Net result from equity method investments 17.1 10.4
Rental income from investment properties & other operating leases 7 170.1 173.6
Personnel expenses 8 -2,537.1 -2,520.7
Other administrative expenses 8 -1,205.1 -1,158.9
Depreciation and amortisation 8 -541.0 -540.9
Gains/losses from derecognition of financial assets measured at amortised cost 9 0.9 6.8
Other gains/losses from derecognition of financial instruments not measured at fair value through profit or loss 10 23.5 -0.4
Impairment result from financial instruments 11 -39.2 -1,294.8
Other operating result 12 -628.2 -278.3
Levies on banking activities 12 -128.0 -117.7
Pre-tax result from continuing operations 2,329.7 1,368.0
Taxes on income 13 -418.7 -342.5
Net result for the period 1,911.1 1,025.5
Net result attributable to non-controlling interests 440.9 242.3
Net result attributable to owners of the parent 1,470.1 783.1
Earnings per share Earnings per share constitute net profit/loss for the year attributable to owners of the parent divided by the average number of ordinary shares outstanding. Diluted earnings per share represent the maximum potential dilution (through an increase in the average number of shares) that would occur if all subscription and conversion rights granted were exercised (also see Note 44 Total equity). As in the previous year no subscription and conversion rights were outstanding during the financial year. Diluted earnings per share were equal to the undiluted. 1-12 19 1-12 20
Net result attributable to owners of the parent in EUR thousand 1,470,133 783,129
Dividend on AT1 capital in EUR thousand -92,081 -114,580
Net result for the period attributable to owners of the parent after deduction of AT1 capital dividend in EUR thousand 1,378,052 668,549
Weighted average number of outstanding shares 426,565,097 426,324,725
Earnings per share in EUR 3.23 1.57
Weighted average diluted number of outstanding shares 426,565,097 426,324,725
Diluted earnings per share in EUR 3.23 1.57

121
Consolidated statement of comprehensive income
in EUR million 1-12 19 1-12 20
Net result for the period 1,911.1 1,025.5
Other comprehensive income
Items that may not be reclassified to profit or loss -70.1 62.0
Remeasurement of defined benefit plans -139.9 -61.0
Fair value reserve of equity instruments 54.1 5.8
Own credit risk reserve -17.5 127.5
Deferred taxes relating to items that may not be reclassified 33.2 -10.2
Items that may be reclassified to profit or loss -22.8 -223.4
Fair value reserve of debt instruments 44.6 44.4
Gains/losses during the period 46.3 34.7
Reclassification adjustments -6.1 -1.2
Credit loss allowances 4.3 10.9
Cash flow hedge reserve -54.4 99.2
Gains/losses during the period -29.4 113.5
Reclassification adjustments -25.0 -14.3
Currency reserve -13.5 -338.4
Gains/losses during the period -13.5 -338.4
Income tax relating to items that may be reclassified 0.4 -28.6
Gains/losses during the period -6.2 -32.3
Reclassification adjustments 6.6 3.7
Share of other comprehensive income of associates and joint ventures accounted for by the equity method 0.1 0.0
Total other comprehensive income -93.0 -161.4
Total comprehensive income 1,818.1 864.1
Total comprehensive income attributable to non-controlling interests 394.5 215.0
Total comprehensive income attributable to owners of the parent 1,423.6 649.1
For a detailed split of income tax items within other comprehensive income please refer to Note 13 Taxes on income.

122
Consolidated balance sheet
in EUR million Notes Dec 19 Dec 20
Assets
Cash and cash balances 15 10,693.3 35,838.5
Financial assets held for trading 20, 21 5,759.6 6,356.0
Derivatives 20 2,805.4 2,954.4
Other financial assets held for trading 21 2,954.2 3,401.7
Pledged as collateral 29 429.8 68.0
Non-trading financial assets at fair value through profit or loss 22 3,208.3 3,082.8
Pledged as collateral 29 38.6 7.9
Equity instruments 22 390.1 347.3
Debt securities 22 2,334.8 2,048.5
Loans and advances to customers 22 483.4 687.0
Financial assets at fair value through other comprehensive income 25 9,046.5 8,518.8
Pledged as collateral 29 603.2 50.0
Equity instruments 25 210.1 129.8
Debt securities 25 8,836.4 8,389.0
Financial assets at amortised cost 16 204,162.1 210,940.4
Pledged as collateral 29 2,142.0 1,898.5
Debt securities 16 26,763.8 29,578.9
Loans and advances to banks 16 23,054.6 21,466.2
Loans and advances to customers 16 154,343.7 159,895.3
Finance lease receivables Leases 4,034.4 4,127.1
Hedge accounting derivatives 27 130.1 205.2
Fair value changes of hedged items in portfolio hedge of interest rate risk 27 -3.8 5.3
Property and equipment 38 2,629.2 2,552.1
Investment properties 38 1,265.9 1,280.4
Intangible assets 39 1,368.3 1,358.9
Investments in associates and joint ventures 47 163.0 190.1
Current tax assets 13 80.7 174.7
Deferred tax assets 13 477.1 460.1
Assets held for sale 51 268.9 211.8
Trade and other receivables 18 1,408.1 1,341.0
Other assets 40 1,001.1 750.6
Total assets 245,692.8 277,393.7
in EUR million Notes Dec 19 Dec 20
Liabilities and equity
Financial liabilities held for trading 20, 23 2,421.1 2,625.0
Derivatives 20 2,005.4 2,037.5
Other financial liabilities held for trading 23 415.7 587.6
Financial liabilities at fair value through profit or loss 24 13,494.3 12,091.0
Deposits from customers 24 264.8 254.0
Debt securities issued 24 13,010.5 11,656.6
Other financial liabilities 24 219.0 180.4
Financial liabilities at amortised cost 19 204,143.4 235,125.3
Deposits from banks 19 13,140.6 24,771.3
Deposits from customers 19 173,066.1 190,816.4
Debt securities issued 19 17,360.3 19,019.8
Other financial liabilities 576.3 517.7
Lease liabilities Leases 515.1 559.7
Hedge accounting derivatives 27 269.2 188.7
Fair value changes of hedged items in portfolio hedge of interest rate risk 27 0.0 0.1
Provisions 42 1,918.7 2,081.9
Current tax liabilities 13 60.6 58.5
Deferred tax liabilities 13 17.9 20.0
Liabilities associated with assets held for sale 51 6.2 1.4
Other liabilities 41 2,369.0 2,231.8
Total equity 44 20,477.3 22,410.3
Equity attributable to non-controlling interests 44 4,857.5 5,073.1
Additional equity instruments 44 1,490.4 2,733.0
Equity attributable to owners of the parent 44 14,129.5 14,604.2
Subscribed capital 44 859.6 859.6
Additional paid-in capital 44 1,477.7 1,477.7
Retained earnings and other reserves 44 11,792.1 12,266.9
Total liabilities and equity 245,692.8 277,393.7

123
Consolidated statement of changes in equity
in EUR million Subscribed
capital
Additional paid-in capital
Retained earnings
Cash flow hedge
reserve Fair value
reserve Own credit
risk reserve Currency
reserve
Remeasur-ement of
defined benefit plans
Equity attributable
to owners of the parent
Additional equity
instruments
Equity attributable
to non-controlling
interests Total equity
As of 1 January 2020 860 1,478 13,095 -45 260 -399 -610 -509 14,129 1,490 4,857 20,477
Changes in treasury shares 0 0 -58 0 0 0 0 0 -58 0 0 -58
Dividends paid 0 0 -115 0 0 0 0 0 -115 0 -5 -119
Capital increase/decrease 0 0 0 0 0 0 0 0 0 1,243 6 1,249
Changes in scope of consolidation and ownership interest 0 0 -2 0 0 0 0 0 -2 0 -1 -3
Reclassification from other comprehensive income to retained earnings 0 0 69 0 -68 -1 0 0 0 0 0 0
Other changes 0 0 0 0 0 0 0 0 0 0 0 0
Total comprehensive income 0 0 783 81 47 110 -332 -40 649 0 215 864
Net result for the period 0 0 783 0 0 0 0 0 783 0 242 1,025
Other comprehensive income 0 0 0 81 47 110 -332 -40 -134 0 -27 -161
Change from remeasurement of defined benefit plans 0 0 0 0 0 0 0 -40 -40 0 -19 -59
Change in fair value reserve 0 0 0 0 47 0 0 0 47 0 -8 39
Change in cash flow hedge reserve 0 0 0 81 0 0 0 0 81 0 0 81
Change in currency reserve 0 0 0 0 0 0 -332 0 -332 0 -7 -338
Change in own credit risk reserve 0 0 0 0 0 110 0 0 110 0 6 116
As of 31 December 2020 860 1,478 13,773 36 239 -290 -941 -549 14,604 2,733 5,073 22,410
In the column ‘Additional equity instruments’, Erste Group reports additional tier 1 bonds issued in 2020 with a nominal value of EUR 1,250 million (2019: EUR 500 million). After deduction of costs directly attributable to the capital increase of EUR 7 million (2019: EUR 3 million) the net increase in capital amounted to EUR 1.243 million (2019: EUR 497 million). Additional tier 1 bonds are unsecured and subordinated bonds which are classified as equity under IFRS. For further details, see Note 44 Total equity.
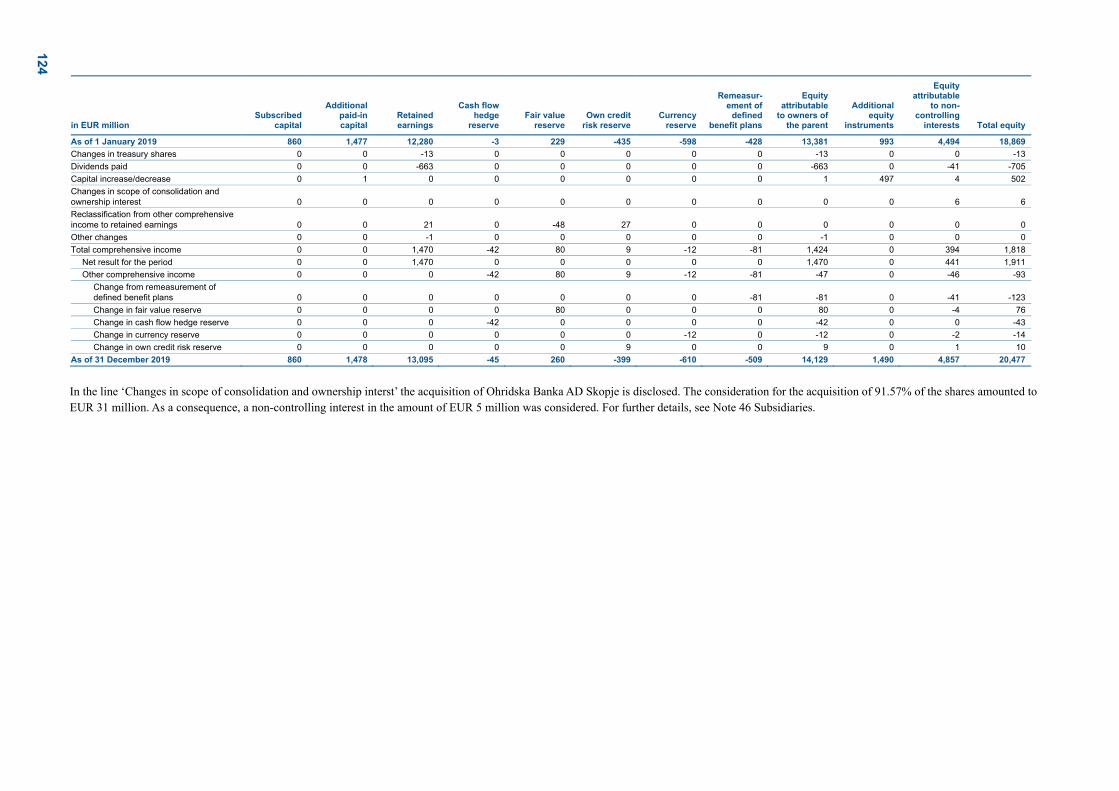
124
in EUR million Subscribed
capital
Additional paid-in capital
Retained earnings
Cash flow hedge
reserve Fair value
reserve Own credit
risk reserve Currency
reserve
Remeasur-ement of
defined benefit plans
Equity attributable
to owners of the parent
Additional equity
instruments
Equity attributable
to non-controlling
interests Total equity
As of 1 January 2019 860 1,477 12,280 -3 229 -435 -598 -428 13,381 993 4,494 18,869
Changes in treasury shares 0 0 -13 0 0 0 0 0 -13 0 0 -13
Dividends paid 0 0 -663 0 0 0 0 0 -663 0 -41 -705
Capital increase/decrease 0 1 0 0 0 0 0 0 1 497 4 502
Changes in scope of consolidation and ownership interest 0 0 0 0 0 0 0 0 0 0 6 6
Reclassification from other comprehensive income to retained earnings 0 0 21 0 -48 27 0 0 0 0 0 0
Other changes 0 0 -1 0 0 0 0 0 -1 0 0 0
Total comprehensive income 0 0 1,470 -42 80 9 -12 -81 1,424 0 394 1,818
Net result for the period 0 0 1,470 0 0 0 0 0 1,470 0 441 1,911
Other comprehensive income 0 0 0 -42 80 9 -12 -81 -47 0 -46 -93
Change from remeasurement of defined benefit plans 0 0 0 0 0 0 0 -81 -81 0 -41 -123
Change in fair value reserve 0 0 0 0 80 0 0 0 80 0 -4 76
Change in cash flow hedge reserve 0 0 0 -42 0 0 0 0 -42 0 0 -43
Change in currency reserve 0 0 0 0 0 0 -12 0 -12 0 -2 -14
Change in own credit risk reserve 0 0 0 0 0 9 0 0 9 0 1 10
As of 31 December 2019 860 1,478 13,095 -45 260 -399 -610 -509 14,129 1,490 4,857 20,477
In the line ‘Changes in scope of consolidation and ownership interst’ the acquisition of Ohridska Banka AD Skopje is disclosed. The consideration for the acquisition of 91.57% of the shares amounted to EUR 31 million. As a consequence, a non-controlling interest in the amount of EUR 5 million was considered. For further details, see Note 46 Subsidiaries.

125
Consolidated statement of cash flows
in EUR million Notes 1-12 19 1-12 20
Net result for the period 1,911.1 1,025.5
Non-cash adjustments for items in net profit/loss for the year
Depreciation, amortisation and net impairment of non-financial assets 38, 39 737.6 614.3
Net allocation of credit loss allowances and other provisions 12 399.9 1,441.2
Gains/losses from measurement and derecognition of financial assets and financial liabilities 9, 10 -89.2 -189.6
Other adjustments 113.5 -277.4
Changes in assets and liabilities from operating activities after adjustment for non-cash components
Financial assets held for trading 20, 21 -147.2 -607.9
Non-trading financial assets at fair value through profit or loss 22
Equity instruments 22 -17.3 42.8
Debt securities 22 489.3 337.1
Loans and advances to customers 22 -194.5 -212.7
Financial assets at fair value through other comprehensive income: debt securities 25 289.1 484.1
Financial assets at amortised cost 16
Debt securities 16 -686.8 -2,816.0
Loans and advances to banks 16 -3,956.9 1,585.3
Loans and advances to customers 16 -10,168.9 -6,790.7
Finance lease receivables Leases -269.3 -106.2
Hedge accounting derivatives 27 -40.0 6.2
Other assets from operating activities 18, 40 -305.9 310.3
Financial liabilities held for trading 20, 23 -83.1 308.9
Financial liabilities at fair value through profit or loss 24 -757.3 -1,271.9
Financial liabilities measured at amortised cost 19
Deposits from banks 19 -4,611.5 11,630.8
Deposits from customers 19 10,127.6 17,750.3
Debt securities issued 19 1,067.7 1,659.4
Other financial liabilities 89.2 -58.6
Hedge accounting derivatives 27 -7.8 -80.5
Other liabilities from operating activities 41 -83.0 -291.1
Cash flow from operating activities -6,193.7 24,493.4
Proceeds of disposal
Financial assets at fair value through other comprehensive income: equity instruments 25 43.5 86.3
Investments in associates and joint ventures 47 4.4 5.0
Property and equipment and intangible assets 38, 39 69.4 147.3
Investment properties 38 17.9 11.5
Acquisition of
Financial assets at fair value through other comprehensive income: equity instruments 25 0.0 -1.1
Investments in associates and joint ventures 47 0.0 0.0
Property and equipment and intangible assets 38, 39 -591.0 -549.5
Investment properties 38 -119.7 -51.1
Acquisition of subsidiaries (net of cash and cash equivalents acquired) 142.4 0.0
Disposal of subsidiaries 0.0 0.0
Cash flow from investing activities -433.1 -351.6
Capital increase 44 501.7 1,248.7
Capital decrease 44 0.0 0.0
Changes in ownership interests that do not result in a loss of control 44 1.5 -2.8
Dividends paid to equity holders of the parent 44 -663.3 -114.6
Dividends paid to non-controlling interests 44 -41.5 -4.8
Changes in non-controlling interests 44 5.0 0.0
Cash flow from financing activities -196.6 1,126.5
Cash and cash equivalents at the beginning of the period 15 17,549.2 10,693.3
Cash flow from operating activities -6,193.7 24,493.4
Cash flow from investing activities -433.1 -351.6
Cash flow from financing activities -196.6 1,126.5
Effect of currency translation -32.5 -123.0
Cash and cash equivalents at the end of period 15 10,693.3 35,838.5
Cash flows related to taxes, interest and dividends (included in cash flow from operating activities) 4,305.6 4,238.4
Payments for taxes on income 13 -468.1 -438.9
Interest received 2 7,800.8 7,233.2
Dividends received 4 27.9 19.9
Interest paid 2 -3,054.9 -2,575.8
Cash and cash equivalents are equal to cash in hand, cash balances at central banks and other demand deposits.

126
Notes to the group financial statements of Erste Group
General information
Erste Group Bank AG is Austria’s oldest savings bank and listed on the Vienna Stock Exchange. It is also quoted on the Prague Stock Exchange and on the Bucharest Stock Exchange. The registered office of Erste Group Bank AG is located at Am Belvedere 1, 1100 Vienna, Austria. The group of Erste Group Bank AG (hereinafter referred to as ‘Erste Group’ or ‘Group’) offers a complete range of banking and other financial services, such as savings accounts, asset management (including investment funds), consumer credit and mortgage lending, in-vestment banking, securities and derivatives trading, portfolio management, project finance, foreign trade financing, corporate finance, capital market and money market services, foreign exchange trading, leasing and factoring. These consolidated financial statements have been prepared and authorised for issue by the management board as at the signing date of this report. Both, the supervisory board (25 March 2021) and the annual general meeting (19 May 2021) may amend the individual financial statements of Erste Group Bank AG, which in turn may have an impact on these consolidated financial statements. The consolidated finan-cial statements have not been accepted by the supervisory board and the financial statements of Erste Group Bank AG have not been approved by the supervisory board at the date of this report. Erste Group is subject to the regulatory requirements of Austrian and European supervisory bodies (National Bank, Financial Market Au-thority, Single Supervisory Mechanism). These regulations include those pertaining to minimum capital adequacy requirements, categori-sation of exposures and off-balance sheet commitments, credit risk connected with clients of the Group, market risk (including interest rate and foreign exchange risk), and operational risk. In addition to the banking entities, some Group companies are subject to regulatory requirements, specifically in relation to asset management.
Significant accounting policies
a) Basis of preparation The consolidated financial statements of Erste Group for the financial year ending on 31 December 2020 and the related comparative infor-mation were prepared in compliance with applicable International Financial Reporting Standards (IFRS) as adopted by the European Union on the basis of IAS Regulation (EC) No. 1606/2002. The requirements of Section 59a of the Austrian Banking Act and Section 245a of the Austrian Commercial Code are fulfilled. The consolidated financial statements have been prepared on a going concern basis. Erste Group is subject to regulatory restrictions on capital distributions stemming from the EU-wide capital requirements regulations appli-cable to all credit institutions based in the EU. As a consequence of the Covid-19 crisis, the European Central Bank as well as some local national banks issued recommendations to restrict dividend payouts. As a result, no dividends were paid out by Erste Group and most of the Erste Group subsidiaries did not pay out dividends to the parent Erste Group Bank AG. Erste Group does not have any other significant restrictions on its ability to access or use the assets and settle the liabilities of the Group. Also, the owners of non-controlling interests in Group subsidiaries do not have rights that can restrict the Group’s ability to access or use the assets and settle the liabilities of the Group. Except as otherwise indicated, all amounts are stated in millions of euro. The tables in this report may contain rounding differences. The abbre-viations used in the consolidated financial statements of Erste Group are explained in the appendix ‘Abbreviations’ at the end of this report. b) Covid-19 disclosures In the consolidated financial statements of Erste Group, considerations and significant impacts of the Covid-19 outbreak are presented in those chapters to which they can be assigned thematically. An overview about these disclosures is presented in the following:
_ The chapter ‘c) Accounting and measurement methods’ discusses the accounting and measurement methods used for public moratoria and payment holidays, public guarantees and impairment of non-financial assets including significant effects of those topics on the consolidated financial statements in 2020.
_ The chapter ‘d) Significant accounting judgements, assumptions and estimates’ contains information about the key sources of estimation uncertainty in the light of the Covid-19 outbreak.
_ Note 33 Own funds and capital requirements discusses the adjustments to the regulatory framework due to the current Covid-19 crisis.

127
_ Note 34 Credit risk contains a separate sub-chapter ‘Covid-19’ which explains the considerations of the pandemic on the ECL measure-ment, sensitivity analyses and information on credit exposures subject to certain Covid 19 measures.
c) Accounting and measurement methods Foreign currency translation The consolidated financial statements are presented in euro, which is the functional currency of Erste Group Bank AG, the parent company of Erste Group. The functional currency is the currency of the primary business environment in which an entity operates. Each entity in Erste Group determines its own functional currency, and items included in the financial statements of each entity are measured using that functional currency. For foreign currency translation, exchange rates quoted by the central banks in each country are used. For Erste Group entities with the euro as functional currency, these are the European Central Bank reference rates. i. Transactions and balances in foreign currency
Transactions in foreign currencies are initially recorded at the functional currency exchange rate effective as of the date of the transaction. Subsequently, monetary assets and liabilities denominated in foreign currencies are translated at the functional currency exchange rate as of the balance sheet date. All resulting exchange differences that arise are recognised in the statement of income under the line item ‘Net trading result’. Non-monetary items that are measured in terms of historical cost in a foreign currency are translated using the exchange rates as of the dates of the initial transactions, i.e. they do not give rise to exchange differences. Non-monetary items that are measured at fair value (such as equity investments) in a foreign currency are translated using the exchange rates at the date when the fair value is measured, thus the exchange differences are part of the fair value gains or losses. ii. Translation of the statements of Group companies
Assets and liabilities of foreign operations (foreign subsidiaries and branches) are translated into Erste Group’s presentation currency, the euro, at the rate of exchange as of the balance sheet date (closing rate). Their consolidated statement of income and consolidated statement of comprehensive income are translated at the average exchange rate of the respective reporting period calculated on the basis of daily rates. Goodwill, intangible assets (i.e. customer relationships and brand) and fair value adjustments to the carrying amounts of assets and liabilities recognised on acquisition of foreign subsidiaries on the acquisition are treated as assets and liabilities of the foreign subsidiaries and are translated at the closing rate. However, goodwill of Česká spořitelna a.s. is translated at the historical FX rate as allowed by the transitional provisions in IAS 21.59. Exchange differences arising on translation are recognised in OCI in the line ‘Currency reserve’ of the statement of comprehensive income. The accumulated OCI is presented in equity, specifically under ‘Currency reserve’ in the statement of changes in equity. On disposal of a foreign subsidiary, the cumulative amount of translation differences recognised in other comprehensive income is recognised in the state-ment of income under the line item ‘Other operating result’. Accounting treatment of issues related to Covid-19 i. Public moratoria and payment holidays
In light of the spread of Covid-19, a variety of measures have been taken by governments in Erste Group’s region aimed at addressing the economic consequences of the outbreak on individuals, households and businesses. Such measures include, for example, public moratoria on repayment of loans, overdraft facilities and mortgages. Further, Erste Group is offering renegotiations of repayment schedules and pay-ment holidays on a voluntary basis to customers facing liquidity shortages. The public moratoria in general relate to customers which were performing and to their exposures existing before the outbreak of the Covid-19 pandemic. Most of the public moratoria are based on an opt-in approach, meaning that customers have to ask the bank for the payment reliefs. However, there are also cases when all applicable customers are automatically subject to the moratorium with an opt-out possibility. Such opt-out models have been implemented in Hungary and Serbia. The range of payment deferral periods in Erste Group countries was originally enacted between 3 to 9 months. However, prolongations of the moratoria have been provided afterwards in some countries. In Austria the clients can currently postpone payment obligations becoming due till 31 January 2021 for 10 months. Apart from prolongations, also new opt-in moratorium schemes were issued by local governments, for example, in Hungary and Romania. In most cases interest continues to accrue on the outstanding balance during the moratorium period. Nevertheless, in many cases an economic loss is incurred and modification losses are recognised from an accounting perspective. This results from the fact that the interest accrued, instead of being repaid or capitalised at the end of the moratorium, is repaid over the period after the moratorium. Both public moratoria and voluntarily granted payment holidays modify contractual cash flows of the related financial asset and are therefore treated as contractual modifications within the meaning of IFRS 9. The accounting policies disclosed in chapter ‘Financial instruments – Significant accounting policies’, part ‘Derecognition of financial instruments including treatment of contractual modifications’ apply.

128
The public moratoria and payment holidays applied in Erste Group did not lead to derecognition. In particular, this is because the moratoria and payment holidays are typically below one year and in most cases the contractual interest continues to accrue during the suspension phase. Thus the present value effect of the modification is less than 10%, thus it is below the threshold defined for significant modifications leading to derecognition. In the statement of income, the modification gain or loss is presented in the line ‘Interest income’ under ‘Net interest income’ if the modi-fication relates to financial assets in Stage 1. For financial assets in Stage 2 and 3 and POCI financial assets, the modification gain or loss is presented in the line ‘Impairment result from financial instruments’. With respect to the assessment of significant increases in credit risk (SICR), Erste Group does not consider the public moratoria and payment holidays in itself as automatic SICR triggers, but applies its specific assessment rules consisting of qualitative information and quantitative thresholds. Details on this assessment and other considerations on the expected credit loss estimation in the light of the Covid-19 outbreak are described in Note 34 Credit risk. In 2020, Erste Group incurred modification losses in total amount of EUR 73.6 million. The vast majority of this impact relates to contrac-tual modifications arising from Covid-19-related to public or private moratoria, as well as to other bilaterally agreed contractual changes aimed at addressing or preventing clients’ liquidity shortages or other financial difficulties associated with the Covid-19 crisis. Out of the total modification losses, an amount of EUR 49.5 million was presented in the statement of income in line item ‘Net interest income’, while the remaining EUR 24.1 million was presented in line item ‘Impairment result from financial instruments’. About 70% of the modification losses was incurred by following major CEE banks: Ceska sporitelna, Erste Bank Hungary, Banca Comerciala Romana, Erste Bank Croatia (Erste & Steiermärkische Bank d.d.) and Erste Bank Serbia. ii. Public guarantees
In their efforts to mitigate the economic effects of Covid-19, some governments and other public institutions in Erste Group’s region are providing public guarantees on banks’ exposures. The relevant accounting policy for financial guarantees is disclosed in note 42 Provisions, part Financial guarantees. Financial guarantees received in the context of public Covid-19 measures typically related to new credit facilities and are therefore considered as integral. Integral financial guarantees are included in the estimates of expected credit losses from the related financial assets. Premiums paid for integral financial guarantees and other credit enhancements are considered in the EIR of the related financial assets. The existence of such credit enhancements does not affect the SICR assessment. iii. Impairment of non-financial assets
The market capitalisation of Erste Group at year-end 2020 was below the carrying amount of the net assets. Therefore, a thorough analysis was performed to ensure the recoverability of the non-financial assets. In the course of this analysis the group has estimated the value in use on the level of the cash-generating units (CGUs). The value in use is determined by discounting the cash flows at a rate that takes into account present market rates and the specific risks of the CGU. The discount rates have been determined based on the capital asset pricing model (CAPM). According to the CAPM, the discount rate comprises a risk-free interest rate together with a market risk premium that itself is multiplied by a factor that represents the systematic market risk (beta factor). Furthermore, a country-risk premium component is consid-ered in calculation of the discount rate. The values used to establish the discount rates are determined using external sources of information. The cash flow projection period is five years. Beyond this planning horizon the cash flows are extrapolated to perpetuity based on a terminal growth rate. For those CGUs for which the carrying amount was higher than the value in use, the fair values of the underlying non-financial assets were derived and compared with the respective book values. In addition to the amounts already recognised in the course of the financial statements preparation process (see Note 38 Property, equipment and investment properties and Note 39 Intangible assets), the analysis did not reveal any need for impairment. Further, the annual impairment test on the goodwill of Česká spořitelna a.s. did not result in an impairment loss booking as the calculated recoverable amount exceeds the carrying amount. Details on the goodwill impairment test are described in Note 39 Intangible assets. iv. Impairment of financial instruments
The main contributor to the impairment allocation in the line item ‘Impairment result from financial instruments’ in the amount of EUR 823.4 million (out of overall impairment result in the amount of EUR 1,294.8 million) is directly attributable to changes in macro environment and management actions to identify mostly affected portfolios due to Covid-19 pandemic. Observed deteriorations in credit portfolios, which were also significantly driven by current Covid-19 situation, are the main reason for the remaining impairment allocation. Details on the effects of Covid-19 on the expected credit loss estimation are described in Note 34 Credit risk. d) Significant accounting judgements, assumptions and estimates The consolidated financial statements contain amounts that have been determined on the basis of judgements and by the use of estimates and assumptions. The estimates and assumptions used are based on historical experience and other factors, such as planning as well as expectations and forecasts of future events that are currently deemed to be reasonable. As a consequence of the uncertainty associated with these assumptions and estimates, actual results could in future periods lead to adjustments in the carrying amounts of the related assets or

129
liabilities. The most significant uses of judgements, assumptions and estimates are described in the notes of the respective assets and liabil-ities and relate in particular to:
_ Taxes on income and deferred tax assets (Note 13 Taxes on income) _ SPPI assessment of financial instruments (Chapter Financial instruments – Significant accounting policies) _ Business model assessment of financial instruments (Chapter Financial instruments – Significant accounting policies) _ Fair value of financial instruments (Note 26 Fair value of financial instruments) _ Impairment of financial instruments (Chapter Financial instruments – Significant accounting policies, Note 34 Credit risk) _ Impairment of non-financial assets (Chapter Non-current assets and other investments) _ Provisions (Note 42 Provisions) _ Defined employees benefit plans (Note 42 Provisions) _ Control of subsidiaries (Note 46 Subsidiaries) _ Significant influence in associates and joint ventures (Note 47 Investments in associates and joint ventures) _ Interest in structured entities (Note 48 Unconsolidated structured entities)
The Covid-19 pandemic increased the level of uncertainty. The consequences for the economy as well as the measures taken by governments and regulators are likely to affect Erste Group’s financial performance and position. The potential effects include significant impacts on expected credit losses, on operating income as well as impacts of potential goodwill and other non-financial assets impairment assessments. All negative effects that could be reasonable estimated were recognised by 2020 end. Erste Group will continue to follow the developments closely and will recognise any effects as the situation further unfolds. e) Application of amended and new IFRS/IAS The accounting policies adopted are consistent with those used in the previous financial year except for standards and interpretations that became effective for financial years beginning after 1 January 2020. As regards new standards and interpretations and their amendments, only those that are relevant for the business of Erste Group are listed below. Effective standards and interpretations The following amendments of standards have become mandatory for the financial year 2020 and have been endorsed by the EU:
_Amendments to IFRS 3: Definition of a Business. _Amendments to IFRS 9, IAS 39 and IFRS 7: Interest Rate Benchmark Reform _Amendment to IFRS 16: Leases Covid-19 Related Rent Concessions _Amendments to IAS 1 and IAS 8: Definition of Material
The amendments to IFRS 9, IAS 39 and IFRS 7: Interest Rate Benchmark Reform were applied early in 2019. Related disclosures are provided in Note 27 Hedge Accounting. Application of the above mentioned amendments in 2020 did not have a significant impact on Erste Group’s financial statements. Standards and interpretations not yet effective The standards and amendments shown below were issued by the IASB but are not yet effective. Following amendments to standards are already endorsed by the EU:
_ Amendments to IFRS 9, IAS 39, IFRS 7, IFRS 4 and IFRS 16: Interest Rate Benchmark Reform – Phase 2 Following standards and amendments and interpretations have not yet been endorsed by the EU until 19 February 2021:
_ IFRS 17: Insurance contracts _ Annual Improvements to IFRSs 2018-2020 Cycle _ Amendments to IAS 1: Disclosure of Accounting Policies _ Amendments to IAS 8: Definition of Accounting Estimates
Amendments to IFRS 9, IAS 39, IFRS 7, IFRS 4 and IFRS 16: Interest Rate Benchmark Reform – Phase 2. The amendments were issued in August 2020 and are effective for annual periods beginning on or after 1 January 2021. The amendments introduce a practical expedient that modifications of financial assets and financial liabilities required by the reform are accounted for by updating the effective interest rate. A similar practical expedient is provided for lessee accounting applying IFRS 16. Regarding hedge accounting the hedge designation and documentation is amended and the effects of the benchmark rate change are included in the measurement of the hedging instrument and the hedged item. IFRS 7 disclosures requirements have been extended in order to allow users to understand the nature, extent and management of risks arising from the IBOR reform as well as progress in transitioning to alternative benchmark rates. Application of these amendments will simplify the treatment compared to previous IFRS requirements which would have led to a more complex modification gain/loss or derecognition accounting or hedge accounting discontinuations. The less complex treatment is not ex-pected to have a significant impact on Erste Group’s financial statements. However, the amendments will result in new disclosures.

130
Erste Group has decided not to apply the amendments early since no replacement of the benchmark rates occurred in 2020. Centrally cleared derivatives were subject to switch in the discounting curve since the cash collateral remuneration changed for the new overnight benchmark rates. However, the valuation effect was compensated by one-off payments without affecting the value of hedging derivatives. Also, there was no change in the designated interest rate risk portion on the hedged items. As a result, the hedge designations and documentations were not considered to be affected by the reform during 2020. IFRS 17: Insurance contracts. IFRS 17 was issued in May 2017 and is effective for annual periods beginning on or after 1 January 2023. IFRS 17 establishes the principles for the recognition, measurement, presentation and disclosure of insurance contracts within the scope of the standard. The objective of IFRS 17 is to ensure that an entity provides relevant information that faithfully represents those contracts. This information gives a basis for users of financial statements to assess the effect that insurance contracts have on the entity's financial position, financial performance and cash flows. Erste Group is in process of assessing whether some of its contracts fall in scope of IFRS 17. Erste Group will estimate the effect on its financial statements when this has been clarified. Annual Improvements to IFRSs 2018-2020 Cycle. In May 2020, the IASB issued a set of amendments to various standards. The amend-ments to IFRS 1, IFRS 9, IFRS 16 and IAS 41 are effective for annual periods beginning on or after 1 January 2022. Application of these amendments is not expected to have a significant impact on Erste Group’s financial statements. Amendments to IAS 1: Disclosure of Accounting policies. The amendments to IAS 1 were issued In February 2021 and are effective for annual periods beginning on or after 1 January 2023. The amendments specify that an entity is required to disclose its material accounting policy information. A guidance was added to explain how an entity can identify material accounting policy information and to give examples of when accounting policy information is likely to be material. Application of these amendments is not expected to have a significant impact on Erste Group’s financial statements. However, revisions in the disclosures of the accounting policies may be required. Amendments to IAS 8: Definition of Accounting Estimates. The amendments to IAS 8 were issued In February 2021 and are effective for annual periods beginning on or after 1 January 2023. The amendments clarify how companies should distinguish changes in accounting policies from changes in accounting estimates. Application of these amendments is not expected to have a significant impact on Erste Group’s financial statements.

131
PERFORMANCE / RETURN
1. Segment reporting Erste Group’s segment reporting is based on IFRS 8 Operating Segments, which adopts the management approach. Accordingly, segment information is prepared on the basis of internal management reporting that is regularly reviewed by the chief operating decision maker to assess the performance of the segments and make decisions regarding the allocation of resources. Within Erste Group the function of the chief operating decision maker is exercised by the management board. Erste Group uses a matrix organisational structure with geographical segmentation and business segments. Since the chief operating decision maker performs the steering primarily based on geographical segments, those are defined as operating segments according to IFRS 8. In order to provide more comprehensive information, the performance of the business segments is reported additionally. Geographical segmentation (operating segments) For the purpose of segment reporting geographical segments are defined as operating segments, for which the information is presented on the basis of the booking entity's location (not the country of risk). In case of information regarding a partial group, the allocation is based on the location of the respective parent entity according to the local management responsibility. Geographical areas are defined according to the core markets in which Erste Group operates. Based on the locations of the banking and other financial institution participations, the geographical areas consist of two core markets, Austria and Central and Eastern Europe and a residual segment Other that comprises the remaining business activities of Erste Group outside its core markets as well as the reconciliation to the consolidated accounting result.
The geographical area Austria consists of the following three operating segments:
_ The Erste Bank Oesterreich & Subsidiaries (EBOe & Subsidiaries) segment comprises Erste Bank der oesterreichischen Sparkassen AG (Erste Bank Oesterreich) and its main subsidiaries (e.g. sBausparkasse, Salzburger Sparkasse, Tiroler Sparkasse, Sparkasse Hain-burg).
_ The Savings banks segment includes those savings banks which are members of the Haftungsverbund (cross-guarantee system) of the Austrian savings banks sector and in which Erste Group does not hold a majority stake but which are fully controlled according to IFRS 10. The fully or majority owned Erste Bank Oesterreich, Tiroler Sparkasse, Salzburger Sparkasse, and Sparkasse Hainburg are not part of the Savings Banks segment.
_ The Other Austria segment comprises Erste Group Bank AG (Holding) with its Corporates and Group Markets business, Erste Group Immorent GmbH, Erste Asset Management GmbH and Intermarket Bank AG.
The geographical area Central and Eastern Europe (CEE) consists of six operating segments covering Erste Group’s banking subsidiaries located in the respective CEE countries:
_ Czech Republic (comprising Česká spořitelna Group) _ Slovakia (comprising Slovenská sporitel’ňa Group) _ Romania (comprising Banca Comercială Română Group) _ Hungary (comprising Erste Bank Hungary Group) _ Croatia (comprising Erste Bank Croatia Group) _ Serbia (comprising Erste Bank Serbia Group).
The residual segment Other covers mainly centrally managed activities and items that are not directly allocated to other segments. It com-prises the corporate center of Erste Group Bank AG (and thus dividends and the refinancing costs from participations, general administrative expenses), internal service providers (facility management, IT, procurement), the banking tax of Erste Group Bank AG as well as free capital of Erste Group (defined as the difference of the total average IFRS equity and the average economical equity allocated to the segments). Asset/Liability Management of Erste Group Bank AG as well as the reconciliation to the consolidated accounting result (e.g. intercompany eliminations, dividend eliminations) are also part of the segment Other.
Erste Group – geographical segmentation - operating segments
Austria Central and Eastern Europe Other
EBOe & Subsidiaries
SavingsBanks
OtherAustria
Czech Republic
Slovakia Romania Hungary Croatia Serbia

132
Business segmentation Apart from geographical segments, which are Erste Group's operating segments, business segments are reported as well.
Retail. The Retail segment comprises the business with private individuals, micros and free professionals within the responsibility of account managers in the retail network. This business is operated by the local banks in cooperation with their subsidiaries such as leasing and asset management companies with a focus on simple products ranging from mortgage and consumer loans, investment products, current accounts, savings products to credit cards and cross selling products such as leasing, insurance and building society products. Corporates. The Corporates segment comprises business done with corporate customers of different turnover size (small and medium-sized enterprises and Large Corporate customers) as well as commercial real estate and public sector business. Group Markets. The Group Markets (GM) segment comprises trading and markets services as well as customer business with financial institutions. It includes all activities related to the trading books of Erste Group, including the execution of trade, market making and short-term liquidity management. In addition, it comprises business connected with servicing financial institutions as clients. Asset/Liability Management & Local Corporate Center. The Asset/Liability Management & Local Corporate Center (ALM & LCC) segment includes all asset/liability management functions – local and of Erste Group Bank AG (Holding) – as well as the local corporate centers which comprise all non-core banking business activities such as internal service providers and reconciliation items to local entity results. The corporate center of Erste Group Bank AG is included in the Group Corporate Center segment. Savings Banks. The Savings Banks segment is identical to the operating segment Savings banks. Group Corporate Center. The Group Corporate Center (GCC) segment covers mainly centrally managed activities and items that are not directly allocated to other segments. It comprises the corporate center of Erste Group Bank AG (and thus dividends and the refinancing costs from participations, general administrative expenses), internal service providers (facility management, IT, procurement), the banking tax of Erste Group Bank AG as well as free capital of Erste Group (defined as the difference of the total average IFRS equity and the average economical equity allocated to the segments). Intragroup Elimination. Intragroup Elimination (IC) is not defined as a segment but is the reconciliation to the consolidated accounting result. It includes intragroup eliminations between participations of Erste Group (e.g. intragroup funding, internal cost charges). Intragroup eliminations within partial groups are disclosed in the respective segments. Dividend elimination between Erste Group Bank AG and its fully consolidated subsidiaries is performed in Group Corporate Center. Con-solidation differences arising between the segments, which are eliminated over the lifespan of the underlying transaction, are part of Group Corporate Center. Measurement The profit and loss statement of the segment report is based on the measures reported to the Erste Group management board for the purpose of allocating resources to the segments and assessing their performance. Management reporting as well as the segment report of Erste Group are based on IFRS. Accounting standards and methods as well as measurements used in segment reporting are the same as for the consolidated financial statements of accounting. Interest revenues are not reported separately from interest expenses for each reportable segment. Those measures are reported on the net basis within the position ‘Net interest income’ as interest revenues and interest expenses are neither included into the measure of segment profit or loss reviewed by the chief operating decision maker nor otherwise regularly provided to the chief operating decision maker. Chief operating decision maker relies solely on net interest income to assess the performance of the segments and make decisions about resources to be allocated to the segments. Net fee and commission income and Other operating result are reported on a net basis according to the regular reporting to the chief operating decision maker. Capital consumption per segment is regularly reviewed by the management of Erste Group to assess the performance of the segments. The average allocated capital is determined by the credit risk, market risk, operational risk and business strategic risk. According to the regular internal reporting to Erste Group management board, total assets and total liabilities as well as risk weighted assets and allocated capital are
Retail
Erste Group – business segments
CorporatesGroup
Markets
Asset/LiabilityManagement &Local Corporate
Center
Savings Banks
Group CorporateCenter
IntragroupElimination

133
disclosed per segment. Total average allocated capital for the Group equals average total equity of the Group. For measuring and assessing the profitability of segments within Erste Group, such key measures as return on allocated capital and cost/income ratio are used. Return on allocated capital is defined as net result for the period before minorities in relation to the average allocated capital of the respective segment. Cost/income ratio is defined as operating expenses (general administrative expenses) in relation to operating income (total of net interest income, net fee and commission income, dividend income, net trading result, gains/losses from financial instruments measured at fair value through profit or loss, net result from equity method investments, rental income from investment properties and other operating lease).

134
Operating segments: Geographical segmentation – overview
Austria Central and Eastern Europe Other Total Group
in EUR million 1-12 19 1-12 20 1-12 19 1-12 20 1-12 19 1-12 20 1-12 19 1-12 20
Net interest income 2,101.1 2,158.6 2,549.7 2,475.4 96.0 140.9 4,746.8 4,774.8
Net fee and commission income 1,130.1 1,176.1 955.6 894.8 -85.6 -94.1 2,000.1 1,976.8
Dividend income 17.6 9.8 4.3 3.5 6.0 6.6 27.9 19.9
Net trading result -1.5 -17.2 268.9 214.9 50.9 -60.1 318.3 137.6
Gains/losses from financial instruments at FVPL 69.6 23.6 8.7 20.1 -102.8 18.3 -24.5 62.0
Net result from equity method investments -0.4 1.8 11.3 4.7 6.2 3.9 17.1 10.4
Rental income from investment properties & other operating leases 131.3 143.7 50.4 49.8 -11.5 -19.9 170.1 173.6
General administrative expenses -2,215.3 -2,184.8 -1,900.2 -1,842.6 -167.8 -193.1 -4,283.3 -4,220.5
thereof depreciation and amortization -177.1 -178.0 -276.8 -265.0 -87.0 -97.8 -541.0 -540.9
Gains/losses from derecognition of financial assets at AC 1.2 7.7 0.0 0.3 -0.3 -1.1 0.9 6.8
Other gains/losses from derecognition of financial instruments not at FVPL -0.9 -0.6 -1.4 0.7 25.8 -0.5 23.5 -0.4
Impairment result from financial instruments -12.5 -605.3 -11.9 -711.2 -14.8 21.7 -39.2 -1,294.8
Other operating result 54.4 -35.2 -365.8 -223.0 -316.8 -20.1 -628.2 -278.3
Levies on banking activities -8.0 -8.5 -103.6 -92.2 -16.4 -17.0 -128.0 -117.7
Pre-tax result from continuing operations 1,274.7 678.3 1,569.5 887.2 -514.5 -197.5 2,329.7 1,368.0
Taxes on income -280.7 -95.2 -307.1 -188.1 169.2 -59.2 -418.7 -342.5
Net result for the period 994.0 583.1 1,262.4 699.1 -345.4 -256.7 1,911.1 1,025.5
Net result attributable to non-controlling interests 387.7 216.2 45.7 22.0 7.5 4.1 440.9 242.3
Net result attributable to owners of the parent 606.3 366.9 1,216.7 677.2 -352.8 -260.9 1,470.1 783.1
Operating income 3,447.8 3,496.5 3,848.8 3,663.1 -40.7 -4.4 7,255.9 7,155.1
Operating expenses -2,215.3 -2,184.8 -1,900.2 -1,842.6 -167.8 -193.1 -4,283.3 -4,220.5
Operating result 1,232.5 1,311.7 1,948.6 1,820.4 -208.4 -197.5 2,972.7 2,934.6
Risk-weighted assets (credit risk, eop) 51,812 52,187 43,021 43,346 2,060 2,933 96,894 98,466
Average allocated capital 7,131 6,789 7,025 7,189 5,632 7,467 19,788 21,445
Cost/income ratio 64.3% 62.5% 49.4% 50.3% >100% >100% 59.0% 59.0%
Return on allocated capital 13.9% 8.6% 18.0% 9.7% -6.1% -3.4% 9.7% 4.8%
Total assets (eop) 158,921 182,528 112,600 119,760 -25,828 -24,894 245,693 277,394
Total liabilities excluding equity (eop) 126,184 146,072 101,011 107,557 -1,979 1,354 225,216 254,983
Impairments -12.2 -612.3 -38.8 -767.9 -231.7 28.1 -282.8 -1,352.1
Net impairment loss on financial assets AC/FVTOCI and finance lease receivables -45.2 -516.2 -57.0 -645.0 -7.0 25.6 -109.2 -1,135.6
Net impairment loss on commitments and guarantees given 32.7 -89.1 45.1 -66.2 -7.8 -3.9 70.0 -159.2
Impairment of goodwill 0.0 0.0 0.0 0.0 -165.0 0.0 -165.0 0.0
Net impairment on investments in subsidiaries, joint ventures and associates 0.3 0.0 -0.0 -8.1 -46.1 25.7 -45.8 17.5
Net impairment on other non-financial assets 0.0 -7.0 -27.0 -48.6 -5.8 -19.3 -32.8 -74.8

135
Operating segments: Geographical area Austria
EBOe & Subsidiaries Savings Banks Other Austria Austria
in EUR million 1-12 19 1-12 20 1-12 19 1-12 20 1-12 19 1-12 20 1-12 19 1-12 20
Net interest income 642.1 638.2 1,052.1 1,069.4 406.9 451.0 2,101.1 2,158.6
Net fee and commission income 398.9 406.6 490.6 519.6 240.7 249.9 1,130.1 1,176.1
Dividend income 6.9 6.4 6.1 4.6 4.5 -1.2 17.6 9.8
Net trading result 16.9 6.5 26.8 8.1 -45.2 -31.7 -1.5 -17.2
Gains/losses from financial instruments at FVPL 12.2 7.3 25.2 8.5 32.2 7.8 69.6 23.6
Net result from equity method investments 1.7 1.6 0.0 0.0 -2.2 0.1 -0.4 1.8
Rental income from investment properties & other operating leases 39.2 59.5 39.3 38.4 52.7 45.7 131.3 143.7
General administrative expenses -717.1 -711.4 -1,120.1 -1,106.1 -378.1 -367.2 -2,215.3 -2,184.8
thereof depreciation and amortization -55.1 -54.2 -83.2 -85.0 -38.8 -38.8 -177.1 -178.0
Gains/losses from derecognition of financial assets at AC 0.0 0.1 2.3 0.1 -1.1 7.4 1.2 7.7
Other gains/losses from derecognition of financial instruments not at FVPL -0.3 -0.1 -0.5 -1.7 0.0 1.2 -0.9 -0.6
Impairment result from financial instruments -6.0 -135.8 0.7 -267.2 -7.3 -202.3 -12.5 -605.3
Other operating result -18.6 -9.6 24.5 -2.6 48.5 -23.1 54.4 -35.2
Levies on banking activities -3.6 -3.7 -4.3 -4.7 -0.1 -0.1 -8.0 -8.5
Pre-tax result from continuing operations 375.9 269.4 547.1 271.2 351.7 137.8 1,274.7 678.3
Taxes on income -88.4 -11.5 -127.8 -54.3 -64.4 -29.4 -280.7 -95.2
Net result for the period 287.5 257.9 419.2 216.8 287.3 108.3 994.0 583.1
Net result attributable to non-controlling interests 24.3 35.9 354.5 175.2 9.0 5.1 387.7 216.2
Net result attributable to owners of the parent 263.2 222.0 64.8 41.6 278.3 103.2 606.3 366.9
Operating income 1,117.9 1,126.1 1,640.2 1,648.6 689.7 721.8 3,447.8 3,496.5
Operating expenses -717.1 -711.4 -1,120.1 -1,106.1 -378.1 -367.2 -2,215.3 -2,184.8
Operating result 400.8 414.7 520.1 542.5 311.6 354.5 1,232.5 1,311.7
Risk-weighted assets (credit risk, eop) 12,536 12,578 24,670 24,185 14,607 15,424 51,812 52,187
Average allocated capital 1,756 1,657 3,218 3,063 2,157 2,069 7,131 6,789
Cost/income ratio 64.1% 63.2% 68.3% 67.1% 54.8% 50.9% 64.3% 62.5%
Return on allocated capital 16.4% 15.6% 13.0% 7.1% 13.3% 5.2% 13.9% 8.6%
Total assets (eop) 46,504 52,572 67,360 73,219 45,057 56,737 158,921 182,528
Total liabilities excluding equity (eop) 44,320 50,363 62,276 67,984 19,588 27,726 126,184 146,072
Impairments -7.1 -135.7 1.8 -271.5 -6.9 -205.1 -12.2 -612.3
Net impairment loss on financial assets AC/FVTOCI and finance lease receivables -20.2 -124.2 -12.7 -232.9 -12.3 -159.2 -45.2 -516.2
Net impairment loss on commitments and guarantees given 14.2 -11.6 13.4 -34.4 5.0 -43.2 32.7 -89.1
Impairment of goodwill 0.0 0.0 0.0 0.0 0.0 0.0 0.0 0.0
Net impairment on investments in subsidiaries, joint ventures and associates 0.0 0.0 0.3 0.0 0.0 0.0 0.3 0.0
Net impairment on other non-financial assets -1.2 0.1 0.8 -4.3 0.4 -2.8 0.0 -7.0
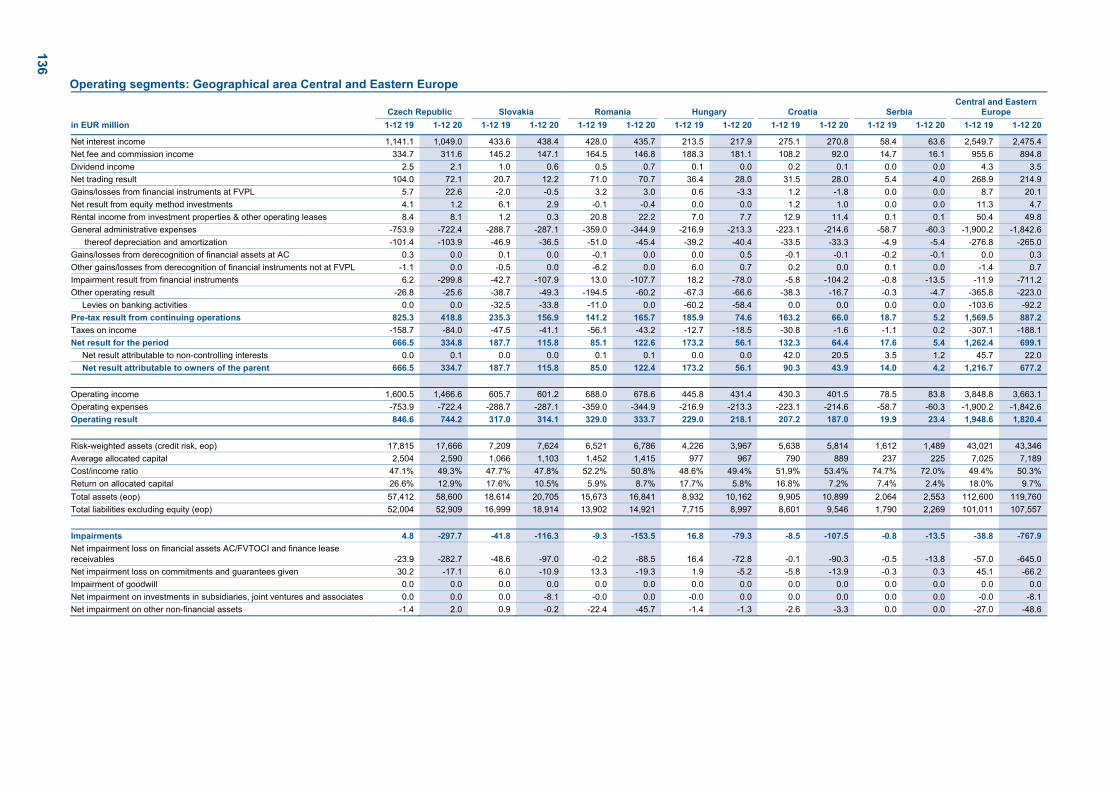
136
Operating segments: Geographical area Central and Eastern Europe
Czech Republic Slovakia Romania Hungary Croatia Serbia Central and Eastern
Europe
in EUR million 1-12 19 1-12 20 1-12 19 1-12 20 1-12 19 1-12 20 1-12 19 1-12 20 1-12 19 1-12 20 1-12 19 1-12 20 1-12 19 1-12 20
Net interest income 1,141.1 1,049.0 433.6 438.4 428.0 435.7 213.5 217.9 275.1 270.8 58.4 63.6 2,549.7 2,475.4
Net fee and commission income 334.7 311.6 145.2 147.1 164.5 146.8 188.3 181.1 108.2 92.0 14.7 16.1 955.6 894.8
Dividend income 2.5 2.1 1.0 0.6 0.5 0.7 0.1 0.0 0.2 0.1 0.0 0.0 4.3 3.5
Net trading result 104.0 72.1 20.7 12.2 71.0 70.7 36.4 28.0 31.5 28.0 5.4 4.0 268.9 214.9
Gains/losses from financial instruments at FVPL 5.7 22.6 -2.0 -0.5 3.2 3.0 0.6 -3.3 1.2 -1.8 0.0 0.0 8.7 20.1
Net result from equity method investments 4.1 1.2 6.1 2.9 -0.1 -0.4 0.0 0.0 1.2 1.0 0.0 0.0 11.3 4.7
Rental income from investment properties & other operating leases 8.4 8.1 1.2 0.3 20.8 22.2 7.0 7.7 12.9 11.4 0.1 0.1 50.4 49.8
General administrative expenses -753.9 -722.4 -288.7 -287.1 -359.0 -344.9 -216.9 -213.3 -223.1 -214.6 -58.7 -60.3 -1,900.2 -1,842.6
thereof depreciation and amortization -101.4 -103.9 -46.9 -36.5 -51.0 -45.4 -39.2 -40.4 -33.5 -33.3 -4.9 -5.4 -276.8 -265.0
Gains/losses from derecognition of financial assets at AC 0.3 0.0 0.1 0.0 -0.1 0.0 0.0 0.5 -0.1 -0.1 -0.2 -0.1 0.0 0.3
Other gains/losses from derecognition of financial instruments not at FVPL -1.1 0.0 -0.5 0.0 -6.2 0.0 6.0 0.7 0.2 0.0 0.1 0.0 -1.4 0.7
Impairment result from financial instruments 6.2 -299.8 -42.7 -107.9 13.0 -107.7 18.2 -78.0 -5.8 -104.2 -0.8 -13.5 -11.9 -711.2
Other operating result -26.8 -25.6 -38.7 -49.3 -194.5 -60.2 -67.3 -66.6 -38.3 -16.7 -0.3 -4.7 -365.8 -223.0
Levies on banking activities 0.0 0.0 -32.5 -33.8 -11.0 0.0 -60.2 -58.4 0.0 0.0 0.0 0.0 -103.6 -92.2
Pre-tax result from continuing operations 825.3 418.8 235.3 156.9 141.2 165.7 185.9 74.6 163.2 66.0 18.7 5.2 1,569.5 887.2
Taxes on income -158.7 -84.0 -47.5 -41.1 -56.1 -43.2 -12.7 -18.5 -30.8 -1.6 -1.1 0.2 -307.1 -188.1
Net result for the period 666.5 334.8 187.7 115.8 85.1 122.6 173.2 56.1 132.3 64.4 17.6 5.4 1,262.4 699.1
Net result attributable to non-controlling interests 0.0 0.1 0.0 0.0 0.1 0.1 0.0 0.0 42.0 20.5 3.5 1.2 45.7 22.0
Net result attributable to owners of the parent 666.5 334.7 187.7 115.8 85.0 122.4 173.2 56.1 90.3 43.9 14.0 4.2 1,216.7 677.2
Operating income 1,600.5 1,466.6 605.7 601.2 688.0 678.6 445.8 431.4 430.3 401.5 78.5 83.8 3,848.8 3,663.1
Operating expenses -753.9 -722.4 -288.7 -287.1 -359.0 -344.9 -216.9 -213.3 -223.1 -214.6 -58.7 -60.3 -1,900.2 -1,842.6
Operating result 846.6 744.2 317.0 314.1 329.0 333.7 229.0 218.1 207.2 187.0 19.9 23.4 1,948.6 1,820.4
Risk-weighted assets (credit risk, eop) 17,815 17,666 7,209 7,624 6,521 6,786 4,226 3,967 5,638 5,814 1,612 1,489 43,021 43,346
Average allocated capital 2,504 2,590 1,066 1,103 1,452 1,415 977 967 790 889 237 225 7,025 7,189
Cost/income ratio 47.1% 49.3% 47.7% 47.8% 52.2% 50.8% 48.6% 49.4% 51.9% 53.4% 74.7% 72.0% 49.4% 50.3%
Return on allocated capital 26.6% 12.9% 17.6% 10.5% 5.9% 8.7% 17.7% 5.8% 16.8% 7.2% 7.4% 2.4% 18.0% 9.7%
Total assets (eop) 57,412 58,600 18,614 20,705 15,673 16,841 8,932 10,162 9,905 10,899 2,064 2,553 112,600 119,760
Total liabilities excluding equity (eop) 52,004 52,909 16,999 18,914 13,902 14,921 7,715 8,997 8,601 9,546 1,790 2,269 101,011 107,557
Impairments 4.8 -297.7 -41.8 -116.3 -9.3 -153.5 16.8 -79.3 -8.5 -107.5 -0.8 -13.5 -38.8 -767.9
Net impairment loss on financial assets AC/FVTOCI and finance lease receivables -23.9 -282.7 -48.6 -97.0 -0.2 -88.5 16.4 -72.8 -0.1 -90.3 -0.5 -13.8 -57.0 -645.0
Net impairment loss on commitments and guarantees given 30.2 -17.1 6.0 -10.9 13.3 -19.3 1.9 -5.2 -5.8 -13.9 -0.3 0.3 45.1 -66.2
Impairment of goodwill 0.0 0.0 0.0 0.0 0.0 0.0 0.0 0.0 0.0 0.0 0.0 0.0 0.0 0.0
Net impairment on investments in subsidiaries, joint ventures and associates 0.0 0.0 0.0 -8.1 -0.0 0.0 -0.0 0.0 0.0 0.0 0.0 0.0 -0.0 -8.1
Net impairment on other non-financial assets -1.4 2.0 0.9 -0.2 -22.4 -45.7 -1.4 -1.3 -2.6 -3.3 0.0 0.0 -27.0 -48.6

137
Business segments (1)
Retail Corporates Group Markets ALM&LCC
in EUR million 1-12 19 1-12 20 1-12 19 1-12 20 1-12 19 1-12 20 1-12 19 1-12 20
Net interest income 2,290.1 2,083.7 1,098.7 1,109.4 257.2 252.2 -104.3 86.2
Net fee and commission income 1,094.5 1,047.9 301.1 282.3 228.3 240.9 -84.5 -79.3
Dividend income 3.6 0.0 1.6 0.8 3.0 -2.0 7.6 9.9
Net trading result 112.0 96.2 95.5 76.7 19.9 20.9 117.3 -39.9
Gains/losses from financial instruments at FVPL 0.5 -6.8 5.4 -12.6 28.5 17.6 -78.7 53.1
Net result from equity method investments 6.1 3.9 0.0 0.0 0.0 0.0 4.8 2.6
Rental income from investment properties & other operating leases 23.0 23.9 100.8 104.7 0.0 0.0 30.8 25.5
General administrative expenses -2,096.2 -2,067.7 -575.3 -535.7 -240.2 -232.0 -110.9 -107.4
thereof depreciation and amortization -273.8 -261.6 -70.7 -66.4 -14.3 -16.8 -12.3 -13.6
Gains/losses from derecognition of financial assets at AC -0.3 0.0 -1.1 7.3 0.0 0.0 5.6 -0.4
Other gains/losses from derecognition of financial instruments not at FVPL 0.0 0.0 21.3 0.7 0.0 1.2 -2.3 -0.2
Impairment result from financial instruments -74.6 -392.2 32.9 -656.0 5.1 -0.8 13.0 -3.0
Other operating result -226.1 -69.0 -22.5 -73.6 -18.4 -26.9 -93.3 -111.2
Levies on banking activities -69.2 -61.0 -27.6 -23.6 -4.1 -4.0 -6.4 -7.3
Pre-tax result from continuing operations 1,132.5 720.1 1,058.4 304.1 283.4 271.1 -295.0 -164.2
Taxes on income -223.3 -121.7 -202.5 -63.1 -52.8 -56.3 46.8 48.8
Net result for the period 909.2 598.4 855.9 241.0 230.6 214.8 -248.1 -115.4
Net result attributable to non-controlling interests 42.8 14.5 41.0 47.3 6.0 3.9 -10.9 -2.7
Net result attributable to owners of the parent 866.4 583.9 814.9 193.7 224.6 211.0 -237.3 -112.7
Operating income 3,529.7 3,248.8 1,603.1 1,561.3 536.9 529.7 -107.1 58.0
Operating expenses -2,096.2 -2,067.7 -575.3 -535.7 -240.2 -232.0 -110.9 -107.4
Operating result 1,433.5 1,181.2 1,027.8 1,025.6 296.7 297.7 -218.0 -49.4
Risk-weighted assets (credit risk, eop) 19,053 18,451 42,693 43,965 3,321 3,209 5,739 5,932
Average allocated capital 3,446 3,254 4,567 4,746 958 880 3,037 3,210
Cost/income ratio 59.4% 63.6% 35.9% 34.3% 44.7% 43.8% >100% >100%
Return on allocated capital 26.4% 18.4% 18.7% 5.1% 24.1% 24.4% -8.2% -3.6%
Total assets (eop) 65,277 65,948 57,342 59,531 31,394 43,529 60,971 71,508
Total liabilities excluding equity (eop) 91,572 100,342 28,210 32,706 31,802 37,968 49,244 53,213
Impairments -74.4 -392.6 20.6 -713.9 5.1 -0.8 -4.6 -22.0
Net impairment loss on financial assets AC/FVTOCI and finance lease receivables -82.6 -387.9 -20.5 -536.4 4.6 -1.1 10.4 -5.4
Net impairment loss on commitments and guarantees given 8.0 -4.3 53.5 -119.6 0.5 0.3 2.6 2.4
Impairment of goodwill 0.0 0.0 0.0 0.0 0.0 0.0 0.0 0.0
Net impairment on investments in subsidiaries, joint ventures and associates 0.0 0.0 -1.3 0.1 0.0 0.0 1.3 -8.3
Net impairment on other non-financial assets 0.2 -0.5 -11.0 -58.0 0.0 0.0 -18.8 -10.8

138
Business segments (2)
Savings Banks Group Corporate Center Intragroup Elimination Total Group
in EUR million 1-12 19 1-12 20 1-12 19 1-12 20 1-12 19 1-12 20 1-12 19 1-12 20
Net interest income 1,052.1 1,069.4 70.6 89.1 82.5 85.0 4,746.8 4,774.8
Net fee and commission income 490.6 519.6 -1.3 6.6 -28.5 -41.2 2,000.1 1,976.8
Dividend income 6.1 4.6 6.0 6.6 0.0 0.0 27.9 19.9
Net trading result 26.8 8.1 17.7 35.0 -70.9 -59.4 318.3 137.6
Gains/losses from financial instruments at FVPL 25.2 8.5 -5.5 2.2 0.0 0.0 -24.5 62.0
Net result from equity method investments 0.0 0.0 6.2 3.9 0.0 0.0 17.1 10.4
Rental income from investment properties & other operating leases 39.3 38.4 -22.9 -18.6 -0.9 -0.4 170.1 173.6
General administrative expenses -1,120.1 -1,106.1 -1,023.9 -1,013.0 883.4 841.3 -4,283.3 -4,220.5
thereof depreciation and amortization -83.2 -85.0 -116.6 -121.2 29.9 23.8 -541.0 -540.9
Gains/losses from derecognition of financial assets at AC 2.3 0.1 0.4 0.0 -6.0 -0.2 0.9 6.8
Other gains/losses from derecognition of financial instruments not at FVPL -0.5 -1.7 -1.1 -0.7 6.1 0.2 23.5 -0.4
Impairment result from financial instruments 0.7 -267.2 -16.4 24.4 0.0 0.0 -39.2 -1,294.8
Other operating result 24.5 -2.6 573.3 830.2 -865.6 -825.3 -628.2 -278.3
Levies on banking activities -4.3 -4.7 -16.4 -17.0 0.0 0.0 -128.0 -117.7
Pre-tax result from continuing operations 547.1 271.2 -396.8 -34.3 0.0 0.0 2,329.7 1,368.0
Taxes on income -127.8 -54.3 141.0 -96.0 0.0 0.0 -418.7 -342.5
Net result for the period 419.2 216.8 -255.8 -130.2 0.0 0.0 1,911.1 1,025.5
Net result attributable to non-controlling interests 354.5 175.2 7.5 4.1 0.0 0.0 440.9 242.3
Net result attributable to owners of the parent 64.8 41.6 -263.3 -134.4 0.0 0.0 1,470.1 783.1
Operating income 1,640.2 1,648.6 70.9 124.8 -17.7 -16.0 7,255.9 7,155.1
Operating expenses -1,120.1 -1,106.1 -1,023.9 -1,013.0 883.4 841.3 -4,283.3 -4,220.5
Operating result 520.1 542.5 -953.0 -888.2 865.6 825.3 2,972.7 2,934.6
Risk-weighted assets (credit risk, eop) 24,670 24,185 1,417 2,725 0 0 96,894 98,466
Average allocated capital 3,218 3,063 4,561 6,293 0 0 19,788 21,445
Cost/income ratio 68.3% 67.1% >100% >100% >100% >100% 59.0% 59.0%
Return on allocated capital 13.0% 7.1% -5.6% -2.1% 9.7% 4.8%
Total assets (eop) 67,360 73,219 4,081 2,810 -40,732 -39,152 245,693 277,394
Total liabilities excluding equity (eop) 62,276 67,984 2,869 1,969 -40,759 -39,197 225,216 254,983
Impairments 1.8 -271.5 -231.3 48.8 0.0 0.0 -282.8 -1,352.1
Net impairment loss on financial assets AC/FVTOCI and finance lease receivables -12.7 -232.9 -8.3 28.1 0.0 0.0 -109.2 -1,135.6
Net impairment loss on commitments and guarantees given 13.4 -34.4 -8.1 -3.6 0.0 0.0 70.0 -159.2
Impairment of goodwill 0.0 0.0 -165.0 0.0 0.0 0.0 -165.0 0.0
Net impairment on investments in subsidiaries, joint ventures and associates 0.3 0.0 -46.1 25.7 0.0 0.0 -45.8 17.5
Net impairment on other non-financial assets 0.8 -4.3 -3.9 -1.3 0.0 0.0 -32.8 -74.8

139
2. Net interest income Net interest income is broken down into line items of interest income, other similar income, interest expenses and other similar expenses. The distinguishing factor is whether the EIR method is mandatorily applied for recognition of interest income or expense in accordance with IFRS 9. ‘Interest income’ relates to interest revenue from financial assets measured at amortised cost and at fair value through other comprehensive income. It is calculated using the EIR method as discussed in chapter ‘Financial instruments – Significant accounting policies’. ‘Other similar income’ captures interest-like sources of income resulting from non-derivative financial assets measured at fair value through profit or loss, held for trading derivatives, hedge accounting derivatives, finance lease receivables and negative interest on financial liabilities. ‘Interest expenses’ relate to interest expense from financial liabilities measured at amortised cost calculated using effective interest rate as discussed in chapter ‘Financial instruments – Significant accounting policies’. ‘Other similar expenses’ capture interest-like sources of expense resulting from non-derivative financial liabilities measured at fair value through profit or loss, held for trading derivatives, hedge accounting derivatives, negative interest on financial assets, lease liabilities, provisions recognised under IFRS 9 and IAS 37 (unwinding of the time value of the money effect due to passage of time) and net defined liabilities (net interest cost on severance payments, pensions and jubilee obligations) under IAS 19. As regards types of financial instruments, interest income and other similar income include interest income on loans and advances to banks and customers, on cash balances, on debt securities in all measurement categories of financial assets, on trade and other receivables and on finance lease receivables. Interest expenses and other similar expenses include interest paid on deposits from customers, deposits from banks, debt securities issued and other financial liabilities in all measurement categories of financial liabilities and interest paid on lease liabilities. Net interest income also includes interest on derivative financial instruments. Interest income also includes modification gains and losses recognised on financial assets in Stage 1. Further, the unamortised balance of the origination fees/transaction costs upon derecognition of assets in Stage 1 and 2 considered in the effective interest rate is presented as interest income at the derecognition date. in EUR million 1-12 19 1-12 20
Financial assets at AC 5,342.1 4,921.4
Financial assets at FVOCI 201.9 186.6
Interest income 5,544.0 5,107.9
Non-trading financial assets at FVPL 63.4 60.8
Financial assets HfT 1,479.7 1,200.5
Hedge accounting derivatives, interest rate risk -59.1 -33.6
Other assets 123.0 119.7
Negative interest from financial liabilities 48.2 114.3
Other similar income 1,655.2 1,461.7
Interest and other similar income 7,199.2 6,569.7
Financial liabilities at AC -1,054.9 -621.2
Interest expenses -1,054.9 -621.2
Financial liabilities at FVPL -411.5 -346.7
Financial liabilities HfT -1,010.2 -855.4
Hedge accounting derivatives, interest rate risk 152.2 142.1
Other liabilities -52.5 -31.8
Negative interest from financial assets -75.5 -81.8
Other similar expenses -1,397.5 -1,173.6
Interest and other similar expenses -2,452.3 -1,794.8
Net interest income 4,746.8 4,774.8
An amount of EUR 78.4 million (2019: EUR 80.9 million) relating to impaired financial assets is included in interest income. In addition modification gains or losses of financial instruments allocated to Stage 1 in the amount of EUR -36.5 million (2019: EUR 4.7 million) is reported in line item ‘Financial assets at AC’. The amounts disclosed in the line items ‘Negative interest from financial liabilities’ and ‘Negative interest from financial assets’ relate to the interbank business, deposits and refinancing with central banks only. Interest expenses on financial liabilities at AC include also catch-up gains from TLTRO III in the amount of EUR 8.0 million (2019: EUR 0.0 million). For more details refer to Note 19 Financial liabilities at amortised costs.

140
3. Net fee and commission income Erste Group earns fee and commission income from a diverse range of services that it provides to its customers. The determination of the timing and amount of income recognition follows the five step model of IFRS 15. Fee and commission income is measured based on the consideration specified in the contract with a customer. Erste Group recognises revenue when it transfers control over a service to a customer. Fees earned for the provision of services over a period of time are accrued over that period. These fees include commitment fees, guarantee fees and other fees from lending business, commission income from asset management, custody and other management and advisory fees as well as fees from insurance brokerage, building society brokerage and foreign exchange transactions. Payment services partly include fees for services satisfied over a period of time like periodic card fees. Fee income earned from providing transaction services, such as arranging the acquisition and sale of shares or other securities on behalf of customers or foreign exchange transactions, as well as commission income earned from services such as the sale of collective investments and insurance products, are recognised upon completion of the underlying transaction. Payment services partly include transaction based fees like withdrawal fees. A contract with a customer that results in the recognition of a financial instrument in the Group’s financial statements may be partially in the scope of IFRS 9 and partially in the scope of IFRS 15. If this is the case, then Erste Group first applies IFRS 9 to separate and measure the part of the contract that is in the scope of IFRS 9 and then applies IFRS 15 to the residual. Fees and commission income that are integral to the effective interest rate of a financial instrument are in the scope of IFRS 9 and are included in the net interest income.
1-12 19 1-12 20
in EUR million Income Expenses Income Expenses
Securities 206.5 -40.1 242.7 -40.6
Issues 45.5 -8.5 35.9 -1.0
Transfer orders 147.2 -30.3 194.1 -38.3
Other 13.8 -1.4 12.7 -1.3
Clearing and settlement 1.5 -2.4 1.4 -3.2
Asset management 376.0 -41.7 401.2 -39.5
Custody 107.0 -20.0 106.5 -21.4
Fiduciary transactions 2.1 0.0 1.1 -0.1
Payment services 1,137.4 -187.6 1,090.2 -186.8
Card business 374.3 -148.4 334.1 -147.5
Other 763.1 -39.1 756.1 -39.3
Customer resources distributed but not managed 241.4 -14.9 228.0 -7.7
Collective investment 11.3 -1.6 16.7 -1.5
Insurance products 186.9 -2.6 184.8 -2.6
Building society brokerage 14.5 -7.5 0.7 -0.9
Foreign exchange transactions 27.4 -1.5 24.4 -1.3
Other 1.4 -1.7 1.3 -1.3
Structured finance 0.0 -0.1 0.4 -0.1
Servicing fees from securitization activities 0.0 -0.2 0.0 -2.1
Lending business 197.1 -41.4 185.8 -38.6
Guarantees given, guarantees received 71.4 -4.4 74.8 -3.4
Loan commitments given, loan commitments received 21.7 -0.5 27.3 -0.8
Other lending business 104.1 -36.4 83.7 -34.4
Other 104.3 -24.9 97.1 -37.8
Total fee and commission income and expenses 2,373.5 -373.4 2,354.5 -377.7
Net fee and commission income 2,000.1 1,976.8
Asset management, custody and fiduciary transactions fees relate to fees earned by Erste Group on trust and other fiduciary activities in which Erste Group holds or invests assets on behalf of its customers and amount to EUR 447.9 million (2019: EUR 423.4 million). Net fee and commission income above include income of EUR 891.9 million (2019: EUR 354.6 million) relating to financial assets and financial liabilities not measured at FVPL. These figures exclude amounts incorporated in determining the effective interest rate on such financial assets and financial liabilities.
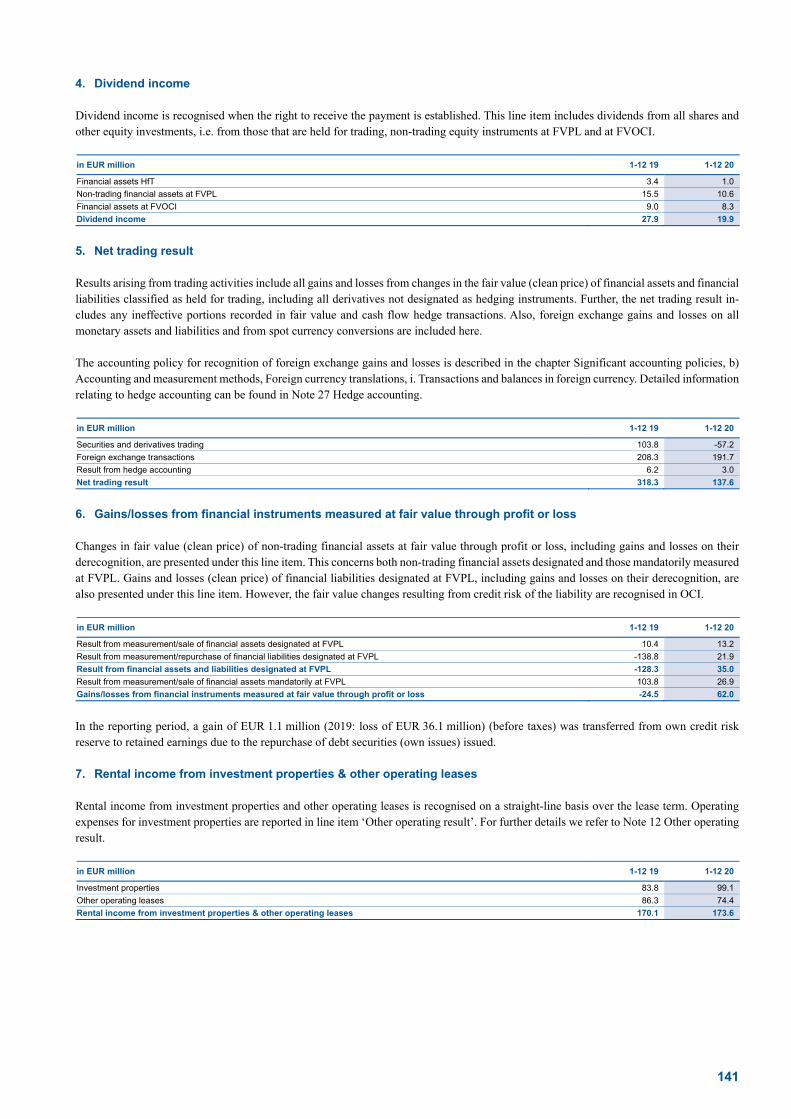
141
4. Dividend income Dividend income is recognised when the right to receive the payment is established. This line item includes dividends from all shares and other equity investments, i.e. from those that are held for trading, non-trading equity instruments at FVPL and at FVOCI. in EUR million 1-12 19 1-12 20
Financial assets HfT 3.4 1.0
Non-trading financial assets at FVPL 15.5 10.6
Financial assets at FVOCI 9.0 8.3
Dividend income 27.9 19.9
5. Net trading result Results arising from trading activities include all gains and losses from changes in the fair value (clean price) of financial assets and financial liabilities classified as held for trading, including all derivatives not designated as hedging instruments. Further, the net trading result in-cludes any ineffective portions recorded in fair value and cash flow hedge transactions. Also, foreign exchange gains and losses on all monetary assets and liabilities and from spot currency conversions are included here. The accounting policy for recognition of foreign exchange gains and losses is described in the chapter Significant accounting policies, b) Accounting and measurement methods, Foreign currency translations, i. Transactions and balances in foreign currency. Detailed information relating to hedge accounting can be found in Note 27 Hedge accounting.
in EUR million 1-12 19 1-12 20
Securities and derivatives trading 103.8 -57.2
Foreign exchange transactions 208.3 191.7
Result from hedge accounting 6.2 3.0
Net trading result 318.3 137.6
6. Gains/losses from financial instruments measured at fair value through profit or loss Changes in fair value (clean price) of non-trading financial assets at fair value through profit or loss, including gains and losses on their derecognition, are presented under this line item. This concerns both non-trading financial assets designated and those mandatorily measured at FVPL. Gains and losses (clean price) of financial liabilities designated at FVPL, including gains and losses on their derecognition, are also presented under this line item. However, the fair value changes resulting from credit risk of the liability are recognised in OCI.
in EUR million 1-12 19 1-12 20
Result from measurement/sale of financial assets designated at FVPL 10.4 13.2
Result from measurement/repurchase of financial liabilities designated at FVPL -138.8 21.9
Result from financial assets and liabilities designated at FVPL -128.3 35.0
Result from measurement/sale of financial assets mandatorily at FVPL 103.8 26.9
Gains/losses from financial instruments measured at fair value through profit or loss -24.5 62.0
In the reporting period, a gain of EUR 1.1 million (2019: loss of EUR 36.1 million) (before taxes) was transferred from own credit risk reserve to retained earnings due to the repurchase of debt securities (own issues) issued. 7. Rental income from investment properties & other operating leases Rental income from investment properties and other operating leases is recognised on a straight-line basis over the lease term. Operating expenses for investment properties are reported in line item ‘Other operating result’. For further details we refer to Note 12 Other operating result.
in EUR million 1-12 19 1-12 20
Investment properties 83.8 99.1
Other operating leases 86.3 74.4
Rental income from investment properties & other operating leases 170.1 173.6
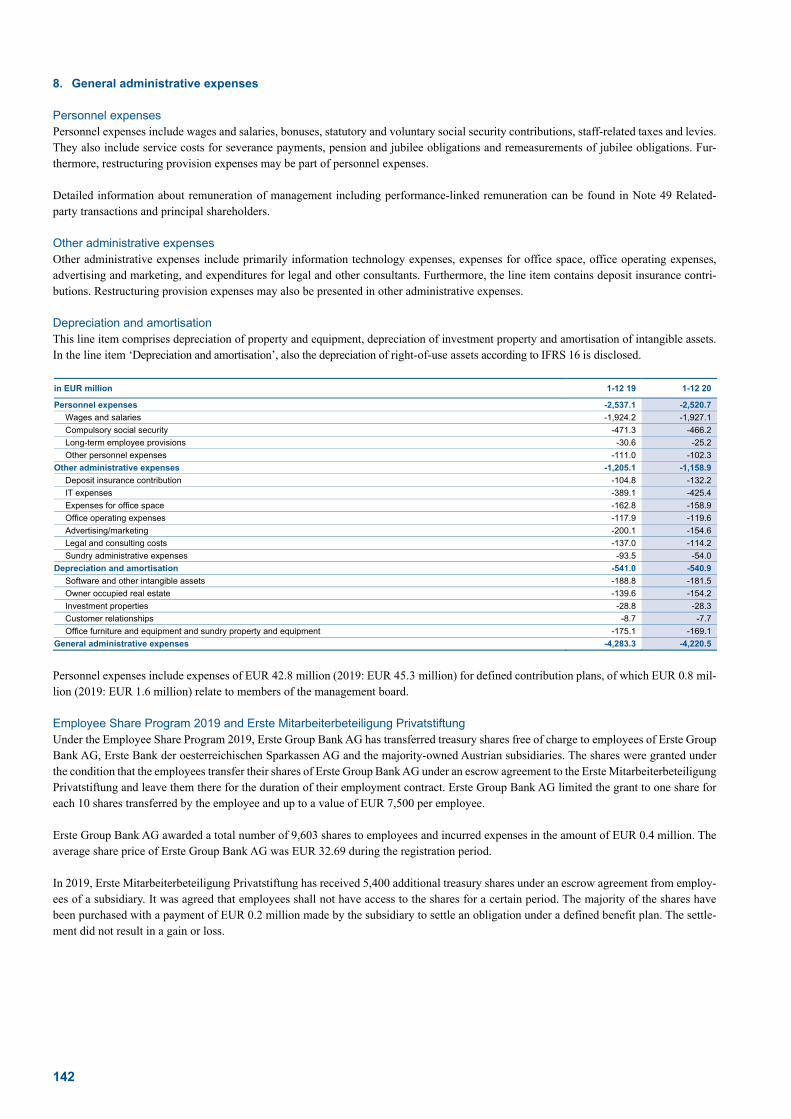
142
8. General administrative expenses Personnel expenses Personnel expenses include wages and salaries, bonuses, statutory and voluntary social security contributions, staff-related taxes and levies. They also include service costs for severance payments, pension and jubilee obligations and remeasurements of jubilee obligations. Fur-thermore, restructuring provision expenses may be part of personnel expenses. Detailed information about remuneration of management including performance-linked remuneration can be found in Note 49 Related-party transactions and principal shareholders. Other administrative expenses Other administrative expenses include primarily information technology expenses, expenses for office space, office operating expenses, advertising and marketing, and expenditures for legal and other consultants. Furthermore, the line item contains deposit insurance contri-butions. Restructuring provision expenses may also be presented in other administrative expenses. Depreciation and amortisation This line item comprises depreciation of property and equipment, depreciation of investment property and amortisation of intangible assets. In the line item ‘Depreciation and amortisation’, also the depreciation of right-of-use assets according to IFRS 16 is disclosed. in EUR million 1-12 19 1-12 20
Personnel expenses -2,537.1 -2,520.7
Wages and salaries -1,924.2 -1,927.1
Compulsory social security -471.3 -466.2
Long-term employee provisions -30.6 -25.2
Other personnel expenses -111.0 -102.3
Other administrative expenses -1,205.1 -1,158.9
Deposit insurance contribution -104.8 -132.2
IT expenses -389.1 -425.4
Expenses for office space -162.8 -158.9
Office operating expenses -117.9 -119.6
Advertising/marketing -200.1 -154.6
Legal and consulting costs -137.0 -114.2
Sundry administrative expenses -93.5 -54.0
Depreciation and amortisation -541.0 -540.9
Software and other intangible assets -188.8 -181.5
Owner occupied real estate -139.6 -154.2
Investment properties -28.8 -28.3
Customer relationships -8.7 -7.7
Office furniture and equipment and sundry property and equipment -175.1 -169.1
General administrative expenses -4,283.3 -4,220.5
Personnel expenses include expenses of EUR 42.8 million (2019: EUR 45.3 million) for defined contribution plans, of which EUR 0.8 mil-lion (2019: EUR 1.6 million) relate to members of the management board. Employee Share Program 2019 and Erste Mitarbeiterbeteiligung Privatstiftung Under the Employee Share Program 2019, Erste Group Bank AG has transferred treasury shares free of charge to employees of Erste Group Bank AG, Erste Bank der oesterreichischen Sparkassen AG and the majority-owned Austrian subsidiaries. The shares were granted under the condition that the employees transfer their shares of Erste Group Bank AG under an escrow agreement to the Erste Mitarbeiterbeteiligung Privatstiftung and leave them there for the duration of their employment contract. Erste Group Bank AG limited the grant to one share for each 10 shares transferred by the employee and up to a value of EUR 7,500 per employee. Erste Group Bank AG awarded a total number of 9,603 shares to employees and incurred expenses in the amount of EUR 0.4 million. The average share price of Erste Group Bank AG was EUR 32.69 during the registration period. In 2019, Erste Mitarbeiterbeteiligung Privatstiftung has received 5,400 additional treasury shares under an escrow agreement from employ-ees of a subsidiary. It was agreed that employees shall not have access to the shares for a certain period. The majority of the shares have been purchased with a payment of EUR 0.2 million made by the subsidiary to settle an obligation under a defined benefit plan. The settle-ment did not result in a gain or loss.

143
Average number of employees during the financial period (weighted according to the level of employment) 1-12 19 1-12 20
Austria 16,293 16,144
Erste Group Bank AG, Erste Bank Oesterreich and subsidiaries 9,107 9,027
Haftungsverbund savings banks 7,187 7,117
Outside Austria 31,210 31,084
Česká spořitelna Group 9,873 9,892
Banca Comercială Română Group 6,951 6,729
Slovenská sporiteľňa Group 4,068 3,931
Erste Bank Hungary Group 3,134 3,218
Erste Bank Croatia Group 3,300 3,309
Erste Bank Serbia Group 1,143 1,173
Savings banks subsidiaries 1,610 1,616
Other subsidiaries and foreign branch offices 1,130 1,217
Total 47,503 47,229
9. Gains/losses from derecognition of financial assets measured at amortised cost This line item includes selling and other derecognition gains or losses on financial assets measured at amortised cost. However, if such gains/losses relate to derecognition of financial assets in Stage 3, they are included in the line item ‘Impairment result from financial instruments’. in EUR million 1-12 19 1-12 20
Gains from derecognition of financial assets at AC 5.1 8.0
Losses from derecognition of financial assets at AC -4.1 -1.2
Gains/losses from derecognition of financial assets measured at amortised cost 0.9 6.8
10. Other gains/losses from derecognition of financial instruments not measured at fair value through profit or loss This line item includes selling and other derecognition gains or losses on financial assets at FVOCI, financial liabilities measured at amor-tised cost and other financial instruments not measured at FVPL, such as finance lease receivables or financial guarantees. However, if such gains/losses relate to financial assets in Stage 3 they are included in the line item ‘Impairment result from financial instruments’.
in EUR million 1-12 19 1-12 20
Sale of financial assets at FVOCI 6.2 1.2
Sale of financial lease receivables 0.1 0.0
Derecognition of financial liabilities at AC 17.2 -1.6
Other gains/losses from derecognition of financial instruments not measured at fair value through profit or loss 23.5 -0.4
11. Impairment result from financial instruments Net impairment losses on financial instruments comprise impairment losses and reversals of impairment on all kinds of financial instruments, to which the IFRS 9 expected credit loss impairment model applies. The impairment result also includes recoveries on written-off financial assets. Modification gains and losses recognised on financial assets in Stage 2 and Stage 3 and POCI assets are also included in this line item. Moreover, gains/losses from derecognition of financial assets in Stage 3 and POCI assets are presented as part of the impairment result. in EUR million 1-12 19 1-12 20
Financial assets at FVOCI -4.2 -11.0
Financial assets at AC -112.5 -1,115.7
Net allocation to credit loss allowances -227.8 -1,219.6
Direct write-offs -35.7 -27.2
Recoveries recorded directly to the income statement 154.0 140.4
Modification gains or losses -3.0 -9.3
Finance lease receivables 7.4 -8.9
Credit loss allowances for loan commitments and financial guarantees given 70.0 -159.2
Impairment result from financial instruments -39.2 -1,294.8
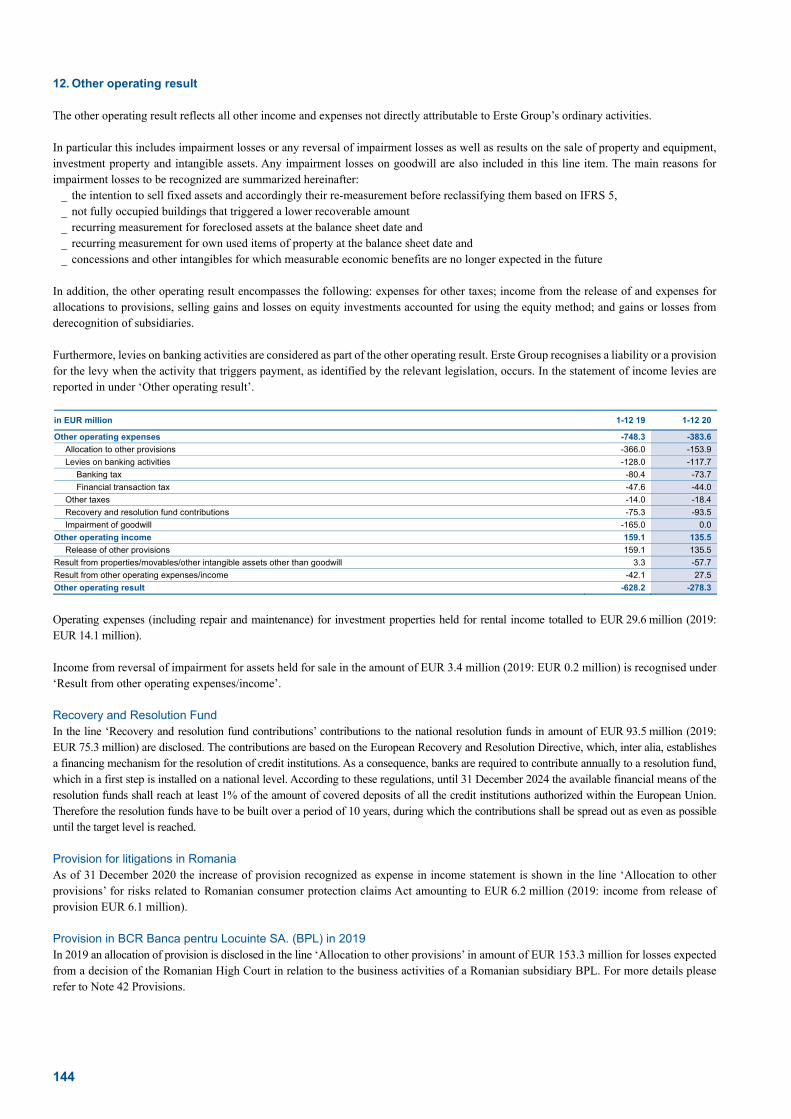
144
12. Other operating result The other operating result reflects all other income and expenses not directly attributable to Erste Group’s ordinary activities. In particular this includes impairment losses or any reversal of impairment losses as well as results on the sale of property and equipment, investment property and intangible assets. Any impairment losses on goodwill are also included in this line item. The main reasons for impairment losses to be recognized are summarized hereinafter:
_ the intention to sell fixed assets and accordingly their re-measurement before reclassifying them based on IFRS 5, _ not fully occupied buildings that triggered a lower recoverable amount _ recurring measurement for foreclosed assets at the balance sheet date and _ recurring measurement for own used items of property at the balance sheet date and _ concessions and other intangibles for which measurable economic benefits are no longer expected in the future
In addition, the other operating result encompasses the following: expenses for other taxes; income from the release of and expenses for allocations to provisions, selling gains and losses on equity investments accounted for using the equity method; and gains or losses from derecognition of subsidiaries. Furthermore, levies on banking activities are considered as part of the other operating result. Erste Group recognises a liability or a provision for the levy when the activity that triggers payment, as identified by the relevant legislation, occurs. In the statement of income levies are reported in under ‘Other operating result’. in EUR million 1-12 19 1-12 20
Other operating expenses -748.3 -383.6
Allocation to other provisions -366.0 -153.9
Levies on banking activities -128.0 -117.7
Banking tax -80.4 -73.7
Financial transaction tax -47.6 -44.0
Other taxes -14.0 -18.4
Recovery and resolution fund contributions -75.3 -93.5
Impairment of goodwill -165.0 0.0
Other operating income 159.1 135.5
Release of other provisions 159.1 135.5
Result from properties/movables/other intangible assets other than goodwill 3.3 -57.7
Result from other operating expenses/income -42.1 27.5
Other operating result -628.2 -278.3
Operating expenses (including repair and maintenance) for investment properties held for rental income totalled to EUR 29.6 million (2019: EUR 14.1 million). Income from reversal of impairment for assets held for sale in the amount of EUR 3.4 million (2019: EUR 0.2 million) is recognised under ‘Result from other operating expenses/income’. Recovery and Resolution Fund In the line ‘Recovery and resolution fund contributions’ contributions to the national resolution funds in amount of EUR 93.5 million (2019: EUR 75.3 million) are disclosed. The contributions are based on the European Recovery and Resolution Directive, which, inter alia, establishes a financing mechanism for the resolution of credit institutions. As a consequence, banks are required to contribute annually to a resolution fund, which in a first step is installed on a national level. According to these regulations, until 31 December 2024 the available financial means of the resolution funds shall reach at least 1% of the amount of covered deposits of all the credit institutions authorized within the European Union. Therefore the resolution funds have to be built over a period of 10 years, during which the contributions shall be spread out as even as possible until the target level is reached. Provision for litigations in Romania As of 31 December 2020 the increase of provision recognized as expense in income statement is shown in the line ‘Allocation to other provisions’ for risks related to Romanian consumer protection claims Act amounting to EUR 6.2 million (2019: income from release of provision EUR 6.1 million). Provision in BCR Banca pentru Locuinte SA. (BPL) in 2019 In 2019 an allocation of provision is disclosed in the line ‘Allocation to other provisions’ in amount of EUR 153.3 million for losses expected from a decision of the Romanian High Court in relation to the business activities of a Romanian subsidiary BPL. For more details please refer to Note 42 Provisions.

145
Impairment of Goodwill in 2019 In Slovakia, the extension and increase of banking tax due to an amendment of the respective law during the year 2019 led to higher projected future expenses. This resulted in a decrease of the budgeted results and consequently the goodwill for Slovenská sporiteľňa was fully impaired in the amount of EUR 165.0 million in financial year 2019. According to IAS 36 it is not allowed to reverse an impairment loss for goodwill in forthcoming periods, even if the reason for impairment is no longer applicable. 13. Taxes on income Current and deferred taxes are recognised as income or an expense and included in profit or loss for the period. However, they are recognised in other comprehensive income or directly in equity if they arise from a transaction or event which itself is recognised in OCI or equity. Current tax Current tax assets and liabilities for the current and prior years are measured at the amount expected to be recovered from or paid to the taxation authorities. The tax rates and tax laws used to compute the amounts are those enacted by the balance sheet date. Coupon payments made to the holders of Additional Tier 1 equity instruments issued by Erste Group Bank AG are tax-deductible interest payments under the Austrian Tax Regulations. Since the AT1 coupons are considered as distributions of profit the income tax effects are recognised in profit or loss. Deferred tax Deferred tax is recognised for temporary differences between the tax bases of assets and liabilities and their carrying amounts as of the balance sheet date. Deferred tax liabilities are recognised for all taxable temporary differences. Deferred tax assets are recognised for all deductible temporary differences and unused tax losses to the extent that it is probable that taxable profit will be available against which the deductible temporary differences and carry forward of unused tax losses can be utilised. Deferred taxes are not recognised on temporary differences arising from the initial recognition of goodwill. The carrying amount of deferred tax assets is reviewed at each balance sheet date and reduced to the extent that it is no longer probable that sufficient taxable profit will be available to allow all or part of the deferred tax asset to be utilised. Unrecognised deferred tax assets are reassessed at each balance sheet date and are recognised to the extent that it has become probable that future taxable profit will allow the deferred tax asset to be recovered. Deferred tax assets and liabilities are measured at the tax rates (and tax laws) that have been enacted or substantively enacted as at balance sheet date and are expected to apply when the temporary differences are reversed. For subsidiaries, the local tax environments are considered. Deferred tax assets and deferred tax liabilities are offset if a legally enforceable right to offset exists and the deferred taxes relate to the same taxation authority. Significant accounting judgements, assumptions and estimates The determination of tax bases are underlying a general level of uncertainty by nature, as interpretation of tax legislation might require judgement. Deferred tax assets are recognised in respect of tax losses and deductible temporary differences to the extent that it is probable that taxable profit will be available against which they can be utilised. Judgement is required to determine the amount of deferred tax assets that can be recognised, based upon the likely timing and level of future taxable profits, together with future tax planning strategies. For this purpose a planning period of 5 years is used. Taxes on income are made up of current taxes on income calculated in each of the Group companies based on the results reported for tax purposes, corrections to taxes on income for previous years and the change in deferred taxes.
in EUR million 1-12 19 1-12 20
Current tax expense/income -465.7 -346.0
current period -461.9 -353.1
prior period -3.8 7.2
Deferred tax expense/income 47.0 3.4
current period 51.4 10.0
prior period -4.4 -6.6
Total -418.7 -342.5
The following table reconciles the income taxes reported in the income statement to the pre-tax result from continuing operations multiplied by the nominal Austrian tax rate.
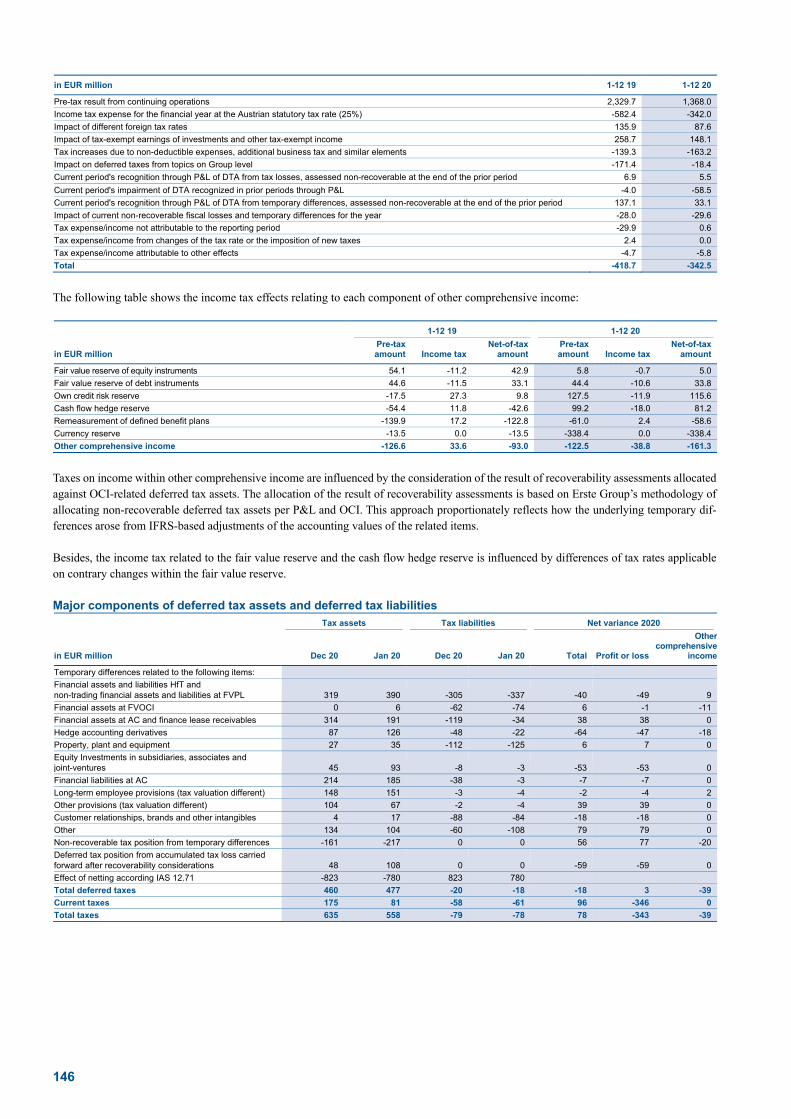
146
in EUR million 1-12 19 1-12 20
Pre-tax result from continuing operations 2,329.7 1,368.0
Income tax expense for the financial year at the Austrian statutory tax rate (25%) -582.4 -342.0
Impact of different foreign tax rates 135.9 87.6
Impact of tax-exempt earnings of investments and other tax-exempt income 258.7 148.1
Tax increases due to non-deductible expenses, additional business tax and similar elements -139.3 -163.2
Impact on deferred taxes from topics on Group level -171.4 -18.4
Current period's recognition through P&L of DTA from tax losses, assessed non-recoverable at the end of the prior period 6.9 5.5
Current period's impairment of DTA recognized in prior periods through P&L -4.0 -58.5
Current period's recognition through P&L of DTA from temporary differences, assessed non-recoverable at the end of the prior period 137.1 33.1
Impact of current non-recoverable fiscal losses and temporary differences for the year -28.0 -29.6
Tax expense/income not attributable to the reporting period -29.9 0.6
Tax expense/income from changes of the tax rate or the imposition of new taxes 2.4 0.0
Tax expense/income attributable to other effects -4.7 -5.8
Total -418.7 -342.5
The following table shows the income tax effects relating to each component of other comprehensive income:
1-12 19 1-12 20
in EUR million Pre-tax amount Income tax
Net-of-tax amount
Pre-tax amount Income tax
Net-of-tax amount
Fair value reserve of equity instruments 54.1 -11.2 42.9 5.8 -0.7 5.0
Fair value reserve of debt instruments 44.6 -11.5 33.1 44.4 -10.6 33.8
Own credit risk reserve -17.5 27.3 9.8 127.5 -11.9 115.6
Cash flow hedge reserve -54.4 11.8 -42.6 99.2 -18.0 81.2
Remeasurement of defined benefit plans -139.9 17.2 -122.8 -61.0 2.4 -58.6
Currency reserve -13.5 0.0 -13.5 -338.4 0.0 -338.4
Other comprehensive income -126.6 33.6 -93.0 -122.5 -38.8 -161.3
Taxes on income within other comprehensive income are influenced by the consideration of the result of recoverability assessments allocated against OCI-related deferred tax assets. The allocation of the result of recoverability assessments is based on Erste Group’s methodology of allocating non-recoverable deferred tax assets per P&L and OCI. This approach proportionately reflects how the underlying temporary dif-ferences arose from IFRS-based adjustments of the accounting values of the related items. Besides, the income tax related to the fair value reserve and the cash flow hedge reserve is influenced by differences of tax rates applicable on contrary changes within the fair value reserve. Major components of deferred tax assets and deferred tax liabilities
Tax assets Tax liabilities Net variance 2020
in EUR million Dec 20 Jan 20 Dec 20 Jan 20 Total Profit or loss
Other comprehensive
income
Temporary differences related to the following items:
Financial assets and liabilities HfT and non-trading financial assets and liabilities at FVPL 319 390 -305 -337 -40 -49 9
Financial assets at FVOCI 0 6 -62 -74 6 -1 -11
Financial assets at AC and finance lease receivables 314 191 -119 -34 38 38 0
Hedge accounting derivatives 87 126 -48 -22 -64 -47 -18
Property, plant and equipment 27 35 -112 -125 6 7 0
Equity Investments in subsidiaries, associates and joint-ventures 45 93 -8 -3 -53 -53 0
Financial liabilities at AC 214 185 -38 -3 -7 -7 0
Long-term employee provisions (tax valuation different) 148 151 -3 -4 -2 -4 2
Other provisions (tax valuation different) 104 67 -2 -4 39 39 0
Customer relationships, brands and other intangibles 4 17 -88 -84 -18 -18 0
Other 134 104 -60 -108 79 79 0
Non-recoverable tax position from temporary differences -161 -217 0 0 56 77 -20
Deferred tax position from accumulated tax loss carried forward after recoverability considerations 48 108 0 0 -59 -59 0
Effect of netting according IAS 12.71 -823 -780 823 780
Total deferred taxes 460 477 -20 -18 -18 3 -39
Current taxes 175 81 -58 -61 96 -346 0
Total taxes 635 558 -79 -78 78 -343 -39

147
Tax assets Tax liabilities Net variance 2019
in EUR million Dec 19 Jan 19 Dec 19 Jan 19 Total Profit or loss
Other comprehensive
income
Temporary differences related to the following items:
Financial assets and liabilities HfT and non-trading financial assets and liabilities at FVPL 390 371 -337 -341 24 5 18
Financial assets at FVOCI 6 8 -74 -105 30 41 -11
Financial assets at AC and finance lease receivables 191 199 -34 -11 -31 -31 0
Hedge accounting derivatives 126 161 -22 -46 -11 -22 12
Property, plant and equipment 35 47 -126 -26 -111 -111 0
Equity Investments in subsidiaries, associates and joint-ventures 93 232 -3 -2 -139 -139 0
Financial liabilities at AC 185 37 -3 -1 146 146 0
Long-term employee provisions (tax valuation different) 151 122 -4 -3 28 11 17
Other provisions (tax valuation different) 67 75 -4 -4 -8 -8 0
Customer relationships, brands and other intangibles 17 18 -84 -73 -12 -12 0
Other 104 142 -108 -134 -11 -11 0
Non-recoverable tax position from temporary differences -217 -314 0 0 97 97 0
Deferred tax position from accumulated tax loss carried forward after recoverability considerations 108 29 0 0 79 79 0
Effect of netting according IAS 12.71 -780 -724 780 724 0 0 0
Total deferred taxes 477 402 -18 -23 80 44 36
Current taxes 81 101 -61 -99 -466 -466 0
Total taxes 558 504 -78 -122 -386 -422 36
The deferred tax assets and liabilities are presented prior to subsidiary-level balance-sheet netting of attributable gross deferred tax assets and gross deferred tax liabilities. The amounts shown in the table are gross amounts before recoverability assessments except for the position deferred tax assets resulting from tax loss carry-forward. The remaining non-recoverable amounts are considered in line ‘Non-recoverable tax position from temporary differences’ in the table. The position ‘Other’ comprises all deferred tax positions not being shown as separate positions in the table above. Out of the total net deferred tax decrease of EUR 18 million (2019: increase EUR 80 million) an amount of EUR 3 million (2019: EUR 47 million) is reflected as deferred tax income in the Group’s income statement for the year 2020, whilst an expense amount of EUR 39 million (2019: income EUR 34 million) represents the impact in the Group’s other comprehensive income for the year. Furthermore, a deferred tax expense of EUR 18 million (2019: EUR 11 million) representing accumulated OCI in respect of deferred tax recognized for cumulative changes in the fair value of FVOCI equity instruments sold during the year has been transferred into retained earnings, conse-quent to the related temporary differences reversing upon sale. Similarly in 2019, deferred tax income in the amount of EUR 9 million representing accumulated OCI in respect of deferred tax recognized for cumulative changes in own credit risk attributable to own issues repurchased during the year has been transferred into retained earnings, consequent to the related temporary differences reversing upon repurchase. In addition to this, in 2019 further tax expense in amount of EUR 3 million were recognised directly in retained earnings and reported in column ‘Profit or loss’. The Group's consolidated deferred tax asset position in amount of EUR 460 million as of 31 December 2020 (2019: EUR 475 million) is expected to be recoverable in the foreseeable future. This is also expected to be the case for deferred tax assets exceeding their deferred tax liabilities by an amount of EUR 15 million as of 31 December 2020 (2019: EUR 11 million) incurred by subsidiaries reporting losses in the current or prior period. These expectations result from year-end recoverability assessments undertaken by the Group's entities, either at individual level, or at relevant tax group level. Such assessments are comparing net temporary deductible differences and available fiscal losses at year-end - after offsetting with deferred tax liabilities at individual level or at relevant tax group level - with fiscal profit forecasts for a group-wide unified and unchanged time horizon of a maximum 5 years depending on the fiscal jurisdiction and applicable facts and circumstances. If the result of these assessments is negative, the deferred tax asset positions are correspondingly not recorded and the already existing deferred tax asset positions are correspondingly depreciated. In accordance with IAS 12.39, no deferred tax liabilities were recognized for temporary differences relating to investments in subsidiaries with an amount of EUR 2,021 million (2019: EUR 1,990 million), as they are not expected to reverse in the foreseeable future. As of 31 December 2020, no deferred tax assets were recognized for tax loss carry-forward and deductible temporary differences with a total amount of EUR 4,354 million (2019: EUR 4,060 million), of which EUR 3,225 million (2019: EUR 3,023 million) relates to tax loss carry-forward, as they are not expected to be realized in the foreseeable future. The figure comprises an amount of EUR 485 million (2019: EUR 508 million) representing temporary differences in connection with investments in subsidiaries no deferred tax assets have been rec-ognized for in accordance with IAS 12.44. From the total of the not recorded deferred tax assets related to tax loss carry-forward in the following period EUR 1 million will expire (2019: EUR 8 million) and in later periods EUR 5 million (2019: EUR 35 million), EUR 788 million (2019: EUR 669 million) will not expire.

148
14. Appropriation of profit In the reporting period, Erste Group Bank AG posted a post-tax loss of EUR 118.4 million under the Austrian accounting regulations, which decreased its distributable capital accordingly (2019 post-tax profit: EUR 1,327.1 million). . On 15 December 2020 the European Central Bank (ECB) has issued a recommendation in respect of dividend payouts. The management board of Erste Group will propose a 2020 dividend, in line with the ECB recommendation, of EUR 0.5 per share to the 2021 AGM for payment in May 2021. Furthermore, an additional reserve of EUR 1.0 per share was created, for payment once the ECB recommendation is withdrawn and subject to profitability and capital performance. On 10 November 2020 the annual general meeting resolved to pay a dividend of EUR 0.75 per share for the business year of 2019 (appro-priation of net profit), conditional upon no regulatory ECB recommendation to refrain from such payments or no other legal restrictions being in force prohibiting such distributions on 8 February 2021. Based on the ECB recommendations conditions to pay dividend of EUR 0.75 per share have not been met as of 8 February 2021 and no dividend was distributed. As a pay out is not possible, the dividend is allocated to retained earnings according to the resolution taken on the annual general meeting on 10 November 2020.

149
Financial instruments – Significant accounting policies
A financial instrument is any contract giving rise to a financial asset of one party and a financial liability or equity instrument of another party. In accordance with IFRS 9, all financial assets and liabilities – which also include derivative financial instruments – have to be recognised on the balance sheet and measured in accordance with their assigned categories. Measurement methods for financial instruments Measurement of financial assets and financial liabilities is subject to two primary measurement methods. i. Amortised cost and effective interest rate
Amortised cost is the amount at which the financial asset or financial liability is measured at initial recognition minus the principal repay-ments, plus or minus the cumulative amortisation using the effective interest method of any difference between that initial amount and the maturity amount. For financial assets the amount is adjusted for any loss allowance. The effective interest rate (‘EIR’) is the rate that exactly discounts estimated future cash payments or receipts through the expected life of the financial asset or financial liability to the gross carrying amount of the financial asset (i.e. its amortised cost before adjusting for any loss allowance) or to the amortised cost of the financial liability. The estimated cash flows consider all the contractual terms of the financial instrument but disregard the expected credit losses. The calculation includes transaction costs, origination fees that are an integral part of the EIR and all other premiums and discounts to the par amount. For purchased or originated credit-impaired financial assets (‘POCI’, see part ‘Impairment of financial instruments’), credit-adjusted EIR is used. It is the rate that exactly discounts the estimated future cash flows which consider expected credit losses to the amortised cost of a financial asset. The EIR is used for recognition of interest income and interest expense. Interest income is calculated in the following way:
_ EIR applied to the gross carrying amount for financial assets that are not credit-impaired (Stage 1 and Stage 2, see part ‘Impairment of financial instruments’);
_ EIR applied to the amortised cost for financial assets that are credit-impaired (Stage 3, see part ‘Impairment of financial instruments’); and _ credit-adjusted EIR applied to the amortised cost for POCI financial assets.
Interest expense is calculated by applying the EIR to the amortised cost of a financial liability. ii. Fair value
Fair value is the price that would be received if an asset were sold or paid if a liability were transferred in an orderly transaction between market participants on the measurement date. The definition also applies to fair value measurements of non-financial assets and liabilities. Details on valuation techniques applied for fair value measurement and on the fair value hierarchy are disclosed in Note 26 Fair value of financial instruments. Initial recognition and measurement i. Initial recognition
Financial instruments are initially recognised when Erste Group becomes a party to the contractual provisions of the instrument. Regular way (spot) purchases and sales of financial assets are recognised at the settlement date, which is the date that an asset is delivered. ii. Initial measurement Financial instruments are measured initially at their fair value including transaction costs (except for financial instruments at fair value through profit or loss, for which transaction costs are recognised directly in profit or loss). In most cases, the fair value at initial recognition equals the transaction price, i.e. the price transferred to originate or acquire a financial asset or the price received to issue or incur a financial liability. Classification and subsequent measurement of financial assets In accordance with IFRS 9, the classification and subsequent measurement of financial assets depend on the following two criteria: (i) The business model for managing the financial assets – the assessment is focused on whether the financial asset is part of a portfolio in
which the assets are held in order to collect contractual cash flows, to both collect the contractual cash flows and sell the assets or they are held in other business models.
(ii) The cash flow characteristics of the financial assets – the assessment is focused on whether the contractual terms of the financial asset give rise on specified dates to cash flows that are solely payments of principal and interest (‘SPPI’) on the principal amount outstanding.
Application of these criteria leads to classification of financial assets into three measurement categories described in the respective note.
_ Financial assets at amortised cost _ Financial assets at fair value through other comprehensive income _ Financial assets at fair value through profit or loss

150
Classification and subsequent measurement of financial liabilities Financial liabilities are classified as measured at amortised cost unless they are measured at fair value through profit or loss. Further details on financial liabilities at amortised cost and financial liabilities at FVPL are in the respective notes: Note 19 Financial liabilities at amortised costs and Note 24 Financial liabilities at fair value through profit or loss. Impairment of financial instruments Erste Group recognises loss allowances for impairment on its debt instrument financial assets, other than those measured at FVPL, its lease receivables, and its off-balance credit risk exposures arising from financial guarantees and certain loan commitments. The impairment is based on expected credit losses whose measurement reflects:
_ an unbiased and probability-weighted amount that is determined by evaluating a range of possible outcomes; _ the time value of money; and _ reasonable and supportable information that is available without undue cost or effort at the reporting date about past events, current
conditions and forecasts of future economic conditions. The amount of the impairment loss is recognised as a loss allowance. For the purpose of the measurement of the amount of expected credit loss and recognition of interest income, Erste Group distinguishes between three stages of impairment. Stage 1 relates to financial instruments for which no significant increase in credit risk has been recorded since their initial recognition. The impairment is measured in the amount of the 12-month expected credit loss. Interest income is recognised by EIR applied to the gross carrying amount of the financial asset. Financial instruments in Stage 2 are subject to significant increase in credit risk since their initial recognition. The impairment is measured in the amount of the lifetime expected credit loss. Interest income is recognised by EIR applied to the gross carrying amount of the financial asset (as for Stage 1). Financial assets in Stage 3 are credit-impaired. In respect of applying the ‘credit-impaired’ concept of IFRS 9, Erste Group generally adopted the approach of aligning it with the regulatory concept of ‘default’ for lending exposures. The impairment for such financial assets is measured in the amount of lifetime expected credit loss. Interest income is recognised by EIR applied to the amortised cost (i.e. the net carrying amount) of the financial asset. From a balance sheet perspective, interest is accrued based on the financial assets’ gross carrying amount. The difference between the interest accrued on the assets and the interest income recognised is reflected through the allowance account (without impacting the impairment loss). More detailed information about identification of significant increases in credit risk including collective assessment, estimation techniques used to measure 12-month and lifetime expected credit losses and definition of default is provided in Note 34 Credit risk. For financial assets measured at amortised cost, the net carrying amount of the financial asset presented on the balance sheet is the difference between the gross carrying amount and the cumulative loss allowance. However, for financial assets measured at FVOCI, the loss allowance is recognised in the accumulated OCI, specifically under ‘Fair value reserve’ in the statement of changes in equity. Loss allowances for loan commitments and financial guarantees are presented under the balance sheet line item ‘Provisions’. For financial assets that are credit-impaired at initial recognition (POCI financial assets) lifetime expected credit losses are initially reflected in the credit-adjusted EIR. As a result, no loss allowance is recognised at inception. Subsequently, only adverse changes in lifetime expected credit losses after the initial recognition are recognised as loss allowance, whilst favourable changes are recognised as impairment gains increasing the gross carrying amount of the POCI financial assets. No impairment stages are distinguished for the POCI financial assets. In the statement of income, impairment losses and their reversals (gains) on all kinds of financial instruments are presented in the line item ‘Impairment result from financial instruments’. Write-offs Erste Group writes off a financial asset or a part of it when it has no reasonable expectations of recovering the respective cash flows. When performing the write-off, the gross carrying amount of the asset is reduced simultaneously with the related loss allowance balance. Erste Group has specified criteria for writing off the unrecoverable balances in its loan business. Write-off can result from forbearance measures whereby the bank contractually waives part of the existing balance in order to help the customers overcome financial difficulties and thus improve the prospects of recovering the remaining loan balance (normally this relates to going concern scenarios for corporate customers). In gone concern scenarios with corporate customers, write-offs of the unrecoverable exposure parts are triggered by enforcement activities such as filing or termination of legal proceedings (bankruptcy, liquidation, court case). Other write-off triggers may result from decisions about no enforcement due to worthlessness of the claim/collateral or generally from assessment that the receivable is economically lost. For retail customers, the non-recoverability and the timing and amounts of write-off crystallise during the collection process when it becomes evident that the amount due cannot be collected, e.g. due to ongoing bankruptcy proceedings. Residual uncollectable balances are written off after the collection process.

151
Derecognition of financial instruments including treatment of contractual modifications i. Derecognition of financial assets
A financial asset (or, where applicable, part of a financial asset or part of a group of similar financial assets) is derecognised when: _ the contractual rights to receive cash flows from the asset have expired; or _ Erste Group has transferred its rights to receive cash flows from the asset or has assumed an obligation to pay the received cash flows
in full without material delay to a third party under a ‘pass-through’ arrangement and either: _ it has transferred substantially all risks and rewards connected with ownership of the asset; or _ has neither transferred nor retained substantially all risks and rewards connected with ownership of the asset but has transferred
control of the asset. The difference between the carrying amount of the derecognised asset and the consideration received is presented in the statement of income in the line ‘Gains/losses from derecognition of financial assets measured at amortised cost’ or, for financial assets at FVOCI, in the line ‘Other gains/losses from derecognition of financial instruments not measured at fair value through profit or loss‘. For financial assets meas-ured at FVPL the derecognition gains or losses are recognised together with the measurement result in the lines ‘Net trading result’ or ‘Gains/losses from financial instruments measured at fair value through profit or loss’. ii. Derecognition criteria with respect to contractual modifications of financial assets
In the normal course of running its lending business and in agreement with the respective debtors, Erste Group may renegotiate or otherwise modify some terms or conditions of the underlying contracts. This can involve either market-driven commercial renegotiations or contrac-tual changes aimed at alleviating or preventing borrower’s financial difficulty. For the purpose of capturing the economic substance and financial effect of such contractual modifications, Erste Group has developed a set of criteria to assess whether or not the modified terms are substantially different from the original terms. Commercial interest rate adjustments fulfilling specific conditions do not trigger the modification significance assessment. Instead, they result in a recalculation of the EIR of related loans. Such interest rate adjustments relate to performing non-forborne lending agreements for which a prepayment/early termination option and a sufficiently competitive refinancing market exist. Furthermore, the costs that the debtor would incur in case of prepayment/early termination would have to be assessed as low. Such conditions introduce an implicit floating rate element to the contract. This kind of interest rate adjustments rarely applies to loan assets in Stage 2. Substantial modifications lead to derecognition of the original financial asset and initial recognition of the modified financial asset as a new financial instrument. They include following events:
_ change of the contractual counterparty (unless this is a formal change such as changes in legal name); _ change in the currency of the contract (unless the change results from exercising an embedded option in the original contract with pre-
agreed conditions of the change, or if the new currency is pegged to the original currency); _ introduction of a non-SPPI contractual feature (unless it is intended to improve recoveries from debtors by granting concessions sup-
porting them to recover from financial difficulties); and _ removal of a non-SPPI contractual feature.
Some derecognition criteria distinguish whether contractual modifications are applied to debtors facing financial difficulties. Application of certain modifications to debtors in financial difficulties is not considered as substantial since they are aimed at improving the prospects of the bank to recover the claims by tailoring the repayment schedules to specific financial conditions of those debtors. On the other hand, such contractual modifications applied to performing debtors may be considered as substantial enough to warrant the derecognition, as further detailed below. From this perspective, the following criteria lead to derecognition unless they are considered as forbearance measures or they are applied to customers in default or they trigger default (i.e. the derecognition occurs if the modification does not relate to financial difficulties):
_ repayment schedule changed in a way that the weighted remaining maturity of the assets is modified by more than 100% and at least two years compared to the original asset; or
_ change in timing/amount of contractual cash flows resulting in the present value of the modified cash flows (discounted at pre-modifi-cation effective interest rate) being different by more than 10% of the gross carrying amount of the asset immediately before the modi-fication (cumulative assessment considering all modifications occurring over the last twelve months);
If contractual modifications that qualify as forbearance measures or they are applied to customers in default or they trigger default (i.e. they relate to customers in financial difficulties) are so significant that they are qualitatively assessed as an extinguishment of original contractual rights, they result in derecognition. Examples of such modifications are:
_ a new agreement with materially different terms signed up as part of distressed restructuring following a standstill agreement suspending the rights of the original assets;
_ consolidation of multiple original loans into one with substantially different terms; or _ transformation of a revolving loan into non-revolving.
152
Contractual modifications leading to derecognition of the related original assets result in the initial recognition of new financial assets. If the debtor is in default or the significant modification leads to the default, then the new asset will be treated as POCI. The difference between the carrying amount of the derecognised asset and initial fair value of the new POCI asset is presented in the statement of income in the line ‘Impairment result from financial instruments’. If the debtor is not in default or the significant modification does not lead to default, the new asset recognised after derecognition of the original asset will be in Stage 1. For loans measured at amortised cost, the unamortised balance of the origination fees/transaction costs considered in the effective interest rate is presented in the line item ‘Interest income’ under ‘Net interest income’ at the derecognition date. The release of the credit loss allowance attached to the original asset at the date of that significant modification as well as the credit loss allowance recognised for the new asset are presented in the line ‘Impairment result from financial instruments’. The remaining difference is presented in the line ‘Gains/losses from derecognition of financial assets measured at amortised cost’. For financial assets measured at FVPL, irrespective of whether they are in default, the derecognition gains and losses are included in the same line items of the statement of income as their measurement result, i.e. in ‘Gains/losses from financial instruments measured at fair value through profit or loss’. For debt instrument assets not measured at FVPL that are subject to contractual modifications that do not result in derecognition, the gross carrying amount of the asset is adjusted against recognising a modification gain or loss in profit or loss. The modification gain or loss equals the difference between the gross carrying amount before the modification and the present value of the cash flows based on the modified terms discounted with the original EIR. In the statement of income, the modification gain or loss is presented in the line ‘Interest income’ under ‘Net interest income’ if the modification relates to financial assets in Stage 1. For financial assets in Stage 2 and 3 and POCI financial assets, the modification gain or loss is presented in the line ‘Impairment result from financial instruments’. However, to the extent that the contractual modification involves the bank giving up its rights of collecting cash flows in respect of an outstanding amount of the asset, such as waiving (part of) principal or accrued interest amount, it is treated as a write-off. iii. Derecognition of financial liabilities
A financial liability is derecognised when the obligation under the liability is discharged, cancelled or expires. This normally occurs when the liability is repaid or repurchased. In the statement of income, the difference between the carrying amount of the derecognised financial liability and the consideration paid is presented in the line ‘Other gains/losses from financial instruments not measured at fair value through profit or loss‘, ‘Gains/losses from financial instruments measured at fair value through profit or loss’ and ‘Net trading result’ depending on the measurement category of the derecognised financial liability. Significant accounting judgements, assumptions and estimates i. SPPI assessment
The assessment of whether the contractual cash flows of financial assets give rise to cash flows that are solely payments of principal and interest (SPPI) is subject to the application of significant judgements which rely on the guidance in IFRS 9. These judgements are crucial in the IFRS 9 classification and measurement process, as they determine whether the asset must be measured at FVPL or, depending on the business model assessment, at amortised cost or at FVOCI. When taking into consideration specific features of loans in the business of Erste Group, significant areas of judgement are prepayment fees, project financing loans and the benchmark test for loans with interest mismatches features. The assessment whether the prepayment fees applied to loans can be considered as a reasonable compensation for early terminations or prepayments is based on comparing the level of the fees with the economic costs incurred by the bank upon the early termination. For these purposes, Erste Group uses a quantitative test where the costs relate to the lost interest margin and the lost interest differential due to a potential decrease in the interest rates upon early termination or prepayment. The adequacy of the fees can also be defended on a qualitative basis, such as common market practice regarding the level of prepayment fees and their acceptance by authorities. For project financing loans Erste Group assesses whether they represent basic loan agreements rather than investments in the financed projects. In this respect, credit rating, level of collateralisation, existing sponsor guarantees and the extent of equity funding of the financed projects are considered. Interest mismatches features relate to floating rate financial assets where: - the reference rate’s (such as Euribor) tenor is different to the rate reset frequency, - time lags arise from interest rates fixed prior to the start of the interest period, or combinations of these features. For this purpose, Erste Group has developed a so called ‘benchmark test’ to assess whether the interest mismatch feature could result in contractual (undiscounted) cash flows that are significantly different from a benchmark deal which does not have the interest mismatch feature. For assets with interest mismatches resulting only from lagged rates (i.e. with no tenor mismatches), SPPI compliance is considered to be met based on a qualitative assessment if the time lag between the fixation of the rate and the start of the interest period does not exceed one month. Performing the quantitative benchmark test was particularly important upon transition to IFRS 9 as at 1 January 2018 for the portfolio existing at that time. Subsequently, the issuance of new loans with interest mismatch features was largely restricted so that a quantitative benchmark test applies only in exceptional cases.

153
ii. Business model assessment
For each SPPI-compliant financial asset at initial recognition, Erste Group must assess whether it is part of a business model where the assets are held in order to collect contractual cash flows, to both collect the contractual cash flows and sell the assets, or they are held in other business models. As a consequence, the critical aspect in distinguishing the business models is frequency and significance of sales of assets in the respective business model. Since asset allocation to business models is based on the initial assessment, it may happen that in subsequent periods cash flows are realised differently than originally expected, and a different measurement method may seem to be appro-priate. In accordance with IFRS 9, such subsequent changes do not generally lead to reclassifications or prior period error corrections in respect of existing financial assets. The new information on how cash flows are realised may, however, indicate that the business model, and thus the measurement method changes for newly acquired or newly originated financial assets. At Erste Group, certain sales or other derecognition events are considered as not contradicting the held to collect contractual cash flows business model. Examples are sales due to increases in credit risk, sales close to assets’ maturity, infrequent sales triggered by a non-recurring event (such as changes in regulatory or tax environment, major internal reorganisation or a business combination, severe liquidity crisis, etc.) or derecognitions resulting from replacements of bonds based on an issuer’s offer. Other kinds of sales carried out in the ‘held to collect’ business model are assessed retrospectively, and if they exceed certain quantitative thresholds, or whenever it is considered necessary with regard to new expectations, Erste Group performs a prospective test. If the outcome was that the carrying amount of assets expected to be sold over the expected life of the current business model portfolio, for reasons other than the cases above, exceeds 10% of the carrying amount of the portfolio, any new acquisitions or originations of assets would be classified in a different business model. iii. Impairment of financial instruments
The expected credit loss impairment model is inherently based on judgement since it requires assessment of significant increases in credit risk and measurement of expected credit losses without providing detailed guidance. In respect of significant increases in credit risk, Erste Group has determined specific assessment rules consisting of qualitative information and quantitative thresholds. Another area of complex-ity relates to establishing groups of similar assets when credit risk deterioration has to be assessed on a collective basis before specific information is available at individual instrument level. Measurement of expected credit losses involves complex models relying on historical statistics of probabilities of default and loss rates in case of defaults, their extrapolations in case of insufficient observations, individual estimates of credit-adjusted cash flows and probabilities of various scenarios including forward-looking information. In addition, the life of the instruments has to be modelled in respect of behavioural life of revolving credit facilities. Detailed disclosures about identification of significant increases in credit risk including collective assessment, estimation techniques used to measure 12-month and lifetime expected credit losses and definition of default is provided in Note 34 Credit risk,. The development of loan loss provisions is described in, Note 16 Financial assets at amortised cost, Note 18 Trade and other receivables, Note 25 Financial assets at fair value through other comprehensive income and in chapter Leases for Finance lease receivables.
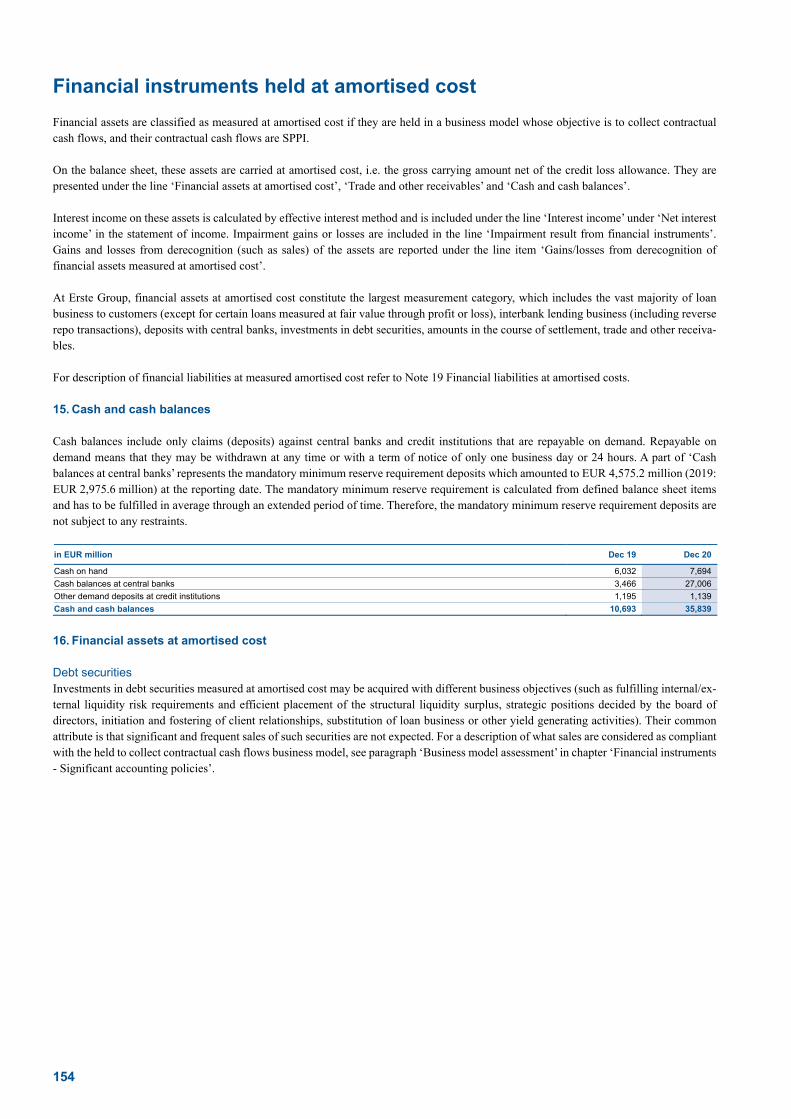
154
Financial instruments held at amortised cost
Financial assets are classified as measured at amortised cost if they are held in a business model whose objective is to collect contractual cash flows, and their contractual cash flows are SPPI. On the balance sheet, these assets are carried at amortised cost, i.e. the gross carrying amount net of the credit loss allowance. They are presented under the line ‘Financial assets at amortised cost’, ‘Trade and other receivables’ and ‘Cash and cash balances’. Interest income on these assets is calculated by effective interest method and is included under the line ‘Interest income’ under ‘Net interest income’ in the statement of income. Impairment gains or losses are included in the line ‘Impairment result from financial instruments’. Gains and losses from derecognition (such as sales) of the assets are reported under the line item ‘Gains/losses from derecognition of financial assets measured at amortised cost’. At Erste Group, financial assets at amortised cost constitute the largest measurement category, which includes the vast majority of loan business to customers (except for certain loans measured at fair value through profit or loss), interbank lending business (including reverse repo transactions), deposits with central banks, investments in debt securities, amounts in the course of settlement, trade and other receiva-bles. For description of financial liabilities at measured amortised cost refer to Note 19 Financial liabilities at amortised costs. 15. Cash and cash balances Cash balances include only claims (deposits) against central banks and credit institutions that are repayable on demand. Repayable on demand means that they may be withdrawn at any time or with a term of notice of only one business day or 24 hours. A part of ‘Cash balances at central banks’ represents the mandatory minimum reserve requirement deposits which amounted to EUR 4,575.2 million (2019: EUR 2,975.6 million) at the reporting date. The mandatory minimum reserve requirement is calculated from defined balance sheet items and has to be fulfilled in average through an extended period of time. Therefore, the mandatory minimum reserve requirement deposits are not subject to any restraints.
in EUR million Dec 19 Dec 20
Cash on hand 6,032 7,694
Cash balances at central banks 3,466 27,006
Other demand deposits at credit institutions 1,195 1,139
Cash and cash balances 10,693 35,839
16. Financial assets at amortised cost Debt securities Investments in debt securities measured at amortised cost may be acquired with different business objectives (such as fulfilling internal/ex-ternal liquidity risk requirements and efficient placement of the structural liquidity surplus, strategic positions decided by the board of directors, initiation and fostering of client relationships, substitution of loan business or other yield generating activities). Their common attribute is that significant and frequent sales of such securities are not expected. For a description of what sales are considered as compliant with the held to collect contractual cash flows business model, see paragraph ‘Business model assessment’ in chapter ‘Financial instruments - Significant accounting policies’.

155
Gross carrying amounts and credit loss allowances per impairment buckets
Gross carrying amount Credit loss allowances
in EUR million Stage 1 Stage 2 Stage 3 Total Stage 1 Stage 2 Stage 3 Total Carrying amount
Dec 20
Central banks 14 0 0 14 0 0 0 0 14
General governments 25,215 11 0 25,227 -7 0 0 -7 25,220
Credit institutions 3,490 19 0 3,510 -2 0 0 -2 3,508
Other financial corporations 135 11 0 146 0 -1 0 -1 145
Non-financial corporations 667 28 3 698 -1 -2 -1 -5 693
Total 29,521 70 3 29,594 -10 -3 -2 -15 29,579
Dec 19
Central banks 53 0 0 53 -1 0 0 -1 52
General governments 22,483 29 0 22,512 -4 0 0 -4 22,508
Credit institutions 3,287 1 0 3,288 -2 0 0 -2 3,286
Other financial corporations 136 7 0 143 0 -1 0 -1 142
Non-financial corporations 760 17 3 780 -1 -2 -2 -4 776
Total 26,718 53 4 26,774 -7 -2 -2 -11 26,764
There are no purchased or originated credit-impaired (POCI) debt securities at AC as of 31 December 2020. Movement in credit loss allowances
in EUR million As of Additions Derecognitions Transfers
between stages Other changes in
credit risk (net) Other As of
Jan 20 Dec 20
Stage 1 -7 -7 2 0 0 0 -11
Stage 2 -2 0 0 -1 0 0 -3
Stage 3 -2 0 0 0 0 0 -2
Total -11 -7 2 -1 1 0 -15
Jan 19 Dec 19
Stage 1 -6 -3 0 0 1 0 -7
Stage 2 0 0 0 -1 -1 0 -2
Stage 3 -2 0 0 0 1 0 -2
Total -8 -3 0 -1 1 0 -11
In column ‘Additions’ increases of CLA due to the initial recognition of debt securities at AC during the current reporting period are dis-closed. Releases of CLA following the derecognition of the related debt securities at AC are reported in column ‘Derecognitions’. In column ‘Transfers between stages’ CLA net changes due to changes in credit risk that triggered re-assignments of the related AC debt securities from Stage 1 (at 1 January 2020 or initial recognition date) to Stages 2 or 3 at 31 December 2020 or vice-versa are reported. The effects of transfers from Stage 1 to Stages 2 or 3 on the related CLAs are adverse and presented in lines attributable to Stages 2 or 3. The effects of transfers from Stages 2 or 3 to Stage 1 on the related CLAs are favourable and presented in line ‘Stage 1’. The P&L-neutral effect from cross-stage transferring of the related CLA amounts recognized prior to stage re-assignments are presented above in column ‘Other changes in credit risk (net)’. Any other changes in credit risk which do not trigger a transfer between Stage 1 and Stage 2 or 3 or vice-versa are disclosed in column ‘Other changes in credit risk (net)’. The year-end total GCAs of AC debt securities that were initially recognized (purchased) during the year 2020 and not fully derecognized by 31 December 2020 amounts to EUR 5.622,0 million (2019: EUR 4,133.8 million.) The GCA of AC debt securities that were held at 1 January 2020 and derecognized during the year 2020 amounts to EUR 2,524.2 million (2019: EUR 3,257.4 million).

156
Loans and advances to banks Gross carrying amounts and credit loss allowances per impairment buckets
Gross carrying amount Credit loss allowances
in EUR million Stage 1 Stage 2 Stage 3 Total Stage 1 Stage 2 Stage 3 Total Carrying amount
Dec 20
Central banks 16,763 0 0 16,763 -1 0 0 -1 16,762
Credit institutions 4,669 38 0 4,707 -2 0 0 -3 4,704
Total 21,432 38 0 21,469 -3 0 0 -3 21,466
Dec 19
Central banks 16,109 0 0 16,109 0 0 0 0 16,108
Credit institutions 6,936 17 2 6,955 -6 0 -2 -9 6,946
Total 23,045 17 2 23,063 -7 0 -2 -9 23,055
There are no purchased or originated credit-impaired (POCI) AC loans and advances to banks at 31 December 2020. Movement in credit loss allowances
in EUR million As of Additions Derecognitions Transfers
between stages Other changes in
credit risk (net) Other As of
Jan 20 Dec 20
Stage 1 -7 -27 13 0 17 0 -3
Stage 2 0 0 0 0 0 0 0
Stage 3 -2 0 2 0 -2 2 0
Total -9 -27 15 0 15 2 -3
Jan 19 Dec 19
Stage 1 -3 -29 27 0 -1 0 -7
Stage 2 -3 0 0 0 3 0 0
Stage 3 -2 0 0 0 0 0 -2
Total -8 -30 27 0 2 0 -9
In column ‘Additions’ increases of CLA due to the initial recognition of loans and advances to banks at AC during the current reporting period are disclosed. Releases of CLA following the derecognition of the related loans and advances to banks at AC are reported in column ‘Derecognitions’. Any changes in credit risk which do not trigger a transfer between Stage 1 and Stage 2 or 3 or vice-versa are disclosed in column ‘Other changes in credit risk (net)’. The year-end total GCA of AC loans and advances to banks that were initially recognized during the year 2020 and not fully de-recognized by 31 December 2020 amounts to EUR 20,962.3 million (2019: EUR 21,878.5 million). The GCA of AC loans and advances to banks that were held as of 1 January 2020 and fully de-recognized during the year 2020 amounts to EUR 21,347.1 million (2019: 17,928.4 million). Loans and advances to customers Gross carrying amounts and credit loss allowances per impairment buckets
Gross carrying amount Credit loss allowances
in EUR million Stage 1 Stage 2 Stage 3 POCI Total Stage 1 Stage 2 Stage 3 POCI Total Carrying amount
Dec 20
General governments 6,455 330 3 3 6,791 -4 -4 -2 -1 -11 6,779
Other financial corporations 2,860 836 19 11 3,727 -8 -38 -6 0 -51 3,676
Non-financial corporations 50,673 18,379 2,075 227 71,354 -186 -657 -1,172 -92 -2,107 69,247
Households 69,241 10,554 1,935 125 81,855 -136 -472 -1,021 -33 -1,662 80,193
Total 129,229 30,100 4,031 367 163,727 -335 -1,171 -2,201 -125 -3,831 159,895
Dec 19
General governments 6,449 325 3 4 6,781 -17 -3 -2 -1 -23 6,757
Other financial corporations 3,342 244 12 13 3,612 -5 -9 -8 0 -22 3,590
Non-financial corporations 60,331 5,618 1,584 242 67,774 -176 -243 -965 -96 -1,479 66,296
Households 70,577 6,538 1,886 145 79,146 -122 -251 -1,029 -43 -1,445 77,701
Total 140,699 12,725 3,484 404 157,312 -320 -506 -2,003 -139 -2,969 154,344

157
Movement in credit loss allowances
in EUR million As of Additions Derecognitions
Transfers between
stages
Other changes in credit risk
(net)
Insignificant modifications
(net) Write-offs Other As of
Jan 20 Dec 20
Stage 1 -320 -233 64 376 -227 0 0 4 -335
General governments -17 -5 2 1 15 0 0 0 -4
Other financial corporations -5 -10 5 8 -9 0 0 3 -8
Non-financial corporations -176 -149 41 157 -60 0 0 0 -186
Households -122 -68 16 210 -173 0 0 2 -136
Stage 2 -506 -133 125 -1,025 361 0 1 6 -1,171
General governments -3 0 0 -3 2 0 0 0 -4
Other financial corporations -9 -2 1 -14 -13 0 0 0 -38
Non-financial corporations -243 -85 83 -533 116 1 0 4 -657
Households -251 -46 41 -475 256 -1 1 2 -472
Stage 3 -2,003 -92 245 -129 -507 2 270 12 -2,201
General governments -2 0 0 0 0 0 0 0 -2
Other financial corporations -8 -2 2 0 -2 0 4 0 -6
Non-financial corporations -965 -51 106 -55 -357 2 143 3 -1,172
Households -1,029 -40 137 -74 -149 1 123 9 -1,021
POCI -139 0 15 0 -9 0 6 2 -125
General governments -1 0 0 0 0 0 0 0 -1
Other financial corporations 0 0 0 0 0 0 0 0 0
Non-financial corporations -96 0 9 0 -9 0 3 1 -92
Households -43 0 6 0 0 0 3 2 -33
Total -2,969 -458 449 -778 -382 3 278 25 -3,831
Jan 19 Dec 19
Stage 1 -321 -255 75 280 -98 0 0 -1 -320
General governments -16 -4 1 1 1 0 0 0 -17
Other financial corporations -8 -8 7 2 2 0 0 0 -5
Non-financial corporations -169 -160 50 104 -1 0 0 0 -176
Households -128 -83 17 174 -101 0 0 -1 -122
Stage 2 -455 -34 79 -486 382 0 3 4 -506
General governments -10 0 0 -1 8 0 0 0 -3
Other financial corporations -5 -1 1 -7 1 0 0 3 -9
Non-financial corporations -191 -15 44 -185 107 -1 0 -1 -243
Households -249 -17 35 -293 266 1 3 3 -251
Stage 3 -2,341 -131 362 -111 -272 0 491 -3 -2,003
General governments -2 0 0 0 0 0 0 0 -2
Other financial corporations -40 -9 4 -1 0 0 9 28 -8
Non-financial corporations -1,133 -78 135 -42 -117 0 300 -30 -965
Households -1,166 -44 223 -68 -155 0 182 -1 -1,029
POCI -173 0 28 0 -10 -4 18 1 -139
General governments 0 0 0 0 1 0 0 -2 -1
Other financial corporations -3 0 0 0 3 0 0 0 0
Non-financial corporations -97 0 17 0 -25 -3 11 1 -96
Households -73 0 11 0 11 -1 7 1 -43
Total -3,290 -419 545 -316 2 -3 512 1 -2,969
In column ‘Additions’ increases of CLA due to the initial recognition of loans and advances to customers at AC during the current reporting period are disclosed. CLAs recognized against drawings from non-revolving loan commitments are deemed as additions for the purpose of presenting current period’s movement in CLA. Therefore, additions in Stages 2 and 3 reflect transfers from Stage 1 having occurred between commitment and drawing dates of related credit facilities. Releases of CLA following the derecognition of the related loans and advances to customers at AC are reported in column ‘Derecognitions’. In column ‘Transfers between stages’ CLA net changes due to changes in credit risk that triggered re-assignments of the related AC loans and advances to customers from Stage 1 at 1 January 2020 (or initial recognition date, if later) to Stages 2 or 3 at 31 December 2020 or vice-versa are reported. The effects of transfers from Stage 1 to Stages 2 or 3 on the related CLAs are adverse (incremental year-on-year allocations) and presented in lines attributable to Stages 2 or 3. The effects of transfers from Stages 2 or 3 to Stage 1 on the related CLAs are favourable (incremental year-on-year releases) and presented in line ‘Stage 1’. The P&L-neutral effect from cross-stage transferring of the related CLA amounts recognized prior to stage re-assignments are presented above in column ‘Other changes in credit risk (net)’.

158
Any other changes in credit risk which do not trigger a transfer between Stage 1 and Stage 2 or 3 or vice-versa are disclosed in column ‘Other changes in credit risk (net)’. This column also captures the passage-of-time adverse effect (‘unwinding correction’) over the lifetime expected cash shortfalls of AC loans and advances to customers that were assigned to Stage 3 for any period throughout the year, as well as of any POCI loans and advances to customers. This adverse effect amounted to EUR 59.9 million (2019: EUR 71.1 million) cumulatively for the year 2020, which also reflects the unrecognized interest income out of the related AC loans and advances to customers throughout the year. The column ‘Insignificant modifications (net)’ reflects the effect on CLA arising from contractual modifications of loans and advances to customers at AC which do not trigger their full derecognition. The use of CLA triggered by full or partial write-offs of AC loans and advances to customers is reported in column ‘Write-offs’. One significant driver of the CLA movements for the year has been the transfer of the related instruments across different impairment stages. The year-end GCA of AC loans and advances to customers that were assigned at 31 December 2020 to a different stage compared to 1 January 2020 (or to the initial recognition date, if originated during the year) are summarized below: Transfers between
Stage 1 and Stage 2 Transfers between
Stage 2 and Stage 3 Transfers between
Stage 1 and Stage 3 POCI
in EUR million To Stage 2
from Stage 1 To Stage 1
from Stage 2 To Stage 3
from Stage 2 To Stage 2
from Stage 3 To Stage 3
from Stage 1 To Stage 1
from Stage 3
To Defaulted from Non-Defaulted
To Non-Defaulted
from Defaulted
Dec 20
General governments 201 89 0 0 0 0 0 0
Other financial corporations 579 65 4 2 8 0 0 0
Non-financial corporations 14,523 1,145 380 49 573 7 2 10
Households 6,549 1,546 287 142 372 41 1 10
Total 21,853 2,845 671 193 954 48 3 20
Dec 19
General governments 120 69 0 0 1 0 0 0
Other financial corporations 157 107 0 1 2 0 0 14
Non-financial corporations 3,925 933 130 37 204 14 10 9
Households 2,928 1,464 269 92 303 51 2 11
Total 7,131 2,572 399 130 509 64 12 34
Detailed information on stage transfers due to Covid-19 measures are described in Note 34 Credit risk. The year-end total GCA of the AC loans and advances to customers that were initially recognized during the reporting period and not fully de-recognized by 31 December 2020 amounts to EUR 39,706.5 million (2019: EUR 38,982.9 million). The GCA of the AC loans and ad-vances to customers that were held at 1 January 2020 and fully de-recognized during the reporting period amounts to EUR 19,576.4 mil-lion (2019: EUR 16,425.7 million). The undiscounted amount of the lifetime expected credit losses considered in the initial measurement of the AC loans and advances to customers initially recognized and identified as POCI during the year 2020 amounted to EUR 43.5 million (2019: EUR 32.4 million).

159
17. Debt instruments subject to contractual modifications Impact of non-significant contractual modifications of debt instruments AC assigned to Stage 2 and 3
Dec 19 Dec 20
in EUR million
Amortised cost before the
modification
Net modification gains/losses
Amortised cost before the
modification
Net modification gains/losses
Loans and advances
General governments 12 0 16 0
Other financial corporations 11 0 131 1
Non-financial corporations 615 -3 4,398 2
Households 489 1 2,929 -13
Total 1,128 -2 7,474 -9
As at 31 December 2020, the total GCA of Erste Group’s debt instruments measured at AC, which were impacted by non-significant con-tractual modifications while they were assigned to Stage 2 or 3 and re-assigned to Stage 1 during the year 2020 amounted to EUR 671.0 mil-lion (2019: EUR 306.2 million). 18. Trade and other receivables Gross carrying amounts and credit loss allowances per impairment buckets
Gross carrying amount Credit loss allowances
in EUR million Stage 1 Stage 2 Stage 3 POCI Total Stage 1 Stage 2 Stage 3 POCI Total Carrying amount
Dec 20
Central banks 1 0 0 0 1 0 0 0 0 0 1
General governments 35 20 0 0 55 0 0 0 0 0 55
Credit institutions 27 2 0 0 29 0 0 0 0 -1 29
Other financial corporations 25 2 0 0 28 0 0 0 0 0 27
Non-financial corporations 484 639 39 0 1,162 -4 -5 -29 0 -38 1,124
Households 88 21 21 0 130 -2 -5 -18 0 -24 106
Total 660 684 61 0 1,405 -6 -10 -47 0 -64 1,341
Dec 19
Central banks 1 0 0 0 1 0 0 0 0 0 1
General governments 44 18 0 0 63 0 0 0 0 0 62
Credit institutions 22 2 0 0 25 0 -1 0 0 -1 24
Other financial corporations 24 5 0 0 30 0 0 0 0 0 29
Non-financial corporations 500 680 50 10 1,240 -3 -2 -41 -1 -47 1,193
Households 70 33 19 0 122 -3 -7 -13 0 -23 99
Total 661 738 70 10 1,480 -6 -10 -55 -1 -72 1,408
Movement in credit loss allowances
in EUR million As of Additions Derecognitions
Transfers between
stages
Other changes in credit risk
(net)
Insignificant modifications
(net) Write-offs Other As of
Jan 20 Dec 20
Stage 1 -6 -4 2 1 1 0 0 0 -6
Stage 2 -10 0 2 -4 1 0 0 0 -10
Stage 3 -55 0 5 -1 -6 0 6 4 -47
POCI -1 0 1 0 0 0 0 0 0
Total -72 -5 9 -3 -4 0 6 4 -64
Jan 19 Dec 19
Stage 1 -5 -5 1 1 0 0 0 0 -6
Stage 2 -19 0 1 -1 4 0 6 0 -10
Stage 3 -98 -1 9 -3 1 0 37 0 -55
POCI -1 0 0 0 0 0 0 0 -1
Total -122 -6 11 -3 5 0 43 0 -72

160
19. Financial liabilities at amortised costs The line item ‘Financial liabilities at amortised cost’ is further broken down into ‘Deposits from banks’, ‘Deposits from customers’, ‘Debt securities issued’ and ‘Other financial liabilities’. Interest expenses incurred are calculated using effective interest method are reported in the line item ‘Interest expenses’ under ‘Net interest income’ in the statement of income. Gains and losses from derecognition (mainly repurchase) are reported under the line item ‘Other gains/losses from derecognition of financial instruments not measured at fair value through profit or loss’. Financial liabilities stemming from the TLTRO programme of the ECB are presented under ‘Deposits from banks’. Erste Group assessed an appropriate accounting treatment of the TLTRO. The conclusion was that such instruments do not qualify as below-market interest rate loans and therefore are not related to IAS 20 government grants accounting. The reason was that the TLTRO is considered as a separate market organised by the ECB as part of its monetary policy. As a result, the IFRS 9 amortised cost accounting treatment applies. The carrying amount of the TLTRO III liabilities was EUR 14,088 million at the end of 2020 (2019: EUR 1,035 million). The negative interest expense recognised for the TLTRO III in 2020, including the catch-up adjustment discussed below, was EUR 52.3 million (2019: EUR 0.2 million). In general, the TLTRO interest rate is reduced if banks reach certain lending thresholds. At the TLTRO inception, the original effective interest rate is determined by considering the contractual terms and assessing whether the eligibility conditions for the reduced interest will be fulfilled. The scenario which is considered more likely is used for the original effective interest rate calculation. Erste Group assesses on an ongoing basis how it meets the eligibility criteria for the lower interest rate. Any subsequent changes in estimates of payments due to the revised assessment of the eligibility conditions are treated as catch-up adjustments. The amount of the catch-up adjustment is determined by discounting the revised estimated payments at the original effective interest rate and comparing it to the gross carrying amount before the adjustment. The catch-up adjustments are presented in the net interest income. In 2020, in order to support the provision of credit in the economy hit by the Covid-19 pandemic, the ECB modified the conditions of the TLTRO III by additional reductions of interest rates. In April the interest rate reduction by 50bp during the period between June 2020 and June 2021 was conditional upon reaching the lending threshold of 0% between 1 March 2020 and 31 March 2021. Erste Group considered that the eligibility criteria were fulfilled. This resulted in a recognition of a positive catch-up adjustment in the amount of EUR 8.0 million (2019: EUR 0.0 million). In December 2020 the ECB announced to extend the pandemic-related low interest for the period between June 2021 and June 2022. Erste Group’s assessment at 2020 year end was that the lending threshold conditions for this interest rate reduction will not be met. No additional catch-up adjustment was recognised based on this announcement. Deposits from banks in EUR million Dec 19 Dec 20
Overnight deposits 1,951 2,115
Term deposits 9,613 21,728
Repurchase agreements 1,577 927
Deposits from banks 13,141 24,771

161
Deposits from customers in EUR million Dec 19 Dec 20
Overnight deposits 121,651 144,864
Savings deposits 31,476 37,265
Other financial corporations 150 185
Non-financial corporations 1,992 2,457
Households 29,334 34,623
Non-savings deposits 90,174 107,599
General governments 5,339 5,806
Other financial corporations 5,705 6,936
Non-financial corporations 27,245 33,312
Households 51,886 61,544
Term deposits 49,910 44,684
Deposits with agreed maturity 43,508 38,142
Savings deposits 28,248 25,996
Other financial corporations 1,098 1,050
Non-financial corporations 1,323 1,331
Households 25,826 23,615
Non-savings deposits 15,261 12,146
General governments 3,294 2,832
Other financial corporations 2,488 1,890
Non-financial corporations 3,493 2,285
Households 5,985 5,140
Deposits redeemable at notice 6,402 6,543
General governments 12 1
Other financial corporations 86 110
Non-financial corporations 163 256
Households 6,140 6,175
Repurchase agreements 1,505 1,269
General governments 9 2
Other financial corporations 1,431 1,260
Non-financial corporations 65 6
Deposits from customers 173,066 190,816
General governments 8,655 8,642
Other financial corporations 10,958 11,431
Non-financial corporations 34,281 39,648
Households 119,173 131,097
Debt securities issued in EUR million Dec 19 Dec 20
Subordinated debt securities issued 1,439 1,477
Senior non-preferred bonds 505 669
Other debt securities issued 15,417 16,874
Bonds 2,929 4,680
Certificates of deposit 81 520
Other certificates of deposits/name certificates 237 178
Mortgage covered bonds 10,796 10,977
Public sector covered bonds 0 0
Other 1,374 519
Debt securities issued 17,360 19,020
In 1998, Erste Group Bank AG launched a EUR 30 billion Debt Issuance Programme (DIP). Since then other issuance programmes had been set up to fulfill high standards of specific seniorities and investor classes. In 2020, 17 DIP new bonds (2019: 49) with a total volume of approximately EUR 165 million (2019: EUR 1.8 billion) were issued under the DIP. In 2020, 120 (2019: 173) new bonds with a total volume of EUR 184 million (2019: EUR 414 million) were issued out of the Structured Notes Programme. In November 2018 the Covered Bonds Programme was implemented, under which 2 (2019: 3) new bonds with a total volume of EUR 2.3 billion (2019: EUR 1.0 billion) were issued. In June 2019, the Capital Guaranteed Structured Notes Programme was implemented, under which 36 (2019: 16) new bonds with a total volume of EUR 129 million (2019: EUR 70 million) were issued. In December 2019, the Multi Issuer EMTN Notes Programme was implemented, under which 5 new bonds with a total volume of EUR 2.7 bil-lion were issued. Furthermore, senior unsecured registered notes (‘Namensschuldverschreibungen’), were issued with a volume of EUR 69 million (2019: EUR 107 million). Starting with August 2008, the Euro Commercial Paper and Certificates of Deposit Programme has an overall volume of EUR 10.0 billion. In total, 56 issues (2019: 34) amounting to EUR 3.7 billion (2019: EUR 1.4 billion) were placed in 2020. Issues totaling approximately EUR 3.7 billion (2019: EUR 1.8 billion) were redeemed over the same period.

162
Erste Group Bank AG, through its branch in NY and through its fully consolidated subsidiary Erste Finance Delaware LLC, issues com-mercial papers and certificates of deposit into the US money market. The total balance as of 31 December 2020 of the Dollar Certificate of Deposit Program of the New York branch amounted to EUR 519 million (USD 635 million) and as of 31 December 2019 EUR 38 million (USD 43 million). The Dollar Commercial Paper Program of Erste Finance Delaware LLC has a maximum issuance volume of EUR 6.7 bil-lion (USD 7.5 billion), with a total balance as of 31 December 2020 of EUR 521 million (USD 637 million) and EUR 1.4 billion (USD 1.5 billion) as of 31 December 2019.

163
Financial instruments at fair value
FINANCIAL INSTRUMENTS AT FAIR VALUE THROUGH PROFIT OR LOSS There are various reasons for assigning the fair value through profit or loss (FVPL) measurement category to debt instrument financial assets. FVPL measurement relates to that are part of residual business models, i.e. they are neither held to collect contractual cash flows nor held to either collect contractual cash flows or sell the assets. These financial assets are generally expected to be sold before their maturity or they are managed and their performance is evaluated on a fair value basis. In the business of Erste Group, such business models are typical of assets that are held for trading (i.e. financial assets held by the trading function of the bank), of assets whose value is expected to be primarily realised through sales, such as investments in securitisations or of failed loan syndications when the loan is offered for sale on the market. Further subject to FVPL measurement are financial assets held by funds consolidated by Erste Group since they are managed and their performance is evaluated on a fair value basis.Another reason for the the FVPL measurement are financial assets whose contractual cash flows are not considered as SPPI. At Erste Group, this concerns certain debt securities and loans to customers. Erste Group also makes use of the option to designate some financial assets as measured at FVPL at initial recognition. Such a classification is used if it eliminates or significantly reduces an accounting mismatch between fixed interest rate financial assets, which in the absence of such a classification would be measured at amortised cost or at FVOCI, and related derivatives measured at FVPL. On the balance sheet, debt instrument financial assets measured at FVPL are presented as ‘Financial assets held for trading’, sub-item ‘Other financial assets held for trading’ and ‘Non-trading financial assets at fair value through profit or loss’, sub-items ‘Debt securities’ and ‘Loans and advances to customers’. Non-trading financial assets at FVPL consist of two sub-categories disclosed in Note 22 Non-trading financial assets at fair value through profit or loss which are ‘mandatorily at fair value through profit or loss’ and ‘designated at fair value through profit or loss’. Financial assets are mandatorily measured at fair value through profit or loss either because they are held as part of residual business models that are other than held for trading or their contractual cash flows are not SPPI. Investments in equity instruments that are held for trading (i.e. financial assets held by the trading function of the bank) are measured at FVPL. They are included in the balance sheet under the line ‘Financial assets held for trading’, sub-item ‘Other financial assets held for trading’. Investments in equity instruments that are not held for trading are also measured at FVPL (unless they are designated at FVOCI). They are presented in the balance sheet under ‘Non-trading financial assets at fair value through profit or loss’, sub-item ‘Equity instruments’, sub-category ‘mandatorily at fair value through profit or loss’ in Note 22 Non-trading financial assets at fair value through profit or loss. From IFRS 9 perspective all derivatives which are not designated as hedging instruments are considered as held for trading. As a result, they are measured at FVPL. They are described more detail in the Note 20 Derivative financial instruments. In the statement of income, the profit or loss effects of non-derivative financial assets measured at FVPL are split into interest income or dividend income and fair value gains and losses. The interest income on debt instruments is presented in the line ‘Other similar income’ under ‘Net interest income’ and is calculated by applying the EIR to the amortised cost component of the financial assets. The dividend income on equity instruments is presented in the line ‘Dividend income’. The fair value gains or losses are calculated net of the interest or dividend income, and they also include transaction costs and origination fees. They are reported in the line ‘Net trading result’ for financial assets held for trading and in the line ‘Gains/losses from financial instruments measured at fair value through profit or loss’ in case of non-trading financial assets at FVPL. For investments in funds, which are not consolidated by Erste Group, the interest or dividend component is not separated from the fair value gains or losses. Financial liabilities at FVPL consist of financial liabilities held for trading and financial liabilities designated at FVPL. On the balance sheet, financial liabilities at FVPL are presented as ‘Financial liabilities held for trading’, sub-items ‘Derivatives’ and ‘Other financial liabilities held for trading’ and as ‘Financial liabilities at fair value through profit or loss’ which are further broken down into ‘Deposits from customers’, ‘Debt securities issued’ and ‘Other financial liabilities’. Accounting policy related to financial liabilities at FVPL can be found in Note 20 Derivative financial instrument, Note 23 Other financial liabilities held for trading and Note 24 Financial liabilities at fair value through profit or loss.

164
20. Derivative financial instruments Derivative financial instruments are used by Erste Group to manage exposures to interest rates, foreign currencies and other market price risks. Derivatives used by Erste Group include mainly interest rate swaps, futures, forward rate agreements, interest rate options, currency swaps and currency options as well as credit default swaps. For presentation purposes, derivatives are split into:
_ Derivatives – held for trading; and _ Derivatives – hedge accounting.
Hedge accounting derivatives are discussed in Note 27 Hedge accounting. Derivative financial instruments are carried at fair value (dirty price) on the balance sheet. Derivatives are carried as assets if their fair value is positive and as liabilities if their fair value is negative. Derivatives – held for trading are those that are not designated as hedging instruments for hedge accounting. They are presented in the line item ‘Derivatives’ under the heading ‘Financial assets/Financial liabilities held for trading’. All kinds of non-hedging derivatives without regard to their internal classification, i.e. both derivatives held in the trading book and banking book, are presented in this line item. Changes in the fair value (clean price) of derivatives – held for trading as well as of derivatives designated as hedging instruments in fair value hedges are reported in the statement of income in the line item ‘Net trading result’. Interest income/expense related both to held for trading and hedging derivatives is presented in the statement of income in the line item ‘Other similar income’ or ‘Other similar expenses’ under ‘Net interest income’. Interest income/expense recognition is based on EIR-like accruals in respect of the derivative notional amount and includes amortisation of the inception value of the derivative (e.g. upfront fees, if any). The effective part of changes in the fair value (clean price) of derivatives in cash flow hedges is reported as OCI in the line ‘Cash flow hedge reserve’ of the statement of comprehensive income. The accumulated OCI is presented under ‘Cash flow hedge reserve’ in the state-ment of changes in equity. The ineffective part of changes in the fair value (clean price) of derivatives in cash flow hedges is reported in the statement of income under the line item ‘Net trading result’. Embedded derivatives Erste Group issues certain financial liabilities which contain structured features. Structured features mean that a derivative is embedded in non-derivative host instruments. Embedded derivatives are separated from the host instruments if
_ the economic characteristics of the derivatives are not closely related to the economic characteristics and risks of the host debt instru-ments;
_ the embedded derivative meets the definition of a derivative; and _ the hybrid instrument is not a financial asset or liability held for trading or designated at fair value through profit or loss.
Embedded derivatives that are separated are accounted for as stand-alone derivatives and presented on the balance sheet under the line item ‘Derivatives’ in financial assets held for trading and financial liabilities held for trading. At Erste Group, these relate to bonds and deposits whose payments are linked to equity prices or FX rates. In the business of Erste Group, majority of non-closely related embedded derivatives relates to bonds issued for which fair value option has been applied since 2018. As a result, these embedded derivatives are part of the measurement of the entire hybrid instrument at FVPL and thus are not separated.

165
Derivatives held for trading
Dec 19 Dec 20
in EUR million Notional
value Positive
fair value Negative fair value
Notional value
Positive fair value
Negative fair value
Derivatives held in the trading book 189,747 3,068 3,305 206,411 3,524 3,606
Interest rate 122,129 2,609 2,728 139,393 2,742 2,829
Equity 311 11 3 435 4 3
Foreign exchange 66,888 423 571 65,541 740 748
Credit 226 3 3 820 15 25
Commodity 10 0 0 16 0 0
Other 183 23 0 205 23 0
Derivatives held in the banking book 28,048 1,353 341 27,229 1,330 409
Interest rate 16,891 1,254 226 16,836 1,233 246
Equity 5,823 52 36 5,202 41 64
Foreign exchange 4,812 41 78 4,742 52 98
Credit 348 6 1 305 4 1
Other 174 1 0 144 0 0
Total gross amounts 217,794 4,422 3,646 233,640 4,854 4,015
Offset 0 -1,616 -1,640 -1,900 -1,977
Total 0 2,805 2,005 2,954 2,037
Erste Group undertakes a part of interest rate derivative and credit derivative transactions via Clearing Houses. These derivatives and related cash margin balances fulfil the requirements for balance sheet offsetting. For more details on balance sheet offsetting please refer to Note 28 Offsetting of financial instruments. 21. Other financial assets held for trading in EUR million Dec 19 Dec 20
Equity instruments 65 34
Debt securities 2,889 3,368
General governments 1,918 2,628
Credit institutions 803 606
Other financial corporations 57 57
Non-financial corporations 111 76
Other financial assets held for trading 2,954 3,402
22. Non-trading financial assets at fair value through profit or loss
Dec 19 Dec 20
in EUR million Designated Mandatorily Designated Mandatorily
Equity instruments 0 390 0 347
Debt securities 664 1,671 603 1,446
General governments 77 258 63 214
Credit institutions 563 160 524 101
Other financial corporations 25 1,062 16 983
Non-financial corporations 0 191 0 148
Loans and advances to customers 0 483 0 687
General governments 0 2 0 1
Other financial corporations 0 1 0 0
Non-financial corporations 0 137 0 107
Households 0 344 0 579
Financial assets designated and mandatorily at FVPL 664 2,544 603 2,480
Non-trading financial assets at fair value through profit or loss 3,208 3,083
Erste Group has designated debt securities at FVPL. The maximum exposure to credit risk on these securities is its fair value. At the reporting date the change in fair value that is attributable to changes in credit risk amounts to EUR 2.9 million (2019: EUR 1.4 million) cumulatively and EUR 7.7 million (2019: EUR 3.4 million) for the reporting period. 23. Other financial liabilities held for trading Non-derivative financial liabilities held for trading are those which are incurred principally for the purpose of repurchasing them in the near term. In the business of Erste Group non-derivative held for trading liabilities largely comprise short sales. These arise from obligations to return securities, which are purchased under agreements to resell or are borrowed through securities lending transactions and subsequently sold to third parties. On the balance sheet such liabilities are presented under the line ‘Financial liabilities held for trading’, sub-item ‘Other financial liabilities’. The gains or losses on financial liabilities held for trading are reported in the line ‘Net trading result’ in the statement of income.

166
in EUR million Dec 19 Dec 20
Short positions 368 521
Equity instruments 35 135
Debt securities 333 386
Debt securities issued 48 66
Other financial liabilities held for trading 416 588
24. Financial liabilities at fair value through profit or loss Erste Group makes use of the option to designate some financial liabilities as measured at FVPL at initial recognition (referred to as fair value option) if:
_ such classification eliminates or significantly reduces an accounting mismatch between fixed interest rate financial liabilities otherwise measured at amortised cost and related derivatives measured at FVPL. Erste Group assesses quantitatively that the designation actually eliminates or significantly reduces the accounting mismatch in respect of fair value changes attributable to interest rate risk; or
_ the entire hybrid contract contains a non-closely related embedded derivative. Financial liabilities designated at FVPL are reported on the balance sheet under the line item ‘Financial liabilities at fair value through profit or loss’ and are further broken down into ‘Deposits from customers’, ‘Debt securities issued’ and ‘Other financial liabilities’. Other financial liabilities relate to fund units issued by funds consolidated by Erste Group. Interest incurred is calculated by applying the EIR to the amor-tised cost of the financial liability and is reported in the statement of income under in line item ‘Other similar expenses’ under ‘Net interest income’. Gains and losses resulting from changes in fair value are recognised net of the interest expense under the line item ‘Gains/losses from financial instruments measured at fair value through profit or loss’. The amount of the fair value change resulting from the credit risk of the financial liability for the period is presented as OCI in the statement of comprehensive income in the line ‘Own credit risk reserve’. The cumulative amount is recognised as accumulated OCI, specifically under ‘Own credit risk reserve’ in the statement of changes in equity. The amount recognised in OCI is never reclassified to profit or loss. However, upon derecognition (mainly repurchases) of the financial liabilities designated at FVPL the amount accumulated in OCI is tran-sferred to retained earnings. The cumulative amount of the credit risk recognised as accumulated OCI is calculated as the difference between the present value of the liability determined by using the original credit spread and the fair value of the liability. The amount of fair value change attributable to changes in credit risk of the liability for the period which is recognised in OCI is the difference between the cumulative amount of the credit risk at the end of the period and at the beginning of the period. When calculating the present value of the liability by using the original credit spread, the rate used for discounting is the sum of the observed interest rate (swap yield curve) and the original credit spread. The original credit spread is determined at initial recognition of the liability and it equals the difference between the total yield of the liability and the observed interest rate (swap yield curve) at that time.
Carrying amount Amount repayable Delta between carrying amount
and amount repayable
in EUR million Dec 19 Dec 20 Dec 19 Dec 20 Dec 19 Dec 20
Deposits 265 254 248 243 17 11
Debt securities issued 13,011 11,657 12,415 11,230 596 427
Other financial liabilities 219 180 219 180 0 0
Financial liabilities at FVPL 13,494 12,091 12,882 11,653 613 438
Fair value changes that are attributable to changes in own credit risk
For reporting period Cumulative amount
in EUR million 1-12 19 1-12 20 Dec 19 Dec 20
Deposits -1 -2 2 0
Debt securities issued 19 -126 484 358
Other financial liabilities 0 0 0 0
Financial liabilities at FVPL 18 -127 486 358
The line ‘Other financial liabilities’ contains fund units issued by investment funds fully consolidated by Erste Group. Their fair value changes are subject to asset-specific performance risk only and are not dependent on changes in the individual own credit risk of the respective investment funds.

167
Debt securities issued in EUR million Dec 19 Dec 20
Subordinated debt securities issued 4,539 3,944
Other debt securities issued 8,471 7,713
Bonds 5,386 4,784
Other certificates of deposits/name certificates 872 854
Mortgage covered bonds 1,961 1,858
Public sector covered bonds 252 216
Debt securities issued 13,011 11,657

168
FINANCIAL ASSETS AT FAIR VALUE THROUGH OTHER COMPREHENSIVE INCOME 25. Financial assets at fair value through other comprehensive income Debt instrument financial assets are measured at fair value through other comprehensive income (FVOCI) if their contractual cash flows are SPPI-compliant and they are held within a business model whose objective is achieved by both to collect contractual cash flows and sell the assets. On the balance sheet, they are included as ‘Debt securities’ under the line ‘Financial asset at fair value through other comprehen-sive income’. Interest income on these assets is calculated using the effective interest method and is included in the line ‘Interest income’ under ‘Net interest income’ in the statement of income. Impairment gains and losses are recognised in profit or loss in the line ‘Impairment result from financial instruments’ with opposite loss allowance entry in OCI rather than against the asset value. As a result, the measurement impact recognised in profit or loss is the same as for financial assets measured at amortised cost. The difference between the fair value at which the assets are carried in the balance sheet and the amortised cost component is recognised as accumulated OCI in equity specifically under ‘Fair value reserve’ in the statement of changes in equity. The change for the period is reported as OCI in the statement of comprehensive income in the line ‘Fair value reserve of debt instruments’ which also includes the loss allowance OCI entry. When the financial asset is derecognised, the amount previously accumulated in OCI is reclassified to profit or loss and reported under the line ‘Other gains/losses from derecognition of financial instruments not measured at fair value through profit or loss’. Erste Group classifies investments in debt securities as measured at FVOCI, i.e. no loan business is included in this measurement category. Similarly to investments in debt securities measured at amortised cost, they relate to various business objectives such as fulfilling inter-nal/external liquidity risk requirements and efficient placement of the structural liquidity surplus, strategic positions decided by the board of directors, initiation and fostering of client relationships, substitution of loan business or other yield-enhancement activities. The common attribute for investments in debt instruments at FVOCI is that an active yield optimisation via sales is integral to achieving the objectives. The sales are carried out in order to optimise the liquidity position or to realise fair value gains or losses. As a result, the business objectives are achieved through both collecting contractual cash flows and sales of the securities. For certain investments in equity instruments that are not held for trading, Erste Group makes use of the option to measure them at FVOCI. This election is applied to strategic, significant banking business relationship investments (except for insurance business). The fair value gains or losses for the period are reported as OCI in the line ‘Fair value reserve of equity instruments’ of the statement of comprehensive income. The cumulative gains or losses are included under ‘Fair value reserve’ in the statement of changes in equity. The amount recognised in OCI is never reclassified to profit or loss. However, upon derecognition of the investments in equity instruments at FVOCI the amount accumulated in OCI is transferred to retained earnings. Dividends received on these investments are reported under the line ‘Dividend income’ of the statement of income. On the balance sheet, financial assets measured at fair value through OCI are included as ‘Equity instruments’ under the line ‘Financial asset at fair value through other comprehensive income’. Equity instruments The carrying amount of Erste Group’s equity instruments at FVOCI as at 31 December 2020 amounts to EUR 129.8 million (2019: EUR 210.1 million), the cumulative fair value change for equity instruments FVOCI before taxes recognized in other comprehensive in-come amounted to EUR 85.9 million (2019: EUR 166.1 million). During the year 2020, the sales of such instruments amounted to EUR 85.7 million (2019: EUR 43.6 million) and were triggered by strategic business decisions. The cumulative gain (net of tax) that was transferred from accumulated other comprehensive income into retained earnings upon such sales amounted to EUR 68.2 million (2019: EUR 48.9 million).

169
Debt instruments Gross carrying amounts and credit loss allowances per impairment buckets
Gross carrying amount Credit loss allowances
in EUR million Stage 1 Stage 2 Stage 3 Total Stage 1 Stage 2 Stage 3 Total Amortised
cost
Accumu-lated OCI changes
Fair value
Dec 20
Central banks 5 0 0 5 0 0 0 0 5 0 5
General governments 5,757 241 0 5,998 -3 -5 0 -9 5,989 212 6,202
Credit institutions 944 0 0 944 -3 0 0 -3 941 43 985
Other financial corporations 122 83 0 205 0 -4 0 -4 201 10 211
Non-financial corporations 655 301 0 957 -3 -7 0 -9 947 39 987
Total 7,483 626 0 8,109 -9 -16 0 -25 8,084 305 8,389
Dec 19
Central banks 0 0 0 0 0 0 0 0 0 0 0
General governments 6,232 8 0 6,240 -3 0 0 -3 6,237 189 6,426
Credit institutions 1,073 27 0 1,099 -1 -1 0 -2 1,097 19 1,116
Other financial corporations 135 46 0 181 0 -1 0 -2 179 9 188
Non-financial corporations 933 137 0 1,070 -2 -5 0 -7 1,062 45 1,107
Total 8,373 217 0 8,590 -6 -8 0 -14 8,575 261 8,836
As defined in IFRS 9, the gross carrying amount of debt instruments at FVOCI equals the amortised cost before deducting any credit loss allowances. The accumulated OCI changes combine the effects of credit loss allowances booked in other comprehensive income and fair value accounting through other comprehensive income, as required by IFRS9 in respect of debt instruments measured at FVOCI There are no purchased or originated credit-impaired (POCI) debt securities at FVOCI as of 31 December 2020. Movement in credit loss allowances
in EUR million As of Additions Derecognitions Transfers
between stages Other changes in
credit risk (net) Other As of
Jan 20 Dec 20
Stage 1 -6 -2 1 1 -4 1 -9
Stage 2 -8 0 3 -10 -1 0 -16
Stage 3 0 0 0 0 0 0 0
Total -14 -2 4 -8 -4 1 -25
Jan 19 Dec 19
Stage 1 -8 -3 2 0 3 0 -6
Stage 2 -2 -1 0 -5 0 0 -8
Stage 3 0 0 0 0 0 0 0
Total -10 -4 2 -5 3 0 -14
In column ‘Additions’ increases of CLA due to the initial recognition of debt securities at FVOCI during the current reporting period are disclosed. Releases of CLA following the derecognition of the related debt securities at FVOCI are reported in column ‘Derecognitions’. In column ‘Transfers between stages’ CLA net changes due to changes in credit risk that triggered re-assignments of the related FVOCI debt securities from Stage 1 (at 1 January 2020 or initial recognition date) to Stages 2 or 3 at 31 December 2020 or vice-versa are reported. The effects of transfers from Stage 1 to Stages 2 or 3 on the related CLAs are adverse and presented in lines attributable to Stages 2 or 3. The effects of transfers from Stages 2 or 3 to Stage 1 on the related CLAs are favourable and presented in line ‘Stage 1’. The P&L-neutral effect from cross-stage transferring of the related CLA amounts recognized prior to stage re-assignments are presented above in column ‘Other changes in credit risk (net)’. Any other changes in credit risk which do not trigger a transfer between Stage 1 and Stage 2 or 3 or vice-versa are disclosed in column ‘Other changes in credit risk (net)’. One significant driver of the above presented CLA movements for the year has been the transfer of the related instruments across different stages. The year-end GCAs of FVOCI debt securities that were assigned at 31 December 2020 to a different stage compared to 1 January 2020 (or to the initial recognition date, if purchased during the year) are summarized in the table below: Transfers between Stage 1 and Stage 2 in EUR million Dec 19 Dec 20
To Stage 2 from Stage 1 98 429
To Stage 1 from Stage 2 7 11

170
Financial instruments – other disclosure matters
26. Fair value of financial instruments Where the fair values of financial assets and financial liabilities recorded on the balance sheet cannot be derived from active markets, they are determined using a variety of valuation techniques that include the use of mathematical models. The inputs to these models are derived from observable market data where possible, but where observable market data is not available judgement is required to establish fair values. Using of unobservable inputs is particularly relevant for models used for valuations of loans and unquoted equity investments. Disclosures on valuation models, the fair value hierarchy and fair values of financial instruments can be found subsequently. Based on an analysis carried out by Erste Group it was decided that for the valuation of OTC derivatives no Funding Value Adjustment (FVA) would be considered. For all financial instruments the fair value is measured on recurring basis. Financial instruments carried at fair value The measurement of fair value at Erste Group is based primarily on external sources of data (stock market prices or broker quotes in highly liquid market segments). Financial instruments for which the fair value is determined on the basis of quoted market prices are mainly listed securities and derivatives as well as liquid OTC bonds. Description of valuation models and parameters Erste Group uses valuation models that have been tested internally and for which the valuation parameters (such as interest rates, exchange rates, volatilities and credit spreads) have been determined independently. In 2015, as a consequence of the negative interest environment, valuation models of interest rate options for the respective currencies were adjusted. Log-normal valuation models were replaced by standard market models which are based on a shifted log-normal distribution or a standard distribution. For such models negative interest rates are no restriction. Loans. Not SPPI (solely payments of principal and interest) compliant loans are to be valued at fair value. The methodology to compute fair value of these loans corresponds to the basic present value technique where expected cash flows of assets are discounted by the full rate including risk premium required for non-market risk based part of the interest rate to be compliant with fair value definition. The credit risk is recognized by adjusting contractual cash flows to come to expected cash flows accounting for customer’s probability of default and loss given default. These adjusted cash flows are then discounted by a yield curve which consists of a risk free rate and a funding spread.For a limited number of profit-participating loans, the expected cash flows are discounted using a risk-adjusted discount rate. This risk-adjusted rate is determined applying the Capital Assets Pricing Model (CAPM) on the basis of comparable listed entities. Debt securities. For plain vanilla (fixed and floating rate) debt securities the fair value is calculated by discounting the future cash flows using a discounting curve depending on the interest rate for the respective issuance currency and a spread adjustment. The spread adjustment is usually derived from the credit spread curve of the issuer. If no issuer curve is available the spread is derived from a proxy instrument and adjusted for differences in the risk profile of the instruments. If no close proxy is available, the spread adjustment is estimated using other information, including estimation of the credit spread based on internal ratings and PDs or management judgment. For more complex debt securities (e.g. including option-like features such as callable, cap/floor, index-linked) the fair value is determined using combinations of discounted cash flow models and more sophisticated modeling techniques including methods described for OTC-derivatives. Equity instruments. Non-trading equity instruments which have quoted market prices in an active market are valued by using the quoted market price. For other investments in non-trading equity instruments the fair value is determined by standard valuation models using also unobservable input parameters. These models include the adjusted net asset value method, the simplified income approach, the dividend discount model and the comparable company multiple method. The adjusted net asset method requires an investor to measure the fair value of the individual assets and liabilities recognized in an investee’s statement of financial position as well as the fair value of any unrecognized assets and liabilities at the measurement date. The resulting fair values of the recognized and unrecognized assets and liabilities should therefore represent the fair value of the investee’s equity. The dividend discount model assumes that the price of equity instruments issued by an entity equals the present value of all its expected future dividends in perpetuity. Similar to the dividend discount model, the simplified income approach estimates the fair value based on the future income. However, it can be used also when only one year planned income is available. The simplified income approach and the dividend discount model discount future income and dividends using the cost of equity. The cost of equity is dependent on the risk-free rate, the market risk premium, the levered beta and the country risk premium. The levered beta is derived from the industry classification which is published and maintained by Damodaran. In rare cases, techniques for non-trading equity instruments may also include models based on multiples. The comparable company multiple method is a valuation technique within the market approach that uses prices and other relevant information generated by market transactions involving comparable company peers of an investee to derive a valuation multiple from which the indicated fair value of the investee’s equity or enterprise value can be inferred. Liabilities. The fair value of financial liabilities designated at fair value through profit or loss under the fair value option is determined based on quoted prices in active markets, if available. For issued securities where the fair value cannot be retrieved from quoted market prices, the fair value is calculated by discounting the future cash flows. Significant input factors for the spread adjustment of Erste Group’s

171
own credit risk for the respective seniority class are credit spreads derived from liquid benchmark bonds and additional indications from external investments banks, which are provided on a regular basis. The applied spreads are validated on a regular basis from an independent Risk Management unit. Moreover optionality is taken into account when calculating the fair value. OTC-derivative financial instruments. Derivative instruments traded in liquid markets (e.g. interest rate swaps and options, foreign exchange forward and options, options on listed securities and indices, credit default swaps and commodity swaps) are valued by using standard valuation models. These models include discounting cash flow models, option models of the Black-Scholes and Hull-White type as well as hazard rate models. Models are calibrated on quoted market data (including implied volatilities). Valuation models for more complex instruments also use Monte-Carlo simulation. For instruments in less liquid markets, data obtained from less frequent transactions or extrapolation techniques are used. For determining the fair value of derivatives collateralised in EURO a discounting interest rate reflect-ing the interest rate of the corresponding cash collateral is used. As a result of the IBOR reform it has been decided that the so far used EONIA (Euro Over Night Index Average) will be replaced by ESTER (Euro Short-Term Rate) with a transition phase until 31 December 2021. In Erste Group all contracts with CCP’s (Central Counter Parties), LCH (London Clearing House) and EUREX have been converted in 2020 and for the respective collaterals ESTER is used as interest rate. Furthermore, the conversion for a significant part of unsecured derivatives was done in November 2020. The fair value of these derivatives is already determined using ESTER as discount rate. Further-more, the conversion for the most part of unsecured derivatives was done in November 2020. The valuation difference resulting from the conversion has been offset by a compensation payment. The change for all bilateral contracts and CSA’s (Credit Support Annex) is in process and will take place the same way as for CCP’s contracts. Erste Group values derivatives at mid-market levels. To reflect the potential bid-ask-spread of the relevant positions an adjustment based on market liquidity is performed. The adjustment parameters depend on product type, currency, maturity and notional size. Parameters are reviewed on a regular basis or in case of significant market moves. Netting is not applied when determining the bid-ask-spread adjustments. Credit value adjustments (CVA) for counterparty risk and debit value adjustments (DVA) for own default credit risk are applied to OTC derivatives. For the CVA the adjustment is driven by the expected positive exposure of all derivatives and the credit quality of the counter-party. DVA is driven by the expected negative exposure and Erste Group’s credit quality. Erste Group has implemented an approach, where the modeling of the expected exposure is based on option replication strategies. For products where an option replication is not feasible the exposure is computed with Monte-Carlo simulation techniques. One of the two modeling approaches is considered for the most relevant portfolios and products. The methodology for the remaining entities and products is determined by market value plus add-on considerations. The probability of default by counterparties that are not traded in an active market is determined from internal PDs mapped to a basket of liquid titles present in the central European market. Market based valuation concepts are incorporated for this. Counterparties with liquid bond or CDS markets are valued by the respective single-name market based PD derived from the prices. Erste Group’s probability of default has been derived from the buy-back levels of Erste Group’s issuances. Netting has only been considered for a few counterparties where the impact was material. In these cases, netting has been applied for both CVA and DVA. For counterparties with CSA-agreements in place no CVA was taken into account for all cases with immaterial threshold amounts. According to the described methodology the accumulated CVA-adjustments amounted to EUR 17.6 million (2019: EUR 15.7 million) and the total DVA-adjustment amounted to EUR 3.1 million (2019: EUR 2.8 million). Validation and control The responsibility for valuation of financial instruments measured at fair value is independent of the trading units. In addition, Erste Group has implemented an independent validation function in order to ensure separation between units responsible for model development, fair value measurement and validation. The aim of independent model validation is to evaluate model risks arising from the models’ theoretical foundation, the appropriateness of input data (market data) and model calibration. Fair value hierarchy Financial assets and financial liabilities measured at fair value are categorized under the three levels of the IFRS fair value hierarchy. Level 1 of the fair value hierarchy The fair value of financial instruments assigned to Level 1 of the fair value hierarchy is determined based on quoted prices in active markets for identical financial assets and liabilities. More particular, the evaluated fair value can qualify as Level 1 if transactions occur with suffi-cient frequency, volume and pricing consistency on an ongoing basis. These include exchange traded derivatives (futures, options), shares, government bonds as well as other bonds and funds, which are traded in highly liquid and active markets. Level 2 of the fair value hierarchy In case a market quote is used for valuation but due to restricted liquidity the market does not qualify as active (derived from available market liquidity indicators) the instrument is classified as Level 2. If no market prices are available the fair value is measured by using valuation models which are based on observable market data. If all the significant inputs in the valuation model are observable the instrument
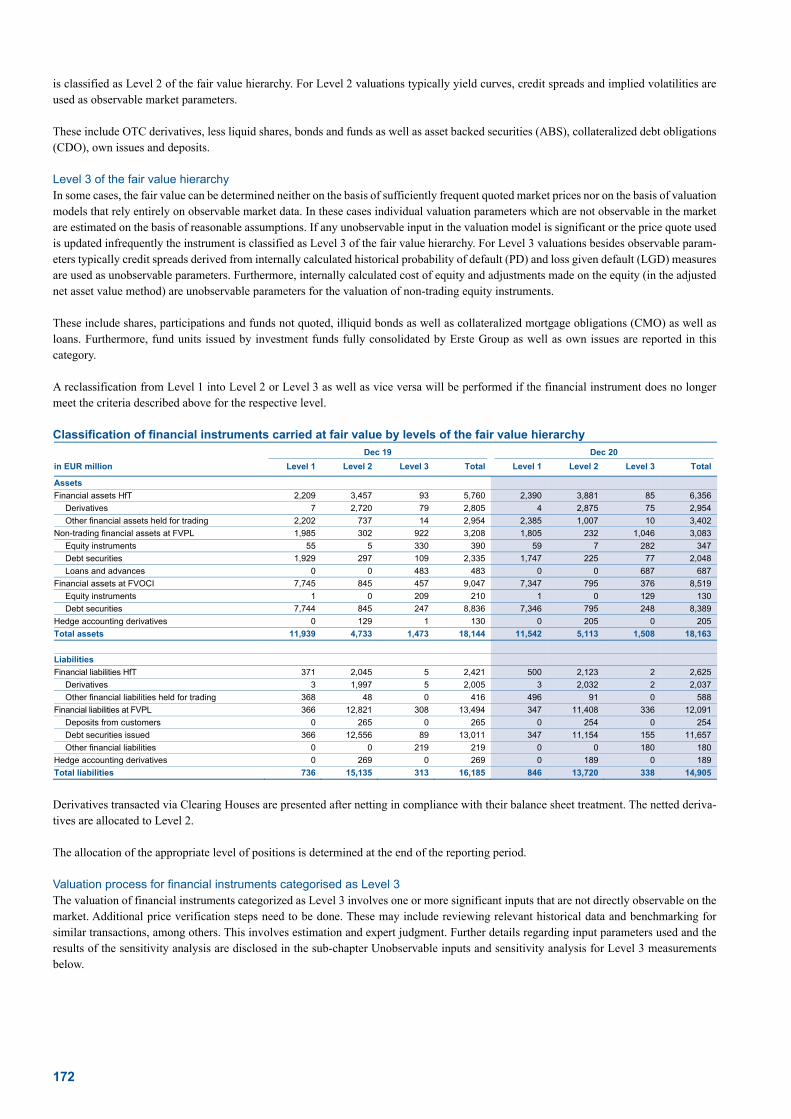
172
is classified as Level 2 of the fair value hierarchy. For Level 2 valuations typically yield curves, credit spreads and implied volatilities are used as observable market parameters. These include OTC derivatives, less liquid shares, bonds and funds as well as asset backed securities (ABS), collateralized debt obligations (CDO), own issues and deposits. Level 3 of the fair value hierarchy In some cases, the fair value can be determined neither on the basis of sufficiently frequent quoted market prices nor on the basis of valuation models that rely entirely on observable market data. In these cases individual valuation parameters which are not observable in the market are estimated on the basis of reasonable assumptions. If any unobservable input in the valuation model is significant or the price quote used is updated infrequently the instrument is classified as Level 3 of the fair value hierarchy. For Level 3 valuations besides observable param-eters typically credit spreads derived from internally calculated historical probability of default (PD) and loss given default (LGD) measures are used as unobservable parameters. Furthermore, internally calculated cost of equity and adjustments made on the equity (in the adjusted net asset value method) are unobservable parameters for the valuation of non-trading equity instruments. These include shares, participations and funds not quoted, illiquid bonds as well as collateralized mortgage obligations (CMO) as well as loans. Furthermore, fund units issued by investment funds fully consolidated by Erste Group as well as own issues are reported in this category. A reclassification from Level 1 into Level 2 or Level 3 as well as vice versa will be performed if the financial instrument does no longer meet the criteria described above for the respective level. Classification of financial instruments carried at fair value by levels of the fair value hierarchy
Dec 19 Dec 20
in EUR million Level 1 Level 2 Level 3 Total Level 1 Level 2 Level 3 Total
Assets
Financial assets HfT 2,209 3,457 93 5,760 2,390 3,881 85 6,356
Derivatives 7 2,720 79 2,805 4 2,875 75 2,954
Other financial assets held for trading 2,202 737 14 2,954 2,385 1,007 10 3,402
Non-trading financial assets at FVPL 1,985 302 922 3,208 1,805 232 1,046 3,083
Equity instruments 55 5 330 390 59 7 282 347
Debt securities 1,929 297 109 2,335 1,747 225 77 2,048
Loans and advances 0 0 483 483 0 0 687 687
Financial assets at FVOCI 7,745 845 457 9,047 7,347 795 376 8,519
Equity instruments 1 0 209 210 1 0 129 130
Debt securities 7,744 845 247 8,836 7,346 795 248 8,389
Hedge accounting derivatives 0 129 1 130 0 205 0 205
Total assets 11,939 4,733 1,473 18,144 11,542 5,113 1,508 18,163
Liabilities
Financial liabilities HfT 371 2,045 5 2,421 500 2,123 2 2,625
Derivatives 3 1,997 5 2,005 3 2,032 2 2,037
Other financial liabilities held for trading 368 48 0 416 496 91 0 588
Financial liabilities at FVPL 366 12,821 308 13,494 347 11,408 336 12,091
Deposits from customers 0 265 0 265 0 254 0 254
Debt securities issued 366 12,556 89 13,011 347 11,154 155 11,657
Other financial liabilities 0 0 219 219 0 0 180 180
Hedge accounting derivatives 0 269 0 269 0 189 0 189
Total liabilities 736 15,135 313 16,185 846 13,720 338 14,905
Derivatives transacted via Clearing Houses are presented after netting in compliance with their balance sheet treatment. The netted deriva-tives are allocated to Level 2. The allocation of the appropriate level of positions is determined at the end of the reporting period. Valuation process for financial instruments categorised as Level 3 The valuation of financial instruments categorized as Level 3 involves one or more significant inputs that are not directly observable on the market. Additional price verification steps need to be done. These may include reviewing relevant historical data and benchmarking for similar transactions, among others. This involves estimation and expert judgment. Further details regarding input parameters used and the results of the sensitivity analysis are disclosed in the sub-chapter Unobservable inputs and sensitivity analysis for Level 3 measurements below.

173
Changes in volumes of Level 1 and Level 2 Changes in Level 1 and Level 2 volumes of financial instruments carried at fair value in the balance sheet
Dec 19 Dec 20
in EUR million Level 1 Level 2 Level 1 Level 2
Securities
Net transfer from Level 1 -60 -5
Net transfer from Level 2 60 5
Net transfer from Level 3 3 146 0 -7
Purchases/sales/expiries 507 -670 -400 163
Changes in derivatives 4 -256 -2 230
Total year-to-date change 574 -840 -397 381
Movements in 2020. The total amount of Level 1 financial assets decreased by EUR 397 million compared to last year. The volume of Level 1 securities decreased by EUR 395 million. The main changes are caused by matured or sold assets in the amount of EUR 3,212 million and by new investments in the amount of EUR 2,474 million. Furthermore, the increase in volume for securities that were allocated to Level 1 at both reporting dates (2020 and 2019) amounted to EUR 344 million (due to partial purchases and sales and fair value changes caused by market movements). Due to improved market liquidity, assets in the amount of EUR 108 million have been reclassified from Level 2 to Level 1. This applied mainly to securities issued by governments (EUR 77 million), but also to securities issued by financial institutions (EUR 29 million) and other corporates (EUR 2 million). Due to lower market activity and changes to modelled fair value, securities in total of EUR 103 million have been moved from Level 1 to Level 2. This applies mainly to securities issued by governments (EUR 50 million), financial institutions (EUR 45 million) as well as securities issued by other corporates (EUR 8 million). The remaining negative change in the amount of EUR 6 million was due to partial sales and fair value changes of reclassified in-struments. The volume of derivatives decreased by EUR 2 million. Movements in 2019. The total amount of Level 1 financial assets increased by EUR 574 million compared to last year. The volume of Level 1 securities increased by EUR 569 million. The main changes are caused by matured or sold assets in the amount of EUR 3,164 million and by new investments in the amount of EUR 2,530 million. Furthermore, the increase in volume for securities that were allocated to Level 1 at both reporting dates (2019 and 2018) amounted to EUR 1,125 million (due to partial purchases and sales and fair value changes caused by market movements). Due to improved market liquidity, assets in the amount of EUR 79 million could be reclassified from Level 2 to Level 1. This applied mainly to securities issued by governments (EUR 32 million), but also to securities issued by other corporates (EUR 24 million) and financial institutions (EUR 23 million). Due to lower market activity and changes to modelled fair value, securities in total of EUR 19 mil-lion have been moved from Level 1 to Level 2. This applies mainly to securities issued by governments (EUR 13 million), other corporates (EUR 4 million) as well as securities issued by financial institutions (EUR 2 million). Level 3 instruments in the amount of EUR 2 million were reclassified to Level 1. The remaining positive change in the amount of EUR 6 million was due to partial sales and fair value changes of reclassified instruments. The volume of derivatives increased by EUR 5 million. Relassification between Level 1 and Level 2 based on balance sheet positions and instruments
Dec 19 Dec 20
in EUR million Level 1
to Level 2 Level 2
to Level 1 Level 1
to Level 2 Level 2
to Level 1
Financial assets HfT 14 11 15 23
Bonds 14 9 15 23
Funds 0 2 0 0
Non-trading financial assets at FVPL 3 4 16 3
Bonds 3 4 14 3
Funds 0 0 2 0
Financial assets at FVOCI 2 64 72 82
Bonds 2 64 72 82
Total 19 79 103 108
Movements in 2020: Financial Assets. The total value of Level 2 financial assets increased between 2020 and 2019 by EUR 380 million. The Level 2 fair value change of securities and other receivables (in total up by EUR 150 million) can be explained for the most part by matured or sold positions in the amount of EUR 835 million and new investments in the amount of EUR 1,056 million. The decrease in volume for securities that have been allocated to Level 2 at both reporting dates 2020 and 2019 amounted to EUR 59 million due to pur-chases or sales in volumes and changes in market values. Due to reduced market depth a total volume of EUR 103 million was reclassified from Level 1 to Level 2 in 2020. This applies mainly to securities issued by governments (EUR 50 million), securities issued by financial institutions (EUR 45 million) and other corporates (EUR 8 million). Securities in the amount of EUR 108 million were reclassified from Level 2 to Level 1 for the reporting date. Due to the use of significant non-observable valuation parameters a total volume of EUR 13 million was reclassified from Level 2 to Level 3. Due to a change to valuation models with significant observable parameters a total volume of EUR 6 mil-lion was reclassified from Level 3 to Level 2. The increase on the asset side derivatives in Level 2 by EUR 230 million are caused by changes in market values and by netting effects.

174
Movements in 2020: Financial Liabilities. The total Level 2 financial liabilities decreased by EUR 1,415 million. Whereas the fair value of derivatives decreased by EUR 46 million, the portfolio of securities decreased by EUR 1,358 million. The fair value of client deposits decreased by EUR 11 million. Movements in 2019: Financial Assets. The total value of Level 2 financial assets decreased between 2019 and 2018 by EUR 840 million. The Level 2 fair value change of securities and other receivables (down by EUR 584 million) can be explained for the most part by matured or sold positions in the amount of EUR 1,472 million and new investments in the amount of EUR 793 million. The increase in volume for securities that have been allocated to Level 2 at both reporting dates 2019 and 2018 amounted to EUR 21 million due to purchases or sales in volumes and changes in market values. Due to reduced market depth a total volume of EUR 19 million was reclassified from Level 1 to Level 2 in 2018. This applies mainly to securities issued by governments (EUR 13 million), securities issued by other corporates (EUR 4 million) and financial institutions (EUR 2 million). Securities in the amount of EUR 79 million were reclassified from Level 2 to Level 1 for the report-ing date. Due to the use of significant non-observable valuation parameters a total volume of EUR 4 million was reclassified from Level 2 to Level 3. Due to a change to valuation models with significant observable parameters a total volume of EUR 150 million was reclassified from Level 3 to Level 2. The remaining decrease in the amount of EUR 12 million was due to partial sales and fair value changes of reclassified instruments. The decrease on the asset side derivatives in Level 2 by EUR 256 million are caused by changes in market values and by netting effects. Movements in 2019: Financial Liabilities. The total Level 2 financial liabilities decreased by EUR 114 million. Whereas the fair value of derivatives increased by EUR 4 million, the portfolio of securities decreased by EUR 171 million. The fair value of client deposits in-creased by EUR 53 million.

175
Movements in Level 3 of financial instruments carried at fair value Development of fair value of financial instruments in Level 3
in EUR million
Gains/ losses
profit or loss
Gains/losses
OCI Purch-
ases Sales Settle-ments
Addition to
Group
Disposal out of Group
Transfer into
Level 3
Transfer out of
Level 3
Currency trans-lation
Jan 20 Dec 20
Assets
Financial assets HfT 93 10 0 1 -5 0 0 0 6 -20 -1 85
Derivatives 79 11 0 0 -1 0 0 0 6 -20 -1 75
Other financial assets held for trading 14 -1 0 1 -4 0 0 0 0 0 0 10
Non-trading financial assets at FVPL 922 5 0 371 -122 -70 0 0 2 -15 -47 1,046
Equity instruments 330 2 0 19 -62 0 0 0 1 -5 -1 282
Debt securities 109 11 0 6 -14 -24 0 0 1 -9 -2 77
Loans and advances 483 -8 0 346 -46 -46 0 0 0 0 -43 687
Financial assets at FVOCI 457 3 7 91 -105 -62 0 0 11 -22 -3 376
Equity instruments 209 0 7 0 -86 -1 0 0 0 0 0 129
Debt securities 247 3 0 91 -20 -61 0 0 11 -21 -2 248
Hedge accounting derivatives 1 -1 0 0 0 0 0 0 0 0 0 0
Total assets 1,473 18 7 464 -233 -132 0 0 19 -56 -50 1,508
Liabilities
Financial liabilities HfT 5 2 0 0 -4 0 0 0 0 -1 0 2
Derivatives 5 2 0 0 -4 0 0 0 0 -1 0 2
Financial liabilities at FVPL 308 8 -2 73 -78 -41 0 0 140 -72 0 336
Debt securities issued 89 3 -2 0 0 -2 0 0 140 -72 0 155
Other financial liabilities 219 5 0 72 -78 -38 0 0 0 0 0 180
Total liabilities 313 10 -2 73 -82 -41 0 0 140 -72 0 338
Jan 19 Dec 19
Assets
Financial assets HfT 80 25 0 4 -5 -2 0 0 2 -11 0 93
Derivatives 61 26 0 3 -5 -1 0 0 2 -7 0 79
Other financial assets held for trading 19 0 0 2 -1 -1 0 0 0 -5 0 14
Non-trading financial assets at FVPL 778 23 0 768 -298 -182 0 0 1 -162 -6 922
Equity instruments 317 5 0 40 -5 -9 0 0 1 -20 0 330
Debt securities 174 14 0 55 -4 -15 0 0 0 -116 0 109
Loans and advances 287 4 0 672 -290 -158 0 0 0 -26 -6 483
Financial assets at FVOCI 502 1 66 6 -50 -59 19 0 21 -47 -2 457
Equity instruments 239 0 53 0 -43 -47 0 0 9 -1 0 209
Debt securities 263 1 13 6 -7 -11 19 0 12 -46 -2 247
Hedge accounting derivatives 1 0 0 1 0 0 0 0 0 -1 0 1
Total assets 1,361 50 66 779 -354 -242 19 0 24 -222 -8 1,473
Liabilities
Financial liabilities HfT 14 -7 0 0 0 -1 0 0 0 0 0 5
Derivatives 14 -7 0 0 0 -1 0 0 0 0 0 5
Financial liabilities at FVPL 561 22 0 143 -85 -6 0 -318 87 -96 -1 308
Debt securities issued 96 5 0 0 0 -2 0 0 87 -96 -1 89
Other financial liabilities 464 17 0 143 -85 -4 0 -318 0 0 0 219
Total liabilities 574 15 0 143 -85 -7 0 -318 87 -96 -1 313
Movements in 2020. The reclassification of securities to Level 3 was caused by a decrease in market liquidity and was based on an in-depth analysis of broker quotes. Based on the described analysis securities in the amount of EUR 13 million were reclassified from Level 2 to Level 3. The change is coming from securities issued by other corporates (EUR 9 million), as well as securities issued by financial institutions (EUR 2 million) and securities issued by governments (EUR 2 million). On the other hand, securities that were on the balance at both reporting dates (2020 and 2019) were reclassified from Level 3 to Level 2 in the amount of EUR 6 million. Thereof, EUR 6 million are securities issued by financial institutions. Loans and advances which are measured at fair value under IFRS 9 in-creased by EUR 204 million, mainly by purchases. The additional change in Level 3 positions was on the one hand caused by a decrease in derivative exposure of EUR 4 million and on the other hand by a decrease caused by the purchase, sale and market value change of securities in the amount of EUR 172 million. Movements in 2019. The reclassification of securities to Level 3 was caused by a decrease in market liquidity and was based on an in-depth analysis of broker quotes. Based on the described analysis securities in the amount of EUR 4 million were reclassified from Level 2 to Level 3. The change is coming from securities issued by financial institutions (EUR 4 million). On the other hand securities in the amount of EUR 150 million were reclassified from Level 3 to Level 2. Thereof EUR 113 million are securities issued by financial insti-tutions, EUR 34 million are securities issued by other corporates and EUR 3 million are issued by central governments. The movement from Level 3 to Level 1 amounted to EUR 2 million. Loans and advances which are measured at fair value under IFRS 9 increased by EUR 197 million. The additional change in Level 3 positions was on the one hand caused by a increase in derivative exposure of EUR 17 million and on the other hand by an increase caused by the purchase, sale and market value change of securities of EUR 46 million.
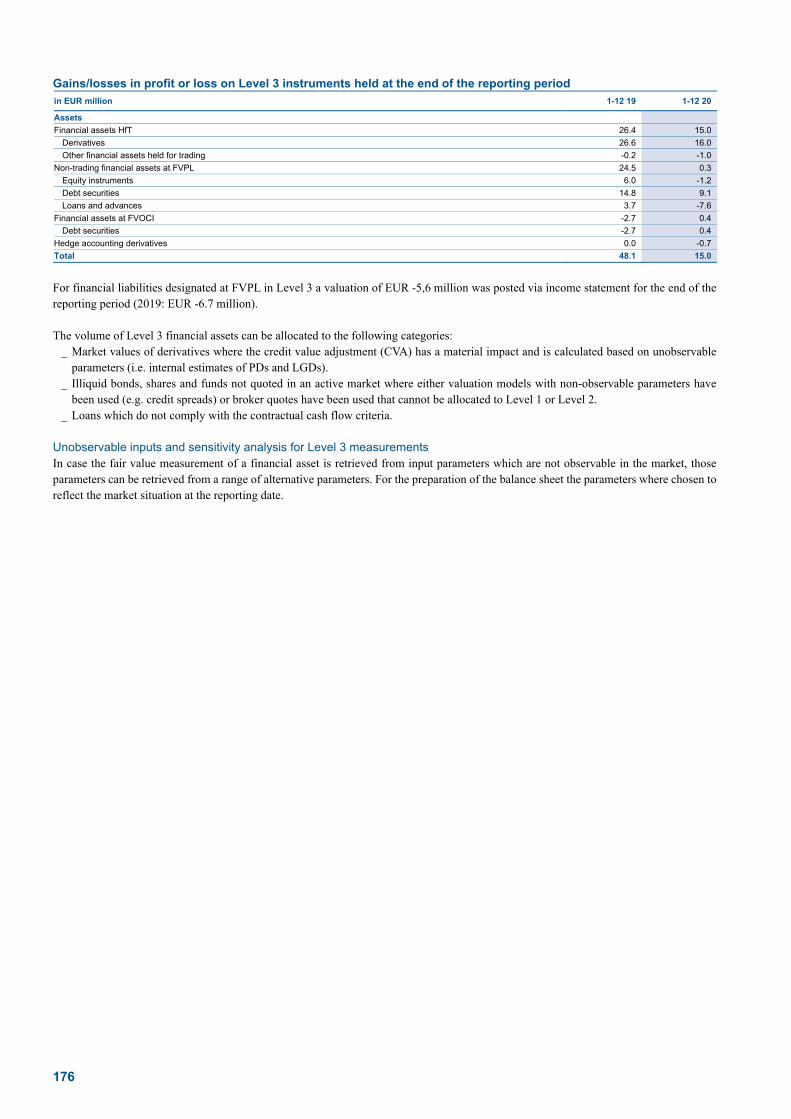
176
Gains/losses in profit or loss on Level 3 instruments held at the end of the reporting period in EUR million 1-12 19 1-12 20
Assets
Financial assets HfT 26.4 15.0
Derivatives 26.6 16.0
Other financial assets held for trading -0.2 -1.0
Non-trading financial assets at FVPL 24.5 0.3
Equity instruments 6.0 -1.2
Debt securities 14.8 9.1
Loans and advances 3.7 -7.6
Financial assets at FVOCI -2.7 0.4
Debt securities -2.7 0.4
Hedge accounting derivatives 0.0 -0.7
Total 48.1 15.0
For financial liabilities designated at FVPL in Level 3 a valuation of EUR -5,6 million was posted via income statement for the end of the reporting period (2019: EUR -6.7 million). The volume of Level 3 financial assets can be allocated to the following categories:
_ Market values of derivatives where the credit value adjustment (CVA) has a material impact and is calculated based on unobservable parameters (i.e. internal estimates of PDs and LGDs).
_ Illiquid bonds, shares and funds not quoted in an active market where either valuation models with non-observable parameters have been used (e.g. credit spreads) or broker quotes have been used that cannot be allocated to Level 1 or Level 2.
_ Loans which do not comply with the contractual cash flow criteria. Unobservable inputs and sensitivity analysis for Level 3 measurements In case the fair value measurement of a financial asset is retrieved from input parameters which are not observable in the market, those parameters can be retrieved from a range of alternative parameters. For the preparation of the balance sheet the parameters where chosen to reflect the market situation at the reporting date.

177
Range of unobservable valuation parameters used in Level 3 measurements
Financial assets Type of instrument Fair value
in EUR million Valuation technique
Significant unobservable inputs
Range of unobservable inputs (weighted average)
Dec 20
Positive fair value of derivatives Forwards, swaps, options 75.5 Discounted cash flow and option models with CVA adjustment based on potential future exposure
PD 0.60%-100% (4.12%)
LGD 60%
Financial assets at FVPL
Fixed and variable coupon bonds
6.1 Discounted cash flow Credit Spread 0.81%-6.10% (4.51%)
Loans 687.0 Discounted cash flow PD 1,16%-6,10% (2,38%)
LGD 0%-68,22% (27,94%)
Financial assets at FVOCI Fixed and variable coupon bonds
132.3 Discounted cash flow Credit Spread 0.86%-6.52% (2.18%)
Financial assets at FVOCI / at FVPL
Non-trading equity instruments (participations)
236.0 Dividend Discount Model; Simplified Income Approach
Beta relevered
Industries: Insurance (General) 0.90-0.95 Recreation 0.96 Real Estate (General/Diversified) 0.78 Real Estate (Operations & Services) 0.49 Financial Svcs. (Non-bank & Insurance) 0.91-1.10 Banks (Regional) 0.51 Health Resort & Gesundheitszentrum GmbH 0.74
Country risk premium
Croatia 4.45%, Austria 0.36%-0.5% Czech Republic 0.90% Romania 3.26%, Russia 2.58%, Slovakia 1.26%, Hungary 3.26% Resulting cost of equity based on above inputs: 4.19%-12.83%
183.6 Adjusted Net Asset Value Adjusted Equity Depending on accounting equity of investment.
33.0 Market comparable companies
EV / SALES EV / EBITDA EV / EBIT P/E P/E (implicit) P/B
Depending on industry classification according to Damodaran.
Dec 19
Positive fair value of derivatives Forwards, swaps, options 75.8 Discounted cash flow and option models with CVA adjustment based on potential future exposure
PD 0.66%-100% (4.40%)
LGD 60%
Financial assets at FVPL
Fixed and variable coupon bonds
6.1 Discounted cash flow Credit Spread 0.81%-6.21% (3.29%)
Loans 483,4 Discounted cash flow PD 0%-39.70% (0.81%)
LGD 0%-79.30% (25.18%)
Financial assets at FVOCI Fixed and variable coupon bonds
140.9 Discounted cash flow Credit Spread 1.23%-7.27% (4.31%)
Financial assets at FVOCI / at FVPL
Non-trading equity instruments (participations)
214.8 Dividend Discount Model; Simplified Income Approach
Beta relevered
Industries: Insurance (General) 0.92-0.96 Recreation 0.93 Real Estate (General/Diversified) 0.75 Financial Svcs. (Non-bank & Insurance) 0.93-1.02 Banks (Regional) 0.58
Country risk premium
Croatia 2.79%, Austria 0.37% Czech Republic 0.65% Romania 2.04%, Russia 2.04%, Slovakia 0.79%, Spain 1.48%, Hungary 2.04% Resulting cost of equity based on above inputs: 6.32%-11.01%
191.7 Adjusted Net Asset Value Adjusted Equity Depending on accounting equity of investment.
159.0 Market comparable companies
EV / SALES EV / EBITDA EV / EBIT P/E P/E (implicit) P/B
Depending on industry classification according to Damodaran.
In addition to the information above, equity instruments with a fair value in amount of EUR 21.6 million (2019: EUR 147.9 million) are assessed on the basis of expert opinions. Furthermore, for equity instruments other than participations classified as Level 3, the amount of EUR 49.9 million (2019: EUR 25.6 mil-lion) is presented in the statement of financial position using the criteria of availability and quality of broker quotes.

178
Sensitivity analysis using reasonably possible alternatives per product type
Dec 19 Dec 20
Fair value changes Fair value changes
in EUR million Positive Negative Positive Negative
Derivatives 2.2 -2.8 2.4 -2.3
Income statement 2.2 -2.8 2.4 -2.3
Debt securities 45.3 -60.3 11.7 -15.6
Income statement 23.7 -31.5 2.1 -2.8
Other comprehensive income 21.6 -28.8 9.6 -12.8
Equity instruments 71.6 -52.8 113.0 -73.4
Income statement 36.2 -31.6 73.1 -49.9
Other comprehensive income 35.4 -21.2 39.9 -23.5
Loans and advances 9.5 -24.8 16.7 -35.4
Income statement 9.5 -24.8 16.7 -35.4
Total 128.6 -140.7 143.8 -126.7
Income statement 71.6 -90.7 94.3 -90.4
Other comprehensive income 57.0 -50.0 49.5 -36.3
In estimating these impacts, mainly changes in credit spreads (for bonds), PDs, LGDs (for CVA of derivatives) and market values of com-parable equities were considered. An increase (decrease) of spreads, PDs and LGDs result in a decrease (increase) of the corresponding fair values. Positive correlation effects between PDs and LGDs were not taken into account in the sensitivity analysis. For non-trading equity instruments increases (decreases) in any of the inputs used for the cost of equity calculation in isolation would result in a lower (higher) fair value. The following ranges of reasonably possible alternatives of the unobservable inputs were considered in the sensitivity analysis table:
_ for debt securities range of credit spreads between +100 basis points and -75 basis points _ for equity related instruments the price range between -10% and +5% _ for unquoted equity instruments measured by the adjusted net asset value the price range between -10% and +10% _ for unquoted equity instruments measured by dividend discount model/simplified income approach the cost of equity range between
-2% and +2% _ for CVA on derivatives PDs rating upgrade/downgrade by one notch, as well as the change of LGD by -5% and +10%. _ for loans, the PDs rating upgrade/downgrade by 1%, the change of LGD by -5% and +10% and a range of credit spreads between +100
basis points and -75 basis points

179
Financial instruments not carried at fair value with fair value disclosed in the notes in EUR million Carrying amount Fair Value Level 1 Level 2 Level 3
Dec 20
Assets
Cash and cash balances 35,839 35,839 0 0 0
Financial assets at AC 210,940 218,023 27,326 3,768 186,929
Loans and advances to banks 21,466 21,502 0 0 21,502
Loans and advances to customers 159,895 165,257 0 0 165,257
Debt securities 29,579 31,264 27,326 3,768 170
Finance lease receivables 4,127 4,124 0 0 4,124
Assets held for sale 4 4 0 0 4
Trade and other receivables 1,341 1,338 0 0 1,338
Liabilities
Financial liabilities at AC 235,125 235,688 10,255 8,707 216,725
Deposits from banks 24,771 24,763 0 0 24,763
Deposits from customers 190,816 191,098 0 0 191,098
Debt securities issued 19,020 19,309 10,255 8,707 346
Other financial liabilities 518 518 0 0 518
Financial guarantees and commitments
Financial guarantees n/a 5 5
Irrevocable commitments n/a 895 895
Dec 19
Assets
Cash and cash balances 10,693 10,693 0 0 0
Financial assets at AC 204,162 208,412 25,273 2,637 180,503
Loans and advances to banks 23,055 23,072 0 0 23,072
Loans and advances to customers 154,344 157,342 0 0 157,342
Debt securities 26,764 27,998 25,273 2,637 89
Finance lease receivables 4,034 4,024 0 0 4,024
Assets held for sale 0 0 0 0 0
Trade and other receivables 1,408 1,412 0 0 1,412
0 0 0
Liabilities
Financial liabilities at AC 204,143 204,392 10,472 6,631 187,289
Deposits from banks 13,141 13,337 0 0 13,337
Deposits from customers 173,066 172,948 0 0 172,948
Debt securities issued 17,360 17,531 10,472 6,631 428
Other financial liabilities 576 577 0 0 577
Financial guarantees and commitments
Financial guarantees n/a 82 82
Irrevocable commitments n/a 357 357
In the table above, positive fair values of financial guarantees and commitments are shown with a positive sign whereas negative fair values are shown with a negative sign. The fair value of loans and advances to customers and credit institutions has been calculated by discounting future cash flows while taking into consideration interest and credit spread effects. The interest rate impact is based on the movements of market rates, while credit spread changes are derived from PDs and LGDs used for internal risk calculations. For the calculation of fair value loans and advances were grouped into homogeneous portfolios based on rating method, rating grade, maturity and the country where they were granted. The fair values of debt securities at amortised cost are either taken directly from the market or they are determined by directly observable input parameters (i.e. yield curves). The fair value of deposits and other liabilities, measured at amortised cost, is estimated by taking into account the current interest rate environment, as well as the own credit spreads. These positions are assigned to the Level 3 category. For liabilities without contractual maturities (e.g. demand deposits), the carrying amount represents the minimum of their fair value. The fair value of issued securities and subordinated liabilities measured at amortized cost is determined based on quoted prices in active markets, if available. For issued securities where the fair value cannot be retrieved from quoted market prices, the fair value is calculated by discounting the future cash flows. Significant input factors for the spread adjustment of Erste Group’s own credit risk for the respective seniority class are credit spreads derived from liquid benchmark bonds and additional indications from external investments banks, which are provided on a regular basis. The applied spreads are validated on a regular basis from an independent Risk Management unit. Moreover optionality is taken into account when calculating the fair value. For off-balance sheet liabilities (i.e. financial guarantees and unused loan commitments) the following fair value approaches are applied:

180
the fair value of unused loan commitments is estimated using regulatory credit conversion factors. The resulting loan equivalents are treated like other on-balance sheet assets. The difference between the calculated total fair value and the notional amount of the hypothetical loan equivalents represents the fair value of the unused loan commitments. In case of the total fair value being higher than the notional amount of the hypothetical loan equivalents the unused loan commitments have a positive fair value. The fair value of financial guarantees is estimated in analogy to credit default swaps. The fair value of the guarantee is the sum of the present value of the protection leg and the present value of the premium leg. The value of the protection leg is estimated using the PDs and LGDs of the respective customers, whereas the value of the premium leg is estimated by the present value of the future fee payments to be received. If the protection leg is higher than the premium leg, financial guarantees have a negative fair value. 27. Hedge accounting Erste Group makes use of derivative instruments to hedge exposures to interest rate risk and foreign currency risk. In order for the derivatives and the exposures to qualify for hedge accounting, at inception of a hedge relationship, the bank formally documents the relationship between the hedged item and the hedging instrument, including the nature of the risk, the objective and strategy for undertaking the hedge and the method that will be used to assess the effectiveness of the hedging relationship. A hedge is considered to be highly effective if the changes in fair value or cash flows attributable to the hedged risk offset the fair value changes of the hedging instrument in a range of 80% to 125%. This is assessed both prospectively, i.e. whether the results are expected to be in the range, and retrospectively, i.e. whether the actual results are in the range. Hedge effectiveness is assessed at inception and throughout the term of each hedging relationship. Exact conditions for particular types of hedges and for testing the hedge effectiveness by Erste Group are specified internally in the hedge ac-counting guidance. As permitted by the transitional provisions of IFRS 9, Erste Group has elected to continue to apply the hedge accounting requirements of IAS 39. On the balance sheet, derivatives designated as hedging instruments are carried at fair value (dirty price). They are presented in the line item ‘Hedge accounting derivatives’ on the asset or liability side depending on whether their fair value is positive or negative. i. Fair value hedges
For qualifying and designated fair value hedges, the change in the fair value (clean price) of a hedging instrument is recognised in the statement of income under the line item ‘Net trading result’. Interest income and expenses on hedging derivatives are reported in the line item ‘Other similar income’ or ‘Other similar expenses’ under ‘Net interest income’. The change in the fair value of the hedged item at-tributable to the hedged risk is also recognised in the statement of income under the line item ‘Net trading result’ and adjusts the carrying amount of the hedged item. Erste Group also applies portfolio fair value hedges of interest rate risk as regulated by IAS 39.AG114-AG132. For this purpose, Erste Group makes use of the relaxation provided by the EU-carve out and hedges the interest rate risk of prepayable loans in respect of the so called ‘bottom layer’ amount. With this approach, prepayments, other derecognitions and impairments are considered as not affecting the hedge effectiveness unless their amount hits the designated hedged bottom layer level. The change in the fair value of the hedged items attributable to the hedged interest risk is presented on the balance sheet under the line item ‘Fair value changes of hedged items in portfolio hedge of interest rate risk’. If the hedging instrument expires, is sold, is terminated or is exercised, or when the hedge no longer meets the criteria for hedge accounting, the hedge relationship is terminated. In this case, the fair value adjustment of the hedged item is amortised until maturity of the financial instrument. In the statement of income the amortisation is presented under ‘Net interest income’ in the line item ‘Interest income’ if the hedged item was a financial asset or in the line item ‘Interest expenses’ if the hedged item was a financial liability. For portfolio fair value hedges of interest rate risk the fair value adjustment related to the terminated hedge is amortised to the statement of income on a straight-line basis in the line item ‘Other similar income’ under ‘Net interest income’. ii. Cash flow hedges
For designated and qualifying cash flow hedges, the effective portion of the gain or loss on the hedging instrument is recognised as OCI in the line ‘Cash flow hedge reserve’ of the statement of comprehensive income. The accumulated other comprehensive income is presented under ‘Cash flow hedge reserve’ in the statement of changes in equity. The ineffective portion of the gain or loss on the hedging instrument is recognised in the statement of income under the line item ‘Net trading result’. For determination of the effective and ineffective portions, the derivative is considered at its clean price, i.e. excluding the interest component. When the hedged cash flow affects the statement of income, the gain or loss on the hedging instrument is reclassified from other comprehensive income on the corresponding income or expense line item in the statement of income (mainly ‘Other similar income’ or ‘Other similar expenses’ under ‘Net interest income’). As far as accounting for hedged items in cash flow hedges is concerned, there is no change compared to the situation when no hedging is applied. When a hedging instrument expires, is sold, is terminated, is exercised, or when a hedge no longer meets the criteria for hedge accounting, the hedge relationship is terminated. In this case, the cumulative gain or loss on the hedging instrument that has been recognised in other comprehensive income remains in ‘Cash flow hedge reserve’ until the transaction occurs.

181
Hedges of interest rate risk As an inherent part of its business Erste Group is exposed to interest rate risk arising from the interest characteristics and behavior of assets, liabilities and off balance sheet items. This relates to the existing balance sheet items as well as to expected development of the balance sheet and banking activities. Interest rate risk can generally be defined as a potential deterioration of a bank’s financial condition in reaction to adverse movements in market interest rates. Hedge accounting activities relate to interest risk bearing exposures in the banking book. The interest rate risk of the banking book is managed by Group Asset Liability Management (ALM). Interest rate risk management actions of ALM are approved as part of the ALM strategy by Group Asset Liability Committee (ALCO). For hedging relationships qualifying for hedge accounting hedge effectiveness is measured by risk management unit which is independent from ALM as the risk taker. The objective of the interest rate risk management in the banking book is to optimise the risk and return of interest rate risk exposures. For this purpose and for compliance with external and internal regulations and limitations Erste Group manages the interest rate risk from the earnings and economic value perspectives. The focal point of the interest rate risk analysis from the earnings perspective is the variation in earnings, i.e. the net interest income. The changes in interest rates have an impact on the bank’s earnings via its distinct impact on interest income and interest expenses accrued on assets and liabilities respectively. The economic value perspective views the interest rate risk as changes in the economic value of equity. It can be identified as the present value of cash-flows arising from asset, liability and off-balance-sheet items. Change in interest rates alters both the size of future cash-flows and the value of discount rates applied in the calculation. Existing balance sheet items and contributions of planned or forecast transactions are analysed through the earnings and economic value based metrics. Erste Group keeps the risk within predefined limits. When actively managing interest rate risk ALM gives preference to entering into bonds and derivatives. In general, the policy of Erste Group is to swap all substantial fixed or structured issued bonds to floating items. In addition of managing the interest rate risk using derivative transactions and investments in bonds, also the intended non-hedging of benchmark issues with derivatives is used for managing the interest rate risk. Interest rate swaps are the most common derivatives used to manage interest rate. If fixed rate repricing profiles of assets or liabilities do not fit to the interest rate risk management strategy they are swapped into variable rate items (usually 3-month money market rate such as Euribor). In other cases, variable rate repricing profiles of assets or liabilities may need to be swapped into fixed rate items. Erste Group employs hedge accounting to address accounting mismatches resulting from different measurement requirements for deriva-tives which are measured at fair value through profit or loss and financial assets and liabilities in the banking book measured at amortised cost or at fair value through other comprehensive income. Some of the accounting mismatches are addressed by designating financial assets or financial liabilities as measured at FVPL (fair value option) without the need to use hedge accounting. Fair value hedges address the risk management activities of swapping fixed rate assets or liabilities into variable rate. On the other hand, cash flow hedges are used when floating rates assets or liabilities are swapped into fixed ones (please refer also to the discussion of proxy hedges below). For hedges of interest rate risk of portfolios of prepayable fixed rate loans Erste Group applies requirements for portfolio fair value hedges of interest rate risk as regulated by IAS 39.AG114-AG132. For this purpose, Erste Group makes use of the relaxation provided by the EU-carve out and hedges the interest rate risk in respect of so called bottom layer amount. The bottom layer amount is expected not to be affected by prepayments of loans (including a margin of conservatism). Thus, it represents a stable fixed interest rate exposure which is hedged by using interest rate swaps. With this approach, any prepayments, other derecognitions and impairments are attributed to the un-hedged buffer amount above the designated bottom layer. Thus, they do not affect the hedge effectiveness unless their amount hits the designated hedged bottom layer level. Fair value hedges are designated in respect of the interest rate risk component of the fair value changes of the hedged fixed rate items. The hedged interest rate risk portion in fair value hedges relates to the observed interest rate (swap yield curve) component. I.e. the fair value volatility resulting from changes in the spread of the hedged fixed rate instrument swap yield curve is excluded from hedge accounting and is not accounted for. Similarly, in cash flow hedges the hedged risk is designated in respect of the variable cash flows portion equal to the interest index of the swap (such as Euribor, Libor). The credit spreads over the swap index are excluded from hedge accounting. The hedging interest derivatives are economically related to the hedged interest rate risk component of the hedged item. The non-interest components (such as credit spreads) of the hedged items are outside the hedging relationship. As a result, comparable valuation inputs are applied on both sides of the hedging relationship. Thus offsetting effects are recognised to the extent the economic relationship exists without giving rise to artificial volatility in profit or loss. The hedged interest risk component is the most significant factor affecting fair value changes of the hedged item.

182
The designated hedging relationships normally correspond to the economic hedges set up by ALM when managing the interest rate risk. However, in some cases, the hedging derivatives may not be directly related to specific assets or liabilities but they manage the overall interest risk position. Also, the derivatives may relate to instruments which do not qualify as hedged items under the IFRS hedge accounting requirements. In order to account for risk mitigating effects of such derivatives Erste Group searches for suitable hedged items providing the best fit to the terms of the derivative and designates an effective hedging relationship (so called proxy hedges). Typically cash flow hedges of variable rate assets are designated on such a basis whereby the actual economically hedged risk may result from modelled fixed rate profile of demand deposit liabilities. Notional amounts of hedged items
Notional amount
in EUR million Type of hedged items Dec 19 Dec 20
Fair value hedges
Assets Portfolios of client loans 319 234
Assets Single loans 383 356
Assets Bonds at FVOCI 543 432
Assets Bonds at AC 600 925
Liabilities Issued bonds 9,412 11,679
Liabilities Other liabilities/repos 54 0
Cash flow hedges
Assets Interbank loans/repos 1,580 1,527
Assets Client loans 1,608 1,125
Assets Corporate/government bonds 94 53
Portfolio hedges of defined bottom layer amounts (bottom layer hedges) are disclosed in the table with the nominal hedged bottom layer amounts. Client loans hedged in portfolio hedges are disclosed in balance sheet line item ’Financial assets measured at amortised cost’, with a carrying amount of EUR 388,0 million (2019: EUR 419.9 million). The hedge ratio is chosen in compliance with the rules defined in IAS 39. The volume of the hedging instrument which is designated for the hedge relation can never be greater than the volume of the hedged item. If the notional of a hedging derivative is greater than the notional of the hedged item the respective proportion of the derivative is designated as hedging instrument. Further, the tenor of the hedging instru-ment is never longer than the tenor of the hedged item. Sources of hedge ineffectiveness can result from:
_ designation of hedging instruments and hedged items during their life rather than from their inception _ different discounting curves applied for hedged item and hedging instrument _ different interest tenors of hedging swaps and hedged variable rate items in cash flow hedges _ volatility of present value of floating leg of hedging swaps in fair value hedges _ different trade dates for the hedging instrument and the hedged item _ real prepayments of a loan portfolio deviating from expected prepayments _ credit risk adjustments (CVA, DVA) on the hedging derivatives
Hedges of foreign exchange risk The objective of foreign exchange risk management in the banking book is to avoid unfavorable market movements of foreign exchange rates which could impact profit or loss of Erste Group. Only a minor part of foreign exchange risk management activities requires using of hedge accounting. Currently fixed rate corporate or government bonds with notional amount of EUR 596 million (2019: EUR 252 million) are hedged in cash flow hedges by using cross currency swaps as hedging instruments. Quantitative disclosures In the tables below, detailed information related to hedging instruments and hedged items in fair value and cash flow hedges as of 31 De-cember 2020 are reported. The indicated values for fair value hedges include single hedges as well as portfolio hedges, which due to immateriality are not shown separately.
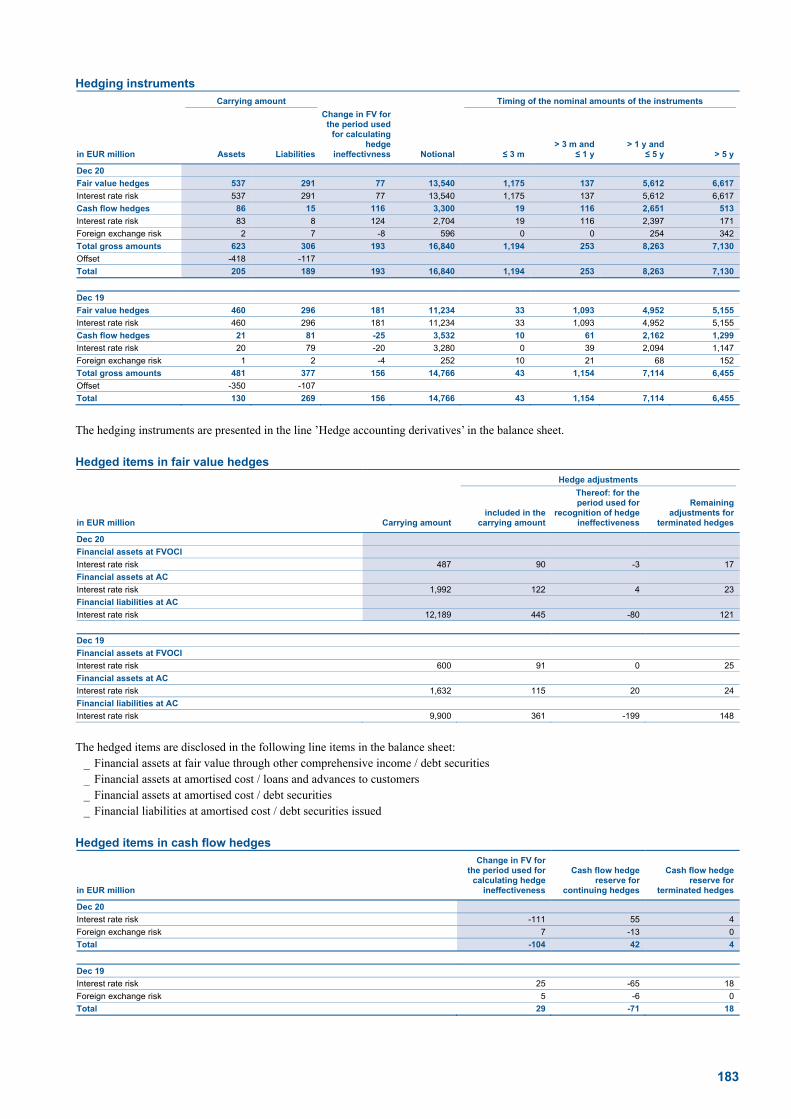
183
Hedging instruments Carrying amount Timing of the nominal amounts of the instruments
in EUR million Assets Liabilities
Change in FV forthe period used
for calculating hedge
ineffectivness Notional ≤ 3 m > 3 m and
≤ 1 y > 1 y and
≤ 5 y > 5 y
Dec 20
Fair value hedges 537 291 77 13,540 1,175 137 5,612 6,617
Interest rate risk 537 291 77 13,540 1,175 137 5,612 6,617
Cash flow hedges 86 15 116 3,300 19 116 2,651 513
Interest rate risk 83 8 124 2,704 19 116 2,397 171
Foreign exchange risk 2 7 -8 596 0 0 254 342
Total gross amounts 623 306 193 16,840 1,194 253 8,263 7,130
Offset -418 -117
Total 205 189 193 16,840 1,194 253 8,263 7,130
Dec 19
Fair value hedges 460 296 181 11,234 33 1,093 4,952 5,155
Interest rate risk 460 296 181 11,234 33 1,093 4,952 5,155
Cash flow hedges 21 81 -25 3,532 10 61 2,162 1,299
Interest rate risk 20 79 -20 3,280 0 39 2,094 1,147
Foreign exchange risk 1 2 -4 252 10 21 68 152
Total gross amounts 481 377 156 14,766 43 1,154 7,114 6,455
Offset -350 -107
Total 130 269 156 14,766 43 1,154 7,114 6,455
The hedging instruments are presented in the line ’Hedge accounting derivatives’ in the balance sheet. Hedged items in fair value hedges
Hedge adjustments
in EUR million Carrying amount included in the
carrying amount
Thereof: for the period used for
recognition of hedge ineffectiveness
Remaining adjustments for
terminated hedges
Dec 20
Financial assets at FVOCI
Interest rate risk 487 90 -3 17
Financial assets at AC
Interest rate risk 1,992 122 4 23
Financial liabilities at AC
Interest rate risk 12,189 445 -80 121
Dec 19
Financial assets at FVOCI
Interest rate risk 600 91 0 25
Financial assets at AC
Interest rate risk 1,632 115 20 24
Financial liabilities at AC
Interest rate risk 9,900 361 -199 148
The hedged items are disclosed in the following line items in the balance sheet:
_ Financial assets at fair value through other comprehensive income / debt securities _ Financial assets at amortised cost / loans and advances to customers _ Financial assets at amortised cost / debt securities _ Financial liabilities at amortised cost / debt securities issued
Hedged items in cash flow hedges
in EUR million
Change in FV for the period used for
calculating hedge ineffectiveness
Cash flow hedge reserve for
continuing hedges
Cash flow hedge reserve for
terminated hedges
Dec 20
Interest rate risk -111 55 4
Foreign exchange risk 7 -13 0
Total -104 42 4
Dec 19
Interest rate risk 25 -65 18
Foreign exchange risk 5 -6 0
Total 29 -71 18

184
Effects of hedge accounting in profit or loss and other comprehensive income
Cash flow hedge reclassified to
profit or loss because
in EUR million
Hedge ineffectiveness
recognised in P&L
Hedging gains/losses
recognized in OCI
the hedged item has affected
profit or loss
the hedged future cash flows are
no longer expected to occur
Dec 20
Fair value hedges
Interest rate risk -2 0 0 0
Cash flow hedges
Interest rate risk 4 120 -14 0
Foreign exchange risk 1 -8 0 0
Total 3 111 -14 0
Dec 19
Fair value hedges
Interest rate risk 2 0 0 0
Cash flow hedges
Interest rate risk 4 -25 -25 0
Foreign exchange risk 0 -4 0 0
Total 6 -29 -25 0
Ineffectiveness from both fair value and cash flow hedges is presented under ’Net trading result’ in the statement of income. The amounts reclassified from the cash flow hedge reserve are presented in the line ’Other similar income’ under ’Net interest income’ for hedges of interest rate risk and ’Net trading result’ for hedges of foreign exchange risk. Application of the Interest Rate Benchmark Reform IAS 39 amendments Erste Group considers that it is exposed to uncertainties resulting from interest rate benchmark reform in respect of its hedges of CHF LIBOR and USD LIBOR interest risk. Hedging instruments with nominal amount of CHF 200 million (EUR 182.2 million) (2019: CHF 200 million (EUR 184.3 million)) designated in fair value hedges of debt securities issued and USD 50 million (EUR 40.7 million) desig-nated in fair value hedges of bonds acquired are affected. Their hedging period reaches beyond 2021 the expected end date of the respective LIBOR rates (in general 31 December 2021 but for USD LIBOR 1M, 3M, 6M and 12M tenors 30 June 2023). When CHF LIBOR and USD LIBOR rates cease to be quoted they are assumed to be replaced by SARON (Swiss Average Rate Overnight for CFH) and SOFR (Secured Overnight Financing Rate for USD) rates. There are significant differences between the LIBOR and SA-RON/SOFR rates. LIBOR is a ‘term rate’ published at a start of a borrowing period with certain tenor (such as 3 months), i.e. it is ‘forward-looking’. SARON and SOFR are overnight rates resulting from actual transactions. The LIBOR term rates used as floating leg reference rates in interest derivative markets will fall back to SARON or SOFR term rates on a ‘backward-looking’ basis. For example a 3-month SARON or SOFR term rate would be based on a compounded average of overnight SARON or SOFR rates over the 3-month period calculated at its end. Moreover, LIBOR rates in general include a credit spread component reflecting the riskiness of an interbank market for respective tenors. As a result, the replacement rates will have as a foundation the term SARON or SOFR rate and on top a spread adjustment to ensure economic equivalence addressing the tenor, credit risk and other differences. When it comes to the replacement, the CHF and USD interest rate swap hedging instruments will be affected both by replacements of the reference rate used for their floating legs (LIBOR rate changed into term SARON or SOFR) and the change in the discounting curve. On the hedged items side, the hedged benchmark interest rate risk portion will be affected only by change in the discounting curve (LIBOR-based discounting curve changed into overnight SARON- or SOFR-based discounting curve). As a result of these uncertainties, Erste Group applies the amendments to IAS 39 Interest Rate Benchmark Reform (issued in September 2019 – Phase 1 of the Interest Rate Benchmark Reform IASB project) which bring some reliefs enabling not to discontinue these hedges as long as uncertainties arising from the reform exist. More specifically, it is necessary to prove that the non-contractually specified benchmark portion of interest rate risk (resulting from the CHF and USD LIBOR curve) is separately identifiable only at the hedge inception and not during the hedge life. For testing of prospective effectiveness it is assumed that the hedging instrument and the hedged risk of the hedged item do not change as a result of the reform. If the retrospective effectiveness requirements were not met the hedges would not need to be discontinued. However, any hedge ineffectiveness would be accounted for in profit or loss. Application of these reliefs will cease when there is no longer uncertainty about the CHF and USD LIBOR-based cash flows of the hedging instruments and the hedged benchmark interest rate risk portion. Erste Group also hedges interest rate risks in EUR and CZK . However, for these currencies it does not consider to be exposed to uncertain-ties resulting from the reform. For EUR all the hedges relate to EURIBOR interest rates which have been reformed and are EU Benchmark Regulation compliant. The same applies in CZK for PRIBOR, whose calculation methodology was strengthened in 2020 while continuing to measure the same underlying interest.

185
Erste Group has established an internal project led by Asset-Liability Management to manage and oversee the implications resulting from the the interest rate benchmark reform with the aim to minimize the potential disruption to business and to mitigate operational and conduct risks and possible financial losses. This transition project will include changes to systems, processes, risk management and valuation models, as well as managing related tax and accounting implications. Erste Group decided not to apply early the amendments to IFRS 9, IAS 39, IFRS 7, IFRS 4 and IFRS 16: Interest Rate Benchmark Reform – Phase 2 issued in August 2020. The reasons are discussed in the part Application of amended and new IFRS/IAS of Significant accounting policies. 28. Offsetting of financial instruments Financial assets and financial liabilities are offset and the net amount is reported on the balance sheet if, and only if, there is a currently enforceable legal right to offset the recognised amounts and there is an intention to settle on a net basis or to realise the asset and settle the liability simultaneously. Erste Group undertakes interest rate derivative transactions via London Clearing House and EUREX, credit deriv-ative transactions via ICE Clear Europe Ltd by fulfilling all offsetting requirements according IAS 32. Offsetting is carried out between asset and liability derivative positions, while the net position is further offset with variation margin amounts. The following table shows netting effects on the balance sheet of Erste Group as well as the impacts of offsetting financial instruments which are subject to offsetting agreements. Financial assets subject to offsetting and potential offsetting agreements
Potential effects of netting agreements
not qualifying for balance sheet offsetting
in EUR million Financial assets
(gross) Amounts offset
(gross)
Financial assets in balance sheet
(net) Financial
instruments Cash collateral
received
Other financial collateral received
Net amount after potential
offsetting
Dec 20
Derivatives 5,477 2,318 3,159 1,476 1,121 0 563
Reverse repurchase agreements 17,869 0 17,869 0 2 17,390 476
Total 23,346 2,318 21,028 1,476 1,123 17,390 1,040
Dec 19
Derivatives 4,902 1,967 2,936 1,520 849 0 567
Reverse repurchase agreements 20,778 0 20,778 0 7 20,604 167
Total 25,680 1,967 23,713 1,520 856 20,604 734
Financial liabilities subject to offsetting and potential offsetting agreements
Potential effects of netting agreements
not qualifying for balance sheet offsetting
in EUR million
Financial liabilities
(gross) Amounts offset
(gross)
Financial liabilities in
balance sheet (net)
Financial instruments
Cash collateral pledged
Other financial collateral pledged
Net amount after potential
offsetting
Dec 20
Derivatives 4,321 2,095 2,226 1,476 359 49 343
Repurchase agreements 2,196 0 2,196 0 12 2,180 4
Total 6,517 2,095 4,422 1,476 371 2,228 348
Dec 19
Derivatives 4,022 1,748 2,275 1,520 270 5 479
Repurchase agreements 3,082 0 3,082 0 14 2,859 209
Total 7,104 1,748 5,357 1,520 284 2,865 688
The impact of offsetting is shown in the column ‘Amounts offset (gross)’. The net position between the offset derivative amounts EUR 223 million (2019: EUR 219 million) is further offset with variation margin balances presented under balance sheet items ‘Cash and cash balances’ in amount EUR 62 million (2019: EUR 58 million) and ‘Financial liabilities measured at amortised cost ’, sub-item ‘Deposits from banks’ in amount of EUR 285 million (2019: EUR 277 million). Erste Group employs repurchase agreements and master netting agreements as a means of reducing credit risk of derivative and financing transactions. They qualify as potential offsetting agreements. Master netting agreements are relevant for counterparties with multiple deriv-ative contracts. They provide for the net settlement of all the contracts in the event of default of any counterparty. For derivatives transactions the values of assets and liabilities that would be set off as a result of master netting agreements are presented in the column ‘Financial instruments’. If the net position is further secured by cash collateral or other financial collaterals the effects are disclosed in columns ‘Cash collateral received / pledged’ and ‘Other financial collateral received / pledged’ respectively. Repurchase agreements are primarily financing transactions. They are structured as a sale and subsequent repurchase of securities at a pre-agreed price and time. This ensures that the securities remain in the hands of the lender as collateral in case the borrower defaults on fulfilling

186
any of its obligations. Offsetting effects from repurchase agreements are disclosed in the column ‘Other financial collateral received / pledged’ respectively. Collateral is presented at the fair value of the transferred securities. However, if the fair value of collateral exceeds the carrying amount of the receivable/liability from the repo transaction the value is capped at the level of the carrying amount. Remaining position may be secured by cash collateral. Cash and other financial collateral involved in these transactions is restricted from being used it by the transferor during the time of the pledge. For further details regarding repurchase and reverse repurchase transactions we refer to Note 29 Transfers of financial assets – repurchase transactions and securities lending 29. Transfers of financial assets – repurchase transactions and securities lending Repurchase and reverse repurchase agreements Transactions involving sales of securities under an agreement to repurchase them at a specified future date are also known as ‘repos’ or ‘sale and repurchase agreements’. Securities sold in such transactions are not derecognised from the balance sheet, as Erste Group retains sub-stantially all risks and rewards of ownership, because the securities are repurchased at a fixed price when the transaction ends. Furthermore, Erste Group is the beneficiary of all coupons and other income payments received on the transferred assets over the period of the transactions. These payments are remitted to Erste Group or are reflected in the repurchase price. The cash received upon sale of securities is recognised on the balance sheet with a corresponding obligation to return under the line item ‘Financial liabilities at amortised cost’, sub-items ‘Deposits from banks’ or ‘Deposits from customers’ reflecting the transaction’s economic substance as a loan to Erste Group. The difference between the sale and repurchase prices is treated as interest expense which is accrued over the life of the agreement and recorded in the statement of income in the line item ‘Interest expenses’ under ‘Net interest income’. Financial assets transferred out by Erste Group under repurchase agreements remain on the Group’s balance sheet and are presented sepa-rately under the original balance sheet items in the ‘thereof pledged as collateral’ lines. The measurement category of the transferred financial assets does not change. Conversely, securities purchased under agreements to resell at a specified future date are not recognised on the balance sheet. Such trans-actions are also known as ‘reverse repos’. The consideration paid is recorded on the balance sheet under the line item ‘Financial assets at amortised cost’, sub-items ‘Loans and advances to banks’ and ‘Loans and advances to customers’ reflecting the transaction’s economic substance as a loan by Erste Group. The difference between the purchase and resale prices is treated as interest income and is accrued over the life of the agreement and recorded in the statement of income in the line item ‘Interest income’ under ‘Net interest income’. Securities lending and borrowing In securities lending transactions, the lender transfers ownership of securities to the borrower on the condition that the borrower will re-transfer, at the end of the agreed loan term, ownership of instruments of the same type, quality and quantity and will pay a fee determined by the duration of the lending. The transfer of the securities to counterparties via securities lending does not result in derecognition. Sub-stantially all the risks and rewards of ownership are retained by Erste Group as a lender because the securities are received at the end of the securities lending transaction. Furthermore, Erste Group is the beneficiary of all the coupons and other income payments received on the transferred assets over the period of the securities lending. Securities lent are presented separately under the original balance sheet items in the ‘thereof pledged as collateral’ lines. Fee income from securities lending transactions is presented in the statement of income in the line ‘Fee and commission income’ under ‘Net fee and commission income’. Securities borrowed are not recognised on the balance sheet unless they are then sold to third parties. If such sales occur, the obligation to return the securities is recorded on the balance sheet as a short sale within ‘Financial liabilities held for trading’, sub-item ‘Other financial liabilities’. Fee expense incurred on securities borrowing transactions is presented in the statement of income in the line ‘Fee and commis-sion expenses’ under ‘Net fee and commission income’.
Dec 19 Dec 20
in EUR million
Carrying amount of transferred
assets
Carrying amount of associated
liabilities
Carrying amount of transferred
assets
Carrying amount of associated
liabilities
Repurchase agreements 1,703 1,645 754 754
Financial assets at AC 741 717 664 666
Trading assets 383 381 40 39
Non-trading financial assets at FVPL 2 2 0 0
Financial assets at FVOCI 578 545 50 49
Securities lendings 1,510 0 1,270 0
Financial assets at AC 1,401 0 1,235 0
Trading assets 47 0 28 0
Non-trading financial assets at FVPL 37 0 8 0
Financial assets at FVOCI 26 0 0 0
Total 3,214 1,645 2,024 754

187
The transferred financial instruments consist of bonds and other interest-bearing securities. The total amount of transferred financial assets represent the carrying amount of financial assets in the respective balance sheet positions for which the transferee has a right to sell or repledge. The associated liabilities from repo transaction, which are measured at amortised cost, represent an obligation to repay the bor-rowed funds. The following table shows fair values of the transferred assets and associated liabilities for repo transactions with an existing recourse right only on the transferred assets:
Dec 19 Dec 20
in EUR million
Fair value of transferred
assets
Fair value of associated
liabilities Net position
Fair value of transferred
assets
Fair value of associated
liabilities Net position
Financial assets at AC 791 718 73 767 665 101
Trading assets 383 381 2 40 39 2
Non-trading financial assets at FVPL 2 2 0 0 0 0
Financial assets at FVOCI 578 545 32 50 49 1
Total 1,753 1,646 107 857 753 104

188
30. Collaterals Carrying amount of financial assets pledged as collaterals in EUR million Dec 19 Dec 20
Financial assets at AC 24,390 40,641
Trading assets 430 181
Non-trading financial assets at FVPL 97 57
Financial assets at FVOCI 862 776
Total 25,780 41,654
The financial assets pledged as collateral consist of loans and advances to customers, bonds and other interest-bearing securities. Collaterals were pledged as a result of repurchase transactions, refinancing transactions with the European Central bank (ECB) and the respective National Banks, loans backing issued mortgage bonds and other collateral arrangements. The fair value of collateral received which may be repledged or resold even without the collateral provider’s default was EUR 19,156.9 mil-lion (2019: EUR 23,776.3 million). Collateral with fair value of EUR 1,532.3 million (2019: EUR 1,654.5 million) was resold. Collateral with fair value of EUR 29.9 million (2019: EUR 400.6 million) was repledged. The bank is obliged to return the resold and repledged collateral. 31. Securities
Dec 19 Dec 20
Financial assets Financial assets
in EUR million At AC Trading assets
Mandatorily at FVPL
Designated at FVPL At FVOCI At AC
Trading assets
Mandatorily at FVPL
Designated at FVPL At FVOCI
Bonds and other interest-bearing securities 26,764 2,889 1,671 664 8,836 29,579 3,368 1,446 603 8,389
Listed 25,663 2,114 844 620 7,123 28,095 2,454 685 164 6,367
Unlisted 1,101 774 826 44 1,714 1,484 914 761 439 2,022
Equity-related securities 0 65 390 0 210 0 34 347 0 130
Listed 0 62 142 0 120 0 28 124 0 43
Unlisted 0 4 248 0 90 0 6 223 0 87
Total 26,764 2,954 2,061 664 9,047 29,579 3,402 1,793 603 8,519
Investment funds units are reported within bonds and other interest bearing securities.

189
Risk and capital management
32. Risk management Risk policy and strategy A core function of a bank is taking risks in a conscious and selective manner and professionally steering those risks. Adequate risk policy and risk strategy is essential to a bank’s fundamental financial health and operational business success. Erste Group has developed a risk management framework that is forward-looking and tailored to its business and risk profile. This frame-work is based on a clear risk strategy that sets out general principles according to which risk taking must be performed across the Group. The risk strategy is consistent with the business strategy and incorporates the expected impact of external environment on the planned business and risk development. The risk strategy describes the current risk profile, defines risk management principles, strategic goals and initiatives for the main risk types as well as sets strategic limits for the significant financial and non-financial risk types as defined in the Risk Materiality Assessment. The risk strategy is executed within a clearly defined governance structure. This structure also applies to monitoring of risk appetite, additional metrics, as well as to the escalation of limit breaches. In 2020, when the Covid-19 pandemic has been the central topic worldwide – and hence also in our core markets, management has continued to steer credit portfolio, including active management of non-performing exposures to further strengthen the risk profile. A forward-looking approach was implemented in the Group and significant provisions were set aside to reflect the expected deterioration in asset quality as a result of worsening in the macroeconomic outlook due to Covid-19. Erste Group Bank AG uses the Internet as the medium for publishing its disclosures under Article 434 of the Regulation (EU) No. 575/2013 on prudential requirements for credit institutions and investment firms (Capital Requirements Regulation - CRR) and Regulation (EU) No. 876/2019 amending Regulation (EU) No. 575/2013. Details are available on the website of Erste Group at www.erstegroup.com/ir. Relevant disclosures are included in the annual report in the section ‘Reports’ or published as separate documents in the section ‘Regulatory disclosure’. Risk management organisation Risk monitoring and control is achieved through a clear organisational structure with defined roles and responsibilities, delegated authorities and risk limits. The following chart presents an overview of Erste Group’s risk management organisation:
At the beginning of 2020, the management boards of Erste Group Bank AG (EGB) and Erste Bank der oesterreichischen Sparkassen AG (EBOe) decided to consolidate the risk management structures of EGB and EBOe in order to establish a more focused support for the corporate and retail business as well as improved processes and collaboration. In April 2020, the common structure was implemented for the areas of operative credit risk management, i.e. the Corporate Risk Management, Retail Risk Management and Credit Risk Portfolio
Erste Group Bank AG – CRO Division
Group Liquidity and Market Risk Mgmt.
Enterprise wideRisk Management
Credit RiskMethods
Group Legal
Cyber Risk Management
Gro
up
CR
O
Subsidiaries
Local CROLocal boards and committees
(e.g. Team Risikomanagement in Austria)Local Riskmanagement Divisions
Retail Risk Management
GroupCompliance
Credit Risk Portfolio
Corporate Risk Management

190
divisions. Furthermore, as of 1 October 2020, EGB and EBOe merged their strategic risk management units and form a uniform compliance function to improve cooperation and processes based on existing synergies. The reorganization included the merger of the enterprise-wide risk management functions and security risk management units as well as the merger of the credit risk methods and models. This step will improve the cooperation and ensures coordinated processes and standards being implemented. In addition, the new structure will enable a standardized data collection and processing and target a harmonized IT infrastructure. The staff unit Group Sustainability Office was transferred to the area of responsibility of the Chief Executive Officer and a new staff unit, Cyber Risk Management, was created. Risk management structure The management board and in particular Erste Group’s Chief Risk Officer (Group CRO) perform the oversight function within Erste Group’s risk management structure. Risk control and risk steering within Erste Group are performed based on the business strategy and risk appetite approved by the management board. The Group CRO, working together with the chief risk officers of the subsidiaries, is responsible for the implementation and adherence to the risk control and risk management strategies across all risk types and business lines. The management board and, in particular, the Group CRO ensure the availability of appropriate infrastructure and staff as well as methods, standards and processes to that effect; the actual identification, measurement, assessment, approval, monitoring, steering and limit setting for the relevant risks are performed on the operating entity level within Erste Group. At group level, the management board is supported by several divisions established to perform operating risk control functions and exercise strategic risk management responsibilities. The following risk management functions report directly to the Group CRO:
_ Group Liquidity and Market Risk Management; _ Enterprise wide Risk Management; _ Credit Risk Methods; _ Group Compliance; _ Retail Risk Management: _ Credit Risk Portfolio; _ Corporate Risk Management; _ Group Legal; _ Cyber Risk Management; _ Local Chief Risk Officers.
Group Liquidity and Market Risk Management The division Group Liquidity and Market Risk Management comprises all market and liquidity risk functions in Erste Group. This division is responsible for steering, measuring, and controlling liquidity and market risk. It covers both banking book and trading book and ensures the development and validation of liquidity and market risk models for regulatory as well as for internal steering purposes. Enterprise wide Risk Management Enterprise wide Risk Management (ERM) focuses on holistic risk management and ensures comprehensive cross-risk group-wide risk portfolio steering, monitoring, analysis, and reporting. ERM drives key strategic initiatives to establish greater cohesion between risk strat-egy (including risk appetite and limit steering) and operational execution. It also comprises recovery & resolution planning as well as the management of non-financial risk. ERM works together with all risk functions and key divisions to strengthen risk oversight group-wide, covering capital, credit, liquidity, market, operational, and business risk. Credit Risk Methods The responsibilities of the area comprise the development, maintenance and validation of credit risk models in accordance with the regula-tory requirements for the internal ratings-based approach. A dedicated organisational unit takes care of model risk governance and the strategic planning of model changes. Group Compliance In line with Austrian and European Union legislations, Group Compliance ensures the implementation and steering of measures to prevent money laundering, terrorism financing and fraud. Furthermore, it is responsible for standards and measures to comply with financial sanc-tions and embargoes. Another central task consists in the implementation and enforcement of regulatory provisions for insider trading, market manipulation and other misconduct in securities business. Retail Risk Management Retail Risk Management covers the operational credit decisions and the collection and workout activities for retail clients of EBOe. The credit decision and collection systems are developed, validated and adapted to the new requirements for EBOe and savings banks. In order to ensure the sustained performance of the retail loan portfolio, Retail Risk Management defines group-wide framework conditions and requirements for lending within the Group’s risk/return profile.

191
Credit Risk Portfolio Credit Risk Portfolio monitors the development of the overall loan portfolio of EBOe, Erste Group Bank AG and the Group with a specific focus on non-retail clients. Active steering ensures the operative implementation of the Group’s credit risk strategies. The division is also in charge of continuously improving underwriting processes as well as for corporate and retail risk management projects with a particular focus on digital initiatives. Credit Risk Portfolio is also responsible for rating control, real estate valuations and credit analytics. Corporate Risk Management Corporate Risk Management is responsible for credit underwriting, restructuring (including sales of non-performing loans) for corporate and real estate clients, financial institutions, sovereigns and municipalities in EBOe and Erste Group Bank AG as well as group-wide for the local customers if their local credit limits are exceeded. Group Legal Group Legal acts as the central legal department of Erste Group Bank AG. This division provides legal support and counsel for the man-agement board, the business units and the central functions, and mitigates legal risk. It also attends to legal sourcing and to dispute resolution and litigation. Cyber Risk Management Cyber Risk Management is a risk control unit segregated from IT and security operations, responsible for managing and overseeing cyber risks, monitoring and controlling adherence to cyber risk management framework. Local Chief Risk Officers Each subsidiary has separate risk control and management units with responsibilities tailored to the local requirements, which are headed by the respective local chief risk officer (Local CRO). Group coordination of risk management activities The management board regularly deals with risk issues of all risk types in its regular board meetings. Actions are discussed and taken when needed. Furthermore, certain cross-divisional committees were established with the purpose of carrying out risk management activities in Erste Group. They are shown in the following diagram:
The Risk Committee of the Supervisory Board is responsible for granting approval in all cases in which loans and exposures reach an amount exceeding the approval authority of the management board according to the Credit Risk Approval Authority Regulations. It is in charge of granting approval to large exposures pursuant to Article 392 CRR, if such a claim is equal to or exceeds 10% of the eligible capital of a credit institution. Within the competence assigned to it, the committee may grant advance approvals to the extent permitted by law. In addition, it is responsible for supervising the risk management of Erste Group Bank AG. The risk committee meets regularly. As the central risk control body, the Risk Management Committee is regularly briefed on the risk status across all risk types. The CRO Board is responsible for the coordination and implementation of risk management activities within Erste Group. The CRO Board consists of the Group CRO, the chief risk officers of major subsidiaries within Erste Group and the B-1 managers of the Holding CRO division. Chaired by the Group CRO, the CRO Board is the primary body for aligning on strategically relevant topics of the risk division across Erste Group entities, including (but not limited to) the group-wide strategic planning, the project portfolio and Change the Bank (CtB) investments. The CRO Board ensures a consistent flow of information from and to the group functions and supports the setting of the overall risk agenda. The Holding Credit Committee (HCC) is the highest operative decision-making body for approvals of credit risks according to the valid credit risk approval authority regulations. Based on the advice of HCC, decisions of significant exposures and extended risks are decided
Holding Board
HCCHolding Credit
CommitteeCRO Board
MRCMarket
Risk Committee
Risk Committee Supervisory Board
ALCOGroup Asset
Liability Committee
OLCOper. Liquidity
Committee
HSTCHolding
Stress Testing Committee
USRCU.S. Risk Committee
OMRCOperative Market Risk Committee
HMCHolding Model
Committee
SRMCStrategic Risk
Mgmt. Committee
ROCCRegional
Op.Conduct Committee

192
by the risk management board of the supervisory committee. It also approves the relevant corporate industry strategies. The HCC is headed by the Group CRO and comprises the board member of Corporates & Markets, the head of Corporate Risk Management, Head of Credit Risk Portfolio and the head of the requesting business line. Each subsidiary has their own local credit committee established by the same principles. The Market Risk Committee (MRC) is the main steering body for market risk and trading book related issues of Erste Group. MRC approves group-wide market risk limits and elaborates on the current market situation. In addition, it approves market risk methodologies and models, model changes, and related validation results. The Operative Market Risk Committee (OMRC) prepares decisions for the MRC and approves sensitivity and notional limits which do not require VaR/SVaR limit adjustments. The Holding Model Committee (HMC) is chaired by the Chief Risk Officer of Erste Group and is the steering and control body for Pilar 1 IRB and Pillar 2 Credit Risk model development, validation and monitoring. All new or changed models and model related aspects (e.g. risk parameters (PD, LGD, CCF, ELBE), group-wide methodology standards, IFRS 9 parameter methodologies) are reviewed by the Hold-ing Model Committee and require its approval. The Strategic Risk Management Committee (SRMC) chaired by the Head of Enterprise-wide Risk Management and consisting of selected B-1 managers of the Holding CRO division, holds the delegated decision authority from the Holding Board with respect to strategic risk management functions. Its responsibility area covers the approach to credit RWA calculation and economic capital calculation method-ology, design of Forward-Looking Information (FLI) adjustments and scenarios for IFRS 9 parameters, monitoring of IFRS 9 models, defining scenarios, staging and expected credit loss (ECL) methodologies, the back-testing of loan loss provisions, and the remedy actions resulting from reporting of credit risk control units on rating system performance. The Holding Stress Testing Committee (HSTC) is the sole forum for all joint resolutions, decisions and acknowledgements in the stress testing area for group-wide stress testing activities. The United States Risk Committee (USRC) has been established to meet the requirements of the United States Federal Reserve Board (FRB) regulation, which has been in force since 1 July 2016. The objective is to involve the management board as key governance and control function for the U.S. trade portfolio which has been specified in the Combined U.S. Operations (CUSO) guidance. The Regional Operational Conduct Committee (ROCC) decides on business applications and implements group-wide corrective measures to steer non-financial risks (NFR). This is done based on a risk-return evaluation. Furthermore, ROCC defines group-wide stand-ards for non-financial risk topics. The ROCC is a forum for joint alignments, decisions, and escalations in non-financial risk areas across Erste Group entities and Erste Group Bank AG itself. The Group Asset/Liability Committee (ALCO) manages the consolidated Erste Group balance sheet, focusing on trade-offs between all affected consolidated balance sheet risks (interest rate, exchange rate and liquidity risks), and takes care of the setting of group standards and limits for the members of Erste Group. In addition, it approves policies and strategies for controlling liquidity risk as well as interest rate risk (net interest income) and examines proposals, statements and opinions of ALM, risk management, controlling and accounting functions. The approved investment strategy complies with the guidelines agreed with Risk Management. The Operational Liquidity Committee (OLC) is responsible for the day-to-day management of the global liquidity position of Erste Group. It analyses the liquidity situation of Erste Group on a regular basis and reports directly to the ALCO. It also proposes measures to ALCO within the scope of the management policies and principles laid down in the Liquidity Risk Management Rule Book. Furthermore, members of the OLC are points of contact for other departments or Erste Group members for liquidity-related matters. Each local bank has its own local operational liquidity committee. In addition, committees are established at local level, such as the ‘Team Risikomanagement’ in Austria. It is responsible for a common risk approach with the Austrian savings banks. Group-wide risk and capital management Enterprise wide Risk Management (ERM) includes as its fundamental component the Internal Capital Adequacy Assessment Process (ICAAP) as required under Pillar 2 of the Basel framework and regulatory guides (e.g. ECB Guide to ICAAP). The ERM framework is designed to support the bank’s management in managing the risk portfolios as well as the coverage potential to ensure that the bank holds adequate capital for the nature and magnitude of its risk profile at all times. The framework is tailored to the Erste Group’s business and risk profile and reflects the strategic goal of protecting shareholders and senior debt holders while ensuring the sustainability of the organisation.

193
ERM framework is a modular and comprehensive management and steering system within Erste Group as well as an essential part of the overall steering and management instruments. The ERM components necessary to ensure all aspects, in particular to fulfil regulatory re-quirements and to provide an effective internal steering tool, can be clustered as follows:
_ Risk Appetite Statement (RAS), limits and risk strategy; _ portfolio and risk analytics including Risk Materiality Assessment (RMA), concentration risk management, and stress testing; _ Risk-bearing Capacity Calculation (RCC); _ Capital allocation and performance management; _ planning of key risk indicators; _ recovery and resolution planning.
In addition to the ICAAP’s ultimate goal of assuring capital adequacy and sustainability at all times, the ERM components serve to support the bank’s management in pursuing its strategy. Risk appetite Erste Group defines the maximum level of risk it is willing to accept in order to meet its business objectives within the Group’s risk appetite (Group RAS). The Group RAS acts as a binding constraint to Erste Group’s business activities within its overall risk appetite via triggers and limits approved by the management board. It is integrated and embedded into Erste Group’s structural processes; including business and risk strategy, budget process, capital and liquidity planning, recovery plan, stress testing and remuneration framework. The Group RAS consists of a set of core risk metrics providing quantitative direction for overall risk-return steering and qualitative statements in the form of key risk principles that are part of the guidelines for managing risks. The core risk metrics (capital, liquidity, risk/earnings) are set as ultimate boundaries for the Group risk-return target setting. They are also a key part of the annual strategic planning / budgeting process and give an overall picture of capital, liquidity and risk-return trade-offs. The key objective of the RAS is to:
_ ensure that Erste Group has sufficient resources to support its business at any given point in time and absorb stress events; _ set boundaries for the Group’s risk target setting; _ support the group’s financial strength and the robustness of its systems and controls.
To foster risk-return steering and ensure proactive management of the risk profile, Erste Group creates its RAS on a forward-looking basis. External constraints such as regulatory requirements create the floor and ceiling for the RAS and therefore the amount of risk Erste Group is willing to accept. In order to ensure that the group remains within the targeted risk profile, a traffic light system was established and assigned to the core metrics. This approach allows a timely delivery of information to the respective governance and the implementation of effective remediation measures. The RAS traffic light system is defined as follows:
_ RAS is green: The target risk profile is within the specified boundaries. _ RAS is amber: The undershooting or overshooting of a pre-defined threshold leads to an escalation to the designated governance and
the discussion of potential remediation actions. _ RAS is red: The undershooting or overshooting of a pre-defined limit initiates an immediate escalation to the designated governance
and a prompt implementation of remediation actions. Moreover, stress indicators are defined for selected core metrics and integrated into the assessment of the stress test results. They are reported as early warning signals to the management board to support proactive management of the risk and capital profile. In addition, supporting metrics and principles are defined by material risk type in the Group Risk Strategy based on Group RAS. These support implementation of the mid- to long-term strategy. Risk management governance ensures full oversight of risk decisions and sound execution of the Group risk strategy. Mitigating actions are undertaken as part of the regular risk management process to ensure that the Group remains within its RAS. Group RAS is also broken down into local entities. Local RAS is approved by the management board to ensure compliance with the Group RAS and also approved by the local management board to ensure alignment with local regulatory requirements. The Group may also decide to include further compulsory constraints and limits in local RAS to ensure alignment with Group RAS and Group Risk Strategy. The Group further developed an aggregated and consolidated risk appetite dashboard (Risk Dashboard) illustrating the group’s and local enti-ties’ risk profile developments by comparing the risk exposure and risk limits. The Risk Dashboard is regularly presented to the management board and to the supervisory board (including risk committee of supervisory board) to support its review, oversight, and monitoring of the group risk profile and the risk profile of its local entities. Group RAS for 2020 was approved by the management board and acknowledged by the risk committee of supervisory board and supervisory board in the last quarter of 2019. On the back of global developments related to Covid-19, as well as changed regulatory requirements/expec-tations towards credit institutions, in the first half of 2020, interim revisions of Group RAS and Risk Strategy, as well as local entities RAS were conducted and approved by the designated governance.

194
Portfolio and risk analytics Erste Group uses dedicated infrastructure, systems and processes to actively identify, measure, control, report and manage risks within its portfolio. Portfolio and risk analytics processes are designed to quantify, qualify and discuss risks in order to raise awareness to management in a timely manner. Risk materiality assessment
The Risk Materiality Assessment (RMA) determines the materiality of risk types and consequently the risk profile across Erste Group and its entities. RMA is an annual process with the purpose of systematically identification of new and assessment of all risks for the Group. As such, the RMA is an integral part of the ICAAP and serves as a steering tool for top and senior management. Insights generated by the assessment are used to improve risk management practices and further mitigate risks within the Group. The assessment also serves as input for the design and definition of the Group’s risk strategy and Risk Appetite Statement. Key outputs and recommendations of the RMA are considered in the scenario design and selection of the comprehensive and reverse stress tests.
Risk concentration analysis
Erste Group has implemented a process to identify measure, control and manage risk concentrations. This process is important to ensure the long-term viability of Erste Group, especially in times of an adverse business environment and stressed economic conditions. The risk concentration analysis at Erste Group is performed on an annual basis covering credit risk, market risk, operational risk, liquidity risk and inter-risk concentrations. Identified risk concentrations are considered in the scenario design of the comprehensive stress test and measured under stressed conditions. The output of the risk concentration analysis additionally contributes to the identification of material risks within the RMA and to the setting/calibration of Erste Group’s limit system.
Stress testing
Modelling sensitivities of the group’s assets, liabilities and profit or loss provide management steering information and help to optimise Erste Group’s risk-return profile. Stress tests help to factor in severe but plausible scenarios providing further robustness to measurement, steering and management. Risk modelling and stress testing are vital forward-looking elements of the ICAAP. Finally, sensitivities and stress scenarios are considered within the group’s planning process. Erste Group’s most complex stress testing activities are scenario stress tests that take a comprehensive account of the impact of various economic scenarios, including second-round effects on all risk types (credit, market, liquidity and operational) and effects on the associated volumes of assets and liabilities as well as on profit and loss sensitivities. In addition to the standard scenario-driven stress testing exercises, reverse stress tests are performed to identify a scenario or a combination of scenarios in which viability of the current business model can be questioned. Erste Group has developed specific tools to translate macroeconomic variables (e.g. GDP or unemployment rate) into risk parameters in order to support the stress testing process, which combines bottom-up and top-down approaches. For adapting the stress parameters, Erste Group additionally leverages the experience of its local professionals and uses, where appropriate, their statistical models to simulate the impacts of macroeconomic variables on the probabilities of default in the respective markets. Special attention is given to account for adequate granularity and special characteristics (i.e. countries and industries) when determining the segmentation in which the stressed parameters are defined. Results from Erste Group’s internal stress tests are analysed in order to decide on appropriate measures. The internal comprehensive stress tests performed in 2020 indicated no breach of stressed RAS triggers after the application of scenario contingent measures in the last year of adverse scenario. Risk-bearing capacity calculation The Risk-bearing Capacity Calculation (RCC) describes the methodology of Pillar 2 capital adequacy calculation. In contrast to the regu-latory view of Pillar 1, the RCC is based on an economic view of Pillar 1+ approach, assuming continuation of Erste Group as expected by the ECB Guide to ICAAP, and determines whether the Group has sufficient capital to cover all relevant risks it is exposed to. With this Pillar 1+ approach the Group increases efficiency and ensures comparability with the Pillar 1 calculation. Based on the results of the RMA, economic capital is considered for relevant risk types as approved by the management board. The economic capital requirement is then compared to internally available capital (coverage potential) to cover the Group’s risks in Pillar 2. Both economic capital and coverage potential are computed on the CRR scope of consolidation of Erste Group as ultimate parent entity based on IFRS accounting standards. Besides the Pillar 1 risk types (credit, market and operational risks), interest rate risk in the banking book, foreign exchange risk arising from equity investments, credit spread risk in the banking book, risk from repayment vehicles as well as business risk are explicitly consid-ered within the economic capital calculated over a horizon of one year and at a confidence level of 99.92%. For the calculation of the economic capital, Erste Group uses, where possible, more risk sensitive/advanced methodologies tailored to Erste Group’s individual risk profile and specificities of the Group’s individual risk exposures. Diversification effects between risks (inter-risk diversification) are not considered, reflecting the Group’s prudent approach to maintain sufficient internal capital in times when correlations between risks may

195
change dramatically (like in times of stress). The largest portion of economic capital requirements is coming from credit risk, which accounts for 73.2% of total economic capital requirements at the end of 2020. The calculation of internal capital or coverage potential required to cover Pillar 2 risks/unexpected losses is based on Pillar 1+ approach. Namely, CRR and CRR II (Regulation (EU) No. 575/2013 and Regulation (EU) No. 876/2019 amending Regulation (EU) No. 575/2013) regulatory own funds are adjusted by internal capital components which reflect economic view (e.g. year-to-date profit (if not already considered in Pillar 1 capital), exclusion of Tier 2 capital instruments, Pillar 2 IRB expected loss excess/shortfall add-on, etc.). The coverage potential must be sufficient to absorb Pillar 2 risks/unexpected losses resulting from the group’s operations at any point in time (normal and stressed), as reflected in the Group’s Risk Appetite through the limits set for Group economic capital adequacy and stressed capital adequacy utilisation. At the end of 2020, the economic capital adequacy was at 55.0%. The management board, risk management committees and supervisory board are briefed quarterly on the results of the ICAAP capital adequacy through the Group Risk Report and the Risk Dashboard. The former includes risk profile developments, available capital (cover-age potential), consideration of potential losses in stress situations, the degree of the risk limit utilisation and the overall status of capital adequacy. The latter outlines risk profile development in relation to risk appetite. Risk planning Group Risk Planning framework is essential for the capital allocation and overall financial planning processes and supports the adequate reflection of risks within the strategy, steering and management processes of the group. Methods and instruments applied
Key risk indicators covered by the Risk Planning framework include indicators that provide an overview of incurred or potential risks, with respect to both portfolio and economic environment developments. Indicators include RWA (and related indicators), portfolio quality indi-cators (impairments, NPL/NPE and relevant performance indicators etc.), as well as indicators required by the regulatory authorities under the responsibility of the Risk division. Planning activities are performed in close cooperation with all stakeholders in the group´s overall process and follow a clear governance structure to ensure sound risk planning process.
Capital allocation
An important task integral to the risk planning process is the allocation of capital to entities, business lines and segments. This is done with close cooperation between Risk Management and Controlling. Methodology for allocation reflects risk and controlling processes in order to allocate capital with risk-return considerations. Erste Group’s aggregate capital requirements by risk type The following diagrams present the composition of the economic capital requirements according to type of risk:
Other risks include business risk. Recovery and resolution plans In compliance with the Austrian Banking Recovery and Resolution Law (‘Bundesgesetz über die Sanierung und Abwicklung von Banken – BaSAG’) Erste Group submits an updated Group Recovery Plan to ECB every year. The Group Recovery Plan identifies options for restoring financial strength and viability in case Erste Group comes under severe economic stress. The plan specifies potential options for the replenishment of capital and liquidity resources of the bank in order to cope with a range of scenarios including both idiosyncratic and market-wide stress (in 2020 one Covid-19 scenario was requested by ECB). The recovery governance described in the plan ensures timely identification and proper management of any recovery situation. Furthermore, the assessment
Economic capital allocation (in %) 31 December 2019
10.4
Operational risk
11.5
Credit risk73.4
Other risks4.7
Market risk
Economic capital allocation (in %) 31 December 2020
12.0
Operational risk
10.4
Credit risk73.2
Other risks4.4
Market risk

196
of the Group Recovery Plan and the recently addressed assessment of the overall recovery capacity are part of the Supervisory Review and Evaluation Process (SREP) assessment. It is relevant to demonstrate that, in a severe stress which is close to a failing or likely to fail situation, there is sufficient recovery capacity available. Erste Group collaborates with the resolution authorities in the drawing up of resolution plans based on BaSAG and EU Regulation No 806/2014 establishing the Single Resolution Mechanism (SRM Regulation). Based on a joint decision taken in the Resolution College, Erste Group in April 2020 received notification of the preferred Multiple Point of Entry (MPE) resolution strategy on cross-country level, but a Single Point of Entry (SPE) resolution strategy within a country. This results in being MPE in Austria, the Czech Republic, Croatia, Hungary, Romania and Slovakia. The Bank Recovery and Resolution Directive (BRRD) introduced the Minimum Requirement for own funds and Eligible Liabilities (MREL), which is – in case of Erste due to the MPE resolution strategy – set on Resolution Group level. Based on the MREL joint decision, the requirement is binding as of the date of the notification in case of notified MREL surplus, however in case of an MREL shortfall the requirement becomes binding at the end of a transition period to be set between 2 and 4 years, at the latest by the end of 2023. MREL is expressed as the amount of own funds and eligible liabilities expressed as a percentage of the total liabilities and own funds (TLOF). In June 2019 the new banking reform package was published, which includes the Bank Recovery and Resolution Directive (BRRD2). The transposition into national law (BaSAG) is set with up to 18 months. Nevertheless, the Austrian Lawmaker delayed the national transposition. The publication of the final text is expected for Q1 2021. Key changes include the MREL expression in terms of Risk Weighted Assets (RWA) and Leverage Ratio Exposure (LRE) instead of TLOF, adapted transition arrangements (binding intermediate MREL target as of 01.01.2022 and a common deadline of 01.01.2024 to meet the final MREL target) as well as tighter eligibility criteria. Hence, MREL target setting will be subject to further changes. Potential changes in the MREL requirement will be reflected in Erste Group Bank AG’s funding plan as to ensure compliance with MREL and subordination targets. 33. Own funds and capital requirements Among others, Erste Group fulfils hereinafter the disclosure requirements according to the Capital Requirements Regulation (CRR), in detail Art. 437 para 1 (a), (d) and (e) CRR. References to chapters refer to the financial statement. Regulatory Requirements Since 1 January 2014, Erste Group has been calculating the regulatory capital and the regulatory capital requirements according to the CRR and the Capital Requirement Directive (CRD IV). The CRD IV was enacted in national law in the Austrian Banking Act (ABA). Erste Group applies these rules and calculates the capital ratios on the one hand by taking into consideration the Austrian transitional provisions which are defined in the CRR ‘Begleitverordnung’, published by the Austrian regulator. On the other hand Erste Group also applies the European Regulation on the exercise of options and discretions available in Union law which entered into force 1 Octo-ber 2016. All requirements as defined in the CRR, the ABA , in technical standards issued by the European Banking Authority (EBA) and EBA guidelines are applied by Erste Group for regulatory purposes and for the disclosure of regulatory information. Accounting Principles The financial and regulatory figures published by Erste Group are based on IFRS. Eligible capital components are derived from the balance sheet and income statement which were prepared in accordance with IFRS. Adjustments to the accounting figures are considered due to the different definitions in the scopes of consolidation. Further details are explained in the section ‘Regulatory scope of consolidation and institutional protection scheme’. The uniform closing date of the consolidated regulatory figures of Erste Group is the 31 December of the respective year. Regulatory scope of consolidation and institutional protection scheme The consolidated regulatory own funds and the consolidated regulatory capital requirements are calculated based on the scope of consoli-dation stipulated in the CRR. Based on Art. 4 para 1 (3), (16) to (27) CRR in line with Art. 18 and 19 CRR and para 30 ABA, the scope consists of credit institutions, investment firms, financial institutions and ancillary service undertakings. In addition, the following update according to Art 18 (7) applies: Where an institution has a subsidiary which is an undertaking other than an institution, a financial institution or an ancillary services undertaking or holds a participation in such an undertaking, it shall apply to that subsidiary or participation the equity method. That method shall not, however, constitute inclusion of the undertakings concerned in supervision on a consolidated basis. The definition pursuant to CRR differs from the scope of consolidation according to IFRS, which also includes insurance companies and other entities, that are subject to full consolidation. The Austrian savings banks are included as subsidiaries in Erste Group’s regulatory scope of consolidation based on the cross-guarantee contract of the ‘Haftungsverbund’. Furthermore, Erste Group Bank AG together with the savings banks forms an institutional protection scheme (IPS) according to Art. 113 para 7 CRR. Disclosure requirements for the institutional protection scheme according to Art. 113 para 7 e CRR are met by the publication of the consolidated financial statements, which cover all entities included in the institutional protection scheme.

197
Consolidated own funds Own funds according to CRR consist of CET1, additional tier 1 (AT1) and tier 2 (T2). In order to determine the capital ratios, each respective capital component – after application of all regulatory deductions and filters – is considered in relation to the total risk amount. The items of own fundsas disclosed are also used for internal capital management purpose, except T2 capital instruments Erste Group fulfilled the capital requirements. The regulatory minimum capital ratios including the capital buffers as of 31 December 2020 amount to
_ 9.18% for CET1 (4.5% CET1, +2.5% capital conservation buffer, +2.0% buffer for systemic vulnerability and for systemic concentra-tion risk and +0.18% countercyclical capital buffer),
_ 10.68% for tier 1 capital (sum of CET1 and AT1) and _ 12.68% for total own funds.
Capital buffer requirements are set out in sections 23 (capital conservation buffer), 23a (countercyclical buffer), 23b (Global Systemic Important Institution (G-SII) buffer), 23c (Other Systemic Important Institution (O-SII) buffer) and 23d (systemic risk buffer) of the ABA and further specified in the regulation of the Financial Market Authority (FMA) on the establishment and recognition of the countercyclical buffer rate in accordance with section 23a para 3 ABA, on the establishment of the systemic risk buffer in accordance with section 23d para 3 ABA as well as on the detailed definition of the bases of calculation in accordance with section 23a para 3 clause 1 ABA and section 24 para 2 ABA (capital buffers regulation). All capital buffers have to be met entirely with CET1 capital and relate, except the countercyclical buffer, to total risk. In addition to minimum capital ratios and capital buffer requirements, institutions also have to fulfil capital requirements determined in the Supervisory Review and Evaluation Process (SREP). The ECB Banking Supervision adjusted the SREP approach for 2020 in light of the Covid-19 crisis. Therefore the ECB has not issued a SREP decision 2020, but rather chose a pragmatic SREP 2020 approach which keeps the SREP 2019 decision in place and confirms a Pillar 2 requirement (P2R) of 1.75%. The adjustments made to the regulatory framework on 12 March 2020 to stabilize the financial markets remain in place. The originally envisaged relief for 2021 regarding the composition of capital for the Pillar 2 requirement under article 104a (4) CRD V can be applied directly by credit institutions under the supervision of the ECB. Therefore, the minimum CET1 ratio of 5.48% encompasses the Pillar 1 minimum requirement of 4.5% and the Pillar 2 requirement of 0.98% (56.25% of 1.75%) as of 31 December 2020. The regulatory minimum capital ratios including the capital buffers ans SREP requirements as of 31 December 2020 amount to
_ a CET1 requirement of 10.16% (Pillar 1 requirement of 4.5%, combined capital buffers of 4.68% and 56.25% of 1.75% Pillar 2 requirement),
_ a T1 requirement of 11.99% (CET1 requirement plus Pillar 1 AT1 requirement of 1.5% and 18.75% of 1.75% Pillar 2 requirement) and
_ a total own funds requirement of 14.43% (Tier 1 requirement plus Pillar 1 T2 requirement of 2.0% and 25% of 1.75% Pillar 2 requirement).
Following the SREP 2019, Erste Group is expected to meet a Pillar 2 Guidance (P2G) of 1.0% valid as of 1 January 2020 onwards. The ECB press release of 12 March 2020 also indicated that the Pillar 2 Guidance need not be fully complied with temporarily by credit insti-tutions during the current Covid-19 crisis. The Pillar 2 Guidance is not MDA (maximum distributable amount) relevant.
Overview of capital requirements and capital buffers Dec 19 Dec 20
Pillar 1
Minimum CET 1 requirement 4,50% 4,50%
Minimum Tier 1 requirement 6,00% 6,00%
Minimum Own Funds requirement 8,00% 8,00%
Combined buffer requirement (CBR) 4,91% 4,68%
Capital conservation buffer 2,50% 2,50%
Countercyclical capital buffer 0,41% 0,18%
Systemic risk buffer 2,00% 2,00%
O-SII capital buffer 2,00% 2,00%
Minimum CET 1 requirement (incl.CBR) 9,41% 9,18%
Minimum Tier 1 requirement (incl.CBR) 10,91% 10,68%
Minimum Own Funds requirement (incl.CBR) 12,91% 12,68%
Pillar 2 1,75% 1,75%
Minimum CET1 requirement 1,75% 0,98%
Minimum T1 requirement n.a. 1,31%
Minimum Own Funds requirement n.a. 1,75%
Total CET 1 requirement for Pillar 1 and Pillar 2 11,16% 10,16%
Total Tier 1 requirement for Pillar 1 and Pillar 2 12,66% 11,99%
Total Capital requirement for Pillar 1 and Pillar 2 14,66% 14,43%

198
The combined buffer requirement is the sum of the capital conservation buffer, the countercyclical capital buffer and the maximum of the O-SII capital buffer or the systemic risk buffer. As announced by the European Central Bank (ECB) in its press release on 12 March 202021, Erste Group is not obliged to fully comply with the capital conservation buffer of 2.5% during the current Covid-19 crisis. In the ‘Frequently Asked Questions - FAQs’22 published on 20 March 2020, however, the ECB states that the incomplete fulfillment of the combined buffer requirement leads to restrictions on distri-butions and banks are only allowed to make distributions within the limits of the maximum distributable amount (MDA). Taking into account ECB’s communication on the temporary capital relief measures with regard to the Pillar 2 requirement, the full usage of the capital conservation buffer as well as the Pillar 2 guidance (P2G), Erste Group’s CET1 requirement amounts to 7.66%, its T1 require-ment amounts to 9.49% and its total own funds requirement amounts to 11.93%. Capital structure according to EU regulation 575/2013 (CRR)
Dec 19 Dec 20
in EUR million CRR articles Phased-in Final Phased-in Final
Common equity tier 1 capital (CET1)
Capital instruments eligible as CET1 26(1)(a)(b), 27-30, 36(1)(f), 42 2.337 2.337 2.337 2.337
Retained earnings 26(1)(c), 26(2) 12.238 12.238 13.002 13.002
Accumulated other comprehensive income 4(1) (100), 26(1) (d) -1.458 -1.458 -1.690 -1.690
Minority interest recognised in CET1 4(1) (120), 84 4.448 4.448 4.891 4.891
Common equity tier 1 capital (CET1) before regulatory adjustments 17.565 17.565 18.540 18.540
Own CET1 instruments 36(1) (f), 42 -68 -68 -63 -63
Prudential filter: cash flow hedge reserve 33(1) (a) 45 45 -36 -36
Prudential filter: cumulative gains and losses due to changes in own credit risk on fair valued liabilities 33(1) (b) 406 406 289 289
Prudential filter: fair value gains and losses arising from the institution's own credit risk related to derivative liabilities 33(1) (c), 33(2) -3 -3 -3 -3
Value adjustments due to the requirements for prudent valuation 34, 105 -85 -85 -58 -58
Regulatory adjustments relating to unrealised gains (0%) 468 0 0 0 0
Regulatory adjustments relating to unrealised losses (0%) 467 0 0 0 0
Securitizations with a risk weight of 1.250% 36(1) (k) -45 -45 -29 -29
Goodwill 4(1) (113), 36(1) (b), 37 -544 -544 -544 -544
Other intangible assets 4(1) (115), 36(1) (b), 37(a) -741 -741 -720 -720
DTA that rely on future profitability and do not arise from temporary differences net of associated tax liabilities 36(1) (c), 38 -102 -102 -48 -48
IRB shortfall of credit risk adjustments to expected losses 36(1) (d), 40, 158, 159 -158 -158 0 0
CET1 capital elements or deductions – other -17 -17 -270 -270
Common equity tier 1 capital (CET1) 50 16.252 16.252 17.057 17.057
Additional tier 1 capital (AT1)
Capital instruments eligible as AT1 51(a) ,52-54, 56(a), 57 1490 1490 2.733 2.733
Instruments issued by subsidiaries that are given recognition in AT1 85, 86 8 8 7 7
Additional tier 1 capital (AT1) before regulatory adjustments 1.498 1.498 2.740 2.740
Own AT1 instruments 52(1)(b), 56(a), 57 -2 -2 -2 -2
Transitional adjustments due to grandfathered AT1 instruments 483(4)(5),484-487,489, 491 0 0 0 0
AT1 instruments of financial sector entities where the institution has a significant investment 4(1) (27), 56(d), 59, 79 0 0 0 0
Additional tier 1 capital (AT1) 61 1.497 1.497 2.738 2.738
Tier 1 capital = CET1 + AT1 25 17.749 17.749 19.795 19.795
Tier 2 capital (T2)
Capital instruments and subordinated loans eligible as T2 62(a), 63-65, 66(a), 67 3.660 3.660 3.222 3.222
Instruments issued by subsidiaries recognised in T2 87, 88 267 267 209 209
Transitional adjustments due to additional recognition in T2 of instruments issued by subsidiaries 480 0 0 0 0
Transitional adjustments due to grandfathered T2 instruments and subordinated loans
483(6) (7), 484, 486, 488, 490, 491 0 0 0 0
IRB excess of provisions over expected losses eligible 62(d) 328 328 467 467
Tier 2 capital (T2) before regulatory adjustments 4.255 4.255 3.899 3.899
Own T2 instruments 63(b)(i), 66(a), 67 -44 -44 -50 -50
Standardised approach general credit risk adjustments 62(c) 0 0 0 0
Tier 2 capital (T2) 71 4.211 4.211 3.848 3.848
Total own funds 4(1) (118) and 72 21.961 21.961 23.643 23.643
Capital requirement 92(3), 95, 96, 98 9.448 9.484 9.440 9.612
CET1 capital ratio 92(2) (a) 13,8% 13,7% 14,5% 14,2%
Tier 1 capital ratio 92(2) (b) 15,0% 15,0% 16,8% 16,5%
Total capital ratio 92(2) (c) 18,6% 18,5% 20,0% 19,7%
21 ECB Banking Supervision: https://www.bankingsupervision.europa.eu/press/pr/date/2020/html/ssm.pr200312~43351ac3ac.en.html 22 ECB Banking Supervision: https://www.bankingsupervision.europa.eu/press/pr/date/2020/html/ssm.pr200320_FAQs~a4ac38e3ef.en.html

199
In accordance with Art. 26 (2) CRR the item retained earnings only includes the interim profits of EUR 451 million approved by the ECB by decision of 8 February 2021. Minority interest recognised in CET1 includes interim result from saving banks in an amount of EUR 115 million. The position CET1 elements or deduction – Others include development of unaudited risk provisions during the year (EU No 183/2014) and starting with year end 2020 also insufficient coverage for non-performing exposures (NPE Backstop) covering the requirements from both Art. 36 para 1 (m) CRR in connection with Art. 47(c) CRR and the Addendum to the ECB Guidance to banks on non-performing loans: supervisory expectations for prudential provisioning of non-performing exposures The capital structure table above is based on the Commission Implementing Regulation (EU) No 1423/2013 laying down implementing technical standards with regard to disclosure of own funds requirements, enlarged by the EBA GL 2014/14. Positions, which are not relevant for Erste Group are not disclosed. Figures shown under full implementation of Basel 3 considered the current CRR. The consolidated financial statements have not been reviewed and noticed by the supervisory board and the financial statements of Erste Group Bank AG have not been reviewed by the supervisory board yet. Likewise financial statements of single entities within the group have not been noticed by the supervisory board yet. In addition, no resolu-tion on the appropriation of the profit has yet been made by the general meeting of the single entity. Erste Group reports since the end of the second quarter of 2017 on consolidated level an RWA-add-on in view of the calculation of risk-weighted assets for credit risk in Banca Comercială Română (BCR). Since the ECB decision in respect of the change in the IRB roll-out plan from 25 May 2020 the RWA add on amounts to EUR 2.1 billion. This RWA increase front-loads the expected difference in BCR between the treatments of exposures under the Standardised Approach compared to the treatment under IRB and is limited in time until the authorization of the IRB-approach in BCR. Furthermore Erste Group reports on consolidated level since Q3 2017 – due to a decision of the European Central Bank in the context of its supervisory assessments in view of deficiencies in credit risk models – a RWA-Add-On of around EUR 1.2 billion until these deficiencies will be addressed in the course of an update of these models. Erste Group was informed by the ECB in the third quarter of 2018 about a final decision in view of credit risk models (targeted review of internal models), which became effective at the end of September 2018. This decision had an effect on risk weighted assets (RWA) on consol-idated level of around EUR 0.3 billion. As pre-emption of the expected effects from the implementation of the new loss given default (LGD) estimation methodology, Erste Group incorporated a RWA add-on in the amount of EUR 0.5 billion as of the first quarter 2019. Erste Group’s AMA model change obtained regulatory approval in October 2018 under the condition of an add-on in the amount of 7% and became applicable in the fourth quarter of 2018. The approval of the new group-wide PD estimation methodology was approved by the ECB in December 2019 with a limitation related to an application of a RWA add-on in the volume of EUR 0.3 billion as of December 2019. With the approval of the updated group wide default definition an additional add-on was imposed in the amount of EUR 0.1 billion as of December 2019. The risk item other exposure amounts to EUR 3.2 billion as of 31 December 2020 and encompasses the BCR add-on (EUR 2.1 billion), the add-on resulting from the targeted review of internal models (EUR 0.3 billion), the effect from the updated LGD estimation methodology (EUR 0.5 billion) and the new group-wide PD estimation methodology (EUR 0.3 billion). All other credit risk related add-ons are directly reflected in the RWA calculation for credit risk. In order to mitigate the ramifications of the Covid-19 pandemic further, certain adjustments to the CRR and CRR II became effective on 27 June 2020 through EU Regulation No. 2020/873. The so-called CRR quick fix encompassed a revised supporting factor for loans to small and medium-sized enterprises (SMEs) which resulted in a credit RWA reduction of EUR -4.5 billion at Erste Group in June 2020. Furthermore, the temporary treatment of a 0% risk weight on public debt issued in the EEA currency of another EU member state lead to an additional RWA relief in the amount of EUR -1.0 billion for the exposure in standardized approach and EUR -1.2 billion under the IRB treatment, respectively. The temporary treatment of 0% risk weight is valid until 31 December 2022. On 2 September 2020 the ECB granted permission to revert to the use of the Standardised Approach for the exposures of Česká spořitelna towards leasing and insurance companies. This change led to the increase of RWA in the amount of EUR 70.8 million in the fourth quarter 2020.

200
Risk structure according to EU regulation 575/2013 (CRR)
Dec 19 Dec 20
in EUR million CRR articles Total risk
(phased-in)
Capital requirement (phased-in)
Total risk (phased-in)
Capital requirement(phased-in)
Total Risk Exposure Amount 92(3), 95, 96, 98 118.105 9.448 118.005 9.440
Risk weighted assets (credit risk) 92(3) (a)(f) 96.325 7.706 95.923 7.674
Standardised approach 18.006 1.440 18.056 1.444
IRB approach 78.318 6.265 77.852 6.228
Contribution to the default fund of a CCP 2 0 15 1
Settlement Risk 92(3) (c)(ii), 92(4) (b) 0 0 1 0
Trading book, foreign FX risk and commodity risk 92(3) (b)(i) and (c)(i) and (iii), 92(4(b) 2.795 224 3.630 290
Operational Risk 92(3) (e), 92(4) (b) 14.934 1.195 14.813 1.185
Exposure for CVA 92(3) (d) 569 46 397 32
Other exposure amounts (incl. Basel 1 floor) 3, 458, 459, 500 3.483 279 3.241 259
Dec 19 Dec 20
in EUR million CRR articles Total risk
(final)
Capital requirement
(final) Total risk
(final)
Capital requirement
(final)
Total Risk Exposure Amount 92(3), 95, 96, 98 118.556 9.484 120.151 9.612
Risk weighted assets (credit risk) 92(3) (a)(f) 96.776 7.742 98.069 7.846
Standardised approach 18.457 1.477 18.065 1.445
IRB approach 78.318 6.265 79.988 6.399
Contribution to the default fund of a CCP 2 0 15 1
Settlement Risk 92(3) (c)(ii), 92(4) (b) 0 0 1 0
Trading book, foreign FX risk and commodity risk 92(3) (b)(i) and (c)(i) and (iii), 92(4(b) 2.795 224 3.630 290
Operational Risk 92(3) (e), 92(4) (b) 14.934 1.195 14.813 1.185
Exposure for CVA 92(3) (d) 569 46 397 32
Other exposure amounts (incl. Basel 1 floor) 3, 458, 459, 500 3.483 279 3.241 259
34. Credit risk Credit risk arises in Erste Group’s traditional lending and investment businesses. It involves both credit losses incurred as a result of borrowers’ default (Stage 3) and credit losses expected if default occurs either within 1 year (Stage 1) or at any time until maturity (Stage 2). Stage 1 credit losses apply to non-defaulted credit risk exposures without significant increase in credit risk (SICR) since inception, whilst Stage 2 credit losses apply to non-defaulted credit risk exposures for which SICR is observed at the reporting date. It also involves credit losses due to counterparty risk from trading in instruments and derivatives bearing market risk. Country risk and related macro-economic forward-looking information is also considered in the calculation of credit risk. Operative credit decisions are made by the credit risk management units in each of the banking subsidiaries locally and by Corporate Risk Management at group level. In contrast to large corporates, banks and governments, managing credit risk in retail and SME involves dealing with a large number of relatively small exposures extended to private individuals, free professionals, entrepreneurs, or micro and small companies. Credit risk related to retail and SME loan portfolios is managed at group and at local entity level with a common interest in order to ensure regulatory compliant risk management practices and to provide customers with manageable loan facilities that are within their financial capacities and supported by underlying profitability. The central database used for credit risk management is the Business Intelligence data warehouse (BI-DWH). All data relevant to credit risk management, performance management, and determination of risk-weighted assets and regulatory capital requirements is regularly loaded into this database. Relevant subsidiaries not yet integrated into the Group data pool regularly deliver reporting packages. The Group Risk Reporting, Planning and Risk Cost Management department uses the BI-DWH in particular for centralised credit risk reporting. This ensures centralised analysis and application of ratios according to unified methods and segmentation across Erste Group as a whole. Credit risk reporting comprises regular reports on Erste Group’s credit portfolio for external and internal recipients and permits continuous monitoring of credit risk developments, thus enabling management to take control measures. In-house recipients of these reports include, above all, the supervisory and management boards of Erste Group Bank AG as well as the risk managers, business unit directors and internal audit staff. Internal rating system Erste Group has business and risk strategies in place that govern policies for lending and credit approval processes. These policies are reviewed and adjusted regularly, at a minimum on an annual basis. They cover the entire lending business, considering the nature, scope

201
and risk level of the transactions and the counterparties involved. Credit approval considers individual information on the creditworthiness of the customer, the type of credit, collateral, covenant package and other risk mitigation factors involved. The assessment of counterparty default risk within Erste Group is based on the customer’s probability of default (PD). For each credit exposure and lending decision, Erste Group assigns an internal rating, which is a unique measure of the counterparty default risk.The internal rating of each customer is updated event-specific, however, at least once a year (annual rating review). Ratings of workout customers are reviewed with a higher frequency. The main purpose of the internal ratings is to support the decision-making for lending and for the terms of credit facilities. Internal ratings also determine the level of credit approval authority within Erste Group and the monitoring procedures for existing exposures. At a quanti-tative level, internal ratings influence the level of required risk pricing, loss allowances and risk-weighted assets under Pillar 1 and 2. For entities of Erste Group that use the internal ratings-based (IRB) approach, internal ratings are key input for the risk-weighted assets calculation. They are also used in the group’s assessment of the economic capital requirements according to Pillar 2. For these purposes, a distinct PD value is assigned to each rating grade for its IRB portfolios within a calibration process that is performed individually for each rating method and each regional portfolio. PD values reflect a 12-month probability of default based on long-term average default rates per rating grade. The bank assigns margins of conservatism to the calculated PDs. Internal ratings take into account all available significant information for the assessment of counterparty default risk. For non-retail borrow-ers, internal ratings take into account the financial strength of the counterparty, the possibility of external support, flexibility in corporate financing, general company information and external credit history information, where available. For retail clients, internal ratings are based mainly on payment behaviour versus the bank and, where applicable, credit bureau information, supplemented with information provided by the respective client and general demographic information. Rating ceiling rules on credit quality are applied based on membership in a group of economically related entities and the country of main economic activity (applicable to cross-border financing facilities). Internal specialist teams develop and improve internal rating models and risk parameters in cooperation with risk managers. Model devel-opment follows an internal group-wide methodological standard and utilises relevant data covering the respective market. In this way, Erste Group ensures the availability of rating models with the best possible prediction and discriminatory ability across its core regions. The central organisational unit Model Validation is responsible for defining the validation methodologies and standards to be applied to all credit risk models within Erste Group as well as for conducting the validation activities across the whole Erste Group. All credit risk rating models are validated on the ongoing basis. Model Validation employs qualitative as well as quantitative validation methods to challenge conceptual soundness, performance and model use aspects. The validation outcomes are approved by the respective model committees and shared with the regulatory bodies. In addition to the validation process, the group applies a regular monitoring process on the performance of rating tools, reflecting developments in new defaults and early delinquencies. The Holding Model Committee (HMC) holds delegated approval authorities of the Erste Holding Management Board and is established as the steering and oversight body for the model development and validation process. Approvals of all new models, model changes, changes to risk parameters within the group, changes in group-wide methodological standards and other model-related aspects are following a dual approval process within the Group – corresponding Holding and local model committee structures reflect joint responsibilities for decisions on Pillar 1 IRB and Pillar 2 credit risk models as well as on methodologies related to IFRS9 parameters. Responsibilities are assigned depending on model perimeter (group-wide or locally developed model). Ultimate responsibility for all models used within the Group (at consolidated level) lies with the Group CRO. All model governance, development and validation activities are coordinated by the Credit Risk Methods division. Credit risk classification For the disclosure of asset quality Erste Group assigns each customer to one of the following four risk categories: Low risk. Typically, regional customers with well-established and rather long-standing relationships with Erste Group or large internation-ally recognised customers. Very good to satisfactory financial position and low likelihood of financial difficulties relative to the respective market in which the customers operate. Retail clients having long relationships with the bank, or clients with a wide product pool use. No relevant late payments currently or in the most recent 12 months. New business is generally done with clients in this risk category. Management attention. Vulnerable non-retail clients, who may have overdue payments or defaults in their credit history or may encounter debt repayment difficulties in the medium term. Retail clients with possible payment problems in the past triggering early collection re-minders. These clients typically have a good recent payment history. Substandard. The borrower is vulnerable to short-term negative financial and economic developments and shows an elevated probability of failure. In some cases, restructuring measures are possible or already in place. As a rule, such loans are managed in specialised risk management departments.

202
Non-performing. One or more of the default criteria under Article 178 of the CRR are met, which include full repayment unlikely, interest or principal payments on a material exposure more than 90 days past due, restructuring resulting in a loss to the lender, realisation of a loan loss, or initiation of bankruptcy proceedings. Erste Group applies the customer view for all customer segments, including retail clients; if an obligor defaults on one deal then the customer’s performing transactions are classified as non-performing as well. All non-performing exposures are also defaulted. Based on the calibration of internal PDs (probabilities of default) for regulatory purposes to the default rates published by rating agencies, the equivalent external customer rating was used for the assignment to risk categories. For the agency ratings, average one-year default rates resulting from long-term time series were applied. In 2020, the method for determining risk categories was adjusted to consider necessary changes in the group-wide PD methodology, result-ing in a more stable distribution of exposure to risk categories over time. Compared to the method used for the assignment of credit exposures to risk categories until 2019, the adjusted methodology results in an increase of the portfolio share of the ‘low risk’ and ‘management attention’ categories by 0.1 and 0.7 percentage points, respectively, as of 31 December 2019. The ‘substandard’ category decreases by 0.8 percentage points. The ‘non-performing’ risk category was not affected by the adjustment of the methodology. Credit risk review and monitoring Group Retail Risk Management as well as Credit Risk Portfolio in cooperation with Corporate Risk Management conduct periodical reviews of the loan portfolio for each local entity to ensure an adequate portfolio quality and to monitor the compliance of local portfolios with the principles and parameters as stipulated by Erste Group’s credit risk policies. All credit limits and the transactions booked within the limits are reviewed at least once a year. Counterparty credit risk limits are monitored daily in an internal limit management system with remedial actions taken in case limits are exceeded. A group-wide standardised early warning monitoring process is implemented to proactively identify negative developments. The early warn-ing monitoring process for corporate clients is managed at group level by Credit Risk Portfolio and, at subsidiary level, by the local units responsible for corporate risk management, retail risk management and collections, for respective segments. When early warning signals are identified and validated, the overall client exposure and creditworthiness is reviewed, and adequate risk mitigating actions are taken if deemed necessary. Watch list review meetings are held on a regular basis to monitor customers with a poor credit standing and to discuss pre-emptive measures. For smaller enterprises (micro) and retail customers, the monitoring and credit review are based on an automated early warning system. In retail risk management, the early warning signals for adverse portfolio developments include, for instance, quality deterioration in new business or a decreasing collections effectiveness and require appropriate countermeasures. Additionally, the monitoring is performed for clients where early warning signals have been identified, even if they are still fulfilling their contractual repayment obligations. Adverse portfolio developments regarding the non-performing and substandard loans portfolio of Erste Group are monitored, discussed and reported. In case of further negative developments clients are handled in specialized workout units aiming to minimize potential losses. Credit risk exposure Credit risk exposure relates to the sum of the following balance sheet items:
_ cash and cash balances - demand deposits to credit institutions; _ debt instruments held for trading; _ non-trading debt instruments at fair value through profit or loss (FVPL); _ debt instruments at fair value through other comprehensive income (FVOCI); _ debt instruments at amortised cost (AC), other than trade and other receivables; _ trade and other receivables (for disclosure purposes in the tabular summaries below, any contract assets are also included in this category); _ finance lease receivables; _ debt instruments held for sale in disposal groups; _ positive fair value of hedge accounting derivatives; _ off-balance sheet exposures (primarily financial guarantees and undrawn loan commitments).
The credit risk exposure equates the gross carrying amount (or nominal value in the case of off-balance sheet positions) excluding:
_ credit loss allowances for financial assets; _ credit loss allowances for loan commitments and financial guarantees; _ provisions for other commitments; _ any collateral held (including risk transfer to guarantors); _ netting effects; _ other credit enhancements; _ credit risk mitigating transactions.
Between the 31 December 2019 and 31 December 2020, the credit risk exposure increased from EUR 273,778 million to EUR 286,699 million. This is an increase of 4.7% or EUR 12,921 million.

203
Reconciliation between the gross carrying amount and the carrying amount of the credit risk exposure components
in EUR million Credit risk exposure
Credit loss allowances Adjustments
Net carrying amount
Dec 20
Cash and cash balances - demand deposits to credit institutions 1,140 -1 0 1,139
Debt instruments held for trading 6,322 0 0 6,322
Non-trading debt instruments at FVPL 2,736 0 0 2,736
Debt securities 2,048 0 0 2,048
Loans and advances to banks 0 0 0 0
Loans and advances to customers 687 0 0 687
Debt instruments at FVOCI 8,109 -25 280 8,389
Debt securities 8,109 -25 280 8,389
Loans and advances to banks 0 0 0 0
Loans and advances to customers 0 0 0 0
Debt instruments at AC 214,790 -3,850 0 210,940
Debt securities 29,594 -15 0 29,579
Loans and advances to banks 21,469 -3 0 21,466
Loans and advances to customers 163,727 -3,831 0 159,895
Trade and other receivables 1,405 -64 0 1,341
Finance lease receivables 4,235 -108 0 4,127
Debt instruments held for sale in disposal groups 0 0 0 0
Positive fair value of hedge accounting derivatives 205 0 0 205
Off-balance sheet exposures 47,758 -474 0 -
Total 286,699 -4,522 280 235,199
Dec 19
Cash and cash balances - demand deposits to credit institutions 1,196 0 0 1,195
Debt instruments held for trading 5,694 0 0 5,694
Non-trading debt instruments at FVPL 2,818 0 0 2,818
Debt securities 2,335 0 0 2,335
Loans and advances to banks 0 0 0 0
Loans and advances to customers 483 0 0 483
Debt instruments at FVOCI 8,590 -14 247 8,836
Debt securities 8,590 -14 247 8,836
Loans and advances to banks 0 0 0 0
Loans and advances to customers 0 0 0 0
Debt instruments at AC 207,150 -2,988 0 204,162
Debt securities 26,774 -11 0 26,764
Loans and advances to banks 23,063 -9 0 23,055
Loans and advances to customers 157,312 -2,969 0 154,344
Trade and other receivables 1,480 -72 0 1,408
Finance lease receivables 4,169 -134 0 4,034
Debt instruments held for sale in disposal groups 0 0 0 0
Positive fair value of hedge accounting derivatives 130 0 0 130
Off-balance sheet exposures 42,552 -310 0 -
Total 273,778 -3,518 247 228,279
Credit loss allowances comprise impairments for financial assets measured at amortised cost (including finance lease and trade and other receivables) and at fair value through other comprehensive income (FVOCI), as well as credit loss allowances and provisions for off-balance sheet exposures. Adjustments refer to the fair value changes of the carrying amount for financial assets at FVOCI. Breakdown of credit risk exposure On the following pages the credit risk exposure is presented according to different segmentation criteria.

204
Credit risk exposure by counterparty sector and financial instrument
At amortised cost
in EUR million
Cash and cash balances -
demand deposits to credit
institutions
Debt instruments
held for trading
Non-trading debt
instruments at FVPL
Debt instruments
at FVOCI Debt
securities
Loans and advances to banks
Loans and advances
to customers
Trade and other
receivables
Finance lease
receivables
Debt instruments held for sale
in disposal groups
Positive fair value of hedge
accounting derivatives
Off-balance sheet
exposures Total
Dec 20
Central banks 0 38 0 42 35 16,763 0 1 0 0 0 0 16,878
General governments 0 2,806 278 5,961 25,206 0 6,791 55 374 0 0 3,154 44,625
Credit institutions 1,140 2,914 625 944 3,510 4,707 0 29 4 0 204 852 14,928
Other financial corporations 0 146 999 205 146 0 3,727 28 73 0 1 2,235 7,560
Non-financial corporations 0 418 254 957 698 0 71,324 1,162 2,974 0 0 29,595 107,381
Households 0 1 579 0 0 0 81,885 130 810 0 0 11,922 95,327
Total 1,140 6,322 2,736 8,109 29,594 21,469 163,727 1,405 4,235 0 205 47,758 286,699
Dec 19
Central banks 0 19 0 19 50 16,109 0 1 0 0 0 21 16,218
General governments 0 2,037 336 6,221 22,514 0 6,781 63 379 0 0 2,098 40,429
Credit institutions 1,196 3,059 723 1,099 3,288 6,955 0 25 1 0 129 955 17,429
Other financial corporations 0 98 1,088 181 143 0 3,612 30 71 0 0 1,513 6,735
Non-financial corporations 0 481 328 1,070 780 0 67,774 1,240 2,934 0 1 26,493 101,099
Households 0 1 344 0 0 0 79,146 122 783 0 0 11,472 91,868
Total 1,196 5,694 2,818 8,590 26,774 23,063 157,312 1,480 4,169 0 130 42,552 273,778

205
Contingent liabilities / Off-balance sheet exposures by product in EUR million Dec 19 Dec 20
Financial guarantees 7,190 6,426
Loan commitments 31,225 35,650
Other commitments 4,137 5,682
Total 42,552 47,758
Credit risk exposure by industry and IFRS 9 treatment
in EUR million Stage 1 Stage 2 Stage 3 POCI
Credit risk exposure
(AC and FVOCI)
Not subject to IFRS 9
impairment Total
Dec 20
Agriculture and forestry 2,550 593 122 5 3,270 19 3,289
Mining 544 64 16 2 626 207 832
Manufacturing 13,658 4,914 585 46 19,202 1,023 20,226
Energy and water supply 4,054 577 56 8 4,695 198 4,893
Construction 9,330 1,789 279 16 11,414 1,231 12,645
Development of building projects 4,766 904 68 4 5,743 305 6,048
Trade 9,251 3,758 472 44 13,525 1,019 14,544
Transport and communication 5,759 1,993 196 4 7,952 361 8,313
Hotels and restaurants 1,281 3,977 331 29 5,618 79 5,697
Financial and insurance services 32,797 1,714 30 12 34,551 5,060 39,611
Holding companies 2,061 976 10 11 3,058 139 3,197
Real estate and housing 25,893 5,824 262 129 32,108 857 32,965
Services 9,461 3,976 488 5 13,930 745 14,675
Public administration 38,571 560 1 3 39,135 3,235 42,370
Education, health and art 2,604 932 102 1 3,638 38 3,677
Households 71,994 7,967 1,541 116 81,619 784 82,403
Other 452 19 0 0 471 88 558
Total 228,200 38,655 4,480 419 271,754 14,945 286,699
Dec 19
Agriculture and forestry 2,849 265 111 11 3,236 14 3,250
Mining 680 52 27 23 781 26 807
Manufacturing 16,043 1,805 431 46 18,324 951 19,274
Energy and water supply 3,657 558 75 4 4,294 124 4,418
Construction 10,160 862 389 31 11,441 890 12,332
Development of building projects 4,908 327 71 9 5,314 245 5,559
Trade 11,290 1,363 396 41 13,091 666 13,757
Transport and communication 6,934 462 104 5 7,506 292 7,798
Hotels and restaurants 4,314 503 243 26 5,086 41 5,126
Financial and insurance services 34,931 515 27 13 35,486 5,362 40,848
Holding companies 2,406 189 5 13 2,614 136 2,749
Real estate and housing 27,130 2,031 316 134 29,611 592 30,203
Services 11,709 1,322 243 6 13,279 759 14,038
Public administration 35,748 385 1 3 36,137 2,459 38,595
Education, health and art 3,097 417 216 0 3,730 37 3,767
Households 71,273 5,715 1,511 136 78,636 562 79,198
Other 361 0 0 0 361 7 368
Total 240,176 16,256 4,087 480 260,999 12,779 273,778
From industry and financial instrument point of view, the highest exposure is represented by households in loans and advances to customers (exposure of 71,093 million, representing 24.8% from total) followed by real estate and housing in loans and advances to customers (expo-sure of 28,338 million, representing 9.9% from total) and public administration in debt securities (exposure of 25,013 million, representing 8.7% from total).

206
Credit risk exposure by industry and risk category
in EUR million Low risk Management
attention Substandard Non-
performing Total
Dec 20
Agriculture and forestry 2,080 830 253 125 3,289
Mining 742 63 4 23 832
Manufacturing 15,950 2,966 676 634 20,226
Energy and water supply 3,940 655 233 64 4,893
Construction 9,594 2,284 435 331 12,645
Development of building projects 4,909 976 94 69 6,048
Trade 10,754 2,702 575 513 14,544
Transport and communication 6,555 1,368 189 202 8,313
Hotels and restaurants 3,618 1,442 294 343 5,697
Financial and insurance services 37,653 1,557 364 37 39,611
Holding companies 2,415 693 73 16 3,197
Real estate and housing 26,262 4,982 1,344 377 32,965
Services 12,086 1,719 375 495 14,675
Public administration 41,937 387 46 1 42,370
Education, health and art 2,877 620 77 103 3,677
Households 74,640 4,507 1,662 1,593 82,403
Other 352 3 203 0 558
Total 249,041 26,086 6,731 4,841 286,699
Dec 19
Agriculture and forestry 2,063 851 214 122 3,250
Mining 713 33 11 50 807
Manufacturing 16,376 1,942 483 474 19,274
Energy and water supply 3,654 485 199 79 4,418
Construction 9,867 1,612 435 418 12,332
Development of building projects 4,586 784 109 79 5,559
Trade 10,906 1,979 434 438 13,757
Transport and communication 6,669 712 309 108 7,798
Hotels and restaurants 3,662 928 285 251 5,126
Financial and insurance services 39,692 884 244 27 40,848
Holding companies 2,558 164 22 5 2,749
Real estate and housing 24,692 3,747 1,326 438 30,203
Services 12,202 1,245 335 254 14,038
Public administration 38,218 292 85 1 38,595
Education, health and art 2,982 413 155 216 3,767
Households 71,039 4,813 1,759 1,587 79,198
Other 306 0 61 0 368
Total 243,042 19,936 6,338 4,463 273,778
The low risk exposure has the highest proportion in total credit risk exposure, with 86.9%, while management attention represents 9.1%. The substandard exposure represents 2.3% and the non-performing 1.7%
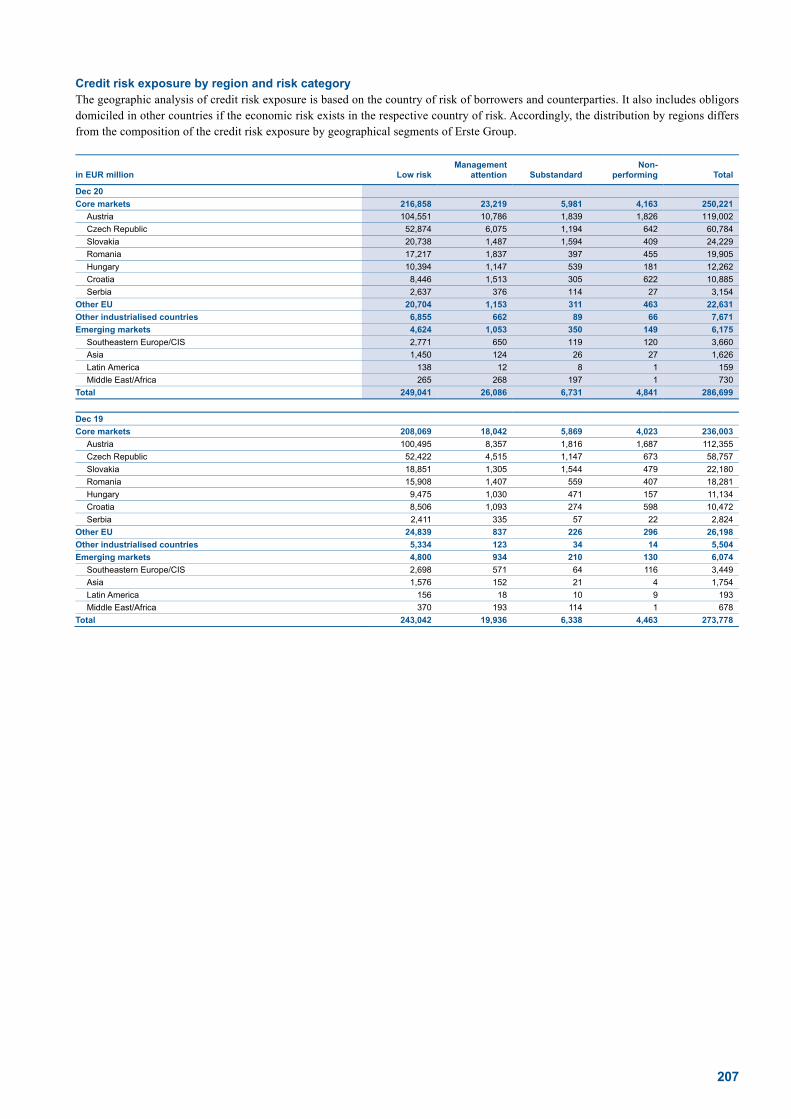
207
Credit risk exposure by region and risk category The geographic analysis of credit risk exposure is based on the country of risk of borrowers and counterparties. It also includes obligors domiciled in other countries if the economic risk exists in the respective country of risk. Accordingly, the distribution by regions differs from the composition of the credit risk exposure by geographical segments of Erste Group.
in EUR million Low risk Management
attention Substandard Non-
performing Total
Dec 20
Core markets 216,858 23,219 5,981 4,163 250,221
Austria 104,551 10,786 1,839 1,826 119,002
Czech Republic 52,874 6,075 1,194 642 60,784
Slovakia 20,738 1,487 1,594 409 24,229
Romania 17,217 1,837 397 455 19,905
Hungary 10,394 1,147 539 181 12,262
Croatia 8,446 1,513 305 622 10,885
Serbia 2,637 376 114 27 3,154
Other EU 20,704 1,153 311 463 22,631
Other industrialised countries 6,855 662 89 66 7,671
Emerging markets 4,624 1,053 350 149 6,175
Southeastern Europe/CIS 2,771 650 119 120 3,660
Asia 1,450 124 26 27 1,626
Latin America 138 12 8 1 159
Middle East/Africa 265 268 197 1 730
Total 249,041 26,086 6,731 4,841 286,699
Dec 19
Core markets 208,069 18,042 5,869 4,023 236,003
Austria 100,495 8,357 1,816 1,687 112,355
Czech Republic 52,422 4,515 1,147 673 58,757
Slovakia 18,851 1,305 1,544 479 22,180
Romania 15,908 1,407 559 407 18,281
Hungary 9,475 1,030 471 157 11,134
Croatia 8,506 1,093 274 598 10,472
Serbia 2,411 335 57 22 2,824
Other EU 24,839 837 226 296 26,198
Other industrialised countries 5,334 123 34 14 5,504
Emerging markets 4,800 934 210 130 6,074
Southeastern Europe/CIS 2,698 571 64 116 3,449
Asia 1,576 152 21 4 1,754
Latin America 156 18 10 9 193
Middle East/Africa 370 193 114 1 678
Total 243,042 19,936 6,338 4,463 273,778

208
Credit risk exposure by region and IFRS 9 treatment
in EUR million Stage 1 Stage 2 Stage 3 POCI
Credit risk exposure
(AC and FVOCI)
Not subject to IFRS 9
impairment Total
Dec 20
Core markets 203,419 33,645 3,897 351 241,312 8,909 250,221
Austria 92,710 20,412 1,778 37 114,938 4,064 119,002
Czech Republic 54,645 4,789 614 34 60,082 702 60,784
Slovakia 20,270 3,006 319 111 23,706 523 24,229
Romania 15,069 2,711 406 69 18,254 1,652 19,905
Hungary 9,600 1,100 152 77 10,929 1,333 12,262
Croatia 8,654 1,331 604 22 10,611 274 10,885
Serbia 2,470 296 24 2 2,793 361 3,154
Other EU 15,697 3,078 371 55 19,201 3,431 22,631
Other industrialised countries 4,784 1,112 66 12 5,972 1,698 7,671
Emerging markets 4,301 821 146 1 5,269 907 6,175
Southeastern Europe/CIS 2,639 578 119 1 3,336 324 3,660
Asia 932 124 27 0 1,083 544 1,626
Latin America 82 67 0 0 149 10 159
Middle East/Africa 648 52 1 0 701 29 730
Total 228,200 38,655 4,480 419 271,754 14,945 286,699
Dec 19
Core markets 210,624 14,007 3,715 417 228,762 7,240 236,003
Austria 97,589 9,071 1,652 30 108,343 4,012 112,355
Czech Republic 55,975 1,678 648 27 58,328 428 58,757
Slovakia 20,865 666 384 116 22,031 149 22,180
Romania 15,377 1,661 335 110 17,483 798 18,281
Hungary 9,454 295 111 94 9,955 1,179 11,134
Croatia 9,004 530 565 37 10,137 335 10,472
Serbia 2,360 105 19 2 2,486 338 2,824
Other EU 20,390 1,608 237 49 22,283 3,914 26,198
Other industrialised countries 4,601 234 14 13 4,862 643 5,504
Emerging markets 4,561 408 122 1 5,091 982 6,074
Southeastern Europe/CIS 2,928 267 114 1 3,310 138 3,449
Asia 949 34 4 0 987 767 1,754
Latin America 142 25 2 0 169 24 193
Middle East/Africa 543 81 1 0 625 53 678
Total 240,176 16,256 4,087 480 260,999 12,779 273,778
Stage 1 and Stage 2 comprise not impaired credit risks while Stage 3 includes impaired credit risks. POCI (purchased or originated credit impaired) consists of credit risks already impaired when purchased or originated. The defaulted part of POCI amounted to EUR 274 million (2019: 339 million), the non-defaulted part to EUR 145 million (2019: 141 million). The credit risk exposure increased by EUR 6,647 million, or 5.9% in Austria, and by EUR 7,572 million, or 6.1% in the CEE core markets. In the other EU member states (EU 27 excluding core markets), the credit risk exposure decreased by EUR 3,566 million, or -13.6%, mainly caused by the exit of the United Kingdom from the European Union. Growth was recorded in other industrialised countries (EUR 2,167 mil-lion) and in emerging markets (EUR 102 million). In total, Erste Group’s core markets and the EU accounted for 95.2% (2019: 95.8%) of credit risk exposure as of 31 December 2020. At 2.2% (2019: 2.2%), the share of emerging markets remained of minor importance.

209
Credit risk exposure by reporting segment and risk category The segment reporting of Erste Group is based on the matrix organisation by business segments as well as by geographical segments which are defined as operating segments. The geographical segmentation follows the country markets in which Erste Group operates and the locations of the banking and other financial institutions participations. Credit risk exposure by business segment and risk category
in EUR million Low risk Management
attention Substandard Non-
performing Total
Dec 20
Retail 60,580 5,596 2,143 1,514 69,833
Corporates 66,644 11,727 2,747 1,819 82,936
Group Markets 16,522 384 224 1 17,131
ALM & LCC 44,527 223 155 20 44,925
Savings Banks 60,446 8,111 1,221 1,470 71,249
GCC 320 46 242 17 625
Total 249,041 26,086 6,731 4,841 286,699
Dec 19
Retail 58,616 5,977 2,512 1,474 68,579
Corporates 67,378 6,807 2,189 1,467 77,841
Group Markets 17,962 346 133 3 18,444
ALM & LCC 41,554 121 92 75 41,842
Savings Banks 57,280 6,673 1,403 1,431 66,786
GCC 252 13 9 13 287
Total 243,042 19,936 6,338 4,463 273,778
Credit risk exposure by business segment and IFRS 9 treatment
Credit risk exposure Credit loss allowances Coverage ratio
in EUR million Stage 1 Stage 2 Stage 3 POCI
Not subject to IFRS 9
impairment Stage 1 Stage 2 Stage 3 POCI Stage 2 Stage 3 POCI
Dec 20
Retail 59,028 8,461 1,461 118 763 -141 -478 -859 -34 5.6% 58.8% 29.0%
Corporates 60,296 16,931 1,551 251 3,907 -182 -560 -901 -89 3.3% 58.1% 35.5%
Group Markets 10,273 116 1 0 6,741 -6 -3 0 0 2.5% 6.2% 100.0%
ALM & LCC 44,273 308 19 0 326 -16 -12 -19 0 3.8% 102.0% 0.0%
Savings Banks 53,972 12,669 1,431 50 3,126 -119 -371 -636 -4 2.9% 44.4% 7.8%
GCC 357 169 17 0 82 0 0 -16 0 0.1% 93.7% 0.0%
Total 228,200 38,655 4,480 419 14,945 -464 -1,424 -2,430 -127 3.7% 54.2% 30.4%
Dec 19
Retail 61,886 4,613 1,398 139 543 -125 -227 -837 -45 4.9% 59.9% 32.4%
Corporates 67,684 5,489 1,203 294 3,170 -173 -191 -767 -96 3.5% 63.8% 32.6%
Group Markets 12,199 126 2 0 6,116 -8 -3 -2 0 2.2% 100.0% 100.0%
ALM & LCC 41,380 78 75 0 309 -11 -7 -35 0 9.3% 47.4% 0.0%
Savings Banks 56,822 5,945 1,397 47 2,576 -108 -179 -672 -3 3.0% 48.1% 5.6%
GCC 205 3 13 0 65 0 0 -13 0 0.2% 96.6% 0.0%
Total 240,176 16,256 4,087 480 12,779 -425 -607 -2,327 -143 3.7% 56.9% 29.9%
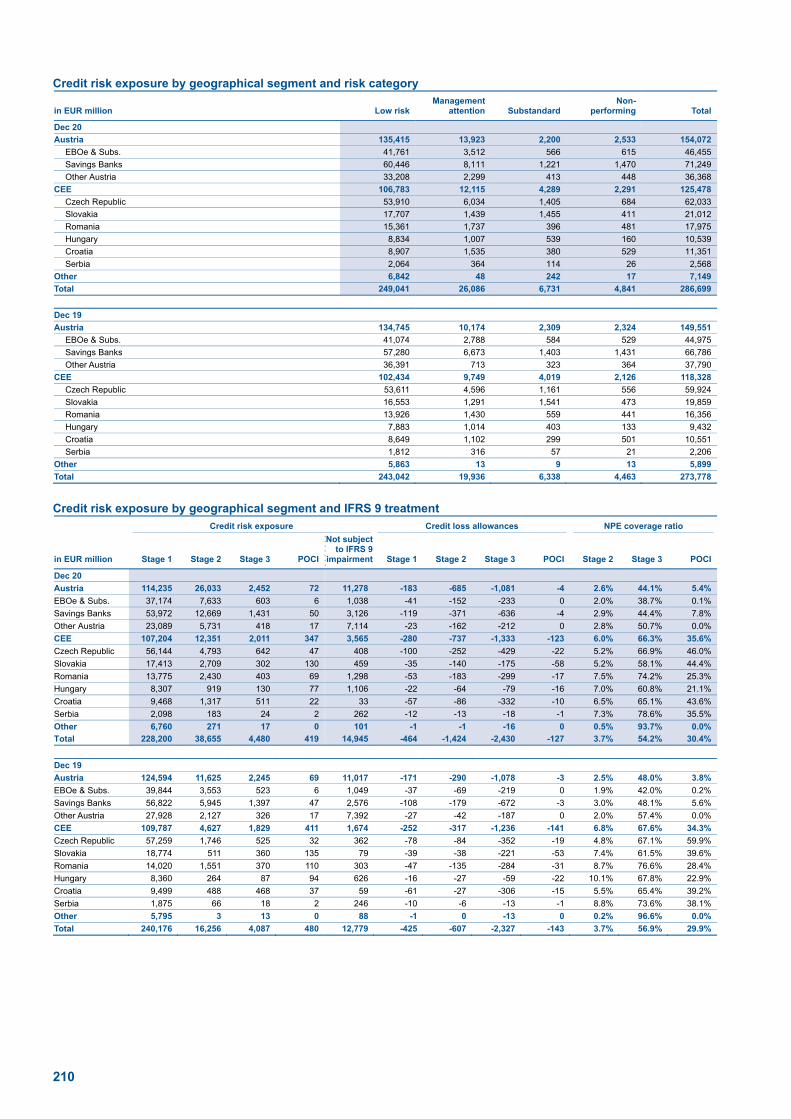
210
Credit risk exposure by geographical segment and risk category
in EUR million Low risk Management
attention Substandard Non-
performing Total
Dec 20
Austria 135,415 13,923 2,200 2,533 154,072
EBOe & Subs. 41,761 3,512 566 615 46,455
Savings Banks 60,446 8,111 1,221 1,470 71,249
Other Austria 33,208 2,299 413 448 36,368
CEE 106,783 12,115 4,289 2,291 125,478
Czech Republic 53,910 6,034 1,405 684 62,033
Slovakia 17,707 1,439 1,455 411 21,012
Romania 15,361 1,737 396 481 17,975
Hungary 8,834 1,007 539 160 10,539
Croatia 8,907 1,535 380 529 11,351
Serbia 2,064 364 114 26 2,568
Other 6,842 48 242 17 7,149
Total 249,041 26,086 6,731 4,841 286,699
Dec 19
Austria 134,745 10,174 2,309 2,324 149,551
EBOe & Subs. 41,074 2,788 584 529 44,975
Savings Banks 57,280 6,673 1,403 1,431 66,786
Other Austria 36,391 713 323 364 37,790
CEE 102,434 9,749 4,019 2,126 118,328
Czech Republic 53,611 4,596 1,161 556 59,924
Slovakia 16,553 1,291 1,541 473 19,859
Romania 13,926 1,430 559 441 16,356
Hungary 7,883 1,014 403 133 9,432
Croatia 8,649 1,102 299 501 10,551
Serbia 1,812 316 57 21 2,206
Other 5,863 13 9 13 5,899
Total 243,042 19,936 6,338 4,463 273,778
Credit risk exposure by geographical segment and IFRS 9 treatment
Credit risk exposure Credit loss allowances NPE coverage ratio
in EUR million Stage 1 Stage 2 Stage 3 POCI
Not subject to IFRS 9
impairment Stage 1 Stage 2 Stage 3 POCI Stage 2 Stage 3 POCI
Dec 20
Austria 114,235 26,033 2,452 72 11,278 -183 -685 -1,081 -4 2.6% 44.1% 5.4%
EBOe & Subs. 37,174 7,633 603 6 1,038 -41 -152 -233 0 2.0% 38.7% 0.1%
Savings Banks 53,972 12,669 1,431 50 3,126 -119 -371 -636 -4 2.9% 44.4% 7.8%
Other Austria 23,089 5,731 418 17 7,114 -23 -162 -212 0 2.8% 50.7% 0.0%
CEE 107,204 12,351 2,011 347 3,565 -280 -737 -1,333 -123 6.0% 66.3% 35.6%
Czech Republic 56,144 4,793 642 47 408 -100 -252 -429 -22 5.2% 66.9% 46.0%
Slovakia 17,413 2,709 302 130 459 -35 -140 -175 -58 5.2% 58.1% 44.4%
Romania 13,775 2,430 403 69 1,298 -53 -183 -299 -17 7.5% 74.2% 25.3%
Hungary 8,307 919 130 77 1,106 -22 -64 -79 -16 7.0% 60.8% 21.1%
Croatia 9,468 1,317 511 22 33 -57 -86 -332 -10 6.5% 65.1% 43.6%
Serbia 2,098 183 24 2 262 -12 -13 -18 -1 7.3% 78.6% 35.5%
Other 6,760 271 17 0 101 -1 -1 -16 0 0.5% 93.7% 0.0%
Total 228,200 38,655 4,480 419 14,945 -464 -1,424 -2,430 -127 3.7% 54.2% 30.4%
Dec 19
Austria 124,594 11,625 2,245 69 11,017 -171 -290 -1,078 -3 2.5% 48.0% 3.8%
EBOe & Subs. 39,844 3,553 523 6 1,049 -37 -69 -219 0 1.9% 42.0% 0.2%
Savings Banks 56,822 5,945 1,397 47 2,576 -108 -179 -672 -3 3.0% 48.1% 5.6%
Other Austria 27,928 2,127 326 17 7,392 -27 -42 -187 0 2.0% 57.4% 0.0%
CEE 109,787 4,627 1,829 411 1,674 -252 -317 -1,236 -141 6.8% 67.6% 34.3%
Czech Republic 57,259 1,746 525 32 362 -78 -84 -352 -19 4.8% 67.1% 59.9%
Slovakia 18,774 511 360 135 79 -39 -38 -221 -53 7.4% 61.5% 39.6%
Romania 14,020 1,551 370 110 303 -47 -135 -284 -31 8.7% 76.6% 28.4%
Hungary 8,360 264 87 94 626 -16 -27 -59 -22 10.1% 67.8% 22.9%
Croatia 9,499 488 468 37 59 -61 -27 -306 -15 5.5% 65.4% 39.2%
Serbia 1,875 66 18 2 246 -10 -6 -13 -1 8.8% 73.6% 38.1%
Other 5,795 3 13 0 88 -1 0 -13 0 0.2% 96.6% 0.0%
Total 240,176 16,256 4,087 480 12,779 -425 -607 -2,327 -143 3.7% 56.9% 29.9%

211
Non-performing credit risk exposure and credit loss allowances For the definition of credit risk exposure classified as non-performing, please refer to the description of risk categories in the subsection ‘Credit risk classification’. Credit risk allowances include credit loss allowances for financial assets, credit loss allowances for loan commitments and financial guarantees (all allowances within the scope of IFRS 9) and provisions for other commitments. Credit loss allowances (all stages combined) covered 93.5% (2019: 79.1%) of the reported non-performing on-balance and off-balance credit risk exposure as of 31 December 2020. For the portion of the non-performing credit risk exposure that is not covered by allowances, Erste Group assumes there are sufficient levels of collateral and expected other recoveries. During 2020, the non-performing credit risk exposure increased by EUR 378 million, or 8.5%. The credit loss allowances for loans and advances together with credit loss allowances for loan commitments and financial guarantees increased by EUR 944 million, or 27.0%. This development resulted in a substantial increase of 14.4 percentage points in the coverage of non-performing credit risk exposure by credit risk allowances. The following tables show the coverage of the non-performing credit risk exposure by credit loss allowances (without taking into consideration collateral) as of 31 December 2020 and 31 December 2019. The differences in the credit allowance levels between the reporting segments result from the risk situation in the respective markets, different levels of collateralisation as well as the local legal environment and regulatory requirements. The non-performing exposure ratio (NPE ratio) is calculated as the non-performing credit risk exposure divided by total credit risk exposure while the NPE coverage ratio is computed as total credit loss allowances (all allowances within the scope of IFRS 9) divided by non-performing credit risk exposure at AC and FVOCI. Collateral is not taken into account in the NPE coverage ratio. Non-performing credit risk exposure by business segment and coverage by credit loss allowances and collateral
Non-performing Credit risk exposure Credit loss allowances Collateral for NPE NPE ratio
NPE coverage
ratio NPE collateralisation
ratio
in EUR million Total AC and
FVOCI Total AC and
FVOCI AC and FVOCI
Total AC and FVOCI
Total AC and FVOCI
AC and FVOCI
Total AC and FVOCI
Dec 20
Retail 1,514 1,513 69,833 69,070 -1,512 602 602 2.2% 2.2% 99.9% 39.8% 39.8%
Corporates 1,819 1,746 82,936 79,030 -1,731 658 657 2.2% 2.2% 99.2% 36.2% 37.7%
Group Markets 1 1 17,131 10,390 -9 0 0 0.0% 0.0% >500.0% 0.0% 0.0%
ALM & LCC 20 19 44,925 44,599 -47 0 0 0.0% 0.0% 249.7% 0.4% 0.4%
Savings Banks 1,470 1,459 71,249 68,122 -1,130 751 748 2.1% 2.1% 77.4% 51.1% 51.3%
GCC 17 15 625 543 -16 8 6 2.7% 2.7% 111.4% 47.3% 39.4%
Total 4,841 4,753 286,699 271,754 -4,446 2,019 2,013 1.7% 1.7% 93.5% 41.7% 42.4%
Dec 19
Retail 1,474 1,472 68,579 68,036 -1,234 619 618 2.1% 2.2% 83.8% 42.0% 42.0%
Corporates 1,467 1,441 77,841 74,671 -1,227 508 506 1.9% 1.9% 85.2% 34.6% 35.1%
Group Markets 3 2 18,444 12,327 -13 0 0 0.0% 0.0% >500.0% 0.0% 0.0%
ALM & LCC 75 75 41,842 41,533 -53 48 48 0.2% 0.2% 71.6% 64.7% 64.9%
Savings Banks 1,431 1,424 66,786 64,210 -961 707 705 2.1% 2.2% 67.5% 49.5% 49.5%
GCC 13 11 287 222 -13 5 3 4.6% 5.1% 115.1% 39.8% 29.0%
Total 4,463 4,425 273,778 260,999 -3,502 1,888 1,881 1.6% 1.7% 79.1% 42.3% 42.5%

212
Non-performing credit risk exposure by geographical segment and coverage by credit loss allowances and collateral
Non-performing Credit risk exposure Credit loss allowances Collateral for NPE NPE ratio
NPE coverage
ratio NPE collateralisation
ratio
in EUR million Total AC and
FVOCI Total AC and
FVOCI AC and FVOCI
Total AC and FVOCI
Total AC and FVOCI
AC and FVOCI
Total AC and FVOCI
Dec 20
Austria 2,533 2,500 154,072 142,793 -1,953 1,209 1,207 1.6% 1.8% 78.1% 47.7% 48.3%
EBOe & Subs. 615 606 46,455 45,417 -426 326 326 1.3% 1.3% 70.3% 53.1% 53.8%
Savings Banks 1,470 1,459 71,249 68,122 -1,130 751 748 2.1% 2.1% 77.4% 51.1% 51.3%
Other Austria 448 434 36,368 29,254 -397 132 132 1.2% 1.5% 91.4% 29.6% 30.4%
CEE 2,291 2,238 125,478 121,913 -2,474 802 801 1.8% 1.8% 110.5% 35.0% 35.8%
Czech Republic 684 682 62,033 61,625 -803 181 181 1.1% 1.1% 117.6% 26.5% 26.6%
Slovakia 411 411 21,012 20,553 -408 145 145 2.0% 2.0% 99.3% 35.3% 35.3%
Romania 481 436 17,975 16,677 -552 162 162 2.7% 2.6% 126.7% 33.8% 37.2%
Hungary 160 156 10,539 9,433 -182 93 93 1.5% 1.7% 116.6% 58.4% 59.4%
Croatia 529 528 11,351 11,318 -485 216 216 4.7% 4.7% 91.8% 40.9% 40.9%
Serbia 26 25 2,568 2,307 -44 4 4 1.0% 1.1% 174.0% 14.0% 14.2%
Other 17 15 7,149 7,048 -18 8 6 0.2% 0.2% 126.6% 47.3% 39.4%
Total 4,841 4,753 286,699 271,754 -4,446 2,019 2,013 1.7% 1.7% 93.5% 41.7% 42.4%
Dec 19
Austria 2,324 2,294 149,551 138,534 -1,543 1,143 1,141 1.6% 1.7% 67.3% 49.2% 49.7%
EBOe & Subs. 529 527 44,975 43,926 -326 289 289 1.2% 1.2% 61.7% 54.6% 54.7%
Savings Banks 1,431 1,424 66,786 64,210 -961 707 705 2.1% 2.2% 67.5% 49.5% 49.5%
Other Austria 364 342 37,790 30,398 -256 147 147 1.0% 1.1% 74.7% 40.3% 42.8%
CEE 2,126 2,120 118,328 116,653 -1,945 740 737 1.8% 1.8% 91.7% 34.8% 34.8%
Czech Republic 556 555 59,924 59,562 -534
129 129 0.9% 0.9% 96.3% 23.2% 23.3%
Slovakia 473 473 19,859 19,780 -351 169 169 2.4% 2.4% 74.2% 35.8% 35.8%
Romania 441 440 16,356 16,052 -497 151 151 2.7% 2.7% 112.9% 34.2% 34.2%
Hungary 133 130 9,432 8,806 -123 78 78 1.4% 1.5% 94.6% 59.1% 59.6%
Croatia 501 501 10,551 10,493 -409 207 205 4.7% 4.8% 81.7% 41.3% 41.0%
Serbia 21 21 2,206 1,961 -30 5 5 1.0% 1.0% 148.5% 23.0% 23.0%
Other 13 11 5,899 5,811 -14 5 3 0.2% 0.2% 124.8% 39.8% 29.0%
Total 4,463 4,425 273,778 260,999 -3,502 1,888 1,881 1.6% 1.7% 79.1% 42.3% 42.5%
Expected credit loss measurement The general principles and standards for credit loss allowances are governed by internal policies in Erste Group. According to IFRS 9, credit loss allowances are calculated for all components of credit risk exposures which are measured at amortised cost (AC) or at fair value through other comprehensive income. They include debt securities, loans and advances, demand deposits on nostro accounts with commercial banks as well as finance lease and trade receivables. In addition, credit loss allowances are calculated for loan commitments and financial guaran-tees if they meet the applicable IFRS 9 definitions. Classification into stages and definition of credit-impaired financial instruments There are three main stages outlined for expected credit loss (ECL) determination. The stages approach applies to financial instruments within the scope of the impairment requirements of IFRS 9 and those that are not categorised as purchased or originated credit impaired financial assets (POCI), which form a category of their own. Depending on the impairment status and the assessment of the development of credit risk, these financial instruments are assigned to one of the three stages. Stage 1 includes not credit-impaired financial instruments at initial recognition and not credit-impaired financial instruments without a significant increase in credit risk (SICR) since initial recognition, irrespective of their credit quality, or subject to the ‘low risk exemption’ allowed by IFRS 9. Financial instruments in Stage 1 have their ECL measured at an amount equal to the portion of lifetime expected credit losses that result from default events possible within the next 12 months. Stage 2 includes not credit-impaired financial instruments with a significant increase in credit risk since initial recognition and not subject to the ‘low credit risk exemption’ allowed by IFRS 9, and not credit-impaired financial instruments if a PD curve valid at initial recognition was missing at the time of the implementation of IFRS 9 according to IFRS 9 7.2.20. Also, Stage 2 includes trade receivables without significant financing component to which the ‘simplified approach’ is applied mandatorily based on IFRS 9 requirements. In stage 2, the credit loss allowances are calculated as lifetime ECL. In the case of drawings by non-defaulted customers on previously committed credit lines, the whole exposure (on-balance and off-balance) is categorised as either Stage 1 or Stage 2, depending on the development of credit risk between the commitment date and the drawing date. Stage 3 includes financial instruments that are credit-impaired at the reporting date but were not credit-impaired at initial recognition. In prin-ciple, a financial instrument becomes credit-impaired when the customer defaults. The default definition applied in Erste Group has been de-veloped in accordance with EBA/GL/2016/07 ‘Guidelines on the application of the definition of default under Article 178 of Regulation (EU) No 575/2013’ and ‘Commission Delegated Regulation (EU) 2018/171 of 19 October 2017 on supplementing Regulation (EU) No 575/2013 of

213
the European Parliament and of the Council with regard to regulatory technical standards for the materiality threshold for credit obligations past due’. The definition specifies the rules for default contagion across groups of connected clients and clarifies the concept of technical default. Erste Group generally applies a customer view in applying the default definition, which leads to an impairment of all claims even if the customer defaults only on one of several transactions (‘pulling effect’). On the other hand, an upgrade to a non-defaulted rating grade implies that the total exposure ceases to be impaired. In stage 3, credit loss allowances are calculated as lifetime ECLs. POCI includes financial instruments that were credit-impaired at initial recognition, irrespective of whether they are still credit-impaired at the reporting date. Expected credit losses against POCI exposures are always calculated on a lifetime basis (cumulative changes in lifetime ECL since initial recognition) and are reflected in the credit-adjusted effective interest rate at initial recognition. As a result, no loss allow-ance is recognised at inception. Subsequently, only adverse changes in lifetime expected credit losses after the initial recognition are recog-nised as loss allowance, whilst favourable changes are recognised as impairment gains increasing the gross carrying amount of the POCI financial assets. Significant increase in credit risk determination Assessment of significant increase in credit risk (SICR) of financial instruments as at the reporting date since initial recognition is one of the key drivers affecting the amount of the ECL recognised based on IFRS 9 requirements. In this respect, across portfolios and product types, quantitative and qualitative indicators are defined for assessing SICR, including the indicator of 30 days-past-due (DPD). Quantitative criteria. Quantitative SICR indicators include adverse changes in annualised lifetime probability of default or in lifetime probability of default with significance being assessed by reference to a mix of relative and absolute change thresholds. The bank has established thresholds for significant increases in credit risk based on both a percentage (relative) and absolute change in PD compared to initial recognition. In order for the SICR to occur for a particular financial instrument, both the relative and absolute thresholds need to be breached. The relative measure is calculated as a ratio between current annualised PD and annualised PD value on initial recognition. The breach means that such ratio has reached or is higher than the established threshold. These relative thresholds for SICR assessment are established at PD segment level or client rating level for each consolidated entity, as necessary, and are subject to initial and on-going validation. Relative thresholds for SICR assessment by geographical segment
Threshold interval (x times)
Min Max
Dec 20
Austria 1.13 2.37
EBOe & Subs. 1.13 2.37
Savings Banks 1.13 2.37
Other Austria 1.13 2.37
CEE 1.03 4.08
Czech Republic 1.13 3.59
Slovakia 1.13 4.08
Romania 1.13 3.37
Hungary 1.13 3.21
Croatia 1.13 3.13
Serbia 1.03 3.47
Total 1.03 4.08
Dec 19
Austria 1.13 2.37
EBOe & Subs. 1.13 2.37
Savings Banks 1.13 2.37
Other Austria 1.13 2.37
CEE 1.03 4.41
Czech Republic 1.13 3.59
Slovakia 1.13 4.41
Romania 1.13 3.36
Hungary 1.13 3.21
Croatia 1.13 3.13
Serbia 1.03 3.47
Total 1.03 4.41
Thresholds might seem to show high dispersion, but they are driven mainly by regional and rating diversity. Regions with higher credit quality portfolios have lower thresholds than those with lower credit quality portfolios. The minimal threshold in almost all regions of 1.13 refers to sovereign rating classes that are centrally established. The average threshold of the Group is between 2 and 3. There are certain portfolios where SICR quantitative criteria are assessed based on the ratings rather than PDs. The main rule in those cases is that downgrading of the ratings would lead to a positive conclusion on SICR. These rules are applied primarily to leasing and factoring business receivables.

214
Erste Group has not significantly recalibrated relative thresholds since IFRS9 implementation. They are kept stable as one of the most significant estimate in ECL measurement, therefore can be changed as a result of validation or after significant change of PD models. There were re-estimations for individual entities and portfolios. For migration back to Stage 1 there are no additional cure periods established for quantitative criteria other than those already established in general credit risk practice (e.g. for rating improvement). The absolute threshold refers to difference of annualised or LT PD on initial recognition and current annualised or LT PD. It is set to a maximum of 50 bps and serves as a backstop for migrations between the best ratings. In such cases, relative thresholds may be breached, however overall LT PD is very low, and therefore SICR is not positively concluded. Qualitative criteria. Qualitative SICR indicators include forbearance-type flags (identification of regulatory forbearance), work-out trans-fer flags (when the account starts being monitored by the work-out department), information from the early-warning system (if it is not sufficiently considered in the rating) and fraud indicators. The assignment of some of the qualitative indicators inherently relies on experi-enced credit risk judgment being exercised adequately and in a timely manner. The related group-wide and entity-level credit risk controlling policies and procedures (adapted as necessary in the light of transition to IFRS 9) ensure the necessary governance framework. These indicators are used internally for identification of insolvency or increased probability that a borrower will enter bankruptcy and there is increased risk of default in the foreseeable future. Besides the qualitative indicators defined on a client level, the assessment of a significant increase in credit risk is performed on a portfolio level if the increase in credit risk on individual instruments or at a client level is available only with a certain time lag or is observable exclusively on a portfolio level. We have introduced additional portfolio level SICR assessment criteria due to Covid-19 pandemic and related economic impacts. Please see Covid-19 disclosures in the next chapter. Additional examples are stage 2 overrides for parts of Swiss franc retail portfolio or in case of high LTV loans resulting from a specific law in Romania (clients are allowed to give up on real estate collateral against waiver of principal). For migration back to Stage 1 there are no additional cure periods established for qualitative criteria other than those already established in general credit risk practice for the above-mentioned flags (forbearance, watch lists). Backstop. A backstop is applied and the financial instruments are considered to have experienced a SICR if the borrower is more than 30 days past due on contractual payments. As observed during validation, this does not represent a major trigger for Stage 2 classification. Low credit risk exemption. The ‘low credit risk exemption’ allowed by IFRS 9 for ‘investment grade’ assets or other assets deemed ‘low risk’ (and resulting in 12 months expected credit losses being calculated irrespective of SICR quantitative measures) has been implemented with limitations in Erste Group. Thus, the potential activation of this exemption is limited to particular types of debt instruments and coun-terparty categories, and only if supported by sufficient ‘low risk’ evidence. On this basis, the ‘low risk exemption’ is expected to occasionally apply to some debt security exposures and only exceptionally to loans. As of 31 December 2020, low credit risk exemption is applied only to debt securities in the Czech subsidiary (Česká spořitelna) and sover-eign exposures in the Romanian subsidiary (Banca Comercială Română). In Česká spořitelna, the corresponding exposure amounted to EUR 10.5 billion (2019: EUR 10.2 billion) with PDs interval of 0.01%-0.5%. In Banca Comercială Română, the respective exposure amounted to EUR 4.5 billion (2019: 4.3 billion) with PD interval of 0.01%-0.5%. Measuring ECL – explanation of inputs and measurement Credit loss allowances are calculated individually or collectively. The individual calculation approach is applied in case of exposures to significant defaulted customers in Stage 3 or POCI. It consists in the individual assessment of the difference between the gross carrying amount and the present value of the expected cash flows, which are estimated by workout or risk managers. The discounting of the cash flows is based on the effective interest rate (POCI: credit-adjusted effective interest rate). However, the discount rate for financial guarantees shall reflect the current market assessment of the time value of money and the risks that are specific to the cash flows which in Erste Group’s implementation means using a risk-free rate as a proxy. A defaulted customer is classified as individually significant if the total on- and off-balance exposure exceeds a predefined materiality limit. Otherwise, the customer is considered insignificant and a rule-based (collective) approach is used for the calculation of the related credit loss allowance as the product of gross carrying amount and LGD, where the LGD depends on characteristics such as time in default or the stage of the workout process. For exposures to non-defaulted customers (i.e. in Stage 1 and Stage 2), collective allowances are calculated according to a rule-based approach irrespective of the significance of the customer. The calculation of collective allowances requires grouping the related exposures

215
into homogenous clusters based on shared risk characteristics. The grouping criteria may differ based on the customer segment (retail, corporate) and include product type, collateral type, repayment type, loan to value band, and credit rating band. The calculation of credit loss allowances is done on a monthly basis on a single exposure level and in the contractual currency of the exposure. To compute the collective credit loss allowance, Erste Group applies an expected credit loss (ECL) model based on a three-stage approach that leads to either a 12-month ECL or to a lifetime ECL. ECL is the discounted product of exposure at default (EAD) that also includes a credit conversion factor in the case of off-balance sheet exposures, probability of default (PD) and loss given default (LGD), defined as follows:
_ PD represents the likelihood of a borrower defaulting on its financial obligation (per definition of default below), either over next 12 months (1Y PD) for Stage 1 exposures or over the remaining lifetime (LT PD) for Stage 2 and 3 and POCI exposures.
_ EAD is based on the amounts Erste Group expects to be owed at the time of default, over next 12 months (1Y EAD) for Stage 1 exposures, or over the remaining lifetime (LT EAD) for Stage 2 and 3 and POCI exposures. The estimation includes current balance, expected repayments and expected drawings up to the current contractual limit by the time of default.
_ LGD represents the Erste Group’s expectation of the extent of loss on a defaulted exposure. LGD varies by type of counterparty, type and seniority of claim and availability of collateral or other credit support. LGD is expressed as a percentage loss per unit exposure at the time of default (EAD).
Life-time parameters
The LT PD is developed through observation of historical defaults from initial recognition through the lifetime of the loans. It is assumed to be the same across all assets in the same portfolio and rating band. The 1Y and LT EADs are determined based on the expected payment profiles, which vary by product type. The LT EAD calculation utilises repayment schedule or repayment type (annuity, linear, bullet). In the case of undrawn commitments, credit conversion factor is estimated for reflecting the expected credit exposure in the EAD. The LGD is estimated as a lifetime curve for any point in time, based on historical loss observations. The risk parameters used in the ECL calculation take into account available information at the reporting date about past events, current conditions and forecasts on future economic trends. Generally, the risk parameters applied in the calculation of collective allowances differ from the risk parameters compliant with capital requirement regulations, calculated on a through-the-cycle basis, if the characteristics of the respective portfolio in combination with IFRS standards necessitate this. Incorporation of forward-looking information Parameters are determined to reflect the risk as a ‘point-in-time’ measure and with consideration of forward-looking information (FLI). This results in using a baseline forecast and several alternative scenarios for selected macroeconomic variables. The alternative scenarios are derived, together with their probabilities of occurrence, as a deviation from baseline forecasts, where the baseline forecasts are, with a few exceptions, internally determined by Erste Group’s research department. Given multiple scenarios, the ‘neutral’ PDs (and, with a few ex-ceptions, also LGDs) are adjusted using macro models that link relevant macroeconomic variables with risk drivers. The same macro-shift models as for external and internal stress test are used. Forward-looking information is incorporated for first three years of ECL measurement. Measurement of the parameters for the remaining lifetime returns to through-the-cycle observations immediately in year four. Specific situation of the Covid-19 pandemic and extensive supporting measures, mainly moratoria, lead to the lagging of the macroeconomic reflection in credit risk parameters. Therefore, macroeconomic variables of 2020 were included as additional predictors for future values of credit risk parameters. Variables in year 2020 have same values across all three scenarios. Thus, the unbiased probability weighted ECL considering FLI is derived using the weights representing the probability of occurrence of each macroeconomic scenario. Typical macroeconomic variables may include real gross domestic product, unemployment rate, inflation rate, production index as well as market interest rates. The selection of variables also depends on the availability of reliable forecasts for the given local market. Nevertheless, the main indication of estimated economic development is the GDP development. We are disclosing sensitivity of the staging and ECL on macro scenarios in the Covid-19 section below.

216
Baseline, upside and downside scenarios of GDP growth by geographical segment
Probability weights GDP growth in %
Scenario 2021-2023 2020 2021 2022 2023
Dec 20
Austria
Upside 1% -7.6 5.0 3.9 3.3
Baseline 40% -7.6 3.4 2.3 1.7
Downside 59% -7.6 -2.1 1.0 -0.1
Czech Republic
Upside 4% -7.7 5.5 7.3 6.4
Baseline 40% -7.7 3.9 5.7 4.8
Downside 56% -7.7 -1.7 1.2 1.7
Slovakia
Upside 25% -7.1 8.2 6.7 6.4
Baseline 35% -7.1 6.0 4.5 4.2
Downside 40% -7.1 -1.2 -0.0 0.9
Romania
Upside 18% -5.9 5.3 7.1 7.3
Baseline 40% -5.9 2.7 4.5 4.7
Downside 42% -5.9 -3.6 -0.2 1.9
Hungary
Upside 6% -6.4 5.1 6.6 5.2
Baseline 40% -6.4 3.9 5.4 4.0
Downside 54% -6.4 -1.3 1.6 2.0
Croatia
Upside 8% -9.9 8.2 9.0 9.1
Baseline 40% -9.9 5.2 3.6 4.0
Downside 52% -9.9 -2.5 -1.4 0.9
Serbia
Upside 15% -1.3 6.3 5.3 5.8
Baseline 40% -1.3 5.0 4.0 4.5
Downside 45% -1.3 -0.5 0.9 2.6
Dec 19 2020-2022 2019 2020 2021 2022
Austria
Upside 11% 1.7 3.1 3.2 3.1
Baseline 50% 1.7 1.6 1.7 1.6
Downside 39% 1.7 -0.2 -0.1 -0.2
Czech Republic
Upside 13% 2.6 4.6 4.7 4.8
Baseline 50% 2.6 2.6 2.7 2.8
Downside 37% 2.6 0.1 0.2 0.3
Slovakia
Upside 12% 3.4 5.7 5.3 5.2
Baseline 50% 3.4 3.3 2.9 2.8
Downside 38% 3.4 0.1 -0.3 -0.4
Romania
Upside 10% 4.5 6.9 6.5 5.0
Baseline 50% 4.5 3.8 3.4 1.9
Downside 40% 4.5 0.3 -0.1 -1.6
Hungary
Upside 7% 4.1 5.0 4.4 4.3
Baseline 50% 4.1 3.2 2.6 2.5
Downside 43% 4.1 0.6 0.0 -0.1
Croatia
Upside 10% 3.2 4.1 5.3 6.3
Baseline 50% 3.2 2.5 2.4 2.4
Downside 40% 3.2 0.9 -0.5 -1.5
Serbia
Upside 10% 3.3 5.7 6.2 n/a
Baseline 50% 3.3 3.5 4.0 n/a
Downside 40% 3.3 1.1 1.6 n/a
As of 31 December 2019, the growth rates for the year 2020 correspond to estimated values. As of 31 December 2020, they represent real observed values. In order to reflect on the higher volatility of macro-economic variables estimates and significantly higher downward risk of macro-economic recovery due to current developments of the Covid-19 pandemics we have introduced a conservative downside scenario with relatively high probability of occurrence as shown in the GDP overview table above. Covid-19 The Covid-19 pandemic has been causing high uncertainty in the global economy and on the global markets. Social distancing rules and lockdown restrictions imposed by governments led to economic slow-down and a significant drop of revenues across industries. Unprece-dented state aid packages (e.g. state guarantees, bridge financing, the state temporarily paying workers’ salaries to avoid redundancies, hardship funds for one-person and micro businesses) and moratoria programs were introduced in all Erste Group’s core markets to support private individuals and companies. While such measures mitigate the negative economic effects, they complicate a timely reflection of a potential deterioration of the loan portfolios. Effect on customers Immediately upon the crisis showing severe economic impacts in our region (governmental decisions on lockdowns in countries of Erste Group perimeter), initiatives were started aiming to, on the one hand support Erste Group´s clients to the utmost extent, and on the other hand, manage the respective risks and bearing the responsibility of Erste Group towards all stakeholders in mind.

217
The measures differed from country to country as they had to be based on the legislative steps taken by the respective governments. Never-theless, Erste Group gave a guidance to the entities in respect of underwriting, reporting and classification processes. Apart from overall valid state-moratoria as e.g. in Hungary and Serbia, some measures like short-term deferrals were applied in all countries, whereas financial support schemes with public or state guarantees were offered only in some countries or to some client-segments. In addition to programmes with standard parameters that were defined at a very early stage of the crisis and should support an efficient processing, also individual solutions were agreed with clients that did not meet all predefined requirements. Credit risk exposure of non-financial corporations by industry – measures applied in response to the Covid-19 crisis
in EUR million
Loans and advances subject to
EBA-compliant moratoria
Other loans and advances subject to
COVID-19-related forbearance measures
Newly originated loans and advances
subject to public guarantee schemes in the context of
the COVID-19 crisis
Dec 20
Agriculture and forestry 54 1 31
Mining 0 - 5
Manufacturing 274 15 514
Energy and water supply 9 - 19
Construction 45 12 125
Trade 116 22 416
Transport and communication 96 4 235
Hotels and restaurants 497 17 164
Financial and insurance services 17 - 0
Real estate and housing 369 63 14
Services 90 1 181
Public administration 0 - -
Education, health and art 17 18 35
Total 1,583 155 1,739
Loans and advances of non-financial corporations to which the measures applied in the response to Covid-19 were granted and are currently valid (have not been expired), amounted to EUR 3.5 billion as of 31 December 2020. Measures mostly refer to EBA-compliant moratoria. The highest amount of granted moratoria measures in non-financial corporations refers to real estate and housing and manufacturing, follo-wed by hotels and restaurants and trade. Loans and advances of households to which the measures applied in the response to Covid-19 were granted and are currently valid (have not been expired), amounted to EUR 3.3 billion as of 31 December 2020 Besides measures disclosed in the table above, as a direct response to Covid-19 crisis additional measures that do not meet the forbearance criteria were approved amounting to EUR 3.6 billion as of 31 December 2020. Effect on business In March 2020, risk management and business divisions started a joint initiative aiming to quickly provide a harmonised guidance for a focused industry approach within Erste Group, reflecting the changed economic environment. Industries and sub-industries were categorised into critical, high, medium or low risk according to the expected impacts from Covid-19 based on a combination of research material, feedback collected from client meetings and single name analyses, both centrally as well as in the entities. Main driver for assigning an industry classification was the assessment of impacts of the crisis on the specific (sub)industry. The classifica-tions are regularly reviewed on a 12-month rolling forecast basis to take current developments into account. A respective business and risk strategy for the (sub)industries was formulated based on the assessment. The assessed risk for the specific (sub)industry can lead to strategic recommendations (e.g. to temporarily limit financing for specific categories to existing clients only) and/or the revision of underwriting standards. This approach was aligned with all affected entities and business lines and approved by the respective governance bodies of Erste Group. Exposures in particular industries that belong to critical or high risk sub-industries are referred to as significant risk in the following tables.

218
Credit risk exposure and credit loss allowances by industry and IFRS9 treatment – industry heatmap
in EUR million Stage 1 Stage 2 Stage 3 POCI
Credit risk exposure
(AC and FVOCI)
Not subject to IFRS 9
impairment Total Credit loss allowances
Dec 20
Agriculture and forestry 2,550 593 122 5 3,270 19 3,289 - 101
of which significant risk 6 8 0 - 14 0 14 -0
Mining 544 64 16 2 626 207 832 -20
of which significant risk 382 10 8 2 401 199 601 -13
Manufacturing 13,658 4,914 585 46 19,202 1,023 20,226 - 587
of which significant risk 3,838 3,264 268 22 7,392 434 7,826 - 278
Energy and water supply 4,054 577 56 8 4,695 198 4,893 -97
of which significant risk 0 3 - - 3 0 3 -0
Construction 9,330 1,789 279 16 11,414 1,231 12,645 - 320
of which significant risk 23 13 4 0 40 2 43 -3
Trade 9,251 3,758 472 44 13,525 1,019 14,544 - 441
of which significant risk 2,169 2,244 193 10 4,617 213 4,830 - 172
Transport and communication 5,759 1,993 196 4 7,952 361 8,313 - 182
of which significant risk 977 1,192 29 1 2,199 60 2,259 -48
Hotels and restaurants 1,281 3,977 331 29 5,618 79 5,697 - 271
of which significant risk 1,225 3,933 312 29 5,500 73 5,573 - 255
Financial and insurance services 32,797 1,714 30 12 34,551 5,060 39,611 - 110
Real estate and housing 25,893 5,824 262 129 32,108 857 32,965 - 390
of which significant risk 242 340 17 0 599 4 603 -21
Services 9,461 3,976 488 5 13,930 745 14,675 - 426
of which significant risk 2,395 2,688 341 5 5,430 173 5,603 - 263
Public administration 38,571 560 1 3 39,135 3,235 42,370 -25
Education, health and art 2,604 932 102 1 3,638 38 3,677 -99
of which significant risk 280 465 60 0 806 8 814 -58
Private households 71,994 7,967 1,541 116 81,619 784 82,403 -1,452
Other 452 19 0 0 471 88 558 -1
Total 228,200 38,655 4,480 419 271,754 14,945 286,699 -4,522
Dec 19
Agriculture and forestry 2,849 265 111 11 3,236 14 3,250 -83
Mining 680 52 27 23 781 26 807 -27
Manufacturing 16,043 1,805 431 46 18,324 951 19,274 -406
Energy and water supply 3,657 558 75 4 4,294 124 4,418 -89
Construction 10,160 862 389 31 11,441 890 12,332 -348
Trade 11,290 1,363 396 41 13,091 666 13,757 -346
Transport and communication 6,934 462 104 5 7,506 292 7,798 -97
Hotels and restaurants 4,314 503 243 26 5,086 41 5,126 -148
Financial and insurance services 34,931 515 27 13 35,486 5,362 40,848 -56
Real estate and housing 27,130 2,031 316 134 29,611 592 30,203 - 291
Services 11,709 1,322 243 6 13,279 759 14,038 -222
Public administration 35,748 385 1 3 36,137 2,459 38,595 - 13
Education, health and art 3,097 417 216 0 3,730 37 3,767 - 136
Private households 71,273 5,715 1,511 136 78,636 562 79,198 -1,256
Other 361 0 0 0 361 7 368 - 1
Total 240,176 16,256 4,087 480 260,999 12,779 273,778 -3,518
Effect on Expected Credit Loss As described above, an increase of the ECL might result from a re-assessment of the credit risk parameters and a migration to worse stages either via significant increase in credit risk (SICR) or a default. We have concluded so far that majority of moratoria introduced in our core markets until 31 December 2020 fulfil the conditions as defined in the EBA guidelines published during the year 2020. Relief offered to credit owners thus did not result in an automatic transfer from Stage 1 to Stage 2. However, Erste Group continues to perform individual assessments whether there are other circumstances that would lead to forbearance or default classification. We have re-assessed credit risk parameters based on the new macro-scenarios FLI overlay. Reference is also made to the explanations in the sub-chapter ‘incorporation of forward-looking information’ above. We will continue monitoring of the macro and macro-prediction development in order to reflect up-to-date information in our credit risk parameters. GDP scenarios and weights are shown in the table displayed within Incorporation of forward looking information section above. The effect of the FLI in the ECL calculation as of 31 Decem-ber 2020 amounted to EUR 527 million. The increase of EUR 410 million in comparison with EUR 117 million as of 31 December 2019 can be directly attributed to the Covid-19 situation. Erste Group has addressed expected SICR by introducing Covid-19 portfolio overlays. We divided the portfolio in private individuals (PIs) and non-private individuals (non-PIs) and assessed the customers by taking into account any Covid-19 related relief measure granted as

219
well as the internal industry heat-map and corresponding customer-specific one-year IFRS PD levels. Based on this assessment and indivi-dual reviews, customers were migrated to stage 2, i.e. lifetime ECL measure. The industry heat map and the portfolio overlays are subject to regular reviews. The effect of Covid-19 portfolio overlays in the ECL calculation as of 31 December 2020 amounted to EUR 245 million. In the Q4-2020 Erste Group performed additional portfolio review in order to assess migrations to Stage 3 due to unlikeliness-to-pay default designation. This was done in order to properly and timely identify Stage 3 exposure. We have migrated additional EUR 518 million credit risk exposure resulting in allocation of the EUR 168 million credit loss allowances. Erste Group will assess releases of Covid-19 portfolio overlays for PI portfolios once the moratoria are lifted. When moratoria do no longer distort DPD information, behavioural scoring will allow an unbiased SICR assessment. In case of non-PI portfolios, release of the overlays will be assessed after expiration of the measures enables a proper re-rating. Release will follow in combination with a consistent improve-ment of the macro indicators. Erste Group expects an increase in defaults especially after state aid measures, in particular moratoria, are lifted. The analysis tables below present staging splits of the current performing exposure and ECL. Movements of exposures between performing stages and resulting changes in ECL triggered by effect of Covid-19 SICR overlays and FLI macro overlays is shown. Effects on industry segments, high risk industry subsegments and geographical segment are disclosed. Analysis shows that out of EUR 38,665 million exposure in Stage 2 EUR 14,420 million were migrated due to Covid-19 overlays, resulting in increase of ECL of 245 million. Additional EUR 5,884 million were migrated to Stage 2 due to FLI overlay, resulting in ECL increase of EUR 410 million (difference between FLI effect as of 31.12.2020 of EUR 527 million and as of 31.12.2019 of EUR 117 million). For the ECL change a positive sign (+) equals a release while a negative sign (-) equals an allocation. The presented values are results of internal simulations.

220
Forward looking information (FLI) and stage overlays due to the Covid-19 pandemic Impact on credit risk exposure by geographical segment
Current status - parameters (FLI shifted)
Effect of stage overlays due to Covid-19 Effect of FLI shifts
in EUR million Stage 1 Stage 2 Stage 1 Stage 2 Stage 1 Stage 2
Dec 20
Austria 114,235 26,033 +9,496.9 -9,496.9 +4,519.9 -4,519.9
EBOe & Subs. 37,174 7,633 +2,635.1 -2,635.1 +1,305.2 -1,305.2
Savings Banks 53,972 12,669 +5,007.5 -5,007.5 +2,042.6 -2,042.6
Other Austria 23,089 5,731 +1,854.4 -1,854.4 +1,172.1 -1,172.1
CEE 107,204 12,351 +4,922.6 -4,922.6 +1,363.7 -1,363.7
Czech Republic 56,144 4,793 +1,576.0 -1,576.0 +534.2 -534.2
Slovakia 17,413 2,709 +1,535.5 -1,535.5 +103.1 -103.1
Romania 13,775 2,430 +793.4 -793.4 +480.2 -480.2
Hungary 8,307 919 +468.0 -468.0 +162.2 -162.2
Croatia 9,468 1,317 +455.8 -455.8 +66.7 -66.7
Serbia 2,098 183 +93.9 -93.9 +17.3 -17.3
Other 6,760 271 +0.0 +0.0 +0.0 +0.0
Total 228,200 38,655 +14,419.5 -14,419.5 +5,883.6 -5,883.6
Dec 19
Austria 124,594 11,625 +0.0 +0.0 +1,159.5 -1,159.5
EBOe & Subs. 39,844 3,553 0 0 +264.8 -264.8
Savings Banks 56,822 5,945 0 0 +632.7 -632.7
Other Austria 27,928 2,127 0 0 +261.9 -261.9
CEE 109,787 4,627 +0.0 +0.0 +444.3 -444.3
Czech Republic 57,259 1,746 0 0 +82.3 -82.3
Slovakia 18,774 511 0 0 +21.8 -21.8
Romania 14,020 1,551 0 0 +251.1 -251.1
Hungary 8,360 264 0 0 +58.2 -58.2
Croatia 9,499 488 0 0 +23.1 -23.1
Serbia 1,875 66 0 0 +7.7 -7.7
Other 5,795 3 +0.0 +0.0 +0.0 +0.0
Total 240,176 16,256 +0.0 +0.0 +1,603.8 -1,603.8
Impact on credit loss allowances by geographical segment
Current status - parameters (FLI shifted)
Effect of stage overlays due to Covid-19 Effect of FLI shifts
in EUR million Stage 1 Stage 2 Stage 1 Stage 2 Stage 1 Stage 2
Dec 20
Austria -183 -685 -43.6 +158.4 +68.6 +202.3
EBOe & Subs. -41 -152 -10.2 +39.8 +17.8 +39.1
Savings Banks -119 -371 -28.6 +95.2 +42.9 +94.2
Other Austria -23 -162 -4.8 +23.4 +7.8 +69.0
CEE -280 -737 -66.0 +196.2 +97.6 +159.1
Czech Republic -100 -252 -20.6 +50.4 +40.9 +56.3
Slovakia -35 -140 -13.7 +51.4 +12.7 +3.1
Romania -53 -183 -12.9 +39.7 +6.2 +62.1
Hungary -22 -64 -6.5 +19.1 +14.3 +25.6
Croatia -57 -86 -10.2 +30.5 +20.2 +9.6
Serbia -12 -13 -2.1 +5.2 +3.3 +2.5
Other -1 -1 +0.0 +0.0 +0.0 +0.0
Total -464 -1,424 -109.5 +354.6 +166.2 +361.4
Dec 19
Austria -173 -290 +0.0 +0.0 +2.2 +42.2
EBOe & Subs. -37 -69 0 0 +1.0 +8.0
Savings Banks -108 -179 0 0 +1.5 +22.8
Other Austria -28 -42 0 0 -0.3 +11.3
CEE -252 -317 +0.0 +0.0 +24.3 +48.5
Czech Republic -78 -84 0 0 +1.1 +4.7
Slovakia -39 -38 0 0 -0.3 +2.4
Romania -47 -135 0 0 +4.5 +32.1
Hungary -16 -27 0 0 +5.1 +7.8
Croatia -61 -27 0 0 +11.7 +1.0
Serbia -10 -6 0 0 +2.2 +0.6
Other 0 0 +0.0 +0.0 +0.0 +0.0
Total -425 -607 +0.0 +0.0 +26.4 +90.7

221
Impact on credit risk exposure by industry
Current status - parameters (FLI shifted)
Effect of stage overlays due to Covid-19 Effect of FLI shifts
in EUR million Stage 1 Stage 2 Stage 1 Stage 2 Stage 1 Stage 2
Dec 20
Agriculture and forestry 2,550 593 +145.9 -145.9 +88.3 -88.3
of which significant risk 6 8 +0.4 -0.4 +0.0 -0.0
Mining 544 64 +16.4 -16.4 +8.7 -8.7
of which significant risk 382 10 +5.9 -5.9 +0.1 -0.1
Manufacturing 13,658 4,914 +3,199.3 -3,199.3 +1,020.0 -1,020.0
of which significant risk 3,838 3,264 +2,737.2 -2,737.2 +236.2 -236.2
Energy and water supply 4,054 577 +6.5 -6.5 +84.7 -84.7
of which significant risk 0 3 +0.0 +0.0 +0.0 +0.0
Construction 9,330 1,789 +186.3 -186.3 +848.6 -848.6
of which significant risk 23 13 +103.6 -103.6 +0.0 +0.0
Trade 9,251 3,758 +1,861.1 -1,861.1 +386.5 -386.5
of which significant risk 2,169 2,244 +1,600.7 -1,600.7 +72.0 -72.0
Transport and communication 5,759 1,993 +1,178.8 -1,178.8 +201.2 -201.2
of which significant risk 977 1,192 +989.0 -989.0 +10.8 -10.8
Hotels and restaurants 1,281 3,977 +2,935.3 -2,935.3 +100.9 -100.9
of which significant risk 1,225 3,933 +2,898.5 -2,898.5 +100.9 -100.9
Financial and insurance services 32,797 1,714 +13.0 -13.0 +137.3 -137.3
Real estate and housing 25,893 5,824 +1,415.7 -1,415.7 +1,715.3 -1,715.3
of which significant risk 242 340 +240.3 -240.3 +6.1 -6.1
Services 9,461 3,976 +1,916.4 -1,916.4 +173.4 -173.4
of which significant risk 2,395 2,688 +1,891.4 -1,891.4 +92.6 -92.6
Public administration 38,571 560 +1.3 -1.3 +253.8 -253.8
Education, health and art 2,604 932 +572.5 -572.5 +117.7 -117.7
of which significant risk 280 465 +336.0 -336.0 +7.6 -7.6
Households 71,994 7,967 +971.0 -971.0 +745.7 -745.7
Other 452 19 +0.0 -0.0 +1.4 -1.4
Total 228,200 38,655 +14,419.5 -14,419.5 +5,883.6 -5,883.6
Dec 19
Agriculture and forestry 2,849 265 +0.0 +0.0 +15.5 -15.5
Mining 680 52 +0.0 +0.0 +0.3 -0.3
Manufacturing 16,043 1,805 +0.0 +0.0 +193.7 -193.7
Energy and water supply 3,657 558 +0.0 +0.0 +8.9 -8.9
Construction 10,160 862 +0.0 +0.0 +122.7 -122.7
Trade 11,290 1,363 +0.0 +0.0 +167.5 -167.5
Transport and communication 6,934 462 +0.0 +0.0 +36.4 -36.4
Hotels and restaurants 4,314 503 +0.0 +0.0 +29.9 -29.9
Financial and insurance services 34,931 515 +0.0 +0.0 +30.9 -30.9
Real estate and housing 27,130 2,031 +0.0 +0.0 +276.8 -276.8
Services 11,709 1,322 +0.0 +0.0 +219.1 -219.1
Public administration 35,748 385 +0.0 +0.0 +0.0 -0.0
Education, health and art 3,097 417 +0.0 +0.0 +26.5 -26.5
Households 71,273 5,715 +0.0 +0.0 +474.6 -474.6
Other 361 0 +0.0 +0.0 +1.0 -1.0
Total 240,176 16,256 +0.0 +0.0 +1,603.8 -1,603.8

222
Impact on credit loss allowances by industry
Current status - parameters (FLI shifted)
Effect of stage overlays due to Covid-19 Effect of FLI shifts
in EUR million All stages Stage 1 Stage 2 Stage 1 Stage 2
Dec 20
Agriculture and forestry -101 -2.4 +5.3 +4.4 +15.9
of which significant risk 0 -0.0 +0.0 +0.1 +0.0
Mining -20 -0.1 +0.3 +0.3 +0.4
of which significant risk -13 -0.0 +0.1 +0.2 +0.1
Manufacturing -587 -26.2 +64.8 +20.9 +65.2
of which significant risk -278 -20.6 +51.4 +11.7 +22.4
Energy and water supply -97 -0.1 +0.2 +5.4 +8.2
of which significant risk 0 +0.0 +0.0 +0.0 +0.0
Construction -320 -1.7 +4.5 +12.6 +29.4
of which significant risk -3 -0.7 +1.1 +0.4 +0.2
Trade -441 -14.0 +35.1 +16.3 +29.7
of which significant risk -172 -9.6 +25.3 +6.2 +10.3
Transport and communication -182 -6.9 +26.9 +8.3 +15.8
of which significant risk -48 -4.5 +20.0 +2.8 +3.4
Hotels and restaurants -271 -19.1 +72.5 +9.7 +15.7
of which significant risk -255 -18.9 +71.7 +9.6 +15.7
Financial and insurance services -110 -0.1 +0.4 +5.8 +8.5
Real estate and housing -390 -10.8 +44.5 +24.1 +46.0
of which significant risk -21 -1.8 +7.6 +0.1 +0.2
Services -426 -8.7 +32.0 +7.2 +15.0
of which significant risk -263 -8.5 +31.4 +4.1 +8.2
Public administration -25 -0.0 +0.0 +2.7 +0.3
Education, health and art -99 -7.5 +18.8 +18.8 +22.2
of which significant risk -58 -1.9 +6.1 +2.2 +2.4
Households -1,452 -11.9 +49.2 +29.5 +88.1
Other -1 -0.0 +0.0 +0.2 +0.9
Total -4,522 -109.5 +354.6 +166.2 +361.4
Dec 19
Agriculture and forestry -83 +0.0 +0.0 +0.9 +1.1
Mining -27 +0.0 +0.0 +0.1 +0.1
Manufacturing -406 +0.0 +0.0 +1.8 +8.6
Energy and water supply -89 +0.0 +0.0 +1.1 +0.7
Construction -348 +0.0 +0.0 +5.3 +3.4
Trade -346 +0.0 +0.0 +1.2 +7.1
Transport and communication -97 +0.0 +0.0 +1.0 +2.0
Hotels and restaurants -148 +0.0 +0.0 +1.1 +2.3
Financial and insurance services -56 +0.0 +0.0 +0.9 +1.2
Real estate and housing -291 +0.0 +0.0 +1.8 +8.9
Services -222 +0.0 +0.0 +0.3 +5.5
Public administration -13 +0.0 +0.0 +0.0 +0.0
Education, health and art -136 +0.0 +0.0 +0.9 +1.5
Private households -1,256 +0.0 +0.0 +10.0 +48.3
Other -1 +0.0 +0.0 -0.0 +0.0
Total -3,518 +0.0 +0.0 +26.4 +90.7
The following tables present analyses taking into consideration only changes due to the different values of PDs according to the baseline, upside and downside FLI scenarios. Covid-19 SICR overlays are ignored. Values of these particular scenarios are calculated in comparison to current probability-weighted FLI scenarios shifted - PDs (weights and scenarios are disclosed in the ‘Incorporation of forward-looking information’ section above). The staging and ECL results if each baseline, upside or downside scenario were of 100% weight are shown in industry and geographical segmentation. The point in time PD effect as of 31 December 2019 is displayed as comparative information only. The analyses confirm that the FLI macro shift due to the Covid-19 induced macro situation is significantly higher in both exposure and ECL as of 31 December 2020 in comparison to 31 December 2019. Credit risk exposure in an amount of EUR 5,884 million is in stage 2 due to FLI shift as of 31 December 2020 compared to EUR 1,604 million as of 31 December 2019. This increase of stage 2 credit risk exposure led to an ECL increase of EUR 410 million (difference between EUR 527 million as of 31 December 2020 and EUR 117 million as of 31 December 2019). Our conservative probability weighted scenario results in higher Stage 2 migrations than pure baseline scenario. That would lead to release of EUR 1,867 million from Stage 2 resulting in decrease of ECL by EUR 97 million (EUR 103 million release from stage 2 and EUR 6 million net allocation in Stage 1). Fully employed downside scenario would lead to additional EUR 1,590 million of exposure migration to Stage 2, resulting in ECL increase of EUR 100 million. Differences between scenarios are rather mild. Biggest effect is caused by incorporation of 2020 macro variables to the scenarios as these represent Covid-19 induced crisis. These variables are however included in each scenario with the same value. Differences among scenarios are therefore caused by differences in the recovery estimation of years 2021-2023.

223
Scenario analysis – Different probabilities of default (PD) Impact of different scenarios on credit risk exposure by geographical segment
Point in time (effect of FLI shifts) Upside scenario Baseline scenario Downside scenario
in EUR million Stage 1 Stage 2 Stage 1 Stage 2 Stage 1 Stage 2 Stage 1 Stage 2
Dec 20
Austria +4,519.9 -4,519.9 +2,187.5 -2,187.5 +1,537.0 -1,537.0 -1,131.9 +1,131.9
EBOe & Subs. +1,305.2 -1,305.2 +730.6 -730.6 +569.4 -569.4 -269.3 +269.3
Savings Banks +2,042.6 -2,042.6 +911.6 -911.6 +597.5 -597.5 -509.4 +509.4
Other Austria +1,172.1 -1,172.1 +545.4 -545.4 +370.1 -370.1 -353.2 +353.2
CEE +1,363.7 -1,363.7 +688.1 -688.1 +330.0 -330.0 -458.1 +458.1
Czech Republic +534.2 -534.2 +305.0 -305.0 +164.1 -164.1 -164.1 +164.1
Slovakia +103.1 -103.1 +8.5 -8.5 +4.8 -4.8 -5.3 +5.3
Romania +480.2 -480.2 +315.0 -315.0 +129.2 -129.2 -247.6 +247.6
Hungary +162.2 -162.2 +20.6 -20.6 +9.2 -9.2 -8.0 +8.0
Croatia +66.7 -66.7 +30.5 -30.5 +15.9 -15.9 -15.0 +15.0
Serbia +17.3 -17.3 +8.5 -8.5 +6.8 -6.8 -18.1 +18.1
Other +0.0 +0.0 +0.0 +0.0 +0.0 +0.0 +0.0 +0.0
Total +5,883.6 -5,883.6 +2,875.7 -2,875.7 +1,867.1 -1,867.1 -1,590.0 +1,590.0
Dec 19
Austria +1,159.5 -1,159.5 n/a n/a n/a n/a n/a n/a
EBOe & Subs. +264.8 -264.8 n/a n/a n/a n/a n/a n/a
Savings Banks +632.7 -632.7 n/a n/a n/a n/a n/a n/a
Other Austria +261.9 -261.9 n/a n/a n/a n/a n/a n/a
CEE +444.3 -444.3 n/a n/a n/a n/a n/a n/a
Czech Republic +82.3 -82.3 n/a n/a n/a n/a n/a n/a
Slovakia +21.8 -21.8 n/a n/a n/a n/a n/a n/a
Romania +251.1 -251.1 n/a n/a n/a n/a n/a n/a
Hungary +58.2 -58.2 n/a n/a n/a n/a n/a n/a
Croatia +23.1 -23.1 n/a n/a n/a n/a n/a n/a
Serbia +7.7 -7.7 n/a n/a n/a n/a n/a n/a
Other +0.0 +0.0 n/a n/a n/a n/a n/a n/a
Total +1,603.8 -1,603.8 n/a n/a n/a n/a n/a n/a
Impact of different scenarios on credit loss allowances by geographical segment
Point in time (effect of FLI shifts) Upside scenario Baseline scenario Downside scenario
in EUR million Stage 1 Stage 2 Stage 1 Stage 2 Stage 1 Stage 2 Stage 1 Stage 2
Dec 20
Austria +68.6 +202.3 -11.8 +100.8 -7.5 +66.2 +6.2 -52.6
EBOe & Subs. +17.8 +39.1 -2.8 +20.6 -2.0 +14.2 +1.7 -10.1
Savings Banks +42.9 +94.2 -6.2 +43.6 -3.4 +26.7 +3.4 -24.5
Other Austria +7.8 +69.0 -2.9 +36.7 -2.1 +25.3 +1.1 -18.1
CEE +97.6 +159.1 +2.4 +64.8 +1.9 +36.3 -2.6 -51.3
Czech Republic +40.9 +56.3 +1.5 +25.4 +1.0 +17.4 -0.2 -16.3
Slovakia +12.7 +3.1 +2.8 +1.8 +1.6 +1.0 -3.2 -1.7
Romania +6.2 +62.1 -3.2 +30.7 -1.5 +14.3 +1.8 -29.3
Hungary +14.3 +25.6 -0.4 +2.3 -0.2 +1.2 +0.2 -0.9
Croatia +20.2 +9.6 -1.0 +3.9 -0.5 +2.1 +0.4 -1.8
Serbia +3.3 +2.5 +2.6 +0.6 +1.5 +0.4 -1.6 -1.2
Other +0.0 +0.0 +0.0 +0.0 +0.0 +0.0 +0.0 +0.0
Total +166.2 +361.4 -9.4 +165.6 -5.6 +102.5 +3.6 -103.9
Dec 19
Austria +2.2 +42.2 n/a n/a n/a n/a n/a n/a
EBOe & Subs. +1.0 +8.0 n/a n/a n/a n/a n/a n/a
Savings Banks +1.5 +22.8 n/a n/a n/a n/a n/a n/a
Other Austria -0.3 +11.3 n/a n/a n/a n/a n/a n/a
CEE +24.3 +48.5 n/a n/a n/a n/a n/a n/a
Czech Republic +1.1 +4.7 n/a n/a n/a n/a n/a n/a
Slovakia -0.3 +2.4 n/a n/a n/a n/a n/a n/a
Romania +4.5 +32.1 n/a n/a n/a n/a n/a n/a
Hungary +5.1 +7.8 n/a n/a n/a n/a n/a n/a
Croatia +11.7 +1.0 n/a n/a n/a n/a n/a n/a
Serbia +2.2 +0.6 n/a n/a n/a n/a n/a n/a
Other +0.0 +0.0 n/a n/a n/a n/a n/a n/a
Total +26.4 +90.7 n/a n/a n/a n/a n/a n/a
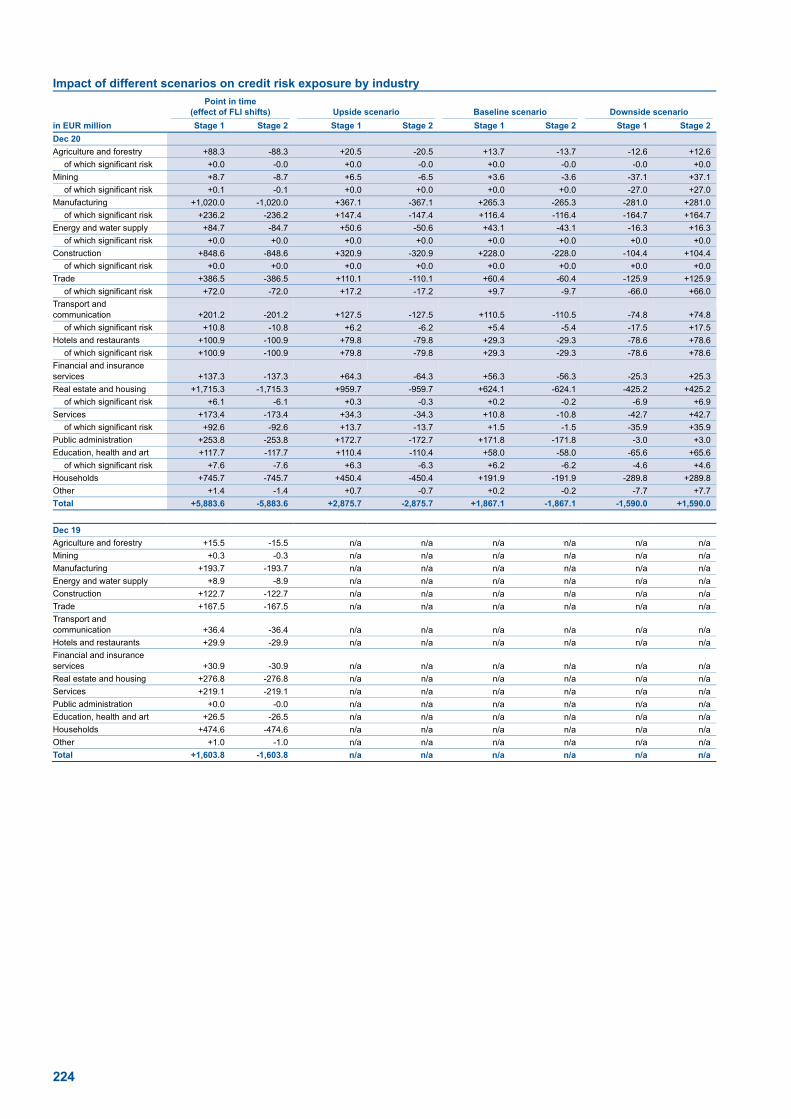
224
Impact of different scenarios on credit risk exposure by industry
Point in time (effect of FLI shifts) Upside scenario Baseline scenario Downside scenario
in EUR million Stage 1 Stage 2 Stage 1 Stage 2 Stage 1 Stage 2 Stage 1 Stage 2
Dec 20
Agriculture and forestry +88.3 -88.3 +20.5 -20.5 +13.7 -13.7 -12.6 +12.6
of which significant risk +0.0 -0.0 +0.0 -0.0 +0.0 -0.0 -0.0 +0.0
Mining +8.7 -8.7 +6.5 -6.5 +3.6 -3.6 -37.1 +37.1
of which significant risk +0.1 -0.1 +0.0 +0.0 +0.0 +0.0 -27.0 +27.0
Manufacturing +1,020.0 -1,020.0 +367.1 -367.1 +265.3 -265.3 -281.0 +281.0
of which significant risk +236.2 -236.2 +147.4 -147.4 +116.4 -116.4 -164.7 +164.7
Energy and water supply +84.7 -84.7 +50.6 -50.6 +43.1 -43.1 -16.3 +16.3
of which significant risk +0.0 +0.0 +0.0 +0.0 +0.0 +0.0 +0.0 +0.0
Construction +848.6 -848.6 +320.9 -320.9 +228.0 -228.0 -104.4 +104.4
of which significant risk +0.0 +0.0 +0.0 +0.0 +0.0 +0.0 +0.0 +0.0
Trade +386.5 -386.5 +110.1 -110.1 +60.4 -60.4 -125.9 +125.9
of which significant risk +72.0 -72.0 +17.2 -17.2 +9.7 -9.7 -66.0 +66.0
Transport and communication +201.2 -201.2 +127.5 -127.5 +110.5 -110.5 -74.8 +74.8
of which significant risk +10.8 -10.8 +6.2 -6.2 +5.4 -5.4 -17.5 +17.5
Hotels and restaurants +100.9 -100.9 +79.8 -79.8 +29.3 -29.3 -78.6 +78.6
of which significant risk +100.9 -100.9 +79.8 -79.8 +29.3 -29.3 -78.6 +78.6
Financial and insurance services +137.3 -137.3 +64.3 -64.3 +56.3 -56.3 -25.3 +25.3
Real estate and housing +1,715.3 -1,715.3 +959.7 -959.7 +624.1 -624.1 -425.2 +425.2
of which significant risk +6.1 -6.1 +0.3 -0.3 +0.2 -0.2 -6.9 +6.9
Services +173.4 -173.4 +34.3 -34.3 +10.8 -10.8 -42.7 +42.7
of which significant risk +92.6 -92.6 +13.7 -13.7 +1.5 -1.5 -35.9 +35.9
Public administration +253.8 -253.8 +172.7 -172.7 +171.8 -171.8 -3.0 +3.0
Education, health and art +117.7 -117.7 +110.4 -110.4 +58.0 -58.0 -65.6 +65.6
of which significant risk +7.6 -7.6 +6.3 -6.3 +6.2 -6.2 -4.6 +4.6
Households +745.7 -745.7 +450.4 -450.4 +191.9 -191.9 -289.8 +289.8
Other +1.4 -1.4 +0.7 -0.7 +0.2 -0.2 -7.7 +7.7
Total +5,883.6 -5,883.6 +2,875.7 -2,875.7 +1,867.1 -1,867.1 -1,590.0 +1,590.0
Dec 19
Agriculture and forestry +15.5 -15.5 n/a n/a n/a n/a n/a n/a
Mining +0.3 -0.3 n/a n/a n/a n/a n/a n/a
Manufacturing +193.7 -193.7 n/a n/a n/a n/a n/a n/a
Energy and water supply +8.9 -8.9 n/a n/a n/a n/a n/a n/a
Construction +122.7 -122.7 n/a n/a n/a n/a n/a n/a
Trade +167.5 -167.5 n/a n/a n/a n/a n/a n/a
Transport and communication +36.4 -36.4 n/a n/a n/a n/a n/a n/a
Hotels and restaurants +29.9 -29.9 n/a n/a n/a n/a n/a n/a
Financial and insurance services +30.9 -30.9 n/a n/a n/a n/a n/a n/a
Real estate and housing +276.8 -276.8 n/a n/a n/a n/a n/a n/a
Services +219.1 -219.1 n/a n/a n/a n/a n/a n/a
Public administration +0.0 -0.0 n/a n/a n/a n/a n/a n/a
Education, health and art +26.5 -26.5 n/a n/a n/a n/a n/a n/a
Households +474.6 -474.6 n/a n/a n/a n/a n/a n/a
Other +1.0 -1.0 n/a n/a n/a n/a n/a n/a
Total +1,603.8 -1,603.8 n/a n/a n/a n/a n/a n/a

225
Impact of different scenarios on credit loss allowances by industry
Point in time (effect of FLI shifts) Upside scenario Baseline scenario Downside scenario
in EUR million Stage 1 Stage 2 Stage 1 Stage 2 Stage 1 Stage 2 Stage 1 Stage 2
Dec 20
Agriculture and forestry +4.4 +15.9 +0.1 +4.3 +0.0 +2.7 -0.1 -2.1
of which significant risk +0.1 +0.0 +0.1 +0.0 +0.1 +0.0 -0.1 -0.0
Mining +0.3 +0.4 -0.0 +0.2 -0.0 +0.1 +0.1 -0.9
of which significant risk +0.2 +0.1 +0.0 +0.0 +0.0 +0.0 +0.1 -0.7
Manufacturing +20.9 +65.2 -1.4 +28.7 -1.1 +19.5 +0.9 -16.8
of which significant risk +11.7 +22.4 -0.5 +11.3 -0.6 +8.5 +0.4 -7.3
Energy and water supply +5.4 +8.2 -0.3 +4.2 -0.3 +3.1 -0.1 -2.0
of which significant risk +0.0 +0.0 +0.0 +0.0 +0.0 +0.0 +0.0 +0.0
Construction +12.6 +29.4 -2.0 +12.2 -1.3 +8.0 +0.7 -5.5
of which significant risk +0.4 +0.2 +0.0 +0.0 +0.0 +0.0 +0.0 -0.0
Trade +16.3 +29.7 +0.0 +10.4 +0.1 +6.3 +0.5 -6.9
of which significant risk +6.2 +10.3 +0.4 +3.5 +0.2 +2.2 +0.5 -3.5
Transport and communication +8.3 +15.8 -0.3 +9.4 -0.4 +7.2 -0.1 -4.8
of which significant risk +2.8 +3.4 +0.2 +1.8 +0.1 +1.2 -0.1 -1.2
Hotels and restaurants +9.7 +15.7 -0.4 +7.6 -0.0 +4.3 +0.8 -6.2
of which significant risk +9.6 +15.7 -0.4 +7.6 -0.0 +4.3 +0.8 -6.2
Financial and insurance services +5.8 +8.5 -0.2 +4.8 -0.2 +3.3 +0.1 -2.3
Real estate and housing +24.1 +46.0 -4.3 +25.0 -2.8 +17.3 +2.0 -12.3
of which significant risk +0.1 +0.2 +0.0 +0.2 +0.0 +0.1 +0.1 -0.3
Services +7.2 +15.0 -0.0 +5.0 +0.1 +2.8 +0.2 -3.2
of which significant risk +4.1 +8.2 -0.0 +3.0 +0.0 +1.7 +0.3 -2.2
Public administration +2.7 +0.3 -0.0 +0.3 -0.0 +0.3 +0.0 -0.1
Education, health and art +18.8 +22.2 +0.4 +12.9 +0.4 +8.2 -0.4 -6.9
of which significant risk +2.2 +2.4 +0.0 +1.3 -0.0 +1.0 +0.0 -0.6
Households +29.5 +88.1 -1.1 +40.4 -0.1 +19.2 -1.1 -33.4
Other +0.2 +0.9 +0.0 +0.3 +0.0 +0.1 +0.0 -0.5
Total +166.2 +361.4 -9.4 +165.6 -5.6 +102.5 +3.6 -103.9
Dec 19
Agriculture and forestry +0.9 +1.1 n/a n/a n/a n/a n/a n/a
Mining +0.1 +0.1 n/a n/a n/a n/a n/a n/a
Manufacturing +1.8 +8.6 n/a n/a n/a n/a n/a n/a
Energy and water supply +1.1 +0.7 n/a n/a n/a n/a n/a n/a
Construction +5.3 +3.4 n/a n/a n/a n/a n/a n/a
Trade +1.2 +7.1 n/a n/a n/a n/a n/a n/a
Transport and communication +1.0 +2.0 n/a n/a n/a n/a n/a n/a
Hotels and restaurants +1.1 +2.3 n/a n/a n/a n/a n/a n/a
Financial and insurance services +0.9 +1.2 n/a n/a n/a n/a n/a n/a
Real estate and housing +1.8 +8.9 n/a n/a n/a n/a n/a n/a
Services +0.3 +5.5 n/a n/a n/a n/a n/a n/a
Public administration +0.0 +0.0 n/a n/a n/a n/a n/a n/a
Education, health and art +0.9 +1.5 n/a n/a n/a n/a n/a n/a
Households +10.0 +48.3 n/a n/a n/a n/a n/a n/a
Other -0.0 +0.0 n/a n/a n/a n/a n/a n/a
Total +26.4 +90.7 n/a n/a n/a n/a n/a n/a
Composition of credit loss allowances in EUR million Dec 19 Dec 20
Credit loss allowances -3,209 -4,047
Credit loss allowances for loan commitments and financial guarantees -293 -399
Provisions for other commitments -17 -76
Total -3,518 -4,522
Credit loss allowances are computed based on IFRS 9 requirements, while provisions for other commitments are subject to IAS 37.

226
Restructuring, renegotiation and forbearance Restructuring means contractual modification of any of the customer’s loan repayment conditions including tenor, interest rate, fees, principal amount due or a combination thereof. Restructuring can be business restructuring (in the retail segment), commercial renegotiation (in the corporate segment), or forbearance (e.g. concession due to financial difficulties) in line with EBA requirements in both segments. Restructuring and renegotiation
Restructuring as business restructuring in the retail segment or as commercial renegotiation in the corporate segment is a potentially effective customer retention tool involving, for example, re-pricing or the offering of an additional loan or both in order to maintain the business relationship. Forbearance
The definition of ‘forbearance’ is included in Regulation (EU) 2015/227. A restructuring is considered ‘forbearance’ if it entails a concession towards a customer facing or about to face financial difficulties in meeting their contractual financial commitments. A borrower is in finan-cial difficulties if any of the following conditions are met:
_ the customer was more than 30 days past due in the past 3 months; _ the customer would be 30 days past due or more without receiving forbearance; _ the customer is in default; _ the customer would default without receiving forbearance.
Additional criteria for non-retail segment:
_ early warning signals for this customer identified; _ customer has deteriorated financial figures, which led to decline of the rating grade; _ customer has increased probability of default.
Forborne exposure is assessed at loan contract level and means only the exposure to which forbearance measures have been extended and excludes any other exposure the customer may have, as long as no forbearance was extended to these. Concession means that any of the following conditions are met:
_ modification/refinancing of the contract would not have been granted, had the customer not been in financial difficulty; _ there is a difference in favour of the customer between the modified/refinanced terms of the contract and the previous terms of the contract; _ the modified/refinanced contract includes more favourable terms than other customers with a similar risk profile would have obtained
from the same institution; _ the contract modification involves total or partial cancellation of the debt by (partial) write-off; _ activation of embedded forbearance clause of the contract; _ any waiver of a material financial or non-financial covenant.
Forbearance can be initiated by the bank or by the customer (on account of loss of employment, illness etc.). Components of forbearance can be instalment reduction, tenor extension, interest reduction or forgiveness, principal reduction or forgiveness, revolving exposure change to instalment and/or others. Forbearance measures are divided and reported as:
_ performing forbearance (incl. performing forbearance under probation that was upgraded from non-performing forbearance); _ non-performing forbearance (incl. defaulted forbearance; since 10/2019 the definition of non-performing status is aligned with default).
Forborne exposures are considered performing when: _ the exposure did not have non-performing status at the time the extension of or application for forbearance was approved; _ granting the forbearance has not led to classifying the exposure as non-performing/default.
Performing forborne exposures become non-performing when one of the following forbearance classifications is fulfilled during the monitoring period of a minimum two years:
_ an additional forbearance measure is extended; _ the customer becomes more than 30 days past due on forborne exposure and in the past the customer was in the non-performing
forbearance category; _ the customer meets any of the default event criteria defined in the default definition; _ for corporate customers, when a final restructuring agreement cannot be concluded within 18 months after the first forbearance measure.
The performing forbearance classification can be discontinued and the account can become a non-forborne account when all the following conditions are met:
_ a minimum of two years has passed from the date of classifying the exposure as performing forbearance (probation period); _ under the forborne payment plan, at least 50% of the original (pre-forbearance) instalment has been regularly repaid (significant repay-
ment) at least during half of the probation period (in the case of retail customers); _ regular repayments in a significant amount during at least half of the probation period have been made (in the case of non-retail customers);

227
_ significant repayment includes amount previously past-due (if any) or written-off (if no-past due amounts) for both segments retail and non-retail;
_ none of the exposure of the customer is more than 30 days past due at the end of the probation period. The non-performing forbearance classification can be discontinued and reclassified as performing under probation when all the follow-ing conditions are met:
_ one year has passed from the date of classifying the exposure as non-performing forbearance or from the latest of the following events: _ the moment of extending the restructuring measure; _ the end of the grace period included in the restructuring agreement; _ the moment when the exposure has been classified as defaulted.
_ the forbearance has not led the exposure to be classified as non-performing; _ the customer is not classified as defaulted according to the definition of default; _ retail customers: the customer has demonstrated the ability to comply with the post-forbearance conditions by either of the following:
_ the customer has never been more than 30 days past due during the 12 months prior to the reclassification and there is no delinquent amount; _ the customer has repaid the full past due amount or the written-off amount (if there was any).
_ corporate customers: significant amount has been paid in regular repayments, analysis of financial development that leaves no concern about future compliance with post-forbearance terms and conditions. Furthermore, the customer has never been more than 30 days past due during the 12 months prior to the reclassification and there is no delinquent amount.
The largest part of the forbearance measures is set and monitored within the responsibility of the local workout units according to the internal regulations and standards for the workout involvement. Forbearance measures are defined as qualitative trigger events in the SICR concept according to the internal regulations of Erste Group. Default definition
Since October 2019 Erste Group has implemented the new definition of default, based on regulatory joint decision, in all entities using IRB approach to comply with the EBA ‘Guidelines on the application of the definition of default under Art.178 of Regulation (EU) No 575/2013’ and ‘Commission Delegated Regulation (EU) 2018/171 of 19 October 2017 on supplementing Regulation (EU) No 575/2013 of the Euro-pean Parliament and of the Council with regard to regulatory technical standards for the materiality threshold for credit obligations past due’. The impact of the modified default definition is immaterial. Erste Group follows the two-step approach of the European Central Bank which requires the adjustment of the risk parameters and recalibration of rating systems as a second step afterwards. Entities with standardized approach have to implement the new Group Forbearance, Non-performing and Default Definition Policy latest by end of 2020. The group requirements stipulated in the Group policy cover the EBA requirements given in the Guidelines on the application of default definition (EBA GL 2016-07). Deviations to the group requirements are allowed only if are triggered by local regulatory requirements. The definitions of non-performing and default are aligned within Erste Group. The materiality of 90 days past due credit obligation is applied for on-balance exposure at client level and assessed daily against the group-wide defined materiality threshold (except the local regulator has defined different thresholds) for the:
_ retail exposure: as an absolute limit on client level of 100 EUR and relative 1% on client level; _ non-retail exposure: as an absolute limit on client level of 500 EUR and relative 1% on client level.
Changes in the treatment of forbearance and default due to the Covid-19 pandemic are described in the previous chapter ‘Covid-19’.

228
Credit risk exposure, forbearance exposure and credit loss allowances
in EUR million Loans and advances Debt securities Other positions
Loan commitments Total
Dec 20
Gross exposure 191,523 39,751 19,774 35,650 286,699
thereof gross forborne exposure 3,572 3 0 151 3,726
Performing exposure 186,989 39,747 19,608 35,514 281,858
thereof performing forborne exposure 2,324 0 0 83 2,407
Credit loss allowances for performing exposure -1,554 -39 -158 -173 -1,923
thereof credit loss allowances for performing forborne exposure -90 0 0 -3 -93
Non-performing exposure 4,534 4 166 137 4,841
thereof non-performing forborne exposure 1,248 3 0 68 1,319
Credit loss allowances for non-performing exposure -2,452 -2 -97 -48 -2,598
thereof credit loss allowances for non-performing forborne exposure -617 -1 0 -10 -629
Dec 19
Gross exposure 186,507 37,699 18,347 31,225 273,778
thereof gross forborne exposure 2,213 3 0 96 2,313
Performing exposure 182,363 37,695 18,147 31,110 269,316
thereof performing forborne exposure 910 0 0 30 939
Credit loss allowances for performing exposure -869 -23 -72 -79 -1,042
thereof credit loss allowances for performing forborne exposure -33 0 0 -4 -37
Non-performing exposure 4,144 4 200 115 4,463
thereof non-performing forborne exposure 1,303 3 0 67 1,373
Credit loss allowances for non-performing exposure -2,315 -2 -128 -32 -2,476
thereof credit loss allowances for non-performing forborne exposure -662 -2 0 -11 -675
Types of forbearance exposure
in EUR million Gross
forborne exposure
Modification in terms and
conditions Refinancing
Dec 20
Loans and advances 3,572 3,335 237
Debt securities 3 3 0
Loan commitments 151 126 25
Total 3,726 3,464 262
Dec 19
Loans and advances 2,213 1,933 280
Debt securities 3 3 0
Loan commitments 96 82 14
Total 2,313 2,019 294
Loans and advances also include lease, trade and other receivables. Collateral Recognition of credit collateral
Collateral Management is integrated in Underwriting Processes department of Credit Risk Portfolio division. The Group Collateral Management Policy Part 1 Credit Collateral defines, among other things, uniform valuation standards for credit collateral across the entire group. It ensures that the credit risk decision processes are standardised with respect to accepted collateral values. All collateral types acceptable within the group are contained in the Group Collateral Catalogue. Locally permitted collateral is defined by the respective bank in accordance with applicable national legal provisions. The valuation and revaluation of collateral is done according to the principles defined in the Group Collateral Catalogue broken down by collateral type and based on the internal work instructions in accordance with the individual supervisory requirements. Whether a type of collateral or a specific collateral asset is accepted for credit risk mitigation is decided by Enterprise-wide Risk Management after determining if the applicable regulatory requirements are met. Credit underwriting monitors adherence to the standard work processes stipulated for assigning the acceptable collateral assets to the categories available.
Main types of credit collateral
The following types of credit collateral are accepted: _ real estate: residential and commercial real estate; _ financial collateral: securities, cash deposits and life insurance policies; _ guarantees: given by sovereigns, public sector entities, financial institutes, companies and private individuals. All guarantors must have
a minimum credit rating, which is reviewed annually; _ movables: equipment, investment goods, machinery and motor vehicles; _ claims and rights: trade account receivables, leasehold rights and shares in a company’s capital.

229
Collateral valuation and management
Collateral valuation is based on current market prices while taking into account an amount that can be recovered within a reasonable period. The valuation processes are defined and their IT-supported technical application is performed by Collateral Management at group level and by authorised staff in each country with the assistance of software applications. The allocated collateral values are capped by the amount of the secured transaction. Therefore, imputed excess collateral values are not possible. Only independent appraisers not involved in the lending decision process are permitted to conduct real estate valuations, and the valuation methods to be applied are defined by the bank. For quality assurance purposes, the real estate evaluation mechanism and real estate valuations are validated on an ongoing basis. The methods and discounts used for valuations are based on empirical data representing past experience of the workout departments and on the collected data on recoveries from realising collateral. The valuation discounts are adjusted regularly – at least once a year – to reflect current recoveries. The revaluation of collateral is done periodically and is automated as far as possible. In the case of external data sources, the appropriate interfaces are used. The maximum periods for the revaluation of individual collateral assets are predefined and compliance is monitored by risk management using software applications. Apart from periodic revaluations, collateral is assessed when information becomes available that indicates a decrease in the value of the collateral for exceptional reasons. Concentration risks resulting from credit risk mitigation techniques may affect a single customer, but also a portfolio defined by region, industry, or type of collateral. Erste Group is a retail bank, and, due to its customer structure and the markets in which it operates, it does not have any concentrations with respect to collateral from customers. All guarantee liabilities and loans of a corporate guarantee provider are taken into consideration in the credit application process in order to prevent possible concentrations. Guarantees provided by sovereigns, a public sector entity or financial institutions have to lie within the approved limit of the guarantor. Concerning other areas of a potentially detrimental correlation of risks, the collateral portfolios are analysed using statistical evaluations for, among other things, regional or in-dustry-specific concentrations within the scope of portfolio monitoring. The response to those risks identified includes, above all, the ad-justment of volume targets, setting of corresponding limits and modification of the staff’s discretionary limits for lending. Collateral obtained in foreclosure proceedings is made available for sale in an orderly fashion, with the proceeds used to reduce or repay the outstanding claim. Generally, Erste Group does not occupy repossessed properties for its own business use. The main part of assets taken onto its own books is commercial land and buildings. In addition, residential real estate properties and transport vehicles are taken into Erste Group’s possession. As of 31 December 2020, the carrying value of these assets obtained during the reporting period amounted to EUR 15 million (2019: EUR 9 million). Treasury collateral
The department Trading Book Risk Management is responsible for treasury collateral. The Group Collateral Management Policy Part 2 defines, among other things, uniform valuation standards for treasury collateral across the entire group. Under the framework of treasury collateral, netting agreements (international framework agreements for derivatives of the International Swap and Derivatives Association (ISDA), Austrian or German framework agreements, framework agreements for securities lending transactions and repurchase deals) as well as collateral agreements (e.g. ISDA Credit Support Annex) are used for reducing the credit risk from derivatives. Netting agreements make it possible to net all amounts due or payable for each individual transaction under a framework agreement in the case of a credit default, with the result that only the net receivables vis-à-vis the business partner are of relevance for credit risk. Within the scope of these collateral agreements, the portfolio with the respective counterparty is revalued periodically, usually daily, and in case of insufficient coverage additional collateral is requested. The policy restrictions on collateral types ensure that collateral received predomi-nantly consists of cash or securities of investment grade quality. In the case of securities used as collateral, an additional valuation discount (haircut) depending on credit quality and residual maturity is applied. The following table compares the credit risk exposure broken down by business segments to the allocated collateral. The amount of allocated collateral corresponds to the accepted value after internal haircuts capped by the exposure amount.

230
Credit risk exposure by business segment and collateral
Collateralised by
in EUR million
Total credit risk exposure
Collateral total Guarantees Real estate Other
Credit risk exposure
net of collateral
Dec 20
Retail 69,833 41,249 2,044 36,602 2,603 28,583
Corporates 82,936 30,826 5,788 19,980 5,058 52,110
Group Markets 17,131 4,648 2,206 20 2,422 12,483
ALM & LCC 44,925 17,099 1,084 1 16,013 27,826
Savings Banks 71,249 33,601 2,223 28,361 3,017 37,648
GCC 625 37 0 8 29 587
Total 286,699 127,461 13,346 84,973 29,142 159,238
Dec 19
Retail 68,579 39,853 1,568 35,357 2,928 28,725
Corporates 77,841 27,408 4,459 17,738 5,211 50,433
Group Markets 18,444 7,408 1,719 11 5,678 11,036
ALM & LCC 41,842 16,392 1,322 31 15,038 25,450
Savings Banks 66,786 31,117 1,529 26,343 3,244 35,669
GCC 287 30 0 6 23 257
Total 273,778 122,208 10,597 79,488 32,123 151,570
Credit risk exposure by financial instrument and collateral
Collateralised by IFRS 9 impairment relevant
in EUR million
Total credit risk exposure
Collateral total Guarantees Real estate Other
Credit risk exposure
net of collateral
Neither past due
nor credit impaired
Past due but not
credit impaired
Credit impaired
Dec 20
Cash and cash balances - demand deposits to credit institutions 1,140 49 0 0 49 1,091 1,114 25 0
Debt instruments held for trading 6,322 1,203 205 1 997 5,119 0 0 0
Non-trading debt instruments at FVPL 2,736 630 448 174 8 2,106 0 0 0
Debt instruments at FVOCI 8,109 781 781 0 0 7,328 8,109 0 0
Debt instruments at AC 214,790 116,305 10,154 81,555 24,596 98,486 208,472 2,058 4,260
Debt securities 29,594 1,167 1,165 0 3 28,427 29,591 0 3
Loans and advances to banks 21,469 18,964 1,258 0 17,706 2,505 21,469 0 0
Loans and advances to customers 163,727 96,173 7,731 81,554 6,888 67,553 157,411 2,058 4,257
Trade and other receivables 1,405 20 2 1 16 1,385 881 463 61
Finance lease receivables 4,235 2,355 56 251 2,047 1,880 3,878 155 201
Debt instruments held for sale in disposal groups 0 0 0 0 0 0 0 0 0
Positive fair value of hedge accounting derivatives 205 59 0 0 59 146 0 0 0
Off-balance sheet exposures 47,758 6,061 1,700 2,991 1,370 41,697 41,808 36 232
thereof other commitments 5,682 843 304 103 436 4,839 0 0 0
Total 286,699 127,461 13,346 84,973 29,142 159,238 264,262 2,738 4,754
Dec 19
Cash and cash balances - demand deposits to credit institutions 1,196 189 0 0 189 1,007 1,139 56 0
Debt instruments held for trading 5,694 1,022 153 1 868 4,672 0 0 0
Non-trading debt instruments at FVPL 2,818 437 289 136 12 2,381 0 0 0
Debt instruments at FVOCI 8,590 925 925 0 0 7,664 8,587 3 0
Debt instruments at AC 207,150 112,644 8,310 76,360 27,973 94,507 200,902 2,486 3,762
Debt securities 26,774 1,144 1,141 0 3 25,631 26,771 0 4
Loans and advances to banks 23,063 20,811 822 0 19,990 2,252 23,064 0 2
Loans and advances to customers 157,312 90,689 6,348 76,360 7,981 66,624 151,067 2,486 3,757
Trade and other receivables 1,480 6 2 1 3 1,473 1,317 85 78
Finance lease receivables 4,169 2,322 57 350 1,915 1,847 3,763 122 284
Debt instruments held for sale in disposal groups 0 0 0 0 0 0 0 0 0
Positive fair value of hedge accounting derivatives 130 0 0 0 0 130 0 0 0
Off-balance sheet exposures 42,552 4,662 861 2,640 1,162 37,889 38,077 35 302
thereof other commitments 4,137 314 21 71 222 3,823 0 0 0
Total 273,778 122,208 10,597 79,488 32,123 151,570 253,786 2,787 4,426
The collateral attributable to exposures that are credit-impaired at 31 December 2020 amounts to EUR 2,013 million (2019: 1,881 million).

231
Loans and advances to customers The tables on the following pages present the structure of the customer loan book, excluding loans to central banks and credit institutions broken down by different categories. Loans and advances to customers comprise:
_ loans to customers at FVPL; _ loans and advances to customers at AC; _ finance lease receivables; _ trade and other receivables.
The presentation is by gross carrying amount excluding loan loss allowances and collateral. Loans and advances to customers by business segment and risk category
in EUR million Low risk Management
attention Substandard Non-
performing Total
Dec 20
Retail 52,511 5,013 2,007 1,495 61,025
Corporates 44,961 8,735 2,247 1,624 57,567
Group Markets 565 10 1 1 577
ALM & LCC 65 50 124 4 243
Savings Banks 41,535 6,449 1,016 1,394 50,393
GCC 23 17 158 17 215
Total 139,660 20,275 5,552 4,534 170,020
Dec 19
Retail 50,297 5,385 2,277 1,454 59,413
Corporates 46,518 5,308 1,759 1,266 54,851
Group Markets 896 33 5 0 934
ALM & LCC 199 15 77 59 351
Savings Banks 39,959 5,319 1,196 1,349 47,823
GCC 24 7 2 13 46
Total 137,892 16,066 5,317 4,142 163,417
Loans and advances to customers by geographical segment and risk category
in EUR million Low risk Management
attention Substandard Non-
performing Total
Dec 20
Austria 86,658 10,610 1,708 2,401 101,376
EBOe & Subs. 31,623 2,928 504 578 35,634
Savings Banks 41,535 6,449 1,016 1,394 50,393
Other Austria 13,500 1,233 188 428 15,349
CEE 52,956 9,645 3,687 2,116 68,404
Czech Republic 22,899 4,771 1,275 651 29,597
Slovakia 12,481 1,227 1,216 364 15,289
Romania 7,317 1,231 349 419 9,316
Hungary 3,512 851 433 151 4,947
Croatia 5,465 1,237 303 506 7,511
Serbia 1,281 327 110 25 1,744
Other 46 20 158 17 240
Total 139,660 20,275 5,552 4,534 170,020
Dec 19
Austria 85,578 7,958 1,912 2,191 97,639
EBOe & Subs. 31,302 2,303 540 500 34,645
Savings Banks 39,959 5,319 1,196 1,349 47,823
Other Austria 14,317 337 177 341 15,172
CEE 52,268 8,101 3,403 1,938 65,709
Czech Republic 23,703 3,909 1,057 519 29,188
Slovakia 11,540 1,175 1,296 426 14,437
Romania 6,890 1,073 448 359 8,771
Hungary 3,534 866 307 124 4,831
Croatia 5,451 817 242 489 6,999
Serbia 1,149 261 52 20 1,483
Other 46 7 2 13 69
Total 137,892 16,066 5,317 4,142 163,417

232
In the following tables, the non-performing loans and advances to customers divided by reporting segment are contrasted with allowances for customer loans (all allowances for loans and advances to customers within the scope of IFRS 9) and the collateral for non-performing loans (NPL). The NPL ratio, the NPL coverage ratio (excluding collateral), and the NPL collateralisation ratio are also included. Non-performing loans and advances to customers by business segment and coverage by loan loss allowances and collateral
Non-performing Customer loans Loan loss
allowances Collateral for NPL NPL ratio
NPL coverage
ratio NPL collateralisation
ratio
in EUR million Total AC Total AC AC Total AC Total AC AC Total AC
Dec 20
Retail 1,495 1,494 61,025 60,452 -1,466 599 599 2.4% 2.5% 98.2% 40.1% 40.1%
Corporates 1,624 1,614 57,567 57,466 -1,530 631 630 2.8% 2.8% 94.8% 38.9% 39.1%
Group Markets 1 1 577 577 -3 0 0 0.1% 0.1% 378.4% 0.0% 0.0%
ALM & LCC 4 4 243 243 -11 0 0 1.6% 1.6% 278.6% 1.8% 1.8%
Savings Banks 1,394 1,391 50,393 50,383 -976 732 729 2.8% 2.8% 70.2% 52.5% 52.4%
GCC 17 15 215 211 -16 8 6 7.8% 6.9% 111.4% 47.3% 39.4%
Total 4,534 4,518 170,020 169,333 -4,002 1,970 1,964 2.7% 2.7% 88.6% 43.5% 43.5%
Dec 19
Retail 1,454 1,452 59,413 59,073 -1,202 617 616 2.4% 2.5% 82.8% 42.4% 42.4%
Corporates 1,266 1,247 54,851 54,719 -1,069 481 481 2.3% 2.3% 85.7% 38.0% 38.5%
Group Markets 0 0 934 934 -2 0 0 0.0% 0.0% >500.0% 0.0% 0.0%
ALM & LCC 59 59 351 351 -26 48 48 16.9% 16.9% 44.0% 81.5% 81.5%
Savings Banks 1,349 1,347 47,823 47,814 -861 695 693 2.8% 2.8% 63.9% 51.5% 51.5%
GCC 13 11 46 43 -13 5 3 28.4% 25.6% 115.3% 40.4% 29.5%
Total 4,142 4,117 163,417 162,934 -3,174 1,847 1,842 2.5% 2.5% 77.1% 44.6% 44.7%
Total gross customer loans, total non-performing loans, and total collateral include both AC and FVPL portfolios. Loans and advances to customers and coverage by loan loss allowances by business segment and IFRS 9 treatment
Loans to customers Loan loss allowances Coverage ratio
in EUR million Stage 1 Stage 2 Stage 3 POCI
Not subject to IFRS 9
impairment Stage 1 Stage 2 Stage 3 POCI Stage 2 Stage 3 POCI
Dec 20
Retail 51,256 7,638 1,443 115 573 -129 -455 -849 -34 6.0% 58.8% 29.4%
Corporates 42,700 13,097 1,466 203 100 -135 -443 -865 -88 3.4% 59.0% 43.2%
Group Markets 532 44 1 0 0 -1 -2 0 0 4.5% 5.3% 100.0%
ALM & LCC 213 26 4 0 0 -1 -6 -4 0 21.7% 115.2% 0.0%
Savings Banks 38,616 10,355 1,363 49 10 -93 -287 -592 -4 2.8% 43.5% 7.6%
GCC 26 169 17 0 4 0 0 -16 0 0.1% 93.7% 0.0%
Total 133,343 31,329 4,293 368 687 -358 -1,193 -2,326 -125 3.8% 54.2% 34.1%
Dec 19
Retail 53,491 4,067 1,379 136 340 -116 -214 -827 -44 5.3% 60.0% 32.8%
Corporates 49,049 4,371 1,066 233 132 -137 -157 -682 -93 3.6% 64.0% 40.1%
Group Markets 888 46 0 0 0 -1 -1 0 0 3.1% 98.7% 100.0%
ALM & LCC 274 17 59 0 0 -1 -5 -20 0 29.9% 34.5% 0.0%
Savings Banks 41,373 5,074 1,320 46 9 -86 -143 -629 -3 2.8% 47.7% 5.5%
GCC 27 3 13 0 3 0 0 -13 0 0.1% 96.6% 0.0%
Total 145,104 13,578 3,837 415 483 -341 -520 -2,172 -140 3.8% 56.6% 33.9%
Stage 1 and Stage 2 comprise not credit impaired loans and advances while Stage 3 includes credit impaired loans and advances. POCI (purchased or originated credit impaired) consists of loans already credit impaired when purchased or originated. The defaulted part of POCI loans amounted to EUR 226 million (2019: 281 million), the non-defaulted part to EUR 142 million (2019: 134 mil-lion).

233
Non-performing loans and advances to customers by geographical segment and coverage by loan loss allowances and collateral
Non-performing Customer loans Loan loss
allowances Collateral for NPL NPL ratio
NPL coverage
ratio NPL collateralisation
ratio
in EUR million Total AC Total AC AC Total AC Total AC AC Total AC
Dec 20
Austria 2,401 2,388 101,376 101,267 -1,670 1,182 1,179 2.4% 2.4% 69.9% 49.2% 49.4%
EBOe & Subs. 578 578 35,634 35,622 -367 318 318 1.6% 1.6% 63.4% 54.9% 54.9%
Savings Banks 1,394 1,391 50,393 50,383 -976 732 729 2.8% 2.8% 70.2% 52.5% 52.4%
Other Austria 428 419 15,349 15,262 -327 132 132 2.8% 2.7% 78.1% 30.9% 31.5%
CEE 2,116 2,115 68,404 67,829 -2,317 780 779 3.1% 3.1% 109.5% 36.9% 36.8%
Czech Republic 651 651 29,597 29,596 -750 178 178 2.2% 2.2% 115.1% 27.3% 27.3%
Slovakia 364 364 15,289 15,289 -391 145 145 2.4% 2.4% 107.4% 39.8% 39.8%
Romania 419 418 9,316 9,316 -512 154 154 4.5% 4.5% 122.5% 36.7% 36.7%
Hungary 151 150 4,947 4,374 -167 90 89 3.0% 3.4% 111.4% 59.8% 59.6%
Croatia 506 506 7,511 7,511 -454 210 210 6.7% 6.7% 89.7% 41.5% 41.5%
Serbia 25 25 1,744 1,744 -43 4 4 1.5% 1.5% 168.2% 14.1% 14.1%
Other 17 15 240 237 -16 8 6 7.0% 6.1% 111.4% 47.3% 39.4%
Total 4,534 4,518 170,020 169,333 -4,002 1,970 1,964 2.7% 2.7% 88.6% 43.5% 43.5%
Dec 19
Austria 2,191 2,171 97,639 97,530 -1,367 1,128 1,126 2.2% 2.2% 63.0% 51.5% 51.9%
EBOe & Subs. 500 500 34,645 34,633 -290 286 286 1.4% 1.4% 58.0% 57.2% 57.3%
Savings Banks 1,349 1,347 47,823 47,814 -861 695 693 2.8% 2.8% 63.9% 51.5% 51.5%
Other Austria 341 323 15,172 15,084 -216 147 147 2.2% 2.1% 66.8% 43.0% 45.3%
CEE 1,938 1,935 65,709 65,338 -1,794 713 712 2.9% 3.0% 92.7% 36.8% 36.8%
Czech Republic 519 519 29,188 29,157 -500 124 124 1.8% 1.8% 96.3% 24.0% 24.0%
Slovakia 426 426 14,437 14,437 -344 169 169 3.0% 3.0% 80.8% 39.7% 39.7%
Romania 359 359 8,771 8,770 -417 138 138 4.1% 4.1% 116.3% 38.5% 38.5%
Hungary 124 122 4,831 4,491 -115 74 73 2.6% 2.7% 93.8% 59.8% 59.8%
Croatia 489 489 6,999 6,999 -390 203 203 7.0% 7.0% 79.7% 41.4% 41.4%
Serbia 20 20 1,482 1,482 -29 5 5 1.4% 1.4% 140.3% 22.9% 22.9%
Other 13 11 69 66 -13 5 3 19.0% 16.8% 115.5% 40.4% 29.5%
Total 4,142 4,117 163,417 162,934 -3,174 1,847 1,842 2.5% 2.5% 77.1% 44.6% 44.7%
Total gross customer loans, total non-performing loans, and total collateral include both AC and FVPL portfolios. The NPL ratio of loans and advances to customers is calculated by dividing the gross carrying amount of non-performing loans and advances to customers by the total gross carrying amount of loans and advances to customers. Consequently, it differs from the NPE ratio in section ‘Credit risk exposure’. Collaterals for non-performing loans mainly consist of real estates. The NPL coverage ratio is calculated by dividing total loss allowances by the gross carrying amount of the non-performing loans and advances to customers. Collateral is not considered.

234
Loans and advances to customers and coverage by loan loss allowances by geographical segment and IFRS 9 treatment
Loans to customers Loan loss allowances Coverage ratio
in EUR million Stage 1 Stage 2 Stage 3 POCI
Not subject to IFRS 9
impairment Stage 1 Stage 2 Stage 3 POCI Stage 2 Stage 3 POCI
Dec 20
Austria 78,106 20,748 2,341 71 109 -139 -514 -1,014 -4 2.5% 43.3% 5.3%
EBOe & Subs. 28,688 6,352 575 6 12 -31 -119 -217 0 1.9% 37.6% 0.1%
Savings Banks 38,616 10,355 1,363 49 10 -93 -287 -592 -4 2.8% 43.5% 7.6%
Other Austria 10,803 4,041 403 16 87 -15 -107 -205 0 2.7% 50.8% 0.0%
CEE 55,187 10,410 1,935 296 575 -219 -679 -1,297 -122 6.5% 67.0% 41.1%
Czech Republic 24,980 3,958 611 47 2 -83 -232 -413 -22 5.9% 67.6% 46.1%
Slovakia 12,514 2,390 301 84 0 -31 -128 -175 -57 5.4% 58.1% 68.5%
Romania 6,818 2,044 387 66 0 -38 -170 -287 -17 8.3% 74.3% 25.1%
Hungary 3,354 820 124 76 573 -16 -59 -76 -16 7.2% 61.5% 21.2%
Croatia 5,973 1,028 489 22 0 -41 -76 -327 -9 7.4% 66.8% 43.5%
Serbia 1,548 171 23 2 0 -10 -13 -18 -1 7.8% 78.6% 35.5%
Other 49 171 17 0 4 0 0 -16 0 0.1% 93.7% 0.0%
Total 133,343 31,329 4,293 368 687 -358 -1,193 -2,326 -125 3.8% 54.2% 34.1%
Dec 19
Austria 85,639 9,700 2,123 68 109 -130 -230 -1,004 -3 2.4% 47.3% 3.8%
EBOe & Subs. 31,130 3,001 496 6 12 -29 -55 -206 0 1.8% 41.5% 0.0%
Savings Banks 41,373 5,074 1,320 46 9 -86 -143 -629 -3 2.8% 47.7% 5.5%
Other Austria 13,136 1,624 307 16 88 -16 -31 -169 0 1.9% 54.9% 0.0%
CEE 59,415 3,875 1,701 347 372 -210 -290 -1,155 -138 7.5% 67.9% 39.8%
Czech Republic 27,169 1,467 489 32 31 -68 -77 -335 -19 5.3% 68.4% 60.1%
Slovakia 13,519 474 358 85 0 -35 -36 -220 -53 7.6% 61.6% 62.2%
Romania 7,102 1,272 300 97 1 -37 -122 -229 -29 9.6% 76.3% 29.9%
Hungary 4,071 247 80 94 340 -13 -25 -55 -21 10.3% 69.4% 22.8%
Croatia 6,154 352 456 37 0 -48 -24 -303 -15 6.8% 66.4% 39.3%
Serbia 1,399 63 18 2 0 -9 -6 -13 -1 9.0% 73.6% 38.1%
Other 50 3 13 0 3 0 0 -13 0 0.1% 96.6% 0.0%
Total 145,104 13,578 3,837 415 483 -341 -520 -2,172 -140 3.8% 56.6% 33.9%
The NPL exposures above exclude any write-offs recognised in accordance with IFRS 9. Erste Group distinguishes between contractual write-offs (debt forgiveness towards the defaulted client, either unconditional or subject to conditions) and technical write-offs (claim re-moval from the books due to no reasonable expectation of recovery, whereby the legal claim towards the customer remains). Both types of write-offs have as a pre-condition that all reasonable workout measures and late collections tools have been applied for optimal recovery. In case of collateralised loans, write-off prior to the realisation of the collateral is not allowed unless specific circumstances apply. Additional technical write-off triggers include enforcement, worthlessness of claim/collateral, legally binding bankruptcy/liquidation or other economic loss of the rights to claim/sale. The amount written off during 2020, which is still subject to enforcement activity, totals EUR 114 million (2019: 253 million).

235
Loans and advances to customers by geographical segment and currency
in EUR million EUR CEE-LCY CHF USD Other Total
Dec 20
Austria 93,915 0 2,672 2,518 2,272 101,376
EBOe & Subs. 34,395 0 1,124 41 73 35,634
Savings Banks 47,503 0 1,505 57 1,329 50,393
Other Austria 12,017 0 43 2,420 869 15,349
CEE 29,657 38,515 22 154 56 68,404
Czech Republic 4,069 25,446 0 41 40 29,597
Slovakia 15,269 0 0 3 16 15,289
Romania 3,108 6,130 0 78 0 9,316
Hungary 1,277 3,643 3 23 0 4,947
Croatia 4,624 2,864 19 4 0 7,511
Serbia 1,310 431 0 3 0 1,744
Other 175 45 4 16 0 240
Total 123,747 38,560 2,698 2,687 2,327 170,020
Dec 19
Austria 89,317 0 3,185 2,637 2,500 97,639
EBOe & Subs. 33,167 0 1,325 60 93 34,645
Savings Banks 44,643 0 1,809 87 1,284 47,823
Other Austria 11,507 0 51 2,490 1,124 15,172
CEE 28,261 37,042 28 289 90 65,709
Czech Republic 3,822 25,155 0 151 60 29,188
Slovakia 14,391 0 0 16 30 14,437
Romania 3,192 5,471 0 108 0 8,771
Hungary 1,282 3,541 6 2 0 4,831
Croatia 4,426 2,544 22 7 0 6,999
Serbia 1,147 331 0 4 0 1,482
Other 22 42 0 5 0 69
Total 117,599 37,084 3,214 2,931 2,589 163,417
‘CEE-LCY’ refers to the CEE geographical segment view where the local currency is the currency of the respective country (e.g. CZK in Czech Republic, RON in Romania etc.).
Securitisations As of 31 December 2020, Erste Group held a further reduced residual portfolio of securitisations; there were no new investments undertaken and all repayments were made as scheduled in 2020. As of year-end 2020, the carrying amount of Erste Group’s securitisation portfolio totalled EUR 13.8 million. The entire exposure consists of three individual transactions, which are triple-, double- and single-A rated. 35. Market risk Market risk is the risk of loss that may arise due to adverse changes in market prices and to the parameters derived from them. These market value changes might appear in the profit and loss account, in the statement of comprehensive income or in hidden reserves. At Erste Group, market risk is divided into interest rate risk; credit spread risk, currency risk, equity risk, commodity risk, and volatility risk. This concerns both trading and banking book positions. Methods and instruments employed At Erste Group, potential losses that may arise from market movements are assessed using the value at risk (VaR). The VaR describes what level of losses may be expected as a maximum at a defined probability – the confidence level – within a certain holding period of the positions under historically observed market conditions. The calculation is based on the method of historic simulation with a one-sided confidence level of 99%, a holding period of one day, and a look back period of two years. Back-testing is used to constantly monitor the validity of the internal market risk model. This process is conducted with a one-day delay to monitor if the model projections regarding losses have actually materialised. At a confidence level of 99%, the actual loss on a given day should exceed the VaR estimate statistically only two to three times a year (1% of around 250 workdays). A known limitation of the VaR approach is that on the one hand, the confidence level is limited to 99%, and on the other hand, the model takes into account only those market scenarios observed within the look-back period of two yearsto calculate the VaR for the current position of the bank. To address this limitation and in order to investigate any extreme market situations not reflected in the VaR approach, stress tests are conducted at Erste Group. These stress tests are designed to cover market movements of low probability and high impact. The stress tests are carried out according to several methods: stressed VaR (SVaR) is derived from the normal VaR calculation. But instead of simulating only over the two most recent years, an analysis of a much longer period is carried out in order to identify a one-year period

236
that constitutes a relevant period of stress for the current portfolio mix. According to the legal framework, that one-year period is used to calculate a VaR with a 99% confidence level. This enables Erste Group on the one hand to hold sufficient own funds available for the trading book even in periods of elevated market volatility, while on the other hand also enabling it to incorporate these resulting effects into the management of trading positions. Standard scenarios are also defined, in which selected market factors are subject to extreme movements. Such scenarios are calculated at Erste Group for interest rates, stock prices, exchange rates and volatilities. Historic scenarios are a modification of the concept of standard scenarios. In this case, risk factor movements modelled after certain crisis events such as ‘9/11’or the ‘Lehman bankruptcy’ form the basis of the stress calculation. In addition, hypothetical stress test scenarios are defined based on analysis of the current economic environment and projections of adverse developments of key market risk drivers. These analyses are made available to the management board within the scope of the regular market risk reporting. Methods and instruments of risk mitigation At Erste Group, market risks are controlled in the trading book by setting several layers of limits. The overall limit on the basis of risk-weighted assets (RWAs) for the trading book is allocated by the management board in the Risk Appetite Statement while taking into account the risk-bearing capacity and projected earnings. A further breakdown in VaR, SVaR, and sensitivity limits is done by the Market Risk Committee (MRC) on the basis of a proposal from the Trading Book Risk Management unit. All market risk activities of the trading book are assigned risk limits that are entirely consistent with the overall RWA limit. The RWA limit is broken down into dedicated VaR and SVaR limits and assigned in a top-down procedure to the individual trading units. Additionally, in a bottom-up procedure, sensitivity limits are assigned on trading desk level in order to control exposures to individual risk drivers and ensure sufficient diversification. These are then aggregated and applied as a second-limit layer to the VaR and SVaR limits.. Limit compliance is verified at two levels: by the appropriate local risk management unit and by the Trading Book Risk Management unit. The monitoring of sensitivity limits is performed on both intraday and end-of-day basis. On demand, limit reports can also be triggered by the trading units or risk management on an ad-hoc basis. Trading book VaR and SVaR are calculated daily at group level and reported to all key stakeholders including the relevant board members. In case of a limit breach, the escalation procedure ensures the timely remediation of the limit breach. The VaR for banking book positions (BB-VaR) is based on the ICAAP calculation of Erste Group where 250.000 historical scenarios are calculated with a theoretical holding period of 1 year and a confidence level of 99.92%. The same calculation is used for the BB-VaR with a 1 day holding period and a 99% confidence level, consistent with the trading book methodology. The results of both calculations, ICAAP and BB-VaR are presented in the Group ALCO to the management board. Analysis of market risk The following tables show the VaR amounts at the 99% confidence level using equally weighted market data and with a holding period of one day: Value at Risk of banking book and trading book in EUR thousand Total Interest Credit spread Currency Shares Commodity Volatility
Dec 20
Erste Group 25,700 21,359 4,251 1,626 1,388 499 544
Banking book 22,200 17,950 4,251 - - - -
Trading book 3,500 3,409 - 1,626 1,388 499 544
Dec 19
Erste Group 34,079 22,960 11,195 775 370 133 747
Banking book 30,985 19,790 11,195 - - - -
Trading book 3,094 3,170 - 775 370 133 747
Interest rate risk in the banking book (IRRBB)
Interest rate risk is the risk of an adverse change in both, the earnings and economic value of financial instruments caused by a movement in market interest rates. This type of risk arises when mismatches exist between assets and liabilities, including derivatives, in respect of their maturities or of the timing of interest rate adjustments. In order to identify interest rate risk, all financial instruments, including off-balance instruments are used to calculate the impact of certain interest rate scenarios on their economic value and their earnings. Limits and thresholds are implemented for both aspects of the IRRBB, the change in economic value as well as the change in earnings. Positions without contractually defined maturity or repricing structures, such as demand deposits or overdrafts are modelled accordingly. For positions where the customer has the right to prepay his debt prepay-ment models are applied.

237
During 2020, some new models were introduced in Erste Group such as a demand deposit model for private accounts in Česká spořitelna, a.s. or a savings accounts model for the Austrian savings banks and EBOe. Furthermore, several existing models have been recalibrated. Erste Group responded to the low or even negative interest rate environment since 2015, which poses a challenge for the interest rate risk measurement and management of banks, in recent years by adjusting its methodologies for measuring the interest rate risk. For internal risk calculations and for the regulatory interest rate risk measures, the maximum downward shock is floored according to the Annex III of the EBA guidelines on the management of interest rate risk arising from non-trading activities (EBA/GL/2018/02). The following tables list the open fixed-income positions held by Erste Group in the four currencies that carry a significant interest rate risk: EUR, CZK, HUF and RON. Only the open fixed-income positions that are not allocated to the trading book are presented. Positive values indicate fixed-income risks on the asset side, i.e. a surplus of asset items; negative values represent a surplus on the liability side. Open fixed-income positions not assigned to the trading book in EUR million 1-3 years 3-5 years 5-7 years 7-10 years Over 10 years
Dec 20
Fixed-interest gap in EUR positions 5,223.4 3,675.6 2,984.1 3,574.3 1,590.4
Fixed-interest gap in CZK positions 4,158.2 3,512.6 2,554.1 2,015.2 1,092.0
Fixed-interest gap in HUF positions 1,007.6 523.9 3,017.2 204.2 43.6
Fixed-interest gap in RON positions 1,679.5 846.2 205.5 76.1 0.1
Dec 19
Fixed-interest gap in EUR positions 1,889.7 4,018.4 2,928.4 2,128.5 1,088.8
Fixed-interest gap in CZK positions 3,890.6 2,748.6 3,147.9 2,128.1 945.7
Fixed-interest gap in HUF positions 1,040.9 646.5 443.9 -32.9 33.4
Fixed-interest gap in RON positions 1,683.2 879.2 292.4 267.2 0.2
Exchange rate risk
Risk from open foreign exchange positions is the risk related to exchange rates that derives from the mismatch between assets and liabilities, or from currency-related financial derivatives. In the trading book, these risks might originate from customer-related or trading operations and are monitored and managed on a daily basis. Foreign currency exposure is subject to regulatory and internal limits. The internal limits for the trading book are set by the Market Risk Committee. Erste Group separately measures and manages other types of risks relating to the group’s balance sheet and earnings structure. The translation risk related to the valuation of the balance sheet items, earnings, dividends and participations/net investments in local currency or foreign exchange has an impact on consolidated earnings and consolidated capital. Erste Group is also reducing the negative impact related to volatility of foreign exchange rates on asset performance (for example as a result of foreign exchange lending in the CEE countries that was stopped for clients not having sufficient regular income in the respective loan currency). In order to manage its multi-currency earnings structure, Erste Group regularly discusses hedging opportunities and takes decisions in the Group Asset Liability Committee (ALCO). Asset and Liability Management (ALM) uses as the usual source of information the current financial results and the financial budget prepared for the upcoming period to obtain as much information as possible on the future foreign currency cash flows. The proposal, which mainly includes the volume, hedging level, hedge ratio and timeline of the hedging, is submitted by ALM to ALCO. The impact of translation on consolidated capital is monitored and reported to ALCO. The ALCO decisions are then implemented by ALM and the implementation status is reported on a monthly basis to ALCO. The following table shows the largest open foreign currency positions of Erste Group as of 31 December 2020 and the corresponding open positions of these currencies as of 31 December 2019 (excluding foreign currency positions arising from equity participation). Open foreign currency positions in EUR thousand Dec 19 Dec 20
Czech Koruna (CZK) -61,217 -189,279
Hungarian Forint (HUF) -18,943 19,284
Swiss Franc (CHF) -18,262 6,595
Romanian Leu (RON) 12,494 -5,184
Polish Zloty (PLN) -2,137 4,990
Serbian Dinar (RSD) 190 3,698
Swedish Krona (SEK) 1089 -2,133
US Dollar (USD) 11,014 1,491
Croatian Kuna (HRK) 11,570 -1,284
British Pound (GBP) 9,919 -1,069

238
Credit spread risk
Credit spread risk is the risk of an adverse movement in the fair value of financial instruments caused by a change in the creditworthiness of an issuer perceived by the market. Erste Group is exposed to credit spread risk with respect to its securities portfolio, both in the trading as well as in the banking book. For the trading book, credit spread risk for government bonds is part of the general market risk covered by VaR and SVaR. Corporate bonds are allocated to benchmark spread curves depending on sector, rating, and currency as part of the general risk covered by VaR and SVaR. The issuer specific risk is covered by the standardised approach for Pillar 1 of regulatory capital requirements. For the issuer specific risk of the trading book in Pillar 2, the spread risk is broken down into a systematic and a residual part risk and reported on an aggregated level. Quantifying the credit spread risk of the securities in the banking book is based on a historical simulation. The maximum (hypothetical) drawdown that can be attributed to credit related risk factors over a one-year horizon is calculated. It is based on credit spread sensitivities (CR01) and the risk factors used are mainly asset swap spreads for sovereigns and iTRAXX CDS indices for financials and corporates. The resulting amount is used as part of the ICAAP calculations to determine the capital consumption of the banking book portfolio. Hedging
Banking book market risk management consists of optimising Erste Group’s risk position by finding the proper trade-off between the economic value of the balance sheet and forecasted earnings. Decisions are based on balance sheet development, economic environment, competitive landscape, fair value of risk, effect on net interest income and appropriate liquidity position. The steering body responsible for interest rate risk management is ALCO. ALM submits proposals for actions to steer the interest rate risk to ALCO and implements ALCO’s decisions. In order to achieve the goals of risk management, hedging activities focus on the two main control variables: net interest income and market value of equity risk. In a broader sense, hedging refers to an economic activity that mitigates risk but does not necessarily qualify for hedge accounting under IFRS rules. IFRS hedge accounting is applied, if possible, to avoid accounting mismatches due to hedging activity. Within the scope of IFRS-compliant hedge accounting, fair value hedges and cash flow hedges are used. In addition, the fair value option is used for hedging the market risk from the economic perspective. Most of the hedging within Erste Group concerns hedging of interest rate risk. The remainder is hedging of foreign exchange rate risk. 36. Liquidity risk The liquidity risk in Erste Group is defined in line with the principles set out by the Basel Committee on Banking Supervision as well as the European and Austrian regulations (Capital Requirements Regulation (CRR) - Regulation (EU) No 575/2013, Commission Del-egated Regulation (EU) 2015/61 amended by Commission Delegated Regulation (EU) 2018/1620, Kreditinstitute-Risikomanagement-Verordnung - KI-RMV). Accordingly, a distinction is made between market liquidity risk, which is the risk that the group entities cannot easily offset or close a position at the market price because of inadequate market depth or market disruption, and funding liquidity risk, which is the risk that the banks in the group will not be able to meet efficiently both expected and unexpected current and future cash flow and collateral needs without affecting either daily operations or the financial condition of the group members. Funding liquidity risk is further divided into insolvency risk and structural liquidity risk. The former is the short-term risk that current or future payment obligations cannot be met in full and on time in an economically justified manner, while structural liquidity risk is the long-term risk of losses due to a change in the Group’s own refinancing cost or spread. In 2020, Erste Group implemented a new technical environment for monitoring and management of liquidity risk starting with the Liquidity Coverage Ratio (LCR). Implementation of further metrics such as Net Stable Funding Ratio (NSFR), Additional Liquidity Monitoring Metrics (ALMM) etc. is planned for 2021. The environment is based on daily deal level data from the significant entities in the CRR Liquidity scope and is planned to provide centrally calculated cash flows for all banking book risk reports. Liquidity strategy In 2020, customer deposits remained the primary source of funding for Erste Group. The growth in loan volume was lower than inflows of customer deposits, the excess liquidity was mainly placed with central banks. With regards its own issuance, Erste Group Bank AG issued EUR 5.2 billion in bonds in 2020 (2019: EUR 4.0 billion) which in net terms was approx. EUR 1.0 billion above the original plan at the beginning of the year due to pre-funding activities. EUR 750 million (2019: EUR 1.0 billion) was collected via a mortgage covered bond in benchmark size. EUR 2.6 billion (2019: EUR 1.3 billion) was collected by issuing senior preferred bonds, of which EUR 2.0 billion (2019: 0.5 billion) were printed via three benchmark sized transactions and the rest via private placements or the retail network. Tier 2 subordinated debt issuance amounted to EUR 0.6 billion (2019: EUR 0.6 billion). Furthermore, two additional tier 1 benchmark bonds EUR 1.25 billion (2019: EUR 0.5 billion) was issued. This was offset by repurchases of EUR 62 million (2019: EUR 266 million). The average tenor of all new issues in 2020 is approximately 7.1 years (2019: 7.1 years). Erste Group’s total TLTRO participation in 2020 was increased to EUR 14.1 billion (2019: 1.9 billion).
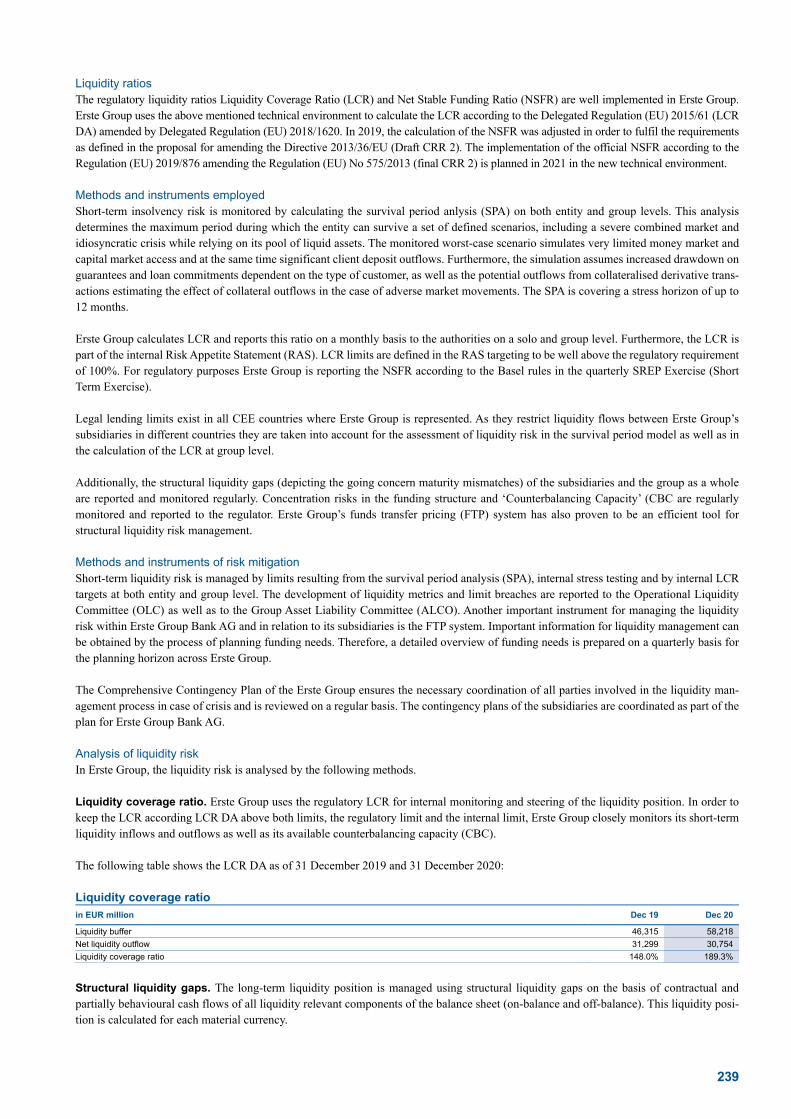
239
Liquidity ratios The regulatory liquidity ratios Liquidity Coverage Ratio (LCR) and Net Stable Funding Ratio (NSFR) are well implemented in Erste Group. Erste Group uses the above mentioned technical environment to calculate the LCR according to the Delegated Regulation (EU) 2015/61 (LCR DA) amended by Delegated Regulation (EU) 2018/1620. In 2019, the calculation of the NSFR was adjusted in order to fulfil the requirements as defined in the proposal for amending the Directive 2013/36/EU (Draft CRR 2). The implementation of the official NSFR according to the Regulation (EU) 2019/876 amending the Regulation (EU) No 575/2013 (final CRR 2) is planned in 2021 in the new technical environment. Methods and instruments employed Short-term insolvency risk is monitored by calculating the survival period anlysis (SPA) on both entity and group levels. This analysis determines the maximum period during which the entity can survive a set of defined scenarios, including a severe combined market and idiosyncratic crisis while relying on its pool of liquid assets. The monitored worst-case scenario simulates very limited money market and capital market access and at the same time significant client deposit outflows. Furthermore, the simulation assumes increased drawdown on guarantees and loan commitments dependent on the type of customer, as well as the potential outflows from collateralised derivative trans-actions estimating the effect of collateral outflows in the case of adverse market movements. The SPA is covering a stress horizon of up to 12 months. Erste Group calculates LCR and reports this ratio on a monthly basis to the authorities on a solo and group level. Furthermore, the LCR is part of the internal Risk Appetite Statement (RAS). LCR limits are defined in the RAS targeting to be well above the regulatory requirement of 100%. For regulatory purposes Erste Group is reporting the NSFR according to the Basel rules in the quarterly SREP Exercise (Short Term Exercise). Legal lending limits exist in all CEE countries where Erste Group is represented. As they restrict liquidity flows between Erste Group’s subsidiaries in different countries they are taken into account for the assessment of liquidity risk in the survival period model as well as in the calculation of the LCR at group level. Additionally, the structural liquidity gaps (depicting the going concern maturity mismatches) of the subsidiaries and the group as a whole are reported and monitored regularly. Concentration risks in the funding structure and ‘Counterbalancing Capacity’ (CBC are regularly monitored and reported to the regulator. Erste Group’s funds transfer pricing (FTP) system has also proven to be an efficient tool for structural liquidity risk management. Methods and instruments of risk mitigation Short-term liquidity risk is managed by limits resulting from the survival period analysis (SPA), internal stress testing and by internal LCR targets at both entity and group level. The development of liquidity metrics and limit breaches are reported to the Operational Liquidity Committee (OLC) as well as to the Group Asset Liability Committee (ALCO). Another important instrument for managing the liquidity risk within Erste Group Bank AG and in relation to its subsidiaries is the FTP system. Important information for liquidity management can be obtained by the process of planning funding needs. Therefore, a detailed overview of funding needs is prepared on a quarterly basis for the planning horizon across Erste Group. The Comprehensive Contingency Plan of the Erste Group ensures the necessary coordination of all parties involved in the liquidity man-agement process in case of crisis and is reviewed on a regular basis. The contingency plans of the subsidiaries are coordinated as part of the plan for Erste Group Bank AG. Analysis of liquidity risk In Erste Group, the liquidity risk is analysed by the following methods. Liquidity coverage ratio. Erste Group uses the regulatory LCR for internal monitoring and steering of the liquidity position. In order to keep the LCR according LCR DA above both limits, the regulatory limit and the internal limit, Erste Group closely monitors its short-term liquidity inflows and outflows as well as its available counterbalancing capacity (CBC). The following table shows the LCR DA as of 31 December 2019 and 31 December 2020: Liquidity coverage ratio in EUR million Dec 19 Dec 20
Liquidity buffer 46,315 58,218
Net liquidity outflow 31,299 30,754
Liquidity coverage ratio 148.0% 189.3%
Structural liquidity gaps. The long-term liquidity position is managed using structural liquidity gaps on the basis of contractual and partially behavioural cash flows of all liquidity relevant components of the balance sheet (on-balance and off-balance). This liquidity posi-tion is calculated for each material currency.

240
Cash flows are broken down by contractual maturities in accordance with the amortisation schedule and arranged in maturity ranges. All customer products without contractual maturities (such as demand deposits and overdrafts) are included according to a going concern maturity profile using model based on statistically observed client behaviour. The following table shows the structural liquidity gaps as of 31 December 2019 and 31 December 2020: Structural liquidity gap
0-12 months 1-3 years 3-5 years > 5 years
in EUR million Dec 19 Dec 20 Dec 19 Dec 20 Dec 19 Dec 20 Dec 19 Dec 20
Liquidity gap 13,548 30,829 -5,321 -6,329 -3,360 -5,487 -6,465 -20,221
An excess of assets over liabilities is indicated by a positive value, while an excess of liabilities over assets is indicated by a negative value. The cash inflows from liquid securities amounting to EUR 27.4 billion (2019: EUR 33.6 billion), which are accepted as collateral by the central banks to which Erste Group has access, are taken into account in the first time bucket rather than considering them at their contractual maturity. Counterbalancing capacity. Erste Group regularly monitors its counterbalancing capacity, which consists of cash, excess minimum re-serves at the central banks as well as unencumbered central bank eligible assets and other liquid securities, including impacts from repos, reverse repos and securities lending transactions. These assets can be mobilised in the short term to offset potential cash outflows in a crisis situation. Term structure of counterbalancing capacity in EUR million < 1 week 1 week-1 month 1-3 months 3-6 months 6-12 months
Dec 20
Cash, excess reserve 23,741 0 0 0 0
Liquid assets 31,000 -2,904 -2,121 -801 -2,037
Other central bank eligible assets 3,223 -88 1,534 -188 -205
Thereof retained covered bonds 601 0 1,677 0 0
Thereof credit claims 774 0 0 0 0
Counterbalancing capacity 57,964 -2,992 -587 -990 -2,242
Dec 19
Cash, excess reserve 5,831 0 0 0 0
Liquid assets 36,499 -2,998 -1,634 -2,523 -2,037
Other central bank eligible assets 5,096 -298 1,059 526 -121
Thereof retained covered bonds 1,330 0 1,296 750 0
Thereof credit claims 1,709 0 0 0 18
Counterbalancing capacity 47,426 -3,297 -575 -1,997 -2,158
The figures above show the total amount of potential liquidity available for the group in a going concern situation, taking into account the applicable central bank haircuts. In a crisis situation, adverse market movements can decrease this amount. The initial counterbalancing capacity available at group level is reduced by additional stressed haircuts. Negative figures are maturing positions of the counterbalancing capacity. Positive figures after one week are positions not immediately available as counterbalancing capacity.

241
Financial liabilities. The table below shows the undiscounted principal cash flows for all financial liabilities, derivative liabilities contain additionally the interest cash flows. Financial liabilities
in EUR million Carrying amounts
Contractual cash flows < 1 month 1-12 months 1-5 years > 5 years
Dec 20
Non-derivative liabilities 246,518 255,108 175,767 25,824 37,358 16,159
Deposits by banks 24,771 25,141 4,671 1,486 17,408 1,576
Customer deposits 191,070 194,088 164,600 20,655 7,330 1,503
Debt securities in issue 24,587 31,016 6,470 3,324 10,129 11,092
Subordinated liabilities 6,089 4,863 25 359 2,491 1,988
Derivative liabilities 2,226 1,512 -5 524 666 326
Derivatives liabilities with netted Cash Flows - 1,469 237 293 606 333
Derivatives liabilities with gross Cash Flow (net) - 43 -242 231 60 -7
Outflows - 51,265 38,785 7,464 4,032 983
Inflows - -51,222 -39,027 -7,234 -3,972 -990
Contingent liabilities - 47,758 47,758 0 0 0
Financial guarantees - 6,426 6,426 0 0 0
Commitments - 41,332 41,332 0 0 0
Other financial liabilities 1,286 1,286 1,286 0 0 0
Total 250,030 305,664 224,806 26,348 38,024 16,485
Dec 19
Non-derivative liabilities 216,842 217,231 147,320 28,535 25,571 15,805
Deposits by banks 13,141 13,765 5,758 2,487 3,852 1,667
Customer deposits 173,331 174,770 141,406 23,449 8,010 1,906
Debt securities in issue 23,888 23,546 151 2,134 11,273 9,988
Subordinated liabilities 6,482 5,149 5 465 2,435 2,244
Derivative liabilities 2,275 2,126 6 576 1,034 508
Derivatives liabilities with netted Cash Flows - 2,043 128 413 986 516
Derivatives liabilities with gross Cash Flow (net) - 82 -122 163 48 -8
Outflows - 63,199 46,724 9,451 6,146 878
Inflows - -63,117 -46,846 -9,288 -6,098 -886
Contingent liabilities - 42,552 42,552 0 0 0
Financial guarantees - 7,190 7,190 0 0 0
Commitments - 35,362 35,362 0 0 0
Other financial liabilities 1,211 1,211 1,211 0 0 0
Total 220,328 263,119 191,089 29,111 26,605 16,313
As of year-end 2020, the currency composition of the non-derivative liabilities consisted of approximately 70% EUR, 19% CZK, 3% RON, 3% USD, and 5% in other currencies (2019: 69% EUR, 18% CZK, 4% USD, 4% RON and 5% in other currencies). Besides the contingent liabilities from unused credit lines and guarantees, material potential cash outflow is calculated from the collateral-ised derivative transactions for the stress testing, following a historical lookback approach, which amounted to EUR 1,054 million (2019: EUR 960 million) in the severe combined idiosyncratic and market crisis scenario as of 31 December 2020. As of 31 December 2020, the volume of customer deposits due on demand amounted to EUR 144.9 billion (2019: EUR 121.6 billion). According to customer segments, the customer demand deposits are composed as follows: 65% private individuals, 15% large corporates, 14% small and medium-sized enterprises, 4% public sector, and 2% non-banking financial institutions (2019: 65% private individuals, 15% large corporates, 14% small and medium-sized enterprises, 4% public sector, and 2% non-banking financial institutions). 37. Operational risk In line with Article 4 Section 52 of regulation (EU) 575/2013 (CRR), Erste Group defines operational risk as the risk of loss resulting from inadequate or failed internal processes, people and systems, or from external events, including legal risks. Both quantitative and qualitative methods are used to identify operational risks. Consistent with international practice, the responsibility for managing operational risk rests with the line management. Methods and instruments employed The quantitative measurement methods are based on internal loss experience data, which are collected across Erste Group using a standard methodology and entered into a central data pool. Additionally, in order to be able to model losses that have not occurred in the past but are nonetheless possible, scenarios and external data are also used. Erste Group sources external data from a leading non-profit risk-loss data consortium. Erste Group calculates capital requirements for operational risk based on the Advanced Measurement Approach (AMA) that is subject to regula-tory approval. AMA is a sophisticated approach for measuring operational risk. Pursuant to AMA, the required capital is calculated using an

242
internal VaR model, taking into account internal data, external data, scenario analysis, business environment and internal risk control factors. Additionally, Erste Group received the approval to use insurance contracts for mitigation within the AMA pursuant to Article 323 CRR. Methods and instruments of risk mitigation In addition to quantitative methods, qualitative methods are also used to determine operational risk, such as risk and control assessments through expert panels. Additional methods include setting of key risk indicators and risk assessments in connection with product approvals, outsourcing assessments and risk return decisions. The results of these assessments and processes are reported to line management along with mitigation measures and thus help to reduce operational risks. In order to ensure early detection of changes in the risk profile that may lead to losses, Erste Group monitors a number of key risk indicators such as system availability, staff turnover, and customer complaints. Erste Group uses a group-wide insurance program that has reduced the cost of meeting Erste Group’s traditional property insurance needs. Freed-up resources made it possible to buy additional insurance for previously uninsured bank-specific risks. This program uses a captive reinsurance entity as a vehicle to share losses within the group and access the external market. The quantitative and qualitative methods used, together with the insurance strategy and the modelling approaches described above, form the operational risk framework of Erste Group. Information on operational risk is periodically communicated to the management board via various reports, including the quarterly top management reports, which describe the recent loss history, loss development, qualitative infor-mation from risk assessments and key risk indicators as well as the operational VaR for Erste Group.

243
Non-current assets and other investments
38. Property, equipment and investment properties Property and equipment Property and equipment is measured at cost less accumulated depreciation and accumulated impairment. Borrowing costs for qualifying assets are capitalised into the costs of property and equipment. Depreciation is calculated using the straight-line method to write down the cost of property and equipment to their residual values over their estimated useful lives. Depreciation is recognised in the statement of income in the line item ‘Depreciation and amortisation’ and impairment in the line item ‘Other operating result’.
Useful lives in years
Buildings 30-50
Re-buildings on own and foreign real estates 15-50
Office furniture and equipment 4-10
Passenger cars 4-8
Computer hardware 4-6
Land is not depreciated. Property and equipment is derecognised on disposal or when no future economic benefits are expected from its use. Any gain or loss arising on disposal of the asset (calculated as the difference between the net disposal proceeds and the carrying amount of the asset) is recognised in the statement of income under the line item ‘Other operating result’. Investment properties Investment property is property (land and buildings or part of a building or both) held for the purpose of earning rental income or for capital appreciation or both. In the case of partial own use, the property is investment property only if the owner-occupied portion is insignificant. Investments in land and buildings under construction when the future use is expected to be the same as for investment property are treated as investment property. Investment property is measured initially at cost, including transaction costs. Subsequent to initial recognition, investment property is meas-ured at cost less accumulated depreciation and impairment. Investment property is presented on the balance sheet in the line item ‘Investment properties’. Rental income is recognised in the statement of income in the line item ‘Rental income from investment properties and other operating leases’. Depreciation is presented in the statement of income in the line item ‘Depreciation and amortisation’ using the straight-line method over an estimated useful life. The useful lives of investment properties are in the range of 15-100 years. Any impairment losses, as well as their reversals, are recognised under the line item ‘Other operating result’. Impairment The bank assesses at each reporting date whether there is an indication that a non-financial asset may be impaired. Testing for impairment is done at individual asset level if the asset generates cash inflows that are largely independent of those from other assets. The typical case is investment property. Otherwise, the impairment test is carried out at the level of the cash-generating unit (CGU) to which the asset belongs. A CGU is the smallest identifiable group of assets that generates cash inflows that are largely independent of the cash inflows from other assets or groups of assets. If any indication of impairment exists or when annual impairment testing for an asset is required, the bank estimates the asset’s recoverable amount. An asset’s recoverable amount is the higher of the asset’s or the CGU’s fair value less costs of disposal and its value in use. If the carrying amount of an asset or CGU exceeds its recoverable amount, the asset is considered impaired and is written down to its recoverable amount. In measuring the value in use, the estimated future cash flows are discounted to their present value using a pre-tax discount rate that reflects current market assessments of the time value of money and the risks specific to the asset. At each reporting date, an assessment is made as to whether there is any indication that previously recognised impairment losses may no longer exist or may have decreased. If such an indication exists, the bank estimates the asset’s or the CGU’s recoverable amount. Judgement and estimates are required to determine the value in use and fair value less costs of disposal by estimating the timing and amount of future expected cash flows and the discount rates. The previously recognised impairment loss is reversed only if there has been a change in the assumptions used to determine the asset’s recoverable amount since the last impairment loss was recognised. The reversal is limited so that the carrying amount of the asset does not exceed its recoverable amount or does not exceed the carrying amount that would have been determined, net of depreciation, had no impairment loss been recognised for the asset in prior years. Impairments and their reversals are recognised in the statement of income under the line item ‘Other operating result’.

244
The analysis on the recoverability of non-financial assets in the context of the Covid-19 pandemic is explained in section ‘Accounting treatment of issues related to Covid-19’ in the chapter ‘Significant accounting policies’. Acquisition and production costs Own property, equipment and investment properties
in EUR million Land and buildings
Office and plant equipment/other
fixed assets IT assets
(hardware) Movable other
property Property and
equipment Investment properties
Jan 19 2,668 1,067 597 610 4,941 1,568
Additions 109 74 63 148 395 120
Disposals -100 -74 -131 -332 -637 -26
Acquisition of subsidiaries 11 3 4 0 18 0
Disposal of subsidiaries 0 0 0 0 0 -7
Reclassification -32 0 7 -1 -26 26
Assets held for sale -120 -19 0 0 -138 -3
Currency translation 4 -1 -1 2 3 -1
Dec 19 2,540 1,050 538 427 4,555 1,678
Additions 170 54 57 117 399 44
Disposals -218 -127 -30 -124 -499 -34
Acquisition of subsidiaries 0 2 0 0 2 16
Disposal of subsidiaries 0 0 0 -2 -3 0
Reclassification -26 2 0 0 -25 26
Assets held for sale -41 0 0 0 -41 -34
Currency translation -30 -9 -8 -8 -56 -12
Dec 20 2,393 970 557 410 4,331 1,684
Rights of use: property, equipment and investment properties
in EUR million Land and buildings
Office and plant equipment/other
fixed assets IT assets
(hardware) Movable other
property Property and
equipment Investment properties
Jan 19 404 2 1 2 410 21
Additions 152 1 1 1 155 6
Disposals -13 -1 -1 -2 -17 0
Acquisition of subsidiaries 1 2 0 0 3 0
Disposal of subsidiaries 0 0 0 0 0 0
Reclassification 0 0 0 0 0 0
Assets held for sale -2 0 0 0 -2 0
Currency translation 0 0 0 0 0 0
Dec 19 541 5 2 2 550 27
Additions 121 1 0 0 122 34
Disposals -36 -1 0 0 -37 -1
Acquisition of subsidiaries 1 0 0 0 1 0
Disposal of subsidiaries -1 0 0 0 -1 0
Reclassification 0 0 0 0 0 0
Assets held for sale 0 0 0 0 0 0
Currency translation -13 0 0 0 -14 0
Dec 20 613 4 2 2 621 60

245
Accumulated depreciation Own property, equipment and investment properties
in EUR million Land and buildings
Office and plant equipment/other
fixed assets IT assets
(hardware) Movable other
property Property and
equipment Investment properties
Jan 19 -1,217 -763 -443 -225 -2,648 -409
Amortisation and depreciation -70 -58 -58 -58 -243 -27
Disposals 69 65 133 161 427 9
Acquisition of subsidiaries -3 -2 -3 0 -8 0
Disposal of subsidiaries 0 0 0 0 0 7
Impairment -9 -4 0 -8 -22 -6
Reversal of impairment 2 0 0 0 2 1
Reclassification 14 3 -4 1 14 -13
Assets held for sale 59 18 0 0 77 1
Currency translation -4 1 1 -1 -3 0
Dec 19 -1,159 -740 -374 -131 -2,404 -436
Amortisation and depreciation -69 -61 -59 -48 -236 -26
Disposals 155 122 31 43 352 12
Acquisition of subsidiaries 0 -1 0 0 -1 -3
Disposal of subsidiaries 0 0 0 2 3 0
Impairment -16 -2 0 -50 -68 -8
Reversal of impairment 9 0 0 0 9 1
Reclassification 15 0 0 0 15 -15
Assets held for sale 28 0 0 16 44 13
Currency translation 16 7 6 4 33 3
Dec 20 -1,021 -674 -395 -164 -2,253 -459
Rights of use: property, equipment and investment properties
in EUR million Land and buildings
Office and plant equipment/other
fixed assets IT assets
(hardware) Movable other
property Property and
equipment Investment properties
Jan 19 0 0 0 0 0 0
Amortisation and depreciation -70 -1 0 0 -72 -2
Disposals 2 0 0 0 2 0
Acquisition of subsidiaries -2 0 0 0 -2 0
Disposal of subsidiaries 0 0 0 0 0 0
Impairment 0 0 0 0 0 0
Reversal of impairment 0 0 0 0 0 0
Reclassification 0 0 0 0 0 0
Assets held for sale 0 0 0 0 0 0
Currency translation 0 0 0 0 0 0
Dec 19 -70 -1 0 0 -72 -2
Amortisation and depreciation -85 -1 -1 0 -87 -2
Disposals 12 0 0 0 12 0
Acquisition of subsidiaries 0 0 0 0 0 0
Disposal of subsidiaries 0 0 0 0 0 0
Impairment -2 0 0 0 -2 -1
Reversal of impairment 0 0 0 0 0 0
Reclassification 0 0 0 0 0 0
Assets held for sale 0 0 0 0 0 0
Currency translation 2 0 0 0 2 0
Dec 20 -143 -1 -1 -1 -146 -5
Carrying amounts Own property, equipment and investment properties
in EUR million
Land and buildings (used
by the Group)
Office and plant equipment/other
fixed assets IT assets
(hardware) Movable other
property Property and
equipment Investment properties
Dec 19 1,381 310 165 296 2,152 1,241
Dec 20 1,372 296 162 247 2,077 1,225
Rights of use: property, equipment and investment properties
in EUR million
Land and buildings (used
by the Group)
Office and plant equipment/other
fixed assets IT assets
(hardware) Movable other
property Property and
equipment Investment properties
Dec 19 471 4 1 1 478 25
Dec 20 470 3 1 1 475 55

246
Total carrying amounts
in EUR million
Land and buildings (used
by the Group)
Office and plant equipment/other
fixed assets IT assets
(hardware) Movable other
property Property and
equipment Investment properties
Dec 19 1,852 314 166 298 2,629 1,266
Dec 20 1,842 299 163 248 2,552 1,280
The carrying amount of investment properties include properties subject to operating leases in the amount of EUR 1,227.4 million (2019: EUR 1,200.4 million). Investment properties with a carrying amount of EUR 425.7 million (2019: EUR 429.4 million) are pledged as collaterals. Investment properties with a carrying amount of EUR 563.0 million (2019: EUR 551.4 million) are subject to the Austrian Non-Profit Housing Act (Wohnungsgemeinnützigkeitsgesetz) and hence are subject to the specific rules in respect of sale and use of these prop-erties. The carrying amount of property and equipment includes properties subject to operating leases in the amount of EUR 360.6 million (2019: EUR 411.1 million). In the reporting period, expenditures in the amount of EUR 147.4 million (2019: EUR 93.2 million) are capitalised in the carrying amount of fixed assets and investment properties during their construction. The contractual commitments for purchase of fixed assets are EUR 74.2 million (2019: EUR 82.6 million). In 2020, land and buildings were impaired in the amount of EUR 9.8 million in Romania (2019: EUR 7.2 million in Romania and Slowakia). As of 31 December 2020, the recoverable amount of these impaired assets amounted to EUR 12.3 million (2019: EUR 26.8 million). Fair values and fair value hierarchy of investment properties in EUR million Carrying amount Fair value Level 1 Level 2 Level 3
Dec 20
Assets for which the FV is disclosed in the notes
Investment property 1,038 1,114 0 0 1,114
Dec 19
Assets for which the FV is disclosed in the notes
Investment property 1,061 1,205 0 0 1,205
The fair values are determined by experts with recognised and relevant professional qualification. Fair values of commercial real estate in Austria and CEE owned by Erste Group through Austrian companies are based on valuation reports relying essentially, but not solely, on observable market inputs (such as selling price per square meter charged in recent market observable transactions for similar assets). For all other property owned by Erste Group through subsidiaries located in CEE countries the valuations are carried out mainly using the comparative and investment methods. Assessment is made on the basis of a comparison and analysis of appropriate comparable investment and rental transactions, together with evidence of demand within the vicinity of the relevant property. The characteristics of such similar transactions are then applied to the asset, taking into account size, location, terms, covenant and other material factors. The book value related to investment properties for which no disclosure according to IFRS 13 is required amounts to EUR 242 million as of 31 December 2020 (2019: EUR 205 million). The corresponding fair value amounts to EUR 318 million (2019: EUR 209 million). 39. Intangible assets Goodwill Goowill arises from business combinations whereby a subsidiary is acquired. Subsequently, goodwill is carried at cost as established on the acquisition date, less accumulated subsequent impairment losses, if any. For more details on measurement of goodwill at the acquisition date refer to Note 46 Subsidiaries. Other intangible assets Erste Group’s intangible assets other than goodwill include computer software and customer relationships, the brand and other intangible assets. An intangible asset is recognised only when its cost can be measured reliably and it is probable that the expected future economic benefits that are attributable to it will flow to the bank. Intangible assets are measured on initial recognition at cost, including transaction costs. Costs of internally generated software are capital-ised if Erste Group can demonstrate the technical feasibility and intention of completing the software, the ability to use it, how it will generate probable economic benefits, the availability of resources and the ability to measure the expenditures reliably. Following initial recognition, intangible assets are carried at cost less any accumulated amortisation and any accumulated impairment losses. The cost of intangible assets acquired in a business combination is their fair value as of the acquisition date. In the case of Erste Group, these are brands and customer relationships, and they are capitalised on acquisition if they can be measured with sufficient reliability.

247
Intangible assets with finite lives are amortised over their useful economic lives using the straight-line method. The amortisation period and method are reviewed at least at each financial year-end and adjusted if necessary. The amortisation expense on intangible assets with finite lives is recognised in the statement of income under the line item ‘Depreciation and amortisation’. Useful lives in years
Computer software 4-8
Customer relationships 10-20
Brands have been impaired to nil carrying amount. As a result, they are not being amortised. Impairment of intangible assets including goodwill Impairment of intangible assets is based on the same requirements as described in Note 36 Property, equipments and investment properties. It is typical of intangible assets that they do not generate cash inflows that are largely independent of those from other assets. As a result, the impairment test is carried out at the level of the cash-generating unit (CGU) to which the asset belongs. Goodwill is tested for impairment annually in November, or whenever there is an indication of possible impairment during the year, with any impairment determined recognised in profit or loss. The impairment test is carried out for each cash-generating unit (CGU) to which goodwill has been allocated. A CGU is the smallest identifiable group of assets that generates cash inflows that are largely independent of the cash inflows from other assets or groups of assets. Goodwill is tested for impairment by comparing the recoverable amount of each CGU to which goodwill has been allocated with its carrying amount. The carrying amount of a CGU is based on the amount of net asset value allocated to the CGU taking into account any goodwill and intangible assets recognised at the time of business combination if they are allocated to the CGU. The recoverable amount is the higher of a CGU’s fair value less costs of disposal and its value in use. When available, the fair value less costs of disposal is determined based on recent transactions, market quotations or appraisals. The value in use is determined using a dis-counted cash flow model (DCF model), which incorporates the specifics of the banking business and its regulatory environment. In deter-mining value in use, the present value of future earnings distributable to shareholders is calculated. The estimation of future earnings distributable to shareholders is based on financial plans for the CGUs as agreed by the management while taking into account the fulfilment of the respective regulatory capital requirements. The planning period is five years. Any forecasted earnings beyond the planning period are derived on the basis of the last year of the planning period and a long-term growth rate. The present value of such perpetual earnings growing at a stable rate (referred to as terminal value) takes into consideration macroeconomic parameters and economically sustainable cash flows for each CGU. The cash flows are determined by subtracting the annual capital requirement generated by a change in the amount of risk-weighted assets from the estimated future earnings. The capital requirement was defined through the target tier 1 ratio in light of the expected future mini-mum regulatory capital requirements. The value in use is determined by discounting the cash flows at a rate that takes into account present market rates and the specific risks of the CGU. The discount rates have been determined based on the capital asset pricing model (CAPM). According to the CAPM, the discount rate comprises a risk-free interest rate together with a market risk premium that itself is multiplied by a factor that represents the systematic market risk (beta factor). Furthermore, a country-risk premium component is considered in calculation of the discount rate. The values used to establish the discount rates are determined using external sources of information. When the recoverable amount of a CGU is less than its carrying amount, the difference is recognised as an impairment loss in the statement of income under the line item ‘Other operating result’. The impairment loss is allocated first to write down the CGU’s goodwill. Any remaining impairment loss reduces the carrying amount of the remaining individual assets of the CGU, though not to an amount lower than their fair value less costs of disposal. No impairment loss is recognised if the recoverable amount of the CGU is higher than or equal to its carrying amount. Impairment losses relating to goodwill cannot be reversed in future periods. The goodwill included in the acquisition cost of investments in associates and joint ventures is not tested separately. Instead, the entire carrying amount of the investment is tested for impairment as a single asset by comparing its recoverable amount (higher of value in use and fair value less costs of disposal) with its carrying amount (after application of the equity method) whenever relevant objective evidence of impairment is identified. Such evidence includes information about significant changes with an adverse effect that have taken place in the technological, market, economic or legal environments in which associates and joint ventures operate, indicating that the cost of the investment may not be recovered. The analysis on the recoverability of non-financial assets in the context of the Covid-19 pandemic is explained in section ‘Accounting treatment of issues related to Covid-19’ in the chapter ‘Significant accounting policies’.

248
Acquisition and production costs
in EUR million Goodwill Customer
relationships Brand Software acquired
Self-constructed software within
the Group
Others (licenses,
patents, etc.) Total
Jan 19 3,867 755 277 1,509 453 333 7,194
Additions 0 0 0 146 76 12 233
Disposals 0 0 0 -83 -15 -4 -102
Acquisition of subsidiaries 0 0 0 0 0 5 5
Disposal of subsidiaries 0 0 0 0 0 0 0
Reclassification 0 0 0 -2 -1 3 0
Assets held for sale 0 0 0 0 0 0 0
Currency translation -53 -16 -7 -1 -1 0 -78
Dec 19 3,814 739 270 1,569 511 349 7,252
Additions 0 0 0 129 70 13 213
Disposals -3,124 -570 -267 -11 -30 -6 -4,008
Acquisition of subsidiaries 0 0 0 0 0 0 0
Disposal of subsidiaries -3 0 0 0 0 -1 -3
Reclassification 0 0 0 -1 -2 2 -1
Assets held for sale 0 0 0 0 0 0 0
Exchange-rate changes -25 -10 -3 -43 -1 -4 -85
Dec 20 662 159 0 1,644 549 353 3,367
Accumulated depreciation
in EUR million Goodwill Customer
relationships Brand Software acquired
Self-constructed software within
the Group
Others (licenses,
patents, etc.) Total
Jan 19 -3,154 -694 -277 -1,099 -226 -236 -5,687
Amortisation and depreciation 0 -9 0 -114 -52 -23 -197
Disposals 0 0 0 80 15 3 98
Acquisition of subsidiaries 0 0 0 0 0 -4 -4
Disposal of subsidiaries 0 0 0 0 0 0 0
Impairment -165 0 0 -2 -3 0 -170
Reversal of impairment 0 0 0 0 0 0 0
Reclassification 0 0 0 0 0 -1 -1
Assets held for sale 0 0 0 0 0 0 0
Currency translation 53 15 7 0 0 0 76
Dec 19 -3,267 -687 -270 -1,134 -266 -260 -5,884
Amortisation and depreciation 0 -8 0 -106 -53 -23 -189
Disposals 3,124 570 267 23 8 6 3,998
Acquisition of subsidiaries 0 0 0 0 0 0 0
Disposal of subsidiaries 0 0 0 0 0 1 1
Impairment 0 0 0 -2 -1 0 -2
Reversal of impairment 0 0 0 0 0 0 0
Reclassification 0 0 0 -1 0 1 0
Assets held for sale 0 0 0 0 0 0 0
Currency translation 25 9 3 28 0 3 68
Dec 20 -118 -117 0 -1,191 -311 -272 -2,008
Carrying amounts
in EUR million Goodwill Customer
relationships Brand Software acquired
Self-constructed software within
the Group
Others (licenses,
patents, etc.) Total
Dec 19 547 51 0 435 246 89 1,368
Dec 20 544 42 0 452 238 81 1,359
The contractual commitments for the purchase of intangible assets amounted to EUR 1.8 million (2019: EUR 11.2 million). As of 31 De-cember 2020 the customer relationship Ringturm Kapitalanlagegesellschaft m.b.H. amounted to EUR 32.1 million (2019: EUR 36.2 mil-lion). The remaining amortization period of the customer relationship in Ringturm Kapitalanlagegesellschaft m.b.H. was 7.8 years. Goodwill The goodwill of Česká spořitelna a.s. (‘CSAS’) was assessed for objective evidence of impairment on a quarterly basis in 2020. Due to the Covid-19 pandemic, impairment indicators were identified and therefore impairment tests were performed for the first and second quarter during 2020. The recoverable amount was always higher than the carrying amount, so no impairment was required. For this CGU, also the annual goodwill impairment test was performed for the year-end 2020. Due to the increased uncertainty in financial planning in the current economic environment caused by the Covid-19 pandemic, Erste Group derived additional planning scenarios for performing the impairment tests. In addition to the most probable base case-scenario which is weighted with 60% probability, a best case-scenario and a worst case-scenario with 20% probability each was defined.

249
Impairment assessment of goodwill in 2019 In 2019 the goodwill of Slovenská sporiteľňa a.s. (‘SLSP’) was impaired as of 31 December 2019. This impairment was triggered by an extension and increase of the Slovak banking tax which led to a decline in projected results. For Česká spořitelna a.s. (‘CSAS’) no objective evidence of impairment was identified during the year, therefore the annual goodwill impairment assessment for the year 2019 was carried out for this CGU. Carrying amount and material parameters used for the impairment test per subsidiary (CGU) for significant goodwills CSAS
Carrying amount of goodwill as of 1 January 2020 (in EUR million) 544
Effect of exchange rate changes for the year 2020 (in EUR million) 0
Basis upon which recoverable amount has been determined Value in Use (discounted cash flow model based)
Key interest input parameters into the discounted cash flow model Risk Free Rate, Terminal Growth Rate, β Factor, Market Risk Premium
Description of approach to determining value assigned to risk free rate
Risk Free Rate has been set at -0.23% p.a. throughout relevant Group's CGUs based on relevant financial statistics published by Deutsche Bundesbank as at the reference date 31 October 2020.
Description of approach to determining values assigned to terminal growth rate
For non-Austrian (CEE) CGUs: Terminal Growth Rate has been equated to 3.00%, representing the recommended cap level for the Terminal Growth Rate, as per the report ESMA/2013/2 ‘European Enforcers Review of Impairment of Goodwill and Other Intangible Assets in the IFRS Financial Statements’ published by the European Securities and Markets Authority (ESMA).
Description of approach to determining values assigned to β factor
Set as the median value of a group of levered β factors attributable to a sample of ‘peer banks’ representative of the tested banks (CGUs), as published by Capital IQ as of the reference date 31 October 2020.
Description of approach to determining values assigned to market risk premium
Set at 8.03% throughout relevant Group's CGUs based on published evaluations by the Austrian Chamber of Commerce (Kammer der Steuerberater und Wirtschaftsprüfer).
Period of cash flow projection (years) 5 years (2021 - 2025); extrapolation to perpetuity based on Terminal Growth Rate
Discount rate applied to cash flow projections (pre-tax) 13.2%
The value assigned to β Factor 1.17
Amount of goodwill impairment loss recognised in profit or loss for the year 2020 (in EUR million) 0
Post-impairment carrying amount of goodwill as of 31 December 2020 (in EUR million) 544
CSAS SLSP
Carrying amount of goodwill as of 1 January 2019 (in EUR million) 544 165
Effect of exchange rate changes for the year 2019 (in EUR million) 0 0
Basis upon which recoverable amount has been determined Value in Use (discounted cash flow model based)
Key interest input parameters into the discounted cash flow model Risk Free Rate, Terminal Growth Rate, β Factor, Market Risk Premium
Description of approach to determining value assigned to risk free rate
Risk Free Rate has been set at 0.13% p.a. throughout relevant Group's CGUs based on relevant financial statistics published by Deutsche Bundesbank as at the reference date 31 October 2019.
Description of approach to determining values assigned to terminal growth rate
For non-Austrian (CEE) CGUs: Terminal Growth Rate has been equated to 3.00%, representing the recommended cap level for the Terminal Growth Rate, as per the report ESMA/2013/2 ‘European Enforcers Review of Impairment of Goodwill and Other Intangible Assets in the IFRS Financial Statements’ published by the European Securities and Markets Authority (ESMA).
Description of approach to determining values assigned to β factor
Set as the median value of a group of levered β factors attributable to a sample of ‘peer banks’ representative of the tested banks (CGUs), as published by Capital IQ as of the reference date 31 October 2019.
Description of approach to determining values assigned to market risk premium
Set at 7.88% throughout relevant Group's CGUs based on published evaluations by the Austrian Chamber of Commerce (Kammer der Steuerberater und Wirtschaftsprüfer).
Period of cash flow projection (years) 5 years (2020 - 2024); extrapolation to perpetuity based on Terminal Growth Rate
Discount rate applied to cash flow projections (pre-tax) 13.7% 13.7%
The value assigned to β Factor 1.18 1.18
Amount of goodwill impairment loss recognised in profit or loss for the year 2019 (in EUR million) 0 165
Post-impairment carrying amount of goodwill as of 31 December 2019 (in EUR million) 544 0
For cash generating units outside the euro-zone, an inflation differential has been considered when determining the discount rates applicable to the related 2021-2025 cash flow projections. In respect to tested cash-generating units for which no goodwill impairment loss was determined as of 31 December 2020, the table below summarizes the outcome of the sensitivity analysis performed to determine by how much the key input parameters into the applied dis-counted cash flow models would need to vary in order to cause the unit’s calculated recoverable amount to equal its related carrying amount:

250
Dec 20 CSAS
Amount by which recoverable amount exceeds/fall short the carrying amount (in EUR million) 412
Risk free rate increase/decrease that would cause recoverable amount to equal carrying amount (basis points) 71
Terminal growth rate increase/decrease that would cause recoverable amount to equal carrying amount (basis points) -1,192
β factor increase/decrease that would cause recoverable amount to equal carrying amount (coefficient value) 0.088
Market risk premium increase/decrease that would cause recoverable amount to equal carrying amount (basis points) 61
Dec 19
Amount by which recoverable amount exceeds/fall short the carrying amount (in EUR million) 734
Risk free rate increase/decrease that would cause recoverable amount to equal carrying amount (basis points) 131
Terminal growth rate increase/decrease that would cause recoverable amount to equal carrying amount (basis points) -2,011
β factor increase/decrease that would cause recoverable amount to equal carrying amount (coefficient value) 0.167
Market risk premium increase/decrease that would cause recoverable amount to equal carrying amount (basis points) 111
40. Other assets in EUR million Dec 19 Dec 20
Prepayments 123 124
Inventories 198 171
Sundry assets 680 456
Other assets 1,001 751
In the line ‘Inventories’ real estate project developments and repossessed assets (mainly real estate) are disclosed. The impairment of inventories, shown as expense in the reporting period amounts to EUR 4.7 million (2019: EUR 2.0 million). The carrying amount of inventories carried at fair value less costs to sell amounts to EUR 50.4 million (2019: EUR 20.4 million). The cost of inventories recognised as expense in the reporting period amounts to EUR 16.3 million (2019: EUR 15.2 million). Fiduciary assets The Group provides trust and other fiduciary services that result in the holding or investing of assets on behalf of its clients. Assets held in a fiduciary capacity are not reported in the financial statements, as they are not the assets of Erste Group.

251
Leases
A lease is a contract, or part of a contract, that conveys the right to use an asset for a period of time in exchange for consideration. Erste Group as a lessor A finance lease is a lease that transfers substantially all the risks and rewards incidental to ownership of an asset. In the case of a finance lease, the lessor reports a receivable from the lessee under the line item ‘Finance lease receivables’. The receivable is equal to the present value of the contractually agreed payments taking into account any residual value. Interest income on the receivable is reported in the statement of income in the line item ‘Other similar income’ under ‘Net interest income’. In the case of operating leases, which are leases other than finance leases, the leased asset is reported by the lessor in ‘Property and equipment’ or in ‘Investment properties’ and is depreciated in accordance with the principles applicable to the assets involved. Lease income is recog-nised on a straight-line basis over the lease term in the statement of income under the line item ‘Rental income from investment properties and other operating leases’. Operating leases mainly include the leasing of commercial real estate, automobiles and small trucks. The lessor is mitigating the risk associated with any rights it retains in underlying assets. This is achieved especially by means of residual value guarantees, variable lease payments for use in excess of specified limits and buy-back agreements with third parties. An intermediate lessor accounts for the head lease and the sublease as two separate contracts. The intermediate lessor is required to classify the sublease as a finance or operating lease by reference to the right-of-use asset arising from the head lease. The vast majority of lease agreements in which Erste Group operates as a lessor are finance leases. Finance leases Erste Group leases both movable property and real estate to other parties under finance lease arrangements. For finance lease receivables included in this item, the reconciliation of the gross investment in leases to the present value of the minimum lease payments is as follows: in EUR million Dec 19 Dec 20
Outstanding lease payments 4,082 4,154
Non-guaranteed residual values 200 189
Gross investment 4,283 4,342
Unrealised financial income 316 250
Net investment 3,967 4,093
Present value of non-guaranteed residual values 181 168
Present value of outstanding lease payments 3,786 3,924
Maturity analysis by residual maturities
Dec 19 Dec 20
in EUR million Gross investment
Present value of outstanding lease
payments Gross investment
Present value of outstanding lease
payments
< 1 year 984 892 1,056 972
1-2 years 859 793 892 824
2-3 years 744 683 770 715
3-4 years 580 532 608 570
4-5 years 393 361 415 382
> 5 years 722 525 600 462
Total 4,283 3,786 4,342 3,924
During 2020, Erste Group recognised interest income on finance lease receivables in the amount of EUR 118.2 million (2019: EUR 118.3 million). Gains/losses from derecognition of finance lease receivables are recognized in line item ‘Gains/losses from derecog-nition of financial assets measured at amortised cost’ (Note 10). The Erste Group leases an office building and subleases it. The sublease is classified as finance lease because it is for the whole of the remaining term of the head lease. During 2020, income from subleasing right-of-use assets was recognised in the amount of EUR 3.5 million (2019: EUR 1,8 million).

252
Finance lease receivables Gross carrying amounts and credit loss allowances per impairment buckets
Gross carrying amount Credit loss allowances
in EUR million Stage 1 Stage 2 Stage 3 POCI Total Stage 1 Stage 2 Stage 3 POCI Total Carrying amount
Dec 20
General governments 358 1 16 0 374 -3 0 -2 0 -4 370
Credit institutions 4 0 0 0 4 0 0 0 0 0 4
Other financial corporations 66 7 0 0 73 0 0 0 0 0 73
Non-financial corporations 2,319 484 171 0 2,974 -11 -10 -70 0 -91 2,883
Households 739 56 15 0 810 -3 -2 -7 0 -12 798
Total 3,485 548 201 0 4,235 -17 -12 -78 0 -108 4,127
Dec 19
General governments 363 0 16 0 379 -2 0 0 0 -2 377
Credit institutions 1 0 0 0 1 0 0 0 0 0 1
Other financial corporations 71 0 0 0 71 0 0 0 0 0 71
Non-financial corporations 2,585 96 253 0 2,934 -10 -4 -106 0 -121 2,813
Households 747 21 15 0 783 -3 -1 -7 0 -11 772
Total 3,768 117 284 0 4,169 -15 -5 -114 0 -134 4,034
Movement in credit loss allowances
in EUR million As of Additions Derecognitions
Transfers between
stages
Other changes in credit risk
(net)
Insignificant modifications
(net) Write-offs Other As of
Jan 20 Dec 20
Stage 1 -15 -6 1 7 -4 0 0 0 -17
Stage 2 -5 0 0 -8 1 0 0 0 -12
Stage3 -114 0 35 -11 3 0 6 2 -78
POCI 0 0 0 0 0 0 0 0 0
Total -134 -6 36 -11 1 0 6 2 -108
Jan 19 Dec 19
Stage 1 -18 -6 0 4 5 0 0 0 -15
Stage 2 -3 0 0 -4 1 0 0 0 -5
Stage3 -130 0 3 -5 5 0 15 -1 -114
POCI 0 0 0 0 0 0 0 0 0
Total -151 -6 3 -5 11 0 15 -1 -134
In column ‘Additions’ increases of CLA due to the initial recognition of finance lease receivables during the current reporting period are disclosed. Releases of CLA following the derecognition of the related finance lease receivables are reported in column ‘Derecognitions’. In column ‘Transfers between stages’ CLA net changes due to changes in credit risk that triggered re-assignments of the related finance lease receivables from Stage 1 as of 1 January 2020 or initial recognition date to Stages 2 or 3 as of 31 December 2020 or vice-versa are reported. The effects of transfers from Stage 1 to Stages 2 or 3 on the related CLAs are adverse and presented in lines attributable to Stages 2 or 3. The effects of transfers from Stages 2 or 3 to Stage 1 on the related CLAs are favourable and presented in line ‘Stage 1’. The P&L-neutral effect from cross-stage transferring of the related CLA amounts recognized prior to stage re-assignments are presented above in column ‘Other changes in credit risk (net)’. Any other changes in credit risk which do not trigger a transfer between Stage 1 and Stage 2 or 3 or vice-versa are disclosed in column ‘Other changes in credit risk (net)’. This column also captures the passage-of-time adverse effect (‘unwinding correction’) over the lifetime expected cash shortfalls of finance lease receivables that were assigned to Stage 3 for any period throughout the year, as well as of any POCI finance lease receivables. This adverse effect amounted to EUR 4.4 million (2019: EUR 5.7 million) cumulatively for the year 2020, which also reflects the unrecognized interest income out of the related finance lease receivables throughout the year. The column ‘Insignificant modifications (net)’ reflects the effect on CLA arising from contractual modifications of finance lease receivables which do not trigger their full derecognition. The use of CLA triggered by full or partial write-offs of finance lease receivables is reported in column ‘Write-offs’. One significant driver of the CLA movements for the year has been the transfer of the related instruments across impairment stages. The year-end GCA of finance lease receivables that were assigned at 31 December 2020 to a different stage compared to 1 January 2020 (or to the initial recognition date, if originated during the year) are summarized below:

253
Transfers between stages in EUR million Dec 19 Dec 20
Transfers between Stage 1 and Stage 2
To Stage 2 from Stage 1 92 421
To Stage 1 from Stage 2 49 36
Transfers between Stage 2 and Stage 3
To Stage 3 from Stage 2 57 40
To Stage 2 from Stage 3 51 1
Transfers between Stage 1 and Stage 3
To Stage 3 from Stage 1 15 47
To Stage 1 from Stage 3 2 6
The year-end total GCA of the finance lease receivables that were initially recognized during the reporting period and not fully de-recognized by 31 December 2020 amounts to EUR 1,026.9 million (2019: EUR 1,017.2 million). The GCAs of the finance lease receivables that were held at 1 January 2020 and fully de-recognized during the year 2020 amounts to EUR 390.3 million (2019: EUR 62.2 million). Operating leases Under operating leases, Erste Group leases both real estate and movable property to other parties. Maturity analysis of lease payments from operating leases in EUR million Dec 19 Dec 20
< 1 year 129 175
1-2 years 106 115
2-3 years 93 98
3-4 years 75 73
4-5 years 63 58
> 5 years 137 122
Total 603 641
During 2020, Erste Group recognised income relating to variable lease payments in the amount of EUR 4.5 million (2019: EUR 4.8 million). For information about rental income please refer to Note 7 Rental income from investment properties and other operating leases. Leases where the Group is a lessee Under IFRS 16, a lessee recognises a right-of-use asset representing its right to use the underlying asset and a lease liability representing its obligation to make lease payments. There are recognition exemptions for short-term leases (less than 12 months) and leases of low-value items. The right-of-use asset is initially measured at cost. The cost comprises the amount of the initial measurement of the lease liability and also includes other elements such as initial direct costs incurred by the lessee. Subsequently, the right-of-use asset is depreciated to the earlier of the end of its useful life or the end of the lease term. Erste Group uses the straight-line method of depreciation. The right-of-use assets are presented on the balance sheet as part of ‘Property and equipment’ or, if they are subleased to third parties, for operating leases as part of ‘Investment properties’ and for finance leases as a ‘Finance lease receivable’. The lease liability is initially measured at the present value of the lease payments that are not paid at the commencement date, discounted using the interest rate implicit in the lease or, if the rate cannot be readily determined, the lessee’s incremental borrowing rate. Lease payments comprise fixed lease payments, variable lease payments that depend on an index or a rate, amounts expected to be payable under a residual value guarantee. Additionally, the exercise price under a purchase option and lease payments in an optional renewal period are considered if the lessee is reasonably certain to exercise the options. Extension and termination options are included in a number of real estate leases across Erste Group. The use of extension and termination options gives Erste Group added flexibility in case more suitable premises in terms of costs and/or location are identified or in case it is considered favourable to remain in a location beyond the original lease term. Subsequently, the carrying amount of the lease liability is increased by interest accrued using the applicable discount rate, reduced by lease payments made and remeasured to reflect any reassessment or lease modification. The incremental borrowing rate for movables consists of Euribor as a base rate, adjusted by a surcharge based on the entity’s rating, the amount of funds borrowed, the term of the lease and the collateral provided. The determination of the incremental borrowing rate for property leases is based on two components, the market rate and the single property rate. The market rate considers the lease term, creditworthiness and the base rate Euribor and is derived from existing bank data. The single property rate represents a surcharge to the market rate based on the quality of the single property. On the balance sheet the lease liabilities are presented in the line item ‘Lease liabilities’. Erste Group primarily rents real estate’s such as buildings and land for headquarters, branches and parking lots. In addition, movables such as IT equipment and ATMs are rented for business operations. For details related to right of use assets capitalized in balance sheet arising from leases where Erste Group is lessee, please see Note 38 Property, plant and equipment.

254
Maturity analysis of lease liabilities based on undiscounted cash flows in EUR million Dec 19 Dec 20
< 1 year 85 91
1-5 years 275 285
> 5 years 198 222
Total 558 598
During 2020, interest expenses on lease liabilities were recognised in the amount of EUR 7.0 million (2019: EUR 24.6 million). In addition expenses in the amount of EUR 4.1 million (2019: EUR 6.4 million) relating to short term leases and expenses amounting to EUR 5.3 million (2019: EUR 5.3 million) relating to leases of low value items, for which the recognition exemption of IFSR 16 applies, were recognised. Gains arising from sale and leaseback transactions in the amount of EUR 0.8 million (2019: EUR 3,5 million) were recognised. Total cash outflow for leases in 2020 was EUR 105.7 million (2019: EUR 100.0 million). Erste Group has commitments for future cash outflows which are not reflected in the measurement of lease liabilities as of 31 Decem-ber 2020. The total undiscounted cash flow amounts to EUR 71.7 million (2019: EUR 71.0 million). In 2019, Erste Group signed rental agreement amounting to EUR 71.0 million (without considering consumer price indexation) with commencement date April 2021 and lease term 15 years.

255
Accruals, provisions, contingent liabilities and legal proceedings
41. Other liabilities
in EUR million Dec 19 Dec 20
Deferred income 117 117
Sundry liabilities 2,252 2,115
Other liabilities 2,369 2,232
Deferred income outstanding at 31 December 2020 includes ‘contract liabilities’ in accordance with IFRS 15 in amount of EUR 109 million (2019: EUR 107 million). Revenue recognised in the reporting year 2020 that was included in the contract liability balance at the beginning of the period amounts to EUR 39 million (2019: EUR 38 million). The item ‘Sundry liabilities’ mainly contains outstanding settlement liabilities as well as other liabilities from employee benefits. 42. Provisions Provisions are recognised when the Group has a present obligation as a result of a past event, it is probable that an outflow of resources embodying economic benefits will be required to settle the obligation, and the amount of the obligation can be estimated reliably. On the balance sheet, provisions are reported under the line item ‘Provisions’. They include credit risk loss provisions (particularly for financial guarantees and loan commitments) as well as provisions for litigations and restructuring. Expenses or income related to provisions for loan commitments and financial guarantees are reported in the statement of income under the line item ‘Impairment result from financial instru-ments’. Expenses or income related to other provisions are reported in the statement of income under the line item ‘Other operating result’. Defined employee benefit plans Defined employee benefit plans operated by Erste Group are for pensions, severance and jubilee benefits. From IAS 19 categorisation perspective, pension and severance benefits qualify as post-employment defined benefits plans whereas jubilee benefits are other long-term employee benefits. In Austria, the defined benefit pension plans relate largely to retired employees. The pension obligations for current employees were trans-ferred to external pension funds. Remaining with Erste Group is a defined benefit obligation for entitlements of former employees who were already retired as of 31 December 1998 before the pension reform took effect and for those former employees who retired only in 1999 but remained entitled to a direct pension from Erste Group under individual agreements. Also included are entitlements to resulting survivor pensions. In addition, an already closed plan for a small number of active entitled employees exists entitling them to defined benefits from Erste Group upon reaching pension age. In the case of defined benefit pension plans in other countries, the commitments for active employees are primarily dependent on future salary increases, as well as on the expected entitlement date. Due to the nature of the commitment to the defined benefit pensioners, the future, regularly expected pension adjustments according to the collective agreement and the state pension are estimated and taken into consideration as deduction from the total pension. The inflation rate is not indicated separately, but implicitly represented in the assumption for the future collective agreement development. Employees of Austrian entities who started their employment before 1 January 2003, are entitled to receive a severance payment if their employment is terminated by the employer or if they retire. The amount to be paid depends on the number of years of service and the employee’s salary at termination of the employment. For employees who started their employment after 31 December 2002, a contribution-based system is provided. The contributions to external employee pension funds are recognised as expenses. Defined benefit plans include jubilee benefits. Jubilee provisions are special one-off payments stipulated in the collective agreement which are dependent on remuneration and duration of service. Eligibility is conditioned on a certain minimum duration of the employment. In addition, there are defined employee benefit plans for foreign subsidiaries and branches, mainly in Romania, Croatia, Serbia and Slovakia. Obligations ensuing from defined employee benefit plans are determined using the projected unit credit method. Future obligations are determined based on actuarial expert opinions. The calculation takes into account not only those salaries, pensions and vested rights to future pension payments known as of the balance sheet date but also anticipated future rates of increase in salaries and pensions. The liability recognised under a defined benefit plan represents the present value of the defined benefit obligation less the fair value of the plan assets available for the direct settlement of obligations. For all plans, the present value of the obligation exceeds the fair value of the plan assets. The resulting defined benefit liability is reported on the balance sheet under the line item ‘Provisions’. At Erste Group, the plan assets consist of qualifying insurance policies purchased to back severance and jubilee benefit provisions. Plan assets for pension provision are held by a long-term employee benefit fund.

256
Remeasurements consist of actuarial gains and losses on the defined benefit obligations and the return on plan assets. Remeasurements of pension and severance defined benefit plans are recognised as accumulated OCI in equity specifically under ‘Remeasurement of defined benefit plans’ in the statement of changes in equity. The change for the period is reported as OCI in the statement of comprehensive income in the line ‘Remeasurement of defined benefit plans’. Remeasurements of jubilee defined benefit plans are recognised in the statement of income under the line item ‘Personnel expenses’. The cost of the defined benefit pension plan is determined using an actuarial valuation. The actuarial valuation involves making assumptions about discount rates, expected rates of return on assets, future salary increases, mortality rates and future pension increases. Assumptions, estimates and sensitivities used for the defined benefit obligation calculations, as well as related amounts are disclosed in the section ‘Long-term employee provisions’. Financial guarantees In the ordinary course of business, Erste Group provides financial guarantees, consisting of various types of letters of credit and guarantees. A financial guarantee is a contract that requires the guarantor to make specified payments to reimburse the holder for a loss it incurs in case a specified debtor fails to make a payment when due in accordance with the original or modified terms of a debt instrument. Erste Group as a guarantor recognises financial guarantees as soon as it becomes a contracting party. Financial guarantees are initially measured at fair value. Generally, the initial measurement is the premium received for a guarantee. This amount is subsequently amortised to fee income. If no premium is received at contract inception (i.e. the initial transaction price is zero), this is the price that would be paid to transfer the liability in an orderly transaction between market participants. As a result, the fair value of such a financial guarantee and thus the initial measurement is nil. Subsequent to initial recognition, provisions are recognised based on the expected credit loss impairment model if the amount is higher than the unamortised balance of the initial premium. They are presented on the balance sheet under the line ‘Provisions’. The premium received is recognised in the statement of income under the line item ‘Fee and commission income’ under ‘Net fee and commission income’ on a straight-line basis over the life of the guarantee. If Erste Group is a guarantee holder, the treatment depends on whether the financial guarantee is considered as integral to the contractual terms of financial assets whose risk is guaranteed. Erste Group considers as integral those guarantees which are entered into at or close to the inception of the guaranteed financial assets. If the bank has in a loan contract an option to require provision of a guarantee, it is also considered as integral. Integral financial guarantees are included in the estimates of expected credit losses from the related financial assets. Premiums paid for integral financial guarantees and other credit enhancements are considered in the EIR of the related financial assets. Financial guarantees which are not considered integral are recognised as reimbursement assets under ‘Other assets’ in the balance sheet. In the statement of income they reduce the impairment loss incurred on guaranteed financial assets under ‘Impairment result from financial instruments’. A precondition for this treatment is that it must be virtually certain that the guarantee would reimburse the bank for the loss. Premiums paid for non-integral financial guarantees are presented in the statement of income under the line item ‘Fee and commission expense’ under ‘Net fee and commission income’. Significant accounting judgements, assumptions and estimates Recognition of provisions requires judgement with respect to whether Erste Group has a present obligation as a result of a past event and whether it is probable that an outflow of resources embodying economic benefits will be required to settle the obligation. Furthermore, estimates are necessary with respect to the amount and timing of future cash flows when determining the amount of provisions. Further details on provisions for off-balance credit risk exposures in Note 34 Credit risk. Legal proceedings that do not meet the criteria for recog-nition of provisions are described in Note 43 Contingent liabilities. in EUR million Dec 19 Dec 20
Long-term employee provisions 1,054 1,042
Pending legal issues and tax litigation 353 359
Loan commitments and financial guarantees given 293 399
CLA for loan commitments and financial guarantees in Stage 1 64 83
CLA for loan commitments and financial guarantees in Stage 2 75 211
CLA for loan commitments and financial guarantees - Defaulted 154 104
Other provisions 219 282
Provisions for onerous contracts 3 3
Other 216 279
Provisions 1,919 2,082

257
Long-term employee provisions
in EUR million Pensions Severance payments
Jubilee benefits Total
Present value of long-term employee benefit obligations − Dec 16 714 446 90 1,250
Present value of long-term employee benefit obligations − Dec 17 700 431 88 1,219
Present value of long-term employee benefit obligations − Dec 18 750 445 97 1,292
Increase 1 0 0 1
Decrease 0 0 0 0
Settlements/curtailments 0 0 0 0
Service cost 1 15 7 23
Interest cost 15 4 1 20
Payments -64 -34 -5 -103
Exchange rate difference 1 0 0 0
Other changes -1 5 0 4
Actuarial gains/losses recognised in OCI
Adjustments in financial assumptions 81 57 0 137
Adjustments in demografic assumptions 0 0 0 0
Experience adjustments 8 6 0 14
Actuarial gains/losses recognised in PL
Adjustments in financial assumptions 0 0 14 14
Adjustments in demografic assumptions 0 0 0 0
Experience adjustments 0 0 -2 -2
Present value of long-term employee benefit obligations − Dec 19 791 497 113 1,400
Obligations covered by plan assets 27 258 62 347
Obligations covered by provisions 764 239 51 1,054
Less fair value of plan assets 27 258 62 347
Provisions − Dec 19 764 239 51 1,054
Present value of long-term employee benefit obligations − Dec 19 791 497 113 1,400
Increase 0 0 0 0
Decrease 0 0 0 0
Settlements/curtailments 2 0 0 1
Service cost 1 12 8 22
Interest cost 8 5 1 14
Payments -64 -43 -5 -112
Exchange rate difference -3 0 0 -4
Other changes 0 0 0 0
Actuarial gains/losses recognised in OCI
Adjustments in financial assumptions 33 26 0 59
Adjustments in demografic assumptions 0 0 0 0
Experience adjustments 7 -5 0 2
Actuarial gains/losses recognised in PL
Adjustments in financial assumptions 0 0 5 5
Adjustments in demografic assumptions 0 0 0 0
Experience adjustments 0 0 -2 -2
Present value of long-term employee benefit obligations − Dec 20 774 493 119 1,386
Obligations covered by plan assets 28 251 65 344
Obligations covered by provisions 746 242 54 1,042
Less fair value of plan assets 28 251 65 344
Provisions − Dec 20 746 242 54 1,042

258
Actuarial assumptions For Austrian entities the actuarial calculation of pension obligations is based on the following assumptions: in % Dec 19 Dec 20
Interest rate 0.95 0.50
Expected increase in retirement benefits 2.00 2.00
The expected retirement age for each employee was individually calculated on the basis of the changes set out in the Budget Implementation Act of 2003 (Austrian Federal Law Gazette Vol. I No. 71/2003) regarding the increase in the minimum retirement age. The currently appli-cable legislation on the gradual raising of the retirement age for men and women to 65 was taken into consideration. For Austrian entities the actuarial calculation of severance payment and jubilee benefits is based on the following assumptions: in % Dec 19 Dec 20
Interest rate 0.95 0.50
Average increase in salary (incl. career trend and collective agreement trend) 2.90 2.90
The interest rate applied for the calculation of the long-term employee provisions is derived from the yield of a portfolio of AA-rated corporate bonds. For this purpose the weighted average yield of the underlying portfolio with a corresponding duration is determined. For the non-Austrian subsidiaries and branches interest rates between 0.01% (2019: 0.4%) and 3.7% (2019: 4.45%) were used. The legal retirement age is in a range between 61 years for women and 65 years for men. Obligations were calculated based on mortality tables entitled ‘AVÖ 2018–P – Rechnungsgrundlagen für die Pensionsversicherung’ or comparable mortality tables. Movements in plan assets
in EUR million Pensions Severance payments
Jubilee benefits Total
Fair value of plan assets − Dec 18 22 235 54 311
Addition 0 0 0 0
Interest income on plan assets 0 4 1 5
Contributions by the employer 1 33 11 45
Benefits paid -1 -21 -6 -27
Actuarial gains/losses recognised in OCI 5 7 0 12
Actuarial gains/losses recognised in PL 1 0 1 2
Fair value of plan assets − Dec 19 27 258 62 347
Addition 0 0 0 0
Interest income on plan assets 0 2 1 3
Contributions by the employer 0 26 9 35
Benefits paid -3 -31 -5 -40
Actuarial gains/losses recognised in OCI 3 -4 0 -1
Actuarial gains/losses recognised in PL 1 0 0 1
Fair value of plan assets − Dec 20 28 251 65 344
In 2021, the expected contributions for the severance and jubilee benefit obligations will amount to EUR 9.0 million (2020: EUR 9.6 mil-lion). The contributions shown in the table include not only regular contributions but also one-time payments at the end of the year. The total gain on plan assets amounted to EUR 2.8 million (2019: gain EUR 18.8 million). Investment strategy The primary investment strategy of Erste Group is the continuous optimization of plan assets and the effective coverage of existing entitle-ments. The Group works with professional fund managers for the investment of plan assets. The Investment Fund Act applies as a require-ment with respect to specific investment guidelines relating to the investment of plan assets. Additionally, the Investment Committee which is composed of senior staff in the financial sector and representatives of the S-Versicherung and Erste Asset Management meets once a year. Erste Group’s severance payments and jubilee payments are partially covered by the fair value of plan assets, while defined benefit pension plans are not financed with segregated assets. Majority of defined benefit pension plans only exist for already retired employees. Majority of pension plans are dedicated to former employees of Austrian entities of Erste Group and are unfunded. Major part of the plans (sum over severance payments, defined benefit pension plans and jubilee payments) are not matched with dedicated assets. For the yearly pension payments of the unfunded defined benefit plans and the unfunded part of severance payments Erste Group generally takes care within its asset-liability management strategy covering the funding plan and interest rate risk position of the Group. The payments for 2021 are expected with EUR 79 million (2020: EUR 86 million) for both plans.

259
The average duration of these provisions is assumed to be for severance payments 11.67 years (2019: 11.51 years) and 8.86 years (2019: 8.89 years) for defined benefit pension plans. Control and risk The effective allocation of plan assets is determined by the administering body including the relevant existing economic and market conditions as well as considering specific risks of the individual asset classes and the risk profile. Moreover the Investment Committee is responsible for monitoring the mandate guidelines and the investment structure, the supervision, which may arise from regulatory or other legal requirements, as well as the monitoring of demographic changes. As an additional steering tool the fund management generates a report, which is transmitted on a quarterly basis to the Group. Overall, the Group tries to minimize the impact caused by market movements on the pension plans. Asset allocation in the different asset classes
Dec 19 Dec 20
in EUR million Europe-
EMU Europe-
non EMU USA Other
countries Total Europe-
EMU Europe-
non EMU USA Other
countries Total
Cash and cash equivalents 0 0 0 0 20 105
Equity instruments 5 5 40 11 61 1 1 22 8 32
Investment-grade bonds
Government 56 23 5 29 113 1 0 0 0 1
Non-government bonds 16 10 19 11 55 13 4 4 2 22
Non-investment-grade bonds
Government 0 1 14 22 37 2 0 0 0 2
Non-government bonds 17 5 14 8 45 101 20 8 38 167
Alternatives
Commodities 0 0 0 0 0 0 0 0 0 0
Other 0 0 1 8 8 0 0 0 0 0
Derivatives (market risk)
Interest rate risk 0 0 0 0 0 0 0 0 0 0
Credit risk 0 0 0 0 0 0 0 0 0 0
Equity price risk 0 0 0 0 0 0 0 0 0 0
Foreign exchange risk 0 0 0 0 0 0 0 0 0 0
Other 0 0 0 0 7 0 0 0 0 15
Plan assets 0 0 0 0 347 0 0 0 0 344
In the table above, Investment-grade refers to BBB and above. The plan assets shown in the table above include mainly assets that are quoted and traded on active markets. As of 31 December 2020, the plan assets did not include material amounts of securities issued by the Group or other claims upon it. Moreover none of the mortgage securities used by the Group are included. Effects of defined post-employment benefit plans in profit or loss in EUR million Dec 19 Dec 20
Settlements/curtailments 0 -1
Service cost -23 -22
Net interest -15 -11
Total -38 -35
Settlements and curtailments as well as service costs are included in the income statement in the line item ‘Personnel expenses’. Net interest includes interest expenses for long-term employee benefits as well as the expected return on plan assets.These are disclosed in the income statement in the line item ‘Other similar income’ and ‘Other similar expense’ under ‘Net interest income’. As of 31 December 2020, the cumulative amount of remeasurement from defined benefit plans, recognised in other comprehensive income amounted to EUR -843.8 million before tax (2019: EUR -782.9 million). Sensitivity to key assumption The following table presents a sensitivity analysis for each significant actuarial assumptions showing how the defined benefit obligation would have been affected by changes in the relevant actuarial assumptions that were reasonably possible at the balance sheet.
Dec 19 Dec 20
in EUR million Pensions Severance payments Total Pensions
Severance payments Total
Change in discount rate +0.5% 758 470 1,228 741 466 1,207
Change in discount rate -0.5% 827 526 1,353 809 523 1,332
Change in future salary increases +0.5% 791 526 1,317 774 522 1,296
Change in future salary increases -0.5% 791 470 1,261 774 466 1,240
Change in future benefit increases +0.5% 849 497 1,346 830 493 1,323
Change in future benefit increases -0.5% 737 497 1,234 721 493 1,214
Increase in survival rate by approx. 10% 853 0 853 838 0 838

260
Impact on cash flows Benefits expected to be paid by the defined benefit plans in each of the respective periods
in EUR million Pensions Severance payments Total
2021 59 20 79
2022 55 18 73
2023 52 22 74
2024 49 22 71
2025 45 20 65
2026-2030 179 124 303
Duration Weighted average duration of the defined-benefit obligations
Dec 19 Dec 20
in years Pensions Severance payments Total Pensions
Severance payments Total
Duration 8.89 11.51 9.84 8.86 11.67 9.96
The weighted average duration is affected by changes in longevity and in the mortality table. Sundry provisions Movement in credit loss allowances for loan commitments and financial guarantees
in EUR million As of Additions Derecognitions Transfers
between stages Other changes in
credit risk (net) Other As of
Jan 20 Dec 20
Stage 1 64 214 -69 -82 -42 -1 83
Stage 2 75 0 -78 174 47 -7 211
Defaulted 154 22 -55 7 28 -52 104
Total 293 236 -202 99 33 -60 399
Jan 19 Dec 19
Stage 1 76 148 -56 -54 -49 -2 64
Stage 2 58 0 -29 78 -34 2 75
Defaulted 196 1 -102 8 51 0 154
Total 329 149 -186 33 -31 0 293
In column ‘Additions’ increases of CLA due to the initial recognition of loan commitments and financial guarantees during the current reporting period are disclosed. Releases of CLA following the derecognition of the related loan commitments and financial guarantees are reported in column ‘Derecognitions’. In the column ‘Transfers between stages’ CLA net changes due to changes in credit risk that triggered re-assignments of the related loan commitments and financial guarantees from Stage 1 (at 1 January 2020 or initial recognition date) to Stages 2 or Defaulted at 31 December 2020 or vice-versa are reported. The effects of transfers from Stage 1 to Stages 2 or Defaulted on the related CLAs are adverse and presented in lines attributable to Stages 2 or Defaulted. The effects of transfers from Stages 2 or Defaulted to Stage 1 on the related CLAs are favour-able and presented in line ‘Stage 1’. The P&L-neutral effect from cross-stage transferring of the related CLA amounts recognized prior to stage re-assignments are presented above in column ‘Other changes in credit risk (net)’. This column also captures the passage-of-time adverse effect (‘unwinding’) over the lifetime expected cash shortfalls of defaulted loan commitments and financial guarantees. One significant driver of the CLA movements for the year has been the transfer of the related instruments across different stages. The year-end notional amounts of loan commitments and financial guarantees that were assigned at 31 December 2020 to a different stage compared to 1 January 2020 (or to the initial recognition date, if originated during the year) are summarized below: Transfers between stages in EUR million Dec 19 Dec 20
Transfers between Stage 1 and Stage 2 1,644 5,321
To Stage 2 from Stage 1 1,044 4,684
To Stage 1 from Stage 2 600 637
Transfers between Stage 2 and Defaulted 19 72
To Defaulted from Stage 2 12 32
To Stage 2 from Defaulted 8 40
Transfers between Stage 1 and Defaulted 99 65
To Defaulted from Stage 1 79 45
To Stage 1 from Defaulted 20 20
The year-end nominal amounts of unused off-balance commitments and financial guarantees that were initially recognized during the year 2020 and not fully de-recognized by 31 December 2020 amounts to EUR 14,165.7 million (2019: EUR 11,918.6 million). The nominal

261
amounts of unused off-balance commitments or financial guarantees that were held at 1 January 2020 and fully de-recognized during the year 2020 amounts to EUR 7,915.1 million (2019: EUR 7,397.3 million). Sundry provisions 2020
in EUR million Jan 20 Allocations Use Releases Unwind of
discount
Exchange rate and other changes Dec 20
Pending legal issues and tax litigation 353 37 -8 -17 0 -5 359
Commitments and guarantees given out of scope of IFRS9 17 101 0 -105 0 63 76
Other provisions 202 36 -13 -15 0 -4 206
Provisions for onerous contracts 3 0 -1 0 0 0 3
Other 199 36 -13 -15 0 -4 204
Provisions 571 174 -21 -137 0 54 641
Jan 19 Dec 19
Pending legal issues and tax litigation 332 73 -13 -37 0 -2 353
Commitments and guarantees given out of scope of IFRS9 14 19 -1 -17 0 1 17
Other provisions 48 277 -18 -105 0 -1 202
Provisions for onerous contracts 3 0 0 0 0 0 3
Other 46 277 -18 -105 0 -1 199
Provisions 394 369 -32 -159 0 -1 571
Under position ‘Pending legal issues and tax litigation’ provisions related to litigations from lending business, asset management or litiga-tions with customer protection associations, which normally occur in banking business, are disclosed. In 2020, the increase of provision for risks related to Romanian Consumer Protection Claims Act was recognized in income statement in amount of EUR 6.2 million (2019: release EUR 6.1 million). The total amount of the provision as of 31 December 2020 was EUR 122.8 million (2019: EUR 118.8 million). The level of other provisions is the best possible estimate of expected outflow of economic benefits at the reporting date, while taking into account the risks and uncertainties underlying the commitment to fulfill the obligation. Risks and uncertainties are taken into account in the estimate. During 2019 a provision in the amount of EUR 153.3 million was allocated for losses expected from a decision of the Romanian High Court in relation to the business activities of the Romanian building society subsidiary BCR Banca pentru Locuinte SA. (BPL). The related provision is disclosed in line ‘Other provisions’. This case is about whether state subsidies had been disbursed to building society clients in accordance with the applicable legal provisions. The provision was determined based on the expected amount that should be returned to the Romanian State, consisting of state premiums, interest and penalties. The duration of these proceeding cannot be estimated reliably. The total amount of the provision as of 31 December 2020 amounted to EUR 141.6 million (2019: EUR 144.3 million). 43. Contingent liabilities To meet the financial needs of customers, the bank enters into various irrevocable commitments and contingent liabilities. Even though these obligations may not be recognised on the balance sheet, they do involve credit risk and are therefore part of the overall risk of the Bank (see Note 34 Credit risk). Legal proceedings Erste Group Bank AG and some of its subsidiaries are involved in legal disputes, most of which have arisen in the course of ordinary banking business. These proceedings are not expected to have a significant negative impact on the financial position or profitability of Erste Group or Erste Group Bank AG. Erste Group is also subject to the following ongoing proceedings, some of which, if adversely adjudicated, may have a significant impact on the financial position or profitability of Erste Group or Erste Group Bank AG. Any possible financial impacts of these proceedings are not disclosed, as neither the duration nor the outcome can be reliably estimated and to avoid influencing the outcome of the various proceedings. Consumer protection claims Several subsidiaries of Erste Group have been named in their respective jurisdictions as defendants in a number of lawsuits and in regulatory proceedings, filed by individual customers, regulatory authorities or consumer protection agencies and associations. Some of the lawsuits are class actions. The proceedings mainly relate to allegations that certain contractual provisions, particularly in respect of consumer loans, violate mandatory consumer protection laws and regulations and principles of general civil law and that certain fees or parts of interest payments charged to customers in the past must be repaid. The allegations relate to the enforceability of certain fees as well as to contractual provisions for the adjustment of interest rates and currencies. In some jurisdictions, the legal risks in connection with loans granted in the past are also increased by the enactment of politically-motivated laws impacting existing lending relationships, which may result in repay-ment obligations towards customers, as well as a level of unpredictability of judicial decisions beyond the level of uncertainty generally inherent in court proceedings. The following consumer protection issues are deemed particularly noteworthy.

262
In Romania, BCR is, aside from being a defendant in a number of individual law suits filed by consumers, among several local credit institutions pursued by the consumer protection authority for allegedly abusive clauses pertaining to pre-2010 lending practices. In connec-tion therewith, BCR is currently a defendant in individual litigation claims filed by the local consumer protection authority, in each case on behalf of a single or several borrowers. Only a part of these cases have so far been finally decided by the courts, only few of them with an adverse result for BCR and with rather limited impact so far. Adverse judgments on the validity of certain clauses may have the impact of invalidating such clauses also in other similar agreements concluded by BCR with other consumers. In Croatia, the Supreme Court of Croatia, in a proceeding initiated by a local consumer protection association against several credit institu-tions, among them Erste Bank Croatia, declared in 2015 that Swiss Franc (CHF) clauses in loan agreements with consumers are valid, but contractual provisions permitting unilateral change of the variable interest rates in CHF denominated consumer loans, used by the majority of credit institutions until 2008, are null and void. In 2016, the Croatian Constitutional Court rescinded the part of the Supreme Court of Croatia decision relating to the validity of CHF clauses. After the case had been returned for a retrial with respect to the CHF clause to the court of second instance, such court delivered its decision in 2018, declaring in essence the nullification of the CHF currency clause, holding that collective and individual consumer rights were breached. However, no specific obligation of the bank was ordered by the verdict. In 2019 the Supreme Court rejected the appeal of the credit Institutions against the 2018 decision. The impact of this decision on legal disputes with individual clients related to CHF denominated loan agreements is difficult to predict, especially in light of the laws enacted in 2015 that forced credit institutions to accept requests from clients that are consumers or individual professionals to convert their CHF denominated loans into EUR with retroactive effect. In Austria, Erste Bank der oesterreichischen Sparkassen AG (‘EBOe’) is a defendant in legal proceedings in which the Verein für Kon-sumenteninformation (‘VKI’) is, challenging in collective actions (Verbandsklagen) the validity of a number of clauses in EBOe’s general terms and/or contract forms for a number of bank products, claiming that they are not transparent or violate other provisions of consumer protection laws or general principles of civil law and EBOe should discontinue the use of these clauses or of synonymous clauses and should no longer invoke these clauses. CSAS minority shareholders claims Following the completion of a squeeze-out procedure in CSAS resulting in Erste Group Bank AG becoming the sole shareholder of CSAS, some former minority shareholders of CSAS have filed legal actions with the courts in Prague. In the case against CSAS the plaintiffs aim in essence at invalidating the shareholders´ resolution approving the squeeze-out. In the proceedings against Erste Group Bank AG the plaintiffs allege in essence that the share price of 1.328 CZK (then ca. 51 Euro per share) paid by Erste Group Bank AG in the squeeze-out of the CSAS minority shareholders in 2018 was unfair and too low and should be increased. In case the courts find there should be an increase, this would affect all minority shareholders squeezed-out. In the squeeze-out performed in 2018 Erste Group Bank AG acquired a total of 1.03% of minority shares for a consideration of ca. EUR 80 million. Erste Group Bank AG views that the purchase price, established by a valuation done by professional external experts, was correct and fair.

263
Capital instruments, equity and reserves
44. Total equity
in EUR million Dec 19 Dec 20
Subscribed capital 860 860
Additional paid-in capital 1,478 1,478
Retained earnings and other reserves 11,792 12,267
Owners of the parent 14,129 14,604
Additional equity instruments 1,490 2,733
Non-controlling interests 4,857 5,073
Total 20,477 22,410
As of 31 December 2020, subscribed capital (also known as registered capital) consists of 429,800,000 (2019: 429,800,000) voting bearer shares (ordinary shares). The pro rata amount of registered capital, per no-par value share, was EUR 2.00. Additional paid-in capital (or share premium) represents the amount by which the issue price of the shares exceeded their par value. Retained earnings and other reserves represent accumulated net profit brought forward, as well as income and expenses recognised in other comprehensive income. Additional equity instruments In addition Erste Group Bank AG issued additional tier 1 capital (AT1 bonds). AT1 bonds are perpetual and can be cancelled only by the issuer at predetermined dates. The bonds include discretionary non-cumulative coupon payments. AT1 bonds issued
Nominal value Currency Issue Initial fixed rate Reset rate after the first call date Coupon payments
First and subsequent calls dates
500 million EUR June 2016 8,875% 5Y swap +9.02% Semi-annually on 15th April and 15th October
15.10.2021 + coupon dates thereafter
500 million EUR April 2017 6.5% 5Y swap +6,204% Semi-annually on 15th April and 15th October
15.04.2024 + coupon dates thereafter
500 million EUR March 2019 5,125% 5Y swap +4,851% Semi-annually on 15th April and 15th October
15.10.2025 + coupon dates thereafter
500 million EUR January 2020 3,375% 5Y swap +3,433% Semi-annually on 15th April and 15th October
15.04.2027 + coupon dates thereafter
750 million EUR November 2020 4.25% 5Y swap +4,646% Semi-annually on 15th April and 15th October
15.10.2027 + coupon dates thereafter
If common equity tier 1 ratio of Erste Group or Erste Group Bank AG falls below 5.125% (i.e. a trigger event occurs) the principal amount will be written down (fully or partially) on a temporary basis. The issuer may, at its sole discretion, write up the amount (fully or partially) provided a positive profit has been recorded and the trigger event no longer exists. Distributions on own equity instruments Distributions on own equity instruments are recognised as a liability and deducted from equity when their payment is confirmed. For dividends on common shares the decision is taken by the Annual General Meeting. For coupons on Additional Tier 1 instruments the payouts do not need approvals but an event of non-payment would require a decision of Erste Group Bank AG Board. Changes in number of outstanding shares Dec 19 Dec 20
Shares outstanding as of 1 January 408,617,137 408,127,137
Acquisition of treasury shares -7,677,249 -7,517,744
Disposal of treasury shares 7,187,249 4,861,317
Shares outstanding as of 31 December 408,127,137 405,470,710
Treasury shares 21,672,863 24,329,290
Number of shares issued as of 31 December 429,800,000 429,800,000
Weighted average number of outstanding shares 426,565,097 426,324,725
Weighted average diluted number of outstanding shares 426,565,097 426,324,725
In addition to the calculation of the annual average number of shares outstanding by incorporation of acquisitions and disposals of treasury shares during the year, the line items ‘weighted average number of outstanding shares’ and ‘weighted average diluted number of outstanding shares’ consider a proportionate allocation of the treasury shares held by non-controlling interests. Treasury shares and contracts on treasury shares Equity instruments of Erste Group that it or any of its subsidiaries acquire (referred to as treasury shares) are deducted from equity. Con-sideration paid or received on the purchase, sale, issue or cancellation of Erste Group’s own equity instruments, including transaction costs, is recognised directly in equity. No gain or loss is recognised in profit or loss or OCI on the purchase, sale, issue or cancellation of own equity instruments.

264
Transactions and shares held by the management board and supervisory board The shares of management- and supervisory board member, whose office term began or ended during the financial year, held as at the date of inception or termination of their term in office were recognized as additions or disposals. Shares and related dividends held by management board
Managing board member Dec 19 Additions Disposals Dec 20
Dividends received in
2020 (in EUR)
Spalt Bernhard (Chairman) 5,000 5,000 0 10,000 0
Abrahamyan Ara 0 510 0 510 0
Bleier Ingo 3,111 0 0 3,111 0
Bosek Peter 1,500 0 0 1,500 0
Dörfler Stefan 800 700 0 1,500 0
Habeler-Drabek Alexandra 72 0 0 72 0
O’Mahony David 0 0 0 0 0
Shares and related dividends held by supervisory board
Supervisory board member Dec 19 Additions Disposals Dec 20
Dividends received in
2020 (in EUR)
Rödler Friedrich (Chairman) 2,202 300 0 2,502 0
Homan Jan (1st Vice Chairman) 4,400 0 0 4,400 0
Hardegg Maximilian (2nd Vice Chairman) 240 0 0 240 0
Bulach Matthias 0 0 0 0 0
Egerth-Stadlhuber Henrietta 0 0 0 0 0
Grießer Martin (until 21 January 2021) 14 0 14 0 0
Griss Gunter (until 10 November 2020) 0 0 0 0 0
Gual Solé Jordi 0 0 0 0 0
Haag Markus 176 0 0 176 0
Haberhauer Regina 188 0 0 188 0
Khüny Marion 0 0 0 0 0
Krainer Senger-Weiss Elisabeth 0 0 0 0 0
Lachs Andreas 0 0 0 0 0
Pichler Barbara 309 0 0 309 0
Pinter Jozef 0 0 0 0 0
Rasinger Wilhelm (until 10 November 2020) 24,303 500 24,803 0 0
Santner Friedrich (since 10 November 2020) 0 0 0 0 0
Simor András (since 10 November 2020) 0 0 0 0 0
Stack John James 32,761 0 0 32,761 0
Sutter-Rüdisser Michèle F. 0 0 0 0 0
Zeisel Karin 38 0 0 38 0
As of 31 December 2020, supervisory board members did not hold options in Erste Group Bank AG shares. Persons related to members of the management board or supervisory board held 111 shares (2019: 3,412 shares) of Erste Group Bank AG. Remaining authorised and contingent capital as of 31 December 2020 Clause 5 of the articles of association authorises the management board to increase the registered capital with the consent of the supervisory board until 24 May 2023 – also in several tranches – by an amount of up to EUR 343,600,000 by issuing up to 171,800,000 voting no-par value bearer shares in return for contributions in cash and/or in kind, with the issue price and the issuing conditions being determined by the management board with the consent of the supervisory board. Furthermore, the management board is authorized to fully or partly exclude the statutory subscription right of the shareholders with the consent of the supervisory board if the capital increase is in return for a cash contribution and the shares issued while excluding the subscription right of the shareholders, taken together, do not exceed EUR 43,000,000; and/or if the capital increase is in return for contributions in kind. The measures in sections 5.1.1 (capital increase against cash contribution) to 5.1.2 (capital increase against contributions in kind) can also be combined. The aggregate pro rata amount of registered capital represented by shares in respect of which the shareholders’ subscription rights are excluded under this authorization in section 5.1 (authorized capital), together with the pro rata amount of registered capital at-tributable to shares to which conversion or subscription rights or obligations relate under bonds which were issued and sold on the basis of the authorization in section 8.3, subject to an exclusion of subscription rights, on or after 24 May 2018 must not, however, exceed the proportionate amount of EUR 171,920,000. Clause 6.3 of the articles of association states that conditional capital based on the resolutions of the management board in 2002 and 2010 (both approved by the supervisory board) with a nominal value of EUR 21,923,264 persists that can be consumed by issuing up to 10,961,632 ordinary bearer shares or ordinary registered shares (ordinary share) with an issue price of at least EUR 2.00 per share against cash contribution and by excluding the subscription rights of the current shareholders. This conditional capital is used for granting options to staff, management and members of the management board of the entity of one of its related undertakings.

265
Under clause 6.4 of the articles of association, the company has conditional capital of EUR 124,700,000.00 available, which may be utilized by issuing up to 62,350,000 pieces bearer shares. This conditional capital can be used for granting conversion or subscription rights to holders of convertible bonds. In case the terms and conditions of the convertible bonds provide for a mandatory conversion, it shall also serve to cover the mandatory conversion. The issue price and exchange ratio shall be determined pursuant to a recognized pricing method on the basis of accepted finance-mathematical methods and the share price of the company. According to clause 7 of the articles of association, currently no authorized conditional capital exists. 45. Non controlling interest
Haftungsverbund Savings Banks, thereof:
in EUR million Total Sparkasse
Oberösterreich Sparkasse Steiermark
Sparkasse Kärnten
Dec 20
Country of incorporation Austria Austria Austria Austria
Place of business Austria Austria Austria Austria
Main business activity Banking Banking Banking Banking
Ownership% held by NCI 50.1%-100% 60% 75% 75%
Reporting currency EUR EUR EUR EUR
Dividends paid to equity holders of the parent 2 0 0 0
Net result attributable to non-controlling interests 175 31 44 8
Accumulated NCI 4,480 540 1,096 237
Subsidiary-level stand-alone key financial information
Current assets 26,874 6,554 5,581 1,522
Non-current assets 48,556 8,341 10,934 3,137
Current liabilities 56,282 9,021 13,192 3,348
Non-current liabilities 12,824 4,904 1,781 964
Operating income 1,665 300 349 109
Profit or loss from continuing operations 297 60 82 20
Total comprehensive income 47 18 29 -2
Dec 19
Country of incorporation Austria Austria Austria Austria
Place of business Austria Austria Austria Austria
Main business activity Banking Banking Banking Banking
Ownership% held by NCI 50.1%-100% 60% 75% 75%
Reporting currency EUR EUR EUR EUR
Dividends paid to equity holders of the parent 33 5 9 4
Net result attributable to non-controlling interests 356 30 73 13
Accumulated NCI 4,317 508 1,018 228
Subsidiary-level stand-alone key financial information
Current assets 23,561 5,203 5,003 1,236
Non-current assets 46,391 8,062 9,376 3,154
Current liabilities 49,396 7,865 11,339 3,076
Non-current liabilities 14,238 4,449 1,575 967
Operating income 1,710 307 352 112
Profit or loss from continuing operations 584 79 154 35
Total comprehensive income 493 64 118 35

266
Scope of consolidation
As at 31 December 2020, Erste Group Bank AG, as parent entity of Erste Group, includes in its IFRS scope of consolidation a total of 353 subsidiaries (31 December 2019: 379). This includes a total of 47 local savings banks which, alongside Erste Group Bank AG and Erste Bank der oesterreichischen Sparkassen AG, are members of the Haftungsverbund (cross-guarantee system) of the Austrian savings bank sector. In 2014, following the implementation of the new agreements of the cross-guarantee system (please refer to Note 46. Subsidiaries) and the related financial support of the members, an ‘ex-ante fund’ was established. The fund is managed by a civil law company named IPS GesbR. The assets of the fund – the members of the cross-guarantee system are required to pay into the fund over a period of ten years - are bound and can be used solely for the purpose to cover loss events of members of the cross-guarantee system. The company IPS GesbR was included in the scope of consolidation in year 2014. Additions and disposals 2020. Additions and disposals had no material impact on the financial position and performance of the Group. Additions in 2019. On 28 February 2019 Steiermärkische Bank und Sparkassen AG signed a share purchase agreement with Société Générale S.A. (SocGen) for the acquisition of 74.53% of the share capital (384,844 shares) of Ohridska Banka AD Skopje (OBS) in North Macedonia. OBS is a North Macedonian based business bank, which offers a range of services in corporate and retail business as well as brokerage services. This transaction enables Steiermärkische Sparkasse to significantly strengthen its existing market position in North Macedonia. After approval by the European Central Bank (ECB) and the National Bank of the Republic of North Macedonia, the application for the acquisition to the Macedonian Securities and Markets Authority (SEC) was filed, the acquisition process was started and a purchase offer was made to all shareholders. The closing took place on 4 November 2019. On this reporting date, the OBS was included in Erste Group’s consolidated financial statements. Additionally taking into account the shares from free float, a total of 91.57% of share capital with voting rights (472,839 shares) were acquired. Furthermore, supplementary capital of OBS was taken over from SocGen. As of 31 December 2019, the measurement period for the business combination has not yet been completed. Due to the complexity of the analyses to be performed and the focus on the rapid implementation of immediately necessary integration steps, the purchase price allocation in 2019 was carried out on a preliminary basis. The finalisation of the business combination during the fourth quarter of 2020 did not lead to a significant change of the fair value of the net assets as identified as of the date of first consolidation. The identifiable assets acquired and liabilities assumed, measured at fair value, had the following composition from the time of initial consolidation:
in EUR million Carrying amount
Fair value adjustment Fair value
Cash and cash balances 173.5 0.0 173.5 Financial assets at fair value through other comprehensive income 10.9 0.0 10.9 Financial assets at amortised cost 489.0 -6.3 482.7 Property and equipment 13.2 -2.1 11.1 Intangible assets 1.3 0.0 1.3 Current tax assets 0.6 0.0 0.6 Other assets 1.5 0.0 1.5 Total assets 690.0 -8.4 681.6 Financial liabilities measured at amortised cost 608.4 0.0 608.4 Provisions 1.7 3.7 5.4 Tax liabilities 0.0 0.0 0.0 Other liabilities 3.7 0.0 3.7 Total liabilities 613.9 3.7 617.6 Subscribed capital 22.2 0.0 22.2 Additional paid-in capital 5.7 0.0 5.7 Retained earnings and other reserves 41.8 -12.1 29.7 Net result attributable to owners of the parent 6.4 0.0 6.4 Total equity 76.2 -12.1 64.0 Total liabilities and equity 690.0 -8.4 681.6
The fair value adjustments relate to credit risk valuations and the land and buildings acquired in the course of the OBS acquisition, which were valued on the basis of an appraisal report. The fair value of the acquired loans at the acquisition date amounted to EUR 455.2 million. The total gross contractual amount of these receivables was EUR 491.9 million. The best estimate at the acquisition date of the contractual cash flows not expected to be collected amounts to EUR 36.5 million. The proportionate share of non-controlling interests in the fair value of the acquired net assets amounted to EUR 5.4 million. The cash consideration transferred for the shares acquired totaled EUR 31.9 million. In addition, acquisition related costs of EUR 2.2 mil-lion were recognised as expenses. Taking into account the fair value adjustments to the net assets, the transaction resulted in a gain from bargain purchase as follows:

267
in EUR million 2019
Purchase price excl. acquisition related expenses 31.9
Direct own interest of Steiermärkische Sparkasse in the net assets -58.6
Bargain purchase gain 26.7
The bargain purchase gain is presented in the statement of income under line item ‚Other operating result‘. The opportunity for this bargain purchase arose due to the decision of SocGen to dispose of bank investments in Southeastern Europe in order to concentrate its international activities as a retail bank on markets with higher market shares and greater synergy potential. Since the acquisition date, OBS’s contribution to Erste Group’s operating income amounted to EUR 4.3 million. The contribution to the net result for the period after taking into account the non-controlling interests amounted to EUR 4.0 million. If OBS had already been included in Erste Group’s consolidated financial statements as of 1 January 2019, the contribution to the operating income would have been EUR 27.1 million and the contribution to net result for the period after taking into account the non-controlling interests would have been EUR 10.4 million. Further additions to the consolidation scope had no material impact on the financial position and performance of the Group. Disposals in 2019. The disposals had no material impact on the financial position and performance of the Group. For further details regarding the scope of consolidation please refer to Note 56 Details of the companies wholly or partly owned by Erste Group as of 31 December 2020. 46. Subsidiaries A subsidiary is an entity controlled by another entity. All entities directly or indirectly controlled by Erste Group Bank AG are consolidated in the Group financial statements on the basis of their annual accounts as of 31 December 2020, and for the year then ended. Subsidiaries are consolidated from the date when control is obtained until the date when control is lost. Control is achieved when Erste Group is exposed to, or has rights to, variable returns from its involvement with the investee and has the ability to affect those returns through its power to direct the relevant activities of the investee. Relevant activities are those which most significantly affect the variable returns of an entity. The results of subsidiaries acquired or disposed of during the year are included in the consolidated statement of income and consolidated statement of comprehensive income from the date of acquisition or up to the date of disposal. The financial statements of the bank’s subsidiaries are prepared for the same reporting year as that of Erste Group Bank AG and using consistent accounting policies. All intra-Group balances, transactions, income and expenses as well as unrealised gains and losses and dividends are eliminated. Non-controlling interests represent those portions of total comprehensive income and net assets that are neither directly nor indirectly attributable to the owners of Erste Group Bank AG. Non-controlling interests are presented separately in the consolidated statement of income, in the consolidated statement of comprehensive income and within equity on the consolidated balance sheet. Acquisitions of non-controlling interests as well as disposals of non-controlling interests that do not lead to a change of control are accounted for as equity transactions, whereby the difference between the consideration transferred and the share in the carrying amount of the net assets acquired is recognised in equity. Control IFRS 10 ‘Consolidated Financial Statements’ defines the investor’s control over an investee in terms of the investor having all of the fol-lowing:
_ power to direct the relevant activities of the investee, i.e. activities that significantly affect the investee’s returns; _ exposure, or rights, to variable returns from its involvement with the investee; and _ the ability to use its power over the investee to affect the amount of the investor’s returns.
Hence, assessing the existence of control under this definition may require considerable accounting judgements, assumptions and estimates, notably in non-standard situations such as:
_ power stemming both from voting rights and from contractual arrangements (or mostly from the latter); _ exposure stemming both from on-balance investments and from off-balance commitments or guarantees (or mostly from the latter); or _ variable returns stemming both from readily identifiable income streams (e.g. dividends, interest, fees) and from cost savings, economies
of scale and/or operational synergies (or mostly from the latter).

268
In the case of Erste Group, such accounting judgements, assumptions and estimates have been primarily relevant for the assessment of the following cases: i. The savings bank members of the Austrian cross-guarantee system (Haftungsverbund)
Erste Group Bank AG is a member of the Haftungsverbund (cross-guarantee system) of the Austrian savings bank sector. As of the balance sheet date, all of Austria’s savings banks, in addition to Erste Group Bank AG and Erste Bank der oesterreichischen Sparkassen AG, formed part of this cross-guarantee system. The provisions of the agreement governing the Haftungsverbund are implemented by the steering com-pany Haftungsverbund GmbH. Erste Group Bank AG always holds directly and indirectly at least 51% of the voting rights of the steering company. The indirect voting rights are held through Erste Bank der oesterreichischen Sparkassen AG and through other savings banks in which companies of Erste Group hold the majority of voting rights. For all savings banks in which Erste Group holds less than 50% of the voting rights, an assessment of whether control is achieved through the provisions of the Haftungsverbund agreement has been performed. Based on the contractual agreement, Haftungsverbund GmbH as the steering company is vested with the following substantive rights related to the savings banks:
_ participation in the appointment of board members; _ approval of budgets including capital decisions; _ provision of binding guidelines in the areas of risk and liquidity management as well as internal audit; and _ determination of thresholds for capital requirement including the payment of dividends.
Furthermore, taking into account the magnitude of Erste Group’s involvement with the member banks – whether in the form of synergies, investments, commitments, guarantees, or access to common resources – the Group has significant exposure to each of the member banks’ variable returns. As Haftungsverbund GmbH is able to affect the variable returns through its power, it has been assessed that Haftungsver-bund GmbH has control over the savings banks. As Erste Group Bank AG controls the steering company, it exercises control over the members of the cross-guarantee system. ii. Investment funds under own management
The Group has assessed whether the investment funds it manages through its asset management subsidiaries are controlled and hence shall be consolidated. This assessment has been made on the basis that power over such investment funds is generally conferred based on the contractual arrangements appointing an Erste Group subsidiary as fund manager without any substantive removal rights by fund’s investors. Furthermore, Erste Group made the conclusive judgement that its exposure to such own-managed funds’ variable returns is basically con-sidered as significant if, additionally to the exposure through management fees, Erste Group is also exposed in the form of at least 20% investment in the fund. Furthermore, in its capacity as fund manager, Erste Group is also able to affect the returns of the funds through its power. Following this assessment, investment funds under own management in which Erste Group – directly or through its subsidiaries – has significant unit holdings (i.e. holds at least 20% of the units issued by the fund) are deemed to be controlled and included in the scope of consolidation. iii. Pension funds under own management
The Group has assessed whether the contractual arrangements appointing an Erste Group subsidiary as pension fund manager (with no substantive removal rights by the fund’s participants) are generally expected to confer power over such funds, followed by an assessment of the Group’s exposure/rights to the pension fund’s variable returns. The relevant legal requirements regulating the activities of such pension funds in their respective jurisdictions were also considered, notably in assessing the significance of the rights to variable returns from management fees, as well as of the exposure to losses from any guarantees that the fund manager may be legally bound to. As a result of this review, the Czech pension fund ‘Transformovaný fond penzijního připojištění se státním příspěvkem Česká spořitelna – penzijní společnost, a.s’ (the ‘Transformed pension fund’) is not consolidated. There are no further cases of application in Erste Group. Business combinations Business combinations are accounted for using the acquisition method. Goodwill represents the future economic benefits resulting from the business combination arising from assets that are not individually identified and separately recognised. Goodwill is measured as the excess of the sum of the consideration transferred, the amount of any non-controlling interests, and the fair value of the previously held equity interest over the net of the acquisition date amounts of the identifiable assets acquired as well as the liabilities assumed. At the acquisition date, the identifiable assets acquired and the liabilities assumed are generally recognised at their fair values. If, after reassessment of all components described above, the calculation results in a negative amount, it is recognised as a bargain purchase gain and reported in the statement of income under the line item ‘Other operating result’ in the year of acquisition. Upon business combinations, non-controlling interests are measured at the proportionate share of the acquiree’s identifiable net assets. Other types of non-controlling interests are measured at fair value or, when applicable, on the basis specified in another IFRS. Acquisition costs incurred are expensed and included under the statement of income line item ‘Other operating result’.
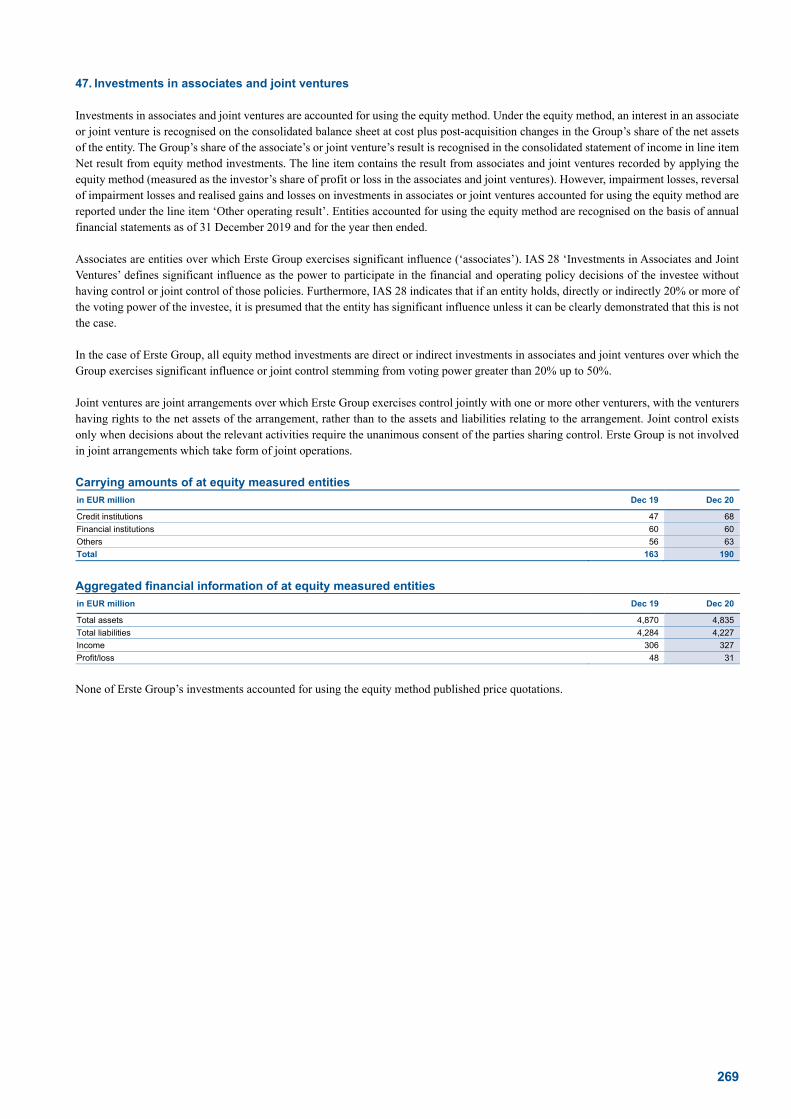
269
47. Investments in associates and joint ventures Investments in associates and joint ventures are accounted for using the equity method. Under the equity method, an interest in an associate or joint venture is recognised on the consolidated balance sheet at cost plus post-acquisition changes in the Group’s share of the net assets of the entity. The Group’s share of the associate’s or joint venture’s result is recognised in the consolidated statement of income in line item Net result from equity method investments. The line item contains the result from associates and joint ventures recorded by applying the equity method (measured as the investor’s share of profit or loss in the associates and joint ventures). However, impairment losses, reversal of impairment losses and realised gains and losses on investments in associates or joint ventures accounted for using the equity method are reported under the line item ‘Other operating result’. Entities accounted for using the equity method are recognised on the basis of annual financial statements as of 31 December 2019 and for the year then ended. Associates are entities over which Erste Group exercises significant influence (‘associates’). IAS 28 ‘Investments in Associates and Joint Ventures’ defines significant influence as the power to participate in the financial and operating policy decisions of the investee without having control or joint control of those policies. Furthermore, IAS 28 indicates that if an entity holds, directly or indirectly 20% or more of the voting power of the investee, it is presumed that the entity has significant influence unless it can be clearly demonstrated that this is not the case. In the case of Erste Group, all equity method investments are direct or indirect investments in associates and joint ventures over which the Group exercises significant influence or joint control stemming from voting power greater than 20% up to 50%. Joint ventures are joint arrangements over which Erste Group exercises control jointly with one or more other venturers, with the venturers having rights to the net assets of the arrangement, rather than to the assets and liabilities relating to the arrangement. Joint control exists only when decisions about the relevant activities require the unanimous consent of the parties sharing control. Erste Group is not involved in joint arrangements which take form of joint operations. Carrying amounts of at equity measured entities in EUR million Dec 19 Dec 20
Credit institutions 47 68
Financial institutions 60 60
Others 56 63
Total 163 190
Aggregated financial information of at equity measured entities in EUR million Dec 19 Dec 20
Total assets 4,870 4,835
Total liabilities 4,284 4,227
Income 306 327
Profit/loss 48 31
None of Erste Group’s investments accounted for using the equity method published price quotations.

270
Selected equity method investments where the Erste Group has strategic interest
Dec 19 Dec 20
in EUR million Prvá stavebná Global Payments
s.r.o. VBV - Betriebliche Altersvorsorge AG Prvá stavebná
Global Payments s.r.o.
VBV - Betriebliche Altersvorsorge AG
Country of Incorporation Slovakia Czech Republic Austria Slovakia Czech Republic Austria
Place of business Slovakia Czech Republic Austria Slovakia Czech Republic Austria
Main business activity Financing building
society Payment services Insurance Financing building
society Payment services Insurance
Ownership held % 35% 49% 30% 35% 49% 32%
Voting rights held % 35% 49% 27% 35% 49% 29%
IFRS Classification (JV/A) Associate Associate Associate Associate Associate Associate
Reporting currency EUR CZK EUR EUR CZK EUR
Investee's financial information for the reporting year
Cash and cash balances 1 13 6 1 20 6
Other current assets 583 47 13 171 28 16
Non-current assets 2,411 52 43 2,779 56 47
Current liabilities 693 38 0 657 20 0
Non-current liabilities 2,043 0 2 2,028 9 10
Operating Income 71 40 0 71 36 8
Post-tax result from continuing operations 17 8 10 8 3 7
Other comprehensive income 0 0 0 0 0 0
Total comprehensive income 17 8 10 8 3 7
Depreciation and amortization -5 -6 0 -6 -5 0
Interest income 93 0 0 89 0 0
Interest expense -35 -1 0 -29 -1 0
Tax expense/income -5 -3 0 -3 -1 0
Reconciliation of investee's net assets against equity investment's carrying amount
Net assets attributable to Erste Group 90 37 18 93 37 19
Accumulated impairment -46 0 0 -28 0 0
Carrying amount 45 37 18 65 37 19
The classification of current and non-current financial assets and liabilities is based on the expected remaining maturities of assets and liabilities. In 2020 the impairment of the investment in Prvá stavebná was partly reversed with EUR 17.5 million recognised as income in line item ‘Other operating result’. In 2019 the carrying amount of Prvá stavebná was impaired in the amount of EUR 46 million as a consequence of the extension and increase of the Slovak banking tax. The impairment loss was disclosed in line item ‘Other operating result’. Other equity method investments
Dec 19 Dec 20
in EUR million Associates Joint Ventures Associates Joint Ventures
Investees' aggregated key financial information
Post-tax result from continuing operations 6 6 7 7
Other comprehensive income 0 0 0 0
Total comprehensive income 6 6 7 7
Loan commitments, financial guarantees and other commitments given 0 0 0 0
0 0
Carrying amount 40 24 42 27
48. Unconsolidated structured entities IFRS 12 ‘Interests in Other Entities’ defines structured entities as entities that have been designed so that voting or similar rights are not the dominant factor in deciding who controls the entity, such as when any voting rights relate to the administrative tasks only, and the relevant activities are directed by means of contractual arrangements. IFRS 12 defines the interests as contractual and non-contractual involvements exposing an entity to the variability of returns from the performance of the other entity. Assessing which entities are structured entities, and which involvements in such entities are interests, may require considerable accounting judgements and assumptions. In the case of Erste Group, such accounting judgements, assumptions and estimates have been primarily relevant for assessing involvements with investment funds and securitisation vehicles. For investment funds, Erste Group reached the conclusion that direct Group exposure would typically indicate an interest in these structured entities, irrespective of whether such exposure comes from on-balance financial assets – mostly in the form of units held in such funds, off-balance commitments given or management fees varying in relation to the assets under management (for own-managed funds in general). As described under Note 46 Subsidiaries above, own-managed funds where the Group cumulatively holds less than 20% of the related fund units in issue are not consolidated due to lack of control and thus are subject to specific disclosures for unconsolidated structured entities.
271
Erste Group uses following structured entities in the course of its business activity. Investment funds Direct investments in own-managed and third-party-managed investment funds as well as management fees earned for the management of investment funds by subsidiaries of Erste Group are classified as interests in unconsolidated structured entities, if they are not consolidated. Direct investments in investment funds. Erste Group is invested in several mutual funds as well as in private investment funds which are registered in Austria, Central- and Eastern Europe or other countries. The majority of those funds is managed by subsidiaries of Erste Group, the smaller part of the funds being managed by independent third parties. The investments in funds held by Erste Group do not constitute material investments (basically below 20%) and mostly take the form of redeemable fund unit investments. They are measured at fair value on the Group’s balance sheet, and are disclosed as debt securities either under line item ‘Non-trading financial assets at fair value through profit or loss’ or ‘Financial assets held for trading’. Management fees. Moreover, Erste Group earnes management fees for providing investment management services as fund manager (by subsidiaries of Erste Group); meaning for making the investment decision for the funds under management of the relevant investment fund. Beside the management fees for the services as fund manager Erste Group also receives distributions for their investments in fund units. On the other side stand expenses for the administration of investment funds and fees for the business activity of investment funds, especially custodian fees and fees for securities trading transactions. In the normal course of business activity Erste Group enters into derivative transactions with own-managed unconsolidated investment funds. Moreover, own-managed unconsolidated investment funds are also in-vested - over different time periods - in debt securities issued by or deposits of Erste Group. In restricted cases Erste Group offers capital guarantees for own-managed unconsolidated investment funds. The magnitude of the Group’s equity interests in unconsolidated investment funds may vary in the future depending on the future perfor-mance of their respective underlying assets, relevant market circumstances and opportunities, or regulatory requirements. Securitization vehicles Erste Group is also involved as an investor in a number of unconsolidated securitization vehicles sponsored and managed by unrelated third parties in foreign jurisdictions. These interests are asset backed securities with the purpose to securitize certain assets, usually loan receivables, into tradeable interest-bearing securities. The securitization vehicles are financed by the issuance of different tranches of asset backed securities. Investors of those securities cover the default risk of the underlying assets. Erste Group is invested in tranches with investment grade, which are measured at fair value on the balance sheet. All investments in unconsolidated securitizations relates to bond investments maturing beyond 1 year. At year end the remaining, weighted average maturity of those debt securities is slightly more than 11.58 years. The interests in securitization vehicles include Collateralized Mortgage Obligations (CMO) and securitized student loans from the US, which will be disposed in the next years. Others To a lesser extent, Erste Group is also exposed (notably as lender) to unconsolidated structured entities having other business activities. The respective loans and advances are either measured at amortised cost or at fair value through profit or loss, depending whether they are SPPI-compliant or not. Maximum exposure to unconsolidated structured entities Erste Group’s maximum exposure to losses from its interests in unconsolidated structured entities is equal to the total fair value of its fund units, bond investments, trading derivative assets, provided loans and off-balance sheet commitments and guarantees as of the respective balance sheet date. The maximum exposure corresponds to the carrying amounts after risk provisions as of the balance sheet date. For off-balance sheet loan commitments and guarantees the maximum exposure corresponds to the respective nominal value. The table below summarises the Group’s business relations to unconsolidated structured entities per balance sheet line item, business activity and business location. The summary includes the assets identified as impaired at year-end, as well as related net impairment losses/gains incurred during the year. The carrying amounts of the exposures summarized below are mostly referring to assets already measured at fair value in the balance sheet of the Group. The carrying amounts of the remaining exposures (notably ‘Loans and advances’) are materially similar to their fair values.

272
Investment Funds Securitization vehicles
in EUR million Own-
managed Third-party
managed Total Own-
managed Third-party
managed Total Other Total
Dec 20
Assets
Equity instruments, thereof: 0 0 0 0 0 0 0 0
at FVPL 0 0 0 0 0 0 0 0
Debt securities, thereof: 650 79 728 0 41 41 0 770
Financial assets HfT 1 23 24 0 0 0 0 24
at FVPL 648 56 704 0 41 41 0 746
Loans and advances 9 0 9 0 0 0 49 58
Trading derivatives 16 0 16 0 0 0 0 16
Total assets 674 79 753 0 41 41 49 843
thereof impaired 0 0 0 0 0 0 0 0
On-balance sheet exposure analysis per jurisdiction
Austria 644 0 644 0 0 0 0 644
Central and Eastern Europe 30 6 35 0 0 0 49 84
Other jurisdictions 0 73 73 0 41 41 0 115
Liabilities
Equity instruments 87 0 87 0 0 0 0 87
Debt securities issued 232 0 232 0 0 0 0 232
Deposits 1,994 0 1,994 0 0 0 1 1,995
Trading derivatives 79 0 79 0 0 0 0 79
Total liabilities 2,392 0 2,392 0 0 0 1 2,393
Off balance-sheet commitments 131 0 131 0 0 0 0 131
Dec 19
Assets
Equity instruments, thereof: 0 0 0 0 0 0 9 9
at FVPL 0 0 0 0 0 0 9 9
Debt securities, thereof: 649 46 695 0 59 59 0 754
Financial assets HfT 6 8 14 0 0 0 0 14
at FVPL 643 39 681 0 59 59 0 741
Loans and advances 78 0 78 0 0 0 55 133
Trading derivatives 5 0 5 0 0 0 0 5
Total assets 732 46 778 0 59 59 64 901
thereof impaired 0 0 0 0 0 0 0 0
On-balance sheet exposure analysis per jurisdiction
Austria 685 0 685 0 0 0 0 685
Central and Eastern Europe 47 5 52 0 0 0 64 116
Other jurisdictions 0 41 41 0 59 59 0 100
Liabilities
Equity instruments 100 0 100 0 0 0 0 100
Debt securities issued 214 0 214 0 0 0 0 214
Deposits 1,785 0 1,785 0 0 0 2 1,787
Trading derivatives 47 0 47 0 0 0 0 47
Total liabilities 2,146 0 2,146 0 0 0 2 2,148
Off balance-sheet commitments 26 0 26 0 0 0 0 26

273
Other disclosure matters
49. Related-party transactions and principal shareholders In addition to principal shareholders, Erste Group also defines as related parties subsidiaries that are not consolidated due to non-materiality and associates that are included in the consolidated financial statements by the equity method. Furthermore, related parties consist of man-agement and supervisory board members of Erste Group Bank AG. Moreover, Erste Group defines close family members of management and supervisory board members of Erste Group Bank AG, as well as companies over which management and supervisory board members of Erste Group Bank AG have significant influence, as other related parties. Transactions between Erste Group Bank AG and fully consolidated companies are not recognised in the consolidated financial statements as they have been eliminated. Transactions with related parties are done at arm’s length. Principal shareholders The interests disclosed in the paragraph below relate to shares in capital. This is different to the ones presented in the Consolidated Financial Statements 2019, in which shares in voting rights have been presented. Therefore comparative figures are slightly different. As of 31 December 2020, DIE Erste österreichische Spar-Casse Privatstiftung (ERSTE Foundation), a foundation, holds together with its partners to shareholder agreements approximately 31.17% (2019: 30.39%) share capital of the subscribed capital of Erste Group Bank AG and is with 16.50% (2019: 15.96%) principal shareholder. The ERSTE Foundation is holding 5.90% (2019: 6.37%) of the share capital directly, the indirect participation of the ERSTE Foundation amounts to 10.60% (2019: 9.59%) of the share capital held by Sparkassen Beteiligungs GmbH & Co KG, which is an affiliated company of ERSTE Foundation. 1.67% (2019: 1.43%) of the share capital are directly held by saving banks foundations acting together with the ERSTE Foundation. 9.92% (2019: 9.92%) of the subscribed capital are held by the ERSTE Foundation on the basis of a shareholder agreement with CaixaBank S.A, 3.08% (2019: 3.08%) are held by other partners to other shareholder agreements. Erste Group did not distribute any dividends in 2020, for details please refer to Note 14 Appropriation of profit. Accordingly, ERSTE Foundation received no dividend on its stake in Erste Group Bank AG in 2020 (2019 EUR 67.5 million). The purpose of the ERSTE Foundation, to be achieved notably by way of the participating interest in Erste Group Bank AG, is to support social, scientific, cultural and charitable institutions as well as to generally promote the guiding principles of the savings bank philosophy. As of 31 December 2020, Mario Catasta (chairman), Boris Marte (vice chairman), Eva Höltl and Franz Portisch were members of ERSTE Foundation’s management board. The supervisory board of ERSTE Foundation had eight members at the end of 2020, two of whom are also members of the supervisory board of Erste Group Bank AG. Under article 15.1 of the articles of association, for the duration of its assumption of liability for all current and future debts in the event of default on payment by the company, the ERSTE Foundation is entitled, pursuant to Section 92 (9) of the Austrian Banking Act, to delegate up to one-third of the supervisory board members to be elected at the Annual General Meeting. Until now, the ERSTE Foundation has not exercised this right. As of 31 December 2020, Erste Group had in relation to the ERSTE Foundation accounts payable of EUR 10.7 million (2019: EUR 8.2 mil-lion). In addition, ERSTE Foundation held bonds issued by Erste Group Bank AG in the amount of EUR 7.2 million (2019: EUR 7.3 mil-lion). The above-mentioned transactions resulted in interest expenses of EUR 0.2 million (2019: EUR 0.3 million). As of 31 December 2020 CaixaBank S.A. with headquarters in Valencia, Spain held a total of 42,634,248 (2019: 42,634,248) Erste Group Bank AG shares, equivalent to 9.92% (2019: 9.92%) of the share capital of Erste Group Bank AG. One seat, for which CaixaBank S.A. has a nomination right according to the shareholders agreement, is occupied by Jordi Gual Sole (chairman of the board of CaixaBank S.A.), since the annual general meeting from 2017. The second seat for which CaixaBank S.A. has a nomination right according to the shareholders agreement is occupied by Matthias Bulach (member of the management board of CaixaBank S.A.) since the annual general meeting from 2019. In addition, the shareholders' agreement between CaixaBank S.A. and the ERSTE Foundation which had been in effect since 2009, was renewed on 15 December 2014 (Preferred Partnership Agreement). On the basis of this agreement, CaixaBank S.A. joined the ranks of the core shareholders, which include ERSTE Foundation as well as the savings banks, their foundations as well as Wiener Städtische Wechselseitige Versicherungsverein – Vermögensverwaltung – Vienna Insurance Group. As member of this syndicate, CaixaBank S.A. will abide by the recommendations of the ERSTE Foundation when electing new supervisory board members. Moreover CaixaBank S.A. gets the right to nominate a second member of the supervisory board. CaixaBank S.A. did not receive a dividend in 2020 for the financial year 2019 (2019 for financial year 2018: EUR 59.7 million).

274
Balances and off-balance exposures with related parties
Dec 19 Dec 20
in EUR million Subsidaries -
not consolidated Associated
entities Joint
ventures Subsidaries -
not consolidated Associated
entities Joint
ventures
Selected financial assets 143 555 209 118 531 223
Equity instruments 97 74 11 85 68 17
Debt securities 0 6 0 0 4 0
Loans and advances 45 474 198 34 460 206
Loans and advances credit institutions 0 1 0 0 0 0
Loans and advances customers 45 473 198 34 460 206
of which impaired 1 0 0 1 0 0
Selected financial liabilities 28 119 10 56 127 16
Deposits 28 119 10 56 127 16
Deposits from banks 0 10 0 0 0 0
Deposits from customers 28 109 10 56 127 16
Loan commitments, financial guarantees and other commitments given (notional amount) 20 190 51 18 172 59
of which defaulted 1 0 0 0 0 0
Loan commitments, financial guarantees and other commitments received (notional amount) 0 0 0 1 0 0
Derivatives (notional amount) 0 0 0 0 0 0
Credit loss allowances and provisions 13 0 0 12 0 0
Expenses/Income generated by transactions with related parties
1-12 19 1-12 20
in EUR million Subsidaries -
not consolidated Associated
entities Joint
ventures Subsidaries -
not consolidated Associated
entities Joint
ventures
Interest income 1 7 3 1 6 3
Fee and commission income 0 1 1 0 1 0
Dividend income 3 6 1 1 4 1
Rental income from operating leasing 0 0 0 0 0 0
Interest expenses 0 0 0 0 0 0
Fee and commission expenses -1 -2 0 -1 -2 0
Expenses from impairment of financial instruments -15 0 0 0 -2 0
Income from impairment of financial instruments 0 0 0 1 0 0
Remuneration of management and supervisory board members The following table shows total remuneration of the members of the management and supervisory board according to IAS 24.17. The expenses according to IAS 24 were recognized on an accrual basis in line with the respective rules of the underlying standards IAS 19 and IFRS 2. The amounts disclosed correspond to the estimated disbursement as of the balance sheet date and may deviate from the ones which will be finally paid.
1-12 19 1-12 20
in EUR thousand Management
board Supervisory
board Total Management
board Supervisory
board Total
Short-term employee benefits 6.114 1.489 7.603 5.952 1.635 7.588
Post-employment benefits 1.983 1.983 889 889
Other long-term benefits 249 249 7 7
Termination benefits 0 0
Share-based payment 5.302 5.302 4.421 4.421
Total 13.648 1.489 15.137 11.270 1.635 12.906
Short-term employee benefits. Under this category salaries, benefits in kind, social security contributions and other short-term benefits are included. Disclosed remuneration for supervisory board members comprises supervisory board compensation, meeting fees as well as remuneration for board functions in fully consolidated subsidiaries. Post-employment benefits. The members of the management board participate in the defined contribution pension plan of Erste Group according to the same principles as the employees of the Group (see Note 42 Provisons). Post-employment benefits shown in the table above contain contribution payments to pension schemes and to severance schemes (‘Mitarbeitervorsorgekasse’).
Other long-term benefits. Other long-term benefits mainly include net allocations to provisions for jubilee payments. (see Note 42 Pro-visions). Share-based payment transactions. Share-based payments are variable remuneration components, which – according to the remunera-tion policy of Erste Group – are deferred over a period of five years and may only be paid if regulatory requirements in respect of own funds and liquidity are met, both für Erste Group and Erste Group Bank AG. The amount paid is dependent on the average share price of Erste Group Bank AG in the year of payment (‘phantom shares’). Following the EBA-Statement on dividends distribution, share buybacks and variable remuneration, in order to achieve an appropriate alignment with risks stemming from the Covid-19 pandemic, a significant part of

275
the variable remuneration will be deferred for a longer period and entirely - depending on meeting minimum performance standards - be awarded in phantom shares. Accordingly, for performance year 2019, 100% of any variable remuneration of the management board in Erste Group Bank AG was granted in non-cash instruments only. The expense for the variable remuneration is accrued based on the estimated amount which will be decided by the Remuneration Committee in April of the following year. In balance sheet, the recognized provision is disclosed under line item ‘Provisions’. The amount of the liability is fixed in the next year. After the performance period the liability is measured by using the average stock price. Subsequent adjustments of the liability from changes in the share price are recognized in profit or loss. As of 31 December 2020, the valuation of the liability is based on the average weighted daily share price of Erste Group Bank AG of the year 2020 in the amount of EUR 21.81 (2019: EUR 32.08) per share. Pay-outs of firmly awarded share-equivalents are made after one-year vesting period. The outstanding amount of liability related to the performance period 2020 and unpaid deferred tranches from the previous years was EUR 8.7 million (2019: EUR 17.8 million). The members of the management board of Erste Group were granted a remuneration of 0.4% (2019: 0.5%) of the total personnel expenses for their activities in the financial year 2020. In 2020, EUR 9,205,553.01 (2019: EUR 1,941,320.82) was paid in cash and EUR 83,569 (2019: EUR 4,862) share-equivalents were as-signed to former board members and their dependents. The remuneration granted to the management board members complies with the banking rules on management remuneration. Banking transactions with key management employees and persons and companies related to key management employees As of the end of 2020, loans and advances granted to members of the management board and supervisory board totalled EUR 1,423 thousand (2019: EUR 2,674 thousand). Deposits of members of the management board and supervisory board at Erste Group amounted to EUR 47,099 thousand (2019: EUR 10,596 thousand) in total. Members of the management and supervisory board held bonds issued by Erste Group in the amount of EUR 422 thousand (2019: EUR 253 thousand). Loan commitments and financial guarantees, issued in favour of members of the management and supervisory board totalled EUR 700 thousand (2019: EUR 4,136 thousand) as of the end of 2020. From banking transactions with members of the management board and supervisory board Erste Group received interest income and fee income of EUR 88 thousand (2019: EUR 23 thousand) in total, and paid interest expense of EUR 7 thousand (2019: EUR 7 thousand). Loans and advances to close family members of key management employees and companies over which key management employees have control or significant influence (hereinafter referred to ‘other related parties’) totalled EUR 60,802 thousand (2019: EUR 34,639 thousand) as of 31 December 2020. As of the end of 2020, deposits of other related parties at Erste Group amounted to EUR 11,809 thousand (2019: EUR 38,641 thousand) in total. As of 31 December 2020 other related parties held no bonds issued by companies of Erste Group (2019: EUR 12,060 thousand). Loan commitments and financial guarantees, issued in favour of other related parties totalled EUR 48 thousand (2019: EUR 1,782 thousand) as of the end of 2020. From banking transactions with other related parties Erste Group received interest income and fee income of EUR 1,086 thousand (2019: EUR 1,005 thousand) in total, and paid interest and fee expenses of EUR 5 thousand (2019: EUR 15 thousand). The applicable interest rates and other terms (maturity dates and collateral) represent market conditions. 50. Share-based payments Every year Erste Group grants a bonus program to defined employees. It relates to services rendered by these employees in that year (‘performance period’). The bonus payments are split into an upfront tranche and five deferred tranches. At least 50 percent of the absolute amount paid depends on the average share price of Erste Group Bank AG in the year of payment (‘phantom shares’). As services are received by Erste Group in the performance year, the total estimated amount of bonus payments is accrued via profit or loss and recognized as provision in balance sheet. The share-based component of the bonus payment is measured with the respective average share price. Subsequent adjustments due to changes in the share price are recognized in profit or loss. As of 31 December 2020, the valuation is based on the average weighted daily share price of Erste Group Bank AG of the year 2020 in the amount of EUR 21.81 (2019: EUR 32.08) per share. Pay-outs of share-based bonus payments are made one-year after the final amount is determined. The outstanding amount of liability related to unpaid deferred tranches was EUR 43.5 million (2019: EUR 33.8 million).

276
51. Audit fees and tax consultancy fees The following table contains fees charged by the auditors of Erste Group Bank AG and subsidiaries for the financial years 2019 and 2018; the auditors being Sparkassen-Prüfungsverband (auditing agency) and Price Waterhouse Coopers. The values for PricewaterhouseCoopers comprise the services of ‘PwC Wirtschaftsprüfung GmbH’ as well as the PwC network. in EUR million Dec 19 Dec 20
Statutory audit of financial statements/consolidated financial statements 13.2 12.5
Audit fees - PwC 5.9 5.3
Audit fees - Sparkassen-Püfungsverband 7.3 7.2
Other assurance services 1.9 2.5
Other assurance services - PwC 0.8 1.5
Other assurance services - Sparkassen-Püfungsverband 1.1 1.0
Tax consulting 0.0 0.0
Tax consulting - PwC 0.0 0.0
Tax consulting - Sparkassen-Püfungsverband 0.0 0.0
Other services 0.4 0.2
Other services - PwC 0.4 0.2
Other services - Sparkassen-Püfungsverband 0.1 0.0
Total 15.6 15.2
The Sparkassen-Prüfungsverband (Austrian Savings Bank Auditing Association) provided audit services for an amount of EUR 1.7 million (2019: EUR 1.7 million) to Erste Group Bank AG and EUR 5.3 million (2019: EUR 5.5 million) for the subsidiaries. For other assurance services EUR 0.0 million (2019: EUR 0.1 million) were charged to the subsidiaries of Erste Group Bank AG while EUR 0.0 million (2019: EUR 0.0 million) is the amount for other services provided to the subsidiaries. The amounts in the table above include also fees for services provided by SPV Wirtschaftsprüfungsges.m.b.H. The auditor ‘PwC Wirtschaftsprüfung GmbH’ provided audit services to Erste Group Bank AG for EUR 1.0 million (2019: EUR 1.1 million) and to the subsidiaries for EUR 0.7 million (2019: EUR 0.9 million). An amount of EUR 3.6 million (2019: EUR 3.9 million) was charged for audit services of the PricewaterhouseCoopers network to the subsidiaries. The total amount for other assurance services provided by ‘PwC Wirtschaftsprüfung GmbH’ is EUR 0.3 million (2019: EUR 0.3 million). 52. Assets held for sale and liabilities associated with assets held for sale Non-current assets are classified as held for sale if they can be sold in their present condition and the sale is highly probable within 12 months of classification as held for sale. If assets are to be sold as part of a group that may also contain liabilities (e.g. a subsidiary), they are referred to as disposal group held for sale. Assets classified as held for sale and assets belonging to disposal groups held for sale are reported under the balance sheet line item ‘Assets held for sale’. Liabilities belonging to the disposal groups held for sale are presented on the balance sheet under the line item ‘Liabilities associated with assets held for sale’. Non-current assets and disposal groups that are classified as held for sale are measured at the lower of carrying amount and fair value less costs to sell. Should the impairment loss in a disposal group exceed the carrying amount of the assets that are within the scope of IFRS 5 measurement requirements, there is no specific guidance on how to treat such a difference. Erste Group recognises this difference as a provi-sion under the balance sheet line item ‘Provisions’. in EUR million Dec 19 Dec 20
Assets held for sale 269 212
Liabilities associated with assets held for sale 6 1
As of the end of 2020, ‘Assets held for sale’ include mainly land and buildings in amount of EUR 163.1 million (2019: EUR 180.9 million). Fair values and fair value hierarchy in EUR million Carrying amount Fair value Level 1 Level 2 Level 3
Dec 20
Assets for which the FV is presented in the balance sheet
Assets held for sale 129 131 0 0 131
Dec 19
Assets for which the FV is presented in the balance sheet
Assets held for sale 133 134 0 0 134

277
Assets held for sale, which consist mainly of property, are measured at fair value on non-recurring basis when their carrying amount is impaired down to fair value less costs to sell. The fair values are determined by experts with recognised and relevant professional qualifi-cation. The book value related to assets held for sale for which no disclosure according to IFRS 13 is required amounts to EUR 49 million (2019: EUR 48 million) as of 31 December 2020. The corresponding fair value amounts to EUR 66 million (2019: EUR 68 million).
53. Assets and liabilities denominated in foreign currencies and outside Austria and return on assets Assets and liabilities not denominated in EUR in EUR million Dec 19 Dec 20
Assets 86,290 101,321
Liabilities 64,877 78,535
Assets and liabilities outside Austria in EUR million Dec 19 Dec 20
Assets 147,865 152,875
Liabilities 104,816 117,457
Return on assets (net profit for the year divided by average total assets) was 0.39% at 31 December 2020 (2019: 0.79%).

278
54. Analysis of remaining maturities Expected remaining maturities of assets and liabilities
Dec 19 Dec 20
in EUR million < 1 year > 1 year < 1 year > 1 year
Cash and cash balances 10,693 0 35,839 0
Financial assets HfT 1,864 3,895 2,745 3,611
Derivatives 608 2,197 925 2,029
Other financial assets held for trading 1,256 1,698 1,820 1,582
Non-trading financial assets at FVPL 1,140 2,009 1,017 2,066
Equity instruments 39 352 22 325
Debt securities 1,055 1,220 984 1,065
Loans and advances to customers 47 437 12 675
Financial assets at FVOCI 1,784 7,336 1,710 6,809
Equity instruments 6 277 -34 164
Debt securities 1,777 7,059 1,744 6,645
Financial assets at AC 55,636 148,526 50,853 160,088
Debt securities 21,802 1,252 3,779 25,800
Loans and advances to banks 31,224 123,120 20,299 1,167
Loans and advances to customers 2,610 24,153 26,775 133,120
Finance lease receivables 392 3,643 471 3,657
Hedge accounting derivatives 33 97 104 101
Fair value changes of hedged items in portfolio hedge of interest rate risk 0 -4 0 5
Property and equipment 0 2,629 0 2,552
Investment properties 0 1,266 0 1,280
Intangible assets 0 1,368 0 1,359
Investments in associates and joint ventures 0 163 0 190
Current tax assets 81 0 175 0
Deferred tax assets 0 475 0 460
Assets held for sale 269 0 212 0
Trade and other receivables 1,384 24 1,302 39
Other assets 736 265 611 140
Total Assets 74,012 171,692 95,037 182,356
Financial liabilities HfT 733 1,688 925 1,700
Derivatives 673 1,332 788 1,250
Other trading liabilities 60 356 137 451
Financial liabilities at FVPL 1,925 11,569 2,168 9,923
Deposits 140 125 144 110
Debt securities issued 1,566 11,444 1,844 9,813
Other financial liabilities 219 0 180 0
Financial liabilities at AC 145,649 58,495 164,170 70,955
Deposits from banks 7,113 6,028 5,120 19,651
Deposits from customers 135,323 37,743 155,521 35,295
Debt securities issued 2,673 14,688 3,033 15,987
Other financial liabilities 540 36 496 22
Lease liabilities 92 423 65 495
Hedge accounting derivatives 250 19 167 22
Fair value changes of hedged items in portfolio hedge of interest rate risk 0 0 0 0
Provisions 696 1,223 704 1,378
Current tax liabilities 61 0 58 0
Deferred tax liabilities 0 18 0 20
Liabilities associated with assets held for sale 6 0 1 0
Other liabilities 1,628 742 1,684 547
Total Liabilites 151,039 74,177 169,943 85,040
55. Events after the balance sheet date Due to the ECB recommendation from 15 December 2020 the disbursement conditions for distributing a dividend of 0.75 EUR as of 8 February 2021 (reference date) have not been satisfied. As a consequence, no dividend has been distributed for financial year 2019.

279
56. Country by country reporting Starting with 2014 Erste Group publishes information about Group’s country by country relevant activities as required by Article 89 of the EU Capital Requirements Directive IV.
in EUR million Operating
income
Pre-tax result from continuing
operations Taxes on
income Taxes paid
Dec 20
Austria 2,968 -4 -120 -112
Croatia 373 51 -1 -20
Czech Republic 1,627 641 -100 -180
Hungary 481 139 -19 -18
Romania 732 265 -52 -50
Serbia 108 26 1 -1
Slovakia 622 199 -41 -55
Other locations 243 51 -10 -3
Total 7,155 1,368 -343 -439
Dec 19
Austria 3,169 620 -71 -136
Croatia 424 182 -30 -40
Czech Republic 1,641 914 -168 -142
Hungary 434 192 -13 -14
Romania 711 207 -64 -80
Serbia 103 40 -2 -3
Slovakia 613 108 -50 -46
Other locations 161 66 -22 -7
Total 7,256 2,330 -419 -468
For information regarding the country of residence of each fully consolidated entity refer to Note 56 Details of the companies wholly or partly owned by Erste Group as of 31 December 2020. During the financial year 2020, Erste Group received only an immaterial amount of public or state subsidies. Information about the geographical split of the average number of headcounts employed in Erste Group throughout 2020 is disclosed in Note 8 General administrative expenses.

280
57. Details of the companies wholly or partly owned by Erste Group as of 31 December 2020 The table below presents material, fully consolidated subsidiaries, investments in associates accounted for at equity and other investments. Interest of Erste Group in %
Company name, registered office Dec 19 Dec 20
Fully consolidated subsidiaries
Credit institutions
Allgemeine Sparkasse Oberösterreich Bankaktiengesellschaft Linz 39.2 39.2
Banca Comerciala Romana Chisinau S.A. Chisinau 99.9 99.9
Banca Comerciala Romana SA Bucharest 99.9 99.9
Banka Sparkasse d.d. Ljubljana 28.0 28.0
Bausparkasse der österreichischen Sparkassen Aktiengesellschaft Wien 95.1 95.1
BCR Banca pentru Locuinte SA Bucharest 99.9 99.9
Ceska sporitelna, a.s. Praha 100.0 100.0
Die Zweite Wiener Vereins-Sparcasse Wien 0.0 0.0
Dornbirner Sparkasse Bank AG Dornbirn 0.0 0.0
Erste & Steiermärkische Bank d.d. Rijeka 69.3 69.3
ERSTE BANK AD PODGORICA Podgorica 69.3 69.3
ERSTE BANK AKCIONARSKO DRUŠTVO, NOVI SAD Novi Sad 80.5 80.5
Erste Bank der oesterreichischen Sparkassen AG Wien 100.0 100.0
Erste Bank Hungary Zrt Budapest 100.0 100.0
Erste Group Bank AG Wien 0.0 0.0
ERSTE Jelzálogbank Zártkörüen Müködö Részvénytársaság Budapest 100.0 100.0
Erste Lakas-Takarekpenztar Zartkoruen Mukodo Reszvenytarsasag Budapest 100.0 100.0
Kärntner Sparkasse Aktiengesellschaft Klagenfurt 25.0 25.0
KREMSER BANK UND SPARKASSEN AKTIENGESELLSCHAFT Krems 0.0 0.0
Lienzer Sparkasse AG Lienz 0.0 0.0
Ohridska Banka AD Skopje Skopje 22.9 23.3
Salzburger Sparkasse Bank Aktiengesellschaft Salzburg 100.0 100.0
Slovenska sporitelna, a. s. Bratislava 100.0 100.0
Sparkasse Baden Baden 0.0 0.0
Sparkasse Bank dd Bosna i Hercegovina Sarajevo 25.0 25.0
SPARKASSE BANK MAKEDONIJA AD SKOPJE Skopje 24.9 24.9
Sparkasse Bludenz Bank AG Bludenz 0.0 0.0
Sparkasse Bregenz Bank Aktiengesellschaft Bregenz 0.0 0.0
Sparkasse der Gemeinde Egg Egg 0.0 0.0
Sparkasse der Stadt Amstetten AG Amstetten 0.0 0.0
Sparkasse der Stadt Feldkirch Feldkirch 0.0 0.0
Sparkasse der Stadt Kitzbühel Kitzbühel 0.0 0.0
Sparkasse Eferding-Peuerbach-Waizenkirchen Eferding 0.0 0.0
Sparkasse Feldkirchen/Kärnten Feldkirchen 0.0 0.0
SPARKASSE FRANKENMARKT AKTIENGESELLSCHAFT Frankenmarkt 0.0 0.0
Sparkasse Hainburg-Bruck-Neusiedl Aktiengesellschaft Hainburg 75.0 75.0
Sparkasse Haugsdorf Haugsdorf 0.0 0.0
Sparkasse Herzogenburg-Neulengbach Bank Aktiengesellschaft Herzogenburg 0.0 0.0
Sparkasse Horn-Ravelsbach-Kirchberg Aktiengesellschaft Horn 0.0 0.0
Sparkasse Imst AG Imst 0.0 0.0
Sparkasse Korneuburg AG Korneuburg 0.0 0.0
Sparkasse Kufstein Tiroler Sparkasse von 1877 Kufstein 0.0 0.0
Sparkasse Lambach Bank Aktiengesellschaft Lambach 0.0 0.0
Sparkasse Langenlois Langenlois 0.0 0.0
Sparkasse Mittersill Bank AG Mittersill 0.0 0.0
Sparkasse Mühlviertel-West Bank Aktiengesellschaft Rohrbach 40.0 40.0
Sparkasse Mürzzuschlag Aktiengesellschaft Mürzzuschlag 0.0 0.0
Sparkasse Neuhofen Bank Aktiengesellschaft Neuhofen 0.0 0.0
Sparkasse Neunkirchen Neunkirchen 0.0 0.0
SPARKASSE NIEDERÖSTERREICH MITTE WEST AKTIENGESELLSCHAFT St. Pölten 0.0 0.0
Sparkasse Pöllau AG Pöllau 0.0 0.0
Sparkasse Pottenstein N.Ö. Pottenstein 0.0 0.0
Sparkasse Poysdorf AG Poysdorf 0.0 0.0
Sparkasse Pregarten - Unterweißenbach AG Pregarten 0.0 0.0
Sparkasse Rattenberg Bank AG Rattenberg 0.0 0.0
Sparkasse Reutte AG Reutte 0.0 0.0
Sparkasse Ried im Innkreis-Haag am Hausruck Ried 0.0 0.0
Sparkasse Salzkammergut AG Bad Ischl 0.0 0.0
Sparkasse Scheibbs AG Scheibbs 0.0 0.0
Sparkasse Schwaz AG Schwaz 0.0 0.0
Sparkasse Voitsberg-Köflach Bankaktiengesellschaft Voitsberg 4.2 4.2
Stavebni sporitelna Ceske sporitelny, a.s. Praha 100.0 100.0
Steiermärkische Bank und Sparkassen Aktiengesellschaft Graz 25.0 25.0
Tiroler Sparkasse Bankaktiengesellschaft Innsbruck Innsbruck 75.0 75.0
Waldviertler Sparkasse Bank AG Zwettl 0.0 0.0
Wiener Neustädter Sparkasse Wiener Neustadt 0.0 0.0

281
Interest of Erste Group in %
Company name, registered office Dec 19 Dec 20
Financial institutions
"DIE EVA" Grundstückverwaltungsgesellschaft m.b.H. Wien 100.0 100.0
"Die Kärntner" Trust- Vermögensverwaltungsgesellschaft m.b.H. & Co KG Klagenfurt 25.0 25.0
"Die Kärntner" Trust-Vermögensverwaltungsgesellschaft m.b.H. Klagenfurt 25.0 25.0
"Nare" Grundstücksverwertungs-Gesellschaft m.b.H. Wien 100.0 100.0
"SELIMMO" - Sparkasse Mühlviertel-West - DIE ERSTE Leasing - Immobilienvermietung GmbH Rohrbach 69.4 69.4
ACP Financial Solutions GmbH Wien 75.0 75.0
Alea-Grundstückverwaltung Gesellschaft m.b.H. Wien 100.0 100.0
Altstadt Hotelbetriebs GmbH Wien 100.0 100.0
AS-Alpha Grundstücksverwaltung Gesellschaft m.b.H. Wien 39.2 39.2
AVION-Grundverwertungsgesellschaft m.b.H. Wien 51.0 51.0
AWEKA - Kapitalverwaltungsgesellschaft m.b.H. Graz 25.0 25.0
BCR Leasing IFN SA Bucharest 99.9 99.9
BCR Payments Services SRL Sibiu 99.9 99.9
BCR Social Finance IFN S.A. Bucharest 79.5 79.5
BOOTES-Immorent Grundverwertungs-Gesellschaft m.b.H. Wien 100.0 100.0
CS Property Investment Limited Nicosia 100.0 100.0
DENAR-Immorent Grundverwertungsgesellschaft m.b.H. Wien 62.5 62.5
DIE ERSTE Leasing Grundaufschließungs- und Immobilienvermietungsgesellschaft m.b.H. Wien 100.0 100.0
DIE ERSTE Leasing Grundbesitzgesellschaft m.b.H. Wien 100.0 100.0
DIE ERSTE Leasing Grundstückverwaltungsgesellschaft m.b.H. Wien 100.0 100.0
DIE ERSTE Leasing Immobilienbesitzgesellschaft m.b.H. Wien 100.0 100.0
DIE ERSTE Leasing Immobilienverwaltungs- und -vermietungsgesellschaft m.b.H. Wien 100.0 100.0
DIE EVA - Liegenschaftsverwaltungsgesellschaft m.b.H. Wien 100.0 100.0
DIE EVA-Gebäudeleasinggesellschaft m.b.H. Wien 100.0 100.0
DIE EVA-Immobilienleasing und -erwerb Gesellschaft m.b.H. Wien 100.0 100.0
Drustvo za lizing nekretnina, vozila, plovila i masina "S-Leasing" doo Podgorica Podgorica 62.5 62.5
EB Erste Bank Internationale Beteiligungen GmbH Wien 100.0 100.0
EB-Grundstücksbeteiligungen GmbH Wien 100.0 100.0
EKZ-Immorent Vermietung GmbH Wien 100.0 100.0
Epsilon Immorent s.r.o. Praha 100.0 100.0
Erste & Steiermärkische S-Leasing drustvo s ogranicenom odgovornoscu za leasing vozila i strojeva Zagreb 47.1 47.1
Erste Bank und Sparkassen Leasing GmbH Wien 100.0 100.0
ERSTE CARD CLUB d.o.o. Zagreb 69.3 69.3
ERSTE CARD poslovanje s kreditnimi karticami, d.o.o. Ljubljana 69.3 69.3
Erste Finance (Delaware) LLC Wilmington 100.0 100.0
Erste Group Immorent CR s.r.o. Praha 100.0 100.0
Erste Group Immorent GmbH Wien 100.0 100.0
Erste Group Immorent International Holding GmbH Wien 100.0 100.0
Erste Group Immorent Lízing Zártkörüen Müködö Részvénytársaság Budapest 100.0 100.0
ERSTE GROUP IMMORENT LJUBLJANA, financne storitve, d.o.o. Ljubljana 100.0 100.0
Erste Leasing, a.s. Znojmo 100.0 100.0
Erste Social Finance Holding GmbH Wien 60.0 60.0
Eva-Immobilienverwaltungsgesellschaft m.b.H. Wien 100.0 100.0
Eva-Realitätenverwaltungsgesellschaft m.b.H. Wien 100.0 100.0
F & S Leasing GmbH Klagenfurt 100.0 100.0
Factoring Ceske sporitelny a.s. Praha 100.0 100.0
GIROLEASING-Mobilienvermietungsgesellschaft m.b.H. Wien 62.5 62.5
Holding Card Service s.r.o. Praha 100.0 100.0
Hotel- und Sportstätten-Beteiligungs-, Errichtungs- und Betriebsgesellschaft m.b.H. Wien 38.0 38.0
Hotel- und Sportstätten-Beteiligungs-, Errichtungs- und Betriebsgesellschaft m.b.H. Leasing KG St. Pölten 54.5 54.5
ILGES - Immobilien- und Leasing - Gesellschaft m.b.H. Rohrbach 40.0 40.0
Immo Smaragd GmbH Schwaz 0.0 0.0
Immorent - Immobilienleasing Gesellschaft m.b.H. Wien 100.0 100.0
Immorent - Weiko Grundverwertungsgesellschaft m.b.H. Wien 100.0 100.0
IMMORENT DELTA, leasing druzba, d.o.o. Ljubljana 50.0 50.0
ImmoRent Einkaufszentren Verwaltungsgesellschaft m.b.H. Wien 100.0 100.0
IMMORENT EPSILON, leasing druzba, d.o.o. Ljubljana 50.0 50.0
Immorent Oktatási Ingatlanhasznosító és Szolgáltató Kft. Budapest 56.0 56.0
IMMORENT PPP Ingatlanhasznosító és Szolgáltató Korlátolt Felelösségü Társaság Budapest 100.0 100.0
IMMORENT PTC, s.r.o. Praha 100.0 100.0
IMMORENT RIED GmbH Wien 100.0 100.0
IMMORENT-ANUBIS Grundverwertungsgesellschaft m.b.H. Wien 100.0 100.0
IMMORENT-ASTRA Grundverwertungsgesellschaft m.b.H. Wien 100.0 100.0
Immorent-Clio-Grundverwertungsgesellschaft m.b.H. Wien 100.0 100.0
Immorent-Gamma-Grundstücksverwertungsgesellschaft m.b.H. Wien 100.0 100.0
IMMORENT-GREKO Grundverwertungsgesellschaft m.b.H. Wien 100.0 100.0
Immorent-Grundverwertungsgesellschaft m.b.H. Wien 100.0 100.0
IMMORENT-JULIA Grundverwertungsgesellschaft m.b.H. Wien 100.0 100.0
Immorent-Kappa Grundverwertungsgesellschaft m.b.H. Wien 100.0 100.0
IMMORENT-LEANDER Grundverwertungsgesellschaft m.b.H. Wien 100.0 100.0
IMMORENT-MOMO Grundverwertungsgesellschaft m.b.H. Wien 100.0 100.0
IMMORENT-MÖRE Grundverwertungsgesellschaft m.b.H. Wien 69.5 69.5

282
Interest of Erste Group in %
Company name, registered office Dec 19 Dec 20
IMMORENT-NERO Grundverwertungsgesellschaft m.b.H. Wien 100.0 100.0
IMMORENT-Objektvermietungsgesellschaft m.b.H. Wien 100.0 100.0
IMMORENT-OSIRIS Grundverwertungsgesellschaft m.b.H. Wien 100.0 100.0
IMMORENT-PAN Grundverwertungsgesellschaft m.b.H. Wien 100.0 100.0
IMMORENT-Raiffeisen Fachhochschule Errichtungs- und BetriebsgmbH Wien 55.0 55.0
IMMORENT-RAMON Grundverwertungsgesellschaft m.b.H. Wien 62.5 62.5
IMMORENT-RASTA Grundverwertungsgesellschaft m.b.H. Wien 100.0 100.0
IMMORENT-REMUS Grundverwertungsgesellschaft m.b.H. Wien 100.0 100.0
IMMORENT-RIALTO Grundverwertungsgesellschaft m.b.H. Wien 100.0 100.0
IMMORENT-RIO Grundverwertungsgesellschaft m.b.H. Wien 55.0 55.0
IMMORENT-RIWA Grundverwertungsgesellschaft m.b.H. Wien 100.0 100.0
IMMORENT-RONDO Grundverwertungsgesellschaft m.b.H. Wien 100.0 100.0
IMMORENT-RUBIN Grundverwertungsgesellschaft m.b.H. Wien 100.0 100.0
IMMORENT-SARI Grundverwertungsgesellschaft m.b.H. Wien 100.0 100.0
Immorent-Theta-Grundverwertungsgesellschaft m.b.H. Wien 100.0 100.0
IMMORENT-TRIAS Grundverwertungsgesellschaft m.b.H. Wien 62.5 62.5
Immorent-WBV Grundverwertungsgesellschaft m.b.H. Wien 50.0 50.0
IMNA-Immorent Immobilienleasing GmbH Wien 100.0 100.0
Intermarket Bank AG Wien 93.8 93.8
IR Beteiligungsverwaltungsgesellschaft mbH Wien 100.0 100.0
IR REAL ESTATE LEASING d.o.o. u likvidaciji Zagreb 92.5 92.5
Kärntner Sparkasse Vermögensverwaltungsgesellschaft m.b.H. Klagenfurt 25.0 25.0
MEKLA Leasing Gesellschaft m.b.H. Wien 100.0 100.0
NAXOS-Immorent Immobilienleasing GmbH Wien 100.0 100.0
NÖ-Sparkassen Beteiligungsgesellschaft m.b.H. Wien 2.5 2.5
Ölim-Grundverwertungsgesellschaft m.b.H. Graz 25.0 25.0
OMEGA IMMORENT s.r.o. Praha 100.0 100.0
OREST-Immorent Leasing GmbH Wien 100.0 100.0
Österreichisches Volkswohnungswerk, Gemeinnützige Gesellschaft mit beschränkter Haftung Wien 100.0 100.0
PAROS-Immorent Grundverwertungsgesellschaft m.b.H. Wien 100.0 100.0
Pischeldorfer Straße 221 Liegenschaftsverwertungs GmbH Wien 100.0 100.0
PREDUZECE ZA FINANSIJSKI LIZING S-LEASING DOO, BEOGRAD Belgrade 66.6 66.6
RHEA-Immorent Holding GmbH Wien 100.0 100.0
s Autoleasing a.s. Praha 100.0 100.0
s Autoleasing SK, s.r.o. Bratislava 100.0 100.0
S IMMORENT OMIKRON drustvo s ogranicenom odgovornoscu za poslovanje nekretninama Zagreb 100.0 100.0
S Slovensko, spol. s r.o. Bratislava 100.0 100.0
s Wohnbaubank AG Wien 100.0 100.0
SCIENTIA Immorent GmbH Wien 100.0 100.0
S-Factoring, faktoring druzba d.d. Ljubljana 28.0 28.0
Sieben Tiroler Sparkassen Beteiligungsgesellschaft m.b.H. Kufstein 0.0 0.0
S-Leasing Gesellschaft m.b.H. Kirchdorf 69.6 69.6
S-Leasing Immobilienvermietungsgesellschaft m.b.H. Wiener Neustadt 33.3 33.3
Sparfinanz-, Vermögens-, Verwaltungs- und Beratungs- Gesellschaft m.b.H. Wiener Neustadt 0.0 0.0
SPARKASSE IMMORENT Grundverwertungsgesellschaft m.b.H. Wien 100.0 100.0
Sparkasse Leasing d.o.o., Sarajevo Sarajevo 25.0 25.0
Sparkasse Leasing d.o.o., Skopje Skopje 25.0 25.0
Sparkasse Leasing S, družba za financiranje d.o.o. Ljubljana 28.0 28.0
Sparkasse Mühlviertel-West Holding GmbH Rohrbach 40.0 40.0
Sparkassen IT Holding AG Wien 31.1 31.1
Sparkassen Leasing Süd GmbH Graz 25.0 25.0
Strabag Oktatási PPP Ingatlanhasznosító és Szolgáltató Korlátolt Felelösségü Társaság Budapest 70.0 70.0
Subholding Immorent GmbH Wien 100.0 100.0
TAURIS-Immorent Grundverwertungsgesellschaft m.b.H. Wien 100.0 100.0
Theta Immorent s.r.o. Praha 100.0 100.0
Theuthras-Immorent Grundverwertungsgesellschaft m.b.H. Wien 62.5 62.5
UBG-Unternehmensbeteiligungsgesellschaft m.b.H. Wien 100.0 100.0
VIA Immobilien Errichtungsgesellschaft m.b.H. Wien 100.0 100.0
Vorarlberger Sparkassen Beteiligungs GmbH Dornbirn 0.0 0.0
WIESTA-Immorent Immobilienleasing GmbH Wien 100.0 100.0
XENIA-Immorent Grundverwertungsgesellschaft m.b.H. Wien 100.0 100.0
Zeta Immorent s.r.o. Praha 100.0 100.0

283
Interest of Erste Group in %
Company name, registered office Dec 19 Dec 20
Other
Asset Management Slovenskej sporitelne, správ. spol., a. s. Bratislava 91.1 91.1
BCR Fleet Management SRL Bucharest 99.9 99.9
BCR Pensii, Societate de Administrare a Fondurilor de Pensii Private SA Bucharest 99.9 99.9
BP Budejovicka, s. r. o. Praha 0.0 100.0
BP Olbrachtova, s. r. o. Praha 0.0 100.0
BP Polackova, s. r. o. Praha 0.0 100.0
brokerjet Ceské sporitelny, a.s. v likvidaci Praha 100.0 100.0
BRS Büroreinigungsgesellschaft der Steiermärkischen Bank und Sparkassen Aktiengesellschaft Gesellschaft m.b.H. Graz 25.0 25.0
BTV-Beteiligungs-, Treuhand-, Vermögens-Verwaltungsgesellschaft m.b.H. Klagenfurt 25.0 25.0
Budejovicka development, s. r. o. Praha 100.0 100.0
C&C Atlantic Limited Dublin 100.0 100.0
CEE Property Development Portfolio 2 a.s. Praha 100.0 100.0
CEE Property Development Portfolio B.V. Amsterdam 20.0 20.0
Ceska sporitelna - penzijni spolecnost, a.s. Praha 100.0 100.0
Cinci-Immorent Grundverwertungsgesellschaft m.b.H. Wien 100.0 100.0
Collat-real Korlátolt Felelösségü Társaság Budapest 100.0 100.0
CP Praha s.r.o., v likvidaci Praha 20.0 20.0
CPDP 2003 s.r.o. Praha 100.0 100.0
CPP Lux S. 'ar.l. Luxembourg 20.0 20.0
CS NHQ, s.r.o. Praha 100.0 100.0
CS Seed Starter, a.s. Praha 100.0 100.0
Czech and Slovak Property Fund B.V. Amsterdam 100.0 100.0
Czech TOP Venture Fund B.V. in liquidation Groesbeek 84.0 84.0
DIE ERSTE Leasing Immobilien Vermietungsgesellschaft m.b.H. in Liqu. Wien 100.0 100.0
Dienstleistungszentrum Leoben GmbH Wien 51.0 51.0
EBB Beteiligungen GmbH Wien 100.0 100.0
EB-Restaurantsbetriebe Ges.m.b.H. Wien 100.0 100.0
Erste Asset Management d.o.o. Zagreb 91.1 91.1
Erste Asset Management GmbH Wien 91.1 91.1
Erste Asset Management Ltd. (vm Erste Alapkezelo Zrt.) Budapest 91.1 91.1
Erste Befektetesi Zrt. Budapest 100.0 100.0
ERSTE CAMPUS Immobilien AG & Co KG Wien 100.0 100.0
Erste Grantika Advisory, a.s. Brno 100.0 100.0
Erste Group Card Processor d.o.o. Zagreb 100.0 100.0
ERSTE GROUP IMMORENT HRVATSKA drustvo s ogranicenom odgovornoscu za upravljanje Zagreb 100.0 100.0
ERSTE GROUP IMMORENT POLSKA SPOLKA Z OGRANICZONA ODPOWIEDZIALNOSCIA W LIKWIDACJI Warsaw 100.0 100.0
Erste Group Immorent Slovensko s.r.o. Bratislava 100.0 100.0
Erste Group IT HR društvo s ogranicenom odgovornošcu za usluge informacijskih tehnologija Bjelovar 75.4 75.4
Erste Group IT International GmbH Wien 99.9 99.9
Erste Group Services GmbH Wien 100.0 100.0
Erste Group Shared Services (EGSS), s.r.o. Hodonin 100.0 100.0
ERSTE Immobilien Kapitalanlagegesellschaft m.b.H. Wien 68.7 68.7
Erste Ingatlan Fejleszto, Hasznosito es Mernoki Kft. Budapest 100.0 100.0
ERSTE NEKRETNINE d.o.o. za poslovanje nekretninama Zagreb 69.3 69.3
Erste Reinsurance S.A. Luxembourg 100.0 100.0
Erste Securities Polska S.A. Warsaw 100.0 100.0
Flottenmanagement GmbH Wien 51.0 51.0
FUKO-Immorent Grundverwertungsgesellschaft m.b.H. Wien 100.0 100.0
George Labs GmbH Wien 100.0 100.0
GLADIATOR LEASING IRELAND DESIGNATED ACTIVITY COMPANY Dublin 100.0 100.0
Gladiator Leasing Limited Pieta 100.0 100.0
GLL A319 AS LIMITED Pieta 100.0 100.0
GLL A330 Designated Activity Company Dublin 100.0 100.0
GLL MSN 2118 DESIGNATED ACTIVITY COMPANY Dublin 100.0 100.0
Haftungsverbund GmbH Wien 63.9 63.9
HBM Immobilien Kamp GmbH Wien 100.0 100.0
HP Immobilien Psi GmbH Wien 100.0 100.0
HT Immobilien Tau GmbH Wien 100.0 100.0
HT Immobilien Theta GmbH Wien 100.0 100.0
HV Immobilien Hohenems GmbH Wien 100.0 100.0
IBF-Anlagenleasing 95 Gesellschaft m.b.H. Wien 100.0 100.0
IGP Industrie und Gewerbepark Wörgl Gesellschaft m.b.H. Kufstein 0.0 0.0
Immobilienverwertungsgesellschaft m.b.H. Klagenfurt 25.0 25.0
IMMORENT - ANDROMEDA Grundverwertungsgesellschaft m.b.H. Wien 41.9 41.9
IMMORENT Alpha Ingatlanbérbeadó és Üzemeltetö Karlátolt Felelösségü Társaság "végelszámolás alatt" Budapest 100.0 100.0
Immorent Lehrbauhöfeerrichtungsgesellschaft m.b.H. "in Liqu." Wien 100.0 100.0
IMMORENT Orion, s.r.o. Praha 100.0 100.0
IMMORENT Österreich GmbH Wien 100.0 100.0
Immorent Singidunum d.o.o. Belgrade 100.0 100.0
IMMORENT Térinvest Ingatlanhasznosító és Szolgáltató Korlátolt Felelösségü Társaság Budapest 100.0 100.0
IMMORENT-BRAUGEBÄUDE-Leasinggesellschaft m.b.H. "in Liqu." Wien 100.0 100.0
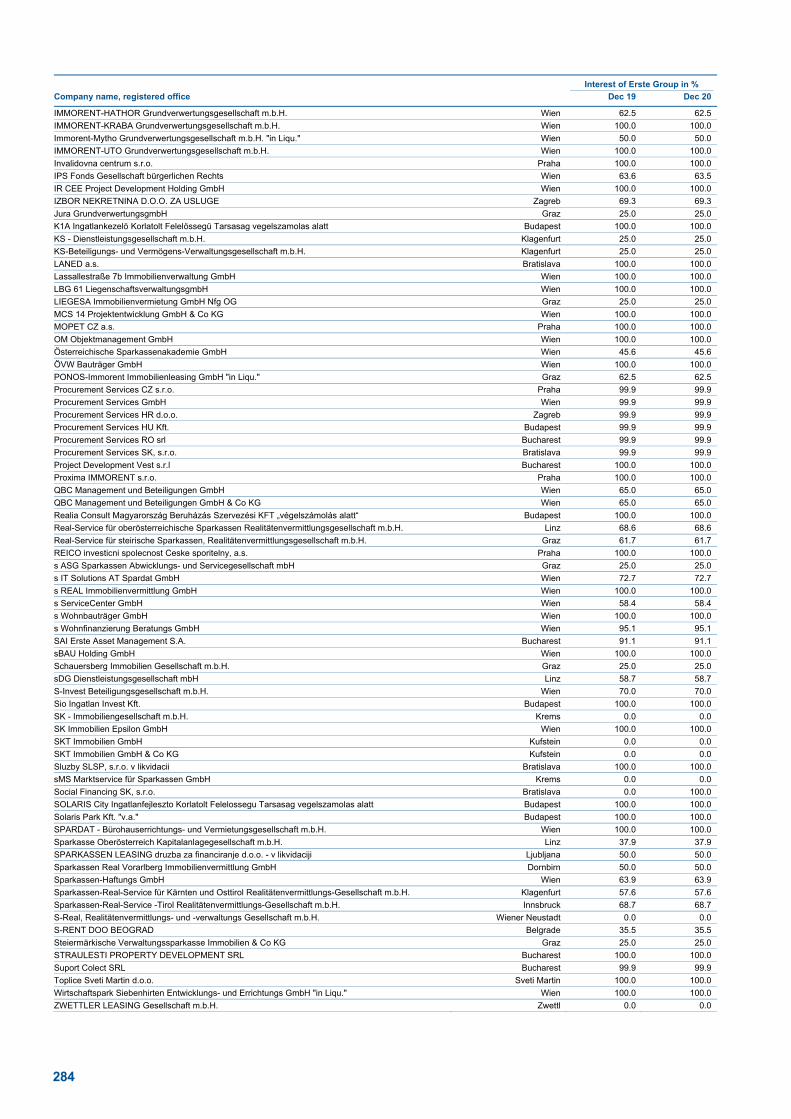
284
Interest of Erste Group in %
Company name, registered office Dec 19 Dec 20
IMMORENT-HATHOR Grundverwertungsgesellschaft m.b.H. Wien 62.5 62.5
IMMORENT-KRABA Grundverwertungsgesellschaft m.b.H. Wien 100.0 100.0
Immorent-Mytho Grundverwertungsgesellschaft m.b.H. "in Liqu." Wien 50.0 50.0
IMMORENT-UTO Grundverwertungsgesellschaft m.b.H. Wien 100.0 100.0
Invalidovna centrum s.r.o. Praha 100.0 100.0
IPS Fonds Gesellschaft bürgerlichen Rechts Wien 63.6 63.5
IR CEE Project Development Holding GmbH Wien 100.0 100.0
IZBOR NEKRETNINA D.O.O. ZA USLUGE Zagreb 69.3 69.3
Jura GrundverwertungsgmbH Graz 25.0 25.0
K1A Ingatlankezelö Korlatolt Felelössegü Tarsasag vegelszamolas alatt Budapest 100.0 100.0
KS - Dienstleistungsgesellschaft m.b.H. Klagenfurt 25.0 25.0
KS-Beteiligungs- und Vermögens-Verwaltungsgesellschaft m.b.H. Klagenfurt 25.0 25.0
LANED a.s. Bratislava 100.0 100.0
Lassallestraße 7b Immobilienverwaltung GmbH Wien 100.0 100.0
LBG 61 LiegenschaftsverwaltungsgmbH Wien 100.0 100.0
LIEGESA Immobilienvermietung GmbH Nfg OG Graz 25.0 25.0
MCS 14 Projektentwicklung GmbH & Co KG Wien 100.0 100.0
MOPET CZ a.s. Praha 100.0 100.0
OM Objektmanagement GmbH Wien 100.0 100.0
Österreichische Sparkassenakademie GmbH Wien 45.6 45.6
ÖVW Bauträger GmbH Wien 100.0 100.0
PONOS-Immorent Immobilienleasing GmbH "in Liqu." Graz 62.5 62.5
Procurement Services CZ s.r.o. Praha 99.9 99.9
Procurement Services GmbH Wien 99.9 99.9
Procurement Services HR d.o.o. Zagreb 99.9 99.9
Procurement Services HU Kft. Budapest 99.9 99.9
Procurement Services RO srl Bucharest 99.9 99.9
Procurement Services SK, s.r.o. Bratislava 99.9 99.9
Project Development Vest s.r.l Bucharest 100.0 100.0
Proxima IMMORENT s.r.o. Praha 100.0 100.0
QBC Management und Beteiligungen GmbH Wien 65.0 65.0
QBC Management und Beteiligungen GmbH & Co KG Wien 65.0 65.0
Realia Consult Magyarország Beruházás Szervezési KFT „végelszámolás alatt“ Budapest 100.0 100.0
Real-Service für oberösterreichische Sparkassen Realitätenvermittlungsgesellschaft m.b.H. Linz 68.6 68.6
Real-Service für steirische Sparkassen, Realitätenvermittlungsgesellschaft m.b.H. Graz 61.7 61.7
REICO investicni spolecnost Ceske sporitelny, a.s. Praha 100.0 100.0
s ASG Sparkassen Abwicklungs- und Servicegesellschaft mbH Graz 25.0 25.0
s IT Solutions AT Spardat GmbH Wien 72.7 72.7
s REAL Immobilienvermittlung GmbH Wien 100.0 100.0
s ServiceCenter GmbH Wien 58.4 58.4
s Wohnbauträger GmbH Wien 100.0 100.0
s Wohnfinanzierung Beratungs GmbH Wien 95.1 95.1
SAI Erste Asset Management S.A. Bucharest 91.1 91.1
sBAU Holding GmbH Wien 100.0 100.0
Schauersberg Immobilien Gesellschaft m.b.H. Graz 25.0 25.0
sDG Dienstleistungsgesellschaft mbH Linz 58.7 58.7
S-Invest Beteiligungsgesellschaft m.b.H. Wien 70.0 70.0
Sio Ingatlan Invest Kft. Budapest 100.0 100.0
SK - Immobiliengesellschaft m.b.H. Krems 0.0 0.0
SK Immobilien Epsilon GmbH Wien 100.0 100.0
SKT Immobilien GmbH Kufstein 0.0 0.0
SKT Immobilien GmbH & Co KG Kufstein 0.0 0.0
Sluzby SLSP, s.r.o. v likvidacii Bratislava 100.0 100.0
sMS Marktservice für Sparkassen GmbH Krems 0.0 0.0
Social Financing SK, s.r.o. Bratislava 0.0 100.0
SOLARIS City Ingatlanfejleszto Korlatolt Felelossegu Tarsasag vegelszamolas alatt Budapest 100.0 100.0
Solaris Park Kft. "v.a." Budapest 100.0 100.0
SPARDAT - Bürohauserrichtungs- und Vermietungsgesellschaft m.b.H. Wien 100.0 100.0
Sparkasse Oberösterreich Kapitalanlagegesellschaft m.b.H. Linz 37.9 37.9
SPARKASSEN LEASING druzba za financiranje d.o.o. - v likvidaciji Ljubljana 50.0 50.0
Sparkassen Real Vorarlberg Immobilienvermittlung GmbH Dornbirn 50.0 50.0
Sparkassen-Haftungs GmbH Wien 63.9 63.9
Sparkassen-Real-Service für Kärnten und Osttirol Realitätenvermittlungs-Gesellschaft m.b.H. Klagenfurt 57.6 57.6
Sparkassen-Real-Service -Tirol Realitätenvermittlungs-Gesellschaft m.b.H. Innsbruck 68.7 68.7
S-Real, Realitätenvermittlungs- und -verwaltungs Gesellschaft m.b.H. Wiener Neustadt 0.0 0.0
S-RENT DOO BEOGRAD Belgrade 35.5 35.5
Steiermärkische Verwaltungssparkasse Immobilien & Co KG Graz 25.0 25.0
STRAULESTI PROPERTY DEVELOPMENT SRL Bucharest 100.0 100.0
Suport Colect SRL Bucharest 99.9 99.9
Toplice Sveti Martin d.o.o. Sveti Martin 100.0 100.0
Wirtschaftspark Siebenhirten Entwicklungs- und Errichtungs GmbH "in Liqu." Wien 100.0 100.0
ZWETTLER LEASING Gesellschaft m.b.H. Zwettl 0.0 0.0

285
Interest of Erste Group in %
Company name, registered office Dec 19 Dec 20
Funds
ERSTE BOND EURO TREND Wien 0.0 0.0
ERSTE RESERVE CORPORATE Wien 0.0 0.0
SPARKASSEN 19 Wien 0.0 0.0
SPARKASSEN 2 Wien 0.0 0.0
SPARKASSEN 21 Wien 0.0 0.0
SPARKASSEN 26 Wien 0.0 0.0
SPARKASSEN 4 Wien 0.0 0.0
SPARKASSEN 5 Wien 0.0 0.0
SPARKASSEN 8 Wien 0.0 0.0
SPARKASSEN 9 Wien 0.0 0.0

286
Interest of Erste Group in %
Company name, registered office Dec 19 Dec 20
Equity method investments
Credit institusions
Prva stavebna sporitelna, a.s. Bratislava 35.0 35.0
SPAR-FINANZ BANK AG Salzburg 50.0 50.0
Financial institutions
Adoria Grundstückvermietungs Gesellschaft m.b.H. St. Pölten 24.5 24.5
Aventin Grundstückverwaltungs Gesellschaft m.b.H. Horn 24.5 24.5
Epsilon - Grundverwertungsgesellschaft m.b.H. Wien 50.0 50.0
Esquilin Grundstücksverwaltungs Gesellschaft m.b.H. St. Pölten 24.5 24.5
Fondul de Garantare a Creditului Rural IFN SA Bucharest 33.3 33.3
FORIS Grundstückvermietungs Gesellschaft m.b.H. St. Pölten 24.5 24.5
Global Payments s.r.o. Praha 49.0 49.0
HOSPES-Grundstückverwaltungs Gesellschaft m.b.H. St. Pölten 33.3 33.3
Immorent-Hypo-Rent Grundverwertungsgesellschaft m.b.H. Innsbruck 49.0 49.0
LITUS Grundstückvermietungs Gesellschaft m.b.H. St. Pölten 24.5 24.5
N.Ö. Kommunalgebäudeleasing Gesellschaft m.b.H. Wien 33.4 33.4
Neue Eisenstädter gemeinnützige Bau-, Wohn- und Siedlungsgesellschaft m.b.H. Eisenstadt 50.0 50.0
NÖ Bürgschaften und Beteiligungen GmbH Wien 14.4 14.4
NÖ-KL Kommunalgebäudeleasing Gesellschaft m.b.H. Wien 28.4 33.4
O.Ö. Kommunalgebäude-Leasing Gesellschaft m.b.H. Linz 40.0 40.0
Quirinal Grundstücksverwaltungs Gesellschaft m.b.H. Wien 33.3 33.3
Steirische Gemeindegebäude Leasing Gesellschaft m.b.H. Wien 50.0 50.0
Steirische Kommunalgebäudeleasing Gesellschaft m.b.H. Wien 50.0 50.0
Steirische Leasing für Gebietskörperschaften Gesellschaft m.b.H. Wien 50.0 50.0
Steirische Leasing für öffentliche Bauten Gesellschaft m.b.H. Wien 50.0 50.0
STUWO Gemeinnützige Studentenwohnbau Aktiengesellschaft Wien 50.5 50.5
SUPRIA Raiffeisen-Immobilien-Leasing Gesellschaft m.b.H. Wien 50.0 50.0
SWO Kommunalgebäudeleasing Gesellschaft m.b.H. Wien 50.0 50.0
TKL V Grundverwertungsgesellschaft m.b.H. Innsbruck 33.3 33.3
TKL VIII Grundverwertungsgesellschaft m.b.H. Innsbruck 24.5 24.5
TRABITUS Grundstückvermietungs Gesellschaft m.b.H. Wien 25.0 25.0
VALET-Grundstückverwaltungs Gesellschaft m.b.H. St. Pölten 24.5 24.5
VOLUNTAS Grundstückvermietungs Gesellschaft m.b.H. St. Pölten 35.0 35.0
Vorarlberger Kommunalgebäudeleasing Gesellschaft m.b.H. Dornbirn 33.3 33.3
Other
APHRODITE Bauträger Aktiengesellschaft Wien 50.0 50.0
Bankovní identita, a.s. Praha 0.0 33.3
CALDO Grundstücksverwertungsgesellschaft m.b.H. in Liqu. Wien 31.2 31.2
CIT ONE SA Bucharest 99.9 33.3
Dostupny Domov j.s.a. Nitra 0.0 49.9
ERSTE d.o.o. Zagreb 45.2 45.2
Erste ÖSW Wohnbauträger GmbH Wien 50.5 50.5
GELUP GmbH Wien 33.3 33.3
Gemdat Niederösterreichische Gemeinde-Datenservice Gesellschaft m. b. H. Korneuburg 0.8 0.8
Hochkönig Bergbahnen GmbH Mühlbach 47.4 47.4
KWC Campus Errichtungsgesellschaft m.b.H. Klagenfurt 13.6 13.6
SILO DREI next LBG 57 Liegenschaftsverwertung GmbH & Co KG Wien 49.0 49.0
SILO II LBG 57 – 59 Liegenschaftsverwertung GmbH & Co KG Wien 49.0 49.0
Slovak Banking Credit Bureau, s.r.o. Bratislava 33.3 33.3
VBV - Betriebliche Altersvorsorge AG Wien 27.9 29.8
Viminal Grundstückverwaltungs Gesellschaft m.b.H. in Liqu. Wien 25.0 25.0
VKL III Gebäudeleasing-Gesellschaft m.b.H. in Liqu. Dornbirn 33.3 33.3
Other investments
Credit institusions
ALTA BANKA AD BEOGRAD Belgrade 0.0 0.0
EUROAXIS BANK AD Moskva Moscow 1.6 1.6
Oesterreichische Kontrollbank Aktiengesellschaft Wien 12.9 12.9
Public Joint-stock company commercial Bank "Center-Invest" Rostov 9.1 9.1
Südtiroler Sparkasse AG Bozen 0.1 0.1
Financial institutions
"Österreichisches Siedlungswerk" Gemeinnützige Wohnungsaktiengesellschaft Wien 1.0 1.0
"Wohnungseigentum", Tiroler gemeinnützige Wohnbaugesellschaft m.b.H. Innsbruck 19.1 19.1
"Wohnungseigentümer" Gemeinnützige Wohnbaugesellschaft m.b.H. Mödling 20.3 20.3
ARWAG Holding-Aktiengesellschaft Wien 19.3 19.3
CONATUS Grundstückvermietungs Gesellschaft m.b.H. St. Pölten 24.5 24.5
CULINA Grundstücksvermietungs Gesellschaft m.b.H. St. Pölten 25.0 25.0
Diners Club BH d.o.o. Sarajevo Sarajevo 69.3 69.3
Diners Club Bulgaria AD Sofia 3.6 3.6
Diners Club International Belgrade d.o.o. Beograd in bankruptcy Belgrade 69.3 69.3
Diners Club International Montenegro d.o.o. in Podgorica Podgorica 69.3 69.3
Erste Asset Management Deutschland GmbH Vaterstetten 91.1 91.1
EUROPEAN INVESTMENT FUND Luxembourg 0.1 0.1
EWU Wohnbau Unternehmensbeteiligungs-GmbH St. Pölten 20.2 20.2
Fondul Roman de Garantare a Creditelor pentru Intreprinzatorii Privati SA Bucharest 9.5 9.5

287
Interest of Erste Group in %
Company name, registered office Dec 19 Dec 20
Garantiqa Hitelgarancia Zrt. Budapest 1.8 1.8
GEBAU-NIOBAU Gemeinnützige Baugesellschaft m.b.H. Mödling 19.2 19.2
Gemeinnützige Bau- und Siedlungsgenossenschaft "Waldviertel" registrierte Genossenschaft mit beschränkter Haftung Raabs 0.0 0.0
Gemeinnützige Wohn- und Siedlungsgesellschaft Schönere Zukunft, Gesellschaft m.b.H. Wien 15.0 15.0
Gemeinnützige Wohnungsgesellschaft "Austria" Aktiengesellschaft Mödling 20.0 20.0
GWG - Gemeinnützige Wohnungsgesellschaft der Stadt Linz GmbH Linz 5.0 5.0
GWS Gemeinnützige Alpenländische Gesellschaft für Wohnungsbau und Siedlungswesen m.b.H. Graz 7.5 7.5
GZ-Finanz Leasing Gesellschaft m.b.H. Wien 100.0 100.0
IMMORENT S-Immobilienmanagement GesmbH Wien 100.0 100.0
Immorent-Hackinger Grundverwertungsgesellschaft m.b.H. Wien 11.3 11.3
KERES-Immorent Immobilienleasing GmbH Wien 25.0 25.0
LBH Liegenschafts- und Beteiligungsholding GmbH Innsbruck 75.0 75.0
Lorit Kommunalgebäudeleasing Gesellschaft m.b.H. Wien 26.7 26.7
LV Holding GmbH Linz 35.4 35.4
MIGRA Gemeinnützige Wohnungsges.m.b.H. Wien 19.8 19.8
O.Ö. Kommunal-Immobilienleasing GmbH Linz 40.0 40.0
O.Ö. Leasing für öffentliche Bauten Gesellschaft m.b.H. Linz 33.3 33.3
Oberösterreichische Kreditgarantiegesellschaft m.b.H. Linz 5.6 5.6
ÖSW Wohnbauvereinigung Gemeinnützige Gesellschaft m.b.H. Salzburg 15.6 15.6
ÖWB Gemeinnützige Wohnungsaktiengesellschaft Innsbruck 25.6 26.3
ÖWGES Gemeinnützige Wohnbaugesellschaft m.b.H. Graz 2.5 2.5
PSA Payment Services Austria GmbH Wien 18.5 18.5
Salzburger Kreditgarantiegesellschaft m.b.H. Salzburg 18.2 18.2
Seilbahnleasing GmbH Innsbruck 33.3 33.3
SREDISNJE KLIRINSKO DEPOZITARNO DRUSTVO D.D.(CENTRAL DEPOZITORY & CLEARING COMPANY Inc.)
Zagreb0.1 0.1
TKL II. Grundverwertungsgesellschaft m.b.H. Wien 26.7 26.7
TKL VI Grundverwertungsgesellschaft m.b.H. Innsbruck 28.2 33.3
TKL VII Grundverwertungsgesellschaft m.b.H. Innsbruck 28.4 33.3
UNDA Grundstückvermietungs Gesellschaft m.b.H. St. Pölten 25.0 25.0
WBV Beteiligungs- und Vermögensverwaltungsgesellschaft m.b.H. Feldkirch 0.0 0.0
WKBG Wiener Kreditbürgschafts- und Beteiligungsbank AG (vorm.Kapital-Beteiligungs Aktiengesellschaft) Wien 14.4 14.4
Other
"Die Kärntner" - Förderungs- und Beteiligungsgesellschaft für die Stadt Friesach Gesellschaft m.b.H. Friesach 25.0 25.0
"Die Kärntner" - Förderungsgesellschaft für das Gurktal Gesellschaft m.b.H. Gurk 25.0 25.0
"Die Kärntner"-Förderungs- und Beteiligungsgesellschaft für den Bezirk Wolfsberg Gesellschaft m.b.H. Wolfsberg 25.0 25.0
"Gasthof Löwen" Liegenschaftsverwaltung GmbH & Co., KG Feldkirch 0.0 0.0
"Photovoltaik-Gemeinschaftsanlage" der Marktgemeinde Wolfurt Wolfurt 0.0 0.0
"SIMM" Liegenschaftsverwertungsgesellschaft m.b.H. in Liquidation Graz 25.0 25.0
"S-PREMIUM" Drustvo sa ogranicenom odgovornoscu za posredovanje i zastupanje u osiguranju d.o.o. Sarajevo Sarajevo 25.0 25.0
"Stolz auf Wien" Beteiligungs GmbH Wien 0.0 0.0
"TBG" Thermenzentrum Geinberg Betriebsgesellschaft m.b.H. Geinberg 1.5 1.5
"THG" Thermenzentrum Geinberg Errichtungs-GmbH Linz 1.5 1.5
AB Banka, a.s. v likvidaci Mladá Boleslav 4.5 4.5
Achenseebahn-Aktiengesellschaft Jenbach 0.0 0.0
Achtundsechzigste Sachwert Rendite-Fonds Holland GmbH & Co KG Hamburg 0.0 0.0
AD SPORTSKO POSLOVNI CENTAR MILLENNIUM VRŠAC Vršac 0.2 0.2
Agrargemeinschaft Kirchschlag Kirchschlag 0.0 0.0
AKCIONARSKO DRUŠTVO ZA PROIZVODNJU DELOVA ZA MOTORE GARANT, FUTOG - U STECAJU Futog 6.2 6.2
ALBA Services GmbH Wien 50.0 50.0
Alpbacher Bergbahn Gesellschaft m.b.H. & Co.KG. Alpbach 0.0 0.0
ALPENDORF BERGBAHNEN AG St. Johann 0.0 0.0
AREALIS Liegenschaftsmanagement GmbH Wien 50.0 50.0
Argentum Immobilienverwertungs Ges.m.b.H. Linz 39.2 39.2
AS LEASING Gesellschaft m.b.H. Linz 39.2 39.2
AS Support GmbH Linz 39.2 39.2
AS-WECO Grundstückverwaltung Gesellschaft m.b.H. Linz 39.2 39.2
Austrian Reporting Services GmbH Wien 14.3 14.3
AWEKA-Beteiligungsgesellschaft m.b.H. Graz 25.0 25.0
aws Gründerfonds Beteiligungs GmbH & Co KG Wien 5.1 5.1
Bäuerliches Blockheizkraftwerk reg. Gen.m.b.H. Kautzen 0.0 0.0
BCR Asigurari de Viata Vienna Insurance Group SA Bucharest 5.5 5.5
beeex GmbH Pöllau 0.0 0.0
Beogradska Berza, Akcionarsko Drustvo Beograd Belgrade 12.6 12.6
Berg- und Schilift Schwaz-Pill Gesellschaft m.b.H. Schwaz 0.0 0.0
Bergbahn Aktiengesellschaft Kitzbühel Kitzbühel 0.0 0.0
Bergbahn Lofer GmbH Lofer 7.9 7.1
Bergbahnen Oetz Gesellschaft m.b.H. Oetz 0.0 0.0
Bergbahnen Westendorf Gesellschaft m.b.H. Westendorf 0.0 0.0
BGM - EB-Grundstücksbeteiligungen GmbH & Co KG Wien 0.0 0.0
Biogenrohstoffgenossenschaft Kamptal und Umgebung registrierte Genossenschaft mit beschränkter Haftung Maiersch 0.0 0.0

288
Interest of Erste Group in %
Company name, registered office Dec 19 Dec 20
Biomasse Heizwerk Zürs GmbH Zürs 0.0 0.0
Biroul de Credit SA Bucharest 19.4 19.4
Biroul de Credit SRL Chisinau 6.7 6.7
Brauerei Murau eGen Murau 0.6 0.6
Bregenz Tourismus & Stadtmarketing GmbH Bregenz 0.0 0.0
Budapesti Értéktozsde Zártköruen Muködo Részvénytársaság Budapest 2.0 2.0
Burza cennych papierov v Bratislave, a.s. Bratislava 3.9 3.9
Camelot Informatik und Consulting Gesellschaft m.b.H. Wien 3.6 3.6
CAMPUS 02 Fachhochschule der Wirtschaft GmbH Graz 3.8 3.8
capital300 EuVECA GmbH & Co KG Linz 2.6 2.6
Cargo-Center-Graz Betriebsgesellschaft m.b.H. Werndorf 1.6 1.6
Cargo-Center-Graz Betriebsgesellschaft m.b.H. & Co KG Werndorf 1.6 1.6
Carlyle Europe Partners,L.P. (in Liquidation) Vale 0.6 0.6
Casa Romana de Compensatie Sibiu Sibiu 0.4 0.4
CBCB-Czech Banking Credit Bureau, a.s. Praha 20.0 20.0
CRNOMEREC CENTAR D.O.O. ZA PROJEKTIRANJE GRAÐENJE I NADZOR Zagreb 0.0 0.0
D.C. Travel d.o.o Beograd Belgrade 69.3 69.3
Dachstein Tourismus AG Gosau 0.0 0.0
Dateio s.r.o. Praha 22.2 22.2
Die Kärntner Sparkasse - Förderungsgesellschaft für den Bezirk Hermagor Gesellschaft m.b.H. Hermagor 25.0 25.0
DINESIA a.s. Praha 100.0 100.0
Dolomitencenter Verwaltungs GmbH Lienz 50.0 50.0
Dornbirner Seilbahn AG Dornbirn 0.0 0.0
DRUŠTVO ZA KONSALTING I MENADŽMENT POSLOVE TRŽIŠTE NOVCA A.D. BEOGRAD (SAVSKI VENAC) Belgrade 0.8 0.8
EBB-Delta Holding GmbH Wien 100.0 100.0
EBV-Leasing Gesellschaft m.b.H. Wien 51.0 51.0
EC Energie Center Lipizzanerheimat GmbH Bärnbach 0.0 0.0
Egg Investment GmbH Egg 0.0 0.0
E-H Liegenschaftsverwaltungs-GmbH Etsdorf 0.0 0.0
Einlagensicherung AUSTRIA Ges.m.b.H. Wien 0.6 0.5
Einlagensicherung der Banken und Bankiers Gesellschaft m.b.H. in Liqu. Wien 0.1 0.2
ELAG Immobilien AG Linz 1.5 1.5
Energie AG Oberösterreich Linz 0.2 0.2
ERSTE Immobilien Alpha "WE-Objekte" GmbH & Co KG Wien 0.0 0.0
ERSTE Immobilien Alpha APS 85 GmbH & Co KG Wien 0.0 0.0
ERSTE Immobilien Alpha Baufeld Omega GmbH & Co KG Wien 0.0 0.0
ERSTE Immobilien Alpha Brünner Straße 124 Liegenschaftsverwaltung GmbH & Co KG Wien 0.0 0.0
ERSTE Immobilien Alpha Eggenberger Gürtel GmbH & Co KG Graz 0.0 0.0
ERSTE Immobilien Alpha Favoritenstraße 92 GmbH & Co KG Wien 0.0 0.0
ERSTE Immobilien Alpha GmbH Wien 68.7 68.7
ERSTE Immobilien Alpha Kerensstraße GmbH & Co KG Wien 0.0 0.0
ERSTE Immobilien Alpha Lastenstraße GmbH & Co KG Wien 0.0 0.0
ERSTE Immobilien Alpha Monte Laa GmbH & Co. KG Wien 0.0 0.0
ERSTE Immobilien Alpha Paragonstraße GmbH & Co KG Wien 0.0 0.0
ERSTE Immobilien Alpha Ulmgasse GmbH & Co. KG Wien 0.0 0.0
ERSTE Immobilien Alpha W175 GmbH & Co KG Wien 0.0 0.0
ERSTE Immobilien Aspernbrückengasse 2 GmbH & Co KG Wien 0.1 0.1
ERSTE Immobilien Beta GmbH Wien 68.7 68.7
ERSTE Immobilien Beta GS 131 GmbH & Co KG Wien 0.0 0.0
ERSTE Immobilien Gamma GmbH Wien 68.7 68.7
ERSTE Immobilien Gamma Hilde-Spiel-Gasse GmbH & Co KG Wien 0.0 0.0
ERSTE Immobilien Gamma Lemböckgasse GmbH & Co KG Wien 0.0 0.0
ERSTE Immobilien Gamma Pflegeheim Fischamend GmbH & Co KG Wien 0.0 0.0
ERSTE Immobilien Gamma Seepark Campus West GmbH & Co KG Wien 0.0 0.0
FINAG D.D. INDUSTRIJA GRADJEVNOG MATERIJALA BANKRUPTCY Garesnica 18.2 18.2
Finanzpartner GmbH Wien 51.1 51.1
Fortenova Group STAK Stichting Amsterdam 0.3 0.3
FRC2 Croatia Partners SCSp Luxembourg 5.6 5.6
Freizeitpark Zell GmbH Zell 0.0 0.0
Freizeitzentrum Zillertal GmbH Fügen 0.0 0.0
Fund of Excellence Förderungs GmbH Wien 45.0 45.0
FWG-Fernwärmeversorgung Engelbrechts registrierte Genossenschaft mit beschränkter Haftung Kautzen 0.0 0.0
FWG-Fernwärmeversorgung Raabs a.d. Thaya registrierte Genossenschaft mit beschränkter Haftung Raabs 0.0 0.0
Gasteiner Bergbahnen Aktiengesellschaft Bad Hofgastein 13.4 13.4
GEMDAT OÖ GmbH Linz 10.6 10.6
GEMDAT OÖ GmbH & Co KG Linz 11.8 11.8
Gerlitzen - Kanzelbahn - Touristik Gesellschaft m.b.H. & Co KG Sattendorf 0.0 0.0
Gewerbe- und Dienstleistungspark der Stadtgemeinde Bad Radkersburg KG Bad Radkersburg 12.5 12.5
Gladiator Aircraft Management Limited Pieta 100.0 100.0
Golfclub Bludenz-Braz GmbH Bludenz-Braz 0.0 0.0
Golfclub Brand GmbH Brand 0.0 0.0
Golfclub Pfarrkirchen im Mühlviertel GesmbH Pfarrkirchen 0.2 0.2
Golfplatz Hohe Salve - Brixental Errichtergesellschaft m.b.H. & Co KG Westendorf 0.0 0.0

289
Interest of Erste Group in %
Company name, registered office Dec 19 Dec 20
Golfresort Haugschlag GmbH & Co KG Litschau 0.0 0.0
Graben 21 Liegenschaftsverwaltung GmbH Wien 100.0 100.0
Großarler Bergbahnen Gesellschaft mit beschränkter Haftung & Co. KG. Großarl 0.5 0.5
GW St. Pölten Integrative Betriebe GmbH St. Pölten 0.0 0.0
GXT Vermögensverwaltung GmbH & Co KG Wien 0.0 0.0
HAPIMAG AG Baar 0.0 0.0
Harkin Limited Dublin 100.0 100.0
Hauser Kaibling Seilbahn- und Liftgesellschaft m.b.H. & Co. KG. Haus 0.4 0.4
HDL Fiecht GmbH Vomp 0.0 0.0
Heiltherme Bad Waltersdorf GmbH Bad Waltersdorf 4.5 4.5
Heiltherme Bad Waltersdorf GmbH & Co KG Bad Waltersdorf 4.1 4.1
Hinterstoder-Wurzeralm Bergbahnen Aktiengesellschaft Hinterstoder 0.4 0.4
Hrvatski olimpijski centar Bjelolosica d.o.o. (Kroatisches Olympiazentrum) in bankruptcy Jesenak 1.2 1.2
Hrvatski registar obveza po kreditima d.o.o. (HROK) Zagreb 7.3 7.3
HV-Veranstaltungsservice GmbH St. Lorenzen 100.0 100.0
ILGES - Liegenschaftsverwaltung G.m.b.H. Rohrbach 40.0 40.0
JAVNO SKLADIŠTE SLOBODNA CARINSKA ZONA NOVI SAD AD NOVI SAD Novi Sad 4.1 4.1
JUGOALAT-JAL AD NOVI SAD Novi Sad 1.7 5.0
Kaiser-Ebersdorfer Straße 8 GmbH & Co KG Wien 0.0 0.0
Kapruner Freizeitzentrum Betriebs GmbH Kaprun 0.0 0.0
Kapruner Promotion und Lifte GmbH Kaprun 6.5 6.5
Kitzbüheler Anzeiger Gesellschaft m.b.H. Kitzbühel 0.0 0.0
Kleinkraftwerke-Betriebsgesellschaft m.b.H. Wien 100.0 100.0
Kommanditgesellschaft MS "SANTA LORENA" Offen Reederei GmbH & Co. Hamburg 0.0 0.0
Kommanditgesellschaft MS "SANTA LUCIANA" Offen Reederei GmbH & Co. Hamburg 0.0 0.0
KOOPERATIVA poistovna, a.s. Vienna Insurance Group Bratislava 1.5 1.5
Kooperativa pojistovna, a.s. Vienna Insurance Group Praha 1.6 1.6
'KULSKI ŠTOFOVI' FABRIKA ZA PROIZVODNJU VUNENIH TKANINA I PREDIVA AKCIONARSKO DRUŠTVO IZ KULE - U STECAJU Kula 0.2 6.1
ländleticket marketing gmbh Dornbirn 0.0 0.0
Langenloiser Liegenschaftsverwaltungs-Gesellschaft m.b.H. Langenlois 0.0 0.0
Lantech Innovationszentrum GesmbH Landeck 0.0 0.0
Lebens.Resort & Gesundheitszentrum GmbH Ottenschlag 0.0 0.0
Lienzer-Bergbahnen-Aktiengesellschaft Gaimberg 0.0 0.0
Liezener Bezirksnachrichten Gesellschaft m.b.H. Liezen 1.1 1.1
LOCO 597 Investment GmbH Egg 0.0 0.0
M Schön Wohnen Immorent GmbH Wien 100.0 100.0
Maissauer Amethyst GmbH Maissau 0.0 0.0
MAJEVICA HOLDING AKCIONARSKO DRUŠTVO, BACKA PALANKA Bacčka Palanka 0.6 5.2
MasterCard Incorporated Wilmington 0.0 0.0
Mayer Property Alpha d.o.o. Zagreb 100.0 100.0
Mayrhofner Bergbahnen Aktiengesellschaft Mayrhofen 0.0 0.0
MCG Graz e.gen. Graz 1.4 1.4
MEG Hausgemeinschaft "Bahnhofstraße 1, 4481 Asten" Asten 0.0 0.0
Mittersiller Golf- und Freizeitanlagen Gesellschaft m.b.H. Mittersill 0.0 0.0
Montfort Investment GmbH Götzis 0.0 0.0
MPC Rendite-Fonds Leben plus spezial III GmbH & Co KG Quickborn 0.0 0.0
Mühlbachgasse 8 Immobilien GmbH Langenlois 0.0 0.0
MUNDO FM & S GmbH Wien 100.0 100.0
Murauer WM Halle Betriebsgesellschaft m.b.H. Murau 3.1 3.1
Nahwärme Frankenmarkt eGen Frankenmarkt 0.0 0.0
Neo Investment B.V. Amsterdam 0.0 0.0
Neuhofner Bauträger GmbH Neuhofen 0.0 0.0
Oberösterreichische Unternehmensbeteiligungsgesellschaft m.b.H. Linz 5.6 5.6
Oberpinzgauer Fremdenverkehrsförderungs- und Bergbahnen - Aktiengesellschaft Neukirchen 0.0 0.0
Obertilliacher Bergbahnen-Gesellschaft m.b.H. Obertilliach 0.0 0.0
Öhlknecht-Hof Errichtungs- und Verwaltungsgesellschaft m.b.H. Horn 0.0 0.0
ÖKO-Heizkraftwerk Pöllau GmbH Pöllau 0.0 0.0
ÖKO-Heizkraftwerk Pöllau GmbH & Co KG Pöllau 0.0 0.0
Old Byr Holding ehf. Reykjavik 1.5 1.5
Omniasig Vienna Insurance Group SA Bucharest 0.1 0.1
OÖ HightechFonds GmbH Linz 7.8 7.8
Ortswärme Fügen GmbH Fügen 0.0 0.0
Österreichische Wertpapierdaten Service GmbH Wien 32.7 32.7
Osttiroler Wirtschaftspark GesmbH Lienz 0.0 0.0
Planai - Hochwurzen - Bahnen Gesellschaft m.b.H. Schladming 0.7 0.7
Planung und Errichtung von Kleinkraftwerken Aktiengesellschaft Wien 98.9 99.6
POSLOVNO UDRUŽENJE DAVAOCA LIZINGA "ALCS" BEOGRAD Belgrade 8.3 8.3
PREDUZECE ZA PRUŽANJE CONSULTING USLUGA BANCOR CONSULTING GROUP DOO NOVI SAD Novi Sad 2.6 2.6
Prvni certifikacni autorita, a.s. Praha 23.3 23.3
Radio Osttirol GesmbH Lienz 0.0 0.0
Rätikon-Center Errichtungs- und Betriebsgesellschaft m.b.H. Bludenz 0.0 0.0
Realitäten und Wohnungsservice Gesellschaft m.b.H. Köflach 4.0 4.0

290290
Interest of Erste Group in %
Company name, registered office Dec 19 Dec 20
Realitni spolecnost Ceske sporitelny, a.s. Praha 100.0 100.0
REGIONALNA AGENCIJA ZA RAZVOJ MALIH I SREDNJIH PREDUZECA ALMA MONS D.O.O. Novi Sad 3.3 3.3
REICO nemovitostni fond SICAV a.s. Praha 100.0 100.0
Riesneralm - Bergbahnen Gesellschaft m.b.H. & Co. KG. Donnersbach 0.0 0.0
Rolling Stock Lease s.r.o. Bratislava 100.0 3.0
ROMANIAN EQUITY PARTNERS COÖPERATIEF U.A. Amsterdam 77.4 77.4
RTG Tiefgaragenerrichtungs und -vermietungs GmbH Graz 25.0 25.0
S - Leasing und Vermögensverwaltung - Gesellschaft m.b.H. Peuerbach 0.0 0.0
S IMMOKO Leasing GesmbH Korneuburg 0.0 0.0
S Servis, s.r.o. Znojmo 100.0 100.0
SALIX-Grundstückserwerbs Ges.m.b.H. Eisenstadt 50.0 50.0
SALZBURG INNENSTADT, Vereinigung zur Förderung selbständiger Unternehmer der Salzburger Innenstadt, registrierte Genossenschaft mit beschränkter Haftung Salzburg 2.0 2.0
S-AMC1 DOOEL Skopje Skopje 24.9 24.9
Schweighofer Gesellschaft m.b.H. & Co KG Friedersbach 0.0 0.0
S-City Center Wirtschaftsgütervermietungsgesellschaft m.b.H. Wiener Neustadt 0.0 0.0
S-Commerz Beratungs- und Handelsgesellschaft m.b.H. Neunkirchen 0.0 0.0
SEG Sport Event GmbH Hohenems 0.0 0.0
Seniorenresidenz "Am Steinberg" GmbH Graz 25.0 25.0
S-Finanzservice Gesellschaft m.b.H. Baden 0.0 0.0
SILO DREI Komplementärgesellschaft m.b.H. Wien 49.0 49.0
SILO II Komplementärgesellschaft m.b.H. Wien 49.0 49.0
Silvrettaseilbahn Aktiengesellschaft Ischgl 0.0 0.0
SK 2 Properties s.r.o. Bratislava 0.0 0.0
Skilifte Unken - Heutal Gesellschaft m.b.H. & Co, KG Unken 0.0 0.0
Skilifte Unken Heutal Gesellschaft m.b.H. Unken 2.2 2.2
Smart City GmbH Eferding 0.0 0.0
SOCIETATEA DE TRANSFER DE FONDURI SI DECONTARI TRANSFOND SA Bucharest 3.2 3.2
Society for Worldwide Interbank Financial Telecommunication scrl La Hulpe 0.3 0.3
Sparkasse Amstetten Service- und Verwaltungsgesellschaft m. b. H. Amstetten 0.0 0.0
Sparkasse Bludenz Beteiligungsgesellschaft mbH Bludenz 0.0 0.0
Sparkasse Bludenz Immobilienverwaltungsgesellschaft mbH Bludenz 0.0 0.0
Sparkasse Imst Immobilienverwaltung GmbH Imst 0.0 0.0
Sparkasse Imst Immobilienverwaltung GmbH & Co KG Imst 0.0 0.0
Sparkassen Bankbeteiligungs GmbH Dornbirn 0.0 0.0
Sparkassen Beteiligungs GmbH & Co KG Wien 7.8 7.8
Sparkassen Facility Management GmbH Innsbruck 75.0 75.0
Sparkassengarage Imst Errichtungs- und Betriebs GmbH Imst 0.0 0.0
Sparkassengarage Imst Errichtungs- und Betriebs GmbH & Co KG Imst 0.0 0.0
Speedinvest III EuVECA GmbH & Co KG Wien 0.0 2.5
SPES GmbH & Co. KG Schlierbach 0.0 0.0
SPKB Beteiligungs- und Verwaltungsgesellschaft m.b.H. Bregenz 0.0 0.0
SPKR Liegenschaftsverwertungs GmbH Reutte 0.0 0.0
Sport- und Freizeitanlagen Gesellschaft m.b.H. Schwanenstadt 12.9 12.9
SPRON ehf. Reykjavik 4.9 4.9
Stadtgemeinde Weiz - Wirtschaftsentwicklung KG Weiz 0.0 0.0
Stadtmarketing-Ternitz Gmbh Ternitz 0.0 0.0
Sternstein Sessellift Gesellschaft m.b.H. Bad Leonfelden 7.2 7.2
Stoderzinken - Liftgesellschaft m.b.H. & Co. KG. Gröbming 0.4 0.4
SVB Lambach Versicherungsmakler GmbH Lambach 0.0 0.0
SZG-Dienstleistungsgesellschaft m.b.H. Salzburg 100.0 100.0
Tannheimer Bergbahnen GmbH & Co KG Tannheim 0.0 0.0
Tauern SPA World Betriebs- Gmbh & Co KG Kaprun 11.1 11.1
Tauern SPA World Betriebs-GmbH Kaprun 12.2 12.2
Tauern SPA World Errichtungs- GmbH & Co KG Kaprun 11.1 11.1
Tauern SPA World Errichtungs-GmbH Kaprun 12.2 12.2
TAUROS Capital Investment GmbH & Co KG Wien 40.4 40.4
TAUROS Capital Management GmbH Wien 49.0 44.6
TDG Techn. Dienstleistungs- und Objektservicegesellschaft m.b.H. Wien 100.0 100.0
TDZ Technologie- und Dienstleistungszentrum Donau-Böhmerwald Bezirk Rohrbach GmbH. Neufelden 1.0 1.0
TECH21 Bürohaus und Gewerbehof Errichtungs- und Betriebsgesellschaft mbH & Co KG Wien 0.1 0.1
Technologie- und Dienstleistungszentrum Ennstal GmbH Reichraming 0.0 0.0
TECHNOLOGIE- und GRÜNDERPARK ROSENTAL GmbH Rosental 0.3 0.3
Technologie- und Innovationszentrum Kirchdorf GmbH Schlierbach 0.0 0.0
Technologiezentrum Inneres Salzkammergut GmbH Bad Ischl 0.0 0.0
Technologiezentrum Salzkammergut GmbH Gmunden 0.6 0.6
Technologiezentrum Salzkammergut-Bezirk Vöcklabruck GmbH Attnang-Puchheim 0.0 0.0
Techno-Z Ried Technologiezentrum GmbH Ried 0.0 0.0
Tennis-Center Hofkirchen i. M. GmbH Hofkirchen 7.3 7.3
Thermalquelle Loipersdorf Gesellschaft m.b.H. & Co KG Loipersdorf 0.0 0.0
Therme Wien Ges.m.b.H. Wien 15.3 15.3
Therme Wien GmbH & Co KG Wien 15.3 15.3
Tiefgarage Anger, Gesellschaft m.b.H. & Co. KG. Lech 0.0 0.0
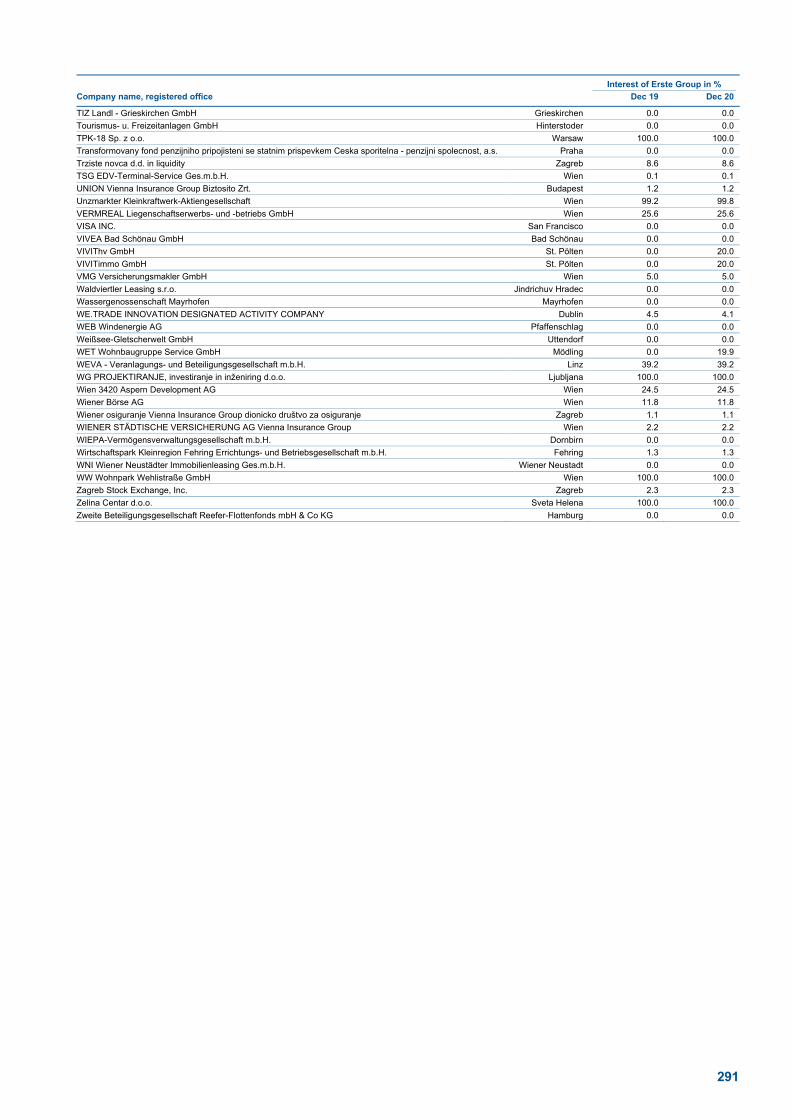
291
Interest of Erste Group in %
Company name, registered office Dec 19 Dec 20
TIZ Landl - Grieskirchen GmbH Grieskirchen 0.0 0.0
Tourismus- u. Freizeitanlagen GmbH Hinterstoder 0.0 0.0
TPK-18 Sp. z o.o. Warsaw 100.0 100.0
Transformovany fond penzijniho pripojisteni se statnim prispevkem Ceska sporitelna - penzijni spolecnost, a.s. Praha 0.0 0.0
Trziste novca d.d. in liquidity Zagreb 8.6 8.6
TSG EDV-Terminal-Service Ges.m.b.H. Wien 0.1 0.1
UNION Vienna Insurance Group Biztosito Zrt. Budapest 1.2 1.2
Unzmarkter Kleinkraftwerk-Aktiengesellschaft Wien 99.2 99.8
VERMREAL Liegenschaftserwerbs- und -betriebs GmbH Wien 25.6 25.6
VISA INC. San Francisco 0.0 0.0
VIVEA Bad Schönau GmbH Bad Schönau 0.0 0.0
VIVIThv GmbH St. Pölten 0.0 20.0
VIVITimmo GmbH St. Pölten 0.0 20.0
VMG Versicherungsmakler GmbH Wien 5.0 5.0
Waldviertler Leasing s.r.o. Jindrichuv Hradec 0.0 0.0
Wassergenossenschaft Mayrhofen Mayrhofen 0.0 0.0
WE.TRADE INNOVATION DESIGNATED ACTIVITY COMPANY Dublin 4.5 4.1
WEB Windenergie AG Pfaffenschlag 0.0 0.0
Weißsee-Gletscherwelt GmbH Uttendorf 0.0 0.0
WET Wohnbaugruppe Service GmbH Mödling 0.0 19.9
WEVA - Veranlagungs- und Beteiligungsgesellschaft m.b.H. Linz 39.2 39.2
WG PROJEKTIRANJE, investiranje in inženiring d.o.o. Ljubljana 100.0 100.0
Wien 3420 Aspern Development AG Wien 24.5 24.5
Wiener Börse AG Wien 11.8 11.8
Wiener osiguranje Vienna Insurance Group dionicko društvo za osiguranje Zagreb 1.1 1.1
WIENER STÄDTISCHE VERSICHERUNG AG Vienna Insurance Group Wien 2.2 2.2
WIEPA-Vermögensverwaltungsgesellschaft m.b.H. Dornbirn 0.0 0.0
Wirtschaftspark Kleinregion Fehring Errichtungs- und Betriebsgesellschaft m.b.H. Fehring 1.3 1.3
WNI Wiener Neustädter Immobilienleasing Ges.m.b.H. Wiener Neustadt 0.0 0.0
WW Wohnpark Wehlistraße GmbH Wien 100.0 100.0
Zagreb Stock Exchange, Inc. Zagreb 2.3 2.3
Zelina Centar d.o.o. Sveta Helena 100.0 100.0
Zweite Beteiligungsgesellschaft Reefer-Flottenfonds mbH & Co KG Hamburg 0.0 0.0

292292
Additional information
GLOSSARY Book value per share Equity (attributable to owners of the parent) divided by the number of outstanding shares at the end of the period. Cash return on equity (cash RoE) Net profit for the period attributable to the owners of the parent less dividends for Additional Tier 1 capital (AT1), adjusted for non-cash items such as goodwill amortisation and amortisation of customer relationship as a percentage of the average equity attributable to the owners of the parent. The average is calculated on the basis of final quarterly values. Cash earnings per share Net profit for the period attributable to owners of the parent, less dividends for Additional Tier 1 capital (AT1), adjusted for non-cash items such as goodwill impairment and amortisation of customer relationship divided by the weighted average number of outstanding shares. CEE (Central and Eastern Europe) Abbreviation for the economic area Central and Eastern Europe. Includes the new EU member states of the enlargement rounds 2004 and 2007 as well as the successor states of Yugoslavia and the Soviet Union as well as Albania. CET1 Common equity Tier 1. CET1 ratio Common equity Tier 1 as a percentage of the total risk (according to CRR). CRR Capital Requirements Regulation: one of the two legal acts containing the new Capital Requirements. Cost/income ratio General administrative expenses or operating expenses as a percentage of operating income. Dividend yield Dividend distribution of the financial year as a percentage of the year-end closing price or the most recent price of the share. Earnings per share Net profit for the period attributable to owners of the parent, less dividends for Additional Tier 1 capital (AT1), divided by the weighted average number of outstanding shares. Interest-bearing assets Total assets less cash and cash balances, derivatives – held for trading, hedge accounting derivatives, property and equipment, investment properties, intangible assets, current and deferred tax assets, assets held for sale and other assets. Loan to deposit ratio Loans and receivables to customers (net) in relation to deposits from customers Miscellaneous assets The total of hedge accounting derivatives, property and equipment, investment properties, investments in associates and joint ventures associates, current and deferred tax assets, assets held for sale and other assets, Miscellaneous liabilities The total of other financial liabilities at fair value through profit or loss, other financial liabilities at amortised cost, hedge accounting derivatives, changes in fair value of portfolio hedged items, provisions, current and deferred tax liabilities, liabilities associated with assets held for sale and other liabilities. Net interest margin Net interest income as a percentage of average interest-bearing assets. The average is calculated on the basis of quarterly values.

293
Operating expenses (general administrative expenses) The total of personnel expenses, other administrative expenses and depreciation and amortisation. Operating income Total of net interest income, net fee and commission income, dividend income, net trading result, gains/losses from financial instruments measured at fair value through profit or loss, net result from equity method investments and rental income from investment properties & other operating leases. Operating result Operating income less operating expenses. Own funds Own funds according to CRR consist of Common equity Tier 1 (CET1), Additional Tier 1 capital (AT1) and the supplementary capital (T2). Price/earnings ratio Ratio between closing price of the financial year and earnings per share of the financial year. Market capitalisation Total value of a company which results from multiplying the share price by the number of shares outstanding (share capital). Non-performing exposure (NPE) collateralisation ratio Collateral for non-performing credit risk exposure as a percentage of non-performing credit risk exposure. Non-performing exposure (NPE) coverage ratio Credit risk allowances for credit risk exposure (all allowances in scope of IFRS 9 and provisions for other commitments) as a percentage of non-performing credit risk exposure. Non-performing exposure (NPE) ratio Non-performing credit risk exposure as a percentage of total credit risk exposure. Non-performing loans (NPL) collateralisation ratio Collateral for non-performing loans and advances to customers as a percentage of non-performing loans and advances to customers. Non-performing loans (NPL) coverage ratio Credit risk allowances for loans and advances to customers as a percentage of non-performing loans and advances to customers. Non-performing loans (NPL) ratio Non-performing loans and advances to customers as a percentage of total loans and advances to customers. Return on equity (RoE) Net profit for the period attributable to owners of the parent, less dividends for Additional Tier 1 capital (AT1) as a percentage of the average equity attributable to the owners of the parent. The average is calculated on the basis of final quarterly figures. Return on equity excluding intangible assets (ROTE) Net profit for the period attributable to owners of the parent, less dividends for Additional Tier 1 capital (AT1) as a percentage of average equity attributable to owners of the parent and adjusted for intangible assets. The average is calculated on the basis of quarterly final values. Risk Appetite Statement (RAS) The RAS is a strategic document, which concludes the maximum risk an organization is willing to take in order to reach any given target. Risk categories Risk categories classify the risk exposures of Erste Group based on the internal ratings of Erste Group. There exist three risk categories for performing risk exposures and one risk category for non-performing risk exposures. Risk category – low risk Typically regional customers with well-established and rather long-standing relationships with Erste Group or large, internationally recog-nised customers. Very good to satisfactory financial position and low likelihood of financial difficulties relative to the respective market in which the customers operate. Retail clients having long relationships with the bank, or clients with a wide product pool use. No relevant late payments currently or in the most recent 12 months. New business is generally done with clients in this risk category.

294294
Risk category – management attention Vulnerable non-retail clients, which may have overdue payments or defaults in their credit history or may encounter debt repayment diffi-culties in the medium term. Retail clients with possible payment problems in the past triggering early collection reminders. These clients typically have a good recent payment history. Risk category – substandard The borrower is vulnerable to short term negative financial and economic developments and shows an elevated probability of failure. In some cases, restructuring measures are possible or already in place. As a rule, such loans are managed in specialised risk management departments. Risk category – non-performing One or more of the default criteria under Article 178 of the CRR are met: among others, full repayment unlikely, interest or principal payments on a material exposure more than 90 days past due, restructuring resulting in a loss to the lender, realisation of a loan loss, or initiation of bankruptcy proceedings. Erste Group applies the customer view for all customer segments, including retail clients; if an obligor defaults on one deal then the customer’s performing transactions are classified as non-performing as well. Furthermore, non-performing exposures also comprise non-performing forborne transactions even in cases where the client has not defaulted. Share capital Total equity attributable to owners of the parent subscribed by the shareholders. Tax ratio Taxes on income as a percentage of pre-tax profit from continuing operations. Texas ratio Total capital according to IFRS dividends for Additional Tier 1 capital (AT1), and intangible assets plus allowances for loans and advances to customers as a percentage of non-performing loans. T 1 ratio Tier 1 as a percentage of the total risk (according to CRR). Total capital ratio Total of own funds as a percentage of the total risk (according to CRR). Total risk (risk-weighted assets, RWA) Includes credit, market and operational risk (according to CRR). Total shareholder return Performance of an investment in Erste Group Bank AG shares within one year including all distributions, such as dividends, as a percentage of the share price at the end of the previous year.

295
ABBREVIATIONS ABA Austrian Banking Act
AC Amortized cost
ACC Austrian Commercial Code
AFS Available for sale
ALM Asset Liability Management
ALCO Asset Liability Committee
AMA Advanced Measurement Approach
AT1 Additional Tier 1
BCR Banca Comercialǎ Romȃnlǎ S.A.
BSM & LCC Balance sheet management & Local Corporate Center
CBCR Country-by-Country-Reporting
CCF Credit Conversion Factor
CEE Central and Eastern Europe
CGU Cash-Generating Unit
CRD Capital Requirements Directive
CRR Capital Requirements Regulation
CRO Chief Risk Officer
CSAS Česká spořitelna, a.s.
CVA Credit Value Adjustments
DIP Debt Issuance-Programme
DVA Debit Value Adjustment
EBA European Banking Authority
EBC Erste Bank Croatia
EBH Erste Bank Hungary Zrt.
EBOe Erste Bank Oesterreich
ECL Expected Credit Loss
ECJ European Court of Justice
EIR Effective interest rate
ERM Enterprise wide Risk Management
FVO Fair value option-designated at fair value
FVOCI Fair value through other comprehensive income
FVPL Fair value through profit or loss
FX Foreign exchange
GDPR General Data Protection Regulation
G-SII Global Systemic Important Institution
GLMRM Group Liquidity and Market Risk Management
HFT Held for trading
HTM Held to maturity
IAS International Accounting Standards
ICAAP Internal Capital Adequacy Assessment Process
IFRS International Financial Reporting Standards
LGD Loss Given Default
L&R Loans and receivables
LT PD Lifetime Probability of Default
MDA Maximum distributable amount
OCI Other comprehensive income
O-SII Other Systemic Important Institution
P2G Pillar 2 Guidance
P2R Pillar 2 Requirement
P&L Profit or loss
PD Probability of Default
POCI Purchased or originated credit impaired
RAS Risk Appetite Statement
RTS Regulatory Technical Standards
RW Risk weight
RWA Risk Weighted Assets
SICR Significant increase in credit risk
SLSP Slovenská sporiteľňa
Sparkasse Oberösterreich Allgemeine Sparkasse Oberösterreich Bankaktiengesellschaft
Sparkasse Steiermark Erste & Steiermärkische Bank d.d.
Sparkasse Kärnten Kärntner Sparkasse Aktiengesellschaft
SPPI Solely payments of principal and interest
SREP Supervisory Review and Evaluation Process
T1 Tier 1
T2 Tier 2
VAR Value at Risk

296296
Management Board
Bernhard Spalt mp, Chairman
Ingo Bleier mp, Member Stefan Dörfler mp, Member
Alexandra Habeler-Drabek mp, Member David O‘Mahony mp, Member
Maurizio Poletto mp, Member Thomas Schaufler mp, Member
Vienna, 26 February 2021

297
STATEMENT OF ALL MEMBERS OF THE MANAGEMENT BOARD
We confirm that to the best of our knowledge the consolidated financial statements give a true and fair view of the assets, liabilities, financial position and profit or loss of the Group as required by the applicable accounting standards and that the Group management report gives a true and fair view of the development and performance of the business and the position of the Group, together with a description of the principal risks and uncertainties to which the Group is exposed.
Management Board
Bernhard Spalt mp, Chairman
Ingo Bleier mp, Member Stefan Dörfler mp, Member
Alexandra Habeler-Drabek mp, Member David O‘Mahony mp, Member
Maurizio Poletto mp, Member Thomas Schaufler mp, Member
Vienna, 26 February 2021

298298
ERSTE GROUP BANK AG
Am Belvedere 1 A-1100 Vienna Tel: +43 (0) 50100 10100 SWIFT/BIC: GIBAATWGXXX E-Mail: [email protected] Website: www.erstegroup.com AUSTRIA
Erste Bank der oesterreichischen Sparkassen AG
(Erste Bank Oesterreich)
Am Belvedere 1 A-1100 Vienna Tel: +43 (0) 50100 20111 SWIFT/BIC: GIBAATWWXXX E-Mail: [email protected] Website: www.erstebank.at CZECH REPUBLIC
Česká spořitelna, a.s.
Olbrachtova 1929/62 CZ-140 00 Prague 4 Tel: +420 956 777901 SWIFT/BIC: GIBACZPX E-Mail: [email protected] Website: www.csas.cz SLOVAKIA
Slovenská sporiteľňa, a.s.
Tomášikova 48 SK-832 37 Bratislava Tel: +421 2 582681 11 SWIFT/BIC: GIBASKBX E-Mail: [email protected] Website: www.slsp.sk ROMANIA
Banca Comercială Română S.A.
159 Calea Plevnei, Business Garden Bucharest, Building A RO-060013 Bucharest 6 Tel: +40 21 4074200 SWIFT/BIC: RNCBROBU E-Mail: [email protected] Website: www.bcr.ro
HUNGARY
Erste Bank Hungary Zrt.
Népfürdő u. 24-26 H-1138 Budapest Tel: +36 12980222 SWIFT/BIC: GIBAHUHB E-Mail: [email protected] Website: www.erstebank.hu CROATIA
Erste&Steiermärkische Bank d.d.
(Erste Bank Croatia)
Jadranski trg 3A HR-51000 Rijeka Tel: +385 51 365591 SWIFT/BIC: ESBCHR22 E-Mail: [email protected] Website: www.erstebank.hr SERBIA
Erste Bank a.d. Novi Sad
(Erste Bank Serbia)
Bulevar oslobođenja 5 SRB-21000 Novi Sad Tel: +381 66 89669000 SWIFT/BIC: GIBARS22XXX E-Mail: [email protected] Website: www.erstebank.rs
Important addresses

Imprint
Publisher and copyright owner:Erste Group Bank AGAm Belvedere 1, A-1100 Vienna
Editorial staff:Investor Relations & Accounting-Teams, Erste Group
Production:Erste Group with the assistance of firesys GmbH
Graphics:Schneeweis Wittmann www.schneeweiswittmann.at
Print management:SPV-Druck Gesellschaft m. b. H.Bockfließerstraße 60–62, A-2214 Auersthal
Contact:
Erste Group Bank AGAm Belvedere 1, A-1100 Vienna Phone: +43 (0)5 0100 - 17731 Email: [email protected] Internet: www.erstegroup.com/investorrelations
Thomas SommerauerPhone: +43 (0)5 0100 - 17326 Email: [email protected]
Peter MakrayPhone: +43 (0)5 0100 - 16878 Email: [email protected]
Simone Pilz Phone: +43 (0)5 0100 - 13036 Email: [email protected]
Gerald Krames Phone: +43 (0)5 0100 - 12751 Email: [email protected]
IMPORTANT INFORMATION:We have prepared this annual report with the greatest possible care and have thoroughly checked the data presented in it. However, we cannot rule out errors associated with rounding, transmission, typesetting or printing. The English version of the annual report is a translation. This report contains forward-looking statements. These statements are based on current estimates, assumptions and projections of Erste Group Bank AG and currently available public information. They are not guarantees of future performance and involve certain known and yet unknown risks and uncertainties and are based upon assumptions as to future events that may not prove to be accurate. Many factors could cause the actual results or performance to be materially different from those that may be expressed or implied by such statements. Erste Group Bank AG does not assume any obligation to update the forward-looking statements contained in this report.

www.erstegroup.com