Annual Report 2016 | BankTrack
308
Annual Report 2016 Ordinary H-Share Stock Code: 3988 Offshore Preference Share Stock Code: 4601
-
Upload
khangminh22 -
Category
Documents
-
view
3 -
download
0
Transcript of Annual Report 2016 | BankTrack

No. 1 Fuxingmen Nei Dajie, Beijing, China, 100818 Tel: (86) 10-6659 6688 Fax: (86) 10-6601 6871 Customer Service and Complaint Hotline: (86) Area Code-95566 http://www.boc.cn
Annual R
eport 2016
Stock C
ode: 3988 / 4601
Annual Report2016
Ordinary H-Share Stock Code: 3988Offshore Preference Share Stock Code: 4601

Bank of China is the most internationalised bank in China. After establishing the London Agency in 1929, which was the first overseas institution of Chinese financial institutions, the Bank gradually expanded its overseas network to major global financial centres including Tokyo, Singapore and New York. At present, the Bank provides a comprehensive range of financial services to customers across the Chinese mainland as well as 51 countries and regions.
Bank of China Global Network
BERLINHAMBURG
MUNICH
MANCHESTER
KUCHINGNAIROBI
PORT LOUIS
DAR ES SALAAMLUANDA
JOHANNESBURG
LUSAKAKITWE
DURBAN
SYDNEYADELAIDE
MELBOURNE
PERTH
BRISBANE
AUCKLAND
VANCOUVER
CALGARY
LOS ANGELES
CHICAGO
TORONTO
NEW YORK
MONTREAL
MOSCOW
AKTOBEALMATY
KHABAROVSKULAANBAATAR
SEOULANSAN
DAEGUOSAKA NAGOYA
KOBETOKYOYOKOHAMA
VLADIVOSTOK
TAIPEIHONG KONGMACAU
LISBON
CASABLANCA
DUBAIABU DHABI
BAHRAIN
HO CHI MINH CITY
VIENTIANE
STOCKHOLM
SURABAYAJAKARTA
GLASGOW
DUBLINBIRMINGHAM
LONDON
ISTANBULROME
VIENNA
PRAGUEFRANKFURT
BELGRADEBUDAPEST
WARSAW
PARISBRUSSELS
DUSSELDORF
ROTTERDAM
LUXEMBOURGLYON
MILAN
YANGON KHON KAENBANGKOK RANONG
PHNOM PENH
NAKHON RATCHASIMAMANILA
STUTTGART
GRAND CAYMAN
PANAMACOLON
SAO PAULORIO DE JANEIRO
LIMA
CHIANG MAI
BANDAR SERI BEGAWAN
SINGAPORE
PENANG
JOHOR BAHRU
MUAR
PUCHONG
MEDANKUALA LUMPURHAT YAI
KLANG

Introduction
2016 Annual Report1
Bank of China was formally established in February 1912 following the approval of Dr. Sun Yat-sen. From 1912
to 1949, the Bank served consecutively as the country’s central bank, international exchange bank and specialised
international trade bank. Fulfilling its commitment to serving the public and developing China’s financial services
sector, the Bank rose to a leading position in the Chinese financial industry and developed a good standing in the
international financial community, despite many hardships and setbacks. After 1949, drawing on its long history
as the state-designated specialised foreign exchange and trade bank, the Bank became responsible for managing
China’s foreign exchange operations and provided vital support to the nation’s foreign trade development and
economic infrastructure by its offering of international trade settlement, overseas fund transfer and other non-
trade foreign exchange services. During China’s reform and opening up period, the Bank seized the historic
opportunity presented by the government’s strategy of capitalising on foreign funds and advanced technologies
to boost economic development, and became the country’s key foreign financing channel by building up its
competitive advantages in foreign exchange business. In 1994, the Bank was transformed into a wholly state-
owned commercial bank. In August 2004, Bank of China Limited was incorporated. The Bank was listed on the
Hong Kong Stock Exchange and the Shanghai Stock Exchange in June and July 2006 respectively, becoming
the first Chinese commercial bank to launch an A-Share and H-Share initial public offering and achieve a dual
listing in both markets. In 2016, Bank of China was again designated as a Global Systemically Important Bank,
thus becoming the sole financial institution from emerging economies to be designated as a Global Systemically
Important Bank for six consecutive years.
As China’s most internationalised and diversified bank, Bank of China provides a comprehensive range of
financial services to customers across the Chinese mainland as well as 51 countries and regions. The Bank’s core
business is commercial banking, including corporate banking, personal banking and financial markets services.
BOC International Holdings Limited, a wholly owned subsidiary, is the Bank’s investment banking arm. Bank of
China Group Insurance Company Limited and Bank of China Insurance Company Limited, both wholly owned
subsidiaries, run the Bank’s insurance business. Bank of China Group Investment Limited, a wholly owned
subsidiary, undertakes the Bank’s direct investment and investment management business. Bank of China
Investment Management Co., Ltd., a controlled subsidiary, operates the Bank’s fund management business. BOC
Aviation Limited, a controlled subsidiary, is in charge of the Bank’s aircraft leasing business.
Bank of China has upheld the spirit of “pursuing excellence” throughout its history of over one century. With
adoration of the nation in its soul, integrity as its backbone, reform and innovation as its path forward and “people
first” as its guiding principle, the Bank has built up an excellent brand image that is widely recognised within the
industry and by its customers. Faced with new historic opportunities, the Bank will meet its social responsibilities,
strive for excellence, and make further contributions to achieving the China Dream and the great rejuvenation of
the Chinese nation.

Development Strategy
2016 Annual Report 2
Core Values
Pursuing excellence
Integrity Performance Responsibility Innovation Harmony
Strategic Goal
Serving Society, Delivering Excellence
Overall Requirements of the Development Strategy
To build Bank of China into an excellent bank driven by the
pursuit of noble values, a bank that shoulders significant
responsibility for the nation’s revival, a bank that possesses
a competitive edge in the globalisation process, a bank that
leads lifestyle changes through technological innovations, a
bank that earns customer loyalty through market competition
and a bank that meets the expectations of shareholders,
employees and society in the course of its sustained
development.

2016 Annual Report3
Contents
4 Definitions
5 Important Notice
6 Honours and Awards
7 Financial Highlights
10 Corporate Information
11 Message from the Chairman
15 Message from the President
19 Message from the Chairman of the Board of Supervisors
21 Management Discussion and Analysis
21 — Financial Review
37 — Business Review
62 — Risk Management
72 — Organisational Management, Human Resources Development
and Management
74 — Outlook
75 Corporate Social Responsibilities
78 Changes in Share Capital and Shareholdings of Shareholders
84 Directors, Supervisors and Senior Management Members
103 Corporate Governance
119 Report of the Board of Directors
126 Report of the Board of Supervisors
130 Significant Events
132 Independent Auditor’s Report
137 Consolidated Financial Statements
294 Reference for Shareholders
297 Organisational Chart
299 List of Major Branches and Subsidiaries

2016 Annual Report 4
Definitions
In this report, unless the context otherwise requires, the following terms shall have the meaning set
out below:
The Bank/the Group Bank of China Limited or its predecessors and, except where the context otherwise requires, all of the subsidiaries of Bank of China Limited
Articles of Association The performing Articles of Association of the Bank
A Share Domestic investment share(s) in the ordinary share capital of the Bank, with a nominal value of RMB1.00 each, which are listed on SSE (Stock Code: 601988)
Basis Point (Bp, Bps) Measurement unit of changes in interest rate or exchange rate. 1 basis point is equivalent to 0.01 percentage point
BOC Aviation BOC Aviation Limited, a public company limited by shares incorporated in Singapore under the Singapore Companies Act, the shares of which are listed on the Hong Kong Stock Exchange
BOC Insurance Bank of China Insurance Company Limited
BOC Life BOC Group Life Assurance Co., Ltd.
BOCG Insurance Bank of China Group Insurance Company Limited
BOCG Investment Bank of China Group Investment Limited
BOCHK Bank of China (Hong Kong) Limited, an authorised financial institution incorporated under the laws of Hong Kong and a wholly-owned subsidiary of BOCHK (Holdings)
BOCHK (Holdings) BOC Hong Kong (Holdings) Limited, a company incorporated under the laws of Hong Kong, the ordinary shares of which are listed on the Hong Kong Stock Exchange
BOCI BOC International Holdings Limited
BOCIM Bank of China Investment Management Co., Ltd.
BOCI China BOC International (China) Limited
BOC-Samsung Life BOC-Samsung Life Ins. Co., Ltd.
CBRC China Banking Regulatory Commission
Central and Southern China The area including, for the purpose of this report, the branches of Henan, Hubei, Hunan, Guangdong, Shenzhen, Guangxi and Hainan
Company Law The Company Law of PRC
CSRC China Securities Regulatory Commission
Domestic Preference Share Domestic preference share(s) in the preference share capital of the Bank, with a nominal value of RMB100 each, which are traded on SSE (Stock Code: 360002, 360010)
Eastern China The area including, for the purpose of this report, the branches of Shanghai, Jiangsu, Suzhou, Zhejiang, Ningbo, Anhui, Fujian, Jiangxi, Shandong and Qingdao
HKEx Hong Kong Exchanges and Clearing Limited
Hong Kong Listing Rules The Rules Governing the Listing of Securities on The Stock Exchange of Hong Kong Limited
Hong Kong Stock Exchange The Stock Exchange of Hong Kong Limited
H Share Overseas-listed foreign investment share(s) in the ordinary share capital of the Bank, with a nominal value of RMB1.00 each, which are listed on the Hong Kong Stock Exchange and traded in Hong Kong dollars (Stock Code: 3988)
Huijin Central Huijin Investment Ltd.
Independent Director Independent director under the listing rules of SSE and the Articles of Association, and independent non-executive director under the Hong Kong Listing Rules
MOF Ministry of Finance, PRC
Northeastern China The area including, for the purpose of this report, the branches of Heilongjiang, Jilin, Liaoning and Dalian
Northern China The area including, for the purpose of this report, the branches of Beijing, Tianjin, Hebei, Shanxi, Inner Mongolia and the Head Office
Offshore Preference Share Offshore preference share(s) in the preference share capital of the Bank, with a nominal value of RMB100 each, which are listed on the Hong Kong Stock Exchange and traded in US dollars (Stock Code: 4601)
PBOC The People’s Bank of China, PRC
PRC The People’s Republic of China
RMB Renminbi, the lawful currency of PRC
SAFE State Administration of Foreign Exchange, PRC
SFO Securities and Futures Ordinance (Chapter 571 of the Laws of Hong Kong)
SSE The Shanghai Stock Exchange
Western China The area including, for the purpose of this report, the branches of Chongqing, Sichuan, Guizhou, Yunnan, Shaanxi, Gansu, Ningxia, Qinghai, Tibet and Xinjiang

Important Notice
2016 Annual Report5
The Board of Directors, the Board of Supervisors, directors, supervisors and senior management members of the Bank warrant that the information in this report is authentic, accurate and complete, contains no false record, misleading statement or material omission, and jointly and severally accept full responsibility for the information in this report.
The 2016 Annual Report and Annual Results Announcement of the Bank have been reviewed and approved at the meeting of the Board of Directors of the Bank held on 31 March 2017. The number of directors who should attend the meeting is thirteen, with twelve directors attending the meeting in person. Chairman of the Board of Directors TIAN Guoli did not attend the meeting because of other important business engagements and appointed Vice Chairman of the Board of Directors CHEN Siqing as his authorised proxy to attend and vote on his behalf at the meeting. All of the thirteen directors of the Bank exercised their voting rights at the meeting. Some supervisors and senior management members of the Bank attended the meeting as non-voting attendees.
The 2016 financial statements prepared by the Bank in accordance with Chinese Accounting Standards (“CAS”) and International Financial Reporting Standards (“IFRS”) have been audited by Ernst & Young Hua Ming LLP and Ernst & Young in accordance with Chinese and international auditing standards, respectively. Both auditors issued an unqualified opinion.
Chairman of the Board of Directors TIAN Guoli, President CHEN Siqing, Executive Vice President responsible for the Bank’s finance and accounting ZHANG Qingsong and General Manager of the Accounting and Information Department ZHANG Jianyou warrant the authenticity, accuracy and completeness of the financial statements in this report.
The Board of Directors has recommended a final dividend on ordinary shares for 2016 of RMB0.168 per share (before tax), subject to the approval of the forthcoming Annual General Meeting scheduled on 29 June 2017. No capitalisation of the capital reserve to share capital is proposed in this profit distribution.
During the reporting period, there was no misappropriation of the Bank’s funds by its controlling shareholder or other related parties for non-operating purposes and no material guarantee business that violated the applicable regulations and procedures.
This report may contain forward-looking statements that involve risks and future plans. These forward-looking statements are based on the Bank’s own information and information from other sources the Bank believes to be reliable. They relate to future events or the Bank’s future financial, business or other performance and are subject to a number of factors and uncertainties that may cause our actual results to differ materially. Any future plans mentioned do not constitute a substantive commitment by the Bank to its investors. Investors and people concerned should be fully aware of the risks and understand the differences between plans, forecast and commitment.
The Bank is faced with risks arising from changes in the macroeconomic environment and from political and economic conditions in different countries and regions as well as risks arising from its day-to-day operations, including the risk arising from changes in the credit status of borrowers, adverse changes in market prices and operational risk. It shall at the same time meet regulatory and compliance requirements. The Bank actively adopts various measures to effectively manage all types of risks. Please refer to the section “Management Discussion and Analysis — Risk Management” for details.

Honours and Awards
2016 Annual Report 6
Directors & BoardsGolden Prize of Round Table for Best Board of
Directors
HKICPA2016 Best Corporate Governance Award — Gold Award
The BankerRanked 4th in Top 1,000 World Banks
Ranked 6th in Top 500 Global Banking Brands
FORTUNERanked 35th in Global 500 (2016)
Ranked 8th in China Top 500 Companies (2016)
ForbesRanked 6th in Global 2000
Global FinanceBest Global RMB Service Bank
The Asian BankerRanked 3rd among the Best 20 Offshore RMB Bond
Issuers
2016 Best Mobile Phone Banking Application
EuromoneyBest Regional Cash Manager in Asia
The AssetBest Bond in Asia
Best Financial Institution Green Bond in Asia
Thomson ReutersAsian Bank of the Year (2016)
China Bond House
SRI Bond of the Year
China Foreign Exchange Trade SystemBest Market Maker
WPP GroupRanked 11th in BrandZ Top 100 Most Valuable
Chinese Brands
World Brand LabRanked 11th in China’s 500 Most Valuable Brands
Hurun Research InstituteRanked 8th in Top 200 Brands
China Banking AssociationMost Socially Responsible Financial Institution
China News ServiceMost Socially Responsible Enterprise
Southern WeeklyOutstanding Chinese Enterprise in Social Responsibilities
The Beijing News2016 Best Social Responsibility Bank
Eastmoney.comMost Socially Responsible Bank
ChinaHRBest Employer in Financial Industry in the Opinion of
Chinese University Students
Ta Kung Wen Wei Media GroupChina Securities Golden Bauhinia Awards — Best Investor
Relations Listed Company
League of American Communications ProfessionalsGolden Award for 2015 Annual Report

Financial Highlights
2016 Annual Report7
Operating incomeRMB Million
Operating profitRMB Million
Profit for the yearRMB Million
EPS (basic)RMB
ROA%
ROE%
Net interest margin%
Cost to income (calculated under domestic regulations)%
Non-interest income to operating income %
Credit cost%
Non-performing loans to total loans%
Allowance for loan impairment losses to non-performing loans%
20162015201420132012 2016201520142013201220162015201420132012
20162015201420132012 2016201520142013201220162015201420132012
20162015201420132012 2016201520142013201220162015201420132012
20162015201420132012 2016201520142013201220162015201420132012
366,176407,509
456,328 473,912 485,656
187,060211,685
230,159 229,237 221,515
145,746163,741
177,198 179,417 184,051
0.500.56
0.610.56 0.54
1.19 1.23 1.221.12
1.05
18.13 18.04 17.28
14.5312.58
2.15 2.24 2.252.12
1.83
31.73 30.6128.57 28.30 28.08
29.83 30.41 29.63
36.98
30.65
0.95 0.96
1.18
1.43 1.46 236.30 229.35
187.60
153.30162.82
0.91
0.29 0.32
0.580.63

2016 Annual Report 8
Financial Highlights
Note: The financial information in this report has been prepared in accordance with IFRS. The data are presented in RMB and reflect
amounts related to the Group, unless otherwise noted.
Unit: RMB million
Note 2016 2015 2014 2013 2012
Results of operations
Net interest income 306,048 328,650 321,102 283,585 256,964
Non-interest income 1 179,608 145,262 135,226 123,924 109,212
Operating income 485,656 473,912 456,328 407,509 366,176
Operating expenses (175,069) (185,401) (177,788) (172,314) (159,729)
Impairment losses on assets (89,072) (59,274) (48,381) (23,510) (19,387)
Operating profit 221,515 229,237 230,159 211,685 187,060
Profit before income tax 222,412 231,571 231,478 212,777 187,673
Profit for the year 184,051 179,417 177,198 163,741 145,746
Profit attributable to equity holders of the Bank 164,578 170,845 169,595 156,911 139,656
Total dividend of ordinary shares N.A. 51,518 55,934 54,755 48,851
Financial position
Total assets 18,148,889 16,815,597 15,251,382 13,874,299 12,680,615
Loans, gross 9,973,362 9,135,860 8,483,275 7,607,791 6,864,696
Allowance for loan impairment losses (237,716) (200,665) (188,531) (168,049) (154,656)
Investments 2 3,972,884 3,595,095 2,710,375 2,403,631 2,272,724
Total liabilities 16,661,797 15,457,992 14,067,954 12,912,822 11,819,073
Due to customers 12,939,748 11,729,171 10,885,223 10,097,786 9,173,995
Capital and reserves attributable to
equity holders of the Bank 1,411,682 1,304,946 1,140,859 923,916 824,677
Share capital 294,388 294,388 288,731 279,365 279,147
Per share
Basic earnings per share (RMB) 0.54 0.56 0.61 0.56 0.50
Dividend per share (before tax, RMB) 3 0.168 0.175 0.19 0.196 0.175
Net assets per share (RMB) 4 4.46 4.09 3.70 3.31 2.95
Key financial ratios
Return on average total assets (%) 5 1.05 1.12 1.22 1.23 1.19
Return on average equity (%) 6 12.58 14.53 17.28 18.04 18.13
Net interest margin (%) 7 1.83 2.12 2.25 2.24 2.15
Non-interest income to operating income (%) 8 36.98 30.65 29.63 30.41 29.83
Cost to income ratio (calculated under
domestic regulations, %) 9 28.08 28.30 28.57 30.61 31.73
Capital ratios 10
Common equity tier 1 capital 1,297,421 1,197,868 1,068,706 925,037 N.A.
Additional tier 1 capital 103,523 103,159 72,923 698 N.A.
Tier 2 capital 225,173 212,937 250,714 262,768 N.A.
Common equity tier 1 capital adequacy ratio (%) 11.37 11.10 10.61 9.69 N.A.
Tier 1 capital adequacy ratio (%) 12.28 12.07 11.35 9.70 N.A.
Capital adequacy ratio (%) 14.28 14.06 13.87 12.46 13.63
Asset quality
Identified impaired loans to total loans (%) 11 1.46 1.43 1.18 0.96 0.95
Non-performing loans to total loans (%) 12 1.46 1.43 1.18 0.96 0.95
Allowance for loan impairment losses to
non-performing loans (%) 13 162.82 153.30 187.60 229.35 236.30
Credit cost (%) 14 0.91 0.63 0.58 0.32 0.29
Allowance for loan impairment losses to total loans (%) 15 2.87 2.62 2.68 2.62 2.62
Exchange rate
USD/RMB year-end middle rate 6.9370 6.4936 6.1190 6.0969 6.2855
EUR/RMB year-end middle rate 7.3068 7.0952 7.4556 8.4189 8.3176
HKD/RMB year-end middle rate 0.8945 0.8378 0.7889 0.7862 0.8108

2016 Annual Report9
Financial Highlights
Notes:
1 Non-interest income = net fee and commission income + net trading gains/(losses) + net gains/(losses) on financial investments + other operating income.
2 Investments include financial investments available for sale, debt securities held to maturity, financial investments classified as loans and receivables, and financial assets at fair value through profit or loss.
3 Dividend per share is the dividend per ordinary share distributed to ordinary shareholders.
4 Net assets per share = (capital and reserves attributable to equity holders of the Bank at year-end – other equity instruments) ÷ number of ordinary shares in issue at year-end.
5 Return on average total assets = profit for the year ÷ average total assets × 100%. Average total assets = (total assets at the beginning of the year + total assets at year-end) ÷ 2.
6 Return on average equity = profit attributable to ordinary shareholders of the Bank ÷ weighted average capital and reserves attributable to ordinary shareholders of the Bank × 100%. Calculation is based on No. 9 Preparation and Reporting Rules of Information Disclosure of Public Offering Companies — Calculation and Disclosure of Return on Average Equity and Earnings per Share (Revised in 2010) (CSRC Announcement [2010] No. 2) issued by the CSRC.
7 Net interest margin = net interest income ÷ average balance of interest-earning assets × 100%. Average balance is average daily balance derived from the Bank’s management accounts (unaudited).
8 Non-interest income to operating income = non-interest income ÷ operating income × 100%.
9 Cost to income ratio is calculated in accordance with the Measures of the Performance Evaluation of Financial Enterprises (Cai Jin [2016] No. 35) formulated by the MOF.
10 In accordance with Capital Rules for Commercial Banks (Provisional) (Y.J.H.L. [2012] No. 1) and related regulations, the capital ratios of 2016, 2015 and 2014 are calculated under the advanced approaches, and the capital ratios of 2013 are calculated under the non-advanced approaches. The capital ratios of 2012 are calculated in accordance with the Regulation Governing Capital Adequacy of Commercial Banks (Y.J.H.L. [2004] No. 2) and related regulations. Therefore, the capital ratios of 2016, 2015 and 2014 should not be compared directly with those of previous years in this regard.
11 Identified impaired loans to total loans = identified impaired loans at year-end ÷ total loans at year-end × 100%.
12 Non-performing loans to total loans = non-performing loans at year-end ÷ total loans at year-end × 100%.
13 Allowance for loan impairment losses to non-performing loans = allowance for loan impairment losses at year-end ÷ non-performing loans at year-end × 100%.
14 Credit cost = impairment losses on loans ÷ average balance of loans × 100%. Average balance of loans = (balance of loans at the beginning of the year + balance of loans at year-end) ÷ 2.
15 Allowance for loan impairment losses to total loans = allowance for loan impairment losses at year-end ÷ total loans at year-end × 100%. Calculation is based on the data of the Bank’s domestic institutions.
Corporate Information
2016 Annual Report 10
Registered Name in Chinese中國銀行股份有限公司 (“中國銀行”)
Registered Name in EnglishBANK OF CHINA LIMITED (“Bank of China”)
Legal Representative and ChairmanTIAN Guoli
Vice Chairman and PresidentCHEN Siqing
Secretary to the Board of Directors and Company SecretaryGENG WeiOffice Address:No. 1 Fuxingmen Nei Dajie, Beijing, ChinaTelephone: (86) 10-6659 2638Facsimile: (86) 10-6659 4568E-mail: [email protected]
Listing Affairs RepresentativeYU KeOffice Address:No. 1 Fuxingmen Nei Dajie, Beijing, ChinaTelephone: (86) 10-6659 2638Facsimile: (86) 10-6659 4568E-mail: [email protected]
Registered AddressNo. 1 Fuxingmen Nei Dajie, Beijing, China
Office AddressNo. 1 Fuxingmen Nei Dajie, Beijing, China, 100818Telephone: (86) 10-6659 6688Facsimile: (86) 10-6601 6871Website: http://www.boc.cnE-mail: [email protected] Service and Complaint Hotline:(86) Area Code-95566
Place of Business in Hong KongBank of China Tower, 1 Garden Road, Central, Hong Kong
Selected Newspapers for Information Disclosure (A Share)China Securities Journal, Shanghai Securities News, Securities Times, Securities Daily
Website Designated by CSRC for Publication of the Annual Reporthttp://www.sse.com.cn
Website of HKEx for Publication of the Annual Reporthttp://www.hkexnews.hk
Place where Annual Report can be ObtainedHead Office of Bank of China LimitedShanghai Stock Exchange
Domestic Legal AdvisorKing & Wood Mallesons
Hong Kong Legal AdvisorAllen & Overy
AuditorsDomestic auditorErnst & Young Hua Ming LLP
Office Address:Level 16, Ernst & Young Tower, Oriental Plaza,No. 1 East Chang An Avenue, Dongcheng District, Beijing, ChinaCertified Public Accountants who signed the auditor’s report: ZHANG Xiaodong, FENG Suoteng
International auditorErnst & YoungOffice Address:22/F, CITIC Tower, 1 Tim Mei AvenueCentral, Hong Kong
Unified Social Credit Code911000001000013428
Financial Institution Licence Serial NumberB0003H111000001
Registered CapitalRMB279,147,223,195
Securities InformationA ShareShanghai Stock ExchangeStock Name: 中國銀行Stock Code: 601988
H ShareThe Stock Exchange of Hong Kong LimitedStock Name: Bank of ChinaStock Code: 3988
Domestic Preference ShareShanghai Stock Exchange
First TrancheStock Name: 中行優1Stock Code: 360002
Second TrancheStock Name: 中行優2Stock Code: 360010
Offshore Preference ShareThe Stock Exchange of Hong Kong LimitedStock Name: BOC 2014 PREFStock Code: 4601
Joint Sponsors for Domestic Preference SharesCITIC Securities Company LimitedOffice Address:North Tower, Excellence Times Plaza II,No. 8 Zhongxinsan Road, Futian District, Shenzhen, Guangdong Prov., ChinaSponsor Representatives: MA Xiaolong, ZHU Jie
BOC International (China) LimitedOffice Address:39/F, BOC Building, 200 Mid. Yincheng Road, Pudong New Area, Shanghai, ChinaSponsor Representatives: CHEN Wei, LIU Guoqiang
Continuous Supervision PeriodFrom 31 March 2015 to 31 December 2016 (Second Tranche)

Message from the Chairman
2016 Annual Report11

2016 Annual Report 12
Message from the Chairman
In this beautiful spring season, I am pleased to present
our annual results for 2016 to the shareholders of
the Bank and the public. According to International
Financial Reporting Standards, the Group achieved
a profit for the year of RMB184.1 billion, a year-on-
year increase of 2.58%. Asset quality was controlled
within the target range, and the ratio of allowance
for loan impairment losses to non-performing loans
(NPLs) increased by 9.52 percentage points from last
year to 162.82%. The Board of Directors has proposed
a dividend of RMB0.168 per ordinary share for 2016,
pending approval by the Annual General Meeting to
be held in June 2017.
The past year has seen dramatic changes in the
global political and economic situation. “Black swan”
events took place one after another and the financial
market experienced serious fluctuations. Faced with a
complicated and challenging operating environment,
the Bank upheld its development strategy of “Serving
Society, Delivering Excellence”. We addressed difficulties
and challenges with reform and innovation, accelerated
business structure adjustment, optimised our systems
and institutions, and thus promoted the Group to
achieve sustained and steady development.
We undertook social responsibilities and made
active contributions to the rejuvenation of the
Chinese nation. Committed to serving SMEs, the
Bank hosted 10 worldwide matchmaking events
successfully, playing a significant role in boosting
SME development and deepening international
economic and trade cooperation. We devoted great
energy towards developing inclusive finance and
provided more support to personal consumption.
We earnestly carried out targeted poverty alleviation
efforts, providing more than RMB72 million in aid to
designated areas. This directly benefited over 27,000
low-income people. In addition, we also actively served
the nation’s diplomatic strategy by holding the “Belt
and Road” international financial communication and
cooperation seminar, which was widely acclaimed at
home and abroad.
Giving full play to our advantages in internationalisation,
we maintained a leading position in the globalisation
process. Our overseas institutions realised a profit
before income tax of USD12.234 billion, increasing by
39.42% year-on-year and making a greater contribution
to the Group’s profit. The Bank’s overseas institutions
now cover 51 countries and regions around the world,
marking a new step in growing our global footprint.
Actively supporting such major national strategies as
the “Belt and Road” initiative and “Going Global”
efforts, we strongly pushed Chinese enterprises to
integrate more quickly into the global industrial chain
and value chain. We continued to lead in the business
of RMB internationalisation, not only being qualified
as an RMB clearing bank in the United States, but also
registering the largest cross-border RMB settlement and
clearing volumes in the global banking industry, in the
endeavour to provide the best RMB services for global
customers.

2016 Annual Report13
Message from the Chairman
We closely followed the contemporary trends and
improved our services through technological reform.
Applying cutting-edge information technology and
Internet thinking, we trialled “smart counters” in an
effort to reshape the counter procedures in our outlets.
Our “Mobile Banking 3.0” launched successfully and
achieved a sharp increase in both the number of
customers and transaction volumes. We proactively
established the “E-BOC” internet finance brand,
enriched the four product lines of payment, asset
management, transaction and financing, and made our
financial services more efficient. Taking the initiative
to adapt to new trends in technological development,
we actively introduced cutting-edge technologies and
continuously enhanced our technological output.
By daring to reform and make innovations, we
won customer loyalty through market competition.
Drawing on the advantages of internationalised,
diversified and professional operations, the Bank
led its Chinese counterparts in the underwriting of
offshore RMB bonds and overseas bonds, as well as
the issuance of Panda Bonds. We issued the first asset-
backed green bond in China and acted as underwriter
for 12 green bonds, comprising a total amount of
RMB15.6 billion, the largest in the industry.
We held fast to the risk bottom line and consolidated
foundations through sustained development.
Attaching greater importance to risk prevention
and control, the Bank made continuous efforts to
consolidate its capital base with a view to supporting
sustainable growth. Our capital adequacy ratio
reached a new high in recent years, the ratio of
allowance for loan impairment losses to NPLs
strengthened against the market trend, and the
ability of risk resistance and compensation was
further enhanced. Stepping up efforts to clear out
and eliminate NPLs, we made substantial progress in
a number of key projects, eliminating more NPLs than
ever before. We also reinforced our comprehensive
risk management capability so as to guarantee
sound and sustainable operations. This includes the
management of consolidated financial statements,
country risk, liquidity risk, market risk, internal control
and compliance, and anti-money laundering.
In 2016, the Bank continued to improve the
governance architecture and system, enhanced the
working mechanisms of the Board of Directors, and
earnestly fulfilled its responsibilities for all stakeholders
including shareholders, customers, employees and
society, in the effort to achieve the best practice in
2016 Annual Report 14
Message from the Chairman
corporate governance. Changes were made to the
board composition smoothly according to applicable
laws and regulations. All Board members worked with
diligence and commitment to guide and push the
Group towards sustained and sound development.
At present, the international situation is anything
but optimistic. The world economy is becoming
increasingly complicated, unstable and uncertain.
China’s economy is at a critical juncture, with new
growth drivers taking the place of old. While we
must clearly recognise that the banking industry faces
mounting conflicts and difficulties in terms of its
operation and management, we should also see the
silver linings amid the plentiful clouds of uncertainty
and instability. China will continue to implement
the proactive fiscal policy and prudent monetary
policy, and will deepen the supply-side structural
reform. As such, we expect the national economy to
maintain sustained and solid growth. The in-depth
implementation of major national strategies such as
the “Belt and Road” initiative, the advance of supply-
side structural reform and other key reforms, the
rapid increase of residents’ wealth and the extensive
application of smart technologies – all of these will
present rare opportunities for the development of the
banking industry.
Faced with new circumstances and fresh tasks, we
will continue to follow our development strategy
of “Serving Society, Delivering Excellence”. We will
pursue internationalised development and continued
to serve the people and SMEs. We will carry on
technological innovations, intensify Party and team
building, and take concrete steps to perform our social
responsibilities, so as to reward our shareholders and
the public for their trust and support by delivering
better and better performance!
TIAN GuoliChairman
31 March 2017

Message from the President
2016 Annual Report15

2016 Annual Report 16
Message from the President
In 2016, the Bank faithfully implemented the
Government’s guidelines, policies and strategic
arrangements while pursuing its development strategy
of “Serving Society, Delivering Excellence”. Placing
emphasis on “innovation, transformation, mitigation,
management and control”, the Bank met its annual
development objectives and made a strong start for
the 13th Five-Year Plan Period.
At the end of 2016, the Bank’s total assets stood
at RMB18.15 trillion, its total liabilities amounted
to RMB16.66 trillion and the equity attributable
to shareholders of the Bank was RMB1.41 trillion
according to International Financial Reporting
Standards, representing an increase of 7.93%, 7.79%
and 8.18% respectively from the prior year-end. The
Bank achieved a profit for the year of RMB184.1
billion, a year-on-year increase of 2.58%. The Bank’s
common equity tier 1 capital adequacy ratio, tier 1
capital adequacy ratio and capital adequacy ratio
stood at 11.37%, 12.28% and 14.28%, respectively.
The non-performing loan ratio was 1.46%, up 0.03
percentage point from the prior year-end, which
remained within the target range.
In 2016, the Bank achieved steady profit growth,
driven mainly by the following four factors: First, the
income structure was further optimised. The Bank
realised non-interest income of RMB179.6 billion,
a year-on-year increase of 23.64%. Non-interest
income accounted for 36.98% of total income, up
6.33 percentage points from the prior year. Second,
operating efficiency improved steadily. The cost to
income ratio was 28.08%, a year-on-year decrease
of 0.22 percentage point. Third, the international
strategy gained pace. The Bank’s overseas institutions
realised a profit before income tax of USD12.234
billion, a year-on-year increase of 39.42%. Their
contribution to the Group’s overall profit before
income tax rose by 12.63 percentage points from the
prior year to 36.27%. Fourth, the Bank made solid
progress in its strategic adjustments. It completed
a number of major projects, including the transfer
of shares of Nanyang Commercial Bank, Limited,
the listing of BOC Aviation, the integration of its
Southeast Asian institutions and the organisational
restructuring in Shandong and Liaoning provinces.
In particular, the Bank continued to cement its
capital base and maintained its capital adequacy
ratio above 14% at the end of 2016. The ratio of
allowance for loan impairment losses to NPLs grew
by 9.52 percentage points year-on-year to 162.82%,
indicating stronger risk resilience against the market
trend.
Over the past year, the Bank has injected stronger
impetus into innovation-led development. The
development of internet finance picked up speed,
with the number of registered customers increasing
by 93% over the prior year and the transaction
volumes breaking the RMB2.6 trillion mark. The Bank
launched the “BOC E-Credit” product to provide
comprehensive online financing services. Its electronic
channels were upgraded at a faster pace, including
the successful launch of the “Mobile Banking 3.0”.
“Smart counters” were put into trial operation,
significantly improving outlets’ customer throughput,
customer experience and product sales. As part of the
growing IT outputs, the Bank successfully completed a
number of major IT projects, including the integration
and transformation of overseas information systems
in the Americas. The Bank also achieved significant
milestones in process optimisation, including the
launch of its electronic seal system and standardisation
of outlet workflows.

2016 Annual Report17
Message from the President
In the past year, the Bank deepened business
transformation and improved its asset and liability
structure in order to achieve higher efficiency. Due to
customers increased by RMB1.2 trillion, up 10.32%
from the prior year, while the ratio of average balance
of domestic RMB demand deposits increased by 3.47
percentage points. Loans and advances to customers
added RMB837.5 billion, up 9.17%. The proportion of
loans to industries classified as “aggressive growth”
and “selective growth” rose by 2.3 percentage
points. The Bank’s loans to small and micro-sized
enterprises met the “Three No-Less-Than’s” objective.
Bond investment income surged by 238% thanks to
the well-timed sale of bonds. The Bank’s business
transformation efforts were fruitful. The proportion
of the Bank’s comprehensive income from personal
banking business rose by 1.3 percentage points,
marking a notable achievement in the Bank’s strategy
for accelerating the development of personal banking.
Quickening the pace of its corporate banking
transformation, the Bank has granted a cumulative
total of USD59.4 billion in credit facilities to support
the building of the “Belt and Road” financial artery.
The Bank provided USD14.8 billion of financing for
cross-border M&A in 2016, ranking first among Asia
Pacific banks. The Bank maintained a leading edge
in global markets business, topping the industry in
foreign exchange trading. The Bank remains the
world’s number one bank in terms of cross-border
RMB clearing and settlement. The “key regions”
strategy has also delivered remarkable results,
evidenced by a rise of 3.6 percentage points in the
proportion of total operating income contributed by
key regions including the Beijing-Tianjin-Hebei region,
the Yangtze River Delta and the Guangdong-Hong
Kong-Macau region.
In the past year, the Bank made strenuous efforts to
mitigate risks and thus maintained stable asset quality.
The Bank stepped up efforts to tackle non-performing
assets (NPAs) on an intensive, specialised and market-
based basis. In 2016, the Bank resolved RMB128.9
billion of NPAs, a year-on-year increase of RMB24.5
billion. Thanks to proactive efforts to identify and
mitigate potential risks, the Bank resolved RMB152.3
billion of corporate overdue loans before they became
non-performing. As a new method of resolving
NPAs, the Bank successfully issued China’s first NPA-
backed corporate securities since the relaunch of
the credit asset-backed securitisation business. Low-
risk business and wealth management business were
incorporated into aggregate credit management in an
effort to strengthen comprehensive risk management
and unified credit granting. Customer concentration
management was strengthened by setting limits
on Group-wide balances and member shares of
credit facilities. Interest rate and foreign exchange
risk management was intensified in order to reduce
the overseas institutions’ foreign exchange risk and
trading costs. The Bank also stepped up liquidity risk
management and raised funds by various means to
allow for business development.
In the past year, the Bank enhanced its Group-wide
management so as to create stronger momentum for
future development. Systems and mechanisms were
improved to enhance the customer-centric marketing
of all products, with the mechanism of collaboration
between customer and product implemented
successfully. The Bank implemented dynamic
management of assets and liabilities, refined its
mechanism for the allocation of expenses and capital,
so as to achieve greater management refinement

2016 Annual Report 18
Message from the President
and specialisation. The Bank made steadfast efforts
in internal control and fraud prevention, including
risk screening and rectification in key work areas.
The monetary amount and number of fraud cases
fell by 69% and 38% in 2016, respectively. The Bank
implemented a three-year anti-money laundering
(AML) plan and set up AML centres in Beijing and
Guangdong for the centralised screening of inbound
and outbound remittance transactions against AML
sanctions lists. With its audit supervision strengthened,
the Bank audited nearly 3,000 domestic and overseas
institutions across the major business lines and high-
risk fields in 2016.
2017 comes with challenges and opportunities. The
Bank will fully implement the guiding principles of
the 18th National Congress of the CPC, the Third,
Fourth, Fifth and Sixth Plenary Sessions of the 18th
CPC Central Committee and the Central Economic
Work Conference. The Bank will follow the general
principle of “progress with stability”, emphasising
steadiness in its core work with the aim of achieving
sustainable development. First, the Bank will
steadfastly implement the development strategy of
“Serving Society, Delivering Excellence” and make
new progress in international development, cross-
border matchmaking, community banking, targeted
poverty alleviation and international financial exchange
and training. Second, the Bank will endeavour to make
progress while maintaining stable performance on all
fronts. It will make progress in structural adjustments
while keeping the asset size stable, make progress in
liability business while keeping asset business stable,
make progress in overseas operations while keeping
domestic businesses stable, make progress in non-
interest income while keeping interest income stable,
make progress in service quality while keeping service
base stable, and make progress in resolving non-
performing assets while keeping asset quality stable.
In addition, we will take effective measures to further
connect on-shore and off-shore markets, integrate
on-balance-sheet and off-balance-sheet businesses,
and synchronise online and offline services, under the
prerequisite of conforming to domestic and overseas
regulatory requirements and policies. Third, we will
strengthen comprehensive risk management and
implement the Central Government’s arrangements
to prevent and control risks more proactively and
urgently. We will plug loopholes and eliminate
problems, parse problems into root causes and
symptoms, and adopt classification-based solutions to
ensure that, as a large state-owned bank, the Bank
plays a vital role in safeguarding China’s financial
stability.
On behalf of the Management, I would like to avail
myself of this opportunity to express my heartfelt
gratitude to our directors and supervisors for your
guidance, to all of our employees for your hard work,
and to our customers, investors and friends for your
constant support. We will forge ahead and repay
the trust and support of our investors, employees
and friends with better business performance and by
working hard towards our strategic goal of “Serving
Society, Delivering Excellence”.
CHEN SiqingPresident
31 March 2017

Message from the Chairman of the Board of Supervisors
2016 Annual Report19

2016 Annual Report 20
Message from the Chairman of the Board of Supervisors
In 2016, the Board of Supervisors made new progress in all working areas. Adhering to the issue-focused approach, it strived to proactively assume its responsibilities, closely followed up the Bank’s strategic development, operation and management, and risk management dynamics and internal control. It highlighted the key aims on supervision and strengthened the actual effects of its supervisory activity, exercised its supervision functions constructively and pushed forward the Bank’s continued stable development, in accordance with the relevant laws and regulations, regulatory requirements and the Articles of Association of the Bank.
During the past year, the Board of Supervisors was persistent in improving its internal supervision mechanism and earnestly supervised the day-to-day duty performance of the Board of Directors, the Senior Management and its members. It objectively assessed the annual duty performance of the Board of Directors, the Senior Management and its members and urged directors and senior management members to enhance their professional competence and duty performance capability so that the Board of Directors, the Senior Management and the Board of Supervisors could fully utilize their respective functions in strategic decision-making, operation and management and supervision. Employing an issue-focused approach, it carried out concrete measures regarding financial supervision, scrutinised the Bank’s work arrangement and implementation concerning strategic, financial and accounting management, oversaw deliberations regarding the preparation, review and disclosure of regular reports and provided supervisory opinions. Using a risk-oriented approach, it strengthened the monitoring over risk control in priority areas and over the progress of major work projects. It investigated into material risk events, alerted the Board of Directors, the Senior Management and functional departments to the major potential, tendentious issues and weak links identified in the relevant work, thus assisting the Board of Directors and the Senior Management in fulfilling their respective risk prevention and risk control responsibilities. By reinforcing the supervision over effectiveness of the “three lines of defence” system of internal control, it focused on the general risk management and internal control issues identified by internal audit reports, and supervised and followed up on the rectification measures so that the rectification measures could be implemented properly. It carried out special surveys into the key areas and links that involved the Bank’s drive to deepen reform and secure stable development and put forth supervisory opinions to support the Board of Directors, the Senior Management and functional departments in improving their work and perfecting relevant policies and measures. All members of the Board of Supervisors faithfully and diligently brought their strengths into play by proactively offering opinions and suggestions to the Bank regarding its sound and healthy development.
The Board of Directors and the Senior Management attached great importance to the supervisory opinions issued by the Board of Supervisors, researched on and discussed relevant rectifications and arranged the relevant improvement work, thus enhancing operational management, risk management and internal control.
Mr. LI Jun ceased to be Supervisor, Chairman of the Board of Supervisors and Chairman of the Duty Performance and Due Diligence Supervision Committee of the Board of Supervisors of the Bank in 2016 due to reasons of age. During his nearly seven-year tenure, Mr. LI Jun, a senior banker, worked with commitment and diligence and made outstanding contributions to the Bank in terms of enhancing the operation of the Board of Supervisors, perfecting corporate governance, improving risk management and internal control, and promoting the sustained and healthy development of the Bank. On behalf of the Board of Supervisors, I would like to pay the highest tribute and extend the most heartfelt gratitude to Mr. LI Jun.
In the past year, the Board of Supervisors smoothly completed certain changes in Supervisors according to the applicable laws and regulations and the Articles of Association. Mr. LIU Xiaozhong ceased to be Supervisor of the Bank and Mr. GAO Zhaogang began to serve as Supervisor of the Bank. On behalf of the Board of Supervisors, I would like to take this opportunity to express the sincere appreciation to Mr. LIU Xiaozhong for the endeavours and contributions he made for the Bank during his tenure and extend a warm welcome to Mr. GAO Zhaogang as he joins us.
In the coming year, guided by the strategy of “Serving Society, Delivering Excellence”, the Board of Supervisors will prioritise the pivotal issues and the overall interest of the Bank, strengthen awareness of the risk bottom line, focus on prominent problems, fulfil its supervisory role in duty performance, finance, internal control and risk management, and continue to communicate and interact effectively with the Board of Directors and the Senior Management. It will effectively perform the Board of Supervisor’s constructive supervisory role in corporate governance and make new and greater contributions to the Bank’s continued, stable development.
WANG XiquanChairman of the Board of Supervisors
31 March 2017

Management Discussion and Analysis — Financial Review
2016 Annual Report21
%
2013 2014 20152012 2016
Growth of Global and Chinese Economy (2012 to 2016)
Growth rate of global economy Growth rate of Chinese economy
Source: International Monetary Fund (IMF), National Bureau of Statistics of China
0
2
4
6
8
Economic and Financial Environment
In 2016, the global economy was characterised by sluggish growth and persistent differences among various economies’ growth patterns. The US economy rallied after a disappointing start. The Eurozone economy experienced a mild recovery. Japan’s economy grew slowly. Growth in some emerging economies slowed due to the effecting factors of external demand and capital outflows. The growth rate of international trade was the lowest since 2010, and international direct investment fell substantially.
Global financial markets experienced heightened volatility. Emerging economies faced increasing pressures on capital outflows and exchange rate depreciation as a result of Brexit and the US Federal Reserve’s interest rate hike, etc. The US dollar appreciated strongly against the currencies of its major trade partners. Commodity prices experienced a moderate recovery, while the bond markets of some developed countries entered an era of “negative interest rates”.
China’s economy realised moderate but stable performance with sound momentum for growth. The country’s economic structure continued to be improved, with consumption and service sector making greater contributions towards economic growth and enterprises’ profits gradually improving. Supply-side structural reform was accelerated, the number of new jobs increased steadily and inflation remained at a low level. There were also challenges, such as a dearth of endogenous growth drivers and fast-rising property prices. In 2016, China’s gross domestic product (GDP) increased by 6.7%, with the consumer price index (CPI) rising by 2.0%. Total retail sales of consumer goods (TRSCG) increased by 10.4%. Total fixed asset investments (TFAI) grew by 8.1%. Energy consumption per unit of GDP decreased by 5.0%.
The Chinese government continued to carry out proactive fiscal policy and prudent monetary policy. On-going financial reform efforts included the introduction of a macro prudential assessment (MPA) system, faster opening up of the inter-bank bond market, the launch of the Shenzhen-Hong Kong Stock Connect and the promotion of non-performing asset
HKD discount rate ECB MRO rateRMB 1-year deposit rate U.S. federal fund rate
Benchmark Interest Rates of Major Countries/Regions (2012 to 2016)
Source: Thomson Reuters EcoWin
%
0.0
0.5
1.0
1.5
2.0
2.5
3.0
3.5
4.0
2013 2014 20152012 2016

2016 Annual Report 22
Management Discussion and Analysis — Financial Review
0
50
100
150
5.50
5.80
6.10
6.40
6.70
7.00
2014 20152012 2013 2016
Movement of RMB Exchange Rate (2012 to 2016)
USD/RMB (right axis)
RMB nominal effective rate index (left axis)RMB real effective rate index (left axis)
Source: Thomson Reuters EcoWin
RM
B T
rillio
n %
0.0
0.8
1.6
2.4
3.2
0
5
10
15
20
2014 20152012 2013 2016
New RMB loans (left axis)M2 growth rate (right axis)
RMB loans growth rate (right axis) RMB deposits growth rate (right axis)
Growth of Chinese Money Supply and Loans (2012 to 2016)
Source: Thomson Reuters EcoWin
securitisation and trials of debt-for-equity conversion. Monetary credit realised steady growth and financial markets functioned smoothly. The broad money supply (M2) grew by 11.3%, 2.0 percentage points lower than the growth rate of the prior year. The balance of RMB loans increased by RMB12.65 trillion, RMB0.93 trillion more than that of the prior year. The balance of all-system financing aggregates was RMB155.99 trillion, an increase of 12.8% compared with the prior year. The scale of bond issuance grew to a total issuance of RMB35.6 trillion, an increase of 55.5% compared with the prior year. The SSE composite index dropped by 12.3%, and the floating market value of the Shanghai and Shenzhen stock markets declined by 5.9% compared with the prior year.
China’s banking sector remained stable. Commercial banks implemented the five development concepts of innovation, coordination, green development, opening-up and sharing, achieving positive results in terms of serving the real economy, optimising business structure, facilitating reform and innovation, and strengthening risk control. The banking sector supported supply-side structural reform and constantly improved its ability to serve the real economy. It devoted greater efforts to developing inclusive finance, supported micro and small-sized enterprises’ development, and created effective solutions to reduce the financing difficulties and the cost of financing. It accelerated innovation in business models, continued to promote the “investment and loan linkage mechanism” pilot programme and supported the growth of the new economy and the cultivation of new growth drivers. It promoted the two-way opening up of the financial industry and extended the breadth and depth of overseas financial services. The banking sector reinforced its comprehensive risk management capacities, effectively eliminated the credit risk associated with sectors plagued by overcapacity and resolutely prevented systemic and regional financial risks. As at the end of 2016, the total assets of China’s banking industry grew by 15.8% from the prior year-end to RMB232.3 trillion, while total liabilities increased by 16% to RMB214.8 trillion. Commercial banks recorded profit after tax of RMB1.65 trillion, an increase of 3.54% compared with the prior year. The outstanding non-performing loans (NPLs) stood at RMB1.5123 trillion, with an NPL ratio of 1.74%.

2016 Annual Report23
Management Discussion and Analysis — Financial Review
Income Statement Analysis
In 2016, the Group achieved a profit for the year of RMB184.051 billion, an increase of 2.58% compared with the
prior year. Return on average total assets (ROA) was 1.05%, a decrease of 0.07 percentage point compared with
the prior year. Return on average equity (ROE) was 12.58%, a decrease of 1.95 percentage points compared with
the prior year.
The principal components and changes of the Group’s consolidated income statement are set out below:
Unit: RMB million, except percentages
Items 2016 2015 Change Change (%)
Net interest income 306,048 328,650 (22,602) (6.88%)
Non-interest income 179,608 145,262 34,346 23.64%
Including: net fee and commission income 88,664 92,410 (3,746) (4.05%)
Operating income 485,656 473,912 11,744 2.48%
Operating expenses (175,069) (185,401) 10,332 (5.57%)
Impairment losses on assets (89,072) (59,274) (29,798) 50.27%
Operating profit 221,515 229,237 (7,722) (3.37%)
Profit before income tax 222,412 231,571 (9,159) (3.96%)
Income tax expense (38,361) (52,154) 13,793 (26.45%)
Profit for the year 184,051 179,417 4,634 2.58%
A detailed review of the Group’s principal items in each quarter of 2016 is summarised in the following table:
Unit: RMB million
For the three-month period ended
Items31 December
201630 September
201630 June
2016 31 March
2016
Operating income 115,377 107,660 139,506 123,113
Profit attributable to equity holders of the Bank 29,765 41,776 46,418 46,619
Net cash flow from operating activities 234,765 (87,017) 184,996 (150,663)
Net Interest Income and Net Interest Margin
In 2016, the Group achieved a net interest income of
RMB306.048 billion, a decrease of RMB22.602 billion
or 6.88% compared with the prior year. The average
balances1 and average interest rates of the major
interest-earning assets and interest-bearing liabilities
of the Group, as well as the impact of volume and
interest rate changes on the interest income and
expense2, are summarised in the following table:
1 Average balances are average daily balances derived from the Group’s management accounts (unaudited).2 The impact on interest income/expense of variances in the volume factor is calculated based on the changes in average balances
of interest-earning assets and interest-bearing liabilities during the reporting period. The impact on interest income/expense of
variances in interest rate factor is calculated based on the changes in the average interest rates of interest-earning assets and
interest-bearing liabilities during the reporting period. The impact relating to the combined changes in both the volume factor and
the interest rate factor has been classified as changes in interest rate factor.

2016 Annual Report 24
Management Discussion and Analysis — Financial Review
Unit: RMB million, except percentages
2016 2015Analysis of changes
in interest income/expense
ItemsAverage balance
Interest income/expense
Average interest rate
Average balance
Interest income/expense
Average interest rate
Volume factor
Interest rate factor Total
GroupInterest-earning assets Loans 9,705,782 391,956 4.04% 8,916,436 435,062 4.88% 38,520 (81,626) (43,106) Investments 3,723,928 114,399 3.07% 3,145,750 108,651 3.45% 19,947 (14,199) 5,748 Balances with central banks 2,231,364 29,831 1.34% 2,257,994 29,543 1.31% (349) 637 288 Due from and placements with banks and other financial institutions 1,106,274 29,953 2.71% 1,204,278 41,800 3.47% (3,401) (8,446) (11,847) Total 16,767,348 566,139 3.38% 15,524,458 615,056 3.96% 54,717 (103,634) (48,917)Interest-bearing liabilities Due to customers 12,501,297 199,915 1.60% 11,388,012 221,288 1.94% 21,598 (42,971) (21,373) Due to and placements from banks and other financial institutions and due to central banks 2,606,838 47,993 1.84% 2,703,157 54,209 2.01% (1,936) (4,280) (6,216) Bonds issued 322,431 12,183 3.78% 271,374 10,909 4.02% 2,052 (778) 1,274 Total 15,430,566 260,091 1.69% 14,362,543 286,406 1.99% 21,714 (48,029) (26,315)Net interest income 306,048 328,650 33,003 (55,605) (22,602) Net interest margin 1.83% 2.12% (29) Bps
Notes:
1 Investments include available for sale debt securities, held to maturity debt securities, debt securities classified as loans and
receivables, trading debt securities, debt securities designated at fair value through profit or loss, and investment trusts and asset
management plans.
2 Balances with central banks include the mandatory reserves, the surplus reserves and other deposits.
3 Due to and placements from banks and other financial institutions and due to central banks include due to and placements from
banks and other financial institutions, due to central banks and other funds.

2016 Annual Report25
Management Discussion and Analysis — Financial Review
The average balances and average interest rates of domestic loans and due to customers, classified by business
type, are summarised in the following table:
Unit: RMB million, except percentages
2016 2015 Change
ItemsAverage balance
Average interest rate
Average balance
Average interest rate
Average balance
Average interest rate
Domestic RMB businesses Loans Corporate loans 4,265,998 4.73% 4,022,655 6.00% 243,343 (127) Bps Personal loans 2,701,868 4.42% 2,234,610 5.44% 467,258 (102) Bps Trade bills 248,002 3.34% 202,356 4.75% 45,646 (141) Bps Total 7,215,868 4.57% 6,459,621 5.77% 756,247 (120) Bps Including: Medium and long term loans 4,810,011 4.78% 4,312,654 5.98% 497,357 (120) Bps Short term loans within 1 year and others 2,405,857 4.14% 2,146,967 5.35% 258,890 (121) Bps Due to customers Corporate demand deposits 2,555,909 0.60% 2,144,678 0.69% 411,231 (9) Bps Corporate time deposits 2,229,930 2.99% 2,215,337 3.45% 14,593 (46) Bps Personal demand deposits 1,632,989 0.59% 1,381,000 0.52% 251,989 7 Bps Personal time deposits 2,554,838 2.88% 2,435,218 3.37% 119,620 (49) Bps Other 336,713 3.22% 316,189 4.09% 20,524 (87) Bps Total 9,310,379 1.89% 8,492,422 2.28% 817,957 (39) Bps Domestic foreign currency businesses Unit: USD million, except percentagesLoans 54,490 2.22% 75,272 2.35% (20,782) (13) Bps Due to customers Corporate demand deposits 36,762 0.13% 27,031 0.14% 9,731 (1) Bp Corporate time deposits 16,602 1.14% 19,854 1.80% (3,252) (66) Bps Personal demand deposits 24,916 0.07% 19,695 0.05% 5,221 2 Bps Personal time deposits 18,711 0.58% 15,532 0.63% 3,179 (5) Bps Other 2,120 2.41% 2,466 2.31% (346) 10 Bps Total 99,111 0.42% 84,578 0.66% 14,533 (24) Bps
Note: “Due to customers – Other” includes structured deposits.

2016 Annual Report 26
Management Discussion and Analysis — Financial Review
In 2016, the Group’s net interest margin was 1.83%, a decrease of 29 basis points compared with the prior year.
Specifically, net interest margin of its domestic RMB and domestic foreign currency businesses were 2.06% and
0.63% respectively. Major factors that affected the Group’s net interest margin include:
First, the PBOC cut RMB benchmark deposit and loan interest rates on five separate occasions and removed
the floating deposit rate ceiling altogether for commercial banks in 2015. The repercussions of these changes
continued into 2016.
Second, according to the requirements of the Notice concerning the Nationwide Adoption of Value-added Tax in
lieu of Business Tax Pilot Tax Collection Policy (Caishui [2016] No. 36), all of the Bank’s institutions in the Chinese
mainland started to change from business tax to value-added tax (BT-to-VAT) as of 1 May 2016. Accordingly,
interest income under VAT was reported on a net basis.
Third, in response to changes in the external environment, the Bank effectively optimised existing assets and
liabilities and efficiently allocated their increments, resulting in continuous improvement to its assets and liabilities
structure. In 2016, the proportion of the average balance of loans to total interest-earning assets rose by 0.45
percentage point, and the proportion of the average balance of investments to total interest-earning assets rose by
1.95 percentage points. The proportion of the average balance of demand deposits to RMB deposits in the Group’s
domestic RMB businesses rose by 3.47 percentage points.
Non-interest Income
In 2016, the Group reported a non-interest income of RMB179.608 billion, an increase of RMB34.346 billion or 23.64% compared with the prior year. Non-interest income represented 36.98% of operating income.
Net fee and Commission Income
The Group earned a net fee and commission income of RMB88.664 billion, a decrease of RMB3.746 billion or 4.05% compared with the prior year. Net fee and commission income represented 18.26% of operating income. This was primarily because the Bank made great efforts to support the national strategy of mass entrepreneurship and innovation and proactively fulfilled its social responsibility to support the real economy, and reduced enterprises’ operating and trading costs. As a result, the Bank’s fee and commission income from credit commitment business and consultancy and advisory business decreased compared with the prior year. The Bank’s fee and commission income from settlement and clearing business also shrank due to a contraction in overseas trading volumes. On the other hand, the Bank seized opportunities to develop its asset management business, continually reinforced its product innovation and improved its investment management capability. As a result, the Bank realised a fee income of RMB9.169 billion from off-balance-sheet wealth management products business and a fee income of RMB4.673 billion from insurance agency business.

2016 Annual Report27
Management Discussion and Analysis — Financial Review
Unit: RMB million, except percentages
Items 2016 2015 Change Change (%)
GroupAgency commissions 24,178 24,481 (303) (1.24%)
Bank card fees 24,054 24,215 (161) (0.66%)
Settlement and clearing fees 11,113 11,888 (775) (6.52%)
Credit commitment fees 15,426 16,541 (1,115) (6.74%)
Consultancy and advisory fees 5,701 5,757 (56) (0.97%)
Spread income from foreign exchange business 7,149 7,388 (239) (3.23%)
Custodian and other fiduciary service fees 3,397 3,677 (280) (7.61%)
Other 7,301 6,958 343 4.93%
Fee and commission income 98,319 100,905 (2,586) (2.56%)
Fee and commission expense (9,655) (8,495) (1,160) 13.66%
Net fee and commission income 88,664 92,410 (3,746) (4.05%)
DomesticAgency commissions 18,278 16,951 1,327 7.83%
Bank card fees 20,366 20,771 (405) (1.95%)
Settlement and clearing fees 9,613 10,237 (624) (6.10%)
Credit commitment fees 7,685 9,891 (2,206) (22.30%)
Consultancy and advisory fees 5,561 5,677 (116) (2.04%)
Spread income from foreign exchange business 6,335 6,556 (221) (3.37%)
Custodian and other fiduciary service fees 3,282 3,322 (40) (1.20%)
Other 4,133 5,040 (907) (18.00%)
Fee and commission income 75,253 78,445 (3,192) (4.07%)
Fee and commission expense (4,550) (3,225) (1,325) 41.09%
Net fee and commission income 70,703 75,220 (4,517) (6.01%)
Other Non-interest Income
The Group realised other non-interest income of RMB90.944 billion, an increase of RMB38.092 billion or 72.07%
compared with the prior year. This was primarily because the Bank completed the sale and delivery of Nanyang
Commercial Bank, Limited (NCB) and recognised the related gain from the investment disposal. Meanwhile, net
gains on financial investments realised rapid growth compared with the prior year. Please refer to Notes V.3, 4, 5
to the Consolidated Financial Statements for detailed information.
2016 Annual Report 28
Management Discussion and Analysis — Financial Review
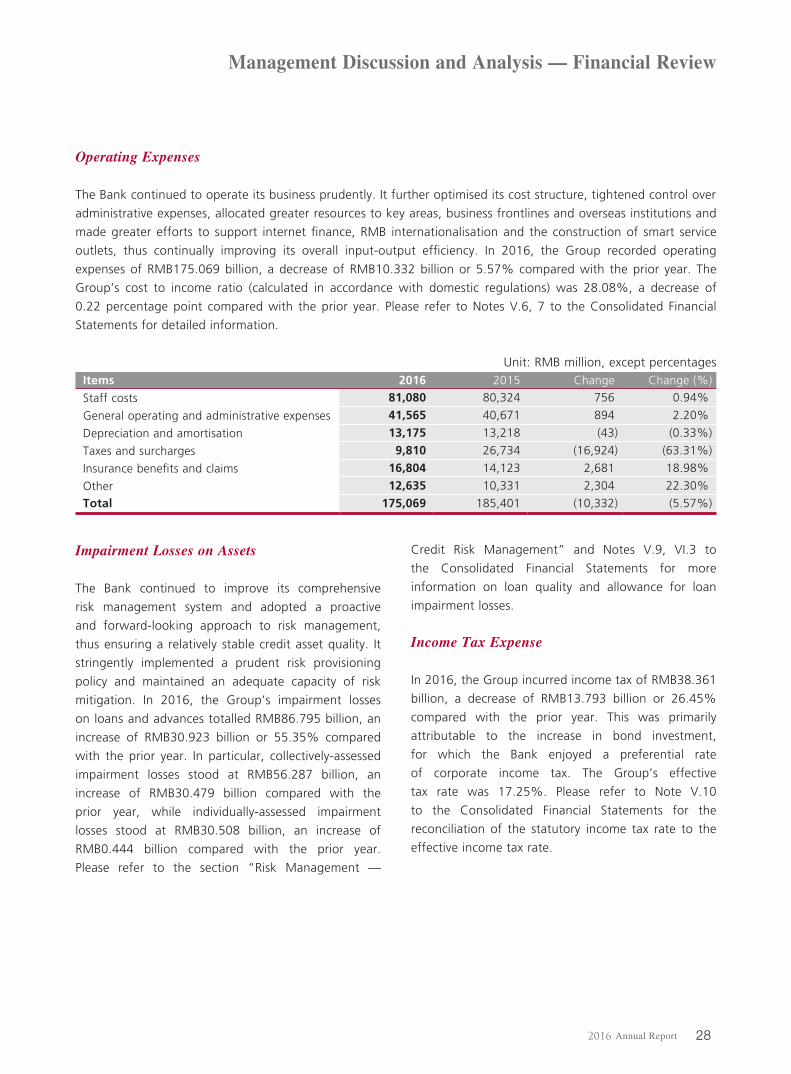
Operating Expenses
The Bank continued to operate its business prudently. It further optimised its cost structure, tightened control over
administrative expenses, allocated greater resources to key areas, business frontlines and overseas institutions and
made greater efforts to support internet finance, RMB internationalisation and the construction of smart service
outlets, thus continually improving its overall input-output efficiency. In 2016, the Group recorded operating
expenses of RMB175.069 billion, a decrease of RMB10.332 billion or 5.57% compared with the prior year. The
Group’s cost to income ratio (calculated in accordance with domestic regulations) was 28.08%, a decrease of
0.22 percentage point compared with the prior year. Please refer to Notes V.6, 7 to the Consolidated Financial
Statements for detailed information.
Unit: RMB million, except percentages Items 2016 2015 Change Change (%)
Staff costs 81,080 80,324 756 0.94%
General operating and administrative expenses 41,565 40,671 894 2.20%
Depreciation and amortisation 13,175 13,218 (43) (0.33%)
Taxes and surcharges 9,810 26,734 (16,924) (63.31%)
Insurance benefits and claims 16,804 14,123 2,681 18.98%
Other 12,635 10,331 2,304 22.30%
Total 175,069 185,401 (10,332) (5.57%)
Impairment Losses on Assets
The Bank continued to improve its comprehensive
risk management system and adopted a proactive
and forward-looking approach to risk management,
thus ensuring a relatively stable credit asset quality. It
stringently implemented a prudent risk provisioning
policy and maintained an adequate capacity of risk
mitigation. In 2016, the Group’s impairment losses
on loans and advances totalled RMB86.795 billion, an
increase of RMB30.923 billion or 55.35% compared
with the prior year. In particular, collectively-assessed
impairment losses stood at RMB56.287 billion, an
increase of RMB30.479 billion compared with the
prior year, while individually-assessed impairment
losses stood at RMB30.508 billion, an increase of
RMB0.444 billion compared with the prior year.
Please refer to the section “Risk Management —
Credit Risk Management” and Notes V.9, VI.3 to
the Consolidated Financial Statements for more
information on loan quality and allowance for loan
impairment losses.
Income Tax Expense
In 2016, the Group incurred income tax of RMB38.361
billion, a decrease of RMB13.793 billion or 26.45%
compared with the prior year. This was primarily
attributable to the increase in bond investment,
for which the Bank enjoyed a preferential rate
of corporate income tax. The Group’s effective
tax rate was 17.25%. Please refer to Note V.10
to the Consolidated Financial Statements for the
reconciliation of the statutory income tax rate to the
effective income tax rate.

2016 Annual Report29
Management Discussion and Analysis — Financial Review
Financial Position Analysis
As at the end of 2016, the Group’s total assets amounted to RMB18,148.889 billion, an increase of RMB1,333.292
billion or 7.93% compared with the prior year-end. The Group’s total liabilities amounted to RMB16,661.797
billion, an increase of RMB1,203.805 billion or 7.79% compared with the prior year-end.
The principal components of the Group’s consolidated statement of financial position are set out below:
Unit: RMB million, except percentages
As at 31 December 2016 As at 31 December 2015Items Amount % of total Amount % of total
AssetsLoans and advances to customers, net 9,735,646 53.64% 8,935,195 53.14%
Investments 3,972,884 21.89% 3,595,095 21.38%
Balances with central banks 2,271,640 12.52% 2,196,063 13.06%Due from and placements with banks and other financial institutions 1,176,482 6.48% 1,007,855 5.99%
Other assets 992,237 5.47% 1,081,389 6.43%
Total assets 18,148,889 100.00% 16,815,597 100.00%
LiabilitiesDue to customers 12,939,748 77.66% 11,729,171 75.88%Due to and placements from banks and other financial institutions and due to central banks 2,590,413 15.55% 2,627,973 17.00%
Other borrowed funds 389,470 2.34% 313,210 2.03%
Other liabilities 742,166 4.45% 787,638 5.09%
Total liabilities 16,661,797 100.00% 15,457,992 100.00%
Notes:
1 Investments include financial investments available for sale, debt securities held to maturity, financial investments classified as
loans and receivables, and financial assets at fair value through profit or loss.
2 Other borrowed funds include bonds issued and other borrowings.
Loans and Advances to Customers
In line with China’s macroeconomic policies and the financial demands of the real economy, the Bank rationally
allocated credit extension and expanded its lending scale at a stable and moderate pace. The Bank continually
improved its credit structure, supported key national investment fields, promoted the coordinated development
of regional economies and provided credit support to a series of national projects, such as the construction of the
“Belt and Road” financial artery, cross-border capacity transfer and Chinese enterprises’ “Going Global” initiative.

2016 Annual Report 30
Management Discussion and Analysis — Financial Review
The Bank strictly controlled credit facilities granted to industries characterised by high pollution, high energy
consumption and overcapacity. As at the end of 2016, the Group’s loans and advances to customers amounted to
RMB9,973.362 billion, an increase of RMB837.502 billion or 9.17% compared with the prior year-end. Specifically,
the Group’s RMB loans and advances to customers totalled RMB7,607.730 billion, an increase of RMB595.863
billion or 8.50% compared with the prior year-end, while its foreign currency loans amounted to USD341.017
billion, an increase of USD13.927 billion or 4.26%.
The Bank further improved its risk management, paid close attention to changes in the macroeconomic situation,
strengthened risk identification and management in key areas and made more efforts to dispose the non-
performing assets, maintaining a relatively stable asset quality. As at the end of 2016, the balance of the Group’s
allowance for loan impairment losses amounted to RMB237.716 billion, an increase of RMB37.051 billion
compared with the prior year-end. The balance of the Group’s restructured loans amounted to RMB9.699 billion,
an increase of RMB4.394 billion compared with the prior year-end.
Investments
The Bank tracked market dynamics, increased its investment in both RMB and foreign currency bonds, continuously
adjusted its investment structure, properly managed investment portfolio duration and struck a balance between
risk and return.
As at the end of 2016, the Group held investments of RMB3,972.884 billion, an increase of RMB377.789 billion
or 10.51% compared with the prior year-end. Specifically, the Group’s RMB investments totalled RMB3,000.935
billion, an increase of RMB167.873 billion or 5.93% compared with the prior year-end, while foreign currency
investments totalled USD140.111 billion, an increase of USD22.760 billion or 19.39% compared with the prior
year-end.
The classification of the Group’s investment portfolio is shown below:
Unit: RMB million, except percentages
As at 31 December 2016 As at 31 December 2015Items Amount % of total Amount % of total
Financial assets at fair value through profit or loss 124,090 3.12% 119,062 3.31%
Financial investments available for sale 1,609,830 40.52% 1,078,533 30.00%
Debt securities held to maturity 1,843,043 46.39% 1,790,790 49.81%Financial investments classified as loans and receivables 395,921 9.97% 606,710 16.88%
Total 3,972,884 100.00% 3,595,095 100.00%

2016 Annual Report31
Management Discussion and Analysis — Financial Review
Investments by Issuer Type
Unit: RMB million, except percentages
As at 31 December 2016 As at 31 December 2015Items Amount % of total Amount % of total
Debt securities Issuers in Chinese mainland Government 2,004,727 50.46% 1,411,475 39.26%
Public sectors and quasi-governments 52,015 1.31% 62,293 1.73%
Policy banks 389,774 9.81% 441,288 12.28%
Financial institutions 292,861 7.37% 292,978 8.15%
Corporates 190,222 4.79% 278,719 7.75%
China Orient Asset Management Corporation 160,000 4.03% 160,000 4.45%
Subtotal 3,089,599 77.77% 2,646,753 73.62% Issuers in Hong Kong, Macau, Taiwan and other countries and regions Governments 342,698 8.62% 289,498 8.05%
Public sectors and quasi-governments 90,101 2.27% 50,534 1.41%
Financial institutions 217,554 5.47% 157,267 4.37%
Corporates 120,620 3.04% 106,776 2.97%
Subtotal 770,973 19.40% 604,075 16.80%
Equity instruments and others 112,312 2.83% 344,267 9.58%
Total 3,972,884 100.00% 3,595,095 100.00%
Investments by Currency
As at 31 December 2016
RMB
USD
Other
HKD
Unit: RMB million, except percentages
619,420
3,000,935
15.59%
75.54%
199,0695.01%
153,4603.86%
Unit: RMB million, except percentages
As at 31 December 2015
477,259
2,833,062
13.28%
78.80%RMB
USD
145,8814.06%Other
138,893HKD 3.86%

2016 Annual Report 32
Management Discussion and Analysis — Financial Review
Top Ten Financial Bonds by Value Held by the Group
Unit: RMB million, except percentages Bond Name Par Value Annual Rate Maturity Date ImpairmentBond issued by financial institutions in 2016 20,000 3.50% 2017-06-14 –Bond issued by policy banks in 2014 7,626 5.44% 2019-04-08 –Bond issued by policy banks in 2010 6,070 Term deposit rate for 1 year + 0.52% 2017-01-26 –Bond issued by financial institutions in 2015 5,500 4.95% 2018-01-19 –Bond issued by financial institutions in 2016 5,000 3.30% 2017-08-10 –Bond issued by financial institutions in 2016 5,000 3.40% 2017-05-26 –Bond issued by policy banks in 2010 4,750 Term deposit rate for 1 year + 0.59% 2020-02-25 –Bond issued by policy banks in 2015 4,420 4.10% 2020-03-24 –Bond issued by financial institutions in 2015 4,400 4.00% 2025-12-21 –Bond issued by policy banks in 2011 4,400 3.83% 2018-11-24 –
Note: Financial bonds refer to the debt securities issued by financial institutions in the bond market, including the bonds issued by policy
banks, other banks and non-bank financial institutions, but excluding restructured bonds and PBOC bills.
Due to Customers
The Bank aligned itself with the trend towards
interest rate liberalisation and the rapid development
of internet finance, accelerated product and service
innovation and thus constantly enhanced its financial
services offering. As a result, its liability business grew
steadily. It further improved salary payment agency,
payment collection and other basic services, optimised
the functions of personal certificates of deposit
(CDs), steadily expanded its administrative institution
customer base, solidified its relationships with basic
settlement and cash management customers and
seized such business opportunities as the acceleration
of direct financing. As a result, it steadily grew its
customer base.
As at the end of 2016, the Group’s due to customers
amounted to RMB12,939.748 billion, an increase of
RMB1,210.577 billion or 10.32% compared with the
prior year-end. Specifically, the Group’s RMB due to
customers totalled RMB9,744.207 billion, an increase
of RMB629.540 billion or 6.91% compared with
the prior year-end, while its foreign currency due to
customers stood at USD460.652 billion, an increase of
USD58.024 billion or 14.41%.

2016 Annual Report33
Management Discussion and Analysis — Financial Review
The principal components of due to customers of the Group and its domestic institutions are set out below:
Unit: RMB million, except percentages
As at 31 December 2016 As at 31 December 2015Items Amount % of total Amount % of totalGroupCorporate deposits Demand deposits 3,620,945 27.98% 3,130,624 26.69%
Time deposits 3,100,383 23.96% 3,037,783 25.90%
Structured deposits 271,885 2.10% 274,799 2.34%
Subtotal 6,993,213 54.04% 6,443,206 54.93%Personal deposits Demand deposits 2,490,309 19.25% 2,092,841 17.84%
Time deposits 2,992,051 23.12% 2,841,372 24.22%
Structured deposits 78,426 0.61% 65,112 0.56%
Subtotal 5,560,786 42.98% 4,999,325 42.62%
Certificates of deposit 327,908 2.53% 230,793 1.97%
Other deposits 57,841 0.45% 55,847 0.48%Total 12,939,748 100.00% 11,729,171 100.00%DomesticCorporate deposits Demand deposits 3,046,617 29.48% 2,599,679 27.58%
Time deposits 2,286,107 22.12% 2,282,082 24.20%
Structured deposits 259,434 2.51% 251,251 2.67%
Subtotal 5,592,158 54.11% 5,133,012 54.45%Personal deposits Demand deposits 1,904,292 18.42% 1,616,747 17.15%
Time deposits 2,711,679 26.24% 2,559,844 27.16%
Structured deposits 75,374 0.73% 63,008 0.67%
Subtotal 4,691,345 45.39% 4,239,599 44.98%
Other deposits 51,398 0.50% 53,409 0.57%Total 10,334,901 100.00% 9,426,020 100.00%
Due to Customers by Currency
As at 31 December 2016
RMB
USD
HKD
Other
Unit: RMB million, except percentages
1,538,40811.89%
657,058
9,744,207
1,000,0757.73%
5.08%
75.30%
As at 31 December 2015
1,201,16210.24%
532,002
9,114,667
881,3407.51%
4.54%
77.71%RMB
USD
HKD
Other
Unit: RMB million, except percentages

2016 Annual Report 34
Management Discussion and Analysis — Financial Review
Equity
As at the end of 2016, the Group’s total equity was
RMB1,487.092 billion, an increase of RMB129.487
billion or 9.54% compared with the prior year-
end. This was primarily attributable to the following
reasons: (1) In 2016, the Group realised a profit for
the year of RMB184.051 billion. (2) As per the 2015
profit distribution plan approved at the 2015 Annual
General Meeting, the Bank paid a cash dividend of
RMB51.518 billion. (3) The Bank paid a dividend on its
preference shares of RMB6.718 billion. (4) The listing
of BOC Aviation on the Hong Kong Stock Exchange
gave rise to an increase of RMB7.287 billion in the
Group’s total equity. Please refer to the “Consolidated
Statement of Changes in Equity” in the Consolidated
Financial Statements for detailed information.
Off-balance Sheet Items
Off-balance sheet items include derivative financial
instruments, contingent liabilities and commitments,
etc.
The Group entered into various derivative financial
instruments relating to foreign currency exchange
rates, interest rates, equity, credit, precious metals
and other commodities for trading, hedging, asset
and liability management and on behalf of customers.
Please refer to Note V.17 to the Consolidated Financial
Statements for the contractual/notional amounts and
fair values of derivative instruments.
Contingent liabilities and commitments include
legal proceedings and arbitrations, assets pledged,
collateral accepted, capital commitments, operating
leases, Treasury bonds redemption commitments,
credit commitments and underwriting obligations,
etc. Please refer to Note V.42 to the Consolidated
Financial Statements for more detailed information on
contingent liabilities and commitments.
Cash Flow Analysis
As at the end of 2016, the balance of the Group’s
cash and cash equivalents was RMB1,019.247 billion,
a decrease of RMB32.831 billion compared with the
prior year-end.
In 2016, net cash flow from operating activities
was an inflow of RMB182.081 billion, a decrease of
RMB490.013 billion compared with the prior year. This
was mainly attributable to the increase of net increase
in due to customers and the decrease of net changes
in due to and placements from banks and other
financial institutions compared with the prior year.
Net cash flow from investing activities was an outflow
of RMB246.386 billion, a decrease of RMB510.893
billion compared with the prior year. This was mainly
attributable to the decrease in net cash outflow of
financial investments.
Net cash flow from financing activities was an outflow
of RMB1.713 billion, a decrease of RMB27.002
billion compared with the prior year. This was mainly
attributable to the increase of proceeds from issuance
of bonds compared with the prior year.

2016 Annual Report35
Management Discussion and Analysis — Financial Review
Segment Reporting by Geography
The Group conducts its business activities in Chinese mainland, Hong Kong, Macau, Taiwan and other countries. A
geographical analysis of profit contribution and the related assets and liabilities is set forth in the following table:
Unit: RMB million
Chinese mainlandHong Kong, Macau
and Taiwan Other countries Elimination GroupItems 2016 2015 2016 2015 2016 2015 2016 2015 2016 2015Net interest income 263,642 282,151 29,342 31,738 13,064 14,761 – – 306,048 328,650Non-interest income 104,432 101,468 72,299 41,769 6,151 3,150 (3,274) (1,125) 179,608 145,262 Including: net fee and commission income 70,703 75,220 14,486 14,729 4,285 3,302 (810) (841) 88,664 92,410Operating Expenses (138,639) (150,393) (31,731) (31,370) (5,987) (4,763) 1,288 1,125 (175,069) (185,401)Impairment losses on assets (86,427) (56,409) (1,803) (2,095) (842) (770) – – (89,072) (59,274)Profit before income tax 143,008 176,817 69,004 42,376 12,386 12,378 (1,986) – 222,412 231,571As at the year-endAssets 14,341,792 13,053,114 3,256,526 3,010,958 1,812,521 1,819,844 (1,261,950) (1,068,319) 18,148,889 16,815,597Liabilities 13,198,402 11,970,984 2,967,621 2,784,066 1,757,564 1,770,859 (1,261,790) (1,067,917) 16,661,797 15,457,992
As at the end of 2016, total assets3 of the Bank’s Chinese mainland segment amounted to RMB14,341.792 billion,
an increase of RMB1,288.678 billion or 9.87% compared with the prior year-end, representing 73.88% of the
Group’s total assets. In 2016, this segment recorded a profit before income tax of RMB143.008 billion, a decrease
of RMB33.809 billion or 19.12% compared with the prior year, representing 63.73% of the Group’s profit before
income tax for the year.
Total assets of the Hong Kong, Macau and Taiwan segment amounted to RMB3,256.526 billion, an increase of RMB245.568 billion or 8.16% compared with the prior year-end, representing 16.78% of the Group’s total assets. In 2016, this segment recorded a profit before income tax of RMB69.004 billion, an increase of RMB26.628 billion or 62.84% compared with the prior year, representing 30.75% of the Group’s profit before income tax for the year.
Total assets of the other countries segment amounted to RMB1,812.521 billion, a decrease of RMB7.323 billion or 0.40% compared with the prior year-end, representing 9.34% of the Group’s total assets. In 2016, this segment recorded a profit before income tax of RMB12.386 billion, an increase of RMB8 million or 0.06% compared with the prior year, representing 5.52% of the Group’s profit before income tax for the year.
Please refer to the section “Business Review” for more detailed information on the Group’s business segments.
Critical Accounting Estimates and Judgements
The Bank makes accounting estimates and judgements that affect the reported amounts of assets and liabilities of the next financial year. These estimates and judgements are continually evaluated and are based on historical experience, expectations of future events that are believed to be reasonable under the circumstances and other factors. The management believes that the accounting estimates and judgements have properly reflected the Bank’s operating environment. Please refer to Notes II and III to the Consolidated Financial Statements for more detailed information related to the Bank’s accounting policies and accounting estimates.
3 The figures for segment assets, segment profit before income tax and their respective proportions are prior to intragroup
elimination.

2016 Annual Report 36
Management Discussion and Analysis — Financial Review
Fair Value Measurement
Movement of Financial Instruments Measured at Fair Value
Unit: RMB million
ItemsOpening balance
Closing balance
Change in the year
Impact on profit for the year
Financial assets at fair value through profit or loss
Debt securities 99,864 106,172 6,308
(327) Loans 4,218 6,022 1,804
Equity securities 9,338 7,547 (1,791)
Fund investments and other 5,642 4,349 (1,293)
Investment securities available for sale
Debt securities 1,029,842 1,535,963 506,121
(946) Equity securities 30,209 33,936 3,727
Fund investments and other 18,482 39,931 21,449
Derivative financial assets 82,236 130,549 48,313 1,074
Derivative financial liabilities (69,160) (107,109) (37,949) Placements from banks and other financial institutions at fair value (1,617) (1,968) (351) –
Due to customers at fair value (339,911) (350,311) (10,400) (73)
Short position in debt securities (7,012) (9,990) (2,978) 49
The Bank has put in place a sound internal control mechanism for fair value measurement. In accordance with
the Guidelines on Market Risk Management in Commercial Banks, Regulatory Guidelines on Valuation of Financial
Instruments in Commercial Banks, CAS and IFRS, with reference to the New Basel Capital Accord, and drawing on
the best practices of leading international banks regarding valuations, the Bank formulated the Valuation Policy of
Financial Instrument Fair Values of Bank of China Limited to standardise the fair value measurement of financial
instruments and enable timely and accurate financial information disclosure. Please refer to Note VI.6 to the
Consolidated Financial Statements for more detailed information related to the fair value measurement.
Other Financial Information
There are no differences in the equity and profit for the year of the Group prepared in accordance with IFRS to
those prepared in accordance with CAS. Please refer to Supplementary Information I to the Consolidated Financial
Statements for detailed information.

Management Discussion and Analysis — Business Review
2016 Annual Report37
Operating income for each line of business of the Group is set forth in the following table:
Unit: RMB million, except percentages2016 2015
Items Amount % of total Amount % of total
Commercial banking business 420,498 86.59% 440,847 93.02%
Including: Corporate banking business 211,245 43.50% 206,231 43.52%
Personal banking business 150,609 31.01% 135,652 28.62%
Treasury operations 58,644 12.08% 98,964 20.88%
Investment banking and insurance 24,634 5.07% 22,062 4.66%
Others and elimination 40,524 8.34% 11,003 2.32%
Total 485,656 100.00% 473,912 100.00%
A detailed review of the Group’s principal deposits and loans is summarised in the following table:
Unit: RMB million
ItemsAs at
31 December 2016As at
31 December 2015As at
31 December 2014
Corporate deposits Domestic: RMB 5,213,790 4,818,850 4,431,867
Foreign currency 378,368 314,162 265,826
Hong Kong, Macau, Taiwan and overseas operations 1,401,055 1,310,194 1,213,479
Subtotal 6,993,213 6,443,206 5,911,172
Personal deposits Domestic: RMB 4,349,300 3,982,160 3,688,329
Foreign currency 342,045 257,439 198,621
Hong Kong, Macau, Taiwan and overseas operations 869,441 759,726 754,215
Subtotal 5,560,786 4,999,325 4,641,165
Corporate loans Domestic: RMB 4,496,888 4,402,258 4,021,257
Foreign currency 336,294 398,103 500,208
Hong Kong, Macau, Taiwan and overseas operations 1,735,787 1,569,551 1,524,131
Subtotal 6,568,969 6,369,912 6,045,596
Personal loans Domestic: RMB 2,983,945 2,397,327 2,082,757
Foreign currency 1,381 1,406 1,551
Hong Kong, Macau, Taiwan and overseas operations 419,067 367,215 353,371
Subtotal 3,404,393 2,765,948 2,437,679

2016 Annual Report 38
Management Discussion and Analysis — Business Review
Commercial Banking
Domestic Commercial Banking
In 2016, the Bank’s domestic commercial banking business recorded an operating income of RMB359.240 billion, a decrease of RMB18.681 billion or 4.94% compared with the prior year. Details are set forth below:
Unit: RMB million, except percentages2016 2015
Items Amount % of total Amount % of total
Corporate banking business 185,014 51.50% 183,928 48.67%
Personal banking business 133,220 37.08% 118,849 31.45%
Treasury operations 37,902 10.55% 73,820 19.53%
Other 3,104 0.87% 1,324 0.35%Total 359,240 100.00% 377,921 100.00%
Corporate Banking
The Bank devoted great efforts to transforming its corporate banking business. It continued to promote product innovation, further optimise its customer structure, expand its customer base and enhance its diversified operations and the integration of its domestic and overseas operations. The Bank strived to improve its global service capability for corporate banking customers, thus achieving balanced and steady development of its corporate banking business. In 2016, the Bank’s domestic corporate banking business realised an operating income of RMB185.014 billion, an increase of RMB1.086 billion or 0.59% compared with the prior year.
Corporate Deposits
The Bank accelerated the development of its corporate liability business, constantly enhanced financial service standards and thus realised sustainable growth in corporate deposits. Seizing business opportunities arising from key industries, the Bank strengthened the marketing of its full product line. It managed to attract more administrative institution customers by improving product and service systems aimed at corporate customers engaged in supporting the people’s livelihood, public finance and social security, education and public health, etc., reporting rapid growth in deposits from such institutions. The Bank also actively sought out customers along the upstream and downstream of supply chains and industrial chains in order to identify and attract more potential customer deposits. In response to the trend of interest rate liberalisation, the Bank pursued innovation-led
development, reinforced marketing promotion and optimised product functions, while at the same time insisting on maintaining the right balance between scale and benefit. In addition, seizing business opportunities arising from the rapid expansion of direct financing, the Bank stepped up its marketing efforts for cash management and settlement products. It also enhanced the corporate banking service functions and service levels of its outlets, resulting in an increase in deposit contribution per outlet.
As at the end of 2016, RMB corporate deposits in the Bank’s domestic operations totalled RMB5,213.790 billion, an increase of RMB394.940 billion or 8.20% compared with the prior year-end. Foreign currency corporate deposits amounted to USD54.543 billion.
Corporate Loans
The Bank continued to implement national industrial policies and strengthen its support for the real economy. It actively supported key investment areas, provided greater credit support for such key areas as technological upgrade of enterprises, technology-driven innovation, high-end equipment manufacturing and environmental protection, as well as to the regions of central and western China, micro, small and medium-sized enterprises and to traditional infrastructures such as railways and water conservation. The Bank constantly optimised its credit structure by making better use of new assets and revitalising existing assets, providing credit support for the transformation and upgrading of the domestic economy and for international collaboration on production capacity. It strictly limited lending to

2016 Annual Report39
Management Discussion and Analysis — Business Review
industries characterised by high pollution, high energy consumption and overcapacity. The Bank stepped up the transformation of its corporate banking service and helped customers to broaden their financing channels so as to meet their diversified financing needs. In addition, the Bank also further enhanced the development of green finance and improved its system of green financial products and services.
As at the end of 2016, RMB corporate loans of the
Bank’s domestic operations totalled RMB4,496.888
billion, an increase of RMB94.630 billion or 2.15%
compared with the prior year-end. Foreign currency
corporate loans totalled USD48.478 billion.
Trade Finance and Services
The Bank fully leveraged its traditional advantages
in trade finance while effectively managing and
controlling risks. It accelerated innovation in its
business model and seized opportunities arising
from national strategies, thus driving forward stable
growth and continuously consolidating its market
dominance. In 2016, the Group’s transaction volume
of international trade reached USD3.63 trillion. The
Bank’s domestic institutions retained the leading
position among peers in providing international trade
services and held the leading market share in overseas
guarantee business.
The Bank built up its brand reputation as the premier
free trade zones (FTZs) financial services provider,
promoted innovation in commodity-related structured
financial services, supported the international
development strategy pursued by domestic commodity
exchanges and pushed forward the use of RMB-
denominated commodity trading. The Bank took the
lead in launching new businesses such as OTC bond
transactions, RMB currency swaps under separate
accounting, free trade foreigner (FTF) account opening
and fully functional cross-border two-way RMB cash
pooling in the China (Shanghai) Pilot Free Trade Zone
(the “Shanghai FTZ”). The Bank took the lead in
launching cross-border two-way RMB cash pooling,
cross-border RMB under individual current accounts
and overseas RMB lending in the Guangdong, Tianjin
and Fujian FTZs. In addition, the Bank accelerated
innovation in centralised collection and payment
products for the local and foreign currency funds of
multinational corporations’ headquarters and actively
promoted the adoption of digital documents for
international payment.
In line with national strategies, the Bank actively
promoted China’s economic and trade cooperation
along the “Belt and Road” by facilitating business
growth of institutions in the “Belt and Road”
countries. It engaged deeply with the China-Singapore
(Chongqing) Demonstration Initiative on Strategic
Connectivity. To further advance the development
of RMB internationalisation, the Bank endeavoured
to serve as the main channel for cross-border RMB
fund flows and as a leader in RMB-related financial
product and service innovation. In 2016, the Group’s
transaction volume of cross-border RMB payment
was over RMB4 trillion, and the transaction volume of
cross-border RMB payment of the domestic institutions
of the Bank was over RMB2.35 trillion, maintaining
its leading market share. The Bank further improved
its global RMB clearing network, with the New York
Branch authorised as an RMB clearing bank in the
US. The Bank also actively promoted the use of RMB
in emerging sectors and assisted foreign financial
institutions in issuing Panda Bonds, thus playing an
innovative and pioneering role in the opening up of
China’s bond market. It completed the first RMB/ZAR,
RMB/KRW, RMB/AED and RMB/SAR direct transactions
in the interbank foreign exchange market. The Bank
also continued to release the “BOC Cross-border RMB
Index (CRI)”, the “BOC Offshore RMB Index (ORI)”
and the “BOC OBOR RMB Index (BOC OBORR)”, as
well as the White Paper on RMB Internationalisation,
providing more professional support for global clients
to understand and use RMB. The Bank served as
the overall lead bank in the China Foreign Exchange
Committee, set up in 2016, and as the lead bank of
the Retail Foreign Exchange and Cross-border RMB
Business Working Group under the Committee, with
the twin aims of improving the foreign exchange
market’s self-discipline and driving the development of
RMB internationalisation.

2016 Annual Report 40
Management Discussion and Analysis — Business Review
The Bank received awards granted by prestigious local and international media and professional institutions, such as “Best Trade Finance Bank in China”, “Best RMB Internationalisation Bank in China”, “Best Trade Finance Provider (Domestic)” and “Best Supply Chain Finance Provider (Domestic)”.
Cash Management
Drawing on the strength of its globally integrated operations, the Bank continued to improve the functions and related services of its global cash management platform and made greater efforts to promote its global cash management business. Grasping the business opportunities arising from the centralised operation of cross-border local and foreign currency funds and the development of FTZs, the Bank actively expanded its cross-border cash management business and maintained a leading market share. The Bank successfully secured the cash management business of many large-sized multinational corporations through competitive bids. Its global cash management group customer base increased rapidly, with coverage now extending to 43 countries and regions across Asia-Pacific, Europe, Africa and the Americas. The Bank introduced the Bank Host-to-Host Direct Connection, Swift Direct Connection and Multi-Bank Cash Management System services in order to effectively meet the differentiated requirements of the market. It also strengthened risk control over its cash management business and improved customer experience. The Bank was recognised as the “Best Regional Cash Manager in Asia” by Euromoney and the “Best Local Currency Cash Management Bank in China” by Asiamoney.
Financial Institutions Business
The Bank continued to deepen comprehensive cooperation with various global financial institutions, including domestic banks, overseas correspondent banks, non-bank financial institutions, overseas central banks, sovereign wealth funds and international financial organisations. It enhanced its integrated financial services platform and maintained a leading position in terms of financial institution customer coverage. Having established correspondent relationships with more than 1,600 financial institutions in 179 countries and regions, the Bank provided financial services for multinational institutions
and enterprises in fields such as international settlement, bond financing, foreign exchange trading, custody and global cash management. Closely supporting the national “Belt and Road” initiative, the Bank consolidated cooperation with key correspondent banks along the “Belt and Road”. It initiated wide-reaching cooperation with emerging international organisations and development institutions such as Asian Infrastructure Investment Bank, New Development Bank and Silk Road Fund, participated in the investment and financing projects of domestic policy financial institutions along the “Belt and Road” and provided extended financial services. The Bank devoted more efforts to expanding its cross-border RMB business and thus became the major RMB clearing channel for overseas central banks, correspondent banks and exchanges and the preferred bank of Chinese enterprises for RMB business. It opened 1,508 cross-border RMB clearing accounts for correspondent banks from 119 countries and regions, thus holding a leading position among domestic banks. It also promoted the RMB Cross-Border Interbank Payment System (CIPS) and signed cooperation agreements for indirect participants with 160 domestic and overseas financial institutions, seizing the largest market share in the banking industry. The Bank’s custodian service for Qualified Foreign Institutional Investors (QFIIs) and RMB Qualified Foreign Institutional Investors (RQFIIs) ranked among the top in terms of both customer base and business scale. The Bank strengthened cooperation with global sovereign institutions and non-bank financial institutions. As a result, the Bank was chosen by four foreign sovereign institutions as their agent in the interbank bond market and was appointed by five foreign sovereign institutions as their agent for interbank foreign exchange trading. The Bank was selected by China Securities Depository and Clearing Corporation Limited as the settlement bank for Southbound Hong Kong Trading Link under the Shenzhen-Hong Kong Stock Connect. Hong Kong Securities Clearing Company Ltd. authorised the Bank to be the sole settlement bank for the Northbound Shenzhen Trading Link. Furthermore, the Bank helped international financial institutions to issue SDR-denominated bonds in the domestic interbank market and to issue RMB3.0 billion of green bonds in the domestic market, and the Bank conducted strategic cooperation regarding “Belt and Road” business.

2016 Annual Report41
Management Discussion and Analysis — Business Review
As at the end of 2016, the Bank ranked first in terms of market share in foreign currency deposits from financial institutions. It also led its peers in B-Share clearing business volume. The inbound international settlement business volume directed to the Bank by its overseas correspondent banks also ranked first in the market. Its third-party custody business continued to grow rapidly and the annual fee income from its bancassurance business reached a record high.
SME Finance
The Bank comprehensively implemented national policies and measures to support the development of small and medium-sized enterprises (SMEs), and endeavoured to develop an SME finance service model integrating the “Credit Factory”, “investment and loan linkage mechanism” and “cross-border matchmaking”, thus constantly enhancing SME finance services. In 2016, loans to micro and small-sized enterprises in the Chinese mainland continued to grow stably, with the Bank satisfying the regulatory requirement of the “Three No-Less-Thans” — that is, an SME loan growth rate of no less than the average growth rate of domestic loans, a number of SME borrowers no less than that of the prior year and a loan approval ratio for SME borrowers of no less than that of the prior year. The Bank followed the national development strategies of innovation-driven development and supported “mass entrepreneurship and innovation”. Among large commercial banks in the Chinese mainland, the Bank was the only one to be included in the first batch of the “investment and loan linkage mechanism” pilot programme, and piloted “investment and loan linkage mechanism” in the national autonomous innovation demonstration zones in five provinces and cities including Beijing, Tianjin, Shanghai, Hubei and Shaanxi. In addition, the Bank fully leveraged its advantages in specialised operations, established franchising institution specialised in science and technology and set up external expert database, so as to support the development of technology and innovation-oriented SMEs. It also reinforced business cooperation among BOCG Investment, BOCI China and BOCIM, in a bid to
promote the linkage of investment and lending in an in-depth manner.
The Bank earnestly promoted cross-border investment
matchmaking services for SMEs by supporting
enterprises to access foreign funds and advanced
technologies and by boosting transformation and
upgrading, technological exchanges and cross-border
cooperation, so as to help domestic SMEs to integrate
into the global industrial and value chain. This was
highly praised by all sectors of society. To date, the
Bank has organised 28 cross-border matchmaking
events across five continents, attracting over 20,000
SMEs from both China and other countries and
regions. The Ministry of Industry and Information
Technology (MIIT) and the Bank jointly issued the
Five-year Action Plan on Promoting the International
Development of Small and Medium-sized Enterprises
(2016–2020) and the Bank was invited to attend
the APEC SME Working Group Meeting and the EU-
China SME Policy Dialogue. The Bank enhanced risk
control and compliance management, improved its
early-warning mechanism on asset quality control and
continuously enhanced its capabilities in identifying
and mitigating credit risk, thus maintaining SME loan
quality at a stable and controllable level.
As at the end of 2016, the Bank’s outstanding loans
to micro and small-sized enterprises4 amounted to
RMB1,284.9 billion, an increase of RMB139.2 billion
compared with the prior year-end. The Bank served
3.11 million SME customers and granted SME loans of
RMB1,912.5 billion.
Pension Business
In an effort to support the development of China’s
social security system, the Bank continuously increased
its pension-related product offerings, promoted
product innovation, optimised service system functions
and developed a comprehensive service system. It
4 Micro and small-sized enterprise loans statistical standards are executed in accordance with the Guiding Opinions on Financial
Services for Micro and Small-sized Enterprises in 2014 (Yinjianfa [2014] No. 7).
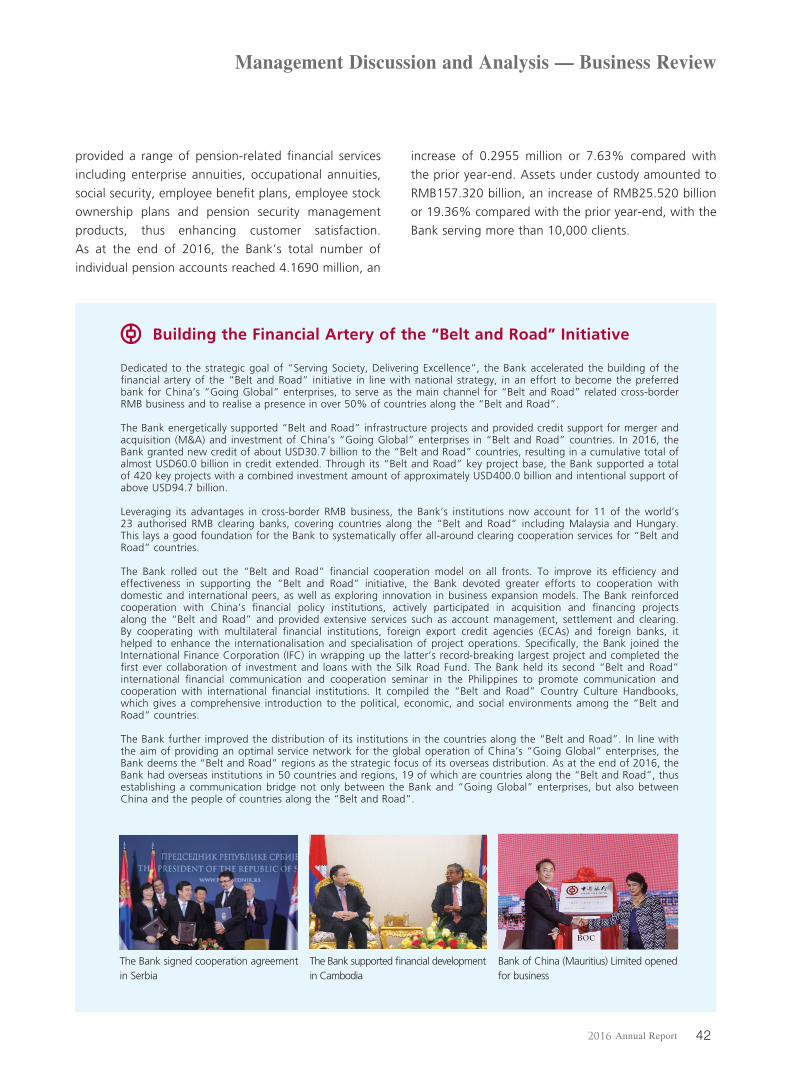
2016 Annual Report 42
Management Discussion and Analysis — Business Review
provided a range of pension-related financial services
including enterprise annuities, occupational annuities,
social security, employee benefit plans, employee stock
ownership plans and pension security management
products, thus enhancing customer satisfaction.
As at the end of 2016, the Bank’s total number of
individual pension accounts reached 4.1690 million, an
increase of 0.2955 million or 7.63% compared with
the prior year-end. Assets under custody amounted to
RMB157.320 billion, an increase of RMB25.520 billion
or 19.36% compared with the prior year-end, with the
Bank serving more than 10,000 clients.
Building the Financial Artery of the “Belt and Road” Initiative
Dedicated to the strategic goal of “Serving Society, Delivering Excellence”, the Bank accelerated the building of the financial artery of the “Belt and Road” initiative in line with national strategy, in an effort to become the preferred bank for China’s “Going Global” enterprises, to serve as the main channel for “Belt and Road” related cross-border RMB business and to realise a presence in over 50% of countries along the “Belt and Road”.
The Bank energetically supported “Belt and Road” infrastructure projects and provided credit support for merger and acquisition (M&A) and investment of China’s “Going Global” enterprises in “Belt and Road” countries. In 2016, the Bank granted new credit of about USD30.7 billion to the “Belt and Road” countries, resulting in a cumulative total of almost USD60.0 billion in credit extended. Through its “Belt and Road” key project base, the Bank supported a total of 420 key projects with a combined investment amount of approximately USD400.0 billion and intentional support of above USD94.7 billion.
Leveraging its advantages in cross-border RMB business, the Bank’s institutions now account for 11 of the world’s 23 authorised RMB clearing banks, covering countries along the “Belt and Road” including Malaysia and Hungary. This lays a good foundation for the Bank to systematically offer all-around clearing cooperation services for “Belt and Road” countries.
The Bank rolled out the “Belt and Road” financial cooperation model on all fronts. To improve its efficiency and effectiveness in supporting the “Belt and Road” initiative, the Bank devoted greater efforts to cooperation with domestic and international peers, as well as exploring innovation in business expansion models. The Bank reinforced cooperation with China’s financial policy institutions, actively participated in acquisition and financing projects along the “Belt and Road” and provided extensive services such as account management, settlement and clearing. By cooperating with multilateral financial institutions, foreign export credit agencies (ECAs) and foreign banks, it helped to enhance the internationalisation and specialisation of project operations. Specifically, the Bank joined the International Finance Corporation (IFC) in wrapping up the latter’s record-breaking largest project and completed the first ever collaboration of investment and loans with the Silk Road Fund. The Bank held its second “Belt and Road” international financial communication and cooperation seminar in the Philippines to promote communication and cooperation with international financial institutions. It compiled the “Belt and Road” Country Culture Handbooks, which gives a comprehensive introduction to the political, economic, and social environments among the “Belt and Road” countries.
The Bank further improved the distribution of its institutions in the countries along the “Belt and Road”. In line with the aim of providing an optimal service network for the global operation of China’s “Going Global” enterprises, the Bank deems the “Belt and Road” regions as the strategic focus of its overseas distribution. As at the end of 2016, the Bank had overseas institutions in 50 countries and regions, 19 of which are countries along the “Belt and Road”, thus establishing a communication bridge not only between the Bank and “Going Global” enterprises, but also between China and the people of countries along the “Belt and Road”.
The Bank supported financial development in Cambodia
The Bank signed cooperation agreement in Serbia
Bank of China (Mauritius) Limited opened for business

2016 Annual Report43
Management Discussion and Analysis — Business Review
Personal Banking
Seizing development opportunities brought about by
the transformation of China’s economic structure, the
Bank closely followed the policies of interest rate and
exchange rate liberalisation and the reform of RMB
settlement accounts, etc., continued to boost product
competitiveness and further improved customer
experience, thus gradually highlighting the strategic
importance of personal banking. In 2016, the Bank’s
domestic personal banking business realised an
operating income of RMB133.220 billion, an increase
of RMB14.371 billion or 12.09% compared with the
prior year.
Personal Deposits
The Bank actively responded to external challenges,
including interest rate liberalisation and internet
finance development, leveraged the advantage of
comprehensive financial services and vigorously
expanded fundamental businesses such as salary
payment agency, collection and payment agency,
sweep agency and escrow agency, thus promoting
steady growth in its personal deposit business. The
Bank ramped up innovation in personal deposit
products and provided customers with deposit
products of different terms and types aimed at
meeting their diverse needs. In line with the PBOC
account reform requirement, the Bank was the first
to roll out and apply Category II and Category III
accounts among the domestic banks. It also built a
“BOC Good Accounts” system, providing customers
with more integrated services, a more convenient
experience, safer protections and more intelligent
management. Exploiting its specialised advantages
in foreign exchange, the Bank continued to optimise
its business process to better meet customer
requirements for opening and using foreign exchange
savings, settlement and capital accounts and offered a
higher-quality account opening witness agency service
for cross-border customers. It diversified personal
foreign currency deposit products, increasing the
number of foreign currencies offered for personal
deposit and withdrawal businesses to 25 and further
enhancing its competitive advantage in foreign
exchange services. The Bank introduced a Turkish Lira
and Saudi Arabian Riyal banknote exchange business,
bringing the number of convertible foreign currencies
to 33, thus remaining in first position among its peers
and also facilitating the foreign exchange needs of
customers going abroad.
As at the end of 2016, the Bank’s domestic RMB
personal deposits totalled RMB4,349.300 billion, an
increase of RMB367.140 billion or 9.22% compared
with the prior year-end. Personal foreign currency
deposits amounted to USD49.307 billion, maintaining
a leading market share.
Personal Loans
The Bank vigorously implemented national policies
aimed at expanding domestic demand, promoting
new consumption and supporting the real economy
by accelerating the healthy development of its
personal loan business. The Bank strengthened the
development of personal housing loans, mainly serving
the needs of households seeking to buy owner-
occupied homes. Insisting on prudential operation, the
Bank strictly executed a differentiated housing credit
policy and reinforced risk management practices. It
accelerated its consumer finance business in response
to the trend of consumption upgrade. Based on
internet and big data technologies, it launched “BOC
E-Credit”, a whole-process online consumer loan
service, boosting its support of new consumption.
The Bank rationally adjusted the industrial structure
of its personal business loans in order to support the
financing needs of the real economy. It researched
and developed distinct service models for different
customer segments, such as customers targeted
according to shopping districts or industrial chains,
or those commonly engaged in agriculture-related
businesses. The Bank continued to improve its
government-sponsored student loan service, spared no

2016 Annual Report 44
Management Discussion and Analysis — Business Review
efforts to help low-income students to finish school
and assumed its share of responsibility for poverty
alleviation. The Bank optimised and upgraded its
personal loan business system by further enriching the
self-service functions of e-channels. Fully leveraging
its globally integrated operations, the Bank provided
customers with cross-border financial services such as
individual loans for overseas study and credit rating
certification.
As at the end of 2016, the total amount of RMB
personal loans of the Bank’s domestic operations
stood at RMB2,983.945 billion, an increase of
RMB586.618 billion or 24.47% compared with the
prior year-end. The Bank also maintained a leading
market position in personal auto loans and sponsored
student loans.
A Leap Forward in Personal BankingTo implement its strategy of “Serving Society, Delivering Excellence”, the Bank devoted to build the best retail banking in the Chinese mainland. In 2016, the Bank’s personal banking business captured market opportunities and made new arrangements in people’s livelihood finance, wealth finance, consumer finance and cross-border finance, thus successfully lifting its overall operation levels of personal banking to new highs.
Developing the inclusive finance by continually upgrading the functions of basic products and expanding coverage of people’s livelihood service areas. To undertake its social responsibilities, the Bank carried out account reform required by the PBOC for preventing telecommunications and internet scam and rolled out the ATM payment delay and scam-prevention reminder functions, with the aim of protecting the safety of customers’ assets. To meet diverse financial needs of customers, the Bank introduced innovative personal deposit products and expanded the negotiable functions of personal CDs. The Bank strived to better serve pension customers by issuing a total of 83.7278 million social security financial IC cards and providing such services as agency payment, agency deduction and information enquiry of the social insurance funds, linked loss reporting between social security account and financial account and old card replacement and new card issuance through its multiple channels. The Bank promoted bank-hospital cooperation by partnering with hundreds of hospitals nationwide to provide appointment, fee payment and other services through multiple channels both online and offline. The Bank has served as the host bank of government-sponsored student loans for central government-administered colleges for 12 consecutive years, granting financial aid to 1.6 million students at more than 400 colleges accumulatively. In addition, the Bank improved its agriculture-related financial service capacity, promoted the construction of E Supply & Marketing cooperatives online and set up about 10 thousands service stations to assist farmers.
Improving wealth finance by fully sharpening product competitiveness and leading the market in specialist services. The Bank continually improved its wealth management product system, introducing wealth management products such as BOC Zhifu, BOC Selected Series, Smart Choice and BOC Strategy, with 7-day BOC Zhifu generating the highest yield in the whole market. It enhanced cooperation with specialised agencies and provided exclusive products and services to private banking customers. The Bank bolstered its customer manager and strategy research teams, thus substantially boosting customer service and market forecast abilities. The Bank improved its system of “merchants with bonus points” and now has more than 1,200 such merchants across China, satisfying the requirements of middle and high-end customers for medical care and health, sports and entertainment, culture and charity, travelling and trips abroad.
Strengthening consumer finance by rapidly enlarging business size and enriching the product system. To meet people’s needs for buying houses, the Bank gave more credit to support the people’s livelihood improvement. Following new trends in consumer finance, it promoted “BOC E-Credit”, the first ever “quick loan” product, thus realising rapid extension of loans, real-time approval and immediate drawdown. In response to developments in internet finance, the Bank enhanced its mobile payment business and introduced a series of innovative products. The Bank also vigorously promoted such credit card instalment products as Auto Instalments, Cash Instalments, BOC Express Cash and Decoration Instalments, set up more than 200 consumer finance centres and more than 300 featured branches to meet customers’ diverse consumption demands.
Professionalising cross-border finance and leveraging the Bank’s internationalisation advantages to realise integrated development at home and abroad. The Bank continued to build global service platform and established Singapore Private Bank, marking the formation of a private banking business network in Southeast Asia based in Hong Kong, Macau and Singapore. The Bank signed a cooperation MOU with Immigration New Zealand and was the first in the banking industry to offer a “VIP Service for Applying to Visit New Zealand”. Deepening cooperation with study abroad agencies and international schools, it significantly increased its Canada Guaranteed Investment Certificate (GIC) business. The Bank promoted its account opening witness business by improving a series of brands relating to studying and working in the US, Singapore, Macau and Australia. To improve its overseas personal loan service capabilities, it started to provide housing loans from its Luxembourg Branch and engaged in home lending service through Bank of China (New Zealand) Limited. The Bank launched the “Global Splendours in One Card” and “BOC Overseas E-shopping” for cross-border credit card holders to bring them preferential, convenient and high-quality services.

2016 Annual Report45
Management Discussion and Analysis — Business Review
Wealth Management and Private Banking
The Bank accelerated the development of its wealth
management business and enhanced its private
banking service capabilities. The Bank further
cultivated its personal customer relationship manager
and private banker teams and made unremitting
efforts to improve customer relationships and
customer experience, thereby recording a steady
increase in the number of middle and high-end
customers. It launched precision marketing to attract
more high-quality existing customers by capitalising
on big data technology and its customer relationship
management system. Taking advantage of its
diversified and internationalised operations, the Bank
expanded its incremental customer base in bulk via
internal collaboration across the Group with a focus
on featured customer groups. The Bank improved its
product R&D model, enhanced its innovation ability for
investment products, established a multi-dimensional
product shortlisting platform and offered customised
discretionary assets management and family trust
services, with the aim of further building up the
competitiveness of its wealth management business.
To address customer requirements for cross-border
financial services, the Bank leveraged the advantages
arising from its global presence and accelerated the
development of its overseas private banking channels
by establishing the Singapore Branch Private Bank,
which helped to further improve its global service
network and marked a key step forward in the global
expansion of the Bank’s private banking services. In
addition, the Bank remained devoted to undertaking
its social responsibilities and called on customers to
join a series of public welfare campaigns such as
donations for education and auctions for charity.
As at the end of 2016, the Bank had set up 7,632
wealth management centres, 323 prestigious wealth
management centres and 36 private banking centres
in the Chinese mainland. The Group had 95,400
private banking customers and managed over
RMB1 trillion of financial assets on their behalf. In
2016, the Bank was recognised as the “Best Private
Banking Brand in China” by Securities Times and
won the “Best China Private Bank — Most Innovative
Performer” from Wealth Management and the
“Excellent Wealth Management Award” from jrj.com.
Bank Card
The Bank actively pushed forward credit card
innovation and continually enhanced its credit card
products in the five categories of wealth, business
travel, cross-border, consumer finance and urban
youth. It promoted key products such as BOC Car
Cards, BOC Great Wall Traveller’s Cards, BOC Multi-
Currency Credit Cards and BOC Overseas Student
Cards, and issued such innovative products as BOC
City Fun Platinum Cards, BOC New Oriental Co-
branded Cards, Sino-US Tourism Year Souvenir
Cards, BOC Tencent Video Co-branded Cards, Rio
Olympics Multi-Currency Cards (Limited Edition),
BOC-China Eastern Airlines Co-branded Cards,
Wonderful Europe Great Wall Traveller’s Cards and
Great Wall World Elite Credit Cards. With the goal
of developing inclusive finance, the Bank strived to
build up a multi-level system that serves people’s
livelihood and consumption-related financial needs.
It energetically expanded its featured instalment
business lines including Billing Instalments, Decoration
Instalments and Cash Instalments, and innovatively
rolled out a “One Certification Lending” Auto
Instalments product. In addition, the Bank continually
upgraded the functionality of its online services such
as the official “BOC Credit Card” WeChat account
and the “Colourful Life” mobile app, and enriched

2016 Annual Report 46
Management Discussion and Analysis — Business Review
the “Smart Buy” and value-added services provided
by the preferential merchant platform. The Bank
innovatively launched the QR code and other mobile
payment products, expanded “Internet Plus” customer
attracting mode, and diversified the functions of
online application, online approval and online
customer services, so as to provide customers with a
comprehensive, convenient and safe app experience.
The Bank built a stereoscopic credit card marketing
system, strengthened the promotion of the “BOC VIP
Day” among domestic customers, continually carried
out its “Global Splendours in One Card” and “BOC
Overseas E-shopping” campaigns for cross-border
customers, and promoted the “More Instalments,
More Gifts” campaign to instalment customers.
Moreover, with the aim of improving the customer
service experience and guided by the goal of providing
“efficient, considerate and safe” services, the Bank
advanced 360-degree management of the customer
card usage life cycle and refined the structure
of customer credit limits, thus comprehensively
enhancing the quality of its customer services.
The Bank kept improving its debit card product and
service system and secured rapid development of
its debit card business through product innovation.
It pursued the development of online debit card
business and pushed forward the transformation
towards “Internet Plus”, put in place UnionPay small-
amount password-free quick payment for debit IC
cards and introduced new mobile payment products,
thus offering convenient payment and settlement
services for customers. Meanwhile, the Bank enhanced
the construction of the rights and interests system of
debit card holders. With the aim of using finance for
the convenience and benefit of the people, it rolled
out the “People’s Livelihood Finance” service in a
variety of sectors such as social security and medical
treatment. As at the end of 2016, the Bank had issued
social security cards with financial functions in nearly
30 provinces (including municipalities directly under
the Central Government) in cooperation with local
Human Resources and Social Security Bureau. These
deliver comprehensive financial services including
convenient channel, collection and payment agency
in social insurance funds (including pension insurance
funds, medical insurance funds, unemployment
insurance funds, work-related injury insurance funds
and maternity insurance funds), investment of wealth
management products and preferential measures for
customers. It also issued the “resident health card with
financial function” in provinces such as Guangdong,
Liaoning, Hebei, Guizhou and Sichuan, offering
treatment payment and health management services
across the country to cardholders.
As at the end of 2016, the Bank’s bank card issuance and transaction volumes are set forth below:
Unit: million cards/RMB billion, except percentages
ItemsAs at
31 December 2016As at
31 December 2015 Change (%)
Cumulative number of debit cards 441.4327 419.4756 5.23%
Cumulative number of effective credit cards 59.3356 53.2818 11.36%Cumulative number of social security cards with financial functions 83.7278 73.9719 13.19%
2016 2015 Change (%)Transaction amount of debit cards 3,397.818 2,726.753 24.61%
Instalment volume of credit cards 212.196 159.050 33.41%

2016 Annual Report47
Management Discussion and Analysis — Business Review
Financial Markets Business
The Bank actively aligned itself with the trend towards interest rate and exchange rate liberalisation and RMB internationalisation, closely tracked developments in financial markets, leveraged its specialised advantages, continued to deepen the adjustment of its business structure and enhanced its efforts in financial market innovation, thus further enhancing its influence in financial markets.
Securities Investment
The Bank strengthened its research and judgment regarding market interest rates and actively seized market opportunities arising from interest rate fluctuations to realise bond investment gains. The Bank continued to increase the investment of RMB interest rate bonds, narrowed its credit risk exposure and rationally adjusted its investment portfolio duration, thus further optimising its investment structure. Consistent with national macroeconomic policy, the Bank participated in local government bond investment in a market-oriented manner. The Bank tracked trends in international bond markets and optimised its foreign currency investment structure, preventing interest rate risk and credit risk. Furthermore, the Bank strengthened the centralised management of group-wide bond investment.
Trading
Effectively responding to market changes, the Bank continually strived for innovation-driven development, enhanced its core trading capabilities and promoted customer structure optimisation, thus registering a stable yet rapid growth in its trading business. Specifically, it sped up the construction of the Hong Kong Offshore RMB Trading Centre and the London Trading Centre, as well as highlighting its offshore RMB quotation capacity, thereby becoming the top pick of other financial institutions for exchange rate enquiries. Thanks to enhanced product innovation and business transformation, the Bank became one of the first core trading institutions for credit risk mitigation in the domestic interbank market. The Bank was among the first group of market makers for the direct trading of 12 currency pairs including RMB/ZAR, RMB/HUF, RMB/PLN and RMB/DKK in
the interbank foreign exchange market, meaning that the Bank now offers direct transactions of 22 foreign currencies against RMB. The Bank became one of the first batch of “Shanghai Gold” pricing members. It conducted the first interbank gold enquiry option deal, launched an iron ore forward hedging business, completed the first OTC bond transaction and handled the first currency swap of RMB against foreign currency on behalf of customers and the first FTF foreign exchange business in Shanghai FTZ. Closely following the “Belt and Road” initiative, the Bank bolstered its hedging business in emerging markets to help China’s “Going Global” companies manage their foreign exchange and interest rate risks, conducted Saudi Arabian Riyal cash exchange trading and Turkish Lira cash/spot exchange trading businesses against RMB, and launched trading in 19 emerging market currencies including the Czech Koruna and Mongolian Tugrik, bringing the total number of tradable foreign currencies up to 47. Following trends in internet finance and big data, the Bank vigorously expanded its online transaction business by releasing a comprehensive treasury transaction brand called “E Rong Hui” and sharpening the first-mover advantages of its e-trading platforms for corporate customers. Actively playing its part in the opening up of domestic financial markets, the Bank promoted its agency business in the interbank bond market and foreign exchange market to overseas institutional investors and established trading relationships with a number of sovereign agencies and international multilateral organisations. The Bank secured the leading market share in foreign currency exchange against the RMB.
Investment Banking and Asset Management
The Bank grasped opportunities arising from the rapid
development of asset management in the domestic
market, leveraged the competitive advantages of
its diversified businesses and provided customers
with comprehensive, professional and customised
investment banking and asset management services,
including bond underwriting and distribution, asset
management and financial advisory. To facilitate the
building of China’s multi-layered capital markets
system and to support domestic customers’ direct
financing needs, it underwrote 384 debt financing
instruments for non-financial enterprises in the

2016 Annual Report 48
Management Discussion and Analysis — Business Review
domestic open market with a total financing amount
of RMB348.3 billion. The Bank assisted its overseas
customers with financing activities in the domestic
market and has successfully underwritten 15 Panda
Bonds for customers including the Canadian Province
of British Columbia and the Ministry of Finance of the
Republic of Poland, etc., becoming the only bank in
the Chinese mainland to successfully underwrite Panda
Bonds issued by enterprises, financial institutions and
sovereign institutions around the globe. Following the
trend of RMB internationalisation, the Bank assisted
sovereign and quasi-sovereign institutions in offshore
Leading Best Practices in Green Finance
The Bank vigorously implemented the nation’s “Green Development” concept and continually built a global and multi-dimensional green financial system. The Bank successively issued senior green bonds and green covered bonds in the international market, the proceeds of which were used to support the development of its domestic green credit projects.
On 5 July 2016, the Bank successfully issued green bonds totalling USD3 billion equivalent, denominated in USD, EUR and RMB, in the international market. The bonds, covering three tenors and five tranches, were issued through the Luxembourg Branch and New York Branch simultaneously and listed on the Luxembourg Stock Exchange and Hong Kong Stock Exchange respectively. The bonds conformed to the Green Bond Principles, 2016, including related recommended best practices on information disclosure. The bonds received “green assurance” and quantitative “green assessment” from the international third party, with a score of GB-AAA and a “Dark Green” classification owing to assessment of the management mechanism, as well as the actual green projects related to the bonds. The bonds were the largest green credit bonds covering the most tranches in the international market, and were included in well-recognised green bond indices such as the Barclays MSCI Green Bond Index and Bank of America Merrill Lynch Green Bond Index. The Bank consequently was awarded the “SRI Bond of the Year” by International Financing Review.
The Bank carried out a pilot programme of green finance innovation in active response to the “Green Finance” theme of the G20 Hangzhou Summit. On 3 November 2016, the London Branch successfully issued USD500 million green covered bonds in the international market. The bonds, listed on the London Stock Exchange, were the first covered bonds ever issued by a Chinese bank. The bonds were backed by the onshore green assets of the Bank, which provided a guarantee for the payment obligation. The bonds were rated “Aa3” by Moody’s, the same as China’s sovereign rating and one notch higher than the Bank’s rating (A1), making it the highest international rating for Chinese green bonds. The bonds represented “double greenness”, both in terms of the use of proceeds and the underlying assets in the cover pool. The proceeds of the bonds were allocated to the Bank’s domestic green credit projects and all of the green assets in the cover pool were components of the China Bond-China Climate Aligned Bond Index. The bonds were in line with both international and domestic green bond standards and best practices. With green structure and cross-border nature, the bonds not only introduced offshore funds to high-quality domestic green projects but also connected the domestic green industry with international green investors, thus increasing the international market’s understanding of China’s green industry policy and green finance policy as well as promoting the gradual merging of China’s onshore and offshore green bond markets.
The first China Green Covered Bond issued by the Bank was listed on the London Stock Exchange

2016 Annual Report49
Management Discussion and Analysis — Business Review
RMB bond issuance. It acted as the sole underwriter
and bookrunner for the Republic of Hungary in its
Dim Sum Bond issuance and led the underwriting
of Dim Sum Bond issued in London for the Ministry
of Finance of China. The Bank solidly maintained its
leading market share among Chinese peers in offshore
RMB bond underwriting. Leveraging the advantages
arising from its globally integrated operations, the
Bank assisted its customers with cross-border financing
services and participated in the underwriting of
foreign currency bond and offshore RMB bond in
overseas market for a number of medium and large-
sized enterprises, sovereign institutions, financial
institutions and international development institutions.
The Bank participated in the bookrunning of the first
offshore USD-denominated sovereign bonds issued by
Saudi Arabia, which amounted to USD17.5 billion, as
the only Chinese underwriter. It captured the leading
market share as an underwriter of Chinese enterprises’
offshore G3 currency (i.e. USD, EUR and JPY) bonds.
The Bank optimised and transformed its asset
management business to refocus on the substance
of asset management business. Building on its
competitive advantages in global asset allocation,
the Bank launched new products, such as BOC
Rong Hui, BOC Strategy, BOC Structural-Linked
Products and BOC Accumulated Asset Series (USD),
to fulfil customers’ diversified investment needs. In
2016, the Bank issued 5,879 wealth management
products with a total year-end value of RMB1,512.1
billion, including RMB1,176.8 billion of non-
principal-guaranteed products and RMB335.3 billion
of principal-guaranteed products. The Bank also
established Private Wealth Management Product
Centres to provide differentiated products for clients
with diverse risk appetites. Meanwhile, the Bank
expanded its investment targets in the private equity
and capital markets, broadened investment channels
and optimised overall asset allocation to improve asset
yields. It leveraged the advantage of cross-border
integration within the BOC Group to promote its
overseas asset management business. It established
Bank of China Asset Management Centre (Asia) and
Bank of China Asset Management Centre (Europe),
which successfully issued the BOC Group’s first
Undertakings for Collective Investment in Transferable
Securities (UCITS) fund.
The Bank enhanced the quality of its financial
advisory services and provided professional advisory
including financing plans, cross-border finance
advisory and restructuring and M&A advisory, so
as to satisfy customers’ multifaceted demands
regarding financing and cross-border operations.
The Bank steadily promoted its credit asset-backed
securitisation business and stepped up the structural
optimisation of its existing assets. It successfully
issued three residential mortgage-backed securities
with a total amount of RMB30.941 billion and two
non-performing credit asset-backed securities with
a total amount of RMB0.916 billion, including the
first non-performing credit asset-backed securities
since the resumption of domestic credit asset-backed
securitisation business.
Custody Business
The Bank actively seized market opportunities
and continuously promoted marketing, product
innovation, service optimisation and systematic
upgrading in its custody business, working towards
the initial formation of a globally-integrated custody
service network. The Bank proactively embraced the
opportunities arising from prosperous development of
assets management business and vigorously promoted
its custody products such as insurance funds,
securitisation, industry funds, RQFIIs and overseas
institutions in the interbank bond market. It mounted
a successful bid to become the custody bank for basic
endowment insurance funds, and its assets under
custody continued to expand. The Bank accelerated
the construction of its global custody network,
established and improved its global custody service
capacity and set up multiple domestic and overseas
custody centres in Asia and Europe, becoming the
first commercial bank in the Chinese mainland to
launch an overseas custody system. The Bank is also
among the first to provide a custody service for clients
investing in the Shenzhen-Hong Kong Stock Connect,
enhancing its capacity to provide a one-stop service
for clients’ global asset allocation needs. By the end

2016 Annual Report 50
Management Discussion and Analysis — Business Review
of 2016, the Group’s assets under custody exceeded
RMB8 trillion.
Village Bank
BOC Fullerton Community Bank actively implemented
national strategies on agriculture, farmers and rural
areas, with the aim of “focusing on county area
development, supporting farmers and small-sized
enterprises, and growing together with communities”.
It is committed to providing modern financial services
to farmers, micro and small-sized enterprises,
individual merchants and the wage-earning class,
thus promoting the construction of China’s “New
Countryside”. The Bank focused its business efforts on
agriculture, farmers and rural areas, introducing more
than 50 kinds of products belonging to 10 agricultural
categories, i.e. poultry, cattle, aquaculture and plants.
All products were highly praised by customers.
BOC Fullerton Community Bank significantly expanded
its institutional reach with a focus on counties in
central and western regions where financial services
were previously lacking. As at the end of 2016, 82
BOC Fullerton Community Banks and 77 sub-branches
had been established in 12 provinces (including
municipalities directly under the Central Government).
In particular, 78% of BOC Fullerton Community Banks
and sub-branches were established in central and
western regions, and 33% were in official poverty-
level counties. BOC Fullerton Community Bank has
become the largest domestic village bank in terms
of total institutions and business scope. In 2016,
BOC Fullerton Community Bank served 1.048 million
customers, an increase of 43.56% compared with
the prior year-end. The balances of total deposits and
loans of these banks were RMB20.219 billion and
RMB18.511 billion respectively, an increase of 34.08%
and 21.43% compared with the prior year-end,
among which loans to farmers and micro and small-
sized enterprises accounted for 92.52%. The NPL
ratio was 1.70% and the ratio of allowance for loan
impairment losses to NPLs stood at 208.53%.
BOC Fullerton Community Bank received several
prizes including the “Best Innovation Award for
Financial Model” issued by China Business Journal,
the “Outstanding Management of Community Banks
Award” issued by China Finance and the “2016
Corporate Social Responsibility Award” issued by
xinhuanet.com.
Overseas Commercial Banking
In 2016, the Bank practically implemented national
strategies and seized market opportunities arising
from the construction of the financial artery of the
“Belt and Road” initiative, RMB internationalisation
and Chinese enterprises’ “Going Global” initiative. It
promoted the establishment of overseas institutions
in an organised manner and pushed forward the
integrated development of its domestic and overseas
operations, thus continually enhancing its global
service and support capabilities and sharpening its
market competitiveness. As at the end of 2016,
the balance of due to customers and loans of the
Bank’s overseas commercial banking operations
amounted to USD372.832 billion and USD308.591
billion respectively. In 2016, the Bank’s overseas
commercial banking achieved a profit before income
tax of USD11.329 billion, accounting for 33.88% of
the Group’s total profit before income tax. The Bank
continued to lead its domestic peers in international
business in terms of scale, profitability and the overall
proportion of its internationalised operations.
Regarding branch distribution, the Bank closely
kept up with customers’ financial service needs
around the globe, accelerated improvements in the
distribution of institutions in countries along the “Belt
and Road” and in emerging markets, and increased
outlets in countries with an existing BOC presence,
so as to provide comprehensive financial services for
customers. As at the end of 2016, overseas institutions
of the Bank totalled 578, covering 50 countries
and regions across six continents, up by four new
countries, of which 19 countries are along the “Belt
and Road”.
For corporate banking, the Bank tapped into the
“Blue Ocean” of cross-border business, improving its
global hierarchical customer service system and the

2016 Annual Report51
Management Discussion and Analysis — Business Review
construction of its cross-border financing product and
service system. Giving full play to its advantages in
overseas business, the Bank supported the large-scale
cross-border projects of Chinese enterprises, mainly
through high-end products including syndicated
loans, project financing, M&A financing, leverage
financing and private equity financing. This included
projects in global infrastructure construction, energy
and mineral resources, equipment manufacturing
and cooperation to improve production capacity. In
this way, the Bank assisted both the “Going Global”
initiative for Chinese enterprises and the “Bringing
In” initiative for overseas enterprises, helping them
carry out cross-border investment and international
cooperation in production capacity and supporting
the internationalisation of overseas enterprises. As
a result, the Bank continuously optimised the core
customer group of its overseas corporate banking
business. Strengthening its business cooperation with
international mainstream banks and policy financial
institutions, the Bank committed to provide more
financial support and deliver better services to the
major projects of countries along the “Belt and Road”.
For personal banking, the Bank provided “one-
stop” financial services for personal “Going Global”
customers by leveraging its extensive overseas
institutions network. Targeting customers studying
or working overseas, the Bank offered an account
opening witness service in 18 countries and regions
covering North America, Europe, Asia and Australia
and built up account opening witness service brands
such as “Brilliant Tomorrow” in the US, “Golden
Age” and “UK Manager” in the UK, “Home in
Canada”, and “Golden Years” in Australia, continually
enhancing its integrated service capabilities. The Bank
increased its efforts to push forward the development
of its cross-border payment business and continuously
developed a differentiated, multi-feature cross-border
system for its products and services, thus enhancing
the cross-border customer experience. It launched
the “Traveller’s Credit Card + Multi-Currency Credit
Card” product portfolio in order to diversify its cross-
border products offers, and upgraded the “basic
cashback + products cashback + additional special
offers” market system in order to diversify its cross-
border services. The Bank insisted to differentiated
and localised strategies for the development of its
overseas bank card business, continued to promote
the research and development of new products
including business credit card in Macau and UnionPay
credit card in Sydney, and expanded cooperation with
overseas mainstream and well-known merchants and
third-party institutions in an in-depth manner. The
Bank optimised the structure of its overseas debit
card system and launched UnionPay dual-currency
(RMB and local currency) debit cards and Visa and
MasterCard single currency debit cards. As at the end
of 2016, overseas institutions of the Bank that issue
debit card products covered 17 countries and regions.
For financial market business, the Bank continued to
leverage the advantages arising from its integrated
domestic and overseas businesses, expanded the
business scope of its overseas operations, and
delegated authority to RMB clearing banks to
perform local primary quotation, thus stimulating the
development of its offshore RMB trading business.
It sped up the construction of overseas trading
centres with the London Trading Centre bringing all
business lines’ products into operation. It also focused
on improving its offshore RMB quotation capacity,
becoming the top pick of other financial institutions
for exchange rate enquiry. It conducted forward
cross-border RMB purchase and sale business for
multinational corporations in Frankfurt, New York,
Sydney, etc., and provided debt hedging services for
China’s “Going Global” enterprises. The Bank took
full advantage of its cross-border operational strengths
by actively marketing custody services to domestic
sovereign investment funds, qualified domestic
institutional investors (QDII), QFIIs, RQFIIs and overseas
institutions with funds invested in the interbank bond
market, and developed innovative custody services for
Shenzhen-Hong Kong Stock Connect. Assets under
custody for its overseas institutions ranked among the
top in the industry. The Bank successfully issued green
bonds totalling USD3 billion equivalent, the largest
green credit bond issuance covering the most tranches
in the international market. The Bank also issued
USD500 million green covered bonds, which were the
first covered bonds ever issued by a Chinese bank.

2016 Annual Report 52
Management Discussion and Analysis — Business Review
For clearing services, the Bank consolidated its position
at the leading edge of international payments by
continuously improving its cross-border RMB clearing
capabilities. In 2016, the Bank’s cross-border RMB
clearing transactions totalled RMB311.98 trillion,
maintaining first place in global markets. The Bank
was designated as the local RMB clearing bank in
the US, thus accounting for 11 of the world’s 23
authorised RMB clearing banks, leading its peers.
The Bank ranked first in terms of the number of
CIPS indirect participants, further improving its
comprehensive settlement services.
For e-banking, the Bank further expanded the
coverage of its overseas channel services and
promoted its online banking service in Bank of
China (Canada), Toronto Branch, Panama Branch
and Vienna Branch, etc. The Bank further expanded
its mobile financial services and promoted personal
mobile banking services in its 15 overseas institutions
including its Tokyo Branch, Bank of China (Thai) Public
Company Limited, Bank of China (Malaysia) Berhad,
Frankfurt Branch and Milan Branch. The service
functionality of overseas online banking, telephone
banking and SMS banking was further enhanced.
BOCHK
In 2016, BOCHK vigorously implemented the Group’s
strategies, captured development opportunities arising
in the market and leveraged its own competitive
advantages. Its core business realised sound growth
and key financial indicators remained at solid levels.
BOCHK actively explored business opportunities in
the ASEAN region and saw the strategic value of
its regional development beginning to emerge. It
expedited business transformation and technological
innovation and continued to refine its business
structure to become more customer-centric. It
optimised its distribution channels and internet
finance capabilities in order to enhance overall
service capabilities. BOCHK continued to sharpen
its competitive edge in the RMB clearing business
and stepped up its efforts in building key business
platforms.
BOCHK’s operating results reached another record
high and it maintained leadership in key business
areas. In 2016, BOCHK effectively improved its
income mix and saw its financial performance reach
a new high. It further optimised its asset and liability
structure. The total deposits and loans grew rapidly
and ahead of the market with a higher market share.
The proportion of low-cost and interest-free deposits
continued to rise. The growth rate of loans and
deposits outpaced that of market peers. BOCHK’s
asset quality also outperformed that of its peers. In
its role as the Asia-Pacific Syndicated Loan Centre,
BOCHK diversified its corporate finance business and
maintained its status as the top mandated arranger in
the Hong Kong-Macau syndicated loan market for the
12th consecutive year. It cultivated the local market
in Hong Kong, providing comprehensive financial
solutions to industrial and commercial enterprises. It
maintained its leadership in the UnionPay merchant
acquiring and card issuance business in Hong Kong. It
accelerated the acquisition of SMEs, government and
institutional customers, and introduced a new wealth
management service model, achieving continuous
growth in the total number of middle to high-end
customers together with related total assets under
management (AUM). BOCHK continued to optimise
its private banking products and service platform,
resulting in solid growth in the number of private
banking customers.
BOCHK accelerated the optimisation of its regional
distribution and saw regional synergies beginning
to emerge. BOCHK successfully completed the
sale of NCB and pushed forward its proposed sale
of shares in Chiyu Banking Corporation Limited.
Meanwhile, its regional development within the
ASEAN region proceeded smoothly. It completed the
share acquisition of Bank of China (Malaysia) Berhad
and Bank of China (Thai) Public Company Limited on
17 October 2016 and 9 January 2017 respectively.
On 20 December 2016, BOCHK’s first overseas
institution, the Brunei Branch, formally commenced
business, further improving its business structure and
distribution.

2016 Annual Report53
Management Discussion and Analysis — Business Review
BOCHK deepened collaborative activities and
strengthened cross-border business development. By
capitalising on the Group’s competitive advantage
in internal collaboration, BOCHK provided leading
Chinese mainland enterprises in their expansion into
the ASEAN region, as well as enterprises in countries
along the “Belt and Road”, with a comprehensive
range of financial solutions. Business support was also
extended to non-Chinese and leading local enterprises,
and business relationships were established with
overseas central banks and financial institutions.
Moreover, by leveraging its advantage in banking
product, BOCHK cooperated closely with the Group’s
ASEAN entities to help them expand their business,
while raising their influence and competitive edge
in the ASEAN region. BOCHK pursued its business
development in FTZs and made use of the Group’s
collaborative mechanism and platform for cross-
border business to develop the cross-border financing
and cross-border cash pooling business. To meet
the growing demand among the Chinese mainland
customers for overseas asset deployment, BOCHK set
up a new service model to facilitate two-way customer
referral activities.
BOCHK consolidated its competitive edge in RMB
clearing business and developed its key business
platforms. In 2016, BOCHK successfully joined the
CIPS, becoming the only clearing bank with both CIPS
and the China National Advanced Payment System
(CNAPS) as its clearing channels. It continued to
consolidate and enhance its leading position in the
global RMB clearing business. BOCHK successfully
obtained all business qualifications for Shenzhen-Hong
Kong Stock Connect and became the sole settlement
bank for the Northbound Shenzhen Trading Link as
well as a provider of cross-border fund settlement
services for the Southbound Hong Kong Trading Link.
At the same time, BOCHK expedited the development
of its key business platforms with continuous
expansion of business scale in key businesses
such as credit cards, asset management and cash
management.
BOCHK fully implemented its channel integration and
strengthened its competitive advantages in internet
finance. BOCHK leveraged its advantages in branch
network and implemented the branch transformation
project to be more customer-centric. Following
changes to the reporting structure, functions and
duties of its branches, BOCHK was able to optimise
its branch service offerings to both corporate and
personal customers. It deepened the integration
of both online and offline channels to improve
business process. BOCHK remains committed to
the development of internet finance. It pioneered
the blockchain technology application for mortgage
property valuation and completed the first property
valuation case with this application, thereby increasing
operational efficiency in financial services. BOCHK
also actively developed mobile payment services with
the introduction of services such as mobile banking
small value transfers and QR code payment. It also
stepped up its establishment of the big data platform
with enhanced overall service capabilities, leading to a
continuous rise in the total number of customers using
e-channels.
BOCHK was recognised with a number of awards
from The Asian Banker, including the “Strongest
Bank in Asia Pacific and Hong Kong”, “Best Cash
Management Bank in Hong Kong”, “Best Retail
Bank in Hong Kong”, “Best Transaction Bank in
Hong Kong”, “Best Corporate Trade Finance Deal
in Hong Kong”, “Technology Innovation Awards —
Best Mobile Social Media Engagement Project” and
“Wealth Management Business of the Year”. It won
the “Best SME’s Partner Award” from the Hong Kong
General Chamber of Small and Medium Business for
the ninth consecutive year.
(Please refer to the results report of BOCHK for a full review of
BOCHK’s business performance and related information.)

2016 Annual Report 54
Management Discussion and Analysis — Business Review
Diversified Business Platforms
The Bank gave full play to the competitive advantages arising from its diversified business platforms and fully implemented the “Belt and Road” initiative by focusing on its specialised business areas, deepening business collaboration and promoting cross-selling and product innovation, thus enhancing synergies across the Group while providing comprehensive and high quality financial services to customers.
Investment Banking Business
BOCI
The Bank is engaged in investment banking through BOCI. As at the end of 2016, BOCI had total assets of HKD60.87 billion, net assets of HKD15.73 billion, and realised an operating revenue of HKD3.15 billion. BOCI achieved leading positions in multiple core businesses.
BOCI emphasised a customer-centric approach and improved its customer management system. It established Sales, Trading and Research division, further enhancing its overall service capability to global institutional customers. BOCI continued to strengthen its research capability and expand its research coverage, saw the value of this “think tank” function gradually emerge as a consequence. It further explored the business potential of “investment banking + commercial banking” dual driving model. BOCI accelerated the implementation of its internationalisation strategy, further leveraged the expertise of its Government Services Division and Financial Solutions Team, providing comprehensive financial solutions to both domestic and overseas customers.
BOCI’s equity financing and financial advisory services recorded solid growth with 15 IPO projects, three financial advisory projects and one placement project completed in 2016. BOCI also ranked first in Hong Kong’s IPO underwriting market in terms of total raised funds. BOCI involved in the largest banking M&A transaction in Asia (ex. Japan) and the largest financial services M&A transaction in China. BOCI’s
bond underwriting business maintained a leading position while expanding step-by-step worldwide. It provided a one-stop professional bond financing services, including bond underwriting, sales support, market making, B&D and fixed income research. In 2016, it successfully participated in the underwriting of 66 bond issues. Its structure products business also recorded steady growth in 2016.
As one of the largest brokerage houses in Hong Kong, BOCI maintained its leading position in the securities industry, recording a substantial turnover. It strived to expand the business related to Shanghai-Hong Kong Stock Connect and Shenzhen-Hong Kong Stock Connect, and continuously developed the employee stock option programmes with sufficient project pipelines. By paying equal attention to development and compliance, BOCI strengthened and improved its private banking products and service platform, thus providing diversified, value-added wealth management services to customers. It recorded strong growth in insurance business. In addition, its subsidiary, BOCI-Prudential Asset Management Limited, maintained its position as the top-ranked service provider in the Hong Kong Mandatory Provident Fund market and the Macau pension market, and received official designation as an asset manager for the Mandatory Provident Fund Scheme of the Hong Kong Special Administrative Region Government from 2016 to 2026.
BOCI recorded steady development of its global commodity business and further strengthened its market making capability. It became the first Chinese financial institution to obtain the trading membership of Bursa Malaysia. By fully leveraging its self-clearing system, BOCI provided clearing services on the London Metal Exchange (LME) and InterContinental Exchange Europe (ICE Europe) to other Chinese securities firms. In line with economic and industry trends, it comprehensively improved its equity investment business structure and investment portfolio. Its Bohai Industrial Investment Fund, China Culture Industrial Investment Fund and BOCI Infrastructure Fund all achieved good performance, investing in several landmark projects in different industries.

2016 Annual Report55
Management Discussion and Analysis — Business Review
BOCI was awarded “Best Investment Bank in China”
and “Best DCM House in Asia-Pacific” by Global
Finance, “Best Chinese DCM House in Hong Kong”
and “Best FIG Deal” by FinanceAsia, “Best Investment
Grade Corporate Bond” by AsiaMoney, “Best
Investment Management Company, Hong Kong” by
World Finance, “CAPITAL Merits of Achievements in
Banking & Finance — MPF & ETF” by CAPITAL, “Best
Fund Management Company Hong Kong 2016” by
Global Banking and Finance Review, and “The Most
Welcomed Broker in Greater China” by Hong Kong
Commercial Newspapers.
BOCI China
The Bank is engaged in securities-related business
in the Chinese mainland through BOCI China. As
at the end of 2016, BOCI China had total assets of
RMB42.439 billion and net assets of RMB10.706
billion.
Adhering to a robust and aggressive development
principle, BOCI China implemented the “Synergy +
Transition” strategy and pushed forward business
development in order to cultivate its core
competitiveness while focusing on risk compliance.
As a result, its industry influence increased. It
transformed its investment banking business model to
“investment bank + commercial bank”, “investment
bank + investment” and “domestic + overseas”. It
shifted its brokerage business focus towards wealth
management, improved the versatility of its branches
and continually increased its service capability and
market share. BOCI China maintained its leading
position in AUM and successfully issued its first
publicly offered fund product.
BOCI China was awarded “Best Bond Investment Bank
in China”, “Best Refinancing Investment Bank” and
“Best Securities Company for Institutional Service” by
Securities Times, “Three-Year Golden Bull Securities
Company’s Collective Asset Management Plan”
by China Securities Journal and “Best IPO”, “Best
Refinancing Project”, “Best Enterprise Bond Project”
and “Best Financial Advisory Project” by New Fortune.
BOCIM
The Bank is engaged in fund management business
in the Chinese mainland through BOCIM. As at the
end of 2016, BOCIM’s total assets stood at RMB2.627
billion and its net assets totalled RMB1.861 billion.
BOCIM realised a profit after tax of RMB1.009 billion,
up by 35.62% compared with the prior year.
BOCIM’s total AUM reached RMB928.0 billion, an
increase of 37% compared with the prior year-
end. Total AUM for publicly offered funds reached
RMB342.1 billion, up by 23% compared with the
prior year-end. In addition, BOCIM maintained sound
internal control and risk management, and greatly
enhanced its brand image and market reputation.
BOCIM has been honoured as a “Five-year Sustainable
Return Star Fund Company” for four consecutive
years. Its BOC Steadiness Increased Income Bond Seed
Fund was awarded “Golden Fund One-year Bond Star
Fund” and its BOC Guaranteed Fund was awarded
“Three Years Continuous Return Guaranteed Star
Fund”.
Insurance
BOCG Insurance
The Bank is engaged in general insurance business in
Hong Kong through BOCG Insurance. As at the end
of 2016, BOCG Insurance reported total assets of
HKD7.607 billion and net assets of HKD3.875 billion.
In 2016, BOCG Insurance recorded gross written
premium of HKD2.008 billion and a profit after tax of
HKD103 million. Its gross written premium remained
consistently at the forefront of the Hong Kong general
insurance market.
BOCG Insurance continuously promoted business
restructuring and intensified the expansion of its high-
quality business. In 2016, it recorded gross written
premium for its high-quality business of HKD1.240
billion, accounting for 61.76% of total gross written
premium, an increase of 8.92 percentage points
compared with the prior year.
2016 Annual Report 56
Management Discussion and Analysis — Business Review
BOCG Insurance deepened business linkages within
the Group and strengthened cross-border cooperation
synergies. Giving full play to the advantages arising
from the integrated and diversified operations of the
Group, BOCG Insurance promoted multilevel synergies
and provided comprehensive combined banking and
insurance service solutions to customers. It continued
to strengthen cooperation with other domestic and
international insurance companies, effectively widened
its sales channels and explored business opportunities
in overseas markets.
BOCG Insurance grasped market trends and increased
efforts to promote its e-channels. It provided online
application and claims services inquiry in respect of
travel insurance, home comprehensive insurance and
motor insurance, etc. through its official website,
mobile app and WeChat, etc. Sales from its online
platforms expanded rapidly. In 2016, the gross written
premium contributed by online platforms increased by
44.98%.
BOCG Insurance improved the comprehensiveness of
its risk management and effectively guarded against
business risks. Based on a sound risk management
system, it enhanced risk control standards and
implemented full-scale, full-process and all-staff risk
management measures. By proactively managing
post-underwriting risks, it strengthened the effective
management of its insurance programmes and
reduced various risks at the source.
BOCG Insurance geared up promotion of its key
product and established a professional brand image.
It hosted the third “BOCG Insurance Forum” which
was well received by the industry. In “The Hong
Kong Insurance Award 2016”, BOCG Insurance was
awarded the “Outstanding Online Platform Award —
General Insurance” and the finalist of “Outstanding
Training and Development Award”.
BOC Life
The Bank is engaged in life insurance business in Hong
Kong through BOC Life. As at the end of 2016, BOC
Life’s total assets amounted to HKD111.186 billion
and net assets amounted to HKD7.402 billion. In
2016, BOC Life recorded a gross premium income of
HKD19.357 billion and a profit after tax of HKD1.041
billion.
BOC Life strengthened collaboration with the Group
and maintained its leading position in the Hong
Kong RMB life insurance market. It leveraged its
multiple distribution channels and continued to
enhance product and service innovation. It launched
featured products such as the MaxiWealth ULife
Insurance Plan, UltraReach Insurance Plan, Cancer
Rider and SmartUp Whole Life Insurance Plan, so
as to further enrich its product portfolio and meet
the different needs of customers. BOC Life solidified
its distribution capabilities so as to enhance service
quality to customers, achieving stronger growth in
its tied agency and broker business. It also opened a
new customer service centre to provide a one-stop
professional and integrated life insurance service to
customers.
BOC Life received the “Insurance Company of the
Year — Outstanding Performance” and “Saving Plan
— Excellence Awards” from Bloomberg Businessweek.
It also received the “RMB Business Outstanding Award
— Outstanding Insurance Business” from Hong Kong
Wen Wei Po.
BOC Insurance
The Bank is engaged in property insurance business in
the Chinese mainland through BOC Insurance. As at
the end of 2016, BOC Insurance reported total assets
of RMB12.180 billion and net assets of RMB4.881
billion. In 2016, it realised gross written premiums of
RMB5.171 billion, and a profit after tax of RMB152
million.
In response to the opportunities brought about by the
implementation of the “Belt and Road” initiative, BOC
Insurance accelerated the pace of its overseas business
development. Its overseas business generated written
premiums of RMB155 million, up by 165% compared
with the prior year. It completed 90 overseas projects
in 2016, reporting a total investment and project

2016 Annual Report57
Management Discussion and Analysis — Business Review
contracting amount of over RMB1.6 trillion. In the
meantime, BOC Insurance also supported large
Chinese “Going Global” enterprises such as China
National Petroleum Corporation, China Petroleum
& Chemical Corporation, China Communications
Construction Group, Power Construction Corporation
of China and China Railway Construction Corporation
Limited, and operated overseas insurance-related
programmes in nearly 60 countries and regions in
Asia, Africa and South America. Undertaking the social
responsibilities, BOC Insurance responded immediately
and worked tirelessly to handle a variety of insurance
claims. BOC Insurance pushed forward the reform
of commercial auto insurance premiums, with all of
its branches receiving regulatory acceptance by the
China Insurance Regulatory Commission regarding
commercial auto insurance premium reform. BOC
Insurance accelerated business channel innovation,
and developed its key customer and e-channels in a
coordinated manner. By expanding accident insurance
and health insurance products through new channels
such as “direct mailing + telesales”, BOC Insurance
recorded a year-on-year growth of 28% in written
premiums in 2016. After substantially expanding its
key customer-related programmes, it accumulatively
contracted with a total of 216 key customers. BOC
Insurance enhanced its comprehensive capacity and
was granted an “A-” rating by Standard & Poor’s.
BOC-Samsung Life
The Bank engages in life insurance business in the
Chinese mainland through BOC-Samsung Life. As
at the end of 2016, BOC-Samsung Life recorded
total assets of RMB10.173 billion and net assets
of RMB1.275 billion. In 2016, it realised written
premiums and premium deposits of RMB5.377 billion.
BOC-Samsung Life accelerated the optimisation of its
business portfolio, placing more weight on regular
premium sales and high-value business. It expanded its
distribution channels, including adding life insurance
sales to BOC online banking, mobile banking and
self-service terminals. It optimised its customer
services by launching an official WeChat account,
upgrading the functionality of its call centre, and
integrating its service hotline into BOC’s “95566” call
centre. It also devoted much more efforts to product
innovation, introducing the protection product
“YuanFu”, critical illness insurance “XiangFu”, life
insurance “ZunXiangJiaYing” for middle and high-
end customers, cancer insurance “XiangRui” and
accidental fracture insurance “XiangTai” for elderly
customers.
BOC-Samsung Life was awarded “Life Insurer
of Excellent Competitiveness” in the “Financial
Institutions of Excellent Competitiveness Selection”
by China Business Journal. It also received “The
7th JinDing Prize Fund — Quality Customer Service
Award” by National Business Daily and “Corporate
Citizen Award” in the “2016 Innovation and
Development Forum of Chinese Insurance Industry”.
Its critical illness insurance “XiangFu” and annuity
insurance “ZunXiangJiaCheng” were awarded “Health
Insurance Product of the Year” and “Endowment
Insurance Product of the Year” respectively by China
Insurance News and other media.
Investment Business
BOCG Investment
The Bank is engaged in direct investment and
investment management business through BOCG
Investment. BOCG Investment’s business scope
includes private equity investment, fund investment
and management, real estate investment and
management, and non-performing asset (NPA)
investment. As at the end of 2016, BOCG Investment
recorded total assets of HKD87.518 billion and net
assets of HKD54.456 billion. In 2016, it recorded a
profit after tax of HKD1.317 billion.
BOCG Investment implemented the Group’s
internationalisation and diversification strategies and
continued to innovate its business model. It grasped
opportunities arising from China’s new urbanisation
plan and plans for infrastructure development in
important strategic regions by establishing the “Bank

2016 Annual Report 58
Management Discussion and Analysis — Business Review
of China Urban Development Fund” and “Bank of
China Innovative Development Fund”, thus constantly
intensifying its financial synergies within the Group.
Taking advantage of market opportunities, it
exploited potential investments arising from emerging
industries and successfully completed its investment
in Shanghai Lujiazui International Financial Asset
Exchange Co., Ltd. (“Lufax”) and Shanghai Insurance
Exchange, China’s first insurance exchange. It
expanded its overseas real estate investment business
and successfully completed the acquisition of a
property project in Sydney, Australia. It continued to
carry forward business model transformation from
“investment” to “investment management”, resolved
non-performing assets of the Group in the form of
funds, and pushed forward innovative businesses
such as entrusted investment and asset securitisation.
It constantly enhanced its investment value by
strengthening post-investment management and exit
management.
BOC Aviation
The Bank is engaged in the aircraft leasing business
through BOC Aviation. BOC Aviation is one of the
world’s top five aircraft operating leasing companies
and is the largest aircraft operating leasing company
headquartered in Asia, as measured by the value of
owned aircraft.
On 1 June 2016, BOC Aviation completed the largest-
ever IPO by market value of any aircraft operating
lessor through its public listing on the main board of
the HKSE. The successful listing has supported BOC
Aviation’s financial stability, grown its balance sheet,
enhanced its standing and influence in the aircraft
leasing industry, and further promoted the Group’s
diversification.
BOC Aviation implemented an active aircraft portfolio
management strategy and had sold all aircraft older
than 10 years of age by 30 June 2016, ahead of
schedule. As at the end of 2016, BOC Aviation had
an average fleet age of 3.2 years (weighted by net
book value), maintaining one of the youngest aircraft
portfolios in the aircraft leasing industry. BOC Aviation
actively services customer demand, build on its existing
order book and invests in new technology aircraft to
pursue sustainable growth. In 2016, it committed to
purchase 25 additional Boeing and Airbus aircraft. At
the end of the year, BOC Aviation had commitments
to acquire 199 aircraft, delivering through 2021.
BOC Aviation continues to maintain its solid financial
strength. In 2016, it raised over USD2.7 billion in debt
financing, including USD1.25 billion from two separate
benchmark bond offerings in the 144A-Regulation S
markets and further diversified its debt investor base.
BOC Aviation has corporate credit ratings of “A-”
from Standard & Poor’s and Fitch.
(Please refer to the results report of BOC Aviation for a full
review of BOC Aviation’s business performance and related
information.)
BOC Aviation listed on the main board of Hong Kong Stock Exchange

2016 Annual Report59
Management Discussion and Analysis — Business Review
Service Channels
As the most internationalised and diversified bank in China, the Bank established specialised and diversified service channels and provided comprehensive financial services to customers in the Chinese mainland and many other countries and regions. The Bank is committed to further developing its physical outlets and electronic service channels in a coordinated manner, and providing one-stop services and a consistent customer experience through the integrated functions of its different channels. By integrating IT systems and financial services, the Bank streamlined its banking services and ensured that a customer accessing the Bank’s services from any spot would trigger a full response, allowing it to satisfactorily meet customers’ needs anytime and anywhere.
Outlet Development
The Bank comprehensively carried out the upgrading of outlets towards smarter functionality across its entire network. In doing this, the Bank further specified the functions of different departments within each bank outlet, upgraded the on-site service system and increased the application of smart devices. It also streamlined the business handling process and standardised the sales process to provide a refreshing customer experience and enhance the brand image of the Bank. In 2016, a total of 2,683 bank outlets achieved smart functionality and the number of smart outlets reached 5,281, accounting for approximately 50% of total domestic outlets, thus significantly optimising business processes.
The Bank consistently improved the management and operation of its bank outlets. The Bank continued to optimise its outlet performance evaluation system and performance rating system, and increased profitability of its low-efficiency outlets. The Bank expanded the range of services offered by its outlets and increased the number of marketing personnel in order to improve its marketing and servicing capacities. It also reinforced the risk management of all businesses and improved comprehensive efficiency in business development of its outlets. The Bank made greater efforts to encourage collaborative innovation across channels to embrace the changes brought about by the development of internet banking and changes in customer behaviour. It launched the Paperless-Counter Project, provided a service to allow companies to fill out their corporate internet banking application forms online, optimised the processes of queue number calling and customer feedback rating and promoted the transformation of its outlets from “transaction-oriented” to “market-oriented”. It also encouraged its branches to differentiate themselves with featured services based on their own business environments. A number of featured branches were successfully set up, including Fudan University Library-featured Branch in Shanghai and Financial Street Library-featured Branch in Beijing, and more featured services were developed in 22 branches located in Tianjin and Hebei, etc. As at the end of 2016, the domestic commercial banking network (including Head Office, tier-1 branches, tier-2 branches and outlets) comprised of 10,651 branches and outlets, domestic non-commercial banking institutions totalled 327, and institutions in Hong Kong, Macau, Taiwan and other countries and regions totalled 578.
Unit: single item, except percentages
ItemAs at
31 December 2016As at
31 December 2015 Change (%)
ATM 46,810 45,506 2.87%
Self-service terminal 36,083 32,302 11.71%
Self-service bank 14,444 14,045 2.84%
E-Banking
The Bank focused on mobile internet in an effort to foster electronic banking habits among its customers. The Bank’s e-channel customers have become
consistently more active and more loyal, leading to rapid growth in the volume of mobile banking business. This in turn has given strong momentum to its customer service and business development. In 2016, the Bank’s cumulative e-channel transaction

2016 Annual Report 60
Management Discussion and Analysis — Business Review
Unit: million customers, except percentages
ItemsAs at
31 December 2016As at
31 December 2015 Change (%)
Number of corporate online banking customers 3.1408 2.8505 10.18%
Number of personal online banking customers 133.7110 122.4606 9.19%
Number of mobile banking customers 94.3995 79.9885 18.02%
Number of telephone banking customers 111.2993 105.4931 5.50%
Unit: RMB billion, except percentages
Items 2016 2015 Change (%)
Transaction amount of corporate online banking 135,853.067 129,322.199 5.05%
Transaction amount of personal e-banking 20,333.010 19,792.780 2.73%
Transaction amount of mobile banking 6,842.408 5,178.079 32.14%
Transaction amount of self-service banking 4,487.556 4,297.750 4.42%
amount reached RMB160.69 trillion, an increase of 4.72% compared with the prior year. The substitution ratio of e-banking channels for outlet-based business transactions reached 90.74%. Among this, mobile
banking transaction volumes hit RMB6.84 trillion, an increase of 32.14% year-on-year, meaning that mobile banking is gradually growing into one of the Bank’s major customer service channels.
The Bank continually enhanced the service ability and functionality of its e-banking channels and fully implemented its mobile finance strategy. It further optimised the functionality of its mobile banking, online banking, telephone banking and WeChat banking channels, thus further improving customer experience. For mobile banking and online banking, in an effort to build a comprehensive mobile financial portal, the Bank conducted an all-round upgrade of its mobile banking service by developing new functions such as “e-account opening”, “life insurance product sales service”, “BOC E-Credit” and “WMP pledged loan” and upgrading its bill payment function. For WeChat banking, the Bank launched three major functions, namely debit card binding, loan application and foreign exchange trading. For personal online banking, the Bank added a function allowing for the online contracting of foreign exchange option transactions. For corporate online banking, the Bank launched loan application and appeal functions for SMEs. Regarding self-service equipment, the Bank refined the most frequently used functions of ATMs and other self-service terminals. In terms of security authentication, the Bank developed a further multi-layer security authentication system and diversified approaches for interim monitoring, to further enhance
both security and convenience. The Bank consolidated its strength in cross-border services by launching an FTZ remittance service and global batch remittance authorisation in corporate online banking, further expanding such global cash management services as foreign currency transfer and uniform payment, developing a dedicated sub-channel for cross-border financial services for personal online banking and launching personal foreign currency remittance services for the PAD client of mobile banking and online banking.
The Bank made remarkable achievements in the development of its internet finance business. Accelerating its strategy for internet finance development, the Bank established the Internet Finance Committee and promoted the sustained development of internet finance based on the core tactic of “Scenario Integration and Data Insight”. The Bank enriched product lines covering payment, asset management, trading and financing businesses through internet finance models and extended its service coverage through scenario building, thus continually enhancing its internet finance service capacity. In terms of mobile payment innovation, it launched NFC payment products, such as HCE Quick

2016 Annual Report61
Management Discussion and Analysis — Business Review
Pass payment-based product, Apple Pay, Samsung Pay, etc. Its B2C online payment service grew rapidly and its productivity has increased significantly. The Bank pushed forward the building of the BOC financial supermarket, continually diversified its online asset management ecosystem and unveiled the innovative “E Rong Hui” mobile fund trading service, on which trading volumes exceeded RMB250.0 billion in 2016. The Bank helped China’s export and foreign trade industries to reorient towards “Internet Plus”, providing service solutions for both importing and exporting scenarios. It also delivered match-making services for cross-border e-commerce businesses in London, Macau, etc. Moreover, its “BOC Easy-trade Cyber-tariff” service maintained a market-leading share for the tenth consecutive year. The Bank enhanced its data insight capacity and used big data to realise precision marketing and bank-wide risk management. It launched “BOC E-Credit”, a whole-process, online consumption-oriented credit product featuring immediate disbursement. The Bank also launched the BOC e-commerce platform, including pilot projects in targeted poverty alleviation, cross-border e-commerce and other special areas.
Information Technology Development
Guided by innovations in information technology, the Bank reinforced the establishment of its IT governance system and promoted deep integration between business and technology. It continually strengthened top-level design and formulated a three-year IT development plan, laying out the strategic direction, risk appetite and technical route for IT development. The Bank pushed forward IT architecture adjustment by establishing software development sub-centres in Xi’an and Hefei, and improved its independent R&D and service capabilities in internet finance and in its domestic and overseas institutions.
The Bank’s IT function actively supported business
development. It completed the launch of the Global
Limit Management System, the upgrading of the
Global Cash Management System and the promotion
of integrated front, middle and back-office processing
for treasury operations in the Asia Pacific region, all
of which strongly supported the Bank’s international
development. Adapting to adjustments in regulatory
policies, the Bank launched BT-to-VAT reform and
PBOC-led personal banking account reform projects,
becoming one of the first banks to provide online
opening services for Category II and Category III
accounts. It intensified system building for internet
finance and was among the first of its peers to
launch a mobile payment function. It also vigorously
pushed forward the implementation of its business
process optimisation system, effectively improving the
experience of internal and external customers.
The Bank steadily rolled out its overseas information
system integration and transformation project and
successfully launched the system in the Americas.
It supported information system building in newly
established overseas institutions, successfully realising
version unification, centralised deployment and
integrated operation and management of overseas
institutions in 34 countries and regions. It was also
the first among its domestic peers to establish a
24/7 nonstop globally integrated operation and
maintenance system. The Bank enhanced the
regionally-integrated IT service capability of the three
overseas information centres in the Americas, Europe
and Asia Pacific. This enabled the Bank to put in place
a firm foundation on which to further consolidate and
enlarge its internationalised advantages.
The Bank boosted the transformation of its IT
technical architecture and accelerated the building
of a distributed private cloud platform. It set up a
blockchain research team and explored blockchain
technology-based application models and scenarios. It
also cooperated with prestigious domestic universities
and professional institutions to establish a joint
laboratory for financial information security, so as to
improve research and application capabilities in new
information security technologies.

Management Discussion and Analysis — Risk Management
2016 Annual Report 62
Based on its status as a Global Systemically Important Bank, the Bank actively responded to the “new normal” of economic development and continued to meet external regulatory requirements. Adhering to the principles of taking an issues-focused approach and implementing top-level design, the Bank pushed forward the establishment of its risk management system in line with its business model. The Bank refined its consolidated risk management
mechanism and improved procedures for product risk management. In addition, it advanced the building of the “three lines of defence” in risk management, specifying the outline and responsibilities of each line. The Bank implemented advanced capital management approaches in an in-depth manner, actively promoted the improvement of its risk measurement model, built its risk management information system at a faster pace and integrated its risk database, thus improving its risk reporting capability.
The risk management framework of the Bank is set forth below:
Chief Audit Officer
Audit Committee
Anti-money LaunderingCommittee
Asset Disposal Committee
Risk Policy Committee
US Risk and Management Committee
Risk Management andInternal Control Committee
Senior Management(Executive Committee)
Risk Management
Task Forces
BusinessDepartments
Domestic andOverseas Branches Subsidiaries
Vertical Board of Directors
Capital Management
Senior M
anagement
Related M
anagement
Departm
ents of the Group
Managem
entM
odes
Board of Directors
Financial Managem
entD
epartment
Financial Managem
entD
epartment
Executive Office
Internal Control andLegal Com
plianceD
epartment
Credit Managem
entD
epartment
Credit Approval
Departm
ent
Risk Managem
entD
epartment
Audit L
ineA
uditD
epartment
Board of
Directors
Credit Risk Management
Closely tracking changes in macroeconomic and financial conditions, the Bank controlled and mitigated risks, promoted development and consolidated the foundations of its credit risk management function. In addition, the Bank strengthened credit asset quality management, further improved its credit risk management policies, pushed forward adjustments to its credit structure and took a proactive and forward-looking stance on risk management.
Taking a customer-centric approach, the Bank further strengthened its unified credit granting management. It improved its asset quality monitoring system and intensified post-lending management. It further enhanced potential risk identification, control and mitigation mechanisms by reinforcing customer
concentration control and establishing large borrower risk mitigation accountability. The Bank maintained relative stability of asset quality by enhancing the supervision of risk analysis and asset quality control in key regions, and strengthening window guidance on all business lines.
The Bank continuously adjusted and optimised its credit structure. With the aim of advancing strategic implementation and balancing risk, capital and return, the Bank stepped up the application of the New Basel
Capital Accord and improved the management plans of its credit portfolios. In line with the government’s macro-control measures and the direction of industrial policy, the Bank enacted guidelines for industrial lending and continued to push forward the building of an industrial policy system so as to optimise its credit structure.

2016 Annual Report63
Management Discussion and Analysis — Risk Management
In terms of corporate banking, the Bank further strengthened risk identification and control, proactively reduced and exited credit relationships in key fields, strictly controlled the gross outstanding amount and portfolio of loans through limit management and prevented and mitigated risk from overcapacity industries. It intensified the management of loans to local government financing vehicles (LGFVs) and strictly controlled the outstanding balances. In addition, the Bank implemented the government’s macro-control policies and regulatory measures in the real estate sector so as to strengthen the risk management of real estate loans.
In terms of personal banking, the Bank enforced regulatory requirements on residential mortgages and continued to strictly implement differentiated policies. It improved management policies for personal housing loans, personal consumption loans, personal carport loans, overseas personal loans and credit card loans. It also strengthened risk control of key products and regions.
The Bank strengthened country risk management and incorporated it into its comprehensive risk management system. It performed an annual review of country risk ratings and implemented limit management of country risk exposures. It constantly optimised the Country Risk Exposure Statistical System to assess, monitor, analyse and report its exposures on a regular basis, thereby managing the use of limits in a precise manner. The Bank also established a country risk monitoring and reporting system covering yearly reporting, quarterly monitoring and the timely reporting of material risk events, which made it possible to regularly publish country risk analysis reports, provide updates on the country risk monitoring tables, make timely assessments of the impact of material country risk events and publish risk prompts. In addition, the Bank differentiated the management of potentially high-risk and sensitive countries and regions.
The Bank further stepped up the collection of NPAs. It continued to carry forward centralised collection through the unified allocation of internal and external collection resources. The Bank centrally managed NPA projects and took measures such as continually enhancing hierarchical management, reinforcing control of key regions and key customers and promoting advanced experience and typical cases regarding NPA mitigation to improve the quality and efficiency of disposals. The Bank tapped the potential value of NPAs through multiple measures and leveraged its internationalised and diversified business
advantages to successfully explore innovative means such as NPA securitisation. It adopted policies based on the actual conditions of individual enterprises, strengthened restructuring efforts and strived to help enterprises get out of difficulty. The Bank actively participated in the study and adjustment of regulatory policies and strengthened support to the real economy. It conducted NPA disposal and continued to implement accountability measures for losses in compliance with relevant laws and regulations.
The Bank scientifically measured and managed the quality of credit assets based on the Guidelines for Loan Credit Risk Classification issued by the CBRC, which requires Chinese commercial banks to classify loans into the following five categories: pass, special-mention, substandard, doubtful and loss, among which loans classified as substandard, doubtful and loss are recognised as NPLs. In order to further refine its credit asset risk management, the Bank used a 13-tier risk classification criteria scheme for corporate loans to domestic companies, covering on-balance sheet and off-balance sheet credit assets. In addition, the Bank strengthened risk classification management of key industries, regions and material risk events, and dynamically adjusted classification results. It strengthened the management of loan terms, managed overdue loans by the name list system and made timely adjustments to risk classification results, so as to truly reflect asset quality. The Guideline for Loan Credit Risk Classification is also applicable to the overseas operations of the Bank. However, the Bank classified credit assets in line with local applicable rules and requirements if they were stricter.
As at the end of 2016, the Group’s NPLs totalled RMB146.003 billion, an increase of RMB15.106 billion compared with the prior year-end. The NPL ratio was 1.46%, up by 0.03 percentage point compared with the prior year-end. The Group’s allowance for impairment losses on loans and advances was RMB237.716 billion, an increase of RMB37.051 billion compared with the prior year-end. The coverage ratio of allowance for loan impairment losses to NPLs was 162.82%, up by 9.52 percentage points from the prior year-end. The NPLs of domestic institutions totalled RMB141.458 billion, an increase of RMB13.823 billion compared with the prior year-end. Domestic institutions’ NPL ratio was 1.81%, up by 0.04 percentage point compared with the prior year-end. The Group’s outstanding special-mention loans stood at RMB310.630 billion, an increase of RMB81.465 billion compared with the prior year-end, accounting for 3.11% of total loans and advances, up by 0.60 percentage point from the prior year-end.

2016 Annual Report 64
Management Discussion and Analysis — Risk Management
Five-category Loan Classification
Unit: RMB million, except percentagesAs at 31 December 2016 As at 31 December 2015
Items Amount % of total Amount % of totalGroup Pass 9,516,729 95.43% 8,775,798 96.06% Special-mention 310,630 3.11% 229,165 2.51% Substandard 61,247 0.61% 58,741 0.64% Doubtful 36,817 0.37% 41,516 0.45% Loss 47,939 0.48% 30,640 0.34% Total 9,973,362 100.00% 9,135,860 100.00% NPLs 146,003 1.46% 130,897 1.43%Domestic Pass 7,387,949 94.49% 6,854,159 95.21% Special-mention 289,101 3.70% 217,300 3.02% Substandard 58,763 0.75% 57,049 0.79% Doubtful 35,758 0.46% 40,612 0.56% Loss 46,937 0.60% 29,974 0.42% Total 7,818,508 100.00% 7,199,094 100.00% NPLs 141,458 1.81% 127,635 1.77%
Migration RatioUnit: %
Items 2016 2015 2014Pass 3.05 2.22 1.92Special-mention 19.39 22.07 9.89Substandard 36.67 48.25 42.38Doubtful 44.31 46.25 46.94
In accordance with International Accounting Standard No. 39, loans and advances to customers are considered impaired, and allowances are made accordingly, if there is objective evidence of impairment resulting in a measurable decrease in estimated future cash flows from loans and advances. As at the end of 2016, the Group’s identified impaired loans totalled RMB145.311 billion, an increase of RMB15.074 billion compared with the prior year-end. The identified impaired loans to total loans ratio was 1.46%, an increase of 0.03 percentage point compared with the prior year-end. For domestic institutions, identified impaired loans totalled RMB141.458 billion, an increase of RMB13.823 billion compared with the prior year-end. The identified impaired loans to total loans ratio of domestic institutions was 1.81%, up by 0.04 percentage point compared with the prior year-end. The Bank’s operations in Hong Kong, Macau, Taiwan and other countries reported identified impaired loans of RMB3.853 billion and the identified impaired loans to total loans ratio of 0.18%, representing an increase of RMB1.251 billion and 0.05 percentage point compared with the prior year-end respectively.
Movement of Identified Impaired LoansUnit: RMB million
Items 2016 2015 2014Group Balance at the beginning of the year 130,237 99,789 73,119 Increase during the year 72,721 71,325 60,197 Decrease during the year (57,647) (40,877) (33,527) Balance at the end of the year 145,311 130,237 99,789Domestic Balance at the beginning of the year 127,635 97,057 70,433 Increase during the year 70,700 69,422 58,577 Decrease during the year (56,877) (38,844) (31,953) Balance at the end of the year 141,458 127,635 97,057

2016 Annual Report65
Management Discussion and Analysis — Risk Management
Loans and Identified Impaired Loans by CurrencyUnit: RMB million
As at 31 December 2016 As at 31 December 2015 As at 31 December 2014Items Total loans Impaired loans Total loans Impaired loans Total loans Impaired loansGroup RMB 7,607,730 130,301 7,011,867 112,983 6,339,052 86,914 Foreign currency 2,365,632 15,010 2,123,993 17,254 2,144,223 12,875 Total 9,973,362 145,311 9,135,860 130,237 8,483,275 99,789Domestic RMB 7,480,833 130,277 6,799,585 112,763 6,104,014 86,205 Foreign currency 337,675 11,181 399,509 14,872 501,759 10,852 Total 7,818,508 141,458 7,199,094 127,635 6,605,773 97,057
The Bank makes adequate and timely allowance for loan impairment losses in accordance with the principles of prudence and authenticity. Allowance for impairment losses on loans consist of individually assessed and collectively assessed allowance. Please refer to Notes II.4 and VI.3 to the Consolidated Financial Statements for the accounting policy in relation to allowance for impairment losses.
In 2016, the Group’s impairment losses on loans and advances stood at RMB86.795 billion, an increase of RMB30.923 billion compared with the prior year. The credit cost was 0.91%, an increase of 0.28 percentage point compared with the prior year. In particular, domestic institutions registered impairment losses on loans and advances of RMB85.282 billion, an increase of RMB31.955 billion compared with the prior year. The credit cost of domestic institutions was 1.14%, an increase of 0.37 percentage point compared with the prior year.
The Bank continued to focus on controlling borrower concentration risk and was in full compliance with regulatory requirements on borrower concentration.
Unit: %
IndicatorsRegulatory
StandardAs at 31
December 2016As at 31
December 2015As at 31
December 2014Loan concentration ratio of the largest single borrower ≤10 2.3 2.3 2.4Loan concentration ratio of the ten largest borrowers ≤50 14.2 14.0 14.7
Notes:
1 Loan concentration ratio of the largest single borrower = total outstanding loans to the largest single borrower ÷ net regulatory capital.
2 Loan concentration ratio of the ten largest borrowers = total outstanding loans to the top ten borrowers ÷ net regulatory capital.
Please refer to Notes V.18 and VI.3 to the Consolidated Financial Statements for detailed information regarding loan classification, the classification of identified impaired loans and allowance for loan impairment losses.
The following table shows the top ten individual borrowers as at the end of 2016.
Unit: RMB million, except percentages
IndustryConnected
Parties or notOutstanding
loans% of
total loansCustomer A Manufacturing No 36,765 0.37%Customer B Transportation, storage and postal services No 32,776 0.33%Customer C Transportation, storage and postal services No 31,297 0.31%Customer D Commerce and services No 19,751 0.20%Customer E Water, environment and public utility management No 18,984 0.19%Customer F Commerce and services No 18,965 0.19%Customer G Transportation, storage and postal services No 18,751 0.19%Customer H Transportation, storage and postal services No 17,501 0.18%
Customer IProduction and supply of electricity, heating, gas, and water No 17,091 0.17%
Customer J Mining No 16,736 0.17%

2016 Annual Report 66
Management Discussion and Analysis — Risk Management
Market Risk Management
In response to changes in the market environment and
in line with its business development and management
requirements, the Bank adopted improvement
measures to comprehensively enhance the
effectiveness of its market risk management system
and continuously made its market risk management
more flexible and forward-looking.
Based on its judgement of financial market trends,
the Bank actively adjusted its business strategies
to prevent and control market risk. It upgraded its
internal model measurement system for market risk
and strengthened its data mining and processing
ability, thus improving the overall accuracy and time-
effectiveness of risk measurement. In addition, the
Bank established a system to evaluate the capacity of
its branches in managing market risk and counterparty
credit risk, so as to enhance risk management and
control capacity. The Bank closely tracked new
regulatory requirements on market risk capital
measurement, carried out quantitative estimation and
planned an implementation route. It also improved
requirements for managing the credit risk of central
counterparties, and reviewed and optimised the risk
weight of treasury business products. Please refer to
Note VI.4 to the Consolidated Financial Statements for
detailed information regarding market risk.
In order to focus on improving credit risk and
contagion risk management, the Bank continually
carried out group-wide risk identification for its bond
investments. Moreover, the Bank enhanced its risk
alert system and introduced innovative risk monitoring
techniques by activating a system for tracking bond
issuers’ negative information, all with the aim of
enhancing the efficiency and accuracy of risk alerts
and continually optimising the graded warning and
hierarchical management of the Group’s integrated
credit bond risk warning mechanism.
The Bank assessed the interest rate risk in its banking
book mainly through analysis of interest rate re-
pricing gaps, made timely adjustments to the structure
of its assets and liabilities based on changes in the
market situation, and controlled the fluctuation of net
interest income at an acceptable level. Assuming that
the yield curves of all currencies were to shift up or
down 25 basis points in parallel, the Group’s banking
book sensitivity analysis of net interest income on all
currencies is as follows5:
5 This analysis is based on the approach prescribed by the CBRC, which includes all off-balance sheet positions. This is presented for
illustrative purposes only, and is based on the Group’s gap position as at the end of 2016 without taking into account any change
in customer behaviour, basis risks or any prepayment options on debt securities. The table has only shown the potential impact
on the Group’s net interest rates moving up or down 25 basis points. The analysis is based on the Group’s audited financial
information.
Unit: RMB million
As at 31 December 2016 As at 31 December 2015Items RMB USD HKD Other RMB USD HKD Other
Up 25 bps (2,316) (560) 97 (222) (2,046) (191) (90) (239)
Down 25 bps 2,316 560 (97) 222 2,046 191 90 239
In terms of the management of exchange rate risk, the Bank sought to achieve currency matching between fund
source and application and managed exchange rate risk through timely settlement, thus effectively controlling its
foreign exchange exposure.

2016 Annual Report67
Management Discussion and Analysis — Risk Management
Liquidity Risk Management
The Bank continued to develop and improve its
liquidity risk management system with the aim of
effectively identifying, measuring, monitoring and
controlling liquidity risk at the institution and group
level, including that of branches, subsidiaries and
business lines, thus ensuring that liquidity demand is
met in a timely manner and at a reasonable cost.
Seeking at all times to balance safety, liquidity and
profitability, and following regulatory requirements, the
Bank improved its liquidity risk management system and
continually upgraded its liquidity management function
in a forward-looking and scientific manner. The Bank
enhanced liquidity risk management at the institution
and group level, including that of branches, subsidiaries
and business lines. The Bank formulated sound
liquidity risk management policies and contingency
plans, periodically re-examined the liquidity risk limit,
upgraded the early warning system for liquidity risk and
strengthened the management of high-quality liquid
assets, such as bond investments, in order to strike a
balance between risk and return. In addition, the Bank
regularly improved its liquidity stress-testing scheme and
performed stress tests on a quarterly basis. The stress
tests showed that the Bank had adequate payment
ability to cope with distressed scenarios.
As at the end of 2016, the Bank’s liquidity risk indicators
met regulatory requirements, as shown in the table
below (liquidity ratios apply to the Group’s operations
and excess reserve ratios and interbank ratios apply
to the Bank’s domestic operations. Major regulatory
ratios here are calculated in accordance with relevant
provisions of domestic regulatory authorities):
Unit: %
Major regulatory ratiosRegulatory standard
As at 31 December 2016
As at 31 December 2015
As at 31 December 2014
Liquidity ratio RMB ≥25 45.6 48.6 49.9Foreign currency ≥25 52.7 62.0 59.9
Excess reserve ratio RMB – 1.3 1.5 2.3Foreign currency – 10.9 19.0 14.6
Inter-bank ratio Interbank borrowings ratio ≤8 0.05 1.1 0.3Interbank loans ratio ≤8 0.04 0.1 0.4
Liquidity gap analysis is one of the methods used by the Bank to assess liquidity risk. Liquidity gap results are
periodically calculated, monitored and used for sensitivity analysis and stress testing. As at the end of 2016, the
Bank’s liquidity gap was as follows (please refer to Note VI.5 to the Consolidated Financial Statements):
Unit: RMB million
Items As at 31 December 2016 As at 31 December 2015Overdue/undated 2,132,049 1,940,702
On demand (6,502,279) (5,673,516)
Up to 1 month (1,130,916) (1,163,853)
1–3 months (inclusive) (73,401) (236,711)
3–12 months (inclusive) 39,125 734,148
1–5 years (inclusive) 2,561,345 2,009,358
Over 5 years 4,461,169 3,747,477Total 1,487,092 1,357,605
Note: Liquidity gap = assets that mature in a certain period – liabilities that mature in the same period.

2016 Annual Report 68
Management Discussion and Analysis — Risk Management
Reputational Risk Management
The Bank implemented the policy on reputational risk management, continued to improve its reputational risk management system and mechanism, and strengthened the consolidated management of reputational risk so as to enhance the reputational risk management capability. It attached great importance to the investigation of potential reputational risk factors, strengthened daily public opinion monitoring and continually carried out monitoring, identification and pre-warning of reputational risks. It established a coordination mechanism between reputational risk management departments and liable departments, and dealt appropriately with reputational risk events, thus effectively maintaining the brand reputation of the Group. In addition, the Bank continued to implement training sessions on reputational risk management so as to enhance employees’ awareness of reputational risk management and cultivate the reputational risk management culture.
Internal Control and Operational Risk Management
Internal Control
The Board of Directors, senior management and their special committees earnestly performed their duties regarding internal control and supervision, emphasising early risk warning and prevention.
The Bank continued to improve the “three lines of defence” mechanism for internal control. The first line of defence consists of departments of the Head Office, tier-1 branches, direct branches, tier-2 branches and all banking outlets under tier-2 branches (with the exception of those departments that form part of the second or third lines of defence). They are the owners of, and are accountable for, local risks and controls. They undertake self-control risk management functions in the course of their business operations, including the formulation and implementation of policies, business examination, the reporting of control deficiencies and the organisation of rectification measures.
The internal control and risk management departments of the Bank’s institutions at all levels form the second line of defence. They are responsible for overall planning, implementing, examining and assessing risk management and internal control. They are also responsible for identifying, measuring, monitoring and controlling risks. The Group’s operational risk monitoring and analysis platform is used to realise the regular and automated smart monitoring of major risks, helping the Bank to take timely risk prevention and mitigation measures. To enhance business processes and systems, the Bank adjusted policies and regulations in a timely manner during the year.
The third line of defence rests in the audit and inspection departments of the Bank. The audit department is responsible for performing internal audit of the Bank’s internal control and risk management function in respect of its adequacy and effectiveness. The inspection department is responsible for staff non-compliance sanction, investigation of cases and management accountability. In 2016, the Bank accelerated the reform of its human resource management system for the audit line. It clarified that domestic audit sub-divisions are dispatched institutions of the Audit Department of the Head Office, with their personnel dispatched and directly managed by the Head Office, so as to further strengthen audit independence. Taking an issue-oriented approach that concentrates attention on matters of systemic, emerging trends, concerning tendency and importance, the audit department strengthened inspection and monitoring of the Bank’s high-risk institutions and businesses, the Group’s priority areas for risk control and fields of special concern to regulators, all with the aim of effectively performing the pre-warning and prevention function of internal audit. It actively promoted IT-based audit approaches, strengthened off-site technology applications and enhanced on-site examination efficiency. It refined mechanisms for rectification management by establishing specific institutions and procedures and clearly assigning responsibilities for rectification. It advanced rectification management at various levels including grassroots outlets, line management departments and the Head Office, so as to facilitate the effective rectification and systematic solution of issues and increase the efficiency of the Bank’s internal governance and management mechanism.

2016 Annual Report69
Management Discussion and Analysis — Risk Management
In order to continually improve its anti-fraud
management system, the Bank clarified which bodies
were responsible for organisational leadership, policy-
making and enforcement, supervision and inspection
and accountability. To secure a comprehensive
performance of counter-fraud duties, it adhered to the
basic principles of fraud case accountability, including
“inquiry of four accountable subjects into one case”,
“both institutional and business-line management
accountability” and “management two levels higher
than the branch-outlet accountable where serious
fraud occurs”, and established the mechanism
of “presenting one case to five units”. The Bank
comprehensively enhanced day-to-day internal control
management by giving full play to the guiding role of
the risk management and internal control committee
in tier-2 branches, and rolling out such practices as
“branch outlet head contact” to enhance the risk
prevention and control capacity of sub-branches and
outlets. It also used management tools such as on-site
examination, off-site monitoring and issue rectification
to enhance its fraud case prevention and resolution
capacity. In addition, the Bank carried out governance
of internal control cases and used the review
mechanism of “Two Strengthen and Two Curbing”,
investigated risks, rectified problems and held relevant
parties accountable.
The Bank continued to implement the Basic Standard
for Enterprise Internal Control and its supporting
guidelines, adhering to the primary goal of ensuring
the effectiveness of its internal control over financial
reporting and the accuracy of its financial information.
It also constantly improved non-financial internal
control. The Bank earnestly implemented the
Guidelines for Internal Control of Commercial Banks by
following the basic principles of “complete coverage,
checks and balances, prudence and correspondence”,
so as to promote internal control governance and an
organisational structure characterised by a reasonable
division of work, well-defined responsibilities and clear
reporting relationships.
The Bank established and implemented a systematic
financial accounting policy system in accordance
with the relevant accounting laws and regulations.
Accordingly, the Bank’s accounting basis was solidified
and the level of standardisation and refinement of
its financial accounting management was further
improved. The Bank set criteria for accounting
appraisal and continued to promote the qualification
of accounting groundwork in-depth. The Bank
continually strengthened the quality management
of its accounting information, so as to ensure
the effectiveness of internal control over financial
reporting. The financial statements of the Bank were
prepared in accordance with the applicable accounting
standards and related accounting regulations, and the
financial position, operational performance and cash
flows of the Bank were fairly presented in all material
respects.
The Bank paid close attention to fraud risk prevention
and control, proactively identifying, assessing,
controlling and mitigating risks. In 2016, the Bank
succeeded in preventing 89 external cases involving
RMB624 million.
Operational Risk Management
The Bank continually improved its operational risk
management system. It promoted the application of
operational risk management tools, using the three
major tools of Risk and Control Assessment (RACA),
Key Risk Indicators (KRI) and Loss Data Collection
(LDC) to continually identify, assess and monitor
operational risks. The Bank enhanced its system
supporting capability by optimising its operational
risk management information system. It continually
strengthened its business continuity management
system and improved operating mechanism. It carried
out business impact analysis and risk assessment,
and launched emergency drills in key businesses
to enhance the capacity for continuous business
operation.

2016 Annual Report 70
Management Discussion and Analysis — Risk Management
Compliance Management
The Bank continually improved its compliance risk
governance mechanism to better meet compliance
risk management requirements. It continued to track
compliance risk information including regulatory
requirements, inspections and evaluations, so as
to ensure compliance with domestic and overseas
regulatory requirements. It monitored and assessed
compliance risk and adopted a reporting mechanism
for compliance risk information and material
risk events, hence enhancing its compliance risk
management capacity.
The Bank enhanced group-wide anti-money
laundering (AML) management by implementing the
plan for AML. It enhanced its processes for customer
identification and due diligence and strengthened its
real time control capability. It improved the sanctions
aspect of its compliance management by improving
the policies for sanction management and the sanction
list as well as its related system functions. The Bank
improved the functions of its large-amount and
suspicious AML transaction system and optimised the
new screening models for suspicious transactions. It
continued to roll out the AML system in its overseas
institutions, tailoring the transformation and overall
optimisation of each system based on the regulatory
requirements of each business location. It also
conducted various forms of training, and implemented
AML training plans for all employees.
The Bank enhanced the management of its connected
transactions and internal transactions. It strengthened
the routine monitoring of its connected transactions
and strictly controlled their risks. It carried out
special self-inspections on connected transactions by
conducting self-evaluation and seeking improvement
with regard to regulation implementation, system
management, data quality and other dimensions.
In addition, it implemented internal transaction
monitoring and reporting, and guided and
standardised the operation mechanism of internal
transaction verification.
Capital Management
The Bank continually reinforced its capital
management to tap its internal potential. It optimised
its capital allocation methods, improved its capital
budget mechanism, and reinforced capital assessment
in order to guide all units of the Bank to improve
their awareness of capital constraints. It continually
optimised its on-balance sheet and off-balance sheet
asset structures, developed capital-lite businesses,
reduced the proportion of high-capital-consumption
assets, properly controlled increases in off-balance
sheet risk assets and expanded asset securitisation.
These methods were effective as the Bank’s risk
weight decreased year-on-year, while its capital
adequacy ratio continuously increased and hit a
historic high. The Bank continued to replenish capital
in a prudent manner. The shareholders’ meeting
approved the issuance of qualified write-down tier-
2 capital instruments amounting to RMB60.0 billion
or equivalent in foreign currencies. The Bank will
continue to implement its capital replenishment plan
so as to enhance its capital strength and improve
capital structure. The Bank was awarded “Best Capital
Management Bank” by The Chinese Banker.

2016 Annual Report71
Management Discussion and Analysis — Risk Management
Capital Adequacy Ratios
As at the end of 2016, the capital adequacy ratios separately calculated in accordance with the Capital Rules for
Commercial Banks (Provisional) and the Regulation Governing Capital Adequacy of Commercial Banks are listed
below:
Capital Adequacy Ratios
Unit: RMB million, except percentages
Group Bank
ItemsAs at 31
December 2016As at 31
December 2015As at 31
December 2016As at 31
December 2015Calculated in accordance with the Capital Rules for Commercial Banks (Provisional)
Net common equity tier 1 capital 1,280,841 1,182,300 1,106,112 1,042,396
Net tier 1 capital 1,384,364 1,285,459 1,205,826 1,142,110
Net capital 1,609,537 1,498,396 1,414,052 1,335,327
Common equity tier 1 capital adequacy ratio 11.37% 11.10% 10.98% 11.06%
Tier 1 capital adequacy ratio 12.28% 12.07% 11.96% 12.12%
Capital adequacy ratio 14.28% 14.06% 14.03% 14.17%Calculated in accordance with the Regulation Governing Capital Adequacy of Commercial Banks
Core capital adequacy ratio 11.77% 11.38% 11.65% 11.56%
Capital adequacy ratio 14.67% 14.45% 14.50% 14.53%
Please refer to Note VI.7 to the Consolidated Financial Statements for detailed information.
Leverage Ratio
As at the end of 2016, the leverage ratio calculated in accordance with the Administrative Measures for the
Leverage Ratio of Commercial Banks (Revised) and the Capital Rules for Commercial Banks (Provisional) is listed
below:
Unit: RMB million, except percentages
Items As at 31 December 2016 As at 31 December 2015
Net tier 1 capital 1,384,364 1,285,459
Adjusted on- and off-balance sheet assets 19,604,737 18,297,331
Leverage ratio 7.06% 7.03%
Please refer to Supplementary Information II.5 to the Consolidated Financial Statements for detailed information.

Management Discussion and Analysis — Organisational Management, Human Resources Development and Management
2016 Annual Report 72
Organisational Management
As at the end of 2016, the Bank had a total of 11,556 institutions worldwide, including 10,978 institutions in the
Chinese mainland and 578 institutions in Hong Kong, Macau, Taiwan and other countries. Its domestic commercial
banking business comprised 10,651 institutions, including 37 tier-1 and direct branches, 326 tier-2 branches and
10,287 outlets.
The geographic distribution of organisations and employees of the Bank is set forth below:
Unit: RMB million/unit/person, except percentagesAssets Organisations Employees
Items Total assets % of total Number % of total Number % of total
Northern China 5,469,424 28.09% 1,925 16.66% 58,998 19.10%
Northeastern China 682,682 3.51% 951 8.23% 26,019 8.42%
Eastern China 3,930,025 20.19% 3,601 31.16% 94,024 30.43%
Central and Southern China 2,861,340 14.70% 2,789 24.13% 69,092 22.37%
Western China 1,453,868 7.47% 1,712 14.81% 38,258 12.39%
Hong Kong, Macau and Taiwan 3,256,526 16.73% 440 3.82% 17,270 5.59%
Other countries 1,812,521 9.31% 138 1.19% 5,239 1.70%
Elimination (1,317,497)
Total 18,148,889 100.00% 11,556 100.00% 308,900 100.00%
Note: The proportion of geographic assets was based on data before intra-group elimination.
Human Resources Development and Management
As at the end of 2016, the Bank had 308,900 employees. There were 286,391 employees in the Chinese mainland,
of which 277,966 worked in the Bank’s domestic commercial banking business. The Bank had 22,509 employees
in Hong Kong, Macau, Taiwan and other countries. As at the end of 2016, the Bank bore costs for a total of 5,855
retirees.
In 2016, in line with the strategic development plan and annual priorities, the Bank further deepened reform of
its organisational structure and management mechanism. It reorganised institutions in Liaoning and Shandong,
so as to enhance market competitiveness in the Bohai Rim. The Bank actively responded to “smart channel”
development, and optimised its channel management functions, providing solid support for the implementation of
strategic development plan and operational development.

2016 Annual Report73
Management Discussion and Analysis — Organisational Management, Human Resources Development and Management
Composition of Staff by Age Group
0
20
40
60
80
100
Up to 30
Between 31 and 40
Between 41 and 50
51 and above
The Group Domestic commercial
banking business
Overseas institutions and
subsidiaries
%
10.02%
31.94%
29.19%
34.32%
9.84%
22.47%
24.67%
34.06%
11.63%
30.99%
24.16%
36.71%
0
20
40
60
80
100
Master degreeand above
Bachelor degree
Associate degree
Other
Composition of Staff by Education Level
The Group Domestic commercial
banking business
Overseas institutions and
subsidiaries
%
6.25%
23.02%
47.71%
8.28%
5.40%
19.68%
62.78%
7.13%
13.93%
22.69%
64.45%
18.68%
12.81%
13.55%
0.35%
42.92%
9.56%
8.89%
9.40%
Composition of Staff by Job Function(Domestic Commercial Banking Business)
Corporate banking
Personal banking
Financial markets
Cross-marketing and teller
Operation services and financial management
Risk managementand internal controlInformation technology
Other2.52%
The Bank accelerated the construction of personnel teams, implemented its special personnel supplementation plan in key strategic areas, increased staffing in important business areas, stepped up efforts in cultivating the international and diversified experience of its personnel and reinforced the construction of a talent pool of employees fluent in minority languages. In compliance with China’s targeted poverty alleviation policy, the Bank assigned cadres for eliminating poverty to the certain poverty areas in batches and hired low-income university graduates through a special programme within its campus recruitment campaign. The Bank ranked first in the “Best Employer in Financial Industry in the Opinion of Chinese University Students” for the ninth consecutive year and ranked second in the overall list of the 14th “Employers in the Opinion of Chinese University Students”.
The Bank optimised personnel expense allocation and promoted the “broad-band” remuneration system in a bid to improve the input-output efficiency of resources. It continued to improve its remuneration policies and implement the “position-related and performance-based” remuneration distribution principle, in line with corporate governance requirements, operational and development strategy and market positioning and talent competition strategy. According to these policies, base salary is determined by the job’s value and the employee’s duty performance, while the performance-related bonus is determined by the performance assessment results of the Bank, employees’ institutions or departments and employees. These remuneration policies apply to all employees who sign an employment contract with the Bank.
The Bank held a “Belt and Road” international financial communication and cooperation seminar in the Philippines, thus actively promoting national strategies. The Bank conducted key training programmes so as to enhance the professional capabilities of employees with regard to the internal control of risk and mitigation of non-performing loans, RMB internationalisation, the integrated development of the Beijing-Tianjin-Hebei region, internet finance, interest rate liberalisation and green credit. In 2016, the domestic commercial banking institutions of the Bank held a variety of training courses, totalling 68,122 sessions with 2,725,361 participants.
Management Discussion and Analysis — Outlook
2016 Annual Report 74
The domestic and international economic situation will remain complicated in 2017. On the international front, global economy will continue to stay in complex, unstable and uncertain condition and become further divergent in macroeconomic policies. On the domestic front, China’s economy is in a critical transition period, shifting from old to new growth drivers and experiencing structural challenges. Meanwhile, commercial banks will continue to see development opportunities from the implementation of China’s 13th Five-Year Plan, as supply-side structural reform will continue to deepen and the quality of economic growth is expected to improve further.
The Bank will implement national macroeconomic policy, uphold the strategic goal of “Serving Society, Delivering Excellence”, maintain the overall theme of seeking progress while ensuring stability and make solid progress towards key tasks related to “innovation, transformation, mitigation and control”, in pursuit of the sustainable and healthy development of all businesses.
Remain confident and endeavour to fulfil five commitments. First, the Bank will persevere in international development. It will accelerate the construction of the “Belt and Road” financial artery, fully leverage its global operations and traditional advantages and continue to improve its international development system while helping domestic enterprises to “Going Global”. Second, the Bank will persevere in serving the people. Dedicated to a customer-centric approach, the Bank will accelerate the improvement of business procedures and comprehensively enhance customer experience. Third, the Bank will persevere in serving SMEs. The Bank will optimise the business flow of the “Credit Factory”, further develop cross-border matchmaking services and encourage innovation-driven development. Fourth, the Bank will persevere in technological innovation. The Bank will strengthen the guiding role of technology, continue to develop mobile finance, smart counters, and e-finance, and promote deeper integration between business and technology. Fifth, the Bank will persevere in team building.
Forge ahead to achieve stability and progress in six aspects. First, the Bank will seek progress in structural adjustment while maintaining stable scale in terms of assets. It will continue to uphold a prudent operational approach, strengthen capital constraints, pursue structural improvements and continuously improve the quality and efficiency of its development. Second, the Bank will seek progress in its liability business while maintaining stable asset business. Giving balanced consideration to capital and liquidity constraints, the Bank will endeavour to achieve stable and moderate credit growth and the RMB loan of its domestic operations is expected to increase by 10% in 2017. The Bank will also maintain deposit business as a core business, in a bid to provide stable sources of funding for the development of its asset business. Third, the Bank will seek progress in its overseas business while maintaining stable in its domestic business. It will rely on the Group’s overall strengths to seek new opportunities from global market development and create new sources of growth. Fourth, the Bank will seek progress in building its non-interest income while maintaining stable interest income. It will strengthen the balanced management of assets and liabilities, maintain steady growth in interest income, step up products and service innovation and sharpen its competitive edge in fee-based business. Fifth, the Bank will seek progress in service quality while maintaining stable service fundamentals. The Bank will improve service quality and customer experience through product R&D, process optimisation and business innovation, so as to further cement its service foundations. Sixth, the Bank will seek progress in the mitigation of NPAs while maintaining stable asset quality. The Bank will spare no effort to mitigate potential risks and existing NPAs, promote innovative practices for NPAs mitigation and increase the efficiency and effectiveness of NPAs disposal.

Corporate Social Responsibilities
2016 Annual Report75
Guangdong Branch actively participated in the financial
knowledge promotion activity
Henan Branch carried out targeted poverty alleviation through
financial innovation
Responsibility to the country
The Bank continued to deeply implement its the
development strategy of “Serving Society, Delivering
Excellence”. The Bank was visited by political
leaders of many countries including the United
Kingdom, the Philippines, Peru, Cambodia and
Turkey. It also held a “Belt and Road” international
financial cooperation seminar for Cambodia and the
Philippines. The Group’s loans were largely granted
to major programmes and projects that the country
supported as well as to the key sectors and areas that
benefit the people’s livelihood. The Bank accelerated
the construction of the financial artery of the “Belt
and Road” initiative and gave significant support to
projects related to the coordinated development of
the Beijing-Tianjin-Hebei economic area. The financial
business in Shanghai FTZ continued to lead its peers in
terms of financial innovation and business scale. The
Bank held 10 cross-border matchmaking conferences
for global SMEs and published the Five-year Action
Plan for Promoting the Internationalised Development
of Small and Medium-sized Enterprises together with
the Ministry of Industry and Information Technology
of PRC. It accelerated the building of BOC Fullerton
Community Banks.
Responsibility to shareholders
Attaching great importance to shareholders’ rights,
the Bank continuously innovated and improved its
corporate governance mechanism and proactively
promoted the construction of the information
disclosure system. It maintained a stable external
rating, and continued to deliver long-term value to
shareholders. As of the end of 2016, the Bank’s total
assets achieved RMB18.15 trillion, ranking it among
the top global banks. With Stand-alone Credit Profile
and preference share rating upgraded by Standard
& Poor’s Rating Services, the Bank’s various ratings
reached the highest level amid Chinese peers. The
Bank ranked 35th among the “Global 500”, up 10
places compared to last year, 4th in “Top 1,000 World
Banks” and 6th in the “Top 500 Global Banking
Brands in 2016” with a brand value of USD27.7
billion, up 36% year on year.
Responsibility to customers
The Bank served as the RMB clearing bank in 11
countries and regions and established an RMB
clearing network that covers five continents to
provide 24x7 service. It was the first Chinese bank

2016 Annual Report 76
Corporate Social Responsibilities
Milan Branch actively engaged in community charity activity Macau Branch conferred academic awards to employees’ children
to set up subsidiaries in 51 foreign countries and
regions. Throughout the year, the Bank completed
RMB311.98 trillion in cross-border RMB clearing and
RMB4 trillion in settlement volume, maintaining its
leading position among global peers. A comprehensive
online financial services platform was realised through
the building of the “E-BOC” internet finance brand.
The Bank launched “Mobile Banking 3.0”, which
greatly improved customer experience. With the
launch of “smart counters”, the Bank’s smaller outlets
largely achieved “immediately business handling”
for customers, while larger outlets substantially
shortened customer waiting time. The substitution
ratio of e-banking channels for outlet-based business
transactions reached 90.74%, up 2.77 percentage
points on a yearly basis.
Responsibility to employees
Adhering to the principle of “people first”, the Bank
placed high importance on employee needs and
proactively developed a human resource management
model suited to its corporate culture and operational
management. In addition to offering continuous
enhanced trainings, the Bank encouraged employees
to gain working experience both in its outlets and
overseas. The aim is to develop inter-disciplinary
professional expertise with international profiles and
to provide employees with the space needed for
further career development. The Bank held training
courses for outstanding local employees overseas
on the Bank’s history and national education. It
encouraged employees to work in grassroots and
challenging areas. The Bank has topped the “Best
Employer in Financial Industry in the Opinion of
Chinese University Students” ranking organised by
ChinaHR.com for nine consecutive years.
Responsibility to the society
The Bank supported the poverty alleviation work in
Yongshou, Changwu, Xunyi and Chunhua counties
of Xianyang, Shaanxi Province (the “Four North
Counties”) for the 14th consecutive year. In 2016, it
formulated the Management Measures for Targeted
Poverty Alleviation of Bank of China and the 13th Five-
Year Plan for Financial Poverty Alleviation of Bank of
China and drew up and implemented the “Ten One-
batch” poverty alleviation programs. It dispatched
two batches of officials to work in the Four North
Counties, and helped households registered as living
in poverty to increase their incomes. It carried out
the Recruitment Program for Impoverished College
Graduates and recruited more than 100 graduates in
need. It organised the development of “BOC for Public
Welfare”, a targeted poverty alleviation platform in
which people in poverty in the Four North Counties
link to the supply side and BOC employees to the

2016 Annual Report77
Corporate Social Responsibilities
demand side. The Bank prepared to set up Charity
Foundation of the Bank. Fully mobilising its own
strengths and those of the international community,
its customers and its employees, it built up a brand for
BOC Targeted Poverty Alleviation and explore a path
that is sustainable and replicable.
The Bank extended government-sponsored student
loans for the 17th consecutive year and accumulatively
provided RMB22 billion for over 1.7 million financially
underprivileged students. It supported the Chinese
Spring Festival celebrations in Trafalgar Square in
London for the 16th consecutive year, making the
activity the largest one of its kind outside Asia.
The Bank sponsored the Tan Kah Kee Science
Award for the 13th consecutive year to honour
Chinese scientists who had made original scientific
and technological achievements. For the eighth
consecutive year, it conducted strategic cooperation
with the National Center for the Performing Arts. The
Bank sponsored the Rainbow Bridge programme for
the fifth consecutive year, supporting more than 250
outstanding but financially disadvantaged Chinese
and American students to take part in cross-border
study exchanges. It continued to support the poverty
alleviation programmes in Xinjiang for the third
consecutive year.
Responsibility to the environment
The Bank continually improved its credit policies
in favor of environmental protection. It vigorously
enhanced innovations in green financial products and
services, actively conducted international exchange
and cooperation in green finance and successfully
issued the first China Green Covered Bond. It persisted
in green and low-carbon operation and adopted
electronic seals for all businesses. Furthermore, it fully
implemented electronic review and encouraged staff
to hold meetings by video and telephone conference
to reduce resource consumption. The Bank won the
awards of “Asian Bank of the Year”, “China Bond
House” and “SRI Bond of the Year” conferred by
Thomson Reuters’ International Financing Review.
The Bank’s fulfilment of its social responsibilities was
widely recognised by the society. In 2016, it won the
awards including “Most Socially Responsible Financial
Institution” from the China Banking Association, the
“Most Socially Responsible Enterprise” from China
News Service and the “Outstanding Chinese Enterprise
in Social Responsibilities” from Southern Weekly.
For details of the Bank’s corporate social responsibility
performance, please refer to the Bank’s 2016
Corporate Social Responsibility Report published on
the websites of SSE, HKEx and the Bank.

Changes in Share Capital and Shareholdings of Shareholders
2016 Annual Report 78
Ordinary Shares
Changes in Ordinary Share Capital
Unit: Share
Increase/decrease during the reporting periodAs at 1 January 2016 Issuance of
new sharesBonus shares
Shares transferred from surplus reserve Others Subtotal
As at 31 December 2016Number of share Percentage Number of shares Percentage
I. Shares subject to selling restrictions – – – – – – – – –II. Shares not subject to selling restrictions 294,387,791,241 100.00% – – – – – 294,387,791,241 100.00%1. RMB-denominated ordinary shares 210,765,514,846 71.59% – – – – – 210,765,514,846 71.59%
2. Domestically listed foreign shares – – – – – – – – –
3. Overseas listed foreign shares 83,622,276,395 28.41% – – – – – 83,622,276,395 28.41%
4. Others – – – – – – – – –
III. Total Ordinary Shares 294,387,791,241 100.00% – – – – – 294,387,791,241 100.00%
Notes:
1 As at 31 December 2016, the Bank had issued a total of 294,387,791,241 ordinary shares, including 210,765,514,846 A Shares
and 83,622,276,395 H Shares.
2 As at 31 December 2016, none of the Bank’s A Shares and H Shares were subject to selling restrictions.

2016 Annual Report79
Changes in Share Capital and Shareholdings of Shareholders
Number of Ordinary Shareholders and Shareholdings
Number of ordinary shareholders as at 31 December 2016: 860,471 (including 660,201 A-Share Holders and 200,270 H-Share Holders)
Number of ordinary shareholders as at the end of the last month before the disclosure of this report: 833,098 (including 633,536 A-Share Holders and 199,562 H-Share Holders)
The top ten ordinary shareholders as at 31 December 2016 are set forth below:
Unit: Share
No. Name of ordinary shareholder
Changes
during the
reporting
period
Number of
shares held
as at the end of
the reporting
period
Percentage
of total
ordinary
shares
Number of
shares subject
to selling
restrictions
Number of
shares
pledged
or frozen Type of shareholder
Type of
ordinary
shares
1 Central Huijin Investment Ltd. – 188,461,533,607 64.02% – None State A
2 HKSCC Nominees Limited (7,155,493) 81,797,876,460 27.79% – Unknown Foreign legal person H
3 China Securities Finance Co., Ltd. 163,611,354 7,604,218,558 2.58% – None State-owned legal person A
4 Central Huijin Asset Management Ltd. – 1,810,024,500 0.61% – None State-owned legal person A
5 Buttonwood Investment Platform Ltd. – 1,060,059,360 0.36% – None State-owned legal person A
6 The Bank of Tokyo-Mitsubishi UFJ Ltd. – 520,357,200 0.18% – Unknown Foreign legal person H
7 Anbang Life Insurance Co., Ltd. —
Conservative Investment Portfolio – 477,023,612 0.16% – None Other A
8 HKSCC Limited 158,856,026 313,708,551 0.11% – None Foreign legal person A
9 Anbang Property & Casualty Insurance Co.,
Ltd. — Traditional Product – 208,018,959 0.07% – None Other A
10 China 50 ETF (7,668,100) 156,180,250 0.05% – None Other A
The number of shares held by H-Share Holders was recorded in the register of members kept at the H-Share Registrar of the Bank.
HKSCC Nominees Limited acted as the nominee for all the institutional and individual investors that maintain an account with it as at 31 December 2016. The aggregate number of the Bank’s H Shares held by HKSCC Nominees Limited included the number of shares held by the National Council for Social Security Fund.
Central Huijin Asset Management Ltd. is a wholly-owned subsidiary of Central Huijin Investment Ltd.
Both Anbang Life Insurance Co., Ltd. and Anbang Property & Casualty Insurance Co., Ltd. are subsidiaries of Anbang Insurance Group Co., Ltd.
HKSCC Limited is the nominee holder who holds securities on behalf of others. The securities included the SSE securities acquired by Hong Kong and overseas investors through Shanghai-Hong Kong Stock Connect.
Save as disclosed above, the Bank is not aware of any connected relation or concerted action among the aforementioned ordinary shareholders.

2016 Annual Report 80
Changes in Share Capital and Shareholdings of Shareholders
Substantial Shareholder Interests
The register maintained by the Bank under section 336 of the SFO recorded that, as at 31 December 2016, the
shareholders indicated in the following table were substantial shareholders having interests in shares of the Bank
(as defined in the SFO):
Name of shareholder Capacity (types of interest)
Number of shares held/Number of
underlying shares (unit: share)
Type of shares
Percentage of total issued
A-Share capital
Percentage of total issued
H-Share capital
Percentage of total issued
ordinary share capital
Central Huijin Investment Ltd. Beneficial owner 188,461,533,607 A 89.42% – 64.02%
Interest of controlled corporations 1,810,024,500 A 0.86% – 0.61%
Total 190,271,558,107 A 90.28% – 64.63%
National Council for Social Security Fund Beneficial owner 7,518,157,041 H – 8.99% 2.55%
BlackRock, Inc. Interest of controlled corporations 5,806,249,443 H – 6.94% 1.97%
JPMorgan Chase & Co. Beneficial owner 2,152,000,896 H – 2.57% 0.73%
180,789,229(S) H – 0.22% 0.06%
Investment manager 325,820,115 H – 0.39% 0.11%
Trustee 28,075 H – 0.00003% 0.00001%
Custodian corporation/ approved lending agent 2,482,887,298(P) H – 2.97% 0.84%
Total 4,960,736,384 H – 5.93% 1.69%
180,789,229(S) H – 0.22% 0.06%
2,482,887,298(P) H – 2.97% 0.84%
Notes:
1 BlackRock, Inc. holds the entire issued share capital of BlackRock Holdco 2 Inc., while BlackRock Holdco 2 Inc. holds the entire issued share capital of BlackRock Financial Management, Inc. Thus BlackRock, Inc. and BlackRock Holdco 2 Inc. are deemed to have equal interests in shares of the Bank as BlackRock Financial Management, Inc. under the SFO. BlackRock, Inc. holds a long position of 5,806,249,443 H Shares of the Bank through BlackRock Financial Management, Inc. and other corporations controlled by it, including 17,050,000 H Shares which are held through derivatives.
2 JPMorgan Chase & Co. holds the entire issued share capital of JPMorgan Chase Bank, N.A. Thus JPMorgan Chase & Co. is deemed to have equal interests in shares of the Bank as JPMorgan Chase Bank, N.A. under the SFO. JPMorgan Chase & Co. holds a long position of 4,960,736,384 H Shares and a short position of 180,789,229 H Shares of the Bank through JPMorgan Chase Bank, N.A. and other corporations controlled by it. In the long position of 4,960,736,384 H Shares, 2,482,887,298 H Shares are held in the lending pool and 162,206,912 H Shares are held through derivatives. In the short position of 180,789,229 H Shares, 180,446,728 H Shares are held through derivatives.
3 “S” denotes short position, “P” denotes lending pool.
Unless stated otherwise, all interests stated above represented long positions. Save as disclosed above, as at 31
December 2016, no other interests (including derivative interests) or short positions were recorded in the register
maintained by the Bank under section 336 of the SFO.

2016 Annual Report81
Changes in Share Capital and Shareholdings of Shareholders
Controlling Shareholder of the Bank
Central Huijin Investment Ltd.
Central Huijin Investment Ltd. (“Huijin”) is a state-
owned investment company established under the
Company Law on 16 December 2003, with Mr. DING
Xuedong as its legal representative. Wholly owned by
China Investment Corporation, Huijin makes equity
investments in key state-owned financial institutions,
as authorised by the State Council. To the extent of
its capital contribution, Huijin exercises its rights and
fulfils its obligations as an investor on behalf of the
State, in accordance with applicable laws aimed at
preserving and enhancing the value of state-owned
financial assets. Huijin neither engages in other
business activities nor intervenes in the daily operation
of the key state-owned financial institutions of which
it is the controlling shareholder.
As at 31 December 2016, the basic information of companies directly held by Huijin is as follows:
No. Company nameProportion of the total
capital held by Huijin
1 China Development Bank 34.68%
2 Industrial and Commercial Bank of China Limited ★✩ 34.71%
3 Agricultural Bank of China Limited ★✩ 40.03%
4 Bank of China Limited ★✩ 64.02%
5 China Construction Bank Corporation ★✩ 57.11%
6 China Everbright Group Ltd. 55.67%
7 China Everbright Bank Company Limited ★✩ 21.96%
8 China Export & Credit Insurance Corporation 73.63%
9 China Reinsurance (Group) Corporation ✩ 71.56%
10 New China Life Insurance Company Limited ★✩ 31.34%
11 China Jianyin Investment Limited 100.00%
12 China Galaxy Financial Holding Co., Ltd. 78.57%
13 Shenwan Hongyuan Group Co., Ltd. ★ 25.03%
14 China International Capital Corporation Limited ✩ 28.45%
15 China Securities Co., Ltd. ✩ 33.29%
16 China Investment Securities Co., Ltd. 100.00%
17 Jiantou & Zhongxin Assets Management Limited 70.00%18 Guotai Junan Investment Management Co., Ltd. 14.54%
Notes:
1 ★ denotes A share listed company and ✩ denotes H share listed company.
2 Huijin entered into an equity transfer agreement with China International Capital Corporation Limited (“CICC”) on 4 November
2016. CICC purchased 100% of shares of China Investment Securities Co., Ltd. through share issuance to Huijin. As at the end of
2016, the relevant procedures were still in process. Upon completion of the above transaction, Huijin will directly hold 58.58% of
the shares of CICC and China Investment Securities Co., Ltd. will be a wholly-owned subsidiary of CICC.
3 On 30 December 2016, China Securities Co., Ltd. exercised over-allotment option. After its completion on 5 January 2017, Huijin
directly held 32.93% of shares of China Securities Co., Ltd.
4 Besides the above companies controlled or held by Huijin, Central Huijin Asset Management Ltd. is a wholly-owned subsidiary of
Huijin. Central Huijin Asset Management Ltd., established in November 2015 and registered in Beijing with registered capital of
RMB5 billion, provides asset management business.

2016 Annual Report 82
Changes in Share Capital and Shareholdings of Shareholders
For further details regarding China Investment Corporation, please refer to the information on its website (www.china-inv.cn). China Investment Corporation was established in 2007. Please refer to the Announcement on Matters Related to the Incorporation of China Investment Corporation published on 9 October 2007 by the Bank for relevant information.
As at 31 December 2016, no other legal-person shareholder held 10% or more voting shares of the Bank (excluding HKSCC Nominees Limited).
Preference Shares
Issuance and Listing of Preference Shares
With the approvals of CBRC (Yinjianfu [2014] No. 563) and CSRC (Zhengjianxuke [2014] No. 938), the Bank made a non-public issuance of RMB39.94 billion (approximately USD6.5 billion) Offshore Preference Shares on 23 October 2014 in the offshore market. Such Offshore Preference Shares have been listed on the Hong Kong Stock Exchange since 24 October 2014.
With the approvals of CBRC (Yinjianfu [2014] No. 562) and CSRC (Zhengjianxuke [2014] No.990), the Bank made a non-public issuance of RMB32 billion Domestic Preference Shares (First Tranche) on 21 November 2014 in the domestic market. With the approval of SSE (Shangzhenghan [2014] No. 818), Domestic Preference Shares (First Tranche) have been traded on the Comprehensive Business Platform of SSE since 8 December 2014. The Bank made a non-public issuance of RMB28 billion Domestic Preference Shares (Second Tranche) on 13 March 2015 in the domestic market. With the approval of SSE (Shangzhenghan [2015] No. 377), Domestic Preference Shares (Second Tranche) have been traded on the Comprehensive Business Platform of SSE since 31 March 2015.
For the terms of issuance of the Offshore Preference Shares and Domestic Preference Shares, please refer to the Bank’s announcements published on the websites of SSE, HKEx and the Bank.
Number of Preference Shareholders and Shareholdings
Number of preference shareholders as at 31 December 2016: 48 (including 47 domestic preference shareholders and 1 offshore preference shareholder)
Number of preference shareholders as at the end of the last month before the disclosure of this report: 48 (including 47 domestic preference shareholders and 1 offshore preference shareholder)
The top ten preference shareholders as at 31 December 2016 are set forth below:
Unit: Share
No. Name of preference shareholder
Changes during
the reporting period
Number ofshares held
as at the end of the reporting
period
Percentage of total
preference shares
Number of shares pledged
or frozen Type of shareholder Type of preference shares1 Bank of New York Mellon Corporation – 399,400,000 39.96% Unknown Foreign legal person Offshore Preference Shares
2 China Mobile Communications Corporation – 180,000,000 18.01% None State-owned legal person Domestic Preference Shares
3 China National Tobacco Corporation – 50,000,000 5.00% None State-owned legal person Domestic Preference Shares
4 Zhongwei Real Estate Co., Ltd. – 30,000,000 3.00% None State-owned legal person Domestic Preference Shares
5 Yunnan Branch of China National Tobacco Corporation – 22,000,000 2.20% None State-owned legal person Domestic Preference Shares
6 China Life Insurance Company Limited — dividend — personal dividend — 005L — FH002SH – 21,000,000 2.10% None Other Domestic Preference Shares
7 China Shuangwei Investment Co., Ltd. – 20,000,000 2.00% None State-owned legal person Domestic Preference Shares
7 National Social Security Fund Portfolio 304 – 20,000,000 2.00% None Other Domestic Preference Shares
7 Bosera Fund — ICBC — Bosera — ICBC — Flexible Allocation No. 5 Specific Multi-customer Assets Management Plan – 20,000,000 2.00% None Other Domestic Preference Shares
10 Ping An Life Insurance Company of China, Ltd. — proprietary fund – 19,000,000 1.90% None
Domestic non-state-owned legal person Domestic Preference Shares

2016 Annual Report83
Changes in Share Capital and Shareholdings of Shareholders
The Bank of New York Mellon Corporation, acting
as the custodian for all the offshore preference
shareholders that maintain an account with Euroclear
and Clearstream as at 31 December 2016, held
399,400,000 Offshore Preference Shares, representing
100% of the Offshore Preference Shares.
Both Yunnan Branch of China National Tobacco
Corporation and China Shuangwei Investment Co.,
Ltd. are wholly-owned subsidiaries of China National
Tobacco Corporation. Zhongwei Real Estate Co., Ltd.
is a subsidiary of China Shuangwei Investment Co.,
Ltd.
Save as disclosed above, the Bank is not aware of
any connected relation or concerted action among
the aforementioned preference shareholders, and
between the aforementioned preference shareholders
and the Bank’s aforementioned top ten ordinary
shareholders.
Profit Distribution of the Preference Shares
For the profit distribution policy of the preference
shares and the profit distribution arrangement during
the reporting period, please refer to the section
“Report of the Board of Directors”.
Other Information regarding the Preference Shares
During the reporting period, there was no redemption,
conversion into ordinary shares or voting rights
recovery in respect of the preference shares of the
Bank.
Preference shares issued by the Bank contain no
contractual obligation to deliver cash or another
financial asset; or to exchange financial assets or
financial liabilities with another entity under conditions
that are potentially unfavourable to the entity;
and preference shares issued are non-derivative
instruments that will be settled in the entity’s own
equity instruments, but includes no contractual
obligation for the entity to deliver a variable number
of its own equity instruments. The Bank classifies
preference shares issued as an equity instrument.
Fees, commissions and other transaction costs of
preference shares issuance are deducted from equity.
The dividends on preference shares are recognised as
profit distribution at the time of declaration.
The funds raised from the issuance of the Offshore
Preference Shares and Domestic Preference Shares
have been fully used to replenish the Bank’s additional
tier 1 capital and increase its capital adequacy ratio.
Issuance of Other Securities
Please refer to Note V.30 to the Consolidated Financial
Statements for details of the bonds issued by the
Bank.
No shares of the Bank have been specifically issued to
its employees.

Directors, Supervisors and Senior Management Members
2016 Annual Report 84
Basic Information
Incumbent Directors, Supervisors and Senior Management Members
Name Year of birth Gender Position Term of office
TIAN Guoli 1960 Male Chairman From May 2013 to the date of the Annual General Meeting in 2019CHEN Siqing 1960 Male Vice Chairman and President From April 2014 to the date of the Annual General Meeting in 2017REN Deqi 1963 Male Executive Director and
Executive Vice PresidentFrom December 2016 to the date of the Annual General Meeting in 2019
GAO Yingxin 1962 Male Executive Director and Executive Vice President
From December 2016 to the date of the Annual General Meeting in 2019
ZHANG Xiangdong 1957 Male Non-executive Director From July 2011 to the date of the Annual General Meeting in 2017ZHANG Qi 1972 Male Non-executive Director From July 2011 to the date of the Annual General Meeting in 2017LIU Xianghui 1954 Male Non-executive Director From October 2014 to the date of the Annual General Meeting in 2017LI Jucai 1964 Male Non-executive Director From September 2015 to the date of the Annual General Meeting in 2018Nout WELLINK 1943 Male Independent Director From October 2012 to the date of the Annual General Meeting in 2018LU Zhengfei 1963 Male Independent Director From July 2013 to the date of the Annual General Meeting in 2019LEUNG Cheuk Yan 1951 Male Independent Director From September 2013 to the date of the Annual General Meeting in 2019WANG Changyun 1964 Male Independent Director From August 2016 to the date of the Annual General Meeting in 2019Angela CHAO 1973 Female Independent Director From January 2017 to the date of the Annual General Meeting in 2019WANG Xiquan 1960 Male Chairman of the Board of Supervisors From November 2016 to the date of the Annual General Meeting in 2019WANG Xueqiang 1957 Male Shareholder Supervisor From August 2004 to the date of the Annual General Meeting in 2019LIU Wanming 1958 Male Shareholder Supervisor From August 2004 to the date of the Annual General Meeting in 2019DENG Zhiying 1959 Male Employee Supervisor From August 2010 to the date of the 2019 Employee Delegates’ MeetingGAO Zhaogang 1969 Male Employee Supervisor From April 2016 to the date of the 2019 Employee Delegates’ MeetingXIANG Xi 1971 Female Employee Supervisor From August 2012 to the date of the 2019 Employee Delegates’ MeetingCHEN Yuhua 1953 Male External Supervisor From June 2015 to the date of the Annual General Meeting in 2018XU Luode 1962 Male Executive Vice President From June 2015ZHANG Qingsong 1965 Male Executive Vice President and
Chief Information OfficerExecutive Vice President from November 2016 and Chief Information Officer from March 2017
LIU Qiang 1971 Male Executive Vice President From November 2016FAN Dazhi 1964 Male Secretary of Party Discipline Committee From December 2016PAN Yuehan 1964 Male Chief Risk Officer From April 2016XIAO Wei 1960 Male Chief Audit Officer From November 2014GENG Wei 1963 Male Secretary to the Board of Directors and
Company SecretarySecretary to the Board of Directors from June 2015 and Company Secretary from October 2015
Note: During the reporting period, no director, supervisor or senior management member held any share of the Bank.
Former Directors, Supervisors and Senior Management Members
Name Year of birth Gender Position held before leaving the post Term of office
ZHU Hexin 1968 Male Executive Director and Executive Vice President From February 2016 to June 2016
WANG Yong 1962 Male Non-executive Director From July 2013 to September 2016
WANG Wei 1957 Male Non-executive Director From September 2014 to January 2017
CHOW Man Yiu, Paul 1946 Male Independent Director From October 2010 to August 2016
Jackson TAI 1950 Male Independent Director From March 2011 to September 2016
LI Jun 1956 Male Chairman of the Board of Supervisors From March 2010 to November 2016
LIU Xiaozhong 1956 Male Employee Supervisor From August 2012 to April 2016
ZHANG Lin 1956 Female Secretary of Party Discipline Committee From August 2004 to July 2016
ZHANG Jinliang 1969 Male Executive Vice President From July 2014 to January 2016
Note: No former director, supervisor or senior management member held any share of the Bank during their terms of office.

Directors, Supervisors and Senior Management Members
2016 Annual Report85
Remuneration of Directors, Supervisors and Senior Management Members Paid in 2016
Name Position
Remuneration before tax from the Bank in 2016 (Unit: RMB ten thousand)Whether
remunerated by
shareholding companies or
other connected
partiesRemuneration
paid
Contribution by the employer to social insurance,
enterprise annuity, supplementary
medical insurance and housing
provident fund
Other monetary
income Total
Incumbent Directors, Supervisors and Senior Management MembersTIAN Guoli Chairman 48.44 17.68 – 66.12 No
CHEN Siqing Vice Chairman and President 48.44 17.49 – 65.93 No
REN Deqi Executive Director and Executive Vice President 43.60 13.96 – 57.56 No
GAO Yingxin Executive Director and Executive Vice President 43.60 15.65 – 59.25 No
ZHANG Xiangdong Non-executive Director – – – – Yes
ZHANG Qi Non-executive Director – – – – Yes
LIU Xianghui Non-executive Director – – – – Yes
LI Jucai Non-executive Director – – – – Yes
Nout WELLINK Independent Director 50.00 – – 50.00 No
LU Zhengfei Independent Director 51.39 – – 51.39 Yes
LEUNG Cheuk Yan Independent Director 40.00 – – 40.00 No
WANG Changyun Independent Director 12.98 – – 12.98 Yes
Angela CHAO Independent Director – – – – –
WANG Xiquan Chairman of the Board of Supervisors 4.04 1.06 – 5.10 No
WANG Xueqiang Shareholder Supervisor 77.63 33.01 4.58 115.22 No
LIU Wanming Shareholder Supervisor 72.63 31.50 4.58 108.71 No
DENG Zhiying Employee Supervisor 5.00 – – 5.00 No
GAO Zhaogang Employee Supervisor 3.75 – – 3.75 No
XIANG Xi Employee Supervisor 5.00 – – 5.00 No
CHEN Yuhua External Supervisor 18.00 – – 18.00 No
XU Luode Executive Vice President 43.60 13.96 – 57.56 No
ZHANG Qingsong Executive Vice President and Chief Information Officer 3.63 1.17 – 4.80 No
LIU Qiang Executive Vice President 3.63 1.05 – 4.68 No
FAN Dazhi Secretary of Party Discipline Committee – – – – No
PAN Yuehan Chief Risk Officer 55.22 23.47 3.30 81.99 No
XIAO Wei Chief Audit Officer 82.83 37.03 4.22 124.08 No
GENG Wei Secretary to the Board of Directors and Company Secretary 78.89 31.25 4.58 114.72 No
Former Directors, Supervisors and Senior Management MembersZHU Hexin Executive Director and
Executive Vice President 18.17 6.07 – 24.24 No
WANG Yong Non-executive Director – – – – Yes
WANG Wei Non-executive Director – – – – Yes
CHOW Man Yiu, Paul Independent Director 30.00 – – 30.00 Yes
Jackson TAI Independent Director 26.67 – – 26.67 Yes
LI Jun Chairman of the Board of Supervisors 44.40 17.99 – 62.39 No
LIU Xiaozhong Employee Supervisor 1.67 – – 1.67 No
ZHANG Lin Secretary of Party Discipline Committee 21.80 9.95 – 31.75 No
ZHANG Jinliang Executive Vice President 3.63 1.21 – 4.84 No

Directors, Supervisors and Senior Management Members
2016 Annual Report 86
Notes:
1 In accordance with the government regulations, since 1 January 2015, the Bank remunerates Chairman of the Board of Directors, President, Chairman of the Board of Supervisors, executive directors, Secretary of Party Discipline Committee and executive vice presidents pursuant to the rules on remuneration reform for central enterprises.
2 The 2016 final remuneration for Chairman of the Board of Directors, President, Chairman of the Board of Supervisors, executive directors, shareholder supervisors and other senior management remembers is to be determined and will be disclosed in an additional announcement by the Bank.
3 The Bank remunerates directors, supervisors and senior management members who are employed by the Bank with salaries, bonuses, contribution by the employer to social insurance, enterprise annuity, supplementary medical insurance and housing provident fund, as well as other monetary income. Independent directors receive directors’ remunerations and allowances. Other directors are not remunerated by the Bank. Chairman of the Board of Directors, executive directors and senior management members do not receive any remuneration from the Bank’s subsidiaries.
4 Independent directors receive remuneration in accordance with the resolution of the 2007 Annual General Meeting. External supervisors receive remuneration in accordance with the resolution of the 2009 Annual General Meeting. Remuneration for shareholder supervisors is in accordance with relevant remuneration scheme of the Bank and approved by the shareholders’ meeting.
5 In 2016, Non-executive Directors Mr. ZHANG Xiangdong, Mr. ZHANG Qi, Mr. LIU Xianghui, Mr. LI Jucai, Mr. WANG Yong and Mr. WANG Wei were not remunerated by the Bank.
6 Some independent directors of the Bank served as independent non-executive directors of other legal entities or organisations, which caused such legal entities or organisations to be defined as connected parties of the Bank. Save as disclosed above, none of the directors, supervisors or senior management members of the Bank was remunerated by the connected parties of the Bank during the reporting period.
7 The above persons’ remuneration is calculated on the basis of their actual time working as directors, supervisors or senior management members of the Bank in 2016. Employee supervisors’ remuneration above is paid for their service as supervisors of the Bank during the reporting period.
8 For the starting time of the term of office of the above-mentioned directors, supervisors and senior management members, please refer to the section “Basic Information”. Mr. FAN Dazhi began to serve as Secretary of Party Discipline Committee of the Bank as of 27 December 2016. Ms. Angela CHAO began to serve as Independent Director of the Bank as of 4 January 2017. During the reporting period, Mr. FAN Dazhi and Ms. Angela CHAO were not remunerated by the Bank.
9 The Bank incurred RMB12.3340 million in remuneration to its directors, supervisors and senior management members’ services in 2016.
Positions held in Shareholding Companies by Directors, Supervisors and Senior Management Members
From 1 January 2016 to 23 December 2016, Non-executive Director Mr. ZHANG Xiangdong served as Director
of the Bank of China Equity Investment Management Division of Banking Institutions Department I, Huijin. Save
as disclosed above, in 2016, none of the Bank’s directors, supervisors or senior management members held any
position in the shareholding companies of the Bank.

Directors
2016 Annual Report87
1
2 3 4
5 6 7
8

Directors
2016 Annual Report 88
1 TIAN Guoli Chairman
Chairman of the Board of Directors since May 2013. Mr. TIAN joined the Bank in April 2013. From December
2010 to April 2013, Mr. TIAN served as Vice Chairman of the Board of Directors and General Manager of China
CITIC Group. During this period, he also served as Chairman of the Board of Directors and Non-executive Director
of China CITIC Bank. From April 1999 to December 2010, Mr. TIAN served successively as Vice President and
President of China Cinda Asset Management Company, and Chairman of the Board of Directors of China Cinda
Asset Management Co., Ltd. From July 1983 to April 1999, Mr. TIAN held various positions in China Construction
Bank (“CCB”), including sub-branch general manager, deputy branch general manager, department general
manager of the CCB Head Office, and Executive Assistant President of CCB. Mr. TIAN has been serving as
Chairman of the Board of Directors and a Non-executive Director of BOC Hong Kong (Holdings) Limited since June
2013. Mr. TIAN received a Bachelor’s Degree in Economics from Hubei Institute of Finance and Economics in 1983.
He holds the title of Senior Economist.
2 CHEN Siqing Vice Chairman and President
Vice Chairman of the Board of Directors since April 2014 and President of the Bank since February 2014. Mr. CHEN
joined the Bank in 1990 and served as Executive Vice President of the Bank from June 2008 to February 2014. Mr.
CHEN held various positions in the Bank from June 2000 to May 2008, including Assistant General Manager and
Vice General Manager of the Fujian Branch, General Manager of the Risk Management Department of the Head
Office and General Manager of the Guangdong Branch. Mr. CHEN previously worked in the Hunan Branch of the
Bank before he was dispatched to the Hong Kong Branch of China and South Sea Bank Ltd. as Assistant General
Manager. Since December 2011, Mr. CHEN has been serving as a Non-executive Director of BOC Hong Kong
(Holdings) Limited and Chairman of the Board of Directors of BOC Aviation Limited. Mr. CHEN has been serving as
Vice Chairman of the Board of Directors of BOCHK (Holdings) since March 2014. Mr. CHEN graduated from Hubei
Institute of Finance and Economics in 1982. He obtained an MBA from Murdoch University, Australia in 1999. He is
a Certified Public Accountant and holds the title of Senior Economist.
3 REN Deqi Executive Director and Executive Vice President
Executive Director of the Bank since December 2016 and Executive Vice President of the Bank since July 2014. Mr.
REN joined the Bank in 2014. He worked in China Construction Bank (“CCB”) for many years and held various
positions. From October 2013 to May 2014, Mr. REN served as General Manager of Risk Management Department
of CCB. From August 2003 to October 2013, Mr. REN successively served as Deputy General Manager of Credit
Approval Department, General Manager of Risk Control Department, General Manager of Credit Management
Department, and General Manager of the Hubei Branch of CCB. Mr. REN has been serving as a Non-executive
Director of BOC Hong Kong (Holdings) Limited since October 2015, and President of Shanghai RMB Trading Unit
since September 2016. He obtained a Master’s Degree in Engineering from Tsinghua University in 1988. He holds
the title of Senior Economist.

Directors
2016 Annual Report89
4 GAO Yingxin Executive Director and Executive Vice President
Executive Director of the Bank since December 2016 and Executive Vice President of the Bank since May 2015.
Mr. GAO joined the Bank in 1986. He served as Executive Director and Deputy Chief Executive of BOC Hong Kong
(Holdings) Limited and Bank of China (Hong Kong) Limited from February 2005 to March 2015, as President and
Chief Operating Officer of BOC International Holdings Limited from July 2004 to February 2005, and as Deputy
General Manager of the Credit Business Department of the Head Office and Deputy General Manager and General
Manager of the Corporate Banking Department of the Head Office from September 1996 to July 2004. Mr. GAO
has been serving as a Non-executive Director of BOCHK (Holdings) since March 2015 and has been serving as
Chairman of BOC International Holdings Limited, Bank of China (UK) Limited and Bank of China (Luxembourg)
S.A. since August 2015, and has been severing as Chairman of BOC International (China) Limited since September
2016. Currently, Mr. GAO also serves as Chairman of the Board of Directors of China Culture Industrial Investment
Fund Co., Ltd. Mr. GAO graduated from East China University of Science and Technology in 1986 with a Master’s
Degree in Engineering. He holds the title of Senior Economist.
5 ZHANG Xiangdong Non-executive Director
Non-executive Director of the Bank since July 2011. Mr. ZHANG served as a non-executive director of China
Construction Bank Corporation from November 2004 to June 2010, and served as Chairman of the Risk
Management Committee under its Board of Directors from April 2005 to June 2010. From August 2001 to
November 2004, Mr. ZHANG worked as Vice President of PBOC’s Haikou Central Sub-branch and concurrently
served in the SAFE as Deputy Director General of Hainan Province Branch and Deputy Director General and
Inspector of the General Affairs Department. Mr. ZHANG served as a member of the Stock Offering Approval
Committee of CSRC from September 1999 to September 2001. He served as a member of China International
Economic and Trade Arbitration Commission from January 2004 to December 2008. Mr. ZHANG graduated from
Renmin University of China with a Bachelor’s degree in Law in 1986. He completed his post-graduate studies in
international economic law at Renmin University of China in 1988, and was awarded a Master’s degree in Law in
1990. Mr. ZHANG holds the professional title of senior economist and is qualified to practice law in China.
6 ZHANG Qi Non-executive Director
Non-executive Director of the Bank since July 2011. Mr. ZHANG worked in Central Expenditure Division One,
Comprehensive Division of the Budget Department, and Ministers’ Office of the General Office of Ministry of
Finance, as well as in the Operation Department of China Investment Corporation, serving as Deputy Director,
Director and Senior Manager from 2001 to 2011. Mr. ZHANG studied in the Investment Department and Finance
Department of China Northeast University of Finance and Economics from 1991 to 2001, and obtained the
Bachelor’s degree, Master’s degree and Doctorate in Economics respectively in 1995, 1998 and 2001.

Directors
2016 Annual Report 90
7 LIU Xianghui Non-executive Director
Non-executive Director of the Bank since October 2014. Mr. LIU served as the external supervisor of China Cinda
Asset Management Co., Ltd. from June 2013 to June 2014. He served as the non-executive director of China Cinda
Asset Management Company from June 2010 to June 2013, and non-executive director of China Construction
Bank Corporation from September 2004 to June 2010. From September 1978 to May 1994, he held various
positions at the State Economic Commission and the State Planning Commission and he worked for half a year
at the United States Environmental Protection Agency in 1993. From May 1994 to September 2004, he worked
consecutively as the division chief of the Industry and Transportation Group, assistant inspector (deputy director-
general level) and inspector (director-general level) of the Economic and Trade Group under the Office of Central
Leading Group on the Financial and Economic Affairs. Mr. LIU graduated from Liaoning University in August 1978,
and studied the senior courses of national economic planning at the Central College of Planning and Statistics of
Poland from October 1989 to February 1990. He also studied modern economic management at Beijing Economic
Correspondence University from April 1985 to April 1986. Mr. LIU is a senior economist.
8 LI Jucai Non-executive Director
Non-executive Director of the Bank since September 2015. Mr. LI served as Party Committee Member and
Secretary of Party Discipline Committee of the Information Network Center under the Ministry of Finance from
December 2014 to September 2015. He acted as the specialised Deputy Secretary of Party Committee of the
Information Network Center under the Ministry of Finance from April 2010 to December 2014. From November
1996 to April 2010, he had successively been the Deputy Head of the Science Division of the Culture, Education
and Administration Department, Division Head of the Investment Evaluation Center, Director of Administration
Office and Head of the Administrative Division of the Information Network Center under the Ministry of Finance.
Mr. LI majored in Finance in China Northeast University of Finance and Economics and graduated with a Bachelor’s
degree in 1986. Mr. LI has qualification of senior economist.

Directors
2016 Annual Report91
9 10 11
12 13

Directors
2016 Annual Report 92
9 Nout WELLINK Independent Director
Independent Director of the Bank since October 2012. Mr. WELLINK served as a member of the Executive Board
of the Dutch Central Bank (“DNB”) for almost 30 years, the last 14 years as its President. He retired from DNB
on 1 July 2011. DNB is part of the European System of Central Banks since 1999, but still holds supervision on
national pension funds and insurance companies. Since the establishment of the European Monetary Union, Mr.
WELLINK served as a member of the Governing Council of the European Central Bank (“ECB”). Starting from
1997, Mr. WELLINK served as a member of the Board of Directors of the Bank for International Settlements,
which he chaired from 2002 to 2006. From 2006 to 2011, he also chaired the Basel Committee on Banking
Supervision. From 1997 to 2011, Mr. WELLINK was a member of the Group of Ten Central Bank Governors and
Governor of the International Monetary Fund. Prior to his appointment in 1982 as an executive director of DNB,
Mr. WELLINK held several posts in the Dutch Ministry of Finance, including as the Treasurer General from 1977
to 1982. After studying Dutch law at Leyden University from 1961 to 1968 with a Master’s degree obtained,
Mr. WELLINK obtained a doctor’s degree in economics at the Rotterdam Erasmus University in 1975. In 2008 he
received an honorary doctorate from Tilburg University. From 1988 to 1998, Mr. WELLINK was an Extraordinary
Professor at the Free University in Amsterdam. Mr. WELLINK is currently Vice Chairman of Supervisory Board of
PricewaterhouseCoopers Accountants N.V., and Member of Advisory Board of Systemic Risk Council. Mr. WELLINK
had served many additional functions in the past, including member of the supervisory board of a bank, a re-
insurance company and other enterprises on behalf of the Dutch authorities, Chairman of the Board of Supervisors
of the Netherlands Open Air Museum, member and treasurer of the Royal Picture Gallery Mauritshuis and the
Westeinde Hospital in The Hague. He was awarded a Knighthood in the Order of the Netherlands Lion in 1980 and
is Commander of the Order of Orange-Nassau since 2011.
10 LU Zhengfei Independent Director
Independent Director of the Bank since July 2013. Mr. LU currently serves as the distinguished professor of
Cheung Kong Scholar of Guanghua School of Management, Peking University. He served as the head of the
Accounting Department of the School of Business, Nanjing University between 1994 and 1999, and the head of
the Accounting Department of Guanghua School of Management, Peking University between 2001 and 2007,
and Associate Dean of Guanghua School of Management, Peking University between 2007 and 2014. Mr. LU
also currently serves as an executive director of the Accounting Society of China and Deputy Director of Financial
Management Committee, an editorial board member of Accounting Research and Audit Research, and a member
of the Disciplinary Committee of the Chinese Institute of Certified Public Accountants. In 2001, he was elected as
a member of “The Hundred People Project of Beijing New Century Social Science Theoretical Talent”. In 2005, he
was elected to the “New Century Excellent Talent Support Plan” of the Ministry of Education, PRC. In 2013, he
was elected to the “Renowned Expert Training Project” (first batch) of the Ministry of Finance. In 2014, he was
elected as distinguished professor of Cheung Kong Scholar of the Ministry of Education, PRC. He currently serves
as an independent non-executive director or an independent supervisor of a number of companies listed on the
Hong Kong Stock Exchange, including: Independent Non-executive Director of Sinotrans Ltd. since September
2004, Independent Non-executive Director of Sino Biopharmaceutical Ltd. since November 2005, Independent
Non-executive Director of China National Materials Co., Ltd. since December 2009, and Independent Supervisor
of PICC Property and Casualty Co., Ltd. (“PICC P&C”) since January 2011. He was an independent non-executive
director of PICC P&C from February 2004 to December 2010. Mr. LU graduated from Renmin University of
China in 1988 with a Master’s degree in Economics (Accounting), and received his Doctor’s degree in Economics
(Management) from Nanjing University in 1996.

Directors
2016 Annual Report93
11 LEUNG Cheuk Yan Independent Director
Independent Director of the Bank since September 2013. He is a former partner of Baker & McKenzie, which he
joined in July 1987 and from which he retired in June 2011. During 2009 and 2010, he had served as a part-time
member of the Central Policy Unit of The Hong Kong Special Administrative Region Government. Mr. LEUNG has
been an independent non-executive director of MMG Limited, which is listed on The Stock Exchange of Hong
Kong Limited, since July 2012. Mr. LEUNG graduated from The Chinese University of Hong Kong with a Bachelor
of Social Science degree (First Class Honours) in 1976, obtained a Master of Philosophy degree from The University
of Oxford in 1981 and completed his legal study at The College of Law in England in 1982. He was admitted to
practice as a solicitor in Hong Kong in 1985, in England and Wales in 1988, in the Australian Capital Territory in
1989 and in Victoria, Australia in 1991. He is a Senior Associate Member of St. Antony’s College, Oxford.
12 WANG Changyun Independent Director
Independent Director of the Bank since August 2016. Mr. WANG currently serves as professor and doctoral
supervisor in finance at Renmin University of China (“RUC”). He served as a lecturer at RUC from 1989 to 1995
and as a lecturer at Business School, National University of Singapore from 1999 to 2005. He served successively
as the Chair of Applied Finance Department of RUC, Director of China Financial Policy Research Center (a key
research base of Ministry of Education) and Executive Vice Dean of Hanqing Advanced Institute of Economics
and Finance at RUC from 2006 to 2016. Mr. WANG is currently also the Vice Chairman of China Investment
Specialty Construction Association, Director of China Finance Annual Meeting Committee, Director of China
Finance Association, Deputy Editor of Finance Research Quarterly, Deputy Editor of China Finance Research, and
Deputy Editor of China Financial Review. He also serves as the standing committee member of Beijing Haidian
District People’s Political Consultative Conference, the Central Committee member of China Democratic League,
the special auditor of State Auditing Administration, the independent non-executive director of Hope Commercial
Factoring Co., Ltd., Sichuan Star Cable Co., Ltd. and Beijing Haohua Energy Resource Co., Ltd. Mr. WANG has
received social recognition and prizes including the Special Government Allowance of State Council, Best Paper
Award of Chicago Board of Trade in 2001, and the “Middle Age Experts with National Outstanding Contribution”,
membership of “the Program for New Century Excellent Talents” of Ministry of Education in 2004, “Financial
Support of National Science Fund for Distinguished Young Scholars” in 2007, a member of the “New Century
National Hundred, Thousand and Ten Thousand Talent Program” in 2013, and the “Cheung Kong Distinguished
Professor” of Ministry of Education in 2014. He obtained his Master degree in economics from RUC in July 1989
and Doctorate in Financial Economics from the University of London in January 1999.

Directors
2016 Annual Report 94
13 Angela CHAO Independent Director
Independent Director of the Bank since January 2017. Ms. CHAO serves as Deputy Chairman of Foremost Group
where she is responsible for international shipping finance, strategy, chartering and ship management and
operations. From 1994 to 1996, Ms. CHAO worked in the mergers & acquisitions department of Smith Barney,
which is now Morgan Stanley Smith Barney. From 1996 to 1999, Ms. CHAO served as deputy general manager
of Foremost Group, and from 2001 to 2008, Ms. CHAO had successively served as vice president and senior vice
president of Foremost Group. Since 2008, she has served as deputy chairman of Foremost Group. In May 2005,
Ms. CHAO was unanimously voted to be BIMCO39’s (The Baltic and International Maritime Council 39) Counsellor.
In September 2005, she was selected as “Eminent Young Overseas Chinese” by the Overseas Chinese Affairs
Office of the State Council of China. In November 2007, she was invited as speaker of World Shipping (China)
Summit. In April 2011, she became a Founding Member of the Wall Street Journal’s Task Force on Women in
the Economy. Ms. CHAO currently serves on the Boards of The Metropolitan Opera, Museum of Modern Art PS1,
the UK P&I Marine Insurance Mutual, Foremost Foundation, Shanghai Mulan Education Foundation, and she also
serves on the Harvard Business School’s Board of Dean’s Advisors, Carnegie-Tsinghua Center for Global Policy
Board of Advisors, Lincoln Center Global’s China Advisory Council, the Chairman’s Council of the Metropolitan
Museum of Art and American Bureau of Shipping Council. In addition, she is also a member of the Council on
Foreign Relations, serves on the Young Leaders Forum of the National Committee on US-China Relations and
serves as the member of Shanghai Jiao Tong University’s Antai College of Economics and Management Advisory
Board, and honorary chairperson of the Jiao Tong University Alumni Association in America. Ms. CHAO graduated
from Harvard College in three years in 1994 with a Bachelor’s degree in economics (Magna Cum Laude), and
received her Master of Business Administration degree from Harvard Business School in 2001.

Supervisors
2016 Annual Report95
1
2 3 4
5 6 7

Supervisors
2016 Annual Report 96
1 WANG Xiquan Chairman of the Board of Supervisors
Chairman of the Board of Supervisors of the Bank since November 2016 and Vice Party Secretary of the Bank since June 2016. Mr. WANG previously served in several positions at Industrial and Commercial Bank of China Limited (“ICBC”) for many years. He served as the Executive Vice President of ICBC from September 2012 to July 2016 and Executive Director from June 2015 to July 2016. Mr. WANG served as a member of the senior management of ICBC from April 2010 to September 2012. Between September 1999 and April 2010, he successively served as Deputy Head of the Hebei Branch of ICBC, General Manager of Risk Management Department, General Manager of Internal Audit Bureau, and General Manager of Human Resource Department. Mr. WANG graduated from Shanxi Institute of Finance and Economics in 1983 and received a Doctorate degree in Management from Nanjing University in 2009. He holds the title of Senior Economist.
2 WANG Xueqiang Shareholder Supervisor
Shareholder Supervisor of the Bank since August 2004 and Head of the Office of Board of Supervisors since April 2005. Mr. WANG served as Deputy Director General Supervisor and Director General Supervisor of the Bank from July 2003 to August 2004 before the Bank’s corporate restructuring. Mr. WANG served as Deputy Director General Supervisor at Agricultural Development Bank of China from October 2001 to July 2003, and worked with the Central Financial Working Commission from October 2000 to October 2001. From November 1996 to September 2000, Mr. WANG worked with Hong Kong Gang Ao International (Holdings) Co., Ltd. and Hong Kong Fujian Group Limited in succession. Prior to that, Mr. WANG worked with the Ministry of Finance from August 1985 to October 1996. Mr. WANG graduated from China Central University of Finance and Economics in 1985 and obtained his Doctorate in Economics from Public Finance Institute of the Ministry of Finance in 2008. Mr. WANG is a senior accountant and Certified Public Accountant, accredited by the Chinese Institute of Certified Public Accountants.
3 LIU Wanming Shareholder Supervisor
Shareholder Supervisor of the Bank since August 2004 and Deputy General Manager of the Office of Board of Supervisors since April 2005. Since January 2014, Mr. LIU has served as Deputy General Manager of the Audit Department of the Head Office of the Bank. From November 2001 to August 2004, Mr. LIU was designated by the State Council to serve as Director Supervisor and a Deputy Director General Supervisor at Bank of Communications and the Bank respectively. From August 1984 to November 2001, he worked with the National Audit Office, Agricultural Development Bank of China and the Central Financial Working Commission. Mr. LIU received a Bachelor’s degree in Economics from Jiangxi University of Finance and Economics in 1984.
4 DENG Zhiying Employee Supervisor
Employee Supervisor of the Bank since August 2010. Mr. DENG currently serves as General Manager of the Supervisory Department in the Bank’s Head Office. Mr. DENG has served as Deputy General Manager of the Supervisory Department in the Bank’s Head Office from July 2008 to July 2010. From June 2007 to July 2008, Mr. DENG served as a member of the Party Committee and as secretary of the Party Discipline Committee in the Tianjin Branch of the Bank. From February 2008 to July 2008, Mr. DENG also served as the Director of the Labour Union of the branch. From June 1993 to June 2007, Mr. DENG worked in the Supervisory Office, the Inspection and Audit Department and the Supervisory Department of the Bank’s Head Office. From August 1984 to June 1993, Mr. DENG worked in the Party Discipline Committee. Mr. DENG received a Bachelor’s degree in History from Nankai University in 1984.

Supervisors
2016 Annual Report97
5 GAO Zhaogang Employee Supervisor
Employee Supervisor of the Bank since April 2016. Mr. GAO is currently the General Manager of the Human
Resources Department of the Bank. Mr. GAO worked in the Organization Department of the CPC Central
Committee from January 2001 to July 2014, successively serving as a Consultant (of deputy head level) of the
Office of Enterprise Cadres, the Deputy Head, Head and Deputy Inspector of the Bureau Five of Cadres. From
December 1998 to January 2001, he served as the Deputy Head of Development Research Department of China
National Petroleum Corporation. Mr. GAO worked in Dagang Oilfield and China National Petroleum Company
from July 1992 to December 1998. Mr. GAO graduated from Xi’an Shiyou Institute in 1992 and obtained
Doctorate in Management Science and Engineering from Beijing University of Technology in 2012.
6 XIANG Xi Employee Supervisor
Employee Supervisor of the Bank since August 2012. Ms. XIANG is currently Deputy General Manager and Chief
Financial Officer of Jiangsu Branch of the Bank. She previously held the following various positions in the Bank,
including Deputy General Manager and Chief Financial Officer of Suzhou Branch of the Bank from March 2010
to June 2015, a member of the CPC Committee, Deputy General Manager and Chief Financial Officer of Suzhou
Branch from July 2005 to March 2010, Assistant to General Manager of the Suzhou Branch from March 2003 to
July 2005, Deputy General Manager and General Manager of High-tech Industrial Development Zone Sub-branch
of the Suzhou Branch from October 2000 to July 2005, cadre, deputy group chief, section chief, Deputy Director
and Deputy General Manager of the International Trade Settlement Division of the Suzhou Branch from July
1993 to October 2000. Ms. XIANG graduated from the Department of English of East China University of Science
and Technology in 1993, and obtained an MBA Degree jointly conferred by Fudan University and University of
Washington in December 2004.
7 CHEN Yuhua External Supervisor
External Supervisor of the Bank since June 2015. Mr. CHEN served as Vice President of China Cinda Asset
Management Co., Ltd. from December 2008 to August 2013. Mr. CHEN served as Chairman of China Cinda
Investment Co., Ltd. from April 2004 to December 2008. Mr. CHEN served as Head of the Equity Department of
China Cinda Asset Management Company and General Manager of China Cinda Investment Co., Ltd from March
2000 to April 2004. Mr. CHEN served as President of China Cinda Trust & Investment Company from December
1996 to March 2000. Mr. CHEN served as Deputy General Manager of the Personnel Department and Deputy
General Manager of the Personnel & Training Department of China Construction Bank (CCB) Head Office from
April 1994 to December 1996. Mr. CHEN served as Division Head of the Construction Economy Department of
CCB Head Office and General Manager of CCB Real Estate Consulting Corporation from March 1992 to March
1994. Mr. CHEN served as Deputy Head of the Construction Economy Division, Deputy Head of the Real Estate
Credit Department and Head of a direct sub-branch of CCB Sichuan Branch from August 1986 to March 1992. Mr.
CHEN graduated from Zhongnan University of Finance and Economics in 1986 and received a Master’s degree in
Economics.

Senior Management Members
2016 Annual Report 98
1
2 3 4
5 6 7

Senior Management Members
2016 Annual Report99
1 CHEN Siqing Vice Chairman and President
Please refer to the section “Directors”.
2 REN Deqi Executive Director and Executive Vice President
Please refer to the section “Directors”.
3 GAO Yingxin Executive Director and Executive Vice President
Please refer to the section “Directors”.
4 XU Luode Executive Vice President
Executive Vice President of the Bank since June 2015. Mr. XU joined the Bank in 2015. From August 2013 to April
2015, he served as President of Shanghai Gold Exchange. Mr. XU worked as Vice Chairman and President of China
Unionpay from August 2007 to August 2013. He also worked in the People’s Bank of China (“PBOC”) for many
years. The positions he held in PBOC included Director of the Payment and Settlement Department from October
2003 to August 2007 and Deputy Director of the General Executive Office from March 1999 to October 2003. Mr.
XU has been serving as Chairman of Bank of China Consumer Finance Company Limited, Non-executive Director
of BOC Hong Kong (Holdings) Limited, and Chairman of Expresspay Co., Ltd. since July 2015, October 2015, and
April 2016, respectively. Mr. XU graduated from Hunan University of Finance and Economics with a Bachelor’s
Degree in Economics in 1983. He has the qualification of Senior Accountant.
5 ZHANG Qingsong Executive Vice President and Chief Information Officer
Executive Vice President of the Bank since November 2016 and Chief Information Officer of the Bank since March
2017. Mr. ZHANG joined the Bank in 1990. He served as General Manager of the Clearing Department of the
Bank from March 2014 to July 2016, and served as General Manager of Singapore Branch from December 2011
to June 2014. From March 2006 to December 2011, he successively served as Deputy General Manager of the
Asset-Liability Management Department, Deputy General Manager of the Treasury, Director of the Global Markets
Department, Director (Securities Investment) of the Global Markets Unit, General Manager (Securities Investment)
of the Global Markets Unit, and also as General Manager of Hong Kong Trading Center (Hong Kong Branch) from
July 2009 to December 2011. He graduated from Graduate School of People’s Bank of China with a Master’s
degree in Economics in 1990. He holds the title of Associate Researcher.

Senior Management Members
2016 Annual Report 100
6 LIU Qiang Executive Vice President
Executive Vice President of the Bank since November 2016. Mr. LIU joined the Bank in 2016. He worked in
Agricultural Bank of China (“ABC”) for many years and held various positions. He served as General Manager
of the Shanghai Branch of ABC from July 2015 to July 2016 and also as Executive Deputy Director of Shanghai
Management Department of ABC from September 2015 to July 2016. From June 2005 to June 2015, he
successively served as Deputy General Manager and General Manager of Business Department, General Manager
of Important Client Department, and Deputy General of Beijing Branch, General Manager of the Asset-Liability
Management Department/County Area Capital and Funds Management Center, and also served as Chairman of
the Board of Supervisors of ABC Financial Leasing Co.,Ltd. He graduated from China Agricultural University in 1993
and obtained a Master’s degree in Agriculture from China Agricultural University in 1997. He holds the title of
Senior Economist.
7 FAN Dazhi Secretary of Party Discipline Committee
Secretary of Party Discipline Committee of the Bank since December 2016. Mr. FAN joined the Bank in 2016.
He served as Chairman of the Board of Directors of Hua Xia Bank since November 2016. From August 2007 to
November 2016, he served as Director, Vice President, and President of Hua Xia Bank. From January 2004 to
August 2007, he served as Director and General Manager of Beijing Securities Co,.Ltd. From December 1999
to January 2004, Mr. FAN successively served as Deputy Head of Beijing Overseas Financing and Investment
Management Center, Director and Deputy General Manager of Beijing State-owned Assets Management Co.,Ltd.
He graduated from Dongbei University of Finance and Economics in 1987, and graduated from Graduate School of
China Academy of Social Sciences with a Doctor’s degree in Economics in 2012. He has the qualification of Senior
Accountant.

Senior Management Members
2016 Annual Report101
8 PAN Yuehan Chief Risk Officer
Chief Risk Officer of the Bank since April 2016. Mr. PAN joined the Bank in 1984. He served as General Manager of the Shanghai Branch of the Bank from March 2011 to November 2015 and concurrently as Vice President of Shanghai RMB Trading Unit of the Bank from March 2012 to November 2015. From April 2009 to March 2011, he served as General Manager of the Suzhou Branch of the Bank. He previously served as the Deputy General Manager and Chief Financial Officer of the Jiangsu Branch of the Bank. He obtained a Master’s Degree from China Europe International Business School in 2008.
9 XIAO Wei Chief Audit Officer
Chief Audit Officer of the Bank since November 2014. Mr. XIAO joined the Bank in 1994, and served as General Manager of Financial Management Department of the Bank’s Head Office from November 2009 to November 2014. Mr. XIAO served as Deputy General Manager of the Beijing Branch of the Bank from May 2004 to November 2009, and also concurrently served as Chief Financial Officer of the Beijing Branch of the Bank from January 2007 to November 2009. He successively served as the Assistant General Manager and the Deputy General Manager of the Asset-and-Liability Management Department of the Bank’s Head Office from December 1999 to May 2004, and also served as temporary Deputy General Manager of the Beijing Branch of the Bank from November 2002 to May 2004. Mr. XIAO obtained a Doctorate’s Degree in Economics from Renmin University of China in 1994. He has the qualification of Senior Accountant.
10 GENG Wei Secretary to the Board of Directors and Company Secretary
Secretary to the Board of Directors of the Bank since June 2015 and Company Secretary of the Bank since October 2015. Mr. GENG joined the Bank in 2006. He had assumed various positions including the Chief Compliance Officer of the Legal and Compliance Department, Deputy General Manager and Chief Compliance Officer of the Risk Management Unit (Compliance Management), and Deputy General Manager (in charge of the department’s work) and Chief Compliance Officer of the Legal and Compliance Department, General Manager of the Board Secretariat. Before joining the Bank, he served various positions of Industrial and Commercial Bank of China, including the Deputy Division Head, Division Head and Deputy General Manager of the Legal Affairs Department, and Deputy Director of the Joint Stock Reform Office. Mr. GENG obtained a Doctorate’s degree in law from Peking University in 1995.
8 9 10

Directors, Supervisors and Senior Management Members
2016 Annual Report 102
Changes in Directors, Supervisors and Senior Management Members
Changes in the Bank’s directors were as follows:
Mr. ZHU Hexin began to serve as Executive Director and member of the Connected Transactions Control Committee of the Bank as of 1 February 2016. Mr. ZHU Hexin ceased to serve as Executive Director and member of the Connected Transactions Control Committee of the Bank as of 1 June 2016 due to change of job.
Mr. WANG Changyun began to serve as Independent Director of the Bank as of 18 August 2016, and began to serve as a member of the Strategic Development Committee, the Audit Committee, the Risk Policy Committee and the Personnel and Remuneration Committee of the Bank as of 21 September 2016.
Mr. CHOW Man Yiu, Paul ceased to serve as Independent Director, Chairman of the Personnel and Remuneration Committee, and member of the Audit Committee, the Risk Policy Committee and the Connected Transactions Control Committee of the Bank as of 18 August 2016 due to the fulfilment of his term of office.
Mr. Jackson TAI ceased to serve as Independent Director and member of the Strategic Development Committee, the Audit Committee, the Risk Policy Committee and the Connected Transactions Control Committee of the Bank as of 1 September 2016 due to change of job.
Mr. WANG Yong ceased to serve as Non-executive Director and member of the Strategic Development Committee and the Audit Committee of the Bank as of 14 September 2016 due to change of job.
Mr. LU Zhengfei began to serve as Chairman of the Personnel and Remuneration Committee of the Bank as of 21 September 2016.
Mr. REN Deqi began to serve as Executive Director and member of the Connected Transactions Control Committee of the Bank as of 8 December 2016.
Mr. GAO Yingxin began to serve as Executive Director and member of the Risk Policy Committee of the Bank as of 8 December 2016.
Ms. Angela CHAO began to serve as Independent Director and member of the Audit Committee, the Risk Policy Committee and the Connected Transactions Control Committee of the Bank as of 4 January 2017.
Mr. WANG Wei ceased to serve as Non-executive Director and member of the Strategic Development Committee and the Risk Policy Committee of the Bank as of 19 January 2017 due to change of job.
Changes in the Bank’s supervisors were as follows:
Mr. LIU Xiaozhong ceased to serve as Employee Supervisor and member of the Duty Performance and Due Diligence Supervision Committee of the Board of Supervisors of the Bank as of 14 April 2016 due to the fulfilment of his term of office.
Mr. GAO Zhaogang began to serve as Employee Supervisor of the Bank as of 14 April 2016. Mr. GAO Zhaogang began to serve as member of the Duty Performance and Due Diligence Supervision Committee of the Board of Supervisors of the Bank as of 20 February 2017.
Mr. LI Jun ceased to serve as Supervisor and Chairman of the Board of Supervisors and Chairman of the Duty Performance and Due Diligence Supervision Committee of the Board of Supervisors of the Bank as of 18 November 2016 due to the reason of age.
Mr. WANG Xiquan began to serve as Supervisor, Chairman of the Board of Supervisors and Chairman of the Duty Performance and Due Diligence Supervision Committee of the Board of Supervisors of the Bank as of 18 November 2016.
Mr. CHEN Yuhua began to serve as Chairman of the Financial and Internal Control Supervision Committee of the Board of Supervisors of the Bank as of 20 February 2017.
Changes in the Bank’s senior management members were as follows:
Mr. ZHANG Jinliang ceased to serve as Executive Vice President of the Bank as of 14 January 2016.
Mr. PAN Yuehan began to serve as Chief Risk Officer of the Bank as of 20 April 2016.
Mr. ZHU Hexin ceased to serve as Executive Vice President of the Bank as of 1 June 2016.
Ms. ZHANG Lin ceased to serve as Secretary of Party Discipline Committee of the Bank as of 5 July 2016.
Mr. ZHANG Qingsong began to serve as Executive Vice President of the Bank as of 16 November 2016. Mr. ZHANG Qingsong began to serve as Chief Information Officer of the Bank as of 31 March 2017.
Mr. LIU Qiang began to serve as Executive Vice President of the Bank as of 16 November 2016.
Mr. FAN Dazhi began to serve as Secretary of Party Discipline Committee of the Bank as of 27 December 2016.

Corporate Governance
2016 Annual Report103
Overview of the Corporate Governance
The Bank takes excellent corporate governance as an important objective. Adhering to the rules and regulations governing capital markets and relevant industries, the Bank has made constant efforts to improve its corporate governance framework, which comprises the shareholders’ meeting, the Board of Directors, the Board of Supervisors, and the Senior Management. This framework operates smoothly owing to a clear division of duties. All special committees of the Board of Directors and the Board of Supervisors have performed their duties and functioned effectively, thereby enhancing the Bank’s corporate governance capabilities.
The Bank continually refines its corporate governance system. Its corporate governance normative documents including the Articles of Association are constantly revised to reflect regulatory requirements and the Bank’s actual development. This includes the implementation on the authorisation to the Board of Directors granted by the shareholders’ meeting and that to the President granted by the Board of Directors. In this way, the Bank has established a system of responsibilities based on a clear division of powers and effective checks and balances.
The Bank places great emphasis on improving its corporate governance mechanisms. It ensures that minority shareholders are properly informed and able to participate and make decisions. The annual shareholders’ meetings are held in Beijing and Hong Kong by way of video conference, allowing shareholders from both the Chinese mainland and Hong Kong to attend in person. In addition, online voting for A-Share Holders is available to guarantee the rights of minority shareholders. By constantly improving the mechanisms for the smooth operations of the Board of Directors, information disclosure and stakeholder engagement, the Bank continuously enhances the effectiveness of the Board’s work, supports the scientific and highly efficient decision-making of the Board and increases the corporate transparency, thus meeting its responsibilities to all of its stakeholders, including shareholders, customers, employees and society.
The Bank makes great efforts to promote Board
diversity. It has formulated the Bank of China Limited
Board Diversity Policy, which lays out the stance of the
Bank on the diversity of the Board of Directors and
specifies the approaches to realise Board diversity on
an on-going basis. All Board appointments are made
on merit, in the context of the skills and experience
the Board as a whole requires, and taking into
account various aspects of the Board diversity which
include but not limited to regulatory requirements and
gender, age, cultural and educational background,
geographical location, professional experience, skills,
knowledge, and length of service of directors, etc. The
Bank implements the aforementioned diversity policy
and requirements throughout the director selection
and engagement process.
The Bank highly recognises the importance of the
independence of the election of independent director.
The work of election of independent director is led
and promoted by the independent director who serves
as the Chairman of the Personnel and Remuneration
Committee of the Board of Directors. Candidates for
independent directors are mainly recommended by
incumbent independent directors and are proposed to
the Board of Directors after discussion at the selection
meetings attended by all independent directors. The
selection and engagement procedures of independent
directors are compliant and independent, which
ensure the objective and fair duty performance of
independent directors and safeguard the overall
interests of shareholders especially the legitimate
rights and interests of minority shareholders.
In 2016, the Bank’s corporate governance
performance continued to be recognised by the capital
markets and the wider public. The Bank was granted
the 12th “Golden Prize of Round Table” for Best
Board of Directors of Chinese Listed Companies, the
“2016 Best Corporate Governance Award — Gold
Award” by Hong Kong Institute of Certified Public
Accountants and the “Best Board Secretary of China
Securities Golden Bauhinia Awards” by Ta Kung Wen
Wei Media Group, and other corporate governance
awards.

2016 Annual Report 104
Corporate Governance
Corporate Governance Framework
The Bank’s corporate governance framework is shown below:
Shareholders’ Meeting
Senior Management (Executive Committee)
Board of Supervisors
Board of Supervisors Office
Duty Performance and Due Diligence Supervision Committee
Finance and Internal Control Supervision Committee
Anti-money LaunderingCommittee
Asset Disposal Committee
Risk Management and Internal Control Committee
Procurement Review Committee
Internet Finance Committee
IT Management Committee
Asset and LiabilityManagement Committee
Securities Investment and Management Committee
Board of Directors
Board Secretariat
Strategic DevelopmentCommittee
Audit Committee
Risk Policy Committee
Personnel andRemuneration CommitteeConnected Transactions
Control Committee
US Risk and Management Committee
Audit Department
Corporate Governance Compliance
During the reporting period, the actual performance
of the Bank’s corporate governance was fully
in compliance with the Company Law and the
requirements for the governance of listed companies
set out in the normative documents of CSRC.
During the reporting period, the Bank strictly observed
the Corporate Governance Code (the “Code”) as set
out in Appendix 14 to the Hong Kong Listing Rules.
Save as disclosed in this annual report, during the
reporting period, the Bank has complied with all
provisions of the Code and has substantially complied
with most of the recommended best practices set out
in the Code.
Amendments to the Articles of Association
The 2016 First Extraordinary General Meeting
approved the proposal on the amendments to the
Articles of Association of the Bank. These amendments
are made to reflect the latest status of share capital
of the Bank and to satisfy the new requirements on
corporate governance put forward in regulatory rules
of Chinese mainland and Hong Kong. The corporate
governance section of the amendments clarified
certain rights and obligations of the shareholders,
particularly the major shareholders, added and clarified
certain requirements on the duties and procedural
rules of the shareholders’ meeting, the Board of
Directors and the Board of Supervisors, as well as
the duty performance by directors and supervisors,
made further provisions on the shareholders’ creation
of pledge over the shares of the Bank, and updated
the scope of functions and responsibilities of the
Risk Policy Committee of the Board of Directors of
the Bank pursuant to relevant regulatory rules. The
amendments are still under the approval by CBRC.

2016 Annual Report105
Corporate Governance
Shareholders and Shareholders’ Rights
The Bank highly values the protection of its
shareholders’ interests and has established and
maintained an effective and multi-channel shareholder
communication platform. This includes holding
shareholders’ meetings and maintaining an investor
hotline to ensure that all shareholders are treated
equally, properly informed and able to participate in
and exercise their voting and other rights regarding
the major issues of the Bank. The Bank is independent
and completely autonomous in all of its business
operations. It operates independently and separately
from its controlling shareholder, Huijin, in respect
of its business, personnel, asset, institutional and
financial matters.
Shareholders’ Right to Convene an Extraordinary Shareholders’ Meeting and a Meeting of Shareholders of Different Categories
According to the Articles of Association, shareholders
individually or in aggregate holding a total of 10%
or more voting shares of the Bank have the right
to make a written request to the Board of Directors
to convene an extraordinary shareholders’ meeting.
Two or more shareholders holding a total of 10%
or more voting shares carrying voting rights of the
Bank may sign one or more written requests of
identical form and substance requesting the Board
of Directors to convene a meeting of shareholders
of different categories and stating the subject of
the meeting. If the Board of Directors fails to issue a
notice of such a meeting within 30 days after receipt
of a written request for convening an extraordinary
shareholders’ meeting or a meeting of shareholders
of different categories submitted by the proposing
shareholders, the proposing shareholders may by
themselves convene the meeting within four months
after the Board of Directors received the request. The
procedures according to which they convene such
meeting shall, to the extent possible, be identical
to the procedures according to which shareholders’
meetings are convened by the Board of Directors.
Where the proposing shareholders convene and
hold a meeting because the Board of Directors failed
to convene such meeting pursuant to a request as
mentioned above, the reasonable expenses incurred by
such shareholders shall be borne by the Bank and shall
be deducted from the sums owed by the Bank to the
negligent directors.
Shareholders’ Right to Propose Resolutions at Shareholders’ Meetings
According to the Articles of Association, any
shareholder who holds, individually or in aggregate,
3% or more voting shares of the Bank shall have
the right to propose a resolution in a shareholders’
meeting. Any shareholder who holds, individually or in
aggregate, 3% or more voting shares of the Bank shall
have the right to propose and submit in writing to
the Board of Directors interim proposals 10 days prior
to the convening of a shareholders’ meeting. When
the Board of Directors decides not to include such
proposals in the meeting’s agenda, it shall explain and
clarify the reasons in the shareholders’ meeting. When
the proposing shareholders dissent with the Board
of Directors’ decision to exclude such proposals, they
may request to call for an extraordinary shareholders’
meeting by themselves based on the relevant
procedures stipulated in the Articles of Association.
Shareholders’ Right to Present Enquiries
According to the Articles of Association, any
shareholder who holds severally or jointly with others
5% or more voting shares of the Bank shall have
the right to present enquiries to the shareholders’
meeting. The Board of Directors, the Board of
Supervisors, or other relevant senior management
personnel shall attend the shareholders’ meeting,
accept enquiries, and answer or explain accordingly.
Please refer to the Articles of Association for details
of the rights entitled to shareholders. If shareholders
need to contact the Board of Directors regarding
the aforementioned items or for other enquiries to
the Board of Directors, please refer to the section
“Reference for Shareholders — Investor Enquiry” for
contact details.

2016 Annual Report 106
Corporate Governance
Shareholders’ Meeting
Functions and Powers of Shareholders’ Meeting
The shareholders’ meeting is the body of authority of
the Bank. The shareholders’ meeting is responsible
for making decisions on important issues of the Bank,
including considering and approving the Bank’s profit
distribution plan, annual financial budget and financial
statements, changes in the Bank’s registered capital,
adopting resolutions on matters such as the issue
of bonds and other securities, merger and division,
amending the Articles of Association of the Bank,
electing directors, electing shareholders’ representative
supervisors and external supervisors and deciding the
remunerations of directors and supervisors.
Convening of Shareholders’ Meeting
On 7 June 2016, the Bank held its 2015 Annual
General Meeting in Beijing and Hong Kong by way of
video conference. Online voting for A-Share Holders
was available. This meeting considered and approved
11 proposals including the 2015 work report of the
Board of Directors, the 2015 work report of the Board
of Supervisors, the 2015 annual financial statements,
the 2015 profit distribution plan, the 2016 annual
budget for fixed assets investment, the appointment
of Ernst & Young Hua Ming as the Bank’s external
auditor for 2016, the election of directors,
independent directors and supervisors of the Bank, the
issuance of bonds and the issuance of the qualified
write-down tier-2 capital instruments. The meeting
also heard the 2015 report on connected transactions,
the 2015 duty report of independent directors and the
2015 report on the implementation on the Scheme on
the Authorisation to the Board of Directors Granted
by the Shareholders’ Meeting of Bank of China. The
proposals regarding the issuance of bonds and the
issuance of the qualified write-down tier-2 capital
instruments were special resolutions.
On 18 November 2016, the Bank held its 2016 First
Extraordinary General Meeting in Beijing. Online
voting for A-Share Holders was available. The meeting
considered and approved 7 proposals including the
election of Mr. WANG Xiquan to be appointed as
shareholders’ representative supervisor of the Bank,
the election of Mr. REN Deqi to be appointed as
executive director of the Bank, the election of Mr.
GAO Yingxin to be appointed as executive director
of the Bank, the election of Ms. Angela CHAO to be
appointed as independent director of the Bank, the
2015 remuneration distribution plan for Chairman of
the Board of Directors, executive directors, Chairman
of the Board of Supervisors and shareholders’
representative supervisors, the establishment of the
Charity Foundation of the Bank and the amendments
to the Articles of Association. The proposal regarding
the amendments to the Articles of Association was a
special resolution.
All of the aforementioned meetings were convened
and held in strict compliance with the relevant
laws and regulations as well as the listing rules of
the Chinese mainland and Hong Kong. The Bank’s
directors, supervisors and senior management
members attended the meetings and communicated
with shareholders on issues of their concern.
The Bank issued announcements on the resolutions
and legal opinions of the aforementioned
shareholders’ meetings on 7 June 2016 and 18
November 2016 respectively, pursuant to regulatory
requirements. Please refer to the websites of SSE,
HKEx and the Bank.
Implementation of the Resolutions Passed at the Shareholders’ Meeting by the Board of Directors
During the reporting period, the Board of Directors
has fully implemented the resolutions and scheme on
the authorisation to the Board of Directors granted by
the shareholders’ meeting passed at the shareholders’
meetings, and earnestly carried out the proposals
regarding the 2015 profit distribution plan, the
2016 annual budget for fixed assets investment, the
issuance of bonds, the appointments of directors and
2016 external auditor and so on.

2016 Annual Report107
Corporate Governance
Board of Directors
Functions and Powers of the Board of Directors
The Board of Directors, which is responsible to
the shareholders’ meeting, is the Bank’s decision-
making body. The Board of Directors exercises
the following functions and powers as specified
by the Bank’s Articles of Association: convening
shareholders’ meetings and implementing the
resolutions of shareholders’ meetings; deciding on
the Bank’s strategic policies, business plans and
material investment plans (except for those material
investment plans that are subject to shareholders’
meeting approval as specified in the Articles of
Association); formulating the annual financial budgets,
final accounts and plans for profit distribution
and loss making-up of the Bank; appointing or
dismissing members of special committees and
the Senior Management of the Bank; reviewing
and deciding on the establishment of the Bank’s
basic administrative system, internal management
framework and important sub-entities; developing
and reviewing corporate governance policies of the
Bank; taking charge of performance evaluation and
matters of material reward and punishment for senior
management members, and hearing the reports of the
Senior Management and examining their work, among
others. The Board of Directors continuously reviews
and updates the Articles of Association and the
Bank’s corporate governance policies and systems in
accordance with the applicable laws and regulations,
relevant regulatory requirements and listing rules, and
ensures compliance with such policies and systems.
Composition of the Board of Directors
The Board of Directors has set up the Strategic
Development Committee, Audit Committee, Risk
Policy Committee, Personnel and Remuneration
Committee and the Connected Transactions
Control Committee, as well as the US Risk and
Management Committee established under the Risk
Policy Committee, to assist the Board of Directors in
performing its functions under the authorisation of the
Board of Directors.
The Board of Directors of the Bank is rationally
structured and diversified. Currently, the Board
of Directors comprises thirteen members. Besides
the Chairman, there are three executive directors,
four non-executive directors and five independent
directors. The proportion of independent directors
exceeds one-third of the total number of directors.
The Bank’s directors are elected at the shareholders’
meeting, with a term of office of three years starting
from the date when the Bank receives approval of
the appointment from CBRC. A director may serve
consecutive terms by re-election and re-appointment
unless otherwise specified by laws, regulations and
supervisory requirements. The positions of Chairman
and President of the Bank are assumed by two
persons. For detailed background and an explanation
of recent changes of the Board members, please
refer to the section “Directors, Supervisors and Senior
Management Members”.
0123456789
10111213
66–75
56–65
Nationality Age Directorship with the Bank
(years)
GenderDesignation
Number of Directors
male
female
under 55
other countries and regions
over 3
under 3
Chinese mainland
Executive Director
Independent Director
Non-executive Director
Hong Kong China
Board Composition
Convening of Board Meetings
In 2016, the Bank convened 8 on-site meetings of
the Board of Directors on 19 January, 30 March, 26
April, 12 May, 8 June, 30 August, 26 October, and 21
December, respectively. At these meetings, the Board
of Directors reviewed and approved 56 proposals
related to the Bank’s regular reports, the nomination
of candidates for the directors, the amendments
to the Articles of Association, the establishment of
asset management company, the issuance of bonds,
the dividend distribution plan, the establishment of
overseas branches and subsidiaries, the liquidity risk

2016 Annual Report 108
Corporate Governance
management policy, the market risk stress test policy,
the value at risk policy, the management measures
on information disclosure suspension and exemption,
and so on. It also heard 6 reports related to the 2015
report on internal control audit and internal control
recommendations by the Bank’s external auditors, and
other matters.
In 2016, the Bank convened 3 meetings of the Board
of Directors via written resolutions. At these meetings,
the Board of Directors mainly reviewed and approved
the proposals on the establishment of the Charity
Foundation of the Bank, adjustments to chairman and
members of the special committees of the Board of
Directors, and the Pilot Plan of the Investment and
Loan Linkage Mechanism of Bank of China, among
others.
Risk Management and Internal Control by the Board of Directors and its Special Committees
The Board of Directors of the Bank considers a sound
risk management system and continuously improved
independence, specialty, foresight, and initiative of
risk management are the basis and prerequisite of
realising the Bank’s strategic goals, ensuring the sound
and sustained development of banking businesses and
creating greater value for shareholders.
According to regulatory rules and internal
management requirements, the Senior Management
submits important risk management policies, systems
and procedures to the Board of Directors and Risk
Policy Committee for review and approval. The Risk
Policy Committee regularly reviews the Group’s
overall risk status (covering major risk categories such
as credit risk, market risk, operational risk, liquidity
risk, legal and compliance risk and reputational risk)
and work plan for the next stage and puts forward
corresponding work requirements.
The Board of Directors and the Risk Policy Committee
have acknowledged the full effectiveness of the
existing risk management system of the Bank based on
their close monitoring and quarterly evaluation of the
system’s effectiveness.
The Board of Directors attached great importance to
the Group’s far-reaching internal control system and
continued to promote its construction. It regularly
heard and reviewed Senior Management reports
concerning implementation of the Guidelines on
Internal Control of Commercial Banks, bank-wide
operational management, risk management, fraud
case management and internal control system
construction and assessment, thus earnestly assuming
its responsibility to improve and fulfil a sound and
effective internal control function.
The Audit Committee closely monitored the changing
economic and financial environment at home and
abroad, as well as the overall conditions of the
Group’s internal control function, including the
establishment and operation of its internal control
systems for both financial reporting and non-financial
reporting. In addition, the committee heard and
reviewed, on a regular and ad hoc basis, internal audit
reports and assessment opinions on internal control,
the progress in internal control improvements and
remediation suggested by external auditors, as well
as the overall situation regarding the prevention,
control and redress of fraud cases and risk events. The
committee guided and urged the Senior Management
to improve the “three lines of defence” system of
internal control and conducted special research into
internal audit effectiveness.
During the reporting period, the Bank performed
self-assessment on internal control in line with the
Basic Standard for Enterprise Internal Control and its
supporting guidelines. No material deficiencies were
identified in the internal control systems for both
the financial reporting and non-financial reporting
of the Bank. Ernst & Young Hua Ming LLP, as the
Bank’s external auditor for internal control, audited
the effectiveness of the Bank’s internal controls over
financial reporting and issued a standard unqualified
opinion. The 2016 Internal Control Assessment Report
of Bank of China Limited and the Auditor’s Report on
Internal Control issued by Ernst & Young Hua Ming LLP
have been published on the websites of SSE, HKEx and
the Bank.

2016 Annual Report109
Corporate Governance
Duty Performance of Directors
Directors’ Attendance of Shareholders’ Meetings, Meetings of the Board of Directors and Special Committees
During the reporting period, the attendance rate of each director of the shareholders’ meetings, meetings of the
Board of Directors and special committees is given below:
Number of meetings attended in person/Number of meetings convened during term of office
Meetings of the Special Committees of the Board of Directors
DirectorsShareholders’
Meetings
Meetings of the Board of
Directors
Strategic Development
CommitteeAudit
CommitteeRisk Policy Committee
Personnel and Remuneration
Committee
Connected Transactions
Control Committee
Incumbent DirectorsTIAN Guoli 1/2 9/11 11/11 – – – –CHEN Siqing 2/2 11/11 11/11 – – – –REN Deqi 0/0 1/1 – – – – 1/1GAO Yingxin 0/0 1/1 – – 1/1 – –ZHANG Xiangdong 2/2 11/11 11/11 – – 7/7 –ZHANG Qi 2/2 11/11 11/11 – – 7/7 –LIU Xianghui 2/2 11/11 11/11 – 5/5 – –LI Jucai 2/2 11/11 11/11 5/5 – – –Nout WELLINK 2/2 11/11 11/11 5/5 5/5 – –LU Zhengfei 1/2 11/11 – 5/5 – 7/7 3/3LEUNG Cheuk Yan 2/2 11/11 – 5/5 – 7/7 3/3WANG Changyun 1/1 5/5 3/3 2/2 2/2 2/2 –Former DirectorsZHU Hexin 0/0 3/3 – – – – 1/1WANG Yong 1/1 6/7 6/7 2/3 – – –WANG Wei 2/2 11/11 11/11 – 5/5 – –CHOW Man Yiu, Paul 1/1 4/6 – 2/2 2/2 4/4 1/1Jackson TAI 1/1 7/7 7/7 3/3 3/3 – 2/2
Notes:
1 Please refer to the section “Directors, Supervisors and Senior Management Members — Changes in Directors, Supervisors and
Senior Management Members” for changes in directors.
2 Mr. TIAN Guoli was not able to attend the 2016 First Extraordinary General Meeting of the Bank on 18 November 2016 and
the meetings of the Board of Directors on 30 March and 30 August 2016 due to other important business engagements. He
authorised another director to attend and vote at the meetings of the Board of Directors as his proxy.
3 Mr. LU Zhengfei was not able to attend the 2016 First Extraordinary General Meeting of the Bank on 18 November 2016 due to
other important business engagements.
4 Mr. WANG Yong was not able to attend the meeting of the Board of Directors on 30 August 2016, the meeting of the Audit
Committee on 29 August 2016 and the meeting of the Strategic Development Committee on 30 August 2016 due to other
important business engagements.
5 Mr. CHOW Man Yiu, Paul was not able to attend the meetings of the Board of Directors on 19 January and 12 May 2016 due to
other important business engagements.

2016 Annual Report 110
Corporate Governance
Training and Expertise Enhancement of Directors
In 2016, the Board of Directors paid significant
attention to enhancing directors’ expertise, with
a special focus on arranging relevant training. All
directors of the Bank fully observed Rule A.6.5 of
the Code as well as PRC regulatory requirements,
actively participating in specialised training including
sessions on internet finance, internationalisation
strategy, enterprise M&A and reorganisation
during reform of state-owned enterprises, key US
regulation and supervisory expectations, challenges
for banks applying the new international accounting
standards, among others. The Bank also gave special
presentations and training to the newly appointed
directors in 2016 regarding its business operations,
risk management system and directors’ responsibilities.
The Bank’s directors also took it upon themselves
to enhance their professional skills in various ways,
including attending forums and seminars, meeting
with domestic and overseas regulators and conducting
on-site research exercises at the Bank’s domestic
and overseas branches as well as at other advanced
international banks.
Independence and Duty Performance of Independent Directors
Following the appointments of Mr. REN Deqi and
Mr. GAO Yingxin as Executive Directors of the Bank
with effect from 8 December 2016, the number of
the members of the Board of Directors of the Bank
has been changed to thirteen, four of which were
independent directors (the qualifications of Ms. Angela
CHAO to be appointed as Independent Director of the
Bank were still subject to the approval by CBRC at that
time), representing less than one-third of the number
of members of the Board of Directors of the Bank.
Ms. Angela CHAO has begun to serve as Independent
Director of the Bank with effect from 4 January
2017 as approved by CBRC. There are currently five
independent directors on the Board of Directors. This
exceeds one-third of the total number of directors
and is in compliance with the quorum requirement
specified in the Articles of Association and relevant
regulatory requirements.
For the professional backgrounds and other details of the independent directors, please refer to the section “Directors, Supervisors and Senior Management Members”. The independent directors individually serve as the Chairman of the Audit Committee, Risk Policy Committee, Personnel and Remuneration Committee and Connected Transactions Control Committee. As stipulated in the relevant domestic regulatory requirements and Rule 3.13 of the Hong Kong Listing Rules, the Bank has received the annual confirmation in writing from each independent director with regard to their independence. Based on these confirmations and relevant information in possession of the Board of Directors, the Bank confirms their independent status.
In 2016, the Bank’s independent directors attended meetings of the Board of Directors, reviewed proposals, participated in discussions and offered their professional opinions independently, objectively and diligently, in accordance with the Articles of Association, the Procedural Rules for Board of Directors of Bank of China Limited and the Work Rules of Independent Directors of Bank of China Limited. Please refer to the section “Directors’ Attendance of the Shareholders’ Meeting, Meetings of the Board of Directors and Special Committees” for the attendance of independent directors at meetings.
In 2016, independent directors put forward constructive recommendations on the Bank’s strategic management, group risk management, anti-money laundering and development of overseas institutions, among others. These recommendations were adopted and diligently implemented by the Bank.
In 2016, the independent directors did not raise any objection to the resolutions of the Board of Directors or its special committees.
Specific Explanation and Independent Opinions of Independent Directors on the Guarantee Business of the Bank
Pursuant to the provisions and requirements set forth in the circular (ZhengJianFa [2003] No. 56) issued by CSRC, and according to the principles of justice,

2016 Annual Report111
Corporate Governance
fairness and objectivity, the Independent Directors of the Bank, Mr. Nout WELLINK, Mr. LU Zhengfei, Mr. LEUNG Cheuk Yan, Mr. WANG Changyun and Ms. Angela CHAO have provided the following information regarding the Bank’s guarantee business:
The guarantee business is one of the Bank’s ordinary
business activities approved by PBOC and CBRC and
does not fall within the scope of guarantees as defined
in the Circular on Regulating Guarantee Businesses
of Listed Companies. The Bank has formulated
specific management measures, operational processes
and approval procedures in light of the risks of the
guarantee business and carried out this business
accordingly. The Bank’s guarantee business principally
comprises letters of guarantee. As at 31 December
2016, the outstanding amount of letters of guarantee
issued by the Bank was RMB1,097.448 billion.
Responsibility Statement of Directors on Financial Reports
The following statement, which sets out the
responsibilities of the directors regarding financial
statements, should be read in conjunction with, but
understood separately from, the auditor’s statement
of their responsibilities as set out in the Independent
Auditor’s Report contained in this annual report.
The directors acknowledge that they are responsible
for preparing financial statements of the Bank that
truly represent the operating results of the Bank for
each financial year. To the best knowledge of the
directors, there was no material event or condition
during the reporting period that might have a material
adverse effect on the continuing operation of the
Bank.
Special Committees of the Board of Directors
Strategic Development Committee
The Strategic Development Committee comprises
eight members, including Chairman Mr. TIAN Guoli,
Vice Chairman and President Mr. CHEN Siqing,
Non-executive Directors Mr. ZHANG Xiangdong,
Mr. ZHANG Qi, Mr. LIU Xianghui, Mr. LI Jucai and
Independent Directors Mr. Nout WELLINK and Mr.
WANG Changyun. Chairman Mr. TIAN Guoli serves as
the Chairman of the committee.
The committee is mainly responsible for reviewing the
strategic development plans presented by the Senior
Management, assessing the factors that may affect
the strategies of the Bank and their implementation,
and advising the Board with regard to strategy
adjustments; reviewing the annual budget, strategic
capital allocation (policies on capital structure, capital
adequacy ratio and risk-reward trade-off), objectives
of asset-liability management, IT development and
other special strategic development plans of the Bank,
and advising the Board accordingly; coordinating
strategies on the overall development of various
financial businesses and the development of domestic
and overseas institutions, and deciding on the setup,
cancellation and increase or decrease of the Bank’s
capital of domestic and overseas institutions within
its scope of authorisation; designing and formulating
key investment and financing plans and merger and
acquisition plans of the Bank; and reviewing the
substantial internal reorganisation and adjustment
plans of the Bank, and advising the Board accordingly.
The Strategic Development Committee held eight
on-site meetings and three meetings via written
resolutions in 2016. At these meetings, it mainly
approved the proposal on profit distribution for
2015, the dividend distribution plan for preference
shares, pilot plan of the investment and loan
linkage mechanism, the establishment of the asset
management company and so on. In response to
changes in international and domestic economic
and financial situations, the Strategic Development
Committee stepped up its analysis of the operating
environment, paid constant attention to opportunities
and challenges brought about by supply-side structural
reform, and put forward many important comments
and recommendations regarding the implementation
of the Bank’s strategic development plans and
improving its transformational development thus
providing strong support to the scientific decision-
making of the Board of Directors.

2016 Annual Report 112
Corporate Governance
Audit Committee
The Audit Committee comprises six members, including Non-executive Director Mr. LI Jucai and Independent Directors Mr. Nout WELLINK, Mr. LU Zhengfei, Mr. LEUNG Cheuk Yan, Mr. WANG Changyun and Ms. Angela CHAO. Independent Director Mr. LU Zhengfei serves as the Chairman of the committee.
The committee is mainly responsible for reviewing financial reports and other significant accounting policies and regulations formulated by the Senior Management; reviewing the external auditors’ audit opinion on financial reporting, annual audit plan and recommendations for management; approving the annual internal audit plan and budget; appraising the duty performance and work quality and effect of the external auditors and internal audit and monitoring their independence; recommending the engagement, reappointment, replacement and audit fee of the external auditors; recommending the appointment and dismissal and appraising the performance of the Chief Audit Officer; overseeing the Bank’s internal control function, reviewing material deficiencies in internal control design and execution by the Senior Management and investigating fraud cases; reviewing the employee reporting system and urging the Bank to conduct fair investigations and take appropriate measures regarding matters reported by the employees.
The Audit Committee held five meetings in 2016. It mainly reviewed the Bank’s quarterly, interim and annual financial reports, the annual internal control assessment report, the scheme on the adjustment of HR management system of audit line and the proposal on the appointment and audit fee of the external auditors for 2017. It also reviewed and approved the 2016 work plan and financial budget for internal audit. In addition, it heard the Senior Management response to the external auditor’s management proposal for 2015, report on the 2016 overseas supervision information, reports on internal audit in 2015 and the first half of 2016, report on asset quality in the first quarter of 2016, report on internal control progress in 2016, the prevention and control
of external infringement cases in 2016, report on the internal control audit progress and independence compliance of the external auditor in 2016 and report on the audit plan of the external auditors for 2017, among others.
Moreover, in response to changes in domestic and overseas economic trends, the Audit Committee paid close attention to the changes in the Bank’s achievements in improving business performance and cost-effectiveness control and put forward many important opinions and suggestions regarding the improvement of corporate governance mechanism, the enhancement of internal audit independence, the amelioration of credit asset quality and the improvement of internal control measures.
According to the Procedure Rules on the Preparation of Annual Report of the Board Audit Committee of Bank of China Limited, prior to the start of audit field work by the auditors, the Audit Committee confirmed with the auditors the details of the 2016 audit plan, including areas of focus for auditing the 2016 Annual Report, risk assessment and identification methods, the application of accounting standards, tests of internal control, compliance and fraud related procedures, and the allocation of human resources. In particular, the committee reminded the auditors to report any difference of judgment between the auditors and the Senior Management during the audit, as well as the process and results of reconciling such differences.
The Audit Committee heard and reviewed reports from the Senior Management concerning the Bank’s business performance and major financial data. It also requested that the Senior Management submit the annual financial statements to the auditors in a timely manner, so as to ensure sufficient time for the annual audit. During the audit, the committee maintained independent communications with the auditors and arranged independent communications between the auditors and the independent directors. At its first meeting of 2017, the Audit Committee reviewed and approved the Bank’s 2016 financial statements and submitted them to the Board of Directors for approval.

2016 Annual Report113
Corporate Governance
In accordance with the Policies of Selection, Rotation
and Dismissal for External Auditors of Bank of China
Limited, the external auditors made a summary audit
report and submitted a report on their independence
compliance to the committee. The Bank’s Senior
Management appraised the external auditors’
work. Based on this appraisal, the Audit Committee
conducted its own assessment on the auditors’
performance, effectiveness and independence
compliance in 2016. It discussed re-engagement
matters, and decided to reappoint Ernst & Young Hua
Ming LLP as the Bank’s domestic auditor and internal
control auditor for 2017, and to reappoint Ernst &
Young as the Bank’s international auditor for 2017.
Such proposals have been submitted to the Board of
Directors for approval.
Risk Policy Committee
The Risk Policy Committee of the Bank comprises
five members, including Executive Director Mr. GAO
Yingxin, Non-executive Director Mr. LIU Xianghui,
Independent Directors Mr. Nout WELLINK, Mr. WANG
Changyun and Ms. Angela CHAO. Independent
Director Mr. Nout WELLINK serves as the Chairman of
the committee.
The committee is mainly responsible for reviewing the
Bank’s risk management strategies, substantial risk
management policies and procedures and system, and
providing the suggestions to the Board of Directors;
discussing with the Senior Management about the
risk management procedures and rules, and putting
forward relevant suggestions on improvement
to make sure that the risk management policies,
procedures and rules are uniformly abided by in the
Bank; reviewing the Bank’s major risk activities, and
exercising its veto power in a reasonable manner over
any transaction that will or may lead to debts to the
Bank and/or expose the Bank to market risk in excess
of the single transaction risk limit or the accumulated
transaction risk limit approved by the Risk Policy
Committee or the Board of Directors; monitoring
the implementation of the Bank’s risk management
strategies, policies and procedures, and providing
suggestions to the Board of Directors; examining
the risk management status and re-checking the
risk management procedures and rules; regularly
hearing and evaluating the reports on implementation
status of risk management and internal control
responsibilities by the Senior Management, functional
departments and institutions, and putting forward
requirements on improvement; assessing the material
investigation results of risk management matters and
the Senior Management’s response to such results
voluntarily or as required by the Board of Directors.
The Risk Policy Committee held five meetings in
2016, at which it mainly reviewed and approved the
US Risk and Management Committee Charter, stress
test policy for market risk, liquidity risk management
policy, management measures for suspension and
exemption of information disclosure, country risk
limits, market risk limits, and advanced approach to
capital management. The committee also regularly
reviewed the Group risk reports and so on.
In addition, the committee paid close attention to
critical risk issues, in response to changes in overseas
and domestic economic and financial conditions,
adjustments of the government’s macro policies
and overall overseas and domestic regulations.
The committee offered important opinions and
recommendations regarding the improvement of the
Bank’s risk governance mechanism and the effective
prevention and control of risks, including credit risk,
market risk, operational risk, legal and compliance risk,
liquidity risk and so on.
In line with the Heightened Standards for Large Banks
issued by the US Office of the Comptroller of the
Currency (OCC), the Board of Directors of the Bank
reviewed and approved the US Risk and Management
Committee Charter, and established the US Risk and
Management Committee on the basis of the former
US Risk Committee under the Risk Policy Committee
on 30 March 2016. The US Risk and Management
Committee oversees and manages all the risks incurred
by the Bank’s institutions in the US, and performs the
duties of the board of directors of the Bank’s New
York Branch and its special committees.

2016 Annual Report 114
Corporate Governance
The US Risk and Management Committee currently comprises three members, all of which are members of the Risk Policy Committee, including Executive Director Mr. GAO Yingxin, Independent Directors Mr. Nout WELLINK and Ms. Angela CHAO. Executive Director Mr. GAO Yingxin and Independent Director Mr. Nout WELLINK serve as co-chairmen of the US Risk and Management Committee.
In 2016, the US Risk and Management Committee convened five meetings and regularly listened to reports on risk management and operation of all the Bank’s institutions in the US, latest dynamics of US regulators, etc. In addition, the committee reviewed and approved relevant framework documents and important policies and regulations of the Bank’s institutions in the US and the New York Branch.
The US Risk and Management Committee put forward important opinions and recommendations regarding strengthening prevention and control of risks and compliance based on US regulatory dynamics, market changes and the business strategies of US operations.
Personnel and Remuneration Committee
The Personnel and Remuneration Committee comprises five members, including Non-executive Directors Mr. ZHANG Xiangdong and Mr. ZHANG Qi, Independent Directors Mr. LU Zhengfei, Mr. LEUNG Cheuk Yan and Mr. WANG Changyun. Independent Director Mr. LU Zhengfei serves as the Chairman of the committee.
The committee is mainly responsible for assisting the Board of Directors in reviewing the Bank’s human resources and remuneration strategies and overseeing their implementation; reviewing the structure, size and composition of the Board of Directors on an annual basis, and making suggestions to the Board regarding the scale and composition of the Board of Directors; studying and reviewing the standards and procedures for selecting, nominating and appointing directors, members of the Board committees and Senior Management, and making recommendations to the Board of Directors; identifying individuals suitably qualified to become directors and making recommendations to the Board of Directors on the selection of individuals nominated for directorships;
performing preliminary review of the candidates for the members of the Senior Management and the chairmanship of Board committees, selecting and nominating candidates for different Board committees, and reporting to the Board of Directors for approval; reviewing and monitoring the remuneration and incentive policies of the Bank; considering and examining the remuneration plan of directors, supervisors and senior management members, and making recommendations to the Board of Directors; and setting the performance appraisal standards for the Senior Management of the Bank, evaluating the performance of the directors, and members of the Senior Management, and making recommendations to the Board of Directors.
The Personnel and Remuneration Committee held five on-site meetings and two meetings by written resolutions in 2016. At these meetings, the committee mainly approved proposals on the performance evaluation and remuneration distribution plan for the Chairman, executive directors and senior management members for 2015, and the implementation plan for performance evaluation of the Chairman, the President, the Chairman of the Board of Supervisors and other senior management members in 2016, the proposals on nominating Mr. TIAN Guoli, Mr. WANG Yong, Mr. LU Zhengfei and Mr. LEUNG Cheuk Yan to be re-appointed as directors of the Bank, the proposals on nominating Mr. REN Deqi and Mr. GAO Yingxin as executive directors of the Bank, the proposals on appointing Mr. ZHANG Qingsong and Mr. LIU Qiang as executive vice presidents of the Bank, the proposals on nominating Mr. WANG Changyun and Ms. Angela CHAO as independent director candidates of the Bank, the proposal on adjustments of chairman and members of special committees of the Board of Directors, the proposal on appointing Mr. GAO Yingxin to be Co-chairman of the US Risk and Management Committee, and the proposal on adjustment of secretary of the Strategic Development Committee. The committee also reviewed the remuneration distribution plan for the Chairman of the Board of Supervisors and shareholder supervisors in 2015. The committee put forward important opinions and recommendations on further improving the Bank’s performance evaluation management in line with regulatory requirements.

2016 Annual Report115
Corporate Governance
According to Articles of Association of the Bank, any shareholder who holds by himself or jointly with others 5% or more of the total number of voting shares of the Bank may, by submitting a written proposal to the shareholders’ meeting, recommend candidates for directors, provided the number of candidates nominated shall be in accordance with the provisions of the Articles of Association (between 5 and 17) and not exceed the number to be elected. List of candidates for directors may be recommended by the Board of Directors within the number of candidates stipulated in the Articles of Association, with reference to the diversity policy of the Bank and according to the number to be elected. The Personnel and Remuneration Committee shall preliminarily review the qualifications and conditions of candidates for directors, and refer those qualified candidates to the Board of Directors for further examination. After the Board of Directors’ approval by resolutions, the candidates shall be referred to shareholders’ meeting in written proposals. When directors need to be added or filled temporarily, the Board of Directors shall raise the proposal and suggest the shareholders’ meeting to elect or replace. During the reporting period, the Bank appointed directors in strict compliance with the Articles of Association.
Connected Transactions Control Committee
The Connected Transactions Control Committee comprises four members, including Executive Director Mr. REN Deqi, Independent Directors Mr. LU Zhengfei, Mr. LEUNG Cheuk Yan and Ms. Angela CHAO. Independent Director Mr. LEUNG Cheuk Yan serves as the Chairman of the committee.
The committee is mainly responsible for administering the connected transactions of the Bank in accordance with relevant laws, regulations and normative documents, and formulating administrative regulations with regard to connected transactions; confirming the Bank’s connected parties according to laws, regulations and normative documents, and reporting the relevant confirmation to the Board of Directors and the Board of Supervisors; defining the connected transactions of the Bank in accordance with laws, regulations and normative documents; examining the connected transactions of the Bank pursuant to
relevant laws, regulations and normative documents, as well as the business principles of justice and fairness; and examining information disclosure matters related to significant connected transactions of the Bank.
The Connected Transactions Control Committee held three meetings in 2016, at which it mainly reviewed and approved the report on connected transactions in 2015 and the report on the connected party list, among others. It also reviewed the statement of connected transactions of the Bank in 2015 and report on the thematic internal audit of connected transaction management of the Group in 2015, among others. During the reporting period, the Connected Transactions Control Committee paid constant attention to the development of the Bank’s connected transaction monitoring system and the transmission of its connected transaction policy. Committee members put forward constructive suggestions regarding connected transaction policymaking and system development.
Board of Supervisors
Functions and Powers of the Board of Supervisors
The Board of Supervisors is the Bank’s supervisory organ and is responsible to the shareholders’ meeting. As stipulated in the Company Law and the Articles of Association of the Bank, the Board of Supervisors is responsible for overseeing the Board of Directors so as to ensure a stable operational concept, principles of values and a development strategy suitable for the Bank. It supervises the duty performance and due diligence of the Board of Directors, the Senior Management and its members as well as the Bank’s financial activities, internal control and, risk management.
Composition of the Board of Supervisors
The Board of Supervisors currently comprises seven members. There are three shareholder supervisors (including the Chairman of the Board of Supervisors), three employee supervisors and one external supervisor. According to the Articles of Association, a supervisor has a term of office of three years

2016 Annual Report 116
Corporate Governance
and may serve consecutive terms by re-election
and re-appointment. Shareholder supervisors and
external supervisors are elected or replaced by the
shareholders’ meeting.
The Board of Supervisors has set up the Duty
Performance and Due Diligence Supervision
Committee and the Finance and Internal Control
Supervision Committee to assist in performing its
authorised duties. The special committees mentioned
above are responsible to the Board of Supervisors,
members of which are supervisors, and each
committee shall have at least three members.
Duty Performance of the Board of Supervisors
In 2016, the Board of Supervisors and its special
committees earnestly performed their supervisory
responsibilities and reviewed relevant proposals
through detailed discussion. The Board of Supervisors
held five meetings and made relevant resolutions.
The Duty Performance and Due Diligence Supervision
Committee held two meetings, while the Finance and
Internal Control Supervision Committee held four
meetings. For the performance of, and supervisory
opinions from the Board of Supervisors during the
reporting period, please refer to the section “Report of
the Board of Supervisors”.
Senior Management
Functions and Powers of the Senior Management
The Senior Management is the executive organ of the
Bank. It is headed by the President, with executive
vice presidents and other senior management
members assisting the President’s work. The main
responsibilities of the President include presiding over
the Bank’s daily administrative, business and financial
management; organising the implementation of
the business plan and investment schemes; drafting
basic management regulations and specific rules;
nominating candidates for other senior management
members; and reviewing employees’ remuneration,
benefit, reward and punishment measures.
Duty Performance of the Senior Management
In 2016, the Senior Management of the Bank managed the Bank’s operations in accordance with the powers bestowed upon them by the Articles of Association and the authorisations of the Board of Directors, and carried out the Bank’s development strategy based on the annual performance objectives approved by the Board of Directors. Following the strategic objective of “Serving Society, Delivering Excellence”, the Senior Management remained focusing on “innovation, transformation, mitigation, management and control”, and thus continuously enhanced the Bank’s performance.
During the reporting period, the Senior Management of the Bank held 26 regular meetings, at which it discussed and decided upon a series of significant matters, including the Group’s business development, asset and liability management, risk management, IT system development, product innovation, human resources and performance management. It also convened 186 special meetings to arrange for matters relating to internet finance, corporate banking, personal banking, financial markets, process improvement, risk management and internal control, overseas development and integrated operations.
In 2016, in response to business development needs, the Senior Management established the Internet Finance Committee, which is responsible for formulating the development strategy and the medium and long-term development plans of internet finance and for deliberating and determining major issues relating to internet finance. The Senior Management of the Bank currently presides over the Asset and Liability Management Committee, the Risk Management and Internal Control Committee (which governs the Anti-money Laundering Committee and the Asset Disposal Committee), the Procurement Review Committee, the IT Management Committee, the Securities Investment and Management Committee and the Internet Finance Committee. During the reporting period, all of the committees diligently fulfilled their duties and responsibilities as per the powers specified in their committee charters and the rights delegated by the Executive Committee, and strived to push forward the sound development of the Bank’s various operations.

2016 Annual Report117
Corporate Governance
Securities Transactions by Directors and Supervisors
Pursuant to domestic and overseas securities regulatory requirements, the Bank formulated and implemented the Management Measures on Securities Transactions by Directors, Supervisors and Senior Management Personnel of Bank of China Limited (the “Management Rules”) to govern securities transactions by directors, supervisors and senior management members of the Bank. The terms of the Management Rules are more stringent than the mandatory standards set out in the Model Code for Securities Transactions by Directors of Listed Issuers contained in Appendix 10 to the Hong Kong Listing Rules (the “Model Code”). All directors and supervisors confirmed that they have complied with the standards set out in both the Management Rules and the Model Code throughout the reporting period.
Appointment of External Auditors
Upon approval by the 2015 Annual General Meeting, Ernst & Young Hua Ming LLP was reappointed as the Bank’s domestic auditor and internal control auditor for 2016 and Ernst & Young was reappointed as the Bank’s international auditor for 2016.
Fees paid to Ernst & Young and its member firms for financial statements audit of the Group, including those of the Bank’s overseas subsidiaries and branches, were RMB213 million for the year ended 31 December 2016, of which the fees for internal control audit paid to Ernst & Young Hua Ming LLP totalled RMB14 million.
Ernst & Young and its member firms were not engaged in other significant non-auditing services with the Bank in 2016. The Bank paid RMB32.9838 million for non-auditing services to Ernst & Young and its member firms in the year.
Ernst & Young Hua Ming LLP and Ernst & Young have provided audit services to the Bank for four consecutive years. Mr. ZHANG Xiaodong and Mr. FENG Suoteng are the certificated public accountants who signed the auditor’s report on the Bank’s financial
statements prepared in accordance with CAS for the year ended 31 December 2016.
At the forthcoming 2016 Annual General Meeting, the Board of Directors will tender a resolution for review and approval regarding the proposal on engaging Ernst & Young Hua Ming LLP as the Bank’s domestic auditor and internal control auditor for 2017, providing audit services on its financial statements and internal control pursuant to CAS; and engaging Ernst & Young as the Bank’s international auditor for 2017, providing financial statements audit services pursuant to IFRS.
Investor Relations and Information Disclosure
In 2016, the Bank enhanced its market communication and promotional efforts and continued to promote its differentiated competitive advantages in such areas as the “Belt and Road” initiatives, RMB internationalisation and its diversified businesses. As a result, it received positive recognition from capital markets. The Bank successfully arranged presentations for its 2015 annual results and 2016 interim results, as well as road shows in which the Senior Management continued to actively explain the Bank’s development strategies and operating performance to investors from the Chinese mainland, Asia-pacific, Europe and North America. The Senior Management also listened earnestly to market concerns and feedback. Such activities were warmly welcomed by investors. Through active participations in influential investment forums, the Bank increased the frequency of its communications with markets and expanded its investor coverage. During the reporting period, the Bank’s Senior Management and representatives from major business departments had approximately 200 meetings and conversations in varied forms with institutional investors and analysts from home and abroad, thus effectively enhancing the investment community’s understanding of the investment value in the Bank. The Bank continued to explore new communication channels, continuously enriching its investor relations webpage on the Bank’s official
website and providing timely and comprehensive
responses to enquiries from investors via the investor

2016 Annual Report 118
Corporate Governance
hotline, email, and e-interaction online platform run
by SSE, as well as other channels. In 2016, the Bank
answered over 400 calls on its investor relations
hotline, and replied nearly 300 enquiries from its
investor relations inbox as well as the e-interaction
online platform run by SSE.
Faced with the severe economic and financial
environment, the Bank continued to strengthen
communications with its external rating agencies,
making continuous efforts to conduct multilevel
and targeted communications on market concerns
such as its risk management, liquidity management,
capital sufficiency, operating performance and
development strategies. During the reporting period,
the Bank’s credit ratings were reaffirmed by the
major rating agencies like Moody’s Investors Service
and Fitch Ratings. In December 2016, Standard &
Poor’s Ratings Services upgraded the Bank’s Stand-
alone credit profile to “bbb+”, and preference shares
rating to “BB”. The Bank continued to maintain the
highest level among domestic peers for all aspects
of its external credit ratings. The Bank’s efforts in
maintaining the stability and making improvement of
its credit ratings helped boost investors’ confidence,
lower financing cost and enhance the Bank’s market
influence.
In 2016, the Bank prepared and disclosed its regular
and provisional reports in strict adherence to the
principles of truthfulness, accuracy, completeness,
timeliness and fairness. It continuously enhanced
the pertinence, effectiveness and transparency of
information disclosure in order to guarantee investors’
access to relevant information. The Bank earnestly
organised compliance analysis and information
disclosure regarding major projects, thus providing
timely, sufficient and useful information to investors.
It pioneered numerous market-leading best practices,
ensuring that the investors in the Chinese mainland
and Hong Kong are provided with equal opportunity
to access relevant information. In 2016, the Bank
released a total of more than 320 information
disclosure documents on SSE and Hong Kong Stock
Exchange.
The Bank has established a comprehensive and
complete information disclosure system and put
in place clear specifications regarding information
disclosure standard and scope of application,
responsibility and the division of work of the parties
concerned, information handling and disclosing
procedures and internal monitoring measures. In
2016, closely tracking changes in regulatory rules and
considering its internal management requirements,
the Bank timely reviewed and revised the Information
Disclosure Management Measures of Bank of China
Limited and the Regular Report Work Management
Measures of Bank of China Limited. It also formulated
the Management Measures on Information Disclosure
Suspension and Exemption of Bank of China Limited
according to regulatory requirements and disclosed
it after the review and approval by the Board of
Directors of the Bank. Moreover, the Bank reexamined
and revised its information disclosure working
procedures in a timely manner, thus further improving
the completeness of its regulation system and the
standardisation of its management work. The Bank
completed the registration of the insiders and the
filing of memoranda on the progress of significant
events in strict compliance with relevant regulatory
requirements and the rules of the Bank. The Bank
reinforced the principal responsibility system and
information correspondent mechanism at the Group
level, organised information disclosure training
and conducted guidance on information disclosure
obligations, so as to promote the building of a strong
compliance culture of information disclosure and to
improve the initiative and long-term perspective of its
information disclosure management work.
In 2016, the Bank continued to receive wide
recognitions for its work in investor relations and
its information disclosure performance. The Bank
won the “China Securities Golden Bauhinia Awards
— Best Investor Relations Listed Company” and the
Hong Kong “Quam Excellence Investor Relations”.
The Bank’s annual report won a Golden Award in the
overall category of the annual report competition of
the League of American Communications Professionals
(LACP). It also won a Silver Award in interior design of
the Annual Report Competition (ARC).

Report of the Board of Directors
2016 Annual Report119
The Board of Directors is pleased to present its report
together with the audited Consolidated Financial
Statements of the Bank and its subsidiaries (the
“Group”) for the year ended 31 December 2016.
Principal Activities
The Bank provides a range of banking and related
financial services, including commercial banking,
investment banking, insurance, direct investment and
investment management, fund management and
aircraft leasing business.
Major Customers
During the year, the five largest customers of the
Group accounted for less than 30% of the interest
income and other operating income of the Group.
Results and Profit Distribution
The Group’s annual results for 2016 are set out in
the Consolidated Financial Statements. The Board
of Directors has recommended a final dividend
on ordinary shares for 2016 of RMB0.168 per
share (before tax), subject to the approval of the
forthcoming Annual General Meeting scheduled on
29 June 2017. If approved, the 2016 final dividend
on the Bank’s ordinary shares will be denominated
and declared in RMB and paid in RMB or equivalent
Hong Kong dollars. The actual amount distributed in
Hong Kong dollars will be calculated according to the
average of the exchange rates announced by PBOC
in the week before 29 June 2017 (inclusive), being
the date of the Bank’s Annual General Meeting. The
A-Share dividend distribution date is expected to be 14
July 2017 and the H-Share dividend distribution date
is expected to be 9 August 2017 in accordance with
relevant regulatory requirements and business rules.
No capitalisation of the capital reserve to share capital
is proposed in this profit distribution.
At the 2015 Annual General Meeting held on 7 June
2016, a final dividend on ordinary shares for 2015 of
RMB0.175 per share (before tax) was approved for
payment. The A-Share and H-Share dividends were
distributed to the shareholders separately in June and
July of 2016 in accordance with relevant regulations.
The distribution plan has been accomplished and
the actual distributed amount was approximately
RMB51.518 billion (before tax). No interim dividend on
ordinary shares was paid for the period ended on 30
June 2016 by the Bank. The Bank did not propose any
capitalisation of the capital reserve to share capital in
2016.
At the Board meeting held on 19 January 2016, the
dividend distribution plan for the Bank’s Domestic
Preference Shares (Second Tranche) was approved.
The Bank distributed a total of RMB1.540 billion
(before tax) of dividends on the Domestic Preference
Shares (Second Tranche) on 14 March 2016, with
an annual dividend rate of 5.50% (before tax). The
dividend distribution plan has been accomplished.
At the Board meeting held on 30 August 2016, the
dividend distribution plans for the Bank’s Offshore
Preference Shares and Domestic Preference Shares
(First Tranche) were approved. The Bank distributed
dividends on the Offshore Preference Shares on 24
October 2016. According to the issuance terms of the
Offshore Preference Shares, dividends on Offshore
Preference Shares were denominated in RMB and paid
in US dollars converted at a fixed exchange rate, with
a total of approximately USD439 million (after tax)
at an annual dividend rate of 6.75% (after tax). The
Bank distributed a total of RMB1.920 billion (before
tax) of dividends on the Domestic Preference Shares
(First Tranche) on 21 November 2016, with an annual
dividend rate of 6.00% (before tax). The dividend
distribution plans have been accomplished.
At the Board meeting held on 23 January 2017, the
dividend distribution plan for the Bank’s Domestic
Preference Shares (Second Tranche) was approved.
The Bank distributed a total of RMB1.540 billion
(before tax) of dividends on the Domestic Preference
Shares (Second Tranche) on 13 March 2017, with
an annual dividend rate of 5.50% (before tax). The
dividend distribution plan has been accomplished.

2016 Annual Report 120
Report of the Board of Directors
Cash Dividend Payout for Ordinary Shares and Capitalisation of the Capital Reserve to Share Capital for the Past Three Years
Year of dividend distribution
Dividend per share
(before tax) (Unit: RMB)
Total dividend (before tax)
(Unit: RMB million)
Profit attributable to equity holders
of the Bank (Unit:
RMB million) Payout ratio
Capitalisation of the
capital reserve to share
capital
2015 0.175 51,518 170,845 30% Nil2014 0.190 55,934 169,595 33% Nil2013 0.196 54,755 156,911 35% Nil
Dividend Distribution for Preference Shares
Types of preference sharesDividend
payment date Total dividend Dividend rate
Offshore Preference Shares 23 October 2015 439 (USD million, after tax) 6.75% (after tax)Domestic Preference Shares (First Tranche) 23 November 2015 1,920 (RMB million, before tax) 6.00% (before tax)Domestic Preference Shares (Second Tranche) 14 March 2016 1,540 (RMB million, before tax) 5.50% (before tax)Offshore Preference Shares 24 October 2016 439 (USD million, after tax) 6.75% (after tax)Domestic Preference Shares (First Tranche) 21 November 2016 1,920 (RMB million, before tax) 6.00% (before tax)Domestic Preference Shares (Second Tranche) 13 March 2017 1,540 (RMB million, before tax) 5.50% (before tax)
Formulation and Implementation of Cash Dividend Policy
Ordinary Shares
In 2009, the Bank amended the Articles of Association to state that the Bank should maintain the continuity and stability of its profit distribution policy.
In 2013, the Bank amended the Articles of Association related to the cash dividend. This amendment clarified the Bank’s profit distribution principles, policy and adjustment procedures, the consideration process of the profit distribution plan and other matters. The amendment states that the Bank shall adopt cash dividend as the priority form of profit distribution. Except under special circumstances, the Bank shall adopt cash as the form of dividend distribution where there is profit in that year and the accumulated undistributed profit is positive, and that the cash
distribution of the dividend shall not be less than 10% of the profit after tax attributable to the ordinary shareholders of the Bank. The amendment also states that the Bank shall offer online voting to shareholders when considering amendments to profit distribution policy and profit distribution plan.
In 2014, the Bank formulated the Shareholder Return Plan for 2014 to 2016 to specify the basic principles, shareholder return plan and decision-making and supervisory mechanisms regarding the formulation, implementation and amendment of the shareholder return of the Bank.
The procedure to formulate the aforementioned dividend distribution policy was compliant, transparent and complete. The criterion and ratio of the dividend are explicit and clear. The independent directors fully expressed their opinions and the legitimate rights and interests of minority shareholders were fully respected

2016 Annual Report121
Report of the Board of Directors
and protected. The procedure was in line with the provisions of the Articles of Association and other rules and regulations.
The dividend distribution plan for ordinary shares of the Bank has been approved by the shareholders’ meeting. In 2016, the Bank distributed dividends on ordinary shares for 2015 in strict compliance with the Articles of Association, its dividend distribution policy and the shareholders’ meeting resolution on profit distribution.
Preference Shares
The preference shareholders of the Bank receive dividend at the specified dividend rate prior to the ordinary shareholders. The Bank shall pay the dividend to the preference shareholders in cash. The Bank shall not distribute dividends on ordinary shares before all the dividends on preference shares have been paid.
Dividends on the Bank’s preference shares will be distributed on an annual basis. The first dividend period begins on the date of issuance of the preference shares. Once the preference shareholders have received dividends at the specified dividend rate, they shall not be entitled to participate in the distribution of the remaining profits of the Bank together with the ordinary shareholders.
The preference share dividend is non-cumulative. If any preference share dividend for any dividend period is not paid in full, such remaining amount of dividend shall not be carried forward to the following dividend year. The Bank shall be entitled to cancel the payment of any dividend of the preference shares, and such cancellation shall not constitute a default. The Bank may at its discretion use the funds arising from the cancellation of such dividend payment to repay other indebtedness due and payable.
Dividend payments are independent from the Bank’s credit rating, nor do they vary with the credit rating.
The dividend distribution plans for preference shares of the Bank have been approved by the Board of Directors. In 2016, the Bank distributed dividends on domestic and offshore preference shares in strict compliance with the Articles of Association, the terms
of issuance of preference shares and the Board of Directors’ resolutions on dividend distribution.
Closure of H-Share Register of Members
The H-Share register of members of the Bank will be closed from Monday, 10 July to Thursday, 13 July 2017 (both days inclusive), for the purpose of determining the list of shareholders entitled to the proposed final dividends on ordinary shares. In order to qualify for the proposed final dividends, the H-Share Holders of the Bank who have not registered the relevant transfer documents are required to lodge them, together with the relevant share certificates, with the H-Share Registrar of the Bank, Computershare Hong Kong Investor Services Limited, at Rooms 1712–1716, 17th Floor, Hopewell Centre, 183 Queen’s Road East, Wanchai, Hong Kong, no later than 4:30 p.m. on Friday, 7 July 2017. The ex-dividend date of the Bank’s H Shares will be on Thursday, 6 July 2017.
Donations
Charitable and other donations made by the Group during the reporting period amounted to approximately RMB60.9463 million.
Share Capital
As at the latest practicable date prior to the issue of this annual report, the Bank had sufficient public float based on publicly available information, in compliance with the minimum requirement of the Hong Kong Listing Rules and the waiver granted by the Hong Kong Stock Exchange at the time of the Bank’s listing.
Distributable Reserves
Please refer to Note V.39 to the Consolidated Financial Statements for details of distributable reserves of the Bank.
Fixed Assets
Please refer to Note V.21 to the Consolidated Financial Statements for details of the fixed assets of the Bank.

2016 Annual Report 122
Report of the Board of Directors
Financial Summary
Please refer to the section “Financial Highlights” for
the summary of the annual results, assets and liabilities
of the Bank for the last five years.
Connected Transactions
Under the Hong Kong Listing Rules, transactions
between the Bank and its connected persons
(as defined under the Hong Kong Listing Rules)
constitute connected transactions to the Bank. Such
transactions are monitored and administered by
the Bank in accordance with the Hong Kong Listing
Rules. In 2016, the Bank has engaged in a number
of connected transactions with its connected persons
in the ordinary and usual course of its business. Such
transactions are exempted from the reporting, annual
review, announcement and independent shareholders’
approval requirements according to the Hong Kong
Listing Rules.
Directors’ Interests in Competing Businesses of the Bank
None of the directors has interests in any business
that competes or is likely to compete, either directly or
indirectly, with the business of the Group.
Remuneration Policy of Directors, Supervisors and Senior Management Members
The Bank has made a clear regulation on the
remuneration of directors, supervisors and senior
management members. The remuneration for
Chairman of the Board of Directors, President,
Chairman of the Board of Supervisors, executive
directors, Secretary of Party Discipline Committee
and executive vice presidents shall be paid in
accordance with the rules on remuneration
reform for central enterprises, which consists of
basic annual remuneration, performance-based
annual remuneration and incentive income linked
to term appraisal. The remuneration for other
senior management members and shareholder
supervisors consist of basic annual remuneration
and performance-based remuneration, and part of
performance-based remuneration is paid in a deferred
manner. Independent directors as well as external
supervisors and employee supervisors are remunerated
by the Bank while non-executive directors are not
remunerated by the Bank. The Bank remunerates
directors, supervisors and senior management
members who are employed by the Bank with salaries,
bonuses, contribution by the employer to social
insurance, enterprise annuity, supplementary medical
insurance and housing provident fund, as well as other
monetary income.
Please refer to the section “Directors, Supervisors
and Senior Management Members” for details of
the remuneration of directors, supervisors and senior
management members.
Directors’ and Supervisors’ Service Contracts
None of the directors or supervisors of the Bank has
a service contract with the Bank or its subsidiaries
that is not determinable within one year or is not
determinable without payment of compensation other
than normal statutory compensation.
Directors’ and Supervisors’ Interests in Transactions, Arrangements and Contracts of Significance
No transaction, arrangement or contract of
significance, in relation to the Bank’s business
to which the Bank, its holding companies, or its
subsidiaries or fellow subsidiaries was a party and
in which a director or a supervisor or any entity
connected with them was materially interested,
directly or indirectly, subsisted during the reporting
period.
Directors’ and Supervisors’ Rights to Acquire Shares
During the reporting period, none of the Bank, its
holding companies, or any of its subsidiaries or fellow
subsidiaries was a party to any arrangement that

2016 Annual Report123
Report of the Board of Directors
would enable the Bank’s directors and supervisors, or their respective spouses or children below the age of 18, to benefit by acquiring shares in, or debentures of, the Bank or any other body corporate.
Directors’ and Supervisors’ Interests in Shares, Underlying Shares and Debentures
To the best knowledge of the Bank, as at 31 December 2016, none of the directors or supervisors of the Bank or their respective associates had any interests or short positions in the shares, underlying shares or debentures of the Bank or any of its associated corporations (within the meaning of Part XV of the SFO) as recorded in the register required to be kept by the Bank pursuant to Section 352 of the SFO or as otherwise notified to the Bank and the Hong Kong Stock Exchange pursuant to the Model Code as set out in Appendix 10 of the Hong Kong Listing Rules.
Financial, Business and Family Relations among Directors
Directors of the Bank are not related to one another with respect to finance, business and family, or other material relations.
Substantial Shareholder Interests
Please refer to the section “Changes in Share Capital and Shareholdings of Shareholders” for the details of the Bank’s substantial shareholder interests.
Management Contracts
No contract concerning the management or administration of the whole or any substantial part of the business of the Bank was entered into or existed during the reporting period.
Share Appreciation Rights Plan and Share Option Scheme
Please refer to Note V.34 to the Consolidated Financial Statements for details of the share appreciation rights plan and share option scheme of the Group.
Purchase, Sale or Redemption of the Bank’s Securities
As at 31 December 2016, approximately 17.23 million shares of the Bank were held as treasury shares.
Please refer to the Notes to the Consolidated Financial Statements for details of purchase, sale or redemption of the Bank’s securities by the Bank and its subsidiaries.
Pre-emptive Rights
There are no compulsory provisions for pre-emptive rights requiring the Bank to offer new shares to existing shareholders in proportion to their existing shareholdings under the Articles of Association. The Articles of Association provide that the Bank may increase its capital by public offering, private placing, issuing rights of new shares to existing shareholders or allotting new shares to existing shareholders, transferring its capital reserve, issuing convertible bonds, or through other means as permitted by laws, administrative regulations and relevant regulatory authorities.
Permitted Indemnity Provision
As stipulated in the Articles of Association, within the scope permitted under applicable laws, administrative regulations and the Articles of Association, the Bank may purchase and maintain any liabilities insurance for the Bank’s former and incumbent directors. The Bank will indemnify every former and incumbent director out of its own assets against any liability incurred when he/she served as director of the Bank to the maximum extent permitted by law and administrative regulations or alternatively to the extent that it is not prohibited by law and administrative regulations unless it is established that the director has not acted honestly or in good faith in performing his duties.
During the reporting period, the Bank renewed its directors’ liability insurance to provide protection against claims arising from the lawful discharge of duties by the directors, thus encouraging the directors to fully perform their duties.

2016 Annual Report 124
Report of the Board of Directors
Equity-linked Agreement
The Bank has not been engaged in any equity-linked agreement during the reporting period.
Business Review
For disclosures of the Bank in respect of business review under paragraph 28 of Appendix 16 to the Hong Kong Listing Rules, please refer to sections “Management Discussion and Analysis” and “Corporate Social Responsibilities”. The relevant disclosure constitutes part of the Report of the Board of Directors.
Use of Raised Funds
All proceeds raised from initial public offerings, issuance of subordinated bonds, the rights issue, issuances of tier 2 capital bonds and preference shares have been used to replenish the Bank’s capital and increase the level of capital adequacy.
For details, please refer to the related announcements on the websites of SSE, HKEx and the Bank and the Notes to the Consolidated Financial Statements.
Tax and Tax Relief
Shareholders of the Bank are taxed in accordance with the following tax regulations and the amendments thereof from time to time. They shall enjoy possible tax relief according to the actual situation. Shareholders should seek professional advice from their tax and legal advisors. The following cited laws, regulations and stipulations are all relevant provisions issued before 31 December 2016.
A-Share Holders
In accordance with the provisions of the Notice on Implementing Differentiated Individual Income Tax Policy for Stock Dividends and Bonuses of Listed Companies (Caishui [2012] No. 85) and the Notice on Differentiated Individual Income Tax Policy for Stock Dividends and Bonuses of Listed Companies (Caishui [2015] No. 101) issued jointly by MOF, State Administration of Taxation of PRC and CSRC, for
shares of listed companies obtained by individuals from public offerings or the transfer market, where the holding period is less than one month (inclusive), the dividends and bonuses shall be counted as taxable income in the full amount; where the holding period is more than one month and less than one year (inclusive), 50% of the dividends and bonuses shall be counted as taxable income on a provisional basis; and where the holding period exceeds one year, the dividends and bonuses shall not be counted as taxable income on a provisional basis. The individual income tax rate of 20% shall be applicable for all incomes mentioned above. The individual income tax levied on dividends and bonuses obtained by equity investment funds from listed companies is also calculated in accordance with the aforementioned rules.
In accordance with the provisions of Article 26.2 of the Enterprise Income Tax Law of the People’s Republic of China, dividends, bonuses and other equity investment proceeds distributed between qualified resident enterprises shall be tax-free.
In accordance with Article 83 of the Implementation Rules of Enterprise Income Tax Law of the People’s Republic of China, dividends, bonuses and other equity investment proceeds distributed between qualified resident enterprises referred to in Article 26.2 of the Enterprise Income Tax Law of the People’s Republic of China mean those investment proceeds obtained from direct investment of resident enterprises into other resident enterprises, excluding those investment proceeds obtained from publicly offered and tradable stocks of resident enterprises held for less than 12 months on a continuing basis.
In accordance with the Enterprise Income Tax Law of the People’s Republic of China and the Implementation Rules of the Enterprise Income Tax Law of the People’s Republic of China, dividend income obtained by non-resident enterprises shall be levied at a preferential enterprise income tax rate of 10%.
H-Share Holders
In accordance with Chinese tax laws and regulations, the dividends and bonuses received by overseas
2016 Annual Report125
Report of the Board of Directors
resident individual shareholders from stocks issued by
domestic non-foreign investment enterprises in Hong
Kong are subject to the payment of individual income
tax, which shall be withheld by the withholding
agents. However, overseas resident individual
shareholders of stocks issued by domestic non-foreign
investment enterprises in Hong Kong are entitled to
the relevant preferential tax treatment pursuant to
the provisions in the tax agreements signed between
the countries in which they are residents and China,
or to the tax arrangements between the Chinese
mainland and Hong Kong and Macau. Accordingly,
the Bank generally withholds 10% of the dividends
to be distributed to the individual H-Share Holders as
individual income tax unless otherwise specified by the
relevant tax laws, regulations and agreements.
In accordance with the provisions of the Notice on
Issues concerning Withholding the Enterprise Income
Tax on Dividends Paid by Chinese Resident Enterprises
to H-share Holders who are Overseas Non-resident
Enterprises (Guoshuihan [2008] No. 897) published
by the State Administration of Taxation of PRC,
when Chinese resident enterprises distribute annual
dividends for 2008 onwards to H-share holders who
are overseas non-resident enterprises, the enterprise
income tax shall be withheld at a uniform rate of
10%.
In accordance with the current practice of the Inland
Revenue Department of Hong Kong, no tax is payable
in Hong Kong in respect of dividends on H Shares paid
by the Bank.
The tax and tax relief of Shanghai-Hong Kong Stock
Connect shall comply with the Notice on the Relevant
Taxation Policy regarding the Pilot Programme that
Links the Stock Markets in Shanghai and Hong Kong
issued jointly by MOF, State Administration of Taxation
of PRC, and CSRC.
Domestic Preference Share Holders
The individual income tax levied on dividends obtained
by individuals from non-public issuance of domestic
preference shares is calculated in accordance with the
relevant Chinese tax laws and regulations.
In accordance with the provisions of the Enterprise
Income Tax Law of the People’s Republic of China and
the Implementation Rules of the Enterprise Income
Tax Law of the People’s Republic of China, dividend
income from domestic preference shares distributed
between qualified resident enterprises are non-taxable,
and dividend income from domestic preference shares
obtained by non-resident enterprises shall be levied at
a preferential enterprise income tax rate of 10%.
Offshore Preference Share Holders
In accordance with Chinese tax laws and regulations,
when distributing dividends to overseas non-resident
enterprises on offshore preference shares, the Bank
shall withhold enterprise income tax at a rate of 10%.
In accordance with the current practice of the Inland
Revenue Department of Hong Kong, no tax is payable
in Hong Kong in respect of the dividends on offshore
preference shares paid by the Bank.
Auditors
Please refer to the section “Corporate Governance —
Appointment of External Auditors” for details of the
Bank’s external auditors.
Members of the Board of Directors
Executive Directors: TIAN Guoli, CHEN Siqing, REN Deqi,
GAO Yingxin
Non-executive Directors: ZHANG Xiangdong, ZHANG Qi,
LIU Xianghui, LI Jucai
Independent Directors: Nout WELLINK, LU Zhengfei,
LEUNG Cheuk Yan, WANG Changyun, Angela CHAO
On behalf of the Board of Directors
TIAN GuoliChairman
31 March 2017

Report of the Board of Supervisors
2016 Annual Report 126
Meetings of the Board of Supervisors
In 2016, the Bank convened five on-site meetings of the Board of Supervisors on 30 March, 26 April, 30 August, 27 October and 18 November. At these meetings, the Board of Supervisors reviewed and approved 13 proposals on the Bank’s regular reports, 2015 profit distribution plan, 2015 internal control assessment report, 2015 work report of the Board of Supervisors, 2016 work plan of the Board of Supervisors, evaluation opinions on the duty performance of directors and senior management members for 2015, the nomination of candidates for supervisors of the Bank and election of the Chairman of the Board of Supervisors, among others.
In 2016, the attendance rate of each supervisor of the meetings of the Board of Supervisors is given below:
Supervisors
Number of meetings attended in person/Number of meetings convened during term of office
Incumbent SupervisorsWANG Xiquan 1/1
WANG Xueqiang 5/5
LIU Wanming 4/5
DENG Zhiying 4/5
GAO Zhaogang 3/4
XIANG Xi 5/5
CHEN Yuhua 5/5
Former SupervisorsLI Jun 2/4
LIU Xiaozhong 1/1
Notes:
1 Please refer to the section “Directors, Supervisors and
Senior Management Members — Changes in Directors,
Supervisors and Senior Management Members” for
changes in supervisors.
2 Mr. LIU Wanming was not able to attend the meeting
of the Board of Supervisors in person on 18 November
2016 due to other important business engagements. He
authorised another supervisor to attend and vote at the
meeting as his proxy.
3 Mr. DENG Zhiying was not able to attend the meeting
of the Board of Supervisors in person on 27 October
2016 due to other important business engagements. He
authorised another supervisor to attend and vote at the
meeting as his proxy.
4 Mr. GAO Zhaogang was not able to attend the meeting
of the Board of Supervisors in person on 27 October
2016 due to other important business engagements. He
authorised another supervisor to attend and vote at the
meeting as his proxy.
5 Mr. LI Jun was not able to attend the meetings of the
Board of Supervisors in person on 27 October and
18 November 2016 due to other important business
engagements. He authorised another supervisor to attend
and vote at the meetings as his proxy.
In 2016, the Duty Performance and Due Diligence
Supervision Committee of the Board of Supervisors
held one on-site meeting and one meeting by written
resolution, at which it reviewed and approved
the proposal on evaluation opinions on the duty
performance of directors and senior management
members for 2015, the nomination of candidates for
supervisors of the Bank, as well as other proposals. The
Finance and Internal Control Supervision Committee
of the Board of Supervisors held four on-site meetings,
at which it reviewed and approved the Bank’s regular
reports, 2015 profit distribution plan, 2015 internal
control assessment report and other proposals.
Performance of Supervision and Inspection by the Board of Supervisors
In 2016, the Board of Supervisors made new progress
in all working areas. Bearing the big picture of the
Bank in mind and adhering to the issue-focused
approach, it closely followed up the Bank’s strategic
development, operation and management, and
risk management dynamics and internal control.
It highlighted the key aims on supervision and
strengthen the actual effects of its supervisory activity,
intensified investigations into detected problems,
developed reports in high quality, exercised its
supervision functions constructively, and pushed
forward the Bank’s continued stable development, in
accordance with the relevant laws and regulations,
regulatory requirements and the Articles of Association
of the Bank.

2016 Annual Report127
Report of the Board of Supervisors
Steadily improved the internal supervision mechanism and improved supervision of the duty performance of directors and senior management members. The Board of Supervisors arranged for
supervisors to attend the shareholders’ meetings
and the meetings of the Board of Directors, special
committees and the Senior Management. This allowed
supervisors to stay informed of the major strategic
decisions made in these meetings and to keep abreast
of how major operational and management measures
are being implemented, as well as to share their
supervisory opinions and suggestions on major issues.
It gathered and analysed the important speeches
delivered by directors on the meetings of the Board
of Directors and its special committees as well as the
information on implementation of resolutions and
major instructions made on the special meetings of
the Senior Management, in order to gain an all-round
understanding of directors’ and senior management
members’ day-to-day duty performance and develop
the monthly analysis report of senior management
members’ duty performance and alert relevant parties
to the major issues that require special attention. The
Board of Supervisors researched and formulated the
Bank’s annual performance assessment plan, collected
and read reports on the annual duty performance
of directors and senior management members and
organised annual duty performance interviews with
them. Based on the day-to-day supervision as well
as duty performance reporting and interviews, it
objectively and fairly assessed the duty performance
of the Board of Directors, the Senior Management
and its members and, expressed opinions regarding
the Bank’s annual performance assessment. These
assessments were approved on the meetings of
the Board of Supervisors and reverted back to the
Board of Directors, the Senior Management and
their members in an appropriate manner. As per
regulatory requirements, such opinions were sent to
the CBRC and the assessment results were reported at
the Annual General Meeting. The duty performance
assessment work won the emphasis and support of
the Board of Directors and the Senior Management.
Directors were motivated to work diligently and
proactively got involved in decision-making and senior
management members maintained their enthusiasm
for work. Additionally, the duty performance
assessment further enhanced the Bank’s corporate
governance and provided an important institutional
guarantee for its drive to advance reform and
innovation and secure continued stable development.
Persistently supervised the Bank’s finance, risk management and internal control by adhering to issue and risk-focused approaches. First, the Board
of Supervisors made concrete efforts to carry out
the financial supervision, prioritising the legality and
compliance of financial activities and the authenticity,
accuracy and completeness of financial data. The
Board of Supervisors followed up and learned about
the Bank’s progress in implementing Group-wide
development strategies and plans, annual business
plans and financial budgets, as well as its major issues
concerning establishment of overseas institutions,
restructuring of certain institutions, sales of major
assets, bond issuance, distribution of dividends on
preference shares and connected transactions. It
paid adequate attention to the Bank’s arrangements
and executions in terms of strategy, finance and
accounting management, streamlined and analysed
the Bank’s financial and accounting data on a monthly
basis, and gained an in-depth understanding of the
bank-wide dynamics in operations and management.
Through monthly summary and analysis of strategy
implementation and financial and accounting
management, it pertinently reported on problems,
explored for causes, gave suggestions, and provided
guidance for the Board of Directors, the Senior
Management and functional department through
various forms.
Second, the Board of Supervisors strengthened
the supervision of risk management and internal
control. It proactively adapted itself to the changes
in the operational environment. Aiming to enhance
the Bank’s risk prevention and mitigation abilities,
it continuously tracked and comprehended the risk
profiles in such fields as collateral management, anti-
money laundering, asset management business,
physical precious metals, reconciliation management,
and liquidity management. It heard and reviewed
reports on risk control across the Group, and alerted

2016 Annual Report 128
Report of the Board of Supervisors
the Board of Directors, the Senior Management
and functional departments to the major potential,
tendentious issues as well as the weak links identified
in the relevant work through a variety of means
including speeches at meetings, supervision letters
and face-to-face interaction. Together with the Board
of Supervisors, the Board of Directors and the Senior
Management fulfilled their respective responsibilities
in risk prevention and control and maintained a firm
grip on the risk bottom line. The Board of Supervisors received reports regarding the Bank’s internal control status, internal control assessment and internal control audit, and reviewed reports on internal control assessment. Through daily prompts and duty performance interviews, among other means, it further urged the internal audit function to reinforce its responsibilities and improve the means of audit. With respect to the problems identified in internal and external audits and regulatory inspections, it improved analysis and urged the Senior Management and functional departments to keep improving the relevant policies, procedures and systems as well as the resource allocation.
Third, the Board of Supervisors reviewed the problems identified in special surveys of last year. With regard to the findings of last year’s special surveys concerning anti-money laundering, internal control case prevention, small and micro credit business and other aspects, it proceeded with the daily supervision and followed up on the implementation of survey opinions and Senior Management instructions by the relevant departments, branches and subsidiaries.
Fourth, the Board of Supervisors earnestly reviewed and oversaw regular reports. It regularly communicated on special issues with the accounting and information, financial management, credit management, audit and other business departments as well as with external auditors. It received reports on the Bank’s operations, financial position and, changes in risk assets and provisioning, among others. It made suggestions including enhancing risk management and control in key areas, rectifying problems identified in internal control audits through intensified efforts, managing and controlling concentration risk and risk of renewed loans, putting high-risk bonds under efficient oversight and early warning,
substantially mitigating the adverse influence arising from the decrease of net interest margin, vigorously tapping new initiatives to drive profit growth, and strengthening the operation and management of non-performing assets. The Board of Directors, the Senior Management and relevant functional departments actively responded to these recommended measures, by proactively studying and improving the relevant work.
Strictly adhered to the Bank’s overall requirement for preventing risk and promoting development and arranged special surveys. Concentrating on the key areas and links that involved the Bank’s drive to deepen reform and secure stable development, the Board of Supervisors closely tracked the overarching issues and weak links related to bank-wide strategy implementation, operation and management and risk management control. It focused on carrying out three special surveys on non-performing asset disposal, personal credit risk management and asset management business. The survey team made up of supervisors and personnel from relevant departments of the Head Office communicated with the relevant Head Office departments and a number of branches and institutions through interviews and other means. It heard relevant reports from different levels, gathered and collated cases, explored countermeasures, gave multiple suggestions, and submitted report on the special surveys to the Board of Directors and the Senior Management. The Board of Directors and Senior Management attached high importance and recognition to the report, requiring the relevant functional departments to study it earnestly, propose measures for improvement and improve the implementation of the rectification. In addition, the Senior Management convened a meeting in which the relevant departments reported on their progress and develop plans for rectifying the problems raised by the survey report. The surveys carried out by the Board of Supervisors played active roles in realising the Bank’s requirement for preventing risk and promoting development.
Stuck to stringent, concrete management and pushed forward self-improvement. In line with regulatory requirements, the Board of Supervisors amended the sections of the Bank’s Articles of Association that relate to itself, in an effort to

2016 Annual Report129
Report of the Board of Supervisors
point out the direction for its duty performance. It organised and carried out inspections and surveys to communicate with and learn about its peers. It visited and held adequate discussions with the Board of Supervisors in multiple banks about the functional structure and supervisory functions of the Board of Supervisors and its special committees, its dedicated examinations and inspections, the construction of the Board of Supervisors and other aspects. The Board of Supervisors closely studied the reform and implementation plan of how it could play its role in the new environment, taking into consideration organisational, institutional, staffing and policy perspectives. In addition, improvements were made with regards to the ideology, work style and competence. The Board of Supervisors completed the procedures related to the selection, appointment and resignation of its chairman and some of its members. According to regulatory requirements and measures for the assessment of supervisors’ duty performance, the Board of Supervisors continued to conduct self-assessment of its overall duty performance and annual assessment of the individual duty performance of supervisors, urging all supervisors to consciously perform their supervisory duties as defined by relevant laws, regulations and the Articles of Association. It organised the seminars and training courses on supervisory activity in 2016, and arranged supervisors to attend the duty performance trainings given by regulators as well as the trainings held by the Board of Directors on regulatory rules. Through these trainings, supervisors were expected to improve their understanding of the global banking operational dynamics and supervisory trend.
The Board of Directors and the Senior Management attached great importance to the supervision and guidance of the Board of Supervisors, checked and implemented relevant rectifications, allocated responsibility for operation and management measures, effectively mitigated potential risks and improved operation and management.
During the reporting period, the Board of Supervisors held no objection to such matters under its supervision regarding the Bank’s operational and legal compliance, financial position, use of raised funds, purchase and sale of assets, connected transactions, internal control and corporate information disclosure.

Significant Events
2016 Annual Report 130
Material Litigation and Arbitration
The Bank was involved in certain litigation and
arbitration cases in its regular course of business. In
addition, because of the scope and scale of the Bank’s
international operations, the Bank is from time to time
subject to a variety of claims under the laws of various
jurisdictions in which the Bank operates such as anti-
money laundering. After consulting legal professionals,
the Senior Management holds that none of the
litigation and arbitration cases will have a significant
impact on the financial position or operating results of
the Bank at the current stage.
Material Purchase and Sale of Assets, and Merger and Acquisition
BOCHK (as seller) entered into a sale and purchase
agreement with Cinda Financial Holdings Co.,
Limited (as buyer) and China Cinda (HK) Holdings
Company Limited (as buyer’s guarantor) in relation
to the disposal of all the issued shares of Nanyang
Commercial Bank, Limited on 18 December 2015.
The completion of the disposal took place on 30 May
2016 in accordance with the terms and conditions of
the sale and purchase agreement. Upon completion,
Nanyang Commercial Bank, Limited ceased to be a
subsidiary of both the Bank and BOCHK (Holdings).
As part of the Group’s strategic restructuring plan
in the ASAEN region, on 30 June 2016, the Bank (as
seller) and BOCHK (as buyer) entered into sale and
purchase agreements in relation to sale and purchase
of the entire issued share capital of Bank of China
(Malaysia) Berhad, and the entire issued share capital
of Bank of China (Thai) Public Company Limited,
respectively. All the conditions precedent set out in
the sale and purchase agreements have been satisfied
and completion of the both transfers have taken place
in accordance with the terms and conditions of the
sale and purchase agreements. On 28 February 2017,
the Bank (as seller) and BOCHK (as buyer) entered
into sale and purchase agreements in relation to sale
and purchase of the banking businesses operated by
the Bank in Indonesia through Bank of China Limited,
Jakarta Branch and its eight sub-branches; and the
banking businesses operated by the Bank in Cambodia
through Bank of China Limited, Phnom Penh Branch,
Cambodia and its two sub-branches, respectively.
The completion of each transfer is subject to the
satisfaction or waiver of the respective conditions
precedent including the obtaining of the requisite
approvals from domestic and overseas regulatory
authorities.
BOCHK (as seller) entered into a sale and purchase
agreement with Xiamen International Investment
Limited and the Committee of Jimei Schools (as
buyers) in relation to the proposed disposal of
approximately 70.49% of the total issued shares
of Chiyu Banking Corporation Limited for a total
consideration of HKD7.685 billion on 22 December
2016. The completion of the disposal took place
on 27 March 2017 in accordance with the terms
and conditions of the sale and purchase agreement.
Upon completion, Chiyu Banking Corporation Limited
ceased to be a subsidiary of the Bank, BOCHK
(Holdings) and BOCHK respectively.
For details, please refer to relevant announcements of
the Bank on the websites of SSE, HKEx and the Bank.
Implementation of Stock Incentive Plan and Employee Stock Ownership Plan
The Bank approved a long-term incentive policy,
including the Management Stock Appreciation Rights
Plan and the Employee Stock Ownership Plan, at the
Board meeting and the extraordinary shareholders’
meeting held in November 2005. To date, the
Management Stock Appreciation Rights Plan and
the Employee Stock Ownership Plan have not been
implemented.
Significant Connected Transactions
The Bank had no significant connected transactions
during the reporting period. For details of the
related party transactions as defined by the relevant
accounting standards by the end of the reporting
period, please refer to Note V.44 of the Consolidated
Financial Statements.

2016 Annual Report131
Significant Events
Major Contracts and the Enforcement thereof
Material Custody, Sub-contracts and Leases
During the reporting period, the Bank did not take
any significant custody of, sub-contract or lease any
material business assets from other companies, or
allow its material business assets to be subject to such
arrangements that are required to be disclosed.
Material Guarantee Business
As approved by PBOC and CBRC, the Bank’s
guarantee business is an off-balance-sheet item
in the ordinary course of its business. The Bank
operates its guarantee business in a prudent manner
and has formulated specific management measures,
operational processes and approval procedures in
accordance with the risks of the guarantee business
and carries out this business accordingly. During the
reporting period, save as disclosed above, the Bank did
not enter into any material guarantee business that is
required to be disclosed.
Other Major Contracts
During the reporting period, the Bank had no other
major contract that was required to be disclosed.
Misappropriation of Funds by Controlling Shareholder and Other Related Parties
During the reporting period, there was no
misappropriation of the Bank’s funds by its controlling
shareholder or other related parties for non-operating
purposes.
Undertakings
Huijin made a “non-competing commitment” when
the Bank launched its IPO. As at 31 December 2016,
Huijin has strictly observed and has not breach such
undertaking.
Disciplinary Actions Imposed on the Bank, its Directors, Supervisors, Senior Management Members and Controlling Shareholder
During the reporting period, neither the Bank nor
any of its directors, supervisors, senior management
members or controlling shareholder was subject to
any investigation, compulsory measures or criminal
responsibilities by relevant authorities or any
investigation, administrative punishment or regulatory
measures by CSRC, or had material administrative
punishment imposed on them by other administrative
authorities, or were publicly reprimanded by any stock
exchange.
Integrity of the Bank and its Controlling Shareholder
During the reporting period, neither the Bank nor its
controlling shareholder failed to perform effective
judgment of the court or pay off any due debt in large
amount.
Performing Social Responsibility of Poverty Alleviation
For details of the Bank’s performance of social
responsibility regarding poverty alleviation during
the reporting period, please refer to the section
“Corporate Social Responsibilities” and the Bank’s
2016 Corporate Social Responsibility Report published
on the websites of SSE, HKEx and the Bank.

Independent Auditor’s Report
2016 Annual Report 132
22/F, CITIC Tower1 Tim Mei AvenueCentral, Hong Kong
To the shareholders of Bank of China Limited(Established in the People’s Republic of China with limited liability)
Opinion
We have audited the consolidated financial statements of Bank of China Limited (the “Bank”) and its subsidiaries (the “Group”) set out on pages 139 to 288, which comprise the consolidated statement of financial position as at 31 December 2016, and the consolidated income statement, the consolidated statement of comprehensive income, the consolidated statement of changes in equity and the consolidated statement of cash flows for the year then ended, and notes to the consolidated financial statements, including a summary of significant accounting policies.
In our opinion, the consolidated financial statements give a true and fair view of the consolidated financial position of the Group as at 31 December 2016, and of its consolidated financial performance and its consolidated cash flows for the year then ended in accordance with International Financial Reporting Standards (“IFRSs”) issued by the International Accounting Standards Board (“IASB”) and have been properly prepared in compliance with the disclosure requirements of the Hong Kong Companies Ordinance.
Basis for Opinion
We conducted our audit in accordance with International Standards on Auditing (“ISAs”) issued by the International Auditing and Assurance Standards Board. Our responsibilities under those standards are further described in the Auditor’s Responsibilities for the Audit of the Consolidated Financial Statements section of our report. We are independent of the Group in accordance with the Code of Ethics for Professional Accountants (the “Code”) issued by the Hong Kong Institute of Certified Public Accountants, and we have fulfilled our other ethical responsibilities in accordance with the Code. We believe that the audit evidence we have obtained is sufficient and appropriate to provide a basis for our opinion.
Key Audit Matters
Key audit matters are those matters that, in our professional judgement, were of most significance in our audit of the consolidated financial statements of the current period. These matters were addressed in the context of our audit of the consolidated financial statements as a whole, and in forming our opinion thereon, and we do not provide a separate opinion on these matters. For each matter below, our description of how our audit addressed the matter is provided in that context.
We have fulfilled the responsibilities described in the Auditor’s Responsibilities for the Audit of the Consolidated Financial Statements section of our report, including in relation to these matters. Accordingly, our audit included the performance of procedures designed to respond to our assessment of the risks of material misstatement of the consolidated financial statements. The results of our audit procedures, including the procedures performed to address the matters below, provide the basis for our audit opinion on the accompanying consolidated financial statements.

2016 Annual Report133
Independent Auditor’s Report
Key Audit Matters (Continued)
Key audit matter How our audit addressed the key audit matter
Impairment assessment of loans and advances to customers
The assessment of impairment of loans and advances to customers involves significant judgement. The Group adopts an individual impairment assessment approach for individually significant loans; and a collective impairment assessment approach for loans not individually significant or not individually impaired. Under the collective approach, assessment of future cash flows for loan portfolios is based on historical loss experience of loans with similar credit risk characteristics, with adjustments based on the impact from changes of and uncertainties in the macro-economic environment. The future cash flows of loans without collateral or guarantees, or loans that are not adequately collateralised, are subject to higher uncertainties.
Since loan impairment assessment involves judgement and assumptions, and in view of the significance of the amount (as at 31 December 2016, gross loans and advances to customers amounted to RMB9,973,362 million, representing 55% of total assets, and impairment allowance for loans and advances to customers amounted to RMB237,716 million), impairment of loans and advances is considered a key audit matter.
Relevant disclosures are included in Note V.18 and Note VI.3 to the consolidated financial statements.
We evaluated and tested the effectiveness of design and implementation of key controls related to the credit approval process, post approval credit management, loan grading system, collateral monitoring and loan impairment assessment, including testing of relevant data quality and information systems.
We adopted a risk-based sampling approach in our loan review procedures. We assessed the debtors’ repayment capacity and evaluated the Group’s loan classification, taking into consideration post-lending investigation reports, debtors’ financial information, collateral valuation reports and other available information.
We assessed the collective impairment model and considered management’s assumptions on the loss identification period, migration rate, loss ratio and impact of macro-economic changes for various types of loan portfolio. We evaluated the Group’s modification of parameters and assumptions used in the collective impairment model, and compared them with historical loss data for loan portfolios, observable economic data, market information and industry trends.
We tested the discounted cash flow models and the related assumptions used in individual impairment assessment by assessing the amount, timing and likelihood of estimated future cash flows, including cash flows from collateral. We compared the assumptions with available external information.
Furthermore, we evaluated and tested the design and operating effectiveness of internal controls related to disclosures of credit risk and impairment allowance.

2016 Annual Report 134
Independent Auditor’s Report
Key Audit Matters (Continued)
Key audit matter How our audit addressed the key audit matter
Valuation of financial instruments
The Group has applied valuation techniques to determine the fair value of financial instruments that are not quoted in active markets. These valuation techniques, particularly those require significant unobservable inputs, usually involve subjective judgement and assumptions. With different valuation techniques and assumptions applied, the valuation results can vary significantly.
As at 31 December 2016, financial assets and financial liabilities measured at fair value amounted to RMB1,864,469 million and RMB469,378 million respectively, representing 10% and 3% of total assets and total liabilities respectively. Financial instruments which require significant unobservable inputs in estimating fair value, and hence categorised within level 3 of the fair value hierarchy, involve higher uncertainty in their valuation. As at 31 December 2016, 3% of financial assets measured at fair value were categorised within level 3. Due to the significance of financial instruments measured at fair value, and the uncertainty in valuation involving significant judgement for unlisted equity and fund investments, illiquid asset-backed securities, and over-the-counter derivatives, valuation of financial instruments is considered a key audit matter.
Relevant disclosures are included in Note VI.6 to the consolidated financial statements.
We evaluated and tested the design and operating effectiveness of key controls related to valuation of financial instruments, independent price verification, independent model validation and approval.
We evaluated the valuation techniques, inputs and assumptions through comparison with the valuation techniques commonly used in the markets, validation of observable inputs using external market data, and comparison with valuation outcomes obtained from various pricing sources.
For valuations which used significant unobservable inputs, such as unlisted equity investments and private equity fund investments, we involved our internal valuation specialists in assessing the models used, re-performing independent valuations, and analysing the sensitivities of valuation results to key inputs and assumptions.
Furthermore, we evaluated and tested the design and operating effectiveness of internal controls related to disclosures of fair value.
Structured entities
The Group has interests in various structured entities, such as bank wealth management products, funds and trust plans, in conducting financial investments, asset management business and credit assets transfers. The Group determines whether or not to consolidate these structured entities based on the assessment of whether the Group has control taking into consideration power arising from rights, variable returns, and link between power and returns.
The assessment of the Group’s control over structured entities involves significant judgement on factors such as the purpose and design of structured entities, its ability to direct the relevant activities, direct and indirect beneficial interests and returns, performance fee, remuneration and exposure to loss from providing credit enhancement or liquidity support. Due to the significance of the unconsolidated structured entities and the complexity of judgement exercised by management, consolidation or non-consolidation of structured entities is considered a key audit matter.
Relevant disclosures are included in Note V.47 to the consolidated financial statements.
We evaluated and tested the design and operating effectiveness of the key controls related to the Group’s assessment of whether it controls a structured entity.
We assessed the Group’s analysis and conclusions on whether or not it controls structured entities based on the Group’s analysis on its power over structured entities, the magnitude and variability of variable returns from its involvement with structured entities. We also assessed whether the Group has legal or constructive obligation to absorb any loss of structured entities by reviewing relevant term sheets, and whether the Group has provided liquidity support or credit enhancement to structured entities, as well as the fairness of transactions between the Group and structured entities.
Furthermore, we evaluated and tested the design and operating effectiveness of internal controls related to disclosures of unconsolidated structured entities.

2016 Annual Report135
Independent Auditor’s Report
Other Information included in the Annual Report
The directors of the Bank are responsible for the other information. The other information comprises the information included in the Annual Report, other than the consolidated financial statements and our auditor’s report thereon.
Our opinion on the consolidated financial statements does not cover the other information and we do not express any form of assurance conclusion thereon.
In connection with our audit of the consolidated financial statements, our responsibility is to read the other information and, in doing so, consider whether the other information is materially inconsistent with the consolidated financial statements or our knowledge obtained in the audit or otherwise appears to be materially misstated. If, based on the work we have performed, we conclude that there is a material misstatement of this other information, we are required to report that fact. We have nothing to report in this regard.
Responsibilities of the Directors for the Consolidated Financial Statements
The directors of the Bank are responsible for the preparation of the consolidated financial statements that give a true and fair view in accordance with IFRSs and the disclosure requirements of the Hong Kong Companies Ordinance, and for such internal control as the directors determine is necessary to enable the preparation of consolidated financial statements that are free from material misstatement, whether due to fraud or error.
In preparing the consolidated financial statements, the directors of the Bank are responsible for assessing the Group’s ability to continue as a going concern, disclosing, as applicable, matters related to going concern and using the going concern basis of accounting unless the directors of the Bank either intend to liquidate the Group or to cease operations, or have no realistic alternative but to do so.
The directors of the Bank are assisted by the Audit Committee in discharging their responsibilities for overseeing the Group’s financial reporting process.
Auditor’s Responsibilities for the Audit of the Consolidated Financial Statements
Our objectives are to obtain reasonable assurance about whether the consolidated financial statements as a whole are free from material misstatement, whether due to fraud or error, and to issue an auditor’s report that includes our opinion. Our report is made solely to you, as a body, and for no other purpose. We do not assume responsibility towards or accept liability to any other person for the contents of this report.
Reasonable assurance is a high level of assurance, but is not a guarantee that an audit conducted in accordance with ISAs will always detect a material misstatement when it exists. Misstatements can arise from fraud or error and are considered material if, individually or in the aggregate, they could reasonably be expected to influence the economic decisions of users taken on the basis of these consolidated financial statements.
As part of an audit in accordance with ISAs, we exercise professional judgement and maintain professional scepticism throughout the audit. We also:
• Identify and assess the risks of material misstatement of the consolidated financial statements, whether due to fraud or error, design and perform audit procedures responsive to those risks, and obtain audit evidence that is sufficient and appropriate to provide a basis for our opinion. The risk of not detecting a material misstatement resulting from fraud is higher than for one resulting from error, as fraud may involve collusion, forgery, intentional omissions, misrepresentations, or the override of internal control.
• Obtain an understanding of internal control relevant to the audit in order to design audit procedures that are appropriate in the circumstances, but not for the purpose of expressing an opinion on the effectiveness of the Group’s internal control.
• Evaluate the appropriateness of accounting policies used and the reasonableness of accounting estimates and related disclosures made by the directors.

2016 Annual Report 136
Independent Auditor’s Report
Auditor’s Responsibilities for the Audit of the Consolidated Financial Statements (Continued)
• Conclude on the appropriateness of the directors’ use of the going concern basis of accounting and, based on the audit evidence obtained, whether a material uncertainty exists related to events or conditions that may cast significant doubt on the Group’s ability to continue as a going concern. If we conclude that a material uncertainty exists, we are required to draw attention in our auditor’s report to the related disclosures in the consolidated financial statements or, if such disclosures are inadequate, to modify our opinion. Our conclusions are based on the audit evidence obtained up to the date of our auditor’s report. However, future events or conditions may cause the Group to cease to continue as a going concern.
• Evaluate the overall presentation, structure and content of the consolidated financial statements, including the disclosures, and whether the consolidated financial statements represent the underlying transactions and events in a manner that achieves fair presentation.
• Obtain sufficient appropriate audit evidence regarding the financial information of the entities or business activities within the Group to express an opinion on the consolidated financial statements. We are responsible for the direction, supervision and performance of the group audit. We remain solely responsible for our audit opinion.
We communicate with the Audit Committee regarding, among other matters, the planned scope and timing of the audit and significant audit findings, including any significant deficiencies in internal control that we identify during our audit.
We also provide the Audit Committee with a statement that we have complied with relevant ethical requirements regarding independence and to communicate with them all relationships and other matters that may reasonably be thought to bear on our independence, and where applicable, related safeguards.
From the matters communicated with the Audit Committee, we determine those matters that were of most significance in the audit of the consolidated financial statements of the current period and are therefore the key audit matters. We describe these matters in our auditor’s report unless law or regulation precludes public disclosure about the matter or when, in extremely rare circumstances, we determine that a matter should not be communicated in our report because the adverse consequences of doing so would reasonably be expected to outweigh the public interest benefits of such communication.
The engagement partner on the audit resulting in this independent auditor’s report is Choi Kam Cheong, Geoffrey.
Ernst & YoungCertified Public Accountants
Hong Kong31 March 2017

Consolidated Financial Statements
2016 Annual Report137
CONTENTS
CONSOLIDATED FINANCIAL STATEMENTS
CONSOLIDATED INCOME STATEMENT . . . . . . . . . . . . . . . . . . . . . . . . . . . . . . . . . . . . . . . . . . . . . . . . . . . . . . . . . 139
CONSOLIDATED STATEMENT OF COMPREHENSIVE INCOME . . . . . . . . . . . . . . . . . . . . . . . . . . . . . . . . . . . . . . . . . 140
CONSOLIDATED STATEMENT OF FINANCIAL POSITION . . . . . . . . . . . . . . . . . . . . . . . . . . . . . . . . . . . . . . . . . . . . . 141
CONSOLIDATED STATEMENT OF CHANGES IN EQUITY . . . . . . . . . . . . . . . . . . . . . . . . . . . . . . . . . . . . . . . . . . . . . 143
CONSOLIDATED STATEMENT OF CASH FLOWS. . . . . . . . . . . . . . . . . . . . . . . . . . . . . . . . . . . . . . . . . . . . . . . . . . . 144
NOTES TO THE CONSOLIDATED FINANCIAL STATEMENTS
I. GENERAL INFORMATION AND PRINCIPAL ACTIVITIES. . . . . . . . . . . . . . . . . . . . . . . . . . . . . . . . . . . . . . . 146
II. SUMMARY OF PRINCIPAL ACCOUNTING POLICIES . . . . . . . . . . . . . . . . . . . . . . . . . . . . . . . . . . . . . . . . . 146
III. CRITICAL ACCOUNTING ESTIMATES AND JUDGEMENTS IN
APPLYING ACCOUNTING POLICIES . . . . . . . . . . . . . . . . . . . . . . . . . . . . . . . . . . . . . . . . . . . . . . . . . . . . 171
IV. TAXATION . . . . . . . . . . . . . . . . . . . . . . . . . . . . . . . . . . . . . . . . . . . . . . . . . . . . . . . . . . . . . . . . . . . . . . . . . 174
V. NOTES TO THE CONSOLIDATED FINANCIAL STATEMENTS
1 Net interest income . . . . . . . . . . . . . . . . . . . . . . . . . . . . . . . . . . . . . . . . . . . . . . . . . . . . . . . . . . . . . . . 174
2 Net fee and commission income. . . . . . . . . . . . . . . . . . . . . . . . . . . . . . . . . . . . . . . . . . . . . . . . . . . . . . 175
3 Net trading gains . . . . . . . . . . . . . . . . . . . . . . . . . . . . . . . . . . . . . . . . . . . . . . . . . . . . . . . . . . . . . . . . . 175
4 Net gains on financial investments . . . . . . . . . . . . . . . . . . . . . . . . . . . . . . . . . . . . . . . . . . . . . . . . . . . . 175
5 Other operating income . . . . . . . . . . . . . . . . . . . . . . . . . . . . . . . . . . . . . . . . . . . . . . . . . . . . . . . . . . . . 176
6 Operating expenses . . . . . . . . . . . . . . . . . . . . . . . . . . . . . . . . . . . . . . . . . . . . . . . . . . . . . . . . . . . . . . . 177
7 Staff costs . . . . . . . . . . . . . . . . . . . . . . . . . . . . . . . . . . . . . . . . . . . . . . . . . . . . . . . . . . . . . . . . . . . . . . 177
8 Directors’, supervisors’ and senior management’s emoluments . . . . . . . . . . . . . . . . . . . . . . . . . . . . . . . 178
9 Impairment losses on assets . . . . . . . . . . . . . . . . . . . . . . . . . . . . . . . . . . . . . . . . . . . . . . . . . . . . . . . . . 181
10 Income tax expense . . . . . . . . . . . . . . . . . . . . . . . . . . . . . . . . . . . . . . . . . . . . . . . . . . . . . . . . . . . . . . . 182
11 Earnings per share (basic and diluted). . . . . . . . . . . . . . . . . . . . . . . . . . . . . . . . . . . . . . . . . . . . . . . . . . 183
12 Other comprehensive income . . . . . . . . . . . . . . . . . . . . . . . . . . . . . . . . . . . . . . . . . . . . . . . . . . . . . . . . 184
13 Cash and due from banks and other financial institutions . . . . . . . . . . . . . . . . . . . . . . . . . . . . . . . . . . . 185
14 Balances with central banks . . . . . . . . . . . . . . . . . . . . . . . . . . . . . . . . . . . . . . . . . . . . . . . . . . . . . . . . . 185
15 Placements with and loans to banks and other financial institutions . . . . . . . . . . . . . . . . . . . . . . . . . . . 186
16 Financial assets at fair value through profit or loss . . . . . . . . . . . . . . . . . . . . . . . . . . . . . . . . . . . . . . . . 187
17 Derivative financial instruments and hedge accounting . . . . . . . . . . . . . . . . . . . . . . . . . . . . . . . . . . . . . 188
18 Loans and advances to customers. . . . . . . . . . . . . . . . . . . . . . . . . . . . . . . . . . . . . . . . . . . . . . . . . . . . . 191
19 Financial investments . . . . . . . . . . . . . . . . . . . . . . . . . . . . . . . . . . . . . . . . . . . . . . . . . . . . . . . . . . . . . . 194
20 Investment in associates and joint ventures. . . . . . . . . . . . . . . . . . . . . . . . . . . . . . . . . . . . . . . . . . . . . . 197
21 Property and equipment. . . . . . . . . . . . . . . . . . . . . . . . . . . . . . . . . . . . . . . . . . . . . . . . . . . . . . . . . . . . 198
22 Investment properties. . . . . . . . . . . . . . . . . . . . . . . . . . . . . . . . . . . . . . . . . . . . . . . . . . . . . . . . . . . . . . 200
23 Other assets. . . . . . . . . . . . . . . . . . . . . . . . . . . . . . . . . . . . . . . . . . . . . . . . . . . . . . . . . . . . . . . . . . . . . 201
24 Impairment allowance . . . . . . . . . . . . . . . . . . . . . . . . . . . . . . . . . . . . . . . . . . . . . . . . . . . . . . . . . . . . . 204
25 Due to banks and other financial institutions . . . . . . . . . . . . . . . . . . . . . . . . . . . . . . . . . . . . . . . . . . . . 205
26 Due to central banks . . . . . . . . . . . . . . . . . . . . . . . . . . . . . . . . . . . . . . . . . . . . . . . . . . . . . . . . . . . . . . 205
27 Government certificates of indebtedness for bank notes issued and bank notes in circulation . . . . . . . . 205
28 Placements from banks and other financial institutions . . . . . . . . . . . . . . . . . . . . . . . . . . . . . . . . . . . . . 205

2016 Annual Report 138
29 Due to customers. . . . . . . . . . . . . . . . . . . . . . . . . . . . . . . . . . . . . . . . . . . . . . . . . . . . . . . . . . . . . . . . . 206
30 Bonds issued . . . . . . . . . . . . . . . . . . . . . . . . . . . . . . . . . . . . . . . . . . . . . . . . . . . . . . . . . . . . . . . . . . . . 207
31 Other borrowings. . . . . . . . . . . . . . . . . . . . . . . . . . . . . . . . . . . . . . . . . . . . . . . . . . . . . . . . . . . . . . . . . 208
32 Current tax liabilities . . . . . . . . . . . . . . . . . . . . . . . . . . . . . . . . . . . . . . . . . . . . . . . . . . . . . . . . . . . . . . 209
33 Retirement benefit obligations . . . . . . . . . . . . . . . . . . . . . . . . . . . . . . . . . . . . . . . . . . . . . . . . . . . . . . . 209
34 Share appreciation rights plan . . . . . . . . . . . . . . . . . . . . . . . . . . . . . . . . . . . . . . . . . . . . . . . . . . . . . . . 210
35 Deferred income taxes . . . . . . . . . . . . . . . . . . . . . . . . . . . . . . . . . . . . . . . . . . . . . . . . . . . . . . . . . . . . . 210
36 Assets and liabilities held for sale . . . . . . . . . . . . . . . . . . . . . . . . . . . . . . . . . . . . . . . . . . . . . . . . . . . . . 213
37 Other liabilities. . . . . . . . . . . . . . . . . . . . . . . . . . . . . . . . . . . . . . . . . . . . . . . . . . . . . . . . . . . . . . . . . . . 214
38 Share capital, capital reserve, treasury shares and other equity instruments. . . . . . . . . . . . . . . . . . . . . . 217
39 Statutory reserves, general and regulatory reserves and undistributed profits . . . . . . . . . . . . . . . . . . . . 219
40 Non-controlling interests . . . . . . . . . . . . . . . . . . . . . . . . . . . . . . . . . . . . . . . . . . . . . . . . . . . . . . . . . . . 221
41 Changes in the consolidation . . . . . . . . . . . . . . . . . . . . . . . . . . . . . . . . . . . . . . . . . . . . . . . . . . . . . . . . 221
42 Contingent liabilities and commitments . . . . . . . . . . . . . . . . . . . . . . . . . . . . . . . . . . . . . . . . . . . . . . . . 222
43 Note to the consolidated statement of cash flows . . . . . . . . . . . . . . . . . . . . . . . . . . . . . . . . . . . . . . . . 226
44 Related party transactions . . . . . . . . . . . . . . . . . . . . . . . . . . . . . . . . . . . . . . . . . . . . . . . . . . . . . . . . . . 226
45 Segment reporting . . . . . . . . . . . . . . . . . . . . . . . . . . . . . . . . . . . . . . . . . . . . . . . . . . . . . . . . . . . . . . . . 232
46 Transfers of financial assets . . . . . . . . . . . . . . . . . . . . . . . . . . . . . . . . . . . . . . . . . . . . . . . . . . . . . . . . . 237
47 Interests in the unconsolidated structured entities . . . . . . . . . . . . . . . . . . . . . . . . . . . . . . . . . . . . . . . . 238
48 Offsetting financial assets and financial liabilities . . . . . . . . . . . . . . . . . . . . . . . . . . . . . . . . . . . . . . . . . 239
49 The Bank’s statement of financial position and changes in equity . . . . . . . . . . . . . . . . . . . . . . . . . . . . . 241
50 Events after the financial reporting date . . . . . . . . . . . . . . . . . . . . . . . . . . . . . . . . . . . . . . . . . . . . . . . . 244
VI. FINANCIAL RISK MANAGEMENT
1 Overview . . . . . . . . . . . . . . . . . . . . . . . . . . . . . . . . . . . . . . . . . . . . . . . . . . . . . . . . . . . . . . . . . . . . . . . 245
2 Financial risk management framework . . . . . . . . . . . . . . . . . . . . . . . . . . . . . . . . . . . . . . . . . . . . . . . . . 245
3 Credit risk . . . . . . . . . . . . . . . . . . . . . . . . . . . . . . . . . . . . . . . . . . . . . . . . . . . . . . . . . . . . . . . . . . . . . . 245
4 Market risk . . . . . . . . . . . . . . . . . . . . . . . . . . . . . . . . . . . . . . . . . . . . . . . . . . . . . . . . . . . . . . . . . . . . . 266
5 Liquidity risk. . . . . . . . . . . . . . . . . . . . . . . . . . . . . . . . . . . . . . . . . . . . . . . . . . . . . . . . . . . . . . . . . . . . . 274
6 Fair value . . . . . . . . . . . . . . . . . . . . . . . . . . . . . . . . . . . . . . . . . . . . . . . . . . . . . . . . . . . . . . . . . . . . . . . 280
7 Capital management . . . . . . . . . . . . . . . . . . . . . . . . . . . . . . . . . . . . . . . . . . . . . . . . . . . . . . . . . . . . . . 284
8 Insurance risk. . . . . . . . . . . . . . . . . . . . . . . . . . . . . . . . . . . . . . . . . . . . . . . . . . . . . . . . . . . . . . . . . . . . 287
SUPPLEMENTARY INFORMATION
I. DIFFERENCES BETWEEN IFRS AND CAS CONSOLIDATED FINANCIAL STATEMENTS. . . . . . . . . . . . . . . . 288
II. UNAUDITED SUPPLEMENTARY INFORMATION
1 Liquidity ratios and liquidity coverage ratio . . . . . . . . . . . . . . . . . . . . . . . . . . . . . . . . . . . . . . . . . . . . . . 288
2 Currency concentrations. . . . . . . . . . . . . . . . . . . . . . . . . . . . . . . . . . . . . . . . . . . . . . . . . . . . . . . . . . . . 290
3 International claims . . . . . . . . . . . . . . . . . . . . . . . . . . . . . . . . . . . . . . . . . . . . . . . . . . . . . . . . . . . . . . . 290
4 Overdue assets. . . . . . . . . . . . . . . . . . . . . . . . . . . . . . . . . . . . . . . . . . . . . . . . . . . . . . . . . . . . . . . . . . . 291
5 Leverage ratio . . . . . . . . . . . . . . . . . . . . . . . . . . . . . . . . . . . . . . . . . . . . . . . . . . . . . . . . . . . . . . . . . . . 292
6 Global systemically importance assessment indicators of commercial banks. . . . . . . . . . . . . . . . . . . . . . 293

Consolidated Income StatementFor the year ended 31 December 2016 (Amount in millions of Renminbi, unless otherwise stated)
2016 Annual Report139
Year ended 31 DecemberNote 2016 2015
Interest income V.1 566,139 615,056Interest expense V.1 (260,091) (286,406)
Net interest income 306,048 328,650
Fee and commission income V.2 98,319 100,905Fee and commission expense V.2 (9,655) (8,495)
Net fee and commission income 88,664 92,410
Net trading gains V.3 8,496 9,460Net gains on financial investments V.4 12,524 5,765Other operating income V.5 69,924 37,627
Operating income 485,656 473,912
Operating expenses V.6 (175,069) (185,401)Impairment losses on assets V.9 (89,072) (59,274)
Operating profit 221,515 229,237Share of results of associates and joint ventures V.20 897 2,334
Profit before income tax 222,412 231,571Income tax expense V.10 (38,361) (52,154)
Profit for the year 184,051 179,417
Attributable to:Equity holders of the Bank 164,578 170,845Non-controlling interests 19,473 8,572
184,051 179,417
Earnings per share (Expressed in RMB per ordinary share) V.11 — Basic 0.54 0.56 — Diluted 0.54 0.56
For details of the dividends paid or proposed, please refer to Note V.39.3.
The accompanying notes form an integral part of these consolidated financial statements.

Consolidated Statement of Comprehensive IncomeFor the year ended 31 December 2016 (Amount in millions of Renminbi, unless otherwise stated)
2016 Annual Report 140
Year ended 31 DecemberNote 2016 2015
Profit for the year 184,051 179,417
Other comprehensive income: V.12
Items that will not be reclassified to profit or loss
— Actuarial gains/(losses) on defined benefit plans 259 (161)
— Other 18 14
Subtotal 277 (147)
Items that may be reclassified subsequently to profit or loss
— Net fair value (losses)/gains on available for sale
financial assets (15,128) 6,573
— Share of other comprehensive income of associates and
joint ventures accounted for using the equity method (131) (361)
— Exchange differences from the translation of
foreign operations 15,480 6,896
— Other 1,898 336
Subtotal 2,119 13,444
Other comprehensive income for the year, net of tax 2,396 13,297
Total comprehensive income for the year 186,447 192,714
Total comprehensive income attributable to:
Equity holders of the Bank 163,069 182,171
Non-controlling interests 23,378 10,543
186,447 192,714
The accompanying notes form an integral part of these consolidated financial statements.

Consolidated Statement of Financial PositionAs at 31 December 2016 (Amount in millions of Renminbi, unless otherwise stated)
2016 Annual Report141
As at 31 DecemberNote 2016 2015
ASSETS
Cash and due from banks and other financial institutions V.13 659,982 654,378
Balances with central banks V.14 2,271,640 2,196,063
Placements with and loans to banks and
other financial institutions V.15 594,048 426,848
Government certificates of indebtedness
for bank notes issued V.27 117,421 91,191
Precious metals 161,417 176,753
Financial assets at fair value through profit or loss V.16 124,090 119,062
Derivative financial assets V.17 130,549 82,236
Loans and advances to customers, net V.18 9,735,646 8,935,195
Financial investments V.19 3,848,794 3,476,033
— available for sale 1,609,830 1,078,533
— held to maturity 1,843,043 1,790,790
— loans and receivables 395,921 606,710
Investment in associates and joint ventures V.20 14,059 10,843
Property and equipment V.21 194,897 182,031
Investment properties V.22 21,659 23,281
Deferred income tax assets V.35 34,341 22,246
Assets held for sale V.36 50,371 237,937
Other assets V.23 189,975 181,500
Total assets 18,148,889 16,815,597
The accompanying notes form an integral part of these consolidated financial statements.

2016 Annual Report 142
As at 31 DecemberNote 2016 2015
LIABILITIESDue to banks and other financial institutions V.25 1,420,527 1,764,320Due to central banks V.26 867,094 415,709Bank notes in circulation V.27 117,656 91,331Placements from banks and other financial institutions V.28 302,792 447,944Derivative financial liabilities V.17 107,109 69,160Due to customers V.29 12,939,748 11,729,171 — at amortised cost 12,589,437 11,389,260 — at fair value 350,311 339,911Bonds issued V.30 362,318 282,929Other borrowings V.31 27,152 30,281Current tax liabilities V.32 28,055 37,982Retirement benefit obligations V.33 3,439 4,255Deferred income tax liabilities V.35 4,501 4,291Liabilities classified as held for sale V.36 42,488 196,850Other liabilities V.37 438,918 383,769
Total liabilities 16,661,797 15,457,992
EQUITYCapital and reserves attributable to equity holders of the BankShare capital V.38.1 294,388 294,388Other equity instruments V.38.4 99,714 99,714Capital reserve V.38.2 141,972 140,098Treasury shares V.38.3 (53) (86)Other comprehensive income V.12 (3,854) (2,345)Statutory reserves V.39.1 125,714 111,511General and regulatory reserves V.39.2 193,462 179,485Undistributed profits V.39 560,339 482,181
1,411,682 1,304,946
Non-controlling interests V.40 75,410 52,659
Total equity 1,487,092 1,357,605
Total equity and liabilities 18,148,889 16,815,597
Approved and authorised for issue by the Board of Directors on 31 March 2017.
The accompanying notes form an integral part of these consolidated financial statements.
TIAN Guoli CHEN SiqingDirector Director
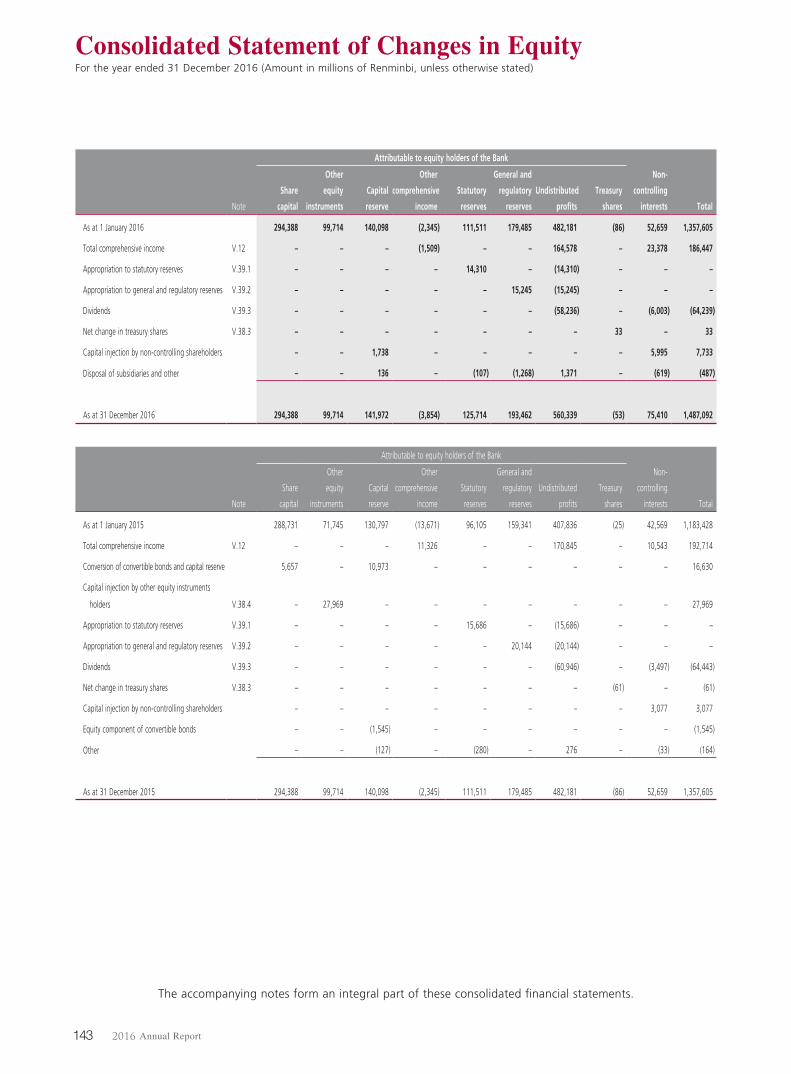
Consolidated Statement of Changes in EquityFor the year ended 31 December 2016 (Amount in millions of Renminbi, unless otherwise stated)
2016 Annual Report143
Attributable to equity holders of the Bank
Note
Share
capital
Other
equity
instruments
Capital
reserve
Other
comprehensive
income
Statutory
reserves
General and
regulatory
reserves
Undistributed
profits
Treasury
shares
Non-
controlling
interests Total
As at 1 January 2016 294,388 99,714 140,098 (2,345) 111,511 179,485 482,181 (86) 52,659 1,357,605
Total comprehensive income V.12 – – – (1,509) – – 164,578 – 23,378 186,447
Appropriation to statutory reserves V.39.1 – – – – 14,310 – (14,310) – – –
Appropriation to general and regulatory reserves V.39.2 – – – – – 15,245 (15,245) – – –
Dividends V.39.3 – – – – – – (58,236) – (6,003) (64,239)
Net change in treasury shares V.38.3 – – – – – – – 33 – 33
Capital injection by non-controlling shareholders – – 1,738 – – – – – 5,995 7,733
Disposal of subsidiaries and other – – 136 – (107) (1,268) 1,371 – (619) (487)
As at 31 December 2016 294,388 99,714 141,972 (3,854) 125,714 193,462 560,339 (53) 75,410 1,487,092
Attributable to equity holders of the Bank
Note
Share
capital
Other
equity
instruments
Capital
reserve
Other
comprehensive
income
Statutory
reserves
General and
regulatory
reserves
Undistributed
profits
Treasury
shares
Non-
controlling
interests Total
As at 1 January 2015 288,731 71,745 130,797 (13,671) 96,105 159,341 407,836 (25) 42,569 1,183,428
Total comprehensive income V.12 – – – 11,326 – – 170,845 – 10,543 192,714
Conversion of convertible bonds and capital reserve 5,657 – 10,973 – – – – – – 16,630
Capital injection by other equity instruments
holders V.38.4 – 27,969 – – – – – – – 27,969
Appropriation to statutory reserves V.39.1 – – – – 15,686 – (15,686) – – –
Appropriation to general and regulatory reserves V.39.2 – – – – – 20,144 (20,144) – – –
Dividends V.39.3 – – – – – – (60,946) – (3,497) (64,443)
Net change in treasury shares V.38.3 – – – – – – – (61) – (61)
Capital injection by non-controlling shareholders – – – – – – – – 3,077 3,077
Equity component of convertible bonds – – (1,545) – – – – – – (1,545)
Other – – (127) – (280) – 276 – (33) (164)
As at 31 December 2015 294,388 99,714 140,098 (2,345) 111,511 179,485 482,181 (86) 52,659 1,357,605
The accompanying notes form an integral part of these consolidated financial statements.

Consolidated Statement of Cash FlowsFor the year ended 31 December 2016 (Amount in millions of Renminbi, unless otherwise stated)
2016 Annual Report 144
Year ended 31 DecemberNote 2016 2015
Cash flows from operating activitiesProfit before income tax 222,412 231,571Adjustments: Impairment losses on assets 89,072 59,274 Depreciation of property and equipment 12,898 12,850 Amortisation of intangible assets and other assets 2,793 2,758 Net gains on disposal of property and equipment, intangible assets and other long-term assets (576) (788) Net gains on disposal of investment in subsidiaries, associates and joint ventures (29,083) (2,026) Share of results of associates and joint ventures (897) (2,334) Interest income arising from financial investments (110,993) (105,279) Dividends arising from investment securities (775) (483) Net gains on financial investments (12,524) (5,765) Interest expense arising from bonds issued 12,183 10,909 Accreted interest on impaired loans (2,480) (1,329) Net changes in operating assets and liabilities: Net (increase)/decrease in balances with central banks (200,508) 126,827 Net increase in due from and placements with and loans to banks and other financial institutions (25,240) (31,746) Net decrease in precious metals 15,256 17,484 Net increase in financial assets at fair value through profit or loss (1,749) (27,772) Net increase in loans and advances to customers (914,251) (833,615) Net increase in other assets (134,139) (122,913) Net decrease in due to banks and other financial institutions (343,437) (12,809) Net increase in due to central banks 451,386 67,444 Net (decrease)/increase in placements from banks and other financial institutions (155,290) 225,136 Net increase in due to customers 1,248,709 1,028,905 Net decrease in other borrowings (3,129) (166) Net increase in other liabilities 117,732 91,644
Cash inflow from operating activities 237,370 727,777Income tax paid (55,289) (55,683)
Net cash inflow from operating activities 182,081 672,094
The accompanying notes form an integral part of these consolidated financial statements.

2016 Annual Report145
Consolidated Statement of Cash Flows (Continued)For the year ended 31 December 2016 (Amount in millions of Renminbi, unless otherwise stated)
Year ended 31 DecemberNote 2016 2015
Cash flows from investing activitiesProceeds from disposal of property and equipment, intangible assets and other long-term assets 11,201 12,580Proceeds from disposal of investment in subsidiaries, associates and joint ventures 27,857 7,416
Dividends received 1,387 663
Interest income received from financial investments 109,869 94,085
Proceeds from disposal/maturity of financial investments 2,150,079 1,276,488Increase in investment in subsidiaries, associates and joint ventures (2,860) (3,390)Purchase of property and equipment, intangible assets and other long-term assets (34,247) (36,942)
Purchase of financial investments (2,509,672) (2,108,179)
Net cash outflow from investing activities (246,386) (757,279)
Cash flows from financing activities
Proceeds from issuance of bonds 150,721 109,991
Proceeds from issuance of preference shares of the Bank – 27,969
Proceeds from non-controlling shareholders investment 7,733 3,077
Repayments of debts issued (83,560) (93,643)
Cash payments for interest on bonds issued (11,654) (11,445)
Dividend payments to equity holders of the Bank (58,236) (60,946)
Dividend payments to non-controlling shareholders (6,003) (3,497)
Other net cash flows from financing activities (714) (221)
Net cash outflow from financing activities (1,713) (28,715)
Effect of exchange rate changes on cash and cash equivalents 33,187 17,827
Net decrease in cash and cash equivalents (32,831) (96,073)
Cash and cash equivalents at beginning of year 1,052,078 1,148,151
Cash and cash equivalents at end of year V.43 1,019,247 1,052,078
The accompanying notes form an integral part of these consolidated financial statements.

Notes to the Consolidated Financial Statements(Amount in millions of Renminbi, unless otherwise stated)
2016 Annual Report 146
I GENERAL INFORMATION AND PRINCIPAL ACTIVITIESBank of China Limited (the “Bank”), formerly known as Bank of China, a State-owned joint stock commercial bank, was founded on 5 February 1912. From its formation until 1949, the Bank performed various functions of a central bank, foreign exchange bank and commercial bank specialising in trade finance. Following the founding of the People’s Republic of China (the “PRC”) in 1949, the Bank was designated as a specialised foreign exchange bank. Since 1994, the Bank has evolved into a State-owned commercial bank. In this regard, in accordance with the Master Implementation Plan for the Joint Stock Reform approved by the State Council of the PRC, the Bank was converted into a joint stock commercial bank on 26 August 2004 and its name was changed from Bank of China to Bank of China Limited. In 2006, the Bank listed on the Stock Exchange of Hong Kong Limited and the Shanghai Stock Exchange.
The Bank is licensed as a financial institution by the China Banking Regulatory Commission (the “CBRC”) No. B0003H111000001 and is issued the business license of legal enterprise with unified social credit code No. 911000001000013428 by the State Administration of Industry and Commerce of the PRC. The registered address is No. 1, Fuxingmen Nei Dajie, Beijing, China.
The Bank and its subsidiaries (together the “Group”) provide a full range of corporate banking, personal banking, treasury operations, investment banking, insurance and other services to its customers in the Chinese mainland, Hong Kong, Macau, Taiwan and other major international financial centres.
The Bank’s principal regulator is the CBRC. The operations in Hong Kong, Macau, Taiwan and other countries and regions of the Group are subject to the supervision of local regulators.
The parent company is Central Huijin Investment Limited (“Huijin”), a wholly owned subsidiary of China Investment Corporation (“CIC”), which owned 64.02% of the ordinary shares of the Bank as at 31 December 2016 (31 December 2015: 64.02%).
These consolidated financial statements have been approved by the Board of Directors on 31 March 2017.
II SUMMARY OF PRINCIPAL ACCOUNTING POLICIES1 Basis of preparation
The consolidated financial statements of the Group have been prepared in accordance with International Financial Reporting Standards (“IFRS”). In addition, the consolidated financial statements comply with the disclosure requirements of the Hong Kong Companies Ordinance.
Financial assets available for sale, financial assets and financial liabilities at fair value through profit or loss (including derivative financial instruments) and investment properties are measured at their fair values in the consolidated financial statement. Assets that meet the criteria to be classified as held for sale are measured at the lower of their carrying amount and fair value less costs to sell. Other accounting items are measured at their historical costs. Impairment is recognised if there is objective evidence of impairment of assets.
The preparation of financial statements in conformity with IFRS requires the use of certain critical accounting estimates. It also requires management to exercise its judgement in the process of applying the Group’s accounting policies. The areas involving a higher degree of judgement or complexity, or areas where assumptions and estimates are significant to the consolidated financial statements are disclosed in Note III.

2016 Annual Report147
(Amount in millions of Renminbi, unless otherwise stated)
II SUMMARY OF PRINCIPAL ACCOUNTING POLICIES (Continued)
1 Basis of preparation (Continued)
1.1 Standards, amendments and interpretations effective in 2016
On 1 January 2016, the Group adopted the following new standards, amendments and interpretations.
IAS 27 Amendments Equity Method in Separate Financial StatementsIFRS 10, IFRS 12 and IAS 28 Amendments
Investment Entities: Applying the Consolidation Exception
IAS 1 Amendments Disclosure InitiativeIFRS 11 Amendments Accounting for Acquisitions of Interests in Joint OperationsIAS 16 and IAS 38 Amendments Clarification of Acceptable Methods of Depreciation
and AmortisationAnnual Improvements to IFRSs 2012–2014 cycle (issued in September 2014)
IAS 27 Amendments allow entities to use the equity method to account for investments in subsidiaries, joint ventures and associates in their separate financial statements.
The amendments to IFRS 10, IFRS 12 and IAS 28 address issues that have arisen in applying the investment entities exception under IFRS 10. The amendments to IFRS 10 clarify that the exception from presenting consolidated financial statements applies to a parent entity that is a subsidiary of an investment entity, when the investment entity measures all of its subsidiaries at fair value. The amendments also clarify that only a subsidiary of an investment entity that is not an investment entity itself and that provides support services to the investment entity is consolidated. All other subsidiaries of an investment entity are measured at fair value. The amendments to IAS 28 allow the investor, when applying the equity method, to retain the fair value measurement applied by the investment entity associate or joint venture to its interests in subsidiaries.
The amendments to IAS 1 include narrow-focus improvements in materiality, disaggregation and subtotals, notes structure, disclosure of accounting policies and presentation of items of other comprehensive income arising from equity accounted investments.
The amendments to IFRS 11 require an investor to apply the principles of business combination accounting when it acquires an interest in a joint operation that constitutes a “business” (as defined in IFRS 3 Business Combinations).
The amendments to IAS 16 and IAS 38 clarify that revenue reflects a pattern of economic benefits that are generated from operating a business rather than the economic benefits that are consumed through use of the asset. As a result, the ratio of revenue generated to total revenue expected to be generated cannot be used to depreciate property, plant and equipment and may only be used in very limited circumstances to amortise intangible assets.

2016 Annual Report 148
Notes to the Consolidated Financial Statements
II SUMMARY OF PRINCIPAL ACCOUNTING POLICIES (Continued)
1 Basis of preparation (Continued)
1.1 Standards, amendments and interpretations effective in 2016 (Continued)
Annual Improvements to IFRSs 2012–2014 cycle:
IFRS 5 Non-Current Assets Held for Sale and Discontinued Operations
Assets (or disposal groups) are generally disposed of either through sale or distribution to owners. The amendments clarify that changing from one of these disposal methods to the other would not be considered a new plan of disposal, rather it is a continuation of the original plan. There is, therefore, no interruption of the application of the requirements in IFRS 5.
IFRS 7 Financial Instruments: Disclosures
The amendments clarify that a servicing contract that includes a fee can constitute continuing involvement in a financial asset. An entity must assess the nature of the fee and the arrangement against the guidance in IFRS 7 for continuing involvement in order to assess whether the disclosures are required. In addition, the amendments clarify that the offsetting disclosure requirements do not apply to condensed interim financial statements, unless such disclosures provide a significant update to the information reported in the most recent annual report.
IAS 19 Employee Benefits
The amendments clarify that market depth of high quality corporate bonds is assessed based on the currency in which the obligation is denominated, rather than the country where the obligation is located. When there is no deep market for high quality corporate bonds in that currency, government bond rates must be used.
IAS 34 Interim Financial Reporting
The amendments clarify that the required interim disclosures must be either in the interim financial statements or incorporated by cross-reference between the interim financial statements and wherever they are included within the interim financial report (e.g., in the management commentary or risk report). The other information within the interim financial report must be available to users on the same terms as the interim financial statements and at the same time.
The adoption of the above standards and amendments does not have any significant impact on the operating results, financial position and comprehensive income of the Group.

2016 Annual Report149
(Amount in millions of Renminbi, unless otherwise stated)
II SUMMARY OF PRINCIPAL ACCOUNTING POLICIES (Continued)
1 Basis of preparation (Continued)
1.2 Standards, amendments and interpretations that are not yet effective and have not been early
adopted by the Group in 2016
Effective for annual periods
beginning on or after
IAS 7 Amendments Statement of Cash Flows 1 January 2017IAS 12 Amendments Recognition of Deferred Tax Assets
for Unrealised Losses1 January 2017
IAS 40 Amendments Transfers of Investment Property 1 January 2018IFRS 2 Amendments Share-based Payment 1 January 2018IFRS 4 Amendments Insurance Contracts 1 January 2018IFRS 9 Financial Instruments 1 January 2018IFRS 15 and Amendments Revenue from Contracts with Customers 1 January 2018IFRIC Interpretation 22 Foreign Currency Transactions and
Advance Consideration1 January 2018
IFRS 16 Leases 1 January 2019IFRS 10 and IAS 28 Amendments
Sale or Contribution of Assets between an Investor and its Associate or Joint Venture
Effective date has been deferred
indefinitelyAnnual Improvements to IFRSs 2014–2016 cycle (issued in December 2016)
The amendments to IAS 7 require an entity to provide disclosures that enable users of financial statements to evaluate changes in liabilities arising from financing activities, including both changes arising from cash flows and non-cash changes.
The amendments to IAS 12 clarify that an entity needs to consider whether tax law restricts the sources of taxable profits against which it may make deductions on the reversal of that deductible temporary difference. Furthermore, the amendments provide guidance on how an entity should determine future taxable profits and explain the circumstances in which taxable profit may include the recovery of some assets for more than their carrying amount.
IAS 40 Amendments clarify when an entity should transfer property, including property under construction or development into, or out of investment property. The amendments state that a change in use occurs when the property meets, or ceases to meet, the definition of investment property and there is evidence of the change in use. A mere change in management’s intentions for the use of a property does not provide evidence of a change in use.
The IASB issued amendments to IFRS 2 Share-based Payment that address three main areas: the effects of vesting conditions on the measurement of a cash-settled share-based payment transaction; the classification of a share-based payment transaction with net settlement features for withholding tax obligations; and accounting where a modification to the terms and conditions of a share-based payment transaction changes its classification from cash settled to equity settled.
The IASB issued amendments to IFRS 4 that address concerns arising from implementing the new financial instruments standard, IFRS 9, before implementing the new insurance contracts standard that the IASB is developing to replace IFRS 4. The amendments introduce two options for entities issuing insurance contracts: a temporary exemption from applying IFRS 9 and an overlay approach.

2016 Annual Report 150
Notes to the Consolidated Financial Statements
II SUMMARY OF PRINCIPAL ACCOUNTING POLICIES (Continued)
1 Basis of preparation (Continued)
1.2 Standards, amendments and interpretations that are not yet effective and have not been early
adopted by the Group in 2016 (Continued)
In July 2014, the IASB issued the final version of IFRS 9 Financial Instruments which reflects all phases of the financial instruments project and replaces IAS 39 Financial Instruments: Recognition and Measurement and all previous versions of IFRS 9. The standard introduces new requirements for classification and measurement, impairment, and hedge accounting.
IFRS 15 was issued in May 2014 and establishes a new five-step model that will apply to revenue arising from contracts with customers. Under IFRS 15 revenue is recognised at an amount that reflects the consideration to which an entity expects to be entitled in exchange for transferring goods or services to a customer. The principles in IFRS 15 provide a more structured approach to measuring and recognising revenue. The new revenue standard is applicable to all entities and will supersede all current revenue recognition requirements under IFRS.
IFRIC Interpretation 22 clarifies that in determining the spot exchange rate to use on initial recognition of the related asset, expense or income (or part of it) on the derecognition of a non-monetary asset or non-monetary liability relating to advance consideration, the date of the transaction is the date on which an entity initially recognises the non-monetary asset or non-monetary liability arising from the advance consideration. If there are multiple payments or receipts in advance, then the entity must determine a date of the transactions for each payment or receipt of advance consideration.
IFRS 16 Leases requires lessees to recognise assets and liabilities for most leases. For lessors, there is little change to the existing accounting in IAS 17 Leases. The scope of the new standard includes leases of all assets, with certain exceptions.
The amendments to IFRS 10 and IAS 28 address an inconsistency between the requirements in IFRS 10 and in IAS 28 in dealing with the sale or contribution of assets between an investor and its associate or joint venture. The amendments require a full recognition of a gain or loss when the sale or contribution between an investor and its associate or joint venture constitutes a business. For a transaction involving assets that do not constitute a business, a gain or loss resulting from the transaction is recognised in the investor’s profit or loss only to the extent of the unrelated investor’s interest in that associate or joint venture.
Annual Improvements to IFRSs 2014–2016 cycle:
IAS 28 Investments in Associates and Joint Ventures
The amendments clarifies that an entity that is a venture capital organisation, or other qualifying entity, may elect, at initial recognition on an investment-by-investment basis, to measure its investments in associates and joint ventures at fair value through profit or loss. If an entity that is not itself an investment entity has an interest in an associate or joint venture that is an investment entity, the entity may, when applying the equity method, elect to retain the fair value measurement applied by that investment entity associate or joint venture to the investment entity associate’s or joint venture’s interests in subsidiaries. The amendments are effective from 1 January 2018.

2016 Annual Report151
(Amount in millions of Renminbi, unless otherwise stated)
II SUMMARY OF PRINCIPAL ACCOUNTING POLICIES (Continued)
1 Basis of preparation (Continued)
1.2 Standards, amendments and interpretations that are not yet effective and have not been early
adopted by the Group in 2016 (Continued)
IFRS 1 First-time Adoption of International Financial Reporting Standards
Short-term exemptions for first-time adopters in IFRS 1 were deleted because they have now served their intended purpose. The amendment is effective from 1 January 2018.
IFRS 12 Disclosure of Interests in Other Entities
The amendments clarify that the disclosure requirements in IFRS 12, apply to an entity’s interest in a subsidiary, a joint venture or an associate (or a portion of its interest in a joint venture or an associate) that is classified (or included in a disposal group that is classified) as held for sale. The amendments are effective from 1 January 2017.
The Group is in the process of assessing the impact of these new standards, amendments and interpretations on the consolidated and separate financial statements of the Group and the Bank respectively.
2 Consolidation
2.1 Subsidiaries
Subsidiaries are all entities (including corporates, divided parts of associates and joint ventures, and structured entities controlled by corporates) over which the Group has control. That is the Group controls an entity when it is exposed, or has rights, to variable returns from its involvement with the entity and has the ability to affect those returns through its power over the entity. The existence and effect of potential voting rights that are currently exercisable or convertible and rights arising from other contractual arrangements are considered when assessing whether the Group controls another entity. Subsidiaries are fully consolidated from the date on which control is transferred to the Group. They are de-consolidated from the date that control ceases. If the changes of the relevant facts and circumstances resulting in the definition of control involved in the changes of relevant elements, the Group will re-evaluate whether subsidiaries are controlled.
The Group uses the acquisition method of accounting to account for business combinations. The consideration transferred for the acquisition of a subsidiary is the fair values of the assets transferred, the liabilities incurred and the equity interests issued by the Group. The consideration transferred includes the fair value of any asset or liability resulting from a contingent consideration arrangement. Acquisition-related costs are expensed as incurred. Identifiable assets acquired and liabilities and contingent liabilities assumed in a business combination are measured initially at their fair values at the acquisition date. On an acquisition by acquisition basis, the Group recognises any non-controlling interest in the acquiree either at fair value or at the non-controlling interest’s proportionate share of the acquiree’s net assets.
The excess of the consideration transferred, the amount of any non-controlling interest in the acquiree and the acquisition-date fair value of any previous equity interest in the acquiree over the fair value of the identifiable net assets acquired is recorded as goodwill. If this is less than the fair value of the net assets of the subsidiary acquired in the case of a bargain purchase, the difference is recognised directly in the income statement. Goodwill is tested annually for impairment and carried at cost less accumulated impairment losses. If there is any indication that goodwill is impaired, recoverable amount is estimated and the difference between carrying amount and recoverable amount is recognised as an impairment charge. Impairment losses on goodwill are not reversed. Gains and losses on the disposal of an entity include the carrying amount of goodwill relating to the entity sold.

2016 Annual Report 152
Notes to the Consolidated Financial Statements
II SUMMARY OF PRINCIPAL ACCOUNTING POLICIES (Continued)
2 Consolidation (Continued)
2.1 Subsidiaries (Continued)
All intra-group assets and liabilities, equity, income, expenses and cash flows relating to transactions between members of the Group are eliminated in full on consolidation. Where necessary, accounting policies of subsidiaries have been changed to ensure consistency with the policies adopted by the Group.
In the Bank’s statement of financial position, investments in subsidiaries are accounted for at cost less impairment. Cost is adjusted to reflect changes in consideration arising from contingent consideration amendments, but does not include acquisition-related costs, which are expensed as incurred. The dividends or profits declared to distribute by the invested entity shall be recognised by the Bank as the current investment income of subsidiaries. The Group assesses at each financial reporting date whether there is objective evidence that investment in subsidiaries is impaired. An impairment loss is recognised for the amount by which the investment in subsidiaries’ carrying amount exceeds its recoverable amount. The recoverable amount is the higher of the investment in subsidiaries’ fair value less costs to sell and value in use.
2.2 Associates and joint ventures
Associates are all entities over which the Group has significant influence but no control or joint control, generally accompanying a shareholding of between 20% and 50% of the voting rights.
Joint ventures exist where the Group has a contractual arrangement with one or more parties to undertake economic activities which are subject to joint control.
Investments in associates and joint ventures are initially recognised at cost and are accounted for using the equity method of accounting. The Group’s “Investment in associates and joint ventures” includes goodwill.
Unrealised gains on transactions between the Group and its associates and joint ventures are eliminated to the extent of the Group’s interests in the associates and joint ventures; unrealised losses are also eliminated unless the transaction provides evidence of impairment of the asset transferred. Accounting policies of associates and joint ventures have been changed where necessary to ensure consistency with the policies adopted by the Group.
The Group assesses at each financial reporting date whether there is objective evidence that investments in associates and joint ventures are impaired. Impairment losses are recognised for the amounts by which the investments in associates and joint ventures’ carrying amounts exceed its recoverable amounts. The recoverable amounts are the higher of investments in associates and joint ventures’ fair value less costs to sell and value in use.
2.3 Transactions with non-controlling interests
The Group treats transactions with non-controlling interests as transactions with equity owners of the Group. For purchases from non-controlling interests, the difference between any consideration paid and the relevant share acquired of the carrying value of net assets of the subsidiary is recorded in equity. Gains or losses on disposals to non-controlling interests are also recorded in equity.
When the Group ceases to have control or significant influence, any retained interest in the entity is re-measured to its fair value, with the change in carrying amount recognised in the income statement. The fair value is the initial carrying amount for the purposes of subsequently accounting for the retained interest as an associate, joint venture or financial asset. In addition, any amounts previously recognised in other comprehensive income are reclassified to the income statement.

2016 Annual Report153
(Amount in millions of Renminbi, unless otherwise stated)
II SUMMARY OF PRINCIPAL ACCOUNTING POLICIES (Continued)
3 Foreign currency translation
3.1 Functional and presentation currency
The functional currency of the operations in the Chinese mainland is the Renminbi (“RMB”). Items included in the financial statements of each of the Group’s operations in Hong Kong, Macau, Taiwan and other countries and regions are measured using the currency of the primary economic environment in which the entity operates (the “functional currency”). The presentation currency of the Group is RMB.
3.2 Transactions and balances
Foreign currency transactions are translated into the functional currency using the exchange rates prevailing at the dates of the transactions, or the exchange rates that approximate the exchange rates prevailing at the dates of the transaction. Foreign exchange gains and losses resulting from the settlement of such transactions are recognised in the income statement.
Monetary assets and liabilities denominated in foreign currencies at the financial reporting date are translated at the foreign exchange rates ruling at that date. Changes in the fair value of monetary securities denominated in foreign currency classified as available for sale are analysed between translation differences resulting from changes in the amortised cost of the security and other changes in the carrying amount of the security. Translation differences related to changes in the amortised cost are recognised in the income statement, and other changes in the carrying amount are recognised in other comprehensive income. Translation differences on all other monetary assets and liabilities are recognised in the income statement.
Non-monetary assets and liabilities that are measured at historical cost in foreign currencies are translated using the foreign exchange rates at the date of the transaction. Non-monetary assets and liabilities that are measured at fair value in foreign currencies are translated using the foreign exchange rates at the date the fair value is determined. Translation differences on non-monetary financial assets classified as available for sale are recognised in other comprehensive income. Translation differences on non-monetary financial assets and liabilities held at fair value through profit or loss are recognised as “Net trading gains” in the income statement.
The results and financial positions of all the Group entities that have a functional currency different from the presentation currency are translated into the presentation currency as follows:
• assets and liabilities for each statement of financial position presented are translated at the closing rate at the date of that statement of financial position;
• income and expenses for each income statement are translated at exchange rates at the date of the transactions, or a rate that approximates the exchange rates of the date of the transaction; and
• all resulting exchange differences are recognised in other comprehensive income.
On consolidation, exchange differences arising from the translation of the net investment in foreign entities, and of deposit taken and other currency instruments designated as hedges of such investments are taken to other comprehensive income. When a foreign entity is disposed, these exchange differences are recognised in the income statement. The effect of exchange rate changes on cash and cash equivalents is presented individually in the statement of cash flows.

2016 Annual Report 154
Notes to the Consolidated Financial Statements
II SUMMARY OF PRINCIPAL ACCOUNTING POLICIES (Continued)
4 Financial instruments
4.1 Classification
The Group classifies its financial assets into the following four categories: financial assets at fair value through profit or loss, held to maturity investments, loans and receivables and available for sale investments.
Financial liabilities are classified into two categories: financial liabilities at fair value through profit or loss and other financial liabilities.
The Group determines the classification of its financial assets and financial liabilities at initial recognition.
(1) Financial assets and financial liabilities at fair value through profit or loss
Financial assets and financial liabilities at fair value through profit or loss have two sub-categories: financial assets and financial liabilities held for trading, and those designated as at fair value through profit or loss at inception.
A financial asset or financial liability is classified as held for trading if it is acquired or incurred principally for the purpose of selling or repurchasing it in the near term or if it is part of a portfolio of identified financial instruments that are managed together and for which there is evidence of recent actual pattern of short-term profit-making. Derivatives are also categorised as held for trading unless they are financial guarantee contracts or designated and effective as hedging instruments.
A financial asset or financial liability is classified at fair value through profit or loss at inception if it meets either of the following criteria and is designated as such by management on initial recognition:
• the designation eliminates or significantly reduces a measurement or recognition inconsistency that would otherwise arise from measuring the financial assets or financial liabilities or recognising the gains and losses on them on different bases; or
• a group of financial assets, financial liabilities or both is managed and its performance is evaluated on a fair value basis in accordance with a documented risk management or investment strategy, and information is provided internally on that basis to key management personnel; or
• the financial instrument contains one or more embedded derivatives, unless the embedded derivative(s) does not significantly modify the cash flows or it is clear, with little or no analysis, that it would not be separately recorded.

2016 Annual Report155
(Amount in millions of Renminbi, unless otherwise stated)
II SUMMARY OF PRINCIPAL ACCOUNTING POLICIES (Continued)
4 Financial instruments (Continued)
4.1 Classification (Continued)
(2) Held to maturity investments
Held to maturity investments are non-derivative financial assets with fixed or determinable payments and fixed maturities that the Group’s management has the positive intention and ability to hold to maturity and that do not meet the definition of loans and receivables nor are designated as at fair value through profit or loss or as available for sale.
The Group shall not classify any financial assets as held to maturity if the entity has, during the current financial year or during the two preceding financial years, sold or reclassified more than an insignificant amount of held to maturity investments before maturity other than restricted circumstances such as sales or reclassifications due to a significant deterioration in the issuer’s creditworthiness or industry’s regulatory requirements.
(3) Loans and receivables
Loans and receivables are non-derivative financial assets with fixed or determinable payments that are not quoted in an active market, other than:
• those that the Group intends to sell immediately or in the short term, which are classified as held for trading, and those that the Group upon initial recognition designates as at fair value through profit or loss;
• those that the Group upon initial recognition designates as available for sale; or
• those for which the Group may not recover substantially all of its initial investment, other than because of credit deterioration.
(4) Available for sale investments
Available for sale investments are non-derivative financial assets that are either designated in this category or not classified in any of the other categories.
(5) Other financial liabilities
Other financial liabilities are non-derivative financial liabilities that are not classified or designated as financial liabilities at fair value through profit or loss.
4.2 Initial recognition
A financial asset or financial liability is recognised on trade-date, the date when the Group becomes a party to the contractual provisions of the instrument.
For all financial assets and financial liabilities not carried at fair value through profit or loss, financial assets are initially recognised at fair value together with transaction costs and financial liabilities are initially recognised at fair value net of transaction costs. Financial assets and financial liabilities carried at fair value through profit or loss are initially recognised at fair value, and transaction costs are expensed in the income statement.

2016 Annual Report 156
Notes to the Consolidated Financial Statements
II SUMMARY OF PRINCIPAL ACCOUNTING POLICIES (Continued)
4 Financial instruments (Continued)
4.3 Subsequent measurement
Financial assets available for sale and financial assets and financial liabilities at fair value through profit or loss are subsequently carried at fair value. Financial assets classified as loans and receivables and held to maturity and other financial liabilities are carried at amortised cost using the effective interest method.
Gains and losses arising from changes in the fair value of the financial assets and financial liabilities at fair value through profit or loss category are included in the income statement in the period in which they arise. Dividends on equity instruments of this category are also recognised in the income statement when the Group’s right to receive payments is established.
Gains and losses arising from changes in the fair value of available for sale assets are recognised in “Other comprehensive income”, until the financial asset is de-recognised or impaired. At this time the cumulative gain or loss previously recognised in “Other comprehensive income” is reclassified from equity to the income statement. Interest on available for sale debt instruments calculated using the effective interest method as well as dividends on equity instruments of this category when the Group’s right to receive such payments is established are recognised in the income statement.
4.4 Determination of fair value
The fair value is the price that would be received to sell an asset or paid to transfer a liability in an orderly transaction between market participants at the measurement date. The fair values of quoted financial assets and financial liabilities in active markets are based on current bid prices and ask prices, as appropriate. If there is no active market, the Group establishes fair value by using valuation techniques. These include the use of recent arm’s length transactions, discounted cash flow analysis and option pricing models, and other valuation techniques commonly used by market participants.
The Group uses the valuation techniques commonly used by market participants to price financial instruments and techniques which have been demonstrated to provide reliable estimates of prices obtained in actual market transactions. The Group makes use of all factors that market participants would consider in setting a price, and incorporates these into its chosen valuation techniques and tests for validity using prices from any observable current market transactions in the same instruments.
4.5 De-recognition of financial instruments
Financial assets are de-recognised when the rights to receive cash flows from the investments have expired, or when the Group has transferred substantially all risks and rewards of ownership, or when the Group neither transfers nor retains substantially all risks or rewards of ownership of the financial asset but has not retained control of the financial asset.
On de-recognition of a financial asset in its entirety, the difference between the carrying amount and the sum of the consideration received and any cumulative gain or loss that had been recognised in equity through other comprehensive income is recognised in the income statement.
Financial liabilities are de-recognised when they are extinguished — that is, when the obligation is discharged, cancelled or expires. The difference between the carrying amount of a financial liability de-recognised and the consideration paid is recognised in the income statement.

2016 Annual Report157
(Amount in millions of Renminbi, unless otherwise stated)
II SUMMARY OF PRINCIPAL ACCOUNTING POLICIES (Continued)
4 Financial instruments (Continued)
4.6 Impairment of financial assets
The Group assesses at each financial reporting date whether there is objective evidence that a financial asset or a group of financial assets excluding those fair valued through profit or loss is impaired. A financial asset or a group of financial assets is impaired and impairment losses are incurred only if there is objective evidence of impairment as a result of one or more events that occurred after the initial recognition of the asset (a “loss event”) and that loss event has an impact on the estimated future cash flows of the financial asset or group of financial assets that can be reliably estimated. Objective evidence that a financial asset or group of assets is impaired includes observable data that comes to the attention of the Group about the following loss events:
• significant financial difficulty of the issuer or obligor;
• a breach of contract, such as a default or delinquency in interest or principal payments;
• the Group granting to the borrower, for economic or legal reasons relating to the borrower’s financial difficulty, a concession that the lender would not otherwise consider;
• it becoming probable that the borrower will enter into bankruptcy or other financial re-organisation;
• the disappearance of an active market for that financial asset because of financial difficulties;
• observable data indicating that there is a measurable decrease in the estimated future cash flows from a group of financial assets since the initial recognition of those assets, although the decrease cannot yet be identified with the individual financial assets in the group, including adverse changes in the payment status of borrowers in the group, an increase in the unemployment rate in the geographical area of the borrowers, a decrease in property price for the mortgages in the relevant area or national or local economic conditions that correlate with defaults on the assets in the group;
• any significant change with an adverse effect that has taken place in the technological, market, economic or legal environment in which the issuer operates and indicates that the cost of investments in equity instruments may not be recovered;
• a significant or prolonged decline in the fair value of an equity instrument is an indicator of impairment in such investments where a decline in the fair value of equity instrument below its initial cost by 50% or more; or fair value below cost for one year or longer. An impairment is also indicated by a decline in fair value of 20% or more below initial cost for six consecutive months or longer or where fair value is below initial cost by 30% or more over a short period of time (i.e., one month); or
• other objective evidence indicating impairment of the financial asset.
The Group first assesses whether objective evidence of impairment exists individually for financial assets that are individually significant. If there is objective evidence of impairment, the impairment loss is recognised in the income statement. The Group performs a collective assessment for all other financial assets that are not individually significant or for which impairment has not yet been identified by including the asset in a group of financial assets with similar credit risk characteristics and collectively assesses them for impairment.

2016 Annual Report 158
Notes to the Consolidated Financial Statements
II SUMMARY OF PRINCIPAL ACCOUNTING POLICIES (Continued)
4 Financial instruments (Continued)
4.6 Impairment of financial assets (Continued)
(1) Assets carried at amortised cost
Impairment loss for financial assets carried at amortised cost is measured as the difference between the asset’s carrying amount and the present value of estimated future cash flows (excluding future credit losses that have not been incurred) discounted at the financial asset’s original effective interest rate. The original effective interest rate is computed at initial recognition. The carrying amount of the asset is reduced through the use of an allowance account and the amount of the loss is recognised in the income statement. For financial assets with variable interest rate, the discount rate for measuring any impairment loss is the current effective interest rate determined under the contract.
The calculation of the present value of the estimated future cash flows of a collateralised financial asset reflects the cash flows that may result from foreclosure less costs for obtaining and selling the collateral, whether or not foreclosure is probable.
As a practical expedient, the Group may measure impairment on the basis of an instrument’s fair value using an observable market price.
For the purposes of a collective assessment of impairment, financial assets are grouped on the basis of similar and relevant credit risk characteristics. Those characteristics are relevant to the estimation of future cash flows for groups of such assets by being indicative of the debtors’ ability to pay all amounts due according to the contractual terms of the assets being evaluated.
Future cash flows in a group of financial assets that are collectively evaluated for impairment are estimated on the basis of historical loss experience for assets with credit risk characteristics similar to those in the group. Historical loss experience is adjusted on the basis of current observable data to reflect the effects of current conditions that did not affect the period on which the historical loss experience is based and to remove the effects of conditions in the historical period that do not currently exist.
When a financial asset is uncollectible, it is written off against the related allowance for impairment after all the necessary procedures have been completed. Subsequent recoveries of amounts previously written off are recognised in the income statement.
Estimates of changes in future cash flows for groups of assets should reflect and be directionally consistent with changes in related observable data from period to period. The methodology and assumptions used for estimating future cash flows are reviewed regularly by the Group to reduce any differences between loss estimates and actual loss experience.
If, in a subsequent period, the amount of the impairment loss decreases and the decrease can be related objectively to an event occurring after the impairment was recognised (such as an improvement in the debtor’s credit rating), the previously recognised impairment loss is reversed by adjusting the allowance account and recognised in the income statement. The reversal shall not result in a carrying amount of the financial asset that exceeds what the amortised cost would have been had the impairment not been recognised at the date the impairment is reversed.

2016 Annual Report159
(Amount in millions of Renminbi, unless otherwise stated)
II SUMMARY OF PRINCIPAL ACCOUNTING POLICIES (Continued)
4 Financial instruments (Continued)
4.6 Impairment of financial assets (Continued)
(2) Assets classified as available for sale
If objective evidence of impairment exists for available for sale financial assets, the cumulative loss recognised in “Other comprehensive income” is reclassified from equity to the income statement and is measured as the difference between the acquisition cost (net of any principal repayment and amortisation) and the current fair value, less any impairment loss on that financial asset previously recognised in the income statement.
If, in a subsequent period, the fair value of a debt instrument classified as available for sale increases and the increase can be objectively related to an event occurring after the impairment loss was recognised in the income statement, the previously recognised impairment loss is reversed through the income statement.
With respect to equity instruments, impairment losses recognised in the income statement are not subsequently reversed through the income statement. If there is objective evidence that an impairment loss has been incurred on an unquoted equity investment that is not carried at fair value because its fair value cannot be reliably measured, the impairment loss is not reversed.
4.7 Derivative financial instruments and hedge accounting
Derivatives are initially recognised at fair value on the date a derivative contract is entered into and are subsequently remeasured at their fair value. Fair values are obtained from quoted market prices in active markets, including recent market transactions, and valuation techniques, including discounted cash flow analysis and option pricing models, as appropriate. Credit risk valuation adjustments are applied to the Group’s over-the-counter derivatives to reflect the credit risk of the counterparties and the Group respectively. They are dependent on expected future values of exposures for each counterparty and default probabilities, etc. All derivatives are carried as assets when fair value is positive and as liabilities when fair value is negative.
The best evidence of the fair value of a derivative at initial recognition is the transaction price (i.e. the fair value of the consideration given or received) unless the fair value of that instrument is evidenced by comparison with other observable current market transactions in the same instrument (i.e. without modification or repackaging) or based on a valuation technique whose variables include only data from observable markets. When such evidence exists, the Group recognises profit or loss on the date of transaction.
The method of recognising the resulting fair value gain or loss depends on whether the derivative is designated and qualifies as a hedging instrument, and if so, the nature of the item being hedged. For derivatives not designated or qualified as hedging instruments, including those intended to provide effective economic hedges of specific interest rate and foreign exchange risks, but do not qualify for hedge accounting, changes in the fair value of these derivatives are recognised in “Net trading gains” in the income statement.
The Group documents, at inception, the relationship between hedging instruments and hedged items, as well as its risk management objective and strategy for undertaking various hedge transactions. The Group also documents its assessment, both at hedge inception and on an ongoing basis, of whether the derivatives that are used in hedging transactions are highly effective in offsetting changes in fair values or cash flows of hedged items. These criteria should be met before a hedge can be qualified to be accounted for under hedge accounting.

2016 Annual Report 160
Notes to the Consolidated Financial Statements
II SUMMARY OF PRINCIPAL ACCOUNTING POLICIES (Continued)
4 Financial instruments (Continued)
4.7 Derivative financial instruments and hedge accounting (Continued)
(1) Fair value hedge
Fair value hedge is a hedge of the exposure to changes in fair value of a recognised asset or liability or an unrecognised firm commitment, or an identified portion of such an asset, liability or firm commitment, that is attributable to a particular risk and could affect income statement.
The changes in fair value of hedging instruments that are designated and qualify as fair value hedges are recorded in the income statement, together with the changes in fair value of the hedged item attributable to the hedged risk. The net result is included as ineffectiveness in the income statement.
If the hedge no longer meets the criteria for hedge accounting, the adjustment to the carrying amount of a hedged item for which the effective interest method is used is amortised to the income statement over the period to maturity. If the hedged item is de-recognised, the unamortised carrying value adjustment is recognised immediately in the income statement.
(2) Cash flow hedge
Cash flow hedge is a hedge of the exposure to variability in cash flows that is attributable to a particular risk associated with a recognised asset or liability (such as all or some future interest payments on variable rate debt) or a highly probable forecast transaction that could ultimately affect income statement.
The effective portion of changes in the fair value of hedging instruments that are designated and qualify as cash flow hedges is recognised in “Other comprehensive income”. The ineffective portion is recognised immediately in the income statement.
Amounts accumulated in equity are reclassified to the income statement in the same periods when the hedged item affects the income statement.
When a hedging instrument expires or is sold, or the hedge designation is revoked or when a hedge no longer meets the criteria for hedge accounting, any cumulative gain or loss on the hedging instrument existing in equity at that time remains in equity and is reclassified to the income statement when the forecast transaction ultimately occurs. When a forecast transaction is no longer expected to occur, the cumulative gain or loss existing in equity is immediately transferred to the income statement.
(3) Net investment hedge
Net investment hedge is a hedge of a net investment in a foreign operation.
Hedges of net investments in foreign operations are accounted for similarly to cash flow hedges. Any gain or loss on the hedging instrument relating to the effective portion of the hedge is recognised directly in other comprehensive income; the gain or loss relating to the ineffective portion is recognised immediately in the income statement. Gains and losses accumulated in equity are included in the income statement when the foreign operation is disposed of as part of the gain or loss on the disposal.

2016 Annual Report161
(Amount in millions of Renminbi, unless otherwise stated)
II SUMMARY OF PRINCIPAL ACCOUNTING POLICIES (Continued)
4 Financial instruments (Continued)
4.8 Embedded derivatives
An embedded derivative is a component of a hybrid (combined) instrument that also includes a non-derivative host contract with the effect that some of the cash flows of the hybrid (combined) instrument vary in a way similar to a stand-alone derivative.
The Group separates embedded derivatives from the host contract and accounts for these as derivatives, if, and only if:
• the economic characteristics and risks of the embedded derivative are not closely related to those of the host contract;
• a separate instrument with the same terms as the embedded derivative would meet the definition of a derivative; and
• the hybrid (combined) instrument is not measured at fair value with changes in fair value recognised in the income statement.
These embedded derivatives separated from the host contract are measured at fair value with changes in fair value recognised in the income statement.
4.9 Convertible bonds
Convertible bonds comprise of the liability and equity components. The liability component, representing the obligation to make fixed payments of principal and interest, is classified as liability and initially recognised at the fair value, calculated using the market interest rate of a similar liability that does not have an equity conversion option, and subsequently measured at amortised cost using the effective interest method. The equity component, representing an embedded option to convert the liability into ordinary shares, is initially recognised in “Equity” as the difference between the proceeds received from the convertible bonds as a whole and the amount of the liability component. Any directly attributable transaction costs are allocated to the liability and equity components in proportion to the allocation of proceeds.
On conversion of the bonds into shares, the amount transferred to share capital is calculated as the par value of the shares multiplied by the number of shares converted. The difference between the carrying value of the related component of the converted bonds and the amount transferred to share capital is recognised in capital surplus under “Capital reserve”.
4.10 Offsetting financial instruments
Financial assets and liabilities are offset and the net amount is reported in the statement of financial position when there is a current legally enforceable right to set off the recognised amounts and there is an intention to settle on a net basis, or realise the asset and settle the liability simultaneously.

2016 Annual Report 162
Notes to the Consolidated Financial Statements
II SUMMARY OF PRINCIPAL ACCOUNTING POLICIES (Continued)
5 Precious metals and precious metals swaps
Precious metals comprise gold, silver and other precious metals. The Group retains all risks and rewards of ownership related to precious metals deposited with the Group as precious metals deposits, including the right to freely pledge or transfer, and it records the precious metals received as an asset. A liability to return the amount of precious metals deposited is also recognised. Precious metals that are not related to the Group’s precious metal market making and trading activities are initially measured at acquisition cost and subsequently measured at lower of cost and net realisable value. Precious metals that are related to the Group’s market making and trading activities are initially recognised at fair value and subsequent changes in fair value included in “Net trading gains” are recognised in the income statement.
Consistent with the substance of the transaction, if the precious metals swaps are for financing purpose, they are accounted for as precious metals subject to collateral agreements. Precious metals collateralised are not de-recognised and the related counterparty liability is recorded in “Placements from banks and other financial institutions”. If precious metals swaps are for trading purpose, they are accounted for as derivative transactions.
6 Repurchase agreements, agreements to re-sell and securities lending
Securities and bills sold subject to repurchase agreements (“Repos”) continue to be recognised, and are recorded as “Financial investments”. The corresponding obligation is included in “Placements from banks and other financial institutions” and “Due to central banks”. Securities and bills purchased under agreements to re-sell (“Reverse repos”) are not recognised. The receivables are recorded as “Placements with and loans to banks and other financial institutions” or “Balances with central banks”, as appropriate.
The difference between purchase and sale price is recognised as “Interest expense” or “Interest income” in the income statement over the life of the agreements using the effective interest method.
Securities lending transactions are generally secured, with collateral taking the form of securities or cash. Securities lent to counterparties by the Group are recorded in the consolidated financial statements. Securities borrowed from counterparties by the Group are not recognised in the consolidated financial statements of the Group. Cash collateral received or advanced is recognised as a liability or an asset in the consolidated financial statements.
7 Property and equipment
The Group’s fixed assets mainly comprise buildings, equipment and motor vehicles, aircraft and construction in progress. When the costs attributable to the land use rights cannot be reliably measured and separated from that of the building at inception, the costs are included in the cost of properties and buildings and recorded in “Property and equipment”.
The assets purchased or constructed are initially measured at acquisition cost or deemed cost, as appropriate. Such initial cost includes expenditure that is directly attributable to the acquisition of the assets.
Subsequent costs are included in an asset’s carrying amount, only when it is probable that future economic benefits associated with the item will flow to the Group and the cost of the item can be measured reliably. All other repairs and maintenance costs are charged to the income statement during the financial period in which they are incurred.

2016 Annual Report163
(Amount in millions of Renminbi, unless otherwise stated)
II SUMMARY OF PRINCIPAL ACCOUNTING POLICIES (Continued)
7 Property and equipment (Continued)
Depreciation is calculated on the straight-line method to write down the cost of such assets to their residual values over their estimated useful lives. The residual values and useful lives of assets are reviewed, and adjusted if appropriate, at each financial reporting date.
Property and equipment are reviewed for impairment at each financial reporting date. Where the carrying amount of an asset is greater than its estimated recoverable amount, it is written down immediately to its recoverable amount. The recoverable amount is the higher of the asset’s fair value less costs to sell and value in use.
Gains and losses on disposals are determined by the difference between proceeds and carrying amount, after deduction of relevant taxes and expenses. These are included in the income statement.
7.1 Buildings, equipment and motor vehicles
Buildings comprise primarily branch and office premises. The estimated useful lives, depreciation rate and estimated residual value rate of buildings, equipment and motor vehicles are as follows:
Type of assetsEstimated
useful lives
Estimated residual
value rate
Annual depreciation
rate
Buildings 15–50 years 3% 1.9%–6.5%Equipment 3–15 years 3% 6.4%–32.4%Motor vehicles 4–6 years 3% 16.1%–24.3%
7.2 Aircraft
Aircraft are used in the Group’s aircraft operating leasing business.
Aircraft are depreciated using the straight-line method over the expected useful life of 25 years, less the years in service at the time of purchase to an estimated residual value rate varying from 0% to 15%.
7.3 Construction in progress
Construction in progress consists of assets under construction or being installed and is stated at cost. Cost includes equipment cost, cost of construction, installation and other direct costs. Items classified as construction in progress are transferred to property and equipment when such assets are ready for their intended use and the depreciation charge commences after such assets are transferred to property and equipment.
8 Leases
8.1 Lease classification
Leases of assets where substantially all the risks and rewards of ownership have been transferred are classified as finance leases. Title may or may not eventually be transferred. All leases other than finance leases are classified as operating leases.

2016 Annual Report 164
Notes to the Consolidated Financial Statements
II SUMMARY OF PRINCIPAL ACCOUNTING POLICIES (Continued)
8 Leases (Continued)
8.2 Finance leases
When the Group is a lessee under finance leases, the leased assets are capitalised initially at the fair value of the asset or, if lower, the present value of the minimum lease payments. The corresponding liability to the lessor is included in “Other liabilities”. Finance charges are charged over the term of the lease using an interest rate which reflects a constant rate of return.
The Group adopts the same depreciation policy for the finance leased assets as those for which it has title rights. If the Group can reasonably determine that a lease will transfer ownership of the asset to the Group by the end of the lease term, related assets are depreciated over their useful life. If there is no reasonable certainty that the Group can determine that a lease will transfer ownership of the asset to the Group by the end of the lease term, related assets are depreciated over the shorter of the lease term and useful life.
When the Group is a lessor under finance leases, the present value of the aggregation of the minimum lease payment receivable from the lessee, unguaranteed residual value and initial direct costs is recognised as a receivable. The difference between the receivable and the present value of the receivable is recognised as unearned finance income. Lease income is recognised over the term of the lease using an interest rate which reflects a constant rate of return.
8.3 Operating leases
When the Group is the lessee under an operating lease, rental expenses are charged to “Operating expenses” in the income statement on a straight-line basis over the period of the lease.
When the Group is the lessor under operating leases, the assets subject to the operating lease are accounted for as the Group’s assets. Rental income is recognised as “Other operating income” in the income statement on a straight-line basis over the lease term net of any incentives given to lessees.
9 Investment propertiesInvestment properties, principally consisting of office buildings, are held to generate rental income or earn capital gains or both and is not occupied by the Group. Investment properties are carried at fair value and changes in fair value are recorded in the income statement, representing the open market value and other related information determined periodically by independent appraisers.
10 Intangible assetsIntangible assets are identifiable non-monetary assets without physical substance, including computer software and other intangible assets.
Computer software and other intangible assets are stated at acquisition cost less accumulated amortisation and impairment. These costs are amortised on a straight-line basis over their estimated useful lives with the amortisation recognised in the income statement.
The value of intangible assets is reviewed for impairment at each financial reporting date. Where the carrying amount of an asset is greater than its estimated recoverable amount, it is written down immediately to its recoverable amount.
The recoverable amount of an intangible asset is the higher of the asset’s fair value less costs to sell and value in use.

2016 Annual Report165
(Amount in millions of Renminbi, unless otherwise stated)
II SUMMARY OF PRINCIPAL ACCOUNTING POLICIES (Continued)
11 Repossessed assets
Repossessed assets are initially recognised at fair value plus related costs when they are obtained as the compensation for the loans’ principal and interest. When there are indicators that the recoverable amount is lower than carrying amount, the carrying amount is written down immediately to its recoverable amount.
12 Employee benefits
12.1 Defined contribution plans and Defined benefit plans
In accordance with the policies of relevant state and local governments, employees in Chinese mainland participate in various defined contribution retirement schemes administered by local Labour and Social Security Bureaus. Operations in Chinese mainland contribute to pension and insurance schemes administered by the local pension and insurance agencies using applicable contribution rates stipulated in the relevant local regulations. Upon retirement, the local Labour and Social Security Bureaus are responsible for the payment of the basic retirement benefits to the retired employees. In addition to these basic staff pension schemes, employees in Chinese mainland who retire after 1 January 2004 can also voluntarily participate in a defined contribution plan established by the Bank (“the Annuity Plan”). The Bank contributes to the Annuity Plan based on certain percentages of the employees’ gross salaries.
All eligible employees in operations in Hong Kong, Macau, Taiwan and other countries and regions participate in local defined contribution schemes or defined benefit plans.
Contributions made by the Group to the retirement schemes described above are recognised as “Operating expenses” in the income statement as incurred. Forfeited contributions by those employees who leave the schemes prior to the full vesting of their contributions are used to reduce the existing level of contributions or retained in the retirement schemes in accordance with the requirements of the respective defined contribution plans.
The obligations related to the defined benefit plans are calculated by independent actuaries using the projected unit credit method at each financial reporting date. The actuarial gains or losses are recognised in “Other comprehensive income” immediately when they occur, the gains or losses arising from amendments to pension plans are charged or credited to the income statement immediately as “Operating expenses” when they occur.
12.2 Retirement benefit obligations
The Group pays supplemental retirement benefits to employees in Chinese mainland who retired prior to 31 December 2003 and early retirement benefits to those employees who accepted an early retirement arrangement.
Supplemental retirement benefits include supplemental pension payments and medical expense coverage.
Early retirement benefits have been paid to those employees who accept voluntary retirement before the normal retirement date, as approved by management. The related benefit payments are made from the date of early retirement to the normal retirement date.

2016 Annual Report 166
Notes to the Consolidated Financial Statements
II SUMMARY OF PRINCIPAL ACCOUNTING POLICIES (Continued)
12 Employee benefits (Continued)
12.2 Retirement benefit obligations (Continued)
The liability related to the above supplemental retirement benefit obligations and early retirement obligations existing at each financial reporting date is calculated by independent actuaries using the projected unit credit method and is recorded as a liability under “Retirement benefit obligations” in the statement of financial position. The present value of the liability is determined through discounting the estimated future cash outflows using interest rates of RMB treasury bonds which have terms to maturity approximating the terms of the related liability. The actuarial gains or losses of supplemental retirement benefit are recognised in “Other comprehensive income” immediately when they occur. The actuarial gains or losses of early retirement benefit obligations and the gains or losses arising from amendments to retirement benefit obligations are charged or credited to the income statement immediately as “Operating expenses” when they occur.
12.3 Housing funds
Pursuant to local government regulations, all employees in Chinese mainland participate in various local housing funds administered by local governments. Operations in Chinese mainland contribute on a monthly basis to these funds based on certain percentages of the salaries of the employees. These payments are recognised as “Operating expenses” in the income statement as incurred.
12.4 Cash-settled share-based compensation
The related cost of services received from the employees and the liability to pay for such services are measured at fair value and recognised over the vesting period as the employees render services. Fair value is established at the grant date, re-measured at each financial reporting date with any changes in fair value recognised as “Operating expenses” in the income statement for the period and de-recognised when the liability is settled.
The total amount to be expensed over the vesting period is determined by reference to the fair value of the rights granted, excluding the impact of any non-market vesting conditions. Non-market conditions are included in the assumptions about the number of rights that are expected to vest. At each financial reporting date, the Group revises its estimates of the number of rights that are expected to vest. It recognises the impact of the revision to original estimates, if any, as “Operating expenses” in the income statement, with a corresponding adjustment to liability.
12.5 Bonus plans
The Group recognises a liability and an expense for bonuses, taking into consideration its business performance and profit attributable to the Bank’s equity holders. The Group recognises a liability where contractually obliged or where there is a past practice that has created a constructive obligation.
13 Provisions
Provisions are recognised when: the Group has a present legal or constructive obligation as a result of past events, it is probable that an outflow of resources embodying economic benefits will be required to settle the obligation, and a reliable estimate of the amount of the obligation can be made. The amount initially recognised as a provision should be the best estimate of the expenditure required to settle the present obligation.

2016 Annual Report167
(Amount in millions of Renminbi, unless otherwise stated)
II SUMMARY OF PRINCIPAL ACCOUNTING POLICIES (Continued)
14 Insurance contracts
14.1 Insurance contracts classification
The Group’s insurance subsidiaries issue insurance contracts that transfer significant insurance risk. The Group performs a significant insurance risk test at the contract initial recognition date. Insurance risk is significant if, and only if, an insured event could cause an insurer to pay significant additional benefits in any scenario, excluding scenarios that lack commercial substance. The Group issues non-life insurance contracts, which cover casualty and property insurance risk, and life insurance contracts, which insure events associated with human life (for example death, or survival) over a long duration.
The Group does not separately measure embedded derivatives that itself meet the definition of an insurance contract or options to surrender insurance contracts for a fixed amount (or an amount based on a fixed amount and an interest rate).
14.2 Insurance contracts recognition and measurement
(1) Non-life insurance contracts
Premiums on non-life insurance contracts are recognised as revenue (earned premiums) proportionally over the period of coverage. The portion of premium received on in-force contracts that relates to unexpired risks at the financial reporting date is reported as the unearned premium liability in “Other liabilities”. Claims and loss adjustment expenses are charged to the income statement as “Operating expenses” when incurred based on the estimated liability for compensation owed to contract holders or third parties damaged by the contract holders. They include direct and indirect claims settlement costs and arise from events that have occurred up to the financial reporting date even if they have not yet been reported to the Group.
(2) Life insurance contracts
Premiums on life insurance contracts are recognised as revenue when they become payable by the contract holders. Benefits and claims are recorded as an expense when they are incurred. A liability for contractual benefits that are expected to be incurred in the future is recorded when premiums are recognised. For certain long-term insurance contracts (investment-linked long-term insurance contracts) with embedded derivatives linking payments on the contract to units of an investment fund set up by the Group with the consideration received from the contract holders, the liability is adjusted for all changes in the fair value of the underlying assets, and includes a liability for contractual benefits that are expected to be incurred in the future which is recorded when the premiums are recognised.
14.3 Liability adequacy test
At each financial reporting date, liability adequacy tests are performed to ensure the adequacy of the insurance contract liabilities (including unearned premium in the case of non-life insurance contracts). In performing these tests, current best estimates of future contractual cash flows and claims handling and administration expenses, as well as investment income from the assets backing such liabilities, are used. Any deficiency is immediately charged to the income statement and reported as “Operating expenses”, with a provision established for losses arising from the liability adequacy test.
2016 Annual Report 168
Notes to the Consolidated Financial Statements
II SUMMARY OF PRINCIPAL ACCOUNTING POLICIES (Continued)
15 Assets and liabilities held for sale
The Group classifies non-current assets or an asset group as held for sale if their carrying amounts are recovered principally through disposal rather than through continuing use. Assets and liabilities classified as held for sale are presented separately on the statement of financial position. Such non-current assets and disposal groups classified as held for sale are measured at the lower of their carrying amount and fair value less costs to sell. Property and equipment and intangible assets are not depreciated or amortised once classified as held for sale.
16 Treasury shares and preference shares
Where the Bank or other members of the Group purchase the Bank’s ordinary shares, “Treasury shares” are recorded at the amount of consideration paid and deducted from total equity holders’ equity until they are cancelled, sold or reissued. Where such shares are subsequently sold or reissued, any consideration received is included in capital and reserves attributable to equity holders of the Bank.
Preference shares issued by the Group contain no contractual obligation to deliver cash or another financial asset; or to exchange financial assets or financial liabilities with another entity under conditions that are potentially unfavourable to the Group; and preference shares issued are non-derivative instruments that will be settled in the Group’s own equity instruments, but includes no contractual obligation for the Group to deliver a variable number of its own equity instruments. The Group classifies preference shares issued as an equity instrument. Fees, commissions and other transaction costs of preference shares issuance are deducted from equity. The dividends on preference shares are recognised as profit distribution at the time of declaration.
17 Contingent liabilities
A contingent liability is a possible obligation that arises from past events and whose existence will only be confirmed by the occurrence or non-occurrence of one or more uncertain future events not wholly within the control of the Group. It can also be a present obligation arising from past events that is not recognised because it is not probable that an outflow of economic resources will be required or the amount of obligation cannot be measured reliably.
18 Financial guarantee contracts
Financial guarantee contracts are contracts that require the issuer to make specified payments to reimburse the holder for a loss it incurs because a specified debtor fails to make payments when due, in accordance with the terms of a debt instrument. Such financial guarantees are given to banks, financial institutions and other bodies to secure customer loans, overdrafts and other banking facilities.
Financial guarantees are initially recognised at fair value on the date the guarantee was given. Subsequent to initial recognition, the Group’s liabilities under such guarantees are measured at the higher of the initial measurement less amortisation calculated and the best estimate of the expenditure required to settle any financial obligation arising at the financial reporting date, any increase in the liability relating to guarantees is taken to the income statement. These estimates are determined based on experience of similar transactions, historical losses and by the judgement of management.

2016 Annual Report169
(Amount in millions of Renminbi, unless otherwise stated)
II SUMMARY OF PRINCIPAL ACCOUNTING POLICIES (Continued)
19 Fiduciary activities
The Group acts as a custodian, trustee or in other fiduciary capacities, that result in its holding or placing of assets on behalf of individuals, securities investment funds, social security funds, insurance companies, qualified foreign institutional investors, annuity schemes and other customers. These assets are not included in the statement of financial position of the Group, as they are not assets of the Group.
The Group also administers entrusted loans on behalf of third-party lenders. In this regard, the Group grants loans to borrowers, as an intermediary, at the direction of third-party lenders, who fund these loans. The Group has been contracted by these third-party lenders to manage the administration and collection of these loans on their behalf. The third-party lenders determine both the underwriting criteria for and all terms of the entrusted loans, including their purposes, amounts, interest rates, and repayment schedule. The Group charges a commission related to its activities in connection with the entrusted loans, but the risk of loss is borne by the third-party lenders. Entrusted loans are not recognised in the statement of financial position of the Group.
20 Interest income and expense
Interest income and expense for all interest-bearing financial instruments, except derivatives, are recognised within “Interest income” and “Interest expense” in the income statement using the effective interest method. Interest income and expense for derivatives is recognised in “Net trading gains” in the income statement.
The effective interest method is a method of calculating the amortised cost of a financial asset or a financial liability and of allocating the interest income or interest expense over the relevant period. The effective interest rate is the rate that discounts estimated future cash payments or receipts through the expected life of the financial instrument or, when appropriate, a shorter period to the net carrying amount of the financial asset or financial liability. When calculating the effective interest rate, the Group estimates cash flows considering all contractual terms of the financial instrument but does not consider future credit losses. The calculation includes all amounts paid or received by the Group that are an integral part of the effective interest rate, including transaction costs and all other premiums or discounts.
Once a financial asset or a group of similar financial assets has been written down as a result of an impairment loss, interest income is recognised using the rate of interest used to discount the future cash flows for the purpose of measuring the impairment loss.
21 Fee and commission income
The Group earns fee and commission income from a diverse range of services it provides to its customers. For those services that are provided over a period of time, fee and commission income are accrued over that period. For other services, fee and commission income are recognised when the transactions are completed.
22 Income taxes
Income taxes comprise current income tax and deferred income tax. Tax is recognised in the income statement except to the extent that it relates to items directly recognised in Equity. In these cases, tax is also directly recognised in Equity.
22.1 Current income tax
Current income tax is the expected tax payable on the taxable income for the year, using tax rates enacted or substantially enacted at the financial reporting date, and any adjustment to tax payable in respect of previous years.

2016 Annual Report 170
Notes to the Consolidated Financial Statements
II SUMMARY OF PRINCIPAL ACCOUNTING POLICIES (Continued)
22 Income taxes (Continued)
22.2 Deferred income tax
Deferred income tax is recognised using the liability method, on temporary differences arising between the tax bases of assets and liabilities and their carrying amounts in the consolidated financial statements. Deferred income tax is determined using tax rates and laws that have been enacted or substantially enacted by the financial reporting date and are expected to apply when the related deferred income tax asset is realised or the deferred income tax liability is settled.
The principal temporary differences arise from asset impairment allowances, revaluation of certain financial assets and financial liabilities including derivative contracts, revaluation of investment properties, depreciation of property and equipment, provisions for pension, retirement benefits and salary payables.
“Deferred income tax assets” are recognised to the extent that it is probable that future taxable profit will be available against which deductible temporary differences can be utilised except the deferred tax asset arises from the initial recognition of an asset or liability in a transaction that is not a business combination and at the time of the transaction, affects neither accounting profit nor taxable profit/(tax loss).
For deductible temporary differences associated with investment in subsidiaries, associates and joint ventures, a deferred tax asset is recognised to the extent that, and only to the extent that, it is probable that the temporary difference will reverse in the foreseeable future; and taxable profit will be available against which the temporary difference can be utilised.
Deferred tax liabilities shall be recognised for all taxable temporary differences, except to the extent that the deferred tax liability arises from the initial recognition of goodwill, or the initial recognition of an asset or liability in a transaction which is not a business combination, and at the time of the transaction, affects neither accounting profit nor taxable profit/(tax loss).
Deferred income tax liabilities on taxable temporary differences arising from investment in subsidiaries, associates and joint ventures are recognised, except where the timing of the reversal of the temporary difference can be controlled and it is probable that the difference will not reverse in the foreseeable future.
The tax effects of income tax losses available for carrying forward are recognised as an asset when it is probable that future taxable profits will be available against which these losses can be utilised.
23 Segment reporting
The Group reviews the internal reporting in order to assess performance and allocate resources. Segment information is presented on the same basis as the Group’s management and internal reporting.
24 Comparative figures
Certain comparative figures have been adjusted to conform with changes in disclosures in current year.

2016 Annual Report171
(Amount in millions of Renminbi, unless otherwise stated)
III CRITICAL ACCOUNTING ESTIMATES AND JUDGEMENTS IN APPLYING ACCOUNTING POLICIESThe Group makes estimates and judgements that affect the reported amounts of assets and liabilities within the next financial year. Estimates and judgements are continually evaluated and are based on historical experience and other factors, including expectations of future events that are believed to be reasonable under the circumstances.
The Group has taken into consideration the impact of the economic environment on the industries and territories in which the Group operates when determining critical accounting estimates and judgements in applying accounting policies.
Areas susceptible to changes in critical estimates and judgements, which affect the carrying value of assets and liabilities, are set out below. It is possible that actual results may be materially different from the estimates and judgements referred below.
1 Impairment allowances on loans and advances
The Group reviews its loans and advances to assess impairment on a periodic basis, unless known circumstances indicate that impairment may have occurred as of an interim date.
In determining whether an impairment loss should be recorded in the income statement, the Group makes judgements and assumptions when calculating loan impairment allowances related to loans and advances. These allowances, which reflect the difference between the carrying amount of a loan, or a portfolio of similar loans, and the present value of estimated future cash flows, are assessed individually, for significant loans, and collectively, all other loans that are not individually significant or for which impairment has not yet been identified by including the loan in a group of loans with similar credit risk characteristics.
The estimate of future cash flows is most significantly related to impaired loans for which the impairment loss is assessed individually. Factors affecting this estimate include, among other things, the granularity of financial information related to specific borrowers, the availability of meaningful information related to industry competitors and the relevance of sector trends to the future performance of individual borrowers. China continues to experience economic growth and these facts are not as well established as those in more developed markets. The effect of these factors requires significant judgement to be applied in the estimation of future cash flows. This is especially true in emerging sectors.
Significant judgement is also applied to the calculation of collectively assessed impairment allowances. The Group makes judgements as to whether there is any observable data indicating that there is a measurable decrease in the estimated future cash flows from a portfolio of loans and advances before the decrease can be identified with an individual loan in that portfolio. This evidence may include observable data indicating that there has been an adverse change in the payment status of borrowers in a group (e.g. payment delinquency or default), or national or local economic conditions that correlate with defaults on assets in the Group. Management uses estimates based on historical loss experience for assets with similar credit risk characteristics and objective evidence of impairment similar to those in the portfolio when estimating expected future cash flows. The methodology and assumptions used for estimating both the amount and timing of future cash flows are reviewed regularly to reduce any differences between loss estimates and actual loss experience. The Group has considered the impact of the changes and uncertainty in the macro-economic environments in which the Group operates when assessing the methodology and assumptions used for loss estimates and made adjustments where appropriate.

2016 Annual Report 172
Notes to the Consolidated Financial Statements
III CRITICAL ACCOUNTING ESTIMATES AND JUDGEMENTS IN APPLYING ACCOUNTING POLICIES (Continued)
2 Fair value of derivatives and other financial instruments
The Group establishes fair value of financial instruments with reference to a quoted market price in an active market or, if there is no active market, using valuation techniques. These valuation techniques include the use of recent arm’s length transactions, observable prices for similar instruments, discounted cash flow analysis using risk-adjusted interest rates, and commonly used market pricing models. Whenever possible these models use observable market inputs and data including, for example, interest rate yield curves, foreign currency rates and option volatilities. The results of using valuation techniques are calibrated against industry practice and observable current market transactions in the same or similar instruments.
The Group assesses assumptions and estimates used in valuation techniques including review of valuation model assumptions and characteristics, changes to model assumptions, the quality of market data, whether markets are active or inactive, other fair value adjustments not specifically captured by models and consistency of application of techniques between reporting periods as part of its normal review and approval processes. Valuation techniques are validated and periodically reviewed and, where appropriate, have been updated to reflect market conditions at the financial reporting date.
With respect to the PRC government obligations related to large-scale policy directed financing transactions, fair value is determined using the stated terms of the related instrument and with reference to terms determined by the PRC government in similar transactions engaged in or directed by the PRC government. In this regard, there are no other relevant market prices or yields reflecting arm’s length transactions of a comparable size and tenor.
3 Impairment of available for sale investment securities and held to maturity investment securities
The Group follows the guidance of IAS 39 to determine when an available for sale or held to maturity investment security is impaired and when impairment on a debt security is reversed. This determination requires significant judgement. In making this judgement, the Group evaluates, among other factors, the duration and extent to which the fair value of an investment is less than its cost, the extent to which changes in fair value relate to credit events, and the financial health of and near-term business outlook for the investee/underlying portfolio, including factors such as industry and sector performance, technological innovations, credit ratings, delinquency rates, loss coverage ratios and counterparty risk.
4 Held to maturity securities
The Group follows the guidance of IAS 39 on classifying non-derivative financial assets with fixed or determinable payments and fixed maturity date as held to maturity. This classification requires significant judgement. In making this judgement, the Group evaluates its intention and ability to hold such investments to maturity.
5 Provisions
The Group uses judgement to assess whether the Group has a present legal or constructive obligation as a result of past events at each financial reporting date, and judgement is used to determine if it is probable that an outflow of resources embodying economic benefits will be required to settle the obligation, and to determine a reliable estimate of the amount of the obligation and relevant disclosure in the consolidated financial statements.

2016 Annual Report173
(Amount in millions of Renminbi, unless otherwise stated)
III CRITICAL ACCOUNTING ESTIMATES AND JUDGEMENTS IN APPLYING ACCOUNTING POLICIES (Continued)
6 Employee retirement benefit obligationsAs described in Note II.12.2 and Note V.33, the Bank has established liabilities in connection with benefits payable to certain retired and early retired employees. These liabilities are calculated using actuarial assumptions such as discount rates, pension benefit inflation rates, medical benefit inflation rates, and other factors. While management believes that its assumptions are appropriate, differences in actual experience or changes in assumptions may affect other comprehensive income, expenses and employee retirement benefit obligations.
7 TaxesThe Group is subject to income, value-added and business taxes in numerous jurisdictions, principally in Chinese mainland and Hong Kong. There are certain transactions and activities for which the ultimate tax determination is uncertain during the ordinary course of business. The Group has made estimates for items of uncertainty and application of new tax legislation taking into account existing tax legislation and past practice, in particular, the treatment of supplementary PRC tax applied to results of overseas operations.
Where the final tax outcome of these matters is different from the amounts that were initially estimated, such differences will impact the current income tax, deferred income tax, and business tax in the period during which such a determination is made.
8 Impairment of non-financial assetsNon-financial assets are periodically reviewed for impairment and where the carrying amount of an asset is greater than its estimated recoverable amount, it is written down immediately to its recoverable amount. The recoverable amount is the higher of the asset’s fair value less costs to sell and value in use.
When estimating the value in use of aircraft held by subsidiaries, the Group estimates expected future cash flows from the aircraft and uses a suitable discount rate to calculate present value. The Group obtains valuations of aircraft from independent appraisers for which the principal assumptions underlying aircraft value are based on current market transactions for similar aircraft in the same location and condition. The Group also uses the fair value of aircraft obtained from independent appraisers in its assessment of the recoverable amount of intangible assets and the goodwill arising from the purchase of the Group’s aircraft leasing subsidiary.
9 Judgement in assessing control over structured entitiesThe Group is involved with structured entities in its normal business course, and the Group determines whether or not to consolidate those structured entities depending on whether the Group has control over them. When assessing control over structured entities, the Group takes consideration of power arising from rights it directly owns or indirectly owns through subsidiaries (including controlled structured entities), variable returns, and link between power and returns.
The variable returns the Group is exposed to from its involvement with structured entities include decision makers’ remuneration (such as management fees and performance-related fees), as well as other benefits (such as investment income, remuneration and exposure to loss from providing credit or liquidity support, and variable returns from transactions with structured entities). When assessing whether it controls a structured entity, the Group not only considers applicable legal or regulatory requirements, and contractual agreements, but also other circumstances where the Group may have obligation to absorb any loss of the structured entity.
The Group reassesses whether it controls a structured entity if facts and circumstances indicate that there are changes to one or more of the relevant elements of control.

2016 Annual Report 174
Notes to the Consolidated Financial Statements
IV TAXATIONIn accordance with the Notice concerning the Nationwide Adoption of Value-added Tax in lieu of Business Tax Pilot Tax Collection Policy (Caishui [2016] No. 36) issued by the Ministry of Finance of the PRC (the “MOF”) and the State Administration of Taxation, the financial services provided by the Group within Chinese mainland shall be subject to value-added tax instead of business tax from 1 May 2016. The principal income and other taxes to which the Group is subject are listed below:
Taxes Tax basis Statutory ratesChinese mainlandCorporate income tax Taxable income 25%Value-added tax Taxable added value 6%Business tax Business income 5%City construction and maintenance tax Turnover tax paid 1%–7%Education surcharges Turnover tax paid 3%Local education surcharges Turnover tax paid 2%Hong KongHong Kong profits tax Assessable profits 16.5%
V NOTES TO THE CONSOLIDATED FINANCIAL STATEMENTS1 Net interest income
Year ended 31 December2016 2015
Interest income Loans and advances to customers 391,956 435,062 Financial investments and financial assets at fair value through profit or loss(1) 114,399 108,651 Due from central banks 29,831 29,543 Due from and placements with and loans to banks and other financial institutions 29,953 41,800
Subtotal 566,139 615,056
Interest expense Due to customers (199,915) (221,288) Due to and placements from banks and other financial institutions (46,427) (53,050) Bonds issued and other (13,749) (12,068)
Subtotal (260,091) (286,406)
Net interest income(2) 306,048 328,650
Interest income accrued on impaired financial assets (included within interest income) 2,532 1,387
(1) Interest income on “Financial investments and financial assets at fair value through profit or loss” is principally derived from debt securities listed on China Domestic Interbank Bond Market and unlisted debt securities in Hong Kong, Macau, Taiwan and other countries and regions.
(2) Included within “Interest income” and “Interest expense” are RMB562,518 million (2015: RMB611,519 million) and RMB249,103 million (2015: RMB273,306 million) for financial assets and financial liabilities that are not at fair value through profit or loss, respectively.

2016 Annual Report175
(Amount in millions of Renminbi, unless otherwise stated)
V NOTES TO THE CONSOLIDATED FINANCIAL STATEMENTS (Continued)
2 Net fee and commission income
Year ended 31 December2016 2015
Agency commissions 24,178 24,481Bank card fees 24,054 24,215Credit commitment fees 15,426 16,541Settlement and clearing fees 11,113 11,888Spread income from foreign exchange business 7,149 7,388Consultancy and advisory fees 5,701 5,757Custodian and other fiduciary service fees 3,397 3,677Other 7,301 6,958
Fee and commission income 98,319 100,905
Fee and commission expense (9,655) (8,495)
Net fee and commission income 88,664 92,410
3 Net trading gains
Year ended 31 December2016 2015
Net gains from foreign exchange and foreign exchange products 6,221 10,057Net gains/(losses) from interest rate products 334 (1,884)Net gains from equity products 254 841Net gains from commodity products 1,687 446
Total(1) 8,496 9,460
(1) Included in “Net trading gains” above for the year ended 31 December 2016 are gains of RMB520 million in relation
to financial assets and financial liabilities designated as at fair value through profit or loss (2015: losses of RMB3,985
million).
4 Net gains on financial investments
Year ended 31 December2016 2015
Net gains from investment securities available for sale 7,301 5,727Net gains from debt securities held to maturity 4,674 23Other 549 15
Total 12,524 5,765

2016 Annual Report 176
Notes to the Consolidated Financial Statements
V NOTES TO THE CONSOLIDATED FINANCIAL STATEMENTS (Continued)
5 Other operating income
Year ended 31 December2016 2015
Gains on disposal of subsidiaries, associates and joint ventures(1) 29,083 2,026Insurance premiums(2) 18,346 16,166Aircraft leasing income 6,976 6,088Revenue from sale of precious metals products 6,737 6,130Dividend income 1,054 765Gains on disposal of property and equipment, intangible assets and other assets 669 857Changes in fair value of investment properties (Note V.22) 1,134 620Other 5,925 4,975
Total 69,924 37,627
(1) This mainly represents the gains on disposal of Nanyang Commercial Bank, Limited (“NCB”) for the year.
(2) Details of insurance premium income are as follows:
Year ended 31 December
2016 2015
Life insurance contracts
Gross earned premiums 20,727 19,204
Less: gross written premiums ceded to reinsurers (7,495) (8,215)
Net insurance premium income 13,232 10,989
Non-life insurance contracts
Gross earned premiums 5,954 5,884
Less: gross written premiums ceded to reinsurers (840) (707)
Net insurance premium income 5,114 5,177
Total 18,346 16,166

2016 Annual Report177
(Amount in millions of Renminbi, unless otherwise stated)
V NOTES TO THE CONSOLIDATED FINANCIAL STATEMENTS (Continued)
6 Operating expenses
Year ended 31 December2016 2015
Staff costs (Note V.7) 81,080 80,324General operating and administrative expenses(1) 41,565 40,671Insurance benefits and claims — Life insurance contracts 13,322 10,531 — Non-life insurance contracts 3,482 3,592Depreciation and amortisation 13,175 13,218Taxes and surcharges 9,810 26,734Cost of sales of precious metals products 6,234 5,723Other 6,401 4,608
Total(2) 175,069 185,401
(1) Included in the “General operating and administrative expenses” are principal auditors’ remuneration of RMB213
million for the year ended 31 December 2016 (2015: RMB214 million), of which RMB59 million was for Hong Kong,
Macau, Taiwan and other countries and regions of the Group (2015: RMB47 million).
(2) Included in the “Operating expenses” are operating lease expenses of RMB7,368 million and premises and
equipment related expenses (mainly comprised of property management and building maintenance expenses and
taxes) of RMB11,977 million (2015: RMB7,104 million and RMB11,770 million, respectively).
7 Staff costs
Year ended 31 December2016 2015
Salary, bonus and subsidy 55,792 54,462Staff welfare 2,908 2,919Retirement benefits 18 202Social insurance — Medical 3,254 3,280 — Pension 6,585 6,587 — Annuity 2,060 2,060 — Unemployment 325 413 — Injury at work 102 163 — Maternity insurance 203 223Housing funds 5,066 5,428Labour union fee and staff education fee 1,918 1,911Reimbursement for cancellation of labour contract 11 7Other 2,838 2,669
Total 81,080 80,324

2016 Annual Report 178
Notes to the Consolidated Financial Statements
V NOTES TO THE CONSOLIDATED FINANCIAL STATEMENTS (Continued)
8 Directors’, supervisors’ and senior management’s emoluments
Details of the directors’ and supervisors’ emoluments are as follows:
For the year ended 31 December 2016
Fees
Remuneration paid
Contributions to pension
schemesBenefits
in kind TotalRMB’000 RMB’000 RMB’000 RMB’000 RMB’000
Executive directorsTIAN Guoli(4) –(2) 484 114 63 661CHEN Siqing(4) –(2) 484 112 63 659REN Deqi(4)(5) –(2) 436 76 63 575GAO Yingxin(4)(5) –(2) 436 93 63 592ZHU Hexin(4)(5)(6) –(2) 182 35 25 242
Non-executive directorsZHANG Xiangdong(1) – – – – –ZHANG Qi(1) – – – – –LIU Xianghui(1) – – – – –LI Jucai(1) – – – – –WANG Yong(1)(6) – – – – –WANG Wei(1)(6) – – – – –
Independent directorsNout WELLINK 500 – – – 500LU Zhengfei 514 – – – 514LEUNG Cheuk Yan 400 – – – 400WANG Changyun(5) 130 – – – 130CHOW Man Yiu, Paul(6) 300 – – – 300Jackson TAI(6) 267 – – – 267
SupervisorsWANG Xiquan(4)(5) – 40 5 5 50WANG Xueqiang(4) – 776 128 248 1,152LIU Wanming(4) – 726 123 237 1,086DENG Zhiying 50(3) – – – 50GAO Zhaogang(5) 38(3) – – – 38XIANG Xi 50(3) – – – 50CHEN Yuhua 180 – – – 180LI Jun(4)(6) – 444 122 58 624LIU Xiaozhong(6) 17(3) – – – 17
2,446 4,008 808 825 8,087

2016 Annual Report179
(Amount in millions of Renminbi, unless otherwise stated)
V NOTES TO THE CONSOLIDATED FINANCIAL STATEMENTS (Continued)
8 Directors’, supervisors’ and senior management’s emoluments (Continued)
For the year ended 31 December 2015
Fees
Remuneration paid
Contributions to pension
schemesBenefits in kind Total
RMB’000 RMB’000 RMB’000 RMB’000 RMB’000Executive directorsTIAN Guoli(4) –(2) 625 112 58 795CHEN Siqing(4) –(2) 625 107 58 790LI Zaohang(4) –(2) 282 75 27 384
Non-executive directorsZHANG Xiangdong(1) – – – – –ZHANG Qi(1) – – – – –WANG Yong(1) – – – – –WANG Wei(1) – – – – –LIU Xianghui(1) – – – – –LI Jucai(1) – – – – –SUN Zhijun(1) – – – – –
Independent directorsCHOW Man Yiu, Paul 450 – – – 450Jackson TAI 400 – – – 400Nout WELLINK 500 – – – 500LU Zhengfei 500 – – – 500LEUNG Cheuk Yan 400 – – – 400
SupervisorsLI Jun(4) – 625 129 58 812WANG Xueqiang(4) – 1,364 113 238 1,715LIU Wanming(4) – 1,276 100 228 1,604DENG Zhiying 50(3) – – – 50LIU Xiaozhong 50(3) – – – 50XIANG Xi 50(3) – – – 50CHEN Yuhua 97 – – – 97MEI Xingbao 150 – – – 150
2,647 4,797 636 667 8,747
2016 Annual Report 180
Notes to the Consolidated Financial Statements
V NOTES TO THE CONSOLIDATED FINANCIAL STATEMENTS (Continued)
8 Directors’, supervisors’ and senior management’s emoluments (Continued)
(1) For the years ended 31 December 2016 and 2015, these non-executive directors of the Bank were not remunerated by the Bank.
(2) For the years ended 31 December 2016 and 2015, these executive directors of the Bank did not receive any fees.
(3) Employee supervisors’ above compensation is paid for serving as the supervisors of the Bank.
(4) The total compensation packages for executive directors and supervisors for the year ended 31 December 2016 including discretionary bonus have not yet been finalised in accordance with relevant regulations of the PRC authorities. The amount of the compensation not provided for is not expected to have any significant impact on the Group’s 2016 financial statements. The final compensation for the year ended 31 December 2016 will be disclosed in a separate announcement when determined.
The compensation amounts for these directors and supervisors for the year ended 31 December 2015 were restated based on the finalised amounts as disclosed in the Bank’s announcement dated 30 August 2016.
A portion of the discretionary bonus payments for executive directors and the chairman of the board of supervisors are deferred for a minimum of 3 years contingent upon the future performance in accordance with relevant regulations of the PRC authorities.
(5) ZHU Hexin began to serve as Executive Director of the Bank as of 1 February 2016. REN Deqi began to serve as Executive Director of the Bank as of 8 December 2016. GAO Yingxin began to serve as Executive Director of the Bank as of 8 December 2016. WANG Changyun began to serve as Independent Director of the Bank as of 18 August 2016. Angela CHAO began to serve as Independent Director of the Bank as of 4 January 2017. Since Angela CHAO did not hold any position at the Bank in 2016, no emoluments were disclosed in 2016. WANG Xiquan began to serve as Supervisor and Chairman of the Board of Supervisors of the Bank as of 18 November 2016. GAO Zhaogang began to serve as Supervisor of the Bank as of 14 April 2016.
(6) ZHU Hexin ceased to serve as Executive Director of the Bank as of 1 June 2016. WANG Yong ceased to serve as Non-executive Director of the Bank as of 14 September 2016. WANG Wei ceased to serve as Non-executive Director of the Bank as of 19 January 2017. CHOW Man Yiu, Paul ceased to serve as Independent Director of the Bank as of 18 August 2016. Jackson TAI ceased to serve as Independent Director of the Bank as of 1 September 2016. LI Jun ceased to serve as Supervisor and Chairman of the Board of Supervisors of the Bank as of 18 November 2016. LIU Xiaozhong ceased to serve as Supervisor of the Bank as of 14 April 2016.
Five highest paid individuals
Of the five individuals with the highest emoluments, none of them are directors or supervisors whose emoluments are disclosed above.
The emoluments payable to the five individuals whose emoluments were the highest in the Group for the years ended 31 December 2016 and 2015 respectively are as follows:
Year ended 31 December2016 2015
Basic salaries and allowances 20 16Discretionary bonuses 81 83Contributions to pension schemes and other 3 2
104 101

2016 Annual Report181
(Amount in millions of Renminbi, unless otherwise stated)
V NOTES TO THE CONSOLIDATED FINANCIAL STATEMENTS (Continued)
8 Directors’, supervisors’ and senior management’s emoluments (Continued)
Five highest paid individuals (Continued)
Emoluments of the individuals were within the following bands:
Year ended 31 DecemberAmounts in RMB 2016 201513,000,001–14,000,000 – 114,000,001–15,000,000 1 116,000,001–20,000,000 3 230,000,001–40,000,000 1 1
The above five highest paid individuals’ emoluments are based on best estimates of discretionary bonuses. Discretionary bonuses include portions of payments that are deferred to future periods.
During the years ended 31 December 2016 and 2015, the Group has not paid any emoluments to the directors, supervisors, or senior management as an inducement to join or upon joining the Group or as compensation for loss of office.
9 Impairment losses on assets
Year ended 31 December2016 2015
Loans and advances — Individually assessed 30,508 30,064 — Collectively assessed 56,287 25,808
Subtotal 86,795 55,872
Financial investments — available for sale 946 (1) — held to maturity (20) (35) — loans and receivables 718 1,690
Subtotal 1,644 1,654
Other 633 1,748
Total(1) 89,072 59,274
(1) Details of new allowances and reversal of impairment losses on loans and advances and financial investments are
disclosed in Notes V.18 and V.24, respectively.

2016 Annual Report 182
Notes to the Consolidated Financial Statements
V NOTES TO THE CONSOLIDATED FINANCIAL STATEMENTS (Continued)
10 Income tax expense
Year ended 31 December2016 2015
Current income tax — Chinese mainland income tax 38,097 44,376 — Hong Kong profits tax 4,446 4,210 — Macau, Taiwan and other countries and regions taxation 4,275 3,218Adjustments in respect of current income tax of prior years (1,590) 273
Subtotal 45,228 52,077
Deferred income tax (Note V.35) (6,867) 77
Total 38,361 52,154
The principal tax rates applicable to the Group are set out in Note IV.
Provision for Chinese mainland income tax includes income tax based on the statutory tax rate of 25% of the taxable income of the Bank and each of its subsidiaries established in the Chinese mainland, and supplementary PRC tax on overseas operations as determined in accordance with the relevant PRC income tax rules and regulations (Note III.7).
Taxation on profits of Hong Kong, Macau, Taiwan and other countries and regions has been calculated on the estimated assessable profits in accordance with local tax regulations at the rates of taxation prevailing in the countries or regions in which the Group operates.
The tax rate on the Group’s profit before tax differs from the theoretical amount that would arise using the basic Chinese mainland tax rate of the Bank as follows:
Year ended 31 December2016 2015
Profit before income tax 222,412 231,571
Tax calculated at the applicable statutory tax rate 55,603 57,893Effect of different tax rates on Hong Kong, Macau, Taiwan and other countries and regions (5,641) (4,010)Supplementary PRC tax on overseas income 3,689 3,696Income not subject to tax(1) (20,154) (10,865)Items not deductible for tax purposes(2) 6,292 6,569Other (1,428) (1,129)
Income tax expense 38,361 52,154
(1) Income not subject to tax mainly comprises interest income from PRC Treasury bonds and local government bonds,
and the tax-free income recognised by the overseas entities in accordance with the local tax law.
(2) Non-deductible items primarily include losses resulting from write-off of certain non-performing loans, and marketing
and entertainment expenses in excess of the relevant deductible threshold under the relevant PRC tax regulations.

2016 Annual Report183
(Amount in millions of Renminbi, unless otherwise stated)
V NOTES TO THE CONSOLIDATED FINANCIAL STATEMENTS (Continued)
11 Earnings per share (basic and diluted)Basic earnings per share
Basic earnings per share was computed by dividing the profit attributable to the ordinary shareholders of the Bank by the weighted average number of ordinary shares in issue during the period.
Year ended 31 December2016 2015
Profit attributable to equity holders of the Bank 164,578 170,845Less: dividends on preference shares declared (6,718) (5,012)
Profit attributable to ordinary shareholders of the Bank 157,860 165,833
Weighted average number of ordinary shares in issue (in million shares) 294,376 293,722
Basic earnings per share (in RMB per share) 0.54 0.56
Weighted average number of ordinary shares in issue (in million shares)
Year ended 31 December2016 2015
Issued ordinary shares as at 1 January 294,388 288,731Add: weighted average number of shares from conversion of convertible bonds – 5,018Less: weighted average number of treasury shares (12) (27)
Weighted average number of ordinary shares in issue 294,376 293,722
Diluted earnings per share
Diluted earnings per share was computed by dividing the adjusted profit attributable to the ordinary shareholders of the Bank based on assuming conversion of all potentially dilutive shares for the period by the adjusted weighted average number of ordinary shares in issue. There was no difference between basic and diluted earnings per share as there were no potentially dilutive shares outstanding for the year ended 31 December 2016.
Year ended 31 December2016 2015
Profit attributable to ordinary shareholders of the Bank 157,860 165,833Add: interest expense on convertible bonds, net of tax – 47
Profit used to determine diluted earnings per share 157,860 165,880
Weighted average number of ordinary shares in issue (in million shares) 294,376 293,722Add: weighted average number of ordinary shares assuming conversion of all convertible bonds (in million shares) – 640
Weighted average number of ordinary shares in issue for diluted earnings per share (in million shares) 294,376 294,362
Diluted earnings per share (in RMB per share) 0.54 0.56

2016 Annual Report 184
Notes to the Consolidated Financial Statements
V NOTES TO THE CONSOLIDATED FINANCIAL STATEMENTS (Continued)
12 Other comprehensive income
Accrual amount of other comprehensive income:
Year ended 31 December2016 2015
Items that will not be reclassified to profit or lossActuarial gains/(losses) on defined benefit plans 259 (161)Other 18 14
Subtotal 277 (147)
Items that may be reclassified subsequently to profit or lossFair value (losses)/gains on available for sale financial assets (12,920) 14,096Less: related income tax impact 2,823 (3,674)
Amount transferred to the income statement (6,786) (4,972) Less: related income tax impact 1,755 1,123
(15,128) 6,573
Share of other comprehensive income of associates and joint ventures accounted for using the equity method (133) 1,498Less: related income tax impact 2 5
Amount transferred to the income statement – (1,864)
(131) (361)
Exchange differences on translation of foreign operations 16,949 6,765Less: net amount transferred to the income statement from other comprehensive income (1,469) 131
15,480 6,896
Other 1,898 336
Subtotal 2,119 13,444
Total 2,396 13,297

2016 Annual Report185
(Amount in millions of Renminbi, unless otherwise stated)
V NOTES TO THE CONSOLIDATED FINANCIAL STATEMENTS (Continued)
12 Other comprehensive income (Continued)
Other comprehensive income attributable to equity holders of the Bank in the consolidated statement of financial position:
Fair value gains on
available for sale financial assets
Exchange differences on translation of
foreign operations Other TotalAs at 1 January 2015 9,702 (24,393) 1,020 (13,671)Changes in amount for the previous year 7,278 4,345 (297) 11,326
As at 1 January 2016 16,980 (20,048) 723 (2,345)Changes in amount for the year (14,850) 11,825 1,516 (1,509)
As at 31 December 2016 2,130 (8,223) 2,239 (3,854)
13 Cash and due from banks and other financial institutions
As at 31 December2016 2015
Cash 77,548 73,371Due from banks in Chinese mainland 521,567 538,501Due from other financial institutions in Chinese mainland 6,579 1,377Due from banks in Hong Kong, Macau, Taiwan and other countries and regions 54,201 41,063Due from other financial institutions in Hong Kong, Macau, Taiwan and other countries and regions 87 66
Total 659,982 654,378
14 Balances with central banks
As at 31 December2016 2015
Mandatory reserves(1) 1,723,495 1,580,456Surplus reserves(2) 118,166 132,833Other(3) 429,979 482,774
Total 2,271,640 2,196,063
(1) The Group places mandatory reserve funds with the People’s Bank of China (the “PBOC”) and the central banks of Hong Kong, Macau, Taiwan and other countries and regions where it has operations. As at 31 December 2016, mandatory reserve funds placed with the PBOC were calculated at 17.0% (31 December 2015: 17.0%) and 5.0% (31 December 2015: 5.0%) of qualified RMB deposits and foreign currency deposits from customers of branches in Chinese mainland of the Bank respectively. The mandatory reserve funds placed with the central bank of domestic subsidiaries of the Group is determined by the PBOC. The amount of mandatory reserve funds placed with the central banks of other jurisdictions is determined by local regulations.
(2) This mainly represented the surplus reserve funds placed with the PBOC by branches in Chinese mainland of the Group.
(3) This mainly represented balances, other than mandatory reserves and surplus reserves, placed with central banks by operations in Hong Kong, Macau, Taiwan and other countries and regions.

2016 Annual Report 186
Notes to the Consolidated Financial Statements
V NOTES TO THE CONSOLIDATED FINANCIAL STATEMENTS (Continued)
15 Placements with and loans to banks and other financial institutions
As at 31 December2016 2015
Placements with and loans to: Banks in Chinese mainland 206,246 118,664 Other financial institutions in Chinese mainland 285,122 214,495 Banks in Hong Kong, Macau, Taiwan and other countries and regions 100,291 93,881 Other financial institutions in Hong Kong, Macau, Taiwan and other countries and regions 2,589 –
Subtotal(1) 594,248 427,040
Allowance for impairment losses (200) (192)
Total 594,048 426,848
Impaired placements 158 158
Percentage of impaired placements to total placements with and loans to banks and other financial institutions 0.03% 0.04%
(1) “Placements with and loans to banks and other financial institutions” include balances arising from reverse repo
agreements and collateralised financing agreements. These are presented by collateral type as follows:
As at 31 December
2016 2015
Debt securities
— Governments 40,853 33,500
— Policy banks 56,696 41,452
— Financial institutions 9,408 151
— Corporate 3,162 –
Subtotal 110,119 75,103
Bills – 1,527
Total 110,119 76,630

2016 Annual Report187
(Amount in millions of Renminbi, unless otherwise stated)
V NOTES TO THE CONSOLIDATED FINANCIAL STATEMENTS (Continued)
16 Financial assets at fair value through profit or loss
As at 31 December2016 2015
Trading financial assetsDebt securities Issuers in Chinese mainland — Government 3,399 5,151 — Public sectors and quasi-governments 49 – — Policy banks 4,525 6,301 — Financial institutions 31,773 19,122 — Corporate 4,044 4,694 Issuers in Hong Kong, Macau, Taiwan and other countries and regions — Governments 16,371 12,646 — Public sectors and quasi-governments 587 506 — Financial institutions 4,886 2,138 — Corporate 2,921 3,446
68,555 54,004
Equity securities 5,567 7,471Fund investments and other 1,503 3,547
Subtotal 75,625 65,022
Financial assets designated as at fair value through profit or lossDebt securities Issuers in Chinese mainland — Government 224 390 — Policy banks 136 102 — Financial institutions 1,815 2,291 — Corporate 4,213 4,216 Issuers in Hong Kong, Macau, Taiwan and other countries and regions — Governments 5,721 2,305 — Financial institutions 20,952 25,016 — Corporate 4,556 11,540
37,617 45,860
Loans(1) 6,022 4,218Equity securities 1,980 1,867Fund investments 2,846 2,095
Subtotal 48,465 54,040
Total(2)(3) 124,090 119,062

2016 Annual Report 188
Notes to the Consolidated Financial Statements
V NOTES TO THE CONSOLIDATED FINANCIAL STATEMENTS (Continued)
16 Financial assets at fair value through profit or loss (Continued)
As at 31 December2016 2015
Analysed as follows: Listed in Hong Kong 25,260 31,921 Listed outside Hong Kong(4) 64,555 53,690 Unlisted 34,275 33,451
Total 124,090 119,062
(1) There was no significant change during the years ended 31 December 2016 and 2015 and cumulatively, in the fair
value of the loans that was attributable to changes in the credit risk of the loans.
(2) As at 31 December 2016, the Group held bonds issued by the MOF and bills issued by the PBOC included in
“Financial assets at fair value through profit or loss”. The carrying value and the related coupon rate range on such
bonds and bills are as follows:
As at 31 December
2016 2015
Carrying value 3,613 5,541
Coupon rate range 0.00%–4.67% 0.00%–4.26%
(3) As at 31 December 2016, included in the Group’s “Financial assets at fair value through profit or loss” were
certificates of deposit held of RMB28,737 million (31 December 2015: RMB17,200 million).
(4) Debt securities traded on the China Domestic Interbank Bond Market are included in “Listed outside Hong Kong”.
17 Derivative financial instruments and hedge accounting
The Group enters into foreign currency exchange rate, interest rate, equity, credit or precious metals and other commodity related derivative financial instruments for trading, hedging, asset and liability management and on behalf of customers.
The contractual/notional amounts and fair values of derivative instruments held by the Group are set out in the following tables. The contractual/notional amounts of financial instruments provide a basis for comparison with the fair values of instruments recognised on the statement of financial position but do not necessarily indicate the amounts of future cash flows involved or the current fair value of the instruments and, therefore, do not indicate the Group’s exposure to credit or market risks. The derivative instruments become favourable (assets) or unfavourable (liabilities) as a result of fluctuations in market interest rates, foreign currency exchange rates, credit spreads, or equity/commodity prices relative to their terms. The aggregate fair values of derivative financial assets and liabilities can fluctuate significantly from time to time.

2016 Annual Report189
(Amount in millions of Renminbi, unless otherwise stated)
V NOTES TO THE CONSOLIDATED FINANCIAL STATEMENTS (Continued)
17 Derivative financial instruments and hedge accounting (Continued)
17.1 Derivative financial instruments
As at 31 December 2016 As at 31 December 2015
Contractual/notional amount
Fair valueContractual/
notional amount
Fair valueAssets Liabilities Assets Liabilities
Exchange rate derivatives Currency forwards and swaps, and cross-currency interest rate swaps(1) 5,364,363 109,007 (86,779) 4,516,512 67,447 (55,366) Currency options 302,945 2,224 (3,873) 225,919 1,727 (1,710) Currency futures 953 1 (4) – – –
Subtotal 5,668,261 111,232 (90,656) 4,742,431 69,174 (57,076)
Interest rate derivatives Interest rate swaps 1,779,761 10,616 (8,654) 1,051,031 5,235 (5,802) Interest rate options 9,910 18 (24) – – – Interest rate futures 3,304 3 (8) 2,512 4 (1)
Subtotal 1,792,975 10,637 (8,686) 1,053,543 5,239 (5,803)
Equity derivatives 12,168 224 (225) 9,855 441 (279)Commodity derivatives and other 405,541 8,456 (7,542) 189,905 7,382 (6,002)
Total 7,878,945 130,549 (107,109) 5,995,734 82,236 (69,160)
(1) These exchange rate derivatives primarily include foreign exchange transactions with customers; foreign
exchange transactions to manage foreign currency exchange risks arising from customers; and foreign currency
exchange transactions entered into as part of the asset and liability management and funding requirements.

2016 Annual Report 190
Notes to the Consolidated Financial Statements
V NOTES TO THE CONSOLIDATED FINANCIAL STATEMENTS (Continued)
17 Derivative financial instruments and hedge accounting (Continued)
17.2 Hedge accounting
Included in the derivative financial instruments above are those designated as hedging instruments by the Group as follows:
As at 31 December 2016 As at 31 December 2015
Contractual/notionalamount
Fair valueContractual/
notionalamount
Fair valueAssets Liabilities Assets Liabilities
Derivatives designated as hedging instruments in fair value hedges Cross-currency interest rate swaps 7,718 – (1,369) 7,225 – (993) Interest rate swaps 123,642 2,502 (1,024) 73,721 1,461 (1,014)
Subtotal(1) 131,360 2,502 (2,393) 80,946 1,461 (2,007)
Derivatives designated as hedging instruments in cash flow hedges Cross-currency interest rate swaps 1,087 66 (79) 1,017 42 (80) Interest rate swaps 5,550 122 – – – –
Subtotal(2) 6,637 188 (79) 1,017 42 (80)
Total 137,997 2,690 (2,472) 81,963 1,503 (2,087)
(1) Fair value hedges
The Group uses cross-currency interest rate swaps and interest rate swaps to hedge against changes in fair
value of bonds issued and debt securities available for sale arising from changes in foreign currency exchange
rates and interest rates.
Gains or losses on fair value hedges are as follows:
Year ended 31 December
2016 2015
Net gains/(losses) on
— hedging instruments 1,651 (89)
— hedged items (1,117) 317
Ineffectiveness recognised in net trading gains 534 228

2016 Annual Report191
(Amount in millions of Renminbi, unless otherwise stated)
V NOTES TO THE CONSOLIDATED FINANCIAL STATEMENTS (Continued)
17 Derivative financial instruments and hedge accounting (Continued)
17.2 Hedge accounting (Continued)
(2) Cash flow hedges
The Group uses cross-currency interest rate swaps and interest rate swaps to hedge against exposure to cash flow variability primarily from foreign exchange rate risk and interest rate risk of placement and loan transactions.
For the year ended 31 December 2016, a net gain from cash flow hedges of RMB86 million was recognised in “Other comprehensive income” (2015: net gain of RMB26 million), and there was no ineffectiveness for the years ended 31 December 2016 and 2015.
There were no transactions for which cash flow hedge accounting had to be ceased in the years ended 31 December 2016 and 2015 as a result of the highly probable cash flows no longer being expected to occur.
(3) Net investment hedges
The Group’s consolidated statement of financial position is affected by exchange differences between the functional currencies of respective holding companies and functional currencies of their branches and subsidiaries. The Group hedges such exchange exposures only in limited circumstances. Hedging is undertaken using deposits taken in the same currencies as the functional currencies of related branches and subsidiaries which are accounted for as hedges of certain net investments in foreign operations.
For the year ended 31 December 2016, a net loss from the hedging instrument of RMB1,357 million was recognised in “Other comprehensive income” on net investment hedges (2015: net loss of RMB1,023 million), and there was no ineffectiveness in the years ended 31 December 2016 and 2015.
18 Loans and advances to customers
18.1 Analysis of loans and advances to customers
As at 31 December2016 2015
Corporate loans and advances — Loans and advances 6,270,728 6,105,959 — Discounted bills 298,241 263,953
Subtotal 6,568,969 6,369,912
Personal loans — Mortgages 2,635,960 2,045,787 — Credit cards 302,302 268,923 — Other 466,131 451,238
Subtotal 3,404,393 2,765,948
Total loans and advances 9,973,362 9,135,860
Less: allowance for impairment losses — Individually assessed (70,093) (60,791) — Collectively assessed (167,623) (139,874)
Total allowance for impairment losses (237,716) (200,665)
Loans and advances to customers, net 9,735,646 8,935,195

2016 Annual Report 192
Notes to the Consolidated Financial Statements
V NOTES TO THE CONSOLIDATED FINANCIAL STATEMENTS (Continued)
18 Loans and advances to customers (Continued)
18.2 Analysis of loans and advances to customers by geographical area, industry, collateral type and analysis of overdue loans and advances to customers by collateral type is presented in Note VI.3.5.
18.3 Analysis of loans and advances to customers by collective and individual allowance assessments
Loans and advances for which
allowance is collectively assessed(1)
Identified impaired loans and advances(2)
Total
Identified impaired loans
and advances as % of total
loans and advances
for which allowance is
collectively assessed
for which allowance is individually
assessed Subtotal
As at 31 December 2016
Total loans and advances 9,828,051 44,225 101,086 145,311 9,973,362 1.46%
Allowance for impairment losses (139,957) (27,666) (70,093) (97,759) (237,716)
Loans and advances to customers, net 9,688,094 16,559 30,993 47,552 9,735,646
As at 31 December 2015
Total loans and advances 9,005,623 39,563 90,674 130,237 9,135,860 1.43%
Allowance for impairment losses (117,530) (22,344) (60,791) (83,135) (200,665)
Loans and advances to customers, net 8,888,093 17,219 29,883 47,102 8,935,195
(1) Loans and advances for which allowance is collectively assessed consist of loans and advances which have not
been specifically identified as impaired.
(2) Identified impaired loans and advances are loans for which objective evidence of impairment exists and which
have been identified as bearing an impairment loss and assessed either:
• individually (including mainly significant corporate loans and advances over a certain amount which are
impaired); or
• collectively (portfolios of individually insignificant homogenous loans which share similar credit risk
characteristics, including insignificant corporate loans and advances and personal loans which are
impaired).

2016 Annual Report193
(Amount in millions of Renminbi, unless otherwise stated)
V NOTES TO THE CONSOLIDATED FINANCIAL STATEMENTS (Continued)
18 Loans and advances to customers (Continued)
18.4 Reconciliation of allowance for impairment losses on loans and advances to customers by individual and
collective assessments
Year ended 31 December
2016 2015
Individuallyassessed
allowance
Collectivelyassessed
allowance Total
Individuallyassessed
allowance
Collectivelyassessed
allowance Total
As at 1 January 60,791 139,874 200,665 49,239 139,292 188,531Impairment losses for the year 40,589 86,847 127,436 36,419 67,358 103,777Reversal (10,081) (30,560) (40,641) (6,355) (41,550) (47,905)Write-off and transfer out (23,611) (28,865) (52,476) (19,551) (25,646) (45,197)Transfer in — Recovery of loans and advances written off 3,106 237 3,343 1,186 136 1,322 — Unwind of discount on allowance (1,261) (1,219) (2,480) (529) (800) (1,329)
— Exchange differences 560 1,309 1,869 382 1,084 1,466
As at 31 December 70,093 167,623 237,716 60,791 139,874 200,665
18.5 Reconciliation of allowance for impairment losses on loans and advances to customers by customer type
Year ended 31 December
2016 2015
Corporate Personal Total Corporate Personal Total
As at 1 January 160,380 40,285 200,665 152,682 35,849 188,531Impairment losses for the year 105,936 21,500 127,436 89,871 13,906 103,777Reversal (40,551) (90) (40,641) (47,704) (201) (47,905)Write-off and transfer out (42,962) (9,514) (52,476) (36,210) (8,987) (45,197)Transfer in — Recovery of loans and advances written off 3,279 64 3,343 1,279 43 1,322
— Unwind of discount on allowance (2,027) (453) (2,480) (961) (368) (1,329)
— Exchange differences 1,773 96 1,869 1,423 43 1,466
As at 31 December 185,828 51,888 237,716 160,380 40,285 200,665

2016 Annual Report 194
Notes to the Consolidated Financial Statements
V NOTES TO THE CONSOLIDATED FINANCIAL STATEMENTS (Continued)
19 Financial investments
As at 31 December2016 2015
Investment securities available for saleDebt securities Issuers in Chinese mainland — Government 505,537 198,333 — Public sectors and quasi-governments 21,919 22,245 — Policy banks 152,188 153,831 — Financial institutions 174,998 153,622 — Corporate 133,362 129,027 Issuers in Hong Kong, Macau, Taiwan and other countries and regions — Governments 272,531 189,310 — Public sectors and quasi-governments 33,682 18,020 — Financial institutions 160,399 106,867 — Corporate 81,347 58,587
1,535,963 1,029,842
Equity securities 33,936 30,209Fund investments and other 39,931 18,482
Total investment securities available for sale(1) 1,609,830 1,078,533
Debt securities held to maturity Issuers in Chinese mainland — Government 1,336,609 1,117,213 — Public sectors and quasi-governments 30,047 37,548 — Policy banks 231,425 276,054 — Financial institutions 51,696 70,272 — Corporate 42,111 128,292 Issuers in Hong Kong, Macau, Taiwan and other countries and regions — Governments 47,728 84,913 — Public sectors and quasi-governments 41,878 20,092 — Financial institutions 31,185 23,361 — Corporate 30,408 33,239
1,843,087 1,790,984
Allowance for impairment losses (44) (194)
Total debt securities held to maturity(2) 1,843,043 1,790,790

2016 Annual Report195
(Amount in millions of Renminbi, unless otherwise stated)
V NOTES TO THE CONSOLIDATED FINANCIAL STATEMENTS (Continued)
19 Financial investments (Continued)
As at 31 December2016 2015
Financial investments classified as loans and receivablesDebt securities Issuers in Chinese mainland — Government(3)(4) 158,958 90,388 — Public sectors and quasi-governments – 2,500 — Policy banks 1,500 5,000 — Financial institutions 32,579 47,671 — Corporate 6,548 12,546 — China Orient(5) 160,000 160,000 Issuers in Hong Kong, Macau, Taiwan and other countries and regions — Governments 347 324 — Public sectors and quasi-governments 13,995 11,957 — Financial institutions 135 2 — Corporate 1,394 8
375,456 330,396
Investment trusts, asset management plans and other(6) 22,938 278,068Allowance for impairment losses (2,473) (1,754)
Total financial investments classified as loans and receivables 395,921 606,710
Total financial investments(7)(8) 3,848,794 3,476,033
Analysed as follows:
Investment securities available for saleDebt securities — Listed in Hong Kong 81,136 47,203 — Listed outside Hong Kong 1,070,542 639,331 — Unlisted 384,285 343,308
Equity, fund and other — Listed in Hong Kong 7,102 5,775 — Listed outside Hong Kong 1,188 162 — Unlisted 65,577 42,754
Debt securities held to maturity — Listed in Hong Kong 36,990 26,561 — Listed outside Hong Kong 1,701,213 1,552,348 — Unlisted 104,840 211,881
Financial investments classified as loans and receivables — Unlisted 395,921 606,710
Total 3,848,794 3,476,033
Listed in Hong Kong 125,228 79,539Listed outside Hong Kong 2,772,943 2,191,841Unlisted 950,623 1,204,653
Total 3,848,794 3,476,033

2016 Annual Report 196
Notes to the Consolidated Financial Statements
V NOTES TO THE CONSOLIDATED FINANCIAL STATEMENTS (Continued)
19 Financial investments (Continued)
As at 31 December2016 2015
Carryingvalue
Marketvalue
Carryingvalue
Marketvalue
Debt securities held to maturity — Listed in Hong Kong 36,990 37,196 26,561 26,791 — Listed outside Hong Kong 1,701,213 1,711,302 1,552,348 1,593,092
(1) The Group’s accumulated impairment charge on the above available for sale debt securities, equity instruments and
other as at 31 December 2016 amounted to RMB1,295 million and RMB5,808 million, respectively (31 December
2015: RMB1,410 million and RMB4,864 million, respectively).
(2) In 2016, the Group reclassified certain debt securities with a total carrying value of RMB1,635 million from
“Investment securities available for sale” to “Investment securities held to maturity” (2015: RMB7,513 million).
The Group had the intention and ability to hold these reclassified debt securities until maturity at the date of
reclassification. In 2016, the Group reclassified certain debt securities with amortised cost of RMB4,243 million from
“Investment securities held to maturity” to “Investment securities available for sale” due to the implementation of
value-added tax reform and management’s change of investment intention (2015: Nil).
(3) On 18 August 1998, a Special Purpose Treasury Bond was issued by the MOF with a par value of RMB42,500 million
maturing on 18 August 2028. This bond was originally issued with an annual coupon rate of 7.20% and its coupon
rate was restructured to 2.25% per annum from 1 December 2004.
(4) The Bank underwrites certain Treasury bonds issued by the MOF and undertakes the role of a distributor of these
Treasury bonds through its branch network earning commission income on bonds sold. The investors of these bonds
have a right to redeem the bonds at any time prior to maturity and the Bank is committed to redeem these Treasury
bonds. The balance of these bonds held by the Bank as at 31 December 2016 amounted to RMB1,891 million
(31 December 2015: RMB2,507 million).
(5) The Bank transferred certain non-performing assets to China Orient Asset Management Corporation (“China
Orient”) in 1999 and 2000. On 1 July 2000, China Orient issued a ten-year bond (“Orient Bond”) with a par value of
RMB160,000 million and interest rate of 2.25% to the Bank as consideration. During the year ended 31 December
2010, the maturity of this bond was extended to 30 June 2020 with the other terms unchanged. The MOF shall
continue to provide funding support for the principal and interest of the Orient Bond held by the Bank pursuant
to Caijin [2004] No. 87 Notice of the MOF Regarding Relevant Issues Relating to the Principal and Interest of Debt
Securities of Financial Asset Management Companies Held by Bank of China and China Construction Bank.
(6) This represents the Group’s investments in investment trusts and asset management plans which were managed by
trust companies or securities companies. The underlying assets of these investment trusts and asset management
plans mainly consist of beneficial rights in financial assets, of which other banks bear the payment obligations in the
future.
(7) As at 31 December 2016, the Group held bonds issued by the MOF and bills issued by the PBOC included in financial
investments. The carrying value and the related coupon rate range on such bonds and bills are as follows:
As at 31 December
2016 2015
Carrying value 900,817 955,457
Coupon rate range 0.00%–5.41% 0.00%–5.41%
(8) Included in the Group’s financial investments were certificates of deposit held amounting to RMB76,152 million as at
31 December 2016 (31 December 2015: RMB118,251 million).
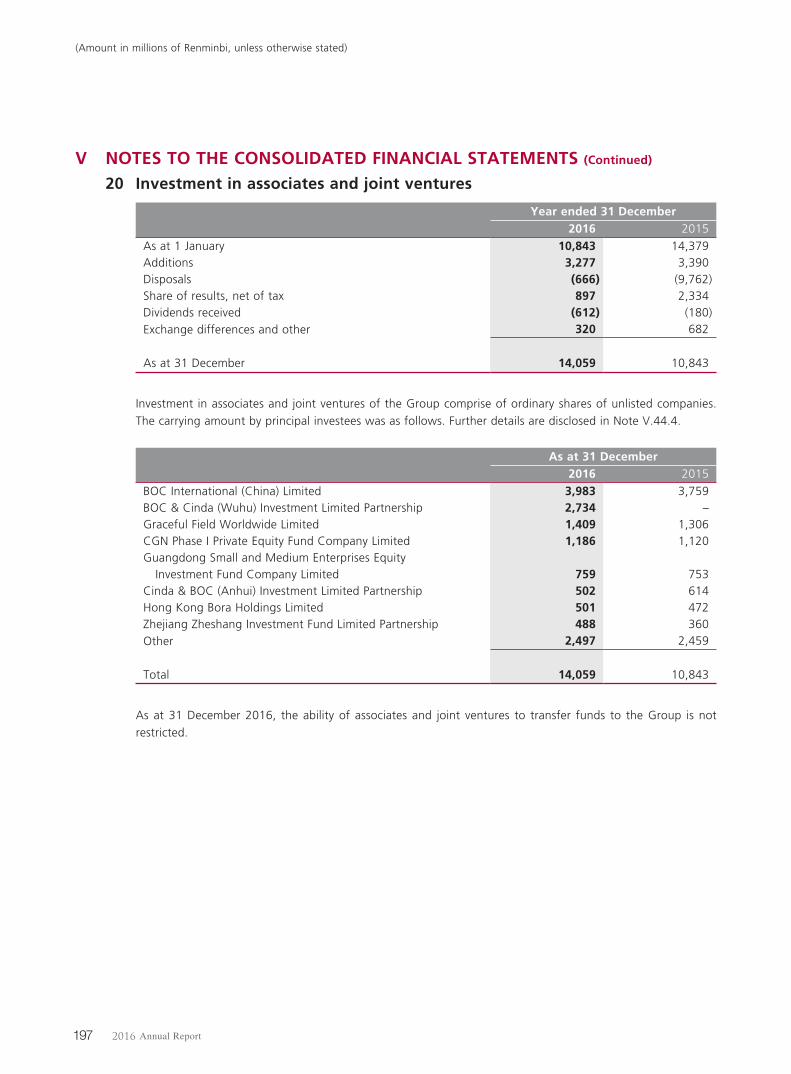
2016 Annual Report197
(Amount in millions of Renminbi, unless otherwise stated)
V NOTES TO THE CONSOLIDATED FINANCIAL STATEMENTS (Continued)
20 Investment in associates and joint ventures
Year ended 31 December2016 2015
As at 1 January 10,843 14,379Additions 3,277 3,390Disposals (666) (9,762)Share of results, net of tax 897 2,334Dividends received (612) (180)Exchange differences and other 320 682
As at 31 December 14,059 10,843
Investment in associates and joint ventures of the Group comprise of ordinary shares of unlisted companies. The carrying amount by principal investees was as follows. Further details are disclosed in Note V.44.4.
As at 31 December2016 2015
BOC International (China) Limited 3,983 3,759BOC & Cinda (Wuhu) Investment Limited Partnership 2,734 –Graceful Field Worldwide Limited 1,409 1,306CGN Phase I Private Equity Fund Company Limited 1,186 1,120Guangdong Small and Medium Enterprises Equity Investment Fund Company Limited 759 753Cinda & BOC (Anhui) Investment Limited Partnership 502 614Hong Kong Bora Holdings Limited 501 472Zhejiang Zheshang Investment Fund Limited Partnership 488 360Other 2,497 2,459
Total 14,059 10,843
As at 31 December 2016, the ability of associates and joint ventures to transfer funds to the Group is not restricted.

2016 Annual Report 198
Notes to the Consolidated Financial Statements
V NOTES TO THE CONSOLIDATED FINANCIAL STATEMENTS (Continued)
21 Property and equipment
Year ended 31 December 2016
Buildings
Equipmentand motor
vehiclesConstruction
in progress Aircraft TotalCostAs at 1 January 102,447 66,288 29,100 71,303 269,138Additions 404 5,152 5,349 18,476 29,381Transfer from investment properties (Note V.22) 1,495 – – – 1,495Construction in progress transfer in/(out) 7,279 639 (9,184) 1,266 –Deductions (1,341) (2,903) (133) (13,047) (17,424)Exchange differences 1,039 445 1,028 4,878 7,390
As at 31 December 111,323 69,621 26,160 82,876 289,980
Accumulated depreciationAs at 1 January (28,658) (49,468) – (7,555) (85,681)Additions (3,504) (6,878) – (2,516) (12,898)Deductions 462 2,773 – 2,337 5,572Transfer to investment properties (Note V.22) 174 – – – 174Exchange differences (245) (316) – (624) (1,185)
As at 31 December (31,771) (53,889) – (8,358) (94,018)
Allowance for impairment lossesAs at 1 January (768) – (221) (437) (1,426)Additions – – – (32) (32)Deductions – – – 424 424Exchange differences – – – (31) (31)
As at 31 December (768) – (221) (76) (1,065)
Net book valueAs at 1 January 73,021 16,820 28,879 63,311 182,031
As at 31 December 78,784 15,732 25,939 74,442 194,897

2016 Annual Report199
(Amount in millions of Renminbi, unless otherwise stated)
V NOTES TO THE CONSOLIDATED FINANCIAL STATEMENTS (Continued)
21 Property and equipment (Continued)
Year ended 31 December 2015
Buildings
Equipmentand motor
vehiclesConstruction
in progress Aircraft TotalCostAs at 1 January 94,323 62,216 26,061 68,398 250,998Additions 446 5,736 13,607 10,848 30,637Transfer from/(to) investment properties (Note V.22) 557 – (3) – 554Construction in progress transfer in/(out) 8,194 816 (10,875) 1,865 –Deductions (1,943) (2,775) (125) (14,031) (18,874)Exchange differences 870 295 435 4,223 5,823
As at 31 December 102,447 66,288 29,100 71,303 269,138
Accumulated depreciationAs at 1 January (26,189) (44,373) – (7,043) (77,605)Additions (3,015) (7,456) – (2,390) (12,861)Deductions 713 2,567 – 2,313 5,593Transfer to investment properties (Note V.22) 27 – – – 27Exchange differences (194) (206) – (435) (835)
As at 31 December (28,658) (49,468) – (7,555) (85,681)
Allowance for impairment lossesAs at 1 January (749) – (245) (202) (1,196)Additions (24) – – (285) (309)Deductions 5 – 24 62 91Exchange differences – – – (12) (12)
As at 31 December (768) – (221) (437) (1,426)
Net book valueAs at 1 January 67,385 17,843 25,816 61,153 172,197
As at 31 December 73,021 16,820 28,879 63,311 182,031
As at 31 December 2016, the net book amount of aircraft owned by BOC Aviation Limited, a subsidiary of the Group, acquired under finance lease arrangements was RMB673 million (31 December 2015: RMB655 million).
As at 31 December 2016, the net book amount of aircraft leased out by BOC Aviation Limited, a subsidiary of the Group, under operating leases was RMB74,140 million (31 December 2015: RMB62,974 million).
As at 31 December 2016, the net book amount of aircraft owned by BOC Aviation Limited, a subsidiary of the Group, that has been pledged for loan facilities was RMB31,904 million (31 December 2015: RMB41,622 million) (Note V.31).

2016 Annual Report 200
Notes to the Consolidated Financial Statements
V NOTES TO THE CONSOLIDATED FINANCIAL STATEMENTS (Continued)
21 Property and equipment (Continued)
According to the relevant the PRC laws and regulations, after conversion into a joint stock limited liability company, the Bank is required to re-register its property and equipment under the name of Bank of China Limited. As at 31 December 2016, the process of re-registration has not been completed. However, this registration process does not affect the rights of Bank of China Limited to these assets.
The carrying value of buildings is analysed based on the remaining terms of the leases as follows:
As at 31 December2016 2015
Held in Hong Kong on long-term lease (over 50 years) 3,030 2,916 on medium-term lease (10–50 years) 7,914 8,505 on short-term lease (less than 10 years) 13 14
Subtotal 10,957 11,435
Held outside Hong Kong on long-term lease (over 50 years) 4,323 1,934 on medium-term lease (10–50 years) 59,365 56,269 on short-term lease (less than 10 years) 4,139 3,383
Subtotal 67,827 61,586
Total 78,784 73,021
22 Investment properties
Year ended 31 December2016 2015
As at 1 January 23,281 18,653Additions 2,932 4,263Transfer to property and equipment, net (Note V.21) (1,669) (581)Deductions (5,292) (334)Fair value changes (Note V.5) 1,134 620Exchange differences 1,273 660
As at 31 December 21,659 23,281
The Group’s investment properties are located in active real estate markets, and external appraisers make reasonable estimation of fair value using market prices of the same or similar properties and other related information from the real estate market.
Investment properties are mainly held by Bank of China Hong Kong (Holdings) Limited (“BOCHK (Holdings)”) and Bank of China Group Investment Limited (“BOCG Investment”), subsidiaries of the Group. The carrying value of investment properties held by BOCHK (Holdings) and BOCG Investment as at 31 December 2016 amounted to RMB12,597 million and RMB6,883 million, respectively (31 December 2015: RMB9,334 million and RMB11,965 million). The valuation of these investment properties as at 31 December 2016 were principally performed by Knight Frank Petty Limited based on open market price and other related information.

2016 Annual Report201
(Amount in millions of Renminbi, unless otherwise stated)
V NOTES TO THE CONSOLIDATED FINANCIAL STATEMENTS (Continued)
22 Investment properties (Continued)
The carrying value of investment properties is analysed based on the remaining terms of the leases as follows:
As at 31 December2016 2015
Held in Hong Kong on long-term lease (over 50 years) 3,774 3,566 on medium-term lease (10–50 years) 9,514 6,504 on short-term lease (less than 10 years) – –
Subtotal 13,288 10,070
Held outside Hong Kong on long-term lease (over 50 years) 3,337 4,790 on medium-term lease (10–50 years) 3,965 7,523 on short-term lease (less than 10 years) 1,069 898
Subtotal 8,371 13,211
Total 21,659 23,281
23 Other assets
As at 31 December2016 2015
Interest receivable(1) 79,836 77,354Accounts receivable and prepayments(2) 81,489 76,706Land use rights(3) 7,679 8,104Intangible assets(4) 6,863 5,750Long-term deferred expense 3,235 2,949Repossessed assets(5) 2,775 2,070Goodwill(6) 2,473 2,449Other 5,625 6,118
Total 189,975 181,500
(1) Interest receivable
As at 31 December
2016 2015
Financial investments and financial assets at fair value
through profit or loss 47,121 46,202
Loans and advances to customers 25,531 24,309
Due from and placements with and loans to banks,
other financial institutions and central banks 7,184 6,843
Total 79,836 77,354

2016 Annual Report 202
Notes to the Consolidated Financial Statements
V NOTES TO THE CONSOLIDATED FINANCIAL STATEMENTS (Continued)
23 Other assets (Continued)
(1) Interest receivable (Continued)
The movements of interest receivable are as follows:
Year ended 31 December
2016 2015
As at 1 January 77,354 76,814
Accrued during the year 561,670 613,255
Received during the year (559,188) (612,715)
As at 31 December 79,836 77,354
(2) Accounts receivable and prepayments
As at 31 December
2016 2015
Accounts receivable and prepayments 85,886 80,560
Impairment allowance (4,397) (3,854)
Net value 81,489 76,706
Accounts receivable and prepayments mainly include items in the process of clearing and settlement. The analysis of
the aging of accounts receivable and prepayments is as follows:
As at 31 December
2016 2015
Balance
Impairment
allowance Balance
Impairment
allowance
Within 1 year 77,782 (379) 73,523 (943)
From 1 year to 3 years 3,048 (2,062) 2,436 (1,077)
Over 3 years 5,056 (1,956) 4,601 (1,834)
Total 85,886 (4,397) 80,560 (3,854)
(3) Land use rights
The carrying value of land use rights is analysed based on the remaining terms of the leases as follows:
As at 31 December
2016 2015
Held outside Hong Kong
on long-term lease (over 50 years) 123 140
on medium-term lease (10–50 years) 6,657 6,992
on short-term lease (less than 10 years) 899 972
Total 7,679 8,104

2016 Annual Report203
(Amount in millions of Renminbi, unless otherwise stated)
V NOTES TO THE CONSOLIDATED FINANCIAL STATEMENTS (Continued)
23 Other assets (Continued)
(4) Intangible assets
Year ended 31 December2016 2015
CostAs at 1 January 11,629 9,479Additions 2,291 2,128Deductions (117) (15)Exchange differences 58 37
As at 31 December 13,861 11,629
Accumulated amortisationAs at 1 January (5,879) (4,825)Additions (1,130) (1,032)Deductions 55 8Exchange differences (44) (30)
As at 31 December (6,998) (5,879)
Net book valueAs at 1 January 5,750 4,654
As at 31 December 6,863 5,750
(5) Repossessed assets
The Group obtained repossessed assets by taking possession of collateral held as security due to default. Such repossessed assets are as follows:
As at 31 December2016 2015
Commercial properties 1,913 1,352Residential properties 691 533Other 821 832
Subtotal 3,425 2,717
Allowance for impairment (650) (647)
Repossessed assets, net 2,775 2,070
The total book value of repossessed assets disposed of during the year ended 31 December 2016 amounted to RMB257 million (2015: RMB580 million). The Group plans to dispose of the repossessed assets held at 31 December 2016 by auction, bidding or transfer.
(6) Goodwill
Year ended 31 December2016 2015
As at 1 January 2,449 1,953Addition through acquisition of subsidiaries 147 386Deductions (262) –Exchange differences 139 110
As at 31 December 2,473 2,449
The goodwill mainly arose from the acquisition of BOC Aviation Limited in 2006 amounting to USD241 million (equivalent to RMB1,671 million).

2016 Annual Report 204
Notes to the Consolidated Financial Statements
V NOTES TO THE CONSOLIDATED FINANCIAL STATEMENTS (Continued)
24 Impairment allowance
As at 1 January
2016 Additions
DecreaseExchange
differences
As at 31 December
2016ReversalWrite-off and
transfer outImpairment allowance Placements with and loans to banks and other financial institutions 192 13 (7) – 2 200 Loans and advances to customers(1) 200,665 127,436 (40,641) (51,613) 1,869 237,716 Financial investments — available for sale (Note V.19) 6,274 1,012 (66) (508) 391 7,103 — held to maturity 194 – (20) (140) 10 44 — loans and receivables 1,754 1,114 (396) – 1 2,473 Property and equipment 1,426 32 – (424) 31 1,065 Repossessed assets 647 54 (10) (58) 17 650 Land use rights 15 – – – – 15 Accounts receivable and prepayments 3,854 1,137 (609) (80) 95 4,397 Other 1,449 94 (71) (57) 51 1,466
Total 216,470 130,892 (41,820) (52,880) 2,467 255,129
As at 1 January
2015 Additions
DecreaseExchange
differences
As at 31 December
2015ReversalWrite-off and
transfer outImpairment allowance Placements with and loans to banks and other financial institutions 207 3 (18) – – 192 Loans and advances to customers(1) 188,531 103,777 (47,905) (45,204) 1,466 200,665 Financial investments — available for sale (Note V.19) 7,127 125 (126) (1,299) 447 6,274 — held to maturity 218 – (35) – 11 194 — loans and receivables 64 2,161 (471) – – 1,754 Property and equipment 1,196 285 – (67) 12 1,426 Repossessed assets 1,010 – (200) (174) 11 647 Land use rights 15 – – – – 15 Accounts receivable and prepayments 2,421 2,414 (988) (43) 50 3,854 Other 1,206 253 (1) (55) 46 1,449
Total 201,995 109,018 (49,744) (46,842) 2,043 216,470
(1) Included within “Write-off and transfer out” on loans and advances to customers are amounts relating to loans and
advances write-off, transfer out, recovery of loans and advances written off and unwind of discount on allowance.

2016 Annual Report205
(Amount in millions of Renminbi, unless otherwise stated)
V NOTES TO THE CONSOLIDATED FINANCIAL STATEMENTS (Continued)
25 Due to banks and other financial institutions
As at 31 December2016 2015
Due to: Banks in Chinese mainland 377,882 535,209 Other financial institutions in Chinese mainland 847,818 1,022,792 Banks in Hong Kong, Macau, Taiwan and other countries and regions 144,915 183,973 Other financial institutions in Hong Kong, Macau, Taiwan and other countries and regions 49,912 22,346
Total 1,420,527 1,764,320
26 Due to central banks
As at 31 December2016 2015
Foreign exchange deposits 206,210 160,533Other 660,884 255,176
Total 867,094 415,709
27 Government certificates of indebtedness for bank notes issued and bank notes in circulationBank of China (Hong Kong) Limited (“BOCHK”) and Bank of China Macau Branch are note issuing banks for Hong Kong Dollar and Macau Pataca notes in Hong Kong and Macau, respectively. Under local regulations, these two entities are required to place deposits with the Hong Kong and Macau governments, respectively to secure the currency notes in circulation.
Bank notes in circulation represent the liabilities in respect of Hong Kong Dollar notes and Macau Pataca notes in circulation, issued respectively by BOCHK and Bank of China Macau Branch.
28 Placements from banks and other financial institutions
As at 31 December2016 2015
Placements from: Banks in Chinese mainland 134,754 271,387 Other financial institutions in Chinese mainland 43,353 107,482 Banks in Hong Kong, Macau, Taiwan and other countries and regions 116,723 53,721 Other financial institutions in Hong Kong, Macau, Taiwan and other countries and regions 7,962 15,354
Total(1) 302,792 447,944
(1) Included in “Placements from banks and other financial institutions” are amounts received from counterparties under repurchase agreements and collateral agreements as follows:
As at 31 December2016 2015
Repurchase debt securities(i) 116,375 183,498
(i) Debt securities used as collateral under repurchase agreements were principally government bonds and were included in the amount disclosed under Note V.42.2.

2016 Annual Report 206
Notes to the Consolidated Financial Statements
V NOTES TO THE CONSOLIDATED FINANCIAL STATEMENTS (Continued)
29 Due to customers
As at 31 December2016 2015
At amortised costDemand deposits — Corporate deposits 3,620,945 3,130,624 — Personal deposits 2,490,309 2,092,841
Subtotal 6,111,254 5,223,465
Time deposits — Corporate deposits 3,100,383 3,037,783 — Personal deposits 2,992,051 2,841,372
Subtotal 6,092,434 5,879,155
Certificates of deposit 327,908 230,793Other deposits(1) 57,841 55,847
Total due to customers at amortised cost 12,589,437 11,389,260
At fair valueStructured deposits — Corporate deposits 271,885 274,799 — Personal deposits 78,426 65,112
Total due to customers at fair value(2) 350,311 339,911
Total due to customers(3) 12,939,748 11,729,171
(1) Included in other deposits are special purpose fundings, which represent long-term fundings provided in multiple
currencies from foreign governments and/or entities in the form of export credit, foreign government and other
subsidised credit. These special purpose fundings are normally used to finance projects with a special commercial
purpose in the PRC as determined by the foreign governments or entities and the Group is obliged to repay these
fundings when they fall due.
As at 31 December 2016, the remaining maturity of special purpose fundings ranges from 31 days to 37 years. The
interest-bearing special purpose fundings bear floating and fixed interest rates ranging from 0.03% to 7.92% (31
December 2015: 0.15% to 7.92%). These terms are consistent with those related development loans granted to
customers.
(2) Due to customers measured at fair value are structured deposits designated as at fair value through profit or loss at
inception.
There were no significant changes in the Group’s credit risk and therefore there were no significant gains or losses
attributable to changes in the Group’s credit risk for the above-mentioned structured deposits during the years ended
31 December 2016 and 2015.
(3) Due to customers included margin deposits for security received by the Group as at 31 December 2016 of
RMB339,216 million (31 December 2015: RMB338,385 million).

2016 Annual Report207
(Amount in millions of Renminbi, unless otherwise stated)
V NOTES TO THE CONSOLIDATED FINANCIAL STATEMENTS (Continued)
30 Bonds issued
Issue date Maturity dateAnnual
interest rateAs at 31 December
2016 2015Subordinated bonds issued2009 RMB Debt Securities First Tranche(1) 6 July 2009 8 July 2024 4.00% 24,000 24,000
2010 RMB Debt Securities(2) 9 March 2010 11 March 2025 4.68% 24,930 24,930
2010 US Dollar Subordinated notes issued by BOCHK 11 February 2010 11 February 2020 5.55% 16,634 15,921
2011 RMB Debt Securities(3) 17 May 2011 19 May 2026 5.30% 32,000 32,000
2012 RMB Debt Securities First Tranche(4) 27 November 2012 29 November 2022 4.70% 5,000 5,000
2012 RMB Debt Securities Second Tranche(4) 27 November 2012 29 November 2027 4.99% 18,000 18,000
Subtotal(7) 120,564 119,851
Tier 2 capital bonds issued2014 RMB Debt Securities(5) 8 August 2014 11 August 2024 5.80% 29,972 29,971
2014 US Dollar Debt Securities(6) 13 November 2014 13 November 2024 5.00% 20,700 19,365
Subtotal(7) 50,672 49,336
Other bonds issuedUS Dollar Debt Securities(8) 100,021 67,670
RMB Debt Securities(9) 17,754 20,104
Other(10) 22,219 12,673
Subtotal 139,994 100,447
Interbank negotiable certificates of deposit(11) 51,088 13,295
Total bonds issued(12) 362,318 282,929
(1) The fixed rate portion of the first tranche of the subordinated bonds issued on 6 July 2009 has a maturity of 15 years,
with a fixed coupon rate of 4.00%, paid annually. The Group has the option to early redeem all of the bonds at face
value on 8 July 2019. If the Group does not exercise this option, the coupon rate of the bonds for the remaining
5-year period shall be the original coupon rate plus 3.00%, and shall remain fixed until the maturity date.
(2) The subordinated bonds issued on 9 March 2010, have a maturity of 15 years, with a fixed coupon rate of 4.68%,
paid annually. The Group has the option to redeem all of the bonds at face value on 11 March 2020. If the Group
does not exercise this option, the coupon rate of the bonds for the third 5-year period shall be the original coupon
rate plus 3.00%, and shall remain fixed until the maturity date.

2016 Annual Report 208
Notes to the Consolidated Financial Statements
V NOTES TO THE CONSOLIDATED FINANCIAL STATEMENTS (Continued)
30 Bonds issued (Continued)
(3) The subordinated bonds issued on 17 May 2011, have a maturity of 15 years, with a fixed coupon rate of 5.30%, paid annually. The Group is entitled to redeem all the subordinated bonds on the tenth anniversary. If the Group does not exercise this option, the coupon rate of the bonds for the remaining 5-year period shall remain fixed at 5.30%.
(4) Two subordinated bonds issued on 27 November 2012 in the domestic interbank bond market. The first subordinated bond has a maturity of 10 years, with a fixed coupon rate of 4.70%, paid annually. The Group is entitled to redeem these bonds on the fifth anniversary. If the Group does not exercise this option, the coupon rate of the bonds for the remaining 5-year period shall remain fixed at 4.70%. The second subordinated bond has a maturity of 15 years, with a fixed coupon rate of 4.99%, paid annually. The Group is entitled to redeem all these bonds on the tenth anniversary. If the Group does not exercise this option, the coupon rate of the bonds for the remaining 5-year period shall remain fixed at 4.99%.
(5) Pursuant to the approval by the CBRC and the PBOC, the Group issued tier 2 capital bonds in an amount of RMB30 billion in the domestic interbank bond market on 8 August 2014. The bonds have a maturity of 10 years, with a fixed coupon rate of 5.80%. The Group is entitled to redeem the bonds at the end of the fifth year.
(6) Pursuant to the approval by the CBRC, the PBOC and the National Development and Reform Commission, the Group issued tier 2 capital bonds in an amount of USD3 billion in offshore markets on 13 November 2014. The bonds have a maturity of 10 years, with a fixed coupon rate of 5.00%.
(7) Subordinated bonds and tier 2 capital bonds are subordinated to all other claims on the assets of the Group, except those of the equity holders.
(8) US Dollar Debt Securities are issued in Hong Kong and Europe between 2012 and 2016 by the Group, which due dates ranges from 2017 to 2026.
(9) RMB Debt Securities are issued in Mainland China, Hong Kong, Europe, North America and other Asia-Pacific regions between 2013 and 2016 by the Group, which due dates ranges from 2017 to 2030.
(10) Other Debt Securities excluding RMB and US dollar are issued in Hong Kong, Europe, Africa and other Asia-Pacific regions between 2013 and 2016 by the Group. The due dates ranges from 2017 to 2025.
(11) The RMB interbank negotiable certificates of deposit issued by the Group in 2015 matured in 2016. For the year ended 31 December 2016, the Group issued 27 tranches of RMB interbank negotiable certificates of deposit at discount in the domestic interbank bond market, with face value of RMB100 per certificate of deposit. The outstanding balance as at 31 December 2016 was RMB51,088 million, which matures in 2017.
(12) During the years ended 31 December 2016 and 2015, the Group did not default on any principal, interest or redemption amounts with respect to its bonds issued.
31 Other borrowings
These other borrowings relate to the financing of the aircraft leasing business of BOC Aviation Limited, a subsidiary of the Group. These other borrowings are secured by its aircraft (Note V.21).
As at 31 December 2016, these other borrowings had a maturity ranging from 75 days to 10 years and bore floating and fixed interest rates ranging from 0.90% to 2.95% (31 December 2015: 0.36% to 2.45%).
During the years ended 31 December 2016 and 2015, the Group did not default on any principal, interest or redemption amounts with respect to its other borrowings.

2016 Annual Report209
(Amount in millions of Renminbi, unless otherwise stated)
V NOTES TO THE CONSOLIDATED FINANCIAL STATEMENTS (Continued)
32 Current tax liabilities
As at 31 December2016 2015
Corporate Income Tax 22,023 31,563Value-added Tax 4,832 (525)Business Tax 225 5,996City Construction and Maintenance Tax 355 395Education Surcharges 252 292Other 368 261
Total 28,055 37,982
33 Retirement benefit obligationsAs at 31 December 2016, the actuarial liabilities existing in relation to the retirement benefit obligations for employees who retired prior to 31 December 2003 and the early retirement obligations for employees who early retired were RMB2,261 million (31 December 2015: RMB2,635 million) and RMB1,178 million (31 December 2015: RMB1,620 million) respectively, using the projected unit credit method.
The movements of the net liabilities recognised are as follows:
Year ended 31 December2016 2015
As at 1 January 4,255 4,566Interest cost 109 150Net actuarial (gain)/loss recognised (350) 213Benefits paid (575) (674)
As at 31 December 3,439 4,255
Primary assumptions used:
As at 31 December2016 2015
Discount rate — Normal retiree 3.00% 2.83% — Early retiree 2.80% 2.60%
Pension benefit inflation rate — Normal retiree 5.0%–3.0% 6.0%–4.0% — Early retiree 7.0%–3.0% 8.0%–4.0%
Medical benefit inflation rate 8.0% 8.0%
Retiring age — Male 60 60 — Female 50/55 50/55
Assumptions regarding future mortality experience are based on the China Life Insurance Mortality Table (published historical statistics in China).
As at 31 December 2016 and 2015, there was no significant change in employee retirement benefit obligations that was attributable to changes in actuarial assumptions.

2016 Annual Report 210
Notes to the Consolidated Financial Statements
V NOTES TO THE CONSOLIDATED FINANCIAL STATEMENTS (Continued)
34 Share appreciation rights plan
In November 2005, the Bank’s Board of Directors and equity holders approved and adopted a Share Appreciation Rights Plan under which eligible participants including directors, supervisors, management and other personnel designated by the Board, will be granted share appreciation rights, up to 25% of which will be exercisable each year beginning on the third anniversary date from the date of grant. The share appreciation rights will be valid for seven years from the date of grant. Eligible participants will be entitled to receive an amount equal to the difference, if any, between the average closing market price of the Bank’s H shares in the ten days prior to the date of grant and the average closing market price of the Bank’s H shares in the 12 months prior to the date of exercise as adjusted for any change in the Bank’s equity. The plan provides cash-settled share-based payment only and accordingly, no shares will be issued under the share appreciation rights plan.
No share appreciation rights were granted since the inception of the plan.
35 Deferred income taxes
35.1 Deferred income tax assets and liabilities are offset when there is a legally enforceable right to offset current tax assets against current tax liabilities and when the deferred income taxes are related to the same fiscal authority. The table below includes the deferred income tax assets and liabilities of the Group after offsetting qualifying amounts and related temporary differences.
As at 31 December2016 2015
Temporary difference
Deferred tax assets/ (liabilities)
Temporary difference
Deferred tax assets/ (liabilities)
Deferred income tax assets 129,323 34,341 81,700 22,246Deferred income tax liabilities (25,998) (4,501) (22,035) (4,291)
Net 103,325 29,840 59,665 17,955

2016 Annual Report211
(Amount in millions of Renminbi, unless otherwise stated)
V NOTES TO THE CONSOLIDATED FINANCIAL STATEMENTS (Continued)
35 Deferred income taxes (Continued)
35.2 Deferred income tax assets/liabilities and related temporary differences, before offsetting qualifying amounts, are attributable to the following items:
As at 31 December2016 2015
Temporary difference
Deferred tax assets/ (liabilities)
Temporary difference
Deferred tax assets/ (liabilities)
Deferred income tax assetsAsset impairment allowances 150,865 37,952 121,017 30,437Pension, retirement benefits and salary payables 19,504 4,871 19,125 4,781Fair value changes of financial instruments at fair value through profit or loss and derivative financial instruments 89,688 22,339 27,946 6,922Fair value changes of available for sale investment securities credited to other comprehensive income 7,318 1,617 1,629 290Other temporary differences 14,004 2,924 12,493 2,329
Subtotal 281,379 69,703 182,210 44,759
Deferred income tax liabilitiesFair value changes of financial instruments at fair value through profit or loss and derivative financial instruments (100,862) (25,216) (37,615) (9,404)Fair value changes of available for sale investment securities charged to other comprehensive income (7,690) (1,792) (20,402) (5,045)Depreciation of property and equipment (18,671) (3,207) (14,917) (2,575)Revaluation of property and investment properties (8,351) (1,555) (10,447) (2,048)Other temporary differences (42,480) (8,093) (39,164) (7,732)
Subtotal (178,054) (39,863) (122,545) (26,804)
Net 103,325 29,840 59,665 17,955
As at 31 December 2016, deferred tax liabilities relating to temporary differences of RMB100,428 million associated with the Group’s investments in subsidiaries have not been recognised (31 December 2015: RMB70,336 million). Refer to Note II.22.2.

2016 Annual Report 212
Notes to the Consolidated Financial Statements
V NOTES TO THE CONSOLIDATED FINANCIAL STATEMENTS (Continued)
35 Deferred income taxes (Continued)
35.3 The movements of the deferred income tax account are as follows:
Year ended 31 December2016 2015
As at 1 January 17,955 20,756Credited/(charged) to the income statement (Note V.10) 6,867 (77)Credited/(charged) to other comprehensive income 4,580 (2,546)Other 438 (178)
As at 31 December 29,840 17,955
35.4 The deferred income tax credit/charge in the income statement comprises the following temporary differences:
Year ended 31 December2016 2015
Asset impairment allowances 7,515 1,195Fair value changes of financial instruments at fair value through profit or loss and derivative financial instruments (395) (1,550)Pension, retirement benefits and salary payables 90 (295)Other temporary differences (343) 573
Total 6,867 (77)

2016 Annual Report213
(Amount in millions of Renminbi, unless otherwise stated)
V NOTES TO THE CONSOLIDATED FINANCIAL STATEMENTS (Continued)
36 Assets and liabilities held for sale
The major classes of assets held for sale and liabilities classified as held for sale are as follows:
As at 31 December2016 2015
Assets held for saleCash and due from banks and other financial institutions 657 13,679Balances with central banks 289 13,433Placements with and loans to banks and other financial institutions 3,347 18,214Loans and advances to customers, net 27,555 138,292Financial investments 11,108 44,267Investment properties 5,299 347Other assets 2,116 9,705
Total 50,371 237,937
Liabilities classified as held for saleDue to banks and other financial institutions 356 3,118Placements from banks and other financial institutions 375 2,522Due to customers 40,669 184,957Deferred income tax liabilities 728 –Other liabilities 360 6,253
Total 42,488 196,850
Cumulative income recognised in other comprehensive income relating to assets held for sale (29) 228
As at 31 December 2016, the Group’s disposal group classified as assets and liabilities held for sale mainly included the assets and liabilities held by BOCHK’s subsidiary Chiyu Banking Corporation Limited (“Chiyu Bank”) and by the subsidiaries of BOCG Investment of which the Group planned to dispose.
In December 2016, BOCHK, a direct wholly-owned subsidiary of BOCHK (Holdings), entered into a Sale and Purchase Agreement with Xiamen International Investment Limited and the Committee of Jimei Schools in relation to the proposed sale and purchase of approximately 70.49% of the total issued shares of Chiyu Bank (the “Proposed Disposal”). The completion of the Proposed Disposal is conditional upon the satisfaction of all the conditions precedent set out in the Sale and Purchase Agreement.
As at 31 December 2015, the Group classified the disposal group of the assets and liabilities of NCB as assets and liabilities held for sale. The sale of NCB was completed on 30 May 2016, refer to Note V.41.

2016 Annual Report 214
Notes to the Consolidated Financial Statements
V NOTES TO THE CONSOLIDATED FINANCIAL STATEMENTS (Continued)
37 Other liabilities
As at 31 December2016 2015
Interest payable(1) 183,516 174,256Insurance liabilities — Life insurance contracts 82,166 72,867 — Non-life insurance contracts 8,725 8,242Items in the process of clearance and settlement 51,838 37,193Salary and welfare payables(2) 27,817 26,711Short position in debt securities 9,990 7,012Deferred income 8,000 7,099Provision(3) 6,065 3,362Placements from banks and other financial institutions at fair value(4) 1,968 1,617Other(5) 58,833 45,410
Total 438,918 383,769
(1) Interest payable
As at 31 December
2016 2015
Due to customers 163,878 155,652
Due to and placements from banks and
other financial institutions 9,476 11,099
Bonds issued and other 10,162 7,505
Total 183,516 174,256
The movements of interest payable are as follows:
Year ended 31 December
2016 2015
As at 1 January 174,256 163,228
Accrued during the year 260,091 286,406
Paid during the year (250,831) (275,378)
As at 31 December 183,516 174,256

2016 Annual Report215
(Amount in millions of Renminbi, unless otherwise stated)
V NOTES TO THE CONSOLIDATED FINANCIAL STATEMENTS (Continued)
37 Other liabilities (Continued)
(2) Salary and welfare payables
As at
1 January
2016 Accrual Payment
As at
31 December
2016
Salary, bonus and subsidy 21,916 55,792 (55,386) 22,322
Staff welfare – 2,908 (2,908) –
Social insurance
— Medical 888 3,254 (3,157) 985
— Pension 158 6,585 (6,573) 170
— Annuity 22 2,060 (2,059) 23
— Unemployment 7 325 (325) 7
— Injury at work 1 102 (101) 2
— Maternity insurance 2 203 (202) 3
Housing funds 50 5,066 (5,084) 32
Labour union fee and staff education fee 3,369 1,918 (1,402) 3,885
Reimbursement for cancellation of labour contract 13 11 (9) 15
Other 285 2,838 (2,750) 373
Total(i) 26,711 81,062 (79,956) 27,817
As at
1 January
2015 Accrual Payment
As at
31 December
2015
Salary, bonus and subsidy 22,147 54,462 (54,693) 21,916
Staff welfare – 2,919 (2,919) –
Social insurance
— Medical 697 3,280 (3,089) 888
— Pension 134 6,587 (6,563) 158
— Annuity 24 2,060 (2,062) 22
— Unemployment 7 413 (413) 7
— Injury at work 1 163 (163) 1
— Maternity insurance 2 223 (223) 2
Housing funds 30 5,428 (5,408) 50
Labour union fee and staff education fee 2,865 1,911 (1,407) 3,369
Reimbursement for cancellation of labour contract 12 7 (6) 13
Other 239 2,669 (2,623) 285
Total(i) 26,158 80,122 (79,569) 26,711
(i) There was no overdue payment for staff salary and welfare payables as at 31 December 2016 and 2015.

2016 Annual Report 216
Notes to the Consolidated Financial Statements
V NOTES TO THE CONSOLIDATED FINANCIAL STATEMENTS (Continued)
37 Other liabilities (Continued)
(3) Provision
As at 31 December
2016 2015
Allowance for litigation losses (Note V.42.1) 727 860
Other 5,338 2,502
Total 6,065 3,362
The movement of the provision was as follows:
Year ended 31 December
2016 2015
As at 1 January 3,362 2,616
Provision for the year, net 2,992 807
Utilised during the year (289) (61)
As at 31 December 6,065 3,362
(4) Placements from banks and other financial institutions at fair value
Certain financial liabilities related to placements from banks and other financial institutions have been matched with
derivatives as part of a documented risk management strategy to mitigate market risk. By designating these financial
liabilities at fair value through profit or loss, the movement in their fair values is recorded in the income statement. As
at 31 December 2016, the fair value of the financial liabilities related to placements from banks and other financial
institutions was approximately the same as the amount that the Group would be contractually required to pay to
the holders. There were no significant changes in the Group’s credit risk and therefore the amounts of changes in
fair value of the abovementioned placements from banks and other financial institutions that were attributable to
changes in credit risk were considered not significant during the years ended 31 December 2016 and 2015.
(5) Other
Other includes finance lease payments which are principally related to aircraft held by BOC Aviation Limited under
finance lease.
As at 31 December
2016 2015
Within 1 year (inclusive) 82 75
1 year to 2 years (inclusive) 243 75
2 years to 3 years (inclusive) 23 226
Over 3 years 169 178
Total minimum rental payments 517 554
Unrecognised finance charge (43) (53)
Finance lease payments, net 474 501

2016 Annual Report217
(Amount in millions of Renminbi, unless otherwise stated)
V NOTES TO THE CONSOLIDATED FINANCIAL STATEMENTS (Continued)
38 Share capital, capital reserve, treasury shares and other equity instruments
38.1 Share capital
The Bank’s share capital are as follows: Unit: Share
As at 31 December2016 2015
Domestic listed A shares, par value RMB1.00 per share 210,765,514,846 210,765,514,846Overseas listed H shares, par value RMB1.00 per share 83,622,276,395 83,622,276,395
Total 294,387,791,241 294,387,791,241
All A and H shares rank pari passu with the same rights and benefits.
38.2 Capital reserve
As at 31 December2016 2015
Share premium 139,921 139,921Other capital reserve 2,051 177
Total 141,972 140,098
38.3 Treasury shares
A wholly-owned subsidiary of the Group holds certain listed shares of the Bank in relation to its derivative and arbitrage business. These shares are treated as treasury shares, a deduction from equity holders’ equity. Gains and losses on sale or redemption of the treasury shares are credited or charged to equity. The total number of treasury shares as at 31 December 2016 was approximately 17.23 million (31 December 2015: approximately 29.69 million).

2016 Annual Report 218
Notes to the Consolidated Financial Statements
V NOTES TO THE CONSOLIDATED FINANCIAL STATEMENTS (Continued)
38 Share capital, capital reserve, treasury shares and other equity instruments (Continued)
38.4 Other equity instruments
For the year ended 31 December 2016, the movements of the Bank’s other equity instruments were as follows:
As at
1 January 2016 Increase/(Decrease)
As at
31 December 2016
Quantity
(million
shares)
Carrying
amount
Quantity
(million
shares)
Carrying
amount
Quantity
(million
shares)
Carrying
amount
Preference Shares
2014 Offshore Preference Shares(1) 399.4 39,782 – – 399.4 39,782
2014 Domestic Preference Shares(2) 320.0 31,963 – – 320.0 31,963
2015 Domestic Preference Shares(3) 280.0 27,969 – – 280.0 27,969
Total 999.4 99,714 – – 999.4 99,714
(1) Pursuant to the approvals by the relevant authorities in China, the Bank issued the US Dollar settled non-
cumulative Offshore Preference Shares in the aggregate par value of RMB39.94 billion on 23 October 2014.
Each Offshore Preference Share has a par value of RMB100 and 399.4 million Offshore Preference Shares were
issued in total. The initial annual dividend rate is 6.75% and is subsequently subject to reset per agreement,
but in no case shall exceed 18.07%. Dividends are calculated on the basis of RMB but paid out in US Dollars
per a fixed exchange rate.
The Offshore Preference Shares have no maturity date. However, subject to the satisfaction of the redemption
conditions and having obtained the prior approval of the CBRC, all or part of the Offshore Preference Shares
may be redeemed at the discretion of the Bank on 23 October 2019 or on any dividend payment date
thereafter at the redemption price which is the sum of the par value of the Offshore Preference Shares and the
dividends declared but not yet distributed, as calculated on the basis of RMB but paid out in US Dollars per a
fixed exchange rate.
(2) Pursuant to the approvals by relevant authorities in China, the Bank issued 6.0% non-cumulative Domestic
Preference Shares on 21 November 2014, in the aggregate par value of RMB32 billion. Each Domestic
Preference Share has a par value of RMB100 and a total number of 320 million Domestic Preference Shares
were issued.
The Domestic Preference Shares have no maturity date. However, subject to the satisfaction of the redemption
conditions and having obtained the prior approval of the CBRC, the Bank may redeem all or part of the
Domestic Preference Shares on 21 November 2019 or any dividend payment date thereafter of its choosing at
the redemption price which is the sum of the par value of the Domestic Preference Share and the dividends
declared but not yet distributed.
(3) Pursuant to the approvals by relevant authorities in China, the Bank issued 5.5% non-cumulative Domestic
Preference Shares on 13 March 2015, in the aggregate par value of RMB28 billion. Each Domestic Preference
Share has a par value of RMB100 and a total number of 280 million Domestic Preference Shares were issued.
The Domestic Preference Shares have no maturity date. However, subject to the satisfaction of the redemption
conditions and having obtained the prior approval of the CBRC, the Bank may redeem all or part of the
Domestic Preference Shares on 13 March 2020 or any dividend payment date thereafter of its choosing at
the redemption price which is the sum of the par value of the Domestic Preference Share and the dividends
declared but not yet distributed.

2016 Annual Report219
(Amount in millions of Renminbi, unless otherwise stated)
V NOTES TO THE CONSOLIDATED FINANCIAL STATEMENTS (Continued)
38 Share capital, capital reserve, treasury shares and other equity instruments (Continued)
38.4 Other equity instruments (Continued)
Save for such dividend at the agreed dividend payout ratio, the holders of the above preference shares shall not be entitled to share in the distribution of the remaining profits of the Bank together with the holders of the ordinary shares. The dividends on preference shares are non-cumulative. The Bank shall be entitled to cancel any dividend on the preference shares, and such cancellation shall not be deemed a default. However, the Bank shall not distribute profits to the holders of ordinary shares until resumption of full payment of dividends on the preference shares. Upon the occurrence of a trigger event for the compulsory conversion of preference shares into ordinary shares per agreement, the Bank shall report to the CBRC for review and determination and the Bank will convert the preference shares into ordinary shares in whole or in part.
Capital raised from the issuance of the above preference shares, after deduction of transaction costs, was wholly used to replenish the Bank’s additional tier 1 capital and to increase its capital adequacy ratio.
39 Statutory reserves, general and regulatory reserves and undistributed profits
39.1 Statutory reserves
Under relevant PRC laws, the Bank is required to transfer 10% of its net profit to a non-distributable statutory surplus reserves. Appropriation to the statutory surplus reserves may cease when the balance of such reserves has reached 50% of the share capital. Subject to the approval of the equity holders, the statutory surplus reserves can be used for replenishing the accumulated losses or increasing the Bank’s share capital. The statutory surplus reserves amount used to increase the share capital is limited to a level where the balance of the statutory surplus reserves after such capitalisation is not less than 25% of the share capital.
In accordance with a resolution of the Board of Directors dated 31 March 2017, the Bank appropriated 10% of the net profit for the year ended 31 December 2016 to the statutory surplus reserves, amounting to RMB13,688 million (2015: RMB15,220 million).
In addition, some operations in Hong Kong, Macau, Taiwan and other countries and regions are required to transfer certain percentages of their net profits to the statutory surplus reserves as stipulated by local banking authorities.

2016 Annual Report 220
Notes to the Consolidated Financial Statements
V NOTES TO THE CONSOLIDATED FINANCIAL STATEMENTS (Continued)
39 Statutory reserves, general and regulatory reserves and undistributed profits (Continued)
39.2 General and regulatory reserves
Pursuant to Caijin [2012] No. 20 Requirements on Impairment Allowance for Financial Institutions (“Requirement”), issued by the MOF, in addition to the impairment allowance, the Bank establishes a general reserve within the equity holders’ equity through the appropriation of profit to address unidentified potential impairment losses. The general reserve as a distribution of profits, being part of the owner’s rights and interests, should not be less than 1.5% of the aggregate amount of risk assets as defined by the Requirement, and the minimum threshold can be accumulated over a period of no more than five years.
In accordance with a resolution dated 31 March 2017 and on the basis of the Bank’s profit for the year ended 31 December 2016, the Board of Directors of the Bank approved the appropriation of RMB14,505 million (2015: RMB19,005 million) to the general reserve for the year ended 31 December 2016.
The regulatory reserve mainly refers to the reserve amount set aside by BOC Hong Kong (Group) Limited (“BOCHK Group”), a subsidiary of the Group, for general banking risks, including future losses or other unforeseeable risks. As at 31 December 2016 and 2015, the reserve amounts set aside by BOCHK Group were RMB5,712 million and RMB6,651 million, respectively.
39.3 Dividends
Dividends for Ordinary Shares
An ordinary share dividend of RMB51,518 million in respect of the profit for the year ended
31 December 2015 was approved by the equity holders of the Bank at the Annual General Meeting held
on 7 June 2016 and was distributed during the year.
An ordinary share dividend of RMB0.168 per share in respect of the profit for the year ended
31 December 2016 (2015: RMB0.175 per share), amounting to a total dividend of RMB49,457 million
based on the number of shares issued as at 31 December 2016 will be proposed for approval at the
Annual General Meeting to be held on 29 June 2017. The dividend payable is not reflected in liabilities
of the financial statements.
Dividends for Preference Shares
The dividend distribution of Domestic Preference Shares (Second Tranche) amounting to
RMB1,540 million was approved by the Board of Directors of the Bank at the Board Meeting held on
19 January 2016 and the dividend was distributed on 14 March 2016.
The dividend distribution of Offshore Preference Shares and Domestic Preference Shares (First Tranche)
was approved by the Board of Directors of the Bank at the Board Meeting held on 30 August 2016.
The dividend of Offshore Preference Shares amounting to USD487 million before tax (equivalent to
RMB3,258 million) was distributed on 24 October 2016. The dividend of Domestic Preference Shares
(First Tranche) amounting to RMB1,920 million was distributed on 21 November 2016.

2016 Annual Report221
(Amount in millions of Renminbi, unless otherwise stated)
V NOTES TO THE CONSOLIDATED FINANCIAL STATEMENTS (Continued)
40 Non-controlling interests
Non-controlling interests of the subsidiaries of the Group are as follows:
As at 31 December2016 2015
BOC Hong Kong (Group) Limited 60,476 45,539Bank of China Group Investment Limited 6,335 87Tai Fung Bank Limited 5,640 4,658Other 2,959 2,375
Total 75,410 52,659
41 Changes in the consolidation
Disposal of investment in subsidiaries
BOCHK, a subsidiary directly wholly owned by BOCHK (Holdings), entered into a Sale and Purchase Agreement with Cinda Financial Holdings Co., Limited (as the buyer) and China Cinda (HK) Holdings Company Limited (as the buyer’s guarantor) in relation to the sale and purchase of all the issued shares of NCB on 18 December 2015. The sale was completed in accordance with the terms and conditions of the Sale and Purchase Agreement on 30 May 2016. Upon completion, NCB ceased to be a subsidiary of the Bank and BOCHK (Holdings).
Gain on disposal of NCB:
Year ended 31 December 2016
Total consideration 57,236Net assets disposed (28,203)Transaction costs (308)Cumulative other comprehensive income reclassified to the income statement 325
Gain on disposal 29,050

2016 Annual Report 222
Notes to the Consolidated Financial Statements
V NOTES TO THE CONSOLIDATED FINANCIAL STATEMENTS (Continued)
41 Changes in the consolidation (Continued)
Disposal of investment in subsidiaries (Continued)
Net assets of NCB at the date of disposal:
At the date of disposal
Cash and due from banks and other financial institutions 16,637Balances with central banks 10,279Placements with and loans to banks and other financial institutions 18,484Loans and advances to customers, net 138,803Financial investments 47,585Other assets 10,242Due to banks and other financial institutions (7,560)Placements from banks and other financial institutions (8,996)Due to customers (189,271)Other liabilities (8,000)
Net assets disposed 28,203
Net cash inflow from disposal of NCB:
Year ended 31 December 2016
Cash received from disposal of NCB 57,236Transaction costs (308)Cash and cash equivalents held by NCB at the date of disposal (34,273)
Net cash inflow from disposal of NCB 22,655
42 Contingent liabilities and commitments
42.1 Legal proceedings and arbitrations
As at 31 December 2016, the Group was involved in certain litigation and arbitration cases in the regular course of its business. In addition, in terms of the range and scale of its international operations, the Group may face a variety of legal proceedings within different jurisdictions, including issues related to anti-money laundering. As at 31 December 2016, provisions of RMB727 million (31 December 2015: RMB860 million) were made based on court judgements or the advice of counsel (Note V.37). After consulting legal professionals, senior management of the Group believes that at the current stage these legal proceedings and arbitrations will not have a material impact on the financial position or operations of the Group.

2016 Annual Report223
(Amount in millions of Renminbi, unless otherwise stated)
V NOTES TO THE CONSOLIDATED FINANCIAL STATEMENTS (Continued)
42 Contingent liabilities and commitments (Continued)
42.2 Assets pledged
Assets pledged by the Group as collateral mainly for placement, repurchase, short positions, derivative transactions with other banks and financial institutions and for local statutory requirements are set forth in the table below. These transactions are conducted under standard and normal business terms.
As at 31 December2016 2015
Debt securities 804,425 325,025Bills 656 2,052
Total 805,081 327,077
42.3 Collateral accepted
The Group accepts securities as collateral that are permitted to be sold or re-pledged in connection with reverse repurchase and derivative agreements with banks and other financial institutions. As at 31 December 2016, the fair value of collateral received from banks and other financial institutions accepted by the Group amounted to RMB11,468 million (31 December 2015: RMB24,094 million). As at 31 December 2016, the fair value of the collateral that the Group had sold or re-pledged, but was obligated to return, was RMB1,098 million (31 December 2015: Nil). These transactions are conducted under standard terms in the normal course of business.
42.4 Capital commitments
As at 31 December2016 2015
Property and equipment — Contracted but not provided for 61,237 64,492 — Authorised but not contracted for 1,967 2,652Intangible assets — Contracted but not provided for 860 721 — Authorised but not contracted for 15 23Investment properties — Contracted but not provided for 13 148 — Authorised but not contracted for 1 –
Total 64,093 68,036

2016 Annual Report 224
Notes to the Consolidated Financial Statements
V NOTES TO THE CONSOLIDATED FINANCIAL STATEMENTS (Continued)
42 Contingent liabilities and commitments (Continued)
42.5 Operating leases
(1) Operating lease commitments — As lessee
Under irrevocable operating lease contracts, the future minimum lease payments that should be paid by the Group are summarised as follows:
As at 31 December2016 2015
Within 1 year 6,446 6,313Between 1 and 2 years 5,049 4,864Between 2 and 3 years 3,711 3,675Over 3 years 7,157 7,498
Total 22,363 22,350
(2) Operating lease commitments — As lessor
The Group acts as lessor in operating leases principally through aircraft leasing undertaken by its subsidiary BOC Aviation Limited. Under irrevocable operating lease contracts, as at 31 December 2016, the minimum lease payments which will be received by the Group under the operating leases for existing aircraft and aircraft yet to be delivered amounted to RMB9,212 million not later than one year (31 December 2015: RMB7,001 million), RMB37,767 million later than one year and not later than five years (31 December 2015: RMB30,115 million) and RMB38,589 million later than five years (31 December 2015: RMB30,220 million).
42.6 Treasury bonds redemption commitments
The Bank is entrusted by the MOF to underwrite certain Treasury bonds. The investors of these Treasury bonds have a right to redeem the bonds at any time prior to maturity and the Bank is committed to redeem these Treasury bonds. The MOF will not provide funding for the early redemption of these Treasury bonds on a back-to-back basis but will pay interest and repay the principal at maturity. The redemption price is the principal value of the bonds plus unpaid interest in accordance with the early redemption arrangement.
As at 31 December 2016, the outstanding principal value of the Treasury bonds sold by the Bank under obligation to redeem prior to maturity amounted to RMB46,737 million (31 December 2015: RMB44,698 million). The original maturities of these Treasury bonds vary from 3 to 5 years and management expects the amount of redemption before the maturity dates of these bonds through the Bank will not be material.

2016 Annual Report225
(Amount in millions of Renminbi, unless otherwise stated)
V NOTES TO THE CONSOLIDATED FINANCIAL STATEMENTS (Continued)
42 Contingent liabilities and commitments (Continued)
42.7 Credit commitments
As at 31 December2016 2015
Loan commitments(1)
— with an original maturity of less than 1 year 179,110 88,629 — with an original maturity of 1 year or over 992,264 744,650Undrawn credit card limits 673,669 558,141Letters of guarantee issued(2) 1,097,448 1,077,070Bank bill acceptance 331,138 386,725Letters of credit issued 151,155 121,720Accepted bills of exchange under letters of credit 119,490 169,876Other 45,334 63,222
Total(3) 3,589,608 3,210,033
(1) Loan commitments mainly represent undrawn loan facilities agreed and granted to customers. Unconditionally
revocable loan commitments are not included in loan commitments. As at 31 December 2016, the
unconditionally revocable loan commitments of the Group amounted to RMB255,527 million (31 December
2015: RMB313,131 million).
(2) Letters of guarantee issued mainly include financial guarantees and performance guarantees. These obligations
on the Group to make payment are dependent on the outcome of a future event.
(3) Risk-weighted assets for credit risk of credit commitments
The risk-weighted assets for credit risk of the Group were calculated in accordance with the Capital Rules for
Commercial Banks (Provisional) and other relevant regulations promulgated by the CBRC under the advanced
capital measurement approaches. The amounts are determined by the creditworthiness of the counterparties,
the maturity characteristics of each type of contract and other factors.
As at 31 December
2016 2015
Credit commitments 1,057,647 1,045,835
42.8 Underwriting obligations
As at 31 December 2016, there was no firm commitment in underwriting securities of the Group (31 December 2015: Nil).

2016 Annual Report 226
Notes to the Consolidated Financial Statements
V NOTES TO THE CONSOLIDATED FINANCIAL STATEMENTS (Continued)
43 Note to the consolidated statement of cash flows
For the purpose of the consolidated statement of cash flows, cash and cash equivalents comprise the following balances with an original maturity of less than three months:
As at 31 December2016 2015
Cash and due from banks and other financial institutions 293,410 217,599Balances with central banks 456,304 586,733Placements with and loans to banks and other financial institutions 236,846 185,606Short-term bills and notes 32,687 62,140
Total 1,019,247 1,052,078
44 Related party transactions
44.1 CIC was established on 29 September 2007 with registered capital of RMB1,550 billion. CIC is a wholly State-owned company engaging in foreign currency investment management. The Group is subject to the control of the State Council of the PRC government through CIC and its wholly owned subsidiary, Huijin.
The Group enters into banking transactions with CIC in the normal course of its business at commercial terms.
44.2 Transactions with Huijin and companies under Huijin
(1) General information of Huijin
Central Huijin Investment Ltd.
Legal representative DING XuedongRegistered capital RMB828,209 millionLocation of registration BeijingCapital shares in the Bank 64.02%Voting rights in the Bank 64.02%Nature Wholly State-owned companyPrincipal activities Investment in major State-owned financial
institutions on behalf of the State Council; other related businesses approved by the State Council
Unified social credit code 911000007109329615

2016 Annual Report227
(Amount in millions of Renminbi, unless otherwise stated)
V NOTES TO THE CONSOLIDATED FINANCIAL STATEMENTS (Continued)
44 Related party transactions (Continued)
44.2 Transactions with Huijin and companies under Huijin (Continued)
(2) Transactions with Huijin
The Group enters into banking transactions with Huijin in the normal course of its business at commercial terms.
Due to Huijin
Year ended 31 December2016 2015
As at 1 January 17,944 26,442Received during the year 52,762 75,811Repaid during the year (57,357) (84,309)
As at 31 December 13,349 17,944
Bonds issued by HuijinAs at 31 December 2016, the Group held government backed bonds issued by Huijin in the carrying value of RMB6,430 million (31 December 2015: RMB6,471 million) which were classified as held to maturity and available for sale. These bonds have maturity of not more than 30 years and bear fixed interest rates, payable annually. Purchasing of these bonds was in the ordinary course of business of the Group, complying with requirements of related regulations and corporate governance.
(3) Transactions with companies under Huijin
Companies under Huijin include its equity interests in subsidiaries, joint ventures and associates in certain other bank and non-bank entities in the PRC. The Group enters into banking transactions with these companies in the normal course of business at commercial terms which include mainly purchase and sale of debt securities, money market transactions and derivative transactions.

2016 Annual Report 228
Notes to the Consolidated Financial Statements
V NOTES TO THE CONSOLIDATED FINANCIAL STATEMENTS (Continued)
44 Related party transactions (Continued)
44.2 Transactions with Huijin and companies under Huijin (Continued)
(3) Transactions with companies under Huijin (Continued)
The Group’s outstanding balances and related interest rate ranges with these companies were as follows:
As at 31 December2016 2015
Due from banks and other financial institutions 117,584 35,668Placements with and loans to banks and other financial institutions 106,948 122,169Financial assets at fair value through profit or loss and financial investments 229,305 389,968Derivative financial assets 7,606 2,542Loans and advances to customers 12,868 10,533Due to customers, banks and other financial institutions (184,894) (313,280)Placements from banks and other financial institutions (71,632) (205,400)Derivative financial liabilities (4,022) (2,631)Credit commitments 4,599 2,553
As at 31 December2016 2015
Interest rate ranges Due from banks and other financial institutions 0.00%–5.50% 0.00%–5.70% Placements with and loans to banks and other financial institutions 0.00%–8.30% 0.00%–6.20% Financial assets at fair value through profit or loss and financial investments 0.00%–6.74% 0.00%–6.38% Loans and advances to customers 1.23%–4.75% 0.66%–6.40% Due to customers, banks and other financial institutions 0.00%–6.10% 0.00%–6.25% Placements from banks and other financial institutions 0.00%–9.50% 0.00%–9.50%
44.3 Transactions with government authorities, agencies, affiliates and other State-controlled entities
The State Council of the PRC government directly and indirectly controls a significant number of entities through its government authorities, agencies, affiliates and other State-controlled entities. The Group enters into extensive banking transactions with these entities in the normal course of business at commercial terms.
Transactions conducted with government authorities, agencies, affiliates and other State-controlled entities include purchase and redemption of investment securities issued by government agencies, underwriting and distribution of Treasury bonds issued by government agencies through the Group’s branch network, foreign exchange transactions and derivative transactions, lending, provision of credit and guarantees and deposit placing and taking.

2016 Annual Report229
(Amount in millions of Renminbi, unless otherwise stated)
V NOTES TO THE CONSOLIDATED FINANCIAL STATEMENTS (Continued)
44 Related party transactions (Continued)
44.4 Transactions with associates and joint ventures
The Group enters into banking transactions with associates and joint ventures in the normal course of business at commercial terms. These include loans and advances, deposit taking and other normal banking businesses. The main outstanding balances with associates and joint ventures are stated below:
As at 31 December2016 2015
Loans and advances to customers 2,464 593Due to customers, banks and other financial institutions (8,270) (8,975)Credit commitments 16,845 2,261
The general information of principal associates and joint ventures is as follows:
Name
Place of incorporation/ establishment
Unified social credit code
Effective equity held
Voting right
Paid-in capital Principal business
(%) (%) (in millions)BOC International (China)
LimitedPRC 91310000736650364G 37.14 37.14 RMB2,500 Securities brokerage; securities investment
consulting; financial advisory services related to securities trading and
securities investment activities; securities underwriting and sponsorship; securities
proprietary business; securities asset management; securities investment
fund sales agency; margin financing and securities lending; distribution of financial products; management of publicly raised
securities investment funds
BOC & Cinda (Wuhu) Investment Limited Partnership
PRC 91340202MA2MU5438W 49.00 49.00 NA Asset management; investment consulting
Graceful Field Worldwide Limited
BVI NA 80.00 Note (1) USD0.0025 Investment
CGN Phase I Private Equity Fund Company Limited
PRC 91110000717827478Q 20.00 20.00 RMB100 Investment in nuclear power projects and related industries; asset management;
investment consulting
Guangdong Small and Medium Enterprises Equity Investment Fund Company Limited
PRC 91440000564568961E 40.00 40.00 RMB1,940 Investment
Cinda & BOC (Anhui) Investment Limited Partnership
PRC 91340202MA2MRFTW53 46.83 46.83 NA Asset management; investment consulting
Hong Kong Bora Holdings Limited
Hong Kong NA 19.50 Note (1) HKD0.01 Investment holding
Zhejiang Zheshang Investment Fund Limited Partnership
PRC 91330000559679480L 38.96 38.96 NA Investment
(1) In accordance with the respective articles of association, the Group has significant influence or joint control
over these companies.

2016 Annual Report 230
Notes to the Consolidated Financial Statements
V NOTES TO THE CONSOLIDATED FINANCIAL STATEMENTS (Continued)
44 Related party transactions (Continued)
44.5 Transactions with the Annuity Plan
Apart from the obligations for defined contributions to Annuity Fund and normal banking transactions, no other transactions were conducted between the Group and the Annuity Fund for the years ended 31 December 2016 and 2015.
44.6 Transactions with key management personnel
Key management personnel are those persons having authority and responsibility for planning, directing and controlling the activities of the Group, directly or indirectly, including Directors and Executive Officers.
The Group enters into banking transactions with key management personnel in the normal course of business. During the years ended 31 December 2016 and 2015, there were no material transactions and balances with key management personnel on an individual basis.
The key management compensation for the years ended 31 December 2016 and 2015 comprises:
Year ended 31 December2016 2015
Compensation for short-term employment benefits(1) 8 13Compensation for post-employment benefits 1 1
Total 9 14
(1) The total compensation package for these key management personnel for the year ended 31 December 2016 has not yet been finalised in accordance with regulations of the PRC relevant authorities. The amount of the compensation not provided for is not expected to have significant impact on the Group’s 2016 financial statements. The final compensation will be disclosed in a separate announcement when determined.
44.7 Transactions with Connected Natural Persons
As at 31 December 2016, the Bank’s balance of loans to the connected natural persons as defined in the Administration of Connected Transactions between Commercial Banks and Their Insiders and Shareholders of the CBRC and the Administrative Measures for the Disclosure of Information of Listed Companies of the China Security Regulatory Commission totalled RMB109 million (31 December 2015: RMB61 million) and RMB11 million (31 December 2015: RMB18 million) respectively.
44.8 Balances with subsidiaries
Mainly included in the following captions of the Bank’s statement of financial position are balances with subsidiaries:
As at 31 December2016 2015
Due from banks and other financial institutions 47,406 32,415Placements with and loans to banks and other financial institutions 71,543 64,707Due to banks and other financial institutions (27,300) (58,889)Placements from banks and other financial institutions (98,073) (52,888)

2016 Annual Report231
(Amount in millions of Renminbi, unless otherwise stated)
V NOTES TO THE CONSOLIDATED FINANCIAL STATEMENTS (Continued)
44 Related party transactions (Continued)
44.8 Balances with subsidiaries (Continued)
The general information of principal subsidiaries is as follows:
Name
Place of incorporation
and operation
Date of incorporation/ establishment
Paid-in capital
Effective equity held Voting right
Principal business
(in millions) (%) (%)Directly held(1)
BOC Hong Kong (Group) Limited Hong Kong 12 September 2001 HKD34,806 100.00 100.00 Holding company
BOC International Holdings Limited(4) Hong Kong 10 July 1998 HKD3,539 100.00 100.00 Investment banking
Bank of China Group Insurance Company Limited Hong Kong 23 July 1992 HKD3,749 100.00 100.00 Insurance services
Bank of China Group Investment Limited Hong Kong 18 May 1993 HKD34,052 100.00 100.00 Investment holding
Tai Fung Bank Limited Macau 1942 MOP1,000 50.31 50.31 Commercial banking
Bank of China (UK) Limited United Kingdom 24 September 2007 GBP250 100.00 100.00 Commercial banking
BOC Insurance Company Limited Beijing 5 January 2005 RMB4,535 100.00 100.00 Insurance services
Indirectly held
BOC Hong Kong (Holdings) Limited(2) Hong Kong 12 September 2001 HKD52,864 66.06 66.06 Holding company
Bank of China (Hong Kong) Limited(3)(4) Hong Kong 16 October 1964 HKD43,043 66.06 100.00 Commercial banking
Chiyu Banking Corporation Limited(3) Hong Kong 24 April 1947 HKD300 46.57 70.49 Commercial banking
BOC Credit Card (International) Limited Hong Kong 9 September 1980 HKD480 66.06 100.00 Credit card services
BOC Group Trustee Company Limited(4) Hong Kong 1 December 1997 HKD200 77.60 100.00 Provision of trustee services
BOC Aviation Limited Singapore 25 November 1993 USD1,158 70.00 70.00 Aircraft leasing
(1) These directly held principal subsidiaries are unlisted companies. All holdings are in the ordinary share capital
of the undertaking concerned, and the ability of the subsidiaries to transfer funds to the Group and the Bank is
not restricted.
(2) BOCHK (Holdings) is listed on the Stock Exchange of Hong Kong Limited.
(3) BOCHK, in which the Group holds a 66.06% equity interest, holds 70.49% of the equity interest of Chiyu
Bank.
(4) BOCHK and BOC International Holdings Limited (“BOCI”), in which the Group holds 66.06% and 100% of
their equity interests, respectively, hold 66% and 34% equity interest of BOC Group Trustee Company Limited,
respectively.
For certain subsidiaries listed above, the voting rights ratio is not equal to the effective equity held ratio, mainly due to the impact of the indirect holdings.

2016 Annual Report 232
Notes to the Consolidated Financial Statements
V NOTES TO THE CONSOLIDATED FINANCIAL STATEMENTS (Continued)
45 Segment reporting
The Group manages the business from both geographic and business perspectives. From the geographic perspective, the Group operates in three principal regions: Chinese mainland; Hong Kong, Macau and Taiwan; and other countries and regions. From the business perspective, the Group provides services through six main business segments: corporate banking, personal banking, treasury operations, investment banking, insurance and other operations.
Measurement of segment assets, liabilities, income, expenses, results and capital expenditure is based on the Group’s accounting policies. The segment information presented includes items directly attributable to a segment as well as those that can be allocated on a reasonable basis. Funding is provided to and from individual business segments through treasury operations as part of the asset and liability management process. The pricing of these transactions is based on market rates. The transfer price takes into account the specific features and maturities of the product. Internal transactions are eliminated on consolidation. The Group regularly examines the transfer price and adjusts the price to reflect current situation.
Geographical segments
Chinese mainland — Corporate banking, personal banking, treasury operations, insurance services, etc. are performed in the Chinese mainland.
Hong Kong, Macau and Taiwan — Corporate banking, personal banking, treasury operations, investment banking and insurance services are performed in Hong Kong, Macau and Taiwan. The business of this segment is centralised in BOCHK Group.
Other countries and regions — Corporate and personal banking services are provided in other countries and regions. Significant locations include New York, London, Singapore and Tokyo.
Business segments
Corporate banking — Services to corporate customers, government authorities and financial institutions including current accounts, deposits, overdrafts, loans, trade-related products and other credit facilities, foreign exchange, derivative products and wealth management products.
Personal banking — Services to retail customers including savings deposits, personal loans, credit cards and debit cards, payments and settlements, wealth management products and funds and insurance agency services.
Treasury operations — Consisting of foreign exchange transactions, customer-based interest rate and foreign exchange derivative transactions, money market transactions, proprietary trading and asset and liability management. The results of this segment include the inter-segment funding income and expenses, results from interest-bearing assets and liabilities; and foreign currency translation gains and losses.
Investment banking — Consisting of debt and equity underwriting and financial advisory, sales and trading of securities, stock brokerage, investment research and asset management services, and private equity investment services.
Insurance — Underwriting of general and life insurance business and insurance agency services.
Other — Other operations of the Group comprise investment holding and other miscellaneous activities, none of which constitutes a separately reportable segment.

2016 Annual Report233
(Amount in millions of Renminbi, unless otherwise stated)
V NOTES TO THE CONSOLIDATED FINANCIAL STATEMENTS (Continued)
45 Segment reporting (Continued)
As at and for the year ended 31 December 2016Hong Kong, Macau and Taiwan Other
countries and regions
Chinese mainland
BOCHK Group Other Subtotal Elimination Total
Interest income 494,913 35,293 21,393 56,686 30,231 (15,691) 566,139Interest expense (231,271) (10,663) (16,681) (27,344) (17,167) 15,691 (260,091)
Net interest income 263,642 24,630 4,712 29,342 13,064 – 306,048
Fee and commission income 75,253 12,783 6,529 19,312 5,820 (2,066) 98,319Fee and commission expense (4,550) (3,636) (1,190) (4,826) (1,535) 1,256 (9,655)
Net fee and commission income 70,703 9,147 5,339 14,486 4,285 (810) 88,664
Net trading gains 2,496 3,567 787 4,354 1,646 – 8,496Net gains on financial investments 11,078 929 495 1,424 22 – 12,524Other operating income(1) 20,155 39,585 12,450 52,035 198 (2,464) 69,924
Operating income 368,074 77,858 23,783 101,641 19,215 (3,274) 485,656Operating expenses(1) (138,639) (20,632) (11,099) (31,731) (5,987) 1,288 (175,069)Impairment losses on assets (86,427) (864) (939) (1,803) (842) – (89,072)
Operating profit 143,008 56,362 11,745 68,107 12,386 (1,986) 221,515Share of results of associates and joint ventures – (1) 898 897 – – 897
Profit before income tax 143,008 56,361 12,643 69,004 12,386 (1,986) 222,412
Income tax expense (38,361)
Profit for the year 184,051
Segment assets 14,341,792 2,048,841 1,193,626 3,242,467 1,812,521 (1,261,950) 18,134,830Investment in associates and joint ventures – 170 13,889 14,059 – – 14,059
Total assets 14,341,792 2,049,011 1,207,515 3,256,526 1,812,521 (1,261,950) 18,148,889
Include: non-current assets(2) 98,685 25,544 109,091 134,635 5,522 (161) 238,681
Segment liabilities 13,198,402 1,870,712 1,096,909 2,967,621 1,757,564 (1,261,790) 16,661,797
Other segment items: Intersegment net interest (expense)/income (3,251) 985 6,363 7,348 (4,097) – – Intersegment net fee and commission income/(expense) 349 26 1,230 1,256 (795) (810) – Capital expenditure 10,909 1,325 21,058 22,383 815 – 34,107 Depreciation and amortisation 11,346 864 3,245 4,109 236 – 15,691 Credit commitments 3,062,802 267,190 128,792 395,982 481,663 (350,839) 3,589,608

2016 Annual Report 234
Notes to the Consolidated Financial Statements
V NOTES TO THE CONSOLIDATED FINANCIAL STATEMENTS (Continued)
45 Segment reporting (Continued)
As at and for the year ended 31 December 2015Hong Kong, Macau and Taiwan Other
countries and regions
Chinese mainland
BOCHK Group Other Subtotal Elimination Total
Interest income 544,487 38,541 24,710 63,251 32,059 (24,741) 615,056Interest expense (262,336) (13,441) (18,072) (31,513) (17,298) 24,741 (286,406)
Net interest income 282,151 25,100 6,638 31,738 14,761 – 328,650
Fee and commission income 78,445 12,984 6,782 19,766 4,978 (2,284) 100,905Fee and commission expense (3,225) (3,470) (1,567) (5,037) (1,676) 1,443 (8,495)
Net fee and commission income 75,220 9,514 5,215 14,729 3,302 (841) 92,410
Net trading gains/(losses) 8,942 887 (80) 807 (289) – 9,460Net gains on financial investments 3,487 1,193 1,077 2,270 8 – 5,765Other operating income(1) 13,819 12,246 11,717 23,963 129 (284) 37,627
Operating income 383,619 48,940 24,567 73,507 17,911 (1,125) 473,912Operating expenses(1) (150,393) (20,857) (10,513) (31,370) (4,763) 1,125 (185,401)Impairment losses on assets (56,409) (1,252) (843) (2,095) (770) – (59,274)
Operating profit 176,817 26,831 13,211 40,042 12,378 – 229,237Share of results of associates and joint ventures – 1 2,333 2,334 – – 2,334
Profit before income tax 176,817 26,832 15,544 42,376 12,378 – 231,571
Income tax expense (52,154)
Profit for the year 179,417
Segment assets 13,053,114 1,946,338 1,053,777 3,000,115 1,819,844 (1,068,319) 16,804,754Investment in associates and joint ventures – 51 10,792 10,843 – – 10,843
Total assets 13,053,114 1,946,389 1,064,569 3,010,958 1,819,844 (1,068,319) 16,815,597
Include: non-current assets(2) 99,138 22,463 101,458 123,921 4,702 (161) 227,600
Segment liabilities 11,970,984 1,811,943 972,123 2,784,066 1,770,859 (1,067,917) 15,457,992
Other segment items: Intersegment net interest (expense)/income (13,701) 2,287 10,328 12,615 1,086 – – Intersegment net fee and commission
income/(expense) 446 38 982 1,020 (625) (841) – Capital expenditure 11,030 1,040 24,619 25,659 209 – 36,898 Depreciation and amortisation 11,540 837 2,991 3,828 240 – 15,608 Credit commitments 2,909,919 238,142 136,096 374,238 356,650 (430,774) 3,210,033
(1) Other operating income includes insurance premium income earned, and operating expenses include insurance benefits and
claims.
(2) Non-current assets include property and equipment, investment properties and other long-term assets.

2016 Annual Report235
(Amount in millions of Renminbi, unless otherwise stated)
V NOTES TO THE CONSOLIDATED FINANCIAL STATEMENTS (Continued)
45 Segment reporting (Continued)
As at and for the year ended 31 December 2016Corporate
bankingPersonalbanking
Treasuryoperations
Investmentbanking Insurance Other Elimination Total
Interest income 301,759 194,421 152,986 942 2,714 833 (87,516) 566,139Interest expense (130,312) (89,877) (124,623) (174) (28) (2,593) 87,516 (260,091)
Net interest income/(expense) 171,447 104,544 28,363 768 2,686 (1,760) – 306,048
Fee and commission income 39,751 41,435 13,680 4,351 – 953 (1,851) 98,319Fee and commission expense (3,180) (3,507) (1,022) (901) (2,484) (59) 1,498 (9,655)
Net fee and commission income/(expense) 36,571 37,928 12,658 3,450 (2,484) 894 (353) 88,664
Net trading gains/(losses) 1,610 867 5,102 136 (255) 1,007 29 8,496Net gains on financial investments 31 6 11,677 33 366 411 – 12,524Other operating income 1,586 7,264 844 238 19,696 41,784 (1,488) 69,924
Operating income 211,245 150,609 58,644 4,625 20,009 42,336 (1,812) 485,656Operating expenses (65,248) (68,278) (16,502) (2,181) (18,887) (5,785) 1,812 (175,069)Impairment losses on assets (65,651) (21,308) (828) 10 (25) (1,270) – (89,072)
Operating profit 80,346 61,023 41,314 2,454 1,097 35,281 – 221,515Share of results of associates and joint ventures – – – 413 (13) 538 (41) 897
Profit before income tax 80,346 61,023 41,314 2,867 1,084 35,819 (41) 222,412
Income tax expense (38,361)
Profit for the year 184,051
Segment assets 7,039,052 3,475,983 7,219,165 61,634 126,461 297,078 (84,543) 18,134,830Investment in associates and joint ventures – – – 4,114 – 10,013 (68) 14,059
Total assets 7,039,052 3,475,983 7,219,165 65,748 126,461 307,091 (84,611) 18,148,889
Segment liabilities 8,378,306 5,675,800 2,366,627 49,998 112,474 162,974 (84,382) 16,661,797
Other segment items: Intersegment net interest income/(expense) 21,591 65,132 (86,117) 88 53 (747) – – Intersegment net fee and commission income/(expense) 102 1,411 17 (162) (1,324) 309 (353) – Capital expenditure 3,442 3,812 182 131 116 26,424 – 34,107 Depreciation and amortisation 4,891 6,000 1,274 73 160 3,293 – 15,691 Credit commitments 2,803,340 786,268 – – – – – 3,589,608

2016 Annual Report 236
Notes to the Consolidated Financial Statements
V NOTES TO THE CONSOLIDATED FINANCIAL STATEMENTS (Continued)
45 Segment reporting (Continued)
As at and for the year ended 31 December 2015Corporate
bankingPersonalbanking
Treasuryoperations
Investmentbanking Insurance Other Elimination Total
Interest income 338,078 186,931 141,272 1,228 2,166 942 (55,561) 615,056Interest expense (171,106) (97,287) (70,820) (315) (11) (2,428) 55,561 (286,406)
Net interest income/(expense) 166,972 89,644 70,452 913 2,155 (1,486) – 328,650
Fee and commission income 41,428 41,356 14,738 4,326 – 658 (1,601) 100,905Fee and commission expense (2,943) (2,948) (753) (1,205) (1,834) (32) 1,220 (8,495)
Net fee and commission income/(expense) 38,485 38,408 13,985 3,121 (1,834) 626 (381) 92,410
Net trading gains/(losses) 76 573 9,493 306 (582) (419) 13 9,460Net gains on financial investments 10 519 3,771 295 413 757 – 5,765Other operating income 688 6,508 1,263 307 16,968 13,878 (1,985) 37,627
Operating income 206,231 135,652 98,964 4,942 17,120 13,356 (2,353) 473,912Operating expenses (73,563) (70,594) (18,850) (2,758) (15,914) (6,075) 2,353 (185,401)Impairment losses on assets (42,153) (14,362) (1,793) 60 (67) (959) – (59,274)
Operating profit 90,515 50,696 78,321 2,244 1,139 6,322 – 229,237Share of results of associates and joint ventures – – – 844 (4) 1,533 (39) 2,334
Profit before income tax 90,515 50,696 78,321 3,088 1,135 7,855 (39) 231,571
Income tax expense (52,154)
Profit for the year 179,417
Segment assets 7,185,768 2,960,341 6,300,439 74,058 106,706 279,010 (101,568) 16,804,754Investment in associates and joint ventures – – – 3,888 – 7,015 (60) 10,843
Total assets 7,185,768 2,960,341 6,300,439 77,946 106,706 286,025 (101,628) 16,815,597
Segment liabilities 7,907,454 5,232,341 2,078,706 64,366 93,485 183,047 (101,407) 15,457,992
Other segment items: Intersegment net interest (expense)/income (18,528) 54,247 (35,228) 166 116 (773) – – Intersegment net fee and commission income/(expense) 495 781 (1) – (1,207) 313 (381) – Capital expenditure 3,371 3,738 178 125 104 29,382 – 36,898 Depreciation and amortisation 5,046 6,178 1,168 68 92 3,056 – 15,608 Credit commitments 2,559,433 650,600 – – – – – 3,210,033

2016 Annual Report237
(Amount in millions of Renminbi, unless otherwise stated)
V NOTES TO THE CONSOLIDATED FINANCIAL STATEMENTS (Continued)
46 Transfers of financial assets
The Group enters into transactions in the normal course of business by which it transfers recognised financial assets to third parties or to special purpose entities. In some cases where these transferred financial assets qualify for derecognition, the transfers may give rise to full or partial derecognition of the financial assets concerned. In other cases where the transferred assets do not qualify for derecognition as the Group has retained substantially all the risks and rewards of these assets, the Group continued to recognise the transferred assets.
Repurchase agreements
Transferred financial assets that do not qualify for derecognition mainly include debt securities held by counterparties as collateral under repurchase agreements and securities lent to counterparties under securities lending agreements. The counterparties are allowed to sell or re-pledge those securities in the absence of default by the Group, but have an obligation to return the securities at the maturity of the contract. If the securities increase or decrease in value, the Group may in certain circumstances require or be required to pay additional cash collateral. The Group has determined that the Group retains substantially all the risks and rewards of these securities and therefore has not derecognised them. In addition, the Group recognises a financial liability for cash received as collateral.
The following table analyses the carrying amount of the abovementioned financial assets transferred to third parties that did not qualify for derecognition and their associated financial liabilities:
As at 31 December 2016 As at 31 December 2015Carrying
amount of transferred
assets
Carrying amount of associated
liabilities
Carrying amount of transferred
assets
Carrying amount of associated
liabilitiesRepurchase agreements 45,558 44,695 5,170 4,942
Credit assets transfers
The Group enters into credit assets transfers in the normal course of business during which it transfers credit assets to special purpose entities which in turn issue asset-backed securities or fund shares to investors. The Group may acquire some asset-backed securities and fund shares at the subordinated tranche level and accordingly, may retain parts of the risks and rewards of the transferred credit assets. The Group would determine whether or not to derecognise the associated credit assets by evaluating the extent to which it retains the risks and rewards of the assets.
With respect to the credit assets that were securitised and qualified for derecognition, the Group derecognised the transferred credit assets in their entirety. The corresponding total carrying amount of asset-backed securities held by the Group in the securitisation transactions was RMB1,719 million as at 31 December 2016 (31 December 2015: RMB858 million), which also approximates the Group’s maximum exposure to loss.

2016 Annual Report 238
Notes to the Consolidated Financial Statements
V NOTES TO THE CONSOLIDATED FINANCIAL STATEMENTS (Continued)
46 Transfers of financial assets (Continued)
Credit assets transfers (Continued)
For those in which the Group has neither transferred nor retained substantially all the risks and rewards of the transferred credit assets, and retained control of the credit assets, the transferred credit assets are recognised on the statement of financial position to the extent of the Group’s continuing involvement. The carrying amount at the time of transfer of the original credit assets, which the Group determined that it has continuing involvement through acquiring some tranches, was RMB22,721 million for this year (2015: RMB3,385 million) and the carrying amount of assets that the Group continues to recognise on the statement of financial position was RMB3,370 million as at 31 December 2016 (31 December 2015: RMB614 million).
47 Interests in the unconsolidated structured entities
The Group is principally involved with structured entities through financial investments, asset management and credit assets transfers. These structured entities generally finance the purchase of assets by issuing securities or by other means. The Group determines whether or not to consolidate these structured entities depending on whether the Group has control over them. The interests held by the Group in the unconsolidated structured entities are set out as below:
Structured entities sponsored by the Group
In conducting wealth management business in Chinese mainland, the Group established various structured entities to provide customers specialised investment opportunities within narrow and well-defined objectives. As at 31 December 2016, the balance of the above unconsolidated bank wealth management products sponsored by the Group amounted to RMB1,176,824 million (31 December 2015: RMB1,107,079 million). For the year ended 31 December 2016, fee and commission income from wealth management business, which includes commission, custodian fee and management fee amounted to RMB9,354 million (2015: RMB8,597 million).
For the purpose of asset-liability management, wealth management products may raise short-term financing needs to the Group and other banks. The Group is not contractually obliged to provide financing. After internal risk assessment, the Group may enter into repurchase and placement transactions with these wealth management products in accordance with market principles. For the year ended 31 December 2016, the maximum balance of such financing provided by the Group to the unconsolidated wealth management products was RMB26,000 million (2015: RMB19,300 million). Such financing provided by the Group was included in “Placements with and loans to banks and other financial institutions”. As at 31 December 2016, the balance of above trading was nil (31 December 2015: Nil). The maximum exposure to loss of those placements approximated to the carrying amount.
In addition, the total carrying amount as at the transfer date of credit assets transferred by the Group into the unconsolidated structured entities was RMB31,866 million for the year ended 31 December 2016 (2015: RMB12,892 million). For description of the portion of asset-backed securities issued by above structured entities and held by the Group, refer to Note V.46.

2016 Annual Report239
(Amount in millions of Renminbi, unless otherwise stated)
V NOTES TO THE CONSOLIDATED FINANCIAL STATEMENTS (Continued)
47 Interests in the unconsolidated structured entities (Continued)
Structured entities sponsored by other financial institutions
The interests held by the Group in the structured entities sponsored by other financial institutions through direct investments are set out as below:
Structured entity type
Financial assets at
fair value through
profit or loss
Investment securities available
for sale
Debt securities
held to maturity
Financial investments classified as
loans and receivables Total
Maximum exposure to
lossAs at 31 December 2016Fund 3,409 17,148 – – 20,557 20,557Wealth management plans – 15,000 – – 15,000 15,000Investment trusts and asset management plans – – – 15,852 15,852 15,852Asset-backed securitisations – 21,572 31,838 1,387 54,797 54,797
As at 31 December 2015Fund 4,832 15,853 – – 20,685 20,702Wealth management plans – – – 100 100 100Investment trusts and asset management plans – 243 – 270,886 271,129 271,129Asset-backed securitisations – 26,837 6,353 116 33,306 33,306
48 Offsetting financial assets and financial liabilities
Financial assets subject to offsetting, enforceable master netting arrangements and similar agreements are analysed as below:
Gross amounts of recognised
financial assets
Gross amounts
offset in the statement
of financial position
Amounts presented
in the statement
of financial position
Amounts not set off in the statement of financial position
Net amount
Financial instruments*
Cash collateral received
As at 31 December 2016Derivatives 66,258 – 66,258 (40,962) (6,082) 19,214Reverse repo agreements 6,212 – 6,212 (6,212) – –Other assets 14,251 (8,090) 6,161 – – 6,161
Total 86,721 (8,090) 78,631 (47,174) (6,082) 25,375
As at 31 December 2015Derivatives 32,710 – 32,710 (19,513) (834) 12,363Reverse repo agreements 851 – 851 (851) – –Other assets 9,308 (6,934) 2,374 – – 2,374
Total 42,869 (6,934) 35,935 (20,364) (834) 14,737
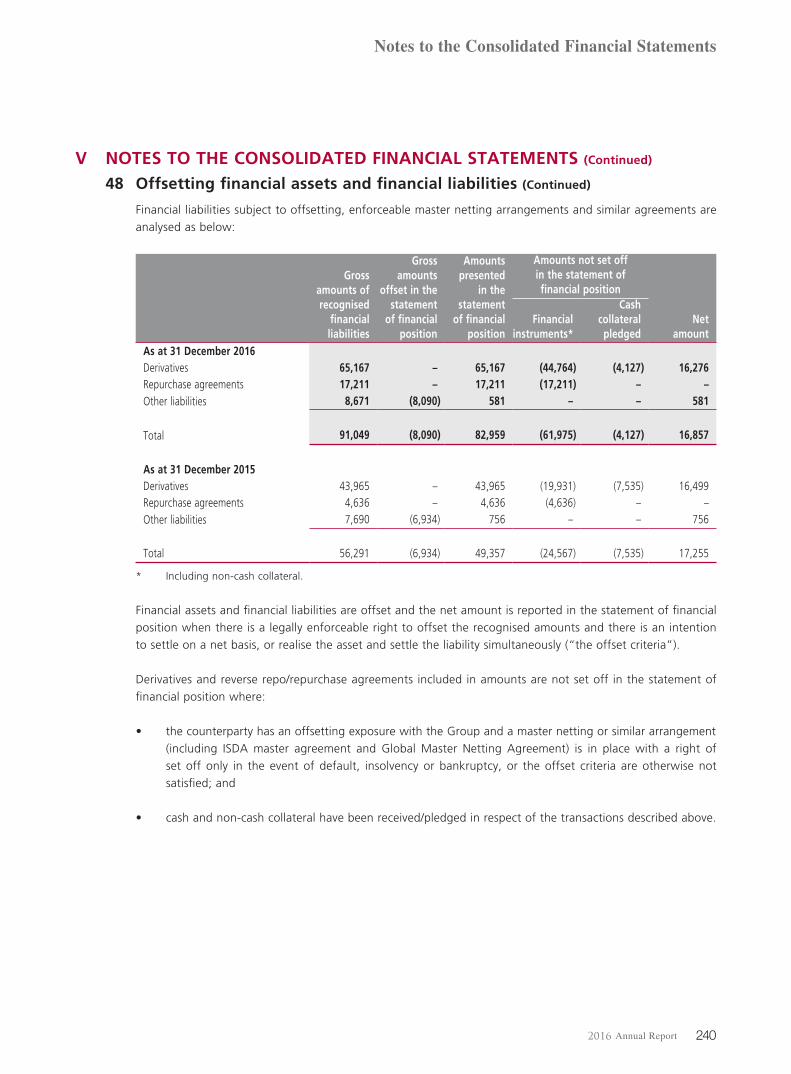
2016 Annual Report 240
Notes to the Consolidated Financial Statements
V NOTES TO THE CONSOLIDATED FINANCIAL STATEMENTS (Continued)
48 Offsetting financial assets and financial liabilities (Continued)
Financial liabilities subject to offsetting, enforceable master netting arrangements and similar agreements are analysed as below:
Gross amounts of recognised
financial liabilities
Gross amounts
offset in the statement
of financial position
Amounts presented
in the statement
of financial position
Amounts not set off in the statement of financial position
Financial instruments*
Cash collateral pledged
Net amount
As at 31 December 2016Derivatives 65,167 – 65,167 (44,764) (4,127) 16,276Repurchase agreements 17,211 – 17,211 (17,211) – –Other liabilities 8,671 (8,090) 581 – – 581
Total 91,049 (8,090) 82,959 (61,975) (4,127) 16,857
As at 31 December 2015Derivatives 43,965 – 43,965 (19,931) (7,535) 16,499Repurchase agreements 4,636 – 4,636 (4,636) – –Other liabilities 7,690 (6,934) 756 – – 756
Total 56,291 (6,934) 49,357 (24,567) (7,535) 17,255
* Including non-cash collateral.
Financial assets and financial liabilities are offset and the net amount is reported in the statement of financial position when there is a legally enforceable right to offset the recognised amounts and there is an intention to settle on a net basis, or realise the asset and settle the liability simultaneously (“the offset criteria”).
Derivatives and reverse repo/repurchase agreements included in amounts are not set off in the statement of financial position where:
• the counterparty has an offsetting exposure with the Group and a master netting or similar arrangement (including ISDA master agreement and Global Master Netting Agreement) is in place with a right of set off only in the event of default, insolvency or bankruptcy, or the offset criteria are otherwise not satisfied; and
• cash and non-cash collateral have been received/pledged in respect of the transactions described above.

2016 Annual Report241
(Amount in millions of Renminbi, unless otherwise stated)
V NOTES TO THE CONSOLIDATED FINANCIAL STATEMENTS (Continued)
49 The Bank’s statement of financial position and changes in equity
49.1 The Bank’s statement of financial position
As at 31 December2016 2015
ASSETSCash and due from banks and other financial institutions 656,003 649,628Balances with central banks 2,188,722 2,089,759Placements with and loans to banks and other financial institutions 553,551 425,192Government certificates of indebtedness for bank notes issued 7,048 5,777Precious metals 156,155 173,540Financial assets at fair value through profit or loss 59,144 56,129Derivative financial assets 85,604 58,178Loans and advances to customers, net 8,683,440 8,027,160Financial investments 3,178,695 2,993,194 — available for sale 1,026,700 688,981 — held to maturity 1,773,569 1,710,303 — loans and receivables 378,426 593,910Investment in subsidiaries 96,892 94,354Investment in associates and joint ventures 68 60Consolidated structured entities 93,000 –Property and equipment 84,962 85,685Investment properties 2,144 1,951Deferred income tax assets 35,892 24,085Other assets 106,665 101,986
Total assets 15,987,985 14,786,678

2016 Annual Report 242
Notes to the Consolidated Financial Statements
V NOTES TO THE CONSOLIDATED FINANCIAL STATEMENTS (Continued)
49 The Bank’s statement of financial position and changes in equity (Continued)
49.1 The Bank’s statement of financial position (Continued)
As at 31 December2016 2015
LIABILITIESDue to banks and other financial institutions 1,401,155 1,746,218Due to central banks 813,197 364,428Bank notes in circulation 7,284 5,917Placements from banks and other financial institutions 364,149 479,216Derivative financial liabilities 74,549 48,344Due to customers 11,428,022 10,403,693 — at amortised cost 11,093,065 10,089,331 — at fair value 334,957 314,362Bonds issued 309,616 233,986Current tax liabilities 23,712 34,455Retirement benefit obligations 3,439 4,255Deferred income tax liabilities 109 101Other liabilities 283,743 254,157
Total liabilities 14,708,975 13,574,770
EQUITYShare capital 294,388 294,388Other equity instruments 99,714 99,714Capital reserve 138,832 138,832Other comprehensive income (4,441) 7,104Statutory reserves 122,975 109,215General and regulatory reserves 186,640 172,029Undistributed profits 440,902 390,626
Total equity 1,279,010 1,211,908
Total equity and liabilities 15,987,985 14,786,678
Approved and authorised for issue by the Board of Directors on 31 March 2017.
TIAN Guoli CHEN SiqingDirector Director

2016 Annual Report243
(Amount in millions of Renminbi, unless otherwise stated)
V NOTES TO THE CONSOLIDATED FINANCIAL STATEMENTS (Continued)
49 The Bank’s statement of financial position and changes in equity (Continued)
49.2 The Bank’s statement of changes in equity
Share
capital
Other
equity
instruments
Capital
reserve
Other
comprehensive
income
Statutory
reserves
General and
regulatory
reserves
Undistributed
profits Total
As at 1 January 2016 294,388 99,714 138,832 7,104 109,215 172,029 390,626 1,211,908
Total comprehensive income – – – (11,545) – – 136,883 125,338
Appropriation to statutory reserves – – – – 13,760 – (13,760) –
Appropriation to general and
regulatory reserves – – – – – 14,611 (14,611) –
Dividends – – – – – – (58,236) (58,236)
As at 31 December 2016 294,388 99,714 138,832 (4,441) 122,975 186,640 440,902 1,279,010
Share
capital
Other
equity
instruments
Capital
reserve
Other
comprehensive
income
Statutory
reserves
General and
regulatory
reserves
Undistributed
profits Total
As at 1 January 2015 288,731 71,745 129,404 (346) 93,868 152,633 334,116 1,070,151
Total comprehensive income – – – 7,450 – – 152,199 159,649
Conversion of convertible bonds
and capital reserve 5,657 – 10,973 – – – – 16,630
Capital injection by other
equity instruments holders – 27,969 – – – – – 27,969
Appropriation to statutory reserves – – – – 15,347 – (15,347) –
Appropriation to general and
regulatory reserves – – – – – 19,396 (19,396) –
Dividends – – – – – – (60,946) (60,946)
Equity component of
convertible bonds – – (1,545) – – – – (1,545)
As at 31 December 2015 294,388 99,714 138,832 7,104 109,215 172,029 390,626 1,211,908

2016 Annual Report 244
Notes to the Consolidated Financial Statements
V NOTES TO THE CONSOLIDATED FINANCIAL STATEMENTS (Continued)
50 Events after the financial reporting date
Dividend distribution plan of Domestic Preference Shares (Second Tranche)
The dividend distribution of Domestic Preference Shares (Second Tranche) was approved by the Board of Directors of the Bank at the Board meeting held on 23 January 2017. The dividend of RMB1,540 million was paid at a rate of 5.5% on 13 March 2017. The dividend payable was not reflected in liabilities of the financial statements.
Issuance of overseas bonds
On 7 February 2017, the Bank issued USD2 billion notes, which was then listed on 15 February 2017 on the Stock Exchange of Hong Kong Limited, as part of the Bank’s USD20 billion Medium Term Note Programme. The issuance details had been set out in the Bank’s announcement dated 14 February 2017.
Disposal of Chiyu Bank
The sale of the Group’s disposal of issued shares of Chiyu Bank was completed in accordance with the terms and conditions of the Sale and Purchase Agreement for a total consideration of HKD7.685 billion on 27 March 2017. Upon completion, Chiyu Bank ceased to be a subsidiary of the Bank and BOCHK (Holdings).
Strategic restructuring plan in the ASAEN region
As part of the Group’s strategic restructuring plan in the ASAEN region, the Bank (as seller) and BOCHK (as buyer) completed the sale and purchase of Bank of China (Thai) Public Company Limited on 9 January 2017. On 28 February 2017, the Bank (as seller) and BOCHK (as buyer) entered into sale and purchase agreements in relation to sale and purchase of the banking businesses operated by the Bank in Indonesia through Bank of China Limited, Jakarta Branch and its eight sub-branches; and the banking businesses operated by the Bank in Cambodia through Bank of China Limited, Phnom Penh Branch, Cambodia and its two sub-branches, respectively. The completion of each equity transfer is subject to the satisfaction or waiver of the respective preconditions.

2016 Annual Report245
(Amount in millions of Renminbi, unless otherwise stated)
VI FINANCIAL RISK MANAGEMENT1 Overview
The Group’s primary risk management objectives are to maximise value for equity holders while maintaining risk within acceptable parameters, optimising capital allocation and satisfying the requirements of the regulatory authorities, the Group’s depositors and other stakeholders for the Group’s prudent and stable development.
The Group has designed a series of risk management policies and has set up controls to analyse, identify, monitor and report risks by means of relevant and up-to-date information systems. The Group regularly reviews and revises its risk management policies and systems to reflect changes in markets, products and emerging best practice.
The most significant types of risks to the Group are credit risk, market risk and liquidity risk. Market risk includes interest rate risk, currency risk and other price risk.
2 Financial risk management framework
The Board of Directors is responsible for establishing the overall risk appetite of the Group and reviewing and approving the risk management objectives and strategies.
Within this framework, the Group’s senior management has overall responsibility for managing all aspects of risks, including implementing risk management strategies, initiatives and credit policies and approving internal policies, measures and procedures related to risk management. The Risk Management Department, the Credit Management Department, the Financial Management Department and other relevant functional departments are responsible for monitoring financial risks.
The Group manages the risks at the branch level through direct reporting from the branches to the relevant departments responsible for risk management at the Head Office. Business line related risks are monitored through establishing specific risk management teams within the business departments. The Group monitors and controls risk management at subsidiaries by appointing members of their boards of directors and risk management committees as appropriate.
3 Credit risk
The Group takes on exposure to credit risk, which is the risk that a customer or counterparty will cause a financial loss for the Group by failing to discharge an obligation. Credit risk is one of the most significant risks for the Group’s business.
Credit risk exposures arise principally in lending activities and debt securities investment activities. There is also credit risk in off-balance sheet financial instruments, such as derivatives, loan commitments, bill acceptance, letters of guarantee and letters of credit.

2016 Annual Report 246
Notes to the Consolidated Financial Statements
VI FINANCIAL RISK MANAGEMENT (Continued)
3 Credit risk (Continued)
3.1 Credit risk measurement
(1) Loans and advances and off-balance sheet commitments
Monitoring and measurement of credit risk over loans and advances and off-balance sheet credit related exposures are performed by the Credit Management Department, and reported to the senior management and the Board of Directors regularly.
In measuring the credit risk of loans and advances to corporate customers, the Group mainly reflects the “probability of default” by the customer on its contractual obligations and considers the current financial position of the customer and the exposures to the customer and its likely future development. For retail customers, the Group uses standard approval procedures to manage credit risk for personal loans, and uses credit score-card models, which are based on historical default data to measure credit risk for credit cards.
For credit risk arising from off-balance sheet commitments, the Group manages the risks according to the characteristics of the products. These mainly include loan commitments, guarantees, bill acceptances and letters of credit. Loan commitments, guarantees, bill acceptances and standby letters of credit carry similar credit risk to loans and the Group takes a similar approach on risk management. Documentary and commercial letters of credit are written undertakings by the Group on behalf of a customer authorising a third party to draw drafts on the Group up to a stipulated amount under specific terms and conditions and are collateralised by the underlying shipment documents of goods to which they relate or deposits and are therefore assessed to have less credit risk than a direct loan. Besides, the Group monitors the term to maturity of off-balance sheet commitments and those with longer-terms are assessed to have greater credit risk than shorter-term commitments.
The Group measures and manages the credit quality of loans and advances to corporate and personal customers based on the Guideline for Loan Credit Risk Classification (the “Guideline”) issued by the CBRC, which requires commercial banks to classify their corporate and personal loans into five categories: pass, special-mention, substandard, doubtful and loss, among which loans classified in the substandard, doubtful and loss categories are regarded as non-performing loans. Off-balance sheet commitments with credit exposures are also assessed and categorised with reference to the Guideline. For operations in Hong Kong, Macau, Taiwan and other countries and regions, where local regulations and requirements are more prudent than the Guideline, the credit assets are classified according to local regulations and requirements.

2016 Annual Report247
(Amount in millions of Renminbi, unless otherwise stated)
VI FINANCIAL RISK MANAGEMENT (Continued)
3 Credit risk (Continued)
3.1 Credit risk measurement (Continued)
(1) Loans and advances and off-balance sheet commitments (Continued)
The five categories are defined as follows:
Pass: loans for which borrowers can honour the terms of the contracts, and there is no reason to
doubt their ability to repay principal and interest of loans in full and on a timely basis.
Special-mention: loans for which borrowers are still able to service the loans currently, although
the repayment of loans might be adversely affected by some factors.
Substandard: loans for which borrowers’ ability to service loans is apparently in question and
borrowers cannot depend on their normal business revenues to pay back the principal and interest
of loans. Certain losses might be incurred by the Group even when guarantees are executed.
Doubtful: loans for which borrowers cannot pay back principal and interest of loans in full and
significant losses will be incurred by the Group even when guarantees are executed.
Loss: principal and interest of loans cannot be recovered or only a small portion can be recovered
after taking all possible measures and resorting to necessary legal procedures.
The Group has developed an internal customer credit rating system, using measurements of the
probability of default within one year based on regression analysis. These probability of default
measurements are then mapped to internal credit ratings. The Group performs back testing to
actual default rates and refines the model according to the results.
The customer credit ratings in the internal model are based on four categories of A, B, C and D
which are further classified into fifteen grades as AAA, AA, A, BBB+, BBB, BBB-, BB+, BB, BB-,
B+, B-, CCC, CC, C, and D. Credit grading D equates to defaulted customers while the others are
assigned to performing customers.
Five-category loan classifications and customer credit ratings are determined by Head Office and
tier 1 branch management under approved delegated authorities. The Bank performs centralised
review on customer credit ratings and five-category loan classifications on an annual basis. Further,
five-category loan classifications are re-examined on a quarterly basis. Adjustments are made to
these classifications and ratings as necessary according to customers’ operational and financial
position.
The Group identifies credit risk collectively based on industry, geography and customer type. This
information is monitored regularly by management.

2016 Annual Report 248
Notes to the Consolidated Financial Statements
VI FINANCIAL RISK MANAGEMENT (Continued)
3 Credit risk (Continued)
3.1 Credit risk measurement (Continued)
(1) Loans and advances and off-balance sheet commitments (Continued)
Management periodically reviews various elements of the Group’s credit risk management process, in the context of loan portfolio growth, the changing mix and concentration of assets, and the evolving risk profile of the credit portfolio. From time to time, in this regard, refinements are made to the Group’s credit risk management processes to most effectively manage the effects of these changes on the Group’s credit risk. These refinements include, among other things, adjustments to portfolio level controls, such as revisions to lists of approved borrowers, industry quotas and underwriting criteria. Where circumstances related to specific loans or a group of loans increase the Bank’s credit risk, actions are taken, to the extent possible, to strengthen the Group’s security position. The actions may include obtaining additional guarantors or collateral.
(2) Due from, placements with and loans to banks and other financial institutions
The Group manages the credit quality of due from, placements with and loans to banks and other financial institutions considering the size, financial position and the internal and external credit rating of banks and financial institutions. In response to adverse credit market conditions, various initiatives were implemented since 2008 to better manage and report credit risk, including establishing a special committee which meets periodically and on an ad hoc basis to discuss actions in response to market changes impacting the Group’s exposure to credit risk, and formulating a watch list process over counterparty names at risk.
(3) Debt securities and derivatives
Credit risk within debt securities arises from exposure to movements in credit spreads, default rates and loss given default, as well as changes in the credit of underlying assets.
The Group manages the credit risk within debt securities by monitoring the external credit rating, such as Standard & Poor’s ratings or their equivalents, of the security, the internal credit rating of the issuers of debt securities, and the credit quality of underlying assets of securitisation products, including review of default rates, prepayment rates, industry and sector performance, loss coverage ratios and counterparty risk, to identify exposure to credit risk.
The Group has policies to maintain strict control limits on net open derivative positions based on notional amount and term. At any time, the amount subject to credit risk is limited to the current fair value of instruments that are favourable to the Group (i.e. assets for which fair value is positive). The derivative credit risk exposure is managed as part of the overall exposure lending limits set for customers and financial institutions. Collateral or other security is not usually obtained for credit risk exposures on these financial instruments.

2016 Annual Report249
(Amount in millions of Renminbi, unless otherwise stated)
VI FINANCIAL RISK MANAGEMENT (Continued)
3 Credit risk (Continued)
3.2 Credit risk limit control and mitigation policies
The Group manages limits and controls concentrations of credit risk in particular, to individual customers and to industries.
(1) Credit risk limits and controls
(i) Loans and advances and off-balance sheet commitments
In order to manage the exposure to credit risk, the Group has adopted credit policies and procedures that are reviewed and updated by the Credit Management Department and the Credit Approval Department at Head Office. The credit approval process for both corporate loans and personal loans can be broadly divided into three stages: (1) credit origination and assessment; (2) credit review and approval; and (3) fund disbursement and post-disbursement management.
Credit to corporate customers in the Chinese mainland are originated by the Corporate Banking Department at Head Office and the Corporate Banking Department at branch level and submitted to the Credit Approval Department for due diligence and approval. All credit applications for corporate customers must be approved by authorised credit application approvers at Head Office and tier 1 branches level in Chinese mainland, except for the low risk credit applications which are in accordance with the rules. The exposure to any one borrower, including banks, is restricted by credit limits covering on and off-balance sheet exposures.
Personal loans in the Chinese mainland are originated by the Personal Banking Departments at branch level and must be approved by authorised approvers at tier 1 branches level in Chinese mainland, except for individual pledged loans and government-sponsored student loans, which may be approved by authorised approvers at sub-branches below tier 1 level. High risk personal loans such as personal loans for business purposes in excess of certain limits must also be reviewed by the Risk Management Department.
The Head Office also oversees the risk management of the branches in Hong Kong, Macau, Taiwan and other countries and regions. In particular, any credit application at these branches exceeding the authorisation limits is required to be submitted to the Head Office for approval.
Exposure to credit risk is also managed through regular analysis of the ability of borrowers and potential borrowers to meet interest and capital repayment obligations and by changing these lending limits where appropriate.
(ii) Debt securities and derivatives
The Group is also exposed to credit risk through investment activities and trading activities. Credit limits are established based on type of instruments and the credit quality of counterparties, securities issuers and the securities, and set limits are actively monitored.

2016 Annual Report 250
Notes to the Consolidated Financial Statements
VI FINANCIAL RISK MANAGEMENT (Continued)
3 Credit risk (Continued)
3.2 Credit risk limit control and mitigation policies (Continued)
(2) Credit risk mitigation policies
(i) Collateral and guarantees
The Group has a range of policies and practices intended to mitigate credit risk. The most prevalent of these is the taking of security for funds advances (collateral) and guarantees, which is common practice. The Group implements guidelines on the acceptability of specific classes of collateral. The amount of acceptable collateral at the time of loan origination is determined by the Credit Management Department and is subject to loan-to-value ratio limits based on type and is monitored on an ongoing basis by the Credit Management Department. The principal collateral types for corporate loans and advances are:
Collateral Maximum loan-to-value ratioDeposit receipt 95%PRC Treasury bonds 90%PRC financial institution bonds 85%Publicly traded stocks 50%Construction land use rights 70%Real estate 70%Automobiles 40%
Mortgages to retail customers are generally collateralised by mortgages over residential properties. Other loans are collateralised dependent on the nature of the loan.
For loans guaranteed by a third party guarantor, the Group will assess the guarantor’s credit rating, financial condition, credit history and ability to meet obligations.
Collateral held as security for financial assets other than loans and advances is determined by the nature of the instrument. Debt securities, treasury and other eligible bills are generally unsecured, with the exception of certain asset-backed securities and similar instruments, which are secured by portfolios of financial instruments.
Collateral is also held as part of reverse repurchase agreements. Under such agreements, the Group is permitted to sell or repledge collateral in the absence of default by the owner of the collateral. Details of collateral accepted and which the Group is obligated to return are disclosed in Note V.42.3.
(ii) Master netting arrangements
The Group further restricts its exposure to credit losses by entering into master netting arrangements with counterparties with which it undertakes a significant volume of transactions. Master netting arrangements do not generally result in the offsetting of assets and liabilities in the statement of financial position, as transactions are usually settled on a gross basis. However, the credit risk associated with favourable contracts is reduced by a master netting arrangement to the extent that if a default occurs, all amounts with the customer are terminated and settled on a net basis. The Group’s overall exposure to credit risk on derivative instruments subject to master netting arrangements can change substantially within a short period, as it is affected by each transaction subject to the arrangement.

2016 Annual Report251
(Amount in millions of Renminbi, unless otherwise stated)
VI FINANCIAL RISK MANAGEMENT (Continued)
3 Credit risk (Continued)
3.3 Impairment and provisioning policies
Relevant policies are included in Note II.4.6.
3.4 Maximum exposure to credit risk before collateral held or other credit enhancements
As at 31 December2016 2015
Credit risk exposures relating to on-balance sheet financial assets are as follows:Due from banks and other financial institutions 582,434 581,007Balances with central banks 2,271,640 2,196,063Placements with and loans to banks and other financial institutions 594,048 426,848Government certificates of indebtedness
for bank notes issued 117,421 91,191Financial assets at fair value through profit or loss 112,194 104,082Derivative financial assets 130,549 82,236Loans and advances to customers, net 9,735,646 8,935,195Financial investments — available for sale 1,554,675 1,032,004 — held to maturity 1,843,043 1,790,790 — loans and receivables 395,921 606,710Other assets 144,039 147,441
Subtotal 17,481,610 15,993,567
Credit risk exposures relating to off-balance sheet items are as follows:Letters of guarantee issued 1,097,448 1,077,070Loan commitments and other credit commitments 2,492,160 2,132,963
Subtotal 3,589,608 3,210,033
Total 21,071,218 19,203,600
The table above represents a worst case scenario of credit risk exposure of the Group as at 31 December 2016 and 2015, without taking into account of any collateral held, master netting agreements or other credit enhancements attached. For on-balance sheet assets, the exposures set out above are based on net carrying amounts as reported in the statements of financial position.
As at 31 December 2016, 46.20% of the Group’s total maximum credit exposure is derived from loans and advances to customers (31 December 2015: 46.53%) and 18.42% represents investments in debt securities (31 December 2015: 18.37%).

2016 Annual Report 252
Notes to the Consolidated Financial Statements
VI FINANCIAL RISK MANAGEMENT (Continued)
3 Credit risk (Continued)
3.5 Loans and advances
(1) Concentrations of risk for loans and advances to customers
(i) Analysis of loans and advances to customers by geographical area
GroupAs at 31 December
2016 2015Amount % of total Amount % of total
Chinese mainland 7,818,508 78.40% 7,199,094 78.80%Hong Kong, Macau and Taiwan 1,220,962 12.24% 1,100,615 12.05%Other countries and regions 933,892 9.36% 836,151 9.15%
Total loans and advances to customers 9,973,362 100.00% 9,135,860 100.00%
Chinese mainlandAs at 31 December
2016 2015Amount % of total Amount % of total
Northern China 1,254,192 16.04% 1,158,592 16.09%Northeastern China 494,595 6.33% 484,432 6.73%Eastern China 3,096,019 39.60% 2,863,049 39.77%Central and Southern China 1,979,793 25.32% 1,768,388 24.57%Western China 993,909 12.71% 924,633 12.84%
Total loans and advances to customers 7,818,508 100.00% 7,199,094 100.00%
(ii) Analysis of loans and advances to customers by customer type
Chinese mainland
Hong Kong, Macau and
Taiwan
Other countries
and regions TotalAs at 31 December 2016Corporate loans and advances — Trade bills 687,283 86,887 166,922 941,092 — Other 4,145,899 745,297 736,681 5,627,877Personal loans 2,985,326 388,778 30,289 3,404,393
Total loans and advances to customers 7,818,508 1,220,962 933,892 9,973,362
As at 31 December 2015Corporate loans and advances — Trade bills 734,829 127,512 194,426 1,056,767 — Other 4,065,532 632,015 615,598 5,313,145Personal loans 2,398,733 341,088 26,127 2,765,948
Total loans and advances to customers 7,199,094 1,100,615 836,151 9,135,860

2016 Annual Report253
(Amount in millions of Renminbi, unless otherwise stated)
VI FINANCIAL RISK MANAGEMENT (Continued)
3 Credit risk (Continued)
3.5 Loans and advances (Continued)
(1) Concentrations of risk for loans and advances to customers (Continued)
(iii) Analysis of loans and advances to customers by industry
GroupAs at 31 December
2016 2015Amount % of total Amount % of total
Corporate loans and advances Manufacturing 1,632,912 16.37% 1,684,276 18.43% Commerce and services 1,313,693 13.17% 1,318,028 14.43% Transportation, storage and postal services 988,773 9.91% 892,207 9.77% Real estate 751,035 7.53% 760,511 8.32% Production and supply of electricity, heating, gas and water 519,161 5.21% 442,536 4.84% Financial services 426,023 4.27% 332,835 3.64% Mining 352,706 3.54% 371,581 4.07% Construction 193,318 1.94% 184,112 2.01% Water, environment and public utility management 159,660 1.60% 168,631 1.85% Public utilities 107,372 1.08% 110,242 1.21% Other 124,316 1.25% 104,953 1.15%
Subtotal 6,568,969 65.87% 6,369,912 69.72%
Personal loans Mortgages 2,635,960 26.43% 2,045,787 22.39% Credit cards 302,302 3.03% 268,923 2.95% Other 466,131 4.67% 451,238 4.94%
Subtotal 3,404,393 34.13% 2,765,948 30.28%
Total loans and advances to customers 9,973,362 100.00% 9,135,860 100.00%

2016 Annual Report 254
Notes to the Consolidated Financial Statements
VI FINANCIAL RISK MANAGEMENT (Continued)
3 Credit risk (Continued)
3.5 Loans and advances (Continued)
(1) Concentrations of risk for loans and advances to customers (Continued)
(iii) Analysis of loans and advances to customers by industry (Continued)
Chinese mainlandAs at 31 December
2016 2015Amount % of total Amount % of total
Corporate loans and advances Manufacturing 1,361,631 17.42% 1,401,271 19.47% Commerce and services 890,841 11.40% 859,541 11.94% Transportation, storage and postal services 846,349 10.83% 779,443 10.83% Real estate 394,156 5.04% 462,914 6.43% Production and supply of electricity, heating, gas and water 414,180 5.30% 397,511 5.52% Financial services 291,587 3.73% 209,285 2.91% Mining 201,186 2.57% 227,805 3.16% Construction 157,465 2.01% 161,428 2.24% Water, environment and public utility management 147,995 1.89% 168,608 2.34% Public utilities 98,654 1.26% 104,719 1.45% Other 29,138 0.37% 27,836 0.39%
Subtotal 4,833,182 61.82% 4,800,361 66.68%
Personal loans Mortgages 2,335,210 29.87% 1,779,310 24.72% Credit cards 288,788 3.69% 256,204 3.56% Other 361,328 4.62% 363,219 5.04%
Subtotal 2,985,326 38.18% 2,398,733 33.32%
Total loans and advances to customers 7,818,508 100.00% 7,199,094 100.00%

2016 Annual Report255
(Amount in millions of Renminbi, unless otherwise stated)
VI FINANCIAL RISK MANAGEMENT (Continued)
3 Credit risk (Continued)
3.5 Loans and advances (Continued)
(1) Concentrations of risk for loans and advances to customers (Continued)
(iv) Analysis of loans and advances to customers by collateral type
GroupAs at 31 December
2016 2015Amount % of total Amount % of total
Unsecured loans 2,913,913 29.22% 2,727,927 29.86%Guaranteed loans 2,025,819 20.31% 1,867,312 20.44%Collateralised and other secured loans — Loans secured by property and other immovable assets 3,991,922 40.03% 3,548,200 38.84% — Other pledged loans 1,041,708 10.44% 992,421 10.86%
Total loans and advances to customers 9,973,362 100.00% 9,135,860 100.00%
Chinese mainland
As at 31 December2016 2015
Amount % of total Amount % of totalUnsecured loans 2,005,701 25.65% 1,925,265 26.74%Guaranteed loans 1,667,546 21.33% 1,583,108 21.99%Collateralised and other secured loans — Loans secured by property and
other immovable assets 3,363,869 43.03% 2,992,839 41.57% — Other pledged loans 781,392 9.99% 697,882 9.70%
Total loans and advances to customers 7,818,508 100.00% 7,199,094 100.00%

2016 Annual Report 256
Notes to the Consolidated Financial Statements
VI FINANCIAL RISK MANAGEMENT (Continued)
3 Credit risk (Continued)
3.5 Loans and advances (Continued)
(2) Analysis of loans and advances to customers by overdue and impaired status
As at 31 DecemberGroup Chinese mainland
2016 2015 2016 2015Corporate loans and advances — Neither past due nor impaired 6,401,135 6,229,020 4,670,792 4,665,423 — Past due but not impaired 51,520 35,316 49,627 31,746 — Impaired 116,314 105,576 112,763 103,192
Subtotal 6,568,969 6,369,912 4,833,182 4,800,361
Personal loans — Neither past due nor impaired 3,350,369 2,713,972 2,935,352 2,351,401 — Past due but not impaired 25,027 27,315 21,279 22,889 — Impaired 28,997 24,661 28,695 24,443
Subtotal 3,404,393 2,765,948 2,985,326 2,398,733
Total 9,973,362 9,135,860 7,818,508 7,199,094
(i) Loans and advances neither past due nor impaired
The Group classifies loans and advances based on regulatory guidance including the Guideline issued by the CBRC as set out in Note VI.3.1. The loans and advances neither past due nor impaired are classified under these principles and guidelines as set out in the table below.
GroupAs at 31 December
2016 2015
Pass Special-mention Total Pass Special-mention Total
Corporate loans
and advances 6,164,951 236,184 6,401,135 6,052,761 176,259 6,229,020
Personal loans 3,349,132 1,237 3,350,369 2,712,922 1,050 2,713,972
Total 9,514,083 237,421 9,751,504 8,765,683 177,309 8,942,992
Chinese mainlandAs at 31 December
2016 2015
Pass Special-mention Total Pass Special-mention Total
Corporate loans
and advances 4,449,893 220,899 4,670,792 4,497,469 167,954 4,665,423
Personal loans 2,935,191 161 2,935,352 2,351,299 102 2,351,401
Total 7,385,084 221,060 7,606,144 6,848,768 168,056 7,016,824

2016 Annual Report257
(Amount in millions of Renminbi, unless otherwise stated)
VI FINANCIAL RISK MANAGEMENT (Continued)
3 Credit risk (Continued)
3.5 Loans and advances (Continued)
(2) Analysis of loans and advances to customers by overdue and impaired status (Continued)
(i) Loans and advances neither past due nor impaired (Continued)
Collectively assessed impairment allowances are provided on loans and advances neither past due nor impaired to estimate losses that have been incurred but not yet specifically identified. As part of this assessment, the Group considers information collected as part of the process to classify loans and advances under the CBRC regulatory guidelines, as well as additional information on industry and portfolio exposure.
(ii) Loans and advances past due but not impaired
The total amount of loans and advances that were past due but not impaired is as follows:
Group
Within 1 month
1–3 months
More than 3 months Total
As at 31 December 2016Corporate loans and advances 28,912 22,607 1 51,520Personal loans 14,330 10,657 40 25,027
Total 43,242 33,264 41 76,547
As at 31 December 2015Corporate loans and advances 27,271 7,727 318 35,316Personal loans 14,925 12,361 29 27,315
Total 42,196 20,088 347 62,631
Chinese mainland
Within 1 month
1–3months
More than 3 months Total
As at 31 December 2016Corporate loans and advances 27,471 22,156 – 49,627Personal loans 11,132 10,147 – 21,279
Total 38,603 32,303 – 70,906
As at 31 December 2015Corporate loans and advances 23,924 7,589 233 31,746Personal loans 10,953 11,936 – 22,889
Total 34,877 19,525 233 54,635
Collateral held against loans and advances to customers which have been overdue for more than 3 months principally includes properties, equipment and cash deposits.

2016 Annual Report 258
Notes to the Consolidated Financial Statements
VI FINANCIAL RISK MANAGEMENT (Continued)
3 Credit risk (Continued)
3.5 Loans and advances (Continued)
(2) Analysis of loans and advances to customers by overdue and impaired status (Continued)
(iii) Identified impaired loans and advances
(a) Impaired loans and advances by geographical area
GroupAs at 31 December
2016 2015
Amount % of totalImpaired
loan ratio Amount % of totalImpaired
loan ratioChinese mainland 141,458 97.35% 1.81% 127,635 98.00% 1.77%Hong Kong, Macau and Taiwan 1,630 1.12% 0.13% 1,482 1.14% 0.13%Other countries and regions 2,223 1.53% 0.24% 1,120 0.86% 0.13%
Total 145,311 100.00% 1.46% 130,237 100.00% 1.43%
Chinese mainlandAs at 31 December
2016 2015
Amount % of totalImpaired
loan ratio Amount % of totalImpaired
loan ratioNorthern China 15,863 11.22% 1.26% 20,363 15.95% 1.76%Northeastern China 26,342 18.62% 5.33% 8,081 6.33% 1.67%Eastern China 54,521 38.54% 1.76% 54,508 42.71% 1.90%Central and Southern China 28,774 20.34% 1.45% 29,970 23.48% 1.69%Western China 15,958 11.28% 1.61% 14,713 11.53% 1.59%
Total 141,458 100.00% 1.81% 127,635 100.00% 1.77%
(b) Impaired loans and advances by customer type
GroupAs at 31 December
2016 2015
Amount % of totalImpaired
loan ratio Amount % of totalImpaired
loan ratioCorporate loans and advances 116,314 80.04% 1.77% 105,576 81.06% 1.66%Personal loans 28,997 19.96% 0.85% 24,661 18.94% 0.89%
Total 145,311 100.00% 1.46% 130,237 100.00% 1.43%
Chinese mainlandAs at 31 December
2016 2015
Amount % of totalImpaired
loan ratio Amount % of totalImpaired
loan ratioCorporate loans and advances 112,763 79.71% 2.33% 103,192 80.85% 2.15%Personal loans 28,695 20.29% 0.96% 24,443 19.15% 1.02%
Total 141,458 100.00% 1.81% 127,635 100.00% 1.77%

2016 Annual Report259
(Amount in millions of Renminbi, unless otherwise stated)
VI FINANCIAL RISK MANAGEMENT (Continued)
3 Credit risk (Continued)
3.5 Loans and advances (Continued)
(2) Analysis of loans and advances to customers by overdue and impaired status (Continued)
(iii) Identified impaired loans and advances (Continued)
(c) Impaired loans and advances by geographical area and industry
As at 31 December2016 2015
Amount % of totalImpaired
loan ratio Amount % of totalImpaired
loan ratioChinese mainlandCorporate loans and advances Manufacturing 58,433 40.22% 4.29% 44,385 34.08% 3.17% Commerce and services 33,918 23.34% 3.81% 35,561 27.30% 4.14% Transportation, storage and postal services 5,395 3.71% 0.64% 7,878 6.05% 1.01% Real estate 3,411 2.35% 0.87% 4,205 3.23% 0.91% Production and supply of electricity, heating, gas and water 3,018 2.08% 0.73% 3,427 2.63% 0.86% Financial services 2 – – 136 0.10% 0.06% Mining 4,232 2.91% 2.10% 3,337 2.56% 1.46% Construction 2,832 1.95% 1.80% 3,150 2.42% 1.95% Water, environment and public utility management 295 0.20% 0.20% 282 0.22% 0.17% Public utilities 221 0.15% 0.22% 299 0.23% 0.29% Other 1,006 0.69% 3.45% 532 0.41% 1.91%
Subtotal 112,763 77.60% 2.33% 103,192 79.23% 2.15%
Personal loans Mortgages 9,675 6.66% 0.41% 7,118 5.47% 0.40% Credit cards 9,954 6.85% 3.45% 8,636 6.63% 3.37% Other 9,066 6.24% 2.51% 8,689 6.67% 2.39%
Subtotal 28,695 19.75% 0.96% 24,443 18.77% 1.02%
Total for Chinese mainland 141,458 97.35% 1.81% 127,635 98.00% 1.77%
Hong Kong, Macau, Taiwan and other countries and regions 3,853 2.65% 0.18% 2,602 2.00% 0.13%
Total 145,311 100.00% 1.46% 130,237 100.00% 1.43%

2016 Annual Report 260
Notes to the Consolidated Financial Statements
VI FINANCIAL RISK MANAGEMENT (Continued)
3 Credit risk (Continued)
3.5 Loans and advances (Continued)
(2) Analysis of loans and advances to customers by overdue and impaired status (Continued)
(iii) Identified impaired loans and advances (Continued)
(d) Impaired loans and advances and related allowance by geographical area
Impaired loans
Individually assessed
allowance
Collectively assessed
allowance NetAs at 31 December 2016Chinese mainland 141,458 (67,915) (27,472) 46,071Hong Kong, Macau and Taiwan 1,630 (773) (82) 775Other countries and regions 2,223 (1,405) (112) 706
Total 145,311 (70,093) (27,666) 47,552
As at 31 December 2015Chinese mainland 127,635 (59,279) (22,227) 46,129Hong Kong, Macau and Taiwan 1,482 (752) (78) 652Other countries and regions 1,120 (760) (39) 321
Total 130,237 (60,791) (22,344) 47,102
For description of allowances on identified impaired loans and advances, refer to Note V.18.3.
(e) Within impaired corporate loans and advances, the portions covered and not covered by collateral held are as follows:
As at 31 DecemberGroup Chinese mainland
2016 2015 2016 2015Portion covered 73,121 73,143 71,794 72,103Portion not covered 43,193 32,433 40,969 31,089
Total 116,314 105,576 112,763 103,192
Fair value of collateral held 29,304 24,894 28,471 24,041
Collateral of corporate loans and advances includes land, buildings, equipment and others. The fair value of collateral was estimated by the Group with reference to the latest available external valuations adjusted for recent experience in disposal of collateral as well as the market conditions.

2016 Annual Report261
(Amount in millions of Renminbi, unless otherwise stated)
VI FINANCIAL RISK MANAGEMENT (Continued)
3 Credit risk (Continued)
3.5 Loans and advances (Continued)
(3) Loans and advances rescheduled
Rescheduling (referring to loans and other assets that have been restructured and renegotiated) is a voluntary or, to a limited extent, court-supervised procedure, through which the Group and a borrower and/or its guarantor, if any, rescheduled credit terms as a result of deterioration in the borrower’s financial condition or of the borrower’s inability to make payments when due. The Group reschedules a non-performing loan only if the borrower has good prospects. In addition, prior to approving the rescheduling of loans, the Group typically requires additional guarantees, pledges and/or collateral, or the assumption of the loan by a borrower with better repayment ability.
Rescheduled loans are generally subject to a surveillance period of six months. During the surveillance period, rescheduled loans remain as non-performing loans and the Group monitors the borrower’s business operations and loan repayment patterns. After the surveillance period, rescheduled loans may be upgraded to “special-mention” upon review if certain criteria are met. If the rescheduled loans fall overdue or if the borrower is unable to demonstrate its repayment ability, these loans will be reclassified to “doubtful” or below. All rescheduled loans within surveillance period are determined to be impaired as at 31 December 2016 and 2015.
As at 31 December 2016 and 2015, within impaired loans and advances, rescheduled loans and advances that were overdue for 90 days or less were insignificant.

2016 Annual Report 262
Notes to the Consolidated Financial Statements
VI FINANCIAL RISK MANAGEMENT (Continued)
3 Credit risk (Continued)
3.5 Loans and advances (Continued)
(4) Overdue loans and advances to customers
(i) Analysis of overdue loans and advances to customers by collateral type and overdue days
GroupPast due
up to 90 daysPast due
91–360 daysPast due
361 days–3 yearsPast due
over 3 years TotalAs at 31 December 2016Unsecured loans 11,036 15,530 5,197 788 32,551Guaranteed loans 48,645 19,293 21,585 4,595 94,118Collateralised and other secured loans — Loans secured by property and other immovable assets 34,906 21,952 15,217 5,406 77,481 — Other pledged loans 7,694 1,292 1,105 350 10,441
Total 102,281 58,067 43,104 11,139 214,591
As at 31 December 2015Unsecured loans 17,438 13,626 6,740 2,713 40,517Guaranteed loans 19,002 27,470 9,287 4,328 60,087Collateralised and other secured loans — Loans secured by property and other immovable assets 34,465 19,904 10,135 5,347 69,851 — Other pledged loans 1,513 4,380 2,260 419 8,572
Total 72,418 65,380 28,422 12,807 179,027
Chinese mainland
Past due up to 90 days
Past due 91–360 days
Past due 361 days–3 years
Past dueover 3 years Total
As at 31 December 2016Unsecured loans 9,815 15,351 5,096 659 30,921Guaranteed loans 48,492 18,691 21,306 4,144 92,633Collateralised and other secured loans — Loans secured by property and other immovable assets 30,431 21,685 15,019 5,357 72,492 — Other pledged loans 7,405 1,082 1,060 350 9,897
Total 96,143 56,809 42,481 10,510 205,943
As at 31 December 2015Unsecured loans 16,410 13,479 6,586 2,664 39,139Guaranteed loans 16,501 27,455 9,268 3,900 57,124Collateralised and other secured loans — Loans secured by property and other immovable assets 30,140 19,691 10,040 5,337 65,208 — Other pledged loans 1,045 4,236 2,175 413 7,869
Total 64,096 64,861 28,069 12,314 169,340

2016 Annual Report263
(Amount in millions of Renminbi, unless otherwise stated)
VI FINANCIAL RISK MANAGEMENT (Continued)
3 Credit risk (Continued)
3.5 Loans and advances (Continued)
(4) Overdue loans and advances to customers (Continued)
(ii) Analysis of overdue loans and advances by geographical area
As at 31 December2016 2015
Chinese mainland 205,943 169,340Hong Kong, Macau and Taiwan 6,032 5,882Other countries and regions 2,616 3,805
Subtotal 214,591 179,027Percentage 2.15% 1.96%Less: total loans and advances to customers which have been overdue for less than 3 months (102,281) (72,418)
Total loans and advances to customers which have been overdue for more than 3 months 112,310 106,609
Individually assessed impairment allowance — for loans and advances to customers which have been overdue for more than 3 months (51,834) (49,286)
3.6 Due from and placements with and loans to banks and other financial institutions
Banks and other financial institutions comprise those institutions in Chinese mainland, Hong Kong, Macau, Taiwan and other countries and regions.
The Group monitors the credit risk of counterparties by collecting and analysing counterparty information and establishing credit limits taking into account the nature, size and credit rating of counterparties.
As at 31 December 2016, the majority of the balances of due from and placements with and loans to banks and other financial institutions were with banks in Chinese mainland, including policy banks, large-sized and medium-sized commercial banks (Note V.13 and Note V.15). As at 31 December 2016, the majority of the credit ratings of the banks in Hong Kong, Macau, Taiwan and other countries and regions were above A.
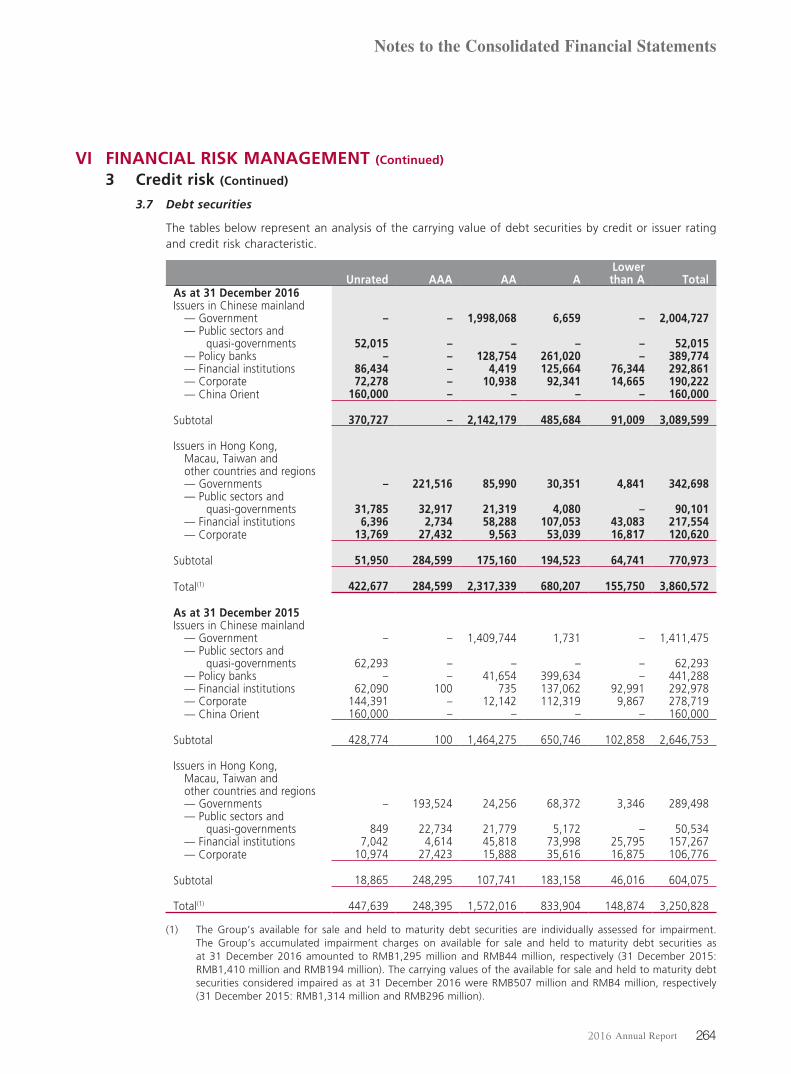
2016 Annual Report 264
Notes to the Consolidated Financial Statements
VI FINANCIAL RISK MANAGEMENT (Continued)
3 Credit risk (Continued)
3.7 Debt securities
The tables below represent an analysis of the carrying value of debt securities by credit or issuer rating and credit risk characteristic.
Unrated AAA AA ALower than A Total
As at 31 December 2016Issuers in Chinese mainland — Government – – 1,998,068 6,659 – 2,004,727 — Public sectors and quasi-governments 52,015 – – – – 52,015 — Policy banks – – 128,754 261,020 – 389,774 — Financial institutions 86,434 – 4,419 125,664 76,344 292,861 — Corporate 72,278 – 10,938 92,341 14,665 190,222 — China Orient 160,000 – – – – 160,000
Subtotal 370,727 – 2,142,179 485,684 91,009 3,089,599
Issuers in Hong Kong, Macau, Taiwan and other countries and regions — Governments – 221,516 85,990 30,351 4,841 342,698 — Public sectors and quasi-governments 31,785 32,917 21,319 4,080 – 90,101 — Financial institutions 6,396 2,734 58,288 107,053 43,083 217,554 — Corporate 13,769 27,432 9,563 53,039 16,817 120,620
Subtotal 51,950 284,599 175,160 194,523 64,741 770,973
Total(1) 422,677 284,599 2,317,339 680,207 155,750 3,860,572
As at 31 December 2015Issuers in Chinese mainland — Government – – 1,409,744 1,731 – 1,411,475 — Public sectors and quasi-governments 62,293 – – – – 62,293 — Policy banks – – 41,654 399,634 – 441,288 — Financial institutions 62,090 100 735 137,062 92,991 292,978 — Corporate 144,391 – 12,142 112,319 9,867 278,719 — China Orient 160,000 – – – – 160,000
Subtotal 428,774 100 1,464,275 650,746 102,858 2,646,753
Issuers in Hong Kong, Macau, Taiwan and other countries and regions — Governments – 193,524 24,256 68,372 3,346 289,498 — Public sectors and quasi-governments 849 22,734 21,779 5,172 – 50,534 — Financial institutions 7,042 4,614 45,818 73,998 25,795 157,267 — Corporate 10,974 27,423 15,888 35,616 16,875 106,776
Subtotal 18,865 248,295 107,741 183,158 46,016 604,075
Total(1) 447,639 248,395 1,572,016 833,904 148,874 3,250,828
(1) The Group’s available for sale and held to maturity debt securities are individually assessed for impairment. The Group’s accumulated impairment charges on available for sale and held to maturity debt securities as at 31 December 2016 amounted to RMB1,295 million and RMB44 million, respectively (31 December 2015: RMB1,410 million and RMB194 million). The carrying values of the available for sale and held to maturity debt securities considered impaired as at 31 December 2016 were RMB507 million and RMB4 million, respectively (31 December 2015: RMB1,314 million and RMB296 million).
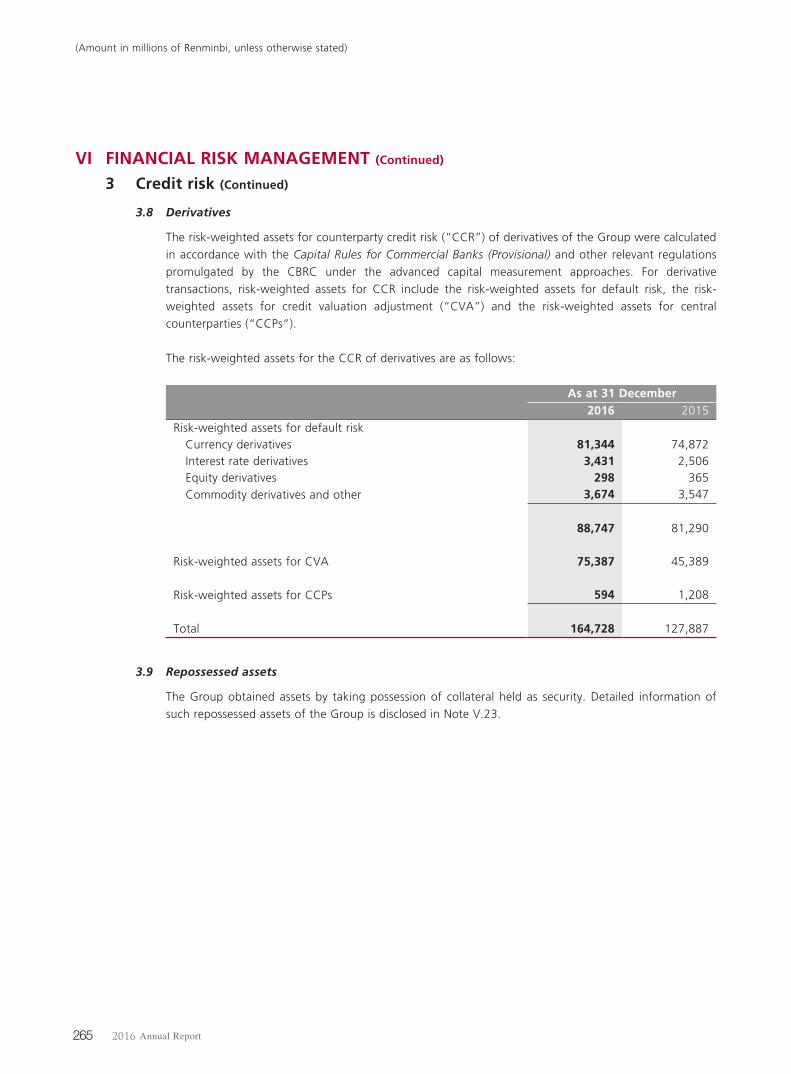
2016 Annual Report265
(Amount in millions of Renminbi, unless otherwise stated)
VI FINANCIAL RISK MANAGEMENT (Continued)
3 Credit risk (Continued)
3.8 Derivatives
The risk-weighted assets for counterparty credit risk (“CCR”) of derivatives of the Group were calculated in accordance with the Capital Rules for Commercial Banks (Provisional) and other relevant regulations promulgated by the CBRC under the advanced capital measurement approaches. For derivative transactions, risk-weighted assets for CCR include the risk-weighted assets for default risk, the risk-weighted assets for credit valuation adjustment (“CVA”) and the risk-weighted assets for central counterparties (“CCPs”).
The risk-weighted assets for the CCR of derivatives are as follows:
As at 31 December2016 2015
Risk-weighted assets for default risk Currency derivatives 81,344 74,872 Interest rate derivatives 3,431 2,506 Equity derivatives 298 365 Commodity derivatives and other 3,674 3,547
88,747 81,290
Risk-weighted assets for CVA 75,387 45,389
Risk-weighted assets for CCPs 594 1,208
Total 164,728 127,887
3.9 Repossessed assets
The Group obtained assets by taking possession of collateral held as security. Detailed information of such repossessed assets of the Group is disclosed in Note V.23.

2016 Annual Report 266
Notes to the Consolidated Financial Statements
VI FINANCIAL RISK MANAGEMENT (Continued)
4 Market risk
4.1 Overview
The Group is exposed to market risks from on-balance and off-balance businesses, that may cause losses to the Group as a result of adverse changes in market prices of interest rate, exchange rate, equities and commodities. Market risk arises from open positions in the trading and banking books. Both the Group’s trading book and banking book face market risks. The trading book consists of positions in financial instruments and commodities that are held with trading intent or in order to hedge other elements of the trading book. The banking book consists of financial instruments not included in the trading book (including those financial instruments purchased with surplus funds and managed in the investment book).
The Board of Directors of the Group takes the ultimate responsibility for the oversight of market risk management, including the approval of market risk management policies and procedures and the determination of market risk tolerance. Senior management is responsible for execution of such policies and ensuring that the level of market risk is within the risk appetite determined by the Board, while meeting the Group’s business objectives.
Market risk management departments are responsible for the identification, measurement, monitoring, control and reporting of market risks on a Group basis. Business units are responsible for monitoring and reporting of market risk within their respective business lines.
4.2 Market risk measurement techniques and limits
(1) Trading book
For the purpose of market risk management in the trading book, the Group monitors trading book Value at Risk (VaR) limits, stress testing results and exposure limits and tracks each trading desk and dealer’s observance of each limit on a daily basis.
VaR is used to estimate the largest potential loss arising from adverse market movements in a specific holding period and within a certain confidence level.
VaR is performed separately by the Bank and its major subsidiaries that are exposed to market risk, BOCHK (Holdings) and BOCI. The Bank, BOCHK (Holdings) and BOCI used a 99% level of confidence (therefore statistical probability of 1% that actual losses could be greater than the VaR estimate) and a historical simulation model to calculate the VaR estimate. The holding period of the VaR calculations is one day. To enhance the Group’s market risk management, the Group has established the market risk data mart, which enabled a group level trading book VaR calculation on a daily basis.
Accuracy and reliability of the VaR model is verified by daily back-testing of the VaR result on trading book. The back-testing results are regularly reported to senior management.
The Group utilises stress testing as an effective supplement to the trading book VaR analysis. Stress testing scenarios are performed based on the characteristics of trading transactions to simulate and estimate losses in adverse and exceptional market conditions. To address changes in the financial markets, the Group enhances its market risk identification capabilities by continuously modifying and improving the trading book stress testing scenarios and measurement methodologies in order to capture the potential impact to transaction market prices stemming from changes in market prices and volatility.

2016 Annual Report267
(Amount in millions of Renminbi, unless otherwise stated)
VI FINANCIAL RISK MANAGEMENT (Continued)
4 Market risk (Continued)
4.2 Market risk measurement techniques and limits (Continued)
(1) Trading book (Continued)
The table below shows the VaR of the trading book by type of risk during the years ended 31 December 2016 and 2015:
Unit: USD million
Year ended 31 December2016 2015
Average High Low Average High LowThe Bank’s trading VaRInterest rate risk 10.24 16.45 6.59 6.98 13.32 3.44Foreign exchange risk 5.24 9.75 2.62 3.86 8.41 1.81Volatility risk 0.69 1.55 0.29 0.30 0.81 0.09Commodity risk 0.93 1.56 0.01 0.71 1.32 0.06
Total of the Bank’s trading VaR 10.31 17.45 6.75 7.91 14.41 4.09
The Bank’s VaR for the years ended 31 December 2016 and 2015 were calculated on the Group’s trading positions, excluding those of BOCHK (Holdings) and BOCI.
The reporting of risk in relation to bullion is included in foreign exchange risk above.
Unit: USD million
Year ended 31 December2016 2015
Average High Low Average High LowBOCHK (Holdings)’s trading VaR(i)
Interest rate risk 3.71 7.37 1.97 2.67 4.85 1.65Foreign exchange risk 4.62 8.05 3.13 1.70 2.62 1.13Equity risk 0.27 0.74 0.00 0.02 0.05 0.00Commodity risk 0.03 0.18 0.00 0.00 0.02 0.00
Total BOCHK (Holdings)’s trading VaR 5.92 9.09 3.79 3.27 4.95 2.30
BOCI’s trading VaR(ii)
Equity derivatives unit 1.33 2.68 0.71 1.35 2.29 0.50Fixed income unit 0.84 1.57 0.42 0.95 1.76 0.66Global commodity unit 0.11 0.33 0.04 0.08 0.32 0.04
Total BOCI’s trading VaR 2.28 3.44 1.63 2.33 3.74 1.31
(i) BOCHK (Holdings)’s trading VaR for the years ended 31 December 2016 and 2015 was calculated
including the subsidiaries of NCB, BOC Credit Card (International) Limited and Chiyu Bank. Since NCB
was disposed of on 30 May 2016, BOCHK (Holdings)’s VaR of the trading book for the year ended 31
December 2016 only included NCB’s VaR for the five-month period ended 30 May 2016.
(ii) BOCI monitors its trading VaR for equity derivatives unit, fixed income unit and global commodity unit
separately, which include equity risk, interest rate risk, foreign exchange risk and commodity risk.

2016 Annual Report 268
Notes to the Consolidated Financial Statements
VI FINANCIAL RISK MANAGEMENT (Continued)
4 Market risk (Continued)
4.2 Market risk measurement techniques and limits (Continued)
(1) Trading book (Continued)
VaR for each risk factor is the independently derived largest potential loss in a specific holding period and within a certain confidence level due to fluctuations solely in that risk factor. The individual VaRs did not add up to the total VaR as there was diversification effect due to correlation amongst the risk factors.
(2) Banking book
The banking book is exposed to interest rate risk arising from mismatches in repricing periods and inconsistent adjustments between the benchmark interest rates of assets and liabilities. The Group takes on exposure to interest rate risk and fluctuations in market interest rates will impact the Group’s financial position.
The Group assesses interest rate risk in the banking book primarily through an interest rate repricing gap analysis. Interest rate repricing gap analysis measures the difference between the amount of interest-earning assets and interest-bearing liabilities that must be repriced within certain periods. The Group employs the interest rate repricing gap analysis and takes impact of the off-balance sheet business into consideration when calculating the indications of sensitivity of earnings to changing interest rates. The interest rate gap analysis is set out in Note VI.4.3 and also covers the trading book.
Sensitivity analysis on Net interest income
The Group performs sensitivity analysis by measuring the impact of a change in interest rates on “Net interest income”. This analysis assumes that yield curves change in parallel while the structure of assets and liabilities remains unchanged, and does not take changes in customer behaviour, basis risk or any prepayment options on debt securities into consideration. The Group makes timely adjustment to the structure of assets and liabilities based on changes in the market situation, and controls the fluctuation of net interest income within an acceptable level.
The table below illustrates the potential impact of a 25 basis points interest rate move on the net interest income of the Group. The actual situation may be different from the assumptions used and it is possible that actual outcomes could differ from the estimated impact on net interest income of the Group.
(Decrease)/increase in net interest incomeAs at 31 December
2016 2015+ 25 basis points parallel move in all yield curves (3,001) (2,566)– 25 basis points parallel move in all yield curves 3,001 2,566
Given the nature of demand deposits, their interest rate fluctuations are less volatile than those of other products. Had the impact of yield curves movement on interest expenses related to demand deposits been excluded, the net interest income for the next twelve months from the reporting date would increase or decrease by RMB12,367 million (2015: RMB10,716 million) for every 25 basis points upwards or downwards parallel shift, respectively.

2016 Annual Report269
(Amount in millions of Renminbi, unless otherwise stated)
VI FINANCIAL RISK MANAGEMENT (Continued)
4 Market risk (Continued)
4.3 GAP analysis
The tables below summarise the Group’s exposure to interest rate risks. It includes the Group’s assets and liabilities at carrying amounts, categorised by the earlier of contractual repricing or maturity dates.
As at 31 December 2016
Less than 1 month
Between 1 and 3 months
Between 3 and 12 months
Between 1 and 5
yearsOver
5 yearsNon-interest
bearing Total
AssetsCash and due from banks and other financial institutions 176,032 223,847 178,222 2,020 – 79,861 659,982Balances with central banks 2,064,238 1,431 1,364 781 – 203,826 2,271,640Placements with and loans to banks and other financial institutions 231,961 110,994 224,351 26,742 – – 594,048Financial assets at fair value through profit or loss 9,184 19,636 29,709 23,198 30,467 11,896 124,090Derivative financial assets – – – – – 130,549 130,549Loans and advances to customers, net 2,641,864 2,056,767 4,581,188 104,586 54,745 296,496 9,735,646Financial investments — available for sale 73,205 175,806 245,619 662,649 394,030 58,521 1,609,830 — held to maturity 17,739 63,545 216,412 966,564 578,783 – 1,843,043 — loans and receivables 4,341 15,611 16,767 234,036 123,788 1,378 395,921Assets held for sale 27,428 5,973 5,630 4,285 3 7,052 50,371Other 3,536 578 3,413 – – 726,242 733,769
Total assets 5,249,528 2,674,188 5,502,675 2,024,861 1,181,816 1,515,821 18,148,889
LiabilitiesDue to banks and other financial institutions 921,705 97,435 180,102 73,590 – 147,695 1,420,527Due to central banks 343,246 131,312 380,647 11,862 – 27 867,094Placements from banks and other financial institutions 178,931 62,562 61,150 149 – – 302,792Derivative financial liabilities – – – – – 107,109 107,109Due to customers 7,405,926 1,341,350 2,391,472 1,611,515 13,319 176,166 12,939,748Bonds issued 27,287 27,661 56,063 198,432 52,875 – 362,318Liabilities classified as held for sale 25,716 6,645 6,392 60 – 3,675 42,488Other 15,558 20,804 4,522 2,144 605 576,088 619,721
Total liabilities 8,918,369 1,687,769 3,080,348 1,897,752 66,799 1,010,760 16,661,797
Total interest repricing gap (3,668,841) 986,419 2,422,327 127,109 1,115,017 505,061 1,487,092

2016 Annual Report 270
Notes to the Consolidated Financial Statements
VI FINANCIAL RISK MANAGEMENT (Continued)
4 Market risk (Continued)
4.3 GAP analysis (Continued)
As at 31 December 2015
Less than 1 month
Between 1 and 3 months
Between 3 and 12
months
Between 1 and 5
yearsOver
5 yearsNon-interest
bearing Total
AssetsCash and due from banks and other financial institutions 124,019 91,767 361,286 1,827 – 75,479 654,378Balances with central banks 2,064,120 – – – – 131,943 2,196,063Placements with and loans to banks and other financial institutions 158,286 71,528 173,974 23,060 – – 426,848Financial assets at fair value through profit or loss 8,972 13,959 20,211 30,615 30,325 14,980 119,062Derivative financial assets – – – – – 82,236 82,236Loans and advances to customers, net 2,271,591 1,900,358 4,337,626 93,349 59,740 272,531 8,935,195Financial investments — available for sale 64,132 151,607 167,734 455,700 192,482 46,878 1,078,533 — held to maturity 46,486 91,150 301,202 819,218 532,734 – 1,790,790 — loans and receivables 39,338 53,237 204,940 206,918 102,277 – 606,710Assets held for sale 135,688 35,564 39,997 21,372 443 4,873 237,937
Other 6,006 1,907 588 – – 679,344 687,845
Total assets 4,918,638 2,411,077 5,607,558 1,652,059 918,001 1,308,264 16,815,597
LiabilitiesDue to banks and other financial institutions 1,170,766 60,558 221,521 129,352 – 182,123 1,764,320Due to central banks 230,608 80,054 83,282 19,335 – 2,430 415,709Placements from banks and other financial institutions 237,435 181,274 27,917 1,318 – – 447,944Derivative financial liabilities – – – – – 69,160 69,160Due to customers 6,529,728 1,221,139 2,225,183 1,581,239 3,628 168,254 11,729,171Bonds issued 5,828 9,235 32,987 126,217 108,662 – 282,929Liabilities classified as held for sale 115,324 31,314 33,242 4,999 16 11,955 196,850
Other 9,250 3,689 2,960 12,116 17,017 506,877 551,909
Total liabilities 8,298,939 1,587,263 2,627,092 1,874,576 129,323 940,799 15,457,992
Total interest repricing gap (3,380,301) 823,814 2,980,466 (222,517) 788,678 367,465 1,357,605

2016 Annual Report271
(Amount in millions of Renminbi, unless otherwise stated)
VI FINANCIAL RISK MANAGEMENT (Continued)
4 Market risk (Continued)
4.4 Foreign currency risk
The Group conducts a substantial portion of its business in RMB, with certain transactions denominated in USD, HKD and, to a much lesser extent, other currencies. The major subsidiary, BOCHK Group, conducts the majority of its business in HKD, RMB and USD. The Group endeavours to manage its sources and uses of foreign currencies to minimise potential mismatches in accordance with management directives.
The Group manages its exposure to currency exchange risk through management of its net foreign currency position and monitors its foreign currency risk on trading books using VaR (Note VI.4.2). Meanwhile, the Group performs currency risk sensitivity analysis to estimate the effect of potential exchange rate changes of foreign currencies against RMB on profit before tax and equity.
The tables below indicate a sensitivity analysis of exchange rate changes of the currencies to which the Group had significant exposure. The analysis calculates the effect of a reasonably possible movement in the currency rates against RMB, with all other variables held constant, on profit before tax and equity. A negative amount in the table reflects a potential net reduction in profit before tax or equity, while a positive amount reflects a potential net increase. Such analysis does not take into account the correlation effect of changes in different foreign currencies, any further actions that may have been or could be taken by management after the financial reporting date to mitigate the effect of exchange differences, nor any consequential changes in the foreign currency positions.
Effect on profit before tax Effect on equity*
CurrencyChange in
currency rate
As at 31 December
2016
As at 31 December
2015
As at 31 December
2016
As at 31 December
2015USD +1% 631 654 325 280HKD +1% (247) (472) 2,012 1,471
* Effect on other comprehensive income (irrespective of income tax effect).
While the table above indicates the effect on profit before tax and equity of 1% appreciation of USD and HKD, there will be an opposite effect with the same amounts if the currencies depreciate by the same percentage.

2016 Annual Report 272
Notes to the Consolidated Financial Statements
VI FINANCIAL RISK MANAGEMENT (Continued)
4 Market risk (Continued)
4.4 Foreign currency risk (Continued)
The tables below summarise the Group’s exposure to foreign currency exchange rate risk as at 31 December 2016 and 2015. The Group’s exposure to RMB is provided in the tables below for comparison purposes. Included in the table are the carrying amounts of the assets and liabilities of the Group along with off-balance sheet positions and credit commitments in RMB equivalent, categorised by the original currencies. Derivative financial instruments are included in the net off-balance sheet position using notional amounts.
As at 31 December 2016
RMB USD HKD EURO JPY GBP Other Total
AssetsCash and due from banks and other financial institutions 498,095 107,735 14,324 6,477 15,944 1,700 15,707 659,982Balances with central banks 1,807,526 340,513 4,510 32,245 21,640 33,772 31,434 2,271,640Placements with and loans to banks and other financial institutions 379,735 123,994 36,454 2,286 3,886 255 47,438 594,048Financial assets at fair value through profit or loss 50,702 47,475 23,527 1,540 360 475 11 124,090Derivative financial assets 56,291 4,507 52,945 695 286 12,085 3,740 130,549Loans and advances to customers, net 7,399,294 1,167,127 722,240 190,822 11,866 31,372 212,925 9,735,646Financial investments — available for sale 894,034 416,315 125,060 22,604 87,159 7,609 57,049 1,609,830 — held to maturity 1,676,845 153,896 4,035 1,941 720 516 5,090 1,843,043 — loans and receivables 379,354 1,734 838 – – – 13,995 395,921Assets held for sale 10,556 8,860 29,185 229 78 224 1,239 50,371Other 263,114 125,563 160,709 2,472 1,213 1,415 179,283 733,769
Total assets 13,415,546 2,497,719 1,173,827 261,311 143,152 89,423 567,911 18,148,889
LiabilitiesDue to banks and other financial institutions 785,818 394,408 31,258 41,011 15,053 6,685 146,294 1,420,527Due to central banks 610,339 242,546 9,931 2,448 – 1,830 – 867,094Placements from banks and other financial institutions 115,806 146,285 3,816 21,877 4,815 7,215 2,978 302,792Derivative financial liabilities 33,338 3,299 50,653 771 204 12,118 6,726 107,109Due to customers 9,744,207 1,538,408 1,000,075 178,965 56,706 60,916 360,471 12,939,748Bonds issued 202,744 137,355 1,287 14,709 – 2,034 4,189 362,318Liabilities classified as held for sale 5,044 7,278 28,398 253 76 215 1,224 42,488Other 341,041 71,241 186,466 2,482 1,398 1,415 15,678 619,721
Total liabilities 11,838,337 2,540,820 1,311,884 262,516 78,252 92,428 537,560 16,661,797
Net on-balance sheet position 1,577,209 (43,101) (138,057) (1,205) 64,900 (3,005) 30,351 1,487,092Net off-balance sheet position (313,211) 84,443 298,500 10,334 (64,129) 4,699 2,668 23,304Credit commitments 2,249,059 861,382 255,971 94,639 7,432 39,121 82,004 3,589,608

2016 Annual Report273
(Amount in millions of Renminbi, unless otherwise stated)
VI FINANCIAL RISK MANAGEMENT (Continued)
4 Market risk (Continued)
4.4 Foreign currency risk (Continued)
As at 31 December 2015
RMB USD HKD EURO JPY GBP Other TotalAssetsCash and due from banks and other financial institutions 547,998 64,079 17,314 6,457 7,234 2,374 8,922 654,378Balances with central banks 1,719,641 344,446 13,189 20,454 28,358 44,901 25,074 2,196,063Placements with and loans to banks and other financial institutions 273,947 82,142 30,764 2,908 32 2,655 34,400 426,848Financial assets at fair value through profit or loss 46,844 52,709 18,831 580 17 81 – 119,062Derivative financial assets 29,044 2,213 35,320 438 312 11,200 3,709 82,236Loans and advances to customers, net 6,840,062 1,147,024 631,308 140,075 9,256 24,824 142,646 8,935,195Financial investments — available for sale 576,382 261,381 114,358 12,222 65,685 2,647 45,858 1,078,533 — held to maturity 1,618,055 160,191 5,702 117 647 584 5,494 1,790,790 — loans and receivables 591,781 2,978 2 – – – 11,949 606,710Assets held for sale 82,994 44,845 102,090 3,614 235 694 3,465 237,937
Other 269,996 114,845 109,632 2,057 2,809 1,793 186,713 687,845
Total assets 12,596,744 2,276,853 1,078,510 188,922 114,585 91,753 468,230 16,815,597
LiabilitiesDue to banks and other financial institutions 1,002,165 510,671 21,686 32,645 16,113 6,443 174,597 1,764,320Due to central banks 232,832 170,901 9,909 – – 2,067 – 415,709Placements from banks and other financial institutions 289,664 112,002 13,527 22,310 1,940 4,522 3,979 447,944Derivative financial liabilities 6,718 14,438 32,383 498 144 10,993 3,986 69,160Due to customers 9,114,667 1,201,162 881,340 148,277 45,044 44,191 294,490 11,729,171Bonds issued 167,300 102,956 788 8,321 – – 3,564 282,929Liabilities classified as held for sale 74,740 39,000 75,136 3,909 227 535 3,303 196,850
Other 327,837 62,504 144,082 2,463 426 2,263 12,334 551,909
Total liabilities 11,215,923 2,213,634 1,178,851 218,423 63,894 71,014 496,253 15,457,992
Net on-balance sheet position 1,380,821 63,219 (100,341) (29,501) 50,691 20,739 (28,023) 1,357,605Net off-balance sheet position (208,637) 22,587 181,262 36,718 (48,410) (18,568) 49,757 14,709Credit commitments 2,055,776 725,409 250,301 81,590 6,348 22,980 67,629 3,210,033

2016 Annual Report 274
Notes to the Consolidated Financial Statements
VI FINANCIAL RISK MANAGEMENT (Continued)
4 Market risk (Continued)
4.5 Price risk
The Group is exposed to equity price risk on its available for sale listed equity securities. As at 31 December 2016, a 5 percentage variance in listed equity prices from the year end price would impact the fair value of available for sale listed equity positions by RMB415 million (31 December 2015: RMB297 million). For those available for sale equities considered impaired, the impact would be taken to the income statement. The Group is also exposed to commodity risk, mainly related to bullion. The Group manages such risk together with foreign exchange risk (Note VI.4.2).
5 Liquidity risk
The liquidity risk means the risk that a commercial bank fails to timely acquire adequate funds at a reasonable cost to deal with repayment of debts at maturity, perform other payment obligations and meet other fund needs for normal business operation.
5.1 Liquidity risk management policy and process
The Bank continued to develop and improve its liquidity risk management system with the aim of effectively identifying, measuring, monitoring and controlling liquidity risk at the institution and group level, including that of branches, subsidiaries and business lines, thus ensuring that liquidity demand is met in a timely manner and at a reasonable cost.
The Group considers liquidity risk management a significant component of asset-liability management, and determines the size, structure and duration of assets and liabilities consistent with the principle of overall balance between assets and liabilities. The Group establishes its liquidity portfolio to mitigate liquidity risk, and to minimise the gaps in the amount and duration between the funding sources and the uses of funds. The Group refines its financing strategy, taking into consideration of various factors including customer risk sensitivity, financing cost and concentration of funding sources. In addition, the Group prioritises the development of customer deposits, dynamically adjusts the structure of fund sources by market-oriented financing modes, including due to banks and other financial institutions, inter-bank borrowing and improve the diversity and stability of financing sources.
Assets available to meet all of the liabilities and to cover outstanding loan commitments include “Cash and due from banks and other financial institutions”, “Balances with central banks”, “Placements with and loans to banks and other financial institutions” and “Loans and advances to customers, net”, etc. In the normal course of business, a proportion of short-term loans contractually repayable will be extended and a portion of short-term customer deposits will not be withdrawn upon maturity. The Group would also be able to meet unexpected net cash outflows by entering into repurchase and reverse repurchase transactions, and by selling securities and accessing additional funding sources.

2016 Annual Report275
(Amount in millions of Renminbi, unless otherwise stated)
VI FINANCIAL RISK MANAGEMENT (Continued)
5 Liquidity risk (Continued)
5.2 Maturity analysis
The tables below analyse the Group’s assets and liabilities into relevant maturity groupings based on the remaining period at the financial reporting date to the contractual maturity date. For purposes of the tables set forth, “Loans and advances to customers, net” are considered overdue only if principal payments are overdue. In addition, for loans and advances to customers that are repayable by installments, only the portion of the loan that is actually overdue is reported as overdue. Any part of the loan that is not due is reported according to residual maturity.
As at 31 December 2016
Overdue/Undated
On demand
Less than 1 month
Between 1 and 3 months
Between 3 and 12 months
Between 1 and 5
yearsOver
5 years Total
AssetsCash and due from banks and other financial institutions 22 171,837 84,034 223,847 178,222 2,020 – 659,982Balances with central banks 1,743,459 448,607 16,841 15,383 46,569 781 – 2,271,640Placements with and loans to banks and other financial institutions – – 229,651 106,802 229,002 28,593 – 594,048Financial assets at fair value through profit or loss 11,896 – 8,783 18,065 28,217 25,495 31,634 124,090Derivative financial assets – 13,239 15,745 23,369 62,855 12,310 3,031 130,549Loans and advances to customers, net 52,413 82,783 410,546 1,002,740 2,208,527 2,555,287 3,423,350 9,735,646Financial investments — available for sale 56,897 – 45,239 131,697 256,484 718,220 401,293 1,609,830 — held to maturity – – 10,623 45,020 212,939 983,275 591,186 1,843,043 — loans and receivables 1,378 – 4,291 14,221 14,073 234,830 127,128 395,921Assets held for sale 6,652 4,144 5,432 4,143 8,722 16,193 5,085 50,371Other 259,332 301,848 36,294 30,690 45,714 42,247 17,644 733,769
Total assets 2,132,049 1,022,458 867,479 1,615,977 3,291,324 4,619,251 4,600,351 18,148,889
LiabilitiesDue to banks and other financial institutions – 891,046 166,691 96,552 180,941 85,297 – 1,420,527Due to central banks – 170,646 172,626 131,312 380,647 11,863 – 867,094Placements from banks and other financial institutions – – 178,624 62,562 61,150 149 307 302,792Derivative financial liabilities – 9,443 11,081 21,432 49,358 12,953 2,842 107,109Due to customers – 6,208,198 1,355,804 1,319,746 2,380,204 1,652,646 23,150 12,939,748Bonds issued – – 19,669 16,851 57,014 214,169 54,615 362,318Liabilities classified as held for sale – 21,680 6,882 6,679 6,428 819 – 42,488Other – 223,724 87,018 34,244 136,457 80,010 58,268 619,721
Total liabilities – 7,524,737 1,998,395 1,689,378 3,252,199 2,057,906 139,182 16,661,797
Net liquidity gap 2,132,049 (6,502,279) (1,130,916) (73,401) 39,125 2,561,345 4,461,169 1,487,092

2016 Annual Report 276
Notes to the Consolidated Financial Statements
VI FINANCIAL RISK MANAGEMENT (Continued)
5 Liquidity risk (Continued)
5.2 Maturity analysis (Continued)
As at 31 December 2015
Overdue/Undated
On demand
Less than 1 month
Between 1 and 3 months
Between 3 and 12
months
Between 1 and 5
yearsOver
5 years Total
AssetsCash and due from banks and other financial institutions 22 130,446 69,030 91,767 361,286 1,827 – 654,378Balances with central banks 1,580,456 576,307 26,582 136 12,582 – – 2,196,063Placements with and loans to banks and other financial institutions – – 158,256 69,729 174,865 23,998 – 426,848Financial assets at fair value through profit or loss 14,460 – 8,729 12,997 18,787 32,407 31,682 119,062Derivative financial assets – 13,629 7,091 6,845 44,929 8,834 908 82,236Loans and advances to customers, net 49,971 110,598 406,547 918,256 2,173,435 2,250,542 3,025,846 8,935,195Financial investments — available for sale 46,529 – 28,557 116,306 181,096 510,301 195,744 1,078,533 — held to maturity – – 29,719 68,270 287,726 869,988 535,087 1,790,790 — loans and receivables – – 39,338 53,237 204,616 207,242 102,277 606,710Assets held for sale 10,061 13,924 39,762 24,869 53,170 71,440 24,711 237,937
Other 239,203 293,031 34,025 26,729 47,425 29,215 18,217 687,845
Total assets 1,940,702 1,137,935 847,636 1,389,141 3,559,917 4,005,794 3,934,472 16,815,597
LiabilitiesDue to banks and other financial institutions – 1,121,330 182,428 68,261 236,929 155,372 – 1,764,320Due to central banks – 123,381 109,657 80,054 83,282 19,335 – 415,709Placements from banks and other financial institutions – – 237,435 181,274 27,917 1,318 – 447,944Derivative financial liabilities – 8,874 7,279 7,721 33,636 9,422 2,228 69,160Due to customers – 5,310,840 1,349,408 1,211,480 2,236,700 1,606,338 14,405 11,729,171Bonds issued – – 5,828 9,235 32,987 124,591 110,288 282,929Liabilities classified as held for sale – 77,062 48,191 31,001 35,309 5,265 22 196,850
Other – 169,964 71,263 36,826 139,009 74,795 60,052 551,909
Total liabilities – 6,811,451 2,011,489 1,625,852 2,825,769 1,996,436 186,995 15,457,992
Net liquidity gap 1,940,702 (5,673,516) (1,163,853) (236,711) 734,148 2,009,358 3,747,477 1,357,605

2016 Annual Report277
(Amount in millions of Renminbi, unless otherwise stated)
VI FINANCIAL RISK MANAGEMENT (Continued)
5 Liquidity risk (Continued)
5.3 Undiscounted cash flows by contractual maturities
The tables below present the cash flows of the Group of non-derivative financial assets and financial liabilities and derivative financial instruments that will be settled on a net basis and on a gross basis by remaining contractual maturities at the financial reporting date. The amounts disclosed in the table are the contractual undiscounted cash flow, except for certain derivatives which are disclosed at fair value (i.e. discounted cash flows basis). The Group also manages its inherent short-term liquidity risk based on expected undiscounted cash flows.
As at 31 December 2016
Overdue/Undated
On demand
Less than 1 month
Between 1 and 3 months
Between 3 and 12 months
Between 1 and 5
yearsOver
5 years Total
Non-derivative cash flowCash and due from banks and other financial institutions 22 172,950 84,820 226,525 182,202 2,188 – 668,707Balances with central banks 1,743,459 448,631 16,847 15,383 46,574 781 – 2,271,675Placements with and loans to banks and other financial institutions – – 230,363 109,093 233,774 29,622 – 602,852Financial assets at fair value through profit or loss 11,896 – 9,113 18,601 30,266 31,095 41,800 142,771Loans and advances to customers, net 54,286 82,785 433,586 1,070,564 2,428,493 3,255,189 4,470,367 11,795,270Financial investments — available for sale 56,903 – 49,509 147,292 302,474 830,459 447,665 1,834,302 — held to maturity – – 13,889 52,801 267,465 1,144,917 685,195 2,164,267 — loans and receivables 1,455 – 4,330 16,266 24,228 268,263 144,179 458,721Assets held for sale 340 4,006 5,465 4,234 9,104 17,095 5,750 45,994Other financial assets 3,800 124,632 17,565 2,946 7,676 549 1,145 158,313
Total financial assets 1,872,161 833,004 865,487 1,663,705 3,532,256 5,580,158 5,796,101 20,142,872
Due to banks and other financial institutions – 891,758 171,650 97,787 183,745 90,885 – 1,435,825Due to central banks – 170,717 173,318 132,379 388,036 12,777 – 877,227Placements from banks and other financial institutions – – 179,072 62,893 62,544 236 352 305,097Due to customers – 6,215,933 1,407,034 1,348,339 2,458,734 1,808,556 23,900 13,262,496Bonds issued – – 20,088 18,543 67,294 247,772 60,864 414,561Liabilities classified as held for sale – 21,670 6,881 6,660 6,477 62 – 41,750Other financial liabilities – 171,126 23,466 6,629 9,970 25,523 14,098 250,812
Total financial liabilities – 7,471,204 1,981,509 1,673,230 3,176,800 2,185,811 99,214 16,587,768
Derivative cash flowDerivative financial instruments settled on a net basis – 3,675 (30) 872 15,639 409 399 20,964Derivative financial instruments settled on a gross basis Total inflow – 73,950 1,540,606 1,258,275 2,420,131 258,759 5,649 5,557,370 Total outflow – (72,307) (1,534,915) (1,256,284) (2,421,057) (257,888) (5,664) (5,548,115)

2016 Annual Report 278
Notes to the Consolidated Financial Statements
VI FINANCIAL RISK MANAGEMENT (Continued)
5 Liquidity risk (Continued)
5.3 Undiscounted cash flows by contractual maturities (Continued)
As at 31 December 2015
Overdue/Undated
On demand
Less than 1 month
Between 1 and 3 months
Between 3 and 12
months
Between 1 and 5
yearsOver
5 years Total
Non-derivative cash flowCash and due from banks and other financial institutions 22 130,775 70,082 93,589 369,511 2,035 – 666,014Balances with central banks 1,580,456 577,123 26,583 136 12,582 – – 2,196,880Placements with and loans to banks and other financial institutions – – 158,573 70,307 178,895 26,064 – 433,839Financial assets at fair value through profit or loss 14,460 – 8,938 13,328 20,900 38,744 41,881 138,251Loans and advances to customers, net 50,893 111,302 429,958 990,650 2,406,538 2,958,049 3,994,428 10,941,818Financial investments — available for sale 46,529 – 31,559 125,094 217,720 573,281 212,372 1,206,555 — held to maturity – – 33,406 77,370 339,288 1,022,008 616,860 2,088,932 — loans and receivables – – 40,185 55,679 215,572 240,346 120,271 672,053Assets held for sale 8,308 13,634 39,790 25,417 55,129 77,388 30,924 250,590
Other financial assets 364 102,252 15,254 2,090 8,704 84 1,013 129,761
Total financial assets 1,701,032 935,086 854,328 1,453,660 3,824,839 4,937,999 5,017,749 18,724,693
Due to banks and other financial institutions – 1,122,036 185,851 70,309 242,674 165,323 – 1,786,193Due to central banks – 123,387 110,100 80,652 84,367 20,826 – 419,332Placements from banks and other financial institutions – – 238,145 182,799 28,512 1,462 – 450,918Due to customers – 5,318,884 1,390,053 1,240,530 2,319,899 1,781,907 14,918 12,066,191Bonds issued – – 6,081 10,827 42,509 162,305 126,208 347,930Liabilities classified as held for sale – 76,972 48,112 30,883 35,495 5,468 22 196,952
Other financial liabilities – 131,021 20,277 6,996 5,491 18,092 17,214 199,091
Total financial liabilities – 6,772,300 1,998,619 1,622,996 2,758,947 2,155,383 158,362 15,466,607
Derivative cash flowDerivative financial instruments settled on a net basis – 3,265 26 – (3,602) (975) (361) (1,647)Derivative financial instruments settled on a gross basis Total inflow – 118,046 1,059,809 734,110 2,652,194 340,921 4,237 4,909,317 Total outflow – (118,004) (1,058,948) (731,960) (2,646,928) (339,347) (4,223) (4,899,410)

2016 Annual Report279
(Amount in millions of Renminbi, unless otherwise stated)
VI FINANCIAL RISK MANAGEMENT (Continued)
5 Liquidity risk (Continued)
5.4 Off-balance sheet items
The Group’s off-balance sheet financial instruments that commit it to extend credit to customers and other facilities are summarised in the table below at the remaining period to the contractual maturity date. Financial guarantees are also included below at notional amounts and based on the earliest contractual maturity date. Where the Group is the lessee under operating lease commitments, the future minimum lease payments under non-cancellable operating leases, as disclosed in Note V.42.5, are summarised in the table below.
Less than 1 year
Between 1 and 5 years
Over 5 years Total
As at 31 December 2016Loan commitments(1) 1,357,703 387,117 100,223 1,845,043Guarantees, acceptances and other financial facilities 1,088,797 384,629 271,139 1,744,565
Subtotal 2,446,500 771,746 371,362 3,589,608
Operating lease commitments 6,446 13,165 2,752 22,363Capital commitments 23,554 40,537 2 64,093
Total 2,476,500 825,448 374,116 3,676,064
As at 31 December 2015Loan commitments(1) 1,072,470 255,368 63,582 1,391,420Guarantees, acceptances and other financial facilities 1,241,276 347,950 229,387 1,818,613
Subtotal 2,313,746 603,318 292,969 3,210,033
Operating lease commitments 6,313 13,040 2,997 22,350Capital commitments 17,160 47,596 3,280 68,036
Total 2,337,219 663,954 299,246 3,300,419
(1) Included within “Loan commitments” are amounts relating to loan commitments and undrawn credit card
limits, refer to Note V.42.7.
2016 Annual Report 280
Notes to the Consolidated Financial Statements
VI FINANCIAL RISK MANAGEMENT (Continued)
6 Fair value
6.1 Assets and liabilities measured at fair value
Assets and liabilities measured at fair value are classified into the following three levels:
• Level 1: Quoted prices (unadjusted) in active markets for identical assets or liabilities, including equity securities listed on exchange or debt instrument issued by certain governments and certain exchange-traded derivative contracts.
• Level 2: Valuation technique using inputs other than quoted prices included within level 1 that are observable for the asset or liability, either directly or indirectly. This level includes the majority of the over-the-counter derivative contracts, debt securities for which quotations are available from pricing services providers, traded loans and issued structured deposits.
• Level 3: Valuation technique using inputs for the asset or liability that is not based on observable market data (unobservable inputs). This level includes equity investments and debt instruments with significant unobservable components.
The Group’s policy is to recognise transfers between levels of fair value hierarchy as at the end of the reporting period in which they occur.
The Group uses valuation techniques or counterparty quotations to determine the fair value when it is unable to obtain open market quotation in active markets.
The main parameters used in valuation techniques include bond prices, interest rates, foreign exchange rates, equity and stock prices, volatilities, correlations, early repayment rates, counterparty credit spreads and others, which are all observable and obtainable from the open market.
For certain illiquid debt securities (mainly asset-backed securities), unlisted equity (private equity), over-the-counter structured derivatives transactions, unlisted funds and part of investment properties held by the Group, the management obtains valuation quotations from counterparties or uses valuation techniques to determine the fair value, including discounted cash flow analysis, net asset value and market comparison approach, etc. The fair value of these financial instruments may be based on unobservable inputs which may have significant impact on the valuation of these financial instruments, and therefore, these assets and liabilities have been classified by the Group as level 3. The unobservable inputs which may have impact on the valuation include weighted average cost of capital, liquidity discount, price to book ratio, rental growth, etc. As at 31 December 2016, fair value changes resulting from changes in the unobservable inputs were not significant. Management determines whether to make necessary adjustments to the fair value for the Group’s level 3 financial instruments by assessing the impact of changes in macro-economic factors, valuations by external valuation agencies and other inputs, including loss coverage ratios. The Group has established internal control procedures to control the Group’s exposure to such financial instruments.

2016 Annual Report281
(Amount in millions of Renminbi, unless otherwise stated)
VI FINANCIAL RISK MANAGEMENT (Continued)
6 Fair value (Continued)
6.1 Assets and liabilities measured at fair value (Continued)
As at 31 December 2016Level 1 Level 2 Level 3 Total
Assets measured at fair valueFinancial assets at fair value through profit or loss — Debt securities 5,257 98,206 2,709 106,172 — Loans – 6,022 – 6,022 — Equity securities 7,547 – – 7,547 — Fund investments and other 4,349 – – 4,349Derivative financial assets 14,914 115,635 – 130,549Investment securities available for sale — Debt securities 196,730 1,337,577 1,656 1,535,963 — Equity securities 7,744 2,830 23,362 33,936 — Fund investments and other 4,883 15,895 19,153 39,931Investment properties – 2,592 19,067 21,659
Liabilities measured at fair valuePlacements from banks and other financial institutions at fair value – (1,968) – (1,968)Due to customers at fair value – (350,311) – (350,311)Short position in debt securities (840) (9,150) – (9,990)Derivative financial liabilities (11,235) (95,874) – (107,109)
As at 31 December 2015Level 1 Level 2 Level 3 Total
Assets measured at fair valueFinancial assets at fair value through profit or loss — Debt securities 1,342 96,991 1,531 99,864 — Loans – 4,218 – 4,218 — Equity securities 9,338 – – 9,338 — Fund investments and other 5,642 – – 5,642Derivative financial assets 13,621 68,615 – 82,236Investment securities available for sale — Debt securities 117,498 911,390 954 1,029,842 — Equity securities 5,588 2,352 22,269 30,209 — Fund investments and other 3,812 715 13,955 18,482Investment properties – 2,170 21,111 23,281
Liabilities measured at fair valuePlacements from banks and other financial institutions at fair value – (1,617) – (1,617)Due to customers at fair value – (339,911) – (339,911)Short position in debt securities – (7,012) – (7,012)Derivative financial liabilities (9,115) (60,045) – (69,160)

2016 Annual Report 282
Notes to the Consolidated Financial Statements
VI FINANCIAL RISK MANAGEMENT (Continued)
6 Fair value (Continued)
6.1 Assets and liabilities measured at fair value (Continued)
Reconciliation of Level 3 items
Financial assets at fair
value through profit or loss
— Debt securities
Investment securities available for sale
Debt securities
Equity securities
Fund investments
and otherInvestment properties
As at 1 January 2016 1,531 954 22,269 13,955 21,111Total gains and losses — profit/(loss) 12 2 (177) (448) 1,054 — other comprehensive income – (35) 1,069 1,974 –Sales – (10) (195) (1,613) –Purchases 1,166 1,184 401 5,285 1,530Settlements – – – – –Transfers into/(out of) Level 3, net – 77 – – (175)Other changes – (516) (5) – (4,453)
As at 31 December 2016 2,709 1,656 23,362 19,153 19,067
Total gains/(losses) for the period included in the income statement for assets/liabilities held as at 31 December 2016 12 2 (181) (848) 1,054
As at 1 January 2015 850 979 19,269 9,329 16,379Total gains and losses — profit – 7 581 16 474 — other comprehensive income – 3 (148) 2,852 –Sales (73) (251) (1,063) (1,852) –Purchases 754 675 697 3,610 3,893Settlements – (1) – – –Transfers (out of)/into Level 3, net – (458) – – 83Other changes – – 2,933 – 282
As at 31 December 2015 1,531 954 22,269 13,955 21,111
Total gains/(losses) for the period included in the income statement for assets/liabilities held as at 31 December 2015 – 2 (36) (38) 474
Total gains or losses for the years ended 31 December 2016 and 2015 included in the income statement as well as total gains or losses included in the income statement relating to financial instruments held as at 31 December 2016 and 2015 are presented in “Net trading gains”, “Net gains on financial investments” or “Impairment losses on assets” depending on the nature or category of the related financial instruments.

2016 Annual Report283
(Amount in millions of Renminbi, unless otherwise stated)
VI FINANCIAL RISK MANAGEMENT (Continued)
6 Fair value (Continued)
6.1 Assets and liabilities measured at fair value (Continued)
Gains or losses on Level 3 assets and liabilities included in the income statement for the year comprise:
Year ended 31 December 2016 Year ended 31 December 2015Realised Unrealised Total Realised Unrealised Total
Total gains for the year 404 39 443 676 402 1,078
The assets and liabilities measured at fair value have been no significant transfers between Level 1 and Level 2 during the year ended 31 December 2016.
6.2 Financial assets and liabilities not measured at fair value
Financial assets and liabilities not presented at their fair value on the statement of financial position mainly represent “Balances with central banks”, “Due from banks and other financial institutions”, “Placements with and loans to banks and other financial institutions”, “Loans and advances to customers, net”, “Financial investments” classified as held to maturity and loans and receivables, “Due to central banks”, “Due to banks and other financial institutions”, “Placements from banks and other financial institutions”, and “Due to customers” measured at amortised cost, and “Bonds issued”.
The tables below summarise the carrying amounts and fair values of “Debt securities” classified as held to maturity and loans and receivables, and “Bonds issued” not presented at fair value on the statement of financial position.
As at 31 December
Carrying value Fair value
2016 2015 2016 2015
Financial assetsDebt securities(1)
— held to maturity 1,843,043 1,790,790 1,853,050 1,835,942
— loans and receivables 375,394 330,332 374,161 332,428
Financial liabilitiesBonds issued(2) 362,318 282,929 369,686 294,821
(1) Debt securities classified as held to maturity and loans and receivables
The China Orient Bond and Special Purpose Treasury Bond held by the Bank are non-negotiable. As there are no observable market prices or yields reflecting arm’s length transactions of a comparable size and tenor, the fair value is determined based on stated interest rate of the instruments.
Fair values of other debt securities are based on market prices or broker/dealer price quotations. Where this information is not available, the Bank will perform valuation by referring to prices from valuation service providers or on the basis of discounted cash flows models. Valuation parameters include market interest rates, expected future default rates, prepayment rates and market liquidity. The fair values of RMB bonds are mainly determined based on the valuation results provided by China Central Depository Trust & Clearing Co., Ltd.
(2) Bonds issued
The aggregate fair values are calculated based on quoted market prices. For those bonds where quoted market prices are not available, a discounted cash flow model is used based on a current yield curve appropriate for the remaining term to maturity.

2016 Annual Report 284
Notes to the Consolidated Financial Statements
VI FINANCIAL RISK MANAGEMENT (Continued)
6 Fair value (Continued)
6.2 Financial assets and liabilities not measured at fair value (Continued)
The tables below summarise the fair values of three levels of “Debt securities” classified as held to maturity and loans and receivables (excluding the China Orient Bond and Special Purpose Treasury Bond), and “Bonds issued” not presented at fair value on the statement of financial position.
As at 31 December 2016
Level 1 Level 2 Level 3 Total
Financial assetsDebt securities — held to maturity 45,967 1,807,083 – 1,853,050
— loans and receivables – 170,041 1,620 171,661
Financial liabilitiesBonds issued – 369,686 – 369,686
As at 31 December 2015
Level 1 Level 2 Level 3 Total
Financial assetsDebt securities — held to maturity 82,146 1,753,796 – 1,835,942 — loans and receivables – 129,812 116 129,928
Financial liabilitiesBonds issued – 294,821 – 294,821
Other than the above, the difference between the carrying amounts and fair values of those financial assets and liabilities not presented at their fair value on the statement of financial position is insignificant. Fair value is measured using a discounted cash flow model.
7 Capital management
The Group follows the principles below with regard to capital management:
• Adequate capital and sustainable development. Implement the Scientific Outlook on Development thoroughly; follow the lead of the strategic planning of the Group development; and maintain the high quality and adequacy of capital as to meet regulation requirements, support business growth, and advance the sustainable development of the scale, quality and performance of the business in the Group.
• Allocation optimisation and benefit augmentation. Allocate capital properly by prioritising the asset businesses with low capital occupancy and high comprehensive income, to steadily improve the efficiency and return of capital, achieving the reciprocal matchup and dynamic equilibrium among risks, assets and returns.

2016 Annual Report285
(Amount in millions of Renminbi, unless otherwise stated)
VI FINANCIAL RISK MANAGEMENT (Continued)
7 Capital management (Continued)
• Refined management and capital level improvement. Optimise the capital management system by sufficiently identifying, calculating, monitoring, mitigating, and controlling various types of risks; incorporate capital restraints into the whole process of product pricing, resource allocation, structural adjustments, performance evaluation, etc., ensuring that the capital employed is commensurate with the related risks and the level of risk management.
Capital adequacy and regulatory capital are monitored by the Group’s management, employing techniques based on the guidelines developed by the Basel Committee, as implemented by the CBRC, for supervisory purposes. The required information is filed with the CBRC on a quarterly basis.
The Group’s capital adequacy ratios are calculated in accordance with the Capital Rules for Commercial Banks (Provisional) and other relevant regulations promulgated by the CBRC. With the approval of the CBRC, the Group adopts the advanced capital measurement approaches, which include Foundation Internal Ratings-based Approach for corporate exposures, Internal Ratings-based Approach for retail exposures, Internal Models Approach for market risk and Standardised Approach for operational risk. For risk exposures not covered by the advanced approaches, the corresponding portion shall be calculated adopting non-advanced approaches.
As a Systemically Important Bank, the Group’s capital adequacy ratios are required to meet the lowest requirements of the CBRC by the end of 2018, that is, the common equity tier 1 capital adequacy ratio, tier 1 capital adequacy ratio and capital adequacy ratio should be no less than 8.50%, 9.50% and 11.50%, respectively.
The Group’s regulatory capital is managed by its capital management related departments and consists of the following:
• Common equity tier 1 capital, including common shares, capital reserve, surplus reserve, general reserve, undistributed profits, eligible portion of minority interests and others;
• Additional tier 1 capital, including additional tier 1 capital instruments issued and related premium and eligible portion of minority interests;
• Tier 2 capital, including tier 2 capital instruments issued and related premium, excess loan loss provisions and eligible portion of minority interests.
Goodwill, other intangible assets (except land use rights), investments in common equity tier 1 capital of financial institutions with controlling interests but outside of the scope of regulatory consolidation, significant minority capital investment in tier 2 capital of financial institutions that are outside of the scope of regulatory consolidation and other deductible items are deducted from common equity tier 1 and tier 2 capital to derive at the regulatory capital.

2016 Annual Report 286
Notes to the Consolidated Financial Statements
VI FINANCIAL RISK MANAGEMENT (Continued)
7 Capital management (Continued)
The table below summarises the Group’s common equity tier 1 capital adequacy ratio, tier 1 capital adequacy ratio and capital adequacy ratio(1) calculated in accordance with the Capital Rules for Commercial Banks (Provisional) and other relevant regulations promulgated by the CBRC.
As at 31 December
2016
As at 31 December
2015Common equity tier 1 capital adequacy ratio 11.37% 11.10%Tier 1 capital adequacy ratio 12.28% 12.07%Capital adequacy ratio 14.28% 14.06%
Composition of the Group’s capital base
Common equity tier 1 capital 1,297,421 1,197,868 Common shares 294,388 294,388 Capital reserve 139,443 139,572 Surplus reserve 125,109 111,207 General reserve 193,338 179,416 Undistributed profits 526,804 451,585 Eligible portion of minority interests 30,051 29,016 Other(2) (11,712) (7,316)
Regulatory deductions (16,580) (15,568) Goodwill (96) (96) Other intangible assets (except land use rights) (6,498) (5,369) Gains on sales related to securitisation transactions – (204) Direct or indirect investments in own shares (53) (86) Reserve relating to cash-flow hedge items not measured at fair value 20 16 Investments in common equity tier 1 capital of financial institutions with controlling interests but outside the scope of regulatory consolidation (9,953) (9,829)
Net common equity tier 1 capital 1,280,841 1,182,300
Additional tier 1 capital 103,523 103,159 Preference shares and related premium 99,714 99,714 Eligible portion of minority interests 3,809 3,445
Net tier 1 capital 1,384,364 1,285,459
Tier 2 capital 225,173 212,937 Tier 2 capital instruments issued and related premium 149,406 153,266 Excess loan loss provisions 64,572 45,839 Eligible portion of minority interests 11,195 13,832
Net capital 1,609,537 1,498,396
Risk-weighted assets 11,269,592 10,654,081

2016 Annual Report287
(Amount in millions of Renminbi, unless otherwise stated)
VI FINANCIAL RISK MANAGEMENT (Continued)
7 Capital management (Continued)
(1) When calculating the capital adequacy ratios, BOCG Investment, Bank of China Insurance Company Limited (“BOC
Insurance”), Bank of China Group Insurance Company Limited (“BOCG Insurance”) and Bank of China Group Life
Assurance Company Limited (“BOCG Life”) were excluded from the scope of consolidation in accordance with
requirements of the CBRC.
(2) This mainly represented exchange differences from the translation of foreign operations and fair value gains/(losses)
on available for sale financial assets.
8 Insurance risk
Insurance contracts are mainly sold in Chinese mainland and Hong Kong denominated in RMB and HKD. The risk under any one insurance contract is the possibility that the insured event occurs and the uncertainty of the amount of the resulting claim. This risk is inherently random and, therefore, unpredictable. The Group manages its portfolio of insurance risks through its underwriting strategy and policies, portfolio management techniques, adequate reinsurance arrangements and proactive claims handling and processing. The underwriting strategy attempts to ensure that the underwritten risks are well diversified in terms of type and amount of risk and industry.
For a portfolio of insurance contracts where the theory of probability is applied to pricing and provisioning, the principal risk that the Group faces under its insurance contracts is that the actual claims and benefit payments exceed the carrying amount of the insurance liabilities. This could occur because the frequency or severity of the claims and benefits are greater than estimated. Insurance events are random and the actual number and amount of claims and benefits will vary from year to year from the level established using statistical techniques.
Uncertainty in the estimation of future benefit payments and premium receipts for long-term life insurance contracts arises from the unpredictability of long-term changes in overall levels of mortality. In order to assess the uncertainty due to the mortality assumption and lapse assumption, the Group conducted mortality rate studies and policy lapse studies in order to determine the appropriate assumptions.

Supplementary Information(Amount in millions of Renminbi, unless otherwise stated)
2016 Annual Report 288
I DIFFERENCES BETWEEN IFRS AND CAS CONSOLIDATED FINANCIAL STATEMENTSThere are no differences in the Group’s operating results for the years ended 31 December 2016 and 2015 or total equity as at 31 December 2016 and 2015 presented in the Group’s consolidated financial statements prepared under IFRS and those prepared under CAS.
II UNAUDITED SUPPLEMENTARY INFORMATION1 Liquidity ratios and liquidity coverage ratio
As at 31 December2016 2015
RMB current assets to RMB current liabilities 45.60% 48.65%Foreign currency current assets to foreign currency current liabilities 52.73% 62.02%
The liquidity ratios are calculated in accordance with the relevant provisions of the CBRC.
Liquidity coverage ratio
According to the Measures for the Information Disclosure of Liquidity Coverage Ratio of Commercial Banks issued by the CBRC, the Group disclosed the information of liquidity coverage ratio (“LCR”)(1) as follows.
Regulatory requirements of liquidity coverage ratio
As stipulated by the Rules on Liquidity Risk Management of Commercial Banks (Provisional), the commercial banks’ LCR should reach 100% by the end of 2018. During the transition period, the LCR should reach 70%, 80%, 90% and 100% by the end of 2015, 2016, 2017 and 2018, respectively. During the transition period, eligible commercial banks are encouraged to fulfil the requirements in advance, and banks with LCR already reaching 100% are encouraged to continuously maintain it at 100% or above.
The Group’s liquidity coverage ratio
The Group’s (2) average value of LCR(3) was 117.17% in the fourth quarter of 2016, representing a decrease of 0.37 percentage points over the previous quarter. It was primarily due to the decrease in the high-quality liquid assets (“HQLA”).
The Group’s HQLA is comprised of cash, central bank reserves which are able to be drawn down under stress scenarios, and debt securities that meet the qualifying criteria for Level 1 or Level 2 assets pursuant to the Liquidity Risk Management of Commercial Banks (Provisional).
2016Quarter
ended 31 December
Quarter ended
30 September
Quarter ended
30 June
Quarter ended
31 MarchAverage value of LCR 117.17% 117.54% 118.08% 119.42%

2016 Annual Report289
(Amount in millions of Renminbi, unless otherwise stated)
II UNAUDITED SUPPLEMENTARY INFORMATION (Continued)
1 Liquidity ratios and liquidity coverage ratio (Continued)
The Group’s liquidity coverage ratio (Continued)
The Group’s average values of LCR individual line items in the fourth quarter of 2016 are as follows:
No.
Totalun-weighted
value
Totalweighted
valueHigh-quality liquid assets1 Total high-quality liquid assets (HQLA) 3,232,892Cash outflows2 Retail deposits and deposits from small business customers,
of which: 6,090,758 498,1063 Stable deposits 2,218,754 110,9064 Less stable deposits 3,872,004 387,2005 Unsecured wholesale funding, of which: 7,582,514 2,831,2906 Operational deposits (excluding those generated
from correspondent banking activities) 4,039,907 991,1317 Non-operational deposits (all counterparties) 3,530,957 1,828,5098 Unsecured debt 11,650 11,6509 Secured funding 4,25610 Additional requirements, of which: 1,239,036 134,41311 Outflows related to derivative exposures and
other collateral requirements 38,742 38,74212 Outflows related to loss of funding on debt products – –13 Credit and liquidity facilities 1,200,294 95,67114 Other contractual funding obligations 155,017 154,80415 Other contingent funding obligations 3,042,529 54,53016 Total cash outflows 3,677,399Cash inflows17 Secured lending (including reverse repos and securities borrowing) 124,150 109,74818 Inflows from fully performing exposures 1,055,528 650,66919 Other cash inflows 265,852 157,37520 Total cash inflows 1,445,530 917,792
Total adjusted
value21 Total HQLA 3,232,89222 Total net cash outflows 2,759,60723 Liquidity coverage ratio 117.17%
(1) The LCR aims to ensure that commercial banks have sufficient HQLA that can be converted into cash to meet the
liquidity requirements for at least thirty days under stress scenarios determined by the CBRC.
(2) When calculating the consolidated LCR, BOCG Investment, BOC Insurance, BOCG Insurance and BOCG Life were
excluded from the scope of subsidiary consolidation in accordance with the requirements of the CBRC.
(3) The average values of LCR and individual line items are the simple arithmetic average of month-end values in the quarter.

2016 Annual Report 290
Supplementary Information
II UNAUDITED SUPPLEMENTARY INFORMATION (Continued)
2 Currency concentrations
The following information is computed in accordance with the provisions of the CBRC.
Equivalent in millions of RMBUSD HKD Other Total
As at 31 December 2016Spot assets 1,312,715 22,870 353,621 1,689,206Spot liabilities (1,382,623) (361,995) (321,029) (2,065,647)Forward purchases 4,624,107 569,469 1,023,746 6,217,322Forward sales (4,439,207) (254,529) (1,073,565) (5,767,301)Net options position* (51,861) (515) (141) (52,517)
Net long/(short) position 63,131 (24,700) (17,368) 21,063
Structural position 32,534 201,228 54,047 287,809
As at 31 December 2015Spot assets 1,038,079 15,909 248,416 1,302,404Spot liabilities (991,084) (266,086) (289,553) (1,546,723)Forward purchases 4,395,569 408,637 793,915 5,598,121Forward sales (4,375,139) (205,517) (780,544) (5,361,200)Net options position* (1,998) (131) (44) (2,173)
Net long/(short) position 65,427 (47,188) (27,810) (9,571)
Structural position 27,971 147,136 55,557 230,664
* The net option position is calculated using the delta equivalent approach as set out in the requirements of the CBRC.
3 International claims
The Group discloses international claims according to Banking (Disclosure) Rules (L.N. 160 of 2014). International claims are risk exposures generated from the countries or geographical areas where the counterparties take the ultimate risk while considering the transfer of the risk, exclude local claims on local residents in local currency. Risk transfer is only made if the claims are guaranteed by a party in a country which is different from that of the counterparty or if the claims are on an overseas branch of a counterparty whose head office is located in another country.
International claims include “Balances with central banks”, “Due from and placements with and loans to banks and other financial institutions”, “Government certificates of indebtedness for bank notes issued”, “Financial assets at fair value through profit or loss”, “Loans and advances to customers” and “Financial investments”.
International claims have been disclosed by major countries or geographical areas. A country or geographical area is reported where it constitutes 10% or more of the aggregate amount of international claims, after taking into account any risk transfers.

2016 Annual Report291
(Amount in millions of Renminbi, unless otherwise stated)
II UNAUDITED SUPPLEMENTARY INFORMATION (Continued)
3 International claims (Continued)
BanksOfficial
sector
Non-bank private sector Total
As at 31 December 2016Asia Pacific Chinese mainland 601,461 200,367 709,491 1,511,319 Hong Kong 15,532 3,188 423,094 441,814 Other Asia Pacific locations 125,198 102,622 343,365 571,185
Subtotal 742,191 306,177 1,475,950 2,524,318
North and South America 64,201 190,282 148,600 403,083Other 70,327 51,652 145,130 267,109
Total 876,719 548,111 1,769,680 3,194,510
4 Overdue assets
For the purpose of the table below, the entire outstanding balance of “Loans and advances to customers” and “Placements with and loans to banks and other financial institutions” are considered overdue if either principal or interest payment is overdue.
4.1 Total amount of overdue loans and advances to customers
As at 31 December2016 2015
Total loans and advances to customers which have been overdue within 3 months 102,281 72,418 between 3 and 6 months 20,203 21,143 between 6 and 12 months 37,864 44,237 over 12 months 54,243 41,229
Total 214,591 179,027
Percentage within 3 months 1.03% 0.79% between 3 and 6 months 0.20% 0.23% between 6 and 12 months 0.38% 0.49% over 12 months 0.54% 0.45%
Total 2.15% 1.96%
4.2 Total amount of overdue placements with and loans to banks and other financial institutions
The total amount of overdue “Placements with and loans to banks and other financial institutions” as at 31 December 2016 and 2015 is not considered material.

2016 Annual Report 292
Supplementary Information
II UNAUDITED SUPPLEMENTARY INFORMATION (Continued)
5 Leverage ratioThe leverage ratios of the Group calculated in accordance with the Administrative Measures for the Leverage Ratio of Commercial Banks (Revised) and the Capital Rules for Commercial Banks (Provisional) are as follows(1):
2016As at
31 DecemberAs at
30 SeptemberAs at
30 JuneAs at
31 MarchNet tier 1 capital 1,384,364 1,362,159 1,322,016 1,325,582Adjusted on- and off-balance sheet assets 19,604,737 19,251,144 19,062,650 18,497,683
Leverage ratio 7.06% 7.08% 6.94% 7.17%
No. ItemsAs at
31 December 20161 Total consolidated assets 18,148,8892 Adjustments that are consolidated for accounting purposes
but outside the scope of regulatory consolidation (9,953)3 Adjustments for fiduciary assets –4 Adjustments for derivative financial instruments 91,6155 Adjustments for securities financing transactions 24,6836 Adjustments for off-balance sheet exposures 1,602,6787 Other adjustments (253,175)
8 Adjusted on- and off-balance sheet assets 19,604,737
No. ItemsAs at
31 December 20161 On-balance sheet assets (excluding derivatives and
securities financing transactions) 17,661,6732 Less: Tier 1 capital deductions (16,580)3 Total on-balance sheet exposures (excluding derivatives and SFTs) 17,645,0934 Replacement cost associated with all derivative transactions
(i.e. net of eligible cash variation margin) 130,4075 Add-on amounts for potential future exposure associated with
all derivative transactions 91,7576 Gross-up for derivative collateral provided where deducted from
the balance sheet assets –7 Less: Deductions of receivable assets for cash variation margin
provided in derivative transactions –8 Less: Exempted CCP leg of client-cleared trade exposures –9 Adjusted effective notional amount of written credit derivatives –10 Less: Deductible amounts for written credit derivatives –11 Total derivative exposures 222,16412 Accounting balance for securities financing transaction assets 109,40813 Less: Deducted amounts for securities financing transaction assets –14 Counterparty credit risk exposure for securities financing transaction assets 25,39415 Agent transaction exposures –16 Balance of assets in securities financing transactions 134,80217 Off-balance sheet items 3,986,64518 Less: Adjustments for conversion to credit equivalent amounts (2,383,967)19 Adjusted off-balance sheet exposures 1,602,67820 Net tier 1 capital 1,384,36421 Adjusted on- and off-balance sheet exposures 19,604,737
22 Leverage ratio 7.06%
(1) When calculating the consolidated leverage ratio, BOCG Investment, BOC Insurance, BOCG Insurance and BOCG Life
were excluded from the scope of consolidation in accordance with the Capital Rules for Commercial Banks (Provisional).

2016 Annual Report293
(Amount in millions of Renminbi, unless otherwise stated)
II UNAUDITED SUPPLEMENTARY INFORMATION (Continued)
6 Global systemically importance assessment indicators of commercial banks
The following global systemically importance assessment indicators of commercial banks are disclosed in accordance with the Guidelines for the Disclosure of Global Systemically Importance Assessment Indicators of Commercial Banks (Yin Jian Fa, [2014] No. 1) promulgated by the CBRC.
No. Indicators(1) 2016 value1 Adjusted on-balance and off-balance sheet assets 19,604,7372 Intra-financial system assets 1,794,9573 Intra-financial system liabilities 1,485,7124 Securities and other financing instruments 2,250,6545 Payments settled via payment systems or correspondent banks 432,865,2066 Assets under custody 8,206,0317 Underwritten transactions in debt and equity markets 636,9458 Notional amount of over-the-counter derivatives 8,144,5839 Trading and available for sale securities 659,62710 Level 3 assets 8,89011 Cross-jurisdictional claims 2,944,58712 Cross-jurisdictional liabilities 4,031,201
(1) The above indicators are calculated and disclosed in accordance with the Guidelines for the Disclosure of Global
Systemically Importance Assessment Indicators of Commercial Banks, which are unaudited and inconsistent with the
disclosures in the financial report.

Reference for Shareholders
2016 Annual Report 294
Financial Calendar for 2017
2016 Annual Results To be announced on 31 March 20172016 Annual Report To be printed and dispatched to H-Share Holders in late April 20172016 Annual General Meeting To be held on 29 June 20172017 Interim Results To be announced no later than 30 August 2017
Annual General Meeting
The Bank’s 2016 Annual General Meeting is scheduled to be held in Beijing and Hong Kong, China at 9:30 a.m. on Thursday, 29 June 2017.
Dividends on Ordinary Shares
The Board of Directors recommended a final dividend on ordinary shares of RMB0.168 per share (before tax), subject to the approval of shareholders at the 2016 Annual General Meeting.
Securities Information
Listing and Trading
The Bank’s ordinary shares were listed on the Hong Kong Stock Exchange and SSE on 1 June and 5 July 2006 respectively.
The Bank’s Offshore Preference Shares were listed on the Hong Kong Stock Exchange on 24 October 2014. The Domestic Preference Shares (First Tranche) were traded on the Comprehensive Business Platform of SSE on 8 December 2014. The Domestic Preference Shares (Second Tranche) were traded on the Comprehensive Business Platform of SSE on 31 March 2015.
Ordinary Shares
Issued shares: 294,387,791,241 shares (as at 31 December 2016)Including: A Share: 210,765,514,846 shares H Share: 83,622,276,395 shares
Preference Shares
Issued shares: 999,400,000 shares (as at 31 December 2016)Including: Domestic Preference Share: 600,000,000 shares Offshore Preference Share: 399,400,000 shares
Market Capitalisation
As at the last trading day in 2016 (30 December for both A Shares and H Shares), the Bank’s market capitalisation was RMB982.349 billion (based on the closing price of A Shares and H Shares on 30 December 2016, and the exchange rate of HKD100 = RMB89.451 as published by the SAFE on 30 December 2016).

2016 Annual Report295
Reference for Shareholders
Securities Price
Closing price on 30 December 2016
Highest trading price in the year
Lowest trading price in the year
A Share RMB3.44 RMB4.01 RMB3.08H Share HKD3.44 HKD3.77 HKD2.83
Securities Code
A Share H ShareStock Name 中國銀行 Stock Name Bank of ChinaShanghai Stock Exchange 601988 Hong Kong Stock Exchange 3988Reuters 601988.SS Reuters 3988.HKBloomberg 601988 CH Bloomberg 3988 HK
Domestic Preference Share (First Tranche) Domestic Preference Share (Second Tranche)Stock Name 中行優1 Stock Name 中行優2Shanghai Stock Exchange 360002 Shanghai Stock Exchange 360010Bloomberg EK6323670 Bloomberg EK8196546
Offshore Preference ShareStock Name BOC 2014 PREFHong Kong Stock Exchange 4601Reuters 4601.HKBloomberg EK5371647
Shareholder Enquiry
If a shareholder wishes to enquire about share transfers, changes of name or address, or loss of share certificates, or to receive other information concerning the shares held, please write to the following address:
A Share H Share
Shanghai Branch of China Securities Depositoryand Clearing Corporation Limited36/F, China Insurance Building,166 East Lujiazui Road,Pudong New Area, ShanghaiTelephone: (86) 21-3887 4800
Computershare Hong Kong Investor Services Limited17M, Hopewell Centre,183 Queen’s Road East,Wanchai, Hong KongTelephone: (852) 2862 8555Facsimile: (852) 2865 0990
Domestic Preference Share
Shanghai Branch of China Securities Depository and Clearing Corporation Limited36/F, China Insurance Building,166 East Lujiazui Road,Pudong New Area, ShanghaiTelephone: (86) 21-3887 4800

2016 Annual Report 296
Reference for Shareholders
Credit Rating (Long Term, Foreign Currency)Standard & Poor’s Ratings Services: AMoody’s Investors Service: A1Fitch Ratings: ARating and Investment Information, Inc.: ADagong Global Credit Rating Co., Ltd. (RMB): AAA
Index ConstituentsHang Seng Index Dow Jones Index SeriesHang Seng China H-Financial Index S&P Index SeriesHang Seng China Enterprises Index Bloomberg Index SeriesHang Seng Composite Index (HSCI) Series FTSE Index SeriesHang Seng Corporate Sustainability Index Series Shanghai Stock Exchange Index SeriesMSCI Index Series CSI Index Series
Investor EnquiryInvestor Relations Team, Board Secretariat, Bank of China Limited8/F, Bank of China Building, 1 Fuxingmen Nei Dajie, Beijing, ChinaTelephone: (86) 10-6659 2638Facsimile: (86) 10-6659 4568E-mail: [email protected]
Other InformationYou may write to the Bank’s H-Share Registrar, Computershare Hong Kong Investor Services Limited (address: 17M, Hopewell Centre, 183 Queen’s Road East, Wanchai, Hong Kong) to request the annual report prepared under IFRS or go to the Bank’s office address for copies prepared under CAS. The Chinese and/or English versions of the annual report are also available on the following websites: www.boc.cn, www.sse.com.cn and www.hkexnews.hk.
Should you have any queries about how to obtain copies of this annual report or access the document on the Bank’s website, please call the Bank’s H-Share Registrar at (852) 2862 8688 or the Bank’s hotlines at (86) 10-6659 2638.

Organisational Chart
2016 Annual Report297
Domestic and OverseasBranches and Subsidiaries
Head Office Departmentsand Institutions
Shareholders’ Meeting
Board of Supervisors
Accounting andInformation Department
Treasury
Financial ManagementDepartment
Human ResourcesDepartment
Executive Office
Corporate BankingDepartment
Shanghai RMB Trading Unit
Risk ManagementDepartment
Institute of InternationalFinance
Bank Card Center
Data Center
Software Center
International StatementCenter
BOC College
Shanghai College of International Finance
Credit ApprovalDepartment
Credit ManagementDepartment
Internal Control andLegal & Compliance
Department
E-finance Department
Distribution and OperationManagement Department
Information TechnologyDepartment
Inspection Department
Security Department
Corporate CultureDepartment
Labor Union Office
Retired Staff Office
Logistics Office
ClearingDepartment
Financial InstitutionsDepartment
Global Trade ServicesDepartment
SME ServicesDepartment
Personal BankingDepartment
Custody ServicesDepartment
Global MarketsDepartment
Investment Banking andAsset Management
Department
Wealth Management andPrivate Banking
Department
Board of Directors
Audit Department
Board Secretariat
Senior Management
Head Office Departments
Institutions
Board of Supervisors Office
Institutions in Hong Kong, Macau, Taiwan and
other countries and regions (578)
Institutions in the Chinese mainland (10,978)
Diversified business
BOC Insurance BOCHK BOCI
BOCG Investment
BOCG Insurance
BOC Life
BOC Aviation
Hong Kong Branch
Macau Branch
Tai Fung Bank Limited
Taipei Branch
Branches, subsidiaries and representative
offices located in 47 countries
BOC-Samsung Life
BOCIM
BOCI China Note
Bank of China Consumer Finance Company Limited
Commercial banking business
Diversified business
37 tier-one and direct branches, 326 tier-two branches and 10,287
sub-branches
BOC Fullerton Community Bank (82 community banks
and 77 sub-branches)
Commercial banking business

2016 Annual Report 298
Organisational Chart
Note: The Bank holds 37.14% of the equity interest of BOCI China by its wholly-owned subsidiary BOCI.
Domestic and OverseasBranches and Subsidiaries
Head Office Departmentsand Institutions
Shareholders’ Meeting
Board of Supervisors
Accounting andInformation Department
Treasury
Financial ManagementDepartment
Human ResourcesDepartment
Executive Office
Corporate BankingDepartment
Shanghai RMB Trading Unit
Risk ManagementDepartment
Institute of InternationalFinance
Bank Card Center
Data Center
Software Center
International StatementCenter
BOC College
Shanghai College of International Finance
Credit ApprovalDepartment
Credit ManagementDepartment
Internal Control andLegal & Compliance
Department
E-finance Department
Distribution and OperationManagement Department
Information TechnologyDepartment
Inspection Department
Security Department
Corporate CultureDepartment
Labor Union Office
Retired Staff Office
Logistics Office
ClearingDepartment
Financial InstitutionsDepartment
Global Trade ServicesDepartment
SME ServicesDepartment
Personal BankingDepartment
Custody ServicesDepartment
Global MarketsDepartment
Investment Banking andAsset Management
Department
Wealth Management andPrivate Banking
Department
Board of Directors
Audit Department
Board Secretariat
Senior Management
Head Office Departments
Institutions
Board of Supervisors Office
Institutions in Hong Kong, Macau, Taiwan and
other countries and regions (578)
Institutions in the Chinese mainland (10,978)
Diversified business
BOC Insurance BOCHK BOCI
BOCG Investment
BOCG Insurance
BOC Life
BOC Aviation
Hong Kong Branch
Macau Branch
Tai Fung Bank Limited
Taipei Branch
Branches, subsidiaries and representative
offices located in 47 countries
BOC-Samsung Life
BOCIM
BOCI China Note
Bank of China Consumer Finance Company Limited
Commercial banking business
Diversified business
37 tier-one and direct branches, 326 tier-two branches and 10,287
sub-branches
BOC Fullerton Community Bank (82 community banks
and 77 sub-branches)
Commercial banking business

List of Major Branches and Subsidiaries
2016 Annual Report299
MAJOR BRANCHES AND SUBSIDIARIES IN THE CHINESE MAINLANDHEAD OFFICE
1 FUXINGMEN NEI DAJIE,BEIJING,CHINASWIFT: BKCHCNBJTEL: (86) 010-66596688FAX: (86) 010-66016871POST CODE: 100818WEBSITE: www.boc.cn
BEIJING BRANCH
A, C, E KAIHENG CENTER,2 CHAOYANGMEN NEI DAJIE,DONGCHENG DISTRICT,BEIJING,CHINASWIFT: BKCHCNBJ110TEL: (86) 010-85122288FAX: (86) 010-85121739POST CODE: 100010
TIANJIN BRANCH
8 YOUYI NORTH ROAD,HEXI DISTRICT,TIANJIN,CHINASWIFT: BKCHCNBJ200TEL: (86) 022-27108001FAX: (86) 022-23312805POST CODE: 300204
HEBEI BRANCH
28 ZIQIANG ROAD,SHIJIAZHUANG,HEBEI PROV.,CHINASWIFT: BKCHCNBJ220TEL: (86) 0311-69696681FAX: (86) 0311-69696692POST CODE: 050000
SHANXI BRANCH
186 PINGYANG ROAD,XIAODIAN DISTRICT,TAIYUAN,SHANXI PROV.,CHINASWIFT: BKCHCNBJ680TEL: (86) 0351-8266016FAX: (86) 0351-8266021POST CODE: 030006
INNER MONGOLIA BRANCH
12 XINHUA DAJIE,XIN CHENG DISTRICT,HUHHOT,INNER MONGOLIA AUTONOMOUS REGION,CHINASWIFT: BKCHCNBJ880TEL: (86) 0471-4690052FAX: (86) 0471-4690001POST CODE: 010010
LIAONING BRANCH
253 SHIFU ROAD,SHENHE DISTRICT,SHENYANG,LIAONING PROV.,CHINASWIFT: BKCHCNBJ810TEL: (86) 024-22810827FAX: (86) 024-22857333POST CODE: 110013
JILIN BRANCH
699 XI AN DA LU,CHANGCHUN,JILIN PROV.,CHINASWIFT: BKCHCNBJ840TEL: (86) 0431-88408888FAX: (86) 0431-88408901POST CODE: 130061
HEILONGJIANG BRANCH
19 HONGJUN STREET,NANGANG DISTRICT,HARBIN,HEILONGJIANG PROV.,CHINASWIFT: BKCHCNBJ860TEL: (86) 0451-53627774FAX: (86) 0451-53623330POST CODE: 150001
SHANGHAI BRANCH
200 MID. YINCHENG ROAD,PUDONG NEW DISTRICT,SHANGHAI,CHINASWIFT: BKCHCNBJ300TLX: 33062BOCSHCNTEL: (86) 021-50375566FAX: (86) 021-50372911POST CODE: 200120
JIANGSU BRANCH
148 ZHONG SHAN NAN LU,NANJING,JIANGSU PROV.,CHINASWIFT: BKCHCNBJ940TLX: 34116BOCJSCNTEL: (86) 025-84207888FAX: (86) 025-84206082POST CODE: 210005
ZHEJIANG BRANCH
321 FENG QI ROAD,HANGZHOU,ZHEJIANG PROV.,CHINASWIFT: BKCHCNBJ910TEL: (86) 0571-85011888FAX: (86) 0571-87074837POST CODE: 310003
ANHUI BRANCH
NO.1688, YUNGU ROAD, BINHU NEW DISTRICT,HEFEI, ANHUI PROV.,CHINASWIFT: BKCHCNBJ780TEL: (86) 0551-62926995FAX: (86) 0551-62926993POST CODE: 230091
FUJIAN BRANCH
BOC BLDG., 136 WUSI ROAD,FUZHOU,FUJIAN PROV.,CHINASWIFT: BKCHCNBJ720TLX: 92109BOCFJCNTEL: (86) 0591-87090999FAX: (86) 0591-87090111POST CODE: 350003
JIANGXI BRANCH
10, LVYIN ROAD,HONGGUTAN NEW DISTRICT,NANCHANG,JIANGXI PROV.,CHINASWIFT: BKCHCNBJ550TEL: (86) 0791-86471503FAX: (86) 0791-86471505POST CODE: 330038
SHANDONG BRANCH
22 LUOYUAN STREET,JINAN,SHANDONG PROV.,CHINASWIFT: BKCHCNBJ500TEL: (86) 0531-58522000FAX: (86) 0531-58522001POST CODE: 250000
HENAN BRANCH
3-1 BUSINESS OUTER RING ROAD,ZHENGDONG NEW DISTRICT,ZHENGZHOU,HENAN PROV.,CHINASWIFT: BKCHCNBJ530TEL: (86) 0371-87008888FAX: (86) 0371-87007888POST CODE: 450018
HUBEI BRANCH
677 JIANSHE ROAD,WUHAN,HUBEI PROV.,CHINASWIFT: BKCHCNBJ600TEL: (86) 027-85562866
(86) 027-85562959FAX: (86) 027-85562955POST CODE: 430022
HUNAN BRANCH
593 MID. FURONG ROAD (1 DUAN),CHANGSHA,HUNAN PROV.,CHINASWIFT: BKCHCNBJ970TEL: (86) 0731-82580703FAX: (86) 0731-82580707POST CODE: 410005
GUANGDONG BRANCH
197–199 DONGFENG XI LU,GUANGZHOU,GUANGDONG PROV.,CHINASWIFT: BKCHCNBJ400TEL: (86) 020-83398888FAX: (86) 020-83348080POST CODE: 510180
GUANGXI BRANCH
39 GUCHENG ROAD,NANNING,GUANGXI ZHUANG AUTONOMOUS REGION,CHINASWIFT: BKCHCNBJ480TEL: (86) 0771-2879316FAX: (86) 0771-2813844POST CODE: 530022

2016 Annual Report 300
List of Major Branches and Subsidiaries
HAINAN BRANCH
29, 31 DATONG ROAD,LONGHUA DISTRICT,HAIKOU,HAINAN PROV.,CHINASWIFT: BKCHCNBJ740TEL: (86) 0898-66562023FAX: (86) 0898-66562040POST CODE: 570102
SICHUAN BRANCH
35 MID. RENMIN ROAD (2 DUAN),CHENGDU,SICHUAN PROV.,CHINASWIFT: BKCHCNBJ570TEL: (86) 028-86741950FAX: (86) 028-86403346 (86) 028-86744859POST CODE: 610031
GUIZHOU BRANCH
BOC BLDG., 347 RUIJIN SOUTH ROAD,GUIYANG,GUIZHOU PROV.,CHINASWIFT: BKCHCNBJ240TEL: (86) 0851-85822419FAX: (86) 0851-85825770POST CODE: 550002
YUNNAN BRANCH
515 BEIJING ROAD,KUNMING,YUNNAN PROV.,CHINASWIFT: BKCHCNBJ640TEL: (86) 0871-63106335FAX: (86) 0871-63107516POST CODE: 650051
TIBET BRANCH
113 JINZHU XI LU,LHASA,TIBET AUTONOMOUS REGION,CHINASWIFT: BKCHCNBJ900TEL: (86) 0891-6599394FAX: (86) 0891-6599394POST CODE: 850000
SHAANXI BRANCH
18 TANGYAN ROAD BEIDUAN,LIANHU DISTRICT,XI’AN,SHAANXI PROV.,CHINASWIFT: BKCHCNBJ620TEL: (86) 029-89593900FAX: (86) 029-89592999POST CODE: 710077
GANSU BRANCH
525 TIANSHUI SOUTH ROAD,CHENGGUAN DISTRICT,LANZHOU,GANSU PROV.,CHINASWIFT: BKCHCNBJ660TEL: (86) 0931-7825003FAX: (86) 0931-7825004POST CODE: 730000
QINGHAI BRANCH
218 DONGGUAN STREET,CHENG DONG DISTRICT,XINING,QINGHAI PROV.,CHINASWIFT: BKCHCNBJ280TEL: (86) 0971-8178888FAX: (86) 0971-8174971POST CODE: 810000
NINGXIA BRANCH
39 XINCHANG EAST ROAD,JINFENG DISTRICT,YINCHUAN,NINGXIA HUIAUTONOMOUS REGION,CHINASWIFT: BKCHCNBJ260TEL: (86) 0951-5681501FAX: (86) 0951-5681509POST CODE: 750002
XINJIANG BRANCH
1 DONGFENG ROAD,URUMQI,XINJIANG UYGUR AUTONOMOUS REGION,CHINASWIFT: BKCHCNBJ760TEL: (86) 0991-2328888FAX: (86) 0991-2825095POST CODE: 830002
CHONGQING BRANCH
218 ZHONG SHAN YI ROAD,YU ZHONG DISTRICT,CHONGQING,CHINASWIFT: BKCHCNBJ59ATEL: (86) 023-63889234FAX: (86) 023-63889217POST CODE: 400013
SHENZHEN BRANCH
INTERNATIONAL FINANCE BUILDING,2022 JIANSHE ROAD,LUOHU DISTRICT, SHENZHEN,GUANGDONG PROV.,CHINASWIFT: BKCHCNBJ45ATEL: (86) 0755-22338888FAX: (86) 0755-82259209POST CODE: 518001
SUZHOU BRANCH
128 WANGDUN ROAD, SUZHOU INDUSTRIAL PARK,SUZHOU,JIANGSU PROV.,CHINASWIFT: BKCHCNBJ95BTEL: (86) 0512-66595566FAX: (86) 0512-65114906POST CODE: 215028
NINGBO BRANCH
139 YAOHANG STREET,NINGBO,ZHEJIANG PROV.,CHINASWIFT: BKCHCNBJ92ATEL: (86) 0574-87196666FAX: (86) 0574-87198889POST CODE: 315000
QINGDAO BRANCH
59 HONGKONG MIDDLE ROAD,QINGDAO,SHANDONG PROV.,CHINASWIFT: BKCHCNBJ50ATEL: (86) 0532-81858000FAX: (86) 0532-85818243POST CODE: 266071
DALIAN BRANCH
9 ZHONGSHAN SQUARE,ZHONGSHAN DISTRICT,DALIAN,LIAONING PROV.,CHINASWIFT: BKCHCNBJ81ATEL: (86) 0411-82586666FAX: (86) 0411-82637098POST CODE: 116001
XIAMEN BRANCH
BANK OF CHINA BUILDINGNO. 40 NORTH HUBIN ROAD,XIAMEN,CHINASWIFT: BKCHCNBJ73ATEL: (86) 0592-5066417FAX: (86) 0592-5095130POST CODE: 361012
BANK OF CHINA INSURANCE COMPANY LIMITED
9/10/11F NO.110 XIDAN NORTH STREET, XICHENG DISTRICT, BEIJING,CHINATEL: (86) 010-83260001FAX: (86) 010-83260006P.O.BOX: 100032WEBSITE: WWW.BOCINS.COM
BANK OF CHINA INVESTMENT MANAGEMENT CO., LTD
45/F, BOC BUILDING 200 MID. YINCHENG ROAD, PUDONG NEW DISTRICT, SHANGHAI,CHINATEL: (86) 021-38834999FAX: (86) 021-68873488P.O.BOX: 200120WEBSITE: WWW.BOCIM.COM
BANK OF CHINA CONSUMER FINANCE COMPANY LIMITED
1409#, BOC BUILDING 200 MID. YINCHENG ROAD, PUDONG NEW DISTRICT, SHANGHAI,CHINATEL: (86) 021-63291680FAX: (86) 021-63291789P.O.BOX: 200120WEBSITE: WWW.BOCCFC.CNEMAIL: [email protected]

2016 Annual Report301
List of Major Branches and Subsidiaries
BOC INTERNATIONAL (CHINA) LIMITED
39/F, BOC BUILDING 200 MID. YINCHENG ROAD, PUDONG NEW DISTRICT, SHANGHAI,CHINATEL: (86) 021-20328000FAX: (86) 021-58883554P.O.BOX: 200120WEBSITE: WWW.BOCICHINA.COMEMAIL: [email protected]
PREPARATION TEAM OF BOC FULLERTON COMMUNITY BANKS
9/F NO.110 XIDAN NORTH STREET, XICHENG DISTRICT, BEIJING, CHINATEL: (86) 010-57765000FAX: (86) 010-57765550P.O.BOX: 100032WEBSITE: WWW.BOCFULLERTONBANK.COM
BOC-SAMSUNG LIFE INS. CO., LTD.
9/F, NO.110 XIDAN NORTH STREET, XICHENG DISTRICT, BEIJING,CHINATEL: (86) 010-8326 2688FAX: (86) 010-8326 2777P.O.BOX: 100032WEBSITE: WWW.BOC-SAMSUNGLIFE.CN
MAJOR BRANCHES AND SUBSIDIARIES IN HONG KONG, MACAU AND TAIWANBOC HONG KONG (HOLDINGS) LIMITED
24/F, BANK OF CHINA TOWER,1 GARDEN ROAD,HONG KONGTEL: (852) 28462700FAX: (852) 28105830WEBSITE: www.bochk.com
BOC INTERNATIONAL HOLDINGS LIMITED
26/F, BANK OF CHINA TOWER,1 GARDEN ROAD,HONG KONGTEL: (852) 39886000FAX: (852) 21479065WEBSITE: www.bocigroup.comEMAIL: [email protected]
HONG KONG BRANCH
7/F, BANK OF CHINA TOWER,1 GARDEN ROAD,HONG KONGTEL: (852) 28101203FAX: (852) 25377609
BANK OF CHINA GROUP INSURANCE COMPANY LIMITED
9/F, WING ON HOUSE,71 DES VOEUX ROAD CENTRAL,HONG KONGTEL: (852) 28670888FAX: (852) 25221705WEBSITE: www.bocgins.comEMAIL: [email protected]
BANK OF CHINA GROUP INVESTMENT LIMITED
23/F, BANK OF CHINA TOWER,1 GARDEN ROAD,HONG KONGTEL: (852) 22007500FAX: (852) 28772629WEBSITE: www.bocgi.comEMAIL: [email protected]
BOC GROUP LIFE ASSURANCE CO., LTD.
13/F, CITYPLAZA ONE,1111 KING’S ROAD, TAIKOO SHING,HONG KONGTEL: (852) 21608800FAX: (852) 28660938WEBSITE: www.boclife.com.hkEMAIL: [email protected]
MACAU BRANCH
BANK OF CHINA BUILDING,AVENIDA DOUTOR MARIO SOARES,MACAUSWIFT: BKCHMOMXTEL: (853) 28781828FAX: (853) 28781833WEBSITE: www.bocmacau.com
TAI FUNG BANK LIMITED
418, ALAMEDA DR. CARLOS,d’ASSUMPCAO,MACAUTEL: (853) 28322323FAX: (853) 28570737WEBSITE: www.taifungbank.comEMAIL: [email protected]
TAIPEI BRANCH
1–4/F, NO. 105, SONGREN ROAD,XINYI DIST., TAIPEI CITY,TAIWANSWIFT: BKCHTWTPTEL: (886) 227585600FAX: (886) 227581598EMAIL: [email protected]
MAJOR BRANCHES AND SUBSIDIARIES IN OTHER COUNTRIESASIA-PACIFIC AREA
SINGAPORE BRANCH
4 BATTERY ROAD, BANK OF CHINA BUILDING, SINGAPORE 049908SWIFT: BKCHSGSGXXXTEL: (65) 65352411FAX: (65) 65343401EMAIL: [email protected]: www.bankofchina.com/sg
TOKYO BRANCH
BOC BLDG. 3-4-1 AKASAKA MINATO-KU,TOKYO 107-0052JAPANSWIFT: BKCHJPJTTEL: (81) 335058818FAX: (81) 335058868EMAIL: [email protected]: www.bankofchina.com/jp
SEOUL BRANCH
1/2/3F YOUNG POONG BLDG.41, CHEONG GYE CHEON-RO, JONGNO-GU,SEOUL 03188KOREASWIFT: BKCHKRSEXXXTEL: (82) 16705566FAX: (82) 23996265WEBSITE: www.bankofchina.com/kr
BANK OF CHINA (THAI) PUBLIC COMPANY LIMITED
179/4 BANGKOK CITY TOWER,SOUTH SATHORN ROAD, TUNGMAHAMEK SATHORN DISTRICT, BANGKOK 10120,THAILANDSWIFT: BKCHTHBKTEL: (66) 22861010FAX: (66) 22861020CUSTOMER SERVICE CENTRE: (66) 26795566EMAIL: [email protected]: www.bankofchina.com/th
BANK OF CHINA (MALAYSIA) BERHAD
GROUND, MEZZANINE, & 1ST FLOOR PLAZA OSK, 25 JALAN AMPANG50450 KUALA LUMPUR,MALAYSIASWIFT: BKCHMYKLTEL: (60) 323878888FAX: (60) 321615150EMAIL: [email protected]
HOCHIMINH CITY BRANCH
GROUND & 11TH FL, TIMES SQUARE BUILDING, 22–36 NGUYEN HUE STREET, DISTRICT 1, HOCHIMINH CITY,VIETNAMSWIFT: BKCHVNVXTEL: (84) 838219949FAX: (84) 838219948EMAIL: [email protected]
MANILA BRANCH
G/F. & 36/F. PHILAMLIFE TOWER8767 PASEO DE ROXAS, MAKATI CITY, MANILAPHILIPPINESSWIFT: BKCHPHMMTEL: (63) 28850111FAX: (63) 28850532EMAIL: [email protected]
JAKARTA BRANCH
TAMARA CENTER 11TH FLOOR, JALAN JEND. SUDIRMAN KAV. 24 JAKARTA 12920,INDONESIASWIFT: BKCHIDJATEL: (62) 215205502FAX: (62) 215201113/215207552EMAIL: [email protected]: www.bankofchina.co.id
SYDNEY BRANCH
39-41 YORK STREET, SYDNEY NSW 2000,AUSTRALIASWIFT: BKCHAU2SXXXTEL: (61) 282355888FAX: (61) 292621794EMAIL: [email protected]: www.bankofchina.com/au

2016 Annual Report 302
List of Major Branches and Subsidiaries
BANK OF CHINA (AUSTRALIA) LIMITED
39-41 YORK STREET, SYDNEY NSW 2000,AUSTRALIASWIFT: BKCHAU2AXXXTEL: (61) 282355888FAX: (61) 292621794EMAIL: [email protected]: www.bankofchina.com/au
BANK OF CHINA (NEW ZEALAND) LIMITED
LEVEL 17, TOWER 1, 205 QUEEN STREET,AUCKLAND, 1010,NEW ZEALANDSWIFT: BKCHNZ22TEL: (64) 99809000FAX: (64) 99809088EMAIL: [email protected]: www.bankofchina.com/nz
JSC AB (BANK OF CHINA KAZAKHSTAN)
71B, MICRODISTRICT ZHETYSU-2, AUEZOV DISTRICT, 050063, ALMATY,REPUBLIC OF KAZAKHSTANSWIFT: BKCHKZKATEL: (7) 7272585510FAX: (7) 7272585514EMAIL: [email protected]
BANK OF CHINA (HONGKONG) LIMITED BRUNEI BRANCH
KIARONG JAYA KOMPLEK, LOT NO. 56244, SIMPANG 22, JALAN DATO RATNA, KAMPONG KIARONG, BANDAR SERI BEGAWAN BE1318,BRUNEI DARUSSALAMSWIFT: BKCHBNBBTEL: (673) 2459888FAX: (673) 2459878
PHNOM PENH BRANCH
CANADIA TOWER, 1ST & 2ND FLOOR,#315 ANG DOUNG ST. P.O. BOX 110, PHNOM PENH,CAMBODIASWIFT: BKCHKHPPTEL: (855) 23988886FAX: (855) 23988880EMAIL: [email protected]: www.boc.cn/kh
VIENTIANE BRANCH
NO.A1003-A2003, VIENTIANE CENTER, KHOUVIENG ROAD, NONGCHAN VILLAGE, SISATTANAK DISTRICT, VIENTIANE CAPITAL,LAO P.D.R.SWIFT: BKCHLALAXXXTEL: (856) 21228888FAX: (856) 21228880EMAIL: [email protected]
ULAANBAATAR REPRESENTATIVE OFFICE
11TH FLOOR CENTRAL TOWER, 2 GREAT CHINGGIS KHAAN SQUARE, SBD-8, ULAANBAATAR 14200,MONGOLIATEL: (976) 77095566FAX: (976) 77195566
BAHRAIN REPRESENTATIVE OFFICE
OFFICE 1502, AL JASRAH TOWER,DIPLOMATIC AREA BUILDING 95, ROAD 1702, BLOCK 317, MANAMAKINGDOM OF BAHRAINTEL: (973) 17531119FAX: (973) 17531009EMAIL: [email protected]
BANK OF CHINA MIDDLE EAST (DUBAI) LIMITED
LEVEL 11 TOWER 2, AL FATTAN CURRENCY HOUSE DUBAI INTERNATIONAL FINANCIAL CENTRE P.O. BOX 118842, DUBAI, U.A.E.SWIFT: BKCHAEADTEL: (9714)3819100FAX: (9714)3880778
BANK OF CHINA (DHABI) BRANCH
LEVEL 11 TOWER 2, AL FATTAN CURRENCY HOUSE DUBAI INTERNATIONAL FINANCIAL CENTRE P.O. BOX 118842, DUBAI, U.A.E.SWIFT: BKCHAEADTEL: (9714)3819100FAX: (9714)3880778EMAIL: [email protected]
BANK OF CHINA LTD-ABU DHABI
GROUND FLOOR, MANSOUR TOWER, AL SALAM STREET, P.O. BOX 73098, ABU DHABI, U.A.E.SWIFT: BKCHAEAATEL: (9712) 4041666FAX: (9712) 4041668EMAIL: [email protected]
ISTANBUL REPRESENTATIVE OFFICE
ESENTEPE, BUYUKDERE CD. NO: 209 KAT: 21, 34394 4. LEVENT, SISLI, ISTANBUL, TURKEYTEL: (90) 2122608888FAX: (90) 2122798866EMAIL: [email protected]
YANGON REPRESENTATIVE OFFICE
08-06, LEVEL 8, UNION FINANCIAL CENTER (UFC), CORNER OF MAHABANDOOLA ROAD & THEIN PHYU ROAD 45TH STREET, BOTATUNG TOWNSHIP,YANGON,MYANMARTEL: (95) 18610408EMAIL: [email protected]
BOC AVIATION LIMITED
8 SHENTON WAY #18-01SINGAPORE 068811TEL: (65) 63235559FAX: (65) 63236962WEBSITE: www.bocaviation.com
EUROPE
LONDON BRANCH
1 LOTHBURY, LONDON EC2R 7DB,U.K.SWIFT: BKCHGB2LTEL: (44) 2072828888FAX: (44) 2076263892EMAIL: [email protected]: www.bankofchina.com/uk
BANK OF CHINA (UK) LIMITED
1 LOTHBURY, LONDON EC2R 7DB,U.K.SWIFT: BKCHGB2UTEL: (44) 2072828888FAX: (44) 2076263892EMAIL: [email protected]: www.bankofchina.com/uk
BOC AVIATION (IRELAND) LIMITED
THE CRESCENT BUILDINGNORTHWOOD, SANTRYDUBLIN 9 D09 C6X8REPUBLIC OF IRELANDTEL: (353) 18934173
PARIS BRANCH
23–25 AVENUE DE LA GRANDE ARMEE 75116 PARIS,FRANCESWIFT: BKCHFRPPTLX: 281 090 BDCSPTEL: (33) 149701370FAX: (33) 149701372WEBSITE: www.bankofchina.com/fr
FRANKFURT BRANCH
BOCKENHEIMER LANDSTR. 24 60323 FRANKFURT AM MAIN,GERMANYSWIFT: BKCHDEFFTEL: (49) 691700900FAX: (49) 69170090500EMAIL: [email protected]: www.bankofchina.com/de
LUXEMBOURG BRANCH
37/39 BOULEVARD PRINCE HENRI L-1724 LUXEMBOURG P.O. BOX 114 L-2011,LUXEMBOURGSWIFT: BKCHLULLTEL: (352) 268688300FAX: (352) 221795EMAIL: [email protected]: www.bankofchina.com/lu
BANK OF CHINA (LUXEMBOURG) S.A.
37/39 BOULEVARD PRINCE HENRI L-1724 LUXEMBOURG P.O. BOX 721 L-2017,LUXEMBOURGSWIFT: BKCHLULATEL: (352) 268688300FAX: (352) 221795EMAIL: [email protected]: www.bankofchina.com/lu
BANK OF CHINA (LUXEMBOURG) S.A.BRUSSELS BRANCH
20 AVENUE DES ARTS, 1000, BRUSSELS,BELGIUMSWIFT: BKCHBEBBTEL: (32) 24056688FAX: (32) 22302892EMAIL: [email protected]
BANK OF CHINA (LUXEMBOURG) S.A.ROTTERDAM BRANCH
COOLSINGEL 63,3012AB ROTTERDAM, THE NETHERLANDSSWIFT : BKCHNL2RXXXTEL: (31) 102175888FAX: (31) 102175899EMAIL: [email protected]
BANK OF CHINA (LUXEMBOURG) S.A. STOCKHOLM BRANCH
BIRGER JARLSGATAN 28, 114 34 STOCKHOLM,SWEDENSWIFT: BKCHSESSTEL: (46) 107888888FAX: (46) 107888801EMAIL: [email protected]

2016 Annual Report303
List of Major Branches and Subsidiaries
BANK OF CHINA (LUXEMBOURG) S.A. POLAND BRANCH
UL. ZIELNA 41/43, 00-108 WARSAW,POLANDSWIFT: BKCHPLPXTEL: (48) 224178888FAX: (48) 224178887EMAIL: [email protected]
BANK OF CHINA (LUXEMBOURG) S.A. LISBON BRANCH
RUA DUQUE DE PALMELA NO.35,35A E 37; 1250-097 LISBOA, PORTUGALSWIFT: BKCHPTPLTEL: (351) 210495710FAX: (351) 210495738EMAIL: [email protected]
MILAN BRANCH
VIA SANTA MARGHERITA,14/16-20121 MILAN,ITALYSWIFT: BKCHITMMTEL: (39) 02864731FAX: (39) 0289013411WEBSITE: www.bankofchina.com/it
BANK OF CHINA (HUNGARY) CLOSE LTD.
7 JOZSEF NADOR TER,1051 BUDAPEST,HUNGARYSWIFT: BKCHHUHBTEL: (36) 14299200FAX: (36) 14299202EMAIL: [email protected]: www.boc.cn/hu
HUNGARIAN BRANCH
7 JOZSEF NADOR TER, 1051 BUDAPEST,HUNGARYSWIFT: BKCHHUHHTEL: (36) 14299200FAX: (36) 14299202WEBSITE: www.boc.cn/hu
BANK OF CHINA (HUNGARY) CLOSE LTD.PRAGUE BRANCH
NA FLORENCI 2116/15, NOVE MESTO, 11000 PRAHA 1,CZECH REPUBLICSWIFT: BKCHCZPPXXXTEL: (42) 0225986666FAX: (42) 0225986699EMAIL: [email protected]
BANK OF CHINA (HUNGARY) CLOSE LTD.VIENNA BRANCH
BOERSEPLATZ 6, A-1010 VIENNAAUSTRIASWIFT: BKCHATWWXXXTEL: (43) 153666FAX: (43) 153666888EMAIL: [email protected]
BANK OF CHINA SRBIJA A.D. BEOGRAD
BULEVAR ZORANA DINDICA 2A, BELGRADE,SERBIATEL: (381) 112018976FAX: (381) 112018977EMAIL: [email protected]
BANK OF CHINA (RUSSIA)
72, PROSPEKT MIRA, MOSCOW, 129110RUSSIASWIFT: BKCHRUMMTEL: (7) 4952585301FAX: (7) 4957950454EMAIL: [email protected]
AMERICA
NEW YORK BRANCH
1045 AVENUE OF THE AMERICAS,NEW YORK, NY 10018,U.S.A.SWIFT: BKCHUS33TLX: WU 661723TEL: (1212) 9353101FAX: (1212) 5931831WEBSITE: www.bocusa.com
BANK OF CHINA (CANADA)
SUITE 600, 50 MINTHORN BOULEVARD MARKHAM, ONTARIOCANADA, L3T 7X8SWIFT: BKCHCATTTEL: (1905) 7716886FAX: (1905) 7718555EMAIL: [email protected]
TORONTO BRANCH
6108 ONE FIRST CANADIAN PLACE,100 KING STREET WEST, P.O. BOX 241,TORONTO, ONTARIO,CANADA, M5X 1C8SWIFT: BKCHCAT2TEL: (1416) 9559788FAX: (1416) 9559880EMAIL: [email protected]
GRAND CAYMAN BRANCH
GRAND PAVILION COMMERCIAL CENTER802 WEST BAY ROAD, P.O. BOX 30995,GRAND CAYMAN KY1-1204CAYMAN ISLANDSSWIFT: BKCHKYKYTEL: (1345) 9452000FAX: (1345) 9452200EMAIL: [email protected]
PANAMA BRANCH
P.O. BOX 0823-01030 PUNTA PACIFICACALLE ISAAC HANONO MISSRIP.H. OCEANIA BUSINESS PLAZATORRE 2000 PISO 36PANAMA CITY,REPUBLIC OF PANAMASWIFT: BKCHPAPATEL: (507) 2635522/2169400FAX: (507) 2239960EMAIL: [email protected]
BANCO DA CHINA BRASIL S.A.
AVENIDA PAULISTA, 901-14 ANDAR BELA VISTA CEP: 01311-100, SAO PAULO, SP,BRASILSWIFT: BKCHBRSPTEL: (5511) 35083200FAX: (5511) 35083299
PERU REPRESENTATIVE OFFICE
AV. JORGE BASADRE 607, OFFICE 701,SAN ISIDRO, LIMA,PERUTEL: (51) 920137238EMAIL: [email protected]
AFRICA
JOHANNESBURG BRANCH
14TH–16TH FLOORS, ALICE LANE TOWERS,15 ALICE LANE, SANDTON,JOHANNESBURG,SOUTH AFRICASWIFT: BKCHZAJJTEL: (27) 115209600FAX: (27) 117832336EMAIL: [email protected]
BANK OF CHINA (ZAMBIA) LIMITED
PLOT NO. 2339, KABELENGA ROAD,P. O. BOX 34550, LUSAKA,ZAMBIASWIFT: BKCHZMLUTEL: (260) 211233271FAX: (260) 211236782EMAIL: [email protected]
BANK OF CHINA (MAURITIUS) LIMITED
4TH–5TH FLOOR, DIAS PIER BUILDING,CAUDAN WATERFRONT, PORT LOUIS, MAURITIUSSWIFT: BKCHMUMUTEL: (230) 2034878FAX: (230) 2034879EMAIL: [email protected]
NAIROBI REPRESENTATIVE OFFICE
MORNING SIDE OFFICE PARK, NGONG ROAD,P.O. BOX 21357-00505, NAIROBI,KENYATEL: (254) 203862811FAX: (254) 203862812EMAIL: [email protected]
LUANDA REPRESENTATIVE OFFICE
CONDOMINIO CAJUEIRO,CASA NO. I16, TALATONA,LUANDA,REPUBLIC OF ANGOLATEL: (244) 222020568FAX: (244) 222020568
MOROCCO REPRESENTATIVE OFFICE
NO.71, ANFA CENTER, 128, BD D’ANFA & ANGLE RUE LAHCEN BASRI, CASABLANCA,MAROCTEL: (212) 522203779FAX: (212) 522273083EMAIL: [email protected]
TANZANIA REPRESENTATIVE OFFICE
8TH FLOOR, AMANI PLACE, OHIO STREET, P.O. BOX 13602, DAR ES SALAAM, TANZANIA TEL: (225) 222112973FAX: (225) 222112974EMAIL: [email protected]

The report is printed on FSCTM certified
paper and is fully recyclable. The FSCTM
logo identifies products which contain
wood from responsible sources certified
in accordance with the rules of the
Forest Stewardship Council®.

No. 1 Fuxingmen Nei Dajie, Beijing, China, 100818 Tel: (86) 10-6659 6688 Fax: (86) 10-6601 6871 Customer Service and Complaint Hotline: (86) Area Code-95566 http://www.boc.cn
Annual R
eport 2016
Stock C
ode: 3988 / 4601
Annual Report2016
Ordinary H-Share Stock Code: 3988Offshore Preference Share Stock Code: 4601