policy on collection of cheques/instruments - Union Bank of India
Upload
khangminh22Category
view
2download
0
ANNUAL REPORT 2016
TOwARds A Bold
Union Bank of Colombo PlC Head office: 64, Galle Road, Colombo 03, Sri Lanka.
: +94 11 2374100 | www.unionb.com

1|ANNUAL REPORT 2016
Etched with stability that underwrites stakeholder confidence, and enriched with a comprehensive products and
services portfolio inspired through continuous innovation, Union Bank has now bourgeoned its presence amongst a
diverse clientele across the island.
Today as a fully-fledged commercial bank, we deliver a convenient banking experience to our clients through a
vibrant channel strategy that blends state-of-the-art technology with empathetic human touch.
Positioned at a significant threshold on our evolutionary journey to become a leading financial services group in Sri Lanka;
Union Bank is now set to take a bold leap towards success, thus unlocking a new phase of growth for all our stakeholders.
TowardS a BoLd

2|ANNUAL REPORT 2016
ConTEnTS
COMPANY AND REPORT OVERVIEWCover Story 1Financial Highlights 3Corporate Profile 4report Profile 8Stakeholder Engagement 13Key Performance Indicators 16Sustainability Impacts, risks and opportunities 18
MANAGEMENT REPORTS Chairman’s Message 22CEO’s Message 24Management Discussion and Analysis 30Corporate Highlights 56Media Highlights 62Social and Environment review 64Subsidiary Update 73Investor Relations 78Risk Management 84
STEWARDSHIPCorporate Governance 99 Board Audit Committee Report 126Human Resources and Remuneration Committee Report 128Integrated Risk Management Committee Report 129directors’ Statement on Internal Control over Financial reporting 131Assurance Report on Internal Control 133Nomination Committee Report 134Related Party Transactions Review Committee Report 135GRI G4 Content Index 136Independent assurance report on Sustainability reporting 140Board of Directors 142Profiles of the Board of directors 144Leadership Team 148Assistant Vice Presidents 149Chief Managers 150Senior Managers 151
FINANCIAL REPORTSFinancial Calendar 2016 156annual report of the Board of directors on the State of Affairs of the Bank 157Independent auditors’ report on Financial Statements 167Statement of Profit or Loss 168Statement of Comprehensive Income 169Statement of Financial Position 170Statement of Changes in Equity 171Statement of Cash Flows 172notes to the Financial Statements 173Ten Years at a Glance 258Capital adequacy 260Quarterly Performance of the Bank 264Direct Economic Value Generated & Distributed 265Compliance with Annual Report Disclosure requirements of Central Bank of Sri Lanka 266
SUPPLEMENTARY INFORMATIONGlossary of Financial Terms 269Branch Network 276Notice of Meeting 278Form of Proxy 279Stakeholder Feedback Form 281Corporate Information Inner Back Cover
3|ANNUAL REPORT 2016
FInanCIaL HIgHLIgHTS
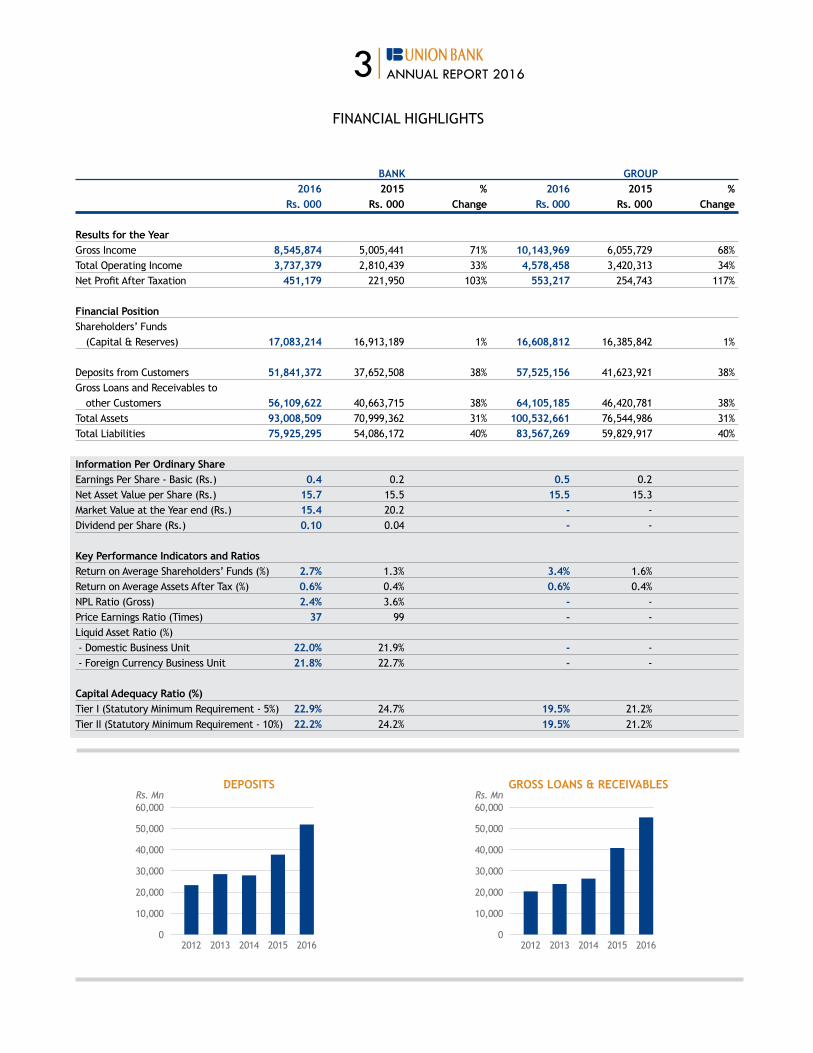
BANK GROUP 2016 2015 % 2016 2015 % Rs. 000 Rs. 000 Change Rs. 000 Rs. 000 Change
Results for the YearGross Income 8,545,874 5,005,441 71% 10,143,969 6,055,729 68%Total Operating Income 3,737,379 2,810,439 33% 4,578,458 3,420,313 34%net Profit after Taxation 451,179 221,950 103% 553,217 254,743 117%
Financial PositionShareholders’ Funds (Capital & Reserves) 17,083,214 16,913,189 1% 16,608,812 16,385,842 1%
Deposits from Customers 51,841,372 37,652,508 38% 57,525,156 41,623,921 38%gross Loans and receivables to other Customers 56,109,622 40,663,715 38% 64,105,185 46,420,781 38%Total Assets 93,008,509 70,999,362 31% 100,532,661 76,544,986 31%Total Liabilities 75,925,295 54,086,172 40% 83,567,269 59,829,917 40%
Information Per Ordinary ShareEarnings Per Share - Basic (rs.) 0.4 0.2 0.5 0.2net asset Value per Share (rs.) 15.7 15.5 15.5 15.3Market Value at the Year end (Rs.) 15.4 20.2 - -dividend per Share (rs.) 0.10 0.04 - -
Key Performance Indicators and Ratios return on average Shareholders’ Funds (%) 2.7% 1.3% 3.4% 1.6%return on average assets after Tax (%) 0.6% 0.4% 0.6% 0.4%nPL ratio (gross) 2.4% 3.6% - -Price Earnings Ratio (Times) 37 99 - -Liquid asset ratio (%) - Domestic Business Unit 22.0% 21.9% - - - Foreign Currency Business Unit 21.8% 22.7% - -
Capital Adequacy Ratio (%)Tier I (Statutory Minimum requirement - 5%) 22.9% 24.7% 19.5% 21.2%Tier II (Statutory Minimum requirement - 10%) 22.2% 24.2% 19.5% 21.2%
2012 20142013 2015 20160
10,000
40,000
20,000
50,000
30,000
60,000
DEPOSITSRs. Mn
2012 20142013 2015 20160
10,000
40,000
20,000
50,000
30,000
60,000
GROSS LOANS & RECEIVABLESRs. Mn
4|ANNUAL REPORT 2016
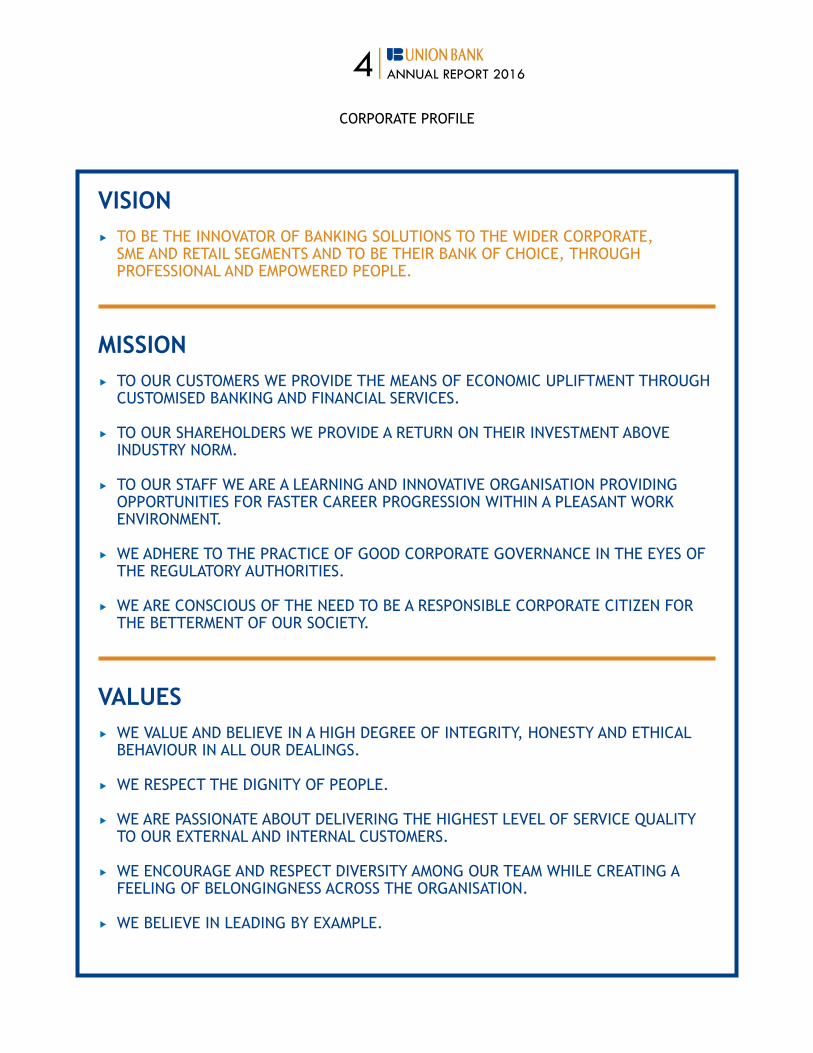
CorPoraTE ProFILE
VISIONff To BE THE InnoVaTor oF BankIng SoLUTIonS To THE wIdEr CorPoraTE, SME and rETaIL SEgMEnTS and To BE THEIr Bank oF CHoICE, THroUgH ProFESSIonaL and EMPowErEd PEoPLE.
MISSIONff To oUr CUSToMErS wE ProVIdE THE MEanS oF EConoMIC UPLIFTMEnT THroUgH CUSToMISEd BankIng and FInanCIaL SErVICES.
ff To oUr SHarEHoLdErS wE ProVIdE a rETUrn on THEIr InVESTMEnT aBoVE IndUSTry norM.
ff To oUr STaFF wE arE a LEarnIng and InnoVaTIVE organISaTIon ProVIdIng oPPorTUnITIES For FaSTEr CarEEr ProgrESSIon wITHIn a PLEaSanT work ENVIRONMENT.
ff wE adHErE To THE PraCTICE oF good CorPoraTE goVErnanCE In THE EyES oF THE rEgULaTory aUTHorITIES.
ff wE arE ConSCIoUS oF THE nEEd To BE a rESPonSIBLE CorPoraTE CITIzEn For THE BETTErMEnT oF oUr SoCIETy.
VALUESff wE VaLUE and BELIEVE In a HIgH dEgrEE oF InTEgrITy, HonESTy and ETHICaL BEHaVIoUr In aLL oUr dEaLIngS.
ff wE rESPECT THE dIgnITy oF PEoPLE.
ff wE arE PaSSIonaTE aBoUT dELIVErIng THE HIgHEST LEVEL oF SErVICE qUaLITy To oUr ExTErnaL and InTErnaL CUSToMErS.
ff wE EnCoUragE and rESPECT dIVErSITy aMong oUr TEaM wHILE CrEaTIng a FEELIng oF BELongIngnESS aCroSS THE organISaTIon.
ff wE BELIEVE In LEadIng By ExaMPLE.

5|ANNUAL REPORT 2016
ABOUT TPG TPg is a leading global private investment firm founded in 1992 with over US$74 Bn of assets under management and offices in San Francisco, Fort worth, austin, dallas, Houston, new york, Beijing, Hong kong, London, Luxembourg, Melbourne, Moscow, Mumbai, São Paulo and Singapore.
TPG has extensive experience with global public and private investments executed through leveraged buyouts, recaptialisations, spinouts, growth investments, joint ventures and restructurings.
CorPoraTE ProFILE
Established in 1995 as the 8th indigenous bank, Union Bank is amongst the highest capitalised private commercial banks in Sri Lanka, offering a wide range of products and services to retail, SME and Corporate segments.
Listed in the Colombo Stock Exchange, Union Bank is synonymous with progressiveness and potential for growth and is an entity that has attracted global and local investors.
The global investment company TPG’s investment of US$117 Mn in Union Bank in 2014, acquiring 70% of the Bank’s equity through its affiliate Culture Financial Holdings Ltd, marked a milestone in the financial services industry as one of the largest foreign direct investments to Sri Lanka. with a solid foundation etched with financial stability and international know-how, Union Bank is now a full service bank offering a comprehensive range of products and services to financially empower individuals, entrepreneurs and corporates in Sri Lanka. Following the capital infusion, the Bank implemented a cohesive plan for accelerated growth with substantial innovations
and developments to its product offering, technological and delivery platforms with the view of providing a differentiated banking experience to its clientele.
Union Bank’s growth is further augmented by the extensive investments made in network development initiatives. The Bank’s fast growing network stands at 65 branches at present, providing unsurpassed service experiences to a diverse clientele across the island. This fast growing brick and mortar presence of the Bank is ably supplemented by alternate channels that include, dedicated sales forces for assets and Liability products, a 24-hour Call Centre, an online Banking platform and a rapidly growing island-wide ATM network of over 100 Bank owned ATMs
and access to over 3,600 aTMs across Sri Lanka through LankaPay providing our clients with convenient access to financial services.
Union Bank’s renewed positioning as a fully-fledged commercial bank providing a comprehensive range of financial products and services is further enhanced with its strategic diversifications within the financial services sphere. Union Bank’s subsidiaries include National Asset Management Limited and UB Finance Company Limited.
delivering a unique value proposition and backed by the strength of TPg, today Union Bank continues to expand its horizons as one of the fastest growing commercial banks in Sri Lanka.

6|ANNUAL REPORT 2016

STABILITY
Taking pride of place amongst the highest capitalised banks in the country, Union Bank is well equipped to enable our stakeholders to take advantage of the wealth of opportunities available in this dynamic and fast-growing market.
8|ANNUAL REPORT 2016
rEPorT ProFILE
OVERVIEW (g4-18/g4-28/g4-29/g4-30/g4-32)
The report reviews the operations of the Bank and its respective subsidiaries during the financial year from 1 January 2016 to 31 december 2016, complying with all the due financial and non-financial requirements. The report precisely exhibits the Bank’s strategy, operations and stakeholder management processes which significantly contribute to the Bank’s sustainable journey towards achieving its ultimate objectives, framed within the identified boundaries. Union Bank publishes its performance on an annual basis and the most recent, previous report published was for the financial year of 2015.
This report has been compiled following the Global Reporting Initiative (GRI) G4 guidelines for sustainability reporting and is presented “in accordance” Core. According to the G4 sustainability reporting guidelines, the Bank’s prioritisation of GRI content aspects have been based on the principle of materiality and stakeholder inclusiveness. The GRI content index is set out on pages 136-139 of this report.
The Financial Statements appearing in this report have been prepared in accordance with the Sri Lanka accounting Standards (LkaS’s/SLFrS’s) in effect as at 31 december 2016, issued by the Institute of Chartered Accountants of Sri Lanka. The Bank operates in compliance with the requirements of the Companies act no.07 of 2007, Banking Act and the listing rules of the Colombo Stock Exchange.
ENDORSEMENT OR SUBSCRIPTION TO ExTERNALLY DEVELOPED CHARTERS AND PRINCIPLES (G4-15)
In addition to all the relevant legal and regulatory frameworks and charters the Bank also endorses and/or subscribes to the following,
ff Code of Best Practices on Corporate governance issued jointly by the Institute of Chartered Accountants of Sri Lanka and the Securities and Exchange Commission of Sri Lanka.
ff The Global Reporting Initiatives for Sustainability reporting (grI)
ExTERNAL ASSURANCE (g4-33) we have appointed M/s Ernst & young Chartered accountants, an Independent External Auditor to provide an assurance on the Bank’s integrated sustainability initiatives and measures included in the report. The Board of Directors’ recommendation is obtained in determining the external assurance provider and shareholders’ approval has been obtained at the Annual General Meeting to appoint an independent external auditor.
REPORTING BOUNDARIES AND MATERIALITY (g4-6/g4-20/g4-21/g4-22/g4-23)
This report is about the performance of Union Bank’s operations within the boundaries of Sri Lanka. reporting is mainly focused on indicators that reflect on the Bank’s performance against defined core sustainability focus areas such as economic, environmental and
social impacts or that would influence the assessment and decisions of its stakeholders. Material assessment attached here, further reveals details on the material aspects and setting of aspect boundaries with regard to each factor. There have been no significant restatements to the information provided in previous reports or to the scope and aspect boundaries.
There were no significant changes regarding the Bank’s size, structure and ownership or its supply chain, including changes in the location or changes in the operations, changes in the capital structure and other capital formation, maintenance, and alteration operations and changes in the location of suppliers, the structure of the supply chain, or in relationships with suppliers, including selection and termination.
MATERIAL ASPECTS Material assessment and Shareholder Matrix

9|ANNUAL REPORT 2016
rEPorT ProFILE
MATERIAL ASPECTS AND BOUNDARIES (g4-19)
ASPECT INTERNAL STAKEHOLDERS’ PRIORITIES
ExTERNAL STAKEHOLDERS’ PRIORITIES
REASONS FOR LOW PRIORITY BY INTERNAL STAKEHOLDERS
Category : Economic
1. Economic performance
High High
2. Market presence Low Low Employment opportunities of the Bank are filled locally.
3. Indirect economic impacts
Low Low Impact in the context of external benchmarks and stakeholder priorities are of low risk.
4. Procurement practices High Moderate
Category : Environment
5. Materials Moderate Low
6. Energy Moderate Low
7. water Low Low due to the nature of the operations of the Bank, the volume of consumption is insignificant.
8. Biodiversity Low Low The operations of the Bank has minimum impact on biodiversity.
9. Emissions Low Low Due to the nature of the operations of the Bank the volume of emissions are negligible.
10. Effluents and waste Moderate Moderate
11. Product and services Low Low Impact on the environment by the products & services offered is minimal.
12. Compliance Low Low There is low potential for environmental non-compliance due to the nature of the Bank’s operations.
13. Transport Low Low due to the nature of the operations of the Bank, impact on environment due to transportation is minimal.
14. Overall Low Low due to the nature of the operations of the Bank, overall impact on environment is minimal.
15. Supplier environment assessment
Low Low Bank adopts stringent supplier screening mechanisms, as such, the negative impact on the environment is minimal.
16. Environmental grievance mechanisms
Low Low due to the nature of the operations of the Bank, the direct impact on environment is minimal.
Category : Social - Labour Practices
17. Employment High High
18. Labour/management relations
High Moderate
19. occupational health and safety
Low Low The Bank operates in a relatively safe and non-hazardous work environment and the possibility of diseases or injury related to occupation is low.
20. Training and education High High

10|ANNUAL REPORT 2016
rEPorT ProFILE
ASPECT INTERNAL STAKEHOLDERS’ PRIORITIES
ExTERNAL STAKEHOLDERS’ PRIORITIES
REASONS FOR LOW PRIORITY BY INTERNAL STAKEHOLDERS
21. diversity and equal opportunity
Moderate Moderate
22. Equal remuneration for women and men
Moderate Moderate
23. Suppliers’ assessment for labour practices
Low Low Bank adopts stringent supplier screening mechanisms, as such, the negative impact on labour practices is minimal.
24. Labour practices governance mechanisms
Moderate Moderate
Category : Social - Human Rights
25. Investment Low Low The Bank complies with all local laws and regulations in respect of Human Rights.
26. Non-discrimination Low Low The Bank complies with all local laws and regulations in respect of Human Rights.
27. Freedom of association and collective bargaining
Low Low Based on the management practices adopted by the Bank, impact is minimal.
28. Child labour Low Low There is no impact due to the management practices adopted by the Bank.
29. Forced or compulsory labour
Low Low There is no impact due to the management practices adopted by the Bank.
30. Security practices Low Low Security services are outsourced and are maintained within strict guidelines given by the Bank as such the impact is minimal.
31. Indigenous rights Low Low Due to the nature of the Bank’s operations impact is minimal.
32. assessment Low Low The Bank’s Human Resources function is governed by a comprehensive HR Policy which is designed to minimise impact.
33. Supplier Human rights assessment
Low Low Bank adopts stringent supplier screening mechanisms as such the impact is minimal.
34. Human rights grievance mechanisms
Moderate Moderate
Category : Social - Society
35. Local communities Low Low Due to the nature of operations of the Bank the impact on local community is minimal.
36. anti-corruption Low Low Bank operates and complies within strict policies set by the Regulators and adopts a culture inculcating awareness on Anti-corruption.

11|ANNUAL REPORT 2016
ASPECT INTERNAL STAKEHOLDERS’ PRIORITIES
ExTERNAL STAKEHOLDERS’ PRIORITIES
REASONS FOR LOW PRIORITY BY INTERNAL STAKEHOLDERS
37. Public policy Low Low The Bank adopts policies that clearly defines its boundaries with regard to public/political involvement.
38. anti-competitive behaviour
Low Low no significant incidents have been noted.
39. Compliance Moderate Moderate
40. Supplier assessment for impacts on society
Low Low Bank adopts stringent supplier screening mechanisms as such the impact on the Supply Chain is minimal.
41. Grievance Mechanisms for impacts on society
Low Low no significant incidents have been noted.
Category : Social - Product Responsibility
42. Customer health and safety
Low Low The nature of the Bank’s operations result in relatively low health and safety risks.
43. Product and service labeling
High High
44. Marketing communications
High High
45. Customer privacy High High
46. Compliance High High
rEPorT ProFILE
12|ANNUAL REPORT 2016
S
IGN
IFIC
AN
CE T
O T
HE
ExTE
RNA
L ST
AKE
HO
LDER
S
H 1,17,20,
43,44,45,46
M 10,21,22,24,
34,394,18
L
2,3, 7,8,9,11,12, 13,14,
15,16,19,23,25, 26,27, 28,
29,30,31,32,33,35, 36,37,38,40,41,42
5,6
L M H
SIGNIFICANCE TO THE INTERNAL STAKEHOLDERS
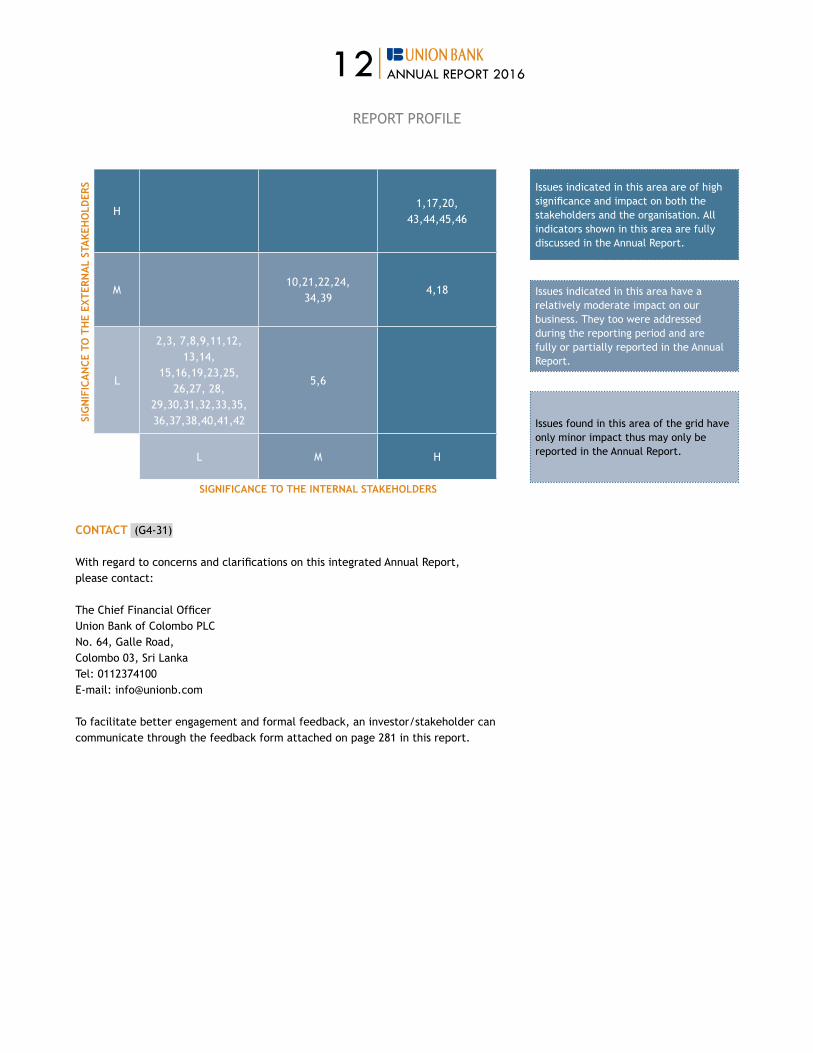
Issues indicated in this area are of high significance and impact on both the stakeholders and the organisation. All indicators shown in this area are fully discussed in the Annual Report.
Issues indicated in this area have a relatively moderate impact on our business. They too were addressed during the reporting period and are fully or partially reported in the Annual Report.
Issues found in this area of the grid have only minor impact thus may only be reported in the Annual Report.
CONTACT (g4-31) with regard to concerns and clarifications on this integrated annual report, please contact: The Chief Financial officer Union Bank of Colombo PLC no. 64, galle road, Colombo 03, Sri Lanka Tel: 0112374100 E-mail: [email protected] To facilitate better engagement and formal feedback, an investor/stakeholder can communicate through the feedback form attached on page 281 in this report.
rEPorT ProFILE
13|ANNUAL REPORT 2016
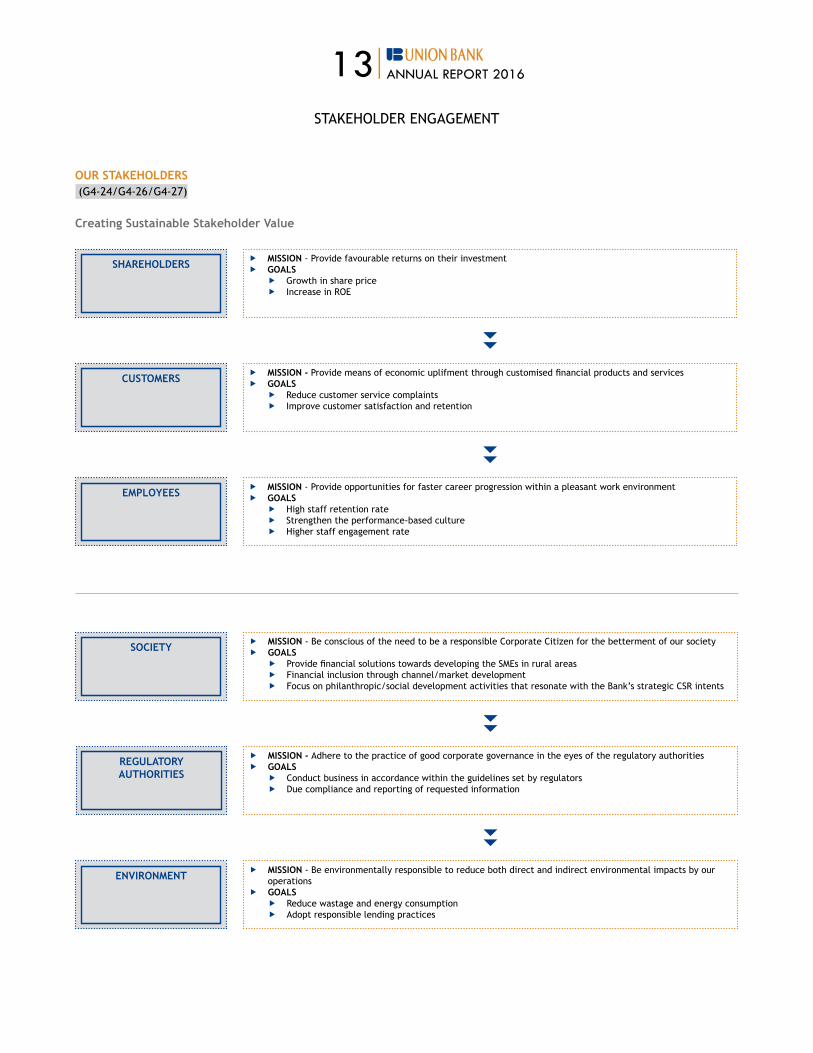
OUR STAKEHOLDERS (g4-24/g4-26/g4-27)
Creating Sustainable Stakeholder Value
ff MISSION - Provide opportunities for faster career progression within a pleasant work environment ff GOALS
ff High staff retention rate ff Strengthen the performance-based culture ff Higher staff engagement rate
ff MISSION - Provide favourable returns on their investmentff GOALS
ff Growth in share priceff Increase in ROE
SHAREHOLDERS
ff MISSION - Provide means of economic uplifment through customised financial products and services ff GOALS
ff Reduce customer service complaints ff Improve customer satisfaction and retention
CUSTOMERS
EMPLOYEES
ff MISSION - Be conscious of the need to be a responsible Corporate Citizen for the betterment of our societyff GOALS
ff Provide financial solutions towards developing the SMEs in rural areas ff Financial inclusion through channel/market development ff Focus on philanthropic/social development activities that resonate with the Bank’s strategic CSr intents
ff MISSION - Adhere to the practice of good corporate governance in the eyes of the regulatory authoritiesff GOALS
ff Conduct business in accordance within the guidelines set by regulators ff due compliance and reporting of requested information
ff MISSION - Be environmentally responsible to reduce both direct and indirect environmental impacts by our operations
ff GOALSff Reduce wastage and energy consumptionff Adopt responsible lending practices
SOCIETY
REGULATORY AUTHORITIES
ENVIRONMENT
STakEHoLdEr EngagEMEnT

14|ANNUAL REPORT 2016
STakEHoLdEr EngagEMEnT
The table below illustrates how we engage with our important stakeholder groups
STAKEHOLDER ENGAGEMENT METHOD KEY TOPICS/ISSUES RAISED RESPONSES/ACTION PLAN FREqUENCY
Shareholders ff Annual General Meetingsff Investor feedback formff Publications and
announcements through CSEff access via email/
telephone
ff Financial resultsff Strategy and goalsff Enhancing shareholder
wealth ff return on equity and
share price
ff Implementation of planned business strategy
quarterly/Annually
Customers ff One to one interviews and feedback from customers who visit the Bank
ff Customer surveysff SMS alerts and call centreff Internet banking ff Social media interactionff official web-site
ff Relationship management
ff Products and services ff Accessibility and reachff Return on investments
and cost of borrowing
ff Customer Charterff Seasonal offersff Investment in ATMs
across Sri Lankaff Customer suggestions
and recommendations approach
Ongoing
Employees ff Town hall meetingsff Open door policyff Circulars, email
notificationsff Employee intranetff Exit Interview upon
resignation
ff Career path and development opportunities
ff Work-life balanceff Ethical employee
practices ff Talent management
approach ff Promotions and salary
increments
ff Adhering to the HR policy of the Bank
Ongoing
Society & Environment
ff Feedback formsff Call centreff Employee involvement in
local community projectsff CSr projects ff Registration of suppliers
ff SME development ff Community development ff Employment
opportunities
ff Focused SME lending practices
ff Green procurement practices
ff Funding towards relevant causes through Bank’s CSr/sponsorships
ff Reduce wastage and energy consumption
Ongoing
Regulators ff Industry forumsff Meetings with Central
Bankff Reporting to the Central
Bank and CSE to ensure compliance
ff Compliance with the regulatory requirement
ff Mergers and acquisitions ff Compliance with the
Code of Best Practices
ff Strengthening relationships with public and professional institutions
ff Monitoring and responding on time
Monthly/ quarterly/ and whenever required

15|ANNUAL REPORT 2016
STakEHoLdEr EngagEMEnT
STAKEHOLDER ENGAGEMENT PROCESS (G4-25)
The Bank’s stakeholders were identified through collection and evaluation of various data. The Bank’s stakeholder engagement process is as follows.
STEP 1Stakeholder identification and initial outreach
STEP 2Establish Mission, Goals and objectives
STEP 3 define performance criteria and resource requirement
STEP 4Evaluate deficiencies anddevelop alternative plan
STEP 5 Performance measurement and feedback
kEy PErForManCE IndICaTorS
ENVIRONMENT
Saved
24,395Liters of oil
Saved
236Fully Grown Trees
Saved
55,600kWh of Electricity
Saved
42Cubic Meters of Land Fill
13,900Green House Gas (Kg)Reduction from Paper Recycling
Saved
441,742Liters of water
16|ANNUAL REPORT 2016
kEy PErForManCE IndICaTorS
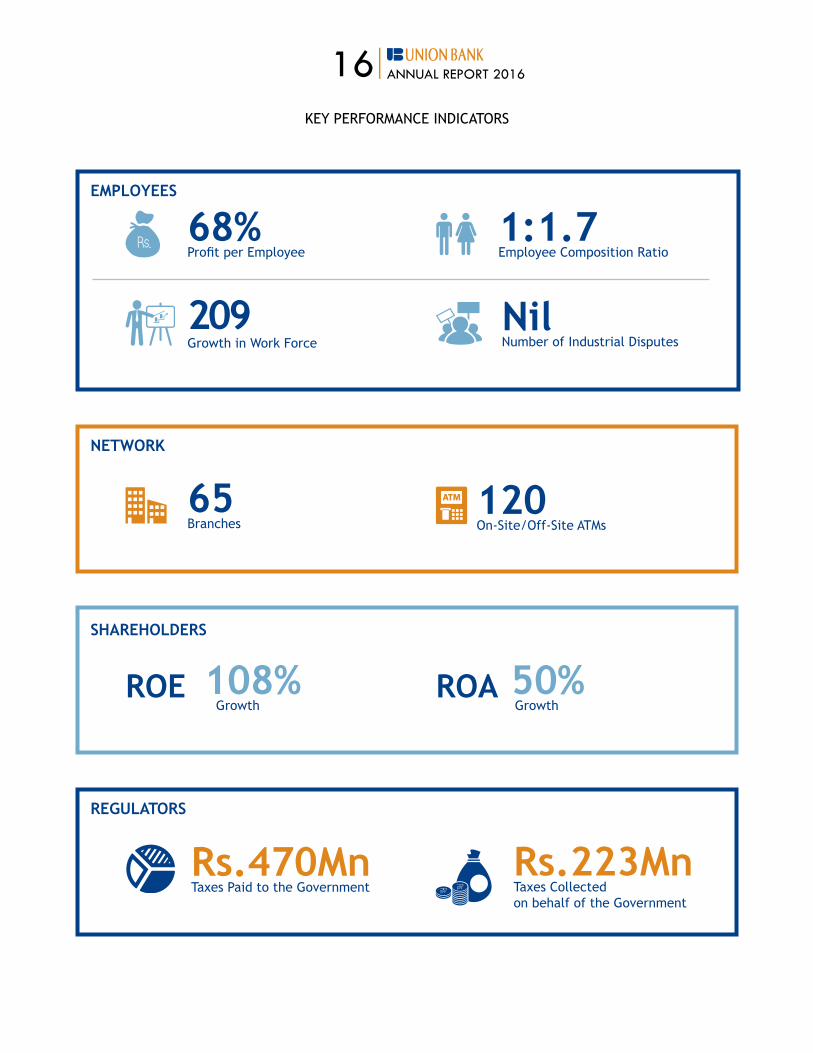
65Branches
120on-Site/off-Site aTMs
NETWORK
SHAREHOLDERS
108% GrowthROE 50%
GrowthROA
1:1.7Employee Composition Ratio
NilNumber of Industrial Disputes
EMPLOYEES
68%Profit per Employee
209Growth in Work Force
Rs.470MnTaxes Paid to the Government
Rs.223MnTaxes Collected on behalf of the Government
REGULATORS
17|ANNUAL REPORT 2016
kEy PErForManCE IndICaTorS
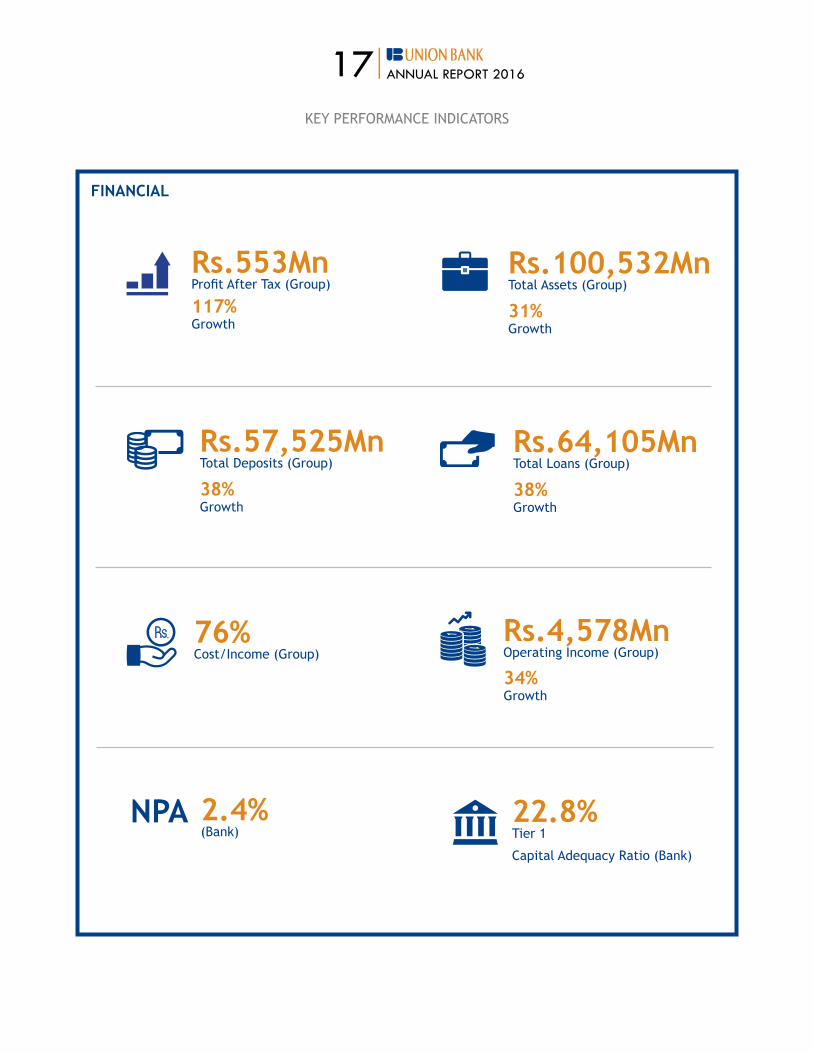
FINANCIAL
Rs.553MnProfit after Tax (Group)
117%Growth
Rs.100,532MnTotal Assets (Group)
31% Growth
Rs.64,105Mn Total Loans (group)
38% Growth
Rs.57,525MnTotal Deposits (Group)
38%Growth
2.4%(Bank)
NPACapital adequacy ratio (Bank)
22.8%Tier 1
Rs.4,578MnOperating Income (Group)
34% Growth
76%Cost/Income (group)

18|ANNUAL REPORT 2016EC
ON
OM
IC IM
PACT
ff Supporting sustainable economic development through nurturing and encouraging entrepreneurship.
ff actively support SMEs and empower self employment by offering a comprehensive portfolio of products (Micro Finance, Leasing, Project Finance and working Capital Solutions).
ff Enhancing skills and knowledge to empower entrepreneurs.
ff Instilling the habit of savings by offering a range of savings and deposit products across all customer segments.
ff Meeting the financial needs of the commercial and corporate sector.
SOCI
AL
IMPA
CT
ff directing the Bank’s operations and offering financial solutions that enables enhanced living standards of the society.
ff Empowering the employees through facilitating significant financial, health care and education support.
ENVI
RON
MEN
TAL
IMPA
CTS
ff Initiatives related to minimising the impact on the environment are addressed within the Bank’s business operations.
ff achieving optimum consumption through energy efficient processes and effective waste management.
ff Encouraging environmental responsibility with suppliers.
(g4-2/g4-EC2)
SUSTaInaBILITy IMPaCTS, rISkS and oPPorTUnITIES

19|ANNUAL REPORT 2016
SUSTaInaBILITy IMPaCTS, rISkS and oPPorTUnITIES
ECO
NO
MIC
RIS
KS/O
PPO
RTU
NIT
IES
ff Opportunities for business growth in terms of increased deposits and lending due to enhanced network.
ff Limitations in reaching the preferred target segments due to higher poverty level and low literacy levels which obstruct these segments from appreciating the benefits of financial schemes.
ff Ensuring the repayment of facilities granted is a challenge for which the Bank has put in place stringent credit screening processes.
SOCI
AL
RISK
S/O
PPO
RTU
NIT
IES
ff With an enhanced network and a comprehensive product portfolio we reach out to a wider segment of the society there by strengthening our links with the community.
ENVI
RON
MEN
TAL
RISK
S/O
PPO
RTU
NIT
IES
ff The nature of our business doesn’t directly place an impact on the environment.
ff We act as a change agent to minimise impact on environment through effective screening and communication processes with our stakeholders.
RESP
ON
SIVE
BU
SIN
ESS
PRO
CESS
ES
ff Implementation of KYC (Know Your Customer) and effective anti-money laundering policies.
ff Stringent follow up process for loan recovery.
ff Risk & Compliance.
ff Encourage responsible lending practices.
ff Implementation of an environmental friendly business model.
ff Enhancing the effectiveness of the supplier screening process to ensure the selection of most appropriate suppliers.
ff Encouraging equal opportunity and gender equality in Hr practices.
(g4-2/g4-EC2)

INNOVATION
Creating customised financial solutions that yield optimum returns to our clients is of foremost importance to us and Union Bank will continue to deliver cutting-edge financial solutions that cater to the emerging needs of our diverse clientele.

22|ANNUAL REPORT 2016
CHaIrMan’S MESSagE
“THE ENERGY DISPLAYED, THE CAREFUL STRATEGISATION AT ALL LEVELS OF THE BANK, THE COURTESIES ExTENDED TO OUR CUSTOMERS, AND THE ExCELLENT TEAM-WORK, HAVE BROUGHT A NEW-FOUND PRIDE TO THE BANK.”

23|ANNUAL REPORT 2016
TOWARDS A BOLD LEAP2016 has been a deeply satisfying year of consolidation for Union Bank. The business transformation engineered in the previous year brought into the Bank new products, differentiated business strategies, operational efficiency, a superior risk management rigour and, in order to put all this into place, new specialist teams to complement the existing management. Union Bank has become a full-service bank.
Although some of this transformation continued through 2016, the year also reaped the benefits of the earlier change. net profit more than doubled based on a loan growth of 38%, demonstrating the more productive use of capital. The Bank has also grown significantly faster than the banking industry. Low cost current and savings account deposits, which have a major impact on profitability, grew 37% for the Bank, much more rapidly than the estimated 7% for the industry. The Bank’s loan book too grew at more than twice the pace of the industry. Clearly, as the Bank captures market share it is well poised towards executing a bold leap.
when organisations change rapidly, viewing the impact of transformation through the narrow lens of a single year can sometimes be inadequate. We need a wider prism to appreciate the impact of the management change that occurred when TPg, one of the world’s foremost private equity funds, brought in capital to take management control of the Bank in late 2014. Going beyond mere numbers, such a wider lens provides an understanding of qualitative changes which have occurred which facilitate enhanced competitiveness.
The qualitative changes have been as much in the conduct of business as in the support services needed to conduct business well. In the conduct of business they encompass both customer handling and internal efficiency. relationship managers, in both wholesale and retail banking, have enhanced their reach and provide customer focus, presently to
high value clients, but with the intent of extending their reach down the Bank’s customer value chain. Branch personnel too have become more relationship-oriented, enabled also by a conscious reduction in their operations work-load. Sales teams for specified products have brought a valuable sales culture and energy into the branches. The marketing focus has brought a gloss to the corporate brand. The Bank’s upgradation of technology, operations, risk mitigation and human resources have combined to qualitatively improve support services. The focus on regulatory compliance and internal audit has further minimised the errors of mistakes and misjudgment.
The consequence is evident in the Bank’s sharper business edge. Transaction Banking through Cash Management has brought a new sophistication to Wholesale Banking clients. Retail Banking digitalisation is being rolled out, providing for ease in executing customer banking transactions, and we expect this to further attract customers to the Bank’s Elite Circle. The sale of third-party products has gained traction. Trade finance volumes have grown rapidly, and the Treasury has provided excellent liquidity management, cleverly exploiting opportunities in bond market trading. Slowly but steadily the Bank is expanding the average number of product touch-points per customer. new customer acquisition, growth in alternate channels, impeccable service quality, and optimisation of revenue have become the organisation’s new buzz words, together with maintaining our commitment towards long-term, sustainable growth. Ideas for innovation spring from all sections of the Bank’s employees. The corporate culture of Union Bank has become more internally networked and empathetic to customer needs.
APPRECIATIONThe Bank has received support from multiple agencies. The Central Bank, and particularly the Governor and the deputy governors, have provided sage counsel which has been greatly
beneficial. Customers, the touchstone upon which the Bank’s success is determined, have been as generous in their appreciation of good service, as they have been critical when service has been poor. we hope that 2017 sees more of the former and less of the latter! within the Bank, members of the Board of directors, and specially the Chairpersons and members of Board Committees, have provided sharp guidance which has charted the successful direction of the Bank’s growth. To all these institutions and individuals, and to many other counter-parties and well-wishers, I would like to record the Bank’s deep appreciation of the support provided. In addition I would like to thank our shareholders, both retail and Institutional, for reposing their trust in the Bank.
Finally, a big salute and thank you to the Union Bank employees for making 2016 such a splendid year. The energy displayed, the careful strategisation at all levels of the Bank, the courtesies extended to our customers, and the excellent team-work, have brought a new-found pride to the Bank. The sustained sense of mission fostered by the senior management of the Bank, led by the CEo, has been uncompromising in striving for banking excellence. We could not have had a more cohesive team.
Two years ago, in the Chairman’s message, I had expressed confidence that the CEO would keep the scoreboard ticking. It ticked furiously. Last year I had predicted that his stroke-play would become more stylish. His strokes were indeed a delight to watch. For 2017 my forecast is that he will bowl a few googlies - as he inevitably must if Union Bank is to successfully capture further market share.
P. Jayendra NayakChairman
CHaIrMan’S MESSagE
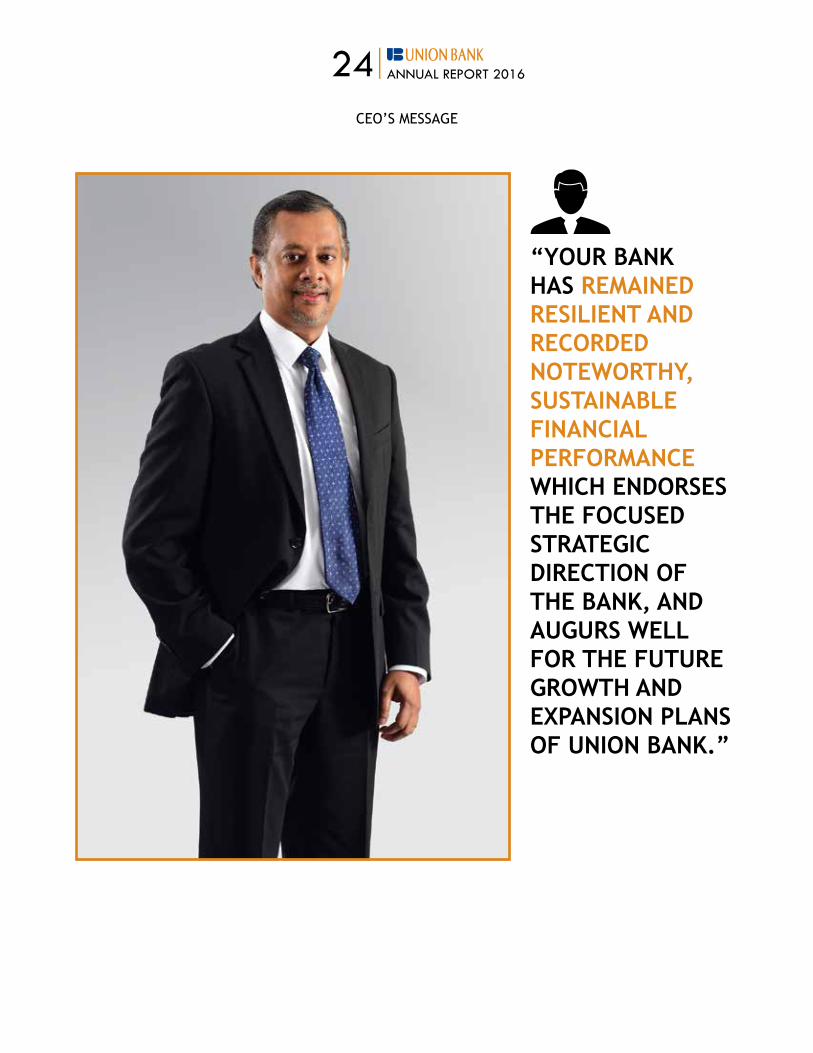
24|ANNUAL REPORT 2016
“YOUR BANK HAS REMAINED RESILIENT AND RECORDED NOTEWORTHY, SUSTAINABLE FINANCIAL PERFORMANCE WHICH ENDORSES THE FOCUSED STRATEGIC DIRECTION OF THE BANK, AND AUGURS WELL FOR THE FUTURE GROWTH AND ExPANSION PLANS OF UNION BANK.”
CEo’S MESSagE
25|ANNUAL REPORT 2016
CEo’S MESSagE
ExPANDING VISTAS 2016 was a year of continued progress and broad basing of the growth plans grounded in the previous two years, following the capital infusion by the global investment giant TPg, while setting a strong footing for an accelerated take-off in the ensuing year.
Union Bank’s new strategic focus formulated with the objective to broaden the business mix and capture newer client segments while retaining its earlier focus on meeting the funding needs of good quality SMEs, was aggressively pursued within the year under review. The Bank continued to expand its financial propositions towards larger Corporates, Small and Medium Enterprises (SMEs) as well as retail consumers, thus growing its diversified client bases with the provision of customised banking products and services.
within the year under review, the Bank executed its plans in line with its business strategy, outlining the key actions that include the addition of a layer of sophistication to the delivery of our banking facilities while introducing new products and services that meet emerging customer needs and the aggressive growth of Current and Savings account (CaSa) bases through channel and network expansion.
With the enrichment of our Retail Banking portfolio and the expansion of our branch network, the Bank experienced notable growth into new markets and territories. Supported by rapid credit growth and noteworthy customer deposit acquisition enabled through strategic investments and enablers, in 2016 Union Bank further reinforced its new phase of growth in the retail Banking arena, and the noteworthy financial results endorse the strategic pursuits executed during the year under review.
While continuing to harness our internal capabilities to boost organisational performance, we have made significant investments in people, processes, technology, products and network development this year as well; in a bid to grow our customer bases and enhance our ability to compete in a rapidly changing industry space.
during a year of change and flux in the macro-economic environment, your Bank has remained resilient and recorded noteworthy, sustainable financial performance which endorses the focused strategic direction of the Bank, and augurs well for the future growth and expansion plans of Union Bank. I present herewith an overview of your Bank’s performance for the year 2016, giving you extensive insight of our growth, both quantitative and qualitative and the strategic initiatives that have made these possible.
ECONOMIC VALUE ADDED It is my pleasure to report that Union Bank recorded a Profit after Tax of rs. 451 Mn and an asset growth of 31% recording a remarkable year for growth across all business lines.
The Bank’s Loan portfolios and deposits grew by 38% and 38% respectively, supported by a strong franchise and a customer centric business model. At the close of the year, our Loans and advances were rs. 55,438 Mn as a result of our aggressive client acquisition strategies. Resurged demand for private sector credit in the 1st half of the year, supported growth in Corporate and SME portfolios whilst retail lending was driven by growth in Personal Loans and Home Loans. It is commendable that the quality of the portfolio improved during the year as revealed by the improved nPL ratio of 2.4% and the decline in nPLs in absolute terms.
The focused efforts on increasing the low cost fund acquisition by building the Current and Savings (CaSa) portfolios of the Bank continued throughout the year 2016. This focus on growing CaSa portfolio was backed by numerous strategic initiatives including expansion of delivery channels, conducting localised promotions, inter-branch competitions and development of new products to enrich the offerings in this category. Such concerted efforts resulted in a saving portfolio growth of 44%, reflecting a prominent overall CaSa growth of 37%.
deposits stood at rs. 51,841 Mn as at year-end, accounting for 69% of the Bank’s funding with an improved CaSa ratio of 23.8%.
The increasing Cost of Deposits and lagged increase in lending rates in the second half of the year, resulted in narrowing interest spreads as foreseen. The focus on fee-based income increased during the year to compensate on the reduced interest margins. as such, the introduction of the Union Bank Biz Direct Cash Management system, debit Card acquisition, and focused drive on Trade Finance were a few strategic initiatives implemented towards the envisioned growth in Fee Income.
Continuous focus on streamlining and centralisation of operations to achieve better efficiencies, supported the bottom line growth.
The Bank also contributed to the national economic growth by continued commitment to support the entrepreneurial efforts of Small and Medium Enterprises as well as grass root level industrialists. In furtherance of this commitment, Union Bank’s SME financing unit led the SME credit growth of 34.4% during the year.

26|ANNUAL REPORT 2016
The Corporate Banking unit of the Bank recorded impressive growth, contributing immensely towards the overall assets and Liability portfolio growth of the Bank. Focused efforts were placed on forging new banking relationships with corporates and strengthening existing banking relationships with the delivery of superior service propositions.
The soundness indicators of the Bank reflect a healthy position with Core Capital and Total Capital ratios well above regulatory requirements at 22.87% and 22.24% at the close of the fiscal year 2016.
A focused business strategy coupled with a measured risk appetite, a strong brand building exercise and a solid capital base earned the Bank a ‘Positive’ outlook by Fitch ratings Sri Lanka, an upgrade from the ‘Stable’ outlook assigned in the previous year.
A YEAR OF CONSOLIDATED GROWTH With the belief that innovation brings unprecedented value to our stakeholders, Union Bank continued to invest in delivering innovative products and services customised to meet the emerging needs of our stakeholders. Towards this, the retail Banking segment of the Bank introduced Union Bank Invest Plus - a systematic investment plan designed to reward the commitment of prudent savers who are willing to save on a continuous basis and Union Bank remit2SriLanka Money Transfer Service - a simple, fast, secure and affordable method to send money from anywhere in the world to Sri Lanka through an online money transfer platform. Union Bank Biz Direct was one of the most significant products introduced by the Bank in 2016 towards enhancing its service proposition to Corporates and top tier SMEs. Union Bank Bizdirect is
a comprehensive Transaction Banking solution that provides global access and usage for the Bank’s Corporate and SME clients; enabling local and cross-border trading at the click of a button. The product is expected to make significant contribution to the Fee Income of the Bank while creating long term relationships with the corporate clientele.
The Bank continued to invest on expanding customer reach and convenience. The Bank expanded its island-wide network to 65 branches and added 18 new aTMs to its network. The Union Bank ATM network across the country now stands at 120.
Having placed foremost emphasis on our greatest asset of Human resources, Union Bank continued to invest in career development of our staff, by taking bold steps towards creating better opportunities for training and development while motivating them for performance through enhanced compensations, benefits and recreational experiences.
Technology is another key driver of our business growth and hence significant investments were made in augmenting our IT excellence in the year 2016. Implementation of the comprehensive Cash Management system, deployment of the Digital Banking platforms to enable greater customer convenience through Mobile/Internet Banking and implementation of an improved Collection and Recovery system were some of the key highlights in the year, which contributed to smoother execution of the business priorities of the Bank.
The Bank continued to place great focus on streamlining and centralising of operations for enhanced efficiency and performance. Against the backdrop
of intense competition and highly regulated operating environment, Union Bank reaped the cost benefits of enhanced operational performance, which also contributed to a significant enhancement of the service delivery standards of the Bank. Centralisation of the account opening process, processing of post-dated bulk cheques, and the successful implementation of the Safety deposit Locker systems were some key operational process achievements of the year that ensured reduction in transaction times, costs and improved service quality. Focused efforts were also implemented towards minimising the impact on the environment through the Bank’s operations.
We remain conscious and cognisant of the need to continue to build positive customer sentiments towards the Union Bank brand and therefore, continued to invest in enhancing our brand outlook to strengthen our position as an energetic, progressive bank driving the financial growth of our diverse clientele. our Marketing Strategy recognises this diversity and marketing programmes have been targeted at different segments of the market, while recognising imperfections of competitiveness in a highly regulated market where competition is permitted only within the regulatory framework. Marking a milestone in the Bank’s rebranding efforts, Union Bank received the award for Excellence in Branding in the Banking, Financial Services and Insurance sector at the Global Brand Excellence Awards 2016 held in kuala Lumpur, Malaysia. The award acknowledged the great strides made by the Union Bank brand within the banking industry of Sri Lanka, subsequent to the repositioning of the brand as a fully-fledged commercial bank in 2015.
With a view to create sustainable long term value to the community and
CEo’S MESSagE
27|ANNUAL REPORT 2016
the greater environment in which we operate, the Bank took the first steps towards implementing a Corporate Social responsibility (CSr) Strategy guided by the theme of ‘empowering children and youth of Sri Lanka’ in the year 2016. I’m pleased to announce that the groundwork to implementing this focused CSr strategy has been laid out in the year 2016, in a bid to take forward the CSr initiatives in the coming year.
FOCUSED ON A BOLD LEAPHaving consolidated our growth and performance in the previous years, I am confident that Union Bank is now at a significant threshold, and is ready to take the bold leap towards success.
The envisioned growth of the Bank in the ensuing years is intended to bring about many benefits and returns to our stakeholders while energising their financial positions; to make the rest of their lives the best of their lives.
As a fast growing private sector commercial bank making waves in the banking landscape in Sri Lanka, Union Bank will continue to challenge the status quo and deliver outstanding growth prospects to our customers, shareholders, partners and all others stakeholders.
Providing convenience through technological advancement will play a key role in the coming year enabled through increased digitalisation of our service delivery. While maintaining our empathetic human touch across our brick and mortar presence we will place focused efforts to deliver true value and convenience to our clients through real-time convenient banking channels such as aTMs, Internet/Mobile Banking platforms and automated banking services which would pave the way for branches to focus on building and
strengthening our client relationships. Deploying technology that is easily accessible and readily understood with mass appeal will be key to attracting a generation of tech savvy youth and taking banking to the emerging customer. Investments in technology will also support our thrust on the financial inclusion agenda with cost effective banking solutions for new segments of customers.
The focus on building the CaSa base will continue with commitment towards building a nation of savers.
We will also continue our programmes to facilitate access to finance for SMEs and support capacity building in this sector focusing on the regional funding requirements and a new generation of eager entrepreneurs. The commitment towards strengthening our proposition towards larger corporates will be continued with greater focus on tech-enabled facilities that would afford greater cost-benefits to our clients.
The Bank will further enhance its investment in building brand equity with a strong national presence, and fortify its value added product range serving the diverse sectors of this economy.
Backed by the strength and support of TPg Capital, your Bank will continue on its growth trajectory towards becoming one of the leading private sector banking institutions in Sri Lanka. Through targeted brand building and marketing initiatives, we will continue to build our corporate identity as a progressive Bank providing optimum financial solutions enriched with the convenience of the latest technology.
our journey in the year 2017 will be etched with innovation, technology and an enhanced outlook. As we take the bold leap towards success in the
coming year, we invite our stakeholders to reap the benefits of this growth and evolution.
APPRECIATION our successful journey in 2016 would not have not been possible without the support of our stakeholders, especially our valued clientele who have continued to place their confidence in us and built stronger relationships with us.
I extend my sincere gratitude to the leadership team, management and staff members at all levels who have played a pivotal role in successfully implementing the strategic objectives, and extending their commitment and support especially during this phase of change and growth.
My grateful thanks to the Chairman, deputy Chairman, former deputy Chairman Mr. alex Lovell and members of the Board of Directors for their unstinted support and guidance.
Indrajit Wickramasinghe Director/Chief Executive Officer
CEo’S MESSagE

28|ANNUAL REPORT 2016

CONNECTIVITYGiving our customers multiple platforms from which to connect with us has resulted in the digitalisation and efficiency of our business. We continue to innovate in creating new pathways to provide greater convenience to our customers.

30|ANNUAL REPORT 2016
ManagEMEnT dISCUSSIon and anaLySIS
REGULATORY BODIES
EMPLOYEES
LOCAL COMMUNITY
SHAREHOLDERS
CUSTOMERS
ff Trade Finance ff Working Capital
Solutions ff Leasingff Long-Term Finance
ff Foreign Exchange Services
ff Treasuryff Cash Management
Services
ff Elite Circleff Savings and
Current Accountsff Time Depositsff Debit Cardsff Loans – Personal
and Home
ff Leasingff Foreign Currency
Accountsff Remittances ff Bancassuranceff Pawning
HUMAN CAPITAL
SOCIAL CAPITAL
INTELLECTUAL CAPITAL
FINANCIAL CAPITAL
Talent and Culture
Portfolio and Capital Management
Risk and Regulatory
Management
Product and Service Solutions
Customer Relationships
Business Unit Strategy
Data and Technology
Vision
Mission
CORPORATE PHILOSOPHY
GOVERNANCE
Input Output
BAC aLCo
IRMC
BCC
HRRC
RPTRC
Values
BUSIN
ESS SEGM
ENTSBU
SIN
ESS
SEG
MEN
TS
OUR BUSINESS MODEL (G4-4)
CORPORATE
RETAIL
ff Project Financeff Leasingff Factoringff Working Capital
Solutions
ff Trade Financeff Bancassurance
SME

31|ANNUAL REPORT 2016
ManagEMEnT dISCUSSIon and anaLySIS
SRI LANKA’S MACRO ECONOMIC
REVIEW
Uncertainty, both globally and domestically, was widespread during the year, with back and forth revisions to tax proposals locally, and decisive changes taking place in the global political landscape. The agreement between the Central Bank of Sri Lanka (CBSL) and the International Monetary Fund (IMF) for an Extended Fund Facility (EFF), however, gave some respite to Sri Lanka’s ailing external balances and rising debt obligations. This agreement also encouraged the implementation of much needed reforms and began a path of fiscal consolidation.
according to the CBSL, economic growth is expected to accelerate to 5.5% in 2016 from 4.8% growth seen in 2015. during the first half of the year however, the economy recorded slower growth of 3.9%, weighed down by poor performance in the Agrarian sector, which was affected by severe weather conditions. Despite the Agriculture sector contracting by 2.5% in the first half of 2016, healthy growth in the Services sector continued to drive overall gdP growth, rising by 4.9% due to increased activity in Financial Services and real Estate as well as Wholesale and Retail trade. The Industrial sector also contributed positively to overall economic growth, recording a 5.2% increase during the same period, supported largely by robust growth in the Construction sector. The CBSL expects growth to be driven by the Industrial and Services sectors in the second half of 2016, while agriculture is expected to contribute only marginally due to subdued performance in growing of tea, rice and rubber.
Inflation, as measured by the CCPI, remained in single digits throughout 2016. During the second quarter of the year, however, rising inflation was attributed to adverse weather conditions; together with implementation of tax revisions saw a bout of rising prices during this period. This saw headline inflation surging to a 31 month high of 6% yoy in June. nevertheless, subsequent withdrawal of these tax revisions together with improved food supply thereafter led to a moderation in inflation, subduing concerns by the CBSL. The re-implementation of these tax proposals in November saw a moderate increase in inflation of 0.6% over the month, despite yoy growth slowing to 3.4% due to base effects. Following a similar pattern, core inflation too edged up towards mid 2016 but has since moderated.
DESPITE THE CHALLENGING MACRO ENVIRONMENT THE GROUP PERFORMED ExCEPTIONALLY WELL IN 2016 RECORDING A POST-TAx PROFIT OF Rs. 553 MN.
The low interest rate environment which prevailed through much of 2015 supported an acceleration in private sector credit. In efforts to curb this excess credit demand and keep inflation in check, in 2016 the CBSL began a round of tightening policy measures, including two policy rate hikes of 50 basis points each in February and July. This also saw market interest rates increasing steadily through 2016. The lagged impacts of the tightening measures only became evident towards the end of the third quarter, with private sector credit moderating to 25.6% yoy growth in September. In absolute terms, however, credit growth remained strong, increasing by rs. 514.7 Bn for the first nine months of the year.
Sri Lanka’s Balance of Payments (BoP) improved in 2016, recording a surplus of US$ 243 Mn during the first nine months of the year. This is in contrast to a deficit of US$2.3 Bn seen at during the corresponding period in 2015. Robust growth in tourist earnings and workers’ remittances, and increased capital inflows contributed largely to the surplus, despite the poor performance in the Trade Account. Earnings from tourism gained 14.6% in the first three quarters of 2016, aided by higher arrivals from China and India. Meanwhile, workers’ remittances increased by a modest 5.3% during this period. gross official reserves, which hit a multi year low of US$ 5.3 Bn in June 2016 strengthened in the second half of the year, supported by the issuance of a dual-tranche sovereign bond and inflows from the IMF EFF agreement. Given the Government’s reform agenda together with support from the IMF, the CBSL expects the BOP to further improve to US$ 690 Mn in 2017, while gross official reserves are expected to climb to US$ 7.6 Bn.

32|ANNUAL REPORT 2016
ManagEMEnT dISCUSSIon and anaLySIS
The deficit in the trade account widened by 1.6% in the first eight months of 2016 owing to the sustained decline in exports outpacing the decline in imports. The contraction in export earnings was led by declines in exports of tea and rubber which were affected by poor demand from most of its major markets, particularly russia and the Middle East, as well as owing to lower international commodity prices. Textiles and Garments however recorded positive growth due to higher exports to EU and non-traditional markets. Lower expenditure on fuel imports, owing to lower international prices, as well as fewer vehicle imports, contributed primarily to the overall reduction in import expenditure. Nevertheless imports of investment goods remained strong during the year, led by imports of Machinery and Equipment and Building materials. Foreign Direct Investments (FdI) remained subdued in the first half of 2016, amounting to US$ 336 Mn below the US$ 534 Mn inflows in the same period in 2015.
With emerging markets being viewed in a more positive light following the outcome of the Brexit vote, spillover effects were seen into Sri Lanka as well, with capital flows into the country turning positive. This gave some respite to the Lkr, which experienced notable depreciatory pressure during the start of the year, and enabled the CBSL to maintain a more flexible exchange rate regime as advocated by the IMF. As at 6th december, the Lkr has weakened by 2.9% year-to-date (yTd) against the Lkr. The Lkr strengthened considerably against the sterling pound, gaining 11.5% during the same period.
The volatile global environment together with a challenging domestic economic environment weighed on the Colombo Stock Exchange, as the all Share Price Index (aSPI) declined 7.9% yTd, while
market capitalisation fell by rs. 228 Bn to rs. 2.7 Trillion as at 6th december.
Moving forward, with the support of the IMF shedding a positive light for investor sentiment, as well as recent steps taken by the government of Sri Lanka, particularly with regards to fiscal consolidation, as was evident in the presentation of the Budget for 2017, Sri Lanka could be heading towards a more stable path in the coming year. However, while recent developments indicate that Sri Lanka is on a more positive trajectory, it remains vulnerable to changes in the political and economic environment that could significantly alter this stable course.
GLOBAL ECONOMIC OVERVIEW
The IMF forecasts for global economic growth rate of 3.1% in 2016 and 3.4% in 2017 do not represent much change from the 3.1% seen in 2015, validating the title ‘Subdued demand’ for its latest World Economic Outlook report. The IMF has revised its growth expectations over the course of 2016 owing to the June Uk vote in favour of leaving the European Union (Brexit) and weaker-than-expected growth in the United States. Thus, the IMF has downgraded economic growth prospects of advanced economies to just 1.6% in 2016, less than the previous year’s 2.1% pace and down from the July forecast of 1.8%.
In contrast, the IMF expects emerging market and developing economies to experience an acceleration of growth, after five consecutive years of decline, to 4.2%, slightly up from the July forecast of 4.1%. In 2017, emerging economies are expected to grow 4.6%. However, prospects vary across countries and regions.
In their latest Regional Economic outlook report, published in october, the IMF expects the asia Pacific region
to grow at a rate of 5.4% in 2016 and 5.3% in 2017, higher than the rate of global growth, owing to accommodative policies and easing of financial conditions that will help domestic demand offset weak export growth. Similarly, it expects the South asian region to maintain its lead as the fastest growing region in the world, forecasting growth of 7.5% in 2016 and 2017.
The Chinese economy is predicted to remain relatively strong in the near term, growing at 6.6% in 2016 and 6.2% in 2017. This is helped by fiscal stimulus on infrastructure spending and credit support. However, contribution from exports is expected to drop and imports are expected to rise amidst growing domestic demand. Considering the rising vulnerabilities and slow progress on curbing credit growth and state-owned enterprises reforms, medium term growth has been cut to 5.8% from 6.2%.
The year has seen several rounds of foreign fund outflows from Emerging Markets (EMs). The most recent round of outflows, following the U.S. Presidential election, saw foreigners pulling out US$24.2 Bn in november from EM assets; US$8.1 Bn from equities and US$16.1 Bn from debt, according to the Institute of International Finance. This is the largest outflow since the June 2013 ‘Taper Tantrum’ and has been catalysed by speculation that President-elect’s fiscal and tax policies would force the US Federal reserve (Fed) to increase the pace of its rate hikes in 2017. The outflows have put pressure on EM currencies, forcing several governments to intervene to prevent record depreciations. Earlier in the year EMs faced outflows following the december 2015 US Federal reserve rate hike and concerns over a slowdown in growth.
Europe was the centre of attention following the surprise Brexit result for the UK to leave the European Union

33|ANNUAL REPORT 2016
(EU), sparking concern about the very survival of the EU. The Sterling Pound dropped to a 31 year low and global equities lost a record US$3 trillion, following the surprise result. The economic impact of Brexit on Britain and Europe has not been as severe as predicted, but attention is now on other European elections to see the direction of the populist wave in global politics. Italy, on december 4th, rejected constitutional reforms at a referendum, forcing its Prime Minister to resign and opening greater opportunities for a populist party to come to power. netherlands, France and germany are next in line for unpredictable election results in 2017.
oil prices have seen a significant recovery in the year after dropping to the lowest level since 2003 in January. The low prices affected the economies of oil producing countries, with Saudi Arabia and others suffering from massive budget deficits. It has prompted economic diversification and even forced Saudi arabia to release its first international bond; the largest of its kind from an emerging market economy. The economic woes prompted Saudi to seek a production limiting agreement among oPEC members, which succeeded in reaching an initial agreement on September 28th and another on november 30th. oil prices have been largely volatile in the US$40-US$50 range over recent months, moving along with speculation about the outcomes of discussions and impact of these agreements.
FINANCIAL SERVICES INDUSTRY OVERVIEWThe increased domestic demand for credit seen during the first 8 months of 2016 supported the growth momentum of the sector. Banking sector loan growth for the first 8 months of 2016 stood at 17% amid the high interest rate environment.
during the year, the CBSL took measures to tighten its Monetary Policy stance to address the issues arising from high credit growth, with the aim of managing demand driven inflationary pressures and pressures on the trade deficit. The Statutory reserve requirement was adjusted upward at the beginning of the year while the Monetary Policy tightening took place at two instances – in February and July 2016.
Term Loans dominated the loan books of the Banks, while the overdraft category too saw an expansion. Sectors such as Construction, Financial and Business Services, Consumption and Manufacturing have seen notable increases in lending, while the Infrastructure sector has experienced a decline.
Profitability of the sector during the first eight months improved, with net Interest Income improving due to increased lending and investment activities and overall business expansion. The roa and roE ratios improved accordingly to 1.9% and 16.9%, from 1.8% and 15.5% respectively, compared to the corresponding period in the previous year.
The banking sector added 40 new branches for the first eight months of the year. Meanwhile 89 new aTM machines were installed by august 2016.
Funding at banks was mainly fueled by deposit base expansion which increased by rs. 452 Bn during the first eight months of the year, which amounts to a growth rate of 8.4% over the period. a shift from demand to term deposits was noted during this period and the CaSa ratio deteriorated in line with this shift.
Asset quality Improvedasset quality improved with Total non-Performing Loans (nPL) in absolute terms decreasing by rs. 0.7 Bn during the first eight months of 2016. The gross nPL ratio recorded a decrease from 3.2% (as at end december 2015) to 3% by end august 2016. according to the CBSL, this is a considerably low gross nPL ratio when compared to the above 6% levels of nPLs seen during most months in 2014. The lower gross nPL ratio during the first 8 months of 2016 was mainly as a result of both the recovery of nPLs and increased loan growth during the said period.
FIGURE 1- NET LOANS AND ADVANCES (IN Rs. MILLION) [SOURCE: CBSL]
2008
2009
2010
2014
2012
2013
Q1
2016
Q2
2016
q3
2016
2011
2015
0
4,000
2,000
1,000
5,000
3,000
6,000‘000
ManagEMEnT dISCUSSIon and anaLySIS

34|ANNUAL REPORT 2016
FIGURE 2- GROSS NON-PERFORMING ADVANCES (IN Rs. MILLION) [SOURCE: CBSL]
2008
2009
2010
2014
2012
2013
Q1
2016
Q2
2016
q3
2016
2011
2015
0
150,000
50,000
100,000
200,000‘000
FIGURE 3 - RETURN ON EqUITY AND RETURN ON ASSETS AFTER TAx IN % [SOURCE: CBSL]
0.8
1.6
1.2
1
1.8
1.4
2%
return on Equity (roE) - Left axis Return on Assets (ROA) After Tax - Right Axis
2008
2009
2010
2014
*
2012
*
2013
*
Q1
2016
*
Q2
2016
*
q3
2016
*
2011
2015
*0
15
20
5
10
25%
ManagEMEnT dISCUSSIon and anaLySIS
Recent Developments in the Sector The appointment of the new governor of the CBSL in July 2016 was viewed positively by the business community. the Monetary Board has taken steps to curb excessive credit growth and is likely to maintain this stance in the coming quarters. This proactive step is taken so as to avoid the boom and bust cycles that the economy is periodically subject to.
The discussion with respect to Financial Sector consolidation continued into 2016 as well with focus on a more market-driven consolidation process inorder to generate long term benefits. Budget 2017 proposed that banks meet the requirements of Basel III by 2019. Licensed Commercial Banks are expected to increase minimum capital to rs. 20,000 Mn, Licensed Specialised Banks to rs. 7,500 Mn and Primary dealers to rs. 1, 500 Mn.
FINANCIAL PERFORMANCE REVIEW2016 was a challenging year from an operational perspective given the uncertainty that prevailed in the local markets due to economic volatility experienced during the year.
Deposit interest rates continued to increase during the year. Cost of funding was seen as a critical factor which contributed adversely, impacting on the Net Interest Margins of the Bank. The year started with lower interest rates, low single digit inflation and stable currency which were favourable for banking. However, towards the latter half of the year, volatility in currency, increase in interest rates and increase in inflation were experienced.
Despite the challenging macro environment the Group performed exceptionally well in 2016 recording a Post Tax Profit of rs. 553 Mn. This is a 117% growth over rs. 255 Mn recorded in 2015. In addition, the group surpassed the Rs. 100 Bn landmark in Total Assets to achieve Rs. 100.5 Bn as at the year end.
The Bank recorded Rs. 451.1 Mn in Post-Tax Profits reflecting a 104% yoy growth. This highlights the Bank’s continuing progress in its swift transition to a fully-fledged Commercial Bank with a wider focus on retail, Corporate and SME sectors. The impressive results, reflect the success of the rapid expansion initiatives, implemented by the Bank following the capital infusion made in the latter part of 2014. Total Assets of the Bank remained at rs. 93,187 Mn as at the year end. This is a rs. 22,009 Mn growth reflecting a 31% over previous year.

35|ANNUAL REPORT 2016
ManagEMEnT dISCUSSIon and anaLySIS
During 2016 the Bank implemented changes to its Accounting Policy with regard to investments in subsidiaries receding the previously used policy of cost method. disclosures regarding the change is given in note no. 26 in the Financial Statements.
FINANCIAL INDICATOR PERFORMANCE
2013 20152014 20160
100
2,100
1,600
600
2,600
1,100
3,100
NET INTEREST INCOME LKR Mn.
The principal source of income from the Bank’s fund based operations reached rs. 2,507 Mn in 2016. This is an increase of rs. 485 Mn or 24% compared to rs. 2,022 Mn recorded in the previous year.
This was a noteworthy achievement, given the substantial reduction in interest spreads which continued for a second consecutive year. However, the Bank experienced a recovery in spreads towards the end of the year.
while net Interest Margins were affected due to lower spreads, a steady increase in Net Interest Income was noticed towards the end of the year as a result of transferring of Investments in Unit Trusts to Interest Bearing Investments.
returns on these Unit Trust Investments are reflected under net Trading Income of the Bank. Capital infusion that took place in the latter part of 2014, further supported to manage spreads in unfavorable market conditions.
2013 20152014 20160
40,100
30,100
10,100
50,100
20,100
60,100
LOANS AND ADVANCESLKR Mn.
The Bank’s Loans and advances stood at rs. 55,438 Mn. This is rs. 15,343 Mn a 38% growth in comparison to the previous year. This marks marking a milestone in the Bank’s growth in loans and advances since its inception.
Composition of the Loans and advances of the Bank changed in line with the new strategic focus. retail Banking share increased to 11% from 7% of the previous year. as at the end of the year, the Loans and advances mix stood as follows:
Corporate 47%
SME 46%
retail 7%
2015
Corporate 47%
SME 42%
retail 11%
2016
36|ANNUAL REPORT 2016
ManagEMEnT dISCUSSIon and anaLySIS
FINANCIAL INDICATOR PERFORMANCE
2013 20152014 20160
65
12
4
78
3
9
qUALITY OF THE PORTFOLIO
%
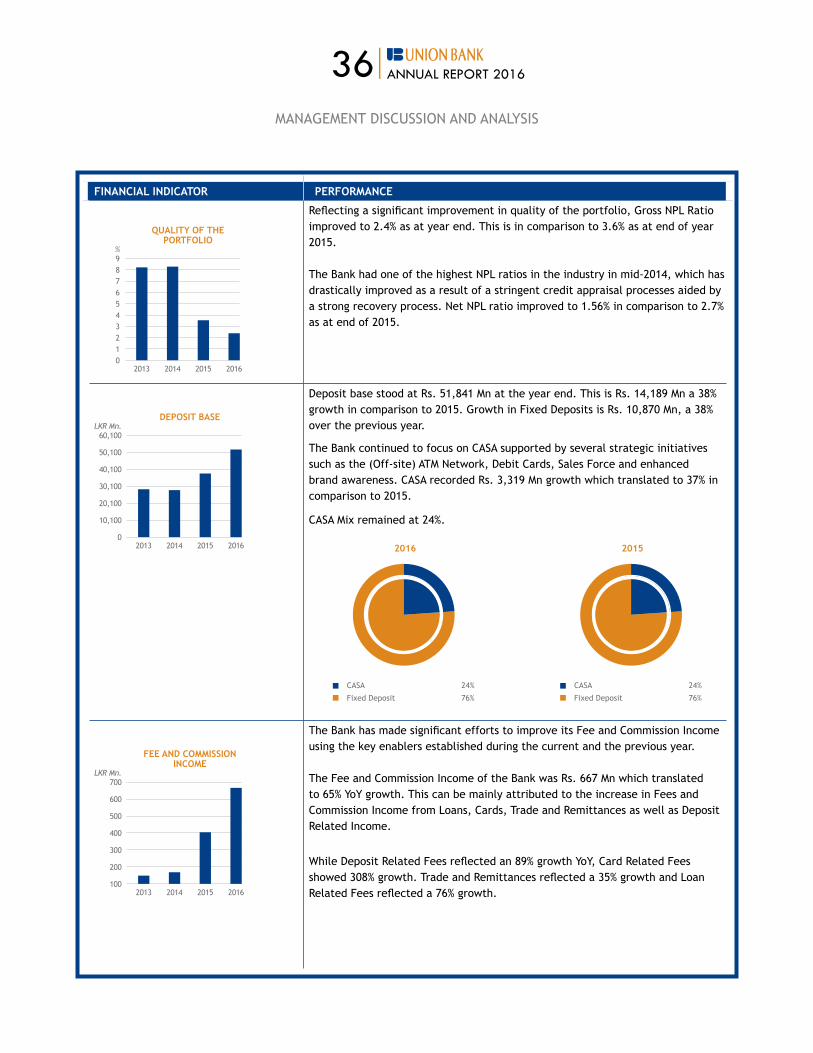
reflecting a significant improvement in quality of the portfolio, gross nPL ratio improved to 2.4% as at year end. This is in comparison to 3.6% as at end of year 2015.
The Bank had one of the highest nPL ratios in the industry in mid-2014, which has drastically improved as a result of a stringent credit appraisal processes aided by a strong recovery process. net nPL ratio improved to 1.56% in comparison to 2.7% as at end of 2015.
2013 20152014 20160
30,100
20,100
10,100
40,100
50,100
60,100
DEPOSIT BASELKR Mn.
deposit base stood at rs. 51,841 Mn at the year end. This is rs. 14,189 Mn a 38% growth in comparison to 2015. growth in Fixed deposits is rs. 10,870 Mn, a 38% over the previous year.
The Bank continued to focus on CaSa supported by several strategic initiatives such as the (off-site) aTM network, debit Cards, Sales Force and enhanced brand awareness. CaSa recorded rs. 3,319 Mn growth which translated to 37% in comparison to 2015.
CaSa Mix remained at 24%.
CaSa 24%
Fixed deposit 76%
2016
CaSa 24%
Fixed deposit 76%
2015
2013 20152014 2016100
600
200
300
500
400
700
FEE AND COMMISSION INCOME
LKR Mn.
The Bank has made significant efforts to improve its Fee and Commission Income using the key enablers established during the current and the previous year.
The Fee and Commission Income of the Bank was rs. 667 Mn which translated to 65% yoy growth. This can be mainly attributed to the increase in Fees and Commission Income from Loans, Cards, Trade and remittances as well as deposit Related Income.
while deposit related Fees reflected an 89% growth yoy, Card related Fees showed 308% growth. Trade and remittances reflected a 35% growth and Loan related Fees reflected a 76% growth.

37|ANNUAL REPORT 2016
ManagEMEnT dISCUSSIon and anaLySIS
FINANCIAL INDICATOR PERFORMANCE
2013 20152014 2016100
600
200
300
500
400
700
NET TRADING AND OTHER INCOME
LKR Mn.
The Bank reported a net Trading Income of rs. 409 Mn, which is a significant 47% growth YoY. This is due to an increase in investments made in Unit Trusts. Due to directional uncertainty with regard to tax implications, towards the latter part of the year, the Bank reduced its holding of Unit Trust Investments significantly.
The Bank has no Trading Equities and has not invested in any Equity Funds as at Balance Sheet date.
other operating Income of the Bank was rs. 246 Mn, which reflects a growth of 47% yoy. This is mainly attributable to the rs. 132 Mn yoy increase, reflected in Capital gains made through the sale of available for Sale investments.
Foreign Exchange Income from customer transactions along with revaluation increased to rs. 187 Mn from rs. 175 Mn, a year ago. However due to increase in SwaP cost, reported total Foreign Exchange Income reflected a rs. 52 Mn reduction yoy of the Bank for the year was rs. 86 Mn. This is in comparison to previous year’s Rs. 21 Mn.
2013 20152014 2016100
3,100
3,600
2,600
600
1,100
2,100
1,600
4,100
TOTAL OPERATING INCOME
LKR Mn.
reflecting the effectiveness of the strategies adopted, in a backdrop of challenging market conditions the Bank recorded rs. 3,737 Mn Total operating Income for the year. This is rs. 927 Mn a 33% increase yoy.
2013 20152014 2016100
550500
150200250
350
450400
300
600
IMPAIRMENT AND CREDIT qUALITY
LKR Mn.
reflecting a significant improvement in portfolio quality, the Credit Loss Expense of the Bank reduced to rs. 152 Mn from rs. 177 Mn in 2015. This is a 14% reduction YoY.
The Bank assesses approximately 80% of the portfolio under individual impairment. The individual threshold remained similar to last year. Loans meeting the criteria were analysed on a case by case basis for actions on recovery.
Collective impairment was made based on the product categories of the Bank. Historical information of individual products were analysed to assess the Probability of default and Loss given default, enabling a more comprehensive assessment of default in arriving at the Impairments.

38|ANNUAL REPORT 2016
FINANCIAL INDICATOR PERFORMANCE
2013 20152014 2016100
600
1,100
1,600
2,600
3,100
2,100
3,600
OPERATING ExPENSESLKR Mn.
operating Expenses of the Bank was rs. 3,009 Mn which is a 30% increase yoy. The Bank continued to invest in strategic initiatives such as the expansion of footfall and reach, Investments in technology and processes and human capital development during the year. In addition, impact of some of the initiatives established in 2015 were reflected in the expenses during the year.
Staff costs of the Bank rs. 1,361 Mn is a 37% increase yoy. other expenses rs. 1,251 Mn is a 26% increase yoy.
Total headcount of the Bank 1,194 is a 30% increase over the previous year. Total number of aTMs of the Bank 120 is a 17% increase in comparison to the previous year. In addition, the Bank opened 01 branch during the year.
Cost to Income ratio marginally improved to 80.5% from 82.5% in 2015.
Share of profit of equity accounted investees, net of tax
The Bank implemented changes to its accounting policy during the year with regard to reporting of subsidiaries. The Bank’s Financials are re-stated to reflect the change in the comparative period.
Share of profit of equity accounted investees rs. 77 Mn is a 78% increase over previous reporting period. This is mainly due to an increase in profit share of UB Finance Limited.
Financial Services VaT, nBT and Corporate Tax
The Bank has paid rs. 202 Mn as FSVaT, nBT & Corporate Taxes. This is a 50% increase YoY.
This is effectively 31% of the results from the operating activities of the Bank.
Liquidity The Bank maintained a healthy Liquid assets ratio throughout the year.
Liquid Asset Ratios 2016 2015 2014 2013
Year End 22.17% 21.87% 50.78% 22.14%
Maximum 22.71% 51.93% 51.78% 23.52%
Minimum 20.78% 21.42% 20.74% 20.59%
Average 21.77% 31.86% 29.13% 21.88%
ManagEMEnT dISCUSSIon and anaLySIS

39|ANNUAL REPORT 2016
FINANCIAL INDICATOR PERFORMANCE
Capital adequacy ratio The Bank maintained a robust Capital adequacy ratio throughout the year reporting 22.87% Core Capital ratio as at the year end.
Capital adequacy ratio 2016 2015 2014 2013
Core Capital 22.87% 24.68% 41.70% 17.91%
roa, roE & naV Post tax return on assets of the Bank increased to 0.6% from 0.4% a year ago.Post Tax return on Equity of the Bank improved to 2.7% from 1.3% a year ago.net assets per share improved to rs. 15.7 in comparison to rs. 15.5 year ago.
GROUP PERFORMANCEThe group, consisting of the Bank and its two subsidiaries - UB Finance Company Limited and national assets Management Limited reported robust results in 2016. group also includes the special purpose entity Serendib Capital (Pvt) Limited. The operations of these companies are briefly described in the section on Subsidiaries, on page 73.
The group reported Post-Tax Profits of rs. 553 Mn compared to rs. 255 Mn reported in 2015. This is a 117% growth yoy. Total assets of the group crossed rs. 100 Bn mark to record rs. 100.5 Bn as at the year end. This is rs. 23,988 Mn a 31% increase yoy. The Bank accounts for 93% of the group’s Balance Sheet.
ManagEMEnT dISCUSSIon and anaLySIS
40|ANNUAL REPORT 2016
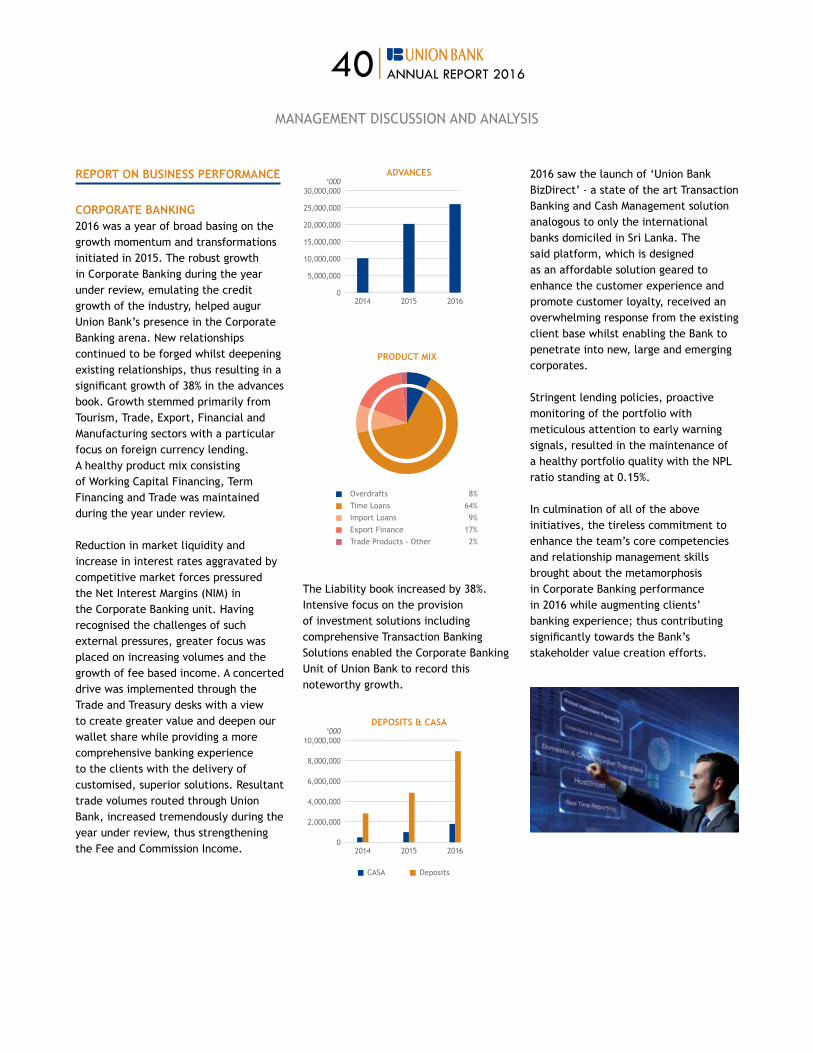
2016 saw the launch of ‘Union Bank BizDirect’ - a state of the art Transaction Banking and Cash Management solution analogous to only the international banks domiciled in Sri Lanka. The said platform, which is designed as an affordable solution geared to enhance the customer experience and promote customer loyalty, received an overwhelming response from the existing client base whilst enabling the Bank to penetrate into new, large and emerging corporates.
Stringent lending policies, proactive monitoring of the portfolio with meticulous attention to early warning signals, resulted in the maintenance of a healthy portfolio quality with the nPL ratio standing at 0.15%.
In culmination of all of the above initiatives, the tireless commitment to enhance the team’s core competencies and relationship management skills brought about the metamorphosis in Corporate Banking performance in 2016 while augmenting clients’ banking experience; thus contributing significantly towards the Bank’s stakeholder value creation efforts.
REPORT ON BUSINESS PERFORMANCE
CORPORATE BANKING 2016 was a year of broad basing on the growth momentum and transformations initiated in 2015. The robust growth in Corporate Banking during the year under review, emulating the credit growth of the industry, helped augur Union Bank’s presence in the Corporate Banking arena. New relationships continued to be forged whilst deepening existing relationships, thus resulting in a significant growth of 38% in the advances book. Growth stemmed primarily from Tourism, Trade, Export, Financial and Manufacturing sectors with a particular focus on foreign currency lending. A healthy product mix consisting of working Capital Financing, Term Financing and Trade was maintained during the year under review.
reduction in market liquidity and increase in interest rates aggravated by competitive market forces pressured the Net Interest Margins (NIM) in the Corporate Banking unit. Having recognised the challenges of such external pressures, greater focus was placed on increasing volumes and the growth of fee based income. A concerted drive was implemented through the Trade and Treasury desks with a view to create greater value and deepen our wallet share while providing a more comprehensive banking experience to the clients with the delivery of customised, superior solutions. resultant trade volumes routed through Union Bank, increased tremendously during the year under review, thus strengthening the Fee and Commission Income.
2014 2015 20160
5,000,000
20,000,000
10,000,000
25,000,000
15,000,000
30,000,000
ADVANCES‘000
overdrafts 8%Time Loans 64%Import Loans 9%Export Finance 17%Trade Products - other 2%
PRODUCT MIx
The Liability book increased by 38%. Intensive focus on the provision of investment solutions including comprehensive Transaction Banking Solutions enabled the Corporate Banking Unit of Union Bank to record this noteworthy growth.
2014 2015 20160
8,000,000
4,000,000
2,000,000
6,000,000
10,000,000‘000
DEPOSITS & CASA
CaSa Deposits
ManagEMEnT dISCUSSIon and anaLySIS

41|ANNUAL REPORT 2016
PROSPECTS FOR 2017 Macroeconomic stability, improved international relationships and resumption of gSP Plus is expected to enhance investor confidence and widen access to existing and emerging markets. The unit hopes to leverage on capturing greater share of the opportunities thus presented.
In the ensuing year, the new Transaction Banking and Cash Management digital platform launched in 2016 will be aggressively leveraged for customer-centric service delivery with the provision of unified, real-time access to information and processing of transactions. We believe that our tech-enabled Transaction Banking solutions will enhance the banking experience of our valued clients and provide the Bank with the cutting-edge required to augment our market share and create greater value.
The Corporate Banking team of Union Bank will continue to forge ahead with the provision of integrated financing strategies to cater to evolving customer financing needs. Exports, Leisure, Trade and Project Financing are some of the key growth sectors that the team envisages to focus on. Continued focus on fee and forex income will prevail with an aggressive focus on Cash Management services. Investment solutions supported by the digital platform, will enable the team to achieve the ambitious CaSa goals, while cross-selling initiatives will be aggressively pursued in a bid to fulfill the premise of providing comprehensive banking solutions to the Bank’s clientele.
While pursuing aggressive growth in 2017, the unit recognises the need to adopt a holistic understanding of potential risks amidst changing
market conditions brought about by macroeconomic changes and technological advancements. We believe that this will enable us to expand our portfolios while maintaining high quality and performance.
Continued focus on creating long term value with corporates and emerging corporates facilitated by the newly launched Transaction Banking platform will form the core focus of Corporate Banking in 2017.
SME BANKING
The SME Banking unit of the Bank provides financial facilities and advisory services to the Small and Medium Entrepreneurs (SMEs). with a view to support the growth of the SMEs, the Bank provides customised banking solutions including Project Financing, Leasing/Factoring, working Capital Financing, and Trade Finance as well as Transaction Banking solutions.
As an outcome of the key initiatives implemented in 2015, the SME Banking portfolio achieved strong and sustainable growth during the year 2016. The far reaching strategic initiatives which were introduced in 2015 after a careful study of the credit approving process were successfully implemented within the period under review, resulting in an impressive growth of rs. 6.029 Bn or 34.9% of the SME Banking portfolio during the year 2016.
The year 2016 was a challenging year for the SME sector. Severe floods in the early part of 2016, affected many of the SME clientele of the Bank while subsequent drought towards the latter part of the year affected the agricultural Sector. However, with timely intervention and counsel, the
Bank managed to prevent possible losses due to these twin natural disasters.
The increase in interest rates towards the latter part of 2016 from the low interest rate regime which prevailed in 2015 and early 2016 posed a challenge to the SME sector.
re-pricing of the SME assets portfolio was carried out in line with the increase in the rates in order to maintain interest spreads. The Bank also pursued cross-selling opportunities in order to supplement thinning margins by increasing the fee based income with close collaboration with the other business units of the Bank.
The results of upgrading the zonal offices situated in the respective regions were reaped in 2016, with the deepening of existing relationships. Further with the implementation of relationship driven marketing strategies, the Bank was able to penetrate into sectors such as Export, Tourism etc, which were hitherto not fully explored. Centralisation of the SME credit underwriting unit resulted in a significant improvement in the credit evaluation process, thus enabling to improve turnaround times and quality of the facilities sanctioned. Flexibility and continuous development of the product range enabled the Bank to cater to the ever-changing needs of the SME Sector.
during the year 2016, the Bank consciously penetrated into SME trade hubs and established dedicated Trade desks to boost Union Bank’s share of the lucrative Import/Export business. These strategic initiatives resulted in a commendable growth in the portfolio from rs. 17.23 Bn in december, 2015 to rs. 23.259 Bn in december, 2016.
ManagEMEnT dISCUSSIon and anaLySIS
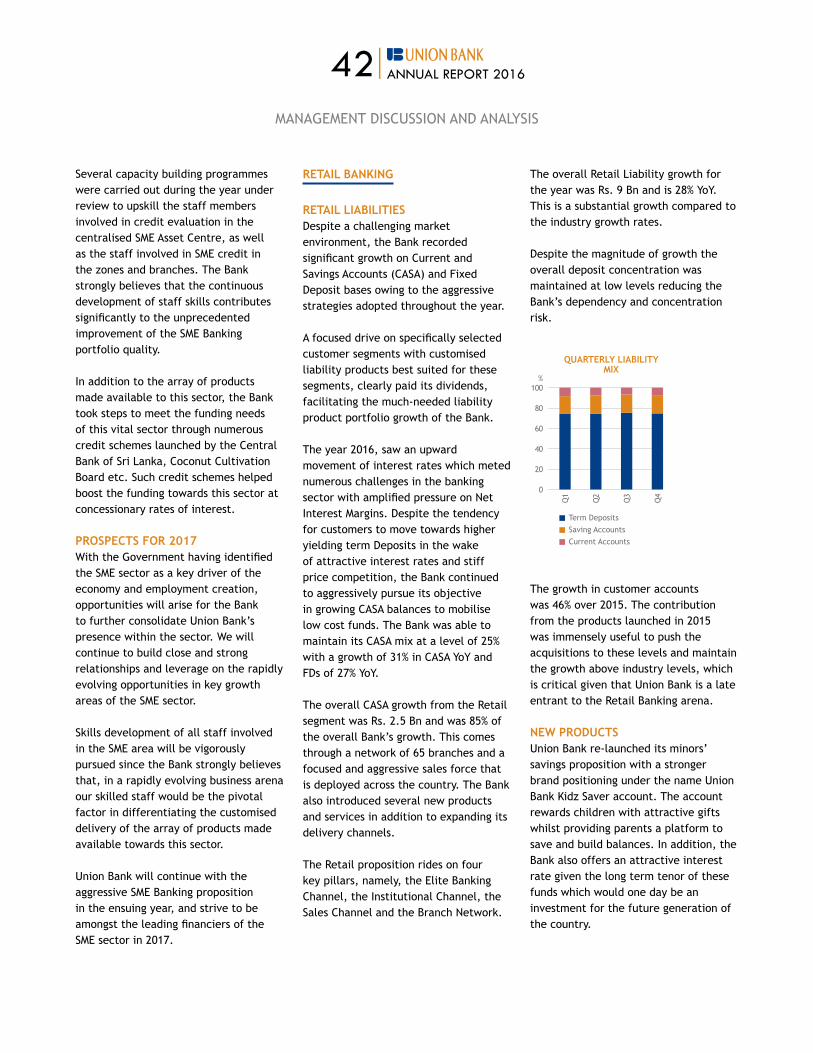
42|ANNUAL REPORT 2016
Several capacity building programmes were carried out during the year under review to upskill the staff members involved in credit evaluation in the centralised SME asset Centre, as well as the staff involved in SME credit in the zones and branches. The Bank strongly believes that the continuous development of staff skills contributes significantly to the unprecedented improvement of the SME Banking portfolio quality.
In addition to the array of products made available to this sector, the Bank took steps to meet the funding needs of this vital sector through numerous credit schemes launched by the Central Bank of Sri Lanka, Coconut Cultivation Board etc. Such credit schemes helped boost the funding towards this sector at concessionary rates of interest.
PROSPECTS FOR 2017 with the government having identified the SME sector as a key driver of the economy and employment creation, opportunities will arise for the Bank to further consolidate Union Bank’s presence within the sector. We will continue to build close and strong relationships and leverage on the rapidly evolving opportunities in key growth areas of the SME sector.
Skills development of all staff involved in the SME area will be vigorously pursued since the Bank strongly believes that, in a rapidly evolving business arena our skilled staff would be the pivotal factor in differentiating the customised delivery of the array of products made available towards this sector.
Union Bank will continue with the aggressive SME Banking proposition in the ensuing year, and strive to be amongst the leading financiers of the SME sector in 2017.
RETAIL BANKING
RETAIL LIABILITIESDespite a challenging market environment, the Bank recorded significant growth on Current and Savings accounts (CaSa) and Fixed Deposit bases owing to the aggressive strategies adopted throughout the year.
a focused drive on specifically selected customer segments with customised liability products best suited for these segments, clearly paid its dividends, facilitating the much-needed liability product portfolio growth of the Bank.
The year 2016, saw an upward movement of interest rates which meted numerous challenges in the banking sector with amplified pressure on net Interest Margins. Despite the tendency for customers to move towards higher yielding term Deposits in the wake of attractive interest rates and stiff price competition, the Bank continued to aggressively pursue its objective in growing CaSa balances to mobilise low cost funds. The Bank was able to maintain its CaSa mix at a level of 25% with a growth of 31% in CaSa yoy and Fds of 27% yoy.
The overall CaSa growth from the retail segment was rs. 2.5 Bn and was 85% of the overall Bank’s growth. This comes through a network of 65 branches and a focused and aggressive sales force that is deployed across the country. The Bank also introduced several new products and services in addition to expanding its delivery channels.
The Retail proposition rides on four key pillars, namely, the Elite Banking Channel, the Institutional Channel, the Sales Channel and the Branch network.
The overall retail Liability growth for the year was rs. 9 Bn and is 28% yoy. This is a substantial growth compared to the industry growth rates.
Despite the magnitude of growth the overall deposit concentration was maintained at low levels reducing the Bank’s dependency and concentration risk.
0
80
40
20
60
100%
qUARTERLY LIABILITY MIx
Q1
Q2
q3
Q4
Term DepositsSaving accountsCurrent Accounts
The growth in customer accounts was 46% over 2015. The contribution from the products launched in 2015 was immensely useful to push the acquisitions to these levels and maintain the growth above industry levels, which is critical given that Union Bank is a late entrant to the Retail Banking arena.
NEW PRODUCTSUnion Bank re-launched its minors’ savings proposition with a stronger brand positioning under the name Union Bank kidz Saver account. The account rewards children with attractive gifts whilst providing parents a platform to save and build balances. In addition, the Bank also offers an attractive interest rate given the long term tenor of these funds which would one day be an investment for the future generation of the country.
ManagEMEnT dISCUSSIon and anaLySIS

43|ANNUAL REPORT 2016
Having identified the need for life-style based events and the smart investors who would opt to plan out their future through targeted savings, the Bank launched Union Bank Invest Plus, an investment planner account, thus offering customised solutions to two market segments of the monthly saver and the lump sum saver. The monthly option enables the investor to select a targeted saving option up to Rs. 10 Mn rupees and offers shorter tenors starting from 2 years. The lump sum option is for the longer tenor where the Bank identified that customers prefer to opt for 10 year or similar periods targeting major lifestyle events – generally associated with their children’s future.
Adding further versatility and accessibility to its Retail Banking proposition, a revolutionary Internet Banking platform was launched in the 4th quarter. (refer network and Channels).
PROMOTIONSThe Bank focused on two main campaign initiatives for CaSa growth during the year and highlighted increased customer acquisitions.
The ‘Kalin Avurudu’ promotion launched in February was focused on the ‘early-bird’ saver who wished to be rewarded for building up savings balances prior to the Sinhala and Tamil new year.
The promotion was applicable for all deposits made to savings accounts up to 15 April 2016 and offered attractive gifts including LEd TVs to motivate customers to build savings balances. The low cost funds mobilised early was useful during the 2nd quarter when rates were seeing an upward movement. The second campaign was launched in the 2nd half of the year to motivate and reward branches and sales teams. The campaign saw the Bank aggressively promoting Term Deposits as well as low cost funds.
INSTITUTIONAL CASAInstitutional CaSa was a new channel that became a key contributor for mobilising low cost funds. The channel focuses on the institutions that maintain collection accounts and requires a personalised and speedy service as well as financial advisory services to improve the overall cash flows and Cash Management in general. The channel also focuses on inward and outward payments that facilitate salary processing, distributor payments and short term investments for these institutions. With dedicated relationship managers, the Bank offers a service proposition that supports these companies manage their funds economically with the flexibility to transfer at short notice.
ELITE BANKINGHaving unveiled the newly transformed Elite Circle in 2015, the Bank aggressively targeted the elite clientele of the country expanding its specialised and personalised banking services through the branch network and moving beyond the Western province to provide this special service to clients in various other parts of the country. The Bank further expanded its dedicated relationship manager network to 30 by year end.
The exclusive ‘Elite Circle’ centre offers a redefined experience in personalised banking with an elegant and welcoming ambience, spacious meeting facilities and dedicated relationship managers who will support and advise clients on all their financial needs.
Union Bank’s Elite Circle, is designed to understand the unique needs of customers and offers tailor-made financial solutions to meet individual requirements. In addition to preferential tariffs, structured on the volume of business, the Bank offers financial advisory services as well as concierge services through a facilitated service provider supported by a 24-hour Contact Centre.
Building customer engagement, initiatives were carried out for Elite Banking clients throughout the year including the sponsorship of a golf tournament, wine tasting events and seasonal get-togethers. RETAIL LIABILITY SALESThe liability sales force was further strengthened during the year. The team focuses on the acquisition of CaSa clients and creating awareness for the Bank’s liability products across the regions. during 2016, the sales channel contributed 56% of the overall customer acquisitions and was supported by the several marketing and awareness initiatives.
Differentiating its proposition in building and retaining the sales team, the Bank offers employees of the sales team greater career prospects with opportunity for high performers to enter the main banking stream. This has enabled the Bank to retain the best performers and maintain attrition rates
ManagEMEnT dISCUSSIon and anaLySIS

44|ANNUAL REPORT 2016
below industry standard. Continuous training, investments in employee development and a transparent career progression path have been pivotal in maintaining the sales force active throughout the year.
Branch network 44%Sales Force 56%
SOURCING
BANCASSURANCEEnhancing its product offering, the Bank offers life and general insurance products to its customers through agreements facilitated with Union assurance general Limited and Union assurance PLC. 2016 highlighted accelerated growth in the Bancassuarance business of the Bank. The service is offered through selected Union Bank branches with trained staff deployed by Union Assurance.
Whilst enabling a new revenue line for the Bank, it provides the opportunity to offer an expansive product portfolio to customers. Customer could secure their most valuable assets via Fire and Motor Insurance solutions , Mortgage Protection Polices for Home Loan customers, and lifestyle protection with Life insurance products combined with cutting-edge health insurance products to cover their personal insurance needs.
While enhancing awareness across the branch network several initiatives were carried out on training and development
and included branch staff, sales staff and product champions. Further, insurance advisors have been provided with a digital advisor Toolkit (daT), a trilingual application compatible for digital devices to assist in providing life insurance solutions instantly.
These initiatives supported by timely product promotions resulted in an increase in lead generation through 2016. The year however saw several challenges, amongst which, the attrition rate of insurance advisers affected some of the branches. However, the targeted promotions and focus efforts helped push the volumes towards desired levels.
Fee income through which the Bancassuarnce performance is evaluated, was improved as a result of the implementation of a focused Bancassurance strategy.
REMITTANCESworker remittances play a significant role in the Sri Lankan economy and has highlighted steady growth over the year. Estimated remittances to the country was over USd rs. 7 Bn in 2016.
The Bank currently offers inward remittance services through Western Union Money Transfer service and the Bank’s own remittance platform Union Bank remit2SriLanka. The services are offered to the public through all Union Bank branches and through www.unionb.com.
The Bank explored strategic business options on cash-to-cash and bank-to- bank money transfer opportunities in the highly potential GCC region. Union Bank remit2SriLanka is an internet-based remittance platform launched in 2016 to capture the more internet-savvy migrant workers and diasporas offering
even greater convenience. The process was rolled out to tie up with Instant Cash, a global remittance platform by 2017. with the launch of Instant Cash, customers from over 90 countries would be able to remit money to Sri Lanka.
Growth in the area of remittances in 2017 is expected with the addition of new product lines as well as enhanced marketing promotions and activations.
asia 54%america 15%africa 1%oceania 5%Europe 25%
TRANSACTION DISTRIBUTION BY
REGION
CARDSThe debut of the Union Bank Debit card in 2015 was a significant addition to the Bank’s gamut of product and services, aptly supporting the Bank’s CaSa focus. The Bank was commended for its efforts for the launch and received the ‘Speed to market’ award for 2015 at the VISa global awards ceremony held in India.
during 2016, the Bank’s focus was on delivering value to customers through the Debit Card and included attractive offers and deals for shopping, leisure, health, lifestyle and much more. In addition reach and convenience was also increased for customers with the Bank owned ATMs reaching 120 and access to other bank aTMs via LankaPay reaching over 3500 aTMs island-wide.
ManagEMEnT dISCUSSIon and anaLySIS

45|ANNUAL REPORT 2016
Both card usage through aTMs and PoS has shown above market momentum and the cross sell ratio continued to grow as a result with increased volumes being recorded in debit card spend.
The Bank also successfully upgraded its ATM network during the year to support VISa EMV acquiring to reach higher standards in security and spear headed compliance to stringent PCI standards in the industry. This has opened new avenues of income by way of servicing the international VISa clientele.
The Bank will continue to strengthen its offer of payment solutions that provide convenience and value additions to the consumer and intend to further strengthen the products suite in 2017.
RETAIL ASSETS
Personal LoansUnion Bank Personal Loans play a significant role in the Bank’s retail Banking product portfolio and has supported the Bank largely in its customer acquisition drive. Promoted through a dynamic direct sales force and through the Bank’s branch network Union Bank Personal Loans have seen a growth of 300% in 2016 and is now commanding over 57% of the retail asset book. The retail Personal Loans unit with the youngest vintage in the market has showcased leading growth
levels in the industry, whilst maintaining unparalleled standards in the industry for service, disbursement of funds and managing of non-Performing Loans.
Mortgaged Loans The Union Bank Home Loan is a competitive loan scheme offering speedy processing and personalised service. Marketed through an experienced and dedicated sales team and the branch network, the loan scheme also offers condominium financing for pre-approved developers. Many awareness initiatives were carried out for the product during the year including an advertising campaign themed “ finally, an address of our own” enabling Union Bank to connect with many customers across diverse market segments. The initiatives also included Union Bank becoming the exclusive banking partner for the ‘Home & You’ exhibition.
Adding further value to the Bank’s gamut of products, Union Bank Loan against Immovable Property (LaP) was also introduced during the year. LaP provides the Bank the opportunity to target and fulfill the financial requirements of individuals against the mortgage of their immovable property as collateral. A structured product such as the LaP which facilitates relatively longer repayment tenors supports the Bank to maintain a balanced portfolio backed by secured assets.
NETWORK AND CHANNELS (g4-13)
BRANCH NETWORK during the year 2016, Union Bank branch network reached a total of 65 branches with its newest branch being opened in Borella, a key strategic business and residential location. The Bank also re-located galle and old Moor Street branches and reopened several branches with a new outlook offering an enhanced banking experience to customers.
NOS.
New Branches 1
Renovations 8
Relocations 2
Off-site ATMs 17
The Bank network operates under four zones and the revived zonal focus played a key role in supporting the noteworthy business growth and reaching desired service standards across the network. Maintaining the regulatory compliances and checks and controls throughout the network too was managed very effectively under the restructured zonal organisational structures. Extensive efforts were taken to develop skills and knowledge for the new recruits whilst each zone too engaged in team building activities and zonal events that saw the staff and the communities coming together throughout the year.
The centralisation of operations and the account opening process has resulted in improved operational efficiencies enabling branch staff to have greater focus on business as well as provide enhanced customer service.
ManagEMEnT dISCUSSIon and anaLySIS
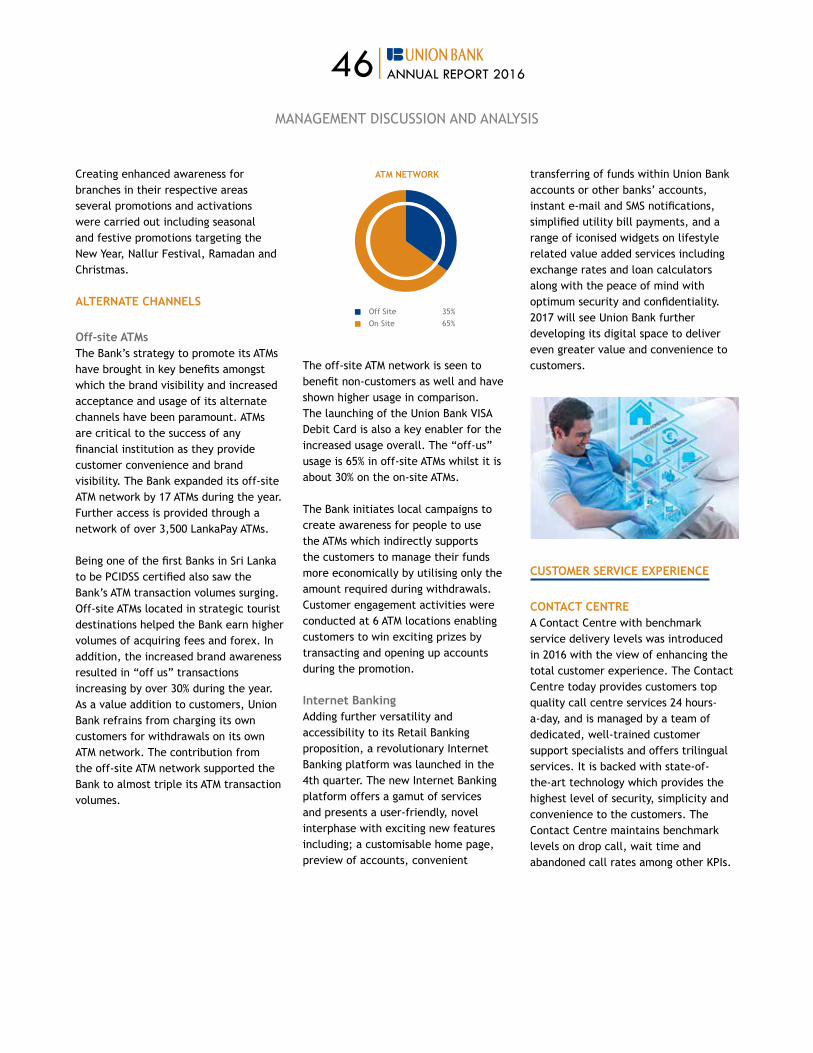
46|ANNUAL REPORT 2016
Creating enhanced awareness for branches in their respective areas several promotions and activations were carried out including seasonal and festive promotions targeting the new year, nallur Festival, ramadan and Christmas. ALTERNATE CHANNELS
Off-site ATMsThe Bank’s strategy to promote its ATMs have brought in key benefits amongst which the brand visibility and increased acceptance and usage of its alternate channels have been paramount. ATMs are critical to the success of any financial institution as they provide customer convenience and brand visibility. The Bank expanded its off-site aTM network by 17 aTMs during the year. Further access is provided through a network of over 3,500 LankaPay aTMs.
Being one of the first Banks in Sri Lanka to be PCIdSS certified also saw the Bank’s ATM transaction volumes surging. Off-site ATMs located in strategic tourist destinations helped the Bank earn higher volumes of acquiring fees and forex. In addition, the increased brand awareness resulted in “off us” transactions increasing by over 30% during the year. as a value addition to customers, Union Bank refrains from charging its own customers for withdrawals on its own ATM network. The contribution from the off-site ATM network supported the Bank to almost triple its ATM transaction volumes.
off Site 35% on Site 65%
ATM NETWORK
The off-site ATM network is seen to benefit non-customers as well and have shown higher usage in comparison. The launching of the Union Bank VISa Debit Card is also a key enabler for the increased usage overall. The “off-us” usage is 65% in off-site aTMs whilst it is about 30% on the on-site aTMs.
The Bank initiates local campaigns to create awareness for people to use the ATMs which indirectly supports the customers to manage their funds more economically by utilising only the amount required during withdrawals. Customer engagement activities were conducted at 6 ATM locations enabling customers to win exciting prizes by transacting and opening up accounts during the promotion.
Internet BankingAdding further versatility and accessibility to its Retail Banking proposition, a revolutionary Internet Banking platform was launched in the 4th quarter. The new Internet Banking platform offers a gamut of services and presents a user-friendly, novel interphase with exciting new features including; a customisable home page, preview of accounts, convenient
transferring of funds within Union Bank accounts or other banks’ accounts, instant e-mail and SMS notifications, simplified utility bill payments, and a range of iconised widgets on lifestyle related value added services including exchange rates and loan calculators along with the peace of mind with optimum security and confidentiality. 2017 will see Union Bank further developing its digital space to deliver even greater value and convenience to customers.
CUSTOMER SERVICE ExPERIENCE
CONTACT CENTRE A Contact Centre with benchmark service delivery levels was introduced in 2016 with the view of enhancing the total customer experience. The Contact Centre today provides customers top quality call centre services 24 hours-a-day, and is managed by a team of dedicated, well-trained customer support specialists and offers trilingual services. It is backed with state-of-the-art technology which provides the highest level of security, simplicity and convenience to the customers. The Contact Centre maintains benchmark levels on drop call, wait time and abandoned call rates among other KPIs.
ManagEMEnT dISCUSSIon and anaLySIS
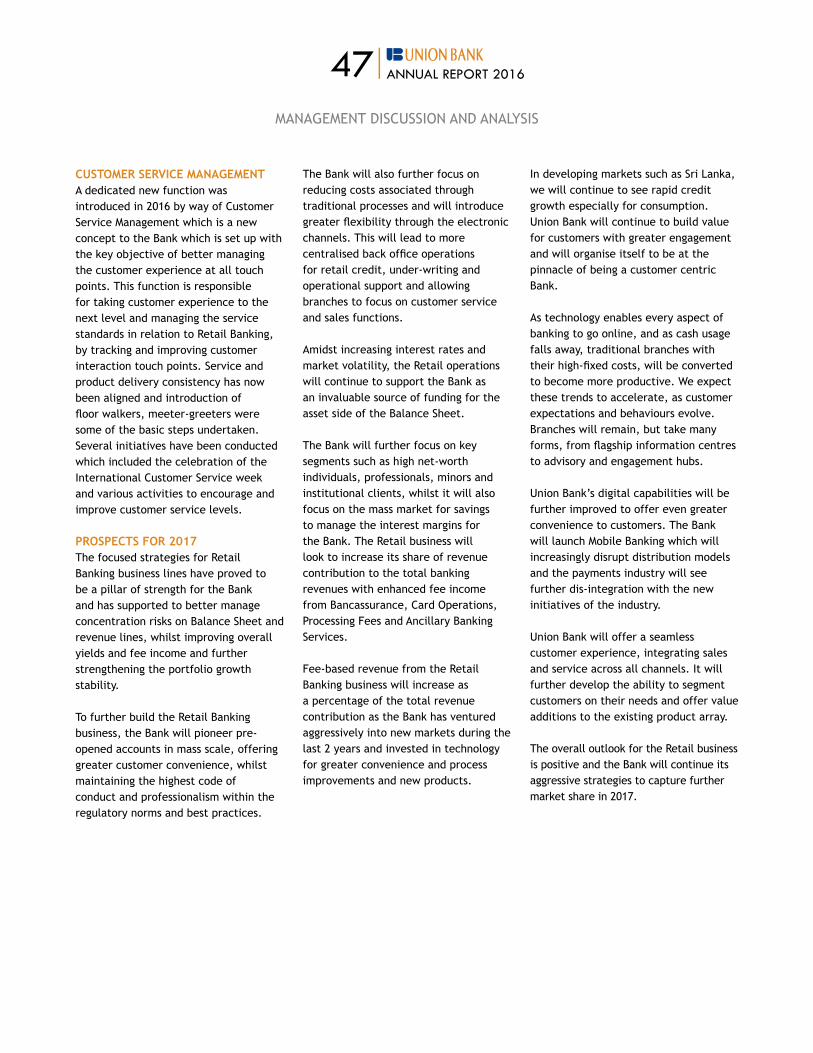
47|ANNUAL REPORT 2016
CUSTOMER SERVICE MANAGEMENTA dedicated new function was introduced in 2016 by way of Customer Service Management which is a new concept to the Bank which is set up with the key objective of better managing the customer experience at all touch points. This function is responsible for taking customer experience to the next level and managing the service standards in relation to retail Banking, by tracking and improving customer interaction touch points. Service and product delivery consistency has now been aligned and introduction of floor walkers, meeter-greeters were some of the basic steps undertaken. Several initiatives have been conducted which included the celebration of the International Customer Service week and various activities to encourage and improve customer service levels.
PROSPECTS FOR 2017 The focused strategies for Retail Banking business lines have proved to be a pillar of strength for the Bank and has supported to better manage concentration risks on Balance Sheet and revenue lines, whilst improving overall yields and fee income and further strengthening the portfolio growth stability.
To further build the Retail Banking business, the Bank will pioneer pre-opened accounts in mass scale, offering greater customer convenience, whilst maintaining the highest code of conduct and professionalism within the regulatory norms and best practices.
The Bank will also further focus on reducing costs associated through traditional processes and will introduce greater flexibility through the electronic channels. This will lead to more centralised back office operations for retail credit, under-writing and operational support and allowing branches to focus on customer service and sales functions.
Amidst increasing interest rates and market volatility, the retail operations will continue to support the Bank as an invaluable source of funding for the asset side of the Balance Sheet.
The Bank will further focus on key segments such as high net-worth individuals, professionals, minors and institutional clients, whilst it will also focus on the mass market for savings to manage the interest margins for the Bank. The Retail business will look to increase its share of revenue contribution to the total banking revenues with enhanced fee income from Bancassurance, Card operations, Processing Fees and Ancillary Banking Services.
Fee-based revenue from the Retail Banking business will increase as a percentage of the total revenue contribution as the Bank has ventured aggressively into new markets during the last 2 years and invested in technology for greater convenience and process improvements and new products.
ManagEMEnT dISCUSSIon and anaLySIS
In developing markets such as Sri Lanka, we will continue to see rapid credit growth especially for consumption. Union Bank will continue to build value for customers with greater engagement and will organise itself to be at the pinnacle of being a customer centric Bank.
As technology enables every aspect of banking to go online, and as cash usage falls away, traditional branches with their high-fixed costs, will be converted to become more productive. We expect these trends to accelerate, as customer expectations and behaviours evolve. Branches will remain, but take many forms, from flagship information centres to advisory and engagement hubs.
Union Bank’s digital capabilities will be further improved to offer even greater convenience to customers. The Bank will launch Mobile Banking which will increasingly disrupt distribution models and the payments industry will see further dis-integration with the new initiatives of the industry.
Union Bank will offer a seamless customer experience, integrating sales and service across all channels. It will further develop the ability to segment customers on their needs and offer value additions to the existing product array.
The overall outlook for the Retail business is positive and the Bank will continue its aggressive strategies to capture further market share in 2017.

48|ANNUAL REPORT 2016
ManagEMEnT dISCUSSIon & anaLySIS
BRANCH AND ATM NETWORK (g4-8)
BRANCHES WITH ATMS
North Central Province
47.anuradhapura
48.Horowpothana
49.kebithigollewa
50.Kekirawa
51.Medawachchiya
Central Province
52.Dambulla
53.gampola
54.Kandy
55.Nawalapitiya
56.Pilimathalawa
Eastern Province
57.Batticaloa
58.Trincomalee
UVA Province
59.Badulla
60.Monaragala
Sabaragamuwa Province
61.Balangoda
62.Embilipitiya
63.kegalle
64.Ratnapura
65.WarakapolaSouthern Province
40.Akuressa
41.Ambalangoda
42.Ambalantota
43.angunakolapelessa
44.Elpitiya
45.Galle
46.Matara
North Province1.Atchuvely2.Chunnakam3.Jaffna4.Mannar5.Vavuniya
North Western Province6.Chilaw7.Ibbagamuwa8.kuliyapitiya9.kurunegala10.Marawila11.Narammala12.Wennappuwa
Western Province13.attidiya14.Borella15.Kollupitiya16.Gampaha17.ganemulla18.Head office19.Horana20.Ja-Ela21.Kadawatha22.Kohuwala23.kotahena24.Maharagama25.Matugama26.Minuwangoda27.Moratuwa28.nawala29.negombo30.nugegoda31.old Moor Street32.Panadura33.Pelawatte34.Pettah35.Piliyandala36.rajagiriya37.ratmalana38.wattala39.wellawatte

49|ANNUAL REPORT 2016
ManagEMEnT dISCUSSIon and anaLySIS
01. Mahabuthgamuwa, angoda
02. Bandaranaike Mawatha, anuradhapura
03. Pore, athurugiriya
04. Thalangama north, Battaramulla
05. divulapitiya, Boralesgamuwa
06. Egaloya, Bulathsinhala
07. r a de Mel Mawatha, Colombo 05
08. Marine drive, wellawatte, Colombo 06
09. Cotta road, Colombo 08
10. Elvitigala Mawatha, Colombo 08
11. Panchikawatta road, Maradana, Colombo 10
12. Prince of wales avenue, Colombo 14
13. attidiya, dehiwala
14. gangodawila, delkanda
15. kurundugahahethekma, Elpitiya
16. Church Street, galle Fort, galle
17. welipillewa, ganemulla
18. galle road, Hikkaduwa
19. Thirunelvely, Jaffna
20. yMCa office Building, Jaffna
21. Hospital road, kalubowila
22. Peradeniya road, kandy
23. kandy road, kelaniya
24. nandasena Mawatha, kiribathgoda
25. High Level road, kirulapone
26. Marine drive, kollupitiya
27. Bogahawila road, kottawa
28. Colombo road, kurunegala
29. Sannasgama (Lanka Filling Station), Lellopitiya
30. Pamunuwa, Maharagama
31. Makola South, Makola
32. Pittugala, Malabe
33. Sirigala, Monaragala
34. angulana, Moratuwa
35. gorakana, Moratuwa
36. Colombo road, negombo
37. Ethukala, negombo
38. Mirihana, nugegoda
39. galagedara Junction, Padukka
40. Modarawila road, Panadura
41. walana, Panadura
42. High Level road, Pannipitiya
43. kottawa, Pannipitiya
44. Makumbura, Pannipitiya
45. Batakettara, Piliyandala
46. Colombo road, Pokunuwita
47. Maradana road, Punchi Borella
48. Belek kade Junction, ratmalana
49. new Town, ratnapura
50. Madiwela road, Thalawathugoda
51. karaliedha, Theldeniya
52. Thalpitiya, wadduwa
53. Hendala, wattala
54. Mabola, wattala
OFF-SITE ATM NETWORK
50|ANNUAL REPORT 2016
TREASURY
The Treasury of Union Bank maintains the overall risk reward mix for the Bank, while supporting the business growth of the Corporate, retail and SME Banking units along with the Trade Business.
The Treasury primarily focuses on providing the necessary funding at the best possible yields, investing and entering in to strategic positions both in Sri Lankan rupee (Lkr) and Foreign Currency on behalf of the Bank, whilst ensuring complete adherence to the laid down procedures and guidelines of the Central Bank of Sri Lanka (CBSL).
2016 witnessed the Bank’s Treasury unit being segregated to three (03) sub segments in order to facilitate the above functions more effectively. As such, the Treasury department was able to add greater value to the business performance of the Bank through the collaborative efforts of these segments namely; the Inter-Bank, Corporate Sales and Fixed Income Desks.
The Inter-Bank desk focuses on the funding options for the Bank at the best possible rates. It also manages the overall regulatory ratios along with the Bank’s overall cash flows both in Lkr and Foreign Currency while handling currency SwaPS which are used as a funding option.
The Corporate Desk places greater focus on serving the requirements of Institutional, Corporate and Individual clients with the facilitation of FX Forward Contracts, Import/Export related transactions and advisory services.
The Fixed Income Desk which constitutes the Primary dealer Unit of the Bank, handles bidding for the Primary Auctions by CBSL, along with the sale/purchase of Treasury Bills and Bonds, managing Repurchase and Reverse Repurchase agreements, handling the Leverage Trading and Interest Rate swaps to Customers both corporate and Individual while liaising with the Bank’s Corporate Sales desk in serving the customers with comprehensive financial solutions.
The Treasury of Union Bank has made a significant contribution to the Bank’s overall profitability. The volatility that prevailed in the financial markets contributed largely to the profits of the Treasury. Capital gains derived from disposal of Fixed Income Securities and Foreign Exchange Income during the period under review were reported at rs. 101 Mn and rs. 187 Mn respectively.
PROSPECTS FOR 2017 Against the backdrop of a tightened Monetary Policy, the Bank’s Treasury division will continue to place strategic emphasis on strengthening contributions from its core businesses in the year 2017. The new structure with focused strategic direction will enable the division to achieve a more stable business model and is anticipated to drive divisional growth in the ensuing year.
OPERATIONS
CENTRAL OPERATIONS Against the backdrop of increased competition in the industry, the Bank continually reviews its process efficiencies for improved delivery of services. In the year 2016, the Bank further extended its centralised services to Corporate/SME Banking Domestic Banking Unit (DBU) and Foreign Currency Banking Unit (FCBU) which has contributed to a significant enhancement of the service delivery standards of the Bank.
Further in the year 2016, the Savings Account KIT was introduced to branches by centralising the account opening process at Central Operations. A KIT contains pre-opened account details, welcome letter, debit card and a Personal Identification number. The welcome KIT is handed over to the customer instantly, which drastically improves service delivery and relieves the branches to spend more time with customers and generating business.
Another addition made to the Central Operations portfolio within the year under review was the Cash Management Operations solution which was introduced to facilitate and provide corporate customers with visibility and control over their cash status, movement and overall liquidity. Further, the Credit Operations department was also reorganised to focus on the centralisation processes of preparation of security documents; follow up on insurance policies of lease facilities as well as safekeeping of lease security documents. The Factoring operations unit was merged with Credit operations bringing all operational aspects related to loans and advances under one unit.
ManagEMEnT dISCUSSIon and anaLySIS
51|ANNUAL REPORT 2016
Under the Clearing operations, the processing of post-dated bulk cheques was centralised within the year under review. Further, to automate and improve the outward clearing process, workflow management was introduced to track all physical outward cheques transmitted from branches to the centre. A solution was also provided to the internal business lines of the Bank, who can now view all inward and outward cheque images online.
BRANCH OPERATIONS In 2016, an automated monitoring process was implemented for Safe deposit Lockers to track and monitor the movement from a central location. Further a simplified branch operations manual was also implemented within the year, which was executed to simplify and better understand the processes. A post-audit branch inspection was carried out for all Branches by visiting each Branch in order to ensure enhanced process efficiencies and compliance standards at branches.
The centralised operations concept/system has ensured reduction in transaction times, costs and improved service quality and efficiency.
TRADE AND TREASURY OPERATIONSWith the strengthening of the Corporate and zonal relationship Management teams, a more focused and cohesive approach was adopted to growing the Trade Finance business in the year under review. This has contributed immensely in growing the transaction volumes flowing through the Bank.
In the year 2016, fully-fledged independent Trade Desks were established at old Moor Street and Pettah branches to cater to the needs of the expanding clientele in these markets. The Bank expects to extend this service further by setting up more
Trade desks at strategic locations to support the growing Trade Finance business of the Bank.
Union Bank has an on-going system enhancement and process automation initiatives both at Trade and Treasury Operations to optimise operational capabilities with enhanced controls. The integration of the front end system with the Core Banking system for the Primary dealer Unit was one such significant achievement in the year 2016.
With the centralisation of processes at Head office, there has been increased focus on the flow of transactions from branches and a Work Flow Management system is being introduced to streamline the delivery of documents and to ensure better monitoring and controls.
PROCESS CONTROLProcess Control Operations unit supports branches and units coming under operations and back office functions such as, certain reconciliation processes, communication with regulatory authorities and issuing balance confirmations.
In the year under review, the unit was further strengthened to support the Bank’s expansion plan. System administration unit was also brought under process control and streamlined to provide an efficient timely service. Since setting up of the unit, the team has undertaken the key initiatives for process improvements such as full automation of data extraction for balance confirmations, issuing withholding tax certificates on behalf of branches. Processes with regard to court cases, Inland revenue orders and balance confirmation information have been included in the workflow system for better monitoring. In addition, improvements to the system administration process and monitoring
of daily submission of e-forms to ensure compliance to CBSL requirements is also done, creating greater value to the Bank.
OPERATIONAL ExCELLENCE A state of the art document and Work Flow Management system was purchased and many processes were identified to be implemented to the system in the year 2016. This platform will assist the Bank to manage and track the turnaround time of processes and deliver a speedier service to Union Bank’s valued customers. The system will also be a tool to identify gaps in certain processes and allow the management to take timely remedial action.
The Service quality Management Unit which manages the Service quality across the branches and operational units, was equipped with UBCnS (Union Bank Complaints and Suggestions System) which was developed by in-house IT professionals taking into consideration the Bank’s commitment for service excellence. This system assists the Bank to record customer complaints, escalate, and closely monitor until resolved. It is expected to work primarily on harnessing customer loyalty and ensure a high level of customer service is maintained at all times. The team also conducts Service Quality Audits by visiting branches and carrying out knowledge tests by interviewing staff.
BUSINESS CONTINUITY MANAGEMENTA BCP drill and Call Tree testing was conducted in 2016 to test the Bank’s readiness and ability to continue its business in line with the Bank’s strategic plan. The Bank successfully operated from the fully equipped disaster recovery site located in Wattala. An evacuation drill was successfully performed at Head office building to test the staff preparedness in case of an emergency.
ManagEMEnT dISCUSSIon and anaLySIS
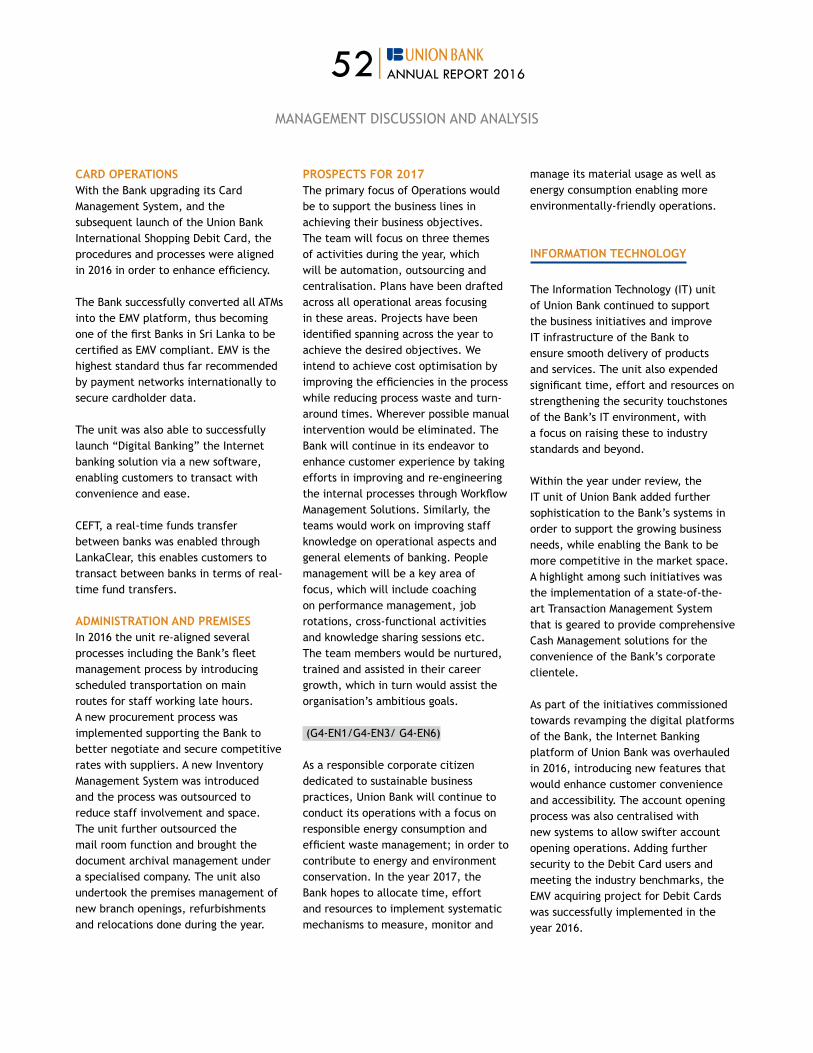
52|ANNUAL REPORT 2016
CARD OPERATIONSWith the Bank upgrading its Card Management System, and the subsequent launch of the Union Bank International Shopping debit Card, the procedures and processes were aligned in 2016 in order to enhance efficiency.
The Bank successfully converted all ATMs into the EMV platform, thus becoming one of the first Banks in Sri Lanka to be certified as EMV compliant. EMV is the highest standard thus far recommended by payment networks internationally to secure cardholder data.
The unit was also able to successfully launch “Digital Banking” the Internet banking solution via a new software, enabling customers to transact with convenience and ease.
CEFT, a real-time funds transfer between banks was enabled through LankaClear, this enables customers to transact between banks in terms of real- time fund transfers.
ADMINISTRATION AND PREMISESIn 2016 the unit re-aligned several processes including the Bank’s fleet management process by introducing scheduled transportation on main routes for staff working late hours. A new procurement process was implemented supporting the Bank to better negotiate and secure competitive rates with suppliers. A new Inventory Management System was introduced and the process was outsourced to reduce staff involvement and space. The unit further outsourced the mail room function and brought the document archival management under a specialised company. The unit also undertook the premises management of new branch openings, refurbishments and relocations done during the year.
PROSPECTS FOR 2017 The primary focus of Operations would be to support the business lines in achieving their business objectives. The team will focus on three themes of activities during the year, which will be automation, outsourcing and centralisation. Plans have been drafted across all operational areas focusing in these areas. Projects have been identified spanning across the year to achieve the desired objectives. we intend to achieve cost optimisation by improving the efficiencies in the process while reducing process waste and turn-around times. Wherever possible manual intervention would be eliminated. The Bank will continue in its endeavor to enhance customer experience by taking efforts in improving and re-engineering the internal processes through workflow Management Solutions. Similarly, the teams would work on improving staff knowledge on operational aspects and general elements of banking. People management will be a key area of focus, which will include coaching on performance management, job rotations, cross-functional activities and knowledge sharing sessions etc. The team members would be nurtured, trained and assisted in their career growth, which in turn would assist the organisation’s ambitious goals.
(g4-En1/g4-En3/ g4-En6)
As a responsible corporate citizen dedicated to sustainable business practices, Union Bank will continue to conduct its operations with a focus on responsible energy consumption and efficient waste management; in order to contribute to energy and environment conservation. In the year 2017, the Bank hopes to allocate time, effort and resources to implement systematic mechanisms to measure, monitor and
ManagEMEnT dISCUSSIon and anaLySIS
manage its material usage as well as energy consumption enabling more environmentally-friendly operations.
INFORMATION TECHNOLOGY
The Information Technology (IT) unit of Union Bank continued to support the business initiatives and improve IT infrastructure of the Bank to ensure smooth delivery of products and services. The unit also expended significant time, effort and resources on strengthening the security touchstones of the Bank’s IT environment, with a focus on raising these to industry standards and beyond.
within the year under review, the IT unit of Union Bank added further sophistication to the Bank’s systems in order to support the growing business needs, while enabling the Bank to be more competitive in the market space. A highlight among such initiatives was the implementation of a state-of-the-art Transaction Management System that is geared to provide comprehensive Cash Management solutions for the convenience of the Bank’s corporate clientele.
As part of the initiatives commissioned towards revamping the digital platforms of the Bank, the Internet Banking platform of Union Bank was overhauled in 2016, introducing new features that would enhance customer convenience and accessibility. The account opening process was also centralised with new systems to allow swifter account opening operations. Adding further security to the Debit Card users and meeting the industry benchmarks, the EMV acquiring project for debit Cards was successfully implemented in the year 2016.

53|ANNUAL REPORT 2016
ManagEMEnT dISCUSSIon and anaLySIS
also within the year under review, several other systems were implemented to improve the process controls and optimise productivity and efficiency of the Bank’s operations. Significant systems introduced within the year include, asset and Liability System, Collection and recovery System, Cheque referral optimisation, Supplier Expense Management System and the Complaints Management System (CMS).
Safeguarding the Bank’s data by intensifying security across all channels of contact remained a priority for the IT unit of Union Bank and accordingly in the year 2016, the unit implemented system defense initiatives with a key focus on the digital channels. Also within the year under review, the Bank obtained the PCI PIn certification to comply with the security standards.
PROSPECTS FOR 2017While continuing to support the business growth, smoother operations and swift delivery of the Bank’s products and services; the IT unit of Union Bank will be geared to take on the challenges and opportunities set forth by the rapidly evolving digital future of the financial industry. Looking towards year 2017 and beyond, the IT unit of Union Bank will continue to invest in adding further sophistication to the Bank’s IT infrastructure and continue to strengthen the security of the Bank’s systems and data.
MARKETING COMMUNICATIONS
Marketing continued to play the role of key communicator, in strengthening Union Bank’s new positioning as a fully-fledged commercial bank during the year under review. Several key initiatives were carried out throughout the year
to build brand equity and awareness while many targeted communication campaigns were designed to position the personal banking propositions which highlight the Bank’s transformation with a wider focus on Retail Banking.
The marketing communications efforts to build product and brand awareness were driven through strategic communication campaigns launched to selected targeted audiences. as such, above the Line (aTL) campaigns were launched, to give a new look and feel to some of the key Retail and Corporate Banking products. Union Bank Home Loans, Union Bank kidz Saver account, Union Bank remit2SriLanka, Union Bank Biz direct, Union Bank Loan against Property and Union Bank Invest Plus were key products that were rebranded in 2016.
The Below the Line (BTL) marketing efforts were continued to strengthen the brand visibility around the island with numerous outdoor branding activities including the procurement of strategic hoarding sites, and street name boards.
The branch network continued to be given a new outlook, enabling to create greater brand awareness defining a more vibrant brand persona and a redefined customer experience at strategic localities. In addition, the expansion of the off-site ATM network paved the way for greater brand visibility. A cohesive Public relations Strategy was mooted to strengthen the Bank’s image, perception and status.
Union Bank continues to support the SME sector where the Bank has excelled for over two decades. reaffirming its commitment to the SMEs Union Bank pledged its support for the NCE Export Awards in the year 2016.
Marking a milestone in the Bank’s rebranding efforts, Union Bank received the award for Excellence in Branding in the Banking, Financial Services and Insurance sector at the Global Brand Excellence Awards 2016 held in kuala Lumpur, Malaysia. The award acknowledged the great strides made by Union Bank brand within the Banking industry of Sri Lanka, subsequent to the repositioning of the brand as a fully-fledged commercial bank in 2015. our culture of uncompromising compliance was well rewarded with the Union Bank’s Annual Report being conferred the Compliance Award at the 52nd CA annual report awards, acknowledging our efforts in delivering excellence in reporting. Further enhancing brand awareness amongst key target segments, Union Bank strengthened its social media presence by being positioned as a dynamic financial brand which reaches out to the aspirational youth and the young-at-heart on several key social media platforms including Facebook, Instagram and Youtube.
PROSPECTS FOR 2017 Marketing will remain a key support driver in Union Bank’s growth plans next year. Union Bank intends to leverage on its strong financial standing, global expertise and experience garnered from the pathway the Bank has inked, to reinforce its brand as a dynamic financial brand that supports the growth of individuals, communities and the nation. This will mean that marketing will be at the forefront in increasing awareness for the anticipated great leap of growth.

54|ANNUAL REPORT 2016
OUTLOOK
Through our new and energised outlook as a progressive brand, Union Bank offers a fresh perspective on financial growth to our stakeholders while inspiring them to make the rest of their lives, the best of their lives.

56|ANNUAL REPORT 2016
CorPoraTE HIgHLIgHTS
BranCH oPEnIngS
Union Bank opened its 65th branch in Borella, whilst the branches in galle, Jaffna, old Moor Street and Pelawatte were re-opened with a brand new outlook providing greater banking convenience to customers.
oFF-SITE aTMS
17 new aTMs were commissioned at strategic locations island-wide, enhancing customer reach.
kaLIn aVUrUdU ProMoTIon
In February 2016, Union Bank launched ‘kalin avurudu Ganudenu’ an early Avurudu promotion offering exciting gifts for Savings and 01 year Fixed deposits.

57|ANNUAL REPORT 2016
CorPoraTE HIgHLIgHTS
CUSToMEr EngagEMEnT - SME BankIng
Customer networking events were held in galle, kandy and Jaffna to further strengthen relationships with SMEs.
knowLEdgE ForUMS SME BankIng
A special forum was held in Kuliyapitiya to educate the SME entrepreneurs in the area, with the latest economic developments and entrepreneural skills.
CUSToMEr EngagEMEnT ELITE CIrCLE
Exclusive wine tasting events were held to promote engagement amongst the Elite Banking Customers of the Bank.

58|ANNUAL REPORT 2016
HOME AND YOU EXHIBITION
Creating awareness for Union Bank Home Loans, the Bank was the official banking partner of ‘Home and you’ lifestyle fair 2016, held at the BMICH.
CorPoraTE HIgHLIgHTS
CorPoraTE SPonSorSHIPS
The Bank engaged in strategic corporate sponsorships that resonated with Union Bank’s new positioning as a fully-fledged commercial bank. 1. gold sponsor of the Sri Lanka Super Sevens rugby Tournament 20162. Premier Sponsor of the nCE Export awards 20163. Banking partner for the annual Conference of College of Surgeons
BUDGET FORUM
Insights to the 2017 budget were shared at a budget forum held for SME customers. The discussion was facilitated by experts from KPMG and Frontier Research.

59|ANNUAL REPORT 2016
CorPoraTE HIgHLIgHTS
‘CaSa/Fd oVEr drIVE’ InTEr-BranCH PROMOTION
Branches were rewarded for their exceptional achievements in an inter-branch competition held for the acquisition of new Savings and Current accounts (CaSa) and Fixed Deposits.
aVUrUdU CELEBraTIon
Union Bank staff members enjoyed the traditions and games of the Sinhala and Tamil new year festivities at an event held at the Bloomfield grounds.
awardS
1. Union Bank received the award for Excellence in Branding in the Banking, Financial Services and Insurance sector at the global Brand Excellence awards 2016 held in kuala Lumpur, Malaysia.
2. Union Bank was once again commended for excellence in Financial Reporting at the 2016 Annual Report Awards. The event was held for the 52nd year and is conducted by the Institute of Chartered accountants Sri Lanka (Ca).

60|ANNUAL REPORT 2016
CorPoraTE HIgHLIgHTS
STaFF annUaL TrIP 2016
Staff members of Union Bank enjoyed a well-deserved break with colleagues and family members at the annual staff trip to Habarana.
UnIon Bank annUaL dInnEr danCE
The annual dinner dance of Union Bank, was a gala, fun-filled event with entertainment in abundance attended by a large gathering of employees.
Long SErVICE awardS
The Bank acknowledged the long-standing dedication and commitment of employees who have been a part of the Bank’s growth for over 20 years.

61|ANNUAL REPORT 2016
CorPoraTE HIgHLIgHTS
aCHIEVEMEnTS In SPorTS
1. Union Bank’s men’s Basketball team emerged E-Division champions at the 11th Mercantile Ram Ratnavale Memorial
knockout Tournament 2016 organised by the Mercantile Services Basketball association.
2. Union Bank’s Badminton Team emerged ‘Plate’ Champions at the inter-bank Badmintion tournament and Runners up in
the Mercantile Badminton Championship – Veterans “C” division/Mens’ “H” division.
3. The Chess team of Union Bank participated in the Mercantile open chess tournament for the first time, where two staff
members gained overall rankings at the open tournament.
CHrISTMaS CaroLS
Union Bank’s Annual Christmas Carols programme, presented by staff members was held at St. andrew’s Scots kirk Church with the participation of staff and their families.
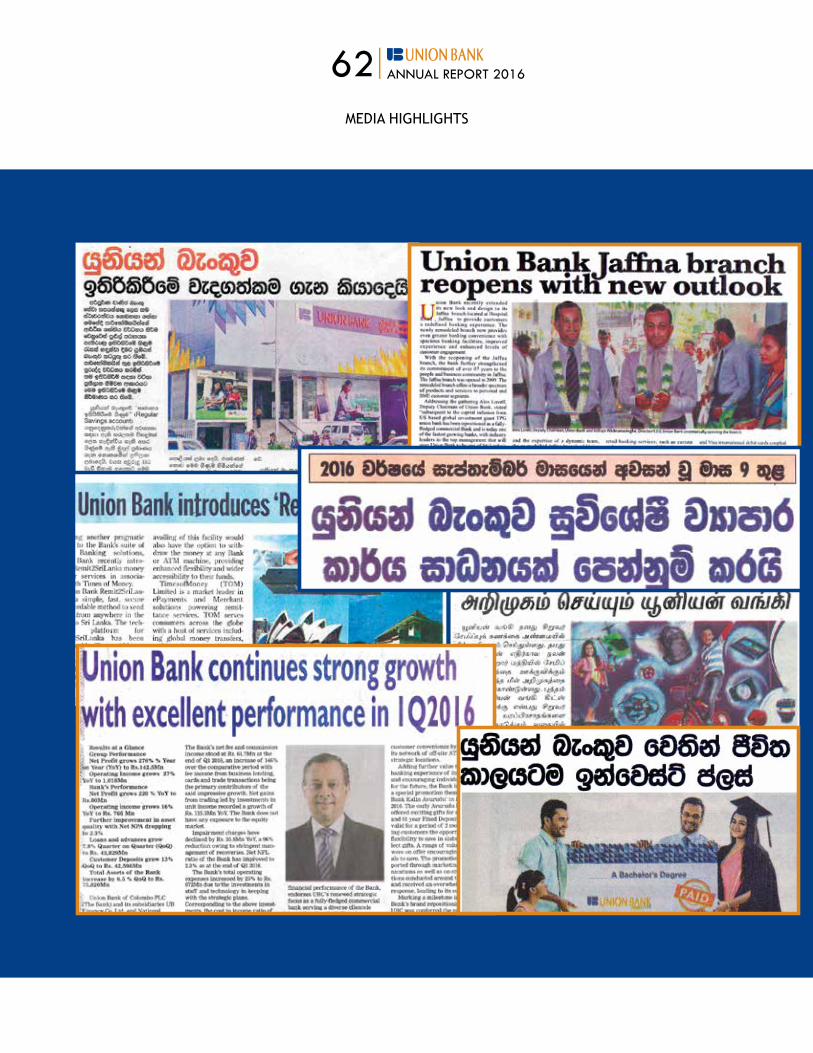
62|ANNUAL REPORT 2016
MEdIa HIgHLIgHTS

63|ANNUAL REPORT 2016
MEdIa HIgHLIgHTS

64|ANNUAL REPORT 2016
Our social and environment report focuses on the key stakeholder groups of customers, employees, and the community and aims to provide our investor community clear and sufficient information on our engagement with these stakeholders and how they impact our operations.
OUR CUSTOMERS Our customer base comprises of individuals, SMEs and corporates, spread across the different parts of the island. With determination to place the customer at the heart of the Banking experience, we consistently strive to serve the emerging needs of our customers while enhancing their banking experience with us. We endeavor to consciously pay heed to customer needs, while providing them convenient access; which enables open communications with our clientele at all key touch points.
The Customer Charter mandated by the Central Bank of Sri Lanka (CBSL) is in full application at Union Bank. The Customer Charter sets the standards for fair banking and provides guidance on customer rights, grievance mechanism and special provisions for selected customer groups.
PRODUCT RESPONSIBILITY (g4-14/g4-Pr3)
Products and services of the Bank are aligned to meet the needs of the diverse clients we serve. For instance, in 2016 the Bank introduced a new savings proposition named ‘Union Bank Invest Plus’ to cater to the specific financial needs of the individuals seeking maximum returns on their commitment to save monthly for a targeted lifestyle event or purpose. Similarly, within the year under review, the Bank also revamped its housing financing proposition and children’s savings accounts to deliver better value and enhanced privileges to clients. The
Bank provides a comprehensive range of products and services that are relevant and effective in meeting the needs of our clientele at various lifestyle stages and milestones of their personal/commercial endeavours.
To enable our customers to make well-informed decisions, details of products and services offered at branches could be found on printed material such as leaflets, posters and banners prominently displayed at branches for easy access. Details of Bank’s products are also available on Bank’s corporate website in English, Sinhala and Tamil along with advise on how to contact the Bank; providing customers with direct access to such details. Further details may also be inquired through the 24- hour Contact Centre hotline where trained customer service personnel will be available to assist customers with requested information and queries. In addition to the above, in compliance with the CBSL customer charter, tri-lingual Key Fact Documents on all products and services are also made available at branches as well and the corporate website for easy access by clients. Interest rates, fees and charges are clearly communicated via rate sheets displayed at branches as well as on an updated tariff sheet published on the Bank’s corporate website. In addition, the Bank’s customer agreements, terms and conditions documents as well as applications are designed in a customer-friendly, easily comprehensible format and are made available in all three languages upon request.
COMMUNICATIONS Communication of the Bank’s products and services have been maintained via mass media (paid-for media such as TV, radio and Press) supported by branch branding, outdoor branding and enhanced external brand visibility across the country.
SoCIaL and EnVIronMEnT rEVIEw
A mix of communication tools including advertising, corporate events, street promotions, corporate sponsorships etc. have been employed to target the different segments of clients served. In addition to paid-for media, awareness of products and services have been created in the public domain via public relations and publicity in the print, electronic and online media. Incidents of non-compliance with regulations and voluntary codes concerning marketing communications that include advertising, promotions and sponsorships did not occur during the year under review.
The marketing communications of the Bank focus on creating better knowledge and awareness of the Bank and its product propositions. Outdoor promotions in suburbs and main cities outside Colombo have been conducted within the year under review in order to raise awareness of the Bank’s products and services, with a special focus on encouraging the public to save and invest. The outdoor visibility of the Union Bank brand and its products have also been enhanced in 2016, with the addition of new branch locations, off site aTM sites as well as the acquisition of new outdoor branding sites.
In conducting its communications, the Bank adheres to a Communication Policy approved by the Board of Directors which governs the objectives, division of responsibilities and general guidelines for communicating with various target groups. Therefore, the Communication Policy encompasses the following aspects;
ff The communication of public and non-public information
ff Communications with media, shareholders, regulators and other stakeholder groups
ff Business communication and usage of email, etc.
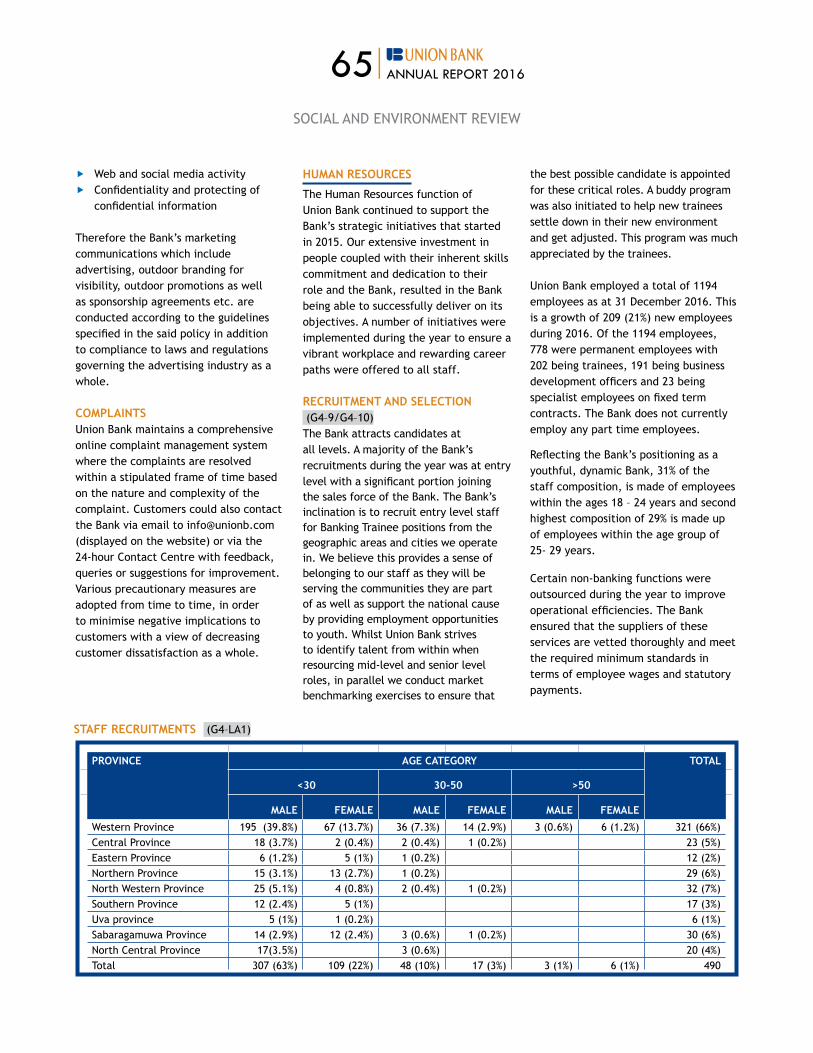
65|ANNUAL REPORT 2016
SoCIaL and EnVIronMEnT rEVIEw
ff Web and social media activityff Confidentiality and protecting of
confidential information
Therefore the Bank’s marketing communications which include advertising, outdoor branding for visibility, outdoor promotions as well as sponsorship agreements etc. are conducted according to the guidelines specified in the said policy in addition to compliance to laws and regulations governing the advertising industry as a whole.
COMPLAINTS Union Bank maintains a comprehensive online complaint management system where the complaints are resolved within a stipulated frame of time based on the nature and complexity of the complaint. Customers could also contact the Bank via email to [email protected] (displayed on the website) or via the 24-hour Contact Centre with feedback, queries or suggestions for improvement. Various precautionary measures are adopted from time to time, in order to minimise negative implications to customers with a view of decreasing customer dissatisfaction as a whole.
HUMAN RESOURCES
The Human Resources function of Union Bank continued to support the Bank’s strategic initiatives that started in 2015. Our extensive investment in people coupled with their inherent skills commitment and dedication to their role and the Bank, resulted in the Bank being able to successfully deliver on its objectives. a number of initiatives were implemented during the year to ensure a vibrant workplace and rewarding career paths were offered to all staff. RECRUITMENT AND SELECTION (g4–9/g4–10)The Bank attracts candidates at all levels. a majority of the Bank’s recruitments during the year was at entry level with a significant portion joining the sales force of the Bank. The Bank’s inclination is to recruit entry level staff for Banking Trainee positions from the geographic areas and cities we operate in. We believe this provides a sense of belonging to our staff as they will be serving the communities they are part of as well as support the national cause by providing employment opportunities to youth. Whilst Union Bank strives to identify talent from within when resourcing mid-level and senior level roles, in parallel we conduct market benchmarking exercises to ensure that
the best possible candidate is appointed for these critical roles. A buddy program was also initiated to help new trainees settle down in their new environment and get adjusted. This program was much appreciated by the trainees.
Union Bank employed a total of 1194 employees as at 31 december 2016. This is a growth of 209 (21%) new employees during 2016. of the 1194 employees, 778 were permanent employees with 202 being trainees, 191 being business development officers and 23 being specialist employees on fixed term contracts. The Bank does not currently employ any part time employees.
reflecting the Bank’s positioning as a youthful, dynamic Bank, 31% of the staff composition, is made of employees within the ages 18 – 24 years and second highest composition of 29% is made up of employees within the age group of 25- 29 years.
Certain non-banking functions were outsourced during the year to improve operational efficiencies. The Bank ensured that the suppliers of these services are vetted thoroughly and meet the required minimum standards in terms of employee wages and statutory payments.
STAFF RECRUITMENTS (g4–La1)
PROVINCE AGE CATEGORY TOTAL
<30 30-50 >50
MALE FEMALE MALE FEMALE MALE FEMALE
Western Province 195 (39.8%) 67 (13.7%) 36 (7.3%) 14 (2.9%) 3 (0.6%) 6 (1.2%) 321 (66%)Central Province 18 (3.7%) 2 (0.4%) 2 (0.4%) 1 (0.2%) 23 (5%)Eastern Province 6 (1.2%) 5 (1%) 1 (0.2%) 12 (2%)Northern Province 15 (3.1%) 13 (2.7%) 1 (0.2%) 29 (6%)North Western Province 25 (5.1%) 4 (0.8%) 2 (0.4%) 1 (0.2%) 32 (7%)Southern Province 12 (2.4%) 5 (1%) 17 (3%)Uva province 5 (1%) 1 (0.2%) 6 (1%)Sabaragamuwa Province 14 (2.9%) 12 (2.4%) 3 (0.6%) 1 (0.2%) 30 (6%)North Central Province 17(3.5%) 3 (0.6%) 20 (4%)Total 307 (63%) 109 (22%) 48 (10%) 17 (3%) 3 (1%) 6 (1%) 490
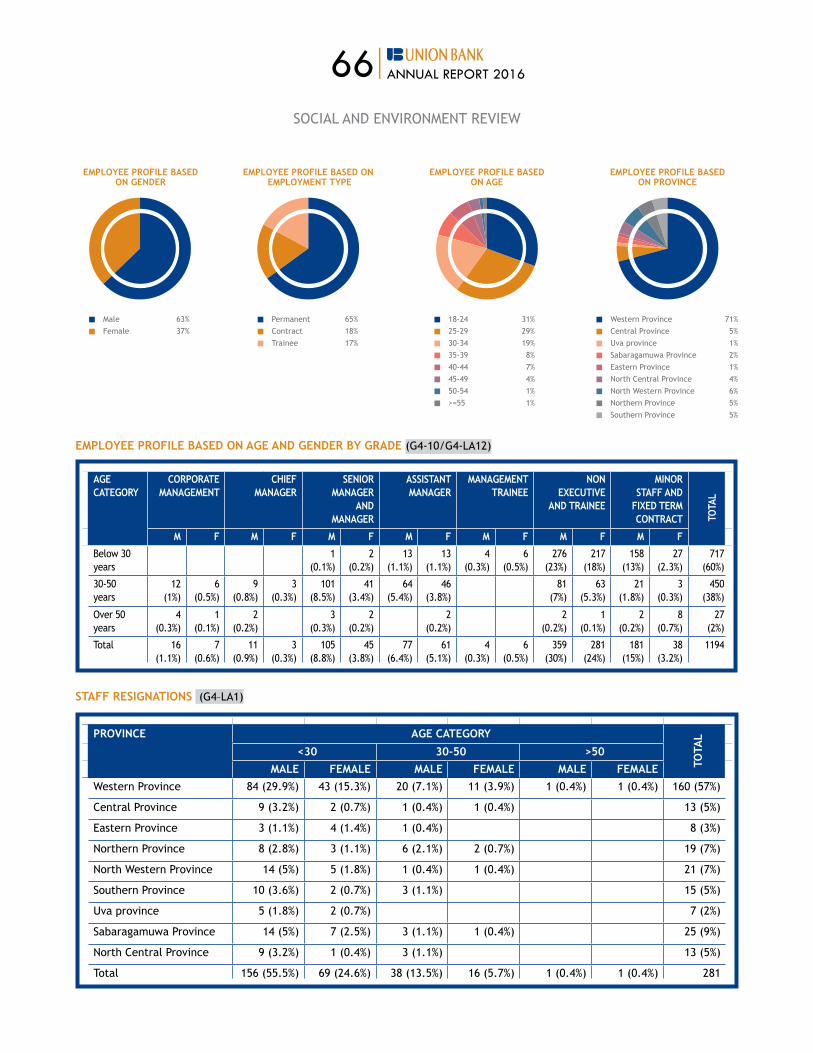
66|ANNUAL REPORT 2016
SoCIaL and EnVIronMEnT rEVIEw
18-24 31%25-29 29%30-34 19%35-39 8%40-44 7%45-49 4%50-54 1%>=55 1%
EMPLOYEE PROFILE BASED ON AGE
Male 63% Female 37%
EMPLOYEE PROFILE BASED ON GENDER
Permanent 65%Contract 18%Trainee 17%
EMPLOYEE PROFILE BASED ON EMPLOYMENT TYPE
western Province 71%Central Province 5%Uva province 1%Sabaragamuwa Province 2%Eastern Province 1%north Central Province 4%north western Province 6%northern Province 5%Southern Province 5%
EMPLOYEE PROFILE BASED ON PROVINCE
EMPLOYEE PROFILE BASED ON AGE AND GENDER BY GRADE (g4-10/g4-La12)
AGE CATEGORY
CORPORATE MANAGEMENT
CHIEF MANAGER
SENIOR MANAGER
AND MANAGER
ASSISTANT MANAGER
MANAGEMENT TRAINEE
NON ExECUTIVE
AND TRAINEE
MINOR STAFF AND
FIxED TERM CONTRACT TO
TAL
M F M F M F M F M F M F M F
Below 30 years
1 (0.1%)
2 (0.2%)
13 (1.1%)
13 (1.1%)
4 (0.3%)
6 (0.5%)
276 (23%)
217 (18%)
158 (13%)
27 (2.3%)
717 (60%)
30-50years
12 (1%)
6 (0.5%)
9 (0.8%)
3 (0.3%)
101 (8.5%)
41 (3.4%)
64 (5.4%)
46(3.8%)
81 (7%)
63 (5.3%)
21 (1.8%)
3 (0.3%)
450 (38%)
Over 50 years
4 (0.3%)
1 (0.1%)
2 (0.2%)
3 (0.3%)
2 (0.2%)
2 (0.2%)
2 (0.2%)
1 (0.1%)
2 (0.2%)
8 (0.7%)
27 (2%)
Total 16 (1.1%)
7 (0.6%)
11 (0.9%)
3 (0.3%)
105 (8.8%)
45 (3.8%)
77 (6.4%)
61 (5.1%)
4 (0.3%)
6 (0.5%)
359 (30%)
281 (24%)
181 (15%)
38 (3.2%)
1194
STAFF RESIGNATIONS (g4–La1)
PROVINCE AGE CATEGORY
TOTA
L
<30 30-50 >50MALE FEMALE MALE FEMALE MALE FEMALE
Western Province 84 (29.9%) 43 (15.3%) 20 (7.1%) 11 (3.9%) 1 (0.4%) 1 (0.4%) 160 (57%)
Central Province 9 (3.2%) 2 (0.7%) 1 (0.4%) 1 (0.4%) 13 (5%)
Eastern Province 3 (1.1%) 4 (1.4%) 1 (0.4%) 8 (3%)
Northern Province 8 (2.8%) 3 (1.1%) 6 (2.1%) 2 (0.7%) 19 (7%)
North Western Province 14 (5%) 5 (1.8%) 1 (0.4%) 1 (0.4%) 21 (7%)
Southern Province 10 (3.6%) 2 (0.7%) 3 (1.1%) 15 (5%)
Uva province 5 (1.8%) 2 (0.7%) 7 (2%)
Sabaragamuwa Province 14 (5%) 7 (2.5%) 3 (1.1%) 1 (0.4%) 25 (9%)
North Central Province 9 (3.2%) 1 (0.4%) 3 (1.1%) 13 (5%)
Total 156 (55.5%) 69 (24.6%) 38 (13.5%) 16 (5.7%) 1 (0.4%) 1 (0.4%) 281

67|ANNUAL REPORT 2016
SoCIaL and EnVIronMEnT rEVIEw
PERFORMANCE AND REWARDS (g4-La11)The benchmarking exercise initiated in 2015 in a bid to benchmark the Bank’s salaries to market salaries continued in the year 2016 as well. The year under review saw our employees being remunerated equitably and competitively with further market adjustments being affected.
The approach to performance management was revisited and further refined during the year. Upon evaluation of several Performance Management solutions and implementation partners, the Bank tied up with SaP SuccessFactors. SuccessFactors’ Talent Management suite is recognised as best in class by leading market research firms. Union Bank is Sri Lanka’s first Bank to implement SaP SuccessFactors for employee performance management. Every confirmed employee participates in the year end performance review
process. Review is initiated with a self-review which is followed by the line manager review. Finally ratings are reviewed by the Senior Management and the distribution of ratings is agreed on.
Trainees are evaluated on an annual basis during the training period and the probationers evaluated prior to their confirmation. Their evaluations are carried out by the relevant line managers.
A fast-track process for promotions was introduced in the year under review, under which 21 staff members benefited by getting early promotions in recognition of their exceptional performance.
The Bank’s remuneration practices are governed by a Remuneration Policy which has been approved by the Human Resources and Remuneration Committee of the Board. In keeping
with the objective of maintaining transparency and integrity, all proposals on the mechanisms for employee salary adjustments in 2016 were tabled at the Board Human Resources and Remuneration Committee for deliberation and approval prior to being implemented. Thereby strengthening the governance on employee remuneration in the Bank and ensuring an equitable approach to rewards management.
The remuneration of the CEO and Key Management Personnel (KMP) are linked to delivering the Bank’s strategic objectives and are measured via the Balanced Score Card. CEo and KMP performance is reviewed by the Human Resources and Remuneration Committee of the Board which is responsible for evaluating performance and recommending any changes in remuneration to the Board of Directors.
BENEFITS PROVIDED TO EMPLOYEES (g4-La2)Permanent employees are eligible for the following benefits based on their grade in addition to remuneration.
BENEFITS PROVIDED PERMANENT EMPLOYEES
TRAINEE EMPLOYEES
Private Provident Fund with the option for increased contribution
Loans for staff members at concessionary interest rates for housing, motor vehicle, personal needs, furniture loans, festival advances.
Medical reimbursement, Spectacle reimbursement.
Personal accident & Life Insurance
Special Critical Cover Insurance covering employee and spouse
reimbursement of course fee and exam fees in relation to Banking exams conducted by IBSL
Reimbursement of cost of obtaining a Master’s degree for staff in the grade of Manager and above
Payment of membership subscriptions of Professional bodies for Assistant Manager and above grades
Bonuses based on Bank performance
difficult station allowance
Travelling allowance
Incentives for high performing sales staff
Awards for high performing teams
Recognition of long standing employees for those who completed 20 years of service
** The Bank has not employed temporary or part time employees during the year under review
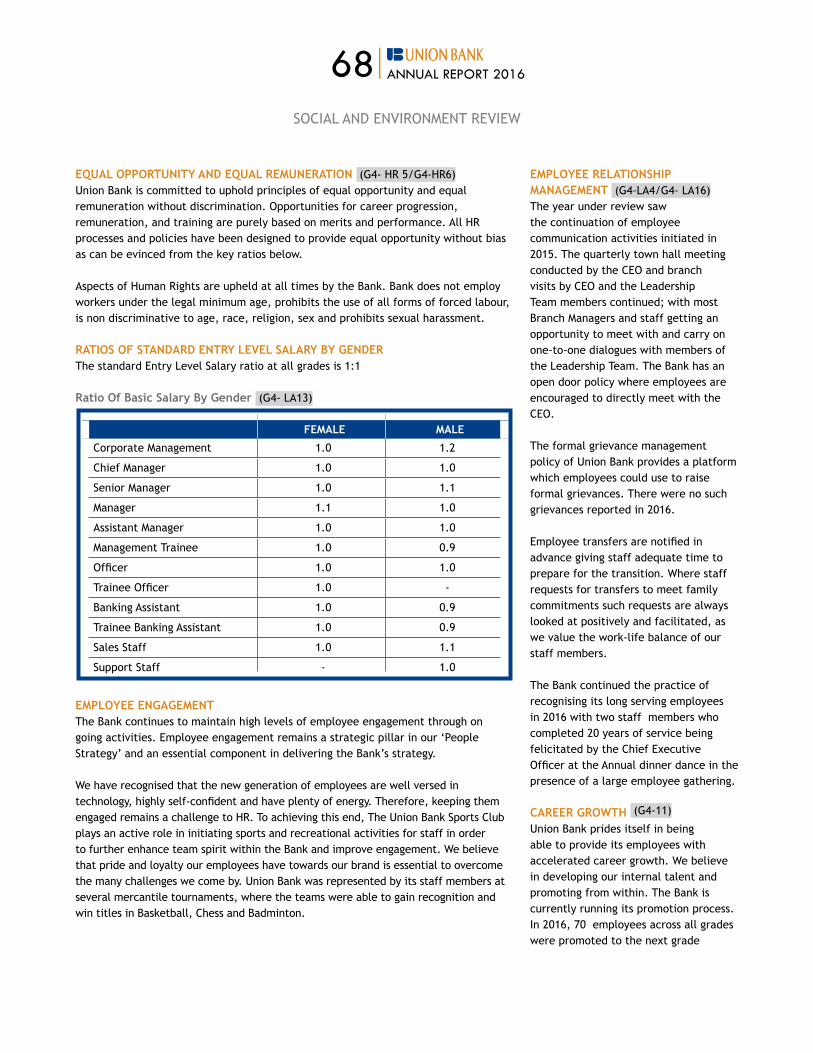
68|ANNUAL REPORT 2016
EqUAL OPPORTUNITY AND EqUAL REMUNERATION (g4- Hr 5/g4-Hr6)Union Bank is committed to uphold principles of equal opportunity and equal remuneration without discrimination. opportunities for career progression, remuneration, and training are purely based on merits and performance. all Hr processes and policies have been designed to provide equal opportunity without bias as can be evinced from the key ratios below.
Aspects of Human Rights are upheld at all times by the Bank. Bank does not employ workers under the legal minimum age, prohibits the use of all forms of forced labour, is non discriminative to age, race, religion, sex and prohibits sexual harassment.
RATIOS OF STANDARD ENTRY LEVEL SALARY BY GENDER The standard Entry Level Salary ratio at all grades is 1:1
Ratio Of Basic Salary By Gender (g4- La13)
FEMALE MALE
Corporate Management 1.0 1.2
Chief Manager 1.0 1.0
Senior Manager 1.0 1.1
Manager 1.1 1.0
Assistant Manager 1.0 1.0
Management Trainee 1.0 0.9
officer 1.0 1.0
Trainee officer 1.0 -
Banking Assistant 1.0 0.9
Trainee Banking Assistant 1.0 0.9
Sales Staff 1.0 1.1
Support Staff - 1.0
EMPLOYEE ENGAGEMENTThe Bank continues to maintain high levels of employee engagement through on going activities. Employee engagement remains a strategic pillar in our ‘People Strategy’ and an essential component in delivering the Bank’s strategy.
We have recognised that the new generation of employees are well versed in technology, highly self-confident and have plenty of energy. Therefore, keeping them engaged remains a challenge to Hr. To achieving this end, The Union Bank Sports Club plays an active role in initiating sports and recreational activities for staff in order to further enhance team spirit within the Bank and improve engagement. We believe that pride and loyalty our employees have towards our brand is essential to overcome the many challenges we come by. Union Bank was represented by its staff members at several mercantile tournaments, where the teams were able to gain recognition and win titles in Basketball, Chess and Badminton.
EMPLOYEE RELATIONSHIP MANAGEMENT (g4-La4/g4- La16)The year under review saw the continuation of employee communication activities initiated in 2015. The quarterly town hall meeting conducted by the CEO and branch visits by CEo and the Leadership Team members continued; with most Branch Managers and staff getting an opportunity to meet with and carry on one-to-one dialogues with members of the Leadership Team. The Bank has an open door policy where employees are encouraged to directly meet with the CEO.
The formal grievance management policy of Union Bank provides a platform which employees could use to raise formal grievances. There were no such grievances reported in 2016.
Employee transfers are notified in advance giving staff adequate time to prepare for the transition. Where staff requests for transfers to meet family commitments such requests are always looked at positively and facilitated, as we value the work-life balance of our staff members.
The Bank continued the practice of recognising its long serving employees in 2016 with two staff members who completed 20 years of service being felicitated by the Chief Executive officer at the annual dinner dance in the presence of a large employee gathering.
CAREER GROWTH (G4-11)
Union Bank prides itself in being able to provide its employees with accelerated career growth. We believe in developing our internal talent and promoting from within. The Bank is currently running its promotion process. In 2016, 70 employees across all grades were promoted to the next grade
SoCIaL and EnVIronMEnT rEVIEw

69|ANNUAL REPORT 2016
providing them opportunities of career advancement. As a further example of the Bank’s HR policies being non discriminatory, earlier during the year (as mentioned elsewhere in this report) the Bank also provided permanent employment to 9 Trainee Banking Assistants as Banking Assistants based on their performance.
Employees were rotated on a periodic basis giving opportunity for them to widen their horizons. The Bank has a policy governing transfers which requires staff in branches to be rotated once they complete 5 years at a branch.
Union Bank employees are not covered by collective bargaining agreements or represented by employee unions. This has allowed the management to directly engages employees in dialogue and recognise, reward and support employees at all levels to pursue their career ambitions in an environment based on trust and professionalism.
EMPLOYEE WELLBEING AND OCCUPATIONAL HEALTH The Bank places priority in employee well-being and maintaining zero occupational health issues. Necessary policies and procedures are in place and are strictly implemented to ensure emotional wellbeing and a secure office environment to our staff.
There were no work place related injuries during the year under review. Standard safety measures such as periodic fire alarm checks, training of fire wardens, conducting fire drills etc. further ensured a safe working environment. In addition, physical security measures such as security guards, access controlled doors and CCTV cameras have been put in place to ensure the physical safety of our employees.
The permanent staff are provided a comprehensive medical insurance cover for hospitalisation and critical illnesses. The Bank further provides reimbursements of outdoor medical expenses such as OPD visits and costs of prescribed medicines to ease the burden of high medical costs on our employees.
LEARNING AND DEVELOPMENTThe Bank invested heavily on Learning and Development to drive a culture of learning, one that is built on a firm foundation of attitudes, skills and knowledge. The Bank’s investment in the refurbishment of its training facility in the year under review, was a noteworthy commitment made towards the development of its employees. The facility was renovated to the current industry standard and was renamed as ‘UB Learning & development Centre’.
Based on the training needs analysis and the critical business imperatives at a Bank-wide level, training was heavily concentrated on Customer Service, Sales and on-boarding. a total of 17,454 hours were delivered across multiple categories of staff this year and average training hours per employee per year is 8.4 hours. 2,078 employees were trained through a total of 144 training programmes. This is an impressive 110% increase from 2015 and an example of the Bank’s commitment to invest in the learning and development activities of the staff. Further details of training activities are elaborated below.
Fostering a culture of Customer Service and Sellinga fully-fledged programme on ‘Sales and Selling Techniques’ was launched in 2016 to support the Bank’s thrust on Sales and Marketing. all branch managers, the entire assets Sales team and forty high performers of the Liability Sales Team were exposed to this programme with positive impacts.
SoCIaL and EnVIronMEnT rEVIEw
a key objective of the Bank is to achieve customer service excellence. as such, a special training facilitated by an external trainer was launched for the benefit of the entire staff of Union Bank in the latter part of 2015 and was continued within the first quarter of 2016.
Nurturing the new entrants to the BankThe Bank firmly believes in developing and nurturing the young talent that joins the Union Bank team. as such, the on-boarding programme was revamped to cater to the needs of this group followed with a two day programme to develop their technical skills. at the same time, all newly promoted staff members were duly inducted to their new roles across all levels of staff.
Credit Evaluation SkillsEven though the Bank’s credit function is centralised, training programmes were conducted on Credit Evaluation and Credit Operations through a 2 day structured programme for all credit staff in the Bank.
Partnerships with External Training InstitutesIn addition to an increase in the in- house training, the Bank continued to partner with the Institute of Bankers Sri Lanka, The Centre For Banking Studies, Central Bank of Sri Lanka, and other key training institutes in Sri Lanka, to provide specialised training for its employees. A substantial number of staff were provided opportunities within the year, to attend special conferences and seminars of international repute which helped them to enhance their knowledge and also network with the industry contemporaries.

70|ANNUAL REPORT 2016
SoCIaL and EnVIronMEnT rEVIEw
EMPLOYEE CATEGORY-WISE TRAINING HOURS (g4-La9)
EMPLOYEE CATEGORY NO. OF STAFF TOTAL TRAINING HOURS AVERAGE HOURS
Bda/Bdo 320 2,466.0 7.7
outsourced Staff 12 12.0 1.0
Support Staff 3 21.0 7.0
TBA 336 3,020.0 9.0
BA 435 3,654.5 8.4
officer 337 2,934.0 8.7
Team Leader 21 169.0 8.0
Relationship Manager 6 72.0 12.0
Management Trainee 15 137.5 9.2
Assistant Manager 257 2,154.0 8.4
Manager/BM 259 1,953.0 7.5
Senior Manager 37 408.5 11.0
Chief Manager 19 190.0 10.0
aVP/VP 20 253.0 12.7
Total 2,078 17,454.0 8.4
GENDER-WISE TRAINING HOURS DETAILS (g4-La9)
GENDER NO. OF STAFF TOTAL TRAINING HOURS AVERAGE HOURS
Male 1,357 11,089 8.2
Female 721 6,365 8.8
Total 2,078 17,454 8.4
SKILLS MANAGEMENT PROGRAMMES (g4-La10)
PROGRAM NO. OF PROGRAMS
NO. OF TRAINING HOURS
TOTAL NO. OF PARTICIPANTS
DURATION OF THE PROGRAM
Self-development Program 2 368.0 46 8 hours
Tech. Skills for TBas 2 912.0 58 16 hours
SaP SF Train the trainer 7 339.5 97 3.5 hours
Workshop on leadership & people Management Skills
1 232.0 29 8 hours
Total 12 1,851.5 230

71|ANNUAL REPORT 2016
SoCIaL and EnVIronMEnT rEVIEw
PROSPECTS FOR THE YEAR 2017 (G4-HR12)As Human Rights become a prominent topic in today’s world, being a responsible corporate body, we have decided to keep record on “The number of grievances about the Human Rights impacts filed, addressed, and resolved through formal grievance mechanisms”, in directing forward.
COMMUNITY
Previously, as a Bank dedicated to serving the needs of the Small and Medium Enterprises (SMEs), Union Bank has continuously engaged with this segment through relevant events and activities which included capacity building seminars for SME entrepreneurs across the island.
Today with the new strategic direction of the Bank, Union Bank focuses on a more diversified clientele including individuals, SMEs as well as corporates. In line with this new strategic focus, in the year under review, the Bank continued to engage with regional SMEs through knowledge and capacity building programmes while engaging with other key client segments including Corporate and Elite Banking clients through customised events and one-to-one interactions.
In terms of engagement with the extended communities in which we operate, the Bank is currently in the process of redefining the parameters for its intended community engagement practices, in accordance with the future strategic direction of Union Bank. accordingly, the Bank is in the process of compiling a comprehensive Corporate Social responsibility (CSr) Policy, that outlines the Bank’s strategic direction on CSr, which will be built around the key focus area of ‘children and youth’ in the country. The said policy will be put into action in the year 2017, and will act as a guide for the envisioned CSr activity of the Bank in the year 2017 and beyond.
SUPPLY CHAIN MANAGEMENT g4-12/g4-EC9
The Bank’s procurement policy was reviewed during the year and the reviewed policy was approved by the Board of directors. The main objectives of the policy are to;
1) Maximise economy, timeliness and quality in procurement, resulting in the best value proposition for the Bank
2) adhere to prescribed standards, specifications, rules, regulations and good governance;
3) Provide fair, transparent, equal and maximum opportunity for eligible interested parties to participate in procurement;
4) Expeditiously execute work and delivery of goods and services;5) Ensures fairness, transparency and consistency in the evaluation and selection
procedure; and6) retain confidentiality of information provided by bidders.
The supplier selection process gives preference to competitive pricing, quality and turnaround time for deliveries. Factors such as environment friendliness would give the suppliers an added advantage.
Union Bank works with many types of suppliers, who are key stakeholders in the Bank’s processes and are actively involved in the processes as business partners of our end solutions providing a win-win solution for all parties involved in the process. Priority is given for local suppliers for ease of business, enhanced monitoring and control. a significant proportion of our suppliers are based in Sri Lanka, while a few important technological service providers are based out of Sri Lanka. The Bank’s archival management, inventory management, janitorial service, mail room service and catering services are outsourced to specialists in the respective industries.
The following is an analysis done on the Bank’s suppliers. Suppliers are registered under the following types;
TYPES OF SUPPLIERS LOCATION (LOCAL)
Advertising Sri Lanka
Banking equipment and household electric equipment suppliers
Sri Lanka
Civil Construction and interior/exterior décor, architecture Sri Lanka
IT equipment/hardware, networking equipment Sri Lanka
office furniture suppliers Sri Lanka
Printing of security documents such as cheque books, vouchers etc. Sri Lanka
Services and maintenance of office equipment (photo copy, fax etc.) Sri Lanka
Statement printing (pressure seal) and dispatching Sri Lanka
Supply and maintenance of security related equipment (fire extinguishers, CCTV cameras, police alarm guard tour system etc.)
Sri Lanka
Supply of all kinds of stationery Sri Lanka
Supply of printing stationery items/plastic material/ advertising materials
Sri Lanka

72|ANNUAL REPORT 2016
The registered suppliers belong to different types of entities and the concentration of categories are indicated on the chart below. 87% of the Bank’s suppliers are private limited companies and public companies while the rest of the suppliers represent the category of small and medium enterprises.
RECYCLING OF WASTE PAPER (g4-En23)
The Bank has implemented an initiative to recycle used paper in an environmentally friendly manner which not only saves precious natural resources, but also assists to dispose of confidential documents in a safe manner.
during 2016, the Bank has recycled 13,900 kg of waste paper and saved,
ff 236 fully grown treesff 24,395 liters of oilff 55,600 kwh of electricityff 441,742 liters of waterff 42 cubic meter of land fillff Reduce Green House gas emission by
13,900 kg’s of Carbon equivalent
Co-operative 0%Partnership 7%Private Company 83%Public Company 4%Sole Proprietor 6%
ENTITY TYPES
OUR ExISTING AND PROPOSED COMMITMENT TO SUSTAINABLE BUSINESS PRACTICES (g4-So8/g4-Pr4/g4-Pr7/g4-Pr8/g4-Pr9)
MEASUREMENT ACHIEVEMENT
Monetary value of significant fines and total number of non-monetary sanctions for non -compliance with laws and regulations
no significant incidents recorded during the year under review
Total number of incidents off non-compliance with regulations and voluntary codes concerning product and service information and labelling by type of outcomes
Monetary value of significant fines for non-compliance with laws and regulations concerning the provision and use of products and services
Total number of incidents of non-compliance with regulations and voluntary codes concerning marketing communications, including advertising, promotion and sponsorship by type of outcomes
Total number of substantiated complaints regarding breaches of customer privacy and losses of customer data
MEMBERSHIP IN ASSOCIATIONS (G4-16)The Bank has general membership in a number of sectorial, industrial and professional organisations and associations. The list of the Bank’s corporate membership with relevant associations are as follows:ff Sri Lanka Banks’ associationff Institute of Bankers of Sri Lankaff Ceylon Chamber of Commerceff The Employees’ Federation of Ceylonff The Association of Primary Dealers
SoCIaL and EnVIronMEnT rEVIEw

73|ANNUAL REPORT 2016
KEY HIGHLIGHTSff naMaL Equity Funds out-performed
aSPIff national Equity Fund has delivered
an annualised return of 13.9% for the past 25 years setting the benchmark for the unit trust industry
ff Market Share of 8% in unit trust industry
ff Assets under Management of Rs. 10.6 Bn
ff PaT of rs. 39.6 Mnff Income from proprietary funds
increased by 117% yoy
DELIVERING POSITIVE RETURNS IN A FALLING MARKETFor the second successive year the unit trust business was faced with bearish equity markets with aSPI declining - 9.7% yoy in Fy16. However naMaL was able to deliver positive returns to investors with national Equity Fund (+1.64%), naMaL growth Fund (+0.19%) and naMaL acuity Value Fund (+1.5%) all significantly out-performing the aSPI. national Equity Fund and naMaL Growth Fund ranked amongst the top 3 best performing equity funds in their respective category.
Interest rates continued an upward trajectory with benchmark 1 year TB yields rising above 10% during the year. naMaL fixed income funds provided attractive tax adjusted returns. naMaL High yield Fund and naMaL gilt Fund delivered annualised returns of 10.1% and 8.4% in Fy16 to be within the top 3 best performing funds in their respective categories.
FOCUSED ON MAINTAINING LONG TERM TRACK RECORDDelivering superior fund performance is our key priority and has underpinned the long term profitability of our asset
management business. We endeavour to differentiate - in terms of investments strategy and style - to maintain sustainable long term returns to the investors in our funds. Our successful long term track record is highlighted by national Equity Fund delivering 13.9% compounded annualised returns for the past 25 years and naMaL growth Fund delivering 15.2% compounded annualised returns for the past 18 years.
TAx CHANGES RESULT IN SIGNIFICANT HEADWINDS FOR THE INDUSTRYThe adverse market conditions facing the unit trust business were magnified by unfavourable changes in taxation. The FY16 budget proposals reduced WHT on interest income on bank deposits for individuals to 2.5% whereas unit trusts were still subject to 10% wHT and therefore at a disadvantage to attract retail depositors. The Fy17 budget proposals withdrew the tax incentives available to corporate investors thus making unit trust investments significantly less attractive. From april 2017 unit trusts will be tax neutral investment vehicles.
The fundamental changes in tax structures and uncertainties significantly affected the industry with a 22% yoy decline in auM to rs. 103.6 Bn in Fy16.
naMaL recorded a market share of 8% in Fy16 (10% in Fy15) to be amongst the 5 largest managers in the industry. naMaL’s equity unit trust auM remained resilient at rs. 4.4 Bn in Fy16 , decline of 4% yoy while fixed income unit trust auM stood at rs. 3.7 Bn in Fy16 ,decline of 42% due to institutional withdrawals in view of the impending tax changes. Private portfolio AuM was Rs. 2.5 Bn in Fy16 , increase of 5%yoy. naMaL experienced a decline in total AuM of 32.6% yoy to rs. 10.6 Bn in Fy16.
Retail sales volumes too were affected during the year but continued to maintain dominance in retail sales
volumes and client acquisitions in the market. Despite having one of the largest retail sales teams in the industry, the volumes were down almost 60% yoy to rs. 700 Mn while account acquisition was stable at 1900 new clients in Fy16.
HIGHER TRADING INCOME MITIGATES DROP IN FEE INCOMEIncome from asset management business showed a negative growth of 7% yoy to rs. 92.8 Mn in Fy16. Income from equity unit trusts showed negative growth of 1% to rs. 60.6 Mn while income from fixed income unit trusts was most affected , showing decline of 14% yoy to rs. 30.1 Mn . Income from proprietary funds showed an income of rs. 25.5 Mn, up 117% yoy due to rebalancing of key stockholdings in the equity portfolio and realising capital gains in mutual fund investments. Total income reported an increase of 0.4% yoy to rs. 134.1 Mn for FY16. Total overheads were under check, recording an increase of 1.7% yoy to rs. 92.6 Mn. PaT for 12 months ending december 2016 stood at rs. 39.5 Mn, showing a decline of 3% yoy, compared to Rs. 40.5 Mn the previous year.
FUTURE WILL BE IN EqUITIES The unit trust industry benefitted significantly from the corporate tax incentives since 2013 with industry AuM rising to Rs. 120 Bn from Rs. 45 Bn in 2013 and a large number of new managers entering the industry. although the unit trust industry in Sri Lanka was launched with the intention of broad basing equity ownership by attracting retail investors the focus shifted towards money market and income funds which currently account for over 85% of industry auM. with the repeal of tax incentives from April 2017, we anticipate a large decline in money market and income funds AuM and the focus will shift back to equity unit trusts. naMaL as the pioneering unit trust manager can leverage on the 25 year track record and retail sales force. We continue to see opportunities
SUBSIdIary UPdaTE

74|ANNUAL REPORT 2016
in private wealth management for high net worth individuals and mid-scale enterprises. naMaL is very optimistic of the future growth potential in the capital markets and remains committed to delivering long term capital appreciation and income to all our valued investors.
This year has been a year of transformation and extraordinary achievement for UB Finance. The organisation has highlighted an impressive growth reflecting the development initiatives undertaken to significantly strengthen their rapidly progressive position. This can be evident in its quantitative results, although, from a holistic perspective, its achievements over the year have been much more than that. The strategy employed ever since UB Finance was brought under the umbrella of the Union Bank Group was simply to tap into that unbridled passion that remains inherent in the Group and fuel strategic growth constructed on consistent and sustainable trajectories. Using the competencies and talents of an amazing team fueled by the vision of forward thinking leadership, the organsiation also instigated a landmark capital infusion from global private investment TPg, to ensure that UB Finance truly becomes a force to be reckoned with.
Therefore today, UB Finance is at top of mind recall and enjoying the fruits of these far-sighted strategies that have placed it in the honour ranks of a sustainably-run organisation. UB Finance has undoubtedly demonstrated that the results presented are consistent, the strategies employed are innovative and the focus enables them to partner the country in its development journey to deliver the unique proposition.
KEY PERFORMANCE HIGHLIGHTSduring the year under review, significant improvements in business volumes and customer bases were achieved by the sales team. Total income for the period increased by 60% to rs. 1,502 Mn and operating income for the period increased by 43 % to rs. 647 Mn. net profit after tax was rs. 88 Mn in comparison to rs. 36 Mn in 2015. Since the takeover, the Company has continually invested in brand and capacity building which is now paying off and will continue to lead to substantial returns in future.
The asset position remained well matched to the liabilities whilst maintaining sound liquidity levels. The depositor base increased from rs. 4,122 Mn to rs. 5,839 Mn contributing to a 42% increase, highlighting the confidence placed by depositors in the Company. Net loans and receivables from customers grew from rs. 5,894 Mn to rs. 7,997 Mn, an increase of 36 % due to the substantial investment made in previous years in channel development and networking. The total assets increased by 30%, with the asset base standing at rs. 9,318 Mn as at 31 december 2016.
BUSINESS REVIEWUB Finance continue to follow a very dynamic and agile business model which has been the key factor enabling the organisation to identify and grasp opportunities to create value and respond to fast changing trends, customer requirements and ever changing business landscape.
The period under review was marked by a focused strategy of expansion. In this respect well-orchestrated programs were implemented and executed across the divisions of the organisation that helped the organisation edge closer to its goals.
SUBSIdIary UPdaTE
Supporting growing customer needs, UB Finance offers an enhanced range of products and services including investment solutions such as fixed deposits and savings, coupled with financial solutions in the form of leasing, vehicle and mortgage loans as well as working capital solutions through factoring, cheque discounting and easy drafts. The organisation continues to create innovative tailor made solutions for its customers that offer greater convenience, better support and enhanced flexibility.
UB Finance’s growing focus on the SME sector continued to gain momentum during the year and its progressive suite of products for this segment has been well received by them. Furthermore, several initiatives were carried out across the country to enhance the value proposition to the small and medium enterprise customers through a wide products and services range to meet the evolving needs of this sector. UB Finance remains emphatic on extending financial assistance to entrepreneurs who contribute towards the development of the nation.
IT undoubtedly is a key factor that drives successful business and gaining a competitive edge remains hinged on IT initiatives been timely, efficient and driving productivity, to stay ahead of competition.
Technology continues to drive its core being and during the year a number of IT initiatives were launched which enabled the complete automation of a number of processes thereby imbuing speed and efficiency into the organisation’s operations. This has added impetus to the Organisation’s focused expansion strategy and value additions to its products and services.

75|ANNUAL REPORT 2016
SUBSIdIary UPdaTE
Given the importance of human capital as a key driver of the business, UB Finance continues to provide an enriching work environment that motivates and inspires its employees to perform at peak. The Company takes pride in its team that has been courageous, spirited and fearless in their endeavours to navigate the Company towards a positive trajectory. UB Finance emphasises on productivity and efficiency and strongly believes that high achievement and performance excellence should be rewarded. With an island-wide cadre of over 252, UB Finance remains steadfast with regard to developing its employees and encouraging them towards becoming true professionals in their chosen fields.
Re-engineering of the business operations, documentation, procedures, processes and systems during the year has geared the company to offer its customers a superior level of service due to the overall efficiency and effectiveness of business operations.
UB Finance is also committed to the highest standards of Corporate governance, upgrading its practices in line with regulatory requirements, and further strengthening them qualitatively in line with industry best practices. Thus, in-line with its sustainable growth and good governance structure in place, ICra Lanka Limited gave UB Finance an issuer rating of BB with a Stable outlook. The Company considers compliance with the regulatory requirements and guidelines as core to its business and good governance.
LOOKING AHEADThe future looks promising for the Company’s continued success. UB Finance will continue to facilitate access to finance for the SME sector and support capacity building across this sector especially focusing on rural areas as well as young adult and woman entrepreneurs who have much potential.
In the longer term, in line with our parent company, UB Finance look to invest heavily in core technology and other hi-tech solutions in order to improve our performance, alleviate our services, widen our reach and facilitate greater financial inclusion. our core strategies remain firmly focused on diversification, growth and expansion, through further capital investments and by strengthening our existing partnerships and alliances, while identifying and converting potential opportunities into sustainable business avenues.
We will strive ahead towards achieving our future objectives, not only in terms of profitability but also in terms of governance and corporate social responsibility, which we are extremely conscious of due to our legacy. It is in this light that we also look forward to a successful listing on the Colombo Stock Exchange to elevate the Company to the next level to benefit our stakeholders.

76|ANNUAL REPORT 2016

TECHNOLOGYThrough world class technology that creates undeniable convenience to our customers, we are employing best practices to create ease of use and faster transactions.

78|ANNUAL REPORT 2016
InVESTor rELaTIonS
dear Shareholder,We are proud to present this section in our Annual Report in appreciation of your continued support extended to us and in line with the Listing rules issued by the Colombo Stock Exchange.
We have continuously communicated with our shareholders. We have published the Interim and Annual Financial Reports on the Bank’s website (www.unionb.com). alternatively, shareholders can elect to receive a mailed copy of the accounts on request. The Company Secretary of the Bank will respond to individual letters received from shareholders.
There is a continuous dialogue with institutional shareholders through such means as the participation in investor forums, the publication of general press releases after the preliminary year end and interim results etc. The Board is advised of any specific comments from institutional investors to enable them to develop an understanding of the views of the major shareholders. all shareholders have the opportunity to raise questions/obtain clarifications at the Bank’s annual general Meeting.
The Bank’s shares are listed on the Colombo Stock Exchange. daily share prices are found in newspapers including the daily FT, daily news, The Island and daily Mirror.
MOVEMENT IN ORDINARY VOTING SHARES OF THE BANK DURING THE YEAR 2016
COMPLIANCE REPORT AS PER RULE NO.7.6 OF THE LISTING RULES OF THE COLOMBO STOCK ExCHANGE:we are pleased to inform you that the Bank has complied with all the requirements of Section 7.6 of the Listing rules of the Colombo Stock Exchange on the contents of the annual report and accounts of a Listed Entity. The table below provides the details of the sections of this annual report where specified information is found together with page references for the convenience of the readers.
5,700
6,500
6,100
5,900
6,900
6,700
6,300
7,100ASPI Index
UB aSPI
Jan-
16
Feb-
16
Mar
-16
Jul-1
6
May
-16
Jun-
16
Sep-
16
Oct
-16
Dec-
16
Nov
-16
Apr-
16
Aug-
16
0
15
20
5
10
25UB Price (LKR)
INDEx/PRICE MOVEMENT
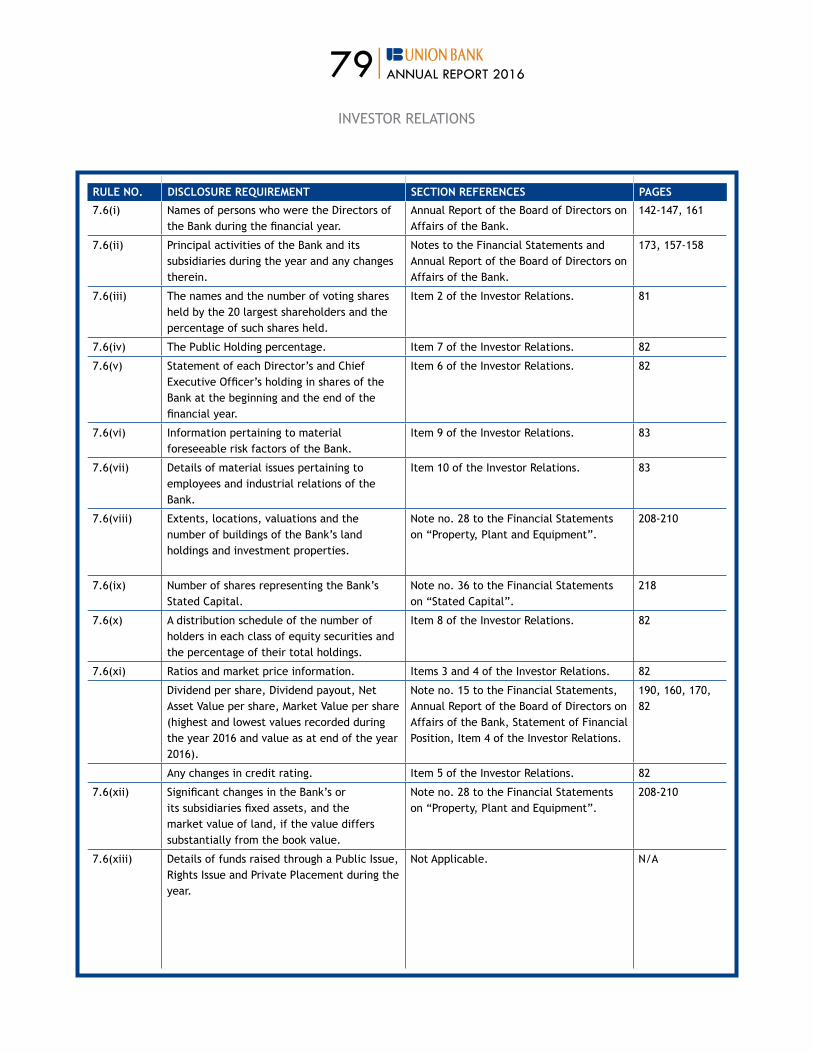
79|ANNUAL REPORT 2016
InVESTor rELaTIonS
RULE NO. DISCLOSURE REqUIREMENT SECTION REFERENCES PAGES
7.6(i) Names of persons who were the Directors of the Bank during the financial year.
Annual Report of the Board of Directors on Affairs of the Bank.
142-147, 161
7.6(ii) Principal activities of the Bank and its subsidiaries during the year and any changes therein.
notes to the Financial Statements and Annual Report of the Board of Directors on Affairs of the Bank.
173, 157-158
7.6(iii) The names and the number of voting shares held by the 20 largest shareholders and the percentage of such shares held.
Item 2 of the Investor Relations. 81
7.6(iv) The Public Holding percentage. Item 7 of the Investor relations. 82
7.6(v) Statement of each director’s and Chief Executive officer’s holding in shares of the Bank at the beginning and the end of the financial year.
Item 6 of the Investor Relations. 82
7.6(vi) Information pertaining to material foreseeable risk factors of the Bank.
Item 9 of the Investor relations. 83
7.6(vii) Details of material issues pertaining to employees and industrial relations of the Bank.
Item 10 of the Investor Relations. 83
7.6(viii) Extents, locations, valuations and the number of buildings of the Bank’s land holdings and investment properties.
note no. 28 to the Financial Statements on “Property, Plant and Equipment”.
208-210
7.6(ix) Number of shares representing the Bank’s Stated Capital.
note no. 36 to the Financial Statements on “Stated Capital”.
218
7.6(x) A distribution schedule of the number of holders in each class of equity securities and the percentage of their total holdings.
Item 8 of the Investor relations. 82
7.6(xi) Ratios and market price information. Items 3 and 4 of the Investor relations. 82
dividend per share, dividend payout, net asset Value per share, Market Value per share (highest and lowest values recorded during the year 2016 and value as at end of the year 2016).
note no. 15 to the Financial Statements, Annual Report of the Board of Directors on affairs of the Bank, Statement of Financial Position, Item 4 of the Investor relations.
190, 160, 170, 82
Any changes in credit rating. Item 5 of the Investor Relations. 82
7.6(xii) Significant changes in the Bank’s or its subsidiaries fixed assets, and the market value of land, if the value differs substantially from the book value.
note no. 28 to the Financial Statements on “Property, Plant and Equipment”.
208-210
7.6(xiii) details of funds raised through a Public Issue, Rights Issue and Private Placement during the year.
Not Applicable. n/a
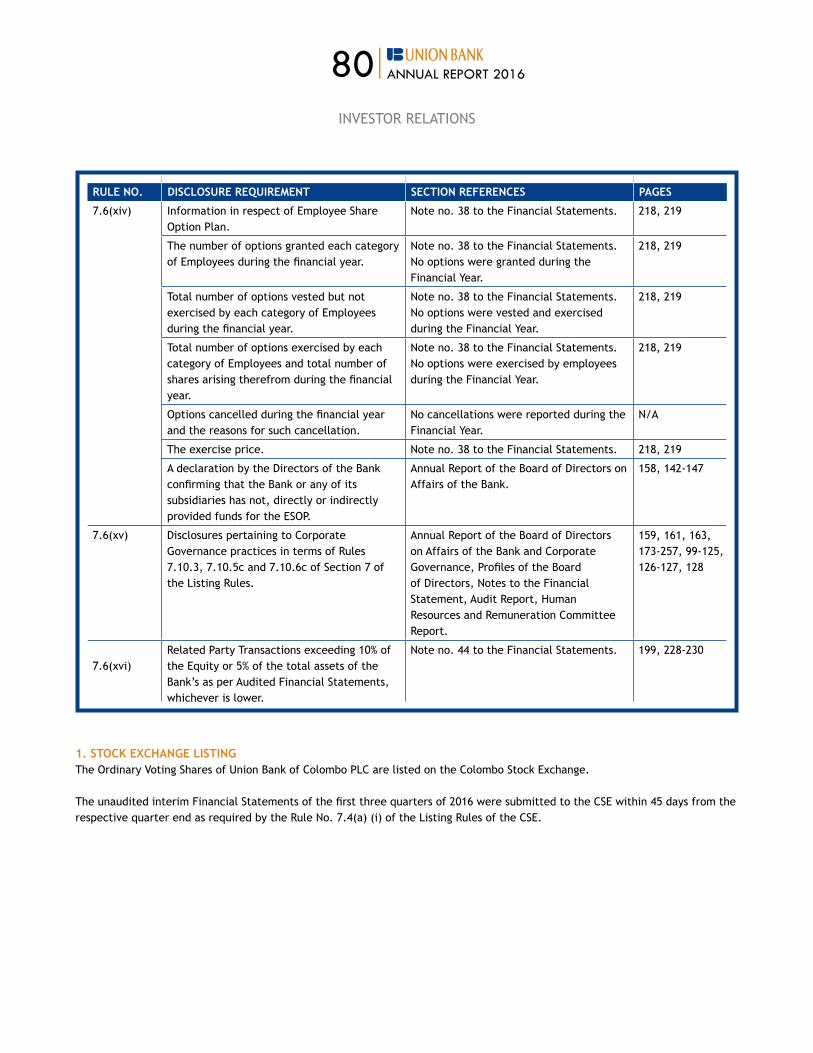
80|ANNUAL REPORT 2016
RULE NO. DISCLOSURE REqUIREMENT SECTION REFERENCES PAGES
7.6(xiv) Information in respect of Employee Share Option Plan.
note no. 38 to the Financial Statements. 218, 219
The number of options granted each category of Employees during the financial year.
note no. 38 to the Financial Statements. No options were granted during the Financial Year.
218, 219
Total number of options vested but not exercised by each category of Employees during the financial year.
note no. 38 to the Financial Statements. No options were vested and exercised during the Financial Year.
218, 219
Total number of options exercised by each category of Employees and total number of shares arising therefrom during the financial year.
note no. 38 to the Financial Statements. No options were exercised by employees during the Financial Year.
218, 219
options cancelled during the financial year and the reasons for such cancellation.
No cancellations were reported during the Financial Year.
n/a
The exercise price. note no. 38 to the Financial Statements. 218, 219
A declaration by the Directors of the Bank confirming that the Bank or any of its subsidiaries has not, directly or indirectly provided funds for the ESoP.
Annual Report of the Board of Directors on Affairs of the Bank.
158, 142-147
7.6(xv) Disclosures pertaining to Corporate Governance practices in terms of Rules 7.10.3, 7.10.5c and 7.10.6c of Section 7 of the Listing rules.
Annual Report of the Board of Directors on Affairs of the Bank and Corporate governance, Profiles of the Board of directors, notes to the Financial Statement, audit report, Human Resources and Remuneration Committee Report.
159, 161, 163, 173-257, 99-125, 126-127, 128
7.6(xvi)related Party Transactions exceeding 10% of the Equity or 5% of the total assets of the Bank’s as per audited Financial Statements, whichever is lower.
note no. 44 to the Financial Statements. 199, 228-230
1. STOCK ExCHANGE LISTING The ordinary Voting Shares of Union Bank of Colombo PLC are listed on the Colombo Stock Exchange.
The unaudited interim Financial Statements of the first three quarters of 2016 were submitted to the CSE within 45 days from the respective quarter end as required by the rule no. 7.4(a) (i) of the Listing rules of the CSE.
InVESTor rELaTIonS
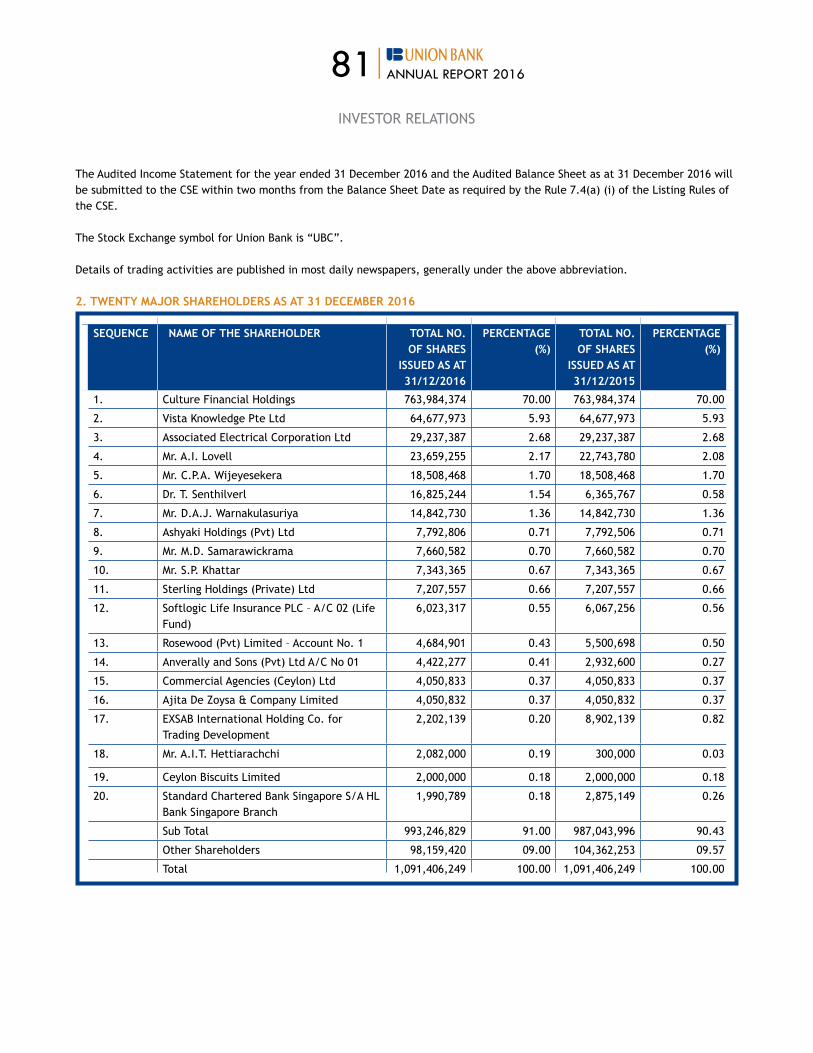
81|ANNUAL REPORT 2016
The audited Income Statement for the year ended 31 december 2016 and the audited Balance Sheet as at 31 december 2016 will be submitted to the CSE within two months from the Balance Sheet date as required by the rule 7.4(a) (i) of the Listing rules of the CSE.
The Stock Exchange symbol for Union Bank is “UBC”.
details of trading activities are published in most daily newspapers, generally under the above abbreviation.
2. TWENTY MAJOR SHAREHOLDERS AS AT 31 DECEMBER 2016
SEqUENCE NAME OF THE SHAREHOLDER TOTAL NO. OF SHARES
ISSUED AS AT 31/12/2016
PERCENTAGE (%)
TOTAL NO. OF SHARES
ISSUED AS AT 31/12/2015
PERCENTAGE (%)
1. Culture Financial Holdings 763,984,374 70.00 763,984,374 70.00
2. Vista knowledge Pte Ltd 64,677,973 5.93 64,677,973 5.93
3. associated Electrical Corporation Ltd 29,237,387 2.68 29,237,387 2.68
4. Mr. a.I. Lovell 23,659,255 2.17 22,743,780 2.08
5. Mr. C.P.a. wijeyesekera 18,508,468 1.70 18,508,468 1.70
6. dr. T. Senthilverl 16,825,244 1.54 6,365,767 0.58
7. Mr. d.a.J. warnakulasuriya 14,842,730 1.36 14,842,730 1.36
8. ashyaki Holdings (Pvt) Ltd 7,792,806 0.71 7,792,506 0.71
9. Mr. M.d. Samarawickrama 7,660,582 0.70 7,660,582 0.70
10. Mr. S.P. khattar 7,343,365 0.67 7,343,365 0.67
11. Sterling Holdings (Private) Ltd 7,207,557 0.66 7,207,557 0.66
12. Softlogic Life Insurance PLC – a/C 02 (Life Fund)
6,023,317 0.55 6,067,256 0.56
13. rosewood (Pvt) Limited – account no. 1 4,684,901 0.43 5,500,698 0.50
14. anverally and Sons (Pvt) Ltd a/C no 01 4,422,277 0.41 2,932,600 0.27
15. Commercial agencies (Ceylon) Ltd 4,050,833 0.37 4,050,833 0.37
16. ajita de zoysa & Company Limited 4,050,832 0.37 4,050,832 0.37
17. ExSaB International Holding Co. for Trading Development
2,202,139 0.20 8,902,139 0.82
18. Mr. A.I.T. Hettiarachchi 2,082,000 0.19 300,000 0.03
19. Ceylon Biscuits Limited 2,000,000 0.18 2,000,000 0.18
20. Standard Chartered Bank Singapore S/a HL Bank Singapore Branch
1,990,789 0.18 2,875,149 0.26
Sub Total 993,246,829 91.00 987,043,996 90.43
other Shareholders 98,159,420 09.00 104,362,253 09.57
Total 1,091,406,249 100.00 1,091,406,249 100.00
InVESTor rELaTIonS

82|ANNUAL REPORT 2016
3. INFORMATION ON SHARE TRADING
YEAR 2016
Number of Transactions 9,282
number of Shares Traded 31,611,520
Value of Shares Traded (rs.) 533,273,570.10
4. INFORMATION ON MARKET PRICES
MARKET PRICE (RS.) DATE
Highest Price 20.80 04.01.2016
Lowest Price 14.20 09.03.2016
Year end Price 15.40 30.12.2016
5. CREDIT RATINGFitch – BB+ (lka)ICra - (SL) BBB
6. DIRECTORS’ SHAREHOLDINGS INCLUDING CHIEF ExECUTIVE OFFICER
The directors’ shareholdings as at 31 december 2016 were as follows;
NAME OF THE DIRECTOR NO. OF ORDINARY SHARESBeginning of Year
2016End of Year
2016Bodahandi asoka keerthi de Silva 8900 8900
*alexis Indrajit Lovell (*Completed the term of the directorate on 27 September 2016)
22,743,780 23,308,009*
7. PUBLIC SHAREHOLDINGas per the rule no. 7.13.1 (a) of the Colombo Stock Exchange, the Public Holding as at 31 december 2016 was 21.89% representing 238,901,847 shares.
8. SHAREHOLDER BASEordinary Voting Shares
SHARE RANGE NO OF SHAREHOLDERS
PERCENTAGE % NO OF SHARES SHARE HOLDING (%)
1-1,000 28,493 87.29 4,179,073 0.38
1,001-10,000 3069 9.40 10,708,836 0.98
10,001-100,000 898 2.75 25,548,012 2.34
100,001-1,000,000 142 0.44 39,713,312 3.64
1,000,001-10,000,000 32 0.10 106,207,450 9.73
10,000,001-& aBoVE 6 0.02 905,049,566 82.93
ToTaL 32,640 100.00 1,091,406,249 100.00
InVESTor rELaTIonS
83|ANNUAL REPORT 2016
InVESTor rELaTIonS
9. Information pertaining to the material foreseeable risk factors that require disclosures as per the rule 7.6(vi) of the Listing rules of the CSE are disclosed in the Section on “Managing risk at Union Bank” on pages 84 to 98.
10. There were no material issues pertaining to employees and industrial relations pertaining to the Bank that occurred during the year under review which need to be discussed as per the rule no. 7.6 (vii) of the Listing rule of the CSE.
Public Holding shall mean shares of a Listed Entity held by any person other than those directly or indirectly held by;
a) Its parent, subsidiary or associate Entities or any subsidiaries or associates of its parent Entity;b) Its directors who are holding office as directors of the Entity and their close family membersc) Chief Executive officer, his/her close family members;d) key Management Personnel and their Close Family Members; and;e) any party acting in concert with the parties set out in (a), (b), (c) and (d) above;f) Shares that are in a locked account with the Central depository Systems (CdS) due to a statutory or regulatory requirement
other than those shareholders exempted under (h) below and those which have been subject to a voluntary lock-in at the option of the shareholder.
g) shares that have been allotted to employees whereby the shares of a Listed Entity are, directly or indirectly controlled by the management or the majority shareholder of the Entity;
h) any Entity or an individual or individuals jointly or severally holding 5% or more of the shares of the Listed Entity if the Entity is a diriSavi Board Entity and 10% or more of the shares if the Listed Entity is a Main Board Entity except where such shareholder is;i. a statutory institution managing funds belonging to contributors or investors who are members of the public; orii. an Entity established as a unit trust or any other investment fund approved by the SEC; oriii. not a related party declared in terms of Sri Lanka accounting Standards or a party acting in concert declared in terms of
the Takeovers and Mergers Code.

84|ANNUAL REPORT 2016
SCOPE OF RISK MANAGEMENT at Union Bank, we understand that risk measurement, monitoring and control is vital in its each and every aspect of our operational areas. We believe risk management cannot exist in isolation, and therefore the Bank takes all efforts to ensure that all its risk management policies and processes are robust and integrated with the business lines, in accordance with the overall risk management strategy.
a balance between the probable returns and acceptable risk levels.
The IrMC reviews, monitors and places additional processes, policies and procedures as the business continues to grow, covering a wide spectrum of risks of the key areas, which could hinder the optimisation of the Bank’s performance.
The Bank is aware that it is exposed to many types of risks while operating within the business strategy in fulfilling shareholder expectations. These risks arise from the key areas of Credit, operational, Market, and Liquidity. The Bank takes conscious and calculated risk decisions in its overall operations keeping in mind the related risks, and the Board, through the Integrated risk Management Committee (IRMC) provides the strategic risk direction while striking
RISK RELATED KEY MANAGEMENT BODIES
COMMITTEE KEY OBJECTIVES REPRESENTED BY
The Board Integrated Risk Management Committee(IRMC)
The committee ensures that Group wide risks are managed within the risk strategy and appetite as approved by the Board of Directors.
Please refer Page 129 (Board Integrated risk Management Committee Report).
Board Credit Committee(BCC)
To approve high value credit in line with the Bank’s risk appetite and in line with regulatory requirements.
Chairman, representative directors and CEo.
Board Audit Committee (BAC)
To assist the Board in maintaining an effective system of internal control, compliance with legal and regulatory requirements of CBSL and CSE, external Financial reporting and internal audit function itself.
Please refer Page 126 (Board Audit Committee Report).
Executive Credit Committee(ECC)
review, and approve credit proposals under ECCs’ delegated authority as directed by BCC.
wholesale Banking, retail Banking, CEo and CRO.
Executive Risk Management Committee(ERMC)
review, monitor and evaluate the policies and procedures in the areas of credit risk, operational risk, market risk in accordance with the IRMC guidelines.
risk Management, wholesale Banking, Treasury, retail Banking, operations, Finance, Compliance, Internal audit and Information Technology.
Operational Risk Management Committee(ORMC)
Review and monitor the operational risk related areas including people, process and systems in accordance with the IRMC guidelines.
risk Management, operations, Compliance, Internal Audit and Information Technology.
asset Liability Committee(aLCo)
optimise the financial resources and to manage the connected risks in the areas of Market and Liquidity.
risk Management, wholesale Banking, retail Banking, Finance and Treasury.
IT Steering Committee (ITSC)
To monitor and review the IT infrastructure to support the optimisation of overall business strategy and mitigate technological risks.
risk Management, wholesale Banking, retail Banking, operations, Finance, Compliance and Information Technology.
rISk ManagEMEnT

85|ANNUAL REPORT 2016
THREE LINES OF DEFENSE PRINCIPLEThe Bank follows both the industry and international best practices in its risk management function. As identified by the BaSEL committee and practiced worldwide, the three lines of defense principle is in force within the Bank. The front line or the business line management act as the first line of defense and deals with the risk exposures at the very primitive level. The Bank makes sure that business line managers are empowered to deal with risk and to take the ownership of the risks borne. The IRMC directs the Risk Management Department (RMD) as an independent corporate risk management function to act as the second line of defense, and directed by The Board, the Audit and Compliance functions with their independent review mechanisms act as the third line of defense in managing risks.
RISK APPETITE AND TOLERANCE Risk appetite is an expression of the amount of risk that the Bank is prepared to accept in delivering its promises and meeting the responsibilities to the stakeholders at large. It is inevitable that the Bank will accept risks, hence risk taken within appetite may give rise to expected losses, but these as analysed and accepted will be sufficiently absorbed by the expected earnings.
The Bank strives to make the integrated risk management function as one of its most critical core competency. Bank relies upon the overall policy framework to ensure the maintenance of consistent high standards in its operations and to encourage the risk decision making process by raising the risk awareness that could hinder the risk and return relationship.
rISk ManagEMEnT
Operational Liquidity
Legal
Cred
it
Market
Conc
entr
atio
n
Reputational Interest Rate
Risk Policy Framework
Risk Management
Business Unit(s)
Audit & Compliance
Compliance
Dis
clos
ure
IRMC
Risk Monitoring
Risk
Pri
cing
RISKDECISIONS
Credit Com
mittee Audit Co
mm
itte
e
BOD
Independent Verification
BASEL FRAMEWORK AND IMPLEMENTATIONUnder the new consultative paper issued by CBSL for implementation of BaSEL III minimum capital requirements, regulator has advised that, Capital adequacy ratio (CAR) shall be maintained as a percentage of Risk Weighted Assets (RWA) based on the following approaches.
i) The Standardised approach for Credit riskii) The Standardised Measurement Method for Market riskiii) The Basic Indicator approach, the Standardised approach or the alternative
Standardise approach for operational risk.
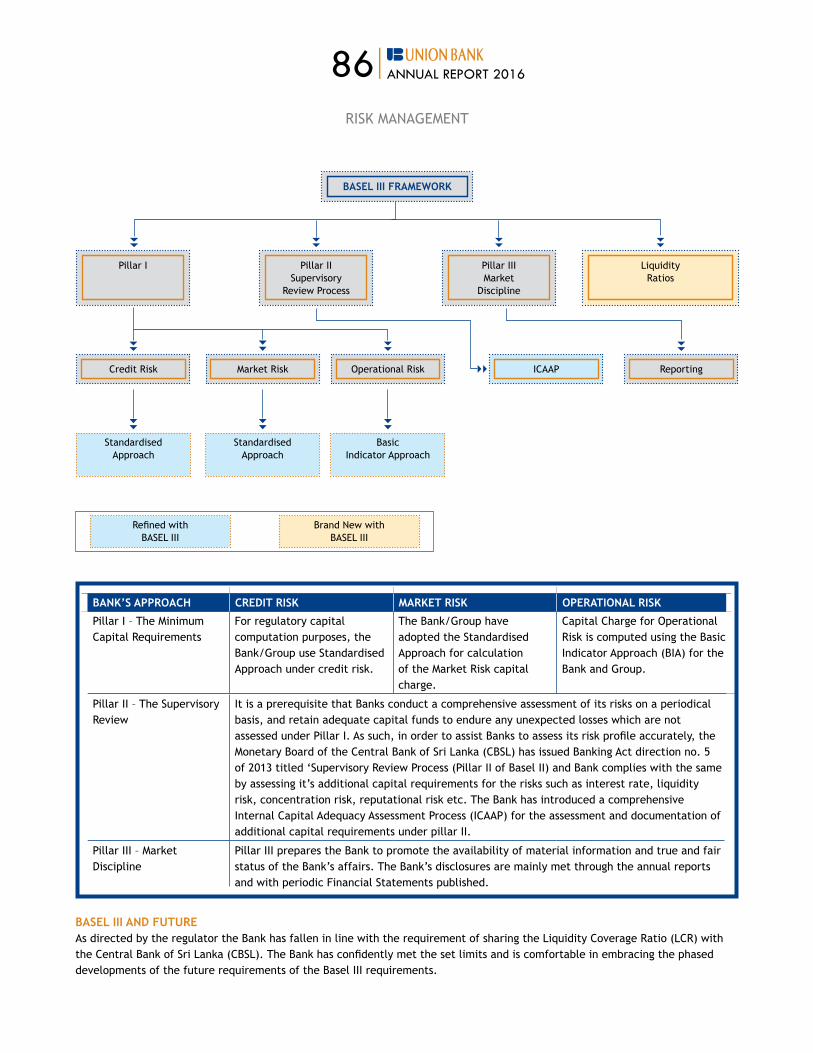
86|ANNUAL REPORT 2016
BANK’S APPROACH CREDIT RISK MARKET RISK OPERATIONAL RISK
Pillar I – The Minimum Capital requirements
For regulatory capital computation purposes, the Bank/group use Standardised Approach under credit risk.
The Bank/group have adopted the Standardised Approach for calculation of the Market Risk capital charge.
Capital Charge for Operational Risk is computed using the Basic Indicator Approach (BIA) for the Bank and Group.
Pillar II – The Supervisory Review
It is a prerequisite that Banks conduct a comprehensive assessment of its risks on a periodical basis, and retain adequate capital funds to endure any unexpected losses which are not assessed under Pillar I. as such, in order to assist Banks to assess its risk profile accurately, the Monetary Board of the Central Bank of Sri Lanka (CBSL) has issued Banking act direction no. 5 of 2013 titled ‘Supervisory review Process (Pillar II of Basel II) and Bank complies with the same by assessing it’s additional capital requirements for the risks such as interest rate, liquidity risk, concentration risk, reputational risk etc. The Bank has introduced a comprehensive Internal Capital adequacy assessment Process (ICaaP) for the assessment and documentation of additional capital requirements under pillar II.
Pillar III – Market Discipline
Pillar III prepares the Bank to promote the availability of material information and true and fair status of the Bank’s affairs. The Bank’s disclosures are mainly met through the annual reports and with periodic Financial Statements published.
BASEL III AND FUTUREas directed by the regulator the Bank has fallen in line with the requirement of sharing the Liquidity Coverage ratio (LCr) with the Central Bank of Sri Lanka (CBSL). The Bank has confidently met the set limits and is comfortable in embracing the phased developments of the future requirements of the Basel III requirements.
rISk ManagEMEnT
Standardised Approach
Standardised Approach
Basic Indicator Approach
BASEL III FRAMEWORK
Credit Risk Operational RiskMarket Risk ReportingICAAP
Pillar II Supervisory
Review Process
Pillar IIIMarket
Discipline
Liquidity Ratios
refined with BaSEL III
Brand New with BaSEL III
Pillar I
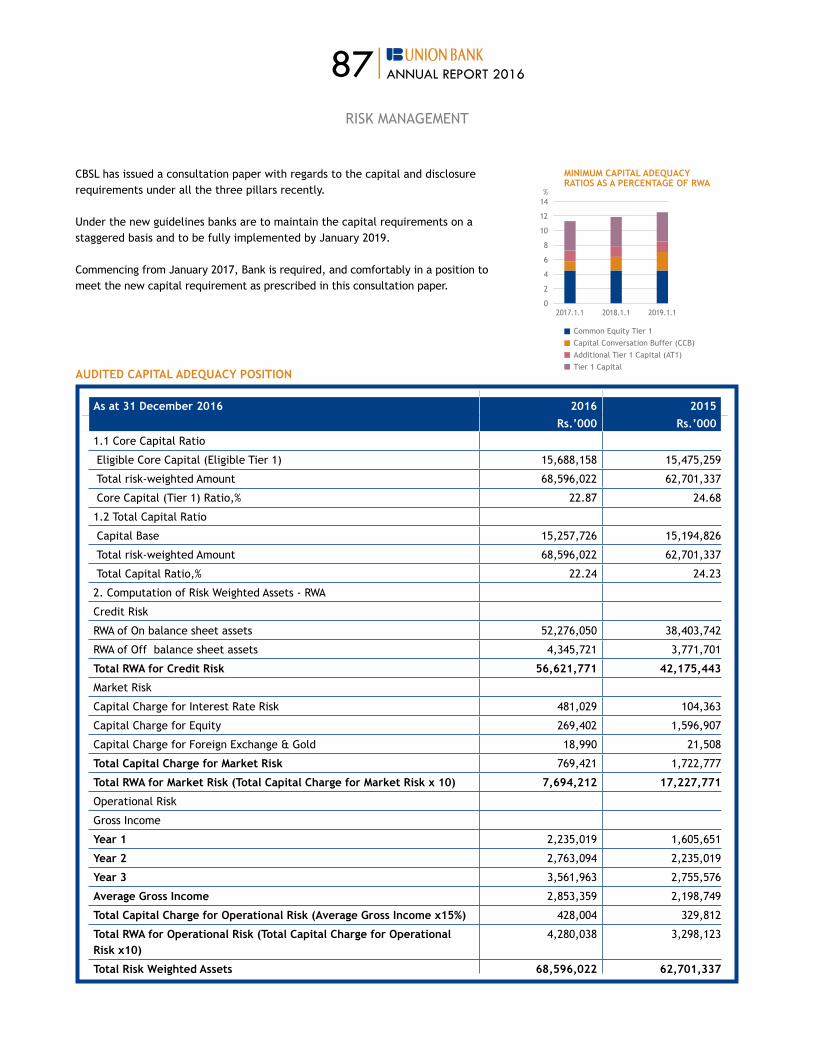
87|ANNUAL REPORT 2016
CBSL has issued a consultation paper with regards to the capital and disclosure requirements under all the three pillars recently.
Under the new guidelines banks are to maintain the capital requirements on a staggered basis and to be fully implemented by January 2019.
Commencing from January 2017, Bank is required, and comfortably in a position to meet the new capital requirement as prescribed in this consultation paper.
rISk ManagEMEnT
0
12
6
4
2
10
8
14%
MINIMUM CAPITAL ADEqUACY RATIOS AS A PERCENTAGE OF RWA
2017.1.1 2018.1.1 2019.1.1
Common Equity Tier 1Capital Conversation Buffer (CCB)Additional Tier 1 Capital (AT1)Tier 1 Capital
AUDITED CAPITAL ADEqUACY POSITION
As at 31 December 2016 2016 2015Rs.’000 Rs.’000
1.1 Core Capital Ratio
Eligible Core Capital (Eligible Tier 1) 15,688,158 15,475,259
Total risk-weighted Amount 68,596,022 62,701,337
Core Capital (Tier 1) ratio,% 22.87 24.68
1.2 Total Capital Ratio
Capital Base 15,257,726 15,194,826
Total risk-weighted Amount 68,596,022 62,701,337
Total Capital ratio,% 22.24 24.23
2. Computation of Risk Weighted Assets - RWA
Credit Risk
RWA of On balance sheet assets 52,276,050 38,403,742
RWA of Off balance sheet assets 4,345,721 3,771,701
Total RWA for Credit Risk 56,621,771 42,175,443
Market Risk
Capital Charge for Interest Rate Risk 481,029 104,363
Capital Charge for Equity 269,402 1,596,907
Capital Charge for Foreign Exchange & Gold 18,990 21,508
Total Capital Charge for Market Risk 769,421 1,722,777
Total RWA for Market Risk (Total Capital Charge for Market Risk x 10) 7,694,212 17,227,771
Operational Risk
Gross Income
Year 1 2,235,019 1,605,651
Year 2 2,763,094 2,235,019
Year 3 3,561,963 2,755,576
Average Gross Income 2,853,359 2,198,749
Total Capital Charge for Operational Risk (Average Gross Income x15%) 428,004 329,812
Total RWA for Operational Risk (Total Capital Charge for Operational Risk x10)
4,280,038 3,298,123
Total Risk Weighted Assets 68,596,022 62,701,337

88|ANNUAL REPORT 2016
The Bank uses a sophisticated loan originating system which generates credit proposal and rates the borrower against specified parameters, and is submitted for approval online. The ratings lie on a scale between AAA (lowest credit risk) and D (very high vulnerability to default).
The Bank’s credit disbursements to the rating categories of BBB and above have significantly increased due to the improved credit selection in sanctioning. At the same time the portfolios below the rating of BB have reduced to lower levels when compared to the previous year. The alignment of Bank’s credit policies, lending principles and risk appetite to the strategic objectives has driven the rating composition to the current improved mix.
AAA AA A BB B & Below
BBB0
40
20
10
50
30
60%
CORPORATE & SME RATING COMPARISON
Dec’15Dec’16
MANAGING COUNTERPARTY RISKCounterparty credit risk emanating from the Bank’s trading book is managed by fixing limits against the counterparties and in certain trade transaction, against an approved underlying transaction. The Bank can also reduce the counterparty risk by its ability to offset trading positions of a counterparty. at present, Union Bank’s counterparty credit risk is minimal due to the relatively small volumes in trading book, mainly consisting of government Securities.
RISK GOVERNANCE STRUCTURE
Manager Market Risk
Manager Operational
Risk
Credit Risk
Senior Manager Litigation
Chief Manager Loan review
Senior Manager Credit Review
Manager Portfolio Risk
Manager Recoveries
BOARD OF DIRECTORS
Chief Executive officer
Chairman of Integrated Risk Management Committee
Chief risk officer
rISk ManagEMEnT
CREDIT RISK MANAGEMENT Credit risk is the risk of potential loss arising due to the borrower or counterparty failing to meet its contractual obligations when they fall due.
The Bank strives to achieve/maintain a high quality of its loan portfolio by accommodating exposures within the Bank’s risk appetite and improving/maintaining the non-performing loans % below the industry norm.
The Bank’s Credit Policy, approved by the Board of directors, provides the basic framework for lending and the Credit Manual and circular instructions give more details on how to perform the functional responsibilities. The credit policy and the credit manual are reviewed regularly to ensure that the Bank is able to meet its business objectives against the country’s frequently changing financial landscape.
The Bank’s credit proposal generation takes place at 3 locations namely retail assets Centre, SME asset Centre, and Corporate Banking division. The Bank took a policy decision to shift to ‘centralised credit processing’ as opposed to branch based credit processing and successfully set up the retail and SME asset Centre. retail assets refer to housing loans, personal loans, vehicle loans, credit cards and also known as schematised loans.

89|ANNUAL REPORT 2016
MANAGING BORROWER RISK The Bank’s Credit Policy and the Credit Manual can be described as the rules and parameters within which the Bank’s credit officers manage daily business activities. These documents define the principles encompassing client selection, early warning reporting, tolerable levels of concentration risk and portfolio monitoring in line with the Bank’s risk appetite. apart from a clearly defined Credit Policy and the Credit Manual, the Bank has a comprehensive credit approval process with delegated authority linked to the risk profile of the borrower.
Loan Origination
Scientific risk rating derived from Kalypto system
using quantitative and qualitative information
Choose appropriate model (Corporate, SME w/Fin &
without Fin, nBFC etc.) and economic sector Vertical and lateral submission of
E-applications
Approval
DAs are individual to each eligible staff memberIn-built in the system
Higher levels of authority at Executive Credit Committee and Board Credit CommitteeRecommendations of Risk Mgt cannot be overridden, thus maintaining independence.
Disbursement
Loan disbursement is independent from Loan origination. Centralised Credit Administration
is responsible for loan sanctioning and
housekeeping. Loan review at risk Mgt
dept. independently verifies the sanctions according to
approval terms.
Monitoring
All loans are reviewed annually or earlier if
warranted. Past dues are constantly monitored by the rMs, Branch Managers and the Recoveries dept. 60 to
90 days past dues are watch listed for close monitoring.
Various portfolio level MIS are prepared by Risk Mgt Dept. for Management and Board
information.
rISk ManagEMEnT
Meeting the regulatory requirements assessment on top borrowers and adherence to the single and related party limits are closely monitored by the Bank.
Trad
ers
Man
ufac
turi
ng
Fina
ncia
l &
Busi
ness
Ser
vice
s
Cons
truc
tion
Tour
ism
Infr
astr
uctu
re
Paw
ning
Tran
spor
t
oth
er S
ervi
ces
Oth
er C
usto
mer
s
Agri
cult
ure
&
Fish
ing
New
Eco
nom
y
0 0
200.0800
100.0400
5 0.0200
25
30 0.1000
150.0600
35 0.1200% HHI Number
ECONOMIC SECTOR CONCENTRATION DEC’16
% of PortfolioLimitHHI
Effective discussions take place at various forums to mitigate risks of the credit portfolio. Apart from the economic sector and name concentration mentioned above, the Bank reviews Borrower rating distributions, age analysis, geographical distribution, Country risk etc for portfolio level monitoring.
MANAGING CONCENTRATION RISKDisproportionate concentration to one area or segment creates a potentially high risk since there are borrowers with similar characteristics within such groups e.g. unexpected drought or heavy rains will affect Agriculture sector etc.
The Bank mainly monitors credit concentration risk using economic sector groups and large names group. The economic sector concentration risk is monitored against the Board approved limits as well as stress tests using the HHI (Herfindhal-Hirshman Index) method.
To manage the credit concentration of the book, the Bank has devised the credit model to define various limits on the maximum exposure for different industry segments. Depending on the performance of the specific industries and micro economic conditions that affects the performance of such industries, interim limits too are put in to place.
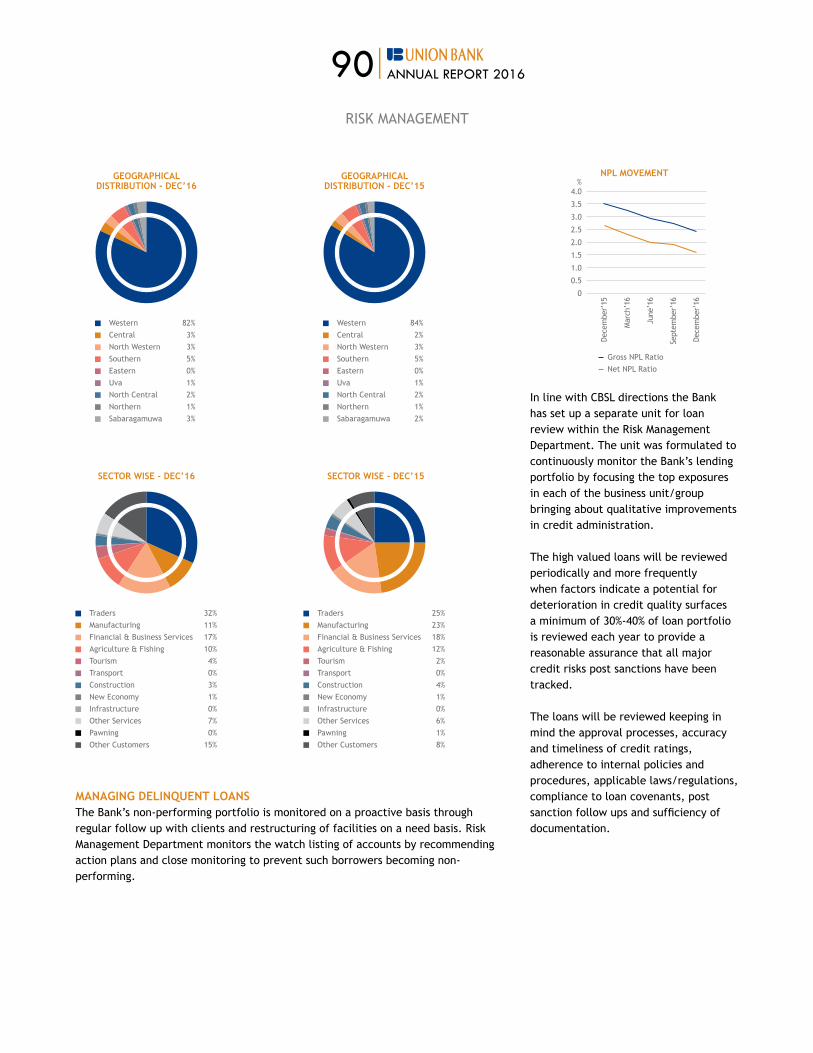
90|ANNUAL REPORT 2016
western 82%Central 3%north western 3%Southern 5%Eastern 0%Uva 1%north Central 2%northern 1%Sabaragamuwa 3%
GEOGRAPHICAL DISTRIBUTION - DEC’16
western 84%Central 2%north western 3%Southern 5%Eastern 0%Uva 1%north Central 2%northern 1%Sabaragamuwa 2%
GEOGRAPHICAL DISTRIBUTION - DEC’15
Traders 32%Manufacturing 11%Financial & Business Services 17%agriculture & Fishing 10%Tourism 4%Transport 0%Construction 3%new Economy 1%Infrastructure 0%other Services 7%Pawning 0%other Customers 15%
SECTOR WISE - DEC’16
Traders 25%Manufacturing 23%Financial & Business Services 18%agriculture & Fishing 12%Tourism 2%Transport 0%Construction 4%new Economy 1%Infrastructure 0%other Services 6%Pawning 1%other Customers 8%
SECTOR WISE - DEC’15
MANAGING DELINqUENT LOANSThe Bank’s non-performing portfolio is monitored on a proactive basis through regular follow up with clients and restructuring of facilities on a need basis. Risk Management Department monitors the watch listing of accounts by recommending action plans and close monitoring to prevent such borrowers becoming non-performing.
NPL MOVEMENT
0
2.0
2.5
1.0
0.5
3.0
3.5
1.5
4.0%
Dece
mbe
r’15
Mar
ch’1
6
June
’16
Sept
embe
r’16
Dece
mbe
r’16
gross nPL rationet nPL ratio
In line with CBSL directions the Bank has set up a separate unit for loan review within the Risk Management Department. The unit was formulated to continuously monitor the Bank’s lending portfolio by focusing the top exposures in each of the business unit/group bringing about qualitative improvements in credit administration.
The high valued loans will be reviewed periodically and more frequently when factors indicate a potential for deterioration in credit quality surfaces a minimum of 30%-40% of loan portfolio is reviewed each year to provide a reasonable assurance that all major credit risks post sanctions have been tracked.
The loans will be reviewed keeping in mind the approval processes, accuracy and timeliness of credit ratings, adherence to internal policies and procedures, applicable laws/regulations, compliance to loan covenants, post sanction follow ups and sufficiency of documentation.
rISk ManagEMEnT

91|ANNUAL REPORT 2016
MANAGING CROSS BORDER ExPOSURESThe Bank is also exposed to cross border risks, where in the instances that the Bank is unable to receive or recover the dues overseas. Convertibility, transferability, government specific rules and regulation affect the cross border exposure risk.
Turkey 40% U.S.a 25% India 9% U.a.E 8% russia 5% other Countries 13%
COUNTRY WISE ExPOSURE- DEC’16
Turkey 10% U.S.a 25% India 26% U.a.E 1% russia 30% other Countries 7%
COUNTRY WISE ExPOSURE- DEC’15
OPERATIONAL RISK MANAGEMENToperational risk is defined as the risk of loss resulting from inadequate or failed internal processes, people and systems or from external events. The definition includes legal risks but excludes strategic and reputational risks. The Bank uses heat maps to assess the risks.
Structure
Loss Event Data
KRI and Saq
Scenario Analysis
rCSa New Product Reviews
REPORTING
POLICIES AND PROCEDURES
MODELING
CULTURE AND AWARENESS
Operational Risk Management Model
rISk ManagEMEnT

92|ANNUAL REPORT 2016
ORMD Governance
D/CEO
Board of Directors
IRMC
ERMC
ORMC
Chief risk officer
Manager ORMD
Branch Ops - Risk Coordinators
Department Ops - Risk
METHODS OF OPERATIONAL RISK MANAGEMENT:
a. Loss EventsLoss event data are historic and backward looking which provides valuable insights into current operational risk exposures. Data gathered are segregated into seven Basel risk types (excluding legal and compliance risk) for Advanced Capital Computation in the future. all staff members are responsible to report risk/loss events as soon as they perceive or materialise and are responsible to record such risk/loss events immediately as either an actual loss, a potential loss or a near miss using one of industry’s best web-based solution for Operational Risk Management (orM). once an event is input, it is reviewed by the system independently, and submitted to Operational Risk Management Department for causal and impact analysis, recovery, provisioning and closure, if applicable. Follow ups or reports from
rISk ManagEMEnT
audit department or any other branch/department can be obtained using the Action Management module of ORM solution. There are various dashboards available in the ORM solution to provide snapshot of Operational Risk information at Branch, Management and Business Unit level and as a Bird-Eye view for the Bank which are useful in determining the trends and potential areas to avoid, mitigate by improving/implementing control/s. The losses incurred during the year amounts to Lkr 12.69 Mn which is 0.44% of the three year average gross income of the Bank. also 0.63% of these losses are related to Credit Risk.
This indicates that the Bank will withstand in a stressed situation.
b. Key Risk Indicators (KRI) and Self-Assessment questions (SAqs) detailed krI and Saq programs are scheduled every month to record the changing environment. Answers to KRIs will be number driven whilst for Saqs, users will choose from a drop down list of answers. The information, so gathered is then analysed to see if there are any trends that poses/would result in operational risk/Loss to the Bank.
c. Scenario Analysis along with krIs and Saqs, users are required to complete a scenario analysis on a monthly basis. In this, users are free to report any current and potential risks they envisage within their area of work, whether internal or external. In addition, scenarios of potential events, which are infrequent, but have severe impact to the Bank when they happen would be identified and analysed by the Risk Management Department (RMD).

93|ANNUAL REPORT 2016
rISk ManagEMEnT
d. Risk and Control Self-Assessment (RCSA)In a rCSa program, branches and departments takes the ownership of its own risks and controls and assess the risks that may exist in its area. rCSa programs are done annually or more frequently to assess the risk areas of the Bank and apply controls where necessary. Information so gathered will also be used for capital computation purposes under score card method in the Advanced Measurement Approach in the future. The Bank has rolled out rCSa for business unit/service units as the first phase of rCSa program.
There are three types of rCSas: questionnaire approach, workshop approach and Hybrid (mix of above two) approach. The Bank will initially use the questionnaire based approach to assess risks under rCSas.
e. Ad-hoc Incident Reporting The Bank encourages staff to report any operational lapses or potential frauds directly to designated senior management officials as described in the Bank’s whistleblower policy, if the staff member is fearful to route the concerns through the line management. The Bank views this method as a useful method of communication to reduce potential losses to a greater extent.
f. New Product, Service or Process LaunchPrior to launching new products, services or processes, the owners must evaluate the risks as per new product policy. Then the detailed Product Programme Guide with a Risk Matrix listing such risk identified and mitigants shall be signed off by all key stakeholders.
MANAGING OPERATIONAL RISKThe Bank has strived to manage the operational risk using the above tools to anticipated levels in addition to frequent process/control reviews by the rMd and participation in IT system/process requirement gathering by recommending effective controls to be in-built at the earliest stage of IT system/process development life cycle. The sound operational risk management could be evident via the illustration of Actual loss data given below.
In the wake of increasing financial cyber-crimes, rMd has introduced the Information Security officer (ISo) function with industry expertise within to independently further improve Information Security environment of the Bank.
MARKET RISKMarket risk is defined as the risk of losses in on/off Balance Sheet positions arising from movements in market prices. It comprises of Interest Rate Risk (Irr), Foreign Exchange risk (Fx), Equity Price Risk and Commodity Price Risk.
MANAGING OF MARKET RISK asset and Liability Management Committee (aLCo) of the Bank is mainly responsible for managing the Interest rate risk, Exchange rate risk, and Liquidity risk and Equity Price risk. Within the overall Risk Management Framework, both treasury front office and back office functions are monitored by Treasury Middle office (TMo). TMo operates as an independent to the business functions. In the Bank market risk management is governed by the Integrated risk Management Policy, Market Risk Management Policy and asset Liability risk Management Policy and Investment Policy.
TMO is primarily responsible for the setting up of suitable policy/procedures for the treasury operations and Setting up and monitoring of various limits to monitor business operations. TMO also maintains its independent MIS reports and dashboard reports which are reported to Senior Management, aLCo, Integrated Risk Management Committee and to the Board of Directors in support of the decision making process. TMO uses various tools in measuring Market Risk exposures such as Value at Risk(VaR) duration, Modified duration(Md), Mark to Market valuations (MTM) and Stress Testing.
MANAGING FOREIGN ExCHANGE RISKThe Foreign Exchange (FX) risk arises due to mismatches in assets and liabilities in different currencies. The cost of aggregate exposure will fluctuate with the changes in the exchange rates. Foreign exchange risk is managed through approved limits by the Board of directors and in line with the CBSL requirements. Limits include net open Position, Trading Limits, and dealer Limits, Counter party Limits and gap Limits.
Bank has been prudent in managing the FX risk throughout. Bank has been able to manage its Net Open Position (NOP) within the limit allowed by CBSL and the no major losses were incurred during the volatile period underwent by USd/Lkr exchange rate in recent past.
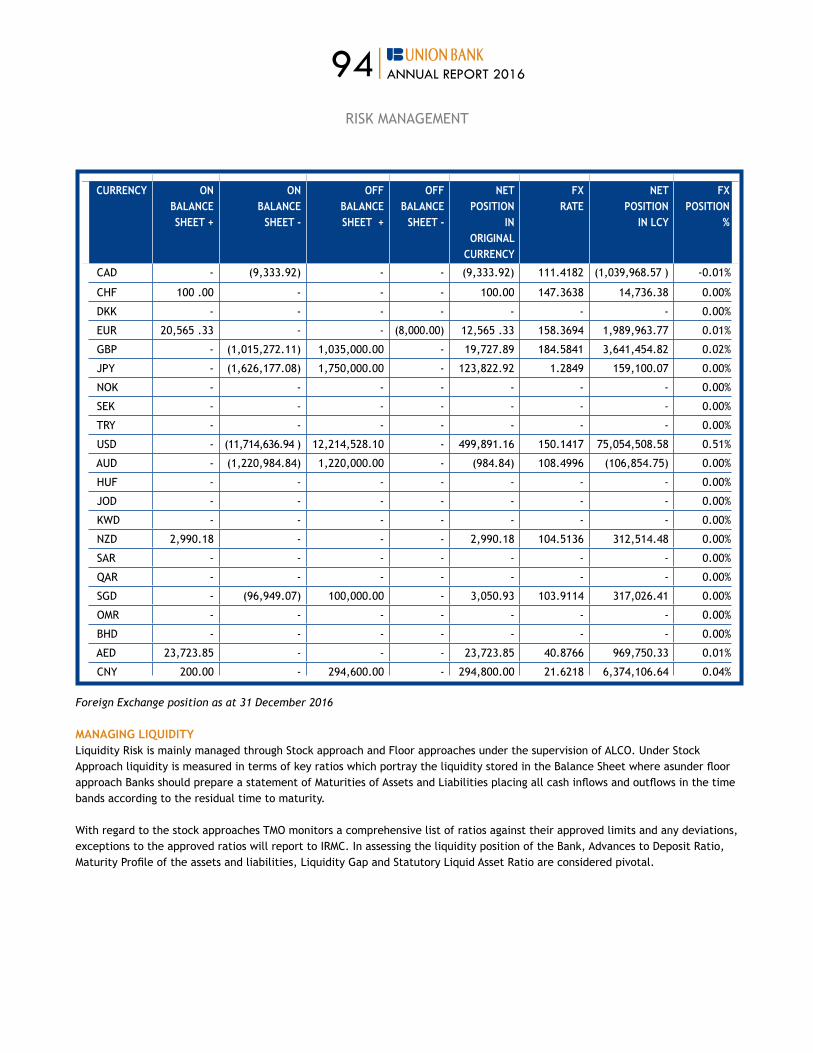
94|ANNUAL REPORT 2016
rISk ManagEMEnT
CURRENCY ON BALANCE SHEET +
ON BALANCE
SHEET -
OFF BALANCE SHEET +
OFF BALANCE
SHEET -
NET POSITION
IN ORIGINAL
CURRENCY
Fx RATE
NET POSITION
IN LCY
Fx POSITION
%
CAD - (9,333.92) - - (9,333.92) 111.4182 (1,039,968.57 ) -0.01%
CHF 100 .00 - - - 100.00 147.3638 14,736.38 0.00%
DKK - - - - - - - 0.00%
EUR 20,565 .33 - - (8,000.00) 12,565 .33 158.3694 1,989,963.77 0.01%
GBP - (1,015,272.11) 1,035,000.00 - 19,727.89 184.5841 3,641,454.82 0.02%
JPy - (1,626,177.08) 1,750,000.00 - 123,822.92 1.2849 159,100.07 0.00%
NOK - - - - - - - 0.00%
SEk - - - - - - - 0.00%
TRY - - - - - - - 0.00%
USd - (11,714,636.94 ) 12,214,528.10 - 499,891.16 150.1417 75,054,508.58 0.51%
AUD - (1,220,984.84) 1,220,000.00 - (984.84) 108.4996 (106,854.75) 0.00%
HUF - - - - - - - 0.00%
Jod - - - - - - - 0.00%
KWD - - - - - - - 0.00%
nzd 2,990.18 - - - 2,990.18 104.5136 312,514.48 0.00%
Sar - - - - - - - 0.00%
QAR - - - - - - - 0.00%
Sgd - (96,949.07) 100,000.00 - 3,050.93 103.9114 317,026.41 0.00%
OMR - - - - - - - 0.00%
BHD - - - - - - - 0.00%
AED 23,723.85 - - - 23,723.85 40.8766 969,750.33 0.01%
CNY 200.00 - 294,600.00 - 294,800.00 21.6218 6,374,106.64 0.04%
Foreign Exchange position as at 31 December 2016
MANAGING LIqUIDITY Liquidity risk is mainly managed through Stock approach and Floor approaches under the supervision of aLCo. Under Stock approach liquidity is measured in terms of key ratios which portray the liquidity stored in the Balance Sheet where asunder floor approach Banks should prepare a statement of Maturities of assets and Liabilities placing all cash inflows and outflows in the time bands according to the residual time to maturity.
with regard to the stock approaches TMo monitors a comprehensive list of ratios against their approved limits and any deviations, exceptions to the approved ratios will report to IrMC. In assessing the liquidity position of the Bank, advances to deposit ratio, Maturity Profile of the assets and liabilities, Liquidity gap and Statutory Liquid asset ratio are considered pivotal.

95|ANNUAL REPORT 2016
rISk ManagEMEnT
also the Bank conducts regular stress tests and scenario analysis to measure impact on liquidity due to adverse movements in its cash flows. Bank has already devised the Contingency Funding Plan which makes sure the completeness of a comprehensive market risk management framework.
MATURITIES OF ASSETS AND LIABILITIES (MAL)
Item Upto 1 Month
Rs.
1 to 3 Months
Rs.
3 to 6 Months
Rs.
6 to 9 Months
Rs.
9 to 12 Months
Rs.
1 to 3 Years
Rs.
3 to 5 Years
Rs.
Over 5 Years
Rs.
Total
Rs. Inflows
Cash on Hand 1,503,757,500 - - - - - - - 1,503,757,500
Nostro 3,534,513 - - - - - - - 3,534,513
deposits with CBSL - - - - - - - 2,487,804,975 2,487,804,975
Investments 3,180,465,069 773,193,644 946,767,558 2,544,990,120 460,046,636 8,265,502,177 5,940,782,853 8,216,005,075 30,327,753,132
Bills of Exchange 27,763,294 8,178,768 - - - - - - 35,942,062
Overdrafts 934,184,697 980,700,064 1,056,567,708 1,031,344,128 1,003,185,361 2,914,106,263 2,506,072,047 2,647,145,082 13,073,305,350
Loans & advances 9,063,469,252 8,115,612,193 3,186,114,327 1,761,048,637 1,646,016,368 10,391,654,375 5,141,103,173 2,788,807,227 42,093,825,552
nPL - - - - 316,251,931 - - 948,755,792 1,265,007,722
Accrued Interest - - - - - - - - -
Other Assets - - - - - - - 1,017,002,994 1,017,002,994
Fixed Assets - - - - - - - 2,048,781,616 2,048,781,616Letters of Credit ---Sight
- 6,033,456 - - - - - - 6,033,456
Letters of Credit ---Usance
- - 14,347,472 - - - - - 14,347,472
Overdraft undrawn 2,126,044,517 2,037,459,328 2,037,459,328 2,037,459,328 2,037,459,328 3,720,577,904 3,720,577,904 3,488,273,718 21,205,311,355
Forex Spot Forward 826,866,750 - - - - - - - 826,866,750
Guarantees 51,895 3,822,699 6,128,512 4,322,089 6,089,173 3,280,227 201,536 - 23,896,131
Total (a) 17,666,137,487 11,925,000,152 7,247,384,905 7,379,164,302 5,469,048,797 25,295,120,946 17,308,737,513 23,642,576,479 115,933,170,581
OutflowsDemand deposits 499,115,800 499,178,876 399,330,485 299,513,633 299,513,633 - - 1,157,118,584 3,153,771,011
Savings deposits 171,617,087 203,400,331 238,508,888 237,640,616 235,635,008 1,120,041,527 1,080,256,367 6,315,079,309 9,602,179,133
Time Deposits 2,860,418,318 5,926,788,110 3,536,409,695 1,614,748,789 1,127,286,676 204,189,003 689,825,486 19,474,761,270 35,434,427,347Certificates of Deposits
181,303,200 155,209,838 523,898,517 200,279,584 51,260,979 3,354,343 - 1,360,951,223 2,476,257,684
Nostro - - - - - - - - -
Borrowings 9,621,074,231 1,562,363,956 1,167,170,630 32,296,615 1,210,403,949 - - - 13,593,309,381
Interest payable - - - - - - - - -
Other liabilities 1,672,431,463 - - - - - - - 1,672,431,463
Shareholders Funds - - - - - - - 16,631,554,270 16,631,554,270Letters of Credit ---Sight
- 6,033,456 - - - - - - 6,033,456
Letters of Credit ---Usance
6,502,096 7,845,376 - - - - - - 14,347,472
Overdraft undrawn 6,192,471,292 9,522,876,020 2,627,897,481 1,431,033,282 1,431,033,282 - - - 21,205,311,357
Forex Spot Forward 2,770,276,500 226,487,500 - - - - - - 2,996,764,000
Guarantees 2,060,277 4,529,712 5,722,955 4,220,527 4,899,457 2,281,931 181,271 - 23,896,130
Total (b) 23,977,270,264 18,114,713,175 8,498,938,651 3,819,733,046 4,360,032,984 1,329,866,804 1,770,263,124 44,939,464,656 106,810,282,704
Gap=(a)-(b) (6,311,132,777) (6,189,713,023) (1,251,553,746) 3,559,431,256 1,109,015,813 23,965,254,142 15,538,474,389 (4,665,333,907) 9,122,887,877
Cumulative Gap (6,311,132,777) (12,500,845,800) (13,752,399,546) (10,192,968,290) (9,083,952,477) 14,881,301,665 30,419,776,054 25,754,442,149 -Cumulative Liabilities
23,977,270,264 42,091,983,439 50,590,922,090 54,410,655,136 58,770,688,120 60,100,554,924 61,870,818,048 106,810,282,704 -
Cumulative Gap as a % Cumulative liabilities
(0) (0) (0) (0) (0) 0 0 0 -
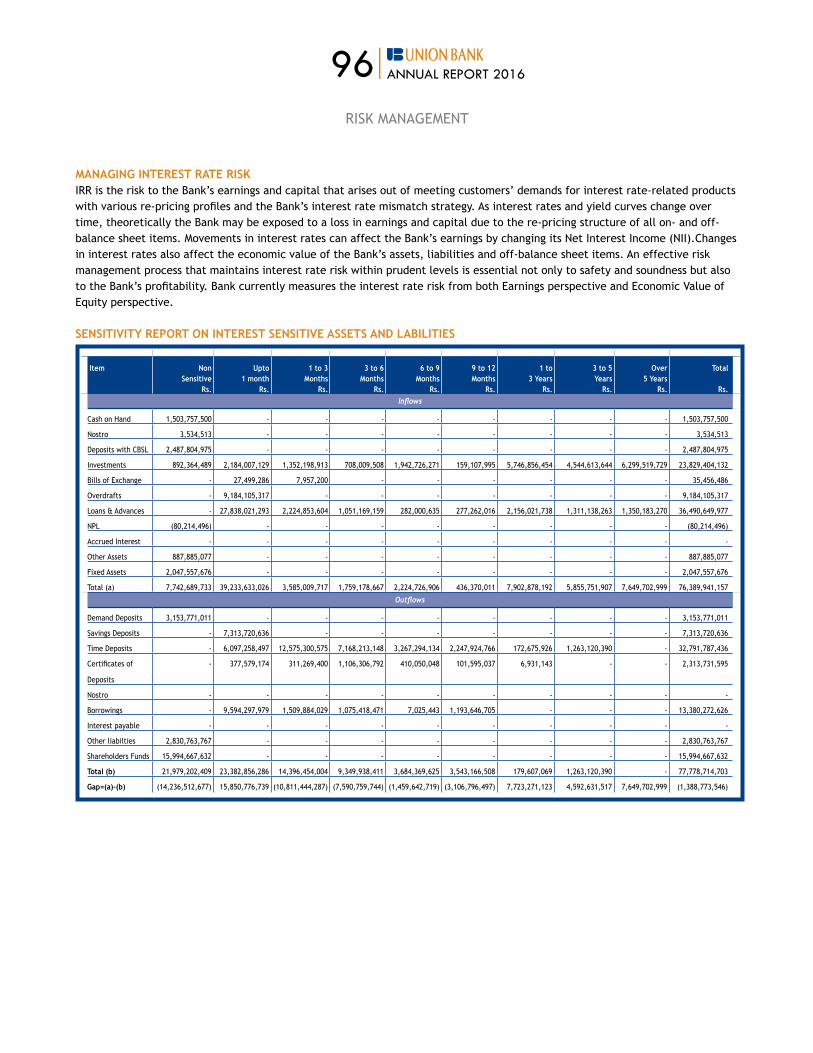
96|ANNUAL REPORT 2016
rISk ManagEMEnT
MANAGING INTEREST RATE RISKIRR is the risk to the Bank’s earnings and capital that arises out of meeting customers’ demands for interest rate-related products with various re-pricing profiles and the Bank’s interest rate mismatch strategy. as interest rates and yield curves change over time, theoretically the Bank may be exposed to a loss in earnings and capital due to the re-pricing structure of all on- and off-balance sheet items. Movements in interest rates can affect the Bank’s earnings by changing its Net Interest Income (NII).Changes in interest rates also affect the economic value of the Bank’s assets, liabilities and off-balance sheet items. an effective risk management process that maintains interest rate risk within prudent levels is essential not only to safety and soundness but also to the Bank’s profitability. Bank currently measures the interest rate risk from both Earnings perspective and Economic Value of Equity perspective.
SENSITIVITY REPORT ON INTEREST SENSITIVE ASSETS AND LABILITIES
Item Non Sensitive
Rs.
Upto 1 month
Rs.
1 to 3 Months
Rs.
3 to 6 Months
Rs.
6 to 9 Months
Rs.
9 to 12 Months
Rs.
1 to 3 Years
Rs.
3 to 5 Years
Rs.
Over 5 Years
Rs.
Total
Rs. Inflows
Cash on Hand 1,503,757,500 - - - - - - - - 1,503,757,500
Nostro 3,534,513 - - - - - - - - 3,534,513
deposits with CBSL 2,487,804,975 - - - - - - - - 2,487,804,975
Investments 892,364,489 2,184,007,129 1,352,198,913 708,009,508 1,942,726,271 159,107,995 5,746,856,454 4,544,613,644 6,299,519,729 23,829,404,132
Bills of Exchange - 27,499,286 7,957,200 - - - - - - 35,456,486
Overdrafts - 9,184,105,317 - - - - - - - 9,184,105,317
Loans & advances - 27,838,021,293 2,224,853,604 1,051,169,159 282,000,635 277,262,016 2,156,021,738 1,311,138,263 1,350,183,270 36,490,649,977
nPL (80,214,496) - - - - - - - - (80,214,496)
Accrued Interest - - - - - - - - - -
Other Assets 887,885,077 - - - - - - - - 887,885,077
Fixed Assets 2,047,557,676 - - - - - - - - 2,047,557,676
Total (a) 7,742,689,733 39,233,633,026 3,585,009,717 1,759,178,667 2,224,726,906 436,370,011 7,902,878,192 5,855,751,907 7,649,702,999 76,389,941,157
Outflows
Demand Deposits 3,153,771,011 - - - - - - - - 3,153,771,011
Savings deposits - 7,313,720,636 - - - - - - - 7,313,720,636
Time Deposits - 6,097,258,497 12,575,300,575 7,168,213,148 3,267,294,134 2,247,924,766 172,675,926 1,263,120,390 - 32,791,787,436
Certificates of
Deposits
- 377,579,174 311,269,400 1,106,306,792 410,050,048 101,595,037 6,931,143 - - 2,313,731,595
Nostro - - - - - - - - - -
Borrowings - 9,594,297,979 1,509,884,029 1,075,418,471 7,025,443 1,193,646,705 - - - 13,380,272,626
Interest payable - - - - - - - - - -
Other liabilties 2,830,763,767 - - - - - - - - 2,830,763,767
Shareholders Funds 15,994,667,632 - - - - - - - - 15,994,667,632
Total (b) 21,979,202,409 23,382,856,286 14,396,454,004 9,349,938,411 3,684,369,625 3,543,166,508 179,607,069 1,263,120,390 - 77,778,714,703
Gap=(a)-(b) (14,236,512,677) 15,850,776,739 (10,811,444,287) (7,590,759,744) (1,459,642,719) (3,106,796,497) 7,723,271,123 4,592,631,517 7,649,702,999 (1,388,773,546)

97|ANNUAL REPORT 2016
rISk ManagEMEnT
LEGAL RISKas per the definition of BaSEL the legal risk is covered under operational risk Management. Legal risk is connected with the people, processes, systems and also the outside events affecting the normal cause of business.
In managing Banks’ legal risk, factors such as regulatory guidelines which may lead to subsequent penalties and fines in non compliance are taken in to consideration. Banking relationships maintained with other entities, individuals both domestic and foreign are also giving rise to legal risk. This is mainly due to the non fulfillment of required precise contractual documentation and adherence to the same. Bank takes adequate measures and process enhancements to ensure the compliance of such legal requirement under its overall risk governance structure.
STRATEGIC RISKStrategic risk refers to the strategic decisions/plans/objectives which may go wrong due to actions or inactions by the parties to strategic decision making process, adversely affecting the shareholder wealth of the Bank e.g. incorrect decisions, inadequate information for decision making, delayed remedial actions etc.
STRATEGICRISK
Formulation of Business & Corporate
objectives
Business Environment Scan
Economic Environment Scan
Customer Profiling
Product Profiling
Change Management
Business Planning
Strategy Implementation
Drivers of Strategic Risk
COMPLIANCE RISKCompliance risk is the current and prospective risk to earnings or capital arising from violations of, or nonconformance with, laws, rules, regulations, prescribed corporate governance practices, internal policies and procedures, or ethical standards.
Compliance risk also arises in situations where the laws or rules governing certain bank products or activities of the Bank’s clients may be ambiguous or untested. This risk exposes the institution to fines, penalties, payment of damages, and the voiding of contracts. Compliance risk can lead to diminish reputation, limited business opportunities, reduced expansion potential, and an inability to enforce contracts. Bank has identified this risk as a material risk and various internal controls, policies, procedures are in place to manage risk.

98|ANNUAL REPORT 2016
rISk ManagEMEnT
REPUTATION RISKreputation risk refers to the potential adverse effects, which can arise from the Bank’s reputation being tarnished due to factors such as unethical practices, regulatory actions, subsidiary/associate company’s actions, customer dissatisfaction and complaints, negative/adverse publicity etc. The Bank remains committed to continuously strive to maintain and improve its reputation in all the businesses it operates.
REPUTATIONRISK
Loss Event Identification Peer Group
Comparison
Management Integrity
Staff Competence & Support
Corporate Culture
Risk Management & Control Environment
Financial Soundness
Business Practices
Customer Satisfaction
Legal/regulatory Compliance
Contagion Risk
Crisis Management
Transparency/Accountability
Drivers of Reputation Risk
STRESS TESTINGBank uses various techniques (quantitative and/or qualitative) to gauge the vulnerability to exceptional but plausible risk events. Stress Testing is a risk management technique used to evaluate the potential effects of a specific event and/or movement in a set of financial variables on the Bank’s financial condition.
Stress testing is an important part of risk management function in the Bank and is considered as an integral part of ICaaP under Pillar II.
The Bank has a robust Stress Testing Policy which describes the procedure for identifying principal risk factors, frequency, methodology for constructing stress tests and procedure for setting risk tolerance limits. The findings are communicated effectively to the management group in support of the decision making and capital planning process.
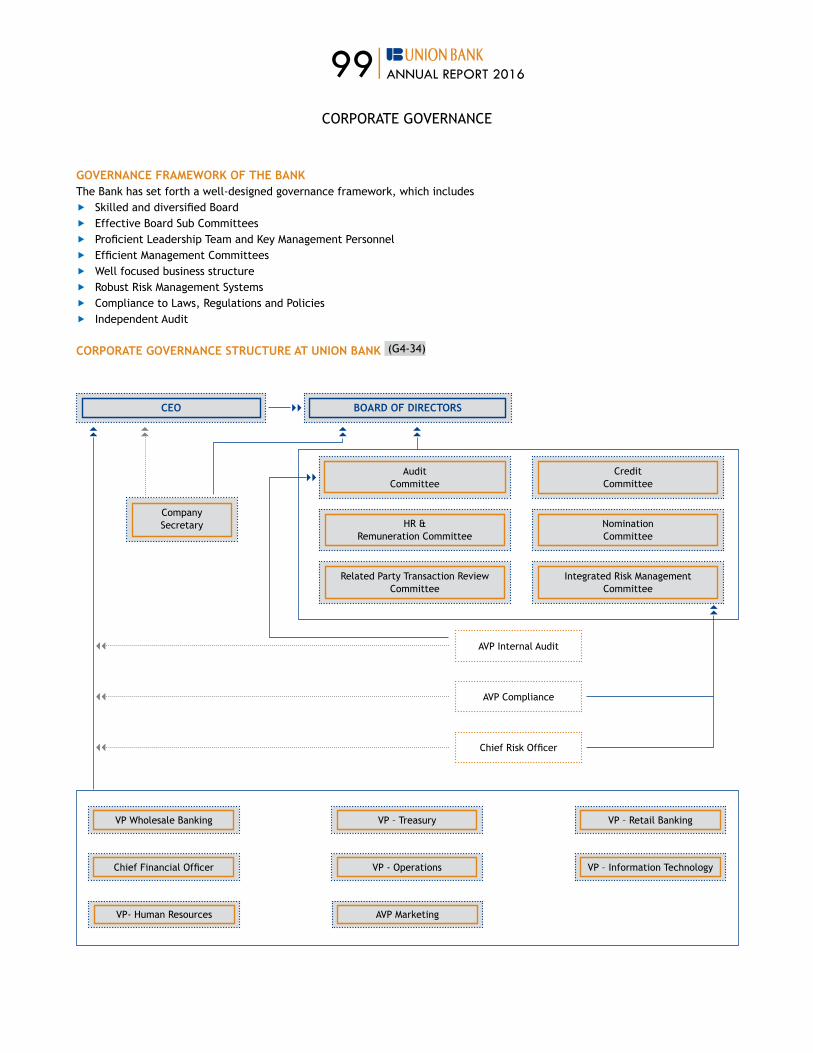
99|ANNUAL REPORT 2016
CORPORATE GOVERNANCE
GOVERNANCE FRAMEWORK OF THE BANKThe Bank has set forth a well-designed governance framework, which includes ff Skilled and diversified Board ff Effective Board Sub Committees ff Proficient Leadership Team and key Management Personnel ff Efficient Management Committees ff Well focused business structure ff robust risk Management Systems ff Compliance to Laws, regulations and Policiesff Independent Audit
CORPORATE GOVERNANCE STRUCTURE AT UNION BANK (g4-34)
AVP Internal Audit
AVP Compliance
Chief risk officer
BOARD OF DIRECTORSCEO
Audit Committee
HR & Remuneration Committee
Related Party Transaction Review Committee
VP Wholesale Banking
Chief Financial officer
VP – Treasury
VP - Operations
VP- Human Resources AVP Marketing
VP – Information Technology
VP – retail Banking
Credit Committee
Nomination Committee
Integrated Risk Management Committee
Company Secretary
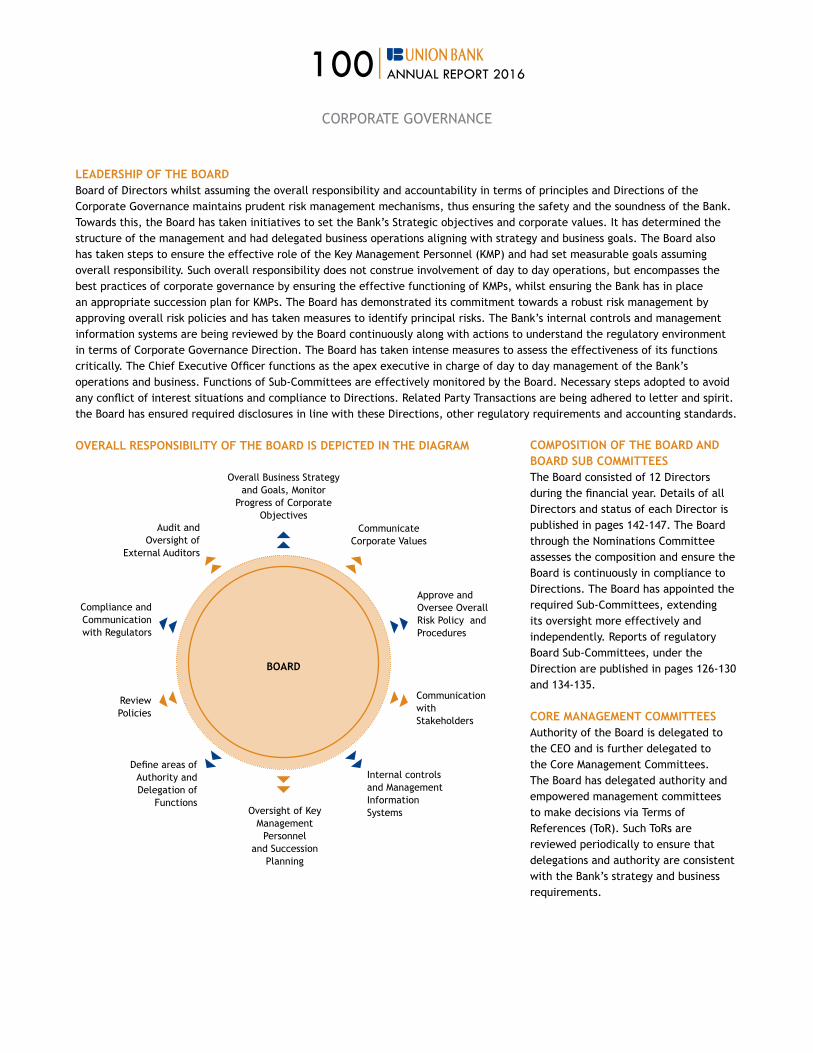
100|ANNUAL REPORT 2016
LEADERSHIP OF THE BOARD Board of Directors whilst assuming the overall responsibility and accountability in terms of principles and Directions of the Corporate governance maintains prudent risk management mechanisms, thus ensuring the safety and the soundness of the Bank. Towards this, the Board has taken initiatives to set the Bank’s Strategic objectives and corporate values. It has determined the structure of the management and had delegated business operations aligning with strategy and business goals. The Board also has taken steps to ensure the effective role of the Key Management Personnel (KMP) and had set measurable goals assuming overall responsibility. Such overall responsibility does not construe involvement of day to day operations, but encompasses the best practices of corporate governance by ensuring the effective functioning of kMPs, whilst ensuring the Bank has in place an appropriate succession plan for KMPs. The Board has demonstrated its commitment towards a robust risk management by approving overall risk policies and has taken measures to identify principal risks. The Bank’s internal controls and management information systems are being reviewed by the Board continuously along with actions to understand the regulatory environment in terms of Corporate Governance Direction. The Board has taken intense measures to assess the effectiveness of its functions critically. The Chief Executive officer functions as the apex executive in charge of day to day management of the Bank’s operations and business. Functions of Sub-Committees are effectively monitored by the Board. necessary steps adopted to avoid any conflict of interest situations and compliance to directions. related Party Transactions are being adhered to letter and spirit. the Board has ensured required disclosures in line with these directions, other regulatory requirements and accounting standards. OVERALL RESPONSIBILITY OF THE BOARD IS DEPICTED IN THE DIAGRAM
BOARD
overall Business Strategy and goals, Monitor
Progress of Corporate objectives
Communicate Corporate Values
Approve and Oversee Overall Risk Policy and Procedures
Communication with Stakeholders
Internal controls and Management Information Systems Oversight of Key
Management Personnel
and Succession Planning
define areas of Authority and Delegation of
Functions
Review Policies
Compliance and Communication with Regulators
Audit and Oversight of
External Auditors
COMPOSITION OF THE BOARD AND BOARD SUB COMMITTEESThe Board consisted of 12 Directors during the financial year. details of all Directors and status of each Director is published in pages 142-147. The Board through the Nominations Committee assesses the composition and ensure the Board is continuously in compliance to Directions. The Board has appointed the required Sub-Committees, extending its oversight more effectively and independently. Reports of regulatory Board Sub-Committees, under the direction are published in pages 126-130 and 134-135.
CORE MANAGEMENT COMMITTEES Authority of the Board is delegated to the CEO and is further delegated to the Core Management Committees. The Board has delegated authority and empowered management committees to make decisions via Terms of references (Tor). Such Tors are reviewed periodically to ensure that delegations and authority are consistent with the Bank’s strategy and business requirements.
CORPORATE GOVERNANCE

101|ANNUAL REPORT 2016
MANAGEMENT COMMITTEES
Board
Leadership Team
Asset and Liability
ManagementCommittee
Executive Risk Management Committee
Information Technology
Steering Committee
Operational Risk Management Committee
Outsourcing Management Committee
Executive Credit
Committee
BENCHMARK POLICIES PERTAINING TO CORPORATE GOVERNANCE AT UNION BANK During the years the Bank has endeavored to cultivate best practices of Corporate Governance throughout the Bank in all significant areas, by way of Board approved policies and manuals, reviewed annually.
Board of Directors and KMP
Overall Risk Management Policies
IT Governance Policies
ff Code of Corporate Governance ff Policy for Selection and appointment of directors, CEo and kMPsff Anti Corruption Policy ff Targets and Goals for CEO and KMPs ff Remuneration Policy for KMPsff Policy of Related Party Transactions ff Policy on Maximum percentage of Share Capital ff Charters and Tors of Board Sub committees and Management Committees
ff Integrated Risk Management Policy Framework ff assets and Liability Management Policy ff Market Risk Management Policy ff Operational Risk Management Policy ff Credit Risk Management Policy ff Contingency Funding Policy
ff IT Security Management Policies ff Change Management Policiesff User Access and Administration Policies
Human Resources ff HR Manualff Professional Study Supportff Training Policyff Grievance Policy ff Disciplinary Action Policy
CORPORATE GOVERNANCE
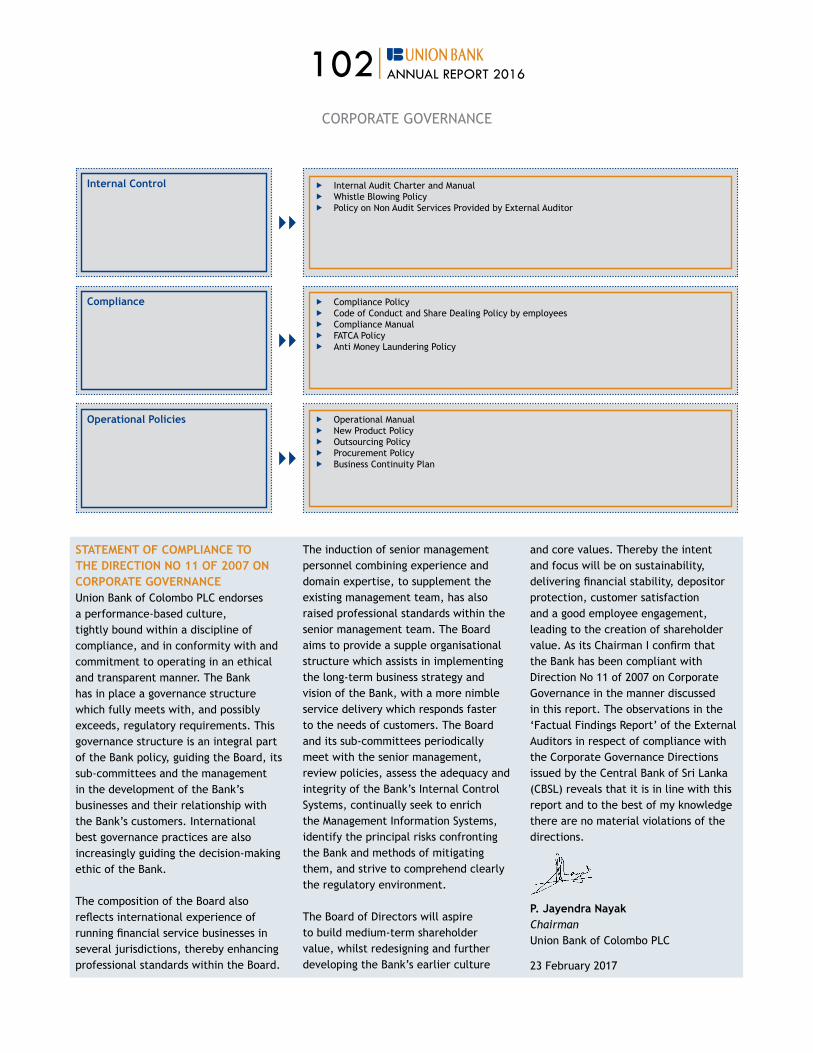
102|ANNUAL REPORT 2016
CORPORATE GOVERNANCE
Internal Control
Compliance
Operational Policies
ff Internal Audit Charter and Manual ff Whistle Blowing Policy ff Policy on non audit Services Provided by External auditor
ff Compliance Policy ff Code of Conduct and Share dealing Policy by employeesff Compliance Manual ff FATCA Policyff anti Money Laundering Policy
ff Operational Manualff New Product Policyff Outsourcing Policyff Procurement Policyff Business Continuity Plan
STATEMENT OF COMPLIANCE TO THE DIRECTION NO 11 OF 2007 ON CORPORATE GOVERNANCE Union Bank of Colombo PLC endorses a performance-based culture, tightly bound within a discipline of compliance, and in conformity with and commitment to operating in an ethical and transparent manner. The Bank has in place a governance structure which fully meets with, and possibly exceeds, regulatory requirements. This governance structure is an integral part of the Bank policy, guiding the Board, its sub-committees and the management in the development of the Bank’s businesses and their relationship with the Bank’s customers. International best governance practices are also increasingly guiding the decision-making ethic of the Bank.
The composition of the Board also reflects international experience of running financial service businesses in several jurisdictions, thereby enhancing professional standards within the Board.
The induction of senior management personnel combining experience and domain expertise, to supplement the existing management team, has also raised professional standards within the senior management team. The Board aims to provide a supple organisational structure which assists in implementing the long-term business strategy and vision of the Bank, with a more nimble service delivery which responds faster to the needs of customers. The Board and its sub-committees periodically meet with the senior management, review policies, assess the adequacy and integrity of the Bank’s Internal Control Systems, continually seek to enrich the Management Information Systems, identify the principal risks confronting the Bank and methods of mitigating them, and strive to comprehend clearly the regulatory environment.
The Board of Directors will aspire to build medium-term shareholder value, whilst redesigning and further developing the Bank’s earlier culture
and core values. Thereby the intent and focus will be on sustainability, delivering financial stability, depositor protection, customer satisfaction and a good employee engagement, leading to the creation of shareholder value. as its Chairman I confirm that the Bank has been compliant with direction no 11 of 2007 on Corporate Governance in the manner discussed in this report. The observations in the ‘Factual Findings Report’ of the External Auditors in respect of compliance with the Corporate Governance Directions issued by the Central Bank of Sri Lanka (CBSL) reveals that it is in line with this report and to the best of my knowledge there are no material violations of the directions.
P. Jayendra NayakChairman Union Bank of Colombo PLC
23 February 2017

103|ANNUAL REPORT 2016
CORPORATE GOVERNANCE
CORPORATE GOVERNANCE The Bank’s compliance with direction no 11 of 2007, issued by the Central Bank of Sri Lanka on the subject ‘ Corporate governance for Licensed Commercial Banks in Sri Lanka’
annual Corporate governance report of Union Bank of Colombo PLC for the year ended 31 december 2016 is given below:-
SECTION RULE LEVEL OF COMPLIANCE 2016 3(1) The Responsibilities of the Board 3(1) (i) The Board shall strengthen the safety and soundness of the Bank by ensuring the implementation of the
following
(a) Approve and oversee the Bank’s strategic objectives and corporate values and ensure that these are communicated throughout the Bank;
CompliedThe Bank has set its strategic objectives and goals through the Board approved strategic plan and through the annual budgets. Strategies and Corporate values have been communicated to all business units and other staff through regular management meetings.
(b) Approve the overall business strategy of the Bank, including the overall risk policy and risk management procedures and mechanisms with measurable goals, for at least the next three years.
Complied The Bank has developed the 4-year strategic plan for 2017 – 2020. Strategic plan include measurable goals for the period of 2017-2020.
(c) Identify the principal risks and ensure implementation of appropriate systems to manage the risks prudently;
Complied The Board has discussed the risks arising out of new strategies and the ways and means to mitigate them.Further identifying principal risks and implementation of appropriate risk management techniques are performed via the Board appointed Integrated Risk Management Committee (IRMC). Risk Management Department has sent in policies and procedures on Integrated Risk Management Framework and have enforced mechanisms in order to assist the IRMC to identify principal risks prudently.
(d) Approve implementation of a policy of communication with all stakeholders, including depositors, borrowers ,creditors, share-holders and borrowers.
Complied The Board approved Communication Policy is in place. The policy will be reviewed in 2017.
(e) review the adequacy and the integrity of the Bank’s Internal Control Systems and Management Information Systems.
CompliedThe Bank has in place a mechanism to identify the accuracy of the Management Information and Internal Control Systems. Internal audit Department conducts reviews regularly in this regard and adds value to the process. The Board has reviewed this report for 2016.

104|ANNUAL REPORT 2016
CORPORATE GOVERNANCE
SECTION RULE LEVEL OF COMPLIANCE 2016
(f) The Board has identified and designated key Management Personnel, as officers Performing Executive Functions of LCBs as defined in Banking act determination no. 3 of 2010 as per Bank Supervision dept. guideline ref. 02/17/550/0002/003 on 02 december 2015.
Complied The Board of directors has identified and designated the CEo, VPs, Chief risk officer, Chief Financial officer, Chief Internal auditor, Compliance officer, Head of Treasury, Head of Information Technology Board Secretary, officers serving as consultants/advisor to the Board or Bank.
(g) define the areas of authority and key responsibilities for the Board of Directors themselves and for the Key Management Personnel.
Complied Articles of the Bank stipulates the authority of directors and matters specifically reserved for the Directors. Further responsibilities and authority are delegated to the Directors and KMPs via the Board approved policies, Terms of references, and operational delegation arrangements. Key responsibilities of the Key Management Personnel are included in their respective job descriptions.
(h) Ensure that there is appropriate oversight of the affairs of the Bank by key Management Personnel, that is consistent with Board policy;
Complied Key Management Personnel make regular presentations to the Board on matters under their purview and are also called in by the Board and to Board Sub Committees to explain matters relating to their concerns.
(i) Periodically assess the effectiveness of the Board of directors’ own governance practices, including:
(i) the selection, nomination and election of directors and key Management Personnel;
(ii) the management of conflicts of interests; and (iii) the determination of weaknesses and
implementation of changes where necessary;
Complied The Directors’ assessments are conducted annually and complied for 2016.The Board has a procedure for selection and appointment of director, CEo and key Management Personnel. Code of Corporate Governance approved by the Board has a provision (Section 8) in this regard. The Bank has a Self-Evaluation process in place for the Board of Directors which include the evaluation of Board of Directors’ own governance practices.Summary of Self-Evaluations obtained have submitted to the Board for their review and action if deem necessary.
(j) Ensure that the Bank has an appropriate succession plan for key Management Personnel;
Complied The HRRC and the Board has approved a succession plan for Key Management Personnel.
(k) Meet regularly, on a needs basis, with the key Management Personnel to review policies, establish communication lines and monitor progress towards corporate objectives;
Complied Key Management Personnel make regular presentations to the Board on matters under their purview and are also called in by the Board and to Board Sub-committees to explain matters relating to their concerns.

105|ANNUAL REPORT 2016
CORPORATE GOVERNANCE
SECTION RULE LEVEL OF COMPLIANCE 2016
(l) Understand the regulatory environment and ensure that the Bank maintains an effective relationship with regulators;
Complied The Compliance officer submits monthly reports to the Board that assists the Board to identify the regulatory environment. Board ensures that an effective relationship with the regulators are maintained by way of active participation at meetings with the regulators by the CEO.
(m) Exercise due diligence in the hiring and oversight of external auditors.
CompliedTerms of Reference of the Board Audit Committee (BAC) includes provisions to recommend appointment of External auditors;Recommended the re-appointment of Messrs Ernst & young, Chartered accountants as the Bank’s External Auditors for audit services for year 2016. Pursuant to recommendations, Messrs Ernst & Young was re-appointed as the Auditors for the Financial Year 2016 by the shareholders at the annual general Meeting held on 31 March 2016.
3(1) (ii) The Board shall appoint the Chairman and the Chief Executive officer and define and approve the functions and responsibilities of the Chairman and the Chief Executive officer in line with direction 3(5) of these Directions.
Complied Positions of the Chairman and the director/Chief Executive officer (CEo) are separated.Further, function and responsibilities of the Chairman and the CEo are properly defined and approved in line with the direction 3(5) of these direction, and included in the Board approved Terms of Reference (Functions and Responsibilities of Chairman, CEo and Senior director).
3(1) (iii) The Board shall meet regularly and Board meetings shall be held at least twelve times a year at approximately monthly intervals. Such regular Board Meetings shall normally involve active participation in person of a majority of directors entitled to be present. obtaining the Board’s consent through the circulation of written resolutions/papers shall be avoided as far as possible.
Complied The Board ensures that it meets regularly and involves active participation by the Directors. The Board has met twelve times during the year at monthly intervals and as and when it was required. A circular resolution was passed during the year.
3(1) (iv) The Board shall ensure that arrangements are in place to enable all Directors to include matters and proposals in the agenda for regular Board meetings where such matters and proposals relate to the promotion of business and the management of risks of the Bank.
Complied Procedure to include matters is stated in the Code of Corporate Governance and meetings are notified in advance allowing directors to raise matters concerning promotion of business and management of risks.
3(1) (v) The Board procedures shall ensure that notice of at least 7 days is given of a regular Board Meeting to provide all Directors an opportunity to attend. For all other Board Meetings, reasonable notice may be given.
Complied Regular monthly meetings are informed to the Directors prior to seven days giving them the opportunity to attend.

106|ANNUAL REPORT 2016
CORPORATE GOVERNANCE
SECTION RULE LEVEL OF COMPLIANCE 2016
3(1) (vi) The Board procedures shall ensure that a director, who has not attended at least two-thirds of the meetings in the period of 12 months immediately preceding or has not attended the immediately preceding three consecutive meetings held, shall cease to be a director. Participation at the Directors’ meeting through an alternate director shall, however, be acceptable as attendance .
Complied As per Board Attendance schedule all Directors have attended the required number of meetings for 2016.
3(1) (vii) The Board shall appoint a company secretary who satisfies the provisions of Section 43 of the Banking act no. 30 of 1988 whose primary responsibilities shall be to handle the secretariat service to the Board and shareholder meeting and to carry out other functions specified in the statutes and other regulations.
Complied The Board has appointed a Company Secretary who’s primary responsibilities are handling secretariat services to the Board and Shareholder meeting and to carry out the other functions specified in the statues and other regulations and is also stipulated in the Code of Corporate Governance of the Bank.
3(1) (viii) All Directors shall have access to advice and services of the Company Secretary with a view to ensuring that Board procedures and all applicable rules and regulations are followed.
Complied all the directors have equal opportunity to access the Company Secretary. The Board approved procedure is in place to enable all Directors to have access to advice and services of the Company Secretary.
3(1) (ix) The Company Secretary shall maintain the minutes of Board Meetings and such minutes shall be open for inspection at any reasonable time, on reasonable notice by any Director.
Complied Minutes of Board Meetings are maintained by the Company Secretary and there is a Board approved procedure under Corporate Governance Code in place to enable all Directors to have access to such minutes. Any Director can inspect the minutes of Board Meeting with reasonable notice that is being maintained by the Company Secretary.

107|ANNUAL REPORT 2016
CORPORATE GOVERNANCE
SECTION RULE LEVEL OF COMPLIANCE 2016
3(1) (x) Minutes of Board Meetings shall be recorded in sufficient detail so that it is possible to gather from the minutes, as to whether the Board acted with due care and prudence in performing its duties. The minutes shall also serve as a reference for regulatory and supervisory authorities to assess the depth of deliberations at the Board Meetings. Therefore, the minutes of a Board Meeting shall clearly contain or refer to the following: (a) a summary of data and information used by the Board
in its deliberations; (b) the matters considered by the Board; (c) the fact-finding discussions and the issues of
contention or dissent which may illustrate whether the Board was carrying out its duties with due care and prudence;
(d) the testimonies and confirmations of relevant executives which indicate compliance with the Board’s strategies and policies and adherence to relevant laws and regulations;
(e) the Board’s knowledge and understanding of the risks to which the Bank is exposed and an overview of the risk management measures adopted; and
(f) the decisions and Board resolutions.
Compiled The Minutes of the meetings include:a summary of data and information used by the Board in its deliberations; (b) the matters considered by the Board; (c) the fact-finding discussions and the issues of
contention or dissent(d) the testimonies and confirmations of relevant
Executives with regard to the Board’s strategies and policies and adherence to relevant laws and regulations;
(e) matters regarding the risks to which the Bank is exposed and an overview of the risk management measures including reports of the Board risk Management Committee; and
(f) the decisions and Board Resolutions including reports of all Board committees.
3(1) (xi) There shall be a procedure agreed by the Board to enable directors, upon reasonable request, to seek independent professional advice in appropriate circumstances, at the Bank’s expense. The Board shall resolve to provide separate independent professional advice to Directors to assist the relevant director or directors to discharge his/her/their duties to the Bank.
Complied Code of Corporate Governance includes provisions for Board of Directors to seek professional advice required to assist the them on discharging their duties effectively.
3(1) (xii) directors shall avoid conflicts of interests, or the appearance of conflicts of interest, in their activities with, and commitments to, other organisations or related parties. If a director has a conflict of interest in a matter to be consider by the Board, which the Board has determined to be material the matter should be dealt with at a Board Meeting, where independent non- Executive Directors who have no material interest in the transaction are present. Further, a director shall abstain from voting on any Board Resolution in relation to which he/she or any of his/her close relation or a concern in which a director has substantial interest, is interested and he/she shall not be counted in the quorum for the relevant agenda item at the Board Meeting.
Complied The Board approved procedure is in place to avoid conflicts of interests or the appearance of conflicts of interest is included in the Corporate Governance Code and is implemented.This procedure further evidence that the Director is to abstain from voting on any Board Resolution in relation to which he/she or any of his/her close relation or a concern in which a Director has substantial interest and he/she not has been counted in the quorum.During the year Board of Directors has complied to the procedure.
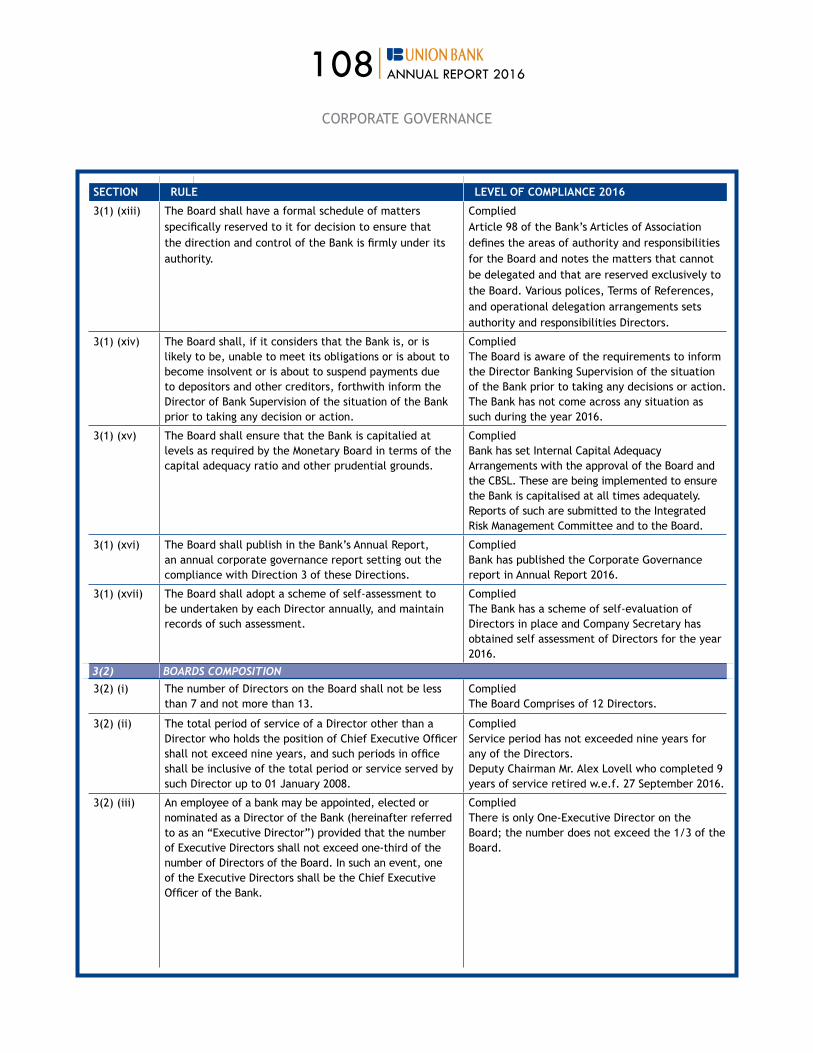
108|ANNUAL REPORT 2016
CORPORATE GOVERNANCE
SECTION RULE LEVEL OF COMPLIANCE 2016
3(1) (xiii) The Board shall have a formal schedule of matters specifically reserved to it for decision to ensure that the direction and control of the Bank is firmly under its authority.
Complied article 98 of the Bank’s articles of association defines the areas of authority and responsibilities for the Board and notes the matters that cannot be delegated and that are reserved exclusively to the Board. Various polices, Terms of references, and operational delegation arrangements sets authority and responsibilities Directors.
3(1) (xiv) The Board shall, if it considers that the Bank is, or is likely to be, unable to meet its obligations or is about to become insolvent or is about to suspend payments due to depositors and other creditors, forthwith inform the director of Bank Supervision of the situation of the Bank prior to taking any decision or action.
Complied The Board is aware of the requirements to inform the director Banking Supervision of the situation of the Bank prior to taking any decisions or action. The Bank has not come across any situation as such during the year 2016.
3(1) (xv) The Board shall ensure that the Bank is capitalied at levels as required by the Monetary Board in terms of the capital adequacy ratio and other prudential grounds.
Complied Bank has set Internal Capital adequacy Arrangements with the approval of the Board and the CBSL. These are being implemented to ensure the Bank is capitalised at all times adequately. Reports of such are submitted to the Integrated Risk Management Committee and to the Board.
3(1) (xvi) The Board shall publish in the Bank’s annual report, an annual corporate governance report setting out the compliance with direction 3 of these directions.
Complied Bank has published the Corporate Governance report in Annual Report 2016.
3(1) (xvii) The Board shall adopt a scheme of self-assessment to be undertaken by each director annually, and maintain records of such assessment.
Complied The Bank has a scheme of self-evaluation of directors in place and Company Secretary has obtained self assessment of Directors for the year 2016.
3(2) BOARDS COMPOSITION 3(2) (i) The number of Directors on the Board shall not be less
than 7 and not more than 13.Complied The Board Comprises of 12 Directors.
3(2) (ii) The total period of service of a Director other than a director who holds the position of Chief Executive officer shall not exceed nine years, and such periods in office shall be inclusive of the total period or service served by such director up to 01 January 2008.
Complied Service period has not exceeded nine years for any of the Directors.deputy Chairman Mr. alex Lovell who completed 9 years of service retired w.e.f. 27 September 2016.
3(2) (iii) an employee of a bank may be appointed, elected or nominated as a Director of the Bank (hereinafter referred to as an “Executive Director”) provided that the number of Executive Directors shall not exceed one-third of the number of directors of the Board. In such an event, one of the Executive Directors shall be the Chief Executive officer of the Bank.
Complied There is only One-Executive Director on the Board; the number does not exceed the 1/3 of the Board.

109|ANNUAL REPORT 2016
CORPORATE GOVERNANCE
SECTION RULE LEVEL OF COMPLIANCE 2016
3(2) (iv) The Board shall have at least three Independent Non Executive Directors or one third of the total number of directors, whichever is higher. This sub-direction shall be applicable from 1 January 2010 onwardsA Non Executive Director shall not be considered independent if he/she has a) direct and indirect shareholdings of more than 1% of
the Bankb) currently has or had during the period of two years
immediately preceding his/her appointment as director, any business transactions with the Bank as described in direction 3 (7) hereof, exceeding 10% of the regulatory capital of the Bank;
c) has been employed by the Bank during the two-year period immediately preceding the appointment as Director
d) has a close relation who is a Director of Chief Executive officer or a member of key Management Personnel or a material shareholder of the Bank or another Bank. For this purpose, a ‘close relation’ shall mean the spouse or a financially dependent child;
e) represents a specific stakeholder of the Bank;f) If an employee or a Director or a material
shareholder in a company organisation:(i) which currently has a transaction with the Bank
as defined in direction 3 (7) of these directions, exceeding 10% of the regulatory capital of the Bank, or
(ii) In which any of other Director of the Bank are employed or are material shareholders; or
(iii)In which any of other Directors of the Bank has a transaction as defined in direction 3(7) of these directions, exceeding 10% of regulatory capital in the Bank.
CompliedThe Board comprises of 05 Independent Non Executive directors, which is more than one third of the total number of Directors.
Please refer pages 81 and 162.
3(2) (v) In the event an alternate Director is appointed to represent an Independent director, the person so appointed shall also meet the criteria that apply to the Independent Director.
Complied Independent Directors had not appointed alternates during the year 2016.
3(2) (vi) Non-executive Directors shall be persons with credible track records and/or have necessary skills and experience to bring an independent judgment to bear on issues of strategy, performance and resources.
Complied Nominations committee has a procedure in place to appoint non Executive directors, who possess skills and experience and new appointments during 2016 done in accordance with the Policy.

110|ANNUAL REPORT 2016
CORPORATE GOVERNANCE
SECTION RULE LEVEL OF COMPLIANCE 2016
3(2) (vii) a meeting of the Board shall not be duly constituted, although the number of directors required to constitute the quorum at such meeting is present, unless more than one half of the number of Directors present at such meeting are Non Executive Directors.
Complied during 2016 all the quorum of meetings had been in line with the Direction.
3(2) (viii) The independent Non Executive Directors shall be expressly identified as such in all corporate communications that disclose the names of Directors of the Bank. The Bank shall disclose the composition of the Board, by category of directors, including the names of the Chairman, Executive directors, non – Executive directors, and Independent non Executive directors in the Annual Corporate Governance Report.
Complied Please refer pages 142-147.
3(2) (ix) There shall be a formal, considered and transparent procedure for the appointment of new Directors to the Board. There shall also be procedures in place for the orderly succession of appointments to the Board.
Complied Nominations committee has a procedure in place to appoint Directors and all new appointments have been done in accordance with the procedure.
3(2) (x) all directors appointed to fill a casual vacancy shall be subject to election by shareholders at the first general meeting after their appointment.
Complied all directors appointed to fill casual vacancies during the year 2016 are subject to election at the first annual general meeting after their appointment.
3(2) (xi) If a director resigns or is removed from office, the Board shall: (a) announce the Director’s resignation or removal and the reasons for such removal or resignation; and (b) issue a statement confirming whether or not there are any matters that need to be brought to the attention of shareholders.
Complied Directors’ resignation and the reason for such resignation are duly informed to Central Bank of Sri Lanka (CBSL) and Colombo Stock Exchange (CSE). All resignations during the year are disclosed in the Annual Report. Please refer page 161.
3(2) (xii) A Director or an employee of a bank shall not be appointed, elected or nominated as a director of another bank except where such bank is a subsidiary company or an associate company of the first mentioned bank.
Complied The Bank has a process to identify whether a director of a Bank is appointed, elected or nominated as a Director of another bank based on the affidavit obtained and submitted to CBSL annually. Letter of appointment of selected employees include a clause with regard to this restriction.None of the present Directors or an employee acts as a Director of any bank. Nominations Committee shall ascertain at the time of selection of directors for such appointment of their fit and propriety in accordance with the Banking Act and other regulations by the CBSL.

111|ANNUAL REPORT 2016
CORPORATE GOVERNANCE
SECTION RULE LEVEL OF COMPLIANCE 2016 3(3) CRITERIA TO ASSESS THE FITNESS AND PROPRIETY OF DIRECTORS3(3) (i) The age of a person who serves as Director shall not
exceed 70 years.Complied none of the directors exceeds 70 years.
3(3) (ii) a person shall not hold office as a director of more than 20 companies/entities/institutions inclusive of subsidiaries or associate companies of the Bank.
Complied None of the Directors holds Directorships of more than 20 Companies/entities/institutions inclusive of subsidiaries or associate companies of the Bank.
3(4) MANAGEMENT FUNCTIONS DELEGATED BY THE BOARD3(4) (i) The Directors shall carefully study and clearly understand
the delegation arrangements in place.Complied The Board is empowered by the articles 98 of the Bank’s Articles of Association to delegate its powers to CEO upon such terms and conditions and with such restrictions as the Board may think fit and in terms of the articles. directors are aware of such delegation arrangements.
3(4) (ii) The Board shall not delegate any matters to a Board committee, Chief Executive officer, Executive directors or key Management Personnel, to an extent that such delegation would significantly hinder or reduce the ability of the Board as a whole to discharge its functions.
Complied The Board has delegated powers to the Sub-Committees, CEo and the key Management Personnel without hindering their ability to discharge functions. Please refer 3.1.(i) g
3(4) (iii) The Board shall review the delegation processes in place on a periodic basis to ensure that they remain relevant to the needs of the Bank.
Complied Section 98 of the Bank’s articles of association defines the delegation process and review of such delegated powers on a periodic basis.Such delegated powers are reviewed periodically to ensure that they are remaining relevant to the needs of the Bank at Board meetings, Sub-Committee meetings when reviewing polices and ToRs.
3(5) THE CHAIRMAN AND CHIEF EXECUTIVE OFFICER3(5) (i) The roles of Chairman and Chief Executive officer shall
be separate and shall not be performed by the same individual.
Complied Roles of Chairman and CEO are held by two individuals appointed by the Board.
3(5) (ii) The Chairman shall be a Non Executive Director and preferably an Independent Director as well. In this case where the Chairman is not an Independent director, the Board shall designate an Independent Director as the Senior director with suitably documented terms of reference to ensure a greater independent element. The designation of the Senior director shall be disclosed in the Bank’s Annual Report.
Complied An independent Non Executive Director has been appointed as Senior director of the Bank. designation of the Senior director disclosed in page 142, 144 and 161.
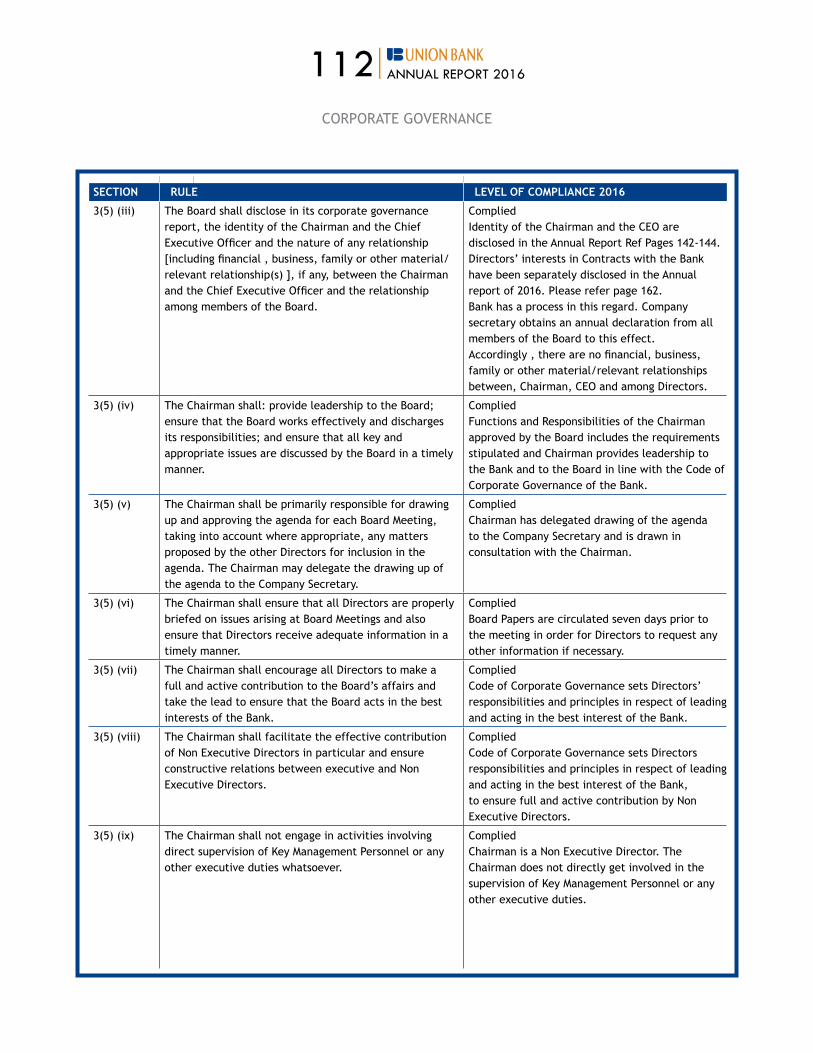
112|ANNUAL REPORT 2016
CORPORATE GOVERNANCE
SECTION RULE LEVEL OF COMPLIANCE 2016
3(5) (iii) The Board shall disclose in its corporate governance report, the identity of the Chairman and the Chief Executive officer and the nature of any relationship [including financial , business, family or other material/relevant relationship(s) ], if any, between the Chairman and the Chief Executive officer and the relationship among members of the Board.
Complied Identity of the Chairman and the CEO are disclosed in the Annual Report Ref Pages 142-144.Directors’ interests in Contracts with the Bank have been separately disclosed in the Annual report of 2016. Please refer page 162.Bank has a process in this regard. Company secretary obtains an annual declaration from all members of the Board to this effect. accordingly , there are no financial, business, family or other material/relevant relationships between, Chairman, CEo and among directors.
3(5) (iv) The Chairman shall: provide leadership to the Board; ensure that the Board works effectively and discharges its responsibilities; and ensure that all key and appropriate issues are discussed by the Board in a timely manner.
Complied Functions and Responsibilities of the Chairman approved by the Board includes the requirements stipulated and Chairman provides leadership to the Bank and to the Board in line with the Code of Corporate Governance of the Bank.
3(5) (v) The Chairman shall be primarily responsible for drawing up and approving the agenda for each Board Meeting, taking into account where appropriate, any matters proposed by the other Directors for inclusion in the agenda. The Chairman may delegate the drawing up of the agenda to the Company Secretary.
Complied Chairman has delegated drawing of the agenda to the Company Secretary and is drawn in consultation with the Chairman.
3(5) (vi) The Chairman shall ensure that all Directors are properly briefed on issues arising at Board Meetings and also ensure that directors receive adequate information in a timely manner.
Complied Board Papers are circulated seven days prior to the meeting in order for directors to request any other information if necessary.
3(5) (vii) The Chairman shall encourage all Directors to make a full and active contribution to the Board’s affairs and take the lead to ensure that the Board acts in the best interests of the Bank.
Complied Code of Corporate Governance sets Directors’ responsibilities and principles in respect of leading and acting in the best interest of the Bank.
3(5) (viii) The Chairman shall facilitate the effective contribution of Non Executive Directors in particular and ensure constructive relations between executive and Non Executive Directors.
Complied Code of Corporate Governance sets Directors responsibilities and principles in respect of leading and acting in the best interest of the Bank, to ensure full and active contribution by Non Executive Directors.
3(5) (ix) The Chairman shall not engage in activities involving direct supervision of Key Management Personnel or any other executive duties whatsoever.
Complied Chairman is a Non Executive Director. The Chairman does not directly get involved in the supervision of Key Management Personnel or any other executive duties.

113|ANNUAL REPORT 2016
CORPORATE GOVERNANCE
SECTION RULE LEVEL OF COMPLIANCE 2016
3(5) (x) The Chairman shall ensure that appropriate steps are taken to maintain effective communication with shareholders and that the views of shareholders are communicated to the Board.
Complied Communication with shareholders are done in accordance with the Board approved Communication Policy.
3(5) (xi) The Chief Executive officer shall function as the apex executive-in-charge of the day-to-day-management of the Bank’s operations and business.
Complied The Chief Executive officer is in charge of the day-to-day management of the Bank’s operations and business and is supported by the Corporate Management.
3(6) BOARD APPOINTED COMMITTEES3(6) (i) Each bank shall have at least four Board committees as
set out in directions 3(6) (ii), 3(6) (iii), 3(6) (iv) and 3(6) (v) of these Directions. Each committee shall report directly to the Board. All committees shall appoint a secretary to arrange the meetings and maintain minutes, record, etc., under the supervision of the Chairman of the committee. The Board shall present a report of the performance on each Committee, on their duties and roles at the Annual General Meeting.
Complied The following mandatory Board Sub-Committees have been appointed by the Board requiring each such committee to report to the Board:1. Human Resources and Remuneration
Committee2. Integrated Risk Management Committee 3. nomination Committee4. Audit Committee
All committees have a secretary appointed. Report of each Board Committee is presented in the annual report ref Pages 126-130 and 134.
3(6) (ii) The following rules shall apply in relation to the Audit Committee:
(a) The Chairman of the committee shall be an Independent Non Executive Director who possesses qualifications and experience in accountancy and/or audit.
CompliedMr. Imtiaz Muhseen Chairman of Audit Committee retired on 1 June 2016. Mr. Yudhishtran Kanagasabai (Fellow of the Institute of Chartered accountants of Sri Lanka)an independent, non Executive director was appointed as the Chairman of the Audit Committee w.e.f. October 2016.
(b) All members of the committee shall be Non Executive Directors.
CompliedAll members of the Committee are Non Executive Directors.

114|ANNUAL REPORT 2016
CORPORATE GOVERNANCE
SECTION RULE LEVEL OF COMPLIANCE 2016
(c) The committee shall make recommendations on matters in connection with: (i) the appointment of the external auditor for audit
services to be provided in compliance with the relevant statutes;
(ii) the implementation of the Central Bank guidelines issued to auditors from time to time;
(iii) the application of the relevant accounting standards; and
(iv)the service period, audit fee and any resignation or dismissal of the auditor; provided that the engagement of the Audit partner shall not exceed five years, and that the particular audit partner is not re-engaged for the audit before the expiry of three years from the date of the completion of the previous term.
CompliedIn line with its Terms of reference, the BaC has reviewed and/or made relevant recommendations including the following:(i) The re-appointment of Messrs Ernst & young,
Chartered Accountants as the Bank’s External Auditors for audit services in compliance with the relevant regulations and guidelines.
(ii) The implementation of guidelines applicable to the External Auditors issued from time to time by the Central Bank of Sri Lanka.
(iii) The application of relevant accounting standards, including the requirements of the Sri Lanka Financial reporting Standards (SLFrS/LkaS) complying with the IaS and the IFrS complying to it in all material respects.
(iv) Reviewed and recommended the service period and audit fee.
(d) Review and monitor external auditor’s independence and objectivity and the effectiveness of the audit processes.
CompliedThe BaC discussed with the External auditors, the nature and the scope of audit and the effectiveness of the audit processes in respect of the financial year, 2016 at a meeting held with the auditors in the last quarter of 2016. Representation submitted by the External Auditors stating their independence and the objectivity and effectiveness of the audit processes in accordance with SLauS, applicable standards and best practices.

115|ANNUAL REPORT 2016
CORPORATE GOVERNANCE
SECTION RULE LEVEL OF COMPLIANCE 2016
(e) The committee shall develop and implement a policy on the engagement of an external auditor to provide non-audit services that are permitted under the relevant statutes, regulations, requirements and guidelines, in doing so; the Committee shall ensure that the provision by an External Auditor of non audit service does not impair the External Auditor’s Independence or objectivity. when assessing the external auditor’s independence or objectivity in relation to the provision non audit services, the Committee shall consider,(i) whether the skills and experience of the audit
firm make it a suitable provider of the non-audit services
(ii) whether there are safeguards in place to ensure that there is no threat to the objectivity and/or independence in the conduct of the audit resulting form the provision of such services by the External auditor; and
(iii) whether the nature of the non-audit services, the related fee levels and the fee levels individually and in aggregate relative to the audit firm, pose any threat to the objectivity and/or independence of the External Auditor
CompliedThe Committee has implemented a process on the engagement of an External Auditor to provide non audit services after considering relevant statutes, regulations, requirements and guidelines. Further, relevant information is obtained from External Auditors to ensure that their independence or objectivity is not impaired, as a result of providing any non-audit services.
(f) The committee shall, before the audit commences, discuss and finalise with the external auditors the nature and scope of the audit , including (i) an assessment of the Bank’s compliance with the relevant Direction in relation to corporate governance and the management’s internal controls over Financial reporting; (ii) the preparation of Financial Statements for external purposes in accordance with relevant accounting principles and reporting obligations; and (iii) the co-ordination between firms where more than one audit firm is involved.
CompliedThe Auditors make a presentation at the Board Audit Committee Meeting with details of the proposed audit Plan and the Scope. The committee discussed and agreed on the nature and the scope of the audit to be performed in accordance with SLauS. The letters of engagement of the External Auditors in respect of the audits for the year 2016 were reviewed and recommended by the BAC prior to approval of the Board.

116|ANNUAL REPORT 2016
CORPORATE GOVERNANCE
SECTION RULE LEVEL OF COMPLIANCE 2016
(g) Check that the committee has a process to review the financial information of the Bank, in order to monitor the integrity of the Financial Statements of the Bank, its annual report, accounts and quarterly reports prepared for disclosure, and a process in place to receive from the CFo the following;(i) major judgmental areas;(ii) any changes in accounting policies and practices;(iii) the going concern assumption; and(iv) the compliance with relevant accounting
standards and other legal requirements, and;(v) in respect of the annual Financial Statements the
significant adjustments arising from the audit.
Complied
Committee has a process to review financial information of the Bank when the quarterly and annual audited Financial Statement and the reports prepared for disclosure are presented to the committee by the Chief Financial officer.Once the members of the Board Audit Committee have obtained required clarifications in respect of all aspects included in the Financial Statements. Such Financial Statements are recommended for approval by the Board of Directors by the Board Audit Committee.
(h) The committee shall discuss issues, problems and reservations arising from the interim and final audits, and any matters the auditor may wish to discuss including those matters that may need to be discussed in the absence of Key Management Personnel, if necessary.
CompliedThe BAC met with the External Auditors during the year which included three meetings without the presence of the management and ensured that there was no limitation of scope or incidents that could have a negative impact on the effectiveness of the external audit.
(i) The committee shall review the external auditor’s management letter and the management’s response thereto.
CompliedBAC reviewed management letter with the management’s responses thereto. A separate Board Audit Committee meeting was held with the external auditors and relevant Heads of departments to discuss significant findings and remedial action to be taken in respect of such findings.
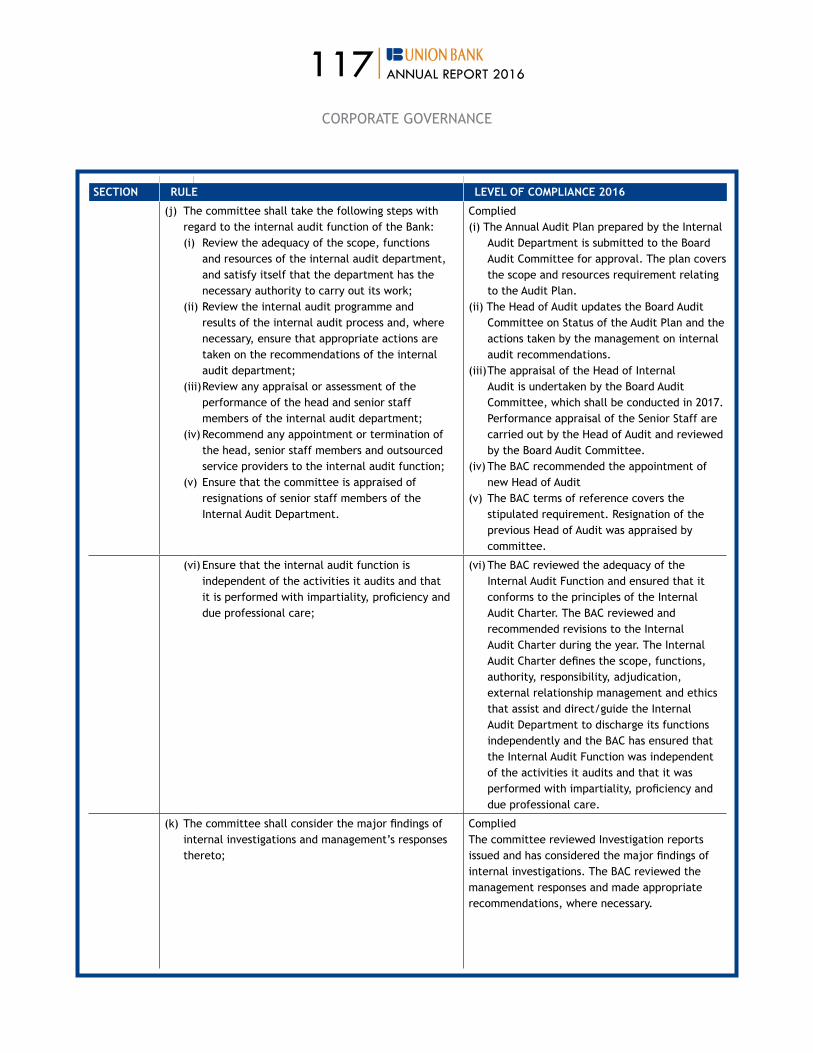
117|ANNUAL REPORT 2016
CORPORATE GOVERNANCE
SECTION RULE LEVEL OF COMPLIANCE 2016
(j) The committee shall take the following steps with regard to the internal audit function of the Bank:(i) review the adequacy of the scope, functions
and resources of the internal audit department, and satisfy itself that the department has the necessary authority to carry out its work;
(ii) Review the internal audit programme and results of the internal audit process and, where necessary, ensure that appropriate actions are taken on the recommendations of the internal audit department;
(iii) Review any appraisal or assessment of the performance of the head and senior staff members of the internal audit department;
(iv) Recommend any appointment or termination of the head, senior staff members and outsourced service providers to the internal audit function;
(v) Ensure that the committee is appraised of resignations of senior staff members of the Internal Audit Department.
Complied(i) The Annual Audit Plan prepared by the Internal
Audit Department is submitted to the Board Audit Committee for approval. The plan covers the scope and resources requirement relating to the Audit Plan.
(ii) The Head of Audit updates the Board Audit Committee on Status of the audit Plan and the actions taken by the management on internal audit recommendations.
(iii) The appraisal of the Head of Internal Audit is undertaken by the Board Audit Committee, which shall be conducted in 2017. Performance appraisal of the Senior Staff are carried out by the Head of Audit and reviewed by the Board Audit Committee.
(iv) The BAC recommended the appointment of new Head of Audit
(v) The BAC terms of reference covers the stipulated requirement. resignation of the previous Head of Audit was appraised by committee.
(vi) Ensure that the internal audit function is independent of the activities it audits and that it is performed with impartiality, proficiency and due professional care;
(vi) The BaC reviewed the adequacy of the Internal Audit Function and ensured that it conforms to the principles of the Internal Audit Charter. The BAC reviewed and recommended revisions to the Internal Audit Charter during the year. The Internal audit Charter defines the scope, functions, authority, responsibility, adjudication, external relationship management and ethics that assist and direct/guide the Internal Audit Department to discharge its functions independently and the BAC has ensured that the Internal Audit Function was independent of the activities it audits and that it was performed with impartiality, proficiency and due professional care.
(k) The committee shall consider the major findings of internal investigations and management’s responses thereto;
CompliedThe committee reviewed Investigation reports issued and has considered the major findings of internal investigations. The BAC reviewed the management responses and made appropriate recommendations, where necessary.

118|ANNUAL REPORT 2016
CORPORATE GOVERNANCE
SECTION RULE LEVEL OF COMPLIANCE 2016
(l) The Chief Finance officer, the Chief Internal auditor and a representative of the External Auditor may normally attend meetings, other Board Members and the Chief Executive officer may also attend meetings upon the invitation of the Committee. However, at least twice a year, the Committee shall meet with the External Auditors without the Executive Directors being present.
CompliedThe Chief Internal Auditor who is secretary to the audit committee attends meetings, Chief Financial officer, d/CEo and other corporate heads attended meetings by invitation. Committee has met the external auditors without the Executive Directors being present.
(m) The committee shall have:(i) explicit authority to investigate into any matter
within its terms of reference; (ii) the resources which it needs to do so; (iii) full access to information; and (iv) authority to obtain external professional advice
and to invite outsiders with relevant experience to attend, if necessary.
CompliedThe BAC’s Terms of Reference provides it authority to investigate into any matter within its terms of reference; obtain the resources which it needs to carry out the investigation; full access to information; and authority to obtain external professional advice and to invite outsiders with relevant experience to be involved, if necessary.
(n) The committee shall meet regularly, with due notice of issues to be discussed and shall record its conclusions in discharging its duties and responsibilities.
CompliedThe BaC met 08 times during the year with due notice. The agenda and the papers for discussions and consideration/approval were circulated prior to the meeting. The minutes of the meetings were recorded by the Head of Internal Audit who functioned as the Secretary to the Committee. The minutes were confirmed by the BaC at the next regular meeting.
(o) The Board shall disclose in an informative way, (i) details of the activities of the audit committee; (ii) the number of audit committee meetings held in the year; and (iii) details of attendance of each individual Director at such meetings.
CompliedPlease Refer the Board Audit Committee Report on and attendance on pages 126-127.
(p) The secretary of the committee (who may be the company secretary or the head of the internal audit function) shall record and keep detailed minutes of the committee meetings.
CompliedThe Head of audit, who is secretary of the Committee, records and maintains all minutes of the meetings.
(q) The committee shall review arrangements by which employees of the Bank may, in confidence, raise concerns about possible improprieties in Financial reporting, internal control or other matters. accordingly, the committee shall ensure that proper arrangements are in place for the fair and independent investigation of such matters and for appropriate follow-up action and to act as the key representative body for overseeing the Bank’s relations with the external auditor.
CompliedThe Bank has in place a Whistle-Blower Policy which was reviewed/revised during the year. The BAC has ensured that all employees are duly informed and duly advised of the effective use of the whistle-Blower process. Independent investigations were carried out by the Internal Audit Department on whistle blower complaints and were reported to the BAC.

119|ANNUAL REPORT 2016
CORPORATE GOVERNANCE
SECTION RULE LEVEL OF COMPLIANCE 2016
3(6) (iii) The following rules shall apply in relation to the Human Resources and Remuneration Committee:
(a) The committee shall determine the remuneration policy (salaries, allowances and other financial payments) relating to directors, Chief Executive officer (CEo) and key Management Personnel of the Bank.
Complied A Board approved Remuneration Policy is in place to determine remuneration in relation to directors, Chief Executive officer (CEo) and key Management Personnel of the Bank.
(b) The committee shall set goals and targets for the directors, CEo and the key Management Personnel.
Complied Goals and targets for Directors are in place approved by the committee.Goals and Targets for Key Management Personnel had been set for the year 2016.
(c) The committee shall evaluate the performance of the CEO and Key Management Personnel against the set targets and goals periodically and determine the basis for revising remuneration, benefits and other payments of performance-based incentives.
Complied A balanced score card was used to set the targets for the Key Management Personnel in 2016. Their performance will be assessed in February 2017 against the set targets. Revision of remuneration in 2017 will be linked to the 2016 performance of the respective Key Management Personnel.
(d) The CEO shall be present at all meetings of the committee, except when matters relating to the CEo are being discussed.
Complied The Board approved HrrC Charter defines the criteria that the CEO shall attend all meetings of the committee by invitation except when matters relating to him are being discussed.
3(6) (iv) The following rules shall apply in relation to the Nomination Committee:
(a) The committee shall implement a procedure to select/appoint new directors, CEo and key Management Personnel.
Complied The Board approved policy is in place to select/appoint new directors, CEo and key Management Personnel.
(b) The committee shall consider and recommend (or not recommend) the re-election of current directors, taking into account the performance and contribution made by the Director concerned towards the overall discharge of the Board’s responsibilities.
Complied The Board approved policy and process in place.The Committee has considered and recommended the appointment of current Directors.
(c) The committee shall set the criteria for eligibility to be considered for appointment or promotion to the post of CEO and the key management positions.
Complied Policy is in place for ‘ Selection Criteria for directors, CEo and key Management Personnel’ which includes the required criteria and appointments and promotions. All Key Management Personnel have been appointed with the approval of the committee.

120|ANNUAL REPORT 2016
CORPORATE GOVERNANCE
SECTION RULE LEVEL OF COMPLIANCE 2016
(d) The committee shall ensure that directors, CEo and key Management Personnel are fit and proper persons to hold office as specified in the criteria given in direction 3(3) and as set out in the Statutes.
Complied Policy is in place for ‘ Selection Criteria for directors, CEo and key Management Personnel’ which includes the required criteria and appointments and promotions. All Key Management Personnel have been appointed with the approval of the committee.
a fit and proper certificate from Central Bank has been obtained for all appointments of Directors and Key Management Personnel.
(e) The committee shall consider and recommend from time to time, the requirements of additional/new expertise and the succession arrangements for retiring Directors and Key Management Personnel.
Complied The committee has considered the requirements for succession arrangements for new Directors and KMPs during the year 2016.
The Committee shall be chaired by an Independent Director. The CEO may be present at meetings by invitation.
Complied Chairman of NC is an Independent Director.CEO has attended NC meetings by invitation.
3(6) (v) The following rules shall apply in relation to the Integrated Risk Management Committee:
(a) The committee shall consist of at least three Non Executive directors, Chief Executive officer and Key Management Personnel supervising broad risk categories,
i.e., credit, market, liquidity, operational and strategic risks. The committee shall work with Key Management Personnel very closely and make decision on behalf of the Board within the framework of the authority and responsibility assigned to the Committee.
Complied A Board approved Terms of Reference for the IRMC is in place.
Committee consists of five non Executive directors, CEo and Chief risk officer. other key Management Personnel supervising broad risk categories i. e. Chief Financial officer, VP – whole sale Banking VP – retail VP –IT, VP – operations, aVP – audit and Compliance officer are called by invitation to discuss respective risk areas.
(b) The committee shall assess all risks, i.e., credit, market, liquidity, operational and strategic risks to the Bank on a monthly basis. In the case of subsidiary companies and associate companies, risk management shall be done, both on a bank basis and group basis.
Complied on a monthly basis, IrMC has implemented a procedure to assess the risks such as credit, market, and operational risks of the Bank through relevant risk indicators and management information and such Risks are reported to IRMC through Quarterly risk report and Risk Matrix table. The Bank has also formed a Group Risk Governance structure covering its connected entities.
(c) The committee shall review the adequacy and effectiveness of all management level committees such as the Credit Committee and the asset-Liability Committee to address specific risks and to manage those risks within quantitative and qualitative risk limits as specified by the Committee.
Complied The committee reviews the adequacy and effectiveness of all management level committees.
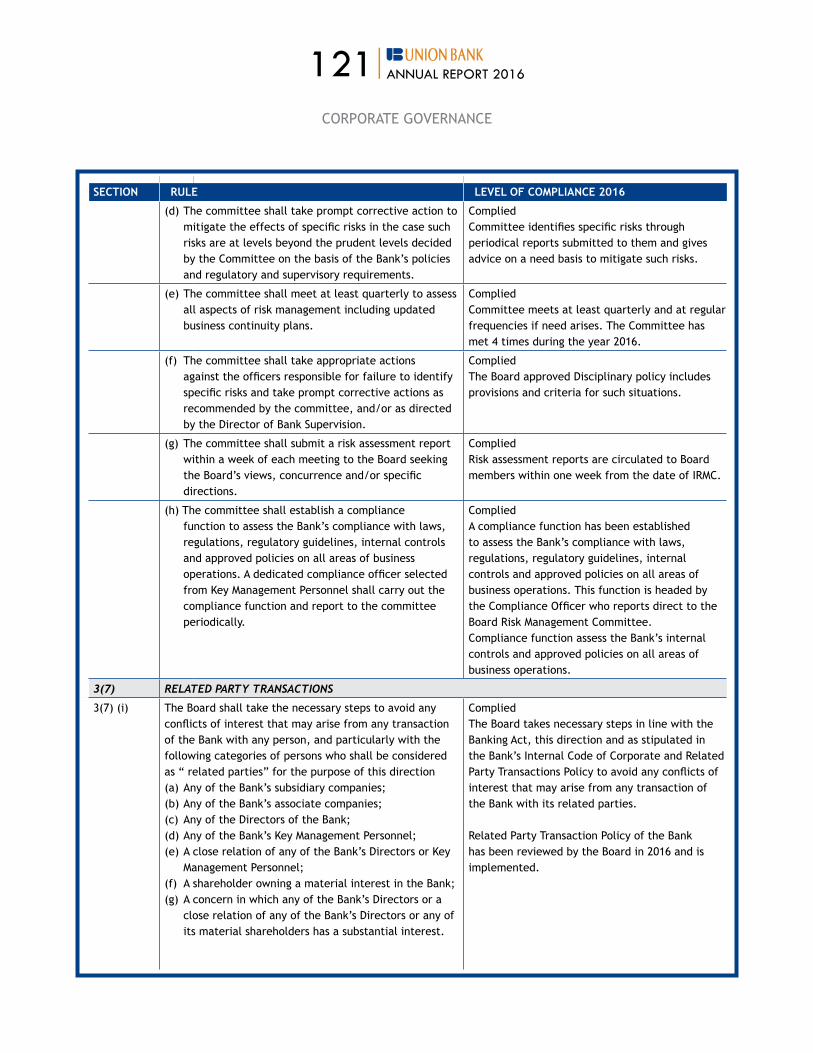
121|ANNUAL REPORT 2016
CORPORATE GOVERNANCE
SECTION RULE LEVEL OF COMPLIANCE 2016
(d) The committee shall take prompt corrective action to mitigate the effects of specific risks in the case such risks are at levels beyond the prudent levels decided by the Committee on the basis of the Bank’s policies and regulatory and supervisory requirements.
Complied Committee identifies specific risks through periodical reports submitted to them and gives advice on a need basis to mitigate such risks.
(e) The committee shall meet at least quarterly to assess all aspects of risk management including updated business continuity plans.
Complied Committee meets at least quarterly and at regular frequencies if need arises. The Committee has met 4 times during the year 2016.
(f) The committee shall take appropriate actions against the officers responsible for failure to identify specific risks and take prompt corrective actions as recommended by the committee, and/or as directed by the director of Bank Supervision.
Complied The Board approved Disciplinary policy includes provisions and criteria for such situations.
(g) The committee shall submit a risk assessment report within a week of each meeting to the Board seeking the Board’s views, concurrence and/or specific directions.
Complied Risk assessment reports are circulated to Board members within one week from the date of IRMC.
(h) The committee shall establish a compliance function to assess the Bank’s compliance with laws, regulations, regulatory guidelines, internal controls and approved policies on all areas of business operations. a dedicated compliance officer selected from Key Management Personnel shall carry out the compliance function and report to the committee periodically.
Complied A compliance function has been established to assess the Bank’s compliance with laws, regulations, regulatory guidelines, internal controls and approved policies on all areas of business operations. This function is headed by the Compliance officer who reports direct to the Board Risk Management Committee. Compliance function assess the Bank’s internal controls and approved policies on all areas of business operations.
3(7) RELATED PARTY TRANSACTIONS
3(7) (i) The Board shall take the necessary steps to avoid any conflicts of interest that may arise from any transaction of the Bank with any person, and particularly with the following categories of persons who shall be considered as “ related parties” for the purpose of this direction (a) any of the Bank’s subsidiary companies;(b) any of the Bank’s associate companies;(c) any of the directors of the Bank;(d) any of the Bank’s key Management Personnel;(e) A close relation of any of the Bank’s Directors or Key
Management Personnel;(f) a shareholder owning a material interest in the Bank;(g) A concern in which any of the Bank’s Directors or a
close relation of any of the Bank’s Directors or any of its material shareholders has a substantial interest.
Complied The Board takes necessary steps in line with the Banking act, this direction and as stipulated in the Bank’s Internal Code of Corporate and Related Party Transactions Policy to avoid any conflicts of interest that may arise from any transaction of the Bank with its related parties.
Related Party Transaction Policy of the Bank has been reviewed by the Board in 2016 and is implemented.
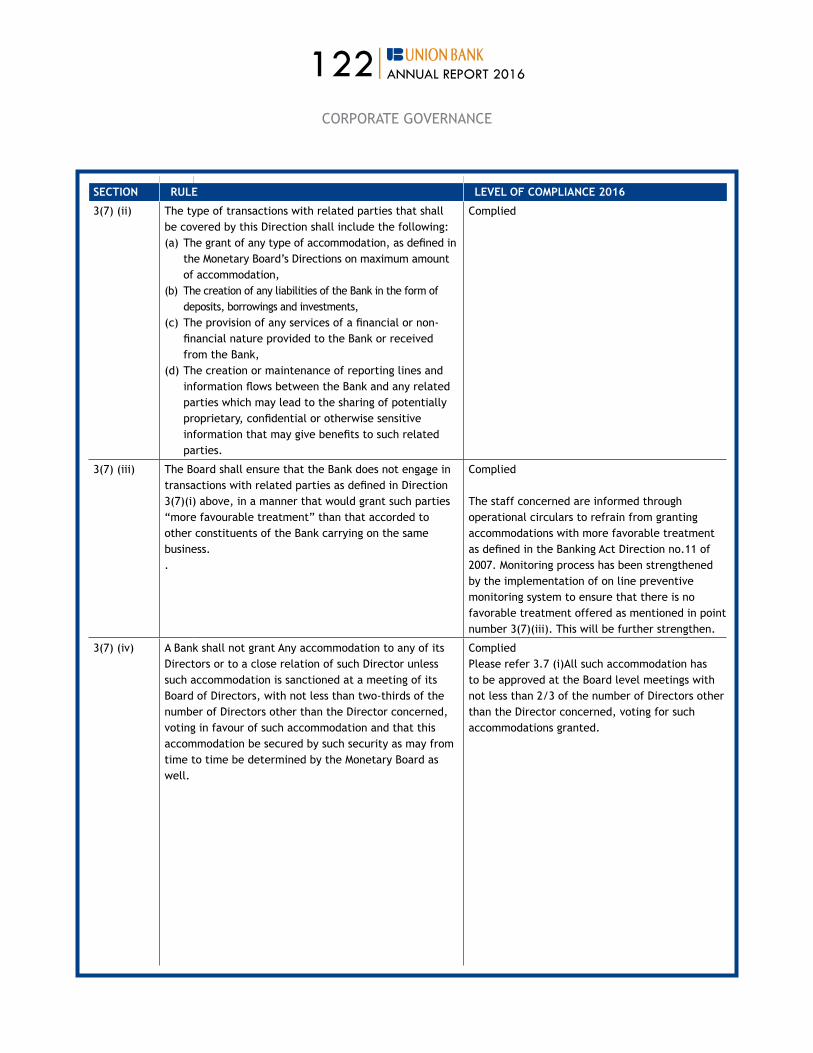
122|ANNUAL REPORT 2016
CORPORATE GOVERNANCE
SECTION RULE LEVEL OF COMPLIANCE 2016
3(7) (ii) The type of transactions with related parties that shall be covered by this Direction shall include the following:(a) The grant of any type of accommodation, as defined in
the Monetary Board’s Directions on maximum amount of accommodation,
(b) The creation of any liabilities of the Bank in the form of deposits, borrowings and investments,
(c) The provision of any services of a financial or non-financial nature provided to the Bank or received from the Bank,
(d) The creation or maintenance of reporting lines and information flows between the Bank and any related parties which may lead to the sharing of potentially proprietary, confidential or otherwise sensitive information that may give benefits to such related parties.
Complied
3(7) (iii) The Board shall ensure that the Bank does not engage in transactions with related parties as defined in direction 3(7)(i) above, in a manner that would grant such parties “more favourable treatment” than that accorded to other constituents of the Bank carrying on the same business. .
Complied
The staff concerned are informed through operational circulars to refrain from granting accommodations with more favorable treatment as defined in the Banking act direction no.11 of 2007. Monitoring process has been strengthened by the implementation of on line preventive monitoring system to ensure that there is no favorable treatment offered as mentioned in point number 3(7)(iii). This will be further strengthen.
3(7) (iv) A Bank shall not grant Any accommodation to any of its Directors or to a close relation of such Director unless such accommodation is sanctioned at a meeting of its Board of directors, with not less than two-thirds of the number of directors other than the director concerned, voting in favour of such accommodation and that this accommodation be secured by such security as may from time to time be determined by the Monetary Board as well.
Complied Please refer 3.7 (i)all such accommodation has to be approved at the Board level meetings with not less than 2/3 of the number of directors other than the director concerned, voting for such accommodations granted.
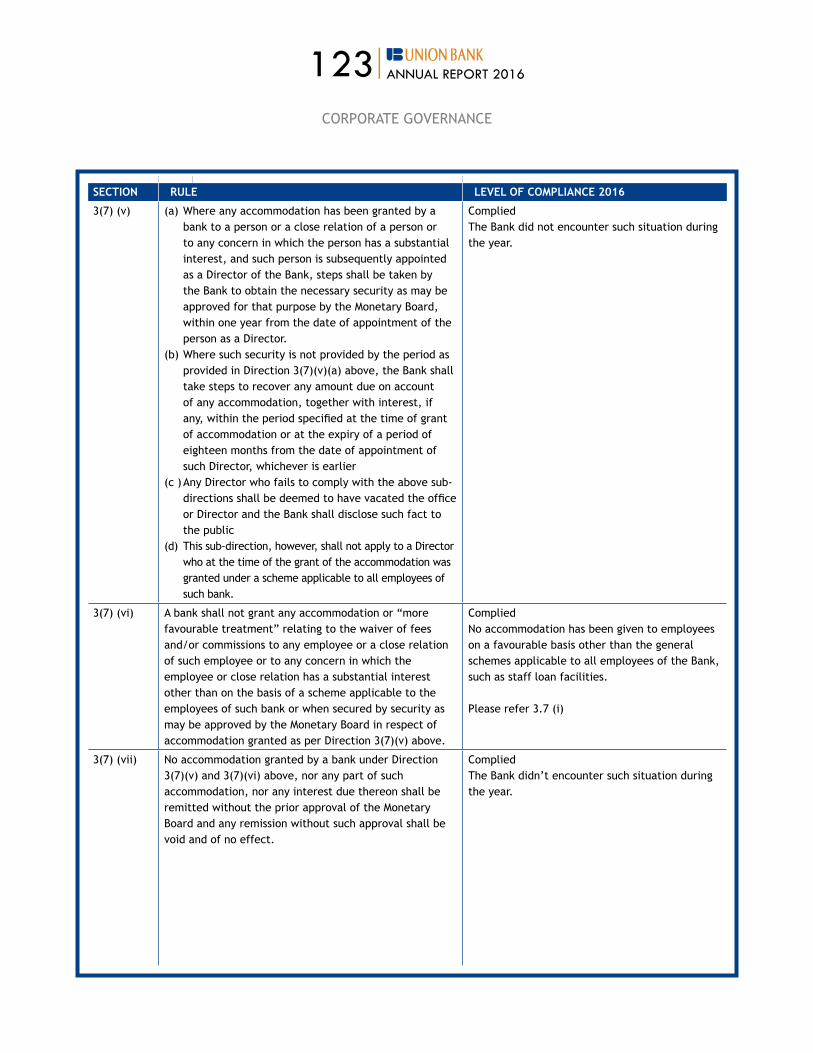
123|ANNUAL REPORT 2016
CORPORATE GOVERNANCE
SECTION RULE LEVEL OF COMPLIANCE 2016
3(7) (v) (a) Where any accommodation has been granted by a bank to a person or a close relation of a person or to any concern in which the person has a substantial interest, and such person is subsequently appointed as a director of the Bank, steps shall be taken by the Bank to obtain the necessary security as may be approved for that purpose by the Monetary Board, within one year from the date of appointment of the person as a Director.
(b) Where such security is not provided by the period as provided in direction 3(7)(v)(a) above, the Bank shall take steps to recover any amount due on account of any accommodation, together with interest, if any, within the period specified at the time of grant of accommodation or at the expiry of a period of eighteen months from the date of appointment of such director, whichever is earlier
(c ) Any Director who fails to comply with the above sub-directions shall be deemed to have vacated the office or Director and the Bank shall disclose such fact to the public
(d) This sub-direction, however, shall not apply to a director who at the time of the grant of the accommodation was granted under a scheme applicable to all employees of such bank.
Complied The Bank did not encounter such situation during the year.
3(7) (vi) A bank shall not grant any accommodation or “more favourable treatment” relating to the waiver of fees and/or commissions to any employee or a close relation of such employee or to any concern in which the employee or close relation has a substantial interest other than on the basis of a scheme applicable to the employees of such bank or when secured by security as may be approved by the Monetary Board in respect of accommodation granted as per direction 3(7)(v) above.
Complied No accommodation has been given to employees on a favourable basis other than the general schemes applicable to all employees of the Bank, such as staff loan facilities.
Please refer 3.7 (i)
3(7) (vii) No accommodation granted by a bank under Direction 3(7)(v) and 3(7)(vi) above, nor any part of such accommodation, nor any interest due thereon shall be remitted without the prior approval of the Monetary Board and any remission without such approval shall be void and of no effect.
Complied The Bank didn’t encounter such situation during the year.
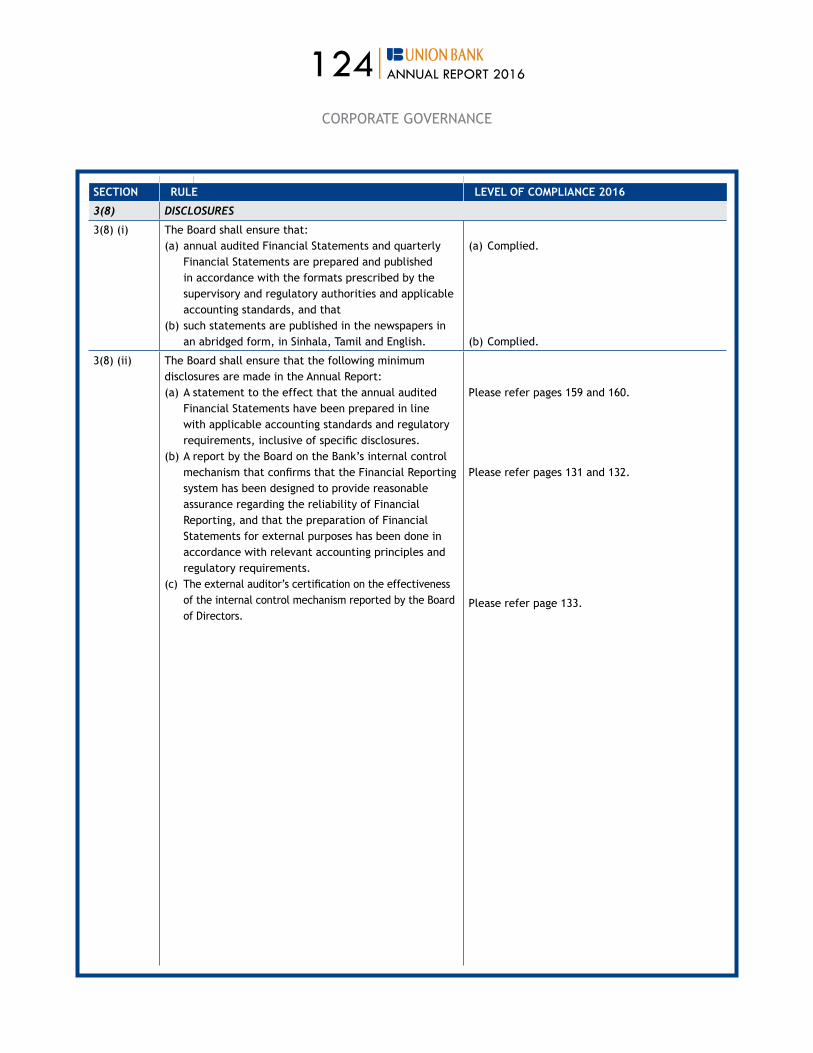
124|ANNUAL REPORT 2016
CORPORATE GOVERNANCE
SECTION RULE LEVEL OF COMPLIANCE 2016
3(8) DISCLOSURES
3(8) (i) The Board shall ensure that: (a) annual audited Financial Statements and quarterly
Financial Statements are prepared and published in accordance with the formats prescribed by the supervisory and regulatory authorities and applicable accounting standards, and that
(b) such statements are published in the newspapers in an abridged form, in Sinhala, Tamil and English.
(a) Complied.
(b) Complied.
3(8) (ii) The Board shall ensure that the following minimum disclosures are made in the Annual Report: (a) A statement to the effect that the annual audited
Financial Statements have been prepared in line with applicable accounting standards and regulatory requirements, inclusive of specific disclosures.
(b) A report by the Board on the Bank’s internal control mechanism that confirms that the Financial reporting system has been designed to provide reasonable assurance regarding the reliability of Financial reporting, and that the preparation of Financial Statements for external purposes has been done in accordance with relevant accounting principles and regulatory requirements.
(c) The external auditor’s certification on the effectiveness of the internal control mechanism reported by the Board of Directors.
Please refer pages 159 and 160.
Please refer pages 131 and 132.
Please refer page 133.

125|ANNUAL REPORT 2016
CORPORATE GOVERNANCE
SECTION RULE LEVEL OF COMPLIANCE 2016
(d) details of directors, (i) including names, fitness and propriety,(ii) transactions with the Bank and (iii) the total of fees/remuneration paid by the Bank.
(e) Total net accommodation as defined in 3(7)(iii) granted to each category of related parties. The net accommodation granted to each category of related parties shall also be disclosed as a percentage of the Bank’s regulatory capital.
(f) The aggregate values of remuneration paid by the Bank to its Key Management Personnel and the aggregate values of the transactions of the Bank with its key Management Personnel, set out by broad categories such as remuneration
(g) The external auditor’s certification of the compliance with these Directions in the annual corporate governance directions in the annual corporate governance reports published in the annual report.
(h) A report setting out details of the compliance with(i) prudential requirements, regulations, laws and (ii) internal controls and (iii) Measures taken to rectify any material non-
compliance.(i) A statement of the regulatory and supervisory
concerns on lapses in the Bank’s risk management, or non-compliance with these Directions that have been pointed out by the director of Bank Supervision, if so directed by the Monetary Board to be disclosed to the public, together with the measures taken by the Bank to address such concerns.
Please refer pages 142-147, 159, 162.
Please refer page 159.
Please refer page 159.
The Bank has obtained External Auditor’s Factual Finding Report on this Corporate Governance Report.
Please refer page 162.
There is no such non compliance issues pointed out by the director of Bank Supervision to be disclosed to the public.
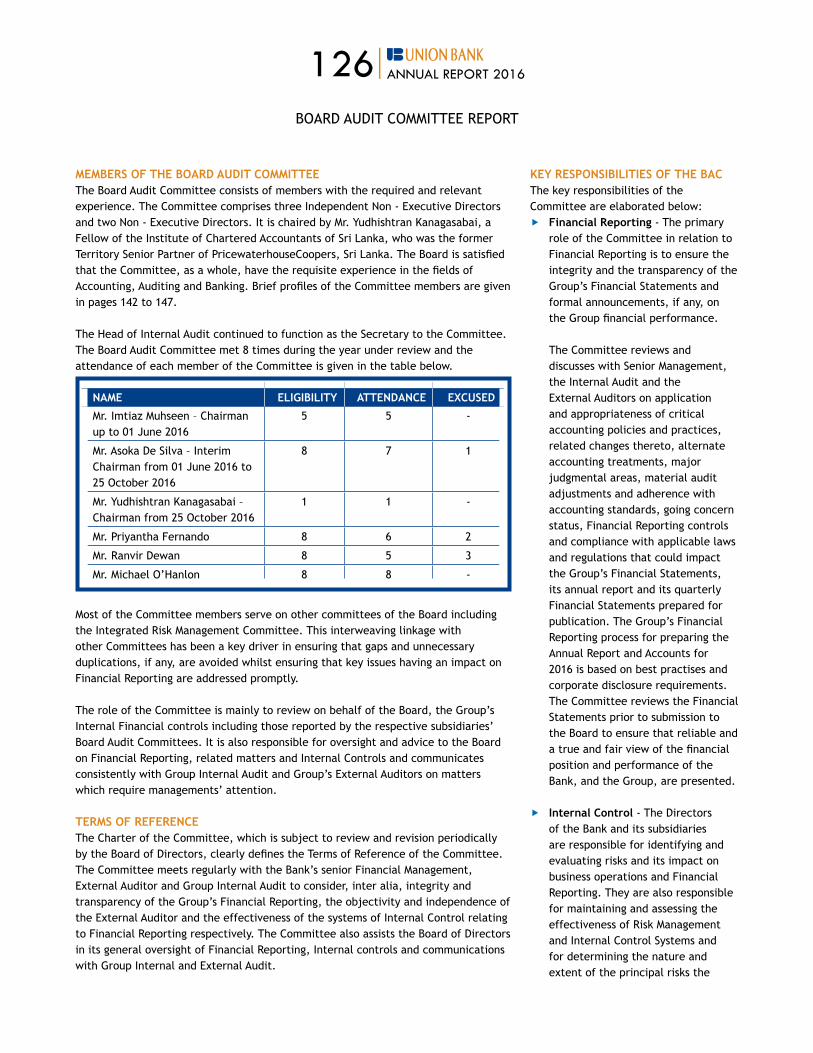
126|ANNUAL REPORT 2016
MEMBERS OF THE BOARD AUDIT COMMITTEEThe Board audit Committee consists of members with the required and relevant experience. The Committee comprises three Independent Non - Executive Directors and two non - Executive directors. It is chaired by Mr. yudhishtran kanagasabai, a Fellow of the Institute of Chartered accountants of Sri Lanka, who was the former Territory Senior Partner of PricewaterhouseCoopers, Sri Lanka. The Board is satisfied that the Committee, as a whole, have the requisite experience in the fields of accounting, auditing and Banking. Brief profiles of the Committee members are given in pages 142 to 147.
The Head of Internal audit continued to function as the Secretary to the Committee. The Board audit Committee met 8 times during the year under review and the attendance of each member of the Committee is given in the table below.
NAME ELIGIBILITY ATTENDANCE ExCUSED
Mr. Imtiaz Muhseen – Chairman up to 01 June 2016
5 5 -
Mr. asoka de Silva – Interim Chairman from 01 June 2016 to 25 October 2016
8 7 1
Mr. yudhishtran kanagasabai –Chairman from 25 October 2016
1 1 -
Mr. Priyantha Fernando 8 6 2
Mr. Ranvir Dewan 8 5 3
Mr. Michael O’Hanlon 8 8 -
Most of the Committee members serve on other committees of the Board including the Integrated Risk Management Committee. This interweaving linkage with other Committees has been a key driver in ensuring that gaps and unnecessary duplications, if any, are avoided whilst ensuring that key issues having an impact on Financial Reporting are addressed promptly.
The role of the Committee is mainly to review on behalf of the Board, the group’s Internal Financial controls including those reported by the respective subsidiaries’ Board Audit Committees. It is also responsible for oversight and advice to the Board on Financial reporting, related matters and Internal Controls and communicates consistently with Group Internal Audit and Group’s External Auditors on matters which require managements’ attention.
TERMS OF REFERENCEThe Charter of the Committee, which is subject to review and revision periodically by the Board of directors, clearly defines the Terms of reference of the Committee. The Committee meets regularly with the Bank’s senior Financial Management, External auditor and group Internal audit to consider, inter alia, integrity and transparency of the group’s Financial reporting, the objectivity and independence of the External Auditor and the effectiveness of the systems of Internal Control relating to Financial Reporting respectively. The Committee also assists the Board of Directors in its general oversight of Financial reporting, Internal controls and communications with Group Internal and External Audit.
KEY RESPONSIBILITIES OF THE BACThe key responsibilities of the Committee are elaborated below: ff Financial Reporting - The primary
role of the Committee in relation to Financial Reporting is to ensure the integrity and the transparency of the group’s Financial Statements and formal announcements, if any, on the group financial performance. The Committee reviews and discusses with Senior Management, the Internal Audit and the External Auditors on application and appropriateness of critical accounting policies and practices, related changes thereto, alternate accounting treatments, major judgmental areas, material audit adjustments and adherence with accounting standards, going concern status, Financial reporting controls and compliance with applicable laws and regulations that could impact the group’s Financial Statements, its annual report and its quarterly Financial Statements prepared for publication. The Group’s Financial Reporting process for preparing the Annual Report and Accounts for 2016 is based on best practises and corporate disclosure requirements. The Committee reviews the Financial Statements prior to submission to the Board to ensure that reliable and a true and fair view of the financial position and performance of the Bank, and the group, are presented.
ff Internal Control - The Directors of the Bank and its subsidiaries are responsible for identifying and evaluating risks and its impact on business operations and Financial Reporting. They are also responsible for maintaining and assessing the effectiveness of Risk Management and Internal Control Systems and for determining the nature and extent of the principal risks the
BOARD AUDIT COMMITTEE REPORT
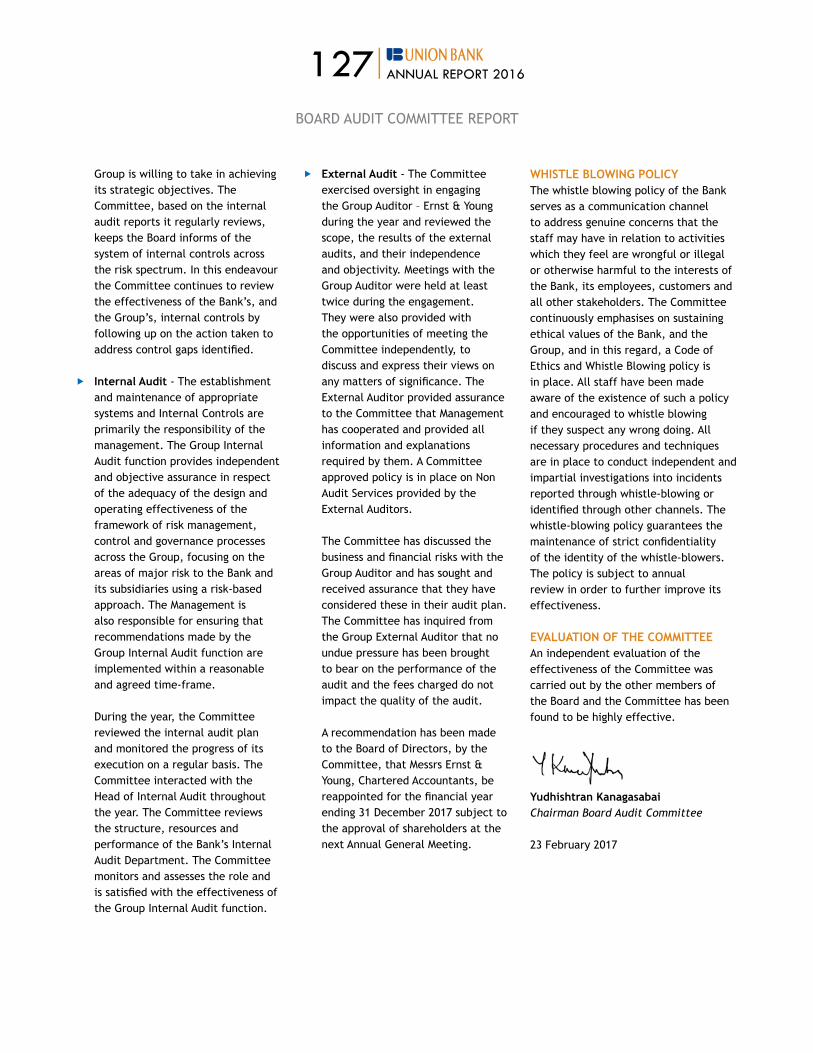
127|ANNUAL REPORT 2016
Group is willing to take in achieving its strategic objectives. The Committee, based on the internal audit reports it regularly reviews, keeps the Board informs of the system of internal controls across the risk spectrum. In this endeavour the Committee continues to review the effectiveness of the Bank’s, and the group’s, internal controls by following up on the action taken to address control gaps identified.
ff Internal Audit - The establishment and maintenance of appropriate systems and Internal Controls are primarily the responsibility of the management. The Group Internal Audit function provides independent and objective assurance in respect of the adequacy of the design and operating effectiveness of the framework of risk management, control and governance processes across the group, focusing on the areas of major risk to the Bank and its subsidiaries using a risk-based approach. The Management is also responsible for ensuring that recommendations made by the Group Internal Audit function are implemented within a reasonable and agreed time-frame. during the year, the Committee reviewed the internal audit plan and monitored the progress of its execution on a regular basis. The Committee interacted with the Head of Internal Audit throughout the year. The Committee reviews the structure, resources and performance of the Bank’s Internal Audit Department. The Committee monitors and assesses the role and is satisfied with the effectiveness of the Group Internal Audit function.
ff External Audit - The Committee exercised oversight in engaging the group auditor – Ernst & young during the year and reviewed the scope, the results of the external audits, and their independence and objectivity. Meetings with the Group Auditor were held at least twice during the engagement. They were also provided with the opportunities of meeting the Committee independently, to discuss and express their views on any matters of significance. The External Auditor provided assurance to the Committee that Management has cooperated and provided all information and explanations required by them. a Committee approved policy is in place on Non audit Services provided by the External Auditors. The Committee has discussed the business and financial risks with the Group Auditor and has sought and received assurance that they have considered these in their audit plan. The Committee has inquired from the Group External Auditor that no undue pressure has been brought to bear on the performance of the audit and the fees charged do not impact the quality of the audit. A recommendation has been made to the Board of directors, by the Committee, that Messrs Ernst & young, Chartered accountants, be reappointed for the financial year ending 31 december 2017 subject to the approval of shareholders at the next Annual General Meeting.
WHISTLE BLOWING POLICY The whistle blowing policy of the Bank serves as a communication channel to address genuine concerns that the staff may have in relation to activities which they feel are wrongful or illegal or otherwise harmful to the interests of the Bank, its employees, customers and all other stakeholders. The Committee continuously emphasises on sustaining ethical values of the Bank, and the group, and in this regard, a Code of Ethics and Whistle Blowing policy is in place. All staff have been made aware of the existence of such a policy and encouraged to whistle blowing if they suspect any wrong doing. All necessary procedures and techniques are in place to conduct independent and impartial investigations into incidents reported through whistle-blowing or identified through other channels. The whistle-blowing policy guarantees the maintenance of strict confidentiality of the identity of the whistle-blowers. The policy is subject to annual review in order to further improve its effectiveness.
EVALUATION OF THE COMMITTEE An independent evaluation of the effectiveness of the Committee was carried out by the other members of the Board and the Committee has been found to be highly effective.
Yudhishtran KanagasabaiChairman Board Audit Committee
23 February 2017
BOARD AUDIT COMMITTEE REPORT

128|ANNUAL REPORT 2016
HUMan rESoUrCES and rEMUnEraTIon CoMMITTEE rEPorT
COMPOSITION OF THE COMMITTEE The Human Resources and Remuneration Committee (“the Committee”) is comprised of five directors appointed by the Board of Directors of the Bank out of whom three are Independent Non Executive Directors.
The present Committee is constituted with Ayomi Aluwihare-Gunawardene as Chairperson and P. Jayendra nayak (Chairman of the Board), Sabry ghouse, Priyantha Fernando and Gaurav Trehan. The director/Chief Executive officer (CEo) who is responsible for the overall management of the Bank, attends and participates in meetings of the Committee except when matters relating to the CEO are discussed.
The Committee reported directly to the Board of Directors of the Bank.
The Company Secretary of the Bank functioned as the Secretary to the Committee.
THE COMMITTEE CHARTERThe Committee which is governed by the Human Resources and Remuneration Committee Charter amended and approved by the Board of Directors in november 2015, has set the following as its objectives:
ff To establish and maintain performance and market oriented remuneration policies in relation to directors, Chief Executive officer, Key Management Personnel and Staff.
ff To determine goals and targets for the directors, Chief Executive officer and key Management Personnel of the Bank, and evaluate performance against those.
ff To provide assistance to the Board on Corporate Governance matters in relation to the Committee.
ff To prepare a sustainable succession plan for all Key Management positions.
In achieving the above objectives in the year under review, the Committee provided necessary oversight to the Human Resources function to strengthen and develop the human resource pool of the Bank with appropriate professional, managerial and operational expertise necessary to achieve the overall objectives of the Bank. KEY FOCUS AREAS IN 2016The Committee reviewed and revised several policies in 2016 including the Policy on Remuneration for Directors and Consultants and the Policy on Liability Sales Staff Incentives and Career Advancement.
Further the Committee reviewed the performance of the CEO and the Key Management Personnel for 2015 and made suitable recommendations to the Board with regard to their remuneration. Salary revisions required to align salaries of other staff to market levels was reviewed by the Committee and approved. The Committee also reviewed and approved a proposal to improve the medical insurance facilities provided to staff in order to provide enhanced medical benefits.
In 2016 the performance objectives of the CEO and Key Management Personnel were reviewed by the Committee for alignment to the strategic objective and annual budgets approved. In order to improve the technology supporting the employee performance management process, the Committee approved the investment in SaP SuccessFactors – Performance and Goal Management Module during the 4th quarter of 2016 to be implemented and conduct staff appraisals for 2016.
Furthermore, the Committee approved the promotions of 77 staff members including 2 staff who were promoted as Key Management Personnel and a new appointment to the post of Head of Internal Audit as a replacement for resignation.
MEETINGSThe Committee held 8 meetings during the year 2016.
The minutes of these meetings reflecting the decisions of the Committee including recommendations were presented at subsequent monthly meetings of the Board of directors for discussion, approval and ratification or to otherwise be acted upon by the Board.
Ayomi Aluwihare-GunawardeneChairperson – Human Resources and Remuneration Committee
23 February 2016

129|ANNUAL REPORT 2016
InTEgraTEd rISk ManagEMEnT CoMMITTEE rEPorT
For the year ended december 2016, the Integrated Risk Management Committee (IRMC) comprised of six members of which five members were non Executive Directors.
ff Mr.P d J Fernando – Chairman/IRMC (Independent Non Executive Director)
ff Mr.asoka de Silva (deputy Chairman)ff Mr.Indrajit wickramasinghe (CEo-
Executive Director)ff Mr.Ranvir Dewan (Non Independent
Non Executive Director)ff Mr.Puneet Bhatia (Non Independent
Non Executive Director)ff Mr.Michael J o’Hanlon (non
Independent Non Executive Director)
CHARTER OF THE COMMITTEE The IRMC was established as a sub Committee of the Board, in compliance with Section 3 (6) of the Banking act direction no. 11 of 2007, on “Corporate governance for Licensed Commercial Banks in Sri Lanka”. The composition and the scope of work of the Committee are in conformity with the provisions of the aforementioned Direction. The Bank has adopted an Integrated Risk Management (IRM) framework in line with the Central Bank of Sri Lanka Banking act direction no. 7 of 2011.
The charter of the Integrated Risk Management Committee was approved by the Board outlining the responsibilities. The charter details the composition, duties, responsibilities and authority. The detailed functionalities, supportive structures and framework are discussed in detail under “Risk Management at Union Bank” from pages 84 to 98 of this annual report.
MEETINGS OF THE COMMITTEE The committee held four meetings on a quarterly basis in the year 2016.
The IRMC is responsible for the implementation of the risk strategy of the Bank as laid down by the Board of Directors. The Committee is vested with the responsibilities of approving frameworks for efficient functioning of the business units and monitoring of risks. Committee is in charge of reviewing the risk profile of the Bank within the context determined by the Board. The Committee is also responsible for the assessment of all risks relating to Credit, Market, Liquidity and operational risks, using appropriate risk indicators, management information and making necessary recommendation to the Board. Among other responsibilities pertaining to risk management, the Committee monitors oversights of the implementation and risk management in relation to credit, operations and legal/compliance and takes prompt corrective actions to alleviate the risk effects.
In compliance with the section no.3(6)(v)(g) of Corporate Governance Direction no.11 of 2007 issued by the Central Bank of Sri Lanka, the Committee submitted a quarterly risk assessment report within a week of each meeting to the Board seeking Board’s views, concurrence and/ or specific directions.
UNDERTAKINGS OF THE COMMITTEE In fulfilling the duties and responsibilities, the committee engaged in following activities during the year.
ff Committee kept its close monitoring mechanism in managing the Non-Performing Assets (NPA) while appraising the Board of the trends at portfolio level.
ff Operational Risk Management (ORM) function has been closely dealing with zonal offices to enhance the risk culture and to guide branch staff on ORM processes while collecting Operational Risk data in the ORM system. In addition the committee accepted the importance of creating awareness during zonal level meetings and introduction of ORM Handbook which spells out Operational Risk Management Process and Regulatory perspective. These initiatives have contributed in changing the perception and making better risk culture resulting in prompt Operational Risk Data collection.
ff Committee appreciated that an updated Format of Market Risk report is now in use, covering many aspects of the treasury function. Market risk management unit enhancing its monitoring mechanism introduced a limit structure for front office staffs with close monitoring on trading transactions. Both the Treasury Information and Recording Systems were modified to ease limit monitoring while reducing the amount of manual work involved. The Committee guided that validation of ‘VAR’ model in year 2016 and Primary Dealer Unit (PDU) system was integrated with Market Risk Management module.
ff The Bank’s risk matrix, as a model was extended to the Bank’s subsidiary, naMaL enhancing the risk monitoring mechanism at group level. Further, the Bank’s risk aggregation was presented in a quantitative manner by cohesively accumulating and measuring all risk parameters.

130|ANNUAL REPORT 2016
InTEgraTEd rISk ManagEMEnT CoMMITTEE rEPorT
ff Review of the risk indicators were continuously performed to arrive at an ‘early warning’ signals of risks and with emphasis on continuously strengthening and updating the indicators.
ff Committee reviews the developments in the regulatory environment with new enhanced Directions from the regulator on capital and Basel III guidelines.
ff Internal Capital adequacy Assessment Process (ICAAP) was continuously upgraded with taking the relationships to account with subsidiary companies. In year 2016, the Bank assessed the capital adequacy at group level with weightages to the Strategy, Reputation and Compliance risks.
ff The Bank’s risk infrastructure was reviewed by the committee by reviewing the adequacy and performance of the closely related management committees such as asset and Liability Committee(aLCo),Executive risk Management Committee(ERMC) and Operational Risk Management Committee(ORMC).Effectiveness of the compliance function too was reviewed ensuring the status of compliance with the regulations, guidelines, laws and internal controls.
During the year the committee extended its support for the execution of the Bank’s overall strategy keeping in line with the prudential risk parameters set through an effective framework of Integrated Risk Management.
Mr. P D J FernandoChairmanBoard Integrated Risk Management Committee
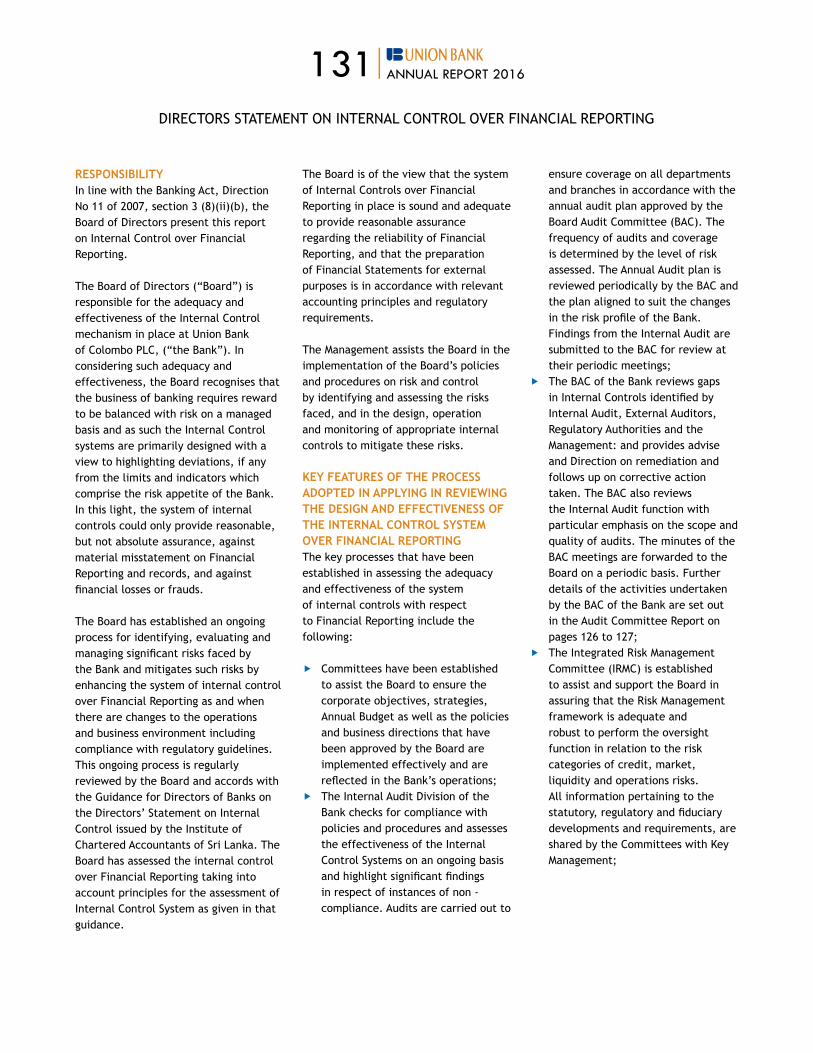
131|ANNUAL REPORT 2016
dIrECTorS STaTEMEnT on InTErnaL ConTroL oVEr FInanCIaL rEPorTIng
RESPONSIBILITYIn line with the Banking act, direction no 11 of 2007, section 3 (8)(ii)(b), the Board of Directors present this report on Internal Control over Financial Reporting.
The Board of Directors (“Board”) is responsible for the adequacy and effectiveness of the Internal Control mechanism in place at Union Bank of Colombo PLC, (“the Bank”). In considering such adequacy and effectiveness, the Board recognises that the business of banking requires reward to be balanced with risk on a managed basis and as such the Internal Control systems are primarily designed with a view to highlighting deviations, if any from the limits and indicators which comprise the risk appetite of the Bank. In this light, the system of internal controls could only provide reasonable, but not absolute assurance, against material misstatement on Financial reporting and records, and against financial losses or frauds.
The Board has established an ongoing process for identifying, evaluating and managing significant risks faced by the Bank and mitigates such risks by enhancing the system of internal control over Financial Reporting as and when there are changes to the operations and business environment including compliance with regulatory guidelines. This ongoing process is regularly reviewed by the Board and accords with the Guidance for Directors of Banks on the directors’ Statement on Internal Control issued by the Institute of Chartered accountants of Sri Lanka. The Board has assessed the internal control over Financial Reporting taking into account principles for the assessment of Internal Control System as given in that guidance.
The Board is of the view that the system of Internal Controls over Financial reporting in place is sound and adequate to provide reasonable assurance regarding the reliability of Financial reporting, and that the preparation of Financial Statements for external purposes is in accordance with relevant accounting principles and regulatory requirements.
The Management assists the Board in the implementation of the Board’s policies and procedures on risk and control by identifying and assessing the risks faced, and in the design, operation and monitoring of appropriate internal controls to mitigate these risks.
KEY FEATURES OF THE PROCESS ADOPTED IN APPLYING IN REVIEWING THE DESIGN AND EFFECTIVENESS OF THE INTERNAL CONTROL SYSTEM OVER FINANCIAL REPORTINGThe key processes that have been established in assessing the adequacy and effectiveness of the system of internal controls with respect to Financial Reporting include the following:
ff Committees have been established to assist the Board to ensure the corporate objectives, strategies, Annual Budget as well as the policies and business directions that have been approved by the Board are implemented effectively and are reflected in the Bank’s operations;
ff The Internal Audit Division of the Bank checks for compliance with policies and procedures and assesses the effectiveness of the Internal Control Systems on an ongoing basis and highlight significant findings in respect of instances of non - compliance. Audits are carried out to
ensure coverage on all departments and branches in accordance with the annual audit plan approved by the Board Audit Committee (BAC). The frequency of audits and coverage is determined by the level of risk assessed. The Annual Audit plan is reviewed periodically by the BAC and the plan aligned to suit the changes in the risk profile of the Bank. Findings from the Internal Audit are submitted to the BAC for review at their periodic meetings;
ff The BAC of the Bank reviews gaps in Internal Controls identified by Internal audit, External auditors, Regulatory Authorities and the Management: and provides advise and Direction on remediation and follows up on corrective action taken. The BAC also reviews the Internal Audit function with particular emphasis on the scope and quality of audits. The minutes of the BAC meetings are forwarded to the Board on a periodic basis. Further details of the activities undertaken by the BAC of the Bank are set out in the Audit Committee Report on pages 126 to 127;
ff The Integrated Risk Management Committee (IRMC) is established to assist and support the Board in assuring that the Risk Management framework is adequate and robust to perform the oversight function in relation to the risk categories of credit, market, liquidity and operations risks. All information pertaining to the statutory, regulatory and fiduciary developments and requirements, are shared by the Committees with Key Management;

132|ANNUAL REPORT 2016
ff In assessing the Internal Control System over Financial reporting, the Bank continues to review and update all procedures and controls that are connected with significant accounts and disclosures in the Financial Statements. The Bank has processes and procedures to adopt new and revised Sri Lanka accounting standards. The Bank will continue to improve procedure manuals for incorporating changes and adopting new Sri Lanka Accounting standards as appropriate. The Bank has also recognised the need to introduce an automated Financial Reporting process in order to comply with the requirements of recognition, measurement, classification and disclosure of the financial instruments more effectively and efficiently. The Bank is in the process of further strengthening the processes of impairment of Loans and advances, identification of related parties and Financial Statement disclosures. The assessment did not include subsidiaries of the Bank; and
ff The comments made by the External Auditors in connection with Internal Control System over Financial Reporting in previous years were reviewed during the year and appropriate steps have been taken to rectify them. The recommendations made by the External Auditors in 2016 in connection with the Internal Control System over Financial Reporting will be dealt within the next financial year.
CONFIRMATIONBased on the above processes, the Board confirms that the Financial reporting system of the Bank has been designed to provide a reasonable assurance regarding the reliability of Financial reporting and the preparation of Financial Statements for external purposes and has been done in accordance with Sri Lanka accounting Standards and regulatory requirements of the Central Bank of Sri Lanka.
REVIEW OF THE STATEMENT BY ExTERNAL AUDITORSThe External auditors, Messrs Ernst & young, have reviewed the above directors Statement on Internal Control over Financial reporting included in the annual report of the Bank for the year ended 31 december 2016 and reported to the Board that nothing has come to their attention that causes them to believe that the statement is inconsistent with their understanding of the process adopted by the Board in the review of the design and effectiveness of the Internal Control over Financial reporting of the Bank. Their report on the Statement of Internal Control over Financial reporting is given on page 133 of this annual report.
By order of the Board,
Yudhishtran Kanagasabai Chairman - Board Audit Committee
P.Jayendra Nayak Asoka De Silva Chairman Deputy Chairman
Indrajit Wickramasinghe Nirosha KannangaraChief Executive Officer Company Secretary
Colombo, Sri Lanka31 January 2017
dIrECTorS STaTEMEnT on InTErnaL ConTroL oVEr FInanCIaL rEPorTIng

133|ANNUAL REPORT 2016
aSSUranCE rEPorT on InTErnaL ConTroL
INDEPENDENT ASSURANCE REPORT TO THE BOARD OF DIRECTORS OF UNION BANK OF COLOMBO PLC
Report on the Directors’ Statement on Internal Control over Financial ReportingWe were engaged by the Board of directors of Union Bank of Colombo PLC (the “Bank”) to provide assurance on the directors’ Statement on Internal Control over Financial Reporting (the “Statement”) included in the annual report for the year ended 31 december 2016.
MANAGEMENT’S RESPONSIBILITYManagement is responsible for the preparation and presentation of the Statement in accordance with the “Guidance for Directors of Banks on the directors’ Statement on Internal Control” issued in compliance with section 3(8)(ii)(b) of the Banking act direction no. 11 of 2007, by the Institute of Chartered accountants of Sri Lanka.
OUR RESPONSIBILITIES AND COMPLIANCE WITH SLSAE 3050Our responsibility is to issue a report to the Board on the Statement based
on the work performed. We conducted our engagement in accordance with Sri Lanka Standard on assurance Engagements (SLSaE) 3050 – assurance report for Banks on directors’ Statement on Internal Control issued by the Institute of Chartered accountants of Sri Lanka.
SUMMARY OF WORK PERFORMEDWe conducted our engagement to assess whether the Statement is supported by the documentation prepared by or for directors; and appropriately reflected the process the Directors have adopted in reviewing the system of internal control over financial reporting of the Bank.
The procedures performed were limited primarily to inquiries of Bank personnel and the existence of documentation on a sample basis that supported the process adopted by the Board of Directors.
SLSaE 3050 does not require us to consider whether the Statement covers all risks and controls or to form an opinion on the effectiveness of the Bank’s risk and control procedures. SLSaE 3050 also does not require us to consider whether the processes
described to deal with material internal control aspects of any significant problems disclosed in the annual report will, in fact, remedy the problems.
OUR CONCLUSIONBased on the procedures performed, nothing has come to our attention that causes us to believe that the Statement included in the annual report is inconsistent with our understanding of the process the Board of Directors has adopted in the review of the design and effectiveness of internal control over financial reporting of the Bank.
23 February 2017Colombo

134|ANNUAL REPORT 2016
NOMINATION COMMITTEE REPORT
COMPOSITION OF THE NOMINATION COMMITTEEThe Nomination Committee (“the Committee”) is comprised of five Directors appointed by the Board of directors of the Bank. The majority of such Directors are Independent Non Executive Directors.
The Directors serving on the present Committee during the year are listed below. ff ayomi aluwihare-gunawardene,
Chairperson (Independent Non Executive Director)
ff Priyantha Fernando, (Independent Non Executive Director)
ff Sabry ghouse (Independent non Executive Director)
ff P. Jayendra nayak (non Independent Non Executive Director)
ff Gaurav Trehan (Non Independent Non Executive Director)
The Committee reported directly to the Board of Directors of the Bank. The Company Secretary of the Bank and in a few instances a Director of the Committee or another key management personal present by invitation, functioned as the secretary to the Committee.
RESPONSIBILITIES OF THE COMMITTEEThe Committee Charter contains the responsibilities and functions of the Committee, which include:(1) implementing a procedure to select/
appoint new directors, CEo and key Management Personnel according to the regulations and directions imposed by the Monetary Board.
(2) considering and recommending or not recommending the re-election of current directors, taking into account the performance and contribution made by the Directors concerned towards the overall discharge of the Board’s responsibilities.
(3) setting the criteria such as qualifications, experience and key attributes required for eligibility to be considered for appointment or promotion to the post of CEO and the Key Management positions.
(4) ensuring that directors, CEo and the Key Management Personnel are fit and proper persons to hold office as specified in the criteria given in direction 3(3) and set out in the Statutes.
(5) considering and recommending from time to time, the requirements of additional/new expertise and the succession arrangements for retiring Directors and Key Management Personnel.
The Charter of the Committee was adopted by the Board of Directors on the 10 July 2010.
DISCHARGE OF RESPONSIBILITIES AND FUNCTIONSThe Committee met 4 times during the year 2016.
The main matters deliberated on at such meetings wereBoard Compositionff Considered and recommended the
re-election of five directors who retired in terms of article 88(i) read together with article 89 of the Article of Association of the Bank for appointment at the Annual General Meeting of 2016.
ff Recommended the appointment of Mr. Yudhishtran Kanagasabai as Non Executive, Independent director to the Board of the Bank to fill a casual vacancy occurred with the resignation of the former Chairman of the Audit Committee.
ff Considered and recommended re-election of Mr. Yudhishthran kanagasabai, appointed in terms of article 95 of the articles of association of the Bank, as a Director.
ff Considered and recommended the re-election of three Non Executive directors in terms of article 89 of the Article of Association of the Bank for appointment at the Annual general Meeting of 2017.
ff Considered if all Non Executive directors are fit and proper for reappointment as Directors.
Appointment of Key Management Personnelff Considered and evaluated individuals
to fill key Management positions time to time.
ff Recommended the amendments made to the Procedure for the Selection and appointment of directors, CEo and the key Management Personnel by defining the minimum qualifications required for holding Key Management positions defined in the Banking act and its directions there.
Succession Planningff Reviewed the succession plan as of
31 december 2016 to assess the by adequacy of the expertise available at senior management level to allow for succession for the positions of Key Management Personnel and Treasury and reviewed the suggested candidates for each role.
Committee AttendanceAttendance by the members of the Committee is given in the table at page 166 of the Annual Report. The Chief Executive officer/Executive director attended [4] meetings by invitation.
Re-election/re-appointment of Directors at the 22nd Annual General MeetingThe names of asoka de Silva, Sow Lin Chiew and Mr. Michael J o’Hanlon were proposed for the re-election/re-appointment at the 22nd Annual general Meeting to be held on the 31 March 2017 and the Committee decided to recommend the said names to be approved by the full Board.
Ayomi Aluwihare Gunawardene Chairperson - Nomination Committee
23 February 2017

135|ANNUAL REPORT 2016
rELaTEd ParTy TranSaCTIonS rEVIEw CoMMITTEE rEPorT
COMPOSITION OF THE RELATED PARTY TRANSACTIONS REVIEW COMMITTEE The Related Party Transactions Review Committee (“the Committee”) is comprised of four Directors appointed by the Board of Directors of the Bank on 30 September 2015, in compliance with the Listing rules issued by the Colombo Stock Exchange. The majority of such Directors are Independent Non Executive Directors.
The Directors serving on the present committee during the year are listed below.
ff ayomi aluwihare gunawardene, Chairperson (Independent Non Executive Director)
ff asoka de Silva (Independent non Executive Director)
ff Sabry ghouse (Independent non Executive Director)
ff Indrajit wickramasinghe (Executive Director)
The Committee reported directly to the Board of Directors of the Bank. The Company Secretary of the Bank functioned as the Secretary to the Committee. RESPONSIBILITY OF THE COMMITTEEThe Terms of Reference of the Committee contains the responsibilities and functions of the Committee, which include
I. reviewing all Related Party Transactions of the Bank as per the Listing rules issued by the Colombo Stock Exchange prior to the transaction being entered into, and/or if the transaction is expressed to be conditional on such review and prior to completion of the transaction.
II. advising the Board to convene a shareholders meeting and to obtain shareholder approval for Related Party, as may be required.
III. In the absence of a Related Party Transactions Review Committee of a subsidiary, which is a listed entity of the Bank, functioning as the Related Party Transactions Review Committee of a subsidiary company on the instructions and advice of the Board of the Bank.
IV. reviewing and making recommendations for change to the Related Party Transactions policy of the Bank from time to time.
V. considering any other matters relating to a Related Party Transaction, as the Senior Management, the Committee or the Board of the Bank may think relevant taking into account the interests of the shareholders as a whole when entering into a Related Party Transaction and to prevent a Related Party taking advantage of his or her or its position.
VI. where necessary, referring a related Party Transaction for the approval of the Board.
DISCHARGE OF RESPONSIBILITIES AND FUNCTIONSThe Committee met 4 times during the year 2016.
The main matters deliberated on at such meetings were:ff Establishing a process for
identification of related party transactions of the Bank and its two subsidiaries and submission to the Committee for its consideration ;
ff Investing in a subordinated bond to be issued by a subsidiary UB Finance;
ff Initiating a referral program by UB Finance for leasing business of the Bank;
ff Leasing of premises of UB Finance at No 10 Daisy Villa Avenue Colombo 4 by the Bank;
ff Establishing a remote ATM of the Bank at the premises of the UB Finance Factoring Centre on R A de Mel Mawatha.
Ayomi Aluwihare Gunawardene Chairperson - Related Party Transactions Review Committee
23 February 2017

136|ANNUAL REPORT 2016
GRI G4 CONTENT INDEX
GENERAL STANDARD DISCLOSURES
GRI INDICATOR
DISCLOSURE ITEM PAGE NUMBER
ExTERNAL ASSURANCE
STRATEGY AND ANALYSIS
G4-1 Statement from the Chairman 22-23 * Yes
G4-2 key Impacts, risks and opportunities 18-19 Yes
ORGANIZATIONAL PROFILE
g4-3 Name of the organisation Inner Back Cover
Yes
G4-4 Primary Brands, Products and services 30 Yes
G4-5 Location of organization’s head quarters Inner Back Cover
Yes
G4-6 Countries where organization operates 8 Yes
g4-7 nature of ownership and Legal form Inner Back Cover
Yes
g4-8 Markets served 48-49 Yes
g4-9 Scale of the organisation 65,168 Yes
G4-10 Employee Profile 65-66 Yes
G4-11 Percentage of employees covered by collective bargaining agreements 68-69 Yes
G4-12 Organisation’s supply chain 71-72 Yes
g4-13 Significant changes during the year 45-46 Yes
G4-14 Precautionary approach or principle 64* Yes
G4-15 Externally developed charters, principles, or other initiatives to which the organisation subscribe or endorses
8 Yes
G4-16 Membership of associations 72 Yes
IDENTIFIED MATERIAL ASPECTS AND BOUNDARIES
g4-17 Entities included in the organisation’s consolidated Financial Statements or equivalent documents
157-158 Yes
g4-18 Process for defining report content 8 Yes
g4-19 Material Aspects 8-11 Yes
G4-20 Aspect Boundary within the organisation 8 Yes
G4-21 Aspect Boundary outside the organisation 8 Yes
G4-22 Effect of any restatements of information provided in previous reports 8 Yes
g4-23 Significant changes from previous reporting periods in the scope, aspect boundaries in the report
8 Yes
*Partially Disclosed

137|ANNUAL REPORT 2016
GRI G4 CONTENT INDEX
GENERAL STANDARD DISCLOSURES
GRI INDICATOR
DISCLOSURE ITEM PAGE NUMBER
ExTERNAL ASSURANCE
STAKEHOLDER ENGAGEMENT
G4-24 List of stakeholder groups engaged by the organisation 14 Yes
G4-25 Basis for identification and selection of stakeholders 15 Yes
G4-26 Organisation’s approach to stakeholder engagement 14 Yes
g4-27 Key topics and concerns raised through stakeholder engagement 14 Yes
REPORT PROFILE
g4-28 Reporting period 8 Yes
g4-29 Date of most recent previous report 8 Yes
g4-30 Reporting cycle 8 Yes
g4-31 Contact point for questions regarding the report or its contents 12 Yes
g4-32 Compliance with grI g4 guidelines, grI Content index and the external assurance report
8,136-139 Yes
g4-33 Policy and current practice with regard to seeking External assurance 8,140-141 Yes
GOVERNANCE
g4-34 Governance structure of the organisation 99 Yes
ETHICS AND INTEGRITY
G4-56 organisation’s values, principles, standards and norms of behavior such as codes of conduct and codes of ethics
4* Yes
*Partially Disclosed

138|ANNUAL REPORT 2016
SPECIFIC STANDARD DISCLOSURES
DMA AND INDICATORS
DISCLOSURE ITEM PAGE NUMBER
ExTERNAL ASSURANCE
CATEGORY : ECONOMIC
ASPECT ECONOMIC PERFORMANCE
G4-EC1 Direct economic value generated and distributed 265 Yes
G4-EC2 Financial implications and other risks and opportunities for the organisation’s activities due to climate change
18-19 Yes
g4-EC3 Coverage of the organisation’s defined benefit plan obligations 216-217 Yes
ASPECT PROCUREMENT PRACTICES
g4-EC9 Proportion of spending on local suppliers at significant locations of operations
71-72 Yes
CATEGORY : ENVIRONMENT
G4-EN1 Materials used by weight or volume 52 Yes
ASPECT ENERGY
g4-En3 Energy consumption within the organisation 52 Yes
G4-EN6 Reduction of Energy Consumption 52 Yes
g4-En 23 Total weight of waste by type and disposal method 72 Yes
ASPECT SUPPLIER ENVIRONMENTAL ASSESSMENT CATEGORY : SOCIAL - LABOUR PRACTICES
ASPECT EMPLOYMENT
DMA Yes
g4-La1 Total number and rates of new employee hires and employee turnover by age group, gender and region
65-66 Yes
g4-La2 Benefits provided to Full-time employees that are not provided to temporary or Part Time employees, by significant locations of operations
67 Yes
ASPECT LABOUR /MANAGEMENT RELATIONS
DMA Yes
g4-La4 Minimum notice periods regarding operational changes, including whether these are specified in collective agreements
68 Yes
ASPECT TRAINING AND EDUCATION
DMA Yes
g4-La9 average hours of training per year per employee by gender, and any employee category
70* Yes
g4-La10 Programs for skills management and lifelong learning that support the continued employability of employees and assist them in managing career endings
70* Yes
g4-La11 Percentage of employees receiving regular performance and career development reviews, by gender and by employee category
67 Yes
ASPECT DIVERSITY AND EQUAL OPPORTUNITY
g4-La12 Composition of governance bodies and breakdown of employees per employee category according to gender, age group, minority group membership, and other indicators of diversity
66 Yes
GRI G4 CONTENT INDEX
*Partially Disclosed

139|ANNUAL REPORT 2016
SPECIFIC STANDARD DISCLOSURES
DMA AND INDICATORS
DISCLOSURE ITEM PAGE NUMBER
ExTERNAL ASSURANCE
ASPECT EQUAL REMUNERATION FOR WOMEN AND MEN
g4-La13 Ratio of basic salary and remuneration of women to men by employee category, by significant locations of operation
68 Yes
ASPECT LABOR PRACTICES GOVERNANCE MECHANISMS
g4-La16 number of grievances about labor practices filed, addressed, and resolved through formal grievance mechanisms
68 Yes
CATEGORY : SOCIAL - HUMAN RIGHTS
ASPECT CHILD LABOUR
G4-HR 5 operations and suppliers identified as having significant risk for incidents of child labor, and measures taken to contribute to the effective abolition of child labour.
68 Yes
ASPECT FORCED OR COMPULSORY LABOUR
G4-HR 6 operations and suppliers identified as having significant risk for incidents of forced or compulsory labor, and measures to contribute to the elimination of all forms of forced or compulsory labour
68 Yes
ASPECT HUMAN RIGHTS GRIEVANCE MECHANISMS
G4-HR12 number of grievances about Human rights impacts filed, addressed, and resolved through formal grievance mechanisms
71 Yes
CATEGORY : SOCIAL - SOCIETY
ASPECT COMPLIANCE
g4-So8 Monetary value of significant fines and total number of non-monetary sanctions for non -compliance with laws and regulations
72 Yes
CATEGORY : SOCIAL - PRODUCT RESPONSIBILITY
ASPECT PRODUCT AND SERVICE LABELLING
g4-Pr3 Type of product and service information required by the organisation’s procedures for product and service information and la-belling, and percentage of significant product and service categories subject to such information requirements
64 Yes
G4-PR4 Total number of incidents of non-compliance with regulations and voluntary codes concerning product and service information and labelling by type of outcomes
72 Yes
ASPECT MARKETING AND COMMUNICATIONS
g4-Pr7 Total number of incidents of non-compliance with regulations and voluntary codes concerning marketing communications, including advertising, promotions and sponsorships by type of outcomes
72 Yes
ASPECT CUSTOMER PRIVACY
g4-Pr8 Total number of substantiated complaints regarding breaches of customer privacy and losses of customer data
72 Yes
ASPECT COMPLIANCE
g4-Pr9 Monetary value of significant fines for non-compliance with laws and regulations concerning the provision and use of products and services
72 Yes
GRI G4 CONTENT INDEX
*Partially Disclosed
140|ANNUAL REPORT 2016
IndEPEndEnT aSSUranCE rEPorT on SUSTaInaBILITy rEPorTIng
INDEPENDENT ASSURANCE REPORT TO UNION BANK OF COLOMBO PLC ON THE SUSTAINABILITY REPORTING CRITERIA PRESENTED UNDER THE INTEGRATED ANNUAL REPORT- 2016
INTRODUCTION AND SCOPE OF THE ENGAGEMENTThe management of Union Bank of Colombo PLC (“the Bank”) engaged us to provide an independent assurance on the following elements of the sustainability reporting indicators under the annual report- 2016 (“the Report”).
ff Reasonable assurance on the information on financial performance as specified on page 265 of the Report.
ff Limited assurance on other information presented in the report, prepared in accordance with the requirements of the global reporting Initiative G4 ‘In accordance’ - Core guidelines.
BASIS OF OUR WORK AND LEVEL OF ASSURANCE We performed our procedures to provide limited assurance in accordance with Sri Lanka Standard on assurance Engagements (SLSaE 3000): ‘assurance Engagements Other than Audits or Reviews of Historical Financial
Information’, issued by the Institute of Chartered accountants of Sri Lanka (“CaSL”).
The evaluation criteria used for this limited assurance engagement are based on the Sustainability reporting Guidelines (“GRI Guidelines”) and related information in particular, the requirements to achieve grI G4 ‘In accordance’ - Core guideline publication, publicly available at grI’s global website at “www.globalreporting.org”.
Our engagement provides limited assurance as well as reasonable assurance. A limited assurance engagement is substantially less in scope than a reasonable assurance engagement conducted in accordance with SLSaE-3000 and consequently does not enable to obtain assurance that we would become aware of all significant matters that might be identified in a reasonable assurance engagement. accordingly, we do not express an opinion providing reasonable assurance.
MANAGEMENT OF THE BANK’S RESPONSIBILITY FOR THE REPORTThe management of the bank is responsible for the preparation of the self-declaration, the information
and statements contained within the report, and for maintaining adequate records and internal controls that are designed to support the sustaining reporting process in line with the GRI Sustainability reporting guidelines.
ERNST & YOUNG’S RESPONSIBILITYOur responsibility is to express a conclusion as to whether we have become aware of any matter that causes us to believe that the Report is not prepared in accordance with the requirements of the global reporting Initiative G4 ‘In accordance’ - Core guidelines. This report is made solely to the Bank in accordance with our engagement letter dated 30 January 2017. we disclaim any assumption of responsibility for any reliance on this report to any person other than the bank or for any purpose other than that for which it was prepared. In conducting our engagement, we have complied with the independence requirements of the Code for Ethics for Professional Accountants issued by the CaSL.
KEY ASSURANCE PROCEDURES We planned and performed our procedures to obtain the information and explanations considered necessary to provide sufficient evidence to support our limited assurance conclusions. Key assurance procedures included:

141|ANNUAL REPORT 2016
IndEPEndEnT aSSUranCE rEPorT on SUSTaInaBILITy rEPorTIng
ff Interviewing relevant the bank’s personnel to understand the process for collection, analysis, aggregation and presentation of data.
ff Reviewing and validation of the information contained in the Report.
ff Checking the calculations performed by the bank on a sample basis through recalculation.
ff Reconciling and agreeing the data on financial performance are properly derived from the bank’s audited financial statements for the year ended 31 december 2016.
ff Comparison of the content of the Report against the criteria for a Global Reporting Initiative G4 ‘In accordance’ - Core guidelines.
Our procedures did not include testing electronic systems used to collect and aggregate the information.
LIMITATIONS AND CONSIDERATIONSEnvironmental and social performance data are subject to inherent limitations given their nature and the methods used for determining, calculating and estimating such data.
CONCLUSIONBased on the procedures performed, as described above, we conclude that;
ff The information on financial performance as specified on page 265 of the Report are properly derived from the audited financial statements of the Bank for the year ended 31 december 2016.
ff Nothing has come to our attention that causes us to believe that other information presented in the Report are not fairly presented, in all material respects, in accordance with the Bank’s sustainability practices and policies some of which are derived from GRI-G4-‘In accordance’ Core Sustainability Reporting Guidelines.
23 February 2017Colombo

142|ANNUAL REPORT 2016
Board oF dIrECTorS
03 0205
0709
1112
(01) P. JAYENDRA NAYAKChairman/Non Independent Non Executive Director
(02) ASOKA DE SILVA Deputy Chairman/Senior Director Independent Non Executive Director
(03) INDRAJIT WICKRAMASINGHEExecutive Director/Chief Executive Officer
(04) SOW LIN CHIEWNon Independent Non Executive Director
(05) SABRY GHOUSEIndependent Non Executive Director
(06) MICHAEL J O’HANLONNon Independent Non Executive Director
(07) RANVIR DEWANNon Independent Non Executive Director
(08) PUNEET BHATIANon Independent Non Executive Director

143|ANNUAL REPORT 2016
Board oF dIrECTorS
0104
0608 10 13
(09) GAURAV TREHANNon Independent Non Executive Director
(10) PRIYANTHA FERNANDOIndependent Non Executive Director
(11) AYOMI ALUWIHARE-GUNAWARDENEIndependent Non Executive Director
(12) YUDHISHTRAN KANAGASABAIIndependent Non Executive Director
(13) NIROSHA KANNANGARACompany Secretary

144|ANNUAL REPORT 2016
P. JAYENDRA NAYAKChairman/Non Independent Non Executive DirectorP. Jayendra nayak has had 25 years experience of working in India’s financial sector, encompassing policy, banking and markets.
Between 2010-2013 he was the India Country Head for Morgan Stanley, the investment Bank. Earlier between 2000-2009 he was Chairman and CEo of axis Bank, the commercial bank. during this period of close to a decade, axis Bank grew to becoming India’s fourth largest bank by market capitalisation.
Earlier, between 1996-1999, he was the Executive Trustee of Unit Trust of India, the asset management institution.
Dr. Nayak’s earlier career was as a civil servant, including in the Finance Ministry of the Government of India between 1990-1995. This was a period of liberalisation and reform of the Indian economy.
In 2014, dr. nayak chaired the Committee on Governance of Bank Boards, constituted by the reserve Bank of India.
Dr. Nayak has an MA and PhD in Economics from Cambridge University, Uk.
ASOKA DE SILVA Deputy Chairman/Senior Director Independent Non Executive Directorasoka de Silva was appointed to the Board as an Independent Non Executive director in 2008. He served as the Deputy Chairman of the Board during the period of december 2008 to December 2010 and again during May 2012 to November 2014 and serves as the Senior director since January 2009. He has worked in the banking industry for over 35 years and was the Chief Executive officer and general
Manager of People’s Bank, Sri Lanka. He holds a Bachelor’s Degree with Honors from the University of Ceylon, and is a Fellow of the Certified Institute of Professional Management (FCPM), Sri Lanka. Mr. de Silva, who was awarded a prestigious Honorary Fellowship from the Institute of Bankers, Sri Lanka, in recognition of his contribution and leadership provided in restructuring and strengthening the People’s Bank (2nd largest State-owned commercial bank), also holds a Management development Certificate awarded by the Post graduate Institute of Management, University of Sri Jayewardenepura, as well as, Project analysis and Project Management Certificates awarded by the arthur d. Little School of Management (Massachusetts-USa).
A former Director of CRIB (Credit Information Bureau of Sri Lanka), Institute of Bankers of Sri Lanka - Member of the governing Board, People’s Leasing Company PLC, Peoples Travels (Pvt) Ltd, People’s Merchant Bank PLC. He was also a director of Sarvodaya Economic Enterprise development (guarantee) Ltd. Formerly, a Vice Chairman of Sri Lanka Banks’ association (guarantee) Ltd, as well as deputy Chairman of Lanka Financial Services Bureau Ltd. Mr. de Silva was also a committee member of the Financial Sector Cluster of the national Council for Economic development, national Payment Council and Steering Committee of the financial market program for private sector development during his tenure as CEo/gM at the People’s Bank. Previously, a governing council member of the University of Peradeniya, and presently a member of the Faculty Board (Faculty of Management and Commerce) of the University of Sri Jayewardenepura and also a council member of the University of ruhuna Matara. Mr. de Silva is an alumni of the Harvard Business School (aMP 163), USa.
INDRAJIT WICKRAMASINGHEExecutive Director/Chief Executive OfficerIndrajit wickramasinghe was appointed as director/Chief Executive officer on 15 November 2014. He counts for over 27 years of Management experience having worked in both the financial and consumer sectors in both local and multinational companies. He holds an MBA from the University of Sri Jayewardenepura, a Fellow of the Chartered Institute of Marketing Uk, a Member of the Association of the Professional Bankers and a member of the oxford Business alumni, University of Oxford.
Prior to his appointment as director/CEo of Union Bank he served as the Chief operating officer of ndB Bank where he was responsible for all business areas including retail Banking, Corporate Banking, SME Banking and Project Finance. Prior to that he held positions as a Vice President looking after functions such as Hr, Marketing and seven years as Vice President heading Retail Banking. Mr. Wickramasinghe was also a Non Executive Director of Eagle Insurance/aviva ndB Insurance, ndB Capital Holdings PLC, ndB Securities (Pvt) Ltd, development Holdings (Pvt) Ltd and the Credit Information Bureau of Sri Lanka.
He currently serves as a Non Executive Director of the National Asset Management Ltd and UB Finance Company Ltd.
PRIYANTHA FERNANDOIndependent Non Executive DirectorPriyantha Fernando has more than 35 years of experience in the banking and finance sectors. He was attached to the Central Bank of Sri Lanka serving in senior and diverse capacities. He was the Deputy Governor of the Central Bank in 2010-2011 in charge
ProFILES oF THE Board oF dIrECTorS

145|ANNUAL REPORT 2016
of the Financial System Stability and the Corporate Service clusters. Mr. Fernando has extensive experience and expertise in the fields of Banking and Financial Sector regulation, Information Technology, national accounting and Statistics, Fund Management, risk Management and restructuring, recovery and stabilisation of financially distressed companies. At the Central Bank he was the Chairman of the Financial Stability Committee, Member of the Monetary Policy Committee, Member of the Risk Management Committee and the Chairman of the National Payment Council.
He was an Ex-officio Board Member in several regulatory organisations namely the Securities and Exchange Commission, the Insurance Board of Sri Lanka, the Chairman of the Credit Information Bureau, Institute of Bankers - Sri Lanka and Board Member at Employers Trust Fund, Lanka Clear (Pvt) Ltd and Lanka Financial Services Bureau. During his career he has initiated and spearheaded several key projects of national importance, especially in the area of the advancement of the national payments and settlement system.
Mr. Fernando has served in a number of committees at national level covering a range of subjects representing the Central Bank.
Presently, Mr. Fernando holds directorships in Commercial Leasing and Finance Company Ltd, Taprobane Holdings Ltd, Ceylon Leather Products PLC, Imperial Institute of Higher Education, Thomas Cook Travels Sri Lanka Pvt Ltd and Equi Capital Investments Ltd.
SABRY GHOUSEIndependent Non Executive DirectorSabry ghouse was appointed to the Board as an Independent Non Executive
director on 30th august 2012. His banking career spans over 25 years with leading international Banks. He counts 10 years’ experience serving in overseas markets.
He was employed by American Express Bank, Standard Chartered Bank and al rajhi Banking and Investment Corporation of Saudi arabia, and was responsible for the setting up of Retail Banking, allied operations and crafting of Strategy at all of these banks to emerge a leader in their chosen market.
He joined american Express Bank Sri Lanka as Territory Manager in 1991 to launch the American Express card to the Sri Lankan market which was the first corporate card to be launched in the country and was responsible for the card issuance and acquisition business in Sri Lanka and the Maldives. Thereafter he moved to Standard Chartered Bank as Head of Retail Banking. He was seconded by Standard Chartered Bank in 2000 as Regional Head of Consumer Banking for the Levant region where he was responsible for the successful acquisition and transition of the grindlays Bank business, subsequent to Standard Chartered’s global acquisition of Grindlays franchise.
He was recognised by Standard Chartered Bank for his contribution to society and sustainable business for his contribution to the community for his work with mentally-challenged children in Jordan. He was selected for executive leadership programs conducted by the London Business School, Uk and Templeton, oxford Uk.
In 2006 he was appointed Director retail Banking al rajhi Bank Malaysia by its parent al rajhi Banking and Investment Corporation, Saudi arabia, to develop a Retail Banking model and set up operations, on their entry into the Malaysian market. This was a first
for the most profitable bank among the top 50 banks in the Gulf Cooperation Council (GCC) at the time. Under his stewardship the al rajhi Bank Malaysia, was able to break even in the fourth year with a network of branches throughout Malaysia.
Mr. Ghouse was a former Director of the Credit Information Bureau (CrIB) in Sri Lanka and holds a Master’s degree in Business Administration (MBA) from the University of western Sydney, australia.
RANVIR DEWANNon Independent Non Executive Directorranvir dewan joined TPg Capital in July 2006 and is based in Singapore. He is currently the Head of Financial Institutions Group Operations. From april 2000 to July 2006 he was Executive Vice President and Chief Financial officer of Standard Chartered First Bank (formerly korea First Bank) in Seoul, Korea.
Prior to that Mr. dewan spent 13 years with Citibank Global Consumer Bank and held various senior positions in its international businesses. In his previous assignment, he was regional Financial Controller of Citibank’s Global Consumer Bank with responsibilities covering 11 countries in the asia Pacific region. Mr. Dewan has also held senior positions with KPMG in Canada and England where he specialised in the audits of financial Institutions.
Mr. Dewan is a Fellow of the Institute of Chartered Accountants in England and Wales (FCA) and a member of the Canadian Institute of Chartered accountants (CPa, Ca). He holds a Bachelor of Commerce (Honours) degree from the Shriram College of Commerce, delhi University, India. He also serves on the Board of Shriram City Union Finance Limited, India and is a member of the Executive, audit and risk Committees.
ProFILES oF THE Board oF dIrECTorS
146|ANNUAL REPORT 2016
GAURAV TREHANNon Independent Non Executive DirectorGaurav Trehan is a Partner of TPG. Mr. Trehan is based in Mumbai. Since joining TPg in 2004, Mr. Trehan has spent time in TPG’s Hong Kong and Mumbai offices and has evaluated and executed private equity transactions in India and Southeast asia. He serves on the Boards of directors of Jana Capital Ltd., Manipal Health Enterprises Pvt. Ltd., Shriram Properties (Pvt) Ltd., Shriram automall India Ltd, Shriram general Insurance Company Ltd and Shriram Life Insurance Company Ltd., Prior to joining TPg, Mr. Trehan worked in the mergers, acquisitions and restructuring department of Morgan Stanley in Menlo Park with a focus on the Technology Sector. Mr. Trehan received a Bachelor of Science in Mathematics and applied Science and Economics from the University of California, Los angeles.
PUNEET BHATIANon Independent Non Executive DirectorPuneet Bhatia is Managing Director and Country Head for TPG Capital India. He has created nine transactions in India with TPg with Matrix Laboratories, Vishal retail, invested over $500m in the Shriram group in four of the group companies and recently in Manipal Hospitals, Union Bank of Colombo PLC and Janalakshmi Financial Services and currently serves on the Board of Directors of these companies.
Prior to joining TPg in april 2002, Mr. Bhatia was Chief Executive, Private Equity group for gE Capital India (“gE Capital”), where he was responsible for conceptualising and creating its direct and strategic private equity investment group. as Chief Executive, he created and handled a portfolio of almost a
dozen companies such as TCS, Patni Computers, BirlaSoft, Sierra atlantic, igate, Indus Software and rediff. He was also responsible for consummating some of gE Capital’s joint ventures in India. Before this, Mr. Bhatia was with ICICI Ltd from 1990 to 1995 in the Project and Corporate Finance group and worked as Senior analyst with Crosby Securities from 1995 to 1996.
Mr. Bhatia was born, grew up in and is based in India. He has a B.Com Honors degree from the Sriram College of Commerce, delhi and an MBa from the Indian Institute of Management, Calcutta.
MICHAEL J O’HANLONNon Independent Non Executive DirectorMichael J o’Hanlon is a Senior advisor to TPg focusing on its financial institution investments. He currently is Chairman of the Board of Roosevelt Management Company, LLC, an asset manager, and a Board Member of Rushmore Loan Management Services, LLC, a residential mortgage loan originator and servicer. He has served on the Boards of other TPG portfolio companies including Shenzhen development Bank, Korea First Bank and Bank Thai. Until december 2005, Mr. o’Hanlon was a Managing director at Lehman Brothers where he worked for over 25 years. Mr. o’Hanlon led the firm’s commercial and residential mortgage finance efforts during the late 1980s through 1995. In 1996, he became the head of the Financial Institutions Group and in mid 1999, he moved to Japan to head Japanese Investment Banking and the asian Financial Institutions groups, among other roles. Some key projects in Asia included leading the teams for TPG’s investment in Korea First Bank and Lehman Brother’s investment in aozora Bank.
Mr. O’Hanlon holds an MBA in Finance and accounting from the State University of new york at albany and a BS in Business Administration from the College of St. rose.
AYOMI ALUWIHARE-GUNAWARDENEIndependent Non Executive DirectorAyomi Aluwihare-Gunawardene is the precedent partner of the law firm F. J. & g. de Saram. She has over 20 years of experience in advising on a number of aspects of Corporate/Commercial Law. Banking and Finance is a focus practice area.
SOW LIN CHIEWNon Independent Non Executive DirectorSow Lin Chiew is the group Controller of genting Berhad, the holding company of Vista knowledge Pte Ltd. She began her career with an international accounting firm in kuala Lumpur in 1979 and joined genting Berhad in 1984. She is a Member of the Malaysian Institute of Certified Public Accountants and the Malaysian Institute of Accountants.
YUDHISHTRAN KANAGASABAIIndependent Non Executive DirectorThe Board of Directors of Union Bank of Colombo PLC announced the appointment of Mr. Yudhishtran Kanagasabai as an independent Non Executive director with effect from 27 July 2016.
Mr. kanagasabai, is a renowned accountant and a fellow member of the Institute of Chartered Accountants of Sri Lanka and possesses over 35 years of experience in accounting, audit and consulting. He has counseled across several industries with a focus on financial services and
ProFILES oF THE Board oF dIrECTorS

147|ANNUAL REPORT 2016
telecommunications. He has been employed at PricewaterhouseCoopers throughout his career, and has completed his term as a Territory Senior Partner on 30 June 2016.
YOKE SUN WOONAlternate Director to Sow Lin Chiewyoke Sun woon was appointed to the Board as an Alternate Director to Ms. Sow Lin Chiew in January 2015. She is the Senior Vice President – Strategic Investment of genting Berhad, the holding company of Vista Knowledge Pte Ltd. She has been in the investment banking business for nearly 20 years where she specialises in equity research and investment. She holds a Masters in Economics from University of Malaya in Malaysia.
SUMEDH JOGAlternate Director to Michael J O’HanlonSumedh Jog is a Vice-President at TPg Capital India and is based in Mumbai. Prior to joining TPg in 2008 he worked in the investment banking department of dSP Merrill Lynch in Mumbai. He is a Chartered Accountant and an MBA from the Indian Institute of Management, Ahmedabad.
ProFILES oF THE Board oF dIrECTorS

148|ANNUAL REPORT 2016
LEadErSHIP TEaM
(01) INDRAJIT WICKRAMASINGHEDirector/Chief Executive Officer
(02) WIJE DAMBAWINNEVice President/Head of Treasury
(03) HIRANTHI DE SILVAVice President-Wholesale Banking
(04) RAVI DIVULWEWAVice President-Credit
(05) S. SRI GANENDRANVice President-Operations
(06) RAVI JAYASEKERAVice President-Human Resources
(07) CHAYA JAYAWARDENAVice President-Retail Banking
(08) RAJEEV MUNASINGHEVice President-Information Technology
(09) MALINDA SAMARATUNGAChief Financial Officer
(10) SUHEN VANIGASOORIYAChief Risk Officer
01
06 07 08 09 10
02 03 04 05

149|ANNUAL REPORT 2016
aSSISTanT VICE PrESIdEnTS
(01) RUSHIRA DE SILVAAssistant Vice President/Corporate Banking Team Head
(02) THISHANI DISSANAYAKEAssistant Vice President - Marketing
(03) MANISHA FERNANDOAssistant Vice President - Retail Liability Products & Alternate Channels
(04) CHAYA GUNARATHNE Compliance Officer
(05) MAHENDRA ILLANGASINGHEAssistant Vice President/Head of Branch Network
(06) NIROSHA KANNANGARAAssistant Vice President/Company Secretary
(07) LASANTHA MATHUPALAAssistant Vice President - IT
(08) INDIKA MENDIS Assistant Vice President - Treasury
(09) KUSAL PERERA Assistant Vice President - Recoveries
(10) MALINDA PERERAAssistant Vice President/Head of Retail Liability Sales & Contact Centre
(11) THIROSHANI RATNAYAKEAssistant Vice President - Human Resources
(12) ASANGA TENNAKOONAssistant Vice President/Corporate Banking Team Head
(13) BHANU WIJAYARATNEHead of Internal Audit
01
07
02
08
03
09
04
10
05
11
06
12 13

150|ANNUAL REPORT 2016
Inoka DiasChief Manager - Organisational Development
Mahendra Dahanayake Chief Manager - Corporate Banking
Pasindu Dharmasiri Chief Manager/Head of Cash Management
Naveendran Anthonypillai Chief Manager/zonal Head, zone I
Chamara Gomis Chief Manager - Retail Assets & Cards
Isuru Pethiyagoda Chief Manager - Primary Dealer Unit
Jeevan JayawardanaChief Manager - Loan review Management
Nalin Ahangama Chief Manager - Trade & Treasury Operations
CHIEF ManagErS
Nirosha Perera Chief Manager - Internal Audit
Ayesha Naotunna Chief Manager - Finance
Kathirgamathamby Nishaaharan Chief Manager/zonal Head, zone IV
Jayanath Kariyakarawana Chief Manager - Credit Operations

151|ANNUAL REPORT 2016
Shiran Punchihewa Chief Manager - Business IT
Sameera Wijegunawardena Chief Manager - SME
Minoli Fernando Senior Manager - Finance
Deepal Edirisinghe Senior Manager - administration & Premises
Ranjan Asirvatham Senior Manager - Pawning
CHIEF ManagErS
SEnIor ManagErS
Myura Balamurali Senior Manager - Treasury Operations
Rukmal Fernando Senior Manager - risk Management
Kanchana de Silva Senior Manager - Exports & Imports

152|ANNUAL REPORT 2016
Saman Kottawatta Senior Manager/zonal Head, zone III
Deepal Liyanage Senior Manager - SME
SEnIor ManagErS
Irani Karunanayake Senior Manager - Legal
Kumari Jayawardena Senior Manager - Horana Branch
Shanmugeswaran Jesdharajan Senior Manager - wellawatte Branch
Jayanthi Jayasuriya Senior Manager - nugegoda Branch
Minesh Jayasekera Senior Manager - remittances & Non Residents Products
Shamila Jayamaha Senior relationship Manager - Corporate Banking
Janaka Iroshan Senior Manager - Electronic Banking
Nipuna GanegodaSenior Manager/Head of Elite Circle
Thangavelu Gobinath Senior Manager -Institutional Clients
Osadhi Gunasekara Senior Manager - Internal audit

153|ANNUAL REPORT 2016
Sandamali Munasinghe Senior Manager - Legal
Dulin Rajapakse Senior Manager - IT
Mangala Perera Senior Manager - IT Core Banking
Sailajah Nadarajah Senior Manager - Treasury
Sanjeewa Pandithratne Senior Manager - Factoring
Rohan Peiris Senior Manager - Branch operations
Ruchira Perera Senior relationship Manager - Corporate Banking
Chandani Perera Senior Manager - Process Control Operations
Asanka Ranasinghe Senior Manager - zone I
Anuruddha Ranasinghe Senior Manager/zonal Head, zone II
SEnIor ManagErS
Dinuk Perera Senior Manager - SME
Dilan Rodrigo Senior Manager - Transaction Banking Sales

154|ANNUAL REPORT 2016
SEnIor ManagErS
Damith Sumathirathne Senior Manager - retail asset Sales
Nilmini Weerasekera Senior relationship Manager - Corporate Banking
Dhananjeyan Wijendra Senior Manager - retail asset Centre
Ramani WjeratneSenior Manager - wattala Branch
Christella SivapragasamSenior relationship Manager - Elite Circle
Nadika Senaratne Senior Manager - IT
Gihan Samarasinghe Senior Manager - Bancassurance
Angela Seneviratne Senior Manager - Service quality Management

155|ANNUAL REPORT 2016155|ANNUAL REPORT 2016
FINANCIAL REPORTS
CONTENTS
Financial Calendar 156
Annual Report of the Board of Directors on the State of Affairs of the Bank 157
Independent Auditors’ Report on Financial Statements 167
FINANCIAL STATEMENTS
Statement of Profit or Loss 168
Statement of Comprehensive Income 169
Statement of Financial Position 170
Statement of Changes in Equity 171
Statement of Cash Flows 172
Notes to the Financial Statements 173
Ten Years at a Glance 258
Capital Adequacy 260
Quarterly Performance of the Bank 264
Direct Economic Value generated & Distributed 265
Compliance with Annual Report Disclosure Requirements of Central Bank of Sri Lanka 266
Glossary of Financial Terms 269

156|ANNUAL REPORT 2016
Submission of the Interim Financial Statements in terms of Rule 7.4 of the Colombo Stock Exchange and as per the requirements of the Central Bank of Sri Lanka.
2015 Annual Report and Audited Financial Statements was signed on 24 February 2016
21st Annual General Meeting held on 31 March 2016
Rs 0.04 per share Cash Dividend for 2015 paid on 16 March 2016
Submission of the Interim Financial Statements in terms of Rule 8.3 of the Colombo Stock Exchange and as per the requirements of the Central Bank of Sri Lanka.
2016
Colombo Stock ExchangeNews papers (as required by CBSL)
English Sinhala Tamil
For the 3 months ended 31 March, (unaudited) 27 Apr 2016 30 May 2016 30 May 2016 30 May 2016
For the 3 and 6 months ended 30 June, (unaudited) 27 Jul 2016 30 Aug 2016 30 Aug 2016 30 Aug 2016
For the 3 and 9 months ended 30 September, (unaudited) 26 Oct 2016 24 Nov 2016 24 Nov 2016 24 Nov 2016
For the 3 months and year ended 31 December, (unaudited) 23 Feb 2017 31 Mar 2017 31 Mar 2017 31 Mar 2017
PROPOSED FINANCIAL CALENDAR 2017
2016 Annual Report and Audited Financial Statements to be signed on 23 February 2017
22nd Annual General Meeting to be held on 31 March 2017
Dividend for 2016 to be payable on 16 March 2017
Submission of the Interim Financial Statements in terms of Rule 8.3 of the Colombo Stock Exchange and as per the requirements of the Central Bank of Sri Lanka.
2017 to be submitted on or before
Colombo Stock ExchangeNews Papers (as required by CBSL)
English Sinhala Tamil
For the 3 months ended 31 March, (unaudited) 15 May 2017 30 May 2017 30 May 2017 30 May 2017
For the 3 and 6 months ended 30 June, (unaudited) 15 Aug 2017 30 Aug 2017 30 Aug 2017 30 Aug 2017
For the 3 and 9 months ended 30 September, (unaudited) 15 Nov 2017 24 Nov 2017 24 Nov 2017 24 Nov 2017
For the 3 months and year ended 31 December, (unaudited) 28 Feb 2018 30 Mar 2018 30 Mar 2018 30 Mar 2018
FINANCIAL CALENDAR 2016
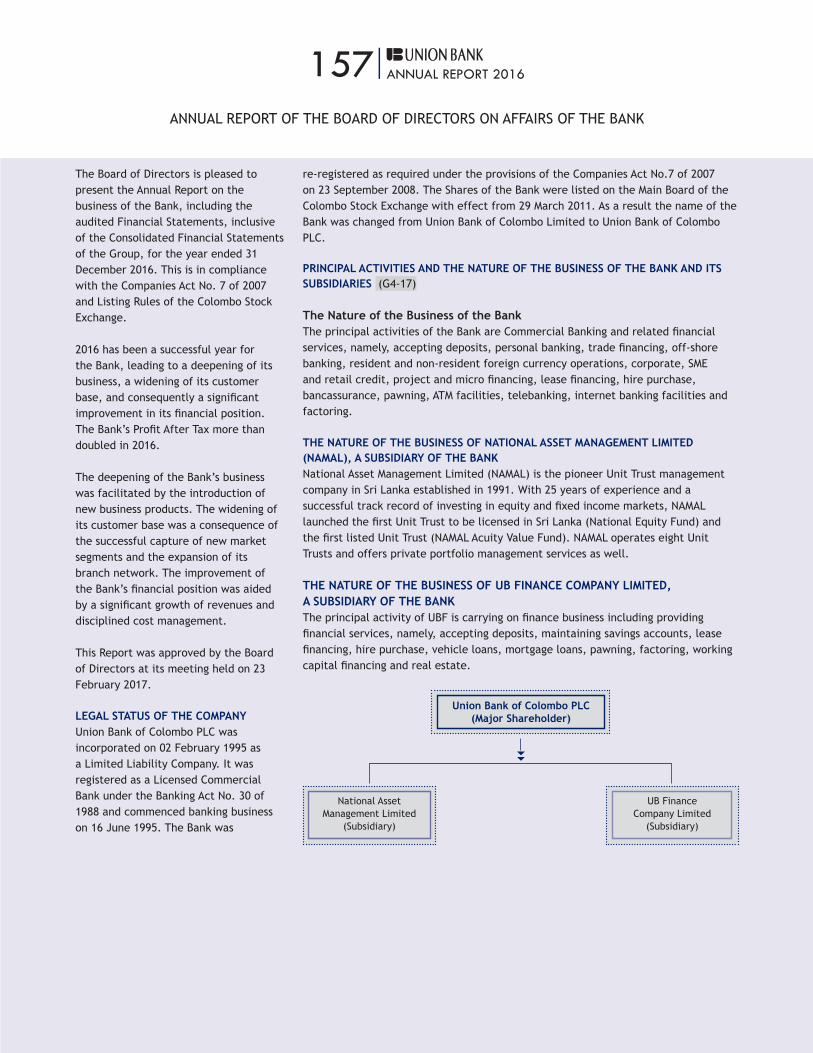
157|ANNUAL REPORT 2016
ANNUAL REPORT OF THE BOARD OF DIRECTORS ON AFFAIRS OF THE BANK
The Board of Directors is pleased to present the Annual Report on the business of the Bank, including the audited Financial Statements, inclusive of the Consolidated Financial Statements of the Group, for the year ended 31 December 2016. This is in compliance with the Companies Act No. 7 of 2007 and Listing Rules of the Colombo Stock Exchange.
2016 has been a successful year for the Bank, leading to a deepening of its business, a widening of its customer base, and consequently a significant improvement in its financial position. The Bank’s Profit After Tax more than doubled in 2016.
The deepening of the Bank’s business was facilitated by the introduction of new business products. The widening of its customer base was a consequence of the successful capture of new market segments and the expansion of its branch network. The improvement of the Bank’s financial position was aided by a significant growth of revenues and disciplined cost management.
This Report was approved by the Board of Directors at its meeting held on 23 February 2017.
LEGAL STATUS OF THE COMPANYUnion Bank of Colombo PLC was incorporated on 02 February 1995 as a Limited Liability Company. It was registered as a Licensed Commercial Bank under the Banking Act No. 30 of 1988 and commenced banking business on 16 June 1995. The Bank was
re-registered as required under the provisions of the Companies Act No.7 of 2007 on 23 September 2008. The Shares of the Bank were listed on the Main Board of the Colombo Stock Exchange with effect from 29 March 2011. As a result the name of the Bank was changed from Union Bank of Colombo Limited to Union Bank of Colombo PLC.
PRINCIPAL ACTIVITIES AND THE NATURE OF THE BUSINESS OF THE BANK AND ITS SUBSIDIARIES (G4-17)
The Nature of the Business of the BankThe principal activities of the Bank are Commercial Banking and related financial services, namely, accepting deposits, personal banking, trade financing, off-shore banking, resident and non-resident foreign currency operations, corporate, SME and retail credit, project and micro financing, lease financing, hire purchase, bancassurance, pawning, ATM facilities, telebanking, internet banking facilities and factoring.
THE NATURE OF THE BUSINESS OF NATIONAL ASSET MANAGEMENT LIMITED (NAMAL), A SUBSIDIARY OF THE BANKNational Asset Management Limited (NAMAL) is the pioneer Unit Trust management company in Sri Lanka established in 1991. With 25 years of experience and a successful track record of investing in equity and fixed income markets, NAMAL launched the first Unit Trust to be licensed in Sri Lanka (National Equity Fund) and the first listed Unit Trust (NAMAL Acuity Value Fund). NAMAL operates eight Unit Trusts and offers private portfolio management services as well.
THE NATURE OF THE BUSINESS OF UB FINANCE COMPANY LIMITED, A SUBSIDIARY OF THE BANK The principal activity of UBF is carrying on finance business including providing financial services, namely, accepting deposits, maintaining savings accounts, lease financing, hire purchase, vehicle loans, mortgage loans, pawning, factoring, working capital financing and real estate.
Union Bank of Colombo PLC(Major Shareholder)
National Asset Management Limited
(Subsidiary)
UB Finance Company Limited
(Subsidiary)
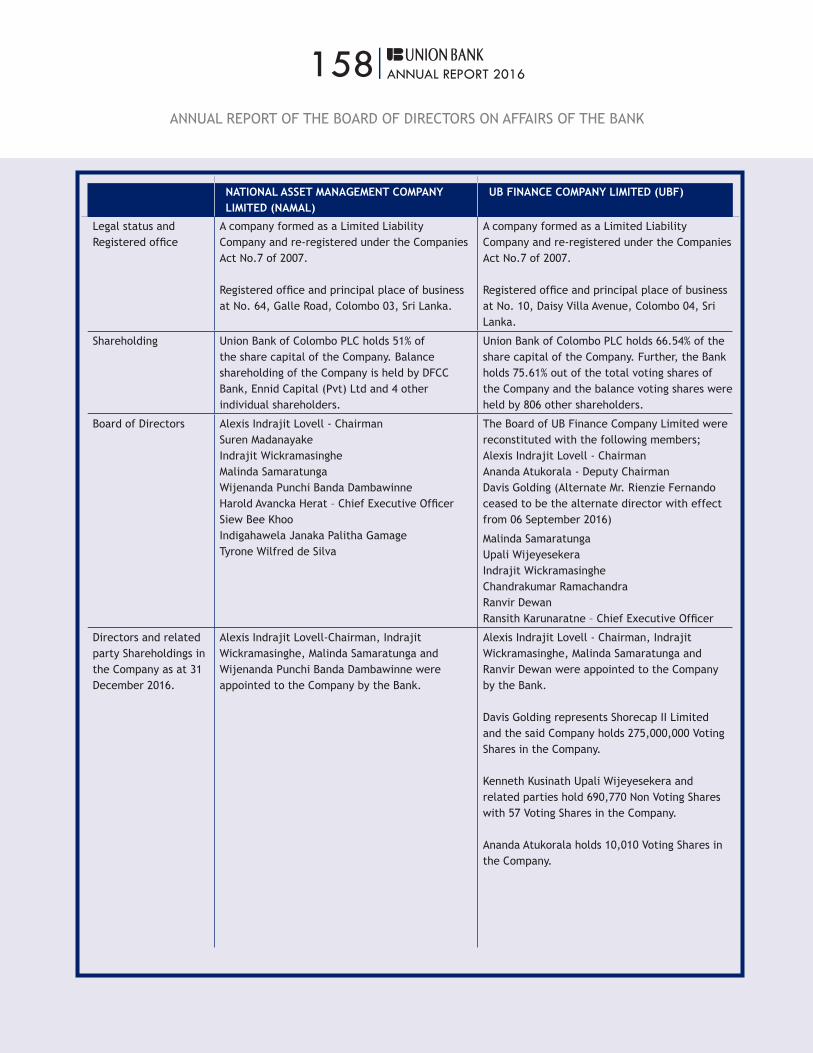
158|ANNUAL REPORT 2016
ANNUAL REPORT OF THE BOARD OF DIRECTORS ON AFFAIRS OF THE BANK
NATIONAL ASSET MANAGEMENT COMPANY LIMITED (NAMAL)
UB FINANCE COMPANY LIMITED (UBF)
Legal status and Registered office
A company formed as a Limited Liability Company and re-registered under the Companies Act No.7 of 2007.
Registered office and principal place of business at No. 64, Galle Road, Colombo 03, Sri Lanka.
A company formed as a Limited Liability Company and re-registered under the Companies Act No.7 of 2007.
Registered office and principal place of business at No. 10, Daisy Villa Avenue, Colombo 04, Sri Lanka.
Shareholding Union Bank of Colombo PLC holds 51% of the share capital of the Company. Balance shareholding of the Company is held by DFCC Bank, Ennid Capital (Pvt) Ltd and 4 other individual shareholders.
Union Bank of Colombo PLC holds 66.54% of the share capital of the Company. Further, the Bank holds 75.61% out of the total voting shares of the Company and the balance voting shares were held by 806 other shareholders.
Board of Directors Alexis Indrajit Lovell - ChairmanSuren MadanayakeIndrajit WickramasingheMalinda SamaratungaWijenanda Punchi Banda DambawinneHarold Avancka Herat – Chief Executive OfficerSiew Bee KhooIndigahawela Janaka Palitha GamageTyrone Wilfred de Silva
The Board of UB Finance Company Limited were reconstituted with the following members;Alexis Indrajit Lovell - ChairmanAnanda Atukorala - Deputy ChairmanDavis Golding (Alternate Mr. Rienzie Fernando ceased to be the alternate director with effect from 06 September 2016)
Malinda SamaratungaUpali WijeyesekeraIndrajit WickramasingheChandrakumar Ramachandra Ranvir DewanRansith Karunaratne – Chief Executive Officer
Directors and related party Shareholdings in the Company as at 31 December 2016.
Alexis Indrajit Lovell-Chairman, Indrajit Wickramasinghe, Malinda Samaratunga and Wijenanda Punchi Banda Dambawinne were appointed to the Company by the Bank.
Alexis Indrajit Lovell - Chairman, Indrajit Wickramasinghe, Malinda Samaratunga and Ranvir Dewan were appointed to the Company by the Bank.
Davis Golding represents Shorecap II Limited and the said Company holds 275,000,000 Voting Shares in the Company.
Kenneth Kusinath Upali Wijeyesekera and related parties hold 690,770 Non Voting Shares with 57 Voting Shares in the Company.
Ananda Atukorala holds 10,010 Voting Shares in the Company.
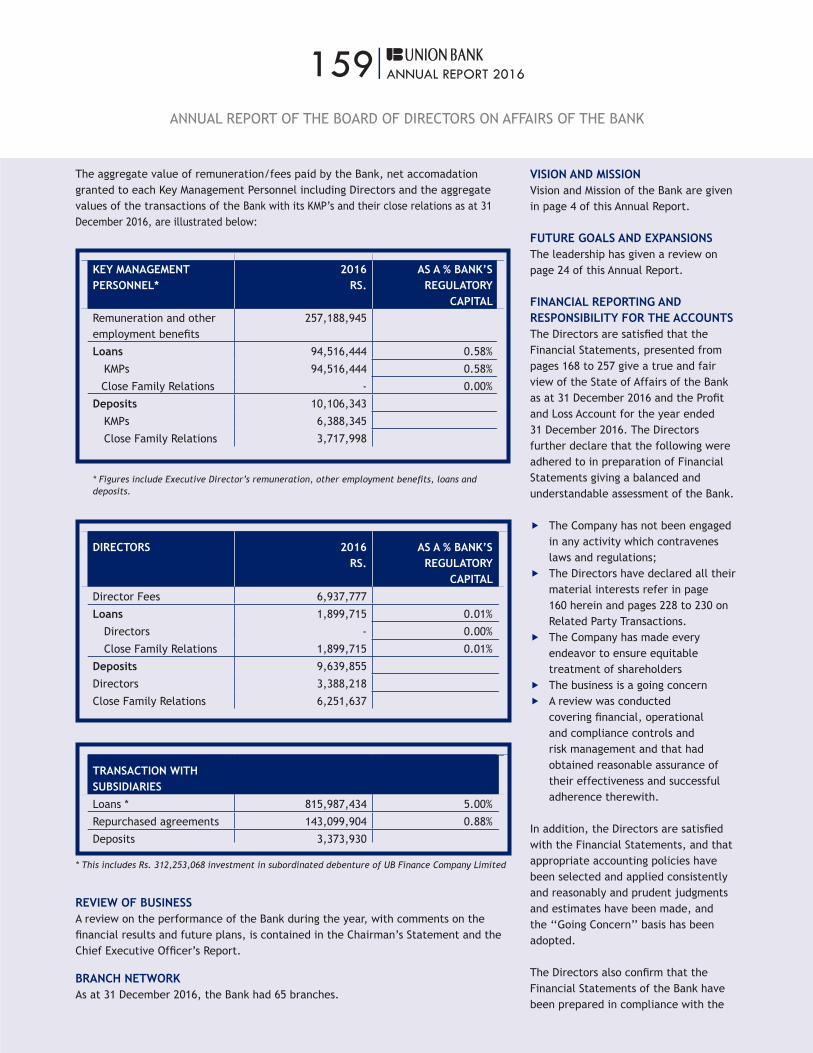
159|ANNUAL REPORT 2016
ANNUAL REPORT OF THE BOARD OF DIRECTORS ON AFFAIRS OF THE BANK
The aggregate value of remuneration/fees paid by the Bank, net accomadation granted to each Key Management Personnel including Directors and the aggregate values of the transactions of the Bank with its KMP’s and their close relations as at 31 December 2016, are illustrated below:
KEY MANAGEMENT PERSONNEL*
2016 RS.
AS A % BANK’S REGULATORY
CAPITALRemuneration and other employment benefits
257,188,945
Loans 94,516,444 0.58%
KMPs 94,516,444 0.58%
Close Family Relations - 0.00%
Deposits 10,106,343
KMPs 6,388,345
Close Family Relations 3,717,998
* Figures include Executive Director’s remuneration, other employment benefits, loans and deposits.
DIRECTORS 2016RS.
AS A % BANK’S REGULATORY
CAPITALDirector Fees 6,937,777
Loans 1,899,715 0.01%
Directors - 0.00%
Close Family Relations 1,899,715 0.01%
Deposits 9,639,855
Directors 3,388,218
Close Family Relations 6,251,637
TRANSACTION WITH SUBSIDIARIESLoans * 815,987,434 5.00%
Repurchased agreements 143,099,904 0.88%
Deposits 3,373,930
* This includes Rs. 312,253,068 investment in subordinated debenture of UB Finance Company Limited
REVIEW OF BUSINESS A review on the performance of the Bank during the year, with comments on the financial results and future plans, is contained in the Chairman’s Statement and the Chief Executive Officer’s Report.
BRANCH NETWORKAs at 31 December 2016, the Bank had 65 branches.
VISION AND MISSIONVision and Mission of the Bank are given in page 4 of this Annual Report.
FUTURE GOALS AND EXPANSIONSThe leadership has given a review on page 24 of this Annual Report.
FINANCIAL REPORTING AND RESPONSIBILITY FOR THE ACCOUNTSThe Directors are satisfied that the Financial Statements, presented from pages 168 to 257 give a true and fair view of the State of Affairs of the Bank as at 31 December 2016 and the Profit and Loss Account for the year ended 31 December 2016. The Directors further declare that the following were adhered to in preparation of Financial Statements giving a balanced and understandable assessment of the Bank.
ff The Company has not been engaged in any activity which contravenes laws and regulations;
ff The Directors have declared all their material interests refer in page 160 herein and pages 228 to 230 on Related Party Transactions.
ff The Company has made every endeavor to ensure equitable treatment of shareholders
ff The business is a going concernff A review was conducted
covering financial, operational and compliance controls and risk management and that had obtained reasonable assurance of their effectiveness and successful adherence therewith.
In addition, the Directors are satisfied with the Financial Statements, and that appropriate accounting policies have been selected and applied consistently and reasonably and prudent judgments and estimates have been made, and the ‘‘Going Concern’’ basis has been adopted.
The Directors also confirm that the Financial Statements of the Bank have been prepared in compliance with the
160|ANNUAL REPORT 2016
ANNUAL REPORT OF THE BOARD OF DIRECTORS ON AFFAIRS OF THE BANK
Companies Act No. 07 of 2007 and as per the requirements of Colombo Stock Exchange, comply with the Sri Lanka Accounting Standards and include Group and the Bank’s results separately with regard to the subsidiaries of the Bank. The Directors have ensured that the Bank has maintained proper books of accounts and records. The Directors have taken reasonable measures to safeguard the assets of the Bank and to establish appropriate systems of internal control with a view to prevention and detection of fraud and other irregularities.
The Directors confirm that to the best of their knowledge all taxes, statutory dues, and levies payable by the Bank as at Balance Sheet date have been paid or where relevant provided for. The Directors are of the view that they have discharged their responsibilities as set out in this statement.
The Gross Income of the Bank and the Group was Rs. 8,546Mn and Rs.10,144Mn respectively.
Profit before taxation, VAT and NBT on financial services for the year ended 31.12.2016 for the Bank was Rs. 653Mn and Rs. 838Mn for the Group.
Retained profit for the year ended 31.12.2016 for the Bank was Rs. 821Mn and the Group retained profit for the year ended 31.12.2016 was Rs. 330Mn respectively.
Property, plant and equipment, leasehold improvement and intangible assets addition during the year amounted to Rs. 417Mn for the Bank and Rs. 590Mn for the Group.
AUDITORS REPORTMessrs. Ernst & Young Chartered Accountants, our Auditors, have done the Audit of the Financial Statements for the financial year ended 31 December 2016 are given on pages 168 to 257 of this Annual Report.
SIGNIFICANT ACCOUNTING POLICIESThe significant accounting policies used by the Bank in preparation of the Financial Statements are given on pages 173 to 181 of this Annual Report.
DONATIONSThe donations given by the Bank during the year 2016 are in total Rs.16,900.
PROPOSED CHANGE TO THE ARTICLES OF ASSOCIATION OF THE BANKThe Board of Directors decided to recommend that the shareholders consider and pass if deemed fit, the following new Article 18 A to be added and included after Article 18 of the existing Articles of Association of the Company, as a special resolution at the forthcoming Annual General Meeting.
“Notwithstanding any other provision herein relating to transfers of shares, the Company shall be bound by any restrictions relating to the ownership of shares imposed by any law or regulation including but not limited to the Banking Act No. 30 of 1988 or any other amendments thereto or any regulations, orders or directions made thereunder. For this purpose, the Company Secretary is authorised to conduct any inquiry as the Board may deem fit into the beneficial ownership of any of the Company’s shares, at any time, whether such shares are held or are to be acquired, in order to determine whether such holding or acquisition has or may result in a contravention of such restriction or prohibition. The Company Secretary may for the purpose of such inquiry require any shareholder, transferee or proposed transferee to provide any information that the Company Secretary may deem necessary for the purpose of conducting such inquiry. Such information may be required by way of proof acceptable to the Company Secretary and may include sworn affidavits. In the event that a shareholder, transferee or proposed transferee fails or neglects to fully cooperate with the Company Secretary in such inquiry or it is determined by the Company Secretary that any holding or acquisition of shares
has or may result in a contravention of such restriction or prohibition, the Board may at its absolute discretion direct such shareholder or transferee or proposed transferee to reduce the number of shares which exceed such restriction or prohibition within a specified period and/or refuse to recognise such transfer, as the case may be. If a shareholder or transferee fails or neglects to divest of such shares within such specified period, the Company shall not recognise such quantity of shares which are determined to be in excess of the amounts permitted to be held by such shareholder or transferee for the purpose of the exercise voting rights or to distributions pertaining to such shares and hold such distributions in a suspense account until its ownership is finally resolved by a duly empowered authority.”
EMPLOYEE SHARE OPTION PLANDuring the year 2015, with the approval of the shareholders the Bank formulated an Employee Share Option Plan (ESOP) for Key Employees and Directors of the Bank. The Plan was set up with the objective of providing key executives in employment with and Directors of the Bank or it subsidiaries with an appropriate incentive to encourage long term and sustainable growth of the Bank.
During the year 2016, no options were offered to the employees under the ESOP. Further, no options offered during the year 2015, were vested.
The Board of Directors confirms that the Bank or any of its subsidiaries have not directly or indirectly provided funds for the ESOP.
POST BALANCE SHEET EVENTS DividendThe Board of Directors resolved at the Board meeting held on 23 February 2017, to pay a final dividend on 1,091,406,249 shares of the Bank amounting to Rupees One Hundred Nine Million One Hundred and Forty Thousand Six Hundred Twenty Five Only (Rs.109,140,625/-) for the year ended 31 December 2016. The dividend payout ratio is 25%.

161|ANNUAL REPORT 2016
ANNUAL REPORT OF THE BOARD OF DIRECTORS ON AFFAIRS OF THE BANK
The Board of Directors has satisfied itself that the Company will meet the requirement of the Solvency Test in terms of Section 56(3) of the Companies Act No. 7 of 2007, immediately after the payment of said dividend.
SHAREHOLDER REGISTERAs at 31 December 2016, the total number of shares issued by the Bank was 1,091,406,249 including 32,640
shareholders. The 20 largest shareholders list is given on page 81 of this Annual Report.
DIRECTORS AND OFFICERS LIABILITY POLICYThe Directors and Officers Liability Policy from AIG - Dubai, fronted by AIA Insurance Lanka Ltd, with comprehensive cover value was in force during the period of review.
The Directors and Officers liability insurance provides indemnity for Directors and Officers against the legal liabilities imposed on them as a consequence of wrongful decisions made in their capacity. The policy also extends its coverage to the Directors and Officers of the subsidiaries of Union Bank of Colombo PLC.
DIRECTORATES AS AT 31 DECEMBER 2016
NAME OF THE DIRECTOR
POSITION/STATUS ALTERNATE DIRECTOR
DATE OF APPOINTMENT AGE
Pangal Jayendra Nayak Chairman – Non Independent Non Executive Director
None 27/10/2014 69
Bodahandi Asoka Keerthi de Silva
Senior Director/Deputy Chairman Independent Non Executive Director
None 30/05/2008 68
Indrajit Asela Wickramasinghe
Executive Director/Chief Executive Officer
None 19/11/2014 49
Priyantha Damian Joseph Fernando
Independent Non Executive Director None 02/11/2011 65
Mohamed Hisham Sabry Ghouse
Independent Non Executive Director None 30/08/2012 52
Ranvir Dewan Non Independent Non Executive Director None 29/09/2014 63
Gaurav Trehan Non Independent Non Executive Director None 29/09/2014 41
Puneet Bhatia Non Independent Non Executive Director None 27/10/2014 50
Michael J O’ Hanlon Non Independent Non Executive Director Sumedh Jog(35 years old)
27/10/2014 and Alternate Director -13/03/2015.
61
Ayomi Aluwihare Gunawardene
Independent Non Executive Director None 19/11/2014 49
Sow Lin Chiew Non Independent Non Executive Director Yoke Sun Woon(52 years old)
20/01/2015 and Alternate Director - 20/01/2015.
57
Yudhishtran Kanagasabai Independent Non Executive Director None 27/07/2016 59
THE NATURE OF DIRECTORATES AS AT 31 DECEMBER 2016P Jayendra Nayak, Chairman of the Board, Ms. Sow Lin Chiew, Mr. Ranvir Dewan, Mr. Gaurav Trehan, Mr. Puneet Bhatia and Mr. Michael J O’Hanlon were the Non Independent Non Executive Directors of the Board. Mr. Asoka de Silva is the Deputy Chairman and the Senior Director of the Bank. Mr. Priyantha Fernando, Mr. Sabry Ghouse, Ms. Ayomi Aluwihare Gunawardene and Mr. Yudhishtran Kanagasabai were the Independent Non-Executive Directors of the Board. Mr. Indrajit Wickramasinghe serves as the Executive Director of the Board and is also the Chief Executive Officer of the Bank. Ms. Yoke Sun Woon and Mr. Sumedh Jog serve as the Alternate Directors to Ms. Sow Lin Chiew and Mr. Michael J O’Hanlon respectively.
NEW APPOINTMENTS AND RESIGNATION OF DIRECTORS Mr. Alexis Indrajit Lovell ceased to be a Director with effect from 27 September 2016 after completing his nine years of service as a Director. Mr. Imtiaz Muhseen resigned from the directorate with effect from 01 June 2016.
162|ANNUAL REPORT 2016
ANNUAL REPORT OF THE BOARD OF DIRECTORS ON AFFAIRS OF THE BANK
Yudhishtran Kanagasabai was appointed as an Independent Non Executive Director on 27 July 2016 to the Board.
RE-APPOINTMENTS In terms of Article 88(i) read together with Article 89 of the Articles of Association of the Bank Asoka de Silva, Sow Lin Chiew, Ayomi Aluwihare Gunawardene and Michael J O’Hanlon retire by rotation at the forthcoming Annual General Meeting and being eligible are recommended by the Directors for re-election in terms of Article 89 of the Articles of Association of the Bank.
Ayomi Aluwihare Gunawardene disclosed that she would not stand for re-election on her retirement by rotation at the forthcoming Annual General Meeting.
APPRAISAL OF BOARD PERFORMANCEA scheme of self assessment for the Board of Directors was approved by the Nominations Committee and the Board in 2010. Two questionnaires were approved enabling the Directors to self-evaluate the Board as a whole and the performance of the fellow Non Executive Directors. The evaluation was made for year ended 2016 with the participation of all Directors presently serving on the Board including the Alternate Directors. The Chairman of the Board tabled the brief summaries of the results of the questionnaire filled independently by all the Directors to the Board.
The Human Resources and Remuneration Committee set goals and targets for the Board of Directors at the meeting held on 15 October 2013 and the Board of Directors approved the same at the meeting held on 01 November 2013. These continued to be applicable to the Board of Directors for the year under reference.
REGISTERS OF DIRECTORS AND SECRETARIESThe Bank maintains a registry of Directors and Secretaries. The names and addresses and their business occupations are set out in this.
COMMUNICATIONThe Bank strongly believes that all stakeholders should have access to complete information on its activities, performance and product initiatives.
DIRECTORS’ INTEREST IN CONTRACTSThe Director’s Interest Register was introduced in December 2007. The Directors have disclosed their interests as per Section 192 (1) of the Companies Act No. 7 of 2007.
Michael J O’Hanlon declared that he has a relevant interest in Union Bank of Colombo PLC as he holds 1,588,324 ordinary voting shares through Culture Financial Holdings Limited, the major shareholder of the Bank.
The Directors of the Bank have no direct or indirect interest in any contract or proposed contract of the Bank other than those disclosed herein and in pages 228 to 230 on Related Party Transactions.
The Directors declare their interest in contracts at meetings and have refrained from voting when decisions are taken in respect of these.
Further, the Board of Directors declare that no transactions required to be disclosed in compliance with Section 9 of the Listing Rules on Related Party Transactions were entered with the subsidiaries of the Bank during the financial year in review other than those disclosed herein and in pages 228 to 230.
ANNUAL GENERAL MEETINGThe Board takes the opportunity to address the issues of shareholders at the Annual General Meeting. The Financial Statement of the Bank is prepared according to the accepted Rules and Accounting Standards. The Financial Accounts were published and also
circulated prior to the Annual General Meeting. A copy of the Notice of Meeting is attached to this Annual Report.
COMPLIANCE WITH RULES AND REGULATIONS INCLUDING CORPORATE GOVERNANCE PRACTICESThe Board of Directors acts in compliance with statutory requirements and has continuously communicated with the regulatory and supervisory bodies. A Compliance Report is tabled at each quarterly Board Meeting informing the status of compliance levels as per the statutory requirements.
The Board has delegated its business operations to the Key Management Personnel led by the Chief Executive Officer and the business operations are monitored by the Board. The Board has formed several Board Committees to provide oversight to areas such as Credit, Risk Management, Audit, Human Resources and Nominations. The Committee members liaise with the Key Management Personnel in their day-to-day activities whenever necessary to ensure the safety and soundness of the Bank.
The Board of Directors has always taken decisions in accordance with the prevailing laws and regulations of the country and specifically imposed by the regulatory bodies.
The Board of Directors confirms that the factual findings of the Auditors issued under Sri Lanka related Services Practice Statement 4750 has been incorporated in the Annual Corporate Governance Report. Further, the Board of Directors confirms that there are no financial, businesses, family, or other material/relevant relationships between the Chairman CEO and among Directors.
For and on behalf of the Board of Directors
P Jayendra Nayak Indrajit Wickramasinghe Nirosha KannangaraChairman Chief Executive Officer Company Secretary
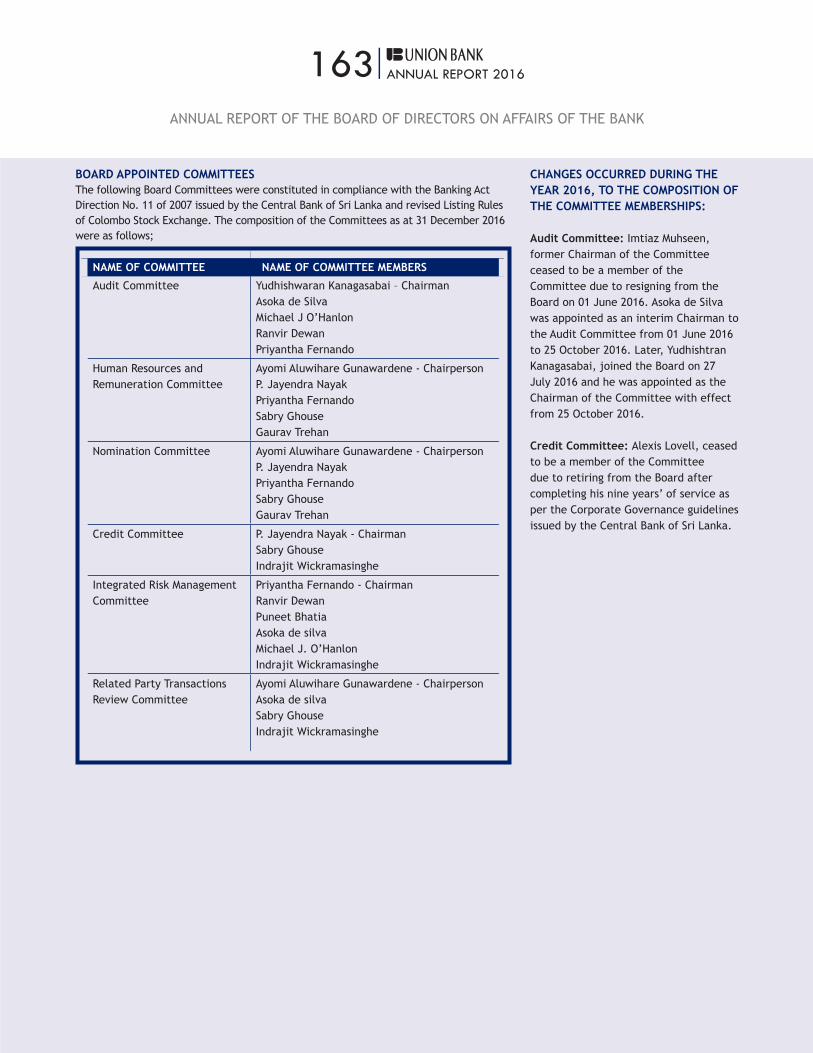
163|ANNUAL REPORT 2016
BOARD APPOINTED COMMITTEESThe following Board Committees were constituted in compliance with the Banking Act Direction No. 11 of 2007 issued by the Central Bank of Sri Lanka and revised Listing Rules of Colombo Stock Exchange. The composition of the Committees as at 31 December 2016 were as follows;
NAME OF COMMITTEE NAME OF COMMITTEE MEMBERS
Audit Committee Yudhishwaran Kanagasabai – ChairmanAsoka de SilvaMichael J O’HanlonRanvir DewanPriyantha Fernando
Human Resources and Remuneration Committee
Ayomi Aluwihare Gunawardene - ChairpersonP. Jayendra NayakPriyantha FernandoSabry GhouseGaurav Trehan
Nomination Committee Ayomi Aluwihare Gunawardene - ChairpersonP. Jayendra NayakPriyantha FernandoSabry GhouseGaurav Trehan
Credit Committee P. Jayendra Nayak - ChairmanSabry GhouseIndrajit Wickramasinghe
Integrated Risk Management Committee
Priyantha Fernando - ChairmanRanvir DewanPuneet BhatiaAsoka de silvaMichael J. O’Hanlon Indrajit Wickramasinghe
Related Party Transactions Review Committee
Ayomi Aluwihare Gunawardene - ChairpersonAsoka de silvaSabry GhouseIndrajit Wickramasinghe
CHANGES OCCURRED DURING THE YEAR 2016, TO THE COMPOSITION OF THE COMMITTEE MEMBERSHIPS:
Audit Committee: Imtiaz Muhseen, former Chairman of the Committee ceased to be a member of the Committee due to resigning from the Board on 01 June 2016. Asoka de Silva was appointed as an interim Chairman to the Audit Committee from 01 June 2016 to 25 October 2016. Later, Yudhishtran Kanagasabai, joined the Board on 27 July 2016 and he was appointed as the Chairman of the Committee with effect from 25 October 2016.
Credit Committee: Alexis Lovell, ceased to be a member of the Committee due to retiring from the Board after completing his nine years’ of service as per the Corporate Governance guidelines issued by the Central Bank of Sri Lanka.
ANNUAL REPORT OF THE BOARD OF DIRECTORS ON AFFAIRS OF THE BANK

164|ANNUAL REPORT 2016
OTHER DIRECTORSHIPS HELD BY THE BOARDSet out below were the directorships held by the Directors in other institutions as at 31 December 2016
NAME OF DIRECTOR OTHER DIRECTORSHIPS
P Jayendra Nayak None
Asoka de Silva None
Indrajit Wickramasinghe Directorff National Asset Management Ltd.ff UB Finance Company Ltd.
Priyantha Fernando Chairmanff Golden Key Credit Card Company Ltd.ff Golden Key Hospitals Ltd.
Directorff Commercial Leasing & Finance PLCff Taprobane Holdings Ltd.ff Imperial Institute of Higher Educationff Ceylon Leather Products PLC ff Thomas Cook Travels - Sri Lanka (Pvt) Ltd.ff Equi Capital Investments Ltd.
Sabry Ghouse Directorff Shah Associates (Pvt) Ltd.
Ranvir Dewan Directorff Shriram City Union Finance Ltd.ff UB Finance Co. Ltd.
Gaurav Trehan
Directorff Shriram Properties (Pvt) Ltd.ff Shriram Automall India Ltd.ff Shriram General Insurance Co. Ltd.ff Shriram Life Insurance Co. Ltd.ff Jana Capital Ltd.ff Manipal Health Enterprises (Pvt) Ltd.
Puneet Bhatia Director ff Flare Estate (Pvt) Ltd.ff Havells India Ltd.ff Shriram Transport Finance Company Ltd.ff Vishal E-commerce (Pvt) Ltd.ff Vishal Mega Mart (Pvt) Ltd.ff Shriram Properties (Pvt) Ltd.ff TPG Capital India (Pvt) Ltd.ff Janalakshmi Financial Services Ltd.
Nominee Directorff Shriram Capital Ltd.ff Jana Capital Ltd.ff Shriram Holdings Madras (Pvt) Ltd.ff Manipal Health Enterprises (Pvt) Ltd.
Michael J O’Hanlon Chairman ff Roosevelt Management Company LLC
Directorff Rushmore Loan Management Services LLC
ANNUAL REPORT OF THE BOARD OF DIRECTORS ON AFFAIRS OF THE BANK

165|ANNUAL REPORT 2016
NAME OF DIRECTOR OTHER DIRECTORSHIPS
Ayomi Aluwihare Gunawardene Directorff Smarased Property Holdings (Pvt) Ltd.ff Corporate Trustee Services (Pvt) Ltd.ff Besra (Pvt) Ltd.ff Corporate Services (Pvt) Ltd.ff Kestral (Pvt) Ltd.
Trusteeff The National Trust Sri Lanka
Sow Lin Chiew Directorff Genting Management and Consultancy Services Sdn Bhdff Sri Highlands Express Sdn Bhd ff Genting Risk Solutions Sdn Bhdff Genting CDX Singapore Pte Ltd formerly known as Genting International Industries
(Singapore) Pte Ltd.ff Genting Bhd (Hongkong) Ltd.ff Resorts World Ltd.ff Resorts World Bhd (Hong Kong) Ltd.ff Genting Power Holdings Ltd.ff Genting Global Pte Ltd - formerly known as Genting (Singapore) Pte Ltd.ff Oxalis Ltd.ff Web Energy Ltd.ff Genting Power International Ltd.ff Awana Hotels & Resorts Management Sdn Bhd ff Vista Knowledge Pte Ltd ff Capax Trading Sdn Berhad
Alternate Directorff CIMB (Pvt) Ltd.
Yudhishtran Kanagasabai Directorff Cargills Food Services (Pvt) Ltd.
Yoke Sun Woon(Alternate Director to Sow Lin Chiew)
Directorff Lacustrine Limitedff Genting Group Sdn Bhdff Genting Gaming Solutions Pte Ltd.ff Genting Innovation Pte Ltd.ff Resorts World (Singapore) Pte Ltd.ff Genting Management (Singapore) Pte Ltd.ff Genting Laboratory Service Sdn Bhdff Applied Proteomics, INC
Alternate Directorff Genting Taurx Diagnostic Centre Sdn Bhdff Taurx Pharmaceuticals Ltd. ff DNAE Group Holdings Limited (formerly known as DNA Electronics Limited)
Sumedh Jog (Alternate Director to Michael J O’Hanlon)
None
ANNUAL REPORT OF THE BOARD OF DIRECTORS ON AFFAIRS OF THE BANK

166|ANNUAL REPORT 2016
NUMBER OF MEETINGS HELD AND ATTENDANCEBoard members attendance for the Board/Sub-committee meetings during the year 2016
NAME OF DIRECTORS
BOARD MEETINGS
AUDIT COMMITTEE
INTEGRATED RISK MANAGEMENTCOMMITTEE
NOMINATIONCOMMITTEE
HUMAN RESOURCES &REMUNERATION COMMITTEE
CREDIT COMMITTEE
Elig
ibil
ity
Atte
ndan
ce
Elig
ibil
ity
Atte
ndan
ce
Elig
ibil
ity
Atte
ndan
ce
Elig
ibil
ity
Atte
ndan
ce
El
igib
ilit
y
Atte
ndan
ce
Elig
ibil
ity
Atte
ndan
ce
Mr. Pangal Jayendra Nayak
12 12 04 04 06 05 11 11
Bodahandi Asoka Keerthi de Silva
12 10 08 07 05 03
Priyantha Damian Joseph Fernando
12 11 08 06 05 04 04 02 06 04
Mohamed Hisham Sabry Ghouse
12 10 04 03 06 05 11 09
Ranvir Dewan 12 11 08 05 05 04
Gaurav Trehan 12 10 04 03 06 06
Puneet Bhatia 12 09 05 -
Michael J O’Hanlon or his Alternate Director Sumedh Jog
12 11 08 08 05 05
Ayomi Aluwihare Gunawardene
12 10 04 04 06 06
Indrajit Wickramasinghe
12 12 05 05 11 11
Sow Lin Chiew or her Alternate Director Yoke Sun Woon
12 12
Yudhishtran Kanagasabai
05 04 01 01
Alexis Indrajit Lovell*
09 09 09 09
Hussain Imtiaz Muhseen**
05 04 05 05
*Alexis Indrajit Lovell retired on 27 September 2016.**Hussain Imtiaz Musheen resigned on 01 June 2016.
ANNUAL REPORT OF THE BOARD OF DIRECTORS ON AFFAIRS OF THE BANK
167|ANNUAL REPORT 2016
INDEPENDENT AUDITORS’ REPORT ON FINANCIAL STATEMENTS
INDEPENDENT AUDITORS’ REPORTTO THE SHAREHOLDERS OF UNION BANK OF COLOMBO PLC
REPORT ON THE FINANCIAL STATEMENTS We have audited the accompanying financial statements of Union Bank of Colombo PLC, (the “Bank”), and the consolidated financial statements of the Bank and its subsidiaries (the “Group”), which comprise the statement of financial position as at 31 December 2016, and the statement of profit or loss, statement of comprehensive income, statement of changes in equity and, statement of cash flows for the year then ended, and a summary of significant accounting policies and other explanatory information.
BOARD’S RESPONSIBILITY FOR THE FINANCIAL STATEMENTSThe Board of Directors (the “Board”) is responsible for the preparation of these financial statements that give a true and fair view in accordance with Sri Lanka Accounting Standards, and for such internal control as Board determines is necessary to enable the preparation of financial statements that are free from material misstatement, whether due to fraud or error.
AUDITORS’ RESPONSIBILITYOur responsibility is to express an opinion on these financial statements based on our audit. We conducted our audit in accordance with Sri Lanka Auditing Standards. Those standards require that
we comply with ethical requirements and plan and perform the audit to obtain reasonable assurance about whether the financial statements are free from material misstatement.
An audit involves performing procedures to obtain audit evidence about the amounts and disclosures in the financial statements. The procedures selected depend on the auditors’ judgment, including the assessment of the risks of material misstatement of the financial statements, whether due to fraud or error. In making those risk assessments, the auditors consider internal control relevant to the Bank’s preparation of the financial statements that give a true and fair view in order to design audit procedures that are appropriate in the circumstances, but not for the purpose of expressing an opinion on the effectiveness of the Bank’s internal control. An audit also includes evaluating the appropriateness of accounting policies used and the reasonableness of accounting estimates made by Board, as well as evaluating the overall presentation of the financial statements.
We believe that the audit evidence we have obtained is sufficient and appropriate to provide a basis for our audit opinion.
OPINIONIn our opinion, the consolidated financial statements give a true and fair view of the financial position of the Group as at 31 December 2016, and of its financial
performance and cash flows for the year then ended in accordance with Sri Lanka Accounting Standards.
REPORT ON OTHER LEGAL AND REGULATORY REQUIREMENTS As required by Section 163(2) of the Companies Act No. 7 of 2007, we state the following:
a) The basis of opinion, scope and limitations of the audit are as stated above.
b) In our opinion :ff we have obtained all the information
and explanations that were required for the audit and, as far as appears from our examination, proper accounting records have been kept by the Bank,
ff the financial statements of the Bank give a true and fair view of the financial position as at 31 December 2016, and of its financial performance and cash flows for the year then ended in accordance with Sri Lanka Accounting Standards, and
ff the financial statements of the Bank and the Group, comply with the requirements of Sections 151 and 153 of the Companies Act No. 07 of 2007.
23 February 2017Colombo
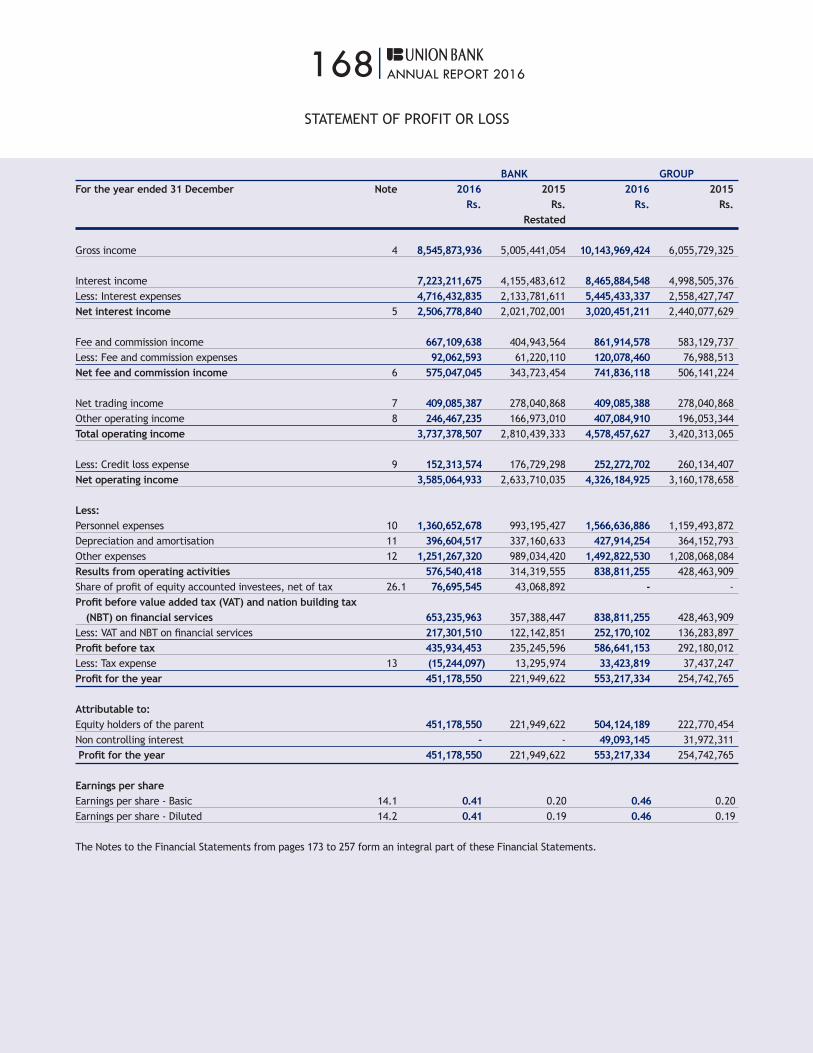
168|ANNUAL REPORT 2016
BANK GROUPFor the year ended 31 December Note 2016 2015 2016 2015 Rs. Rs. Rs. Rs. Restated
Gross income 4 8,545,873,936 5,005,441,054 10,143,969,424 6,055,729,325
Interest income 7,223,211,675 4,155,483,612 8,465,884,548 4,998,505,376Less: Interest expenses 4,716,432,835 2,133,781,611 5,445,433,337 2,558,427,747Net interest income 5 2,506,778,840 2,021,702,001 3,020,451,211 2,440,077,629
Fee and commission income 667,109,638 404,943,564 861,914,578 583,129,737Less: Fee and commission expenses 92,062,593 61,220,110 120,078,460 76,988,513Net fee and commission income 6 575,047,045 343,723,454 741,836,118 506,141,224
Net trading income 7 409,085,387 278,040,868 409,085,388 278,040,868Other operating income 8 246,467,235 166,973,010 407,084,910 196,053,344Total operating income 3,737,378,507 2,810,439,333 4,578,457,627 3,420,313,065
Less: Credit loss expense 9 152,313,574 176,729,298 252,272,702 260,134,407Net operating income 3,585,064,933 2,633,710,035 4,326,184,925 3,160,178,658
Less:Personnel expenses 10 1,360,652,678 993,195,427 1,566,636,886 1,159,493,872Depreciation and amortisation 11 396,604,517 337,160,633 427,914,254 364,152,793Other expenses 12 1,251,267,320 989,034,420 1,492,822,530 1,208,068,084Results from operating activities 576,540,418 314,319,555 838,811,255 428,463,909Share of profit of equity accounted investees, net of tax 26.1 76,695,545 43,068,892 - -Profit before value added tax (VAT) and nation building tax (NBT) on financial services 653,235,963 357,388,447 838,811,255 428,463,909Less: VAT and NBT on financial services 217,301,510 122,142,851 252,170,102 136,283,897Profit before tax 435,934,453 235,245,596 586,641,153 292,180,012Less: Tax expense 13 (15,244,097) 13,295,974 33,423,819 37,437,247Profit for the year 451,178,550 221,949,622 553,217,334 254,742,765
Attributable to:Equity holders of the parent 451,178,550 221,949,622 504,124,189 222,770,454Non controlling interest - - 49,093,145 31,972,311 Profit for the year 451,178,550 221,949,622 553,217,334 254,742,765
Earnings per shareEarnings per share - Basic 14.1 0.41 0.20 0.46 0.20Earnings per share - Diluted 14.2 0.41 0.19 0.46 0.19
The Notes to the Financial Statements from pages 173 to 257 form an integral part of these Financial Statements.
STATEMENT OF PROFIT OR LOSS

169|ANNUAL REPORT 2016
BANK GROUPFor the year ended 31 December Note 2016 2015 2016 2015 Rs. Rs. Rs. Rs. Restated
Profit for the year 451,178,550 221,949,622 553,217,334 254,742,765Other comprehensive income to be reclassified to profit or loss in subsequent periods:Gains and (losses) on re-measuring available for sale financial assets (336,911,529) (26,929,760) (344,698,498) (27,797,978)Net amount transferred to profit or loss (available for sale financial assets) 1,570,516 1,720,629 (941,960) 1,720,629Less: Income tax effect on losses on re-measuring available for sale financial assets 93,895,484 7,058,557 93,895,484 7,058,557Net other comprehensive income to be reclassified to profit or loss in subsequent periods (241,445,529) (18,150,574) (251,744,974) (19,018,792)Other comprehensive income not to be reclassified to profit or loss in subsequent periods:Actuarial gains/(losses) on defined benefit plans 35.1.3 (12,360,300) (5,118,585) (10,503,413) (5,406,969)Less: Income tax effect on actuarial losses on defined benefit plans 3,460,883 1,433,204 3,353,685 1,390,517Net other comprehensive income not to be reclassified to profit or loss in subsequent periods (8,899,417) (3,685,381) (7,149,728) (4,016,452)Share of other comprehensive income of equity accounted investees, net of tax 26.1 (3,958,620) (787,698) - -
Other comprehensive income/(loss) for the year, net of taxes (254,303,566) (22,623,654) (258,894,702) (23,035,244)
Total comprehensive income for the year, net of tax 196,874,984 199,325,968 294,322,632 231,707,521
Attributable to:Equity holders of the parent 196,874,984 199,325,968 249,820,624 200,146,802Non-controlling interest - - 44,502,008 31,560,719Total comprehensive income for the year, net of tax 196,874,984 199,325,968 294,322,632 231,707,521
The Notes to the Financial Statements from pages 173 to 257 form an integral part of these Financial Statements.
STATEMENT OF COMPREHENSIVE INCOME
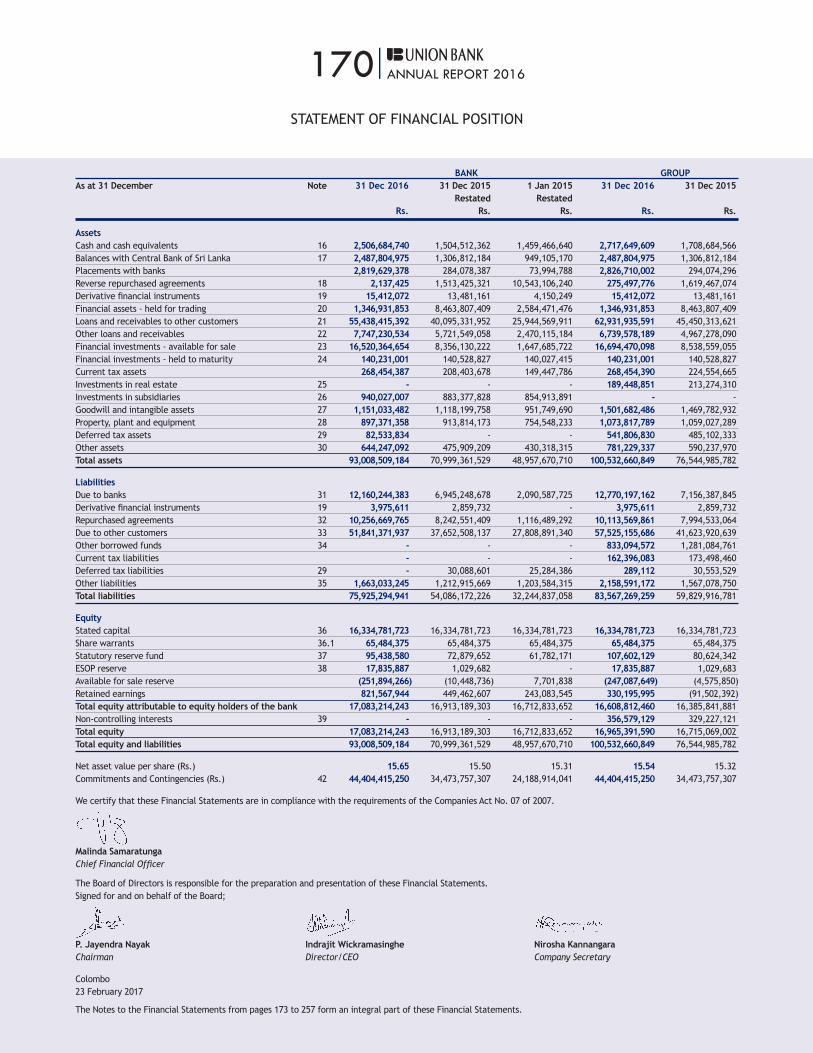
170|ANNUAL REPORT 2016
STATEMENT OF FINANCIAL POSITION
BANK GROUPAs at 31 December Note 31 Dec 2016 31 Dec 2015 1 Jan 2015 31 Dec 2016 31 Dec 2015 Restated Restated Rs. Rs. Rs. Rs. Rs.
AssetsCash and cash equivalents 16 2,506,684,740 1,504,512,362 1,459,466,640 2,717,649,609 1,708,684,566Balances with Central Bank of Sri Lanka 17 2,487,804,975 1,306,812,184 949,105,170 2,487,804,975 1,306,812,184Placements with banks 2,819,629,378 284,078,387 73,994,788 2,826,710,002 294,074,296Reverse repurchased agreements 18 2,137,425 1,513,425,321 10,543,106,240 275,497,776 1,619,467,074Derivative financial instruments 19 15,412,072 13,481,161 4,150,249 15,412,072 13,481,161Financial assets - held for trading 20 1,346,931,853 8,463,807,409 2,584,471,476 1,346,931,853 8,463,807,409Loans and receivables to other customers 21 55,438,415,392 40,095,331,952 25,944,569,911 62,931,935,591 45,450,313,621Other loans and receivables 22 7,747,230,534 5,721,549,058 2,470,115,184 6,739,578,189 4,967,278,090Financial investments - available for sale 23 16,520,364,654 8,356,130,222 1,647,685,722 16,694,470,098 8,538,559,055Financial investments - held to maturity 24 140,231,001 140,528,827 140,027,415 140,231,001 140,528,827Current tax assets 268,454,387 208,403,678 149,447,786 268,454,390 224,554,665Investments in real estate 25 - - - 189,448,851 213,274,310Investments in subsidiaries 26 940,027,007 883,377,828 854,913,891 - -Goodwill and intangible assets 27 1,151,033,482 1,118,199,758 951,749,690 1,501,682,486 1,469,782,932Property, plant and equipment 28 897,371,358 913,814,173 754,548,233 1,073,817,789 1,059,027,289Deferred tax assets 29 82,533,834 - - 541,806,830 485,102,333Other assets 30 644,247,092 475,909,209 430,318,315 781,229,337 590,237,970Total assets 93,008,509,184 70,999,361,529 48,957,670,710 100,532,660,849 76,544,985,782
LiabilitiesDue to banks 31 12,160,244,383 6,945,248,678 2,090,587,725 12,770,197,162 7,156,387,845Derivative financial instruments 19 3,975,611 2,859,732 - 3,975,611 2,859,732Repurchased agreements 32 10,256,669,765 8,242,551,409 1,116,489,292 10,113,569,861 7,994,533,064Due to other customers 33 51,841,371,937 37,652,508,137 27,808,891,340 57,525,155,686 41,623,920,639Other borrowed funds 34 - - - 833,094,572 1,281,084,761Current tax liabilities - - - 162,396,083 173,498,460Deferred tax liabilities 29 - 30,088,601 25,284,386 289,112 30,553,529Other liabilities 35 1,663,033,245 1,212,915,669 1,203,584,315 2,158,591,172 1,567,078,750Total liabilities 75,925,294,941 54,086,172,226 32,244,837,058 83,567,269,259 59,829,916,781
EquityStated capital 36 16,334,781,723 16,334,781,723 16,334,781,723 16,334,781,723 16,334,781,723Share warrants 36.1 65,484,375 65,484,375 65,484,375 65,484,375 65,484,375Statutory reserve fund 37 95,438,580 72,879,652 61,782,171 107,602,129 80,624,342ESOP reserve 38 17,835,887 1,029,682 - 17,835,887 1,029,683Available for sale reserve (251,894,266) (10,448,736) 7,701,838 (247,087,649) (4,575,850)Retained earnings 821,567,944 449,462,607 243,083,545 330,195,995 (91,502,392)Total equity attributable to equity holders of the bank 17,083,214,243 16,913,189,303 16,712,833,652 16,608,812,460 16,385,841,881Non-controlling interests 39 - - - 356,579,129 329,227,121Total equity 17,083,214,243 16,913,189,303 16,712,833,652 16,965,391,590 16,715,069,002Total equity and liabilities 93,008,509,184 70,999,361,529 48,957,670,710 100,532,660,849 76,544,985,782
Net asset value per share (Rs.) 15.65 15.50 15.31 15.54 15.32Commitments and Contingencies (Rs.) 42 44,404,415,250 34,473,757,307 24,188,914,041 44,404,415,250 34,473,757,307
We certify that these Financial Statements are in compliance with the requirements of the Companies Act No. 07 of 2007.
Malinda SamaratungaChief Financial Officer
The Board of Directors is responsible for the preparation and presentation of these Financial Statements.Signed for and on behalf of the Board;
P. Jayendra Nayak Indrajit Wickramasinghe Nirosha KannangaraChairman Director/CEO Company Secretary
Colombo23 February 2017
The Notes to the Financial Statements from pages 173 to 257 form an integral part of these Financial Statements.

171|ANNUAL REPORT 2016
STATEMENT OF CHANGES IN EQUITY
BANK For the year ended 31 December Statutory Available Stated Share Reserve ESOP for Sale Retained Capital Warrants Fund Reserve Reserve Earnings Total Note Rs. Rs. Rs. Rs. Rs. Rs. Rs.
Balance as at 31 December 2014 (As reported previously) 16,334,781,723 65,484,375 61,782,171 - (78,461) 288,314,442 16,750,284,250Changes in Accounting Policies 40 - - - - 7,780,299 (45,230,897) (37,450,598)Balance as at 1 January 2015 (Restated) 16,334,781,723 65,484,375 61,782,171 - 7,701,838 243,083,545 16,712,833,652Total comprehensive income for the yearNet Profit for the year - - - - - 221,949,622 221,949,622Other Comprehensive Income - - - - (18,150,574) (4,473,079) (22,623,653)Total Comprehensive Income - - - - (18,150,574) 217,476,543 199,325,969Transactions with equity holders, recognised directly in equityFair value of ESOP 38 - - - 1,029,683 - - 1,029,683Transfers during the year 37 - - 11,097,481 - - (11,097,481) -Balance as at 31 December 2015 (Restated) 16,334,781,723 65,484,375 72,879,652 1,029,683 (10,448,736) 449,462,607 16,913,189,304Total comprehensive income for the yearNet profit for the year - - - - - 451,178,550 451,178,550Other Comprehensive Income - - - - (241,445,529) (12,858,036) (254,303,566)Total Comprehensive income - - - - (241,445,529) 438,320,504 196,874,984Transactions with equity holders, recognised directly in equityFair value of ESOP 38 - - - 16,806,205 - - 16,806,205Dividends to equity holders - - - - - (43,656,250) (43,656,250)Transfers during the year 37 - - 22,558,928 - - (22,558,927) -Balance as at 31 December 2016 16,334,781,723 65,484,375 95,438,580 17,835,888 (251,894,266) 821,567,944 17,083,214,244
GROUP Statutory Available Non For the year ended 31 December Stated Share Reserve ESOP for Sale Retained Total Controlling Capital Warrants Fund Reserve Reserve Earnings Equity Interest Total Note Rs. Rs. Rs. Rs. Rs. Rs. Rs. Rs. Rs.
Balance as at 1 January 2015 16,334,781,723 65,484,375 69,168,604 - 14,085,075 (298,854,380) 16,184,665,397 312,366,401 16,497,031,798Total comprehensive income for the yearNet Profit for the year - - - - - 222,770,454 222,770,454 31,972,310 254,742,764Other Comprehensive Income - - - - (18,660,925) (3,962,728) (22,623,653) (411,590) (23,035,243)Total comprehensive income - - - - (18,660,925) 218,807,726 200,146,801 31,560,720 231,707,521Transactions with equity holders, recognised directly in equityFair value of ESOP 38 - - - 1,029,683 - - 1,029,683 - 1,029,683Transfers during the year 37 - - 11,455,738 - - (11,455,738) - - -Dividends to equity holders - - - - - - - (14,700,000) (14,700,000)Balance as at 31 December 2015 16,334,781,723 65,484,375 80,624,342 1,029,683 (4,575,850) (91,502,392) 16,385,841,881 329,227,121 16,715,069,002Total comprehensive income for the yearNet Profit for the year - - - - - 504,124,189 504,124,189 49,093,145 553,217,334Other Comprehensive Income - - - - (242,511,799) (11,791,766) (254,303,565) (4,591,137) (258,894,702)Total comprehensive income - - - - (242,511,799) 492,332,423 249,820,624 44,502,008 294,322,632Transactions with equity holders, recognised directly in equityFair value of ESOP 38 - - - 16,806,205 - - 16,806,205 - 16,806,205Transfers during the year 37 - - 26,977,787 - - (26,977,786) - - -Dividends to equity holders - - - - - (43,656,250) (43,656,250) (17,150,000) (60,806,250)Balance as at 31 December 2016 16,334,781,723 65,484,375 107,602,129 17,835,888 (247,087,649) 330,195,995 16,608,812,460 356,579,129 16,965,391,590
The Notes to the Financial Statements from pages 173 to 257 form an integral part of these Financial Statements.

172|ANNUAL REPORT 2016
STATEMENT OF CASH FLOWS
ACCOUNTING POLICYThe cash flow statement has been prepared by using ‘The Direct Method’ in accordance with the Sri Lanka Accounting Standard - LKAS 7 (Statement of Cash Flows), whereby gross cash receipts and gross cash payments of operating activities, finance activities and investing activities have been recognised.
Cash and cash equivalents for the purpose of cash flow statement comprise of cash in hand and at banks, placements with banks, reverse repurchased agreements and unfavourable balances with local and foreign banks that are subject to an insignificant risk of change in their value.
BANK GROUP
For the year ended 31 December Note 2016 2015 2016 2015
Rs. Rs. Rs. Rs.
Cash Flow from Operating ActivitiesInterest receipts 6,443,555,831 3,751,510,811 7,676,041,887 4,485,752,177Fee and commission receipts 575,047,045 180,597,935 741,836,118 343,015,704Interest payments (4,130,949,045) (2,032,621,928) (4,728,341,532) (2,502,990,767)Receipts from other operating activities 933,184,689 362,011,364 1,090,667,235 388,958,933
Payments on other operating activities (2,787,425,207) (2,101,288,729) (3,243,544,511) (2,496,905,627)
Operating profit before changes in operating assets & liabilities 1,033,413,313 160,209,453 1,536,659,197 217,830,420
(Increase)/decrease in operating assets:Balances with Central Bank of Sri Lanka (1,180,992,791) (357,707,014) (1,180,992,791) (357,707,014)Funds advanced to customers (15,273,961,825) (14,240,741,649) (17,558,883,502) (16,347,632,283)
Others (172,406,218) (52,062,076) (171,234,244) (27,178,807)
(16,627,360,834) (14,650,510,739) (18,911,110,537) (16,732,518,104)Increase /(decrease) in operating liabilities:Due to banks & other customers 13,629,074,065 9,800,140,865 15,209,005,605 11,320,893,572Repurchased agreements 2,016,652,422 7,109,813,929 2,121,570,863 6,882,590,895
Others 465,711,480 (140,902,468) 671,267,616 (29,423,525)
16,111,437,967 16,769,052,326 18,001,844,085 18,174,060,941
Net cash from/(used in) operating activities before income tax 517,490,445 2,278,751,040 627,392,744 1,659,373,257Retirement benefit obligation paid 34.1 (8,353,049) (7,038,842) (8,685,203) (8,435,635)
Income tax paid (28,020,134) (10,811,663) (46,052,854) (28,519,955)
Net cash from/(used in) operating activities 481,117,262 2,260,900,535 572,654,687 1,622,417,667
Cash flow from/(used in) investing activitiesDividends received 16,380,246 14,126,272 1,238,888 648,453Investment in other financial assets held for trading 6,829,530,505 (5,608,119,934) 6,830,355,217 (5,608,119,934)Investment in financial assets available for sale (8,151,153,945) (6,647,352,129) (8,153,130,002) (6,677,584,695)Financial investments – held to maturity 7,115,294 (6,889,185) 7,115,294 (6,889,185)Net increase in debt securities (1,840,911,138) (3,069,167,059) (1,528,658,069) (3,068,933,846)Purchase of property, plant & equipment 28 (247,816,323) (390,645,620) (312,068,088) (443,575,069)Purchase of intangible assets (213,288,292) (141,869,091) (305,093,236) (143,212,877)Proceeds from sale of property,plant & equipment 2,321,363 1,416,079 8,402,835 6,988,150Net cash used in investing activities (3,597,822,290) (15,848,500,667) (3,451,837,159) (15,940,679,002)
Cash flow from/(used in) financing activities
Increase/(decrease) in borrowings 5,107,117,148 4,899,216,212 4,846,937,623 5,527,710,017Dividend paid / (used in) (43,656,250) - (60,806,250) (14,700,000)Net cash from investing activities 5,063,460,898 4,899,216,212 4,786,132,373 5,513,010,017
Net increase/(decrease) in cash and cash equivalents 1,946,755,870 (8,688,383,920) 1,906,949,900 (8,805,251,318)Cash and cash equivalents at beginning of the year 3,243,722,925 11,932,106,847 3,563,864,184 12,369,115,502Cash and cash equivalents at end of the year 5,190,478,796 3,243,722,927 5,470,814,084 3,563,864,184
Reconciliation of cash and cash equivalentsCash in hand and at banks 16 2,506,684,740 1,504,512,361 2,717,649,609 1,708,684,566Placements with banks 2,819,207,104 284,074,181 2,826,287,728 294,070,090Due to banks - Unfavourable balances with banks (135,413,048) (55,762,611) (346,483,604) (55,831,220)Reverse repurchased agreements - 1,510,898,995 273,360,351 1,616,940,748Cash and cash equivalents at end of the year 5,190,478,796 3,243,722,927 5,470,814,083 3,563,864,184
The Notes to the Financial Statements from pages 173 to 257 form an integral part of these Financial Statements.

173|ANNUAL REPORT 2016
NOTES TO THE FINANCIAL STATEMENTS
1. CORPORATE INFORMATION
1.1 Reporting EntityUnion Bank of Colombo PLC (“Bank”) is a Public Limited Liability Company listed on the Colombo Stock Exchange, incorporated on 02 February 1995 and domiciled in Sri Lanka. It is a Licensed Commercial Bank regulated under the Banking Act No. 30 of 1988 and amendments thereto. The Bank was re-registered under the Companies Act No7 of 2007. The registered office of the Bank is at No.64, Galle Road, Colombo 03. The ordinary shares of the Bank have a primary listing on the Colombo Stock Exchange.
1.1.1 Consolidated Financial Statements
The Consolidated Financial Statements for the year ended 31 December 2016 comprise the Bank (parent company), two subsidiaries National Assets Management Limited and UB Finance Company Limited and the Special Purpose Entity, Serandib Capital (Pvt) Ltd. (together referred to as the “Group”).
National Asset Management Limited was incorporated on 28 September 1990 as a Limited Liability Company under the Companies Act No.17 of 1982. The company re-registered under the Companies Act No. 07 of 2007.
UB Finance Company Ltd is an unquoted public limited Company, incorporated and domiciled in Sri Lanka. The Company was incorporated in Sri Lanka on 12 July 1961 under the Companies Ordinance No.38 of 1938 and was re-registered as required under the provision of the Companies Act No.7of 2007. The Company has registered with the Central Bank of Sri Lanka as a Finance Company under the Finance Companies’ Act No.78 of 1988.
Serandib Capital (Pvt) Ltd is a private investment company formed in 2003. The Bank considers this as a Special Purpose Entity and due to the combination of activities and arrangements mentioned in Note 3.1.7, management determined that, in substance, the Bank controls this entity. Consequently, Serandib Capital (Pvt) Ltd is included in the Bank’s consolidated Financial Statements.
1.1.2 Parent Entity and Ultimate Controlling Parties
The Bank’s immediate parent is Culture Financial Holdings Limited and the ultimate holding company is TPG Asia GenPar VI, L.P, Both companies are registered in the Cayman Islands.
1.2 Principal Activities and Nature of Operations Bank
BankThe Bank provides a comprehensive range of financial services encompassing accepting deposits, personal banking, retail banking, trade financing, off shore banking, resident and non-resident foreign currency operations, corporate and retail credit, pawning, project financing, lease financing, rural credit, internet banking, money remittance facilities, dealing in Government Securities and Treasury related products and margin trading, etc.
SubsidiariesThe principal activities of the Bank’s Subsidiaries are launching, operating and administrating unit trusts and accepting deposits from public, providing loans, land sales, leasing and hire purchase.
Special Purpose Entity (SPE)Serandib Capital (Pvt) Ltd is a private investment company.
There were no significant changes in the nature of the principal activities of the Bank and the Group during the financial year under review.
1.3 Date of Authorisation for IssueThe Financial Statements of the Group and the Bank for the year ended 31 December 2016 were authorised for issue in accordance with a resolution of the Board of Directors on 23 February 2017.
2. BASIS OF PREPARATION OF FINANCIAL STATEMENTS
2.1 Statement of ComplianceThe Statement of Profit or Loss, Statement of Comprehensive Income, Statement of Financial Position, Statements of Changes
in Equity and Statement of Cash Flows together with Accounting Policies and related notes (Financial Statements), i.e. Consolidated Financial Statements and Separate Financial Statements, as at 31 December 2016 and for the year then ended, have been prepared in accordance with Sri Lanka Accounting Standards (hereafter referred as SLFRS) laid down by The Institute of Chartered Accountants of Sri Lanka and in compliance with the requirements of the Companies Act No. 07 of 2007. The presentation of the Financial Statements is also in compliance with the requirements of the Banking Act No. 30 of 1988 and Finance Business Act No. 42 of 2011 and amendments thereto.
2.2 Basis of MeasurementThe Financial Statements of the Bank and the Group have been prepared on a historical cost basis, except for derivative financial instruments, available for sale financial instruments and other financial assets held for trading that have been measured at fair value and liabilities for defined benefit obligations are recognised as the present value of the defined benefit obligation.
2.3 Functional and Presentation Currency
The Financial Statements of the Bank and the Group are presented in Sri Lankan Rupees which is the currency of the primary economic environment in which the Bank and the Group operates. Financial information presented in Sri Lankan Rupees, except when otherwise indicated.
2.4 Presentation of Financial Statements
The Bank and the Group present their Statement of Financial Position are grouped by nature and listed in order that reflects relative liquidity and maturity pattern. An analysis regarding recovery or settlement within 12 months after the reporting date (current) and more than 12 months after the reporting date (non–current) is presented in Note 48 to the Financial Statements.

174|ANNUAL REPORT 2016
2.5 Responsibility for the Financial Statements
The Board of Directors is responsible for the preparation and presentation of the Financial Statements of the Bank and Group, in compliance with the provisions of the Companies Act No.07 of 2007 and SLFRSs.
The Board of Directors acknowledge their responsibility as set out in the Annual Report of the Board of Director’s Statement of Director’s Responsibilities on financial reporting and the certification given on the Statement of Financial Position on page 159 and page 170 respectively.
These Financial Statements include;• The Statement of Profit or Loss
and a Statement of Comprehensive Income providing information on the performance for the year under review (refer pages 168 and 169).
• Statement of Financial Position providing the information on the financial position of the Bank and the Group as at the year end (refer page 170).
• Statement of Changes in Equity providing the movement in the shareholders’ funds during the year ended under review for the Bank and the Group (refer page 171).
• Statement of Cash Flow providing the information to the users on the ability of the Bank and the Group to generate cash and cash equivalents and the needs for entities to utilise those cash flows (refer page 172).
• Notes to the Financial Statements, which comprise of the accounting policies and other explanatory notes and information (refer pages 173 to 257).
2.6 Materiality and AggregationIn compliance with Sri Lanka Accounting Standard: LKAS 01 (Presentation of Financial Statements), each material class of similar items is presented separately in the Financial Statements. Items of dissimilar nature or functions too are presented separately, if they are material.
Financial Assets and Financial Liabilities are offset and the net amount reported is in the Statement of Financial Position, only when there is a legally enforceable right to offset the recognised amounts and there is an intention to settle on a net basis, or to realise the assets and settle the liabilities simultaneously. Income and expenses are not offset in the Statement of Profit or Loss unless required or permitted by an Accounting Standards or interpretations.
2.7 Comparative InformationThe comparative information is re-classified/restated wherever necessary to conform with the current year’s classification in order to provide a better presentation. Details of the comparitive information disclosed in Note 40.1 to the Financial Statement.
Comparative information of the Bank financial year ended 2014 and 2015 were restated based on the changes in accounting policy of LKAS 8, which is fully described in Note 40.2.
2.8 Foreign Currency Transaction and Balances
All foreign currency transactions are translated in to the functional currency, which is Sri Lankan Rupees, using the exchange rates prevailing at the dates of the transactions were attached.
Monetary assets and liabilitiesdenominated in foreign currencies at the reporting date are translated to Sri Lankan Rupees using the spot/ forward foreign exchange rate prevailed at that date and all differences arising from these activities are taken to “Other operating income” in the Statement of Profit or Loss.
Non-monetary items in a foreign currency that are measured in terms of historical cost are translated using exchange rate as at the dates of the initial transactions. Non-monetary items in foreign currency measured at fair value are translated using the exchange rates at the date when the fair value was determined.
Foreign exchange differences arising on the settlement or reporting of monetary items at rates different from those which were initially recorded are dealt within the Statement of Profit or Loss. Forward exchange contracts are valued at the forward market rates ruling on the reporting date. Resulting net unrealised gains or losses are dealt with the Statement of Profit or Loss.
2.9 Statement of Cash FlowThe Cash Flow Statement has been prepared by using the direct method in accordance with the Sri Lanka Accounting Standard - LKAS 7 (Statement of Cash flows), whereby gross cash receipts and gross cash payments of operating activities, finance activities and investing activities have been recognised. Cash and cash equivalents comprise short term, highly liquid investments that are readily convertible to known amounts of cash and are subject to an insignificant risk of changes in value.
Cash and cash equivalents for the purpose of cash flow statement comprise of cash in hand and at banks, placements with banks, reverse repurchased agreements and un-favourable balances with local and foreign banks that are subject to an insignificant risk of change in their value.
3. GENERAL ACCOUNTING POLICIESFollowing are the general accounting policies adopted in the presentation of Financial Statements. The specific accounting policies and the basis of measurement adopted by the Bank and the Group for each item in the Statement of Profit or Loss and each class of assets and liabilities in the Statement of Financial Position are presented along with the notes to the Financial Statements.
The accounting policies set out below have been applied consistently to all periods presented in these Financial Statements of the Bank and the Group, unless otherwise indicated.
NOTES TO THE FINANCIAL STATEMENTS

175|ANNUAL REPORT 2016
3.1 Significant Accounting Judgments, Estimates and Assumptions
The preparation of Financial Statements of the Bank and the Group in conformity with Sri Lanka Accounting Standards requires management to make judgments, estimates and assumptions that affect the application of accounting policies and the reported amounts of assets, liabilities, income, expenses, the accompanying disclosures as well as the disclosure of contingent liabilities. Actual results may differ from these estimates.
Estimates and underlying assumptions are reviewed on an ongoing basis. Revisions to accounting estimates are recognised in the period in which the estimate is revised on and in any future periods affected.
The most significant areas of estimation, uncertainty and critical judgments in applying accounting policies that have the most significant effect on the amounts recognised in the Financial Statements of the Bank and the Group are as follows;
3.1.1 Going ConcernThe Board of Directors of the Group has made an assessment of its ability to continue as a going concern and is satisfied that it has the resources to continue in business for the foreseeable future. Furthermore, the Board of Directors is not aware of any material uncertainties that may cast significant doubt upon the Group’s ability to continue as a going concern and they do not intend either to liquidate or to cease operations of the Group. Therefore, these Financial Statements continue to be prepared on the going concern basis.
3.1.2 Impairment Losses on Loans and Receivables
The Bank and the Group review their individually significant loans and receivables at each reporting date to assess whether an impairment loss should be recorded in the Statement of Profit or Loss. In particular, management’s judgment is required in the estimation of the amount and timing of future cash flows
when determining the impairment loss. These estimates are based on assumptions about a number of factors and actual results may differ, resulting in future changes to the impairment allowance made.
Loans and receivables that have been assessed individually and found not to be impaired and all individually insignificant loans and receivables are then assessed collectively by categorizing them into, groups of assets with similar risk characteristics, to determine whether a provision should be made due to incurred loss events for which there is objective evidence, but the effects of which are not yet evident. The collective assessment takes account of data from the loan portfolio and judgments on the effect of concentrations of risks and economic data. The impairment loss on loans and receivables is disclosed more detail in Note 21.4 and Note 21.5 to the Financial Statements.
3.1.3 Impairment of Available for Sale Investments
The Bank and the Group reviews their investment securities classified as available for sale investments at each reporting date to assess whether they are impaired. This requires similar judgment as applied to the individual assessment of loans and receivables.
The Bank and the Group also records impairment charges on available for sale equity investments when there has been a significant or prolonged decline in the fair value below their cost.
The Bank and the Group evaluates, among other factors, historical share price movements and duration and extent to which the fair value of an investment is less than its cost.
The determination of what is ‘significant’ or ‘prolonged’ requires judgment. The Bank and the Group generally treats ‘significant’ as 20% or more and ‘prolong’ as greater than six months.
3.1.4 Deferred tax assetsDeferred tax assets are recognised in respect of tax losses to the extent that it is probable that future taxable profit will be available against which such tax losses can be utilised and loan impairment allowances which will be recovered in the foreseeable future. Judgment is required to determine the amount of deferred tax assets that can be recognised, based upon the likely timing and level of future taxable profits, together with future tax planning strategies.
Details of the deferred tax assets are disclosed in Note 29 to the Financial Statements.
3.1.5 Defined Benefit PlansThe costs of the defined benefit plans and the present value of its obligations are determined using an actuarial valuation. The actuarial valuation involves making assumptions about discount rates, expected rates of return on assets, future salary increases, mortality rates and possible future gratuity increases, if any. Due to the long–term nature of this plan, such estimates are subject to significant uncertainty. All assumptions are reviewed at each reporting date.
In determining the appropriate discount rate, management considers the interest rates of Sri Lanka Government Bonds with extrapolated maturities corresponding to the expected duration of the defined benefit obligation.
The mortality rate is based on publicly available mortality tables. Future salary increases are based on expected future inflation rates and expected future salary increase rate of the Bank and the Group.
Details of the key assumption used in the estimates are disclosed in Note 35.1 to the Financial Statements.
NOTES TO THE FINANCIAL STATEMENTS

176|ANNUAL REPORT 2016
3.1.6 Useful lives of Property, Plant and Equipment and Intangibles
The Bank and the Group review the residual values, useful lives and methods of depreciation of Property, Plant and Equipment and intangible assets at each reporting date. Judgment of the management is exercised in the estimation of these values, rates, methods and hence they are subject to uncertainty.
3.1.7 Consolidation of Special Purpose Entities (SPEs)
The Group consolidates those SPEs it controls. In assessing and determining if the Group controls SPEs, judgments are exercised to determine the following: whether the activities of the SPE are being conducted on behalf of the Group to obtain benefits from the SPE’s operation; whether the Group has rights to obtain the majority of the benefits of the SPE’s activities and whether the Group retains the majority of the risks related to the SPE or its assets in order to obtain benefits from its activities. The Group’s involvement with consolidated SPEs is detailed in Note 44.4.
3.1.8 Commitment and ContingenciesAll discernible risks are accounted for in determining the amount of all known liabilities.
Contingent liabilities are possible obligations whose existence will be confirmed only by uncertain future events or present obligations where the transfer of economic benefit is not probable or cannot be reliably measured. Contingent liabilities are not recognised in the Statement of Financial Position but are disclosed unless they are remote.
Details of the Commitment and Contingencies are disclosed in Note 42.1 to the Financial Statements.
3.1.9 Fair Value of Financial Instruments
Fair values of financial assets and financial liabilities recorded on the Statement of Financial Position for which cannot be derived from active market, are determined using a variety of valuation techniques that include the use of mathematical models. The inputs to
these models are derived from observable market data where possible, but if this is not available, judgment is required to established fair values. The valuation of financial instruments is described in more detail in Note 47.
The Bank and the Group measures fair value using the fair value hierarchy that reflects the significance of input used in making measurements. The fair value hierarchy is given in Note 47.1.
3.1.10 Impairment of Goodwill and Intangible Assets
The Group estimates the value in use of the Cash-Generating Units (CGU) to which goodwill and other intangible has been allocated in order to determine whether goodwill and intangible assets is impaired. The value-in use calculation requires the entity to estimate the future cash flows expected to arise from the CGU and a suitable discount rate in order to calculate present value. The assumptions and models used for estimating value in use of goodwill and intangibles are disclosed in Note 27.
3.1.11 Share Based PaymentsThe Bank measures the cost of equity settled transactions with employees by reference to the fair value of the equity instruments at the date at which they are granted. Estimating fair value for share based payment transactions requires determination of the most appropriate valuation model, which is dependent on the terms and conditions of the grant.
This estimate also requires determination of the most appropriate inputs to the valuation model including the expected life of the share option, volatility and making assumptions about them. The assumptions and models used for estimating fair value for share based payment transactions are disclosed in Note 38.
3.2 Significant Accounting Policies
3.2.1 Basis of ConsolidationThe Consolidated Financial Statements comprise the Financial Statements of the Bank and its Subsidiaries for the year ended 31 December 2016 in terms of the Sri Lanka Accounting Standard
– SLFRS 10 (Consolidated Financial Statements). The Financial Statements of the Bank’s Subsidiaries for the purpose of consolidation (including special purpose entity that the Bank consolidates) are prepared for the same reporting year as Union Bank of Colombo PLC using consistent accounting policies.
The Bank’s separate Financial Statements comprise the amalgamation of the Financial Statements of the Domestic Banking Unit and the Foreign Currency Banking Unit.
3.2.1.1 Business Combination and GoodwillBusiness combinations are accounted for using the acquisition method as per the requirement of Sri Lanka Accounting Standards: SLFRS 03 (Business Combinations).
The Group measure goodwill as the fair value of the consideration transferred including the recognised amount of any non-controlling interest in the acquiree, less the net recognised amount (generally fair value) of the identifiable assets acquired and liabilities assumed, all measured as of the acquisition date. When the excess is negative a bargain purchase gain is recognised immediately in Statement of Profit or Loss.
The Group elect on a transaction by transaction basis whether to measure non-controlling interest at its fair value, or at its proportionate share of the recognised amount of the identifiable net assets, at the acquisition date. The consideration transferred does not include amounts related to the settlement of pre-existing relationships. Such amounts are generally recognised in Statement of Profit or Loss.
Transaction costs, other than those associated with the issue of debt or equity securities, that the Group incurs in connection with a business combination are expensed as incurred.
3.2.1.2 Subsidiaries“Subsidiaries are entities that are controlled by the Bank. The Bank is presumed to control an investee when it is exposed, or has rights, to variable returns from its involvement with the investee
NOTES TO THE FINANCIAL STATEMENTS

177|ANNUAL REPORT 2016
and has the ability to affect those returns through its power over the investee.
The Financial Statements of subsidiaries are fully consolidated from the date on which control is transferred to the Bank and continue to be consolidated until the date when such control ceases.
The cost of an acquisition is measured at fair value of the consideration including contingent consideration, given on the date of transfer of title. The acquired identifiable assets, liabilities and contingent liabilities are measured at their fair values at the date of acquisition. Subsequent to the initial measurement, investments in subsidiaries are recognised using the equity method as described in Sri Lanka Accounting Standard: LKAS 27 (Separate Financial Statements) in separate Financial Statements of the Bank.
The total assets and liabilities of the Subsidiaries as at the reporting date are included in the Consolidated Statement of Financial Position. The total profits or losses for the year of the subsidiaries are included in the Consolidated Statement of Profit or Loss.
The non-controlling interest is presented in the Consolidated Statement of Financial Position within equity, separately from the equity attributable to the equity holders of the Bank. Non-controlling interest in the profit or loss of the Group is disclosed in the Consolidated Statement of Profit or Loss.
Loss of ControlUpon the loss of control, the Group de-recognised the assets and liabilities of the subsidiaries, any non-controlling interest and the other components of equity related to the subsidiary. Any surplus or deficit arising on the loss of control is recognised in the statement of changes in equity. If the Group retains any interest in the previous subsidiary, then such interest is measured at fair value at the date that control is lost. Subsequently it is accounted for as an equity-accounted investee or in accordance with the Group’s accounting policy for financial instruments depending on the level of influence retained.
The Group did not acquire or dispose any Subsidiaries during the year ended 31 December 2016.
All subsidiaries of the Bank have been incorporated in Sri Lanka. The information of the subsidiaries is given in Note 26.2.
3.2.1.3 Special purpose entitiesSpecial purpose entities (SPEs) are entities that are created to accomplish narrow and well-defined objectives such as the securitization of particular assets, or the execution of a specific borrowing or lending transaction. SPE is consolidated if, based on an evaluation of the substance of its relationship with the Group and the SPE’s risks and rewards, the Group concludes that it controls the SPE. The following circumstances may indicate a relationship in which, in substance, the Group controls and consequently consolidates a SPE:
• The activities of the SPE are being conducted on behalf of the Group according to its specific business needs so that the Group obtains benefits from the SPE’s operation.
• The Group retains the majority of the residual or ownership risks related to the SPE or its assets in order to obtain benefits from its activities.
• The assessment of whether the Group has control over an SPE is carried out at inception and normally no further reassessment of control is carried out in the absence of changes in the structure or terms of the SPE, or additional transactions between the Group and the SPE.
Day-to-day changes in market conditions normally do not lead to a reassessment of control. However, sometimes changes in market conditions may alter the substance of the relationship between the Group and the SPE and in such instances the Group determines whether the change warrants a reassessment of control based on the specific facts and circumstances. Where the Group’s voluntary actions, such as lending amounts in excess of existing liquidity facilities or extending terms beyond those established originally, change
the relationship between the Group and an SPE, the Group performs a reassessment of control over the SPE.
3.2.1.4 Transactions eliminated on Consolidation
Intra-group transactions and balances and any unrealised income and expenses arising from intra-group transactions are eliminated in preparing the Consolidated Financial Statements. Unrealised losses are eliminated in the same way as unrealised gains; except that they are eliminated to the extent that there is no evidence of impairment.
3.2.2 Reclassification of Financial Instruments
The Bank and the Group does not reclassify any financial instrument into the ‘fair value through profit or loss’ category after initial recognition. Also the Bank and the Group does not reclassify any financial instrument out of the ‘fair value through profit or loss’ category if upon initial recognition it was designated as at fair value through profit or loss.
Reclassification of non derivative financial assets out of the ‘held for trading’ category and into the ‘available for sale’, ‘loans and receivables’, or ’held to maturity’ categories is permitted by the Sri Lanka Accounting Standard - LKAS 39 (Financial Instruments: Recognition and Measurement). In certain circumstances it is also permitted to reclassify financial assets out of the ‘available for sale’ category and into the ’loans and receivables’ or ‘held to maturity’ category. Reclassifications need to be recorded at fair value at the date of reclassification, which becomes the new amortised cost.
For a financial asset reclassified out of the ‘available for sale’ category, any previous gain or loss on that asset that has been recognised in Equity is amortised to profit or loss over the remaining life of the investment using the effective interest rate (EIR). Any difference between the new amortised cost and the expected cash flows is also amortised over the remaining life of the asset using the EIR. If the asset is subsequently determined to be impaired,
NOTES TO THE FINANCIAL STATEMENTS

178|ANNUAL REPORT 2016
then the amount recorded in Equity is recycled to the Statement of Profit or Loss.
It is also permitted to reclassify a non derivative trading asset out of the ‘held for trading’ category and into the ‘loans and receivables’ category if it meets the definition of loans and receivables and the Group has the intention and ability to hold the financial asset for the foreseeable future or until maturity. If a financial asset is reclassified, and if the Group subsequently increases its estimates of future cash receipts as a result of increased recoverability of those cash receipts, the effect of that increase is recognised as an adjustment to the EIR from the date of the change in estimate.
Reclassification is at the election of management, and is determined on an instrument by instrument basis. The Group has not reclassified any financial asset during the year.
3.2.3 De-recognition of Financial Assets and Financial Liabilities
(i) Financial AssetsA financial asset (or, where applicable a part of a financial asset or part of a Group of similar financial assets) is de-recognised when:
• The rights to receive cash flows from the asset have expired; or
• The Group has transferred its rights to receive cash flows from the asset; or has assumed an obligation to pay the received cash flows in full without material delay to a third party under a ‘pass–through’ arrangement; and either;• The Group has transferred
substantially all the risks and rewards of the asset or
• The Group has neither transferred nor retained substantially all the risks and rewards of the asset, but has transferred control of the asset.
On de-recognition of a financial asset, the difference between the carrying amount of the assets and consideration received and any cumulative gain or loss that has been recognised; is recognised in the Statement of Profit or Loss.
When the Group has transferred its rights to receive cash flows from an asset or has entered into a pass–through arrangement, and has neither transferred nor retained substantially all of the risks and rewards of the asset nor transferred control of the asset, the asset is recognised to the extent of the Group’s continuing involvement in the asset. In that case, the Group also recognises an associated liability. The transferred asset and the associated liability are measured on a basis that reflects the rights and obligations that the Group has retained.
Continuing involvement that takes the form of a guarantee over the transferred asset is measured at the lower of the original carrying amount of the asset and the maximum amount of consideration that the Group could be required to repay.
(ii) Financial LiabilitiesA financial liability is de-recognised when the obligation under the liability is discharged, cancelled or expired. Where an existing financial liability is replaced by another from the same lender on substantially different terms, or the terms of an existing liability are substantially modified, such an exchange or modification is related as a de-recognition of the original liability and the recognition of a new liability. The difference between the carrying value of the original financial liability and the consideration paid is recognised in profit or loss.
3.2.4 Impairment of Financial AssetsThe Group assesses at each reporting date, whether there is any objective evidence that a financial asset or a group of financial asset or a group of financial assets is impaired. A financial assets is deemed to be impaired if, and only if, there is objective evidence of impairment as a result of one or more events that have occurred after the initial recognition of the asset (an ‘incurred loss event’) and that loss event (or events) has an impact on the estimated future cash flows of the financial asset or the group if financial assets that can be reliably estimated.
(i) Financial Assets carried at amortised cost
For the financial assets carried at amortised cost, such as Cash and balances with central banks, Reverse repurchased agreements, Placement with banks, Loans and receivables to banks and other customers, Other loans and receivables and held to maturity investments. The Group first assesses individually whether objective evidence of impairment exists for financial assets that are individually significant, or collectively for financial assets that are not individually significant. If the Group determines that no objective evidence of impairment exists for an individually assessed financial asset, it includes the asset in a Group of financial assets with similar credit risk characteristics and collectively assesses them for impairment. Assets that are individually assessed for impairment and for which an impairment loss is, or continues to be, recognised are not included in a collective assessment of impairment.
If there is objective evidence that an impairment loss has been incurred, the amount of the loss is measured as the difference between the assets carrying amount and the present value of estimated future cash flows (excluding future expected credit losses that have not yet been incurred). The carrying amount of the asset is reduced through the use of a true allowance account and the amount of the loss is recognised in the income statement. Interest income continues to be accrued on the reduced carrying amount and is accrued using the rate of interest used to discount the future cash flows for the purpose of measuring the impairment loss. The interest income is recorded as part of ‘Interest income’.
Loans together with the associated allowance are written off when there is no realistic prospect of future recovery and all collateral has been realised or has been transferred to the Group. If, in a subsequent year, the amount of the estimated impairment loss increases or decreases because of an event occurring after the impairment was recognised, the
NOTES TO THE FINANCIAL STATEMENTS
179|ANNUAL REPORT 2016
previously recognised impairment loss is increased or reduced by adjusting the allowance account. If a future write–off is later recovered, the recovery is credited to the ’Credit loss expense’.
The present value of the estimated future cash flows is discounted at the financial asset’s original EIR. If a loan has a variable interest rate, the discount rate for measuring any impairment loss is the current effective interest rate (EIR). If the Group has reclassified trading assets to loans and receivables, the discount rate for measuring any impairment loss is the new EIR determined at the reclassification date. The calculation of the present value of the estimated future cash flows of a collateralised financial asset reflects the cash flows that may result from foreclosure less costs for obtaining and selling the collateral, whether or not foreclosure is probable.
For the purpose of a collective evaluation of impairment, financial assets are grouped on the basis of the product category that considers credit risk characteristics such as collateral type, past–due status and other relevant factors.
Future cash flows on a group of financial assets that are collectively evaluated for impairment are estimated on the basis of historical loss experience for assets with credit risk characteristics similar to those in the group. Historical loss experience is adjusted on the basis of current observable data to reflect the effects of current conditions on which the historical loss experience is based and to remove the effects of conditions in the historical period that do not exist currently.
Estimates of changes in future cash flows reflect, and are directionally consistent with changes in related observable data from year to year (such as changes in unemployment rates, property prices, commodity prices, payment status, or other factors that are indicative of incurred losses in the group and their magnitude). The methodology and assumptions used for estimating future cash flows are reviewed regularly to reduce
any differences between loss estimates and actual loss experience.
Details of impairment losses on financial assets carried at amortised cost and an analysis of the impairment allowance on loans and advances by class is given in Note 21.4 and Note 21.5 respectively.
3.2.5 Fair Value Determination and Measurement
Determination of fair valueThe fair value for financial instruments traded in active markets at the reporting date is based on their quoted market price or dealer price quotations (bid price for long positions and ask price for short positions), without any deduction for transaction costs.
Measurement of fair value‘Fair value’ is the price that would be received to sell an asset or paid to transfer a liability (exit price) in an orderly transaction between market participants at the measurement date in the principal or, in its absence, the most advantageous market to which the Group has access at that date. The fair value of a liability reflects its non-performance risk.
When available, the Group measures the fair value of an instrument using the quoted price in an active market for that instrument (Level 01 valuation). A market is regarded as active if transactions for the asset or liability take place with sufficient frequency and volume to provide pricing information on an ongoing basis.
If there is no quoted price in an active market, then the Group uses valuation techniques that maximise the use of relevant observable inputs and minimise the use of unobservable inputs. The chosen valuation technique incorporates all of the factors that market participants would take into account in pricing a transaction.
The best evidence of the fair value of a financial instrument at initial recognition is normally the transaction price – i.e. the fair value of the consideration given or received. If the Group determines that the fair value at initial recognition differs from
the transaction price and the fair value is evidenced neither by a quoted price in an active market for an identical asset or liability (Level 01 valuation) nor based on a valuation technique that uses only data from observable markets (Level 02 valuation), then the financial instrument is initially measured at fair value, adjusted to defer the difference between the fair value at initial recognition and the transaction price. Subsequently, that difference is recognised in profit or loss on an appropriate basis over the life of the instrument but no later than when the valuation is wholly supported by observable market data or the transaction is closed out.
Fair values reflect the credit risk of the instrument and include adjustments to take account of the credit risk of the Group entity and the counterparty where appropriate. Fair value estimates obtained from models are adjusted for any other factors, such as liquidity risk or model uncertainties; to the extent that the Group believes a third-party market participant would take them into account in pricing a transaction.
The fair value of a demand deposit is not less than the amount payable on demand, discounted from the first date on which the amount could be required to be paid.
A fair value measurement of a non-financial asset takes into account a market participant’s ability to generate economic benefits by using the asset in its highest and best use or by selling it to another market participant that would use the asset in its highest and best use.
The Group recognises transfers between levels of the fair value hierarchy as of the end of the reporting period during which the change has occurred.
Details of fair value of assets and liabilities and their inputs based on fair value hierarchy is given in Note 47 to the Financial Statements.
NOTES TO THE FINANCIAL STATEMENTS

180|ANNUAL REPORT 2016
3.3 Standards issued but not yet effective
The following new accounting standards were issued by the Institute of Chartered Accountants in Sri Lanka which are not yet effective as at 31 December 2016. Accordingly these accounting standards have not been applied in the preparation of the Financial Statements for the year ended 31 December 2016.
3.3.1 SLFRS 9 - Financial Instruments: In July 2014, the Chartered Accountants of Sri Lanka issued SLFRS 9 Financial Instruments (On par with International Accounting Standards Board), the standard that will replace LKAS 39 for annual periods on or after 1 January 2018, with early adoption permitted. In 2016 the Bank set up a multidisciplinary implementation team (‘the Team’) with members from its Risk, Finance and Operations teams to prepare for SLFRS 9 implementation (‘the Project’).
The Bank performed the Diagnostic Phase (Impact Assessment exercise) and identified the gaps. Currently the bank is in the process of developing models/solutions based on the diagnostic findings. Impairment of Financial Assets SLFRS 9 will also fundamentally change the loan loss impairment methodology. The standard will replace LKAS 39’s Incurred Loss approach with a forward-looking Expected Loss (ECL) approach. The Bank will be required to record an allowance for expected losses for all loans and other debt financial assets not held at FVPL, together with loan commitments and financial guarantee contracts. The Impairment methodology under SLFRS 9 requires impairment to be assessed under 3 stages.
Stage 01 Under LKAS 39 the Bank has been recording an allowance for Incurred But Not Identified (IBNI) impairment losses. These are designed to reflect impairment losses that had been incurred in the performing portfolio but have not been identified.
Under SLFRS 9, the impairment of financial assets that are not considered to have suffered a significant increase in their credit risk will be measured on a 12-month ECL basis.
Stage 02 SLFRS 9 requires financial assets to be classified in Stage 2 when their credit risk has increased significantly since their initial recognition. For these assets, a loss allowance needs to be recognised based on their lifetime ECLs. Since this is a new concept compared to LKAS 39, it will result in increased allowance as most such assets are not considered to be credit impaired under LKAS 39. Stage 03 Financial assets will be included in Stage 3 when there is objective evidence that the loan is credit impaired. Loans in Stage 3, where the Bank calculated the LKAS 39 impairment on an individual basis are not expected to be significantly different, but collateral values will be adjusted to reflect the amounts that can be expected to be realised.
Classification & Measurement From a classification and measurement perspective, the new standard will require all financial assets, except equity instruments and derivatives, to be assessed based on a combination of the entity’s business model for managing the assets and the instruments’ contractual cash flow characteristics. The LKAS 39 measurement categories will be replaced by: Fair Value through Profit or Loss (FVPL), Fair value through Other Comprehensive Income (FVOCI) and amortised cost. The accounting for financial liabilities will largely be the same as the requirements of LKAS 39, except for the treatment of gains or losses arising from an entity’s own credit risk relating to liabilities designated at FVPL.
3.3.2 SLFRS 15 Revenue from Contracts with Customers
SLFRS 15 Revenue from Contracts with CustomersSLFRS 15 is effective for periods beginning on 1 January 2018 with early adoption permitted. SLFRS 15 defines principles for recognising revenue and will be applicable to all contracts with customers. However, interest and fee income integral to financial instruments and leases will continue to fall outside the scope of SLFRS 15 and will be regulated by the other applicable standards (e.g., SLFRS 9, and SLFRS 16 Leases).
Revenue under SLFRS 15 will need to be recognised as goods and services are transferred, to the extent that the transferor anticipates entitlement to goods and services. The standard will also specify a comprehensive set of disclosure requirements regarding the nature, extent and timing as well as any uncertainty of revenue and corresponding cash flows with customers. The entity does not anticipate early adopting SLFRS 15.
A preliminary evaluation of the existing contracts which falls mainly under fee and commission based income of the Bank has been performed in relation to the adoption of SLFRS 15. The Bank’s current assessment has not revealed a significant change to the revenue recognition pattern. However, the Bank is currently in the process of evaluating and quantifying the accounting impact and any impacts on the current systems and processors will be modified where necessary. 3.3.3 SLFRS 16 Leases SLFRS 16 provides a single lessee accounting model, requiring leases to recognise assets and liabilities for all leases unless the lease term is 12 months or less or the underlying asset has a low value even though lessor accounting remains similar to current practice. This supersedes: LKAS 17 Leases, IFRIC 4 determining whether an arrangement contains a lease, SIC 15 Operating Leases- Incentives; and SIC 27 Evaluating the substance of Transactions Involving the
NOTES TO THE FINANCIAL STATEMENTS

181|ANNUAL REPORT 2016
Legal form of a Lease. Earlier application is permitted for entities that apply SLFRS 15 Revenue from Contracts with Customers.
SLFRS 16 is effective for annual reporting periods beginning on or after 1 January 2019. The impact on the implementation of the above standard has not been quantified yet.
3.4 Standards issued and became effective from 1 January 2016
SLFRS 14 -Regulatory Deferral AccountThe objective of this standard is to specify the financial reporting requirements for regulatory deferral account balances that arise when an entity provides goods or services to customers at a price or rate that is subject to rate regulation.”SLFRS 14 was effective from 1 January 2016. This standard did not have any impact on the Consolidated/ Separate Financial Statements of the Bank/Group. 3.5 Amendments to existing
accounting standards but not yet effective
The following amendments were issued by the Institute of Chartered Accountants in Sri Lanka which are not yet effective as at 31 December 2016. Accordingly these accounting standards have not been applied in the preparation of the Financial Statements for the year ended 31 December 2016. 3.5.1 LKAS 12 Income Taxes -
Recognition of Deferred Tax Assets for Unrealized Losses
The amendments clarify that an entity needs to consider whether tax law restricts the sources of taxable profits against which it may make deductions on the reversal of that deductible temporary difference. Furthermore, the amendments provide guidance on how an entity should determine future taxable profits and explain the circumstances in which taxable profit may include the recovery of some assets for more than their carrying amount.
NOTES TO THE FINANCIAL STATEMENTS
3.5.2 LKAS 7 Statement of Cashflows - Disclosure Initiative
The amendments to LKAS 7 Statement of Cash Flows are part of the ICASL’s Disclosure Initiative and require an entity to provide disclosures that enable users of Financial Statements to evaluate changes in liabilities arising from financing activities, including both changes arising from cash flows and non-cash changes. On initial application of the amendment, entities are not required to provide comparative information for preceding periods. These amendments are effective for annual periods beginning on or after 1 January 2017, with early application permitted. Application of amendments will result in additional disclosure provided by the Bank and the Group. 3.5.3 SLFRS 2 Share Based Payment -
Classification and Measurement of Share-based Payment Transactions
The ICASL issued amendments to SLFRS 2 Share-based Payment that address three main areas: the effects of vesting conditions on the measurement of a cash-settled share-based payment transaction; the classification of a share-based payment transaction with net settlement features for withholding tax obligations; and accounting where a modification to the terms and conditions of a share-based payment transaction changes its classification from cash settled to equity settled.
On adoption, entities are required to apply the amendments without restating prior periods, but retrospective application is permitted if elected for all three amendments and other criteria are met. The amendments are effective for annual periods beginning on or after 1 January 2018, with early application permitted. The impact on the implementation of the above standard has not been quantified yet.
3.6 Amendments to existing accounting standards effective from 1 January 2016
Amendments to existing Accounting Standards effective from 1 January 2016 as published by the Institute of Chartered Accountants of Sri Lanka did not have any material impact on the Consolidated/Separate Financial Statements of the Bank except for the amendments made to Para 10 of LKAS 27 - “Separate Financial Statements” to allow entities to use the equity method in the separate Financial Statements in accounting for investment in subsidiaries of the Bank.
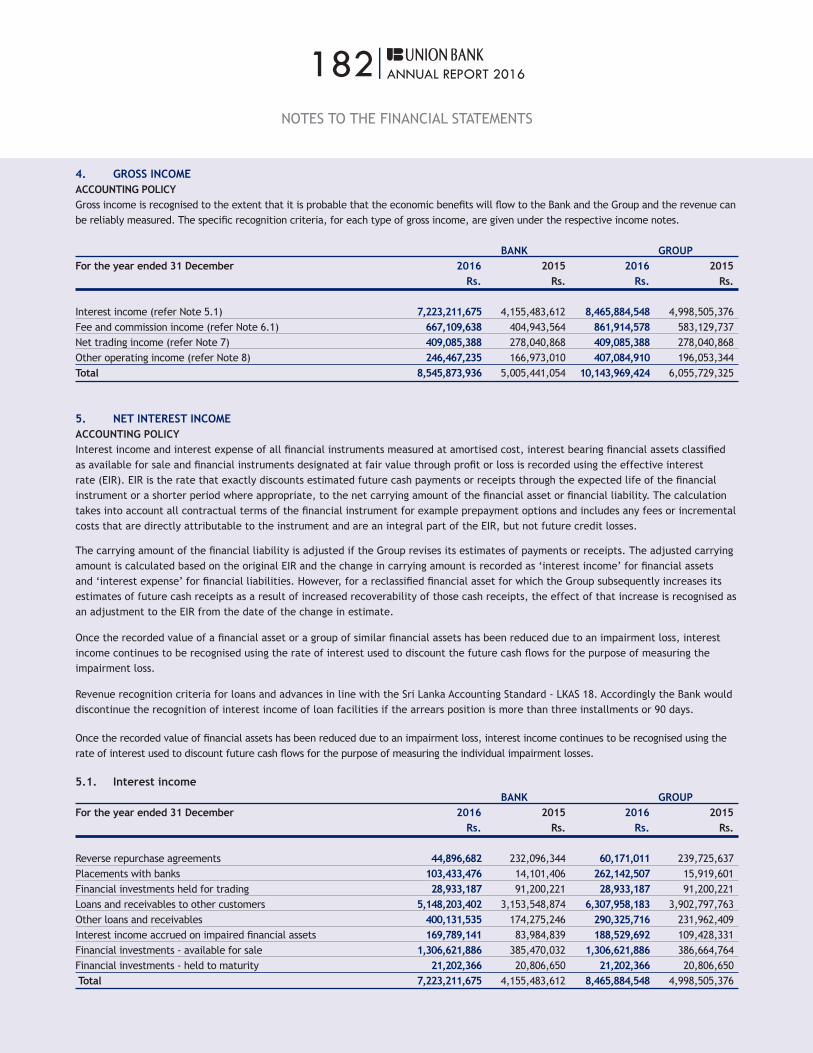
182|ANNUAL REPORT 2016
NOTES TO THE FINANCIAL STATEMENTS
4. GROSS INCOMEACCOUNTING POLICYGross income is recognised to the extent that it is probable that the economic benefits will flow to the Bank and the Group and the revenue can be reliably measured. The specific recognition criteria, for each type of gross income, are given under the respective income notes.
BANK GROUPFor the year ended 31 December 2016 2015 2016 2015 Rs. Rs. Rs. Rs.
Interest income (refer Note 5.1) 7,223,211,675 4,155,483,612 8,465,884,548 4,998,505,376Fee and commission income (refer Note 6.1) 667,109,638 404,943,564 861,914,578 583,129,737Net trading income (refer Note 7) 409,085,388 278,040,868 409,085,388 278,040,868Other operating income (refer Note 8) 246,467,235 166,973,010 407,084,910 196,053,344Total 8,545,873,936 5,005,441,054 10,143,969,424 6,055,729,325
5. NET INTEREST INCOMEACCOUNTING POLICYInterest income and interest expense of all financial instruments measured at amortised cost, interest bearing financial assets classified as available for sale and financial instruments designated at fair value through profit or loss is recorded using the effective interest rate (EIR). EIR is the rate that exactly discounts estimated future cash payments or receipts through the expected life of the financial instrument or a shorter period where appropriate, to the net carrying amount of the financial asset or financial liability. The calculation takes into account all contractual terms of the financial instrument for example prepayment options and includes any fees or incremental costs that are directly attributable to the instrument and are an integral part of the EIR, but not future credit losses.
The carrying amount of the financial liability is adjusted if the Group revises its estimates of payments or receipts. The adjusted carrying amount is calculated based on the original EIR and the change in carrying amount is recorded as ‘interest income’ for financial assets and ‘interest expense’ for financial liabilities. However, for a reclassified financial asset for which the Group subsequently increases its estimates of future cash receipts as a result of increased recoverability of those cash receipts, the effect of that increase is recognised as an adjustment to the EIR from the date of the change in estimate.
Once the recorded value of a financial asset or a group of similar financial assets has been reduced due to an impairment loss, interest income continues to be recognised using the rate of interest used to discount the future cash flows for the purpose of measuring the impairment loss.
Revenue recognition criteria for loans and advances in line with the Sri Lanka Accounting Standard - LKAS 18. Accordingly the Bank would discontinue the recognition of interest income of loan facilities if the arrears position is more than three installments or 90 days.
Once the recorded value of financial assets has been reduced due to an impairment loss, interest income continues to be recognised using the rate of interest used to discount future cash flows for the purpose of measuring the individual impairment losses.
5.1. Interest income BANK GROUPFor the year ended 31 December 2016 2015 2016 2015 Rs. Rs. Rs. Rs.
Reverse repurchase agreements 44,896,682 232,096,344 60,171,011 239,725,637Placements with banks 103,433,476 14,101,406 262,142,507 15,919,601Financial investments held for trading 28,933,187 91,200,221 28,933,187 91,200,221Loans and receivables to other customers 5,148,203,402 3,153,548,874 6,307,958,183 3,902,797,763Other loans and receivables 400,131,535 174,275,246 290,325,716 231,962,409Interest income accrued on impaired financial assets 169,789,141 83,984,839 188,529,692 109,428,331Financial investments - available for sale 1,306,621,886 385,470,032 1,306,621,886 386,664,764Financial investments - held to maturity 21,202,366 20,806,650 21,202,366 20,806,650 Total 7,223,211,675 4,155,483,612 8,465,884,548 4,998,505,376
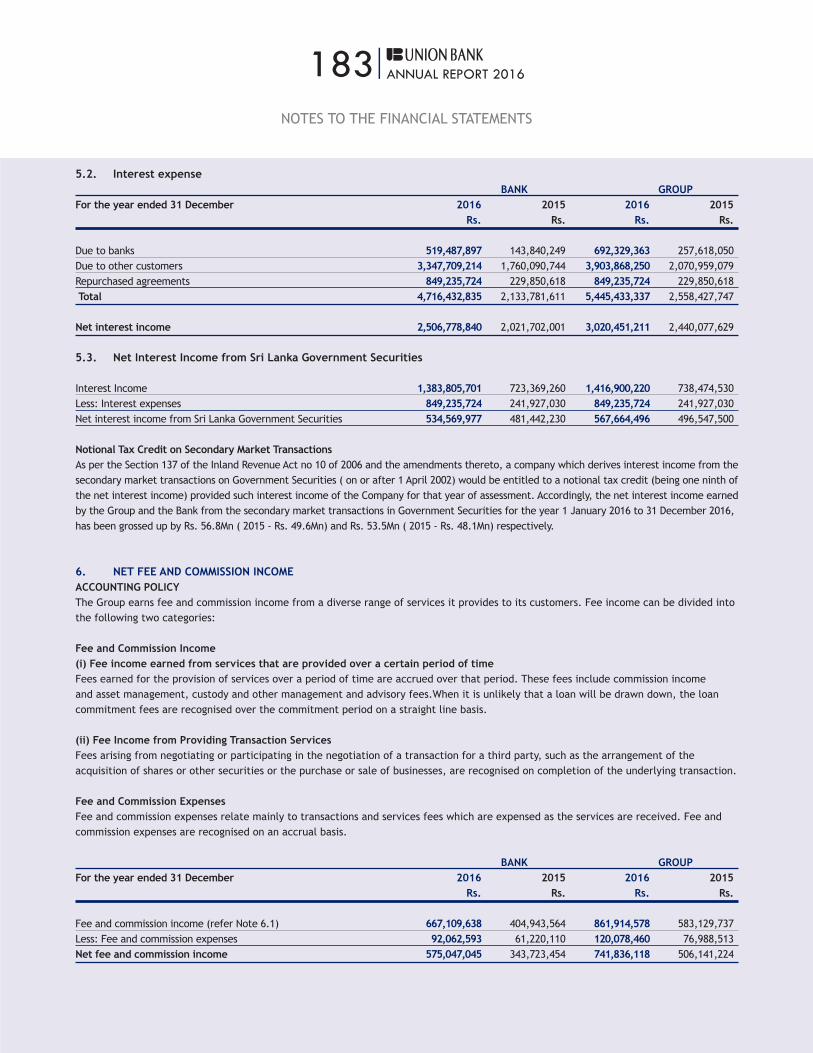
183|ANNUAL REPORT 2016
NOTES TO THE FINANCIAL STATEMENTS
5.2. Interest expense BANK GROUPFor the year ended 31 December 2016 2015 2016 2015 Rs. Rs. Rs. Rs.
Due to banks 519,487,897 143,840,249 692,329,363 257,618,050Due to other customers 3,347,709,214 1,760,090,744 3,903,868,250 2,070,959,079Repurchased agreements 849,235,724 229,850,618 849,235,724 229,850,618 Total 4,716,432,835 2,133,781,611 5,445,433,337 2,558,427,747
Net interest income 2,506,778,840 2,021,702,001 3,020,451,211 2,440,077,629
5.3. Net Interest Income from Sri Lanka Government Securities
Interest Income 1,383,805,701 723,369,260 1,416,900,220 738,474,530Less: Interest expenses 849,235,724 241,927,030 849,235,724 241,927,030Net interest income from Sri Lanka Government Securities 534,569,977 481,442,230 567,664,496 496,547,500
Notional Tax Credit on Secondary Market TransactionsAs per the Section 137 of the Inland Revenue Act no 10 of 2006 and the amendments thereto, a company which derives interest income from the secondary market transactions on Government Securities ( on or after 1 April 2002) would be entitled to a notional tax credit (being one ninth of the net interest income) provided such interest income of the Company for that year of assessment. Accordingly, the net interest income earned by the Group and the Bank from the secondary market transactions in Government Securities for the year 1 January 2016 to 31 December 2016, has been grossed up by Rs. 56.8Mn ( 2015 - Rs. 49.6Mn) and Rs. 53.5Mn ( 2015 - Rs. 48.1Mn) respectively.
6. NET FEE AND COMMISSION INCOMEACCOUNTING POLICYThe Group earns fee and commission income from a diverse range of services it provides to its customers. Fee income can be divided into the following two categories:
Fee and Commission Income(i) Fee income earned from services that are provided over a certain period of timeFees earned for the provision of services over a period of time are accrued over that period. These fees include commission income and asset management, custody and other management and advisory fees.When it is unlikely that a loan will be drawn down, the loan commitment fees are recognised over the commitment period on a straight line basis.
(ii) Fee Income from Providing Transaction ServicesFees arising from negotiating or participating in the negotiation of a transaction for a third party, such as the arrangement of the acquisition of shares or other securities or the purchase or sale of businesses, are recognised on completion of the underlying transaction.
Fee and Commission ExpensesFee and commission expenses relate mainly to transactions and services fees which are expensed as the services are received. Fee and commission expenses are recognised on an accrual basis.
BANK GROUPFor the year ended 31 December 2016 2015 2016 2015 Rs. Rs. Rs. Rs.
Fee and commission income (refer Note 6.1) 667,109,638 404,943,564 861,914,578 583,129,737Less: Fee and commission expenses 92,062,593 61,220,110 120,078,460 76,988,513Net fee and commission income 575,047,045 343,723,454 741,836,118 506,141,224
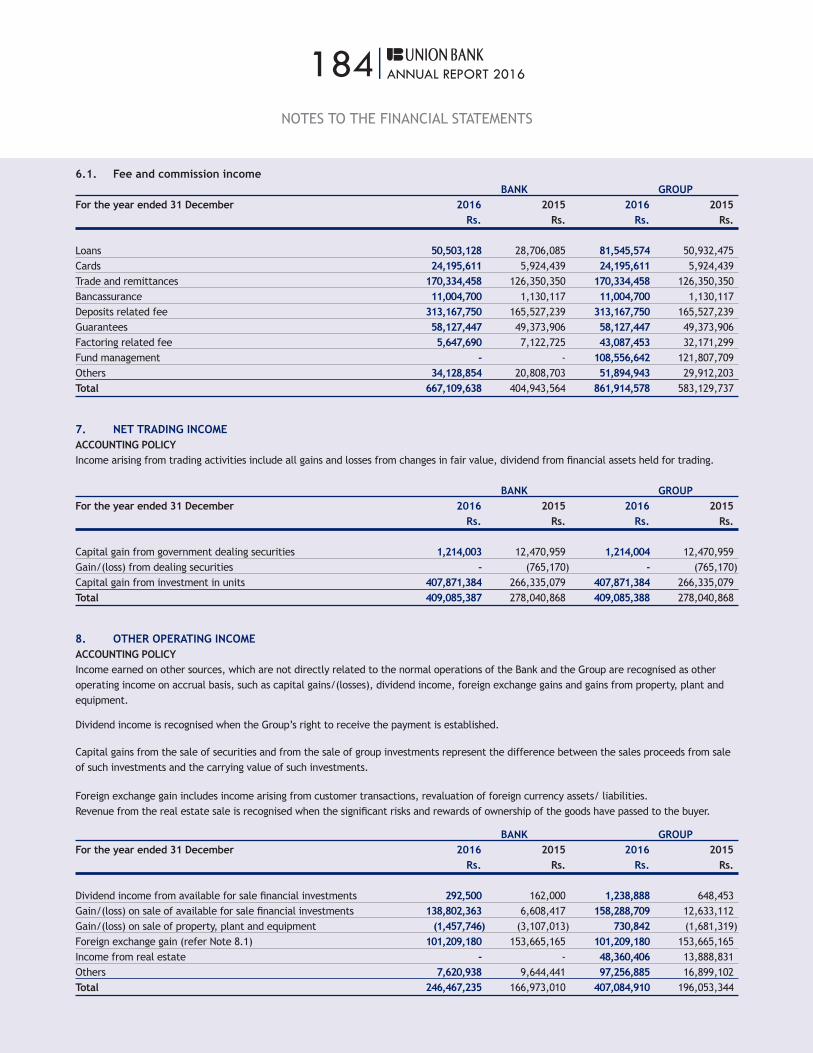
184|ANNUAL REPORT 2016
NOTES TO THE FINANCIAL STATEMENTS
6.1. Fee and commission income BANK GROUPFor the year ended 31 December 2016 2015 2016 2015 Rs. Rs. Rs. Rs.
Loans 50,503,128 28,706,085 81,545,574 50,932,475Cards 24,195,611 5,924,439 24,195,611 5,924,439Trade and remittances 170,334,458 126,350,350 170,334,458 126,350,350Bancassurance 11,004,700 1,130,117 11,004,700 1,130,117Deposits related fee 313,167,750 165,527,239 313,167,750 165,527,239Guarantees 58,127,447 49,373,906 58,127,447 49,373,906Factoring related fee 5,647,690 7,122,725 43,087,453 32,171,299Fund management - - 108,556,642 121,807,709Others 34,128,854 20,808,703 51,894,943 29,912,203Total 667,109,638 404,943,564 861,914,578 583,129,737
7. NET TRADING INCOMEACCOUNTING POLICYIncome arising from trading activities include all gains and losses from changes in fair value, dividend from financial assets held for trading.
BANK GROUPFor the year ended 31 December 2016 2015 2016 2015 Rs. Rs. Rs. Rs.
Capital gain from government dealing securities 1,214,003 12,470,959 1,214,004 12,470,959Gain/(loss) from dealing securities - (765,170) - (765,170)Capital gain from investment in units 407,871,384 266,335,079 407,871,384 266,335,079Total 409,085,387 278,040,868 409,085,388 278,040,868
8. OTHER OPERATING INCOMEACCOUNTING POLICYIncome earned on other sources, which are not directly related to the normal operations of the Bank and the Group are recognised as other operating income on accrual basis, such as capital gains/(losses), dividend income, foreign exchange gains and gains from property, plant and equipment.
Dividend income is recognised when the Group’s right to receive the payment is established.
Capital gains from the sale of securities and from the sale of group investments represent the difference between the sales proceeds from sale of such investments and the carrying value of such investments.
Foreign exchange gain includes income arising from customer transactions, revaluation of foreign currency assets/ liabilities.Revenue from the real estate sale is recognised when the significant risks and rewards of ownership of the goods have passed to the buyer.
BANK GROUPFor the year ended 31 December 2016 2015 2016 2015 Rs. Rs. Rs. Rs.
Dividend income from available for sale financial investments 292,500 162,000 1,238,888 648,453Gain/(loss) on sale of available for sale financial investments 138,802,363 6,608,417 158,288,709 12,633,112Gain/(loss) on sale of property, plant and equipment (1,457,746) (3,107,013) 730,842 (1,681,319)Foreign exchange gain (refer Note 8.1) 101,209,180 153,665,165 101,209,180 153,665,165Income from real estate - - 48,360,406 13,888,831Others 7,620,938 9,644,441 97,256,885 16,899,102Total 246,467,235 166,973,010 407,084,910 196,053,344

185|ANNUAL REPORT 2016
NOTES TO THE FINANCIAL STATEMENTS
8.1 Foreign exchange gain BANK GROUPFor the year ended 31 December 2016 2015 2016 2015 Rs. Rs. Rs. Rs.
Income from customer transactions & revaluation gain 187,151,537 175,011,439 187,151,537 175,011,439SWAP transactions (85,942,357) (21,346,274) (85,942,357) (21,346,274)Total 101,209,180 153,665,165 101,209,180 153,665,165
9. CREDIT LOSS EXPENSEACCOUNTING POLICYThe Bank and the Group recognise the changes in the impairment provisions for loans and receivables to banks and other customers, which are assessed as per the LKAS 39 - Financial Instruments: Recognition and Measurement. The methodology adopted by the Bank and the Group is explained in Note 21 to these Financial Statements. BANK GROUPFor the year ended 31 December 2016 2015 2016 2015 Rs. Rs. Rs. Rs.
Loans & Receivables to other customersTerm loans 111,461,842 72,912,320 130,869,393 67,456,552Overdrafts (20,976,866) 84,751,816 (20,976,866) 84,751,816Trade finance 9,318,982 (21,277,392) 9,318,982 (21,277,392)Lease and Hire Purchase (5,090,522) 7,378,913 74,100,537 85,747,298Retail loans 36,646,740 12,072,108 36,646,740 12,072,108Pawning 13,853 12,554,648 13,853 12,554,648Staff loans (52,149) (514,507) (52,149) (514,507)Others 20,991,693 8,851,392 22,352,212 19,343,884Total 152,313,574 176,729,298 252,272,702 260,134,407
10. PERSONNEL EXPENSESACCOUNTING POLICYPersonnel expenses include salaries and bonus, terminal benefit charges, share-based payments and other related expenses. The provisions for bonus is recognised when it is probable that an outflow of resources embodying economic benefits will be required to settle the obligation and a reliable estimate can be made on the amount of the obligation.
Employees’ Provident Fund and Employees’ Trust FundEmployees are eligible for Employees’ Provident Fund contributions and Employees’ Trust Fund contributions in accordance with the respective statutes and regulations. The Bank and Group contributes 12% and 3% of gross salaries of employees to the Bank’s Employees’ Provident Fund and the Employees’ Trust Fund respectively.
Defined Benefit PlansContributions to defined benefit plans are recognised in the Statement of Profit or Loss based on an actuarial valuation carried out for the gratuity liability of the Bank and Group in accordance with LKAS 19 - ‘Employee Benefits’.
Share Based PaymentsShare-based payments represent the Bank’s cost on the Employee Share Option Plan, which is more fully described in Note 38 to these Financial Statements.
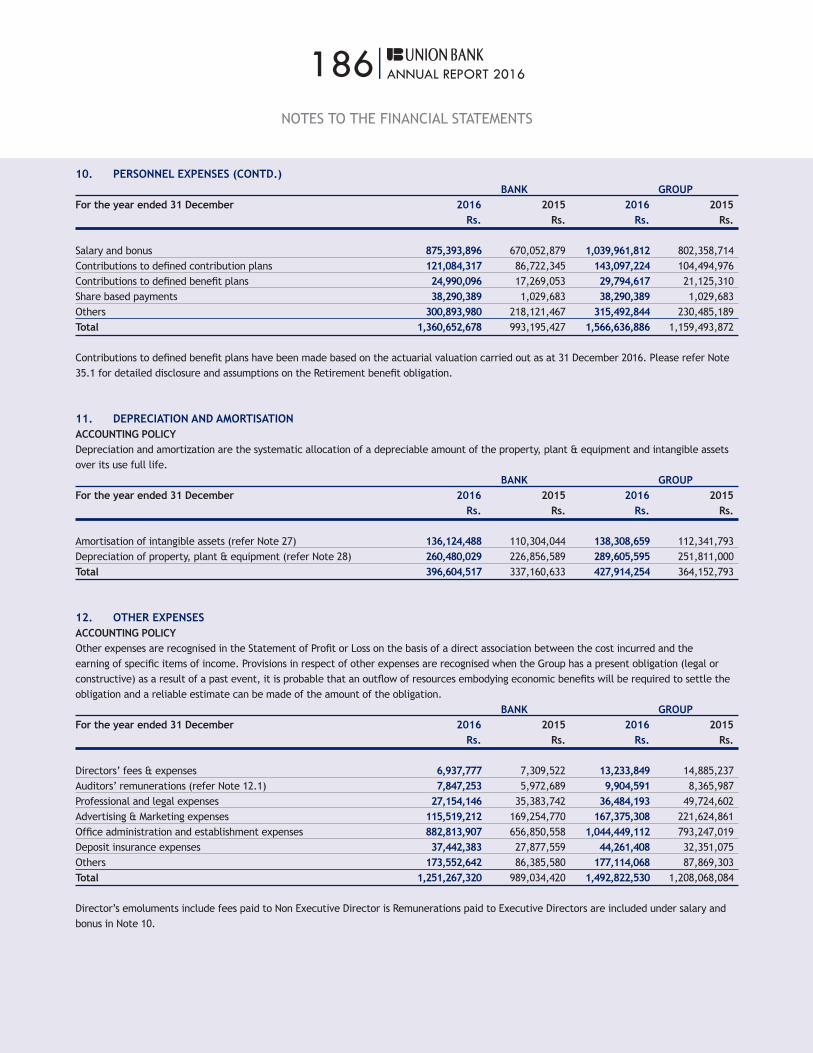
186|ANNUAL REPORT 2016
NOTES TO THE FINANCIAL STATEMENTS
10. PERSONNEL EXPENSES (CONTD.) BANK GROUPFor the year ended 31 December 2016 2015 2016 2015 Rs. Rs. Rs. Rs.
Salary and bonus 875,393,896 670,052,879 1,039,961,812 802,358,714Contributions to defined contribution plans 121,084,317 86,722,345 143,097,224 104,494,976Contributions to defined benefit plans 24,990,096 17,269,053 29,794,617 21,125,310Share based payments 38,290,389 1,029,683 38,290,389 1,029,683Others 300,893,980 218,121,467 315,492,844 230,485,189Total 1,360,652,678 993,195,427 1,566,636,886 1,159,493,872
Contributions to defined benefit plans have been made based on the actuarial valuation carried out as at 31 December 2016. Please refer Note 35.1 for detailed disclosure and assumptions on the Retirement benefit obligation.
11. DEPRECIATION AND AMORTISATIONACCOUNTING POLICYDepreciation and amortization are the systematic allocation of a depreciable amount of the property, plant & equipment and intangible assets over its use full life. BANK GROUPFor the year ended 31 December 2016 2015 2016 2015 Rs. Rs. Rs. Rs.
Amortisation of intangible assets (refer Note 27) 136,124,488 110,304,044 138,308,659 112,341,793Depreciation of property, plant & equipment (refer Note 28) 260,480,029 226,856,589 289,605,595 251,811,000Total 396,604,517 337,160,633 427,914,254 364,152,793
12. OTHER EXPENSESACCOUNTING POLICYOther expenses are recognised in the Statement of Profit or Loss on the basis of a direct association between the cost incurred and the earning of specific items of income. Provisions in respect of other expenses are recognised when the Group has a present obligation (legal or constructive) as a result of a past event, it is probable that an outflow of resources embodying economic benefits will be required to settle the obligation and a reliable estimate can be made of the amount of the obligation. BANK GROUPFor the year ended 31 December 2016 2015 2016 2015 Rs. Rs. Rs. Rs.
Directors’ fees & expenses 6,937,777 7,309,522 13,233,849 14,885,237Auditors’ remunerations (refer Note 12.1) 7,847,253 5,972,689 9,904,591 8,365,987Professional and legal expenses 27,154,146 35,383,742 36,484,193 49,724,602Advertising & Marketing expenses 115,519,212 169,254,770 167,375,308 221,624,861Office administration and establishment expenses 882,813,907 656,850,558 1,044,449,112 793,247,019Deposit insurance expenses 37,442,383 27,877,559 44,261,408 32,351,075Others 173,552,642 86,385,580 177,114,068 87,869,303Total 1,251,267,320 989,034,420 1,492,822,530 1,208,068,084
Director’s emoluments include fees paid to Non Executive Director is Remunerations paid to Executive Directors are included under salary and bonus in Note 10.

187|ANNUAL REPORT 2016
NOTES TO THE FINANCIAL STATEMENTS
12.1 Auditors’ remunerations BANK GROUPFor the year ended 31 December 2016 2015 2016 2015 Rs. Rs. Rs. Rs.
Audit fees 5,868,606 4,882,446 7,040,454 7,235,744Audit related fees and expenses 818,078 385,548 1,703,568 425,548Non-audit expenses 1,160,569 704,695 1,160,569 704,695Total 7,847,253 5,972,689 9,904,591 8,365,987
13. TAXATIONACCOUNTING POLICYAs per the Sri Lanka Accounting Standard - LKAS 12 - ‘Income Taxes’, the tax expense/tax income is the aggregate amount included in determination of profits or loss for the year in respect of income tax and deferred tax. The tax expense/income is recorded in the Statement of Profit or Loss except to the extent it relates to items recognised directly in Equity or Statement of Comprehensive Income , in which case it is recognised in Other Comprehensive Income.
Current tax assets and liabilities consist of amounts expected to be recovered from or paid to the taxation authorities in respect of the current year and any adjustments to tax payable in respect of prior years. The tax rates and tax laws used to compute the amount are those that are enacted or substantially enacted by the reporting date.
Accordingly provision for the taxation is based on the profit for the year adjusted for taxation purpose in accordance with the provisions of the Inland Revenue Act No 10 of 2006 and the amendments thereto.
The components of income tax expense are for the years ended 31 December 2016 and 2015 are;
BANK GROUPFor the year ended 31 December 2016 2015 2016 2015 Rs. Rs. Rs. Rs.
Current tax expense - - 23,311,964 17,348,503(Over)/under provision in respect of prior years - - (279,217) (23,734,567)Deferred tax expense (15,244,097) 13,295,974 10,391,072 43,823,311Total (15,244,097) 13,295,974 33,423,819 37,437,247
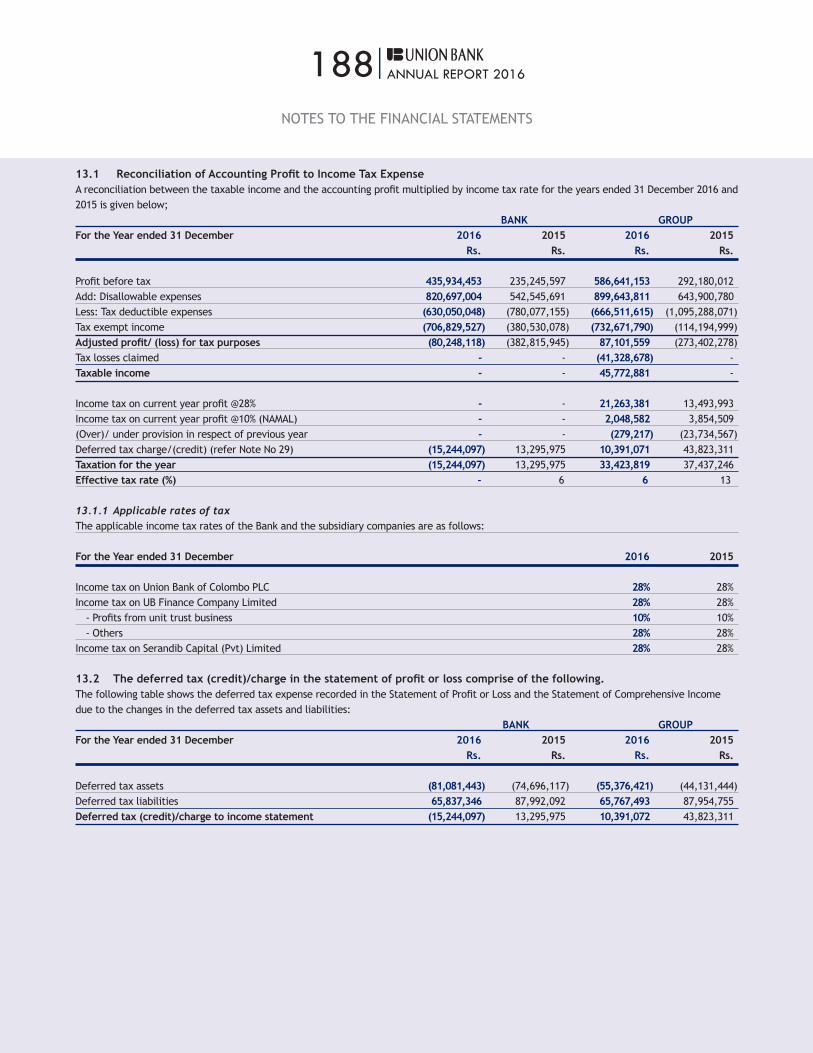
188|ANNUAL REPORT 2016
NOTES TO THE FINANCIAL STATEMENTS
13.1 Reconciliation of Accounting Profit to Income Tax Expense A reconciliation between the taxable income and the accounting profit multiplied by income tax rate for the years ended 31 December 2016 and 2015 is given below; BANK GROUPFor the Year ended 31 December 2016 2015 2016 2015 Rs. Rs. Rs. Rs.
Profit before tax 435,934,453 235,245,597 586,641,153 292,180,012Add: Disallowable expenses 820,697,004 542,545,691 899,643,811 643,900,780Less: Tax deductible expenses (630,050,048) (780,077,155) (666,511,615) (1,095,288,071)Tax exempt income (706,829,527) (380,530,078) (732,671,790) (114,194,999)Adjusted profit/ (loss) for tax purposes (80,248,118) (382,815,945) 87,101,559 (273,402,278)Tax losses claimed - - (41,328,678) -Taxable income - - 45,772,881 -
Income tax on current year profit @28% - - 21,263,381 13,493,993Income tax on current year profit @10% (NAMAL) - - 2,048,582 3,854,509(Over)/ under provision in respect of previous year - - (279,217) (23,734,567)Deferred tax charge/(credit) (refer Note No 29) (15,244,097) 13,295,975 10,391,071 43,823,311Taxation for the year (15,244,097) 13,295,975 33,423,819 37,437,246Effective tax rate (%) - 6 6 13 13.1.1 Applicable rates of tax The applicable income tax rates of the Bank and the subsidiary companies are as follows:
For the Year ended 31 December 2016 2015
Income tax on Union Bank of Colombo PLC 28% 28%Income tax on UB Finance Company Limited 28% 28% - Profits from unit trust business 10% 10% - Others 28% 28%Income tax on Serandib Capital (Pvt) Limited 28% 28%
13.2 The deferred tax (credit)/charge in the statement of profit or loss comprise of the following.The following table shows the deferred tax expense recorded in the Statement of Profit or Loss and the Statement of Comprehensive Income due to the changes in the deferred tax assets and liabilities: BANK GROUPFor the Year ended 31 December 2016 2015 2016 2015 Rs. Rs. Rs. Rs.
Deferred tax assets (81,081,443) (74,696,117) (55,376,421) (44,131,444)Deferred tax liabilities 65,837,346 87,992,092 65,767,493 87,954,755Deferred tax (credit)/charge to income statement (15,244,097) 13,295,975 10,391,072 43,823,311
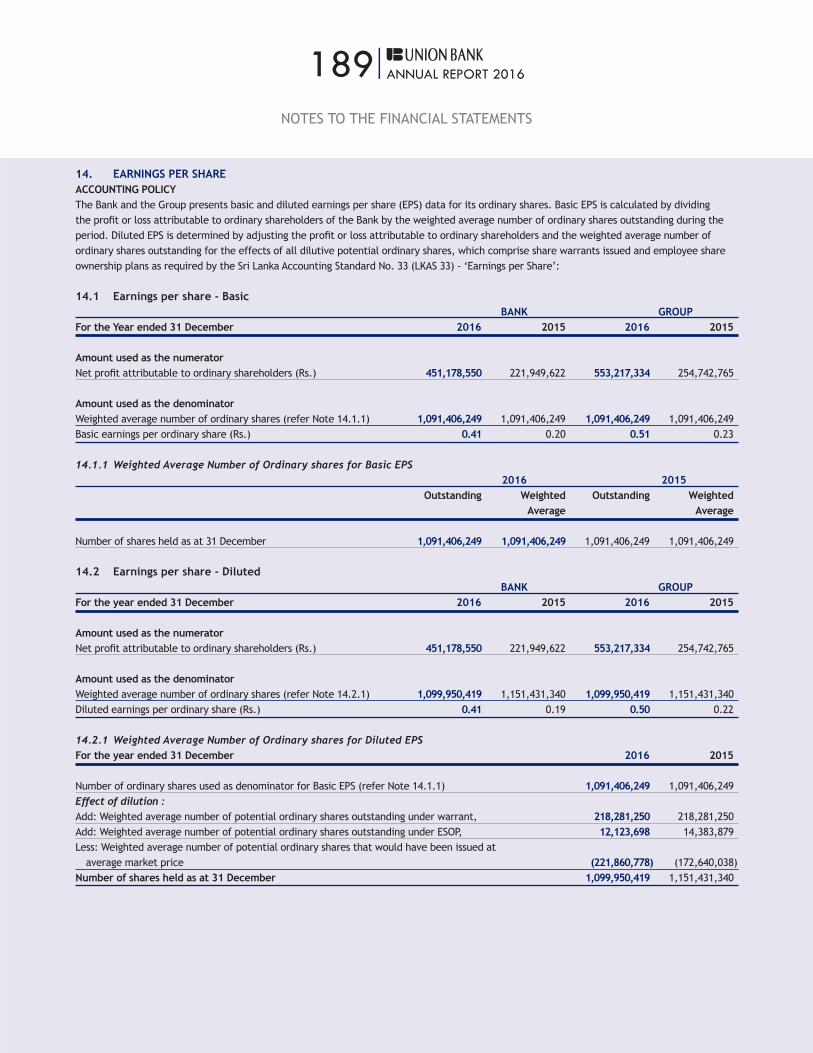
189|ANNUAL REPORT 2016
NOTES TO THE FINANCIAL STATEMENTS
14. EARNINGS PER SHAREACCOUNTING POLICYThe Bank and the Group presents basic and diluted earnings per share (EPS) data for its ordinary shares. Basic EPS is calculated by dividing the profit or loss attributable to ordinary shareholders of the Bank by the weighted average number of ordinary shares outstanding during the period. Diluted EPS is determined by adjusting the profit or loss attributable to ordinary shareholders and the weighted average number of ordinary shares outstanding for the effects of all dilutive potential ordinary shares, which comprise share warrants issued and employee share ownership plans as required by the Sri Lanka Accounting Standard No. 33 (LKAS 33) - ‘Earnings per Share’:
14.1 Earnings per share - Basic BANK GROUPFor the Year ended 31 December 2016 2015 2016 2015
Amount used as the numeratorNet profit attributable to ordinary shareholders (Rs.) 451,178,550 221,949,622 553,217,334 254,742,765
Amount used as the denominatorWeighted average number of ordinary shares (refer Note 14.1.1) 1,091,406,249 1,091,406,249 1,091,406,249 1,091,406,249Basic earnings per ordinary share (Rs.) 0.41 0.20 0.51 0.23
14.1.1 Weighted Average Number of Ordinary shares for Basic EPS 2016 2015 Outstanding Weighted Outstanding Weighted Average Average
Number of shares held as at 31 December 1,091,406,249 1,091,406,249 1,091,406,249 1,091,406,249
14.2 Earnings per share - Diluted BANK GROUPFor the year ended 31 December 2016 2015 2016 2015
Amount used as the numeratorNet profit attributable to ordinary shareholders (Rs.) 451,178,550 221,949,622 553,217,334 254,742,765
Amount used as the denominatorWeighted average number of ordinary shares (refer Note 14.2.1) 1,099,950,419 1,151,431,340 1,099,950,419 1,151,431,340Diluted earnings per ordinary share (Rs.) 0.41 0.19 0.50 0.22
14.2.1 Weighted Average Number of Ordinary shares for Diluted EPSFor the year ended 31 December 2016 2015
Number of ordinary shares used as denominator for Basic EPS (refer Note 14.1.1) 1,091,406,249 1,091,406,249Effect of dilution :Add: Weighted average number of potential ordinary shares outstanding under warrant, 218,281,250 218,281,250Add: Weighted average number of potential ordinary shares outstanding under ESOP, 12,123,698 14,383,879Less: Weighted average number of potential ordinary shares that would have been issued at average market price (221,860,778) (172,640,038)Number of shares held as at 31 December 1,099,950,419 1,151,431,340
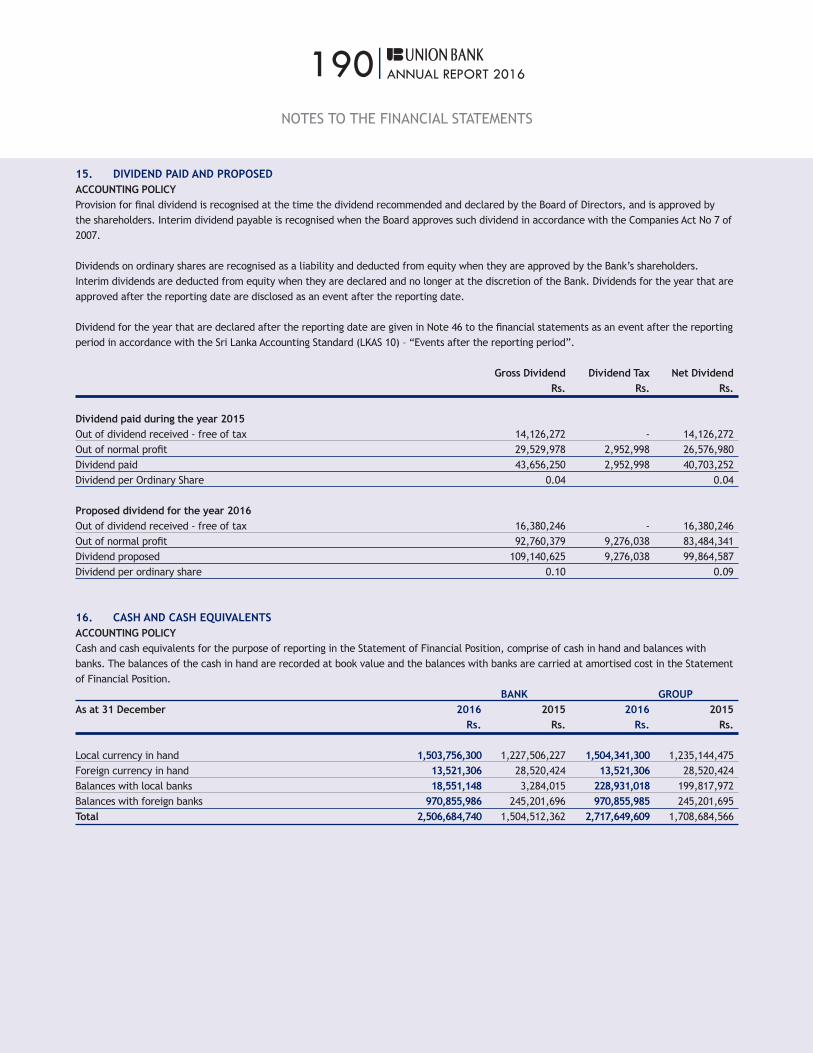
190|ANNUAL REPORT 2016
15. DIVIDEND PAID AND PROPOSEDACCOUNTING POLICYProvision for final dividend is recognised at the time the dividend recommended and declared by the Board of Directors, and is approved by the shareholders. Interim dividend payable is recognised when the Board approves such dividend in accordance with the Companies Act No 7 of 2007.
Dividends on ordinary shares are recognised as a liability and deducted from equity when they are approved by the Bank’s shareholders. Interim dividends are deducted from equity when they are declared and no longer at the discretion of the Bank. Dividends for the year that are approved after the reporting date are disclosed as an event after the reporting date.
Dividend for the year that are declared after the reporting date are given in Note 46 to the financial statements as an event after the reporting period in accordance with the Sri Lanka Accounting Standard (LKAS 10) – “Events after the reporting period”.
Gross Dividend Dividend Tax Net Dividend Rs. Rs. Rs.
Dividend paid during the year 2015Out of dividend received - free of tax 14,126,272 - 14,126,272Out of normal profit 29,529,978 2,952,998 26,576,980Dividend paid 43,656,250 2,952,998 40,703,252Dividend per Ordinary Share 0.04 0.04
Proposed dividend for the year 2016 Out of dividend received - free of tax 16,380,246 - 16,380,246Out of normal profit 92,760,379 9,276,038 83,484,341Dividend proposed 109,140,625 9,276,038 99,864,587Dividend per ordinary share 0.10 0.09
16. CASH AND CASH EQUIVALENTSACCOUNTING POLICYCash and cash equivalents for the purpose of reporting in the Statement of Financial Position, comprise of cash in hand and balances with banks. The balances of the cash in hand are recorded at book value and the balances with banks are carried at amortised cost in the Statement of Financial Position. BANK GROUPAs at 31 December 2016 2015 2016 2015 Rs. Rs. Rs. Rs.
Local currency in hand 1,503,756,300 1,227,506,227 1,504,341,300 1,235,144,475Foreign currency in hand 13,521,306 28,520,424 13,521,306 28,520,424Balances with local banks 18,551,148 3,284,015 228,931,018 199,817,972Balances with foreign banks 970,855,986 245,201,696 970,855,985 245,201,695Total 2,506,684,740 1,504,512,362 2,717,649,609 1,708,684,566
NOTES TO THE FINANCIAL STATEMENTS

191|ANNUAL REPORT 2016
17. BALANCES WITH CENTRAL BANK OF SRI LANKAACCOUNTING POLICYBalances with Central Bank of Sri Lanka include the cash balance that is required as per the provisions of section 93 of the Monetary Law Act.The minimum cash reserve requirement was 7.5% of the rupee deposit liabilities as at 31 December 2016 (6% as at 31 December 2015). This reserve requirement is not applicable for the foreign currency deposit liabilities of Domestic Banking Unit and the deposit liabilities of the Foreign Currency Banking Unit. BANK GROUPAs at 31 December 2016 2015 2016 2015 Rs. Rs. Rs. Rs.
Statutory balances with Central Bank of Sri Lanka 2,487,804,975 1,306,812,184 2,487,804,975 1,306,812,184
18. REVERSE REPURCHASED AGREEMENTSACCOUNTING POLICYSecurities purchased under agreements to resell at a specified future date are not recognised in the Statement of Financial Position. The consideration paid, including accrued interest, is recorded in the Statement of Financial Position, within “reverse repurchase agreements”, reflecting the transaction’s economic substance as a loan by the Bank and the Group. The difference between the purchase and resale prices is recorded in net interest income and is accrued over the life of the agreement using the Effective Interest Rate (EIR).
BANK GROUPAs at 31 December 2016 2015 2016 2015 Rs. Rs. Rs. Rs.
Due from banks - 450,685,714 273,360,351 556,727,467Due from other customers 2,137,425 1,062,739,607 2,137,425 1,062,739,607Total 2,137,425 1,513,425,321 275,497,776 1,619,467,074
19. DERIVATIVE FINANCIAL INSTRUMENTSACCOUNTING POLICYThe Bank uses derivatives such as forward foreign exchange contracts and currency swaps. Bank has not designated any derivatives as hedging instruments and has not followed hedge accounting as at the reporting date. All derivatives are initially recognised and subsequently measured at fair value, with all revaluation gains or losses recognised in the statement of profit or loss under “Other operating income” (Note 8). Derivatives are recorded at fair value and carried as assets when their fair value is positive and as liabilities when their fair value is negative. Fair value is determined using the forward market rates ruling on the reporting date.
Fair values of derivative financial instruments recorded as assets or liabilities together with their notional amounts. The notional amount, recorded gross is the amount of a derivative’s underlying asset, reference rate is the basis upon which changes in the fair value of derivatives are measured. The notional amounts indicate the volume of transactions outstanding at the year end are indicative of neither the market risk nor the credit risk.
The table below shows the fair values of derivative financial instruments, recorded as assets or liabilities.
BANK & GROUP As at 31 December 2016 2015 Notional Notional Assets Liabilities Amount Assets Liabilities Amount Rs. Rs. Rs. Rs. Rs. Rs.
Forward foreign exchange contracts - Sales 15,594 - 4,901,810 - 142,962 44,513,664Currency SWAPS - Sales 1,066 3,405,086 1,708,999,791 5,839 1,251,155 1,600,319,676 - Purchases 15,395,412 570,525 6,745,155,088 13,475,322 1,465,615 4,286,143,373 Total 15,412,072 3,975,611 8,459,056,689 13,481,161 2,859,732 5,930,976,713
NOTES TO THE FINANCIAL STATEMENTS

192|ANNUAL REPORT 2016
20. FINANCIAL ASSETS HELD FOR TRADINGACCOUNTING POLICYA financial asset is classified as fair value through profit or loss if it is held for trading or is designated at fair value through profit or loss.
Financial assets are classified as held for trading if they are acquired principally for the purpose of selling or repurchasing in the near term or holds as a part of a portfolio that is managed together for short term profit or position taking.
Financial assets held for trading are recorded in the Statement of Financial Position at fair value. Changes in fair value are recognised in “Net gain / (loss) from trading” (Note 7). Interest income is recorded in “Interest income” and dividend income are recorded in “Net gain / (loss) from trading” (Note 7) according to the terms of the contract, or when the right to receive the payment is been established.
The Bank and the Group evaluates its financial assets held for trading, other than derivatives, to determine whether the intention to sell them in the near term is still appropriate. When it is unable to trade these financial assets due to inactive markets and management’s intention to sell them in the foreseeable future significantly changes, the Bank and the Group may elect to reclassify these financial assets.
Financial assets held for trading include instruments such as government securities, equity instruments etc. that have been acquired principally for the purpose of selling or repurchasing in the near term. BANK GROUPAs at 31 December 2016 2015 2016 2015 Rs. Rs. Rs. Rs.
Sri Lanka Government securities (refer Note 20.1) - 478,816,674 - 478,816,674Investment in units (refer Note 20.2) 1,346,931,853 7,984,990,735 1,346,931,853 7,984,990,735Total 1,346,931,853 8,463,807,409 1,346,931,853 8,463,807,409
20.1 Sri Lanka Government SecuritiesBANK & GROUP 2016 2015Year of Maturity Cost of Fair Cost of Fair Investment Value Investment Value Rs. Rs. Rs. Rs.
2016 - - 395,342,869 405,105,9992017 - - 74,018,465 73,710,675Total - - 469,361,334 478,816,674
20.2 Investment in UnitsBANK & GROUP 2016 2015 As at 31 December No. of Cost Market Value No of Cost Market Value Units Rs. Rs. Units Rs. Rs.
NAMAL Gilt Edge Fund 21,811,072 253,529,722 253,586,431 157,111,457 1,600,000,000 1,685,240,328NAMAL High Yield Fund 51,711,599 826,971,899 834,982,026 208,482,210 2,900,000,000 3,058,142,133Capital Alliance Investment Grade Fund 20,666,922 258,363,396 258,363,396 - - -NDB Wealth Management - - - 228,473,720 3,200,457,232 3,241,608,274Total 1,338,865,017 1,346,931,853 7,700,457,232 7,984,990,735
NOTES TO THE FINANCIAL STATEMENTS
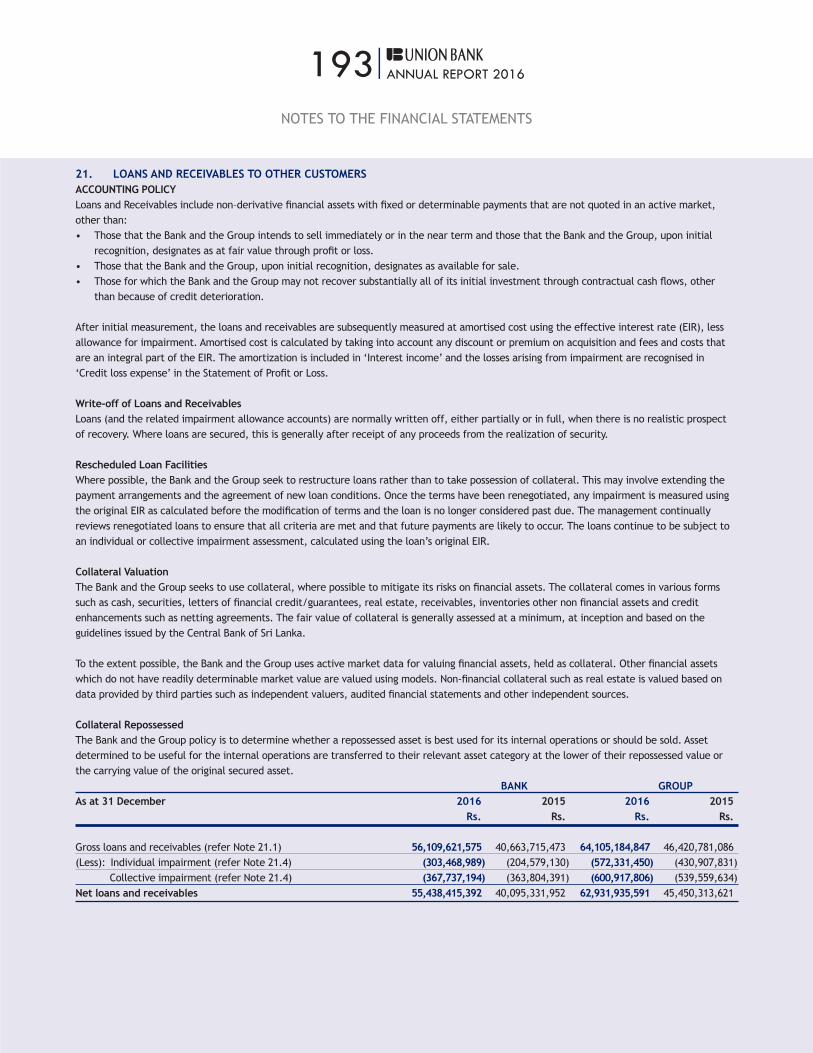
193|ANNUAL REPORT 2016
21. LOANS AND RECEIVABLES TO OTHER CUSTOMERSACCOUNTING POLICYLoans and Receivables include non–derivative financial assets with fixed or determinable payments that are not quoted in an active market, other than:• Those that the Bank and the Group intends to sell immediately or in the near term and those that the Bank and the Group, upon initial
recognition, designates as at fair value through profit or loss.• Those that the Bank and the Group, upon initial recognition, designates as available for sale.• Those for which the Bank and the Group may not recover substantially all of its initial investment through contractual cash flows, other
than because of credit deterioration.
After initial measurement, the loans and receivables are subsequently measured at amortised cost using the effective interest rate (EIR), less allowance for impairment. Amortised cost is calculated by taking into account any discount or premium on acquisition and fees and costs that are an integral part of the EIR. The amortization is included in ‘Interest income’ and the losses arising from impairment are recognised in ‘Credit loss expense’ in the Statement of Profit or Loss.
Write-off of Loans and ReceivablesLoans (and the related impairment allowance accounts) are normally written off, either partially or in full, when there is no realistic prospect of recovery. Where loans are secured, this is generally after receipt of any proceeds from the realization of security.
Rescheduled Loan FacilitiesWhere possible, the Bank and the Group seek to restructure loans rather than to take possession of collateral. This may involve extending the payment arrangements and the agreement of new loan conditions. Once the terms have been renegotiated, any impairment is measured using the original EIR as calculated before the modification of terms and the loan is no longer considered past due. The management continually reviews renegotiated loans to ensure that all criteria are met and that future payments are likely to occur. The loans continue to be subject to an individual or collective impairment assessment, calculated using the loan’s original EIR.
Collateral ValuationThe Bank and the Group seeks to use collateral, where possible to mitigate its risks on financial assets. The collateral comes in various forms such as cash, securities, letters of financial credit/guarantees, real estate, receivables, inventories other non financial assets and credit enhancements such as netting agreements. The fair value of collateral is generally assessed at a minimum, at inception and based on the guidelines issued by the Central Bank of Sri Lanka.
To the extent possible, the Bank and the Group uses active market data for valuing financial assets, held as collateral. Other financial assets which do not have readily determinable market value are valued using models. Non-financial collateral such as real estate is valued based on data provided by third parties such as independent valuers, audited financial statements and other independent sources.
Collateral RepossessedThe Bank and the Group policy is to determine whether a repossessed asset is best used for its internal operations or should be sold. Asset determined to be useful for the internal operations are transferred to their relevant asset category at the lower of their repossessed value or the carrying value of the original secured asset. BANK GROUPAs at 31 December 2016 2015 2016 2015 Rs. Rs. Rs. Rs.
Gross loans and receivables (refer Note 21.1) 56,109,621,575 40,663,715,473 64,105,184,847 46,420,781,086(Less): Individual impairment (refer Note 21.4) (303,468,989) (204,579,130) (572,331,450) (430,907,831) Collective impairment (refer Note 21.4) (367,737,194) (363,804,391) (600,917,806) (539,559,634)Net loans and receivables 55,438,415,392 40,095,331,952 62,931,935,591 45,450,313,621
NOTES TO THE FINANCIAL STATEMENTS
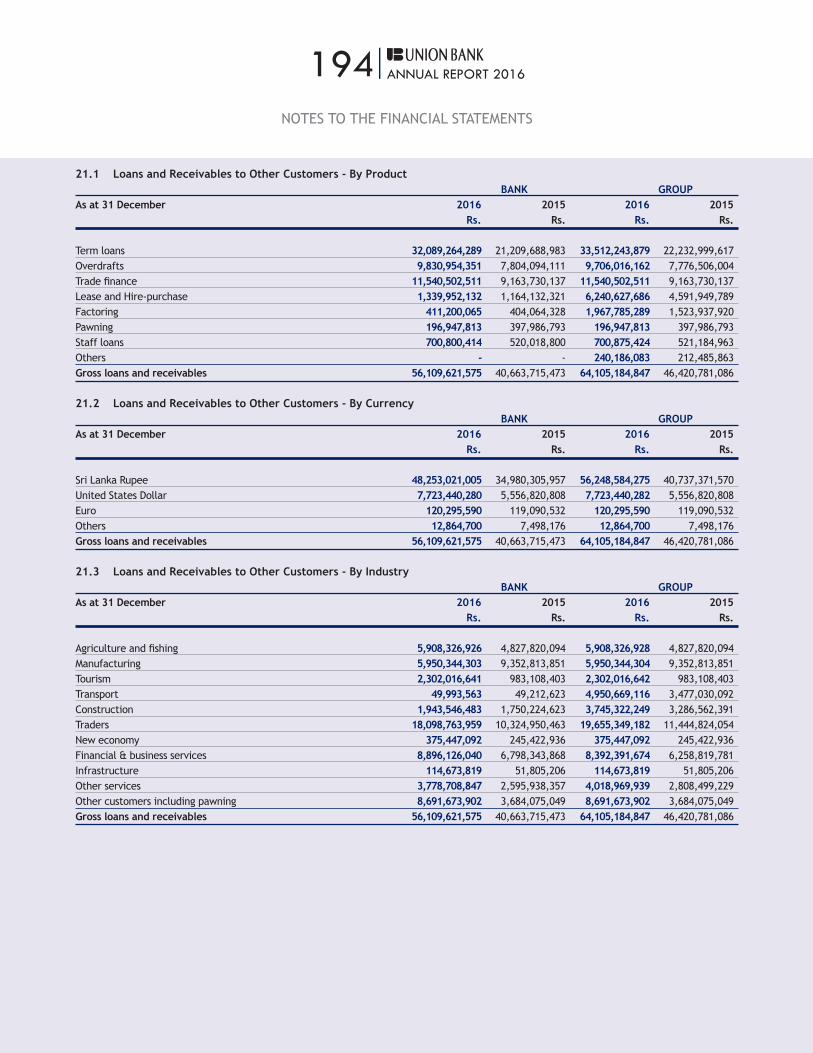
194|ANNUAL REPORT 2016
21.1 Loans and Receivables to Other Customers - By Product BANK GROUPAs at 31 December 2016 2015 2016 2015 Rs. Rs. Rs. Rs.
Term loans 32,089,264,289 21,209,688,983 33,512,243,879 22,232,999,617Overdrafts 9,830,954,351 7,804,094,111 9,706,016,162 7,776,506,004Trade finance 11,540,502,511 9,163,730,137 11,540,502,511 9,163,730,137Lease and Hire-purchase 1,339,952,132 1,164,132,321 6,240,627,686 4,591,949,789Factoring 411,200,065 404,064,328 1,967,785,289 1,523,937,920Pawning 196,947,813 397,986,793 196,947,813 397,986,793Staff loans 700,800,414 520,018,800 700,875,424 521,184,963Others - - 240,186,083 212,485,863Gross loans and receivables 56,109,621,575 40,663,715,473 64,105,184,847 46,420,781,086
21.2 Loans and Receivables to Other Customers - By Currency BANK GROUPAs at 31 December 2016 2015 2016 2015 Rs. Rs. Rs. Rs.
Sri Lanka Rupee 48,253,021,005 34,980,305,957 56,248,584,275 40,737,371,570United States Dollar 7,723,440,280 5,556,820,808 7,723,440,282 5,556,820,808Euro 120,295,590 119,090,532 120,295,590 119,090,532Others 12,864,700 7,498,176 12,864,700 7,498,176Gross loans and receivables 56,109,621,575 40,663,715,473 64,105,184,847 46,420,781,086
21.3 Loans and Receivables to Other Customers - By Industry BANK GROUPAs at 31 December 2016 2015 2016 2015 Rs. Rs. Rs. Rs.
Agriculture and fishing 5,908,326,926 4,827,820,094 5,908,326,928 4,827,820,094Manufacturing 5,950,344,303 9,352,813,851 5,950,344,304 9,352,813,851Tourism 2,302,016,641 983,108,403 2,302,016,642 983,108,403Transport 49,993,563 49,212,623 4,950,669,116 3,477,030,092Construction 1,943,546,483 1,750,224,623 3,745,322,249 3,286,562,391Traders 18,098,763,959 10,324,950,463 19,655,349,182 11,444,824,054New economy 375,447,092 245,422,936 375,447,092 245,422,936Financial & business services 8,896,126,040 6,798,343,868 8,392,391,674 6,258,819,781Infrastructure 114,673,819 51,805,206 114,673,819 51,805,206Other services 3,778,708,847 2,595,938,357 4,018,969,939 2,808,499,229Other customers including pawning 8,691,673,902 3,684,075,049 8,691,673,902 3,684,075,049Gross loans and receivables 56,109,621,575 40,663,715,473 64,105,184,847 46,420,781,086
NOTES TO THE FINANCIAL STATEMENTS

195|ANNUAL REPORT 2016
21. LOANS AND RECEIVABLES TO OTHER CUSTOMERS (CONTD.)ALLOWANCE FOR IMPAIRMENT CHARGES FOR LOANS AND RECEIVABLESACCOUNTING POLICYThe Bank and the Group first assesses whether objective evidence of impairment exists individually for financial assets that are individually significant, and individually or collectively for financial assets that are not individually significant. If an entity determines that no objective evidence of impairment exists for an individually assessed financial asset, whether significant or not, it includes the asset in a group of financial assets with similar credit risk characteristics and collectively assesses them for impairment. Assets that are individually assessed for impairment and for which an impairment loss is or continues to be recognised are not included in a collective assessment of impairment.
A financial asset or a group of financial assets is impaired and impairment losses are incurred if, and only if, there is objective evidence of impairment as a result of one or more events that occurred after the initial recognition of the asset (a ‘loss event’) and that loss event (or events) has an impact on the estimated future cash flows of the financial asset or group of financial assets that can be reliably estimated.
It may not be possible to identify a single, discrete event that caused the impairm ent. Rather the combined effect of several events may have caused the impairment. In lieu, with the same, expected losses as a result of future events, where identifiable due to its likeliness, is recognised under impairment.
“Objective evidence that a financial asset or group of assets is impaired includes observable data that comes to the attention of the holder of the asset about the following loss events:
(a) significant financial difficulty of the issuer or obligor;(b) a breach of contract, such as a default or delinquency in interest or principal payments;(c) the lender, for economic or legal reasons relating to the borrower’s financial difficulty, granting to the borrower a concession that the
lender would not otherwise consider;(d) it becoming probable that the borrower will enter bankruptcy or other financial reorganisation;(e) the disappearance of an active market for that financial asset because of financial difficulties; or(f) observable data indicating that there is a measurable decrease in the estimated future cash flows from a group of financial assets since the
initial recognition of those assets, although the decrease cannot yet be identified with the individual financial assets in the group, including:(i) adverse changes in the payment status of borrowers in the group (eg an increased number of delayed payments or an increased number
of credit card borrowers who have reached their credit limit and are paying the minimum monthly amount); or(ii) national or local economic conditions that correlate with defaults on the assets in the group (eg an increase in the unemployment rate
in the geographical area of the borrowers, a decrease in property prices for mortgages in the relevant area, a decrease in oil prices for loan assets to oil producers, or adverse changes in industry conditions that affect the borrowers in the group).
Collectively Assessed Loans and Receivables to Other CustomersFor the purpose of a collective evaluation of impairment, financial assets are grouped on the basis of the credit risk characteristics such as asset type, industry, past-due status and other relevant factors.
Statistical Models to Calculate Loss StatisticsBank calculates separate loss ratios for capital and interest for the separate products using net flow rate.
Loss Given Default Calculation Method (LGD)Loss given default is the magnitude of likely loss on exposure, and is expressed as a percentage of exposure.
Judgmental Adjustment to Historical Loss ExperienceProbability of Default (PD) and Loss Given Default (LGD) calculated based on historical data should be adjusted appropriately based on relevant economic factors (i.e. GDP growth, inflation rate, employment rate, per capita income etc. ) and relevant portfolio factors such as age of the portfolio, etc.
NOTES TO THE FINANCIAL STATEMENTS

196|ANNUAL REPORT 2016
21.4 Movements in Allowance for Impairment BANK GROUP 2016 2015 2016 2015 Rs. Rs. Rs. Rs.
Individual impairmentOpening balance as at 1 January 204,579,130 126,310,263 430,907,831 761,677,943Charge to statement of profit or loss 98,889,859 78,268,867 141,423,619 167,034,366Net write-off during the year - - - (497,804,478)Closing balance as at 31 December 303,468,989 204,579,130 572,331,450 430,907,831
Collective impairmentOpening balance as at 1 January 363,804,391 487,995,076 539,559,635 669,110,709Charge to statement of profit or loss 53,423,715 98,460,432 110,849,083 93,100,042Net write-off during the year (49,490,912) (222,651,117) (49,490,912) (222,651,117)Closing balance as at 31 December 367,737,194 363,804,391 600,917,806 539,559,634Total 671,206,183 568,383,521 1,173,249,256 970,467,465
21.5 Movements in Allowance for Impairment Charges - By ProductBANK Lease & Loans & Hire Purchases Receivables Pawning Total Rs. Rs. Rs. Rs.
Opening balance as at 1 January 2016 60,163,513 457,723,078 50,496,929 568,383,520Charge to statement of profit or loss (5,090,522) 157,390,243 13,853 152,313,574Net write-off during the year - (6,211,324) (43,279,587) (49,490,911)Closing balance as at 31 December 2016 55,072,991 608,901,997 7,231,195 671,206,183
Opening balance as at 1 January 2015 52,784,601 301,046,614 260,474,124 614,305,339Charge to statement of profit or loss 7,378,913 156,795,737 12,554,649 176,729,299Net write-off during the year - (119,273) (222,531,844) (222,651,117)Closing balance as at 31 December 2015 60,163,514 457,723,078 50,496,929 568,383,521
GROUP Lease & Hire Loans & Purchases Receivables Pawning Total Rs. Rs. Rs. Rs.
Opening balance as at 1 January 2016 156,693,959 763,276,576 50,496,929 970,467,464Charge to statement of profit or loss 74,100,537 178,158,312 13,853 252,272,702Net write-off during the year - (6,211,324) (43,279,587) (49,490,911)Closing balance as at 31 December 2016 230,794,496 935,223,564 7,231,195 1,173,249,255
Opening balance as at 1 January 2015 259,314,505 900,954,719 270,519,428 1,430,788,652Charge to statement of profit or loss 85,747,298 161,832,461 12,554,649 260,134,408Net write-off during the year (188,367,843) (299,510,604) (232,577,148) (720,455,595)Closing balance as at 31 December 2015 156,693,960 763,276,576 50,496,929 970,467,465
NOTES TO THE FINANCIAL STATEMENTS
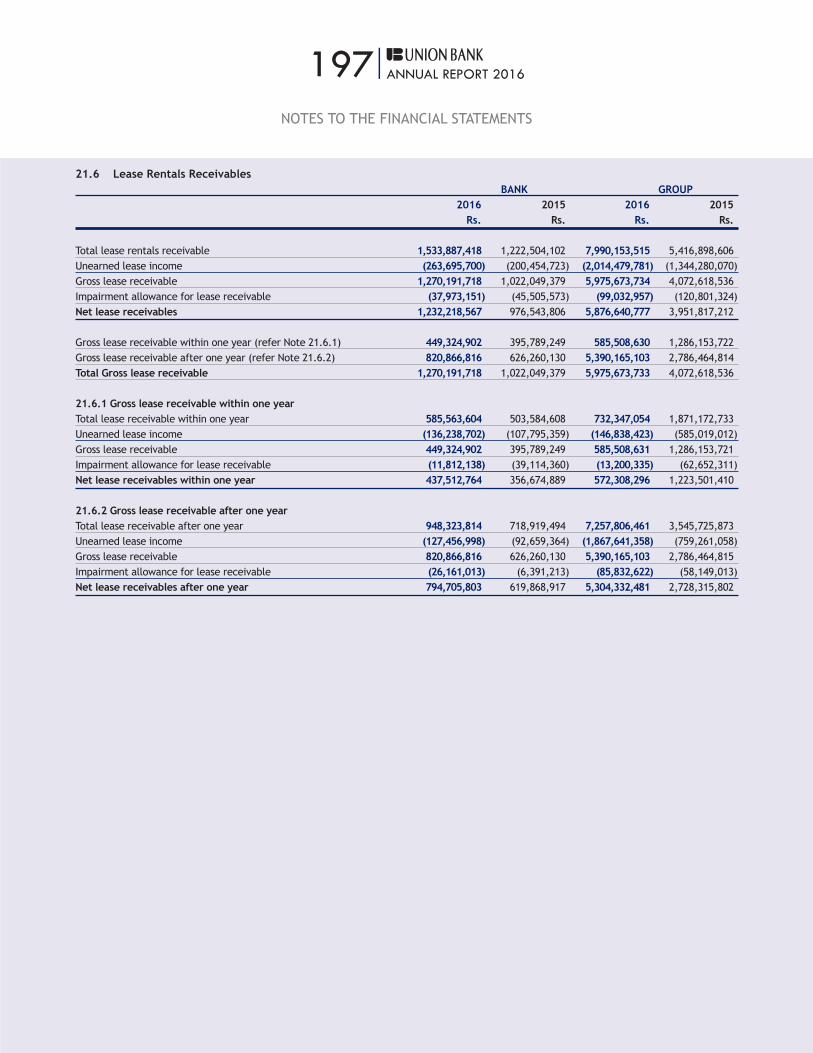
197|ANNUAL REPORT 2016
21.6 Lease Rentals Receivables BANK GROUP 2016 2015 2016 2015 Rs. Rs. Rs. Rs.
Total lease rentals receivable 1,533,887,418 1,222,504,102 7,990,153,515 5,416,898,606Unearned lease income (263,695,700) (200,454,723) (2,014,479,781) (1,344,280,070)Gross lease receivable 1,270,191,718 1,022,049,379 5,975,673,734 4,072,618,536Impairment allowance for lease receivable (37,973,151) (45,505,573) (99,032,957) (120,801,324)Net lease receivables 1,232,218,567 976,543,806 5,876,640,777 3,951,817,212
Gross lease receivable within one year (refer Note 21.6.1) 449,324,902 395,789,249 585,508,630 1,286,153,722Gross lease receivable after one year (refer Note 21.6.2) 820,866,816 626,260,130 5,390,165,103 2,786,464,814Total Gross lease receivable 1,270,191,718 1,022,049,379 5,975,673,733 4,072,618,536
21.6.1 Gross lease receivable within one yearTotal lease receivable within one year 585,563,604 503,584,608 732,347,054 1,871,172,733Unearned lease income (136,238,702) (107,795,359) (146,838,423) (585,019,012)Gross lease receivable 449,324,902 395,789,249 585,508,631 1,286,153,721Impairment allowance for lease receivable (11,812,138) (39,114,360) (13,200,335) (62,652,311)Net lease receivables within one year 437,512,764 356,674,889 572,308,296 1,223,501,410
21.6.2 Gross lease receivable after one yearTotal lease receivable after one year 948,323,814 718,919,494 7,257,806,461 3,545,725,873Unearned lease income (127,456,998) (92,659,364) (1,867,641,358) (759,261,058)Gross lease receivable 820,866,816 626,260,130 5,390,165,103 2,786,464,815Impairment allowance for lease receivable (26,161,013) (6,391,213) (85,832,622) (58,149,013)Net lease receivables after one year 794,705,803 619,868,917 5,304,332,481 2,728,315,802
NOTES TO THE FINANCIAL STATEMENTS

198|ANNUAL REPORT 2016
21.7 Hire Purchase Receivables BANK GROUP 2016 2015 2016 2015 Rs. Rs. Rs. Rs.
Total hire purchase receivable 79,908,917 169,829,782 303,811,226 652,018,782Unearned hire purchase income (10,148,502) (27,746,840) (38,857,273) (132,687,530)Gross hire purchase receivable 69,760,415 142,082,942 264,953,953 519,331,252Impairment allowance for hire purchase receivable (8,564,374) (14,657,940) (26,695,627) (35,892,635)Net hire purchase receivables 61,196,041 127,425,002 238,258,326 483,438,617
Gross hire purchase receivable within one year (refer Note 21.7.1) 51,860,592 78,939,763 88,146,287 263,068,403Gross hire purchase receivable after one year (refer Note 21.7.2) 17,899,823 63,143,179 176,807,666 256,262,849Total Gross hire purchase receivable 69,760,415 142,082,942 264,953,953 519,331,252
21.7.1 Gross hire purchase receivable within one yearTotal hire purchase receivable within one year 60,627,684 98,925,512 98,325,327 350,724,398Unearned hire purchase income (8,767,092) (19,985,749) (10,179,040) (87,655,995)Gross hire purchase receivable 51,860,592 78,939,763 88,146,287 263,068,403Impairment allowance for hire purchase receivable (6,191,193) (12,908,607) (9,243,888) (23,272,910)Net hire purchase receivables within one year 45,669,399 66,031,156 78,902,399 239,795,493
21.7.2 Gross hire purchase receivable after one yearTotal hire purchase receivable after one year 19,281,233 70,904,270 205,485,899 301,294,384Unearned hire purchase income (1,381,410) (7,761,091) (28,678,233) (45,031,535)Gross hire purchase receivable 17,899,823 63,143,179 176,807,666 256,262,849Impairment allowance for hire purchase receivable (2,373,181) (1,749,333) (17,451,739) (12,619,725)Net hire purchase receivables after one year 15,526,642 61,393,846 159,355,927 243,643,124
22. OTHER LOANS AND RECEIVABLESACCOUNTING POLICYLoans and receivables are measured at amortised cost using the effective interest rate (EIR), less allowance for impairment. Amortised cost is calculated by taking into account any discount or premium on acquisition and fees and costs that are an integral part of the EIR. The amortisation is included in ‘Interest income’ and the losses arising from impairment are recognised in ‘Credit loss expense’ in the Statement of Profit or Loss. BANK GROUPAs at 31 December 2016 2015 2016 2015 Rs. Rs. Rs. Rs.
Investment in deep discounted bond (refer Note 22.1) 2,671,940,570 2,569,046,289 - -Fixed deposits - - 1,942,455,700 1,780,685,198Sri Lanka development bond 1,826,699,963 1,318,605,243 1,826,699,963 1,318,605,243Investment in debentures (refer Note 22.2) 2,428,070,204 1,445,719,642 2,149,902,729 1,479,809,765Lease backed trust certificates (refer Note 22.3) 820,519,797 388,177,884 820,519,797 388,177,884Total 7,747,230,534 5,721,549,058 6,739,578,189 4,967,278,090
NOTES TO THE FINANCIAL STATEMENTS

199|ANNUAL REPORT 2016
22.1 Investment in Deep Discounted Bond BANK GROUPAs at 31 December 2016 2015 2016 2015 Rs. Rs. Rs. Rs.
Serandib Capital (Pvt) Ltd 2,671,940,570 2,569,046,289 - -
The Bank purchased a deep discounted bond guaranteed by a Commercial Bank from Serandib Capital (Pvt) Ltd on 1 August 2003. The purchase cost was Rs.1,578Mn settled by transferring part of the Bank’s portfolio at its book value of Rs. 978Mn and balance in cash. The face value of the bond amounts to Rs.3,458Mn and will mature on 1 August 2023. The Bank intends to hold this bond till its maturity and is recorded at cost plus a proportion of the discount over the period to maturity based on its implicit rate of return of 4%.
22.2 Investment in Debentures
2016 2015As at 31 December No. of Carrying No. of Carrying Debentures Value Debentures Value Rs. Rs.
BANK22.2.1 Senior DebenturesCommercial Leasing & Finance PLC 5,000,000 548,883,562 5,000,000 521,904,110DFCC Bank PLC 10,163,300 1,084,782,770 5,163,300 542,719,414Pan Asia Banking Corporation PLC 3,715,280 381,096,118 3,715,280 381,096,118Hayleys PLC 1,000,000 101,054,685 - -Total Senior Debentures 2,115,817,136 1,445,719,642
22.2.2 Subordinated DebentureUB Finance Company Ltd. 3,000,000 312,253,068 - -Total Subordinated Debenture 312,253,068 - -
Total 2,428,070,204 1,445,719,642
GROUP22.2.3 Debentures Commercial Leasing & Finance PLC 5,000,000 548,883,562 5,000,000 521,904,110DFCC Bank PLC 10,163,300 1,084,782,770 5,163,300 542,719,414Pan Asia Banking Corporation PLC 3,715,280 381,096,118 3,715,280 381,096,118Nations Trust Bank PLC 100,000 10,653,552 50,200 5,675,343National Development Bank PLC 50,200 5,348,083 100,000 10,328,982Hayleys PLC 1,000,000 101,054,685 - -Senkadagala Finance PLC 180,000 18,083,959 180,000 18,085,798Ceylinco Sec. % Fin. Services Company Ltd. 2,000 200,000 2,000 200,000Ceylinco Institute of Mgt. Ltd. 2,000 200,000 2,000 200,000Seylan Merchant Leasing Ltd. 300 30,000 300 30,000 2,150,332,729 1,480,239,765Less: Impairment on Debentures 430,000 430,000Total 2,149,902,729 1,479,809,765 22.3 Lease Backed Trust Certificates BANK GROUPAs at 31 December 2016 2015 2016 2015 Rs. Rs. Rs. Rs.
Senkadagala Finance Company PLC 184,938,222 388,177,884 184,938,222 388,177,884Peoples Leasing & Company PLC 444,599,009 - 444,599,009 -Commercial Credit PLC 190,982,566 - 190,982,566 -Total 820,519,797 388,177,884 820,519,797 388,177,884
NOTES TO THE FINANCIAL STATEMENTS
200|ANNUAL REPORT 2016
23. FINANCIAL INVESTMENTS - AVAILABLE FOR SALEACCOUNTING POLICYFinancial investments available for sale includes equity and debt securities. Equity investments classified as available for sale are those which are neither classified as held for trading nor designated at fair value through profit or loss. Debt securities in this category are intended to be held for an indefinite period of time and may be sold in response to needs for liquidity or in response to changes in the market conditions.
Unrealised gains and losses are recognised directly in equity through “Statement of Comprehensive Income” in the ‘Available for sale reserve’. When the investment is disposed of, the cumulative gain or loss previously recognised in equity is recognised in the Statement of Profit or Loss in ‘Other operating income’. Where the Bank and the Group holds more than one investment in the same security, they are deemed to be disposed of on a first-in first-out basis.
Interest earned whilst holding “Available for sale financial investments” is reported as ‘Interest income’ using the effective interest rate (EIR). Dividends earned whilst holding ‘Available for sale financial investments’ are recognised in the Statement of Profit or Loss as ‘Other operating income’ when the right to receive the payment has been established. The losses arising from impairment of such investments are recognised in the Statement of Profit or Loss.
For available for sale financial investments the Bank and the Group assesses at each reporting date whether there is objective evidence that an investment is impaired.
In the case of debt instruments classified as available for sale, the Bank and the Group assesses individually whether there is objective evidence of impairment based on the same criteria as financial assets carried at amortised cost. However, the amount recorded for impairment is the cumulative loss measured as the difference between the amortised cost and the current fair value, less any impairment loss on that investment previously recognised in the Income Statement. Future interest income is based on the reduced carrying amount and is accrued using the rate of interest used to discount the future cash flows for the purpose of measuring the impairment loss, the related interest income is recorded as part of ‘Interest income’. If, in a subsequent period, the fair value of a debt instrument increases and the increase can be objectively related to a credit event occurring after the impairment loss was recognised in the Statement of Profit or Loss, the impairment loss is reversed through the Statement of Profit or Loss.
Where there is evidence of impairment, the cumulative loss measured as the difference between the acquisition cost and the current fair value, less any impairment loss on that investment previously recognised in the Statement of Profit or Loss, is removed from equity and recognised in the Statement of Profit or Loss. In the case of equity investments classified as available for sale, objective evidence would also include a significant or prolonged decline in the fair value of the investment below its cost. The Bank and the Group treats significant ‘generally as 20% and ‘prolonged’ generally as greater than six months.
However, any subsequent recovery in the fair value of an impaired available for sale equity security is recognised in ‘Comprehensive Income’.
The Bank and the Group reviews their investment securities classified as available for sale investments at each reporting date to assess whether they are impaired. This requires similar judgment as applied to the individual assessment of loans and receivables.
The Bank and the Group also records impairment charges on available for sale equity investments when there has been a significant or prolonged decline in the fair value below their cost.
The Bank and the Group evaluates, among other factors, historical share price movements and duration and extent to which the fair value of an investment is less than its cost.
The determination of what is ‘significant’ or ‘prolonged’ requires judgment. The Bank and the Group generally treats ‘significant’ as 20% or more and ‘prolong’ as greater than six months.
NOTES TO THE FINANCIAL STATEMENTS

201|ANNUAL REPORT 2016
23. FINANCIAL INVESTMENTS - AVAILABLE FOR SALE (CONTD.) BANK GROUPAs at 31 December 2016 2015 2016 2015 Rs. Rs. Rs. Rs.
Sri Lanka Government securities (refer Note 23.1) 16,518,834,654 8,354,600,222 16,527,257,938 8,364,044,281Equity securities Unquoted 1,530,000 1,530,000 17,624,900 17,624,900 Quoted (refer Note 23.2) - - 45,694,199 32,201,577Investment in unit trusts (refer Note 23.3) - - 103,893,062 124,688,297Total 16,520,364,654 8,356,130,222 16,694,470,098 8,538,559,055
23.1 Sri Lanka Government Securities
BANK As at 31 December 2016 2015Year of Cost of Fair Year of Cost of Fair Maturity Investment Value Maturity Investment Value Rs. Rs. Rs. Rs.
2017 5,715,070,705 5,714,747,314 2016 5,384,228,342 5,384,991,8472018 3,282,362,350 3,254,478,100 2017 2,217,379,250 2,209,242,0252019 1,929,925,650 1,888,623,050 2018 251,743,350 248,720,3502020 728,904,500 696,366,000 2019 372,067,250 362,760,6502021 2,174,277,550 2,074,113,450 2020 102,505,300 98,821,0002022 759,007,800 734,821,100 2022 51,964,300 50,064,3502023 870,176,300 806,291,300 Total 8,379,887,792 8,354,600,2222024 309,470,300 291,624,1902025 424,670,450 405,046,0502026 685,597,700 652,724,100Total 16,879,463,305 16,518,834,654
GROUP As at 31 December 2016 2015Year of Cost of Fair Year of Cost of Fair Maturity Investment Value Maturity Investment Value Rs. Rs. Rs. Rs.
2017 5,715,070,705 5,714,747,314 2016 5,384,228,342 5,384,991,8472018 3,282,362,350 3,254,478,100 2017 2,224,379,250 2,215,380,6632019 1,931,925,650 1,890,415,867 2018 251,743,350 248,720,3502020 728,904,500 696,366,000 2019 372,067,250 362,760,6502021 2,174,277,550 2,074,113,450 2020 106,505,300 102,126,4212022 759,007,800 734,821,100 2022 51,964,300 50,064,3502023 870,176,300 806,291,300 Total 8,390,887,792 8,364,044,2812024 316,470,300 298,254,6572025 424,670,450 405,046,0502026 685,597,700 652,724,100Total 16,888,463,305 16,527,257,938
NOTES TO THE FINANCIAL STATEMENTS

202|ANNUAL REPORT 2016
23.2 Equity Securities - Quoted InvestmentsGROUP As at 31 December 2016 2015 No. of Cost of Market No. of Cost of Market Shares Investment Value Shares Investment Value Rs. Rs. Rs. Rs.
SoftLogic Holding PLC 600,000 9,555,840 7,800,000 600,000 9,555,840 9,300,000Seylank Bank PLC 35,000 3,919,917 3,150,000 35,000 3,919,917 3,325,000Seylan Bank PLC - Non Voting 45,000 2,958,792 2,655,000 - - -Dialog Axiata PLC 500,000 5,778,948 5,250,000 500,000 5,157,120 5,350,000Commercial Bank of Ceylon PLC - Non Voting 25,000 2,993,935 2,875,000 - - -Tokyo Cement PLC - Non Voting 310,742 15,423,475 16,003,213 150,000 6,542,464 5,925,000Access Engineering PLC 300,000 7,644,439 7,440,000 - - -Blue Diamond Jewellary Worldwide PLC 1,040,657 2,607,424 520,986 2,081,314 3,387,424 1,041,577Lanka IOC PLC - - - 100,000 3,478,528 3,710,000Textured Jersey Lanka PLC - - - 100,000 3,215,616 3,550,000Total 50,882,770 45,694,199 35,256,909 32,201,577
23.3 Investment in Units GROUPAs at 31 December 2016 2015 No. of Market No. of Market Units Cost Value Units Cost Value Rs. Rs. Rs. Rs.
Eagle Growth and Income Fund (Former Pyramid Unit Trust) 8,928 75,000 75,000 8,928 75,000 317,299Cey Bank Unit Trust 12,122 100,000 100,000 11,323 100,000 336,388Investrust Money Market Fund - - - 1,903,529 20,000,000 20,758,122NAMAL Money Market Fund 67,422 694,940 725,146 67,422 694,940 708,695NAMAL High Yield Fund 6,378,495 102,961,663 102,992,916 6,992,337 93,111,468 102,567,793Total 103,831,603 103,893,062 113,981,408 124,688,297
24. FINANCIAL INVESTMENTS - HELD TO MATURITYACCOUNTING POLICYFinancial investments under held to maturity are non-derivative financial assets with fixed or determinable payments and fixed maturities, which the Bank or the Group has the intention and ability to hold to maturity. After the initial recognition, held to maturity financial investments are subsequently measured at amortised cost using the effective interest rate (EIR), less impairment.
Amortised cost is calculated by taking into account any discount or premium on acquisition and fees that are an integral part of the EIR. The amortisation is included in ‘Interest income’ in the Statement of Profit or Loss. The losses arising from impairment of such investments are recognised in the Statement of Profit or Loss under ‘Credit loss expense’. If the Bank and the Group were to sell or reclassify more than an insignificant amount of held to maturity investments before maturity other than in certain specific circumstances permitted in the LKAS 39 (Financial Instruments: Recognition and Measurement), the entire category would be tainted and would have to be reclassified as available for sale. Furthermore, the Bank and the Group would be prohibited from classifying any as financial asset as “held to maturity” for the following two years.
NOTES TO THE FINANCIAL STATEMENTS
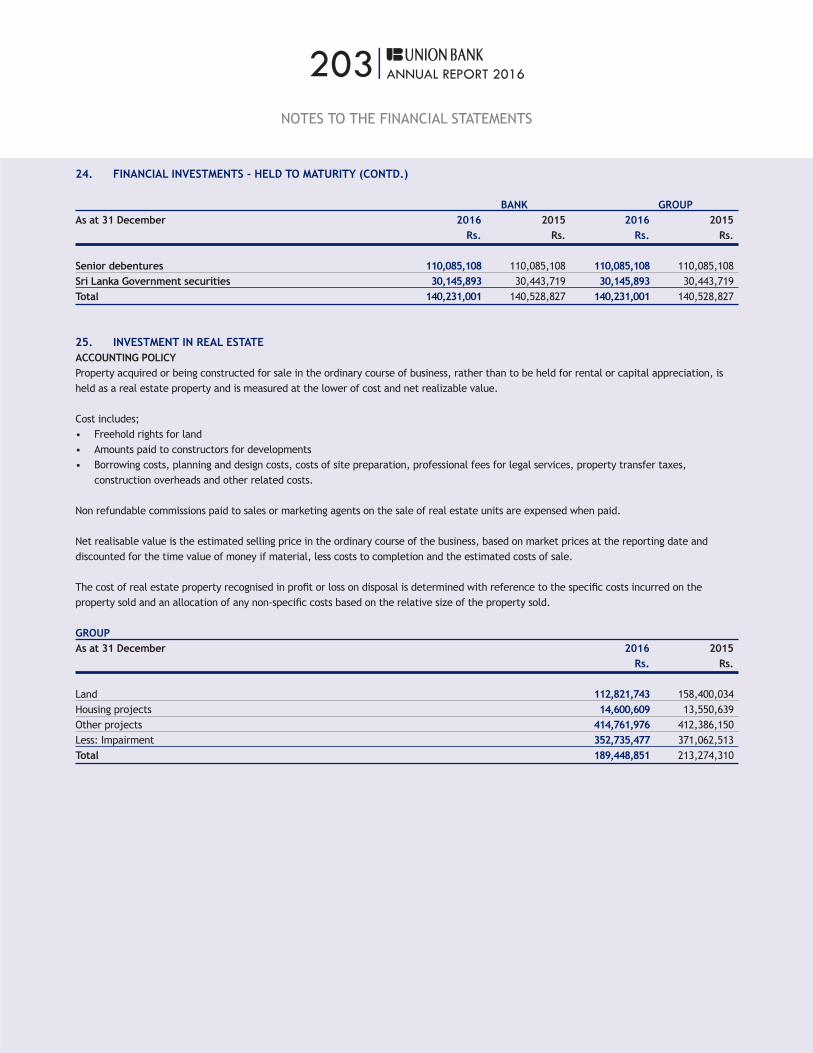
203|ANNUAL REPORT 2016
24. FINANCIAL INVESTMENTS - HELD TO MATURITY (CONTD.)
BANK GROUPAs at 31 December 2016 2015 2016 2015 Rs. Rs. Rs. Rs.
Senior debentures 110,085,108 110,085,108 110,085,108 110,085,108Sri Lanka Government securities 30,145,893 30,443,719 30,145,893 30,443,719Total 140,231,001 140,528,827 140,231,001 140,528,827
25. INVESTMENT IN REAL ESTATEACCOUNTING POLICYProperty acquired or being constructed for sale in the ordinary course of business, rather than to be held for rental or capital appreciation, is held as a real estate property and is measured at the lower of cost and net realizable value.
Cost includes;• Freehold rights for land• Amounts paid to constructors for developments• Borrowing costs, planning and design costs, costs of site preparation, professional fees for legal services, property transfer taxes,
construction overheads and other related costs.
Non refundable commissions paid to sales or marketing agents on the sale of real estate units are expensed when paid.
Net realisable value is the estimated selling price in the ordinary course of the business, based on market prices at the reporting date and discounted for the time value of money if material, less costs to completion and the estimated costs of sale.
The cost of real estate property recognised in profit or loss on disposal is determined with reference to the specific costs incurred on the property sold and an allocation of any non-specific costs based on the relative size of the property sold.
GROUPAs at 31 December 2016 2015 Rs. Rs.
Land 112,821,743 158,400,034Housing projects 14,600,609 13,550,639Other projects 414,761,976 412,386,150Less: Impairment 352,735,477 371,062,513Total 189,448,851 213,274,310
NOTES TO THE FINANCIAL STATEMENTS

204|ANNUAL REPORT 2016
26. INVESTMENT IN SUBSIDIARIESACCOUNTING POLICYThe cost of an acquisition is measured at fair value of the consideration including contingent consideration, given on the date of transfer of title. The acquired identifiable assets, liabilities and contingent liabilities are measured at their fair values at the date of acquisition. Subsequent to the initial measurement, investments in subsidiaries are recognised using the equity method in separate financial statements of the Bank.
BANK
As at 31 December 2016 2015 Percentage Equity Percentage Equity Subsidiary Name Holding Basis Cost Holding Basis Cost % Rs. Rs. % Rs. Rs.
National Asset Management Ltd. (refer Note 26.1.1) 51.00 328,496,228 331,500,000 51.00 332,078,646 331,500,000UB Finance Company Ltd. (refer Note 26.1.2) 66.17 611,530,779 560,864,489 66.17 551,299,184 560,864,489Total 940,027,007 892,364,489 883,377,829 892,364,489
26.1 Movement of Equity Accounted Investee 31 Dec 2016 31 Dec 2015 1 Jan 2015 Rs. Rs. Rs.
Balance brought forward (8,986,659) (37,450,597) (98,778,733)Current year share of profit/(loss) 76,695,545 43,068,892 68,439,822Other comprehensive income (3,958,620) (787,698) 2,093,440Less: Dividends received (16,087,746) (13,817,257) (9,205,125)Total share of equity accounted investees retained profits 47,662,519 (8,986,659) (37,450,597)
Total share of equity accounted investees retained profits 47,662,519 (8,986,659) (37,450,597)Cost of equity accounted investees 892,364,489 892,364,489 892,364,489Total carrying amount of investments in equity accounted investees 940,027,008 883,377,829 854,913,892
26.1.1 National Asset Management Ltd. 31 Dec 2016 31 Dec 2015 1 Jan 2015 Rs. Rs. Rs.
Percentage of ownership interest 51% 51% 51%
Balance brought forward 578,646 (4,556,276) (21,209,357)Current year share of profit/(loss) 18,216,367 18,971,917 24,449,083Other comprehensive income (5,711,039) (19,739) 1,409,123Less: Dividends received (16,087,746) (13,817,257) (9,205,125)Total share of equity accounted investees retained profits (3,003,772) 578,646 (4,556,276)
Total share of equity accounted investees retained profits (3,003,772) 578,646 (4,556,276)Cost of equity accounted investees 331,500,000 331,500,000 331,500,000Total carrying amount of investments in equity accounted investees 328,496,228 332,078,646 328,943,724
NOTES TO THE FINANCIAL STATEMENTS
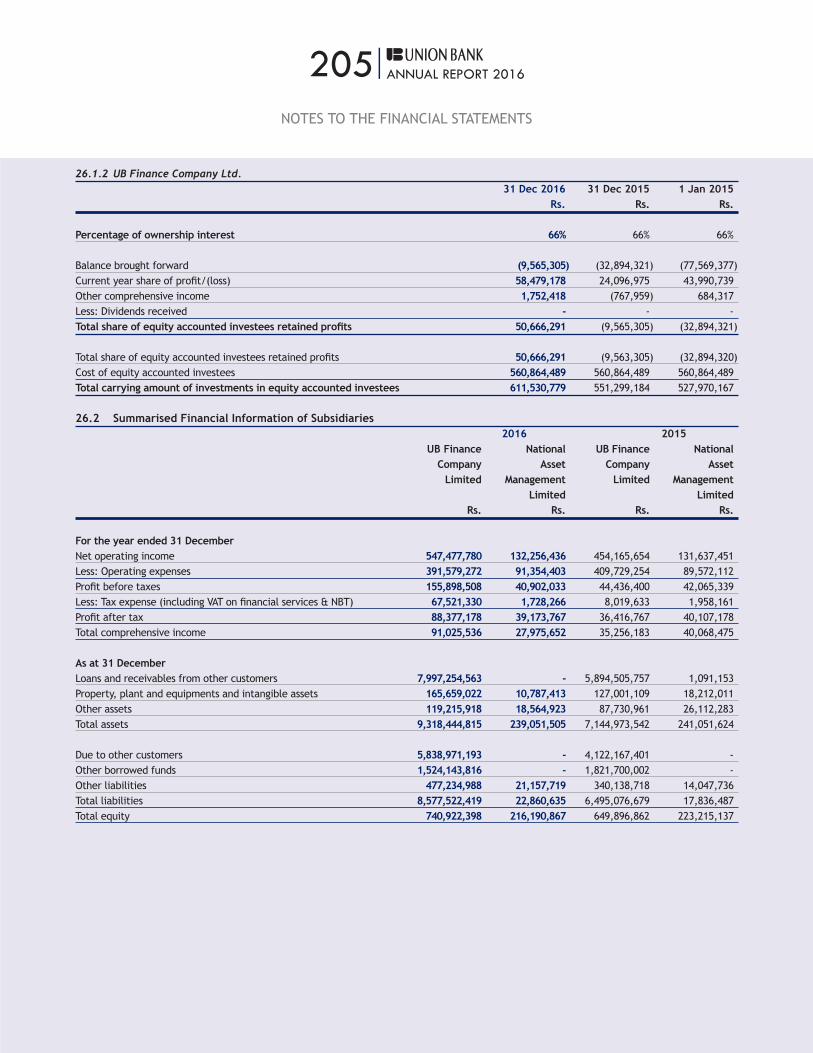
205|ANNUAL REPORT 2016
26.1.2 UB Finance Company Ltd. 31 Dec 2016 31 Dec 2015 1 Jan 2015 Rs. Rs. Rs.
Percentage of ownership interest 66% 66% 66%
Balance brought forward (9,565,305) (32,894,321) (77,569,377)Current year share of profit/(loss) 58,479,178 24,096,975 43,990,739Other comprehensive income 1,752,418 (767,959) 684,317Less: Dividends received - - -Total share of equity accounted investees retained profits 50,666,291 (9,565,305) (32,894,321)
Total share of equity accounted investees retained profits 50,666,291 (9,563,305) (32,894,320)Cost of equity accounted investees 560,864,489 560,864,489 560,864,489Total carrying amount of investments in equity accounted investees 611,530,779 551,299,184 527,970,167
26.2 Summarised Financial Information of Subsidiaries 2016 2015 UB Finance National UB Finance National Company Asset Company Asset Limited Management Limited Management Limited Limited Rs. Rs. Rs. Rs.
For the year ended 31 DecemberNet operating income 547,477,780 132,256,436 454,165,654 131,637,451Less: Operating expenses 391,579,272 91,354,403 409,729,254 89,572,112Profit before taxes 155,898,508 40,902,033 44,436,400 42,065,339Less: Tax expense (including VAT on financial services & NBT) 67,521,330 1,728,266 8,019,633 1,958,161Profit after tax 88,377,178 39,173,767 36,416,767 40,107,178Total comprehensive income 91,025,536 27,975,652 35,256,183 40,068,475
As at 31 DecemberLoans and receivables from other customers 7,997,254,563 - 5,894,505,757 1,091,153Property, plant and equipments and intangible assets 165,659,022 10,787,413 127,001,109 18,212,011Other assets 119,215,918 18,564,923 87,730,961 26,112,283Total assets 9,318,444,815 239,051,505 7,144,973,542 241,051,624
Due to other customers 5,838,971,193 - 4,122,167,401 -Other borrowed funds 1,524,143,816 - 1,821,700,002 -Other liabilities 477,234,988 21,157,719 340,138,718 14,047,736Total liabilities 8,577,522,419 22,860,635 6,495,076,679 17,836,487Total equity 740,922,398 216,190,867 649,896,862 223,215,137
NOTES TO THE FINANCIAL STATEMENTS

206|ANNUAL REPORT 2016
27. GOODWILL AND INTANGIBLE ASSETSACCOUNTING POLICYBasis of RecognitionAn intangible asset is recognised if it is probable that the future economic benefits that are attributable to the asset will flow to the Bank and the Group and the cost of the asset can be measured reliably. An intangible asset is initially measured at cost. The cost of intangible assets acquired in a business combination is the fair value as at the date of acquisition.
(i) GoodwillGoodwill that arises upon the acquisition of subsidiaries is included in intangible assets as initial recognition in accordance LKAS 38, subsequently the goodwill is assessed for impairment.
(ii) Computer SoftwareSoftware acquired by the Bank and the Group is stated at cost less accumulated amortisation and accumulated impairment losses. Expenditure on internally developed software is recognised as an asset when the Bank and the Group is able to demonstrate its intention and ability to complete the development and use the software in a manner that will generate future economic benefits and can reliably measure the costs to complete the development. The capitalised costs of internally developed software include all costs directly attributable to developing the software and capitalised borrowing costs, and are amortised over its useful life. Internally developed software is stated at capitalised cost less accumulated amortisation and impairment. Subsequent expenditure on software assets are capitalised only when it increases the future economic benefits embodied in the specific asset to which it relates. All other expenditure is expensed as incurred.
Amortisation is recognised in profit or loss on a straight-line basis over the estimated useful life of the software, from the date that it is available for use since this most closely reflects the expected pattern of consumption of the future economic benefits embodied in the asset.
Computer software is amortised over 10 Years of estimated useful lives on a straight line basis.
(iii) Other Intangible AssetsOther intangible assets consist of brand value, asset management and advisory intangible, licenses and related infrastructure. Other intangible assets are initially recognised when they are separable or arise from contractual or other legal rights, the cost can be measured reliably and, in the case of intangible assets not acquired in a business combination, where it is probable that future economic benefits attributable to the assets will flow from their use. The value of intangible assets which are acquired in a business combination is generally determined using income approach methodologies such as the discounted cash flow method.
Subsequent MeasurementThese other intangible assets are with an indefinite useful life which shall not be amortised, is required to test for impairment by comparing its recoverable amount with its carrying amount on annually or whenever there is an indication that these intangible assets may be impaired. Accordingly, these other intangible assets are measured at cost less accumulated impairment losses.
De-recognition of Intangible AssetsThe carrying amount of an item of intangible asset is de-recognised on disposal or when no future economic benefits are expected from its use. The gain or loss arising from de-recognition of an item of intangible asset is included in the Statement of Profit or Loss when the item is de-recognised.
NOTES TO THE FINANCIAL STATEMENTS
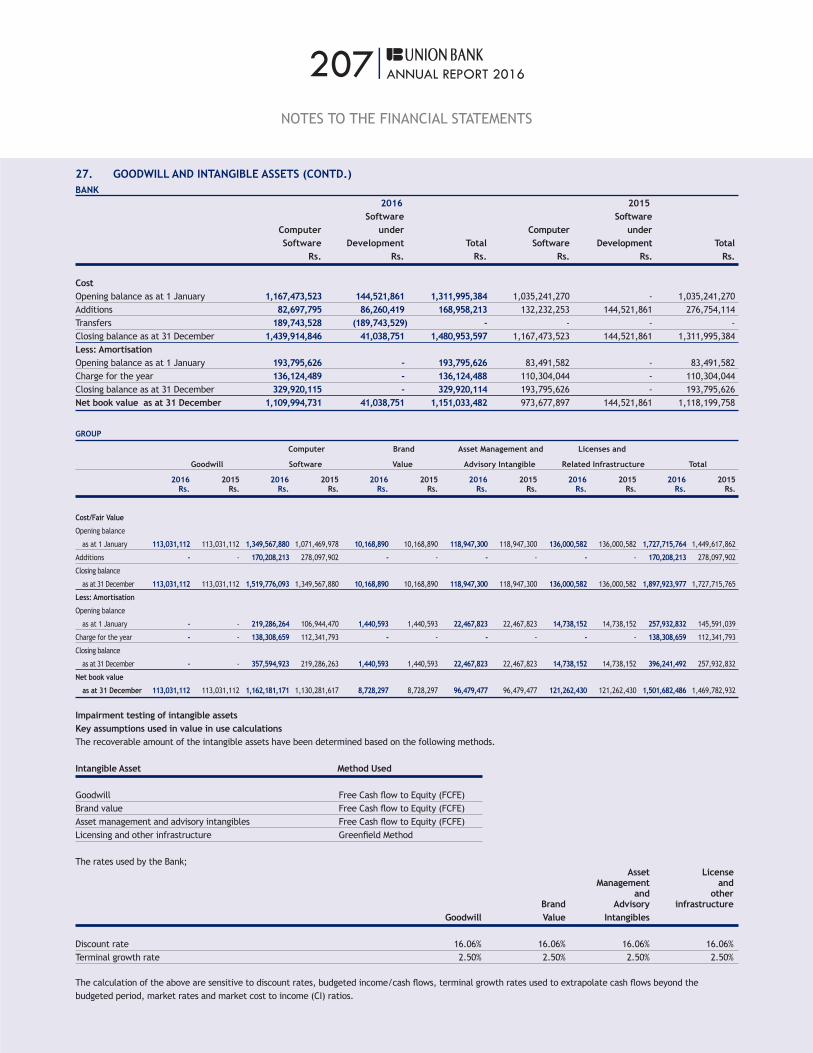
207|ANNUAL REPORT 2016
27. GOODWILL AND INTANGIBLE ASSETS (CONTD.)BANK 2016 2015 Software Software Computer under Computer under Software Development Total Software Development Total Rs. Rs. Rs. Rs. Rs. Rs.
CostOpening balance as at 1 January 1,167,473,523 144,521,861 1,311,995,384 1,035,241,270 - 1,035,241,270Additions 82,697,795 86,260,419 168,958,213 132,232,253 144,521,861 276,754,114Transfers 189,743,528 (189,743,529) - - - -Closing balance as at 31 December 1,439,914,846 41,038,751 1,480,953,597 1,167,473,523 144,521,861 1,311,995,384Less: AmortisationOpening balance as at 1 January 193,795,626 - 193,795,626 83,491,582 - 83,491,582Charge for the year 136,124,489 - 136,124,488 110,304,044 - 110,304,044Closing balance as at 31 December 329,920,115 - 329,920,114 193,795,626 - 193,795,626Net book value as at 31 December 1,109,994,731 41,038,751 1,151,033,482 973,677,897 144,521,861 1,118,199,758
GROUP
Computer Brand Asset Management and Licenses and
Goodwill Software Value Advisory Intangible Related Infrastructure Total
2016 2015 2016 2015 2016 2015 2016 2015 2016 2015 2016 2015 Rs. Rs. Rs. Rs. Rs. Rs. Rs. Rs. Rs. Rs. Rs. Rs.
Cost/Fair Value
Opening balance
as at 1 January 113,031,112 113,031,112 1,349,567,880 1,071,469,978 10,168,890 10,168,890 118,947,300 118,947,300 136,000,582 136,000,582 1,727,715,764 1,449,617,862
Additions - - 170,208,213 278,097,902 - - - - - - 170,208,213 278,097,902
Closing balance
as at 31 December 113,031,112 113,031,112 1,519,776,093 1,349,567,880 10,168,890 10,168,890 118,947,300 118,947,300 136,000,582 136,000,582 1,897,923,977 1,727,715,765
Less: Amortisation
Opening balance
as at 1 January - - 219,286,264 106,944,470 1,440,593 1,440,593 22,467,823 22,467,823 14,738,152 14,738,152 257,932,832 145,591,039
Charge for the year - - 138,308,659 112,341,793 - - - - - - 138,308,659 112,341,793
Closing balance
as at 31 December - - 357,594,923 219,286,263 1,440,593 1,440,593 22,467,823 22,467,823 14,738,152 14,738,152 396,241,492 257,932,832
Net book value
as at 31 December 113,031,112 113,031,112 1,162,181,171 1,130,281,617 8,728,297 8,728,297 96,479,477 96,479,477 121,262,430 121,262,430 1,501,682,486 1,469,782,932
Impairment testing of intangible assetsKey assumptions used in value in use calculationsThe recoverable amount of the intangible assets have been determined based on the following methods.
Intangible Asset Method Used
Goodwill Free Cash flow to Equity (FCFE)Brand value Free Cash flow to Equity (FCFE)Asset management and advisory intangibles Free Cash flow to Equity (FCFE)Licensing and other infrastructure Greenfield Method
The rates used by the Bank; Asset License Management and and other Brand Advisory infrastructure Goodwill Value Intangibles
Discount rate 16.06% 16.06% 16.06% 16.06%Terminal growth rate 2.50% 2.50% 2.50% 2.50%
The calculation of the above are sensitive to discount rates, budgeted income/cash flows, terminal growth rates used to extrapolate cash flows beyond the budgeted period, market rates and market cost to income (CI) ratios.
NOTES TO THE FINANCIAL STATEMENTS

208|ANNUAL REPORT 2016
28. PROPERTY, PLANT AND EQUIPMENTACCOUNTING POLICYProperty, plant and equipment are tangible items that are held for use in the production or supply of goods or services, for rental to others or for administrative purposes and are expected to be used during more than one period.
Basis of RecognitionProperty, plant and equipment are recognised if it is probable that future economic benefits associated with the asset will flow to the Bank and the Group and the cost of the asset can be measured reliably in accordance with LKAS 16 “Property, plant and equipment”.
MeasurementProperty, plant and equipment is stated at cost, net of accumulated depreciation and accumulated impairment losses if any. Initially property, plant and equipment are measured at its cost. Cost includes expenditures that are directly attributable to the acquisition of the asset. The cost of self-constructed assets includes the cost of materials and direct labour, any other costs directly attributable to bringing the assets to a working condition for their intended use and the costs of dismantling and removing the items and restoring the site on which they are located. Purchased software that is integral to the functionality of the related equipment is capitalised as part of that computer equipment.
When parts of an item of property, plant and equipment have different useful lives, they are accounted for as separate items (major components) of property, plant and equipment.
Subsequent costsThe cost of replacing a part of an item of property, plant and equipment is recognised in the carrying amount of the item if it is probable that the future economic benefits embodied within that part will flow to the Bank and the Group and its cost can be measured reliably. The carrying amount of the replaced part is de-recognised. The costs of day-to-day servicing of property, plant and equipment are recognised in profit or loss as incurred.
De-recognitionThe carrying amount of an item of property, plant and equipment is derecognised on disposal or when no future economic benefits are expected from its use or disposal. The gain or loss arising from the de-recognition of an item of property, plant and equipment which is calculated as the difference between the carrying amount and the net disposal proceeds is included in “Other operating income” in the Statement of Profit or Loss in the year the asset is de-recognised. When replacement costs are recognised in the carrying amount of an item of property, plant and equipment, the remaining carrying amount of the replaced part is derecognised. Major inspection costs are capitalised. at each such capitalisation, the remaining carrying amount of the previous cost of inspections is derecognised.
DepreciationDepreciation is recognised in profit or loss on a straight-line basis over the estimated useful lives of each part of an item of property and equipment since this most closely reflects the expected pattern of consumption of the future economic benefits embodied in the asset. Land is not depreciated. The depreciation charges are determined separately for each significant part of an item of Property, plant and equipment and commence to depreciate when it is available for use. Depreciation of an asset ceases at the earlier of the date that the asset is classified as held for sale or the date that the asset is de-recognised. Depreciation doesn’t cease when the asset becomes idle or is retired from active use unless the asset is fully depreciated.
NOTES TO THE FINANCIAL STATEMENTS
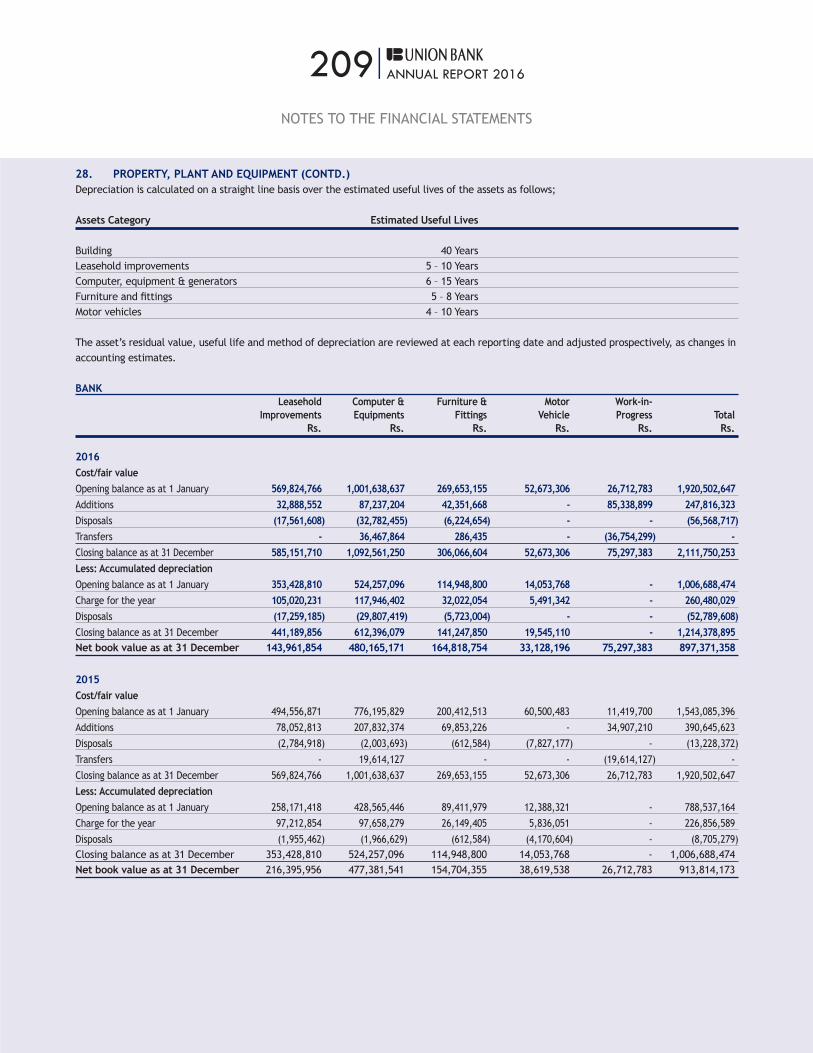
209|ANNUAL REPORT 2016
28. PROPERTY, PLANT AND EQUIPMENT (CONTD.)Depreciation is calculated on a straight line basis over the estimated useful lives of the assets as follows;
Assets Category Estimated Useful Lives
Building 40 YearsLeasehold improvements 5 – 10 YearsComputer, equipment & generators 6 – 15 YearsFurniture and fittings 5 – 8 YearsMotor vehicles 4 – 10 Years
The asset’s residual value, useful life and method of depreciation are reviewed at each reporting date and adjusted prospectively, as changes in accounting estimates.
BANK Leasehold Computer & Furniture & Motor Work-in- Improvements Equipments Fittings Vehicle Progress Total Rs. Rs. Rs. Rs. Rs. Rs.
2016 Cost/fair valueOpening balance as at 1 January 569,824,766 1,001,638,637 269,653,155 52,673,306 26,712,783 1,920,502,647Additions 32,888,552 87,237,204 42,351,668 - 85,338,899 247,816,323Disposals (17,561,608) (32,782,455) (6,224,654) - - (56,568,717)Transfers - 36,467,864 286,435 - (36,754,299) -Closing balance as at 31 December 585,151,710 1,092,561,250 306,066,604 52,673,306 75,297,383 2,111,750,253Less: Accumulated depreciationOpening balance as at 1 January 353,428,810 524,257,096 114,948,800 14,053,768 - 1,006,688,474Charge for the year 105,020,231 117,946,402 32,022,054 5,491,342 - 260,480,029Disposals (17,259,185) (29,807,419) (5,723,004) - - (52,789,608)Closing balance as at 31 December 441,189,856 612,396,079 141,247,850 19,545,110 - 1,214,378,895Net book value as at 31 December 143,961,854 480,165,171 164,818,754 33,128,196 75,297,383 897,371,358
2015
Cost/fair valueOpening balance as at 1 January 494,556,871 776,195,829 200,412,513 60,500,483 11,419,700 1,543,085,396Additions 78,052,813 207,832,374 69,853,226 - 34,907,210 390,645,623Disposals (2,784,918) (2,003,693) (612,584) (7,827,177) - (13,228,372)Transfers - 19,614,127 - - (19,614,127) -Closing balance as at 31 December 569,824,766 1,001,638,637 269,653,155 52,673,306 26,712,783 1,920,502,647Less: Accumulated depreciationOpening balance as at 1 January 258,171,418 428,565,446 89,411,979 12,388,321 - 788,537,164Charge for the year 97,212,854 97,658,279 26,149,405 5,836,051 - 226,856,589Disposals (1,955,462) (1,966,629) (612,584) (4,170,604) - (8,705,279)Closing balance as at 31 December 353,428,810 524,257,096 114,948,800 14,053,768 - 1,006,688,474Net book value as at 31 December 216,395,956 477,381,541 154,704,355 38,619,538 26,712,783 913,814,173
NOTES TO THE FINANCIAL STATEMENTS
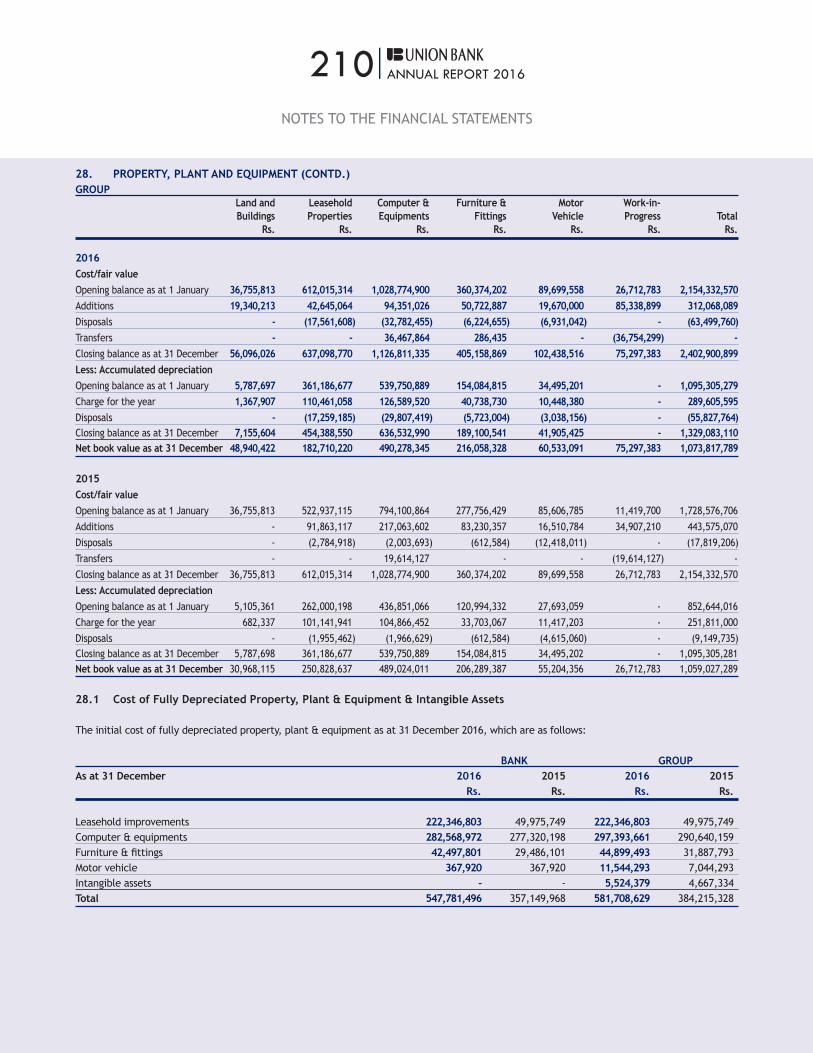
210|ANNUAL REPORT 2016
NOTES TO THE FINANCIAL STATEMENTS
28. PROPERTY, PLANT AND EQUIPMENT (CONTD.)GROUP Land and Leasehold Computer & Furniture & Motor Work-in- Buildings Properties Equipments Fittings Vehicle Progress Total Rs. Rs. Rs. Rs. Rs. Rs. Rs.
2016 Cost/fair valueOpening balance as at 1 January 36,755,813 612,015,314 1,028,774,900 360,374,202 89,699,558 26,712,783 2,154,332,570Additions 19,340,213 42,645,064 94,351,026 50,722,887 19,670,000 85,338,899 312,068,089Disposals - (17,561,608) (32,782,455) (6,224,655) (6,931,042) - (63,499,760)Transfers - - 36,467,864 286,435 - (36,754,299) -Closing balance as at 31 December 56,096,026 637,098,770 1,126,811,335 405,158,869 102,438,516 75,297,383 2,402,900,899Less: Accumulated depreciationOpening balance as at 1 January 5,787,697 361,186,677 539,750,889 154,084,815 34,495,201 - 1,095,305,279Charge for the year 1,367,907 110,461,058 126,589,520 40,738,730 10,448,380 - 289,605,595Disposals - (17,259,185) (29,807,419) (5,723,004) (3,038,156) - (55,827,764)Closing balance as at 31 December 7,155,604 454,388,550 636,532,990 189,100,541 41,905,425 - 1,329,083,110Net book value as at 31 December 48,940,422 182,710,220 490,278,345 216,058,328 60,533,091 75,297,383 1,073,817,789
2015
Cost/fair valueOpening balance as at 1 January 36,755,813 522,937,115 794,100,864 277,756,429 85,606,785 11,419,700 1,728,576,706Additions - 91,863,117 217,063,602 83,230,357 16,510,784 34,907,210 443,575,070Disposals - (2,784,918) (2,003,693) (612,584) (12,418,011) - (17,819,206)Transfers - - 19,614,127 - - (19,614,127) -Closing balance as at 31 December 36,755,813 612,015,314 1,028,774,900 360,374,202 89,699,558 26,712,783 2,154,332,570Less: Accumulated depreciationOpening balance as at 1 January 5,105,361 262,000,198 436,851,066 120,994,332 27,693,059 - 852,644,016Charge for the year 682,337 101,141,941 104,866,452 33,703,067 11,417,203 - 251,811,000Disposals - (1,955,462) (1,966,629) (612,584) (4,615,060) - (9,149,735)Closing balance as at 31 December 5,787,698 361,186,677 539,750,889 154,084,815 34,495,202 - 1,095,305,281Net book value as at 31 December 30,968,115 250,828,637 489,024,011 206,289,387 55,204,356 26,712,783 1,059,027,289
28.1 Cost of Fully Depreciated Property, Plant & Equipment & Intangible Assets
The initial cost of fully depreciated property, plant & equipment as at 31 December 2016, which are as follows:
BANK GROUPAs at 31 December 2016 2015 2016 2015 Rs. Rs. Rs. Rs.
Leasehold improvements 222,346,803 49,975,749 222,346,803 49,975,749Computer & equipments 282,568,972 277,320,198 297,393,661 290,640,159Furniture & fittings 42,497,801 29,486,101 44,899,493 31,887,793Motor vehicle 367,920 367,920 11,544,293 7,044,293Intangible assets - - 5,524,379 4,667,334Total 547,781,496 357,149,968 581,708,629 384,215,328
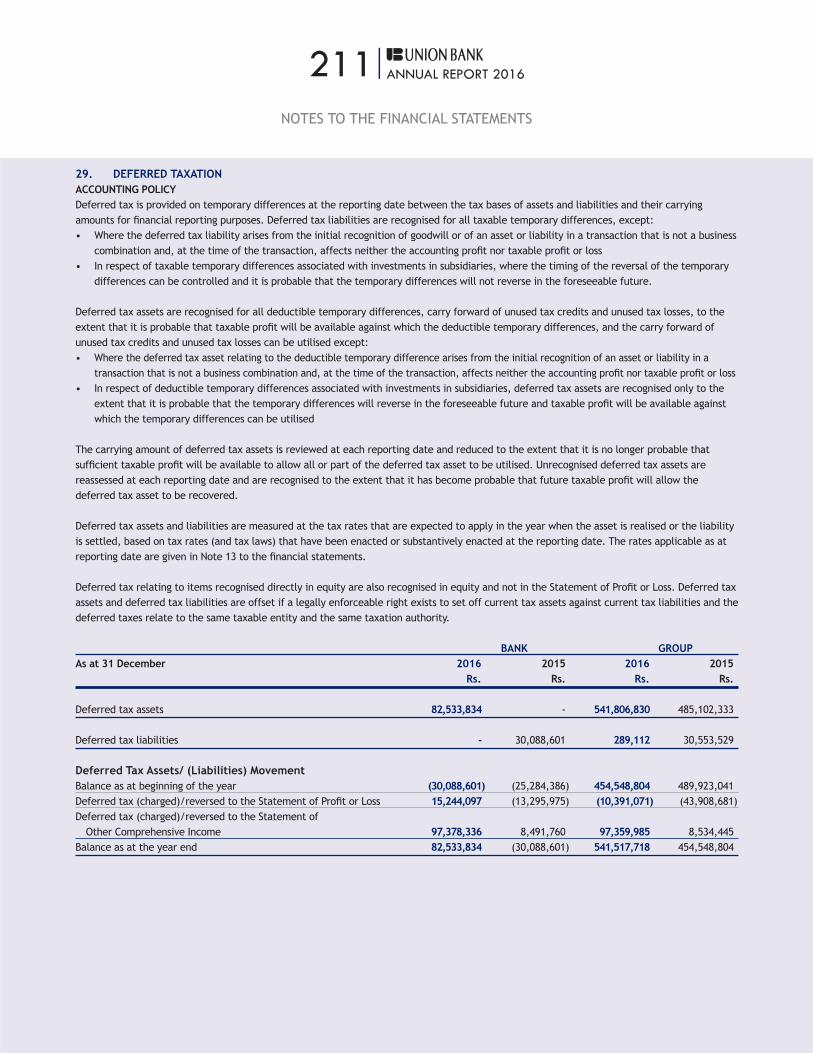
211|ANNUAL REPORT 2016
29. DEFERRED TAXATIONACCOUNTING POLICYDeferred tax is provided on temporary differences at the reporting date between the tax bases of assets and liabilities and their carrying amounts for financial reporting purposes. Deferred tax liabilities are recognised for all taxable temporary differences, except:• Where the deferred tax liability arises from the initial recognition of goodwill or of an asset or liability in a transaction that is not a business
combination and, at the time of the transaction, affects neither the accounting profit nor taxable profit or loss• In respect of taxable temporary differences associated with investments in subsidiaries, where the timing of the reversal of the temporary
differences can be controlled and it is probable that the temporary differences will not reverse in the foreseeable future.
Deferred tax assets are recognised for all deductible temporary differences, carry forward of unused tax credits and unused tax losses, to the extent that it is probable that taxable profit will be available against which the deductible temporary differences, and the carry forward of unused tax credits and unused tax losses can be utilised except:• Where the deferred tax asset relating to the deductible temporary difference arises from the initial recognition of an asset or liability in a
transaction that is not a business combination and, at the time of the transaction, affects neither the accounting profit nor taxable profit or loss• In respect of deductible temporary differences associated with investments in subsidiaries, deferred tax assets are recognised only to the
extent that it is probable that the temporary differences will reverse in the foreseeable future and taxable profit will be available against which the temporary differences can be utilised
The carrying amount of deferred tax assets is reviewed at each reporting date and reduced to the extent that it is no longer probable that sufficient taxable profit will be available to allow all or part of the deferred tax asset to be utilised. Unrecognised deferred tax assets are reassessed at each reporting date and are recognised to the extent that it has become probable that future taxable profit will allow the deferred tax asset to be recovered.
Deferred tax assets and liabilities are measured at the tax rates that are expected to apply in the year when the asset is realised or the liability is settled, based on tax rates (and tax laws) that have been enacted or substantively enacted at the reporting date. The rates applicable as at reporting date are given in Note 13 to the financial statements.
Deferred tax relating to items recognised directly in equity are also recognised in equity and not in the Statement of Profit or Loss. Deferred tax assets and deferred tax liabilities are offset if a legally enforceable right exists to set off current tax assets against current tax liabilities and the deferred taxes relate to the same taxable entity and the same taxation authority.
BANK GROUPAs at 31 December 2016 2015 2016 2015 Rs. Rs. Rs. Rs.
Deferred tax assets 82,533,834 - 541,806,830 485,102,333
Deferred tax liabilities - 30,088,601 289,112 30,553,529
Deferred Tax Assets/ (Liabilities) MovementBalance as at beginning of the year (30,088,601) (25,284,386) 454,548,804 489,923,041Deferred tax (charged)/reversed to the Statement of Profit or Loss 15,244,097 (13,295,975) (10,391,071) (43,908,681)Deferred tax (charged)/reversed to the Statement of Other Comprehensive Income 97,378,336 8,491,760 97,359,985 8,534,445Balance as at the year end 82,533,834 (30,088,601) 541,517,718 454,548,804
NOTES TO THE FINANCIAL STATEMENTS
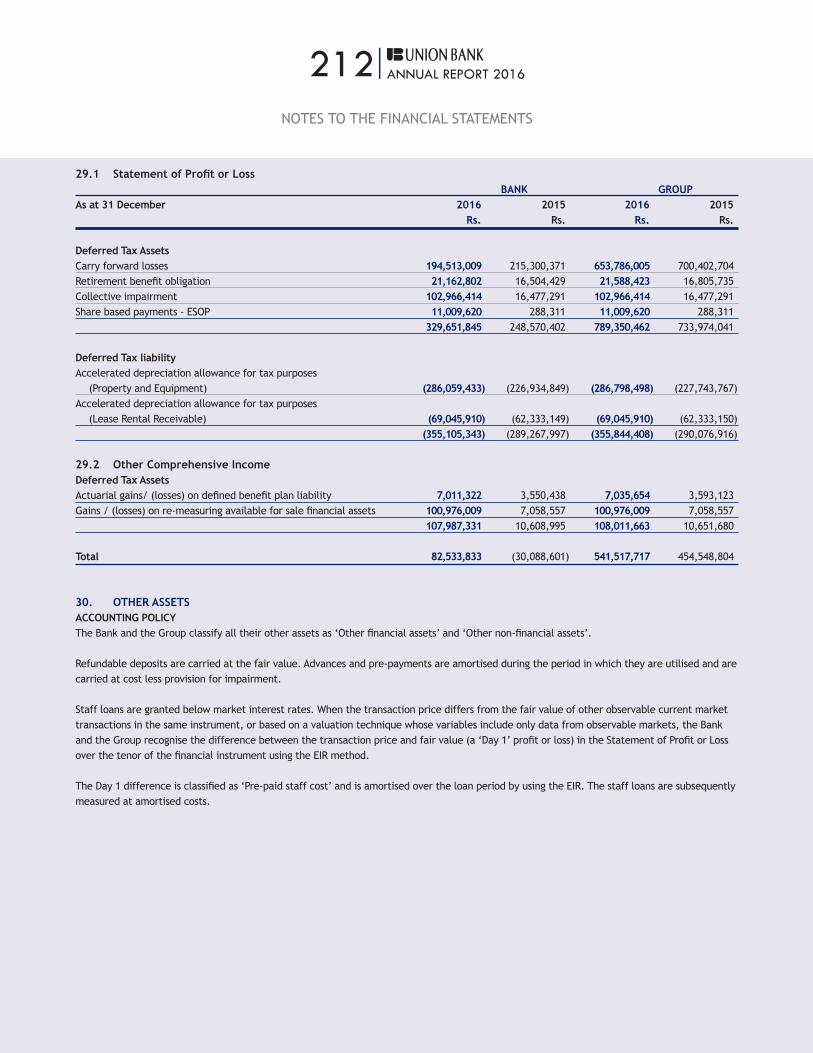
212|ANNUAL REPORT 2016
29.1 Statement of Profit or Loss BANK GROUPAs at 31 December 2016 2015 2016 2015 Rs. Rs. Rs. Rs.
Deferred Tax AssetsCarry forward losses 194,513,009 215,300,371 653,786,005 700,402,704Retirement benefit obligation 21,162,802 16,504,429 21,588,423 16,805,735Collective impairment 102,966,414 16,477,291 102,966,414 16,477,291Share based payments - ESOP 11,009,620 288,311 11,009,620 288,311 329,651,845 248,570,402 789,350,462 733,974,041
Deferred Tax liabilityAccelerated depreciation allowance for tax purposes (Property and Equipment) (286,059,433) (226,934,849) (286,798,498) (227,743,767)Accelerated depreciation allowance for tax purposes (Lease Rental Receivable) (69,045,910) (62,333,149) (69,045,910) (62,333,150) (355,105,343) (289,267,997) (355,844,408) (290,076,916)
29.2 Other Comprehensive IncomeDeferred Tax AssetsActuarial gains/ (losses) on defined benefit plan liability 7,011,322 3,550,438 7,035,654 3,593,123Gains / (losses) on re-measuring available for sale financial assets 100,976,009 7,058,557 100,976,009 7,058,557 107,987,331 10,608,995 108,011,663 10,651,680
Total 82,533,833 (30,088,601) 541,517,717 454,548,804
30. OTHER ASSETSACCOUNTING POLICYThe Bank and the Group classify all their other assets as ‘Other financial assets’ and ‘Other non-financial assets’.
Refundable deposits are carried at the fair value. Advances and pre-payments are amortised during the period in which they are utilised and are carried at cost less provision for impairment.
Staff loans are granted below market interest rates. When the transaction price differs from the fair value of other observable current market transactions in the same instrument, or based on a valuation technique whose variables include only data from observable markets, the Bank and the Group recognise the difference between the transaction price and fair value (a ‘Day 1’ profit or loss) in the Statement of Profit or Loss over the tenor of the financial instrument using the EIR method.
The Day 1 difference is classified as ‘Pre-paid staff cost’ and is amortised over the loan period by using the EIR. The staff loans are subsequently measured at amortised costs.
NOTES TO THE FINANCIAL STATEMENTS
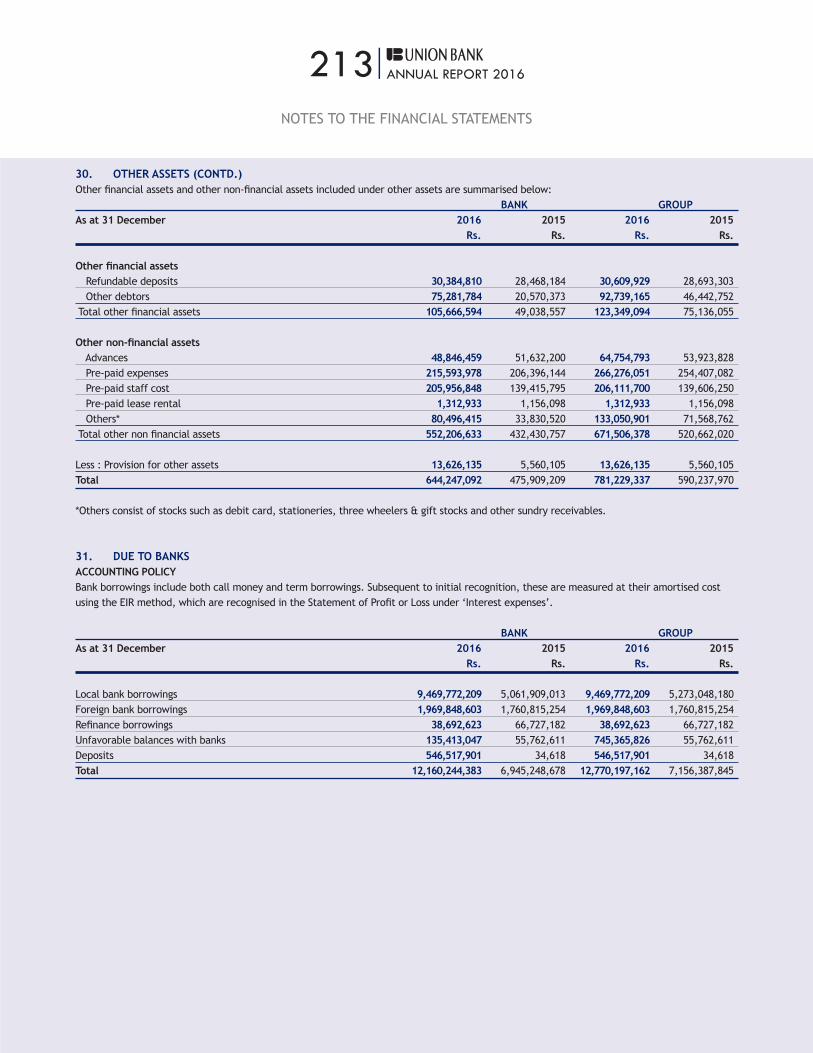
213|ANNUAL REPORT 2016
30. OTHER ASSETS (CONTD.)Other financial assets and other non-financial assets included under other assets are summarised below: BANK GROUPAs at 31 December 2016 2015 2016 2015 Rs. Rs. Rs. Rs.
Other financial assets Refundable deposits 30,384,810 28,468,184 30,609,929 28,693,303 Other debtors 75,281,784 20,570,373 92,739,165 46,442,752 Total other financial assets 105,666,594 49,038,557 123,349,094 75,136,055
Other non-financial assets Advances 48,846,459 51,632,200 64,754,793 53,923,828 Pre-paid expenses 215,593,978 206,396,144 266,276,051 254,407,082 Pre-paid staff cost 205,956,848 139,415,795 206,111,700 139,606,250 Pre-paid lease rental 1,312,933 1,156,098 1,312,933 1,156,098 Others* 80,496,415 33,830,520 133,050,901 71,568,762 Total other non financial assets 552,206,633 432,430,757 671,506,378 520,662,020
Less : Provision for other assets 13,626,135 5,560,105 13,626,135 5,560,105Total 644,247,092 475,909,209 781,229,337 590,237,970
*Others consist of stocks such as debit card, stationeries, three wheelers & gift stocks and other sundry receivables.
31. DUE TO BANKSACCOUNTING POLICYBank borrowings include both call money and term borrowings. Subsequent to initial recognition, these are measured at their amortised cost using the EIR method, which are recognised in the Statement of Profit or Loss under ‘Interest expenses’.
BANK GROUPAs at 31 December 2016 2015 2016 2015 Rs. Rs. Rs. Rs.
Local bank borrowings 9,469,772,209 5,061,909,013 9,469,772,209 5,273,048,180Foreign bank borrowings 1,969,848,603 1,760,815,254 1,969,848,603 1,760,815,254Refinance borrowings 38,692,623 66,727,182 38,692,623 66,727,182Unfavorable balances with banks 135,413,047 55,762,611 745,365,826 55,762,611Deposits 546,517,901 34,618 546,517,901 34,618Total 12,160,244,383 6,945,248,678 12,770,197,162 7,156,387,845
NOTES TO THE FINANCIAL STATEMENTS
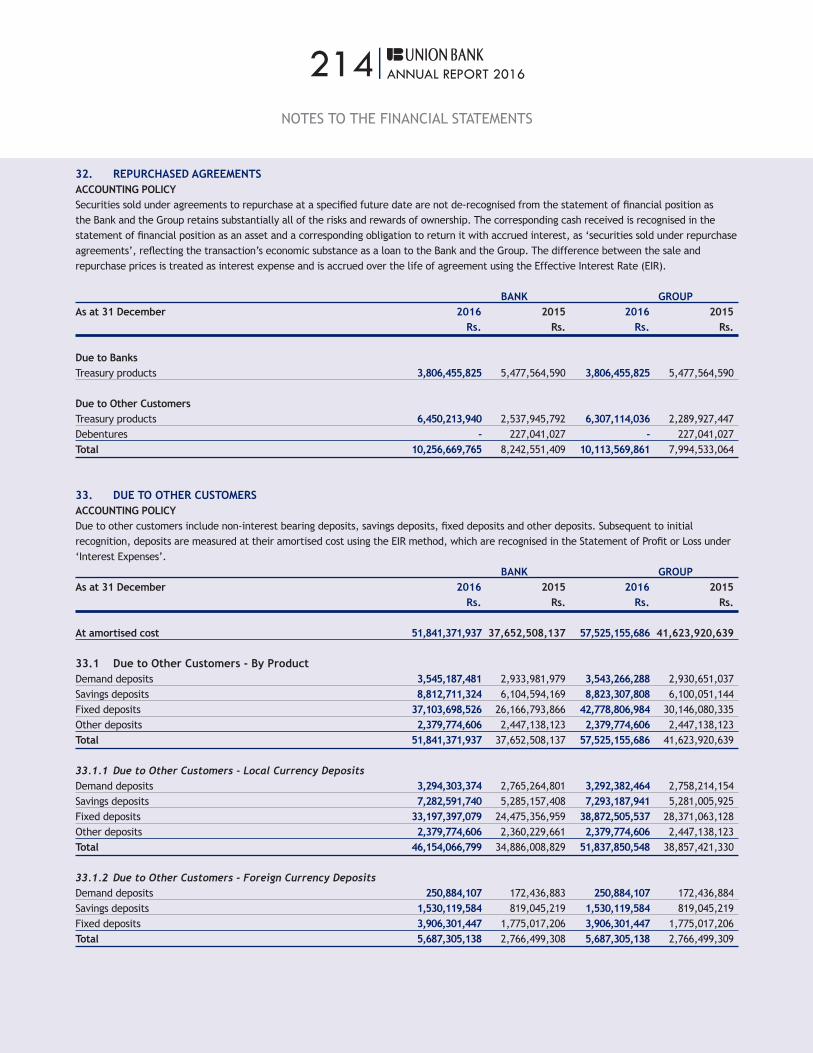
214|ANNUAL REPORT 2016
32. REPURCHASED AGREEMENTSACCOUNTING POLICYSecurities sold under agreements to repurchase at a specified future date are not de-recognised from the statement of financial position as the Bank and the Group retains substantially all of the risks and rewards of ownership. The corresponding cash received is recognised in the statement of financial position as an asset and a corresponding obligation to return it with accrued interest, as ‘securities sold under repurchase agreements’, reflecting the transaction’s economic substance as a loan to the Bank and the Group. The difference between the sale and repurchase prices is treated as interest expense and is accrued over the life of agreement using the Effective Interest Rate (EIR).
BANK GROUPAs at 31 December 2016 2015 2016 2015 Rs. Rs. Rs. Rs.
Due to BanksTreasury products 3,806,455,825 5,477,564,590 3,806,455,825 5,477,564,590
Due to Other Customers Treasury products 6,450,213,940 2,537,945,792 6,307,114,036 2,289,927,447Debentures - 227,041,027 - 227,041,027Total 10,256,669,765 8,242,551,409 10,113,569,861 7,994,533,064
33. DUE TO OTHER CUSTOMERSACCOUNTING POLICYDue to other customers include non-interest bearing deposits, savings deposits, fixed deposits and other deposits. Subsequent to initial recognition, deposits are measured at their amortised cost using the EIR method, which are recognised in the Statement of Profit or Loss under ‘Interest Expenses’. BANK GROUPAs at 31 December 2016 2015 2016 2015 Rs. Rs. Rs. Rs.
At amortised cost 51,841,371,937 37,652,508,137 57,525,155,686 41,623,920,639
33.1 Due to Other Customers - By ProductDemand deposits 3,545,187,481 2,933,981,979 3,543,266,288 2,930,651,037Savings deposits 8,812,711,324 6,104,594,169 8,823,307,808 6,100,051,144Fixed deposits 37,103,698,526 26,166,793,866 42,778,806,984 30,146,080,335Other deposits 2,379,774,606 2,447,138,123 2,379,774,606 2,447,138,123Total 51,841,371,937 37,652,508,137 57,525,155,686 41,623,920,639
33.1.1 Due to Other Customers - Local Currency DepositsDemand deposits 3,294,303,374 2,765,264,801 3,292,382,464 2,758,214,154Savings deposits 7,282,591,740 5,285,157,408 7,293,187,941 5,281,005,925Fixed deposits 33,197,397,079 24,475,356,959 38,872,505,537 28,371,063,128Other deposits 2,379,774,606 2,360,229,661 2,379,774,606 2,447,138,123Total 46,154,066,799 34,886,008,829 51,837,850,548 38,857,421,330
33.1.2 Due to Other Customers - Foreign Currency DepositsDemand deposits 250,884,107 172,436,883 250,884,107 172,436,884Savings deposits 1,530,119,584 819,045,219 1,530,119,584 819,045,219Fixed deposits 3,906,301,447 1,775,017,206 3,906,301,447 1,775,017,206Total 5,687,305,138 2,766,499,308 5,687,305,138 2,766,499,309
NOTES TO THE FINANCIAL STATEMENTS

215|ANNUAL REPORT 2016
33. DUE TO OTHER CUSTOMERS (CONTD.)33.1.2.1 Foreign Currency Deposits - By Currency BANK GROUPAs at 31 December 2016 2015 2016 2015 Rs. Rs. Rs. Rs.
United States Dollar 5,191,118,614 2,265,928,816 5,191,118,614 2,265,928,816Great Britain Pounds 196,043,098 222,075,512 196,043,098 222,075,512Euro 154,264,695 132,001,689 154,264,695 132,001,689Australian Dollar 133,922,897 145,572,987 133,922,897 145,572,987Others 11,955,834 920,304 11,955,835 920,305Total 5,687,305,138 2,766,499,308 5,687,305,138 2,766,499,309
33.2 Due to Other Customers - By ProvinceCentral 1,216,765,517 821,737,865 1,322,469,198 931,660,696Eastern 277,477,364 151,460,965 289,335,647 151,470,990North Central 850,379,566 601,281,524 880,301,736 606,068,177North Western 2,373,859,134 1,968,045,983 2,426,395,010 2,008,021,958Northern 879,312,794 599,651,567 879,312,794 599,651,567Sabaragamuwa 1,054,336,641 776,469,074 1,061,176,720 776,469,074Southern 2,300,323,719 1,525,492,876 2,457,836,161 1,699,244,412Uva 252,246,055 171,061,233 252,246,055 171,061,233Western 42,636,671,147 31,037,307,050 47,956,082,365 34,680,272,532Total 51,841,371,937 37,652,508,137 57,525,155,686 41,623,920,639
34. OTHER BORROWED FUNDSACCOUNTING POLICYOther borrowed funds include borrowings from non-banking institutions. Subsequent to initial recognition, these are measured at their amortised cost using the EIR method, which are recognised in the Statement of Profit or Loss under ‘Interest expenses’.
BANK GROUPAs at 31 December 2016 2015 2016 2015 Rs. Rs. Rs. Rs.
Borrowings from Non-Banking institutions - - 833,094,572 1,281,084,761
NOTES TO THE FINANCIAL STATEMENTS
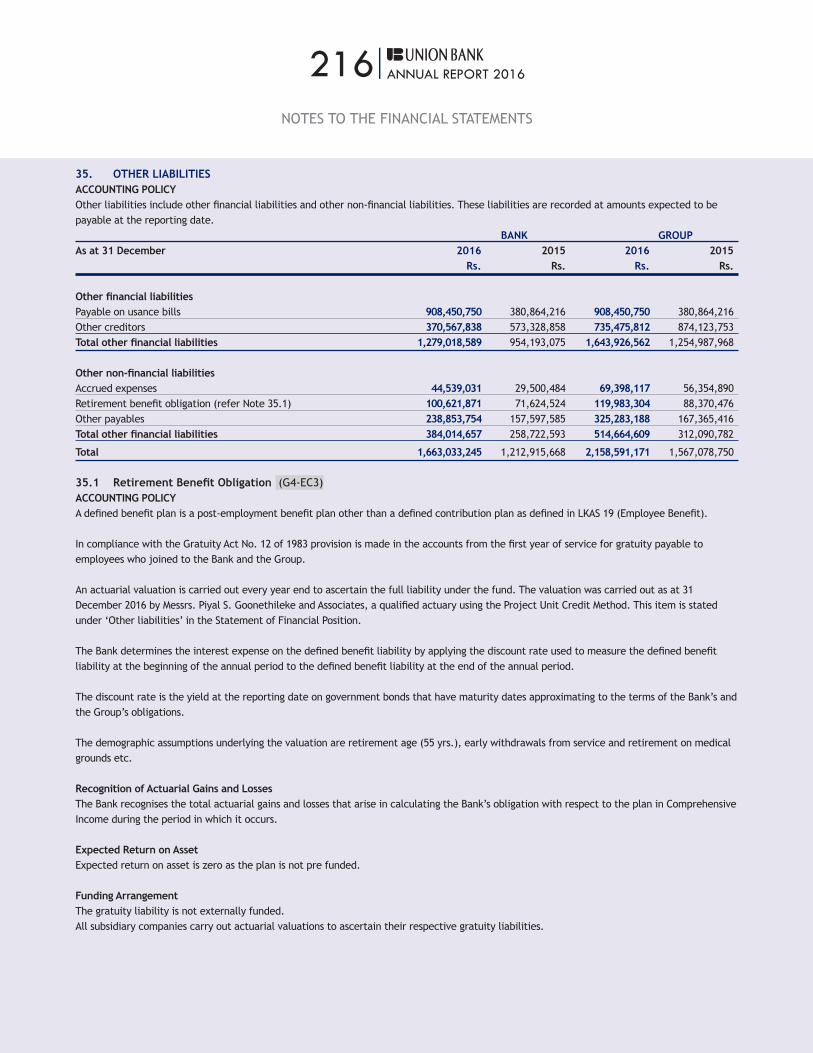
216|ANNUAL REPORT 2016
35. OTHER LIABILITIESACCOUNTING POLICYOther liabilities include other financial liabilities and other non-financial liabilities. These liabilities are recorded at amounts expected to be payable at the reporting date. BANK GROUPAs at 31 December 2016 2015 2016 2015 Rs. Rs. Rs. Rs.
Other financial liabilitiesPayable on usance bills 908,450,750 380,864,216 908,450,750 380,864,216Other creditors 370,567,838 573,328,858 735,475,812 874,123,753Total other financial liabilities 1,279,018,589 954,193,075 1,643,926,562 1,254,987,968
Other non-financial liabilitiesAccrued expenses 44,539,031 29,500,484 69,398,117 56,354,890Retirement benefit obligation (refer Note 35.1) 100,621,871 71,624,524 119,983,304 88,370,476Other payables 238,853,754 157,597,585 325,283,188 167,365,416Total other financial liabilities 384,014,657 258,722,593 514,664,609 312,090,782
Total 1,663,033,245 1,212,915,668 2,158,591,171 1,567,078,750
35.1 Retirement Benefit Obligation (G4-EC3)ACCOUNTING POLICYA defined benefit plan is a post-employment benefit plan other than a defined contribution plan as defined in LKAS 19 (Employee Benefit).
In compliance with the Gratuity Act No. 12 of 1983 provision is made in the accounts from the first year of service for gratuity payable to employees who joined to the Bank and the Group.
An actuarial valuation is carried out every year end to ascertain the full liability under the fund. The valuation was carried out as at 31 December 2016 by Messrs. Piyal S. Goonethileke and Associates, a qualified actuary using the Project Unit Credit Method. This item is stated under ‘Other liabilities’ in the Statement of Financial Position.
The Bank determines the interest expense on the defined benefit liability by applying the discount rate used to measure the defined benefit liability at the beginning of the annual period to the defined benefit liability at the end of the annual period.
The discount rate is the yield at the reporting date on government bonds that have maturity dates approximating to the terms of the Bank’s and the Group’s obligations.
The demographic assumptions underlying the valuation are retirement age (55 yrs.), early withdrawals from service and retirement on medical grounds etc.
Recognition of Actuarial Gains and LossesThe Bank recognises the total actuarial gains and losses that arise in calculating the Bank’s obligation with respect to the plan in Comprehensive Income during the period in which it occurs.
Expected Return on AssetExpected return on asset is zero as the plan is not pre funded.
Funding ArrangementThe gratuity liability is not externally funded.All subsidiary companies carry out actuarial valuations to ascertain their respective gratuity liabilities.
NOTES TO THE FINANCIAL STATEMENTS
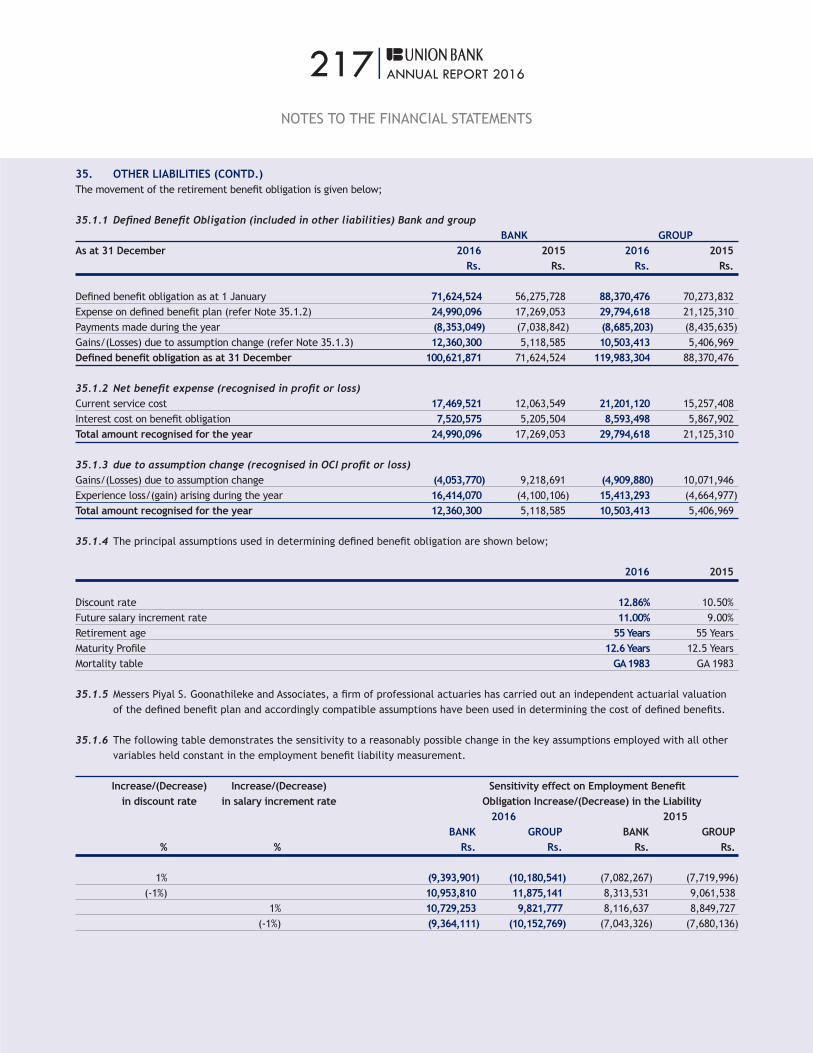
217|ANNUAL REPORT 2016
35. OTHER LIABILITIES (CONTD.)The movement of the retirement benefit obligation is given below;
35.1.1 Defined Benefit Obligation (included in other liabilities) Bank and group BANK GROUPAs at 31 December 2016 2015 2016 2015 Rs. Rs. Rs. Rs.
Defined benefit obligation as at 1 January 71,624,524 56,275,728 88,370,476 70,273,832Expense on defined benefit plan (refer Note 35.1.2) 24,990,096 17,269,053 29,794,618 21,125,310Payments made during the year (8,353,049) (7,038,842) (8,685,203) (8,435,635)Gains/(Losses) due to assumption change (refer Note 35.1.3) 12,360,300 5,118,585 10,503,413 5,406,969Defined benefit obligation as at 31 December 100,621,871 71,624,524 119,983,304 88,370,476
35.1.2 Net benefit expense (recognised in profit or loss)Current service cost 17,469,521 12,063,549 21,201,120 15,257,408Interest cost on benefit obligation 7,520,575 5,205,504 8,593,498 5,867,902Total amount recognised for the year 24,990,096 17,269,053 29,794,618 21,125,310
35.1.3 due to assumption change (recognised in OCI profit or loss)Gains/(Losses) due to assumption change (4,053,770) 9,218,691 (4,909,880) 10,071,946Experience loss/(gain) arising during the year 16,414,070 (4,100,106) 15,413,293 (4,664,977)Total amount recognised for the year 12,360,300 5,118,585 10,503,413 5,406,969
35.1.4 The principal assumptions used in determining defined benefit obligation are shown below;
2016 2015
Discount rate 12.86% 10.50%Future salary increment rate 11.00% 9.00%Retirement age 55 Years 55 YearsMaturity Profile 12.6 Years 12.5 YearsMortality table GA 1983 GA 1983
35.1.5 Messers Piyal S. Goonathileke and Associates, a firm of professional actuaries has carried out an independent actuarial valuation of the defined benefit plan and accordingly compatible assumptions have been used in determining the cost of defined benefits.
35.1.6 The following table demonstrates the sensitivity to a reasonably possible change in the key assumptions employed with all other variables held constant in the employment benefit liability measurement.
Increase/(Decrease) Increase/(Decrease) Sensitivity effect on Employment Benefit in discount rate in salary increment rate Obligation Increase/(Decrease) in the Liability 2016 2015 BANK GROUP BANK GROUP % % Rs. Rs. Rs. Rs.
1% (9,393,901) (10,180,541) (7,082,267) (7,719,996) (-1%) 10,953,810 11,875,141 8,313,531 9,061,538 1% 10,729,253 9,821,777 8,116,637 8,849,727 (-1%) (9,364,111) (10,152,769) (7,043,326) (7,680,136)
NOTES TO THE FINANCIAL STATEMENTS

218|ANNUAL REPORT 2016
36. STATED CAPITALIn accordance with Section 58 of Companies Act No 7 of 2007, which became effective from 3 May 2007, share capital and sharepremium have been classified as stated capital. BANK GROUPAs at 31 December 2016 2015 2016 2015
Ordinary SharesValue (Rs.) 16,334,781,723 16,334,781,723 16,334,781,723 16,334,781,723Number of shares 1,091,406,249 1,091,406,249 1,091,406,249 1,091,406,249
36.1 SHARE WARRANTSShare warrants (Rs.) 65,484,375 65,484,375 65,484,375 65,484,375
During the financial year ended 31 December 2014, the Bank had issued 218,281,250 warrants to be exercised within a period of 6 years at a price of Rs.16 per warrant.
37. STATUTORY RESERVE FUNDThe Statutory Reserve Fund is maintained as per the requirements under Section 20 (1) of the Banking Act No. 30 of 1988. Accordingly, the fund is built up by allocating a sum equivalent to not less than 5% of the profit after tax, but before declaring any dividend or any profits that are transferred to elsewhere until the reserve is equal to 50% of the Bank’s stated capital and thereafter a further sum equivalent to 2% of such profit until the amount of said reserve fund is equal to the stated capital of the Bank.
The balance in the Statutory Reserve Fund will be used only for the purposes specified in the Section 20 (2) of the Banking Act No. 30 of 1988. BANK GROUPAs at 31 December 2016 2015 2016 2015 Rs. Rs. Rs. Rs.
As at 1 January 72,879,652 61,782,171 80,624,342 69,168,604Transferred from retained earnings 22,558,927 11,097,481 26,977,786 11,455,738As at 31 December 95,438,580 72,879,652 107,602,128 80,624,342
38. SHARE BASED PAYMENT TRANSACTIONS - EMPLOYEE SHARE OPTION PLAN (ESOP)On 1 December 2015 the Bank established three Share Option Plans that entitles employees to purchase shares of the Bank. The recognition and measurement principles in Sri Lanka Accounting Standard (SLFRS 2) “Share Based Payment” have been applied to the grants made in 2015 in accordance with the SLFRS 2. All equity based share options are to be settled by physical delivery of shares as new share issuance and cash components are settled in cash.
The first tranche of employee share grants were issued to employees at the grade of Vice President and above. The ESOP grant provides employees an option to purchase shares of the bank at the given exercise price once these vest as per the rules of the plan. Share options vest in two ways. 50% of the share options vest based on time ratably over a 5 year period. The balance 50% of options vest annually over a 5 year period provided that the Bank achieves the pre-set performance targets. Thereby ensuring that these long term incentives are linked to the Bank’s performance.
If an employee leaves the Bank, before the service criteria is met they are not entitled to any of share based payments.
The fair value of the equity settled share based payment was recognised as an expense with a corresponding increase in equity, over the period in which the employees unconditionally become entitled to the awards. The equity component was estimated at grant date using a Black-Scholes-option pricing model, taking into account the terms and conditions on which the share options were granted.
NOTES TO THE FINANCIAL STATEMENTS

219|ANNUAL REPORT 2016
38. SHARE BASED PAYMENT TRANSACTIONS - EMPLOYEE SHARE OPTION PLAN (ESOP) (CONTD.)
The fair value of cash settled share based payments was re-measured at each reporting date. Any changes in the fair value of the liability were recognised as personnel expenses in profit or loss.
Fair value of equity-settled share based payment awards granted to employees on the grant date is recognised as an expense under personnel expenses, with a corresponding increase in equity, over the period in which the service and performance conditioned are fulfilled.
The cumulative expense recognised for equity-settled transactions at each reporting date until the vesting date reflects the extent to which the vesting period has expired and the Bank’s best estimate of the number of equity instruments that will ultimately vest. The expense in the statement of profit or loss for a period represents the movement in cumulative expense recognised as at the beginning and end of that period. Service and non-market performance conditions are taken into account when determining the grant date fair value of awards, but the likelihood of the conditions being met is assessed as part of the Bank’s best estimate of the number of equity instruments that will ultimately vest.
When the terms of an equity-settled award are modified, the minimum expense recognised is the grant date fair value of the unmodified award, provided the original terms of the award are met. An additional expense measured as at the date of modification is recognised for any modification that increases the total fair value of the share-based payment transaction, or is otherwise beneficial to the employee. Where an award is cancelled by the entity or by the counterparty, any remaining element of the fair value of the award is expensed immediately through profit or loss.
The dilutive effect of outstanding options are reflected as additional share dilution in the computation of diluted earnings per share are given in Note 14.2 to the financial statement.
38.1 Inputs and assumptions used for the three option plans for the year ended 31 December 2016 in determining fair value of share option:
Fair value at measurement date 498,319,259Share price 21.60Exercise price 21.95Expected volatility 26.04%Option life (expected weighted average life) 5 YearsRisk free interest rate (based on government bonds) 6.92%
Total expense arising from share-based payment transactions for 2016 is Rs. 38,290,389 and 2015 is Rs. 1,029,683.
38.2 Weighted average exercise prices (WAEP) of, and movements in, share options during the year.
Weighted Average Exercise Price
Outstanding as at 1 January 2016 12,123,698 21.60Granted during the year - -Exercised during the year - -Expired during the year - -Outstanding as at 31 December 2016 12,123,698 21.60
38.3 Movement during the year BANK GROUPAs at 31 December 2016 2015 2016 2015 Rs. Rs. Rs. Rs.
Balance as at 1 January 1,029,683 - 1,029,683 -Transfer to stated capital - - - -Fair value of ESOP for the period 16,806,205 1,029,683 16,806,205 1,029,683Balance as at 31 December 17,835,888 1,029,683 17,835,888 1,029,683
NOTES TO THE FINANCIAL STATEMENTS
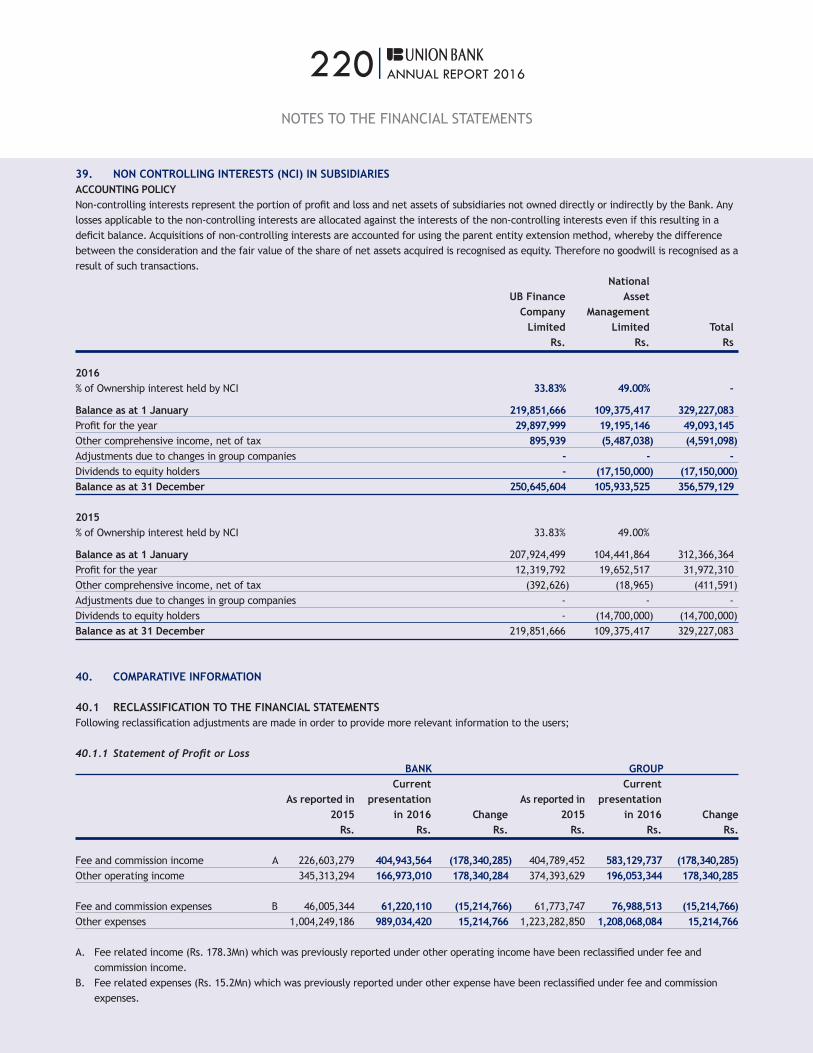
220|ANNUAL REPORT 2016
39. NON CONTROLLING INTERESTS (NCI) IN SUBSIDIARIESACCOUNTING POLICYNon-controlling interests represent the portion of profit and loss and net assets of subsidiaries not owned directly or indirectly by the Bank. Any losses applicable to the non-controlling interests are allocated against the interests of the non-controlling interests even if this resulting in a deficit balance. Acquisitions of non-controlling interests are accounted for using the parent entity extension method, whereby the difference between the consideration and the fair value of the share of net assets acquired is recognised as equity. Therefore no goodwill is recognised as a result of such transactions. National UB Finance Asset Company Management Limited Limited Total Rs. Rs. Rs
2016% of Ownership interest held by NCI 33.83% 49.00% -
Balance as at 1 January 219,851,666 109,375,417 329,227,083Profit for the year 29,897,999 19,195,146 49,093,145Other comprehensive income, net of tax 895,939 (5,487,038) (4,591,098)Adjustments due to changes in group companies - - -Dividends to equity holders - (17,150,000) (17,150,000)Balance as at 31 December 250,645,604 105,933,525 356,579,129
2015% of Ownership interest held by NCI 33.83% 49.00%
Balance as at 1 January 207,924,499 104,441,864 312,366,364Profit for the year 12,319,792 19,652,517 31,972,310Other comprehensive income, net of tax (392,626) (18,965) (411,591)Adjustments due to changes in group companies - - -Dividends to equity holders - (14,700,000) (14,700,000)Balance as at 31 December 219,851,666 109,375,417 329,227,083
40. COMPARATIVE INFORMATION
40.1 RECLASSIFICATION TO THE FINANCIAL STATEMENTSFollowing reclassification adjustments are made in order to provide more relevant information to the users;
40.1.1 Statement of Profit or Loss BANK GROUP Current Current As reported in presentation As reported in presentation 2015 in 2016 Change 2015 in 2016 Change Rs. Rs. Rs. Rs. Rs. Rs.
Fee and commission income A 226,603,279 404,943,564 (178,340,285) 404,789,452 583,129,737 (178,340,285)Other operating income 345,313,294 166,973,010 178,340,284 374,393,629 196,053,344 178,340,285
Fee and commission expenses B 46,005,344 61,220,110 (15,214,766) 61,773,747 76,988,513 (15,214,766)Other expenses 1,004,249,186 989,034,420 15,214,766 1,223,282,850 1,208,068,084 15,214,766
A. Fee related income (Rs. 178.3Mn) which was previously reported under other operating income have been reclassified under fee and commission income.
B. Fee related expenses (Rs. 15.2Mn) which was previously reported under other expense have been reclassified under fee and commission expenses.
NOTES TO THE FINANCIAL STATEMENTS
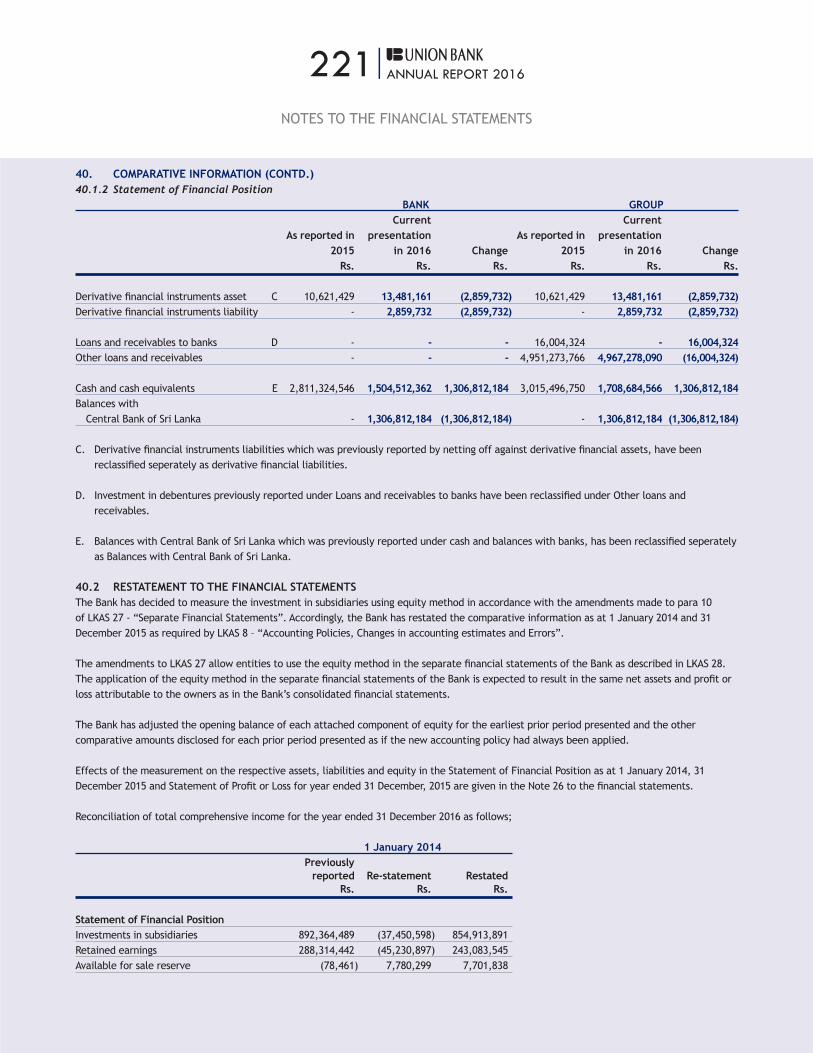
221|ANNUAL REPORT 2016
40. COMPARATIVE INFORMATION (CONTD.)40.1.2 Statement of Financial Position BANK GROUP Current Current As reported in presentation As reported in presentation 2015 in 2016 Change 2015 in 2016 Change Rs. Rs. Rs. Rs. Rs. Rs.
Derivative financial instruments asset C 10,621,429 13,481,161 (2,859,732) 10,621,429 13,481,161 (2,859,732)Derivative financial instruments liability - 2,859,732 (2,859,732) - 2,859,732 (2,859,732)
Loans and receivables to banks D - - - 16,004,324 - 16,004,324Other loans and receivables - - - 4,951,273,766 4,967,278,090 (16,004,324)
Cash and cash equivalents E 2,811,324,546 1,504,512,362 1,306,812,184 3,015,496,750 1,708,684,566 1,306,812,184Balances with Central Bank of Sri Lanka - 1,306,812,184 (1,306,812,184) - 1,306,812,184 (1,306,812,184)
C. Derivative financial instruments liabilities which was previously reported by netting off against derivative financial assets, have been reclassified seperately as derivative financial liabilities.
D. Investment in debentures previously reported under Loans and receivables to banks have been reclassified under Other loans and receivables.
E. Balances with Central Bank of Sri Lanka which was previously reported under cash and balances with banks, has been reclassified seperately as Balances with Central Bank of Sri Lanka.
40.2 RESTATEMENT TO THE FINANCIAL STATEMENTSThe Bank has decided to measure the investment in subsidiaries using equity method in accordance with the amendments made to para 10 of LKAS 27 - “Separate Financial Statements”. Accordingly, the Bank has restated the comparative information as at 1 January 2014 and 31 December 2015 as required by LKAS 8 – “Accounting Policies, Changes in accounting estimates and Errors”.
The amendments to LKAS 27 allow entities to use the equity method in the separate financial statements of the Bank as described in LKAS 28. The application of the equity method in the separate financial statements of the Bank is expected to result in the same net assets and profit or loss attributable to the owners as in the Bank’s consolidated financial statements.
The Bank has adjusted the opening balance of each attached component of equity for the earliest prior period presented and the other comparative amounts disclosed for each prior period presented as if the new accounting policy had always been applied.
Effects of the measurement on the respective assets, liabilities and equity in the Statement of Financial Position as at 1 January 2014, 31 December 2015 and Statement of Profit or Loss for year ended 31 December, 2015 are given in the Note 26 to the financial statements.
Reconciliation of total comprehensive income for the year ended 31 December 2016 as follows;
1 January 2014 Previously reported Re-statement Restated Rs. Rs. Rs.
Statement of Financial PositionInvestments in subsidiaries 892,364,489 (37,450,598) 854,913,891Retained earnings 288,314,442 (45,230,897) 243,083,545Available for sale reserve (78,461) 7,780,299 7,701,838
NOTES TO THE FINANCIAL STATEMENTS
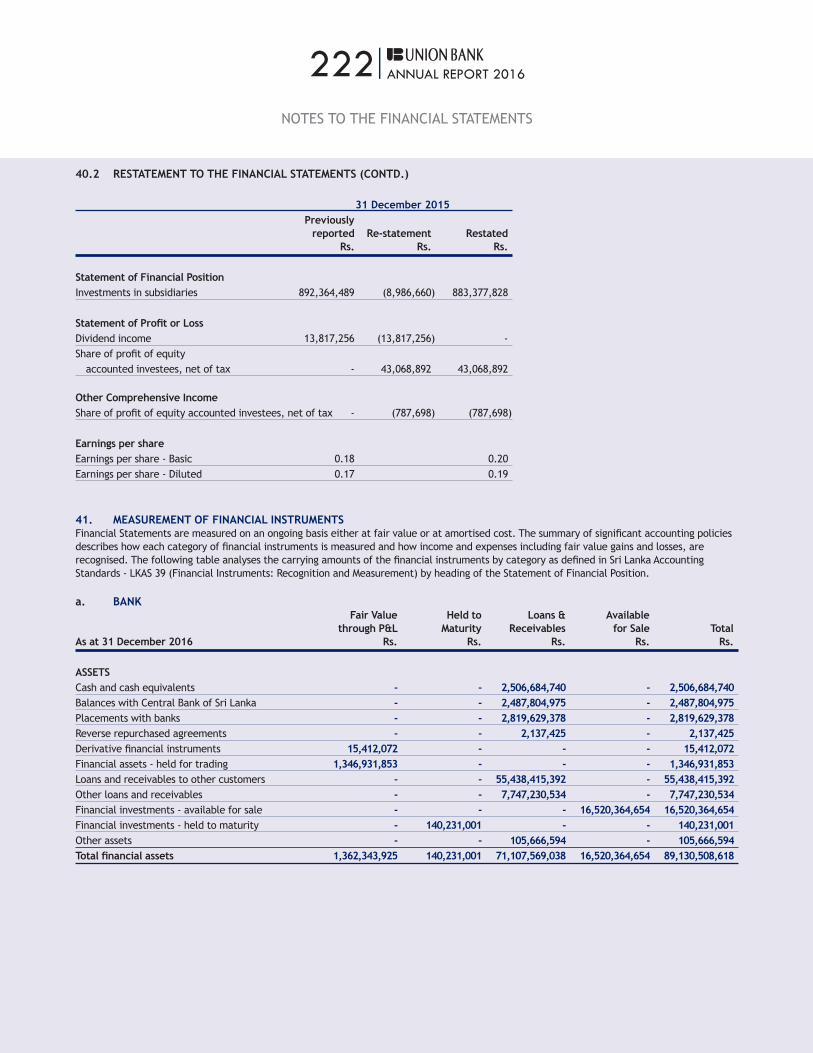
222|ANNUAL REPORT 2016
40.2 RESTATEMENT TO THE FINANCIAL STATEMENTS (CONTD.)
31 December 2015 Previously reported Re-statement Restated Rs. Rs. Rs.
Statement of Financial PositionInvestments in subsidiaries 892,364,489 (8,986,660) 883,377,828
Statement of Profit or LossDividend income 13,817,256 (13,817,256) -Share of profit of equity accounted investees, net of tax - 43,068,892 43,068,892
Other Comprehensive IncomeShare of profit of equity accounted investees, net of tax - (787,698) (787,698)
Earnings per shareEarnings per share - Basic 0.18 0.20 Earnings per share - Diluted 0.17 0.19
41. MEASUREMENT OF FINANCIAL INSTRUMENTSFinancial Statements are measured on an ongoing basis either at fair value or at amortised cost. The summary of significant accounting policies describes how each category of financial instruments is measured and how income and expenses including fair value gains and losses, are recognised. The following table analyses the carrying amounts of the financial instruments by category as defined in Sri Lanka Accounting Standards - LKAS 39 (Financial Instruments: Recognition and Measurement) by heading of the Statement of Financial Position.
a. BANK Fair Value Held to Loans & Available through P&L Maturity Receivables for Sale Total As at 31 December 2016 Rs. Rs. Rs. Rs. Rs.
ASSETSCash and cash equivalents - - 2,506,684,740 - 2,506,684,740Balances with Central Bank of Sri Lanka - - 2,487,804,975 - 2,487,804,975Placements with banks - - 2,819,629,378 - 2,819,629,378Reverse repurchased agreements - - 2,137,425 - 2,137,425Derivative financial instruments 15,412,072 - - - 15,412,072Financial assets - held for trading 1,346,931,853 - - - 1,346,931,853Loans and receivables to other customers - - 55,438,415,392 - 55,438,415,392Other loans and receivables - - 7,747,230,534 - 7,747,230,534Financial investments - available for sale - - - 16,520,364,654 16,520,364,654Financial investments - held to maturity - 140,231,001 - - 140,231,001Other assets - - 105,666,594 - 105,666,594Total financial assets 1,362,343,925 140,231,001 71,107,569,038 16,520,364,654 89,130,508,618
NOTES TO THE FINANCIAL STATEMENTS

223|ANNUAL REPORT 2016
41. MEASUREMENT OF FINANCIAL INSTRUMENTS (CONTD.) Fair Value Amortised Total through P&L Cost Rs. Rs. Rs.
LIABILITIESDue to banks - 12,160,244,383 12,160,244,383Derivative financial instruments 3,975,611 - 3,975,611Repurchased agreements - 10,256,669,765 10,256,669,765Due to other customers - 51,841,371,937 51,841,371,937Other liabilities - 1,279,018,589 1,279,018,589Total financial liabilities 3,975,611 75,537,304,674 75,541,280,285
b. BANK Fair Value Held to Loans & Available through P&L Maturity Receivables for sale Total As at 31 December 2015 Rs. Rs. Rs. Rs. Rs.
ASSETSCash and cash equivalents - - 1,504,512,362 - 1,504,512,362Balances with Central Bank of Sri Lanka - - 1,306,812,184 - 1,306,812,184Placements with banks - - 284,078,387 - 284,078,387Reverse repurchased agreements - - 1,513,425,321 - 1,513,425,321Derivative financial instruments 13,481,161 - - - 13,481,161Financial assets - held for trading 8,463,807,409 - - - 8,463,807,409Loans and receivables to other customers - - 40,095,331,952 - 40,095,331,952Other loans and receivables - - 5,721,549,058 - 5,721,549,058Financial investments - available for sale - - - 8,356,130,222 8,356,130,222Financial investments - held to maturity - 140,528,827 - - 140,528,827Other assets - - 49,038,557 - 49,038,557Total financial assets 8,477,288,570 140,528,827 50,474,747,821 8,356,130,222 67,448,695,440
Fair Value Amortised Total through P&L Cost Rs. Rs. Rs.
LIABILITIESDue to banks - 6,945,248,678 6,945,248,678Derivative financial instruments 2,859,732 - 2,859,732Repurchased agreements - 8,242,551,409 8,242,551,409Due to other customers - 37,652,508,137 37,652,508,137Other liabilities - 954,193,075 954,193,075Total financial liabilities 2,859,732 53,794,501,299 53,797,361,032
NOTES TO THE FINANCIAL STATEMENTS

224|ANNUAL REPORT 2016
41 MEASUREMENT OF FINANCIAL INSTRUMENTS (CONTD.)a. GROUP - 2016 Fair Value Held to Loans & Available through P&L Maturity Receivables for Sale Total Rs. Rs. Rs. Rs. Rs.
ASSETSCash and cash equivalents - - 2,717,649,609 - 2,717,649,609Balances with Central Bank of Sri Lanka - - 2,487,804,975 - 2,487,804,975Placements with banks - - 2,826,710,002 - 2,826,710,002Reverse repurchased agreements - - 275,497,776 - 275,497,776Derivative financial instruments 15,412,072 - - - 15,412,072Financial assets - held for trading 1,346,931,853 - - - 1,346,931,853Loans and receivables to other customers - - 62,931,935,591 - 62,931,935,591Other loans and receivables - - 6,739,578,189 - 6,739,578,189Financial investments - available for sale - - - 16,694,470,098 16,694,470,098Financial investments - held to maturity - 140,231,001 - - 140,231,001Other assets - - 123,349,094 - 123,349,094Total financial assets 1,362,343,925 140,231,001 78,102,525,235 16,694,470,098 93,811,765,284
Fair Value Amortised Total through P&L Cost Rs. Rs. Rs.
LIABILITIES Due to banks - 12,770,197,162 12,770,197,162Derivative financial instruments 3,975,611 - 3,975,611Repurchased agreements - 10,113,569,861 10,113,569,861Due to other customers - 57,525,155,686 57,525,155,686Other borrowed funds - 833,094,572 833,094,572Other liabilities - 1,643,926,562 1,643,926,562Total financial liabilities 3,975,611 82,885,943,843 82,889,919,454
b. GROUP - 2015 Fair Value Held to Loans & Available through P&L Maturity Receivables for Sale Total Rs. Rs. Rs. Rs. Rs.
ASSETSCash and cash equivalents - - 1,708,684,566 - 1,708,684,566Balances with Central Bank of Sri Lanka - - 1,306,812,184 - 1,306,812,184Placements with banks - - 294,074,296 - 294,074,296Reverse repurchased agreements - - 1,619,467,074 - 1,619,467,074Derivative financial instruments 10,621,429 - - - 10,621,429Financial assets held for trading 8,463,807,409 - - - 8,463,807,409Loans and receivables to other customers - - 45,450,313,621 - 45,450,313,621Other loans and receivables - - 4,967,278,089 - 4,967,278,089Financial investments – available for sale - - - 8,538,559,055 8,538,559,055Other Financial investments – held to maturity - 140,528,827 - - 140,528,827Other assets - - 75,136,055 - 75,136,055Total financial assets 8,474,428,838 140,528,827 55,421,765,885 8,538,559,055 72,575,282,605
NOTES TO THE FINANCIAL STATEMENTS

225|ANNUAL REPORT 2016
41 MEASUREMENT OF FINANCIAL INSTRUMENTS (CONTD.) Fair Value Amortised Total through P&L Cost Rs. Rs. Rs.
LIABILITIES Due to banks - 7,156,387,845 7,156,387,845Derivative financial instruments 2,859,732 - 2,859,732Repurchased agreements - 7,994,533,064 7,994,533,064Due to other customers - 41,623,920,639 41,623,920,639Other borrowed funds - 1,281,084,761 1,281,084,761Other liabilities - 1,254,987,968 1,254,987,968Total financial liabilities 2,859,732 59,310,914,277 59,313,774,009
42. COMMITMENTS, CONTINGENT LIABILITIES AND LEASING ARRANGEMENTSACCOUNTING POLICYContingent liabilities are possible obligations whose existence will be confirmed only by uncertain future events or present obligations where the transfer of economic benefit is not probable or cannot be reliably measured in accordance with the Sri Lanka Accounting Standard – LKAS 37 on ‘Provision, Contingent Liabilities and Contingent Assets’.
To meet the financial needs of customers, the Bank enters into various irrevocable commitments and contingent liabilities. These consist of guarantees, letters of credit and other undrawn commitments to lend. Letters of credit and acceptances commit the Bank to make payments on behalf of customers in the event of a specific act, generally related to the import or export of goods. They carry a similar credit risk to loans. Operating lease commitments of the Bank (as a lessor and as a lessee) and pending legal claims against the Bank too form part of commitments of the Bank. Contingent liabilities are not recognised in the Statement of Financial Position but are disclosed unless they are remote. But these contingent liabilities do contain credit risk and are therefore form part of the overall risk of the Bank and the Group.
In the normal course of business, the Bank entered in to various irrevocable commitments and incured certain contingent liabilities. These consists of guarantees, letters of credit and other undrawn commitments to lend.
Though these obligations may not be recognised on the Statement of Financial Position, they do contain credit risk and are therefore part of the overall risk of the Bank.
No material losses are anticipated as a result of these transactions.
42.1 Commitments and Contingencies BANK GROUPAs at 31 December 2016 2015 2016 2015 Rs. Rs. Rs. Rs.
CommitmentsUndrawn loan commitments 26,019,131,442 19,790,078,037 26,019,131,442 19,790,078,037
ContingenciesGuarantees 3,929,129,666 3,404,819,723 3,929,129,666 3,404,819,723Letters of credit 3,161,387,183 2,151,474,153 3,161,387,183 2,151,474,153Forward contracts 7,801,457,961 5,520,399,933 7,801,457,961 5,520,399,933Cheque pending for realisation 1,053,089,384 576,309,106 1,053,089,384 576,309,106Spot contracts 799,505,450 410,576,804 799,505,450 410,576,804Acceptances 598,330,193 707,571,076 598,330,193 707,571,076Other contingent items 1,042,383,971 1,912,528,475 1,042,383,971 1,912,528,475Total contingencies 18,385,283,808 14,683,679,270 18,385,283,808 14,683,679,270
Total 44,404,415,250 34,473,757,307 44,404,415,250 34,473,757,307
NOTES TO THE FINANCIAL STATEMENTS

226|ANNUAL REPORT 2016
42.2 Capital commitmentsThe commitments for the installation of Risk Management System and the core banking system incidental to the ordinary course of business as at 31 December are as follows; BANK GROUPAs at 31 December 2016 2015 2016 2015 Rs. Rs. Rs. Rs.
Approved and Contracted forNew branches/ relocations & refurbishments of branches 17,873,229 15,453,890 17,873,229 15,453,890Capital commitments for new system implementation - 30,570,784 - 30,570,784Others 115,000 - 115,000 -Total 17,988,229 46,024,674 17,988,229 46,024,674
Approved but not Contracted forNew branches/ relocations & refurbishments of branches 100,647,196 141,267,000 100,647,196 141,267,000Capital commitments for new system implementation 66,700,000 66,700,000 66,700,000 66,700,000Others 71,004,645 315,574,280 71,004,645 315,574,280Total 238,351,841 523,541,280 238,351,841 523,541,280
Total Capital Commitments 256,340,070 569,565,954 256,340,070 569,565,954
42.3 Lease Arrangements
Operating Lease Commitments - Bank as LesseeThe bank has entered in to operating leases for bank premises. These leases have an average life of 5 years with no renewal option. There are no restrictions placed upon the lessee by entering in to these leases.
Future minimum lease payments under non cancellable operating leases as at 31 December are, as follows;
BANK GROUPAs at 31 December 2016 2015 2016 2015 Rs. Rs. Rs. Rs.
Within one year 157,846,007 86,212,447 187,709,582 103,589,447After one year to five years 427,707,179 174,359,189 553,023,790 283,683,851More than five years 22,597,921 966,247 92,039,095 97,584,195Total 608,151,107 261,537,883 832,772,467 484,857,493
NOTES TO THE FINANCIAL STATEMENTS

227|ANNUAL REPORT 2016
42.4 Litigations against the Bank and the Group
42.4.1 BankLitigation is a common occurrence in the banking industry due to the nature of the business undertaken. The bank has established legal protocol for dealing with such legal claims. Once professional advice has been obtained on the certainty of the outcome and the amount of damages reasonable estimated, the Bank makes adjustments to account for any adverse effect which the claims may have on its financial standing. Set out below are unresolved legal claims against the Bank as at the year end for which adjustments to the Financial Statements have not been made due to the uncertainty of it’s outcome.
Court actions have been initiated by third parties in District court, to claim the title of the property which has been mortgaged to the Bank by the present owners who are our customers for several facilities granted. The status of the legal cases are summarised below.
Legal Status Case No.
Order made in favour of the Bank 129/12/CL, 22/2011 SC CHC, 389/16 SC(HC) CALA, 0079/2016 SC/HC/LA, 0172/2014 (F)
Trial 2053/L, 2321/L, 2346/L, 23847/P, 518/2014 MR CHC 7406/L, 2632/15 SPL, 0363/2015 MR CHC, 341/2015 MR CHC, 1993/L, 1992/L, 0405/P, 0138/L, 481/2016 MR 425/2016 MR, 0007/2016, 2054/L, 473/P, 11745/L
Appeals filed by customers to obtain enjoining orders to 223/13 M, 0200/2016 MR, 497/2016 MR, 300/2016 MR, stay the auction of property mortgaged. 0496/2017 MR 42.4.2 UB Finance Company Limited
a. Cases filed against the Company over the repossession of vehicles in District court ColomboLegal Status Case No
Trial DSP/0222/10, DMR 835/16, DMR 836/16, DMR 2814/15
b. Actions filed against the Company regarding Joint Venture Projects over the construction matters, advance payments, possession of project properties and unpaid bills.
Court Case No Commercial HC - Colombo HC/Civil/177/10DC - Colombo DLM/107/11, DLM/213/14, 4107/11/M, DMR/1608/14, DMR/1609/14, DMR/1610/14
c. Cases filed against the Company over the Fixed Deposit matters and Unpaid Deposits.Court Case No MC - Colombo B/4004/14, B/4005/14DC - Colombo DTS/279/08, CHC/503/15, CHC/533/15, CHC/535/15, DLM/164/16, CHC/534/15, CHC/536/15
NOTES TO THE FINANCIAL STATEMENTS

228|ANNUAL REPORT 2016
42.4.2 UB Finance Company Limited contd.
d. Actions filed against the Company with respect to mortgaged property, court orders and title of property.Status Case No
District Courts DSP/0266/12, DMR/3020/15, DLM/213/14
e. Cases filed against the Company by the employeesCourt Case No MC - Fort 76305, 76306, 76308LT - Case AS/CO/E/7/280/10, 2/512/2015HC CA(Writ)/377/13 (Appeal Case), CA(Writ)/413/13Labour Arbitration 3540ASupreme Court SC/SPL/LA/26/2014
43. ASSET PLEDGE 2016 2015Nature of Assets Nature of Liability Rs. Rs.
BANKGovernment Treasury Bills & Bonds Repurchased agreements 12,397,946,766 8,015,510,382Debentures Repurchased agreements - 227,041,027
GROUPGovernment Treasury Bills & Bonds Repurchased agreements 11,528,946,766 7,767,492,037Debentures Repurchased agreements - 227,041,027Lease Receivables Securitisation 2,219,492,236 1,589,823,456
44. RELATED PARTY DISCLOSURESThe Bank carries out transactions in the ordinary course of business on an arm’s length basis at commercial rates with related parties who are defined as LKAS 24 “Related Party Disclosures”.
The pricing applicable to such transactions is based on the assessment of risk and pricing model of the Bank and is comparable with what is applied to transactions between the Bank and its unrelated customers.
44.1 Parent and Ultimate Controlling PartyThe Bank’s immediate parent is Culture Financial Holding Limited and the ultimate holding company during the financial year is TPG Asia GenPar VI, L.P. Both companies are registered in the Cayman Islands.
44.2 Transactions with Key Management Personnel (KMPs)Key Management Personnel are those persons having authority and responsibility for planning, directing and controlling the activities of the bank. Accordingly, the Bank’s KMP include the Board of Directors of the Bank and key employees of the Bank holding directorships in subsidiary companies of the Bank.
NOTES TO THE FINANCIAL STATEMENTS

229|ANNUAL REPORT 2016
44.2.1 Compensation of Key Management Personnel 2016 2015 Rs. Rs.
Short–term employee benefits 59,871,273 62,556,179Post–employment benefits 4,976,070 3,772,725Other long term benefits 3,448,700 1,500,000Directors’ fees & expenses 6,937,777 7,309,522 75,233,820 75,138,426
In addition to the above, the Bank has also provided non-cash benefits such as vehicles, insurance for Key Management Personnel in line with the approved benefit plan of the Bank.
44.3 Transactions, Arrangements and Agreements involving KMPs and their Close Family Members (CFMs)CFMs of a KMPs are those family members who may be expected to influence by, that KMP in their dealing with the entity. They may include KMPs’ domestic partner and children, children of KMPs’ domestic partner and dependents of the KMP or the KMPs’ domestic partner.
44.3.1 Transactions with Key Management Personnel and their Close Family Members of the bankThe following table provides the aggregate amount of transactions, which have been executed with key management personnel for the financial year. 2016 2015Items in the Statement of Financial Position Closing Maximum Closing Maximum Balance Balance Balance Balance Rs. Rs. Rs. Rs.
AssetsLoans and receivables 14,087,342 14,297,150 9,313,494 8,290,984
LiabilitiesDue to other customers 13,185,886 18,198,385 14,994,884 33,261,774
Items in the Statement of Profit or Loss 2016 2015 Rs. Rs.
Interest income 1,568,461 186,164Interest expense 2,691,635 796,077
ESOP granted to KMPs 2016 2015
Number of options exercised during the year - -Number of options remaining as at 31 December 7,643,819 7,643,819
NOTES TO THE FINANCIAL STATEMENTS

230|ANNUAL REPORT 2016
44.4 Transactions with other related partiesThe following table shows the outstanding balance and the corresponding interest during the year.
Transaction with Subsidiaries 2016 2015Items in the Statement of Financial Position Closing Maximum Closing Maximum Balance Balance Balance Balance Rs. Rs. Rs. Rs.
AssetsLoans and receivables 503,734,366 602,826,668 540,615,241 645,048,621Other loans & receivables 312,253,068 312,253,068 - -Other assets 2,834,781 2,834,781 23,373 23,373
LiabilitiesDue to other customers 3,373,930 308,926,201 9,580,849 171,099,929Repurchased agreements 143,099,904 143,099,904 248,018,345 350,371,228
Items in the Statement of Profit or Loss 2016 2015 Rs. Rs.
Interest income 65,015,416 27,515,040Interest expense 21,495,459 7,299,697Rent income 5,846,775 5,846,775
Terms and Conditions of Transactions with Related PartiesThe above-mentioned outstanding balances arose from the ordinary course of business. The interest rates charged to and by related parties are at normal commercial rates.
Transactions with the Bank’s Private Provident FundThe Employees’ Private Provident Fund of the Bank is managed by a Committee of Trustees appointed by the members. The Bank has contributed a sum of Rs. 96.5 Mn to the Fund for the year ended 31 December 2016 (2015 - Rs.69.4Mn). Fund has invested a sum of Rs 286 Mn with the bank as at 31 December 2015 (2015 : 220 Mn).
During the year, Bank has incurred sum of Rs 12.3 Mn ( 2015 : 13.5 Mn) as interest expense on the investment made by fund.
Transactions with the Serandib Capital Limited (Special Purpose entity)Bank has invested Rs.1,578Mn in a 20 years deep discount bond maturing in 2023 issued by Serandib Capital Limited, a Special Purpose Vehicle in 2003.
Balance Income/ Balance Income/ as at Expense as at Expense 31-Dec-16 during 2016 31-Dec-15 during 2015 Rs. Rs. Rs. Rs.
Serandib bond 2,671,940,570 102,894,282 2,569,046,289 98,931,105Deposits 151,813,513 13,289,511 141,174,050 8,147,836Bonus coupon - 6,911,538 - 792,043Agency fee - 400,826 - 47,573
NOTES TO THE FINANCIAL STATEMENTS
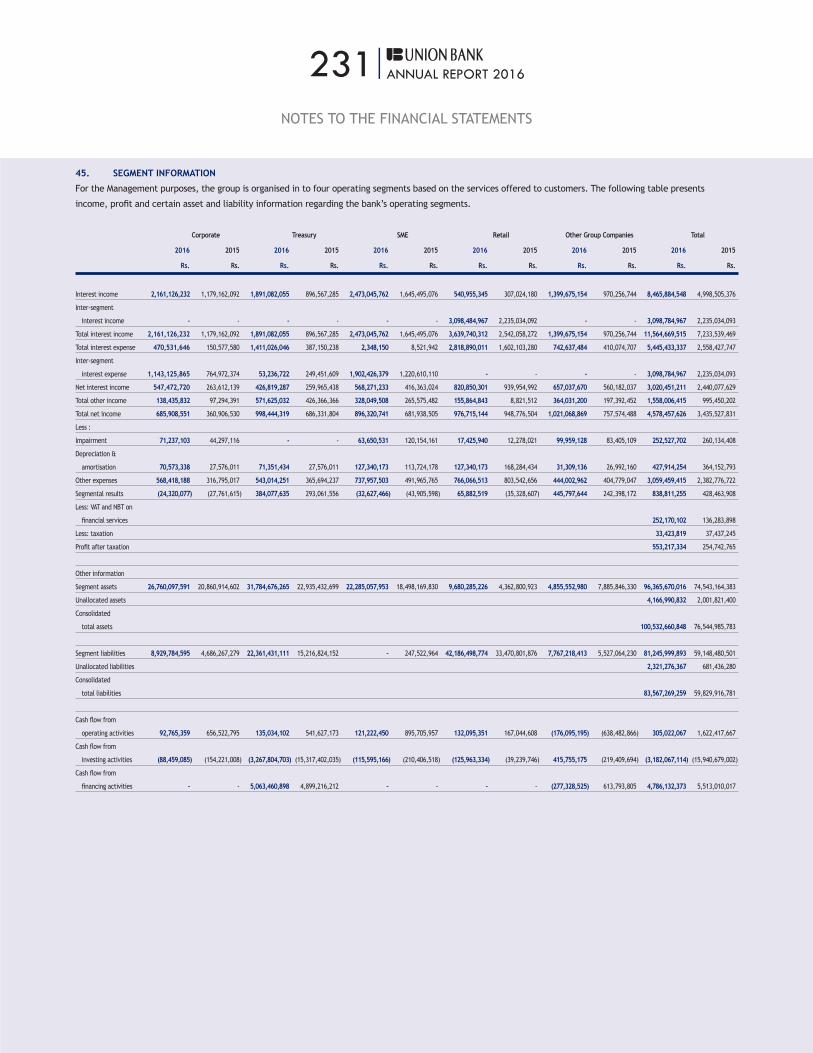
231|ANNUAL REPORT 2016
45. SEGMENT INFORMATION
For the Management purposes, the group is organised in to four operating segments based on the services offered to customers. The following table presents
income, profit and certain asset and liability information regarding the bank’s operating segments.
Corporate Treasury SME Retail Other Group Companies Total
2016 2015 2016 2015 2016 2015 2016 2015 2016 2015 2016 2015
Rs. Rs. Rs. Rs. Rs. Rs. Rs. Rs. Rs. Rs. Rs. Rs.
Interest income 2,161,126,232 1,179,162,092 1,891,082,055 896,567,285 2,473,045,762 1,645,495,076 540,955,345 307,024,180 1,399,675,154 970,256,744 8,465,884,548 4,998,505,376
Inter-segment
interest income - - - - - - 3,098,484,967 2,235,034,092 - - 3,098,784,967 2,235,034,093
Total interest income 2,161,126,232 1,179,162,092 1,891,082,055 896,567,285 2,473,045,762 1,645,495,076 3,639,740,312 2,542,058,272 1,399,675,154 970,256,744 11,564,669,515 7,233,539,469
Total interest expense 470,531,646 150,577,580 1,411,026,046 387,150,238 2,348,150 8,521,942 2,818,890,011 1,602,103,280 742,637,484 410,074,707 5,445,433,337 2,558,427,747
Inter-segment
interest expense 1,143,125,865 764,972,374 53,236,722 249,451,609 1,902,426,379 1,220,610,110 - - - - 3,098,784,967 2,235,034,093
Net interest income 547,472,720 263,612,139 426,819,287 259,965,438 568,271,233 416,363,024 820,850,301 939,954,992 657,037,670 560,182,037 3,020,451,211 2,440,077,629
Total other income 138,435,832 97,294,391 571,625,032 426,366,366 328,049,508 265,575,482 155,864,843 8,821,512 364,031,200 197,392,452 1,558,006,415 995,450,202
Total net income 685,908,551 360,906,530 998,444,319 686,331,804 896,320,741 681,938,505 976,715,144 948,776,504 1,021,068,869 757,574,488 4,578,457,626 3,435,527,831
Less :
Impairment 71,237,103 44,297,116 - - 63,650,531 120,154,161 17,425,940 12,278,021 99,959,128 83,405,109 252,527,702 260,134,408
Depreciation &
amortisation 70,573,338 27,576,011 71,351,434 27,576,011 127,340,173 113,724,178 127,340,173 168,284,434 31,309,136 26,992,160 427,914,254 364,152,793
Other expenses 568,418,188 316,795,017 543,014,251 365,694,237 737,957,503 491,965,765 766,066,513 803,542,656 444,002,962 404,779,047 3,059,459,415 2,382,776,722
Segmental results (24,320,077) (27,761,615) 384,077,635 293,061,556 (32,627,466) (43,905,598) 65,882,519 (35,328,607) 445,797,644 242,398,172 838,811,255 428,463,908
Less: VAT and NBT on
financial services 252,170,102 136,283,898
Less: taxation 33,423,819 37,437,245
Profit after taxation 553,217,334 254,742,765
Other information
Segment assets 26,760,097,591 20,860,914,602 31,784,676,265 22,935,432,699 22,285,057,953 18,498,169,830 9,680,285,226 4,362,800,923 4,855,552,980 7,885,846,330 96,365,670,016 74,543,164,383
Unallocated assets 4,166,990,832 2,001,821,400
Consolidated
total assets 100,532,660,848 76,544,985,783
Segment liabilities 8,929,784,595 4,686,267,279 22,361,431,111 15,216,824,152 - 247,522,964 42,186,498,774 33,470,801,876 7,767,218,413 5,527,064,230 81,245,999,893 59,148,480,501
Unallocated liabilities 2,321,276,367 681,436,280
Consolidated
total liabilities 83,567,269,259 59,829,916,781
Cash flow from
operating activities 92,765,359 656,522,795 135,034,102 541,627,173 121,222,450 895,705,957 132,095,351 167,044,608 (176,095,195) (638,482,866) 305,022,067 1,622,417,667
Cash flow from
investing activities (88,459,085) (154,221,008) (3,267,804,703) (15,317,402,035) (115,595,166) (210,406,518) (125,963,334) (39,239,746) 415,755,175 (219,409,694) (3,182,067,114) (15,940,679,002)
Cash flow from
financing activities - - 5,063,460,898 4,899,216,212 - - - - (277,328,525) 613,793,805 4,786,132,373 5,513,010,017
NOTES TO THE FINANCIAL STATEMENTS

232|ANNUAL REPORT 2016
46. EVENTS AFTER THE REPORTING PERIODNo circumstances have arisen since the reporting date which would require adjustments to, or disclosure in the Financial Statements, other than those disclosed below;
The Board of Directors of the Bank has recommended and approved a dividend of Rs. 0.10 per share for the financial year ended 31 December 2016.
47. FAIR VALUE OF ASSETS AND LIABILITIESAssets and liabilities recorded at fair valueThe following is a description of how fair values are determined for financial instruments that are recorded at fair value using valuation techniques. These incorporate the Bank’s or the Group’s estimate of assumptions that a market participant would make when valuing the instruments.
Derivative financial instrumentsDerivative products are forward foreign exchange contracts which are valued using a valuation technique with market-observable inputs . The most frequently applied valuation techniques include forward pricing models. The model incorporates various inputs including foreign exchange spot and forward premiums.
Financial assets - Held for tradingFinancial assets held for trading, which primarily consist of Government debt securities, quoted equities and investments in units are measured at fair value.
Government debt securities are valued using yield curves published by the Central Bank of Sri Lanka. For quoted equities and investments in units are valued using market price in active markets as at the reporting date.”
Financial investments – Available for Sale“Financial investments - Available for sale, which primarily consist of quoted and un-quoted equities, and investment in units and Government debt securities.
Government debt securities are valued using yield curves published by the Central Bank of Sri Lanka. Investment in Units and quoted equities are valued using market prices in the active markets at the reporting date.Unquoted equities are valued using valuation techniques or pricing models based on the observable and unobservable data at the reporting date.
47.1 Valuation ModelFor all financial instruments where fair values are determined by referring to externally quoted prices or observable pricing inputs to models, independent price determination or validation is obtained. In an inactive market, direct observation of a traded price may not be possible. In these circumstances, the Bank uses alternative market information to validate the financial instrument’s fair value, with greater weight given to information that is considered to be more relevant and reliable.
Fair values are determined according to the following hierarchy:Level 1 – quoted market price (unadjusted): financial instruments with quoted prices in active markets.
Level 2 – valuation technique using observable inputs: financial instruments with quoted prices for similar instruments in active markets or quoted prices for identical or similar instruments in inactive markets and financial instruments are valued using models where all significant inputs are observable.
Level 3 – valuation technique with significant unobservable inputs: This category includes all instruments valued using valuation techniques where one or more significant inputs are unobservable.
NOTES TO THE FINANCIAL STATEMENTS

233|ANNUAL REPORT 2016
47. FAIR VALUE OF ASSETS AND LIABILITIES (CONTD.)
Assets and Liabilities measured at fair value - fair value hierarchyThe following table shows an analysis of assets and liabilities recorded at fair value by level of the fair value hierarchy into which the fair value measurement is categorised. The amounts are based on the value recognised in the statement of financial position in the financial statements.
BANK Quoted prices in Significant Significant active markets observable unobservable inputs inputs (Level 1) (Level 2) (Level 3) Total Rs. Rs. Rs. Rs.
As at 31 December 2016Financial assets measured at fair value
Derivative financial instrumentsForward foreign exchange contracts - 15,412,072 - 15,412,072
Financial assets - held for tradingSri Lankan Government Securities - - - -Investment in units 1,346,931,853 - - 1,346,931,853
Financial assets - available for saleSri Lankan Government Securities 16,518,834,654 - - 16,518,834,654Equity Securities - unquoted - - 1,530,000 1,530,000Total financial assets measured at fair value 17,865,766,507 15,412,072 1,530,000 17,882,708,579
Financial liabilitiesDerivative financial instruments Forward foreign exchange contracts - 3,975,611 - 3,975,611Total financial liabilities - 3,975,611 - 3,975,611
As at 31 December 2015 Level 1 Level 2 Level 3 Total Rs. Rs. Rs. Rs.
Financial assets measured at fair value
Derivative financial instrumentsForward foreign exchange contracts - 13,481,161 - 13,481,161
Financial assets - held for tradingSri Lankan Government Securities 478,816,674 - - 478,816,674Investment in units 7,984,990,735 - - 7,984,990,735
Financial assets - available for saleSri Lankan Government Securities 8,354,600,222 - - 8,354,600,222Equity Securities - unquoted - - 1,530,000 1,530,000Total financial assets measured at fair value 16,818,407,631 13,481,161 1,530,000 16,833,418,792
Financial liabilitiesDerivative financial instrumentsForward foreign exchange contracts - 2,859,732 - 2,859,732Total financial liabilities - 2,859,732 - 2,859,732
NOTES TO THE FINANCIAL STATEMENTS
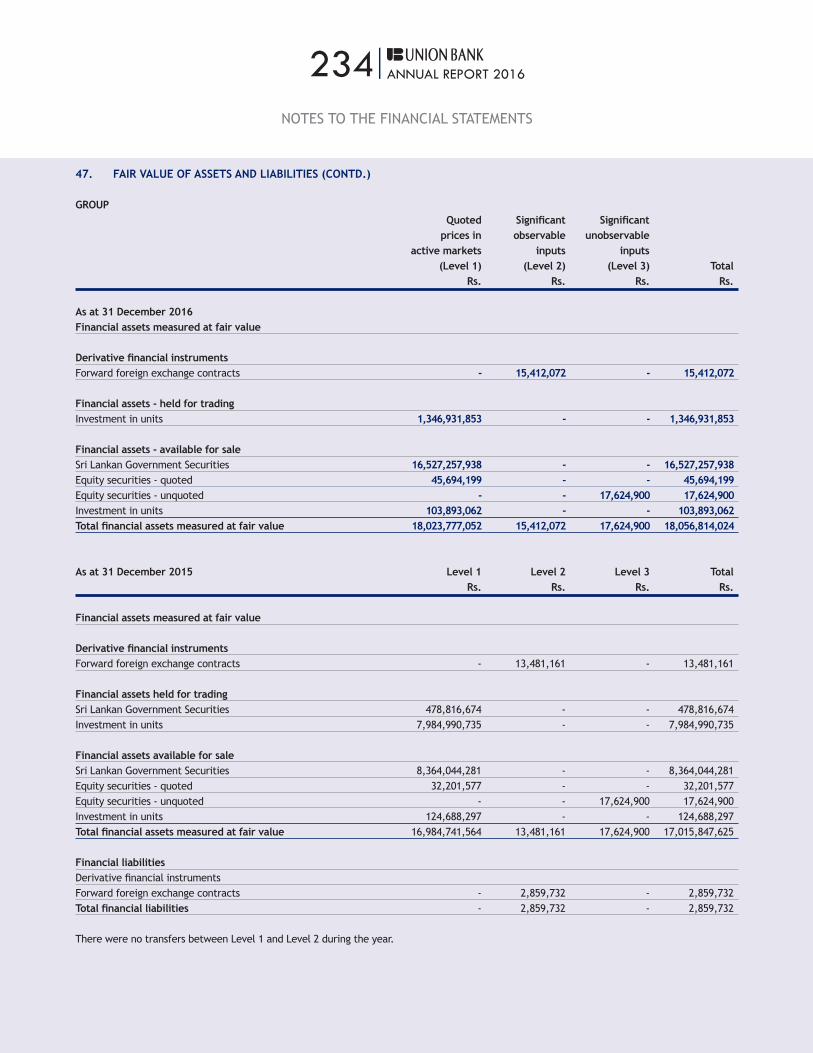
234|ANNUAL REPORT 2016
47. FAIR VALUE OF ASSETS AND LIABILITIES (CONTD.)
GROUP Quoted Significant Significant prices in observable unobservable active markets inputs inputs (Level 1) (Level 2) (Level 3) Total Rs. Rs. Rs. Rs.
As at 31 December 2016Financial assets measured at fair value
Derivative financial instrumentsForward foreign exchange contracts - 15,412,072 - 15,412,072
Financial assets - held for tradingInvestment in units 1,346,931,853 - - 1,346,931,853
Financial assets - available for saleSri Lankan Government Securities 16,527,257,938 - - 16,527,257,938Equity securities - quoted 45,694,199 - - 45,694,199Equity securities - unquoted - - 17,624,900 17,624,900Investment in units 103,893,062 - - 103,893,062Total financial assets measured at fair value 18,023,777,052 15,412,072 17,624,900 18,056,814,024
As at 31 December 2015 Level 1 Level 2 Level 3 Total Rs. Rs. Rs. Rs.
Financial assets measured at fair value
Derivative financial instrumentsForward foreign exchange contracts - 13,481,161 - 13,481,161
Financial assets held for tradingSri Lankan Government Securities 478,816,674 - - 478,816,674Investment in units 7,984,990,735 - - 7,984,990,735
Financial assets available for saleSri Lankan Government Securities 8,364,044,281 - - 8,364,044,281Equity securities - quoted 32,201,577 - - 32,201,577Equity securities - unquoted - - 17,624,900 17,624,900Investment in units 124,688,297 - - 124,688,297Total financial assets measured at fair value 16,984,741,564 13,481,161 17,624,900 17,015,847,625
Financial liabilitiesDerivative financial instrumentsForward foreign exchange contracts - 2,859,732 - 2,859,732Total financial liabilities - 2,859,732 - 2,859,732
There were no transfers between Level 1 and Level 2 during the year.
NOTES TO THE FINANCIAL STATEMENTS
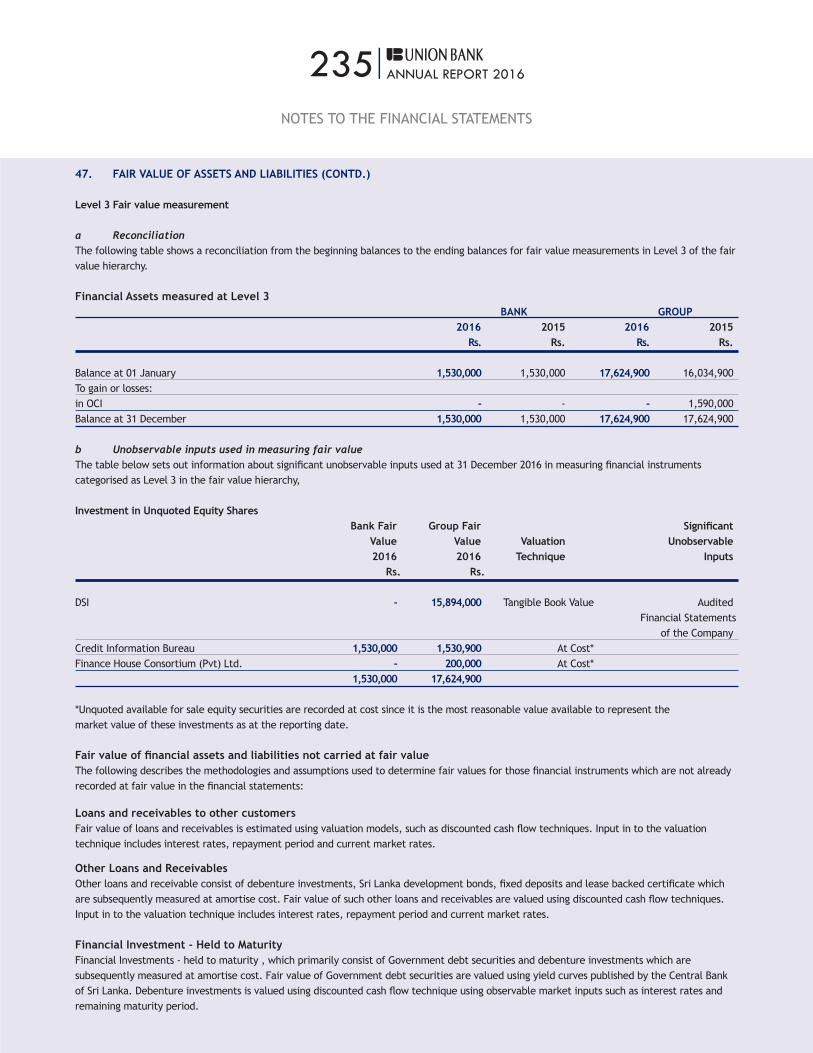
235|ANNUAL REPORT 2016
NOTES TO THE FINANCIAL STATEMENTS
47. FAIR VALUE OF ASSETS AND LIABILITIES (CONTD.)
Level 3 Fair value measurement
a ReconciliationThe following table shows a reconciliation from the beginning balances to the ending balances for fair value measurements in Level 3 of the fair value hierarchy.
Financial Assets measured at Level 3 BANK GROUP 2016 2015 2016 2015 Rs. Rs. Rs. Rs.
Balance at 01 January 1,530,000 1,530,000 17,624,900 16,034,900To gain or losses:in OCI - - - 1,590,000Balance at 31 December 1,530,000 1,530,000 17,624,900 17,624,900
b Unobservable inputs used in measuring fair valueThe table below sets out information about significant unobservable inputs used at 31 December 2016 in measuring financial instruments categorised as Level 3 in the fair value hierarchy,
Investment in Unquoted Equity Shares Bank Fair Group Fair Significant Value Value Valuation Unobservable 2016 2016 Technique Inputs Rs. Rs. DSI - 15,894,000 Tangible Book Value Audited Financial Statements of the CompanyCredit Information Bureau 1,530,000 1,530,900 At Cost* Finance House Consortium (Pvt) Ltd. - 200,000 At Cost* 1,530,000 17,624,900
*Unquoted available for sale equity securities are recorded at cost since it is the most reasonable value available to represent the market value of these investments as at the reporting date.
Fair value of financial assets and liabilities not carried at fair valueThe following describes the methodologies and assumptions used to determine fair values for those financial instruments which are not already recorded at fair value in the financial statements:
Loans and receivables to other customersFair value of loans and receivables is estimated using valuation models, such as discounted cash flow techniques. Input in to the valuation technique includes interest rates, repayment period and current market rates.
Other Loans and ReceivablesOther loans and receivable consist of debenture investments, Sri Lanka development bonds, fixed deposits and lease backed certificate which are subsequently measured at amortise cost. Fair value of such other loans and receivables are valued using discounted cash flow techniques. Input in to the valuation technique includes interest rates, repayment period and current market rates.
Financial Investment - Held to MaturityFinancial Investments - held to maturity , which primarily consist of Government debt securities and debenture investments which are subsequently measured at amortise cost. Fair value of Government debt securities are valued using yield curves published by the Central Bank of Sri Lanka. Debenture investments is valued using discounted cash flow technique using observable market inputs such as interest rates and remaining maturity period.

236|ANNUAL REPORT 2016
NOTES TO THE FINANCIAL STATEMENTS
47. FAIR VALUE OF ASSETS AND LIABILITIES (CONTD.)
Due to other customers - FDs and CDsThe fair value of due to customers (deposits) is estimated using discounted cash flow techniques, apply the rates that are offered to deposits of similar maturities and terms.
BANK - 2016 Fair Value Level 1 Level 2 Level 3 Total Value Carrying Value Rs. Rs. Rs. Rs. Rs.
Financial assetsLoans and receivables to other customers - 55,277,248,910 - 55,277,248,910 55,438,415,392Other loans and receivables - 7,261,314,771 - 7,261,314,771 7,747,230,534Financial investments – held to maturity - 137,326,902 - 137,326,902 140,231,001 - 62,675,890,583 - 62,675,890,583 63,325,876,927
Financial liabilitiesDue to other customers - FDs & Others - 39,828,939,681 - 39,828,939,681 40,029,959,552 - 39,828,939,681 - 39,828,939,681 40,029,959,552
BANK - 2015Financial assetsLoans and receivables to other customers - 40,682,032,992 - 40,682,032,992 40,095,331,952Other loans and receivables - 5,653,473,836 - 5,653,473,836 5,721,549,058Financial investments – held to maturity - 140,647,191 - 140,647,191 140,528,827 - 46,476,154,019 - 46,476,154,019 45,957,409,837
Financial liabilitiesDue to other customers - FDs & Others - 28,540,314,680 - 28,540,314,680 28,613,931,989 - 28,540,314,680 - 28,540,314,680 28,613,931,989
GROUP - 2016Financial assetsLoans and receivables to other customers - 60,402,466,651 - 60,402,466,651 62,931,935,591Other loans and receivables - 7,688,218,204 - 7,688,218,204 6,739,578,189Other Financial investments – held to maturity - 137,326,902 - 137,326,902 140,231,001 - 68,228,011,757 - 68,228,011,757 69,811,744,781
Financial liabilitiesDue to other customers - FDs & Others - 45,184,676,154 - 45,184,676,154 45,158,581,591Other borrowed funds - 833,094,572 - 833,094,572 833,094,572 - 46,017,770,726 - 46,017,770,726 45,991,676,163
GROUP - 2015Financial assetsLoans and receivables to other customers - 45,556,681,094 - 45,556,681,094 45,450,313,621Other loans and receivables - 5,653,473,836 - - 4,951,273,765Other Financial investments – held to maturity - 140,647,191 - 140,647,191 140,528,827 - 51,350,802,121 - 45,697,328,285 50,542,116,213
Financial liabilitiesDue to other customers - FDs & Others - 34,052,591,188 - 34,052,591,188 32,593,218,457Other borrowed funds - 1,282,295,109 - 1,282,295,109 1,281,084,761 - 35,334,886,297 - 35,334,886,297 33,874,303,218
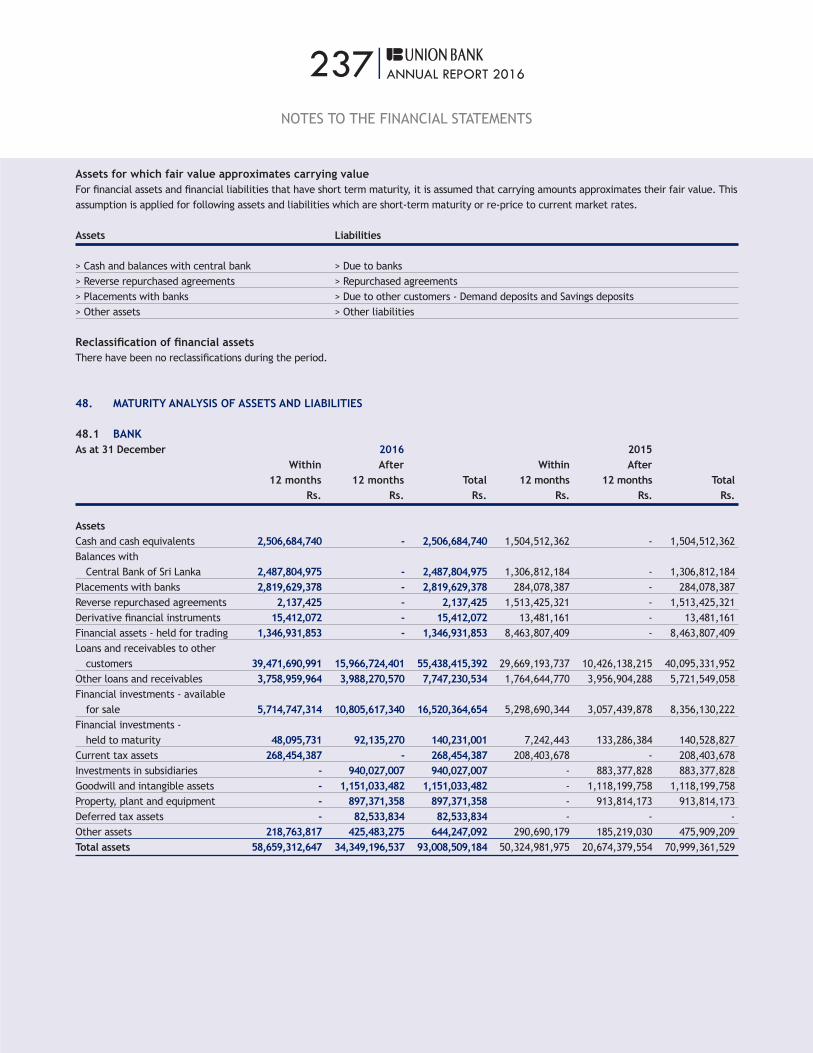
237|ANNUAL REPORT 2016
NOTES TO THE FINANCIAL STATEMENTS
Assets for which fair value approximates carrying valueFor financial assets and financial liabilities that have short term maturity, it is assumed that carrying amounts approximates their fair value. This assumption is applied for following assets and liabilities which are short-term maturity or re-price to current market rates.
Assets Liabilities
> Cash and balances with central bank > Due to banks> Reverse repurchased agreements > Repurchased agreements> Placements with banks > Due to other customers - Demand deposits and Savings deposits> Other assets > Other liabilities
Reclassification of financial assetsThere have been no reclassifications during the period.
48. MATURITY ANALYSIS OF ASSETS AND LIABILITIES
48.1 BANKAs at 31 December 2016 2015 Within After Within After 12 months 12 months Total 12 months 12 months Total Rs. Rs. Rs. Rs. Rs. Rs.
AssetsCash and cash equivalents 2,506,684,740 - 2,506,684,740 1,504,512,362 - 1,504,512,362Balances with Central Bank of Sri Lanka 2,487,804,975 - 2,487,804,975 1,306,812,184 - 1,306,812,184Placements with banks 2,819,629,378 - 2,819,629,378 284,078,387 - 284,078,387Reverse repurchased agreements 2,137,425 - 2,137,425 1,513,425,321 - 1,513,425,321Derivative financial instruments 15,412,072 - 15,412,072 13,481,161 - 13,481,161Financial assets - held for trading 1,346,931,853 - 1,346,931,853 8,463,807,409 - 8,463,807,409Loans and receivables to other customers 39,471,690,991 15,966,724,401 55,438,415,392 29,669,193,737 10,426,138,215 40,095,331,952Other loans and receivables 3,758,959,964 3,988,270,570 7,747,230,534 1,764,644,770 3,956,904,288 5,721,549,058Financial investments - available for sale 5,714,747,314 10,805,617,340 16,520,364,654 5,298,690,344 3,057,439,878 8,356,130,222Financial investments - held to maturity 48,095,731 92,135,270 140,231,001 7,242,443 133,286,384 140,528,827Current tax assets 268,454,387 - 268,454,387 208,403,678 - 208,403,678Investments in subsidiaries - 940,027,007 940,027,007 - 883,377,828 883,377,828Goodwill and intangible assets - 1,151,033,482 1,151,033,482 - 1,118,199,758 1,118,199,758Property, plant and equipment - 897,371,358 897,371,358 - 913,814,173 913,814,173Deferred tax assets - 82,533,834 82,533,834 - - -Other assets 218,763,817 425,483,275 644,247,092 290,690,179 185,219,030 475,909,209Total assets 58,659,312,647 34,349,196,537 93,008,509,184 50,324,981,975 20,674,379,554 70,999,361,529

238|ANNUAL REPORT 2016
48. MATURITY ANALYSIS OF ASSETS AND LIABILITIES (CONTD.)
48.1 BANK (CONTD.)As at 31 December 2016 2015 Within After Within After 12 months 12 months Total 12 months 12 months Total Rs. Rs. Rs. Rs. Rs. Rs.
LiabilitiesDue to banks 12,144,111,413 16,132,970 12,160,244,383 5,884,767,774 1,060,480,904 6,945,248,678Derivative financial instruments 3,975,611 - 3,975,611 2,859,732 - 2,859,732Repurchased agreements 10,256,669,765 - 10,256,669,765 8,242,551,409 - 8,242,551,409Due to other customers 50,585,875,367 1,257,496,570 51,841,371,937 37,059,621,710 592,886,427 37,652,508,137Current tax liabilities - - - - - -Deferred tax liabilities - - - 30,088,601 - 30,088,601Other liabilities 1,567,114,627 95,918,618 1,663,033,245 1,133,150,392 79,765,275 1,212,915,668Total liabilities 74,555,746,783 1,369,548,158 75,925,294,941 52,353,039,619 1,733,132,606 54,086,172,226 Maturity Gap (15,896,434,136) 32,979,648,379 17,083,214,243 (2,028,057,644) 18,941,246,948 16,913,189,304Cumulative Gap (15,896,434,136) 17,083,214,243 - (2,028,057,644) 16,913,189,304
48. MATURITY ANALYSIS OF ASSETS AND LIABILITIES (CONTD.)
48.2 GROUPAs at 31 December 2016 2015 Within After Within After 12 months 12 months Total 12 months 12 months Total Rs. Rs. Rs. Rs. Rs. Rs.
AssetsCash and cash equivalents 2,717,649,609 - 2,717,649,609 1,708,684,566 - 1,708,684,566Balances with Central Bank of Sri Lanka 2,487,804,975 - 2,487,804,975 1,306,812,184 - 1,306,812,184Placements with banks 2,826,710,002 - 2,826,710,002 294,074,296 - 294,074,296Reverse repurchased agreements 275,497,776 - 275,497,776 1,619,467,074 - 1,619,467,074Derivative financial instruments 15,412,072 - 15,412,072 13,481,161 - 13,481,161Financial assets held for trading 1,346,931,853 - 1,346,931,853 8,463,807,409 - 8,463,807,409Loans and receivables to other customers 41,610,691,523 21,321,244,068 62,931,935,591 32,396,813,982 13,053,499,639 45,450,313,621Other loans and receivables 3,758,959,964 2,980,618,225 6,739,578,189 2,704,464,626 2,262,813,464 4,967,278,090Financial investments – available for sale 5,879,532,589 10,814,937,509 16,694,470,098 5,433,126,831 3,105,432,224 8,538,559,055Financial investments – held to maturity 48,095,731 92,135,270 140,231,001 7,242,443 133,286,384 140,528,827Current tax assets 268,454,390 - 268,454,390 224,554,665 - 224,554,665Investments in real estate 189,448,851 - 189,448,851 213,274,310 - 213,274,310Goodwill and intangible assets - 1,501,682,486 1,501,682,486 - 1,469,782,932 1,469,782,932Property, plant and equipment - 1,073,817,789 1,073,817,789 - 1,059,027,289 1,059,027,289Deferred tax assets - 541,806,830 541,806,830 - 485,102,333 485,102,333Other assets 315,277,717 465,951,620 781,229,337 318,314,176 271,923,794 590,237,970Total assets 61,740,467,052 38,792,193,797 100,532,660,849 54,704,117,725 21,840,868,059 76,544,985,783
NOTES TO THE FINANCIAL STATEMENTS
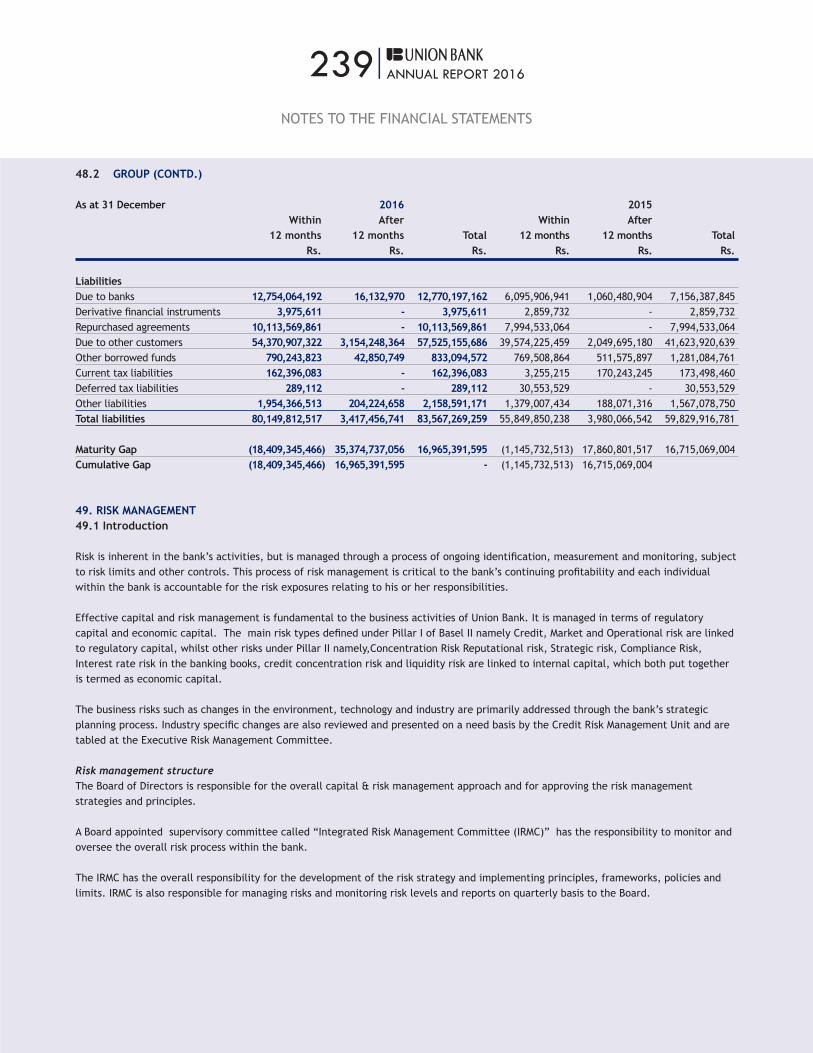
239|ANNUAL REPORT 2016
48.2 GROUP (CONTD.)
As at 31 December 2016 2015 Within After Within After 12 months 12 months Total 12 months 12 months Total Rs. Rs. Rs. Rs. Rs. Rs.
Liabilities Due to banks 12,754,064,192 16,132,970 12,770,197,162 6,095,906,941 1,060,480,904 7,156,387,845Derivative financial instruments 3,975,611 - 3,975,611 2,859,732 - 2,859,732Repurchased agreements 10,113,569,861 - 10,113,569,861 7,994,533,064 - 7,994,533,064Due to other customers 54,370,907,322 3,154,248,364 57,525,155,686 39,574,225,459 2,049,695,180 41,623,920,639Other borrowed funds 790,243,823 42,850,749 833,094,572 769,508,864 511,575,897 1,281,084,761Current tax liabilities 162,396,083 - 162,396,083 3,255,215 170,243,245 173,498,460Deferred tax liabilities 289,112 - 289,112 30,553,529 - 30,553,529Other liabilities 1,954,366,513 204,224,658 2,158,591,171 1,379,007,434 188,071,316 1,567,078,750Total liabilities 80,149,812,517 3,417,456,741 83,567,269,259 55,849,850,238 3,980,066,542 59,829,916,781
Maturity Gap (18,409,345,466) 35,374,737,056 16,965,391,595 (1,145,732,513) 17,860,801,517 16,715,069,004Cumulative Gap (18,409,345,466) 16,965,391,595 - (1,145,732,513) 16,715,069,004
49. RISK MANAGEMENT49.1 Introduction
Risk is inherent in the bank’s activities, but is managed through a process of ongoing identification, measurement and monitoring, subject to risk limits and other controls. This process of risk management is critical to the bank’s continuing profitability and each individual within the bank is accountable for the risk exposures relating to his or her responsibilities.
Effective capital and risk management is fundamental to the business activities of Union Bank. It is managed in terms of regulatory capital and economic capital. The main risk types defined under Pillar I of Basel II namely Credit, Market and Operational risk are linked to regulatory capital, whilst other risks under Pillar II namely,Concentration Risk Reputational risk, Strategic risk, Compliance Risk, Interest rate risk in the banking books, credit concentration risk and liquidity risk are linked to internal capital, which both put together is termed as economic capital.
The business risks such as changes in the environment, technology and industry are primarily addressed through the bank’s strategic planning process. Industry specific changes are also reviewed and presented on a need basis by the Credit Risk Management Unit and are tabled at the Executive Risk Management Committee.
Risk management structureThe Board of Directors is responsible for the overall capital & risk management approach and for approving the risk management strategies and principles.
A Board appointed supervisory committee called “Integrated Risk Management Committee (IRMC)” has the responsibility to monitor and oversee the overall risk process within the bank.
The IRMC has the overall responsibility for the development of the risk strategy and implementing principles, frameworks, policies and limits. IRMC is also responsible for managing risks and monitoring risk levels and reports on quarterly basis to the Board.
NOTES TO THE FINANCIAL STATEMENTS

240|ANNUAL REPORT 2016
The Risk Management Department (RMD) is responsible for implementing and maintaining risk related procedures to ensure an independent control process is maintained. The unit works closely with the IRMC to ensure that procedures are compliant with the overall framework.
The RMD is also responsible for monitoring compliance with risk principles, policies and limits across the bank. This unit ensures the complete capture of the risks in risk measurement and reporting systems. Exceptions are reported on daily/ monthly/ quarterly basis, where necessary, to the IRMC or its sub committees, and the relevant actions are taken to address exceptions and any areas of weakness.
Bank Treasury and the Assets and Liabilities Management Committee (ALCO) are responsible for managing the bank’s assets and liabilities and the overall financial structure. The Treasury Middle Office (independent from treasury), which reports to the Chief Risk Officer (CRO)further monitors positions and transactions. The Treasury and ALCO are also primarily responsible for the funding and liquidity risks of the bank.
The bank’s policy is that risk management processes throughout the bank are audited annually by the Internal Audit function, which examines both the adequacy of the procedures and the bank’s compliance with the procedures. Internal Audit discusses the results of all assessments with management, and reports its findings and recommendations to the Board Audit Committee.
Risk measurement and reporting systemsMonitoring and controlling risks is primarily performed based on limits established by the bank. These limits reflect the business strategy and market environment of the bank as well as the level of risk that the bank is willing to accept, with additional emphasis on selected industries. In addition, the bank’s policy is to measure and monitor the overall risk bearing capacity in relation to the aggregate
risk exposure across all risk types and activities.
Information compiled from all the businesses is examined and processed in order to analyse, control and identify risks on a timely basis. This information is presented and explained to the Board of Directors and Risk Committees. These reports include aggregate credit exposures, credit concentration, operational risk, market risk, liquidity ratios and stress tests. On a quarterly basis, detailed reporting of industry, customer and geographic risks takes place. Senior management assesses the appropriateness of the allowance for credit losses on a monthly basis. The Board receives a comprehensive risk report once a quarter which is designed to provide all the necessary information to assess and conclude on the risks of the bank.
All risk related policy/ frameworks including a well-documented Integrated Risk Management Framework are uploaded in the Bank’s Intranet which are being viewed by all staff at all levels for a comprehensive understanding of the Bank’s risk appetite and the overall risk management of the Bank.
Briefings are also given to other relevant members of the bank on the utilization of market limits, proprietary investments and liquidity, plus any other risk developments.
Risk mitigationAs part of its overall risk management, the bank uses various processes and instruments to manage exposures resulting from credit risks, changes in interest rates, foreign currencies, equity risks, and exposures arising from transactions.
The bank actively uses collateral to reduce its credit risks.
Excessive risk concentrationIn order to avoid excessive concentrations of risk, the bank’s policies and procedures include specific guidelines, including concentration limits to focus
on maintaining a diversified portfolio. Identified concentrations of credit risks are controlled and managed accordingly.
49.2 Credit riskCredit risk is the risk of financial loss for the Bank if a borrower or counterparty to a financial instrument fails to meet its contractual obligations, and arises principally from the Bank’s loans and receivables to customers/other banks and investments in debt securities.
In addition to the credit risk from direct funding exposure, the Bank would also be exposed to indirect liabilities such as Letter of credit, guarantees etc which would carry credit risk.
The bank manages and controls credit risk by setting limits on the amount of risk it is willing to accept for individual counterparties and industry concentrations, and by monitoring exposures in relation to such limits.
The bank has established a credit quality review process to provide early identification of possible changes in the creditworthiness of borrowers, including regular collateral revisions. Bank uses a risk rating process to rate the borrowers according to its risk profile. The credit quality review process aims to allow the bank to assess the potential loss as a result of the risks to which it is exposed and take corrective action.
A structured and standardised credit approval process is in place including a procedure for credit appraisal and borrower risks rating. Credit Authority lies with the Board of Directors, Board Credit Committee, Executive Credit Committee and members of the management as per the assigned limits on delegated credit authority. All credit facilities are required to be reviewed by the Relationship Mangers/ Branch Managers annually. Also bank’s borrower risk rating system forms an integral part of the evaluation of credit proposals and assists the approval authorities to assess the creditworthiness
NOTES TO THE FINANCIAL STATEMENTS

241|ANNUAL REPORT 2016
of the borrowers. Bank’s systems for credit evaluation and decision making are independent from collateralization albeit collateral helps to mitigate credit risk.
The Risk Management Department reviews credit facilities before and after sanctioning of facilities. Under pre-sanction evaluation, RMD independently reviews credit facilities and adds its recommendation where risk is considered acceptable. This independent review covers all new facilities or one-off / temporary facilities for existing lines over an approved threshold. If a facility is not recommended by the Risk Management, such facilities cannot be approved.
In the post sanctioning review of credit facilities, the Loans Review Manager (LRM) reviews among other things, the disbursements, perfection of collaterals and repayments are in accordance with the terms of approval. A separate Loan Review Policy approved by the Board of Directors is in place.
Impairment assessment The methodology of the impairment assessment has explained in the Note 2.3.3.5 under summary of significant accounting policies.
Credit–related commitments risksThe bank makes available to its customers guarantees that may require that the bank makes payments on their behalf and enters into commitments to extend credit lines to secure customer’s liquidity needs. Letters of credit and guarantees commit the bank to make payments on behalf of customers in the event of a specific act, generally related to the import or export of goods or contract financing. Such commitments risks are mitigated by collateral cover, regular review of unfunded limits and exposures similar to review of funded limits and exposures.
Collateral and other credit enhancements
The amount and type of collateral required depends on an assessment of the credit risk of the counterparty.Guidelines are in place covering the acceptability and valuation of each type of collateral.
The main types of collateral obtained are as follows: • For securities lending and reverse
repurchase transactions, cash or securities
• For commercial lending, charges over real estate properties, inventory and trade receivables etc
• For retail lending, mortgages over residential properties etc
The bank also obtains guarantees from parent companies for loans to their subsidiaries.
Management monitors the market value of collateral, and will request additional collateral in accordance with the underlying agreement.
It is the bank’s policy to dispose of repossessed properties in an orderly fashion. The proceeds are used to reduce or repay the outstanding claim. In general, the bank does not occupy repossessed properties for business use.
The bank also makes use of netting agreements with borrowers with whom a significant volume of transactions are undertaken.
Although on Statement of Financial Position netting arrangements may significantly reduce credit risk, it should be noted that:
• Credit risk is eliminated only to the extent that amounts due to the same borrower will be settled after the assets are realised
• that the documentation are legally enforceable
NOTES TO THE FINANCIAL STATEMENTS
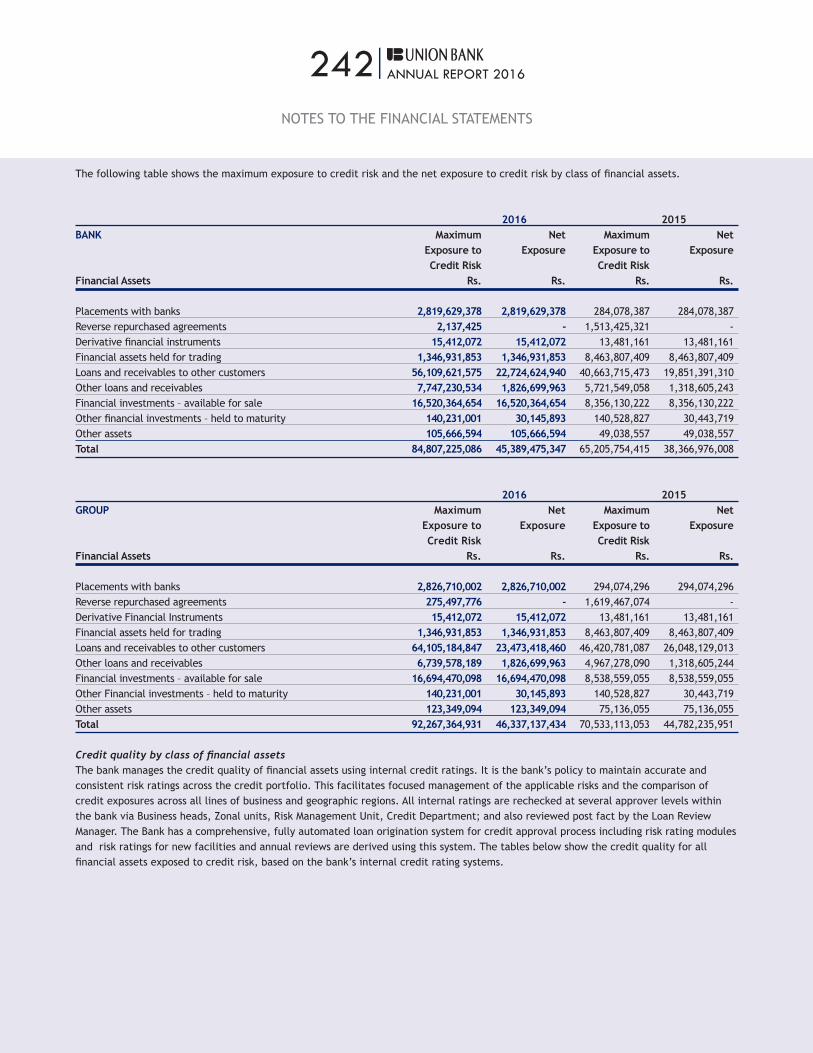
242|ANNUAL REPORT 2016
The following table shows the maximum exposure to credit risk and the net exposure to credit risk by class of financial assets.
2016 2015 BANK Maximum Net Maximum Net Exposure to Exposure Exposure to Exposure Credit Risk Credit Risk Financial Assets Rs. Rs. Rs. Rs. Placements with banks 2,819,629,378 2,819,629,378 284,078,387 284,078,387 Reverse repurchased agreements 2,137,425 - 1,513,425,321 - Derivative financial instruments 15,412,072 15,412,072 13,481,161 13,481,161 Financial assets held for trading 1,346,931,853 1,346,931,853 8,463,807,409 8,463,807,409 Loans and receivables to other customers 56,109,621,575 22,724,624,940 40,663,715,473 19,851,391,310 Other loans and receivables 7,747,230,534 1,826,699,963 5,721,549,058 1,318,605,243 Financial investments – available for sale 16,520,364,654 16,520,364,654 8,356,130,222 8,356,130,222 Other financial investments – held to maturity 140,231,001 30,145,893 140,528,827 30,443,719 Other assets 105,666,594 105,666,594 49,038,557 49,038,557 Total 84,807,225,086 45,389,475,347 65,205,754,415 38,366,976,008
2016 2015 GROUP Maximum Net Maximum Net Exposure to Exposure Exposure to Exposure Credit Risk Credit Risk Financial Assets Rs. Rs. Rs. Rs.
Placements with banks 2,826,710,002 2,826,710,002 294,074,296 294,074,296 Reverse repurchased agreements 275,497,776 - 1,619,467,074 - Derivative Financial Instruments 15,412,072 15,412,072 13,481,161 13,481,161 Financial assets held for trading 1,346,931,853 1,346,931,853 8,463,807,409 8,463,807,409 Loans and receivables to other customers 64,105,184,847 23,473,418,460 46,420,781,087 26,048,129,013 Other loans and receivables 6,739,578,189 1,826,699,963 4,967,278,090 1,318,605,244 Financial investments – available for sale 16,694,470,098 16,694,470,098 8,538,559,055 8,538,559,055 Other Financial investments – held to maturity 140,231,001 30,145,893 140,528,827 30,443,719 Other assets 123,349,094 123,349,094 75,136,055 75,136,055 Total 92,267,364,931 46,337,137,434 70,533,113,053 44,782,235,951
Credit quality by class of financial assetsThe bank manages the credit quality of financial assets using internal credit ratings. It is the bank’s policy to maintain accurate and consistent risk ratings across the credit portfolio. This facilitates focused management of the applicable risks and the comparison of credit exposures across all lines of business and geographic regions. All internal ratings are rechecked at several approver levels within the bank via Business heads, Zonal units, Risk Management Unit, Credit Department; and also reviewed post fact by the Loan Review Manager. The Bank has a comprehensive, fully automated loan origination system for credit approval process including risk rating modules and risk ratings for new facilities and annual reviews are derived using this system. The tables below show the credit quality for all financial assets exposed to credit risk, based on the bank’s internal credit rating systems.
NOTES TO THE FINANCIAL STATEMENTS

243|ANNUAL REPORT 2016
Past due but not impaired
BANK Neither past due Less than 3 3-6 6-12 Over 12 Individually
nor impaired months months months months impaired Total
As at 31 December 2016 Rs. Rs. Rs. Rs. Rs. Rs. Rs.
Cash and cash equivalents 2,506,684,740 - - - - - 2,506,684,740
Balances with
Central Bank of Sri Lanka 2,487,804,975 - - - - - 2,487,804,975
Placements with banks 2,819,629,378 - - - - - 2,819,629,378
Reverse repurchased agreements 2,137,425 - - - - - 2,137,425
Derivative financial instruments 15,412,072 - - - - - 15,412,072
Financial assets held for trading 1,346,931,853 - - - - - 1,346,931,853
Loans and receivables to
other customers (Gross) 43,270,880,281 8,824,395,731 61,649,416 96,233,534 723,151,153 3,133,311,461 56,109,621,575
Other loans and receivables 7,747,230,534 - - - - - 7,747,230,534
Financial investments
– available for sale 16,520,364,654 - - - - - 16,520,364,654
Other financial investments
– held to maturity 140,231,001 - - - - - 140,231,001
Other assets 105,666,594 - - - - - 105,666,594
Total Financial Assets 76,962,973,507 8,824,395,731 61,649,416 96,233,534 723,151,153 3,133,311,461 89,801,714,802
Past due but not impaired
BANK Neither past due Less than 3 3-6 6-12 Over 12 Individually
nor impaired months months months months impaired Total
As at 31 December 2015 Rs. Rs. Rs. Rs. Rs. Rs. Rs.
Cash and cash equivalents 1,504,512,362 - - - - - 1,504,512,362
Balances with
Central Bank of Sri Lanka 1,306,812,184 - - - - - 1,306,812,184
Placements with banks 284,078,387 - - - - - 284,078,387
Reverse repurchased agreements 1,513,425,321 - - - - - 1,513,425,321
Derivative financial instruments 13,481,161 - - - - - 13,481,161
Financial assets held for trading 8,463,807,409 - - - - - 8,463,807,409
Loans and receivables to
other customers (Gross) 33,666,317,538 3,993,863,516 80,572,822 120,878,650 852,953,854 1,949,129,092 40,663,715,473
Other loans and receivables 5,721,549,058 - - - - - 5,721,549,058
Financial investments
– available for sale 8,356,130,222 - - - - - 8,356,130,222
Other financial investments
– held to maturity 140,528,827 - - - - - 140,528,827
Other assets 49,038,557 - - - - - 49,038,557
Total Financial Assets 61,019,681,026 3,993,863,516 80,572,822 120,878,650 852,953,854 1,949,129,092 68,017,078,961
NOTES TO THE FINANCIAL STATEMENTS
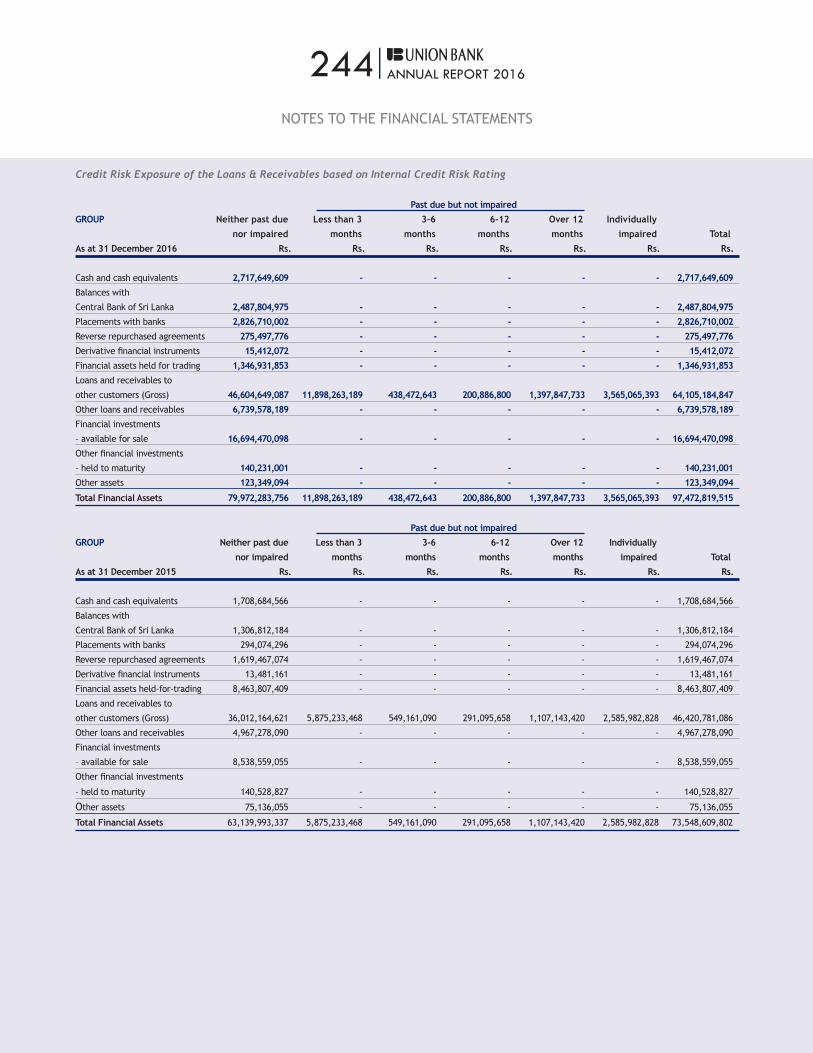
244|ANNUAL REPORT 2016
Credit Risk Exposure of the Loans & Receivables based on Internal Credit Risk Rating
Past due but not impaired
GROUP Neither past due Less than 3 3-6 6-12 Over 12 Individually
nor impaired months months months months impaired Total
As at 31 December 2016 Rs. Rs. Rs. Rs. Rs. Rs. Rs.
Cash and cash equivalents 2,717,649,609 - - - - - 2,717,649,609
Balances with
Central Bank of Sri Lanka 2,487,804,975 - - - - - 2,487,804,975
Placements with banks 2,826,710,002 - - - - - 2,826,710,002
Reverse repurchased agreements 275,497,776 - - - - - 275,497,776
Derivative financial instruments 15,412,072 - - - - - 15,412,072
Financial assets held for trading 1,346,931,853 - - - - - 1,346,931,853
Loans and receivables to
other customers (Gross) 46,604,649,087 11,898,263,189 438,472,643 200,886,800 1,397,847,733 3,565,065,393 64,105,184,847
Other loans and receivables 6,739,578,189 - - - - - 6,739,578,189
Financial investments
– available for sale 16,694,470,098 - - - - - 16,694,470,098
Other financial investments
– held to maturity 140,231,001 - - - - - 140,231,001
Other assets 123,349,094 - - - - - 123,349,094
Total Financial Assets 79,972,283,756 11,898,263,189 438,472,643 200,886,800 1,397,847,733 3,565,065,393 97,472,819,515
Past due but not impaired
GROUP Neither past due Less than 3 3-6 6-12 Over 12 Individually
nor impaired months months months months impaired Total
As at 31 December 2015 Rs. Rs. Rs. Rs. Rs. Rs. Rs.
Cash and cash equivalents 1,708,684,566 - - - - - 1,708,684,566
Balances with
Central Bank of Sri Lanka 1,306,812,184 - - - - - 1,306,812,184
Placements with banks 294,074,296 - - - - - 294,074,296
Reverse repurchased agreements 1,619,467,074 - - - - - 1,619,467,074
Derivative financial instruments 13,481,161 - - - - - 13,481,161
Financial assets held-for-trading 8,463,807,409 - - - - - 8,463,807,409
Loans and receivables to
other customers (Gross) 36,012,164,621 5,875,233,468 549,161,090 291,095,658 1,107,143,420 2,585,982,828 46,420,781,086
Other loans and receivables 4,967,278,090 - - - - - 4,967,278,090
Financial investments
– available for sale 8,538,559,055 - - - - - 8,538,559,055
Other financial investments
– held to maturity 140,528,827 - - - - - 140,528,827
Other assets 75,136,055 - - - - - 75,136,055
Total Financial Assets 63,139,993,337 5,875,233,468 549,161,090 291,095,658 1,107,143,420 2,585,982,828 73,548,609,802
NOTES TO THE FINANCIAL STATEMENTS
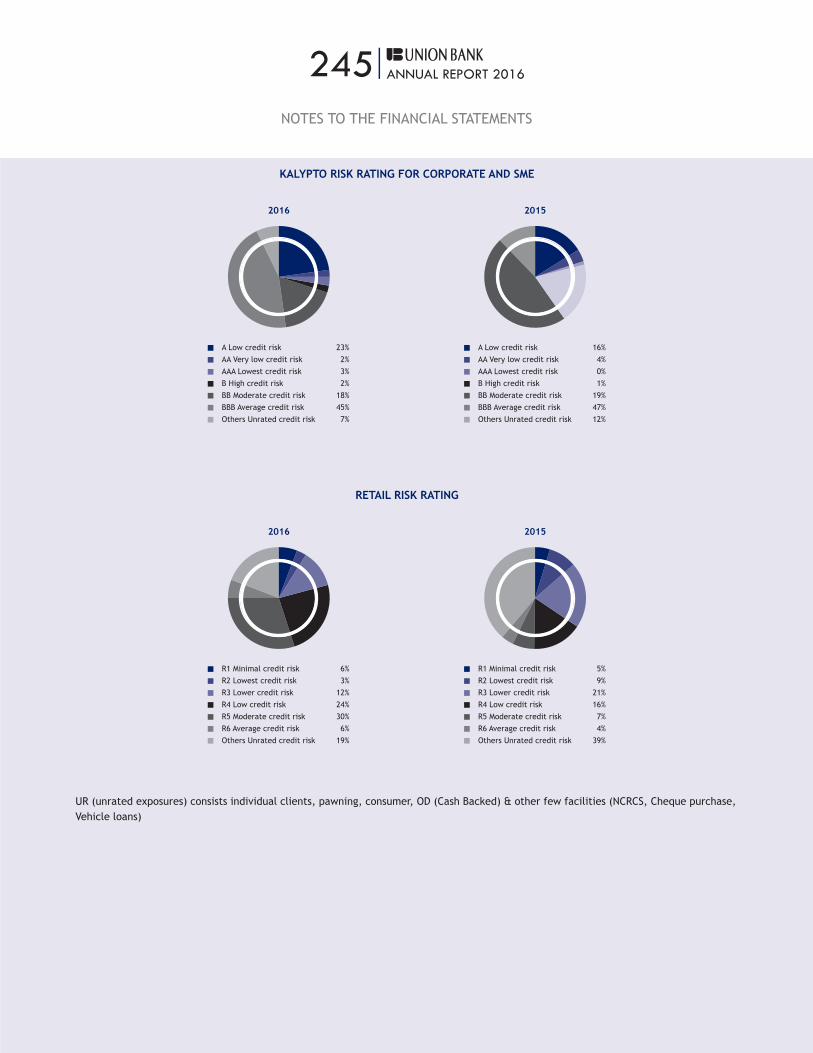
245|ANNUAL REPORT 2016
KALYPTO RISK RATING FOR CORPORATE AND SME
A Low credit risk 16%AA Very low credit risk 4%AAA Lowest credit risk 0%B High credit risk 1%BB Moderate credit risk 19%BBB Average credit risk 47%Others Unrated credit risk 12%
2015
A Low credit risk 23%AA Very low credit risk 2%AAA Lowest credit risk 3%B High credit risk 2%BB Moderate credit risk 18%BBB Average credit risk 45%Others Unrated credit risk 7%
2016
RETAIL RISK RATING
R1 Minimal credit risk 6%R2 Lowest credit risk 3%R3 Lower credit risk 12%R4 Low credit risk 24%R5 Moderate credit risk 30%R6 Average credit risk 6%Others Unrated credit risk 19%
2016
R1 Minimal credit risk 5%R2 Lowest credit risk 9%R3 Lower credit risk 21%R4 Low credit risk 16%R5 Moderate credit risk 7%R6 Average credit risk 4%Others Unrated credit risk 39%
2015
UR (unrated exposures) consists individual clients, pawning, consumer, OD (Cash Backed) & other few facilities (NCRCS, Cheque purchase, Vehicle loans)
NOTES TO THE FINANCIAL STATEMENTS
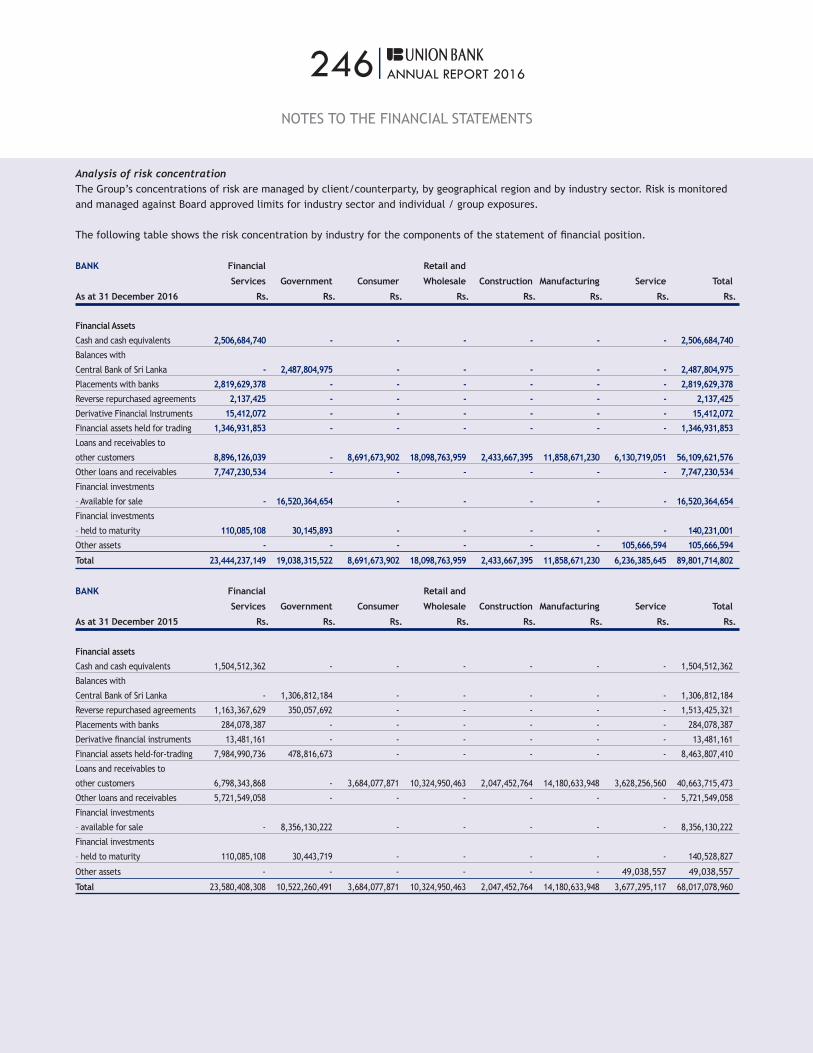
246|ANNUAL REPORT 2016
Analysis of risk concentrationThe Group’s concentrations of risk are managed by client/counterparty, by geographical region and by industry sector. Risk is monitored and managed against Board approved limits for industry sector and individual / group exposures.
The following table shows the risk concentration by industry for the components of the statement of financial position. BANK Financial Retail and
Services Government Consumer Wholesale Construction Manufacturing Service Total
As at 31 December 2016 Rs. Rs. Rs. Rs. Rs. Rs. Rs. Rs.
Financial Assets
Cash and cash equivalents 2,506,684,740 - - - - - - 2,506,684,740
Balances with
Central Bank of Sri Lanka - 2,487,804,975 - - - - - 2,487,804,975
Placements with banks 2,819,629,378 - - - - - - 2,819,629,378
Reverse repurchased agreements 2,137,425 - - - - - - 2,137,425
Derivative Financial Instruments 15,412,072 - - - - - - 15,412,072
Financial assets held for trading 1,346,931,853 - - - - - - 1,346,931,853
Loans and receivables to
other customers 8,896,126,039 - 8,691,673,902 18,098,763,959 2,433,667,395 11,858,671,230 6,130,719,051 56,109,621,576
Other loans and receivables 7,747,230,534 - - - - - - 7,747,230,534
Financial investments
– Available for sale - 16,520,364,654 - - - - - 16,520,364,654
Financial investments
– held to maturity 110,085,108 30,145,893 - - - - - 140,231,001
Other assets - - - - - - 105,666,594 105,666,594
Total 23,444,237,149 19,038,315,522 8,691,673,902 18,098,763,959 2,433,667,395 11,858,671,230 6,236,385,645 89,801,714,802
BANK Financial Retail and
Services Government Consumer Wholesale Construction Manufacturing Service Total
As at 31 December 2015 Rs. Rs. Rs. Rs. Rs. Rs. Rs. Rs.
Financial assets
Cash and cash equivalents 1,504,512,362 - - - - - - 1,504,512,362
Balances with
Central Bank of Sri Lanka - 1,306,812,184 - - - - - 1,306,812,184
Reverse repurchased agreements 1,163,367,629 350,057,692 - - - - - 1,513,425,321
Placements with banks 284,078,387 - - - - - - 284,078,387
Derivative financial instruments 13,481,161 - - - - - - 13,481,161
Financial assets held-for-trading 7,984,990,736 478,816,673 - - - - - 8,463,807,410
Loans and receivables to
other customers 6,798,343,868 - 3,684,077,871 10,324,950,463 2,047,452,764 14,180,633,948 3,628,256,560 40,663,715,473
Other loans and receivables 5,721,549,058 - - - - - - 5,721,549,058
Financial investments
– available for sale - 8,356,130,222 - - - - - 8,356,130,222
Financial investments
– held to maturity 110,085,108 30,443,719 - - - - - 140,528,827
Other assets - - - - - - 49,038,557 49,038,557
Total 23,580,408,308 10,522,260,491 3,684,077,871 10,324,950,463 2,047,452,764 14,180,633,948 3,677,295,117 68,017,078,960
NOTES TO THE FINANCIAL STATEMENTS

247|ANNUAL REPORT 2016
Concentration by Location Concentration by location for loans and advances is measured based on the location of the customer center that granted the facility, which has a high correlation with the location of the borrower except for loans granted by the foreign currency unit (FCBU). Concentration of loans and advances by location is given below.
BANKAs at 31 December 2016 2015 Rs. % Rs. %
Central 1,531,278,653 2.7% 660,501,545 1.6%Eastern 232,582,321 0.4% 165,290,466 0.4%North Central 891,896,705 1.6% 651,160,580 1.6%North Western 1,781,064,542 3.2% 1,195,045,531 2.9%Northern 667,223,225 1.2% 572,514,643 1.4%Sabaragamuwa 1,628,975,637 2.9% 1,000,516,142 2.5%Southern 3,040,064,334 5.4% 2,205,320,265 5.4%Uva 420,658,324 0.7% 264,436,223 0.7%Western 45,915,877,834 81.8% 33,948,930,078 83.5%Total 56,109,621,575 40,663,715,473
GROUPAs at 31 December 2016 2015 Rs. % Rs. %
Central 2,107,495,311 3.3% 1,013,541,545 2.2%Eastern 368,646,176 0.6% 165,290,466 0.4%North Central 1,204,801,409 1.9% 791,766,580 1.7%North Western 2,425,926,277 3.8% 1,792,512,531 3.9%Northern 667,223,225 1.0% 572,514,643 1.2%Sabaragamuwa 2,131,564,272 3.3% 1,298,488,142 2.8%Southern 4,693,717,272 7.3% 3,516,587,265 7.6%Uva 420,658,324 0.7% 264,436,223 0.6%Western 50,085,152,581 78.1% 37,005,643,691 79.7%Total 64,105,184,847 46,420,781,086
NOTES TO THE FINANCIAL STATEMENTS
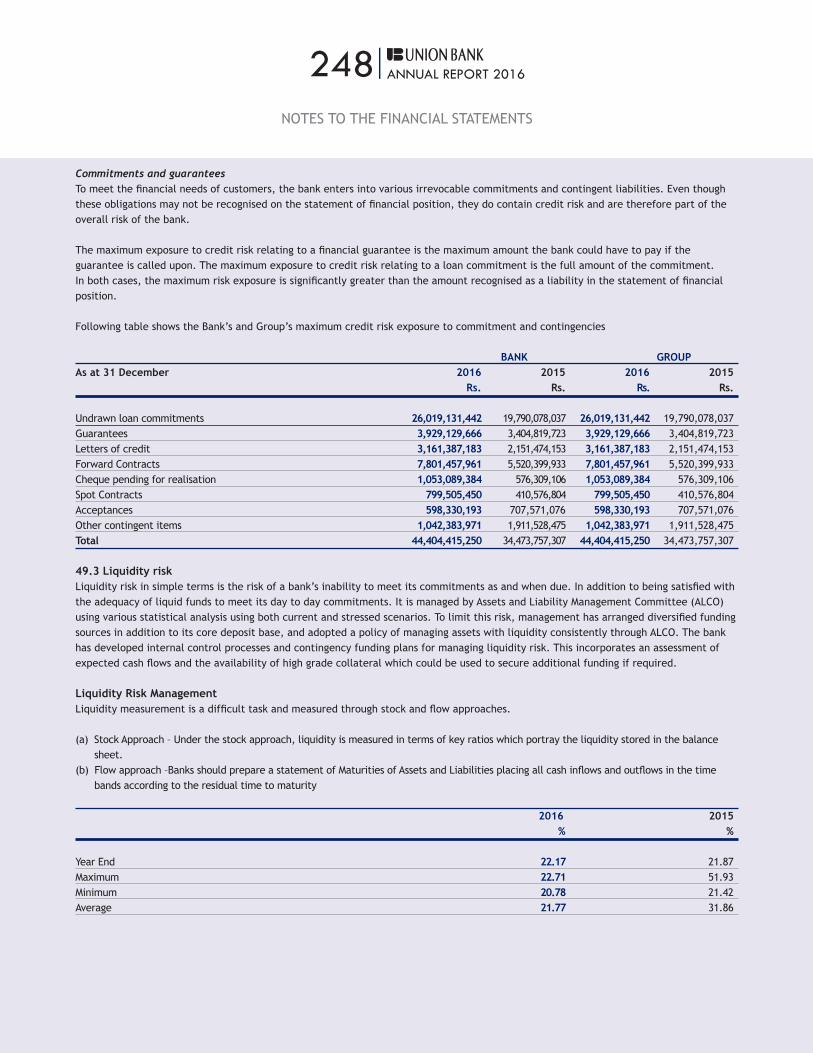
248|ANNUAL REPORT 2016
Commitments and guaranteesTo meet the financial needs of customers, the bank enters into various irrevocable commitments and contingent liabilities. Even though these obligations may not be recognised on the statement of financial position, they do contain credit risk and are therefore part of the overall risk of the bank.
The maximum exposure to credit risk relating to a financial guarantee is the maximum amount the bank could have to pay if the guarantee is called upon. The maximum exposure to credit risk relating to a loan commitment is the full amount of the commitment. In both cases, the maximum risk exposure is significantly greater than the amount recognised as a liability in the statement of financial position.
Following table shows the Bank’s and Group’s maximum credit risk exposure to commitment and contingencies
BANK GROUP As at 31 December 2016 2015 2016 2015 Rs. Rs. Rs. Rs.
Undrawn loan commitments 26,019,131,442 19,790,078,037 26,019,131,442 19,790,078,037 Guarantees 3,929,129,666 3,404,819,723 3,929,129,666 3,404,819,723 Letters of credit 3,161,387,183 2,151,474,153 3,161,387,183 2,151,474,153 Forward Contracts 7,801,457,961 5,520,399,933 7,801,457,961 5,520,399,933 Cheque pending for realisation 1,053,089,384 576,309,106 1,053,089,384 576,309,106 Spot Contracts 799,505,450 410,576,804 799,505,450 410,576,804 Acceptances 598,330,193 707,571,076 598,330,193 707,571,076 Other contingent items 1,042,383,971 1,911,528,475 1,042,383,971 1,911,528,475Total 44,404,415,250 34,473,757,307 44,404,415,250 34,473,757,307
49.3 Liquidity risk Liquidity risk in simple terms is the risk of a bank’s inability to meet its commitments as and when due. In addition to being satisfied with the adequacy of liquid funds to meet its day to day commitments. It is managed by Assets and Liability Management Committee (ALCO) using various statistical analysis using both current and stressed scenarios. To limit this risk, management has arranged diversified funding sources in addition to its core deposit base, and adopted a policy of managing assets with liquidity consistently through ALCO. The bank has developed internal control processes and contingency funding plans for managing liquidity risk. This incorporates an assessment of expected cash flows and the availability of high grade collateral which could be used to secure additional funding if required.
Liquidity Risk ManagementLiquidity measurement is a difficult task and measured through stock and flow approaches.
(a) Stock Approach – Under the stock approach, liquidity is measured in terms of key ratios which portray the liquidity stored in the balance sheet.
(b) Flow approach –Banks should prepare a statement of Maturities of Assets and Liabilities placing all cash inflows and outflows in the time bands according to the residual time to maturity
2016 2015 % %
Year End 22.17 21.87Maximum 22.71 51.93Minimum 20.78 21.42Average 21.77 31.86
NOTES TO THE FINANCIAL STATEMENTS
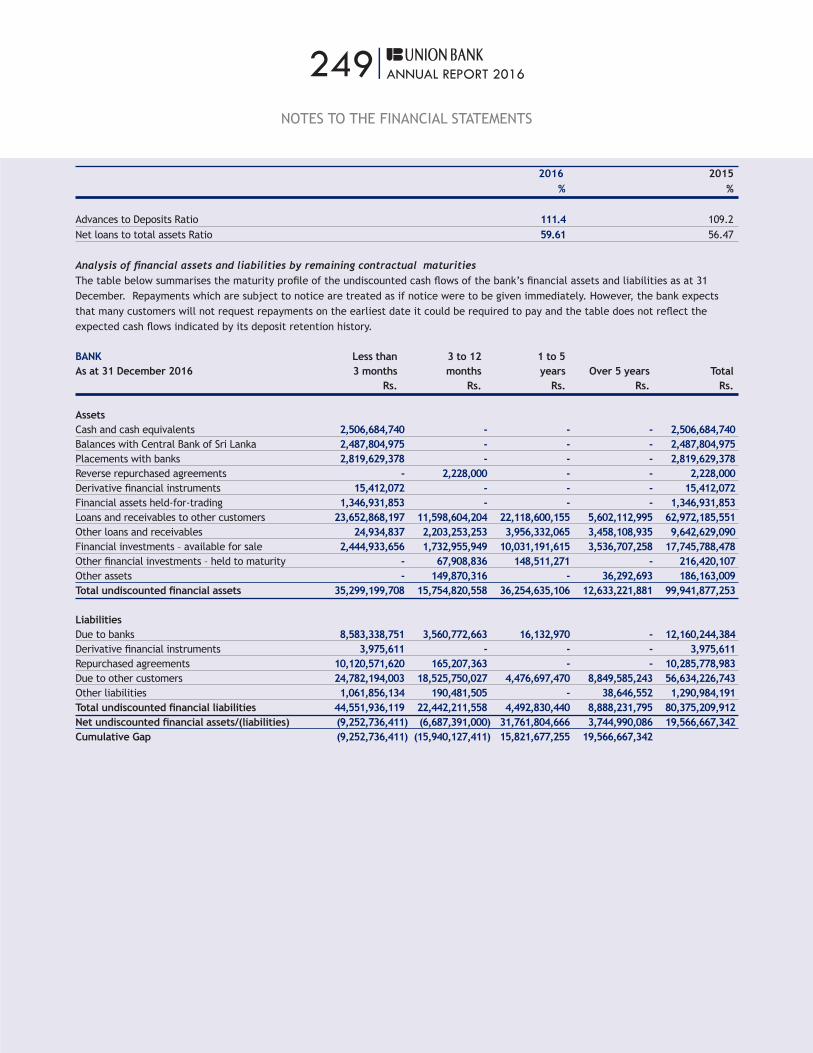
249|ANNUAL REPORT 2016
2016 2015 % %
Advances to Deposits Ratio 111.4 109.2Net loans to total assets Ratio 59.61 56.47
Analysis of financial assets and liabilities by remaining contractual maturitiesThe table below summarises the maturity profile of the undiscounted cash flows of the bank’s financial assets and liabilities as at 31 December. Repayments which are subject to notice are treated as if notice were to be given immediately. However, the bank expects that many customers will not request repayments on the earliest date it could be required to pay and the table does not reflect the expected cash flows indicated by its deposit retention history. BANK Less than 3 to 12 1 to 5 As at 31 December 2016 3 months months years Over 5 years Total Rs. Rs. Rs. Rs. Rs.
Assets Cash and cash equivalents 2,506,684,740 - - - 2,506,684,740 Balances with Central Bank of Sri Lanka 2,487,804,975 - - - 2,487,804,975 Placements with banks 2,819,629,378 - - - 2,819,629,378 Reverse repurchased agreements - 2,228,000 - - 2,228,000 Derivative financial instruments 15,412,072 - - - 15,412,072 Financial assets held-for-trading 1,346,931,853 - - - 1,346,931,853 Loans and receivables to other customers 23,652,868,197 11,598,604,204 22,118,600,155 5,602,112,995 62,972,185,551 Other loans and receivables 24,934,837 2,203,253,253 3,956,332,065 3,458,108,935 9,642,629,090 Financial investments – available for sale 2,444,933,656 1,732,955,949 10,031,191,615 3,536,707,258 17,745,788,478 Other financial investments – held to maturity - 67,908,836 148,511,271 - 216,420,107 Other assets - 149,870,316 - 36,292,693 186,163,009 Total undiscounted financial assets 35,299,199,708 15,754,820,558 36,254,635,106 12,633,221,881 99,941,877,253 Liabilities Due to banks 8,583,338,751 3,560,772,663 16,132,970 - 12,160,244,384Derivative financial instruments 3,975,611 - - - 3,975,611Repurchased agreements 10,120,571,620 165,207,363 - - 10,285,778,983 Due to other customers 24,782,194,003 18,525,750,027 4,476,697,470 8,849,585,243 56,634,226,743 Other liabilities 1,061,856,134 190,481,505 - 38,646,552 1,290,984,191Total undiscounted financial liabilities 44,551,936,119 22,442,211,558 4,492,830,440 8,888,231,795 80,375,209,912Net undiscounted financial assets/(liabilities) (9,252,736,411) (6,687,391,000) 31,761,804,666 3,744,990,086 19,566,667,342Cumulative Gap (9,252,736,411) (15,940,127,411) 15,821,677,255 19,566,667,342
NOTES TO THE FINANCIAL STATEMENTS
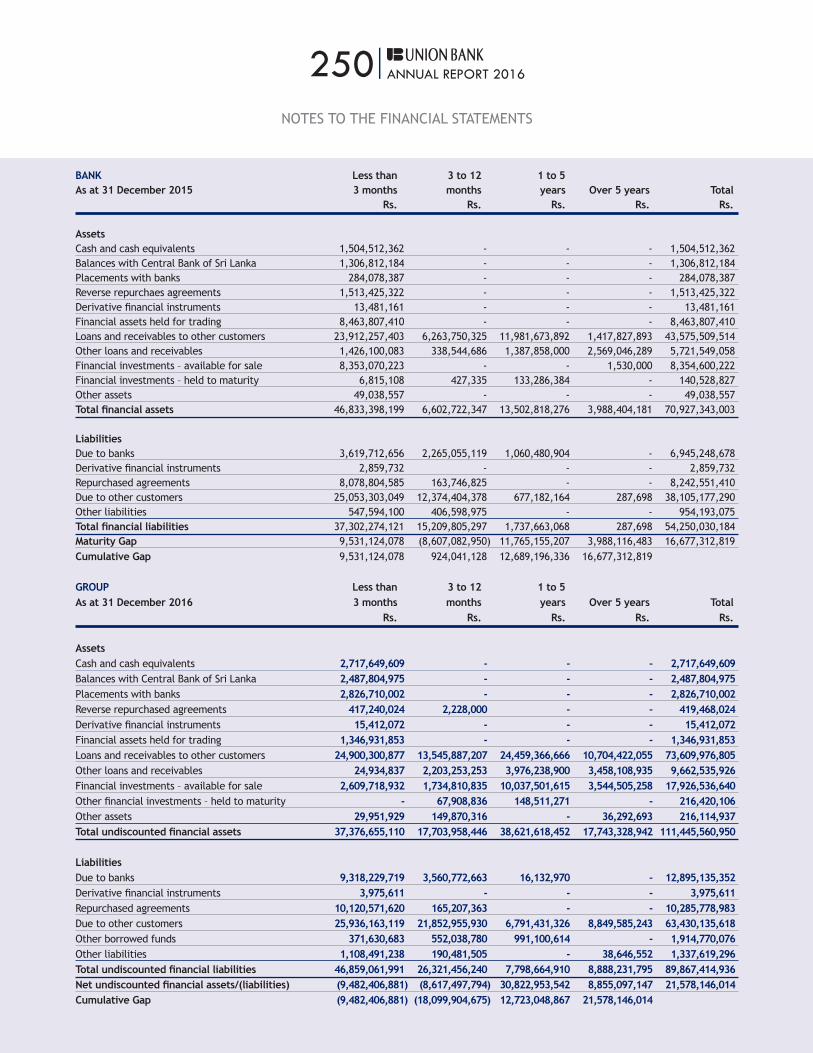
250|ANNUAL REPORT 2016
BANK Less than 3 to 12 1 to 5 As at 31 December 2015 3 months months years Over 5 years Total Rs. Rs. Rs. Rs. Rs. Assets Cash and cash equivalents 1,504,512,362 - - - 1,504,512,362 Balances with Central Bank of Sri Lanka 1,306,812,184 - - - 1,306,812,184 Placements with banks 284,078,387 - - - 284,078,387 Reverse repurchaes agreements 1,513,425,322 - - - 1,513,425,322 Derivative financial instruments 13,481,161 - - - 13,481,161 Financial assets held for trading 8,463,807,410 - - - 8,463,807,410 Loans and receivables to other customers 23,912,257,403 6,263,750,325 11,981,673,892 1,417,827,893 43,575,509,514 Other loans and receivables 1,426,100,083 338,544,686 1,387,858,000 2,569,046,289 5,721,549,058 Financial investments – available for sale 8,353,070,223 - - 1,530,000 8,354,600,222 Financial investments – held to maturity 6,815,108 427,335 133,286,384 - 140,528,827 Other assets 49,038,557 - - - 49,038,557 Total financial assets 46,833,398,199 6,602,722,347 13,502,818,276 3,988,404,181 70,927,343,003
Liabilities Due to banks 3,619,712,656 2,265,055,119 1,060,480,904 - 6,945,248,678Derivative financial instruments 2,859,732 - - - 2,859,732 Repurchased agreements 8,078,804,585 163,746,825 - - 8,242,551,410Due to other customers 25,053,303,049 12,374,404,378 677,182,164 287,698 38,105,177,290Other liabilities 547,594,100 406,598,975 - - 954,193,075Total financial liabilities 37,302,274,121 15,209,805,297 1,737,663,068 287,698 54,250,030,184Maturity Gap 9,531,124,078 (8,607,082,950) 11,765,155,207 3,988,116,483 16,677,312,819 Cumulative Gap 9,531,124,078 924,041,128 12,689,196,336 16,677,312,819
GROUP Less than 3 to 12 1 to 5 As at 31 December 2016 3 months months years Over 5 years Total Rs. Rs. Rs. Rs. Rs.
Assets Cash and cash equivalents 2,717,649,609 - - - 2,717,649,609 Balances with Central Bank of Sri Lanka 2,487,804,975 - - - 2,487,804,975 Placements with banks 2,826,710,002 - - - 2,826,710,002 Reverse repurchased agreements 417,240,024 2,228,000 - - 419,468,024 Derivative financial instruments 15,412,072 - - - 15,412,072 Financial assets held for trading 1,346,931,853 - - - 1,346,931,853 Loans and receivables to other customers 24,900,300,877 13,545,887,207 24,459,366,666 10,704,422,055 73,609,976,805 Other loans and receivables 24,934,837 2,203,253,253 3,976,238,900 3,458,108,935 9,662,535,926 Financial investments – available for sale 2,609,718,932 1,734,810,835 10,037,501,615 3,544,505,258 17,926,536,640 Other financial investments – held to maturity - 67,908,836 148,511,271 - 216,420,106 Other assets 29,951,929 149,870,316 - 36,292,693 216,114,937 Total undiscounted financial assets 37,376,655,110 17,703,958,446 38,621,618,452 17,743,328,942 111,445,560,950 Liabilities Due to banks 9,318,229,719 3,560,772,663 16,132,970 - 12,895,135,352 Derivative financial instruments 3,975,611 - - - 3,975,611 Repurchased agreements 10,120,571,620 165,207,363 - - 10,285,778,983 Due to other customers 25,936,163,119 21,852,955,930 6,791,431,326 8,849,585,243 63,430,135,618 Other borrowed funds 371,630,683 552,038,780 991,100,614 - 1,914,770,076 Other liabilities 1,108,491,238 190,481,505 - 38,646,552 1,337,619,296 Total undiscounted financial liabilities 46,859,061,991 26,321,456,240 7,798,664,910 8,888,231,795 89,867,414,936 Net undiscounted financial assets/(liabilities) (9,482,406,881) (8,617,497,794) 30,822,953,542 8,855,097,147 21,578,146,014 Cumulative Gap (9,482,406,881) (18,099,904,675) 12,723,048,867 21,578,146,014
NOTES TO THE FINANCIAL STATEMENTS

251|ANNUAL REPORT 2016
GROUP Less than 3 to 12 1 to 5 As at 31 December 2015 3 months months years Over 5 years Total Rs. Rs. Rs. Rs. Rs.
Assets Cash and cash equivalents 1,708,684,566 - - - 1,708,684,566Balances with Central Bank of Sri Lanka 1,306,812,184 - - - 1,306,812,184Placements with banks 294,074,296 - - - 294,074,296Reverse repurchaes agreements 1,619,467,075 - - - 1,619,467,075Derivative financial instruments 13,481,161 - - - 13,481,161Financial assets held-for-trading 8,463,807,410 - - - 8,463,807,410Loans and receivables to other customers 25,857,327,629 7,086,448,323 14,969,719,350 1,419,079,824 49,332,575,126Other loans and receivables 1,426,100,083 338,544,686 1,421,948,122 1,780,685,198 4,967,278,090Financial investments – Available for sale 8,506,460,709 - 32,098,344 - 8,538,559,053Financial investments – Held to maturity 6,815,108 427,335 133,286,384 - 140,528,827Other assets 75,136,055 - - - 75,136,055Total financial assets 49,278,166,276 7,425,420,345 16,557,052,200 3,199,765,022 76,460,403,841 Liabilities Due to banks 3,830,851,823 2,265,055,119 1,060,480,903 - 7,156,387,845Derivative financial instruments 2,859,732 - - - 2,859,732Repurchased agreements 7,830,786,240 163,746,825 - - 7,994,533,065Due to other customers 25,996,007,974 13,946,303,203 2,133,990,917 287,698 42,076,589,792Other borrowed funds 163,465,597 606,043,267 511,575,897 - 1,281,084,761Other liabilities 810,819,244 406,598,975 - - 1,217,418,219Total financial liabilities 38,634,790,610 17,387,747,388 3,706,047,718 287,698 59,728,873,414Maturity Gap 10,643,375,666 (9,962,327,044) 12,851,004,482 3,199,477,323 16,731,530,428 Cumulative Gap 10,643,375,666 681,048,623 13,532,053,104 16,731,530,428
NOTES TO THE FINANCIAL STATEMENTS

252|ANNUAL REPORT 2016
Contractual Maturities of Commitments and ContingenciesThe table below shows the contractual expiry by maturity of the bank’s contingent liabilities and commitments. Each undrawn loan commitment is included in the time band containing the earliest date it can be drawn down. For issued financial guarantee contracts, the maximum amount of the guarantee is allocated to the earliest period in which the guarantee could be called.
BANK AND GROUP Total On demand Less than 3 to 12 1 to 5 Over 5 3 months months years years As at 31 December 2016 Rs. Rs. Rs. Rs. Rs. Rs.
Commitments Undrawn OD 1,807,522,582 1,807,522,582 - - - - Commitments for Unutilised Facilities 24,211,608,860 24,211,608,860 - - - - Sub Total 26,019,131,442 26,019,131,442 - - - - Acceptances 598,330,193 205,329,312 376,228,651 16,772,230 - - Guarantees 3,929,129,666 328,354,434 1,799,594,463 1,517,325,092 283,855,677 - Documentary Credit 3,161,387,183 141,224,306 2,680,525,961 339,636,916 - - Others 1,042,383,971 217,521,917 675,841,078 13,061,872 87,041,697 48,917,407 Cheque pending for realisation 1,053,089,384 1,053,089,384 - - - - Sub Total 9,784,320,397 1,945,519,354 5,532,190,152 1,886,796,110 370,897,374 48,917,407 Spot Purchase 399,971,159 - 399,971,159 - - - Spot Sold 399,534,291 - 399,534,291 - - - Sub Total 799,505,450 - 799,505,450 - - - Forward bond 141,906,700 - 141,906,700 - - -Forward Contracts Bought 3,832,142,060 - 3,832,142,060 - - - Forward Contracts Sold 3,827,409,201 - 3,827,409,201 - - - Sub Total 7,801,457,961 - 7,801,457,961 - - - Total Commitments and Contingent Liability 44,404,415,250 27,964,650,796 14,133,153,563 1,886,796,110 370,897,374 48,917,407
BANK AND GROUP Total On demand Less than 3 to 12 1 to 5 Over 5 3 months months years years As at 31 December 2015 Rs. Rs. Rs. Rs. Rs. Rs.
Commitments Undrawn OD 1,258,676,287 1,258,676,287 - - - - Commitments for Unutilised Facilities 18,531,401,750 18,531,401,750 - - - - Sub Total 19,790,078,037 19,790,078,037 - - - - Acceptances 707,571,076 230,086,228 465,878,721 11,606,128 - - Guarantees 3,404,819,723 614,381,671 741,929,168 1,276,996,081 771,512,803 - Documentary Credit 2,151,474,153 123,209,631 1,686,408,384 341,856,138 - - Others 1,912,528,475 100,423,542 1,607,991,464 58,426,160 92,900,268 52,787,041 Cheque pending for realisation 576,309,106 576,309,106 - - - -Sub Total 8,752,702,533 1,644,410,178 4,502,207,736 1,688,884,506 864,413,071 52,787,041Spot Purchase 205,294,646 - 205,294,646 - - - Spot Sold 205,282,158 - 205,282,158 - - - Sub Total 410,576,804 - 410,576,804 - - - Forward Contracts Bought 2,756,856,647 - 2,756,856,647 - - - Forward Contracts Sold 2,763,543,286 - 2,763,543,286 - - - Sub Total 5,520,399,933 - 5,520,399,933 - - - Total Commitments and Contingent Liability 34,473,757,307 21,434,488,215 10,433,184,473 1,688,884,507 864,413,071 52,787,041
NOTES TO THE FINANCIAL STATEMENTS
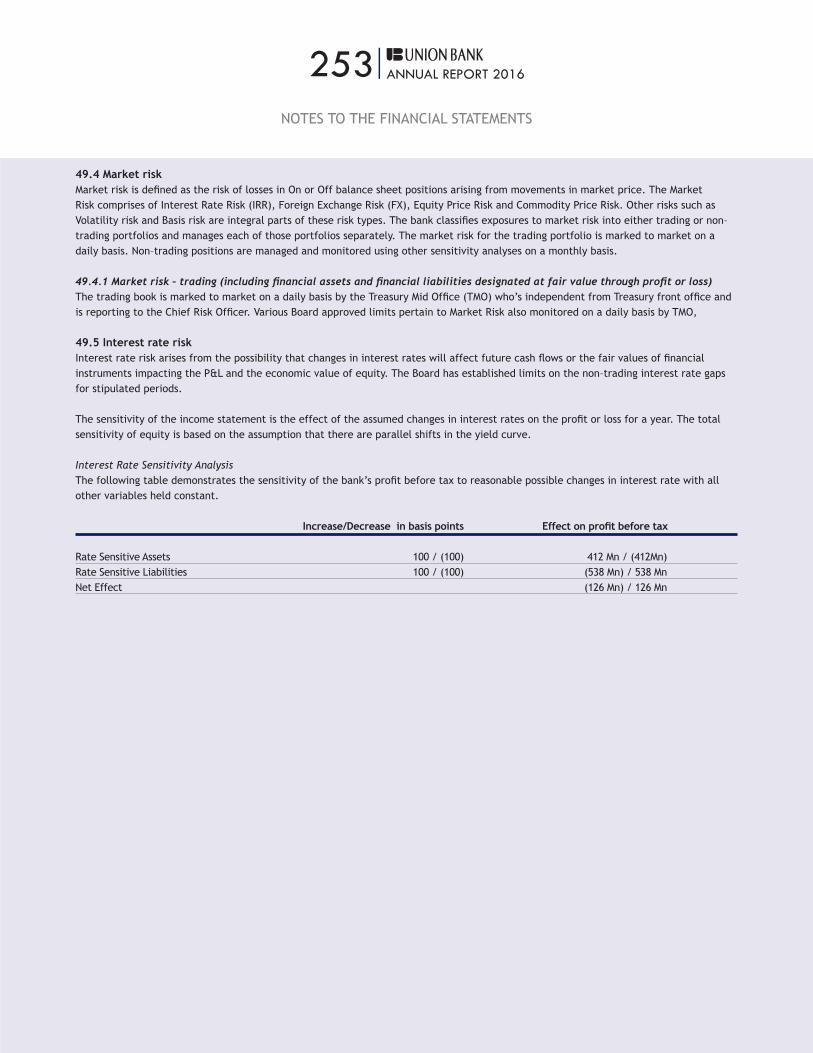
253|ANNUAL REPORT 2016
49.4 Market riskMarket risk is defined as the risk of losses in On or Off balance sheet positions arising from movements in market price. The Market Risk comprises of Interest Rate Risk (IRR), Foreign Exchange Risk (FX), Equity Price Risk and Commodity Price Risk. Other risks such as Volatility risk and Basis risk are integral parts of these risk types. The bank classifies exposures to market risk into either trading or non–trading portfolios and manages each of those portfolios separately. The market risk for the trading portfolio is marked to market on a daily basis. Non–trading positions are managed and monitored using other sensitivity analyses on a monthly basis.
49.4.1 Market risk – trading (including financial assets and financial liabilities designated at fair value through profit or loss)The trading book is marked to market on a daily basis by the Treasury Mid Office (TMO) who’s independent from Treasury front office and is reporting to the Chief Risk Officer. Various Board approved limits pertain to Market Risk also monitored on a daily basis by TMO,
49.5 Interest rate risk Interest rate risk arises from the possibility that changes in interest rates will affect future cash flows or the fair values of financial instruments impacting the P&L and the economic value of equity. The Board has established limits on the non–trading interest rate gaps for stipulated periods.
The sensitivity of the income statement is the effect of the assumed changes in interest rates on the profit or loss for a year. The total sensitivity of equity is based on the assumption that there are parallel shifts in the yield curve.
Interest Rate Sensitivity AnalysisThe following table demonstrates the sensitivity of the bank’s profit before tax to reasonable possible changes in interest rate with all other variables held constant.
Increase/Decrease in basis points Effect on profit before tax
Rate Sensitive Assets 100 / (100) 412 Mn / (412Mn)Rate Sensitive Liabilities 100 / (100) (538 Mn) / 538 MnNet Effect (126 Mn) / 126 Mn
NOTES TO THE FINANCIAL STATEMENTS

254|ANNUAL REPORT 2016
The table below analyses the bank’s interest rate risk exposure on financial assets and financial liabilities. The bank’s financial assets and financial liabilities are included at carrying amount and categorised by the earlier of contractual re–pricing or maturity dates.
BANK Carrying Less than 3 to 12 1 to 5 Over 5 Non-interest As at 31 December 2016 Amount 3 months months years years bearing Rs. Rs. Rs. Rs. Rs. Rs.
Assets Cash and cash equivalents 2,506,684,740 - - - - 2,506,684,740 Balances with Central Bank of Sri Lanka 2,487,804,975 - - - - 2,487,804,975 Placements with banks 2,819,629,378 2,819,629,378 - - - - Reverse repurchased agreements 2,137,425 - 2,137,425 - - - Derivative financial instruments 15,412,072 - - - - 15,412,072 Financial assets held for trading 1,346,931,853 - - - - 1,346,931,853 Loans and receivables to other customers 55,438,415,392 32,524,384,828 6,947,306,163 12,443,683,920 3,523,040,480 - Other loans and receivables 7,747,230,534 2,487,148,231 1,271,811,733 3,988,270,570 - - Financial investments – available for sale 16,520,364,654 2,690,179,314 3,024,568,000 7,913,580,600 2,890,506,740 1,530,000 Other Financial investments – held to maturity 140,231,001 430,623 47,665,108 92,135,270 - - Other assets 105,666,594 - - - - 105,666,594 Total financial assets 89,130,508,619 40,521,772,374 11,293,488,430 24,437,670,360 6,413,547,220 6,464,030,234
Liabilities Due to banks 12,160,244,384 8,583,338,751 3,560,772,663 16,132,970 - - Derivative financial instruments 3,975,611 - - - - 3,975,611 Repurchased agreements 10,256,669,765 10,102,958,419 153,711,347 - - - Due to other customers 51,841,371,937 31,842,946,621 15,195,741,265 1,257,496,570 - 3,545,187,481 Other liabilities 1,279,018,589 - - - - 1,279,018,589 Total financial liabilities 75,541,280,285 50,529,243,790 18,910,225,274 1,273,629,540 - 4,828,181,681 Interest Rate Sensitivity GAP 13,589,228,332 (10,007,471,416) (7,616,736,844) 23,164,040,820 6,413,547,220 1,635,848,553
NOTES TO THE FINANCIAL STATEMENTS

255|ANNUAL REPORT 2016
BANK Carrying Less than 3 to 12 1 to 5 Over 5 Non-interest As at 31 December 2015 Amount 3 months months years years bearing Rs. Rs. Rs. Rs. Rs. Rs.
Assets Cash and cash equivalents 1,504,512,362 - - - - 1,504,512,362 Balances with Central Bank of Sri Lanka 1,306,812,184 - - - - 1,306,812,184 Placements with banks 284,078,387 284,078,387 - - - -Reverse repurchased agreements 1,513,425,321 1,513,425,322 - - - -Derivative Financial Instruments 13,481,161 - - - - 13,481,161 Financial assets held for trading 8,463,807,409 322,788,700 79,999,987 76,027,986 - 7,984,990,736 Loans and receivables to other customers 40,095,331,952 23,720,718,432 5,948,475,303 9,485,576,706 940,561,511 - Other loans and receivables 5,721,549,058 1,426,100,083 338,544,686 3,956,904,289 - -Financial investments – available for sale 8,356,130,222 2,991,054,247 2,307,636,097 3,004,588,698 51,321,181 1,530,000 Financial investments – held to maturity 140,528,827 6,815,108 427,335 133,286,384 - -Other assets 49,038,557 - - - - 49,038,557 Total financial assets 67,448,695,439 30,264,980,282 8,675,083,408 16,656,384,062 991,882,692 10,860,364,999 Liabilities Due to banks 6,945,248,678 3,619,712,655 2,265,055,119 1,060,480,904 - -Derivative Financial Instruments 2,859,732 - - - - 2,859,732 Repurchased agreements 8,242,551,409 8,078,804,584 163,746,825 - - -Due to other customers 37,652,508,137 22,086,492,718 12,039,120,566 592,598,729 287,698 2,934,008,425Other liabilities 954,193,075 - - - - 954,193,075Total financial liabilities 53,797,361,030 33,785,009,958 14,467,922,509 1,653,079,633 287,698 3,891,061,232Interest Rate Sensitivity GAP 13,651,334,409 (3,520,029,680) (5,792,839,101) 15,003,304,429 991,594,993 6,969,303,767
GROUP Carrying Less than 3 to 12 1 to 5 Over 5 Non-interest As at 31 December 2016 Amount 3 months months years years bearing Rs. Rs. Rs. Rs. Rs. Rs.
Assets Cash and cash equivalents 2,717,649,609 - - - - 2,717,649,609 Balances with Central Bank of Sri Lanka 2,487,804,975 - - - - 2,487,804,975 Placements with banks 2,826,710,002 2,816,481,298 - - - 10,228,704 Reverse repurchased agreements 275,497,776 273,360,351 2,137,425 - - - Derivative Financial Instruments 15,412,072 - - - - 15,412,072 Financial assets held-for-trading 1,346,931,853 - - - - 1,346,931,853 Loans and receivables to other customers 62,931,935,591 35,585,680,045 6,860,033,612 13,125,678,282 7,360,543,652 - Other loans and receivables 6,739,578,189 2,487,148,231 1,271,811,733 2,980,618,225 - - Financial investments – available for sale 16,694,470,098 2,854,964,588 3,025,464,886 7,922,003,883 2,890,506,740 1,530,000 Other Financial investments – held to maturity 140,231,001 430,623 47,665,108 92,135,270 - - Other assets 123,349,094 - - - - 123,349,094 Total financial assets 96,299,570,260 44,018,065,136 11,207,112,764 24,120,435,660 10,251,050,392 6,702,906,307
Liabilities Due to banks 12,770,197,163 8,458,400,560 3,560,772,663 16,132,970 - 734,890,968 Derivative financial instruments 3,975,611 - - - - 3,975,611 Repurchased agreements 10,113,569,861 9,959,858,513 153,711,347 - - - Due to other customers 57,525,155,686 32,718,504,325 18,107,215,515 3,154,248,365 - 3,545,187,481 Other borrowed funds 833,094,572 365,847,855 424,395,962 42,850,756 - - Other liabilities 1,643,923,562 - - - - 1,643,923,562
Total financial liabilities 82,889,916,454 51,502,611,254 22,246,095,487 3,213,232,091 - 5,927,977,622 Interest Rate Sensitivity GAP 13,409,653,806 (7,484,546,118) (11,038,982,723) 20,907,203,570 10,251,050,392 774,928,685
NOTES TO THE FINANCIAL STATEMENTS

256|ANNUAL REPORT 2016
GROUP Carrying Less than 3 to 12 1 to 5 Over 5 Non-interest As at 31 December 2015 Amount 3 months months years years bearing Rs. Rs. Rs. Rs. Rs. Rs.
Assets Cash and cash equivalents 1,708,684,566 - - - - 1,708,684,566 Balances with Central Bank of Sri Lanka 1,306,812,184 - - - - 1,306,812,184 Placements with banks 294,074,296 284,078,387 - - - 9,995,909 Reverse repurchased agreements 1,619,467,074 1,619,467,074 - - - - Derivative financial instruments 13,481,161 - - - - 13,481,161 Financial assets held for trading 8,463,807,409 322,788,700 79,999,987 76,027,986 - 7,984,990,736 Loans and receivables to other customers 45,450,313,621 25,263,704,717 6,771,173,300 12,473,622,164 941,813,440 - Other loans and receivables 4,967,278,090 1,426,100,084 338,544,686 3,202,633,319 - - Financial investments – available for sale 8,538,559,055 2,991,054,249 2,307,636,097 3,004,588,698 51,321,181 183,958,831 Financial investments – held to maturity 140,528,827 6,815,108 427,335 133,286,384 - - Other assets 75,136,055 - - - - 75,136,055 Total financial assets 72,578,142,338 31,914,008,318 9,497,781,406 18,890,158,551 993,134,621 11,283,059,441
Liabilities Due to banks 7,156,387,845 3,619,712,655 2,265,055,119 1,060,480,904 - 211,139,167 Derivative financial instruments 2,859,732 2,859,732 Repurchased agreements 7,994,533,064 7,830,786,239 163,746,825 - - - Due to other customers 41,623,920,639 24,559,793,158 13,687,987,526 441,843,830 287,698 2,934,008,425 Other borrowed funds 1,281,084,761 163,465,597 606,043,267 511,575,897 - - Other liabilities 1,254,987,968 - - - - 1,254,987,968Total financial liabilities 59,313,774,008 36,173,757,650 16,722,832,737 2,013,900,631 287,698 4,402,995,292Interest Rate Sensitivity GAP 13,264,368,329 (4,259,749,331) (7,225,051,331) 16,876,257,920 992,846,922 6,880,064,149
Currency risk Currency risk is the risk that the value of a financial instrument will fluctuate due to changes in foreign exchange rates. The Board has set limits on positions by currency. In accordance with the bank’s policy, positions are monitored on a daily basis and hedging strategies are used to ensure positions are maintained within established limits. Following table illustrate the change to the Bank’s capital adequacy ratio (CAR) due to the volatility in exchange rate.
Adjusted CAR for the possible exchange rate movements Revised CAR After Stress Testing
If Exchange Rate Moves Down by Current 5% 10% 15%Bank Tier 1 Ratio 22.99% 22.99% 22.99% 22.97%Total CAR 22.35% 22.34% 22.34% 22.34%
Revised CAR After Stress Testing If Exchange Rate Moves Up by Current 5% 10% 15%Bank Tier 1 Ratio 22.99% 23.00% 23.00% 23.00%Total CAR 22.35% 22.35% 22.35% 22.35%
NOTES TO THE FINANCIAL STATEMENTS

257|ANNUAL REPORT 2016
Foreign currency Sensitivity The following table demonstrates the maximum impact in P & L for the maximum usage if the allowable Net Open Position limit Change Net Open Net Open in foreign Position (Before Position (After Effect currency rate Currency Sensitivity) Currency Sensitivity) on PBT2016 5%/-5% 88 Mn 93 Mn 4 Mn
Equity price riskEquity price risk is the risk that the fair value of equities decreases as the result of changes in the level of equity indices and individual stocks.
Country RiskCountry risk is the risk that an occurrence within a country could have an adverse effect on the Group directly by impairing the value of the Group or indirectly through an obligor’s inability to meet its obligations to the Group.
Generally, these occurrences relate, but are not limited to sovereign events such as defaults or restructuring; political events such as contested elections; restrictions on currency movements; non–market currency convertibility; regional conflicts; economic contagion from other events such as sovereign default issues or regional turmoil; banking and currency crisis; and natural disasters.
Geographical Analysis – Group
As at 31 December 2016 2015 Financial Financial Financial Financial Assets Liability Assets Liability Rs. Rs. Rs. Rs.
Asia 16,393,519 13,443,674 88,284,448 - Europe 40,093,976 - 25,752,692 1,579,757 America 1,141,602,674 353,722,944 128,611,521 31,575,602 Australia 3,590,514 - 2,553,033 - Middle East 928,874 - - - Total 1,202,609,557 367,166,619 245,201,695 33,155,359
Except for the above, the bank does not carry any other Financial Asset or Financial Liability outside Sri Lanka.
50. CAPITALThe Bank maintains an actively managed capital base to cover risks inherent in the business and meet the capital adequacy requirements of the local banking supervisor, Central Bank of Sri Lanka. The adequacy of the Bank’s capital is monitored using, among other measures, the rules and ratios established by the Basel Committee on Banking supervision.
During the past year, the Bank had complied in full with all its externally imposed capital requirements.
Capital managementThe primary objective of the Bank’s capital requirement policy is to ensure that the Bank complies with externally imposed capital requirements and maintains strong credit ratings and healthy capital ratios in order to support its business and to maximize shareholder value.
The Bank manages its capital structure and makes adjustments to it according to changes in economic conditions and the risk characteristics of its activities. In order to maintain or adjust the capital structure, the Bank may adjust the amount of dividend payment to shareholders.
NOTES TO THE FINANCIAL STATEMENTS
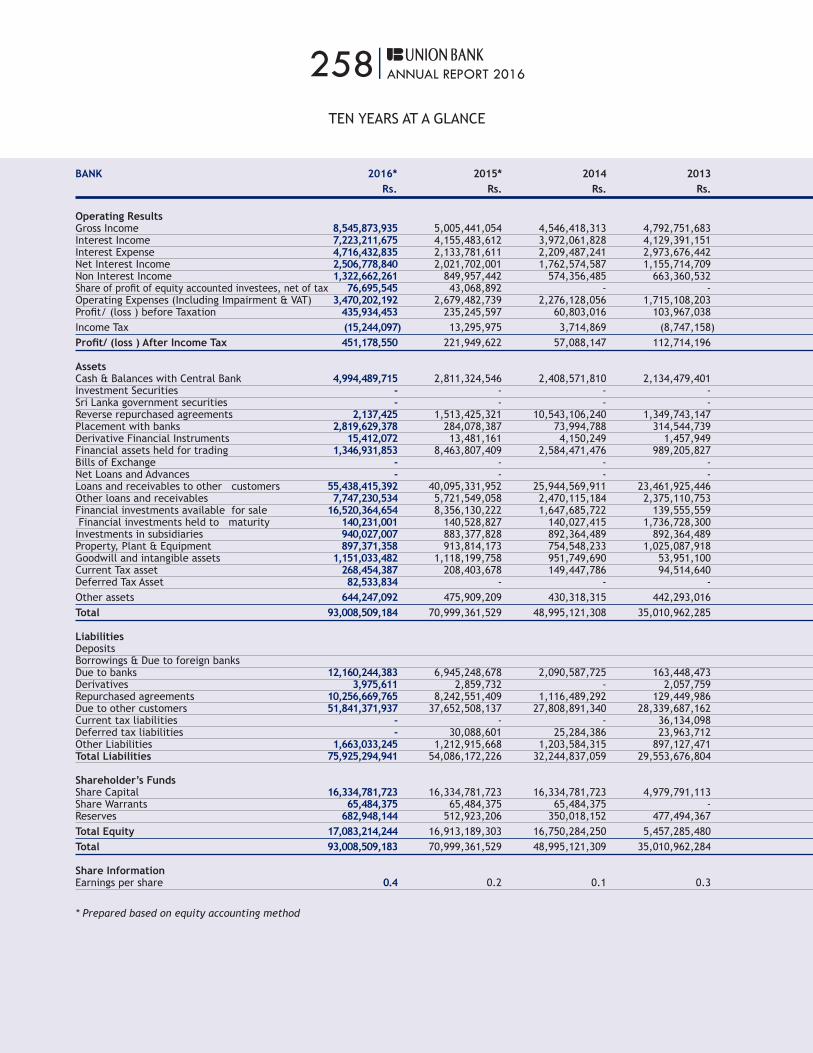
258|ANNUAL REPORT 2016
TEN YEARS AT A GLANCE
BANK 2016* 2015* 2014 2013 2012 2011 2010 2009 2008 2007 Rs. Rs. Rs. Rs. Rs. Rs. Rs. Rs. Rs. Rs.
Operating Results Gross Income 8,545,873,935 5,005,441,054 4,546,418,313 4,792,751,683 3,924,168,495 2,523,138,664 2,078,120,074 2,052,704,053 1,935,829,061 1,311,123,307Interest Income 7,223,211,675 4,155,483,612 3,972,061,828 4,129,391,151 3,444,113,712 2,083,742,198 1,771,976,557 1,855,783,799 1,750,332,385 1,155,289,418Interest Expense 4,716,432,835 2,133,781,611 2,209,487,241 2,973,676,442 2,211,052,866 1,102,214,847 997,841,287 1,392,872,704 1,387,000,585 912,902,139Net Interest Income 2,506,778,840 2,021,702,001 1,762,574,587 1,155,714,709 1,233,060,846 981,527,351 774,135,270 462,911,095 363,331,800 242,387,279Non Interest Income 1,322,662,261 849,957,442 574,356,485 663,360,532 480,054,783 413,064,131 306,143,517 196,920,254 185,496,676 155,833,889Share of profit of equity accounted investees, net of tax 76,695,545 43,068,892 - - - - - - - - Operating Expenses (Including Impairment & VAT) 3,470,202,192 2,679,482,739 2,276,128,056 1,715,108,203 1,250,140,978 943,347,956 772,287,079 525,848,281 473,383,144 357,256,743Profit/ (loss ) before Taxation 435,934,453 235,245,597 60,803,016 103,967,038 462,974,651 451,243,526 307,991,708 133,983,068 75,445,332 40,964,425Income Tax (15,244,097) 13,295,975 3,714,869 (8,747,158) 149,330,531 143,550,243 158,194,702 71,842,056 52,343,464 27,548,269Profit/ (loss ) After Income Tax 451,178,550 221,949,622 57,088,147 112,714,196 313,644,120 307,693,283 149,797,006 62,141,012 23,101,868 13,416,156 Assets Cash & Balances with Central Bank 4,994,489,715 2,811,324,546 2,408,571,810 2,134,479,401 2,325,986,601 1,887,571,088 1,092,431,525 1,396,635,110 2,144,048,967 1,855,471,509Investment Securities - - - - - - - 4,795,820,729 2,350,343,067 2,032,421,349Sri Lanka government securities - - - - 1,632,053,657 1,006,065,002 2,434,526,632 - - -Reverse repurchased agreements 2,137,425 1,513,425,321 10,543,106,240 1,349,743,147 601,312,663 245,126,821 1,852,604,648 - - -Placement with banks 2,819,629,378 284,078,387 73,994,788 314,544,739 1,601,622,423 1,951,977,627 943,348,776 - - -Derivative Financial Instruments 15,412,072 13,481,161 4,150,249 1,457,949 - 148,409 1,275,208 - - -Financial assets held for trading 1,346,931,853 8,463,807,409 2,584,471,476 989,205,827 431,054,402 149,622,004 161,205,900 - - -Bills of Exchange - - - - - - - 330,734,648 121,274,375 111,750,401Net Loans and Advances - - - - - - - 7,189,589,535 7,535,680,642 6,542,913,408Loans and receivables to other customers 55,438,415,392 40,095,331,952 25,944,569,911 23,461,925,446 20,024,729,288 17,292,929,045 9,919,464,662 - - -Other loans and receivables 7,747,230,534 5,721,549,058 2,470,115,184 2,375,110,753 - - - - - -Financial investments available for sale 16,520,364,654 8,356,130,222 1,647,685,722 139,555,559 - - - - - - Financial investments held to maturity 140,231,001 140,528,827 140,027,415 1,736,728,300 2,285,290,340 2,197,453,404 2,112,994,811 - - -Investments in subsidiaries 940,027,007 883,377,828 892,364,489 892,364,489 912,364,489 912,382,009 - - - -Property, Plant & Equipment 897,371,358 913,814,173 754,548,233 1,025,087,918 614,440,620 465,108,037 235,669,824 201,581,378 163,031,569 114,236,432Goodwill and intangible assets 1,151,033,482 1,118,199,758 951,749,690 53,951,100 39,995,579 10,670,522 4,024,643 - - -Current Tax asset 268,454,387 208,403,678 149,447,786 94,514,640 - - - 39,182,113 65,762,470 89,116,311Deferred Tax Asset 82,533,834 - - - - - - - - - Other assets 644,247,092 475,909,209 430,318,315 442,293,016 354,025,008 272,268,917 212,906,869 352,605,675 299,212,971 414,270,269Total 93,008,509,184 70,999,361,529 48,995,121,308 35,010,962,285 30,822,875,070 26,391,322,884 18,970,453,499 14,306,149,188 12,679,354,060 11,160,179,679 Liabilities Deposits Borrowings & Due to foreign banks Due to banks 12,160,244,383 6,945,248,678 2,090,587,725 163,448,473 911,898,460 380,999,451 320,824,567 11,963,995,607 10,492,076,858 8,932,543,714Derivatives 3,975,611 2,859,732 - 2,057,759 2,057,759 1,912,522 - 92,396,759 92,983,345 130,543,576Repurchased agreements 10,256,669,765 8,242,551,409 1,116,489,292 129,449,986 499,494,690 128,288,554 81,785,390 - - -Due to other customers 51,841,371,937 37,652,508,137 27,808,891,340 28,339,687,162 23,142,801,872 19,754,596,560 13,442,439,001 - - -Current tax liabilities - - - 36,134,098 36,134,098 21,534,610 - - - -Deferred tax liabilities - 30,088,601 25,284,386 23,963,712 37,155,236 19,661,352 5,884,454 - - -Other Liabilities 1,663,033,245 1,212,915,668 1,203,584,315 897,127,471 730,329,174 885,385,524 538,351,472 650,982,544 613,330,591 766,730,991Total Liabilities 75,925,294,941 54,086,172,226 32,244,837,059 29,553,676,804 25,359,871,290 21,192,378,574 14,414,047,864 12,707,374,910 11,198,390,794 9,829,818,281 Shareholder’s Funds Share Capital 16,334,781,723 16,334,781,723 16,334,781,723 4,979,791,113 4,979,791,113 4,979,791,113 4,604,791,113 1,813,170,000 1,757,500,000 1,630,000,000Share Warrants 65,484,375 65,484,375 65,484,375 - - - - - - -Reserves 682,948,144 512,923,206 350,018,152 477,494,367 483,212,668 219,153,197 (48,385,479) (214,395,722) (276,536,734) (299,638,602)Total Equity 17,083,214,244 16,913,189,303 16,750,284,250 5,457,285,480 5,463,003,781 5,198,944,310 4,556,405,634 1,598,774,278 1,480,963,266 1,330,361,398Total 93,008,509,183 70,999,361,529 48,995,121,309 35,010,962,284 30,822,875,071 26,391,322,884 18,970,453,498 14,306,149,188 12,679,354,060 11,160,179,679 Share Information Earnings per share 0.4 0.2 0.1 0.3 0.9 0.9 0.6 0.4 0.2 0.1
* Prepared based on equity accounting method

259|ANNUAL REPORT 2016
TEN YEARS AT A GLANCE
BANK 2016* 2015* 2014 2013 2012 2011 2010 2009 2008 2007 Rs. Rs. Rs. Rs. Rs. Rs. Rs. Rs. Rs. Rs.
Operating Results Gross Income 8,545,873,935 5,005,441,054 4,546,418,313 4,792,751,683 3,924,168,495 2,523,138,664 2,078,120,074 2,052,704,053 1,935,829,061 1,311,123,307Interest Income 7,223,211,675 4,155,483,612 3,972,061,828 4,129,391,151 3,444,113,712 2,083,742,198 1,771,976,557 1,855,783,799 1,750,332,385 1,155,289,418Interest Expense 4,716,432,835 2,133,781,611 2,209,487,241 2,973,676,442 2,211,052,866 1,102,214,847 997,841,287 1,392,872,704 1,387,000,585 912,902,139Net Interest Income 2,506,778,840 2,021,702,001 1,762,574,587 1,155,714,709 1,233,060,846 981,527,351 774,135,270 462,911,095 363,331,800 242,387,279Non Interest Income 1,322,662,261 849,957,442 574,356,485 663,360,532 480,054,783 413,064,131 306,143,517 196,920,254 185,496,676 155,833,889Share of profit of equity accounted investees, net of tax 76,695,545 43,068,892 - - - - - - - - Operating Expenses (Including Impairment & VAT) 3,470,202,192 2,679,482,739 2,276,128,056 1,715,108,203 1,250,140,978 943,347,956 772,287,079 525,848,281 473,383,144 357,256,743Profit/ (loss ) before Taxation 435,934,453 235,245,597 60,803,016 103,967,038 462,974,651 451,243,526 307,991,708 133,983,068 75,445,332 40,964,425Income Tax (15,244,097) 13,295,975 3,714,869 (8,747,158) 149,330,531 143,550,243 158,194,702 71,842,056 52,343,464 27,548,269Profit/ (loss ) After Income Tax 451,178,550 221,949,622 57,088,147 112,714,196 313,644,120 307,693,283 149,797,006 62,141,012 23,101,868 13,416,156 Assets Cash & Balances with Central Bank 4,994,489,715 2,811,324,546 2,408,571,810 2,134,479,401 2,325,986,601 1,887,571,088 1,092,431,525 1,396,635,110 2,144,048,967 1,855,471,509Investment Securities - - - - - - - 4,795,820,729 2,350,343,067 2,032,421,349Sri Lanka government securities - - - - 1,632,053,657 1,006,065,002 2,434,526,632 - - -Reverse repurchased agreements 2,137,425 1,513,425,321 10,543,106,240 1,349,743,147 601,312,663 245,126,821 1,852,604,648 - - -Placement with banks 2,819,629,378 284,078,387 73,994,788 314,544,739 1,601,622,423 1,951,977,627 943,348,776 - - -Derivative Financial Instruments 15,412,072 13,481,161 4,150,249 1,457,949 - 148,409 1,275,208 - - -Financial assets held for trading 1,346,931,853 8,463,807,409 2,584,471,476 989,205,827 431,054,402 149,622,004 161,205,900 - - -Bills of Exchange - - - - - - - 330,734,648 121,274,375 111,750,401Net Loans and Advances - - - - - - - 7,189,589,535 7,535,680,642 6,542,913,408Loans and receivables to other customers 55,438,415,392 40,095,331,952 25,944,569,911 23,461,925,446 20,024,729,288 17,292,929,045 9,919,464,662 - - -Other loans and receivables 7,747,230,534 5,721,549,058 2,470,115,184 2,375,110,753 - - - - - -Financial investments available for sale 16,520,364,654 8,356,130,222 1,647,685,722 139,555,559 - - - - - - Financial investments held to maturity 140,231,001 140,528,827 140,027,415 1,736,728,300 2,285,290,340 2,197,453,404 2,112,994,811 - - -Investments in subsidiaries 940,027,007 883,377,828 892,364,489 892,364,489 912,364,489 912,382,009 - - - -Property, Plant & Equipment 897,371,358 913,814,173 754,548,233 1,025,087,918 614,440,620 465,108,037 235,669,824 201,581,378 163,031,569 114,236,432Goodwill and intangible assets 1,151,033,482 1,118,199,758 951,749,690 53,951,100 39,995,579 10,670,522 4,024,643 - - -Current Tax asset 268,454,387 208,403,678 149,447,786 94,514,640 - - - 39,182,113 65,762,470 89,116,311Deferred Tax Asset 82,533,834 - - - - - - - - - Other assets 644,247,092 475,909,209 430,318,315 442,293,016 354,025,008 272,268,917 212,906,869 352,605,675 299,212,971 414,270,269Total 93,008,509,184 70,999,361,529 48,995,121,308 35,010,962,285 30,822,875,070 26,391,322,884 18,970,453,499 14,306,149,188 12,679,354,060 11,160,179,679 Liabilities Deposits Borrowings & Due to foreign banks Due to banks 12,160,244,383 6,945,248,678 2,090,587,725 163,448,473 911,898,460 380,999,451 320,824,567 11,963,995,607 10,492,076,858 8,932,543,714Derivatives 3,975,611 2,859,732 - 2,057,759 2,057,759 1,912,522 - 92,396,759 92,983,345 130,543,576Repurchased agreements 10,256,669,765 8,242,551,409 1,116,489,292 129,449,986 499,494,690 128,288,554 81,785,390 - - -Due to other customers 51,841,371,937 37,652,508,137 27,808,891,340 28,339,687,162 23,142,801,872 19,754,596,560 13,442,439,001 - - -Current tax liabilities - - - 36,134,098 36,134,098 21,534,610 - - - -Deferred tax liabilities - 30,088,601 25,284,386 23,963,712 37,155,236 19,661,352 5,884,454 - - -Other Liabilities 1,663,033,245 1,212,915,668 1,203,584,315 897,127,471 730,329,174 885,385,524 538,351,472 650,982,544 613,330,591 766,730,991Total Liabilities 75,925,294,941 54,086,172,226 32,244,837,059 29,553,676,804 25,359,871,290 21,192,378,574 14,414,047,864 12,707,374,910 11,198,390,794 9,829,818,281 Shareholder’s Funds Share Capital 16,334,781,723 16,334,781,723 16,334,781,723 4,979,791,113 4,979,791,113 4,979,791,113 4,604,791,113 1,813,170,000 1,757,500,000 1,630,000,000Share Warrants 65,484,375 65,484,375 65,484,375 - - - - - - -Reserves 682,948,144 512,923,206 350,018,152 477,494,367 483,212,668 219,153,197 (48,385,479) (214,395,722) (276,536,734) (299,638,602)Total Equity 17,083,214,244 16,913,189,303 16,750,284,250 5,457,285,480 5,463,003,781 5,198,944,310 4,556,405,634 1,598,774,278 1,480,963,266 1,330,361,398Total 93,008,509,183 70,999,361,529 48,995,121,309 35,010,962,284 30,822,875,071 26,391,322,884 18,970,453,498 14,306,149,188 12,679,354,060 11,160,179,679 Share Information Earnings per share 0.4 0.2 0.1 0.3 0.9 0.9 0.6 0.4 0.2 0.1
* Prepared based on equity accounting method
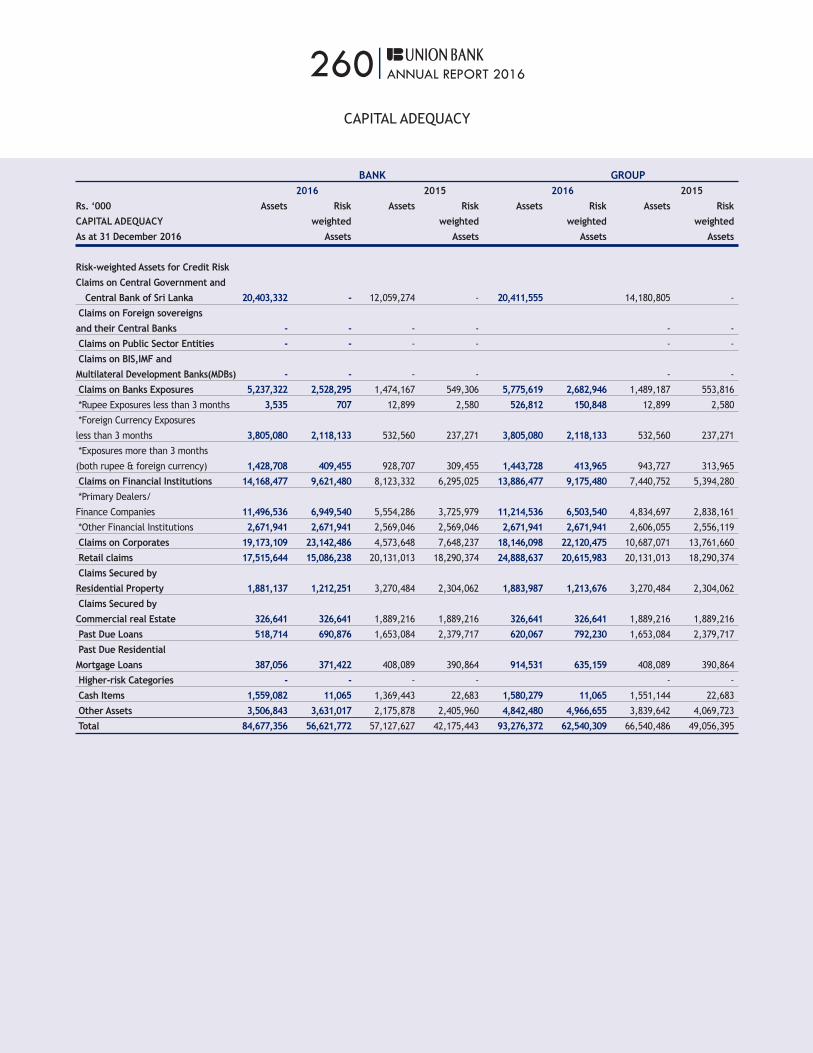
260|ANNUAL REPORT 2016
CAPITAL ADEQUACY
BANK GROUP 2016 2015 2016 2015 Rs. ‘000 Assets Risk Assets Risk Assets Risk Assets Risk CAPITAL ADEQUACY weighted weighted weighted weighted As at 31 December 2016 Assets Assets Assets Assets
Risk-weighted Assets for Credit Risk
Claims on Central Government and Central Bank of Sri Lanka 20,403,332 - 12,059,274 - 20,411,555 14,180,805 -
Claims on Foreign sovereigns and their Central Banks - - - - - -
Claims on Public Sector Entities - - - - - -
Claims on BIS,IMF and Multilateral Development Banks(MDBs) - - - - - -
Claims on Banks Exposures 5,237,322 2,528,295 1,474,167 549,306 5,775,619 2,682,946 1,489,187 553,816
*Rupee Exposures less than 3 months 3,535 707 12,899 2,580 526,812 150,848 12,899 2,580
*Foreign Currency Exposures
less than 3 months 3,805,080 2,118,133 532,560 237,271 3,805,080 2,118,133 532,560 237,271
*Exposures more than 3 months
(both rupee & foreign currency) 1,428,708 409,455 928,707 309,455 1,443,728 413,965 943,727 313,965
Claims on Financial Institutions 14,168,477 9,621,480 8,123,332 6,295,025 13,886,477 9,175,480 7,440,752 5,394,280
*Primary Dealers/
Finance Companies 11,496,536 6,949,540 5,554,286 3,725,979 11,214,536 6,503,540 4,834,697 2,838,161
*Other Financial Institutions 2,671,941 2,671,941 2,569,046 2,569,046 2,671,941 2,671,941 2,606,055 2,556,119
Claims on Corporates 19,173,109 23,142,486 4,573,648 7,648,237 18,146,098 22,120,475 10,687,071 13,761,660
Retail claims 17,515,644 15,086,238 20,131,013 18,290,374 24,888,637 20,615,983 20,131,013 18,290,374
Claims Secured by Residential Property 1,881,137 1,212,251 3,270,484 2,304,062 1,883,987 1,213,676 3,270,484 2,304,062
Claims Secured by Commercial real Estate 326,641 326,641 1,889,216 1,889,216 326,641 326,641 1,889,216 1,889,216
Past Due Loans 518,714 690,876 1,653,084 2,379,717 620,067 792,230 1,653,084 2,379,717
Past Due Residential Mortgage Loans 387,056 371,422 408,089 390,864 914,531 635,159 408,089 390,864
Higher-risk Categories - - - - - -
Cash Items 1,559,082 11,065 1,369,443 22,683 1,580,279 11,065 1,551,144 22,683
Other Assets 3,506,843 3,631,017 2,175,878 2,405,960 4,842,480 4,966,655 3,839,642 4,069,723
Total 84,677,356 56,621,772 57,127,627 42,175,443 93,276,372 62,540,309 66,540,486 49,056,395

261|ANNUAL REPORT 2016
CAPITAL ADEQUACY
BANK GROUP 2016 2015 2016 2015 Credit Principal Credit Principal Credit Principal Credit Principal Credit Rs. ‘000 Conversion amount of equivalent amount of equivalent of amount of equivalent of amount of equivalent of Factor Off-balance Off-balance Off-balance Off-balance Off-balance Off-balance Off-balance Off-balance As at 31 December 2016 (%) sheet items sheet items sheet items sheet items sheet items sheet items sheet items sheet items
Off-balance sheet ItemsDirect Credit Substitutes
General Guarantees of Indebtedness 100% 1,184,846 1,184,846 910,218 910,218 1,184,846 1,184,846 649,048 649,048
Transaction-related Contingencies
Performance Bonds, Bid Bonds & Warranties 50% 1,335,868 667,934 1,411,557 705,779 1,335,868 667,934 1,740,864 870,432
Others 50% 2,484,346 1,242,173 2,244,411 1,122,206 2,484,346 1,242,173 3,482,587 1,741,294
Short-Term Self-Liquidating
Trade-Related Contingencies
Shipping Guarantees 20% 956,328 191,266 410,815 82,163 956,328 191,266 289,859 57,972
Documentary Letters of Credit 20% 3,161,387 632,277 2,151,474 430,295 3,161,387 632,277 695,143 139,029
Trade related acceptances 20% - - - - - -
Others 20% 598,330 119,666 707,571 141,514 598,330 119,666 541,478 108,296
Other Commitments with an Original maturity of up to one year or which can be unconditionally cancelled at any time
Formal Standby Facilities and Credit Lines 0% 7,212,948 10,712,109 7,212,948 10,712,109 -
Undrawn Term Loans 0% 15,655,974 8,539,223 15,655,974 8,539,223 -
Undrawn Overdraft Facilities/
Unused Credit Card Lines 0% 29,168,996 3,901,197 29,168,996 3,901,197 -
Others 0% 1,381,402 780,805 1,381,402 780,805 -
Commitments with an original maturity up to 1 year
Others (please specify) 20% 256,340 51,268 733,599 146,720 256,340 51,268 1,456,764 291,353
Other Commitments with an Original
Maturity of over one year
Undrawn Term Loans 50% -
Others 50% 145,814 72,907 166,723 83,361 145,814 72,907 185,188 92,594
Foreign Exchange Contracts
Original Maturity-less than one year 2% 9,169,221 183,384 7,472,286 149,446 9,169,221 183,384 1,615,029 32,301 Total 72,711,800 4,345,721 40,141,988 3,771,702 72,711,800 4,345,721 34,589,293 3,982,319
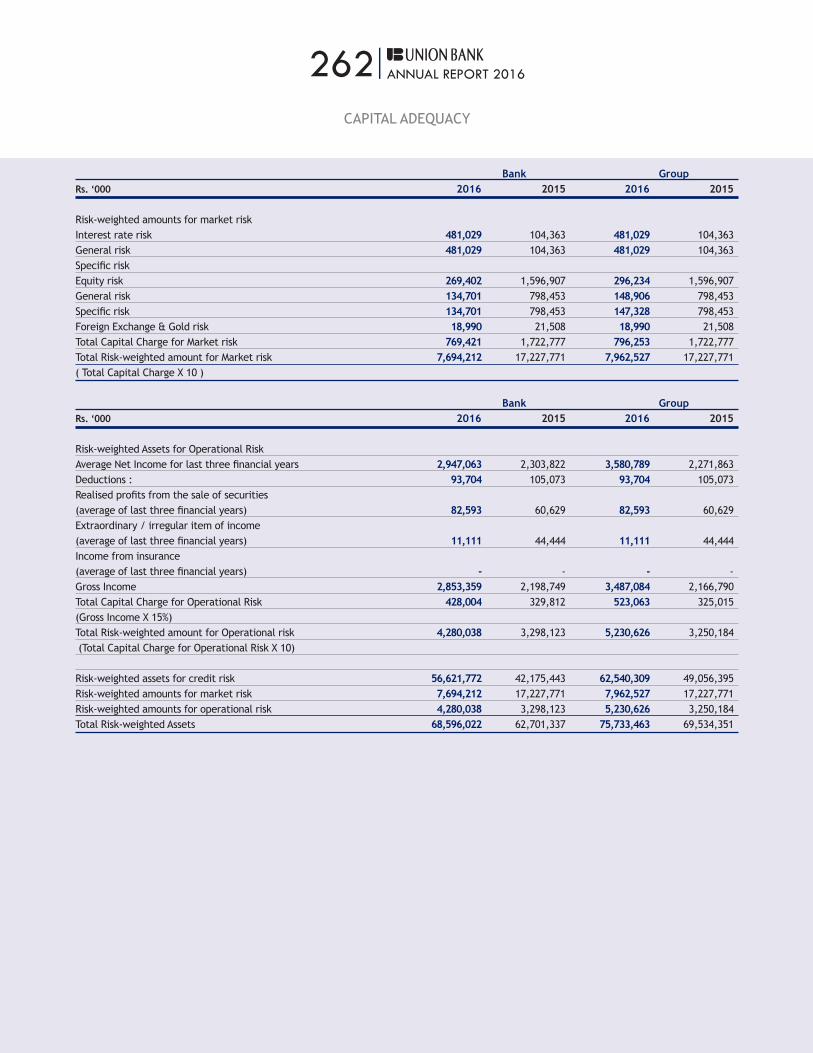
262|ANNUAL REPORT 2016
Bank Group Rs. ‘000 2016 2015 2016 2015
Risk-weighted amounts for market risk Interest rate risk 481,029 104,363 481,029 104,363 General risk 481,029 104,363 481,029 104,363 Specific risk Equity risk 269,402 1,596,907 296,234 1,596,907 General risk 134,701 798,453 148,906 798,453 Specific risk 134,701 798,453 147,328 798,453 Foreign Exchange & Gold risk 18,990 21,508 18,990 21,508 Total Capital Charge for Market risk 769,421 1,722,777 796,253 1,722,777 Total Risk-weighted amount for Market risk 7,694,212 17,227,771 7,962,527 17,227,771 ( Total Capital Charge X 10 ) Bank Group Rs. ‘000 2016 2015 2016 2015
Risk-weighted Assets for Operational Risk Average Net Income for last three financial years 2,947,063 2,303,822 3,580,789 2,271,863Deductions : 93,704 105,073 93,704 105,073Realised profits from the sale of securities (average of last three financial years) 82,593 60,629 82,593 60,629 Extraordinary / irregular item of income (average of last three financial years) 11,111 44,444 11,111 44,444Income from insurance (average of last three financial years) - - - -Gross Income 2,853,359 2,198,749 3,487,084 2,166,790Total Capital Charge for Operational Risk 428,004 329,812 523,063 325,015(Gross Income X 15%) Total Risk-weighted amount for Operational risk 4,280,038 3,298,123 5,230,626 3,250,184 (Total Capital Charge for Operational Risk X 10) Risk-weighted assets for credit risk 56,621,772 42,175,443 62,540,309 49,056,395 Risk-weighted amounts for market risk 7,694,212 17,227,771 7,962,527 17,227,771 Risk-weighted amounts for operational risk 4,280,038 3,298,123 5,230,626 3,250,184 Total Risk-weighted Assets 68,596,022 62,701,337 75,733,463 69,534,351
CAPITAL ADEQUACY
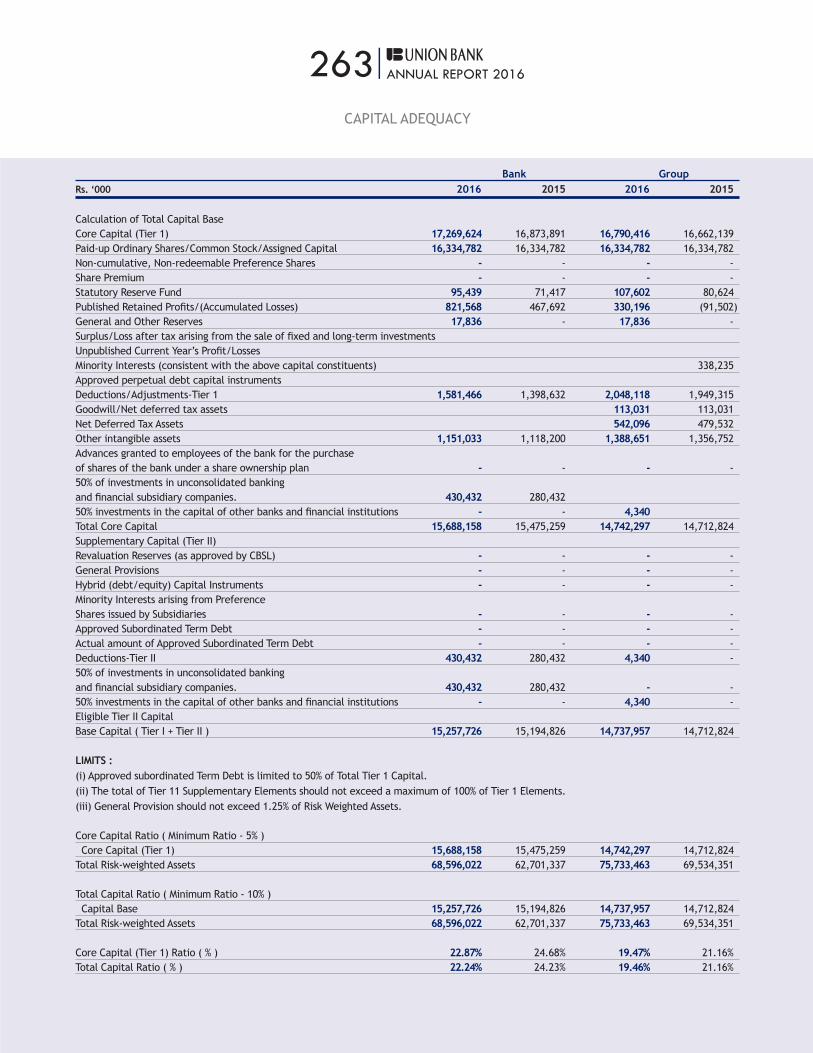
263|ANNUAL REPORT 2016
Bank Group Rs. ‘000 2016 2015 2016 2015
Calculation of Total Capital Base Core Capital (Tier 1) 17,269,624 16,873,891 16,790,416 16,662,139 Paid-up Ordinary Shares/Common Stock/Assigned Capital 16,334,782 16,334,782 16,334,782 16,334,782 Non-cumulative, Non-redeemable Preference Shares - - - -Share Premium - - - -Statutory Reserve Fund 95,439 71,417 107,602 80,624 Published Retained Profits/(Accumulated Losses) 821,568 467,692 330,196 (91,502)General and Other Reserves 17,836 - 17,836 - Surplus/Loss after tax arising from the sale of fixed and long-term investments Unpublished Current Year’s Profit/Losses Minority Interests (consistent with the above capital constituents) 338,235 Approved perpetual debt capital instruments Deductions/Adjustments-Tier 1 1,581,466 1,398,632 2,048,118 1,949,315 Goodwill/Net deferred tax assets 113,031 113,031 Net Deferred Tax Assets 542,096 479,532 Other intangible assets 1,151,033 1,118,200 1,388,651 1,356,752 Advances granted to employees of the bank for the purchase of shares of the bank under a share ownership plan - - - -50% of investments in unconsolidated banking and financial subsidiary companies. 430,432 280,432 50% investments in the capital of other banks and financial institutions - - 4,340 Total Core Capital 15,688,158 15,475,259 14,742,297 14,712,824 Supplementary Capital (Tier II) Revaluation Reserves (as approved by CBSL) - - - - General Provisions - - - - Hybrid (debt/equity) Capital Instruments - - - - Minority Interests arising from Preference Shares issued by Subsidiaries - - - - Approved Subordinated Term Debt - - - - Actual amount of Approved Subordinated Term Debt - - - - Deductions-Tier II 430,432 280,432 4,340 - 50% of investments in unconsolidated banking and financial subsidiary companies. 430,432 280,432 - - 50% investments in the capital of other banks and financial institutions - - 4,340 - Eligible Tier II Capital Base Capital ( Tier I + Tier II ) 15,257,726 15,194,826 14,737,957 14,712,824 LIMITS : (i) Approved subordinated Term Debt is limited to 50% of Total Tier 1 Capital. (ii) The total of Tier 11 Supplementary Elements should not exceed a maximum of 100% of Tier 1 Elements. (iii) General Provision should not exceed 1.25% of Risk Weighted Assets. Core Capital Ratio ( Minimum Ratio - 5% ) Core Capital (Tier 1) 15,688,158 15,475,259 14,742,297 14,712,824 Total Risk-weighted Assets 68,596,022 62,701,337 75,733,463 69,534,351 Total Capital Ratio ( Minimum Ratio - 10% ) Capital Base 15,257,726 15,194,826 14,737,957 14,712,824 Total Risk-weighted Assets 68,596,022 62,701,337 75,733,463 69,534,351 Core Capital (Tier 1) Ratio ( % ) 22.87% 24.68% 19.47% 21.16%Total Capital Ratio ( % ) 22.24% 24.23% 19.46% 21.16%
CAPITAL ADEQUACY

264|ANNUAL REPORT 2016
QUARTERLY PERFORMANCE OF THE BANK
2016 Quarter 1 Quarter 2 Quarter 3 Quarter 4 For the Quarter ended (Rs’000) Net Interest Income 443,834 534,664 672,326 855,955 Non Interest Income 322,621 354,036 357,373 196,570 Less: Impairment 2,610 15,818 20,106 113,780 Non Interest Expense 672,440 760,285 793,533 782,267 Operating Profit Before VAT and Corporate Tax 91,405 112,597 216,060 156,478 Share of profit of equity accounted investees, net of tax 39,546 26,435 10,718 (4)Operating Profit After Corporate Tax 119,932 99,967 118,727 112,552 As At the Quarter ended (Rs’000) Total Assets 75,822,970 82,301,622 86,782,731 93,008,509Loans and Receivables to other customers 43,258,695 48,513,345 52,418,239 55,438,415 Equity Capital and reserves 16,576,952 16,775,679 17,069,570 17,083,214 Regulatory Capital Adequacy Core Capital Adequacy Ratio, as % of Risk Weighted Assets (Minimum Requirement, 5%) 24.94% 23.21% 23.03% 23.13%Total Capital Adequacy Ratio, as % of Risk Weighted Assets (Minimum Requirement, 10%) 24.49% 22.78% 22.38% 22.50% Assets Quality Gross Non-Performing Advances Ratio, % (net of interest in suspense) 3.28% 2.90% 2.73% 2.40%Net-Non Performing Advances,% (net of interest in suspense and provision) 2.31% 2.00% 1.90% 1.56% Regulatory Liquidity Statutory Liquid Assets, Ratio (Minimum Requirement, 20% ) Domestic Banking Unit 20.43% 22.00% 22.25% 22.02%Off-Shore Banking Unit 21.50% 21.04% 22.66% 21.79% Profitability (Annualised) Interest Margin 2.42% 2.55% 2.79% 3.06%Return on Assets (before Tax) 0.48% 0.40% 0.44% 0.53%Return on Equity 2.86% 2.49% 2.25% 2.56% Ordinary share information Market Value (Rs) 16.60 16.50 17.00 20.20High (Rs) 20.80 16.70 17.60 17.10Low (Rs) 14.20 16.00 15.70 15.00
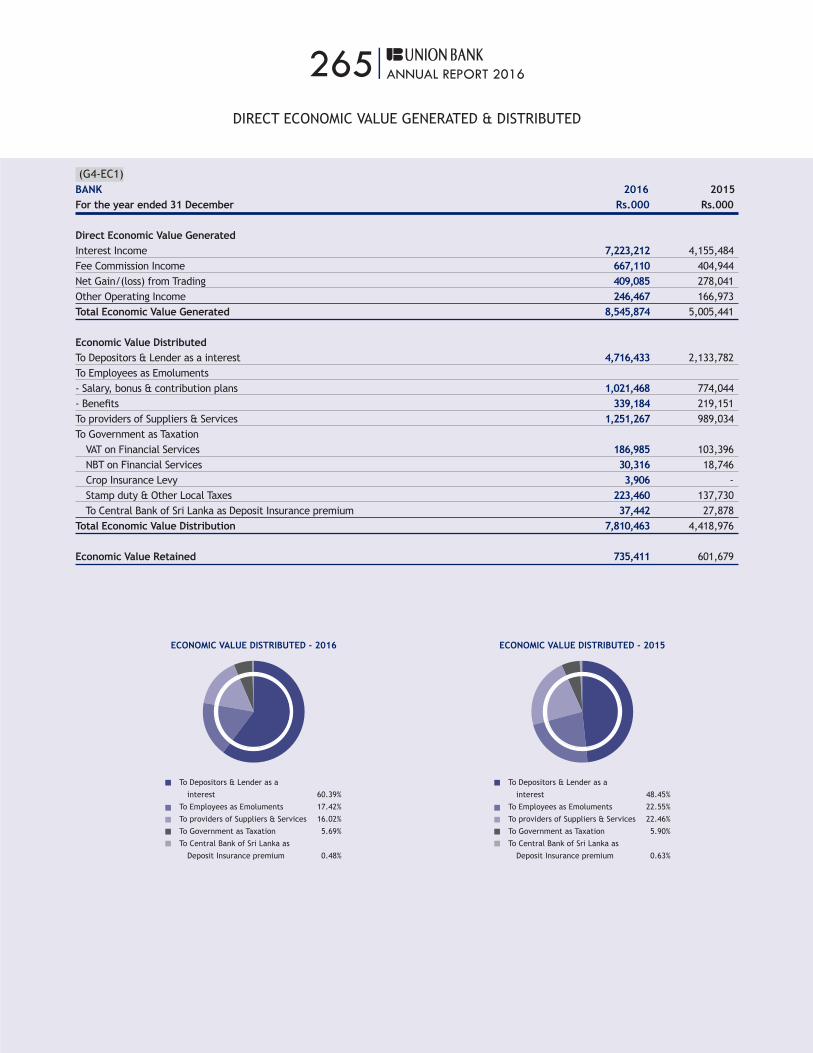
265|ANNUAL REPORT 2016
DIRECT ECONOMIC VALUE GENERATED & DISTRIBUTED
(G4-EC1)BANK 2016 2015For the year ended 31 December Rs.000 Rs.000
Direct Economic Value GeneratedInterest Income 7,223,212 4,155,484Fee Commission Income 667,110 404,944Net Gain/(loss) from Trading 409,085 278,041Other Operating Income 246,467 166,973Total Economic Value Generated 8,545,874 5,005,441
Economic Value DistributedTo Depositors & Lender as a interest 4,716,433 2,133,782To Employees as Emoluments- Salary, bonus & contribution plans 1,021,468 774,044- Benefits 339,184 219,151To providers of Suppliers & Services 1,251,267 989,034To Government as Taxation VAT on Financial Services 186,985 103,396 NBT on Financial Services 30,316 18,746 Crop Insurance Levy 3,906 - Stamp duty & Other Local Taxes 223,460 137,730 To Central Bank of Sri Lanka as Deposit Insurance premium 37,442 27,878Total Economic Value Distribution 7,810,463 4,418,976
Economic Value Retained 735,411 601,679
ECONOMIC VALUE DISTRIBUTED - 2016
To Depositors & Lender as a
interest 60.39%
To Employees as Emoluments 17.42%
To providers of Suppliers & Services 16.02%
To Government as Taxation 5.69%
To Central Bank of Sri Lanka as
Deposit Insurance premium 0.48%
ECONOMIC VALUE DISTRIBUTED - 2015
To Depositors & Lender as a
interest 48.45%
To Employees as Emoluments 22.55%
To providers of Suppliers & Services 22.46%
To Government as Taxation 5.90%
To Central Bank of Sri Lanka as
Deposit Insurance premium 0.63%

266|ANNUAL REPORT 2016
Given below is the state of compliance with the Disclosure requirements specified by the Central Bank of Sri Lanka for the preparation of Annual Financial Statements of Licensed Commercial Banks.
1 INFORMATION ABOUT THE SIGNIFICANCE OF FINANCIAL INSTRUMENTS FOR FINANCIAL POSITION AND PERFORMANCE
1.1 Statement of Financial Position
1.1.1 Disclosures on categories of financial assets and financial liabilities Note 41
1.1.2 Other disclosures
(i) Special disclosures about financial assets and financial liabilities designated to be measured at fair value through profit or loss, including disclosures about credit risk and market risk, changes in fair values attributable to these risks and the methods of measurement
(ii) Reclassifications of financial instruments from one category to another(iii) Information about financial assets pledged as collateral and about financial or non-financial assets
held as collateral(iv) Reconciliation of the allowance account for credit losses by class of financial assets(v) Information about compound financial instruments with multiple embedded derivatives(vi) Breaches of terms of loan agreements
N/A
N/ANote 43
Note 21.4N/AN/A
1.2 Statement of Comprehensive Income
1.2.1 Disclosures on items of income, expense, gains and losses Note 4, 5, 6, 7, 8, 9, 10, 11 and 12
1.2.2 Other disclosures
(i) Total interest income and total interest expense for those financial instruments that are not measured at fair value through profit and loss
(ii) Fee income and expense(iii) Amount of impairment losses by class of financial assets(iv) Interest income on impaired financial assets
Note 5
Note 6Note 9Note 5.1
1.3 Other disclosures
1.3.1 Accounting policies for financial instruments Note 3.1.9 , 3.1.2 , 3.2.3 , 21, 22, 23 and 24
1.3.2 Information on hedge accounting N/A
1.3.3 Information about the fair values of each class of financial asset and financial liability, along with:
(i) Comparable carrying amounts(ii) Description of how fair value was determined(iii) The level of inputs used in determining fair value(iv) Reconciliations of movements between levels of fair value measurement hierarchy, additional
disclosures for financial instruments that fair value is determined using level 3 inputs(v) Information if fair value cannot be reliably measured
Note 47Note 47Note 47Note 47
Note 47
2 INFORMATION ABOUT THE NATURE AND EXTENT OF RISKS ARISING FROM FINANCIAL INSTRUMENTS
2.1 Qualitative disclosures
2.1.1 Risk exposures for each type of financial instrument Note 49 - Risk Management
2.1.2 Management’s objectives, policies, and processes for managing those risks Note 49.1 - Risk Management
2.1.3 Changes from the prior period Risk Management
2.2 Quantitative disclosures
2.2.1 Summary of quantitative data about exposure to each risk at the reporting date Note 49 - Risk Management
COMPLIANCE WITH ANNUAL REPORT DISCLOSURE REQUIREMENTS OF CENTRAL BANK OF SRI LANKA
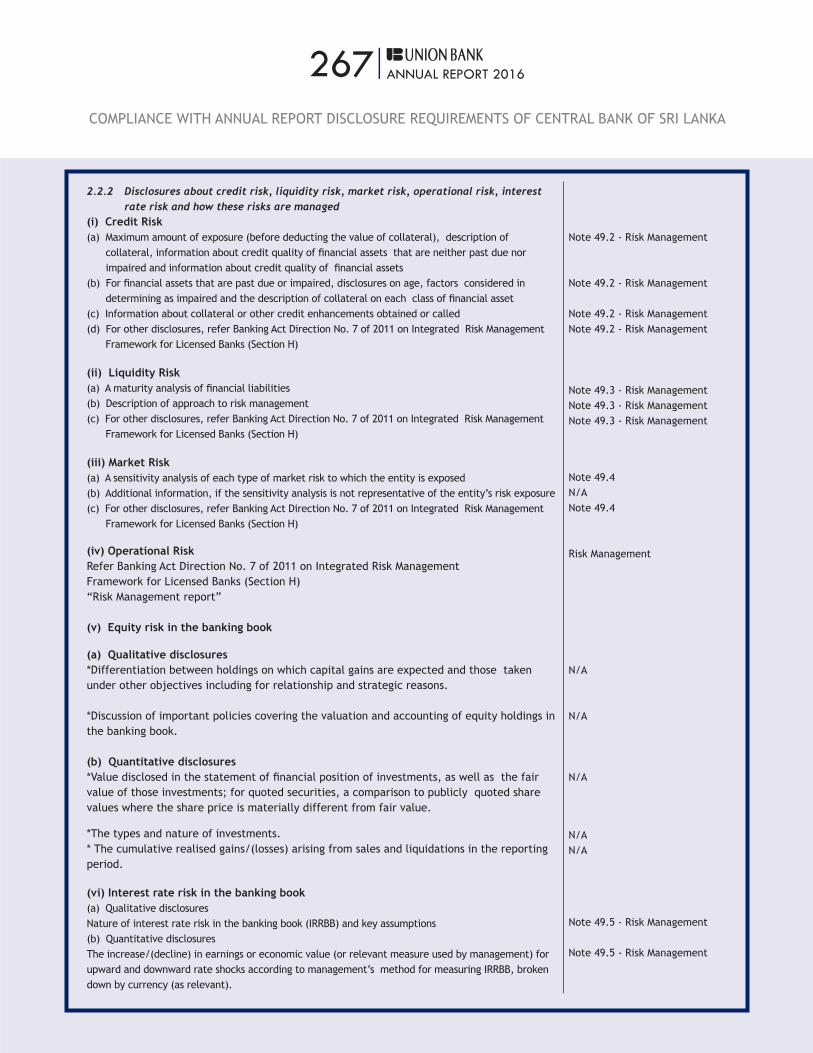
267|ANNUAL REPORT 2016
2.2.2 Disclosures about credit risk, liquidity risk, market risk, operational risk, interest rate risk and how these risks are managed
(i) Credit Risk(a) Maximum amount of exposure (before deducting the value of collateral), description of
collateral, information about credit quality of financial assets that are neither past due nor impaired and information about credit quality of financial assets
(b) For financial assets that are past due or impaired, disclosures on age, factors considered in determining as impaired and the description of collateral on each class of financial asset
(c) Information about collateral or other credit enhancements obtained or called(d) For other disclosures, refer Banking Act Direction No. 7 of 2011 on Integrated Risk Management
Framework for Licensed Banks (Section H)
(ii) Liquidity Risk(a) A maturity analysis of financial liabilities (b) Description of approach to risk management (c) For other disclosures, refer Banking Act Direction No. 7 of 2011 on Integrated Risk Management
Framework for Licensed Banks (Section H)
(iii) Market Risk(a) A sensitivity analysis of each type of market risk to which the entity is exposed (b) Additional information, if the sensitivity analysis is not representative of the entity’s risk exposure(c) For other disclosures, refer Banking Act Direction No. 7 of 2011 on Integrated Risk Management
Framework for Licensed Banks (Section H)
(iv) Operational RiskRefer Banking Act Direction No. 7 of 2011 on Integrated Risk Management Framework for Licensed Banks (Section H)“Risk Management report”
(v) Equity risk in the banking book
(a) Qualitative disclosures*Differentiation between holdings on which capital gains are expected and those taken under other objectives including for relationship and strategic reasons.
*Discussion of important policies covering the valuation and accounting of equity holdings in the banking book.
(b) Quantitative disclosures*Value disclosed in the statement of financial position of investments, as well as the fair value of those investments; for quoted securities, a comparison to publicly quoted share values where the share price is materially different from fair value.
*The types and nature of investments. * The cumulative realised gains/(losses) arising from sales and liquidations in the reporting period.
(vi) Interest rate risk in the banking book (a) Qualitative disclosuresNature of interest rate risk in the banking book (IRRBB) and key assumptions(b) Quantitative disclosuresThe increase/(decline) in earnings or economic value (or relevant measure used by management) for upward and downward rate shocks according to management’s method for measuring IRRBB, broken down by currency (as relevant).
Note 49.2 - Risk Management
Note 49.2 - Risk Management
Note 49.2 - Risk ManagementNote 49.2 - Risk Management
Note 49.3 - Risk ManagementNote 49.3 - Risk ManagementNote 49.3 - Risk Management
Note 49.4N/ANote 49.4
Risk Management
N/A
N/A
N/A
N/AN/A
Note 49.5 - Risk Management
Note 49.5 - Risk Management
COMPLIANCE WITH ANNUAL REPORT DISCLOSURE REQUIREMENTS OF CENTRAL BANK OF SRI LANKA

268|ANNUAL REPORT 2016
2.2.3 Information on concentrations of risk “Risk Management report” Risk Management
3 OTHER DISCLOSURES
3.1 Capital
3.1.1 Capital structure
i) Qualitative disclosuresSummary information on the terms and conditions of the main features of all capital instruments,
especially in the case of innovative, complex or hybrid capital instruments.(ii) Quantitative disclosures (a) The amount of Tier 1 capital, with separate disclosure of:*Paid-up share capital / common stock “Computation of Capital Adequacy Ratio”*Reserves*Non-controlling interests in the equity of subsidiaries*Innovative instruments*Other capital instruments*Deductions from Tier 1 capital(b) The total amount of Tier 2 and Tier 3 capital(c) Other deductions from capital(d) Total eligible capital
Note 50 - Capital Management
Capital Adequacy
Capital AdequacyCapital AdequacyCapital Adequacy
3.1.2 Capital adequacy(i) Qualitative disclosures “Computation of Capital Adequacy Ratio”A summary discussion of the bank’s approach to assessing the adequacy of its capital to support current and future activities.(ii) Quantitative disclosures(a) Capital requirements for credit risk, market risk and operational risk(b) Total and Tier 1 capital ratio
Capital Adequacy
Capital AdequacyCapital Adequacy
COMPLIANCE WITH ANNUAL REPORT DISCLOSURE REQUIREMENTS OF CENTRAL BANK OF SRI LANKA

269|ANNUAL REPORT 2016
A
AcceptancesThe signature on a bill of exchange indicates that the person on whom it is drawn accepts the conditions of the bill. In other words a bill of exchange that has been accepted.
Accounting PoliciesThe specific principals, bases, conventions, rules and practices adopted by an entity in preparing and presenting Financial Statements.
Accrual BasisRecognition of the effects of transactions and other events when they occur without waiting for receipt or payment of cash or its equivalents.
Actuarial Gain/LossGain or Loss arising from the difference between estimates and actual experience in a Company’s Pension Plan.
AmortisationThe systematic allocation of the depreciable amount of an intangible asset over its useful life.
Amortised CostThe amount at which the financial asset of financial liability is measured at initial recognition minus principal repayments, plus or minus the cumulative amortisation using the effective interest rate method of any difference between that initial amount and the maturity amount, and minus any reduction (directly or through the use if an allowance account) for impairment or in collectability.
Amounts Due to CustomersMoney deposited by account holders. Such funds are recorded as liabilities.
AssociatesAn entity, including an unincorporated entity such as a partnership, over which the investor has significant influence and that is neither a subsidiary nor an interest in a joint venture.
Asset and Liability Committee (ALCO)A risk-management committee in a bank that generally comprises the senior-management levels of the institution. The ALCO’s primary goal is to evaluate, monitor and approve practices relating to risk due to imbalances in the capital structure.
Among the factors considered are liquidity risk, interest rate risk, operational risk and external events that may affect the bank’s forecast and strategic balance-sheet allocations.
Available For Sale (AFS) Financial AssetsA debt or equity security that is purchased with the intent of selling before it reaches maturity, or selling prior to a lengthy time period in the event the security does not have a maturity.
B
Bills of CollectionA bill of exchange drawn by an exporter usually at a team, on an importer overseas and brought by the exporter to his Bank with a request to collect the proceeds.
Basel IIThe capital adequacy framework issued by the Basel Committee on Banking upervision in the form of the ‘international convergence of capital measurements and capital standards’.
Basel IIIThe Basel Committee on Banking Supervision’s details of strengthened global regulatory standards on Bank capital adequacy and liquidity.
Basis Point (BP)One hundredth of a percentage point, i.e., 100bp equals 1%, used in quoting movements in interest rates, security yields, etc.
C
Capital Adequacy RatioThe percentage of risk-adjusted assets supported by capital as defined under the framework of risk- based capital standards developed by the Bank for International Settlement (BIS) and as modified to suit local requirements by the Central Bank of Sri Lanka.
Capital Gain (Capital Profit)The gain on the disposal of an asset calculated by deducting the cost of the asset from the proceeds received on its disposal.
Capital ReservesCapital Reserves consist of revaluation reserves arising from revaluation of properties owned by the Bank and Reserve Fund set aside for specific purposes defined under the Banking Act, No 30 of 1988 and shall not be reduced or impaired without the approval of the Monetary Board.
Cash EquivalentsShort-term highly liquid investments that are readily convertible to known amounts of cash and which subject to an insignificant risk of changes in value.
Cash Flow HedgeA cash flow hedge is a hedge of the exposure to the variability in cash flows that (i) is attributable to a particular risk associated with a recognised asset or liability (such as all or some future interest payments on variable rate debt) or a highly probable forecast transaction and (ii) could affect profit or loss.
GLOSSARY OF FINANCIAL TERMS

270|ANNUAL REPORT 2016
Collectively Assessed Loan Impairment ProvisionsAlso known as portfolio impairment provisions. Impairment assessment on a collective basis for homogeneous groups of loans that are not considered individually significant and to cover losses that has been incurred but has not yet been identified at the reporting date. Typically assets within the Consumer Banking business (Housing, personal, vehicle loans etc) are assessed on a portfolio basis.
Commercial Paper (‘CP’)An unsecured, short-term debt instrument issued by a corporation, typically for the financing of accounts receivable, inventories and meeting short-term liabilities. The debt is usually issued at a discount, reflecting prevailing market interest rates.
CommitmentsCredit facilities approved but not yet utilised by the clients at the date of Statement of Financial Position.
ContingenciesA condition or situation existing at the date of the Statement of Financial Position where the outcome will be confirmed only by occurrence or non-occurrence of one or more future events.
ControlControl is the power over an investee, exposure, or rights, to variable returns from its involvement with the investee, and the ability to use its powers over the investee to affect the amount of the investor’s returns.
Corporate GovernanceThe process by which corporate entities are governed. It is concerned with the way in which power is exercised over the management and direction of entity, the supervision of executive actions and accountability to owners and others.
Correspondent BankA bank in a foreign country that offers banking facilities to the customers of a bank in another country.
Cost MethodA method of accounting whereby the investment is recorded at cost. The Income Statement reflects income from the investment only to the extent that the investor receives distributions from accumulated net profits of the investee arising subsequent to the date of acquisition.
Cost to Income RatioOperating expenses excluding impairment for loans and receivables and other losses as a percentage of total operating income.
Country RiskThe risk that a foreign government will not fulfill its obligations or obstructs the remittance of funds by debtors, either for financial reasons (transfer risk) or for other reasons (political risk).
Credit RatingAn evaluation of a corporate ability to repay its obligations or likelihood of not defaulting carried out by an independent rating agency.
Credit RiskCredit risk or default risk is most simply defined as the potential that a borrower or counterparty will fail to meet its obligations in accordance with agreed terms and conditions.
Credit Risk MitigationA technique to reduce the credit risk associated with an exposure by application of credit risk mitigants such as collateral, guarantee and credit protection.
Currency RiskThe risk that the fair value or future cash flows of a financial instrument will fluctuate because of changes in foreign exchange rates.
Currency SWAPsThe simultaneous purchase of an amount of a currency for spot settlement and the sale of the same amount of the same currency for forward settlement.
Customer DepositsMoney deposited by account holders. Such funds are recorded as liabilities.
D Dealing SecuritiesThese are marketable securities acquired and held with the intention to resale over a short period of time.
Deferred TaxationSum set aside in the Financial Statements that may become payable/ receivable in a financial year other than the current financial year. It arises because of temporary differences between tax rules and accounting conventions.
DelinquencyA debt or other financial obligation is considered to be in a state of delinquency when payments are overdue. Loans and advances are considered to be delinquent when consecutive payments are missed. Also known as ‘Arrears’.
DepreciationThe systematic allocation of the depreciable amount of an asset over its useful life.
DerecognitionRemoval of a previously recognised financial asset or financial liability from an entity’s statement of financial position.
DerivativesA derivative is a financial instrument or other contract, the value of which changes in response to some underlying variable (e.g., an interest rate).
GLOSSARY OF FINANCIAL TERMS
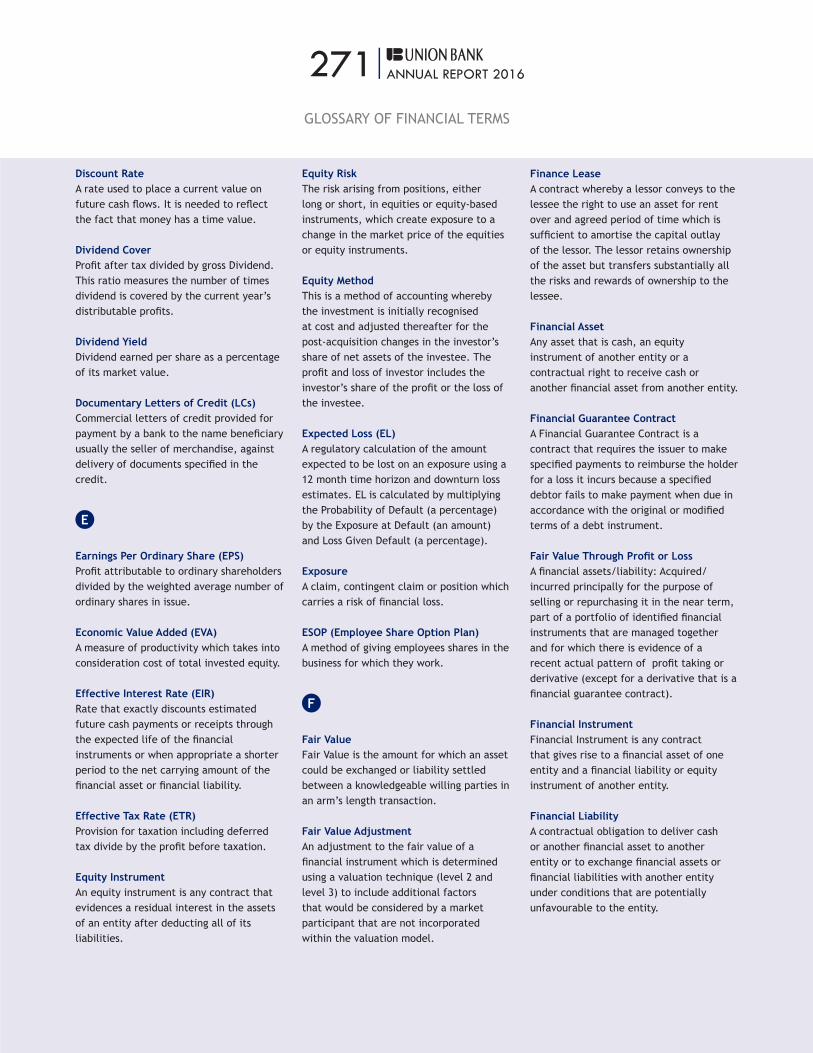
271|ANNUAL REPORT 2016
Discount RateA rate used to place a current value on future cash flows. It is needed to reflect the fact that money has a time value.
Dividend CoverProfit after tax divided by gross Dividend. This ratio measures the number of times dividend is covered by the current year’s distributable profits.
Dividend YieldDividend earned per share as a percentage of its market value.
Documentary Letters of Credit (LCs)Commercial letters of credit provided for payment by a bank to the name beneficiary usually the seller of merchandise, against delivery of documents specified in the credit.
E
Earnings Per Ordinary Share (EPS)Profit attributable to ordinary shareholders divided by the weighted average number of ordinary shares in issue.
Economic Value Added (EVA)A measure of productivity which takes into consideration cost of total invested equity.
Effective Interest Rate (EIR)Rate that exactly discounts estimated future cash payments or receipts through the expected life of the financial instruments or when appropriate a shorter period to the net carrying amount of the financial asset or financial liability.
Effective Tax Rate (ETR)Provision for taxation including deferred tax divide by the profit before taxation.
Equity InstrumentAn equity instrument is any contract that evidences a residual interest in the assets of an entity after deducting all of its liabilities.
Equity RiskThe risk arising from positions, either long or short, in equities or equity-based instruments, which create exposure to a change in the market price of the equities or equity instruments.
Equity MethodThis is a method of accounting whereby the investment is initially recognised at cost and adjusted thereafter for the post-acquisition changes in the investor’s share of net assets of the investee. The profit and loss of investor includes the investor’s share of the profit or the loss of the investee.
Expected Loss (EL)A regulatory calculation of the amount expected to be lost on an exposure using a 12 month time horizon and downturn loss estimates. EL is calculated by multiplying the Probability of Default (a percentage) by the Exposure at Default (an amount) and Loss Given Default (a percentage).
ExposureA claim, contingent claim or position which carries a risk of financial loss. ESOP (Employee Share Option Plan)A method of giving employees shares in the business for which they work.
F
Fair ValueFair Value is the amount for which an asset could be exchanged or liability settled between a knowledgeable willing parties in an arm’s length transaction. Fair Value AdjustmentAn adjustment to the fair value of a financial instrument which is determined using a valuation technique (level 2 and level 3) to include additional factors that would be considered by a market participant that are not incorporated within the valuation model.
Finance LeaseA contract whereby a lessor conveys to the lessee the right to use an asset for rent over and agreed period of time which is sufficient to amortise the capital outlay of the lessor. The lessor retains ownership of the asset but transfers substantially all the risks and rewards of ownership to the lessee.
Financial AssetAny asset that is cash, an equity instrument of another entity or a contractual right to receive cash or another financial asset from another entity.
Financial Guarantee ContractA Financial Guarantee Contract is a contract that requires the issuer to make specified payments to reimburse the holder for a loss it incurs because a specified debtor fails to make payment when due in accordance with the original or modified terms of a debt instrument. Fair Value Through Profit or LossA financial assets/liability: Acquired/incurred principally for the purpose of selling or repurchasing it in the near term, part of a portfolio of identified financial instruments that are managed together and for which there is evidence of a recent actual pattern of profit taking or derivative (except for a derivative that is a financial guarantee contract).
Financial InstrumentFinancial Instrument is any contract that gives rise to a financial asset of one entity and a financial liability or equity instrument of another entity.
Financial LiabilityA contractual obligation to deliver cash or another financial asset to another entity or to exchange financial assets or financial liabilities with another entity under conditions that are potentially unfavourable to the entity.
GLOSSARY OF FINANCIAL TERMS

272|ANNUAL REPORT 2016
Forward Exchange ContractAgreement between two parties to exchange one currency for another at a future date at a rate agreed upon today.
Foreign Exchange ProfitProfit earn on foreign currency transactions arising from the difference in foreign exchange rates between the transaction/last date of the Statement of Financial Position and the settlement/date of the Statement of Financial Position. Also arises from trading in foreign currencies.
Firm CommitmentA Firm Commitment is a binding agreement for the exchange of a specified quantity of resources at a specified price on a specified future date or dates.
G
GearingLong term borrowings divided by the total funds available for shareholders.
Gross DividendThe portion of profits distributed to the shareholders including the tax withheld.
GroupA group is a parent and all its subsidiaries & associates.
GuaranteesA promise made by a third party (Guarantor), who is not a party to a contract between two others, that the guarantor will be liable if the guarantee fails to fulfill the contractual obligations.
Held To Maturity (HTM) Financial AssetsHeld to maturity investments are non- derivative financial assets with fixed or determinable payments and a fixed maturity that an entity has the positive intention and ability to hold to maturity.
H
HedgingA strategy under which transactions are effected with the aim of providing cover against the risk of unfavourable price movements (Interest Rate, Prices and Commodities, etc.).
Held for TradingDebt and equity investments that are purchased with the intent of selling them within a short period of time (usually less than one year).
Historical CostHistorical cost is the original nominal value of an economic item.
I
ImpairmentThis occurs when recoverable amount of an asset is less than its carrying amount.
Impairment Charges for Loan LossesAmounts set aside against possible losses on loans, receivables and other credit facilities as a result of such facilities becoming partly or wholly uncollectible.
Impairment AllowancesManagement’s best estimate of losses incurred in the loan portfolios at the reporting date.
Individually Assessed ImpairmentIndividually Assessed Impairment Exposure to loss is assessed on all individually significant accounts and all other accounts that do not qualify for collective assessment. Intangible AssetAn identifiable non-monetary asset without physical substance held for use in the production / supply of goods / services or for rental to others or for administrative purposes.
Interest MarginNet interest income expressed as a percentage of interest earning assets.
Interest Rate RiskThe risk that the fair value or future cash flows of a financial instrument will fluctuate because of changes in market interest rates.
Interest Rate SWAPArrangement whereby one party exchanges one set of interest payments for another.
Interest SpreadThis represents the difference between the average interest rate earned and the average interest rate paid on funds.
Investment SecuritiesSecurities acquired and held for yield or capital growth purposes and are usually held to maturity.
Integrated ReportingA methodology of reporting an organisation’s strategy, governance, financial performance and prospects in relation to the creation of value over the short, medium and long term in its economic, social and environmental context.
K
Key Management PersonnelKey Management Personnel are those persons having authority and responsibility for planning, directing and controlling the activities of the entity, directly or indirectly, including any Director (whether Executive or otherwise) of that entity and key employees who are holding directorships in subsidiary companies and other key employees who meet the criteria mentioned above.
GLOSSARY OF FINANCIAL TERMS
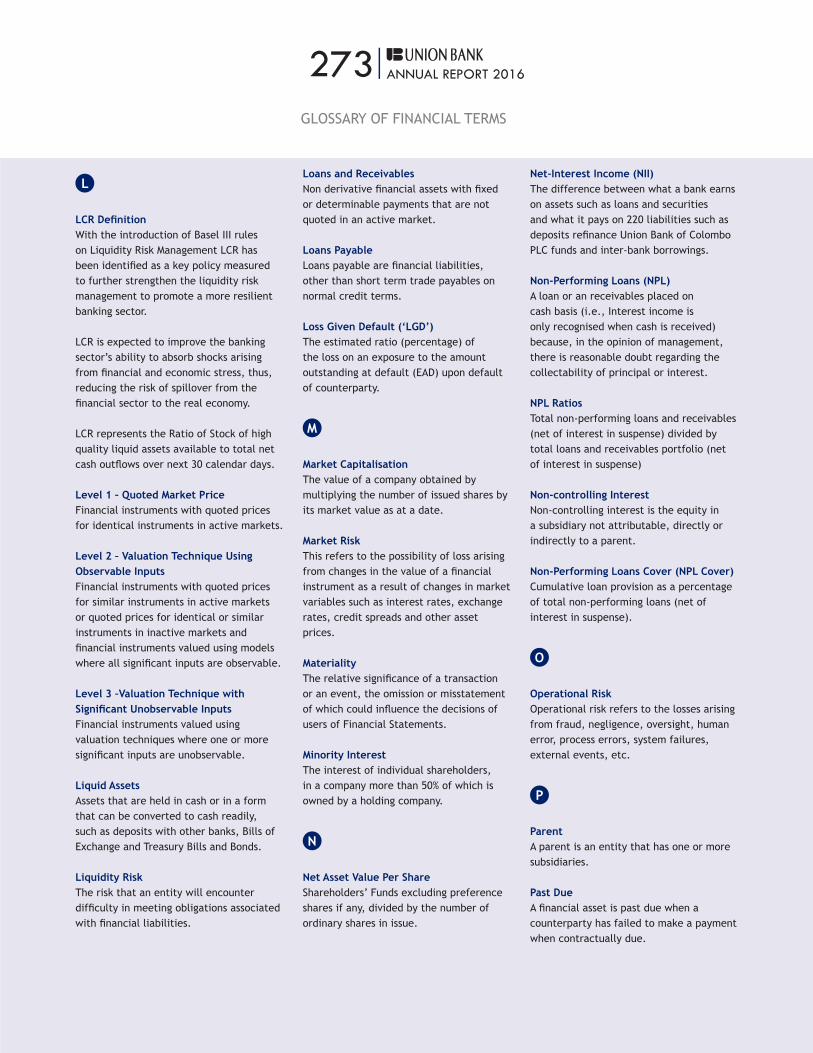
273|ANNUAL REPORT 2016
L
LCR DefinitionWith the introduction of Basel III rules on Liquidity Risk Management LCR has been identified as a key policy measured to further strengthen the liquidity risk management to promote a more resilient banking sector.
LCR is expected to improve the banking sector’s ability to absorb shocks arising from financial and economic stress, thus, reducing the risk of spillover from the financial sector to the real economy.
LCR represents the Ratio of Stock of high quality liquid assets available to total net cash outflows over next 30 calendar days.
Level 1 – Quoted Market PriceFinancial instruments with quoted prices for identical instruments in active markets.
Level 2 – Valuation Technique Using Observable InputsFinancial instruments with quoted prices for similar instruments in active markets or quoted prices for identical or similar instruments in inactive markets and financial instruments valued using models where all significant inputs are observable.
Level 3 –Valuation Technique with Significant Unobservable InputsFinancial instruments valued using valuation techniques where one or more significant inputs are unobservable.
Liquid AssetsAssets that are held in cash or in a form that can be converted to cash readily, such as deposits with other banks, Bills of Exchange and Treasury Bills and Bonds.
Liquidity RiskThe risk that an entity will encounter difficulty in meeting obligations associated with financial liabilities.
Loans and ReceivablesNon derivative financial assets with fixed or determinable payments that are not quoted in an active market.
Loans PayableLoans payable are financial liabilities, other than short term trade payables on normal credit terms.
Loss Given Default (‘LGD’)The estimated ratio (percentage) of the loss on an exposure to the amount outstanding at default (EAD) upon default of counterparty.
M
Market CapitalisationThe value of a company obtained by multiplying the number of issued shares by its market value as at a date.
Market RiskThis refers to the possibility of loss arising from changes in the value of a financial instrument as a result of changes in market variables such as interest rates, exchange rates, credit spreads and other asset prices.
MaterialityThe relative significance of a transaction or an event, the omission or misstatement of which could influence the decisions of users of Financial Statements.
Minority InterestThe interest of individual shareholders, in a company more than 50% of which is owned by a holding company.
N
Net Asset Value Per ShareShareholders’ Funds excluding preference shares if any, divided by the number of ordinary shares in issue.
Net-Interest Income (NII)The difference between what a bank earns on assets such as loans and securities and what it pays on 220 liabilities such as deposits refinance Union Bank of Colombo PLC funds and inter-bank borrowings. Non-Performing Loans (NPL)A loan or an receivables placed on cash basis (i.e., Interest income is only recognised when cash is received) because, in the opinion of management, there is reasonable doubt regarding the collectability of principal or interest.
NPL RatiosTotal non-performing loans and receivables (net of interest in suspense) divided by total loans and receivables portfolio (net of interest in suspense)
Non-controlling InterestNon-controlling interest is the equity in a subsidiary not attributable, directly or indirectly to a parent.
Non-Performing Loans Cover (NPL Cover) Cumulative loan provision as a percentage of total non-performing loans (net of interest in suspense).
O
Operational RiskOperational risk refers to the losses arising from fraud, negligence, oversight, human error, process errors, system failures, external events, etc.
P
ParentA parent is an entity that has one or more subsidiaries.
Past DueA financial asset is past due when a counterparty has failed to make a payment when contractually due.
GLOSSARY OF FINANCIAL TERMS
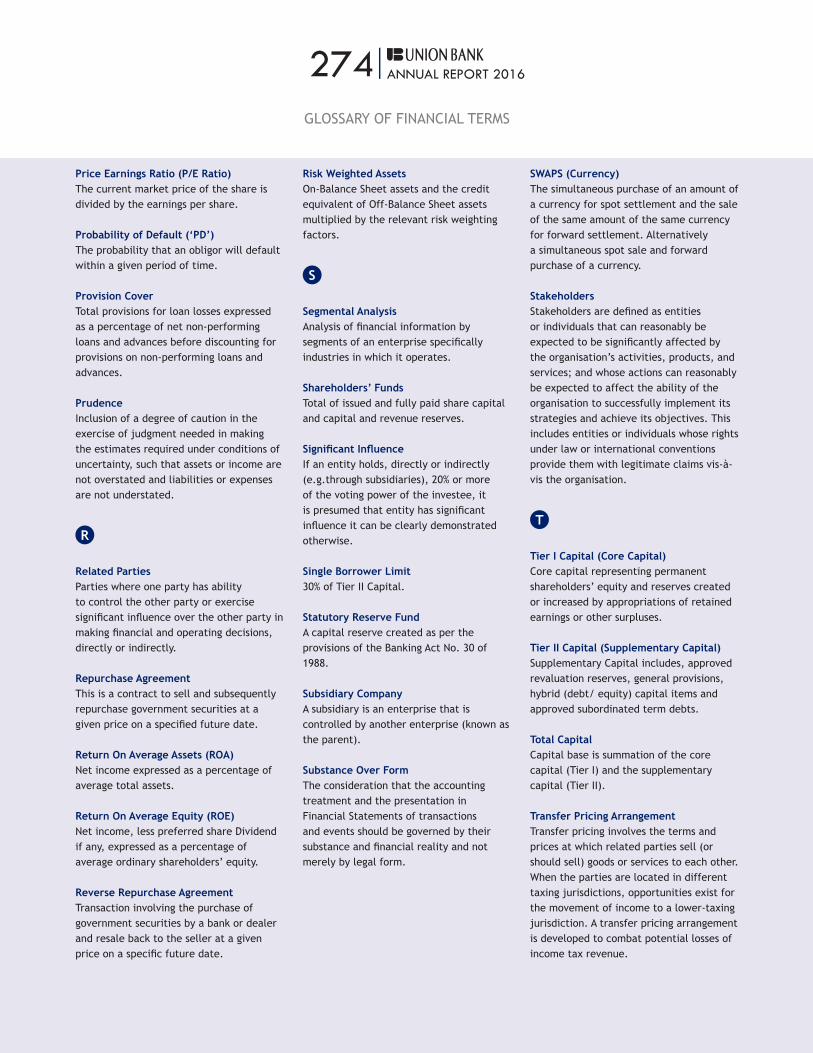
274|ANNUAL REPORT 2016
Price Earnings Ratio (P/E Ratio)The current market price of the share is divided by the earnings per share.
Probability of Default (‘PD’)The probability that an obligor will default within a given period of time.
Provision CoverTotal provisions for loan losses expressed as a percentage of net non-performing loans and advances before discounting for provisions on non-performing loans and advances. PrudenceInclusion of a degree of caution in the exercise of judgment needed in making the estimates required under conditions of uncertainty, such that assets or income are not overstated and liabilities or expenses are not understated.
R
Related PartiesParties where one party has ability to control the other party or exercise significant influence over the other party in making financial and operating decisions, directly or indirectly.
Repurchase AgreementThis is a contract to sell and subsequently repurchase government securities at a given price on a specified future date.
Return On Average Assets (ROA)Net income expressed as a percentage of average total assets.
Return On Average Equity (ROE)Net income, less preferred share Dividend if any, expressed as a percentage of average ordinary shareholders’ equity.
Reverse Repurchase AgreementTransaction involving the purchase of government securities by a bank or dealer and resale back to the seller at a given price on a specific future date.
Risk Weighted AssetsOn-Balance Sheet assets and the credit equivalent of Off-Balance Sheet assets multiplied by the relevant risk weighting factors.
S
Segmental AnalysisAnalysis of financial information by segments of an enterprise specifically industries in which it operates.
Shareholders’ FundsTotal of issued and fully paid share capital and capital and revenue reserves.
Significant InfluenceIf an entity holds, directly or indirectly (e.g.through subsidiaries), 20% or more of the voting power of the investee, it is presumed that entity has significant influence it can be clearly demonstrated otherwise.
Single Borrower Limit30% of Tier II Capital.
Statutory Reserve FundA capital reserve created as per the provisions of the Banking Act No. 30 of 1988.
Subsidiary CompanyA subsidiary is an enterprise that is controlled by another enterprise (known as the parent).
Substance Over FormThe consideration that the accounting treatment and the presentation in Financial Statements of transactions and events should be governed by their substance and financial reality and not merely by legal form.
SWAPS (Currency)The simultaneous purchase of an amount of a currency for spot settlement and the sale of the same amount of the same currency for forward settlement. Alternatively a simultaneous spot sale and forward purchase of a currency.
StakeholdersStakeholders are defined as entities or individuals that can reasonably be expected to be significantly affected by the organisation’s activities, products, and services; and whose actions can reasonably be expected to affect the ability of the organisation to successfully implement its strategies and achieve its objectives. This includes entities or individuals whose rights under law or international conventions provide them with legitimate claims vis-à-vis the organisation.
T
Tier I Capital (Core Capital)Core capital representing permanent shareholders’ equity and reserves created or increased by appropriations of retained earnings or other surpluses.
Tier II Capital (Supplementary Capital)Supplementary Capital includes, approved revaluation reserves, general provisions, hybrid (debt/ equity) capital items and approved subordinated term debts.
Total CapitalCapital base is summation of the core capital (Tier I) and the supplementary capital (Tier II).
Transfer Pricing ArrangementTransfer pricing involves the terms and prices at which related parties sell (or should sell) goods or services to each other. When the parties are located in different taxing jurisdictions, opportunities exist for the movement of income to a lower-taxing jurisdiction. A transfer pricing arrangement is developed to combat potential losses of income tax revenue.
GLOSSARY OF FINANCIAL TERMS

275|ANNUAL REPORT 2016
U
Unit TrustAn undertaking formed to invest in securities under the terms of a trust deed.
V
Value AddedValue of wealth created by providing banking and other related services less the cost of providing such services.
Value-at-Risk (‘VaR’)A measure of the loss that could occur on risk positions as a result of adverse movements in market risk factors (e.g., rates, prices, volatilities) over a specified time horizon and to a given level of confidence.
Y
Yield to MaturityDiscount rate at which the security’s present value of future payments would equal the security’s current price.
GLOSSARY OF FINANCIAL TERMS
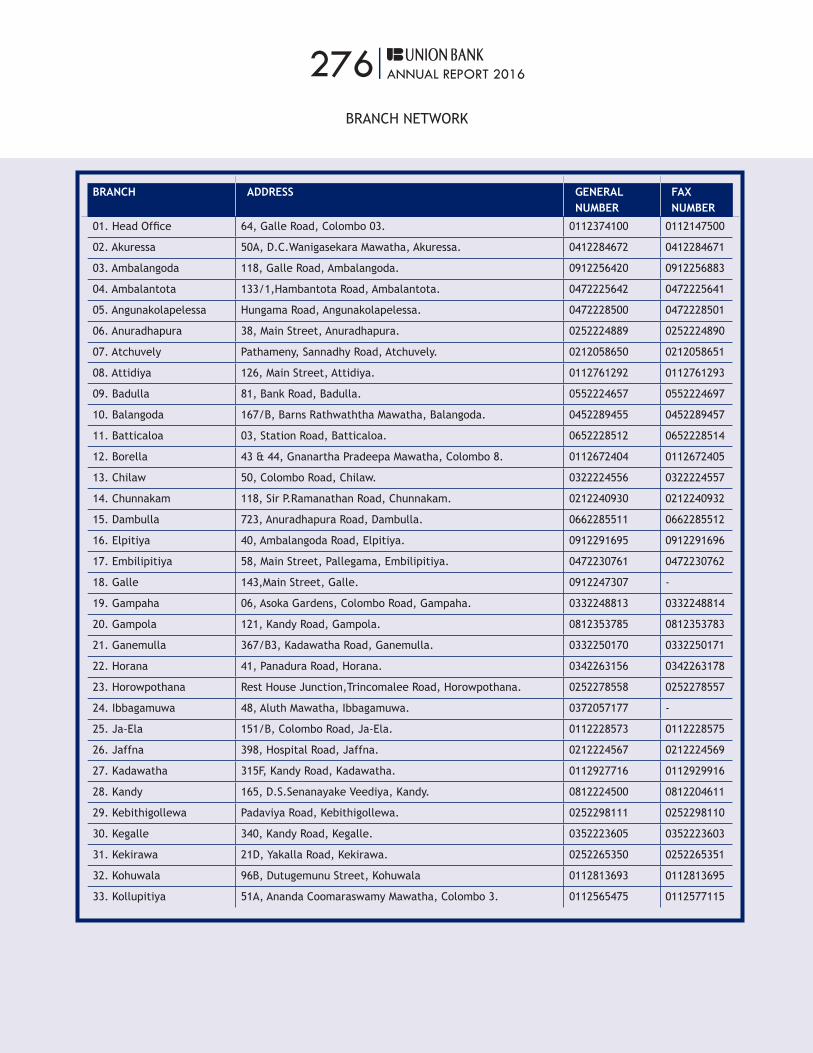
276|ANNUAL REPORT 2016
BRANCH NETWORK
BRANCH ADDRESS GENERAL NUMBER
FAX NUMBER
01. Head Office 64, Galle Road, Colombo 03. 0112374100 0112147500
02. Akuressa 50A, D.C.Wanigasekara Mawatha, Akuressa. 0412284672 0412284671
03. Ambalangoda 118, Galle Road, Ambalangoda. 0912256420 0912256883
04. Ambalantota 133/1,Hambantota Road, Ambalantota. 0472225642 0472225641
05. Angunakolapelessa Hungama Road, Angunakolapelessa. 0472228500 0472228501
06. Anuradhapura 38, Main Street, Anuradhapura. 0252224889 0252224890
07. Atchuvely Pathameny, Sannadhy Road, Atchuvely. 0212058650 0212058651
08. Attidiya 126, Main Street, Attidiya. 0112761292 0112761293
09. Badulla 81, Bank Road, Badulla. 0552224657 0552224697
10. Balangoda 167/B, Barns Rathwaththa Mawatha, Balangoda. 0452289455 0452289457
11. Batticaloa 03, Station Road, Batticaloa. 0652228512 0652228514
12. Borella 43 & 44, Gnanartha Pradeepa Mawatha, Colombo 8. 0112672404 0112672405
13. Chilaw 50, Colombo Road, Chilaw. 0322224556 0322224557
14. Chunnakam 118, Sir P.Ramanathan Road, Chunnakam. 0212240930 0212240932
15. Dambulla 723, Anuradhapura Road, Dambulla. 0662285511 0662285512
16. Elpitiya 40, Ambalangoda Road, Elpitiya. 0912291695 0912291696
17. Embilipitiya 58, Main Street, Pallegama, Embilipitiya. 0472230761 0472230762
18. Galle 143,Main Street, Galle. 0912247307 -
19. Gampaha 06, Asoka Gardens, Colombo Road, Gampaha. 0332248813 0332248814
20. Gampola 121, Kandy Road, Gampola. 0812353785 0812353783
21. Ganemulla 367/B3, Kadawatha Road, Ganemulla. 0332250170 0332250171
22. Horana 41, Panadura Road, Horana. 0342263156 0342263178
23. Horowpothana Rest House Junction,Trincomalee Road, Horowpothana. 0252278558 0252278557
24. Ibbagamuwa 48, Aluth Mawatha, Ibbagamuwa. 0372057177 -
25. Ja-Ela 151/B, Colombo Road, Ja-Ela. 0112228573 0112228575
26. Jaffna 398, Hospital Road, Jaffna. 0212224567 0212224569
27. Kadawatha 315F, Kandy Road, Kadawatha. 0112927716 0112929916
28. Kandy 165, D.S.Senanayake Veediya, Kandy. 0812224500 0812204611
29. Kebithigollewa Padaviya Road, Kebithigollewa. 0252298111 0252298110
30. Kegalle 340, Kandy Road, Kegalle. 0352223605 0352223603
31. Kekirawa 21D, Yakalla Road, Kekirawa. 0252265350 0252265351
32. Kohuwala 96B, Dutugemunu Street, Kohuwala 0112813693 0112813695
33. Kollupitiya 51A, Ananda Coomaraswamy Mawatha, Colombo 3. 0112565475 0112577115
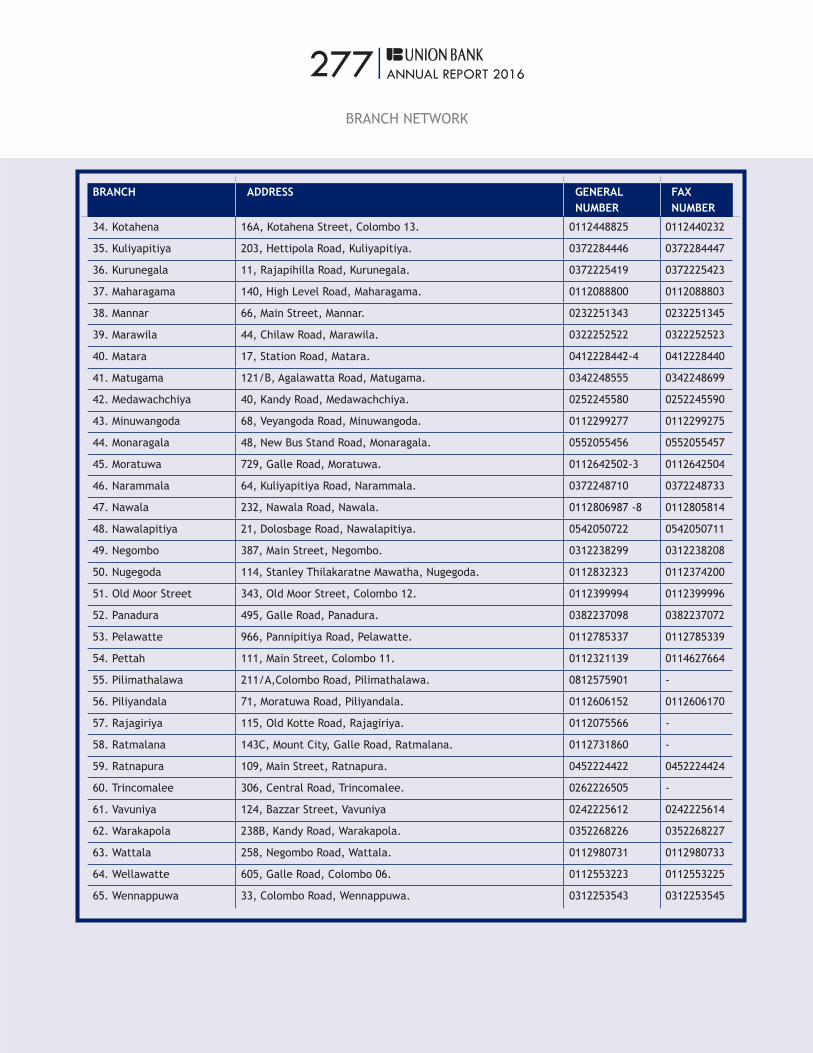
277|ANNUAL REPORT 2016
BRANCH NETWORK
BRANCH ADDRESS GENERAL NUMBER
FAX NUMBER
34. Kotahena 16A, Kotahena Street, Colombo 13. 0112448825 0112440232
35. Kuliyapitiya 203, Hettipola Road, Kuliyapitiya. 0372284446 0372284447
36. Kurunegala 11, Rajapihilla Road, Kurunegala. 0372225419 0372225423
37. Maharagama 140, High Level Road, Maharagama. 0112088800 0112088803
38. Mannar 66, Main Street, Mannar. 0232251343 0232251345
39. Marawila 44, Chilaw Road, Marawila. 0322252522 0322252523
40. Matara 17, Station Road, Matara. 0412228442-4 0412228440
41. Matugama 121/B, Agalawatta Road, Matugama. 0342248555 0342248699
42. Medawachchiya 40, Kandy Road, Medawachchiya. 0252245580 0252245590
43. Minuwangoda 68, Veyangoda Road, Minuwangoda. 0112299277 0112299275
44. Monaragala 48, New Bus Stand Road, Monaragala. 0552055456 0552055457
45. Moratuwa 729, Galle Road, Moratuwa. 0112642502-3 0112642504
46. Narammala 64, Kuliyapitiya Road, Narammala. 0372248710 0372248733
47. Nawala 232, Nawala Road, Nawala. 0112806987 -8 0112805814
48. Nawalapitiya 21, Dolosbage Road, Nawalapitiya. 0542050722 0542050711
49. Negombo 387, Main Street, Negombo. 0312238299 0312238208
50. Nugegoda 114, Stanley Thilakaratne Mawatha, Nugegoda. 0112832323 0112374200
51. Old Moor Street 343, Old Moor Street, Colombo 12. 0112399994 0112399996
52. Panadura 495, Galle Road, Panadura. 0382237098 0382237072
53. Pelawatte 966, Pannipitiya Road, Pelawatte. 0112785337 0112785339
54. Pettah 111, Main Street, Colombo 11. 0112321139 0114627664
55. Pilimathalawa 211/A,Colombo Road, Pilimathalawa. 0812575901 -
56. Piliyandala 71, Moratuwa Road, Piliyandala. 0112606152 0112606170
57. Rajagiriya 115, Old Kotte Road, Rajagiriya. 0112075566 -
58. Ratmalana 143C, Mount City, Galle Road, Ratmalana. 0112731860 -
59. Ratnapura 109, Main Street, Ratnapura. 0452224422 0452224424
60. Trincomalee 306, Central Road, Trincomalee. 0262226505 -
61. Vavuniya 124, Bazzar Street, Vavuniya 0242225612 0242225614
62. Warakapola 238B, Kandy Road, Warakapola. 0352268226 0352268227
63. Wattala 258, Negombo Road, Wattala. 0112980731 0112980733
64. Wellawatte 605, Galle Road, Colombo 06. 0112553223 0112553225
65. Wennappuwa 33, Colombo Road, Wennappuwa. 0312253543 0312253545
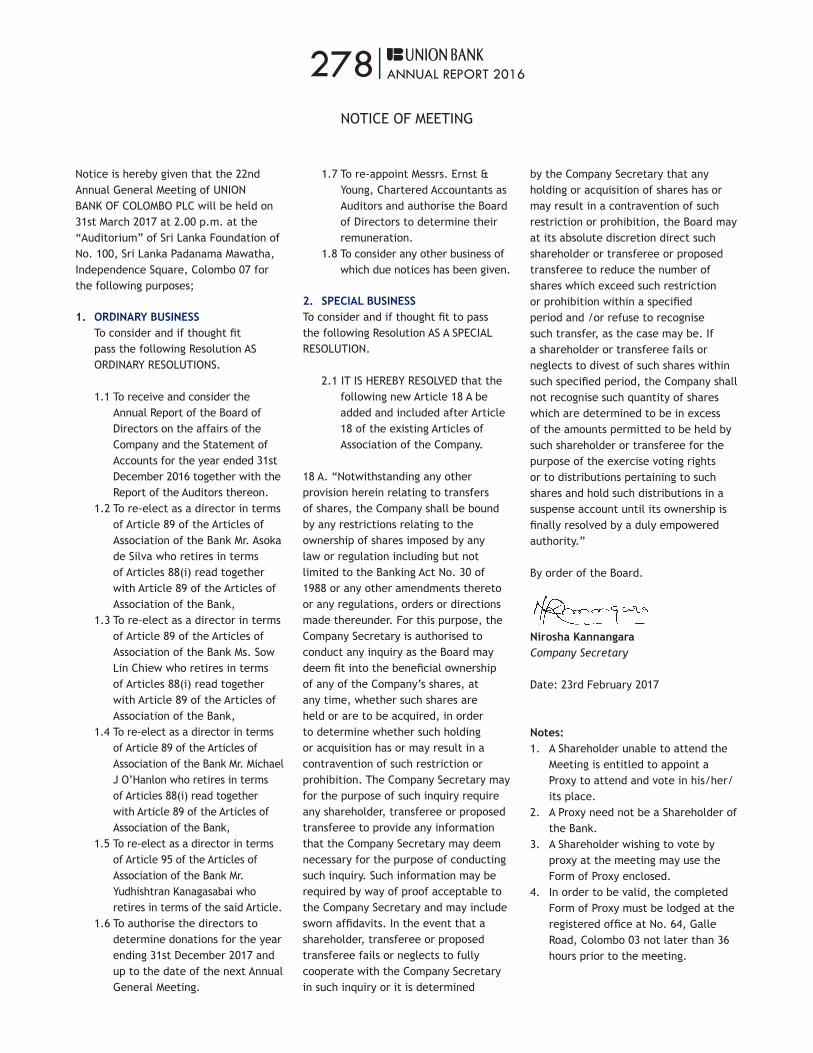
278|ANNUAL REPORT 2016
Notice is hereby given that the 22nd Annual General Meeting of UNION BANK OF COLOMBO PLC will be held on 31st March 2017 at 2.00 p.m. at the “Auditorium” of Sri Lanka Foundation of No. 100, Sri Lanka Padanama Mawatha, Independence Square, Colombo 07 for the following purposes;
1. ORDINARY BUSINESS To consider and if thought fit
pass the following Resolution AS ORDINARY RESOLUTIONS.
1.1 To receive and consider the Annual Report of the Board of Directors on the affairs of the Company and the Statement of Accounts for the year ended 31st December 2016 together with the Report of the Auditors thereon.
1.2 To re-elect as a director in terms of Article 89 of the Articles of Association of the Bank Mr. Asoka de Silva who retires in terms of Articles 88(i) read together with Article 89 of the Articles of Association of the Bank,
1.3 To re-elect as a director in terms of Article 89 of the Articles of Association of the Bank Ms. Sow Lin Chiew who retires in terms of Articles 88(i) read together with Article 89 of the Articles of Association of the Bank,
1.4 To re-elect as a director in terms of Article 89 of the Articles of Association of the Bank Mr. Michael J O’Hanlon who retires in terms of Articles 88(i) read together with Article 89 of the Articles of Association of the Bank,
1.5 To re-elect as a director in terms of Article 95 of the Articles of Association of the Bank Mr. Yudhishtran Kanagasabai who retires in terms of the said Article.
1.6 To authorise the directors to determine donations for the year ending 31st December 2017 and up to the date of the next Annual General Meeting.
1.7 To re-appoint Messrs. Ernst & Young, Chartered Accountants as Auditors and authorise the Board of Directors to determine their remuneration.
1.8 To consider any other business of which due notices has been given.
2. SPECIAL BUSINESSTo consider and if thought fit to pass the following Resolution AS A SPECIAL RESOLUTION.
2.1 IT IS HEREBY RESOLVED that the following new Article 18 A be added and included after Article 18 of the existing Articles of Association of the Company.
18 A. “Notwithstanding any other provision herein relating to transfers of shares, the Company shall be bound by any restrictions relating to the ownership of shares imposed by any law or regulation including but not limited to the Banking Act No. 30 of 1988 or any other amendments thereto or any regulations, orders or directions made thereunder. For this purpose, the Company Secretary is authorised to conduct any inquiry as the Board may deem fit into the beneficial ownership of any of the Company’s shares, at any time, whether such shares are held or are to be acquired, in order to determine whether such holding or acquisition has or may result in a contravention of such restriction or prohibition. The Company Secretary may for the purpose of such inquiry require any shareholder, transferee or proposed transferee to provide any information that the Company Secretary may deem necessary for the purpose of conducting such inquiry. Such information may be required by way of proof acceptable to the Company Secretary and may include sworn affidavits. In the event that a shareholder, transferee or proposed transferee fails or neglects to fully cooperate with the Company Secretary in such inquiry or it is determined
by the Company Secretary that any holding or acquisition of shares has or may result in a contravention of such restriction or prohibition, the Board may at its absolute discretion direct such shareholder or transferee or proposed transferee to reduce the number of shares which exceed such restriction or prohibition within a specified period and /or refuse to recognise such transfer, as the case may be. If a shareholder or transferee fails or neglects to divest of such shares within such specified period, the Company shall not recognise such quantity of shares which are determined to be in excess of the amounts permitted to be held by such shareholder or transferee for the purpose of the exercise voting rights or to distributions pertaining to such shares and hold such distributions in a suspense account until its ownership is finally resolved by a duly empowered authority.”
By order of the Board.
Nirosha KannangaraCompany Secretary
Date: 23rd February 2017
Notes:1. A Shareholder unable to attend the
Meeting is entitled to appoint a Proxy to attend and vote in his/her/its place.
2. A Proxy need not be a Shareholder of the Bank.
3. A Shareholder wishing to vote by proxy at the meeting may use the Form of Proxy enclosed.
4. In order to be valid, the completed Form of Proxy must be lodged at the registered office at No. 64, Galle Road, Colombo 03 not later than 36 hours prior to the meeting.
NOTICE OF MEETING

279|ANNUAL REPORT 2016
I/We,...............................................................................................of.......................................................
..............................................................................being a Shareholder / Shareholders of Union Bank of Colombo PLC
hereby appoint..........................................................................................................................(or failing him)
Dr. Pangal Jayendra Nayak of No. 64, Galle Road, Colombo 03 or failing himMr. Bodahandi Asoka Keerthi de Silva of No.4/1 L, Gemunu Mawatha, Attidiya, Dehiwala or failing himMr. Priyantha Damian Joseph Fernando of No.12/14, Dharmaratne Avenue, Rawatawatte, Moratuwa or failing himMr. Mohamed Hisham Sabry Ghouse of No. 127A, Campbell Place, Colombo 08 or failing himMr. Ranvir Dewan of No. 64, Galle Road, Colombo 03 or failing himMr. Gaurav Trehan of No. 64, Galle Road, Colombo 03 or failing himMr. Puneet Bhatia of No. 64, Galle Road, Colombo 03 or failing himMr. Michael J. O’Hanlon of No. 64, Galle Road, Colombo 03 or failing himMr. Indrajit Asela Wickramasinghe of No. 410/35, Baudhaloka Mawatha, Colombo 07 or failing himMrs. Sow Lin Chiew of No. 64, Galle Road, Colombo 03 or failing herMr. Yudhishtran Kanagasabai of No.56/15, Kurunduwatte Road, Kumaragewatte, Pelawatte, Battaramulla as my/our proxy to represent me/us and to speak and vote whether on a show of hands or on a poll for me/us on my/our behalf at the Annual General Meeting of the Company to be held on 31st March 2017 at 2.00 p.m. at the “Auditorium” of Sri Lanka Foundation of No. 100, Sri Lanka Padanama Mawatha, Independence Square, Colombo 07 and at any adjournment thereof.
For Against1. To receive and consider the Annual Report of the Board of Directors on the affairs of the Company and
the Statement of Accounts for the year ended 31st December 2016 together with the Report of the Auditors thereon.
2. To re-elect, as a director, in terms of Article 89 of the Articles of Association of the Bank, Mr. Asoka de Silva who retires in terms of Article 88 (i) read together with Article 89 of the Articles of Association of the Bank as set out in Clause 1.2 of the Notice of Meeting.
3. To re-elect, as a director, in terms of Article 89 of the Articles of Association of the Bank, Ms. Sow Lin Chiew who retires in terms of Article 88 (i) read together with Article 89 of the Articles of Association of the Bank, as set out in Clause 1.3 of the Notice of Meeting.
4. To re-elect, as a director, in terms of Article 89 of the Articles of Association of the Bank, Mr. Michael J O’Hanlon who retires in terms of Article 88 (i) read together with Article 89 of the Articles of Association of the Bank, as set out in Clause 1.4 of the Notice of Meeting.
5. To re-elect, as a director, in terms of Article 95 of the Articles of Association of the Bank, Mr. Yudhishtran Kanagasabai who retires in terms of the said Article as set out in Clause 1.5 of the Notice of Meeting.
6. To authorise the directors to determine donations for the year ending 31st December 2017 and up to the date of the next Annual General Meeting as set out in Clause 1.6 of the Notice of Meeting.
7. To re-appoint Messrs. Ernst & Young, Chartered Accountants as Auditors and authorise the Board of Directors to determine their Remuneration as set out in Clause 1.7 of the Notice of Meeting.
8. To pass the Special resolution set out in Clause 2.1 of the Notice of Meeting.
Signed on this …………… day of …………………. Two Thousand and Seventeen.
…………………………………Signature
Notes: Instructions as to completion appear overleaf. Please indicate with ‘X’ in the space provided, how your Proxy is to vote on the Resolutions. If no indication is given, the Proxy in it’s discretion will vote as it thinks fit.
FORM OF PROXY

280|ANNUAL REPORT 2016
INSTRUCTIONS FOR COMPLETION1. Kindly perfect the Form of Proxy by filling in legibly your full name, address and date and by signing on the space provided.
2. The completed Form of Proxy should be deposited at the Registered Office of the Company, No.64, Galle Road, Colombo 03 not less than 36 hours before the time appointed for the holding of Meeting.
3. If you wish to appoint a person other than the Chairman or a Director of the Company as your proxy, please insert the relevant details at the space provided (above the names of the Board of Directors) on the Form of Proxy.
4. If the Form of Proxy is signed by an Attorney, the relative notarially certified copy of such Power of Attorney should accompany the Form of Proxy for registration if such Power of Attorney has not already been registered with the Company.
5. If the appointor is a Company or Corporation this Form must be executed as depicted in the Articles of Association of the Company by person/s authorised to do so on behalf of the Company or either under the Common Seal of the Company when applicable.
6. Please indicate with an ‘X’ in the space provided how your Proxy is to vote on the resolution. If no indication is given, the Proxy will vote as it thinks fit.
Please fill the details:
Share Certificate No. / :CDS Account No.
Name :
Address :
Jointly with :
National Identity Card No/s. Passport No/s of the shareholder/s :
FORM OF PROXY

281|ANNUAL REPORT 2016
We welcome your valuable feedback on this integrated Annual Report, on our commitments and our performance. Please complete the following and return this page to :
Chief Financial Officer Union Bank of Colombo PLCNo. 64, Galle road, Colombo 03, Sri Lanka
Name : .........................................................................................................................Permanent Mailing Address : .........................................................................................................................Contact Number – (Tel) : ......................................................................................................................... (Fax) : ......................................................................................................................... E-mail : .........................................................................................................................
Queries / Comments
Recommendations
STAKEHOLDER FEEDBACK FORM

282|ANNUAL REPORT 2016
NOTES

283|ANNUAL REPORT 2016
NOTES

284|ANNUAL REPORT 2016
NOTES
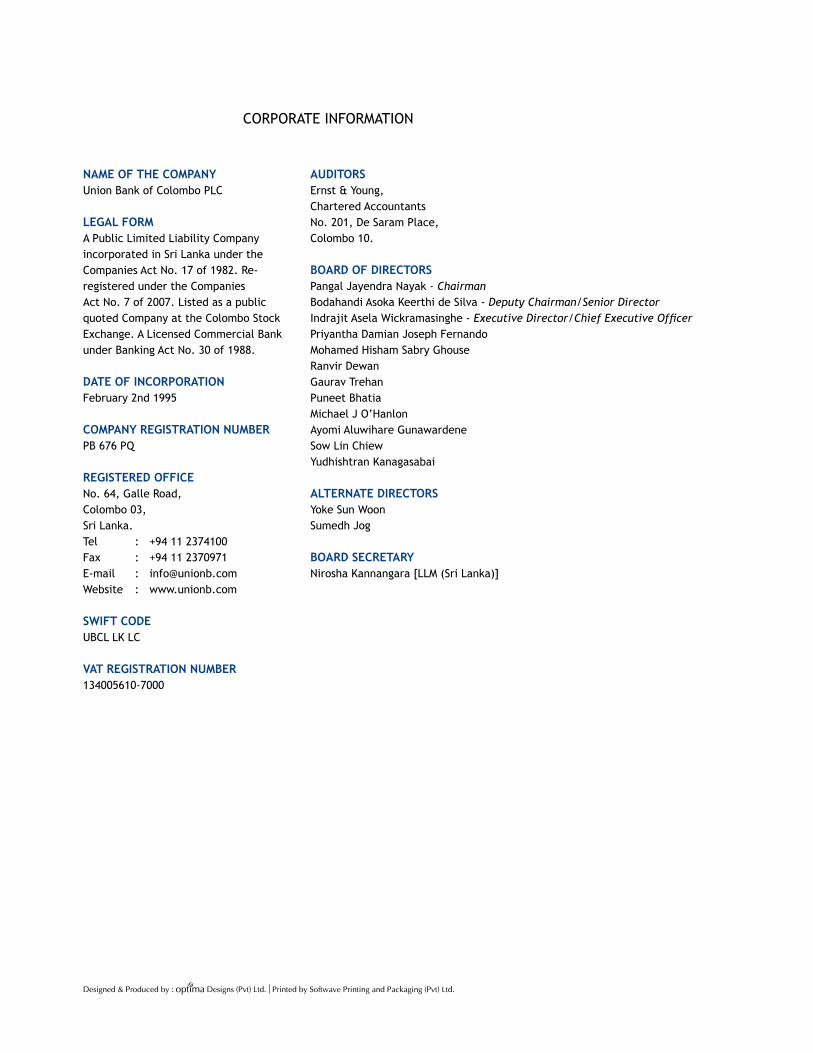
NAME OF THE COMPANYUnion Bank of Colombo PLC
LEGAL FORMA Public Limited Liability Company incorporated in Sri Lanka under the Companies Act No. 17 of 1982. Re-registered under the Companies Act No. 7 of 2007. Listed as a public quoted Company at the Colombo Stock Exchange. A Licensed Commercial Bank under Banking Act No. 30 of 1988.
DATE OF INCORPORATIONFebruary 2nd 1995
COMPANY REGISTRATION NUMBERPB 676 PQ
REGISTERED OFFICENo. 64, Galle Road,Colombo 03,Sri Lanka.Tel : +94 11 2374100 Fax : +94 11 2370971E-mail : [email protected] : www.unionb.com
SWIFT CODEUBCL LK LC VAT REGISTRATION NUMBER134005610-7000
AUDITORSErnst & Young,Chartered AccountantsNo. 201, De Saram Place,Colombo 10.
BOARD OF DIRECTORS Pangal Jayendra Nayak - Chairman Bodahandi Asoka Keerthi de Silva - Deputy Chairman/Senior DirectorIndrajit Asela Wickramasinghe - Executive Director/Chief Executive OfficerPriyantha Damian Joseph FernandoMohamed Hisham Sabry GhouseRanvir DewanGaurav TrehanPuneet BhatiaMichael J O’HanlonAyomi Aluwihare GunawardeneSow Lin ChiewYudhishtran Kanagasabai
ALTERNATE DIRECTORSYoke Sun WoonSumedh Jog
BOARD SECRETARYNirosha Kannangara [LLM (Sri Lanka)]
CORPORATE INFORMATION
Designed & Produced by : Designs (Pvt) Ltd. ƒ Printed by Softwave Printing and Packaging (Pvt) Ltd.

ANNUAL REPORT 2016
TOwARds A Bold
Union Bank of Colombo PlC Head office: 64, Galle Road, Colombo 03, Sri Lanka.
: +94 11 2374100 | www.unionb.com
Copyright © 2022 FDOKUMEN