
FEBRUARY 2016 VOLUME LXX NUMBER 2 - Reserve Bank ...
90
FEBRUARY 2016 VOLUME LXX NUMBER 2
-
Upload
khangminh22 -
Category
Documents
-
view
0 -
download
0
Transcript of FEBRUARY 2016 VOLUME LXX NUMBER 2 - Reserve Bank ...
FEBRUARY 2016
VOLUME LXX NUMBER 2

EDITORIAL COMMITTEEBrajamohan MisraB. K. BhoiGautam ChatterjeeAmitava Sardar
EDITOR Sunil Kumar
The Reserve Bank of India Bulletin is issued monthly by the Department of Economic and Policy Research, Reserve Bank of India, under the direction of the Editorial Committee.The Central Board of the Bank is not responsible for interpretation and opinions expressed. In the case of signed articles, the responsibility is that of theauthor.
© Reserve Bank of India 2016
All rights reserved.Reproduction is permitted provided an acknowledgment of the source is made.
For subscription to Bulletin, please refer toSection ‘Recent Publications’
The Reserve Bank of India Bulletin can beaccessed at http://www.bulletin.rbi.org.in

CONTENTS
Monetary Policy Statement for 2015-16
Sixth Bi-monthly Monetary Policy Statement, 2015-16 1
Speeches
Financial Reforms - Past and Present
Raghuram G. Rajan 5
Research Imperatives for the Indian Banking Sector
S. S. Mundra 13
Articles
Performance of Private Corporate Business
Sector during First Half of 2015-16 21
Composition and Ownership Pattern of Deposits with
Scheduled Commercial Banks: March 2015 31
Current Statistics 41
Recent Publications 76

MONETARY POLICY STATEMENT FOR 2015-16
Sixth Bi-monthly Monetary Policy Statement, 2015-16


RBI Bulletin February 2016 1
MONETARY POLICY STATEMENT FOR 2015-16Sixth Bi-monthly Monetary Policy Statement, 2015-16
United States, an improving labour market continues to support a consumption-led recovery. Manufacturing activity is sluggish, however, refl ecting retrenchment in oil and gas drilling activity and declining exports. In the Euro area, improving labour market and fi nancing conditions are supporting consumer spending and business investment. Although core infl ation and wage growth are subdued, deflation risks appear to be receding. In Japan, the combination of exceptional monetary accommodation and fi scal stimulus has failed to spur sustainable domestic demand so far. In China, growth in Q4 of 2015 was the slowest since 2009, pulled down by manufacturing, residential investment and exports. EME commodity exporters confront recessionary conditions, falling currencies, sluggish exports and still high infl ation relative to their recent histories.
3. The December calm in global fi nancial markets – suggesting that the normalisation of US monetary policy was fully anticipated – was dispelled in January 2016 by fears of further weakening of the Chinese economy and the depreciation of the Renminbi. Capital outfl ows from China triggered sell-offs across AEs and EMEs, exacerbating currency declines and heightening volatility. Crude oil prices fell below US $ 30 per barrel – a 12-year low –on expectations of Iran adding to the supply glut. Prices of gold prices and US Treasuries hardened on safe haven demand. Financial markets remain vulnerable to bouts of volatility and capital outflows from EMEs as an asset class. Bearish commodity price dynamics are also likely to impact investor sentiment.
4. On the domestic front, economic activity lost momentum in Q3 of 2015-16, pulled down by slackening agricultural and industrial growth. The north-east monsoon season ended in December with a defi ciency of 23 per cent relative to the long period average (LPA). By end-January, rabi sowing was mildly deficient relative to a year ago, as well as to the quinquennial average in respect of all crops, except coarse cereals. Rural incomes will continue to be
Monetary and Liquidity Measures
On the basis of an assessment of the current and evolving macroeconomic situation, it has been decided to:
keep the policy repo rate under the liquidity adjustment facility (LAF) unchanged at 6.75 per cent;
keep the cash reserve ratio (CRR) of scheduled banks unchanged at 4.0 per cent of net demand and time liability (NDTL);
continue to provide liquidity under overnight repos at 0.25 per cent of bank-wise NDTL at the LAF repo rate and liquidity under 14-day term repos as well as longer term repos of up to 0.75 per cent of NDTL of the banking system through auctions; and
continue with daily variable rate repos and reverse repos to smooth liquidity.
Consequently, the reverse repo rate under the LAF will remain unchanged at 5.75 per cent, and the marginal standing facility (MSF) rate and the Bank Rate at 7.75 per cent.
Assessment
2. Since the fi fth bi-monthly statement of December 2015, global growth has slowed, with the ongoing weakening of activity in major emerging market economies (EMEs) outweighing the recovery in some advanced economies (AEs). World trade has remained subdued, held down by anaemic demand, new lows in commodity prices and currency realignments. In the
Sixth Bi-monthly Monetary Policy Statement, 2015-16 by Dr. Raghuram G. Rajan, Governor*
* Released on February 02, 2016.

RBI Bulletin February 20162
MONETARY POLICY STATEMENT FOR 2015-16 Sixth Bi-monthly Monetary Policy Statement, 2015-16
supported by allied activities such as dairy and horticulture, which now contribute as much to GDP as food grains.
5. In the first two months of Q3 of 2015-16, industrial activity slowed in relation to the preceding quarter. This mainly refl ects weak investment demand with some deceleration of capital goods production. Stalled projects continue to remain high, and there is a decline in new investment intentions, perhaps on the back of low capacity utilization. While revenue growth in manufacturing has been modest, the fall in costs, partly because of a decline in commodity prices, and partly because of improvements in manufacturing efficiency, have resulted in relatively stronger profi tability. The Reserve Bank’s industrial outlook survey suggests a modest expansion of activity likely in Q4. In January 2016, the manufacturing purchasing managers’ index (PMI) expanded to a four-month high on, inter alia, resumption of output by fi rms affected by the December fl oods as well as on new domestic and export orders.
6. Lead indicators of the services sector are mixed. Construction activity is still tepid, as evidenced by weak growth in cement production, though the pick-up in road construction bodes well for future activity, especially if supported by construction in the major proposed industrial corridors. Railway freight growth is still weak, though it may refl ect lower transport needs for inputs like coal, and competition from roadways. However, the services PMI rose to a ten-month high in December on improvement in new business orders and upbeat expectations.
7. Retail infl ation measured by the consumer price index (CPI) rose for the fi fth month in December across all constituent categories. While the upturn in December essentially reflected unfavourable base effects, the ongoing seasonal decline in prices of fruits and vegetables could temper headline infl ation in the near-term. Prices of cereals recorded modest increases despite the adverse monsoon, indicative of effective supply management. On the other hand, pulses
inflation continued to remain elevated, reflecting structural mismatches.
8. CPI infl ation excluding food and fuel rose for the fourth successive month. Excluding petrol and diesel from this category, infl ation remained fl at. A breakdown into goods and services categories shows that while goods infl ation declined, services infl ation has been sticky since September 2015 across housing, transport and communication, medical and other services. Household infl ation expectations remain elevated and the rate of increase in corporate staff costs picked up. On the other hand, rural wage growth has been muted.
9. Liquidity conditions tightened in the second half of December with advance tax outfl ows. Tightness spilled over into January 2016 on the back of a seasonal pick-up in demand for currency, restrained spending by the government and a pick-up in bank credit growth, in relation to deposit mobilisation. In order to mitigate these conditions, the Reserve Bank injected liquidity through variable rate term repos of varying tenors ranging from overnight to 56 days, besides provision through the regular liquidity windows. The average daily liquidity injection (including variable rate overnight and term repos) increased from ̀ 1,200 billion in December to about `1,345 billion in January. In addition, the Reserve Bank also injected `200 billion through open market purchase operations on December 7 and January 20. In response, money market rates remained close to the policy rate with a marginal downside bias. Bank credit in the form of personal loans and non-bank fl ows from both domestic and foreign sources grew strongly.
10. India’s exports remained in contraction mode for the thirteenth successive month in December, although there are indications of a sequential bottoming out. In volume terms too, the rate of decline appears to be moderating. While softer petroleum, oil and lubricants (POL) and commodity prices helped to contain the trade defi cit, these benign effects were offset by a spike in the quantum of gold and POL imports. As a consequence, the trade defi cit widened during December in relation to preceding months, though the overall current

RBI Bulletin February 2016 3
MONETARY POLICY STATEMENT FOR 2015-16Sixth Bi-monthly Monetary Policy Statement, 2015-16
account defi cit is likely to remain well contained and easily fi nanced. Net foreign direct investment (FDI) and non-resident deposits have remained robust in relation to last year. The persisting decline in oil prices may, however, impact the fl ow of remittances from the Gulf region where fi scal positions are deteriorating rapidly. Portfolio investment also recorded some outfl ows since November. Nevertheless, as on January 22, 2016, foreign exchange reserves stood at US$ 347.6 billion – an accretion of US$ 5.9 billion during the current fi nancial year so far.
Policy Stance and Rationale
11. Infl ation has evolved closely along the trajectory set by the monetary policy stance. With unfavourable base effects on the ebb and benign prices of fruits and vegetables and crude oil, the January 2016 target of 6 per cent should be met. Going forward, under the assumption of a normal monsoon and the current level of international crude oil prices and exchange rates, infl ation is expected to be inertial and be around 5 per cent by the end of fi scal 2016-17 (Chart 1). However, the implementation of the VII Central Pay Commission award, which has not been factored into these projections, will impart upward momentum to this
trajectory for a period of one to two years. The Reserve Bank will adjust the forecast path as and when more clarity emerges on the timing of implementation. Vagaries in the spatial and temporal distribution of the monsoon and the impact of adverse geo-political events on commodity prices and financial markets add additional uncertainty to the baseline.
12. Prospe cts for the rabi harvest are improving slowly. The near-term outlook for industrial activity may be constrained by adverse base effects in Q4 and still weak exports, although the pick-up in corporate profi tability on the back of declining input costs may provide an offset. Some categories of services are likely to gain momentum on expectations of higher activity in coming months, though the aggregate state of activity remains muted. On balance, therefore, GVA growth for 2015-16 is kept unchanged at 7.4 per cent with a downside bias.
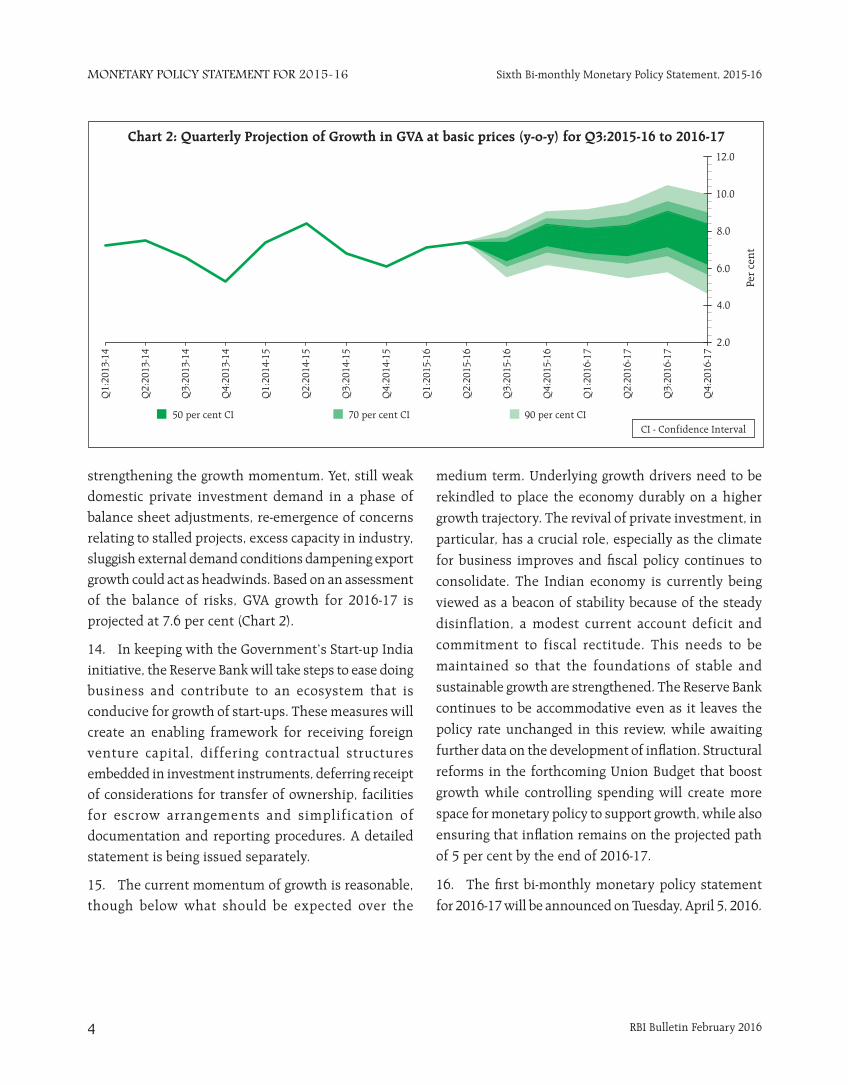
13. For 2016-17, growth is expected to strengthen gradually, notwithstanding significant headwinds. Expectations of a normal monsoon after two consecutive years of rainfall defi ciency, the large positive terms of trade gain, improving real incomes of households and lower input costs of firms should contribute to
RBI Bulletin February 20164
MONETARY POLICY STATEMENT FOR 2015-16 Sixth Bi-monthly Monetary Policy Statement, 2015-16
strengthening the growth momentum. Yet, still weak domestic private investment demand in a phase of balance sheet adjustments, re-emergence of concerns relating to stalled projects, excess capacity in industry, sluggish external demand conditions dampening export growth could act as headwinds. Based on an assessment of the balance of risks, GVA growth for 2016-17 is projected at 7.6 per cent (Chart 2).
14. In keep ing with the Government’s Start-up India initiative, the Reserve Bank will take steps to ease doing business and contribute to an ecosystem that is conducive for growth of start-ups. These measures will create an enabling framework for receiving foreign venture capital, differing contractual structures embedded in investment instruments, deferring receipt of considerations for transfer of ownership, facilities for escrow arrangements and simplification of documentation and reporting procedures. A detailed statement is being issued separately.
15. The current momentum of growth is reasonable, though below what should be expected over the
medium term. Underlying growth drivers need to be
rekindled to place the economy durably on a higher
growth trajectory. The revival of private investment, in
particular, has a crucial role, especially as the climate
for business improves and fi scal policy continues to
consolidate. The Indian economy is currently being
viewed as a beacon of stability because of the steady
disinflation, a modest current account deficit and
commitment to fiscal rectitude. This needs to be
maintained so that the foundations of stable and
sustainable growth are strengthened. The Reserve Bank
continues to be accommodative even as it leaves the
policy rate unchanged in this review, while awaiting
further data on the development of infl ation. Structural
reforms in the forthcoming Union Budget that boost
growth while controlling spending will create more
space for monetary policy to support growth, while also
ensuring that infl ation remains on the projected path
of 5 per cent by the end of 2016-17.
16. The fi rst bi-monthly monetary policy statement
for 2016-17 will be announced on Tuesday, April 5, 2016.

SPEECHES
Financial Reforms - Past and PresentRaghuram G. Rajan
Research Imperatives for the Indian Banking SectorS. S. Mundra


SPEECH
RBI Bulletin February 2016 5
Financial Reforms – Past and Present
waning. Indeed, India appears to be an island of relative
calm in an ocean of turmoil. What is different here and
how can we be assured that it will continue?
A lesson from Brazil?
Perhaps Brazil offers a salutary lesson. Only a few
years ago, the world was applauding the country’s
thriving democracy, its robust economic growth, and
the enormous strides it was making in reducing
inequality. It grew at 7.6 per cent in 2010, and had
discovered huge oil reserves which the then President
Lula likened to ‘winning a lottery ticket’. Yet the country
shrank by 3.8 per cent last year, and its debt got
downgraded to junk. Growth will be no better this year.
What went wrong?
Paradoxical as it may seem, Brazil tried to grow
too fast. The 7.6 per cent growth came on the back of
substantial stimulus after the global fi nancial crisis. In
an attempt to keep growth high, the New York Times
says the central bank was pressed to reduce interest
rates, fueling a credit spree that overburdened
customers are now struggling to repay1. Further, Brazil’s
government-funded development bank hugely
increased subsidised loans to corporations. Certain
industries were favored with tax breaks while price
controls were imposed on gasoline and electricity,
causing huge losses in public sector fi rms. Petrobras,
the national oil company, which was supposed to make
enormous investments in oil drilling, instead became
embroiled in a corruption scandal. Even as government
pensions burned an ever larger hole, budget defi cits
expanded, and the political consensus to narrow them
has become elusive. Infl ation touched double digits in
the 4th quarter of 2015.
While the Brazilian authorities are working hard
to rectify the situation, let us not ignore the lessons
their experience suggests. It is possible to grow too fast
I thank Shekhar Shah for inviting me to deliver
the C. D. Deshmukh lecture at NCAER. Sir Chintaman
Dwarakanath Deshmukh, an ICS offi cer, was truly a
giant of modern India. In 1943, he was the fi rst Indian,
as well as the youngest in its history to date, to be
appointed the Governor of the Reserve Bank of India.
He subsequently served as the Finance Minister in the
Union Cabinet. It was during this time that he also
became a founding member of the Governing Body of
NCAER. After resignation from the Union Cabinet over
a matter of principle, he served at various times as
Chairman of the University Grants Commission, Vice-
Chancellor of the University of Delhi, President of the
Indian Statistical Institute, and founding member and
lifetime President of the India International Center.
Among his many contributions were his insightful
interventions at Bretton Woods as part of the Indian
delegation to that historic meet. He was awarded the
Padma Vibhushan in recognition of his services. Sir C.
D. Deshmukh died in 1982.
C. D. Deshmukh was an institution builder. I am
currently the caretaker of one he led, the Reserve Bank
of India. Let me assure him that the Reserve Bank is in
fi ne fettle. In a country where time has weighed heavily
on the quality of institutions, the integrity, capability,
and motivation of my colleagues allows the Reserve
Bank to continue to stand tall.
The world today, however, is much less comforting.
Industrial countries are still struggling, with a few
exceptions, to grow. Our fellow BRICS all have deep
problems, with confi dence about China waxing and
* C. D. Deshmukh Lecture by Dr. Raghuram G. Rajan, Governor, Reserve Bank of India at NCAER, New Delhi on January 29, 2016.
1 ‘As a Boom Fades, Brazilians Wonder How it all Went Wrong’, Simon Romero, New York Times, September 11, 2015.
Financial Reforms – Past and Present*Raghuram G. Rajan

SPEECH
RBI Bulletin February 20166
Financial Reforms – Past and Present
with substantial stimulus, as we did in 2010 and 2011,
only to pay the price in higher infl ation, higher defi cits,
and lower growth in 2013 and 2014. Of course, India
is not in the same situation today. Given the inhospitable
world economy and two successive droughts, either of
which would have thrown the economy into a tail spin
in the past, it is to the immense credit of the government
that we have over 7 per cent growth, low infl ation, and
a low current account defi cit. But it is at such times that
we should not be overambitious.
Macroeconomic stability
As Brazil’s experience suggests, the enormous
costs of becoming an unstable country far outweigh
any small growth benefi ts that can be obtained through
aggressive policies. We should be very careful about
jeopardising our single most important strength during
this period of global turmoil, macroeconomic stability.
There is a public discussion of whether India
should postpone, yet again, the fi scal consolidation
path it has embarked on. Clearly, the Government will
balance various compulsions in taking its decision. But
a number of facts are worth pointing out:
The consolidated fi scal defi cit of the state and
centre in India is by far the largest among countries we
like to compare ourselves with; presently only Brazil,
a country in difficulty, rivals us on this measure.
According to IMF estimates (which is what the global
investor sees), our consolidated fi scal defi cit went up
from 7 per cent in 2014 to 7.2 per cent in 2015. So we
actually expanded the aggregate defi cit in the last
calendar year. With UDAY, the scheme to revive state
power distribution companies, coming into operation
in the next fi scal, it is unlikely that states will be
shrinking their defi cits, which puts pressure on the
centre to adjust more.
Some say that fi scal expansion is necessary to
generate the growth needed to put our debt to GDP
ratio back on a sustainable path. This is a novel
argument. Ordinarily one would think that a government
should borrow less, that is, run lower fi scal defi cits, in
order to reduce its debt. But there is indeed a theoretical
possibility that the growth generated by the fi scal
expansion is so great as to outweigh the additional debt
that is taken on. Unfortunately, the growth multipliers
on government spending at this juncture are likely to
be much smaller, so more spending will probably hurt
debt dynamics. Put differently, it is worth asking if
there really are very high return investments that we
are foregoing by staying on the consolidation path?
Of course, the common man does not really care
whether we stay on the consolidation path or not. But
the bond markets, where we have to fi nance over `10
lakh crore of defi cits plus UDAY state bonds, do care.
Deviating from the fi scal consolidation path could push
up government bond yields, both because of the greater
volume of bonds to be fi nanced and because of the
potential loss of government credibility on future
consolidation. It was James Carville who said ‘I used
to think if there was reincarnation, I wanted to come
back as the President or the Pope or a .400 baseball
hitter. But now I want to come back as the bond market.
You can intimidate everybody.’ The Government
understands the importance of bond market confi dence,
but I wonder if the economists debating in public put
adequate weight on it.
The fall in infl ation has been a major contributor
to lower bond yields, and is the joint work of the
Government and the RBI, aided to some extent by the
fall in international commodity prices. This is no mean
achievement given two successive droughts that would
have, in the past, pushed infl ation into double digits.
Despite this success, we hear voices suggesting
weakening the fi ght against infl ation. Let me reiterate
that macroeconomic stability relies immensely on
policy credibility, which is the public belief that policy
will depart from the charted course only under extreme
necessity, and not because of convenience. If every time
SPEECH
RBI Bulletin February 2016 7
Financial Reforms – Past and Present
there is any minor diffi culty, we change the goal posts, we signal to the markets that we have no staying power. Let me therefore reiterate that we have absolutely no intent of departing from the infl ation framework that has been agreed with the Government. We look forward to the Government amending the RBI Act to usher in the monetary policy committee, further strengthening the framework.
Macroeconomic stability will be the platform on which we will build the growth that will sustain our country for many years to come, no matter what the world does. Indeed, I am reminded today of the period 1997-2002 when India labored and reformed with only moderate growth, only to see a decade of high growth after that.
Before I turn to the main body of this talk, a word on interest rates. Industrialists grumble about high rates while retirees complain about the low rates they get today on deposits. Both overstate their case, though as I have said repeatedly, the way to resolve their differences is to bring CPI infl ation steadily down.
Let me explain, starting with the retiree. The typical letter I get goes, ‘I used to get 10 per cent earlier on a 1 year fi xed deposit, now I barely get 8 per cent’, please tell banks to pay me more else I won’t be able to make ends meet’. The truth is that the retiree is getting more today but he does not realise it, because he is focusing only on the nominal interest he gets and not on the underlying infl ation which has come down even more sharply, from about 10 per cent to 5.5 per cent.
To see this, let us indulge in Dosa economics. Say the pensioner wants to buy dosas and at the beginning of the period, they cost `50 per dosa. Let us say he has savings of `1,00,000. He could buy 2,000 dosas with the money today, but he wants more by investing.
At 10 per cent interest, he gets `10,000 after one year plus his principal. With dosas having gone up by 10 per cent to ̀ 55, he can buy 182 dosas approximately
with the `10,000 interest.
At 8 per cent interest, he gets `8,000. With dosas
having gone up by 5.5 per cent, each dosa costs ̀ 52.75,
so he can now buy only 152 dosas approximately. So
the pensioner seems vindicated: with lower interest
payments, he can now buy less.
But wait a minute. Remember, he gets his principal
back also and that too has to be adjusted for infl ation.
In the high infl ation period, it was worth 1,818 dosas,
in the low infl ation period, it is worth 1,896 dosas. So
in the high infl ation period, principal plus interest are
worth 2,000 dosas together, while in the low infl ation
period it is worth 2,048 dosas. He is about 2.5 per cent
better off in the low infl ation period in terms of dosas.
This is a long winded way of saying that infl ation
is the silent killer because it eats into pensioners’
principal, even while they are deluded by high nominal
interest rates into thinking they are getting an adequate
return. Indeed, with 10 per cent return and 10 per cent
infl ation, the deposit is not giving you any real return
net of infl ation, which is why you can buy only 2,000
dosas after a year of investing, the same as you could
buy before you invested. In contrast, when infl ation is
5.5 per cent but the interest rate you are getting is 8
per cent, you are earning a real rate of 2.5 per cent,
which means 2.5 per cent more dosas. So while I
sympathise with pensioners, they certainly are better
off today than in the past.
Let us turn to the industrialist. At a recent
conference, I met a businessman who complained that
his business was getting torn to shreds by imports. He
was lobbying for safeguard duties. When asked for
evidence of unfair competition, he said his revenues
had not grown at all, with his volume growth barely
offsetting the price decline for his product. While
commiserating with him, I said lower input costs must
be a boon, because commodity prices have fallen even
more sharply than output prices. He grudgingly agreed
they had helped. When asked about his profi ts, he

SPEECH
RBI Bulletin February 20168
Financial Reforms – Past and Present
eventually admitted they were at an all-time high. But
nevertheless, he said, we need safeguard duties because
foreigners are dumping below cost! Put differently,
businesspeople complain about low output price
infl ation, but the infl ation that matters to them is the
infl ation in their profi ts, which is higher. For instance,
analysing 2nd quarter results for non-fi nancial non-
government corporations, we fi nd that while revenues
have fallen by 8.8 per cent year on year, input costs
have fallen by an even higher 12.4 per cent, so that
gross value added has gone up by 10.8 per cent.
Clearly, there are industries in trouble. We should,
however, be particularly careful about raising tariffs at
a time when costs are falling everywhere – aside from
the infl ationary impact, for every happy domestic
businessman whose prices are raised by the imposition
of tariffs on imports, we have an unhappy domestic
businessman whose costs are raised by the very same
tariffs, as well as unhappy consumers.
Cleaning Up the Banks
One very important contributor to macroeconomic
stability is healthy banks. Banks in India have a number
of stressed loans on their balance sheet. In some cases,
the reality is that existing loans will have to be written
down signifi cantly because of the changed circumstances
since they were sanctioned (which includes extensive
project delays, cost overruns, global overcapacity, and
overoptimistic demand projections). If loans are written
down, the promoter brings in more equity, and other
stakeholders like the tariff authorities or the local
government chip in, the project may have a strong
chance of revival, and the promoter will be incentivised
to try his utmost to put it back on track. But to do all
this deep surgery, the bank has to classify the asset as
a Non Performing Asset (NPA), a label banks are eager
to avoid. Alternatively, instead of deep surgery, the
banks could apply band aids, they could ‘extend and
pretend’, lending the promoter the money he needs to
make loan payments. The project’s debt obligations
grow, the promoter loses further interest, and the
project goes into further losses.
A number of good banks in our system have taken
the necessary action to recognise and resolve stressed
loans in a timely fashion. But some others need to take
more proactive action. Over the last few quarters, the
Reserve Bank has expanded the tools banks have to
recognise and deal with stressed loans. It is now
working with the Government and banks to ensure that
the stressed assets are dealt with on a proactive basis,
and that bank balance sheets both refl ect a true and
fair picture, and are adequately provisioned. The
Finance Minister has indicated he will support the
public sector banks with capital infusions as needed.
Our estimate is that the support that has been indicated
will suffi ce, especially when coupled with other capital
sources that are usually available to banks. Our various
scenarios also show private sector banks will not want
for regulatory capital as a result of this exercise. Finally,
the RBI is also working on identifying currently non-
recognisable capital that is already on bank balance
sheets, such as undervalued assets. The RBI could allow
some of these to count as capital as per Basel norms,
provided a bank meets minimum common equity
standards.
In sum, we believe enough capital is available.
While the profi tability of some banks may be impaired
in the short run, the system, once cleaned, will be able
to support economic growth in a sustainable and
profi table way. To be less proactive, as our past and the
history of banking across the world suggests, will only
see the problem get bigger and less manageable.
Let me now turn to the structural reforms that we
intend to implement in the fi nancial sector, which will
build on the platform of macroeconomic stability to
generate growth. We will increase effi ciency through
greater entry and competition. We need more

SPEECH
RBI Bulletin February 2016 9
Financial Reforms – Past and Present
participation in our fi nancial markets to increase their
size, depth, and liquidity. Participation is best enhanced
not through subventions and subsidies but by creating
supporting frameworks that improve transparency,
contract enforcement, and protections for market
participants against abusive practices. Technology can
be very helpful in reducing the costs of the supportive
frameworks, and can bring hitherto excluded
populations into the fi nancial fold. It is these ideas that
guide our medium-term reform strategy. Let me be
more specifi c.
Fostering Competition
In order to get sustained growth, we need more
competition, especially from new entrants who are in
a better position to reach hitherto excluded parts of
our economy. After over a decade of no new entry, we
have seen two new private banks enter last year, and
a number of payment banks and small fi nance banks
will enter this year. We will put licensing for universal
banks on tap soon.
Incumbents have expressed fears about unfair
competition. Competition is only unfair if it is not on
the same playing fi eld. In fact, new entrants have no
privileges that incumbents do not already enjoy. We
hope, though, that the new entrants will fi nd innovative
ways of giving customers better services at lower prices,
thus shaking up and changing the banking sector for
the better. Payment bank kiosks, post offices, or
business correspondents could be the means by which
the remote villager traverses the last mile to the formal
fi nancial system. Small fi nance banks could be the low
cost assessment and monitoring mechanism to lower
lending costs to small urban and rural fi rms.
Clearly, public sector banks (PSBs), with their large
branch network, will have to adapt because some of
these new entrants will go after their customers. This
is no bad thing because, hitherto, those customers have
had limited choice. Public sector banks will need to
automate more so as to reduce transactions costs, cut
administrative overheads and improve response times,
even while improving their risk assessment and
monitoring systems so that they can use the wealth of
information they have gathered over the years to make
sound lending decisions. Almost surely, this
transformation will require more lateral hires at market
wages, including skilled loan offi cers, risk managers,
forensic accountants, IT professionals, lawyers, and
human resource professionals. While PSBs can
undertake contractual hiring at market wages, it
remains to be seen whether they can attract professionals
without promising them the means for career
advancement within the bank.
Public sector banks will also require more
professional boards that can chart a differentiated
strategy for them. The Bank Board Bureau, which will
select board members, will come into operation soon.
We have to pay board members of PSBs a market
compensation if we are to attract decent talent –
otherwise we risk attracting an unwieldy mix of the
truly patriotic and the truly unscrupulous, with the
latter intending to profi t by their board position. When
thousands of crores can be diverted by a bad board
decision, should we not ensure we have adequate
integrity and talent on bank boards?
More decisions need to be decentralised from the
Government to the PSB boards, once they have been
fully professionalised. For instance, should boards not
determine strategy as well as the appointment or
renewal of their chief executive? What about their
executive directors? Can bank boards have more
freedom in choosing these? Can boards be given the
freedom to set compensation structures and
performance measures for their senior executives,
including long term stock options? If we want to address
the concern that many public sector banks have
identical strategies and are competing for the same pie,
we have to allow the boards more freedom to
differentiate their banks.

SPEECH
RBI Bulletin February 201610
Financial Reforms – Past and Present
Finally, as bank health recovers, the issue of PSB
mergers can be addressed. Almost surely, some banks
will have to merge to optimise their use of resources.
But talking of bank mergers, which take a lot of
management attention, especially when each bank
management is preoccupied with dealing with stressed
assets, is probably premature. At the same time, some
banks could benefi t from governance help to deal with
their current problems. Is it an opportune time to
induct skilled fi nancial fi rms as strategic investors into
public sector bank boards, perhaps with a 10 or 15 per
cent stake? Certainly, the experience of countries like
China who inducted such investors is worth studying.
Technology and Innovation
Regulators are naturally a conservative lot. It is
good we are that way else there would be no speed
breakers in the economy to slow its propensity to get
into trouble. But we also should not stand in the way
of innovation. There is a Chinese saying: ‘Cross the
river by feeling the stones’. The RBI has tried to follow
that path of experimentation and incremental
liberalisation. So, for example, as increasingly
innovative new services want their customers to have
the ability to make payments quickly, we have allowed
small value card payments without two-factor
authentication. As we and fi nancial institutions gain
experience, and as new technologies ensuring security
emerge, we can liberalise further. More generally, our
philosophy is to allow innovation in institutions,
instruments and practices so long as they do not
present a clear and present danger. Once we understand
them better, and they grow to a material size, we can
do a deeper analysis on how they should be regulated.
A number of innovative structures are likely to be
implemented soon. NPCI will go live soon with the
Unifi ed Payment Interface, which when fully rolled out
will allow anyone to make a payment to anyone else
with a bank account simply via a mobile and a unique
email-like address. The Trade Receivables Exchanges
will be a boon to small businesses. Essentially, any
business that has a receivable against a large fi rm can
sell it as a bill on the exchange, after the large fi rm
acknowledges it has been supplied the goods. Not only
will the small fi rm get paid quickly, buyers will discount
the bill at the rate associated with the large fi rm, and
thus pay the small fi rm more. Importantly, the three
Trade Receivables Exchanges that have been licensed
will get a fi llip if public sector fi rms and government
departments are required to allow their receivables to
be traded. This will also discipline these entities to pay
on time, a huge boon to the system.
Yet another technological development to watch
is the alliance between internet marketplaces and
financial firms. The information obtained from
monitoring sales and cash fl ows of the online merchant
can be the basis for making him a loan and recovering
payment. I am especially excited by the possibilities
afforded the carpet seller from Srinagar, who can
display her wares across the globe, with the marketplace
arranging marketing, logistics, and fi nance for her.
Financial Inclusion
The Prime Minister’s Jan Dhan Yojana has created
accounts for much of the excluded population.
Government has taken the next step of attaching a
variety of fi nancial services such as accident and life
insurance to these accounts, and sending Direct
Benefi ts such as scholarships, pensions, and subsidies
to these accounts. We also have to ease access to bank
accounts through Business Correspondents, payment
banks, and point-of-sales machines so that they are
used frequently. Easy payments, access to cash-in and
cash-out facilities, and widespread availability of safe
savings instruments have to be our next objectives in
the fi nancial inclusion of households.
When credit leads the process of financial
inclusion, we risk lending to people who have little

SPEECH
RBI Bulletin February 2016 11
Financial Reforms – Past and Present
ability to manage money and overburdening them. By
drawing them into the formal system through savings
and payments first, then insurance, we get them
accustomed to managing money before tempting them
with credit. This is the successful method we have
followed with Self Help groups, and is what we should
do more widely. Importantly, we need a variety of fi rms
and NGOs to help small businesses with management
advice so that they can fl ourish.
Technology will also help reduce transaction costs,
facilitating inclusion. We now have an internet portal
(Vidyalakshmi) where students can apply to a variety
of banks for education loans. We are exploring a similar
portal for MSMEs, where MSMEs can apply easily to
banks and where we can monitor timely responses to
the loan applications.
In all such lending, we need to address the issue
of collateral. Credit fl ows easily only when the lender
is persuaded that he will get his money back, so easier
access to credit necessitates harsher consequences of
default, including the loss of collateral. Aadhaar has
given individual borrowers the possibility of using their
future access to credit as collateral. I do hope the
Supreme Court clears up the cloud over its use quickly.
But there are also situations where borrowers have
physical collateral they can use to lower their cost of
credit and improve access. We really need to re-examine
mandates that banks should lend without collateral to
certain segments. While the intent is laudable, the
consequence may simply be that banks fear taking
collateral even when available, and thinking the
borrower is too risky, do not lend.
More generally, the best way to facilitate lending
to the excluded is to reduce transactions costs, improve
borrower information and frameworks for recovery,
and create institutions that have lower costs and easier
access to the borrower than existing ones. For this, we
need to improve the structure and working of credit
information bureaus, collateral registries, and debt
recovery tribunals. Perhaps the most important source
of collateral value is land. We need better digital
mapping and clean records of land ownership across
the country so that land can be used more effectively
as collateral. Andhra Pradesh’s pattas for tenant farmers
is also an innovation that will help tenants get access
to credit.
Consumer Protection and Literacy
Finally, newcomers and outsiders need protection
against unfair practices. As one example of what we
are doing, the RBI has developed a Charter of Consumer
Rights after public consultation. Bank boards have been
asked to put in place frameworks that ensure those
rights are protected, including creating an internal
offi ce of ombudsman. Soon, those frameworks will have
been in operation for about a year. After studying
practices, RBI will take a view on best practices and
even regulation, if any is needed. In the meantime,
incognito fi eld visits by RBI, to check mis-selling as well
as the proper functioning of bank infrastructure such
as branches and ATMs, will be expanded. We are also
working with state law enforcement authorities
through State Level Coordination Committees to try
and nab fl y-by-night operators before they do real
damage.
As access to fi nance improves, we need customers
to protect themselves. Higher education is not suffi cient
protection. Many of you must have received an email
from me saying that the RBI had concluded a pact with
the IMF or the British Government to take over the gold
found on pirate ships in the sixteenth century, sell it,
and give the proceeds to deserving citizens like you. In
return for a small transaction fee of ̀ 20,000, the email
goes on, I would be happy to transfer the sum of 50
lakh rupees into your bank account. Without pausing
to think why I need `20,000 when I supposedly have
`50 lakhs of your money with me, some of you send
`20,000 as requested into an untraceable account. My
offi ce then gets repeated phone calls from you asking

SPEECH
RBI Bulletin February 201612
Financial Reforms – Past and Present
what happened when the ̀ 50 lakhs does not show up.
The truth is that we are all gullible – no amount of
warnings that the Reserve Bank does not ask you for
your money helps. The central theorem of fi nancial
literacy is ‘There is no such thing as a free lunch’. In
the context of fi nancial investments, it can be restated
as ‘There is no return without risk’. We need to imprint
these two statements in everyone’s head and we intend
to roll out campaigns to do so.
Conclusion
I have described some of the ways we will position
the fi nancial system towards sustainable growth on a
base of macroeconomic stability. Of course, fi nance can
only facilitate growth, the true engine of growth is the
real economy, where the government’s structural
reforms are facilitating the way.
Throughout its 81 year history, the RBI’s staff has
always risen to the challenges posed by a dynamic,
growing economy. We have never hesitated to say no
when the stability of the system is at stake. At the same
time, we have liberalised when it is needed. Following
the traditions set by our past leaders like Shri C. D.
Deshmukh, we will help take India forward. Thank you
very much again for inviting me to give this talk.

SPEECH
RBI Bulletin February 2016 13
Research Imperatives for the Indian Banking Sector
system also faces a multitude of challenges. Each of
these challenges has different genesis and probably
different solution. But, challenges also throw up
opportunities. In order to overcome current and
impending challenges and also to exploit emerging
opportunities, it is imperative that the sector devotes
adequate time and resources in conducting meaningful
research. At this stage, when the banking sector is on
proverbial ‘crossroads’, I feel this Banking Research
Conference is very timely. I am sure that the deliberations
in the conference would provide new insights into the
issues facing the banks and also pave the way for
further research which would generate fresh ideas for
improving the efficiency and effectiveness of the
banking sector.
Why research is important?
3. According to Ben Bernanke, himself a researcher
and a practitioner, research provides an important long-
run perspective on the issues that we face on a day-to-
day basis. Theories that evolve out of profound research
remain relevant forever. Let me quote from our latest
Financial Stability Report. ‘When current wisdom does
not offer solutions to extant problems, old wisdom can
sometimes be helpful. For instance, the global fi nancial
crisis compelled us to take a look at the Minsky’s
fi nancial instability hypothesis which posited the debt
accumulation by non-government sector as key to
economic crisis. As part of his work, Minsky identifi ed
three types of borrowers – the ‘hedge borrowers’ (those
who could meet their debt obligations – both principal
and interest through current cash flows from
investments), ‘speculative borrowers’ (those who could
service their debts, that is – pay only the interest but
had to roll over the principal periodically through cash
flows from current investments) and ‘Ponzi
borrowers’(whose current cash fl ows were insuffi cient
Introduction
Dr. J. Mahender Reddy, Vice Chancellor, ICFAI
Foundation for Higher Education (IFHE) University;
Shri S. V. Seshaiah, Director, IBS, Hyderabad; members
of faculty from Gokhale Institute of Politics and
Economics, Pune and IBS, Hyderabad; Delegates of the
Research Conference; ladies and gentlemen ! I am
grateful to Gokhale Institute of Politics and Economics,
Pune and IBS, Hyderabad for inviting me to deliver the
inaugural address at the 1st Banking Research Conference
this morning. Both are premier educational institutions
of the country. IBS Hyderabad has made important
contribution in the fi eld of management education and
research in a very short period of time. Gokhale
Institute of Politics and Economics (GIPE), Pune, is one
of the oldest research and training institutes in
Economics in the country and continues to be an
institute of repute for economic research. I complement
their efforts towards education and research.
2. Banks are the bedrock of fi nancial system in all
emerging economies and India is no different. The
banks in India have been quite effectively performing
the vital function of fi nancial intermediation. The
health of the banking system and that of the economy
share a symbiotic relationship and at this juncture
when the global growth is still stuttering, the banking
* Inaugural address delivered by Shri S. S. Mundra, Deputy Governor, Reserve Bank of India, at the 1st Banking Research Conference organised by Gokhale Institute of Politics and Economics and IBS’ in collaboration with IBS Hyderabad at Hyderabad on January 29,2016. Assistance provided by Smt. Rekha Misra, Shri Sanjeev Prakash, Shri Radheshyam Verma and Ms. Anwesha Das is gratefully acknowledged.
Research Imperatives for the Indian Banking Sector*S. S. Mundra

SPEECH
RBI Bulletin February 201614
Research Imperatives for the Indian Banking Sector
to meet debt obligations but borrowed on the faith that
an appreciation in the asset values could take care of
such obligations). The dominance of the Ponzi
borrowers can cause disruptions in the fi nancial system
when asset prices stop rising.’ As IMF and other
fi nancial research houses moan over high indebtedness
of corporate houses in emerging markets and its
consequent implications for global fi nancial stability
today, it reaffi rms the relevance of Minsky’s ‘Financial
Instability Hypothesis’.
4. Let me give another example. Many of you here
must be aware of the ongoing debate on what is called
as ‘Re-embracing Keynes.’ The standard ‘return to
Keynes’ argument is the need for fi scal stimulus to
boost the economy from the depths of recession. The
burden of the defi cit is not seen as the main drawback
of government intervention, but a necessary measure
to address a failure in aggregate demand. It is important
to emphasise here that the theory was fi rst presented
by John Maynard Keynes in his book, The General
Theory of Employment, Interest and Money, published
in 1936, during the Great Depression. Keynes said ‘we
cannot, as a community, provide for future consumption
by fi nancial expedients but only by current physical
output.’ Of course, there are many economists who
vehemently oppose his views on efficacy of fiscal
stimulus. Economists, both in Britain and across the
Atlantic in the US have suggested that action by
Government on rapid reduction of budget defi cit than
currently planned would be better to support a
sustainable recovery. As some of you may be aware, the
debate on increasing government defi cit to support the
economy also fi gured prominently in Government’s
pre-budget consultations with the economist in our
country. In sum, the very fact that Keynesian theory
stays relevant evoking strong reactions from supporters
and baiters alike even after eight decades of being fi rst
published, in itself is a great testimony to the quality
of research undertaken by him.
5. The need for deep-seated research in the area of
banking, which itself is a highly dynamic fi eld, with
close linkages to economic fortunes of the country, can
be hardly over-emphasised. Given the dynamic nature
of the sector, banking research has to continuously
evolve. Failure to ignore emerging trends or risks can
be catastrophic. As former FDIC Chairman Irving
Sprague put it after the onset of the Global Financial
Crisis, ‘Unburdened with the experience of the past,
each generation of bankers believes it knows best, and
each new generation produces some who have to learn
the hard way.’
6. To keep pace with the changing times and to
produce relevant research, researchers today need to
raise new questions, explore new possibilities, regard
old problems from a new angle, which would require
creative imagination and mark real advance in the fi eld.
But in my talk today, rather than discussing more
distant research topics like ‘Effects of Population Aging
on Economic Growth’ or ‘What ails a Demand
Constrained Model of Growth’, I would like to focus
on some ‘bread and butter issues’ confronting Indian
banks, which the sector would do well to study in
greater depth.
Some important research undertaken by RBI/
Government in past and outcome
7. As you may be aware, the RBI and the Government
of India have a rich history of policy research. Policy
oriented research has led to adoption of various pro-
active policy measures which helped in making our
banking system more inclusive and development
oriented. One of the earliest examples of application
of research and surveys relating to credit/banking are

SPEECH
RBI Bulletin February 2016 15
Research Imperatives for the Indian Banking Sector
two studies commissioned by the Reserve Bank in 1936
and 1937 which highlighted that almost the entire
finance required by farmers was supplied by
moneylenders and that credit co-operatives and other
agencies played a negligible role. This prompted the
Reserve Bank to play an active role during 1935-1950
in promoting the co-operative credit movement through
a variety of initiatives.
8. Similarly, the Report of the All India Rural Credit
Survey (1954) highlighted that agricultural credit not
only fell short in terms of quantity, quality but also
failed in serving the right purpose and the right people.
The outcome of the survey was developing co-operatives
as an exclusive agency for providing credit to agriculture
together with outlining a role for commercial banks in
delivering credit for agriculture in specialised areas,
such as marketing, processing and warehousing.
Similarly, All India Rural Credit Review Committee set
up by the Reserve Bank in July 1966 (Chairman: Shri B.
Venkatappiah) emphasised on an increased role for
commercial banks in delivery of rural credit based on
its research fi ndings.
Issues at hand
9. The above instances highlight the signifi cance of
timely and effective research. As I have argued above,
the need for upping the policy research in banking at
the current juncture is very high. The sluggish economic
revival following the GFC has adversely impacted the
banking sector. Some of the issues which concern the
sector relate to those of asset quality, capital adequacy,
profitability, risk management and governance.
Reflecting the concerns and risk aversion, banks’
business (deposits and credit) continues to show
moderation. Slowdown is evident in the growth in the
balance sheets of banks which set in since 2011-12 and
has continued during 2014-15 as well. The return on
assets (RoA) of banks, particularly public sector banks
(PSBs), a common indicator of fi nancial viability has
remained weak in recent period.
10. It is well recognised that a competitive, sound and
inclusive banking system is sine-qua-non for a growing
economy like India that aspires to be globally
competitive. Going forward, banks will need to achieve
the mandated higher capital standards, stricter liquidity
and leverage ratios and a more cautious approach to
risk. This implies that the banks would need to improve
their productivity and effi ciency. They would also need
to make a quantitative assessment of revenue streams
from each product and service and an effi cient transfer-
pricing mechanism for effi cient capital allocation.
11. At the same time, the banks would also need to
venture into hitherto untapped segments to identify
profi table business opportunities. One key segment
that banks are increasingly looking at is the customers
at the bottom of the pyramid. Financial Inclusion, as
you all know, is the new buzzword. While everyone
agrees that the segment has immense potential, it is
certainly not a low hanging fruit. If the banks wish to
profi t from fi nancial inclusion on a sustained basis,
they would need to innovate and leverage technology.
12. Regulatory initiatives like opening up government
business to more banks, licensing of new banks and
subsidiarisation of the foreign bank branches, on the
one hand, and the changing profi le and simultaneously
rising aspirations and expectations of customers on the
other, is making the turf more competitive. Under the
circumstances, the need for supportive research so as
to fi nd out an optimal business delivery model, target
set of customers, product profi le etc., suitable to the
risk profi le of each individual bank, can hardly be
overemphasised. The banks also need to respond to
the changing environment around them. The country
SPEECH
RBI Bulletin February 201616
Research Imperatives for the Indian Banking Sector
is witnessing some signifi cant changes in demographic
patterns, literacy levels and resultantly in consumer
behavior. The rural- urban divide is quite remarkable
and also infl uences the choices the consumers make.
Banks have to be constantly aware of the dynamic
changes in consumer preferences and hence, the need
for research gets buttressed.
13. Let me now come to a few ‘bread and butter’ areas
which according to me have remained under-
researched. Among others, these include, credit to
agriculture, Micro, Small and Medium Enterprises
(MSMEs) and private sector leverage. An analysis of the
trends in bank fi nance to these sectors throws up quite
a few research questions. I would delve into some of
these in detail.
Agriculture
14. A signifi cant transformation has taken place in the
character of agricultural credit since the decade of
2000s. The common perception about agricultural credit
is that it has rural orientation and given the pre-
dominance of small landholdings in the country, small-
sized loans would account for a greater proportion of
agricultural credit. It is also expected that there would
be a fair mix of credit given for crop-loans and
investment credit. However, when one analyses the
data, which is the fi rst step in any meaningful research,
most of these perceptions prove to be wrong. I would
present some salient features of agricultural credit in
recent times purely in terms of trends which would
underscore the need for research in the area.
15. As per the latest available All-India Debt and
Investment Survey, the proportion of debt owed by
cultivator households to formal sources stood at around
64 per cent as compared to 36 per cent owed to informal
sources. Moreover, the proportion of debt owed to
formal sources has seen a decline from 66.3 per cent
in 1991 to 64 per cent in 2013. These fi gures provide
an insight into the existing unmet demand for credit
among cultivator households, which is evidently being
met by informal sources. On the other hand, as per the
recent RBI Internal Working Group1 set up to revisit
existing priority sector lending guidelines in March
2015, the commercial banks have failed to achieve the
targeted level (of 18 per cent) credit to agriculture sector
in all but three years between 2001 and 2014. Hence,
the sector witnesses two contrasting trends: unmet
credit needs of the farmers on the one hand and
shortfall in lending targets of the banks on the other
despite agriculture being designated as one of the
priority sectors for bank lending.
16. Agricultural credit, like overall bank credit in India,
has traditionally been concentrated in the southern
and northern regions of the country. In 2012, the
southern and northern regions together accounted for
about 62 per cent, with the southern region alone
accounting for 41 per cent of total agricultural credit.
Further, there was concentration of agricultural credit
in select districts. In 2012, 15 districts accounted for
about 21 per cent of total agricultural credit. Some
elucidation is needed to explain this concentration.
17. The small and marginal cultivators (operating less
than 5 acres of land) continue to be marginalised in
terms of their share in agricultural credit. The share of
small and marginal farmers has hovered around at
levels less than 50 per cent despite the fact they account
for more than 80 per cent of total cultivators in India.
Likewise, it is also observed that the share of long-term
credit in total agricultural credit has experienced a
secular decline reaching 32 per cent in 2013-14 from
74 per cent in 1990-91 suggesting a neglect of capital
formation in agriculture.
1 RBI (2015), ‘Report of the Internal Working Group to Revisit the Existing Priority Sector Lending Guidelines’, March 2.

SPEECH
RBI Bulletin February 2016 17
Research Imperatives for the Indian Banking Sector
18. Few other patterns that are noticeable in the farm
sector are:
• Decline in average size of operation landholding
to around 1.15 hectare from more than 2
hectare about four decades ago. To put it in
perspective, this size is 1/10th that in Thailand
and about half of that in Indonesia while in
the USA the average farm size is 170 hectares
• Families operating less than 1 hectare farm
size are dis-savers even after including non-
farm income
• 80 per cent of the borrowings of large farmers
(>10 hectare land) are from institutional
sources while for the landless farmers this
fi gure is only around 15 per cent
19. The core areas of research which emerge from the
forgoing discussion are:
• Is there a direct correlation between increased
agricultural credit and productivity in
agriculture/allied activities?
• Whether focus on agriculture as a priority
sector has been effective in encouraging
agricultural investment? Have small farmers
benefi ted relative to large farmers?
• Have incomes of the farmers smoothened if
not actually enhanced?
• While in villages, non-farm sector provides
more income generating activity than farm
sector, why do people still continue to stick to
farming? Can 18 per cent of GDP produced by
agriculture sustain 47 per cent of the workforce?
• What has been the impact of land fragmentation
on ag r i cu l tura l p roduct iv i ty ? Pos t -
fragmentation, whether the farmers have the
capacity to service the loan?
• What needs to be done for making the credit
delivery system for farmers more effi cient in
terms of timeliness?
Micro, Small and Medium Enterprises (MSME)
20. MSMEs play a vital role in the Indian economy.
They not only employ a large number of unskilled and
semi-skilled people but also support large industries
by supplying raw material, basic goods, fi nished parts
and components. There are an estimated 49 million
MSMEs in the country, providing employment to 111
million people which is next only to the agricultural
sector. The sector accounts for 45 per cent of the
manufacturing output and contributes close to 40 per
cent of all exports from the country. Further, about 55
per cent of the MSMEs are located in rural areas, thus
offering a great potential for rural development and
inclusive growth.
21. Despite a large contribution of the MSME sector
to the GDP, the sector often complains about lack of
fi nancing from institutional sources. Fourth Census of
MSME sector (2006-07) revealed that only 5 per cent of
the units (both registered and unregistered) had availed
of fi nance through institutional sources. As on March
2015, only 8.4 per cent of the gross non-food credit
from scheduled commercial banks (SCBs) was lent to
MSMEs against 11.0 per cent in March 2010. This is
despite increased distress in banks’ books in their
lending to large corporates over the same period.
22. There is growing realisation that if the country has
to move to a higher growth trajectory, then MSME
sector would need to play a central role. In recent years,
both Government as well as the RBI have made
substantial efforts to ease various constraints faced by
the sector. While GoI has established Micro Units
Development and Refi nance Agency Ltd. (MUDRA) for
developing and refi nancing all micro-fi nance institutions

SPEECH
RBI Bulletin February 201618
Research Imperatives for the Indian Banking Sector
(MFIs) which are in the business of lending to micro
and small business entities engaged in manufacturing,
trading and service activities, the RBI has prescribed a
target of 7.5 per cent of net bank credit for micro
enterprises for achievement in a phased manner.
Further, medium enterprises2 have also been brought
into the ambit of priority sector credit. In order to
improve liquidity for MSMEs, an electronic Trade
Receivables Discounting System (TReDS) is being set
up by the RBI to enable a speedy realisation of
receivables. The RBI has also launched a National
Mission for Capacity Building of Bankers for MSME
Financing (NAMCABS) for sensitising the bank staff
about the fi nancial and other lifecycle needs of MSME
borrowers. While the steps taken by the authorities are
commendable, a fundamental question remains
whether the remedial measures that are being
administered are based on proper diagnostics?
23. Against this backdrop, research related MSME
sector could focus on:
• Reasons for sickness/quick mortality in MSME
sector and to what extent is delay in sanctioning
by banks responsible for it?
• What are the lifecycle needs of the MSMEs?
What is the appropriate credit delivery model
for the MSMEs?
• Is there a case for a differentiated prudential
norm for MSME borrowers as against the rule
based prescriptions applicable to big
corporates?
Corporate Sector Leverage
24. Corporate sector leverage has currently become
an issue of great concern for the economy in general
and the banking system in particular. In the lead up to
the crisis and even beyond, some of the Indian
corporate houses raised unsustainable amounts of debt
from various sources including bank finance and
oversees borrowings. As we notice now, several
indiscriminate corporate houses continued market
borrowing with a view to increase their market share
and to expand capacity without any regard to domestic
and global demand situation. In fact, the rate of sales
growth of the corporate sector particularly of listed
manufacturing companies, declined from an average
of 28.8 per cent in Q1 of 2010-11 to 11.4 per cent in Q2
of 2012-13 at a time when inflation (CPI-IW)
averaged3 around 10 per cent. Some of these borrowers
necessarily fall into the category that Minsky calls
‘Ponzi borrowers’, which I had alluded to earlier. While
banking system could also be held partly responsible
for continuing to lend to these highly leveraged
corporate groups, most of the times they were
confounded by the labyrinthine maze that these
corporate houses had created to access fi nance through
group companies or thorough special purpose vehicles.
The obvious fallout of this indiscriminate borrowing is
a severe deterioration in their ability to service debt,
besides casting an adverse impact on banks’ balance
sheets. An indirect outcome of higher corporate
leverage is also likely in terms of poor transmission of
monetary policy impulses as corporates may not be in
a position to benefi t from falling interest rates due to
already high levels of debt.
25. Against this backdrop, there are a multitude of
areas that should be looked at in more detail by way of
research. The distribution of leverage is very important.
In India, about a third of total corporate debt is owned
by companies with a debt-equity ratio of more than 3.
Given the concentration of debt, there is a need to
assess the risk associated with multi-layered structures 2 Credit limit is `50 million per unit for Micro and Small Enterprises and `100 million for Medium Enterprises engaged in providing or rendering of services.
3 Average over April – January 2012-13.

SPEECH
RBI Bulletin February 2016 19
Research Imperatives for the Indian Banking Sector
– in the form of holding companies and special purpose
vehicles. Further, while the corporate profi ts wait for a
turnaround in the economy, there are also instances of
companies trying to meet their debt obligations in
different ways, one of which is deleveraging. Many
companies are now deleveraging – paying off debt by
selling off assets, more so as banks cease to restructure
their bad debts. It is important to weigh the effectiveness
of such methods against the costs it imposes on the
growth of the economy.
26. While one is quick to demonise the borrowers that
are unable to repay their debt to the lenders, it would
be unfair to say that all of these highly leveraged
borrowers are ‘Ponzi borrowers’. Ways and means have
to be found to segregate the fraudsters from the
genuine borrowers. Our experience suggests that a
number of these borrowers had borrowed heavily to
set up infrastructure projects that have got stalled due
to external factors. Several projects have faced time and
cost overruns due to delays in receiving various
clearances, cancellation of coal or gas linkages, protests
from environmentalists etc. It is in our collective
interest that productive capacity that has been created
is not jeopardised and right lessons are drawn for future
guidance. It is, therefore, important that some
meaningful research could be conducted into 3-4 of
these stalled projects, undertaking a threadbare analysis
of the development of the project from scratch
including the means and structures used for obtaining
fi nance, extent and quality of equity brought in by the
promoters, subsequent developments at various project
stages, end outcome and so on and develop them as
case studies for reference not only at management
institutes but also by all stakeholders including
Government machinery, regulators etc.
Conclusion
27. I have listed in brief a few basic issues that need
the attention of researchers. These are indicative in
nature and deal with the core areas that the bankers
deal with in their everyday functioning. Besides, the
issues that I have discussed in details above, some of
the researchers present here could also focus their
studies on the behavioral impact of credit guarantee
schemes and interest rate subsidy on the end users and
the intermediaries. Couple of other areas in which I
would like to see some quality research done is on
whether fi nancial inclusion efforts should be savings
led or credit led; and entire gamut of issues surrounding
education loans. Another interesting area of research
could be the policy of public sector banks with regard
to posting of offi cers to rural branches as I feel this
aspect has a significant bearing on progress in
agriculture and MSME credit in rural areas.
28. While I have spoken enough about the subjects
for research, there are issues related to research
methodology per se. The fi rst and foremost of which
is, whether adequate and reliable data is available. Very
often, even within the RBI also we have to grapple with
inconsistent, incoherent and incomplete data sets
which severely undermine policy formulation. There
are also problems around data design and data
architecture like varied defi nitions, different reporting
dates, etc. Quality of research would also depend a lot
on the survey methods employed, adequacy of sample
used etc. What could be done to address these issues?
29. Before I close, I would like to thank the organisers
once again for inviting me to this fi rst ever banking
research conference. The issues that I have raised
during my address today are not exhaustive and I am
sure there are many more interesting research ideas
which would be engaging the attention of our
researchers. I hope to see some quality analytical
research conducted in banking in the days to come.
I wish the Conference all the success and hope that the
deliberations are engaging and insightful.

SPEECH
RBI Bulletin February 201620
Research Imperatives for the Indian Banking Sector
References:
1. Report on Trend and Progress of Banking in India
2014-15 and Financial Stability Report December
2015 (RBI).
2. Re-embracing Keynes (Scholars, Admirers and
Sceptics in the Aftermath of the Crisis (Maria
Cristina Marcuzzo).
3. Rural India: Report by IIFL Institutional Equities.

ARTICLES
Performance of Private Corporate Business Sector during First Half of 2015-16
Composition and Ownership Pattern of Deposits with Scheduled Commercial Banks: March 2015


ARTICLE
RBI Bulletin February 2016 21
Performance of Private Corporate Business Sector during First Half of 2015-16
Other important fi nancial statements have also been
referred. This article incorporates the NIC 2008
industry classifi cation and provides a brief analysis
by sectors and major industry groups. It also captures
the trend in sales, expenditure and profi t margins of
the private corporate sector over a longer horizon.
Detailed quarterly data has been made available
periodically in the website of the Reserve Bank of
India (Q2:2015-16 data has been released on 3rd
December 2015).
1. Contracting sales growth but improved profi t
margins
1.1. Sales of 2,846 listed companies of the private
corporate sector contracted during H1: 2015-16. Over
a longer horizon, since H1:2012-13, aggregate sales
growth recorded a declining trend barring H1: 2014-15
wherein a minor increase was observed (Table 2, Chart
1). Expenditure in the fi rst half of 2015-16 contracted
due to contracting cost of raw materials and lower
growth in staff costs. Power and fuel expenses also
showed a sharp decline as fallout of the global slide
in oil prices.
1.2. EBITDA or operating profi ts and EBIT (Earnings
before Interest and Tax) showed substantial positive
growth at the aggregate level from the levels recorded
in H2:2014-15. Net profi ts showed a minor contraction
in the current half year at -0.7 per cent (Y-o-Y) as
against -21.0 per cent observed in H2:2014-15 mainly
on account of lower tax provisions offsetting the
higher interest growth. Other income recorded a steep
decline of -4.9 per cent in relation to an increase of
0.5 per cent posted for H2:2014-15.
1.3. EBITDA and Net Profit margins recorded
improvement over previous six successive half years
indicating a revival in profi tability.
1.4. Excluding the Petroleum product industry group,
aggregate sales growth (Y-o-Y) indicated continued
The aggregated sales of the private (non-financial) corporate business sector contracted during H1:2015-16. The contraction was primarily on account of the manufacturing sector which is predominated by the fall in crude oil prices. The Iron & Steel and the Textile industries have also recorded significant contraction in sales. Half yearly statement of asset and liabilities indicated a rising tail risk in corporate leverage. Number of companies that are either highly leveraged or have reported negative net worth increased as on September 2015 and a rise in the indebtedness of such companies was also observed. On the positive side, falling raw-material and power and fuel expenses boosted EBITDA (Earnings before Interest, Tax, Depreciation and Amoritisation) growth (Y-o-Y) and margin. EBITDA margin reached a high level previously observed during 2010-11 indicating a revival of profitability. The machinery industry within the manufacturing sector and the IT sector showed an improvement in sales growth. An analysis of the performance of listed non-financial private corporates over the quarters reveals that the slowdown in the aggregate sales growth (Y-o-Y) observed during Q1:2014-15 and Q2:2014-15 worsened into a contraction during Q1:2015-16 and Q2:2015-16. EBITDA margin remained high at around 15 per cent in both the quarters of the first half, while net profit margin improved.
The article analyses the performance of the
private (non-financial) corporate business sector
during the fi rst half (April- September) of 2015-16,
based on earnings results of 2,846 listed companies.
* Prepared in the Corporate Studies Division of the Department of Statistics and Information Management, Reserve Bank of India, Mumbai. The previous study ‘Performance of Private Corporate Business Sector, during fi rst half of 2014-15’ was published in the February 2015 issue of the RBI Bulletin.
Performance of Private Corporate Business Sector during First Half of 2015-16*

ARTICLE
RBI Bulletin February 201622
Performance of Private Corporate Business Sector during First Half of 2015-16
Table 1: Performance of the Listed Non-Government Non-Financial Companies
No. of companies H1:2015-16
H2:2014-15
H1:2014-15*
Items Amount(` billion)
Y-o-Y Growth @ in Per cent
2,846 2,585 2,965
1 2 3 4
Sales 15301 -3.5 -2.3 5.8Value of Production 15303 -4.1 -2.2 6.0Expenditure 12967 -5.8 -2.8 5.0
CRM ** 6219 -15.7 -11.1 7.0Staff Cost 1381 9.8 12.8 8.2Power & fuel 566 -3.2 0.5 8.7
Operating Profi ts (EBITDA) 2336 6.8 2.0 12.6Other Income@@ 458 -4.9 0.5 14.0Depreciation 611 4.1 3.6 6.4Gross Profi ts (EBIT) 2182 4.8 1.2 14.8Interest 679 9.3 6.9 1.4Earnings before tax (EBT)^ 1527 1.4 -11.1 31.1Tax provision 433 7.3 21.3 27.2Net Profi ts^ 1095 -0.7 -21.0 32.6Paid-up Capital 1380 4.4 3.3 2.3
* : Published in February 2015 issue of the RBI Bulletin.@ : Growth rates calculated on the basis of common set of companies
during any period.** : CRM : Consumption of Raw Materials.@@ : Includes forex gain while forex losses are included in Expenditure.^ : Adjusted for non-operating surplus/defi cit.
slowdown since H1:2014-15. Profi tability, as measured
by EBITDA margins increased from 14.0 per cent in
H2:2014-15 to 15.4 per cent in H1:2015-16 and was
the maximum since H1:2012-13
2. Increase in tail risk
2.1. Corporate leverage in terms of debt-equity ratio,
at the aggregate, remained mostly unchanged as at
end September 2015 compared with its position at
end September 2014. However, total debt of highly

ARTICLE
RBI Bulletin February 2016 23
Performance of Private Corporate Business Sector during First Half of 2015-16
Table 2: Important Performance Parameters
PeriodN
o. o
f C
ompa
nies
Sale
s G
row
th
(Y-o
-Y)
Expe
ndit
ure
Gro
wth
(Y-o
-Y)
EBIT
DA
Gro
wth
(Y
-o-Y
)
Net
Pro
fi t
Gro
wth
( Y-
o-Y)
EBIT
DA
Mar
gin
(Per
cen
t)
Net
Pro
fi t
Mar
gin
(Per
cen
t)
1 2 3 4 5 6 7
H1:2012-13 2,832 12.3 13.6 4.9 4.3 13.1 6.4
H2:2012-13 2,912 6.8 5.8 8.0 11.9 13.2 6.5
H1:2013-14 2,731 5.4 5.6 -0.8 -14.9 12.5 5.2
H2:2013-14 2,864 4.7 4.8 1.6 -4.9 12.3 5.1
H1:2014-15 2,965 5.8 5.0 12.6 32.6 13.7 6.8
H2:2014-15 2,585 -2.3 -2.8 2.0 -21.0 13.6 5.1
H2:2015-16 2,846 -3.5 -5.8 6.8 -0.7 15.3 7.2
leveraged companies, either with negative net worth
or debt-equity ratio greater than 300, continued to
increase from ̀ 2,410 billion as at end September 2014
to `2,896 billion at end September 2015. The
percentage of overall debt held by above set of
companies in the debt held by the NGNF companies
covered increased from end September 2014 (22.1 per
Table 4: Size class - wise important performance parameters
Size Classes Large Medium Small
Annualised sales more than `10 billion
Annualised sales between `1 billion and `10 billion
Annualised sales less than `1 billion
Period Growth Rate (Y-o-Y) (%) Margins (%) Growth Rate (Y-o-Y) (%) Margins (%) Growth Rate (Y-o-Y) (%) Margins (%)
Sale
s
EBIT
DA
Net
Pr
ofi t
EBIT
DA
Net
Pr
ofi t
Sale
s
EBIT
DA
Net
Pr
ofi t
EBIT
DA
Net
Pr
ofi t
Sale
s
EBIT
DA
Net
Pr
ofi t
EBIT
DA
Net
Pr
ofi t
1 2 3 4 5 6 7 8 9 10 11 12 13 14 15
H1:2012-13 14.6 5.9 7.8 13.4 7.0 3.8 0.6 -27.1 11.9 3.5 -21.5 -19.1 $ 6.9 -4.0
H2:2012-13 9.2 10.9 22.9 13.9 7.8 -2.7 -10.5 -86.6 10.2 0.5 -24.3 -119.3 $ -0.3 -15.0
H1:2013-14 6.6 1.6 -11.4 13.0 5.9 1.1 -14.1 -40.8 10.2 2.1 -19.3 -56.9 $ 4.2 -7.7
H2:2013-14 6.4 7.4 4.1 13.4 6.7 -1.7 -38.5 $ 6.3 -2.6 -25.8 $ $ -5.9 -25.0
H1:2014-15 7.5 13.2 31.4 14.4 7.9 -0.8 5.6 52.1 9.5 1.0 -24.3 33.1 $ 4.9 -12.2
H2:2014-15 -1.7 2.8 -16.5 14.7 6.6 -5.4 -2.9 $ 7.4 -3.3 -15.0 $ $ -2.6 -23.9
H1:2015-16 -3.1 8.1 0.1 16.2 8.5 -3.5 -0.7 $ 9.3 -0.5 -23.6 -70.9 $ 2.5 -16.0
cent) to end September 2015 (24.5 per cent) indicating
a rise in upside risk in corporate leverage. The total
number of companies in the above group (number of
companies either with negative net worth or debt-
equity ratio greater than 300 per cent) also increased
over three previous half years indicating an increase
in tail risk in corporate leverage.
3. EBITDA Margins improved across size groups
3.1. Large companies (annualised sales more than ̀ 10
billion) which showed some resilience in terms of
Y-o-Y sales growth till H1:2014-15 started to contract
since the second half of 2014-15 (Table 4). This
coincided with falling crude oil prices since the second
quarter of 2014-15, as all major companies in the
Petroleum Products industry belong to the group of
large companies. Medium and small sized companies
also continued to contract in sales.
3.2. Despite contracting sales, EBITDA margin
improved across all of the size groups in H1:2015-16
Table 3: NGNF Listed Companies: Tail Risk in Corporate Leverage (per cent)
Leverage Number of Companies (as percentage of total companies)
Share of Debt to Total Debt
Sep’14 Mar’15 Sep’15 Sep’14 Mar’15 Sep’15
Negative Net worth or DER>=2 18.4 19.0 19.4 31.8 33.8 30.5
Negative Net worth or DER>=3 13.6 14.2 15.3 22.9 23.0 24.9

ARTICLE
RBI Bulletin February 201624
Performance of Private Corporate Business Sector during First Half of 2015-16
over H2:2014-15. It stood at the highest level since
H1:2012-13 for the large companies.
3.3. Net profit margins improved for the large
companies, while the extent of losses as a percentage
of sales lowered in H1:2015-16 for the medium and
small companies.
3.4. Interest coverage ratio (EBIT/Interest Expenses)
hovered around 3.8 to 3.9 for large companies during
the period of H1:2012-13 to H1:2015-16 (Chart 3). For
medium and small companies it slid to very low levels
with an average of 1.2 for medium companies and
only 0.1 for small companies in H1:2015-16.
3.5. Solvency ratio as measured by [(Net Profi t +
depreciation)/ Average borrowings*100] improved
across size groups during H1:2015-16, while leverage
and cost of borrowings remained at similar levels as
seen in H1:2014-15. The debt to EBITDA ratio showed
a signifi cant improvement for the small companies.
4. Margins maintained across sectors
4.1. The sales of the manufacturing sector was
impacted by the petroleum products companies
having a share of 15 per cent in the sales of the
manufacturing sector. The Y-o-Y contraction in the
price of crude oil in turn, was responsible for poor
sales of the petroleum product companies. The
services (other than IT) sector recorded improvement
in sales growth in the second half of 2014-15 and
moderated subsequently in H1:2015-16. Despite
moderation, the services (other than IT) recorded
better sales growth in the last two half years as
compared to that in H2:2013-14 and H1:2014-15. The
IT sector whose performance widely fluctuated
between 2012-13 and 2014-15 has shown signs of
improvement in H1:2015-16.
Table 5: Sector- wise important performance parameters
Sector Manufacturing Services (other than IT) IT
Period Growth Rate (Y-o-Y) (%) Margins (%) Growth Rate (Y-o-Y) (%) Margins (%) Growth Rate (Y-o-Y) (%) Margins (%)
Sale
s
EBIT
DA
Net
Pr
ofi t
EBIT
DA
Net
Pr
ofi t
Sale
s
EBIT
DA
Net
Pr
ofi t
EBIT
DA
Net
Pr
ofi t
Sale
s
EBIT
DA
Net
Pr
ofi t
EBIT
DA
Net
Pr
ofi t
1 2 3 4 5 6 7 8 9 10 11 12 13 14 15
H1:2012-13 11.8 3.5 3 11.5 5.6 10.4 8.0 38.3 17.1 4.9 20.6 25.8 21.9 25.8 19.8
H2:2012-13 6.5 5.9 1.5 11.4 5.1 10.7 0.6 -45.8 16.8 2.9 7.2 7.1 -3.4 25.4 18.7
H1:2013-14 4.2 -3.6 -15.3 10.6 4.5 8.0 -5.2 -31.3 16.6 3.9 19.1 21.8 14.9 27.6 20.3
H2:2013-14 4.7 1.8 -7.9 10.8 4.5 3.0 -19.3 -86.9 13.0 0.4 21.1 33.1 33.5 28.1 21.2
H1:2014-15 5.6 12.1 32.1 11.4 5.4 4.0 17.3 99.3 18.6 8.2 11.4 11.8 26.7 27.5 22.9
H2:2014-15 -4.7 -1.4 -32.1 11.6 3.8 11.1 49.7 $ 18.4 5.8 8.2 3.4 -3.6 26.9 19.7
H1:2015-16 -6.4 7.6 -0.5 13.3 6.0 7.0 19.1 -19.6 19.9 5.7 10.9 6.1 15.1 27.0 24.3

ARTICLE
RBI Bulletin February 2016 25
Performance of Private Corporate Business Sector during First Half of 2015-16
4.2. EBITDA growth (Y-o-Y) improved remarkably for
the manufacturing sector during H1:2015-16 against
a contraction observed during the previous half year.
Notwithstanding the contraction in sales growt h the
sector recorded the highest EBITDA margin of 13.3 per
Table 6: Financial Ratios (Assets and Liabilities)- Sector-wise
Manufacturing Services (other than IT)
IT All
Number of Companies
1,596 424 138 2,368
Debt-equity (in per cent)
H1:2014-15 60.2 57.8 7.7 56.7H2:2014-15 62.0 56.8 8.2 57.7H1:2015-16 57.9 66.9 7.8 56.8
Debt to Total Asset (in per cent)
H1:2014-15 27.2 27.0 5.6 26.4H2:2014-15 27.7 26.4 5.6 26.6H1:2015-16 26.6 29.7 5.7 26.6
Debt to EBITDA (in number of times)
H1:2014-15 4.3 4.9 0.4 4.2H2:2014-15 5.5 5.0 0.4 5.0H1:2015-16 4.3 5.7 0.4 4.4
Current Ratio (in per cent)
H1:2014-15 122.4 113.9 302.3 127.0H2:2014-15 119.9 114.6 248.0 125.4H1:2015-16 119.1 108.8 298.2 124.9
Quick Ratio (in per cent)
H1:2014-15 80.3 88.1 301.2 92.7H2:2014-15 79.9 90.2 246.4 92.0H1:2015-16 80.1 84.4 296.2 92.1
Net Profi t to Average* Total Assets (in per cent)
H1:2014-15 2.8 0.6 9.6 2.6H2:2014-15 1.6 1.3 9.2 1.9H1:2015-16 2.6 1.3 10.8 2.6
Solvency ratio (in per cent)
H1:2014-15 15.1 6.1 165.8 13.8H2:2014-15 10.9 12.2 182.9 12.1H1:2015-16 14.4 11.5 209.4 14.5
Interest Coverage Ratio (in number of times)
H1:2014-15 4.0 2.8 47.7 3.7H2:2014-15 2.9 2.7 43.5 3.1H1:2015-16 3.9 2.4 55.3 3.6
Cost of borrowings (in per cent)
H1:2014-15 9.4 11.2 11.2 10.0H2:2014-15 9.4 9.5 10.1 10.1H1:2015-16 9.3 10.1 8.9 10.3
*: Average is based on outstanding opening and closing position of the half year.
cent since H1:2012-13. The non-IT services sector also
showed the highest EBITDA margin in last seven half
years, despite a moderation in EBITDA growth. The
IT sector recorded a comparatively low Y-o-Y growth in
EBITDA in the last two half years. EBITDA margin for
the IT sector was maintained at a similar level for the
last two half years.
4.3. Net profi ts recorded a good Y-o-Y growth for the
IT sector resulting in the highest net profi t margin in
the entire seven half years under consideration.
Leverage ratio (debt to equity or total assets) showed a
slight decline in the manufacturing sector (Table 6).
Lower contraction in net profi ts for the manufacturing
sector led to an improvement in the solvency ratio in
H1:2015-16 as compared to H2:2014-15. Net profi ts
contracted signifi cantly for the services (other than IT)
sector, lowering the solvency ratio for H1:2015-16.
5. EBITDA margins increased across industries
despite low / declining sales growth
5.1. In the basic goods sector, sales growth of cement
industries decelerated to 2.8 per cent in H1:2015-16
(Chart 4) presumably due to slow down in the

ARTICLE
RBI Bulletin February 201626
Performance of Private Corporate Business Sector during First Half of 2015-16
5.2. In the consumer goods sector, motor vehicles
industry witnessed a decrease in sales growth. EBITDA
margin recorded an improvement in H1:2015-16
compared to H2:2014-15. In the pharmaceuticals and
medicine industry, an increase in sales growth (12.5
construction and real estate sector. EBITDA margin also
moderated slightly and remained range-bound for the
industry. The Iron & Steel industry posted a contraction
in sales by 11.2 per cent (Chart 5) in H1: 2015-16 due
to fall in international steel prices.

ARTICLE
RBI Bulletin February 2016 27
Performance of Private Corporate Business Sector during First Half of 2015-16
per cent) was observed together with an improvement
in EBITDA margin (Chart 7). The textile industry
showed contraction in sales by 2.8 per cent and since
H2:2014-15 remained at the lowest level observed over
the previous fi ve half years (Chart 8).
5.3. In the capital goods sector Machinery industry
recorded noticeable increase in sales growth in
H1:2015-16 after successive moderation in both halves
of 2014-15 (Chart 9). EBITDA margin also recorded an
increase.

ARTICLE
RBI Bulletin February 201628
Performance of Private Corporate Business Sector during First Half of 2015-16
5.4. Construction industry reversed the trend of three
successive half yearly contraction in sales. However,
the EBITDA margin moderated to 9.7 per cent in
H1:2015-16 from 10.4 per cent in H2:2014-15, unlike
the general trend of low sales growth with improved
profi tability observed in other industries.
6. On a quarterly basis, sales growth decelerated,
profi t margin improved
6.1. An analysis of the performance of listed non-
fi nancial private corporates over the quarters reveal
that downturn in the aggregate sales growth (Y-O-Y)
observed during Q1:2014-15 and Q2:2014-15 continued
and contracted further during Q1:2015-16 and
Q2:2015-16(Table 8). With a contraction in the cost of
raw materials since Q3:2014-15 and power & fuel
expenses since Q4:2014-15, overall expenditure
contracted sharper than sales for three consecutive
quarters. This aided in boosting the growth in EBITDA
and revived profi tability of the companies. EBITDA
growth improved in Q2:2015-16 significantly as
compared to that in the previous quarter. EBITDA
Table 7: Important Performance Parameters of Select IndustriesIndustry Period Large Medium Small All Companies
Sale
s
EBIT
DA
Net
Pr
ofi t
Sale
s
EBIT
DA
Net
Pr
ofi t
Sale
s
EBIT
DA
Net
Pr
ofi t
Sale
s
EBIT
DA
Net
Pr
ofi t
Gro
wth
(Y
-o-Y
)
Mar
gin
(Per
cen
t)
Mar
gin
(Per
cen
t)
Gro
wth
(Y
-o-Y
)
Mar
gin
(Per
cen
t)
Mar
gin
(Per
cen
t)
Gro
wth
(Y
-o-Y
)
Mar
gin
(Per
cen
t)
Mar
gin
(Per
cen
t)
Gro
wth
(Y
-o-Y
)
Mar
gin
(Per
cen
t)
Mar
gin
(Per
cen
t)
1 2 3 4 5 6 7 8 9 10 11 12
Cement H1:2014-15 14.2 15.3 7.0 15.0 9.6 8.9 0.5 7.3 -5.6 14.2 14.9 7.1
H2:2014-15 5.6 15.2 6.3 10.6 10.9 4.9 -3.0 18.0 4.3 5.9 14.9 6.2
H1:2015-16 2.2 14.5 4.9 10.7 11.5 2.9 -6.8 11.8 -0.3 2.8 14.2 4.7
Iron & Steel H1:2014-15 10.9 18.1 5.5 0.6 4.9 -4.0 -32.9 -2.6 -26.7 9.1 16.5 4.2
H2:2014-15 -1.2 13.6 -0.5 -8.5 3.0 -8.3 -9.8 2.1 -9.6 -2.1 12.4 -1.4
H1:2015-16 -9.7 13.4 0.7 -17.9 2.8 -11.4 -36.7 1.3 -9.9 -11.2 11.9 -0.9
Motor Vehicles H1:2014-15 10.8 10.8 4.8 7.0 9.5 0.6 -34.6 -3.2 -2.8 10.1 10.6 4.4
H2:2014-15 14.1 10.6 3.2 -3.5 3.8 -5.3 -52.0 -19.3 -17.0 12.0 9.9 2.5
H1:2015-16 12.1 13.4 7.0 -1.6 8.7 -0.7 -44.7 -86.2 $ 10.6 12.7 5.8
Pharmaceuticals H1:2014-15 13.6 23.3 22.8 -1.9 12.2 9.0 -5.8 7.5 -18.2 9.9 20.9 19.4
H2:2014-15 9.5 18.5 8.2 -7.1 11.6 -3.7 -8.6 4.8 -5.3 6.0 17.1 6.0
H1:2015-16 16.1 25.9 16.7 -2.7 15.2 4.1 -12.2 1.1 -8.1 12.5 24.0 14.6
Textiles H1:2014-15 8.0 13.9 3.3 -1.3 6.8 -1.7 -12.4 4.4 -10.2 4.0 11.2 1.2
H2:2014-15 2.3 15.4 3.5 -11.6 2.3 -5.9 -13.1 -1.4 -15.9 -3.2 10.7 -0.1
H1:2015-16 2.6 14.8 5.5 -4.2 8.2 0.0 -47.8 -3.6 -29.8 -2.8 11.8 2.4
Machinery* H1:2014-15 7.9 8.8 4.5 2.5 8.1 0.1 -2.9 7.2 -6.4 6.8 8.7 3.6
H2:2014-15 -0.1 8.1 0.4 1.9 9.2 2.7 -17.8 4.1 -6.8 -0.2 8.2 0.6
H1:2015-16 3.3 10.6 5.9 3.0 9.5 2.5 -15.3 4.9 -5.0 2.9 10.3 5.2
Construction H1:2014-15 -1.4 12.3 1.7 -8.5 12.1 -3.1 -19.7 14.3 2.9 -2.8 12.3 1.1
H2:2014-15 -3.6 10.9 1.9 -10.7 6.7 -12.2 -22.0 2.4 -13.8 -4.6 10.4 0.3
H1:2015-16 2.5 9.4 -0.4 -14.3 12.7 -3.8 -17.5 10.5 -1.0 0.3 9.7 -0.7
*: Includes Machinery & Machine Tools and Electrical Machinery and Apparatus.

ARTICLE
RBI Bulletin February 2016 29
Performance of Private Corporate Business Sector during First Half of 2015-16
Table 8 :Performance of Select Companies over the QuartersIndicator 2014-15 2015-16
Q1 Q2 Q1 Q2
1 2 3 4
No. of Companies 2,755 2,863 2,723 2,711
Growth (Y-o-Y) Per cent
Sales 7.1 4.2 -2.4 -4.6
Expenditure 6.1 3.6 -3.5 -7.8
Operating Profi ts (EBITDA) 16.5 8.3 3.7 8.9
Other Income -2.8 26.1 1.8 -5.8
Depreciation 8.0 3.5 3.6 4.0
Gross Profi ts (EBIT) 14.7 14.1 3.4 6.5
Interest 1.4 -0.6 9.5 8.4
Net Profi ts 27.3 25.6 -9.5 9.9
Ratio Per cent
EBITDA to Sales 14.1 13.2 15.2 15.3
EBIT to Sales 12.9 13.0 14.0 14.6
Net Profi t to Sales 6.7 6.6 6.7 7.7
Interest to Sales 3.8 4.0 4.5 4.4
Interest Burden 29.2 31.0 31.9 30.3
Interest Coverage(times) 3.4 3.2 3.1 3.3
margins remained around a fi ve-year high level of
15.2-15.3 per cent during the fi rst two quarters of
2015-16.
6.2. Y-O-Y growth in interest expenses started to
escalate since Q3:2014-15 and showed considerable
rise in Q1 and Q2 of 2015-16 as compared with the
fi rst two quarters of 2014-15. But it remained at a lower
level than that earlier observed during 2012-13 and
2013-14. Interest coverage ratio (EBIT/interest
expenses) was almost at the similar level, improving
marginally in Q2 as compared with Q1:2015-16. Net
profi t margin stood at a 18 quarter high level of 7.7
per cent in Q2:2015-16.

ARTICLE
RBI Bulletin February 201630
Performance of Private Corporate Business Sector during First Half of 2015-16
1. To compute the growth rates in any period, a common set of companies for the current and previous period is considered.
2. Sector and Industry wise figures may vary slightly from earlier data released, as the industry classifi cation system has been updated broadly following the National Industrial Classifi cation (NIC 2008).
3. The manufacturing sector consists of industries like ‘Iron and Steel’, ‘Cement and Cement Products’, ‘ Machinery and Machine Tools’, ‘Motor Vehicles’, etc. This does not include ‘Agriculture and Related Activities’ and ‘Mining & Quarrying’ industries. The services (non-IT) sector includes ‘Real Estate’, ‘Wholesale and Retail Trade’, ‘Hotel and Restaurants’, etc. This does not include ‘Construction’ and ‘Electricity and Gas - Supply’ industries.
4. FOREX gain and loss are reported on net basis by companies and included in the net profi t
Annex
Explanatory Notes
calculation. While net FOREX loss is considered
as a part of the expenditure and thus included
in EBITDA, net FOREX gain is considered as a
part of other income and included in EBIT.
5. Other income includes various regular incomes
like rents, dividends, royalties etc. and does not
include extra-ordinary income/expenses.
6. Extra-ordinary income/expenses are included in
EBT and net profi t. As the name suggests, these
income/ expenses can be very large for some of
the companies in a particular quarter.
7. Some companies report interest on net basis.
However, some companies include the interest
expenses on gross basis, where, interest received
is reported in other income.
8. ‘$’ (across all tables) indicates that the ratio /
growth rate is not calculated as denominator is
negative or negligible.
Glossary of Terms
EBITDA - Operating Profi ts / Earnings before Interest, Tax, Depreciation & Amortization
- Sales + Change in Stock – Expenditure
EBIT - Gross Profi ts/Earnings before Interest & Tax
- EBITDA+ Other Income – Depreciation & Amortisation
EBT - Earnings before Tax - EBIT – Interest Payment +Extra-ordinary income/expenses
Net Profi t - - EBT – Tax
Interest Burden - - Interest Payment / EBIT*100
Interest Coverage - - EBIT/Interest Payment
Debt - - Short Term Borrowings + Long Term Borrowings
Current Ratio - - Current Assets / Current Liabilities*100
Quick Ratio - - (Current Assets – Inventories) / Current Liabilities*100
Solvency Ratio - - (Net Profi t + depreciation)/ Average borrowings*100

ARTICLE
RBI Bulletin February 2016 31
Composition and Ownership Pattern of Deposits with Scheduled Commercial Banks: March 2015
2. This article presents a brief review of the trends
and pattern as observed from the above data along
with the prevailing economic environment.
Composition of aggregate deposits according to type
of deposit accounts and ownership categories, are
discussed fi rst. Subsequently, the pattern in ownership
of deposits across various population groups is
analysed. Institutional preference for specifi ed bank-
groups, if any, has also been looked into. State-wise
patterns in bank deposits as on March 31, 2015 are
presented in the fi nal section.
Share of term deposits in total deposits continued
to rise
3. In the backdrop of decelerating growth in
nominal GDP, the growth in total deposits continued
to decline during 2014-15 (Table 1). In tandem, growth
in term deposits as well as savings deposits also
decelerated. However, term deposits continued to
maintain its’ dominant share constituting around
two-third of total deposits followed by savings
deposits having around one-fourth share of total
deposits. Despite reduction in term deposits’ growth
rates during 2014-15, the share of term deposits in
total deposits continued to show marginal rise
(Chart 1). Deceleration in growth in savings deposits
during 2014-15 was much sharper, thereby reducing
its share in total deposits by 1.2 percentage points.
Lower income growth together with higher infl ation
in the last few years might have led to shift away from
savings deposits and may also cause deceleration in
overall deposits growth.
Households’ deposits grew at a relatively higher rate
than total deposits
4. Except non-fi nancial private corporate sector,
growth in deposits of all sectors during 2014-15 was
lower than that in the preceding year (Table 2). Non-
fi nancial private corporate sector recorded positive
Composition and Ownership Pattern of Deposits with Scheduled Commercial Banks: March 2015*
This article presents an analysis of composition and ownership pattern of outstanding deposits with scheduled commercial banks (including regional rural banks) during 2007-2015. The data on ownership pattern of deposits as estimated from annual sample survey for the period from 2007-10 is used along with the annual census survey data as collected from-March 2012 to 20151. The analysis brings out broad trends across type of deposit accounts, institutional sectors, population groups and bank groups over the period.
Introduction
The annual survey on Composition and
Ownership Pattern of Bank Deposits with Scheduled
Commercial Banks (SCBs) including Regional Rural
Banks (RRBs) as on March 31, 2015, was conducted by
the Reserve Bank. The branch-wise data were collected,
according to type of deposits (viz., current, savings
and term deposits), and institutional categories of
depositors (i.e., households, government, non-
fi nancial private corporate, fi nancial, and foreign)
under this survey. The aggregated data so collected
under the survey were published on the Bank’s
website under ‘data release’ (https://rbi.org.in/scripts/
BS_PressReleaseDisplay.aspx?prid=35943) in January
2015.
* Prepared in the Bank Branch Statistics Division of the Department of
Statistics and Information Management, Reserve Bank of India, Mumbai.
1 More detailed data for March 2015 is available in the Reserve Bank website
‘URL:http://www.rbi.org.in/’. Previous findings from BSR-4 survey on
Composition and Ownership Pattern of Deposits with scheduled commercial
bank were published in various issues of the Reserve Bank Bulletin; the
latest was published in the March 2015 issue.
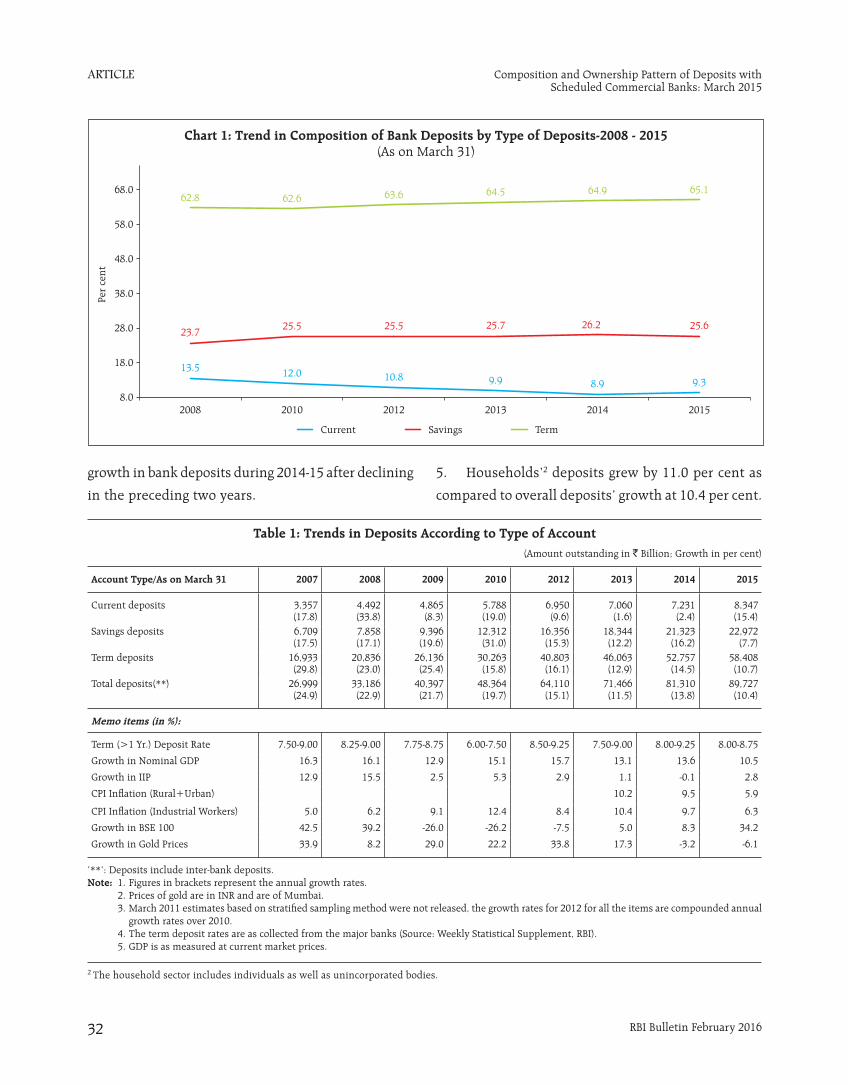
ARTICLE
RBI Bulletin February 201632
Composition and Ownership Pattern of Deposits with Scheduled Commercial Banks: March 2015
Table 1: Trends in Deposits According to Type of Account(Amount outstanding in ` Billion; Growth in per cent)
Account Type/As on March 31 2007 2008 2009 2010 2012 2013 2014 2015
Current deposits 3,357(17.8)
4,492(33.8)
4,865(8.3)
5,788(19.0)
6,950(9.6)
7,060(1.6)
7,231(2.4)
8,347(15.4)
Savings deposits 6,709(17.5)
7,858(17.1)
9,396(19.6)
12,312(31.0)
16,356(15.3)
18,344(12.2)
21,323(16.2)
22,972(7.7)
Term deposits 16,933(29.8)
20,836(23.0)
26,136(25.4)
30,263(15.8)
40,803(16.1)
46,063(12.9)
52,757(14.5)
58,408(10.7)
Total deposits(**) 26,999(24.9)
33,186(22.9)
40,397(21.7)
48,364(19.7)
64,110(15.1)
71,466(11.5)
81,310(13.8)
89,727(10.4)
Memo items (in %):
Term (>1 Yr.) Deposit Rate 7.50-9.00 8.25-9.00 7.75-8.75 6.00-7.50 8.50-9.25 7.50-9.00 8.00-9.25 8.00-8.75
Growth in Nominal GDP 16.3 16.1 12.9 15.1 15.7 13.1 13.6 10.5
Growth in IIP 12.9 15.5 2.5 5.3 2.9 1.1 -0.1 2.8
CPI Infl ation (Rural+Urban) 10.2 9.5 5.9
CPI Infl ation (Industrial Workers) 5.0 6.2 9.1 12.4 8.4 10.4 9.7 6.3
Growth in BSE 100 42.5 39.2 -26.0 -26.2 -7.5 5.0 8.3 34.2
Growth in Gold Prices 33.9 8.2 29.0 22.2 33.8 17.3 -3.2 -6.1
‘**’: Deposits include inter-bank deposits.Note: 1. Figures in brackets represent the annual growth rates. 2. Prices of gold are in INR and are of Mumbai. 3. March 2011 estimates based on stratifi ed sampling method were not released, the growth rates for 2012 for all the items are compounded annual
growth rates over 2010. 4. The term deposit rates are as collected from the major banks (Source: Weekly Statistical Supplement, RBI). 5. GDP is as measured at current market prices.
growth in bank deposits during 2014-15 after declining
in the preceding two years.
5. Households’2 deposits grew by 11.0 per cent as
compared to overall deposits’ growth at 10.4 per cent.
2 The household sector includes individuals as well as unincorporated bodies.

ARTICLE
RBI Bulletin February 2016 33
Composition and Ownership Pattern of Deposits with Scheduled Commercial Banks: March 2015
comprising around 82 per cent. (For detailed data,
refer the RBI website (http://www.rbi.org.in/)).
6. After households, government sector was the
second largest contributor in total deposits constituting
14.4 per cent of total deposits as on March 31, 2015
followed by non-fi nancial private corporate sector,
fi nancial sector, and foreign sector (Chart 2).
Households has the largest shares across all types
of deposits; Term deposits constituted major part
of total deposits across all institutional sectors
7. The contribution of various institutional sectors
in different types of deposits indicated that the
households sector, which is the largest contributor
in total deposits outstanding, also held the largest
shares across all three types of deposits, viz., current,
In total increase of `8,417 billion in total deposits
during 2014-15, `3,731 billion (44.3 per cent) were
contributed by households. This combined with a net
decline in deposits of financial sector, led to
households’ share in total deposits crossing 60 per
cent as on March 31, 2015. Nonetheless, contribution
of households in incremental deposits in 2015
remained lower in comparison with the earlier years.
During 2014-15, while banks’ term deposits rates were
quite competitive to provide real positive returns
against prevailing inflation and negative returns
provided by gold, these were far lower than the return
from stock markets (other investment opportunity
available to households). Within households’ sector,
individuals3 were the single major constituent
3 Individuals include Hindu undivided families (HUF).
Table 2: Total Deposits by Major Institutional Sectors(Amounts in ` Billion; Growth in Per cent)
Major Institutional Sectors Mar-07 Mar-08 Mar-09 Mar-10 Mar-12 Mar-13 Mar-14 Mar-15
I. Government Sector 3,907 4,478 5,652 6,551 9,361 9,912 11,402 12,900(25.2) (14.6) (26.2) (15.9) (19.5) (5.9) (15.0) (13.1)
Of which, Public Sector Corporations 1,238 1,314 1,879 1,879 3,017 2,726 3,735 3,719(19.6) (6.2) (43.0) (0.0) (26.7) (-9.6) (37.0) (-0.4)
II. Private Corporate Sector (Non-Financial) 3,035 4,322 5,867 7,137 9,384 8,875 8,065 9076(39.1) (42.4) (35.7) (21.6) (14.7) (-5.4) (-9.1) (12.5)
III. Financial Sector 2,825 3,429 3,580 4,820 6,019 7150 7,928 7,361(34.6) (21.4) (4.4) (34.7) (11.7) (18.8) (10.9) (-7.2)
Of which, Banks 1,123 1,191 1,578 2,348 2,652 2,939 3,736 3,384(44.7) (6.1) (32.5) (48.8) (6.3) (10.8) (27.1) (-9.4)
Other Financial Institutions 1,181 1,306 1,085 1,346 1,548 1,662 2,136 1,918(28.1) (10.6) (-16.9) (24.0) (7.2) (7.4) (28.5) (-10.2)
Other Financial Companies 521 932 916 1,127 1,819 2,549 2,056 2,060(30.2) (79.0) (-1.7) (23.0) (27.1) (40.1) (-19.3) (0.2)
IV. Household Sector 15,497 19,280 23,552 28,049 37,249 42,568 48,567 53,914(22.6) (24.4) (22.2) (19.1) (15.2) (14.3) (14.1) (11.0)
Of which, Individuals (including Hindu undivided Families)
12,018 14,954 18,732 21,843 28,660 33,314 40,468 44,199
(18.5) (24.4) (25.3) (16.6) (14.5) (16.2) (21.5) (9.2)
V. Foreign Sector 1,736 1,677 1,747 1,807 2,097 2,960 5,348 6,475(10.8) (-3.4) (4.2) (3.4) (7.7) (41.2) (80.7) (21.1)
Of which, Non-Residents 1,494 1,395 1,558 1,605 1,951 2,811 5,013 5,807(7.6) (-6.7) (11.7) (3.0) (10.2) (44.1) (78.3) (15.8)
Total Deposits 26,999 33,186 40,397 48,364 64,110 71,466 81,310 89,727(24.9) (22.9) (21.7) (19.7) (15.1) (11.5) (13.8) (10.4)
Note: Figures in brackets represent the annual growth rates. The estimates for March 2011 were not released. Therefore, the growth rates for 2012 are the compounded annual growth rates (CAGR) over 2010.
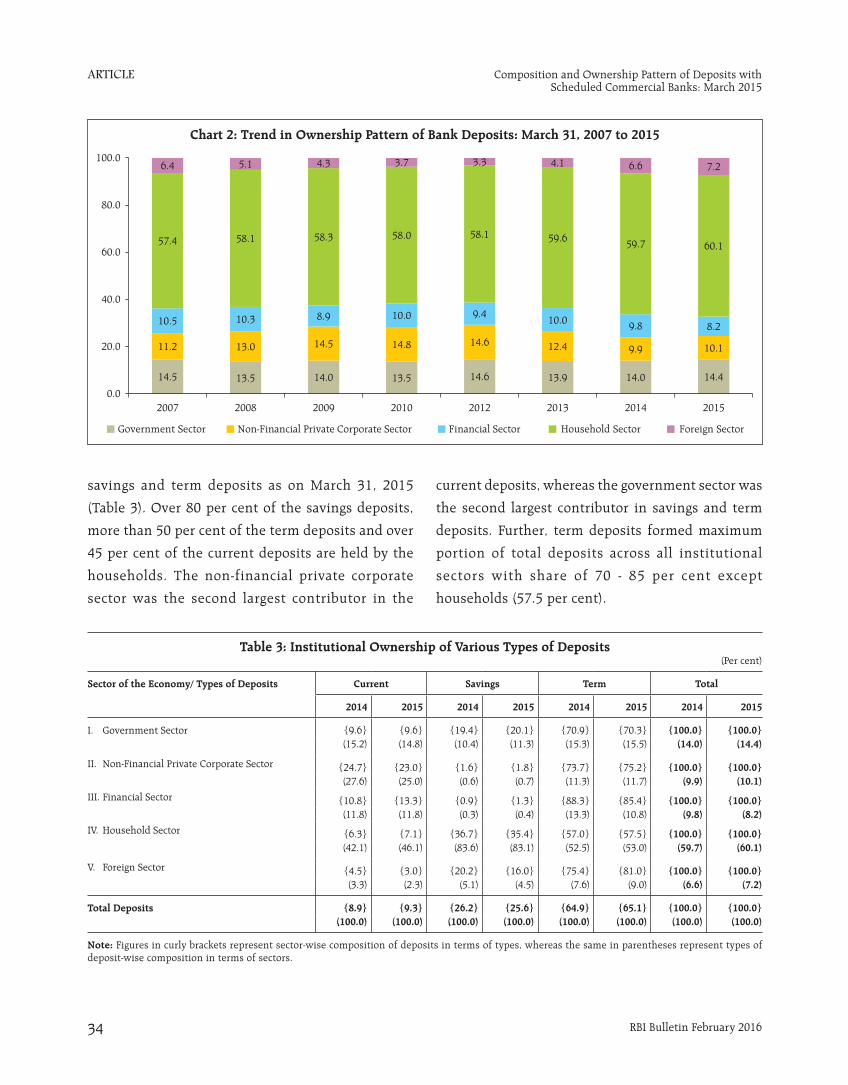
ARTICLE
RBI Bulletin February 201634
Composition and Ownership Pattern of Deposits with Scheduled Commercial Banks: March 2015
Table 3: Institutional Ownership of Various Types of Deposits (Per cent)
Sector of the Economy/ Types of Deposits Current Savings Term Total
2014 2015 2014 2015 2014 2015 2014 2015
I. Government Sector {9.6} {9.6} {19.4} {20.1} {70.9} {70.3} {100.0} {100.0}(15.2) (14.8) (10.4) (11.3) (15.3) (15.5) (14.0) (14.4)
II. Non-Financial Private Corporate Sector {24.7} {23.0} {1.6} {1.8} {73.7} {75.2} {100.0} {100.0}(27.6) (25.0) (0.6) (0.7) (11.3) (11.7) (9.9) (10.1)
III. Financial Sector {10.8} {13.3} {0.9} {1.3} {88.3} {85.4} {100.0} {100.0}(11.8) (11.8) (0.3) (0.4) (13.3) (10.8) (9.8) (8.2)
IV. Household Sector {6.3} {7.1} {36.7} {35.4} {57.0} {57.5} {100.0} {100.0}(42.1) (46.1) (83.6) (83.1) (52.5) (53.0) (59.7) (60.1)
V. Foreign Sector {4.5} {3.0} {20.2} {16.0} {75.4} {81.0} {100.0} {100.0}(3.3) (2.3) (5.1) (4.5) (7.6) (9.0) (6.6) (7.2)
Total Deposits {8.9} {9.3} {26.2} {25.6} {64.9} {65.1} {100.0} {100.0}(100.0) (100.0) (100.0) (100.0) (100.0) (100.0) (100.0) (100.0)
Note: Figures in curly brackets represent sector-wise composition of deposits in terms of types, whereas the same in parentheses represent types of deposit-wise composition in terms of sectors.
savings and term deposits as on March 31, 2015
(Table 3). Over 80 per cent of the savings deposits,
more than 50 per cent of the term deposits and over
45 per cent of the current deposits are held by the
households. The non-financial private corporate
sector was the second largest contributor in the
current deposits, whereas the government sector was
the second largest contributor in savings and term
deposits. Further, term deposits formed maximum
portion of total deposits across all institutional
sectors with share of 70 - 85 per cent except
households (57.5 per cent).

ARTICLE
RBI Bulletin February 2016 35
Composition and Ownership Pattern of Deposits with Scheduled Commercial Banks: March 2015
Current and Savings Accounts constitute more than
40 per cent of households’ deposits
8. Composition of various institutional sectors in
terms of types of deposits accounts maintained by
them, shows that term deposits constituted a major
part of total deposits for all institutional sectors over
the period 2008-2015 (Table 4). Savings deposits was
the second major constituent in all sectors except for
non-fi nancial private corporate and fi nancial sectors,
wherein current deposits was the second most
important part with savings deposits having a
negligible share.
9. Households are keeping around 43 per cent of
their total deposits in current and savings accounts
(CASA) (having lower interest rates), and constitute a
quite stable and cheaper source of funds for banks.
While government sector keeps around 30 per cent of
their total deposits in CASA form, non-financial
private corporate sector keeps 25 per cent in CASA.
More than half of the total deposits are held by
metropolitan branches
10. The distribution of deposits across the population
groups4 indicated that more than half of the total
deposits are held by the metropolitan branches, but
their share has been declining since 2010 (Table 5). It
may be noted that growth in deposits raised by rural,
urban, and metropolitan branches during 2014-15 was
lower as compared to the previous year while it is
higher for semi-urban branches.
Table 4: Composition of Deposits by Various Institutional Sectors(Per cent)
Year(As on March 31)
Deposit Type/Sector
Government Sector
Private Corporate Sector (Non-Financial)
Financial Sector
Household Sector
Foreign Sector
Total
2008
Current 14.8 25.8 21.4 9.5 9.2 13.5Savings 14.0 0.8 1.2 34.8 26.5 23.7Term 71.2 73.4 77.5 55.7 64.3 62.8Total 100.0 100.0 100.0 100.0 100.0 100.0
2010
Current 14.1 26.8 9.6 8.5 6.5 12.0Savings 16.1 1.0 1.0 37.4 36.2 25.5Term 69.8 72.2 89.4 54.2 57.3 62.6Total 100.0 100.0 100.0 100.0 100.0 100.0
2012
Current 12.1 22.0 12.3 7.8 6.1 10.8Savings 18.7 3.0 1.4 36.3 33.0 25.5Term 69.2 75.0 86.2 55.9 60.8 63.6Total 100.0 100.0 100.0 100.0 100.0 100.0
2013
Current 12.1 22.9 11.7 6.8 3.8 9.9Savings 18.1 2.2 1.1 36.5 24.5 25.7Term 69.8 74.9 87.2 56.7 71.7 64.5Total 100.0 100.0 100.0 100.0 100.0 100.0
2014
Current 9.6 24.7 10.8 6.3 4.5 8.9Savings 19.4 1.6 0.9 36.7 20.2 26.2Term 70.9 73.7 88.3 57.0 75.4 64.9Total 100.0 100.0 100.0 100.0 100.0 100.0
2015
Current 9.6 23.0 13.3 7.1 3.0 9.3Savings 20.1 1.8 1.3 35.4 16.0 25.6Term 70.3 75.2 85.4 57.5 81.0 65.1Total 100.0 100.0 100.0 100.0 100.0 100.0
4 The population group classifi cation of banked centres is based on Census 2001.

ARTICLE
RBI Bulletin February 201636
Composition and Ownership Pattern of Deposits with Scheduled Commercial Banks: March 2015
Households’ contributed maximum deposits across
all population groups
11. Households continued to remain the major owner
of bank deposits across all population groups in 2015.
The share of households in total deposits held by rural
branches was 89.1 per cent followed by 76.2 per cent
by semi-urban branches, 66.5 per cent by urban
branches and 47.4 per cent by metropolitan branches.
In the metropolitan area, other notable contributing
sectors were government sector (16.3 per cent), non-
fi nancial private corporate sector (15.5 per cent) and
fi nancial sector (12.5 per cent) (For detailed data, refer
RBI website (http://www.rbi.org.in/)).
Share of savings deposits was the highest in total
deposits held by rural branches
12. It is seen that deposit composition is generally
shifting towards higher interest bearing term-deposits
in all the population groups but more so, in the urban/
metropolitan centres (Chart 3(a)). However, savings
deposits’ share in total deposits was the largest in
rural centres. Similar pattern is observed in
composition of households’ deposits across population
groups (Chart 3(b)).
Public sector banks continued to dominate
13. With wider network of branches, public sector
banks (consisting of SBI & its' associates and
nationalised banks including IDBI Bank and Bhartiya Mahila Bank) continued to have the largest share of
total deposits, which hovered in the range of 70 - 75
per cent between 2007 and 2015 (Table 6). Domestic
private sector banks held 18 - 21 per cent of deposits
while the share of foreign banks remained at 4 - 6 per
cent in 2007-2015. The RRBs contributed at around 3
per cent of total deposits in the same period.
14. Distribution of deposits according to type was
quite similar to earlier years among SBI and its
associates, nationalised banks and private sector
banks, where the term deposits had the largest share
followed by savings deposits (Chart 4). In case of
foreign banks, term deposits constituted more than
Table 5: Distribution of Deposits Across Population Groups(Amounts in ` Billion; Growth Rate and Share in Per cent)
Population Group/Year (as on March 31) 2007 2008 2009 2010 2012 2013 2014 2015
Rural
Amount 2,585 3,010 3,151 4,270 5,780 6,757 7,917 8,900(Growth Rate) (10.8) (16.4) (4.7) (35.5) (16.3) (16.9) (17.2) (12.4){Share} {9.6} {9.1} {7.8} {8.8} {9.0} {9.5} {9.7} {9.9}
Semi-urban
Amount 3,653 4,328 5,488 6,307 8,664 10,132 11,604 13,367(Growth Rate) (18.8) (18.5) (26.8) (14.9) (17.2) (16.9) (14.5) (15.2){Share} {13.5} {13.0} {13.6} {13.0} {13.5} {14.2} {14.3} {14.9}
Urban
Amount 5,526 6,829 8,926 9,833 13,248 15,388 17,640 20,041
(Growth Rate) (20.8) (23.6) (30.7) (10.2) (16.1) (16.2) (14.6) (13.6)
{Share} {20.5} {20.6} {22.1} {20.3} {20.7} {21.5} {21.7} {22.3}
Metropolitan
Amount 15,235 19,020 22,832 27,954 36,417 39,189 44,148 47,420(Growth Rate) (31.0) (24.8) (20.0) (22.4) (14.1) (7.6) (12.7) (7.4){Share} {56.4} {57.3} {56.5} {57.8} {56.8} {54.8} {54.3} {52.8}
All India
Amount 26,999 33,186 40,397 48,364 64,110 71,466 81,310 89,727(Growth Rate) (24.9) (22.9) (21.7) (19.7) (15.1) (11.5) (13.8) (10.4){Share} {100.0} {100.0} {100.0} {100.0} {100.0} {100.0} {100.0} {100.0}
Note: The growth rates for 2012 are the compounded annual growth rates (CAGR) over 2010.
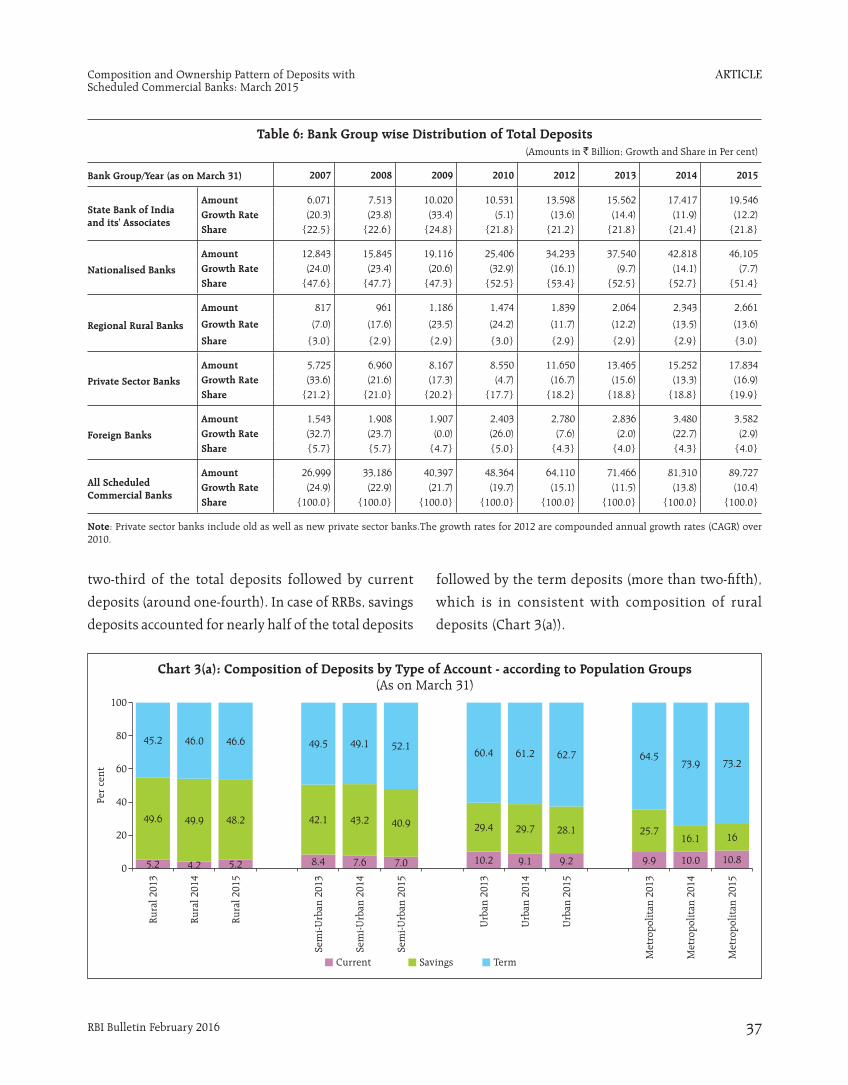
ARTICLE
RBI Bulletin February 2016 37
Composition and Ownership Pattern of Deposits with Scheduled Commercial Banks: March 2015
two-third of the total deposits followed by current
deposits (around one-fourth). In case of RRBs, savings
deposits accounted for nearly half of the total deposits
followed by the term deposits (more than two-fi fth),
which is in consistent with composition of rural
deposits (Chart 3(a)).
Table 6: Bank Group wise Distribution of Total Deposits(Amounts in ` Billion; Growth and Share in Per cent)
Bank Group/Year (as on March 31) 2007 2008 2009 2010 2012 2013 2014 2015
State Bank of India and its' Associates
Amount 6,071 7,513 10,020 10,531 13,598 15,562 17,417 19,546Growth Rate (20.3) (23.8) (33.4) (5.1) (13.6) (14.4) (11.9) (12.2)Share {22.5} {22.6} {24.8} {21.8} {21.2} {21.8} {21.4} {21.8}
Nationalised Banks
Amount 12,843 15,845 19,116 25,406 34,233 37,540 42,818 46,105Growth Rate (24.0) (23.4) (20.6) (32.9) (16.1) (9.7) (14.1) (7.7)Share {47.6} {47.7} {47.3} {52.5} {53.4} {52.5} {52.7} {51.4}
Regional Rural Banks
Amount 817 961 1,186 1,474 1,839 2,064 2,343 2,661
Growth Rate (7.0) (17.6) (23.5) (24.2) (11.7) (12.2) (13.5) (13.6)
Share {3.0} {2.9} {2.9} {3.0} {2.9} {2.9} {2.9} {3.0}
Private Sector Banks
Amount 5,725 6,960 8,167 8,550 11,650 13,465 15,252 17,834Growth Rate (33.6) (21.6) (17.3) (4.7) (16.7) (15.6) (13.3) (16.9)Share {21.2} {21.0} {20.2} {17.7} {18.2} {18.8} {18.8} {19.9}
Foreign Banks
Amount 1,543 1,908 1,907 2,403 2,780 2,836 3,480 3,582Growth Rate (32.7) (23.7) (0.0) (26.0) (7.6) (2.0) (22.7) (2.9)Share {5.7} {5.7} {4.7} {5.0} {4.3} {4.0} {4.3} {4.0}
All Scheduled Commercial Banks
Amount 26,999 33,186 40,397 48,364 64,110 71,466 81,310 89,727Growth Rate (24.9) (22.9) (21.7) (19.7) (15.1) (11.5) (13.8) (10.4)Share {100.0} {100.0} {100.0} {100.0} {100.0} {100.0} {100.0} {100.0}
Note: Private sector banks include old as well as new private sector banks.The growth rates for 2012 are compounded annual growth rates (CAGR) over 2010.
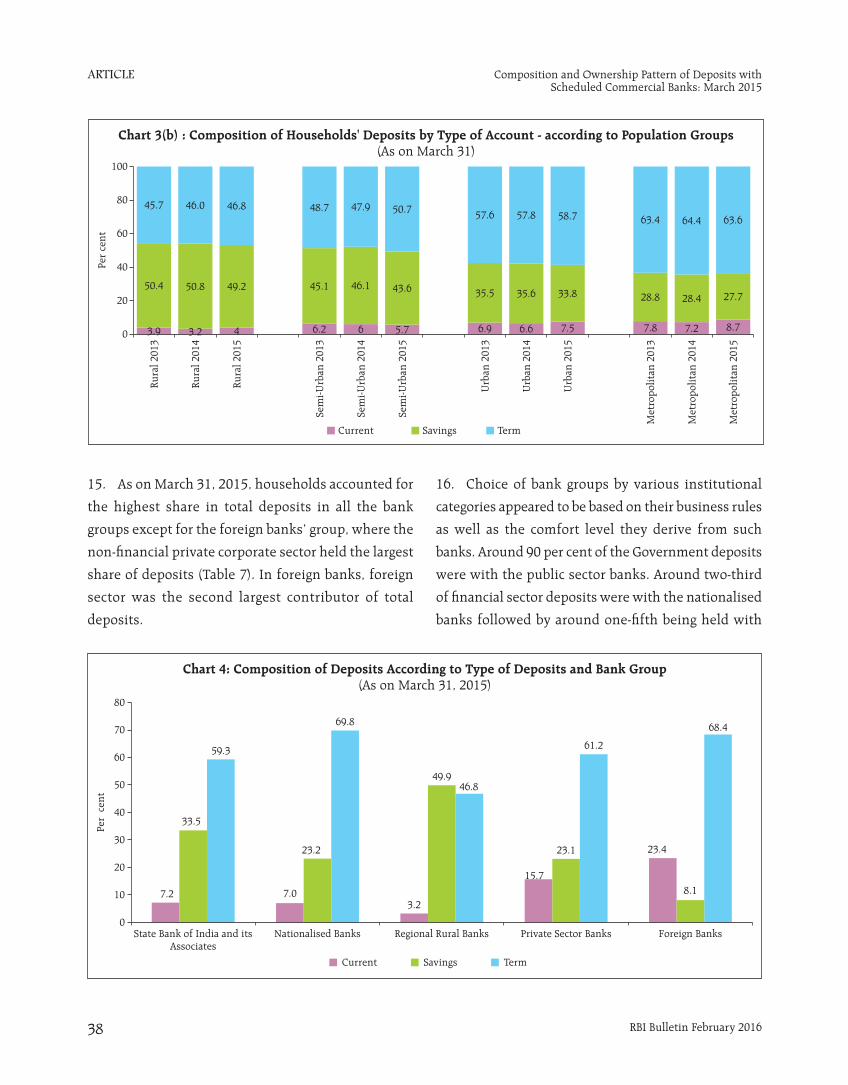
ARTICLE
RBI Bulletin February 201638
Composition and Ownership Pattern of Deposits with Scheduled Commercial Banks: March 2015
15. As on March 31, 2015, households accounted for
the highest share in total deposits in all the bank
groups except for the foreign banks’ group, where the
non-fi nancial private corporate sector held the largest
share of deposits (Table 7). In foreign banks, foreign
sector was the second largest contributor of total
deposits.
16. Choice of bank groups by various institutional
categories appeared to be based on their business rules
as well as the comfort level they derive from such
banks. Around 90 per cent of the Government deposits
were with the public sector banks. Around two-third
of fi nancial sector deposits were with the nationalised
banks followed by around one-fi fth being held with

ARTICLE
RBI Bulletin February 2016 39
Composition and Ownership Pattern of Deposits with Scheduled Commercial Banks: March 2015
private sector banks. Around 56 per cent deposits of
non-fi nancial private corporate sector were held with
the public sector banks, while 44 per cent deposits
were held with the private sector banks and the
foreign banks. More than three-fourth of the
household deposits, especially of individuals (largest
constituent of household sector) were with the public
sector banks, perhaps on account of wider network of
these banks across the country (Table 7).
Large share of deposits contributed by a few states5
17. The composition of deposits as on March 31, 2015
across different States/Union Territories (UTs) showed
higher concentration in seven states viz. Maharashtra,
Delhi, Uttar Pradesh, Karnataka, West Bengal, Tamil
Nadu, and Gujarat. These states accounted for 66.2 per
cent of total deposits and 62.1 per cent of total
households’ deposits. Maharashtra alone contributed
nearly one-fourth of the total deposits.
18. Households maintained dominant contribution
in total bank deposits, but with varying degree, among
different regions. The overall households’ share in
total deposits in the central region was the highest at
71.9 per cent (with the constituent states/union
territories having the share in the range between 62
and 77 per cent), followed by the eastern region at
70.7 per cent (with the constituents having the share
ranging between 61 to 75 per cent) and north-eastern
region at 70.1 per cent (share varying between 64 to
80 per cent). The share of households in total deposits
was lower in the northern region (63.9 per cent), the
southern region (59.8 per cent) and in western region
(47.7 per cent). In these regions, non-fi nancial private
corporate sector, government sector and other sectors
also have a signifi cant share.
19. Of the total deposits by non-fi nancial private
corporates, 58.6 per cent was concentrated in three
states, namely, Maharashtra (33.8 per cent), Delhi
Table 7: Bank Group Wise Pattern of Ownership of Deposits – March 31, 2015(Amounts in ` Billion; Share in Per cent)
Bank Group/Sector of the Economy State Bank of India & its' Associates
Nationalised Banks
Regional RuralBanks
Private Sector Banks
Foreign Banks All ScheduledCommercial
Banks
I. Government Sector 3,439 8,123 180 877 280 12,900{17.6} {17.6} {6.8} {4.9} {7.8} {14.4}(26.7) (63.0) (1.4) (6.8) (2.2) (100)
II. Private Corporate Sector (Non-Financial) 1,704 3,342 13 2,656 1,361 9,076{8.7} {7.2} {0.5} {14.9} {38.0} {10.1}(18.8) (36.8) (0.1) (29.3) (15.0) (100)
III. Financial Sector 296 4,913 29 1,593 530 7,361{1.5} {10.7} {1.1} {8.9} {14.8} {8.2}(4.0) (66.7) (0.4) (21.6) (7.2) (100)
IV. Household Sector 12,628 28,364 2,433 9,957 533 53,914{64.6} {61.5} {91.4} {55.8} {14.9} {60.1}(23.4) (52.6) (4.5) (18.5) (1.0) (100)
V. Foreign Sector 1,478 1,363 6 2,750 879 6,475{7.6} {3.0} {0.2} {15.4} {24.5} {7.2}(22.8) (21.0) (0.1) (42.5) (13.6) (100)
Total Deposits 19,546 46,105 2,661 17,834 3,582 89,727{100} {100} {100} {100} {100} {100}(21.8) (51.4) (3.0) (19.9) (4.0) (100)
Note: 1. Figures in curly brackets represent composition of deposits of a bank group across institutional sectors. 2. Figures in parentheses represent composition of deposits kept by an institutional sector across bank groups.
5 More detailed data for March 2015 is available in the Reserve Bank website ‘URL:http://www.rbi.org.in/’.

ARTICLE
RBI Bulletin February 201640
Composition and Ownership Pattern of Deposits with Scheduled Commercial Banks: March 2015
(13.6 per cent), and Karnataka (11.3 per cent).
Maharashtra constituted around 64 per cent of total
deposits by financial sector, mainly due to
concentration of financial business in Mumbai.
Moreover, Maharashtra and Delhi together contributed
39 per cent of total Government deposits. In the total
foreign sector deposits raised by the SCBs, Maharashtra
contributed 34.0 per cent followed by Kerala (17.0 per
cent), Delhi (9.2 per cent), Gujarat (7.0 per cent), and
Karnataka (6.5 per cent).

CURRENT STATISTICS
Select Economic Indicators
Reserve Bank of India
Money and Banking
Prices and Production
Government Accounts and Treasury Bills
Financial Markets
External Sector
Payment and Settlement Systems


CURRENT STATISTICS
RBI Bulletin February 2016 41
No. Title Page
1 Select Economic Indicators 43
Reserve Bank of India
2 RBI – Liabilities and Assets 44
3 Liquidity Operations by RBI 45
4 Sale/ Purchase of U.S. Dollar by the RBI 46
4A Maturity Breakdown (by Residual Maturity) of Outstanding Forwards of RBI (US$ Million) 47
5 RBI's Standing Facilities 47
Money and Banking
6 Money Stock Measures 48
7 Sources of Money Stock (M3) 49
8 Monetary Survey 50
9 Liquidity Aggregates 50
10 Reserve Bank of India Survey 51
11 Reserve Money – Components and Sources 51
12 Commercial Bank Survey 52
13 Scheduled Commercial Banks' Investments 52
14 Business in India – All Scheduled Banks and All Scheduled Commercial Banks 53
15 Deployment of Gross Bank Credit by Major Sectors 54
16 Industry-wise Deployment of Gross Bank Credit 55
17 State Co-operative Banks Maintaining Accounts with the Reserve Bank of India 56
Prices and Production
18 Consumer Price Index (Base: 2012=100) 57
19 Other Consumer Price Indices 57
20 Monthly Average Price of Gold and Silver in Mumbai 57
21 Wholesale Price Index 58
22 Index of Industrial Production (Base: 2004-05=100) 60
Government Accounts and Treasury Bills
23 Union Government Accounts at a Glance 60
24 Treasury Bills – Ownership Pattern 61
25 Auctions of Treasury Bills 61
Financial Markets
26 Daily Call Money Rates 62
27 Certificates of Deposit 63
28 Commercial Paper 63
29 Average Daily Turnover in Select Financial Markets 63
30 New Capital Issues by Non-Government Public Limited Companies 64
Contents

CURRENT STATISTICS
RBI Bulletin February 201642
No. Title Page
External Sector
31 Foreign Trade 65
32 Foreign Exchange Reserves 65
33 NRI Deposits 65
34 Foreign Investment Inflows 66
35 Outward Remittances under the Liberalised Remittance Scheme (LRS) for Resident Individuals 66
36 Indices of Real Effective Exchange Rate (REER) and Nominal Effective Exchange Rate (NEER) of the Indian Rupee
67
37 External Commercial Borrowings (ECBs) 67
38 India’s Overall Balance of Payments (US $ Million) 68
39 India's Overall Balance of Payments (` Billion) 69
40 Standard Presentation of BoP in India as per BPM6 (US $ Million) 70
41 Standard Presentation of BoP in India as per BPM6 (` Billion) 71
42 International Investment Position 72
Payment and Settlement Systems
43 Payment System Indicators 73
Occasional Series
44 Small Savings
45 Ownership Pattern of Government of India Dated Securities (Face Value)
46 Combined Receipts and Disbursements of the Central and State Governments
Notes: .. = Not available. – = Nil/Negligible. P = Preliminary/Provisional. PR = Partially Revised.

CURRENT STATISTICS
RBI Bulletin February 2016 43
Item2014-15
11 Real Sector (% Change) 1.1 GVA at Basic Prices 7.2 1.1.1 Agriculture 0.2 1.1.2 Industry 6.6 1.1.3 Services 9.4 1.1a Final Consumption Expenditure 6.4 1.1b Gross Fixed Capital Formation 4.6
2014-15
1 1.2 Index of Industrial Production 4.42 Money and Banking (% Change) 2.1 Scheduled Commercial Banks 2.1.1 Deposits 10.7 2.1.2 Credit 9.0 2.1.2.1 Non-food Credit 9.3 2.1.3 Investment in Govt. Securities 12.6 2.2 Money Stock Measures 2.2.1 Reserve Money (M0) 11.2 2.2.2 Broad Money (M3) 10.53 Ratios (%) 3.1 Cash Reserve Ratio 4.00 3.2 Statutory Liquidity Ratio 21.50 3.3 Cash-Deposit Ratio 4.8 3.4 Credit-Deposit Ratio 74.4 3.5 Incremental Credit-Deposit Ratio 44.1 3.6 Investment-Deposit Ratio 29.3 3.7 Incremental Investment-Deposit Ratio 31.14 Interest Rates (%) 4.1 Policy Repo Rate 6.75 4.2 Reverse Repo Rate 5.75 4.3 Marginal Standing Facility (MSF) Rate 7.75 4.4 Bank Rate 7.75 4.5 Base Rate 10.00/10.25 4.6 Term Deposit Rate >1 Year 7.00/8.75 4.7 Savings Deposit Rate 4.00 4.8 Call Money Rate (Weighted Average) 7.36 4.9 91-Day Treasury Bill (Primary) Yield 8.27 4.10 182-Day Treasury Bill (Primary) Yield 8.14 4.11 364-Day Treasury Bill (Primary) Yield 7.98 4.12 10-Year Government Securities Yield 7.805 RBI Reference Rate and Forward Premia 5.1 INR-US$ Spot Rate (` Per Foreign Currency) 62.59 5.2 INR-Euro Spot Rate (` Per Foreign Currency) 67.51 5.3 Forward Premia of US$ 1-month (%) 9.78 3-month (%) 8.50 6-month (%) 8.116 Inflation (%) 6.1 All India Consumer Price Index 5.9 6.2 Consumer Price Index for Industrial Workers 6.3 6.3 Wholesale Price Index 2.0 6.3.1 Primary Articles 3.0 6.3.2 Fuel and Power -0.9 6.3.3 Manufactured Products 2.47 Foreign Trade (% Change) 7.1 Imports -0.6 7.2 Exports -1.2
No. 1: Select Economic Indicators
2014-15 2015-16
Q1 Q2 Q1 Q2
2 3 4 5
7.4 8.4 7.1 7.42.6 2.1 1.9 2.28.1 7.2 6.4 8.38.4 10.2 8.6 8.05.3 7.4 6.3 6.58.7 3.8 4.9 6.8
2014 2015Nov. Dec. Nov. Dec.
2 3 4 55.2 3.6 -3.2 ..
11.0 10.8 10.4 10.910.8 10.1 9.8 11.110.9 10.3 9.9 11.29.0 9.9 11.6 11.1
8.2 9.4 13.2 14.3
10.7 10.7 10.8 11.0
4.00 4.00 4.00 4.0022.00 22.00 21.50 21.50
4.9 4.9 5.0 5.175.7 76.3 75.3 76.446.8 56.2 56.1 73.829.2 29.3 29.6 29.336.5 36.9 34.9 31.2
8.00 8.00 6.75 6.757.00 7.00 5.75 5.759.00 9.00 7.75 7.759.00 9.00 7.75 7.75
10.00/10.25 10.00/10.25 9.30/9.70 9.30/9.708.00/9.00 8.00/9.00 7.00/7.90 7.00/7.90
4.00 4.00 4.00 4.007.90 8.10 6.81 6.768.27 8.31 7.14 7.238.40 8.36 7.21 7.258.29 8.22 7.24 7.258.10 7.90 7.85 7.83
61.97 63.33 66.75 66.2077.16 98.58 70.88 72.41
7.84 7.92 7.10 6.347.49 7.23 6.32 6.227.42 7.13 6.46 6.47
3.3 4.3 5.4 5.64.1 5.9 6.7 6.3
-0.2 -0.5 -2.0 -0.7-1.6 0.3 2.3 5.5-4.5 -7.8 -11.1 -9.21.9 1.4 -1.4 -1.4
26.4 -3.6 -30.4 -3.99.4 -1.0 -27.2 -14.8
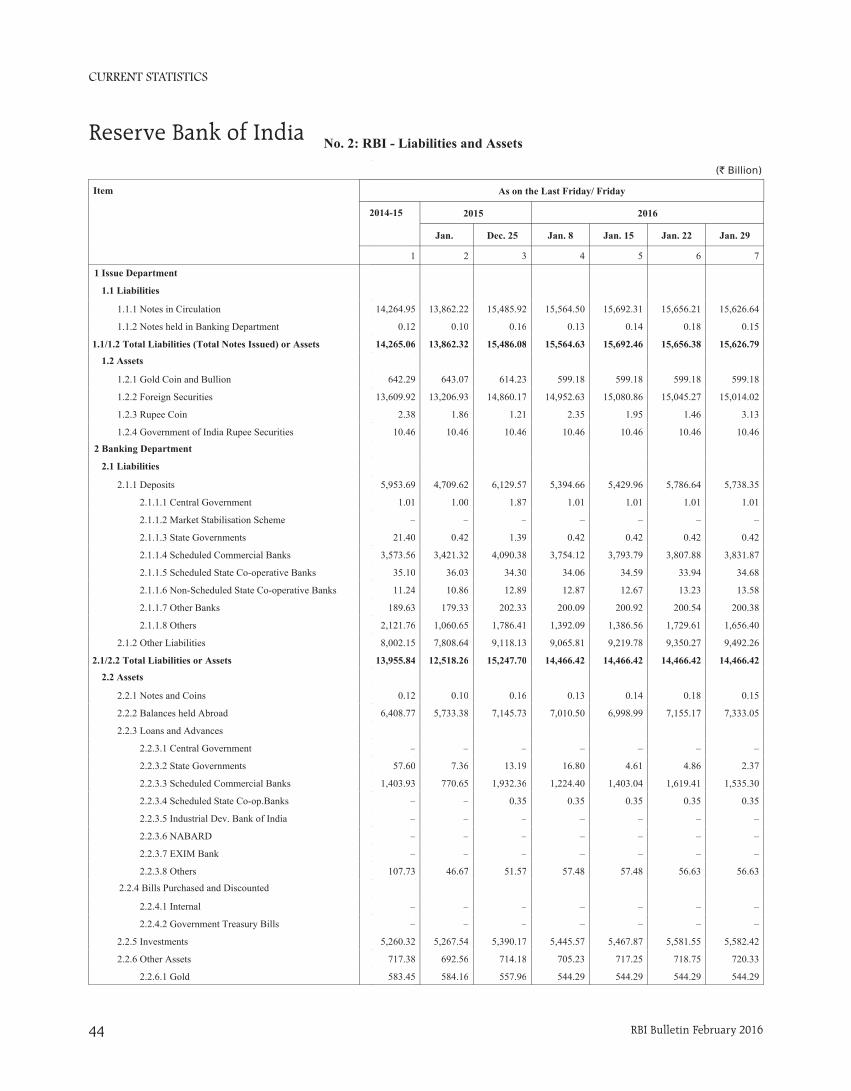
CURRENT STATISTICS
RBI Bulletin February 201644
No. 2: RBI - Liabilities and Assets
(` Billion)
Last Friday/ Friday 2015 2016
Jan. Dec. 25 Jan. 8 Jan. 15 Jan. 22 Jan. 29
2 3 4 5 6 7
1 Issue Department
1 Liabilities
101 1.1.1 Notes in Circulation13,862.22 15,485.92 15,564.50 15,692.31 15,656.21 15,626.64
102 1.1.2 Notes held in Banking Department0.10 0.16 0.13 0.14 0.18 0.15
103 1.1/1.2 Total Liabilities (Total Notes Issued) or Assets13,862.32 15,486.08 15,564.63 15,692.46 15,656.38 15,626.79
2 Assets
104 1.2.1 Gold Coin and Bullion643.07 614.23 599.18 599.18 599.18 599.18
105 1.2.2 Foreign Securities13,206.93 14,860.17 14,952.63 15,080.86 15,045.27 15,014.02
106 1.2.3 Rupee Coin 1.86 1.21 2.35 1.95 1.46 3.13
107 1.2.4 Government of India Rupee Securities10.46 10.46 10.46 10.46 10.46 10.46
2 Banking Department
1 Liabilities
108 2.1.1 Deposits4,709.62 6,129.57 5,394.66 5,429.96 5,786.64 5,738.35
109 2.1.1.1 Central Government1.00 1.87 1.01 1.01 1.01 1.01
110 2.1.1.2 Market Stabilisation Scheme– – – – – –
111 2.1.1.3 State Governments0.42 1.39 0.42 0.42 0.42 0.42
112 2.1.1.4 Scheduled Commercial Banks3,421.32 4,090.38 3,754.12 3,793.79 3,807.88 3,831.87
113 2.1.1.5 Scheduled State Co-operative Banks36.03 34.30 34.06 34.59 33.94 34.68
114 2.1.1.6 Non-Scheduled State Co-operative Banks10.86 12.89 12.87 12.67 13.23 13.58
115 2.1.1.7 Other Banks179.33 202.33 200.09 200.92 200.54 200.38
116 2.1.1.8 Others1,060.65 1,786.41 1,392.09 1,386.56 1,729.61 1,656.40
117 2.1.2 Other Liabilities7,808.64 9,118.13 9,065.81 9,219.78 9,350.27 9,492.26
118 2.1/2.2 Total Liabilities or Assets12,518.26 15,247.70 14,466.42 14,466.42 14,466.42 14,466.42
2 Assets
119 2.2.1 Notes and Coins0.10 0.16 0.13 0.14 0.18 0.15
120 2.2.2 Balances held Abroad5,733.38 7,145.73 7,010.50 6,998.99 7,155.17 7,333.05
121 2.2.3 Loans and Advances
122 2.2.3.1 Central Government– – – – – –
123 2.2.3.2 State Governments 7.36 13.19 16.80 4.61 4.86 2.37
124 2.2.3.3 Scheduled Commercial Banks770.65 1,932.36 1,224.40 1,403.04 1,619.41 1,535.30
125 2.2.3.4 Scheduled State Co-op.Banks– 0.35 0.35 0.35 0.35 0.35
126 2.2.3.5 Industrial Dev. Bank of India– – – – – –
127 2.2.3.6 NABARD– – – – – –
128 2.2.3.7 EXIM Bank– – – – – –
129 2.2.3.8 Others46.67 51.57 57.48 57.48 56.63 56.63
2.2.4 Bills Purchased and Discounted
130 2.2.4.1 Internal– – – – – –
131 2.2.4.2 Government Treasury Bills– – – – – –
132 2.2.5 Investments5,267.54 5,390.17 5,445.57 5,467.87 5,581.55 5,582.42
133 2.2.6 Other Assets 692.56 714.18 705.23 717.25 718.75 720.33
134 2.2.6.1 Gold584.16 557.96 544.29 544.29 544.29 544.29
Item
2014-15
1
1 Issue Department
1.1 Liabilities
1.1.1 Notes in Circulation 14,264.95
1.1.2 Notes held in Banking Department 0.12
1.1/1.2 Total Liabilities (Total Notes Issued) or Assets 14,265.06
1.2 Assets
1.2.1 Gold Coin and Bullion 642.29
1.2.2 Foreign Securities 13,609.92
1.2.3 Rupee Coin 2.38
1.2.4 Government of India Rupee Securities 10.46
2 Banking Department
2.1 Liabilities
2.1.1 Deposits 5,953.69
2.1.1.1 Central Government 1.01
2.1.1.2 Market Stabilisation Scheme –
2.1.1.3 State Governments 21.40
2.1.1.4 Scheduled Commercial Banks 3,573.56
2.1.1.5 Scheduled State Co-operative Banks 35.10
2.1.1.6 Non-Scheduled State Co-operative Banks 11.24
2.1.1.7 Other Banks 189.63
2.1.1.8 Others 2,121.76
2.1.2 Other Liabilities 8,002.15
2.1/2.2 Total Liabilities or Assets 13,955.84
2.2 Assets
2.2.1 Notes and Coins 0.12
2.2.2 Balances held Abroad 6,408.77
2.2.3 Loans and Advances
2.2.3.1 Central Government –
2.2.3.2 State Governments 57.60
2.2.3.3 Scheduled Commercial Banks 1,403.93
2.2.3.4 Scheduled State Co-op.Banks –
2.2.3.5 Industrial Dev. Bank of India –
2.2.3.6 NABARD –
2.2.3.7 EXIM Bank –
2.2.3.8 Others 107.73
2.2.4 Bills Purchased and Discounted
2.2.4.1 Internal –
2.2.4.2 Government Treasury Bills –
2.2.5 Investments 5,260.32
2.2.6 Other Assets 717.38
2.2.6.1 Gold 583.45
As on the Last Friday/ Friday
Reserve Bank of India

CURRENT STATISTICS
RBI Bulletin February 2016 45
No. 3: Liquidity Operations by RBI
(` Billion)
Date Liquidity Adjustment Facility
MSFStandingLiquidityFacilities
OMO (Outright) Net Injection (+)/Absorption (-)
(1+3+5+6+8-2-4-7)
Repo ReverseRepo
VariableRate Repo
VariableRate Reverse
RepoSale Purchase
1 2 3 4 5 6 7 8 9Dec. 1, 2015 147.62 33.19 176.92 – 20.70 – – – 312.05Dec. 2, 2015 48.57 63.43 – 113.36 – – – – –128.22Dec. 3, 2015 34.22 43.47 – 239.07 2.60 –1.00 – – –246.72Dec. 4, 2015 19.97 39.34 291.50 299.45 0.65 – – – –26.67Dec. 5, 2015 36.85 32.49 – – 4.30 – – – 8.66Dec. 7, 2015 102.74 25.11 – 28.12 8.15 – – – 57.66Dec. 8, 2015 108.58 40.73 150.02 52.56 4.00 – – 100.00 269.31Dec. 9, 2015 147.73 51.27 – – 0.10 – – – 96.56Dec. 10, 2015 98.74 34.53 – 56.81 2.20 – – – 9.60Dec. 11, 2015 121.61 84.91 250.04 109.22 2.20 – – 3.60 183.32Dec. 14, 2015 152.16 53.68 – – 1.75 – – 4.95 105.18Dec. 15, 2015 208.01 167.54 311.05 – – – – 8.50 360.02Dec. 16, 2015 223.15 22.31 443.80 – 10.85 – – 8.00 663.49Dec. 17, 2015 202.17 33.21 135.70 – 2.25 – – 8.05 314.96Dec. 18, 2015 171.43 20.32 165.02 – 2.35 – – 8.00 326.48Dec. 19, 2015 – 57.24 – – – – – – –57.24Dec. 21, 2015 213.47 64.27 100.01 – 10.72 –1.40 – 8.05 266.58Dec. 22, 2015 199.71 86.75 300.07 – 1.75 – – 8.00 422.78Dec. 23, 2015 199.62 134.03 755.03 – 0.80 1.40 – 8.00 830.82Dec. 28, 2015 139.65 89.07 250.00 – 0.75 – – 5.80 307.13Dec. 29, 2015 100.77 107.33 402.03 – 7.80 – – 8.00 411.27Dec. 30, 2015 104.20 98.01 – – 0.35 – – 6.65 13.19Dec. 31, 2015 169.58 173.47 124.42 – 28.45 – – 7.05 156.03

CURRENT STATISTICS
RBI Bulletin February 201646
2014 2015
Dec. Nov. Dec.
2 3 4
6,739.00 15.00 –179.00
17,908.00 3,004.00 2,620.00
11,169.00 2,989.00 2,799.00
413.95 –1.26 –13.84
29,200.00 9,073.00 8,894.00
1,701.13 573.89 560.05
6,853.00 1,487.00 1,987.00
No. 4: Sale/ Purchase of U.S. Dollar by the RBI
Item2014-15
1
1 Net Purchase/ Sale of Foreign Currency (US $ Million) (1.1–1.2) 54,837.00
1.1 Purchase (+) 124,414.00
1.2 Sale (–) 69,577.00
2 ` equivalent at contract rate (` Billion) 3,308.59
3 Cumulative (over end-March) (US $ Million) 56,882.00
(` Billion) 3,430.69
4 Outstanding Net Forward Sales (–)/ Purchase (+) at the end of month (US $ Million)
8,322.00
Item2014-15
1
1 Net Purchase/ Sale of Foreign Currency (US $ Million) (1.1–1.2) 0.000
1.1 Purchase (+) 0.000
1.2 Sale (–) 0.000
2 Outstanding Net Currency Futures Sales (–)/ Purchase (+) at the end of month (US $ Million)
0.000
2014 2015
Dec. Nov. Dec.
2 3 4
0.000 0.000 0.000
0.000 2,372.000 1,220.000
0.000 –2,372.000 –1,220.000
0.000 0.000 0.000
i) Operations in OTC segment
ii) Operations in currency futures segment
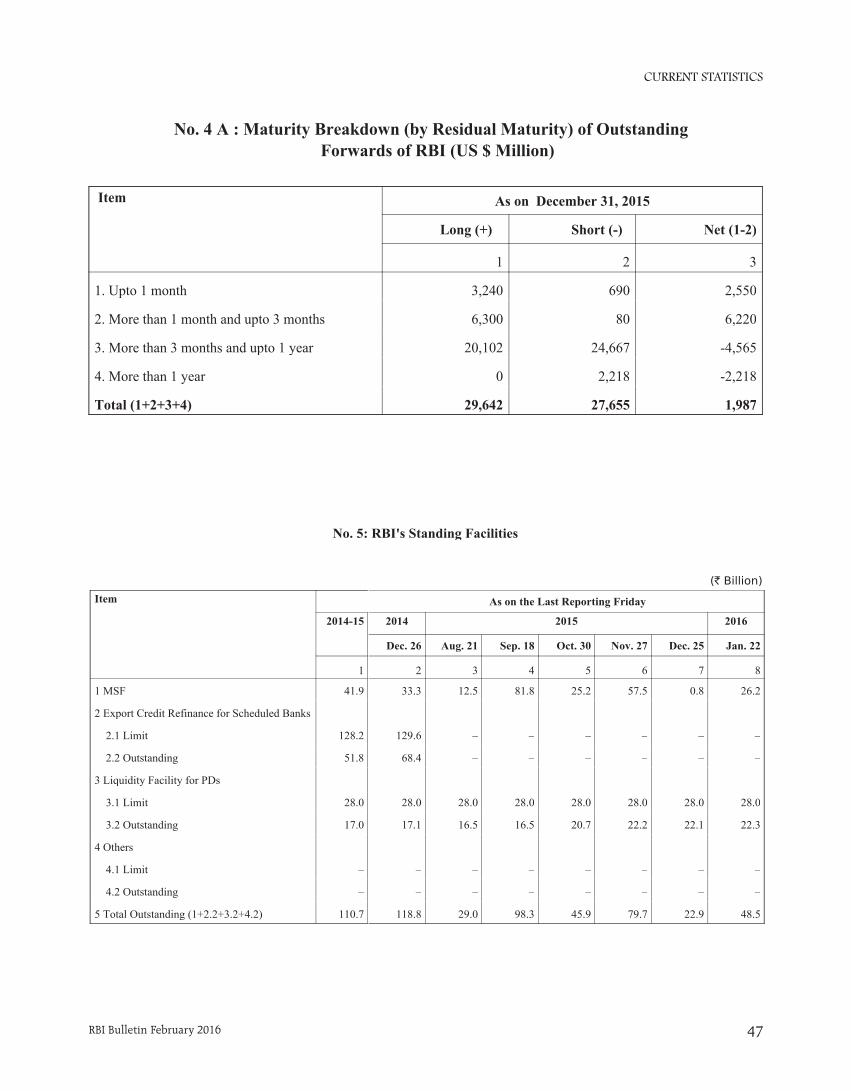
CURRENT STATISTICS
RBI Bulletin February 2016 47
Item As on December 31, 2015
Long (+) Short (-) Net (1-2)
1 2 3
1. Upto 1 month 3,240 690 2,550
2. More than 1 month and upto 3 months 6,300 80 6,220
3. More than 3 months and upto 1 year 20,102 24,667 -4,565
4. More than 1 year 0 2,218 -2,218
Total (1+2+3+4) 29,642 27,655 1,987
No. 4 A : Maturity Breakdown (by Residual Maturity) of Outstanding Forwards of RBI (US $ Million)
No. 5: RBI's Standing Facilities
Item
2014-15
1
1 MSF 41.9
2 Export Credit Refinance for Scheduled Banks
2.1 Limit 128.2
2.2 Outstanding 51.8
3 Liquidity Facility for PDs
3.1 Limit 28.0
3.2 Outstanding 17.0
4 Others
4.1 Limit –
4.2 Outstanding –
5 Total Outstanding (1+2.2+3.2+4.2) 110.7
(` Billion)
2014 2015 2016
Dec. 26 Aug. 21 Sep. 18 Oct. 30 Nov. 27 Dec. 25 Jan. 22
2 3 4 5 6 7 8
33.3 12.5 81.8 25.2 57.5 0.8 26.2
129.6 – – – – – –
68.4 – – – – – –
28.0 28.0 28.0 28.0 28.0 28.0 28.0
17.1 16.5 16.5 20.7 22.2 22.1 22.3
– – – – – – –
– – – – – – –
118.8 29.0 98.3 45.9 79.7 22.9 48.5
As on the Last Reporting Friday

CURRENT STATISTICS
RBI Bulletin February 201648
Money and Banking
Item
2014-15 2014 2015
Dec. 26 Nov. 27 Dec. 11 Dec. 25
1 2 3 4 5
1 Currency with the Public (1.1 + 1.2 + 1.3 – 1.4) 13,863.5 13,264.6 14,812.3 15,028.1 14,994.7
1.1 Notes in Circulation 14,288.8 13,710.0 15,335.8 15,513.5 15,485.9
1.2 Circulation of Rupee Coin 186.9 181.4 204.0 204.0 205.6
1.3 Circulation of Small Coins 7.4 7.4 7.4 7.4 7.4
1.4 Cash on Hand with Banks 619.6 634.2 734.9 696.9 704.3
2 Deposit Money of the Public 9,053.4 8,621.1 9,729.3 9,505.8 9,696.0
2.1 Demand Deposits with Banks 8,907.5 8,539.8 9,577.1 9,357.9 9,552.6
2.2 ‘Other’ Deposits with Reserve Bank 145.9 81.4 152.2 147.9 143.4
3 M (1 + 2) 22,916.8 21,885.8 24,541.6 24,533.8 24,690.8
4 Post Office Saving Bank Deposits 474.3 454.0 538.9 538.9 538.9
5 M (3 + 4) 23,391.1 22,339.8 25,080.4 25,072.7 25,229.6
6 Time Deposits with Banks 82,538.7 80,222.7 88,062.8 88,890.9 88,692.9
7 M (3 + 6) 105,455.5 102,108.4 112,604.4 113,424.7 113,383.7
8 Total Post Office Deposits 1,737.3 1,705.5 1,905.4 1,905.4 1,905.4
9 M (7 + 8) 107,192.8 103,813.9 114,509.8 115,330.1 115,289.0
No. 6: Money Stock Measures
(` Billion)
Outstanding as on March 31/last reporting Fridays of the month/reporting Fridays
1
2
3
4

CURRENT STATISTICS
RBI Bulletin February 2016 49
No. 7: Sources of Money Stock (M )
Sources
2014-15 2014 2015
Dec. 26 Nov. 27 Dec. 11 Dec. 25
1 2 3 4 5
1 Net Bank Credit to Government 30,061.6 30,760.9 33,101.5 33,793.9 32,512.9
1.1 RBI’s net credit to Government (1.1.1–1.1.2) 3,645.2 5,072.7 4,498.1 4,704.6 3,932.1
1.1.1 Claims on Government 5,293.6 5,301.0 5,255.2 5,331.1 5,401.8
1.1.1.1 Central Government 5,258.3 5,291.6 5,252.6 5,326.2 5,388.6
1.1.1.2 State Governments 35.3 9.4 2.6 4.9 13.2
1.1.2 Government deposits with RBI 1,648.4 228.3 757.1 626.5 1,469.7
1.1.2.1 Central Government 1,647.9 227.8 756.7 626.0 1,468.3
1.1.2.2 State Governments 0.4 0.4 0.4 0.4 1.4
1.2 Other Banks’ Credit to Government 26,416.3 25,688.3 28,603.5 29,089.3 28,580.7
2 Bank Credit to Commercial Sector 70,395.8 68,122.1 73,837.0 74,809.2 75,329.2
2.1 RBI’s credit to commercial sector 148.5 57.5 70.9 66.3 64.6
2.2 Other banks’ credit to commercial sector 70,247.4 68,064.7 73,766.2 74,743.0 75,264.6
2.2.1 Bank credit by commercial banks 65,364.2 63,185.2 68,679.3 69,661.1 70,170.0
2.2.2 Bank credit by co-operative banks 4,825.1 4,825.2 5,022.8 5,028.6 5,041.5
2.2.3 Investments by commercial and co-operative banks in other securities 58.0 54.2 64.1 53.2 53.1
3 Net Foreign Exchange Assets of Banking Sector (3.1 + 3.2) 22,506.5 20,837.2 24,531.4 24,628.3 24,418.4
3.1 RBI’s net foreign exchange assets (3.1.1–3.1.2) 21,272.8 20,088.8 23,290.8 23,387.6 23,177.8
3.1.1 Gross foreign assets 21,273.0 20,089.1 23,291.1 23,387.9 23,178.1
3.1.2 Foreign liabilities 0.2 0.3 0.3 0.3 0.3
3.2 Other banks’ net foreign exchange assets 1,233.7 748.3 1,240.6 1,240.6 1,240.6
4 Government’s Currency Liabilities to the Public 194.3 188.8 211.4 211.4 213.1
5 Banking Sector’s Net Non-monetary Liabilities 17,702.7 17,800.7 19,077.0 20,018.1 19,089.9
5.1 Net non-monetary liabilities of RBI 7,852.7 8,613.3 9,177.4 9,236.3 9,003.9
5.2 Net non-monetary liabilities of other banks (residual) 9,849.9 9,187.3 9,899.6 10,781.7 10,086.0
M (1+2+3+4–5) 105,455.5 102,108.4 112,604.4 113,424.7 113,383.7
(` Billion)
Outstanding as on March 31/last reporting Fridays of the month/reporting Fridays
3
3
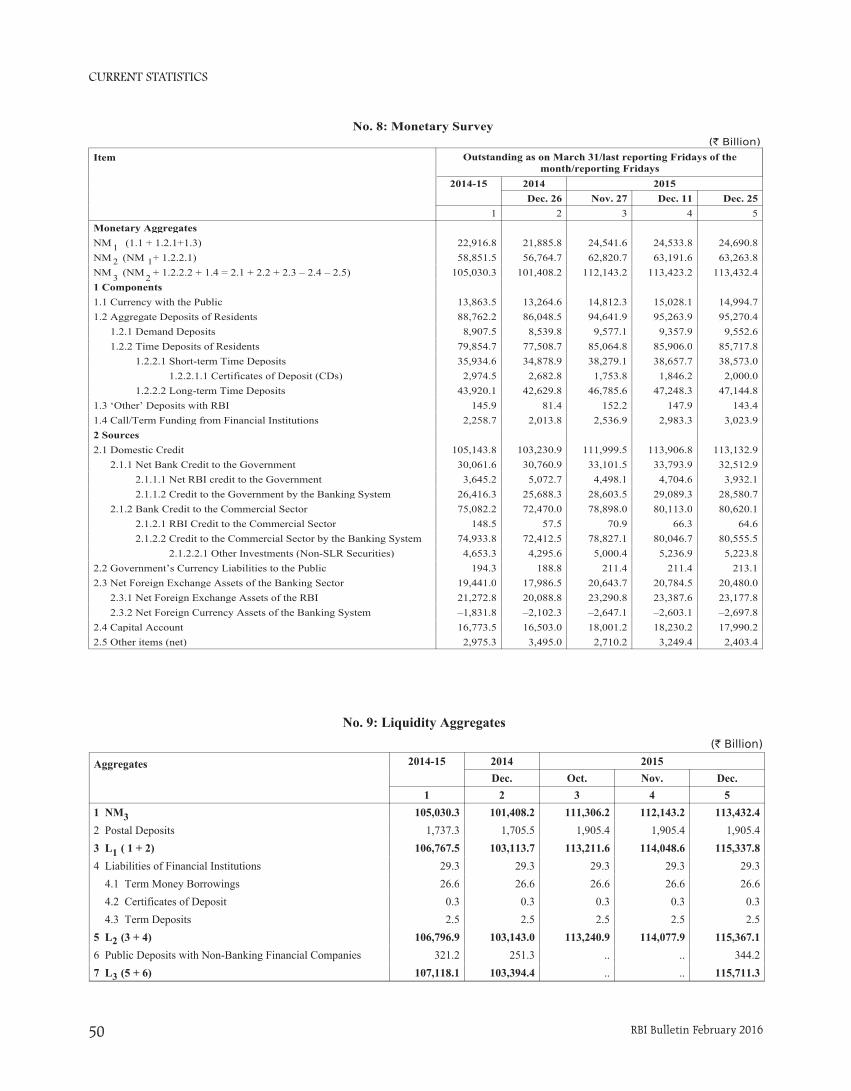
CURRENT STATISTICS
RBI Bulletin February 201650
No. 8: Monetary Survey
Item
2014-15 2014 2015Dec. 26 Nov. 27 Dec. 11 Dec. 25
1 2 3 4 5Monetary AggregatesNM1 (1.1 + 1.2.1+1.3) 22,916.8 21,885.8 24,541.6 24,533.8 24,690.8NM (NM + 1.2.2.1) 58,851.5 56,764.7 62,820.7 63,191.6 63,263.8NM (NM + 1.2.2.2 + 1.4 = 2.1 + 2.2 + 2.3 – 2.4 – 2.5) 105,030.3 101,408.2 112,143.2 113,423.2 113,432.41 Components1.1 Currency with the Public 13,863.5 13,264.6 14,812.3 15,028.1 14,994.71.2 Aggregate Deposits of Residents 88,762.2 86,048.5 94,641.9 95,263.9 95,270.4 1.2.1 Demand Deposits 8,907.5 8,539.8 9,577.1 9,357.9 9,552.6 1.2.2 Time Deposits of Residents 79,854.7 77,508.7 85,064.8 85,906.0 85,717.8 1.2.2.1 Short-term Time Deposits 35,934.6 34,878.9 38,279.1 38,657.7 38,573.0 1.2.2.1.1 Certificates of Deposit (CDs) 2,974.5 2,682.8 1,753.8 1,846.2 2,000.0 1.2.2.2 Long-term Time Deposits 43,920.1 42,629.8 46,785.6 47,248.3 47,144.81.3 ‘Other’ Deposits with RBI 145.9 81.4 152.2 147.9 143.41.4 Call/Term Funding from Financial Institutions 2,258.7 2,013.8 2,536.9 2,983.3 3,023.92 Sources2.1 Domestic Credit 105,143.8 103,230.9 111,999.5 113,906.8 113,132.9 2.1.1 Net Bank Credit to the Government 30,061.6 30,760.9 33,101.5 33,793.9 32,512.9 2.1.1.1 Net RBI credit to the Government 3,645.2 5,072.7 4,498.1 4,704.6 3,932.1 2.1.1.2 Credit to the Government by the Banking System 26,416.3 25,688.3 28,603.5 29,089.3 28,580.7 2.1.2 Bank Credit to the Commercial Sector 75,082.2 72,470.0 78,898.0 80,113.0 80,620.1 2.1.2.1 RBI Credit to the Commercial Sector 148.5 57.5 70.9 66.3 64.6 2.1.2.2 Credit to the Commercial Sector by the Banking System 74,933.8 72,412.5 78,827.1 80,046.7 80,555.5 2.1.2.2.1 Other Investments (Non-SLR Securities) 4,653.3 4,295.6 5,000.4 5,236.9 5,223.82.2 Government’s Currency Liabilities to the Public 194.3 188.8 211.4 211.4 213.12.3 Net Foreign Exchange Assets of the Banking Sector 19,441.0 17,986.5 20,643.7 20,784.5 20,480.0 2.3.1 Net Foreign Exchange Assets of the RBI 21,272.8 20,088.8 23,290.8 23,387.6 23,177.8 2.3.2 Net Foreign Currency Assets of the Banking System –1,831.8 –2,102.3 –2,647.1 –2,603.1 –2,697.82.4 Capital Account 16,773.5 16,503.0 18,001.2 18,230.2 17,990.22.5 Other items (net) 2,975.3 3,495.0 2,710.2 3,249.4 2,403.4
(` Billion)
Outstanding as on March 31/last reporting Fridays of themonth/reporting Fridays
12
3
1
2
No. 9: Liquidity Aggregates(` Billion)
Aggregates 2014-15 2014 2015Dec. Oct. Nov. Dec.
1 2 3 4 51 NM 105,030.3 101,408.2 111,306.2 112,143.2 113,432.4
2 Postal Deposits 1,737.3 1,705.5 1,905.4 1,905.4 1,905.43 L ( 1 + 2) 106,767.5 103,113.7 113,211.6 114,048.6 115,337.8
4 Liabilities of Financial Institutions 29.3 29.3 29.3 29.3 29.3 4.1 Term Money Borrowings 26.6 26.6 26.6 26.6 26.6 4.2 Certificates of Deposit 0.3 0.3 0.3 0.3 0.3 4.3 Term Deposits 2.5 2.5 2.5 2.5 2.55 L (3 + 4) 106,796.9 103,143.0 113,240.9 114,077.9 115,367.1
6 Public Deposits with Non-Banking Financial Companies 321.2 251.3 .. .. 344.27 L (5 + 6) 107,118.1 103,394.4 .. .. 115,711.3
1
2
3
3

CURRENT STATISTICS
RBI Bulletin February 2016 51
No. 10: Reserve Bank of India Survey
Item
2014-15 2014 2015Dec. 26 Nov. 27 Dec. 11 Dec. 25
1 2 3 4 51 Components1.1 Currency in Circulation 14,483.1 13,898.8 15,547.2 15,724.9 15,699.01.2 Bankers’ Deposits with the RBI 4,655.6 3,679.6 4,115.2 4,006.3 4,339.9 1.2.1 Scheduled Commercial Banks 4,396.7 3,458.5 3,870.5 3,760.3 4,090.41.3 ‘Other’ Deposits with the RBI 145.9 81.4 152.2 147.9 143.4Reserve Money (1.1 + 1.2 + 1.3 = 2.1 + 2.2 + 2.3 – 2.4 – 2.5) 19,284.6 17,659.8 19,814.5 19,879.1 20,182.32 Sources2.1 RBI’s Domestic Credit 5,670.3 5,995.5 5,489.7 5,516.4 5,795.4 2.1.1 Net RBI credit to the Government 3,645.2 5,072.7 4,498.1 4,704.6 3,932.1 2.1.1.1 Net RBI credit to the Central Government (2.1.1.1.1 + 2.1.1.1.2 + 2.1.1.1.3 + 2.1.1.1.4 – 2.1.1.1.5) 3,610.4 5,063.8 4,495.9 4,700.2 3,920.3
2.1.1.1.1 Loans and Advances to the Central Government – – – – – 2.1.1.1.2 Investments in Treasury Bills – – – – – 2.1.1.1.3 Investments in dated Government Securities 5,256.2 5,289.8 5,249.7 5,324.2 5,387.4 2.1.1.1.3.1 Central Government Securities 5,245.7 5,279.3 5,239.2 5,313.7 5,377.0 2.1.1.1.4 Rupee Coins 2.2 1.8 2.9 2.0 1.2 2.1.1.1.5 Deposits of the Central Government 1,647.9 227.8 756.7 626.0 1,468.3 2.1.1.2 Net RBI credit to State Governments 34.9 8.9 2.1 4.5 11.8 2.1.2 RBI’s Claims on Banks 1,876.6 865.3 920.8 745.5 1,798.7 2.1.2.1 Loans and Advances to Scheduled Commercial Banks 1,876.1 865.2 920.8 745.2 1,798.3 2.1.3 RBI’s Credit to Commercial Sector 148.5 57.5 70.9 66.3 64.6 2.1.3.1 Loans and Advances to Primary Dealers 24.1 17.1 22.2 22.1 22.1 2.1.3.2 Loans and Advances to NABARD – – – – –2.2 Government’s Currency Liabilities to the Public 194.3 188.8 211.4 211.4 213.12.3 Net Foreign Exchange Assets of the RBI 21,272.8 20,088.8 23,290.8 23,387.6 23,177.8 2.3.1 Gold 1,191.6 1,176.6 1,219.1 1,172.2 1,172.2 2.3.2 Foreign Currency Assets 20,081.4 18,912.4 22,071.8 22,215.6 22,005.82.4 Capital Account 8,166.4 8,087.6 8,587.7 8,682.2 8,441.52.5 Other Items (net) -313.7 525.8 589.8 554.1 562.4
(` Billion)
Outstanding as on March 31/last reporting Fridays of themonth/reporting Fridays
No. 11: Reserve Money - Components and Sources
Item
2014-15 2014 2015Dec. 26 Nov. 27 Dec. 4 Dec. 11 Dec. 18 Dec. 25
1 2 3 4 5 6 7Reserve Money (1.1 + 1.2 + 1.3 = 2.1 + 2.2 + 2.3 + 2.4 + 2.5 – 2.6) 19,284.6 17,659.8 19,814.5 19,765.7 19,879.1 19,903.0 20,182.3
1 Components1.1 Currency in Circulation 14,483.1 13,898.8 15,547.2 15,599.7 15,724.9 15,693.5 15,699.01.2 Bankers' Deposits with RBI 4,655.6 3,679.6 4,115.2 4,014.9 4,006.3 4,060.8 4,339.91.3 ‘Other’ Deposits with RBI 145.9 81.4 152.2 151.0 147.9 148.7 143.42 Sources2.1 Net Reserve Bank Credit to Government 3,645.2 5,072.7 4,498.1 4,993.4 4,704.6 3,828.7 3,932.12.2 Reserve Bank Credit to Banks 1,876.6 865.3 920.8 357.0 745.5 1,634.5 1,798.72.3 Reserve Bank Credit to Commercial Sector 148.5 57.5 70.9 54.6 66.3 64.6 64.62.4 Net Foreign Exchange Assets of RBI 21,272.8 20,088.8 23,290.8 23,376.9 23,387.6 23,184.3 23,177.82.5 Government's Currency Liabilities to the Public 194.3 188.8 211.4 211.4 211.4 211.4 213.12.6 Net Non- Monetary Liabilities of RBI 7,852.7 8,613.3 9,177.4 9,227.6 9,236.3 9,020.6 9,003.9
(` Billion)
Outstanding as on March 31/ last Fridays of the month/ Fridays

CURRENT STATISTICS
RBI Bulletin February 201652
No. 13: Scheduled Commercial Banks' Investments
(` Billion)
Item As onMarch 20,
2015
2014 2015
Dec. 26 Nov. 27 Dec. 11 Dec. 25
1 2 3 4 51 SLR Securities 24,918.3 24,257.5 26,850.8 27,465.8 26,951.72 Commercial Paper 467.9 393.4 854.4 929.9 959.23 Shares issued by 3.1 PSUs 81.8 69.9 82.0 81.6 81.4 3.2 Private Corporate Sector 365.8 351.5 415.0 420.9 424.9 3.3 Others 32.7 32.6 32.2 36.9 39.54 Bonds/Debentures issued by 4.1 PSUs 809.5 798.0 767.0 727.8 725.0 4.2 Private Corporate Sector 1,159.2 1,143.5 1,130.5 1,160.5 1,171.8 4.3 Others 505.1 466.1 495.6 532.1 531.45 Instruments issued by 5.1 Mutual funds 585.6 391.5 611.5 649.4 598.7 5.2 Financial institutions 627.6 631.5 600.8 608.2 602.2
No. 12: Commercial Bank Survey
Item
2014-15 2014 2015Dec. 26 Nov. 27 Dec. 11 Dec. 25
1 2 3 4 51 Components1.1 Aggregate Deposits of Residents 82,648.9 80,119.5 88,249.6 88,864.7 88,871.5 1.1.1 Demand Deposits 7,940.3 7,617.9 8,595.6 8,376.9 8,576.5 1.1.2 Time Deposits of Residents 74,708.6 72,501.6 79,653.9 80,487.8 80,295.0 1.1.2.1 Short-term Time Deposits 33,618.9 32,625.7 35,844.3 36,219.5 36,132.8 1.1.2.1.1 Certificates of Deposits (CDs) 2,974.5 2,682.8 1,753.8 1,846.2 2,000.01.1.2.2 Long-term Time Deposits 41,089.7 39,875.9 43,809.7 44,268.3 44,162.31.2 Call/Term Funding from Financial Institutions 2,258.7 2,013.8 2,536.9 2,983.3 3,023.92 Sources2.1 Domestic Credit 94,881.9 91,703.6 100,633.4 102,343.6 102,325.6 2.1.1 Credit to the Government 24,897.5 24,240.0 26,959.1 27,444.9 26,931.1 2.1.2 Credit to the Commercial Sector 69,984.3 67,463.6 73,674.3 74,898.7 75,394.5 2.1.2.1 Bank Credit 65,364.2 63,185.2 68,679.3 69,661.1 70,170.0 2.1.2.1.1 Non-food Credit 64,420.0 62,102.0 67,590.0 68,567.2 69,059.9 2.1.2.2 Net Credit to Primary Dealers 35.7 54.9 63.2 69.5 69.8 2.1.2.3 Investments in Other Approved Securities 20.7 17.5 21.0 20.9 20.6 2.1.2.4 Other Investments (in non-SLR Securities) 4,563.7 4,205.9 4,910.8 5,147.2 5,134.12.2 Net Foreign Currency Assets of Commercial Banks (2.2.1–2.2.2–2.2.3) –1,831.8 –2,102.3 –2,647.1 –2,603.1 –2,697.8 2.2.1 Foreign Currency Assets 1,647.0 1,281.3 1,365.4 1,410.7 1,370.4 2.2.2 Non-resident Foreign Currency Repatriable Fixed Deposits 2,684.0 2,713.9 2,998.1 2,984.8 2,975.1 2.2.3 Overseas Foreign Currency Borrowings 794.8 669.7 1,014.5 1,029.0 1,093.12.3 Net Bank Reserves (2.3.1+2.3.2–2.3.3) 2,741.5 3,150.5 3,607.2 3,636.3 2,922.4 2.3.1 Balances with the RBI 3,730.7 3,458.5 3,870.5 3,760.3 4,090.4 2.3.2 Cash in Hand 533.5 557.2 657.5 621.2 630.4 2.3.3 Loans and Advances from the RBI 1,522.8 865.2 920.8 745.2 1,798.32.4 Capital Account 8,365.4 8,173.7 9,171.8 9,306.2 9,307.02.5 Other items (net) (2.1+2.2+2.3–2.4–1.1–1.2) 2,518.6 2,444.9 1,635.2 2,222.5 1,347.9 2.5.1 Other Demand and Time Liabilities (net of 2.2.3) 3,777.2 3,676.0 3,516.6 3,552.2 3,523.8 2.5.2 Net Inter-Bank Liabilities (other than to PDs) –620.4 –277.5 –469.7 –478.5 –447.7
(` Billion)
Outstanding as on last reporting Fridays of the month/reporting Fridays of the month

CURRENT STATISTICS
RBI Bulletin February 2016 53
No. 14: Business in India - All Scheduled Banks and All Scheduled Commercial Banks
(` Billion)
All Scheduled Commercial Banks
2014-15 2014 2015
Dec. Nov. Dec.
5 6 7 8
147 146 146 146
1,561.5 1,507.9 2,093.7 2,248.3
1,102.0 1,068.6 1,496.0 1,490.3
398.2 379.2 533.9 550.5
61.4 60.2 63.8 207.5
92,163.6 89,192.8 97,772.1 99,487.3
85,332.9 82,833.4 90,727.2 91,846.5
7,940.3 7,617.9 8,300.1 8,576.5
77,392.6 75,215.5 82,427.1 83,270.2
2,258.7 2,013.8 2,537.0 3,023.9
4,572.0 4,345.6 4,507.9 4,616.9
1,582.0 920.7 1,043.2 1,932.4
– – – –
1,582.0 920.7 1,043.2 1,932.4
4,264.3 4,015.7 4,524.4 4,720.7
533.5 557.2 654.0 630.4
3,730.7 3,458.5 3,870.5 4,090.4
2,217.7 1,840.3 2,449.6 2,765.8
1,374.1 1,194.3 1,667.1 1,822.4
91.3 90.6 96.2 95.3
1,282.7 1,103.7 1,570.9 1,727.1
225.9 204.5 192.1 227.0
189.2 160.3 257.0 256.9
428.5 281.3 333.5 459.5
24,918.3 24,257.5 26,850.8 26,951.7
24,897.5 24,240.0 26,831.9 26,931.1
20.7 17.5 18.9 20.6
65,364.2 63,185.2 68,391.5 70,170.0
944.2 1,083.2 1,089.3 1,110.1
63,123.9 61,012.1 66,246.0 68,021.9
344.1 325.9 284.5 274.4
1,199.9 1,157.4 1,247.6 1,268.7
241.2 235.6 205.1 205.5
455.2 454.2 408.3 399.6
Item
All Scheduled Banks
2014-15 2014 2015
Dec. Nov. Dec.
1 2 3 4
Number of Reporting Banks 214 213 213 213
1 Liabilities to the Banking System 1,619.2 1,558.7 2,153.7 2,307.6
1.1 Demand and Time Deposits from Banks 1,153.7 1,117.3 1,554.4 1,547.9
1.2 Borrowings from Banks 404.1 381.1 535.5 552.1
1.3 Other Demand and Time Liabilities 61.5 60.2 63.8 207.6
2 Liabilities to Others 94,577.6 91,577.0 100,302.2 102,052.4
2.1 Aggregate Deposits 87,651.2 85,122.4 93,157.2 94,304.2
2.1.1 Demand 8,125.7 7,802.6 8,494.6 8,767.2
2.1.2 Time 79,525.6 77,319.8 84,662.6 85,537.0
2.2 Borrowings 2,279.0 2,031.5 2,555.3 3,048.0
2.3 Other Demand and Time Liabilities 4,647.3 4,423.2 4,589.7 4,700.2
3 Borrowings from Reserve Bank 1,582.5 920.8 1,043.2 1,932.7
3.1 Against Usance Bills /Promissory Notes – – – –
3.2 Others 1,582.5 920.8 1,043.2 1,932.7
4 Cash in Hand and Balances with Reserve Bank 4,379.4 4,129.1 4,644.0 4,842.4
4.1 Cash in Hand 544.9 570.1 667.1 641.8
4.2 Balances with Reserve Bank 3,834.6 3,559.0 3,976.9 4,200.6
5 Assets with the Banking System 2,581.2 2,233.7 2,825.5 3,134.3
5.1 Balances with Other Banks 1,540.2 1,346.5 1,814.1 1,971.0
5.1.1 In Current Account 109.3 108.5 111.8 110.0
5.1.2 In Other Accounts 1,430.9 1,238.0 1,702.3 1,860.9
5.2 Money at Call and Short Notice 374.3 369.5 347.3 378.8
5.3 Advances to Banks 192.5 163.7 264.2 258.2
5.4 Other Assets 474.2 354.0 400.0 526.4
6 Investment 25,610.7 24,961.3 27,601.1 27,713.4
6.1 Government Securities 25,586.6 24,940.7 27,579.3 27,689.7
6.2 Other Approved Securities 24.0 20.6 21.8 23.7
7 Bank Credit 67,426.9 65,163.0 70,482.5 72,300.2
7a Food Credit 1,078.0 1,193.6 1,224.1 1,244.9
7.1 Loans, Cash-credits and Overdrafts 65,154.2 62,962.3 68,304.4 70,117.9
7.2 Inland Bills-Purchased 348.6 329.4 290.9 280.7
7.3 Inland Bills-Discounted 1,221.1 1,175.8 1,268.2 1,290.2
7.4 Foreign Bills-Purchased 242.6 236.9 206.1 207.2
7.5 Foreign Bills-Discounted 460.3 458.7 412.9 404.2
As on the Last Reporting Friday (in case of March)/ Last Friday

CURRENT STATISTICS
RBI Bulletin February 201654
No. 15: Deployment of Gross Bank Credit by Major Sectors
(` Billion)
Item Outstanding as on Growth (%)
Mar. 20,2015
2014 2015 Financialyear so far
Y-o-Y
Dec. 26 Nov. 27 Dec. 25 2015-16 2015
1 2 3 4 5 61 Gross Bank Credit 61,023 58,935 63,466 64,335 5.4 9.2
1.1 Food Credit 994 1,065 1,069 1,084 9.1 1.7
1.2 Non-food Credit 60,030 57,870 62,397 63,251 5.4 9.3
1.2.1 Agriculture & Allied Activities 7,659 7,473 8,260 8,424 10.0 12.7
1.2.2 Industry 26,576 25,588 26,687 26,952 1.4 5.3
1.2.2.1 Micro & Small 3,800 3,650 3,722 3,741 –1.6 2.5
1.2.2.2 Medium 1,265 1,246 1,148 1,151 –9.1 –7.6
1.2.2.3 Large 21,511 20,692 21,817 22,060 2.6 6.6
1.2.3 Services 14,131 13,355 14,403 14,582 3.2 9.2
1.2.3.1 Transport Operators 916 866 963 962 5.0 11.0
1.2.3.2 Computer Software 172 170 197 190 10.5 11.9
1.2.3.3 Tourism, Hotels & Restaurants 370 359 378 383 3.5 6.9
1.2.3.4 Shipping 101 96 105 103 2.3 8.1
1.2.3.5 Professional Services 844 715 945 973 15.2 36.1
1.2.3.6 Trade 3,657 3,270 3,605 3,629 –0.8 11.0
1.2.3.6.1 Wholesale Trade 1,801 1,607 1,641 1,641 –8.9 2.1
1.2.3.6.2 Retail Trade 1,856 1,663 1,964 1,988 7.1 19.5
1.2.3.7 Commercial Real Estate 1,665 1,627 1,708 1,723 3.5 5.9
1.2.3.8 Non-Banking Financial Companies (NBFCs) 3,117 2,985 3,124 3,149 1.0 5.5
1.2.3.9 Other Services 3,289 3,268 3,377 3,471 5.5 6.2
1.2.4 Personal Loans 11,663 11,454 13,046 13,293 14.0 16.1
1.2.4.1 Consumer Durables 153 147 165 167 9.2 13.4
1.2.4.2 Housing 6,285 5,987 7,052 7,140 13.6 19.3
1.2.4.3 Advances against Fixed Deposits 625 597 605 635 1.5 6.4
1.2.4.4 Advances to Individuals against share & bonds 54 41 69 60 9.9 46.5
1.2.4.5 Credit Card Outstanding 305 303 376 373 22.5 23.3
1.2.4.6 Education 633 630 677 680 7.4 8.1
1.2.4.7 Vehicle Loans 1,246 1,453 1,379 1,408 13.0 –3.1
1.2.4.8 Other Personal Loans 2,362 2,297 2,723 2,830 19.8 23.2
1.2A Priority Sector 20,103 19,434 21,183 21,564 7.3 11.0
1.2A.1 Agriculture & Allied Activities 7,659 7,473 8,260 8,424 10.0 12.7
1.2A.2 Micro & Small Enterprises 8,003 7,593 8,105 8,283 3.5 9.1
1.2A.2.1 Manufacturing 3,800 3,650 3,722 3,741 –1.6 2.5
1.2A.2.2 Services 4,203 3,944 4,383 4,542 8.1 15.2
1.2A.3 Housing 3,224 3,187 3,352 3,387 5.1 6.3
1.2A.4 Micro-Credit 177 171 192 178 0.3 3.9
1.2A.5 Education Loans 592 591 607 609 2.8 3.0
1.2A.6 State-Sponsored Orgs. for SC/ST 3 3 5 5 50.8 50.9
1.2A.7 Weaker Sections 4,049 3,954 4,533 4,606 13.7 16.5
1.2A.8 Export Credit 426 406 314 322 –24.5 –20.8

CURRENT STATISTICS
RBI Bulletin February 2016 55
No. 16: Industry-wise Deployment of Gross Bank Credit
(` Billion)
Industry Outstanding as on Growth (%)
Mar. 20,2015
2014 2015 Financialyear so far
Y-o-Y
Dec. 26 Nov. 27 Dec. 25 2015-16 2015
1 2 3 4 5 6
1 Industry 26,576 25,588 26,687 26,952 1.4 5.3
1.1 Mining & Quarrying (incl. Coal) 360 366 354 365 1.5 –0.3
1.2 Food Processing 1,715 1,518 1,461 1,489 –13.2 –1.9
1.2.1 Sugar 414 337 353 350 –15.5 3.7
1.2.2 Edible Oils & Vanaspati 211 205 187 193 –8.4 –5.7
1.2.3 Tea 32 32 36 36 13.2 12.9
1.2.4 Others 1,058 944 885 910 –14.0 –3.6
1.3 Beverage & Tobacco 186 186 177 180 –3.4 –3.4
1.4 Textiles 2,019 1,983 1,969 2,023 0.2 2.1
1.4.1 Cotton Textiles 1,000 979 973 1,011 1.0 3.3
1.4.2 Jute Textiles 22 24 22 22 –3.8 –10.5
1.4.3 Man-Made Textiles 204 199 207 209 2.8 5.2
1.4.4 Other Textiles 793 781 767 782 –1.4 0.1
1.5 Leather & Leather Products 102 104 102 103 0.3 –0.7
1.6 Wood & Wood Products 98 95 100 100 1.3 4.7
1.7 Paper & Paper Products 341 339 349 357 4.7 5.2
1.8 Petroleum, Coal Products & Nuclear Fuels 561 532 441 477 –15.1 –10.4
1.9 Chemicals & Chemical Products 1,545 1,497 1,534 1,540 –0.3 2.9
1.9.1 Fertiliser 254 242 226 222 –12.5 –8.1
1.9.2 Drugs & Pharmaceuticals 493 482 501 515 4.4 6.9
1.9.3 Petro Chemicals 331 344 342 342 3.5 –0.5
1.9.4 Others 467 430 464 461 –1.3 7.2
1.10 Rubber, Plastic & their Products 378 371 363 374 –1.0 0.7
1.11 Glass & Glassware 88 88 87 88 –0.8 0.0
1.12 Cement & Cement Products 560 554 552 548 –2.2 –1.1
1.13 Basic Metal & Metal Product 3,854 3,683 3,973 4,008 4.0 8.8
1.13.1 Iron & Steel 2,834 2,729 2,967 2,985 5.3 9.4
1.13.2 Other Metal & Metal Product 1,020 954 1,006 1,023 0.3 7.2
1.14 All Engineering 1,540 1,470 1,545 1,562 1.4 6.3
1.14.1 Electronics 368 377 381 381 3.7 1.2
1.14.2 Others 1,172 1,093 1,163 1,180 0.7 8.0
1.15 Vehicles, Vehicle Parts & Transport Equipment 682 679 673 669 –1.9 –1.5
1.16 Gems & Jewellery 718 705 694 706 –1.7 0.2
1.17 Construction 743 719 756 742 –0.2 3.2
1.18 Infrastructure 9,245 8,952 9,655 9,706 5.0 8.4
1.18.1 Power 5,576 5,380 5,865 5,915 6.1 10.0
1.18.2 Telecommunications 919 864 907 918 –0.1 6.2
1.18.3 Roads 1,687 1,661 1,778 1,793 6.3 7.9
1.18.4 Other Infrastructure 1,064 1,048 1,105 1,080 1.5 3.1
1.19 Other Industries 1,839 1,746 1,901 1,917 4.2 9.8
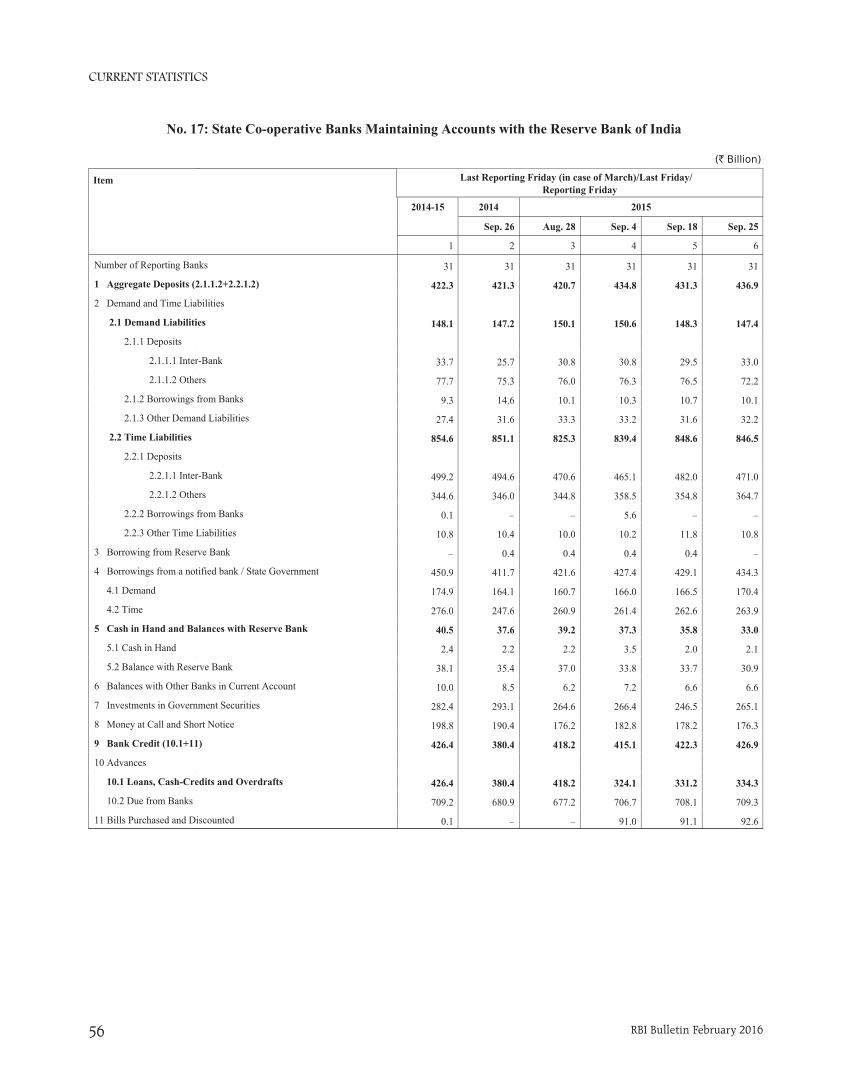
CURRENT STATISTICS
RBI Bulletin February 201656
No. 17: State Co-operative Banks Maintaining Accounts with the Reserve Bank of India
(` Billion)
Last Reporting Friday (in case of March)/Last Friday/ Reporting Friday
2014 2015
Sep. 26 Aug. 28 Sep. 4 Sep. 18 Sep. 25
2 3 4 5 6
Number of Reporting Banks 31 31 31 31 31
1 Aggregate Deposits (2.1.1.2+2.2.1.2) 421.3 420.7 434.8 431.3 436.9
2 Demand and Time Liabilities
2.1 Demand Liabilities 147.2 150.1 150.6 148.3 147.4
2.1.1 Deposits
2.1.1.1 Inter-Bank 25.7 30.8 30.8 29.5 33.0
2.1.1.2 Others 75.3 76.0 76.3 76.5 72.2
2.1.2 Borrowings from Banks 14.6 10.1 10.3 10.7 10.1
2.1.3 Other Demand Liabilities 31.6 33.3 33.2 31.6 32.2
2.2 Time Liabilities 851.1 825.3 839.4 848.6 846.5
2.2.1 Deposits
2.2.1.1 Inter-Bank 494.6 470.6 465.1 482.0 471.0
2.2.1.2 Others 346.0 344.8 358.5 354.8 364.7
2.2.2 Borrowings from Banks – – 5.6 – –
2.2.3 Other Time Liabilities 10.4 10.0 10.2 11.8 10.8
3 Borrowing from Reserve Bank 0.4 0.4 0.4 0.4 –
4 Borrowings from a notified bank / State Government 411.7 421.6 427.4 429.1 434.3
4.1 Demand 164.1 160.7 166.0 166.5 170.4
4.2 Time 247.6 260.9 261.4 262.6 263.9
5 Cash in Hand and Balances with Reserve Bank 37.6 39.2 37.3 35.8 33.0
5.1 Cash in Hand 2.2 2.2 3.5 2.0 2.1
5.2 Balance with Reserve Bank 35.4 37.0 33.8 33.7 30.9
6 Balances with Other Banks in Current Account 8.5 6.2 7.2 6.6 6.6
7 Investments in Government Securities 293.1 264.6 266.4 246.5 265.1
8 Money at Call and Short Notice 190.4 176.2 182.8 178.2 176.3
9 Bank Credit (10.1+11) 380.4 418.2 415.1 422.3 426.9
10 Advances
10.1 Loans, Cash-Credits and Overdrafts 380.4 418.2 324.1 331.2 334.3
10.2 Due from Banks 680.9 677.2 706.7 708.1 709.3
11 Bills Purchased and Discounted – – 91.0 91.1 92.6
Item
2014-15
1
Number of Reporting Banks 31
1 Aggregate Deposits (2.1.1.2+2.2.1.2) 422.3
2 Demand and Time Liabilities
2.1 Demand Liabilities 148.1
2.1.1 Deposits
2.1.1.1 Inter-Bank 33.7
2.1.1.2 Others 77.7
2.1.2 Borrowings from Banks 9.3
2.1.3 Other Demand Liabilities 27.4
2.2 Time Liabilities 854.6
2.2.1 Deposits
2.2.1.1 Inter-Bank 499.2
2.2.1.2 Others 344.6
2.2.2 Borrowings from Banks 0.1
2.2.3 Other Time Liabilities 10.8
3 Borrowing from Reserve Bank –
4 Borrowings from a notified bank / State Government 450.9
4.1 Demand 174.9
4.2 Time 276.0
5 Cash in Hand and Balances with Reserve Bank 40.5
5.1 Cash in Hand 2.4
5.2 Balance with Reserve Bank 38.1
6 Balances with Other Banks in Current Account 10.0
7 Investments in Government Securities 282.4
8 Money at Call and Short Notice 198.8
9 Bank Credit (10.1+11) 426.4
10 Advances
10.1 Loans, Cash-Credits and Overdrafts 426.4
10.2 Due from Banks 709.2
11 Bills Purchased and Discounted 0.1
Last Reporting Friday (in case of March)/Last Friday/ Reporting Friday

CURRENT STATISTICS
RBI Bulletin February 2016 57
No. 18: Consumer Price Index (Base: 2012=100)
Rural Urban Combined
Dec. 14 Nov. 15 Dec. 15 Dec. 14 Nov. 15 Dec. 15 Dec. 14 Nov. 15 Dec. 15
4 5 6 7 8 9 10 11 12
123.3 132.4 131.4 124.0 133.3 131.5 123.6 132.7 131.4
122.4 126.1 126.1 124.0 124.0 124.3 122.9 125.4 125.5
122.4 130.6 131.1 124.7 129.8 131.7 123.2 130.3 131.3
121.8 121.7 123.2 126.3 121.5 127.1 123.5 121.6 124.7
124.2 129.5 129.9 124.9 128.6 128.6 124.5 129.2 129.4
110.2 117.8 118.2 103.0 110.0 110.0 107.6 114.9 115.2
128.6 132.1 131.4 122.3 123.7 120.8 125.7 128.2 126.5
140.3 155.2 145.9 141.0 164.6 149.0 140.5 158.4 147.0
116.3 160.8 162.2 120.1 191.6 190.1 117.6 171.2 171.6
102.0 94.5 95.3 97.8 90.8 92.7 100.6 93.3 94.4
116.0 128.3 128.7 125.4 137.1 138.6 119.1 131.2 132.0
117.3 123.1 123.3 116.1 119.8 120.2 116.8 121.7 122.0
124.8 134.2 135.2 127.6 133.7 134.2 126.1 134.0 134.7
121.7 132.2 133.0 126.4 137.6 138.2 123.0 133.6 134.4
123.3 131.5 132.0 120.0 124.2 124.5 122.0 128.6 129.0
123.8 132.1 132.6 120.7 125.0 125.4 122.6 129.3 129.8
120.6 128.2 128.5 115.8 119.3 119.5 118.6 124.5 124.8
-- -- -- 116.5 122.9 122.4 116.5 122.9 122.4
117.4 125.6 125.6 113.0 115.1 116.0 115.7 121.6 122.0
114.2 119.6 119.8 113.4 116.6 116.7 113.8 118.1 118.3
118.2 125.6 126.0 116.8 121.0 121.0 117.5 123.4 123.6
116.2 122.6 123.1 113.2 118.1 118.6 115.1 120.9 121.4
111.5 114.0 113.9 108.8 109.3 109.3 110.1 111.5 111.5
113.3 120.9 121.5 114.3 117.9 118.1 113.9 119.2 119.6
117.7 125.8 125.6 120.7 126.6 126.6 119.5 126.3 126.2
109.4 114.2 114.1 110.4 113.3 113.1 109.8 113.8 113.7
120.3 128.3 127.9 118.4 124.6 124.0 119.4 126.6 126.1
Group/Sub group 2014-15
Rural Urban Combined
1 2 3
1 Food and beverages 122.6 124.1 123.1
1.1 Cereals and products 122.0 123.9 122.6
1.2 Meat and fish 122.3 125.5 123.5
1.3 Egg 119.0 118.4 118.7
1.4 Milk and products 122.3 122.7 122.5
1.5 Oils and fats 110.6 103.7 108.1
1.6 Fruits 128.6 126.1 127.4
1.7 Vegetables 140.0 146.7 142.3
1.8 Pulses and products 115.1 117.8 116.0
1.9 Sugar and confectionery 102.8 99.5 101.7
1.10 Spices 115.0 122.6 117.5
1.11 Non-alcoholic beverages 116.4 114.9 115.8
1.12 Prepared meals, snacks, sweets etc. 123.0 125.4 124.1
2 Pan, tobacco and intoxicants 120.0 123.7 120.9
3 Clothing and footwear 121.7 118.5 120.5
3.1 Clothing 122.1 119.2 121.0
3.2 Footwear 119.6 114.7 117.6
4 Housing -- 116.1 116.1
5 Fuel and light 116.5 112.3 114.9
6 Miscellaneous 113.6 113.1 113.4
6.1 Household goods and services 116.9 115.8 116.4
6.2 Health 114.9 112.5 114.0
6.3 Transport and communication 112.0 110.3 111.1
6.4 Recreation and amusement 112.8 113.3 113.1
6.5 Education 116.4 118.4 117.6
6.6 Personal care and effects 109.4 110.2 109.7
General Index (All Groups) 119.5 118.1 118.9
Source: Central Statistics Office, Ministry of Statistics and Programme Implementation, Government of India.
No. 19: Other Consumer Price Indices
2014 2015Dec. Nov. Dec.
4 5 6
253 270 269
807 853 853
810 857 857
Item Base Year LinkingFactor
2014-15
1 2 3
1 Consumer Price Index for Industrial Workers 2001 4.63 251
2 Consumer Price Index for Agricultural Labourers 1986-87 5.89 800
3 Consumer Price Index for Rural Labourers 1986-87 – 802
Source: Labour Bureau, Ministry of Labour and Employment, Government of India.
No. 20: Monthly Average Price of Gold and Silver in Mumbai
Source: Business Standard/Business Line/The Economic Times, Mumbai for Gold and Silver prices in Mumbai.
Item 2014-15 2014 2015
Dec. Nov. Dec.
1 2 3 4
1 Standard Gold ( per 10 grams) 27,415 26,678 25,648 25,2072 Silver ( per kilogram) 40,558 37,455 35,340 34,245
`
`
Prices and Production

CURRENT STATISTICS
RBI Bulletin February 201658
No. 21: Wholesale Price Index(Base: 2004-05 = 100)
2014 2015
Dec. Oct. Nov. (P) Dec. (P)
3 4 5 6178.7 176.9 177.6 177.4244.4 253.4 256.5 257.8252.1 267.2 271.0 272.7235.0 257.8 261.4 261.8233.3 235.1 236.1 237.1243.0 364.6 380.4 378.2248.3 270.8 280.5 273.8264.1 305.8 333.1 318.4235.3 242.0 237.2 237.1246.5 250.7 250.8 250.9282.4 282.4 279.3 296.6306.0 346.8 363.3 372.3245.9 244.9 248.0 251.4207.9 220.7 221.7 223.9203.2 200.5 202.9 208.0201.7 219.3 217.8 217.9216.2 234.4 234.3 233.2225.6 226.0 248.8 278.3274.0 215.2 217.6 212.3410.9 278.8 289.8 273.7215.7 205.3 205.3 205.3208.4 182.2 180.4 180.1194.6 176.4 177.9 176.8189.8 189.9 189.9 189.9205.6 173.1 175.6 173.8167.6 177.2 177.2 177.2154.7 153.3 153.0 152.6172.0 174.7 174.9 175.4208.4 207.4 207.9 205.0167.2 163.8 164.1 165.7174.6 181.6 181.2 182.4146.8 149.2 149.4 150.1179.9 164.4 164.6 165.6143.2 150.3 150.3 151.5218.0 260.8 258.5 253.1192.3 192.2 194.8 194.2196.8 199.8 199.8 199.8196.6 205.6 207.0 208.2202.0 205.9 206.0 205.2137.3 137.2 137.2 137.2179.7 180.7 180.7 180.7164.0 166.9 166.9 166.9240.1 246.4 246.4 245.0141.2 139.7 139.8 139.7159.1 155.8 155.6 155.5172.1 165.3 164.7 163.6144.6 145.1 145.4 146.5134.8 130.6 130.8 130.2133.6 128.7 128.9 128.5138.5 136.5 137.1 135.4158.1 150.8 150.6 150.9192.7 222.1 223.1 227.3115.1 116.0 116.1 116.2189.1 196.1 197.7 196.4157.3 165.9 165.5 165.5191.4 195.8 196.3 195.3217.5 226.4 228.4 227.5153.5 148.9 161.9 150.7
Commodities Weight 2014-15
1 21 ALL COMMODITIES 100.000 181.21.1 PRIMARY ARTICLES 20.118 248.8 1.1.1 Food articles 14.337 253.4 1.1.1.1 Food Grains 4.090 235.0 1.1.1.1.1 Cereals 3.373 233.6 1.1.1.1.2 Pulses 0.717 241.4 1.1.1.2 Fruits & Vegetables 3.843 257.3 1.1.1.2.1 Vegetables 1.736 276.6 1.1.1.2.2 Fruits 2.107 241.5 1.1.1.3 Milk 3.238 242.6 1.1.1.4 Eggs, Meat & Fish 2.414 282.3 1.1.1.5 Condiments & Spices 0.569 298.8 1.1.1.6 Other Food Articles 0.183 249.4 1.1.2 Non-Food Articles 4.258 212.1 1.1.2.1 Fibres 0.877 215.3 1.1.2.2 Oil Seeds 1.781 208.9 1.1.2.3 Other Non-Food Articles 1.386 215.6 1.1.2.4 Flowers 0.213 202.6 1.1.3 Minerals 1.524 308.5 1.1.3.1 Metallic Minerals 0.489 388.6 1.1.3.2 Other Minerals 0.135 211.8 1.1.3.3 Crude Petroleum 0.900 279.61.2 FUEL & POWER 14.910 203.5 1.2.1 Coal 2.094 189.8 1.2.2 Mineral Oils 9.364 219.6 1.2.3 Electricity 3.452 168.01.3 MANUFACTURED PRODUCTS 64.972 155.1 1.3.1 Food Products 9.974 172.9 1.3.1.1 Dairy Products 0.568 199.5 1.3.1.2 Canning, Preserving & Processing of Food 0.358 167.2 1.3.1.3 Grain Mill Products 1.340 175.1 1.3.1.4 Bakery Products 0.444 149.2 1.3.1.5 Sugar, Khandsari & Gur 2.089 182.7 1.3.1.6 Edible Oils 3.043 145.0 1.3.1.7 Oil Cakes 0.494 227.0 1.3.1.8 Tea & Coffee Proccessing 0.711 189.7 1.3.1.9 Manufacture of Salt 0.048 197.3 1.3.1.10 Other Food Products 0.879 194.1 1.3.2 Beverages, Tobacco & Tobacco Products 1.762 200.8 1.3.2.1 Wine Industries 0.385 137.0 1.3.2.2 Malt Liquor 0.153 177.5 1.3.2.3 Soft Drinks & Carbonated Water 0.241 162.6 1.3.2.4 Manufacture of Bidi, Cigarettes, Tobacco & Zarda 0.983 238.7 1.3.3 Textiles 7.326 142.6 1.3.3.1 Cotton Textiles 2.605 162.6 1.3.3.1.1 Cotton Yarn 1.377 179.2 1.3.3.1.2 Cotton Fabric 1.228 144.0 1.3.3.2 Man-Made Textiles 2.206 135.3 1.3.3.2.1 Man-Made Fibre 1.672 134.5 1.3.3.2.2 Man-Made Fabric 0.533 138.0 1.3.3.3 Woollen Textiles 0.294 159.5 1.3.3.4 Jute, Hemp & Mesta Textiles 0.261 192.9 1.3.3.5 Other Misc. Textiles 1.960 115.0 1.3.4 Wood & Wood Products 0.587 187.8 1.3.4.1 Timber/Wooden Planks 0.181 156.9 1.3.4.2 Processed Wood 0.128 191.1 1.3.4.3 Plywood & Fibre Board 0.241 214.9 1.3.4.4 Others 0.038 152.6

CURRENT STATISTICS
RBI Bulletin February 2016 59
No. 21: Wholesale Price Index (Concld.)(Base: 2004-05 = 100)
2014 2015
Dec. Oct. Nov. (P) Dec. (P)
3 4 5 6151.1 154.7 154.6 154.9150.7 151.2 151.2 151.2133.2 135.9 135.6 135.4173.1 184.7 184.8 186.2144.3 144.2 143.8 144.4114.1 113.4 113.5 113.5161.0 160.7 159.7 160.3143.7 145.0 145.0 146.2149.4 146.8 146.3 145.8177.9 177.0 177.0 177.2178.0 177.8 177.8 178.0177.3 169.9 169.9 169.9139.6 135.3 135.0 133.9154.4 155.2 153.6 154.2152.4 150.6 150.6 149.9155.7 154.9 154.7 154.9147.9 139.0 138.7 138.3152.5 155.8 156.1 155.3155.3 158.9 159.0 158.4137.0 138.7 140.4 138.5150.4 152.1 152.2 152.2144.3 141.7 142.2 142.1129.7 130.3 130.4 129.0160.7 163.0 163.7 163.1157.8 154.1 154.3 153.5152.5 145.5 145.1 145.0159.8 151.4 150.9 147.8154.4 154.4 153.7 153.1173.6 177.0 176.9 177.5195.3 198.8 197.9 198.5137.3 140.4 140.6 141.2169.2 173.1 173.7 173.6177.7 178.0 176.7 181.1164.7 154.1 152.2 150.3154.5 141.2 139.4 136.8153.3 138.3 135.5 131.8163.3 148.1 144.1 141.9150.1 132.1 130.9 126.7134.4 127.7 127.6 125.7167.4 160.2 159.8 160.1145.5 144.4 144.2 143.5159.8 148.8 148.0 148.8169.9 163.4 163.0 163.4148.0 136.3 135.5 135.9190.8 189.2 189.1 189.6210.4 210.3 207.1 207.4134.6 134.9 134.9 134.9149.8 149.0 149.0 149.0151.0 153.4 153.4 153.6141.4 141.5 141.5 141.5165.1 165.8 165.8 165.7121.0 120.7 120.8 120.8127.3 127.5 127.5 127.6138.6 138.3 138.3 138.4157.2 156.1 156.1 155.8120.9 121.7 121.7 121.7
89.2 89.1 89.2 89.391.7 91.7 91.7 91.998.6 98.7 99.6 99.6
136.0 137.8 137.9 138.0134.9 136.8 136.9 137.0138.9 140.5 140.4 140.3149.8 150.7 150.7 150.6
Commodities Weight 2014-15
1 2 1.3.5 Paper & Paper Products 2.034 150.7 1.3.5.1 Paper & Pulp 1.019 149.8 1.3.5.2 Manufacture of boards 0.550 133.8 1.3.5.3 Printing & Publishing 0.465 172.4 1.3.6 Leather & Leather Products 0.835 145.0 1.3.6.1 Leathers 0.223 116.0 1.3.6.2 Leather Footwear 0.409 161.9 1.3.6.3 Other Leather Products 0.203 143.1 1.3.7 Rubber & Plastic Products 2.987 149.9 1.3.7.1 Tyres & Tubes 0.541 177.3 1.3.7.1.1 Tyres 0.488 177.5 1.3.7.1.2 Tubes 0.053 175.7 1.3.7.2 Plastic Products 1.861 140.2 1.3.7.3 Rubber Products 0.584 155.3 1.3.8 Chemicals & Chemical Products 12.018 152.8 1.3.8.1 Basic Inorganic Chemicals 1.187 156.1 1.3.8.2 Basic Organic Chemicals 1.952 150.9 1.3.8.3 Fertilisers & Pesticides 3.145 152.0 1.3.8.3.1 Fertilisers 2.661 154.9 1.3.8.3.2 Pesticides 0.483 135.7 1.3.8.4 Paints, Varnishes & Lacquers 0.529 149.9 1.3.8.5 Dyestuffs & Indigo 0.563 144.8 1.3.8.6 Drugs & Medicines 0.456 129.3 1.3.8.7 Perfumes, Cosmetics, Toiletries etc. 1.130 160.7 1.3.8.8 Turpentine, Plastic Chemicals 0.586 156.4 1.3.8.9 Polymers including Synthetic Rubber 0.970 152.3 1.3.8.10 Petrochemical Intermediates 0.869 162.0 1.3.8.11 Matches, Explosives & other Chemicals 0.629 153.5 1.3.9 Non-Metallic Mineral Products 2.556 172.9 1.3.9.1 Structural Clay Products 0.658 192.4 1.3.9.2 Glass, Earthenware, Chinaware & their Products 0.256 135.5 1.3.9.3 Cement & Lime 1.386 169.6 1.3.9.4 Cement, Slate & Graphite Products 0.256 177.7 1.3.10 Basic Metals, Alloys & Metal Products 10.748 165.6 1.3.10.1 Ferrous Metals 8.064 155.6 1.3.10.1.1 Iron & Semis 1.563 156.7 1.3.10.1.2 Steel: Long 1.630 164.7 1.3.10.1.3 Steel: Flat 2.611 150.8 1.3.10.1.4 Steel: Pipes & Tubes 0.314 133.4 1.3.10.1.5 Stainless Steel & alloys 0.938 167.3 1.3.10.1.6 Castings & Forgings 0.871 145.6 1.3.10.1.7 Ferro alloys 0.137 158.9 1.3.10.2 Non-Ferrous Metals 1.004 168.6 1.3.10.2.1 Aluminium 0.489 144.9 1.3.10.2.2 Other Non-Ferrous Metals 0.515 191.1 1.3.10.3 Metal Products 1.680 211.6 1.3.11 Machinery & Machine Tools 8.931 134.6 1.3.11.1 Agricultural Machinery & Implements 0.139 148.7 1.3.11.2 Industrial Machinery 1.838 152.3 1.3.11.3 Construction Machinery 0.045 141.1 1.3.11.4 Machine Tools 0.367 165.0 1.3.11.5 Air Conditioner & Refrigerators 0.429 120.6 1.3.11.6 Non-Electrical Machinery 1.026 126.9 1.3.11.7 Electrical Machinery, Equipment & Batteries 2.343 138.6 1.3.11.8 Electrical Accessories, Wires, Cables etc. 1.063 156.0 1.3.11.9 Electrical Apparatus & Appliances 0.337 119.8 1.3.11.10 Electronics Items 0.961 89.6 1.3.11.11 IT Hardware 0.267 91.5 1.3.11.12 Communication Equipments 0.118 98.7 1.3.12 Transport, Equipment & Parts 5.213 136.2 1.3.12.1 Automotives 4.231 135.3 1.3.12.2 Auto Parts 0.804 138.1 1.3.12.3 Other Transport Equipments 0.178 150.1
Source: Office of the Economic Adviser, Ministry of Commerce and Industry, Government of India.
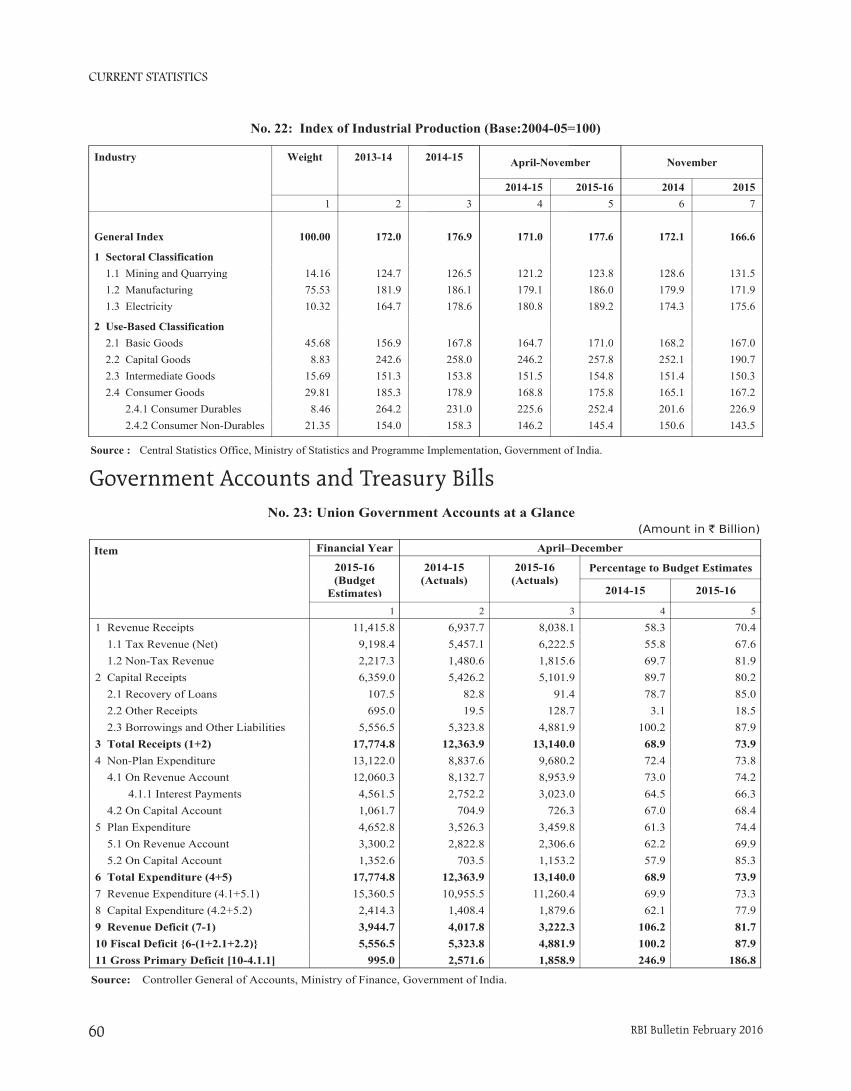
CURRENT STATISTICS
RBI Bulletin February 201660
November
2014 20156 7
General Index
General IndexGeneral Index172.1 166.6
Sectoral Classification
Sectoral Classification1. Mining & Quarrying128.6 131.52. Manufacturing179.9 171.93. Electricity 174.3 175.6
Use-Based Classification
Use-Based Classification1. Basic Goods168.2 167.02. Capital Goods252.1 190.73. Intermediate Goods151.4 150.34. Consumer Goods165.1 167.24(a).Consumer Durables201.6 226.94(b).Consumer Non-durables150.6 143.5
April-November
2014-15 2015-164 5
General Index
General IndexGeneral IndexGeneral Index171.0 177.6
Sectoral Classification
Sectoral ClassificationMining & QuarryingMining & Quarrying121.2 123.8ManufacturingManufacturing179.1 186.0ElectricityElectricity 180.8 189.2
Use-Based Classification
Use-Based ClassificationBasic GoodsBasic Goods164.7 171.0Capital GoodsCapital Goods246.2 257.8Intermediate GoodsIntermediate Goods151.5 154.8Consumer GoodsConsumer Goods168.8 175.8Consumer DurablesConsumer Durables225.6 252.4Consumer Non-durablesConsumer Non-durables146.2 145.4
No. 22: Index of Industrial Production (Base:2004-05=100)
Industry Weight 2013-14 2014-15
1 2 3General IndexGeneral Index 100.00 172.0 176.9
1 Sectoral Classification 1.1 Mining and Quarrying 14.16 124.7 126.5 1.2 Manufacturing 75.53 181.9 186.1 1.3 Electricity 10.32 164.7 178.6
2 Use-Based Classification 2.1 Basic Goods 45.68 156.9 167.8 2.2 Capital Goods 8.83 242.6 258.0 2.3 Intermediate Goods 15.69 151.3 153.8 2.4 Consumer Goods 29.81 185.3 178.9 2.4.1 Consumer Durables 8.46 264.2 231.0 2.4.2 Consumer Non-Durables 21.35 154.0 158.3
Source : Central Statistics Office, Ministry of Statistics and Programme Implementation, Government of India.
Government Accounts and Treasury BillsNo. 23: Union Government Accounts at a Glance
(Amount in ` Billion)
Source: Controller General of Accounts, Ministry of Finance, Government of India.
Budget Account Item Code April–December
2014-15(Actuals)
2015-16(Actuals)
Percentage to Budget Estimates
2014-15 2015-16
2 3 4 5
6,937.7 8,038.1 58.3 70.45,457.1 6,222.5 55.8 67.61,480.6 1,815.6 69.7 81.95,426.2 5,101.9 89.7 80.2
82.8 91.4 78.7 85.019.5 128.7 3.1 18.5
5,323.8 4,881.9 100.2 87.912,363.9 13,140.0 68.9 73.9
8,837.6 9,680.2 72.4 73.88,132.7 8,953.9 73.0 74.22,752.2 3,023.0 64.5 66.3
704.9 726.3 67.0 68.43,526.3 3,459.8 61.3 74.42,822.8 2,306.6 62.2 69.9
703.5 1,153.2 57.9 85.312,363.9 13,140.0 68.9 73.910,955.5 11,260.4 69.9 73.3
1,408.4 1,879.6 62.1 77.94,017.8 3,222.3 106.2 81.75,323.8 4,881.9 100.2 87.92,571.6 1,858.9 246.9 186.8
Item Financial Year
2015-16(Budget
Estimates)1
1 Revenue Receipts 11,415.8 1.1 Tax Revenue (Net) 9,198.4 1.2 Non-Tax Revenue 2,217.32 Capital Receipts 6,359.0 2.1 Recovery of Loans 107.5 2.2 Other Receipts 695.0 2.3 Borrowings and Other Liabilities 5,556.53 Total Receipts (1+2) 17,774.84 Non-Plan Expenditure 13,122.0 4.1 On Revenue Account 12,060.3 4.1.1 Interest Payments 4,561.5 4.2 On Capital Account 1,061.75 Plan Expenditure 4,652.8 5.1 On Revenue Account 3,300.2 5.2 On Capital Account 1,352.66 Total Expenditure (4+5) 17,774.87 Revenue Expenditure (4.1+5.1) 15,360.58 Capital Expenditure (4.2+5.2) 2,414.39 Revenue Deficit (7-1) 3,944.710 Fiscal Deficit {6-(1+2.1+2.2)} 5,556.511 Gross Primary Deficit [10-4.1.1] 995.0

CURRENT STATISTICS
RBI Bulletin February 2016 61
(` Billion)
2014 2015Dec. 26 Nov. 20 Nov. 27 Dec. 4 Dec. 11 Dec. 18 Dec. 25
2 3 4 5 6 7 8
– – – – – – –– – – – – – –
688.0 731.2 650.6 679.5 757.9 616.5 771.77.2 6.8 4.2 6.2 11.5 14.5 17.6
330.8 377.5 331.6 331.6 301.8 316.6 328.6330.9 306.3 313.5 310.9 342.3 367.3 361.3670.1 403.3 557.3 596.3 516.3 626.3 576.3511.0 518.5 549.1 541.7 530.0 476.4 373.9
289.2 252.5 244.6 248.5 202.2 249.4 238.2237.4 382.3 386.2 388.6 407.6 406.2 409.7
12.6 91.0 91.0 91.0 91.0 91.0 91.0157.4 117.8 121.8 115.9 143.1 97.4 104.9
395.4 432.2 436.8 433.0 431.5 436.8 423.3622.8 696.9 686.2 704.8 703.6 706.2 658.4
12.0 19.6 19.6 19.6 19.6 19.6 19.6384.5 321.5 327.6 312.7 325.4 317.6 328.9
4,649.3 4,657.3 4,720.0 4,780.0 4,783.8 4,741.6 4,703.3
No. 24: Treasury Bills – Ownership Pattern
Item 2014-15
11 14-day
1.1 Banks –1.2 Primary Dealers –1.3 State Governments 838.11.4 Others 14.7
2 91-day2.1 Banks 446.92.2 Primary Dealers 284.12.3 State Governments 368.32.4 Others 264.9
3 182-day3.1 Banks 231.53.2 Primary Dealers 408.93.3 State Governments 13.93.4 Others 113.9
4 364-day4.1 Banks 330.84.2 Primary Dealers 657.34.3 State Governments 12.04.4 Others 483.4
5 Total 4,468.7
No. 25: Auctions of Treasury Bills(Amount in ` Billion)
Date ofAuction
NotifiedAmount
Bids Received Bids Accepted TotalIssue(6+7)
Cut-offPrice
Implicit Yieldat Cut-offPrice (per
cent)
Number Total Face Value Number Total Face ValueCompetitive Non-
CompetitiveCompetitive Non-
Competitive
1 2 3 4 5 6 7 8 9 1091-day Treasury Bills
2015-16 Dec. 2 80 56 500.09 64.00 27 80.00 64.00 144.00 98.25 7.1443Dec. 9 80 61 248.08 30.05 49 80.00 30.05 110.05 98.24 7.1858Dec. 16 80 68 334.48 161.12 56 80.00 161.12 241.12 98.23 7.2274Dec. 23 80 65 340.25 120.03 49 80.00 120.03 200.03 98.23 7.2274Dec. 30 80 62 495.50 52.00 51 80.00 52.00 132.00 98.23 7.2274
182-day Treasury Bills2015-16 Dec. 2 60 54 130.91 0.02 30 60.00 0.02 60.02 96.52 7.2308Dec. 16 60 64 186.01 0.10 32 60.00 0.10 60.10 96.51 7.2523Dec. 30 60 48 194.14 – 23 60.00 – 60.00 96.51 7.2523
364-day Treasury Bills2015-16 Nov. 10 60 57 143.00 – 29 60.00 – 60.00 93.27 7.2354Nov. 24 60 57 184.98 0.03 26 60.00 0.03 60.03 93.27 7.2354Dec. 9 60 67 183.35 0.15 32 60.00 0.15 60.15 93.26 7.2470Dec. 23 60 71 248.91 0.06 20 60.00 0.06 60.06 93.26 7.2470

CURRENT STATISTICS
RBI Bulletin February 201662
No. 26: Daily Call Money Rates
As on 05 Feb,2016 Range of Rates Weighted Average Rates
1 Borrowings/ Lendings Borrowings/ Lendings
1 2
December 1, 2015 5.40-7.35 6.69
December 2, 2015 5.00-6.95 6.64
December 3, 2015 5.40-6.80 6.62
December 4, 2015 5.00-6.75 6.54
December 5, 2015 5.00-6.50 6.20
December 7, 2015 5.40-6.90 6.72
December 8, 2015 5.40-7.00 6.65
December 9, 2015 5.40-6.90 6.51
December 10, 2015 5.40-7.05 6.66
December 11, 2015 5.40-6.85 6.72
December 14, 2015 5.40-7.00 6.71
December 15, 2015 5.70-7.10 6.69
December 16, 2015 5.70-7.45 6.79
December 17, 2015 5.70-7.25 6.74
December 18, 2015 5.60-7.40 6.79
December 19, 2015 5.05-6.35 5.83
December 21, 2015 5.70-7.40 6.93
December 22, 2015 5.25-7.20 6.71
December 23, 2015 5.20-7.10 6.74
December 28, 2015 5.70-7.20 6.80
December 29, 2015 5.70-7.05 6.66
December 30, 2015 5.70-7.15 6.68
December 31, 2015 5.60-7.40 6.97
January 1, 2016 5.60-7.10 6.72
January 2, 2016 4.90-6.30 5.68
January 4, 2016 5.70-6.90 6.65
January 5, 2016 5.60-6.90 6.69
January 6, 2016 5.70-7.65 6.84
January 7, 2016 5.70-7.35 6.78
January 8, 2016 5.70-7.20 6.95
January 11, 2016 5.00-7.10 6.88
January 12, 2016 5.00-7.05 6.79
January 13, 2016 5.00-7.05 6.76
January 14, 2016 5.00-7.10 6.76
January 15, 2016 5.00-7.10 6.90
(Per cent per annum)
Note: Includes Notice Money.
Financial Markets

CURRENT STATISTICS
RBI Bulletin February 2016 63
No. 27: Certificates of Deposit
Item 2014 2015
Dec. 26 Nov. 13 Nov. 27 Dec. 11 Dec. 25
1 2 3 4 5
1 Amount Outstanding ( Billion) 2,618.8 1,814.2 1,691.2 1,892.6 2,065.6
1.1 Issued during the fortnight ( Billion) 323.8 143.1 223.8 296.6 299.2
2 Rate of Interest (per cent) 8.24-8.74 7.07-7.66 7.04-7.75 7.24-7.75 7.25-7.78
`
`
No. 28: Commercial Paper
Item 2014 2015
Dec. 31 Nov. 15 Nov. 30 Dec. 15 Dec. 31
1 2 3 4 5
1 Amount Outstanding ( Billion) 2,082.5 3,443.6 3,273.8 3,802.8 3,085.1
1.1 Reported during the fortnight ( Billion) 436.4 701.5 624.7 1,151.3 665.9
2 Rate of Interest (per cent) 7.98-12.61 6.52-11.18 7.07-11.66 7.08-12.13 7.23-11.79
`
`
(` Billion)
2014 2015
Dec. 26 Nov. 20 Nov. 27 Dec. 4 Dec. 11 Dec. 18 Dec. 25
2 3 4 5 6 7 8
210.7 156.8 252.9 243.9 298.4 240.7 293.4
92.1 57.5 11.8 47.6 5.6 67.2 8.1
5.3 5.9 6.6 4.4 4.3 5.5 5.1
1,125.2 1,442.3 1,103.9 1,567.4 1,276.3 1,354.8 1,100.6
949.4 1,165.2 1,267.0 1,446.0 1,438.2 1,240.2 1,101.1
– 0.9 1.4 4.7 2.3 0.4 1.9
44,464 40,806 55,788 51,139 47,269 46,233 48,724
738.1 330.5 382.9 705.0 582.3 715.6 741.5
24.0 18.3 34.2 15.3 30.0 31.4 44.9
31.0 27.1 54.1 54.6 43.4 39.6 52.1
7.7 6.6 2.4 17.3 10.7 12.2 17.9
9.5 8.1 22.3 16.0 10.9 9.4 4.2
– – – – – – –
810.2 390.6 495.8 808.3 677.3 808.1 860.6
3.3 1.2 2.0 1.4 22.7 7.6 8.0
No. 29: Average Daily Turnover in Select Financial Markets
Item 2014-15
1
1 Call Money 190.3
2 Notice Money 65.4
3 Term Money 4.1
4 CBLO 1,168.3
5 Market Repo 1,097.6
6 Repo in Corporate Bond 0.3
7 Forex (US $ million) 56,541
8 Govt. of India Dated Securities 772.4
9 State Govt. Securities 15.8
10 Treasury Bills
10.1 91-Day 35
10.2 182-Day 12.1
10.3 364-Day 21.4
10.4 Cash Management Bills 0.7
11 Total Govt. Securities (8+9+10) 857.4
11.1 RBI –

CURRENT STATISTICS
RBI Bulletin February 201664
Dec. 2014 Dec. 2015
No. ofIssues
Amount No. ofIssues
Amount
7 8 9 10
1 Equity Shares 3 3.6 6 26.3
1A Premium1 3.4 6 25.9
1.1 Prospectus2 3.5 6 26.3
1.1.1 Premium1 3.4 6 25.9
1.2 Rights 1 0.1 – –
1.2.1 Premium– – – –
2 Preference Shares – – – –
2.1 Prospectus– – – –
2.2 Rights – – – –
3 Debentures – – 2 7.0
3.1 Convertible – – – –
3.1.1 Prospectus– – – –
3.1.2 Rights– – – –
3.2 Non-Convertible – – 2 7.0
3.2.1 Prospectus– – 2 7.0
3.2.2 Rights– – – –
4 Bonds – – – –
4.1 Prospectus– – – –
4.2 Rights – – – –
5 Total (1+2+3+4)3 3.6 8 33.3
5.1 Prospectus2 3.5 8 33.3
5.2 Rights 1 0.1 – –
2014-15 (Apr.-Dec.) 2015-16 (Apr.-Dec.)
No. ofIssues
Amount No. ofIssues
Amount
3 4 5 6
1 Equity Shares 44 42.3 59 208.9
1A Premium37 28.2 54 195.7
1.1 Prospectus32 14.2 49 117.5
1.1.1 Premium29 12.5 45 110.0
1.2 Rights12 28.1 10 91.4
1.2.1 Premium8 15.6 9 85.7
2 Preference Shares – – – –
2.1 Prospectus– – – –
2.2 Rights – – – –
3 Debentures 18 61.0 8 25.3
3.1 Convertible – – – –
3.1.1 Prospectus– – – –
3.1.2 Rights– – – –
3.2 Non-Convertible 18 61.0 8 25.3
3.2.1 Prospectus18 61.0 8 25.3
3.2.2 Rights– – – –
4 Bonds – – – –
4.1 Prospectus– – – –
4.2 Rights – – – –
5 Total (1+2+3+4)62 103.4 67 234.2
5.1 Prospectus50 75.2 57 142.8
5.2 Rights12 28.1 10 91.4
No. 30: New Capital Issues By Non-Government Public Limited Companies
Security & Type of Issue 2014-15
No. ofIssues
Amount
1 2
1 Equity Shares 63 93.1
1A Premium 53 76.8
1.1 Prospectus 46 30.4
1.1.1 Premium 40 28.0
1.2 Rights 17 62.8
1.2.1 Premium 13 48.8
2 Preference Shares – –
2.1 Prospectus – –
2.2 Rights – –
3 Debentures 23 77.4
3.1 Convertible – –
3.1.1 Prospectus – –
3.1.2 Rights – –
3.2 Non-Convertible 23 77.4
3.2.1 Prospectus 23 77.4
3.2.2 Rights – –
4 Bonds – –
4.1 Prospectus – –
4.2 Rights – –
5 Total (1+2+3+4) 86 170.6
5.1 Prospectus 69 107.8
5.2 Rights 17 62.8
(Amount in ` Billion)
Source: Based on prospectus/advertisements issued by companies, replies to Reserve Bank’s questionnaire and information received from SEBI, stock exchanges, press reports, etc.
* *
* : Data is Provisional

CURRENT STATISTICS
RBI Bulletin February 2016 65
No. 31: Foreign Trade
Item Unit 2014-15 2014 2015Dec. Aug. Sep. Oct. Nov. Dec.
1 2 3 4 5 6 7
1 Exports` Billion 18,963.5 1,641.3 1,451.3 1,425.3 1,389.0 1,274.4 1,484.9
US $ Million 310,338.5 26,154.5 22,303.6 21,524.4 21,350.1 19,274.3 22,297.5
1.1 Oil` Billion 3,460.8 283.8 182.7 161.8 163.4 146.5 157.5
US $ Million 56,794.2 4,522.6 2,807.2 2,442.8 2,511.7 2,216.1 2,365.6
1.2 Non-oil` Billion 15,502.7 1,357.5 1,268.7 1,263.5 1,225.6 1,127.8 1,327.4
US $ Million 253,544.4 21,631.9 19,496.4 19,081.6 18,838.4 17,058.2 19,931.9
2 Imports` Billion 27,370.9 2,217.3 2,194.2 2,133.0 2,013.1 1,966.8 2,261.7
US $ Million 448,033.4 35,333.3 33,719.6 32,211.5 30,942.9 29,747.5 33,961.5
2.1 Oil` Billion 8,428.7 625.2 479.1 440.4 445.5 425.6 443.3
US $ Million 138,325.5 9,963.4 7,363.1 6,650.6 6,848.0 6,436.4 6,656.7
2.2 Non-oil` Billion 18,942.1 1,592.0 1,715.1 1,692.6 1,567.6 1,541.3 1,818.4
US $ Million 309,707.9 25,369.8 26,356.5 25,561.0 24,094.9 23,311.2 27,304.7
3 Trade Balance` Billion –8,407.4 –576.0 –742.9 –707.7 –624.1 –692.5 –776.8
US $ Million –137,694.9 –9,178.8 –11,416.1 –10,687.1 –9,592.8 –10,473.3 –11,664.0
3.1 Oil` Billion –4,967.9 –341.4 –296.5 –278.6 –282.1 –279.0 –285.8
US $ Million –81,531.4 –5,440.9 –4,556.0 –4,207.8 –4,336.4 –4,220.3 –4,291.2
3.2 Non-oil` Billion –3,439.5 –234.6 –446.4 –429.0 –342.0 –413.4 –491.0
US $ Million –56,163.5 –3,737.9 –6,860.1 –6,479.4 –5,256.5 –6,253.0 –7,372.8Source: DGCI&S and Ministry of Commerce & Industry.
1.4 Reserve Tranche Position in IMF ` Billion 68 86 86 86 86 87 88
US $ Million 1,101 1,296 1,301 1,298 1,297 1,296 1,292
1.3 SDRs SDRs Million 2,889 2,889 2,889 2,889 2,889 2,889 2,889
` Billion 249 266 266 265 267 270 270
US $ Million 4,048 3,997 4,013 4,003 3,999 3,997 3,985
No. 32: Foreign Exchange Reserves
Item Unit 2015 2016
Jan. 23 Dec. 18 Dec. 25 Jan. 1 Jan. 8 Jan. 15 Jan. 22
1 2 3 4 5 6 7
1 Total Reseves ` Billion` Billion` Billion` Billion 19,862 23,222 23,216 23,089 23,144 23,261 23,381
US $ Million 322,038 351,107 352,050 350,369 348,934 347,208 347,563
1.1 Foreign Currency Assets ` Billion 18,318 21,698 21,692 21,595 21,648 21,761 21,880
US $ Million 297,511 328,270 329,192 327,828 326,398 324,675 325,047
1.2 Gold ` Billion 1,227 1,172 1,172 1,144 1,144 1,144 1,144
US $ Million 19,378 17,544 17,544 17,240 17,240 17,240 17,240
No. 33: NRI Deposits
(US$ Million)
Flows
2014-15 2015-16
Apr.-Dec. Apr.-Dec.
5 6
10,056 11,599
599 1,872
8,762 9,009
695 717
2014 2015
Dec. Nov. Dec.
2 3 4
110,070 121,221 122,571
42,422 44,650 44,696
58,367 66,980 68,099
9,281 9,592 9,775
Scheme
2014-15
1
1 NRI Deposits 115,163
1.1 FCNR(B) 42,824
1.2 NR(E)RA 62,746
1.3 NRO 9,593
Outstanding
External Sector

CURRENT STATISTICS
RBI Bulletin February 201666
No. 34: Foreign Investment Inflows(US$ Million)
2014 2015
Dec. Nov. Dec.
4 5 6
1.1 Net Foreign Direct Investment (1.1.1–1.1.2) 2,290 2,460 3,743
1.1.1 Direct Investment to India (1.1.1.1–1. 1.1.2) 2,602 3,030 5,145
1.1.1.1 Gross Inflows/Gross Investments 3,319 3,959 6,074
1.1.1.1.1 Equity 2,245 3,018 4,719
1.1.1.1.1.1 Government (SIA/FIPB) 239 61 106
1.1.1.1.1.2 RBI 1,626 2,679 4,225
1.1.1.1.1.3 Acquisition of shares 296 194 304 1.1.1.1.1.4 Equity capital of unincorporated bodies 84 84 84
1.1.1.1.2 Reinvested earnings 856 856 856
1.1.1.1.3 Other capital 217 84 499
1.1.1.2 Repatriation/Disinvestment 717 929 929
1.1.1.2.1 Equity 695 926 926
1.1.1.2.2 Other capital 23 3 3 1.1.2 Foreign Direct Investment by India (1.1.2.1+1.1.2.2+1.1.2.3–1.1.2.4) 312 570 1,402
1.1.2.1 Equity capital 365 245 1,225
1.1.2.2 Reinvested Earnings 278 278 278
1.1.2.3 Other Capital 269 357 209
1.1.2.4 Repatriation/Disinvestment 600 310 310
1.2 Net Portfolio Investment (1.2.1+1.2.2+1.2.3–1.2.4) –361 –3,795 –2,583
1.2.1 GDRs/ADRs – – –
1.2.2 FIIs –404 –3,784 –2,572
1.2.3 Offshore funds and others – – –
1.2.4 Portfolio investment by India –43 11 11
1 Foreign Investment Inflows 1,929 –1,335 1,160
2014-15 2015-16
Apr.-Dec. Apr.-Dec.
2 3
1.1 Net Foreign Direct Investment (1.1.1–1.1.2) 21,981 27,749
1.1.1 Direct Investment to India (1.1.1.1–1. 1.1.2) 24,796 33,453
1.1.1.1 Gross Inflows/Gross Investments 31,014 40,823
1.1.1.1.1 Equity 21,758 30,153
1.1.1.1.1.1 Government (SIA/FIPB) 1,703 2,875
1.1.1.1.1.2 RBI 13,953 24,128
1.1.1.1.1.3 Acquisition of shares 5,391 2,439 1.1.1.1.1.4 Equity capital of unincorporated bodies 710 710
1.1.1.1.2 Reinvested earnings 7,253 7,253
1.1.1.1.3 Other capital 2,003 3,417
1.1.1.2 Repatriation/Disinvestment 6,218 7,369
1.1.1.2.1 Equity 6,038 7,295
1.1.1.2.2 Other capital 180 74 1.1.2 Foreign Direct Investment by India (1.1.2.1+1.1.2.2+1.1.2.3–1.1.2.4) 2,815 5,705
1.1.2.1 Equity capital 2,672 4,011
1.1.2.2 Reinvested Earnings 2,503 2,503
1.1.2.3 Other Capital 2,572 2,306
1.1.2.4 Repatriation/Disinvestment 4,932 3,115
1.2 Net Portfolio Investment (1.2.1+1.2.2+1.2.3–1.2.4) 28,482 –10,635
1.2.1 GDRs/ADRs – 373
1.2.2 FIIs 28,487 –11,269
1.2.3 Offshore funds and others – –
1.2.4 Portfolio investment by India 5 –261
1 Foreign Investment Inflows 50,463 17,114
Item 2014-15
1
1.1 Net Foreign Direct Investment (1.1.1–1.1.2) 31,252
1.1.1 Direct Investment to India (1.1.1.1–1. 1.1.2) 35,284
1.1.1.1 Gross Inflows/Gross Investments 45,148
1.1.1.1.1 Equity 31,911
1.1.1.1.1.1 Government (SIA/FIPB) 2,219
1.1.1.1.1.2 RBI 22,530
1.1.1.1.1.3 Acquisition of shares 6,185 1.1.1.1.1.4 Equity capital of unincorporated bodies 978
1.1.1.1.2 Reinvested earnings 9,988
1.1.1.1.3 Other capital 3,249
1.1.1.2 Repatriation/Disinvestment 9,864
1.1.1.2.1 Equity 9,612
1.1.1.2.2 Other capital 252 1.1.2 Foreign Direct Investment by India (1.1.2.1+1.1.2.2+1.1.2.3–1.1.2.4) 4,031
1.1.2.1 Equity capital 3,867
1.1.2.2 Reinvested Earnings 3,337
1.1.2.3 Other Capital 3,476
1.1.2.4 Repatriation/Disinvestment 6,649
1.2 Net Portfolio Investment (1.2.1+1.2.2+1.2.3–1.2.4) 42,205
1.2.1 GDRs/ADRs 1,271
1.2.2 FIIs 40,923
1.2.3 Offshore funds and others –
1.2.4 Portfolio investment by India –11
1 Foreign Investment Inflows 73,457
No. 35: Outward Remittances under the Liberalised Remittance Scheme (LRS) for Resident Individuals
(US$ Million)2014 2015Dec. Oct. Nov. Dec.
2 3 4 595.1 412.4 333.4 447.23.4 8.8 6.4 7.13.2 6.2 5.0 6.6
15.8 20.0 19.7 19.930.1 42.2 37.2 48.20.2 0.3 0.4 0.30.8 68.7 36.2 32.7
11.1 122.1 103.1 154.70.8 1.9 1.4 1.6
20.2 101.1 92.1 127.59.4 41.1 31.9 48.6
Item 2014-15
11 Outward Remittances under the LRS 1,325.8 1.1 Deposit 51.4 1.2 Purchase of immovable property 45.5 1.3 Investment in equity/debt 195.5 1.4 Gift 403.5 1.5 Donations 3.2 1.6 Travel 11.0 1.7 Maintenance of close relatives 174.4 1.8 Medical Treatment 7.2 1.9 Studies Abroad 277.1 1.10 Others 157.1
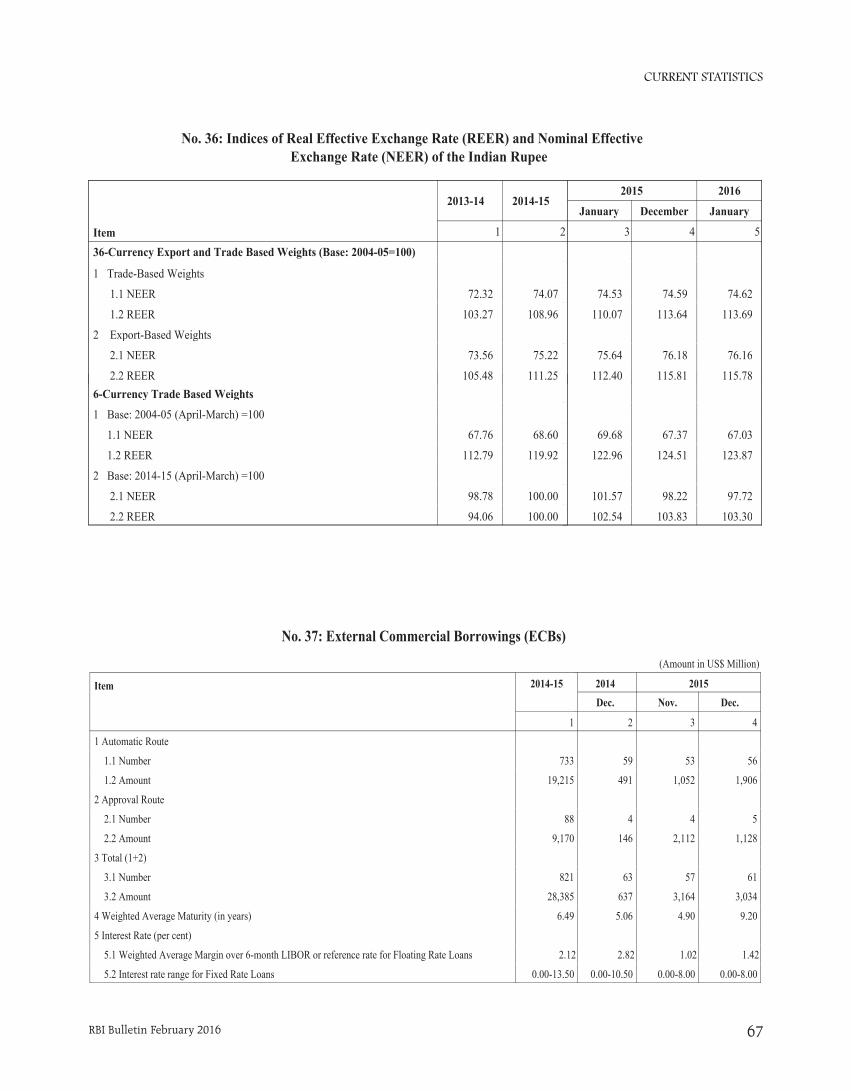
CURRENT STATISTICS
RBI Bulletin February 2016 67
No. 36: Indices of Real Effective Exchange Rate (REER) and Nominal Effective Exchange Rate (NEER) of the Indian Rupee
69.68 67.37 67.03
122.96 124.51 123.87
101.57 98.22 97.72
102.54 103.83 103.30
2015 2016
January December January
3 4 5
74.53 74.59 74.62
110.07 113.64 113.69
75.64 76.18 76.16
112.40 115.81 115.782013-14 2014-15 6-Currency Trade Based Weights
1 Base: 2004-05 (April-March) =100
1.1 NEER 67.76 68.60
1.2 REER 112.79 119.92
2 Base: 2014-15 (April-March) =100
2.1 NEER 98.78 100.00
2.2 REER 94.06 100.00
Item
2013-14 2014-15
1 2
36-Currency Export and Trade Based Weights (Base: 2004-05=100)
1 Trade-Based Weights
1.1 NEER 72.32 74.07
1.2 REER 103.27 108.96
2 Export-Based Weights
2.1 NEER 73.56 75.22
2.2 REER 105.48 111.25
(Amount in US$ Million)
2014 2015
Dec. Nov. Dec.
2 3 4
59 53 56
491 1,052 1,906
4 4 5
146 2,112 1,128
63 57 61
637 3,164 3,034
5.06 4.90 9.20
2.82 1.02 1.42
0.00-10.50 0.00-8.00 0.00-8.00
No. 37: External Commercial Borrowings (ECBs)
Item 2014-15
1
1 Automatic Route
1.1 Number 733
1.2 Amount 19,215
2 Approval Route
2.1 Number 88
2.2 Amount 9,170
3 Total (1+2)
3.1 Number 821
3.2 Amount 28,385
4 Weighted Average Maturity (in years) 6.49
5 Interest Rate (per cent)
5.1 Weighted Average Margin over 6-month LIBOR or reference rate for Floating Rate Loans 2.12
5.2 Interest rate range for Fixed Rate Loans 0.00-13.50

CURRENT STATISTICS
RBI Bulletin February 201668
No. 38: India's Overall Balance of Payments
(US $ Million)
Item
Jul-Sep 2014 (PR) Jul-Sep 2015 (P)
Credit Debit Net Credit Debit Net
1 2 3 4 5 6
Overall Balance of Payments(1+2+3) 276,336 269,439 6,897 254,938 255,794 –8561 CURRENT ACCOUNT (1.1+ 1.2) 142,467 153,413 –10,945 127,315 135,549 –8,2341.1 MERCHANDISE 83,093 122,745 –39,652 67,573 104,998 –37,4251.2 INVISIBLES (1.2.1+1.2.2+1.2.3) 59,374 30,668 28,706 59,743 30,551 29,191 1.2.1 Services 38,358 19,429 18,929 38,752 20,792 17,960 1.2.1.1 Travel 4,992 4,123 869 5,037 4,021 1,016 1.2.1.2 Transportation 4,469 4,109 360 3,535 3,837 –301 1.2.1.3 Insurance 592 261 331 552 286 266 1.2.1.4 G.n.i.e. 138 252 –115 168 247 –79 1.2.1.5 Miscellaneous 28,167 10,683 17,483 29,460 12,402 17,058 1.2.1.5.1 Software Services 17,645 728 16,917 18,873 648 18,225 1.2.1.5.2 Business Services 7,077 6,780 297 7,244 7,511 –267 1.2.1.5.3 Financial Services 1,363 852 512 1,717 875 842 1.2.1.5.4 Communication Services 492 355 138 592 280 312 1.2.2 Transfers 17,505 1,118 16,387 17,084 821 16,263 1.2.2.1 Official 98 224 –126 88 246 –157 1.2.2.2 Private 17,407 894 16,513 16,996 575 16,421 1.2.3 Income 3,511 10,121 –6,610 3,907 8,938 –5,032 1.2.3.1 Investment Income 2,642 9,383 –6,741 2,909 8,341 –5,432 1.2.3.2 Compensation of Employees 869 738 131 998 597 4002 CAPITAL ACCOUNT (2.1+2.2+2.3+2.4+2.5) 133,615 116,026 17,589 127,488 120,245 7,2432.1 Foreign Investment (2.1.1+2.1.2) 75,916 58,679 17,237 65,848 65,723 125 2.1.1 Foreign Direct Investment 12,507 5,032 7,475 11,366 4,799 6,567 2.1.1.1 In India 10,937 2,110 8,827 10,397 2,205 8,191 2.1.1.1.1 Equity 7,690 2,050 5,640 7,355 2,201 5,154 2.1.1.1.2 Reinvested Earnings 2,369 – 2,369 2,369 – 2,369 2.1.1.1.3 Other Capital 878 60 818 673 5 668 2.1.1.2 Abroad 1,570 2,923 –1,353 970 2,594 –1,624 2.1.1.2.1 Equity 1,570 940 630 970 1,012 –42 2.1.1.2.2 Reinvested Earnings – 834 –834 – 834 –834 2.1.1.2.3 Other Capital – 1,148 –1,148 – 747 –747 2.1.2 Portfolio Investment 63,409 53,647 9,762 54,482 60,924 –6,442 2.1.2.1 In India 63,293 53,421 9,872 54,293 60,841 –6,548 2.1.2.1.1 FIIs 63,293 53,421 9,872 54,193 60,841 –6,648 2.1.2.1.1.1 Equity 44,534 43,163 1,371 47,351 53,483 –6,132 2.1.2.1.1.2 Debt 18,760 10,258 8,502 6,842 7,358 –516 2.1.2.1.2 ADR/GDRs – – – 100 – 100 2.1.2.2 Abroad 116 226 –110 189 83 1062.2 Loans (2.2.1+2.2.2+2.2.3) 30,508 31,775 –1,268 30,252 31,228 –975 2.2.1 External Assistance 1,375 686 689 976 1,089 –113 2.2.1.1 By India 15 97 –82 14 131 –117 2.2.1.2 To India 1,360 589 771 963 958 4 2.2.2 Commercial Borrowings 6,693 7,065 –372 5,953 7,123 –1,170 2.2.2.1 By India 366 20 346 253 44 209 2.2.2.2 To India 6,327 7,045 –718 5,700 7,079 –1,379 2.2.3 Short Term to India 22,439 24,024 –1,585 23,323 23,016 307 2.2.3.1 Suppliers' Credit > 180 days & Buyers' Credit 21,773 24,024 –2,251 22,425 23,016 –591 2.2.3.2 Suppliers' Credit up to 180 days 666 – 666 898 – 8982.3 Banking Capital (2.3.1+2.3.2) 19,478 19,906 –428 24,970 17,671 7,300 2.3.1 Commercial Banks 19,344 19,906 –562 24,970 17,668 7,302 2.3.1.1 Assets 2,080 3,114 –1,034 6,119 3,392 2,727 2.3.1.2 Liabilities 17,263 16,791 472 18,852 14,277 4,575 2.3.1.2.1 Non-Resident Deposits 16,883 12,819 4,064 16,184 11,957 4,227 2.3.2 Others 134 – 134 – 3 –32.4 Rupee Debt Service – 2 –2 – 17 –172.5 Other Capital 7,713 5,664 2,050 6,417 5,607 8113 Errors & Omissions 254 – 254 135 – 1354 Monetary Movements (4.1+ 4.2) – 6,897 –6,897 856 – 856 4.1 I.M.F. – – – – – – 4.2 Foreign Exchange Reserves (Increase - / Decrease +) – 6,897 –6,897 856 – 856

CURRENT STATISTICS
RBI Bulletin February 2016 69
No. 39: India's Overall Balance of Payments
(` Billion)
Item
Jul-Sep 2014 (PR) Jul-Sep 2015 (P)
Credit Debit Net Credit Debit Net
1 2 3 4 5 6
Overall Balance of Payments(1+2+3) 16,748 16,330 418 16,565 16,620 –561 CURRENT ACCOUNT (1.1+ 1.2) 8,634 9,298 –663 8,272 8,807 –5351.1 MERCHANDISE 5,036 7,439 –2,403 4,391 6,822 –2,4321.2 INVISIBLES (1.2.1+1.2.2+1.2.3) 3,598 1,859 1,740 3,882 1,985 1,897 1.2.1 Services 2,325 1,178 1,147 2,518 1,351 1,167 1.2.1.1 Travel 303 250 53 327 261 66 1.2.1.2 Transportation 271 249 22 230 249 –20 1.2.1.3 Insurance 36 16 20 36 19 17 1.2.1.4 G.n.i.e. 8 15 –7 11 16 –5 1.2.1.5 Miscellaneous 1,707 647 1,060 1,914 806 1,108 1.2.1.5.1 Software Services 1,069 44 1,025 1,226 42 1,184 1.2.1.5.2 Business Services 429 411 18 471 488 –17 1.2.1.5.3 Financial Services 83 52 31 112 57 55 1.2.1.5.4 Communication Services 30 21 8 38 18 20 1.2.2 Transfers 1,061 68 993 1,110 53 1,057 1.2.2.1 Official 6 14 –8 6 16 –10 1.2.2.2 Private 1,055 54 1,001 1,104 37 1,067 1.2.3 Income 213 613 –401 254 581 –327 1.2.3.1 Investment Income 160 569 –409 189 542 –353 1.2.3.2 Compensation of Employees 53 45 8 65 39 262 CAPITAL ACCOUNT (2.1+2.2+2.3+2.4+2.5) 8,098 7,032 1,066 8,284 7,813 4712.1 Foreign Investment (2.1.1+2.1.2) 4,601 3,556 1,045 4,279 4,270 8 2.1.1 Foreign Direct Investment 758 305 453 739 312 427 2.1.1.1 In India 663 128 535 676 143 532 2.1.1.1.1 Equity 466 124 342 478 143 335 2.1.1.1.2 Reinvested Earnings 144 – 144 154 – 154 2.1.1.1.3 Other Capital 53 4 50 44 – 43 2.1.1.2 Abroad 95 177 –82 63 169 –106 2.1.1.2.1 Equity 95 57 38 63 66 –3 2.1.1.2.2 Reinvested Earnings – 51 –51 – 54 –54 2.1.1.2.3 Other Capital – 70 –70 – 49 –49 2.1.2 Portfolio Investment 3,843 3,251 592 3,540 3,959 –419 2.1.2.1 In India 3,836 3,238 598 3,528 3,953 –425 2.1.2.1.1 FIIs 3,836 3,238 598 3,521 3,953 –432 2.1.2.1.1.1 Equity 2,699 2,616 83 3,077 3,475 –398 2.1.2.1.1.2 Debt 1,137 622 515 445 478 –34 2.1.2.1.2 ADR/GDRs – – – 6 – 6 2.1.2.2 Abroad 7 14 –7 12 5 72.2 Loans (2.2.1+2.2.2+2.2.3) 1,849 1,926 –77 1,966 2,029 –63 2.2.1 External Assistance 83 42 42 63 71 –7 2.2.1.1 By India 1 6 –5 1 8 –8 2.2.1.2 To India 82 36 47 63 62 – 2.2.2 Commercial Borrowings 406 428 –23 387 463 –76 2.2.2.1 By India 22 1 21 16 3 14 2.2.2.2 To India 383 427 –44 370 460 –90 2.2.3 Short Term to India 1,360 1,456 –96 1,515 1,495 20 2.2.3.1 Suppliers' Credit > 180 days & Buyers' Credit 1,320 1,456 –136 1,457 1,495 –38 2.2.3.2 Suppliers' Credit up to 180 days 40 – 40 58 – 582.3 Banking Capital (2.3.1+2.3.2) 1,180 1,206 –26 1,622 1,148 474 2.3.1 Commercial Banks 1,172 1,206 –34 1,622 1,148 474 2.3.1.1 Assets 126 189 –63 398 220 177 2.3.1.2 Liabilities 1,046 1,018 29 1,225 928 297 2.3.1.2.1 Non-Resident Deposits 1,023 777 246 1,052 777 275 2.3.2 Others 8 – 8 – – –2.4 Rupee Debt Service – – – – 1 –12.5 Other Capital 467 343 124 417 364 533 Errors & Omissions 15 – 15 9 – 94 Monetary Movements (4.1+ 4.2) – 418 –418 56 – 56 4.1 I.M.F. – – – – – – 4.2 Foreign Exchange Reserves (Increase - / Decrease +) – 418 –418 56 – 56

CURRENT STATISTICS
RBI Bulletin February 201670
(US $ Million)
Item Jul-Sep 2014 (PR) Jul-Sep 2015 (P)Credit Debit Net Credit Debit Net
1 2 3 4 5 61 Current Account (1.A+1.B+1.C) 142,463 153,391 –10,928 127,310 135,525 –8,214 1.A Goods and Services (1.A.a+1.A.b) 121,451 142,174 –20,723 106,324 125,790 –19,465 1.A.a Goods (1.A.a.1 to 1.A.a.3) 83,093 122,745 –39,652 67,573 104,998 –37,425 1.A.a.1 General merchandise on a BOP basis 83,093 115,069 –31,976 67,573 95,015 –27,443 1.A.a.2 Net exports of goods under merchanting – – – – – – 1.A.a.3 Nonmonetary gold – 7,676 –7,676 – 9,982 –9,982 1.A.b Services (1.A.b.1 to 1.A.b.13) 38,358 19,429 18,929 38,752 20,792 17,960 1.A.b.1 Manufacturing services on physical inputs owned by others 24 7 17 94 5 89 1.A.b.2 Maintenance and repair services n.i.e. 40 46 –6 41 65 –24 1.A.b.3 Transport 4,469 4,109 360 3,535 3,837 –301 1.A.b.4 Travel 4,992 4,123 869 5,037 4,021 1,016 1.A.b.5 Construction 338 276 62 366 229 137 1.A.b.6 Insurance and pension services 592 261 331 552 286 266 1.A.b.7 Financial services 1,363 852 512 1,717 875 842 1.A.b.8 Charges for the use of intellectual property n.i.e. 76 922 –845 100 1,073 –973 1.A.b.9 Telecommunications, computer, and information services 18,184 1,145 17,039 19,522 1,002 18,520 1.A.b.10 Other business services 7,077 6,780 297 7,244 7,511 –267 1.A.b.11 Personal, cultural, and recreational services 322 421 –99 302 421 –119 1.A.b.12 Government goods and services n.i.e. 138 252 –115 168 247 –79 1.A.b.13 Others n.i.e. 741 235 506 75 1,221 –1,147 1.B Primary Income (1.B.1 to 1.B.3) 3,511 10,121 –6,610 3,907 8,938 –5,032 1.B.1 Compensation of employees 869 738 131 998 597 400 1.B.2 Investment income 2,348 9,312 –6,963 2,495 8,169 –5,674 1.B.2.1 Direct investment 1,186 3,419 –2,232 1,315 3,086 –1,771 1.B.2.2 Portfolio investment 49 2,476 –2,427 31 1,961 –1,930 1.B.2.3 Other investment 108 3,415 –3,307 157 3,121 –2,965 1.B.2.4 Reserve assets 1,005 1 1,003 992 1 991 1.B.3 Other primary income 294 71 222 414 172 242 1.C Secondary Income (1.C.1+1.C.2) 17,500 1,096 16,405 17,080 797 16,283 1.C.1 Financial corporations, nonfinancial corporations, households, and NPISHs 17,407 894 16,513 16,996 575 16,421 1.C.1.1 Personal transfers (Current transfers between resident and/ non-resident households) 16,753 813 15,940 16,455 515 15,941 1.C.1.2 Other current transfers 654 81 573 541 60 480 1.C.2 General government 93 202 –109 84 222 –1382 Capital Account (2.1+2.2) 42 95 –53 83 79 4 2.1 Gross acquisitions (DR.)/disposals (CR.) of non-produced nonfinancial assets 9 19 –10 10 14 –3 2.2 Capital transfers 32 76 –44 73 65 83 Financial Account (3.1 to 3.5) 133,578 122,850 10,728 128,266 120,191 8,076 3.1 Direct Investment (3.1A+3.1B) 12,507 5,032 7,475 11,366 4,799 6,567 3.1.A Direct Investment in India 10,937 2,110 8,827 10,397 2,205 8,191 3.1.A.1 Equity and investment fund shares 10,059 2,050 8,009 9,724 2,201 7,523 3.1.A.1.1 Equity other than reinvestment of earnings 7,690 2,050 5,640 7,355 2,201 5,154 3.1.A.1.2 Reinvestment of earnings 2,369 – 2,369 2,369 – 2,369 3.1.A.2 Debt instruments 878 60 818 673 5 668 3.1.A.2.1 Direct investor in direct investment enterprises 878 60 818 673 5 668 3.1.B Direct Investment by India 1,570 2,923 –1,353 970 2,594 –1,624 3.1.B.1 Equity and investment fund shares 1,570 1,774 –204 970 1,846 –877 3.1.B.1.1 Equity other than reinvestment of earnings 1,570 940 630 970 1,012 –42 3.1.B.1.2 Reinvestment of earnings – 834 –834 – 834 –834 3.1.B.2 Debt instruments – 1,148 –1,148 – 747 –747 3.1.B.2.1 Direct investor in direct investment enterprises – 1,148 –1,148 – 747 –747 3.2 Portfolio Investment 63,409 53,647 9,762 54,382 60,924 –6,542 3.2.A Portfolio Investment in India 63,293 53,421 9,872 54,193 60,841 –6,648 3.2.1 Equity and investment fund shares 44,534 43,163 1,371 47,351 53,483 –6,132 3.2.2 Debt securities 18,760 10,258 8,502 6,842 7,358 –516 3.2.B Portfolio Investment by India 116 226 –110 189 83 106 3.3 Financial derivatives (other than reserves) and employee stock options 3,198 3,900 –702 2,573 4,178 –1,606 3.4 Other investment 54,464 53,374 1,090 59,089 50,289 8,800 3.4.1 Other equity (ADRs/GDRs) – – – 100 – 100 3.4.2 Currency and deposits 17,017 12,819 4,198 16,184 11,960 4,225 3.4.2.1 Central bank (Rupee Debt Movements; NRG) 134 – 134 – 3 –3 3.4.2.2 Deposit-taking corporations, except the central bank (NRI Deposits) 16,883 12,819 4,064 16,184 11,957 4,227 3.4.2.3 General government – – – – – – 3.4.2.4 Other sectors – – – – – – 3.4.3 Loans (External Assistance, ECBs and Banking Capital) 10,529 14,837 –4,308 15,716 13,923 1,793 3.4.3.A Loans to India 10,148 14,721 –4,573 15,449 13,748 1,700 3.4.3.B Loans by India 381 117 265 267 175 92 3.4.4 Insurance, pension, and standardized guarantee schemes 71 67 3 34 10 23 3.4.5 Trade credit and advances 22,439 24,024 –1,585 23,323 23,016 307 3.4.6 Other accounts receivable/payable - other 4,408 1,626 2,782 3,733 1,380 2,352 3.4.7 Special drawing rights – – – – – – 3.5 Reserve assets – 6,897 –6,897 856 – 856 3.5.1 Monetary gold – – – – – – 3.5.2 Special drawing rights n.a. – – – – – – 3.5.3 Reserve position in the IMF n.a. – – – – – – 3.5.4 Other reserve assets (Foreign Currency Assets) – 6,897 –6,897 856 – 8564 Total assets/liabilities 133,578 122,850 10,728 128,266 120,191 8,076 4.1 Equity and investment fund shares 59,547 51,181 8,367 60,840 61,802 –962 4.2 Debt instruments 69,623 63,147 6,476 62,738 57,009 5,729 4.3 Other financial assets and liabilities 4,408 8,523 –4,115 4,689 1,380 3,3085 Net errors and omissions 254 – 254 135 – 135
No. 40: Standard Presentation of BoP in India as per BPM6

CURRENT STATISTICS
RBI Bulletin February 2016 71
(` Billion)
Item Jul-Sep 2014 (PR) Jul-Sep 2015 (P)Credit Debit Net Credit Debit Net
1 2 3 4 5 61 Current Account (1.A+1.B+1.C) 8,634 9,296 -662 8,272 8,806 -534 1.A Goods and Services (1.A.a+1.A.b) 7,361 8,617 -1,256 6,908 8,173 -1,265 1.A.a Goods (1.A.a.1 to 1.A.a.3) 5,036 7,439 -2,403 4,391 6,822 -2,432 1.A.a.1 General merchandise on a BOP basis 5,036 6,974 -1,938 4,391 6,174 -1,783 1.A.a.2 Net exports of goods under merchanting – – – – – – 1.A.a.3 Nonmonetary gold – 465 -465 – 649 -649 1.A.b Services (1.A.b.1 to 1.A.b.13) 2,325 1,178 1,147 2,518 1,351 1,167 1.A.b.1 Manufacturing services on physical inputs owned by others 1 – 1 6 – 6 1.A.b.2 Maintenance and repair services n.i.e. 2 3 – 3 4 -2 1.A.b.3 Transport 271 249 22 230 249 -20 1.A.b.4 Travel 303 250 53 327 261 66 1.A.b.5 Construction 20 17 4 24 15 9 1.A.b.6 Insurance and pension services 36 16 20 36 19 17 1.A.b.7 Financial services 83 52 31 112 57 55 1.A.b.8 Charges for the use of intellectual property n.i.e. 5 56 -51 6 70 -63 1.A.b.9 Telecommunications, computer, and information services 1,102 69 1,033 1,268 65 1,203 1.A.b.10 Other business services 429 411 18 471 488 -17 1.A.b.11 Personal, cultural, and recreational services 20 26 -6 20 27 -8 1.A.b.12 Government goods and services n.i.e. 8 15 -7 11 16 -5 1.A.b.13 Others n.i.e. 45 14 31 5 79 -74 1.B Primary Income (1.B.1 to 1.B.3) 213 613 -401 254 581 -327 1.B.1 Compensation of employees 53 45 8 65 39 26 1.B.2 Investment income 142 564 -422 162 531 -369 1.B.2.1 Direct investment 72 207 -135 85 201 -115 1.B.2.2 Portfolio investment 3 150 -147 2 127 -125 1.B.2.3 Other investment 7 207 -200 10 203 -193 1.B.2.4 Reserve assets 61 – 61 64 – 64 1.B.3 Other primary income 18 4 13 27 11 16 1.C Secondary Income (1.C.1+1.C.2) 1,061 66 994 1,110 52 1,058 1.C.1 Financial corporations, nonfinancial corporations, households, and NPISHs 1,055 54 1,001 1,104 37 1,067 1.C.1.1 Personal transfers (Current transfers between resident and/ non-resident households) 1,015 49 966 1,069 33 1,036 1.C.1.2 Other current transfers 40 5 35 35 4 31 1.C.2 General government 6 12 -7 5 14 -92 Capital Account (2.1+2.2) 3 6 -3 5 5 – 2.1 Gross acquisitions (DR.)/disposals (CR.) of non-produced nonfinancial assets 1 1 -1 1 1 – 2.2 Capital transfers 2 5 -3 5 4 –3 Financial Account (3.1 to 3.5) 8,096 7,445 650 8,334 7,809 525 3.1 Direct Investment (3.1A+3.1B) 758 305 453 739 312 427 3.1.A Direct Investment in India 663 128 535 676 143 532 3.1.A.1 Equity and investment fund shares 610 124 485 632 143 489 3.1.A.1.1 Equity other than reinvestment of earnings 466 124 342 478 143 335 3.1.A.1.2 Reinvestment of earnings 144 – 144 154 – 154 3.1.A.2 Debt instruments 53 4 50 44 – 43 3.1.A.2.1 Direct investor in direct investment enterprises 53 4 50 44 – 43 3.1.B Direct Investment by India 95 177 -82 63 169 -106 3.1.B.1 Equity and investment fund shares 95 108 -12 63 120 -57 3.1.B.1.1 Equity other than reinvestment of earnings 95 57 38 63 66 -3 3.1.B.1.2 Reinvestment of earnings – 51 -51 – 54 -54 3.1.B.2 Debt instruments – 70 -70 – 49 -49 3.1.B.2.1 Direct investor in direct investment enterprises – 70 -70 – 49 -49 3.2 Portfolio Investment 3,843 3,251 592 3,533 3,959 -425 3.2.A Portfolio Investment in India 3,836 3,238 598 3,521 3,953 -432 3.2.1 Equity and investment fund shares 2,699 2,616 83 3,077 3,475 -398 3.2.2 Debt securities 1,137 622 515 445 478 -34 3.2.B Portfolio Investment by India 7 14 -7 12 5 7 3.3 Financial derivatives (other than reserves) and employee stock options 194 236 -43 167 271 -104 3.4 Other investment 3,301 3,235 66 3,839 3,268 572 3.4.1 Other equity (ADRs/GDRs) – – – 6 – 6 3.4.2 Currency and deposits 1,031 777 254 1,052 777 275 3.4.2.1 Central bank (Rupee Debt Movements; NRG) 8 – 8 – – – 3.4.2.2 Deposit-taking corporations, except the central bank (NRI Deposits) 1,023 777 246 1,052 777 275 3.4.2.3 General government – – – – – – 3.4.2.4 Other sectors – – – – – – 3.4.3 Loans (External Assistance, ECBs and Banking Capital) 638 899 -261 1,021 905 116 3.4.3.A Loans to India 615 892 -277 1,004 893 110 3.4.3.B Loans by India 23 7 16 17 11 6 3.4.4 Insurance, pension, and standardized guarantee schemes 4 4 – 2 1 2 3.4.5 Trade credit and advances 1,360 1,456 -96 1,515 1,495 20 3.4.6 Other accounts receivable/payable - other 267 99 169 243 90 153 3.4.7 Special drawing rights – – – – – – 3.5 Reserve assets – 418 -418 56 – 56 3.5.1 Monetary gold – – – – – – 3.5.2 Special drawing rights n.a. – – – – – – 3.5.3 Reserve position in the IMF n.a. – – – – – – 3.5.4 Other reserve assets (Foreign Currency Assets) – 418 -418 56 – 564 Total assets/liabilities 8,096 7,445 650 8,334 7,809 525 4.1 Equity and investment fund shares 3,609 3,102 507 3,953 4,016 -62 4.2 Debt instruments 4,220 3,827 393 4,076 3,704 372 4.3 Other financial assets and liabilities 267 517 -249 305 90 2155 Net errors and omissions 15 – 15 9 – 9
No. 41: Standard Presentation of BoP in India as per BPM6

CURRENT STATISTICS
RBI Bulletin February 201672
(US$ Million)
2014 2015
Sep. Jun. Sep.
Assets Assets Assets
3 4 5
–361,073 –363,422 –357,816
Item 2014-15
Assets
1
6 IIP (Assets - Liabilities) –364,742
(US$ Million)
2014 2015
Sep. Jun. Sep.
Assets Liabilities Assets Liabilities Assets Liabilities
3 4 5 6 7 8
130,763 252,705 134,144 271,100 135,768 271,041
91,086 241,550 92,098 258,806 92,975 258,420
39,678 11,155 42,046 12,293 42,794 12,622
1,282 216,355 1,595 236,062 1,701 222,545
947 148,845 1,480 151,105 1,586 140,577
335 67,510 115 84,956 116 81,968
42,362 380,263 42,387 390,388 40,541 392,529
6,996 82,508 4,485 82,180 3,522 82,589
5,142 176,122 4,432 174,890 4,273 173,220
14,972 108,870 17,116 120,059 16,667 122,008
15,252 12,763 16,354 13,259 16,080 14,712
313,841 – 356,001 – 350,288 –
488,249 849,322 534,127 897,550 528,299 886,115
No. 42: International Investment Position
Item2014-15
Assets Liabilities
1 2
1 Direct Investment Abroad/in India 132,741 265,527
1.1 Equity Capital and Reinvested Earnings 91,457 254,055
1.2 Other Capital 41,283 11,472
2 Portfolio Investment 1,429 233,391
2.1 Equity 1,050 153,641
2.2 Debt 378 79,750
3 Other Investment 46,590 388,221
3.1 Trade Credit 5,495 83,692
3.2 Loan 5,664 177,018
3.3 Currency and Deposits 19,432 115,313
3.4 Other Assets/Liabilities 15,998 12,199
4 Reserves 341,639 –
5 Total Assets/ Liabilities 522,398 887,139
As on Financial Year /Quarter End

CURRENT STATISTICS
RBI Bulletin February 2016 73
No. 43: Payment System Indicators
Value (` Billion)
2015
Oct. Nov. Dec.
6 7 8
80,764.99 68,045.93 89,031.27
53,520.48 45,281.08 58,712.64
9,845.09 8,614.95 10,211.40
17,399.42 14,149.90 20,107.23
67,779.96 54,346.61 69,114.62
13,932.05 12,635.52 15,567.72
24,943.03 17,621.84 23,147.93
9,325.71 5,068.58 7,946.88
15,617.32 12,553.26 15,201.05
28,904.88 24,089.25 30,398.97
7,034.90 6,178.45 6,935.57
5,806.75 4,988.06 6,026.51
– – –
– – –
– – –
1,228.15 1,190.39 909.06
7,704.95 7,021.76 8,174.17
160.21 157.77 153.06
95.94 56.31 89.69
6,906.88 6,325.87 7,518.12
137.04 137.67 142.00
404.88 344.14 271.30
2,563.44 2,509.56 2,564.71
219.08 210.27 214.69
2.70 2.58 2.75
216.38 207.69 211.94
2,344.36 2,299.29 2,350.02
2,205.24 2,151.14 2,204.23
139.12 148.15 145.79
38.07 43.40 44.34
15.45 19.31 20.63
20.50 21.80 21.28
2.12 2.29 2.42
305.68 334.71 490.29
– – –
– – –
– – –
– – –
– – –
148,486.89 123,995.81 155,757.44
2014-15
5
929,332.89
631,050.74
122,981.62
175,300.73
752,000.42
167,645.96
258,916.76
101,561.62
157,355.15
325,437.69
85,434.14
66,769.93
1,850.40
614.51
1,235.89
16,939.34
65,365.51
1,739.78
2,019.14
59,803.83
581.87
1,220.88
25,415.27
1,922.63
23.47
1,899.16
23,492.65
22,279.16
1,213.49
213.42
81.84
105.35
26.24
1,035.30
–
–
–
–
–
1,682,461.11
Volume (Million )
2015
Oct. Nov. Dec.
2 3 4
8.34 7.60 8.03
7.97 7.26 7.67
0.37 0.34 0.36
0.001 0.001 0.001
0.27 0.20 0.25
0.02 0.02 0.02
0.09 0.06 0.08
0.08 0.05 0.07
0.010 0.010 0.012
0.16 0.13 0.15
94.78 81.37 93.75
82.97 70.81 82.07
- - -
- - -
- - -
11.81 10.56 11.67
268.99 257.62 290.89
20.27 20.05 31.57
4.00 2.09 2.09
114.60 99.82 111.55
19.42 19.08 20.52
110.70 116.59 125.15
872.69 840.98 885.85
69.44 66.53 69.90
0.52 0.49 0.53
68.92 66.04 69.37
803.25 774.45 815.95
702.82 674.88 707.87
100.43 99.57 108.08
61.82 62.66 68.67
49.58 49.83 53.70
12.20 12.78 14.93
0.04 0.04 0.05
32.48 40.45 39.49
633.66 647.11 659.61
22.88 22.48 22.75
610.78 624.63 636.86
190827 192208 193580
1236933 1270208 1245447
1,306.89 1,250.44 1,347.42
System
2014-15
1
1 RTGS 92.78
1.1 Customer Transactions 88.39
1.2 Interbank Transactions 4.38
1.3 Interbank Clearing 0.012
2 CCIL Operated Systems 3.03
2.1 CBLO 0.21
2.2 Govt. Securities Clearing 1.09
2.2.1 Outright 0.98
2.2.2 Repo 0.109
2.3 Forex Clearing 1.73
3 Paper Clearing 1,196.51
3.1 Cheque Truncation System (CTS) 964.86
3.2 MICR Clearing 22.43
3.2.1 RBI Centres 7.50
3.2.2 Other Centres 14.93
3.3 Non-MICR Clearing 209.82
4 Retail Electronic Clearing 1,687.44
4.1 ECS DR 226.01
4.2 ECS CR (includes NECS) 115.35
4.3 EFT/NEFT 927.55
4.4 Immediate Payment Service (IMPS) 78.37
4.5 National Automated Clearing House (NACH) 340.17
5 Cards 8,423.99
5.1 Credit Cards 619.41
5.1.1 Usage at ATMs 4.29
5.1.2 Usage at POS 615.12
5.2 Debit Cards 7,804.57
5.2.1 Usage at ATMs 6,996.48
5.2.2 Usage at POS 808.09
6 Prepaid Payment Instruments (PPIs) 314.46
6.1 m-Wallet 255.00
6.2 PPI Cards 58.91
6.3 Paper Vouchers 0.55
7 Mobile Banking 171.92
8 Cards Outstanding 574.56
8.1 Credit Card 21.11
8.2 Debit Card 553.45
9 Number of ATMs (in actuals) 181398
10 Number of POS (in actuals) 1126735
11 Grand Total (1.1+1.2+2+3+4+5+6) 11,718.19
Payment and Settlement Systems

CURRENT STATISTICS
RBI Bulletin February 201674
Explanatory Notes to the Current Statistics
Table No. 11.2 & 6: Annual data are averages of months.3.5 & 3.7: Relate to ratios of increments over financial year so far.4.1 to 4.4, 4.8, 4.12 & 5: Relate to the last day of the month/financial year. 4.5, 4.6 & 4.7: Relate to five major banks on the last Friday of the month/financial year. 4.9 to 4.11: Relate to the last auction day of the month/financial year.
Table No. 22.1.2: Include paid-up capital, reserve fund and Long-Term Operations Funds. 2.2.2: Include cash, fixed deposits and short-term securities/bonds, e.g., issued by IIFC (UK).
Table No. 4 Maturity-wise position of outstanding forward contracts is available at http://nsdp.rbi.org.in under ‘‘Reserves Template’’.
Table No. 5 Special refinance facility to Others, i.e. to the EXIM Bank, is closed since March 31, 2013.
Table No. 6 For scheduled banks, March-end data pertain to the last reporting Friday.2.2: Exclude balances held in IMF Account No.1, RBI employees’ provident fund, pension fund, gratuity and superannuation fund.
Table Nos. 7 & 113.1 in Table 7 and 2.4 in Table 11: Include foreign currency denominated bonds issued by IIFC (UK).
Table No. 8NM2 and NM3 do not include FCNR (B) deposits.2.4: Consist of paid-up capital and reserves.2.5: includes other demand and time liabilities of the banking system.
Table No. 9Financial institutions comprise EXIM Bank, SIDBI, NABARD and NHB. L1 and L2 are compiled monthly and L3 quarterly. Wherever data are not available, the last available data have been repeated.
Table No. 15 & 16Data are provisional and relate to select banks which cover 95 per cent of total non-food credit extended by all scheduled commercial banks (excludes ING Vysya which has been merged with Kotak Mahindra since April 2015). Export credit under priority sector relates to foreign banks only. Micro & small under item 2.1 includes credit to micro & small industries in manufacturing sector. Micro & small enterprises under item 5.2 includes credit to micro & small enterprises in manufacturing as well as services sector.Priority Sector is as per old definition and does not conform to FIDD Circular FIDD.CO.Plan.BC.54/04.09.01/2014-15 dated April 23, 2015.
Table No. 172.1.1: Exclude reserve fund maintained by co-operative societies with State Co-operative Banks2.1.2: Exclude borrowings from RBI, SBI, IDBI, NABARD, notified banks and State Governments.4: Include borrowings from IDBI and NABARD.

CURRENT STATISTICS
RBI Bulletin February 2016 75
Table No. 24Primary Dealers (PDs) include banks undertaking PD business.
Table No. 30 Exclude private placement and offer for sale. 1: Exclude bonus shares.2: Include cumulative convertible preference shares and equi-preference shares.
Table No. 32Exclude investment in foreign currency denominated bonds issued by IIFC (UK), SDRs transferred by Government of India to RBI and foreign currency received under SAARC SWAP arrangement. Foreign currency assets in US dollar take into account appreciation/depreciation of non-US currencies (such as Euro, Sterling, Yen and Australian Dollar) held in reserves. Foreign exchange holdings are converted into rupees at rupee-US dollar RBI holding rates.
Table No. 341.1.1.1.2 & 1.1.1.1.1.4: Estimates.1.1.1.2: Estimates for latest months. ‘Other capital’ pertains to debt transactions between parent and subsidiaries/branches of FDI enterprises.Data may not tally with the BoP data due to lag in reporting.
Table No. 351.10: Include items such as subscription to journals, maintenance of investment abroad, student loan repayments and credit card payments.
Table No. 36 Increase in indices indicates appreciation of rupee and vice versa. For 6-Currency index, base year 2012-13 is a moving one, which gets updated every year. REER figures are based on Consumer Price Index (combined). Methodological details are available in December 2005 and April 2014 issues of the Bulletin.
Table No. 37Based on applications for ECB/Foreign Currency Convertible Bonds (FCCBs) which have been allotted loan registration number during the period.
Table Nos. 38, 39, 40 & 41 Explanatory notes on these tables are available in December issue of RBI Bulletin, 2012.
Table No. 431.3: Pertain to multilateral net settlement batches.3.1: Pertain to two centres - New Delhi and Chennai. 3.3: Pertain to clearing houses managed by 21 banks.6: Available from December 2010.7: Include IMPS transactions.
Detailed explanatory notes are available in the relevant press releases issued by RBI and other publications/releases of the Bank such as Handbook of Statistics on the Indian Economy.

RECENT PUBLICATIONSRECENT PUBLICATIONS
RBI Bulletin February 201676
Name of Publication Price
India Abroad
1. Reserve Bank of India Bulletin 2016 `200 per copy (over the counter)
`240 per copy (inclusive of postage)
`2,800 (one year subscription - inclusive of postage)
US$ 11 per copy (inclusive of postage)
US$ 130 (one-year subscription)
(inclusive of air mail courier charges)
2. Handbook of Statistics on the Indian Economy 2014-15
`400 (Normal)
`450 (inclusive of postage)
`300 (concessional)
`375 (concessional with postage)
US$ 40(inclusive of air mail courier charges)
3. Report on Currency and Finance 2009-12 Fiscal-Monetary Co-ordination
`515 (normal)
`555 (inclusive of postage)
US$ 16 per copy (inclusive air mail courier charges)
4. Report on Currency and Finance 2003-08 Vol. I to V (Special Issue)
`1,100 (normal)
` 1,170 (inclusive of postage)
` 830 (concessional)
` 900 (concessional inclusive of postage)
US$ 55 per copy (inclusive air mail courier charges)
5. State Finances -A Study of Budgets of 2014-15
`390 per copy (over the counter)
`430 per copy (including postal charges)
US$ 14 per copy
(inclusive air mail courier charges)
6. Handbook of Statistics on State Government Finances 2010
CD-ROM
`80 (normal)
`105 (inclusive of postage)
`60 (concessional)
`85 (concessional inclusive of postage)
US$ 16 per CD (inclusive of air mail courier charges)
US$ 4 per CD
(inclusive of registered air mail charges)
7. CD Compendium of Articles on State Finances (1950-51 to 2010-11)
`280 (over the counter)
`305 (inclusive of postal charges)
`210 (concessional)
`235 (concessional inclusive of postage)
US$ 8 (inclusive of air mail book post charges)
8. Mint Road Milestones RBI at 75 `1,650 per copy (over the counter) US$ 50 per copy (inclusive of air mail courier charges)
9. India’s Financial Sector, An Assessment Vol. I to VI 2009
`2,000 per copy (over the counter)
`2,300 per copy (inclusive postal charges)
`1,500 per copy (concessional price )
`1,800 per copy (concessional inclusive of postage)
US$ 40 per set and
US$ 120 per set(inclusive of air mail courier charges)
10. The Paper and the Promise: A Brief History of Currency & Banknotes in India, 2009
`200 per copy (over the counter) US$ 30 per copy(inclusive of air mail courier charges)
11. Report of the committee on Fuller Capital account Convertibility (Tarapore Committee Report II)
`140 per copy (normal)
`170 (per copy by post)
US$ 25 per copy((inclusive of air mail courier charges)
12. A Profi le of Banks 2012-13 `80 per copy (over the counter)
`110 per copy (inclusive of postal charges)
US$ 7 per copy(inclusive of air mail courier charges)
Recent Publications of the Reserve Bank of India
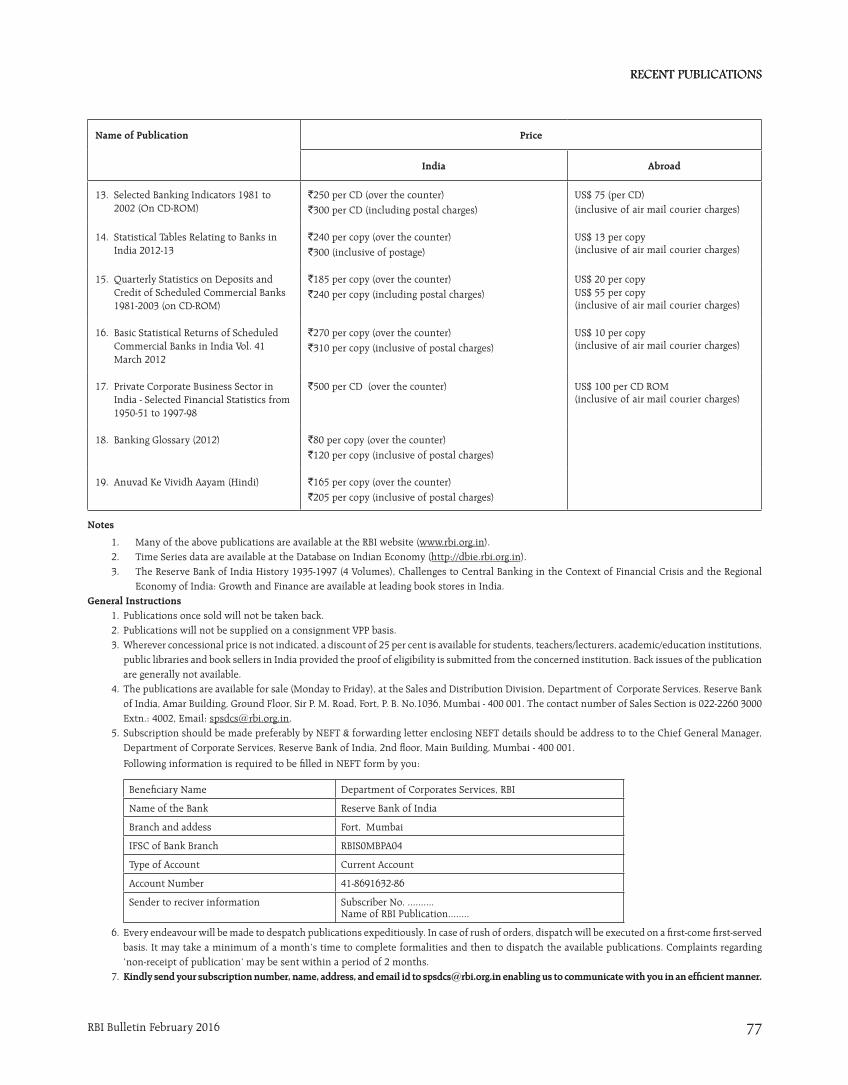
RECENT PUBLICATIONSRECENT PUBLICATIONS
RBI Bulletin February 2016 77
Name of Publication Price
India Abroad
13. Selected Banking Indicators 1981 to 2002 (On CD-ROM)
`250 per CD (over the counter) `300 per CD (including postal charges)
US$ 75 (per CD)(inclusive of air mail courier charges)
14. Statistical Tables Relating to Banks in India 2012-13
`240 per copy (over the counter)`300 (inclusive of postage)
US$ 13 per copy(inclusive of air mail courier charges)
15. Quarterly Statistics on Deposits and Credit of Scheduled Commercial Banks 1981-2003 (on CD-ROM)
`185 per copy (over the counter)`240 per copy (including postal charges)
US$ 20 per copyUS$ 55 per copy(inclusive of air mail courier charges)
16. Basic Statistical Returns of Scheduled Commercial Banks in India Vol. 41 March 2012
`270 per copy (over the counter)`310 per copy (inclusive of postal charges)
US$ 10 per copy(inclusive of air mail courier charges)
17. Private Corporate Business Sector in India - Selected Financial Statistics from 1950-51 to 1997-98
`500 per CD (over the counter) US$ 100 per CD ROM(inclusive of air mail courier charges)
18. Banking Glossary (2012) `80 per copy (over the counter)`120 per copy (inclusive of postal charges)
19. Anuvad Ke Vividh Aayam (Hindi) `165 per copy (over the counter)`205 per copy (inclusive of postal charges)
Notes
1. Many of the above publications are available at the RBI website (www.rbi.org.in).2. Time Series data are available at the Database on Indian Economy (http://dbie.rbi.org.in). 3. The Reserve Bank of India History 1935-1997 (4 Volumes), Challenges to Central Banking in the Context of Financial Crisis and the Regional
Economy of India: Growth and Finance are available at leading book stores in India.General Instructions
1. Publications once sold will not be taken back.2. Publications will not be supplied on a consignment VPP basis.3. Wherever concessional price is not indicated, a discount of 25 per cent is available for students, teachers/lecturers, academic/education institutions,
public libraries and book sellers in India provided the proof of eligibility is submitted from the concerned institution. Back issues of the publication are generally not available.
4. The publications are available for sale (Monday to Friday), at the Sales and Distribution Division, Department of Corporate Services, Reserve Bank of India, Amar Building, Ground Floor, Sir P. M. Road, Fort, P. B. No.1036, Mumbai - 400 001. The contact number of Sales Section is 022-2260 3000 Extn.: 4002, Email: [email protected].
5. Subscription should be made preferably by NEFT & forwarding letter enclosing NEFT details should be address to to the Chief General Manager, Department of Corporate Services, Reserve Bank of India, 2nd fl oor, Main Building, Mumbai - 400 001.
Following information is required to be fi lled in NEFT form by you:
Benefi ciary Name Department of Corporates Services, RBI
Name of the Bank Reserve Bank of India
Branch and addess Fort, Mumbai
IFSC of Bank Branch RBIS0MBPA04
Type of Account Current Account
Account Number 41-8691632-86
Sender to reciver information Subscriber No. ..........Name of RBI Publication........
6. Every endeavour will be made to despatch publications expeditiously. In case of rush of orders, dispatch will be executed on a fi rst-come fi rst-served basis. It may take a minimum of a month’s time to complete formalities and then to dispatch the available publications. Complaints regarding ‘non-receipt of publication’ may be sent within a period of 2 months.
7. Kindly send your subscription number, name, address, and email id to [email protected] enabling us to communicate with you in an effi cient manner.