annual report 2016 - cota commercial bank
196
COTA COMMERCIAL BANK Code: 5830 web page: www.cotabank.com.tw Taiwan Stock Exchange M.O.P.S web page: mops.twse.com.tw ANNUAL REPORT 2016
-
Upload
khangminh22 -
Category
Documents
-
view
1 -
download
0
Transcript of annual report 2016 - cota commercial bank

COTA COMMERCIAL BANK
Code: 5830
web page: www.cotabank.com.tw
Taiwan Stock Exchange M.O.P.S web page:mops.twse.com.tw
ANNUAL REPORT 2016


ANNUAL REPORT 2016

CONTENTS 1. To Our Shareholders
2. Corporate Profile
3. Corporate Governance
4. Capital Arrangement
5. Business Operation
6. Financial Status
7. Financial Status Analysis, Operation Performance Analysis and Risk Management
8. Special Notes
* Chronological Highlights
* Head Office and Branches
001
007
009
049
057
073
163
179
182
187
COTA Commercial Bank Annual Report 2016

1. To Our Shareholders
001COTA Commercial Bank Annual Report 2016

1-1. Year 2017 Business Report
1-1-1. Financial Environment
In retrospect of year 2016, Populism is influence on international politics, such as the variant of EUR caused by Brexit and Mr. Trump was elected unexpectedly president of the United States, risen suddenly and shaken the global economy. The global growth rate presented a level of 3.1% according to IMF, the equivalent of compared to previous year.
The current international situation is still facing variables, Mr. Trump emphasize that the United States preferred trade claims are likely to make trade war in imminent, and leading to global economic changed to protectionism, in the long term, it is a negative impact on global economic development. The variant of political by Brexit and Italian constitutional amendment failure, in addition to global trade is fall into stagnation once again, leading to the economic recovery continued to be weak in European area. Further, The European area economic growth impetus have been reduced by the limited of the low willingness to invest in the enterprise, the sluggish domestic demand, the fragility of the banking industry and the uncertainty of the integration of the European economy.
While the domestic economic growth impetus has no significant improvement compared with 2015, in addition to the international economic situation showed gloomy performance, the result to the more important is the export trade part is still highly dependent on China. Domestic economy show growth rate in GDP as 1.4% for year 2015 released by “Directorate-General of Budget, Accounting and Statistics, Executive Yuan, ROC”. Looking forward into the coming year, the domestic economy will remain stress by the internal and external, the financial industry will be face challenge of business situation, COTA Bank will continue to adhere to the integrity of the business philosophy, to express a flexible management strategy, Meanwhile, continue to expansion and strict implementation of risk control on the basic business.
1-1-2. Organization Development
Set up Longjing Branch, Taiping Branch and Taizhong Branch to expand channel, lift business scale and provide financial service to rural area.
1-1-3. Business Plans and Strategies Performance
1-1-3-1. Main Achievements
• Set up Longjing Branch, Taiping Branch and Taizhong Branch to expand service channel. • Strengthen the digital banking business, there are the online reservations including of establish accounts, agreement of account
transfer, closing the customer TWD account, trusting new account, recognizing customer and risk tolerance test, application for mortgage, application for credit card etc.
• Issue bank debentures of TWD1.8 billion to improve capital operating efficiency.• Launched new official website to support the automatic adaptation to facilitate the use of mobile devices • Launched foreign currency settlement platform for foreign currency collection services.• Set up a project management platform to improve collaboration effectively inter-departmental and manage scheme progress in
effect.
Annual Report 2016002
1. To Our Shareholders

1-1-3-2. Budget Execution
As of Dec. 31, 2016, our deposits balance with sum of TWD139.7 billion (excluding deposits from banks) increased by TWD4.9 billion compared with previous year; our loans balance with sum of TWD113.9 billion increased by TWD6.7 billion compared with previous year. We would be committed to provide diversified products to satisfy the requirement of the customer, strengthen the Fintech services, expansion e-banking services, to develop new financial products, to achieve better structure of quality between deposits and loans and higher multi-source income. Main business budget executions reported as follows:Final account of average deposits balance amounted to TWD135.3 billion, achieved 100.22% budgeting goal of TWD135 billion.Final account of average loans balance amounted to TWD109.3 billion, achieved 99.36% budgeting goal of TWD110 billion.Final account of trust assets balance amounted TWD4.6 billion, achieved 92% budgeting goal of TWD5 billion.
1-1-3-3. Financial Structure and Profitability
Our year 2016 solo earnings before income-tax figured as TWD853,202 thousand turned into EPS before income-tax as TWD1.34; consolidated earnings before income-tax figured as TWD858,643 thousand turned into EPS before income-tax as TWD1.35. While earning after income-tax figured as TWD714,817 thousand, turned into EPS after income-tax as TWD1.12. Our BIS ratio maintained at a level of 10.33% and net worth of per share stood at TWD13.37.Our non-performing loan coverage ratio to 776.36%. Overdue loan ratio decreased to 0.22%. Nevertheless, we would constant improve business effectiveness and risk control to boost operation capability and competitive edge.
1-1-3-4. Research and Development
To keep in line with critical issues of international and domestic political and economic environments and demands of banking business expansion, our H.O. departments compiled assorted analyses and reports regarding financial situations, banking business development, industrial insight and tendency periodically or non-periodically. Such analyses and reports would circulate to our staff for reference and application through our electronic official document system to prompt business development.
1-2. Year 2017 Business Plans Outline
We have always held the spirit of “Integrity, Innovation, and Affability, to meet customer’s need. Continue to promote digital financial services and satisfy the requirement of the customer. Meanwhile, the implementation of budget practice, intensify managerial strength. Main business plans are described as follows.
1-2-1. Business Operating Policy
• With the competent authority’s institution to promote the development of financial technology and regulatory amendments, continue to develop the services system of sophisticated electronic access and expand the digitization of the business functions.
• To develop of potential customers by the methods of e-banking, try to find excellent target customer, providing exclusive benefits and services.
Annual Report 2016 003

• Strengthen the capital structure, improve the quality of assets, the implementation of risk management and corporate governance, and enhance the response ability of the long-term risk.
• Strengthen staff training and education; improve the professional of the staff in order to develop of financial technology.• Investment in profitability and better security of financial products, strengthen the management of excess funds to earn interest
income and capital gains, improve financial performance • At any time to review and improve business regulations, excellence the operation of the adjustment under the simplified operation
and internal control, improve service quality and operation efficiency. • Strengthen the risk control, implement reasonable pricing and uphold the 5P principle of credit, maintain outstanding credit asset
quality, and improve capital efficiency.
1-2-2. Business Target
1-2-2-1. Main Operating VolumeUnit: TWD thousand: %
MainBusiness
Budget ofYear 2017
Result ofYear 2016
Increase volume
Amount %
Average deposits 140,000,000 135,257,733 4,742,267 3.51
Average loans 114,000,000 109,282,150 4,717,850 4.32
Wealth management (Trust asset) 4,752,210 4,557,718 194,492 4.27
1-2-2-2. Schemed Targets
• To create the most appropriate business model to enhance the general competitiveness, to create the best profit in response to external competition and regulatory changes in the environment.
• In order to plan to provide investment and wealth management service as the goal to satisfy of the various stages by the financial needs of customers.
• Propel SME loans and considering customer needs, expand customer base and economic scale, improve the ratio of the market share of juridical person.
• Adjust the domestic operation channel, cultivate the domestic market, Strengthen integration of on-line and off-line channel increase momentum of growth and expand the scale of operations.
• Continue to strengthen the marketing ability and professional quality of the staffs. • Continue to increase the domestic and foreign fund products,
and to help integrate the wealth management business to enhance the fund and trust management products scale of operation.
• Improve the proportion of demand deposits and reduce capital costs, operating ability and profitability.
Annual Report 2016004
1. To Our Shareholders

1-3. Long-term Development Strategy
• Continually holdup the development of new financial products and trace the condition of other bank and the relationship between ourselves and customers. According to customer demand to provide timely development the possibility of new financial products, in order to increase the extensiveness of business and the intensity of profit.
• Actively develop the digital financial business, simplify the operation process to reduce costs, improve the Bank's customer structure, attract young customers
• Develop a database to analyze customer transactions, based on customer transaction habits to provide more in line with customer demand for the new financial products.
• Continued on the official website, online banking, mobile online banking app for innovation and research and development in the future, to provide customers better of the Internet financial platform to satisfy customer needs.
• With the government policy, to provide the overall corporate credit programs and strategies to satisfy the various stages of industrial and commercial enterprises funds demand.
• Continually commit to public benefit activities and fulfill social responsibility • Actively enhance the professional capacity of staff financial professionals, in response to development of science and technology in
the future.• Base on sustain business strategy of strong capital and steady profitability to strengthen capital quality, lower cost of fund, shape
financial structure and stable growth of profitability.• Continue to adjust the deployment of business positions, improve branch access benefits and improve operational efficiency. • Enlarge interest spread and fee income by continually developing wealth management business to increase profitability.• Consist with financial market dynamic condition to innovate consuming banking product, develop diverse and tailor-made program
so as to improve value-add of product and scale of consuming banking.• Adjust banking profit structure, enlarge scale of business and performance to lower cost and raise profitability.
1-4. Impact of Competitive, Regulative and Banking Environments
In recent years, Taiwanese banks industry is in influence of a variety of internal and external factors, The factors are as follows: the rapid development of emerging Southeast Asia countries, as well as cross-border financial services such as intense competition and other important factors, the expected industrial fluctuations will intensify, On the whole, the face of international finance Industry cross-border competition, Taiwan's banking industry's need to further enhanced on operating efficiency and profitability digital finance, For the past few years, It is becoming more and more mature of third-party payment, mobile payment, crowd funding, the development of digital financial services in combination with Internet and mobile technology on Fintech and become a new trend of financial industry. Meanwhile, the development trend in the financial "un-intermediary", the emerging Internet finance has been impact of the traditional banking business development. The traditional banking industry must grasp the opportunity for cooperation in the future, while consider the introduction of Internet financial platform and look for new direction of development. Therefore, COTA Bank will strengthen the professional functions of the important duties of training to satisfy the continuing updated professional capacity requirements, at the same time, under the case of increased complexity jobs; employees must have the ability of the professional functions and innovation in order to satisfy challenges of banking industry in the further.
Overviewed the banking laws and regulations environment, COTA Bank has a greater impact on the compliance “Directions Governing Anti-Money Laundering and Countering Terrorism Financing of banking Sector”. Taiwan will accept assessment by the Asia-Pacific anti-money laundering organization (APG) in the fourth quarter of 2018, FSC require all banks to complete the money-
Annual Report 2016 005

laundering risk assessment operations and anti-money laundering and countering terrorism control plan by the end of September 2016. In accordance with the regulations, COTA bank has confirmed that the identity of the customer and the transaction record of the customer’s transactions, meanwhile, and the continued monitoring of transactions to strengthen anti-money laundering and counter terrorism in order to improve the internal control and audit system. FSC issued an explanatory order on May 25, 105. The bank should be assigned to fiscal year surplus from 105 to 107, the special surplus reserve within the range of 0.5% to 1% of the net profit after tax in order to the provisions of the financial technology development staff transfer or resettlement expenses. Financial digitization has become the future development trend of the financial industry, In order to urge banks to attach importance to the rights and interests of existing employees in the process of digitization, FSC has urged banks to strengthen and continuously carry out on-the-job staff education and training to enhance the skills of employees in financial technology and make it a bank to develop financial and technical assistance.
In response to rapidly changing financial environments, and booming development of digital financial services, we will continue to foster the internet, mobile and digital financial services to improve service efficiency and strengthen the competitiveness. In the future, we will continue to uphold the business strategy of steady growth and also coupled with the laws and regulations, technology progress, and financial policy openness, to develop diversified financial products, to innovate financial services, to construct more comprehensive services network so as to grasp developing opportunity, enhance profitability and expand the scale of operation.
1-5. Corporate Rating
Category Rating AgentRating
Outlook Released DateLong-term Short-term
Local Taiwan Rating Corporate twBBB+ twA-2 Stable Dec.27, 2016
Heading for new coming year, in response to the challenge of digitization in the financial sector, COTA Bank will actively strengthen business competitive advantage, provide customers innovation and diversified financial services. All of our staff would sustain the enthusiasm to fulfill service motto of “sincerity, permanence, candidness, and frank” for the purpose of shareholders, customers, employees of the rights to expand the scale of operation and profitability. At last, we would like to express sincere appreciations to our shareholders, directors, and the elites in all fields. We look forward to obtaining continued support and advice from all of you.
Chairman Song-Yie Liao
Annual Report 2016006
1. To Our Shareholders

2. Corporate Profile
007COTA Commercial Bank Annual Report 2016

2-1. Bank Features
Bank Name COTA Commercial Bank, Ltd.
Chairman Song-Yie Liao
President Chin-Ting Chang
Date of Business Registration Jan. 01, 1999
Date of Inauguration Jan. 01, 1999
Location of Head Office No.32-1, Gongyuan Road, Taichung City 400, Taiwan, R.O.C.
Number of Employee 1,121
Paid-in Capital TWD6,370,695,240
Capital Shares Common Stock in 637,069,524 Shares
2-2. Historical Highlights
COTA Bank was formerly named “Liability Taichung Third Credit Cooperative”. Founded in 1915, we have consistently conveyed the corporate philosophy featuring, well-sustained to combat in the financial environment characterized by severe competition, as “Integrity, Innovation, Cordiality and Service”, in response to the increasingly competitive financial market. In accordance with the promulgation of “Regulations and Criteria Governing Reorganization of Credit Cooperative into Commercial Banks”, COTA Bank started the reorganization task and launched reorganization in Dec. 1995. On Jul. 27, 1998, COTA Bank was officially approved by Ministry of Finance to be transformed into “COTA Commercial Bank”.
In 2005, COTA Bank invited Fengyuan Credit Cooperative to consider a merger proposal for mutual benefits to enhance competitive capacity by expanding business scale. After sincere bilateral negotiation and consideration, COTA Bank decided to wholly acquire Fengyuan Credit Cooperative. Approved by shareholders’ meeting of both parties, Fengyuan Credit Cooperative was formally merged into COTA Bank on Jan. 01, 2006.
Outlook for the future, COTA Bank is determined to become a full-array commercial bank in spite of quick-changing financial market. Under the support of shareholders and members of board, and the endeavor of all staffs, introduce a broader range of online application service. We are committed to providing all-aspect services for our customers by constant business growth, scale expansion and product diversification.
Annual Report 2016008
2. Corporate Profile

3. Corporate Governance
009COTA Commercial Bank Annual Report 2016

3-1. Organization
3-1-1. Organization Chart
Senior Executive Vice President
Auditing OfficeChief Auditor
Secretariat of the Board of Directors
Risk Management Center
General Administration Department
Credit Management Department
Business Department
International Banking Department
Offshore Banking Branch
Accounting Office
IT Management Office
Trust Department
Consumer Banking Center
SME Banking Center
Credit Card Center
Wealth Management Center
Banking Department
Domestic Branches
Electronic Banking Department
Insurance Agency Department
Compliance and Legal Affairs Department
Shareholders’ Meeting
Board of Directors (Board of Managing Directors)
ChairmanVarious Functions Committees (Note1)
SEVP & Chief Compliance Officer
President
Various Committees(Note2)
NOTE1. Audit Committee, Remuneration Committee, Nomination of Directors Committee, etc.NOTE2. Loan Committee, Personnel Appraisal Committee, Trust Assets Screening Committee, Financial Product & Regulation Committee, Asset & Liability and Risk
Management Committee, Security Council supervision Committee, TWD Securities Investment Committee, Foreign Securities Investment Committee, etc
Annual Report 2016010
3. Corporate Governance

3-1-2. Major Business of Each Division
3-1-2-1. Secretariat of the Board of DirectorsTaking charge of such key tasks of the Board of the Directors and official seal keeping, bank affairs, corporate governance, convening of shareholders’ meeting, the Board of the directors and related meetings, election for director and supervisor, etc.3-1-2-2. General Administration Department Taking charge of bank’s official seals, documentation, construction and repair, procurement, property control, public relations, general affairs, personnel affairs, organization management, and affairs not designed to other departments.3-1-2-3. Credit Management DepartmentTaking charge of planning, review and recheck of all loan affairs of the bank, credit investigation, promotion and management for corporate baking, etc.3-1-2-4. Business Department The Department takes charge of deposits, remittance, affairs of the cashier, warehousing, custody, agency, investment, and safe protection.3-1-2-5. International Banking DepartmentTaking charge of the bank’s foreign currency funds management and foreign exchange related operation, planning, administration and promotion.3-1-2-6. Offshore Banking BranchTaking charge of the offshore banking related operation, management and investment.3-1-2-7. Audit OfficeAuditing over bank’s business, accounting, finance, bank affairs, and reserved inventory.3-1-2-8. Accounting Office Taking charge of bank’s accounting, statistics, calculate annual revenues, and analyze financial statement.3-1-2-9. IT Management OfficeTaking charge of the bank’s IT related planning automation, development, operation and management.3-1-2-10. Banking DepartmentEngaging in the commercial bank services (Approved by the Central Bank of R.O.C.) as well as trust banking services.
3-1-2-11. Trust DepartmentPlanning, promoting, and managing the trust banking related affairs.3-1-2-12. Risk Management CenterTaking charge of formulation and revise for risk management policies, plan and design for risk management system, establ ishment and integrat ion for r isk management guidelines, monitoring the performance and others; the Bank’s non-performing loans related planning, tracing and management.3-1-2-13. Consumer Banking CenterTaking charge of planning, review, dunning on overdue receivables, credit investigation, recheck of all loan affairs of the consumer and promote financial products.3-1-2-14. SME Banking CenterTaking charge of planning, review, dunning on overdue receivables, credit investigation, recheck of all loan affairs of the SME and promote financial products.3-1-2-15. Credit Card CenterTaking charge of bank’s credit card affairs related planning, promotion and management.3-1-2-16. Wealth Management CenterTaking charge the business of the Wealth Management, planning the sales for non-wealth management customers, and managing financial representatives.3-1-2-17. Compliance and Legal Affairs Department Taking charge the planning, management and implement of the regulatory compliance system and legal affairs in regulatory compliance office. Taking charge the prevention of money laundry and fighting against terrorism in anti-money-laundry office.3-1-2-18. Electronic Banking DepartmentTaking charge the planning and promotion of the electronic banking channel. 3-1-2-19. Insurance Agency DepartmentTaking charge the planning, marketing, training and managing sales of the life and property insurance agency business.
Above-mentioned department, office or center may, based on business need, propose for Board of Directors’ resolution to establish, dismiss or combine. Units of H.O. may institute north or south regional centers and their joint office.
Annual Report 2016 011

3-2. Major Information of Directors, Supervisors, Executives and the Principal Officers
3-2-1-1. List of Directors and SupervisorsAs of Dec. 31, 2016, Shares Held (%)
Title Nationality and Registry Name Elected Date Tenure First
Elected
ElectedShares Owned
CurrentShares Owned
Shares Owned by Spouses andMinor children
Shares Held under
Surrogate A/C Education & Key Work Experience Current Positions Held in this or other company
No. of Shares % No. of
Shares % No. of Shares % No. of
Shares %
Chairman R.O.C Song-Yie LiaoJan.23, 2015
(Director Dec.29,2014)
3 May. 25, 2005 35,761,115 7.1058 44,664,925 7.0110 640,143 0.1005 - -
Department of Economics, Hosei University of Tokyo, JapanGeneral manager of Chuan Cheng Hat Co., Ltd.
Director of Chuan Cheng Hat Co., Ltd.Director of CCH Plus Inc.Supervisor of Opus High Technology CorporationSupervisor of Jepana Enterprise Co. Ltd.
Managing Director R.O.C Kuo-Chao Hsiao
Jan.23, 2015 (Director
Dec.29,2014)3 Jan. 01,
2002 13,968,050 2.7755 17,445,818 2.7384 3,235,145 0.5078
University of South California, USAChairman of Hong Cheng Construction Co., Ltd.Supervisor of Chen-Ging Development Multimedia Co., Ltd.Director of TINP CorporationVice Chairman of San Da CATV Co., Ltd.
ManagingInde-pendentDirector
R.O.C Kun-Hsien LinJan.23, 2015
(Director Dec.29,2014)
3 Dec. 29, 2014 - - 3,048,904 0.4786 - - - -
Collage of Law, National Taiwan UniversityMaster’s Program, Graduate Institute of Financial and Economic Law, Feng Chia UniversityDirector of Taichung BAR AssociationMembers of Taiwan Bar Committee on the DisciplineChairman of Taichung NTU Alumni Association
Director of Kun Her Industrial Co., Ltd.Manager of Chan Hsin Law FirmCommittee Chairman of Association for Victims Support Taichung OfficeIndependent Director of Yung Shin Global Holding Co. Ltd.Independent Director of Yung Zip Chemical Ind. Co., Ltd.Independent Director of Yung Shin Pharmacy Ind. Co., Ltd. (Representative of a legal entity)
Managing Director R.O.C
Ying-Che ChangJan.23, 2015
(Director Dec.29,2014)
3 Dec. 29, 2014
2,047,102 0.4068 2,556,789 0.4013 32,337 0.0051 - -Department of International Business ,Feng Chia University President of COTA Bank
Director of COTA Culture and Education FoundationChairman of COTA Bank Insurance Broker Co., Ltd.(Representative of a legal entity)
(Representing:Deng Heng Enterprise Co., Ltd.)
919,207 0.1826 1,148,069 0.1802 - - - -
ManagingDirector R.O.C
Chuan Cheng Hat Co., Ltd.
Jan.23, 2015 (Director
Dec.29,2014)3 Dec. 29,
2014
8,466,716 1.6823 11,324,759 1.7776 - - - -
Representative:Chien-Chung Lai - - 2,933,134 0.4604 1,480,985 0.2325 - -
Department of French, Chinese Culture University Overseas Chinese Affairs Committee of Overseas Community Affairs Council, R.O.C.President of The Council of Taiwan Chambers of Commerce In VietnamVice President of The Council of Asia Taiwanese Chambers Of CommercePresident of Chiao Sang Footwears Inc.Supervisors of Lu Yueh Enterprise Co., Ltd.
Advisory Committee of Overseas Community Affairs Council, R.O.C.Consultant of World Taiwanese Chambers of CommerceAdvisory Committee of Asia Taiwanese Chambers Of CommerceConsultant of Taiwan Associtaion of Machinery Industry–Machinery for ShoeConsultant of Overseas Chinese Culture and Education FoundationDirector of Overseas Taiwan Commercial Travel Agency Ltd Co.
Independent Director R.O.C Po-Yao Chi Dec.29, 2014 3 Jun. 20,
2008 2,343,659 0.4657 2,624,912 0.4120 556,572 0.0889 - -Department of Accounting, Soochow UniversityTaichung Factory Director of Cheng Loong Corporation
Director of Ming Foong Plastic Co., Ltd.Director of Ko Loong Industry Co., Ltd.
Independent Director R.O.C Sung-Cheng
Huang Dec.29, 2014 3 Dec.29, 2014 1,000 0.0002 1,248 0.0002 - - - -
College of Law, National Cheng Chi UniversityInvestigator of the Investigation Bureau of the Ministry of InteriorGeneral Counsel of Far East Air Transport Corp.Director of Far East Air Transport Corp.(Representative of a legal entity)
General manager of Far East Air Transport Corp.Supervisor of Le Chi Investment Co. Ltd.(Representative of a legal entity)Supervisor of Yeh Hsiang Investment Co. Ltd. Lawyer
Annual Report 2016012
3. Corporate Governance
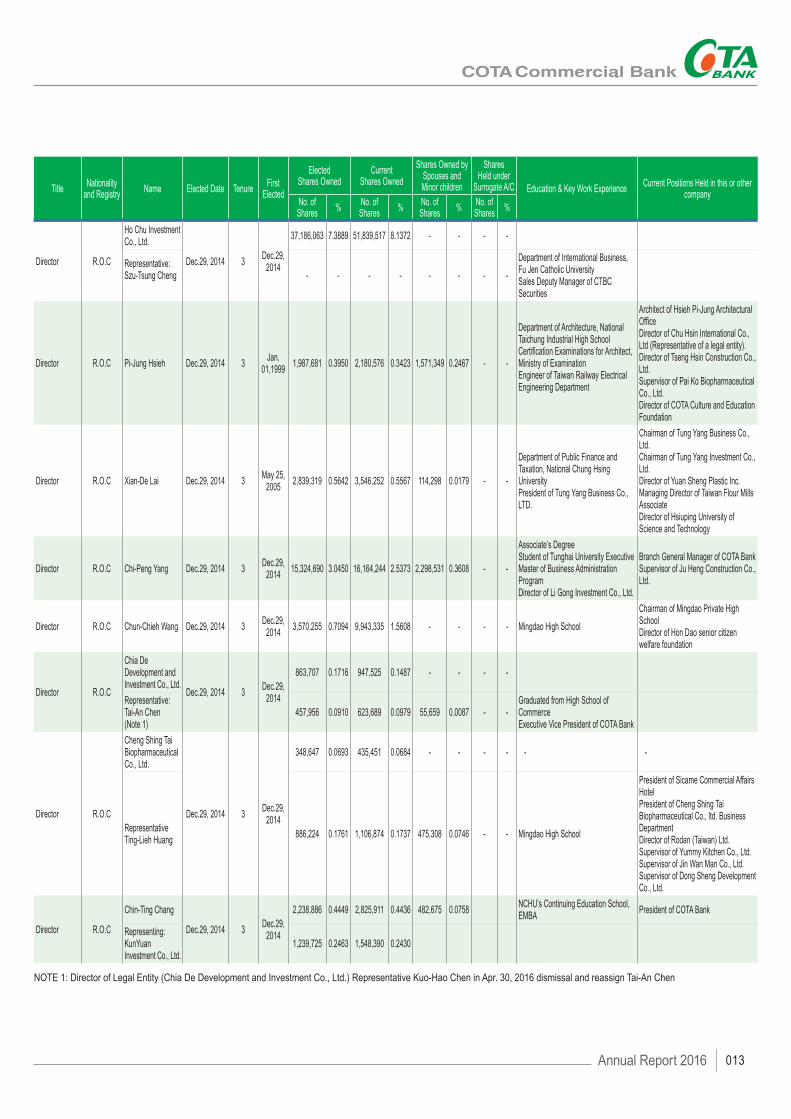
Title Nationality and Registry Name Elected Date Tenure First
Elected
ElectedShares Owned
CurrentShares Owned
Shares Owned by Spouses andMinor children
Shares Held under
Surrogate A/C Education & Key Work Experience Current Positions Held in this or other company
No. of Shares % No. of
Shares % No. of Shares % No. of
Shares %
Director R.O.C
Ho Chu Investment Co., Ltd.
Dec.29, 2014 3 Dec.29, 2014
37,186,063 7.3889 51,839,517 8.1372 - - - -
Representative:Szu-Tsung Cheng - - - - - - - -
Department of International Business, Fu Jen Catholic UniversitySales Deputy Manager of CTBC Securities
Director R.O.C Pi-Jung Hsieh Dec.29, 2014 3 Jan. 01,1999 1,987,681 0.3950 2,180,576 0.3423 1,571,349 0.2467 - -
Department of Architecture, National Taichung Industrial High SchoolCertification Examinations for Architect, Ministry of Examination Engineer of Taiwan Railway Electrical Engineering Department
Architect of Hsieh Pi-Jung Architectural OfficeDirector of Chu Hsin International Co., Ltd (Representative of a legal entity).Director of Tseng Hsin Construction Co., Ltd.Supervisor of Pai Ko Biopharmaceutical Co., Ltd.Director of COTA Culture and Education Foundation
Director R.O.C Xian-De Lai Dec.29, 2014 3 May 25, 2005 2,839,319 0.5642 3,546,252 0.5567 114,298 0.0179 - -
Department of Public Finance and Taxation, National Chung Hsing UniversityPresident of Tung Yang Business Co., LTD.
Chairman of Tung Yang Business Co., Ltd. Chairman of Tung Yang Investment Co., Ltd.Director of Yuan Sheng Plastic Inc.Managing Director of Taiwan Flour Mills AssociateDirector of Hsiuping University of Science and Technology
Director R.O.C Chi-Peng Yang Dec.29, 2014 3 Dec.29, 2014 15,324,690 3.0450 16,164,244 2.5373 2,298,531 0.3608 - -
Associate’s DegreeStudent of Tunghai University Executive Master of Business Administration Program Director of Li Gong Investment Co., Ltd.
Branch General Manager of COTA BankSupervisor of Ju Heng Construction Co., Ltd.
Director R.O.C Chun-Chieh Wang Dec.29, 2014 3 Dec.29, 2014 3,570,255 0.7094 9,943,335 1.5608 - - - - Mingdao High School
Chairman of Mingdao Private High SchoolDirector of Hon Dao senior citizen welfare foundation
Director R.O.C
Chia De Development and Investment Co., Ltd.
Dec.29, 2014 3 Dec.29, 2014
863,707 0.1716 947,525 0.1487 - - - -
Representative:Tai-An Chen(Note 1)
457,956 0.0910 623,689 0.0979 55,659 0.0087 - -Graduated from High School of CommerceExecutive Vice President of COTA Bank
Director R.O.C
Cheng Shing Tai Biopharmaceutical Co., Ltd.
Dec.29, 2014 3 Dec.29, 2014
348,647 0.0693 435,451 0.0684 - - - - - -
RepresentativeTing-Lieh Huang 886,224 0.1761 1,106,874 0.1737 475,308 0.0746 - - Mingdao High School
President of Sicame Commercial Affairs HotelPresident of Cheng Shing Tai Biopharmaceutical Co., ltd. Business DepartmentDirector of Rodan (Taiwan) Ltd.Supervisor of Yummy Kitchen Co., Ltd.Supervisor of Jin Wan Man Co., Ltd.Supervisor of Dong Sheng Development Co., Ltd.
Director R.O.C
Chin-Ting Chang
Dec.29, 2014 3 Dec.29, 2014
2,238,886 0.4449 2,825,911 0.4436 482,675 0.0758 NCHU’s Continuing Education School, EMBA President of COTA Bank
Representing:KunYuan Investment Co., Ltd.
1,239,725 0.2463 1,548,390 0.2430
NOTE 1: Director of Legal Entity (Chia De Development and Investment Co., Ltd.) Representative Kuo-Hao Chen in Apr. 30, 2016 dismissal and reassign Tai-An Chen
Annual Report 2016 013

3-2-1-2. Major Institutional Shareholder:As of Dec. 31, 2016
Institutional Shareholder Major Shareholders of Institutional Shareholders
Chuan Cheng Hat Co., Ltd. Song-Yie Liao (68.35%), Ching-Ling Liu (12.36%), Po-Chi Liao (9.83%), Po-Chun Liao (9.46%)
Deng Heng Enterprise Co., Ltd. Shih-Ying Hsieh (80%), Hsiu-Liu Chen (20%)
Ho Chu Investment Co., Ltd. Chia-Hung Lin (100%)
Chia De Development and Investment Co., Ltd. Hoarder Rich Limited (100%)
Cheng Shing Tai Biopharmaceutical Co., Ltd.Tung-Po Hsieh (40%), Min-Ju Hsieh (15%), Ching-Jung Hsieh (11.5%), You-Che Hsieh (9%), Chia-Sheng Hsieh (8.5%), Chen Chin-Feng Hsieh (6%), Tsung-Chih Hsieh (5%), Tsung-Liang Hsieh (5%)
KunYuan Investment Co., Ltd. Hui-Wen Lee (60%), Kuo-Wei Wang (20%), Kuo-Yu Wang (20%)
3-2-1-3. Major Shareholders of Major Institutional Shareholders of the Bank :As of Dec. 31, 2016
Institutional Shareholder Major Shareholders of Institutional Shareholders
Hoarder Rich Limited Liu, Chen-Han (100%)
Annual Report 2016014
3. Corporate Governance
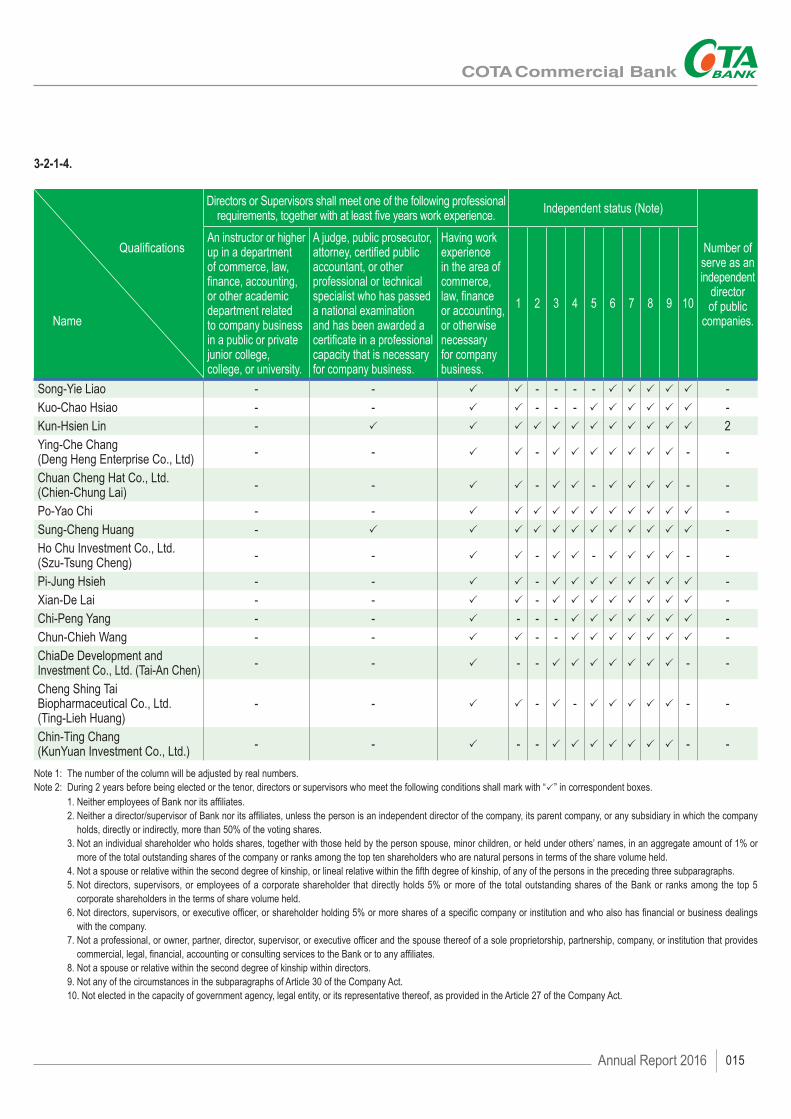
3-2-1-4.
Qualifications
Name
Directors or Supervisors shall meet one of the following professional requirements, together with at least five years work experience. Independent status (Note)
Number of serve as an independent
director of public
companies.
An instructor or higher up in a department of commerce, law, finance, accounting, or other academic department related to company business in a public or private junior college, college, or university.
A judge, public prosecutor, attorney, certified public accountant, or other professional or technical specialist who has passed a national examination and has been awarded a certificate in a professional capacity that is necessary for company business.
Having work experience in the area of commerce, law, finance or accounting, or otherwise necessary for company business.
1 2 3 4 5 6 7 8 9 10
Song-Yie Liao - - P P - - - - P P P P P -Kuo-Chao Hsiao - - P P - - - P P P P P P -Kun-Hsien Lin - P P P P P P P P P P P P 2Ying-Che Chang(Deng Heng Enterprise Co., Ltd) - - P P - P P P P P P P - -
Chuan Cheng Hat Co., Ltd.(Chien-Chung Lai) - - P P - P P - P P P P - -
Po-Yao Chi - - P P P P P P P P P P P -Sung-Cheng Huang - P P P P P P P P P P P P -Ho Chu Investment Co., Ltd.(Szu-Tsung Cheng) - - P P - P P - P P P P - -
Pi-Jung Hsieh - - P P - P P P P P P P P -Xian-De Lai - - P P - P P P P P P P P -Chi-Peng Yang - - P - - - P P P P P P P -Chun-Chieh Wang - - P P - - P P P P P P P -ChiaDe Development and Investment Co., Ltd. (Tai-An Chen) - - P - - P P P P P P P - -
Cheng Shing Tai Biopharmaceutical Co., Ltd.(Ting-Lieh Huang)
- - P P - P - P P P P P - -
Chin-Ting Chang(KunYuan Investment Co., Ltd.) - - P - - P P P P P P P - -
Note 1: The number of the column will be adjusted by real numbers. Note 2: During 2 years before being elected or the tenor, directors or supervisors who meet the following conditions shall mark with “P” in correspondent boxes. 1. Neither employees of Bank nor its affiliates. 2. Neither a director/supervisor of Bank nor its affiliates, unless the person is an independent director of the company, its parent company, or any subsidiary in which the company
holds, directly or indirectly, more than 50% of the voting shares. 3. Not an individual shareholder who holds shares, together with those held by the person spouse, minor children, or held under others’ names, in an aggregate amount of 1% or
more of the total outstanding shares of the company or ranks among the top ten shareholders who are natural persons in terms of the share volume held. 4. Not a spouse or relative within the second degree of kinship, or lineal relative within the fifth degree of kinship, of any of the persons in the preceding three subparagraphs. 5. Not directors, supervisors, or employees of a corporate shareholder that directly holds 5% or more of the total outstanding shares of the Bank or ranks among the top 5
corporate shareholders in the terms of share volume held. 6. Not directors, supervisors, or executive officer, or shareholder holding 5% or more shares of a specific company or institution and who also has financial or business dealings
with the company. 7. Not a professional, or owner, partner, director, supervisor, or executive officer and the spouse thereof of a sole proprietorship, partnership, company, or institution that provides
commercial, legal, financial, accounting or consulting services to the Bank or to any affiliates. 8. Not a spouse or relative within the second degree of kinship within directors. 9. Not any of the circumstances in the subparagraphs of Article 30 of the Company Act. 10. Not elected in the capacity of government agency, legal entity, or its representative thereof, as provided in the Article 27 of the Company Act.
Annual Report 2016 015

3-2-2. List of Executives and Principal OfficersAs of Dec. 31, 2016, Shares Held (%)
Title Name Date ofInauguration
Shares OwnedShares Owned
by Spouses and Minors
Shares Held under
Surrogate A/C Education & Key Past PositionsOther
Positions Held
CurrentNo. of Shares % No. of
Shares % No. of Shares %
President Chin-Ting Chang Oct. 01, 2008 2,825,911 0.44 482,675 0.08 - - NCHU’s Continuing Education School, EMBA
Senior Executive Vice President of COTA Bank -
Senior Executive Vice President
Jung-Hsien Chiu Jan. 01, 2004 1,117,541 0.18 - - - -
Department of Industrial and Information Management, National Cheng Kung University, Master Executive Vice President of COTA Bank
-
Senior Executive Vice President
Shih-Jung Chen Jul. 01, 2016 566,274 0.09 - - - -
Department of Oceanography, Chinese Culture UniversityExecutive Vice President of COTA Bank, General Manager of Credit Management Department
-
Chief Auditor Chih-Sheng Hsiao Jan. 01, 2014 868,217 0.14 255,505 0.04 - - Department of Public Finance and Taxation, Feng Chia University
Senior Executive Vice President of COTA Bank -
Senior Executive Vice President(Department General Manager)
Yun-Ching Wang Jul. 01, 2016 403,059 0.06 245,826 0.04 - -
Department of Finance, National Chung Hsing University, Master Executive Vice President of COTA Bank, General Manager of IT Management Office
-
Senior Executive Vice President
Huan-Mou Cheng Jul. 01, 2016 243,425 0.04 117,938 0.02
Department of Applied Commerce, National Open College of Continuing Education Affiliated to NTITExecutive Vice President of COTA Bank, General Manager of Taichung Branch
-
Executive Vice President(Department General Manager)
Shih-Chien Chin Sep. 15, 2015 661,475 0.10 191,774 0.03 - - Department of Applied Math., University of North Texas, USA, Master
Commissioner of COTA Bank, Business Department -
Department General Manager
Kuang-Hsiung Huang Mar. 03, 2006 309,068 0.05 333,272 0.05 - -
Department of Economics, Feng Chia UniversityDeputy General Manager of COTA Bank, General Administration Department
-
Department General Manager Wei-Bin Lin Jul. 01, 2016 177,414 0.03 - - - -
Graduate School of Management, University of California at Riverside, Master Department General Manager of COTA Bank, International Banking Department and Offshore Banking Branch
-
Department General Manager
Ming-Heng Chan Sep. 01, 2013 195,617 0.03 27,447 0.00 - -
Master Program in Senior Executive Master of Business Administration, Chaoyang University of Technology Deputy General Manager of COTA Bank, Business Department
-
Department General Manager
Chuan-Hung Yang Feb. 07, 2015 124,656 0.02 - - - -
Department and Graduate Institute of Finance, Chaoyang University of TechnologyDeputy General Manager of COTA Bank, Risk Management Center
-
Department General Manager
Hung-Tsang Chiang Oct. 15, 2013 223,811 0.04 128,428 0.02 - -
Department of Public and Management, Supplementary Junior College of the National Open UniversityDepartment General Manager of COTA Bank, Consumer Banking Center
-
Department General Manager
Chun-Sheng Lin Apr. 01, 2010 171,742 0.03 13,410 0.00 - - Department of Chemical Engineering, Chung Yuan Christian University
Deputy General Manager of COTA Bank, Risk Management Center -
Department General Manager
Chang-Chieh Lin Oct. 15, 2013 217,809 0.03 - - - - Department of Economics, Tunghai University
Department General Manager of COTA Bank, Business Department -
Department General Manager
Chi-Nan Huang Jul. 01, 2016 49,587 0.01 - - - -
Department of Public Administration, National Chung Hsing UniversityDeputy General Manager of COTA Bank, International Banking Department and Offshore Banking Branch
-
Department General Manager Jun-Long Tsai Jul. 01, 2016 135,928 0.02 199,854 0.03 - -
Department of Business Administration, National Chung Cheng University, MasterDeputy General Manager of COTA Bank, Business Department
-
Department General Manager
Chih-Hung Huang Jan. 08, 2014 321,605 0.05 132,532 0.02 - -
Department of Applied Commerce, National Open College of Continuing Education Affiliated to NTIT Branch General Manager of COTA Bank, Jinhua Branch
-
Annual Report 2016016
3. Corporate Governance

Title Name Date ofInauguration
Shares OwnedShares Owned
by Spouses and Minors
Shares Held under
Surrogate A/C Education & Key Past PositionsOther
Positions Held
CurrentNo. of Shares % No. of
Shares % No. of Shares %
Department General Manager
Yung-Hsieh Chen Dec. 01, 2015 - - - - - -
Department of Computer Science and Information Engineering (CSIE),National Taiwan University, MasterSenior Engineer of ASUS
-
Branch General Manager
Chih-Peng Yang Jul. 01, 2016 16,164,244 2.54 2,298,531 0.36 - -
Department of Business Administration, National Open College of Continuing Education Affiliated to National Taichung Institute of TechnologyBranch General Manager of COTA Bank, Tainan Branch
Supervisor of Ju Heng
Construction Co., Ltd.
BranchGeneral Manager
Ling-Chen Ting Oct. 08, 2010 584,747 0.09 - - - -
Department of Banking and Insurance, National Taichung Institute of TechnologyDepartment General Manager of COTA Bank, Trust Department
-
Branch General Manager Jui-Sen Liao Apr. 01, 2010 196,447 0.03 7,093 0.00 - -
Department of Public Finance and Taxation, Institute of Industrial & Business Administration, Tamsui Oxford CollegeDepartment of General Manager of COTA Bank, SME Banking Center
-
Branch General Manager
Cheng-Hsien Hsieh Aug. 01, 2014 396,988 0.06 112,650 0.02 - - Department of Business, The National Open University
Branch General Manager of COTA Bank, Dazhi Branch -
Department General Manager Mei-Ling Shih Jul. 01, 2016 264,257 0.04 371 0.00 - -
Department of International Business, National Open College of Continuing EducationDepartment General Manager of COTA Bank, Trust Department
-
Branch General Manager Min-Chang Lin Aug. 01, 2014 174,580 0.03 253,151 0.04 - -
Department of General Business, Shin Min Commercial & Industrial Vocational Senior High SchoolBranch General Manager of COTA Bank, Linsen Branch
-
Branch General Manager
Mao-Sheng Huang Aug. 01, 2014 226,233 0.04 55,435 0.01 - - Department of Finance, Chung Hua University
Branch General Manager of COTA Bank, Xinzhu Branch -
Branch General Manager
Wen-Lung Chen Dec. 08, 2014 296,505 0.05 59,731 0.01 - - Department of Business Administration, Chaoyang University of Technology
Branch General Manager of COTA Bank, Tainan Branch -
Branch General Manager
Chi-Shen Huang Jan. 08, 2014 489,712 0.08 57,145 0.01 - -
Department of Banking and Insurance, National Taichung Institute of TechnologyBranch General Manager of COTA Bank, Banciao Branch
-
Branch General Manager
His-Tung Chang Jan. 09, 2016 645,921 0.10 3,800 0.00 - -
Department of Electronics Engineering, Kuang-Hwa Vocational High School of Technology Branch General Manager of COTA Bank, Zanghua Branch
-
Branch General Manager
Chien-Cheng Hsu Apr. 08, 2015 629,164 0.10 102,402 0.02 - - Department of Business Administration, Tunghai University,
Chief Secretary of COTA Bank, Secretariat of The Board of Directors -
Branch General Manager
Hung-Chi Tung Jan. 01, 2012 296,050 0.05 242,753 0.04 - -
Department of Applied Commerce, National Open College of Continuing Education Affiliated to NTITBranch General Manager of COTA Bank, Fengxin Branch
-
Branch General Manager
Chang-Cheng Chen Jan. 09, 2016 175,150 0.03 831 0.00 - -
Department of Extension Business Vocational School, National Taichung Institute of TechnologyBranch General Manager of COTA Bank, Fengxin Branch
-
Branch General Manager Chia-Wen Ke Dec. 08, 2014 189,494 0.03 - - - - Department of Technology Management, Chung Hua University, Master
Commissioner of COTA Bank, Credit Management Department -
Branch General Manager
Tzu-Hsiu Liang Apr. 01, 2016 157,466 0.02 32,602 0.01 - - Department of Business Administration, Feng Chia University, Master
Project Manager of COTA Bank, Credit Management Department -
Branch General Manager
His-Hsien Wang Jan. 09, 2016 174,351 0.03 - - - - Department of Law, Soochow University
Branch General Manager of COTA Bank, Taipei Branch -
Branch General Manager
Cheng-Hao Wu Jan. 08, 2014 96,220 0.02 - - - - Department of Business Administration, Fujen Catholic University
Deputy General Manager of COTA Bank, Banciao Branch -
Branch General Manager
Shu-Chen Shih Jan. 09, 2016 444,331 0.07 - - - - Department of Social Science, The National Open University
Branch General Manager of COTA Bank, Fengdong Branch -
Branch General Manager
Shih-Tsung Liu Jun. 24, 2013 336,921 0.05 278,052 0.04 - - Department of Business, The National Open University
Branch General Manager of COTA Bank, Fengle Branch -
Annual Report 2016 017

Title Name Date ofInauguration
Shares OwnedShares Owned
by Spouses and Minors
Shares Held under
Surrogate A/C Education & Key Past PositionsOther
Positions Held
CurrentNo. of Shares % No. of
Shares % No. of Shares %
Branch General Manager Hong-Yi Chen Jul. 01, 2016 237,193 0.04 324,674 0.05
Department of Applied Commerce, National Taichung Institute of TechnologyDeputy General Manager of COTA Bank, General Administration Department
-
Branch General Manager Chih-Yin Lin Jan. 01, 2013 85,029 0.01 - - - -
Department of Finance, National Yunlin University of Science and Technology, Master Deputy General Manager of COTA Bank, Nantun Branch
-
Branch General Manager Shi-Zhao Lee Jan. 09, 2016 141,277 0.02 108,692 0.02 - - Department of Business Administration, Chung Yuan University
Deputy General Manager of COTA Bank, Taichung Branch -
BranchGeneral Manager Ming-Yung Yu Aug. 01, 2014 165,941 0.03 22,629 0.00 - - Department of Business Administration, Taichung College of Business
Project Manager of COTA Bank, Credit Management Department -
Branch General Manager
Ping-Hung Chuang Oct. 01, 2012 66,848 0.01 - - - -
The National Kaohsiung First University of Science and Technology, Graduate Institute of Business ManagementSenior Manager of Jih Sun International Bank
-
Branch General Manager
Hsien-Hsun Chiang Jun. 24, 2013 246,141 0.04 18,416 0.00 Department of Cooperative Economics, Tamkang University
Branch General Manager of COTA Bank, Zhongshan Branch -
Branch General Manager Ming-Feng Wu Oct. 01, 2014 17,794 0.00 - - - - Department of Business Administration, Soochow University
Branch General Manager of Sunny Bank, Hsiaokang Branch -
Branch General Manager
Tien-Long Yang Jul. 01, 2014 158,697 0.02 38,061 0.01 Department of Finance, Chaoyang University of Technology
Deputy General Manager of COTA Bank, Taichung Branch -
Branch General Manager
Po-Hsun Chang Oct. 01, 2015 23,995 0.00 - - - - Department of Finance, Chaoyang University of Technology, Master
Project Manager of COTA Bank, Zhungshan Branch -
Branch General Manager Chung-Yi Hsu Jan. 09, 2016 235,719 0.04 93,864 0.01 - -
Department of Applied Commerce, National Open College of Continuing Education Affiliated to NTITBranch General Manager of COTA Bank, Taoyuan Branch
-
Branch General Manager
Yung-Hung Tsao Mar. 01, 2015 82,357 0.01 - - - - Department of Business Administration, Feng Chia University, Master
Project Manager of COTA Bank, Nantun Branch -
Annual Report 2016018
3. Corporate Governance

3-2-3. Directors (including, Supervisors, President and Executive Vice Presidents) Remuneration in Recent Year
(1) Directors’ RemunerationAs of Dec. 31, 2016, Unit: TWD thousand
Title Name
CompensationSum of A, B,
C and D /after- tax profit (%)
Compensations received by part-time employeesSum of A, B, C, D,E, F AND G / after-
tax profit (%)Whether or not any
compensation is received from other
reinvested businesses than
subsidiaries
Rewards(A)
Pensionand
Superannuation (B)
EarningDistribution
(C)
Professional Practice
(D)
Salary, Bonus and Special
Disbursement (E)
Pension andSuperannuation
(F)Employee Bonus Distribution
(G)
Employee Share Subscription
Warrants(H)
BankCon-
Solidation
BankCon-
Solidation
BankCon-
Solidation
BankCon-
Solidation
BankCon-
Solidation
BankCon-
Solidation
BankCon-
Solidation
COTA CON-SOLIDATIONCOTA
CON-SOLIDA
TIONCOTA
CON-SOLIDA
TIONCash
DividendStock
Dividends Cash
DividendStock
Dividends
Chairman Song-Yie Liao
14,400 14,400 - - 18,548 18,548 1,320 1,560 4.79% 4.83% 6,848 6,848 - - 307 - 307 - - - 5.79% 5.83% NIL
Managing Director Kuo-Chao Hsiao
Managing(Independent)
DirectorKun-Hsien Lin
Managing Director
Ying-Che Chang(Representing:Deng Heng Enterprise Co., Ltd.)
ManagingDirector
Chuan Cheng Hat Co., Ltd.Representative:Chien-Chung Lai
Independent Director Po-Yao Chi
Independent Director Sung-Cheng Huang
DirectorHo Chu Investment Co., Ltd.Representative:Szu-Tsung Cheng
Director Pi-Jung HsiehDirector Xian-De LaiDirector Chi-Peng YangDirector Chun-Chieh Wang
Director
Chia De Development and Investment Co., Ltd.Representative:Kuo-Hao Chen (Apr. 30, 2016 dismissal)Representative:Tai-An Chen (May. 01, 2016 reassign)
Director
Cheng Shing Tai Biopharmaceutical Co., Ltd.RepresentativeTing-Lieh Huang
DirectorChin-Ting ChangRepresenting:KunYuan Investment Co., Ltd.
Note: 1. Earnings after income tax amount to TWD714,817 thousand. 2. Director of Chih-Peng Yang is also branch general manager. Director of Chin-Ting Chang (Representing: Deng Heng Enterprise Co., Ltd.), is also the President of the Bank.
Annual Report 2016 019
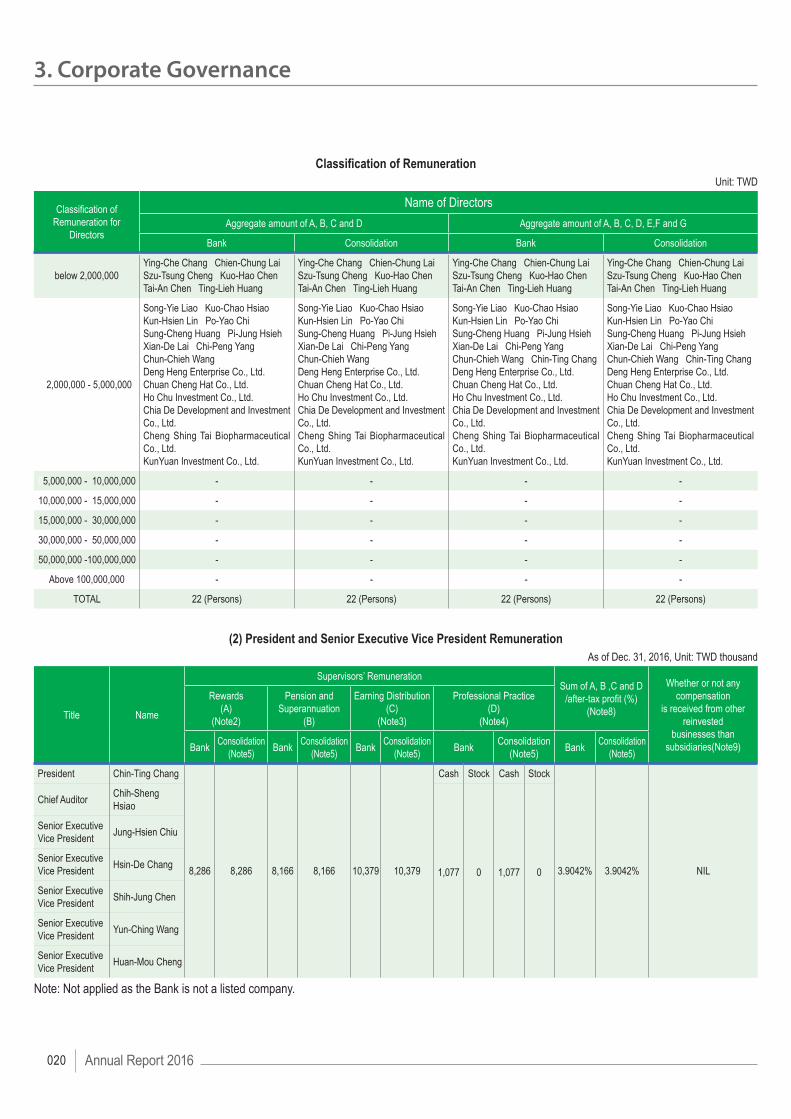
Classification of Remuneration Unit: TWD
Classification of Remuneration for
Directors
Name of DirectorsAggregate amount of A, B, C and D Aggregate amount of A, B, C, D, E,F and G
Bank Consolidation Bank Consolidation
below 2,000,000Ying-Che Chang Chien-Chung LaiSzu-Tsung Cheng Kuo-Hao ChenTai-An Chen Ting-Lieh Huang
Ying-Che Chang Chien-Chung LaiSzu-Tsung Cheng Kuo-Hao ChenTai-An Chen Ting-Lieh Huang
Ying-Che Chang Chien-Chung LaiSzu-Tsung Cheng Kuo-Hao ChenTai-An Chen Ting-Lieh Huang
Ying-Che Chang Chien-Chung LaiSzu-Tsung Cheng Kuo-Hao ChenTai-An Chen Ting-Lieh Huang
02,000,000 - 5,000,000
Song-Yie Liao Kuo-Chao Hsiao Kun-Hsien Lin Po-Yao Chi Sung-Cheng Huang Pi-Jung HsiehXian-De Lai Chi-Peng Yang Chun-Chieh WangDeng Heng Enterprise Co., Ltd.Chuan Cheng Hat Co., Ltd.Ho Chu Investment Co., Ltd.Chia De Development and Investment Co., Ltd.Cheng Shing Tai Biopharmaceutical Co., Ltd.KunYuan Investment Co., Ltd.
Song-Yie Liao Kuo-Chao Hsiao Kun-Hsien Lin Po-Yao Chi Sung-Cheng Huang Pi-Jung HsiehXian-De Lai Chi-Peng YangChun-Chieh WangDeng Heng Enterprise Co., Ltd.Chuan Cheng Hat Co., Ltd.Ho Chu Investment Co., Ltd.Chia De Development and Investment Co., Ltd.Cheng Shing Tai Biopharmaceutical Co., Ltd.KunYuan Investment Co., Ltd.
Song-Yie Liao Kuo-Chao Hsiao Kun-Hsien Lin Po-Yao Chi Sung-Cheng Huang Pi-Jung HsiehXian-De Lai Chi-Peng YangChun-Chieh Wang Chin-Ting ChangDeng Heng Enterprise Co., Ltd.Chuan Cheng Hat Co., Ltd.Ho Chu Investment Co., Ltd.Chia De Development and Investment Co., Ltd.Cheng Shing Tai Biopharmaceutical Co., Ltd.KunYuan Investment Co., Ltd.
Song-Yie Liao Kuo-Chao Hsiao Kun-Hsien Lin Po-Yao ChiSung-Cheng Huang Pi-Jung HsiehXian-De Lai Chi-Peng YangChun-Chieh Wang Chin-Ting ChangDeng Heng Enterprise Co., Ltd.Chuan Cheng Hat Co., Ltd.Ho Chu Investment Co., Ltd.Chia De Development and Investment Co., Ltd.Cheng Shing Tai Biopharmaceutical Co., Ltd.KunYuan Investment Co., Ltd.
05,000,000 - 10,000,000 - - - -
10,000,000 - 15,000,000 - - - -
15,000,000 - 30,000,000 - - - -
30,000,000 - 50,000,000 - - - -
50,000,000 -100,000,000 - - - -
Above 100,000,000 - - - -
TOTAL 22 (Persons) 22 (Persons) 22 (Persons) 22 (Persons)
(2) President and Senior Executive Vice President RemunerationAs of Dec. 31, 2016, Unit: TWD thousand
Title Name
Supervisors’ RemunerationSum of A, B ,C and D
/after-tax profit (%)(Note8)
Whether or not any compensation
is received from other reinvested
businesses than subsidiaries(Note9)
Rewards (A)
(Note2)
Pension and Superannuation
(B)
Earning Distribution (C)
(Note3)
Professional Practice (D)
(Note4)
Bank Consolidation(Note5) Bank Consolidation
(Note5) Bank Consolidation(Note5) Bank Consolidation
(Note5) Bank Consolidation(Note5)
President Chin-Ting Chang
8,286 8,286 8,166 8,166 10,379 10,379
Cash Stock Cash Stock
3.9042% 3.9042% NIL
Chief Auditor Chih-Sheng Hsiao
1,077 0 1,077 0
Senior Executive Vice President Jung-Hsien Chiu
Senior Executive Vice President Hsin-De Chang
Senior Executive Vice President Shih-Jung Chen
Senior Executive Vice President Yun-Ching Wang
Senior Executive Vice President Huan-Mou Cheng
Note: Not applied as the Bank is not a listed company.
Annual Report 2016020
3. Corporate Governance

Classification of RemunerationUnit: TWD
Classification of Remuneration for President and Senior Executive Vice President
Name of President and Senior Executive Vice President
Bank (Note 6) Consolidation (Note7)
below 2,000,000 Huan-Mou Cheng - Huan-Mou Cheng -
2,000,000 - 5,000,000 Chin-Ting Chang, Jung-Hsien Chiu, Chih-Sheng Hsiao, Shih-Jung Chen, Yun-Ching Wang
Chin-Ting Chang, Jung-Hsien Chiu, Chih-Sheng Hsiao, Shih-Jung Chen, Yun-Ching Wang
5,000,000 - 10,000,000 -
10,000,000 - 15,000,000 He-Shun Chang He-Shun Chang
15,000,000 - 30,000,000 - -
30,000,000 - 50,000,000 - -
50,000,000 - 100,000,000 - -
Above 100,000,000 - -
TOTAL 7 (Persons) 7 (Persons)
Note 1: Remuneration paid to presidents and vice presidents should be disclosed aggregately with the names indicated for each remuneration range. Director should be listed in this table and table1-1 or table 1-2 if he/she currently holds the position of presidents and vice presidents.
Note 2: Severance pay, additional pay and salary paid to presidents and vice presidents for the most recent fiscal year. Note 3: Bonus, cash rewards, travel expenses, special disbursement, miscellaneous subsidies, house, vehicle and other pay and goods paid or provided to presidents
and vice presidents. When house, vehicle is provided or exclusive pay is paid to presidents and vice presidents, the nature of the assets and the cost or market value of rent of houses and fuel expenses and miscellaneous should be disclosed. Salary of drivers, not to be included in remuneration, should be disclosed. According to “Share-based payment” in IFRS2, obtaining employee shares option certificate, new restricted employee shares, participating in cash injection for shares are to be included in remuneration.
Note 4: The proposed amount of employee dividends, including stock dividends and cash dividends, paid to presidents and vice presidents approved by the board before shareholder’s meeting. It should also fill in appendix table 1-3.
Note 5: Total remuneration paid by the all companies (including our company) in the consolidated report to presidents and vice presidents should be disclosed.Note 6: Names of president and vice presidents must be disclosed in the suitable range based on the remuneration they received.Note 7: Total remuneration paid by the all companies (including our company) in the consolidated report to presidents and vice presidents should be disclosed. And
names of president and vice presidents must be disclosed in the suitable range based on the remuneration they received.Note 8: Net income disclosed from latest financial statement of each company.Note 9: a. Remuneration amount received by presidents and vice presidents from non-group affiliates. b. For remuneration received by presidents and vice presidents from non-group affiliates, the amount must be shown in the Column E under the Remuneration
Range Table. The Column must be renamed to ―All Investment Businesses. c. Remuneration refers to compensation, remuneration, employee dividends (including dividends to employee, board member and supervisor), and payments
related to business execution expenses received by presidents and vice presidents of COTA serving as directors, supervisors or managers of non-group affiliates.
* Remuneration shown under the chart is for disclosure purpose. It is not subject to “income” under the Income Tax Act, and thereby is not taxable.
Annual Report 2016 021

(3) List of Compensation Paid to President. Executive Vice Presidents and General ManagersAs of Dec. 31, 2016; Unit: TWD thousand
Title Name Stock dividends Cash Dividends Total Amount Total Amount/Net Income (%)
Manager
President Chin-Ting Chang
- 5,626 5,626 0.79%
Chief Auditor Chih-Sheng HsiaoSenior Executive Vice President Jung-Hsien ChiuSenior Executive Vice President Shih-Jung ChenSenior Executive Vice President Yun-Ching WangSenior Executive Vice President Huan-Mou ChengSenior Executive Vice President Hsin-De ChangExecutive Vice President Shih-Chien ChinDepartment General Manager Kuang-Hsiung HuangDepartment General Manager Wei-Bin LinDepartment General Manager Ming-Heng ChanDepartment General Manager Chuan-Hung YangDepartment General Manager Chun-Lung TsaiDepartment General Manager Chih-Huang HuangDepartment General Manager Chih-Nan HuangDepartment General Manage Hung-Tsang ChiangDepartment General Manager Yung-Hsieh ChenDepartment General Manage Chun-Sheng LinBranch General Manager Chang-Chieh LinBranch General Manager Chih-Peng YangBranch General Manager Ling-Chen TingBranch General Manager Jui-Sen LiaoBranch General Manager Cheng-Hsien HsiehBranch General Manager Mei-Ling ShihBranch General Manager Min-Chang LinBranch General Manager Mao-Sheng HuangBranch General Manager Wen-Lung ChenBranch General Manager Chi-Shen HuangBranch General Manager His-Tung ChangBranch General Manager Chien-Cheng HsuBranch General Manager Hung-Chi TungBranch General Manager Chang-Cheng ChenBranch General Manager Chia-Wen KeBranch General Manager Tzu-Hsiu LiangBranch General Manager His-Hsien WangBranch General Manager Cheng-Hao WuBranch General Manager Shu-Chen ShihBranch General Manager Shih-Tsung LiuBranch General Manager Hung-I ChenBranch General Manager Chih-Yin LinBranch General Manager Shih-Chao LiBranch General Manager Ming-Yung YuBranch General Manager Ping-Hung ChuangBranch General Manager Hsien-Hsun ChiangBranch General Manager Ming-Feng WuBranch General Manager Tien-Long YangBranch General Manager Po-Hsun ChangBranch General Manager Chung-Yi HsuBranch General Manager Yung-Hung Tsao
Note: Not applied as the Bank is not a listed company.
Annual Report 2016022
3. Corporate Governance

3-2-4. Analysis of Remuneration Paid to Directors, Supervisors, and Executive Officers of the Bank and All Companies in the Consolidated Financial Statements as a Percentage of Net Profit after Tax during the Past Two Years
ItemTotal Amount / Net Income After Tax
Year 2016 Year 2015 %Director
(Including independent director) 5.83% 5.67% +0.16%
Remarks:Remuneration of director is calculated based on bank’s performance and regular gross profit and is paid in accordance with guidelines of the Bank’s articles of incorporate and the resolution of stockholders’ meeting.
ItemTotal Amount / Net Income After Tax
Year 2016 Year 2015 %President and Senior Executive
Vice President 3.9042% 3.6398% +0.2644%
Remarks:1. Remuneration for president and vice-president is paid in accordance with rules approved by the board of directors.2. Payment of employee salary is calculated by related by-laws.3. Employee bonus is distributed by the resolution of the annual shareholders’ general meeting and applicable rules.4. Performance bonus is paid according to year earning status and rules of performance evaluation.
Annual Report 2016 023

3-3. Operation of Corporate Governance
3-3-1. Operation of board of directors: 4 meetings were convened last year; and the records of attendance of directors and supervisors at the meetings are as below:
Title Name Attendance in Person(B)
Attendance by Proxy
Actual Attendance
Rate (%)Annotations
Chairman Song-Yie Liao 4 0 100Managing Director Kuo-Chao Hsiao 3 0 75Managing (Independent) Director Kun-Hsien Lin 4 0 100
Managing Director Ying-Che Chang(Representing Deng-Heng Ent. Co Ltd.) 4 0 100
Managing DirectorChuan Cheng Hat Co., Ltd.Representative: Chien-Chung Lai 4 0 100
Po-Yao Chi 4 0 100Independent Director Sung-Cheng Huang 4 0 100Independent Director Xian-De Lai 4 0 100Director Pi-Jung Hsieh 4 0 100Director Chun-Chieh Wang 3 1 75Director Chi-Peng Yang 3 1 75
Dirrector HoChu Investment Ltd. Representative:Szu-Tsung Cheng 3 0 100
Director
ChiaDe Development and Investment Co., Ltd.Representative: Kuo-Hao Chen 1 0 100 Resigned on
Apr. 30 2016ChiaDe Development and Investment Co., Ltd.Representative: Tai-An Chen 3 0 100 Succeeded on
May. 01 2016
Director Cheng Shing Tai Biopharmaceutical Co., Ltd.Representative: Ting-Lieh Huang 4 0 100
Director KunYuan Investment Co., Ltd.Representative: Chih-Ting Chang 4 0 100
Remarks:1. List the date and order, proposal, Opinion from Independent Directors and how it was handled in the following circumstances:
a. Matters specified in Article 14-3 of the Securities Exchange Act:
Date and Order of Board Meeting Proposal Opinion from Independent Directors and how it was handled
5th meeting of the 7th Board of Directors on 2016 Mar.24 Amend provisions of acquisition or disposal of assets
5th meeting of the 7th Board of Directors on 2016 Mar.24Whether both dividends for board director and dividends for employees should be given to employee who is also a board director.
Opinion: Such privilege should not be deprived under existing law.How it was handled: Opinion was taken into consideration in this meeting.
5th meeting of the 7th Board of Directors on 2016 Mar.24 Annual donation to COTA Culture and Education Foundation, for 2016
Annual Report 2016024
3. Corporate Governance

5th meeting of the 7th Board of Directors on 2016 Mar.24Annual and Semi-annual financial report
7th meeting of the 7th Board of Directors on 2016 Aug.256th meeting of the 7th Board of Directors on 2016 Jun.23 Appointment and remuneration for CPA6th meeting of the 7th Board of Directors on 2016 Jun.23 Dismissal of financial officer6th meeting of the 7th Board of Directors on 2016 Jun.23 Assignment of new financial officer
8th meeting of the 7th Board of Directors on 2016 Dec.22 Stipulate or amend internal control system in according with article 14-1
8th meeting of the 7th Board of Directors on 2016 Dec.22 Board Director Chih-Peng Yang and Tai-An Chen leasing Bank’s golf card
8th meeting of the 7th Board of Directors on 2016 Dec.22 Annual donation to COTA Culture and Education Foundation, for 2017
b. Other than matters hereinabove, resolutions which were objected or kept qualified opinion by independent board directors: None.
2. Avoidance of Conflict of interest by directors: ◆ The 5th Meeting of the 7th Board of Directors on March.24,2016: ■ Issue: Apportion of employee and board directors dividends, and discussion on whether employee who is also a board director should be given two shares of
dividends Name of director: Chi-Peng Yang Reasons for avoidance: He is a board director and also a branch manager. Participation and voting: Director Chi-Peng Yang requested a leave of absence due to conflict of interest pertaining to the issue. The board passed a
resolution announcing that the decision would be the choice of interested person. Director Yang rejoined the meeting after resolution and stated he would receive both employee and board director dividends.
■ Issue: Donation to COTA Culture and Education Foundation for their activities expenses in 2016. Name of director: Pi-Jung Hsieh, Ying-Che Chang (Representing Deng-Heng Ent. Co Ltd.) Reasons for avoidance: The Director of COTA Culture and Education Foundation. Participation and voting: Director Pi-Jung Hsieh, Ying-Che Chang requested a leave of absence due to conflict of interest pertaining to the issue. ◆ The 6th Meeting of the 7th Board of Directors on June 23, 2016: ■ Issue: Leasing contract with COTA Insurance Brokers Co., Ltd, subsidiary of COTA. Name of director: Ying-Che Chang (Representing Deng-Heng Ent. Co Ltd.) Reasons for avoidance: The Director of COTA Insurance Brokers. Participation and voting: Director Ying-Che Chang requested a leave of absence due to conflict of interest pertaining to the issue. ◆ The 7th Meeting of the 7th Board of Directors on August 25, 2016: ■ Issue: Short-form merger with Cota Insurance Brokers Co., Ltd. Record date January 1st 2017 Name of director: Ying-Che Chang (Representing Deng-Heng Ent. Co Ltd.) Reasons for avoidance: The Director of COTA Insurance Brokers. Participation and voting: Director Ying-Che Chang requested a leave of absence due to conflict of interest pertaining to the issue. ◆ The 8th Meeting of the 7th Board of Directors on December 22, 2015: ■ Issues: Discussion of the qualification of director Chih-Peng Yang and Tai-An Chen (Representing ChiaDe Development and Investment Co., Ltd.)leasing
Bank’s golf card Name of director: Director Chih-Peng Yang and Tai-An Chen Reasons for avoidance: Lessee of golf card. Participation and voting: Director Chih-Peng Yang and Tai-An Chen requested a leave of absence due to conflict of interest pertaining to the issue. ■ Issue: Donation to COTA Culture and Education Foundation for their activities expenses in 2017. Name of director: Pi-Jung Hsieh, Ying-Che Chang (Representing Deng-Heng Ent. Co Ltd.) Reasons for avoidance: The Director of COTA Culture and Education Foundation. Participation and voting: Director Pi-Jung Hsieh, Ying-Che Chang requested a leave of absence due to conflict of interest pertaining to the issue. ■ Issues: Declaration form of internal audit plan for 2017 and control form of internal audit system. Name of director: Chi-Peng Yang Reasons for avoidance: Manager of Taichung branch. Participation and voting: Chi-Peng Yang requested a leave of absence due to conflict of interest pertaining to the issue.
3. Goals to enhance the function of the Board of Directors and evaluation of the execution status in the current and most recent years: Trainings on banking practice and compliance (e.g. FinTech, AML/CFT) were held regularly; and board directors were invited to participate in trainings.
Annual Report 2016 025

3-3-2. Operation of the auditing committee:
5 Meetings were convened last year; and the records of attendance of independent directors at the meetings are as below:
Title Name Attendance in Person (B)
Attendance by Proxy
Actual AttendanceRate (%) Annotations
Independent Director Po-Yao Chi 5 - 100Independent Director Kun-Hsien Lin 5 - 100Independent Director Sung-Cheng Huang 5 - 100
Remarks:1. List the date and order, proposal, resolution passed by audit committee and how it was handled by the bank in the following circumstances: a. Matters specified in Article 14-5 of the Securities Exchange Act:
Proposal Resolution Opinion from bank to the resolution Date and Order of Board Meeting
Stipulate or amend internal control system in according with article 14-1 Unanimous consent Resolution discussed and
passed by board meeting8th meeting of the 7th Board of Directors on 2016 Dec.22
Internal control statement, internal audit plan declaration, proposed improvements to bank’s audit report by CPA
Unanimous consent Resolution discussed and passed by board meeting
5th meeting of the 7th Board of Directors on 2016 Mar.24
Amend provisions of acquisition or disposal of assets Unanimous consent Resolution discussed and
passed by board meeting5th meeting of the 7th Board of Directors on 2016 Mar.24
2015 Stock dividends on common stock Unanimous consent Resolution discussed and passed by board meeting
5th meeting of the 7th Board of Directors on 2016 Mar.24
Board Director Chih-Peng Yang and Tai-An Chen leasing Bank’s golf card Unanimous consent Resolution discussed and
passed by board meeting8th meeting of the 7th Board of Directors on 2016 Dec.22
Appointment and remuneration for CPA Unanimous consent Resolution discussed and passed by board meeting
6th meeting of the 7th Board of Directors on 2016 Jun.23
Dismissal of financial officer Unanimous consent. Suggesting Mr. Chang filed a statement of defense at his own will.
Resolution discussed and passed by board meeting
6th meeting of the 7th Board of Directors on 2016 Jun.23
Assignment of new financial officerUnanimous consent. Assignment would be discussed whilst dismissing Mr. Chang in the board meeting.
Resolution discussed and passed by board meeting
6th meeting of the 7th Board of Directors on 2016 Jun.23
Annual and Semi-annual financial report Unanimous consent Resolution discussed and passed by board meeting
5th meeting of the 7th Board of Directors on 2016 Mar.247th meeting of the 7th Board of Directors on 2016 Aug.25
Annual donation to COTA Culture and Education Foundation, for 2017 Unanimous consent Resolution discussed and
passed by board meeting
5th meeting of the 7th Board of Directors on 2016 Mar.248th meeting of the 7th Board of Directors on 2016 Dec.22
b. Matters not passed by the Audit Committee, which were then agreed upon by two-thirds or more of all membership of the Board of Directors.: None2. Avoidance of Conflict of interest by independent directors: None3. Communication among independent directors, the Chief Auditor and accountants: (1) Communication between accountants and independent directors: Accountants and independent directors are very well communicated when producing annual and semi-annual financial reports. Financial reports are presented
to independent directors before meetings of audit committee. Accounting manager is invited to meetings of audit committee to report the certification of financial report and to ensure integrity of the certification, which is then audited by audit committee after approved by board resolution.
(2) Communication between the chief auditor and independent directors: Director and independent directors are invited to semi-annual meetings discussing faults and issues listed in the report on internal audit and internal control.
Other significant matters are also presented to the audit committee and the board of directors.
3-3-3. Compulsory Disclosure in Accordance with Corporate Governance Best-Practice Principles for Banks:
Disclosure Information in accordance with Corporate Governance Best-Practice Principles for Banks: Please refer to 3-3-4.
Annual Report 2016026
3. Corporate Governance

3-3-4. Current Status of the Bank’s Corporate Governance Practices and Its Comparison against the Corporate Governance Best-Practice Principles for Banks
Item
Status of Operation Differences from “The Corporate Governance
guidelines for banking industry” and Reasons
Y N Summary
I. Ownership structure and Shareholders’ equity of the Bank
(1) Has the bank established procedures handling shareholders’ suggestions, queries, disputes and litigations ?
(2) The ability of the Bank to identify its controlling shareholders and the ultimate person or persons behind such shareholders.
(3) The ways the Bank establishes firewalls and risk management mechanisms with respect to its affiliates.
P
(1) Shareholder’s suggestions and litigations are handled immediately by appropriate department.
(2) The bank has appropriate department compiling list of major shareholders monthly.
(3) The bank and its affiliates are independent in financial, accounting, business and management aspect. Operation profit or loss and goals are regularly reported to Asset-Liability and Risk Management Committee for risk control.
No difference
II. Duties of Board of Directors (1) Besides setting up the Compensation
Committee and Audit Committee according to law, does the Bank voluntarily set up other functional committees ?
(2) Does the Bank evaluate the independence of its CPAs on a regular basis ?
P
(1) The Bank also established Nomination Committee.(2) Assessment of the independency of appointed CPAs is
conducted regularly. No difference.
III. In the event the bank is public or OTC listed company, has the bank instituted a dedicated (or concurrent) corporate governance unit or personnel to be in charge of corporate governance affairs (including but not limited to the provision of necessary data for board directors and supervisors to execute their duties, administering matters relating to the board meetings and shareholder’s meetings in according with law, administering company incorporation and change in incorporation, and producing minute of board meetings and shareholder’s meetings) ?
P The bank is not a public or listed company Not applicable
VI. Has the Bank established a channel to communicate with parties of interest(including but not limited to shareholders, employees and customers, etc) ?
P
Communications among interested parties in persons, by phone, or online. Directors are asked to update and confirm the information of interested parties regularly. Information of managers is updated every February and August. Operated according to San-Xin-Yin-Sheng-Zi-Di No.10403619 (Oct. 15 2015)
No difference.
Annual Report 2016 027
Item
Status of Operation Differences from “The Corporate Governance
guidelines for banking industry” and Reasons
Y N Summary
V. Disclosure of information (1) Has the Bank set up website for the
disclosure of financial information and its corporate governance practices ?
(2) Any other methods adopted by the Bank for the disclosure of information (e.g., establishing English version website, appointing persons responsible for gathering and disclosing Bank information, implementing a spokesperson system, and placing the record of analyst meeting on its website) ?
P
(1) Disclose status of Financial information, Business operation and Corporate governance on the website (http://www.cotabank.com.tw)
(2) Status of Financial information and business operation are disclosed on our website. President of the Bank is the spokesperson of the Bank. No difference.
IV. Has the Bank provided other important information to facilitate better understanding of the Company’s corporate governance practices (including but not limited to employee rights, employee wellness, investor relations, rights of stakeholders, directors’ and supervisors’ training records, the implementation of risk management policies and risk evaluation measures, the implementation of customer relations policies, purchasing insurance for directors and supervisors, political donation and donation to interested parties and public interested group) ?
P
1. Employee rights: Advocates the spirits of humanity. Ensure employee rights by complying with the labor standard law and establishing the Employees’ Welfare Committee. Labor-Management conference is convened regularly.
2. Employee wellness: Organize staff trips to ease the tension of life. Home visiting every year to understand the living condition of staff.
3. Investors relations: Establish designated web-pages for shareholders providing relevant information of stock matters. The Bank formulated the code of practice and voting policy for legal person shareholders with higher privileges to ensure shareholders’ equity.
4. Rights of stakeholders and consumer’s protection and the policy of corporate governance: the Bank has always emphasized customer service quality. It provides customer complain channel and has implemented a number of customer protection policies.
5. Training and advanced studies of board members and supervisors: Taiwan Securities and Futures Institute and Taiwan Academy of Banking and Finance have arranged corporate governance courses for directors and supervisors (total of 12hrs in 2015). Various on-job trainings are instructed periodically.
6. Implementation of risk management policies and risk evaluation measures: Establish Risk Management Center, “Assets, Liabilities and Risk Management Committee’’ evaluate regularly operating risk and report to the board of directors. We obey rules of government and BIS to make policies of risk management to ensure our safety of banking operations and performances.
7. Purchasing insurance for directors and supervisors: In order to round out the company’s corporate governance mechanism and reduce risk exposed to directors and key staff members of the company, the Bank has taken out liability insurance for directors, supervisors and managers.
No difference
Annual Report 2016028
3. Corporate Governance

Item
Status of Operation Differences from “The Corporate Governance
guidelines for banking industry” and Reasons
Y N Summary
8. Political donation and donation to interested parties and public interested group in 2015 are stated as follow:
a. Interested parties: COTA Culture and Education Foundation: 50 thousand dollars.
b. ChenSenMei Social Welfare Foundation: 21,600 dollars. c. TCCE Foundation Book Raising Project: 500 thousand
dollars. d. Political Donation: None.
IIV. With respect to the result of annual corporate governance evaluation most recently issued by the Corporate Governance Center of Taiwan Stock Exchange, please describe done improvements and future actions for undone improvements.
P
None. No difference
3-3-5. Organizational Structure, Responsibility and Operation of Remuneration Committee Established by the Bank
3-3-5-1. Members
Position (Note 1)
Qualifications
Name
Directors or Supervisors shall meet one of the following professional requirements, together with at least five years
work experience.Independent status
(Note 2)
Number s of serve as
Remuneration Committee of Public
Companies.
Annotations(Note 3)
At least lecturer of business, law, finance or accounting departments or other relevant business departments/ divisions of public and private colleges/ universities as required by corporate business needs
Judge, prosecutor, attorney, certified public accountant, or other professionally qualified and technical person who possesses certificates of national examinations
Experience in business, law, finance, accounting or other work as required by corporate business needs.
1 2 3 4 5 6 7 8
Chairman Po-Yao Chi - - P P P P P P P P P N
See remarks
MemberYing-Che Chang
(Representing Deng-Heng Ent. Co Ltd.)
- - P P - P P P P P P N
Member Pi-Jung Hsieh - - P P - P P P P P P NMember Xian-De Lai - - P P - P P - P P P N
Member
ChiaDe Development and Investment Co., Ltd.
Representative: Kuo-Hao Chen- - P P - P P P P P P N
ChiaDe Development and Investment Co., Ltd.
Representative: Tai-An Chen- - P - - P P P P P P N
Annual Report 2016 029

Remarks: 1. COTA Bank is a public company, not subject to Article 14-6 of Securities and Exchange Act.2. COTA Bank voluntarily sets up remuneration committee and operation of which is according to the article of association of COTA Bank remuneration committee.Note: 1. Position Explanation: Director, Independent Director or Others2. In the preceding 2 years before being elected and during the term of office, members who meet the following terms shall with “P” marks. (1) Neither employees of Bank nor its affiliates. (2) Neither a director/supervisor of Bank nor its affiliates, unless the person is an independent director of the company, its parent company, or any subsidiary in
which the company holds, directly or indirectly, more than 50% of the voting shares. (3) Not an individual shareholder who holds shares, together with those held by the person spouse, minor children, or held under others’ names, in an aggregate
amount of 1% or more of the total outstanding shares of the company or ranks among the top 10 shareholders who are natural persons in terms of the share volume held.
(4) Not a spouse or relative within the second-degree of kinship, or lineal relative within the third-degree of kinship, of any of the persons in the preceding three subparagraphs.
(5) Not directors, supervisors, or employees of a corporate shareholder that directly holds 5% or more of the total outstanding shares of the Bank or ranks among the top 5 corporate shareholders in the terms of share volume held.
(6) Not directors, supervisors, or executive officer, or shareholder holding 5% or more shares of a specific company or institution and who also has financial or business dealings with the company.
(7) Not a professional, or owner, partner, director, supervisor, or executive officer and the spouse thereof of a sole proprietorship, partnership, company, or institution that provides commercial, legal, financial, accounting or consulting services to the Bank or to any affiliates.
(8) Not any of the circumstances in the subparagraphs of Article 30 of the Company Act.
3-3-5-2. Operation of Remuneration Committee:
(1) The Bank’s Remuneration Committee has 5 members.(2) The tenor of members of the 5th Remuneration Committee is from Feb. 6, 2015 to Dec. 28, 2017.The Remuneration Committee
convened 4 meetings (A) in the recent year, and the records of attendance at the meetings are as below:
Title Name Attendancein Person (B)
AttendanceBy Proxy
Actual AttendanceRate (%) (B/A) Annotation
Chairman Po-Yao Chi 4 0 100
Member Ying-Che Chang(Representing Deng-Heng Ent. Co Ltd.) 4 0 100
Member Pi-Jung Hsieh 4 0 100
Member Xian-De Lai 4 0 100
Member
Chia De Development and Investment Co., Ltd.Representative: Kuo-Hao Chen
2 0 100 Resigned on Apr. 30 2016
Chia De Development and Investment Co., Ltd.Representative: Tai-An Chen
2 0 100 Succeeded on May. 01 2016
Remarks:1. Please state the meeting’s date, session, agenda, resolution and result of execution regarding if the advice of the remuneration committee was declined or
suggested to amend by the board: None.2. Please state the meeting’s date, session, agenda, resolution and result of execution regarding if there were members oppose or hold different opinions to the
resolution of the remuneration committee: None.
Annual Report 2016030
3. Corporate Governance

3-3-6. Status for fulfillment of social responsibility:
Item
Operating conditions Deviation from the guidelines for the social
responsibilities for TWSE/GTSM Listed
Companies” and reasonsY N Summary
1. Implementation of corporate governance (1) Has the Bank had a corporate social
responsibility policy or system in place and is the performance of such policy reviewed on a regular basis?
(2) Does the bank organize social responsibility education for employee regularly?
(3) Does the bank have a unit that specializes (or is involved) in CSR practices? Is the CSR unit run by senior management and reports its progress to the board of directors?
(4) Has the bank implemented a reasonable remuneration system that commensurate employee’ performance appraisals with CSR? Is the remuneration system supported by an effective reward/discipline system?
P
P
P
P
(1) The Bank strives to fulfill its social responsibility by sponsoring COTA Culture and Education Foundation and other public interest groups, and it has been consistently fulfilling its social responsibility.
(2) Regular education training and conferences emphasize on business ethics
(3) No(4) The bank has not implemented a
reasonable remuneration system that commensurate employee’ performance appraisals with CSR.
The Bank is not a listed company in TWSE or OTC
2. Fostering a sustainable environment (1) Is the bank committed to achieving
efficient use of resources, and using renewable materials that produce less impact on the environment?
(2) Has the bank developed an appropriate environmental management system, given its industry characteristics?
(3) Is the bank aware of how climate changes affect its business activities? Are there any actions taken to measure and reduce greenhouse gas emission and energy use?
P
P
P
(1) Encourage employees to use double-side printing and recycle and reuse used printing papers. Encourage employees to use their own cups in meetings to reduce the use of paper cup.
(2) Turn off the power when leaving the offices, set the air-conditioner temperature at 27 degree, and do recycle.
(3) The Bank replaces high energy consumption lights with T5 or LED lights.
3. Uphold public benefits (1) Has the Bank developed its policies and
procedures in accordance with laws and the International Bill of Human Rights?
(2) Has the Bank had employee grievance policy? Are grievances being handled properly?
(3) Does the bank provide employees with a safe and healthy work environment? Are employees trained regularly on safety and health issues?
(4) Does the bank have channels to communicate with employees on a
P
P
P
PHas the Bank developed its policies (1) No(2) Employee grievances are well handled by
the human resources department.(3) The Bank has developed employee safety
and health policies which complied with the Labor Health Protection Regulations.
(4) Periodical meetings between labor and management.
(5) Employee education and training is carried out according to job responsibilities and personal career development every year.
(6) The bank has developed consumer
Annual Report 2016 031

Item
Operating conditions Deviation from the guidelines for the social
responsibilities for TWSE/GTSM Listed
Companies” and reasonsY N Summary
regular basis, and inform them of operational changes that may be of a significant impact?
(5) Has the bank implemented an effective training program that helps employees develop skills over the course of their career?
(6) Has the bank implemented consumer protection and grievance policies with regards to its research, development, procurement, production, operating and service activities?
(7) Has the bank complied with laws and international standards with regards to the marketing and labeling of products and services?
(8) Does the bank evaluate suppliers’ environmental and social conducts before commencing business relationships?
(9) Is the bank entitled to terminate the supply agreement at any time with a major supplier, if the supplier is found to have violated its corporate social responsibilities and caused significant impacts to the environment or the society?
P
P
P
P
P
protection rules. Self-appraisals of consumer protection should be conducted when designing products, formulating contracts and providing services. Consumer grievances are taken cared according to internal directions for managing customer grievances. And a direct line is designed for consumer grievances.
(7) With respect to advertising and promotional materials, the Bank has developed “Regulations on Soliciting of Business thru Advertisements and Business Promotion Activities” and “Regulations on Provision of Key Contractual Contents and Risk Disclosure before Providing Financial Products and Services” to ensure consumers’ interests.
(8) Bad records and derogatory information of suppliers are taken into consideration when selecting suppliers.
(9) The company has implemented a set of “Supplier Management Guidelines” and CSR commitments to ensure that suppliers comply and fulfill their corporate social responsibilities in terms of worker respects, law compliance, and environmental-friendly and sustainable production, which are all taken into consideration when the company is evaluating or auditing a particular supplier.
4. Intensified information disclosure Has the bank disclosed relevant and reliable
CSR information on its website and at the Market Observation Post System?
P
CSR information is disclosed in annual report and website of the Bank (www.cotabank.com.tw)
5. Description of deviation of the self-made guidelines for corporate social responsibilities from the “Guidelines for corporate social responsibilities of listed firms”: None (The Bank is not a listed company in TWSE or OTC)
6. Other important information that helps to understand the best practices of corporate social responsibility : COTA Bank upholds a philosophy of “Nurtured by the society, requite the society” so that we think it’s our obligation to fulfill social
responsibility. COTA bank cares about and contributes to the society thru various ways such as donation and holding activities among communities. The bank set up COTA Culture and Education Foundation to advocate lifelong learning. COTA bank will adhere to the principle of giving back to society by providing better community financial service and sponsoring and promoting community welfare.
7. The prescription of bank or corporate social responsibility report which have been certified by external certification institution: None
Annual Report 2016032
3. Corporate Governance

3-3-7. Implementation of Ethical Corporate Management and Practices:
Item
Operating conditions Deviation from the guidelines for the social
responsibilities for TWSE/GTSM Listed
Companies” and reasonsY N Summary
1. Establishment of ethical corporate management policies and programs.
(1) Does the Bank adopt an explicit indication of its ethical corporate management policy in internal regulations and external documents; implementation of the pledge by its board of directors and management to enforce the policy rigorously and thoroughly?
(2) Does the Bank adopt an unethical conduct prevention program in which operational procedures, behavioral guidelines, and a mechanism for punishment of appeals for alleged violations are clearly defined, and enforce it without fail?
(3) Does the Bank adopt preventive measures against practices listed in Paragraph 2, Article 7 of the Ethical Corporate Management Best Practice Principles for TWSE/GTSM-Listed Companies or other business activities with higher risk of being linked to unethical conduct?
P
P
P (1) Instead, the Bank established honesty and integrity rules in “Procedure for Board of Directors Meetings”, “Regulation on Donation” and “Employee Code of Conduct”.
(2) The Bank established honesty and integrity rules in “Procedure for Board of Directors Meetings”, “Regulation on Donation”, “Employee Code of Conduct”, “Directions on Internal Control and Risk Management in Wealth Management Business” and “Regulations on Soliciting of Business thru Advertisements and Business Promotion Activities”.
(3) For prevention of unethical behavior, the bank has established “Regulations on Personnel Management”, “Employee Code of Conduct”, “Regulation on Donation” and “Directions on credit extension and other transactions with interested parties”.
The Bank is not a listed company in TWSE or OTC
2. Implementation of ethical corporate management
(1) Does the Bank evaluate the records of ethical/unethical conduct of its business counterparties and include in such contract provision demanding ethical corporate management policy compliance?
(2) Does the Bank establish a unit under the Board of Directors that is exclusively or concurrently responsible for promoting ethical management, and reports its status of implementation to the board on a regular basis?
(3) Status of the Bank’s promulgating policies for prevention of conflicts of interests and offering appropriate means for related personnel to voluntarily explain whether their interests would potentially conflict with those of the Bank.
P
P
P
(1) The Bank avoids dealing with parties that have records of unethical conducts. When entering into contracts with other parties, the Bank shall include in such contract provision demanding ethical corporate management policy compliance. The Bank immediately stops business relation while acknowledging of unethical conducts of its counterparties.
(2) The Bank established the compliance system, internal control systems, internal audit, risk management, and set functional committee by regulation to strengthen the function of decision-making and management of board of directors.
(3) 1. The Bank established policies preventing conflict of interest:
a. Clause of avoidance of conflict of interest is explicitly indicated in “Procedure for Board of Directors Meetings”.
Annual Report 2016 033

Item
Operating conditions Deviation from the guidelines for the social
responsibilities for TWSE/GTSM Listed
Companies” and reasonsY N Summary
(4) To enforce ethical management, does the Bank establish effective accounting and internal control systems that are subject to regular inspection of an internal auditing department or audit by externally engaged CPAs?
(5) Does the Bank offer internal and external training with regard to ethical management on a regular basis?
P
P
b. Build a database of information of interested parties. The term of secured credit extensions to interested parties shall not be more favorable than those terms offered to other same category customers
c. Establishing “Employee Code of Conduct” for prevention of unethical behavior of employee.
d. Establishing “Directions on Internal Control and Risk Management in Wealth Management Business” regulating work ethics and disciplines of financial advisors.
2. All relevant rules and procedures are on the website www.cotabank.com.tw. (4) The Bank has established accounting system and accounting department. To ensure impartiality of financial statements, Bank’s financial statements has audited by CPAs. The Bank established internal audit control system which is subjected to reexamination and readjustment and an auditing division under the board of directors. Internal audit control system is implementing by regular and random internal auditing and by external auditing by CPAs.
(5) The Bank undertakes training with regard to ethnical management and behavioral guidelines on a regular basis. All employees are required to attend. Employees are acknowledged of amendments of relevant regulations.
3. Status of the Bank’s implementation of its offence reporting system:
(1) Does the Bank establish a mechanism that incentivizes prosecutors to step forward, put in place channels convenient for taking such action, and assign appropriate personnel to handle such cases?
(2) Does the Bank set a standard operating procedure (SOP) for handling reports from prosecutors and adopt a mechanism for keeping confidentiality?
(3) Does the Bank adopt measures to make sure that prosecutors do not undergo improper treatment because of their stepping forward?
P The bank has not established offence reporting system; nevertheless the Bank has established “Regulations on Personnel Management”, “Employee Code of Conduct” and has also established Personnel Evaluation committee governing rewards and penalties system for employee. Also, The Bank has established “Directions on Handling Customer Complaints”
Annual Report 2016034
3. Corporate Governance

Item
Operating conditions Deviation from the guidelines for the social
responsibilities for TWSE/GTSM Listed
Companies” and reasonsY N Summary
4. Enforcement of information disclosure Does the Bank disclose the content and
implementation status of its Principles for Ethical Management on its own website and the TSE’s Market Observation Post System website?
P (1) Information of financial, operating and corporate governance of the bank are accessible through website www.cotabank.com.tw (also available in English)
(2) The Bank has designated persons to update and disclose company information.
5. If the Bank has established its own ethical corporate management principles based on the Ethical Corporate Management Best Practice Principles for TWSE/GTSM Listed Companies, please describe any discrepancy in the Bank’s implementation of the principles and explain why : None (The Bank is not a listed company in TWSE or OTC)
6. Other important information to facilitate better understanding of the Bank’s implementation of ethical corporate management (e.g., status of the Bank’s reviewing and amending its own ethical corporate management principles): In building an ethical management corporate culture, the Bank has set honesty and integrity rules in “Procedure for Board of Directors Meetings”, “Regulation on Donation” and “Employee Code of Conduct”. All directors and employees promote business with integrity and strong work ethic and to furthermore fulfill social responsibility. The Bank set the compliance system, internal control systems, internal audit, risk management, strengthening competency of the board and supervisors, functioning audit committee, respecting the right of interested parties, improving information transparency, continuing implementing policies that deepens the culture of ethical management in order to achieve sustainable development.
3-3-8. Corporate Governance Guidelines and Regulations
Please refer to the Bank’s website on Http://www.cotabank.com.tw
3-3-9. Other Important Information Enhancing Understanding of the State of the Company’s Corporate Governance: None.
Annual Report 2016 035

3-3-10. Execution of Internal Control System
(1) Statement of Internal Control
COTA Commercial Bank Statement of Internal Control
February 2, 2017To Financial Supervisory Commission
On behalf of the COTA Commercial Bank, we declare that during the period of January 1, 2016 through December 31, 2016 the Bank did conform to the provisions of the “Guidelines for the establishment of internal control and internal audit systems” by establishing an internal control system and undertaking risk management, and by having auditing carried out by an impartial and independent auditing unit, with reports submitted on a regular basis to the Board of Directors and Audit Committee. Careful assessment shows that with the exception of items listed in the attached chart, the internal control systems of and compliance with laws and regulations by the different units were all implemented effectively. This statement form part of the annual report and publicly disclosed. We understand that we are legally bound to SEC ordinance No.20, 32, 171 and 174.
Attested by
Chairman : Song-Yie Liao
President : Chin-Ting Chang
Chief Auditor : Chih-Sheng Hsiao
Compliance Officer : Hsin-De Chang
Annual Report 2016036
3. Corporate Governance

Items for Improvement and Plan Table of Internal control
As of Dec. 31, 2016
Items for Improvement Improvement Measure Target Date
1. Dealing with construction loans should strengthen risk management of land mortgage, appraisal, approval process and controlling process of Central Bank of China.
1. Appraisal: Diversified Appraisals2. Approval Process: (1) Evaluate fund needs more than mortgage
value. (2) After loaning for a long time has not been
constructed or obtained a building permit, should appraise carefully as to agree to extend or on-lent.
Listed in main credit auditing items in 2014, update Improvement Measure 1 and will keep tracing for 2017.
2. The total amount of loans extended for residential construction and construction for business purposes by a Commercial Bank shall not exceed thirty percent (30%) of the aggregate of such Commercial Bank’s deposits and Bank Debentures issued at the time such loans is extended; provided
1. New home acquisition or construction cases shall be subject to control.
2. Incremental loans or loans transferred from other banks shall be subject to control if the purpose of the existing loan is to acquire real estate.
3. Loans used to acquire commercial property, outstanding balance of building construction loan transferred to loans secured by unsold houses, loans secured by purchased land and buildings acquired but not yet registered shall be subject to control.
4. Revolving loans granted to developers or construction companies shall be controlled according to the purpose of the loan.
5. Loans for working capital interested party should control as building industry control.
6. Should control that the loan for Purchase or build of industrial plants, but the build of industrial plants didn’t for Increase productivity.
7. Borrower shall be included in the limit control if the purpose of the loan is for security deposit of constructing residence.
Listed in main credit auditing items in 2015, add Improvement Measure 7 will keep tracing for 2017.
3. Ministry of Finance 70.5.27 Taiwan Finance No. 16152 letter “for huge amounts of individual household loans, such as business should be restricted, should be changed to the name of the business camp lending” requirement.
In order to confirm the appropriateness of the use of the borrower’s funds and to grasp the source of the repayment, when the credit is engaged in the investment and turnover of the individual business enterprise, the customer shall name of the Company, or approach to the Unincorporated Organization .
Listed in main auditing items in 2016, and will keep tracing for 2017.
4. Handling deposit account KYC operation should be according to the “Assessment of Money Laundering and the Financing of Terrorist Risk Policies and Procedures” ,and to assess and classify the customers whose occupation are risky ,ex. the customers engaged in occupations defined as high risk (such as: jewelry stores, pawnshop) are classified as high risk level.
In order to avoid the recurrence of similar incidents, especially in the December 22, 2016 COTA Bank No. 10503984 letter reaffirmed, please apply for deposit account KYC operation should be assessed in according to the definition of the occupational risk level in COTA Bank.
Listed in main auditing items from 2017.
Annual Report 2016 037

Items for Improvement Improvement Measure Target Date5. Prosecution of money laundering operations and
a suspected money-laundering characterization in line with the Model “Measures to Prevent Money Laundering and Combating the Financing of Terrorism in Banks” should confirm the background and purpose of the transaction and keep the verification trail:
(1) For the list of terrorists or groups, you should indeed enter in the database.
(2) “The deposit account is deposited a large amount of cash, and immediately withdraw by a decentralized manner, leaving only a symbolic balance”. It should be judged whether it is relevant to its identity, income or whether it is related to its nature of business and retain the verification information.
(3) “The transfer of large amounts of funds between the relevant accounts or the processing of the relevant transaction process in cash (transfer by cash)”.It is necessary to verify that the handling of the accounts is consistent with the facts of the transaction.
(4) “Representing others to deposit or withdraw large amounts of funds into a particular account” should specify the factual and business relationship and keep the record.
(5) “The same account or the same customer through different accounts scattered transactions, and often have slightly less than the amount must be declared to the account or from the account of the applicant,” the statement should be verified to explain the rationality of customer account transactions and retention record.
1. Generating “File Exception” additionally for the information which cannot be defined by the program, and distinguish by the artificial decision and enter into success files, then upload the host database.
2. ~ 5. Industry management division has issued a letter, please check the business division to pay attention to handle.
Listed in main auditing items from 2017.
6. Sending the statement of account operation or accepting the depositors to change the basic information by mail, should be improved according to the following:
(1) If the post office is returned, the business division should contract depositors by telephone, visit or other ways, and will be tracked and processed into a record by the cadre review, should be implemented after the management of the operation.
(2) Please confirm the confirmation of the change of mailing address and telephone number by mail.
1. Industry management division has issued a letter, please check the business division to pay attention to handle.
2. The new business division is required to apply for the change of the mailing address and telephone number by mailing the receiving account. In addition to checking the original seal of the depositor, we should contact the customer to confirm the contents of the application and make a blank leave a record for future reference.
Listed in main auditing items from 2017.
7. According to credit risk assessment basis, the risk level is divided into micro, mild, low, medium and low, moderate, high and high level 7 from low to high, the credit case has been overdue lending, or has been rejected by the notice reconciliation; credit rating should be implemented in accordance with the provisions of the handle.
Part of the business division do not implement the internal norms of the Bank for the construction period of management information, has been re-letter again to regulate the business unit should be implemented according to regulations.
Listed in main auditing items from 2017.
Annual Report 2016038
3. Corporate Governance

Items for Improvement Improvement Measure Target Date8. The occurrence of operational risk and credit alerts or
abnormal situation, should according to “Operational Risk Incident Management Points” or 99.3.31 circular requirements for notification:
(1) All divisions should be in accordance with the provisions of the pre-operating points, the incident occurred (occur) within 5 working days for notification of operational risk events.
(2) The operational risk events should be in accordance with the provisions of the operating instructions for the disclosure of the notice, such as, apply for credit on behalf of the Fund on behalf of the liquidation, should disclose the relationship of dishonor by non-payment, avoid the credit fund part of the subrogation.
(3) If a warning or abnormal condition occurs in the credit account, the early warning assessment and notification operation shall be carried out:
1. The borrower has been refused by the BOC, and the collateral has been enforced by him and shall be subject to early warning assessment and notification. Operations, to facilitate the relevant units to take appropriate measures immediately.
2. Other financial institutions have been transferred to overdue receivables or write off bad loans repayment of the ability to pay has been doubts, should be retained to affect the operation or claims to ensure the early warning assessment information.
1. With 2.have been re-issued, please all divisions should be in accordance with the Bank “Operational Risk Incident Management Points” provisions of the report to fill the risk of operational loss events. In particular, the division has indicated that the division has notified the case of major contingencies and decrees to be followed, and the case of applying for compensation to the credit fund only partial compensation or no compensation shall be notified of the operation risk event according to the above points. 3. (1) To reaffirm the occurrence of an unexpected
event in the letter of credit, the “Notice of the Emergency Notice of the Grantor” shall be filled in and provided to the business division before the commencement date of the event. Measures to maintain the safety of the bank’s assets, the implementation of early warning notification and the establishment of credit track control.
(2) If the other financial institutions have transferred their overdue receivables or write off bad loans, please refer to the “4” of the “Loan Other Bad Debt Report” at the end of each month. Single “to implement the warning or abnormal situation of the notification operation.
Listed in main auditing items from 2017.
(2) CPA Audit Report Pursuant to ordinance article 28 of the “Guidelines for the Establishment of Internal Control and Internal Audit Systems’’, the Bank arranged KPMG certified public accountants to audit performance of internal control during the period of Jan. 01, 2016 through Dec. 31, 2016.
The audit report of the Certified Public Accountant concluded as follows:
With the exception of suggested items to improve, no major deficit is found (attaching homepage of auditor’s report and suggestion statement).
Annual Report 2016 039
Independent Auditors’ Report
March 24, 2017
According to the article 28 promulgated by Financial Supervisory Commission Executive Yuan, R.O.C. on “Guidelines for the establishment of internal control and internal audit systems”, when a bank engages an accountant to audit its annual financial statements, it shall also ask the same accountant to audit its internal control system and express opinion regarding the accuracy of information provided in the financial statements as well as the implementation of the Bank’s internal control system, regulatory compliance system, and the appropriateness of bank’s bad debt reserve policy.
On behalf of the KPMG, we accept being a consignor of COTA Commercial Bank to audit its internal control system and express opinion in accordance with regulations during the period of January 01, 2016 through December 31, 2016 as attaching the range and result of audit report.
The audit report is intended only to present the “Financial Supervisory Commission Executive Yuan, R.O.C.” and provide authorized persons.
Accountant
Shi-Hua, Guo
Annual Report 2016040
3. Corporate Governance

Suggestion StatementYear 2016
NO Matter of disclose Suggestion Opinion of Administration
1
Credit operationIn the credit investigation on the table marked interested parties as non-interested parties of Nanmen Branch, that disclosed by randomly audit.
It is recommended that the Bank should execute the regulation.
2016 accountants to check the proposed matters, was on December 9, 2016 issued by the proposed division for improvement, and urged other division should pay attention to the proposed matters. The audit office was closed for review on December 21, 2016, and the recommended divisions have completed educational propaganda. The auditing office also lists the proposed items as future key projects. Track the results of the review, as indicated by the division reply.1. Has been corrected for interested parties.2. Has been filled in checklist.3. Has been filled in KYC Table.4. “Acceptance Register of Credit Cases” has been
registered.5. Signature sub-card has been stamped.6. The original signature has been stamped.
2
Credit operationThe loan case did not fill in COTA Bank of interested parties checklist of Nanmen Branch, that disclosed by randomly audit.
It is recommended that the Bank apply for a loan case, should fill in the COTA Bank of interest parties to check the table.
3
Credit operationThe loan case did not actual fill in the “COTA Commercial Bank Consumer Banking KYC Table” of Nanmen Branch, that disclosed by randomly audit.
It is recommended that the Bank actual fill in the “COTA Commercial Bank Consumer Banking KYC Table”when handling the loan case.
4
Credit operationThe loan case did not registered in the “Acceptance Register of Credit Cases”, and the record is not allowed to be tracked of Nanmen Branch, that disclosed by randomly audit.
It is recommended that the Bank actual fill in the “Acceptance Register of Credit Cases” when handling the loan cases.
5
Deposit operationCheck the account to clear the case, the signature sub-card did not stamped with the stamp of Nanmen Branch, that disclosed by randomly audit.
It is recommended that the Bank actual clear the signature card when handing the account to clear the case.
6
Deposit operationThe original signature card did not stamped with stamp of Fungxin Branch, that disclosed by randomly audit.
It is recommended that the Bank should be stamped with stamps when handing the signature change.
7
Resignation account is not deleted immediately Personnel leave, should fill out the “System Account Transaction”, approved by the management team in charge, by the system group staff, and finally by the information officer review. During the period of the exam, examiner found the resign staff did not fill out the “System Account Transaction”, and its system account did not deleted.
It is advisable to remove the account privilege immediately upon due diligence.
It has been deleted the employee account, and will note in future.
Annual Report 2016 041

NO Matter of disclose Suggestion Opinion of Administration
8
Program change issueIt was found that the program did not carry out the UAT test.
It is recommended that the staff of the Information Department should conduct a program test with the user and keep the relevant test records.
The new development and application system will contact the business-related to send a common test, on-line application system based on the division of the link or business improvement proposal for maintenance changes, will require information system maintenance personnel in the development process to strengthen and recommend to communicate, do control the content of the demand and do the program on the line before the test and acceptance work to ensure that modify the content in line with user needs.
9
Set UPS issueBy field inspection UPS uninterruptible power system of the installation environment, not placed in a separate room.
It is recommended that the UPS uninterruptible power system be placed in a separate environment.
Consider the design of the building and the current situation of the compartment, the establishment of a separate room is not easy, the addition of transparent cover protection in front of the UPS control panel (button), to prevent staff mistakenly touch the button, and set the duty on time patrol UPS panel status display to ensure that UPS Working condition is normal.
10
Software control issueThe actual inventory of Windows 7 Pro key 147 sets of records on the system a total of 149 sets, and the actual purchase of the number does not match.
It is recommended that the software authorization certificate should be kept and managed by the information department, and the software license records and contracts should be checked regularly the actual quantity of the authorized, should be adjusted or purchased it.
1. Buy Windows 7 Pro voucher 149 series as a random version of the Windows upgrade, the use of this item is Windows 7 Pro key of the PC is not more than 147, did not exceed the purchase number.
2. Strengthen the software installation process control, regular inventory authorization software credentials and the actual use of the number of software to keep the custody and use of control.
3-3-11. Cases or Penalties due to Infliction of Laws and Regulations over the Past 2 Years:
1. Any indictment of a responsible person or employee by a prosecutor for an offense related to the occupation: None2. Any fine imposed by the FSC for violation of a law or regulation: None3. Any matters in which sanctions were imposed by the FSC pursuant to Article 61-1 of the Banking Act: None4. Any security incident arising from employee infidelity or material contingencies (e.g. fraudulent acquisition, theft, misappropriation,
or robbery of assets; forgery of documents or securities; acceptance of a bribe; losses from natural disaster; losses from external causes; hacker attack, data theft, or leak of trade secrets or customer data; or other such material incidents) or failure to faithfully abide by the Directions for Maintenance of Security at Financial Institutions. If actual losses, whether singly or in aggregate, exceed TWD50 million in any given year, disclose the nature and amount of the loss: None
5. Other matters that must be disclosed pursuant to FSC designation: None
Annual Report 2016042
3. Corporate Governance
3-3-12. Major Resolutions of Shareholders Meeting or Board of Directors Meeting in Recent Year
3-3-12-1. Shareholders Meeting
YearNature of
Shareholders Meeting
Convoking Date Major Resolutions
2016Regular
Shareholders’ Meeting
June 7, 20161. The earnings distribution of year 2015 and capital increase by
earnings and issuance of new shares. 2. Partial revision in articles of memorandum of association.
3-3-12-2. Board of Directors Meeting
3-3-12-2-1. Major Resolutions
◆ Proposal of Capital Increase by earnings of 2015, and the baseline date by Board of Directors held on March 24, 2016.◆ Proposal of Directors’ remuneration and employee compensation distribution of 2015, and the baseline date by Board of Directors
held on March 24, 2016.◆ Proposal of Issue total NT$1.8 billion subordinate of bank debentures by Board of Directors held on June 23, 2016. ◆ Proposal of Relinquish the manager of the business department of the bank and appoint the new supervisor by Board of Directors
held on June 23, 2016.◆ Proposal of Short-form merge subsidiary COTA Bank insurance Brokers Co., Ltd. into the bank by Board of Directors held on
August 25, 2016.
3-3-12-2-2. The Directors or Supervisors have different opinions to the board of directors meeting through the major resolution, and has the record or announce by statement: None
3-3-12-2-3. Corporate Governance Guidelines and Regulations Please refer to the Bank’s website on http://www.cotabank.com.tw/cotabank/announce/expose/expose.htm
3-3-13. Disclosures of the Resignation or Dismissal of Managerial Officers in Charge of Financial or Accounting Reports:
Position Name Staring date Dismissal date Resign or dismissal date
Manager Kuo-Chiu Chang October 15, 2013 June 30, 2016 Retire
Manager Wei-Bin Lin July 01, 2016 -
Note: Managerial Officers means chairman, president, treasurer, accounting supervisor, and head of internal auditor
Annual Report 2016 043

3-4. Information on the Certified Public Accountant
3-4-1. Information on the Professional Fees of the Certified Public Accountant
3-4-1-1.Disclosure of the Accountant’s Fee
Accountant Firm Name of Accountant Period of Audit Remarks
KPMG Guo, Shi-Hua Mei, Yuan-Chen Year 2016
Unit: TWD thousand
ItemTier Auditing Fee Non-Auditing Fee Total
1 Below 2,000 thousand P
2 2,000 thousand ~ 4,000 thousand P P
3 4,000 thousand ~ 6,000 thousand
4 6,000 thousand ~ 8,000 thousand
5 8,000 thousand ~ 10,000 thousand
6 10,000 thousand and above
3-4-1-2. Fees paid for non-auditing services account for a proportion equal to one-quarter or above of auditing: Unit: TWD thousand
AccountantFirm Name of Accountant Auditing
Fee
Non-Auditing FeePeriod of Audit by Accountant RemarksSystem
DesignCorporateRegisters
HumanResources
Others(note)
Sub-Total
KPMG Guo, Shi-Hua
Mei, Yuan-Chen 1,660 20 2,130 2,150 2016
Note: non-auditing fee including financial investigation TWD250 thousand, BIS checking report TWD50 thousand, verification fee TWD30 thousand for write-off, review of surplus turned capital TWD50 thousand, issue subordinate financial debentures TWD50 thousand, IFRS9 service fee TWD1,700 thousand.
3-4-1-3. Whether the Bank changes its accounting firm and the amount of fees paid for auditing services during the year in which the change is made are lower than for the previous year: None
3-4-1-4. Whether the amount of fees paid for auditing services is lower than for the previous year by 15% or above: None.
3-4-2. Information of Accountants change: None.
3-4-3. Whether the Bank’s chairman, president, or any managerial officer in charge of finance or accounting matters has in the most recent year held a position at the accounting firm of its certified public accountant or at an affiliated enterprise of such accounting firm: None
Annual Report 2016044
3. Corporate Governance

3-5. Change in Shareholdings and Pledged
3-5-1. Changes in Shareholdings of Directors, Supervisors, Executive Officers, and Shareholders conform to the Regulations Governing a Same Person or Same Concerned Party Holding the Issued Shares with Voting Rights over a Particular Ratio of a Bank, Article 11
Title Name2016 Up To February 28, 2017
Net Change in Shareholding
Net Change in Shares Pledged
Net Change in Shareholding
Net Change in Shares Pledged
Chairman (major) Song-Yie Liao 44,664,925 - 0 -Managing Director (major) Kuo-Chao Hsiao 17,445,818 - 0 -Managing (Independent) Director Kun-Hsien Lin 3,048,904 - 0 -
Managing DirectorYing-Che Chang(Delegate of DengHeng Enterprises Co.,Ltd.)
2,556,789 - 0 -
Managing DirectorChien-Chung Lai(Delegate of Chuan Cheng Hat Co., Ltd.)
2,933,134 - 0 -
Independent Director Po-Yao Chi 2,624,912 - 0 -Independent Director Song-Cheng Huang 1,248 - 0 -
DirectorSzu-Tsung Cheng(Delegate of Ho ChuInvestment Co., Ltd.)
0 - 0 -
Director Pi-Jung Hsieh 2,180,576 - 0 -Director Xien-De Lai 3,546,252 - 0 -Director (Branch General Manager) (major)
Chih-Peng Yang 16,164,244 - 0 -
Director Chun-Chieh Wang 9,943,335 - 0 -
Director
Tai-An Chen(Delegate of Chia De Development and Investment Co., Ltd.)
623,689 - 0 -
Director
Ding-Lie Huang(Delegate of Cheng Shing Tai Biopharmaceutical Co., Ltd.)
1,106,874 - 0 -
Director (President)Chin-Ting Chang(Delegate of Kun Yuan Investment Co., Ltd.)
2,825,911-
0-
Annual Report 2016 045

Title Name2016 Up To February 28, 2017
Net Change in Shareholding
Net Change in Shares Pledged
Net Change in Shareholding
Net Change in Shares Pledged
Senior Executive Vice President Jung-Hsien Chiu 1,117,541 - 0 -
Senior Executive Vice President Shih-Jung Chen 566,274 0
Senior Executive Vice President Huan-Mou Cheng 243,425 0
Senior Executive Vice President (Department General Manager) Yun-Ching Wang 403,059 0
Chief Auditor Chih-Sheng Hsiao 868,217 - 0 -
Executive Vice President (Department General Manager) Shi-Jian Zhang 661,475 0
Department General Manager Kuang-Hsiung Huang 309,068 0
Department General Manager Wei-Bin Lin 177,414 0
Department General Manager Ming-Heng Zhan 195,617 - 0 -
Department General Manager Quan-Hong Yang 124,656 0
Department General Manager Hung-Tsang Chiang 223,881 - 0 -
Department General Manager Jun-Sheng Lin 171,742 - 0 -
Department General Manager Chang-Chieh Lin 217,809 - 0 -
Department General Manager Chi-Nan Huang 49,587 0
Department General Manager Jun-Long Tsai 135,928 0
Department General Manager Chih-Huang Huang 321,605 0
Department General Manager Yun-Xie Chen 0 0
Branch General Manager Ling-Chen Ting 584,747 - 0 -
Branch General Manager Jui-Sen Liao 196,447 - 60 -
Branch General Manager Zheng -Xian Xie 396,988 - 0 -
Branch General Manager Mei-Ling Shih 264,257 - 0 -
Branch General Manager Min-Chang Lin 174,580 - 0 -
Branch General Manager Mao-Sheng Huang 226,233 - 0 -
Branch General Manager Wen-Jung Chen 296,505 - 0 -
Branch General Manager Chi-Shen Huang 489,712 - 0 -
Branch General Manager Shi-Tung Chang 645,921 - 0 -
Branch General Manager Jian-Chen xu 629,164 - 0 -
Branch General Manager Hung-Chi Tung 296,050 - 0 -
Branch General Manager Chang-Cheng Chen 175,150 0
Branch General Manager Chia-Wen Ke 189,494 - 0 -
Branch General Manager Tzu-Hsiu Liang 157,466 0
Annual Report 2016046
3. Corporate Governance

Title Name2016 Up To February 28, 2017
Net Change in Shareholding
Net Change in Shares Pledged
Net Change in Shareholding
Net Change in Shares Pledged
Branch General Manager Hsi-Hsien Wang 174,351 - 0 -
Branch General Manager Cheng-Hao Wu 96,220 - 0 -
Branch General Manager Shu-Chen Shih 444,331 - 0 -
Branch General Manager Shih-Tsung Liu 336,921 - 0 -
Branch General Manager Hong-Yi Chen 237,193 0
Branch General Manager Chih-Yin Lin 85,029 - 0 -
Branch General Manager Shih-Chao Li 141,277 0
Branch General Manager Ming-Yung Yu 165,941 0
Branch General Manager Ping-Hung Chuang 66,848 - 0 -
Branch General Manager Hsien-Hsun Chiang 246,141 0
Branch General Manager Ming-Feng Wu 17,794 0
Branch General Manager Tien-Long Yang 158,697 0
Branch General Manager Po-Hsun Chang 23,995 - 0 -
Branch General Manager Chung-Yi Hsu 235,719 - 0 -
Branch General Manager Yung-Hung Tsao 82,357
Information of Shareholding Transfer: None
Shares Pledged Information: None
Annual Report 2016 047

3-5-2. Related Party Transaction of First Ten Largest ShareholdersAs of Dec. 31, 2016
NameShares Owned Shares Owned by
Spouses and MinorsShares Held under
Surrogate A/C
Top ten shareholders who meet the related party
disclosures term of FASC NO.6 shall disclose name
and relationshipRemark
No. of Shares
Shares Held %
No. of Shares
Shares Held %
No. of Shares
Shares Held % Name Relationship
Ho Chu Investment Co., Ltd. (Chia-Hung Lin)
51,839,517 8.14
Song-Yie Liao 44,664,925 7.01 640,143 0.10 - - -Kuo-Chao Hsiao 17,445,818 2.74 3,235,145 0.51 - - -Chih-Peng Yang 16,164,244 2.54 2,298,531 0.36Chuan Cheng Hat Co., Ltd. (Ching-Ling Liu) 11,324,759 1.78 - - - - -
Chun-Chieh Wang 9,943,335 1.56 - - -Yuan Ta Chung Machinery Co., Ltd.(Chi-Cheng Huang)
9,840,194 1.54
Chun-Tse Liao 6,712,827 1.05 - - - - -Dong-Po Xie 6,441,915 1.01Chun Chuang Property Management Incorporated(Chu-LingLiao)
5,276,181 0.83
3-5-3. Consolidated Shareholdings: Unit: share; %
Investees(Note)
Direct Investment Indirect Investment TotalNo. of Shares Shares Held No. of Shares Shares Held No. of Shares Shares Held
Cota Bank Insurance Brokers Co.,Ltd. 500,000 100% 0 0 500,00 100%Taiwan Financial Asset Service Corp. 5,000,000 2.94% 0 0 5,000,000 2.94%Taiwan Asset Management Corp. 7,500,000 0.57% 0 0 7,500,000 0.57%Sunny Asset Management Corp. 25,302 0.42% 0 0 25,302 0.42%Taiwan Depository & Clearing Corp. 278,405 0.08% 0 0 278,405 0.08%
Note: The Bank’s investment pursuant to article 74 of the Banking Act.
Annual Report 2016048
3. Corporate Governance
4. Capital Arrangement
049COTA Commercial Bank Annual Report 2016

4-1. Capital Shares and Dividends
4-1-1. Source of Capital As of Feb. 28, 2017; Shares Held (%)
Month/YearIssuing price
(TWD)
Registered Capital Paid-in Capital Remark
Shares Amount Shares Amount Source Other
July 2016 10 1,000,000,000 10,000,000,000 637,069,524 6,370,695,240
Increased from retained earnings of TWD371,923,820
As of Feb. 28, 2017
Type of StockRegistered Stock Capital
RemarkOutstanding Capital Stock Un-issued Share Total
Common Stock 637,069,524 362,930,476 1,000,000,000 not on the list of TSEC/OTC
Information for comprehensive reporting: None
4-1-2. Shareholder Structure As of Dec. 31, 2016
Category Government Agency
Financial Institution
Other Institution Individual Foreign Institution
and Foreigner Total
Number of Shareholders 2 4 428 64,680 36 65,150Number of Shares 20,210 14,090 1,183,790,430 5,175,350,330 11,394,180 6,370,695,240Percentage - - 18.58% 81.24% 0.18% 100%
Annual Report 2016050
4. Capital Arrangement

4-1-3. Distribution of Shareholders’ Equity
4-1-3-1. Common Stock: par value of TWD10As of Dec. 31, 2016
Tier Number of Shareholders Number of Shares Percentage (%)
1 - 999 47,360 11,465,390 1.801,000 - 5,000 9,782 18,011,427 2.83
5,001 - 10,000 1,857 12,397,789 1.9510,001 - 15,000 2,133 28,164,925 4.4215,001 - 20,000 1,587 26,888,032 4.2220,001 - 30,000 501 12,737,673 2.0030,001 - 40,000 346 11,982,496 1.8840,001 - 50,000 141 6,278,902 0.99
50,001 - 100,000 734 51,647,693 8.11100,001 - 200,000 383 53,521,846 8.40200,001 - 400,000 182 49,604,506 7.79400,001 - 600,000 40 18,893,785 2.97600,001 - 800,000 21 14,243,563 2.24
800,001 - 1,000,000 16 14,475,761 2.271,000,001 and above 67 306,755,736 48.13
Total 65,150 637,069,524 100.00
4-1-3-2. Preferred Stock: None
4-1-4. List of Major Shareholders As of Dec. 31, 2016
Name Number of Shares Percentage (%)Ho Chu Investment Co., Ltd. 51,839,517 8.14%Song-Yie Liao 44,664,925 7.01%Kuo-Chao Hsiao 17,445,818 2.74%Chih-Peng Yang 16,164,244 2.54%Chuan Cheng Hat Co., Ltd. 11,324,759 1.78%Chun-Chieh Wang 9,943,335 1.56%Yuan Ta Chung Machinery Co., Ltd. 9,840,194 1.54%Chun-Tse Liao 6,712,827 1.05%Dong-Po Xie 6,441,915 1.01%
Note: Disclose the ratio of holding shares above 1%.
Annual Report 2016 051

4-1-5. Market Value, Net Worth, Earnings, and Dividend per Share in Recent 2 YearsUnit: TWD
YearItem 2015 2016 Up To Feb. 28, 2017
Market Value
Highest N/A N/A N/ALowest N/A N/A N/AAverage N/A N/A N/A
Net Worth Before Distribution 13.40 13.37 13.67After Distribution 12.43 (Note 4) (Note 2)
Earnings Weighted Average Shares 637,069,524 637,069,524 637,069,524
Earnings per Share
Before Adjust 1.35 1.12 0.28After Adjust 1.13 (Note 4) (Note 2)
Dividend(Note 1)
Cash Dividends 0.33 0.20 0
Stock Dividends
Retained Earning 0.33 0.62 0Capital Reverse 0 0 0
Dividends in Arrear 0 0 0
ROI Analysis(Note 3)
P/E Ratio N/A N/A N/AP/D Ratio N/A N/A N/ACash Dividend Yield N/A N/A N/A
Note 1: Dividends of serial year present earnings assignment of previous year.Note 2: Year 2017 hasn’t ended.Note 3: Not applied as the Bank is not a listed company.Note 4: Year 2016 distribution number is to be been confirmed after the approval of board of directors and the shareholder meeting..
4-1-6. Dividend Policy and Executive Status
In accordance with guidelines of the Bank’s articles of incorporate, our dividend policy is carried out by the access of “assignable earning distribution. After appropriate legal reserves and provide a special earnings reserve, we distribute the full earnings to the shareholders.
According to article 34 of the Bank’s articles of incorporate, earnings of fiscal year should pay taxes and offset prior year’s losses and appropriate 30% as legal reverse in turns. but the accumulated legal reserve equals or exceeds a Bank’s paid-in capital or the Bank is sound in both its finance and business operations and have set aside legal reserve in compliance with the Company Law, the restrictions stipulated in the preceding paragraph shall not apply.; If there is still surplus, the company shall either provide a legal reserve and a special earnings reserve from the surplus, or reverse existing special earnings reserves into the opening balance of undistributed earnings, and the distribution of profits was proposed by Board of Directors and decided to distribute dividends to shareholders in the shareholders’ meeting.
Before the legal reserve is accumulated up to the total capital, the highest cash dividends are limited to not over 15%.
Dividend distributions include cash dividends but not less than 10%, and the rest of dividends are stock dividends. If cash dividends less than TWD0.1, they will not be distributed, except approval by the shareholder’s meeting.
Resolution: Our bank has adopted a Proposal for Distribution of 2016: cash dividends TWD191,120,850 stock dividends TWD254,827,800
Annual Report 2016052
4. Capital Arrangement

4-1-7. Impact of Stock Dividends to Market Value and Earnings per Share: UNIT: Thousands of TWD
Year/Item 2017(Estimate)
Beginning Paid-in capital (TWD) 6,370,695
Stock and Cash Dividends for Current
Cash dividends per share 0.30 (Note 2)Stock dividends per share for capital increment from retained earnings (Shares) 0.40 (Note 2)Stock dividends per share for capital increment from capital surplus (Shares) -
Changes in Performance
Operating profit
N/A (Note 1)
Change in operating profit compared with previous yearAfter-tax profitChange in after-tax profit compared with previous yearEarnings per share (TWD)Change in earnings per share compared with previous yearAverage return on investment (Average annual EP ratio)
Conjectural Earnings per Share and Price/Earnings Ratio
If retained earnings for capital increment all converted to cash dividends
Earnings per share (TWD)Average annual return on increment
If no increment using capital surplusEarnings per share (TWD)Average annual return on increment
If no increment using capital surplus but switch to cash dividends
Earnings per share (TWD)Average annual return on increment
Note 1: According to the amendment by the Securities and futures commission, Ministry of Finance on Feb. 1, 2000 under Doc. No.00371, a public company that publishes a financial forecast in accordance with these Regulations may publicly disclose it on the company website.
Note 2: Cash and stock dividends of this year has not yet been approved by the Shareholders’ Meeting。
Annual Report 2016 053

4-1-8. Remuneration to Staff, Directors and Supervisors:
4-1-8-1. Pursuant to the amendment of article 34 of the Bank’s Articles distributes bonus and remuneration. • to appropriate 6% as employee remuneration. • to appropriate the remuneration of the directors and supervisors do not exceed 2%
4-1-8-2. The difference, if any, between the amount estimated in the current-year and the amount approved by stockholders in the subsequent year shall be accounted for as a change in accounting estimate, and charged to profit or loss in the current year.
4-1-8-3. The dividend distributions proposed at the shareholders’ meeting as follows: • employee cash remuneration: TWD55,644 thousand • director/supervisor remuneration: TWD18,548, thousand • employee stock remuneration: None
4-1-8-4. In 2015, the distribution amount of employee remuneration was TWD53,932 thousand, director/supervisor remuneration: TWD17,977 thousand with no difference as resolution of the board of directors.
4-1-9. Repurchase Stocks: None
Annual Report 2016054
4. Capital Arrangement

4-2. Issuance of Bank Debentures
Type of Bank Debt 1st Unsecured Subordinate Financial Debentures in 2011
1st Unsecured Subordinate Financial Debentures in 2016
Date Approved by Central Competent Authority, Document No.
Financial Supervisory Commission Executive Yuan, R.O.C.September. 10, 2010 Document No.0990361150
Financial Supervisory Commission Executive Yuan, R.O.C.September. 5, 2016 Document No.10500214440
Date of Issue March 29, 2011 November 16, 2016Denomination 500 thousand 500 thousand Issue and transaction Place Taiwan, R.O.C. Taiwan, R.O.C.Currency New Taiwan Dollar New Taiwan DollarIssue Price 100 dollars 100 dollarsTotal Amount 1.5 billion 1.8 billion
Interest Rate
Type A:Fixed rate 3.2%Type B:Current rate 1.65% plus the Bank’s board index rate of time saving deposits.
Fixed rate 2.1%
Term 7 years, matured0 on March 29, 2018 7 years, matured on November 16, 2023
Priority of Payment
The right to receive payment for sums due under the debenture (including principal and interest) takes precedence only over that of bank shareholders for distribution of surplus assets and is subordinate to the claims of all other creditors of the Bank.
The right to receive payment for sums due under the debenture (including principal and interest) takes precedence only over that of bank shareholders for distribution of surplus assets and is subordinate to the claims of all other creditors of the Bank.
Guaranteeing Institution None NoneTrustee None NoneUnderwriter None NoneCertifying Lawyers Wen-Cheng Chiang Wen-Cheng ChiangCertifying CPA Shi-Hua Guo Shi-Hua GuoCertifying Financial Institution None NoneMethod of Redemption Principal paid upon maturity Principal paid upon maturityUnredeemed Balance 1.5 billion 1.8 billionPreceding Year’s Paid-in capital 4,180,451,110 (2010) 5,998,771,420 (2015)Preceding Year’s Post-Audit Net Value 5,111,185,293 (2010) 7,916,736,553 (2015)
Performance Status Normal NormalSellback or Early Redemption conditions None None
Rollover and Exchange Conditions None NoneRestrictive Conditions Subordinated Subordinated
Annual Report 2016 055

Type of Bank Debt 1st Unsecured Subordinate Financial Debentures in 2011
1st Unsecured Subordinate Financial Debentures in 2016
Capital Utilization plan Raise the Bank’s owner’s capital and BIS ratio
Raise the Bank’s owner’s capital and BIS ratio
Amount of Registered Issuance Plus Outstanding Balance Already Issued as Ratio of Net Final Value of Issuance in Preceding Year.
29.35% 22.74%
Whether or not recorded as qualified capital and type
Yes,Tier 2 Capital
Yes,Tier 2 Capital
Name of Rating Institution,Date of Rating, andRating Given
Taiwan Ratings Corp./ March 22, 2011 / Debt Rating: twBBB
Sales targets exclude non-professional investors. According to Regulations Governing Issuance of Bank Debentures by Banks Article 6 Item 2, Debt Rating is not required. At that time, COTA Bank Rating Data: Long-term : twBBB+, Short-term : twA-2, Outlook : Stable (Taiwan Ratings Corp. January 15, 2016)
4-3. Preferred Stock: None
4-4. Issuance of Depositary Receipt: None
4-5. Employee Stock Option Plan: None
4-6. Status of Employee Restricted Stock: None
4-7. Merging or Acquisition of Other Financial Institutions: None
4-8. Utilization of Capital Plan:
The Bank will apply TWD0.8 billion capital increase by cash in 2017.
Annual Report 2016056
4. Capital Arrangement

5. Business Operation
057COTA Commercial Bank Annual Report 2016

5-1. Business Report
5-1-1.Business Results
5-1-1-1. DepositsUnit: TWD thousand
YearItems
2016 2015 Increase(Decrease)
Amount
Increase(Decrease)
%Amount Percentage Amount Percentage
Checking Deposits 2,582,813 1.85% 2,276,193 1.69% 306,620 13.47Demand Deposits 16,569,535 11.85% 15,276,392 11.31% 1,293,143 8.46Foreign Currency Demand Deposits 1,240,040 0.89% 1,133,542 0.84% 106,498 9.40Demand Savings Deposits 35,381,942 25.31% 34,142,785 25.29% 1,239,157 3.63Employees Demand Savings Deposits 801,519 0.57% 755,895 0.56% 45,624 6.04Time Deposits 23,466,510 16.79% 25,504,037 18.89% (2,037,527) (7.99)Foreign Currency Time Deposits 736,604 0.53% 697,506 0.52% 39,098 5.61Negotiable Certificates of Deposit 3,940,000 2.82% 112,000 0.08% 3,828,000 3,417.86Time Savings Deposits 55,042,354 39.38% 55,118,232 40.82% (75,878) (0.14)Remittances 11,775 0.01% 666 0.00% 11,109 1,668.02Total 139,773,092 100.00% 135,017,248 100.00% 4,755,844 3.52
5-1-1-2 LoansUnit: TWD thousand
YearItems
2016 2015 Increase(Decrease)
Amount
Increase(Decrease)
%Amount Percentage Amount Percentage
Export Bills 921 0.00% 9,739 0.01% (8,818) (90.54)Overdraft 930 0.00% 781 0.00% 149 19.08Short-term Loan 3,968,215 3.48% 2,931,572 2.74% 1,036,643 35.36Guarantee Overdraft 58,114 0.05% 68,337 0.06% (10,223) (14.96)Short-term Secured Lending 10,521,785 9.24% 9,760,681 9.11% 761,104 7.8Medium-term Loan 19,055,705 16.72% 20,235,904 18.88% (1,180,199) (5.83)Medium-term Secured Lending 49,137,140 43.12% 43,686,812 40.77% 5,450,328 12.48Long-term Loan 695,497 0.61% 795,218 0.74% (99,721) (12.54)Long-term Secured Lending 30,388,193 26.67% 29,564,101 27.59% 824,092 2.79Collection Money 119,388 0.11% 110,935 0.10% 8,453 7.62Total 113,945,888 100.00% 107,164,080 100.00% 6,781,808 6.33
Annual Report 2016058
5. Business Operation

5-1-1-3 Foreign Exchange Unit: USD thousand
YearItems
2016Amount
2015Amount
Increase(Decrease)
Amount
Increase(Decrease)
%Foreign Currency Deposit 61,236 55,376 5,861 10.58Foreign Currency Loan 21,553 10,912 10,641 97.51Import and Export Business 18,175 28,611 (10,436) (36.48)Exchange Business 166,929 193,951 (27,022) (13.93)
5-1-1-4 Trust BusinessUnit: TWD thousand
YearItems
2016Amount
2015Amount
Increase(Decrease)
Amount
Increase(Decrease)
%Specific Domestic and Foreign Securities Investment Money Trust 4,435,948 4,670,489 (234,541) (5.02)
Other Money Trust 118,074 125,602 (7,528) (5.99)Money Trust (Total) 4,554,022 4,796,091 (242,069) (5.05)Real Estate Trust 3,696 0 3,696 3,696Property Trust (Total) 4,557,718 4,796,091 (238,373) (4.97)Other Affiliated Business 0 0 0 0.00Certified Business 0 0 0 0.00
5-1-1-5 Wealth Management Business Unit: TWD thousand
YearItems
2016Amount
2015Amount
Increase(Decrease)
Amount
Increase(Decrease)
%Fee Income by Mutual Funds 10,376 14,700 (4,324) (29.41)Fee Income by Insurances 165,688 152,707 12,981 8.50Total 176,064 167,407 8,657 5.17
5-1-1-6 Credit Card Business Unit: TWD thousand; number of cards
YearItems
2016Amount
2015Amount
Increase(Decrease)
Amount
Increase(Decrease)
%Cumulative Issuing Cards 94,231 92,195 2,036 2.21Circulation Cards 17,073 16,630 443 2.66Amount of Consumption 1,353,118 1,368,777 (15,659) (1.14)Revolving Credit Balance 29,335 31,659 (2,324) (7.34)
Annual Report 2016 059

5-1-1-7 Fixed Income Investment Unit: TWD thousand
YearItems
2016Amount
2015Amount
Increase(Decrease)
Amount
Increase(Decrease)
%Government Bonds 821,401 254,474 566,924 222.78Short- term of Bills 2,102,052 3,654,787 (1,552,735) (42.48)Financial Bonds and Corporate Bonds 8,948,219 7,537,264 1,410,955 18.72Convertible Bonds 1,467,300 1,897,400 (430,100) (22.67)CBC Certificates of Deposits (include NCD) 15,000,000 16,300,000 (1,300,000) (7.98)
5-1-1-8 Changes in the Proportion of Revenue to Operating Income Unit: TWD thousand
YearItems
2016 2015Amount % Amount %
INTN (Interest Income (net)) 2,401,823 89.23 2,326,915 81.41Service Fee Revenue (net) 249,625 9.27 251,982 8.82FIAL (Gains or Losses on Financial Assets (Liabilities) at Fair Value through Profit or Loss) (42,378) (1.57) 30,073 1.05
REFI (Realized Gain or Loss on Available-for-sale Financial Assets) 0 0.00 0 0.00
ASSO (Share of Profit of Associates Accounted for Using Equity Method) 26,564 0.99 24,310 0.85
Reversal of Impairment Loss on Assets 0 0.00 122,018 4.27XGL (Foreign Exchange Gain or Loss) 28,005 1.04 67,592 2.36OREV (Other Revenue Except for Interest Income) 28,052 1.04 35,287 1.24
NREV (Net Revenue) 2,691,691 100.00 2,858,177 100.00
5-1-2. Business Plans for Year 2017
5-1-2-1. Operation Plans
• With the competent authorities to promote the development of financial technology and regulations, the Bank keeps developing and improving the electronic access service to expand the digital business and diversified financial services.
• Under BANK 3.0 development, the Bank seeks the potential customers and provides exclusive benefits and services.• Strengthening capital structure, improving asset quality, implementing risk management and corporate governance, enhancing the
ability to undertake long-term risks• Strengthening margin fund management into safety financial products to increase ROE.• Continuously simplifying accounting operations and streamlining manpower and time.• Enhancing staff training and education to promote professional functions.• Accumulating operating ability and tracking execution performance periodically.
Annual Report 2016060
5. Business Operation

• Consolidating tax reporting information in an electronic way to improve performance and correctness.• Concerning future growth, the Bank considers relocate branches and broadening channel efficiency• Developing and building related hardware and software system include: new functions of mobile banking, simulate platform of
Fund, the fourth stage Foreign Exchange platform-outward remittance, 24 hours online of FXML business banking, and new version of attendance system to improve work efficiency.
• Strengthening margin fund management into safety financial products to increase ROE.• Concerning to simplify the operation procedure and internal control, review and improve business regulations any time to optimizing
adjustment, promote service quality and work efficiency. • Maintaining relationship with customers, improving transaction channels to satisfy customers’ demand to keep expand saving deposits,
consumer banking, corporate loans, wealth management, trusts, foreign exchange, international banking, and e-banking. And adjusting structure, process for enlarging economy of scale and enhancing operating efficiency to reduce costs and increase profits.
• Strengthening risk management to implementation reasonable pricing and uphold the principles of credit 5P in order to maintain high quality of the loan assets
• Implementation of paperless and save on photocopying to get costs down. • Adjusting valuation method of internal transfer fund to improve efficiency between business and operational units.
5-1-2-2. Consumer Banking
• As the widespread use the internet and mobile devices, revise the version to close customer needs to reach customer satisfaction and use willingness.
• Continuous planning business operations, electronic and paperless, into the virtual and integrated service model, improve service efficiency. • Selecting target customers to provide specific benefits and services.• Strengthening wealthy customers to recognize the Bank’s consumer banking products.• To initiate consumer products according to market momentum and, as the core of lower risk and advanced competition, to develop
diversified and tailor-made projects so to enrich value-added of the products and expand scale of consumer loans.• To create optimized business model to upgrade Bank’s competition so as to cope with external changes on competition and regulations.• To strengthen Relationship Managers’ on-the-job training courses which focus on compliance, product positioning, marketing strategies
and skills and manners accompanied by four principles of integrity, innovation, affability and service to upgrade team productivity.• Strengthening ante-risk review and post-risk management by timely examining operational conditions and asset quality, and
irregularly adjusting product pricing and loan policies• To upgrade quality of Relationship Managers so as to realize business strategy on customer differentiation, to expand low-risk
lending base and on the other side, tightly monitor lending quality from high-risk groups. In addition, improved credit investigation and housing valuation procedure aim strengthen monitoring mechanism and strict management procedure.
• Plan to have a standardized, automatic, paperless back office to achieve more competitive and efficient lending procedure. At the same time, this aims to save operational cost and shorten operating time targeting to reach the purpose of economy of scales.
5-1-2--3. Corporate Banking
• Plan to build up a 24-hour corporate network banking platform to provide funds transfer, investment and financial services to meet customer capital demand in order to expand more SME.
• Wholly-owned and partnership of SME are as the target to expand business portfolio according to their business status, credit quality, lending purpose and repayment plan, and also to enhance debt strengthens through SMEG and government-related policies.
• Cooperating with the government’s policies on economy growth and industries upgrading, providing the whole programs on corporate loans, and satisfying the customers’ funding needs in each level.
Annual Report 2016 061

• Focusing on the financial demands of the corporate clients to provide customized products from investing assets to financing liabilities.• To strengthen risk management mechanism based on Basel III principal so as to control debt ratio and upgrade credit quality.• Implementing account personnel system, actively searching new customers and maintaining old customers at the same time. The Bank
holds the account personnel meeting on a regular time schedule. The meeting will discuss the business performance and educate the personnel to enhance the ability to determine the risk of the business operation that will increase competitiveness and profitability.
• Credit officer overview the industry and report to related person in order to grasp market trends.• To strengthen corporate credit issues beforehand so as to tight control and monitor lending limits by industry and its ratio for
preventing from significant centralized risk considering pulse of macro.• Ensuring claims, increasing secure percentage, and reducing the percentage of credit loans. If the loan met the requirement of the
“Small and Medium Enterprise Credit Guarantee Fund”, it should apply the Fund as a guarantor for reducing capital charge.• Following the policies of the government, continuously promoting SME loans to satisfy customers’ needs, enlarging customers’
base and economy of scale, and enhancing market share of the corporate financing.
5-1-2--4. International Banking & Foreign Exchange Business
• Increasing fixed income investment allocation, seeking high-rating overseas securities and creating revenues from financial operation on foreign currency funds.
• Continuing to enforce the professional knowledge and training for personnel in order to enhance ability to expand foreign exchange business.
• Assisting branch to develop potential customers promoting trading finance to create more profits from foreign exchange.• With Guidelines Governing Money Laundering and Terrorist Financing Risks Assessment and Relevant Prevention Program,
planning a system indent to country risks and controlling processes and blacklist check.• Applying more domestic banking units to provide more extensive services.• Planning to develop a new FX system, including building import /export business, securities, and FX trading data mining.• Customer can apply online banking transfer transactions to enhance foreign exchange automation services.• Collaborative IT development branch directly connected to the “central bank foreign exchange data reporting system”, without the
entity to declare the amount of settlement.
5-1-2--5. Wealth Management
• The trust business staffs continue to strengthen their expertise to enhance the marketing capability and expand the size of the trust assets.• Cooperate with the government policy and master business opportunities of elderly; actively promote the “Trust for Elderly Care” to
enhance the customer favorability.• Actively study Customized Trust Commodities to respond more diversified demand, expect to meet the purpose and protect the
interests of beneficiaries. • Continue to increase the domestic and foreign fund products and help integrate the Wealth Management, expect to expand the
fund and trust financial products scale. • Holding the financial seminars irregularly for wealth management customers to share investment information, tax affairs plan,
medicine general knowledge and health finance courses etc. to give them various finance news and correct finances and concept of risks. And actively planning diversified financial products to meet customers’ needs.
• In order to increase the sales amount of the mutual funds and maintain stable growing on fund balance, the Bank quarterly holds sales competitions to encourage branches to promote the business.
• Continuing to strengthen and implement regulatory compliance such as the risk classification of the financial products, investors’ preferences, the customers’ fitness for the financial products, implementation of the sales regulation, and control of the risk
Annual Report 2016062
5. Business Operation

indicators of the sales. The bank takes into account the customers’ needs, bank profits, the sales of the risk management, and internal and external regulatory compliance on wealth management. In addition, the bank strengthens business-related trading platform, automotive operation functions, and flexible marketing to build professional image and reputation.
• Continuing to strengthen and implement regulatory compliance such as the risk classification of the financial products, investors’ preferences, the customers’ fitness for the financial products, implementation of the sales regulation, and control of the risk indicators of the sales. The bank takes into account the customers’ needs, bank profits, the sales of the risk management, and internal and external regulatory compliance on wealth management. In addition, the bank strengthens business-related trading platform, automotive operation functions, and flexible marketing to build professional image and reputation.
• Developing new types of trust products to clients and providing diversified options to achieve the purpose of the growth on assets, the transfer of property, and charitable trust.
• In order to execute marketing from entire staffs, the Bank encourages staffs to obtain related certificates.• Providing training courses to salespeople, improving the professional abilities of the salespeople, strengthening the processes of
sales, and implementing regulatory compliance and risk control.• The Bank observes related standard by education and training guidance to coordinate “Financial Consumer Protection Act” and
“Personal Information Protection Act” execution.• Enhancing the bank’s internal control through internal self-audit, external audit, and self-discipline.• Through the bank’s internal education and external training, strengthen professional training on trust personnel that will be able to
asset allocation.
5-1-2--6. Asset & Liability Management, Risk Management and Funding
• In response to the implementation of the new Basel III, the bank will plan long-term capital allocation to improve common equity that will meet the minimum capital requirements based on international standards and to strengthen risk tolerance.
• Actively cultivating the core deposit client base, obtaining stable low funding cost, optimizing the liability structure, facilitating and increasing the quantity of deposits for both sides effectiveness.
• Strictly monitoring the limits of the market risk in order to balancing returns against risks, optimizing asset allocation, and maintaining the safety and profitability of the capital.
• The Bank promotes the loan and investment business not only follows the Bank Act, related regulations, and the Bank’s internal rules to diversify the risks and to obtain effective usage on funds but also comply the highest limit provisions by industry, corporate groups, and country categories to avoid risk losses.
• Considering the profitability, liquidity, and safety of the fund operation and stability of the source of funds, constructing integrated ALM system to get the risk under control.
• Tightly controlling source of funds and the usage of tenors and interest rates so as to reduce re-pricing risks and maximize net interest income to raise the Bank’s profitability and value.
• The Bank will effectively use the fixed assets and disposal the idle assets to improve efficiency on assets.• Progressively establishing operational strategies on risk-based, continuing to promote growth and improve the long-term goal of the
sustainable development.• Under the principle of the stability, safety and liquidity, the Bank actively searches available investment on excess funds and creates
profitability on assets allocation.• The Bank reviews the sources of the funds and optimizes asset allocation in order to achieve the target on the best earnings.• The Bank will continuously monitor the credit limit management and risk management function, improve structure of the risk assets,
and strength the Bank’s capital adequacy ratio.• In response to changes in the financial environment, handling all kinds of the operational testing to make improvement and closely
watching global economic to take the safe strategies of the risk control.
Annual Report 2016 063

• Managing gaps of the sensibility of the interest rate of the assets and liabilities to reduce basis risks, to make pricing consistent, and to attain earning target.
5-1-2--7. Administration and Human Resource Management
• Controlling the manpower demand and condition, establishing the processes of the employee recruitment, deployment, layoff, and dismissal to ensure the Bank has talent and appropriate staff within a specified period.
• Place appropriate staff at the right time in the appropriate position, so that it can be efficient and effective to assist the Bank to achieve the overall goal.
• Through the financial incentives to encourage employees to increase staff’s centripetal force and morale, reduce the dissatisfaction with the work and give employees a safe working environment.
• Implementing the counseling operation on staff with poor performance to adjust their attitude on job. If the bank makes sure they are not suitable for the bank, they will be eliminated that will fully effective usage on human resources and to improve the bank’s performance.
5-1-2--8. Credit Card Business
• Increase the of “credit card electronic invoice carrier function” to provide user quality service.• Continues to “higher cash back” for the marketing plan that make effective market deference from other banks and help to promote
credit cards. • Continuously streamline credit card operating procedures and modify execution procedures to improve customer satisfaction and
employee efficiency.• Cardholders’ consumption is affected by the unknown economic outlook and the accumulated annual consumption in 2016 is
slightly reduced. Monthly assessment the credit card group performance and inform the branch manager to grasp the progress to achieve annual goals.
• In 2016 to use the top 30 credit cards, the branch promotion staff pro-send or send birthday cards and gifts to enhance the loyalty of the users.
• For a certain amount and in line with Joint Credit Information Center credit score, employees apply for credit cards, to streamline credit card operating procedures.
• To provide tax concessions, such as income tax, land tax, housing tax, etc., to enhance the customer’s willingness to use.• In response to raising the percentage of the cash reward on issuing banks, the Bank will expand the industries of the free surcharge
installments on LOHAS cards and avoid increasing operational costs.• To use the joint credit card processing center “credit card promotion platform” to increase the credit card exposure opportunities and
increase the credit card of the Bank through marketing activities.• Continuously strengthening internal training for the staff of the credit card center that make them to understand and be
familiar with business, to handle customers’ queries with proficiency, to maintain the level of the service, and to reduce error probability.
• Through the “Payment Platform of the Credit Cards in Official Departments” to add the county’s Mortuary Services Office、Administrative Enforcement Agency, MOJ、National Land Surveying and Mapping Center, MOI、Mortuary Services Office、National Tax Administration, Ministry of Finance、Motor Vehicles Office、Department of Environmental Protection and other official department credit card payment to provide intimate service.
• Regularly review the changes in credit cards rates with the cardholder interest rate statement to observe overall changes and new application entry approval rate、bad debt change to assess whether the interest rate is appropriate and the amount of the review are deviated from the principles of risk and reward.
Annual Report 2016064
5. Business Operation

5-1-3. Market Analysis
5-1-3-1 Business Operation Area of the Bank
The Bank primarily focuses on domestic market. Up to Dec. 31, 2016, the Bank owns 30 branches and 1 Offshore Banking Unit which spread over Taipei, New Taipei City, Taoyuan City, Hsinchu City, Taichung City, Changhua County, Changhua City, Tainan City and Kaohsiung City. The Bank will continue to expand the business location in order to establish the full financial service network.
5-1-3-2 The Condition of Market Supply and Demand and Growth Potential in the Future
With international economy performance getting better in 2017 to promote Taiwan’s trade finance and improve domestic economical growth and consuming environment, but under price rising and limited wage increasing make private consumption in real terms growth momentum. Taiwanese banks were influenced by internal and external factors in recent years like high speed development in emerging countries in Southeast Asia, digital financial inspiration as well as cross-border financial services competition. After financing services digitized and virtualized and providing similar product services for every bank, it is import to deal with the challenges and how to take the chance to find new ways to gain more profits.
5-1-3-3 Advantages in Competition and Prospects of Advantages, Disadvantages and Countermeasures
• Advantages■ With operating century, the Bank has stable financial condition and goodwill.■ The bank will continuously develop wealth management and trust business to increase fee income and diversify profit resources.■ The future operating development of the bank will be more stable after the continuous improvement on the structure of deposits
and loans and asset quality.■ The bank size small and with good elasticity can make decisions closer to the market and with height adjustment capability.
• Disadvantages■ Financial globalization and domestic banks face in highly “large-scale” competition compress small and medium banks financial
services.■ Financial institutions’ products are homogeneous and high competitive in the short term does not eliminate and difficult to improve
banking profits.■ The bank runs smaller scale of deposit and loan business, branches distributed mostly in central region of Taiwan is not conducive
to business development.■ With fewer resources to invest in IT equipment for small and medium sized banks to keep up with “Bank 3.0”—a digital
environment policy.
• Countermeasures■ Strengthening capital adequacy and risk tolerance and improving operational quality.■ Raising current deposit proportion and improving deposit structure to reduce funding cost.■ Increasing fee income on wealth management and actively expanding SME lending.■ To keep adjusting branch positions in order to establish a more complete financial services business.■ To optimize bank digital financial services environment and choose suitable digital development strategies to enhance customer
convenience and break through the limits of entities branch distribution.
Annual Report 2016 065

5-1-4. Financial Commodity Research and Development Overview
5-1-4-1. Major Financial Products and New-established Units in Recent 2 Years
• Scale of Major Financial Product: Major Financial Product include TWD and G7 currency deposit, consumer loan, corporate lending, import and export of foreign currency remittance, exchange, finances advisor, trust product and credit card services, please refer to this annual report part 5: Business Operation
• New-established Units: Sep. 08, 2016: Set up Longjing BranchSep. 26, 2016: Set up Taiping BranchNov. 08, 2016: Set up Tianzhong Branch
5-1-4-2. Expenditure and result of Financial Products Research and Development in Recent 2 years
5-1-4-2-1. Expenditure and result of Financial Products Research and Development in Recent 2 years:
• Expenditure and result of Financial Products Research and Development in recent 2 years. Year 2015: TWD3,534 thousand; Year 2016: TWD2,443 thousand
5-1-4-2-2. Financial Products Research and Development Project in Recent 2 years:
• New version Plus for Mobile E-banking officially online• Development of mobile push notification system• To add ID text automatic identification of seal identification system to improve open bank accounts efficiency• Development of interbank FXML trading system• Building big data analysis system• To develop pad system for internal meeting]• Revision of official website to support pages adaptation function• Development of lottery system for business unit activities• To build up online education and training system for employee• Cooperate with authorities to complete the evaluation of information security and ATM offensive and defensive drills• Replacement partial of ATM to build a good space for disabled persons • Credit card certificate management with computers and make e-book of bad debt• To match authorities require to develop prevention and control of anti-money laundering and counter terrorist financing related
systems• Increase “Firewall Hardware”, “Source Code Analysis”, Financial information service remittance and ATM host business system
encipher• Use Microsoft’s AD system to control computer permissions to observe to Personal Information Protection Law• Complete various types of passbook management and the inventory details
5-1-4-2-3. Research and Development Project in the Future:
• To reinforce electronic financial services by keeping R&D on website and internet banking business in order to provide better internet transaction platform to match varied demands.
• Aggressive to create new trust products to enhance bank’s competitive about the trust business• To start internet online business successively in response to Bank 3.0
Annual Report 2016066
5. Business Operation

• In accordance with the timing of process by authorities, the Bank develops plans of money laundry, information risk assessment and risk control.
• Establish standard and simplify operating processes and enhance of IT system integrator.• Development of new financial product like mobile payment、third-party payment etc.• To construct sound risk management organizations and mechanisms to assess and monitor the efficiency of credit risk, market risk,
operational risk and liquidity risk enhancing performance and asset quality• To keep develop cross-board of cash flow service platform in order to get the latest financial market context and trends all
the time.• To strengthen working capitals and enhance sound financial structure in order to develop business.
5-1-5. Long/Short Term Business Development Plan
5-1-5-1. For our Short Term Business Development Plan, details please refer to our profile of Business Plans for Year 2017
5-1-5-2. Long Term Business Development Plan
• Continually focus on development of new financial products and track the following conditions in interbank and customers maintenance. According to customers’ needs to consider the feasibility and the risk of new financial products to increase business profit.
• Aggressive to develop digital financial services and streamline operational procedures to reduce costs and improve the Bank’s client base to attract younger clientele.
• To set up customer database and analysis on customer transactions behavior to provide more in line with customer demand of new financial products.
• Continued on the official website, E-banking and mobile banking APP for innovation and research and develop on network payment platform to match customer needs.
• In line with government policy to provide enterprise credit facilities and promoting strategies to meet corporate capital needs.• To participate charitable activities and implement social responsibility• Based on Fin-Tech development, the Bank strengthens staff training and education to promote professional skill• Under the purpose of sustainable development, the Bank strengthens capital quality, reduces capital cost and improves finance
structure to upgrade ROE.• The Bank adjusts the layout of locations to improve branch benefit and increase management effectiveness.• To create profits and enhance profitability, the Bank makes effort to expand interest spread, develop wealth management business
and increase proportion of fees.• According to the market of innovative consuming financial products, the Bank develops diversified and tailor-made proposals to
create additional value of products and expand services and scale of personal financial loans.• Adjusting the structure of banking profits and expand economy scale to improve operational efficiency in order to reduce costs.
Annual Report 2016 067

5-2. Human Capital
Information of Educational Background for Employees in Recent 2 Years
Year Item 2015 2016 Up to Feb. 28, 2017
Number of Employee 1,133 1,121 1,143Average Age 40.05 40.57 40.43Average Seniority 13.31 13.79 13.62
Structure of Education
PHD 1 1 1Master 84 88 87University / College 852 841 865Senior High School 194 189 188Below 2 2 2
Certificated Proficiency Tests of Employees Total (Up to Feb. 28, 2017)
Basic Proficiency Test for Bank Lending Personnel 564Advanced Proficiency Test for Bank Lending Personnel 38Proficiency Test for Bank Collateral Appraisal Personnel 48Basic Proficiency Test for International Banking Personnel 353Proficiency Test for Foreign Exchange Trading Personnel 46Proficiency Test for Financial Planning Personnel 336Test for Small-Medium Business Financial Staff 178Proficiency Test for Trust Operations Personnel 701Proficiency Test for Obligation & Debt Collection Personnel 162Proficiency Test for Bank Internal Control and Audit Personnel 717Proficiency Test for Financial Risk Management Personnel 3Securities Investment Analysts 8Senior Securities Specialist 199Securities Specialist 118Future Specialist 172Securities Investment Trust & Consulting Professionals 188Qualified Test for Bill Finance Specialist 87Proficiency Test for Bond Specialist 18Proficiency Test for Stock Affair Specialist 11Basic Ability Test for Asset Securitization 7Personal Insurance Representative 724
Annual Report 2016068
5. Business Operation

Certificated Proficiency Tests of Employees Total (Up to Feb. 28, 2017)
Test for Life Insurance Representative (Foreign Currency Base) – Non Investing Insurance Products 461Investment-Orientated Insurance Representative 429Property Insurance Representative 603Personal Risk Manager 1Financial Risk Management (FRM) 1Land Registry Agent 3Property Insurance Agent 4Personal Insurance Agent 2Personal Insurance Broker 2General English Placement Test –High-Intermediate 1General English Placement Test – Intermediate 4General English Placement Test – Elementary 21TOEIC score above 880 2TOEIC score 750-880 5TOEIC score 550-750 14TOEIC score 350-550 10
5-3. Responsibility and Ethical Code
The Bank all along been upholding “what is taken from society, used for the community” to fulfill social responsibility. In June 2016 as TCCE Found initiates the plan “Strong Will Collects Million Books, Constructs Culture City Again”, the Bank donated TWD500,000 in advance as well as established contribution system and encouraged all staff to join this activity through practical action to build Taichung city becoming a happy LOHAS city of reading and lifelong learning. For many years the Bank also sponsored charity activities of Eden Social Welfare Foundation, Taichung Food Bank and held activity of voluntary blood donation with Taichung Blood Center for 2 years that raised 457 donated blood bags of total in 114,250 c.c. The Bank set up “COTA Culture and Education Foundation” in Aug. 1999 to develop the public welfare like as lifelong learning lectures, arranging book club for elder persons, with other public interest groups held health talks and friendship activities for retirees. To encourage children’s imagination and create positive effect, the Bank sponsored children drawing competition by Taichung City Huludun Cultural Center in 11 years. In the future the Bank commits to provide better financial services and continues to participate in activities that enhance community well-being so as to achieve the effect of resource sharing and with people join social welfare.
Annual Report 2016 069

5-4. Number of non-supervisory positions employees, average annual welfare expenses and the difference between two years
Unit: TWD
Item 2015 2016Non-supervisory Employee Welfare Expenses 1,092,514,541 1,118,223,675Number of Non-supervisory Employees 1,085 1,073Average Welfare Expense for each Non- supervisory Employee 1,006,926 1,042,147
Note: 1. Definition of “Employee” is that individual provides service for the Bank and under the supervision (irrespective of the nationality and foreigners) which does not
contain only contacts with the Bank (ex. Insurance agents earn commission, after completion of agreed work to earn remuneration and without the act of employee rights), outsourcing or the temp as well as directors and supervisors.
2. “Non-Supervisory Position” is not responsible for the management of staff or with administrative responsibility of unit3. “Employee Welfare Expense” is all forms of consideration of the Bank can offer in exchange for the staff to provide services according to IAS19. And follow the rule
of Regulations Governing the Preparation of Financial Reports by Public Banks, “Employee Welfare Expense” includes employee salaries, Labor Insurance, Health Insurance, retirement pensions and other employee benefits (including commission and net income of fees etc.)
5-5. IT Equipment
The Bank uses IBM UNIX server for Business System, Testing System, Inter-bank Business and Utility System separately. Furthermore, we also uses Windows server and Linux server depend on different business lines.
Up to date, our working software includes Demand Deposits System, Time Deposit System, Comprehensive Deposit System, Bill Collection System, Financial Consultants System, Credit System, Trust Business System, Checks Clearing System, ATM & Chip-Card System, Internet Banking System, Mobile Banking System, Automatic Phone Voice Service System, Correspondent System, Credit Checking System, Chops System, Staff Field System (including E-Document System, Staff Management System, Personnel & Wages System, Operation Analysis System, Credit Review System, Messaging System, Information Transmitting System, Consuming Business System, SME Banking Business System, Wealth Management Business System, Joint-Credit MQ Information System, Teaching film Platform, Field of Staff and Banking Business…), Accounting System, Safe System, Foreign Exchange System (DBU and OBU), Credit Card System and Gold Passbook etc.
In respond to the implementation Personal Information Protection Act, prevent data leakage, enhance with query, restriction on use data and record. Build up environment of AD (Active Directory), strengthen the management of Terminal computer equipment using and we built up LDP (Data Loss Prevention/Protection) system to intercept the possible leaking of personal information through email, internet or USB device. On the safety of web page, we have purchased web page safety testing system to prevent from the leaking of program.
To follow the act of Anti-Money Laundering and Counter Terrorist Financing, the Bank sets up related computer systems of customer risk revaluation, high risk list detection, filters of suspicious transaction data, cash transaction report, Import/ Export and cross-border remittance transactions monitoring etc.
The Bank uses Mirror Disks to protect all transactions data completely and keeps duplicates of disc and magnetic film every working day. Use two telecommunication circuits of lines and build 3G/4G wireless backup. Main communication equipment applied HA framework so that on-line automatic replacement is available when it failed. There is a hard copy for surrounded equipments and with a system safety controlling mechanism so as to guarantee safety of transactions.
Annual Report 2016070
5. Business Operation

5-6. Labor-Management Relationship
5-6-1. In order to stabilize the quality of staff life and improve the working efficiency, the Bank takes care of the welfare for staff with regard to give birth, marriage and funeral events, medical treatment and accidents.
5-6-1-1. Group Insurance
In accordance with laws and regulations, the Bank applies Labor Insurance and National Health Insurance for all staff. We will give cash and medical payment through Bureau of Labor Insurance and Bureau of National Health Insurance separately if any accident caused. Moreover, we cover accident insurance with Shin Kong Life for all staff.
5-6-1-2. Bonus
Based on revenue performance, the Bank provides extra bonus at Lunar New Year, Dragon Boat Festival and Mid-Autumn Festival each year. The net earnings by fix ratio are assigned to be bonus for staff with good performance after covering prior years’ deficits, income tax, and legal reserves and distribute bonus.
5-6-1-3. Incentive Interest Rate
The Bank provides favorable interest rate of deposits or loans for all staff.
5-6-1-4. Security and Hygiene
To prevent occupational disaster and ensure staff health, the Bank takes care of security and hygiene in accordance with related laws of worker safety sanitation.
5-6-1-5. Staff Proficiency Training
To enhance the level of our employee of profession, we are holding training courses and professional lessons.
The Bank’s pension fund is pursuant to old-version and updated version which based on Labor Law for “Staff Retirement Plan”. The benefit payments and credits suit separately by the above-mentioned plans and based on the years of service and final salary. In accordance with Labor Law, we will calculate 15% of total salaried employees by month (exclude appointed managerial employee) to be retirement payment that was deposited in the pension account in the Bank of Taiwan. We have another account for appointed management that calculated 8% of their salary each month. The Bank has no significant argument between employee and employer at present.
5-6-2. Damage from Argument between Labor and Capital in Recent 2 Years
All personnel management and staff welfares of the Bank are conformed to Labor Law. We retain agreeable labor-capital relationship and never suffered damage from arguments and wish so for future.
Annual Report 2016 071

5-7. Major Contracts
Nature of Contract Concern Party Contractual Period Major Content Restrictive Covenants
Deposit Insurance Contract
Central Deposit Insurance Corp. Engaged on Aug. 15, 1995 To enhance protection of customer
deposits
The same depositor maximum amount of compensation is up to TWD3 million
Bank Comprehensive Insurance
Chung Kuo Insurance Co., Ltd. From Apr. 1, 2016 to Apr. 1, 2017
1. Staff unfaithful behavior2. Asset of branches3. Asset in transit4. Forged drafts and securities5. Forged cash6. Damage of equipment7. Fault of securities or contracts8. Inadvertency of short banknotes
None
Outsourcing Contract Yuen Foong Paper Co., Ltd. From May 3, 2016 to May 2, 2017 Transaction statements None
Outsourcing Contract Han Yeh Office Supplies Company From May 3, 2016 to May 2, 2017 Computer printing jobs and packages None
Outsourcing Contract Taiwan Security Co., Ltd. and Lian-An Co., Ltd. From Jan. 1, 2016 to Dec. 31, 2017 Loading cash & troubleshooting of
AMT None
Outsourcing Contract Taiwan Security Co., Ltd. From Jun. 1, 2016 to May 31, 2017 Securities, cheques and cash delivery None
Outsourcing Contract Feng Tay Motor Co., Ltd. From Jun. 27, 2016 to Jun. 27, 2017 To search cars for overdue payments of car loans None
Outsourcing Contract 21Century Finance Service From Jun. 27, 2016 to Jun. 27, 2017 To search cars for overdue payments of car loans None
Outsourcing Contract Sinjang Co., Ltd. From Jun. 27, 2016 to Jun. 27, 2017 Authorization of vehicle auction None
Outsourcing Contract President Chain Store Corporation From May 1, 2016 to Apr. 30, 2017 Collection for consumer loans None
Outsourcing Contract National Credit Card Center of R.O.C.
From Mar. 10, 2007 to either party in writing of termination and confirm the termination date
Credit card business (credit card payment system & support services) None
Outsourcing Contract President Chain Store Corporation From Jun. 13, 2016 to Jun. 13, 2017 Collection for credit card payments None
Outsourcing Contract Taiwan Family Mart Co., Ltd. From Apr 5, 2016 to Apr 5, 2017 Collection for credit card payments NoneOutsourcing Contract Hi-Life International Co., Ltd. From Apr 5, 2016 to Apr 5, 2017 Collection for credit card payments NoneOutsourcing Contract OK.Mart From Apr 5, 2016 to Apr 5, 2017 Collection for credit card payments None
Outsourcing Contract Taiwan Name Plate Co., Ltd. From Mar. 10, 2016 to Mar. 9, 2017 Chip-card processing, package and mailing None
Outsourcing Contract Chunghwa Post Co., Ltd. From Jun. 20, 2016 to Jun. 19, 2017 Statements printing & package of full management accounts None
Outsourcing Contract Transnational Logistic Solutions Pte. Ltd. From Dec. 1, 2016 to Nov. 30, 2017 Bank cheques, documents &
securities collection & delivery None
5-8. Information of Approved Securitization Products in Recent Years: None
Annual Report 2016072
5. Business Operation

6. Financial Status
073COTA Commercial Bank Annual Report 2016

6-1. Condensed Balance Sheet and Statement of Comprehensive Income over the Past Five Years
Consolidated Condensed Balance Sheet under IFRSUnit: TWD thousand
YearDescriptions
Financial data during recent 5 yearsUp to
2016 2015 2014 2013 2012Cash, Cash equivalents, due from the Central Bank, and call loan to other banks 24,477,847 24,937,444 23,535,092 24,155,762 25,034,337
Financial asset or Financial Liability at fair value through profit or loss 1,796,034 2,016,660 2,229,841 1,839,732 2,169,921
Available-for-sale financial assets 6,375,802 4,345,123 4,381,065 2,005,933 2,366,152Derivative Financial Assets for Hedging - - - - -Bonds and bills purchased under resale agreements 2,102,052 3,654,787 1,848,138 699,901 1,649,290
Net Receivables 404,658 396,245 374,516 388,615 384,769Current tax Assets 6,725 - - - 23,550Assets Held for Sell - - - - -Net Discounts and Loans 111,725,677 104,728,135 100,969,801 96,230,478 87,964,356Held-to–maturity financial assets 3,525,120 3,506,657 3,423,956 3,535,588 4,523,617Long-term investments under equity method - - - - -Restricted assets - - - - -Other financial assets 186,372 187,701 185,432 182,484 205,909Net property and equipment 1,321,946 1,328,977 1,359,122 1,364,750 1,358,417Investment property 830,192 831,225 691,269 691,906 547,215Intangible assets 107,688 107,588 109,972 109,246 110,300Deferred tax assets 177,823 250,404 257,662 233,766 213,632Other assets 70,841 66,915 69,790 78,482 94,587Total Assets 153,108,777 146,357,861 139,435,656 131,516,643 126,645,052Deposits to The Central Bank and other banks 64,470 64,470 111,139 114,090 652,003Financing to The Central Bank and other banks - - - - -financial liability at fair value through loss 491 1,045 137 237 1,781Hedging derivative financial liabilities - - - - -Bonds and bills held underrepurchased agreements - - - - -
Accounts Payable 732,650 839,543 791,664 721,644 714,472Current tax liability 2,946 8,381 43,427 14,909 76,018Liabilities directly associated with assets held for sale - - - - -
Deposits and remittances 139,736,041 134,979,877 129,389,480 121,910,933 117,510,391Bond payable 3,300,000 1,500,000 1,500,000 1,500,000 1,500,000Preference share liabilities - - - - -Other financial liabilities - - - - -
Annual Report 2016074
6. Financial Status

YearDescriptions
Financial data during recent 5 yearsUp to
2016 2015 2014 2013 2012Provision 299,452 447,437 442,947 448,132 502,254Deferred tax liabilities 115,526 121,430 114,904 116,757 111,412Other liabilities 339,951 358,966 388,658 362,996 298,792
Total liabilitiesBefore allocation 144,591,527 138,321,149 132,782,356 125,189,698 121,367,123After allocation - 138,441,124 132,948,435 125,302,847 121,439,328
Equity attributable to owners of the parent 8,517,250 8,036,712 6,653,300 6,326,945 5,277,929
Share capitalBefore allocation 6,370,695 5,998,771 5,032,692 4,919,543 4,247,338After allocation - 6,370,695 5,198,771 5,032,692 4,319,543
Capital reserve 898,234 898,204 892,620 892,589 884,333
Retained earningsBefore allocation 1,256,421 1,090,916 723,138 508,253 135,666After allocation - 599,017 390,980 281,955 -8,744 (NOTE4)
Other components -8,100 48,821 4,850 6,560 10,592Treasury Shares - - - - -non-controlling interests - - - - -Total Shareholders’ equity
Before allocation 8,517,250 8,036,712 6,653,300 6,326,945 5,277,929After allocation - 7,916,737 6,487,221 6,213,796 5,205,724
Note:1.The earnings distribution for 2016 has not been approved by the 2017 Shareholders’ General Meeting.2. 2013 Implementation evaluation Impairment of individual assets, Recognition Impairment of Assets and Reversal gains TWD145, 327,000. 3. 2015 Implementation evaluation Impairment of individual assets, Recognition Impairment of Investment property and Reversal gains TWD122, 018, 000.4. 2013 Implementation IFRS, Retrospectively Recognition adjusted 2012 Retained earnings.
Entity Condensed Balance Sheet under IFRSUnit: TWD thousand
YearDescriptions
Financial data during recent 5 yearsUp to
2016 2015 2014 2013 2012Cash, Cash equivalents, due from the Central Bank, and call loan to other banks 24,477,847 24,937,444 23,535,092 24,155,759 25,034,333
Financial asset or Financial Liability at fair value through profit or loss 1,796,034 2,016,660 2,229,841 1,839,732 2,169,921
Available-for-sale financial assets 6,375,802 4,345,123 4,381,065 2,005,933 2,366,152Derivative Financial Assets for Hedging - - - - -Bonds and bills purchased under resale agreements 2,102,052 3,654,787 1,848,138 699,901 1,649,290
Net Receivables 390,473 396,919 379,357 388,636 384,692Current tax Assets 6,725 - - - 23,550Assets Held for Sell - - - - -Net Discounts and Loans 111,725,677 104,728,135 100,969,801 96,230,478 87,964,356Held-to–maturity financial assets 3,525,120 3,506,657 3,423,956 3,535,588 4,523,617Long-term investments under equity method 39,513 34,828 24,481 21,514 20,808Restricted assets - - - - -Other financial assets 186,372 187,701 185,432 182,484 205,909
Annual Report 2016 075

YearDescriptions
Financial data during recent 5 yearsUp to
2016 2015 2014 2013 2012Net property and equipment 1,321,946 1,328,904 1,359,012 1,364,602 1,358,359Investment property 830,192 831,225 691,269 691,906 547,215Intangible assets 107,688 107,588 109,972 109,246 110,300Deferred tax assets 177,823 250,404 257,662 233,766 213,632Other assets 68,825 64,790 67,628 76,470 94,178Total Assets 153,132,089 146,391,165 139,462,706 131,536,015 126,666,312Deposits to The Central Bank and other banks 64,470 64,470 111,139 114,090 652,003Financing to The Central Bank and other banks - - - - -financial liability at fair value through loss 491 1,045 137 237 1,781Hedging derivative financial liabilities - - - - -Bonds and bills held underrepurchased agreements - - - - -
Accounts Payable 722,944 839,816 796,955 723,192 715,292Current tax liability - 5,010 41,696 13,577 73,620Liabilities directly associated with assets held for sale - - - - -
Deposits and remittances 139,773,092 135,017,248 129,414,163 121,930,708 117,533,609Bond payable 3,300,000 1,500,000 1,500,000 1,500,000 1,500,000preference share liabilities - - - - -Other financial liabilities - - - - -Provision 299,452 447,437 442,947 448,132 502,254Deferred tax liabilities 115,526 121,430 114,904 116,757 111,412Other liabilities 338,864 357,997 387,465 362,377 298,412
Total liabilitiesBefore allocation 144,614,839 138,354,453 132,809,406 125,209,070 121,388,383After allocation - 138,474,428 132,975,485 125,322,219 121,460,588
Equity attributable to owners of the parent 8,517,250 8,036,712 6,653,300 6,326,945 5,277,929
Share capitalBefore allocation 6,370,695 5,998,771 5,032,692 4,919,543 4,247,338After allocation - 6,370,695 5,198,771 5,032,692 4,319,543
Capital reserve 898,234 898,204 892,620 892,589 884,333
Retained earningsBefore allocation 1,256,421 1,090,916 723,138 508,253 135,666After allocation - 599,017 390,980 281,955 -8,744 (Note.4)
Other components -8,100 48,821 4,850 6,560 10,592Treasury Shares - - - - -non-controlling interests - - - - -Total Shareholders’ equity
Before allocation 8,517,250 8,036,712 6,653,300 6,326,945 5,277,929After allocation - 7,916,737 6,487,221 6,213,796 5,205,724
Note: 1. The earnings distribution for 2016 has not been approved by the 2017 Shareholders’ General Meeting.2. 2013 Implementation evaluation Impairment of individual assets, Recognition Impairment of Assets and Reversal gains TWD145, 327, 000. 3. 2015 Implementation evaluation Impairment of individual assets, Recognition Impairment of Investment property and Reversal gains TWD122, 018, 000.4. 2013 Implementation IFRS, Retrospectively Recognition adjusted2012 Retained earnings.
Annual Report 2016076
6. Financial Status

Entity Consolidated Statement of Comprehensive Income under IFRSUnit: TWD thousand
YearDescriptions
Financial data during recent 5 yearsUp to
2016 2015 2014 2013 2012Interest income 3,414,505 3,467,577 3,283,481 3,133,722 3,053,476Interest expense (Minus) 1,012,506 1,140,481 1,097,041 1,065,136 1,044,144Net Interest income 2,401,999 2,327,096 2,186,440 2,068,586 2,009,332Other net interest income 332,039 576,993 406,865 495,781 334,790Net income 2,734,038 2,904,089 2,593,305 2,564,367 2,344,122Provision for bad debt expense and guarantees 12,120 151,443 292,273 402,713 503,331Operating expense 1,863,275 1,920,708 1,767,902 1,589,294 1,589,168Income from continuing operations before income taxes 858,643 831,938 533,130 572,360 251,623
Tax income (expense) (143,826) (110,746) (92,141) (76,608) (54,748)Net profit from continuing operations 714,817 721,192 440,989 495,752 196,875profit or loss from discontinuing operations - - - - -Current net profit (or loss) 714,817 721,192 440,989 495,752 196,875Current other comprehensive income (after taxes) (114,334) 22,715 (1,516) 17,213 (64,870)
Current Total other comprehensive income 600,483 743,907 439,473 512,965 132,005Net profit attributable to owners of the parent 714,817 721,192 440,989 495,752 196,875Net profit to non-controlling interests - - - - -Current Total other comprehensive income to owners of the parent 600,483 743,907 439,473 512,965 132,005
Current Total other comprehensive income to non-controlling interests - - - - -
Earnings per share 1.12 1.13 0.85 1.08 0.461. Certified public accountants: Shi-Hua Guo and Yuan-Chen Mei for 2012~20162. Opinions: No retained opinion for 2012, No standard retained opinion for 2013~2015, No retained opinion for 2016.
Annual Report 2016 077

Entity Condensed of Comprehensive Income under IFRSUnit: TWD thousand
YearDescriptions
Financial data during recent 5 yearsUp to
2016 2015 2014 2013 2012Interest income 3,414,505 3,467,577 3,283,481 3,133,722 3,053,476Interest expense (Minus) 1,012,682 1,140,662 1,097,231 1,065,307 1,044,254Net Interest income 2,401,823 2,326,915 2,186,250 2,068,415 2,009,222Other net interest income 289,868 531,262 365,273 462,295 295,151Net income 2,691,691 2,904,089 2,593,305 2,564,367 2,344,122Provision for bad debt expense and guarantees 12,120 151,443 292,273 402,713 503,331
Operating expense 1,826,369 1,875,783 1,729,298 1,558,492 1,552,431Income from continuing operations before income taxes 853,202 826,951 529,952 569,3505 248,611
Tax income (expense) (138,385) (105,759) (88,963) (73,753) (51,736)Net profit from continuing operations 714,817 721,192 440,989 495,752 196,875profit or loss from discontinuing operations - - - - -Current net profit (or loss) 714,817 721,192 440,989 495,752 196,875Current other comprehensive income(after taxes) (114,334) 22,715 (1,516) 17,213 (64,870)
Current Total other comprehensive income 600,483 743,907 439,473 512,965 132,005Net profit attributable to owners of the parent 714,817 721,192 440,989 495,752 196,875Net profit to non-controlling interests - - - - -Current Total other comprehensive income to owners of the parent 600,483 743,907 439,473 512,965 132,005
Current Total other comprehensive income to non-controlling interests - - - - -
Earnings per share 1.12 1.13 0.85 1.08 0.461. Certified public accountants: Shi-Hua Guo and Yuan-Chen Mei for 2012~20162. Opinions: No retained opinion for 2012, No standard retained opinion for 2013~2016, No retained opinion for 2016.
Annual Report 2016078
6. Financial Status

6-2. Analysis on Major Financial Ratios for Recent Five Years
Under IFRS ConsolidatedUnit: TWD thousand; %
Year (Note.1)Descriptions (Note.3)
Financial analysis during recent 5 years2016 2015 2014 2013 2012
Operating Capability
Loans to deposits ratio (%) 81.54 79.39 79.97 80.78 76.26Overdue loan ratio (%) 0.22 0.21 0.34 0.36 0.37Interest expense to average balance of deposits ratio (%) 0.70 0.82 0.83 0.89 0.91
Interest income to average balance of loans ratio (%) 2.79 2.80 2.74 2.79 2.96
Total assets turnover (times) 0.02 0.02 0.02 0.02 0.02Average operating revenue per employee 2,417 2,543 2,275 2,246 2,038Average earnings per employee 626 632 387 434 174
Profitability
Return on first capital type assets (%) 10.85 11.90 8.66 10.21 4.87ROA (%) 0.48 0.50 0.33 0.38 0.16ROE (%) 8.64 9.82 6.79 8.54 3.75Net income ratio (%) 26.15 24.83 17.00 19.59 8.54EPS (loss) 1.12 1.35 0.85 1.08 0.46
Financial structure
Ratio of liabilities to assets 94.41 94.49 95.22 95.19 95.83Ratio of fix assets to shareholder’s equity 15.52 16.54 20.43 21.57 25.74
GrowthRate
Asset growth rate (%) 4.61 4.96 6.01 3.84 4.11Profitability growth rate (%) 3.21 56.05 -6.39 129.07 17.72
Cash flow
Cash flow ratio Note9 67.27 Note9 Note9 Note9Cash flow adequacy ratio Note9 N/A N/A N/A N/ARatio of cash flow for operating to cash flow from investing Note9 Note9 Note9 Note9 Note9
Liquid Reserves Ratio (%) 17.42 18.99 18.99 17.43 16.40Secured Loans to Related Parties 787,649 756,883 756,883 720,777 747,910Secured Loans to Related Parties to Total Outstanding Loans Ratio (%) 0.70 0.71 0.71 0.70 0.77
OperationScale
Market share of assets (%) 0.22 0.22 0.22 0.23 0.24Market share of net worth (%) 0.15 0.15 0.14 0.15 0.13Market share of deposits (%) 0.44 0.44 0.45 0.45 0.46Market share of loan (%) 0.49 0.47 0.47 0.47 0.44
The specify reasons of changes in financial ratios for the latest two years: (If the variation does not reach 20%, the analysis can be omitted.) 1. The profitability growth rate fluctuation change reaches 20%, mainly is because Implementation evaluation Impairment of individual assets, Recognition Impairment
of Assets and Reversal gains in 2015, and the loan the quantity increase and the cash capital increase result in 2016.* If the company has the establishment individual financial report, should establish the company individual finance ratio analysis in addition.Note:1. It should be specified if the year without checked visa by CPA auditor.2. If there is recent financial information reviewed by CPA before annual report was printed, the Bank will reveal all information.
Annual Report 2016 079
3. Calculation formula (1) Operating ability (A) Ratio of loans to deposits = Total loans / deposits (B) Ratio of overdue = (Loans Overdue + Other Overdue) / Total Loans (C) Ratio of interest Cost to Annual Average Deposits = interest Cost /Annual Average Deposits (D) Ratio of interest income to Annual Average Loans Outstanding = Interest Income / Annual Average Loans Outstanding (E) Total Assets Turnover = Net Operating Revenue / Total Assets (F) Average Operation Revenue per Employee = Net Operating Revenue / Number of Employees (G) Average Profit per Employee = After-tax Income / Total Number of Employees (2) Profitability (A) Return on Tier I Capital = Pretax Earnings or Losses / Total Average Tier I Capital (B) Return on Assets = Net Income / Average of Total Assets (C) Return on Shareholders’ Equity = Net income / Average of Total Shareholders’ Equities (D) Ratio of Net Income = Net Income / Total Revenue (E) Earnings per Share = (Net Income – Preferred stock Dividend) /Average Weighted Outstanding Stock (Note.5) (3) Financial Structure (A) Ratio of Liabilities to Assets = Liabilities / Total Assets (B) Ratio of Fix Assets to Shareholders’ Equity = Fix Assets / Shareholders’ Equities (4) Growth Rate (A) Asset Growth Rate = (Total Assets of the Year-Total Assets of Previous Year)/Total Assets of Previous Year (B) Profit Growth Rate = (Pretax Earnings or Losses of the Year-Before-tax Earnings or Losses of Previous Year)/ Pretax Earnings or Losses of Previous Year (5) Cash Flow (Note.8) (A) Ratio of Cash Flow = Net cash flow from business activities /(call loans and overdrafts from banks + commercial paper payable +financial liabilities measured
at fair value through profit or loss + bonds and bills sold under repurchase agreement + current portion of payables) (B) Ratio of Net Cash Flow Adequacy = Net cash flow from business activities for the past five years/ (capital expenditures + cash dividends) for the past
five years (C) Ratio of Cash Flow for operating to cash flow from investing = Net cash flow from business activities/ Net cash flow from investing activities (6) Liquidity Reserves Ratio = Liquid Assets Stipulated by CBC/Reserves Appropriated for various Types of Deposits (7) Operating Scale (A) Market Share of Asset = Total Asset/Total Asset of the major financial institutions (Note.6) (B) Market Share of Net Worth = Net Worth/Total Asset of the major financial institutions (C) Market Share of Deposit = Total Deposit/Total Asset of the major financial institutions (D) Market Share of Loan = Total Loan/Total Asset of the major financial institutions4. Total liabilities do not contain Prepare guarantee responsibility and Accident liability reserve.5. The following shall be noted in the equations of EPS of the preceding paragraph: (1) It is based on weighted average common stock shares instead of the issued stock shares at the end of year. (2) For cash capitalization or Treasury stock trade, the circulation period is to be considered for the calculation of weighted average stock shares. (3) For capitalized retained earnings or additional paid-in, for the calculation of earnings per share of previous years and semi-annual, it is to be adjusted
retroactively and proportionally to the ratio of capitalization but not the issuance period of the capitalization. (4) If the preferred stock is non-convertible cumulative preferred stock, the dividend (distributed or not distributed) is to be deducted from Net Income or is to be
added to Net Loss. (5) If the preferred stock is non-cumulative preferred stock; also, if there is Net income generated, preferred stock dividend is to be deducted from Net income;
however, if there is net loss resulted, no adjustment is required. 6. Can apply for deposit and loan business: Local banks, Branches of foreign banks in Taiwan, Credit Cooperatives, Agriculture, Fisheries and credit department7. The income means the total interest income and non-interest income.8. The following shall be considered in measuring of cash flow analysis: (1) Net cash flow from operating activities means the net cash inflow from operating activities in the cash flow statement. (2) Capital expenditure means the cash outflow from capital investment per year. (3) Cash dividends include of common and preferred stocks. (4) Gross for real estate and equipment means the total real estate and equipment before deduction of accumulated depreciation.9. Relevant ratio of cash flow is Negative, no disintegration.
Annual Report 2016080
6. Financial Status

Under IFRS Condensed Unit: TWD thousand; %
Year (Note.1)Descriptions (Note.3)
Financial analysis during recent 5 years2016 2015 2014 2013 2012
Operating Capability
Loans to deposits ratio (%) 81.52 79.37 79.95 80.77 76.42Overdue loan ratio (%) 0.22 0.21 0.34 0.36 0.37Interest expense to average balance of deposits ratio (%) 0.70 0.82 0.83 0.89 0.91
Interest income to average balance of loans ratio (%) 2.79 2.80 2.74 2.79 2.96
Total assets turnover (times) 0.02 0.02 0.02 0.02 0.02Average operating revenue per employee 2,401 2,523 2,254 2,216 2,032Average earnings per employee 638 637 390 434 174
Profitability
Return on first capital type assets (%) 10.78 11.83 8.60 10.21 4.87ROA (%) 0.48 0.50 0.33 0.38 0.16ROE (%) 8.64 9.82 6.79 8.54 3.75Net income ratio (%) 26.56 25.23 17.28 19.59 8.54EPS (loss) 1.12 1.13 0.85 1.08 0.46
Financial structure
Ratio of liabilities to assets 94.41 94.49 95.20 95.18 95.83Ratio of fix assets to shareholder’s equity 15.52 16.54 20.43 21.57 25.74
GrowthRate
Asset growth rate (%) 4.60 4.97 6.03 3.84 4.11Profitability growth rate (%) 3.17 56.04 (6.95) 129.07 N/A
Cash flow
Cash flow ratio Note9 67.25 Note9 Note9 Note9Cash flow adequacy ratio Note9 N/A N/A N/A N/ARatio of cash flow for operating to cash flow from investing Note9 Note9 Note9 Note9 Note9
Liquid Reserves Ratio (%) 17.42 17.43 18.99 17.43 16.40Secured Loans to Related Parties 787,649 720,777 756,883 720,777 747,910Secured Loans to Related Parties to Total Outstanding Loans Ratio (%) 0.70 0.70 0.71 0.70 0.77
OperationScale
Market share of assets (%) 0.22 0.22 0.22 0.23 0.24Market share of net worth (%) 0.15 0.15 0.14 0.15 0.13Market share of deposits (%) 0.44 0.44 0.45 0.45 0.46Market share of loan (%) 0.49 0.47 0.47 0.47 0.44
The specify reasons of changes in financial ratios for the latest two years: (If the variation does not reach 20%, the analysis can be omitted.) 1. The profitability growth rate fluctuation change reaches 20%, mainly is because Implementation evaluation Impairment of individual assets, Recognition Impairment of Assets and Reversal gains in 2015, and the loan the quantity increase and the cash capital increase result in 2016.* If the company has the establishment individual financial report, should establish the company individual finance ratio analysis in addition.Note:1. It should be specified if the year without checked visa by CPA auditor.2. If there is recent financial information reviewed by CPA before annual report was printed, the Bank will reveal all information.3. Calculation formula (1) Operating ability (A) Ratio of loans to deposits = Total loans / deposits
Annual Report 2016 081

(B) Ratio of overdue = (Loans Overdue + Other Overdue) / Total Loans (C) Ratio of interest Cost to Annual Average Deposits = interest Cost /Annual Average Deposits (D) Ratio of interest income to Annual Average Loans Outstanding = Interest Income / Annual Average Loans Outstanding (E) Total Assets Turnover = Net Operating Revenue / Total Assets (F) Average Operation Revenue per Employee (Note.7)= Net Operating Revenue / Number of Employees (G) Average Profit per Employee = After-tax Income / Total Number of Employees (2) Profitability (A) Return on Tier I Capital = Pretax Earnings or Losses / Total Average Tier I Capital (B) Return on Assets = Net Income / Average of Total Assets (C) Return on Shareholders’ Equity = Net income / Average of Total Shareholders’ Equities (D) Ratio of Net Income = Net Income / Total Revenue (E) Earnings per Share = (Net Income – Preferred stock Dividend) /Average Weighted Outstanding Stock (Note.5) (3) Financial Structure (A) Ratio of Liabilities to Assets = Liabilities / Total Assets (B) Ratio of Fix Assets to Shareholders’ Equity = Fix Assets / Shareholders’ Equities (4) Growth Rate (A) Asset Growth Rate = (Total Assets of the Year-Total Assets of Previous Year)/Total Assets of Previous Year (B) Profit Growth Rate = (Pretax Earnings or Losses of the Year-Before-tax Earnings or Losses of Previous Year)/ Pretax Earnings or Losses of Previous Year (5) Cash Flow (Note.8) (A) Ratio of Cash Flow = Net cash flow from business activities /(call loans and overdrafts from banks + commercial paper payable +financial liabilities measured
at fair value through profit or loss + bonds and bills sold under repurchase agreement + current portion of payables) (B) Ratio of Net Cash Flow Adequacy = Net cash flow from business activities for the past five years/ (capital expenditures + cash dividends) for the past
five years (C) Ratio of Cash Flow for operating to cash flow from investing = Net cash flow from business activities/ Net cash flow from investing activities (6) Liquidity Reserves Ratio = Liquid Assets Stipulated by CBC/Reserves Appropriated for various Types of Deposits (7) Operating Scale (A) Market Share of Asset = Total Asset/Total Asset of the major financial institutions (Note.6) (B) Market Share of Net Worth = Net Worth/Total Asset of the major financial institutions (C) Market Share of Deposit = Total Deposit/Total Asset of the major financial institutions (D) Market Share of Loan = Total Loan/Total Asset of the major financial institutions4. Total liabilities do not contain Prepare guarantee responsibility and Accident liability reserve.5. The following shall be noted in the equations of EPS of the preceding paragraph: (1) It is based on weighted average common stock shares instead of the issued stock shares at the end of year. (2) For cash capitalization or Treasury stock trade, the circulation period is to be considered for the calculation of weighted average stock shares. (3) For capitalized retained earnings or additional paid-in, for the calculation of earnings per share of previous years and semi-annual, it is to be adjusted
retroactively and proportionally to the ratio of capitalization but not the issuance period of the capitalization. (4) If the preferred stock is non-convertible cumulative preferred stock, the dividend (distributed or not distributed) is to be deducted from Net Income or is to be
added to Net Loss. (5) If the preferred stock is non-cumulative preferred stock; also, if there is Net income generated, preferred stock dividend is to be deducted from Net income;
however, if there is net loss resulted, no adjustment is required. 6. Can apply for deposit and loan business: Local banks, Branches of foreign banks in Taiwan, Credit Cooperatives, Agriculture, Fisheries and credit department7. The income means the total interest income and non-interest income.8. The following shall be considered in measuring of cash flow analysis: (1) Net cash flow from operating activities means the net cash inflow from operating activities in the cash flow statement. (2) Capital expenditure means the cash outflow from capital investment per year. (3) Cash dividends include of common and preferred stocks. (4) Gross for real estate and equipment means the total real estate and equipment before deduction of accumulated depreciation.9. Net cash flow from business activities or relevant ratio of cash flow is Negative, no disintegration.
Annual Report 2016082
6. Financial Status

Consolidated Capital Adequacy Ratio under IFRS Unit: TWD thousand; %
Year (Note.1) Items
Capital Adequacy Ratio of Recent Five Year (Note.2)2016 2015 2014 2013 2012
NetCapital
Common equity 8,163,589 7,659,153 6,322,519 5,996,666 N/AOther non-common equity of Tier I Capital - - - - N/ATier I Capital 3,379,440 1,721,351 1,949,132 2,167,578 N/ANet Capital Base 11,543,029 9,380,504 8,271,651 8,164,244 N/A
Total Weighted RiskAssets
Credit Risk
Standardized Approach 97,220,081 83,437,336 78,829,506 72,125,004 N/AInternal-rating-based Approach - - - - N/A
Securitization - - - - N/A
Operational Risk
Basic Indicator Approach 4,992,341 4,795,648 4,477,977 4,209,427 N/AStandardized Approach / Alternative Approach - - - - N/A
Advanced Measurement Approach - - - - N/A
Market RiskStandardized Approach 9,524,884 3,757,382 4,247,874 2,098,803 N/AInternal Model Approach - - - - N/A
Total Risk-weighted Assets 111,737,306 91,990,366 87,555,357 78,433,234 N/ACapital Adequacy Ratio 10.33 10.20 9.45 10.41 N/ATier I Capital to Risk Assets Ratio 7.31 8.33 7.22 7.65 N/ACommon equity to Risk Assets Ratio 7.31 8.33 7.22 7.65 N/ALeverage rate 4.65 4.61 3.98 3.94 N/A
Note:1. It should be specified if the year without audited by CPA auditor.2. The definition of Self-Owned Capital, Risk-Weighted Assets and exposure measure hereby shall be in compliance with the “Regulations Governing the Capital
Adequacy Ratio and Capital Category of Banks” and “Methods for calculation the Self-Owned Capital and Risk-Weighted Assets of Banks.3. Calculation formula: (1) Net Capital Base = Common equity + Other non-common equity of Tier I Capital +Tier II Capital (2) Total Weighted Risk Asset = Credit Risk Weighted Risk Asset + (Operational Risk + Market Risk) Capital Requirement × 12.5 (3) Capital Adequacy Ratio = Net Capital Base / Total Risk Asset (4) Ratio of Tier I Capital to Risk Asset = (Common equity + Other non-common equity of Tier I Capital) / Total Risk Asset (5) Common equity to Risk Assets Ratio = Common equity / Total Risk Asset (6) Leverage rate = Net Tier I Capital / Total risk exposure4. If there is recent financial information reviewed by CPA before annual report was printed, the Bank will reveal all information.5. Reveal lever ratio from 2015.
Annual Report 2016 083

Entity Capital Adequacy Ratio under IFRS Unit: TWD thousand; %
Year (Note.1)Items
Capital Adequacy Ratio of Recent Five Year (Note.2)2016 2015 2014 2013 2012
NetCapital
Common equity 8,163,589 7,659,153 6,322,519 5,996,666 N/AOther non-common equity of Tier I Capital - - - - N/ATier I Capital 3,379,440 1,721,351 1,949,132 2,167,578 N/ANet Capital Base 11,543,029 9,380,504 8,271,651 8,164,244 N/A
Total Weighted RiskAssets
Credit Risk
Standardized Approach 97,220,081 83,437,336 78,829,506 72,125,004 N/AInternal-rating-based Approach - - - - N/A
Securitization - - - - N/A
Operational Risk
Basic Indicator Approach 4,992,341 4,795,648 4,477,977 4,209,427 N/AStandardized Approach / Alternative Approach - - - - N/A
Advanced Measurement Approach - - - - N/A
Market RiskStandardized Approach 9,524,884 3,757,382 4,247,874 2,098,803 N/AInternal Model Approach - - - - N/A
Total Risk-weighted Assets 111,737,306 91,990,366 87,555,357 78,433,234 N/ACapital Adequacy Ratio 10.33 10.20 9.45 10.41 N/ATier I Capital to Risk Assets Ratio 7.31 8.33 7.22 7.65 N/ACommon equity to Risk Assets Ratio 7.31 8.33 7.22 7.65 N/ALeverage rate 4.65 4.61 3.98 3.94 N/A
Note:1. It should be specified if the year without audited by CPA auditor.2. The definition of Self-Owned Capital, Risk-Weighted Assets and exposure measure hereby shall be in compliance with the “Regulations Governing the Capital
Adequacy Ratio and Capital Category of Banks” and “Methods for calculation the Self-Owned Capital and Risk-Weighted Assets of Banks.3. Calculation formula: (1) Net Capital Base = Common equity + Other non-common equity of Tier I Capital +Tier II Capital (2) Total Weighted Risk Asset = Credit Risk Weighted Risk Asset + (Operational Risk + Market Risk) Capital Requirement × 12.5 (3) Capital Adequacy Ratio = Net Capital Base / Total Risk Asset (4) Ratio of Tier I Capital to Risk Asset = (Common equity + Other non-common equity of Tier I Capital) / Total Risk Asset (5) Common equity to Risk Assets Ratio = Common equity / Total Risk Asset (6) Leverage rate = Net Tier I Capital / Total risk exposure4. If there is recent financial information reviewed by CPA before annual report was printed, the Bank will reveal all information.5. Reveal lever ratio from 2015.
Annual Report 2016084
6. Financial Status
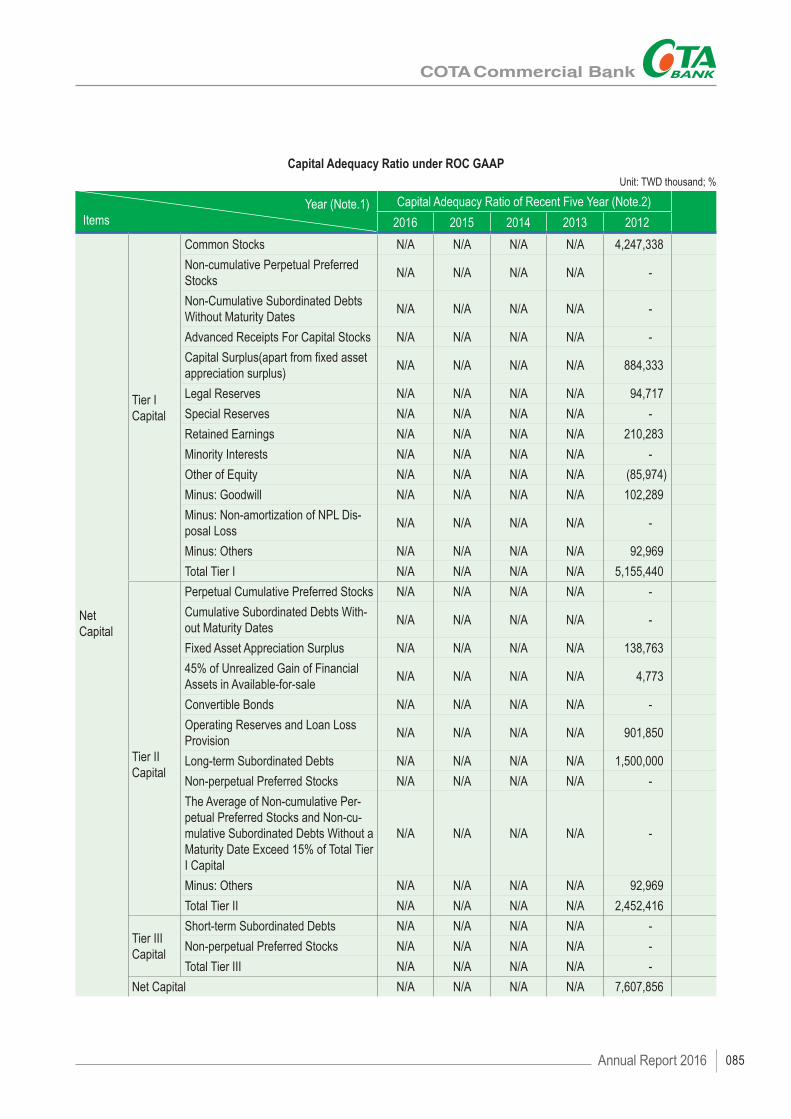
Capital Adequacy Ratio under ROC GAAP Unit: TWD thousand; %
Year (Note.1)Items
Capital Adequacy Ratio of Recent Five Year (Note.2)2016 2015 2014 2013 2012
NetCapital
Tier ICapital
Common Stocks N/A N/A N/A N/A 4,247,338Non-cumulative Perpetual Preferred Stocks N/A N/A N/A N/A -
Non-Cumulative Subordinated Debts Without Maturity Dates N/A N/A N/A N/A -
Advanced Receipts For Capital Stocks N/A N/A N/A N/A -Capital Surplus(apart from fixed asset appreciation surplus) N/A N/A N/A N/A 884,333
Legal Reserves N/A N/A N/A N/A 94,717Special Reserves N/A N/A N/A N/A -Retained Earnings N/A N/A N/A N/A 210,283Minority Interests N/A N/A N/A N/A -Other of Equity N/A N/A N/A N/A (85,974)Minus: Goodwill N/A N/A N/A N/A 102,289Minus: Non-amortization of NPL Dis-posal Loss N/A N/A N/A N/A -
Minus: Others N/A N/A N/A N/A 92,969Total Tier I N/A N/A N/A N/A 5,155,440
Tier IICapital
Perpetual Cumulative Preferred Stocks N/A N/A N/A N/A -Cumulative Subordinated Debts With-out Maturity Dates N/A N/A N/A N/A -
Fixed Asset Appreciation Surplus N/A N/A N/A N/A 138,76345% of Unrealized Gain of Financial Assets in Available-for-sale N/A N/A N/A N/A 4,773
Convertible Bonds N/A N/A N/A N/A -Operating Reserves and Loan Loss Provision N/A N/A N/A N/A 901,850
Long-term Subordinated Debts N/A N/A N/A N/A 1,500,000Non-perpetual Preferred Stocks N/A N/A N/A N/A -The Average of Non-cumulative Per-petual Preferred Stocks and Non-cu-mulative Subordinated Debts Without a Maturity Date Exceed 15% of Total Tier I Capital
N/A N/A N/A N/A -
Minus: Others N/A N/A N/A N/A 92,969Total Tier II N/A N/A N/A N/A 2,452,416
Tier IIICapital
Short-term Subordinated Debts N/A N/A N/A N/A -Non-perpetual Preferred Stocks N/A N/A N/A N/A -Total Tier III N/A N/A N/A N/A -
Net Capital N/A N/A N/A N/A 7,607,856
Annual Report 2016 085
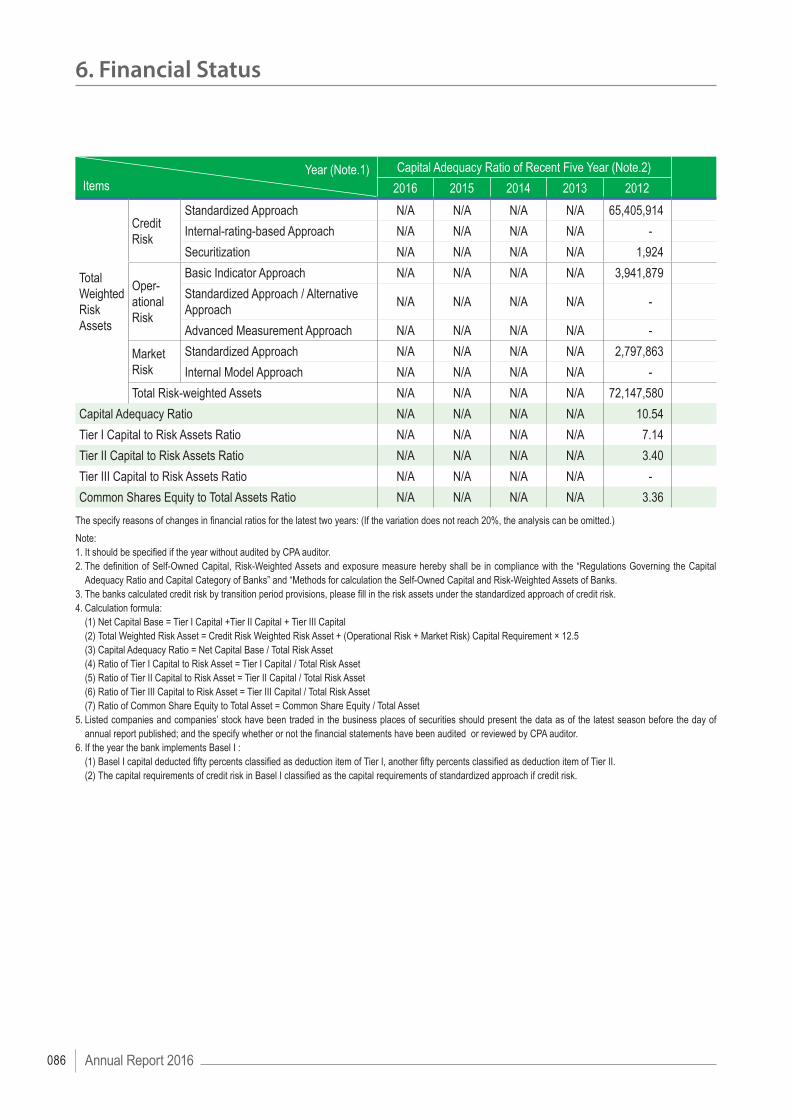
Year (Note.1)Items
Capital Adequacy Ratio of Recent Five Year (Note.2)2016 2015 2014 2013 2012
Total Weighted RiskAssets
Credit Risk
Standardized Approach N/A N/A N/A N/A 65,405,914Internal-rating-based Approach N/A N/A N/A N/A -Securitization N/A N/A N/A N/A 1,924
Oper-ational Risk
Basic Indicator Approach N/A N/A N/A N/A 3,941,879Standardized Approach / Alternative Approach N/A N/A N/A N/A -
Advanced Measurement Approach N/A N/A N/A N/A -
Market Risk
Standardized Approach N/A N/A N/A N/A 2,797,863Internal Model Approach N/A N/A N/A N/A -
Total Risk-weighted Assets N/A N/A N/A N/A 72,147,580Capital Adequacy Ratio N/A N/A N/A N/A 10.54Tier I Capital to Risk Assets Ratio N/A N/A N/A N/A 7.14Tier II Capital to Risk Assets Ratio N/A N/A N/A N/A 3.40Tier III Capital to Risk Assets Ratio N/A N/A N/A N/A -Common Shares Equity to Total Assets Ratio N/A N/A N/A N/A 3.36
The specify reasons of changes in financial ratios for the latest two years: (If the variation does not reach 20%, the analysis can be omitted.)Note: 1. It should be specified if the year without audited by CPA auditor.2. The definition of Self-Owned Capital, Risk-Weighted Assets and exposure measure hereby shall be in compliance with the “Regulations Governing the Capital
Adequacy Ratio and Capital Category of Banks” and “Methods for calculation the Self-Owned Capital and Risk-Weighted Assets of Banks.3. The banks calculated credit risk by transition period provisions, please fill in the risk assets under the standardized approach of credit risk.4. Calculation formula: (1) Net Capital Base = Tier I Capital +Tier II Capital + Tier III Capital (2) Total Weighted Risk Asset = Credit Risk Weighted Risk Asset + (Operational Risk + Market Risk) Capital Requirement × 12.5 (3) Capital Adequacy Ratio = Net Capital Base / Total Risk Asset (4) Ratio of Tier I Capital to Risk Asset = Tier I Capital / Total Risk Asset (5) Ratio of Tier II Capital to Risk Asset = Tier II Capital / Total Risk Asset (6) Ratio of Tier III Capital to Risk Asset = Tier III Capital / Total Risk Asset (7) Ratio of Common Share Equity to Total Asset = Common Share Equity / Total Asset5. Listed companies and companies’ stock have been traded in the business places of securities should present the data as of the latest season before the day of
annual report published; and the specify whether or not the financial statements have been audited or reviewed by CPA auditor.6. If the year the bank implements Basel I : (1) Basel I capital deducted fifty percents classified as deduction item of Tier I, another fifty percents classified as deduction item of Tier II. (2) The capital requirements of credit risk in Basel I classified as the capital requirements of standardized approach if credit risk.
Annual Report 2016086
6. Financial Status

6-3. Auditing committee Report for Latest Year
COTA Commercial Bank Co., Ltd., Auditing committee Report for Year 2017
March 24, 2017
To: Shareholders’ General Meeting of Year 2017
The Business Report, Financial Statement, Consolidated Financial Statement and Earning Distribution of fiscal year 2016, worked out and submitted by COTA Bank board of directors have been duly audited by KPMG Certified Public Accountants, and further verified by us. This Report duly submitted in accordance with Article 219 of the Company Law.
Independent Director : Po-Yao Chi Independent Director : Kun-Hsien Lin Independent Director : Sung-Cheng Huang
Annual Report 2016 087

6-4. Consolidated Financial Report of Accountants’ Examinations for Latest Year
Representation Letter
The entities that are required to be included in the combined financial statements of COTA Commercial Bank Co., Ltd. as of and for the year ended December 31, 2016 under the Criteria Governing the Preparation of Affiliation Reports, Consolidated Business Reports, and Consolidated Financial Statements of Affiliated Enterprises are the same as those included in the consolidated financial statements prepared in conformity with International Financial Reporting Standards No. 10 by the Financial Supervisory Commission, “Consolidated and Separate Financial Statements.” In addition, the information required to be disclosed in the combined financial statements is included in the consolidated financial statements. Consequently, COTA Commercial Bank Co., Ltd. and its Subsidiaries do not prepare a separate set of combined financial statements.
COTA Commercial Bank Co., Ltd. Chairman: Sung-Yie Liao March 24, 2017
Annual Report 2016088
6. Financial Status

Independent Auditors’ Report
To the Board of Directors of COTA Commercial Bank Co., Ltd.:
OpinionWe have audited the consolidated financial statements of COTA Commercial Bank Co., Ltd. and its subsidiaries (“the Group”), which comprise the consolidated balance sheet as of December 31, 2016 and 2015, the consolidated statement of comprehensive income, changes in equity and cash flows for the years ended December 31, 2016 and 2015, and notes to the consolidated financial statements, including a summary of significant accounting policies. In our opinion, the accompanying consolidated financial statements present fairly, in all material respects, the consolidated financial position of the Group as at December 31, 2016 and 2015, and its consolidated financial performance and its consolidated cash flows for the years then ended in accordance with The Regulations Governing the Preparation of Financial Reports by Public Banks, and with the International Financial Reporting Standards (“IFRSs”), International Accounting Standards (“IASs”), interpretation as well as related guidance endorsed by the Financial Supervisory Commission of the Republic of China.
Basis for Opinion We conducted our audit in accordance with the Regulations Governing Auditing and Certification of Financial Statements of Financial Institutions by Certified Public Accountants and the auditing standards generally accepted in the Republic of China. Our responsibilities under those standards are further described in the Auditor’s Responsibilities for the Audit of the Consolidated Financial Statements section of our report. We are independent of the Group in accordance with the Certified Public Accountants Code of Professional Ethics in Republic of China (“the Code”), and we have fulfilled our other ethical responsibilities in accordance with the Code. We believe that the audit evidence we have obtained is sufficient and appropriate to provide a basis of our opinion.
Key Audit MattersKey audit matters are those matters that, in our professional judgment, were of most significance in our audit of the consolidated financial statements of the current period. These matters were addressed in the context of our audit of the consolidated financial statements as a whole, and in forming our opinion thereon, and we do not provide a separate opinion on these matters. We have determined the matters described below to be the key audit matters to be communicated in our report.
1. Impairment of loan and receivablesRefer to Note 4(g) “Financial Instrument”, Note 5(a) “Significant accounting assumptions and judgments, and major sources of estimation uncertainty”, and Note 6(e), 6(f), 6(ag) in the consolidated financial statements.
Description of key audit matter:Loan is the main service for the Bank, so the recoverability of loan and receivables has influence on business operating risk. Therefore, valuation of impairment of loan and receivables has been identified as a key audit matter.How the matter was addressed in our audit:In relation to the key audit matter mentioned above, our principal audit procedures included testing the Company’s internal controls about credit rating of client and its supervising procedure; assessing whether collateral assets are evaluated and the crediting document; whether assessing the loans and receivables are properly classified considering the status of credit guarantee and the length of time overdue; evaluating the measurement of loans and receivables impairment is in accordance with the regulation of the Bank and the Regulations Governing the Procedures for Banking Institutions to Evaluate Assets and Deal with Non-performing/Non-accrual Loans.
2. Measurement of goodwill impairmentRefer to Note 4(k)(2)”intangible assets” for the accounting procedure, Note 5(b)” impairment of goodwill ” for accounting assumption and estimation uncertainty, and Note 6(1)”intangible assets” for further description in the consolidated financial statements.
Annual Report 2016 089

Description of key audit matter:Goodwill is derived from business combination of Feng Yuan credit cooperation. Since the recoverable amount of cash-generating-unit depends on future operating prediction, which is measured at discounted amount of future cash flow that is highly uncertain, and by management’s subjective judgment on future operation, the measurement of goodwill impairment has been identified as a key audit matter.How the matter was addressed in our audit:In relation to the key audit matter mentioned above, our principal audit procedures included assessing the rationality of cash-generating-unit identified by the Bank and assessing whether the assets under impairment testing is completely taken into consideration; obtaining budget document approved by board of director in order to evaluate the rationality of index (such as expected cash flow and discount rate), including retrospective testing and sensitivity analysis.
3. Measurement of investment property impairmentRefer to Note 4(h)”investment property” for the accounting procedure, and Note 6(k)”investment property” for further description in the consolidated financial statements.Description of key audit matter:There are numbers of commercial real estate hold by the Bank are rented to others. In sight of current unsteady of real estate market, the impairment of investment property is possibly under significant risk. Therefore the measurement of investment property impairment has been identified as a key audit matter.How the matter was addressed in our audit:In relation to the key audit matter above, our principal audit procedures included obtaining impairment document prepared by the Bank and assessing the rationality of its evaluating procedure and result through internal and outside collectable information.
Other Matter COTA Commercial Bank Co., Ltd. has prepared its parent-company-only financial statements for reference as of and for the years ended December 31, 2016 and 2015, on which we have issued an unmodified opinion.
Responsibilities of Management and Those Charged with Governance for the Consolidated Financial StatementsManagement is responsible for the preparation and fair presentation of the consolidated financial statements in accordance with “Regulations Governing the Preparation of Financial Reports by Public Banks” and IFRSs, IASs, interpretation as well as related guidance endorsed by the Financial Supervisory Commission of the Republic of China, and for such internal control as management determines is necessary to enable the preparation of consolidated financial statements that are free from material misstatement, whether due to fraud or error. In preparing the consolidated financial statements, management is responsible for assessing the Group’s ability to continue as a going concern, disclosing, as applicable, matters related to going concern and using the going concern basis of accounting unless management either intends to liquidate the Group or to cease operations, or has no realistic alternative but to do so. Those charged with governance (Including members of the Audit committee) are responsible for overseeing the Group’s financial reporting process.
Auditor’s Responsibilities for the Audit of the Consolidated Financial StatementsOur objectives are to obtain reasonable assurance about whether the consolidated financial statements as a whole are free from material misstatement, whether due to fraud or error, and to issue an auditor’s report that includes our opinion. Reasonable assurance is a high level of assurance, but is not a guarantee that an audit conducted in accordance with the auditing standards generally accepted in the Republic of China will always detect a material misstatement when it exists. Misstatements can arise from fraud or error and are considered material if, individually or in the aggregate, they could reasonably be expected to influence the economic decisions of users taken on the basis of these consolidated financial statements.
Annual Report 2016090
6. Financial Status

As part of an audit in accordance with auditing standards generally accepted in the Republic of China, we exercise professional judgment and maintain professional skepticism throughout the audit. We also: 1. Identify and assess the risks of material misstatement of the consolidated financial statements, whether due to fraud or error, design
and perform audit procedures responsive to those risks, and obtain audit evidence that is sufficient and appropriate to provide a basis for our opinion. The risk of not detecting a material misstatement resulting from fraud is higher than for one resulting from error, as fraud may involve collusion, forgery, intentional omissions, misrepresentations, or the override of internal control.
2. Obtain an understanding of internal control relevant to the audit in order to design audit procedures that are appropriate in the circumstances, but not for the purpose of expressing an opinion on the effectiveness of the Group’s internal control.
3. Evaluate the appropriateness of accounting policies used and the reasonableness of accounting estimates and related disclosures made by management.
4. Conclude on the appropriateness of management’s use of the going concern basis of accounting and, based on the audit evidence obtained, whether a material uncertainty exists related to events or conditions that may cast significant doubt on the Group’s ability to continue as a going concern. If we conclude that a material uncertainty exists, we are required to draw attention in our auditor’s report to the related disclosures in the consolidated financial statements or, if such disclosures are inadequate, to modify our opinion. Our conclusions are based on the audit evidence obtained up to the date of our auditor’s report. However, future events or conditions may cause the Group to cease to continue as a going concern.
5. Evaluate the overall presentation, structure and content of the consolidated financial statements, including the disclosures, and whether the consolidated financial statements represent the underlying transactions and events in a manner that achieves fair presentation.
6. Obtain sufficient appropriate audit evidence regarding the financial information of the entities or business activities within the Group to express an opinion on the consolidated financial statements. We are responsible for the direction, supervision and performance of the group audit.
We communicate with those charged with governance regarding, among other matters, the planned scope and timing of the audit and significant audit findings, including any significant deficiencies in internal control that we identify during our audit. We also provide those charged with governance with a statement that we have complied with relevant ethical requirements regarding independence, and to communicate with them all relationships and other matters that may reasonably be thought to bear on our independence, and where applicable, related safeguards.From the matters communicated with those charged with governance, we determine those matters that were of most significance in the audit of the consolidated financial statements of the current period and are therefore the key audit matters. We describe these matters in our auditor’s report unless law or regulation precludes public disclosure about the matter or when, in extremely rare circumstances, we determine that a matter should not be communicated in our report because the adverse consequences of doing so would reasonably be expected to outweigh the public interest benefits of such communication. The engagement partners on the audit resulting in this independent auditor’s report are Shyh-Huar Kuo and Yuan-Chen Mei
KPMGTaipei Taiwan (Republic of China)March 24, 2017
Notes to Readers
The accompanying consolidate financial statements are intended only to present the consolidated financial position, results of operations and cash flows in accordance with the International Financial Reporting Standards approved by the Financial Supervisory Commissions in the Republic of China and not those of any other jurisdictions. The standards, procedures, and practices to audit such financial statements are those generally accepted and applied in the Republic of China.The auditors’ report and the accompanying consolidated financial statements are the English translation of the Chinese version prepared and used in the Republic of China. If there is any conflict between, or any difference in the interpretation of, the English and Chinese language auditors’ report and consolidated financial statements, the Chinese version shall prevail.
Annual Report 2016 091

Dece
mbe
r 31,
20
16De
cem
ber 3
1,
2015
LIAB
ILIT
IES
AND
EQUI
TYAm
ount
%Am
ount
%Li
abilit
ies:
Due t
o the
Cen
tral B
ank a
nd ot
her b
anks
(note
6(m)
)$
64,47
0-
$ 64
,470
- Fin
ancia
l liab
ilities
mea
sure
d at
fair v
alue
throu
gh p
rofit
or lo
ss (n
ote 6(
c))
491
-
1,045
- Pa
yable
s (no
te 6(
n))
732,6
501
839,5
431
Curre
nt inc
ome t
ax lia
bilitie
s 2,9
46-
8,381
- De
posit
s and
remi
ttanc
es (n
ote 6(
o) an
d 7)
139,7
36,04
191
134,9
79,87
793
Subo
rdina
te fin
ancia
l deb
entur
es (n
ote 6(
p))
3,300
,000
21,5
00,00
01
Prov
ision
s (no
tes 6(
q) an
d 6(r)
)29
9,452
- 44
7,437
- De
ferre
d inc
ome t
ax lia
bilitie
s (no
te 6(
s))11
5,526
- 12
1,430
- Ot
her li
abilit
ies33
9,951
- 35
8,966
- To
tal li
abilit
ies14
4,591
,527
9413
8,321
,149
95St
ockh
older
s’ eq
uity (
note
6(t))
:Co
mmon
stoc
k6,3
70,69
54
5,998
,771
4Ca
pital
rese
rve89
8,234
189
8,204
1Re
taine
d ear
nings
:St
atutor
y res
erve
599,0
11-
388,1
94-
Undis
tribute
d ear
nings
657,4
101
702,7
22-
1,256
,421
11,0
90,91
6-
Othe
r item
s in s
tockh
older
s’ eq
uity
(8,10
0)-
48,82
1-
Tota
l sto
ckho
lder
s’ eq
uity
8,517
,250
68,0
36,71
25
Tota
l Liab
ilities
and
Stoc
khol
ders
’ Equ
ity$
153,1
08,77
710
014
6,357
,861
100
Dece
mbe
r 31,
20
16De
cem
ber 3
1,
2015
ASSE
TSAm
ount
%Am
ount
%Ca
sh an
d cas
h equ
ivalen
ts (n
ote 6(
a))
$ 1,7
68,23
11
1,665
,636
1Du
e fro
m Ce
ntral
Bank
and c
all lo
ans t
o ban
k (no
te 6(
b))
22,70
9,616
1523
,271,8
0816
Finan
cial a
ssets
mea
sure
d at
fair v
alue
throu
gh p
rofit
or
loss (
note
6(c))
1,796
,034
12,0
16,66
01
Secu
rities
purch
ased
unde
r res
ell ag
reem
ents(
note
6(d)
)2,1
02,05
22
3,654
,787
3Re
ceiva
bles,
net (
note
6(e)
and 7
)
404,6
58-
396,2
45-
Curre
nt inc
ome t
ax as
sets
6,7
25
- -
- Lo
ans,
net (
note
6(f)
and 7
)11
1,725
,677
7310
4,728
,135
72Av
ailab
le-for
-sale
finan
cial a
ssets
, net
(note
s 6(g
) and
8)6,3
75,80
24
4,345
,123
3He
ld-to-
matur
ity fin
ancia
l ass
ets, n
et (n
otes 6
(h) a
nd 8)
3,525
,120
23,5
06,65
72
Othe
r fina
ncial
asse
ts (n
ote 6(
i))18
6,372
- 18
7,701
- Pr
oper
ty an
d equ
ipmen
t -ne
t (no
te 6(
j))1,3
21,94
61
1,328
,977
1Inv
estm
ent P
rope
rty-
net (
note
6(k))
830,1
921
831,2
251
Intan
gible
asse
ts-
net (
note
6(l))
107,6
88-
107,5
88-
Defer
red i
ncom
e tax
asse
ts (n
ote 6(
s))17
7,823
- 25
0,404
- Ot
her a
ssets
70,84
1-
66,91
5-
TOTA
L ASS
ETS
$ 15
3,108
,777
100
146,3
57,86
110
0
COTA
CO
MM
ERCI
AL
BAN
K CO
., LT
D. A
ND
ITS
SUBS
IDIA
RIES
Cons
olid
ated
Sta
tem
ent o
f Fin
anci
al P
ositi
onD
ecem
ber 3
1, 2
016
and
2015
(E
xpre
ssed
in th
ousa
nds o
f New
Taiw
an D
ollar
s)
See a
ccom
pany
ing no
tes to
finan
cial s
tatem
ents.
Annual Report 2016092
6. Financial Status
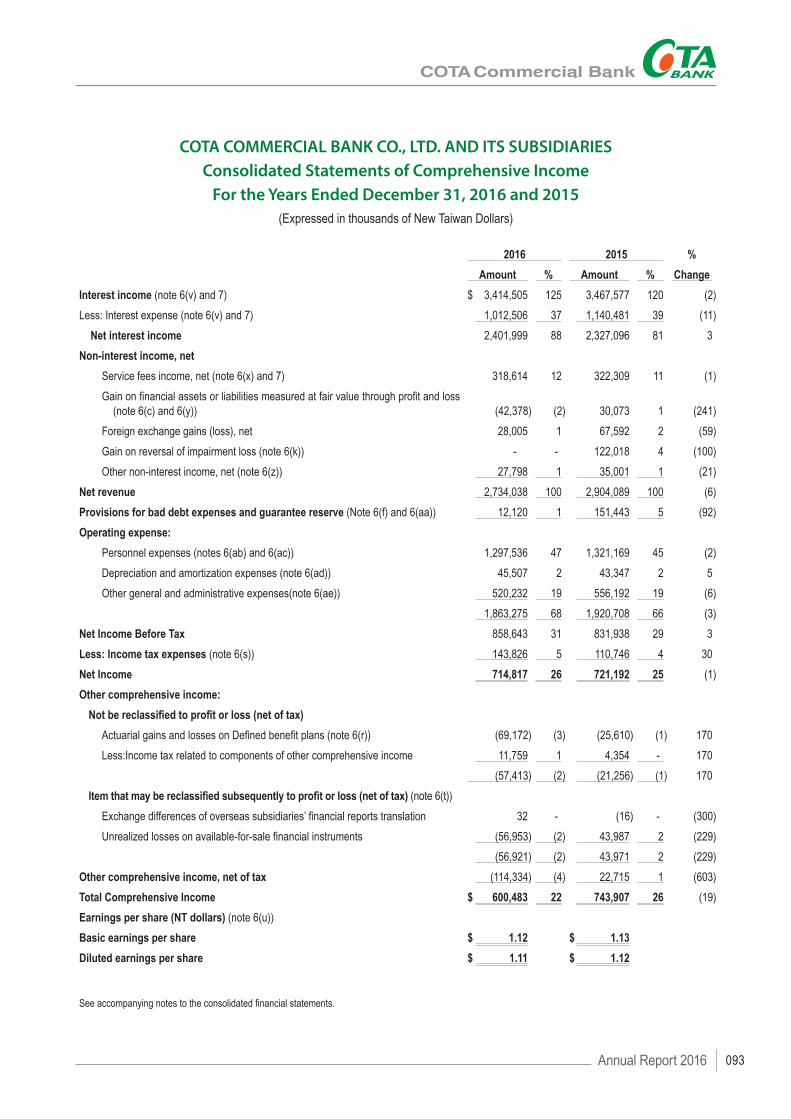
COTA COMMERCIAL BANK CO., LTD. AND ITS SUBSIDIARIESConsolidated Statements of Comprehensive Income
For the Years Ended December 31, 2016 and 2015(Expressed in thousands of New Taiwan Dollars)
2016 2015 %Amount % Amount % Change
Interest income (note 6(v) and 7) $ 3,414,505 125 3,467,577 120 (2)Less: Interest expense (note 6(v) and 7) 1,012,506 37 1,140,481 39 (11)
Net interest income 2,401,999 88 2,327,096 81 3Non-interest income, net
Service fees income, net (note 6(x) and 7) 318,614 12 322,309 11 (1)Gain on financial assets or liabilities measured at fair value through profit and loss
(note 6(c) and 6(y))
(42,378)
(2)
30,073
1
(241)Foreign exchange gains (loss), net 28,005 1 67,592 2 (59)Gain on reversal of impairment loss (note 6(k)) - - 122,018 4 (100)Other non-interest income, net (note 6(z)) 27,798 1 35,001 1 (21)
Net revenue 2,734,038 100 2,904,089 100 (6)Provisions for bad debt expenses and guarantee reserve (Note 6(f) and 6(aa)) 12,120 1 151,443 5 (92)Operating expense:
Personnel expenses (notes 6(ab) and 6(ac)) 1,297,536 47 1,321,169 45 (2)Depreciation and amortization expenses (note 6(ad)) 45,507 2 43,347 2 5Other general and administrative expenses(note 6(ae)) 520,232 19 556,192 19 (6)
1,863,275 68 1,920,708 66 (3)Net Income Before Tax 858,643 31 831,938 29 3Less: Income tax expenses (note 6(s)) 143,826 5 110,746 4 30Net Income 714,817 26 721,192 25 (1)Other comprehensive income:
Not be reclassified to profit or loss (net of tax)Actuarial gains and losses on Defined benefit plans (note 6(r)) (69,172) (3) (25,610) (1) 170Less:Income tax related to components of other comprehensive income 11,759 1 4,354 - 170
(57,413) (2) (21,256) (1) 170Item that may be reclassified subsequently to profit or loss (net of tax) (note 6(t))
Exchange differences of overseas subsidiaries’ financial reports translation 32 - (16) - (300)Unrealized losses on available-for-sale financial instruments (56,953) (2) 43,987 2 (229)
(56,921) (2) 43,971 2 (229)Other comprehensive income, net of tax (114,334) (4) 22,715 1 (603)Total Comprehensive Income $ 600,483 22 743,907 26 (19)Earnings per share (NT dollars) (note 6(u))Basic earnings per share $ 1.12 $ 1.13Diluted earnings per share $ 1.11 $ 1.12
See accompanying notes to the consolidated financial statements.
Annual Report 2016 093

COTA
CO
MM
ERCI
AL
BAN
K CO
., LT
D. A
ND
ITS
SUBS
IDIA
RIES
Cons
olid
ated
Sta
tem
ents
of C
hang
es in
Equ
ity
For t
he Y
ears
End
ed D
ecem
ber 3
1, 2
016
and
2015
(Exp
ress
ed in
thou
sand
s of N
ew Ta
iwan
Doll
ars)
Reta
ined
earn
ings
Othe
r ite
ms i
n st
ockh
olde
rs’ e
quity
Exch
ange
diff
eren
ces o
f ov
erse
as su
bsid
iaries
’ fin
ancia
l rep
orts
tran
slatio
n
Unre
alize
d (lo
sses
) gain
s on
avail
able-
for-s
ale
finan
cial a
sset
s
Tota
l equ
ityCo
mm
on
stoc
kCa
pita
l re
serv
eSt
atut
ory
rese
rve
Undi
strib
uted
ea
rnin
gsBa
lance
- Ja
nuar
y 1, 2
015
$ 5,0
32,69
289
2,620
255,8
9746
7,241
(11)
4,861
6,653
,300
Earn
ings a
ppro
priat
ion an
d dist
ributi
on:
Statu
tory r
eser
ve-
-
13
2,297
(132
,297)
-
-
-
Cash
divid
ends
-
-
-
(166
,079)
-
-
(166
,079)
Stoc
k divi
dend
s16
6,079
-
-
(166
,079)
-
-
-
Issua
nce o
f com
mon s
tock f
or ca
sh80
0,000
-
-
-
-
-
800,0
00Ch
ange
in ot
her c
apita
l sur
plus:
Cost
of em
ploye
e stoc
k opti
on-
5,5
58-
-
-
-
5,5
58Do
nated
capit
al -
26
-
-
-
-
265,9
98,77
189
8,204
388,1
942,7
86(11
)4,8
617,2
92,80
5Ne
t inco
me-
-
-
72
1,192
-
-
721,1
92Ot
her c
ompr
ehen
sive i
ncom
e-
-
-
(2
1,256
)(1
6)43
,987
22,71
5To
tal co
mpre
hens
ive In
come
-
-
-
699,9
36(1
6)43
,987
743,9
07Ba
lance
- De
cem
ber 3
1, 20
15$
5,998
,771
898,2
0438
8,194
702,7
22(2
7)48
,848
8,036
,712
Balan
ce -
Janu
ary 1
, 201
6$
5,998
,771
898,2
0438
8,194
702,7
22(2
7)48
,848
8,036
,712
Earn
ings a
ppro
priat
ion an
d dist
ributi
on:
Statu
tory r
eser
ve-
-
21
0,817
(210
,817)
-
-
-
Cash
divid
ends
-
-
-
(119,9
75)
-
-
(119,9
57)
Stoc
k divi
dend
s37
1,924
-
-
(371
,924)
-
-
-
Chan
ge in
othe
r cap
ital s
urplu
s:Do
nated
capit
al -
30
-
-
-
-
306,3
70,69
589
8,234
599,0
116
(27)
48,84
87,9
16,76
7Ne
t inco
me-
-
-
71
4,817
-
-
714,8
17Ot
her c
ompr
ehen
sive i
ncom
e-
-
-
(5
7,413
)32
(56,9
53)
(114,3
34)
Total
comp
rehe
nsive
Inco
me-
-
-
65
7,404
32(5
6,953
)60
0,483
Balan
ce -
Dece
mbe
r 31,
2016
$ 6,3
70,69
589
8,234
599,0
1165
7,410
5(8
,105)
8,517
,250
See a
ccom
pany
ing no
tes to
the c
onso
lidate
d fina
ncial
state
ments
.
Annual Report 2016094
6. Financial Status

COTA COMMERCIAL BANK CO., LTD. AND ITS SUBSIDIARIESConsolidated Statements of Cash Flows
For the Years Ended December 31, 2016and 2015(Expressed in thousands of New Taiwan Dollars)
2016 2015Cash Flows from Operating Activities:
Net Income Before Tax $ 858,643 831,938Adjustments to Reconcile Net Income Before Tax to Net Cash Provided by Operating Activities:
Income and expense items with no effect on cash flows Depreciation expenses 43,208 40,623Amortization expenses 2,299 2,724Provision for bad debt expenses 8,120 153,943Interest expenses 1,012,506 1,140,481Interest income (3,414,505) (3,467,577)Dividends earned (6,508) (17,315)Change of provisions for bad debt expenses and guarantee reserve 4,000 (2,500)Losses on disposal and retirement of premises and equipment 2,975 (91)Gains on reversal of impairment loss on non-financial assets - (122,018)Cost of employee stock option - 5,558
Subtotal of income and expense items with no effect on cash flows (2,347,905) (2,266,172)Changes in Operating Assets and Liabilities:
Changes in Operating Assets:Increase in due from Central Bank and call loans to banks (32,210) (223,521)Decrease in financial assets measured at fair value through profit or loss 220,626 213,181Decrease (Increase) in Securities purchased under resell agreements 1,552,735 (1,806,649)Increase in receivables (17,964) (12,553)Increase in discounts and loans (7,003,153) (3,911,687)Decrease (Increase) in available-for-sale financial assets (2,087,632) 79,929Increase in held-to-maturity financial assets (18,463) (82,701)Decrease (Increase) in other financial assets 1,329 (2,269)(Increase) Decrease in other assets (9,140) 6,131
Total net change in operating assets (7,393,872) (5,740,139)Changes in Operating Liabilities:
Increase in deposits from Central Bank and banks - (46,669)(Decrease) Increase in financial liabilities measured at fair value through profit or loss (554) 908(Decrease) Increase in payables (94,232) 40,275Increase in deposits and remittances 4,756,164 5,590,397Decrease in provisions for employee benefits (221,149) (18,639)Decrease in other liabilities (19,023) (29,673)Total net change in operating liabilities 4,421,206 5,536,599
Total change in operating assets and liabilities (2,972,666) (203,540)Total Adjustments (5,320,571) (2,469,712)Cash outflow generated from operations (4,461,928) (1,637,774)Interest received 3,421,547 3,457,811Dividends received 6,508 17,315Interest paid (1,025,167) (1,132,877)Income tax paid (77,550) (127,654)
Net Cash flows from used in Operating Activities (2,136,590) 576,821Cash Flows from (used in) Investing Activities:
Purchase of property and equipment (37,621) (28,702)Disposal of property and equipment 573 377Purchase of intangible assets (2,399) (340)Decrease (Increase) in other assets 4,143 (3,256)
Net Cash flows from(used in) Investing Activities (35,304) (31,921)Cash Flows from (used in) Financing Activities:
Issuance of financial debentures 1,800,000 -Issuance of common stock for cash - 800,000Donated capital 30 26Payment of cash dividends (119,975) (166,079)
Net Cash Provided from (used in) Financing Activities 1,680,055 633,947Effect of exchange rate changes on cash and cash equivalents 32 (16)Net Decrease in Cash and Cash Equivalents (491,807) 1,178,831Cash and Cash Equivalents, at the Beginning of the Period 20,601,207 19,422,376Cash and Cash Equivalents, at the End of the Period $ 20,109,400 20,601,207Components of cash and cash equivalents:
Cash and cash equivalents recognized in the balance sheet $ 1,768,231 1,665,636Due from Central Bank and call loans to banks which meet IAS 7 definition of cash and cash equivalents 18,341,169 18,935,571Cash and Cash Equivalents, at the End of the Period $ 20,109,400 20,601,207
See accompanying notes to the consolidated financial statements.
Annual Report 2016 095

COTA COMMERCIAL BANK CO., LTD. AND ITS SUBSIDIARIESNotes to Consolidated Financial Statements
December 31, 2016 and 2015(Expressed in thousands of NTD, unless otherwise stated)
1. Company history
COTA Commercial Bank Co., Ltd. (the Group) was established in 1915 as a credit cooperative. Effective from January 1, 1999, the Company changed its status to commercial bank and its name to COTA Commercial Bank Co., Ltd. in accordance with the Company Law and the Banking Law. Pursuant to a stockholders’ resolution on September 17, 2005 and as approved by the regulatory authorities, the Company merged Fengyuan Credit Cooperative on January 1, 2006. The Company currently has 30 domestic branches and one offshore banking unit.
The Company is engaged in:
■ Receiving deposits, extending loans, investing in bills and bonds, processing funds remittance, acceptances and guarantees, issuing letters of credit and providing other agency business (except for issuing foreign letters of credit and providing foreign guarantees);
■ Buying and selling foreign currencies and traveler’s checks;
■ Credit card related services;
■ Trust and fiduciary services;
■ Foreign exchange service as authorized by the Central Bank;
■ Commercial banking business related to international trade.
2. Approval Date and procedures of the Consolidated Financial Statements
The Consolidated Financial Statements were approved and announced by the board of directors on March 24, 2017.
3. New standards and interpretations
(a) Impact of the International Financial Reporting Standards ( ''IFRSs'' ) endorsed by the Financial Supervisory Commission, R.O.C. ( ''FSC'' ) but not yet in effect
According to Ruling No. 1050026834 issued on July 18, 2016, by the FSC, public entities are required to conform to the IFRSs which were issued by the International Accounting Standards Board (IASB) before January 1, 2016, and were endorsed by the FSC on January 1, 2017 in preparing their financial statements. The related new standards, interpretations and amendments are as follows:
Annual Report 2016096
6. Financial Status

New, Revised or Amended Standards and Interpretations Effective date per IASBAmendments to IFRS 10, IFRS 12 and IAS 28 “Investment Entities: Applying the Consolidation Exception”
January 1, 2016
Amendments to IFRS 11 “Accounting for Acquisitions of Interests in Joint Operations” January 1, 2016IFRS 14 “Regulatory Deferral Accounts” January 1, 2016Amendments to IAS 16 and IAS 38 “Clarification of Acceptable Methods of Depreciation and Amortization”
January 1, 2016
Amendments to IAS 16 and IAS 41 “Agriculture: Bearer Plants” January 1, 2016Amendments to IAS 19 “Defined Benefit Plans: Employee Contributions” July 1, 2014Amendment to IAS 27 “Equity Method in Separate Financial Statements” January 1, 2016Amendments to IAS 36 “Recoverable Amount Disclosures for Non-Financial Assets” January 1, 2014Amendments to IAS 39 “Novation of Derivatives and Continuation of Hedge Accounting” January 1, 2014Annual Improvements to IFRSs 2010-2012 Cycle and 2011-2013 Cycle July 1, 2014Annual Improvements to IFRSs 2012-2014 Cycle January 1, 2016IFRIC 21 “Levies” January 1, 2014
The Group assessed that the initial application of the above IFRSs would not have any material impact on the consolidated financial statements.
(b) Newly released or amended standards and interpretations not yet endorsed by the FSC
A summary of the new standards and amendments issued by the IASB but not yet endorsed by the FSC. The FSC announced that the Group should apply IFRS 9 and IFRS 15 starting January 1, 2018. As of the date the Group’s financial statements were issued, the FSC has yet to announce the effective dates of the other IFRSs.
New, Revised or Amended Standards and Interpretations Effective date per IASBIFRS 9 “Financial Instruments” January 1, 2018Amendments to IFRS 10 and IAS 28 “Sale or Contribution of Assets Between an Investor and Its Associate or Joint Venture”
Effective date to be determined by IASB
IFRS 15 “Revenue from Contracts with Customers” January 1, 2018IFRS 16 “Leases” January 1, 2019Amendment to IFRS 2 “Clarifications of Classification and Measurement of Share-based Payment Transactions”
January 1, 2018
Amendment to IFRS 15 “ Revenue from Contracts with Customers-Clarifications of IFRS 15” January 1, 2018Amendment to IAS 7 “Statement of Cash Flows- Disclosure Initiative” January 1, 2017Amendment to IAS 12 “Income Taxes- Recognition of Deferred Tax Assets for Unrealized Losses” January 1, 2017Amendments to IFRS 4 “Insurance Contracts” (“Applying IFRS 9 Financial Instruments with IFRS 4 Insurance Contracts”)
January 1, 2018
Annual Improvements to IFRS Standards 2014–2016 Cycle:IFRS 12 “Disclosure of Interests in Other Entities”IFRS 1 “First-time Adoption of International Financial Reporting Standards” and IAS 28 “Investments in Associates and Joint Ventures”
January 1, 2017January 1, 2018
IFRIC 22 “Foreign Currency Transactions and Advance Consideration” January 1, 2018Amendments to IAS 40 “Investment Property” January 1, 2018
Annual Report 2016 097

The Group is still currently determining the potential impact of the standards listed below:
Issuance / Release Dates
Standards or Interpretations Content of amendment
May 28, 2014 April 12, 2016
IFRS 15 “Revenue from Contracts
with Customers”
IFRS 15 establishes a five-step model for recognizing revenue that applies to all contracts with customers, and will supersede IAS 18 "Revenue," IAS 11 "Construction Contracts," and a number of revenue-related interpretations.Final amendments issued on April 12, 2016, clarify how to (i) identify perfor-mance obligations in a contract; (ii) determine whether a company is a prin-cipal or an agent; (iii) account for a license for intellectual property (IP); and (iv) apply transition requirements.
November 19, 2013
July 24, 2014
IFRS 9 “Financial Instruments”
The standard will replace IAS 39 “Financial Instruments: Recognition and Measurement”, and the main amendments are as follows:• Classification and measurement: Financial assets are measured at amor-
tized cost, fair value through profit or loss, or fair value through other comprehensive income, based on both the entity's business model for managing the financial assets and the financial assets' contractual cash flow characteristics. Financial liabilities are measured at amortized cost or fair value through profit or loss. Furthermore, there is a requirement that "own credit risk" adjustments be measured at fair value through other com-prehensive income.
• Impairment: The expected credit loss model is used to evaluate impairment.• Hedge accounting: Hedge accounting is more closely aligned with risk
management activities, and hedge effectiveness is measured based on the hedge ratio.
January 13, 2016 IFRS 16 “Leases” The new standard of accounting for lease is amended as follows:• For a contract that is, or contains, a lease, the lessee shall recognize a
right-of-use asset and a lease liability in the balance sheet. In the state-ment of profit or loss and other comprehensive income, a lessee shall pres-ent interest expense on the lease liability separately from the depreciation charge for the right-of use asset during the lease term.
• A lessor classifies a lease as either a finance lease or an operating lease, and therefore, the accounting remains similar to IAS 17.
The Group is evaluating the impact on its financial position and financial performance of the initial adoption of the abovementioned standards or interpretations. The results thereof will be disclosed when the Group completes its evaluation.
4. Summary of significant accounting policies
Significant accounting policies which consistently adopted by the company and its subsidiaries in accounting period of consolidated financial statements are summarized as below.
(a) Assertion of compliance
The consolidated financial reports were prepared in accordance with the Regulations Governing the Preparation of Financial Reports by Public Banks (hereinafter referred to the Regulations).
Annual Report 2016098
6. Financial Status

(b) Basis of Compilation
(1) Basis of measurement
The consolidated financial statements have been prepared on a historical cost basis except for the following material items in the statement of financial:
(i) Financial instruments measured at fair value through profit or loss are measured at fair value (including derivative financial instruments);
(ii) Available-for-sale financial assets measured at fair value; (iii) Defined Benefit liabilities, which are recognized at the present value of defined benefit obligation plus (minus) fair
value of pension plan liabilities (assets), unrecognized actuarial losses (gains), and unrecognized service cost.
(2) Functional currency
The functional currency of the Bank is the currency of the primary economic environment in which it operates. The consolidated financial reports are presented in New Taiwan Dollars, the functional currency of the Company. All financial information presented in New Taiwan Dollar has been rounded to the nearest thousand.
(c) Basis of consolidation
(1) Principles of preparation of the consolidated financial statements
The consolidated financial statements comprise the Company and its subsidiaries. The financial statements of subsidiaries are included in the consolidated financial statements from the date that control commences until the date that control ceases. Losses applicable to the non-controlling interests in a subsidiary are allocated to the non-controlling interests even if doing so causes the non-controlling interests to have a deficit balance.
Intra-group balances, and transactions, and any unrealized income and expenses arising from intra-group transactions are eliminated in preparing the consolidated financial statements.
The financial statements of subsidiaries have been adjusted to conformity of consistency in accounting policies.
(2) Subsidiaries included in the consolidated financial reportsShareholding
Name of investor company
Name of Subsidiary
Principal activity
December 31, 2016
December 31, 2015
COTA Commercial Bank Co., Ltd.
COTA Bank Insurance Brokers Co., Ltd.
Property and personal insurance broker
100% 100%
(d) Foreign Currency
(1) Foreign currency transactions
Transactions in foreign currencies are translated to the respective functional currencies of Group entities at the exchange rates at the dates of the transactions. Monetary assets and liabilities denominated in foreign currencies at the reporting date are retranslated to the functional currency at the exchange rate at that date. The foreign currency gain or loss on monetary items is the difference between amortized cost in the functional currency at the beginning of the period adjusted for the effective interest and payments during the period, and the amortized cost in foreign currency translated at the exchange rate at the end of the period.
Annual Report 2016 099
Non-monetary assets and liabilities denominated in foreign currencies that are measured at fair value are retranslated to the functional currency at the exchange rate at the date when fair value was determined. Non-monetary items in a foreign currency that are measured based on historical cost are translated using the exchange rate at the date of the transaction.
Foreign currency differences arising on retranslation are recognized in profit or loss except for difference relating to available-for-sale equity investment, which are recognized in other comprehensive income.
(2) Foreign operations
Regarding offshore banking unit(OBU), the assets and liabilities reported in functional currencies are translated into New Taiwan dollars at the exchange rates on reporting date; the income and expenses, excluding in hyperinflationary economic situation, are translated into New Taiwan dollars at the rate of exchange prevailing on the date of the transaction date. Exchange differences are recognized as other comprehensive income.
When the settlement of monetary receivables/payables to OBU is neither planned nor likely to happen in the foreseeable future, gains and losses arising from currency exchange are valued as part of net investment and are recognized as other comprehensive income.
(e) Cash and cash equivalents
Cash and cash equivalents comprise cash on hand, checks for clearance, checking and demand deposits due from other banks, money deposited in other financial institutions without designated purposes or with unrestricted access and short-term, highly liquid investments that are readily convertible to known amounts of cash and are subject to an insignificant risk of changes in value. Cash and cash equivalents reported in the statement of cash flows are assets that reported in the statement of financial positions, due from central bank, call loans to bank following the definition of cash and cash equivalents under IAS 7 as accepted by FSC, and securities purchased under resell agreements.
Time deposits with maturities less than one year are aimed for short-term cash commitments instead of investment purposes, subjected to insignificant risk in changes of fair value, and hence are classified as cash and cash equivalents.
(f) Securities under repurchase/resell agreement
Securities sold/purchased with a commitment are treated as financing transactions, which are recorded at cost. The difference between the cost and the repurchase/resell price is treated as interest expenses/revenue and recognized over the term of the agreement.
(g) Financial instruments
Financial assets and financial liabilities are initially recognized when the Group becomes a party to the contractual provisions of the instruments.
(1) Financial assets
The Group classifies financial assets into the following categories: financial assets at fair value through profit or loss (FVTPL), available-for-sale financial assets, held-to-maturity financial assets, loans and receivables, financial assets carried at costs, and investment in debt securities without active market.
Annual Report 2016100
6. Financial Status

(i) Financial assets measured at FVTPL
A financial asset is classified in this category if it is held-for-trading or is designated as financial assets at FVTPL. Financial assets held-for-trading are acquired principally for the purpose of selling or repurchasing in the short term.
The Group designates investment in fair value as financial assets measured at FVTPL.
At initial recognition, financial assets of this category are measured at fair value. Attributable transaction costs are recognized in profit or loss as incurred. Subsequent valuation is measured at fair value and changes therein, which takes into account any dividend and interest income, are recognized in profit or loss. A regular way purchase or sale of financial assets is recognized and derecognized, as applicable, trade date accounting is used.
(ii) Available-for-sale financial assets
Available-for-sale financial assets are non-derivative financial assets that are designated available-for-sale or are not classified in any of the other categories of financial assets. At initial recognition, available-for-sale financial assets are recognized at fair value, plus any directly attributable transaction cost. Subsequent to initial recognition, they are measured at fair value and changes therein, other than impairment losses, interest income calculated using the effective interest method, dividend income, and foreign currency differences on monetary financial instruments are recognized in other comprehensive income and unrealized gains (losses) on available-for-sale financial assets in equity. When an available-for-sale investment is derecognized, the gain or loss accumulated in equity is reclassified to profit or loss, under other income. A regular way purchase or sale of financial assets is recognized and derecognized, as applicable, trade date accounting is used.
Investments in equity instruments that do not have a quoted market price in an active market, and whose fair value cannot be reliably measured, are measured at amortized cost less any impairment loss, and are included in financial assets measured at cost.
Dividend income is recognized in profit or loss on the date when the Group’s right to receive payment is established, which in the case of quoted securities is normally the ex-dividend date. Such dividend income is included in other comprehensive income.
(iii) Held-to-maturity financial assets
If the Group has the positive intent and ability to hold debt securities to maturity, such financial assets are classified as held-to-maturity. Held-to-maturity financial assets are recognized initially at fair value plus any directly attributable transaction costs. Subsequent to initial recognition, held-to-maturity financial assets are measured at amortized cost using the effective interest method, less any impairment losses. A regular way purchase or sale of financial assets shall be recognized and derecognized, as applicable, using trade-date accounting.
Interest income is included in statement of comprehensive income account.
(iv) Financial assets carried at cost
Equity instruments with no quote market price and whose fair value cannot be reliably measured are stated at cost. If there is objective evidence that financial assets carried at cost are impaired, the carrying amount of the assets is reduced, and impairment loss is recognized. However, the impairment losses may not be reversed subsequently.
(v) Debt Instrument Investments for which Active market Exists
The amortized cost and interest income of debt investments without an active market are determined by using the effective-interest rate method. When there is objective evidence that an impairment loss on financial assets has been
Annual Report 2016 101

incurred, impairment loss is recognized. If, in a subsequent period, the amount of the impairment loss decreases and the decrease can be related objectively to an event occurring after the impairment was recognized, the previously recognized impairment loss is reversed through profit or loss. The carrying amount after the reversal shall not exceed the recoverable amount or the depreciated or amortized balance of the assets assuming no impairment loss was recognized.
(vi) Loans and receivables
Loans and receivables are financial assets that have no quoted market price with fixed or determinable payment, including receivables, other receivables and debts investment without active market. At initial recognition, these assets are recognized at fair value, plus, any directly attributable transaction costs Subsequent to initial recognition, receivables are measured at amortized cost using the effective interest method, less any impairment losses other than insignificant interest on short-term receivables.
Interest income is recognized in profit or loss, and it is included in statement of comprehensive income account.
Loans and receivables shall be transferred to overdue loans account if either of the following situations qualifies:
A. Collection of payment of principal or interest accrued is considered highly unlikely; or B. Payment of principal or interest accrued is over 3 or 6 months past due; or
According to“Regulations Governing the Procedures for Banking Institutions to Evaluate Assets and Deal with Non-Performing and Non-Accrual Loans”, non-performing loans with interest accrued shall be transferred to overdue loans After 6-month-additional extension of overdue payment. However, the reclassification does not apply to those of agreed installment payments, consultative consumer credit, and cases executed by the“Statute for Consumer Debt Clearance”.
Reclassified overdue loans are assorted into discounts and loans, while other overdue receivables reclassified from guarantees, acceptances, factoring accounts receivable, and receivables-other credit card are classified as other financial assets.
Outstanding balances of overdue loans’ unrecoverable parts are written-off under approval of board of directors.
(vii) Impairment of financial assets
Except for financial assets at fair value through profit or loss, financial assets are assessed for impairment at each reporting date. A financial asset is impaired if, and only if, there is objective evidence of impairment as a result of one or more events that occurred after the initial recognition of the asset (a ‘loss event’) and that loss event (or events) has an impact on the estimated future cash flows of the financial asset that can be estimated reliably.
Objective evidence that financial assets are impaired includes default or delinquency by a debtor, restructuring of an amount due to the Group on terms that the Group would not consider otherwise, indications that a debtor or issuer will enter bankruptcy, adverse changes in the payment status of borrowers or issuers, economic conditions that correlate with defaults, or the disappearance of an active market for a security. In addition, for an investment in an equity security, a significant or prolonged decline in its fair value below its cost is considered objective evidence of impairment.
A. Available-for-sale financial assets
When impairment loss of available-for-sale financial assets are recognized, the accumulated gains and losses exist in other comprehensive income are reclassified to profit or loss. Impairment losses of available-for-sale equity security cannot be reversed through profit or loss. Any subsequent recovery in fair value from impairment is recognized in
Annual Report 2016102
6. Financial Status

other comprehensive income, and accumulated in other equity. If, in a subsequent period, the fair value of impaired available-for-sale debt security increases and the increase can be related objectively to an event occurring after the impairment loss was recognized, the impairment loss is reversed through profit or loss.
B. Held-to-maturity financial assets
Impairment loss in respect of financial assets measured at amortized cost is the difference between its carrying amount and present value of the estimated future cash flows discounted at the asset’s original effective interest rate.
If, in a subsequent period, the amount of the impairment loss of a financial asset measured at amortized cost decreases and the decrease can be related objectively to an event occurring after the impairment was recognized, the decrease in impairment loss is reversed through profit or loss to the extent that the carrying value of the asset does not exceed its amortized cost before impairment was recognized at the reversal date.
C. Loans and receivables
The ending balance of the allowance for bad debts and the guarantee liability provision on all credit assets on and off the balance sheets is in accordance with the Regulations Governing the Procedures for Banking Institutions to Evaluate Assets and Deal with Non-performing/Non-accrual Loans, with consideration given to the status of loan collateral and the length of time overdue. The Group of balance classifies credit assets into normal credit assets, assets that require special mention, assets that are substandard, assets that are doubtful, and assets for which there is a loss. The allowance for doubtful debt for each category of credit assets is 1%, 2%, 10%, 50% and 100%, respectively. The allowance for doubtful debt on credit card receivables is in accordance with the “Regulations Governing Institutions Engaging in Credit Card Business”. The abovementioned regulations are the minimum standards on allowance for bad debts for credit assets on and off the balance sheets.
For loans and receivables, the objective evidence should be identified first to reveal any impairment existing for financial assets that are individually significant, and individual or collective impairment for financial assets that are individually insignificant. If no objective evidence of impairment exists in an individually assessed financial asset, it should be included in a group of financial assets with similar credit risk characteristics and collectively assessed for impairment. For assets with recognized impairment losses already, the aforementioned assessment method is not required. For loans and receivables with objective evidence of impairment but without incurred impairment loss, they are not required to be included in portfolio of similar credit risk characteristics for collective assessment after considering all significant risks exists in the current situation.
If there any objective evidence that an impairment loss on financial assets has incurred, the amount of the loss is shows the difference between the asset’s carrying amount and the present value of estimated future cash flows discounted at the financial asset’s original effective interest rate; the amount of the loss shall be recognized in profit or loss in the current period. The estimation of future cash flows includes the recoverable amount of collateral and related insurance when determining the amount of the loss.
The aforesaid objective evidence includes: (A) Significant financial difficulty of the issuer or obligor; (B) A breach of contract, such as a default or delinquency in interest or principal payments; (C) The lender, for economic or legal reasons relating to the borrower’s financial difficulty, granting to the borrower a
concession that the lender would not otherwise consider; (D) It becoming probable that the borrower will enter bankruptcy or other financial reorganization; (E) The disappearance of an active market for that financial asset because of the issuer’s financial difficulties; (F) Adverse changes in the payment status of the borrower; and (G) Changes in national or local economic conditions that correlate with defaults on the assets.
Annual Report 2016 103

An impairment loss in respect of a financial asset is deducted from the carrying amount except for accounts receivable, for which an impairment loss is reflected in an allowance account against the receivables. When it is determined a receivable is uncollectible, it is written off from the allowance account. While the allowance, which is written off, is collected, the allowance account should be credited. Changes in the amount of the allowance account are recognized in profit or loss.
D. Financial assets carried at costs
An impairment loss in respect of a financial asset measured at amortized cost is the difference between its carrying amount and the present value of its estimated future cash flows discounted at the asset’s original effective interest rate. Such impairment loss is not reversible in subsequent periods.
(viii) Derecognition of financial assets
The Group derecognizes financial assets when the contractual rights of the cash inflow from the asset are terminated, or when the group transfers substantially the ownership of all risks rewards of the financial assets.
On derecognition of a financial asset in its entirety, the difference between the carrying amount and the sum of the consideration received or receivable and any cumulative gain or loss that had been recognized in other comprehensive income and presented in other equity account unrealized gains or losses from available for sale financial assets is recognized as profit or loss under “other gains and losses, net”.
The Group separates the part that continues to be recognized and the part that is derecognized based on the relative fair values of those parts on the date of the transfer. The difference between the carrying amount allocated to the part derecognized and the sum of the consideration received for the part derecognized, and any cumulative gain or loss allocated to it that had been recognized in other comprehensive income, shall be recognized in profit or loss.
(2) Financial liabilities and equity instruments
(i) Classification of debt or equity
Debt or equity instruments issued by the Bank are classified as financial liabilities or equity instruments in accordance with the substance of the contractual agreement.
(ii) Financial liabilities measured at FVTPL
Financial liabilities are classified as held-for-trading if they are acquired principally for the purpose of selling or repurchasing in a short term.
Attributable transaction costs are recognized in profit or loss as incurred; Subsequent changes in value, including interest expense, are measured at FVTPL through profit or loss.
(iii) Other financial liabilities
Financial liabilities not classified as held for trading or designated as at fair value through profit or loss are measured at fair value, plus any directly attributable transaction costs at the time of initial recognition. Subsequent to initial recognition, they are measured at amortized cost calculated using the effective interest method. Interest expense not capitalized as capitalized cost is recognized in profit or loss, and included in operating costs.
Annual Report 2016104
6. Financial Status

(iv) Derecognition of a financial liability
The Group derecognizes a financial liability when its contractual obligation has been discharged or cancelled, or has expired. The difference between the carrying amount of a financial liability removed and the consideration paid (including any non-cash assets transferred or liabilities assumed) is recognized in profit or loss.
(v) Offsetting of financial assets and liabilities
The Group presents its financial assets and liabilities on a net basis when the Group has the legally enforceable rights to offset, and intends to settle such financial assets and liabilities on a net basis or to realize the assets and settle the liabilities simultaneously.
(3) Derivative financial instruments
The Group holds derivative financial instruments to hedge its foreign currency and interest rate fluctuation exposures. At initial recognition, derivatives are recognized at fair value; and attributable transaction costs are recognized in profit or loss as incurred. Subsequent to initial recognition, derivatives are measured at fair value, and changes therein, are recognized in profit or loss. When a derivative is designated as a hedging instrument, the timing for recognizing gain or loss is determined on the nature of the hedge. When the fair value of a derivative instrument is positive, it is classified as a financial asset; otherwise, it is classified as a financial liability.
(h) Investment property
Investment property is property held either to earn rental income or for capital appreciation or both, but not for sale in the ordinary course of business, for use in the production or supply of goods or services or for administrative purposes. Investment property is measured at cost on initial recognition and subsequently at cost less accumulated depreciation and accumulated impairment losses. Depreciation expense is calculated based on the depreciation method, useful life, and residual value which are the same as those adopted for property, plant and equipment. Cost includes expenditure that is directly attributable to the acquisition of the investment property.
When the use of an investment property changes such that it is reclassified as property, plant and equipment, its book value at the date of reclassification becomes its cost for subsequent accounting.
(i) Property, plant, and equipment
(1) Recognition and measurement
Items of property, plant and equipment are measured at cost less accumulated depreciation and accumulated impairment losses. Cost includes expenditure that is directly attributed to the acquisition of the asset.
Each part of an item of property, plant and equipment with a cost that is significant in relation to the total cost of the item shall be depreciated separately unless the useful life and depreciation method of that significant part are the same as those of another significant part of that same item.
The gain or loss arising from the derecognition of an item of property, plant and equipment is determined as the difference between the net disposal proceeds, if any, and the carrying amount of the item, and it shall be recognized in profit or loss, under net other income and expenses of profit or loss.
Annual Report 2016 105

(2) Subsequent cost
Subsequent expenditure is capitalized only when it is probable that future economic benefits associated with the expenditure will flow to the Group. The carrying amount of those parts of fixed assets that are replaced is derecognized. Ongoing repairs and maintenance are expensed as incurred.
(3) Depreciation
Depreciation is calculated on the cost of an asset less its residual value and is recognized in profit or loss on a straight line basis over the estimated useful lives of each component of an item of property, plant and equipment. Items of property, plant and equipment with the same useful life may be grouped in determining the depreciation charge. The remainder of the items may be depreciated separately.
Leased assets are depreciated by using the straight line method during the period of expected use, consistent with the depreciation policy the lessee adopts for depreciable assets that are owned. If there is reasonable certainty that the lessee will obtain ownership by the end of the lease term, the period of expected use is the useful life of the asset; otherwise, the asset is depreciated over the shorter of the lease term and its useful life.
Land has an unlimited useful life and therefore is not depreciated. The estimated useful lives for the current and comparative years of significant items of property, plant and equipment are
as follows:
(1) Buildings : 8 years ~ 80 years (2) Operating equipment : 1 year ~ 20 years (3) Transportation equipment : 6 years ~ 12 years (4) Miscellaneous equipment : 3 year ~ 50 years (5) The significant portion of buildings and their useful life are as follow :
Item useful lifeBuildingsMain building 60 years ~ 80 yearsPremises Renovation 8 years
The depreciation methods, useful lives, and residual values are reviewed at each reporting date. If expectations differ from the previous estimates, the changes are accounted for as changes in an accounting estimate.
(4) Reclassification to investment property
A property is reclassified to investment property at its carrying amount when the use of the property changes from owner occupied to investment property.
(j) Lease
(1) Lessor
Lease in income from an operating lease is recognized in income on a straight-line basis over the lease term. Incentives granted to the lessee to enter into the operating lease are spread over the lease term on a straight-line basis so that the lease income received is reduced accordingly. Initial direct costs incurred in negotiating and arranging an operating
Annual Report 2016106
6. Financial Status

lease are added to the carrying amount of the leased asset and recognized as an expense over the lease term on the same basis as the lease income. In order to earn lease income, incurred costs would be recognized as expense, such as depreciation.
(2) Lessee
Leases in which the Group assumes substantially all of the risks and rewards of ownership are classified as finance leases. On initial recognition, the lease asset is measured at an amount equal to the lower of its fair value or the present of the minimum lease payments. Subsequent to initial recognition, the asset is accounted for in accordance with the accounting policy applicable to the asset.
Other leases are operating leases and are not recognized in the Group’s statement of financial position.
Payments made under operating lease (excluding insurance and maintenance expenses) are recognized in profit or loss on a straight-line basis over the term of the lease. Lease incentives received are recognized as an integral part of the total lease expense, over the term of the lease.
(k) Intangible assets
(1) Computer software
Computer software system expenses, which are recorded on the basis of the cost of acquisition less accumulated depreciation and accumulated impairment, are amortized using a straight-line method over a period of 3 to 10 years. The amortization is recognized in profit or loss.
Its amortization method, useful life and residual value are referred to the regulation of properties and equipment. If the property is change, the change is accounted for as a change in an accounting estimate.
(2) Goodwill
Goodwill derives from enterprise acquisition is included in intangible assets.
Goodwill is measured at cost less accumulated impairment losses. Impairment loss on equity investment in investees accounted for under the equity method is not allocated to any asset, including goodwill that forms part of the carrying amount of such investment.
(l) Impairment of non-financial assets
The carrying amounts of the Group non-financial assets, other than assets arising from deferred tax assets and assets arising from employee benefits, are reviewed at each reporting date to determine whether there is any indication of impairment. If any such indication exists, then the asset’s recoverable amount is estimated. If it is not possible to determine the recoverable amount (fair value less cost to sell and value in use) for the individual asset, then the Group determine the recoverable amount for the asset’s cash-generating unit (CGU).
The recoverable amount for individual asset or a cash-generating unit is the higher of its fair value less costs to sell and its value in use. The excess of carrying amount of the asset over its recoverable amount is recognized as an impairment loss which is charged to profit or loss.
Annual Report 2016 107

An assessment is made at the end of each reporting period whether there is any indication that an impairment loss recognized in prior periods for an asset other than goodwill may no longer exist or may have decreased. If any such indication exists, the recoverable amount of that asset is estimated.An impairment loss recognized in prior periods for an asset other than goodwill is reversed if, and only if, there has been an improvement in the estimates used to determine the asset’s recoverable amount since the last impairment loss was recognized.
Notwithstanding whether indicators exist, recoverability of goodwill and intangible assets with indefinite useful lives or those not yet in use is tested at least annually. Impairment loss is recognized if the recoverable amount is less than the carrying amount.
For the purpose of impairment testing, goodwill acquired in a business combination is, from the acquisition date, allocated to each of the acquirer’s cash-generating units, or groups of cash-generating units, that is expected to benefit from the synergies of the combination.
If the carrying amount of each of the cash-generating units exceeds the recoverable amount of the unit, impairment loss is recognized and is allocated to reduce the carrying amount of each asset in the unit.Reversal of an impairment loss for goodwill is prohibited.
(m) Provisions
A provision is recognized if, as a result of a past event, the Group has a present legal or constructive obligation that can be estimated reliably, and an outflow of economic benefits is possibly required to settle the obligation. Provisions are determined by discounting the expected future cash flows at a pre-tax rate that reflects the current market assessments of the time value of money and the risks specific to the liability. The unwinding of the discount is recognized as finance cost.
(n) Financial guarantee contract
The Group recognized financial guarantee liabilities initially at their fair value at the date of providing guarantee. The Group receives commission income with arm’s-length transaction at contract date; this is, the income could represent the fair value of financial guarantee contract. The advanced service fee is recognized as deferred item and amortized by straight-line method over the contract period of the financial guarantee.
(o) Revenue recognition
Interest revenue arised from credits are estimated on an accrual basis. All interest accrued shall be suspended from the date the loans are classified as nonperforming loans. Interest earned from nonperforming loans shall be recognized as interest income when the interest has been collected by the Group. If the repayment of loan is extended under an agreement, the related interest should be recognized as deferred revenue, classified into other liability and recognized as income when collected.
Service fee income is recognized when collected or when the majority of project is completed. Service fee income is received when loans and receivables are recognized. The service fee incomes which are caused by loans or receivables shall be recognized as interest revenue when they meet a suggested policy announced by the Bankers Association of the Republic of China. This policy requires an individual loan that meets the materiality criteria to have its effective interest rate be consistent with its interest revenue. Overall, the service fees shall be adjusted from the original agreed interest rate to the effective interest rate.
Annual Report 2016108
6. Financial Status

Rental income of a property is incurred during the lease term. Incentives granted to the lessee to enter into the operating lease are spread over the lease term on a straight-line basis so that the lease income received is reduced accordingly.
(p) Employee benefits
(1) Short-term employee benefit
Short-term employee benefit obligations are measured on an undiscounted basis and expensed as the related services are provided.
A liability is recognized at expected amount of short-term cash bonus or profit-sharing plans if present legal or constructive obligations resulted from past service provided by the employee can be estimated reliably.
(2) Post-employment benefit: The Group’s pension plan comprises defined contribution plan and defined benefit plan.
(i) Defined contribution plans
Obligations for contributions to defined contribution pension plans are recognized as an employee benefit expense in profit or loss in the periods during which services are rendered by employees.
(ii) Defined benefit plans
A defined benefit plan is a post-employment benefit plan other than a defined contribution plan. The Group’s net obligation in respect of defined benefit pension plans is calculated separately for each plan by estimating the amount of future benefit that employees have earned in return for their service in the current and prior periods, based on the discounted present value of the said defined benefit obligation. Any unrecognized past service costs and the fair value of any plan assets are deducted for purposes of determining the Group’s net defined benefit obligation. The discount rate used in calculating the present value is the market yield at the reporting date of government bonds that have maturity dates approximating the terms of the Group’s obligations and that are denominated in the same currency in which the benefits are expected to be paid.
The calculation is performed annually by a qualified actuary using the projected unit credit method. If the calculation results in a benefit to the Group, the recognized asset is limited to the total of any unrecognized past service costs and the present value of economic benefits available in the form of any future refunds from the plan or reductions in future contributions to the plan. In calculating the present value of economic benefits, consideration is given to any minimum funding requirements that apply to any plan in the Group. An economic benefit is available to the Group if it is realizable during the life of the plan, or on settlement of the plan liabilities.
If the benefits of a plan are improved, the pension cost incurred from the portion of the increased benefit relating to past service by employees is recognized immediately in profit or loss.
The Group’s defined benefit pension plan follows the Labor Standards Act. Pension payments to employees are calculated based on years of service and average salary upon retirement. The Group will make monthly contributions to the employees’ pension accounts, which are managed by the Employee Pension Fund Committee, and the contributions are deposited in the employees’ pension accounts with Bank of Taiwan. The pension fund for management is contributed 8% of salaries to individual pension accounts monthly.
Remeasurements of a net defined benefit liability (asset), which comprise (1)actuarial gains and losses; (2)the return on plan assets (excluding interest), and (3)the effect of the asset ceiling (if any, excluding interest), are
Annual Report 2016 109

recognized immediately in other comprehensive income. The Group can reclassify the amounts recognized in other comprehensive income to retained earnings or other equity. If the amounts recognized in other comprehensive income are transferred to other equity, they shall not be reclassified to profit or loss or recognized in retained earnings in a subsequent period. The Group recognizes remeasurements of defined benefits plan in retained earnings.
Gains or losses on the curtailment or settlement of a defined benefit plan are recognized when the curtailment or settlement occurs. The gain or loss on curtailment or settlement arises from any change in the fair value of plan assets and any change in the present value of the defined benefit obligation.
(3) Deposits with favorable rate
The Group provides deposits with favorable rate to employees, which include fix amount deposits with favorable rate for current employees and post-employment fix amount deposits with favorable rate for retired and current employees. The rate difference between the favorable rate and the market rate is considered employee benefit.
According to article 30 of “Regulations Governing the Preparation of Financial Report by Public Banks”, the additional interests resulted from the difference between deposit with favorable rate and the deposits with market interest rate need actuary per the regulations related to defined benefit plan in IAS 19. The parameters of actuarial assumptions should obey the competent authority if any regulation is applicable.
(q) Share-based payment
The grant-date fair value of share-based payment awards granted to employee is recognized as employee salary expenses, with a corresponding increase in equity, over the period that the employees become unconditionally entitled to the awards. The amount recognized as an expense is adjusted to reflect the number of awards which the related service and non-market performance conditions are expected to be met, such that the amount ultimately recognized as an expense is based on the number of awards that meet the related service and non-market performance conditions at the vesting date.
For share-based payment awards, the grant-date fair value of the share-based payment considers such non-vesting conditions and there is no true-up for differences between expected and actual outcomes.
(r) Income taxes
Income tax expenses include both current taxes and deferred taxes. Except for expenses related to business combinations or recognized directly in equity or other comprehensive income, all current and deferred taxes are recognized in profit or loss.
Current taxes include tax payables and tax deduction receivables on taxable gains (losses) for the year calculated using the statutory tax rate on the reporting date or the actual legislative tax rate, as well as tax adjustments related to prior years.
Deferred taxes arise due to temporary differences between the carrying amounts of assets and liabilities for financial reporting purposes and their respective tax bases. Deferred taxes are recognized except for the following:
(1) Assets and liabilities that are initially recognized but are not related to the business combination and have no effect on net income or taxable gains (losses) during the transaction.
(2) Temporary differences arising from equity investments in subsidiaries or joint ventures where there is a high probability that such temporary differences will not reverse.
Annual Report 2016110
6. Financial Status

(3) Initial recognition of goodwill.
Deferred tax assets and liabilities are measured at tax rates that are expected to apply to the period when the asset is realized or the liability is settled, which are normally the tax rates that have been enacted or substantively enacted by the end of the reporting period.
Deferred tax assets and liabilities may be offset against each other if the following criteria are met:
(1) The entity has the legal right to settle tax assets and liabilities on a net basis; and(2) The taxing of deferred tax assets and liabilities fulfill one of the below scenarios: (i) levied by the same taxing authority; or (ii) levied by different taxing authorities, but where each such authority intends to settle tax assets and liabilities (where
such amounts are significant) on a net basis every year of the period of expected asset realization or debt liquidation, or where the timing of asset realization and debt liquidation is matched.
A deferred tax asset is recognized for the carry forward of unused tax losses, unused tax credits, and deductible temporary differences to the extent that it is probable that future taxable profit will be available against which the unused tax losses, unused tax credits, and deductible temporary differences can be utilized. Such unused tax losses, unused tax credits, and deductible temporary differences are also be re-evaluated every year on the financial reporting date, and adjusted based on the probability that future taxable profit will be available against which the unused tax losses, unused tax credits, and deductible temporary differences can be utilized.
Effected amounts of tax directly recognized in other comprehensive income are measured by temporary difference between the book value of related asset and liability and its taxing base multiplied with tax rate that is expected to apply to the period when the asset is realized and the liability is settled.
The surtax on inappropriate earnings of 10% is expensed in the year of shareholder approval.
Reserve for land revaluation increment tax which is generated from land re-evaluated in accordance with reference law and regulations is taxable temporary difference and is recognized as deferred tax liability.
(s) Earnings per share (EPS)
The Group discloses the Group’s basic and diluted earnings per share attributable to ordinary equity holders of the Group. The calculation of basic earnings per share is based on the profit attributable to the ordinary shareholders of the Group divided by the weighted-average number of ordinary shares outstanding. The calculation of diluted earnings per share is based on the profit attributable to ordinary shareholders of the Group, divided by the weighted-average number of ordinary shares outstanding after adjustment for the effects of all dilutive potential ordinary shares.
(t) Operating segment information
An operating segment is a component of an entity that engages in business activities from which it may earn revenues and incur expenses (including revenues and expenses relating to transactions with other components of the same entity). The segment’s operating results are reviewed regularly by the entity’s chief operating decision maker to make decisions pertaining to the allocation of the resources to the segment and to assess its performance for which discrete. Each operating segment consists of standalone financial information.
Annual Report 2016 111

5. Significant accounting assumptions and judgments and major sources of estimation uncertainty
The preparation of the consolidated financial statements in conformity with the Regulations and the IFRSs endorsed by the FSC requires management to make judgments, estimates, and assumptions that affect the application of the accounting policies and the reported amount of assets, liabilities, income, and expenses. Actual results may differ from these estimates.
The management continues to monitor the accounting estimates and assumptions. The management recognizes any changes in accounting estimates during the period and the impact of those changes in accounting estimates in the following period.
Information about judgments made in applying accounting policies that have the most significant effects on the amounts recognized in the consolidated financial statements is as follows:
(a) Impairment loss on loans and receivables
When the Group decides whether to recognize impairment loss, they mainly assess if there are any observable evidence indicating possible impairment. The evidence may include observable information indicating unfavorable changes in debtor payment status, or sovereign or local economic situation related to debt payment in arrears. When analyzing expected cash flow, the estimates by the management are based on past losses experience on assets of similar credit risk characteristics. The Group quarterly reviews methods and assumptions behind the amount and schedule of expected cash flow, reduce the difference between expected and actual loss. Please refer to Note 6(ag) for impairment loss on loans.
(b) Impairment of goodwill
The assessment of impairment of goodwill requires the Group to make subjective judgments to identify cash-generating units, allocate the goodwill to relevant cash-generating units, and estimate the recoverable amount of relevant cash-generating units. Refer to note 6(1) for further description of the impairment of goodwill.
(c) Measurement of defined benefit obligations
Accrued pension liabilities and resulting pension expenses under defined benefit pension plans are calculated using the Projected Unit Credit Method. Actuarial assumptions comprise the discount rate, rate of employee turnover, future salary increase rate, etc. Changes in economic circumstances and market conditions will affect these assumptions and may have a material impact on the amount of the expense and the liability. Refer to note 6(r) for further description of the actuarial assumptions and sensitivity analysis.
The Group’s accounting policies include measuring financial and non-financial assets and liabilities at fair value through profit or loss. The Group’s financial instrument valuation group conducts independent verification on fair value by using data sources that are independent, reliable, and representative of exercise prices. This financial instrument valuation group also periodically adjusts valuation models, conducts back-testing, renews input data for valuation models, and makes all other necessary fair value adjustments to assure the rationality of fair value. The Group strives to use market observable when measuring assets and liabilities. Different levels of the fair value hierarchy to be used in determining the fair value of financial instruments are as follows:(a) Level 1: quoted prices (unadjusted) in active markets for identifiable assets or liabilities.(b) Level 2: inputs other than quoted prices included within Level 1 that are observable for the asset or liability, either directly
(ie as prices) or indirectly (ie derived from prices).(c) Level 3: inputs for the assets or liability that are not based on observable market data.
Annual Report 2016112
6. Financial Status

6. Explanation of significant accounts
(a) Cash and Cash Equivalents
December 31, 2016
December 31, 2015
Cash $ 1,378,262 1,280,469Checks on hand for clearance 139,438 206,903Deposits from other banks 250,531 178,264 $ 1,768,231 1,665,636
The cash and cash equivalents presented in the statement of cash flows had the following components, please refer to note 6(b).
December 31, 2016
December 31, 2015
Cash and cash equivalents in the statement of financial position $ 1,768,231 1,665,636 Due from Central Bank and call loans to bank following the definition of cash
and cash equivalents under IAS 7 as accepted by FSC
18,341,169
18,935,571Cash and cash equivalents reported in the Statement of Cash Flows $ 20,109,400 20,601,207
(b) Due from the Central Bank and Call Loans to Banks
December 31, 2016
December 31, 2015
Deposit reserve - checking accounts $ 1,759,498 2,635,571Deposit reserve - demand accounts 3,963,520 3,812,019Deposit reserve - foreign currency deposits 4,519 4,629Certificate of deposits 15,000,000 16,300,000Call loans to banks 1,581,671 - Deposits with Financial Information Service Co., Ltd. 400,408 519,589
$ 22,709,616 23,271,808
The reserves for deposits are calculated at prescribed rates, using the average monthly balances of various deposit accounts, and are appropriated and deposited in the reserve account of the Central Bank of the Republic of China (Taiwan). Deposits in “Required reserve - Account A” are interest-free and can be withdrawn at any time; deposits in “Required reserve - Account B” are interest-bearing and cannot be withdrawn except for the monthly adjustment to the required reserve permitted by relevant regulations.
Due from Central Bank and call loans to bank following the definition of cash and cash equivalents under IAS 7 as accepted by FSC are as follows:
December 31, 2016
December 31, 2015
Call loans to banks $ 1,581,671 -Certificate of deposits 15,000,000 16,300,000Required reserve - Account A 1,759,498 2,635,571
$ 18,341,169 18,935,571
Annual Report 2016 113

(c) Financial Assets (Liabilities) Measured at Fair Value Through Profit or Loss
December 31, 2016
December 31, 2015
Financial assetsHeld for trading
Securities of listed companies $ 76,185 31,318Beneficiary certificates 248,776 42,835Derivatives 1,245 36,685
Sub-total 326,206 110,838Designated as measured at fair value through profit or loss
Convertible bonds 1,469,828 1,905,822$ 1,796,034 2,016,660
Financial liabilities held for trading Derivatives $ 491 1,045
The Group engages in derivative transactions to mitigate exchange rate risks and interest rate risks. The Group’s financial hedging policy is to minimize its market price or cash flow exposures.The nominal amount information of outstanding derivative contracts as of December 31, 2016 and 2015 was as follows:
December 31, 2016
December 31, 2015
Derivative contracts $ 734,255 2,884,788
The net gains (losses) on financial assets held for trading for the years ended December 31, 2016 and 2015, were $(42,933) thousands and $30,904 thousands, respectively. The net gains (losses) on financial liabilities held for trading for the years ended December 31, 2016 and 2015 were $555 thousands and $(831) thousands, respectively.
(d) Securities purchased under resell agreements
Securities purchased under resell agreements, and their sold back amounts, using determined price were as follow:
December 31, 2016Item Bond Book value Resell agreement Resell Price Resell Date
Reverse sell agreementCommercial papers $ 1,903,800 1,902,052 1,902,268 Resell gradually before 2017.02.14Corporate bonds 200,000 200,000 200,022 Resell gradually before 2017.01.09
$ 2,103,800 2,102,052 2,102,290
December 31, 2015Item Bond Book value Resell agreement Resell Price Resell Date
Reverse sell agreementCommercial papers $ 2,186,800 2,183,590 2,183,825 Resell gradually before 2016.06.20Corporate bonds 1,138,600 1,140,015 1,140,162 Resell gradually before 2018.11.21Government bonds 329,300 331,182 331,226 Resell gradually before 2016.01.07
$ 3,654,700 3,654,787 3,655,213
Annual Report 2016114
6. Financial Status

(e) Receivables, net
December 31, 2016
December 31, 2015
Credit card accounts receivable $ 144,967 148,405Interest receivable 230,052 237,094Tax refund receivable 11,003 13,378Accrued income 563 1,274Guarantee payments Receivable 5,736 21,872Others 52,842 27,746Sub-total 445,163 449,769Less:allowance for doubtful accounts (40,505) (53,524)
$ 404,658 396,245
Please refer to Note 6(ag) for the assessment of allowance for possible losses on receivables.
(f) Discounts and loans - net
December 31, 2016
December 31, 2015
Exchanges and export bills negotiated $ 921 9,738Overdrafts 59,043 69,118Short-term loans 14,490,000 12,692,253Medium-term loans 68,192,846 63,922,716Long-term loans 31,083,689 30,359,320Overdue loans 119,388 110,935Sub-total 113,945,887 107,164,080Less: allowance for loan losses (1,962,647) (2,203,377)discount (257,563) (232,568)
$ 111,725,677 104,728,135
Please refer to Note 6(ag) for the assessment of allowance for possible losses on discounts and loans.
The change in allowance for loan losses for the years ended December 31, 2016 and 2015 was as follows:
2016 2015Beginning balance $ 2,256,927 2,328,389Provision 8,120 153,943Recovery of written-off credits 227,634 142,609Write-offs (489,367) (368,532)Effects of exchange rate changes (89) 518Ending balance $ 2,003,225 2,256,927
Annual Report 2016 115

(g) Available-for-sale financial assets - net
December 31, 2016
December 31, 2015
Government bonds $ - 50,524Corporate bonds 6,375,802 4,294,599
$ 6,375,802 4,345,123
Government bonds provided and deposited as trust compensation reserve as of December 31, 2016 and 2015 were $0 and $50,000 thousands, respectively.
(h) Held-to-Maturity Financial Assets
December 31, 2016
December 31, 2015
Government bonds $ 821,401 204,365Corporate bonds 2,564,312 3,291,102Financial debentures 138,407 10,190Time deposits due from banks 1,000 1,000
$ 3,525,120 3,506,657
Government bonds placed as deposits in courts as of December 31, 2016 and 2015 were $58,000 thousands and $51,000 thousands, respectively. Government bonds provided and deposited as trust compensation reserve as of December 31, 2016 and 2015 were $50,000 thousands and $0 thousands, respectively.
(i) Other Financial Assets-net
December 31, 2016
December 31, 2015
Overdue receivables $ 145 52Less: allowance for bad debts (73) (26)Net 72 26Financial assets carried at cost 129,892 129,892Debts investment without active market 56,408 57,783
$ 186,372 187,701
1. Financial assets carried at cost:
December 31, 2016 December 31, 2015Book Value Ownership % Book Value Ownership %
Taiwan Asset Management Corp. $ 75,000 0.57 75,000 0.57Taiwan Financial Asset Service Corp. 50,000 2.94 50,000 2.94Taiwan Depository & Clearing Corporation 4,639 0.08 4,639 0.08Sunny Asset Management Corporation 253 0.42 253 0.42
$ 129,892 129,892
Annual Report 2016116
6. Financial Status

2. Debts investment without active market
December 31, 2016
December 31, 2015
Auction Rate Security $ 64,558 66,132Less: accumulated impairment (8,150) (8,349)
$ 56,408 57,783
(j) Property, plant and equipment
The cost, depreciation, and impairment of the property, plant and equipment of the Group were as follows:
Land
Buildings
Operating equipment
Transportation equipment
Miscellaneous equipment
Leasehold improvements
Work-in process Total
Cost: Balance at January
1, 2016 $ 828,818 601,349 132,732 32,916 198,678 72,728 - 1,867,221Additions - - 6,990 4,414 3,739 14,928 7,550 37,621Disposals - - (13,757) (2,496) (4,902) (17) - (21,172)Reclassification 1,071 - - - - 1,071Balance at December
31, 2016 $ 828,818 601,349 127,036 34,834 197,515 87,639 7,550 1,884,741Balance at January
1, 2015 $ 832,468 625,174 127,069 31,567 196,663 57,304 - 1,870,245Additions - - 7,355 2,626 3,297 15,424 - 28,702Disposals - - (1,692) (1,277) (1,282) - - (4,251)Reclassification (3,650) (23,825) - - - - - (27,475)Balance at December
31, 2015 $ 828,818 601,349 132,732 32,916 198,678 72,728 - 1,867,221
Annual Report 2016 117

Land
Buildings
Operating equipment
Transportation equipment
Miscellaneous equipment
Leasehold improvements
Work-in process Total
Depreciation and impairment lossesBalance at January
1, 2016 $ - (255,371) (83,913) (11,142) (156,582) (31,236) - (538,244)Depreciation for the
period - (9,850) (12,854) (3,429) (8,337) (7,705) - (42,175)Disposals - - 10,829 1,885 4,893 17 - 17,624Balance at December
31, 2016 $ - (265,221) (85,938) (12,686) (160,026) (38,924) - (562,795)Balance at January
1, 2015 $ - (254,025) (73,629) (8,934) (149,194) (25,341) - (511,123)Depreciation for the
period - (9,850) (11,974) (3,201) (8,670) (5,895) - (39,590)Disposals - - 1,690 993 1,282 - - 3,965Reclassification - 8,504 - - - - - 8,504Balance at December
31, 2015 $ - (255,371) (83,913) (11,142) (156,582) (31,236) - (538,244)Carrying amounts:
Balance at December 31, 2016 $ 828,818 336,128 41,098 22,148 37,489 48,715 7,550 1,321,946
Balance at January 1, 2015 $ 832,468 371,149 53,440 22,633 47,469 31,963 - 1,359,122
Balance at December 31, 2015 $ 828,818 345,978 48,819 21,774 42,096 41,492 - 1,328,977
No premise or equipment was pledged as collateral.
Annual Report 2016118
6. Financial Status

(k) Investment Property-net
Land Buildings Total Cost:
Balance at December 31, 2016(Balance at January 1, 2016)
$ 1,093,531 62,005 1,155,536
Balance at January 1, 2015 $ 1,089,881 38,180 1,128,061Reclassification 3,650 23,825 27,475Balance at December 31, 2015 $ 1,093,531 62,005 1,155,536
Depreciation and impairment losses:Balance at January 1 ,2016 $ (293,669) (30,642) (324,311)Depreciation for the period - (1,033) (1,033)Balance at December 31, 2016 $ (293,669) (31,675) (325,344)Balance at January 1 ,2015 $ (415,687) (21,105) (436,792)Depreciation for the period - (1,033) (1,033)Gain on reversal of impair ment Loss 122,018 - 122,018Reclassification - (8,504) (8,504)Balance at December 31, 2015 $ (293,669) (30,642) (324,311)
Carrying amounts:Balance at December 31, 2016 $ 799,862 30,330 830,192Balance at January 1, 2015 $ 674,194 17,075 691,269Balance at December 31, 2015 $ 799,862 31,363 831,225
Investment property comprises a number of commercial properties that are leased to third parties. Each of the leases contains an initial non-cancellable period of one to five years. Subsequent renewals are negotiated with the lessee. No contingent rents are charged.
The fair value of investment property (as disclosed in the financial statements) is based on a valuation by an internal or independent external value who holds a recognized and relevant professional qualification and has recent experience in the location and category of the investment property being valued.
The fair value of investment property as of December 31, 2016 and 2015 are $1,153,011 thousands and $1,010,028 thousands, respectively.
Based on the results of the Group’s assessment, a $122,018 thousands reversal gain of impairment loss on investment property is recognized for the year ended December 31, 2015.
Related rent revenue and direct operating expenses are as below:
2016 2015Rent revenue $ 19,535 19,881Direct operating expenses $ 1,033 1,033
No investment property was pledged as collateral.
Annual Report 2016 119

(l) Intangible assets
The costs of intangible assets, amortization, and the impairment loss of the Group as of and for the years ended December 31, 2016 and 2015, were as follows:
Goodwill Software Total Cost:
Balance at January 1, 2016 $ 154,027 17,050 171,077Additions - 2,399 2,399Balance at December 31, 2016 $ 154,027 19,449 173,476Balance at January 1, 2015 $ 154,027 24,610 178,637Additions - 340 340Decreases - (7,900) (7,900)Balance at December 31, 2015 $ 154,027 17,050 171,077
Amortization:Balance at January 1, 2016 $ 51,738 11,751 63,489Amortization for the period - 2,299 2,299Balance at December 31, 2016 $ 51,738 14,050 65,788Balance at January 1, 2015 $ 51,738 16,927 68,665Amortization for the period - 2,724 2,724Decreases - (7,900) (7,900)Balance at December 31, 2015 $ 51,738 11,751 63,489
Carrying amounts:Balance at December 31, 2016 $ 102,289 5,399 107,688Balance at January 1, 2015 $ 102,289 7,683 109,972Balance at December 31, 2015 $ 102,289 5,299 107,588
Goodwill represents the excess of consideration over the net fair value of acquired tangible assets, identifiable intangible assets and liabilities in the acquisition of Fengyuan Credit Cooperative on January 1, 2006.
Fengyuan Credit Cooperative’s original business and goodwill are identified as one cash-generating unit (CGV) in impairment test. The recoverable value of the CGU is based on the key assumptions such as operating revenues, operating costs, operating expenses and discount rate.
The Group’s goodwill has been tested for impairment, where the recoverable amount is determined based on the value in use. The goodwill impairment loss cumulative amounted to $51,738 thousands.
No intangible assets were pledged as collateral.
(m) Due to the Central Bank and Other Banks
December 31, 2016
December 31, 2015
Postal deposits accepted $ 64,470 64,470
Annual Report 2016120
6. Financial Status

(n) Payables
December 31, 2016
December 31, 2015
Interest payable $ 126,007 138,668Tax payable 32,091 32,380Collections payable 38,620 44,849Accrued expenses 331,111 342,818Checks awaiting clearance 139,438 206,903Others 65,383 73,925
$ 732,650 839,543
(o) Deposits and Remittances
December 31, 2016
December 31, 2015
Checking accounts $ 2,152,308 1,866,988Cashiers’ checks 430,505 409,205Demand deposits 17,789,525 16,384,563Time deposits 28,126,113 26,301,543Demand savings deposits 36,183,461 34,898,680Term savings deposits 55,042,354 55,118,232Inward Remittance 11,775 666
$ 139,736,041 134,979,877
(p) Subordinate Financial Debentures
December 31, 2016
December 31, 2015
Subordinate financial debentures $ 3,300,000 1,500,000
(1) In order to increase the capital adequacy and raise medium-term and long-term operating funds, the board of directors of the Group resolved to issue subordinate financial debentures in a total amount of $1,800,000 thousands on June 23, 2016, which was approved by the regulation authorities on September 5, 2016. The Group issued these debentures on November 16, 2016, and the subscription was completed during the year.
The details were as follows:
(i) Issue price: At face value. (ii) Issue period: From November 16, 2016 to November 16, 2023. (iii) Interest rate: For 100-1A, 2.1%. (iv) Interest accrual: Annually accrued and paid since the issued date. (v) Repayment of principal: Outright repayment of principal at maturity.
(2) In order to increase the capital adequacy and raise medium-term and long-term operating funds, the board of directors of the Group resolved to issue subordinate financial debentures in a total amount of $1,500,000 thousands on June 24, 2010, which was approved by the regulation authorities on September 10, 2010. The Group issued these debentures on March 29, 2011, and the subscription was completed during the year.
Annual Report 2016 121

The details were as follows:
(i) Issue price: At face value. (ii) Issue period: From March 29, 2011 to March 29, 2018. (iii) Interest rate: For 100-1A, 3.2%. For 100-1B, based on the Group’s term deposits regular rate plus 1.65%. (iv) Interest accrual: Annually accrued and paid since the issued date. (v) Repayment of principal: Outright repayment of principal at maturity.
(q) Provisions
December 31, 2016
December 31, 2015
Provision for guarantees $ 37,527 33,535Provision for employee benefits 261,925 413,902
$ 299,452 447,437
(r) Employee benefits
December 31, 2016
December 31, 2015
Defined benefit plans $ 200,935 359,318Employee Promotions Deposits plans 60,990 54,584 $ 261,925 413,902
(1) Defined benefit plans:
The reconciliation in the present value of defined benefit obligations and fair value of plan assets as follows:
December 31, 2016
December 31, 2015
Total present value of obligations $ 1,040,427 1,001,464Fair value of plan assets (839,492) (642,146)Recognized liabilities for defined benefit obligations $ 200,935 359,318
The Group makes defined benefit plan contributions to the pension fund account in the Bank of Taiwan. Plans (covered by the Labor Standards Law) entitle a retired employee to receive retirement benefits based on the years of service and the average monthly salary for six months prior to retirement.
(i) Composition of plan assets
The Group allocates pension funds in accordance with the Regulations for Revenues, Expenditures, Safeguard and Utilization of the Labor Retirement Fund, and such funds are managed by the Labor Pension Fund Supervisory Committee. With regard to the utilization of the funds, minimum earnings in the annual distributions on the final financial statements shall be no less than the earnings attainable from two-year time deposits with interest rates offered by local banks.
The Group’s Bank of Taiwan labor pension reserve account balance amounted to $839,492 thousands as of December 31, 2016. For information on the utilization of the labor pension fund assets including the asset allocation and yield of the fund, please refer to the website of the Labor Pension Fund Supervisory Committee.
Annual Report 2016122
6. Financial Status

(ii) Change in present value of defined benefit obligations
The change in present value of defined benefit obligations were as follows:
2016 2015Defined benefit obligation at January 1 $ 1,001,464 981,070Current service costs and interest 38,769 40,754Actuarial (losses) gains 62,556 29,302Benefits paid by the plan assets (62,362) (49,662)Defined benefit obligation at December 31 $ 1,040,427 1,001,464
(iii) Change in fair value of defined benefit plan assets
The change in the fair value of the defined benefit plan assets were as follows:
2016 2015Fair value of plan assets at January 1 $ 642,146 621,489Expected return on plan assets 12,214 12,642Actuarial gains (losses) (6,616) 3,692Benefits paid by the plan assets 252,929 53,985Contributions made (61,181) (49,662)Fair value of plan assets at December 31 $ 839,492 642,146
(iv) Expenses recognized in profit or loss
The expenses recognized in profits or losses were as follows:
2016 2015Current service costs $ 20,321 21,456Net Interest on the defined benefit liability (asset) 6,234 6,656
$ 26,555 28,112Administrative expenses $ 26,555 28,112Actual return on assets $ 5,597 16,334
(v) Actuarial gains and losses recognized in other comprehensive income
The Group’s actuarial gains and losses recognized in other comprehensive income were as follows:
2016 2015Cumulative amount at January 1 $ (60,660) (35,050)Recognized during the period (69,172) (25,610)Cumulative amount at December 31 $ (129,832) (60,660)
Annual Report 2016 123

(vi) Actuarial assumptions
The principal actuarial assumptions at the reporting date were as follow:
December 31, 2016
December 31, 2015
Discount rate 1.375% 1.875%Future salary increases 2.00% 2.00%
Actuarial assumptions in deciding cost of defined benefit plans:
2016 2015Discount rate at December 31 1.875% 2.00%Future salary increases 2.00% 2.00%
The expected allocation payment to be made by the Group to the defined benefit plans for the one-year period after the reporting date is $52,089 thousands.
The weighted average duration of the defined benefit plan is 15.56 years.
(vii) Sensitivity analysis
If the actuarial assumptions had changed, the impact on present value of defined benefit obligation shall be as follows:
The impact on defined benefit obligationIncrease 0.25% Decrease 0.25%
December 31, 2016Discount rate $ (28,549) $ 29,708Future salary increase 28,661 (27,693)
The impact on defined benefit obligationIncrease 0.25% Decrease 0.25%
December 31, 2015Discount rate $ (28,122) $ 29,294Future salary increase 28,415 (27,421)
The sensitivity analysis above is based on the static risk structure of discount rate against the constant status of other assumed factors. However, the changes in assumptions are linked in practice. The calculation methodology of sensitivity analysis is the same as the net defined benefit obligations of the balance sheet.
The method and the assumption of the current sensitivity analysis is the same as the previous period.
(2) Employee Promotions Deposits plans
The Group was obligated to pay present employees and retired employees fixed preferential interest rate for their deposits in conformity with “Rules Employee Preferential Deposit for Retired Employees for COTA commercial Bank”. If the Group’s preferential deposit interest rate for an employee as stated in the employment contract exceeds the market interest rate, the excess will be subject to IAS 19 ”Employee Benefits” upon the employees’ retirement.
Annual Report 2016124
6. Financial Status

December 31, 2016
December 31, 2015
Present value of defined benefit obligation $ 60,990 54,584
(i) Expenses recognized in profit or loss
As of December 31, 2016 and 2015, the Group’s expenses recognized in profit or loss were $17,366 thousands and $16,766 thousands, respectively.
(ii) Actuarial assumptions2016 2015
Discount rate 4.00% 4.00%Interest rate of Employee Promotions Deposits plans 8.870% 8.985%Return on funds deposited 2.00% 2.00%Account balance annual decline rate 1.00% 1.00%Chance of future changes in the system of Employee Promotions
Deposits plans 50.00% 50.00%
(3) Defined contribution plans
The Group allocates 6% of each employee’s monthly wages to the labor pension personal account at the Bureau of the Labor Insurance in accordance with the provisions of the Labor Pension Act. Under this defined contribution plan, the Group allocates a fixed amount to the Bureau of Labor Insurance without additional legal or constructive obligations.
The pension costs incurred from the contributions to the Bureau of Labor Insurance amounted to 24,905 thousands and 24,219 thousands for the years ended December 31, 2016 and 2015, respectively.
(s) Income tax
(1) The components of income tax in the years 2016 and 2015 were as follows:
2016 2015Current tax expense
Current $ 65,390 91,456Adjustment for prior periods - 1,152
65,390 92,608Deferred tax expense
Origination and reversal of temporary differences 78,436 18,138Income tax expense excluding tax on sale of discontinued operation $ 143,826 110,746
The amount of income tax recognized in other comprehensive income for 2016 and 2015 was follows:
2016 2015Items that will not be reclassified subsequently to profit or loss:Re-measurement from defined benefit plans $ (11,759) (4,354)
Annual Report 2016 125

Reconciliation of income tax and profit before tax for 2016 and 2015 is as follows:
2016 2015Amount Amount
Profit excluding income tax $ 858,643 831,938Income tax using the Company’s domestic tax rate 145,969 141,429Tax effect of tax-exempt gains from sale of marketable securities 12,493 2,369Changes in unrecognized temporary differences (20,000) (6,000)Other adjustments (2,941) (28,204)Prior years deferred income tax adjustment 8,305 -Prior years income tax adjustment - 1,152
$ 143,826 110,746
(2) Deferred tax asset and liability
(i) Unrecognized deferred tax assets
Deferred tax assets have not been recognized in respect of the following items:
December 31, 2016
December 31, 2015
January 1, 2015
Tax effect of deductible Temporary Differences $ 40,000 60,000 66,000
(ii) Recognized deferred tax assets and liabilities
Changes in the amount of deferred tax assets and liabilities for 2016 and 2015 were as follows:
Defined Benefit Plans
Fair Value Losses
Allowance of impairment loss
Others
Total
Deferred Tax Assets:Balance at January 1, 2016 $ 77,806 21,872 140,822 9,904 250,404Recognized in profit or loss (45,900) - (34,645) (3,795) (84,340)Recognized in other
comprehensive income 11,759 - - - 11,759Balance at December 31, 2016 $ 43,665 21,872 106,177 6,109 177,823
Balance at January 1, 2015 $ 72,222 21,872 153,258 10,310 257,662Recognized in profit or loss 1,230 - (12,436) (406) (11,612)Recognized in othercomprehensive income 4,354 - - - 4,354Balance at December 31, 2015 $ 77,806 21,872 140,822 9,904 250,404
Annual Report 2016126
6. Financial Status

Accrued liabilities for land tax revaluation
increment
Fair
Value Gains
Others
TotalDeferred Tax Liabilities:Balance at January 1, 2016 $ 83,799 6,328 31,303 121,430Recognized in profit or loss - (3,345) (2,559) (5,904)Balance at December 31, 2016 $ 83,799 2,983 28,744 115,526
Balance at January 1, 2015 $ 83,799 599 30,506 114,904Recognized in profit or loss - 5,729 797 6,526Balance at December 31, 2015 $ 83,799 6,328 31,303 121,430
(iii) Examination and Approval
The company’s tax returns for the years through 2014 were examined and approved by the Tax Authorities.
(iv) Information related to the ICA is summarized as follows:December 31,
2016December 31,
2015
Unappropriated earning of 1998 and after $ 657,410 702,722
Balance of imputation credit $ 139,111 206,233
2016 (estimated) 2015 (actual)
Creditable ratio for earnings distributions to ROC residents 20.48% 20.53%
The above stated, information was prepared in accordance with information letter NO.10204562810 issued by the Ministry of Finance of ROC on October 17, 2013.
(t) Share capital and other equity accounts
(1) Share capital
As of December 31, 2016, and 2015, the Company’s authorized capital consisted of 10,000,000 and 6,000,000 thousand shares and issued shares worth $6,370,695 thousands and $5,998,771 thousands, respectively, with par value of $10 per share.
Outstanding shares reconciliation as below:
Common Stock 2016 2015
(thousand shares)Balance at January 1 $ 599,877 503,269 Issuance of common stock for cash - 80,000Common stock dividend 37,192 16,608Balance at December 31 $ 637,069 599,877
It was resolved in the stockholders’ meeting on June 10, 2015 to increase capital through a capitalization of retained earnings amounting to $166,079 thousands. This had been registered and approved by the government authorities on July 27, 2015.
Annual Report 2016 127

It was resolved in the directors’ meeting on March 26, 2015 to increase capital through a cash injection amounting to $800,000 thousands divided into 80,000 thousands shares at $10 par value. This had been registered and approved by the government authorities on October 27, 2015.
It was resolved in the stockholders’ meeting on June 7, 2016 to increase capital through a capitalization of retained earnings amounting to $371,924 thousands. This had been registered and approved by the government authorities on August 3, 2016.
(2) Capital reserve
The components of capital reserve were as follows:December 31,
2016December 31,
2015Statutory reserve and special reserve transferred in $ 742,056 742,056Additional paid-in capital 136,043 136,043Share-based compensation 19,982 19,982Others 153 123Additional paid-in capital $ 898,234 898,204
In accordance with the ROC Company Law, capital reserve is exclusively used for offsetting prior losses and conversion to capital, and cannot be distributed as cash dividends. According to the ROC Company Law and relevant securities exchange regulations, a capital increase using capital reserve has to be reserves arisen from issuing stock or donated assets received and cannot exceed 10% of a company’s paid-in capital in any year. Capital reserve arisen from long-term equity investments cannot be used to offset prior losses or converted to capital.
(3) Retained earnings
The Company’s article of incorporation stipulate that Company’s net earnings should first be used to offset the prior years’ deficits, if any, before paying any income taxes. Of the remaining balance, 30% is to be appropriated as legal reserve but the legal reserve has reached its total capital, or the financial business is sound and raise the legal reserve who under the ROC Bank Act, Have unrestricted preceding paragraph; And the operation needs of the Company with the Act provides for the extension or rotation of the special reserve, If there are reserve, together with the unallocated surplus at the beginning of the period, Drafted by the Board of Directors for distribution of profits brought to the shareholders’ meeting dispatch shareholders dividends.
According to the Banking Law, cash dividends are limited to 15% of total capital until the balance of statutory reserve reaches the amount of capital.
Except as otherwise provided by law, cash dividend shall not be lower than 10% of the total dividend distributed. If the cash dividend distributed per share is lower than $0.1, expect for otherwise resolved by the shareholder’s meeting, it is not distributed.
(i) Legal reserve
Under the ROC Bank Act, the Company must retain10% of its earnings as legal reserve until such retention equals the amount of the total capital. According to the amendment of the ROC Bank Act as of January 2012, legal reserve is limited to the extent of 25% of the share capital. In addition, under the ROC Bank Act, the Bank shall retain 30% of its after-tax earnings as the legal reserve before distributing them. Before the amount of legal reserves reaches the
Annual Report 2016128
6. Financial Status
amount of the total capital, the maximum amount of distributing earnings in cash shall not exceed 15% of the total capital. The restriction is not applied if the amount of legal reserves equals the amount of the total capital, or if the Bank is in a sound financial condition and when it complies the ROC Bank Act.
(ii) Special reserve
In accordance with permit NO.1010012865 as issued by the financial supervisory commission on April 6, 2012, a portion of current-period earnings and undistributed prior-period earnings shall be reclassified as a special earnings reserve during earnings distribution. The amount to be reclassified should be equal to the difference between the total net current-period reduction of other shareholders’ equity resulting from the first-time adoption of IFRSs and the carrying amount of special earnings reserve as stated above. Similarly, a portion of undistributed prior period earnings shall be reclassified as a special earnings reserve (which does not qualify for earnings distribution) to account for cumulative changes to other shareholders’ equity pertaining to prior periods due to the first-time adoption of IFRSs. Amounts of subsequent reversals pertaining to the net reduction of other shareholders’ equity shall qualify for additional distributions.
(iii) Appropriation of earnings
Earning distribution for 2015 and 2014 was decided via the general meeting of shareholders held on June 7, 2016 and June 10, 2015, respectively. The details were as follows:
2016 2015Amount per
shareTotal
amountAmount per
shareTotal
amountDividends distributed to ordinary shareholdersCash $ 0.20 119,975 0.33 166,079Shares 0.62 371,924 0.33 166,079Total 491,899 332,158
(iv) Other equity accountsExchange
differences on translation of
foreign financial statements
Unrealized gains
(losses) on available-for-sale financial assets
OthersBalance, January1, 2016 $ (27) 48,848 48,821
Unrealized losses on available-for-sale financial assets, net of tax: - (56,953) (56,953)
Foreign currency translation differences (net of tax): 32
- 32
Balance, December 31, 2016 $ 5 (8,105) (8,100)Balance, January1, 2015 $ (11) 4,861 4,850
Unrealized losses on available-for-sale financial assets, net of tax: - 43,987 43,987
Foreign currency translation differences (net of tax): (16) - (16)
Balance, December 31, 2015 $ (27) 48,848 48,821
Annual Report 2016 129

(u) Earnings per share
The basic and diluted earnings per share for 2016 and 2015 were calculated as follows:
2016 2015Basic earnings per share:
Profit of the Company for the year $ 714,817 721,192Weighted-average number of ordinary shares at 31 December 637,069 637,069
Basic Earnings per share (in NT dollars) $ 1.12 1.13Diluted earnings per share:
Profit of the Company for the year $ 714,817 721,192Weighted-average number of ordinary shares at 31 December 637,069 637,069Effect of dilutive potential ordinary sharesEmployee bonuses 5,077 5,203Weighted-average number of ordinary shares (diluted) at 31 December 642,146 642,272
Diluted earnings per share (in NT dollar) $ 1.11 1.12
(v) Net interest income
2016 2015 Interest income
Discount and loans $ 2,966,611 3,001,170Due from Banks 143,483 174,673Short-term bills and bonds 124,665 118,462Other 179,746 173,272Sub-total 3,414,505 3,467,577
Interest expenseDeposit 956,898 1,088,063Due to other Central Bank and call loans to banks 3,258 3,926Financial bonds 51,575 47,295Other 775 1,197Sub-total 1,012,506 1,140,481
$ 2,401,999 2,327,096
(x) Service fee income
2016 2015Insurance agency service fee $ 243,922 227,258Fund service fee 9,713 27,747Guarantee service fee 19,868 19,752Consumer financial center service fee 14,523 16,291Remittance service fee 11,730 13,264Trust service fee 12,686 12,971Other 37,360 31,285Sub-total 349,802 348,568Service fee expense 31,188 26,259
$ 318,614 322,309
Annual Report 2016130
6. Financial Status

(y) Gains and losses on financial assets or liabilities measured at fair value through profit or loss
2016 2015Disposal gains (losses)Convertible bonds $ 31,028 33,223Listed and OTC securities (37,344) (5,663)Beneficiary certificates 7,726 524Derivative financial instruments - 77Subtotal 1,410 28,161Valuation(losses) gains Convertible bonds (5,894) 4,500Listed and OTC securities (2,183) (192)Beneficiary certificates (909) 1,345Derivative financial instruments (34,886) (14,527)Subtotal (43,872) (8,874)Dividend and interest income 84 10,786
$ (42,378) 30,073
(z) Other net non-interest income
2016 2015Dividend income $ 6,424 6,529Rental income 19,216 19,563Net gains (losses) on disposal of premises and equipments (2,975) 91Others 5,133 8,818
$ 27,798 35,001
(aa) Bad debt expenses and provision for guarantee reserve
2016 2015Discounts and loans $ 5,611 153,352Receivables 2,509 591Guarantee reserve 4,000 (2,500)
$ 12,120 151,443
Annual Report 2016 131

(ab) Employee compensation and directors’ and supervisors’ remuneration
In accordance with the Articles of incorporation, the Company should contribute no less than 6% of the profit as employee compensation and less than 2% as directors’ and supervisors’ remuneration when there is profit for the year. However, if the Company has accumulated deficits, the profit should be reserved to offset the deficit. The amount of remuneration of each director and supervisor and of compensation for employees entitled to receive the abovementioned employee compensation is approved by the board of directors. The recipients of shares and cash may include the employees of the Company’s affiliated companies who meet certain conditions.
For the year ended December 31, 2016 and 2015, the Company estimated its employee remuneration amounting to $55,644 thousands and $53,932 thousands, and directors’ and supervisors’ remuneration amounting to $18,548 thousands and $17,977 thousands, respectively. The estimated amounts mentioned above are calculated based on the net profit before tax, excluding the remuneration to employees, directors and supervisors of each period, multiplied by the percentage of remuneration to employees, directors and supervisors as specified in the Group’s articles. These remunerations were expensed under operating expenses during 2016 and 2015. The amounts, as stated in the consolidated financial statements, are identical to those of the actual distributions for 2016 and 2015.
(ac) Employee benefits expenses
2016 2015Salary expenses $ 1,079,280 1,109,190Insurance expenses 77,241 75,032Retirement expenses 51,460 52,331Other employee benefits 89,555 84,616
$ 1,297,536 1,321,169
(ad) Depreciation and amortization expenses
2016 2015Depreciation of Property and equipment $ 42,175 39,590Depreciation of investment Property 1,033 1,033Amortization of intangible assets 2,299 2,724
$ 45,507 43,347
(ae) Other general and administrative expenses
2016 2015Taxes and fees $ 213,985 218,106Insurance expense 51,563 50,323Rental expense 54,994 51,430Occupational group membership fee 21,761 44,592Advertising and printing expense 32,027 37,533Security fees 20,251 19,375Other 125,651 134,833
$ 520,232 556,192
Annual Report 2016132
6. Financial Status

(af) Financial instruments
(1) Fair value Measurement
(i) Overview
Fair value is the price that would be received to sell an asset or paid to transfer a liability in an orderly transaction between market participants at the measurement date.
Financial instruments are measured at fair value on initial recognition, which, in most of the situations, refers to the entry price. Subsequent valuation is on the fair value basis except for financial instruments measured at amortized cost. The optimal evidence in deciding fair value is the exit price of active market. Considering those financial instruments without active market, the Group adopts valuation techniques or references of the exit price offered by Bloomberg, Reuters and counterparties in fair value valuation.
(ii) Definition of three - level fair value hierarchy
A. Level 1
Fair value measurement for a financial instrument classified in Level 1 is determined as the quoted price for an identical financial instrument in an active market. The definition of active market has all of the following conditions: the products traded in the market are homogeneous, willing parties are available anytime in the market, and price information is available for the public. The Company and its subsidiaries’ investments in listed and TPEx securities, beneficiary certificates, popular Taiwan central government bonds and derivative financial instruments which had the quoted price in an active market are classified to Level 1.
B. Level 2
Fair value measurement for a financial instrument classified in Level 2 is determined as the observable price other than quoted price in an active market including an observable input obtained in an active market, either directly (i.e., as prices) or indirectly (i.e., derived from prices). The Company and its subsidiaries’ investments in government bonds not in popular demand, corporate bonds, financial debentures, convertible bonds and majority derivative instruments are classified to Level 2.
C. Level 3
Input for a fair value measurement for a financial instrument classified in Level 3 is not based on obtainable data from the market (an unobservable input, such as volatility for a share option derived from the share’s historical prices, as it does not generally represent current market expectations about future volatility).
Annual Report 2016 133

(iii) Fair value hierarchy
A. The table below analyses recurring financial instruments carried at fair value
December 31,2016Fair value measurement for financial instruments Total Level 1 Level 2 Level 3Non-Derivative Financial Instruments
Assets:Financial assets measured at fair value through
profit or lossInvestment in stocks $ 76,185 76,185 - -Investment in bonds 1,469,828 - 1,469,828 -Others 248,776 248,776 - -
Available-for-sale financial assets - netInvestment in bonds 6,375,802 6,375,802 - -
December 31,2016Fair value measurement for financial instruments Total Level 1 Level 2 Level 3Derivative Financial Instruments
Assets:Financial assets measured at fair value through
profit or loss $ 1,245 - 1,245 -Liabilities:
Financial liabilities measured at fair value through profit or loss
491 -
491
-
December 31,2015Fair value measurement for financial instruments Total Level 1 Level 2 Level 3Non-Derivative Financial Instruments
Assets:Financial assets measured at fair value through
profit or lossInvestment in stocks $ 31,318 31,318 - -Investment in bonds 1,905,822 - 1,905,822 -Others 42,835 42,835 - -
Available-for-sale financial assets - netInvestment in bonds 4,345,123 4,345,123 - -
December 31,2015Fair value measurement for financial instruments Total Level 1 Level 2 Level 3Derivative Financial Instruments
Assets:Financial assets measured at fair value through
profit or loss $ 36,685 - 36,685 -Liabilities:
Financial liabilities measured at fair value through profit or loss
1,045 -
1,045
-
Annual Report 2016134
6. Financial Status
B. Valuation techniques of financial assets and liabilities measured by fair value
If there is a quoted price in an active market for non-derivative financial assets and liabilities measured at fair value through profit or loss and available-for-sale financial assets, the quoted price is regarded as its fair value. Financial instruments with public market prices (except for stocks and depositary receipt) such as government bonds use the latest trade price TPEX Electronic Bond Trading System (EBTS) or reference theory price under as fair value. Foreign currency bonds use latest trade price as fair value. If no quoted price referable by, the fair value is estimated valuation techniques of which the assumptions and estimates are in conformity with those information (available for the Group) used in pricing the financial instruments. Financial derivative instruments with active market price use market value as fair value. When there is no active market price, valuation model is mainly adopted in evaluation. Derivative instruments - non-option use discounted cash flow method; Derivative instruments - options mainly use Black - Scholes Model in evaluation.
C. Fair value adjustment
(A) Limitations to Evaluation Models and uncertain inputs The outputs of evaluation models are estimated, while the model is possibly incapable of reflecting all relevant
factors relating to financial instruments held by the group. In such circumstances, the estimates are hence adjusted according to suitable extra parameters such as model risk or liquidity risk. The Group’s operation process of financial instrument evaluation policy considers the adjustment to evaluation is adequate and necessary so as to fairly present the financial instrument’s fair value in statement of financial position. In the evaluation process, the pricing information and parameters are deliberately assessed and modulated in light of market situation.
(B) Credit risk valuation adjustment Credit risk valuation adjustment can be classified into Credit value adjustments and Debit value adjustments.
The adjustments reflect the possibility of delayed repayment by the counterparty or the Group in fair value and of failure in transaction’s entire market value collected (paid) by the Group.
(2) Methods and assumptions used by the Group for fair value evaluation of financial instruments were as follows:
(i) Fair value of short-term financial instruments is estimated by their book value on the balance sheet date. Since these instruments have short maturities, the book value is adopted as a reasonable basis in estimating the fair value. The method is applied to cash and cash equivalents, due from Central Bank and call loans to banks, securities purchased under reverse repurchase agreements, receivables, current tax assets, other financial assets, deposits from Central Bank and other banks, due to Central Bank and other banks, securities sold under repurchase agreements, payables, current tax liabilities, remittances, and other financial liabilities.
(ii) If there is a quoted price in an active market for the financial asset, including financial instruments measured at fair value through profit or loss, available-for-sale, held-to-maturity financial assets, and hedging derivative financial instruments, the quoted price is regarded as its fair value. If there is no quoted price in an active market for the financial asset, its fair value is estimated on the basis of the result of a valuation technique that refers to quoted prices provided by financial institutions. The discounted cash flow technique is used to estimate the fair value of a debt instrument where an active market does not exist. The estimates, hypotheses and discount rates for valuation refer to quoted prices, from financial institutions, of financial instruments having substantially the same terms and characteristics, including the credit quality of debtors, the remaining term over which the contractual interest rate is fixed, the remaining term to repayment of the principal, and the currency in which the payments are to be made. Fair value of debt investments without an active market accounted for under other financial assets is determined by the methods described above, and recorded in accordance with the “Regulations Governing the Preparation of Financial
Annual Report 2016 135

Reports by Public Bank’s” at amortized cost. Fair value for an equity investment is determined based on either the price calculated using a valuation technique or its book value.
(iii) Loans and deposits are both classified as interest-bearing financial assets; therefore, the book value of financial assets is equivalent to their fair value. The net book value of the non-accrual account, after deducting provision for credit loss, is adopted as the fair value.
(iv) The book values of the Group’s financial assets carried at cost and financial liabilities measured at amortized cost are similar to their fair values.
(v) Financial Bonds Payable: It refers to the financial bonds issued by the Company. Their coupon rates are almost equal to the market interest rate, so it is reasonable to using the discounted present values of the expected future cash flow to estimate their fair values. The present values are almost equal to the carrying amounts.
(vi) Except those with quoted price in an active market, the fair values of the other financial instruments are attained by valuation techniques or quoted prices from countered parties. The fair value calculated using valuation techniques can refer to the present fair values of financial instruments with similar conditions and characteristics, the discounted cash flow method or other valuation techniques, including the modular valuation method of which the calculated values are computed using attainable market information (such as the commercial paper fixing rates of Reuters.)
(3) For the year ended December 31, 2016 and 2015, unrealized gains due to the estimated change of fair value recognized by the Group were $(40,780) thousands and $(10,026) thousands, respectively. For the year ended December 31, 2016 and 2015, there were no transfers from one level to another.
(ag) Financial risk information
(1) Overview
The main risks that the Bank faced and the management strategies are as follows:
(i) Management of capital adequacy ratio
The Group risk management considers the Bank as a continuous operation and is being based on the best practice of Basel III, to develop a complete risk management structure and capital adequacy management to ensure the Bank fulfills the minimum capital requirements and enable to bear pressure of capital shock.
(ii) Credit risk management
Credit strategy includes returns and risk diversification. The asset portfolio includes qualified retail bonds, corporate credit and mortgages. It is also distinguished based on the level of client risk to control the acceptable range of the overall credit risk. The Bank also made use of the risk transfer in credit guarantee fund to strengthen the collateral of small-and-medium enterprises, reduce breach of contract risk and accomplish benefits of risk capital at the same time. To effectively maintain the asset quality and risk return, the Bank has improved its credit investigation and review procedures. It has also managed its collateral and strengthened the development use of risk management instruments and credit risk management schemes.
(iii) Liquidity risk and market risk management
Assets and liabilities committee is responsible of the liquidity, security and profitability of assets and liabilities. The committee not only conducts regular assessment on the duration and the maturity analysis of assets and liabilities
Annual Report 2016136
6. Financial Status

but also set limit structure and the related liquidity limits to control index, adjust capital gap in order to conform with the objective of risk appetite. Profitability is strengthened through the optimization of assets and liabilities structure. Market risk management includes investment in trading book and banking book. To prevent financial instruments from suffering from excessive fluctuations in market price, management measures and restrictions on investment are set, sensitivity index on market risk factors.
(iv) Operational risk management
In order to integrate risk management culture with employees, the Group not only restricts employees by undertaking regulations, discipline and incentive and penalty measures, but also adopts standard operating procedures and internal control systems to enhance capability of information systems control and the timeliness and accuracy of information on risk management. Risk is controlled and reviewed regularly through the risk appetite, key risk indicator and warning system of risk events for early planning to improve measures.
The Company has set the risk management policies and risk management procedures, which have been approved by the BOD for effective recognition, measurement, monitoring and control of credit risk, market risk and liquidity risk.
(2) Organizational structure of risk management
The organizational structure of risk management includes BOD, Risk Committee, Risk Management Committee, Assets and Liabilities Committee, Loan Review Committee, Department of Risk Management, Department of Audit, Department of Law, Credit Management Headquarter and Department of Credit Analysis and Appraisal and other management departments, with BOD as the ultimate responsible unit. The risk committee is subordinated to the BOD, and the member of risk committee is elected from the board of directors, who monitor risks on behalf of the BOD. The BOD and risk committee will delegate authorities to the general manager and committees in setting management rules as regards to risk identification, measurement, disclosure, report, monitoring and offsetting. The Group also established independent risk management department to monitor the credit risk, market risk, operational risk and liquidity risk. At the same time, the Group promotes the framework of new Basel capital agreement that identifies measures, discloses and reports management system and proposes each risk management report for management decision on a regular basis. Also, the law department is set up to carry out law risk management and procedures on review of legal compliance. The business units, which are subordinated to the general manager, ensure the coordination of each risk management policies; establish appropriate internal control and standard operating procedures and support the risk management project based on the business needs. The audit department is responsible for auditing the compliance of all internal and external business norms in all units, as well as the implementation of internal control in practice.
(3) Credit risk
(i) The source and definition of credit risk
Credit risk is the risk of financial loss to the Group if a creditor or counterparty fails to meet its contractual obligations. Credit risk management should be adopted in all operating activities that involved in credit risk, including loans, investment in banking book, financial derivatives, transactions in repurchase agreement and other operating activities in relation to the credit risk.
(ii) Management policy of credit risk
The Group has set standard control procedures on credit risk identification, measurement, and information on disclosures and reports to conduct rational identification, measurement, disclosures and effective control on credit risk. The Group also deliberates the fluctuation in economics and adjusts the credit risk structure accordingly to control the
Annual Report 2016 137

risks in credit portfolio within the risk appetite. These procedures include criteria for targeted client, credit investigation, credit approval or rejection, approval on exceptions, risk control and management, credit review, management on non-performing loans and requests and control of all related documents and information. Based on the risk management policies, the illustration of management process carried out by the competent authority is as follows:
A. Credit investigation
With respect to the criteria for targeted client, the Group should ask for all necessary documents from the clients in order to filter client accurately and control credit portfolio within the acceptable range.
B. Credit approval
Cases that have passed through the credit investigation are reviewed by the credit authority of each level. The credit authorities authorize credits in compliance with the credit limitation structure and authorization policies of the Group. The credit limitation structure and authorization policies of the Group are not only based on banking act and the rules stipulated by the authority, concerning the credit extended to same person or same affiliated enterprises/groups, stock collateral, industry and country, but also based on the professionalism of the credit authorities and the quality of asset control. The amounts of credit authorized are reviewed by the credit authorities on occasional basis.
C. Post-lending loan review mechanisms
The corporate banking business of the Group strengthens the tracking control of the financial and business conditions on creditors, carry out risk assessment report of credit asset portfolio on a regular basis, set-up warning system and adjust business development strategy to cope with economic conditions and changes in asset quality through the account management scheme and regular reassessment system. As regards to delinquent loans, the Group uses concentration management method, together with information systems and analysis model to conduct regular review to improve the performance on overdue to expedite the collection of nonperforming loans.
D. Development, application and verification of risk information system
The Group has actively developed quantify risk assessment model as a reference for credit decision. The Bank develops the credit rating model based on products and characteristics of counterparties and uses the results from the model to filter new clients, risk pricing and limit management, to analyze and develop overdue management strategy on overdue loans based on client behavior pattern. To improve the effectiveness of credit investigation and ensure the consistency with the investigation standards, the Company built a credit investigation operating system, which not only strengthen the effectiveness of the Group operation and information system, but also improve the development of model for quantifying risk. The Group conducts verification on the risk assessment model on a regular basis and evaluates the effectiveness of the model and made necessary amendments.
The methods of risk measurement in the main operating departments are as follows:
(A) Loans (including credit commitment and guarantee)
Classifications in credit assets and level of credit quality are illustrated as follows:
i) Classification of credit assets
The credit assets are classified into 5 categories, where the normal credit assets are classified as Category 1. After nonperforming credit assets are evaluated by assessing the status of the loan collaterals and the length of time overdue, they are classified under Category 2 assets that require special mention. Assets that are substandard are classified as Category 3, assets that are doubtful are classified
Annual Report 2016138
6. Financial Status

as Category 4 and assets for which incurred a loss are classified as Category 5. The Bank has set “Regulations Governing the Procedures to Evaluate Credit Assets, Set Aside Loss Reserves and Handle Non-performing Credit, Non-accrual Loans and Bad Debts” as management for doubtful loans and as a basis for handling overdue loans.
ii) Level of credit quality
The level of credit quality is set to accommodate the characteristics and the scale of operating business, and conduct risk management.
(B) Due from the Central Banks and call loans to banks, investments in debt instruments and financial derivatives instruments
The Group always assesses the credit situation of the counterparty before entering into a transaction. The counterparty’s rating and information on financial condition from domestic and international credit rating agency are being considered and different credit risk limits are set. The credit risk limits are approved by the BOD or the authority level. Overall, most of the investments are above investment grade ratings.
(iii) Mitigation or hedging of risk
Based on the risk assessment of the credit counterparty and transactions, the Bank requires high liquidity and sufficient collateral or transfer of credit guarantee and guarantee association (for instance, Small and Medium Enterprise Credit Guarantee Fund) to strengthen the guarantee of loans. In order to avoid and control risks, the Group not only requires the provision of necessary legal documents, but also conducts field survey on the status of collateral and determines whether to reassess the value of collateral and demand for additional collateral or adjust the credit amount. The lists of management conduct by the Group are as follows:
A. Setting the value of collateral and management measures, including types of acceptable collateral, valuation process, frequency of revaluation, market assessment and law enforcement procedures.
B. The liquidity and value of collateral and the degree of law enforcement should be assessed by independent party.
C. The selection of appraise or appraisal institute, the requirements of appraisal and its related fees should be in compliance with the internal management procedures.
D. Transfer of collateral, authority setting and other insurance procedures should be completed before being appropriated, and the amount set, insured and other legal aspects should be complied with the Group regulations.
(iv) Maximum exposure credit risk
Without taking collateral or other credit enhancement mitigation effect into account, the maximum exposure to credit risk of on-balance sheet financial assets is equal to their carrying values and the maximum exposure of credit risk of off-balance sheet financial instruments were as follows:
December 31, 2016
December 31, 2015
Irrevocable loan commitment $ 19,796,661 18,350,297Credit card commitment 21,094 20,090Undrawn letters of credit 9,000 -Guarantees 49,617 43,805
$ 19,876,372 18,416,192
Annual Report 2016 139

The Group believe the adopting stringent selection processes and conducting regular review afterwards are the reasons why they can continuously control and minimize the credit risk exposure of their off-balance sheet items.
(v) Concentrations of credit risk
Concentrations of credit risk arise when a number of counterparties or exposure have comparable economic characteristics, or such counterparties are engaged in similar activities, or operate in the same geographical areas or industry sectors, so that their collective ability to meet contractual obligations is uniformly affected by changes in economic or other conditions.
Credit risk concentration can arise in a bank’s assets, liabilities, or off-balance sheet items, through the execution or processing of transactions (either product or service), or through a combination of exposures across these broad categories. It includes credit, loan and deposits, call loan to banks, investment, receivables and derivatives. The Bank maintains a diversified portfolio, limits its exposure on a continuous basis. The Group’s most significant concentrations of credit risk are summarized as follows:
A. By IndustryDecember 31, 2016 December 31, 2015
Amount % Amount %Private enterprise $ 29,808,474 26.16 23,990,248 22.39 Government-owned businesses - - 15,000 0.01Public Sector 3,005,586 2.64 5,147,542 4.80Non-profit organization 64,089 0.06 117,318 0.11Individuals 80,892,103 70.99 77,728,642 72.53Financial institutions 175,635 0.15 165,330 0.16
$ 113,945,887 100.00 107,164,080 100.00
B. By Area
Not applicable since the Group conducts its business domestically.
C. By CollateralDecember 31, 2016 December 31, 2015
Amount % Amount %Non-secured $ 19,659,273 17.25 20,419,238 19.05 Securities
stock 135,741 0.12 131,027 0.12Bond 155,518 0.14 153,554 0.14Real estate 69,061,011 60.61 63,054,521 58.84Chattel 19,766,569 17.35 18,543,960 17.30Notes receivables 49,283 0.04 53,455 0.05Guarantee 4,997,479 4.38 4,749,588 4.43Other 121,013 0.11 58,737 0.07
$ 113,945,887 100.00 107,164,080 100.00
(vi) Credit quality and overdue impairment loss of financial assets of the Bank
Part of the financial assets, such as cash and cash equivalent, due from the Central Bank and call loans to banks, financial assets at fair value through profit or loss, bills and bonds purchased under resell agreement, guarantee
Annual Report 2016140
6. Financial Status

deposits paid and operation guarantee deposits and settlement funds are considered of minimum credit risk due to the good credit ratings of the trade counterparties.
Expect for the abovementioned items, the credit quality analysis of the rest of the financial assets are as follows:
A. Credit Quality Analysis of Discounts and Loans as well as Receivables
Neither past due nor impaired
Past due not impaired Impaired Total Impairment allowance (D) Net
With objective evidence
Without objective evidenceDecember 31, 2016 (A) (B) (C) (A)+(B)+(C) (A)+(B)+(C)-(D)
Receivables- Credit card 143,286 1,410 416 145,112 95 33,255 111,762- Revenue 563 - - 563 - - 563- Interest 227,121 - 2,931 230,052 322 1,211 228,519- Promissory fare 1,584 - - 1,584 - - 1,584- Others 50,069 - 6,925 56,994 2,901 2,794 51,299
Subtotal 422,623 1,410 10,272 434,305 3,318 37,260 393,727Discounts and loans 112,521,821 478,082 945,984 113,945,887 778,726 1,183,921 111,983,240Off balance sheet items
- Guarantee 2,399,323 - 30,556 2,429,879 - - 2,429,879- Letter of credit 162,939 - - 162,939 - - 162,939
Neither past due nor impaired
Past due not impaired Impaired Total Impairment allowance (D) Net
With objective evidence
Without objective evidenceDecember 31, 2015 (A) (B) (C) (A)+(B)+(C) (A)+(B)+(C)-(D)
Receivables- Credit card 147,081 995 381 148,457 187 31,947 116,323- Revenue 1,274 - - 1,274 - - 1,274- Interest 234,009 - 3,085 237,094 1,462 5,662 229,970- Promissory fare 992 - - 992 - - 992- Others 25,722 - 22,904 48,626 14,292 - 34,334
Subtotal 409,078 995 26,370 436,443 15,941 37,609 382,893Discounts and loans 105,782,311 313,112 1,068,657 107,164,080 921,640 1,281,737 104,960,703Off balance sheet items
- Guarantee 1,380,907 - 29,312 1,410,219 - - 1,410,219- Letter of credit 177,189 - - 177,189 - - 177,189
Annual Report 2016 141

B.Client-credit-quality-based Credit Quality Analysis on None Past Due and None impaired Discount and Loans
Neither past due nor impairedDecember 31, 2016 Very Good Good Medium None Total
Consumers’ financing- Automobile 8,290,515 9,340,336 266 173,539 17,804,656- Real estate 1,179,442 12,854,178 5,816,497 2,672,995 22,523,112- Credit loans 4,713,391 1,731,529 20,700 53,940 6,519,560- Deposit collateral - 703 5,184 61,435 67,322- Land as collateral - 13,112,389 3,591,405 853,434 17,557,228- Other secured 73,879 9,713,670 3,269,144 1,696,261 14,752,954- Other non-secured 4,129 302,656 114,573 127,541 548,899Corporate financing
- Government - - - 3,005,586 3,005,586- PP&E as collateral 2,148,864 9,304,950 2,399,763 491,474 14,345,051- Insurance policies as collateral - 15,727 4,253 3,667 23,647- Other secured 630,306 3,045,606 2,200,383 330,675 6,206,970- Other non-secured 922,464 4,620,972 2,090,351 1,533,050 9,166,837
Total 17,962,990 64,042,716 19,512,519 11,003,597 112,521,822
Neither past due nor impairedDecember 31, 2015 Very Good Good Medium None Total
Consumers’ financing- Automobile 7,992,824 8,528,026 833 171,520 16,693,203- Real estate 1,030,974 13,085,465 5,913,143 2,328,111 22,357,693- Credit loans 4,950,317 1,814,490 23,051 50,045 6,837,903- Deposit collateral - 2,198 9,845 86,570 98,613- Land as collateral 1,920 12,691,779 3,803,574 430,200 16,927,473- Other secured 89,206 9,292,886 2,944,680 846,604 13,173,376- Other non-secured 5,410 406,219 143,999 89,572 645,200Corporate financing
- Government - - - 5,162,543 5,162,543- PP&E as collateral 1,374,854 6,686,224 2,507,130 281,719 10,849,927- Insurance policies as collateral - 28,295 16,269 17 44,581- Other secured 617,361 2,865,444 2,131,871 69,282 5,683,958- Other non-secured 448,806 3,820,949 1,977,078 1,061,008 7,307,841
Total 16,511,672 59,221,975 19,471,473 10,577,191 105,782,311
Annual Report 2016142
6. Financial Status

C.Credit Quality Analysis of Security Investments
December 31, 2016
Neither past due nor impaired Past dueNot Impaired
(B)
Impaired
(C)Total
(A)+(B)+(C)
ImpairmentAllowance
(D)
Net(A)+(B)+ (C)-(D)Very Good Good Normal Total
(A)Available for sale
- Bond 6,375,802 - - 6,375,802 - - 6,375,802 - 6,375,802Held-to-maturity
- Bond 3,524,120 - - 3,524,120 - - 3,524,120 - 3,524,120- Other 1,000 - - 1,000 - - 1,000 - 1,000
Other- Equity 129,892 - - 129,892 - - 129,892 - 129,892- Bond - - - - - 64,558 64,558 8,150 56,408
December 31, 2015
Neither past due nor impaired Past dueNot Impaired
(B)
Impaired
(C)Total
(A)+(B)+(C)
ImpairmentAllowance
(D)
Net(A)+(B)+ (C)-(D)Very Good Good Normal Total
(A)Available for sale
- Bond 4,345,123 - - 4,345,123 - - 4,345,123 - 4,345,123Held-to-maturity
- Bond 3,505,657 - - 3,505,657 - - 3,505,657 - 3,505,657- Other 1,000 - - 1,000 - - 1,000 - 1,000
Other- Equity 129,892 - - 129,892 - - 129,892 - 129,892- Bond - - - - - 66,132 66,132 8,349 57,783
Annual Report 2016 143

(vii) Ageing Analysis on Past Due but Not Impaired Financial Assets
Past due but not impaired loans might results from some temporary administration reasons so the customer is in the early stages of delinquency but no actual impairment occurs yet. According to the internal credit risk assets impairment evaluation guideline, unless there are other objective evidences shown the potential loss, a less than 90-day past due loan is typically not to be treated as impairment.
The aging analysis on past due but not impaired financial assets is as follows:
December 31, 2016 December 31, 2015Overdue
within 1 month
Overdue Between 1
and 3 months Total
Overdue within
1 month
Overdue Between 1
and 3 months TotalReceivables
- credit card 969 441 1,410 524 471 995Discounts and loans
Consumers- automobile - 9,323 9,323 - 10,542 10,542- real estate - 58,409 58,409 - 40,801 40,801- credit line 56,777 35,100 91,877 56,733 41,599 98,332- land as collateral - 8,944 8,944 - 27,892 27,892- other secured - 24,106 24,106 2 78,341 78,343- other non-secured
346 1,084 1,430 698 1,785 2,483
Corporate- real estate - 201,441 201,441- credit line - 78 78- other secured - 21,514 21,514 - 35,650 35,650- other non-secured - 60,960 60,960 - 19,069 19,069
Total 58,092 421,400 479,492 57,957 256,150 314,107
(viii) Analysis of Impairment for Financial Assets
Analysis of impairment for discounts, loans and receivables and accumulated impairment are as follows:
ItemDiscounts and loans (Note1)
December 31, 2016 December 31, 2015
With objective evidence of impairmentIndividual impairment 238,959 319,883Collective impairment 707,025 748,774
Without objective evidence of impairment Collective impairment 112,999,903 106,095,423Total 113,945,887 107,164,080
ItemAllowance for doubtful accounts
December 31, 2016 December 31, 2015
With objective evidence of impairmentIndividual impairment 215,769 309,324Collective impairment 562,975 612,316
Without objective evidence of impairment Collective impairment 1,183,921 1,281,737Total 1,962,647 2,203,377
Annual Report 2016144
6. Financial Status

ItemReceivables (Note2)
December 31, 2016 December 31, 2015
With objective evidence of impairmentIndividual impairment 7,346 23,276Collective impairment 2,926 3,093
Without objective evidence of impairment Collective impairment 424,033 410,074Total 434,305 436,443
ItemAllowance for doubtful accounts
December 31, 2016 December 31, 2015
With objective evidence of impairmentIndividual impairment 392 12,848Collective impairment 2,926 3,093
Without objective evidence of impairment Collective impairment 37,260 37,609Total 40,578 53,550
Note 1: Total loan is the original amount without the adjustments of premium or discounts and the allowance for doubtful accounts.Note 2: Total receivable is the original amount without the adjustments of the allowance for doubtful accounts.Note 3: As of December 31, 2016 and 2015, tax refund receivables not applied to IAS 39 were $11,003 thousands and $13,378 thousands, respectively.
(ix) Management of Foreclosed Collateral
Foreclosed collateral is recorded at cost, using lower-at-cost or market approach as at balance sheet date. If collateral is not disposed of within the statutory period, the Bank should apply for an extension of the disposal period and increase its provision for possible losses if necessary.
(x) Disclosures required in the Regulations Governing the Preparation of Financial Reports by Public Banks
A. Asset quality of nonperforming loan and overdue credits
Period December 31, 2016
Items
Nonperforming Loans (NPL)
(Note 1) Total LoansNPL Ratio (Note 2)
Allowance for Possible
Losses
Coverage Ratio
(Note 3)
CorporateBanking
Secured 45,052 21,015,785 0.21% 359,559 798.10%Unsecured 19,973 12,306,116 0.16% 192,644 964.52%
Consumer Banking
Mortgage loans (Note 4) 78,735 19,396,661 0.41% 328,657 417.42%Cash card - 1,053 - % 22 - %Small-scale credit loans (Note 5) 50,657 10,950,138 0.46% 222,473 439.18%
Other(Note 6)
Secured 51,638 49,789,336 0.10% 837,935 1,622.71%Unsecured 6,747 486,798 1.39% 21,357 316.54%
Total loans 252,802 113,945,887 0.22% 1,962,647 776.36%
Overdue Receivables Receivables
Delinquency Ratio
Allowance for Possible
LossesCoverage
Ratio Credit cards 416 145,112 0.29% 33,350 8.016.83%Accounts receivable factoring without recourse (Note 7) - - - % - - %
Annual Report 2016 145

Period December 31, 2015
Items
Nonperforming Loans (NPL)
(Note 1) Total LoansNPL Ratio (Note 2)
Allowance for Possible
Losses
Coverage Ratio
(Note 3)CorporateBanking
Secured 48,116 16,861,134 0.29% 350,958 729.40%Unsecured 25,942 12,574,303 0.21% 184,878 712.66%
Consumer Banking
Mortgage loans (Note 4) 40,166 19,187,886 0.21% 397,664 990.05%Cash card - 1,252 - % 32 - % Small-scale credit loans (Note 5) 49,784 10,854,680 0.46% 265,506 533.32%Other(Note 6)
Secured 53,682 47,122,434 0.11% 971,318 1,809.39%Unsecured 11,685 562,391 2.08% 33,021 282.59%
Total loans 229,375 107,164,080 0.21% 2,203,377 960.60%
Overdue Receivables Receivables
Delinquency Ratio
Allowance for Possible
LossesCoverage
RatioCredit cards 381 148,457 0.26% 32,134 8.434.12%Accounts receivable factoring without recourse (Note 7) - - - % - - %
Note 1: Nonperforming loans are reported to the authorities and disclosed to the public, as required by the “Regulations Governing the Procedures for Banking Institutions to Evaluate Assets and Deal with Nonperforming / Non-accrued Loans.”
Nonperforming credit card receivables are reported to the authorities and disclosed to the public, as required by the Banking Bureau’s letter dated July 6, 2005 (Ref. No. 0944000378).
Note 2: For loan business: NPL ratio = Nonperforming loans ÷ Total loan balance. For credit card business: Delinquency ratio = Overdue credit card receivables ÷ Credit card receivables balance.Note 3: Coverage ratio of loans: Allowance for possible losses for loans ÷ Nonperforming loans. Coverage ratio of credit card receivables: Allowance for possible losses for credit card receivables ÷ Overdue credit card receivables.Note 4: The mortgage loan is for house purchase or renovation and is fully secured by housing that is purchased (owned) by the borrower or the spouse or the minor
children of the borrower.Note 5: Based on the Banking Bureau’s letter dated December 19, 2005 (Ref. No. 09440010950), small-scale credit loans are unsecured, involve small amounts, and
exclude credit cards and cash cards. Note 6: Other consumer banking loans refer to secured or unsecured loans that exclude mortgages, cash cards, credit cards and small-scale credit loans. Note 7: As required by the Banking Bureau in its letter dated July 19, 2005 (Ref. No. 094000494), accounts receivable factoring without recourse are reported as
overdue receivables within three months after the factors or insurance companies refuse to indemnify banks for any liabilities on these accounts.
B. Exemption of nonperforming loans and overdue receivables
December 31, 2016 December 31, 2015Amount exempted from reporting as non-performing
loans
Amount exempted from reporting as overdue account
receivable
Amount exempted from reporting as non-performing
loans
Amount exempted from reporting as overdue account
receivableAmounts of executed contracts on negotiated debts not reported (Note 1) 10,230 3,693 15,498 5,247Amounts of executed debt settlement program and rehabilitation program not reported (Note 2) 186,304 2,684 195,087 3,189Total 196,534 6,377 210,585 8,436
Note 1: The disclosure of excluded NPLs and excluded overdue receivables resulting from debt negotiations and loan agreements is based on the Banking Bureau letter dated April 25, 2006 (Ref. No. 09510001270).
Note 2: The disclosure of excluded NPLs and excluded overdue receivables resulting from consumer debt clearance is based on the Banking Bureau letter dated September 15, 2008 (Ref. No. 09700318940).
Annual Report 2016146
6. Financial Status

C. Concentration of credit extensions
December 31, 2016
Rank(Note 1)
Business Groups’ Standard Industrial Classification and Symbol
(Note 2)
Total Amount of Credit
Endorsement or Other
Transactions(note 3)
Percentage of the Bank’s
Equity (%)
1 n Company- Real Estate 811,840 9.532 E Company -Real Estate 422,430 4.963 D Company -Transportation 359,471 4.224 I Company -Civil Engineering 356,499 4.195 m Company -Real Estate 350,000 4.116 i Company -Private Pulp, Paper and Paper Products Manufacturing 324,000 3.807 k Company -Private Food Products Manufacturing 279,157 3.288 l Company -Electronic Parts and Components Manufacturing 243,400 2.869 g Company -Corporation Group-Financial Service 231,448 2.7210 h Company -Private Service 229,175 2.69
December 31, 2015
Rank(Note 1)
Business Groups’ Standard Industrial Classification and Symbol
(Note 2)
Total Amount of Credit
Endorsement or Other
Transactions(Note 3)
Percentage of the Bank’s
Equity (%)
1 D Company -Transportation 405,153 5.052 E Company -Real Estate 376,370 4.693 I Company -Civil Engineering 312,607 3.904 W Company -Real Estate 277,280 3.465 c Company -Private Wholesale 232,400 2.906 b Company -Private Wholesale 227,286 2.837 h Company -Private Service 222,800 2.788 i Company -Private Pulp, Paper and Paper Products Manufacturing 206,000 2.579 j Company -Private Pulp, Paper and Paper Products Manufacturing 195,000 2.4310 f Company -Private Machinery and Equipment Manufacturing 193,108 2.41
Note 1: The top ten enterprise groups other than government or state-owned enterprises are ranked according to their total outstanding credit amount. If the borrowers belong to an enterprise group, the aggregate credit balance of the enterprise should be calculated and disclosed as a code number for each such borrower together with an indication of the borrowers’ line of business. In addition, if the borrowers are enterprise groups, the enterprise group’s industry sector with the maximum exposure to credit risk in its main industry sector should be disclosed, along with the “class” of the industry, in compliance with the Standard Industrial Classification System of the R.O.C. posted by the Directorate-General of Budget, Accounting and Statistics, Executive Yuan, R.O.C.
Note 2: Enterprise group is as defined in Article 6 of the “Supplementary Provisions to the Taiwan Stock Exchange Corporation Rules for Review of Securities Listings”.
Note 3: Consists of loans (foreign currency imports financing, foreign currency export financing, notes discounted, customer overdrafts, short-term unsecured loans, short-term secured loans, receivables from securities lending, medium-term unsecured loans, medium-term secured loans, long-term unsecured loans loan-term secured loans, non-performing loans), foreign currency long positions, accounts receivable-factoring discount, bankers’ acceptance receivable, guarantees receivable.
Annual Report 2016 147

(4) Liquidity risk
(i) Causes and definition of liquidity risk
The Group’s definition for liquidity risk is the risk the Group encounter difficulty in meeting the obligations with its financial liabilities and cause the losses, for example, a saving account cancels its saving ahead of time, the ways or conditions to call loans to banks drop, creditors’ credit become worsen and cause an exceptional condition, financial instruments cannot be financed and etc. The situation mentioned above may reduce the money for lending, trading, and investing activities. In some extreme situation, the lack of liquidity may decrease the level of balance sheet, sale assets, or the possibility of could not fulfill the promise of loan. Liquidity risk is containing in the inherent risk of bank operating, and could be affected by every industry individual or whole market’s incident, which are included but not only as: credit event, consolidation or merger and acquisition, system shock, and natural disaster.
(ii) Management policy of liquidity risk
The Group carries out its management procedures respectively and is monitored by their respective independent risk management department. The procedures include:
A. Daily capital movement: monitoring future cash flows in order to ensure all requirements are fulfilled.
B. Maintain adequate stock of liquid assets to buffer unexpected events that may interrupt cash flows.
C. Monitor liquidity ratios of balance sheets in accordance with the internal management purposes and external regulatory requirements.
The monitoring and reporting procedures are based on the estimation of future 1 month, 1-3 months, 3-6 months, 6-12 months and one-year capital flow. The estimation of future cash flow is based on the contract maturity date of financial liabilities and the estimated collection date of financial assets. The Bank monitors the interest rate risk, structure of assets and liabilities, and the liquidity conditions based on the related report and indices in ALCO and set alert and limits or MAT based on the key indices.
Related information is regularly provided to the risk management committee and BOD.
(iii) To manage liquidity risk of financial assets hold and non-derivative financial liabilities maturity analysis
A. To manage liquidity risk of financial assets held
The financial assets include cash and assets that are of highly liquid and high quality for the purpose of paying liabilities and capital movement during emergency. The assets held for managing liquidity risk include cash and cash equivalents, due from the central bank and call loans to banks, financial assets at FVTPL, discounts and loans, available-for-sale financial assets, and held-to-maturity financial assets.
B. Maturity analysis for non-derivative financial liabilities
The Group’s non-derivative financial liabilities are based both on the maturing of assets and liabilities, and the corresponding interest rate and controlled gaps that do not match. As the transaction conditions are uncertain and are of different types, the maturity of assets and liabilities usually does not match. This may result in gains or losses. The following table shows the maturity analysis of liquidity based on liabilities.
Annual Report 2016148
6. Financial Status

December 31, 2016 0~30 days
31~90 days
91~180 days
181 days~ 1 year
Over 1 year Total
Due to the Central Bank and call Loans from Banks - 25,670 - 38,800 - 64,470
Payables 531,904 72,604 91,064 12,538 24,540 732,650Deposit and remittance 12,509,194 18,746,835 21,418,195 44,379,844 42,663,973 139,736,041Financial debentures - - - - 3,300,000 3,300,000
December 31, 2015 0~30 days
31~90 days
91~180 days
181 days~ 1 year
Over 1 year Total
Due to the Central Bank and call Loans from Banks - 25,670 - 38,800 - 64,470
Payables 423,871 271,561 11,420 85,060 47,631 839,543Deposit and remittance 13,056,312 18,021,654 19,393,810 44,110,769 40,397,332 134,979,877Financial debentures - - - - 1,500,000 1,500,000
(iv) The maturity analysis of lease agreement
The derivative instruments of the Group’s possession which are settled by net amount include foreign derivative instruments, such as non-delivery forward contracts, foreign exchange options settled by net amount. After evaluation the Groups concluded that the maturity date is the basic element to comprehend all the derivative financial instruments listed in the consolidated financial statement.
The maturity analysis of derivative financial liabilities settled by net amount is as follows:
December 31, 20160-30 days 31-90 days 91-180 days 180-365 days Over 365 days Total
Financial assets measured at fair value through profit or loss, Derivative instruments - Foreign exchange $ 491 - - 491
December 31, 20150-30 days 31-90 days 91-180 days 180-365 days Over 365 days Total
Financial assets measured at fair value through profit or loss, Derivative instruments - Foreign exchange $ 951 27 67 - - 1,045
(v) Maturity analysis for off balance sheet items
The table below shows the maturity analysis of the off-balance-sheet items of the Bank based on the remaining days from the consolidated financial statement date to the contract maturity date. For the financial guarantee contracts issued, the maximum amount of the guarantee is listed in the earliest time zone that the guarantee may be executed. The amount disclosed is based on the cash flows of the contracts and thus part of the amount disclosed may not correspond to the amount disclosed in the consolidated financial statement.
Annual Report 2016 149

December 31, 2016 0~30 days 31~90 days 91~180 days 181~365 days Over 365 days TotalCommitment of loans 2,612,955 5,197,771 7,817,864 4,168,071 - 19,796,661Commitment for letter of credit card - 924 2,120 4,270 13,780 21,094Undrawn letters of credit - - - 9,000 - 9,000Guarantees - 28,138 21,000 479 - 49,617
December 31, 2015 0~30 days 31~90 days 91~180 days 181~365 days Over 365 days TotalCommitment of loans 2,137,712 4,262,634 6,402,320 5,547,631 - 18,350,297Commitment for letter of credit card - 7 205 446 21,432 22,090Guarantees 3,362 19,513 20,900 30 - 43,805
(vi) The maturity analysis of lease agreement
The lease contracts of the Group are operating lease and financial lease. Operating lease commitment is the future minimum rental payment under irrevocable operating lease condition.
The maturity analysis of lease agreement is as follows:
December 31, 2016 Less than 1 year 1-5 year Over 5 year TotalLease commitmentsOperating lease payments (Lessee) 44,180 86,150 3,574 133,904Operating lease income (Lessor) 20,089 49,781 5,000 74,870
December 31, 2015 Less than 1 year 1-5 year Over 5 year TotalLease commitmentsOperating lease payments (Lessee) 46,536 100,429 1,393 148,358Operating lease income (Lessor) 17,790 50,532 1,521 69,843
(vii) Disclosures required by the Regulations Governing the Preparation of Financial Reports by Public Banks
A. Maturity analysis of assets and liabilities in New Taiwan Dollars(in thousands of New Taiwan dollars)
December 31, 2016
Total Amount for each remaining period to maturity0~10days 11~30 days 31~90 days 91~180 days 181 days ~1 year Over 1 year
Main capital inflow on maturity 152,413,756 16,269,565 9,841,123 7,584,071 10,449,131 21,082,658 87,187,208
Main capital outflow on maturity 171,112,011 5,983,794 9,029,244 23,417,030 29,432,943 48,466,898 54,782,102
Gap (18,698,255) 10,285,771 811,879 (15,832,959) (18,983,812) (27,384,240) 32,405,106
(in thousands of New Taiwan dollars) December 31, 2015
Total Amount for each remaining period to maturity0~10days 11~30 days 31~90 days 91~180 days 181 days ~1 year Over 1 year
Main capital inflow on maturity 148,064,018 15,027,063 13,963,074 7,578,964 10,439,469 20,111,436 80,944,012
Main capital outflow on maturity 165,367,324 6,301,836 10,025,852 23,019,257 25,945,199 49,658,536 50,416,644
Gap (17,303,306) 8,725,227 3,937,222 (15,440,293) (15,505,730) (29,547,100) 30,527,368
Annual Report 2016150
6. Financial Status

B. Maturity analysis of assets and liabilities in US Dollars(in thousands of U.S. dollars)
December 31, 2016
TotalAmount for each remaining period to maturity
0~30 days 31~90 days 91~180 days 181 days ~1 year Over 1 yearMain capital inflow on maturity 93,750 34,533 35,186 6,177 3,000 14,854Main capital outflow on maturity 93,750 69,604 18,597 2,199 3,350 - Gap - (35,071) 16,589 3,978 (350) 14,854
(in thousands of U.S. dollars)
December 31, 2015
TotalAmount for each remaining period to maturity
0~30 days 31~90 days 91~180 days 181 days ~1 year Over 1 yearMain capital inflow on maturity 104,979 52,793 38,241 8,945 - 5,000Main capital outflow on maturity 104,996 82,085 18,187 2,459 2,265 - Gap (17) (29,292) 20,054 6,486 (2,265) 5,000
(5) Financial risk information
(i) Market risk
Market risk means the changes in market price that lead to the fair value and future cash flow volatility risk of the held financial instruments, even if it is not included in the financial statements. The risk factors usually refer to interest rate, exchange rate, equity investment and price. When the factors change, the Group’s net operating income and the value of investment portfolio will have volatility risk.
The main market risks of the Group and its subsidiary are interest rate risk, exchange rate risk and equity investment risk. The main position of interest rate risk includes transactions with conditions, bonds, securities investments, interest rate swaps and so on. The main position of exchange risks includes forward exchange, foreign exchange swaps, and FX options and so on. The main position of equity investment risk includes stocks, funds, and stock market index futures and so on.
The major objective of the risk management of the Group is to control the risk under the scope approved by the board of directors by using effective management methods to utilize resource and create maximum economic profit. For major risks, the Group had established the risk management policies to serve as its primary principle, which covers managerial objective, organizational structure, accountability, and risk management procedures, and by implementing these mechanisms, operational risks can be controlled at an acceptable level.
Market risk is the risk that the Group’s earnings or capital or its ability to meet business objectives will be adversely affected by changes in the level, volatility or correlation of market risk factors, such as interest rate (including credit spread), foreign exchange rate, securities price and commodity price. The market correlation and liquidity of these types of instruments are also covered.
The Group divides market risk exposures into either trading or non-trading portfolios. The trading portfolio includes positions arising from trading activities, which aim at benefiting from short-term price movements, such as proprietary trading and market making. The non-trading portfolio includes positions not held for the purpose of earning capital gains.
Sensitivity analysis for exchange rate risk, interest rate risk and equity security price risk is as follows:
Annual Report 2016 151

December 31, 2016Amount influence
Main risk Range Equity Gain or lossExchange rate risk USD/NTD, EUR/NTD increase 3% - 2,357Exchange rate risk USD/NTD, EUR/NTD decrease 3% - (2,357)Interest rate risk Interest rate curve rise 100BPS - (194,270)Interest rate risk Interest rate curve fall 100BPS - 194,270Price of equity stock risk Price of equity stock rise 15% - 48,744Price of equity stock risk Price of equity stock fall 15% - (48,744)
December 31, 2015Amount influence
Main risk Range Equity Gain or lossExchange rate risk USD/NTD, EUR/NTD increase 3% - 1,248Exchange rate risk USD/NTD, EUR/NTD decrease 3% - (1,248)Interest rate risk Interest rate curve rise 100BPS - (127,495)Interest rate risk Interest rate curve fall 100BPS - 127,495Price of equity stock risk Price of equity stock rise 15% - 11,123Price of equity stock risk Price of equity stock fall 15% - (11,123)
(ii) Exchange rate risk concentration information
All held foreign financial assets and liabilities are classified by currencies and represented using the carrying amounts.
(in thousands of New Taiwan dollars)
December 31, 2016 USD EUR JPY AUD CNY TotalForeign currency Financial assets
Cash and cash equivalents 30,072 7,860 21,749 - 10,567 70,248Due from Central Bank and call
loans to bank 1,620,758 34,096 32,083 1,717 2,190 1,690,844
Loans 680,367 15,349 - - - 695,716Receivables 513,476 15,286 - 183,906 78,413 791,081Others 830,991 17,959 2,101 176,426 14,230 1,041,707
Total assets 3,675,664 90,550 55,933 362,049 105,400 4,289,596Foreign currency Financial liabilities
Deposits and remittances 1,409,539 59,238 73,883 188,583 94,735 1,825,978Payables 756,560 15,271 - 239 6,050 778,120Others 662,306 17,959 1,660 176,426 5,192 863,543
Total liabilities 2,828,405 92,468 75,543 365,248 105,977 3,467,641Note: As of December 31, 2016, USD/TWD: 32.279; EUR/TWD: 33.9285; JPY/TWD: 0.2757; AUD/TWD: 23.3087; CNY/TWD: 4.6445.
Annual Report 2016152
6. Financial Status

(in thousands of New Taiwan dollars)
December 31, 2015 USD EUR JPY AUD NZD TotalForeign currency Financial assets
Cash and cash equivalents 32,641 7,345 22,412 - 12,495 74,893Due from Central Bank and call
loans to bank4,629 - - - - 4,629
Available-for-sale financial assets 57,783 - - - 10,190 67,973Loans 350,967 - 618 - - 351,585Receivables 549,692 - 4,267 - - 553,959Others 3,161,405 22,994 39,468 305,516 62,767 3,592,150
Total assets 4,157,117 30,339 66,765 305,516 85,452 4,645,189Foreign currency Financial liabilities
Deposits and remittances 1,286,639 24,145 60,699 182,879 - 1,554,362Payables 694,824 16 200 19,715 28 714,783Others 2,168,228 165,691 5,866 102,921 - 2,442,706
Total liabilities 4,149,691 189,852 66,765 305,515 28 4,711,851Note: As of December 31, 2015, USD/TWD: 33.066; EUR/TWD: 36.1478; JPY/TWD: 0.2747; AUD/TWD: 24.1712; CNY/TWD: 5.0937.
(iii) Disclosure required by the Regulations Governing the Preparation of Financial Reports by Public Banks.
A. The analysis table of interest rate sensitivity in New Taiwan Dollars
December 31, 2016(in thousands of New Taiwan dollars)
Items 1 to 90 Days 91 to 180 Days 181 Days to 1 Year Over 1 Year TotalInterest-rate-sensitive assets 108,294,948 4,545,373 2,132,810 30,531,372 145,504,503Interest-rate-sensitive liabilities 26,027,615 70,470,024 37,207,420 4,810,093 138,515,152Interest rate sensitivity gap 82,267,333 (65,924,651) (35,074,610) 25,721,279 6,989,351Net worth 8,517,250Ratio of interest-rate-sensitive assets to liabilities (%) 105.05Ratio of interest rate sensitivity gap to net worth (%) 82.06
December 31, 2015(in thousands of New Taiwan dollars)
Items 1 to 90 Days 91 to 180 Days 181 Days to 1 Year Over 1 Year TotalInterest-rate-sensitive assets 106,137,602 4,493,579 2,312,762 27,222,408 140,166,351Interest-rate-sensitive liabilities 25,873,331 65,743,691 37,168,113 3,424,794 132,209,929Interest rate sensitivity gap 80,264,271 (61,250,112) (34,855,351) 23,797,614 7,956,422Net worth 8,036,712Ratio of interest-rate-sensitive assets to liabilities (%) 106.02Ratio of interest rate sensitivity gap to net worth (%) 99.00
Note 1: The above amount included only new Taiwan dollar amounts held by the Bank, and excluded contingent assets and contingent liabilities.Note 2: Interest rate sensitivity assets and liabilities are interest-earning assets and interesting-bearing liabilities with revenues and costs affected by interest rate changes.Note 3: Interest rate sensitivity gap=Interest-rate-sensitivity assets – Interest-rate-sensitivity liabilities.Note 4: Ratio of interest-rate-sensitivity assets to liabilities=Interest-rate-sensitivity assets/Interest-rate-sensitivity liabilities.
Annual Report 2016 153

B. The analysis table of interest rate sensitivity in US Dollars
December 31, 2016(in thousands of U.S. dollars)
Items 1 to 90 Days 91 to 180 Days 181 Days to1 Year Over 1 Year Total
Interest-rate-sensitive assets 57,859 1,173 3,000 14,854 76,886Interest-rate-sensitive liabilities 37,762 2,195 3,346 - 43,303Interest rate sensitivity gap 20,097 (1,022) (346) 14,854 33,583Net worth 313Ratio of interest-rate-sensitive assets to liabilities (%) 177.55Ratio of interest rate sensitivity gap to net worth (%) 10,729.39
December 31, 2015(in thousands of U.S. dollars)
Items 1 to 90 Days 91 to 180 Days 181 Days to1 Year Over 1 Year Total
Interest-rate-sensitive assets 5,711 1,940 - 5,000 12,651Interest-rate-sensitive liabilities 34,190 2,456 2,265 - 38,911Interest rate sensitivity gap (28,479) (516) (2,265) 5,000 (26,260)Net worth 17Ratio of interest-rate-sensitive assets to liabilities (%) 32.51Ratio of interest rate sensitivity gap to net worth (%) 154,470.59
Note 1: The above amount included only new Taiwan dollar amounts held by the Bank, and excluded contingent assets and contingent liabilities.Note 2: Interest rate sensitivity assets and liabilities are interest-earning assets and interesting-bearing liabilities with revenues and costs affected by interest rate changes.Note 3: Interest rate sensitivity gap=Interest-rate-sensitivity assets – Interest-rate-sensitivity liabilities.Note 4: Ratio of interest-rate-sensitivity assets to liabilities=Interest-rate-sensitivity assets/Interest-rate-sensitivity liabilities.
(ah) Capital management
(1) Introduction
In accordance with the “Regulations Governing the Capital Adequacy and Capital Category of Banks” announced by FSC, regular calculation and preparation of related reports and report to the authorities for review are required in order to perform financial disclosures and conduct internal capital adequacy management. In accordance with the operation plans and budget targets, also considering the Group’s development strategy, capital adequacy, liabilities ratios, and increased of return on equity.
(2) Regulatory capital
Based on the “Regulations Governing the Capital Adequacy and Capital Category of Banks” announced by FSC, self-owned capital is classified into Tier 1 capital and Tier 2 capital:
(i) Tier 1 capital: includes common equity and other Tier 1 capital.
Annual Report 2016154
6. Financial Status

A. Common equity: Common equity includes common stock, capital surplus (excluding premium on preference shares issuance), accumulated surplus and equity adjustments, less the following items: intangible assets (including goodwill), unamortized loss on disposal of non-performing loans, major investments, deferred tax assets, deferred pension costs and the items originally deducted from Tier 1 capital and Tier 2 capital.
B. Other Tier 1 capital including non-cumulative perpetual preferred stock and non-cumulative perpetual subordinated debts.
(ii) Tier 2 capital: includes cumulative perpetual preferred stock, cumulative perpetual subordinated debts, revaluation appreciation, convertible debt, operational provisions and loan-loss reserves
(3) Capital adequacy ratio:
YearItem
December 31, 2016
December 31, 2015
Eligible Capital
Common stock capital 8,163,589 7,659,153Other tier 1 capital - -Tier 2 Capital 3,379,440 1,721,351Eligible capital 11,543,029 9,380,504
Risk-weighted Assets
Credit riskStandardized approach 97,220,080 83,437,336Internal-rating-based approach - -Secularization - -
Operational risk
Basic indicator approach 4,992,342 4,795,648Standardized approach / Alternative standardized approach - -
Advanced measurement approach - -
Market riskStandardized approach 9,524,884 3,757,382Internal model approach - -
Total Risk-weighted assets 111,737,306 91,990,366Capital adequacy ratio 10.33% 10.20%Ratio of common stock equity to risk-weighted assets (%) 7.31% 8.33%Ratio of tier 1 capital to risk-weighted assets (%) 7.31% 8.33%Leverage Ratio% 4.65% 4.61%
Note 1: Eligible capital, risk-weighted assets and risk exposure are calculated under the “Regulations Governing the Capital Adequacy and Capital Category of Banks” and the “Explanation of Methods for Calculating the Eligible Capital and Risk-Weighted Assets of Banks.”
Note 2: Formulas used were as follows: 1) Eligible capital = Common equity capital + Other tier 1 capital excluding common stock equity + Tier 2 capital. 2) Risk-weighted assets = Risk-weighted assets for credit risk + Capital requirements for operational risk and market risk x 12.5. 3) Capital adequacy ratio = Eligible capital ÷ Risk-weighted assets. 4) Ratio of common equity to risk-weighted assets = Common equity ÷ Risk-weighted assets. 5) Ratio of tier 1 capital to risk-weighted assets = (Common equity capital + additional tier 1 capital) ÷ Risk-weighted assets. 6) Leverage = Tier 1 capital ÷ Exposure measurement.
Annual Report 2016 155

7. Related-Party transactions
(a) Relations parties of Name and Relationship
Relations parties of Name RelationshipOther Director, supervisors, and managers of the Company
and their relatives.
(b) Significant transactions with related parties
(1) Loans
December 31, 2016
Type
AccountVolume
(Number ofNames)
HighestBalance
EndingBalance
Loan classification
Collateral(note2)
Differences in Transaction Terms
from Those forUnrelated Parties
NormalLoans
Non-performing
loansConsumer loansfor employees 4 $ 1,691 1,106 1,106 - Credit etc. None
Private housingmortgage loan 6 11,610 10,931 10,931 - Real estate None
Other loans 16 240,965 176,686 176,686 - Time deposits etc. None
December 31, 2015
Type
AccountVolume
(Number ofNames)
HighestBalance
EndingBalance
Loan classification
Collateral(note2)
Differences in Transaction Terms
from Those forUnrelated Parties
NormalLoans
Non-performing
loansConsumer loans
for employees 5 $ 1,800 1,800 1,800 - Credit etc. None
Private housing mortgage loan 7 15,960 11,117 11,117 - Real estate None
Other loans 16 241,694 180,464 180,464 - Time deposits etc. None
(2) Deposits
December 31, 2016
Name of related parties Ending Balance %The range of interest rate
The sum of separate accounts balances related parties’ is lower than 1% of total deposits. $ 339,993 0.24 0.08~1.34
December 31, 2015
Name of related parties Ending Balance
%The range of interest rate
The sum of separate accounts balances related parties’ is lower than 1% of total deposits. $ 252,735 0.19 0.14~1.41
Interest resulting from such deposits was $4,509 thousands and $5,014 thousands for 2016 and 2015. The range for employee demand savings deposits interest rate was approximately 8.87% and 8.985%.
Annual Report 2016156
6. Financial Status

(c) Compensation information for main management
2016 2015Salary and other short-term employee benefits $ 51,641 47,559Post-employment benefits 545 484Termination benefits - - Other long-tern employee benefits - - Share-based payment - -
$ 52,186 48,043
8. Pledged assets
Government bonds provided and deposited as trust compensation and placed as deposits in courts please refer to note 6(g) and 6(h).
9. Significant commitments and contingencies
Significant commitments and contingencies of COTA Commercial Bank Co., Ltd
December 31, 2016 December 31, 2015Collections received $ 10,088,704 9,499,010Handled several guarantees 2,429,879 1,410,219Entrusted with the sale of travelers checks 8,533 10,684Letter of credit 162,939 177,189Undrawn loan commitments 19,876,372 18,416,192
10. Significant Disaster Loss: None
11. Significant Subsequent Events: None
12. Other
(a) Personnel expenses, depreciation, and amortization for the years ended December 31, 2016 and 2015, were summarized as follows:
2016 2015
FunctionOperating
CostsOperating Expenses Total
Operating Costs
Operating Expenses Total
Personnel Expenses:Salaries - 1,079,280 1,079,280 - 1,109,190 1,109,190Labor and health insurance - 77,241 77,241 - 75,032 75,032Pension - 51,460 51,460 - 52,331 52,331Other personnel expenses - 89,555 89,555 - 84,616 84,616Depreciation expenses - 43,208 43,208 - 40,623 40,623Amortization expenses - 2,299 2,299 - 2,724 2,724
The Group had 1,131 and 1,142 employees, respectively, as of December 31, 2016 and 2015.
Annual Report 2016 157

(b) Balance sheet and trust property under the Group’s trust accounts are disclosed as follows:
Trust Balance SheetsDecember 31, 2016
Trust Assets Trust LiabilitiesCash in bank $ 118,074 Trust capital - money $ 4,554,022Investment in mutual fund 4,435,948 Trust capital - PP&E 3,696Land 3,696 - Total trust assets $ 4,557,718 Total trust liabilities $ 4,557,718
December 31, 2015Trust Assets Trust Liabilities
Cash in bank $ 125,602 Trust capita - money $ 4,796,091Investment in mutual fund 4,670,489 Trust capita - PP&E - Total trust assets $ 4,796,091 Total trust liabilities $ 4,796,091
Trust Property list of trust accountDecember 31, 2016
Investment ItemsCash in bank $ 118,074Investment in mutual fund 4,435,948Land 3,696
$ 4,557,718
December 31, 2015Investment Items
Cash in bank $ 125,602Investment in mutual fund 4,670,489
$ 4,796,091Trust Income Statement
For the year ended December 31, 2016
Investment ItemsTrust Income
Interest income $ 38Trust Expense
Management fees (692)Income loss before income taxes (654)Income tax expense - Net loss $ (654)
For the year ended December 31, 2015Investment Items
Trust IncomeInterest income $ 26
Trust ExpenseManagement fees (714)
Income loss before income taxes (688)Income tax expense - Net loss $ (688)
Annual Report 2016158
6. Financial Status

(c) Profitability Unit: %
Items December 31, 2016 December 31, 2015
Return on assets ratio Before income tax 0.57 0.58After income tax 0.48 0.50
Return on equity ratio Before income tax 10.37 11.33After income tax 8.64 9.82
Net Income ratio 26.15 24.83Note 1: Return on assets ratio = Net income before/after income tax ÷ average total assetsNote 2: Return on equity ratio = Net income before/after income tax ÷ average total stockholders’ equity. Note 3: Net income ratio = Net income after income tax ÷ Net revenue.
13. Disclosures Required
(a) Information on significant transactions:
Following the principle of financial report for public bank, the disclosure of information on significant transaction of the Bank and its Subsidiary were as follow:
(1) Information regarding securities where the accumulated purchase or sale amounts for the period exceeded NT$300 million or 10% of the Bank’s paid in capital: None.
(2) Information on the acquisition of real estate for which the purchase amount exceeded NT$300 million or 10% of the Bank’s paid-in capital: None.
(3) Information on the disposal of real estate for which the sale amount exceeded NT$300 million or 10% of the Bank’s paid-in capital: None.
(4) Information regarding discounted processing fees on transactions with related parties for which the amount exceeded $5 million: None.
(5) Information regarding receivables from related parties for which the amount exceeded $300 million or 10% of the Bank’s paid-in capital: None.
(6) Information regarding selling non-performing loans: None.
(7) Approved securitization instrument types and related information according to “asset backed securitization” or “mortgage backed securitization”: None.
(8) Information on significant transactions between parent and subsidiary company were as follow:
Annual Report 2016 159

No.Transaction Company Counter-party
Nature of Relationship
(Note 2)
2016 Description of Transactions Financial Statement Account
Transaction Amount
Transaction Item
Percentage of Consolidated
Revenue/Assets
0 COTA Commercial Bank
COTA Bank Insurance Brokers 1 Service fees 165,688 Same as regular
transaction 6.06%
1 COTA Bank Insurance Brokers
COTA Commercial Bank 2 Commission
expenses 165,688 Same as regulartransaction 6.06%
0 COTA Commercial Bank
COTA Bank Insurance Brokers 1 Receivables 15,123 Same as regular
transaction 0.01%
1 COTA Bank Insurance Brokers
COTA Commercial Bank 2 Accrued
Expenses 15,123 Same as regulartransaction 0.01%
No.Transaction Company Counter-party
Nature of Relationship
(Note 2)
2015 Description of Transactions Financial Statement Account
Transaction Amount
Transaction Item
Percentage of Consolidated
Revenue/Assets
0 COTA Commercial Bank
COTA Bank Insurance Brokers 1 Service fees 152,707 Same as regular
transaction 5.26%
1 COTA Bank Insurance Brokers
COTA Commercial Bank 2 Commission
expenses 152,707 Same as regulartransaction 5.26%
0 COTA Commercial Bank
COTA Bank Insurance Brokers 1 Receivables 11,454 Same as regular
transaction 0.01%
1 COTA Bank Insurance Brokers
COTA Commercial Bank 2 Accrued
Expenses 11,454 Same as regulartransaction 0.01%
Note 1: Number is based on the following rules: (a) The parent company is 0. (b) Subsidiaries are numbered by company from 1.Note 2: The relation with trader is numbered as follow: (a) The parent company to its subsidiary is 1. (b) The subsidiary to its parent company is 2. (c) The subsidiary to subsidiary company is 3.Note 3: The transactions mentioned above have already write-off when building the financial report.
(9) Other material transaction items which were significant to people who use the information in the financial statements: None.
(b) Related information on investee companies: (In Thousands of New Taiwan Dollars/Thousands of shares)
Names of investee company Location
Main business
scopeShareholding
ratioCarrying
value
Gain (Loss)recognizedduring the
period
Aggregate shareholding of the Bank and its subsidiaries
RemarkNo. of shares
No. of pro- forma
shares
TotalNumber of
sharesShareholding
ratioCOTA Bank Insurance Brokers Co., Ltd.
Taiwan Financial Service 100 % 39,513 26,564 500,000 - 500,000 100% -
(c) Information regarding investment in China: None.
Annual Report 2016160
6. Financial Status

14. Segment Information:
(a) The Group has three segments need to be disclosed (consumers’ financing, branches, and others). Each department provides different services and products, and managed separately based on their diverse techniques and marketing tactic. The higher level managements of the Group review each department’s internal management report every quarter. The information of asset and income disclose by segments all follow the significant accounting policies stated above.
(b) The operation businesses of the segments which need to be disclosed were as follow:
2016
Consumers’ financing
Branches
Others
Subtotal
Elimination
Total
RevenueNet interest income $ 1,168,462 840,842 392,695 2,401,999 - 2,401,999Net service income 11,646 43,550 263,418 318,614 - 318,614Other income-net - 199 40,109 40,308 (26,883) 13,425Income between segments (395,996) 579,005 (183,009) - - -Total 784,112 1,463,596 513,213 2,760,921 (26,883) 2,734,038
ExpensesBad debt 105,843 141,790 (235,513) 12,120 - 12,120Operating expenses 323,252 766,052 774,290 1,863,594 (319) 1,863,275Total 429,095 907,842 538,777 1,875,714 (319) 1,875,395Income before tax $ 355,017 555,754 (25,564) 885,207 (26,564) 858,643
December 31, 2016
Consumers’ financing Branches Others Subtotal Elimination Total
Assets $ 34,252,045 78,403,616 40,544,802 153,200,463 (91,686) 153,108,777Liabilities $ 33,897,029 77,847,862 32,898,809 32,898,809 (52,173) 144,591,527
2015
Consumers’ financing
Branches
Others
Subtotal
Elimination
Total
RevenueNet interest income $ 1,180,997 755,002 391,097 2,327,096 - 2,327,096Net service income 13,496 53,672 255,141 322,309 - 322,309Other income-net - 336 278,976 279,312 (24,628) 254,684Income between segments (424,540) 653,172 (228,632) - - - Total 769,953 1,462,182 696,582 2,928,717 (24,628) 2,904,089
ExpensesBad debt 120,634 158,950 (128,141) 151,443 - 151,443Operating expenses 315,572 730,767 874,688 1,921,027 (319) 1,920,708Total 436,206 889,717 746,547 2,072,470 (319) 2,072,151Income before tax $ 333,747 572,465 (49,965) 856,247 (24,309) 831,938
December 31, 2015
Consumers’ financing
Branches
Others
Subtotal
Elimination
Total
Assets $ 33,444,996 83,688,313 29,308,205 145,441,514 (83,653) 146,357,861Liabilities $ 33,111,249 83,116,430 22,142,295 138,369,974 (48,825) 138,321,149
Annual Report 2016 161

(c) Service segment information
Services 2016 2015Interest income for loans $ 2,966,611 3,001,170Other interest income 447,894 466,407Service income 349,802 348,568
$ 3,764,307 3,816,145
(d) Geographic segment information:
The Group’s interest income and service fee income are both from the customers in Taiwan. The Group’s non-current assets are all located in Taiwan.
(e) Information on major customers:
For the years ended December 31, 2016 and 2015, no individual customer of the Group accounted for 10% or more of the Bank and its subsidiaries’ revenue in the statements of income.
Annual Report 2016162
6. Financial Status

7. Financial Status Analysis, Operation Performance Analysis and
Risk Management
163COTA Commercial Bank Annual Report 2016

7-1. Financial Status Unit: TWD thousand
Year Item 2016 2015
DifferenceAmount %
Total Asset 153,132,089 146,391,165 6,740,924 4.60Total Liability 144,614,839 138,354,453 6,260,386 4.52Total Equity 8,517,250 8,036,712 480,538 5.98
Remarks: No change of more than 20% of the project
7-2. Operation Performance Unit: TWD thousand
Year Item 2015 2014 Increase/Decrease
AmountIncrease/Decrease
Ratio (%)Interest income 3,414,505 3,467,577 (53,072) (1.53)Interest expense 1,012,682 1,140,662 (127,980) (11.22)Non-interest income, net 289,868 531,262 (241,395) (45.44)Net revenue 2,691,691 2,858,177 (166,486) (5.82)Bad debt expense 12,120 151,443 (139,323) (92.00)Operating expense 1,826,369 1,879,783 (53,414) (2.84)Income before income tax 853,202 826,951 26,251 3.17Net income 714,817 721,192 (6,375) (0.88)
Remarks of Ratio Changes analysis:1. Interest expense decreased by TWD127,980 thousand was due to interest rate lower.2. Net non-interest income decreased by TWD241,395 thousand because of loss on financial investments, exchange loss, and gain on asset reversal of impairment
loss in 20153. Bad debt expense decreased was due to the quality increase on assets.
7-3. Cash Flow
7-3-1. Cash Flow Analysis for the Past Year and Remedy for Shortage of Liquidity:Unit: TWD thousand
Initial Cash Residual
Yearly Operating Cash Flow
Yearly Cash Inflow
Residual Cash Amount (deficiency)
Cash Deficiency Contingency Plan
Investment Plan Financial Plan(1) (2) (3) (1)+(2)+(3)
20,601,207 (2,136,558) 1,644,751 20,109,400 - -
Remarks: 1. Cash Flow Analysis (1) Operating activities: The net cash outflow from operating activities due primarily to loans, deposits and remittances. (2) Investing activities: The net cash outflow from investing activities due primarily to purchase or sell property or equipment. (3) Financial activities: The net cash outflow from financial activities due primarily to issue bank debentures or cash dividend distribution.2. Improvement plan on shortage of liquidity: Not applicable as an occurrence of shortage.
Annual Report 2016164
7. Financial Status Analysis, Operation Performance Analysis and Risk Management

7-3-2. Cash Flow Analysis for Coming YearUnit: TWD thousand
InitialCash Residual
Estimated Yearly Operating Cash Flow
Estimated Yearly Cash Inflow
Estimated Residual Cash Amount (deficiency)
Cash Deficiency Contingency Plan
Investment plan Financial Plan(1) (2) (3) (1)+(2)+(3)
20,109,400 1,103,418 860,768 22,073,586 - -
Remarks: The Bank predicts that the net cash inflow from operating activities will be TWD 1,103,418 thousand in 2017. In addition, the Bank estimates the cash inflow from investment and financial activities will be TWD860,768 thousand due to investment adjustment, property and equipment purchase, issuing new common stocks, and cash dividend distribution.
7-4. Impact of Major Capital Expenditures in Recent Year
7-4-1. Utilization of major capital expenditures and sources of Funds: None
7-4-2. Expected potential benefit: None
7-5. Reinvestment Policy, Improvement Plan and Investment Plan in Next Year
7-5-1. Reinvestment Policy
The reinvestment items major in financial business of COTA Bank and the goal of holding long-term earned dividends. Regarding new reinvestment, the authorized unit shall submit proposal to “Asset, Liability and Risk Management Committee” for discussion and then get approval from standing committee of board. The authorized unit shall closely monitor operation and financial condition of invested companies and report to “Asset, Liability and Risk Management Committee” in timely basis to ensure investment performance.
7-5-2. Source of Profit
1. The cash dividend from reinvest companies: Taiwan depository and clearing corporation; Taiwan Financial Asset Service Corp.; Taiwan Asset Management Corp.; Sunny Asset
Management Corp.
2. Investment income recognized under equity method: COTA Bank Insurance Broker Co., Ltd.
7-5-3. Improvement Plan
The Legislative Yuan passed the five amendment drafts of the financial Acts. The Insurance Act allows banks to establish an insurance section and banks may operate either one of the insurance agent or insurance broker business that means banks have responsibility on insurance sales. The Bank had been approved to operate life insurance and property insurance agent business on
Annual Report 2016 165

January 26, 2017 by authorities. In the future, the Bank will merge COTA Bank Insurance Broker Co., Ltd. to the Bank’s Insurance Agency Department. The Bank will actively cooperate with major insurance companies to introduce appropriate products to meet customers’ needs. The Bank will provide proper training to employees that may help customers to realize their actual demands, to perform the function of the insurance, to bring safety feeling to customers, and to increase the Bank’s insurance premium income.
7-5-4. Investment Plan in Next Year
The Bank sets its main operation target in banking business, therefore no new reinvestment plan undertaking for coming year.
7-6. Risk Management
7-6-1. Financial Risk Information
7-6-1-1. Credit Risk Credit Risk Management System
Year 2016
Items Contents
1. Strategies, Objectives, Policies, and Processes
The Bank’s credit risk policies and processes comply with Basel II and supervisory regulations. The Bank also created credit risk guidelines in written form such as the code of credit, the bylaws of credit information, the law of the credit responsibility and accountability, the bylaws of handle collateral, the business strategy and law of financial derivatives and all kinds of operation hand-books. They provide strict standard on loans, monitor credit risk, and manage non-performing loans. At the same time, since the change in economic cycle will affect the quality of the loan port-folio, the Bank will execute credit policies to ensure credit exposures under control. The Bank will consider developing the internal credit scoring system. The system will identify and estimate risks from all credit exposures.The Bank established a framework for managing credit risk. The framework may execute risk analysis and monitor risk process. It also may discover potential risks that the Bank may re-sponse adequately. In addition, it may assess the relation between risk and return to ensure the goal of the Bank's business.
2. The Structure, and Organization of the Risk Relevant Management Function
(1) The Board of Directors: The Bank’s board of directors is the supervisor of credit risk management. The board is
responsible for the Bank’s business strategies and operation guidelines, and is responsible for reviewing credit risk framework and policies. It also authorizes management to execute credit risk management.
(2) Asset, Liability and Risk Management Committee: The committee executes the board’s risk polices and reports risk profile to the board.(3) Credit Reviewing Committee: The committee reviews the large amount of loans, specific non-performing loans, and the
appointed loans.(4) Risk Management Center: The subcommittee integrates credit risk strategies, designs processes, and introduces
credit identification, measurement, monitor, and reporting systems.(5) Other Bank’s Units: They should understand credit risks under any circumstances, should deal with the assignment
of risk management, and should assist risk management subcommittee in risk monitor.
Annual Report 2016166
7. Financial Status Analysis, Operation Performance Analysis and Risk Management

Items Contents
(6) Audit Office: The office should establish audit plan and process, and should review the Bank's credit and
investment risks at least once a year. 3. The Scope and Nature of
the Risk Reporting and/or Measurement Systems
The Bank adjusts credit risk system to produce enough information according as the change of loan portfolio. The information includes: statistics of pass due loans, evaluation of non-performing loans, and statistics of large amount credit exposure. The board and senior management will receive the information periodically, and will make appropriate business and credit risk decision. In addition, the credit risk measurement to the Bank considers the following factors:(1) Loan characteristics, contract contents, and customers' financial conditions(2) The possible effect of the exposures from market change(3) Collateral and guarantee (4) The possible future risk change of the customers or counterparties(5) Besides specific trading risks, measuring loan portfolio risksThe Bank gradually establishes internal rating framework and measures and analyzes loan risks through quantitative indexes and qualitative methods.
4. Policies for Hedging and/or Mitigating Risk and Strategies and Processes for Monitoring the Continuing Effectiveness of Hedges/Mitigations
The Bank follows the diversified principal on loans and complies with loan limit regulations such as the same person, the same party, relative corporation, stakeholder, and stocks as collateral for the loan. To avoid credit concentration risk, the Bank reviews and adjusts credit exposures regularly. For controlling the quality of the loan assets and mitigating credit risks, the Bank depends on the credit condition of the borrowers and uses a number of techniques to mitigate the credit risks. For example, the Bank demands collateral and guarantee…etc. The Bank had formulated “The Directions of lending rate pricing”. The standard of lending rate considered the market rate, capital cost, operating cost, risk expected loss cost, reasonable profit. For market competition, the customer integral contribution will be the factor of lending pricing. The Bank had formulated “The Directions of the Loan Reviewing Operation” which reviews and follows the cases of the loan and strengthens after-loan management. If the Bank discovers the doubtful loans in the process, it should take necessary measures to protect debt obligations. In order to maintain an effectively monitors hip over credit risk, the Bank had established the indexes of the risk evaluation that regularly monitor the change of them and help to estimate the potential reasons of the future risk occurrence.
5. Approach for calculating the Bank’s capital requirement
Standardized approach
Exposure amount after risk mitigation and capital requirement of the standard approachDec. 31, 2016
Unit: TWD thousand
Category Exposure amount after risk mitigation Capital RequirementSovereigns 23,641,360 12,513Non central government public sector entities 3,085,878 53,231Banks (multilateral development banks) 2,380,799 89,724Corporate (Securities firm and insurance companies) 18,724,388 1,541,854Regulatory retail portfolios 75,712,317 5,204,186Secured by residential property 19,509,338 1,251,378Equities investment - -Other assets 2,421,810 231,887Total 145,475,890 8,384,774
Annual Report 2016 167

7-6-1-2. Assets Securitization Risk
Assets Securization Risk Management SystemYear 2016
Items Contents
1. Strategies and Processes The Bank does not play the role such originator, service, credit enhance agency, or financial liquidity provider and expects to be an investor. The internal regulations for securitizations concentrate on the investor field. If there is necessary on originator field, it will be created in the future.Not only the Bank obeys article 74-1 of the Banking Act, but also it had formulated some investment limits such as total position limit, underlying instrument limit, and internal authorized limit.
2. The Structure, and Organization of the Risk Relevant Management Function
(1) The Board of Directors: The Bank’s board of directors is the supervisor for securitization risk
management. The board is responsible for the Bank’s business strategies, and is responsible for reviewing securitization decisions.
It also monitors effective operation for managing framework. (2) Asset, Liability and Risk Management Committee: The committee reviews the guidelines and policies of the
securitization, controls indicators, and coordinates assignments relative to risk management.
(3) Investment Subcommittee: For strengthening portfolio management and trading quality of the
securitization, the subcommittee depends on the market condition to plan investment strategies.
(4) Risk Management Center: The subcommittee draws strategies and processes of the
securit ization, designs and introduces risk identif ication, measurement, monitor, and reporting system.
(5) Audit Office: The office should establish audit plan and process, and should
review the Bank's risk management at least once a year.3. The Scope and Nature of the Risk Reporting and/or
Measurement SystemsThe Bank reports the periodic information of the securitization exposures to the senior management. It also disclosures in the annual report and on the website. The principal of the valuation should confirm the criteria of methodology and the fairness of the data. Furthermore, the managing reports should effectively control exposure positions and should provide appropriate measurement results to assist risk management processes.
4. Policies for Hedging and/or Mitigating Risk and Strategies and Processes for Monitoring the Continuing Effectiveness of Hedges/Mitigations
The Bank regularly accesses the effectiveness of the strategies of the hedge positions and reviews the limits of the securitizations investment according to the volatility of the market prices. Both of the strategies and l imi ts wi l l report to Investment Subcommittee and make decision. Mitigations such as collaterals, guarantee, and credit derivatives apply to the standardized approach of the credit risk.
5. Approach for calculating the Bank’s capital requirement
Standardized approach
Annual Report 2016168
7. Financial Status Analysis, Operation Performance Analysis and Risk Management

Items Contents
6. General periodic disclosures including : (1) The purpose of securitization and the types of
risks borne and retained by the Bank for re-securitization
(2) Other risks associated with securitized assets(e.g. liquidity risk)
(3) The different roles played by the Bank Asset securitization and the level of participation in every stage
(4) Describe the monitoring procedures adopted for credit risk and market risk exposures associated with asset securitization
(5) Risk management policies adopted by the Bank to mitigate credit risks associated with securitization and re-securitization
Not applicable
7. Provide an overall description of the Bank’s accounting policies on securitization
Not applicable
8. The name of the external Credit Assessment Institution(ECAI) engaged for asset securitization within the Banking book and the ECAI’s involvement in every type of securitized asset
Not applicable
9. Describe any material changes of quantitative information since the last reporting period (e.g. shift of asset balances between the Banking book and the trading book)
Not applicable
Remarks:Item6-9 only applicable to Originating Banks which there is flow in the external positionThe undertaking of securitization: NoneThe original cost of the investing securitization product over TWD300 million in single deal: None The holding positions due to credit enhancement purpose as an originator: NoneAs a credit enhancement agency or liquidating assets agency: NoneAs a guarantee agency or financial liquidity provider: None
Assets securitization exposures and capital requirements Dec. 31, 2016
Unit: TWD thousand
Type of Exposures Type of Assets
Synthetic
Risk ExposuresCapital Requirements
Purchasing or Holding Securitization
Non-Originating Bank
Banking Book - - -
Trading Book - - -
- Total - - -
Annual Report 2016 169

7-6-1-3. Operational Risk
Operational Risk Management SystemYear 2016
Items Contents
1. Strategies and Processes The Bank’s operational strategies and processes are restrained the division of labor, employees training, effective control framework, and internal control procedure of each level. In aspect of internal control, the Bank had fully formulated the system of the internal audit, self-audit, law obedience, and business operational rules that may to search on the internal website for employees’ real time operation. The Bank reduces operational loss by internal and external audit to monitor and trace the risks. In order to assist all employees executing the processes of the operational risk, Risk Management Center is developing applied implements for managing operational.
2. The Structure and Organization of the Relevant Risk Management Function
(1) The Board of Directors: The Bank’s board of directors is the supervisor for risk management. The board
is responsible for the Bank’s business strategies, and is responsible for reviewing significant decisions.
(2) Asset, Liability and Risk Management Committee: The committee follows risk management policies and procedures that the board
of directors had approved. In addition, the committee is responsible to review the guidelines and policies of the operational risk, controls indicators, and coordinates assignments relative to risk management.
(3) Risk Management Center: The subcommittee draws strategies and processes of the operational risk,
designs and introduces risk identification, measurement, monitor, and reporting system. Moreover, the subcommittee develops the loss event databases of operational risk, gathers risk information from all Banks’ units, and reports to ALM committee and the board of the directors regularly.
(4) Headquarters’ Units They should totally understand the risk that they are facing. When they codify
operational regulations, they should consider operational risk management. They also should assist risk management subcommittee to accomplish all kinds of risk monitor.
(5) Other Bank’s Units: Everyone should comply with the Bank’s regulations and should control
operational risk. If risk event occurs, everyone should deal with the event immediately and should report to management.
(6) Audit Office: The office should execute auditing processes independently and should provide
improvement suggestion timely. 3. The Scope and Nature of the Risk
Reporting and/or Measurement Systems
The Bank had established the operational processes for business practices. The processes have been executed on daily operation management and to reduce the occurrence of the operational risk. The executive circumstance of the internal and external audit, self-audit, and the system of law obedience regularly reports to the board. The Bank adopts Supervisory regulation to classify loss event types and executes reporting system of the loss data of the operational risk and establishes whole bank’s loss database of the operational risk. The Bank reports the periodic information of the operational risk to the Asset and Liability Management Committee and The Board of Directors. The Bank conducts the self-assessment of the operational events before the end of May every year, compliance system, internal audit system, and self-inspection system to manage and reduce operational risk.
Annual Report 2016170
7. Financial Status Analysis, Operation Performance Analysis and Risk Management

Items Contents
4. Policies for Hedging and/or Mitigating Risk and Strategies and Processes for Monitoring the Continuing Effectiveness of Hedges/Mitigations
The Bank hedges and mitigates risks through strengthening internal control system, implementing operational risk monitor, training employees, insurance, and outsourcing. The Bank's emergency center and crisis subcommittee had formulated the strategic manual of the disasters and the contingency measures of the operating crisis to ensure every business that may continue to operate normally when the crisis occurs and to protect significant loss of the Bank.
5. Approach for calculating the Bank’s capital requirement
Basic indicator approach
The Operational Risk Capital ChargeDec. 31, 2016
Unit: TWD thousand
Year Annual Gross Income Capital Charge
2014 2,557,013
2015 2,736,068
2016 2,694,665
Total 7,987,746 399,387
7-6-1-4. Market Risk Market Risk Management System
Year 2016
Items Contents
1. Strategies and Processes In order to establish effective market risk management system, the Bank formulated market risk managing standard and other related regulations for the benchmark of the market risk management. To ensure the Bank’s market risk under control, the functional responsibility divides into trading and settlement, and will involve in risk control system. The system is responsible for the risk identification, measurement, monitor, and reporting procedure.The strategies of the Bank’s market risk are as follows: considering the characteristic of each instrument and market condition, regularly measuring endurable risks, expecting balance of returns and risks, optimizing investment allocation. The purpose of all strategies is to improve performance. On the other hand, the Bank formulated a limit system to effectively control risks and reduce exposures.
2. The Structure and Organization of the Relevant Risk Management Function
(1) The Board of Directors: The Bank’s board of directors is the supervisor for risk management. The
board is responsible to review market risk management system and market risk strategies, and to ensure the system reflects the Bank’s business strategies.
(2) Asset, Liability and Risk Management Committee: The committee executes risk management strategies and frameworks that the
board of directors had approved. In addition, the committee is responsible to review the principals, strategies, and monitoring indexes of the risk managing system and to coordinate and monitor each risk management relative to matters.
Annual Report 2016 171

Items Contents
(3) Investment Subcommittee: The subcommittee plans investment strategies and makes decision what the
positions should be sold or hold.(4) Risk Management Center: The subcommittee draws strategies and processes of the market risk
management, designs and introduces risk identification, measurement, monitor, and reporting system.
(5) Related Units: They execute necessary duties of the risk management such monitoring traders
and cooperate with Risk Management Center to finish each item of the risk monitor.
(5) Audit Office: The office should establish audit plan and process, and should review the Bank's
risk management at least once a year. 3. The Scope and Nature of the Risk
Reporting and/or Measurement Systems
Market risk information system should be able to control exposures and provide appropriate risk measurement results. For the purpose of the evaluation, the positions divide into trading book and banking book. The banking book positions evaluate once a month, the trading book positions evaluate on a daily basis. The information about gain/loss and exposures will deliver to management which includes market risk management reporting, derivative financial instruments gain/loss assessment. As close to gain/loss the stop-loss warning of pointers would keep attention to the market changes and take measure to avoid over-limit. Related Units monitor the position of TWD and foreign currency assets, gain/loss and stop-loss alert system for keep the market risk within the limits of the bank strength. In 2015, the Bank will use the PIRS system established by TEJ to pricing Bonds, CBAS, Option to reflect the real market price and compliance with regulations.
4. Policies for Hedging and/or Mitigating Risk and Strategies and Processes for Monitoring the Continuing Effectiveness of Hedges/Mitigations
The Bank’s hedging strategy of the financial products include to use spots or derivatives to evade market price risks and to review each risk limit regularly such as trading position limits, traders’ position limits, and stop loss limits. If the assessment indicates the risk overloaded, the Bank will transfer risks and reduce exposures. If dealers exceed their position limits, Risk Management Center should inform the facts and procedures to management and report daily until under limits. If dealers exceed their stop loss limits, they are required to execute positions.
5. Approach for calculating the Bank’s capital requirement
Standardized approach
The Market Risk Capital ChargeDec. 31, 2016
Unit: TWD thousand
Risk Category Capital Charge
Interest Rate Risk 616,613
Equity Position Risk 51,994
Foreign Exchange Risk 93,384
Option Position 0
Total 761,991
Annual Report 2016172
7. Financial Status Analysis, Operation Performance Analysis and Risk Management

7-6-1-5. Liquidity Risk
According to operating cash flow, market movement, and minimum requirement of the liquidity reserves ratio, the Bank diversifies funding resources and maintains funding stability. Short-term investment considers the safety of the underlying assets, marketable on the secondary market, and lower liquidity risk such as NCDs, treasury bonds, corporate bonds, and bank debentures. The Bank takes some steps to manage liquidity, for example, monitoring the structural change of assets and liabilities in each period, editing “The Gapping Report of the TWD Cash Flow” weekly, making the reporting sheets of the risk management every month and reporting to Asset and Liability Management Committee, and transferring and operating funds effectively.
According to “Standards Implementing the Liquidity Coverage Ratio of Banks” promulgated on Dec. 29, 2014 took effective on Jan. 1, 2015. Our bank Liquidity Coverage Ratio (LCR) was 266.67% that achieved the minimum required 80%.
Analysis for Time-to-Maturity of the Bank’s TWD Assets and Liabilities as of Dec. 31, 2016
Unit: TWD thousand
TotalVolumes during the period prior to the due date
0~10Days
11~30 days
31~90 days
91~180days
181 days~ 1 year
Over 1 year
Major inflows of matured funds 152,413,756 16,269,565 9,841,123 7,584,071 10,449,131 21,082,658 87,187,208
Major outflows of Matured funds 171,112,011 5,983,794 9,029,244 23,417,030 29,432,943 48,466,898 54,782,102
Maturity Gap (18,698,255) 10,285,771 811,879 (15,832,959) (18,983,812) (27,384,240) 32,405,106
Analysis for Time-to-Maturity of the Bank’s USD Assets and Liabilities as of Dec. 31, 2016
Unit: USD thousand
TotalVolumes during the period prior to the due date
0~30 days
31~90 days
91~180 days
181 days - 1 year
Over 1 year
Major inflows ofmatured funds 93,750 34,533 35,186 6,177 3,000 14,854
Major outflows of Matured funds 93,750 69,604 18,597 2,199 3,350 0
Maturity Gap (35,071) 16,589 3,978 (350) 14,854
Annual Report 2016 173

7-6-2. Impact of Alterations in Domestic and Foreign Major Polices and Laws on the Bank’s Financial Operations and Adopting Measures
7-6-2-1 Impact on Money Laundering Control Act
• Change in Regulations The revision of “Money Laundering Control Act” was announced on December 28, 2016, and effective in 6 months after then.
In addition, the Financial Supervisory Commission amended the “Directions Governing Anti-Money Laundering and Countering Terrorism Financing of Banking Sector” on December 2, 2016, and except Article 8、9、16 effective on April 1, 2017, others effective on January 1, 2017.
• Impact and Adopting Measures Based on the “Guidelines Governing Money Laundering and Terrorist Financing Risks Assessment and Relevant Prevention
Program Development by the Banking Sector” of the Bankers Association, the bank had formulated the policy and process of the risk of AML/CFT, and the risk of identify, assess, monitor, and control of money laundering/financing of terrorism. Besides employees’ training, the bank also established an independent department specializing in AML and being responsible for the accomplishment in order to strength the control of AML/CFT.
7-6-2-2 Impact on the Foreign Account Tax Compliance Act (FATCA)
• Change in Regulations Taipei Economic and Cultural Representative Office in the United States (TECRO) and American Institute in Taiwan (AIT) had
signed the FATCA Agreement on Dec. 22, 2016 (The Eastern Time Zone, ET). The Financial Supervisory Commission reported the agreement to Executive Yuan then transferred to Legislative Yuan for reviewing. The agreement will be passed by Legislative Yuan and effected by the announcement of the President.
• Impact and Adopting Measures If banks refuse to follow FATCA, they will result in punishment withholding tax of 30% on investment income from the US territory
or financial institutions of the FFI (Foreign Financial Institution) agreement. The bank has assigned a task group to deal with FATCA and hired KPMG to provide professional consulting services and to assist the bank in practices. The bank has completed registration and obtained a global intermediary identification number (GIIN) on IRS website on April 22, 2014. The bank will revise the policy and procedure and training employees as FACTA Agreement effective in Taiwan.
7-6-2-3 The banks appropriate for financial technology development of employees transition from Special Reserve
• Change in Regulations The Financial Supervisory Commission announced the regulation on May 25, 2016.The public banks must appropriate 0.5 percent
to1 percent of net income (after taxes) for financial technology development of employees transition expense from Special Reserve when distribute 2016-2017 profit.
• Impact and Adopting Measures Financial digitalization has become the future trend for financial industry. The Bank will continuously train the employee and
enhance their skills on financial technologies.
Annual Report 2016174
7. Financial Status Analysis, Operation Performance Analysis and Risk Management

7-6-2-4 Impact on Basel III
• Change in Regulations Financial Supervisory Commission and Central Bank of the Republic of China promulgated “Standards Implementing the Liquidity
Coverage Ratio of Banks” on December 29, 2014. • Impact and Adopting Measures The Basel III made a great impact on Asian banks is the strict regulations on liquidity assets. The reason is parts of banks lack
of the high-quality current assets, the operator must also adopt new science and technology or upgrade the internal system to manage the mobility risk and obey the mobility new standard. The main difference between The Basel III and previously supervision system is the banks have to deal with the Liquidity Coverage Ratio (LCR) and the net stable funding ratio (NSFR) for managing liquidity risks. The LCR requires the banks should own high-quality liquidity assets to meet net cash outflow under severe situation within 30 days. The purpose of the NSFR is to encourage banks to use more stable funding sources that may strengthen the ability of the loading when banking industry faces long-term pressures which means to use the medium and long-term funding strategy, rather than use less short-term assets. The Bank’s LCR is 266.67% based on January 2017 data which has already achieved the minimum requirement of the 80%.
The schedules on LCR implement, LCR cannot be lower the following ratios each year:
2015 2016 2017 2018 2019
Min LCR (%) 60 70 80 90 100
The NSFR will be executed in 2018 based on current expected.
7-6-3. Impact of Technological and Industrial Changes on the Bank’s Financial Operations and Adopting Measures
The Bank had provided e-bank service to reduce cost and enhance business efficiency. Although it brings convenience and cost-down, it still had some risks of the information safety such as program errors, system crashes, or hacker attacks. They will therefore create unpredictable losses and operational risks. To avoid the occurrence of the loss events, the Bank will train employees to recognize the information safety and to deal with emergent events. This will reduce the probability of the risk occurrence. In order to enhance the Bank’s assets quality and reduce loan risks, the related loan departments provide industrial research reports without a fix schedule and observe the industrial changes at any time.
7-6-4. Impact on the Bank of Changes in the Bank’s Image and Adopting Measures The Bank holds the spirit of “take resource from society and contribute to community” to take the responsibility of the enterprise citizen. Participating active social welfare activities through founded “COTA Culture and Education Foundation”. Facing keen competition, the Bank still maintains the spirit of “being respectful to customers” to provide the professional financial services to customers. The Bank hopes to maintain long-term stable relationship with customers by clear and professional image and to create a win-win situation between enterprise and clients.
Annual Report 2016 175

7-6-5. Expected Benefits and Potential Risks of Mergers and Acquisitions and Adopting Measures
Currently, no merger or acquisition plan.
7-6-6. Expected Benefits and Potential Risks of Branches Location Expansion and Adopting Measures
To expand the scale of customer service, increase business efficiency, and create brand awareness and market share, the Bank cautiously evaluates to expand business location every year cause of the business unit might create operating risk and credit risk.
7-6-7. Risk Arising from the Concentration of Business and Adopting Measures
The Bank had formulated risk limit regulations such as the same person, the same party, affiliates and all kind of industries on loan and investment businesses. In addition, the Bank controls concentration of all bank’s business lines through information management system. This can diversify risk, keep assets’ quality and assured operating moderate.
7-6-8. The Influence and Risk Posed by Changes in Operating Control Rights and Adopting Measures
There have been no changes in operating control.
7-6-9. The Influence and Risk Posed by Mass Shares Transfer of Directors, Supervisors or Major Shareholders with Shares holding over 1% and Adopting Measures: None
7-6-10. Lawsuits: None
7-6-11. Other Significant Risks and Adopting Measures
Other risks such as strategically risk, goo dwill risk, and the risk of the obedience of laws, the Bank will adjust the business policy in accordance with the change of the market condition and the modification of the laws to enhance business flexibility and competition.
Annual Report 2016176
7. Financial Status Analysis, Operation Performance Analysis and Risk Management

7-7. Crisis Handling System:
7-7-1. In order to manage crisis handling system, the Bank formulated some related rules, taking measures, and adopting manual of disasters to effectively reduce damage and protect customers’ rights. The Bank also established contingent task team to execute contingency solving measures.
7-7-2. In order to rapidly deal with disasters, the Bank established the emergency call and reporting system in the ordinary time. The managers of each unit charges with contact assignment.
7-7-3. In the event of significant and unforeseeable contingencies, the Bank will report the event to competent authority in addition to inform police department or related institution to take emergency remedy approaches.
7-7-4. In the event of natural disasters, the Bank will obey “The operating directions of the averting disasters for financial institutions” and “The operating directions of closed business as disasters occurring for financial institutions” formulated by competent authority. For check cleaning and dishonored check information filing, the Bank will obey “The operating directions of check cleaning and dishonored check information filing for partly office terminate area” formulated by the Taiwan Cleaning House.
7-8. Other Significant Matters: None
Annual Report 2016 177

Your Best Partner!Integrity.Innovation.Friendly.service
178 Annual Report 2016

8. Special Notes
179COTA Commercial Bank Annual Report 2016

COTA Bank Insurance Broker Co., Ltd.Number of shares: 500,000Percentage of shareholding: 100%
COTA Commercial Bank
8-1. Data of Affiliated Company
8-1-1. Organization Chart of Affiliated Company
8-1-2. Profile of Affiliated CompanyUnit: TWD thousand
Company name Established date Address Paid-in capital Major business itemCOTA Bank Insurance Broker Co., Ltd. Apr 16, 2008 3F., No.339, Dazhi Rd., East Dist.,
Taichung City 401, Taiwan 5,000 Property insurance brokerLife insurance broker
8-1-3. Infer Controller and Subsidiary Own the Same Shareholders’ Data: None
8-1-4. Data of Affiliated Company’s Director and Supervisor
Company name Title Name or RepresentShares
Number of shares Percentage of shareholding (%)
COTA Bank Insurance Broker Co., Ltd.
Chairman Chan-wen Lin
500,000 100.00
Director Yong-Zhi WangDirector Ying-Che ChangDirector Cai-Xiong LiaoDirector Lien-Kui WangDirector Yao-Ting LiSupervisor Jun-ChuanWang
8-1-5. Business Operation of Affiliated CompanyAs of Dec.31, 2016
Unit: TWD thousand
Firm’s Name Capital Asset Liability Net Income
Operating Income
Operating Margin
Net Income After Tax
EPS After Tax(dollar)
COTA Bank Insurance Broker Co., Ltd. 5,000 68,375 28,862 39,513 243,922 31,764 26,564 53.13
8-1-6. Consolidated Financial Statement of Affiliated Company Details
Please see consolidated financial statement.
8-1-7. Affiliated Statement: N/A
Annual Report 2016180
8. Special Notes

8-2. Private Placement of Securities: None
8-3. Holdings or Disposal the Stock of COTA Bank by Subsidies: None
8-4. Other Matters for Supplementary Explanation: None
8-5. Pursuant to Item2, Paragraph 2, Article 36 of Security and Exchange Act, the Incidence Exerting Material Influence on Shareholders’ Rights or Security Prices: None
Annual Report 2016 181

1999.01.01 COTA Commercial Bank Co., Ltd. officially inaugurated business services.1999.01.02 Mr. Liao Chun-Tse, Mr. Yen Chun-chi, Mr. Lin Ping-Chih, Mr. Yang Chao-Hui and Mr. Wu Wen-Hua were elected
the managing directors in the first board of directors meeting of the first session, Mr. Liao Chun-Tse elected the chairman and Mr. Wang Chun-chuan appointed the General Manager.
1999.01.03 Started up foreign exchange services with trading of USD, JPY, and HKD in cash and traveler checks.1999.02.05 Started up comprehensive deposit services.1999.03.16 Totally replaced stock certificates of Taichung Third Credit Cooperative into common share certificates of COTA
Commercial Bank Co., Ltd.1999.03.25 Donated the TWD 54.2 million Taichung Third Credit Cooperative public welfare fund to COTA Culture and
Education Foundation in full, and duly elected directors and supervisors of the Foundation.1999.03.25 Started up guarantee services.1999.03.30 Signed a contract to team up with Chinatrust Commercial Bank to jointly promote foreign exchange services.1999.04.14 Relocated head office, approved by Ministry of Finance under doc. no. Tai-Tsai-Jung 88112588, to 32~1 Park
Avenue, Taichung on Jul 1.1999.07.01 Banking Dept. and Savings Dept. moved address.1999.07.28 Allied with Bank of PanShin, Sunny Commercial Bank, HwaTai Commercial Bank and Kaohsin Commercial Bank
to jointly set up “Financial Development Alliance”1999.09.03 Set up three additional branches, Zhanghua Branch, Yuanlin Branch and Fengyuan Branch as approved by
Ministry of Finance under doc. no. Tai-Tsai-Jung-Tze 88744410.1999.11.29 The board of directors appointed Mr. Chang Ying-Che as president in its 6th extraordinary meeting of the first
term.2000.01.01 President Chang Ying-Che inaugurated.2000.04.26 Set up Fengyuan Branch.2000.05.10 Held 2000 shareholders’ regular meeting.2000.05.19 Set up Zhanghua Branch.2000.07.07 Set up Yuanlin Branch.2000.11.03 Wenhsin Branch spin into 2 mini branches as approved by Ministry of Finance under doc. no. Tai-Tsai-Jung
89759294.2001.01.05 Started business for Credit card.2001.04.02 Set up Wenhsin Mini Branch and Beitun Mini Branch.2001.06.01 Started business of insurance broker.2001.06.19 Held 2001 shareholders’ regular meeting and elected second term of directors and supervisors.2001.06.21 Started Trust business as approved by Ministry of Finance under doc. no. Tai-Tsai-Jung (3)-Tze 90746774.2001.07.17 Started internet banking services as approved by Ministry of Finance under doc. no. Tai-Tsai-Jung- (3)-Tze
90234040.2001.08.01 Established Taipei Branch as approved by Ministry of Finance under doc. no. Tai-Tsai-Jung (3) 90303504.2001.08.23 Started Internet Banking services.2001.09.05 Set up Trusts Department.2001.09.24 Savings Dept. renamed Taichung Branch.2001.09.28 Added Xinzhu city and Xinzhu Hsien to be business area as approved by Ministry of Finance under doc. no.
Tai-Tsai-Jung (3) 90721973.
Annual Report 2016182
*Chronological Highlights
2002.01.01 Mr. Liao Chun-Tse, Mr. Wang Chun-chuan, Mr. Wu Wen-Hua, Mr. Chiang Po-ling and Mr. Lin Ping-Chih were elected as managing directors in the board of directors meeting. Mr. Liao Chun-Tse elected as the chairman.
2002.02.01 Set up Consumer Banking Center and NPL Management Center.2002.03.11 Set up Taipei Branch.2002.05.09 Held 2002 shareholders’ regular meeting.2002.06.27 Added Taoyuan Hsien to be business area as approved by Ministry of Finance under doc. no. Tai-Tsai-Jung- (3)-
Tze 0913000230.2003.02.17 Zhongzheng Branch moved to Taoyuan city and renamed Taoyuan Branch, Wenhsin Mini Branch moved to old
Zhongzheng Branch address and renamed Zhongzheng Mini Branch as approved by Ministry of Finance under doc. no. Tai-Tsai-Jung- (3)-Tze 0920005698.
2003.04.21 Zhongzheng Mini Branch reopened for business.2003.05.06 Held 2003 shareholders’ regular meeting.2003.07.25 Set up Taoyuan Branch.2003.09.16 Added Taipei and Taipei hsien to be business area as approved by Ministry of Finance under doc. no. Tai-Tsai-
Jung- (3)-Tze 0920033399.2004.01.01 Started up chip ATM card services.2004.05.07 Held 2004 shareholders’ regular meeting.2004.07.05 Renewed core computer systems.2004.07.06 Added Taipei city as business area as approved by FSC under doc. no. (3)0930022905.2004.07.27 Relocated Shalu branch to Banciao branch as approved by FSC under doc. no. (3)0930023291.2004.11.11 Banciao branch opened.2004.11.24 FSC approved COTA Bank to set up International Banking Department.2005.03.16 Established International Banking Department.2005.05.24 Held 2005 shareholders’ regular meeting and elected 3rd term of directors and supervisors.2005.05.25 Mr. Liao Chun-Tse, Mr. Hang Mu-Chuan, Mr. Wang Chun-Chuan, Mr. Hsieh Tung-Po, and Mr. Li Yao-Ting were
elected as the managing directors in the board of directors.Mr. Liao Chun-Tse was elected as the chairman.
2005.09.09 Issued subordinated bank debenture for TWD2.5 billion as approved by FSC under doc. no. (3)0940024574.2005.09.17 Held 2005 shareholders’ extraordinary meeting and approved to acquired Fengyuan Credit Cooperative.2005.11.04 Joint as member of SMEG (Small and Medium Enterprise Credit Guarantee Fund) 2005.11.17 Acquired Fengyuan Credit Cooperative as approved by FSC under doc. no. (3)0943001682.2005.12.12 Relocated Credit Card Center to 339, Dazhi Road., Taichung City.2006.01.01 The effective day of Fengyuan Credit Cooperative merged into COTA Bank.
Added six branches: Fengxin branch, Zhongshan branch, Fengle branch, Fengdong branch, Shiqian branch and Sanmin branch.
2006.01.03 Launched Electronic Official Document System. 2006.02.17 Six Branches in Fengyuan started up foreign exchange services in cash and traveler checks.2006.04.01 Established North Area Office of Credit Management Dept.2006.06.09 Held 2006 shareholder’s regular meeting.
Annual Report 2016 183

2006.06.14 FSC approved COTA Bank to set up wealth management banking business. 2006.07.01 Established Wealth Management Center.2006.07.06 FSC approved COTA Bank to set up OBU.2006.09.22 Trusts Dept. moved to 2F. No.339, Dajhih Rd., East District, Taichung City 401, Taiwan2007.01.17 Set up Kaohsiung Branch.2007.06.06 Held 2007 shareholder's regular meeting.2007.07.06 Set up Tainan Branch.2008.05.26 Sanmin Branch moved to Xinzhuang City and renamed Xinzhuang Branch as approved by FSC under doc. no.
Chin-Kuan-Yin-(3)-Tze 09700201230.2008.06.19 Held 2008 shareholder’s regular meeting and elected 4th term of Director and Supervisor.2008.06.20 Mr. Liao Chun-Tse, Mr. Chang Ying-Che, Mr. Xie Dong-Po, Mr. Li Yao-Ting, and Mr. Wang Yen-Chun were elected
as managing directors in board of directors meeting. Mr. Liao Chun-Tse was elected as the chairman.2008.07.21 Set up subsidiary “COTA Bank Insurance Broker Co., Ltd.”2008.09.30 President Mr. Chang Ying-Che retired.
Mr. Chang Chin-Ting was appointed as President.2008.10.01 President Chang Chin-Ting inaugurated.2008.12.06 Sep up Xinzhuang Branch.2009.05.27 Held 2009 shareholder's regular meeting.2009.12.18 Set up “Remuneration and Assessment Committee” and formulated such committee regular activities of an
organization in board of directors meeting.2010.01.20 Fengxin Branch moved to Xinzhu City and renamed as Xinzhu Branch, meanwhile renamed Shiqian Branch as
Fengxin Branch as approved by FSC under doc. no. Chin-Kuan-Yin-He-Tze 09900016600.2010.01.27 Started up「Financial XML Collection service」2010.03.22 Launched Foreign-exchange business with transaction amount more than TWD500,000 in internet banking.2010.04.01 Shiqian Branch renamed as Fengxin Branch.2010.05.14 Been named the winner of special award under “The Program to Encourage Lending by Domestic Bank to SME”
recognized by the FSC 2010.05.27 Held 2010 shareholder's regular meeting.2010.06.14 Sep up Xinzhu Branch.2010.08.11 Publically announced new shares offering in 2010.2010.10.04 COTA Bank was conferred an award of e-Bill Business and two awards of Financial XML Business for best system
stability and business promote from The Bankers Association of the R.O.C. 2010.12.24 COTA Bank was conferred “Chin-An award” from Joint Credit Information Center.2011.01.01 Beitun Mini Branch renamed Beitun Branch and reopened for business.2011.01.12 Launched new self-developed specimen checking system.2011.02.21 Redemption notice of 2006 1st subordinated bank debentures.2011.02.24 Issued 2011 1st subordinated bank debentures.2011.06.09 Held 2011 shareholder’s regular meeting.2011.07.01 Local branches extended banking hours to 4:00 pm on Monday to Friday.
Annual Report 2016184
*Chronological Highlights

2011.08.30 Held 2011 shareholders’ extraordinary meeting and elected fifth term of directors and supervisors.2011.08.31 Mr. Hsiao Kuo-Chao, Mr. Liao Song-Yie, Mr. Chang Ying-Che, Mr. Huang Mu-Chuan, Mr. Wang Yen-Chun
were elected as managing directors in board of directors meeting. Mr. Hsiao Kuo-Chao was elected as the chairman.
2011.10.01 Beitun Branch started up credit business.2012.02.01 Launched business of regular variable special-purpose money trust funds investing in foreign securities and
domestic securities investment trust funds.2012.06.07 Held 2012 shareholder’s regular meeting.2012.08.01 Distribution of 2012 cash dividends.2012.08.10 Obtained approval of foreign exchange licenses for branches of Xitun, Dazhi, Nantun, Fengyuan, Zhanghua,
Yuanlin, Taipei, Taoyuan, Banciao and Tainan.2012.09.05 Publically announced new shares offering in 2012.2012.09.13 Fengdong Branch moved to Fengshan and renamed Fengshan Branch, Zhongzheng Mini Branch moved to
Fengyuan and renamed Fengdong Mini Branch as approved by FSC under doc. no.Chin-Kuan-Yin-He-Tze 10100292650.
2012.10.09 Launched business of pre-construction real estate escrow account trust2012.11.01 COTA Bank was conferred “E-payment business Innovation Excellence Award” from FISC mobile banking
business.2012.11.15 Launched UnionPay card acquiring in ATMs.2012.12.26 COTA Bank was conferred “Golden Security Award” from Joint Credit Information Center. 2013.02.21 Launched business of RMB.2013.03.18 Zhongshan Branch moved, Fengle Branch moved and renamed Daya Branch as approved by FSC under doc.
no.Chin-Kuan-Yin-He-Tze 10200065840.2013.04.22 Zhongzheng Mini Branch moved to Fengyuan and renamed Fengdong Mini Branch and reopened for business.2013.05.30 Held 2013 shareholder’s regular meeting.2013.06.24 Zhongshan Branch moved to 36, Daming Road, Fengyuan District, Taichung City and reopened for business.2013.07.24 Fengshan Branch grand opening.2013.08.20 Received “Best Awards of Creation’’ recognized by Financial Information Service Co., Ltd. for domestic USD
clearing platform.2013.09.27 Publically announced new shares offering in 2013.2014.03.04 Held 2014 shareholder’s extraordinary meeting.2014.04.22 COTA Bank have registered with the IRS and obtained GIINs.2014.05.15 Held 2014 shareholder’s regular meeting2014.05.16 Launched Pre-Construction Real Estate Trust2014.05.26 Daya Branch opened2014.07.01 Launched business of Gold Passbook2014.12.17 Obtained approval of foreign exchange licenses for branches of Banking Dept., Chenggong, Xinzhuang, Xinzhu
and Fengshan.2014.12.22 COTA Bank was conferred “Golden Security Award” from Joint Credit Information Center.2014.12.29 Held 2014 shareholder’s 2rd extraordinary meeting for voting directors.
Annual Report 2016 185

2015.01.08 Mr. Liao Song-Yie and Chuan Cheng Hat Co., Ltd. were elected as managing directors in board of directors of the 7th Session of 1st extraordinary meeting.
2015.01.23 Mr. Kun-Hsien Lin, Mr. Kuo-Chao Hsiao and Ying-Che Chang-Corporation Representative of Deng Heng Enterprise Co., Ltd. were elected as managing directors in board of directors, Mr. Liao Sung-Yie was elected as Chairman in board of directors of the 7th Session of 3rd extraordinary meeting.
2015.02.07 Legal & Compliance Department founded2015.04.01 Obtained approval of foreign exchange licenses for branches of Guoguang, Linsen, Nanmen, Jinhua and Beitun. 2015.04.20 Qiaotou Branch opened2015.04.29 Received ‘The best performance of creative industries loan’’ recognized by FSC 2015.05.06 Gift cards advance payment trust and dealing trust launched2015.06.10 Held 2015 shareholder’s regular meeting.2015.06.13 For celebrating COTA Bank 100 years of history, ‘Living in affluence forever - COTA 100’ a hiking event held2015.07.01 Mobile banking foreign exchange business approved by CBC Foreign Bureaus 2015.07.21 Fengdong Mini-Branch upgraded to Fengdong Branch at the same address as approved by FSC under Doc.
No.Chin-Kuan-Yin-He-Tze 10400174980.2015.08.27 Publically announced cash capital increase issuance of new shares in 2015.2015.09.01 Trust business online account opened for common customer / wealth management customer launched 2015.10.01 Fengdong Mini-Branch upgraded to Fengdong Branch2015.10.24 For celebrating COTA Bank 100 years of history, ‘Love connection Hot blood - COTA 100’ a blood donation
charitable event held at SKM Hui-An Parking lot2015.10.27 Dadu Branch opened2015.11.27 Fengdong Branch moved to Taiping Dist., Taichung and renamed Taiping Branch as approved by FSC under Doc.
No.Chin-Kuan-Yin-He-Tze 10400282100, which self-executing from 2015.11.272015.12.01 Electronic Banking Department founded2016.03.29 New revision website launched.2016.04.15 A new function added about applying for credit card on line.2016.04.18 A new function added about account closing with limited amount on line. 2016.06.07 Held 2016 shareholder’s regular meeting.2016.06.08 The Book Donation Project be initiated from TCCE Foundation and COTA donated TWD 0.5 million. 2016.07.27 Publically announced capital increase by earnings in 2016 and cash dividend in2015.2016.09.08 Longjing Branch opened2016.09.26 Fongdong Branch moved and renamed Taiping Branch and reopened for business.2016.10.28 Provided new currency service that A UD added for FISC domestic clearing platform.2016.11.08 Tianzhong Branch opened2016.12.17 Held blood donation charitable event. 2016.12.27 Chairman attended “Golden Security Award” held from JCIC.
Provided foreign currency ACH.
Annual Report 2016186
*Chronological Highlights

Head Office and Branches
Unit Address Tel FaxHead Office 59 Shihfu Road, Central District, Taichung City 400, Taiwan 886-4-22245171 886-4-22275237Trusts Dept. 2F., .339, Dazhi Road, East District, Taichung City 401, Taiwan 886-4-22807366 886-4-22809021International Banking Dept. 2F., 246 Yangguang Street, Neihu District, Taipei City 114, Taiwan 886-2-87533599 886-2-87533573Offshore Banking Branch 2F., 246 Yangguang Street, Neihu District, Taipei City 114, Taiwan 886-2-87533599 886-2-87533573Consumer Banking Center 10F, 580 Jinhua Road, North District, Taichung City 404, Taiwan 886-4-22384596 886-4-22378150SME Banking Center 11F, 580 Jinhua Road, North District, Taichung City 404, Taiwan 886-4-22370028 886-4-22372595Wealth Management Center 2F., .339, Dazhi Road, East District, Taichung City 401, Taiwan 886-4-22800361 886-4-22809747Credit Card Center 2F., .339, Dazhi Road, East District, Taichung City 401, Taiwan 886-4-22805288 886-4-22807688Taichung Branch 59 Shihfu Road, Central District, Taichung City 400, Taiwan 886-4-22245161 886-4-22234491Banking Dept. 32-1 Gongyuan Road, Central District, Taichung City 400, Taiwan 886-4-22211186 886-4-22229536Chenggong Branch 580 Jinhua Road, North District, Taichung City 404, Taiwan 886-4-22304100 886-4-22304701Xitun Branch 458 Sec. 2, Henan Road, Xitun District, Taichung City 407, Taiwan 886-4-27062968 886-4-27063816Guoguang Branch 333 Sec. 3, Fusing Road, South District, Taichung City 402, Taiwan 886-4-22245111 886-4-22229281Dazhi Branch 339 Dazhi Road, East District, Taichung City 401, Taiwan 886-4-22815998 886-4-22815977Linsen Branch 99 Linsen Road, West District, Taichung City 403, Taiwan 886-4-23725151 886-4-23723024Nanmen Branch 75 Nanmen Road, South District, Taichung City 402, Taiwan 886-4-22871146 886-4-22862412Jinhua Branch 255 Jinhua North Road, North District, Taichung City 404, Taiwan 886-4-22333550 886-4-22335164Nantun Branch 410 Nantun Road, Nantun District, Taichung City 408, Taiwan 886-4-24718500 886-4-24758522Beitun Branch 751 Sec. 4, Wunsin Road, Beitun District, Taichung City 406, Taiwan 886-4-22426565 886-4-22417153Fengyuan Branch 214 Yuanhuan E. Road, Fengyuan District, Taichung City 420, Taiwan 886-4-25151788 886-4-25151895Zhanghua Branch 181 Sec. 2, Zhongzheng Road, Zhanghua City, Zhanghua County 520, Taiwan 886-4-7298686 886-4-7298585Yuanlin Branch 189 Sec. 1, Datong Road, Yuanlin Town, Zhanghua County 510, Taiwan 886-4-8383888 886-4-8383666Taipei Branch 246 Yangguang Street, Neihu District, Taipei City 114, Taiwan 886-2-87512588 886-2-87512788Taoyuan Branch 9 Sec. 2, Chenggong Road, Taoyuan City, Taoyuan County 330, Taiwan 886-3-3470505 886-3-3357373Panchiao Branch 260 Minzu Road, Panchiao City, New Taipei City 220, Taiwan 886-2-89536001 886-2-89536011Fengxin Branch 353, Zhongshan Road, Fengyuan District, Taichung City 420, Taiwan 886-4-25261181 886-4-25269540Zhongshan Branch 9, Daming Road, Fengyuan District, Taichung City 420, Taiwan 886-4-25277155 886-4-25269553Kaohsiung Branch 1, Wenfu Road, Zuoying District, Kaohsiung City 813, Taiwan 886-7-3505685 886-7-3506711Tainan Branch 438,Sec 2,Datung Road, South District, Tainan City 702, Taiwan 886-6-2130966 886-6-2149088Xinzhuang Branch 287,Chung Ping Road, Xinzhuang District, NewTaipei City 242, Taiwan 886-2-22768887 886-2-22768611Xinzhu Branch 196, Minsheng Road, East District, Hsinchu City 300, Taiwan 886-3-5313225 886-3-5323611Fengshan Branch 478, Wenheng Road, Fengshan District, Kaohsiung City 830, Taiwan 886-7-7676772 886-7-7678719Daya Branch 336, Yahuan Road, Daya District, Taichung City 428, Taiwan 886-4-25692549 886-4-25693431Qiaotou Branch 55, Chenggong Road, Qiaotou District, Kaohsiung City 825, Taiwan 886-7-6116860 886-7-6112208Dadu Branch 426-7, Sec.1, Shatian Road, Dadu District, Taichung City 432, Taiwan 886-4-26930289 886-4-26930293Longjing Branch No.196, Sec. 1, Zhongyang Rd., Longjing Dist., Taichung City 434, Taiwan 886-4-26397699 886-4-26397106Tianzhong Branch No.136, Sec. 2, Yuanji Rd., Tianzhong Township, Changhua County 520, Taiwan 886-4-8750886 886-4-8751268Taiping Branch No.233, Huantai E. Rd., Taiping Dist., Taichung City 411, Taiwan 886-4-23915189 886-4-23915255
Annual Report 2016 187

Article 1 The Code of Ethics of COTA Commercial Bank (the “COTA”) was established for the directors and managers of the COTA, as well as persons with the power of signature and managing matters for the COTA, so that they can comply with ethical standards.
Article 2 Directors, managers and persons with the power of signature and managing matters for the COTA must be objective and effective in handling COTA business and must not use their role in the COTA to allow themselves, their spouses, parents, children or close second-level relatives to obtain inappropriate benefits. The COTA must avoid any conflict of interest when providing capital loans or guarantees, or conducting major asset trading or buying (selling) transactions for enterprises related to the aforementioned personnel. These persons must voluntarily explain if there is any potential conflict of interest between themselves and the COTA.
Article 3Directors, managers and persons with the power of signature and managing matters for the COTA must not:(1) plan to obtain personal gains by using COTA assets, COTA information, or their role in the COTA;(2) compete with the COTA. When opportunities for the COTA to obtain profits arise, directors, managers and persons with
the power of signature and managing matters for the COTA have the responsibility to increase the legitimate and legal benefits the COTA may possibly gain.
Article 4Directors, managers and persons with the power of signature and managing matters for the COTA must uphold the principles of fairness, integrity and transparency in the commercial process and shall not offer, promise, demand or receive any improper benefits directly or indirectly, nor commit unethical acts that violate the ethics, laws or their duties to obtain or maintain the benefit.
Article 5Directors, managers and persons with the power of signature and managing matters for the COTA are obligated to not divulge information of the COTA or its buying (selling) clients unless otherwise authorized or required by law. Information to be concealed includes all unpublished information that, if leaked, may be used by competitors or cause damage to the COTA or its clients.
Article 6Directors, managers and persons with the power of signature and managing matters for the COTA must treat buying (selling) clients, competitors and staff fairly, and must not gain benefits inappropriately by manipulating, concealing or abusing information obtained as part of their role in the COTA; or by misrepresenting important facts or employing other unfair trading practices.
Article 7Directors, managers and persons with the power of signature and managing matters for the COTA have the responsibility to protect the assets of the COTA and ensure their effective and legal use in the business.
COTA Commercial Bank Code of Ethical Conduct
Annual Report 2016188

Article 8Directors, managers and persons with the power of signature and managing matters for the COTA must comply with the Financial Holding COTA Act and the Securities and Exchange Act, follow other rules and regulations, and enforce the publicity of ethical values.
Article 9The COTA encourages staff to report to the board of directors, managers, Chief of Internal Audit or other appropriate personnel in the event that they suspect or discover behavior contrary to the laws and regulations or the Code of Ethics, and to provide sufficient information for the COTA to take appropriate follow-up action.To encourage employees to report violations, the COTA should set up a specific report system and let employees know that the COTA will make every effort to protect the safety of the reporter from suffering retaliation.
Article 10If there is a situation where a director, manager or a person with the power of signature and managing matters for the COTA breaches the Code of Ethics, the COTA shall take disciplinary action in accordance with the COTA Act, the Articles of Incorporation, international regulations or other related laws and regulations, and the COTA shall immediately disclose the information regarding the violation on the Market Observation Post System, including the title and name of the offender, violation date and reason, code of violation, processing status, etc. The COTA should also establish a corresponding appeals system to provide assistance for personnel accused of breaching the Code of Ethics.
Article 11The approval of the board of directors is required if an exemption to follow the Code of Ethics by directors, managers or persons with the power of signature and managing matters for the COTA is necessary. Details of the exemption, including exempt person, title, date approved by the board, independent directors’ opposing or reserved opinions, period of the exemption, reason for the exemption and the code applicable, must be posted on MOPs in a timely manner. This allows shareholders to assess if the decision of the board was appropriate and should suppress suspicious exemptions or exemptions requested at will from happening. It also ensures that a proper control and management system exists for any exemption in order to protect the interests of the COTA.
Article 12The COTA should publish its Code of Ethics on annual report, public information booklet and the Open Information observatory; it should do so whenever the Code of Ethics is revised.
Article 13The Code of Ethics of the COTA will be implemented after being approved by the board of directors, audit committee and will be presented in shareholders’ meetings; and the same shall apply whenever it is revised.
189COTA Commercial Bank Annual Report 2016


2016